Notebookcheck Logo

AMD Ryzen AI Max+ 395 Analysis - Strix Halo to rival Apple M4 Pro/Max with 16 Zen 5 cores and iGPU on par with RTX 4070 Laptop

Strix Halo with up to 96 GB VRAM.

The new Ryzen AI Max+ 395 is AMD's latest high-end mobile processor. With up to 16 Zen 5 cores, a powerful Radeon GPU, fast NPU and up to 128 GB RAM, the Ryzen AI Max+ is supposed to be the ideal companion for gaming, content creation, and AI development. Update: Performance at different TDP levels & RAM performance

AMD launches the new Ryzen AI Max chips as new mobile processors with powerful processors and fast iGPUs, which can used shared memory. Depending on the configuration, you can allocate up to 96 GB VRAM, which can be an advantage for demanding picture/video editing or AI development. We review the Ryzen AI Max+ 395, the flagship of the new Strix Halo series and compare it with CPU/GPU performance of the competition. We also check how the monster APU handles games and whether there are efficiency advantages over systems with CPUs and dedicated GPUs.

February 24, 2025 update: CPU performance at difference power limits & RAM performance added

Overview - AMD Ryzen AI Max

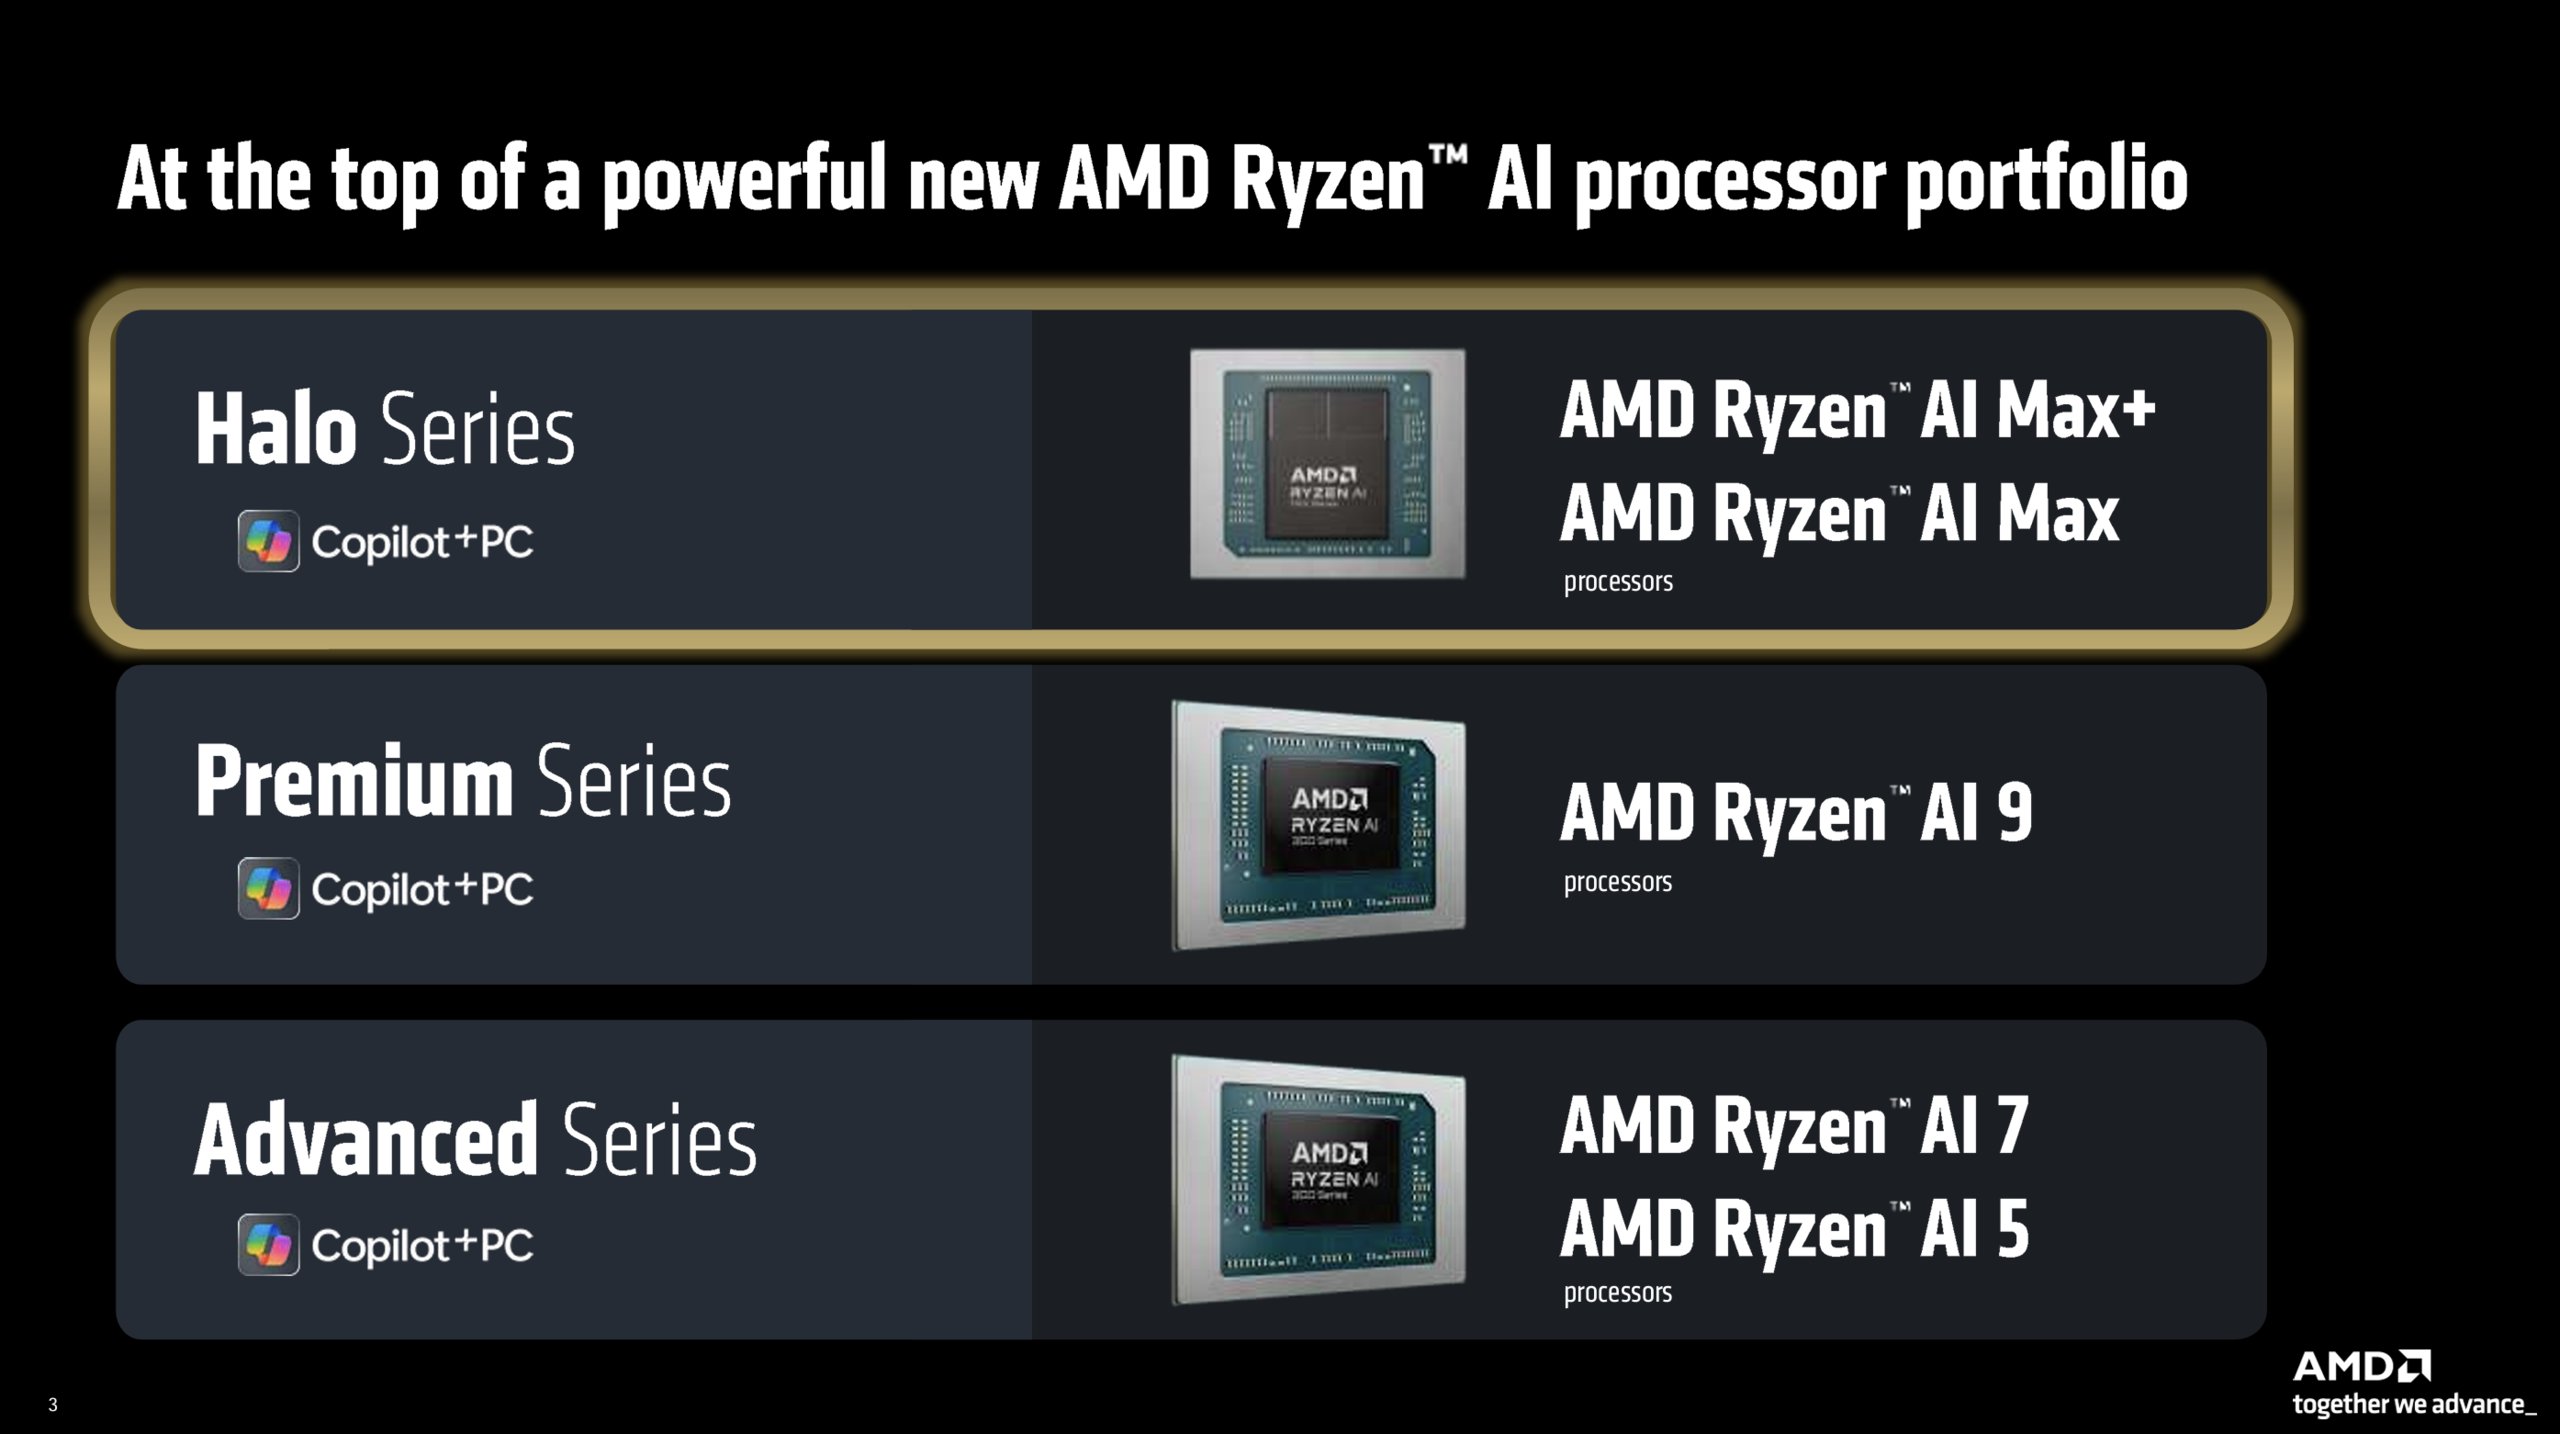
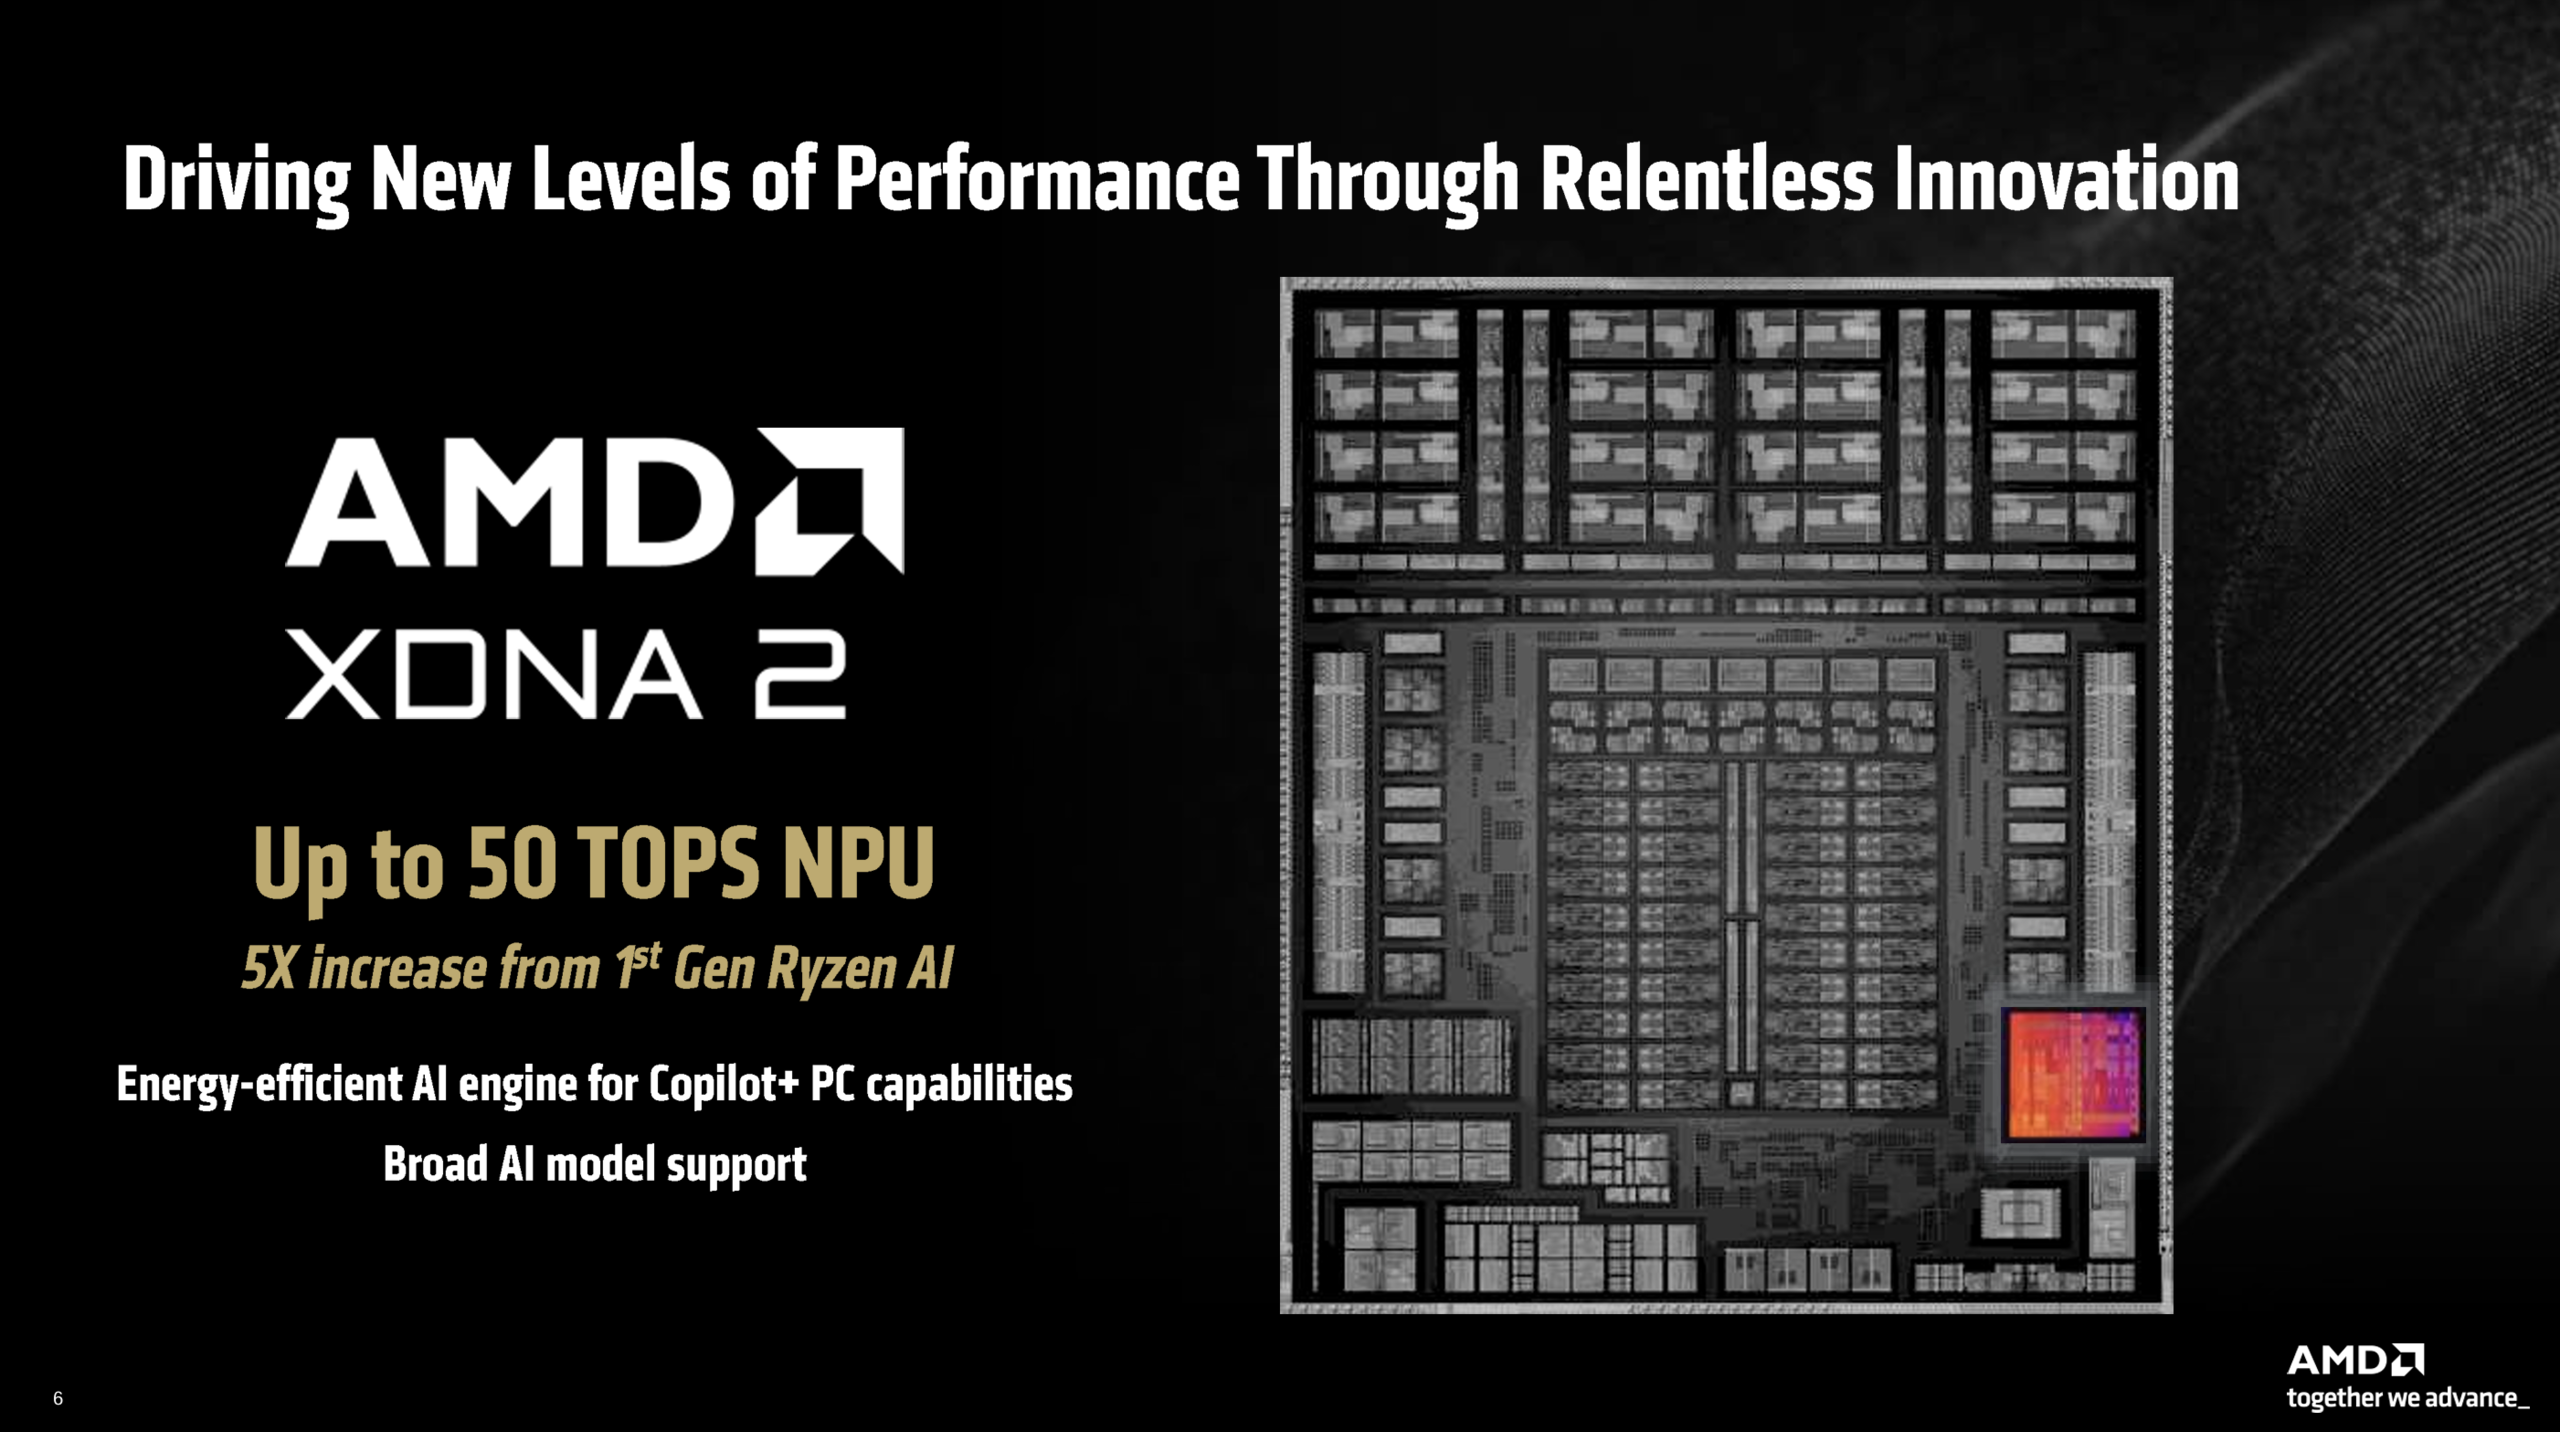
AMD expands its portfolio of APUs with more powerful Ryzen AI Max APUs. It is still a Strix Point CPU architecture (4 nm TSMC) and RDNA 3.5 GPU architecture. AMD calls the new chips Halo series, their flagship models. Hence the popular name Strix Halo, which is often used for Ryzen AI Max APUs. Below the Halo series we have the familiar Ryzen AI 9 APUs in the Premium series (like Ryzen AI 9 365) and Ryzen AI 7/5 APUs in the Advanced series (like Ryzen AI 7 Pro 360). All Ryzen AI APUs are equipped with the same XDNA 2 NPU with a performance of 50 TOPS, so all models get the Copilot+ certification.

Strix Halo overview (image source: AMD)
Strix Halo models (image source: AMD)
Strix Halo CPU (image source: AMD)
Strix Halo GPU (image source: AMD)
Strix Halo NPU (image source: AMD)
Strix Halo RAM (image source: AMD)

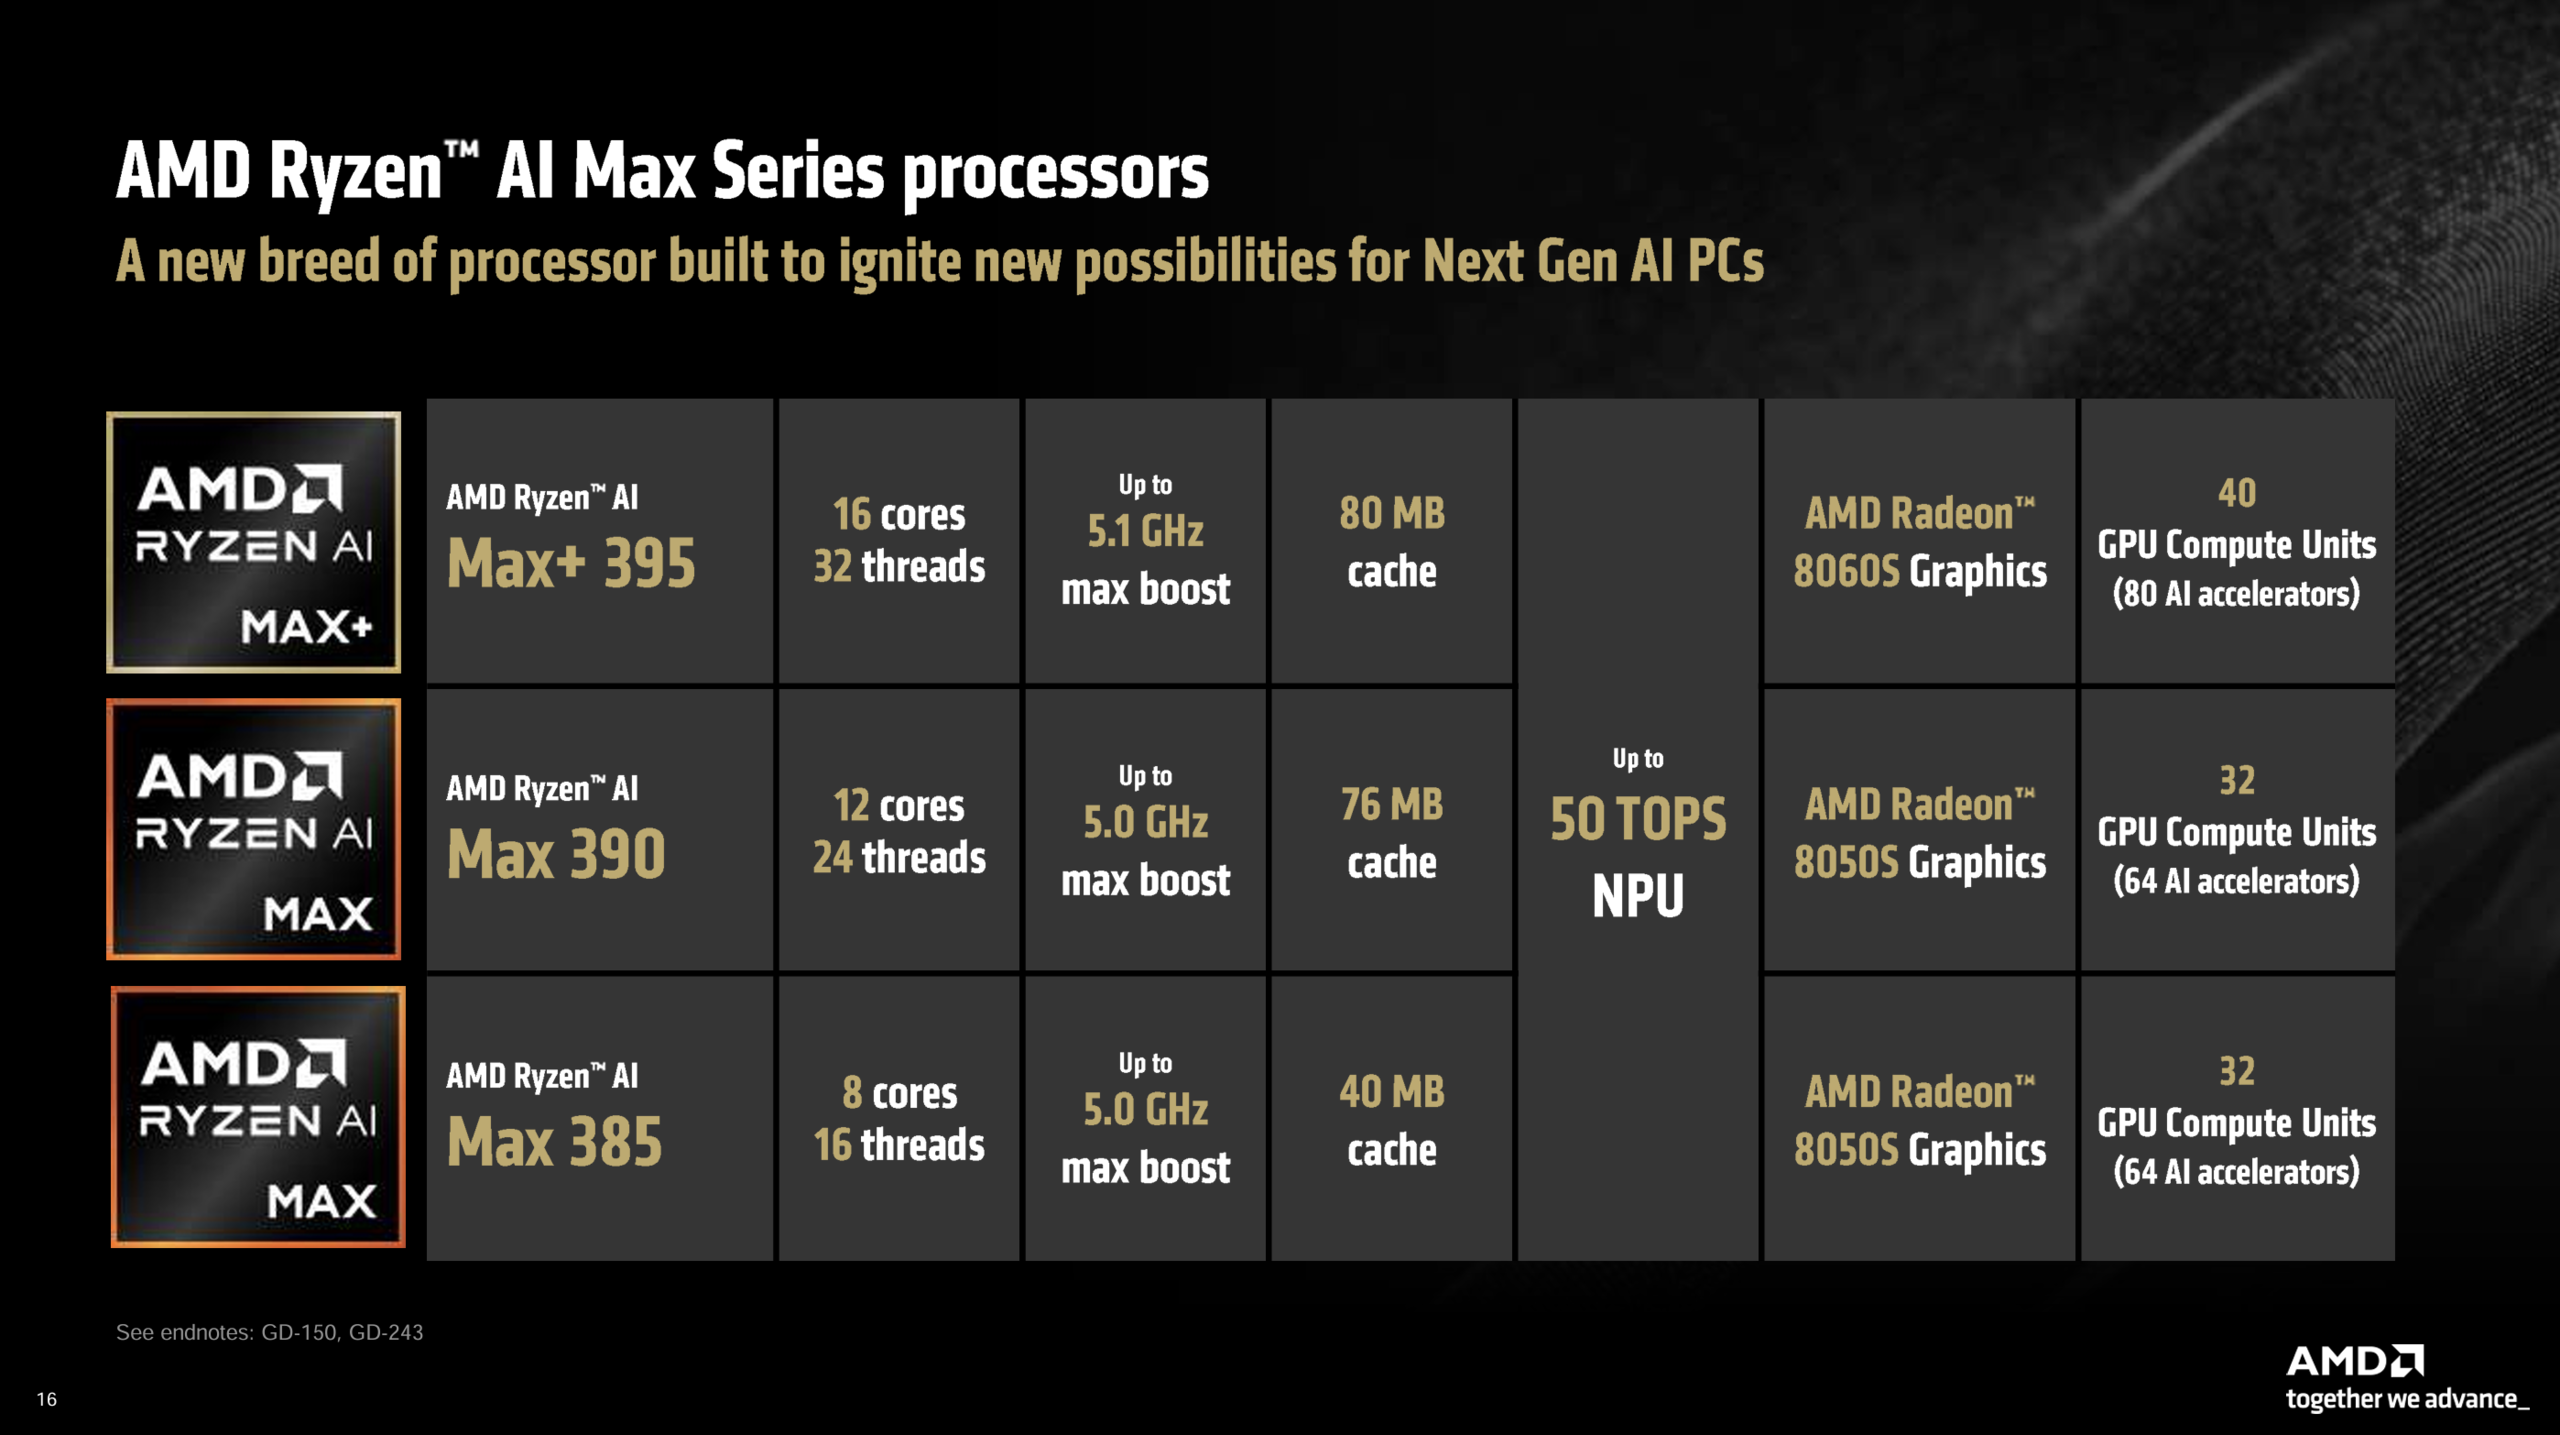
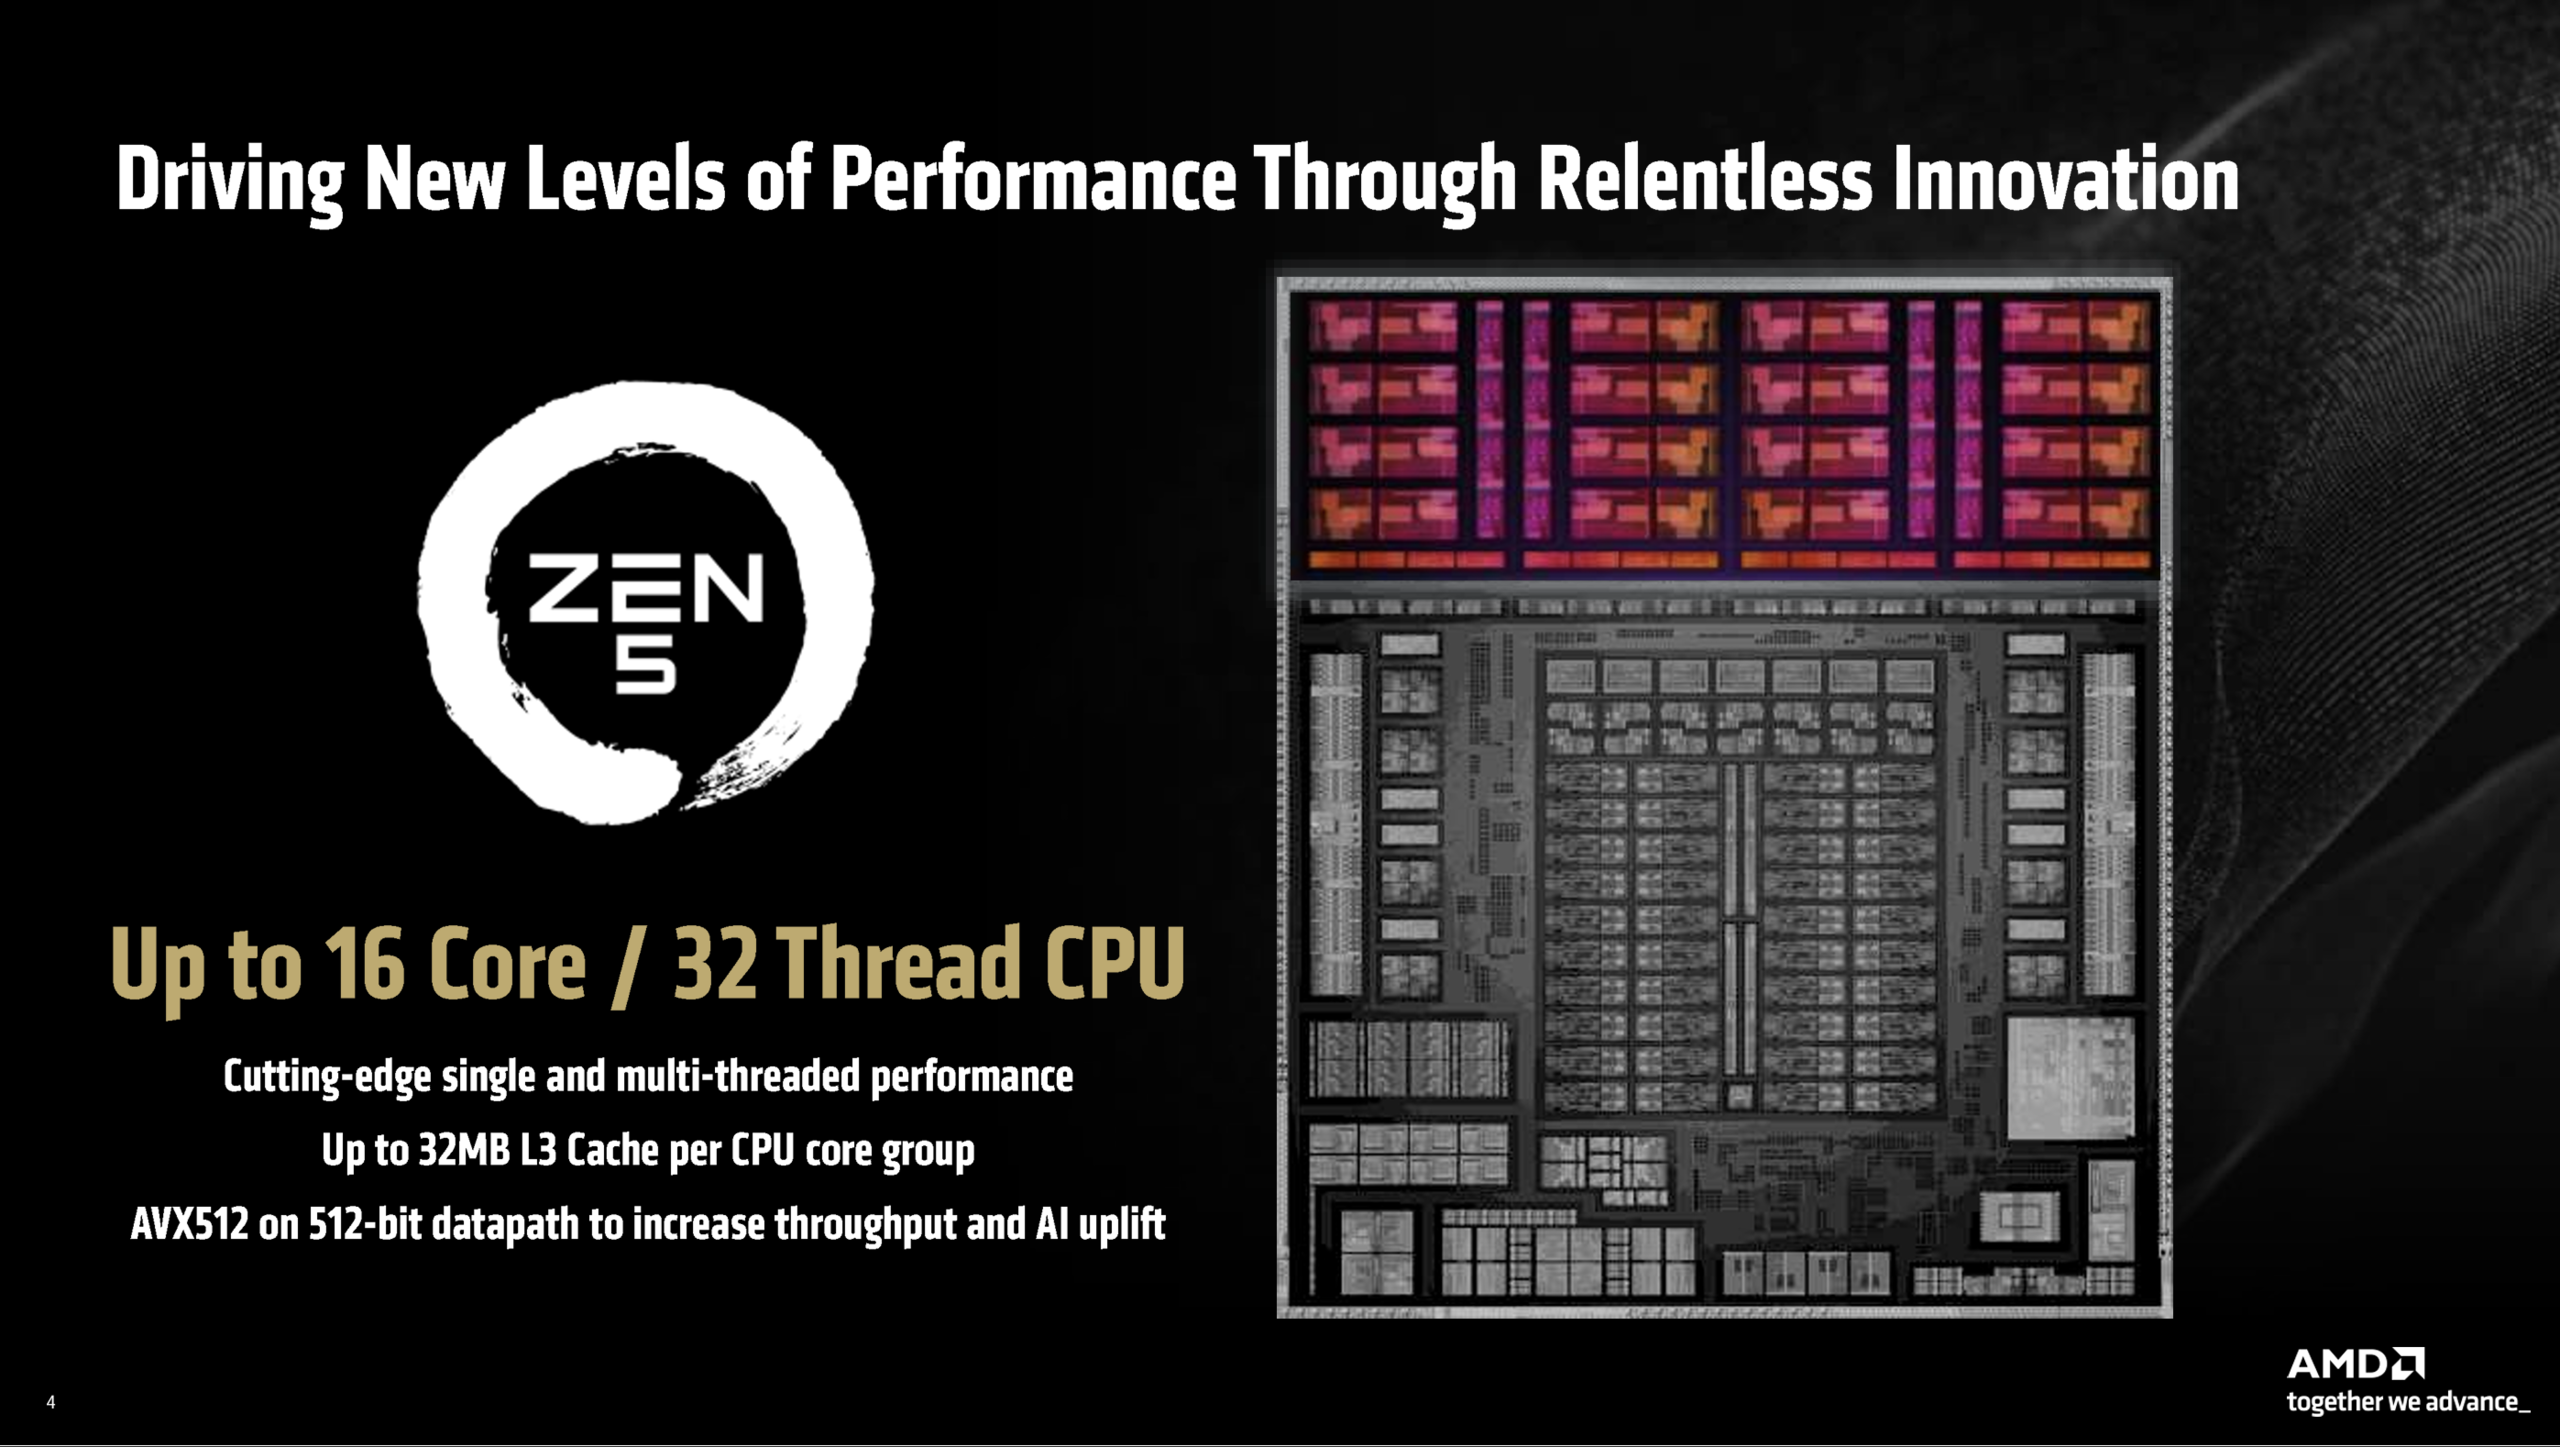
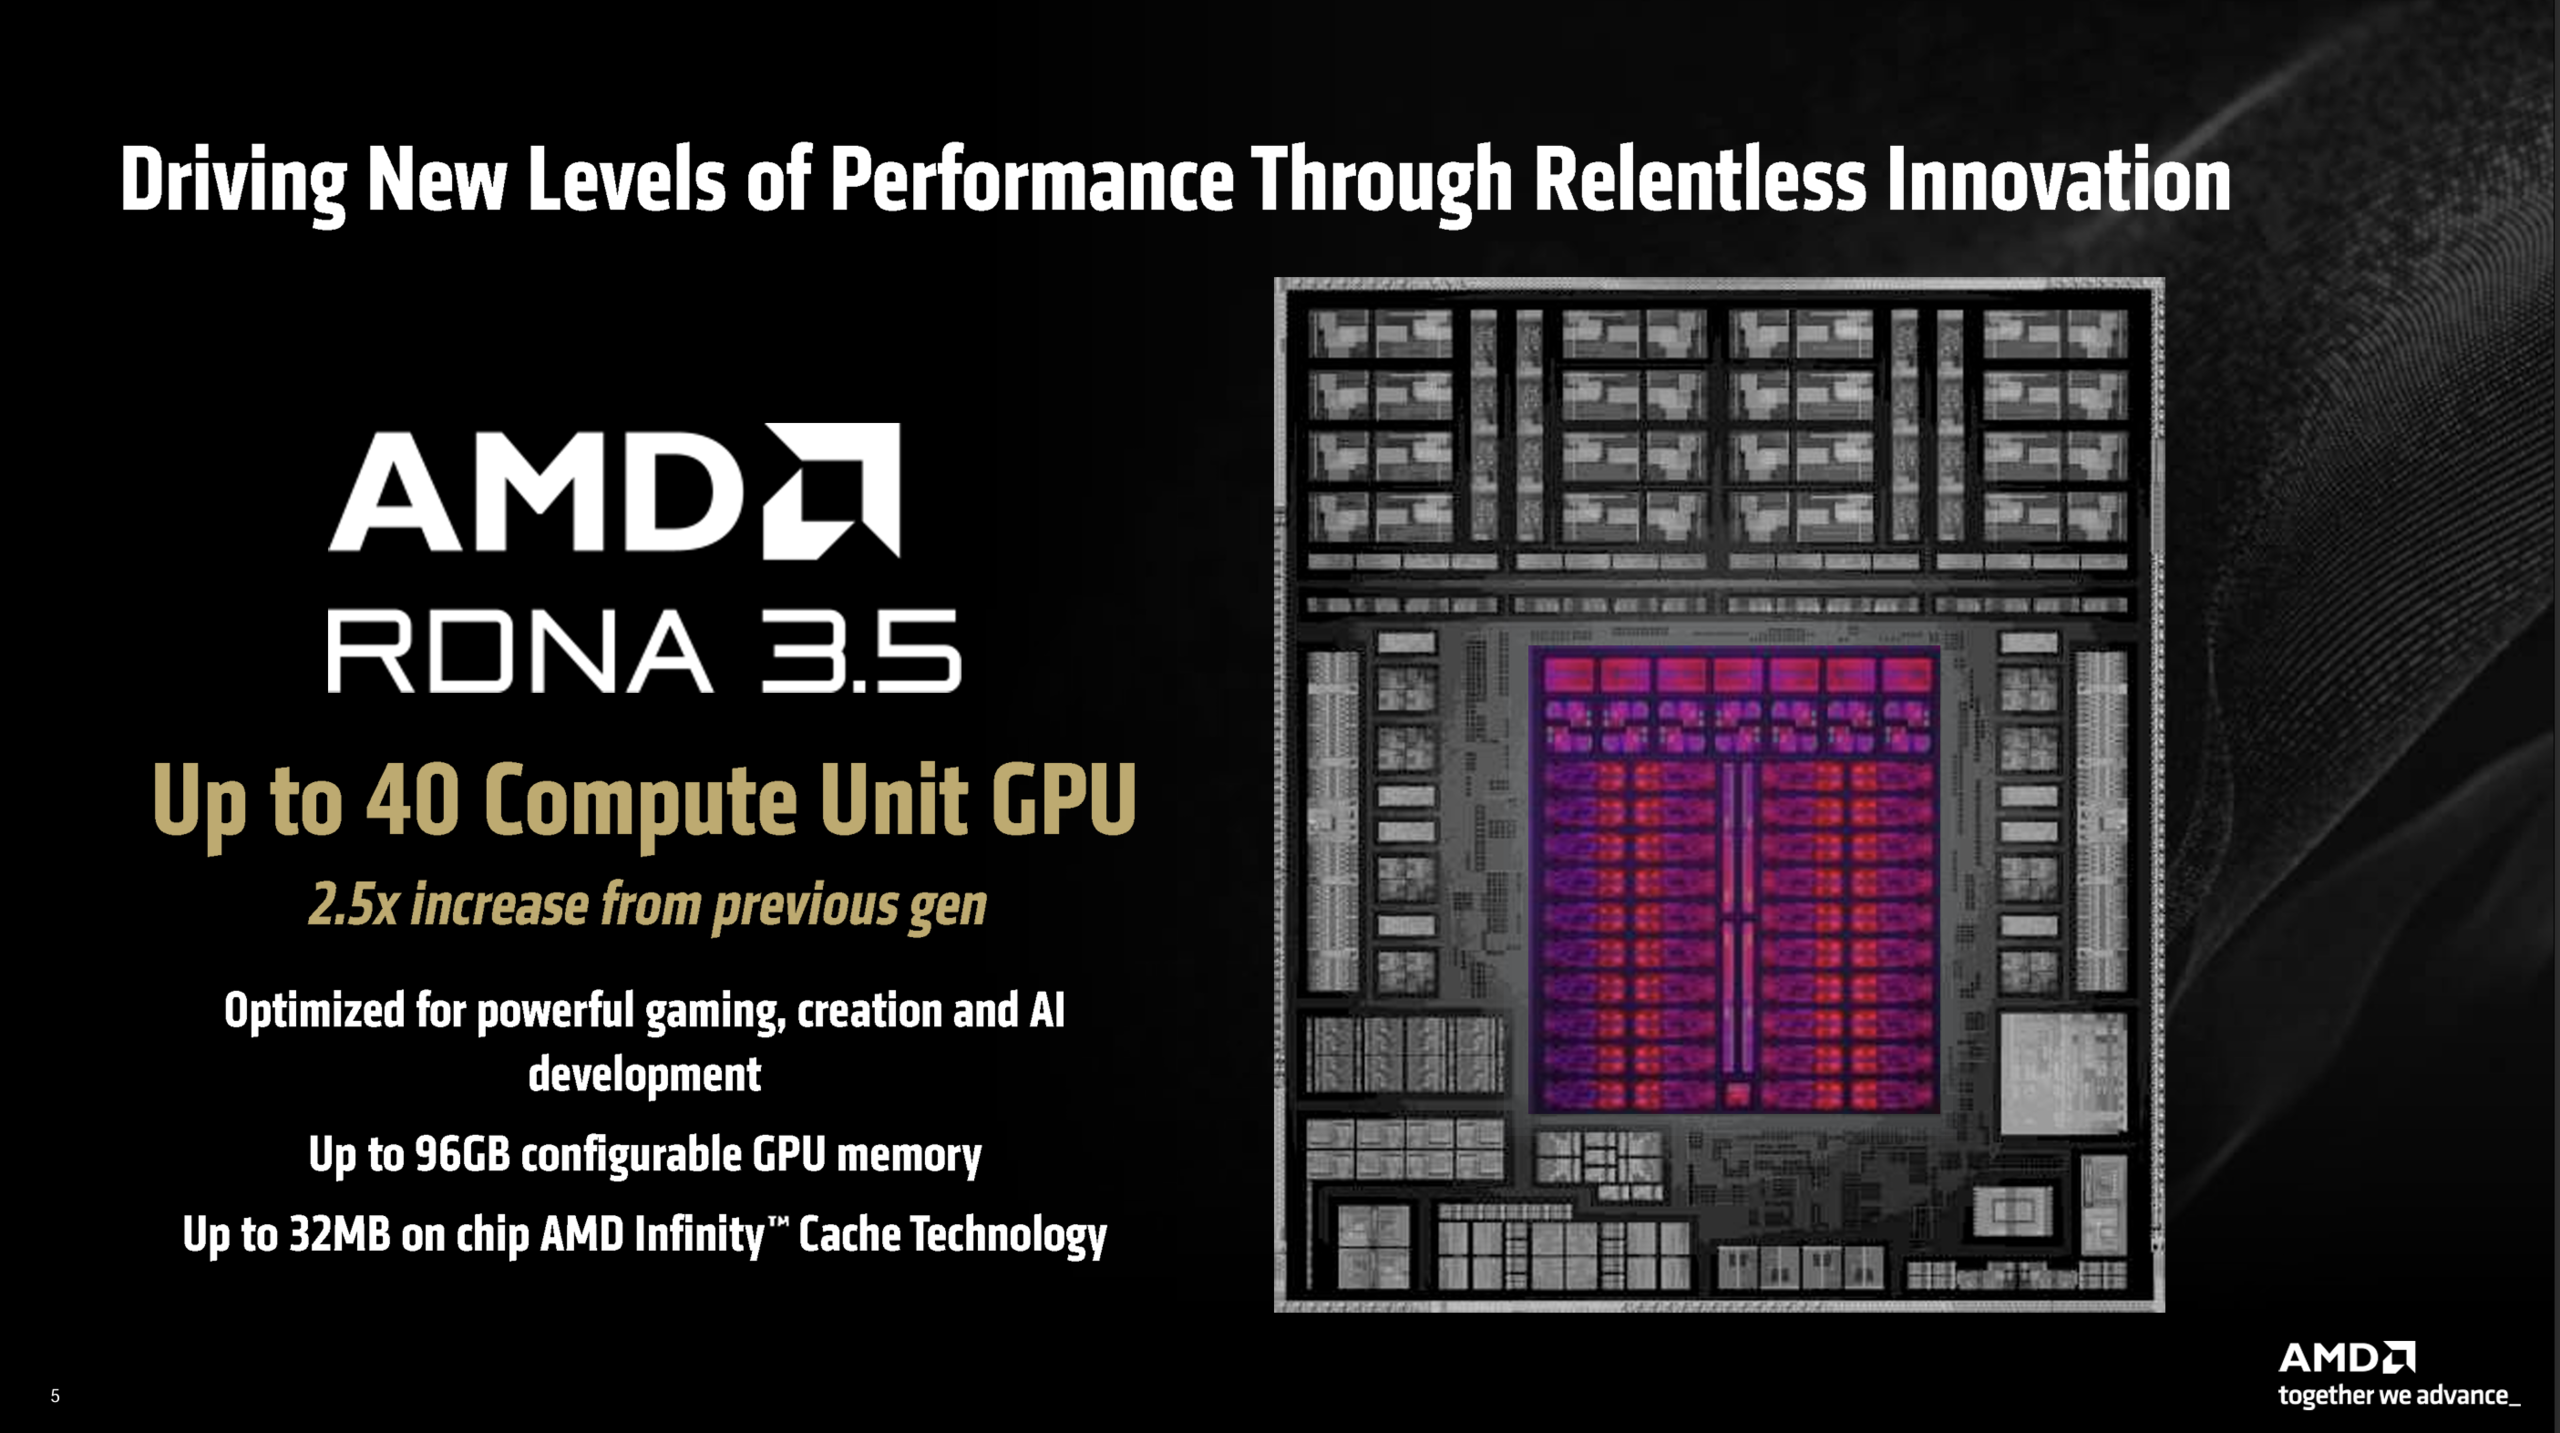
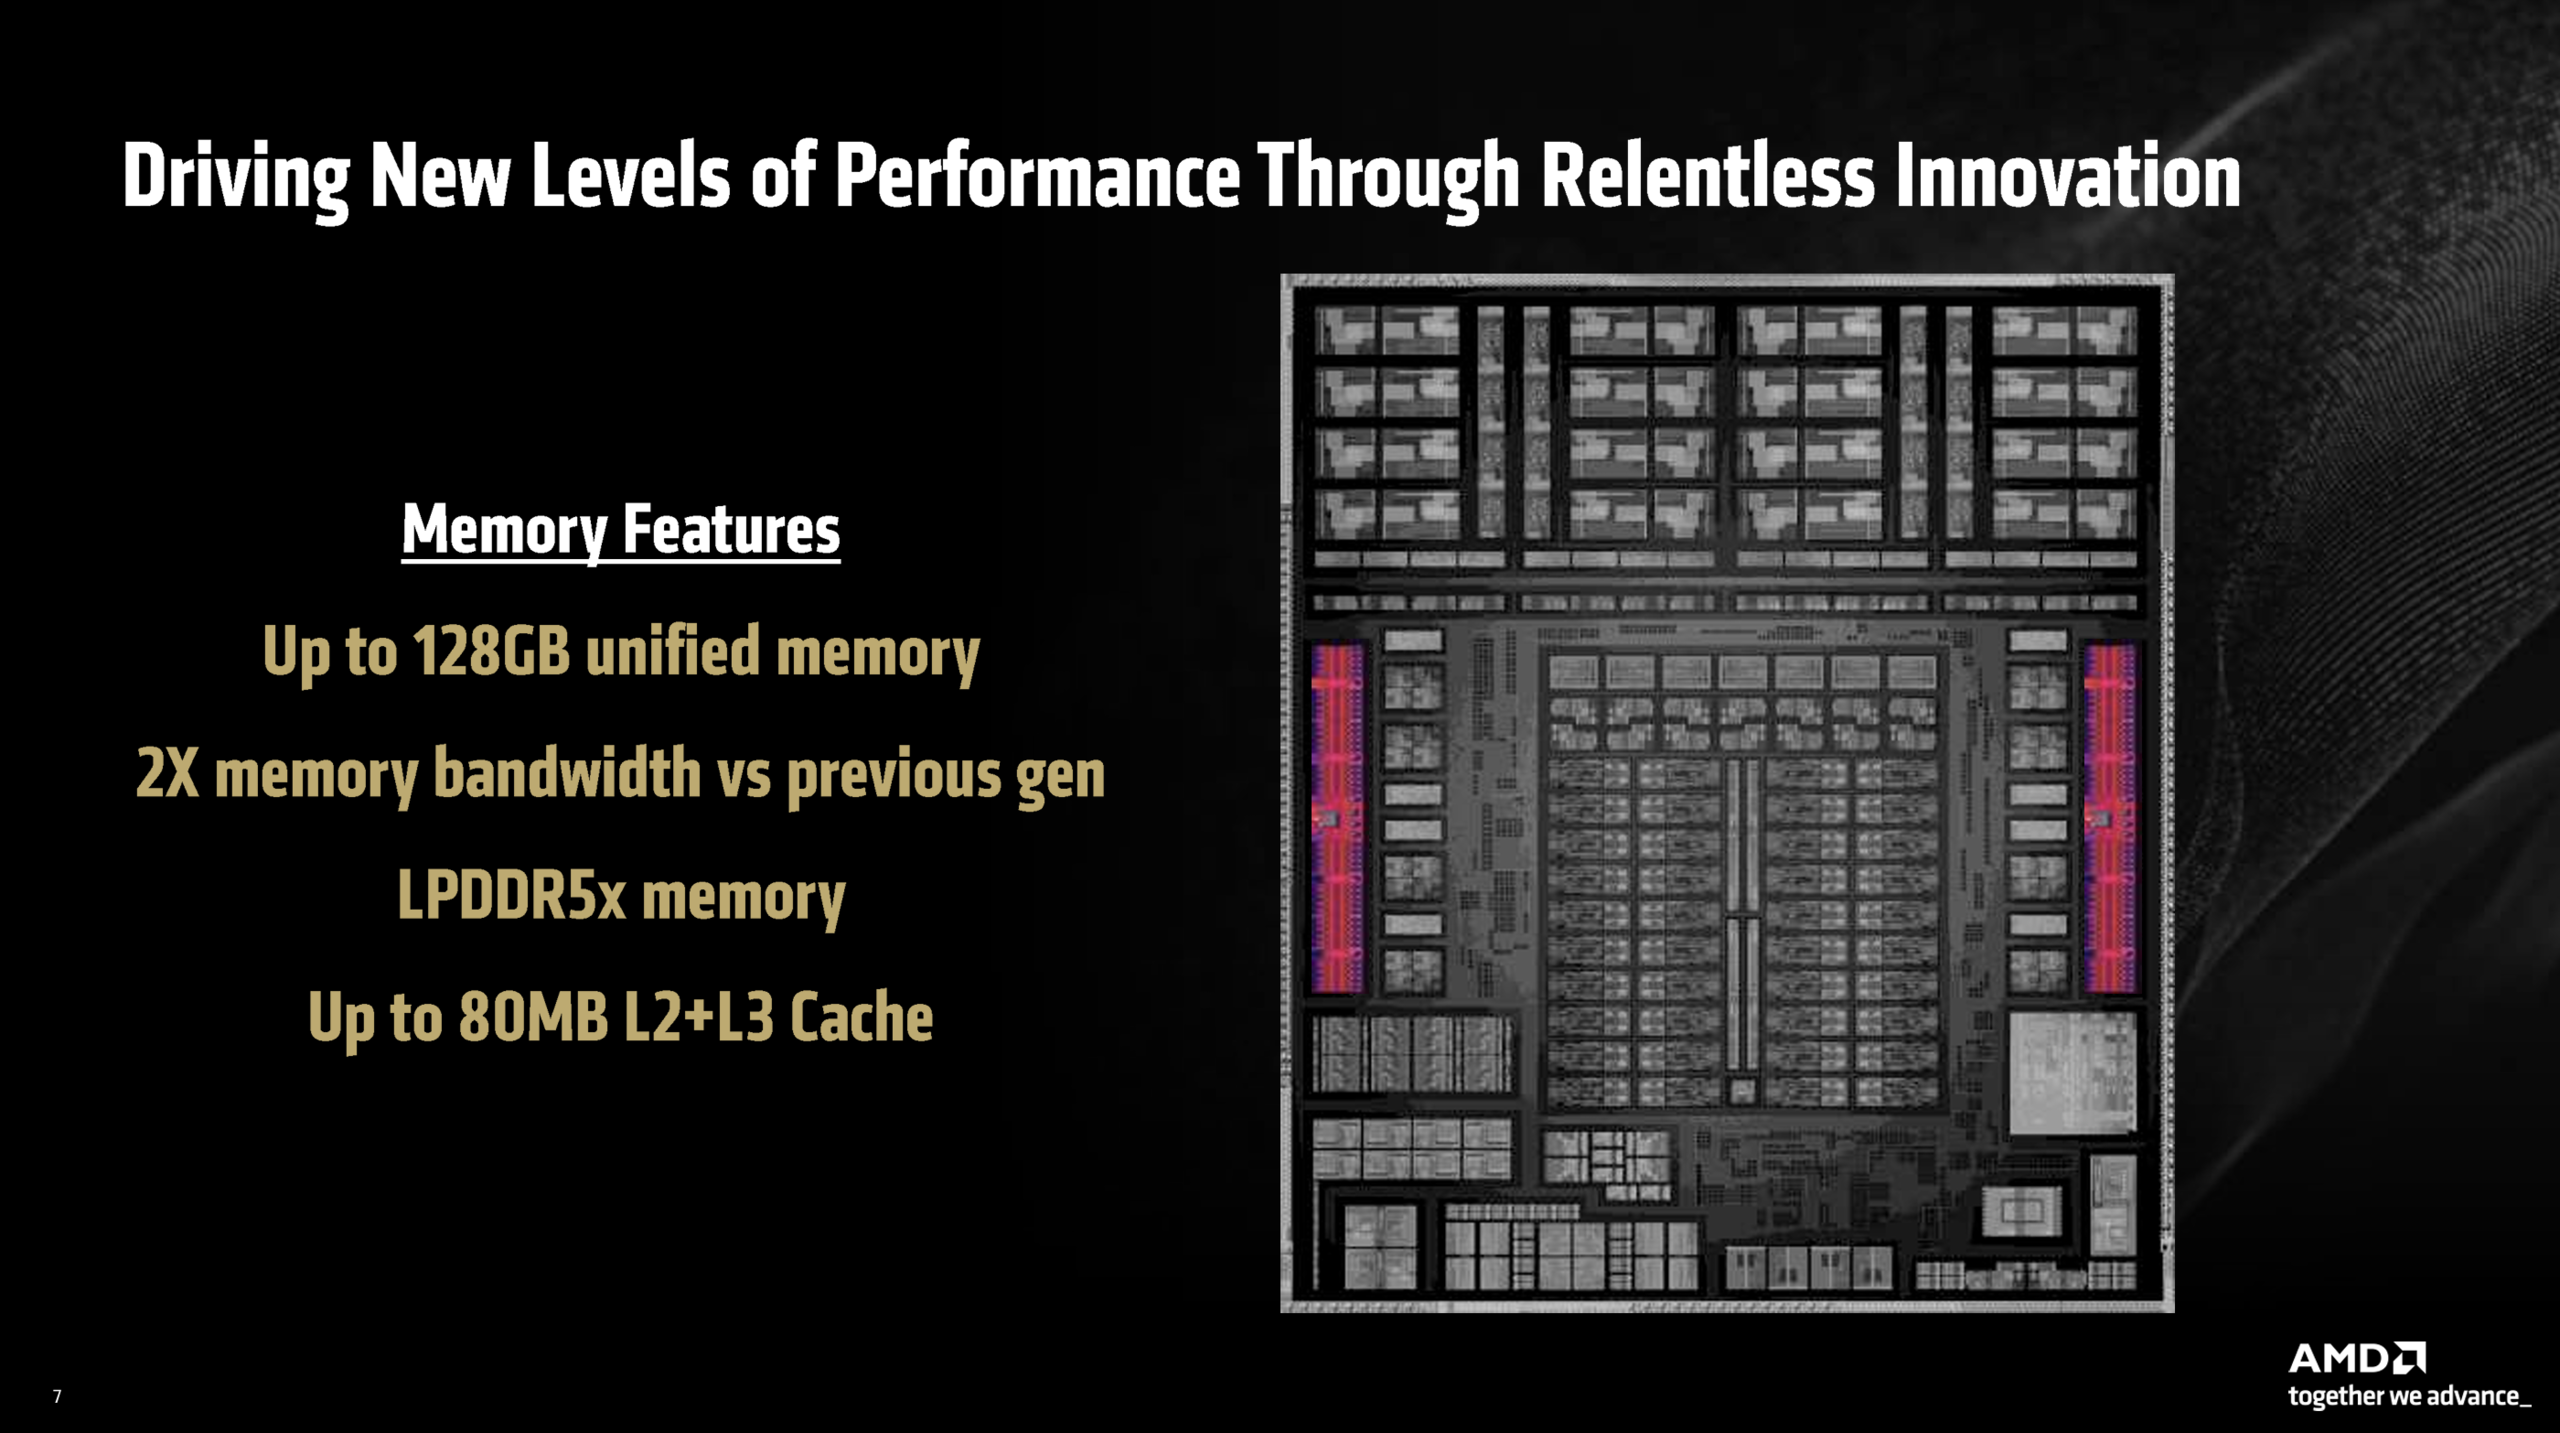
While all the Strix Point APUs so far used a combination of Zen 5 cores and more compact Zen 5c cores with less cache, the Strix Halo APUs only use full-fledged Zen 5 cores with the same maximum clock of 5.1 GHz as before. The top model Ryzen AI Max+ 395 gets 16 cores with 32 threads and 80 MB cache; the Ryzen AI Max 390 gets 12 cores/24 threads with 64 MB cache and the Ryzen AI Max 385 gets 8 cores/16 threads with 40 MB cache. The RAM (LPDDR5x-8000) is also part of the APU and you can get 32, 64 or 128 GB.

The Strix Halo APUs are also equipped with powerful integrated GPUs based on the RDNA 3.5 architecture. The top model Ryzen AI Max+ 395 gets the Radeon 8060S with 40 compute units, while the other two models get the Radeon 8050S with 32 compute units. Depending on the RAM configuration, you can allocate dedicated VRAM for the GPU (up to 24 GB for 32 GB SKUs, 48 GB for 64 GB SKUs and 96 GB for 128 GB SKUs).

AMD specifies the TDP range between 45-125 Watts, so the new Strix Halo APUs are primarily designed for powerful multimedia laptops with corresponding cooling solutions. According to the spec sheet of the HP ZBook Ultra 14, there will be a fourth Strix Halo chip called Ryzen AI Max 380 with 6 cores as well as an even slower Radeon 8040S iGPU.

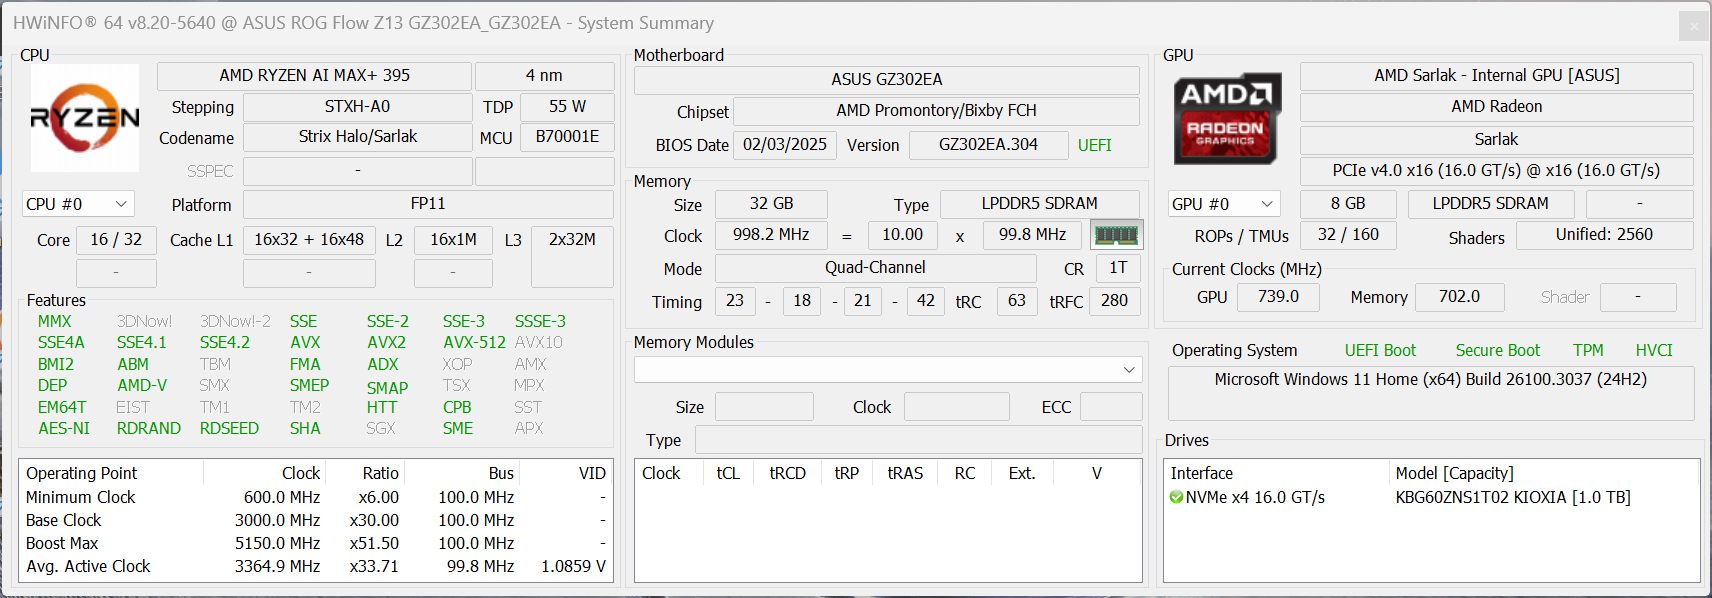
Test System - Asus ROG Flow Z13 GZ302

Asus ROG Flow Z13 GZ302EA

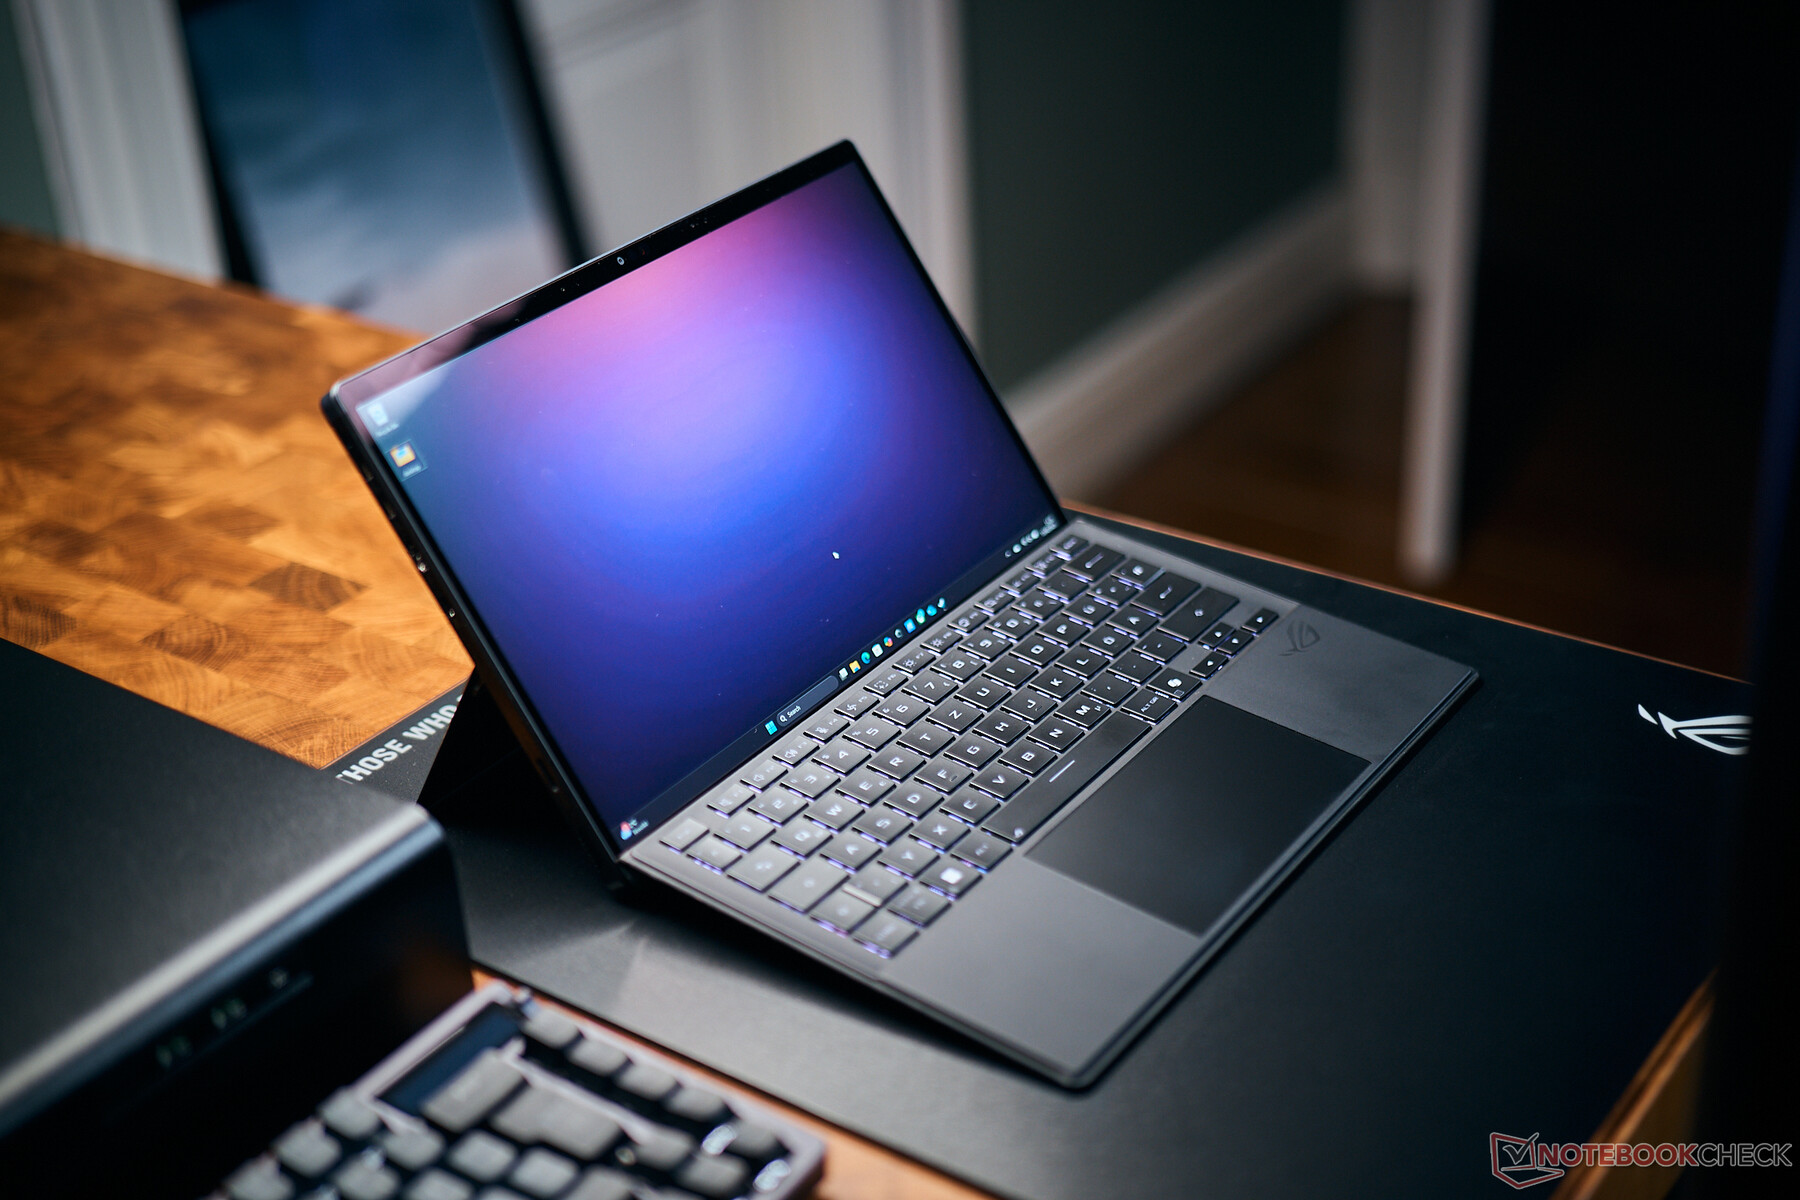
Our test system is the 2025 model of the gaming convertible Asus ROG Flow Z13 GZ302EA that we have already reviewed. It is equipped with the flagship Ryzen AI Max+ 395, the flagship model of the new Strix Halo series with 16 CPU cores and the Radeon 8060S. It is the SKU with 32 GB RAM (LPDDR5x-8000), which can also be used by the GPU. You can also allocate up to 24 GB of dedicated VRAM. Dedicated VRAM can have a positive effect in some games or creative apps, but the Auto mode also worked well in general. We followed Asus' recommendation with 8 GB dedicated VRAM for our benchmarks.

Using the Turbo mode, the Ryzen AI Max+ 395 can consume up to 86 Watts for a brief period and then stabilizes at 70 Watts when you only stress the CPU or GPU. Combined workloads will result in a TDP of 60 Watts.

HWiNFO Asus ROG Flow Z13 with Ryzen AI Max+ 395

Test Procedure

To ensure a meaningful comparison between different processors and graphics cards, we evaluate power consumption alongside synthetic benchmark performance, allowing us to determine overall efficiency. Our power consumption measurements are conducted using an external display, eliminating any influence from varying internal display power usage. However, it is important to note that we measure total system power consumption, rather than just comparing raw TDP values.

CPU Performance

We start our CPU performance section with single-core scenarios. The new APU uses the familiar Zen 5 cores with the same maximum clock of 5.1 GHz, so it is not surprising that we get comparable result to other Zen 5 APUs like the Ryzen AI 9 HX 370 in the Cinebench tests. The results are on par with the old Dragon Range HX series (like the Ryzen 9 7945HX3D), but also slower than Intel's latest Arrow Lake and Lunar Lake chips (at least the fast Core Ultra 9 variants). The fast Snapdragon X Elite SoCs with dual-core turbo (X1E-80-100 and faster) are also ahead, but the ARM models X1E-78-100 and below are slower. Apple is in a completely different league with their M4 SoCs and the latest desktop CPUs from AMD as well as Intel are also faster than the Ryzen AI Max 395.

The new Strix Halo APU performs better in the latest Geekbench 6 test and it can beat all the current mobile processors from AMD, Intel, and Qualcomm. The old Raptor Lake Core i9-14900HX is comparable; the current desktop CPUs and especially Apple's M4 chips are once again ahead.

Cinebench 2024: CPU Single Core | Cinebench R23: Single Core | Geekbench 6.4: Single-Core
Cinebench 2024 / CPU Single Core
Apple M4 Pro (14 cores)
Apple MacBook Pro 16 2024 M4 Pro
178 Points +52%
Apple M4 Max (16 cores)
Apple MacBook Pro 16 M4 Max
178 Points +52%
Intel Core Ultra 9 285K
144 Points +23%
AMD Ryzen 9 9900X
AMD Ryzen 9 9900X
138 Points +18%
AMD Ryzen 7 9700X
AMD Ryzen 7 9700X
136 Points +16%
AMD Ryzen 9 9950X
AMD Ryzen 9 9950X
136 Points +16%
Intel Core i9-14900HX
SCHENKER XMG Neo 17 E24
130 Points +11%
Intel Core i9-14900HX
Asus ROG Strix Scar 16 G634JZR
128 Points +10%
Qualcomm Snapdragon X Elite X1E-84-100
Samsung Galaxy Book4 Edge 16 X1E-84-100
127 Points +9%
Intel Core Ultra 9 285H
MSI Prestige 16 AI Evo B2HMG
127 Points +9%
Intel Core i9-14900HX
Lenovo Legion 7 16 IRX G9
126.4 Points +8%
Qualcomm Snapdragon X Elite X1E-80-100
Microsoft Surface Laptop 15 Snapdragon X Elite
123 Points +5%
Intel Core i9-14900HX
Acer Predator Helios 16 PH16-72
122.9 Points +5%
Intel Core Ultra 9 288V
Asus Zenbook S 14 UX5406 Core Ultra 9
122 Points +4%
Intel Core i7-14650HX
Lenovo Legion 5 16IRX G9
117 Points 0%
AMD Ryzen AI Max+ 395
Asus ROG Flow Z13 GZ302EA-RU073W
116.8 Points
AMD Ryzen AI 9 HX 370
Asus ProArt P16 H7606WI
116 Points -1%
AMD Ryzen 9 7945HX3D
Asus ROG Strix Scar 17 G733PYV-LL053X
115 Points -2%
AMD Ryzen 9 7945HX
Minisforum BD790i
114 Points -2%
AMD Ryzen AI 9 365
Lenovo Yoga Pro 7 14ASP G9
113.5 Points -3%
AMD Ryzen 9 7945HX
Tuxedo Gemini 17 Gen3 AMD
111 Points -5%
AMD Ryzen AI 7 PRO 360
Lenovo ThinkPad T14s Gen 6 21M2S00G00
108.5 Points -7%
Qualcomm Snapdragon X Elite X1E-78-100
Lenovo Yoga Slim 7X 14Q8X9
108 Points -8%
Intel Core i9-13900H
Minisforum MS-01
101 Points -14%
Cinebench R23 / Single Core
Intel Core Ultra 9 285K
2353 Points +16%
Apple M4 Pro (14 cores)
Apple MacBook Pro 16 2024 M4 Pro
2290 Points +13%
AMD Ryzen 9 9900X
AMD Ryzen 9 9900X
2253 Points +11%
Intel Core i9-14900HX
SCHENKER XMG Neo 17 E24
2233 Points +10%
AMD Ryzen 7 9700X
AMD Ryzen 7 9700X
2211 Points +9%
Apple M4 Max (16 cores)
Apple MacBook Pro 16 M4 Max
2209 Points +9%
AMD Ryzen 9 9950X
AMD Ryzen 9 9950X
2202 Points +8%
Intel Core i9-14900HX
Lenovo Legion 7 16 IRX G9
2195 Points +8%
Intel Core i9-14900HX
Asus ROG Strix Scar 16 G634JZR
2193 Points +8%
Intel Core Ultra 9 285H
MSI Prestige 16 AI Evo B2HMG
2126 Points +5%
Intel Core i9-14900HX
Acer Predator Helios 16 PH16-72
2122 Points +4%
Intel Core i9-13980HX
Asus ProArt Studiobook 16 OLED H7604
2110 Points +4%
AMD Ryzen AI 9 HX 370
Asus ProArt P16 H7606WI
2049 Points +1%
AMD Ryzen AI Max+ 395
Asus ROG Flow Z13 GZ302EA-RU073W
2034 Points
AMD Ryzen AI 9 365
Lenovo Yoga Pro 7 14ASP G9
1992 Points -2%
Intel Core i7-14650HX
Lenovo Legion 5 16IRX G9
1963 Points -3%
AMD Ryzen AI 7 PRO 360
Lenovo ThinkPad T14s Gen 6 21M2S00G00
1958 Points -4%
AMD Ryzen 9 7945HX
Minisforum BD790i
1942 Points -5%
AMD Ryzen 9 7945HX3D
Asus ROG Strix Scar 17 G733PYV-LL053X
1935 Points -5%
AMD Ryzen 9 7945HX
Tuxedo Gemini 17 Gen3 AMD
1861 Points -9%
Intel Core i9-13900H
Minisforum MS-01
1806 Points -11%
Qualcomm Snapdragon X Elite X1E-84-100
Samsung Galaxy Book4 Edge 16 X1E-84-100
1350 Points -34%
Qualcomm Snapdragon X Elite X1E-80-100
Microsoft Surface Laptop 15 Snapdragon X Elite
1297 Points -36%
Qualcomm Snapdragon X Elite X1E-78-100
Lenovo Yoga Slim 7X 14Q8X9
1130 Points -44%
Geekbench 6.4 / Single-Core
Apple M4 Max (16 cores)
Apple MacBook Pro 16 M4 Max
3880 Points +30%
Apple M4 Pro (14 cores)
Apple MacBook Pro 16 2024 M4 Pro
3836 Points +29%
AMD Ryzen 9 9900X
AMD Ryzen 9 9900X
3429 Points +15%
AMD Ryzen 9 9950X
AMD Ryzen 9 9950X
3408 Points +14%
AMD Ryzen 7 9700X
AMD Ryzen 7 9700X
3373 Points +13%
Intel Core Ultra 9 285K
3306 Points +11%
Intel Core i9-14900HX
SCHENKER XMG Neo 17 E24
3074 Points +3%
Intel Core i9-14900HX
Asus ROG Strix Scar 16 G634JZR
3025 Points +2%
Intel Core i9-14900HX
Lenovo Legion 7 16 IRX G9
2980 Points 0%
AMD Ryzen AI Max+ 395
Asus ROG Flow Z13 GZ302EA-RU073W
2978 Points
Intel Core i9-14900HX
Acer Predator Helios 16 PH16-72
2970 Points 0%
AMD Ryzen 9 7945HX
Minisforum BD790i
2940 Points -1%
AMD Ryzen 9 7945HX3D
Asus ROG Strix Scar 17 G733PYV-LL053X
2916 Points -2%
Intel Core Ultra 9 285H
MSI Prestige 16 AI Evo B2HMG
2912 Points -2%
Intel Core Ultra 9 288V
Asus Zenbook S 14 UX5406 Core Ultra 9
2864 Points -4%
AMD Ryzen AI 9 HX 370
Asus ProArt P16 H7606WI
2857 Points -4%
Qualcomm Snapdragon X Elite X1E-84-100
Samsung Galaxy Book4 Edge 16 X1E-84-100
2834 Points -5%
AMD Ryzen AI 9 365
Lenovo Yoga Pro 7 14ASP G9
2815 Points -5%
Qualcomm Snapdragon X Elite X1E-80-100
Microsoft Surface Laptop 15 Snapdragon X Elite
2812 Points -6%
Qualcomm Snapdragon X Elite X1E-80-100
Microsoft Surface Laptop 15 Snapdragon X Elite
1896 Points -36%
Qualcomm Snapdragon X Elite X1E-80-100
Microsoft Surface Laptop 15 Snapdragon X Elite
1896 Points -36%
AMD Ryzen 9 7945HX
Tuxedo Gemini 17 Gen3 AMD
2797 Points -6%
Intel Core i7-14650HX
Lenovo Legion 5 16IRX G9
2761 Points -7%
AMD Ryzen AI 7 PRO 360
Lenovo ThinkPad T14s Gen 6 21M2S00G00
2699 Points -9%
Intel Core i9-13900H
Minisforum MS-01
2624 Points -12%
Qualcomm Snapdragon X Elite X1E-78-100
Lenovo Yoga Slim 7X 14Q8X9
2464 Points -17%
Cinebench 2024: CPU Single Core | Cinebench R23: Single Core | Geekbench 6.4: Single-Core

For the single-core efficiency comparison we use Cinebench 2024 as well the older Cinebench R23 where we just have more comparison data (especially with HX CPUs). The new Ryzen AI Max+ 395 is clearly worse than the other current mobile CPUs in Cinebench 2024 (both Ryzen AI as well as Intel Arrow Lake-H/Lunar Lake-V). The ARM competition from Apple and Qualcomm is also much more efficient in single-core scenarios. Only the desktop chips are even worse in terms of efficiency.

The older Cinebench R23 test also shows an advantage for the current mobile processors, but the older HX series chips (which are much closer to the Ryzen AI Max in terms of overall performance) are clearly beaten by the Strix Halo APU. This is also the case for the current desktop CPUs from AMD as well as Intel.

Power Consumption / Cinebench 2024 Single Power Efficiency - external Monitor
Apple M4 Pro (14 cores)
Apple MacBook Pro 16 2024 M4 Pro
9.52 Points per Watt +263%
Apple M4 Max (16 cores)
Apple MacBook Pro 16 M4 Max
8.24 Points per Watt +215%
Qualcomm Snapdragon X Elite X1E-78-100
Lenovo Yoga Slim 7X 14Q8X9
6.84 Points per Watt +161%
Qualcomm Snapdragon X Elite X1E-84-100
Samsung Galaxy Book4 Edge 16 X1E-84-100
6.32 Points per Watt +141%
Qualcomm Snapdragon X Elite X1E-80-100
Microsoft Surface Laptop 7 13.8 Copilot+
5.89 Points per Watt +125%
Intel Core Ultra 9 288V
Asus Zenbook S 14 UX5406 Core Ultra 9
4.78 Points per Watt +82%
AMD Ryzen AI 9 365
Lenovo Yoga Pro 7 14ASP G9
4.01 Points per Watt +53%
Intel Core Ultra 9 285H
MSI Prestige 16 AI Evo B2HMG
3.76 Points per Watt +44%
AMD Ryzen AI 7 PRO 360
Lenovo ThinkPad T14s Gen 6 21M2S00G00
3.65 Points per Watt +39%
AMD Ryzen AI 9 HX 370
Asus ProArt P16 H7606WI
3.4 Points per Watt +30%
AMD Ryzen AI Max+ 395
Asus ROG Flow Z13 GZ302EA-RU073W
2.62 Points per Watt
Intel Core Ultra 9 285K
1.321 Points per Watt -50%
AMD Ryzen 7 9700X
AMD Ryzen 7 9700X
1.236 Points per Watt -53%
AMD Ryzen 9 9900X
AMD Ryzen 9 9900X
1.095 Points per Watt -58%
AMD Ryzen 9 9950X
AMD Ryzen 9 9950X
0.997 Points per Watt -62%
Power Consumption / Cinebench R23 Single Power Efficiency - external Monitor
Apple M4 Pro (14 cores)
Apple MacBook Pro 16 2024 M4 Pro
131.6 Points per Watt +188%
Apple M4 Max (16 cores)
Apple MacBook Pro 16 M4 Max
109.4 Points per Watt +139%
Qualcomm Snapdragon X Elite X1E-78-100
Lenovo Yoga Slim 7X 14Q8X9
70.6 Points per Watt +54%
AMD Ryzen AI 9 365
Lenovo Yoga Pro 7 14ASP G9
67.3 Points per Watt +47%
AMD Ryzen AI 7 PRO 360
Lenovo ThinkPad T14s Gen 6 21M2S00G00
66.4 Points per Watt +45%
Intel Core Ultra 9 285H
MSI Prestige 16 AI Evo B2HMG
63.7 Points per Watt +39%
Qualcomm Snapdragon X Elite X1E-80-100
Microsoft Surface Laptop 7 13.8 Copilot+
61.2 Points per Watt +34%
Qualcomm Snapdragon X Elite X1E-84-100
Samsung Galaxy Book4 Edge 16 X1E-84-100
59.2 Points per Watt +30%
AMD Ryzen AI 9 HX 370
Asus ProArt P16 H7606WI
58.9 Points per Watt +29%
AMD Ryzen AI Max+ 395
Asus ROG Flow Z13 GZ302EA-RU073W
45.7 Points per Watt
Intel Core i9-13900H
Minisforum MS-01
36.4 Points per Watt -20%
AMD Ryzen 9 7945HX
Minisforum BD790i
34 Points per Watt -26%
Intel Core i9-14900HX
Lenovo Legion 7 16 IRX G9
32.7 Points per Watt -28%
Intel Core i7-14650HX
Lenovo Legion 5 16IRX G9
31.9 Points per Watt -30%
Intel Core i9-14900HX
SCHENKER XMG Neo 17 E24
28.4 Points per Watt -38%
AMD Ryzen 9 7945HX
Tuxedo Gemini 17 Gen3 AMD
27.7 Points per Watt -39%
AMD Ryzen 9 7945HX3D
Asus ROG Strix Scar 17 G733PYV-LL053X
26.9 Points per Watt -41%
Intel Core i9-14900HX
Asus ROG Strix Scar 16 G634JZR
26.3 Points per Watt -42%
Intel Core i9-13980HX
Asus ProArt Studiobook 16 OLED H7604
25.4 Points per Watt -44%
Intel Core i9-14900HX
Acer Predator Helios 16 PH16-72
23.9 Points per Watt -48%
Intel Core Ultra 9 285K
21.2 Points per Watt -54%
AMD Ryzen 7 9700X
AMD Ryzen 7 9700X
19.7 Points per Watt -57%
AMD Ryzen 9 9900X
AMD Ryzen 9 9900X
17.6 Points per Watt -61%
AMD Ryzen 9 9950X
AMD Ryzen 9 9950X
15.8 Points per Watt -65%

As expected, the new Ryzen AI Max+ 395 performs much better in multi-core scenarios, but please keep in mind that we tested the new chip in a 13-inch convertible with limited power limits (86/70 Watts). The performance would be noticeably better with the full 125 Watts. The current mobile chips from AMD, Intel and Qualcomm do not stand a chance, only the HX series CPUs are on a comparable level (but usually with much higher consumption values, especially for the Core i9-14900HX rivals). Apple has a small advantage with the M4 Pro, and the majority of current desktop chips is also faster.

The new Ryzen AI Max+ 395 once again performs much better in Geekbench and is one of the fastest models. Apple's M4 Pro and M4 Max SoCs stay in front, but then we have the Ryzen AI Max+ 395 surrounded by current desktop chips like the Intel Core Ultra 9 285K or AMD's Ryzen 9950X.

Cinebench 2024: CPU Multi Core | Cinebench R23: Multi Core | Geekbench 6.4: Multi-Core
Cinebench 2024 / CPU Multi Core
Intel Core Ultra 9 285K
2436 Points +48%
AMD Ryzen 9 9950X
AMD Ryzen 9 9950X
2254 Points +37%
Apple M4 Max (16 cores)
Apple MacBook Pro 16 M4 Max
2069 Points +26%
Apple M4 Max (16 cores)
Apple MacBook Pro 16 M4 Max
2015 Points +22%
AMD Ryzen 9 7945HX
Minisforum BD790i
1828 Points +11%
AMD Ryzen 9 9900X
AMD Ryzen 9 9900X
1818 Points +10%
AMD Ryzen 9 7945HX3D
Asus ROG Strix Scar 17 G733PYV-LL053X
1772 Points +8%
Intel Core i9-14900HX
SCHENKER XMG Neo 17 E24
1731 Points +5%
Apple M4 Pro (14 cores)
Apple MacBook Pro 16 2024 M4 Pro
1729 Points +5%
AMD Ryzen 9 7945HX
Tuxedo Gemini 17 Gen3 AMD
1677 Points +2%
AMD Ryzen AI Max+ 395
Asus ROG Flow Z13 GZ302EA-RU073W
1648 Points
Intel Core i9-14900HX
Asus ROG Strix Scar 16 G634JZR
1639 Points -1%
Intel Core i9-14900HX
Acer Predator Helios 16 PH16-72
1479 Points -10%
Intel Core i9-14900HX
Lenovo Legion 7 16 IRX G9
1450 Points -12%
AMD Ryzen 7 9800X3D
AMD Ryzen 7 9800X3D
1358 Points -18%
Intel Core i7-14650HX
Lenovo Legion 5 16IRX G9
1235 Points -25%
AMD Ryzen AI 9 HX 370
Asus ProArt P16 H7606WI
1213 Points -26%
AMD Ryzen 7 9700X
AMD Ryzen 7 9700X
1203 Points -27%
AMD Ryzen AI 9 365
Lenovo Yoga Pro 7 14ASP G9
996 Points -40%
Intel Core Ultra 9 285H
MSI Prestige 16 AI Evo B2HMG
991 Points -40%
Qualcomm Snapdragon X Elite X1E-84-100
Samsung Galaxy Book4 Edge 16 X1E-84-100
866 Points -47%
Intel Core i9-13900H
Minisforum MS-01
818 Points -50%
AMD Ryzen AI 7 PRO 360
Lenovo ThinkPad T14s Gen 6 21M2S00G00
708 Points -57%
Intel Core Ultra 9 288V
Asus Zenbook S 14 UX5406 Core Ultra 9
598 Points -64%
Cinebench R23 / Multi Core
Intel Core Ultra 9 285K
42705 Points +47%
AMD Ryzen 9 9950X
AMD Ryzen 9 9950X
40924 Points +41%
AMD Ryzen 9 7945HX
Minisforum BD790i
33459 Points +15%
AMD Ryzen 9 7945HX3D
Asus ROG Strix Scar 17 G733PYV-LL053X
32782 Points +13%
AMD Ryzen 9 9900X
AMD Ryzen 9 9900X
32172 Points +11%
Intel Core i9-14900HX
SCHENKER XMG Neo 17 E24
31740 Points +9%
Intel Core i9-14900HX
Lenovo Legion 7 16 IRX G9
31127 Points +7%
Intel Core i9-13980HX
Asus ProArt Studiobook 16 OLED H7604
30789 Points +6%
AMD Ryzen 9 7945HX
Tuxedo Gemini 17 Gen3 AMD
30783 Points +6%
Intel Core i9-14900HX
Asus ROG Strix Scar 16 G634JZR
30411 Points +5%
Intel Core i9-14900HX
Acer Predator Helios 16 PH16-72
30155 Points +4%
AMD Ryzen AI Max+ 395
Asus ROG Flow Z13 GZ302EA-RU073W
29063 Points
Apple M4 Max (16 cores)
Apple MacBook Pro 16 M4 Max
27595 Points -5%
Intel Core i7-14650HX
Lenovo Legion 5 16IRX G9
24455 Points -16%
AMD Ryzen AI 9 HX 370
Asus ProArt P16 H7606WI
23786 Points -18%
Apple M4 Pro (14 cores)
Apple MacBook Pro 16 2024 M4 Pro
23437 Points -19%
AMD Ryzen 7 9800X3D
AMD Ryzen 7 9800X3D
23230 Points -20%
AMD Ryzen 7 9700X
AMD Ryzen 7 9700X
20485 Points -30%
Intel Core Ultra 9 285H
MSI Prestige 16 AI Evo B2HMG
20442 Points -30%
AMD Ryzen AI 9 365
Lenovo Yoga Pro 7 14ASP G9
18748 Points -35%
Intel Core i9-13900H
Minisforum MS-01
16209 Points -44%
AMD Ryzen AI 7 PRO 360
Lenovo ThinkPad T14s Gen 6 21M2S00G00
13794 Points -53%
Qualcomm Snapdragon X Elite X1E-84-100
Samsung Galaxy Book4 Edge 16 X1E-84-100
9471 Points -67%
Geekbench 6.4 / Multi-Core
Apple M4 Max (16 cores)
Apple MacBook Pro 16 M4 Max
25760 Points +21%
Apple M4 Pro (14 cores)
Apple MacBook Pro 16 2024 M4 Pro
22509 Points +6%
Intel Core Ultra 9 285K
21688 Points +2%
AMD Ryzen 9 9950X
AMD Ryzen 9 9950X
21383 Points +1%
AMD Ryzen AI Max+ 395
Asus ROG Flow Z13 GZ302EA-RU073W
21269 Points
AMD Ryzen 9 9900X
AMD Ryzen 9 9900X
20380 Points -4%
Intel Core i9-14900HX
Asus ROG Strix Scar 16 G634JZR
18590 Points -13%
Intel Core i9-14900HX
SCHENKER XMG Neo 17 E24
18572 Points -13%
Intel Core i9-14900HX
Lenovo Legion 7 16 IRX G9
18079 Points -15%
AMD Ryzen 7 9800X3D
AMD Ryzen 7 9800X3D
18074 Points -15%
AMD Ryzen 9 7945HX
Minisforum BD790i
17892 Points -16%
Intel Core i9-14900HX
Acer Predator Helios 16 PH16-72
17654 Points -17%
Intel Core Ultra 9 285H
MSI Prestige 16 AI Evo B2HMG
17262 Points -19%
AMD Ryzen 9 7945HX3D
Asus ROG Strix Scar 17 G733PYV-LL053X
16957 Points -20%
AMD Ryzen 7 9700X
AMD Ryzen 7 9700X
16817 Points -21%
AMD Ryzen 9 7945HX
Tuxedo Gemini 17 Gen3 AMD
16223 Points -24%
Intel Core i7-14650HX
Lenovo Legion 5 16IRX G9
16010 Points -25%
Qualcomm Snapdragon X Elite X1E-84-100
Samsung Galaxy Book4 Edge 16 X1E-84-100
15665 Points -26%
AMD Ryzen AI 9 HX 370
Asus ProArt P16 H7606WI
15221 Points -28%
AMD Ryzen AI 9 365
Lenovo Yoga Pro 7 14ASP G9
14118 Points -34%
Intel Core i9-13900H
Minisforum MS-01
12677 Points -40%
AMD Ryzen AI 7 PRO 360
Lenovo ThinkPad T14s Gen 6 21M2S00G00
12344 Points -42%
Intel Core Ultra 9 288V
Asus Zenbook S 14 UX5406 Core Ultra 9
11069 Points -48%
Cinebench 2024: CPU Multi Core | Cinebench R23: Multi Core | Geekbench 6.4: Multi-Core

We once again start with the Cinebench 2024 efficiency, where the Ryzen AI Max performs well and is only beaten by the new Arrow Lake-H chip Core Ultra 9 285H among the x86 competition. All the other models are either on a comparable level or worse, but the ARM competition is once again more efficient.

The older R23 Multi test is more interesting for the comparison with the x86 rivals since the ARM CPUs emulate this benchmark, which affects the performance. In this scenario, the new Ryzen AI Max APU is one of the most efficient chips and beats all of the HX competitors as well as desktop models.

Power Consumption / Cinebench 2024 Multi Power Efficiency - external Monitor
Apple M4 Max (16 cores)
Apple MacBook Pro 16 M4 Max
22.4 Points per Watt +52%
Qualcomm Snapdragon X Elite X1E-80-100
Microsoft Surface Laptop 7 13.8 Copilot+
22.2 Points per Watt +51%
Qualcomm Snapdragon X Elite X1E-84-100
Samsung Galaxy Book4 Edge 16 X1E-84-100
22.1 Points per Watt +50%
Apple M4 Pro (14 cores)
Apple MacBook Pro 16 2024 M4 Pro
20.2 Points per Watt +37%
Intel Core Ultra 9 285H
MSI Prestige 16 AI Evo B2HMG
19.1 Points per Watt +30%
Qualcomm Snapdragon X Elite X1E-78-100
Lenovo Yoga Slim 7X 14Q8X9
18 Points per Watt +22%
AMD Ryzen AI 7 PRO 360
Lenovo ThinkPad T14s Gen 6 21M2S00G00
15 Points per Watt +2%
AMD Ryzen AI Max+ 395
Asus ROG Flow Z13 GZ302EA-RU073W
14.7 Points per Watt
Intel Core Ultra 9 288V
Asus Zenbook S 14 UX5406 Core Ultra 9
14 Points per Watt -5%
AMD Ryzen AI 9 365
Lenovo Yoga Pro 7 14ASP G9
12.5 Points per Watt -15%
AMD Ryzen AI 9 HX 370
Asus ProArt P16 H7606WI
10.2 Points per Watt -31%
Intel Core Ultra 9 285K
7.43 Points per Watt -49%
AMD Ryzen 9 9950X
AMD Ryzen 9 9950X
7.18 Points per Watt -51%
AMD Ryzen 7 9700X
AMD Ryzen 7 9700X
6.86 Points per Watt -53%
AMD Ryzen 9 9900X
AMD Ryzen 9 9900X
6.61 Points per Watt -55%
Power Consumption / Cinebench R23 Multi Power Efficiency - external Monitor
Apple M4 Pro (14 cores)
Apple MacBook Pro 16 2024 M4 Pro
296 Points per Watt +19%
Apple M4 Max (16 cores)
Apple MacBook Pro 16 M4 Max
281 Points per Watt +13%
AMD Ryzen AI 7 PRO 360
Lenovo ThinkPad T14s Gen 6 21M2S00G00
259 Points per Watt +4%
AMD Ryzen AI Max+ 395
Asus ROG Flow Z13 GZ302EA-RU073W
249 Points per Watt
Qualcomm Snapdragon X Elite X1E-80-100
Microsoft Surface Laptop 7 13.8 Copilot+
247 Points per Watt -1%
AMD Ryzen 9 7945HX
Minisforum BD790i
237 Points per Watt -5%
AMD Ryzen AI 9 365
Lenovo Yoga Pro 7 14ASP G9
235 Points per Watt -6%
Qualcomm Snapdragon X Elite X1E-84-100
Samsung Galaxy Book4 Edge 16 X1E-84-100
234 Points per Watt -6%
Intel Core Ultra 9 285H
MSI Prestige 16 AI Evo B2HMG
218 Points per Watt -12%
AMD Ryzen AI 9 HX 370
Asus ProArt P16 H7606WI
208 Points per Watt -16%
AMD Ryzen 9 7945HX3D
Asus ROG Strix Scar 17 G733PYV-LL053X
207 Points per Watt -17%
AMD Ryzen 9 7945HX
Tuxedo Gemini 17 Gen3 AMD
198 Points per Watt -20%
Qualcomm Snapdragon X Elite X1E-78-100
Lenovo Yoga Slim 7X 14Q8X9
173.7 Points per Watt -30%
Intel Core i9-13900H
Minisforum MS-01
164.2 Points per Watt -34%
Intel Core i9-14900HX
Lenovo Legion 7 16 IRX G9
158.6 Points per Watt -36%
Intel Core i9-14900HX
Asus ROG Strix Scar 16 G634JZR
144.8 Points per Watt -42%
Intel Core i7-14650HX
Lenovo Legion 5 16IRX G9
143.3 Points per Watt -42%
Intel Core i9-14900HX
SCHENKER XMG Neo 17 E24
142.3 Points per Watt -43%
Intel Core i9-14900HX
Acer Predator Helios 16 PH16-72
139.6 Points per Watt -44%
Intel Core i9-13980HX
Asus ProArt Studiobook 16 OLED H7604
135 Points per Watt -46%
AMD Ryzen 9 9950X
AMD Ryzen 9 9950X
129.5 Points per Watt -48%
Intel Core Ultra 9 285K
127.5 Points per Watt -49%
AMD Ryzen 9 9900X
AMD Ryzen 9 9900X
117 Points per Watt -53%
AMD Ryzen 7 9700X
AMD Ryzen 7 9700X
116.9 Points per Watt -53%
AMD Ryzen 7 9800X3D
AMD Ryzen 7 9800X3D
96.4 Points per Watt -61%

CPU Performance at different power limits

The performance you get depends heavily on the laptop model itself and its power limits, so we also performed the Cinebench 2024 Multi benchmark at preset power limits. We used tools like Throttle Stop or Universal x86 Tuning Utility, but that means we are limited to AMD and Intel processors.

Cinebench 2024 Multi
TDP Ryzen AI Max+ 395 Ryzen 9 7945HX3D Core Ultra 9-14900HX Ryzen AI 9 HX 370 Core Ultra 9 285H
45 Watts 1310 points 1146 points 1107 points 977 points
55 Watts 1494 points 1370 points 1012 points 1167 points 1042 points
65 Watts 1602 points 1492 points 1190 points
80 Watts 1731 points 1708 points 1407 points

We also included the results of the two current chips Ryzen 9 AI HX 370 as well as Core Ultra 9 285H in our comparison to get a better picture, especially in the range between 45-55 Watts. This comparison clearly shows that the new Ryzen AI Max+ 395 is already very capable at low power limits and offers a noticeable performance advantage over the other two mobile chips. The older Ryzen 9 7945HX3D starts to be competitive at 80 Watts, while the Core i9-14900HX falls behind. We know from our reviews that the 14900HX simply needs quite a lot of power (much more than 100 Watts) to offer good performance numbers.

RAM Performance

Memory Mark Apple M4 Pro MBP 16

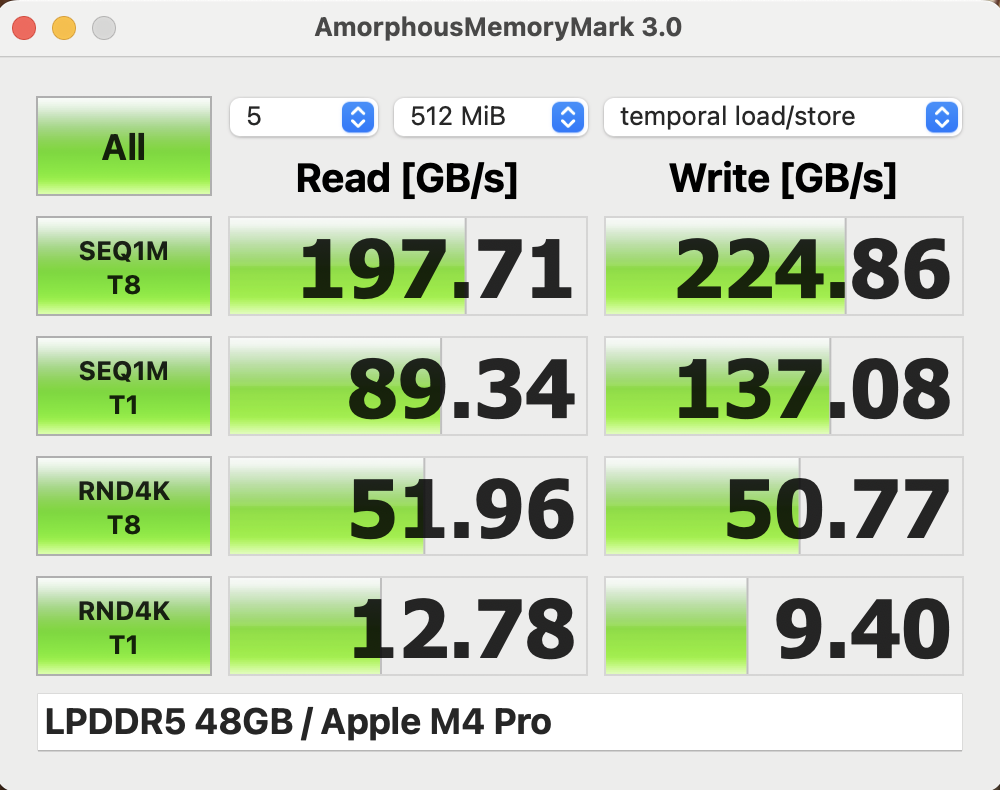
Our reviews always include memory benchmarks with the tool AIDA by default and the results show a noticeable advantage for the new Ryzen AI Max+ 395 compared to the Ryzen AI 9 HX 370 and all the other comparison devices. The Lunar Lake chips with 32 GB RAM also perform well, but the Snapdragon SoCs falls behind. The comparison with the Apple M4 Pro (with the benchmark AmorphousMemoryMark) is also interesting. The M4 Pro is faster in terms of read performance, but the two SoCs are pretty much on par when it comes to the write performance.

AIDA64 / Memory Copy
Asus ROG Flow Z13 GZ302EA-RU073W
AMD Ryzen AI Max+ 395, Radeon RX 8060S
158525 MB/s
Average AMD Ryzen AI Max+ 395
  (n=1)
158525 MB/s 0%
Lenovo Yoga Slim 9 14ILL10
Intel Core Ultra 7 258V, Arc 140V
107767 MB/s -32%
Asus ProArt PX13 HN7306
AMD Ryzen AI 9 HX 370, NVIDIA GeForce RTX 4070 Laptop GPU
89643 MB/s -43%
Acer Predator Helios Neo 14 (2024)
Intel Core Ultra 9 185H, NVIDIA GeForce RTX 4070 Laptop GPU
84317 MB/s -47%
SCHENKER Key 17 Pro (M24)
Intel Core i9-14900HX, NVIDIA GeForce RTX 4090 Laptop GPU
78820 MB/s -50%
Average of class Convertible
  (29473 - 158525, n=63, last 2 years)
75972 MB/s -52%
Asus ROG Zephyrus G14 2024 GA403U
AMD Ryzen 9 8945HS, NVIDIA GeForce RTX 4070 Laptop GPU
68976 MB/s -56%
Razer Blade 14 RZ09-0508
AMD Ryzen 9 8945HS, NVIDIA GeForce RTX 4070 Laptop GPU
68755 MB/s -57%
Asus ROG Flow Z13 ACRNM
Intel Core i9-13900H, NVIDIA GeForce RTX 4070 Laptop GPU
66769 MB/s -58%
Razer Blade 14 RTX 4070
AMD Ryzen 9 7940HS, NVIDIA GeForce RTX 4070 Laptop GPU
60919 MB/s -62%
Honor MagicBook Art 14 Snapdragon
Qualcomm Snapdragon X Elite X1E-80-100, Adreno X1-85 3.8 TFLOPS
60193 MB/s -62%
Asus ROG Strix Scar 17 G733PYV-LL053X
AMD Ryzen 9 7945HX3D, NVIDIA GeForce RTX 4090 Laptop GPU
50335 MB/s -68%
AIDA64 / Memory Read
Asus ROG Flow Z13 GZ302EA-RU073W
AMD Ryzen AI Max+ 395, Radeon RX 8060S
121931 MB/s
Average AMD Ryzen AI Max+ 395
  (n=1)
121931 MB/s 0%
Honor MagicBook Art 14 Snapdragon
Qualcomm Snapdragon X Elite X1E-80-100, Adreno X1-85 3.8 TFLOPS
101883 MB/s -16%
Asus ProArt PX13 HN7306
AMD Ryzen AI 9 HX 370, NVIDIA GeForce RTX 4070 Laptop GPU
100149 MB/s -18%
Lenovo Yoga Slim 9 14ILL10
Intel Core Ultra 7 258V, Arc 140V
87026 MB/s -29%
SCHENKER Key 17 Pro (M24)
Intel Core i9-14900HX, NVIDIA GeForce RTX 4090 Laptop GPU
85763 MB/s -30%
Acer Predator Helios Neo 14 (2024)
Intel Core Ultra 9 185H, NVIDIA GeForce RTX 4070 Laptop GPU
76163 MB/s -38%
Average of class Convertible
  (28905 - 126517, n=63, last 2 years)
66161 MB/s -46%
Asus ROG Flow Z13 ACRNM
Intel Core i9-13900H, NVIDIA GeForce RTX 4070 Laptop GPU
63054 MB/s -48%
Razer Blade 14 RZ09-0508
AMD Ryzen 9 8945HS, NVIDIA GeForce RTX 4070 Laptop GPU
61429 MB/s -50%
Razer Blade 14 RTX 4070
AMD Ryzen 9 7940HS, NVIDIA GeForce RTX 4070 Laptop GPU
60804 MB/s -50%
Asus ROG Strix Scar 17 G733PYV-LL053X
AMD Ryzen 9 7945HX3D, NVIDIA GeForce RTX 4090 Laptop GPU
59921 MB/s -51%
Asus ROG Zephyrus G14 2024 GA403U
AMD Ryzen 9 8945HS, NVIDIA GeForce RTX 4070 Laptop GPU
49966 MB/s -59%
AIDA64 / Memory Write
Asus ROG Flow Z13 GZ302EA-RU073W
AMD Ryzen AI Max+ 395, Radeon RX 8060S
216896 MB/s
Average AMD Ryzen AI Max+ 395
  (n=1)
216896 MB/s 0%
Lenovo Yoga Slim 9 14ILL10
Intel Core Ultra 7 258V, Arc 140V
117866 MB/s -46%
Asus ProArt PX13 HN7306
AMD Ryzen AI 9 HX 370, NVIDIA GeForce RTX 4070 Laptop GPU
98992 MB/s -54%
Asus ROG Zephyrus G14 2024 GA403U
AMD Ryzen 9 8945HS, NVIDIA GeForce RTX 4070 Laptop GPU
93153 MB/s -57%
Razer Blade 14 RZ09-0508
AMD Ryzen 9 8945HS, NVIDIA GeForce RTX 4070 Laptop GPU
87253 MB/s -60%
Average of class Convertible
  (30591 - 216896, n=63, last 2 years)
78041 MB/s -64%
Razer Blade 14 RTX 4070
AMD Ryzen 9 7940HS, NVIDIA GeForce RTX 4070 Laptop GPU
77647 MB/s -64%
SCHENKER Key 17 Pro (M24)
Intel Core i9-14900HX, NVIDIA GeForce RTX 4090 Laptop GPU
77439 MB/s -64%
Asus ROG Flow Z13 ACRNM
Intel Core i9-13900H, NVIDIA GeForce RTX 4070 Laptop GPU
73816 MB/s -66%
Asus ROG Strix Scar 17 G733PYV-LL053X
AMD Ryzen 9 7945HX3D, NVIDIA GeForce RTX 4090 Laptop GPU
58774 MB/s -73%
Acer Predator Helios Neo 14 (2024)
Intel Core Ultra 9 185H, NVIDIA GeForce RTX 4070 Laptop GPU
51880 MB/s -76%
Honor MagicBook Art 14 Snapdragon
Qualcomm Snapdragon X Elite X1E-80-100, Adreno X1-85 3.8 TFLOPS
44519 MB/s -79%
AIDA64 / Memory Latency
Acer Predator Helios Neo 14 (2024)
Intel Core Ultra 9 185H, NVIDIA GeForce RTX 4070 Laptop GPU
144.3 ns * -9%
Asus ROG Flow Z13 GZ302EA-RU073W
AMD Ryzen AI Max+ 395, Radeon RX 8060S
131.9 ns *
Average AMD Ryzen AI Max+ 395
  (n=1)
131.9 ns * -0%
Average of class Convertible
  (7.7 - 173, n=62, last 2 years)
120.1 ns * +9%
Asus ProArt PX13 HN7306
AMD Ryzen AI 9 HX 370, NVIDIA GeForce RTX 4070 Laptop GPU
111.4 ns * +16%
Asus ROG Zephyrus G14 2024 GA403U
AMD Ryzen 9 8945HS, NVIDIA GeForce RTX 4070 Laptop GPU
110.4 ns * +16%
Lenovo Yoga Slim 9 14ILL10
Intel Core Ultra 7 258V, Arc 140V
96.3 ns * +27%
Razer Blade 14 RZ09-0508
AMD Ryzen 9 8945HS, NVIDIA GeForce RTX 4070 Laptop GPU
95.4 ns * +28%
Razer Blade 14 RTX 4070
AMD Ryzen 9 7940HS, NVIDIA GeForce RTX 4070 Laptop GPU
89.9 ns * +32%
Asus ROG Flow Z13 ACRNM
Intel Core i9-13900H, NVIDIA GeForce RTX 4070 Laptop GPU
89.7 ns * +32%
Asus ROG Strix Scar 17 G733PYV-LL053X
AMD Ryzen 9 7945HX3D, NVIDIA GeForce RTX 4090 Laptop GPU
88.6 ns * +33%
SCHENKER Key 17 Pro (M24)
Intel Core i9-14900HX, NVIDIA GeForce RTX 4090 Laptop GPU
84.5 ns * +36%

* ... smaller is better

GPU Performance

In addition to the powerful CPU, you also a powerful integrated graphics card called Radeon 8060S. AMD claims it is the fastest x86-iGPU and we can confirm that right away, since neither the Radeon 890M, nor the Intel Arc Graphics 140V/140T stand a chance against the new Radeon 8060S.

We start with the different 3DMark benchmarks and they clearly show that Radeon 8060S is on par with the GeForce RTX 4070 Laptop with TGP value between 65-75 Watts. This is the case for 3DMark 11 as well as 3DMark Fire Strike and Time Spy, but the Radeon 8060S loses some ground compared to the RTX 4070 Laptop in the Speed Way as well as Steel Nomad tests.

3DMark 11 / Performance GPU
NVIDIA GeForce RTX 4070 Laptop GPU
Razer Blade 14 RZ09-0508, R9 8945HS, 140
44315 Points +9%
NVIDIA GeForce RTX 4070 Laptop GPU
Razer Blade 14 RTX 4070, R9 7940HS, 140
42318 Points +4%
AMD Radeon RX 8060S
Asus ROG Flow Z13 GZ302EA-RU073W, Ryzen AI Max+ 395, 80
40732 Points
NVIDIA GeForce RTX 4070 Laptop GPU
Asus ProArt PX13 HN7306, Ryzen AI 9 HX 370, 75
38156 Points -6%
NVIDIA GeForce RTX 4060 Laptop GPU
Acer Nitro 14 AN14-41-R3MX, R5 8645HS, 110
37827 Points -7%
NVIDIA GeForce RTX 4070 Laptop GPU
Asus ROG Zephyrus G14 2024 GA403U, R9 8945HS, 90
37023 Points -9%
NVIDIA GeForce RTX 4070 Laptop GPU
Acer Predator Helios Neo 14 (2024), Ultra 9 185H, 125
36209 Points -11%
NVIDIA GeForce RTX 4070 Laptop GPU
Asus ROG Flow Z13 ACRNM, i9-13900H, 65
32783 Points -20%
NVIDIA GeForce RTX 4060 Laptop GPU
Asus ROG Flow Z13 GZ301V, i9-13900H, 65
28200 Points -31%
AMD Radeon 890M
Beelink SER9, Ryzen AI 9 HX 370, 0
16800 Points -59%
Intel Arc Graphics 140V
Asus Zenbook S 14 UX5406 Core Ultra 9, Core Ultra 9 288V, 0
11102 Points -73%
3DMark / Fire Strike Graphics
NVIDIA GeForce RTX 4070 Laptop GPU
Razer Blade 14 RZ09-0508, R9 8945HS, 140
33451 Points +29%
NVIDIA GeForce RTX 4070 Laptop GPU
Razer Blade 14 RTX 4070, R9 7940HS, 140
30668 Points +18%
NVIDIA GeForce RTX 4060 Laptop GPU
Acer Nitro 14 AN14-41-R3MX, R5 8645HS, 110
28191 Points +8%
NVIDIA GeForce RTX 4070 Laptop GPU
Asus ProArt PX13 HN7306, Ryzen AI 9 HX 370, 75
28172 Points +8%
NVIDIA GeForce RTX 4070 Laptop GPU
Asus ROG Zephyrus G14 2024 GA403U, R9 8945HS, 90
27525 Points +6%
NVIDIA GeForce RTX 4070 Laptop GPU
Acer Predator Helios Neo 14 (2024), Ultra 9 185H, 125
26653 Points +3%
AMD Radeon RX 8060S
Asus ROG Flow Z13 GZ302EA-RU073W, Ryzen AI Max+ 395, 80
25992 Points
NVIDIA GeForce RTX 4070 Laptop GPU
Asus ROG Flow Z13 ACRNM, i9-13900H, 65
23000 Points -12%
NVIDIA GeForce RTX 4060 Laptop GPU
Asus ROG Flow Z13 GZ301V, i9-13900H, 65
20533 Points -21%
AMD Radeon 890M
Beelink SER9, Ryzen AI 9 HX 370, 0
10037 Points -61%
Intel Arc Graphics 140V
Asus Zenbook S 14 UX5406 Core Ultra 9, Core Ultra 9 288V, 0
9831 Points -62%
3DMark / Time Spy Graphics
NVIDIA GeForce RTX 4070 Laptop GPU
Razer Blade 14 RZ09-0508, R9 8945HS, 140
13215 Points +29%
NVIDIA GeForce RTX 4070 Laptop GPU
Razer Blade 14 RTX 4070, R9 7940HS, 140
12153 Points +19%
NVIDIA GeForce RTX 4060 Laptop GPU
Acer Nitro 14 AN14-41-R3MX, R5 8645HS, 110
10799 Points +6%
NVIDIA GeForce RTX 4070 Laptop GPU
Asus ProArt PX13 HN7306, Ryzen AI 9 HX 370, 75
10693 Points +5%
NVIDIA GeForce RTX 4070 Laptop GPU
Asus ROG Zephyrus G14 2024 GA403U, R9 8945HS, 90
10392 Points +2%
AMD Radeon RX 8060S
Asus ROG Flow Z13 GZ302EA-RU073W, Ryzen AI Max+ 395, 80
10224 Points
NVIDIA GeForce RTX 4070 Laptop GPU
Acer Predator Helios Neo 14 (2024), Ultra 9 185H, 125
10182 Points 0%
NVIDIA GeForce RTX 4070 Laptop GPU
Asus ROG Flow Z13 ACRNM, i9-13900H, 65
9513 Points -7%
NVIDIA GeForce RTX 4060 Laptop GPU
Asus ROG Flow Z13 GZ301V, i9-13900H, 65
7655 Points -25%
Intel Arc Graphics 140V
Asus Zenbook S 14 UX5406 Core Ultra 9, Core Ultra 9 288V, 0
4227 Points -59%
AMD Radeon 890M
Beelink SER9, Ryzen AI 9 HX 370, 0
3546 Points -65%
3DMark / Steel Nomad Light Score
NVIDIA GeForce RTX 4070 Laptop GPU
Asus ProArt PX13 HN7306, Ryzen AI 9 HX 370, 75
10952 Points +13%
NVIDIA GeForce RTX 4070 Laptop GPU
Asus ROG Flow Z13 ACRNM, i9-13900H, 65
9949 Points +3%
AMD Radeon RX 8060S
Asus ROG Flow Z13 GZ302EA-RU073W, Ryzen AI Max+ 395, 80
9653 Points
Intel Arc Graphics 140V
Asus Zenbook S 14 UX5406 Core Ultra 9, Core Ultra 9 288V, 0
3406 Points -65%
3DMark / Steel Nomad Score
NVIDIA GeForce RTX 4070 Laptop GPU
Razer Blade 14 RZ09-0508, R9 8945HS, 140
2795 Points +49%
NVIDIA GeForce RTX 4070 Laptop GPU
Asus ROG Zephyrus G14 2024 GA403U, R9 8945HS, 90
2442 Points +30%
NVIDIA GeForce RTX 4070 Laptop GPU
Asus ProArt PX13 HN7306, Ryzen AI 9 HX 370, 75
2386 Points +27%
NVIDIA GeForce RTX 4060 Laptop GPU
Acer Nitro 14 AN14-41-R3MX, R5 8645HS, 110
2351 Points +25%
NVIDIA GeForce RTX 4070 Laptop GPU
Acer Predator Helios Neo 14 (2024), Ultra 9 185H, 125
2230 Points +19%
NVIDIA GeForce RTX 4070 Laptop GPU
Asus ROG Flow Z13 ACRNM, i9-13900H, 65
2228 Points +19%
AMD Radeon RX 8060S
Asus ROG Flow Z13 GZ302EA-RU073W, Ryzen AI Max+ 395, 80
1874 Points
Intel Arc Graphics 140V
Asus Zenbook S 14 UX5406 Core Ultra 9, Core Ultra 9 288V, 0
915 Points -51%
AMD Radeon 890M
Beelink SER9, Ryzen AI 9 HX 370, 0
502 Points -73%
3DMark / Solar Bay Score
NVIDIA GeForce RTX 4070 Laptop GPU
Acer Predator Helios Neo 14 (2024), Ultra 9 185H, 125
44190 Points
NVIDIA GeForce RTX 4070 Laptop GPU
Razer Blade 14 RTX 4070, R9 7940HS, 140
29.13 Points
3DMark / Speed Way Score
NVIDIA GeForce RTX 4070 Laptop GPU
Razer Blade 14 RZ09-0508, R9 8945HS, 140
3054 Points +127%
NVIDIA GeForce RTX 4070 Laptop GPU
Razer Blade 14 RTX 4070, R9 7940HS, 140
2913 Points +117%
NVIDIA GeForce RTX 4070 Laptop GPU
Asus ROG Zephyrus G14 2024 GA403U, R9 8945HS, 90
2566 Points +91%
NVIDIA GeForce RTX 4070 Laptop GPU
Acer Predator Helios Neo 14 (2024), Ultra 9 185H, 125
2515 Points +87%
NVIDIA GeForce RTX 4070 Laptop GPU
Asus ROG Flow Z13 ACRNM, i9-13900H, 65
2477 Points +84%
AMD Radeon RX 8060S
Asus ROG Flow Z13 GZ302EA-RU073W, Ryzen AI Max+ 395, 80
1343 Points
AMD Radeon 890M
Beelink SER9, Ryzen AI 9 HX 370, 0
328 Points -76%

We also tested the new Radeon 8060S against the ARM competition from Apple as well as Qualcomm. The fastest version of the Qualcomm Adreno X1-85 (4.6 TFLOPS) does not stand a chance against the new Strix Halo iGPU. The situation changes compared to Apple’s GPUs, and depending on the benchmark the 8060S is sitting right between the two M4 Pro GPUs or slightly ahead, respectively. The M4 Max GPU on the other hand is out of reach.

3DMark / Wild Life Extreme Unlimited
Apple MacBook Pro 16 M4 Max
M4 Max 40-Core GPU, M4 Max (16 cores), Apple SSD AP1024Z
37434 Points +91%
Apple MacBook Pro 14 2023 M3 Max
M3 Max 40-Core GPU, Apple M3 Max 16-Core, Apple SSD AP2048Z
31403 Points +60%
Asus ROG Flow Z13 GZ302EA-RU073W
Radeon RX 8060S, Ryzen AI Max+ 395, Kioxia BG6 KBG60ZNS1T02
19615 Points
Apple MacBook Pro 16 2024 M4 Pro
M4 Pro 20-Core GPU, M4 Pro (14 cores), Apple SSD AP2048Z
19345 Points -1%
Apple MacBook Pro 16 2023 M3 Pro
M3 Pro 18-Core GPU, Apple M3 Pro 12-Core, Apple SSD AP0512Z
14545 Points -26%
Apple MacBook Pro 14 2023 M3 Pro
M3 Pro 14-Core GPU, Apple M3 Pro 11-Core, Apple SSD AP0512Z
12094 Points -38%
Samsung Galaxy Book4 Edge 16 X1E-84-100
Adreno X1-85 4.6 TFLOPS, SD X Elite X1E-84-100
6978 Points -64%
3DMark / Steel Nomad Light Score
Apple MacBook Pro 16 M4 Max
M4 Max 40-Core GPU, M4 Max (16 cores), Apple SSD AP1024Z
13989 Points +45%
Asus ROG Flow Z13 GZ302EA-RU073W
Radeon RX 8060S, Ryzen AI Max+ 395, Kioxia BG6 KBG60ZNS1T02
9653 Points
Apple MacBook Pro 16 2024 M4 Pro
M4 Pro 20-Core GPU, M4 Pro (14 cores), Apple SSD AP2048Z
7781 Points -19%
Apple MacBook Pro 14 2024 M4 Pro Entry
M4 Pro 16-Core GPU, M4 Pro (12 cores), Apple SSD AP1024Z
6739 Points -30%
Samsung Galaxy Book4 Edge 16 X1E-84-100
Adreno X1-85 4.6 TFLOPS, SD X Elite X1E-84-100
2467 Points -74%
GFXBench / 4K Aztec Ruins High Tier Offscreen
Apple MacBook Pro 16 M4 Max
M4 Max 40-Core GPU, M4 Max (16 cores), Apple SSD AP1024Z
231.7 fps +103%
Apple MacBook Pro 14 2023 M3 Max
M3 Max 40-Core GPU, Apple M3 Max 16-Core, Apple SSD AP2048Z
188.2 fps +65%
Apple MacBook Pro 16 2024 M4 Pro
M4 Pro 20-Core GPU, M4 Pro (14 cores), Apple SSD AP2048Z
125.8 fps +10%
Asus ROG Flow Z13 GZ302EA-RU073W
Radeon RX 8060S, Ryzen AI Max+ 395, Kioxia BG6 KBG60ZNS1T02
114.1 fps
Apple MacBook Pro 14 2024 M4 Pro Entry
M4 Pro 16-Core GPU, M4 Pro (12 cores), Apple SSD AP1024Z
103.3 fps -9%
Apple MacBook Pro 16 2023 M3 Pro
M3 Pro 18-Core GPU, Apple M3 Pro 12-Core, Apple SSD AP0512Z
97.8 fps -14%
Apple MacBook Pro 14 2023 M3 Pro
M3 Pro 14-Core GPU, Apple M3 Pro 11-Core, Apple SSD AP0512Z
79 fps -31%
GFXBench / Aztec Ruins High Tier Onscreen
Apple MacBook Pro 16 M4 Max
M4 Max 40-Core GPU, M4 Max (16 cores), Apple SSD AP1024Z
120 fps +5%
Apple MacBook Pro 14 2023 M3 Max
M3 Max 40-Core GPU, Apple M3 Max 16-Core, Apple SSD AP2048Z
119.8 fps +5%
Apple MacBook Pro 14 2024 M4 Pro Entry
M4 Pro 16-Core GPU, M4 Pro (12 cores), Apple SSD AP1024Z
119.8 fps +5%
Asus ROG Flow Z13 GZ302EA-RU073W
Radeon RX 8060S, Ryzen AI Max+ 395, Kioxia BG6 KBG60ZNS1T02
114.2 fps
Apple MacBook Pro 14 2023 M3 Pro
M3 Pro 14-Core GPU, Apple M3 Pro 11-Core, Apple SSD AP0512Z
109.2 fps -4%
Apple MacBook Pro 16 2023 M3 Pro
M3 Pro 18-Core GPU, Apple M3 Pro 12-Core, Apple SSD AP0512Z
104.9 fps -8%
Apple MacBook Pro 16 2024 M4 Pro
M4 Pro 20-Core GPU, M4 Pro (14 cores), Apple SSD AP2048Z
94.7 fps -17%
Geekbench 6.4 / GPU OpenCL
Apple MacBook Pro 16 M4 Max
M4 Max 40-Core GPU, M4 Max (16 cores), Apple SSD AP1024Z
116455 Points +29%
Apple MacBook Pro 14 2023 M3 Max
M3 Max 40-Core GPU, Apple M3 Max 16-Core, Apple SSD AP2048Z
91418 Points +1%
Asus ROG Flow Z13 GZ302EA-RU073W
Radeon RX 8060S, Ryzen AI Max+ 395, Kioxia BG6 KBG60ZNS1T02
90181 Points
Apple MacBook Pro 16 2024 M4 Pro
M4 Pro 20-Core GPU, M4 Pro (14 cores), Apple SSD AP2048Z
69778 Points -23%
Apple MacBook Pro 14 2024 M4 Pro Entry
M4 Pro 16-Core GPU, M4 Pro (12 cores), Apple SSD AP1024Z
60506 Points -33%
Apple MacBook Pro 16 2023 M3 Pro
M3 Pro 18-Core GPU, Apple M3 Pro 12-Core, Apple SSD AP0512Z
50373 Points -44%
Apple MacBook Pro 14 2023 M3 Pro
M3 Pro 14-Core GPU, Apple M3 Pro 11-Core, Apple SSD AP0512Z
42798 Points -53%
Samsung Galaxy Book4 Edge 16 X1E-84-100
Adreno X1-85 4.6 TFLOPS, SD X Elite X1E-84-100
23854 Points -74%

Gaming Performance

We have some gaming benchmarks that we perform in every laptop review and the Radeon 8060S is on par with the Radeon RX 7600M XT and slightly ahead of the fastest version of the GeForce RTX 4050 Laptop (90W TGP) in the Lenovo IdeaPad Pro 5 16. The two comparable RTX 4070 Laptop devices Asus ROG Flow Z13 as well as Asus ProArt PX13 have a slight advantage, but this is mainly caused by some of the results in older benchmarks like GTA V. This is also the case for fast versions of the RTX 4060 Laptop. The two newer titles Cyberpunk 2077 and Baldur's Gate 3 show better results for the Radeon 8060S. All in all, you can play almost every game in 1080p and maximum details, while some titles are a bit too demanding for the QHD resolution (more on that in the following paragraphs).

Performance Rating - Percent
NVIDIA RTX 3500 Ada Generation Laptop GPU
HP ZBook Fury 16 G11, i9-14900HX, 105
100 pt
NVIDIA GeForce RTX 4060 Laptop GPU
Asus TUF Gaming A16 FA608WV, Ryzen AI 9 HX 370, 140
83.4 pt
NVIDIA GeForce RTX 4070 Laptop GPU
Acer Predator Helios Neo 14 (2024), Ultra 9 185H, 125
83.1 pt
NVIDIA GeForce RTX 4060 Laptop GPU
Acer Nitro 14 AN14-41-R3MX, R5 8645HS, 110
81.4 pt
NVIDIA GeForce RTX 4070 Laptop GPU
Asus ROG Flow Z13 ACRNM, i9-13900H, 65
81.1 pt
NVIDIA GeForce RTX 4070 Laptop GPU
Asus ProArt PX13 HN7306, Ryzen AI 9 HX 370, 75
77.5 pt
AMD Radeon RX 7600M XT
Minisforum MS-A1 (MGA1 Radeon RX 7600M XT @OCuLink) , Ryzen 7 8700G, 120
76.8 pt
AMD Radeon RX 8060S
Asus ROG Flow Z13 GZ302EA-RU073W, Ryzen AI Max+ 395, 80
76.1 pt
NVIDIA GeForce RTX 4050 Laptop GPU
Lenovo IdeaPad Pro 5 16IMH G9 RTX 4050, Ultra 9 185H, 90
74.8 pt
NVIDIA GeForce RTX 4060 Laptop GPU
SCHENKER Key 14 (M24), Ultra 7 155H, 100
71.5 pt
NVIDIA RTX 2000 Ada Generation Laptop GPU
HP ZBook Power 16 G11 A, R7 8845HS, 50
61.5 pt
NVIDIA GeForce RTX 3050 4GB Laptop GPU
HP Envy 17-da0076ng, Ultra 7 155U, 0
37.3 pt
Intel Arc Graphics 140T
MSI Prestige 16 AI Evo B2HMG, Ultra 9 285H, 0
29.7 pt
AMD Radeon 890M
Asus ProArt PX13 HN7306, Ryzen AI 9 HX 370, 0
29 pt
Intel Arc Graphics 140V
Asus Zenbook S 14 UX5406, Core Ultra 7 258V, 0
26 pt
Average of class Convertible
 
23.3 pt
Cyberpunk 2077 2.2 Phantom Liberty - 1920x1080 Ultra Preset (FSR off)
NVIDIA RTX 3500 Ada Generation Laptop GPU
HP ZBook Fury 16 G11, i9-14900HX, 105
90.3 (73.1min) fps +19%
NVIDIA GeForce RTX 4060 Laptop GPU
Acer Nitro 14 AN14-41-R3MX, R5 8645HS, 110
75.8 (63.1min) fps 0%
NVIDIA GeForce RTX 4060 Laptop GPU
Asus TUF Gaming A16 FA608WV, Ryzen AI 9 HX 370, 140
75.6 (62.9min) fps 0%
AMD Radeon RX 8060S
Asus ROG Flow Z13 GZ302EA-RU073W, Ryzen AI Max+ 395, 80
75.6 (62min) fps
NVIDIA GeForce RTX 4070 Laptop GPU
Asus ProArt PX13 HN7306, Ryzen AI 9 HX 370, 75
74.1 (60.8min) fps -2%
AMD Radeon RX 7600M XT
Minisforum MS-A1 (MGA1 Radeon RX 7600M XT @OCuLink) , Ryzen 7 8700G, 120
73.2 (60.3min) fps -3%
NVIDIA GeForce RTX 4070 Laptop GPU
Acer Predator Helios Neo 14 (2024), Ultra 9 185H, 125
72.4 (59.8min) fps -4%
NVIDIA GeForce RTX 4070 Laptop GPU
Asus ROG Flow Z13 ACRNM, i9-13900H, 65
66.79 (52.29min) fps -12%
NVIDIA GeForce RTX 4050 Laptop GPU
Lenovo IdeaPad Pro 5 16IMH G9 RTX 4050, Ultra 9 185H, 90
59.8 (49.3min) fps -21%
NVIDIA GeForce RTX 4060 Laptop GPU
SCHENKER Key 14 (M24), Ultra 7 155H, 100
56.4 (39.3min) fps -25%
NVIDIA RTX 2000 Ada Generation Laptop GPU
HP ZBook Power 16 G11 A, R7 8845HS, 50
44.8 (37.6min) fps -41%
AMD Radeon 890M
Asus ProArt PX13 HN7306, Ryzen AI 9 HX 370, 0
27.8 (23.1min) fps -63%
Intel Arc Graphics 140T
MSI Prestige 16 AI Evo B2HMG, Ultra 9 285H, 0
27.3 (23.6min) fps -64%
NVIDIA GeForce RTX 3050 4GB Laptop GPU
HP Envy 17-da0076ng, Ultra 7 155U, 0
26.4 (10.2min) fps -65%
NVIDIA GeForce RTX 3050 4GB Laptop GPU
HP Envy 17-da0076ng, Ultra 7 155U, 0
21.1 (8.56min, 12.4P0.1, 18P1) fps -72%
Intel Arc Graphics 140V
Asus Zenbook S 14 UX5406, Core Ultra 7 258V, 0
24.3 (19.9min) fps -68%
Average of class Convertible
  (8.2 - 75.6, n=39, last 2 years)
19.7 fps -74%
Baldur's Gate 3 - 1920x1080 Ultra Preset AA:T
NVIDIA RTX 3500 Ada Generation Laptop GPU
HP ZBook Fury 16 G11, i9-14900HX, 105
117.3 fps +38%
NVIDIA GeForce RTX 4070 Laptop GPU
Acer Predator Helios Neo 14 (2024), Ultra 9 185H, 125
107.9 (57.2min, 71.4P0.1, 87.3P1) fps +26%
NVIDIA GeForce RTX 4060 Laptop GPU
Acer Nitro 14 AN14-41-R3MX, R5 8645HS, 110
100.4 (33.6min, 83P0.1, 88.8P1) fps +18%
NVIDIA GeForce RTX 4060 Laptop GPU
Asus TUF Gaming A16 FA608WV, Ryzen AI 9 HX 370, 140
99 fps +16%
AMD Radeon RX 7600M XT
Minisforum MS-A1 (MGA1 Radeon RX 7600M XT @OCuLink) , Ryzen 7 8700G, 120
87.7 (37.2min, 74.4P0.1, 79.1P1) fps +3%
NVIDIA GeForce RTX 4070 Laptop GPU
Asus ROG Flow Z13 ACRNM, i9-13900H, 65
86.1 (50.7P0.1, 70.2P1) fps +1%
AMD Radeon RX 8060S
Asus ROG Flow Z13 GZ302EA-RU073W, Ryzen AI Max+ 395, 80
85.3 fps
NVIDIA GeForce RTX 4050 Laptop GPU
Lenovo IdeaPad Pro 5 16IMH G9 RTX 4050, Ultra 9 185H, 90
78.6 fps -8%
NVIDIA GeForce RTX 4060 Laptop GPU
SCHENKER Key 14 (M24), Ultra 7 155H, 100
66.9 fps -22%
NVIDIA GeForce RTX 4070 Laptop GPU
Asus ProArt PX13 HN7306, Ryzen AI 9 HX 370, 75
66.7 fps -22%
NVIDIA RTX 2000 Ada Generation Laptop GPU
HP ZBook Power 16 G11 A, R7 8845HS, 50
66.1 fps -23%
NVIDIA GeForce RTX 3050 4GB Laptop GPU
HP Envy 17-da0076ng, Ultra 7 155U, 0
35.7 fps -58%
AMD Radeon 890M
Asus ProArt PX13 HN7306, Ryzen AI 9 HX 370, 0
29.1 fps -66%
Intel Arc Graphics 140T
MSI Prestige 16 AI Evo B2HMG, Ultra 9 285H, 0
26.4 fps -69%
Intel Arc Graphics 140V
Asus Zenbook S 14 UX5406, Core Ultra 7 258V, 0
23 fps -73%
Average of class Convertible
  (9.2 - 85.3, n=32, last 2 years)
22.7 fps -73%
GTA V - 1920x1080 Highest Settings possible AA:4xMSAA + FX AF:16x
NVIDIA RTX 3500 Ada Generation Laptop GPU
HP ZBook Fury 16 G11, i9-14900HX, 105
115.5 (4.64min, 76.9P1) fps +38%
NVIDIA GeForce RTX 4060 Laptop GPU
Asus TUF Gaming A16 FA608WV, Ryzen AI 9 HX 370, 140
114 (4.02min, 71.4P1) fps +37%
NVIDIA GeForce RTX 4070 Laptop GPU
Acer Predator Helios Neo 14 (2024), Ultra 9 185H, 125
104.8 (4.53min, 71.4P1) fps +26%
NVIDIA GeForce RTX 4070 Laptop GPU
Asus ProArt PX13 HN7306, Ryzen AI 9 HX 370, 75
104.5 (9.04min, 66.7P1) fps +25%
NVIDIA GeForce RTX 4060 Laptop GPU
Acer Nitro 14 AN14-41-R3MX, R5 8645HS, 110
100.6 (7.3min, 71.4P1) fps +20%
NVIDIA GeForce RTX 4050 Laptop GPU
Lenovo IdeaPad Pro 5 16IMH G9 RTX 4050, Ultra 9 185H, 90
98.7 (4.28min, 66.7P1) fps +18%
AMD Radeon RX 7600M XT
Minisforum MS-A1 (MGA1 Radeon RX 7600M XT @OCuLink) , Ryzen 7 8700G, 120
97.2 (8.06min, 62.5P1) fps +16%
NVIDIA GeForce RTX 4070 Laptop GPU
Asus ROG Flow Z13 ACRNM, i9-13900H, 65
94.8 (4.6min, 62.5P1) fps +14%
NVIDIA RTX 2000 Ada Generation Laptop GPU
HP ZBook Power 16 G11 A, R7 8845HS, 50
90.3 (5.49min, 55.6P1) fps +8%
AMD Radeon RX 8060S
Asus ROG Flow Z13 GZ302EA-RU073W, Ryzen AI Max+ 395, 80
83.5 (7.23min, 55.6P1) fps
NVIDIA GeForce RTX 4060 Laptop GPU
SCHENKER Key 14 (M24), Ultra 7 155H, 100
79.7 (4.26min, 47.6P1) fps -5%
NVIDIA GeForce RTX 3050 4GB Laptop GPU
HP Envy 17-da0076ng, Ultra 7 155U, 0
48.3 (11.4min, 30.3P1) fps -42%
AMD Radeon 890M
Asus ProArt PX13 HN7306, Ryzen AI 9 HX 370, 0
31.6 (2.04min, 22.7P1) fps -62%
Intel Arc Graphics 140V
Asus Zenbook S 14 UX5406, Core Ultra 7 258V, 0
23.4 (2.44min, 13.3P1) fps -72%
Average of class Convertible
  (7.14 - 89.5, n=51, last 2 years)
18.7 fps -78%
Intel Arc Graphics 140T
MSI Prestige 16 AI Evo B2HMG, Ultra 9 285H, 0
17 (6.65min, 13P1) fps -80%
Final Fantasy XV Benchmark - 1920x1080 High Quality
NVIDIA RTX 3500 Ada Generation Laptop GPU
HP ZBook Fury 16 G11, i9-14900HX, 105
128.9 fps +49%
NVIDIA GeForce RTX 4060 Laptop GPU
Acer Nitro 14 AN14-41-R3MX, R5 8645HS, 110
106 fps +22%
NVIDIA GeForce RTX 4070 Laptop GPU
Acer Predator Helios Neo 14 (2024), Ultra 9 185H, 125
104.6 fps +21%
NVIDIA GeForce RTX 4070 Laptop GPU
Asus ProArt PX13 HN7306, Ryzen AI 9 HX 370, 75
104 fps +20%
NVIDIA GeForce RTX 4060 Laptop GPU
Asus TUF Gaming A16 FA608WV, Ryzen AI 9 HX 370, 140
102.5 fps +18%
NVIDIA GeForce RTX 4060 Laptop GPU
SCHENKER Key 14 (M24), Ultra 7 155H, 100
94 fps +9%
AMD Radeon RX 7600M XT
Minisforum MS-A1 (MGA1 Radeon RX 7600M XT @OCuLink) , Ryzen 7 8700G, 120
93.6 fps +8%
NVIDIA GeForce RTX 4070 Laptop GPU
Asus ROG Flow Z13 ACRNM, i9-13900H, 65
93.3 fps +8%
NVIDIA GeForce RTX 4050 Laptop GPU
Lenovo IdeaPad Pro 5 16IMH G9 RTX 4050, Ultra 9 185H, 90
87.8 fps +1%
AMD Radeon RX 8060S
Asus ROG Flow Z13 GZ302EA-RU073W, Ryzen AI Max+ 395, 80
86.6 fps
NVIDIA RTX 2000 Ada Generation Laptop GPU
HP ZBook Power 16 G11 A, R7 8845HS, 50
66.3 fps -23%
NVIDIA GeForce RTX 3050 4GB Laptop GPU
HP Envy 17-da0076ng, Ultra 7 155U, 0
39.5 fps -54%
AMD Radeon 890M
Asus ProArt PX13 HN7306, Ryzen AI 9 HX 370, 0
33.2 fps -62%
Intel Arc Graphics 140T
MSI Prestige 16 AI Evo B2HMG, Ultra 9 285H, 0
30.6 fps -65%
Intel Arc Graphics 140V
Asus Zenbook S 14 UX5406, Core Ultra 7 258V, 0
30 fps -65%
Average of class Convertible
  (4.48 - 86.6, n=64, last 2 years)
23.2 fps -73%
Strange Brigade - 1920x1080 ultra AA:ultra AF:16
NVIDIA RTX 3500 Ada Generation Laptop GPU
HP ZBook Fury 16 G11, i9-14900HX, 105
223 (52.5min, 159.8P1) fps +33%
NVIDIA GeForce RTX 4060 Laptop GPU
Acer Nitro 14 AN14-41-R3MX, R5 8645HS, 110
193.2 (28.8min, 141.1P1) fps +15%
NVIDIA GeForce RTX 4060 Laptop GPU
Asus TUF Gaming A16 FA608WV, Ryzen AI 9 HX 370, 140
191.9 (103.2min, 137.2P1) fps +14%
NVIDIA GeForce RTX 4070 Laptop GPU
Asus ProArt PX13 HN7306, Ryzen AI 9 HX 370, 75
191.7 (74.9min, 144.8P1) fps +14%
NVIDIA GeForce RTX 4060 Laptop GPU
SCHENKER Key 14 (M24), Ultra 7 155H, 100
186 fps +11%
NVIDIA GeForce RTX 4070 Laptop GPU
Acer Predator Helios Neo 14 (2024), Ultra 9 185H, 125
183 (33.8min, 138.5P1) fps +9%
AMD Radeon RX 7600M XT
Minisforum MS-A1 (MGA1 Radeon RX 7600M XT @OCuLink) , Ryzen 7 8700G, 120
179.5 (125.3min, 133.7P1) fps +7%
NVIDIA GeForce RTX 4070 Laptop GPU
Asus ROG Flow Z13 ACRNM, i9-13900H, 65
174.8 (57min, 127.6P1) fps +4%
AMD Radeon RX 8060S
Asus ROG Flow Z13 GZ302EA-RU073W, Ryzen AI Max+ 395, 80
167.9 (68.9min, 108.1P1) fps
NVIDIA GeForce RTX 4050 Laptop GPU
Lenovo IdeaPad Pro 5 16IMH G9 RTX 4050, Ultra 9 185H, 90
149.4 (44.5min, 115.4P1) fps -11%
NVIDIA RTX 2000 Ada Generation Laptop GPU
HP ZBook Power 16 G11 A, R7 8845HS, 50
138.5 (80.1min, 104.4P1) fps -18%
Intel Arc Graphics 140T
MSI Prestige 16 AI Evo B2HMG, Ultra 9 285H, 0
61.6 (45.2min, 49.5P1) fps -63%
NVIDIA GeForce RTX 3050 4GB Laptop GPU
HP Envy 17-da0076ng, Ultra 7 155U, 0
60.4 (44.9min, 47.5P1) fps -64%
AMD Radeon 890M
Asus ProArt PX13 HN7306, Ryzen AI 9 HX 370, 0
55.7 (36min, 42.8P1) fps -67%
Intel Arc Graphics 140V
Asus Zenbook S 14 UX5406, Core Ultra 7 258V, 0
54 (32min, 42.8P1) fps -68%
Average of class Convertible
  (10.8 - 167.9, n=59, last 2 years)
41.6 fps -75%
Dota 2 Reborn - 1920x1080 ultra (3/3) best looking
NVIDIA RTX 3500 Ada Generation Laptop GPU
HP ZBook Fury 16 G11, i9-14900HX, 105
153.9 (131.9min) fps +8%
AMD Radeon RX 8060S
Asus ROG Flow Z13 GZ302EA-RU073W, Ryzen AI Max+ 395, 80
142 (123.4min) fps
NVIDIA GeForce RTX 4050 Laptop GPU
Lenovo IdeaPad Pro 5 16IMH G9 RTX 4050, Ultra 9 185H, 90
137.4 (115.6min) fps -3%
NVIDIA GeForce RTX 4060 Laptop GPU
Asus TUF Gaming A16 FA608WV, Ryzen AI 9 HX 370, 140
136.2 (117.8min) fps -4%
NVIDIA GeForce RTX 4070 Laptop GPU
Asus ROG Flow Z13 ACRNM, i9-13900H, 65
135 (117.4min) fps -5%
NVIDIA GeForce RTX 4070 Laptop GPU
Acer Predator Helios Neo 14 (2024), Ultra 9 185H, 125
130.8 (114.6min) fps -8%
NVIDIA GeForce RTX 4070 Laptop GPU
Asus ProArt PX13 HN7306, Ryzen AI 9 HX 370, 75
122.8 (106.2min) fps -14%
NVIDIA GeForce RTX 4060 Laptop GPU
SCHENKER Key 14 (M24), Ultra 7 155H, 100
122.6 (97.3min) fps -14%
AMD Radeon RX 7600M XT
Minisforum MS-A1 (MGA1 Radeon RX 7600M XT @OCuLink) , Ryzen 7 8700G, 120
120.8 (106.1min) fps -15%
NVIDIA GeForce RTX 4060 Laptop GPU
Acer Nitro 14 AN14-41-R3MX, R5 8645HS, 110
120.5 (104.4min) fps -15%
NVIDIA RTX 2000 Ada Generation Laptop GPU
HP ZBook Power 16 G11 A, R7 8845HS, 50
119.9 (104.6min) fps -16%
NVIDIA GeForce RTX 3050 4GB Laptop GPU
HP Envy 17-da0076ng, Ultra 7 155U, 0
90 (77.6min) fps -37%
Intel Arc Graphics 140T
MSI Prestige 16 AI Evo B2HMG, Ultra 9 285H, 0
83.8 (45.3min) fps -41%
Intel Arc Graphics 140V
Asus Zenbook S 14 UX5406, Core Ultra 7 258V, 0
62.9 fps -56%
Average of class Convertible
  (18.8 - 142, n=64, last 2 years)
61.9 fps -56%
AMD Radeon 890M
Asus ProArt PX13 HN7306, Ryzen AI 9 HX 370, 0
36 (20.4min) fps -75%
X-Plane 11.11 - 1920x1080 high (fps_test=3)
NVIDIA RTX 3500 Ada Generation Laptop GPU
HP ZBook Fury 16 G11, i9-14900HX, 105
110.9 fps +45%
NVIDIA GeForce RTX 4070 Laptop GPU
Asus ROG Flow Z13 ACRNM, i9-13900H, 65
110.3 fps +44%
NVIDIA GeForce RTX 4050 Laptop GPU
Lenovo IdeaPad Pro 5 16IMH G9 RTX 4050, Ultra 9 185H, 90
89 fps +16%
NVIDIA GeForce RTX 4060 Laptop GPU
SCHENKER Key 14 (M24), Ultra 7 155H, 100
84.6 fps +10%
NVIDIA GeForce RTX 4070 Laptop GPU
Acer Predator Helios Neo 14 (2024), Ultra 9 185H, 125
78 fps +2%
AMD Radeon RX 8060S
Asus ROG Flow Z13 GZ302EA-RU073W, Ryzen AI Max+ 395, 80
76.7 fps
NVIDIA GeForce RTX 4070 Laptop GPU
Asus ProArt PX13 HN7306, Ryzen AI 9 HX 370, 75
74.1 fps -3%
NVIDIA GeForce RTX 4060 Laptop GPU
Acer Nitro 14 AN14-41-R3MX, R5 8645HS, 110
73.4 fps -4%
AMD Radeon RX 7600M XT
Minisforum MS-A1 (MGA1 Radeon RX 7600M XT @OCuLink) , Ryzen 7 8700G, 120
73.2 fps -5%
NVIDIA GeForce RTX 4060 Laptop GPU
Asus TUF Gaming A16 FA608WV, Ryzen AI 9 HX 370, 140
69.9 fps -9%
NVIDIA RTX 2000 Ada Generation Laptop GPU
HP ZBook Power 16 G11 A, R7 8845HS, 50
60.6 fps -21%
NVIDIA GeForce RTX 3050 4GB Laptop GPU
HP Envy 17-da0076ng, Ultra 7 155U, 0
51.6 fps -33%
AMD Radeon 890M
Asus ProArt PX13 HN7306, Ryzen AI 9 HX 370, 0
51.1 fps -33%
Intel Arc Graphics 140T
MSI Prestige 16 AI Evo B2HMG, Ultra 9 285H, 0
38.4 fps -50%
Average of class Convertible
  (12.8 - 82.3, n=63, last 2 years)
31.7 fps -59%
Intel Arc Graphics 140V
Asus Zenbook S 14 UX5406, Core Ultra 7 258V, 0
29.8 fps -61%

We also had the old Flow Z13 with the RTX 4070 Laptop on hand, so we used it for a direct head-to-head comparison in modern titles (Turbo mode on both devices). The situation looks better for the new Radeon 8060S in 1080p and maximum details. Titles like Cyberpunk 2077 or Call of Duty Black Ops 6 show an advantage of 13-17 % for the AMD GPU, while many titles show comparable results. There are also some negative examples like GTA V or F1 24 (-12 up to -21 %). All in all, the two devices are pretty much on par.

Gaming 1080p Ultra Performance Rating - Percent
Asus ROG Flow Z13 ACRNM
Intel Core i9-13900H, NVIDIA GeForce RTX 4070 Laptop GPU
97 pt
Asus ROG Flow Z13 GZ302EA-RU073W
AMD Ryzen AI Max+ 395, AMD Radeon RX 8060S
94.7 pt
Cyberpunk 2077 2.2 Phantom Liberty - 1920x1080 Ultra Preset (FSR off)
Asus ROG Flow Z13 GZ302EA-RU073W
AMD Ryzen AI Max+ 395, AMD Radeon RX 8060S
75.6 (62min - 97.7max) fps
Asus ROG Flow Z13 ACRNM
Intel Core i9-13900H, NVIDIA GeForce RTX 4070 Laptop GPU
66.79 (52.29min - 85.64max) fps -12%
Baldur's Gate 3 - 1920x1080 Ultra Preset AA:T
Asus ROG Flow Z13 ACRNM
Intel Core i9-13900H, NVIDIA GeForce RTX 4070 Laptop GPU
86.1 (50.7P0.1, 70.2P1) fps +1%
Asus ROG Flow Z13 GZ302EA-RU073W
AMD Ryzen AI Max+ 395, AMD Radeon RX 8060S
85.3 fps
GTA V - 1920x1080 Highest Settings possible AA:4xMSAA + FX AF:16x
Asus ROG Flow Z13 ACRNM
Intel Core i9-13900H, NVIDIA GeForce RTX 4070 Laptop GPU
94.8 (4.6min, 62.5P1 - 170.5max) fps +14%
Asus ROG Flow Z13 GZ302EA-RU073W
AMD Ryzen AI Max+ 395, AMD Radeon RX 8060S
83.5 (7.23min, 55.6P1 - 146.4max) fps
Horizon Forbidden West - 1920x1080 Very High Preset AA:T
Asus ROG Flow Z13 ACRNM
Intel Core i9-13900H, NVIDIA GeForce RTX 4070 Laptop GPU
56.1 (39.5P0.1, 45.4P1) fps +15%
Asus ROG Flow Z13 GZ302EA-RU073W
AMD Ryzen AI Max+ 395, AMD Radeon RX 8060S
48.7 (34.9P0.1, 38.9P1) fps
F1 24 - 1920x1080 Ultra High Preset AA:T AF:16x
Asus ROG Flow Z13 ACRNM
Intel Core i9-13900H, NVIDIA GeForce RTX 4070 Laptop GPU
58.4 (48min, 47P1 - 70max) fps +27%
Asus ROG Flow Z13 GZ302EA-RU073W
AMD Ryzen AI Max+ 395, AMD Radeon RX 8060S
46 (34min - 56max) fps
Black Myth: Wukong - 1920x1080 cinematic TSR 100
Asus ROG Flow Z13 GZ302EA-RU073W
AMD Ryzen AI Max+ 395, AMD Radeon RX 8060S
27 (22min - 31max) fps
Asus ROG Flow Z13 ACRNM
Intel Core i9-13900H, NVIDIA GeForce RTX 4070 Laptop GPU
25 (7min - 28max) fps -7%
God of War Ragnarök - 1920x1080 Ultra Preset AA:T
Asus ROG Flow Z13 ACRNM
Intel Core i9-13900H, NVIDIA GeForce RTX 4070 Laptop GPU
76.2 (42.7P0.1, 51.2P1) fps 0%
Asus ROG Flow Z13 GZ302EA-RU073W
AMD Ryzen AI Max+ 395, AMD Radeon RX 8060S
76.1 fps
Call of Duty Black Ops 6 - 1920x1080 Extreme Preset
Asus ROG Flow Z13 GZ302EA-RU073W
AMD Ryzen AI Max+ 395, AMD Radeon RX 8060S
83 fps
Asus ROG Flow Z13 ACRNM
Intel Core i9-13900H, NVIDIA GeForce RTX 4070 Laptop GPU
71 (50P0.1) fps -14%
Ghost of Tsushima - 1920x1080 Very High Preset AA:T
Asus ROG Flow Z13 ACRNM
Intel Core i9-13900H, NVIDIA GeForce RTX 4070 Laptop GPU
55.3 (32.8P0.1, 41.6P1) fps +8%
Asus ROG Flow Z13 GZ302EA-RU073W
AMD Ryzen AI Max+ 395, AMD Radeon RX 8060S
51.2 fps
Monster Hunter Wilds - 1920x1080 ultra, RT: high, no upscaling
Asus ROG Flow Z13 ACRNM
Intel Core i9-13900H, NVIDIA GeForce RTX 4070 Laptop GPU
39.7 fps +1%
Asus ROG Flow Z13 GZ302EA-RU073W
AMD Ryzen AI Max+ 395, AMD Radeon RX 8060S
39.2 fps
Indiana Jones and the Great Circle - 1920x1080 Very Ultra Preset
Asus ROG Flow Z13 GZ302EA-RU073W
AMD Ryzen AI Max+ 395, AMD Radeon RX 8060S
40.3 (28.5P0.1, 33.3P1) fps
Asus ROG Flow Z13 ACRNM
Intel Core i9-13900H, NVIDIA GeForce RTX 4070 Laptop GPU
39.4 (24.9P0.1, 31.4P1) fps -2%
Star Wars Outlaws - 1920x1080 cinem. ultra
Asus ROG Flow Z13 ACRNM
Intel Core i9-13900H, NVIDIA GeForce RTX 4070 Laptop GPU
35.4 (18.1P0.1, 25.9P1) fps +8%
Asus ROG Flow Z13 GZ302EA-RU073W
AMD Ryzen AI Max+ 395, AMD Radeon RX 8060S
32.7 (11.7P0.1, 16P1) fps

The situation is very similar in the QHD resolution, even though the GeForce Flow Z13 has a slightly bigger lead (+5 %). Many titles are generally playable in QHD and maximum details, only very demanding games like Black Myth: Wukong, Star Wars Outlaws, Indiana Jones or Monster Hunter Wilds drop below the 30 fps mark.

Gaming QHD Ultra Performance Rating - Percent
Asus ROG Flow Z13 ACRNM
Intel Core i9-13900H, NVIDIA GeForce RTX 4070 Laptop GPU
96.2 pt
Asus ROG Flow Z13 GZ302EA-RU073W
AMD Ryzen AI Max+ 395, AMD Radeon RX 8060S
91.9 pt
Cyberpunk 2077 2.2 Phantom Liberty - 2560x1440 Ultra Preset (FSR off)
Asus ROG Flow Z13 GZ302EA-RU073W
AMD Ryzen AI Max+ 395, AMD Radeon RX 8060S
46.4 (39.2min - 60.2max) fps
Asus ROG Flow Z13 ACRNM
Intel Core i9-13900H, NVIDIA GeForce RTX 4070 Laptop GPU
40.1 (33.3min - 52.6max) fps -14%
Baldur's Gate 3 - 2560x1440 Ultra Preset AA:T
Asus ROG Flow Z13 ACRNM
Intel Core i9-13900H, NVIDIA GeForce RTX 4070 Laptop GPU
62.3 (48.5P0.1, 52P1) fps +13%
Asus ROG Flow Z13 GZ302EA-RU073W
AMD Ryzen AI Max+ 395, AMD Radeon RX 8060S
55.2 fps
GTA V - 2560x1440 Highest Settings possible AA:4xMSAA + FX AF:16x
Asus ROG Flow Z13 ACRNM
Intel Core i9-13900H, NVIDIA GeForce RTX 4070 Laptop GPU
75.9 (3.4min, 43.5P1 - 128.1max) fps +18%
Asus ROG Flow Z13 GZ302EA-RU073W
AMD Ryzen AI Max+ 395, AMD Radeon RX 8060S
64.3 (8.92min, 45.5P1 - 110.8max) fps
Horizon Forbidden West - 2560x1440 Very High Preset AA:T
Asus ROG Flow Z13 ACRNM
Intel Core i9-13900H, NVIDIA GeForce RTX 4070 Laptop GPU
45.5 (33.7P0.1, 36.4P1) fps +19%
Asus ROG Flow Z13 GZ302EA-RU073W
AMD Ryzen AI Max+ 395, AMD Radeon RX 8060S
38.3 (27P0.1, 31.2P1) fps
F1 24 - 2560x1440 Ultra High Preset AA:T AF:16x
Asus ROG Flow Z13 ACRNM
Intel Core i9-13900H, NVIDIA GeForce RTX 4070 Laptop GPU
36.8 (31min, 30P1 - 44max) fps +28%
Asus ROG Flow Z13 GZ302EA-RU073W
AMD Ryzen AI Max+ 395, AMD Radeon RX 8060S
28.8 (19min, 14P1 - 36max) fps
Black Myth: Wukong - 2560x1440 cinematic TSR 100
Asus ROG Flow Z13 GZ302EA-RU073W
AMD Ryzen AI Max+ 395, AMD Radeon RX 8060S
20 (16min - 22max) fps
Asus ROG Flow Z13 ACRNM
Intel Core i9-13900H, NVIDIA GeForce RTX 4070 Laptop GPU
18 (15min - 20max) fps -10%
God of War Ragnarök - 2560x1440 Ultra Preset AA:T
Asus ROG Flow Z13 ACRNM
Intel Core i9-13900H, NVIDIA GeForce RTX 4070 Laptop GPU
60.5 (40.2P0.1, 47.1P1) fps +5%
Asus ROG Flow Z13 GZ302EA-RU073W
AMD Ryzen AI Max+ 395, AMD Radeon RX 8060S
57.5 fps
Call of Duty Black Ops 6 - 2560x1440 Extreme Preset
Asus ROG Flow Z13 GZ302EA-RU073W
AMD Ryzen AI Max+ 395, AMD Radeon RX 8060S
64 fps
Asus ROG Flow Z13 ACRNM
Intel Core i9-13900H, NVIDIA GeForce RTX 4070 Laptop GPU
52 (38P0.1) fps -19%
Ghost of Tsushima - 2560x1440 Very High Preset AA:T
Asus ROG Flow Z13 ACRNM
Intel Core i9-13900H, NVIDIA GeForce RTX 4070 Laptop GPU
43.6 (28.7P0.1, 36.2P1) fps +9%
Asus ROG Flow Z13 GZ302EA-RU073W
AMD Ryzen AI Max+ 395, AMD Radeon RX 8060S
40.1 fps
Monster Hunter Wilds - 2560x1440 ultra, RT: high, no upscaling
Asus ROG Flow Z13 ACRNM
Intel Core i9-13900H, NVIDIA GeForce RTX 4070 Laptop GPU
29 fps +1%
Asus ROG Flow Z13 GZ302EA-RU073W
AMD Ryzen AI Max+ 395, AMD Radeon RX 8060S
28.8 fps
Star Wars Outlaws - 2560x1440 cinem. ultra
Asus ROG Flow Z13 ACRNM
Intel Core i9-13900H, NVIDIA GeForce RTX 4070 Laptop GPU
25.9 (14.2P0.1, 19.3P1) fps +12%
Asus ROG Flow Z13 GZ302EA-RU073W
AMD Ryzen AI Max+ 395, AMD Radeon RX 8060S
23.1 (5.3P0.1, 12.4P1) fps

Some titles also support FSR 3 upscaling to improve the performance, but the support is more limited compared to Nvidia’s DLSS technology. We checked the results in some modern titles and even though FSR 3 already improves the performance noticeably, you will see the biggest improvements with additional frame generation. The native results can often be more than doubles and even demanding titles like Black Myth Wukong, Monster Hunter Wilds or Star Wars Outlaws will reach smooth fps numbers.  At least in theory, because the gaming experience can vary heavily. Star Wars Outlaws or Horizon Forbidden West, for instance, suffered from visible artifacts and image distortions especially during movements.

Gaming performance QHD Ultra settings
Game Native FSR 3 FSR3 + FG
Ghost of Tsushima 40.1 fps 52.4 fps 90.8 fps
GoW Ragnarök 57.5 fps 49.7 fps 81.4 fps
Cyberpunk 2077 46.4 fps 64.5 fps 109.7 fps
Monster Hunter Wilds 28.4 fps 36.4 fps 59.3 fps
Horizon Forbidden West 38.3 fps 44.8 fps 69 fps
Black Myth: Wukong 16 fps 25 fps 48 fps
Star Wars Outlaws 19.8 fps 27.4 fps 54.3 fps
CoD Black Ops 6 64 fps 79 fps 114 fps
lowmed.highultraQHD FSRQHD4K
GTA V (2015) 166.9 83.5 64.3 72.9
The Witcher 3 (2015) 101
Dota 2 Reborn (2015) 223 192.3 164.4 142 87
Final Fantasy XV Benchmark (2018) 182.7 117.6 86.6 63.6 34.7
X-Plane 11.11 (2018) 138.8 104.9 76.7 60.4
Strange Brigade (2018) 453 221 192.7 167.9 109.9 57.6
Baldur's Gate 3 (2023) 128.8 100.9 87.9 85.3 55.2 28.6
Cyberpunk 2077 2.2 Phantom Liberty (2023) 124.8 105.3 85 75.6 46.4 18.8
Horizon Forbidden West (2024) 48.7 44.8 38.3
Ghost of Tsushima (2024) 78.1 65.1 59.2 51.2 40.1 23
F1 24 (2024) 207 185.6 147.7 46 28.8 13
Black Myth: Wukong (2024) 27 28 20
Star Wars Outlaws (2024) 32.7 33.3 23.1
God of War Ragnarök (2024) 111.8 96.4 82.8 76.1 49.7 57.5 33.2
Call of Duty Black Ops 6 (2024) 83 79 64
Indiana Jones and the Great Circle (2024) 77.2 49.4 40.3 27.4
Monster Hunter Wilds (2025) 59.8 50.2 39.2 28.8 15.9
Doom: The Dark Ages (2025) 57.7 49.4 44.4 42.7

We use Cyberpunk 2077 to evaluate the GPU efficiency and we have data for all current platforms, but please keep in mind that the game is emulated on ARM systems, which affects the performance as well as the efficiency. This will change for Apple silicon very soon when the native version of the game will be published. We still included the data for the sake of completeness.

The Radeon 8060S iGPU is one of the most efficient models in our database and is only beaten by some versions of the Arc Graphics 140V, but the overall performance level is not comparable to the Strix Halo iGPU. The RTX 4070 Laptop in the MSI Katana (with AMD CPU) is also comparable, but the other GeForce GPUs are worse, especially in combination with Intel CPUs.

Power Consumption / Cyberpunk 2077 ultra Efficiency
Intel Arc Graphics 140V
Asus Zenbook S 14 UX5406, Core Ultra 7 258V, 0
0.696 fps per Watt +24%
AMD Radeon RX 8060S
Asus ROG Flow Z13 GZ302EA-RU073W, Ryzen AI Max+ 395, 80
0.562 fps per Watt
NVIDIA GeForce RTX 4070 Laptop GPU
MSI Katana A17 AI B8VG, R7 8845HS, 105
0.552 fps per Watt -2%
Intel Arc Graphics 140V
MSI Prestige 13 AI Plus Evo A2VMG, Core Ultra 7 258V, 0
0.542 fps per Watt -4%
NVIDIA GeForce RTX 4070 Laptop GPU
MSI Katana A15 AI B8VG, R9 8945HS, 105
0.507 fps per Watt -10%
NVIDIA GeForce RTX 4050 Laptop GPU
Lenovo Yoga Pro 7 14IMH9, RTX 4050, Ultra 7 155H, 60
0.4984 fps per Watt -11%
Apple M4 Pro 20-Core GPU
Apple MacBook Pro 14 2024 M4 Pro, M4 Pro (14 cores), 32
0.4547 fps per Watt -19%
Apple M4 Max 40-Core GPU
Apple MacBook Pro 16 M4 Max, M4 Max (16 cores), 75
0.4496 fps per Watt -20%
NVIDIA RTX 4000 Ada Generation Laptop GPU
Lenovo ThinkPad P16 Gen 2, i7-14700HX, 130
0.4466 fps per Watt -21%
NVIDIA GeForce RTX 4050 Laptop GPU
Lenovo IdeaPad Pro 5 16IMH G9 RTX 4050, Ultra 9 185H, 90
0.4205 fps per Watt -25%
AMD Radeon 890M
Asus Zenbook S 16 UM5606-RK333W, Ryzen AI 9 HX 370, 0
0.4176 fps per Watt -26%
NVIDIA GeForce RTX 4060 Laptop GPU
Gigabyte G5 KF5 2024, i7-13620H, 75
0.3965 fps per Watt -29%
NVIDIA GeForce RTX 4070 Laptop GPU
Tuxedo Gemini 17 Gen3 AMD, R9 7945HX, 125
0.3749 fps per Watt -33%
Intel Arc Graphics 140T
MSI Prestige 16 AI Evo B2HMG, Ultra 9 285H, 0
0.368 fps per Watt -35%
NVIDIA GeForce RTX 4080 Laptop GPU
SCHENKER XMG Neo 17 E24, i9-14900HX, 175
0.3616 fps per Watt -36%
AMD Radeon 880M
Lenovo ThinkBook 16 G7+ AMD, Ryzen AI 9 365, 0
0.3226 fps per Watt -43%
Qualcomm SD X Adreno X1-85 3.8 TFLOPS
Microsoft Surface Laptop 15 Snapdragon X Elite, SD X Elite X1E-80-100, 0
0.3171 fps per Watt -44%
NVIDIA GeForce RTX 4060 Laptop GPU
Lenovo ThinkBook 16p G5 IRX 21N50011GE, i9-14900HX, 115
0.3004 fps per Watt -47%
NVIDIA GeForce RTX 4060 Laptop GPU
Lenovo ThinkPad P1 Gen 7 21KV001SGE, Ultra 7 155H, 80
0.277 fps per Watt -51%

System Performance & Creative Apps

The system performance is excellent across all benchmarks. In PCMark 10 and CrossMark, the ROG Flow Z13 with Ryzen AI Max+ 395 beats all the rivals including the MacBook Pro 16 M4 Max. The ARM rivals from Apple and Qualcomm (at least the fast versions of the Snapdragon X Elite) perform a bit better in the browser tests though.

PCMark 10 / Score
Ryzen AI Max+ 395, Radeon RX 8060S
Asus ROG Flow Z13 GZ302EA-RU073W, 32768
9125 Points
Average AMD Ryzen AI Max+ 395, AMD Radeon RX 8060S
  (n=1)
9125 Points 0%
R9 8945HS, NVIDIA GeForce RTX 4070 Laptop GPU
Razer Blade 14 RZ09-0508, 32768
8312 Points -9%
R9 7940HS, NVIDIA GeForce RTX 4070 Laptop GPU
Razer Blade 14 RTX 4070, 16384
8205 Points -10%
i9-13900H, NVIDIA GeForce RTX 4070 Laptop GPU
Asus ROG Flow Z13 ACRNM, 32768
8018 Points -12%
Ryzen AI 9 HX 370, NVIDIA GeForce RTX 4070 Laptop GPU
Asus ProArt PX13 HN7306, 32768
7696 Points -16%
Ultra 9 185H, NVIDIA GeForce RTX 4070 Laptop GPU
Acer Predator Helios Neo 14 (2024), 32768
7490 Points -18%
R5 8645HS, NVIDIA GeForce RTX 4060 Laptop GPU
Acer Nitro 14 AN14-41-R3MX, 16384
7453 Points -18%
R9 8945HS, NVIDIA GeForce RTX 4070 Laptop GPU
Asus ROG Zephyrus G14 2024 GA403U, 32768
7436 Points -19%
i7-13700H, NVIDIA GeForce RTX 4060 Laptop GPU
Microsoft Surface Laptop Studio 2 RTX 4060, 65536
7351 Points -19%
Average of class Convertible
  (3229 - 9125, n=61, last 2 years)
6343 Points -30%
PCMark 10 / Essentials
Ryzen AI Max+ 395, Radeon RX 8060S
Asus ROG Flow Z13 GZ302EA-RU073W, 32768
12005 Points
Average AMD Ryzen AI Max+ 395, AMD Radeon RX 8060S
  (n=1)
12005 Points 0%
R9 8945HS, NVIDIA GeForce RTX 4070 Laptop GPU
Razer Blade 14 RZ09-0508, 32768
11290 Points -6%
i9-13900H, NVIDIA GeForce RTX 4070 Laptop GPU
Asus ROG Flow Z13 ACRNM, 32768
11088 Points -8%
R9 7940HS, NVIDIA GeForce RTX 4070 Laptop GPU
Razer Blade 14 RTX 4070, 16384
10952 Points -9%
Ultra 9 185H, NVIDIA GeForce RTX 4070 Laptop GPU
Acer Predator Helios Neo 14 (2024), 32768
10752 Points -10%
Average of class Convertible
  (7233 - 12222, n=61, last 2 years)
10740 Points -11%
i7-13700H, NVIDIA GeForce RTX 4060 Laptop GPU
Microsoft Surface Laptop Studio 2 RTX 4060, 65536
10696 Points -11%
Ryzen AI 9 HX 370, NVIDIA GeForce RTX 4070 Laptop GPU
Asus ProArt PX13 HN7306, 32768
10144 Points -16%
R9 8945HS, NVIDIA GeForce RTX 4070 Laptop GPU
Asus ROG Zephyrus G14 2024 GA403U, 32768
9861 Points -18%
R5 8645HS, NVIDIA GeForce RTX 4060 Laptop GPU
Acer Nitro 14 AN14-41-R3MX, 16384
9861 Points -18%
PCMark 10 / Productivity
R9 7940HS, NVIDIA GeForce RTX 4070 Laptop GPU
Razer Blade 14 RTX 4070, 16384
10805 Points +4%
Ryzen AI Max+ 395, Radeon RX 8060S
Asus ROG Flow Z13 GZ302EA-RU073W, 32768
10377 Points
Average AMD Ryzen AI Max+ 395, AMD Radeon RX 8060S
  (n=1)
10377 Points 0%
R9 8945HS, NVIDIA GeForce RTX 4070 Laptop GPU
Razer Blade 14 RZ09-0508, 32768
10332 Points 0%
Ryzen AI 9 HX 370, NVIDIA GeForce RTX 4070 Laptop GPU
Asus ProArt PX13 HN7306, 32768
10027 Points -3%
R5 8645HS, NVIDIA GeForce RTX 4060 Laptop GPU
Acer Nitro 14 AN14-41-R3MX, 16384
9972 Points -4%
i9-13900H, NVIDIA GeForce RTX 4070 Laptop GPU
Asus ROG Flow Z13 ACRNM, 32768
9882 Points -5%
R9 8945HS, NVIDIA GeForce RTX 4070 Laptop GPU
Asus ROG Zephyrus G14 2024 GA403U, 32768
9502 Points -8%
i7-13700H, NVIDIA GeForce RTX 4060 Laptop GPU
Microsoft Surface Laptop Studio 2 RTX 4060, 65536
9364 Points -10%
Ultra 9 185H, NVIDIA GeForce RTX 4070 Laptop GPU
Acer Predator Helios Neo 14 (2024), 32768
9330 Points -10%
Average of class Convertible
  (5062 - 10591, n=61, last 2 years)
8387 Points -19%
PCMark 10 / Digital Content Creation
Ryzen AI Max+ 395, Radeon RX 8060S
Asus ROG Flow Z13 GZ302EA-RU073W, 32768
16551 Points
Average AMD Ryzen AI Max+ 395, AMD Radeon RX 8060S
  (n=1)
16551 Points 0%
R9 8945HS, NVIDIA GeForce RTX 4070 Laptop GPU
Razer Blade 14 RZ09-0508, 32768
13363 Points -19%
i9-13900H, NVIDIA GeForce RTX 4070 Laptop GPU
Asus ROG Flow Z13 ACRNM, 32768
12766 Points -23%
R9 7940HS, NVIDIA GeForce RTX 4070 Laptop GPU
Razer Blade 14 RTX 4070, 16384
12666 Points -23%
Ryzen AI 9 HX 370, NVIDIA GeForce RTX 4070 Laptop GPU
Asus ProArt PX13 HN7306, 32768
12165 Points -26%
R9 8945HS, NVIDIA GeForce RTX 4070 Laptop GPU
Asus ROG Zephyrus G14 2024 GA403U, 32768
11907 Points -28%
R5 8645HS, NVIDIA GeForce RTX 4060 Laptop GPU
Acer Nitro 14 AN14-41-R3MX, 16384
11428 Points -31%
Ultra 9 185H, NVIDIA GeForce RTX 4070 Laptop GPU
Acer Predator Helios Neo 14 (2024), 32768
11369 Points -31%
i7-13700H, NVIDIA GeForce RTX 4060 Laptop GPU
Microsoft Surface Laptop Studio 2 RTX 4060, 65536
10763 Points -35%
Average of class Convertible
  (2496 - 16551, n=61, last 2 years)
7844 Points -53%
CrossMark / Overall
Ryzen AI Max+ 395, Radeon RX 8060S
Asus ROG Flow Z13 GZ302EA-RU073W, 32768
2274 Points
Average AMD Ryzen AI Max+ 395, AMD Radeon RX 8060S
  (n=1)
2274 Points 0%
M4 Max (16 cores), M4 Max 40-Core GPU
Apple MacBook Pro 16 M4 Max, 49152
2255 Points -1%
M4 Pro (14 cores), M4 Pro 20-Core GPU
Apple MacBook Pro 16 2024 M4 Pro, 49152
2148 Points -6%
M4 Pro (12 cores), M4 Pro 16-Core GPU
Apple MacBook Pro 14 2024 M4 Pro Entry, 24576
2123 Points -7%
M4 (10 cores), M4 10-Core GPU
Apple MacBook Pro 14 2024 M4, 16384
2066 Points -9%
i9-13900H, NVIDIA GeForce RTX 4070 Laptop GPU
Asus ROG Flow Z13 ACRNM, 32768
1937 Points -15%
Ultra 9 185H, NVIDIA GeForce RTX 4070 Laptop GPU
Acer Predator Helios Neo 14 (2024), 32768
1917 Points -16%
R9 8945HS, NVIDIA GeForce RTX 4070 Laptop GPU
Razer Blade 14 RZ09-0508, 32768
1830 Points -20%
R9 7940HS, NVIDIA GeForce RTX 4070 Laptop GPU
Razer Blade 14 RTX 4070, 16384
1812 Points -20%
Ryzen AI 9 HX 370, NVIDIA GeForce RTX 4070 Laptop GPU
Asus ProArt PX13 HN7306, 32768
1785 Points -22%
R9 8945HS, NVIDIA GeForce RTX 4070 Laptop GPU
Asus ROG Zephyrus G14 2024 GA403U, 32768
1767 Points -22%
R5 8645HS, NVIDIA GeForce RTX 4060 Laptop GPU
Acer Nitro 14 AN14-41-R3MX, 16384
1765 Points -22%
i7-13700H, NVIDIA GeForce RTX 4060 Laptop GPU
Microsoft Surface Laptop Studio 2 RTX 4060, 65536
1733 Points -24%
Average of class Convertible
  (524 - 2274, n=63, last 2 years)
1527 Points -33%
SD X Elite X1E-84-100, Adreno X1-85 4.6 TFLOPS
Samsung Galaxy Book4 Edge 16 X1E-84-100, 16384
1416 Points -38%
SD X Elite X1E-80-100, Adreno X1-85 3.8 TFLOPS
Microsoft Surface Laptop 15 Snapdragon X Elite, 16384
1385 Points -39%
SD X Elite X1E-78-100, Adreno X1-85 3.8 TFLOPS
Lenovo Yoga Slim 7X 14Q8X9, 32768
1255 Points -45%
CrossMark / Productivity
M4 Max (16 cores), M4 Max 40-Core GPU
Apple MacBook Pro 16 M4 Max, 49152
2042 Points +6%
M4 Pro (14 cores), M4 Pro 20-Core GPU
Apple MacBook Pro 16 2024 M4 Pro, 49152
1980 Points +3%
M4 Pro (12 cores), M4 Pro 16-Core GPU
Apple MacBook Pro 14 2024 M4 Pro Entry, 24576
1936 Points +1%
M4 (10 cores), M4 10-Core GPU
Apple MacBook Pro 14 2024 M4, 16384
1933 Points 0%
Ryzen AI Max+ 395, Radeon RX 8060S
Asus ROG Flow Z13 GZ302EA-RU073W, 32768
1925 Points
Average AMD Ryzen AI Max+ 395, AMD Radeon RX 8060S
  (n=1)
1925 Points 0%
Ultra 9 185H, NVIDIA GeForce RTX 4070 Laptop GPU
Acer Predator Helios Neo 14 (2024), 32768
1849 Points -4%
i9-13900H, NVIDIA GeForce RTX 4070 Laptop GPU
Asus ROG Flow Z13 ACRNM, 32768
1820 Points -5%
R9 8945HS, NVIDIA GeForce RTX 4070 Laptop GPU
Razer Blade 14 RZ09-0508, 32768
1783 Points -7%
R9 7940HS, NVIDIA GeForce RTX 4070 Laptop GPU
Razer Blade 14 RTX 4070, 16384
1762 Points -8%
R5 8645HS, NVIDIA GeForce RTX 4060 Laptop GPU
Acer Nitro 14 AN14-41-R3MX, 16384
1736 Points -10%
R9 8945HS, NVIDIA GeForce RTX 4070 Laptop GPU
Asus ROG Zephyrus G14 2024 GA403U, 32768
1686 Points -12%
i7-13700H, NVIDIA GeForce RTX 4060 Laptop GPU
Microsoft Surface Laptop Studio 2 RTX 4060, 65536
1618 Points -16%
Ryzen AI 9 HX 370, NVIDIA GeForce RTX 4070 Laptop GPU
Asus ProArt PX13 HN7306, 32768
1611 Points -16%
Average of class Convertible
  (554 - 1925, n=63, last 2 years)
1478 Points -23%
SD X Elite X1E-84-100, Adreno X1-85 4.6 TFLOPS
Samsung Galaxy Book4 Edge 16 X1E-84-100, 16384
1330 Points -31%
SD X Elite X1E-80-100, Adreno X1-85 3.8 TFLOPS
Microsoft Surface Laptop 15 Snapdragon X Elite, 16384
1303 Points -32%
SD X Elite X1E-78-100, Adreno X1-85 3.8 TFLOPS
Lenovo Yoga Slim 7X 14Q8X9, 32768
1152 Points -40%
CrossMark / Creativity
Ryzen AI Max+ 395, Radeon RX 8060S
Asus ROG Flow Z13 GZ302EA-RU073W, 32768
2949 Points
Average AMD Ryzen AI Max+ 395, AMD Radeon RX 8060S
  (n=1)
2949 Points 0%
M4 Max (16 cores), M4 Max 40-Core GPU
Apple MacBook Pro 16 M4 Max, 49152
2795 Points -5%
M4 Pro (12 cores), M4 Pro 16-Core GPU
Apple MacBook Pro 14 2024 M4 Pro Entry, 24576
2594 Points -12%
M4 Pro (14 cores), M4 Pro 20-Core GPU
Apple MacBook Pro 16 2024 M4 Pro, 49152
2590 Points -12%
M4 (10 cores), M4 10-Core GPU
Apple MacBook Pro 14 2024 M4, 16384
2420 Points -18%
Ryzen AI 9 HX 370, NVIDIA GeForce RTX 4070 Laptop GPU
Asus ProArt PX13 HN7306, 32768
2212 Points -25%
i9-13900H, NVIDIA GeForce RTX 4070 Laptop GPU
Asus ROG Flow Z13 ACRNM, 32768
2172 Points -26%
Ultra 9 185H, NVIDIA GeForce RTX 4070 Laptop GPU
Acer Predator Helios Neo 14 (2024), 32768
2008 Points -32%
i7-13700H, NVIDIA GeForce RTX 4060 Laptop GPU
Microsoft Surface Laptop Studio 2 RTX 4060, 65536
2001 Points -32%
R9 8945HS, NVIDIA GeForce RTX 4070 Laptop GPU
Asus ROG Zephyrus G14 2024 GA403U, 32768
1960 Points -34%
R9 7940HS, NVIDIA GeForce RTX 4070 Laptop GPU
Razer Blade 14 RTX 4070, 16384
1952 Points -34%
R9 8945HS, NVIDIA GeForce RTX 4070 Laptop GPU
Razer Blade 14 RZ09-0508, 32768
1935 Points -34%
R5 8645HS, NVIDIA GeForce RTX 4060 Laptop GPU
Acer Nitro 14 AN14-41-R3MX, 16384
1823 Points -38%
Average of class Convertible
  (550 - 2949, n=63, last 2 years)
1667 Points -43%
SD X Elite X1E-84-100, Adreno X1-85 4.6 TFLOPS
Samsung Galaxy Book4 Edge 16 X1E-84-100, 16384
1595 Points -46%
SD X Elite X1E-80-100, Adreno X1-85 3.8 TFLOPS
Microsoft Surface Laptop 15 Snapdragon X Elite, 16384
1496 Points -49%
SD X Elite X1E-78-100, Adreno X1-85 3.8 TFLOPS
Lenovo Yoga Slim 7X 14Q8X9, 32768
1423 Points -52%
CrossMark / Responsiveness
Ultra 9 185H, NVIDIA GeForce RTX 4070 Laptop GPU
Acer Predator Helios Neo 14 (2024), 32768
1856 Points +8%
Ryzen AI Max+ 395, Radeon RX 8060S
Asus ROG Flow Z13 GZ302EA-RU073W, 32768
1719 Points
Average AMD Ryzen AI Max+ 395, AMD Radeon RX 8060S
  (n=1)
1719 Points 0%
R5 8645HS, NVIDIA GeForce RTX 4060 Laptop GPU
Acer Nitro 14 AN14-41-R3MX, 16384
1681 Points -2%
R9 8945HS, NVIDIA GeForce RTX 4070 Laptop GPU
Razer Blade 14 RZ09-0508, 32768
1672 Points -3%
i9-13900H, NVIDIA GeForce RTX 4070 Laptop GPU
Asus ROG Flow Z13 ACRNM, 32768
1654 Points -4%
M4 Max (16 cores), M4 Max 40-Core GPU
Apple MacBook Pro 16 M4 Max, 49152
1595 Points -7%
R9 7940HS, NVIDIA GeForce RTX 4070 Laptop GPU
Razer Blade 14 RTX 4070, 16384
1575 Points -8%
M4 (10 cores), M4 10-Core GPU
Apple MacBook Pro 14 2024 M4, 16384
1569 Points -9%
M4 Pro (14 cores), M4 Pro 20-Core GPU
Apple MacBook Pro 16 2024 M4 Pro, 49152
1566 Points -9%
M4 Pro (12 cores), M4 Pro 16-Core GPU
Apple MacBook Pro 14 2024 M4 Pro Entry, 24576
1533 Points -11%
R9 8945HS, NVIDIA GeForce RTX 4070 Laptop GPU
Asus ROG Zephyrus G14 2024 GA403U, 32768
1489 Points -13%
i7-13700H, NVIDIA GeForce RTX 4060 Laptop GPU
Microsoft Surface Laptop Studio 2 RTX 4060, 65536
1381 Points -20%
SD X Elite X1E-80-100, Adreno X1-85 3.8 TFLOPS
Microsoft Surface Laptop 15 Snapdragon X Elite, 16384
1320 Points -23%
Average of class Convertible
  (381 - 1868, n=63, last 2 years)
1278 Points -26%
Ryzen AI 9 HX 370, NVIDIA GeForce RTX 4070 Laptop GPU
Asus ProArt PX13 HN7306, 32768
1274 Points -26%
SD X Elite X1E-84-100, Adreno X1-85 4.6 TFLOPS
Samsung Galaxy Book4 Edge 16 X1E-84-100, 16384
1197 Points -30%
SD X Elite X1E-78-100, Adreno X1-85 3.8 TFLOPS
Lenovo Yoga Slim 7X 14Q8X9, 32768
1116 Points -35%
WebXPRT 3 / Overall
M4 Max (16 cores), M4 Max 40-Core GPU
Apple MacBook Pro 16 M4 Max, 49152
543 Points +52%
M4 Pro (12 cores), M4 Pro 16-Core GPU
Apple MacBook Pro 14 2024 M4 Pro Entry, 24576
525 Points +47%
M4 Pro (14 cores), M4 Pro 20-Core GPU
Apple MacBook Pro 16 2024 M4 Pro, 49152
525 Points +47%
SD X Elite X1E-84-100, Adreno X1-85 4.6 TFLOPS
Samsung Galaxy Book4 Edge 16 X1E-84-100, 16384
476 Points +33%
M4 (10 cores), M4 10-Core GPU
Apple MacBook Pro 14 2024 M4, 16384
469 Points +31%
SD X Elite X1E-80-100, Adreno X1-85 3.8 TFLOPS
Microsoft Surface Laptop 15 Snapdragon X Elite, 16384
444 Points +24%
SD X Elite X1E-78-100, Adreno X1-85 3.8 TFLOPS
Lenovo Yoga Slim 7X 14Q8X9, 32768
421 Points +18%
Ryzen AI Max+ 395, Radeon RX 8060S
Asus ROG Flow Z13 GZ302EA-RU073W, 32768
358 Points
Average AMD Ryzen AI Max+ 395, AMD Radeon RX 8060S
  (n=1)
358 Points 0%
R9 8945HS, NVIDIA GeForce RTX 4070 Laptop GPU
Razer Blade 14 RZ09-0508, 32768
324 Points -9%
R9 7940HS, NVIDIA GeForce RTX 4070 Laptop GPU
Razer Blade 14 RTX 4070, 16384
317 Points -11%
i9-13900H, NVIDIA GeForce RTX 4070 Laptop GPU
Asus ROG Flow Z13 ACRNM, 32768
314 Points -12%
i7-13700H, NVIDIA GeForce RTX 4060 Laptop GPU
Microsoft Surface Laptop Studio 2 RTX 4060, 65536
303 Points -15%
R9 8945HS, NVIDIA GeForce RTX 4070 Laptop GPU
Asus ROG Zephyrus G14 2024 GA403U, 32768
303 Points -15%
R5 8645HS, NVIDIA GeForce RTX 4060 Laptop GPU
Acer Nitro 14 AN14-41-R3MX, 16384
295 Points -18%
Ultra 9 185H, NVIDIA GeForce RTX 4070 Laptop GPU
Acer Predator Helios Neo 14 (2024), 32768
287 Points -20%
Ryzen AI 9 HX 370, NVIDIA GeForce RTX 4070 Laptop GPU
Asus ProArt PX13 HN7306, 32768
282 Points -21%
Average of class Convertible
  (171 - 426, n=65, last 2 years)
281 Points -22%
WebXPRT 4 / Overall
M4 Max (16 cores), M4 Max 40-Core GPU
Apple MacBook Pro 16 M4 Max, 49152
353 Points +11%
M4 Pro (12 cores), M4 Pro 16-Core GPU
Apple MacBook Pro 14 2024 M4 Pro Entry, 24576
338 Points +7%
M4 Pro (14 cores), M4 Pro 20-Core GPU
Apple MacBook Pro 16 2024 M4 Pro, 49152
337 Points +6%
SD X Elite X1E-84-100, Adreno X1-85 4.6 TFLOPS
Samsung Galaxy Book4 Edge 16 X1E-84-100, 16384
334 Points +5%
M4 (10 cores), M4 10-Core GPU
Apple MacBook Pro 14 2024 M4, 16384
333 Points +5%
Ryzen AI Max+ 395, Radeon RX 8060S
Asus ROG Flow Z13 GZ302EA-RU073W, 32768
317 Points
Average AMD Ryzen AI Max+ 395, AMD Radeon RX 8060S
  (n=1)
317 Points 0%
SD X Elite X1E-80-100, Adreno X1-85 3.8 TFLOPS
Microsoft Surface Laptop 15 Snapdragon X Elite, 16384
313 Points -1%
SD X Elite X1E-78-100, Adreno X1-85 3.8 TFLOPS
Lenovo Yoga Slim 7X 14Q8X9, 32768
291 Points -8%
i9-13900H, NVIDIA GeForce RTX 4070 Laptop GPU
Asus ROG Flow Z13 ACRNM, 32768
288 Points -9%
i7-13700H, NVIDIA GeForce RTX 4060 Laptop GPU
Microsoft Surface Laptop Studio 2 RTX 4060, 65536
272 Points -14%
R9 8945HS, NVIDIA GeForce RTX 4070 Laptop GPU
Razer Blade 14 RZ09-0508, 32768
269 Points -15%
R9 7940HS, NVIDIA GeForce RTX 4070 Laptop GPU
Razer Blade 14 RTX 4070, 16384
260 Points -18%
Ultra 9 185H, NVIDIA GeForce RTX 4070 Laptop GPU
Acer Predator Helios Neo 14 (2024), 32768
260 Points -18%
R9 8945HS, NVIDIA GeForce RTX 4070 Laptop GPU
Asus ROG Zephyrus G14 2024 GA403U, 32768
250 Points -21%
R5 8645HS, NVIDIA GeForce RTX 4060 Laptop GPU
Acer Nitro 14 AN14-41-R3MX, 16384
248 Points -22%
Ryzen AI 9 HX 370, NVIDIA GeForce RTX 4070 Laptop GPU
Asus ProArt PX13 HN7306, 32768
247 Points -22%
Average of class Convertible
  (91.2 - 317, n=61, last 2 years)
241 Points -24%
Mozilla Kraken 1.1 / Total
Average of class Convertible
  (407 - 1089, n=66, last 2 years)
548 ms * -29%
R5 8645HS, NVIDIA GeForce RTX 4060 Laptop GPU
Acer Nitro 14 AN14-41-R3MX, 16384
547 ms * -29%
R9 8945HS, NVIDIA GeForce RTX 4070 Laptop GPU
Asus ROG Zephyrus G14 2024 GA403U, 32768
509 ms * -20%
Ultra 9 185H, NVIDIA GeForce RTX 4070 Laptop GPU
Acer Predator Helios Neo 14 (2024), 32768
508 ms * -20%
R9 7940HS, NVIDIA GeForce RTX 4070 Laptop GPU
Razer Blade 14 RTX 4070, 16384
499 ms * -17%
i7-13700H, NVIDIA GeForce RTX 4060 Laptop GPU
Microsoft Surface Laptop Studio 2 RTX 4060, 65536
495 ms * -16%
R9 8945HS, NVIDIA GeForce RTX 4070 Laptop GPU
Razer Blade 14 RZ09-0508, 32768
488 ms * -15%
i9-13900H, NVIDIA GeForce RTX 4070 Laptop GPU
Asus ROG Flow Z13 ACRNM, 32768
469 ms * -10%
Ryzen AI 9 HX 370, NVIDIA GeForce RTX 4070 Laptop GPU
Asus ProArt PX13 HN7306, 32768
460 ms * -8%
SD X Elite X1E-78-100, Adreno X1-85 3.8 TFLOPS
Lenovo Yoga Slim 7X 14Q8X9, 32768
453.1 ms * -7%
Ryzen AI Max+ 395, Radeon RX 8060S
Asus ROG Flow Z13 GZ302EA-RU073W, 32768
425 ms *
Average AMD Ryzen AI Max+ 395, AMD Radeon RX 8060S
  (n=1)
425 ms * -0%
SD X Elite X1E-80-100, Adreno X1-85 3.8 TFLOPS
Microsoft Surface Laptop 15 Snapdragon X Elite, 16384
399.4 ms * +6%
SD X Elite X1E-84-100, Adreno X1-85 4.6 TFLOPS
Samsung Galaxy Book4 Edge 16 X1E-84-100, 16384
381.2 ms * +10%
M4 (10 cores), M4 10-Core GPU
Apple MacBook Pro 14 2024 M4, 16384
263.7 ms * +38%
M4 Max (16 cores), M4 Max 40-Core GPU
Apple MacBook Pro 16 M4 Max, 49152
256.2 ms * +40%
M4 Pro (12 cores), M4 Pro 16-Core GPU
Apple MacBook Pro 14 2024 M4 Pro Entry, 24576
256 ms * +40%
M4 Pro (14 cores), M4 Pro 20-Core GPU
Apple MacBook Pro 16 2024 M4 Pro, 49152
254.3 ms * +40%

* ... smaller is better

The results in the two PugetBench tests for Adobe Photoshop as well as Premiere Pro are also decent, but there were limitations for DaVinci Resolve. The Basic benchmark test result is better compared to the RTX 4070 Laptop rivals, but we encountered two crashes while editing one of our review videos, which almost never happens with Nvidia GPUs. At this time, we cannot verify whether this problem is caused by the software or the GPU drivers.

Photoshop PugetBench: Overall Score 1.01 | Premiere Pro PugetBench: Overall Score 1.1 | DaVinci Resolve PugetBench: Basic Score 1.1
Photoshop PugetBench / Overall Score 1.01
M4 Max (16 cores), M4 Max 40-Core GPU
Apple MacBook Pro 16 M4 Max, 49152
13859 Points +27%
M4 Pro (14 cores), M4 Pro 20-Core GPU
Apple MacBook Pro 16 2024 M4 Pro, 49152
12494 Points +15%
Ryzen AI Max+ 395, Radeon RX 8060S
Asus ROG Flow Z13 GZ302EA-RU073W, 32768
10901 Points
M4 (10 cores), M4 10-Core GPU
Apple MacBook Pro 14 2024 M4, 16384
10502 Points -4%
i9-14900HX, NVIDIA GeForce RTX 4090 Laptop GPU
Razer Blade 16 2024, RTX 4090, 32768
8353 Points -23%
R9 7945HX, NVIDIA GeForce RTX 4070 Laptop GPU
Tuxedo Gemini 17 Gen3 AMD, 32768
8197 Points -25%
Ultra 9 285H, Arc 140T
Asus ZenBook Duo OLED UX8406CA, 32768
7934 Points -27%
i9-13900H, NVIDIA GeForce RTX 4070 Laptop GPU
Asus ROG Flow Z13 ACRNM, 32768
7829 Points -28%
Ryzen AI 7 PRO 360, Radeon 880M
Lenovo ThinkPad T14s Gen 6 21M2S00G00, 32768
7343 Points -33%
Core Ultra 7 256V, Arc 140V
Dell XPS 13 9350, 16384
6854 Points -37%
Premiere Pro PugetBench / Overall Score 1.1
M4 Max (16 cores), M4 Max 40-Core GPU
Apple MacBook Pro 16 M4 Max, 49152
12412 Points +63%
i9-14900HX, NVIDIA GeForce RTX 4090 Laptop GPU
Razer Blade 16 2024, RTX 4090, 32768
11855 Points +55%
R9 7945HX, NVIDIA GeForce RTX 4070 Laptop GPU
Tuxedo Gemini 17 Gen3 AMD, 32768
9303 Points +22%
M4 Pro (14 cores), M4 Pro 20-Core GPU
Apple MacBook Pro 16 2024 M4 Pro, 49152
8835 Points +16%
Ryzen AI Max+ 395, Radeon RX 8060S
Asus ROG Flow Z13 GZ302EA-RU073W, 32768
7632 Points
i9-13900H, NVIDIA GeForce RTX 4070 Laptop GPU
Asus ROG Flow Z13 ACRNM, 32768
7436 Points -3%
M4 (10 cores), M4 10-Core GPU
Apple MacBook Pro 14 2024 M4, 16384
4903 Points -36%
Ultra 9 285H, Arc 140T
Asus ZenBook Duo OLED UX8406CA, 32768
3627 Points -52%
Core Ultra 7 256V, Arc 140V
Dell XPS 13 9350, 16384
3330 Points -56%
Ryzen AI 7 PRO 360, Radeon 880M
Lenovo ThinkPad T14s Gen 6 21M2S00G00, 32768
2661 Points -65%
DaVinci Resolve PugetBench / Basic Score 1.1
i9-14900HX, NVIDIA GeForce RTX 4090 Laptop GPU
Razer Blade 16 2024, RTX 4090, 32768
8573 Points +16%
Ryzen AI Max+ 395, Radeon RX 8060S
Asus ROG Flow Z13 GZ302EA-RU073W, 32768
7387 Points
Ryzen AI 9 HX 370, NVIDIA GeForce RTX 4070 Laptop GPU
Asus ROG Zephyrus G16 GA605WI, 32768
6998 Points -5%
i9-13900H, NVIDIA GeForce RTX 4070 Laptop GPU
Asus ROG Flow Z13 ACRNM, 32768
6659 Points -10%
Ultra 9 285H, Arc 140T
Asus ZenBook Duo OLED UX8406CA, 32768
2762 Points -63%
Photoshop PugetBench: Overall Score 1.01 | Premiere Pro PugetBench: Overall Score 1.1 | DaVinci Resolve PugetBench: Basic Score 1.1

Verdict - Impressive performance, but questions about the availability and price remain

The new AMD Ryzen AI Max+ 395 is an impressive piece of hardware and it is definitely the fastest x86-iGPU by quite a margin. The multi-core CPU performance is also excellent and the Radeon 8060S can compete with the gaming performance of the GeForce RTX 4070 Laptop in similar TDP ranges. The chip is also suited for more compact devices since you only have to implement one processor. Thanks to shared memory, there can also be advantages for picture/video editing, where 8-12 GB VRAM of current dGPUs can quickly become a limitation. Compared to Apple's current M4 generation, the flagship model Ryzen AI Max+ 395 can compete keep up quite well with the faster M4 Pro variant (except for the single-core performance, where Apple just beats every competitor right now), but the M4 Max is out of reach.

There are still some unanswered questions, because the two smaller Strix Halo APUs offer fewer CPU cores and slower Radeon 8050S iGPUs. If these APUs can be successful, especially considering the high prices, remains to be seen. The ROG Flow Z13 with the Ryzen AI Max+ 395 and 32 GB RAM already costs 2499 Euros, even though it is the smallest SKU in terms of RAM. We do not have any prices for models with 64 or 128 GB yet.

This brings us to the next problem, the availability. So far, only the Asus ROG Flow Z13 GZ302 as well as the HP ZBook Ultra 14 G1a have been announced with Strix Halo APUs. If you combine all these factors, Strix Halo will probably be pretty rare and the exceptions for multimedia devices, which will most likely be once again dominated by the combination of Intel CPUs and Nvidia GPUs.

Read all 16 comments / answer
static version load dynamic
Loading comments
Comment on this article
Please share our article, every link counts!
Mail Logo
> Expert Reviews and News on Laptops, Smartphones and Tech Innovations > Reviews > AMD Ryzen AI Max+ 395 Analysis - Strix Halo to rival Apple M4 Pro/Max with 16 Zen 5 cores and iGPU on par with RTX 4070 Laptop
Andreas Osthoff, 2025-02-18 (Update: 2025-02-24)