Acer Nitro 14 (2024) review: Compact RTX 4060 gaming notebook with long battery life

After recently reviewing the Acer Predator Helios Neo 14, a powerful 14.5-inch gaming laptop, we now have our hands on the Nitro 14, a more wallet-friendly Acer laptop that largely shares the same design. Whilst the Predator is a high-end notebook, the Nitro is aimed more at the mid-range segment. This is evident in the laptop’s €1,449 (US$1,600) price point and coherent hardware, which features a Ryzen 5 8645HS (Hawk Point), a GeForce RTX 4060, 16 GB of RAM, a 512 GB SSD and a 2.5K display.
The Nitro 14 is competing with the likes of the HP Omen Transcend 14, the Lenovo LOQ 15IRX9, the Razer Blade 14, the Asus TUF Gaming A15 FA507UV, and the XMG Core 15 (M24).
Comparison with possible competitors
Rating | Version | Date | Model | Weight | Height | Size | Resolution | Price |
|---|---|---|---|---|---|---|---|---|
| 80.3 % | v8 | 09 / 2024 | Acer Nitro 14 AN14-41-R3MX R5 8645HS, GeForce RTX 4060 Laptop GPU | 2 kg | 22.84 mm | 14.50" | 2560x1600 | |
| 89.7 % v7 (old) | v7 (old) | 02 / 2024 | Razer Blade 14 RZ09-0508 R9 8945HS, GeForce RTX 4070 Laptop GPU | 1.9 kg | 17.99 mm | 14.00" | 2560x1600 | |
| 79 % | v8 | 07 / 2024 | Lenovo LOQ 15IRX9 i5-13450HX, GeForce RTX 4060 Laptop GPU | 2.4 kg | 23.9 mm | 15.60" | 1920x1080 | |
| 80.3 % | v8 | 07 / 2024 | Asus TUF Gaming A15 FA507UV R9 8945H, GeForce RTX 4060 Laptop GPU | 2.1 kg | 22.4 mm | 15.60" | 1920x1080 | |
| 83.7 % | v8 | 06 / 2024 | Schenker XMG Core 15 (M24) R7 8845HS, GeForce RTX 4060 Laptop GPU | 2.1 kg | 21.9 mm | 15.30" | 2560x1600 | |
| 88.5 % v7 (old) | v7 (old) | 03 / 2024 | HP Omen Transcend 14-fb0014 Ultra 7 155H, GeForce RTX 4060 Laptop GPU | 1.6 kg | 18 mm | 14.00" | 2880x1800 | |
| 80.5 % | v8 | 08 / 2024 | Acer Predator Helios Neo 14 (2024) Ultra 9 185H, GeForce RTX 4070 Laptop GPU | 1.9 kg | 20.9 mm | 14.50" | 3072x1920 |
Note: We have recently updated our rating system and the results of version 8 are not comparable with the results of version 7. More information is available here .
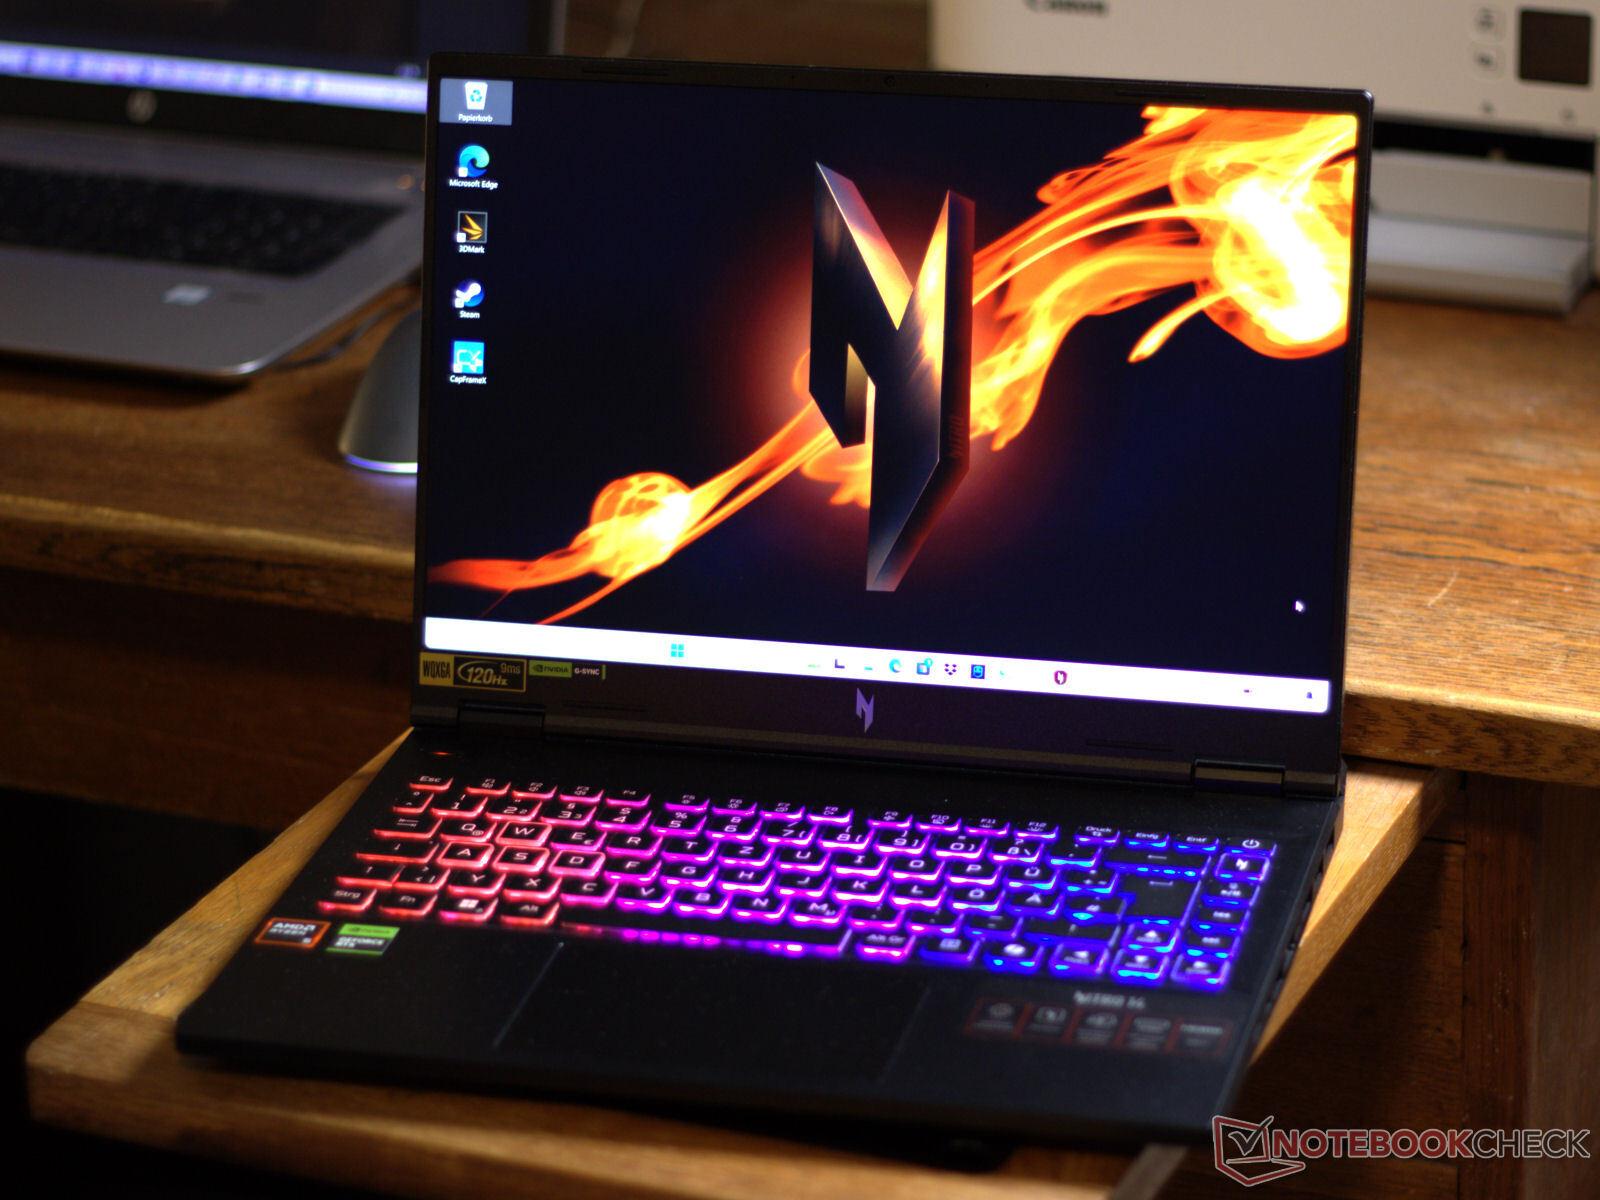
Case - Acer hasn't plastered the Nitro with LEDs
Acer has paired a plastic base unit with an aluminium lid. The latter appears to be quite susceptible to fingerprints. Even though the base section can only be twisted slightly, the lid exhibits more flex. But this doesn’t result in any image distortion, not even when pressure is applied to the back of the lid. The hinges are able to hold the display firmly in position, and the screen doesn’t wobble much after being adjusted. The laptop can be opened with one hand, up to an angle of roughly 155 degrees. Acer has delivered a decent chassis overall.
As mentioned, the Nitro shares mostly the same exterior design as the Helios Neo 14. The latter is around 2 mm (0.08 in) thinner, but otherwise the differences are primarily cosmetic. The Nitro’s chassis is mostly in a shade that Acer calls Obsidian Black, with only the rear exhaust vents sporting an orange highlight. The Nitro doesn’t offer any textured surfaces or prints like those found on the Neo 14. Acer also hasn’t adorn the two laptops with LED strips.


The Nitro is the bulkiest device amongst the 14-inch laptops in our comparison. It is comparable with the competitors in terms of weight. The HP Omen Transcend 14 is a solid pick if compactness and weight are crucial.
Specifications - USB4 complete with Power Delivery
Acer has opted for fast USB connectivity: the USB-C port on the right and the two USB-A ports support USB 3.2 Gen 2, whilst the other USB-C port supports USB4. Both USB-C connectors offer Power Delivery and DisplayPort Alt Mode, giving the Nitro a total of three video outputs (HDMI, 2x DisplayPort). The areas adjacent to the palm rest can mostly be kept free of cables because all ports are located centrally on both the left and right side. Another commendable design choice is that each side features a USB-A and a USB-C port.


SD Card Reader
Acer apparently deemed it necessary to include a microSD card reader but chose a very slow model, as shown by our testing with our AV PRO microSD 128 GB V60 reference card. Comparing the transfer rates with those achieved by the Asus ROG Zephyrus G14 demonstrates what could’ve been possible.
| SD Card Reader | |
| average JPG Copy Test (av. of 3 runs) | |
| Asus ROG Zephyrus G14 2024 GA403U (Angelbird AV Pro V60) | |
| Average of class Gaming (20.9 - 210, n=54, last 2 years) | |
| Schenker XMG Core 15 (M24) | |
| Acer Predator Helios Neo 14 (2024) (AV PRO microSD 128 GB V60) | |
| Acer Nitro 14 AN14-41-R3MX (AV PRO microSD 128 GB V60) | |
| maximum AS SSD Seq Read Test (1GB) | |
| Asus ROG Zephyrus G14 2024 GA403U (Angelbird AV Pro V60) | |
| Average of class Gaming (25.5 - 261, n=51, last 2 years) | |
| Schenker XMG Core 15 (M24) | |
| Acer Nitro 14 AN14-41-R3MX (AV PRO microSD 128 GB V60) | |
| Acer Predator Helios Neo 14 (2024) (AV PRO microSD 128 GB V60) | |
Connectivity
The wireless module houses a MediaTek MT7922 Wi-Fi 6E chip, which achieved excellent data rates under optimal conditions (i.e. no Wi-Fi devices in the surroundings, short distance between the laptop and access point), but only when receiving data. The transmit rates were only around half the receive rates. The module also supports Bluetooth 5.2. The Nitro doesn’t have a built-in Gigabit Ethernet port.
Webcam
Don’t expect to create any art using the 0.9MP webcam, given its low resolution and poor colour accuracy. The camera also doesn’t feature a mechanical shutter or on/off switch.


Accessories
Besides the usual documentation, such as quick start guide and warranty information, the notebook doesn’t come with any other accessories.
Maintenance
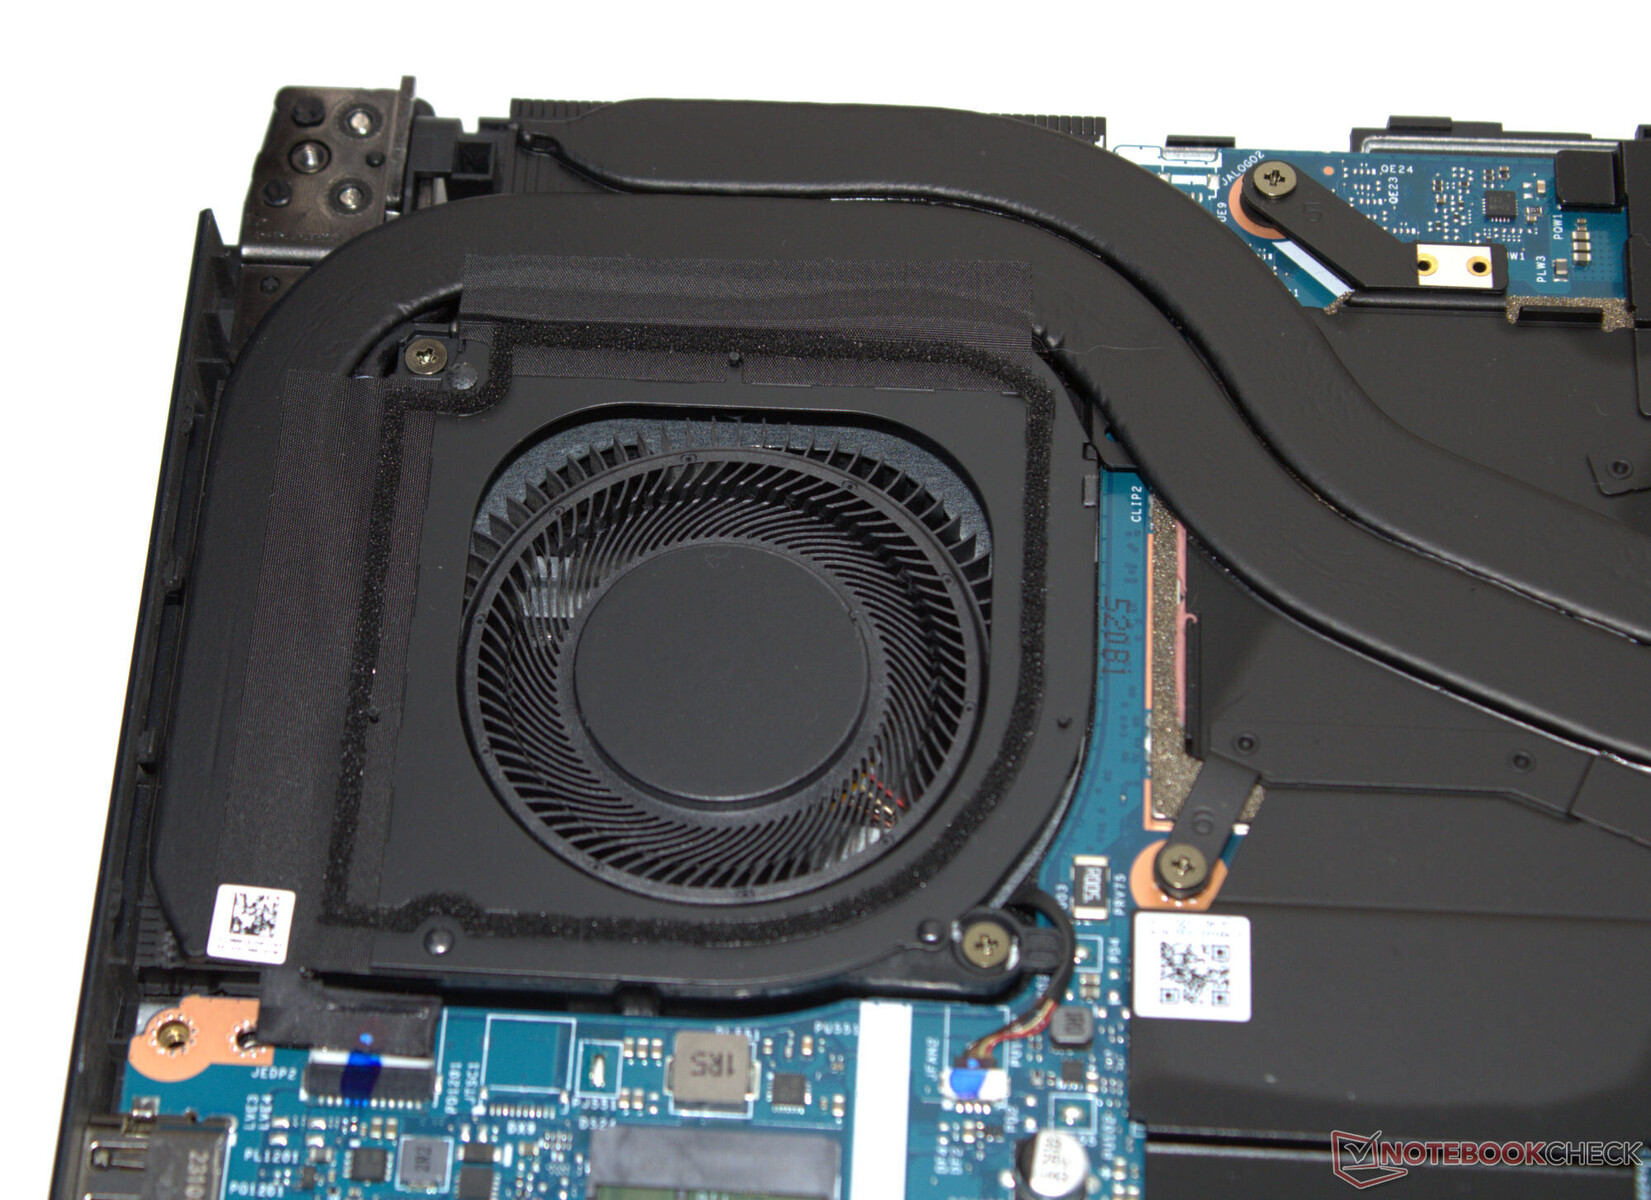
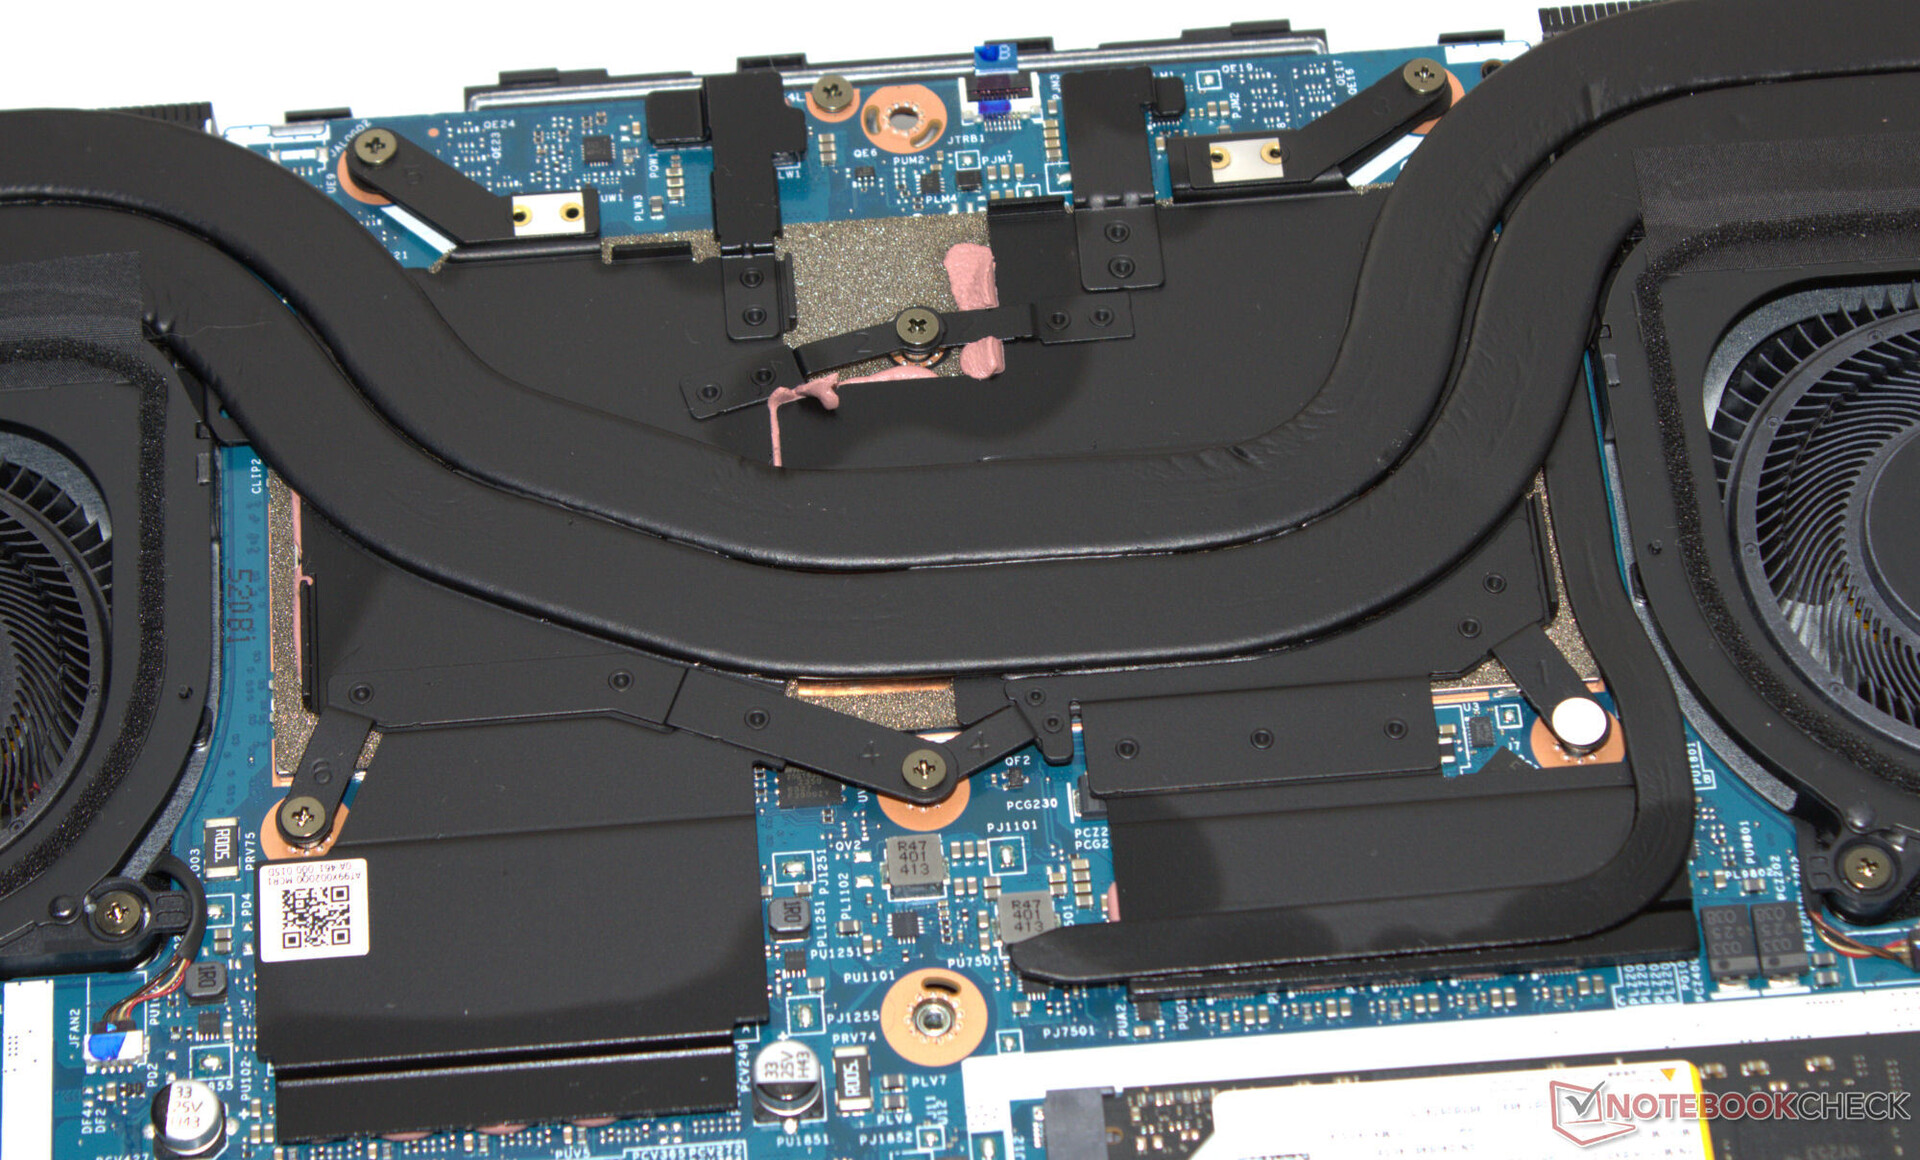
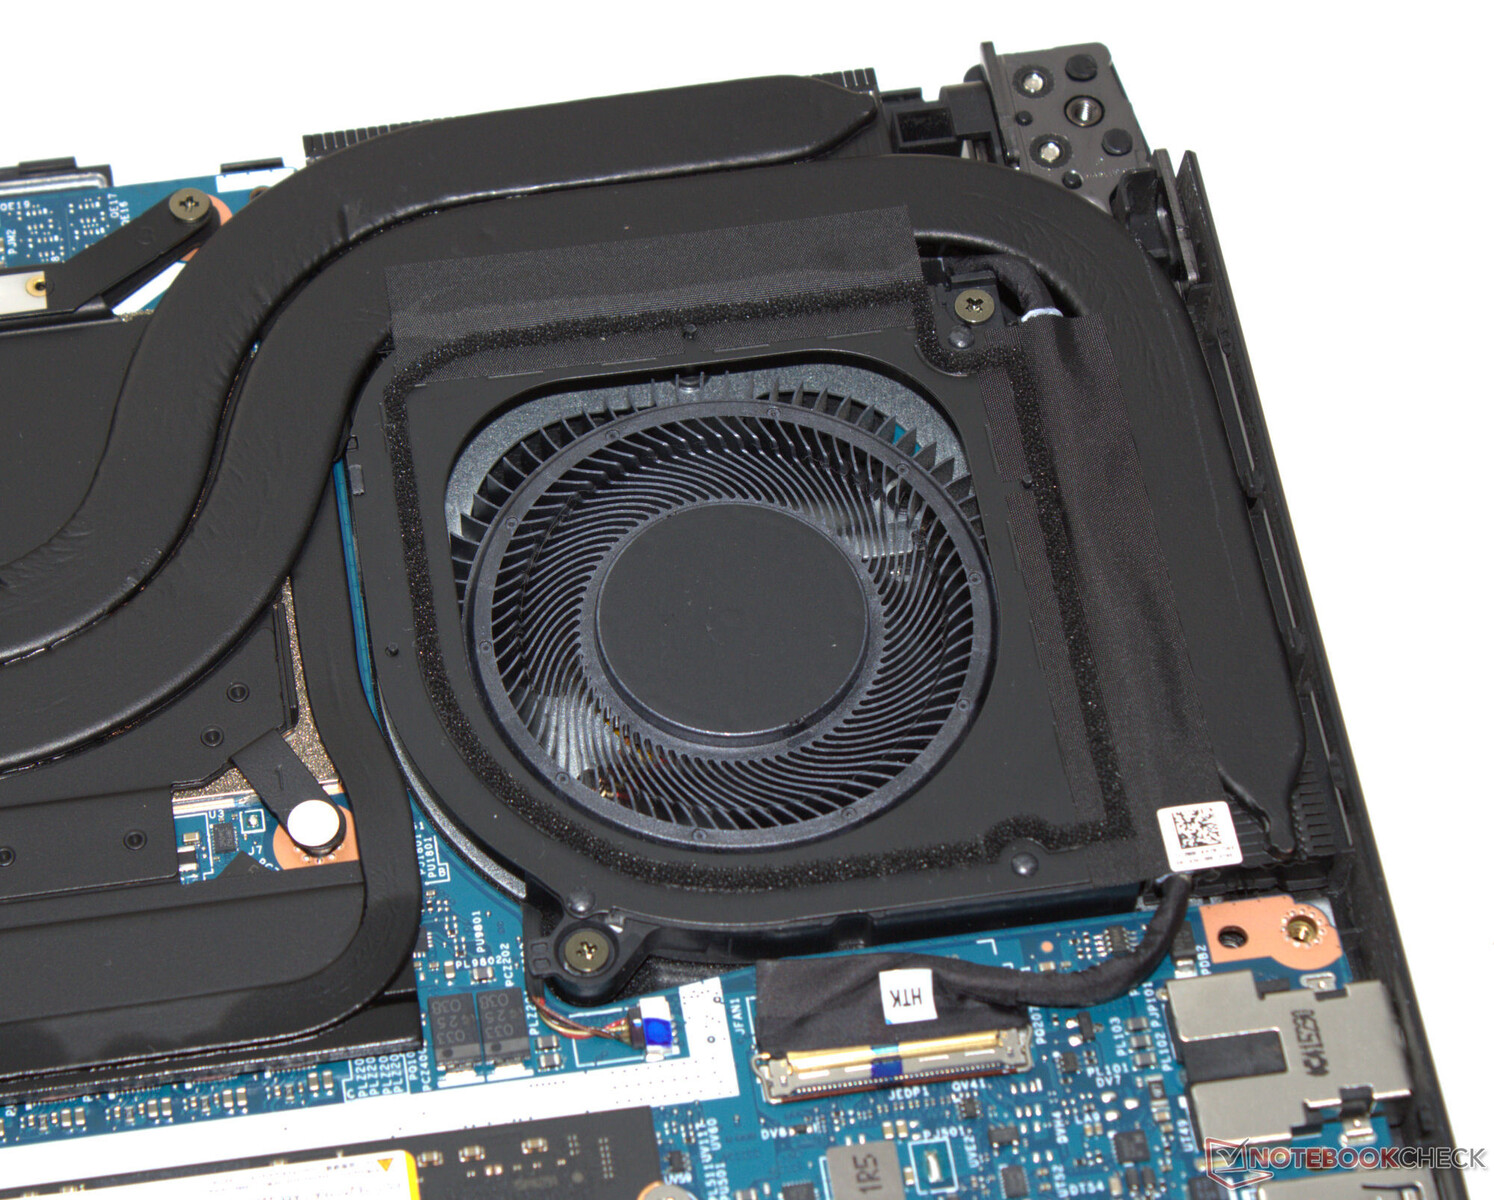
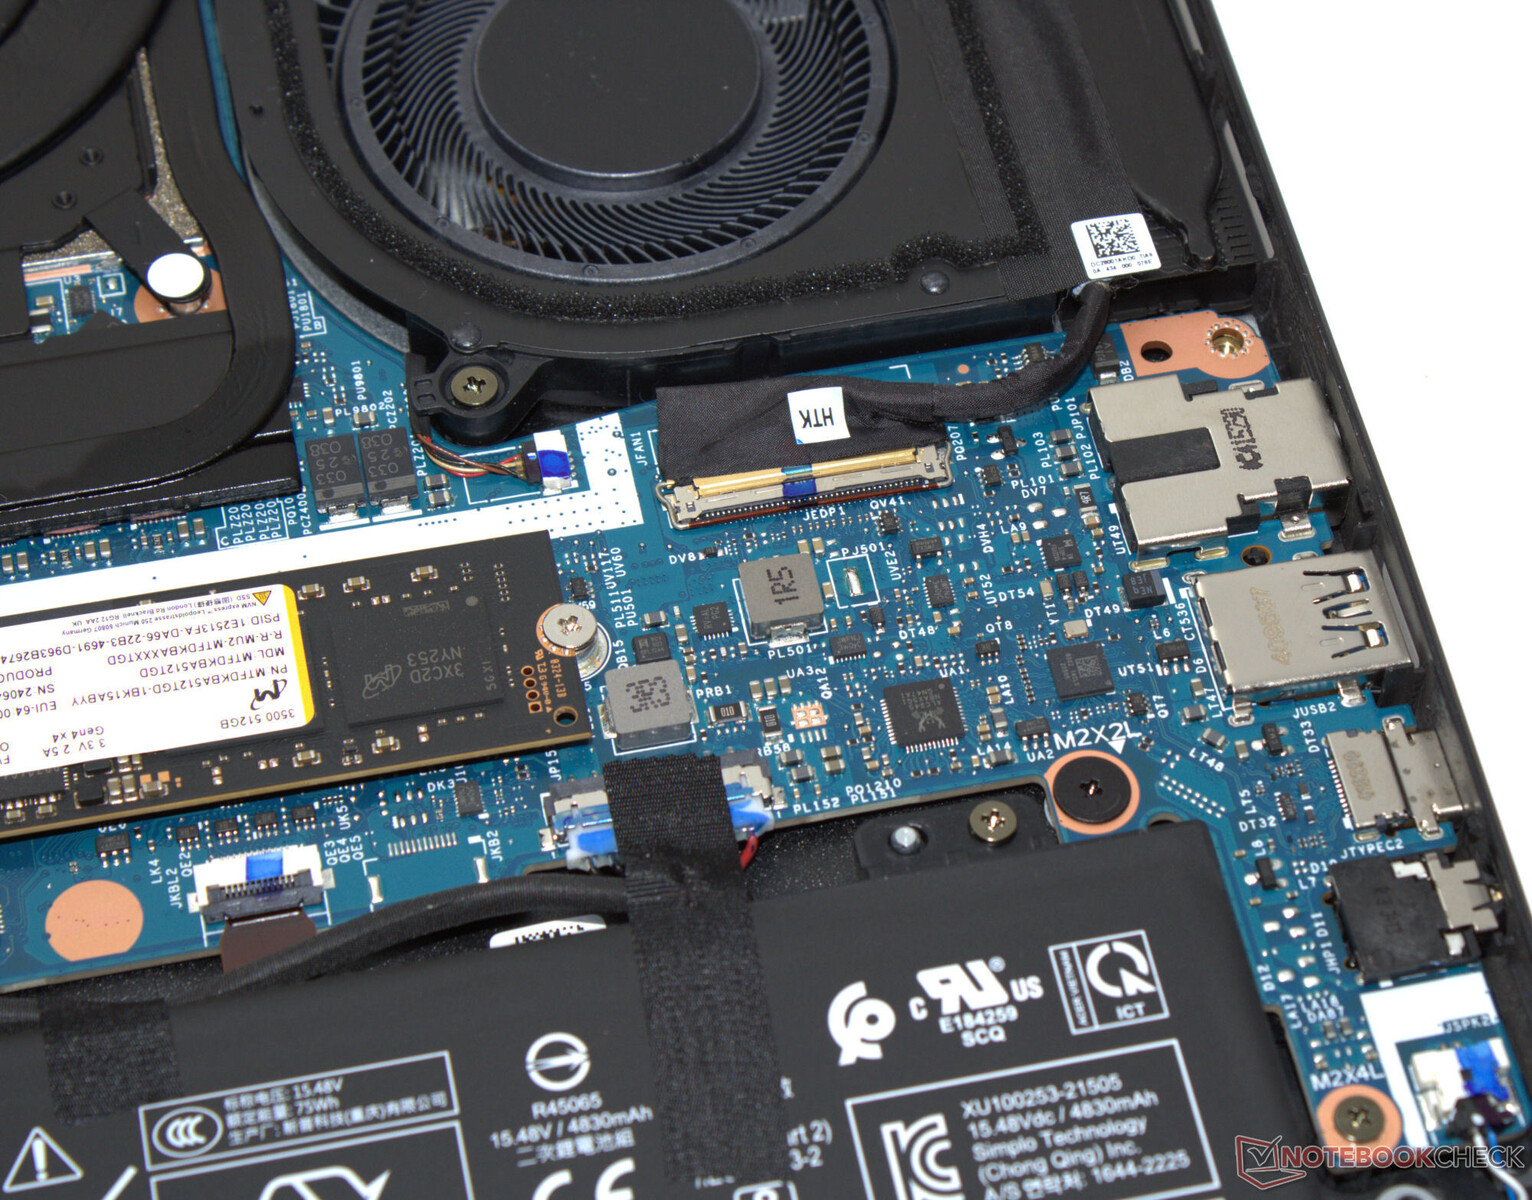
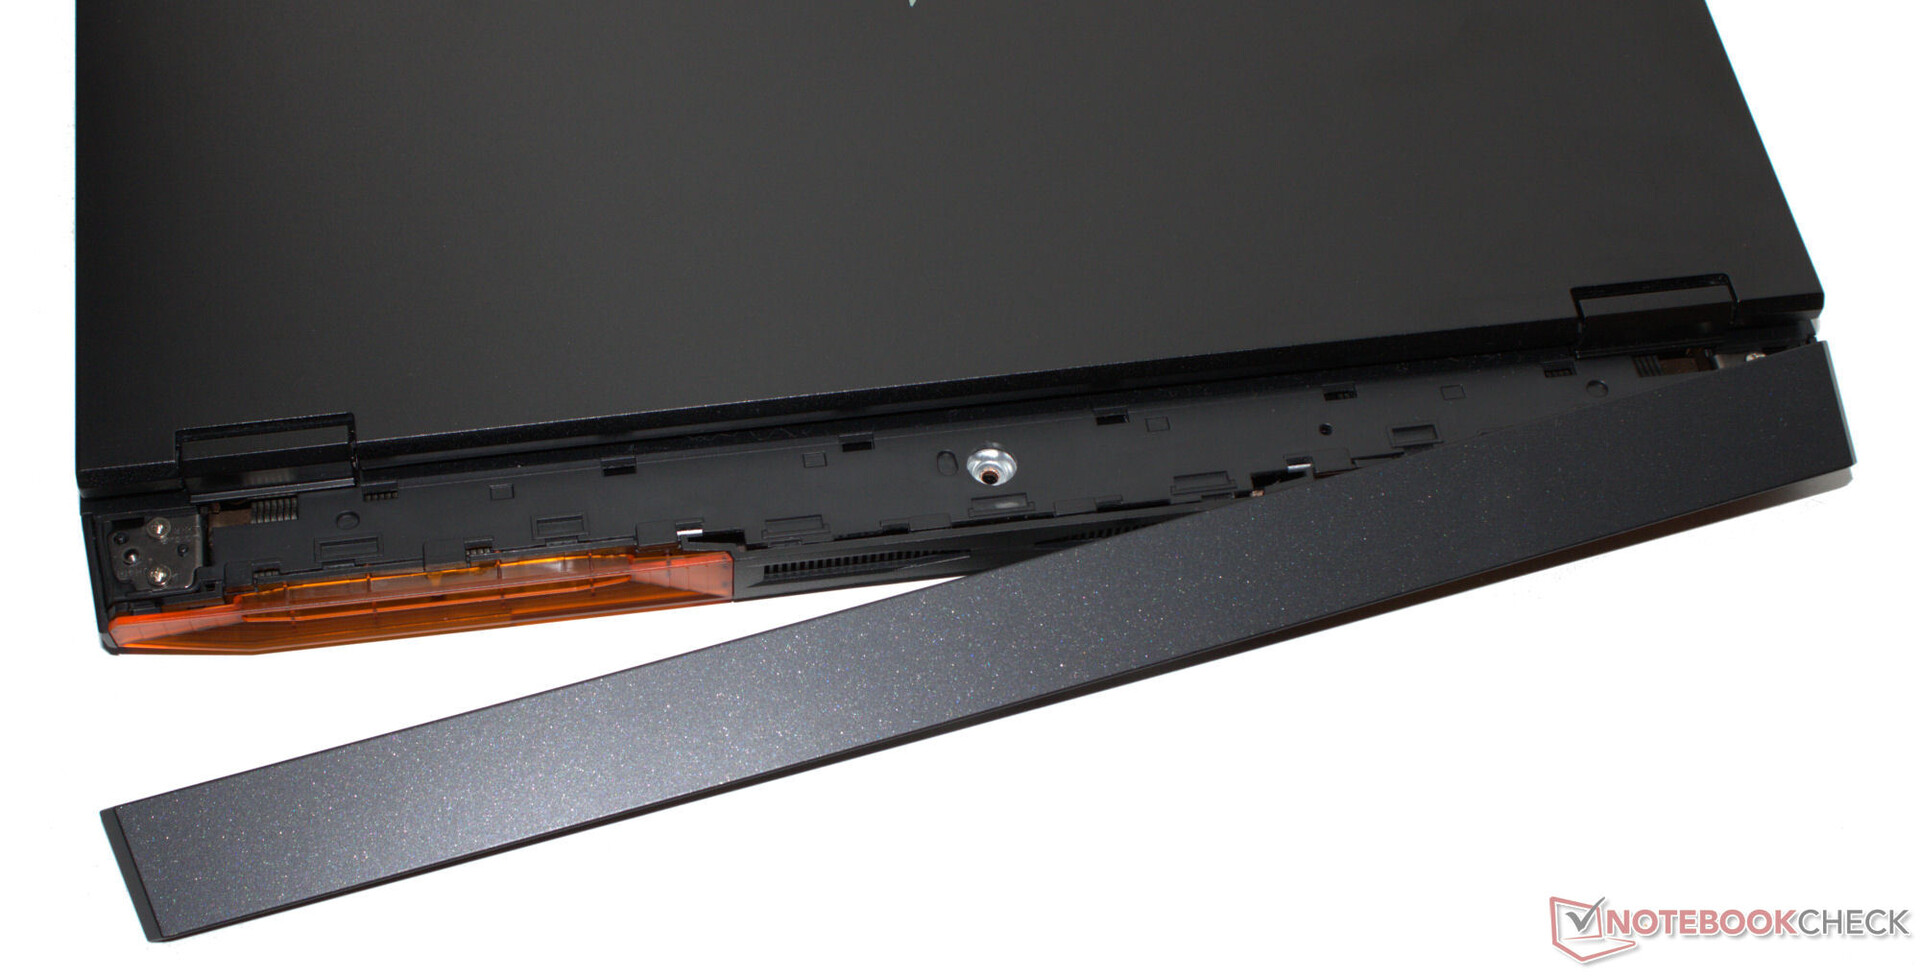
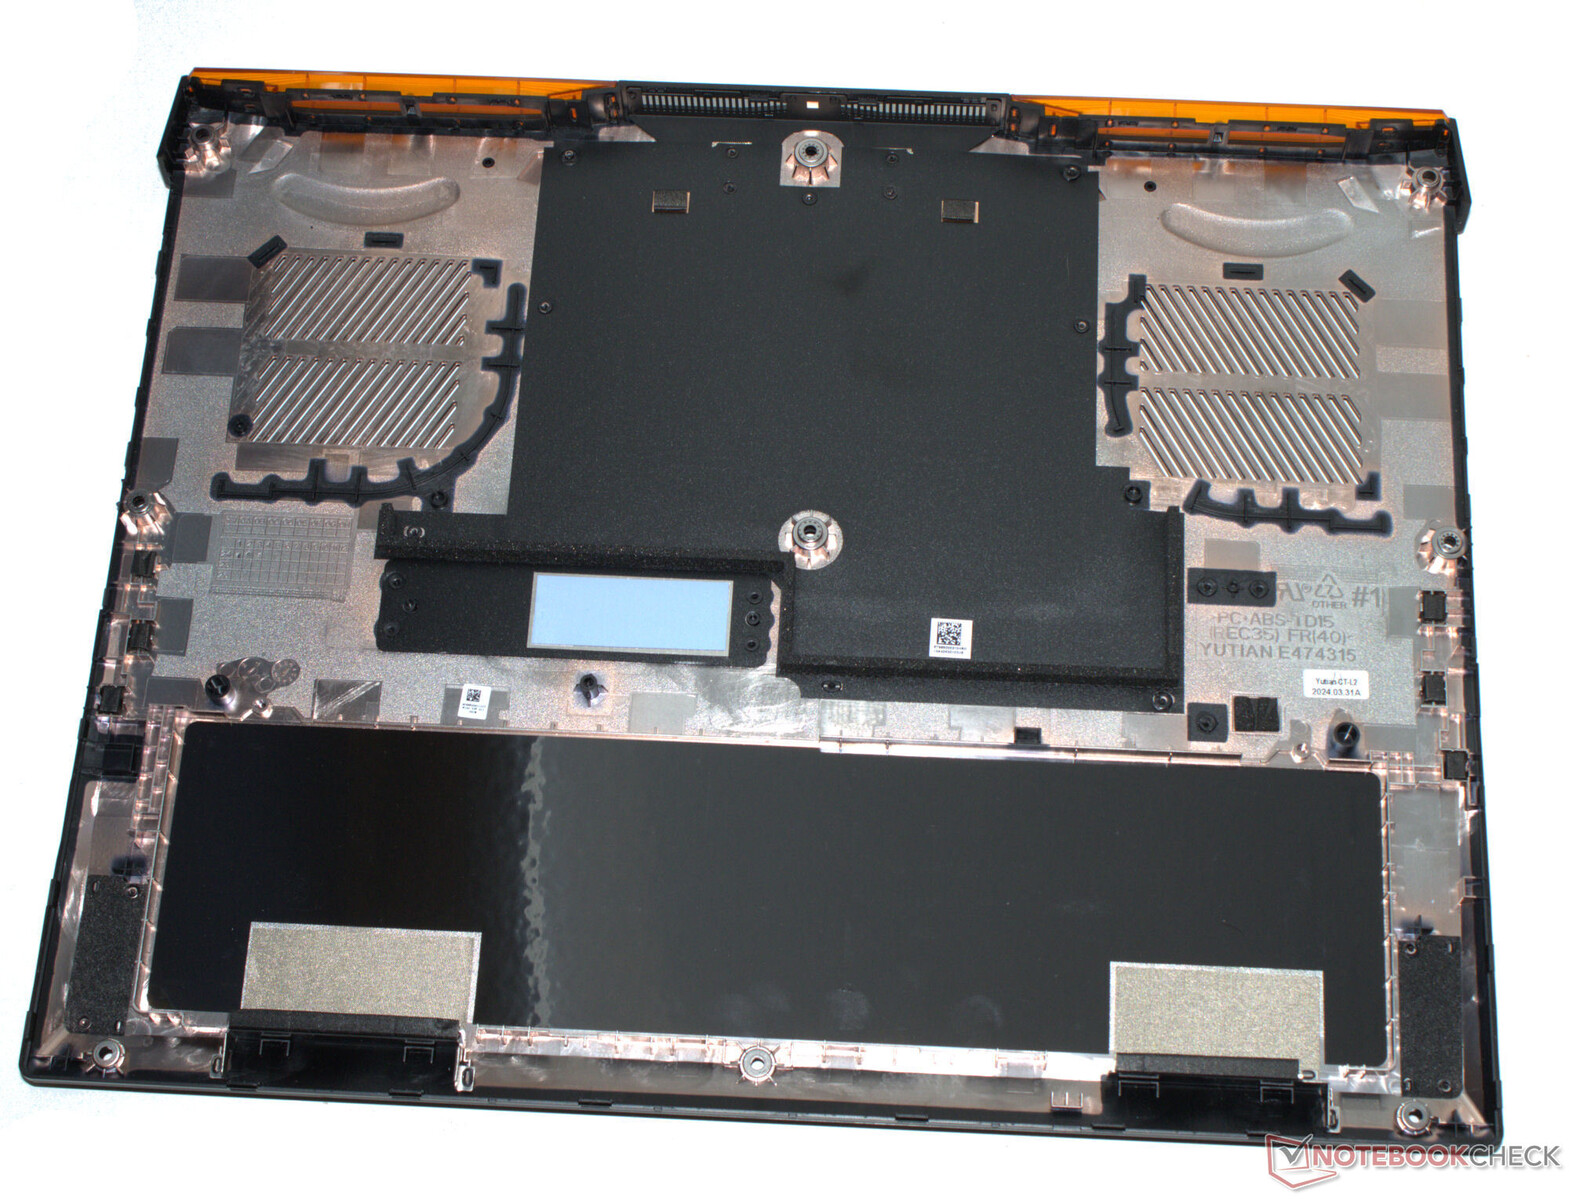
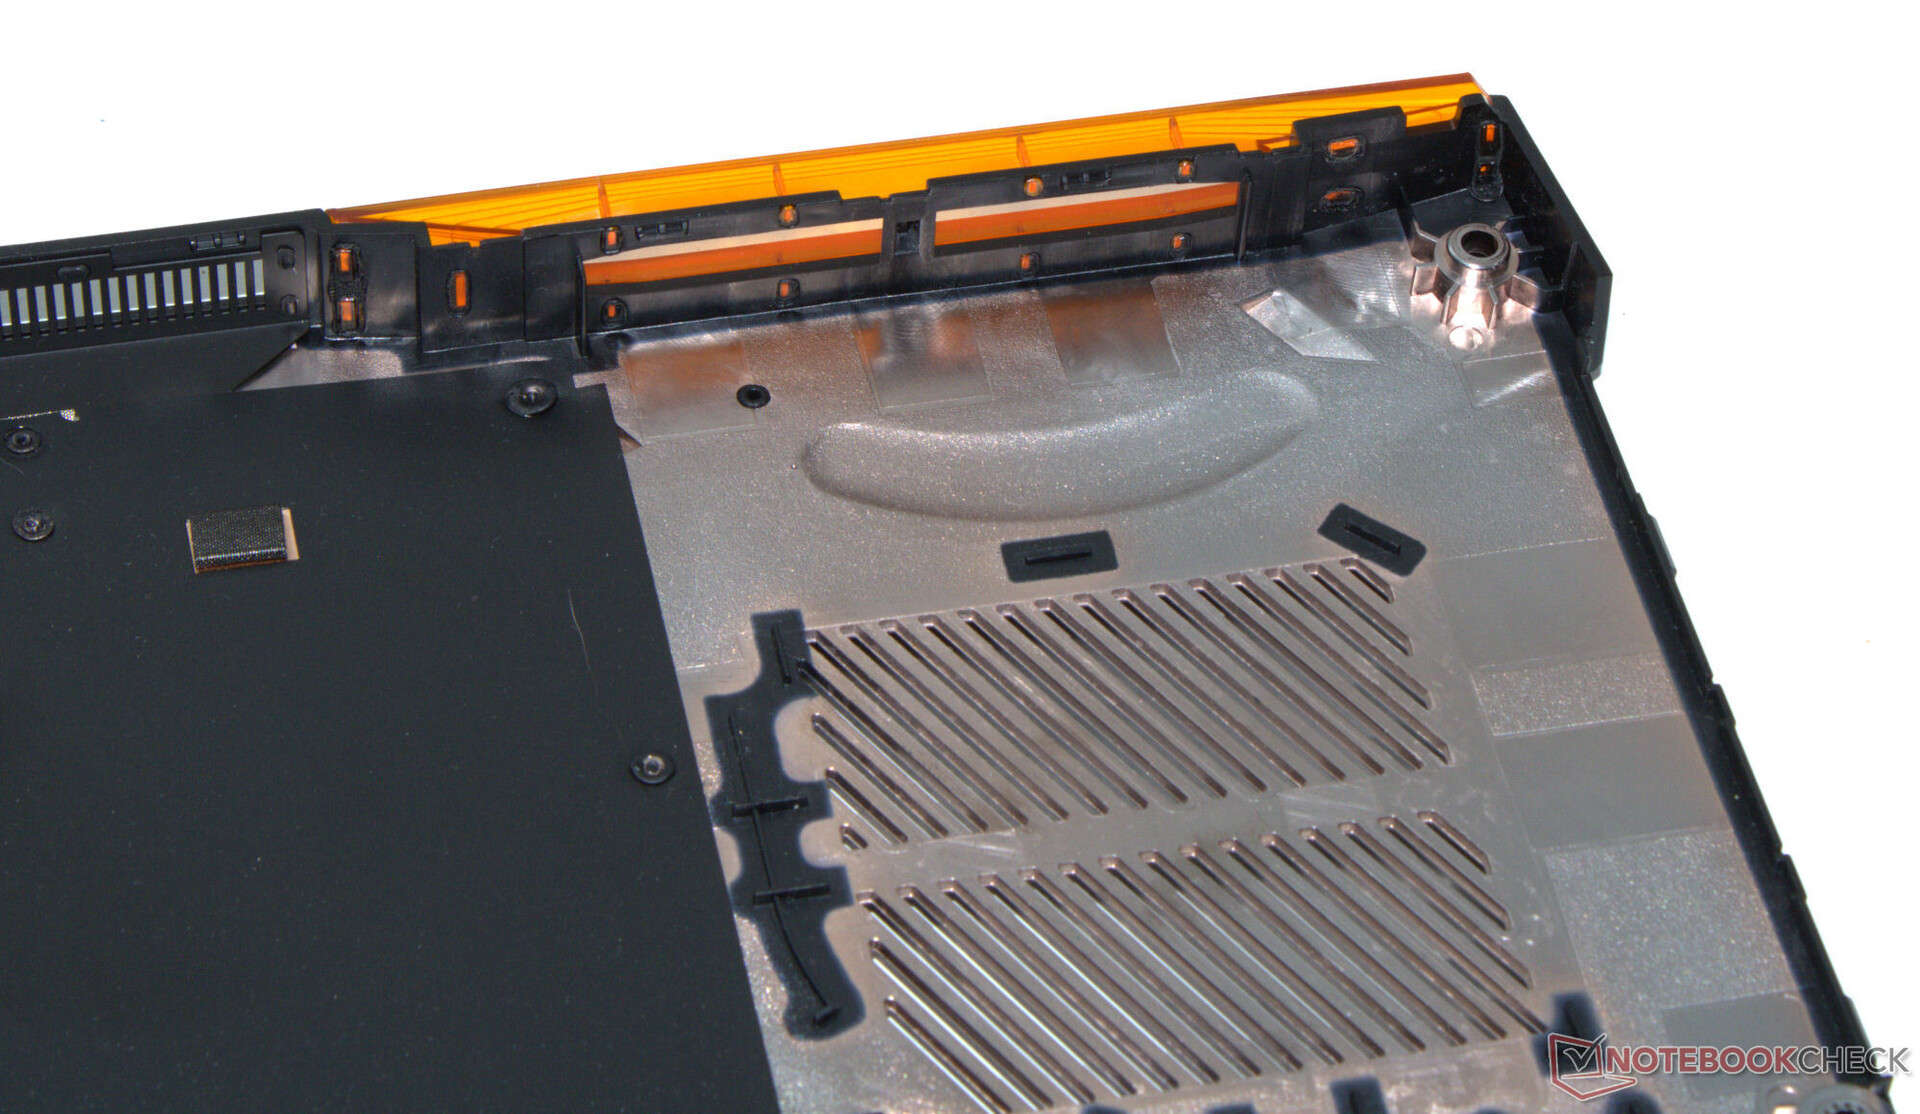
To remove the bottom plate, start by undoing all screws on the bottom. Next, on the upper side of the laptop, detach the plastic bar behind the display. Other than a flatpick or spudger, a fingernail may also be a helpful tool for this step. Be careful when reattaching the bar subsequently, as there are many small, easily breakable plastic clips. Finally, use the above-mentioned tools to release the bottom plate. Another thing to watch out for is that the rear exhaust vents are part of the bottom cover. Once the plate is removed, you’ll have access to the PCIe 4.0 M.2-2280 SSD, the Wi-Fi module along with the antennas, the fans and the battery. There are no memory slots because the RAM is soldered.


Sustainability
Acer provides carbon footprint information for many of its products, but the Nitro 14 is not yet one of them. Its packaging contains a relatively small amount of plastic: a clear bag for the charger, a PET fabric bag for the laptop, and a PP insert to protect the display. Cardboard is used for the rest of the packaging. According to the printed information, the box and all cardboard elements are made of recycled material. Repairs and maintenance are possible thanks to the removable bottom plate. Software updates also shouldn’t be an issue for the next few years.
Warranty
Acer provides a two-year warranty (mail-in) on the 14.5-inch laptop in Germany. Extending the warranty period to three years will cost around €100 (US$110). However, warranty terms and conditions may vary by region.
Input devices - The Acer laptop offers an RGB backlit keyboard
Keyboard
The arrow keys and WASD keys stand out visually on the chiclet keyboard, but their lighting isn't individually customisable. The keyboard supports only three lighting zones and lacks per-key lighting. One positive aspect is that the arrow keys are full-size. All the keys also have a short travel and a clear actuation point. The key resistance is also satisfactory. The keyboard wobbles slightly, but this doesn’t significantly affect the typing experience.
Touchpad
The Nitro 14 features a multi-touch clickpad, measuring 12 x 7 cm (4.7 x 2.8 in), with a short travel and a distinct click point. Its smooth surface allows your fingers to glide effortlessly. The clickpad can be disabled if necessary.

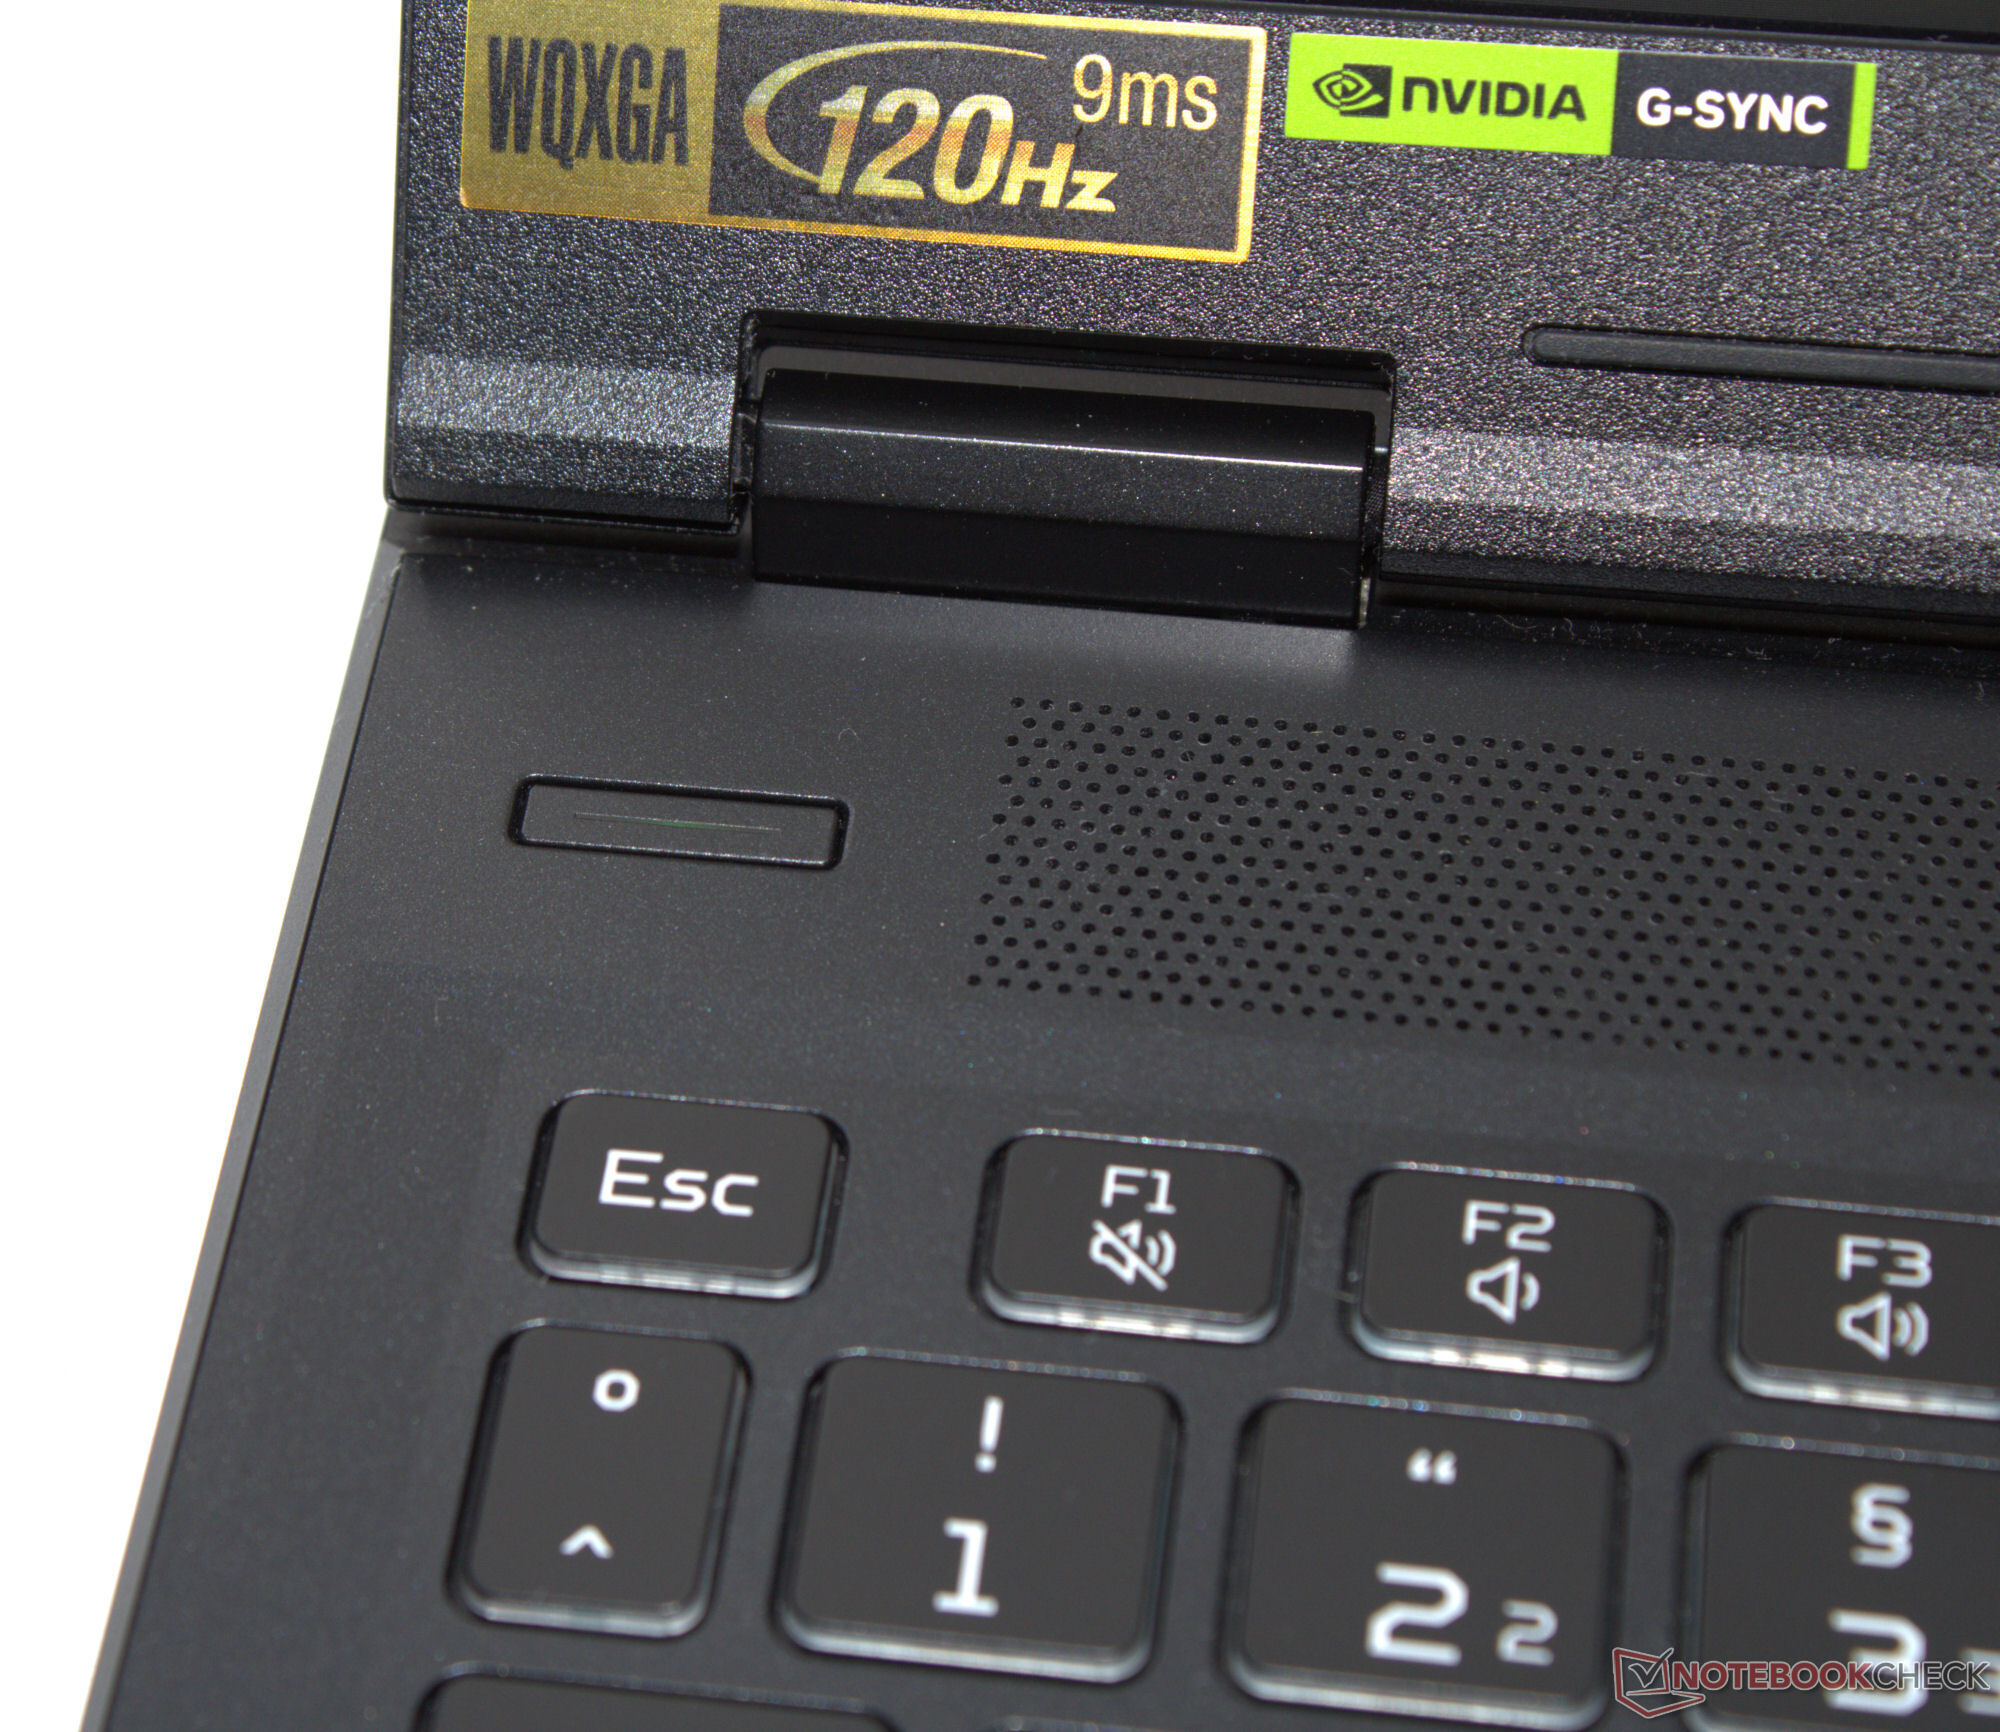
Display - Bright IPS panel with sRGB coverage
With a diagonal of 14.5 inches, the display has a rather uncommon size, but it offers the same height as a 16:9 15.6-inch screen thanks to its 16:10 aspect ratio. The 120Hz IPS panel with a resolution of 2,560 x 1,600 boasts a wide viewing angle, G-Sync support, the absence of PWM flicker, and a fairly high brightness. The display is perfectly readable outdoors, though the sun shouldn’t be shining too brightly. Acer also offers a WUXGA display option (1,920 x 1,200 pixels) for the Nitro 14.


| |||||||||||||||||||||||||
Brightness Distribution: 89 %
Center on Battery: 415 cd/m²
Contrast: 1221:1 (Black: 0.34 cd/m²)
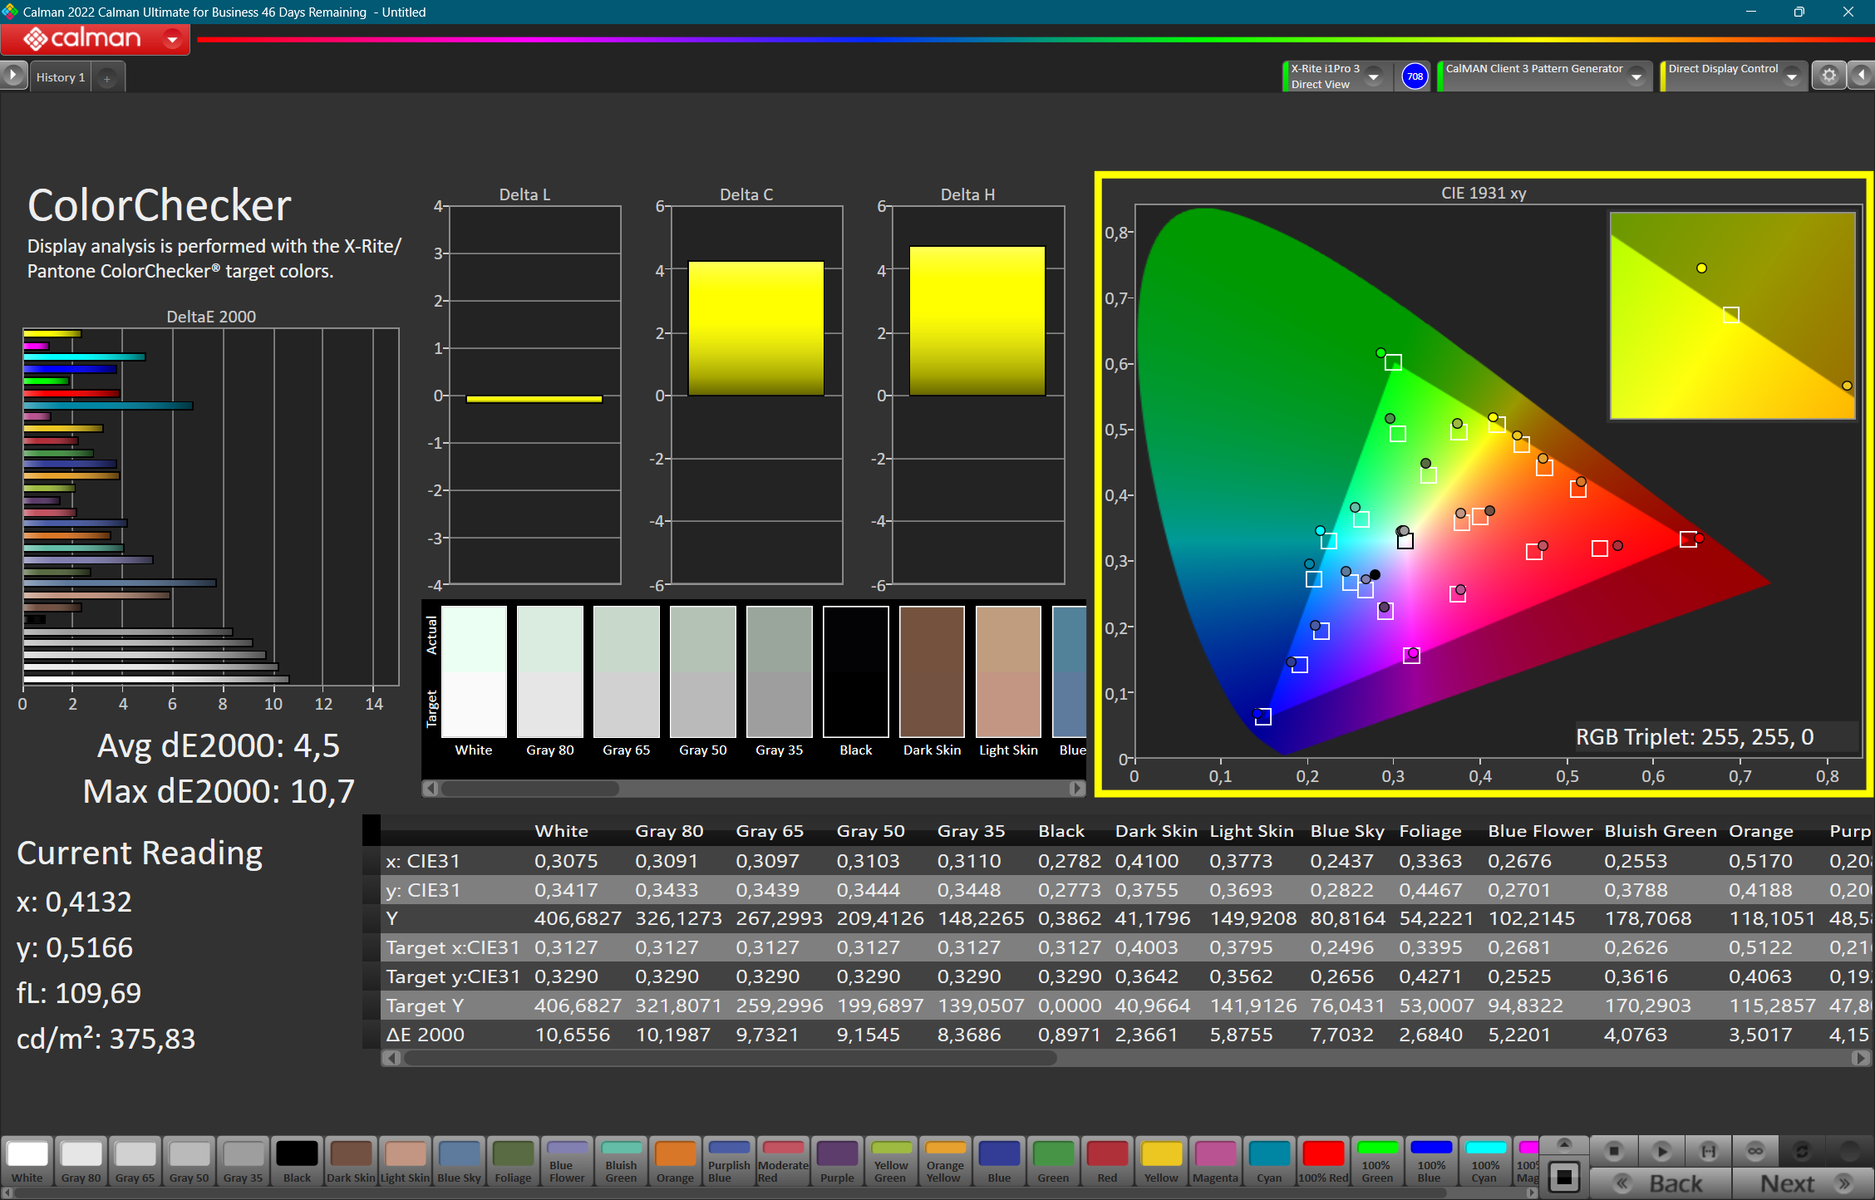
ΔE ColorChecker Calman: 4.5 | ∀{0.5-29.43 Ø4.71}
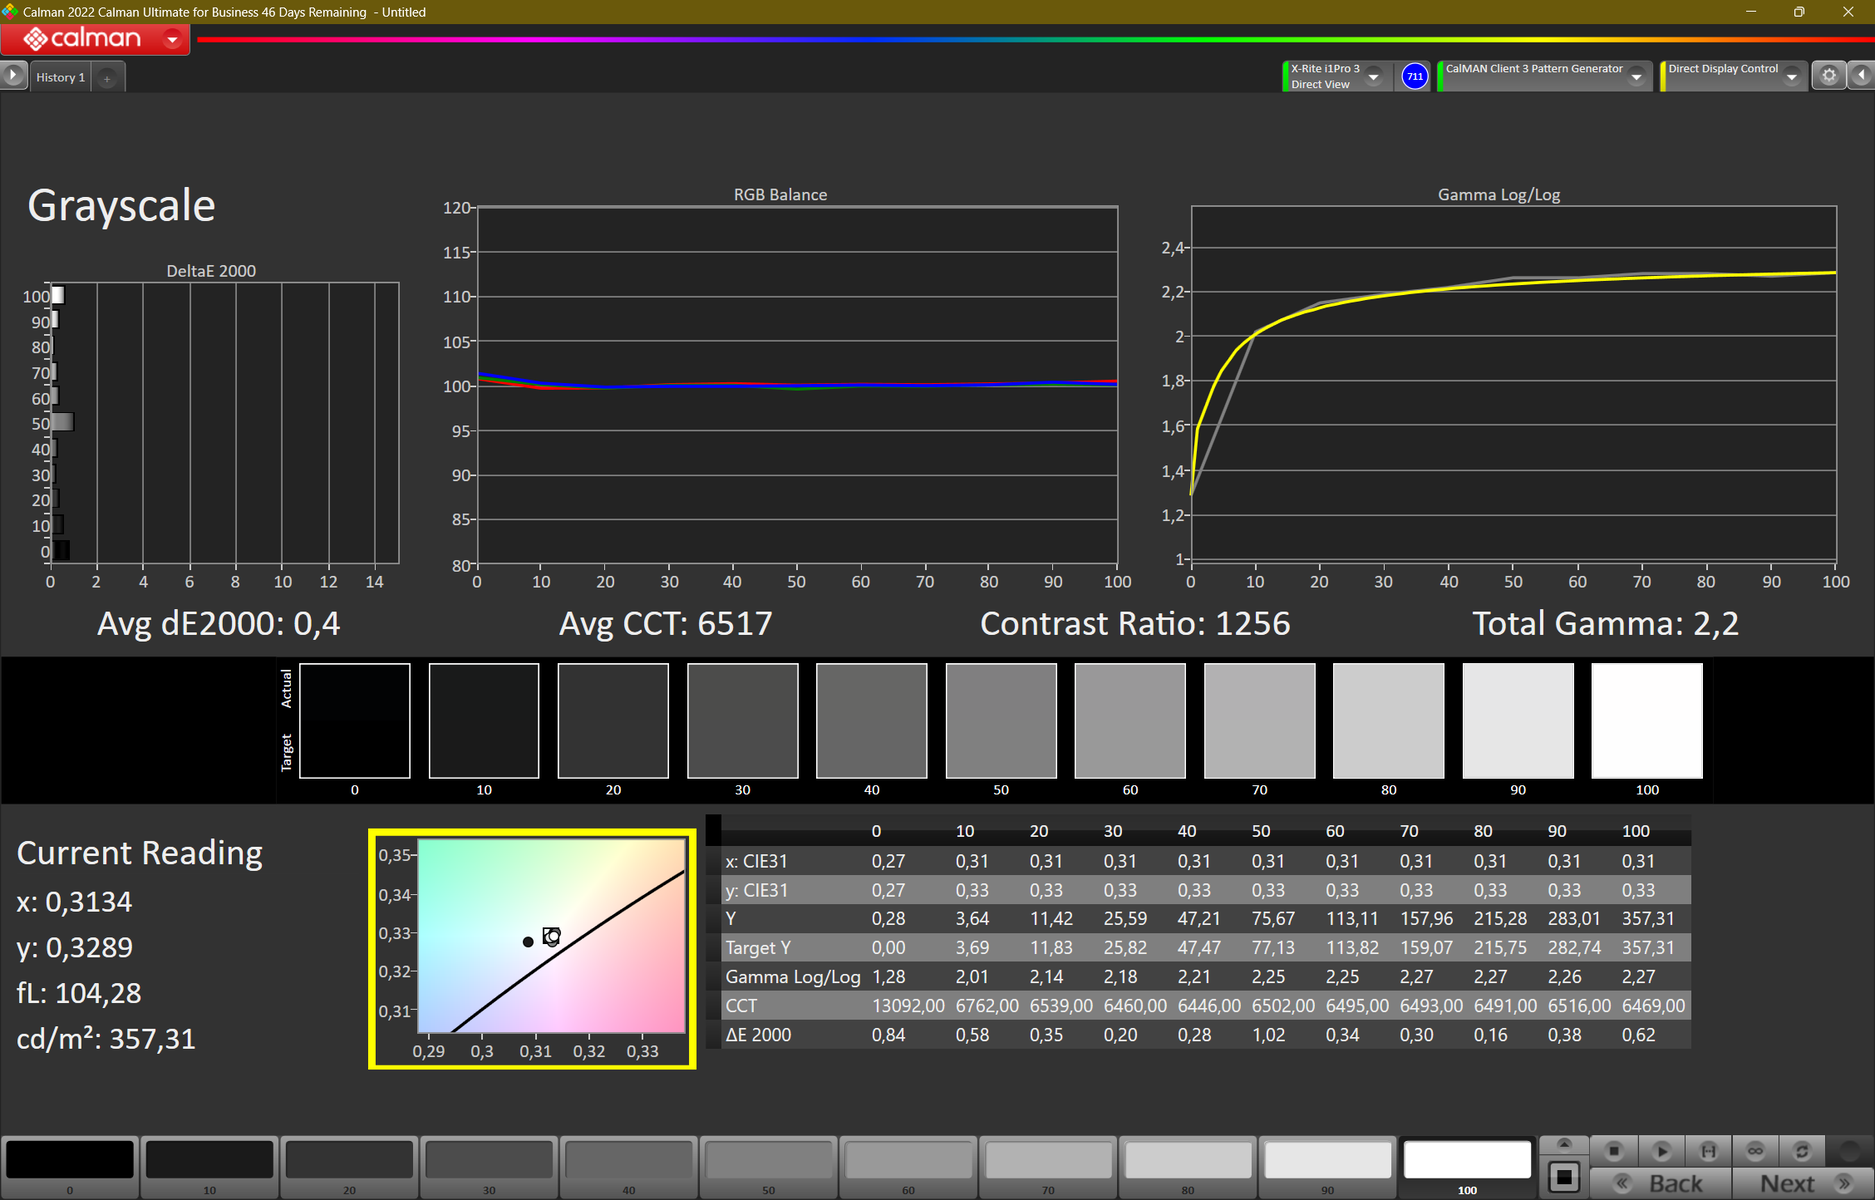
calibrated: 1.8
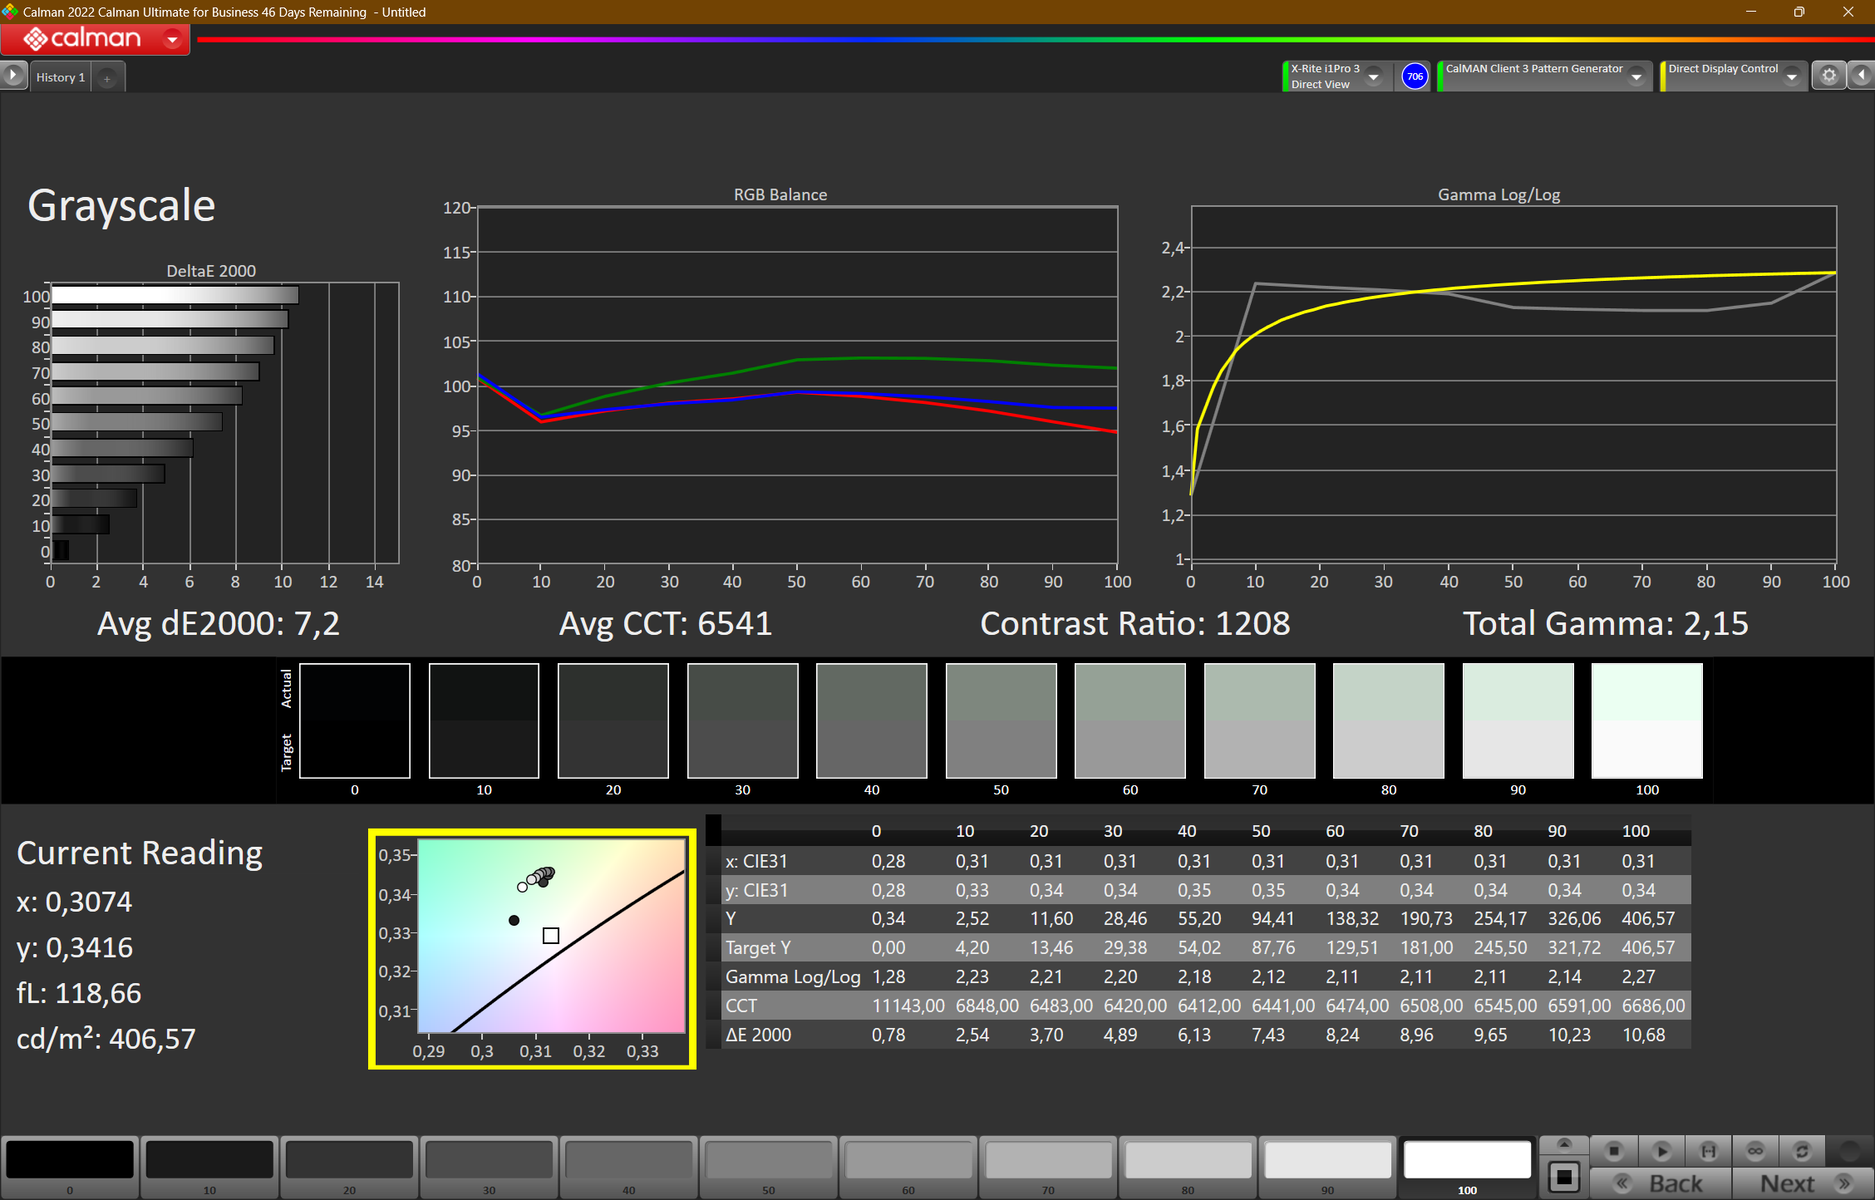
ΔE Greyscale Calman: 7.2 | ∀{0.09-98 Ø4.96}
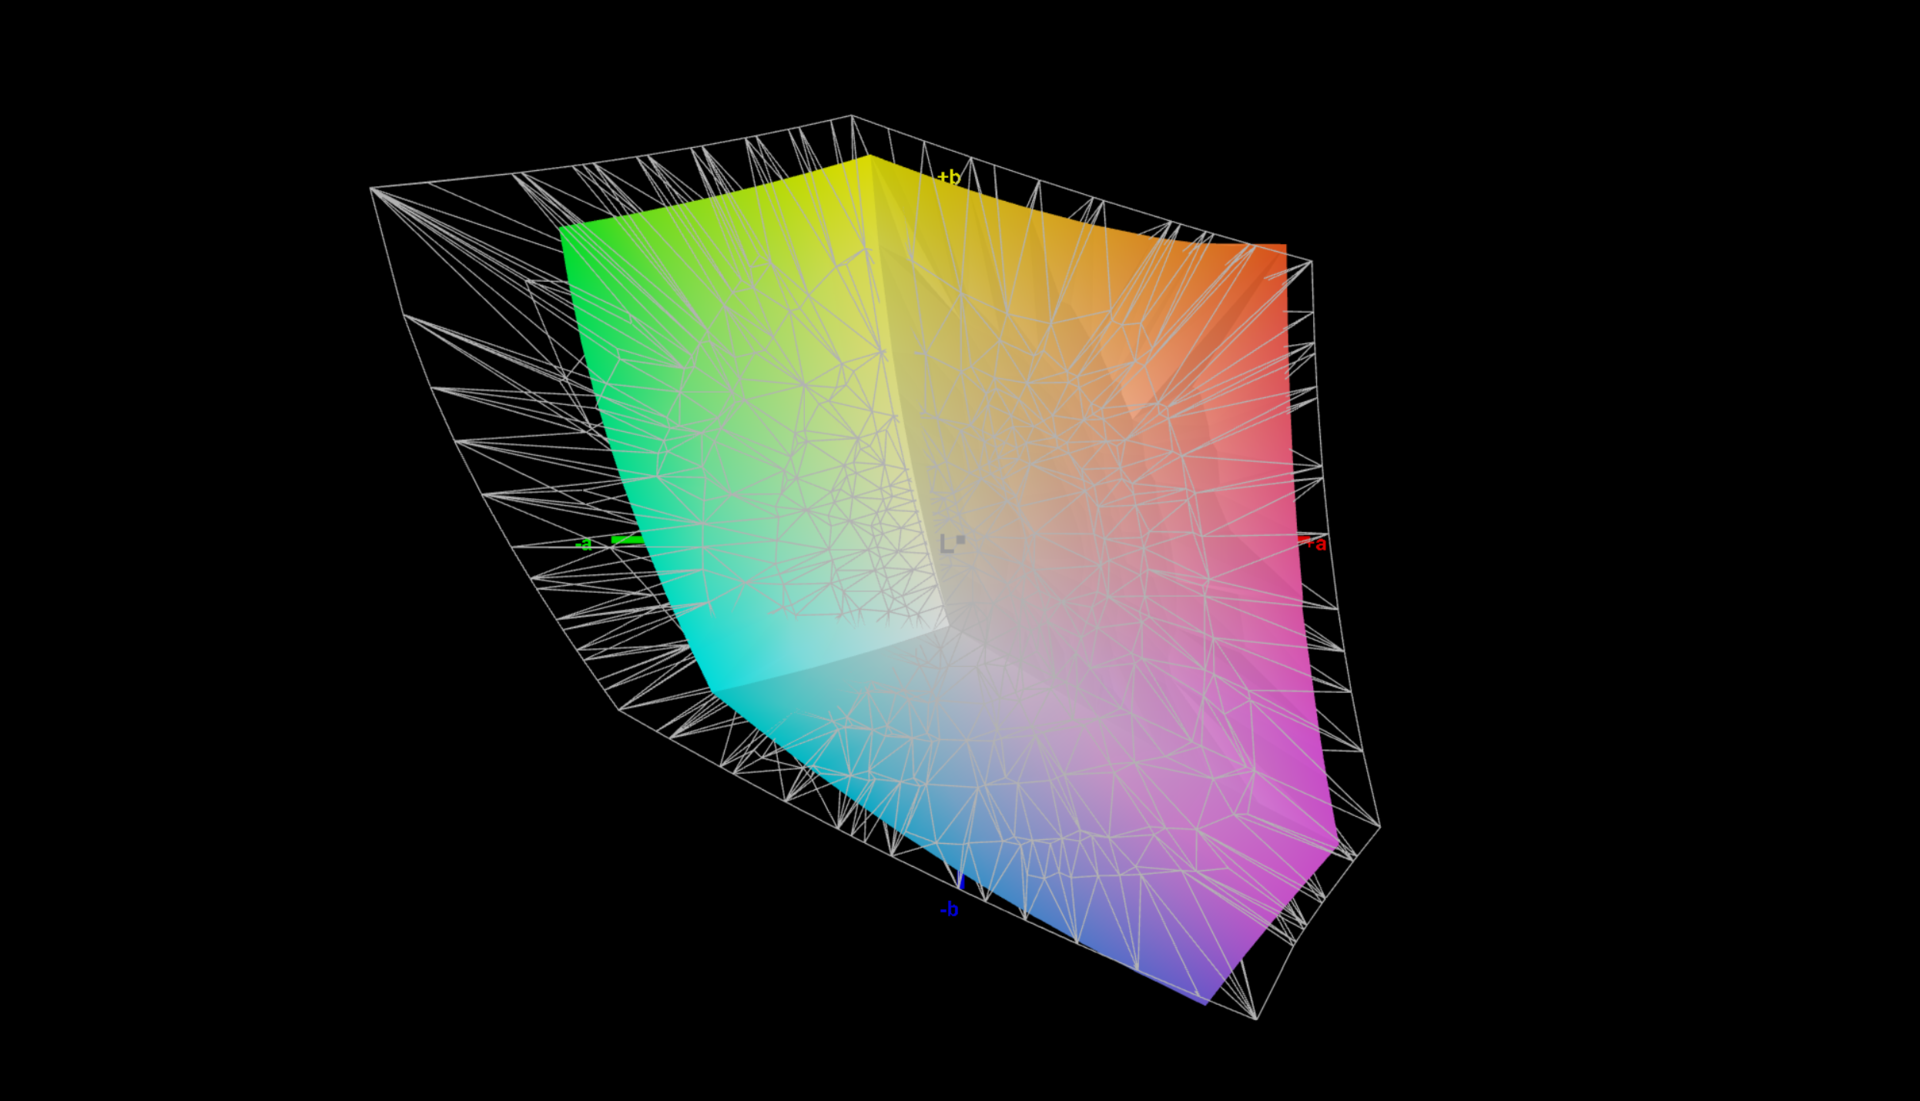
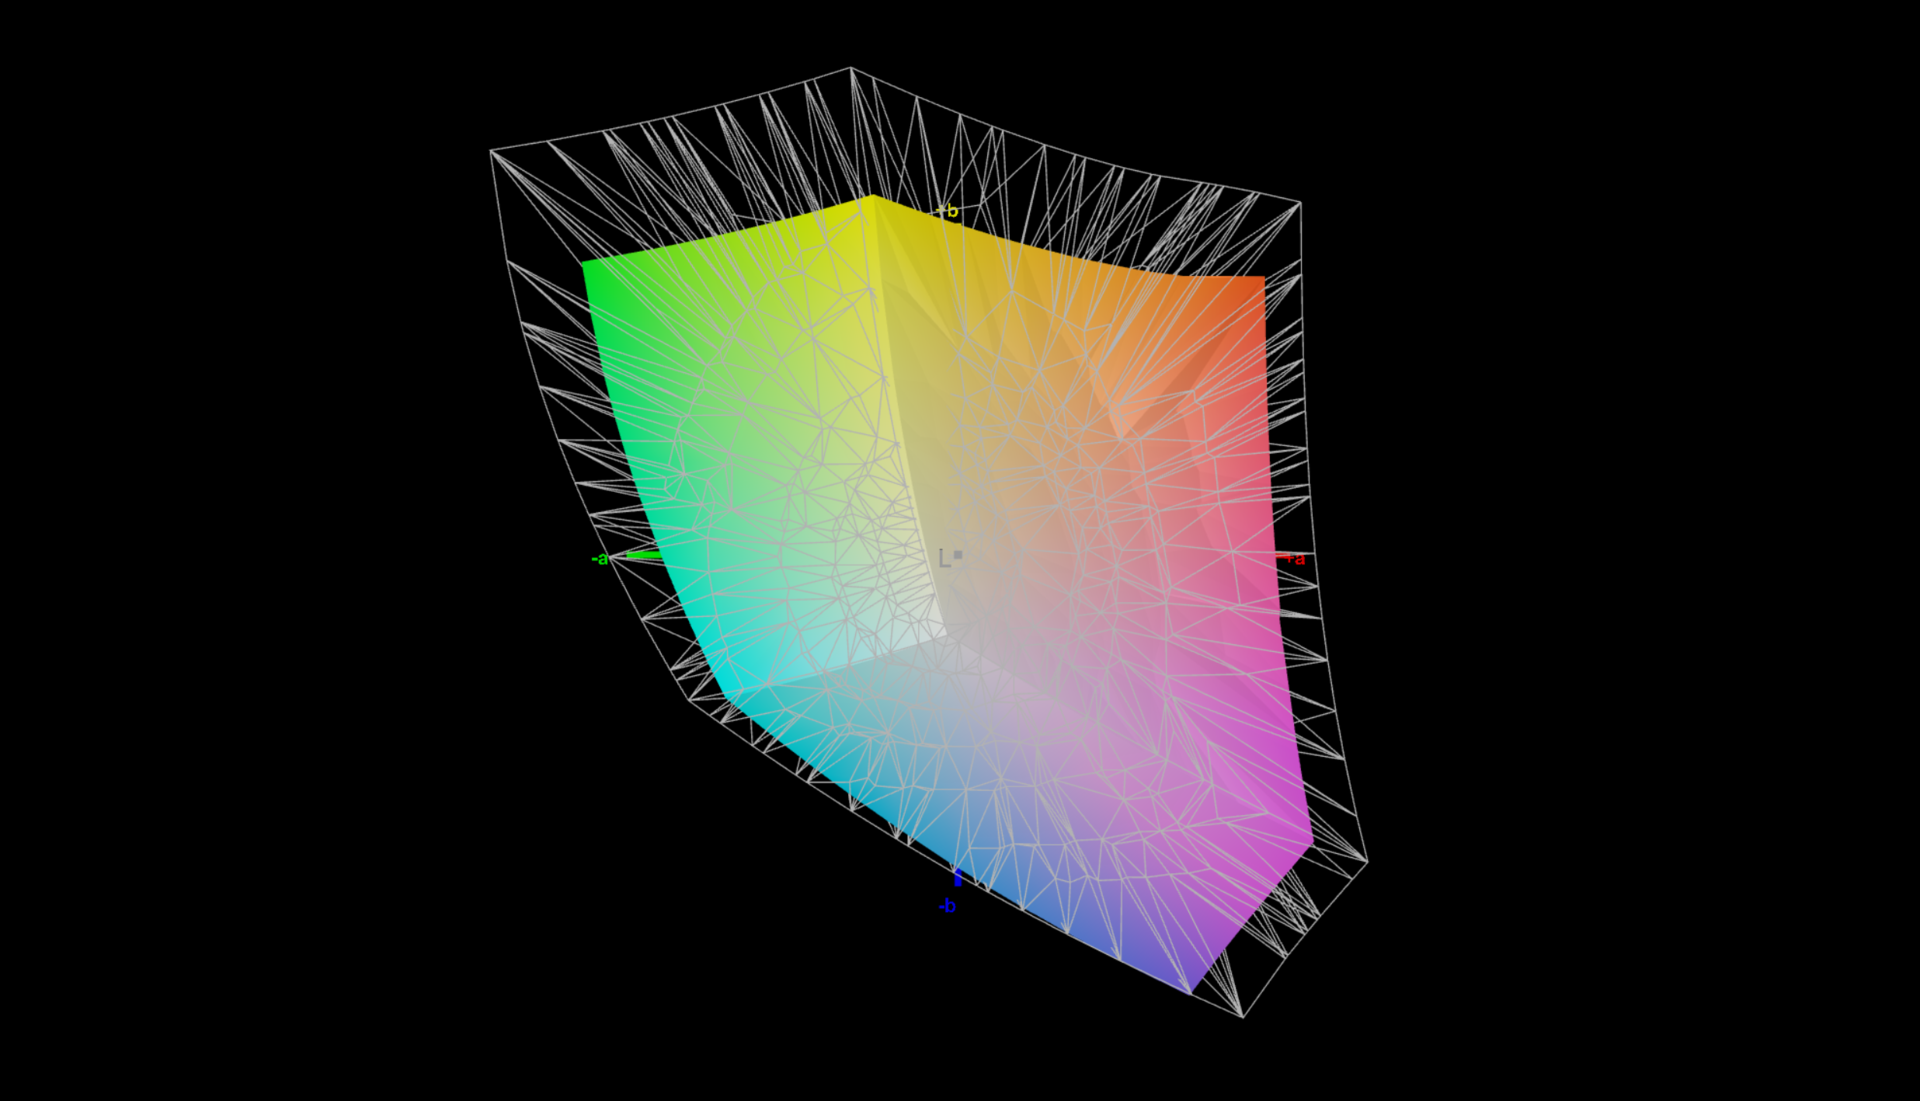
74.7% AdobeRGB 1998 (Argyll 3D)
97.6% sRGB (Argyll 3D)
72.7% Display P3 (Argyll 3D)
Gamma: 2.15
CCT: 6541 K
| Acer Nitro 14 AN14-41-R3MX AU Optronics B145QAN01.J, IPS, 2560x1600, 14.5", 120 Hz | Razer Blade 14 RZ09-0508 TL140ADXP04-0, IPS, 2560x1600, 14", 240 Hz | Lenovo LOQ 15IRX9 BOE NJ NE156FHM-NX9, IPS, 1920x1080, 15.6", 144 Hz | Asus TUF Gaming A15 FA507UV AU Optronics B156HAN15.H, IPS, 1920x1080, 15.6", 144 Hz | Schenker XMG Core 15 (M24) BOE NJ NE153QDM-NZ1 (BOE0C8E), IPS, 2560x1600, 15.3", 240 Hz | HP Omen Transcend 14-fb0014 Samsung SDC4197, OLED, 2880x1800, 14", 120 Hz | Acer Predator Helios Neo 14 (2024) BOE CQ NE145F8M-NY1, IPS, 3072x1920, 14.5", 165 Hz | |
|---|---|---|---|---|---|---|---|
| Display | 16% | 0% | -2% | 1% | 23% | -8% | |
| Display P3 Coverage (%) | 72.7 | 96.9 33% | 73.7 1% | 70.5 -3% | 73.2 1% | 99.6 37% | 65 -11% |
| sRGB Coverage (%) | 97.6 | 99.8 2% | 99.1 2% | 98.5 1% | 100 2% | 100 2% | 95.3 -2% |
| AdobeRGB 1998 Coverage (%) | 74.7 | 85 14% | 72.6 -3% | 72.7 -3% | 74.6 0% | 96.1 29% | 66.8 -11% |
| Response Times | 59% | -71% | -49% | 48% | 95% | 68% | |
| Response Time Grey 50% / Grey 80% * (ms) | 22.3 ? | 6 ? 73% | 42.2 ? -89% | 31.7 ? -42% | 9.6 ? 57% | 0.86 ? 96% | 5.4 ? 76% |
| Response Time Black / White * (ms) | 14.8 ? | 8.3 ? 44% | 22.6 ? -53% | 22.9 ? -55% | 9.2 ? 38% | 0.99 ? 93% | 5.9 ? 60% |
| PWM Frequency (Hz) | 479 ? | ||||||
| Screen | 30% | 22% | 17% | 26% | 25% | 15% | |
| Brightness middle (cd/m²) | 415 | 484.1 17% | 306 -26% | 315 -24% | 635 53% | 386.3 -7% | 450 8% |
| Brightness (cd/m²) | 395 | 466 18% | 287 -27% | 303 -23% | 604 53% | 389 -2% | 433 10% |
| Brightness Distribution (%) | 89 | 89 0% | 88 -1% | 90 1% | 91 2% | 98 10% | 87 -2% |
| Black Level * (cd/m²) | 0.34 | 0.38 -12% | 0.21 38% | 0.25 26% | 0.64 -88% | 0.45 -32% | |
| Contrast (:1) | 1221 | 1274 4% | 1457 19% | 1260 3% | 992 -19% | 1000 -18% | |
| Colorchecker dE 2000 * | 4.5 | 2.23 50% | 2.25 50% | 2.26 50% | 1.89 58% | 4.03 10% | 2.26 50% |
| Colorchecker dE 2000 max. * | 10.7 | 4.57 57% | 4.84 55% | 7.37 31% | 3.14 71% | 6.69 37% | 7.5 30% |
| Colorchecker dE 2000 calibrated * | 1.8 | 0.74 59% | 1.45 19% | 1.03 43% | 1.14 37% | 1.07 41% | 1.21 33% |
| Greyscale dE 2000 * | 7.2 | 1.6 78% | 2.4 67% | 4 44% | 2.53 65% | 1.2 83% | 3.2 56% |
| Gamma | 2.15 102% | 2.24 98% | 2.259 97% | 2.116 104% | 2.36 93% | 2.25 98% | 2.214 99% |
| CCT | 6541 99% | 6816 95% | 6790 96% | 7570 86% | 6434 101% | 6280 104% | 6121 106% |
| Total Average (Program / Settings) | 35% /
31% | -16% /
4% | -11% /
4% | 25% /
24% | 48% /
36% | 25% /
18% |
* ... smaller is better
The display has decent – but not great – colour reproduction right now of the box. With an average colour difference of around 4.5, the screen failed to reach what is considered good (Delta E < 3). Calibration reduced the Delta E to a good value of 1.8. The panel is able to reproduce almost the entire sRGB gamut, but not AdobeRGB and DCI-P3. This is similar to the displays on most of the competitors. Only the panels on the Omen Transcend 14 and the Blade 14 offer full DCI-P3 coverage.
The colour profile we created can be downloaded and used for free. You can find a download link in the infobox regarding the display.


Display Response Times
| ↔ Response Time Black to White | ||
|---|---|---|
| 14.8 ms ... rise ↗ and fall ↘ combined | ↗ 8.4 ms rise | 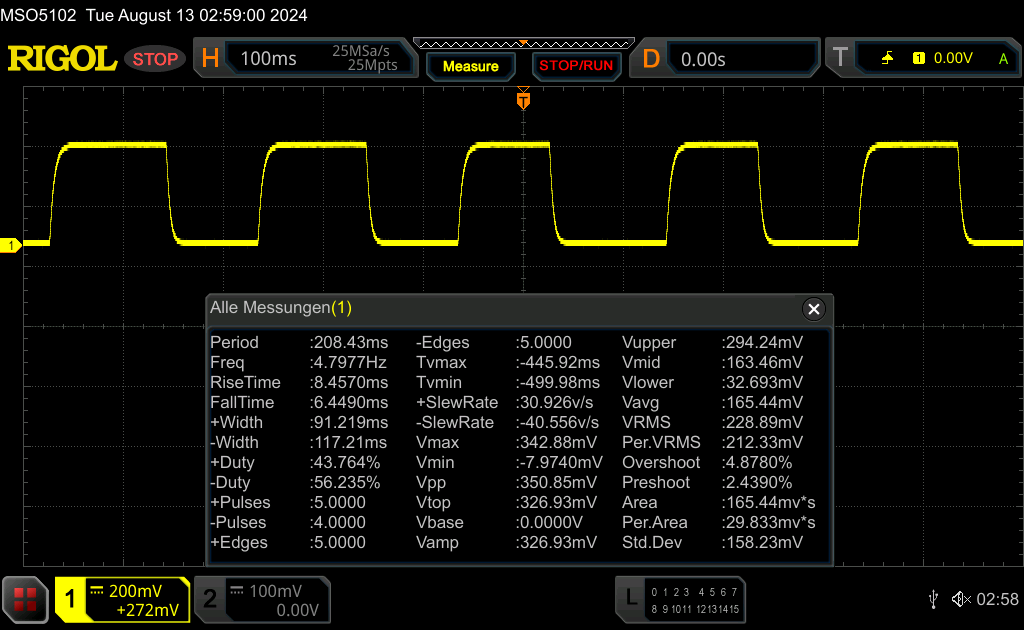 |
| ↘ 6.4 ms fall | ||
| The screen shows good response rates in our tests, but may be too slow for competitive gamers. In comparison, all tested devices range from 0.1 (minimum) to 240 (maximum) ms. » 36 % of all devices are better. This means that the measured response time is better than the average of all tested devices (19.8 ms). | ||
| ↔ Response Time 50% Grey to 80% Grey | ||
| 22.3 ms ... rise ↗ and fall ↘ combined | ↗ 10 ms rise | 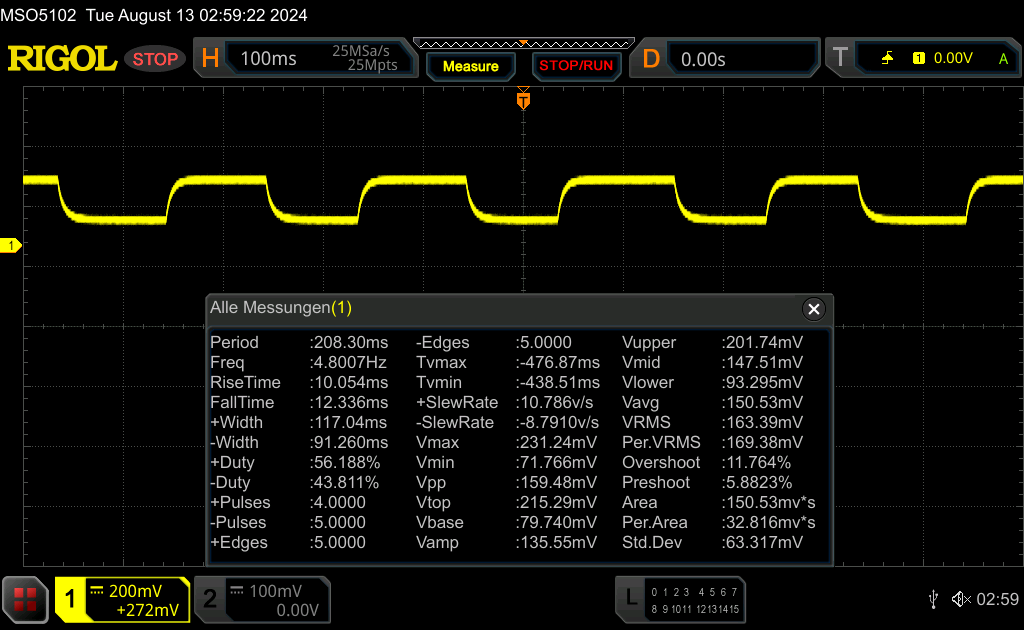 |
| ↘ 12.3 ms fall | ||
| The screen shows good response rates in our tests, but may be too slow for competitive gamers. In comparison, all tested devices range from 0.165 (minimum) to 636 (maximum) ms. » 34 % of all devices are better. This means that the measured response time is better than the average of all tested devices (30.9 ms). | ||
Screen Flickering / PWM (Pulse-Width Modulation)
| Screen flickering / PWM not detected |  | ||
In comparison: 52 % of all tested devices do not use PWM to dim the display. If PWM was detected, an average of 7741 (minimum: 5 - maximum: 343500) Hz was measured. | |||


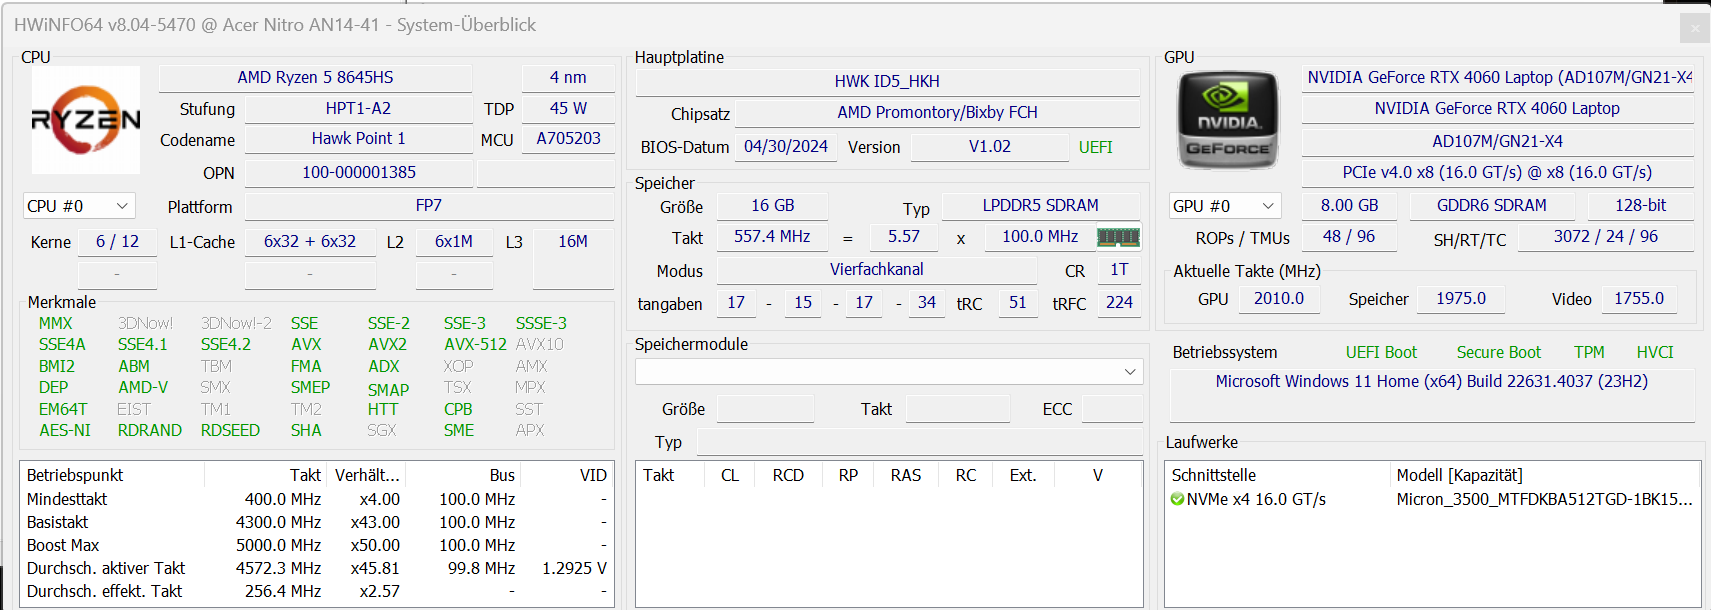
Performance - AMD meets Nvidia
The Acer Nitro is a portable, compact mid-range gaming notebook. The necessary power is provided by a Hawk Point CPU (Ryzen 7 or Ryzen 5) and an Ada Lovelace GPU (RTX 4050 or RTX 4060 available). Priced at nearly €1,450 (US$1,600), our review unit is equipped with a Ryzen 5 8645HS and GeForce RTX 4060. The base model in the lineup costs roughly €1,400 (US$1,550).

Test conditions
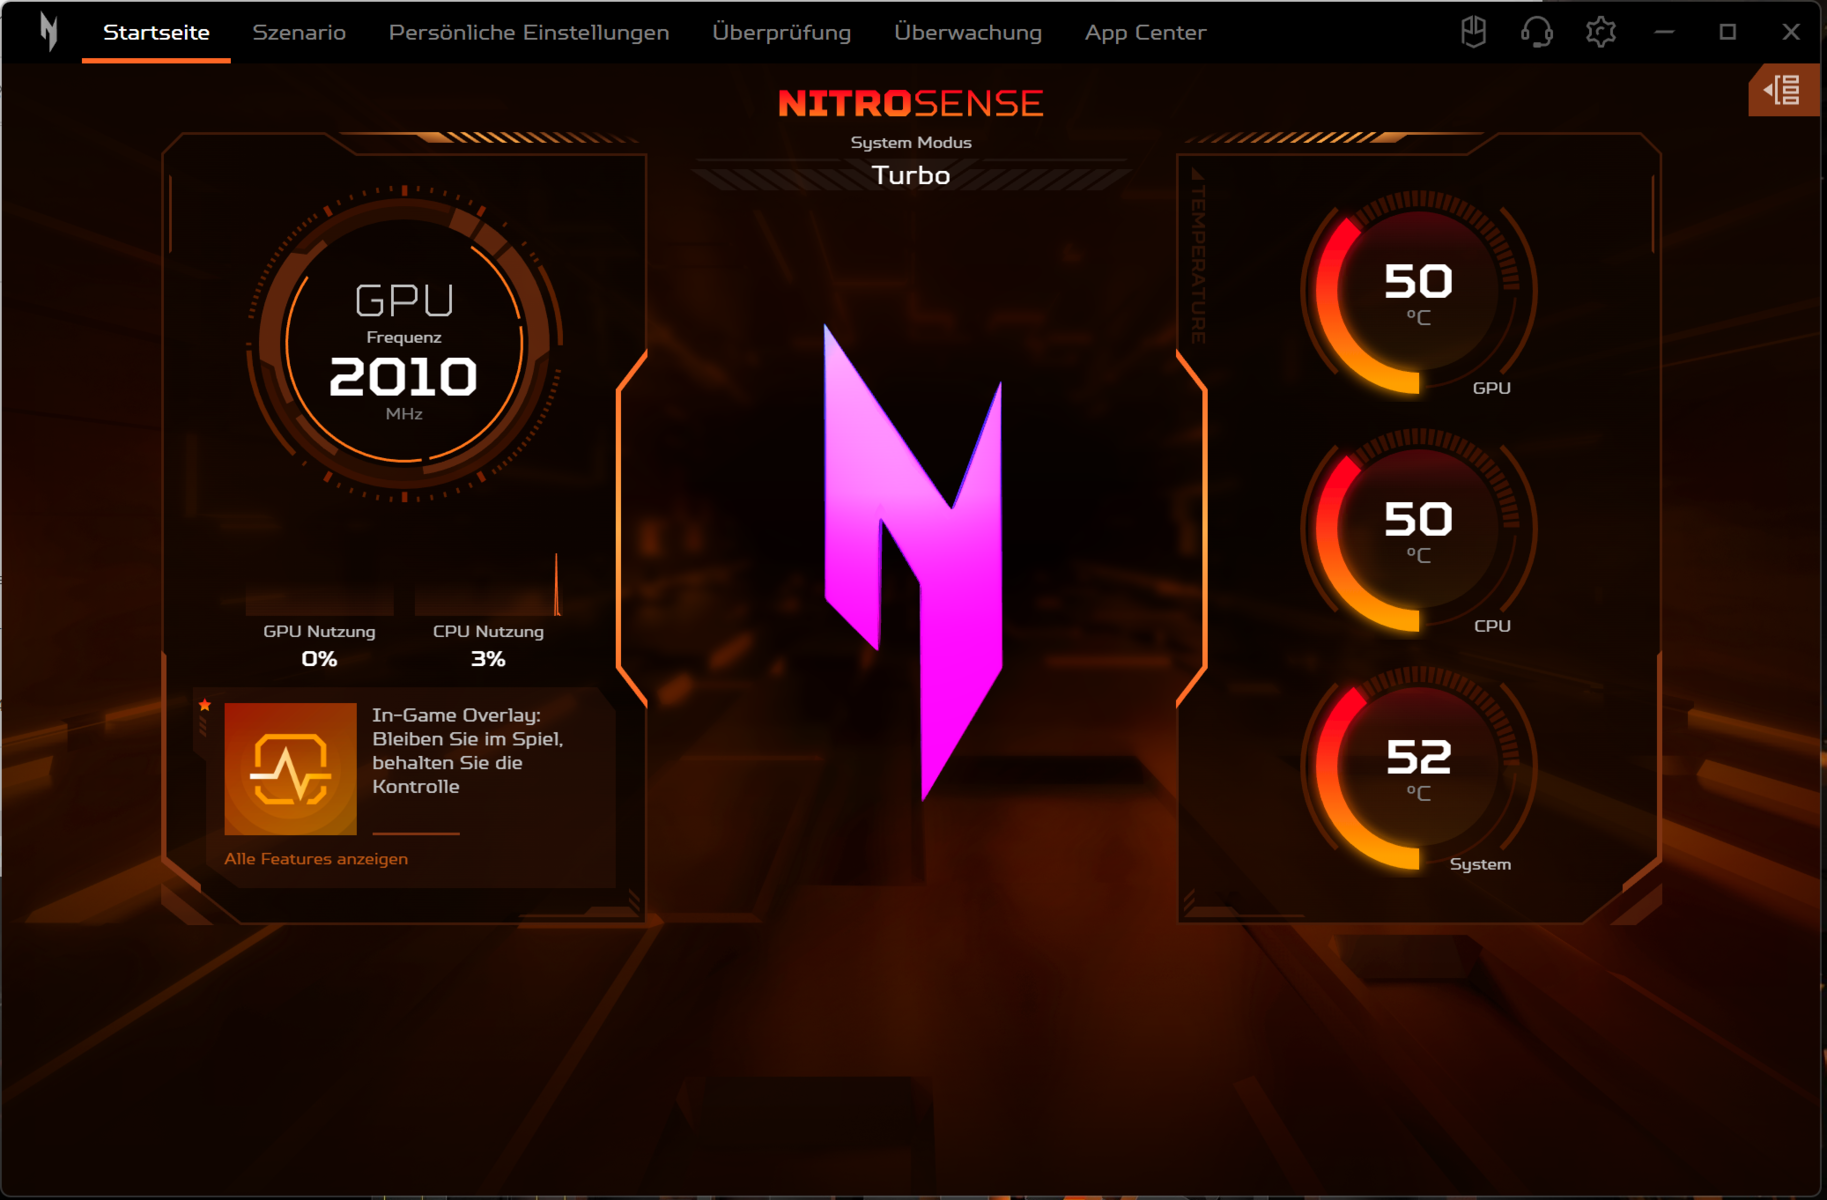
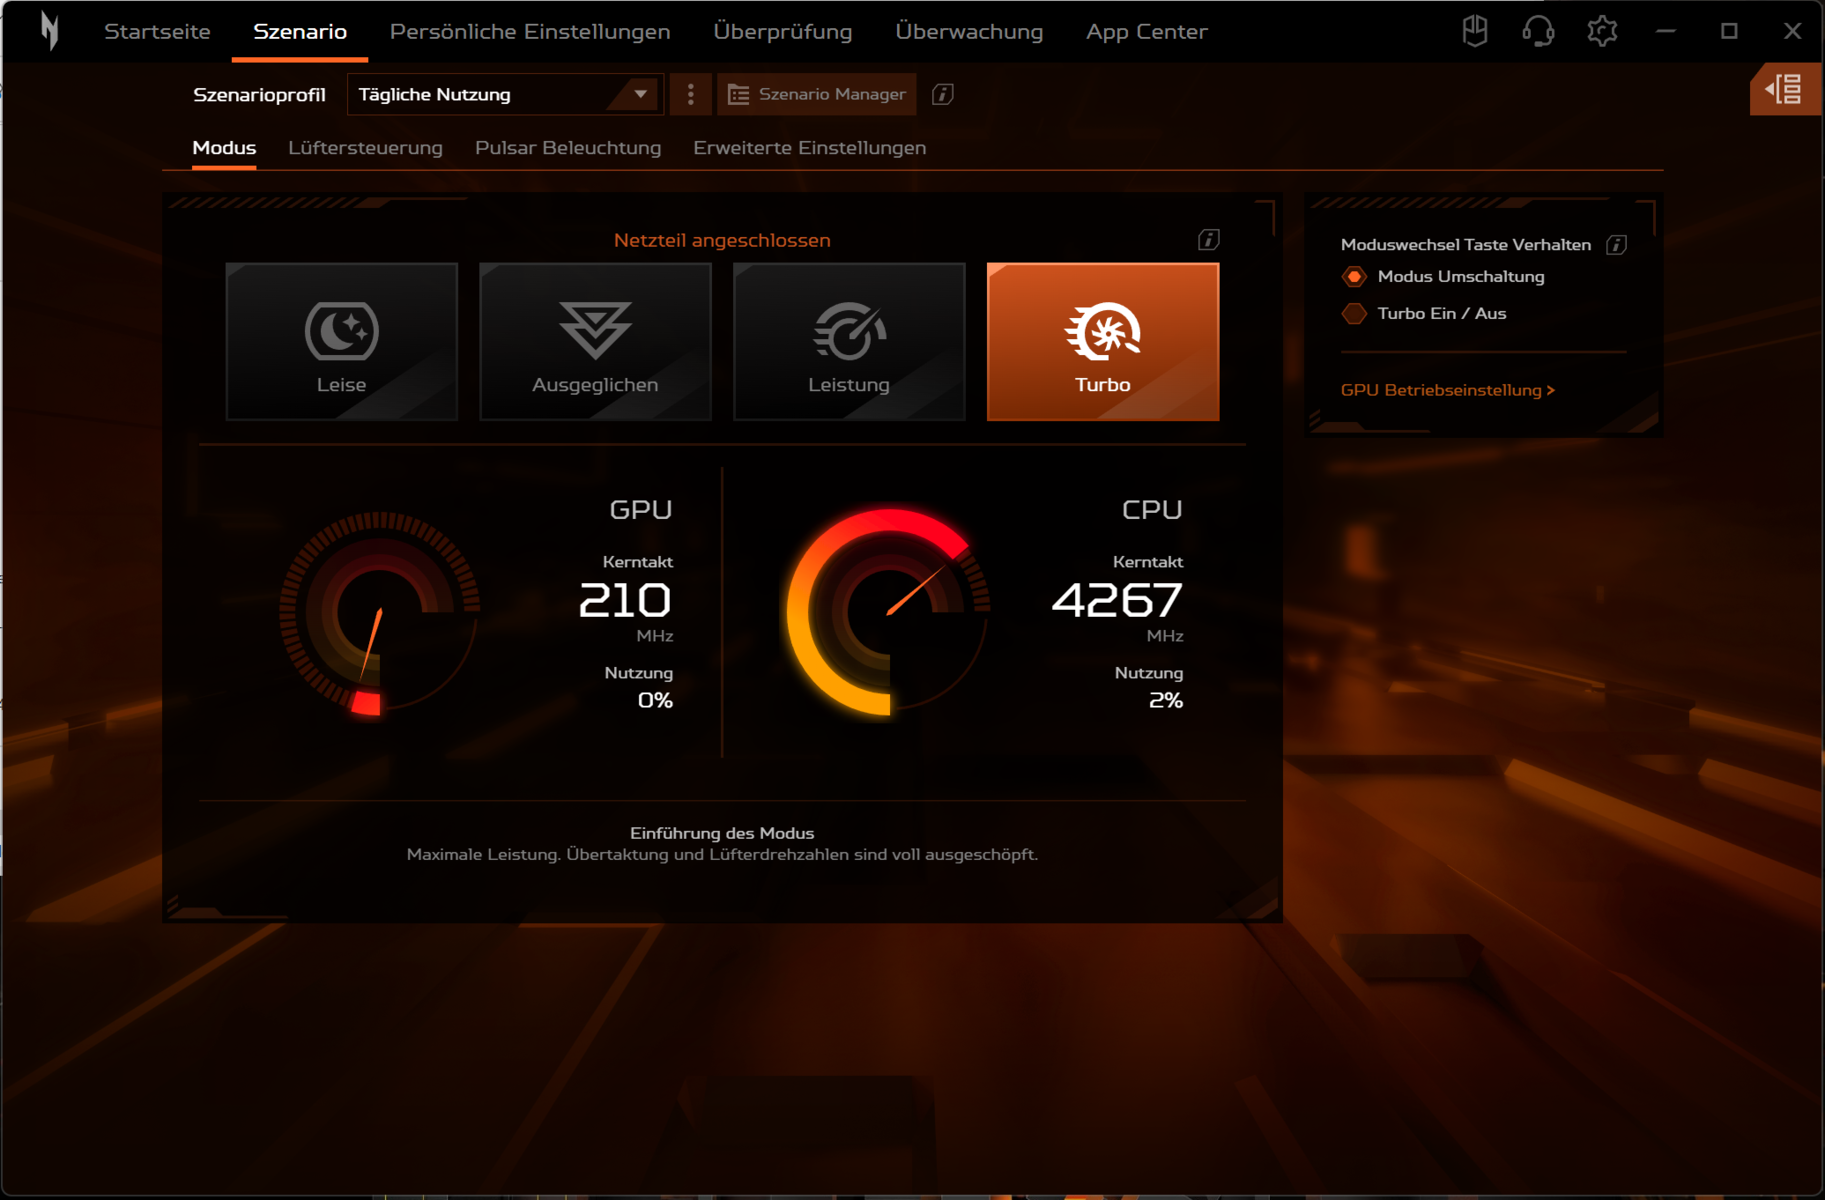
Four power modes (see table) are available when the laptop is plugged in, only two of which (Balanced, Eco) are selectable on battery power. We used Turbo and Eco mode for our benchmarks and battery tests, respectively. You can switch between the modes by pressing a button above the keyboard or using the NitroSense software, which functions as the laptop’s control centre. An LED indicates the mode in use.
Note: Turbo and Performance are available only when the battery level is at least 40% full. Otherwise, only Balanced mode can be used.
| Power plan | PL1 | PL2 | CB R23 Multi | TGP | Time Spy Graphics | CP 2077 QHD/Ultra | Stress test | max. fan noise |
|---|---|---|---|---|---|---|---|---|
| Quiet | 50 W | 100 W | 12,607 points | 65 W | 8,782 points | 38.2 FPS | CPU: 58°C GPU: 64°C |
40.79 dB(A) |
| Balanced | 70 W | 100 W | 13,231 points | 75 W | 9,419 points | 38.8 FPS | CPU: 60°C GPU: 64°C |
45.61 dB(A) |
| Performance | 80 W | 100 W | 13,242 points | 90 W | 10,088 points | 40.7 FPS | CPU: 60°C GPU: 70°C |
50.83 dB(A) |
| Turbo | 90 W | 100 W | 13,220 points | 105 W | 10,799 points | 45.6 FPS | CPU: 76°C GPU: 86°C |
56.98 dB(A) |


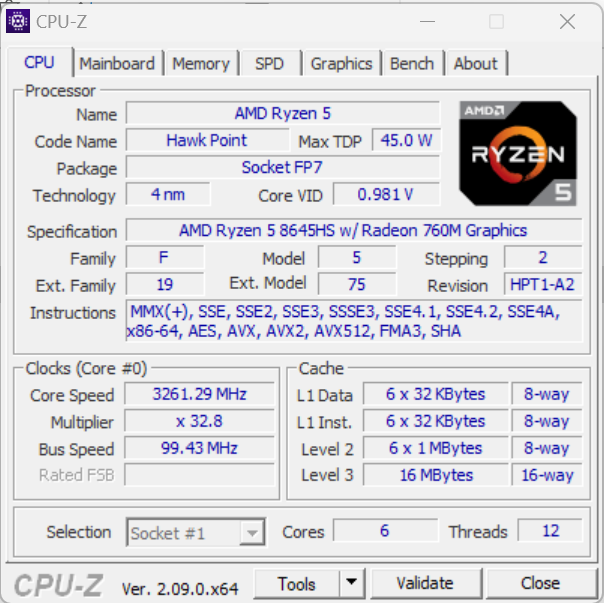
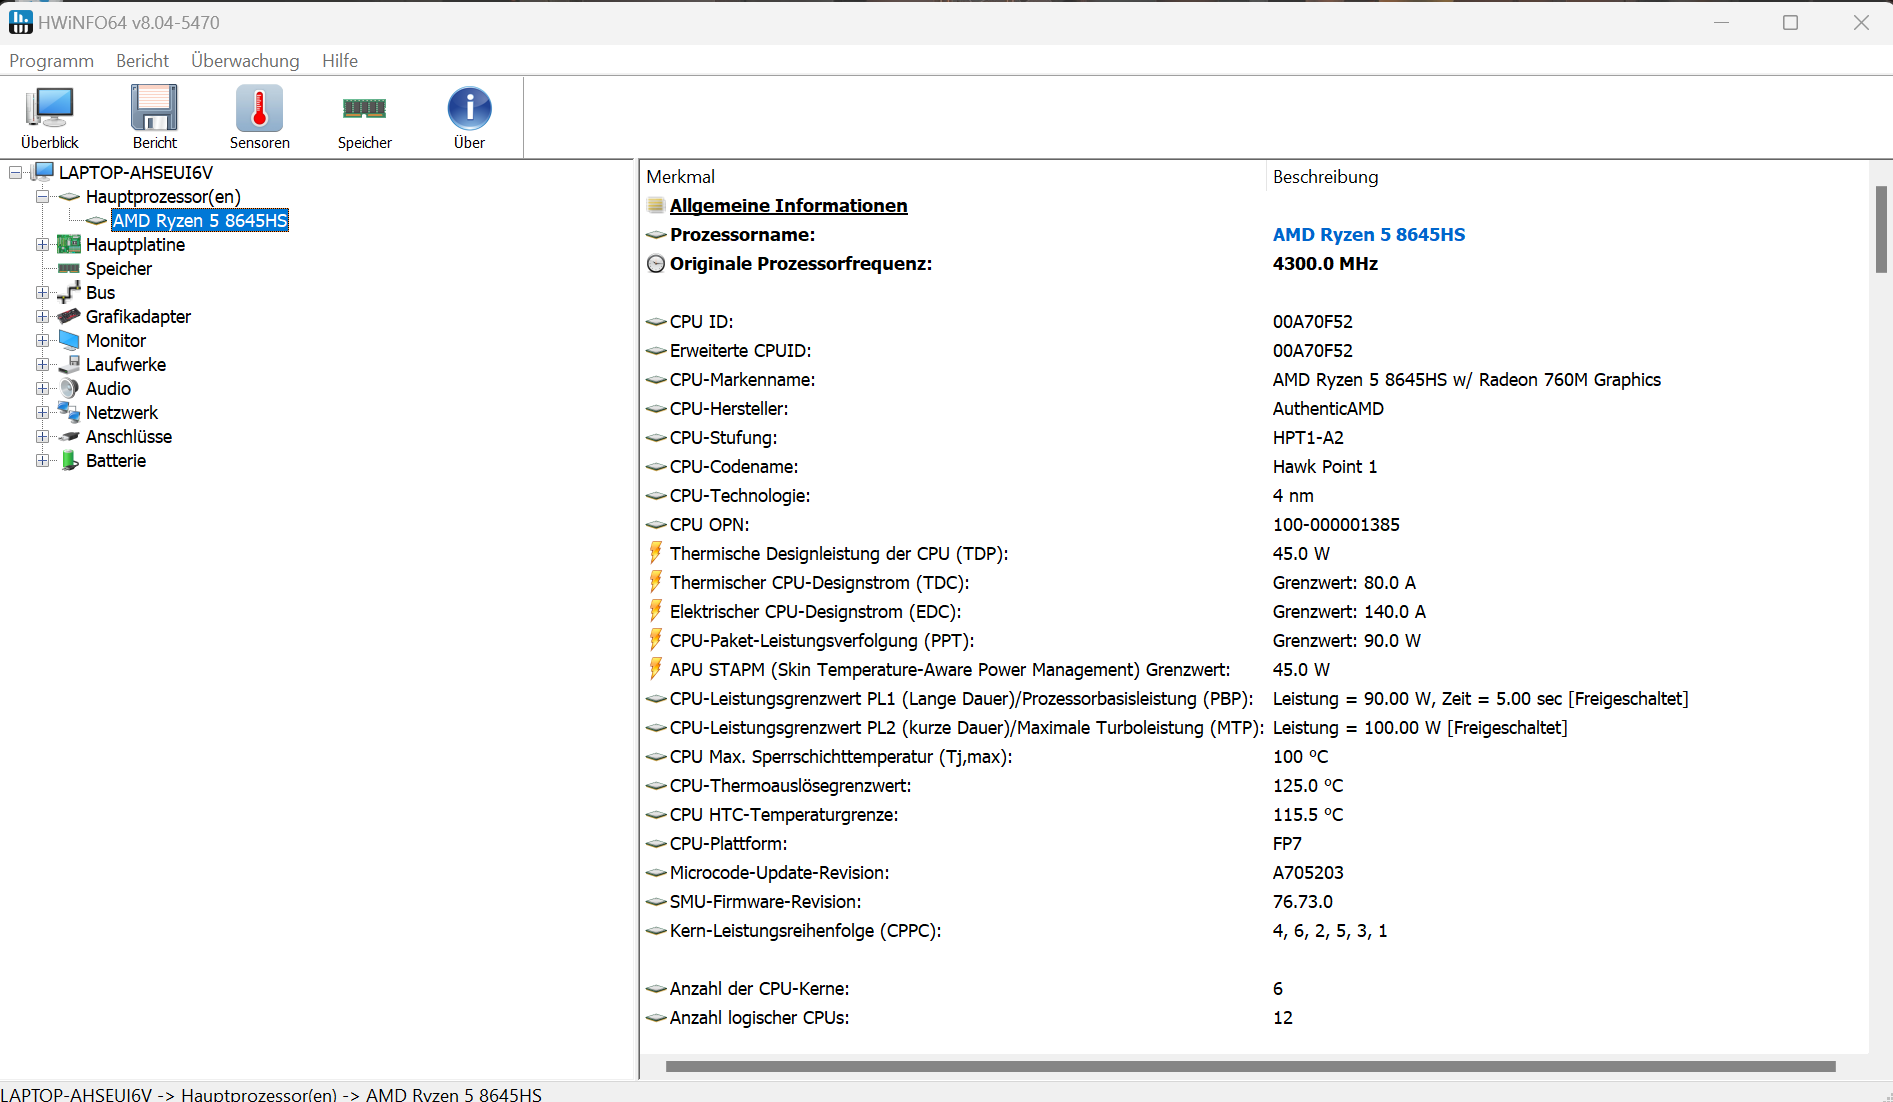
Processor
The Zen 4-based Ryzen 5 8645HS offers 6 CPU cores with a total of 12 threads, capable of running at up to 5 GHz (single core). The processor managed to consistently operate at a high turbo clock speed under a sustained multi-thread load (i.e. Cinebench R15 loop). The three modes available when plugged in delivered more or less the same results, whilst Quiet mode decreased the processor’s performance slightly. The benchmark results are in line with expectations. The Ryzen 5 7640HS, which shares the same design, is included here for comparison.
The CPUs in competing laptops boast more cores than the Ryzen 5 APU and thus deliver considerably better multi-thread performance. However, there is only a small difference in single-thread performance.


Cinebench R15 Multi Sustained load


* ... smaller is better
AIDA64: FP32 Ray-Trace | FPU Julia | CPU SHA3 | CPU Queen | FPU SinJulia | FPU Mandel | CPU AES | CPU ZLib | FP64 Ray-Trace | CPU PhotoWorxx
| Performance rating | |
| Average of class Gaming | |
| Razer Blade 14 RZ09-0508 | |
| Schenker XMG Core 15 (M24) | |
| Asus TUF Gaming A15 FA507UV | |
| Acer Predator Helios Neo 14 (2024) | |
| Acer Nitro 14 AN14-41-R3MX | |
| Average AMD Ryzen 5 8645HS | |
| HP Omen Transcend 14-fb0014 | |
| Lenovo LOQ 15IRX9 | |
| AIDA64 / FP32 Ray-Trace | |
| Average of class Gaming (10227 - 85542, n=102, last 2 years) | |
| Schenker XMG Core 15 (M24) | |
| Razer Blade 14 RZ09-0508 | |
| Asus TUF Gaming A15 FA507UV | |
| Acer Nitro 14 AN14-41-R3MX | |
| Average AMD Ryzen 5 8645HS (n=1) | |
| Acer Predator Helios Neo 14 (2024) | |
| HP Omen Transcend 14-fb0014 | |
| Lenovo LOQ 15IRX9 | |
| AIDA64 / FPU Julia | |
| Average of class Gaming (51376 - 372155, n=102, last 2 years) | |
| Schenker XMG Core 15 (M24) | |
| Razer Blade 14 RZ09-0508 | |
| Asus TUF Gaming A15 FA507UV | |
| Acer Nitro 14 AN14-41-R3MX | |
| Average AMD Ryzen 5 8645HS (n=1) | |
| Acer Predator Helios Neo 14 (2024) | |
| HP Omen Transcend 14-fb0014 | |
| Lenovo LOQ 15IRX9 | |
| AIDA64 / CPU SHA3 | |
| Average of class Gaming (2180 - 10115, n=102, last 2 years) | |
| Schenker XMG Core 15 (M24) | |
| Asus TUF Gaming A15 FA507UV | |
| Razer Blade 14 RZ09-0508 | |
| Acer Predator Helios Neo 14 (2024) | |
| Acer Nitro 14 AN14-41-R3MX | |
| Average AMD Ryzen 5 8645HS (n=1) | |
| HP Omen Transcend 14-fb0014 | |
| Lenovo LOQ 15IRX9 | |
| AIDA64 / CPU Queen | |
| Asus TUF Gaming A15 FA507UV | |
| Razer Blade 14 RZ09-0508 | |
| Schenker XMG Core 15 (M24) | |
| Average of class Gaming (49785 - 173351, n=86, last 2 years) | |
| Acer Nitro 14 AN14-41-R3MX | |
| Average AMD Ryzen 5 8645HS (n=1) | |
| HP Omen Transcend 14-fb0014 | |
| Acer Predator Helios Neo 14 (2024) | |
| Lenovo LOQ 15IRX9 | |
| AIDA64 / FPU SinJulia | |
| Asus TUF Gaming A15 FA507UV | |
| Razer Blade 14 RZ09-0508 | |
| Schenker XMG Core 15 (M24) | |
| Average of class Gaming (4424 - 33636, n=102, last 2 years) | |
| Acer Nitro 14 AN14-41-R3MX | |
| Average AMD Ryzen 5 8645HS (n=1) | |
| Acer Predator Helios Neo 14 (2024) | |
| HP Omen Transcend 14-fb0014 | |
| Lenovo LOQ 15IRX9 | |
| AIDA64 / FPU Mandel | |
| Average of class Gaming (25115 - 196829, n=102, last 2 years) | |
| Schenker XMG Core 15 (M24) | |
| Razer Blade 14 RZ09-0508 | |
| Asus TUF Gaming A15 FA507UV | |
| Acer Nitro 14 AN14-41-R3MX | |
| Average AMD Ryzen 5 8645HS (n=1) | |
| Acer Predator Helios Neo 14 (2024) | |
| HP Omen Transcend 14-fb0014 | |
| Lenovo LOQ 15IRX9 | |
| AIDA64 / CPU AES | |
| Average of class Gaming (39258 - 247074, n=102, last 2 years) | |
| Schenker XMG Core 15 (M24) | |
| Razer Blade 14 RZ09-0508 | |
| Asus TUF Gaming A15 FA507UV | |
| Acer Predator Helios Neo 14 (2024) | |
| HP Omen Transcend 14-fb0014 | |
| Lenovo LOQ 15IRX9 | |
| Acer Nitro 14 AN14-41-R3MX | |
| Average AMD Ryzen 5 8645HS (n=1) | |
| AIDA64 / CPU ZLib | |
| Average of class Gaming (574 - 2531, n=102, last 2 years) | |
| Acer Predator Helios Neo 14 (2024) | |
| Asus TUF Gaming A15 FA507UV | |
| Razer Blade 14 RZ09-0508 | |
| HP Omen Transcend 14-fb0014 | |
| Lenovo LOQ 15IRX9 | |
| Acer Nitro 14 AN14-41-R3MX | |
| Average AMD Ryzen 5 8645HS (n=1) | |
| Schenker XMG Core 15 (M24) | |
| AIDA64 / FP64 Ray-Trace | |
| Average of class Gaming (5509 - 45446, n=102, last 2 years) | |
| Schenker XMG Core 15 (M24) | |
| Razer Blade 14 RZ09-0508 | |
| Asus TUF Gaming A15 FA507UV | |
| Acer Nitro 14 AN14-41-R3MX | |
| Average AMD Ryzen 5 8645HS (n=1) | |
| Acer Predator Helios Neo 14 (2024) | |
| HP Omen Transcend 14-fb0014 | |
| Lenovo LOQ 15IRX9 | |
| AIDA64 / CPU PhotoWorxx | |
| HP Omen Transcend 14-fb0014 | |
| Acer Predator Helios Neo 14 (2024) | |
| Average of class Gaming (12271 - 89891, n=102, last 2 years) | |
| Schenker XMG Core 15 (M24) | |
| Razer Blade 14 RZ09-0508 | |
| Lenovo LOQ 15IRX9 | |
| Acer Nitro 14 AN14-41-R3MX | |
| Average AMD Ryzen 5 8645HS (n=1) | |
| Asus TUF Gaming A15 FA507UV | |
System performance
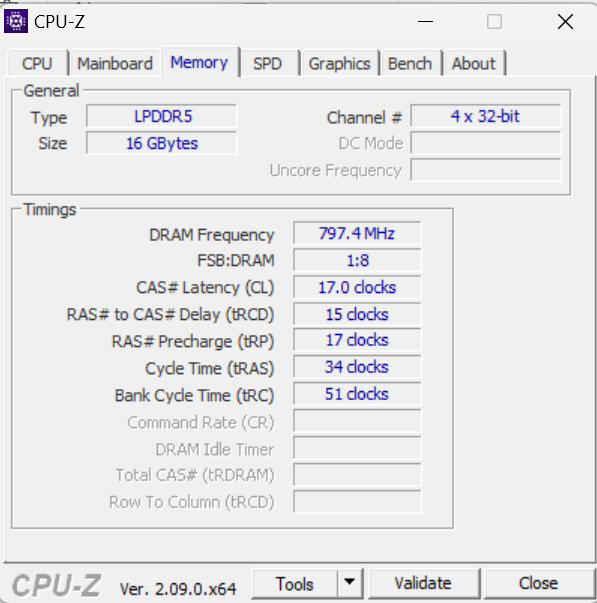
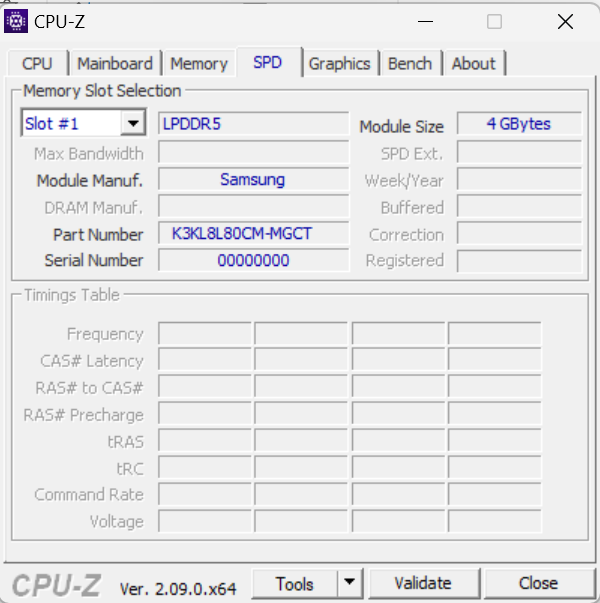
The system feels smooth and provides ample performance for gaming, rendering and streaming. This is not least confirmed by the great results obtained in our system benchmarks. That said, the transfer rates delivered by the 16 GB of memory were sometimes below what LPDDR5X RAM is capable of, which may be caused by AMD’s memory controller. The memory is soldered and can’t be upgraded.
CrossMark: Overall | Productivity | Creativity | Responsiveness
WebXPRT 3: Overall
WebXPRT 4: Overall
Mozilla Kraken 1.1: Total
| PCMark 10 / Score | |
| Schenker XMG Core 15 (M24) | |
| Average of class Gaming (5828 - 12414, n=93, last 2 years) | |
| Razer Blade 14 RZ09-0508 | |
| Asus TUF Gaming A15 FA507UV | |
| Acer Predator Helios Neo 14 (2024) | |
| Acer Nitro 14 AN14-41-R3MX | |
| Average AMD Ryzen 5 8645HS, NVIDIA GeForce RTX 4060 Laptop GPU (n=1) | |
| HP Omen Transcend 14-fb0014 | |
| Lenovo LOQ 15IRX9 | |
| PCMark 10 / Essentials | |
| Razer Blade 14 RZ09-0508 | |
| Asus TUF Gaming A15 FA507UV | |
| Acer Predator Helios Neo 14 (2024) | |
| Average of class Gaming (8810 - 11935, n=97, last 2 years) | |
| Schenker XMG Core 15 (M24) | |
| Acer Nitro 14 AN14-41-R3MX | |
| Average AMD Ryzen 5 8645HS, NVIDIA GeForce RTX 4060 Laptop GPU (n=1) | |
| HP Omen Transcend 14-fb0014 | |
| Lenovo LOQ 15IRX9 | |
| PCMark 10 / Productivity | |
| Schenker XMG Core 15 (M24) | |
| Average of class Gaming (6845 - 25323, n=95, last 2 years) | |
| Razer Blade 14 RZ09-0508 | |
| Asus TUF Gaming A15 FA507UV | |
| Acer Nitro 14 AN14-41-R3MX | |
| Average AMD Ryzen 5 8645HS, NVIDIA GeForce RTX 4060 Laptop GPU (n=1) | |
| HP Omen Transcend 14-fb0014 | |
| Acer Predator Helios Neo 14 (2024) | |
| Lenovo LOQ 15IRX9 | |
| PCMark 10 / Digital Content Creation | |
| Average of class Gaming (7602 - 19954, n=95, last 2 years) | |
| Razer Blade 14 RZ09-0508 | |
| Schenker XMG Core 15 (M24) | |
| Asus TUF Gaming A15 FA507UV | |
| Acer Nitro 14 AN14-41-R3MX | |
| Average AMD Ryzen 5 8645HS, NVIDIA GeForce RTX 4060 Laptop GPU (n=1) | |
| Acer Predator Helios Neo 14 (2024) | |
| Lenovo LOQ 15IRX9 | |
| HP Omen Transcend 14-fb0014 | |
| CrossMark / Overall | |
| Average of class Gaming (1366 - 2409, n=94, last 2 years) | |
| Acer Predator Helios Neo 14 (2024) | |
| Schenker XMG Core 15 (M24) | |
| Razer Blade 14 RZ09-0508 | |
| Lenovo LOQ 15IRX9 | |
| Asus TUF Gaming A15 FA507UV | |
| Acer Nitro 14 AN14-41-R3MX | |
| Average AMD Ryzen 5 8645HS, NVIDIA GeForce RTX 4060 Laptop GPU (n=1) | |
| HP Omen Transcend 14-fb0014 | |
| CrossMark / Productivity | |
| Average of class Gaming (1386 - 2254, n=94, last 2 years) | |
| Acer Predator Helios Neo 14 (2024) | |
| Schenker XMG Core 15 (M24) | |
| Razer Blade 14 RZ09-0508 | |
| Asus TUF Gaming A15 FA507UV | |
| Acer Nitro 14 AN14-41-R3MX | |
| Average AMD Ryzen 5 8645HS, NVIDIA GeForce RTX 4060 Laptop GPU (n=1) | |
| Lenovo LOQ 15IRX9 | |
| HP Omen Transcend 14-fb0014 | |
| CrossMark / Creativity | |
| Average of class Gaming (1343 - 2786, n=94, last 2 years) | |
| Schenker XMG Core 15 (M24) | |
| Acer Predator Helios Neo 14 (2024) | |
| Razer Blade 14 RZ09-0508 | |
| Asus TUF Gaming A15 FA507UV | |
| Lenovo LOQ 15IRX9 | |
| Acer Nitro 14 AN14-41-R3MX | |
| Average AMD Ryzen 5 8645HS, NVIDIA GeForce RTX 4060 Laptop GPU (n=1) | |
| HP Omen Transcend 14-fb0014 | |
| CrossMark / Responsiveness | |
| Acer Predator Helios Neo 14 (2024) | |
| Lenovo LOQ 15IRX9 | |
| Average of class Gaming (1226 - 2334, n=94, last 2 years) | |
| Acer Nitro 14 AN14-41-R3MX | |
| Average AMD Ryzen 5 8645HS, NVIDIA GeForce RTX 4060 Laptop GPU (n=1) | |
| Razer Blade 14 RZ09-0508 | |
| Schenker XMG Core 15 (M24) | |
| Asus TUF Gaming A15 FA507UV | |
| HP Omen Transcend 14-fb0014 | |
| WebXPRT 3 / Overall | |
| Razer Blade 14 RZ09-0508 | |
| Average of class Gaming (220 - 532, n=98, last 2 years) | |
| Asus TUF Gaming A15 FA507UV | |
| Schenker XMG Core 15 (M24) | |
| Acer Nitro 14 AN14-41-R3MX | |
| Average AMD Ryzen 5 8645HS, NVIDIA GeForce RTX 4060 Laptop GPU (n=1) | |
| Acer Predator Helios Neo 14 (2024) | |
| HP Omen Transcend 14-fb0014 | |
| Lenovo LOQ 15IRX9 | |
| WebXPRT 4 / Overall | |
| Average of class Gaming (165 - 354, n=98, last 2 years) | |
| Razer Blade 14 RZ09-0508 | |
| Schenker XMG Core 15 (M24) | |
| Asus TUF Gaming A15 FA507UV | |
| Acer Predator Helios Neo 14 (2024) | |
| Acer Nitro 14 AN14-41-R3MX | |
| Average AMD Ryzen 5 8645HS, NVIDIA GeForce RTX 4060 Laptop GPU (n=1) | |
| Lenovo LOQ 15IRX9 | |
| HP Omen Transcend 14-fb0014 | |
| Mozilla Kraken 1.1 / Total | |
| HP Omen Transcend 14-fb0014 | |
| Lenovo LOQ 15IRX9 | |
| Acer Nitro 14 AN14-41-R3MX | |
| Average AMD Ryzen 5 8645HS, NVIDIA GeForce RTX 4060 Laptop GPU (n=1) | |
| Acer Predator Helios Neo 14 (2024) | |
| Asus TUF Gaming A15 FA507UV | |
| Schenker XMG Core 15 (M24) | |
| Razer Blade 14 RZ09-0508 | |
| Average of class Gaming (391 - 590, n=100, last 2 years) | |
* ... smaller is better
| PCMark 10 Score | 7453 points | |
Help | ||
| AIDA64 / Memory Copy | |
| HP Omen Transcend 14-fb0014 | |
| Acer Predator Helios Neo 14 (2024) | |
| Average of class Gaming (21750 - 129946, n=102, last 2 years) | |
| Acer Nitro 14 AN14-41-R3MX | |
| Average AMD Ryzen 5 8645HS (n=1) | |
| Schenker XMG Core 15 (M24) | |
| Razer Blade 14 RZ09-0508 | |
| Asus TUF Gaming A15 FA507UV | |
| Lenovo LOQ 15IRX9 | |
| AIDA64 / Memory Read | |
| HP Omen Transcend 14-fb0014 | |
| Acer Predator Helios Neo 14 (2024) | |
| Average of class Gaming (22956 - 118858, n=102, last 2 years) | |
| Lenovo LOQ 15IRX9 | |
| Asus TUF Gaming A15 FA507UV | |
| Razer Blade 14 RZ09-0508 | |
| Schenker XMG Core 15 (M24) | |
| Acer Nitro 14 AN14-41-R3MX | |
| Average AMD Ryzen 5 8645HS (n=1) | |
| AIDA64 / Memory Write | |
| Acer Nitro 14 AN14-41-R3MX | |
| Average AMD Ryzen 5 8645HS (n=1) | |
| Schenker XMG Core 15 (M24) | |
| Razer Blade 14 RZ09-0508 | |
| Asus TUF Gaming A15 FA507UV | |
| Average of class Gaming (22297 - 135096, n=102, last 2 years) | |
| HP Omen Transcend 14-fb0014 | |
| Lenovo LOQ 15IRX9 | |
| Acer Predator Helios Neo 14 (2024) | |
| AIDA64 / Memory Latency | |
| HP Omen Transcend 14-fb0014 | |
| Acer Predator Helios Neo 14 (2024) | |
| Acer Nitro 14 AN14-41-R3MX | |
| Average AMD Ryzen 5 8645HS (n=1) | |
| Average of class Gaming (75.3 - 165.4, n=102, last 2 years) | |
| Razer Blade 14 RZ09-0508 | |
| Lenovo LOQ 15IRX9 | |
| Asus TUF Gaming A15 FA507UV | |
| Schenker XMG Core 15 (M24) | |
* ... smaller is better
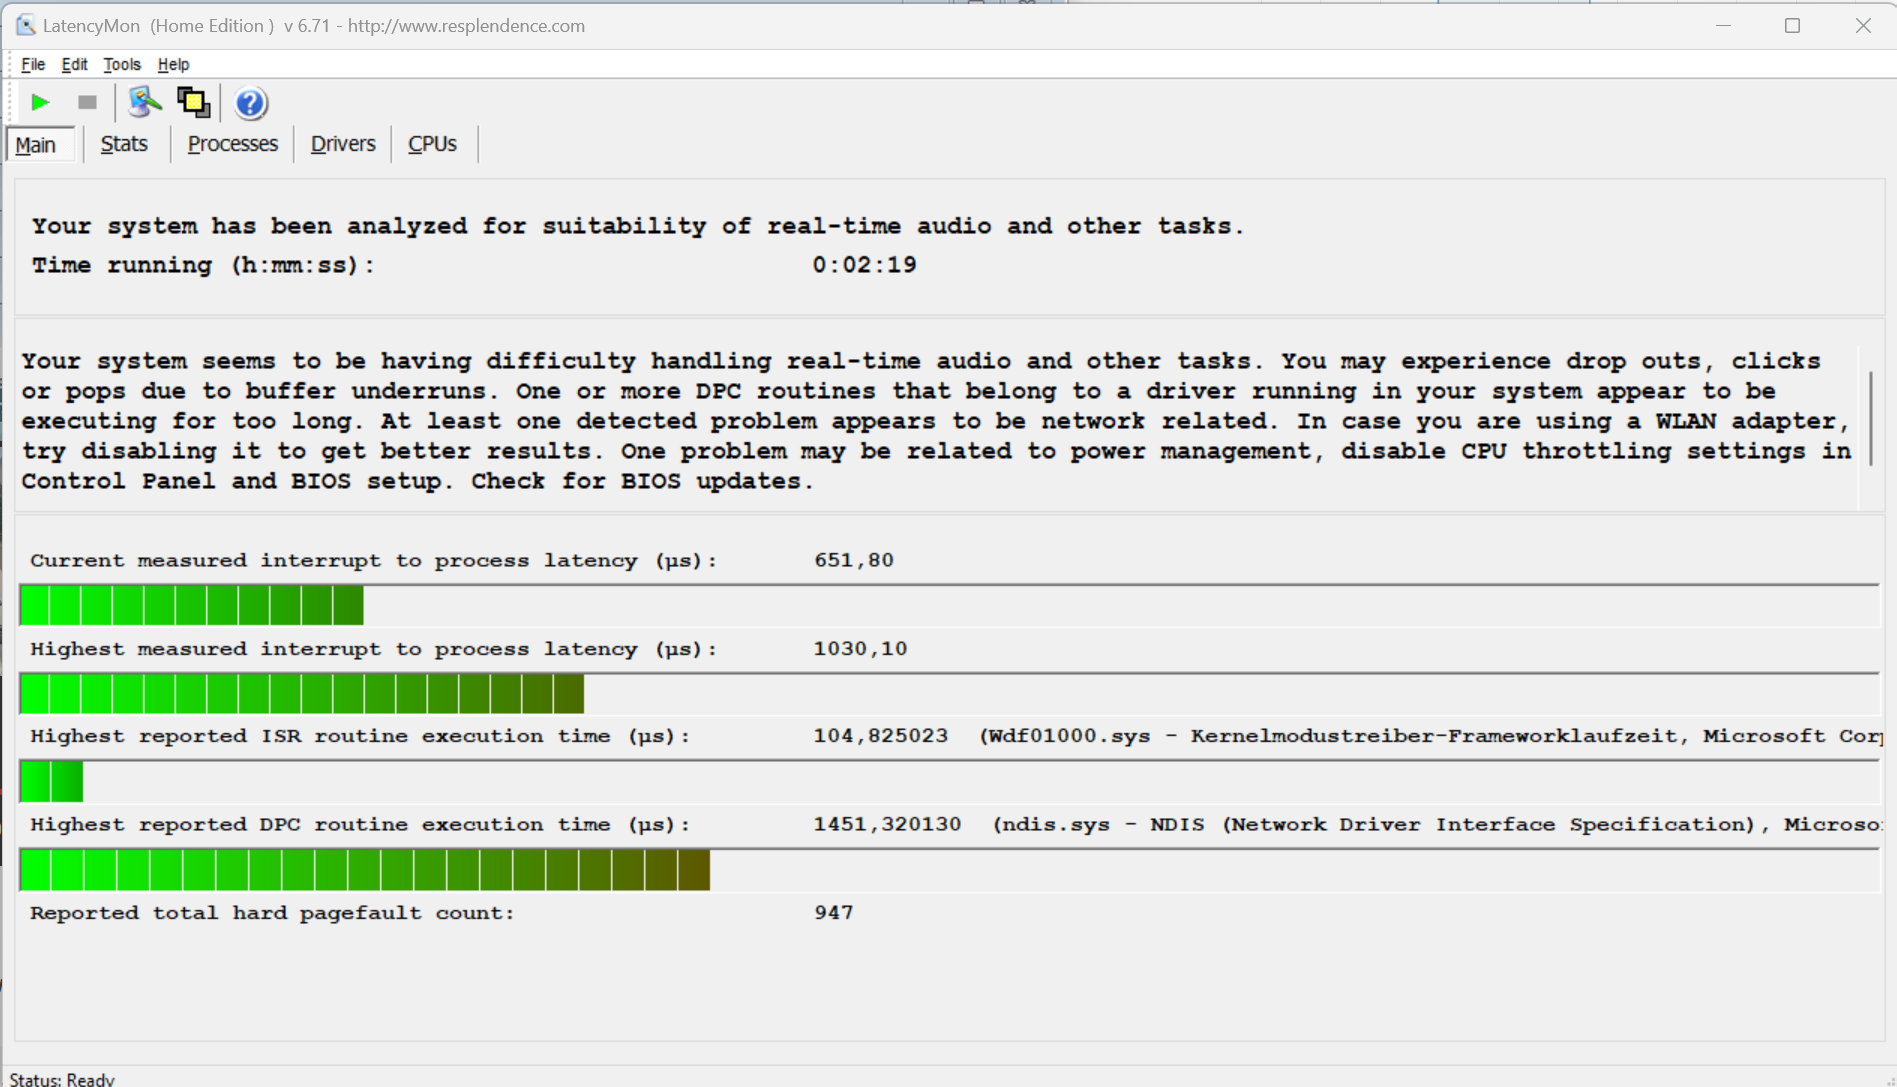
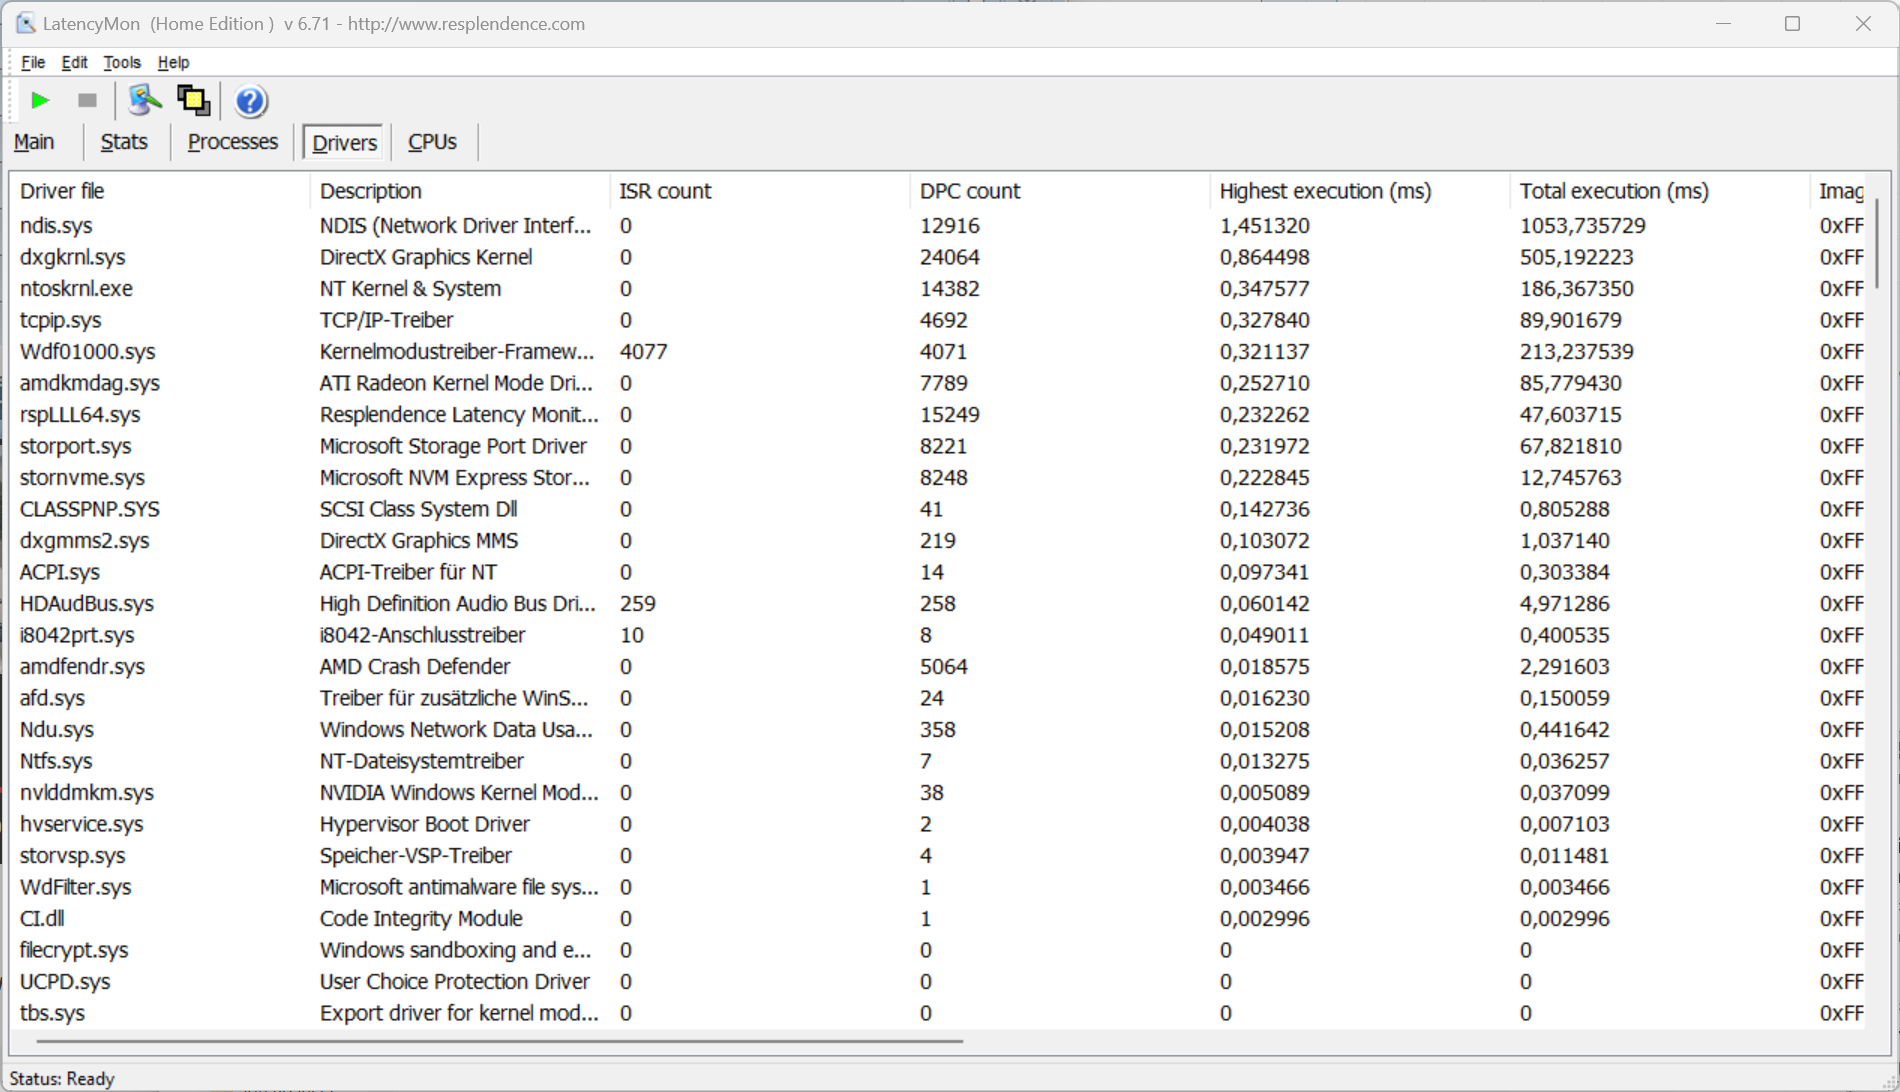
DPC latency
The Nitro 14 appears to have trouble handling real-time video and audio processing due to driver-related issues. But future updates may be able to improve the situation.
| DPC Latencies / LatencyMon - interrupt to process latency (max), Web, Youtube, Prime95 | |
| Lenovo LOQ 15IRX9 | |
| Schenker XMG Core 15 (M24) | |
| Acer Nitro 14 AN14-41-R3MX | |
| Acer Predator Helios Neo 14 (2024) | |
| Asus TUF Gaming A15 FA507UV | |
| Razer Blade 14 RZ09-0508 | |
| HP Omen Transcend 14-fb0014 | |
* ... smaller is better
Mass storage
At just 512 GB, the amount of storage offered by the PCIe 4.0 M.2-2280 SSD seems somewhat meagre. Consumers should be able to expect more from a gaming laptop that costs about €1,450 (US$1,600). Thermal throttling was observed when we ran DiskSpd in a loop. There isn’t any slot for an additional storage drive.


* ... smaller is better
Sustained load Read: DiskSpd Read Loop, Queue Depth 8
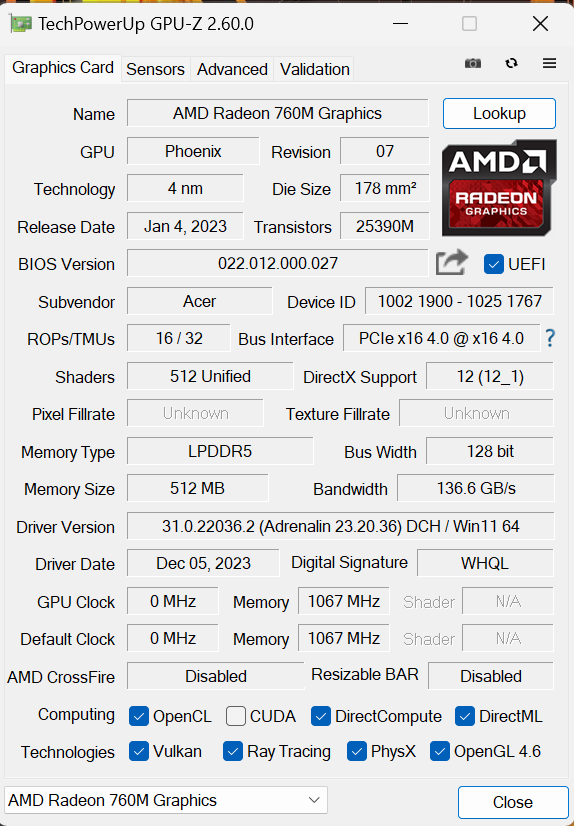
Graphics card
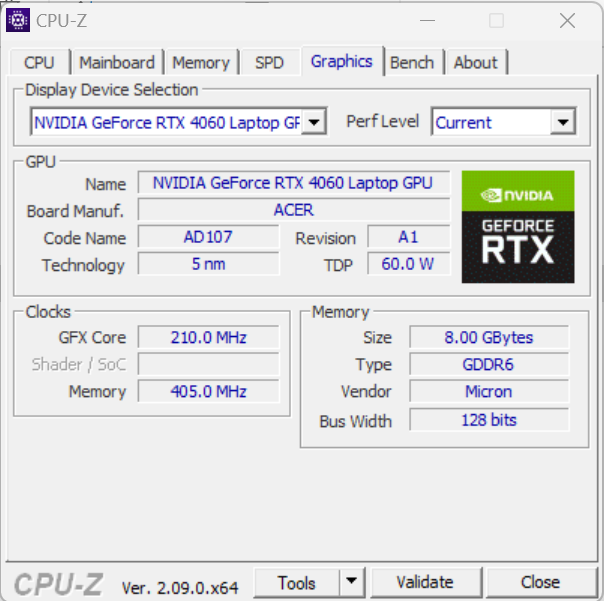
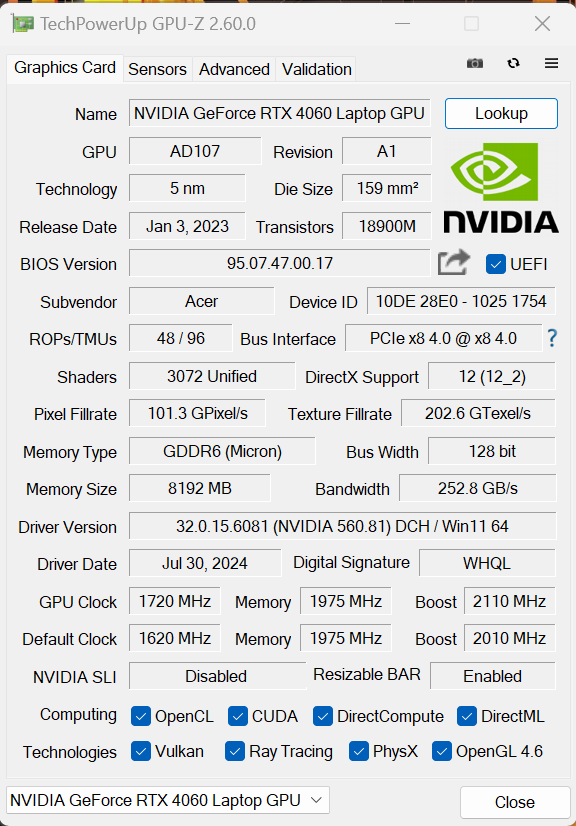
The GeForce RTX 4060, which offers 3,072 shading units, a 128-bit bus, and 8 GB of GDDR6, is a lower mid-range card in Nvidia’s current mobile GPU lineup. Acer has specified the TGP at 110 watts, below the 140-watt max TGP set by Nvidia. The benchmark results produced by the Nitro 14 are slightly above the average of what we have seen from the RTX 4060. The performance difference between the four power modes isn’t too significant. Switching between dGPU and Optimus mode doesn’t require a restart; Advanced Optimus is also supported.
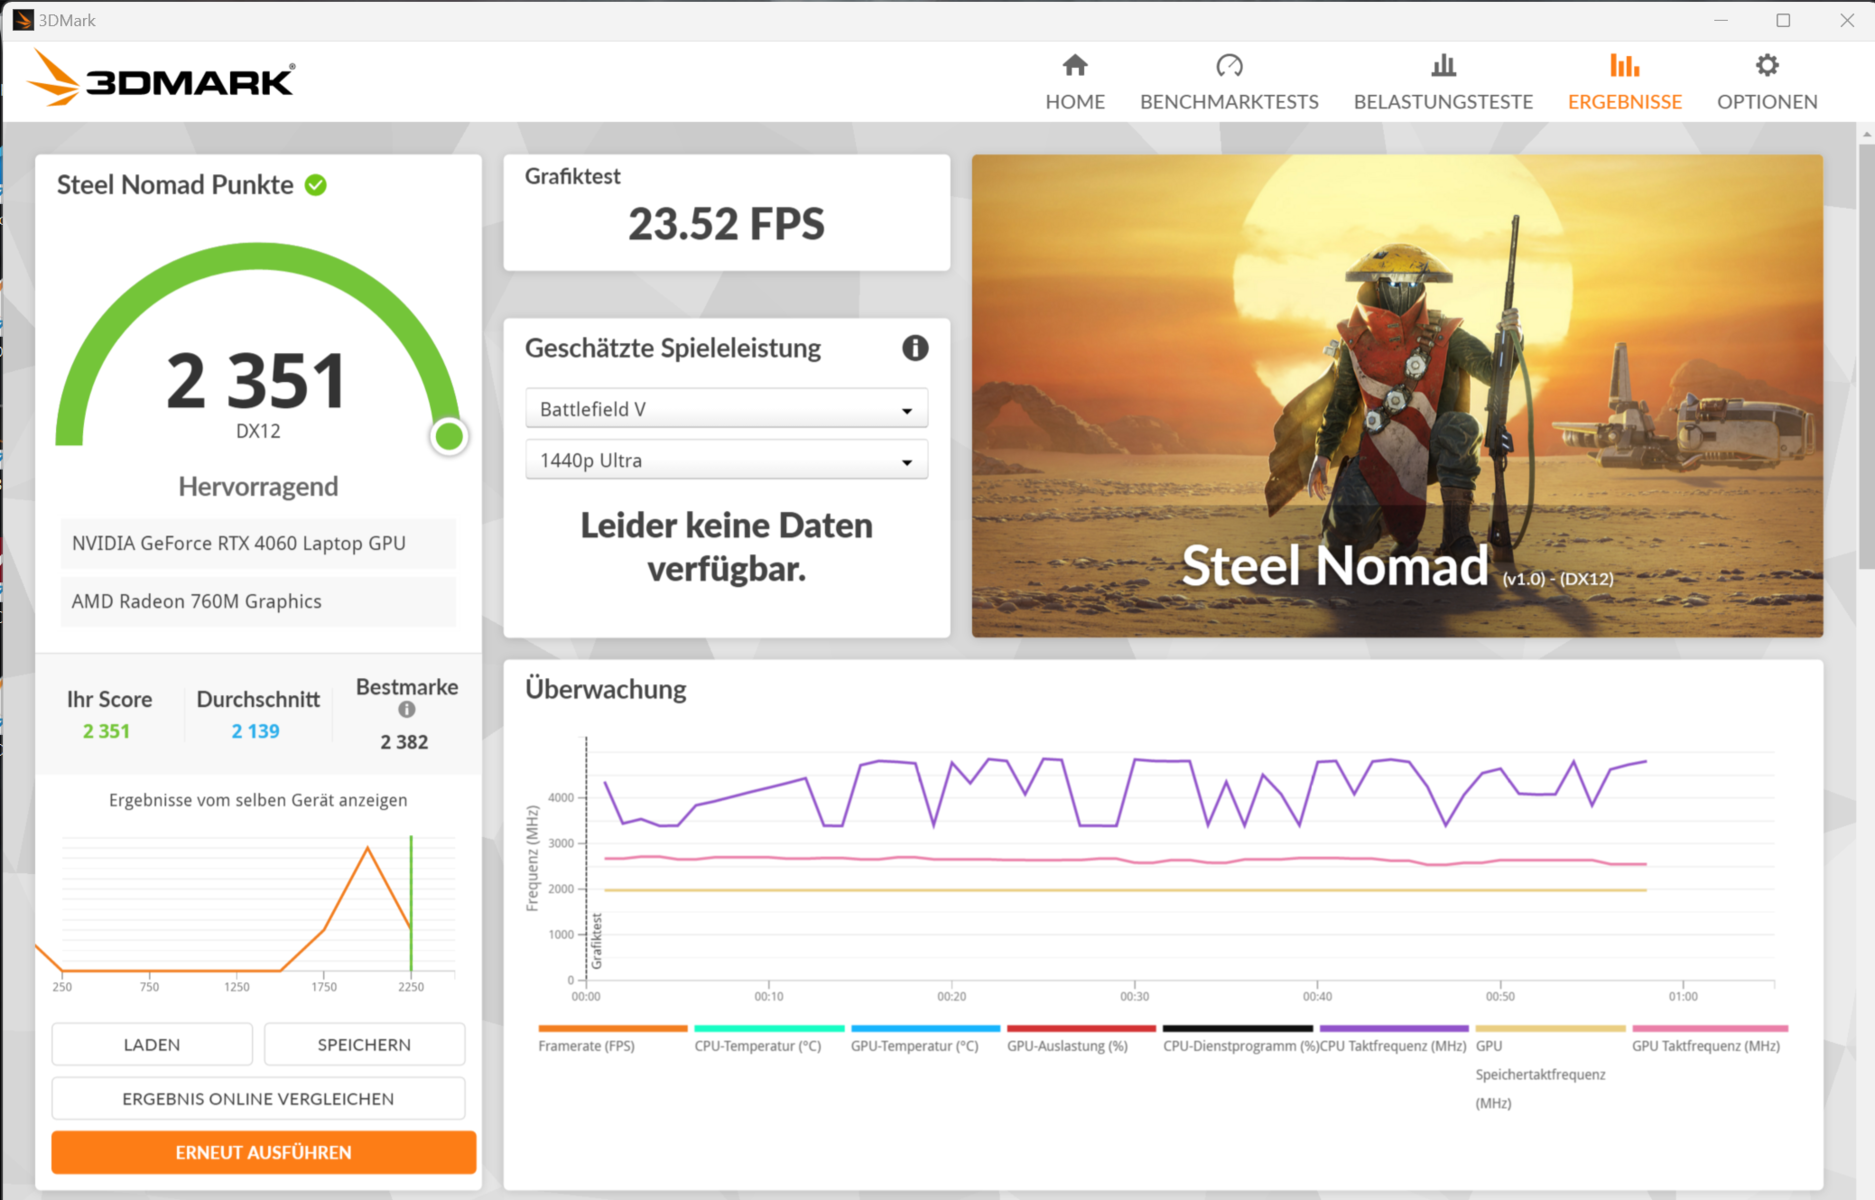

| 3DMark 06 Standard Score | 50749 points | |
| 3DMark 11 Performance | 29555 points | |
| 3DMark Fire Strike Score | 23835 points | |
| 3DMark Time Spy Score | 10280 points | |
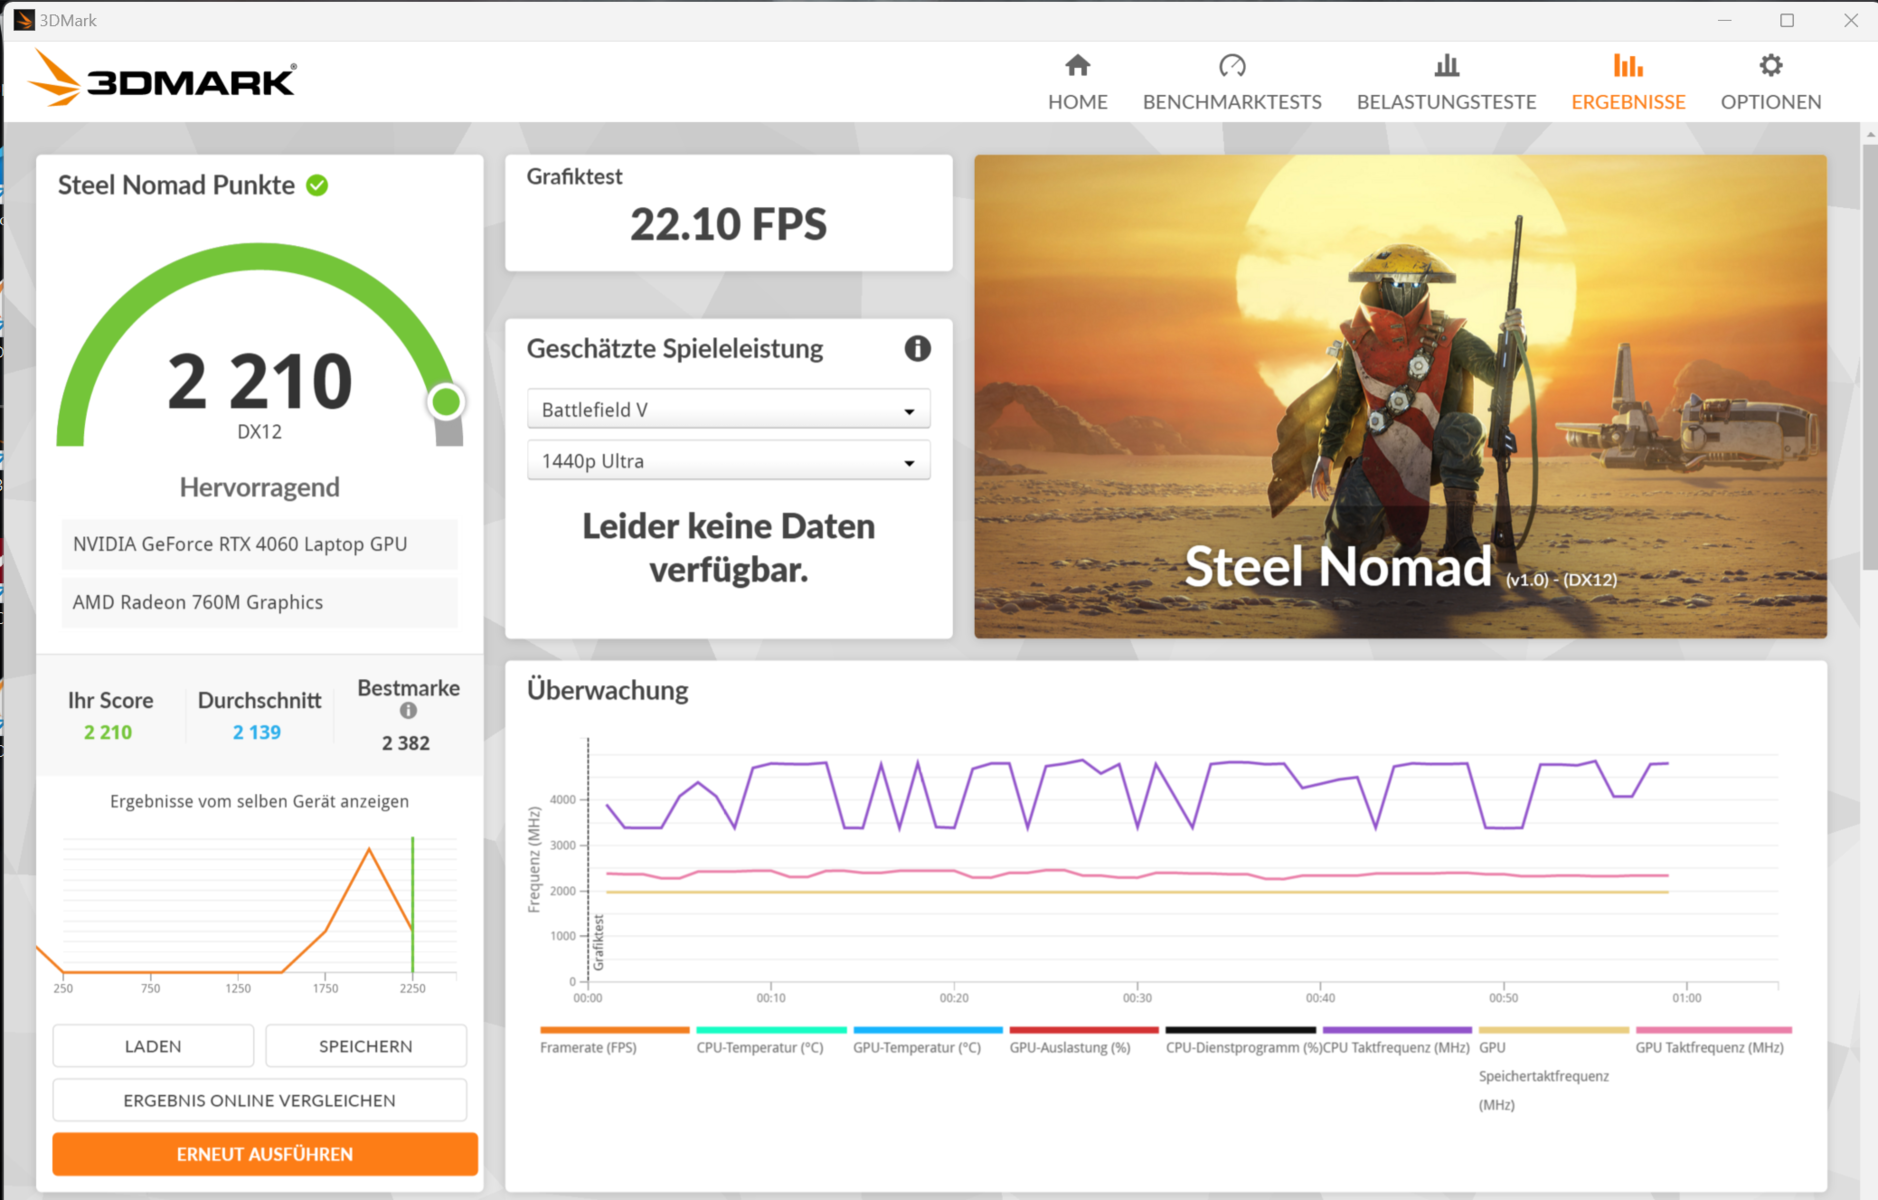
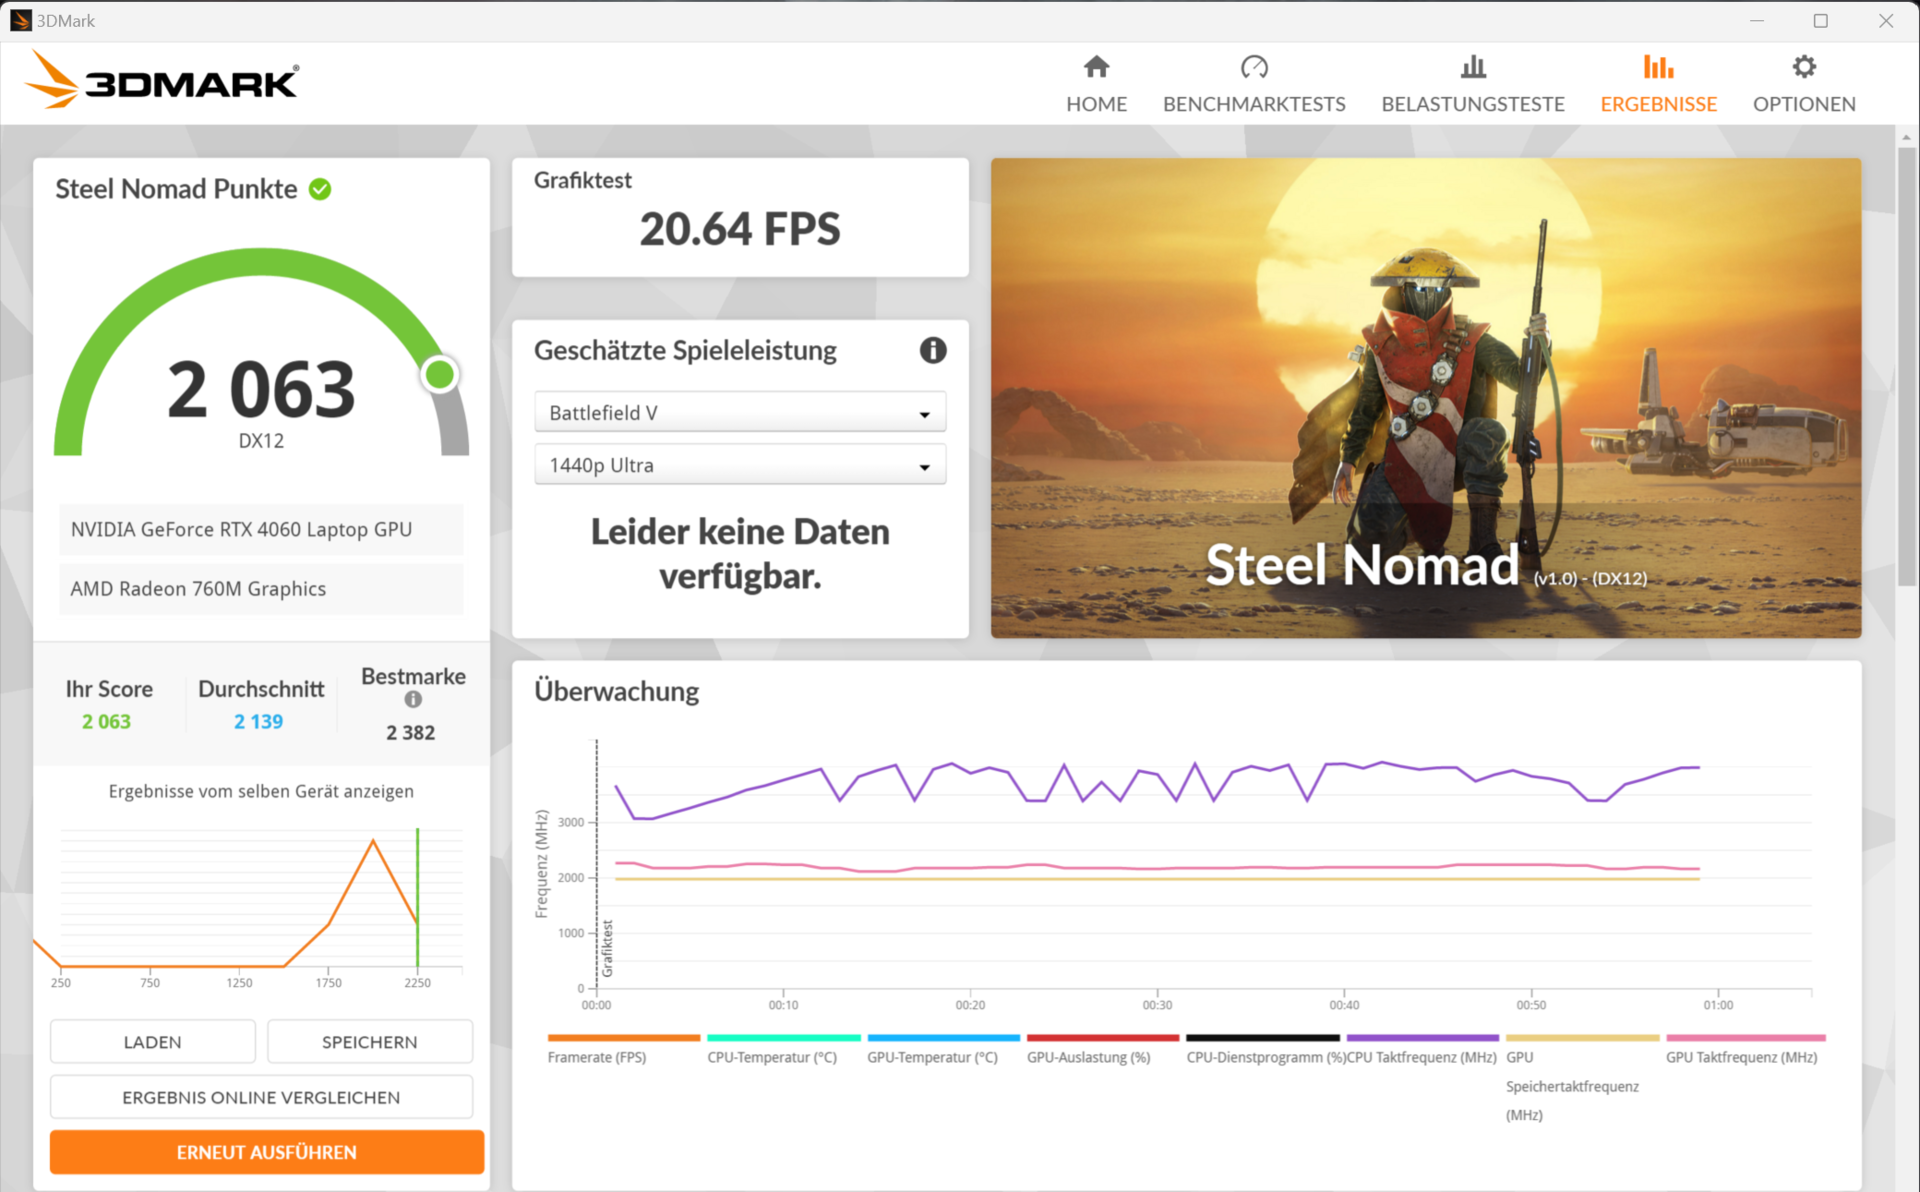
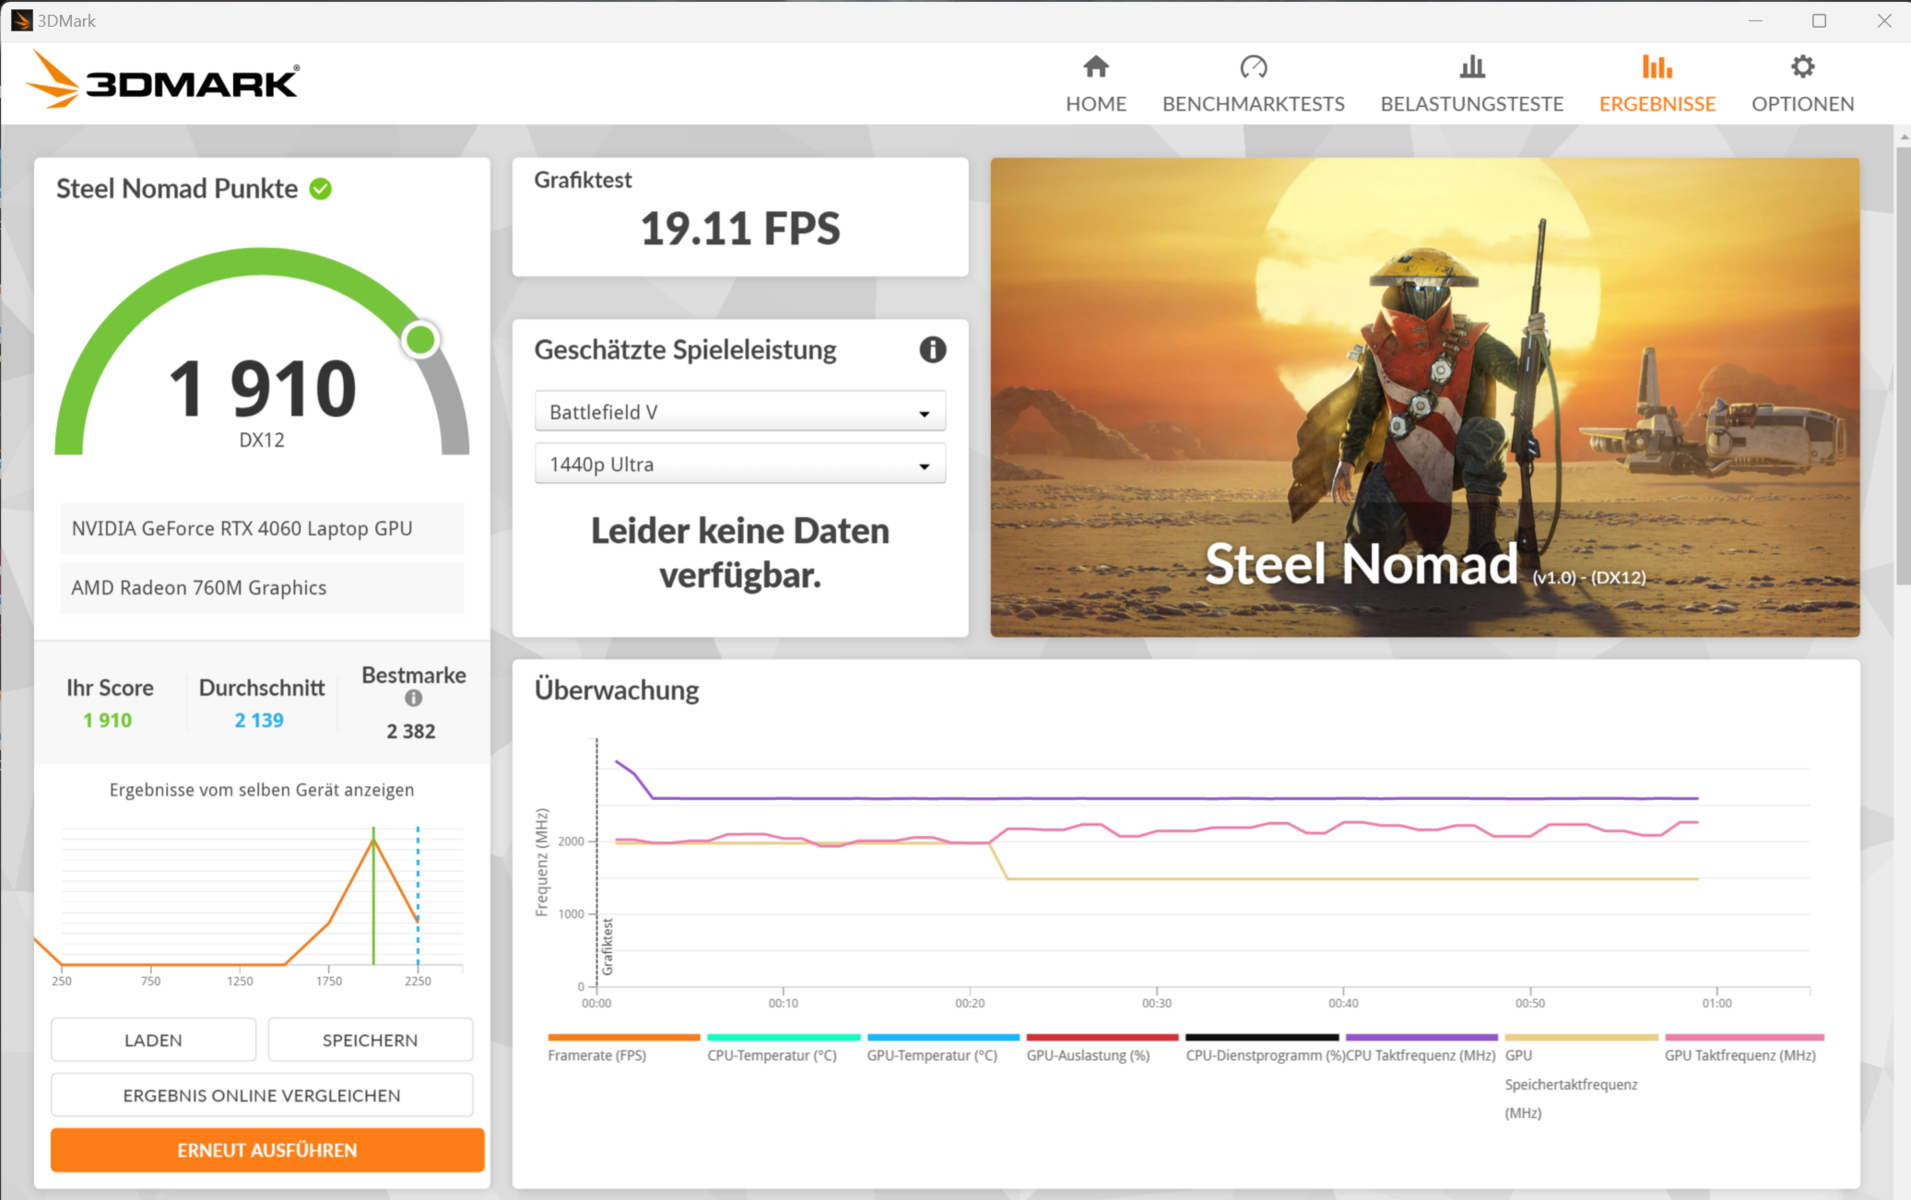
| 3DMark Steel Nomad Score | 2351 points | |
Help | ||
* ... smaller is better
Gaming Performance
The laptop can take advantage of the display’s full resolution when running games at high to max settings. The hardware inside mostly managed to deliver frame rates higher than what the RTX 4060 can do on average. Nevertheless, in CPU-intensive games such as Dota 2 Reborn, GTA V and X-Plane 11, the results were below the RTX 4060 average. Frame Generation and DLSS3 allow games to run at higher resolutions with settings maxed out and ray tracing enabled, but this is only possible in games that support these GPU features. A hardware hog like Black Myth: Wukong pushes the Nitro 14 to its limits, requiring the settings to be lowered.
| F1 24 | |
| 1920x1080 Ultra High Preset AA:T AF:16x | |
| Average of class Gaming (58.8 - 163.6, n=57, last 2 years) | |
| Acer Predator Helios Neo 14 (2024) | |
| Acer Nitro 14 AN14-41-R3MX | |
| Average NVIDIA GeForce RTX 4060 Laptop GPU (47.5 - 61.6, n=10) | |
| Asus TUF Gaming A15 FA507UV | |
| Lenovo LOQ 15IRX9 | |
| 2560x1440 Ultra High Preset AA:T AF:16x | |
| Average of class Gaming (36.7 - 109.4, n=57, last 2 years) | |
| Acer Predator Helios Neo 14 (2024) | |
| Acer Nitro 14 AN14-41-R3MX | |
| Average NVIDIA GeForce RTX 4060 Laptop GPU (24.3 - 38.8, n=6) | |
| 2560x1440 Ultra High Preset + Quality DLSS AF:16x | |
| Average of class Gaming (14.3 - 159.3, n=47, last 2 years) | |
| Acer Predator Helios Neo 14 (2024) | |
| Acer Nitro 14 AN14-41-R3MX | |
| Average NVIDIA GeForce RTX 4060 Laptop GPU (48.6 - 61, n=3) | |
Over a 30-minute period, Cyberpunk 2077: Phantom Liberty maintained fairly stable frame rates at max settings and FHD, without any observable performance drops.
Cyberpunk 2077 ultra FPS chart
| low | med. | high | ultra | QHD DLSS | QHD | |
|---|---|---|---|---|---|---|
| GTA V (2015) | 178.1 | 173.9 | 160.3 | 100.6 | 86.8 | |
| Dota 2 Reborn (2015) | 147.5 | 142.9 | 125.6 | 120.5 | ||
| Final Fantasy XV Benchmark (2018) | 189.5 | 143.4 | 106 | 78.1 | ||
| X-Plane 11.11 (2018) | 109.4 | 96.1 | 73.4 | |||
| Far Cry 5 (2018) | 133 | 115 | 111 | 103 | 96 | |
| Strange Brigade (2018) | 326 | 272 | 222 | 193.2 | 129.4 | |
| Baldur's Gate 3 (2023) | 144.6 | 116.8 | 103.3 | 100.4 | 62.8 | |
| Cyberpunk 2077 (2023) | 124.8 | 101.3 | 86.6 | 75.8 | 45.6 | |
| F1 24 (2024) | 184.4 | 193.8 | 171.9 | 60.9 | 61 | 38.8 |
| Black Myth: Wukong (2024) | 62 | 48 | 27 | 30 | 19 |
Emissions - Acer's gaming laptop only gets moderately warm
Noise emissions
Running Cyberpunk 2077 in Turbo mode pushed the laptop’s noise output up to 57 dB(A). Switching to the other power modes reduced fan noise to more moderate levels. Quiet mode stands out amongst the options: it offered a much lower noise level with only in a modest frame rate drop. The laptop is generally fairly quiet when not under full load. The fans usually don’t spin at idle.
There is likely still plenty of room for Acer to optimise the fan control. When you look at the temperatures in relation to the noise levels during our stress test and Cyberpunk test, the fans seem capable of providing sufficient cooling even at lower speeds.
Noise level
| Idle |
| 24.3 / 24.3 / 24.3 dB(A) |
| Load |
| 33.1 / 57 dB(A) |
 | ||
30 dB silent 40 dB(A) audible 50 dB(A) loud |
||
min: | ||
| Acer Nitro 14 AN14-41-R3MX GeForce RTX 4060 Laptop GPU, R5 8645HS, Micron 3500 MTFDKBA512TGD | Razer Blade 14 RZ09-0508 GeForce RTX 4070 Laptop GPU, R9 8945HS, Samsung PM9A1 MZVL21T0HCLR | Lenovo LOQ 15IRX9 GeForce RTX 4060 Laptop GPU, i5-13450HX, Micron 2400 MTFDKCD1T0QFM | Asus TUF Gaming A15 FA507UV GeForce RTX 4060 Laptop GPU, R9 8945H, WD PC SN560 SDDPNQE-1T00 | Schenker XMG Core 15 (M24) GeForce RTX 4060 Laptop GPU, R7 8845HS, Samsung 990 Pro 1 TB | HP Omen Transcend 14-fb0014 GeForce RTX 4060 Laptop GPU, Ultra 7 155H, WDC PC SN810 1TB | Acer Predator Helios Neo 14 (2024) GeForce RTX 4070 Laptop GPU, Ultra 9 185H, SK Hynix PC801 HFS001TEJ9X125N | |
|---|---|---|---|---|---|---|---|
| Noise | 0% | -16% | -5% | 3% | 4% | -16% | |
| off / environment * (dB) | 24.3 | 24.3 -0% | 25 -3% | 25 -3% | 23 5% | 24.5 -1% | 24 1% |
| Idle Minimum * (dB) | 24.3 | 25 -3% | 26 -7% | 25 -3% | 23 5% | 24.7 -2% | 29 -19% |
| Idle Average * (dB) | 24.3 | 25 -3% | 34 -40% | 27 -11% | 23 5% | 24.7 -2% | 31 -28% |
| Idle Maximum * (dB) | 24.3 | 25 -3% | 36 -48% | 33 -36% | 23 5% | 24.7 -2% | 36 -48% |
| Load Average * (dB) | 33.1 | 33 -0% | 48 -45% | 40 -21% | 38.92 -18% | 25.2 24% | 47 -42% |
| Cyberpunk 2077 ultra * (dB) | 57.1 | 48 16% | 45 21% | 52.06 9% | 50 12% | ||
| Load Maximum * (dB) | 57 | 51.9 9% | 50 12% | 46 19% | 52.09 9% | 52 9% | 52 9% |
| Witcher 3 ultra * (dB) | 49.5 | 50.96 | 47 |
* ... smaller is better
Temperature
Under load (i.e. running our stress test or Cyberpunk), the laptop’s average surface temperature got moderately warm at most, with some spots exceeding 40°C (104°F). Nonetheless, the palm rest remained fairly cool throughout. Surface temperatures were unproblematic in everyday use.
(±) The maximum temperature on the upper side is 43.5 °C / 110 F, compared to the average of 40.4 °C / 105 F, ranging from 21.2 to 68.8 °C for the class Gaming.
(-) The bottom heats up to a maximum of 46.3 °C / 115 F, compared to the average of 43.2 °C / 110 F
(+) In idle usage, the average temperature for the upper side is 27.6 °C / 82 F, compared to the device average of 33.9 °C / 93 F.
(±) 3: The average temperature for the upper side is 32.4 °C / 90 F, compared to the average of 33.9 °C / 93 F for the class Gaming.
(+) The palmrests and touchpad are cooler than skin temperature with a maximum of 28.1 °C / 82.6 F and are therefore cool to the touch.
(±) The average temperature of the palmrest area of similar devices was 28.8 °C / 83.8 F (+0.7 °C / 1.2 F).
| Acer Nitro 14 AN14-41-R3MX AMD Ryzen 5 8645HS, NVIDIA GeForce RTX 4060 Laptop GPU | Razer Blade 14 RZ09-0508 AMD Ryzen 9 8945HS, NVIDIA GeForce RTX 4070 Laptop GPU | Lenovo LOQ 15IRX9 Intel Core i5-13450HX, NVIDIA GeForce RTX 4060 Laptop GPU | Asus TUF Gaming A15 FA507UV AMD Ryzen 9 8945H, NVIDIA GeForce RTX 4060 Laptop GPU | Schenker XMG Core 15 (M24) AMD Ryzen 7 8845HS, NVIDIA GeForce RTX 4060 Laptop GPU | HP Omen Transcend 14-fb0014 Intel Core Ultra 7 155H, NVIDIA GeForce RTX 4060 Laptop GPU | Acer Predator Helios Neo 14 (2024) Intel Core Ultra 9 185H, NVIDIA GeForce RTX 4070 Laptop GPU | |
|---|---|---|---|---|---|---|---|
| Heat | -5% | -13% | -9% | -23% | 14% | -15% | |
| Maximum Upper Side * (°C) | 43.5 | 41.8 4% | 47 -8% | 53 -22% | 52 -20% | 41.2 5% | 57 -31% |
| Maximum Bottom * (°C) | 46.3 | 42.2 9% | 58 -25% | 46 1% | 61 -32% | 39 16% | 55 -19% |
| Idle Upper Side * (°C) | 30.4 | 34.8 -14% | 32 -5% | 32 -5% | 35 -15% | 26.2 14% | 32 -5% |
| Idle Bottom * (°C) | 31.3 | 37.4 -19% | 36 -15% | 34 -9% | 39 -25% | 25.4 19% | 33 -5% |
* ... smaller is better
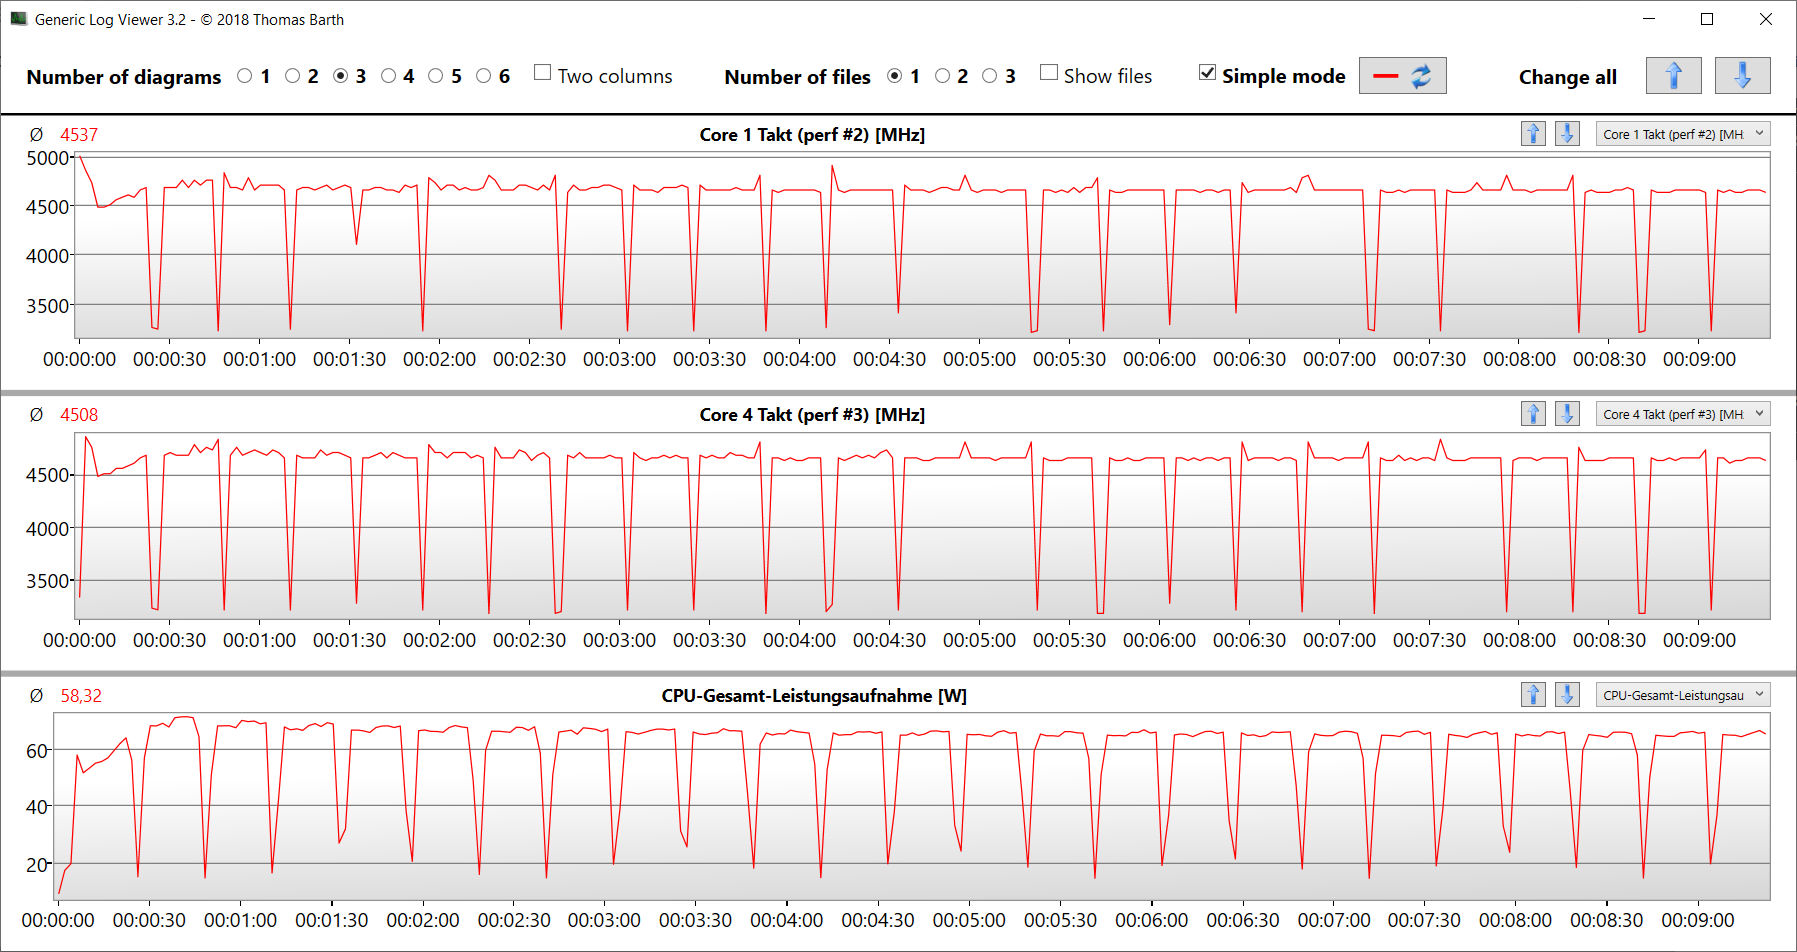
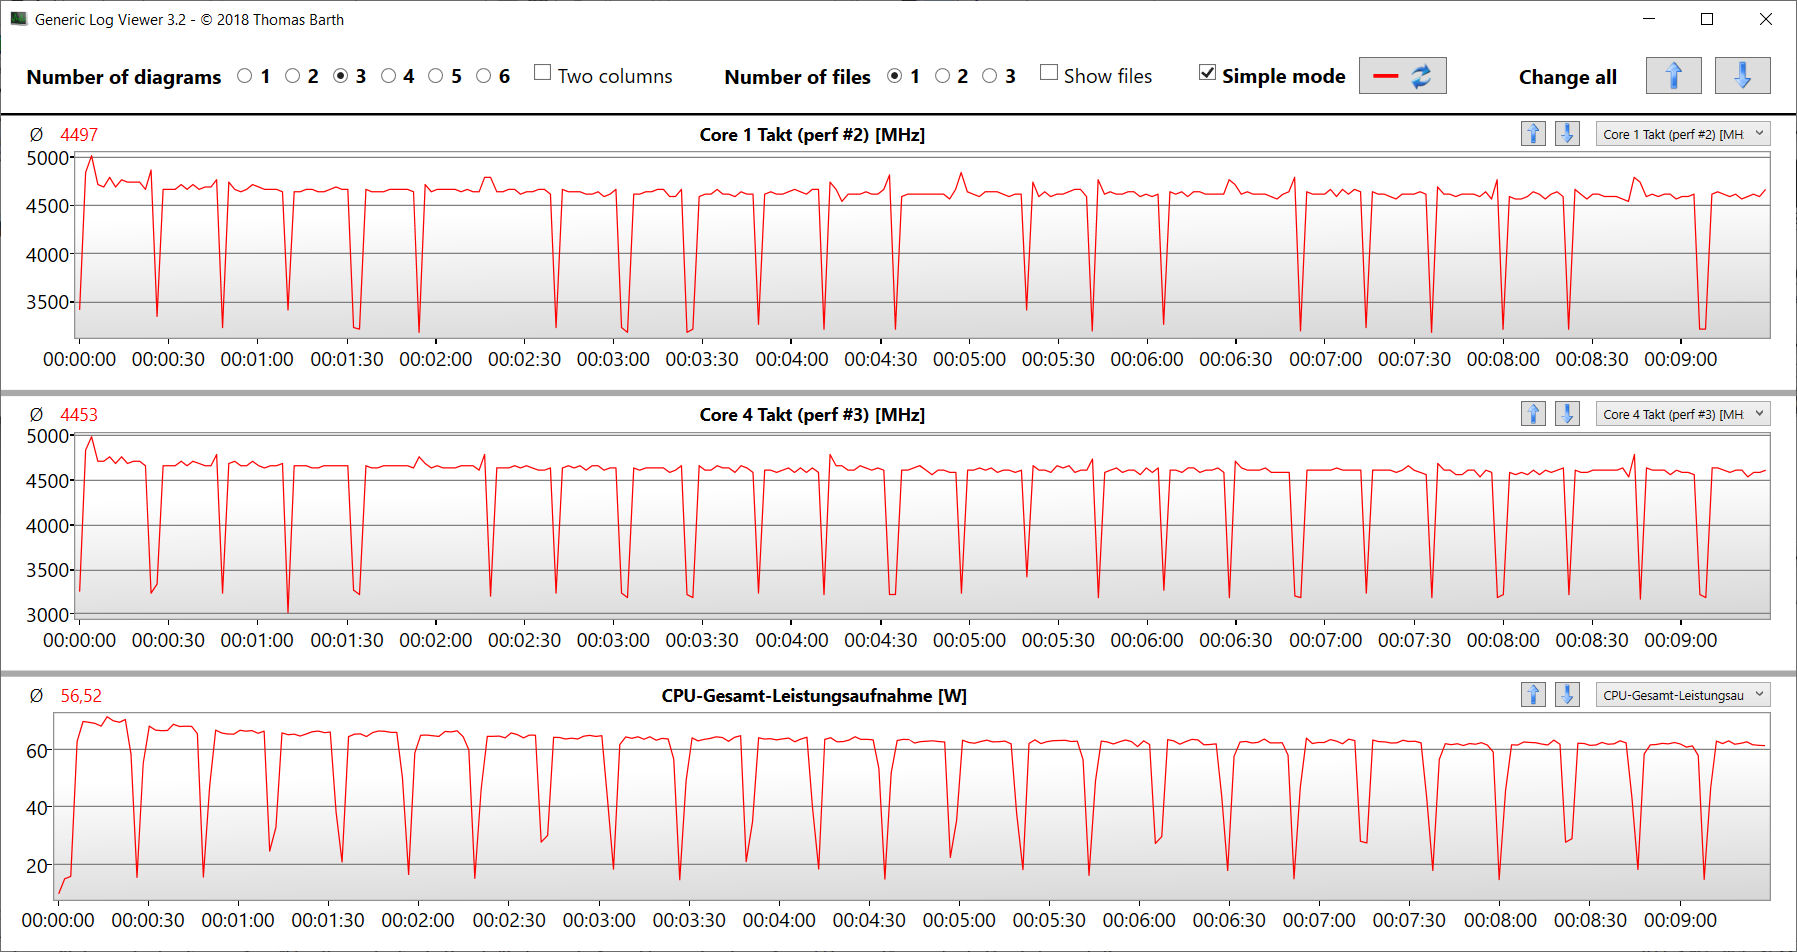
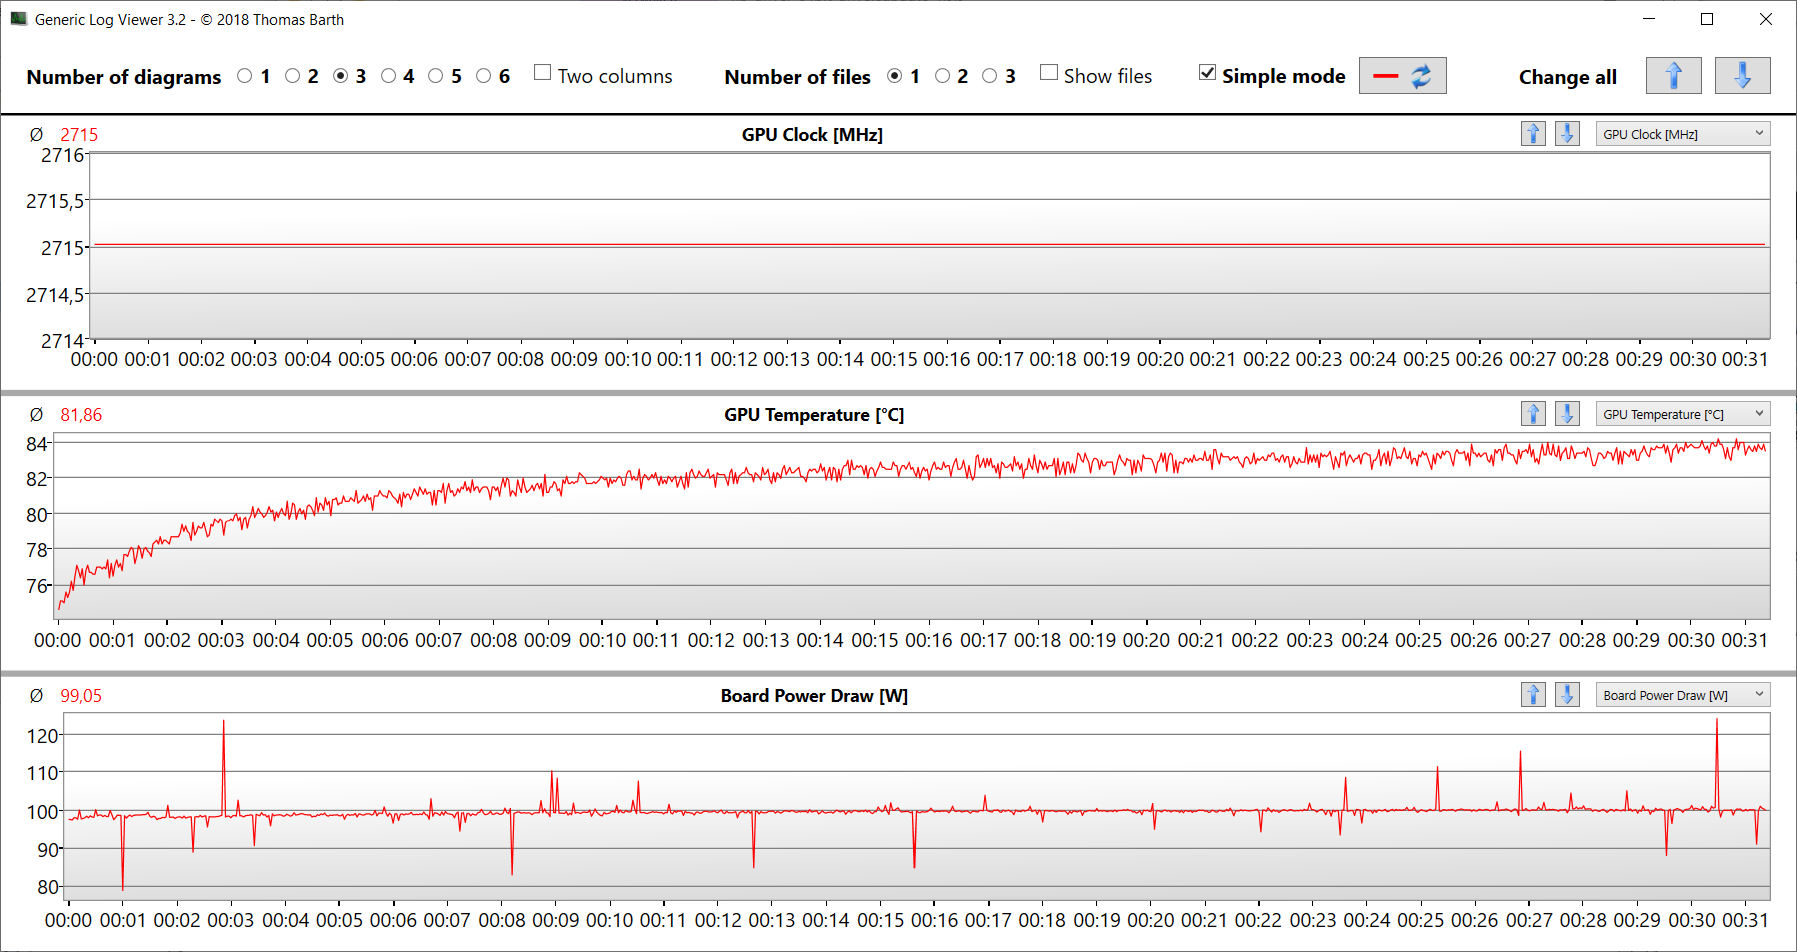
Stress test
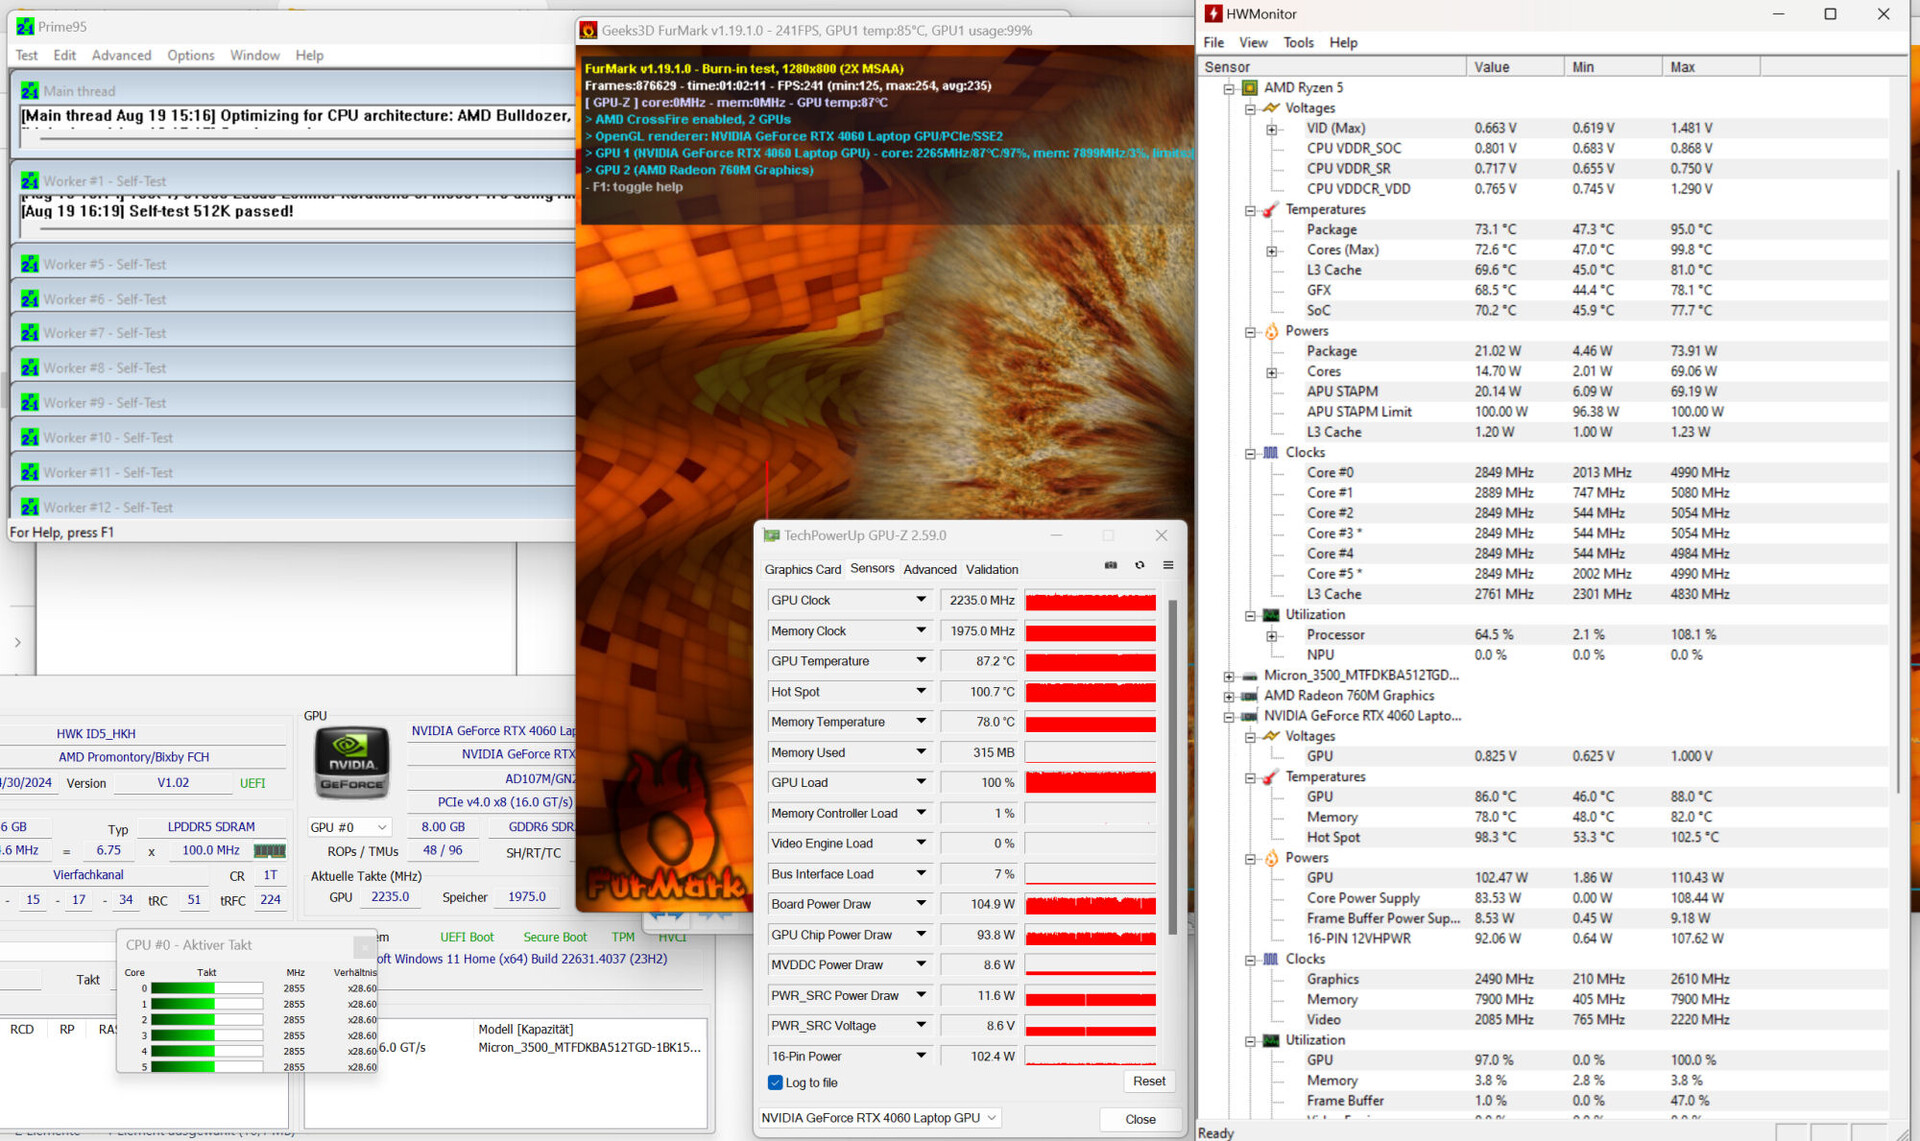
For our extreme stress-test scenario, we ran Prime95 and FurMark for an extended period to assess the system’s stability under full load. The CPU clock dropped from 3.6 GHz to 2.8 GHz over the test duration, whilst GPU clock increased from roughly 2 GHz to 2.2 GHz.
| CPU clock (GHz) | GPU clock (MHz) | Average CPU Temperature (°C) | Average GPU Temperature (°C) | |
| System Idle | 3.6 | 210 | 34 | 36 |
| Prime95 Stress | 4.6 | 210 | 87 | 49 |
| Prime95 + FurMark stress | 3.3 | 2,100 | 76 | 86 |
| Cyberpunk 2077 stress | 4.2 | 2,700 | 73 | 82 |
Speakers
The stereo speakers produce decent sound but lack bass. You will likely get a better audio experience with external speakers or headphones.
Acer Nitro 14 AN14-41-R3MX audio analysis
(±) | speaker loudness is average but good (79.6 dB)
Bass 100 - 315 Hz
(-) | nearly no bass - on average 23.5% lower than median
(±) | linearity of bass is average (10.2% delta to prev. frequency)
Mids 400 - 2000 Hz
(+) | balanced mids - only 2.7% away from median
(±) | linearity of mids is average (7.9% delta to prev. frequency)
Highs 2 - 16 kHz
(±) | higher highs - on average 5.3% higher than median
(±) | linearity of highs is average (9.4% delta to prev. frequency)
Overall 100 - 16.000 Hz
(±) | linearity of overall sound is average (20% difference to median)
Compared to same class
» 70% of all tested devices in this class were better, 7% similar, 23% worse
» The best had a delta of 6%, average was 18%, worst was 132%
Compared to all devices tested
» 51% of all tested devices were better, 8% similar, 40% worse
» The best had a delta of 4%, average was 23%, worst was 134%
Schenker XMG Core 15 (M24) audio analysis
(±) | speaker loudness is average but good (79.12 dB)
Bass 100 - 315 Hz
(-) | nearly no bass - on average 16.7% lower than median
(-) | bass is not linear (15.7% delta to prev. frequency)
Mids 400 - 2000 Hz
(+) | balanced mids - only 4.5% away from median
(+) | mids are linear (4.4% delta to prev. frequency)
Highs 2 - 16 kHz
(+) | balanced highs - only 1% away from median
(+) | highs are linear (2.7% delta to prev. frequency)
Overall 100 - 16.000 Hz
(+) | overall sound is linear (13.7% difference to median)
Compared to same class
» 21% of all tested devices in this class were better, 7% similar, 72% worse
» The best had a delta of 6%, average was 18%, worst was 132%
Compared to all devices tested
» 15% of all tested devices were better, 4% similar, 81% worse
» The best had a delta of 4%, average was 23%, worst was 134%
Power management - The Nitro 14 has superb battery life
Power consumption
The Nitro 14’s energy consumption is rather typical for the hardware inside. It deserves kudos for having the lowest idle power usage amongst the devices in our comparison. The power draw remained at a consistent level throughout the stress test and Cyberpunk test. The included 230-watt charger is powerful enough for the laptop.
| Off / Standby | |
| Idle | |
| Load |
|
Key:
min: | |
| Acer Nitro 14 AN14-41-R3MX R5 8645HS, GeForce RTX 4060 Laptop GPU, Micron 3500 MTFDKBA512TGD, IPS, 2560x1600, 14.5" | Razer Blade 14 RZ09-0508 R9 8945HS, GeForce RTX 4070 Laptop GPU, Samsung PM9A1 MZVL21T0HCLR, IPS, 2560x1600, 14" | Lenovo LOQ 15IRX9 i5-13450HX, GeForce RTX 4060 Laptop GPU, Micron 2400 MTFDKCD1T0QFM, IPS, 1920x1080, 15.6" | Asus TUF Gaming A15 FA507UV R9 8945H, GeForce RTX 4060 Laptop GPU, WD PC SN560 SDDPNQE-1T00, IPS, 1920x1080, 15.6" | Schenker XMG Core 15 (M24) R7 8845HS, GeForce RTX 4060 Laptop GPU, Samsung 990 Pro 1 TB, IPS, 2560x1600, 15.3" | HP Omen Transcend 14-fb0014 Ultra 7 155H, GeForce RTX 4060 Laptop GPU, WDC PC SN810 1TB, OLED, 2880x1800, 14" | Acer Predator Helios Neo 14 (2024) Ultra 9 185H, GeForce RTX 4070 Laptop GPU, SK Hynix PC801 HFS001TEJ9X125N, IPS, 3072x1920, 14.5" | Average NVIDIA GeForce RTX 4060 Laptop GPU | Average of class Gaming | |
|---|---|---|---|---|---|---|---|---|---|
| Power Consumption | -100% | -42% | -9% | -22% | -26% | -18% | -44% | -72% | |
| Idle Minimum * (Watt) | 8 | 20.9 -161% | 13 -63% | 7 12% | 9.3 -16% | 9.1 -14% | 6 25% | 11.5 ? -44% | 13.1 ? -64% |
| Idle Average * (Watt) | 10.9 | 25.6 -135% | 18 -65% | 12 -10% | 12.9 -18% | 12.6 -16% | 11 -1% | 16 ? -47% | 19 ? -74% |
| Idle Maximum * (Watt) | 11.9 | 32.1 -170% | 24 -102% | 18 -51% | 12.8 -8% | 27.4 -130% | 21 -76% | 20.3 ? -71% | 24.6 ? -107% |
| Load Average * (Watt) | 61.8 | 72.7 -18% | 85 -38% | 70 -13% | 63.5 -3% | 93 -50% | 92.9 ? -50% | 111.3 ? -80% | |
| Cyberpunk 2077 ultra * (Watt) | 151.3 | 155.7 -3% | 146.8 3% | 147.9 2% | |||||
| Cyberpunk 2077 ultra external monitor * (Watt) | 147.9 | 150.9 -2% | 146.2 1% | 146.3 1% | |||||
| Load Maximum * (Watt) | 195.1 | 228.4 -17% | 232 -19% | 206 -6% | 286 -47% | 135.3 31% | 252 -29% | 210 ? -8% | 260 ? -33% |
| Witcher 3 ultra * (Watt) | 182.1 | 167 | 118.9 |
* ... smaller is better
Power consumption Cyberpunk / Stress test
Power consumption with external monitor
Battery life
In our Wi-Fi test (accessing websites using a script) and video test (playing back the short film Big Buck Bunny, encoded in H.264, in a loop at FHD), the Nitro 14 managed to last 10h 5min and 13h 57min, respectively. These are excellent results that most office notebooks can’t achieve. However, the Acer laptop couldn’t quite reach the level of the Asus A15 and the XMG Core 15 (M24), as these two devices have larger battery capacities.

| Acer Nitro 14 AN14-41-R3MX R5 8645HS, GeForce RTX 4060 Laptop GPU, 76 Wh | Razer Blade 14 RZ09-0508 R9 8945HS, GeForce RTX 4070 Laptop GPU, 68 Wh | Lenovo LOQ 15IRX9 i5-13450HX, GeForce RTX 4060 Laptop GPU, 60 Wh | Asus TUF Gaming A15 FA507UV R9 8945H, GeForce RTX 4060 Laptop GPU, 90 Wh | Schenker XMG Core 15 (M24) R7 8845HS, GeForce RTX 4060 Laptop GPU, 99.8 Wh | HP Omen Transcend 14-fb0014 Ultra 7 155H, GeForce RTX 4060 Laptop GPU, 71 Wh | Acer Predator Helios Neo 14 (2024) Ultra 9 185H, GeForce RTX 4070 Laptop GPU, 76 Wh | Average of class Gaming | |
|---|---|---|---|---|---|---|---|---|
| Battery runtime | -44% | -48% | 16% | 11% | -36% | -24% | -40% | |
| Reader / Idle (h) | 18 | 8 -56% | 10.4 -42% | 13.5 -25% | 7.84 ? -56% | |||
| H.264 (h) | 14 | 10.1 -28% | 9.3 -34% | 8.27 ? -41% | ||||
| WiFi v1.3 (h) | 10.1 | 7.1 -30% | 5.3 -48% | 11.7 16% | 14.8 47% | 8.6 -15% | 8.7 -14% | 7.08 ? -30% |
| Load (h) | 2.2 | 1.2 -45% | 2.5 14% | 1.1 -50% | 1.7 -23% | 1.496 ? -32% |
Pros
Cons
Verdict - Coherent mid-range gaming laptop
The Nitro 14 boast excellent portability thanks to its compact design, low weight (approx. 2 kg, or 4.4 lb) and realistic battery life of 10 to 14 hours. The battery can be charged using a USB-C adapter because both of the USB-C ports (USB 3.2 Gen 2 and USB4) support Power Delivery, allowing you to leave the proprietary charger at home.
The Acer Nitro 14 is a coherent mid-range gaming laptop with a compact form factor.
The Ryzen 5 8645HS and GeForce RTX 4060 deliver the power required for QHD gaming, rendering and streaming, with both chips capable of running consistently at high clock speeds. Whilst the laptop doesn't really get very warm, it produces a lot of noise. Enabling Quiet mode helps reduce the noise level and only results in a small performance loss. The bright 16:10 14.5-inch display (2,560 x 1,600, IPS, 120Hz, sRGB, G-Sync support) fits well in the laptop’s design.
Moving on to its downsides: Although the snappy PCIe 4.0 SSD in the device helps keep load times short, the amount of storage (512 GB) is lacking in our opinion; considering the €1,450 (US$1,600) price tag, consumers should be able to expect 1 TB of storage. There is also the option of using a memory card, but Acer has included a sluggish card reader. The soldered RAM can’t be upgraded at all.
An alternative to the Nitro 14 is the XMG Core 15 (M24). This laptop offers more performance, upgradable memory, a second SSD slot and superior battery life. However, it lacks a USB4 port and also produces much more heat than the Nitro 14.
Price and availability
In Germany, the Acer Nitro 14 AN14-41-R3MX is available for €1,449 (around US$1,600) from Notebooksbilliger.de. For readers in the US, Amazon.com has a similar model (with a Ryzen 7 CPU but a WUXGA display) on sale for US$1,200.
Note: We have recently updated our rating system and the results of version 8 are not comparable with the results of version 7. More information is available here .
Acer Nitro 14 AN14-41-R3MX
- 08/24/2024 v8
Sascha Mölck
 Total Sustainability Score:
 Transparency
The selection of devices to be reviewed is made by our editorial team. The test sample was provided to the author as a loan by the manufacturer or retailer for the purpose of this review. The lender had no influence on this review, nor did the manufacturer receive a copy of this review before publication. There was no obligation to publish this review. As an independent media company, Notebookcheck is not subjected to the authority of manufacturers, retailers or publishers.
This is how Notebookcheck is testing
Every year, Notebookcheck independently reviews hundreds of laptops and smartphones using standardized procedures to ensure that all results are comparable. We have continuously developed our test methods for around 20 years and set industry standards in the process. In our test labs, high-quality measuring equipment is utilized by experienced technicians and editors. These tests involve a multi-stage validation process. Our complex rating system is based on hundreds of well-founded measurements and benchmarks, which maintains objectivity. Further information on our test methods can be found here.
Price comparison

