Workstation review: Minisforum MS-01 debuts with Intel Core i9-13900H, but lacks a dedicated graphics card ex-works
Minisforum is a well-known brand in the mini-PC market and has a broad portfolio to be prepared for all eventualities. The manufacturer from the Far East has so far left out the workstation sector, which is now set to change with the Minisforum MS-01. The best configuration of the model is equipped with Intel Core i9-13900H which, together with 32 GB RAM and a 1 TB SSD, was closely tested in our laboratory. At 979 euros, the Minisforum MS-01 is certainly no bargain, even though the device can also be ordered as a barebone option. Without RAM and SSD, however, the price is still 799 euros. If you don't need the performance of the Intel Core i9-13900H, the compact workstation can also be equipped with an Intel Core i5-12600H (from 499 euros) or an Intel Core i9-12900H (from 619 euros).
Before we get to the review of the Minisforum MS-01, here is some important information!
The tests on our test sample were repeatedly accompanied by unpredictable crashes. These mainly occurred during longer load scenarios such as the Cinebench R15 multi-loop. There were sometimes problems with the SSD stress test and the Adobe Premiere benchmark. Crashes were repeatedly reproduced in these tests. There was an improvement when we reduced the processor's power limits to 35 watts, but this resulted in a significant deterioration in CPU performance. To narrow down the problem further, we replaced all components such as RAM, SSD, and the power supply unit, but this did not bring any results. In the end, we came to the current conclusion that this can only be a problem with the Intel Core i9-13900H itself. We have informed the manufacturer in order to obtain a solution. Minisforum plans to send us another sample as soon as possible. A final assessment will therefore only be possible once we have looked at the replacement device.
If anyone has experienced similar problems with the Minisforum MS-01, please let us know. Anyone who owns a Minisforum MS-01 and has no such problems is also welcome to let us know.
Possible competitors in comparison
Rating | Date | Model | Memory | Weight | Height |
|---|---|---|---|---|---|
| 81.5 % v7 (old) | 05 / 2024 | Minisforum MS-01 i9-13900H, Iris Xe G7 96EUs | 32768 MB | 1.5 kg | 48 mm |
| 83.4 % v7 (old) | 04 / 2024 | Acemagic F2A Ultra 7 155H, Arc 8-Core | 32768 MB | 768 g | 57 mm |
| 84.1 % | 04 / 2024 | Geekom XT12 Pro i9-12900H, Iris Xe G7 96EUs | 32768 MB | 545 g | 37 mm |
| 82.6 % v7 (old) | 03 / 2024 | Geekom A7 R9 7940HS, Radeon 780M | 32768 MB | 417 g | 38 mm |
| 82.4 % v7 (old) | 05 / 2024 | Minisforum Venus Series NAB9 i9-12900HK, Iris Xe G7 96EUs | 32768 MB | 615 g | 55 mm |
| 81.7 % v7 (old) | 08 / 2023 | Minisforum Venus Series NPB5 i5-13500H, Iris Xe G7 80EUs | 16384 MB | 604 g | 55 mm |
| 79.5 % v7 (old) | 02 / 2024 | Maxtang MTN-FP750 R7 7735HS, Radeon 680M | 16384 MB | 601 g | 52 mm |
Minisforum MS-01 Workstation in detail


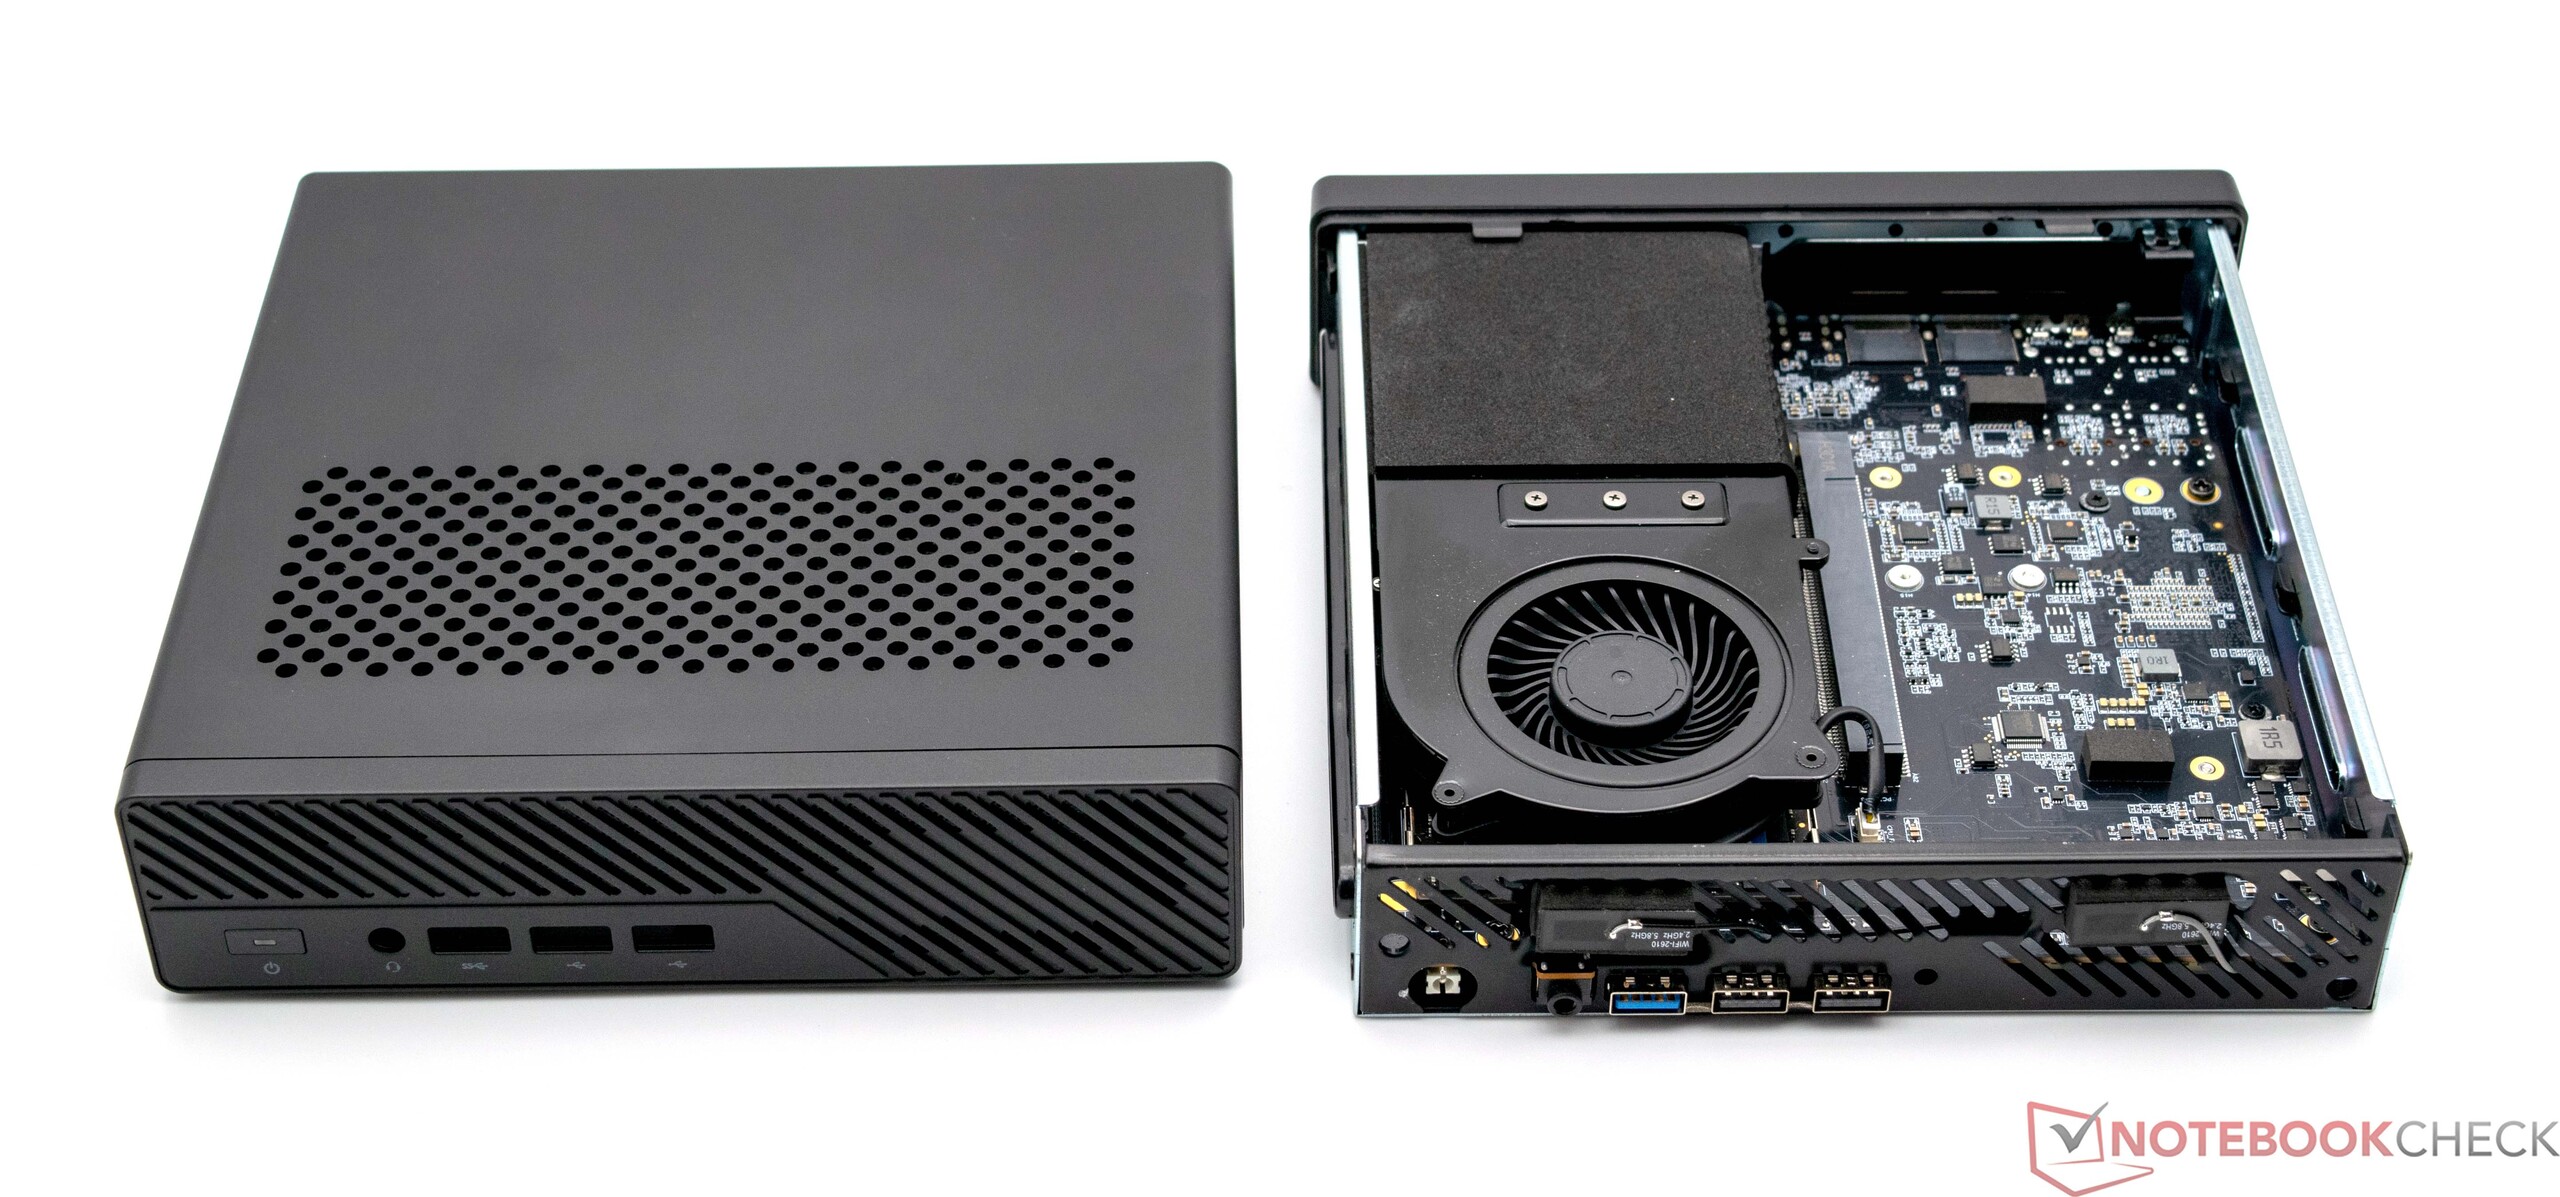
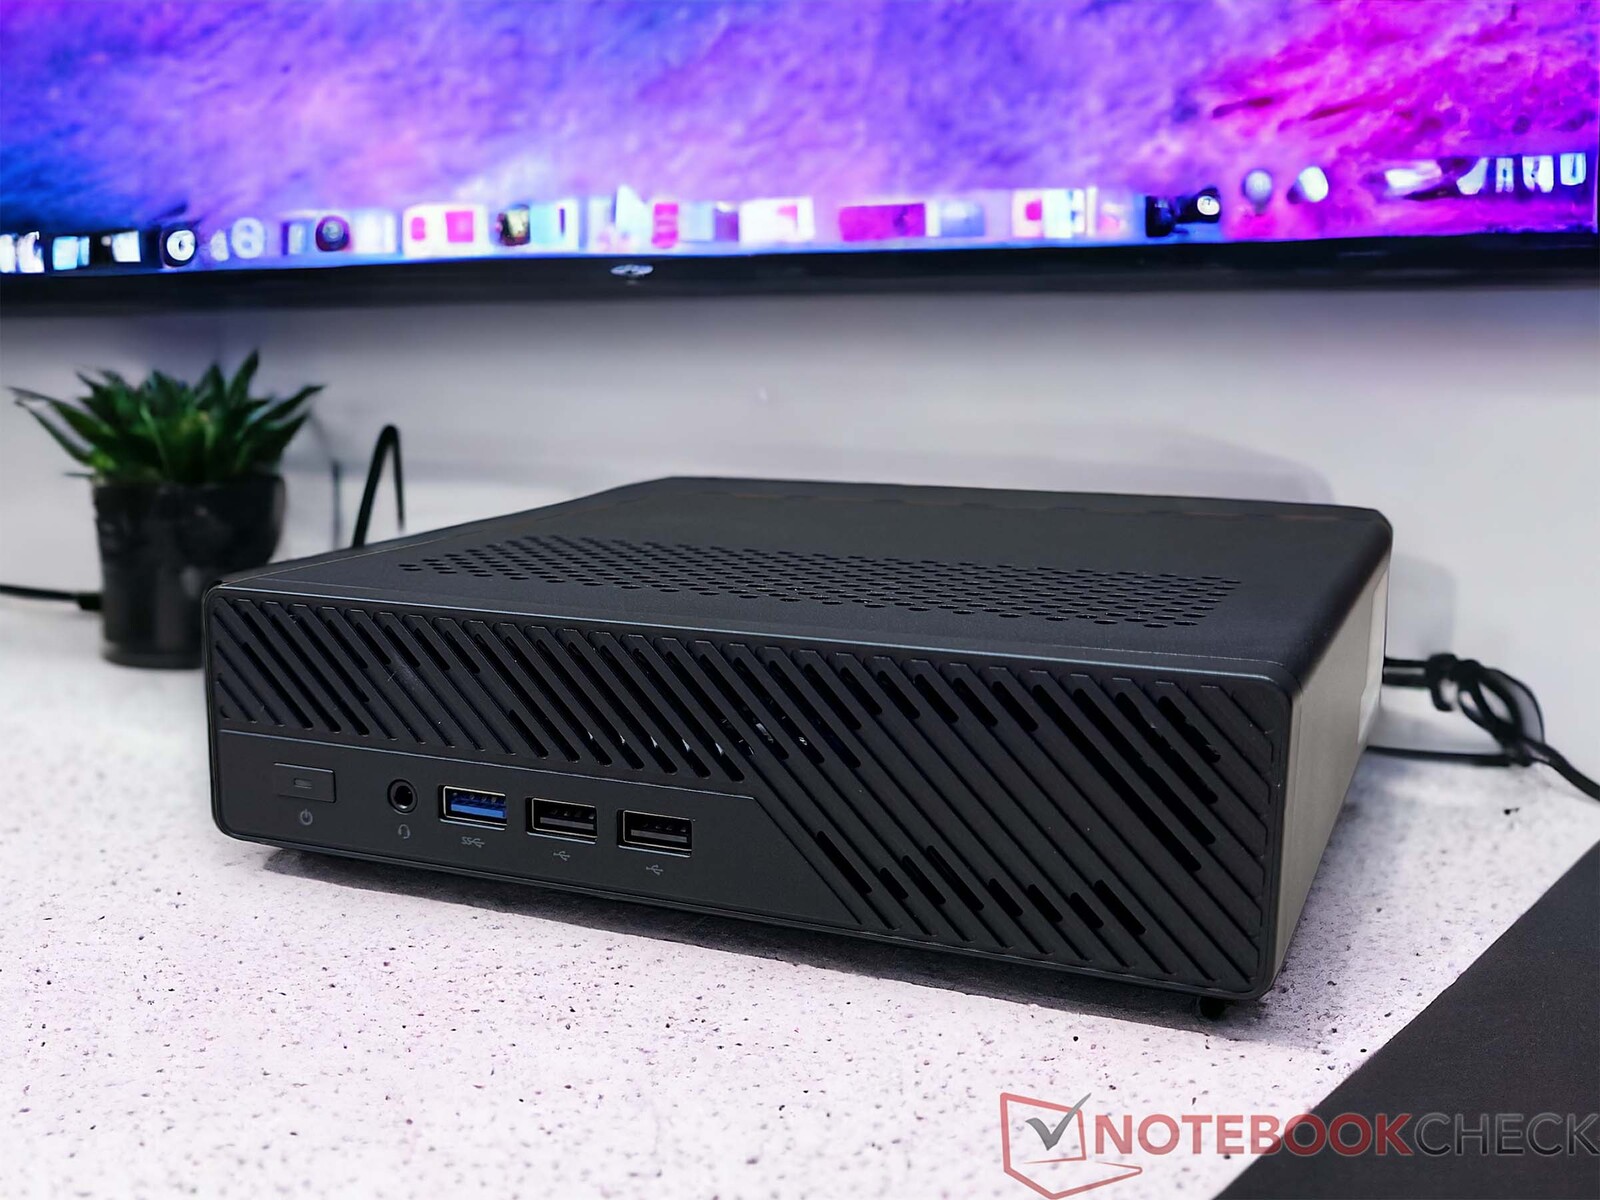
Case - Metal and plastic with an industrial look
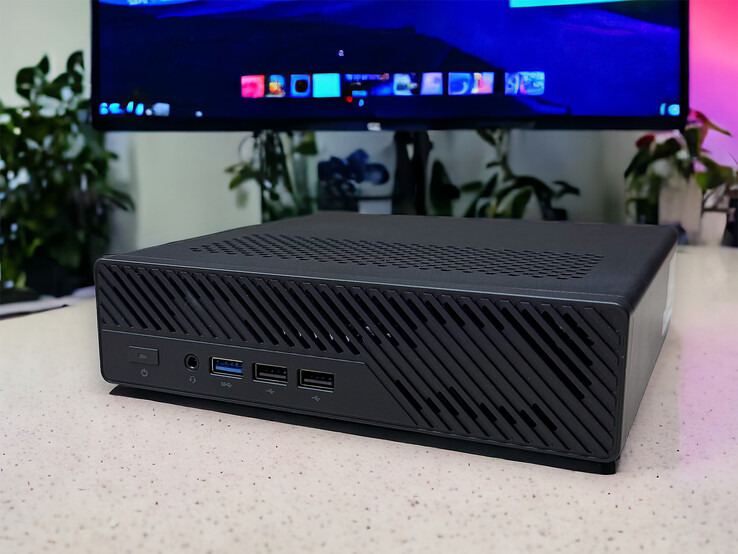
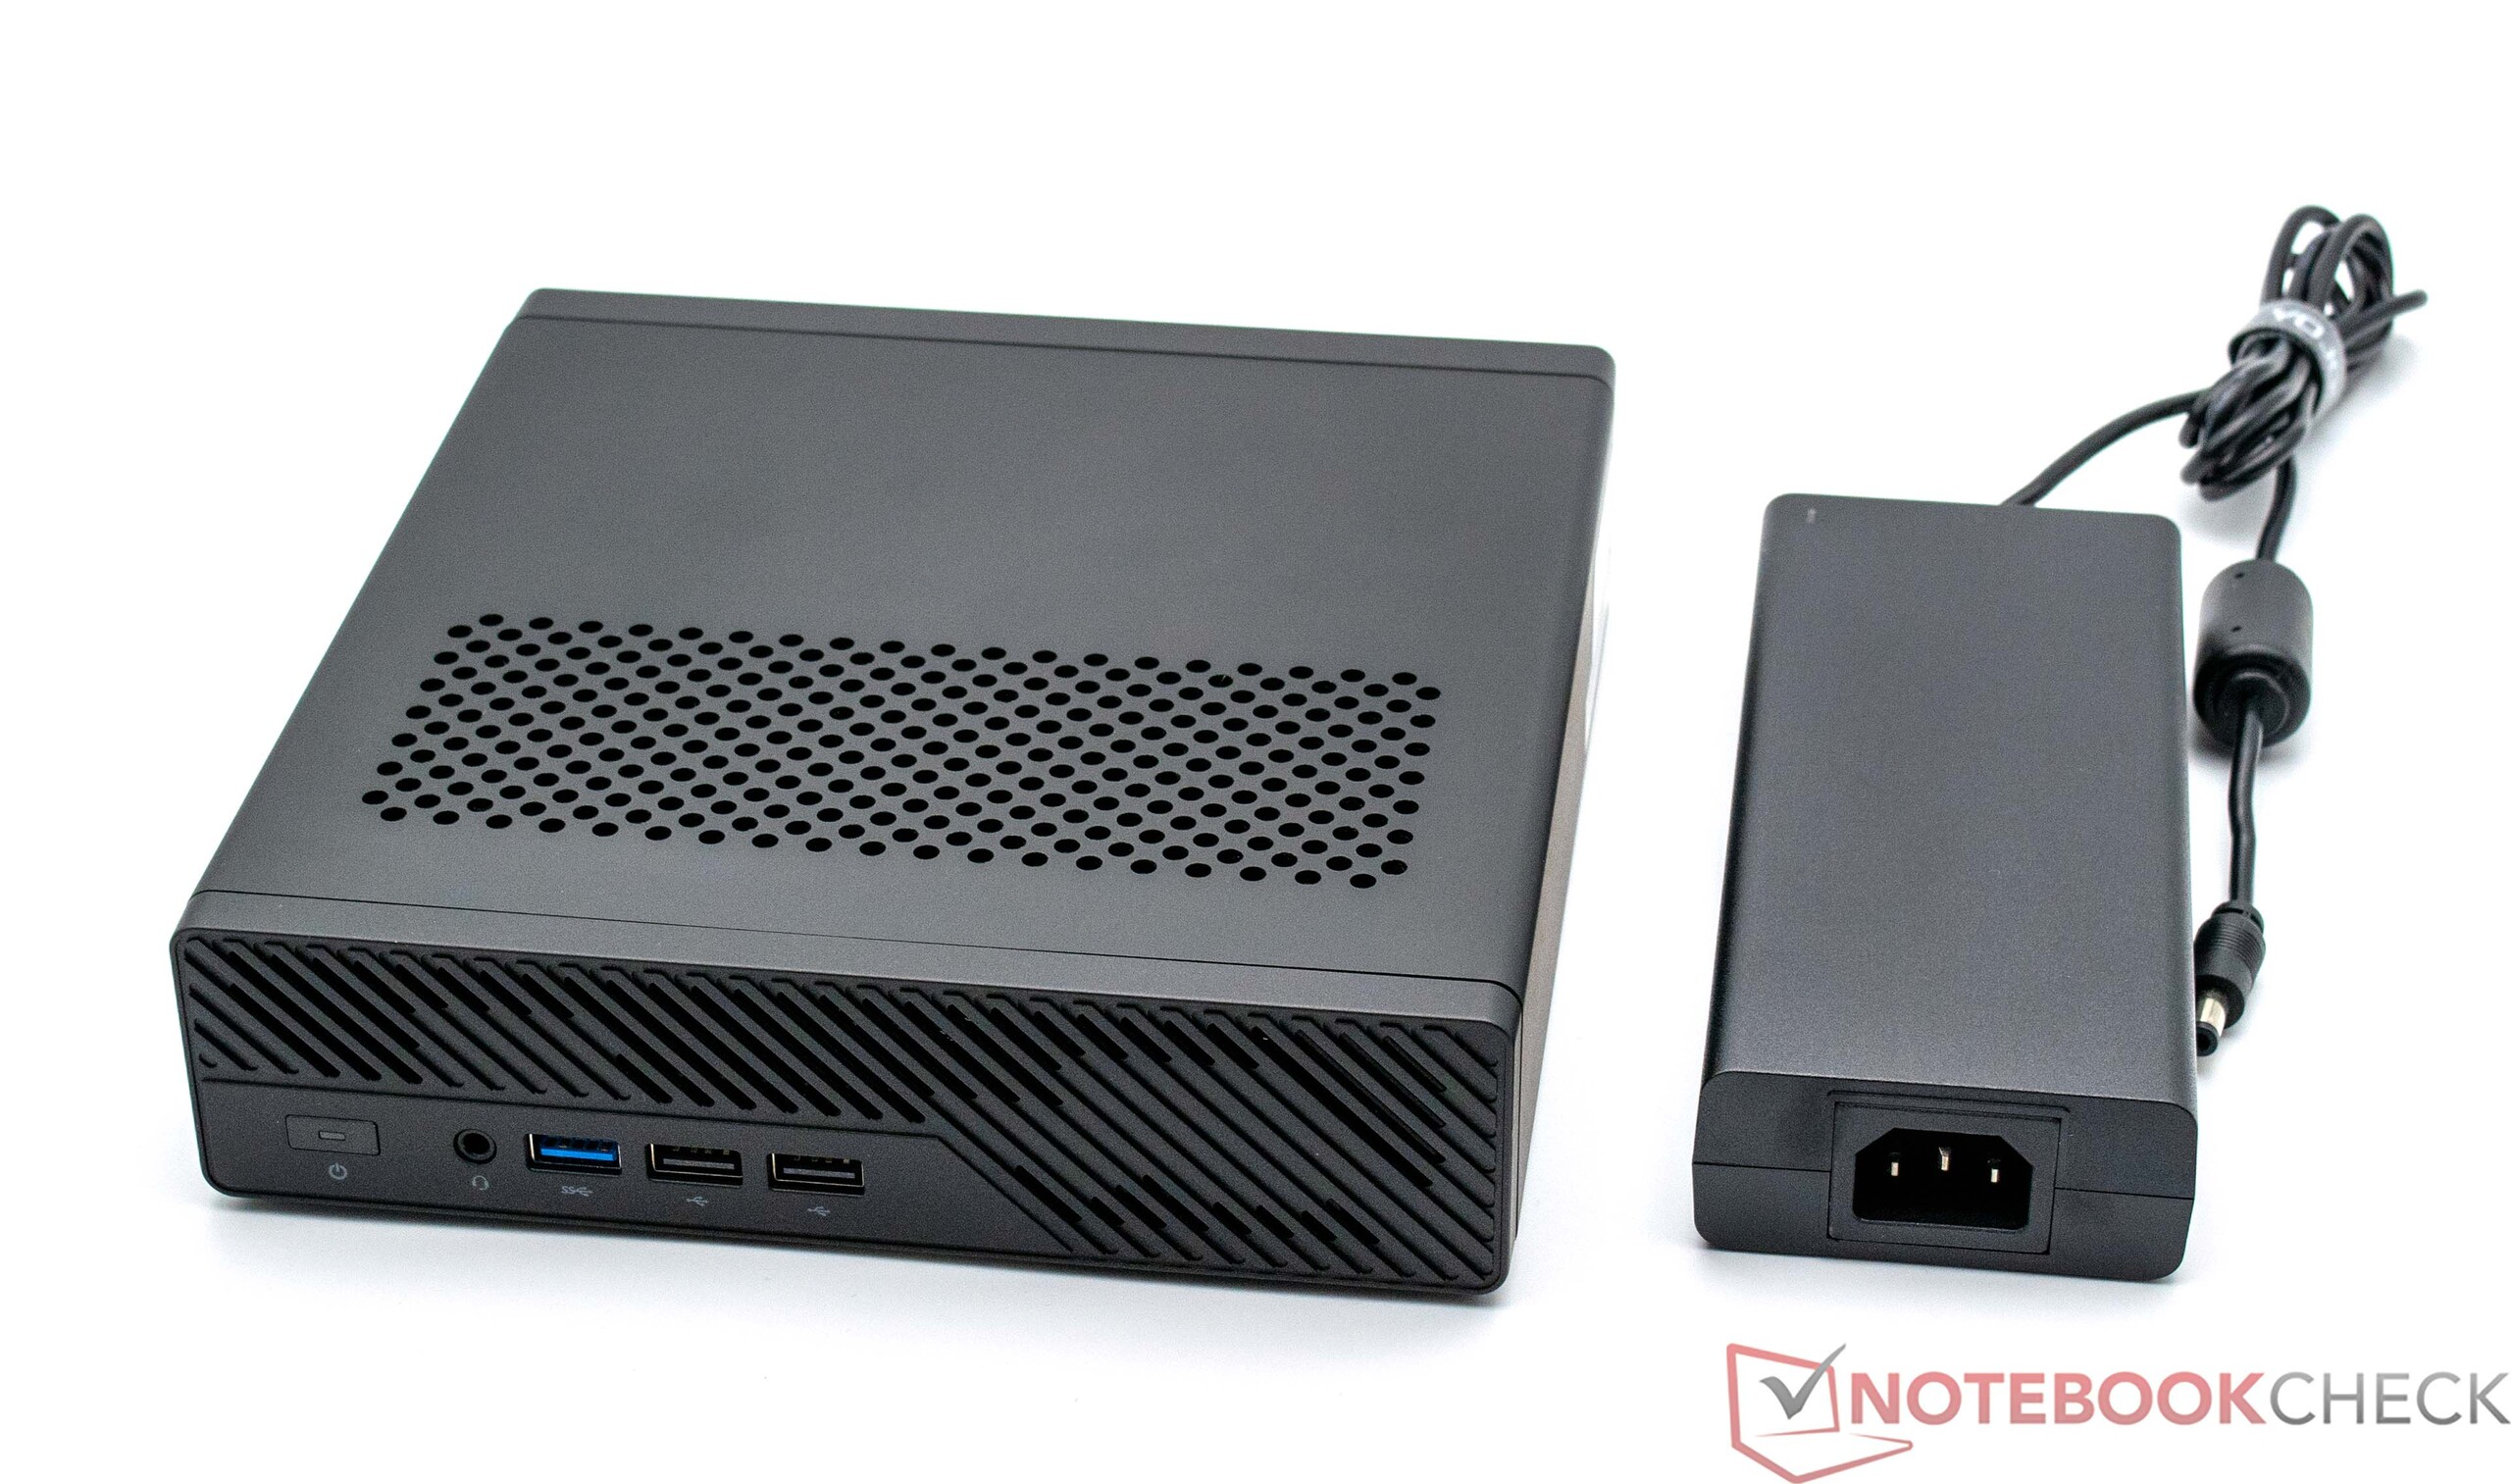
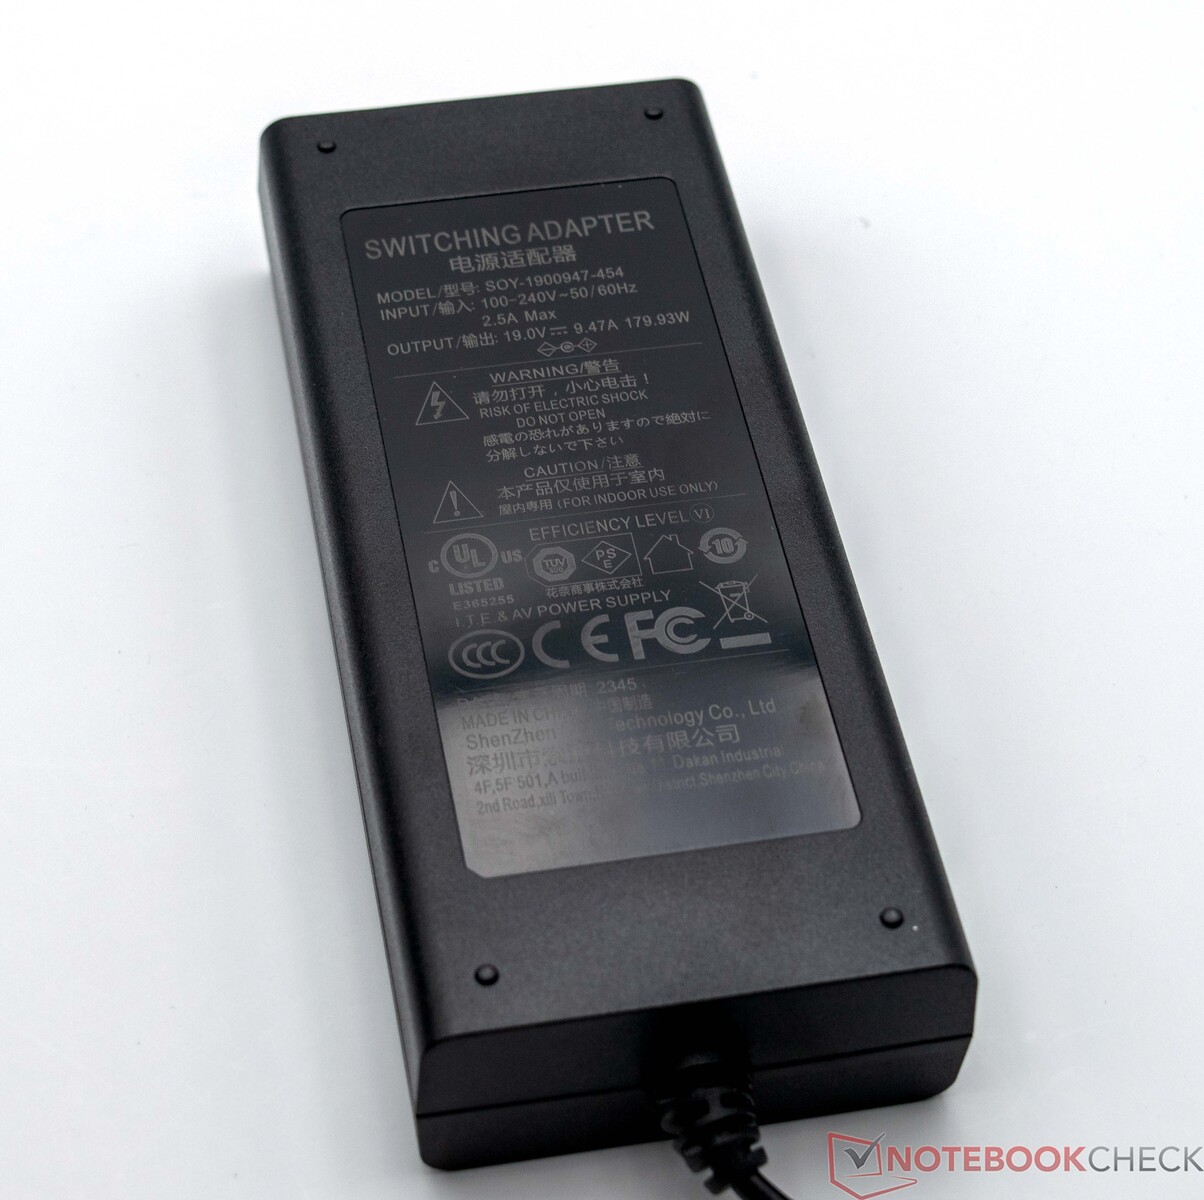
Visually, the Minisforum MS-01 does not resemble any of the manufacturer's previous models. Instead, the look is reminiscent of industrial devices such as Lenovo's ThinkCentre or HP's Elite Mini-800 models. The materials used are predominantly metal, although plastic adorns the front and rear. The Minisforum MS-01 takes up considerably more space on the desk than other conventional mini-PCs. There are no visual highlights and none are necessary. There is nothing to complain about in terms of workmanship. All parts are well-made and fit together perfectly. The extremely high stability should be emphasized, although this takes its toll in terms of weight. At 1.5 kilograms, the Minisforum MS-01 is clearly noticeable compared to the other Mini-PCs. The 180-watt power supply unit weighs in at a further 525 grams.
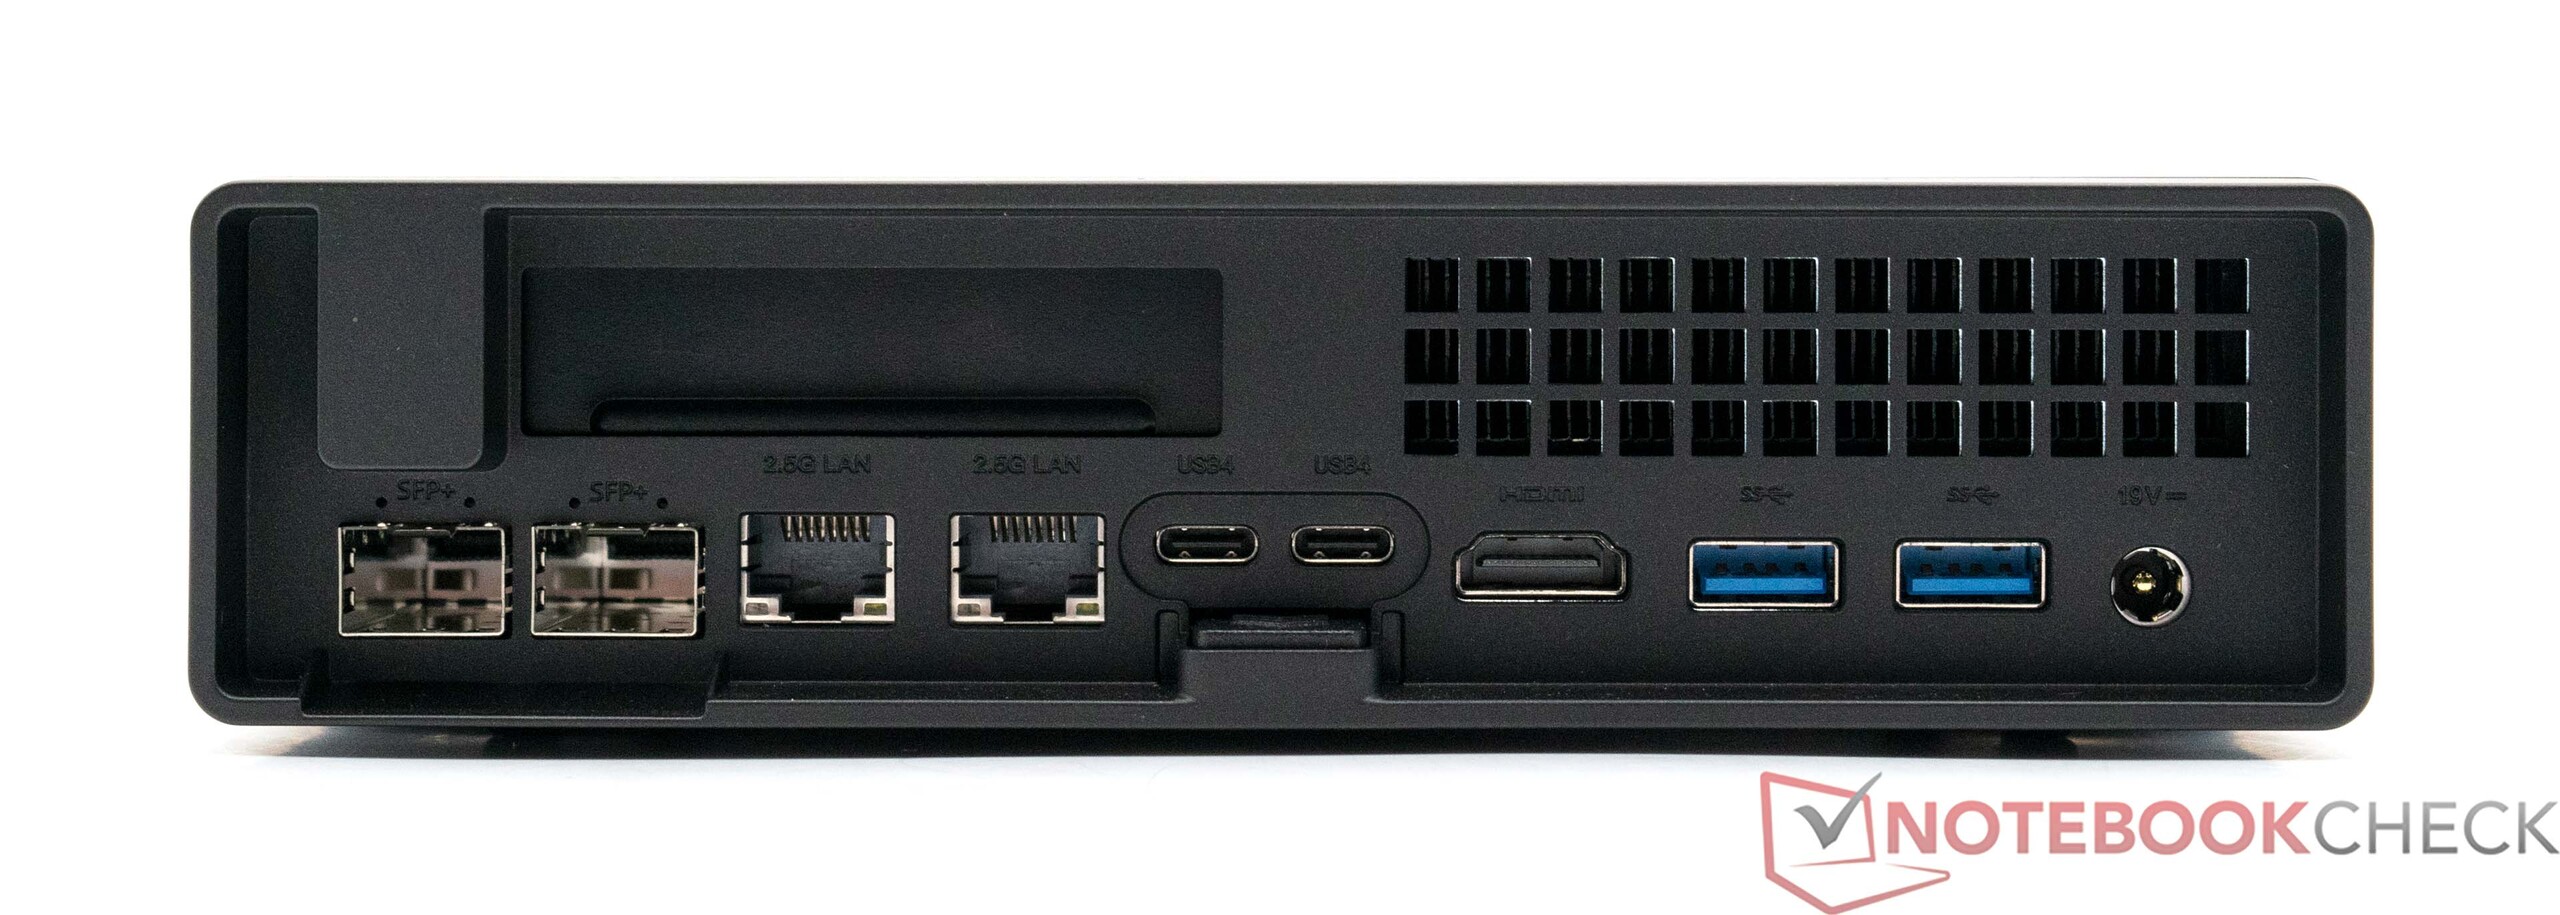
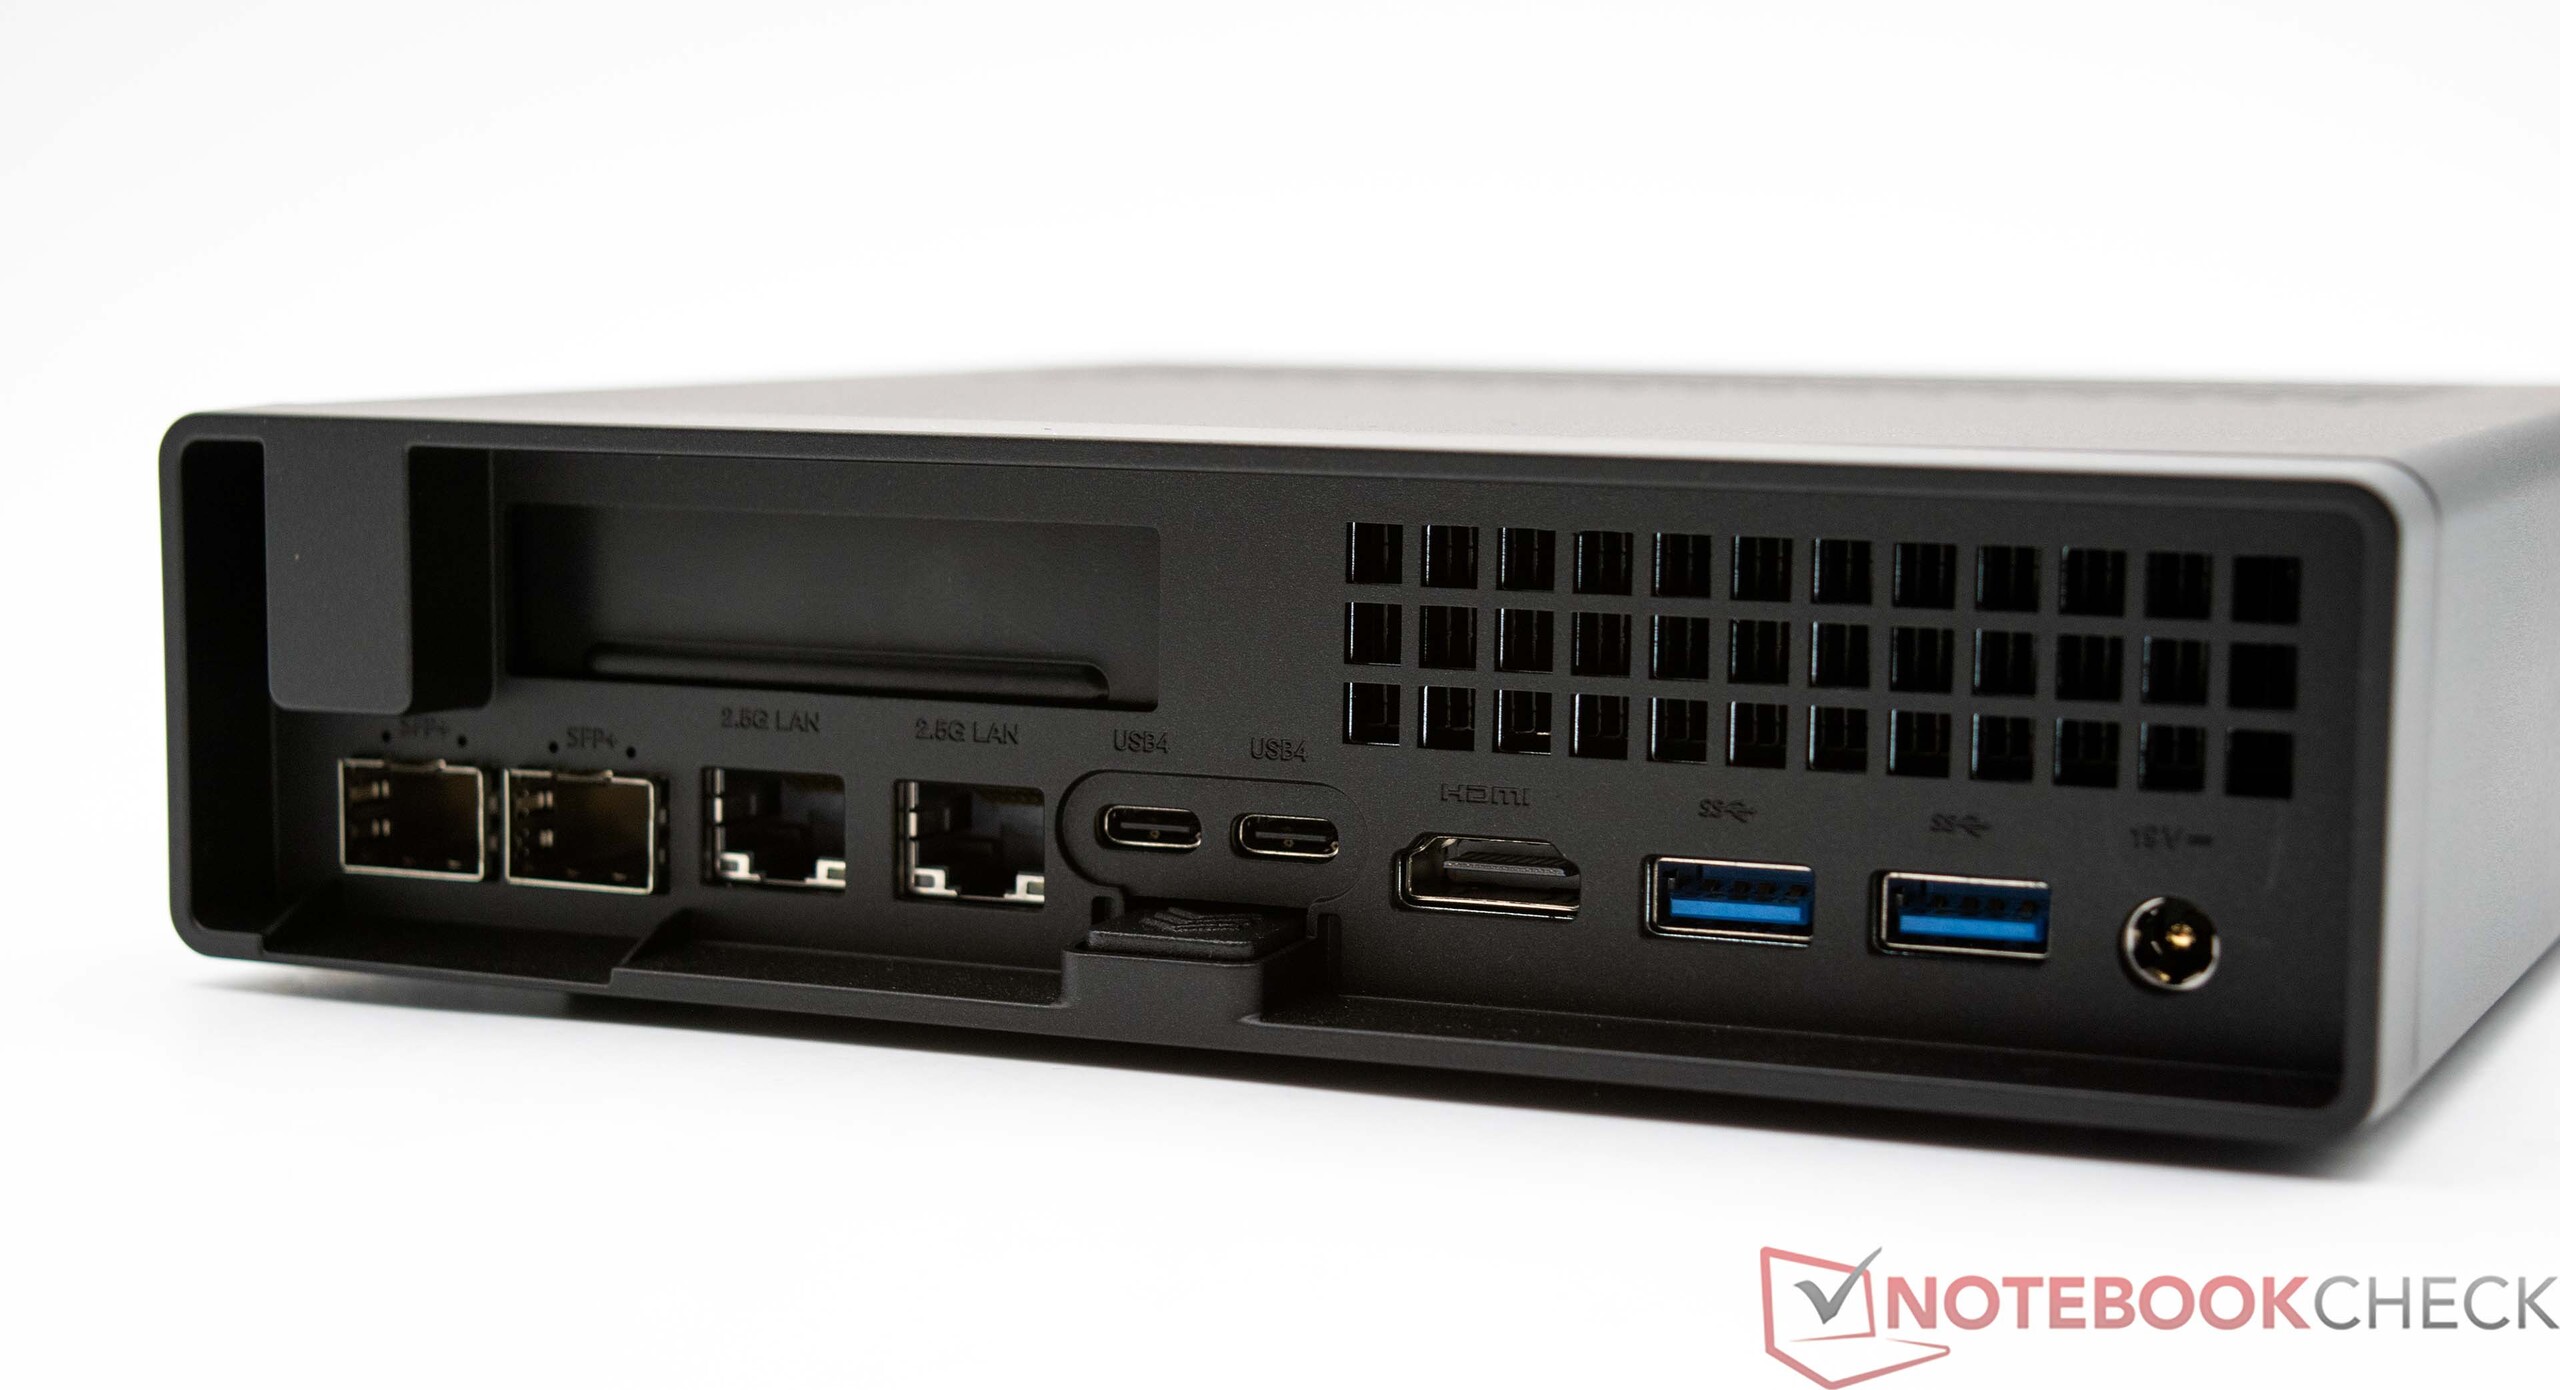
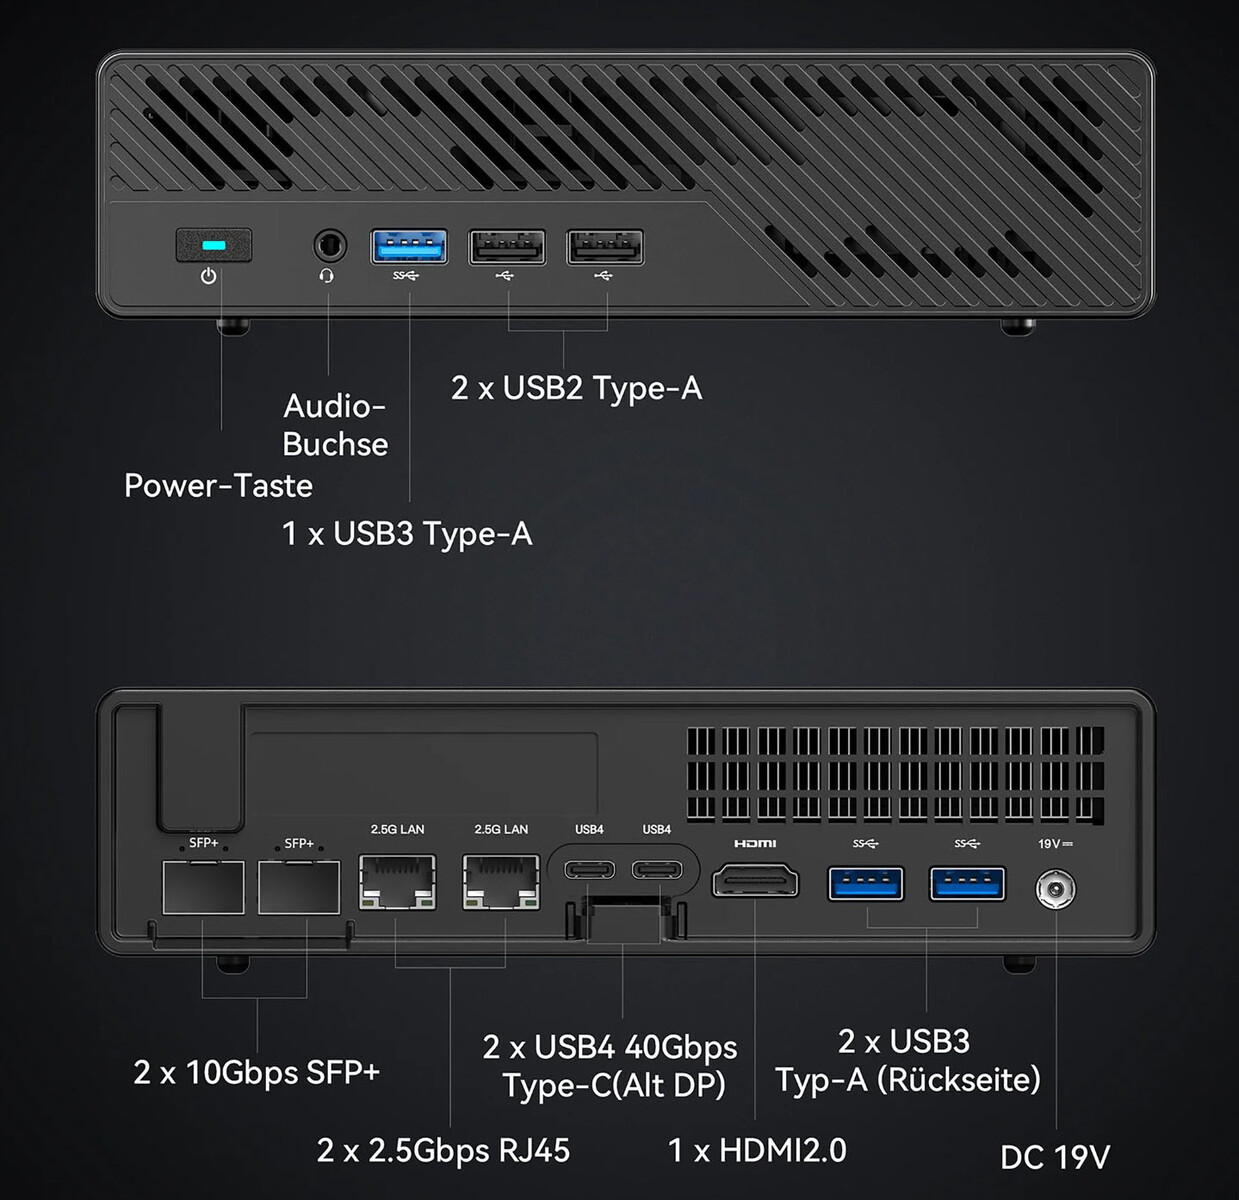
Equipment - PCIe x16 internal and 2x USB4 external
The available ports are spread across the front and rear. The Minisforum MS-01 has seven USB ports, two of which support the slow 2.0 standard. However, this is more than sufficient for input devices. After all, the Minisforum MS-01 can score points with two USB4 ports, which are located in the middle of the rear. On the other hand, the manufacturer is economical with the number of HDMI ports, as only one connection option is significantly less than what we are used to from mini-PCs. Meanwhile, screens can also be connected via USB4, meaning that the Minisforum MS-01 can control a total of three screens simultaneously. Even 8K displays are natively supported by the Minisforum MS-01. However, you will then have to make do with a 30 Hz refresh rate. As a special feature, the Minisforum MS-01 has a physical PCIe x16 interface, which offers native PCIe 4.0 x8 speed. This means that the compact computer can be equipped with a dedicated graphics card. However, the form factor significantly limits the choice of the model, as only half-height cards fit into the case. Only a single-slot design can be used for cooling.
Communication

In the Minisforum MS-01, we find a Wi-Fi module that we have come across many times before. The MediaTek Wi-Fi 6E MT7922 WLAN module achieved consistently excellent results in combination with our test sample. Both when using the 5 GHz wireless network and when using the 6 GHz frequency range, our test sample almost always came out on top. The Asus ROG Rapture GT-AXE11000 was used as the test router. As an alternative to the wireless connection, the Minisforum MS-01 offers many other network ports. There are two RJ45 sockets on the back of the MS-01. Data transmission of up to 2.5 GBit/s is possible here. Alternatively, there is also the option of retrofitting additional network adapters via two SFP+ interfaces.
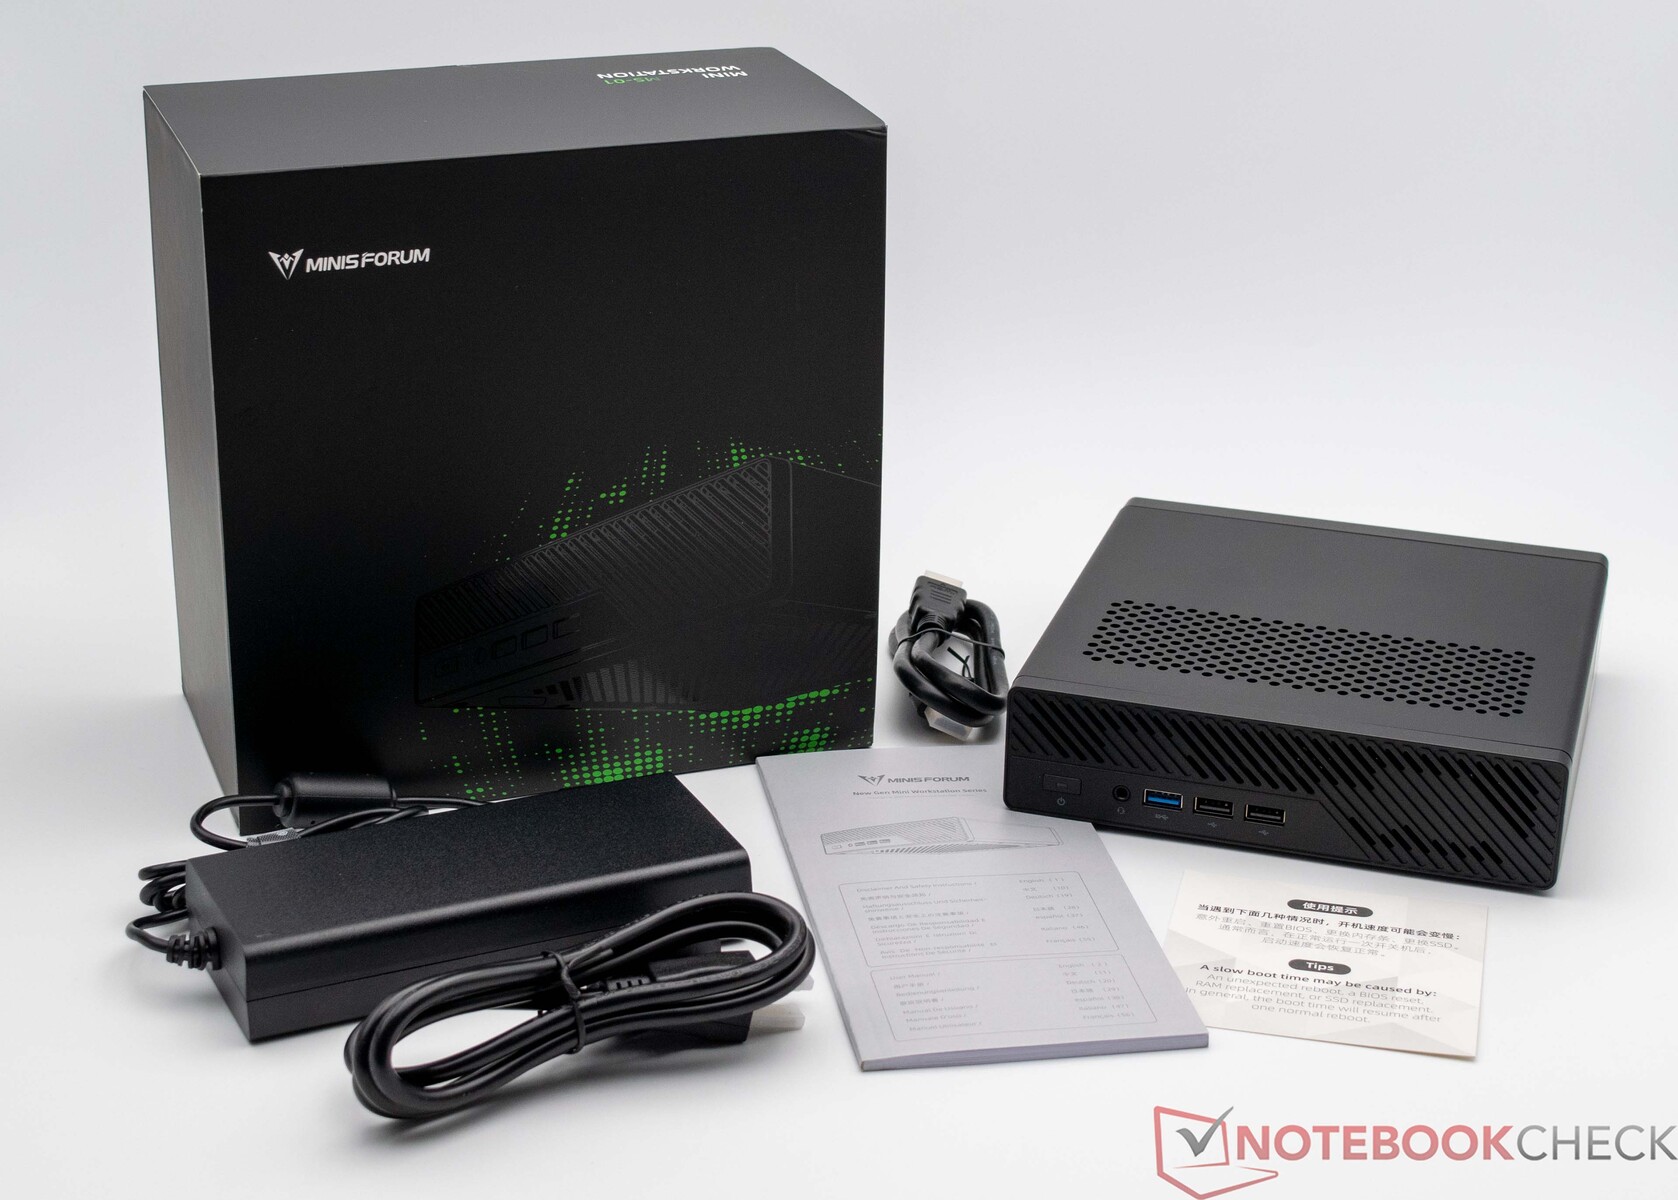
Accessories
The scope of delivery of the Minisforum MS-01 is not very extensive. In addition to the mini-PC itself, the 180-watt power supply unit and an HDMI cable are also included. The device also comes with an adapter for installing a U.2 SSD.
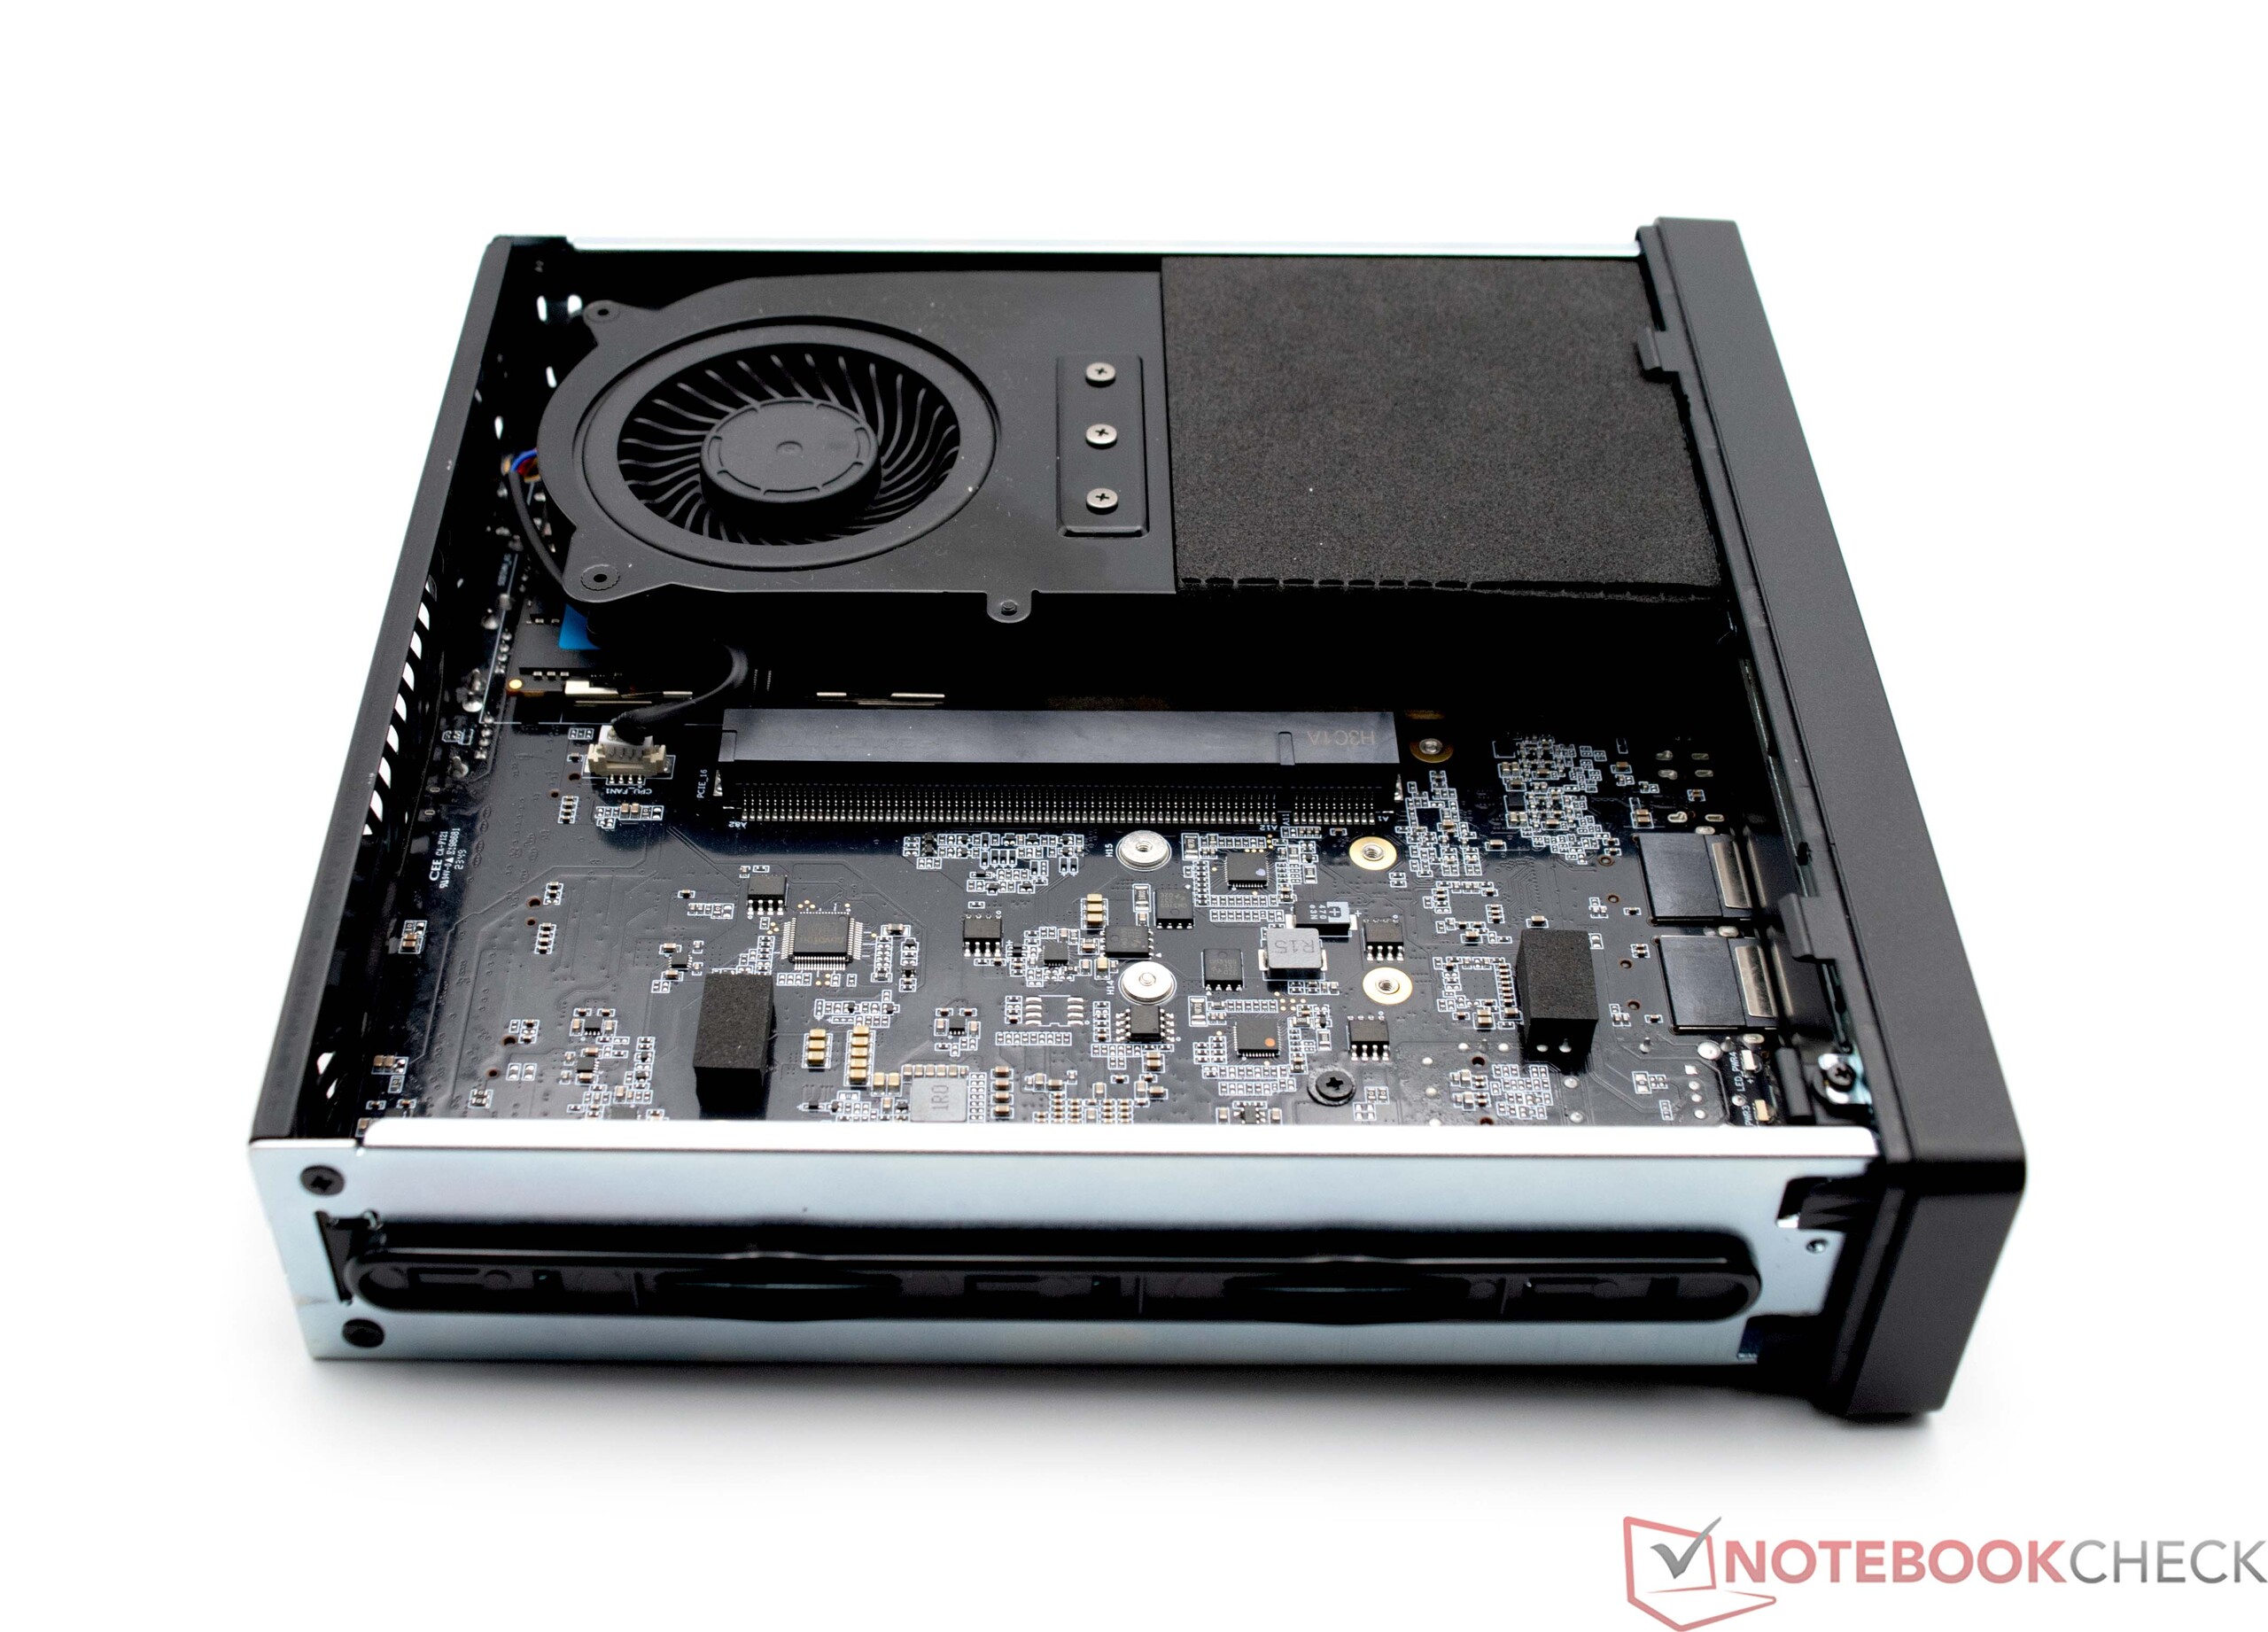
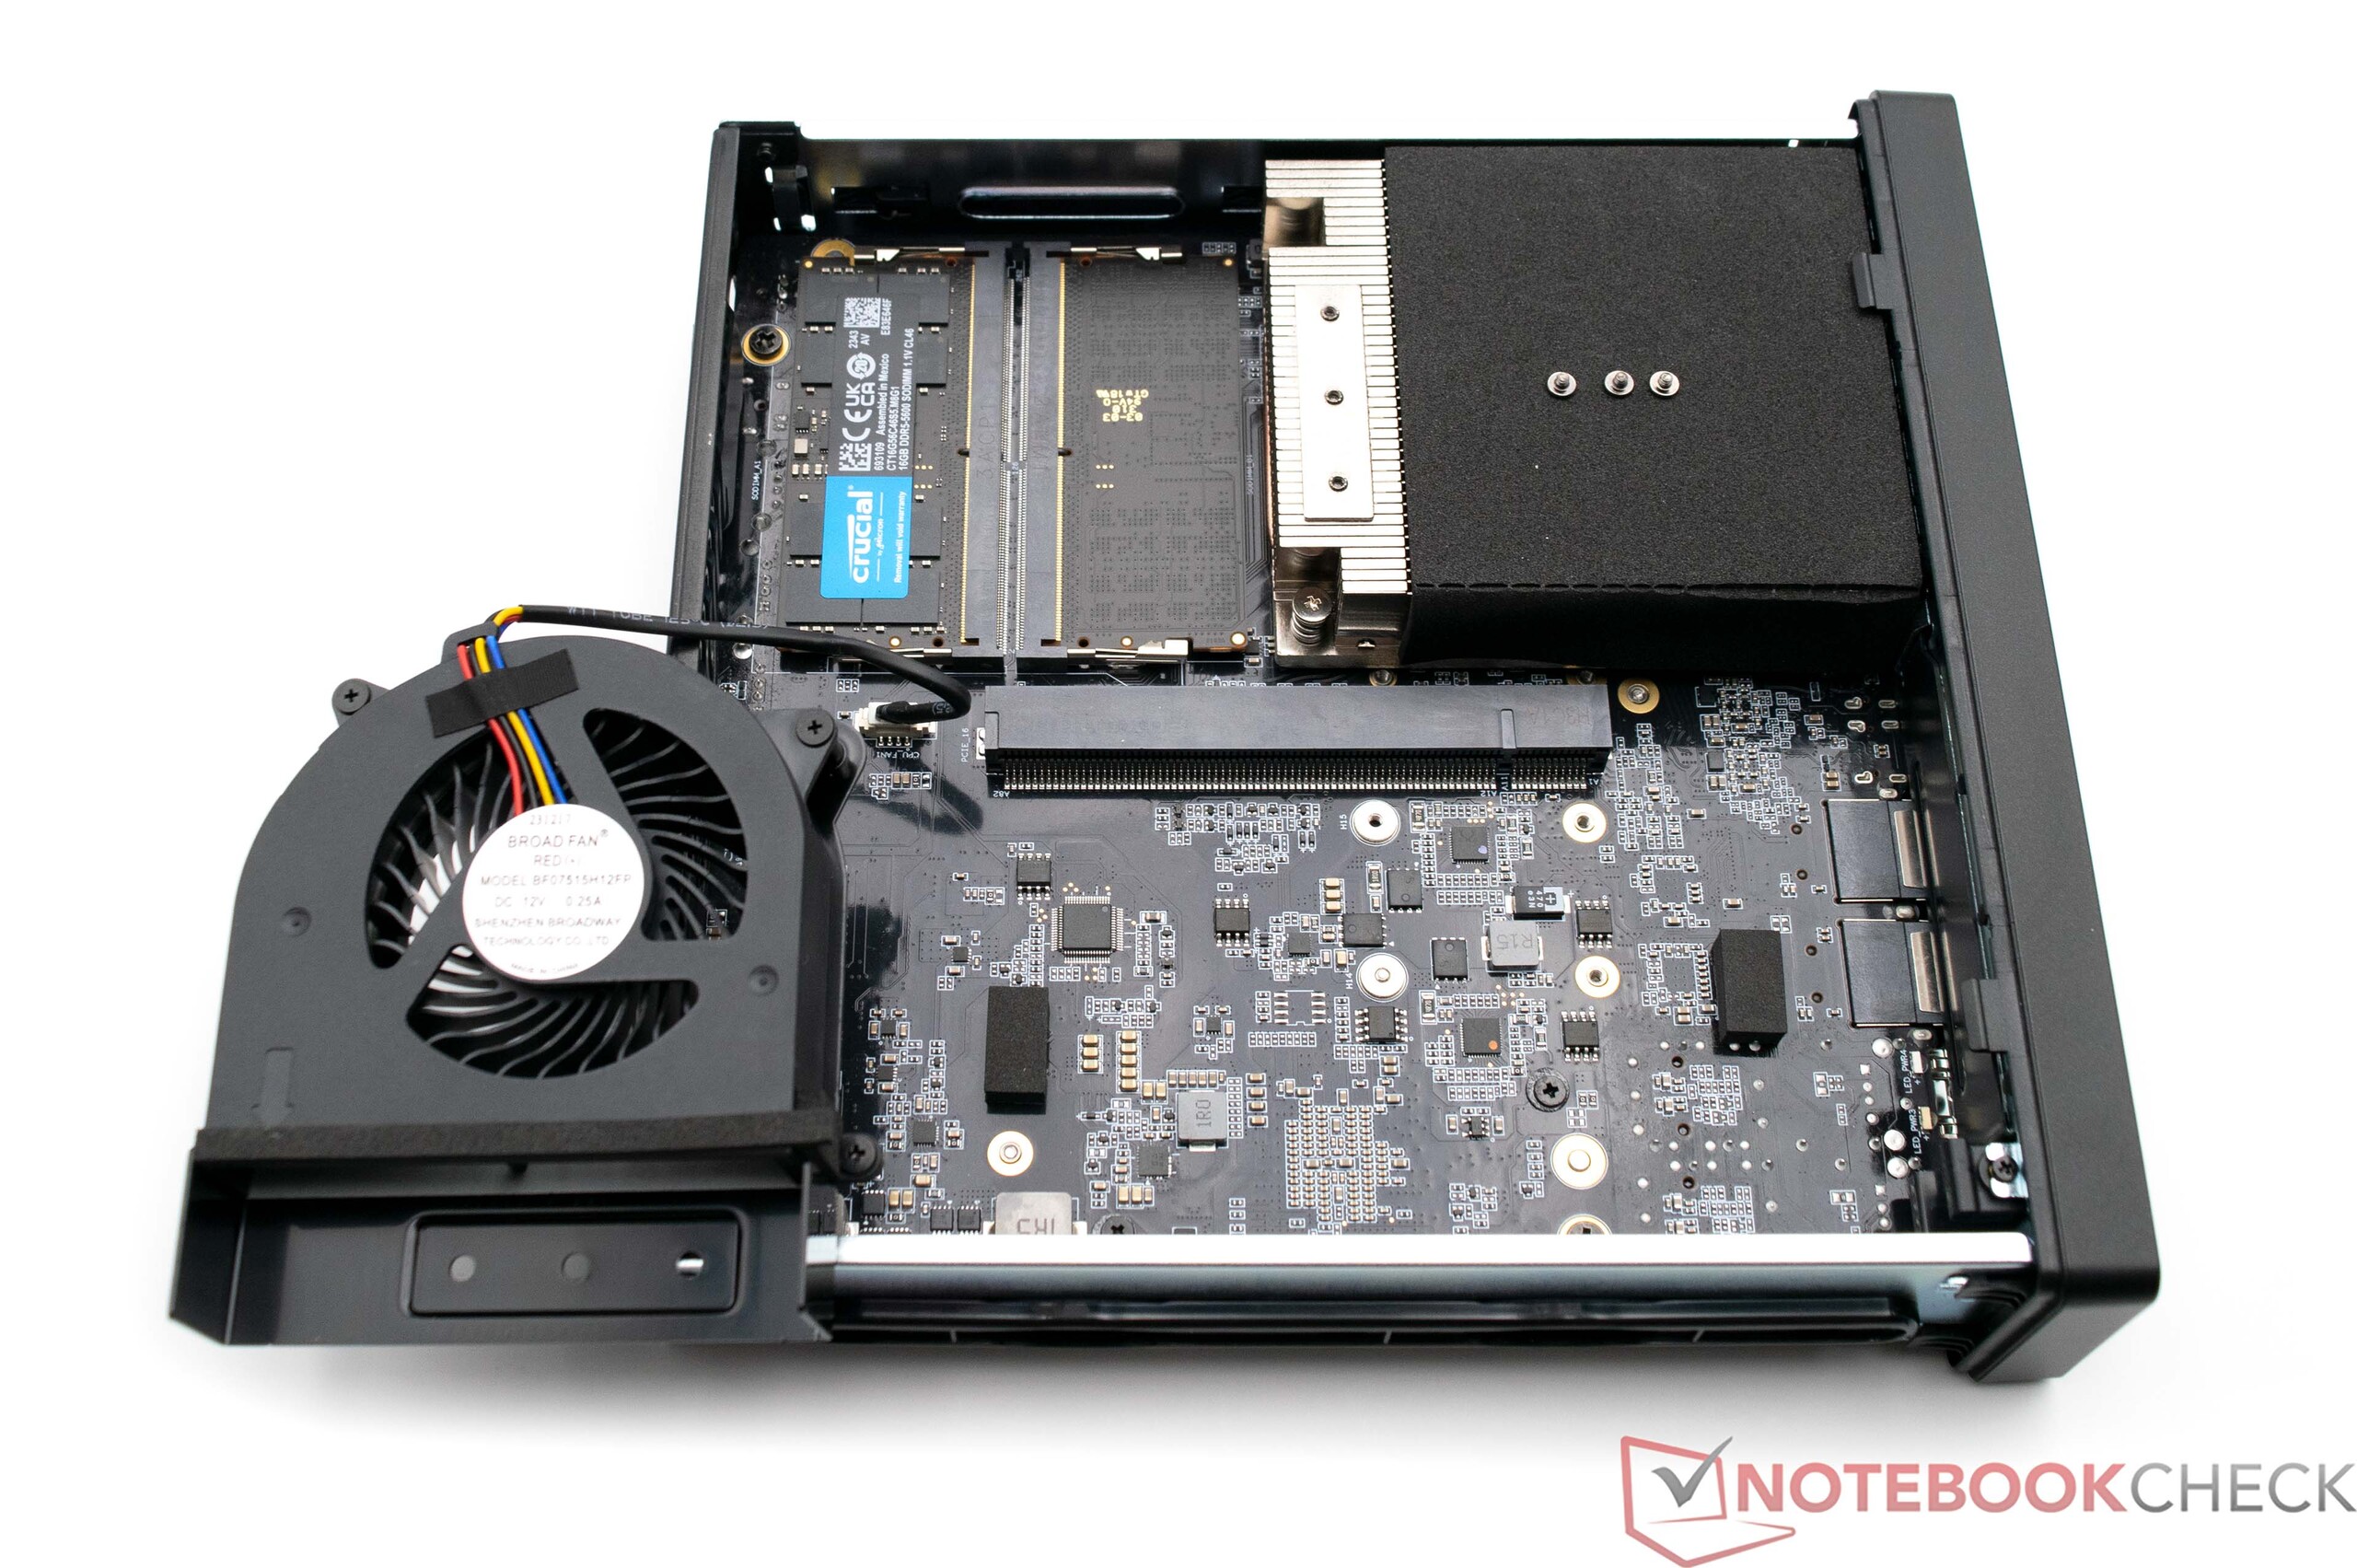
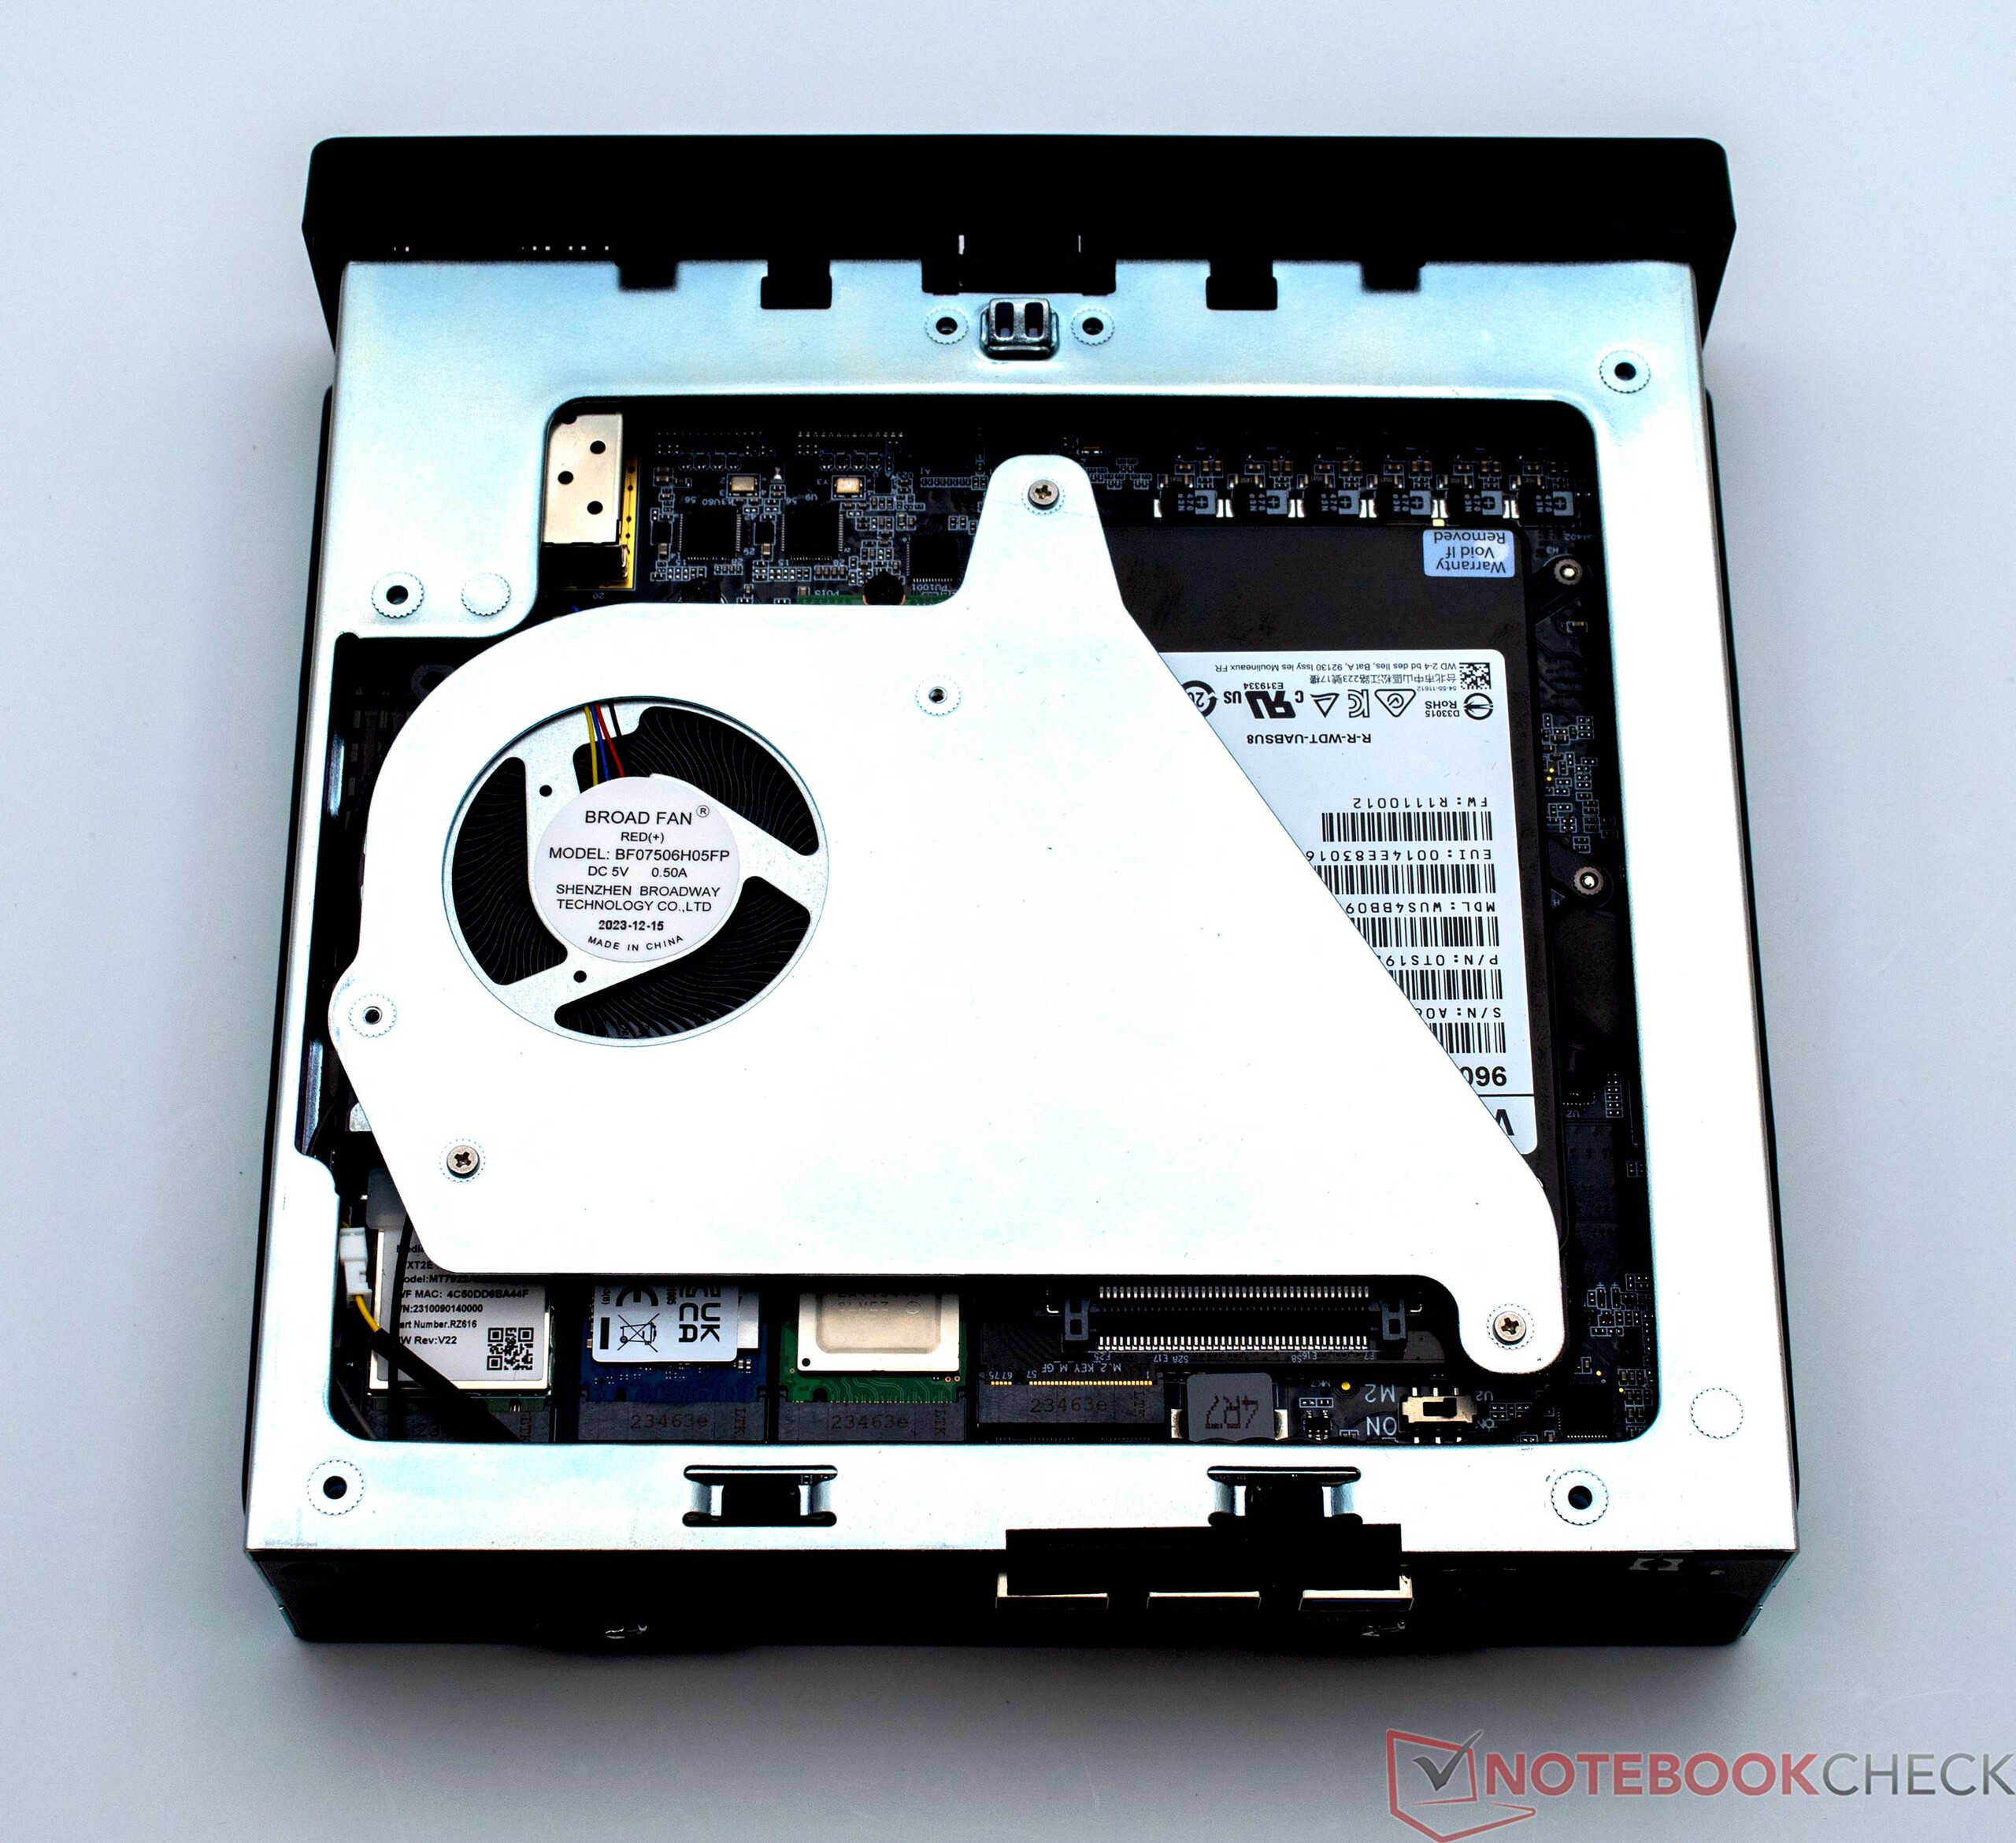
Maintenance
Minisforum MS-01 is unproblematic in terms of the equipment. The device itself can even be opened without tools. This works quite well in reality. So if you buy the device as a barebone option, you will inevitably have to install RAM and SSD, which is not possible without tools. The two SO-DIMM slots are located directly under the CPU fan, and SSDs can be installed on the underside. However, a wide metal cover with another fan has to be removed for this. Only PCIe SSDs can be accommodated in the Minisforum MS-01. Even U.2 SSDs can be installed, although the supplied adapter must be used for this.

Performance - Intel Raptor Lake-H with 14 cores and 20 threads
The Minisforum MS-01 is available with the Intel Core i9-13900H in the top configuration. Alternatively, the model is also available with an Intel Core i9-12900H, which would probably hardly perform worse. However, price-conscious buyers can also opt for the Intel Core i5-12600H. This SoC still combines 12 cores and 16 threads and should also be able to handle most tasks.


Test conditions
For all performance tests with the Minisforum MS-01, we use the "maximum performance" power plan. There were only deviations from this in the energy and noise measurements according to our Test criteria. The power limits of the processor PL1 (60 watts) and PL2 (80 watts) were not changed according to the delivery status.
Processor
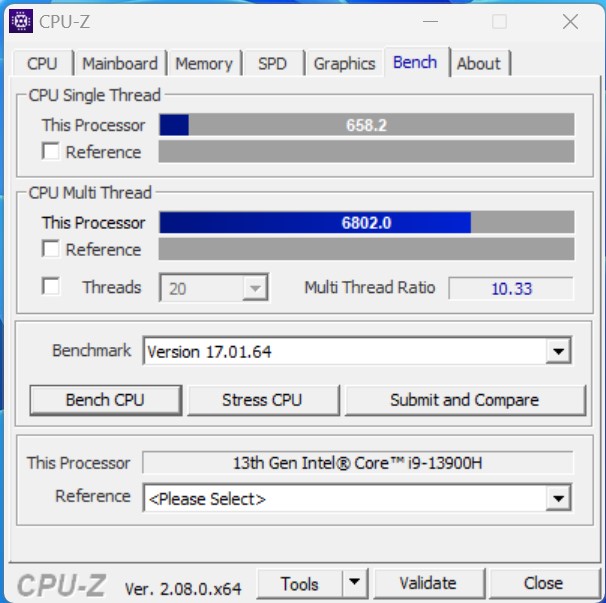
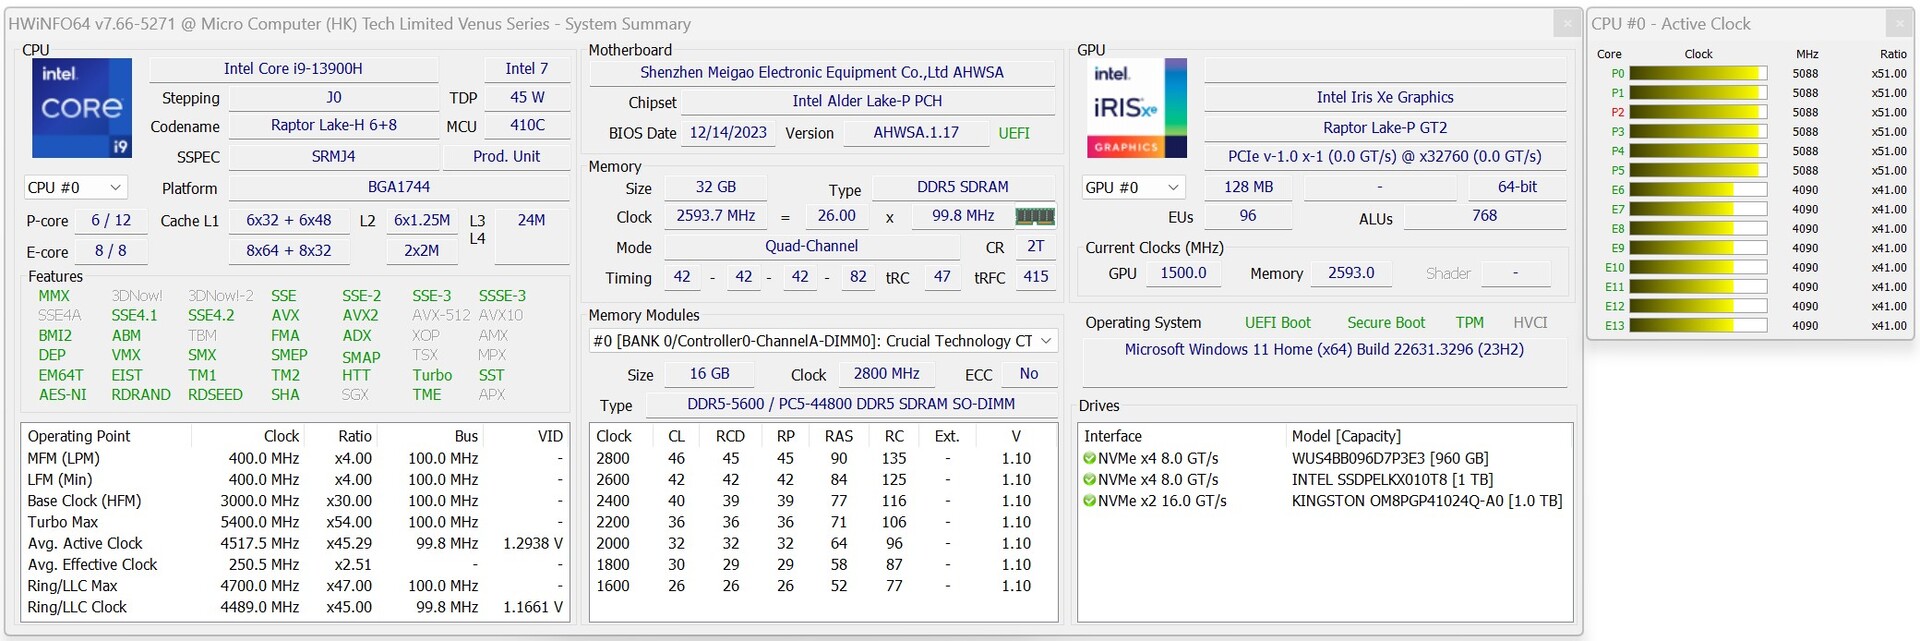
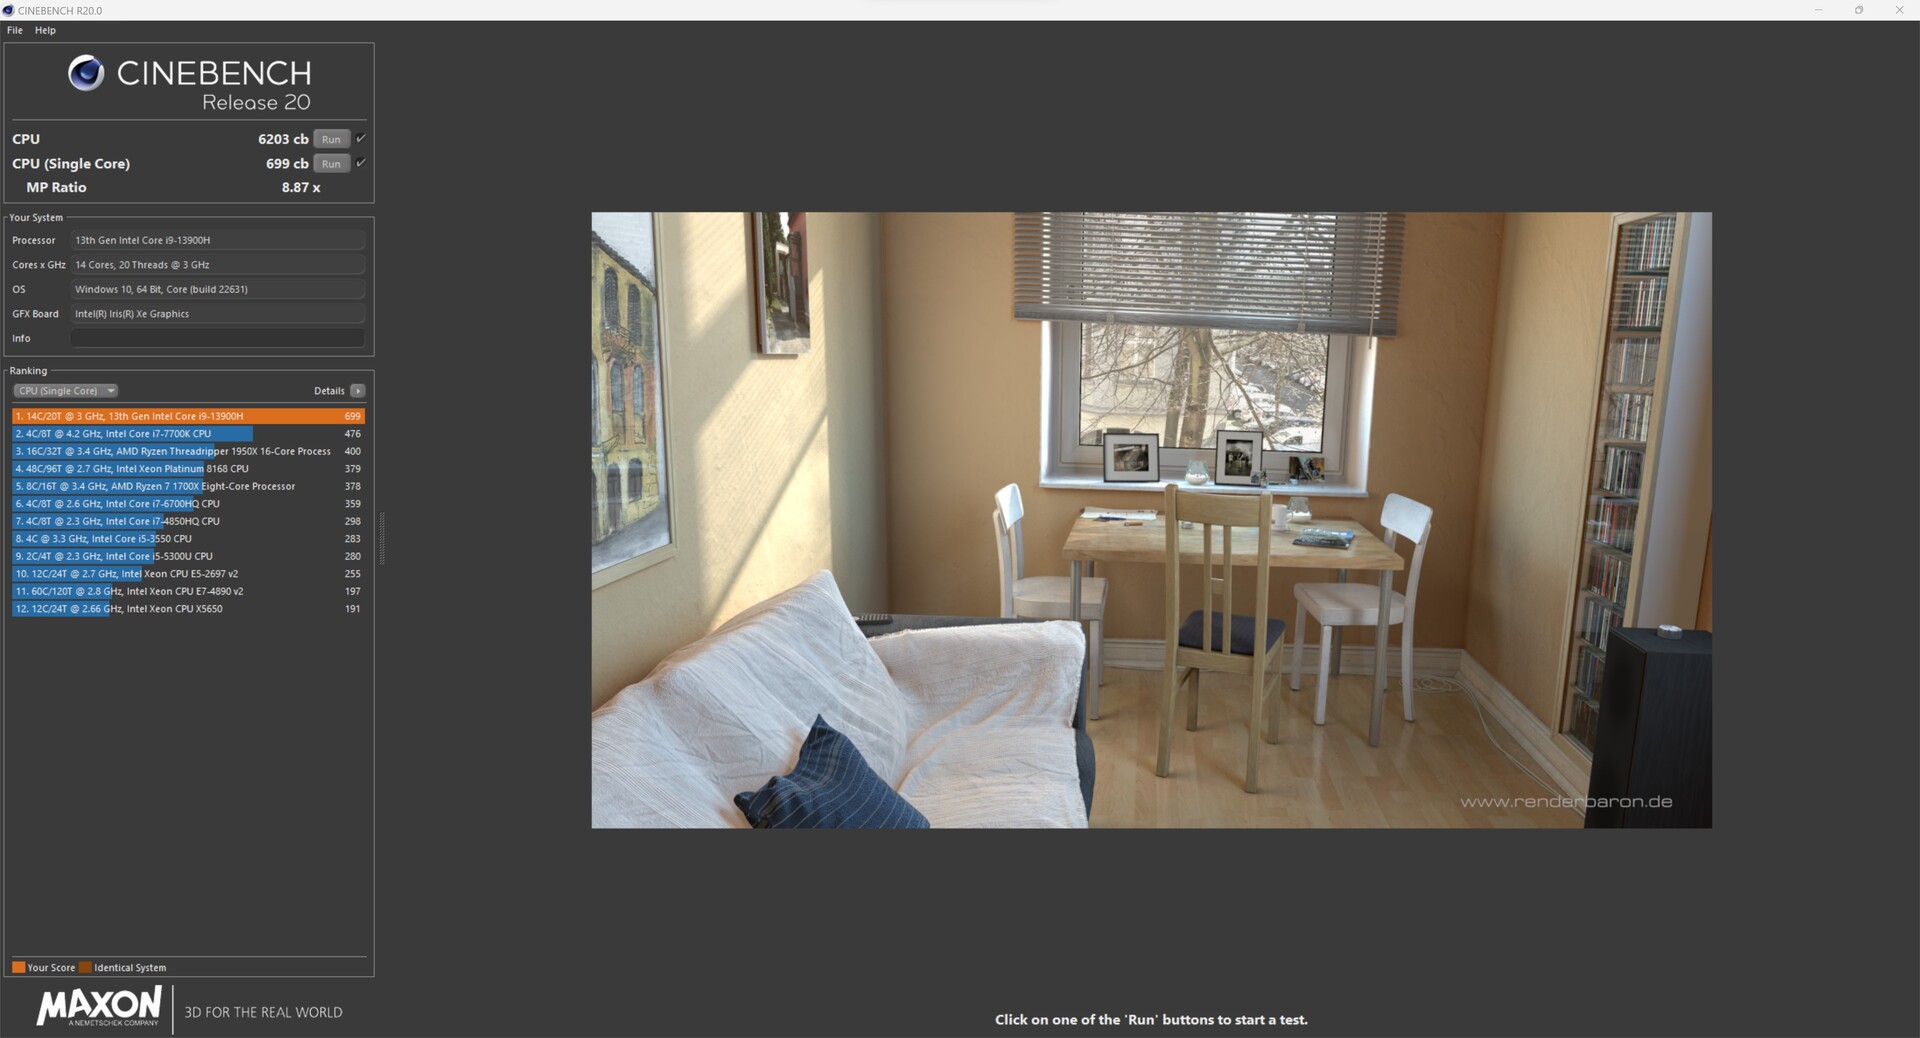
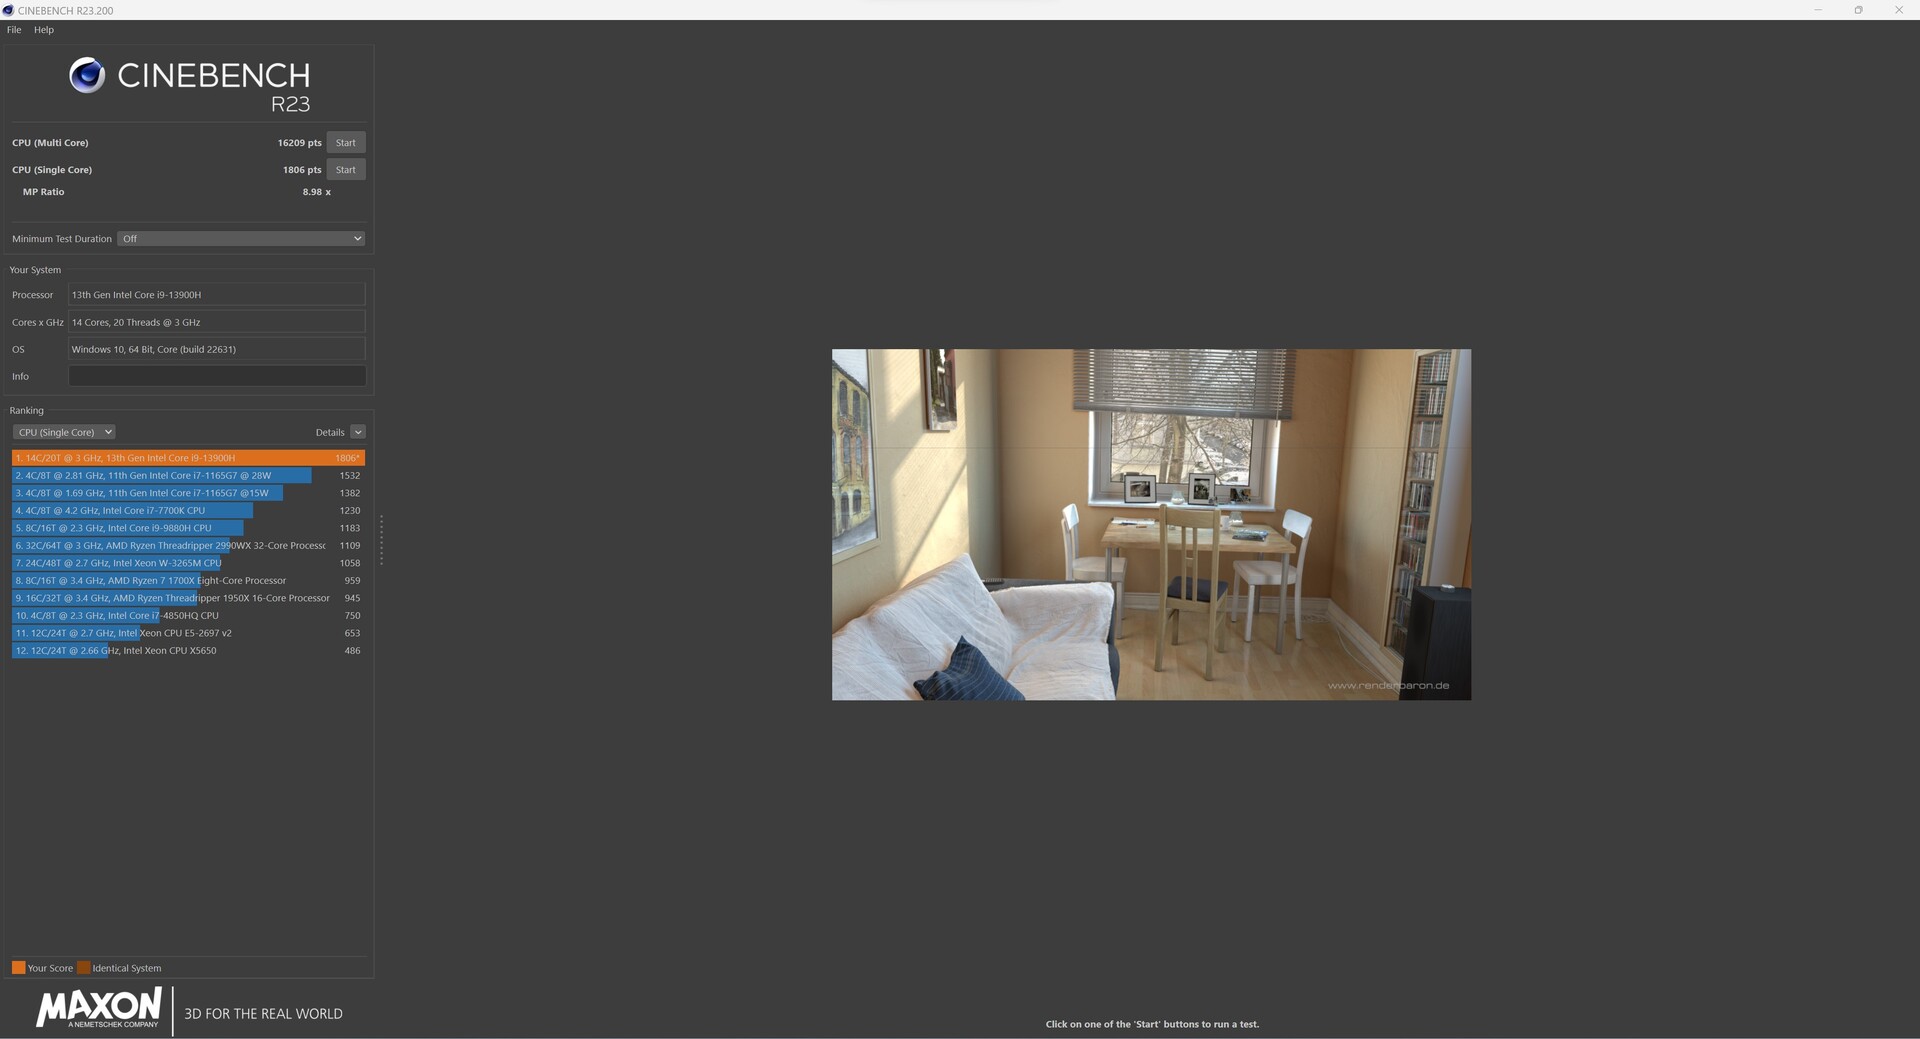
The Minisforum MS-01 comes with the Intel Core i9-13900H in the top configuration. In terms of performance, the SoC delivers outstanding performance in our test sample and ranks very closely to the Geekom A7 with the AMD Ryzen 9 7940HS.
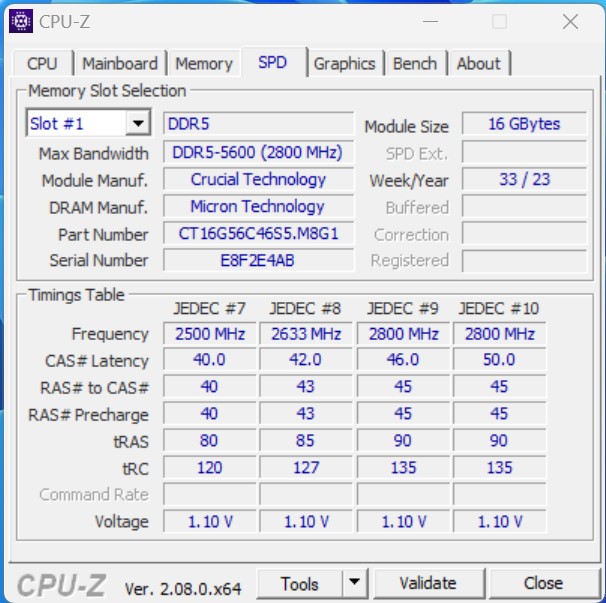
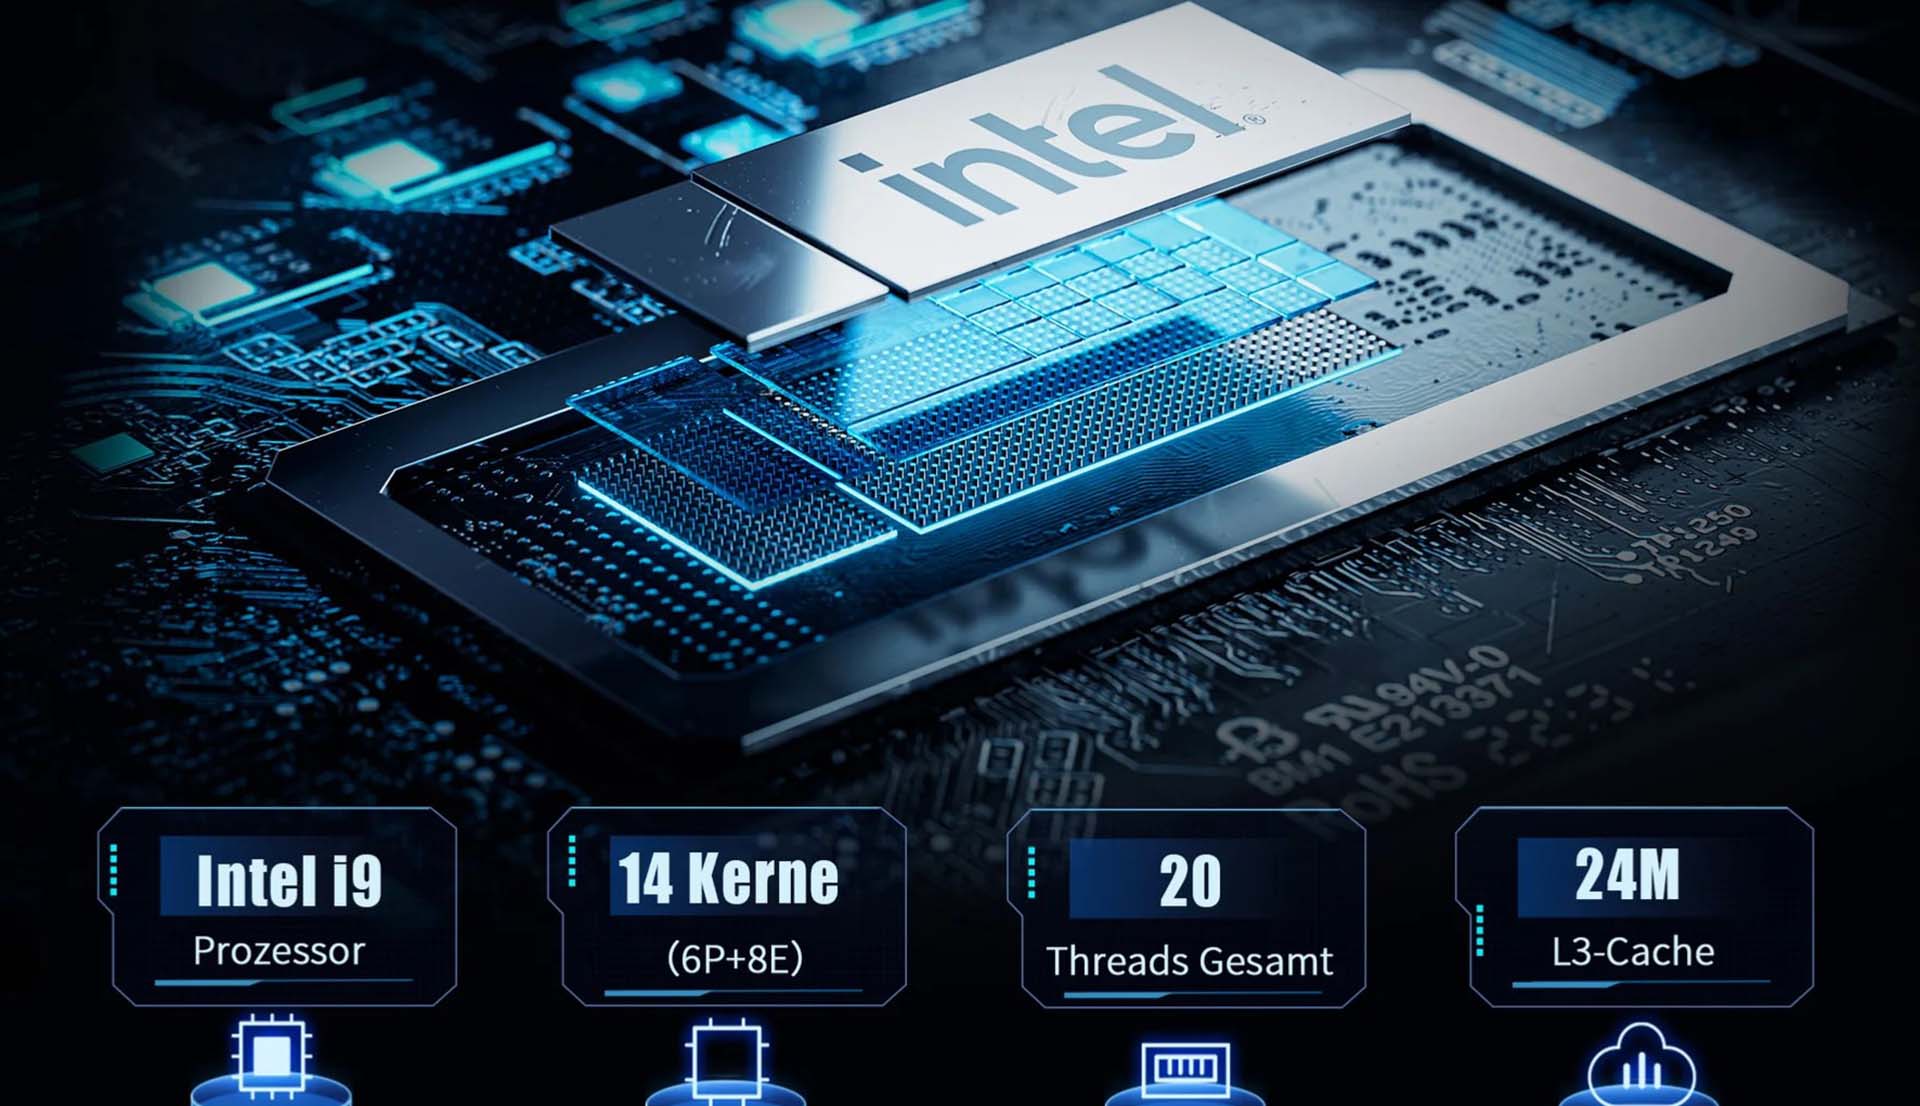
Intel Core i9-13900H offers a total of 14 cores with 20 threads. Minisforum gives the processor a short-term power limit of up to 80 watts. Under continuous load, 60 watts should be achieved. At this point, we are getting ahead of ourselves and can confirm the performance limits.
For further comparisons and benchmarks, please refer to our CPU comparison table.

| Performance rating - Percent | |
| Geekom A7 | |
| Minisforum MS-01 | |
| Minisforum Venus Series NAB9 | |
| Acemagic F2A | |
| Minisforum Venus Series NPB5 | |
| Geekom XT12 Pro | |
| Maxtang MTN-FP750 | |
| Cinebench R10 | |
| Rendering Single CPUs 64Bit | |
| Minisforum Venus Series NAB9 | |
| Minisforum Venus Series NPB5 | |
| Geekom A7 | |
| Acemagic F2A | |
| Minisforum MS-01 | |
| Geekom XT12 Pro | |
| Maxtang MTN-FP750 | |
| Rendering Multiple CPUs 64Bit | |
| Acemagic F2A | |
| Minisforum Venus Series NPB5 | |
| Geekom A7 | |
| Minisforum MS-01 | |
| Minisforum Venus Series NAB9 | |
| Geekom XT12 Pro | |
| Maxtang MTN-FP750 | |
| Blender - v2.79 BMW27 CPU | |
| Geekom XT12 Pro | |
| Maxtang MTN-FP750 | |
| Minisforum Venus Series NPB5 | |
| Minisforum Venus Series NAB9 | |
| Geekom A7 | |
| Minisforum MS-01 | |
| Acemagic F2A | |
| WinRAR - Result | |
| Minisforum MS-01 | |
| Minisforum Venus Series NAB9 | |
| Geekom XT12 Pro | |
| Acemagic F2A | |
| Geekom A7 | |
| Minisforum Venus Series NPB5 | |
| Maxtang MTN-FP750 | |
| 3DMark 11 - 1280x720 Performance Physics | |
| Geekom A7 | |
| Minisforum MS-01 | |
| Minisforum Venus Series NPB5 | |
| Acemagic F2A | |
| Minisforum Venus Series NAB9 | |
| Geekom XT12 Pro | |
| Maxtang MTN-FP750 | |
| HWBOT x265 Benchmark v2.2 - 4k Preset | |
| Geekom A7 | |
| Acemagic F2A | |
| Minisforum MS-01 | |
| Minisforum Venus Series NAB9 | |
| Minisforum Venus Series NPB5 | |
| Maxtang MTN-FP750 | |
| Geekom XT12 Pro | |
| R Benchmark 2.5 - Overall mean | |
| Maxtang MTN-FP750 | |
| Minisforum Venus Series NPB5 | |
| Acemagic F2A | |
| Geekom XT12 Pro | |
| Minisforum Venus Series NAB9 | |
| Minisforum MS-01 | |
| Geekom A7 | |
| LibreOffice - 20 Documents To PDF | |
| Maxtang MTN-FP750 | |
| Geekom A7 | |
| Acemagic F2A | |
| Minisforum Venus Series NPB5 | |
| Geekom XT12 Pro | |
| Minisforum Venus Series NAB9 | |
| Minisforum MS-01 | |
| WebXPRT 3 - Overall | |
| Geekom A7 | |
| Minisforum MS-01 | |
| Minisforum Venus Series NPB5 | |
| Minisforum Venus Series NAB9 | |
| Geekom XT12 Pro | |
| Maxtang MTN-FP750 | |
| Acemagic F2A | |
| Mozilla Kraken 1.1 - Total | |
| Maxtang MTN-FP750 | |
| Acemagic F2A | |
| Minisforum Venus Series NPB5 | |
| Geekom XT12 Pro | |
| Minisforum MS-01 | |
| Geekom A7 | |
| Minisforum Venus Series NAB9 | |
| Super Pi mod 1.5 XS 1M - 1M | |
| Maxtang MTN-FP750 | |
| Geekom XT12 Pro | |
| Geekom A7 | |
| Minisforum Venus Series NAB9 | |
| Acemagic F2A | |
| Minisforum Venus Series NPB5 | |
| Minisforum MS-01 | |
| Super Pi mod 1.5 XS 2M - 2M | |
| Maxtang MTN-FP750 | |
| Geekom A7 | |
| Minisforum Venus Series NAB9 | |
| Geekom XT12 Pro | |
| Acemagic F2A | |
| Minisforum Venus Series NPB5 | |
| Minisforum MS-01 | |
| Super Pi Mod 1.5 XS 32M - 32M | |
| Maxtang MTN-FP750 | |
| Geekom A7 | |
| Minisforum Venus Series NAB9 | |
| Geekom XT12 Pro | |
| Acemagic F2A | |
| Minisforum MS-01 | |
| Minisforum Venus Series NPB5 | |
* ... smaller is better
| Performance rating - Percent | |
| Geekom A7 | |
| Minisforum MS-01 | |
| Acemagic F2A | |
| Minisforum Venus Series NPB5 | |
| Minisforum Venus Series NAB9 | |
| Geekom XT12 Pro | |
| Maxtang MTN-FP750 | |
AIDA64: FP32 Ray-Trace | FPU Julia | CPU SHA3 | CPU Queen | FPU SinJulia | FPU Mandel | CPU AES | CPU ZLib | FP64 Ray-Trace | CPU PhotoWorxx
| Performance rating | |
| Geekom A7 | |
| Average of class Mini PC | |
| Acemagic F2A | |
| Minisforum MS-01 | |
| Minisforum Venus Series NAB9 | |
| Maxtang MTN-FP750 | |
| Minisforum Venus Series NPB5 | |
| Geekom XT12 Pro | |
| AIDA64 / FP32 Ray-Trace | |
| Geekom A7 | |
| Average of class Mini PC (974 - 82725, n=104, last 2 years) | |
| Acemagic F2A | |
| Minisforum MS-01 | |
| Maxtang MTN-FP750 | |
| Minisforum Venus Series NAB9 | |
| Minisforum Venus Series NPB5 | |
| Geekom XT12 Pro | |
| AIDA64 / FPU Julia | |
| Geekom A7 | |
| Average of class Mini PC (6115 - 227429, n=104, last 2 years) | |
| Acemagic F2A | |
| Maxtang MTN-FP750 | |
| Minisforum MS-01 | |
| Minisforum Venus Series NAB9 | |
| Minisforum Venus Series NPB5 | |
| Geekom XT12 Pro | |
| AIDA64 / CPU SHA3 | |
| Geekom A7 | |
| Acemagic F2A | |
| Average of class Mini PC (385 - 9475, n=104, last 2 years) | |
| Minisforum MS-01 | |
| Minisforum Venus Series NAB9 | |
| Maxtang MTN-FP750 | |
| Minisforum Venus Series NPB5 | |
| Geekom XT12 Pro | |
| AIDA64 / CPU Queen | |
| Geekom A7 | |
| Minisforum Venus Series NAB9 | |
| Average of class Mini PC (20501 - 184747, n=104, last 2 years) | |
| Maxtang MTN-FP750 | |
| Acemagic F2A | |
| Minisforum MS-01 | |
| Minisforum Venus Series NPB5 | |
| Geekom XT12 Pro | |
| AIDA64 / FPU SinJulia | |
| Geekom A7 | |
| Average of class Mini PC (1019 - 31931, n=104, last 2 years) | |
| Maxtang MTN-FP750 | |
| Acemagic F2A | |
| Minisforum MS-01 | |
| Minisforum Venus Series NAB9 | |
| Geekom XT12 Pro | |
| Minisforum Venus Series NPB5 | |
| AIDA64 / FPU Mandel | |
| Geekom A7 | |
| Average of class Mini PC (3322 - 121827, n=104, last 2 years) | |
| Acemagic F2A | |
| Maxtang MTN-FP750 | |
| Minisforum MS-01 | |
| Minisforum Venus Series NAB9 | |
| Minisforum Venus Series NPB5 | |
| Geekom XT12 Pro | |
| AIDA64 / CPU AES | |
| Geekom A7 | |
| Acemagic F2A | |
| Minisforum MS-01 | |
| Minisforum Venus Series NAB9 | |
| Minisforum Venus Series NPB5 | |
| Geekom XT12 Pro | |
| Average of class Mini PC (9214 - 325960, n=103, last 2 years) | |
| Maxtang MTN-FP750 | |
| AIDA64 / CPU ZLib | |
| Acemagic F2A | |
| Geekom A7 | |
| Average of class Mini PC (127.2 - 2431, n=104, last 2 years) | |
| Minisforum MS-01 | |
| Minisforum Venus Series NAB9 | |
| Minisforum Venus Series NPB5 | |
| Geekom XT12 Pro | |
| Maxtang MTN-FP750 | |
| AIDA64 / FP64 Ray-Trace | |
| Geekom A7 | |
| Average of class Mini PC (537 - 43587, n=104, last 2 years) | |
| Acemagic F2A | |
| Minisforum MS-01 | |
| Maxtang MTN-FP750 | |
| Minisforum Venus Series NAB9 | |
| Minisforum Venus Series NPB5 | |
| Geekom XT12 Pro | |
| AIDA64 / CPU PhotoWorxx | |
| Minisforum MS-01 | |
| Geekom A7 | |
| Average of class Mini PC (8069 - 94259, n=104, last 2 years) | |
| Minisforum Venus Series NPB5 | |
| Acemagic F2A | |
| Minisforum Venus Series NAB9 | |
| Geekom XT12 Pro | |
| Maxtang MTN-FP750 | |
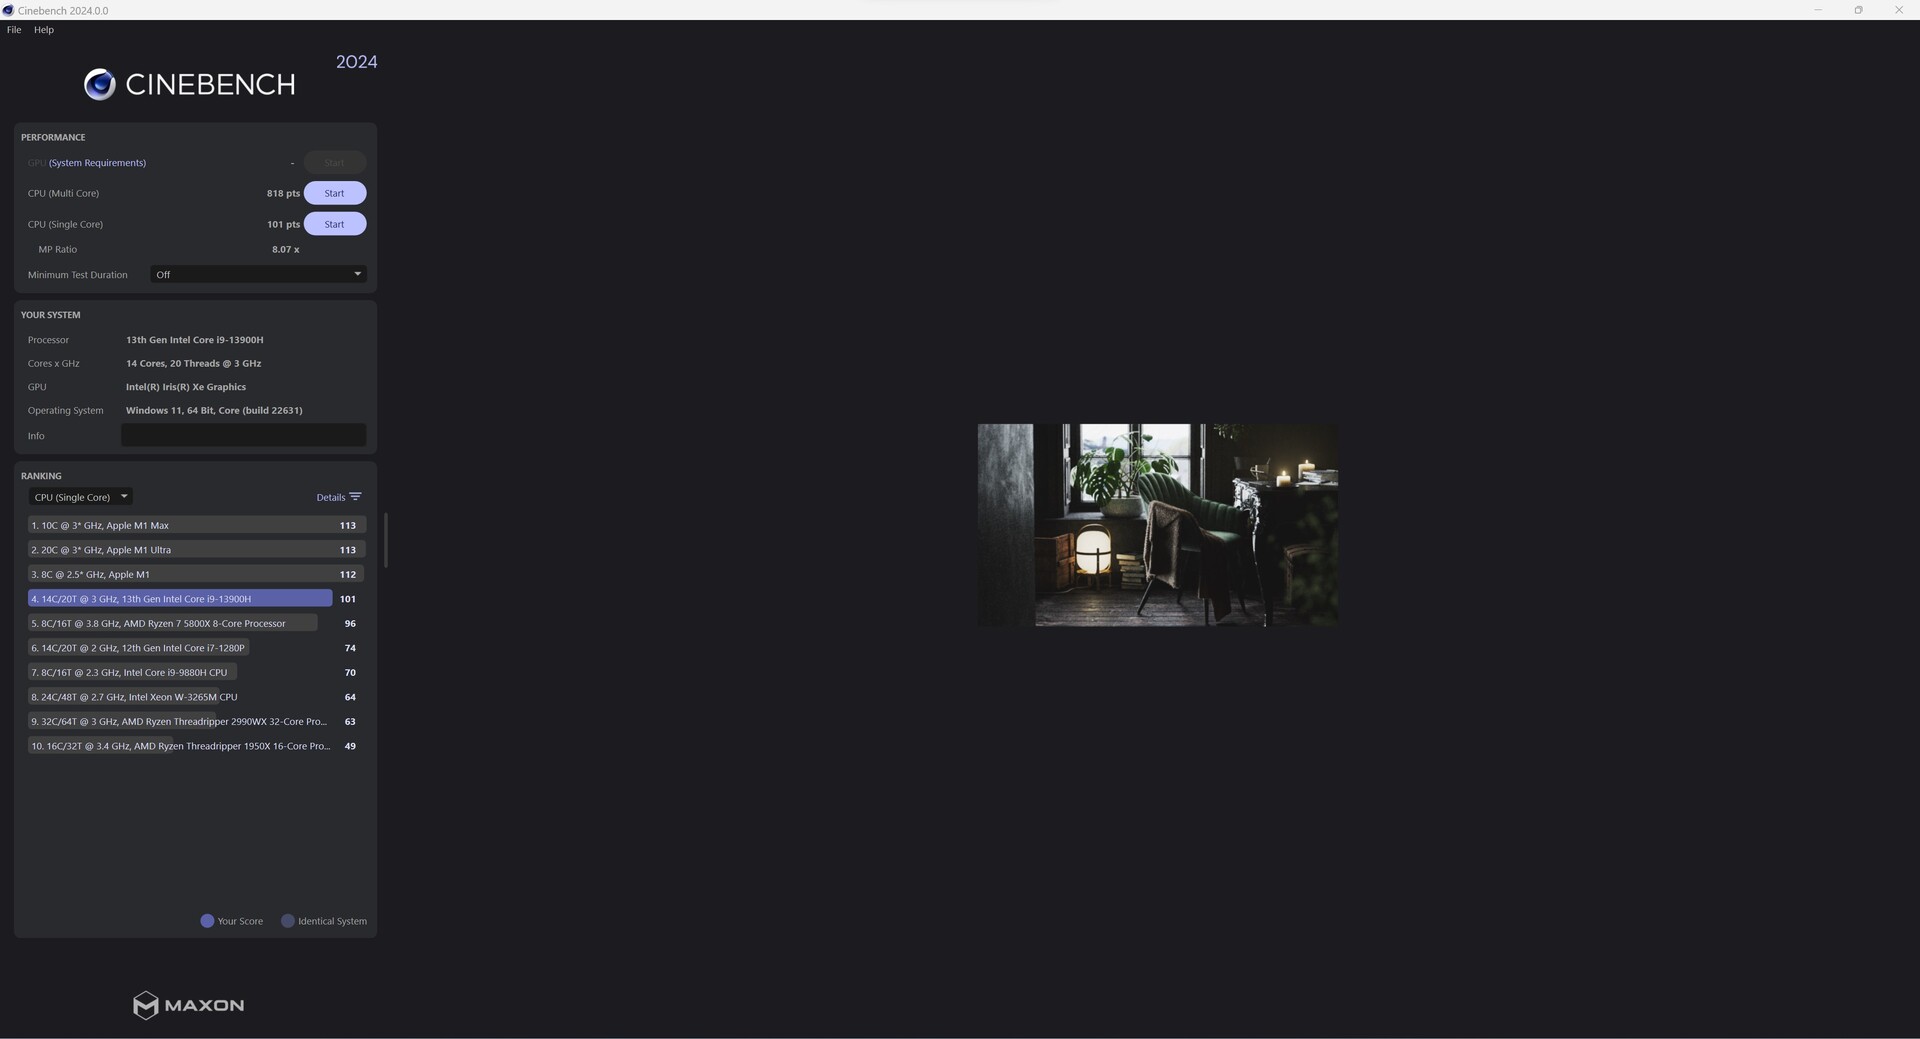
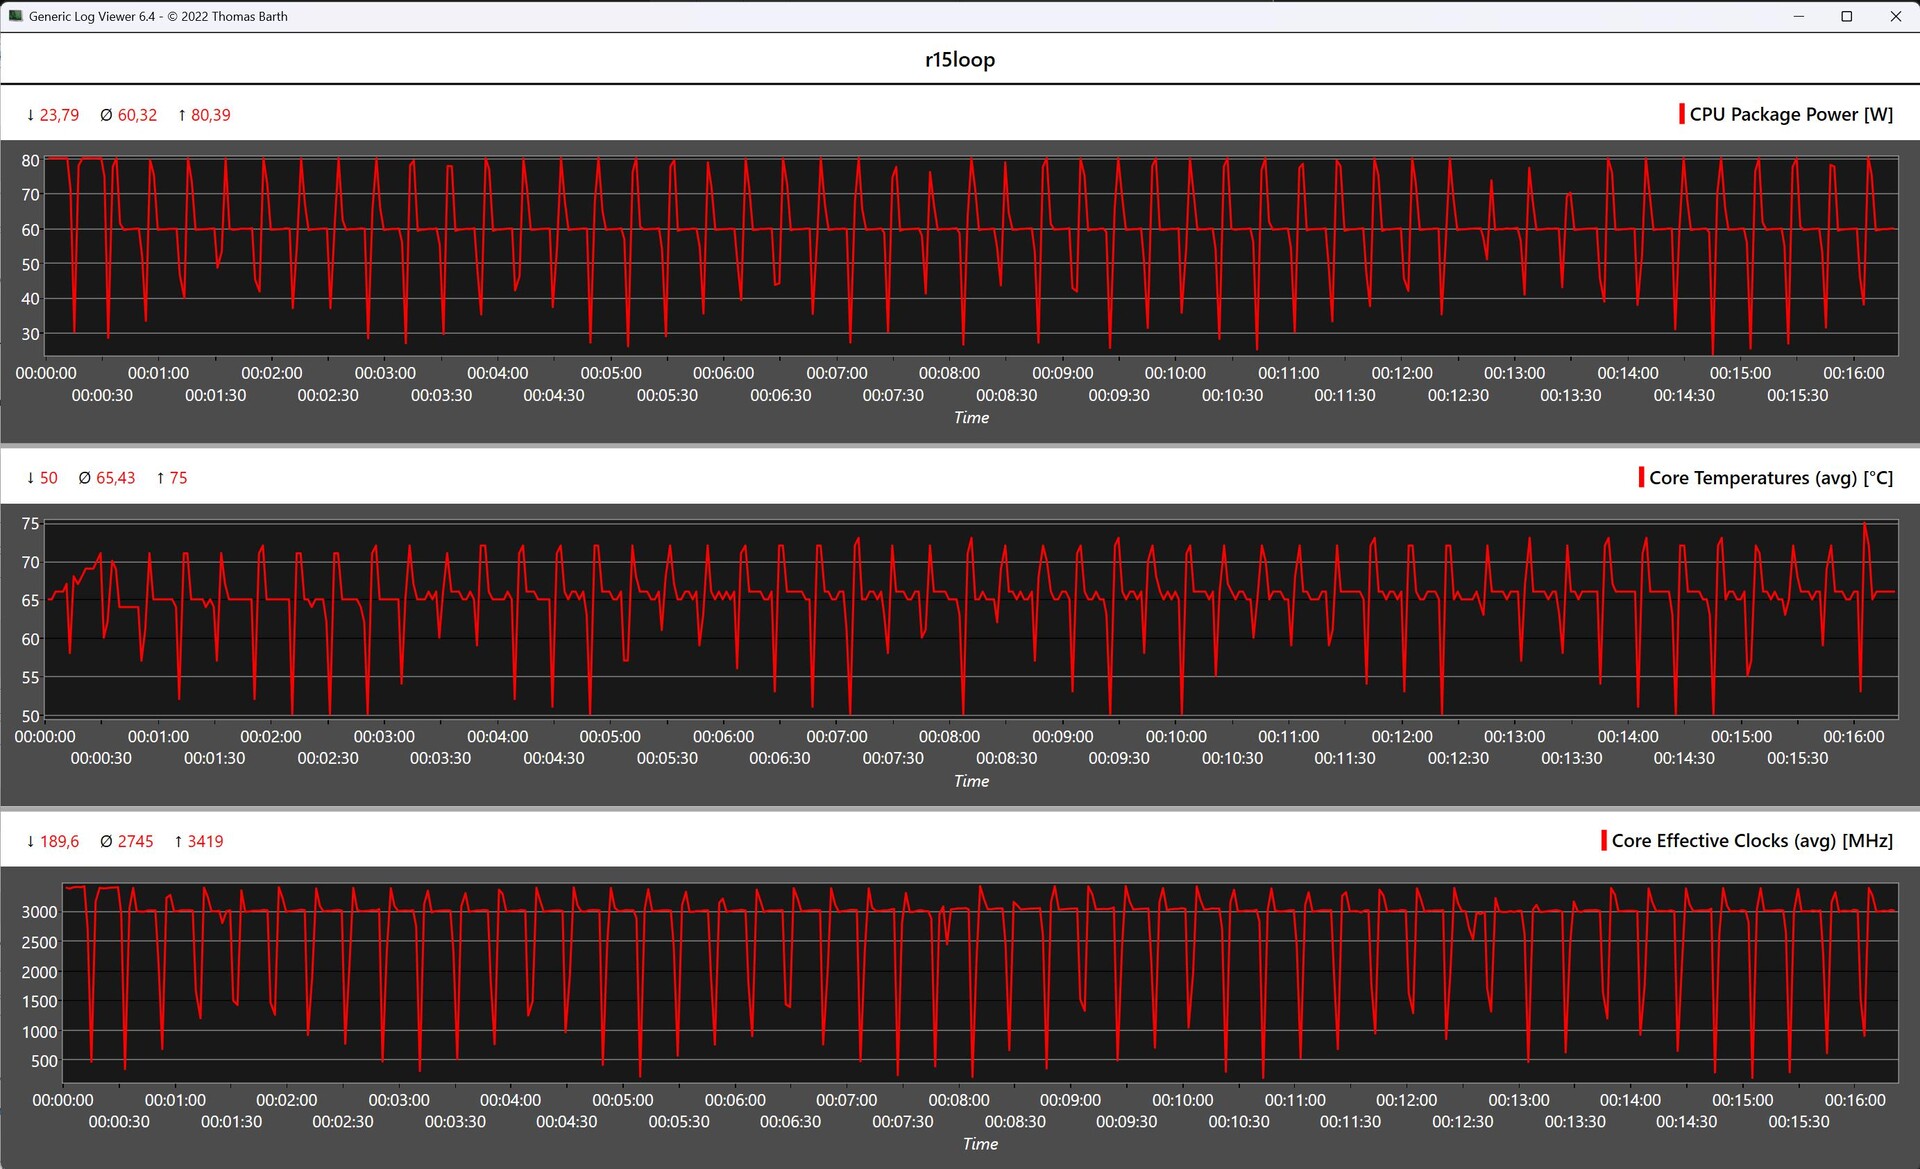
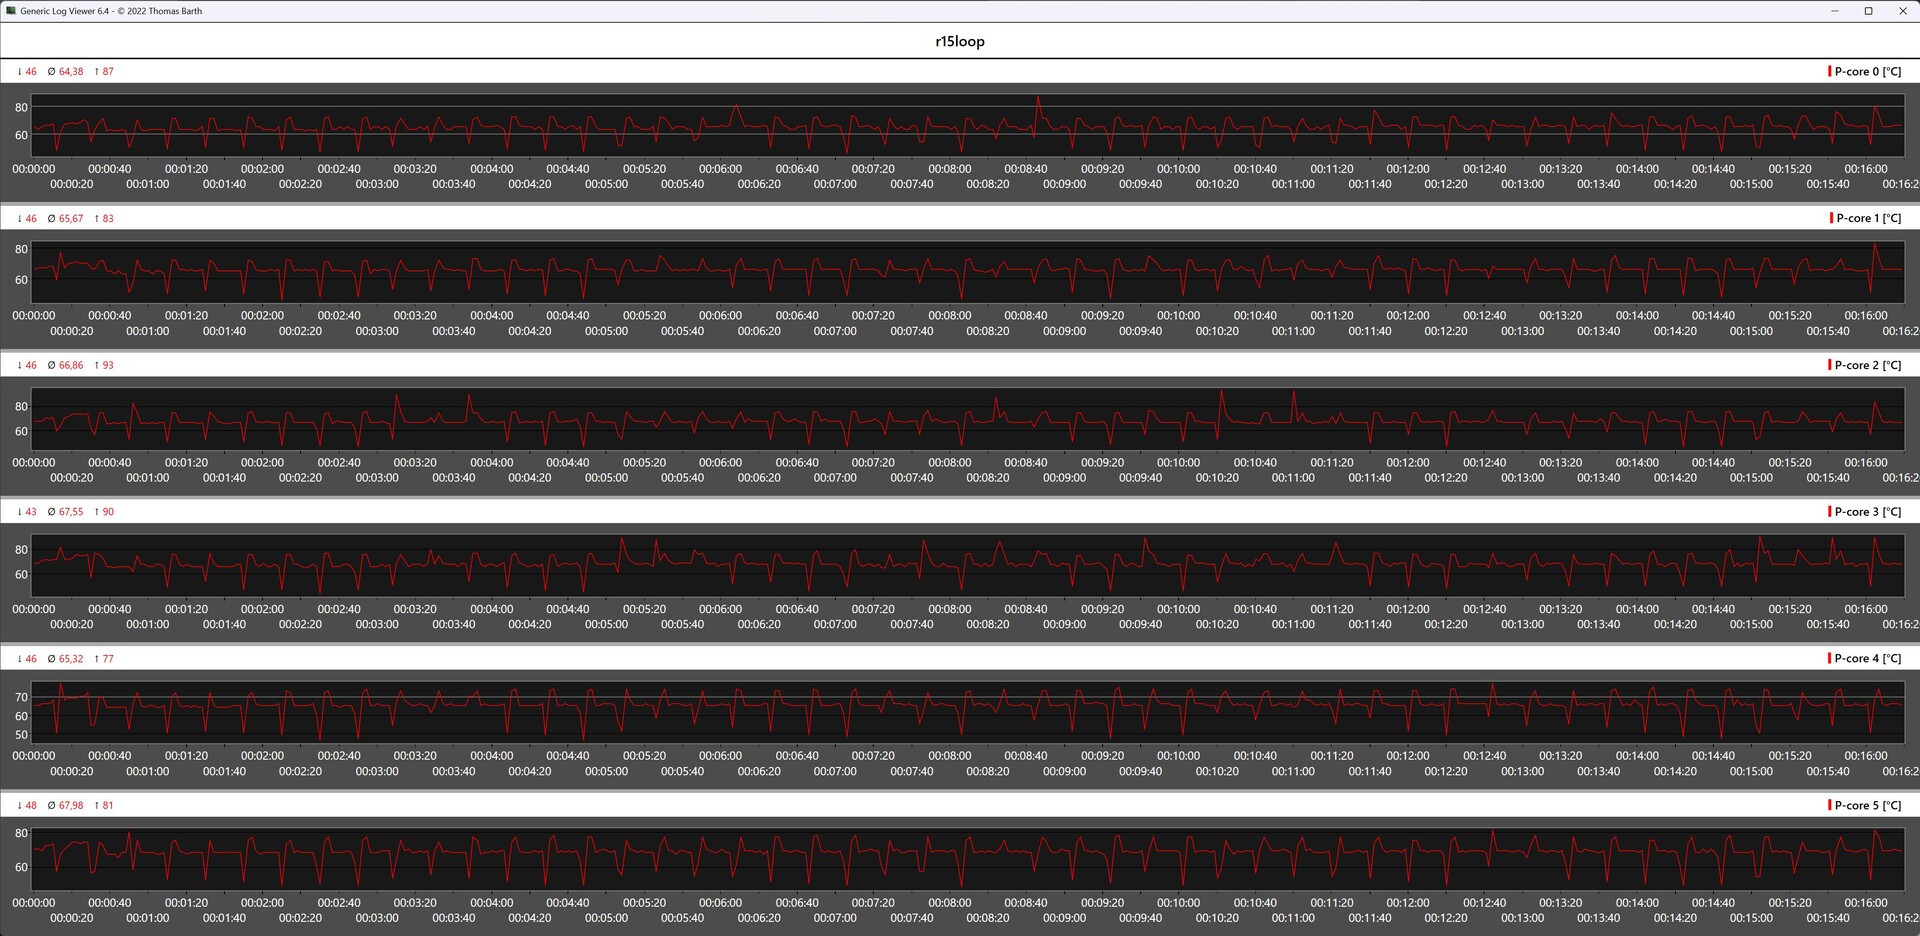
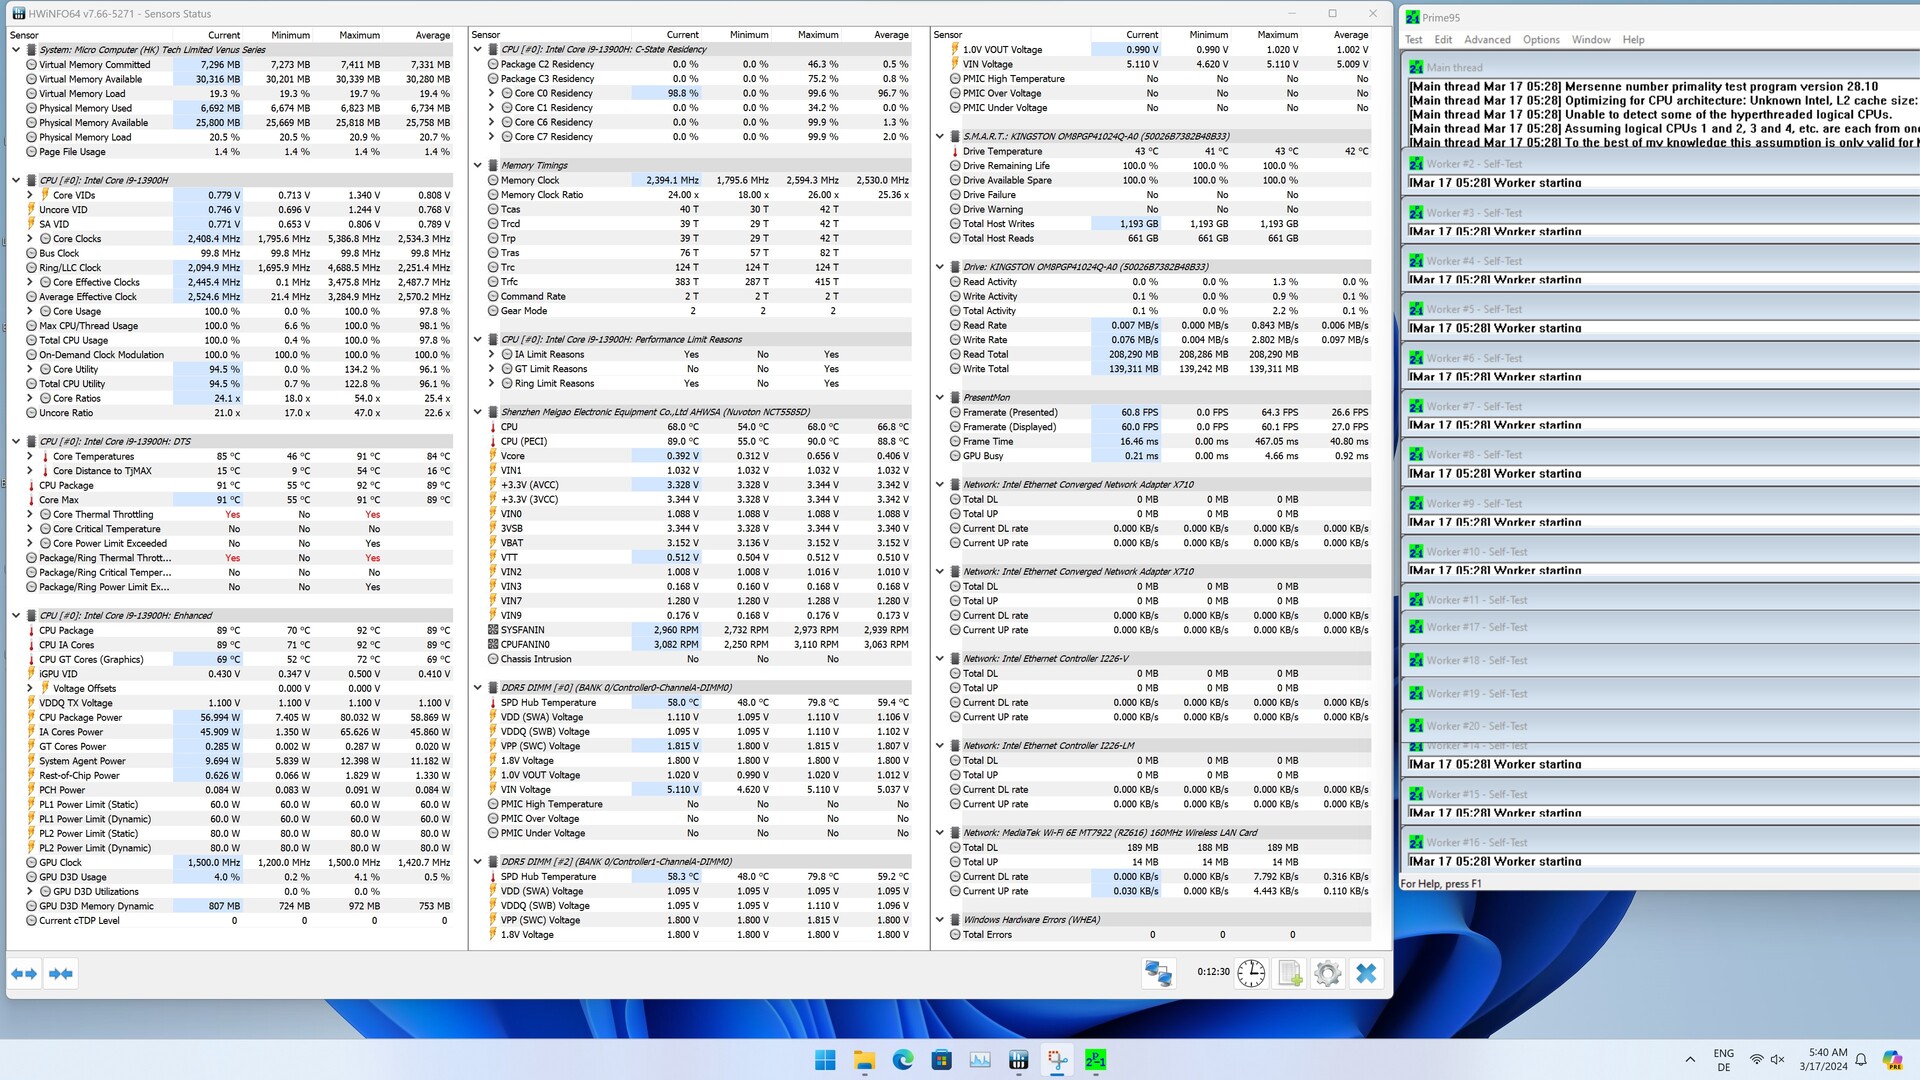
Minisforum MS-01 on the Cinebench R15 multi-loop
Our test system only ran through the Cinebench R15 continuous loop at maximum CPU fan speed. However, a loss of performance cannot be averted, as can be seen from the individual results. In the end, the Minisforum MS-01 ranks at about the same level as the Geekom A7.
The recorded telemetry data shows that two P-cores become significantly warmer and exceed 90 °C. Despite full fan speed, the SoC cannot be operated at cooler temperatures, even though mobile processors can generally handle high temperatures. Nevertheless, we can also see that the power limits of 80 and 60 watts respectively are reached and adhered to.
System performance
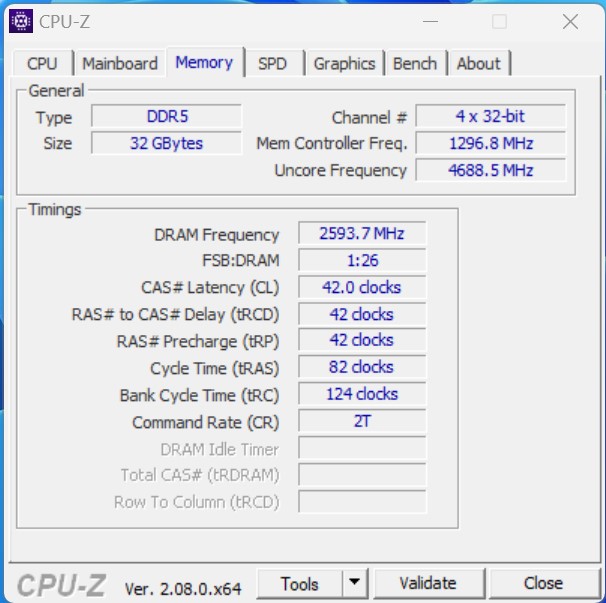
The overall system performance is basically good. The combination of the Intel Core i9-13900H and DDR5 RAM is particularly useful and helps the Minisforum MS-01 to utilize the performance of the processor without further restrictions. This also results in excellent results in the AIDA64 benchmarks in terms of RAM performance.
| AIDA64 / Memory Copy | |
| Minisforum MS-01 | |
| Geekom A7 | |
| Average of class Mini PC (15933 - 163031, n=104, last 2 years) | |
| Acemagic F2A | |
| Minisforum Venus Series NPB5 | |
| Geekom XT12 Pro | |
| Minisforum Venus Series NAB9 | |
| Maxtang MTN-FP750 | |
| AIDA64 / Memory Read | |
| Minisforum MS-01 | |
| Minisforum Venus Series NPB5 | |
| Acemagic F2A | |
| Geekom A7 | |
| Average of class Mini PC (14143 - 123769, n=104, last 2 years) | |
| Geekom XT12 Pro | |
| Minisforum Venus Series NAB9 | |
| Maxtang MTN-FP750 | |
| AIDA64 / Memory Write | |
| Geekom A7 | |
| Average of class Mini PC (10630 - 216693, n=104, last 2 years) | |
| Minisforum MS-01 | |
| Acemagic F2A | |
| Minisforum Venus Series NPB5 | |
| Geekom XT12 Pro | |
| Minisforum Venus Series NAB9 | |
| Maxtang MTN-FP750 | |
| AIDA64 / Memory Latency | |
| Acemagic F2A | |
| Average of class Mini PC (82.3 - 184.8, n=104, last 2 years) | |
| Minisforum Venus Series NPB5 | |
| Minisforum MS-01 | |
| Geekom A7 | |
| Minisforum Venus Series NAB9 | |
| Maxtang MTN-FP750 | |
| Geekom XT12 Pro | |
* ... smaller is better
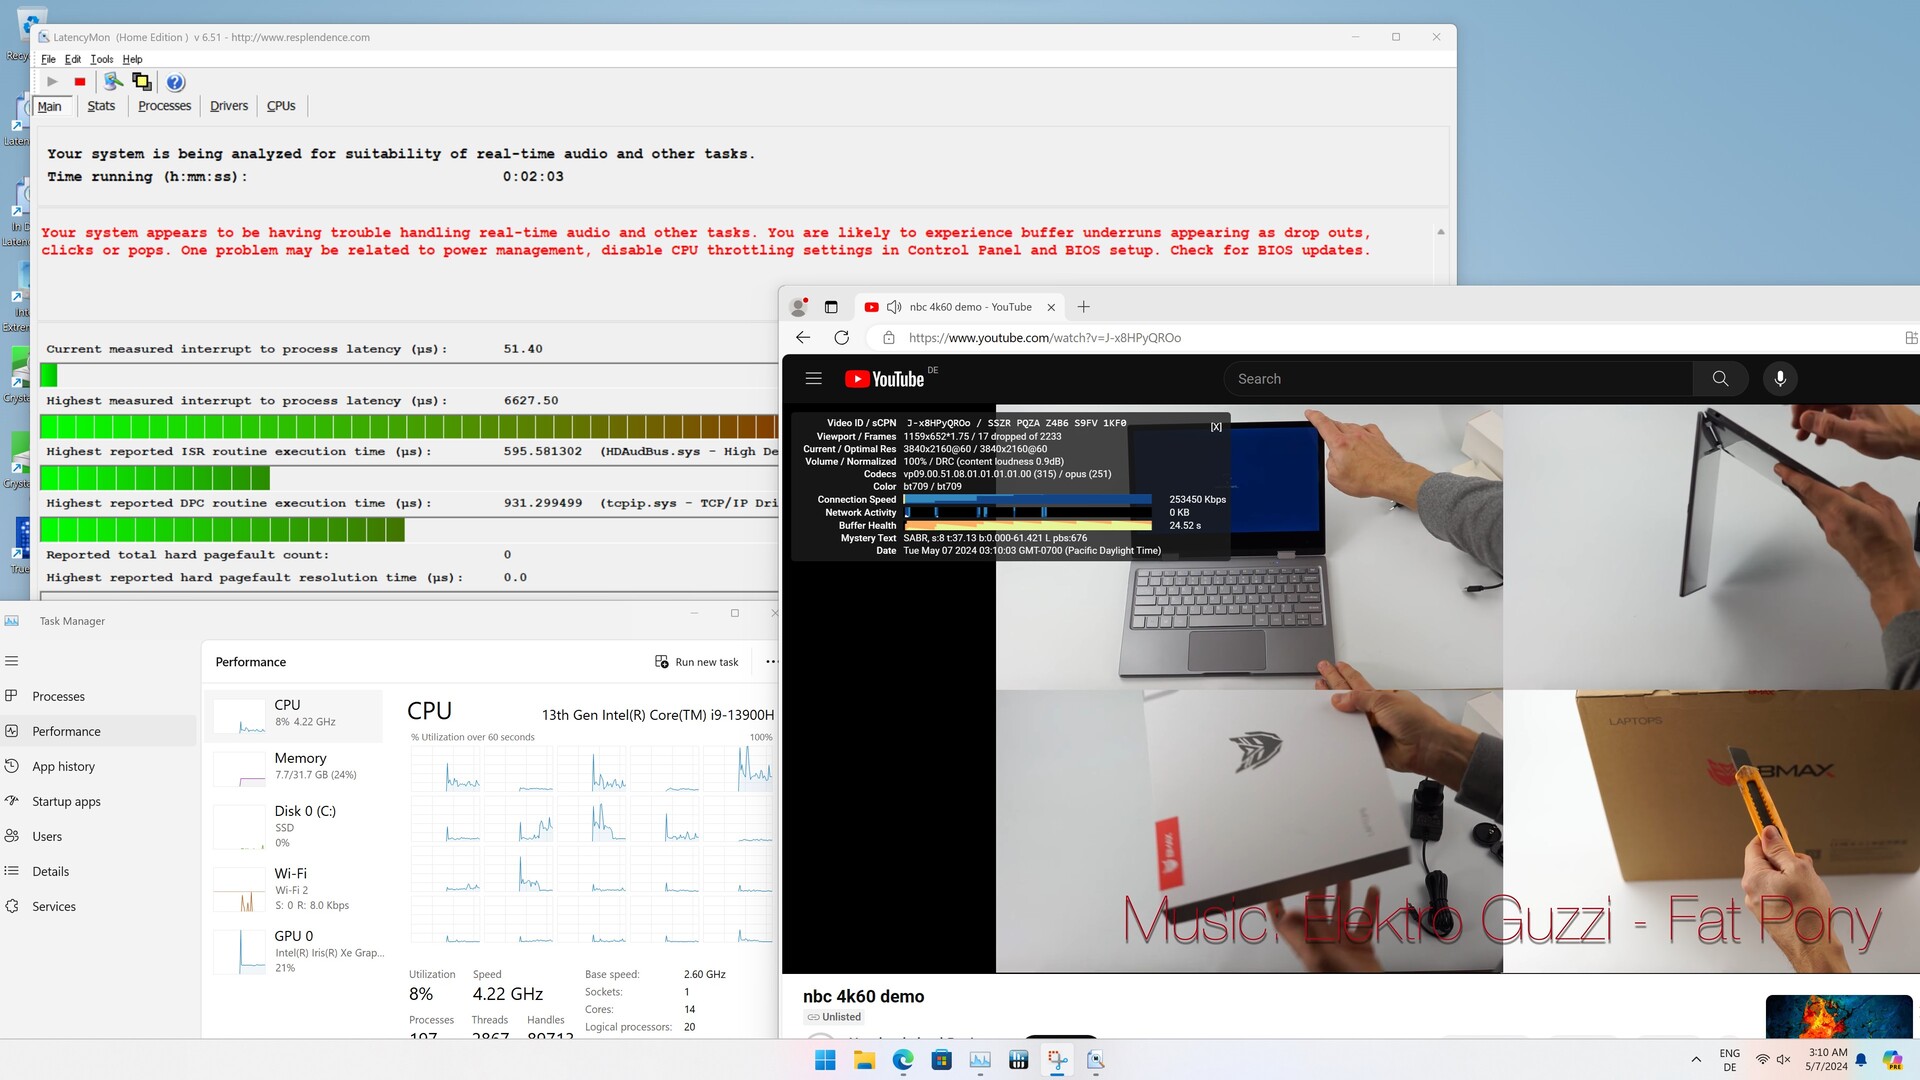
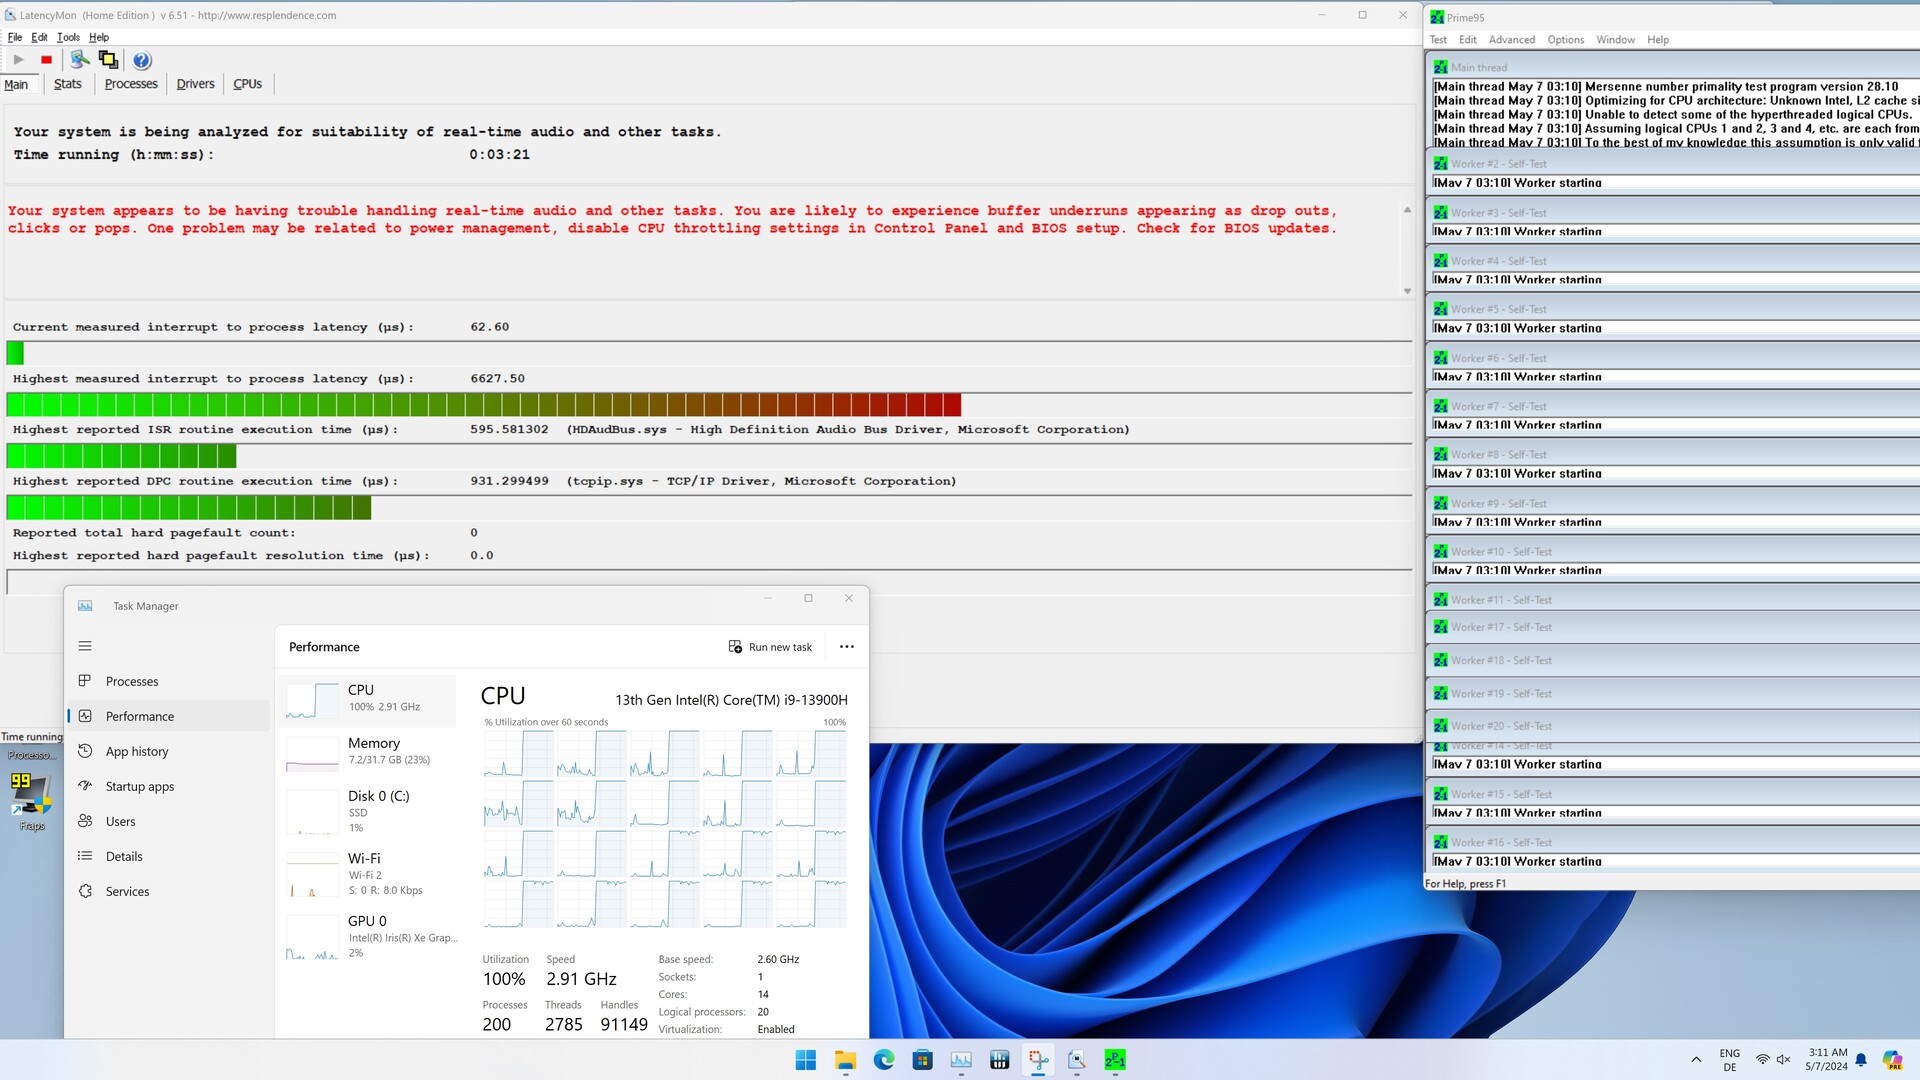
DPC latencies
We already document increased latencies when opening several tabs in the Edge browser, which increase again slightly when playing the 4K test video. A brief load test with Prime95 does not lead to a further increase here. In comparison, our test sample still performs well and secures second place.

| DPC Latencies / LatencyMon - interrupt to process latency (max), Web, Youtube, Prime95 | |
| Acemagic F2A | |
| Geekom XT12 Pro | |
| Geekom A7 | |
| Maxtang MTN-FP750 | |
| Minisforum Venus Series NAB9 | |
| Minisforum MS-01 | |
| Minisforum Venus Series NPB5 | |
* ... smaller is better
Mass storage
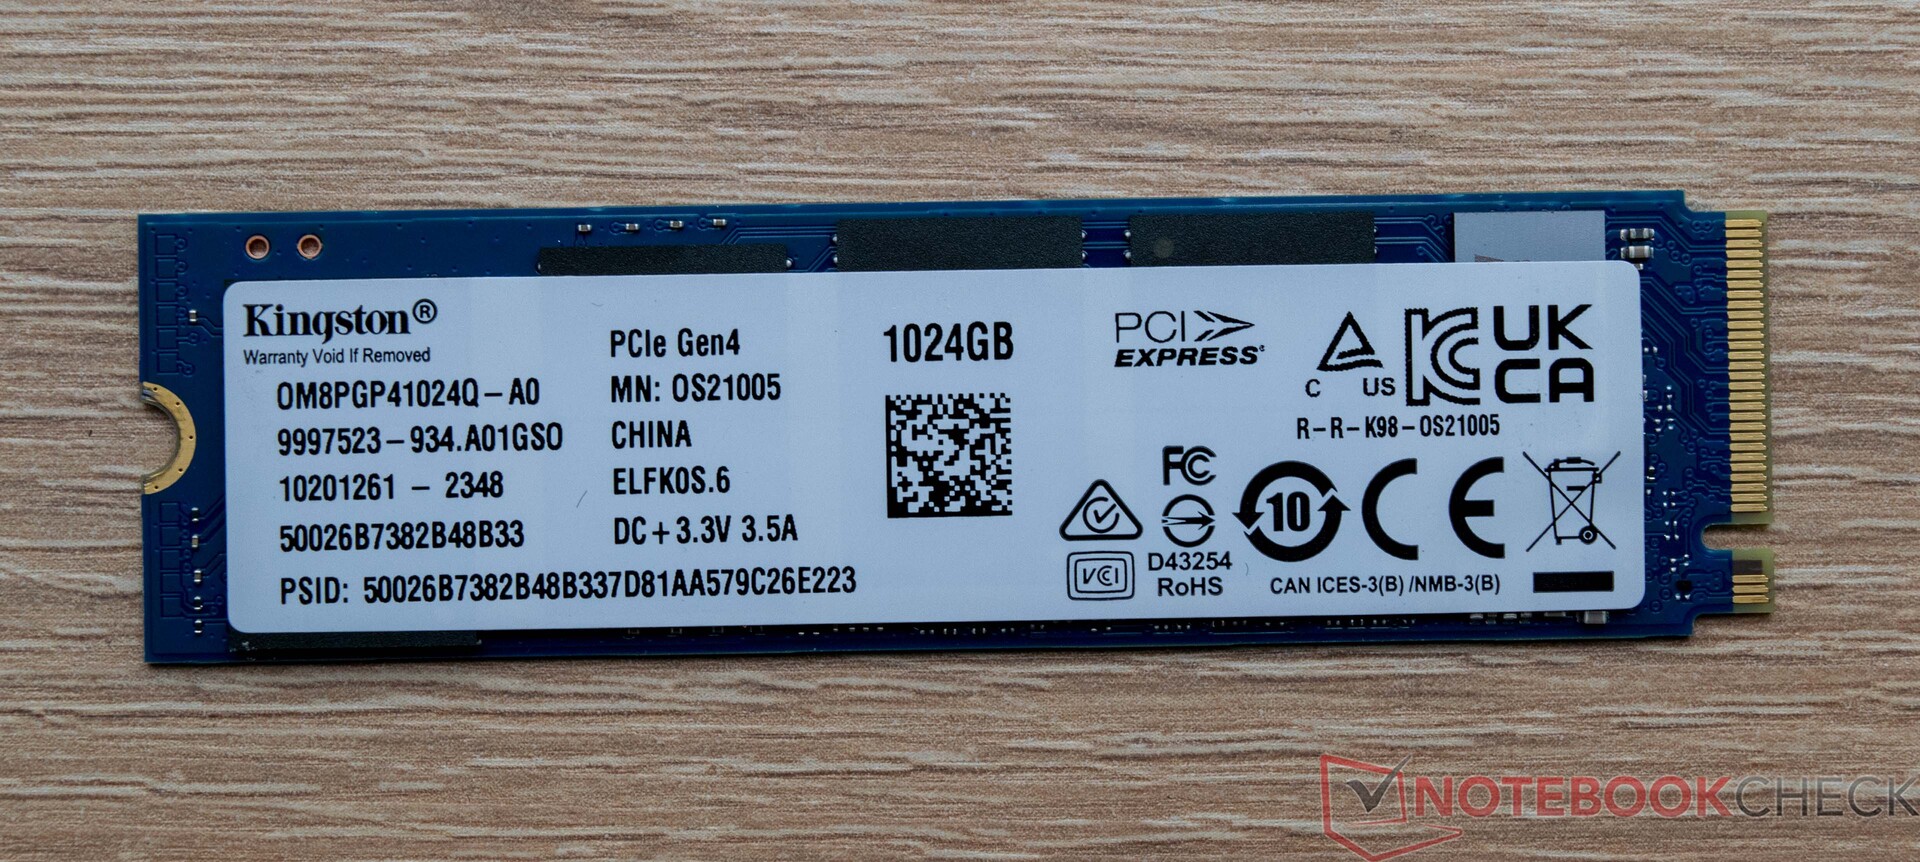
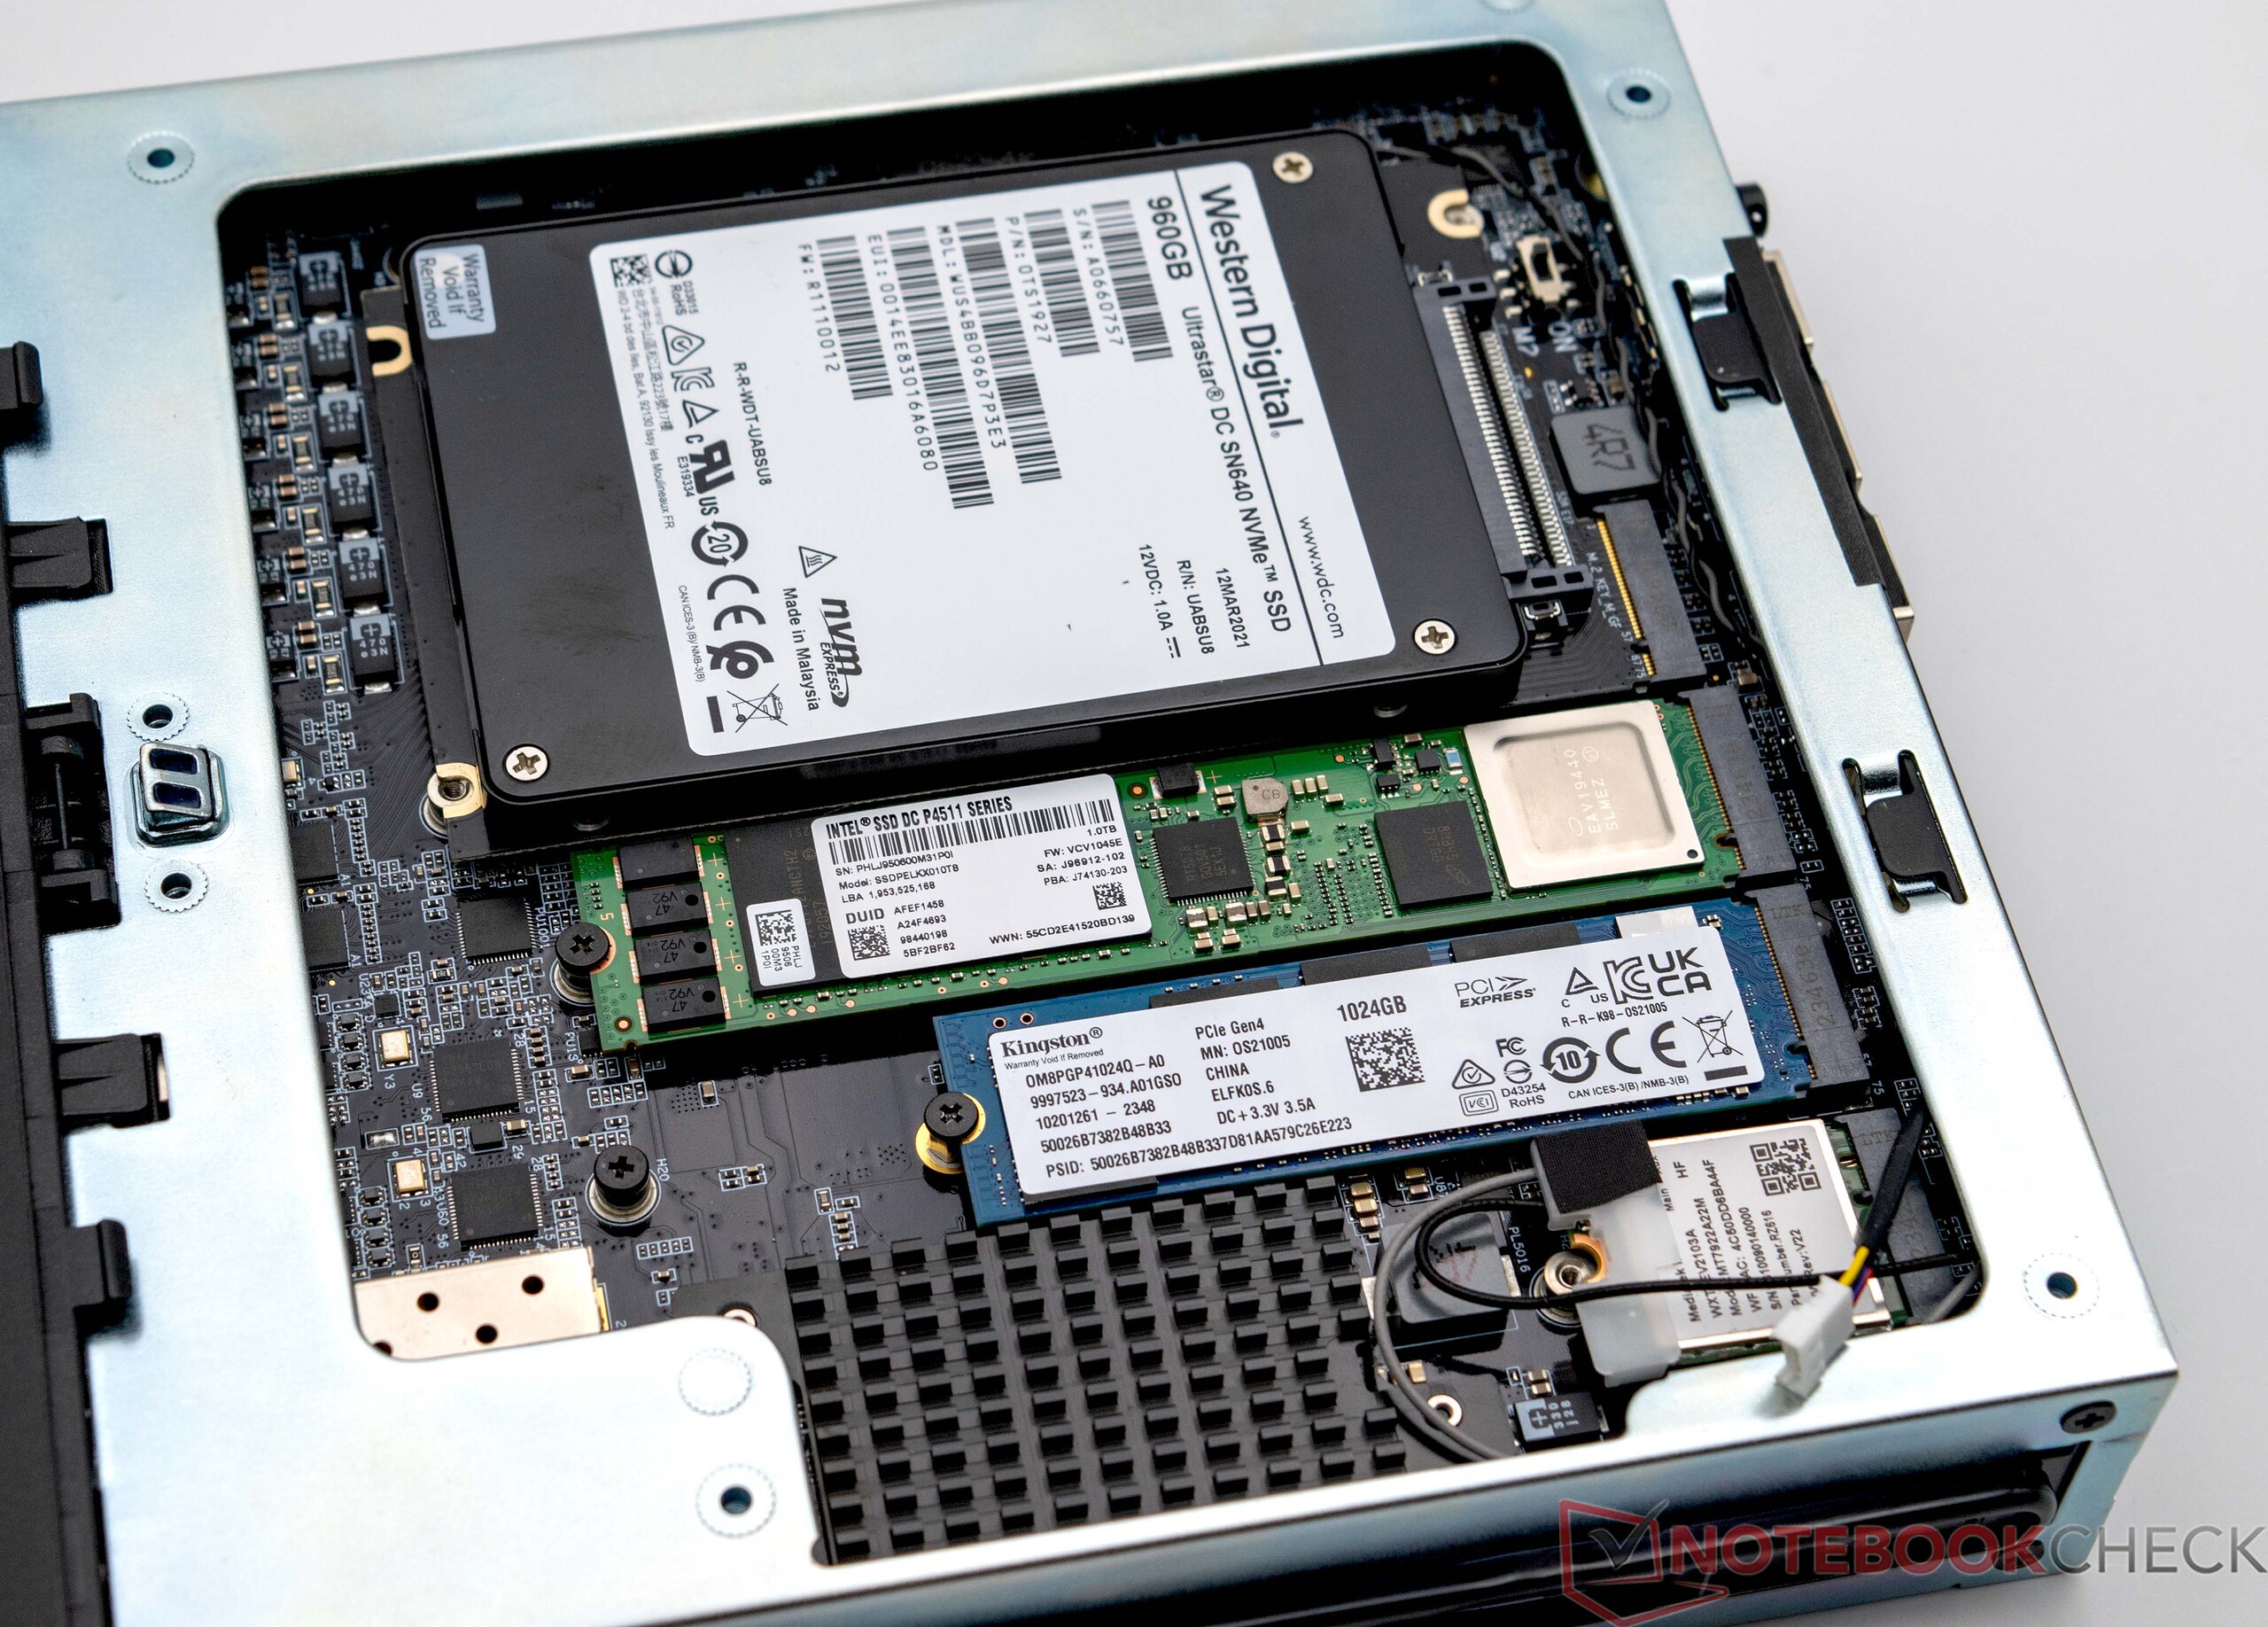
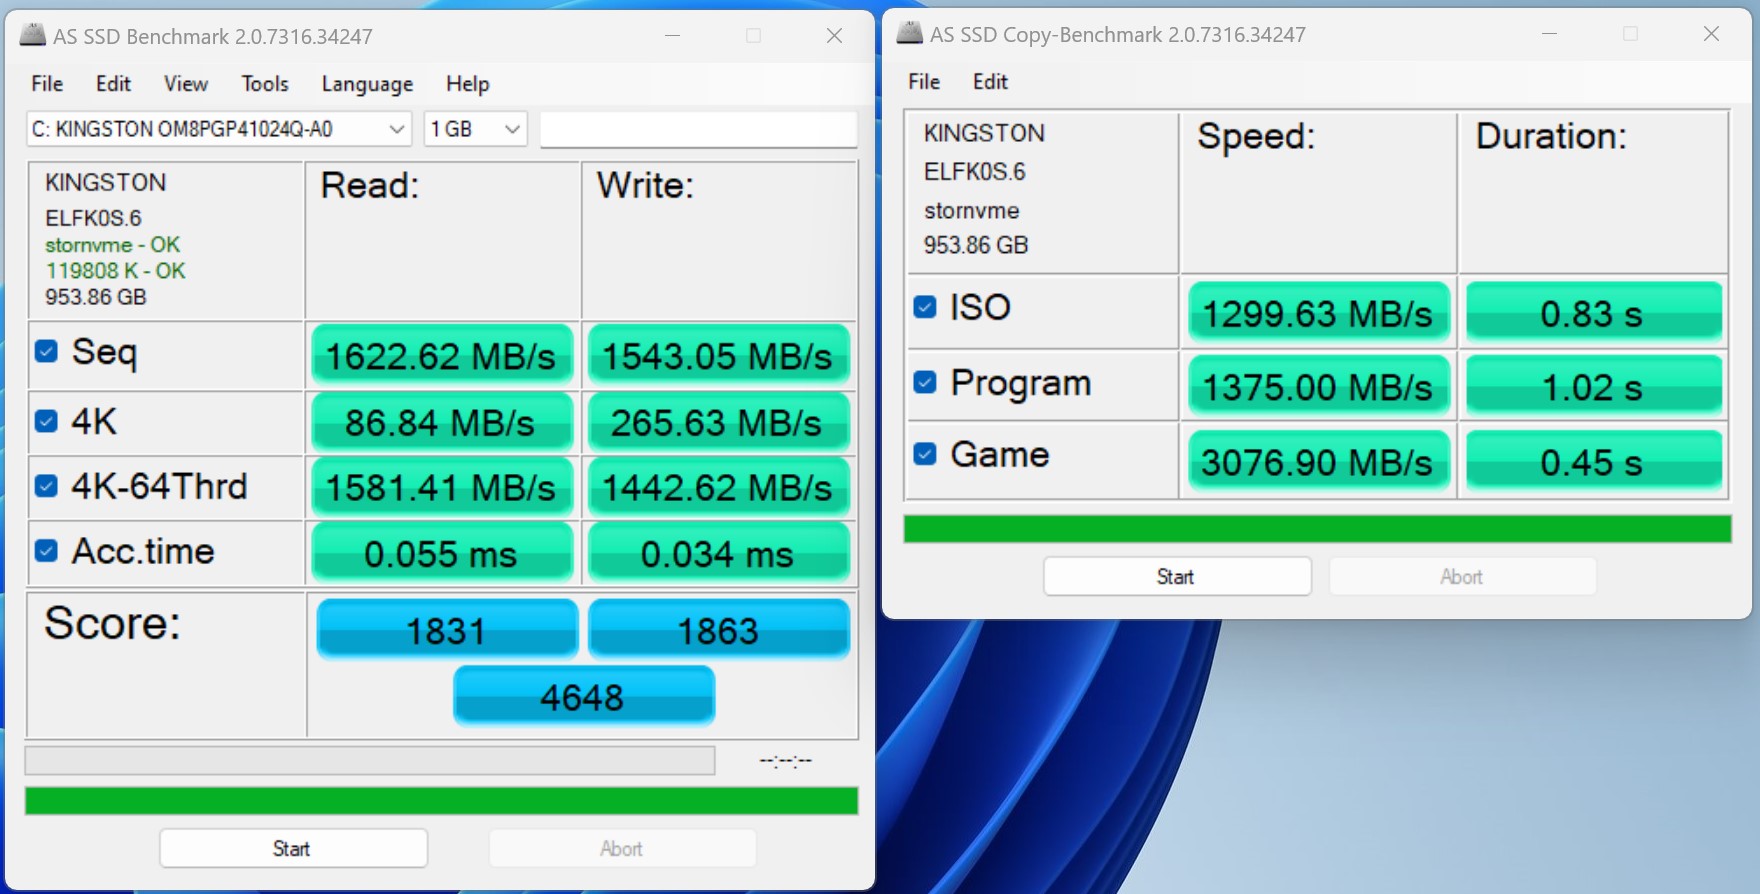
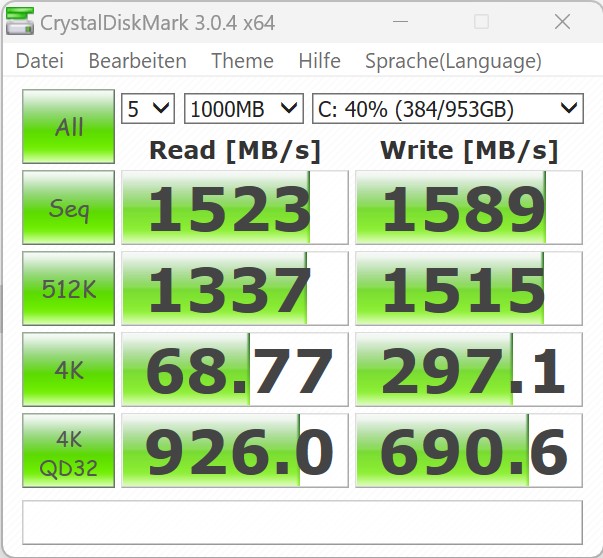
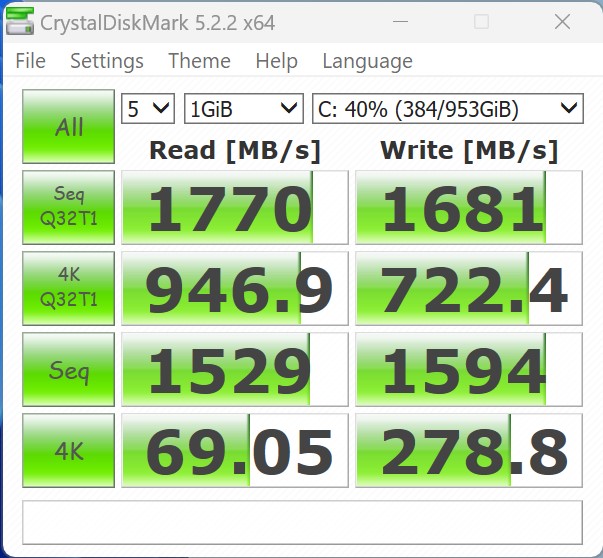
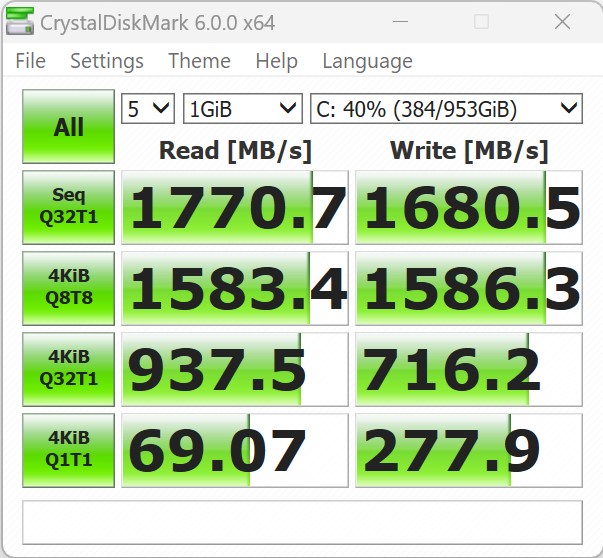
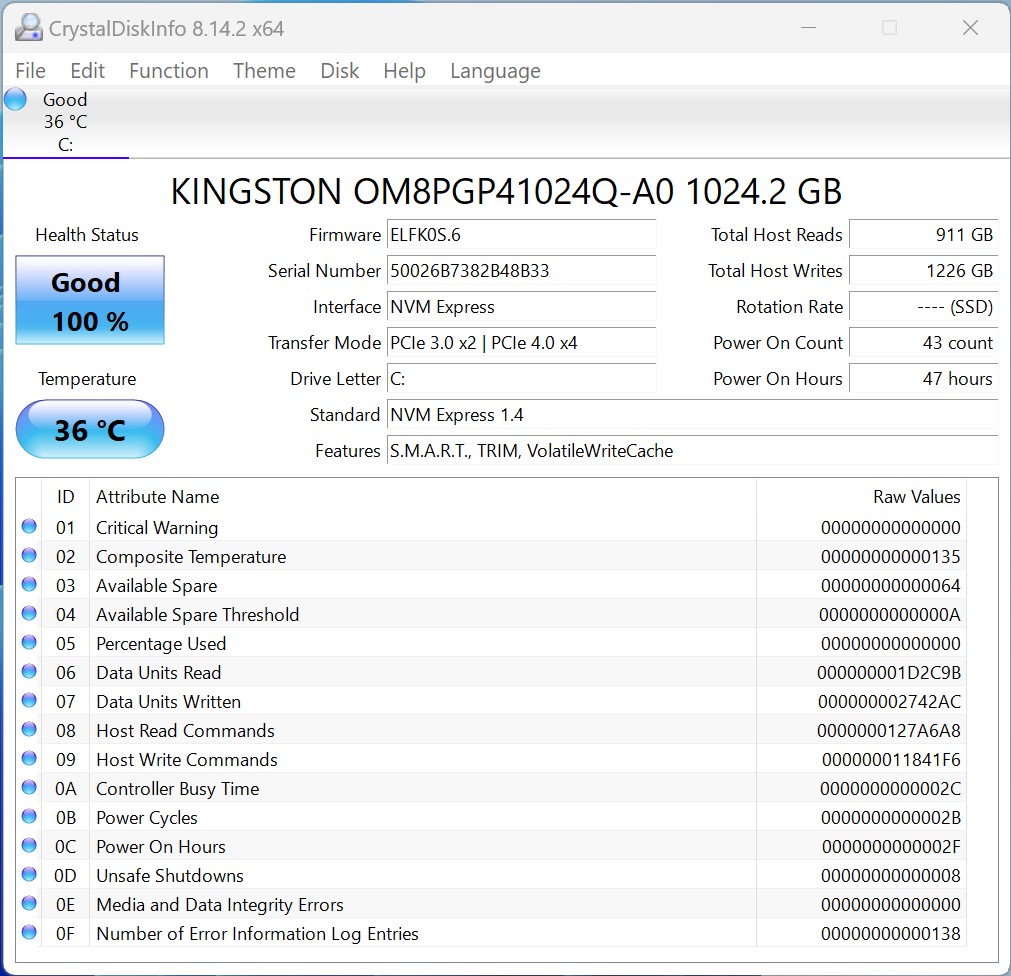
A variety of different SSDs can be installed in the Minisforum MS-01. However, it is important to know that these must be NVMe SSDs. The MS-01 also scores points in terms of form factor, as 110-millimeter SSDs can also be installed in addition to the standard length of 80 millimeters. However, shorter SSDs cannot be installed, or more precisely, attached. The operating system is located on a 1 TB SSD from Kingston. The connection of the SSD does not correspond to what would be technically possible. This affects the transfer rates, but this is hardly an issue in everyday use.
Our measurement results in terms of continuous read performance show that the built-in cooling unit cannot guarantee optimum cooling. There are always significant drops in performance, but these are only short-lived. If you want to take things to the extreme and don't want to install a dedicated graphics card in the system, the Minisforum MS-01 can even be equipped with a total of four mass storage devices. We did the test and installed an Intel SSD DC P4618 PCIe 3.1 x8 in the system.
For further comparisons and benchmarks, please refer to our comparison table.


| Drive Performance rating - Percent | |
| Minisforum Venus Series NAB9 | |
| Minisforum Venus Series NPB5 | |
| Minisforum MS-01 | |
| Geekom XT12 Pro | |
| Geekom A7 | |
| Average of class Mini PC | |
| Acemagic F2A | |
| Maxtang MTN-FP750 | |
* ... smaller is better
Continuous read: DiskSpd Read Loop, Queue Depth 8
Graphics card
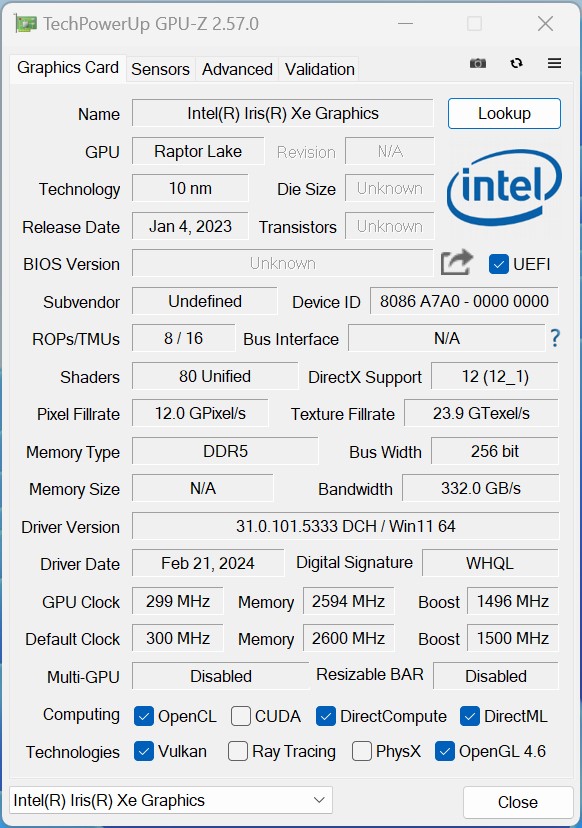
The widely used Intel Iris Xe Graphics G7 handles the 3D calculations and image output in the Minisforum MS-01. Compared to the newer models, aka Intel Arc8, the older model in our test sample lags behind. In some cases, however, the Intel Iris Xe Graphics G7 can keep up relatively well with the supposedly faster model in the Acemagic F2A and even outperform it.
If we look at the use as a workstation again at this point, we can ask ourselves why the manufacturer does not use a dedicated graphics card directly. To illustrate the performance in comparison to an Nvidia GeForce RTX A2000 laptop GPU, we have included it in the comparison graphics. In combination with this graphics accelerator, the 3D performance would be massively increased. There is an enormous increase in performance in the render tests, which are optimized for the use of professional graphics cards.
For further comparisons and benchmarks, please refer to our GPU comparison table.
| Unigine Valley 1.0 | |
| 1920x1080 Extreme HD DirectX AA:x8 | |
| Minisforum MS-01 | |
| Geekom A7 | |
| Acemagic F2A | |
| Minisforum Venus Series NPB5 | |
| Average Intel Iris Xe Graphics G7 96EUs (11.3 - 20, n=24) | |
| Minisforum Venus Series NAB9 | |
| Geekom XT12 Pro | |
| Maxtang MTN-FP750 | |
| 1920x1080 Extreme HD Preset OpenGL AA:x8 | |
| Minisforum MS-01 | |
| Acemagic F2A | |
| Minisforum Venus Series NPB5 | |
| Average Intel Iris Xe Graphics G7 96EUs (11.7 - 21.7, n=24) | |
| Minisforum Venus Series NAB9 | |
| Geekom XT12 Pro | |
| Maxtang MTN-FP750 | |
| Geekom A7 | |
| Affinity Photo 2 - Combined (Single / Multi GPU) | |
| Minisforum MS-01 | |
| Acemagic F2A | |
| Minisforum Venus Series NAB9 | |
| Average Intel Iris Xe Graphics G7 96EUs (1560 - 4958, n=16) | |
| Geekom XT12 Pro | |
| Geekom A7 | |
| Minisforum MS-01, Intel Iris Xe Graphics G7 96EUs i9-13900H | Acemagic F2A, Intel Arc 8-Core iGPU Ultra 7 155H | Geekom XT12 Pro, Intel Iris Xe Graphics G7 96EUs i9-12900H | Geekom A7, AMD Radeon 780M R9 7940HS | Minisforum Venus Series NAB9, Intel Iris Xe Graphics G7 96EUs i9-12900HK | Minisforum Venus Series NPB5, Intel Iris Xe Graphics G7 80EUs i5-13500H | Maxtang MTN-FP750, AMD Radeon 680M R7 7735HS | Average NVIDIA RTX A2000 Laptop GPU | Average of class Mini PC | |
|---|---|---|---|---|---|---|---|---|---|
| SPECviewperf 12 | 7% | -19% | 601% | -17% | -24% | 7% | 457% | 577% | |
| 1900x1060 3ds Max (3dsmax-05) (fps) | 46.7 | 49.8 7% | 40.1 -14% | 84.7 81% | 40.2 -14% | 41.5 -11% | 46.9 0% | 114.2 ? 145% | |
| 1900x1060 Catia (catia-04) (fps) | 41.7 | 48.2 16% | 37.1 -11% | 89 113% | 35.9 -14% | 31 -26% | 51.5 24% | 134.9 ? 224% | 109 ? 161% |
| 1900x1060 Creo (creo-01) (fps) | 30 | 23.1 -23% | 26.9 -10% | 55.4 85% | 27.7 -8% | 23.4 -22% | 33.2 11% | 116.2 ? 287% | 57.5 ? 92% |
| 1900x1060 Energy (energy-01) (fps) | 0.5 | 0.91 82% | 0.4 -20% | 20.7 4040% | 0.4 -20% | 0.35 -30% | 10.7 ? 2040% | 18.5 ? 3600% | |
| 1900x1060 Maya (maya-04) (fps) | 51.9 | 54.9 6% | 38.3 -26% | 69.7 34% | 39.8 -23% | 35.9 -31% | 45.2 -13% | 96 ? 85% | 97 ? 87% |
| 1900x1060 Medical (medical-01) (fps) | 14.5 | 16.9 17% | 11.8 -19% | 60.5 317% | 12.2 -16% | 8.44 -42% | 17.9 23% | 45 ? 210% | 57.4 ? 296% |
| 1900x1060 Showcase (showcase-01) (fps) | 24.8 | 18.2 -27% | 16.6 -33% | 30.3 22% | 17.4 -30% | 20.4 -18% | 17.5 -29% | 69.9 ? 182% | 57.5 ? 132% |
| 1900x1060 Solidworks (sw-03) (fps) | 53.1 | 42.7 -20% | 45.3 -15% | 116 118% | 47.3 -11% | 46.1 -13% | 72.1 36% | 142.1 ? 168% | 105.8 ? 99% |
| SPECviewperf 13 | 5% | -14% | 157% | -14% | -27% | 33% | 266% | 234% | |
| 3ds Max (3dsmax-06) (fps) | 46.5 | 46.4 0% | 40.1 -14% | 83.9 80% | 39.9 -14% | 41.5 -11% | 48.3 4% | 139.4 ? 200% | 113.2 ? 143% |
| Catia (catia-05) (fps) | 58.9 | 71.6 22% | 51.3 -13% | 130 121% | 51.6 -12% | 44.8 -24% | 73.9 25% | 205 ? 248% | 151.9 ? 158% |
| Creo (creo-02) (fps) | 46.2 | 29.6 -36% | 41.1 -11% | 93.4 102% | 40.2 -13% | 37.1 -20% | 44.9 -3% | 165.1 ? 257% | 121.7 ? 163% |
| Energy (energy-02) (fps) | 4.72 | 5.69 21% | 4.5 -5% | 23.8 404% | 4.39 -7% | 2.03 -57% | 11.4 142% | 32.1 ? 580% | 28.7 ? 508% |
| Maya (maya-05) (fps) | 58.4 | 59.5 2% | 47.5 -19% | 107 83% | 48.3 -17% | 46 -21% | 58.3 0% | 174.5 ? 199% | 148.2 ? 154% |
| Medical (medical-02) (fps) | 15.8 | 29.7 88% | 14.4 -9% | 77.6 391% | 14.4 -9% | 7.92 -50% | 32.8 108% | 70.4 ? 346% | 103.3 ? 554% |
| Showcase (showcase-02) (fps) | 25 | 18.2 -27% | 17.3 -31% | 25.4 2% | 17.3 -31% | 20.4 -18% | 17.4 -30% | 68 ? 172% | 55.8 ? 123% |
| Solidworks (sw-04) (fps) | 63.7 | 44.8 -30% | 57.1 -10% | 109 71% | 57.4 -10% | 56 -12% | 72.9 14% | 144.6 ? 127% | 106.2 ? 67% |
| SPECviewperf 2020 | 11% | -15% | 232% | -14% | -32% | 69% | 429% | 363% | |
| 3840x2160 Medical (medical-03) (fps) | 2.72 | 5.05 86% | 3.49 28% | 11.1 308% | 3.48 28% | 1.37 -50% | 4.72 74% | 10.6 ? 290% | 18.7 ? 587% |
| 3840x2160 Energy (energy-03) (fps) | 4.75 | 4.61 -3% | 3.05 -36% | 14.1 197% | 3 -37% | 1.18 -75% | 6.6 39% | 25.6 ? 439% | 28.9 ? 508% |
| 3840x2160 Creo (creo-03) (fps) | 19.2 | 17.9 -7% | 14.8 -23% | 31.4 64% | 15.1 -21% | 13.6 -29% | 17.5 -9% | 55.5 ? 189% | 43.8 ? 128% |
| 3840x2160 CATIA (catia-06) (fps) | 9.99 | 10 0% | 7.78 -22% | 24.8 148% | 8.08 -19% | 7.41 -26% | 13.1 31% | 29.7 ? 197% | 30 ? 200% |
| 3840x2160 3ds Max (3dsmax-07) (fps) | 11.6 | 12.9 11% | 9.69 -16% | 20.9 80% | 9.78 -16% | 10.1 -13% | 9.26 -20% | 36 ? 210% | 43.4 ? 274% |
| 3840x2160 Siemens NX (snx-04) (fps) | 6.9 | 5.7 -17% | 6.29 -9% | 61.4 790% | 6.67 -3% | 6.71 -3% | 33 378% | 112.5 ? 1530% | 49.5 ? 617% |
| 3840x2160 Maya (maya-06) (fps) | 34.1 | 35.4 4% | 23.9 -30% | 47 38% | 24.4 -28% | 23.6 -31% | 29.5 -13% | 83.5 ? 145% | 112.7 ? 230% |
| Total Average (Program / Settings) | 8% /
7% | -16% /
-16% | 330% /
334% | -15% /
-15% | -28% /
-28% | 36% /
36% | 384% /
378% | 391% /
392% |
| 3DMark 05 Standard | 50056 points | |
| 3DMark 06 Score 1366x768 | 38453 points | |
| 3DMark Vantage P Result | 33312 points | |
| 3DMark 11 Performance | 8500 points | |
| 3DMark Ice Storm Standard Score | 179358 points | |
| 3DMark Cloud Gate Standard Score | 30468 points | |
| 3DMark Fire Strike Score | 6105 points | |
| 3DMark Fire Strike Extreme Score | 3023 points | |
| 3DMark Time Spy Score | 2118 points | |
Help | ||
Gaming performance
The Minisforum MS-01 is only partially suitable as a gaming system in the configuration we tested. The iGPU of the Intel Core i9-13900H still manages to bring some games to the screen with playable frame rates. There is noticeably more performance with an AMD Radeon 780M, which is used in the Geekom A7. If you want to install a dedicated graphics card in the Minisforum MS-01, you will certainly get a considerable increase in performance. However, a suitable model must first be found that can be accommodated in the device. Among the current GPU models, there is an Intel Arc A380 which would meet the requirements. To get a rough estimate of the performance in combination with an Intel Arc A380, we have included it in the comparison overview. Independently of this, you can also take the detour of using an external graphics card via USB4.
| The Witcher 3 | |
| 1024x768 Low Graphics & Postprocessing | |
| Sparkle Intel Arc A380 Elf | |
| Geekom A7 | |
| Acemagic F2A | |
| Minisforum MS-01 | |
| Minisforum Venus Series NAB9 | |
| Minisforum Venus Series NPB5 | |
| Geekom XT12 Pro | |
| Maxtang MTN-FP750 | |
| 1920x1080 High Graphics & Postprocessing (Nvidia HairWorks Off) | |
| Sparkle Intel Arc A380 Elf | |
| Geekom A7 | |
| Acemagic F2A | |
| Minisforum MS-01 | |
| Minisforum Venus Series NPB5 | |
| Minisforum Venus Series NAB9 | |
| Geekom XT12 Pro | |
| Maxtang MTN-FP750 | |
| Borderlands 3 | |
| 1280x720 Very Low Overall Quality (DX11) | |
| Sparkle Intel Arc A380 Elf | |
| Geekom A7 | |
| Acemagic F2A | |
| Minisforum MS-01 | |
| Maxtang MTN-FP750 | |
| Minisforum Venus Series NPB5 | |
| Minisforum Venus Series NAB9 | |
| Geekom XT12 Pro | |
| 1920x1080 High Overall Quality (DX11) | |
| Sparkle Intel Arc A380 Elf | |
| Acemagic F2A | |
| Geekom A7 | |
| Minisforum MS-01 | |
| Minisforum Venus Series NAB9 | |
| Minisforum Venus Series NPB5 | |
| Maxtang MTN-FP750 | |
| Geekom XT12 Pro | |
| GTA V | |
| 1024x768 Lowest Settings possible | |
| Sparkle Intel Arc A380 Elf | |
| Geekom A7 | |
| Minisforum MS-01 | |
| Acemagic F2A | |
| Minisforum Venus Series NPB5 | |
| Minisforum Venus Series NAB9 | |
| Maxtang MTN-FP750 | |
| 1920x1080 High/On (Advanced Graphics Off) AA:2xMSAA + FX AF:8x | |
| Geekom A7 | |
| Sparkle Intel Arc A380 Elf | |
| Acemagic F2A | |
| Minisforum MS-01 | |
| Maxtang MTN-FP750 | |
| Minisforum Venus Series NPB5 | |
| Minisforum Venus Series NAB9 | |
| Shadow of the Tomb Raider | |
| 1280x720 Lowest Preset | |
| Sparkle Intel Arc A380 Elf | |
| Acemagic F2A | |
| Geekom A7 | |
| Minisforum MS-01 | |
| Minisforum Venus Series NPB5 | |
| Maxtang MTN-FP750 | |
| Geekom XT12 Pro | |
| 1920x1080 High Preset AA:SM | |
| Sparkle Intel Arc A380 Elf | |
| Acemagic F2A | |
| Geekom A7 | |
| Minisforum MS-01 | |
| Minisforum Venus Series NPB5 | |
| Maxtang MTN-FP750 | |
| Geekom XT12 Pro | |
| F1 2021 | |
| 1280x720 Ultra Low Preset | |
| Sparkle Intel Arc A380 Elf | |
| Geekom A7 | |
| Acemagic F2A | |
| Minisforum MS-01 | |
| Minisforum Venus Series NAB9 | |
| Maxtang MTN-FP750 | |
| Geekom XT12 Pro | |
| 1920x1080 High Preset AA:T AF:16x | |
| Sparkle Intel Arc A380 Elf | |
| Geekom A7 | |
| Acemagic F2A | |
| Minisforum MS-01 | |
| Minisforum Venus Series NAB9 | |
| Maxtang MTN-FP750 | |
| Geekom XT12 Pro | |
| Tiny Tina's Wonderlands | |
| 1280x720 Lowest Preset (DX12) | |
| Sparkle Intel Arc A380 Elf | |
| Geekom A7 | |
| Acemagic F2A | |
| Maxtang MTN-FP750 | |
| Minisforum MS-01 | |
| Minisforum Venus Series NAB9 | |
| Minisforum Venus Series NPB5 | |
| Geekom XT12 Pro | |
| 1920x1080 High Preset (DX12) | |
| Sparkle Intel Arc A380 Elf | |
| Geekom A7 | |
| Acemagic F2A | |
| Minisforum Venus Series NAB9 | |
| Maxtang MTN-FP750 | |
| Minisforum MS-01 | |
| Minisforum Venus Series NPB5 | |
| Geekom XT12 Pro | |
Witcher 3 FPS chart
| low | med. | high | ultra | |
|---|---|---|---|---|
| GTA V (2015) | 166.4 | 149.3 | 31.1 | 12.5 |
| The Witcher 3 (2015) | 117.2 | 77.8 | 43 | 19.5 |
| Dota 2 Reborn (2015) | 128.6 | 94.5 | 80.8 | 70.6 |
| Final Fantasy XV Benchmark (2018) | 56.3 | 31.2 | 21.4 | |
| X-Plane 11.11 (2018) | 65.5 | 48.3 | 40.7 | |
| Far Cry 5 (2018) | 75 | 39 | 35 | 33 |
| Strange Brigade (2018) | 115.1 | 51.4 | 39.8 | 31.7 |
| Shadow of the Tomb Raider (2018) | 68.7 | 32.4 | 30.3 | 25.7 |
| Far Cry New Dawn (2019) | 69 | 38 | 36 | 33 |
| Metro Exodus (2019) | 45.8 | 23.8 | 17.1 | 13.2 |
| Borderlands 3 (2019) | 67.2 | 30.9 | 18.9 | 14 |
| F1 2020 (2020) | 109.6 | 57.5 | 44.4 | 28 |
| F1 2021 (2021) | 129.9 | 64.9 | 50.8 | 34.4 |
| God of War (2022) | 26.4 | 23 | 18.4 | 13.6 |
| GRID Legends (2022) | 66.2 | 49.3 | 36.7 | 33.2 |
| Tiny Tina's Wonderlands (2022) | 37.5 | 29.5 | 18.2 | 14.2 |
| F1 22 (2022) | 57.2 | 52.3 | 37.1 | 28 |
| F1 23 (2023) | 53.7 | 48.6 | 33.3 | 25 |
| Cyberpunk 2077 (2023) | 22.5 | 17.7 | 15 | 13.1 |
| Total War Pharaoh (2023) | 87.5 | 60.2 | 41.6 | 36.7 |
| Prince of Persia The Lost Crown (2024) | 178 | 124.2 | 115.8 |
The Minisforum MS-01 with the Razer Core X in the performance check
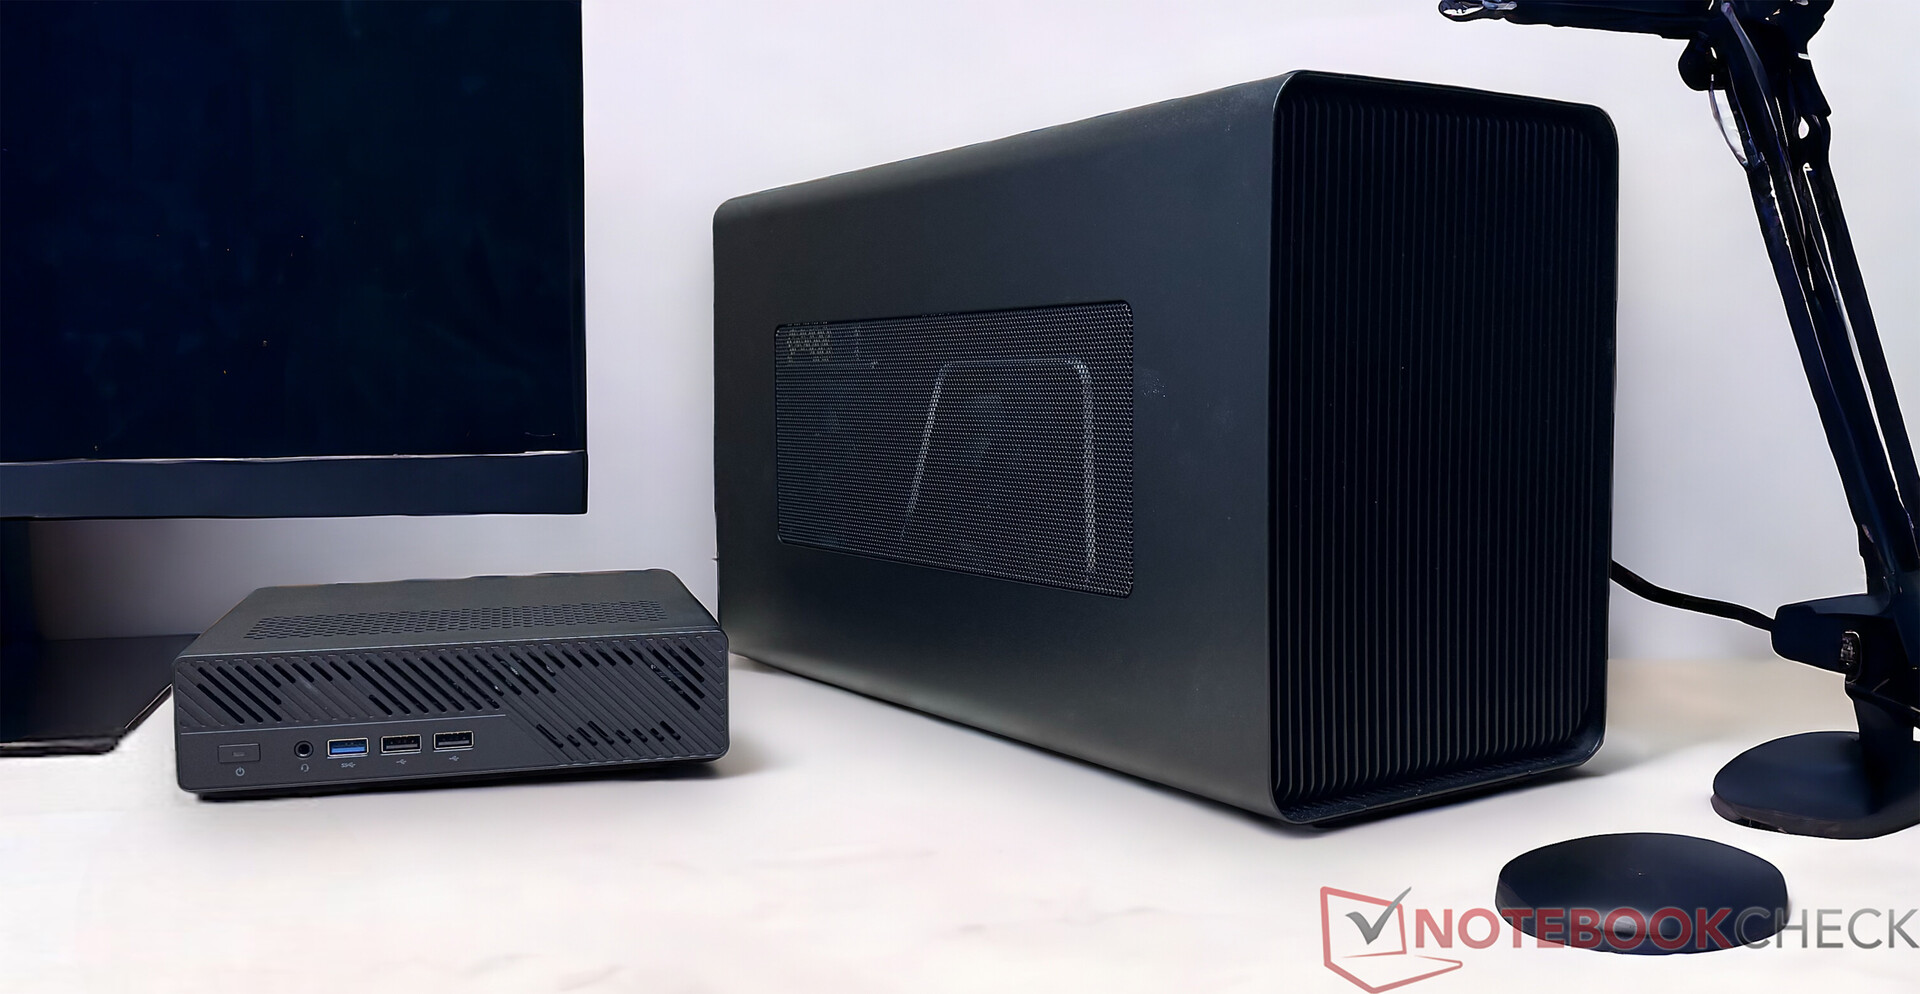
If you want to equip the Minisforum MS-01 with an eGPU instead of finding a suitable model that can be installed directly in the device, you can get an overview of the expected increase in performance here. We took a closer look at the Minisforum MS-01 in combination with the Razer Core X and an Nvidia GeForce RTX 3060 Ti. Compared to its competitors, our test sample delivers an outstanding performance at this point. Our results also show that the Intel Core i9-13900H in combination with our Razer Core X performs significantly better than the comparison devices with AMD processors.
These tests are only a representation of possible performance with an external graphics card. These results do not influence the overall rating in this test.
| Performance rating - Percent | |
| Minisforum MS-01 (Nvidia GeForce RTX 3060 Ti FE) | |
| Geekom A7 (Nvidia GeForce RTX 3060 Ti FE) | |
| Intel NUC 13 Pro Kit NUC13ANK (Nvidia GeForce RTX 3060 Ti FE TB3) | |
| Acemagic AM18 (Nvidia GeForce RTX 3060 Ti FE) | |
| Geekom XT12 Pro (Nvidia GeForce RTX 3060 Ti FE) | |
| Minisforum Venus Series UM790 Pro (Nvidia GeForce RTX 3060 Ti FE TB3) | |
| Ace Magician AM08Pro (Nvidia GeForce RTX 3060 Ti FE TB3) | |
| 3DMark | |
| 1280x720 Sky Diver Graphics | |
| Geekom A7 (Nvidia GeForce RTX 3060 Ti FE) | |
| Minisforum MS-01 (Nvidia GeForce RTX 3060 Ti FE) | |
| Intel NUC 13 Pro Kit NUC13ANK (Nvidia GeForce RTX 3060 Ti FE TB3) | |
| Ace Magician AM08Pro (Nvidia GeForce RTX 3060 Ti FE TB3) | |
| Minisforum Venus Series UM790 Pro (Nvidia GeForce RTX 3060 Ti FE TB3) | |
| Acemagic AM18 (Nvidia GeForce RTX 3060 Ti FE) | |
| Geekom XT12 Pro (Nvidia GeForce RTX 3060 Ti FE) | |
| 1920x1080 Fire Strike Graphics | |
| Geekom A7 (Nvidia GeForce RTX 3060 Ti FE) | |
| Intel NUC 13 Pro Kit NUC13ANK (Nvidia GeForce RTX 3060 Ti FE TB3) | |
| Minisforum MS-01 (Nvidia GeForce RTX 3060 Ti FE) | |
| Acemagic AM18 (Nvidia GeForce RTX 3060 Ti FE) | |
| Geekom XT12 Pro (Nvidia GeForce RTX 3060 Ti FE) | |
| Ace Magician AM08Pro (Nvidia GeForce RTX 3060 Ti FE TB3) | |
| Minisforum Venus Series UM790 Pro (Nvidia GeForce RTX 3060 Ti FE TB3) | |
| Unigine Superposition | |
| 1280x720 720p Low | |
| Minisforum MS-01 (Nvidia GeForce RTX 3060 Ti FE) | |
| Geekom A7 (Nvidia GeForce RTX 3060 Ti FE) | |
| Minisforum Venus Series UM790 Pro (Nvidia GeForce RTX 3060 Ti FE TB3) | |
| Acemagic AM18 (Nvidia GeForce RTX 3060 Ti FE) | |
| Geekom XT12 Pro (Nvidia GeForce RTX 3060 Ti FE) | |
| Intel NUC 13 Pro Kit NUC13ANK (Nvidia GeForce RTX 3060 Ti FE TB3) | |
| Ace Magician AM08Pro (Nvidia GeForce RTX 3060 Ti FE TB3) | |
| 1920x1080 1080p High | |
| Intel NUC 13 Pro Kit NUC13ANK (Nvidia GeForce RTX 3060 Ti FE TB3) | |
| Minisforum MS-01 (Nvidia GeForce RTX 3060 Ti FE) | |
| Geekom A7 (Nvidia GeForce RTX 3060 Ti FE) | |
| Acemagic AM18 (Nvidia GeForce RTX 3060 Ti FE) | |
| Geekom XT12 Pro (Nvidia GeForce RTX 3060 Ti FE) | |
| Ace Magician AM08Pro (Nvidia GeForce RTX 3060 Ti FE TB3) | |
| Minisforum Venus Series UM790 Pro (Nvidia GeForce RTX 3060 Ti FE TB3) | |
| 1920x1080 1080p Extreme | |
| Intel NUC 13 Pro Kit NUC13ANK (Nvidia GeForce RTX 3060 Ti FE TB3) | |
| Minisforum MS-01 (Nvidia GeForce RTX 3060 Ti FE) | |
| Geekom XT12 Pro (Nvidia GeForce RTX 3060 Ti FE) | |
| Acemagic AM18 (Nvidia GeForce RTX 3060 Ti FE) | |
| Geekom A7 (Nvidia GeForce RTX 3060 Ti FE) | |
| Ace Magician AM08Pro (Nvidia GeForce RTX 3060 Ti FE TB3) | |
| Minisforum Venus Series UM790 Pro (Nvidia GeForce RTX 3060 Ti FE TB3) | |
| 3840x2160 4k Optimized | |
| Minisforum MS-01 (Nvidia GeForce RTX 3060 Ti FE) | |
| Intel NUC 13 Pro Kit NUC13ANK (Nvidia GeForce RTX 3060 Ti FE TB3) | |
| Geekom XT12 Pro (Nvidia GeForce RTX 3060 Ti FE) | |
| Geekom A7 (Nvidia GeForce RTX 3060 Ti FE) | |
| Acemagic AM18 (Nvidia GeForce RTX 3060 Ti FE) | |
| Ace Magician AM08Pro (Nvidia GeForce RTX 3060 Ti FE TB3) | |
| Minisforum Venus Series UM790 Pro (Nvidia GeForce RTX 3060 Ti FE TB3) | |
| 7680x4320 8k Optimized | |
| Geekom XT12 Pro (Nvidia GeForce RTX 3060 Ti FE) | |
| Minisforum MS-01 (Nvidia GeForce RTX 3060 Ti FE) | |
| Intel NUC 13 Pro Kit NUC13ANK (Nvidia GeForce RTX 3060 Ti FE TB3) | |
| Acemagic AM18 (Nvidia GeForce RTX 3060 Ti FE) | |
| Geekom A7 (Nvidia GeForce RTX 3060 Ti FE) | |
| Ace Magician AM08Pro (Nvidia GeForce RTX 3060 Ti FE TB3) | |
| Minisforum Venus Series UM790 Pro (Nvidia GeForce RTX 3060 Ti FE TB3) | |
| Unigine Valley 1.0 | |
| 1920x1080 Extreme HD DirectX AA:x8 | |
| Geekom XT12 Pro (Nvidia GeForce RTX 3060 Ti FE) | |
| Minisforum MS-01 (Nvidia GeForce RTX 3060 Ti FE) | |
| Intel NUC 13 Pro Kit NUC13ANK (Nvidia GeForce RTX 3060 Ti FE TB3) | |
| Geekom A7 (Nvidia GeForce RTX 3060 Ti FE) | |
| Acemagic AM18 (Nvidia GeForce RTX 3060 Ti FE) | |
| Minisforum Venus Series UM790 Pro (Nvidia GeForce RTX 3060 Ti FE TB3) | |
| Ace Magician AM08Pro (Nvidia GeForce RTX 3060 Ti FE TB3) | |
| 1920x1080 Extreme HD Preset OpenGL AA:x8 | |
| Minisforum MS-01 (Nvidia GeForce RTX 3060 Ti FE) | |
| Geekom XT12 Pro (Nvidia GeForce RTX 3060 Ti FE) | |
| Geekom A7 (Nvidia GeForce RTX 3060 Ti FE) | |
| Acemagic AM18 (Nvidia GeForce RTX 3060 Ti FE) | |
| Intel NUC 13 Pro Kit NUC13ANK (Nvidia GeForce RTX 3060 Ti FE TB3) | |
| Ace Magician AM08Pro (Nvidia GeForce RTX 3060 Ti FE TB3) | |
| Minisforum Venus Series UM790 Pro (Nvidia GeForce RTX 3060 Ti FE TB3) | |
| Unigine Heaven 4.0 | |
| Extreme Preset OpenGL | |
| Geekom A7 (Nvidia GeForce RTX 3060 Ti FE) | |
| Minisforum MS-01 (Nvidia GeForce RTX 3060 Ti FE) | |
| Acemagic AM18 (Nvidia GeForce RTX 3060 Ti FE) | |
| Geekom XT12 Pro (Nvidia GeForce RTX 3060 Ti FE) | |
| Intel NUC 13 Pro Kit NUC13ANK (Nvidia GeForce RTX 3060 Ti FE TB3) | |
| Ace Magician AM08Pro (Nvidia GeForce RTX 3060 Ti FE TB3) | |
| Minisforum Venus Series UM790 Pro (Nvidia GeForce RTX 3060 Ti FE TB3) | |
| Extreme Preset DX11 | |
| Geekom A7 (Nvidia GeForce RTX 3060 Ti FE) | |
| Intel NUC 13 Pro Kit NUC13ANK (Nvidia GeForce RTX 3060 Ti FE TB3) | |
| Minisforum MS-01 (Nvidia GeForce RTX 3060 Ti FE) | |
| Geekom XT12 Pro (Nvidia GeForce RTX 3060 Ti FE) | |
| Acemagic AM18 (Nvidia GeForce RTX 3060 Ti FE) | |
| Ace Magician AM08Pro (Nvidia GeForce RTX 3060 Ti FE TB3) | |
| Minisforum Venus Series UM790 Pro (Nvidia GeForce RTX 3060 Ti FE TB3) | |
| ComputeMark v2.1 | |
| 1024x600 Normal, Score | |
| Geekom A7 (Nvidia GeForce RTX 3060 Ti FE) | |
| Minisforum MS-01 (Nvidia GeForce RTX 3060 Ti FE) | |
| Acemagic AM18 (Nvidia GeForce RTX 3060 Ti FE) | |
| Minisforum Venus Series UM790 Pro (Nvidia GeForce RTX 3060 Ti FE TB3) | |
| Intel NUC 13 Pro Kit NUC13ANK (Nvidia GeForce RTX 3060 Ti FE TB3) | |
| Ace Magician AM08Pro (Nvidia GeForce RTX 3060 Ti FE TB3) | |
| Geekom XT12 Pro (Nvidia GeForce RTX 3060 Ti FE) | |
| 1024x600 Normal, Fluid 3DTex | |
| Geekom A7 (Nvidia GeForce RTX 3060 Ti FE) | |
| Minisforum MS-01 (Nvidia GeForce RTX 3060 Ti FE) | |
| Intel NUC 13 Pro Kit NUC13ANK (Nvidia GeForce RTX 3060 Ti FE TB3) | |
| Minisforum Venus Series UM790 Pro (Nvidia GeForce RTX 3060 Ti FE TB3) | |
| Acemagic AM18 (Nvidia GeForce RTX 3060 Ti FE) | |
| Ace Magician AM08Pro (Nvidia GeForce RTX 3060 Ti FE TB3) | |
| Geekom XT12 Pro (Nvidia GeForce RTX 3060 Ti FE) | |
| 1024x600 Normal, Fluid 2DTexArr | |
| Minisforum MS-01 (Nvidia GeForce RTX 3060 Ti FE) | |
| Geekom A7 (Nvidia GeForce RTX 3060 Ti FE) | |
| Intel NUC 13 Pro Kit NUC13ANK (Nvidia GeForce RTX 3060 Ti FE TB3) | |
| Minisforum Venus Series UM790 Pro (Nvidia GeForce RTX 3060 Ti FE TB3) | |
| Acemagic AM18 (Nvidia GeForce RTX 3060 Ti FE) | |
| Ace Magician AM08Pro (Nvidia GeForce RTX 3060 Ti FE TB3) | |
| Geekom XT12 Pro (Nvidia GeForce RTX 3060 Ti FE) | |
| 1024x600 Normal, Mandel Vector | |
| Geekom A7 (Nvidia GeForce RTX 3060 Ti FE) | |
| Minisforum MS-01 (Nvidia GeForce RTX 3060 Ti FE) | |
| Acemagic AM18 (Nvidia GeForce RTX 3060 Ti FE) | |
| Minisforum Venus Series UM790 Pro (Nvidia GeForce RTX 3060 Ti FE TB3) | |
| Intel NUC 13 Pro Kit NUC13ANK (Nvidia GeForce RTX 3060 Ti FE TB3) | |
| Ace Magician AM08Pro (Nvidia GeForce RTX 3060 Ti FE TB3) | |
| Geekom XT12 Pro (Nvidia GeForce RTX 3060 Ti FE) | |
| 1024x600 Normal, Mandel Scalar | |
| Geekom A7 (Nvidia GeForce RTX 3060 Ti FE) | |
| Minisforum MS-01 (Nvidia GeForce RTX 3060 Ti FE) | |
| Acemagic AM18 (Nvidia GeForce RTX 3060 Ti FE) | |
| Minisforum Venus Series UM790 Pro (Nvidia GeForce RTX 3060 Ti FE TB3) | |
| Intel NUC 13 Pro Kit NUC13ANK (Nvidia GeForce RTX 3060 Ti FE TB3) | |
| Ace Magician AM08Pro (Nvidia GeForce RTX 3060 Ti FE TB3) | |
| Geekom XT12 Pro (Nvidia GeForce RTX 3060 Ti FE) | |
| 1024x600 Normal, QJuliaRayTrace | |
| Minisforum MS-01 (Nvidia GeForce RTX 3060 Ti FE) | |
| Acemagic AM18 (Nvidia GeForce RTX 3060 Ti FE) | |
| Geekom A7 (Nvidia GeForce RTX 3060 Ti FE) | |
| Intel NUC 13 Pro Kit NUC13ANK (Nvidia GeForce RTX 3060 Ti FE TB3) | |
| Minisforum Venus Series UM790 Pro (Nvidia GeForce RTX 3060 Ti FE TB3) | |
| Ace Magician AM08Pro (Nvidia GeForce RTX 3060 Ti FE TB3) | |
| Geekom XT12 Pro (Nvidia GeForce RTX 3060 Ti FE) | |
| low | med. | high | ultra | QHD | 4K | |
|---|---|---|---|---|---|---|
| GTA V (2015) | 186.2 | 184.2 | 177.4 | 111.8 | 96.1 | 103.5 |
| The Witcher 3 (2015) | 317 | 213 | 155 | 76.2 | 64.9 | 72.7 |
| Dota 2 Reborn (2015) | 202 | 167.4 | 157.5 | 144.6 | 107 | |
| Final Fantasy XV Benchmark (2018) | 205 | 146.8 | 99.6 | 77.9 | 49 | |
| X-Plane 11.11 (2018) | 168.4 | 150.4 | 116.4 | 106.7 | ||
| Far Cry 5 (2018) | 185 | 151 | 139 | 131 | 101 | 59 |
| Strange Brigade (2018) | 231 | 174.9 | 168 | 159.9 | 131.8 | 83.8 |
| Shadow of the Tomb Raider (2018) | 183.7 | 115.4 | 109.9 | 101.6 | 80.8 | 50.3 |
| Far Cry New Dawn (2019) | 160 | 134 | 127 | 115 | 98 | 61 |
| Metro Exodus (2019) | 147.8 | 93.6 | 70.9 | 53.6 | 46.5 | 33.9 |
| Borderlands 3 (2019) | 184.1 | 143 | 108 | 86 | 65.3 | 38.5 |
| F1 2020 (2020) | 223 | 136.2 | 135.8 | 107.2 | 92.5 | 61.5 |
| F1 2021 (2021) | 147.6 | 115.8 | 68.9 | 54.5 | 51 | 42.9 |
| God of War (2022) | 113 | 100.9 | 85.1 | 67.4 | 58.3 | 40.9 |
| Tiny Tina's Wonderlands (2022) | 180 | 140.9 | 101.1 | 81.7 | 62 | 36 |
| F1 22 (2022) | 63.1 | 57.5 | 44.1 | 28.5 | 27.5 | 19.9 |
| F1 23 (2023) | 70.3 | 71 | 56.9 | 36 | 32.6 | 17.4 |
| Cyberpunk 2077 (2023) | 91.7 | 81.5 | 71.6 | 64.6 | 44.6 | 22.4 |
| Assassin's Creed Mirage (2023) | 88 | 82 | 78 | 60 | 55 | 38 |
| Total War Pharaoh (2023) | 334.2 | 179 | 104.6 | 77.3 | 62.7 | 39.2 |
| Avatar Frontiers of Pandora (2023) | 67 | 64 | 57 | 45 | 32 |
Emissions - Unfortunately not very economical
Noise emissions
If you look at the cooling unit, it quickly becomes clear that the fan is too small for the installed CPU, and has to work at high speed to blow enough amount of fresh air through the radiator. The result is audible operation under load. Nevertheless, the device is relatively quiet at idle. At 33.7 to 34.7 dB(A), it is roughly on the same level as the Geekom A7. Under load, it gets quite loud, and our test sample duels with the Acemagic F2A, which delivered similar results in our test.
Noise level
| Idle |
| 33.7 / 33.9 / 34.7 dB(A) |
| Load |
| 47.7 / 49.1 dB(A) |
 | ||
30 dB silent 40 dB(A) audible 50 dB(A) loud |
||
min: | ||
| Minisforum MS-01 i9-13900H, Iris Xe G7 96EUs | Acemagic F2A Ultra 7 155H, Arc 8-Core | Geekom XT12 Pro i9-12900H, Iris Xe G7 96EUs | Geekom A7 R9 7940HS, Radeon 780M | Minisforum Venus Series NAB9 i9-12900HK, Iris Xe G7 96EUs | Minisforum Venus Series NPB5 i5-13500H, Iris Xe G7 80EUs | Maxtang MTN-FP750 R7 7735HS, Radeon 680M | |
|---|---|---|---|---|---|---|---|
| Noise | 12% | 11% | 5% | 9% | 13% | 15% | |
| off / environment * (dB) | 24.4 | 24.9 -2% | 25.4 -4% | 25.4 -4% | 25.4 -4% | 25.1 -3% | 25 -2% |
| Idle Minimum * (dB) | 33.7 | 25.4 25% | 28 17% | 33.3 1% | 27.5 18% | 27.8 18% | 25.3 25% |
| Idle Average * (dB) | 33.9 | 25.7 24% | 28.1 17% | 33.6 1% | 28 17% | 27.8 18% | 25.3 25% |
| Idle Maximum * (dB) | 34.7 | 25.7 26% | 28.5 18% | 33.7 3% | 33 5% | 27.9 20% | 25.4 27% |
| Load Average * (dB) | 47.7 | 47.8 -0% | 39.6 17% | 43.3 9% | 42.8 10% | 38.9 18% | 45.1 5% |
| Witcher 3 ultra * (dB) | 48.9 | 45.23 8% | 47.2 3% | 43.2 12% | 44.5 9% | ||
| Load Maximum * (dB) | 49.1 | 49 -0% | 44.2 10% | 43.3 12% | 44.9 9% | 45.8 7% | 45.3 8% |
* ... smaller is better
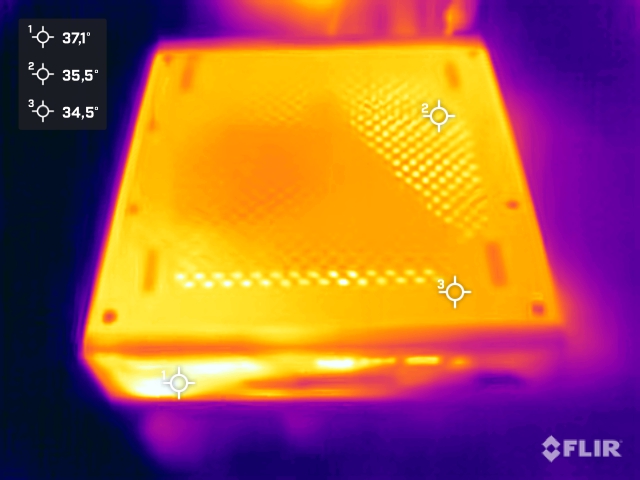
Temperature
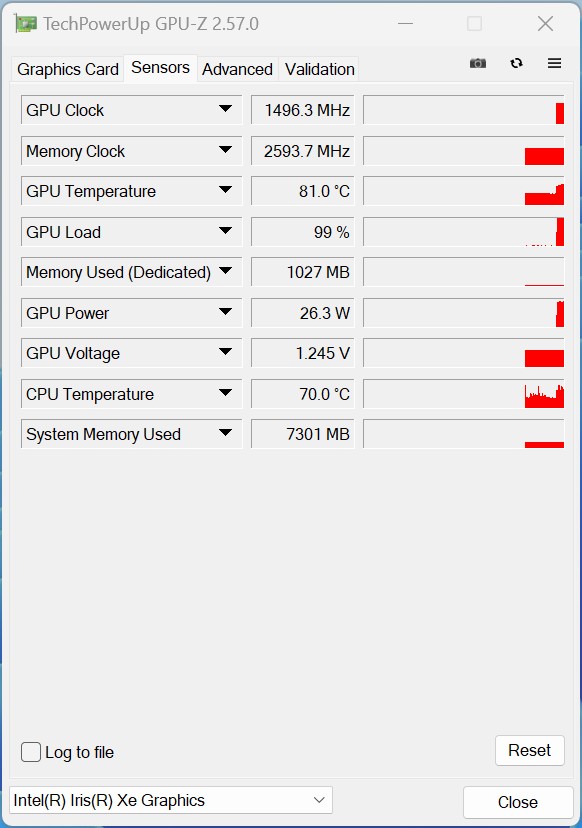
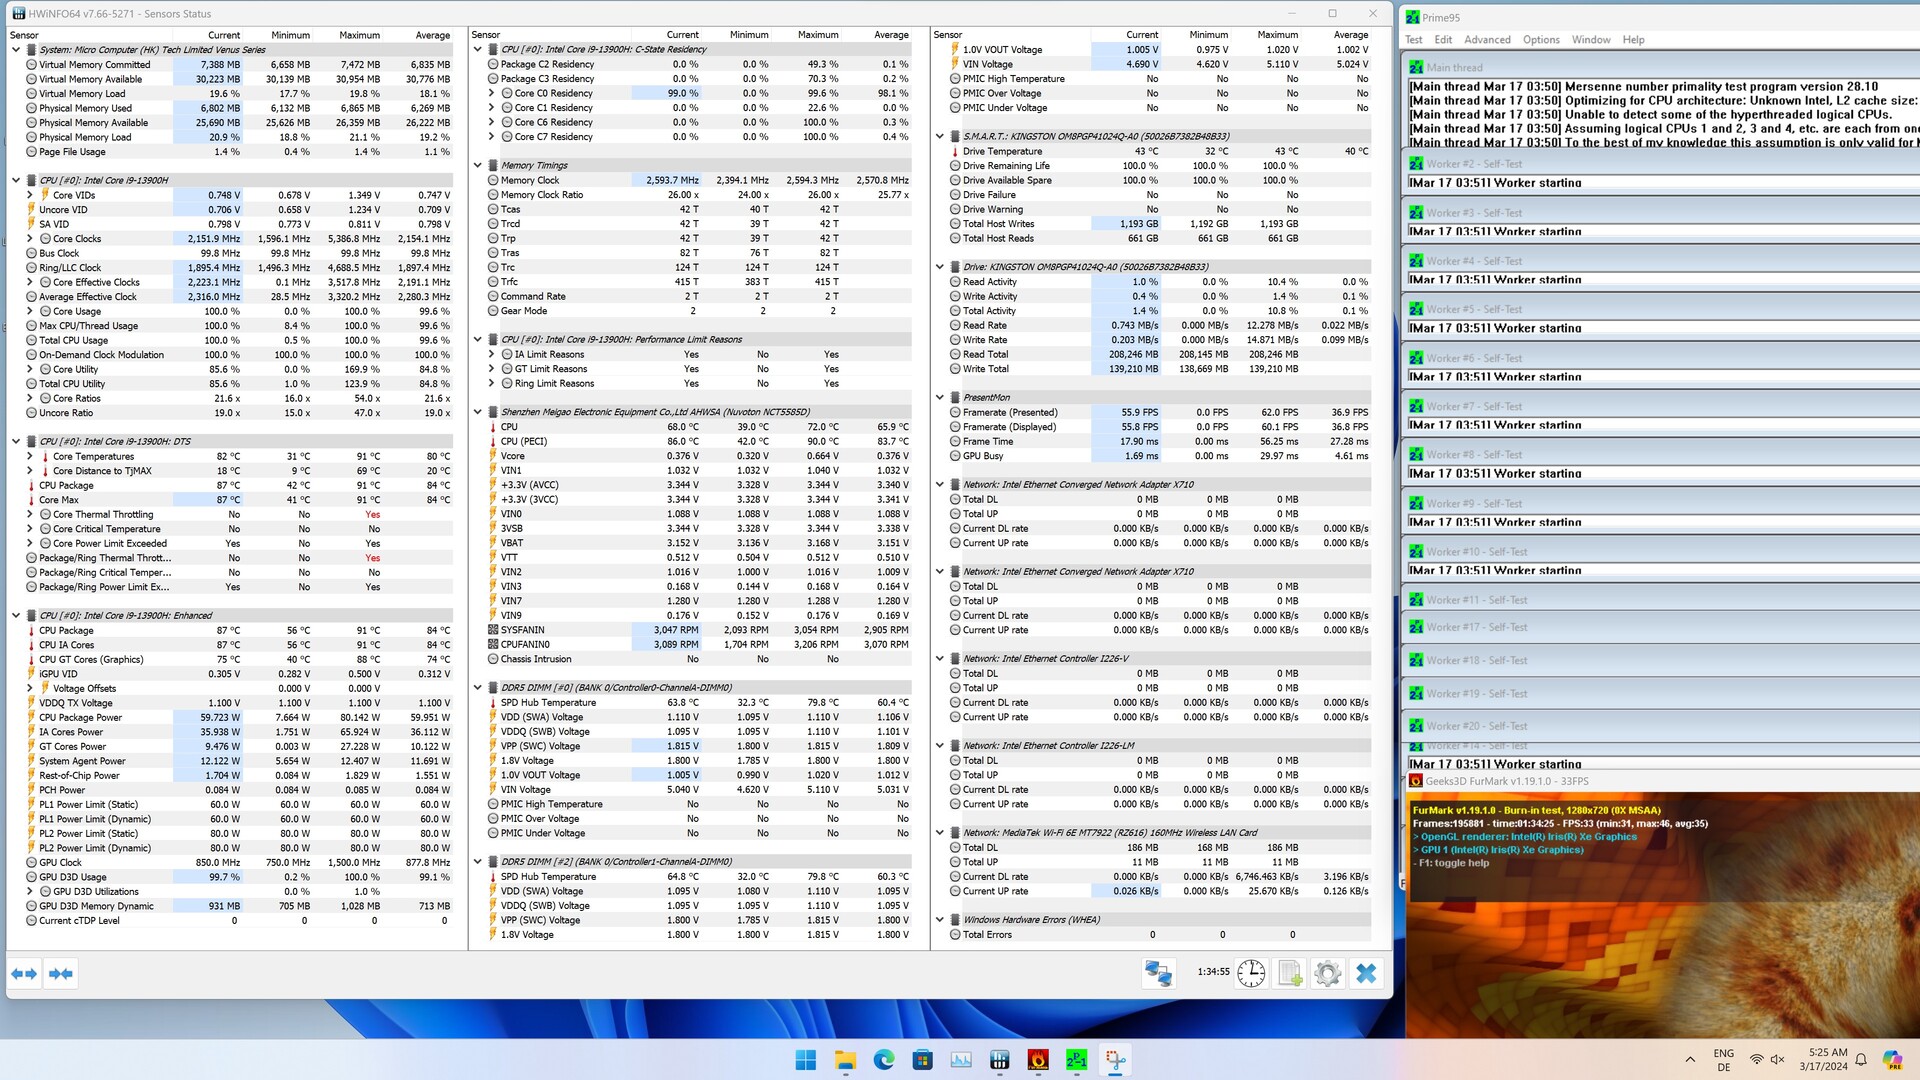
The housing of the Minisforum MS-01 is relatively cool at idle and under load. At well below 40 °C, there is nothing to complain about here. However, the processor is a completely different story: At 101 °C, we note the highest value, which was unusually reached in the FurMark stress test. Due to the problems mentioned at the beginning, we will take another look at this part as soon as we receive the replacement test sample.

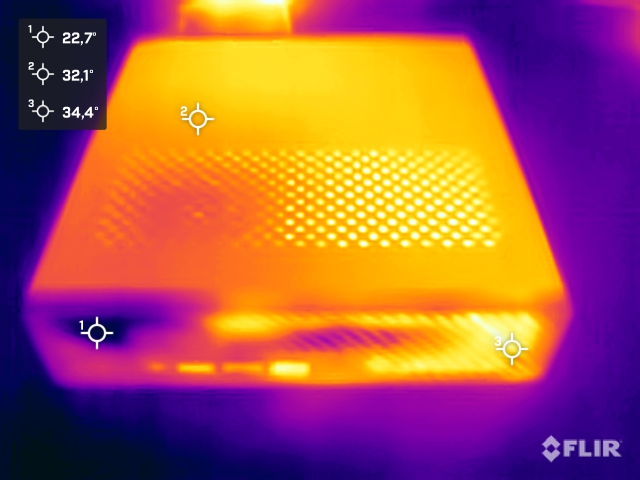
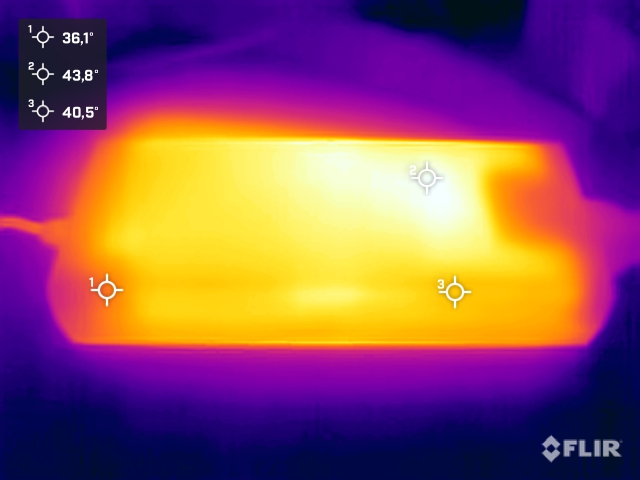
(+) The maximum temperature on the upper side is 36.6 °C / 98 F, compared to the average of 35.8 °C / 96 F, ranging from 20.6 to 69.5 °C for the class Mini PC.
(+) The bottom heats up to a maximum of 33.6 °C / 92 F, compared to the average of 36.3 °C / 97 F
(+) In idle usage, the average temperature for the upper side is 28.4 °C / 83 F, compared to the device average of 32.4 °C / 90 F.
Power consumption
The Minisforum MS-01 is not an economical device. Even at idle, we document quite high values that are well above the average of most mini-PCs. Under average load, the energy requirement climbs to 87 watts, although 123.3 watts were reached at the peak. In comparison with its competitors, we can see that the Minisforum Venus Series NAB9 also achieves similar values. At first glance, the included power supply unit seems oversized with its 180 watts. The possibility of equipping the Minisforum MS-01 with a dedicated graphics card should not be lost sight of, which means that the 180-watt power supply has its raison d'être.

| Off / Standby | |
| Idle | |
| Load |
|
Key:
min: | |
| Minisforum MS-01 i9-13900H, Iris Xe G7 96EUs | Acemagic F2A Ultra 7 155H, Arc 8-Core | Geekom XT12 Pro i9-12900H, Iris Xe G7 96EUs | Geekom A7 R9 7940HS, Radeon 780M | Minisforum Venus Series NAB9 i9-12900HK, Iris Xe G7 96EUs | Minisforum Venus Series NPB5 i5-13500H, Iris Xe G7 80EUs | Maxtang MTN-FP750 R7 7735HS, Radeon 680M | Average Intel Iris Xe Graphics G7 96EUs | Average of class Mini PC | |
|---|---|---|---|---|---|---|---|---|---|
| Power Consumption | 33% | 41% | 52% | 19% | 23% | 51% | 52% | 28% | |
| Idle Minimum * (Watt) | 14.4 | 9.1 37% | 5.7 60% | 3.8 74% | 12.1 16% | 8.4 42% | 7 51% | 5.51 ? 62% | 9.19 ? 36% |
| Idle Average * (Watt) | 16.1 | 10.3 36% | 9.5 41% | 4.8 70% | 13.2 18% | 11.3 30% | 8.1 50% | 8.66 ? 46% | 11.3 ? 30% |
| Idle Maximum * (Watt) | 25.5 | 14.4 44% | 16.5 35% | 6.5 75% | 14.1 45% | 14.5 43% | 8.4 67% | 10.9 ? 57% | 14.8 ? 42% |
| Load Average * (Watt) | 87.3 | 54.9 37% | 53.3 39% | 71.9 18% | 82.9 5% | 70 20% | 54.2 38% | 45.6 ? 48% | 65.5 ? 25% |
| Load Maximum * (Watt) | 123.3 | 110.4 10% | 87.8 29% | 94.7 23% | 106.8 13% | 149 -21% | 61.4 50% | 67.8 ? 45% | 112.4 ? 9% |
* ... smaller is better
Power consumption with external monitor
Power consumption with external monitor
Pros
Cons
Verdict - Powerful tool with above-average features
The Minisforum MS-01 is visually very different from most mini-PCs, but that's not a bad thing. The industrial look clearly shows that it is a work device. In terms of performance, the computing performance of the Intel Core i9-13900H provides plenty of power, which can also be used. The predefined power limits ensure high performance, and AMD's current top models are not noticeably faster here. Due to the noise emissions, we would have liked a much more powerful cooling unit.
The many connection options, which open up a wide range of possible applications, are a positive highlight. Two USB4 ports are probably the most important interfaces of the Minisforum MS-01, but the Mini-PC also scores with many internal connection options. A physical PCIe x16 interface is currently a unique feature in this compact design. A dedicated graphics card can therefore be installed. However, an intensive search for a suitable model is required.
The Minisforum MS-01 is a powerful workstation and has the potential to become a workstation with the right accessories.
We would not describe the Minisforum MS-01 as a pure workstation in the form in which we tested the model. In terms of performance alone, there is no great advantage over other mini-PCs for the consumer sector. In our opinion, a professional graphics solution would be the right way to differentiate itself more clearly. Unfortunately, Minisforum itself does not offer a suitable model of the dedicated graphics card.
Finally, let's take a look at the purchase price because the Minisforum MS-01 is not a bargain at 979 euros. Many competitors are much cheaper and in some cases also more powerful. Nevertheless, the Minisforum MS-01 offers special advantages in terms of usage options that other mini-PCs do not offer.
During the entire test period, we had to contend with massive stability problems. We already pointed out the problems with our test sample at the beginning of the review. Some tests were repeatedly accompanied by sudden crashes, making regular operation impossible for end users in this state. Due to this problem, we have refrained from issuing a final rating for the time being and will look into the matter again as soon as the manufacturer sends us a replacement device.
Prices and availability
You can buy the Minisforum MS-01 directly in the store at Minisforum. Alternatively, Amazon also offers some variants of the Minisforum MS-01 with prices starting at $580.
Transparency
The selection of devices to be reviewed is made by our editorial team. The test sample was given to the author by the manufacturer free of charge for the purposes of review. There was no third-party influence on this review, nor did the manufacturer receive a copy of this review before publication. There was no obligation to publish this review. As an independent media company, Notebookcheck is not subjected to the authority of manufacturers, retailers or publishers.
This is how Notebookcheck is testing
Every year, Notebookcheck independently reviews hundreds of laptops and smartphones using standardized procedures to ensure that all results are comparable. We have continuously developed our test methods for around 20 years and set industry standards in the process. In our test labs, high-quality measuring equipment is utilized by experienced technicians and editors. These tests involve a multi-stage validation process. Our complex rating system is based on hundreds of well-founded measurements and benchmarks, which maintains objectivity. Further information on our test methods can be found here.

