Asus ProArt PX13 review - The world's fastest 13.3-inch 2-in-1 thanks to AMD Zen 5 and RTX 4070 laptop
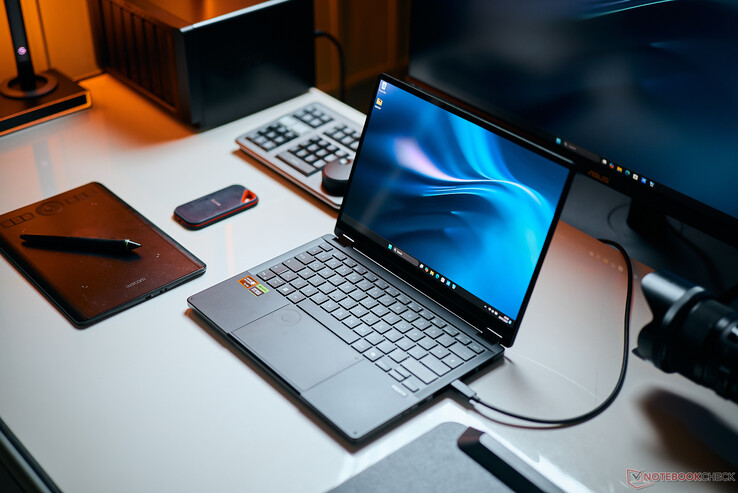
The new Asus ProArt PX13 is a compact 13.3-inch 2-in-1 that is primarily aimed at creative users who seek the most compact and powerful device possible. Appropriately, AMD's brand new Zen 5 mobile processors combined with Nvidia's dedicated GeForce GPUs are on board. The display is provided by a 2,880 x 1,800-pixel, high-resolution OLED panel which is, however, only 60 Hz.
Our review device is the high-end variant which costs around $2,999 and comes with the AMD Ryzen AI 9 HX 370 and the GeForce RTX 4070 laptop with a 75-watt TGP. In addition, there is a 2 TB SSD as well as 32 GB of RAM (Note: the review sample was only equipped with a 1 TB SSD). With the RTX 4050 laptop, the entry-level price sits at $1,999 (24 GB of RAM, 1 TB SSD) and the variant with the RTX 4060 laptop (32 GB of RAM, 1 TB SSD) costs $2,399.
When taking a glance at potential competitors, it quickly becomes clear that when it comes to compact devices with dedicated GPUs, the market is currently dominated by Asus. We will also include multimedia devices such as the ROG Zephyrus G14, the Razer Blade 14 and Microsoft's Surface Laptop Studio 2 in the comparison, even though these devices are larger.
Update 08/01: Updated System Performance section with additional benchmarks for picture/video editing.
Possible competitors compared
Rating | Version | Date | Model | Weight | Height | Size | Resolution | Price |
|---|---|---|---|---|---|---|---|---|
| 86 % | v8 | 07 / 2024 | Asus ProArt PX13 HN7306 Ryzen AI 9 HX 370, GeForce RTX 4070 Laptop GPU | 1.4 kg | 17.7 mm | 13.30" | 2880x1800 | |
| 88.2 % v7 (old) | v7 (old) | 10 / 2023 | Asus ROG Flow X13 GV302XV R9 7940HS, GeForce RTX 4060 Laptop GPU | 1.3 kg | 18.7 mm | 13.40" | 2560x1600 | |
| 89.4 % v7 (old) | v7 (old) | 04 / 2023 | Asus ROG Flow Z13 ACRNM i9-13900H, GeForce RTX 4070 Laptop GPU | 1.7 kg | 20 mm | 13.40" | 2560x1600 | |
| 93 % v7 (old) | v7 (old) | 02 / 2024 | Asus ROG Zephyrus G14 2024 GA403U R9 8945HS, GeForce RTX 4070 Laptop GPU | 1.5 kg | 16.3 mm | 14.00" | 2880x1800 | |
| 89.7 % v7 (old) | v7 (old) | 02 / 2024 | Razer Blade 14 RZ09-0508 R9 8945HS, GeForce RTX 4070 Laptop GPU | 1.9 kg | 17.99 mm | 14.00" | 2560x1600 | |
| 85.5 % v7 (old) | v7 (old) | 10 / 2023 | Microsoft Surface Laptop Studio 2 RTX 4060 i7-13700H, GeForce RTX 4060 Laptop GPU | 2 kg | 22 mm | 14.40" | 2400x1600 |
Note: We have recently updated our rating system and the results of version 8 are not comparable with the results of version 7. More information is available here.
Case - Extremely stable unibody
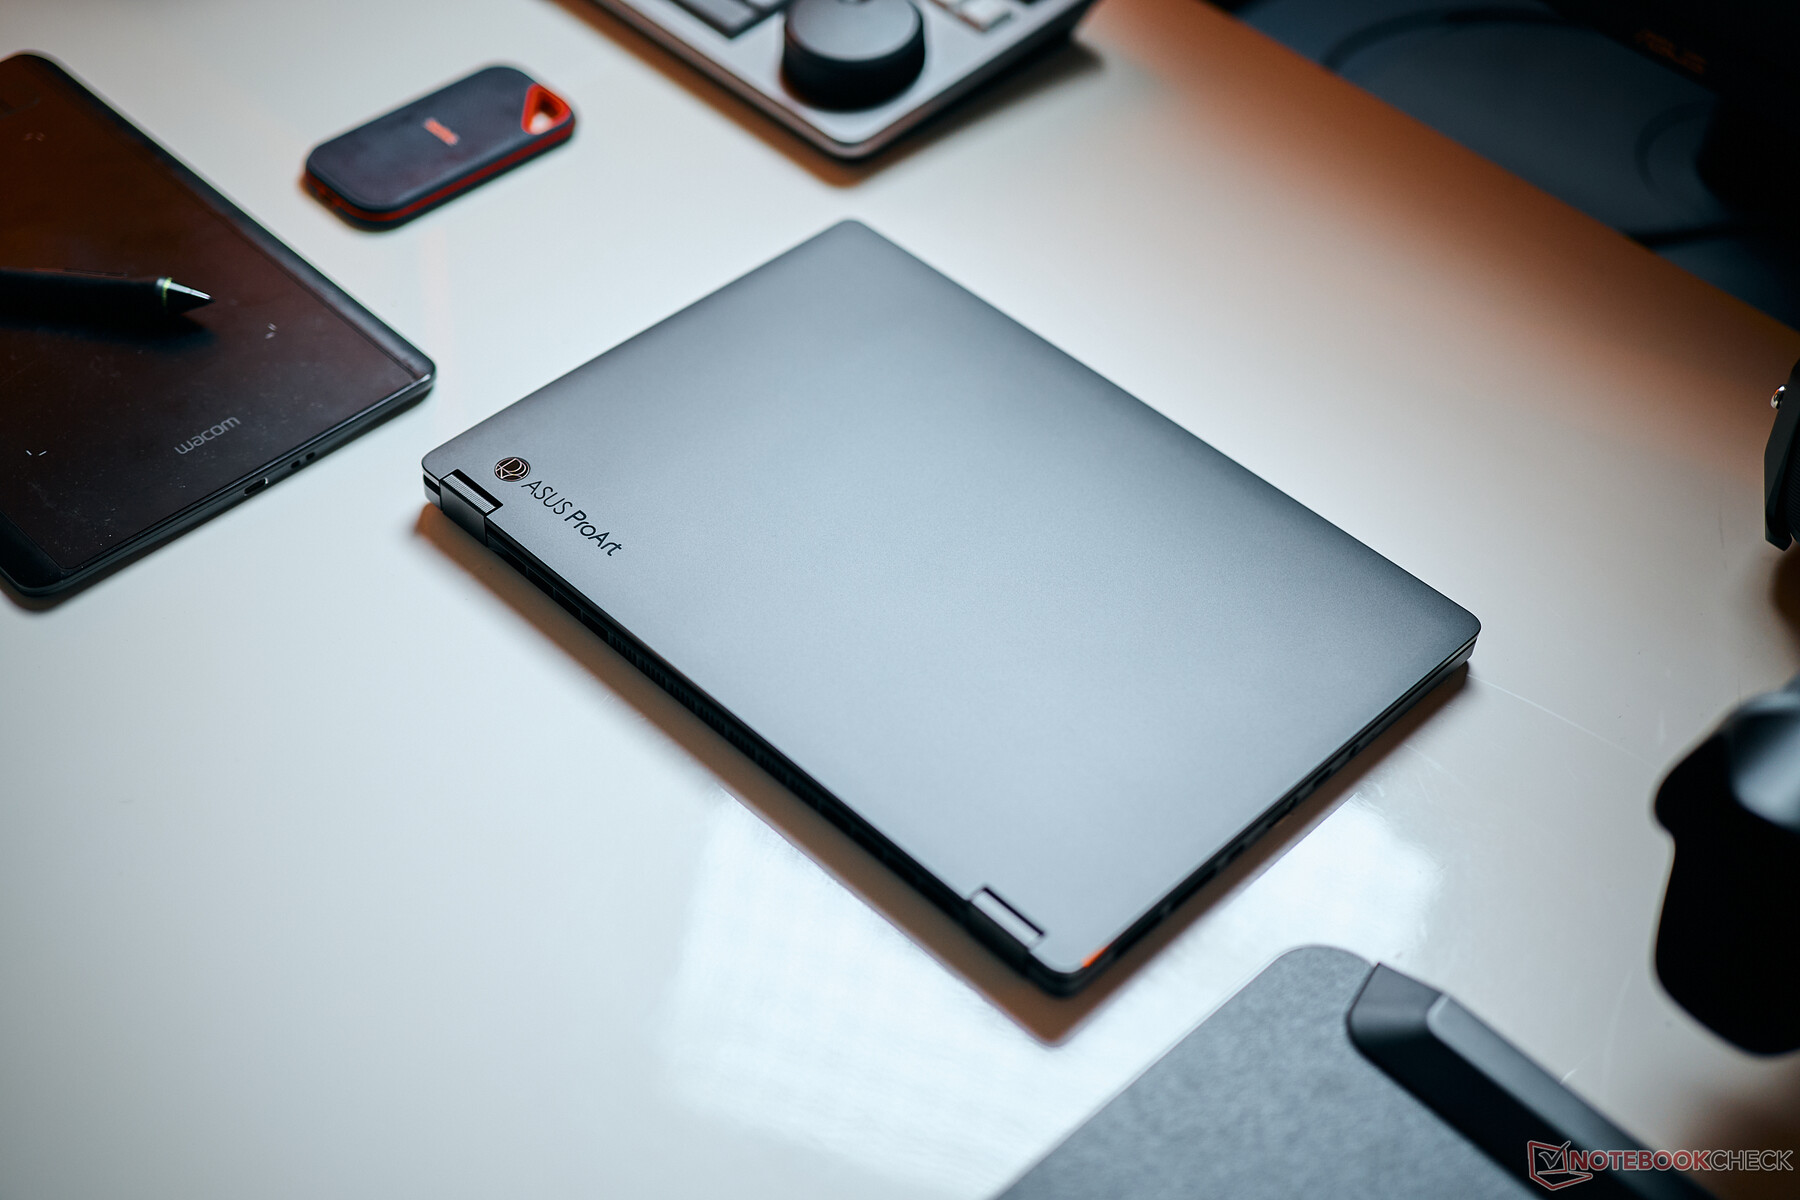
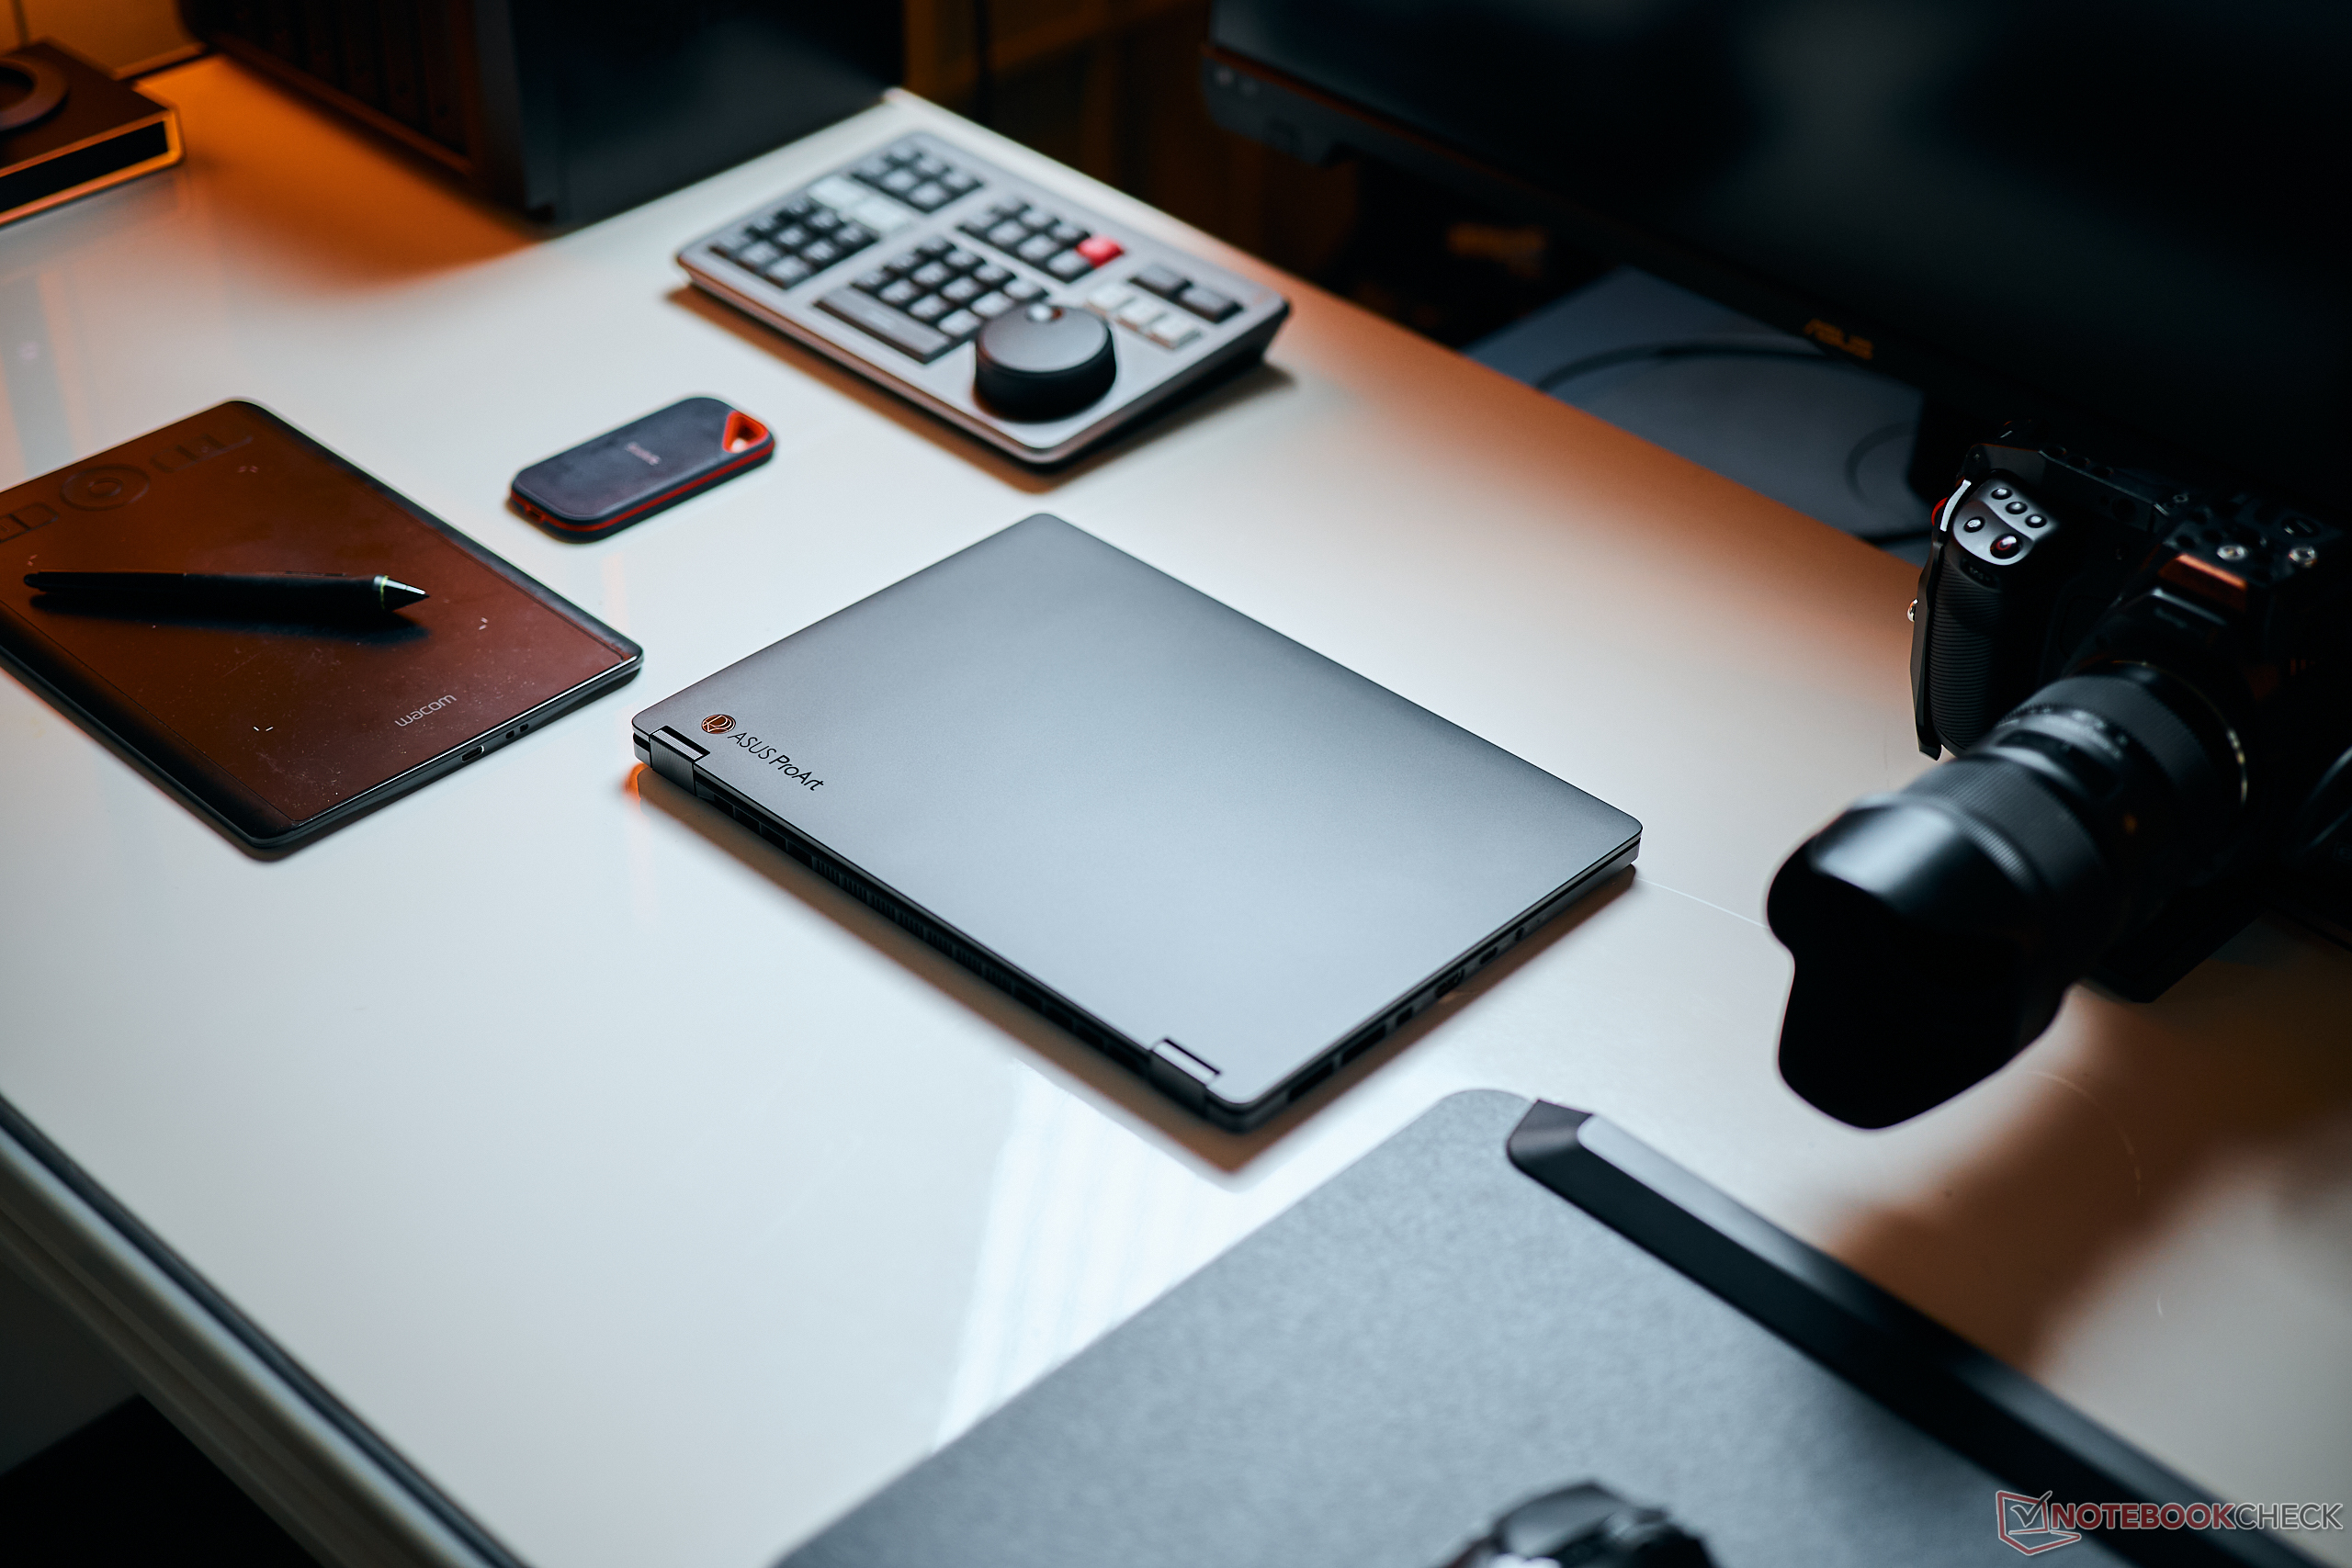
The aluminium unibody case design reminds us very much of the current Asus ROG Zephyrus G14, however, the PX13 is slightly more playful. There might not be an LED strip on the lid but there is a groove pattern in many areas, for example, at the hinges or also the edges of the screen. In addition, the 2-in-1 has small rubber feet on the base unit (circular at the front edges, strips in front of the hinges) which means you can place the device on the keyboard without it sliding away. All in all, the design is very sleek meaning you can also easily use the PX13 in professional environments. The smooth black surfaces are not particularly prone to smudges and fingerprints. An additional difference to the G14 is the fan grille since the entire rear, as well as the rear area of both sides of the device, serve to dissipate the heat.
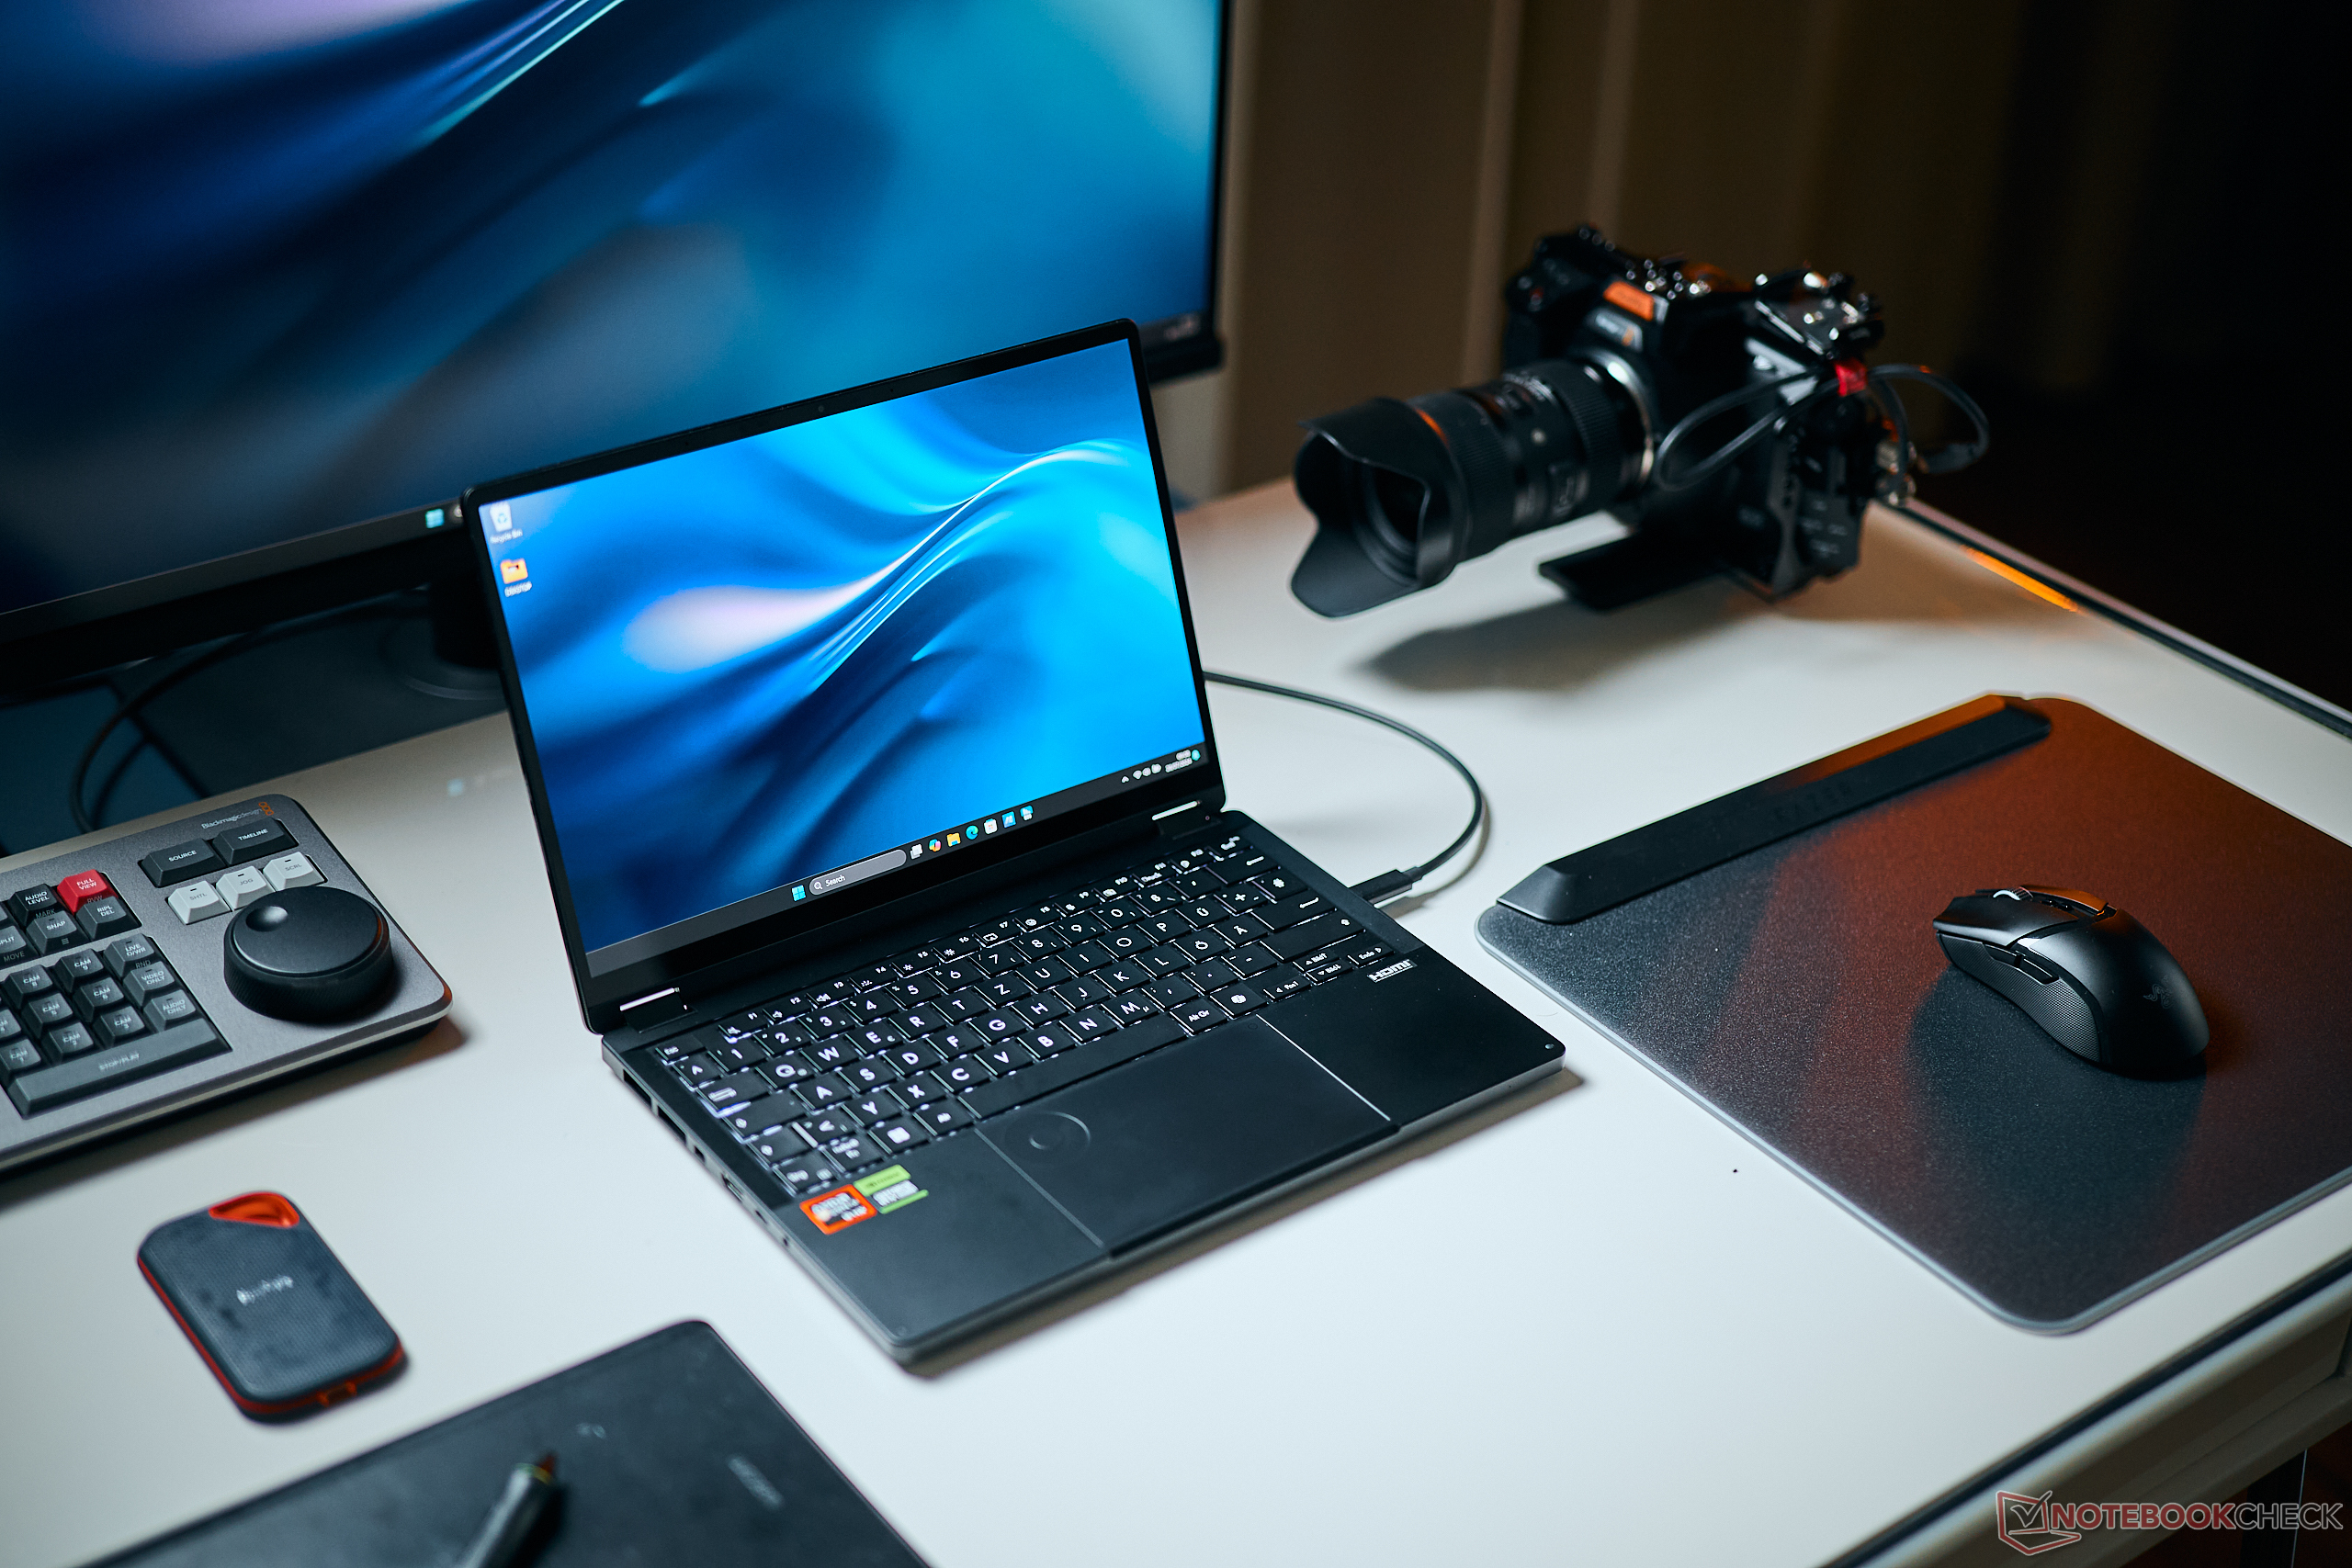
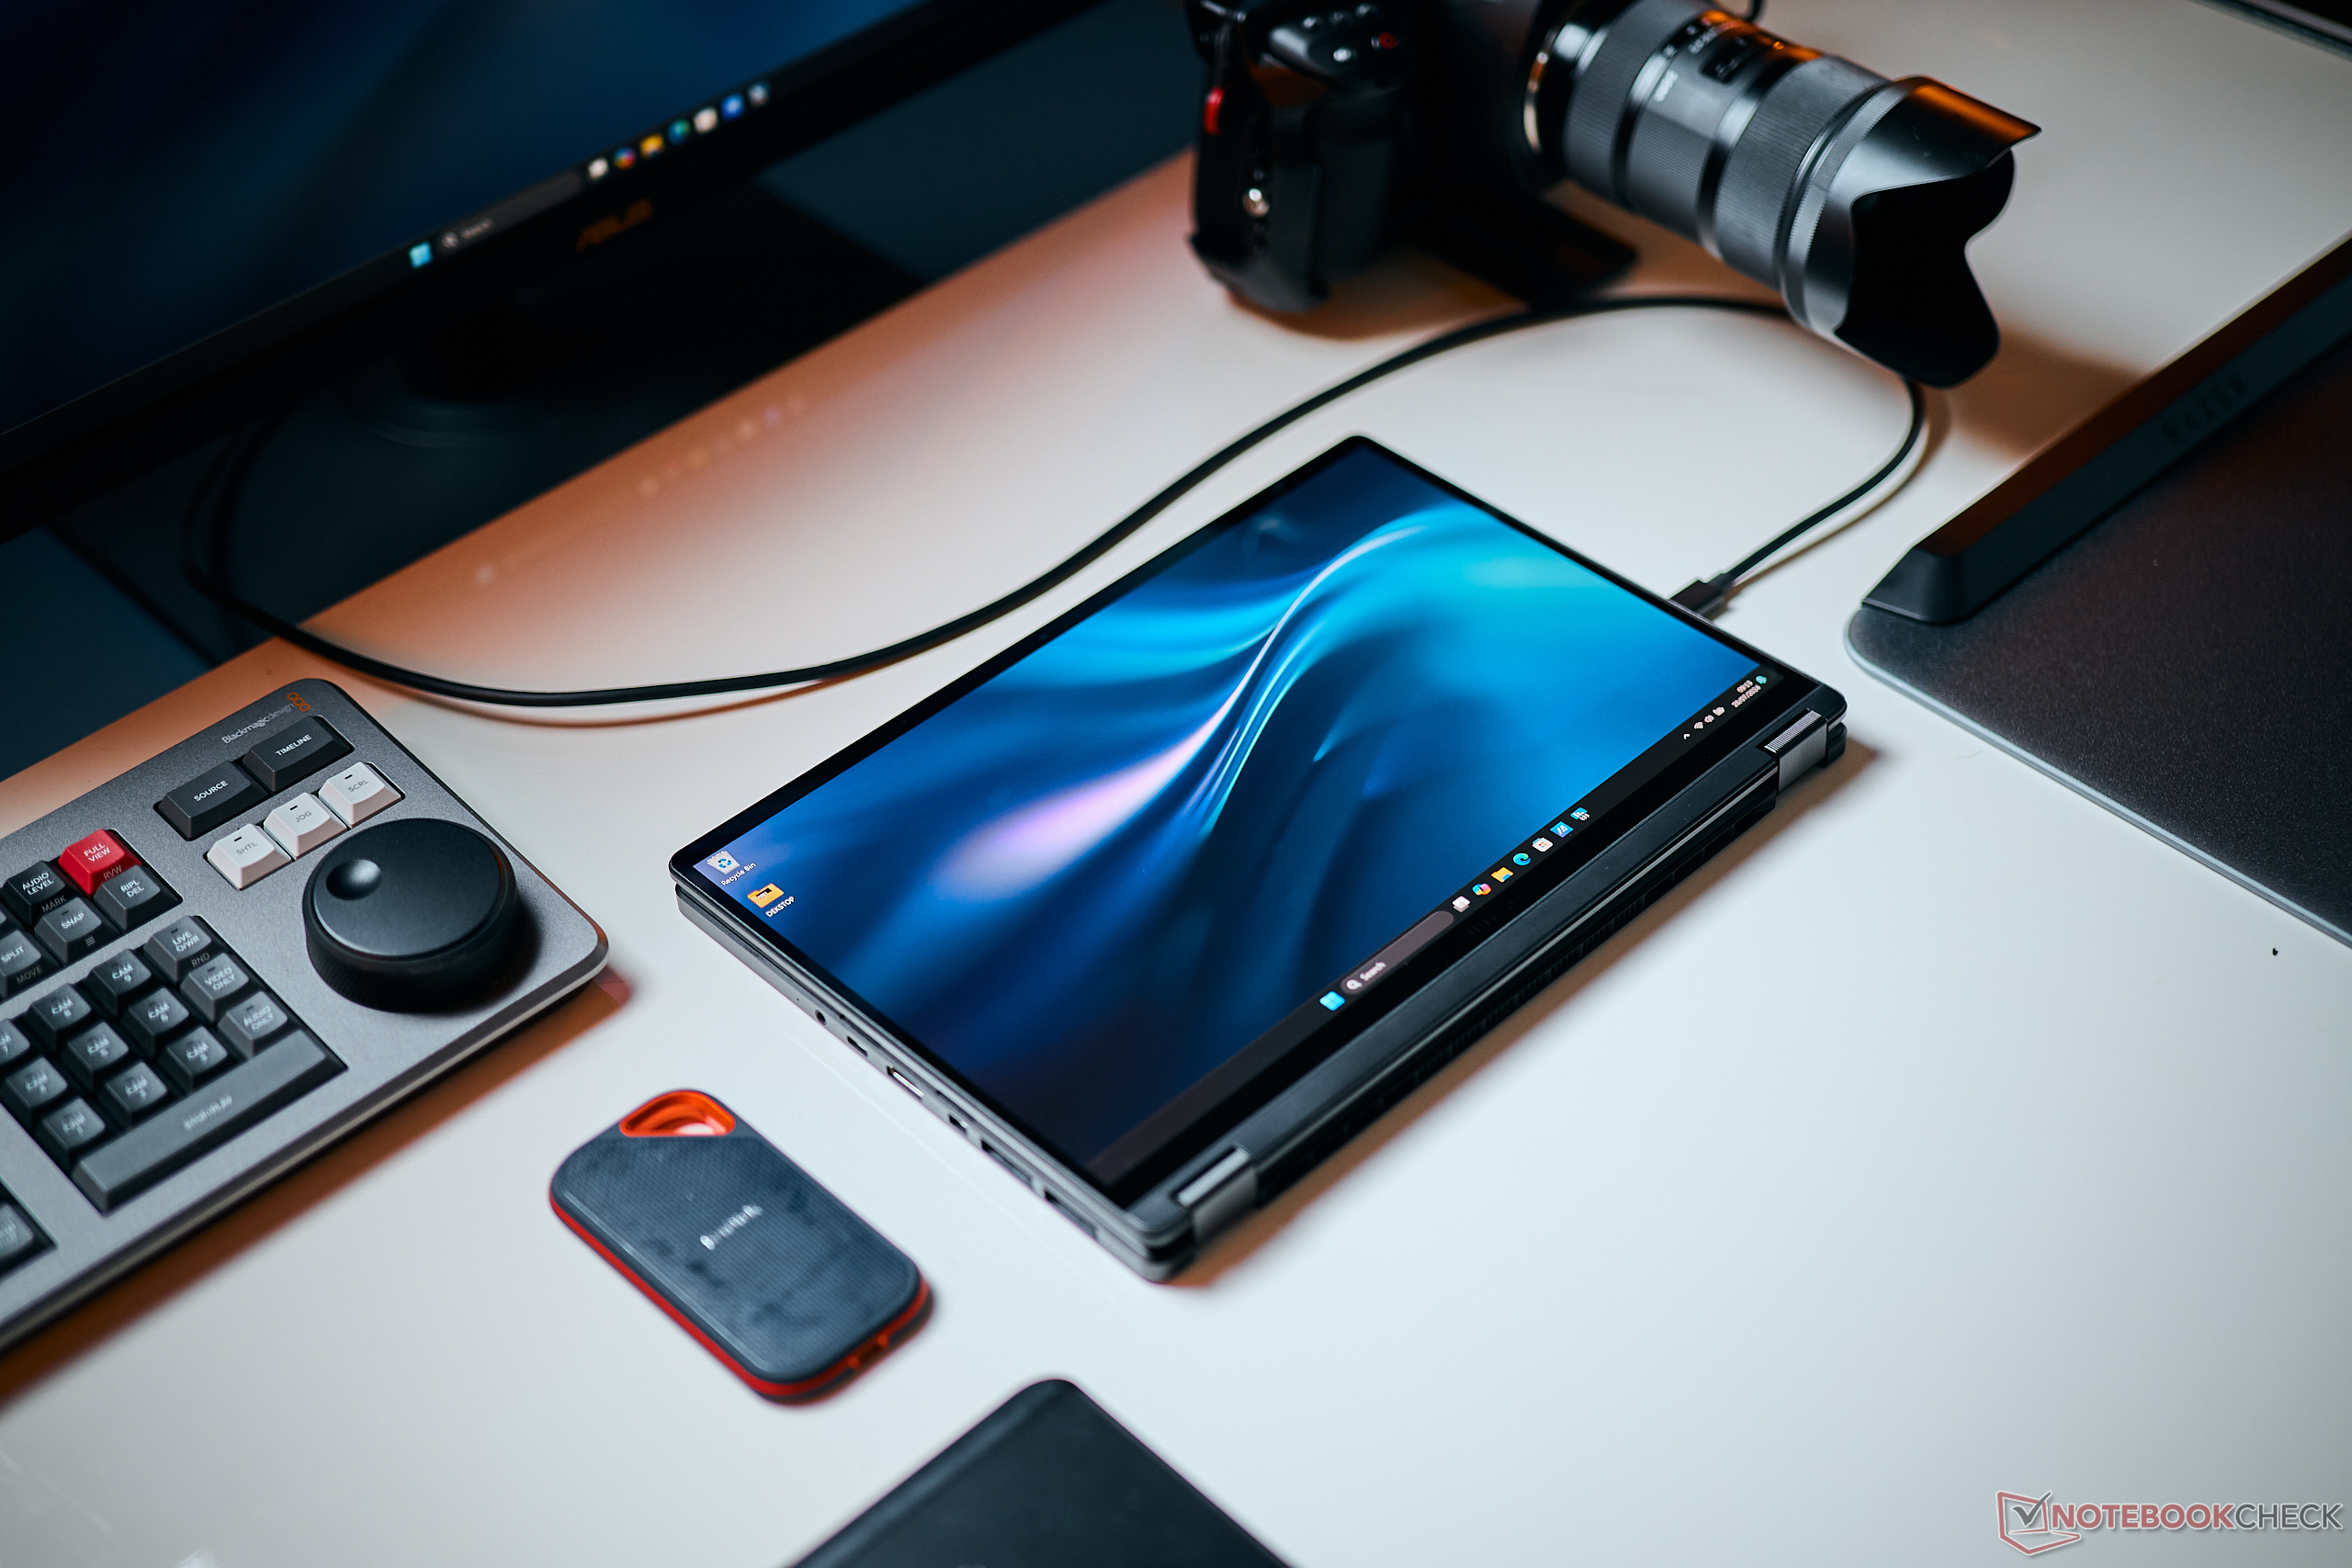
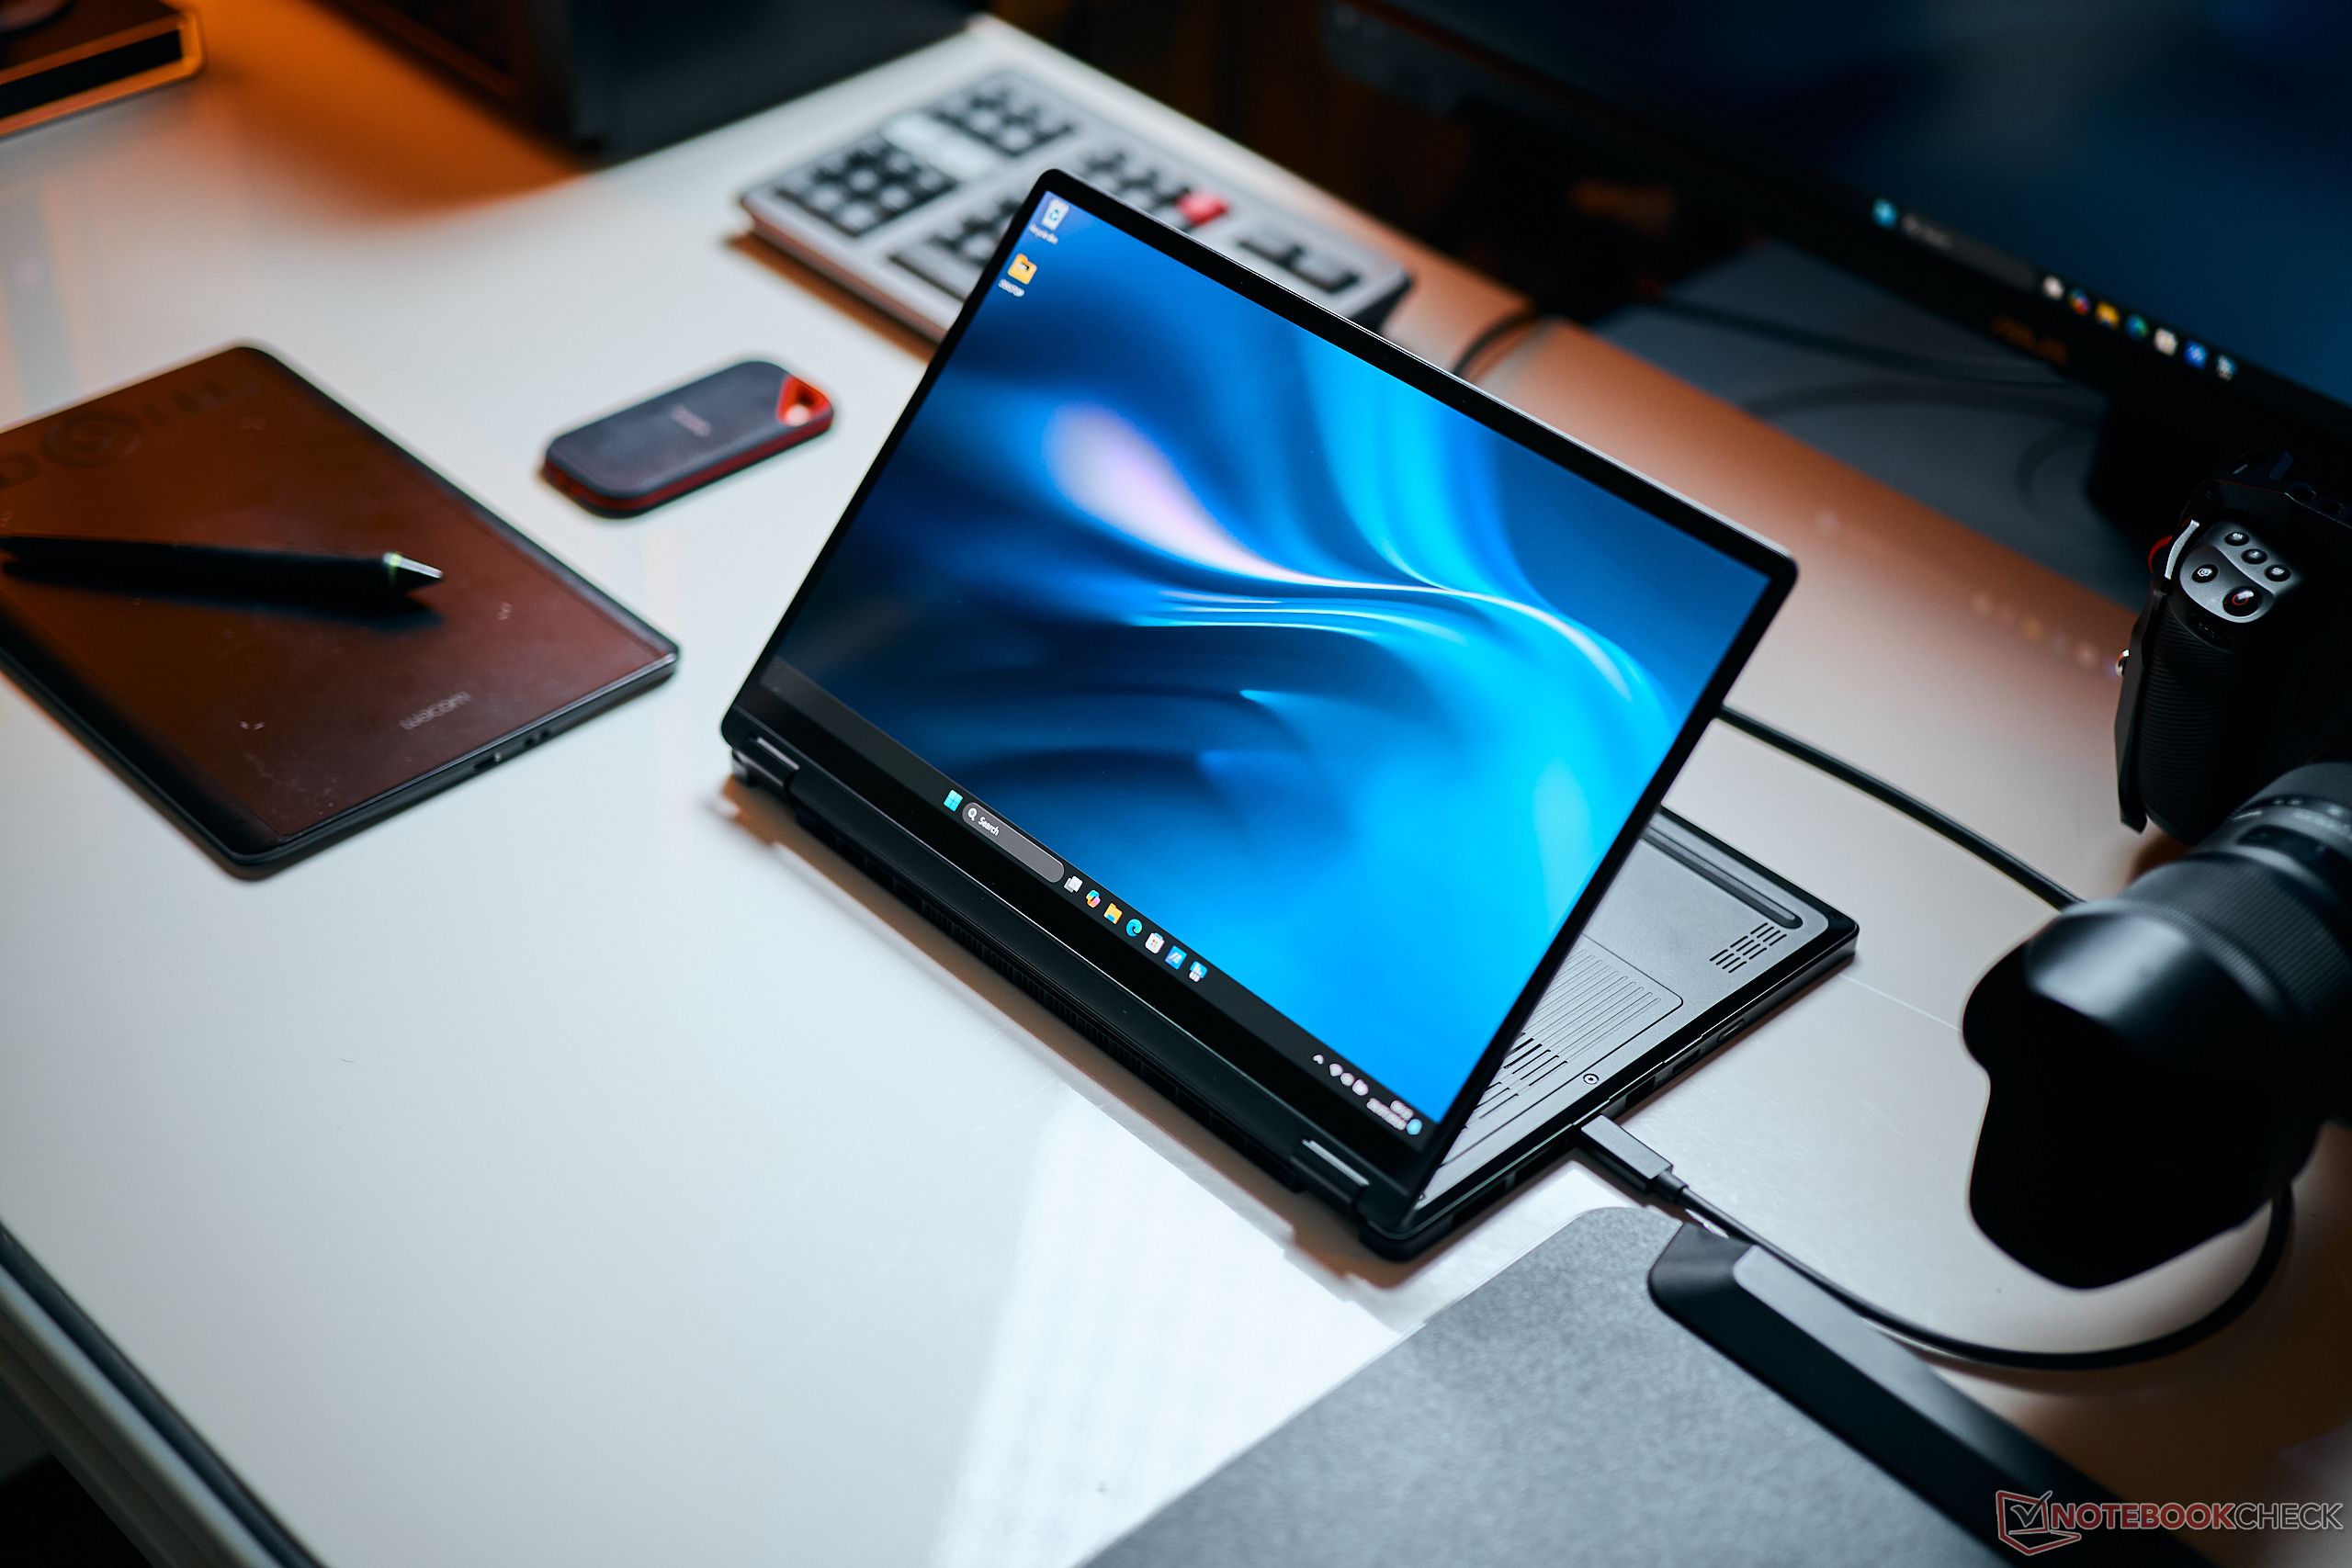
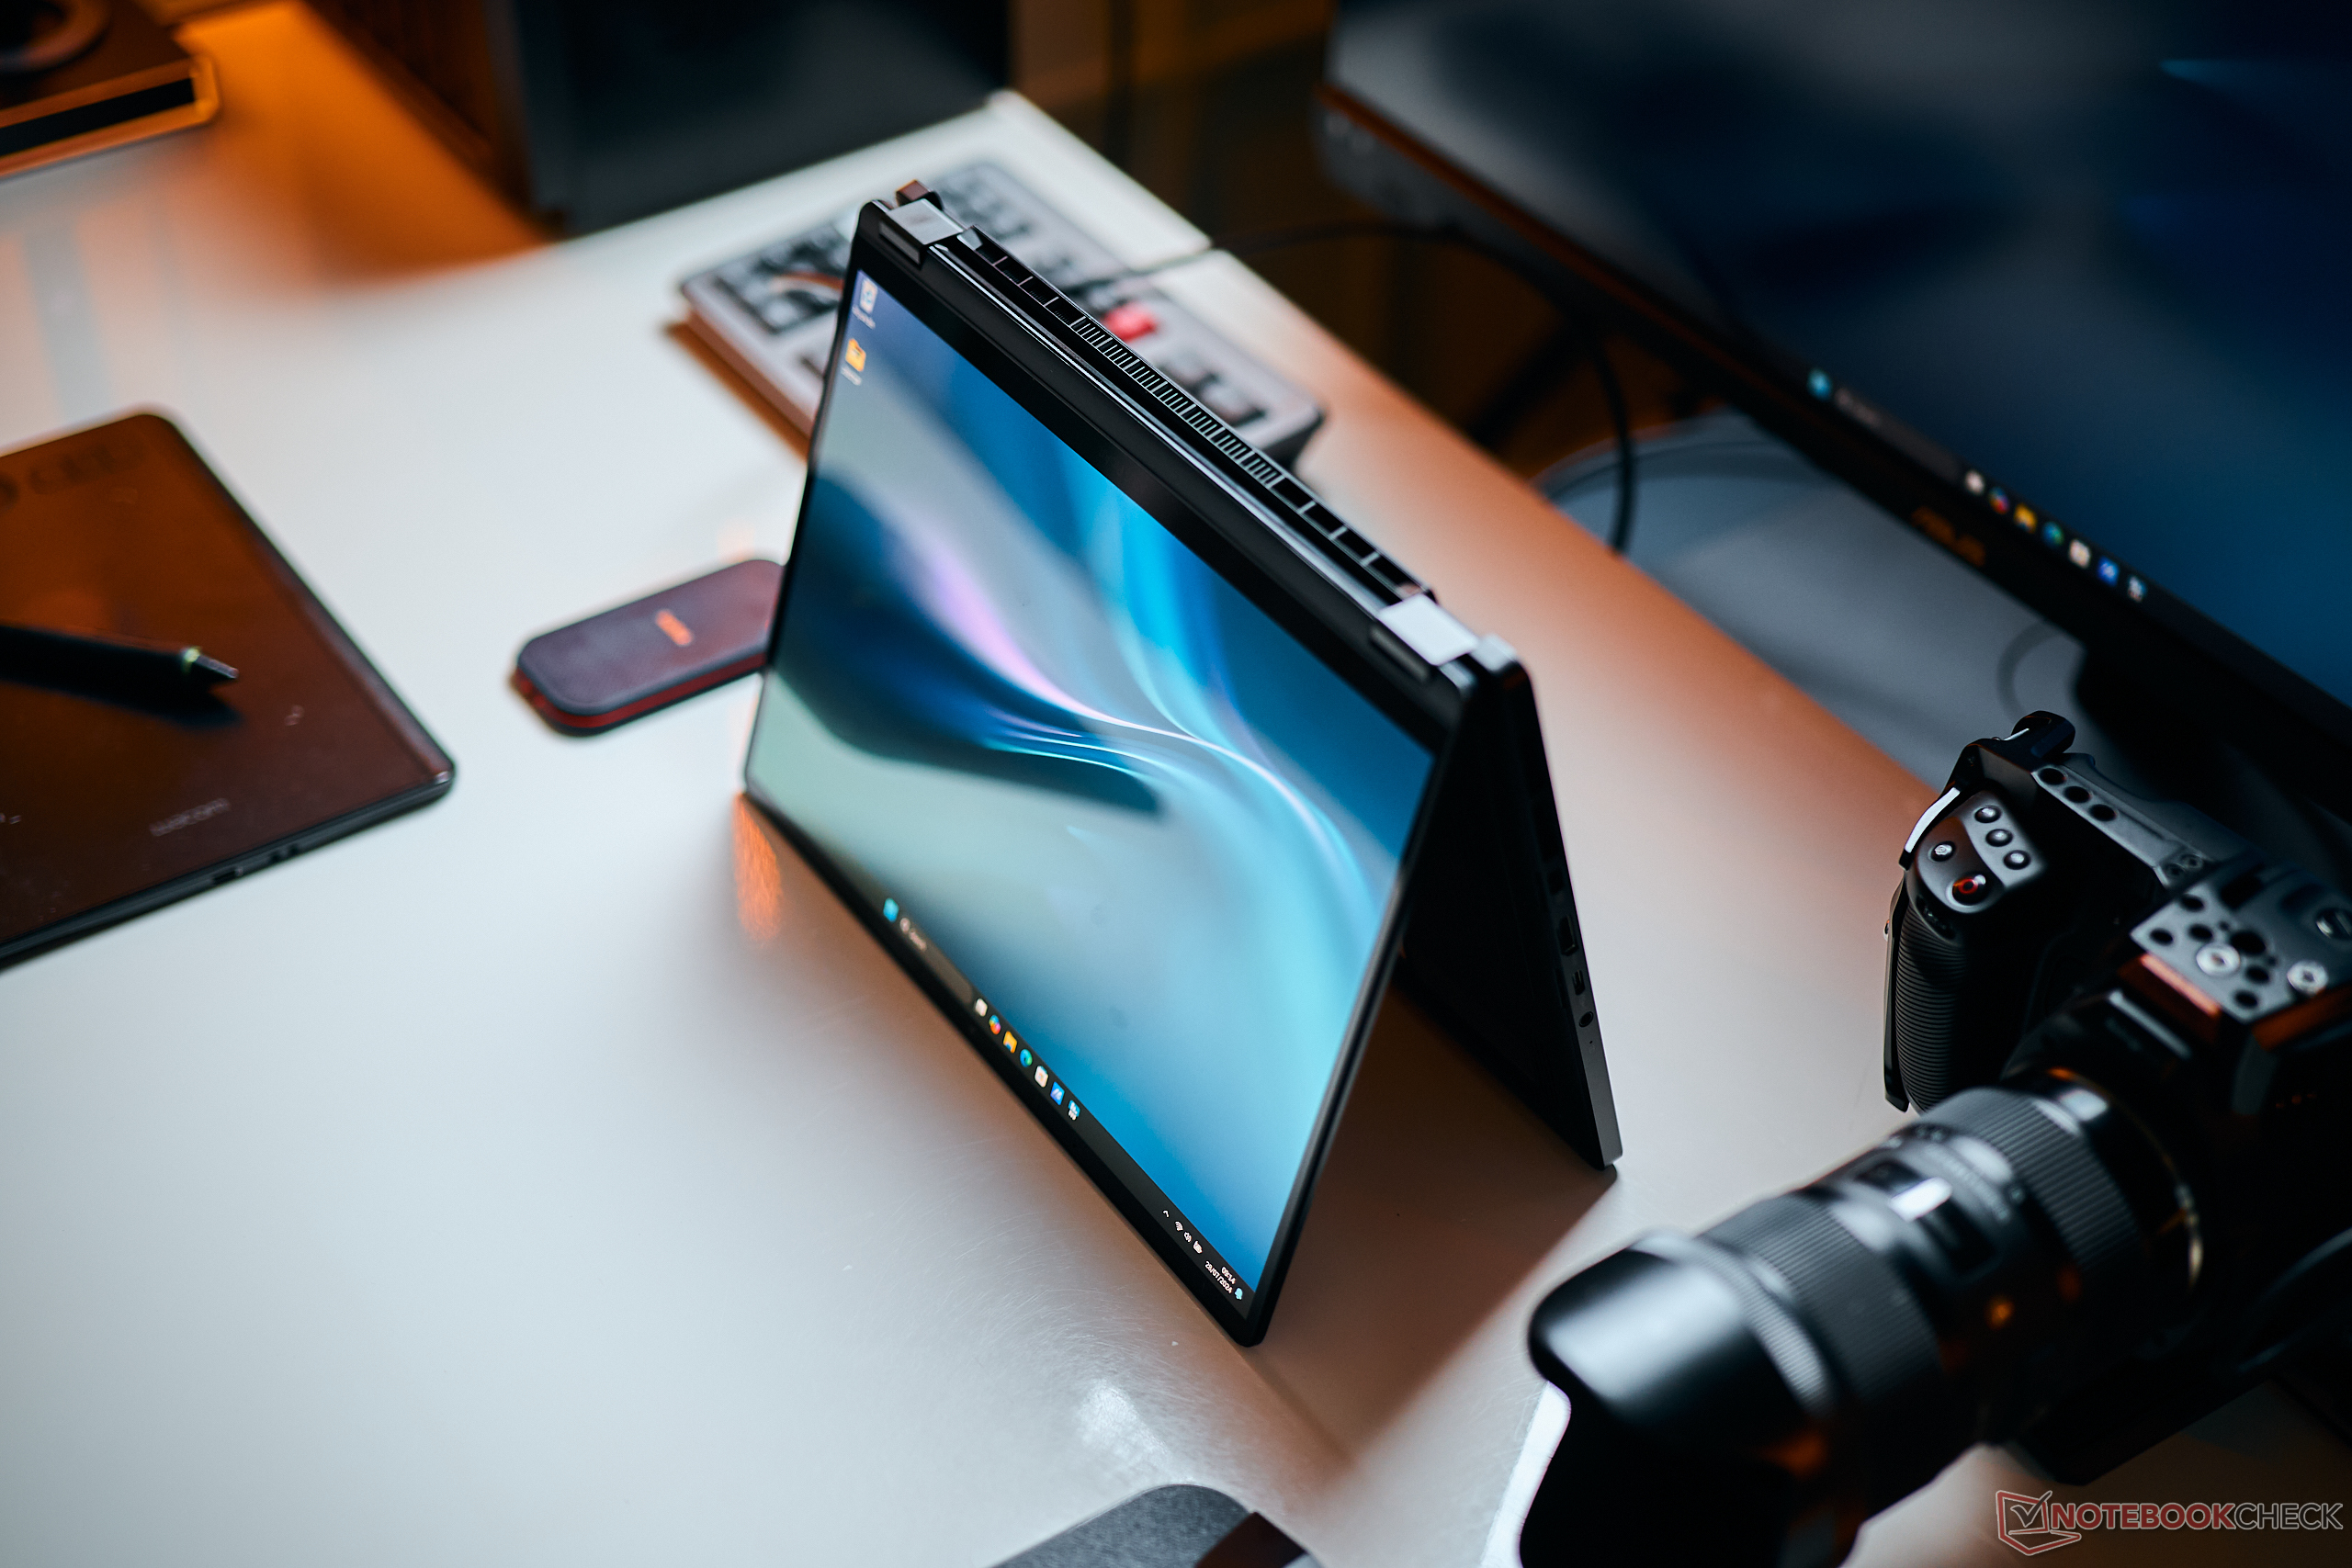
The base unit is wonderfully stable with no give being present even when a lot of pressure is applied. On top of that, we were unable to provoke any creaking noises. Things look different when twisting the significantly thinner lid. However, in everyday situations, this shouldn't present any problems. Image flaws are absent anyway due to the type of OLED panel used. Although the hinges are generally firm, you can still open the lid with one hand but a slight wobble cannot be avoided. The lid can be folded completely open which means there are various ways you can use the device. At almost 1.4 kg, the ProArt is very heavy to hold if used purely as a tablet. Unfortunately, it's not possible to store the supplied Asus Pen 2.0 anywhere on the case.
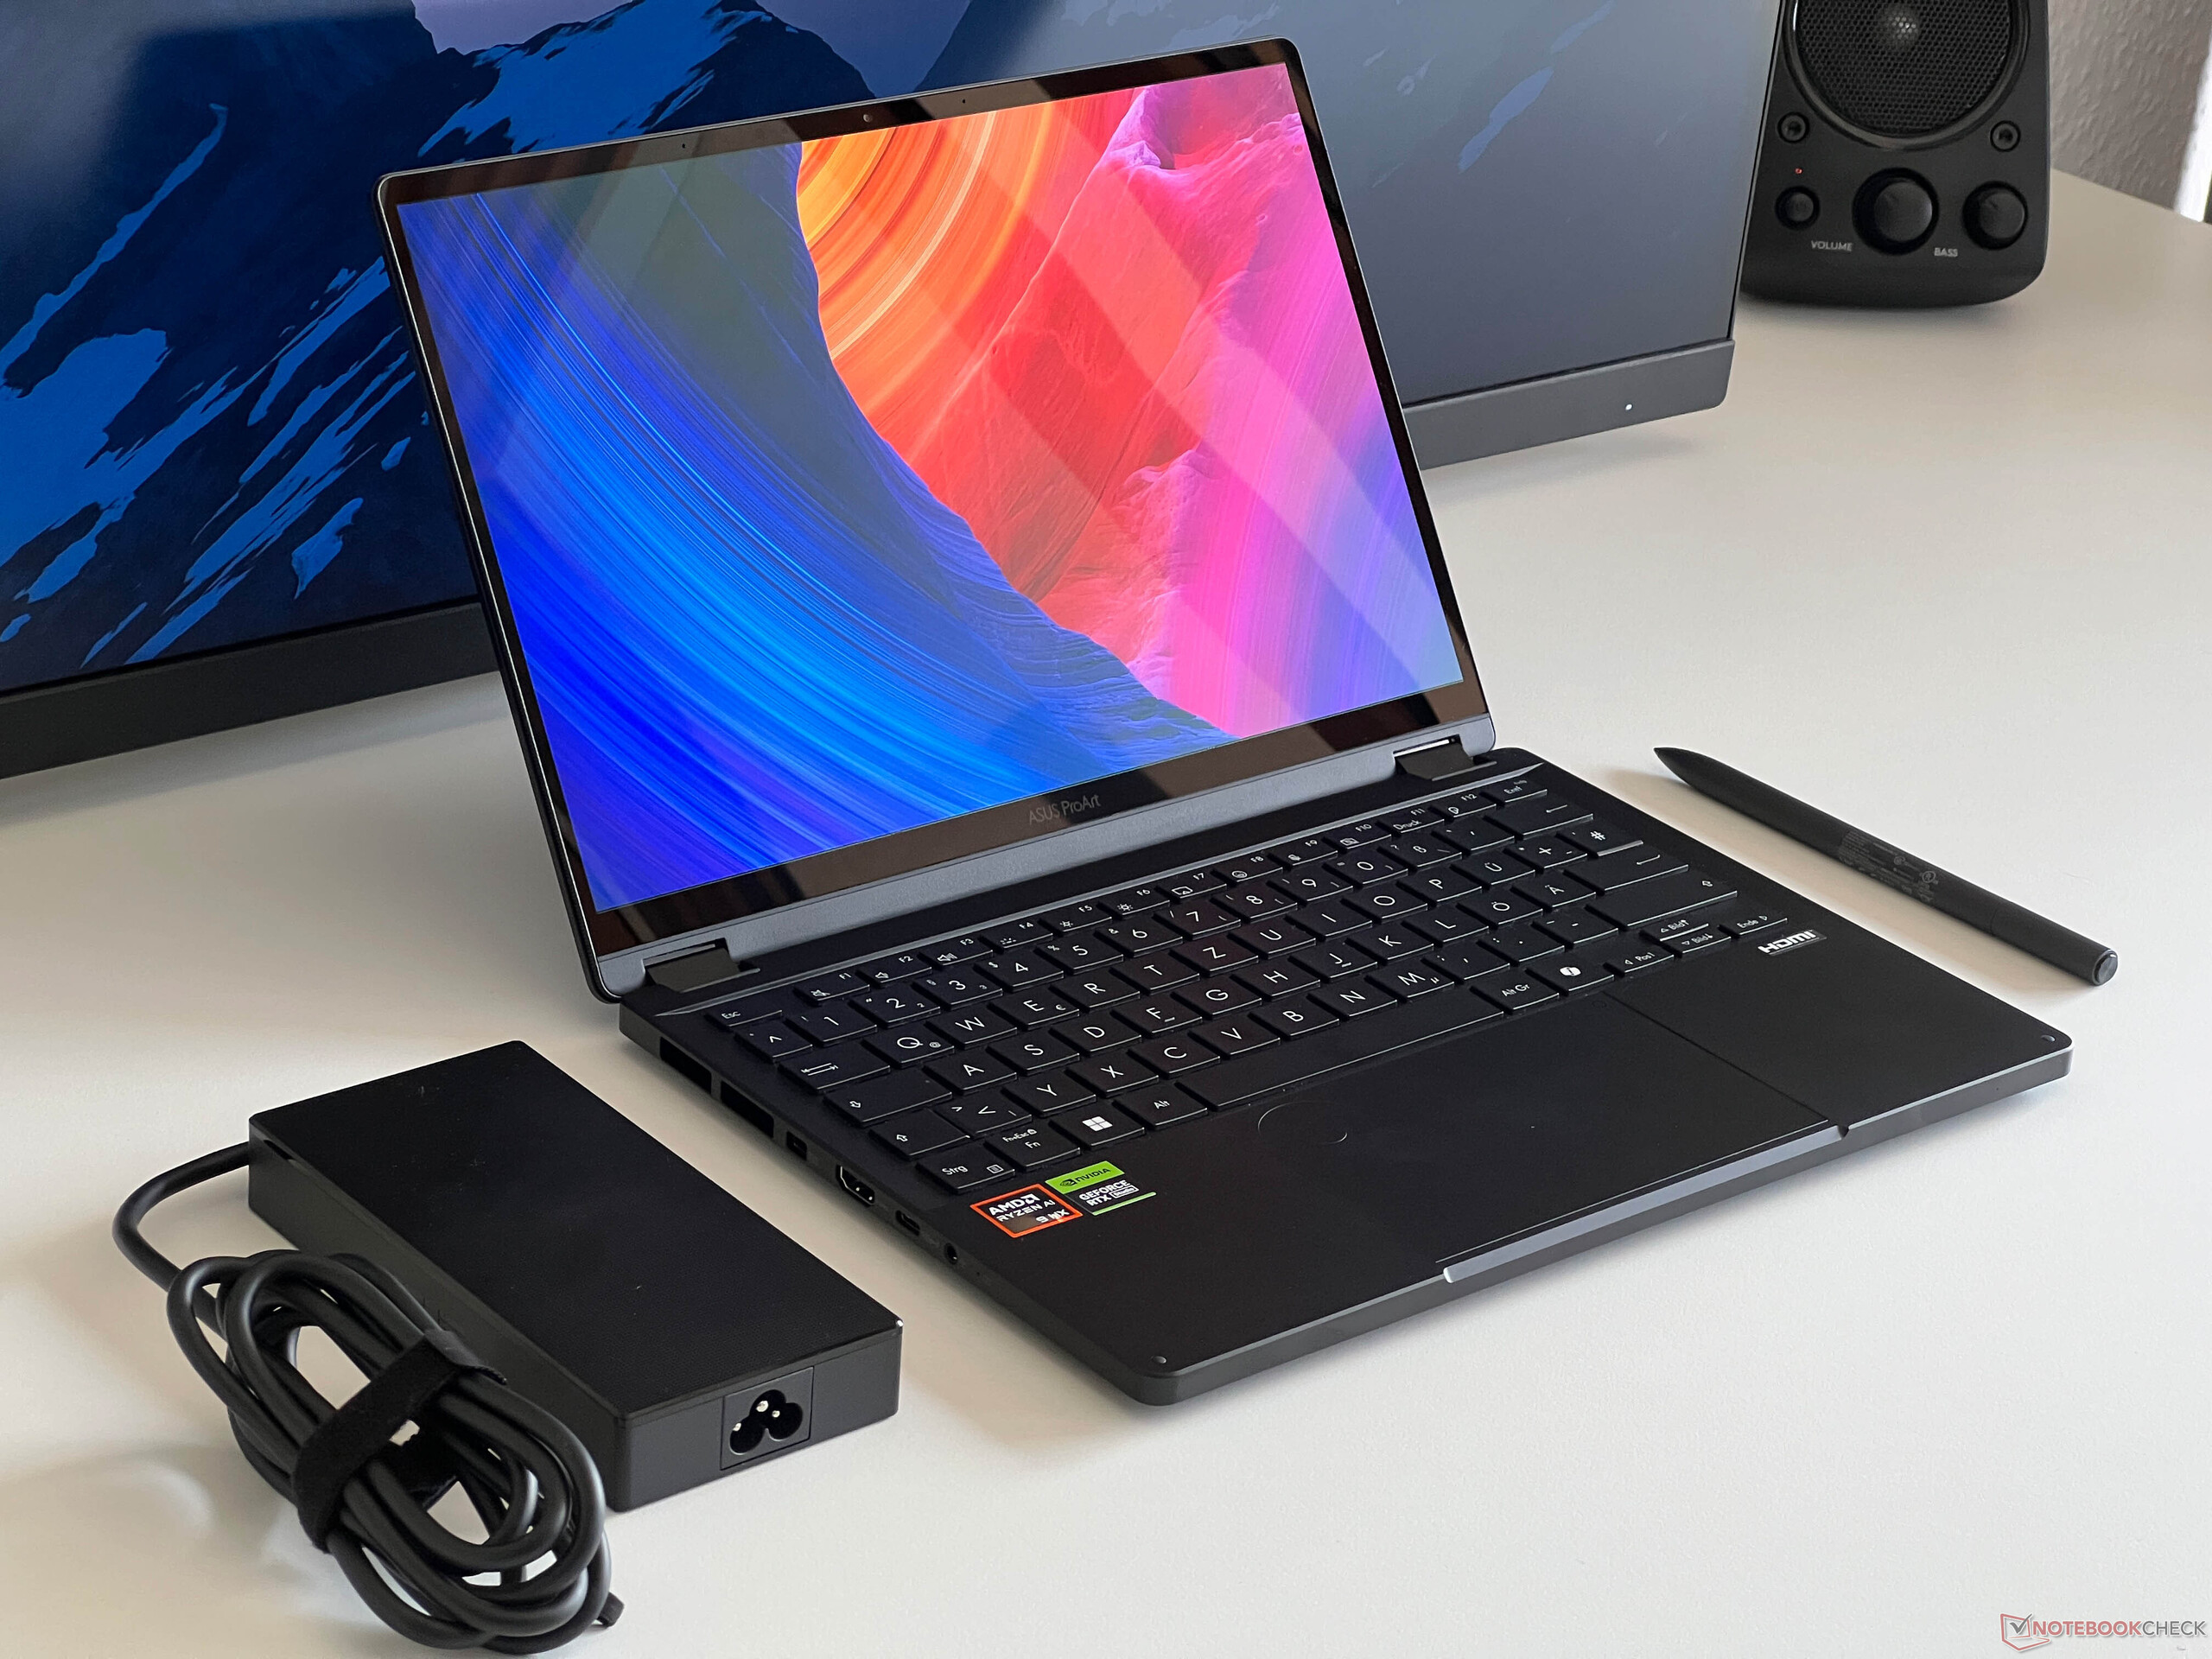

At 17.7 mm, the new ProArt PX13 is both the most compact and thinnest device in the comparison field. Weighing less than 1.4 kg, the 2-in-1 can be easily stowed away in any bag. The 200-watt PSU tips the scales at 588 grams.
Features - USB 4.0 & Wi-Fi 7
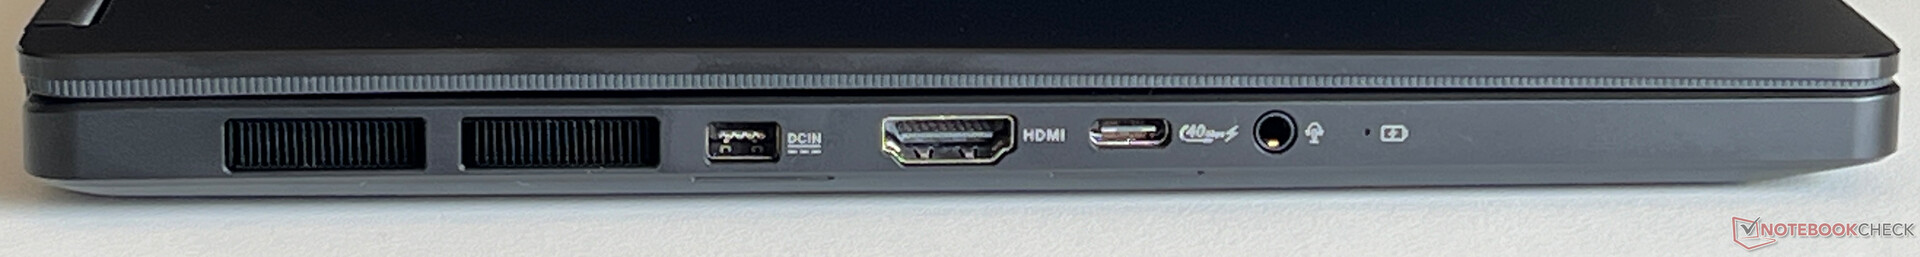
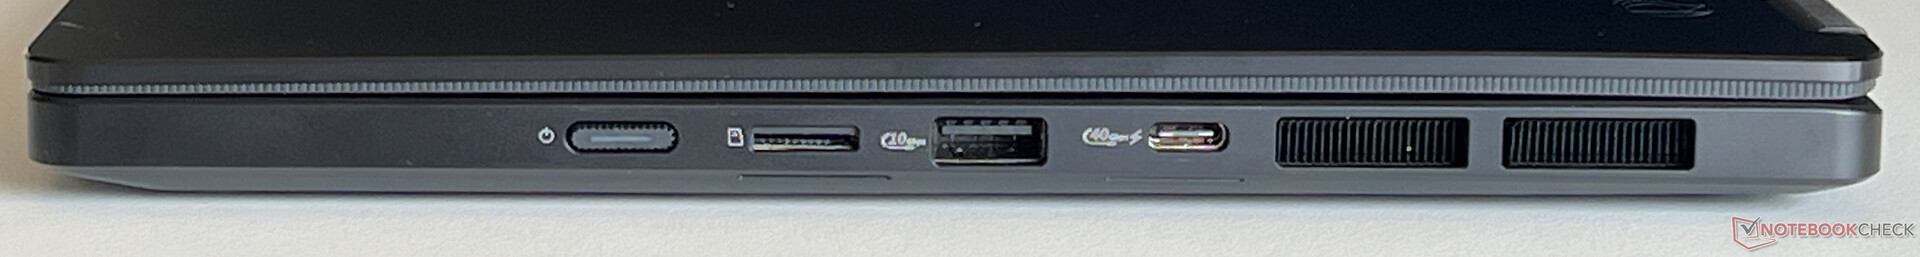
Since the entire rear and the rear area of the sides are used for cooling, the ports are located in the middle of both sides. The port selection itself is very solid because, in addition to 2x USB-C 4.0, a regular and a fast USB-A are available. HDMI and a microSD card reader also come along for the ride. The device can be charged on both sides.
SD card reader
Paired with our reference card (Angelibird AV Pro V60), the microSD card reader achieved very good maximum transfer speeds of 255 MB/s, when copying data this figure falls significantly to 55 MB/s.
| SD Card Reader | |
| average JPG Copy Test (av. of 3 runs) | |
| Asus ROG Flow Z13 ACRNM (Angelbird AV Pro V60) | |
| Asus ROG Flow X13 GV302XV (Angelbird AV Pro V60) | |
| Microsoft Surface Laptop Studio 2 RTX 4060 (Angelbird AV Pro V60) | |
| Asus ROG Zephyrus G14 2024 GA403U (Angelbird AV Pro V60) | |
| Average of class Multimedia (23 - 531, n=43, last 2 years) | |
| Asus ProArt PX13 HN7306 (Angelbird AV Pro V60) | |
| maximum AS SSD Seq Read Test (1GB) | |
| Asus ROG Flow X13 GV302XV (Angelbird AV Pro V60) | |
| Asus ProArt PX13 HN7306 (Angelbird AV Pro V60) | |
| Asus ROG Flow Z13 ACRNM (Angelbird AV Pro V60) | |
| Asus ROG Zephyrus G14 2024 GA403U (Angelbird AV Pro V60) | |
| Microsoft Surface Laptop Studio 2 RTX 4060 (Angelbird AV Pro V60) | |
| Average of class Multimedia (27.9 - 1455, n=42, last 2 years) | |
Communication
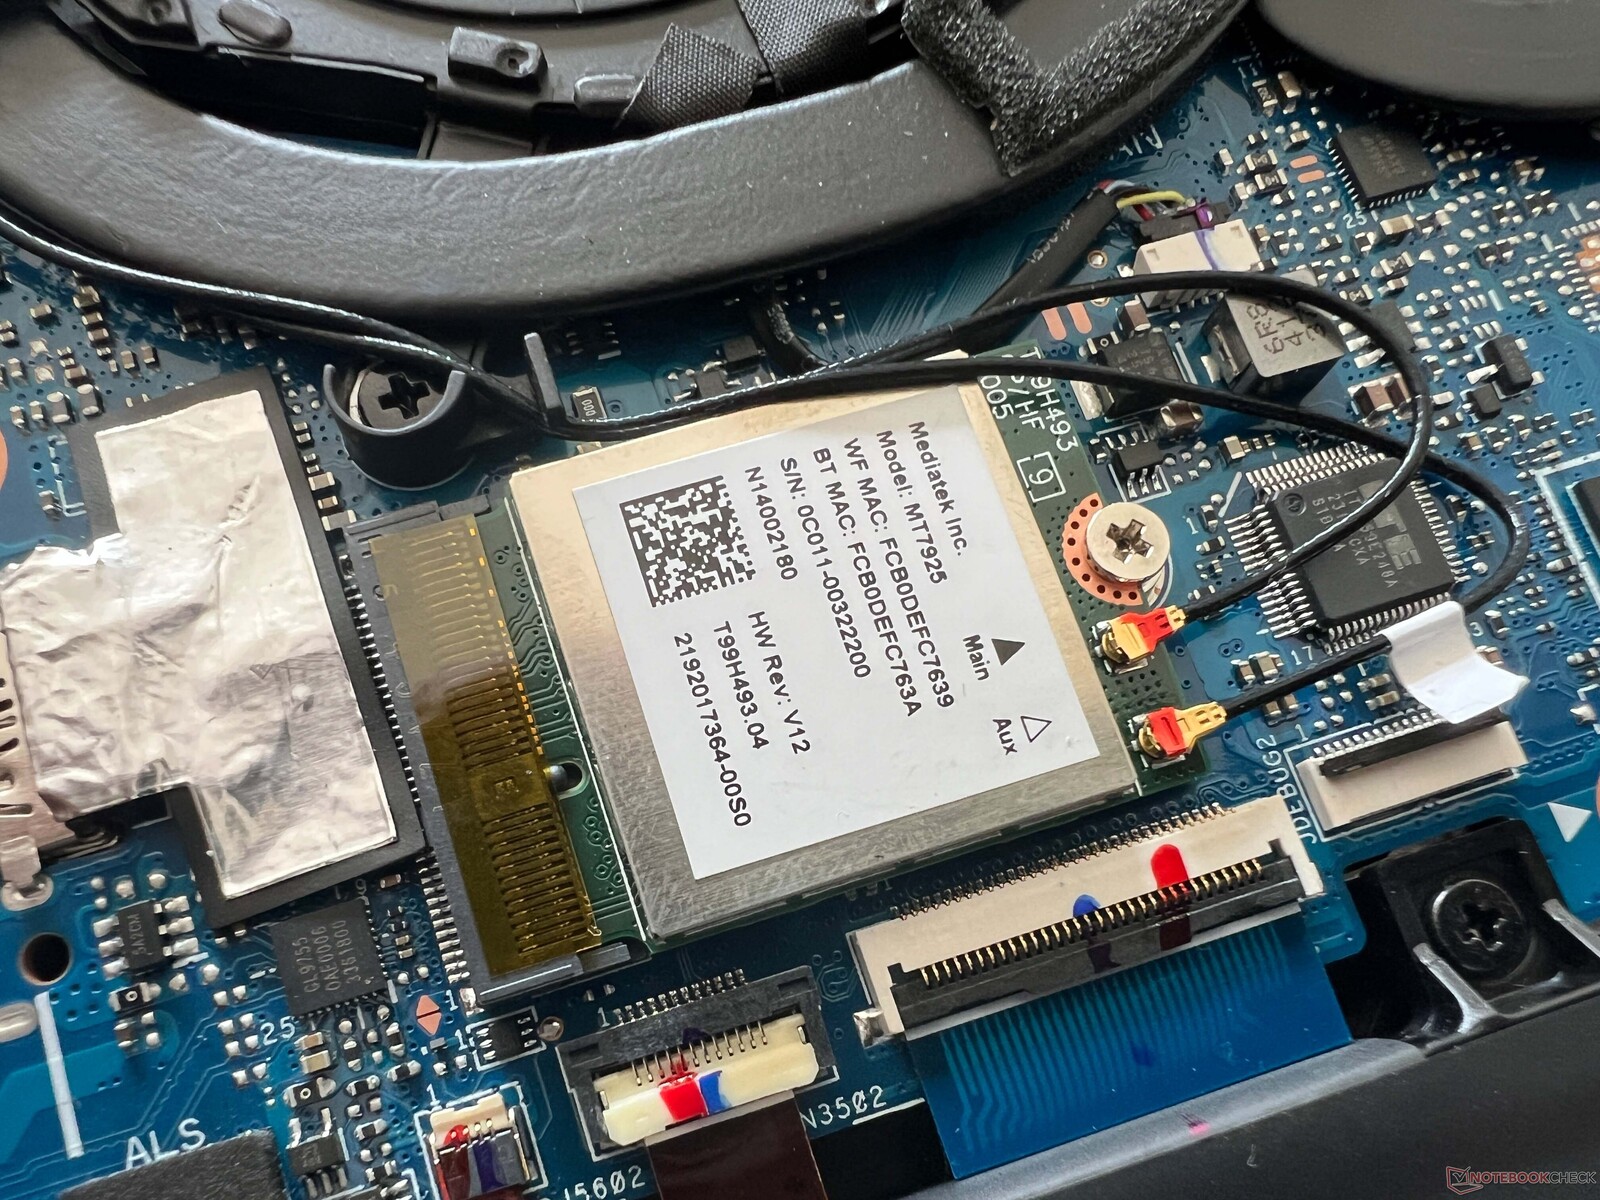
The ProArt PX13 is equipped with a MediaTek MT9725 Wi-Fi module which supports both Bluetooth 5.4 and Wi-Fi 7. Together with our Asus reference router, the Wi-Fi performance was wonderful and belongs to the best we have recorded to date. All of the video outputs run via the dGPU when using an external monitor. However, it is also possible to completely deactivate the dGPU via the ProArt software.
| Networking | |
| Asus ProArt PX13 HN7306 | |
| iperf3 transmit AXE11000 | |
| iperf3 receive AXE11000 | |
| Asus ROG Flow X13 GV302XV | |
| iperf3 transmit AXE11000 | |
| iperf3 receive AXE11000 | |
| iperf3 transmit AXE11000 6GHz | |
| iperf3 receive AXE11000 6GHz | |
| Asus ROG Flow Z13 ACRNM | |
| iperf3 transmit AXE11000 | |
| iperf3 receive AXE11000 | |
| Asus ROG Zephyrus G14 2024 GA403U | |
| iperf3 transmit AXE11000 | |
| iperf3 receive AXE11000 | |
| Razer Blade 14 RZ09-0508 | |
| iperf3 transmit AXE11000 | |
| iperf3 receive AXE11000 | |
| iperf3 transmit AXE11000 6GHz | |
| iperf3 receive AXE11000 6GHz | |
| Microsoft Surface Laptop Studio 2 RTX 4060 | |
| iperf3 transmit AXE11000 | |
| iperf3 receive AXE11000 | |
Webcam
When it comes to image quality, the 2 MP webcam isn't a highlight. Windows-Studio Effects is, of course, supported and an IR module for face recognition via Window Hello is also available.


Maintenance
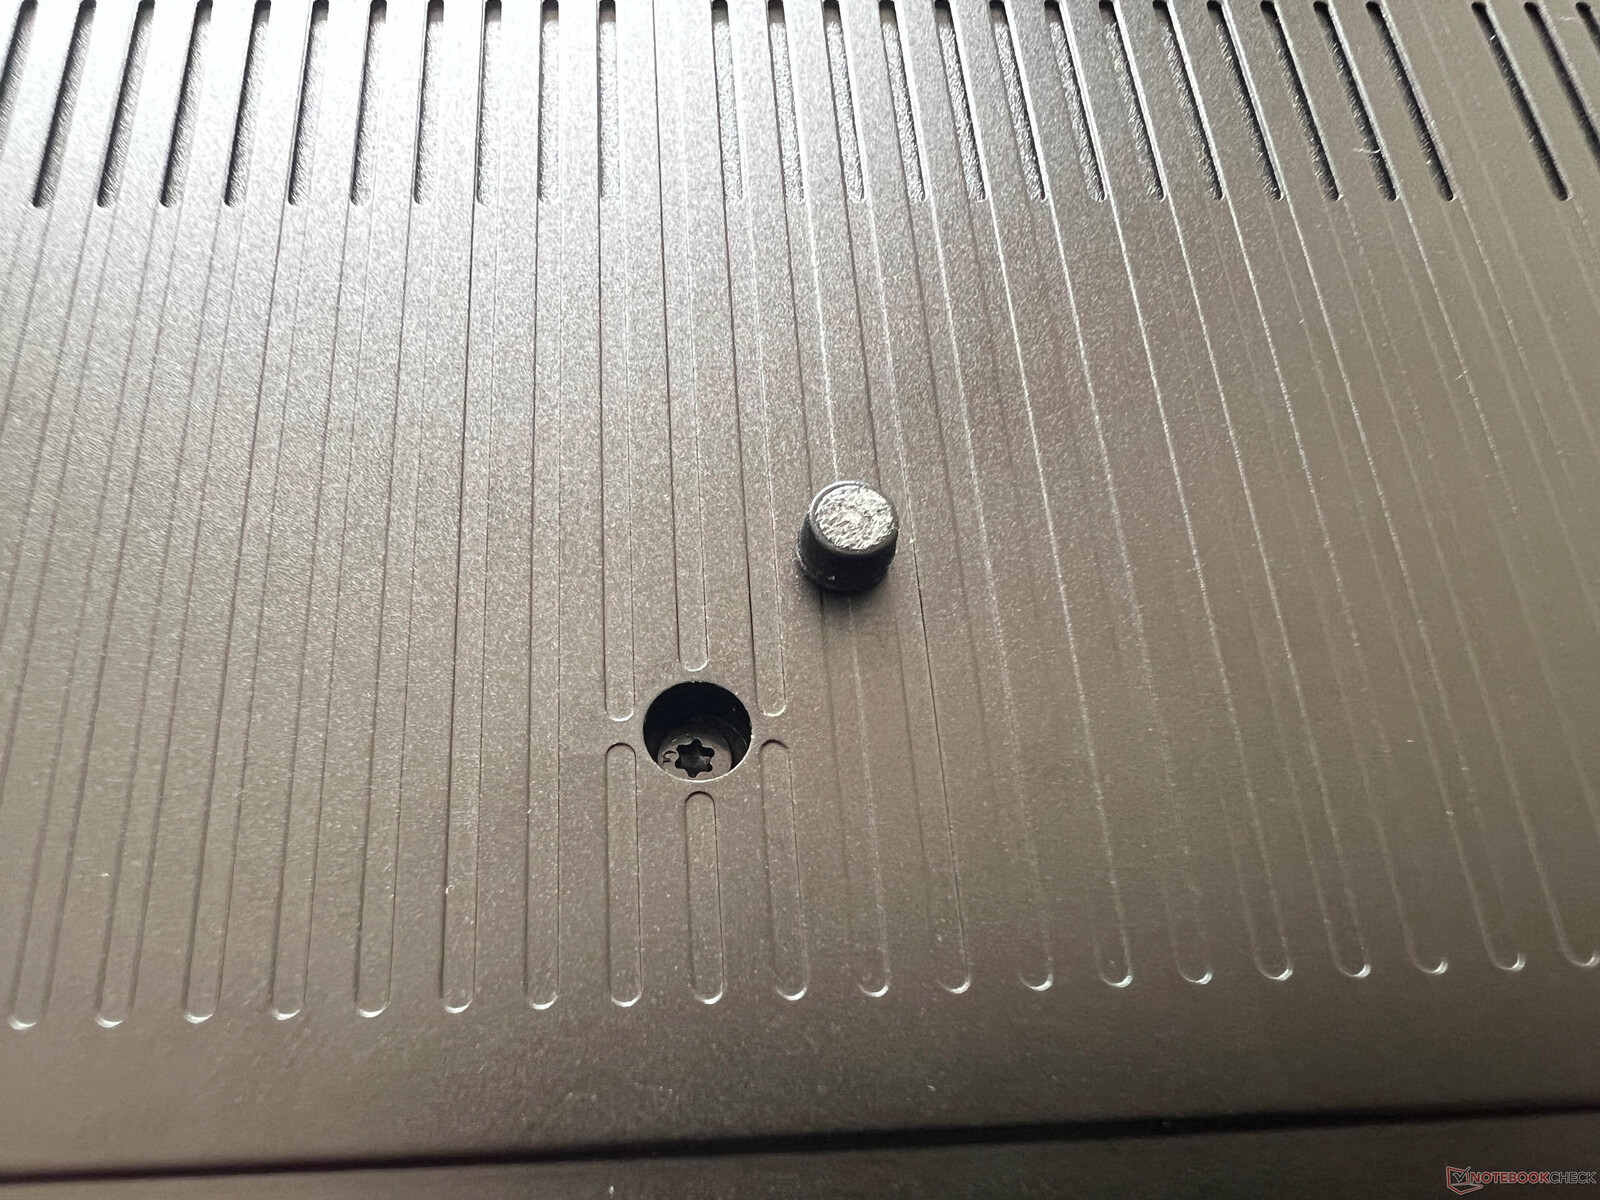
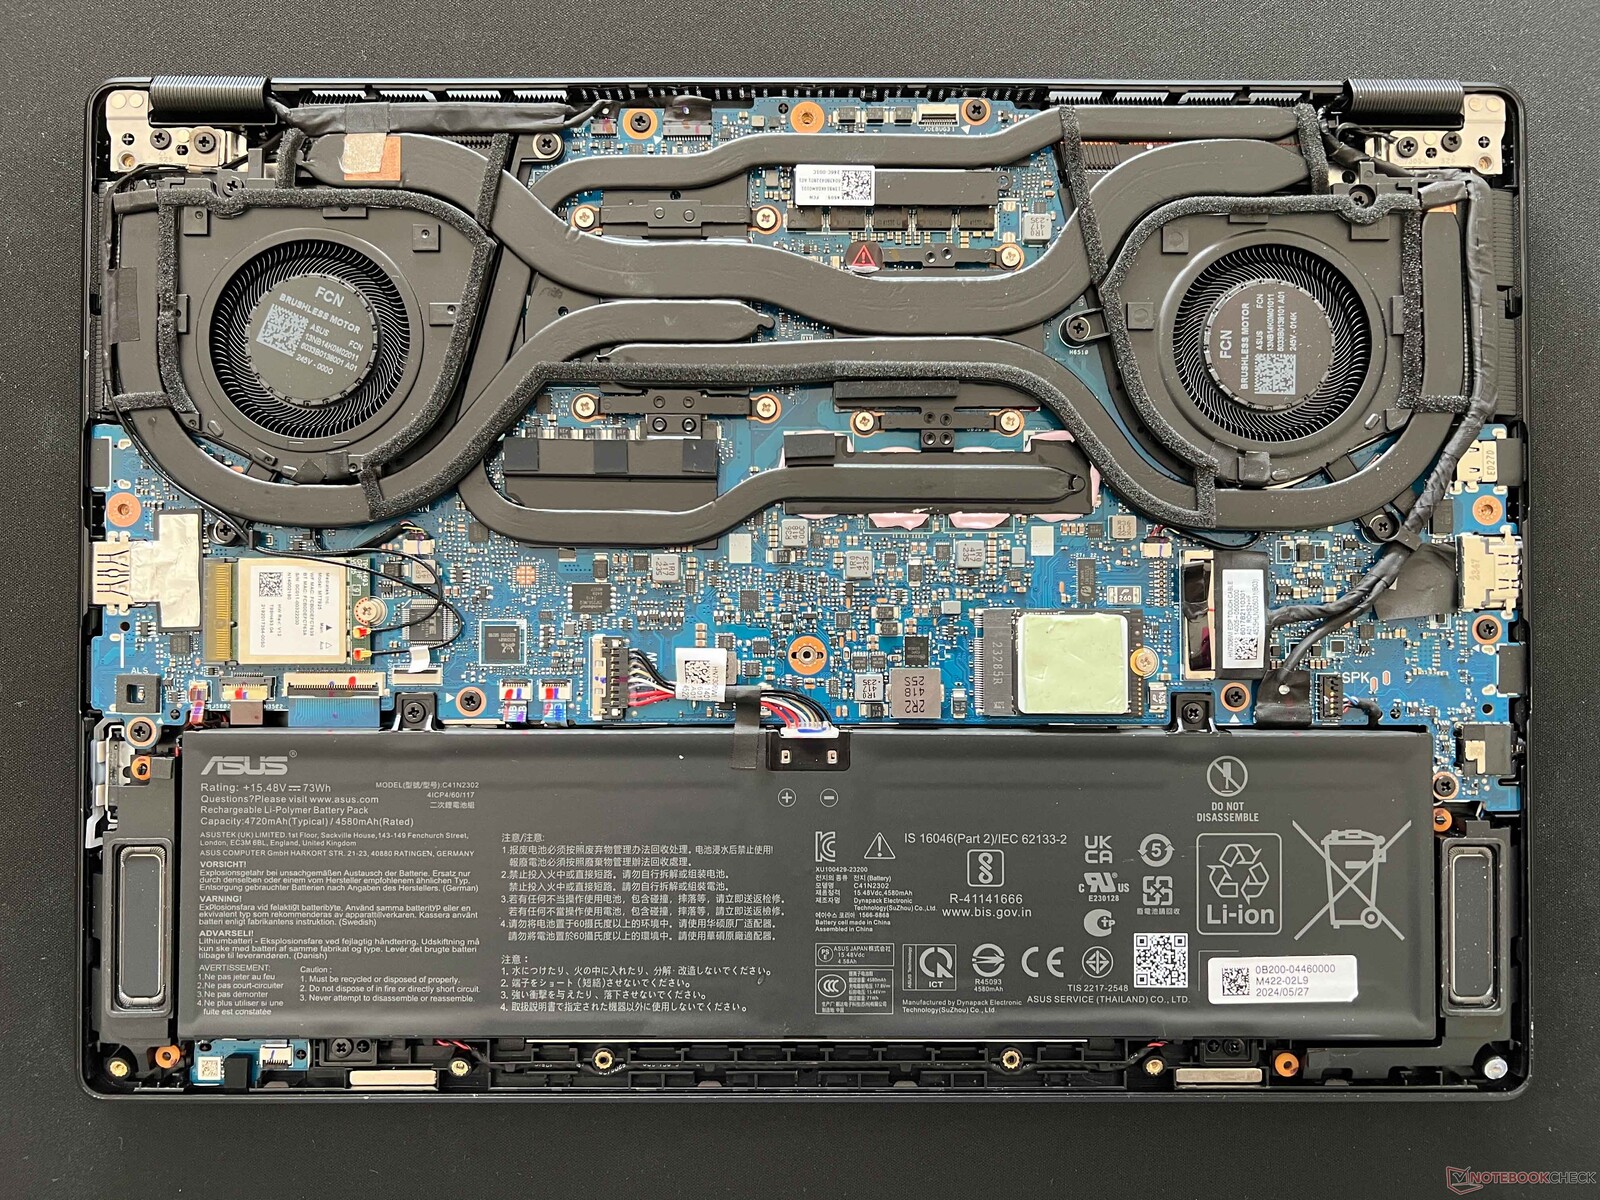
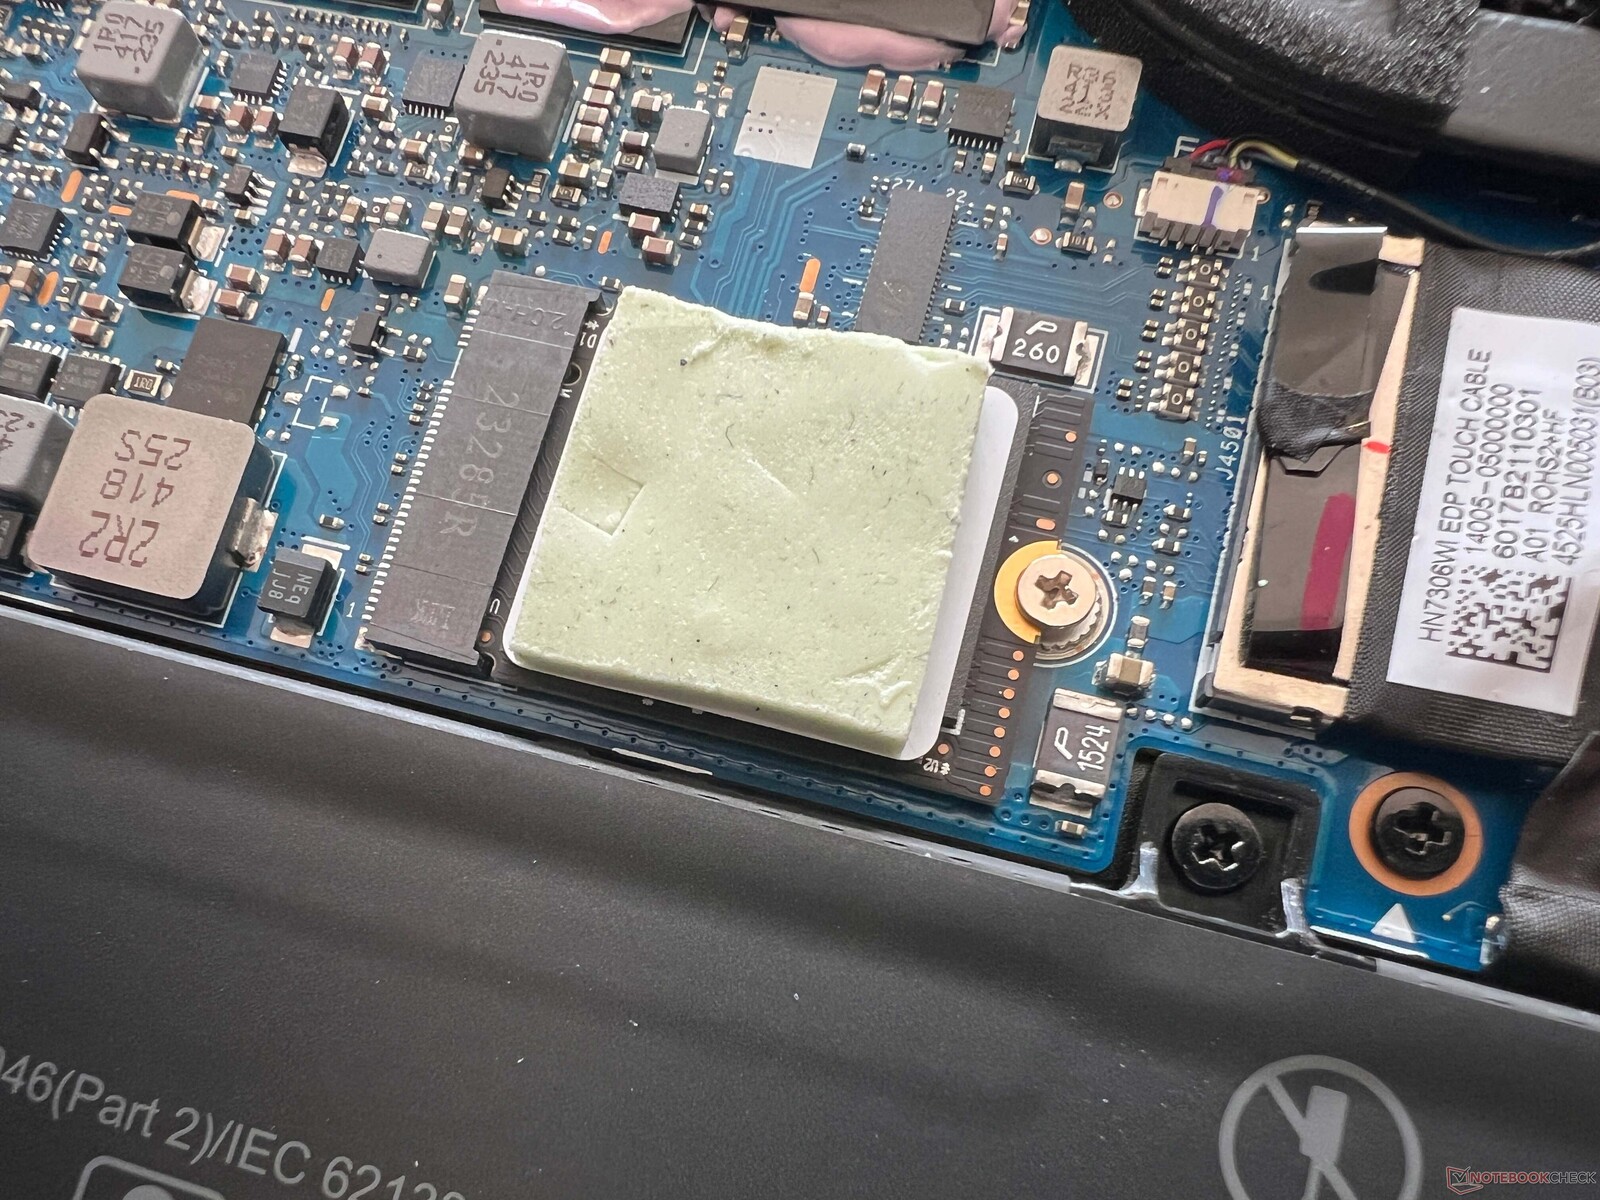
The base cover is secured by Torx screws (T5), however, the middle screw is hidden under a glued rubber cover. We're not sure why this is the case since it only results in greater effort being required to remove the base plate. Inside the device, the fans, screwed battery, Wi-Fi module and compact M.2 2230 SSD are all easily accessible. However, the RAM is soldered.
Sustainability
On the ProArt PX13's product page, no details are available regarding any manufacturing-based C02 emissions or the percentage of recycled material used. The packaging is mostly cardboard but plastic has also been utilized. Asus itself has not made any repair guides available. In its class of comparison devices, the power consumption is comparatively low and there are also no anomalies in terms of the standby consumption or when the device is switched off.
Input devices - An excellent keyboard with 1.7 mm key travel
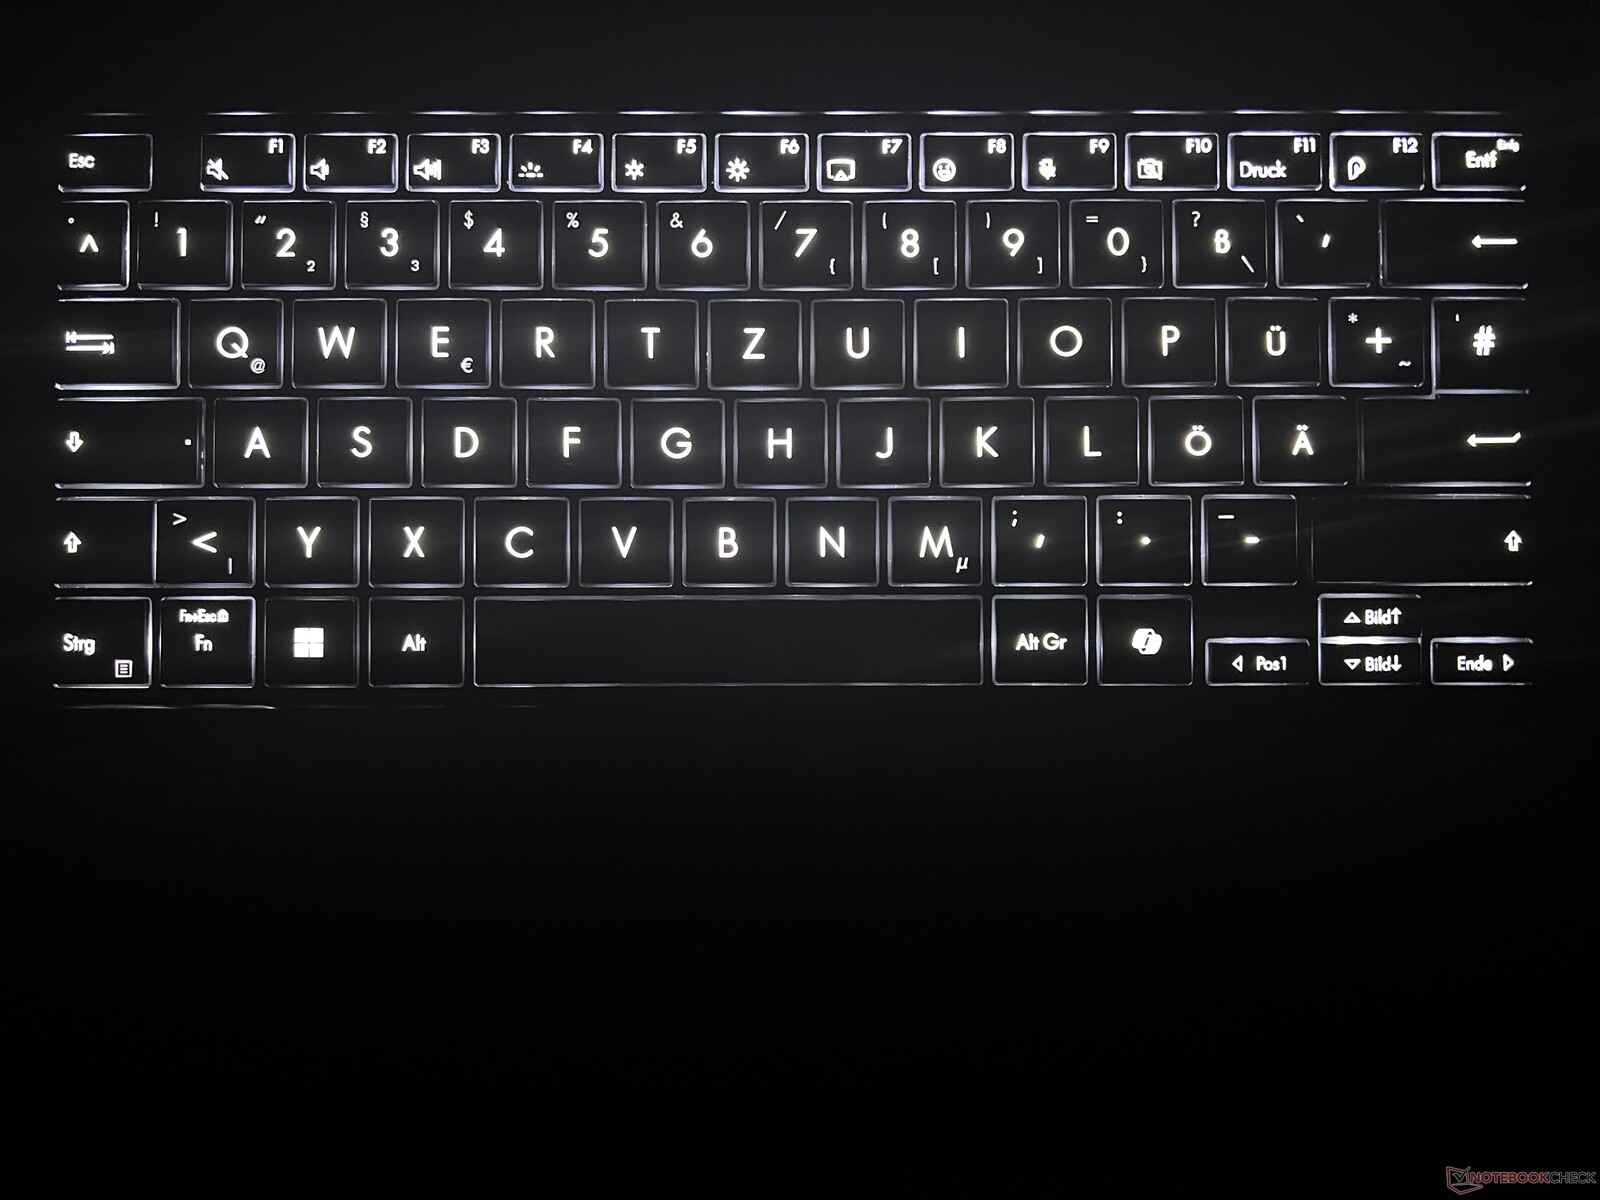
Asus has fitted the ProArt PX13 with a keyboard that has 1.7 mm key travel - a lot for today's standards. Together with the stable base unit, typing is a wonderful experience and puts most current business laptops in the shade. For dark environments, there is also three-level, white backlighting which can also be controlled automatically. Layout-wise, the small arrow keys are not ideal and it would also have been good to use the space better for dedicated up and down keys. As a Copilot+ laptop, the new Copilot button is, of course, also included but it has the same function as the taskbar symbol.
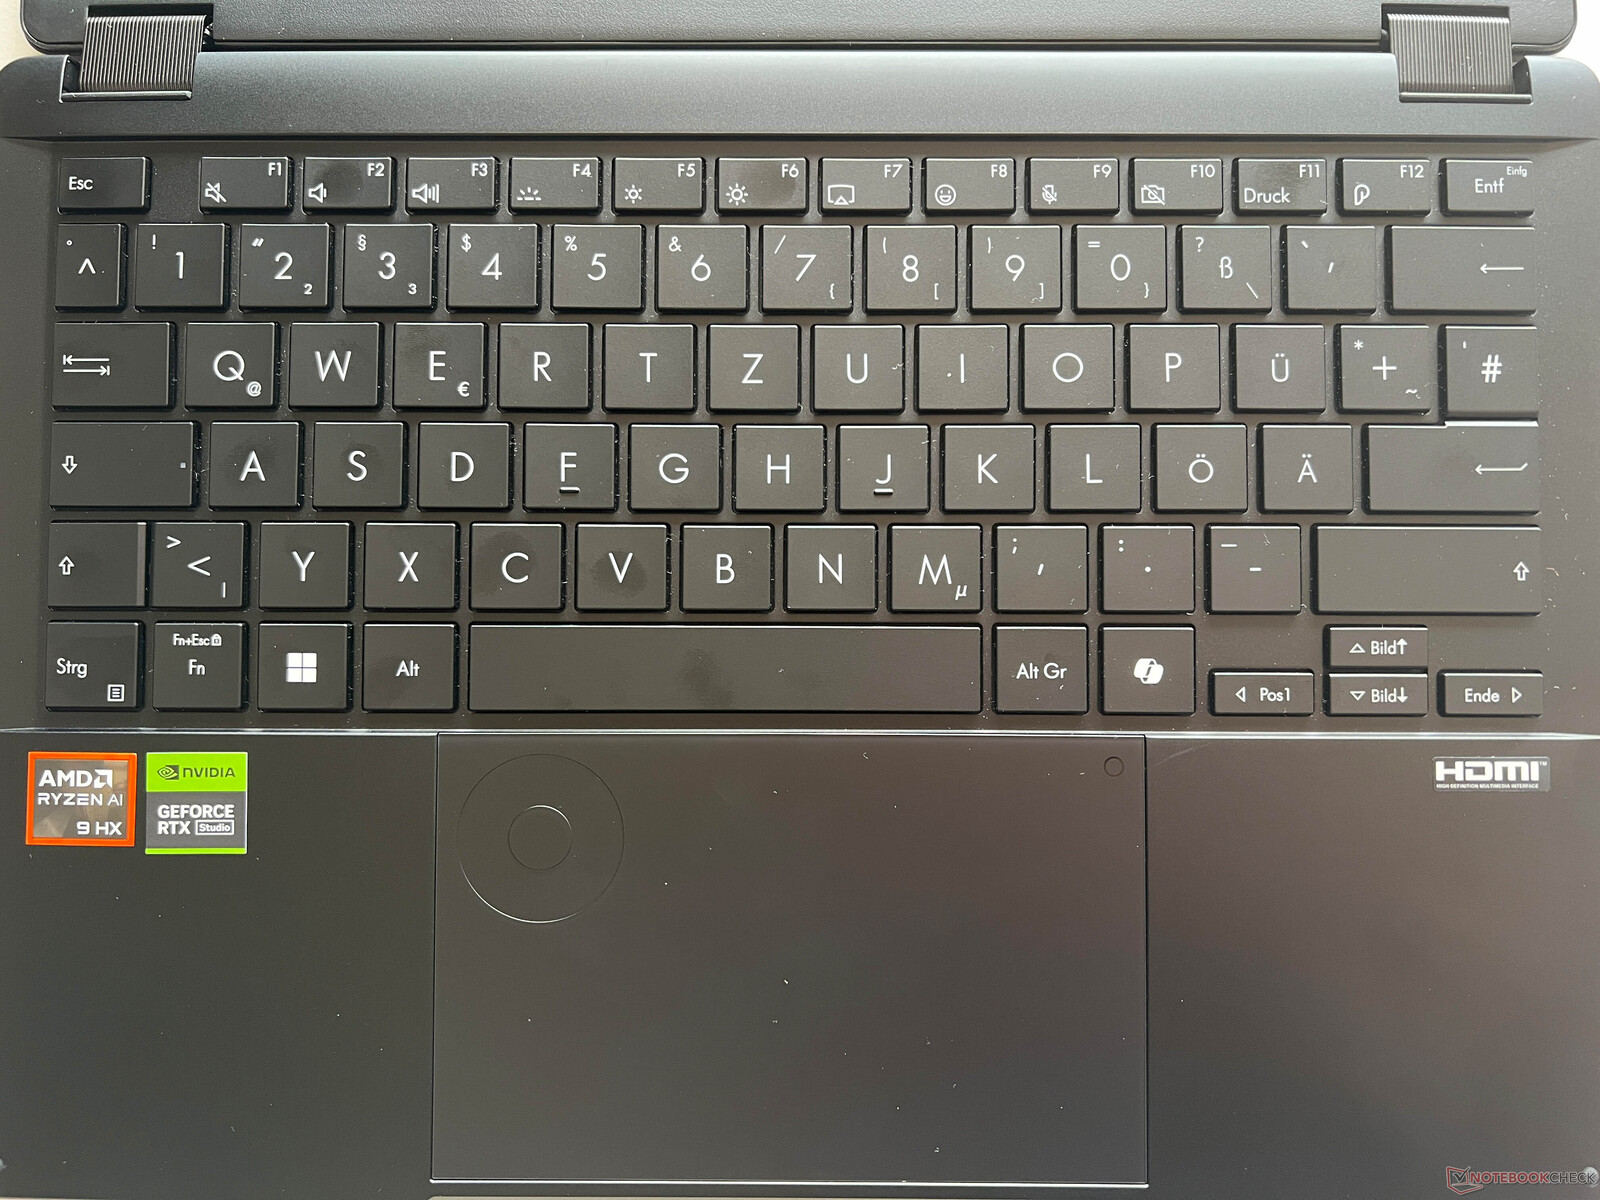
The large clickpad (12.7 x 8 cm) also works beautifully and not only managed to impress us with its smooth feel but also with its muffled, high-quality clicking noises. On the top left, the so-called DialPad is integrated into the touchpad. For several years, we have seen Asus use various versions of this. Of course, whether the dial can be used effectively, depends primarily on the user's individual work flow. During normal use, we were slightly confused by its elevation but pointer movements are generally well-implemented. Inputs can also be undertaken via the capacitive touchscreen and using the supplied Asus Pen 2.0 went without a hitch.
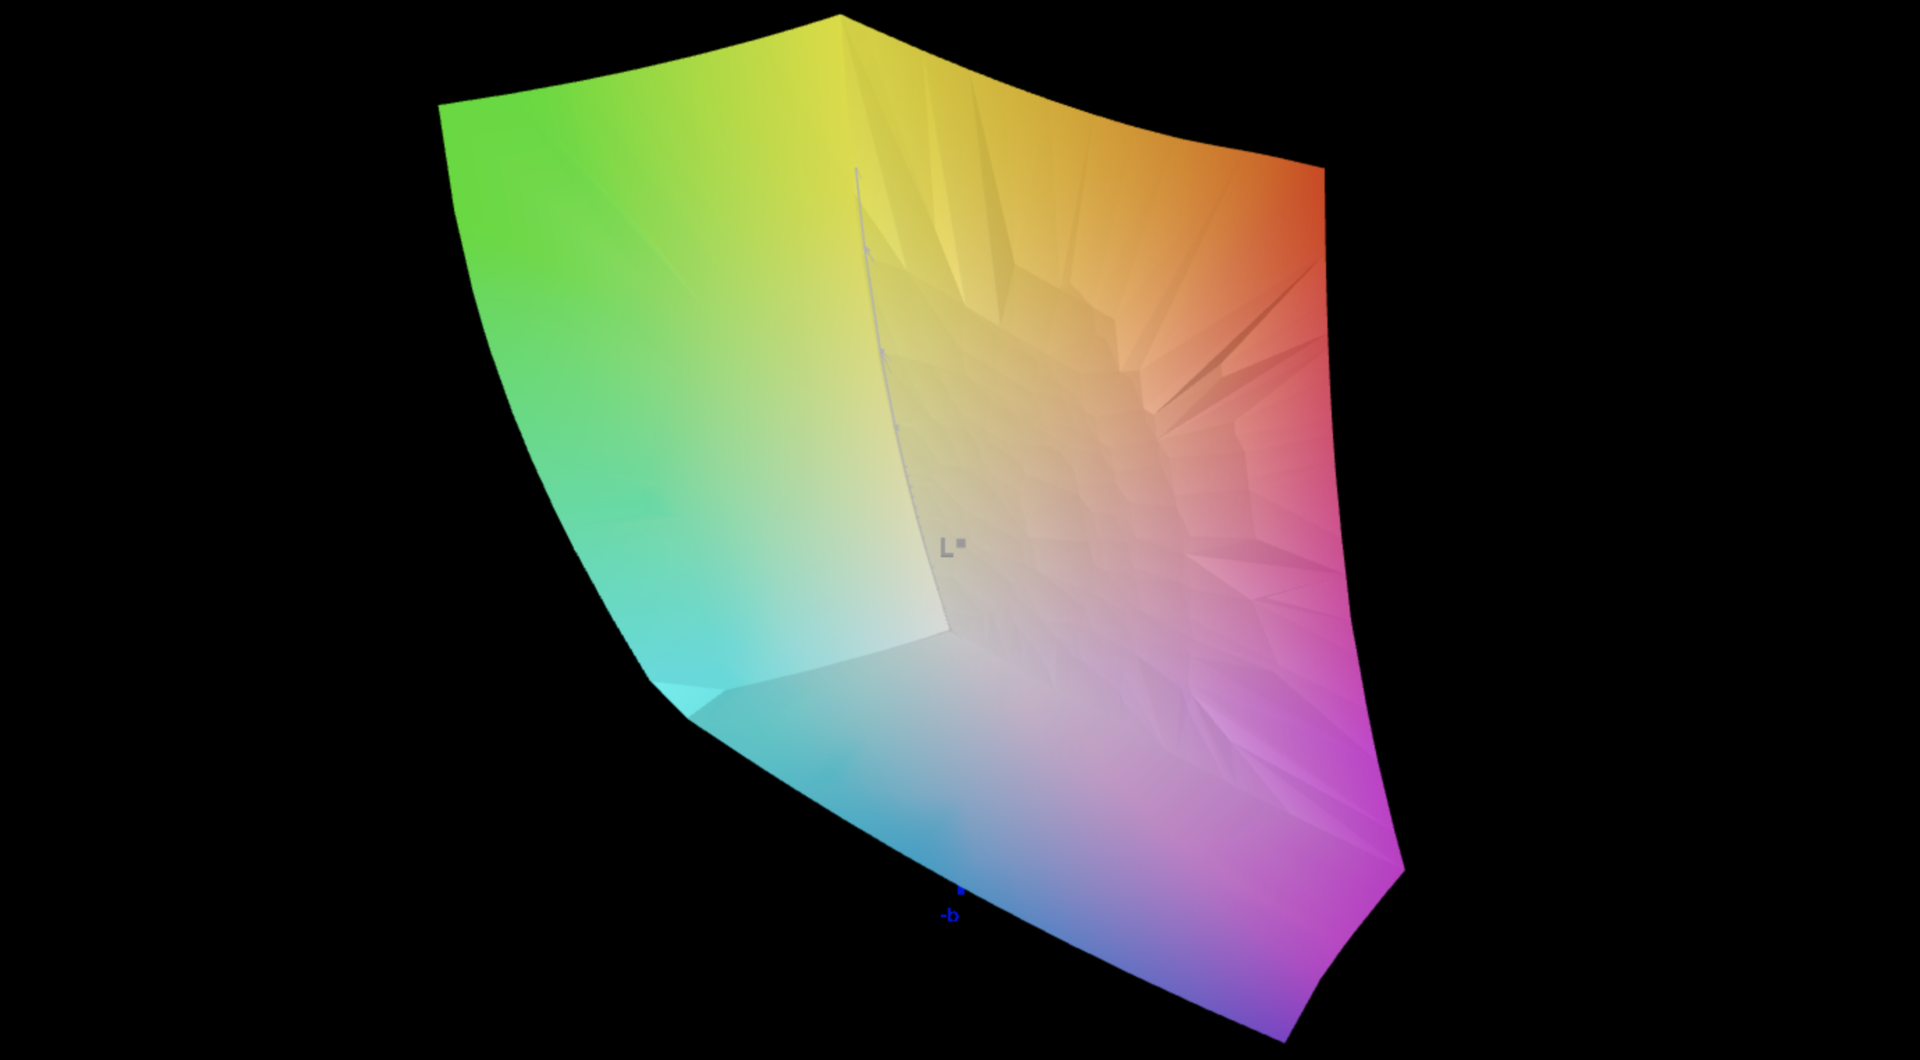
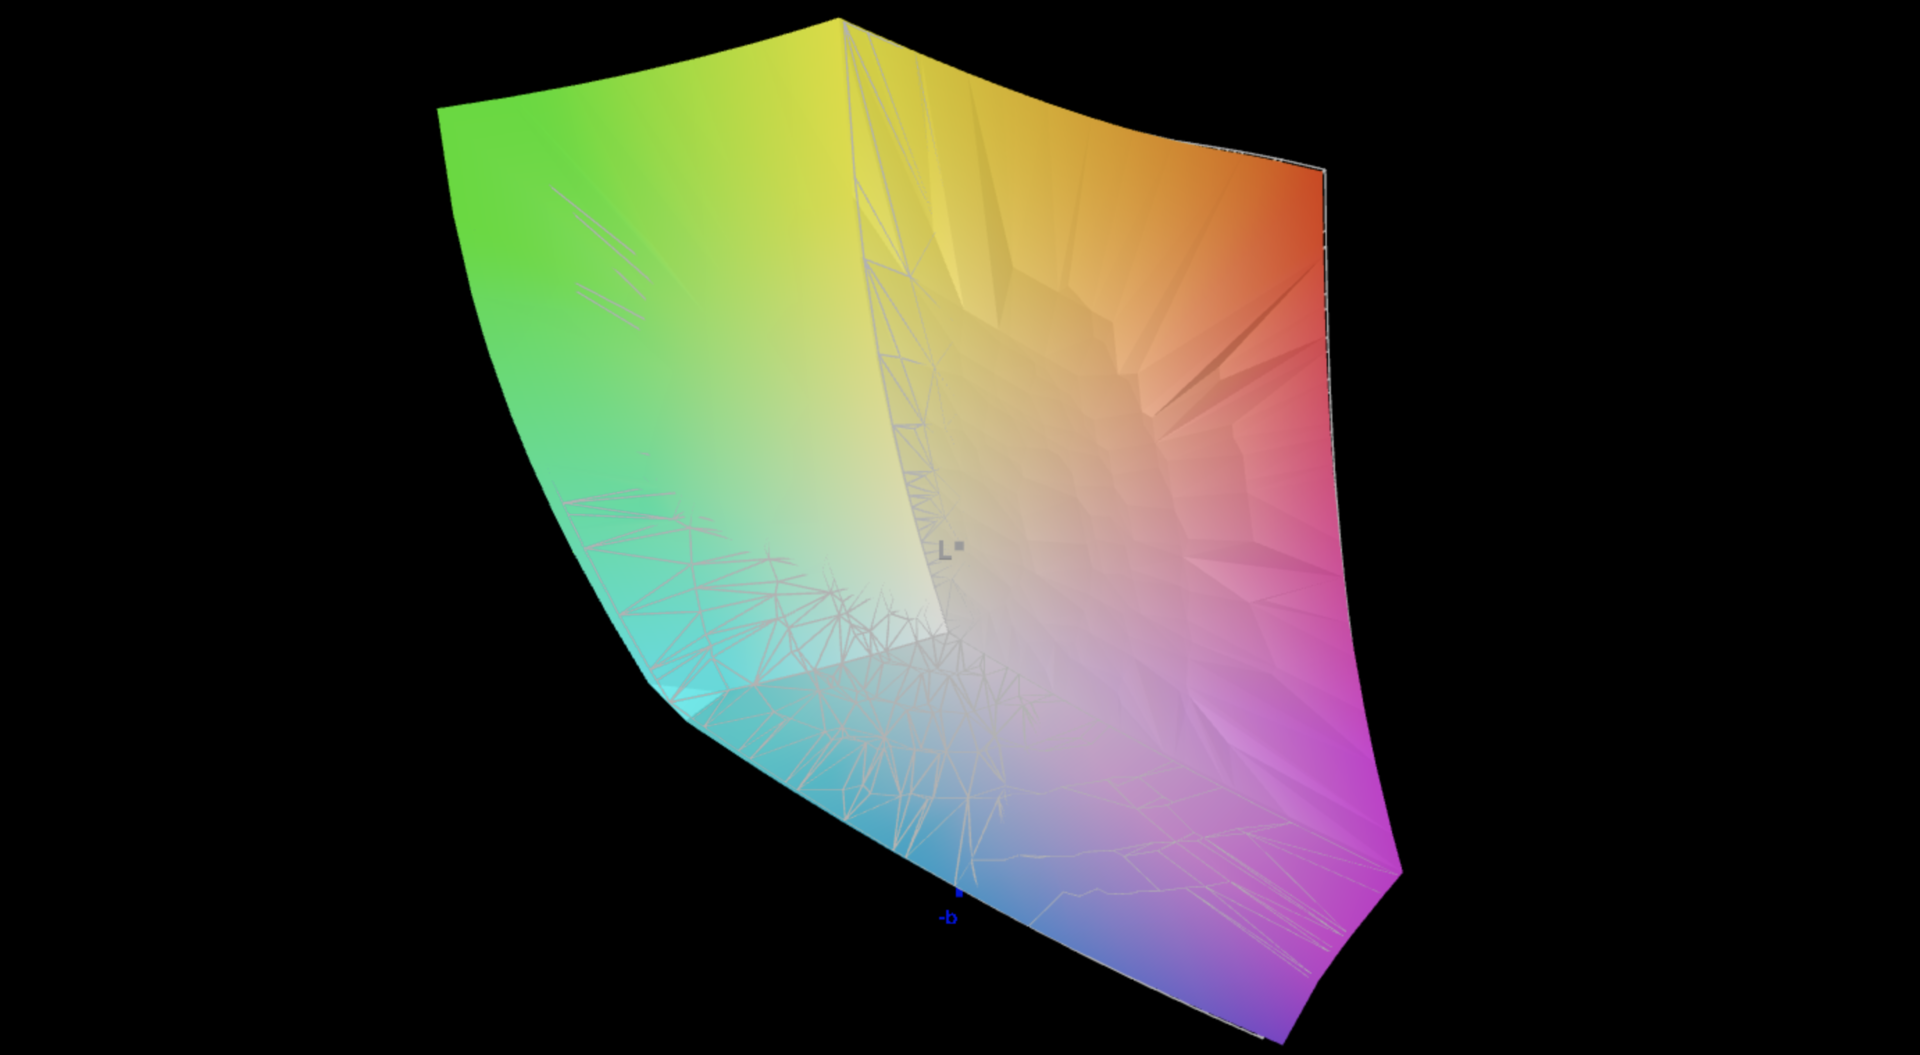
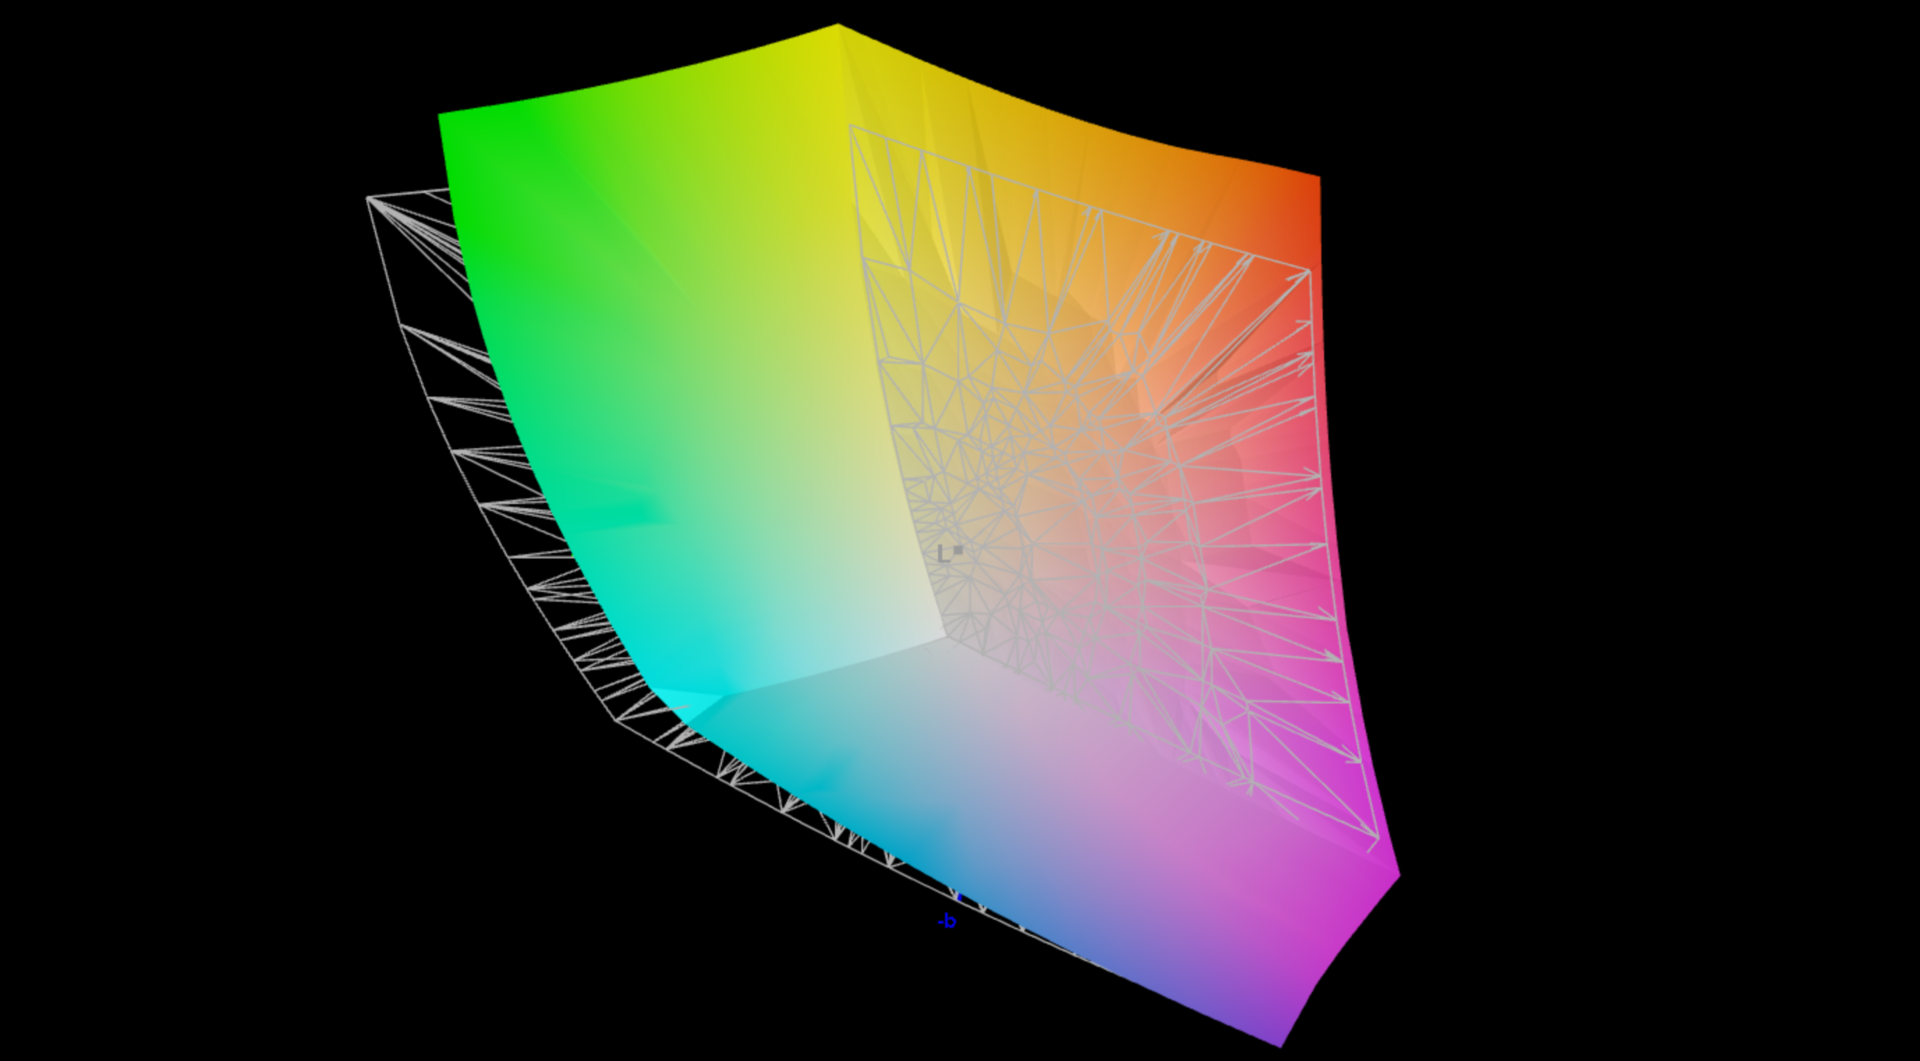
Display - Only a 60 Hz OLED touchscreen
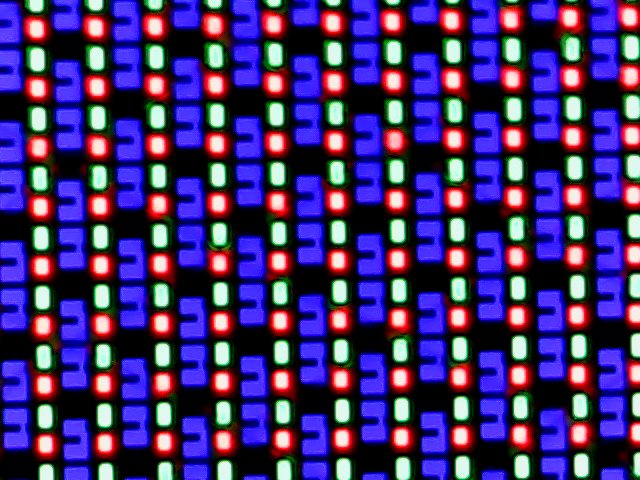
Now we come to what is probably the biggest point of contention with the new ProArt PX13, the display. Asus has equipped the device with a 13.3-inch, Samsung OLED touchscreen with a high resolution of 2,880 x 1,800 pixels. The DPI figure also becomes apparent in a direct comparison with larger panels (for example. the Zenbook S 16's OLED) because all content appears a touch sharper. The colors are vibrant, the black level is good and the response times are very fast. But, the subjective image quality doesn't quite meet 2024-level expectations when it comes to OLED displays. Firstly, bright areas appear a little grainy and you get the impression the screen is somewhat damp. However, the effect is not as pronounced as the one seen, for example, in the current Dell XPS models which have OLED panels. Additionally, in the case of reflections, there is a visible structure which presumably originates from the touch layer. Despite this, the biggest problem is the 60 Hz frequency which is the reason motion doesn't appear as smooth as 90 or 120 Hz models. Both the brightness and color temperature can be adjusted automatically.
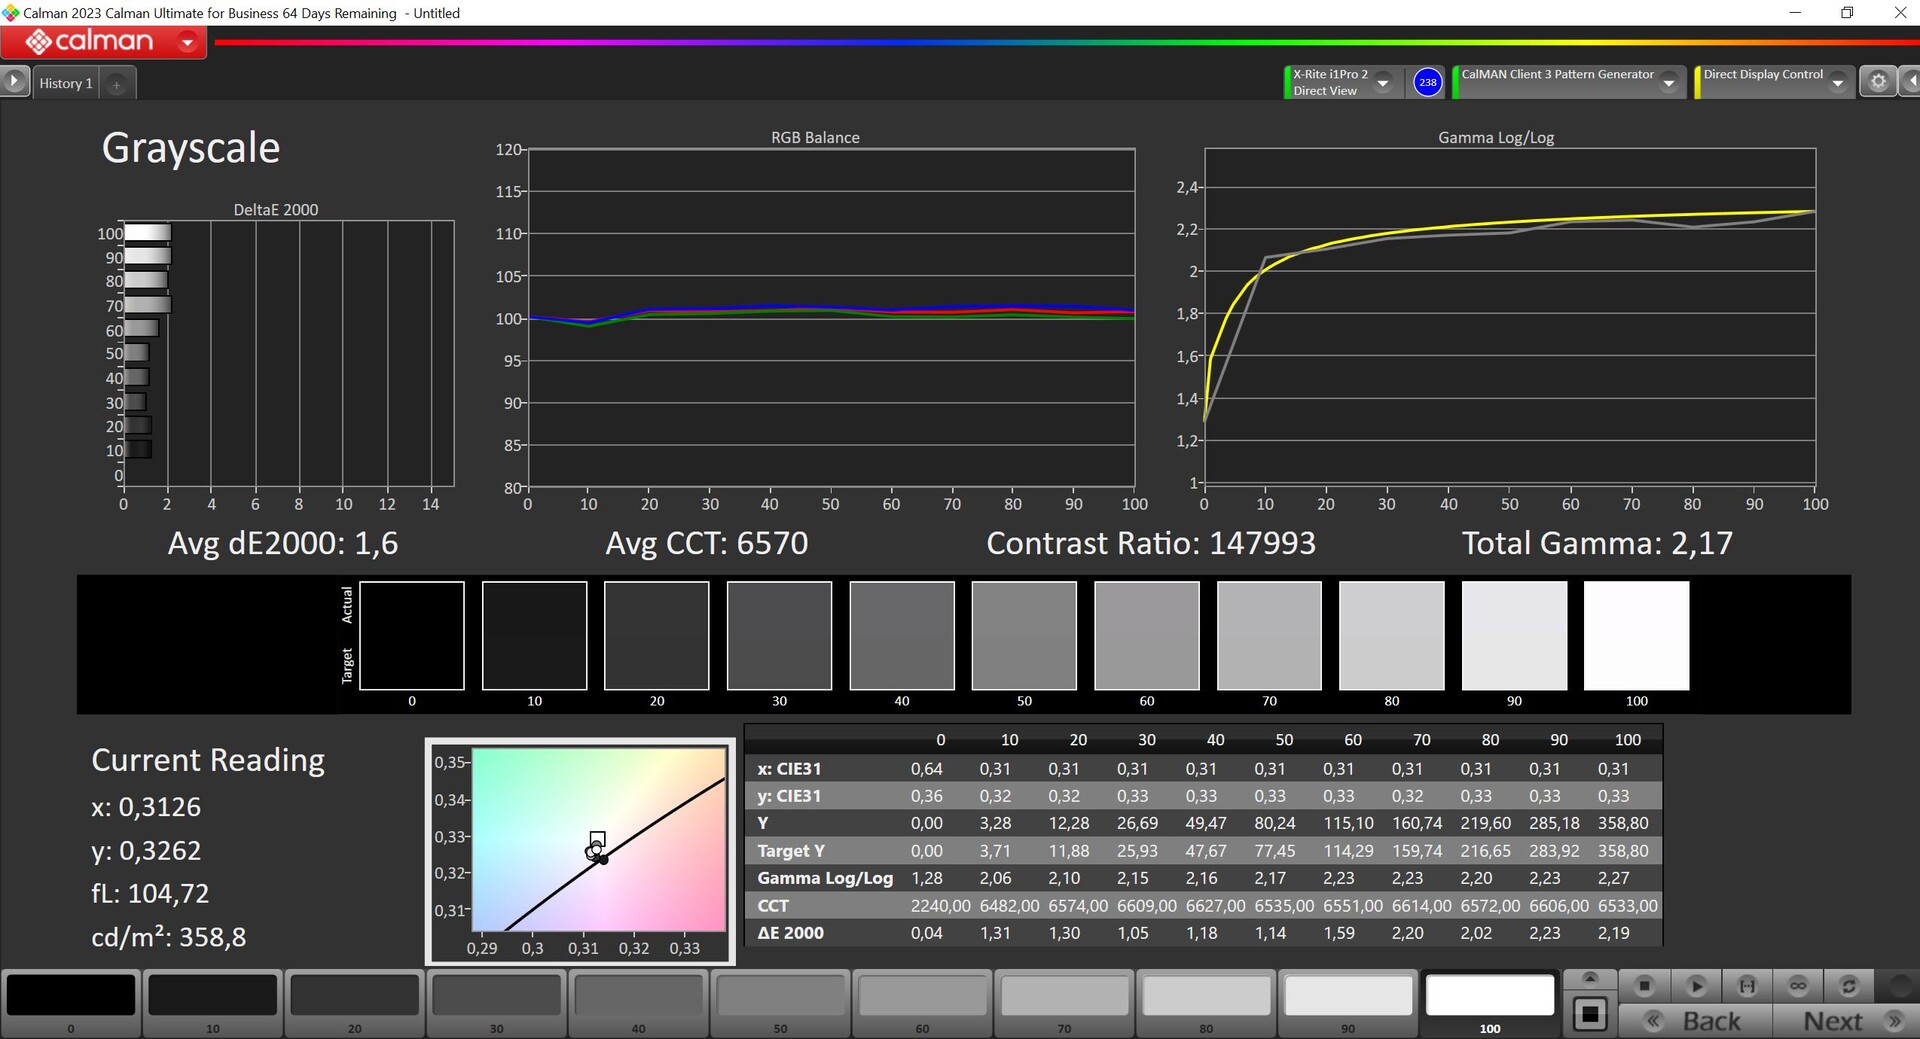
In SDR mode, the brightness sits at an average of almost 360 cd/m² which is slightly below the current OLED generation (400 cd/m² or higher). Nevertheless, together with the low black level, this still results in a wonderful contrast ratio. In HDR mode, (which still has to be activated manually in Windows) we're dealing with a maximum of 577 cd/m² in a small section of the display and 503 cd/m² when the displayed image is almost completely white.
| |||||||||||||||||||||||||
Brightness Distribution: 98 %
Center on Battery: 360 cd/m²
Contrast: 18000:1 (Black: 0.02 cd/m²)
ΔE ColorChecker Calman: 1.1 | ∀{0.5-29.43 Ø4.73}
ΔE Greyscale Calman: 1.4 | ∀{0.09-98 Ø4.97}
88.9% AdobeRGB 1998 (Argyll 3D)
100% sRGB (Argyll 3D)
99.4% Display P3 (Argyll 3D)
Gamma: 2.16
CCT: 6554 K
| Asus ProArt PX13 HN7306 ATNA33AA08-0, OLED, 2880x1800, 13.3", 60 Hz | Asus ROG Flow X13 GV302XV TL134ADXP01-0, IPS, 2560x1600, 13.4", 165 Hz | Asus ROG Flow Z13 ACRNM TL134ADXP01-0, IPS, 2560x1600, 13.4", 165 Hz | Asus ROG Zephyrus G14 2024 GA403U ATNA40CU05-0, OLED, 2880x1800, 14", 120 Hz | Razer Blade 14 RZ09-0508 TL140ADXP04-0, IPS, 2560x1600, 14", 240 Hz | Microsoft Surface Laptop Studio 2 RTX 4060 LQ144P1JX01, IPS, 2400x1600, 14.4", 120 Hz | |
|---|---|---|---|---|---|---|
| Display | -3% | -2% | 0% | -2% | -19% | |
| Display P3 Coverage (%) | 99.4 | 95.1 -4% | 96.94 -2% | 99.6 0% | 96.9 -3% | 66.7 -33% |
| sRGB Coverage (%) | 100 | 99.7 0% | 99.92 0% | 100 0% | 99.8 0% | 99 -1% |
| AdobeRGB 1998 Coverage (%) | 88.9 | 84.4 -5% | 85.17 -4% | 89.9 1% | 85 -4% | 68.9 -22% |
| Response Times | -221% | -46% | 63% | -309% | -2952% | |
| Response Time Grey 50% / Grey 80% * (ms) | 1.94 ? | 4.79 ? -147% | 2.1 ? -8% | 0.62 ? 68% | 6 ? -209% | 77.6 ? -3900% |
| Response Time Black / White * (ms) | 1.63 ? | 6.42 ? -294% | 3 ? -84% | 0.68 ? 58% | 8.3 ? -409% | 34.3 ? -2004% |
| PWM Frequency (Hz) | 240 ? | 960 ? | 17600 ? | |||
| PWM Amplitude * (%) | 50 | |||||
| Screen | -334% | -276% | 40% | -257% | -133% | |
| Brightness middle (cd/m²) | 360 | 473 31% | 464 29% | 423 18% | 484.1 34% | 511 42% |
| Brightness (cd/m²) | 358 | 445 24% | 455 27% | 424 18% | 466 30% | 503 41% |
| Brightness Distribution (%) | 98 | 89 -9% | 89 -9% | 98 0% | 89 -9% | 89 -9% |
| Black Level * (cd/m²) | 0.02 | 0.39 -1850% | 0.4 -1900% | 0.01 50% | 0.38 -1800% | 0.26 -1200% |
| Contrast (:1) | 18000 | 1213 -93% | 1160 -94% | 42300 135% | 1274 -93% | 1965 -89% |
| Colorchecker dE 2000 * | 1.1 | 3.3 -200% | 2 -82% | 0.7 36% | 2.23 -103% | 0.5 55% |
| Colorchecker dE 2000 max. * | 2.3 | 8.93 -288% | 4.2 -83% | 1.8 22% | 4.57 -99% | 1.1 52% |
| Greyscale dE 2000 * | 1.4 | 5.4 -286% | 2.7 -93% | 0.8 43% | 1.6 -14% | 0.8 43% |
| Gamma | 2.16 102% | 2.11 104% | 2.24 98% | 2.18 101% | 2.24 98% | 2.19 100% |
| CCT | 6554 99% | 7540 86% | 6832 95% | 6505 100% | 6816 95% | 6650 98% |
| Colorchecker dE 2000 calibrated * | 1.09 | 1.2 | 0.74 | |||
| Total Average (Program / Settings) | -186% /
-240% | -108% /
-177% | 34% /
35% | -189% /
-206% | -1035% /
-540% |
* ... smaller is better
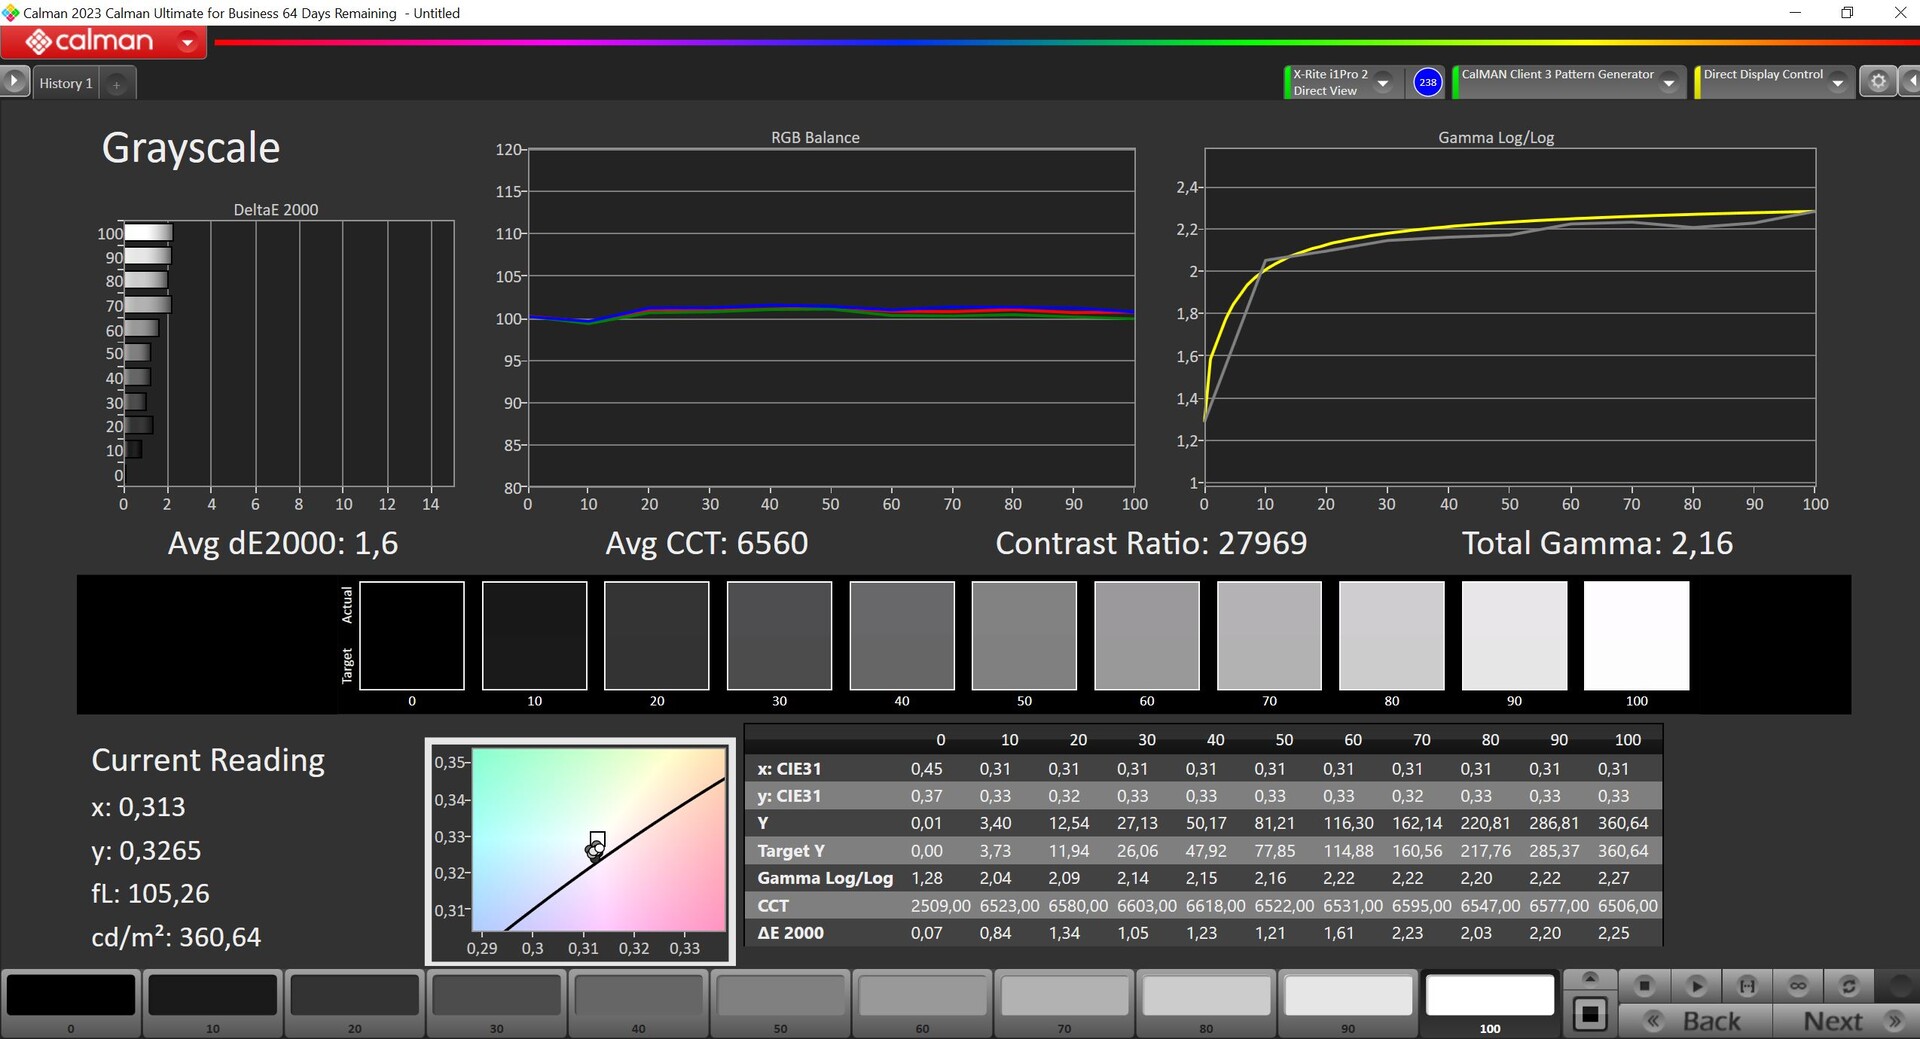
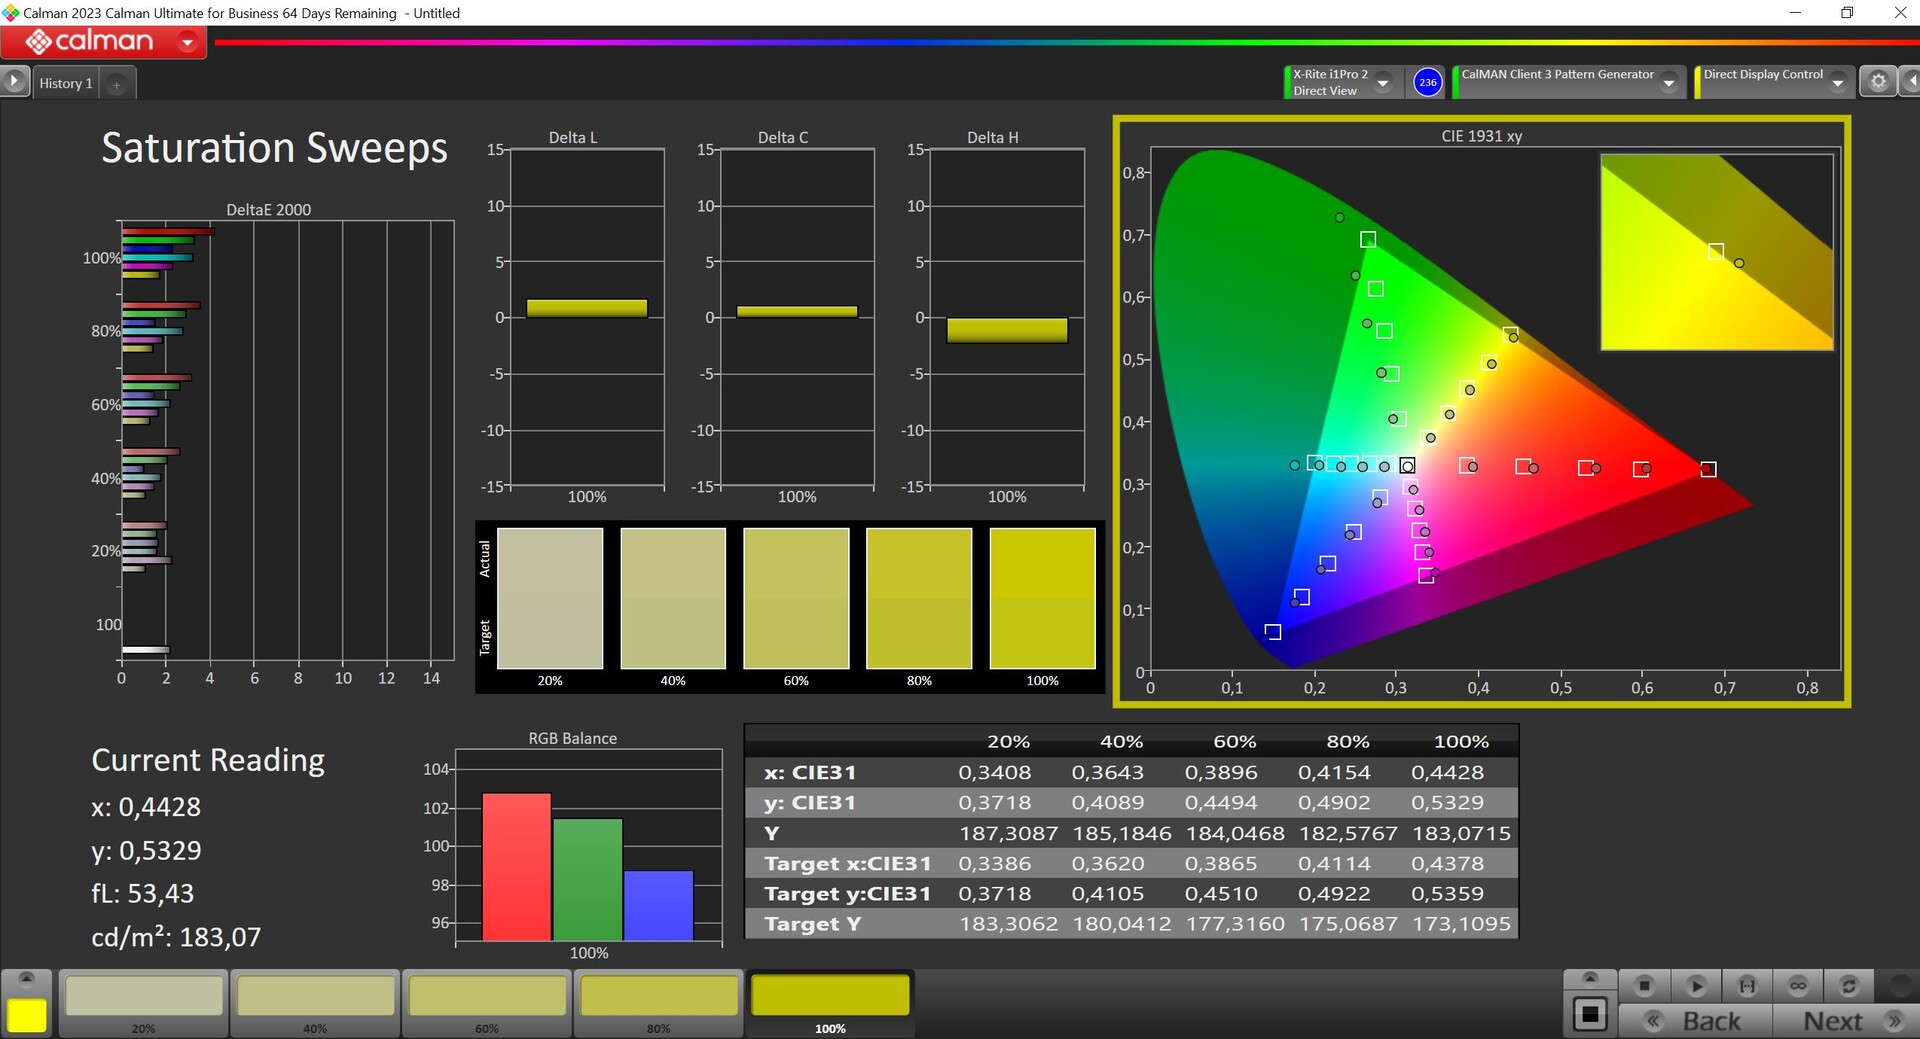

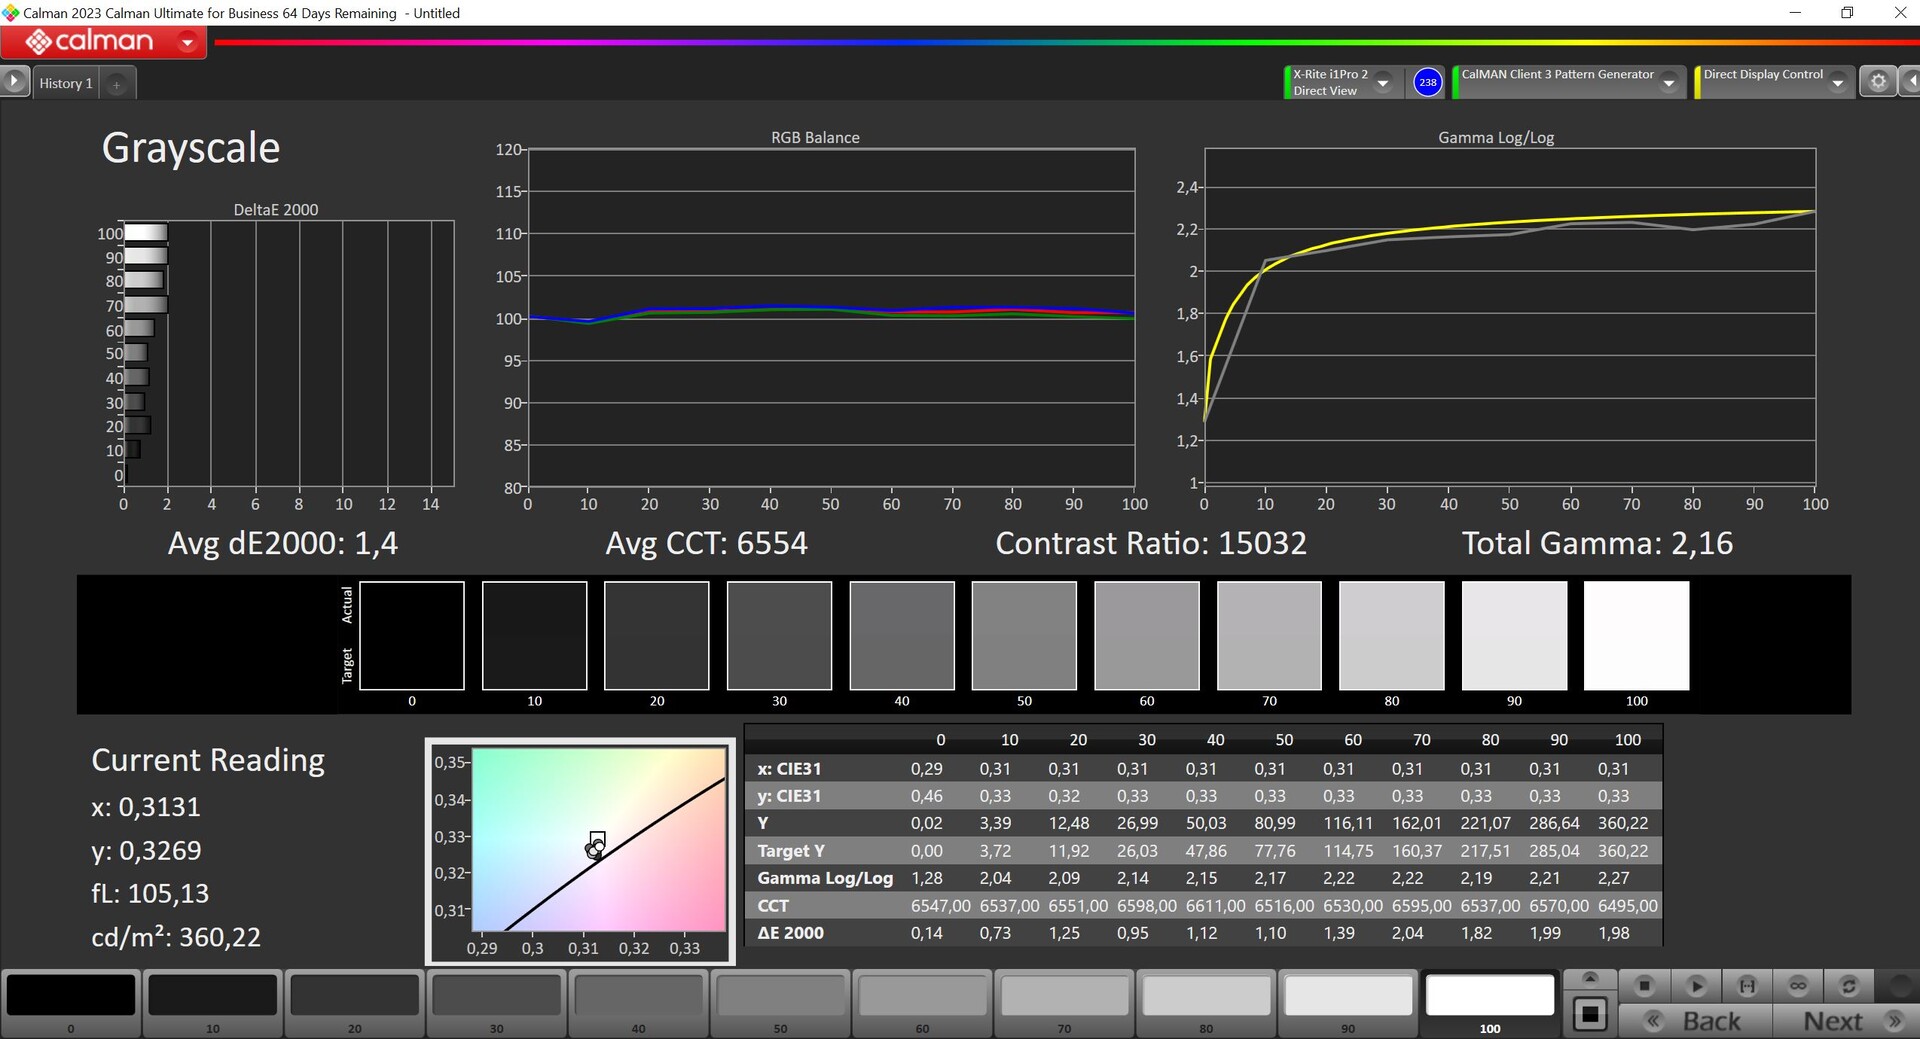
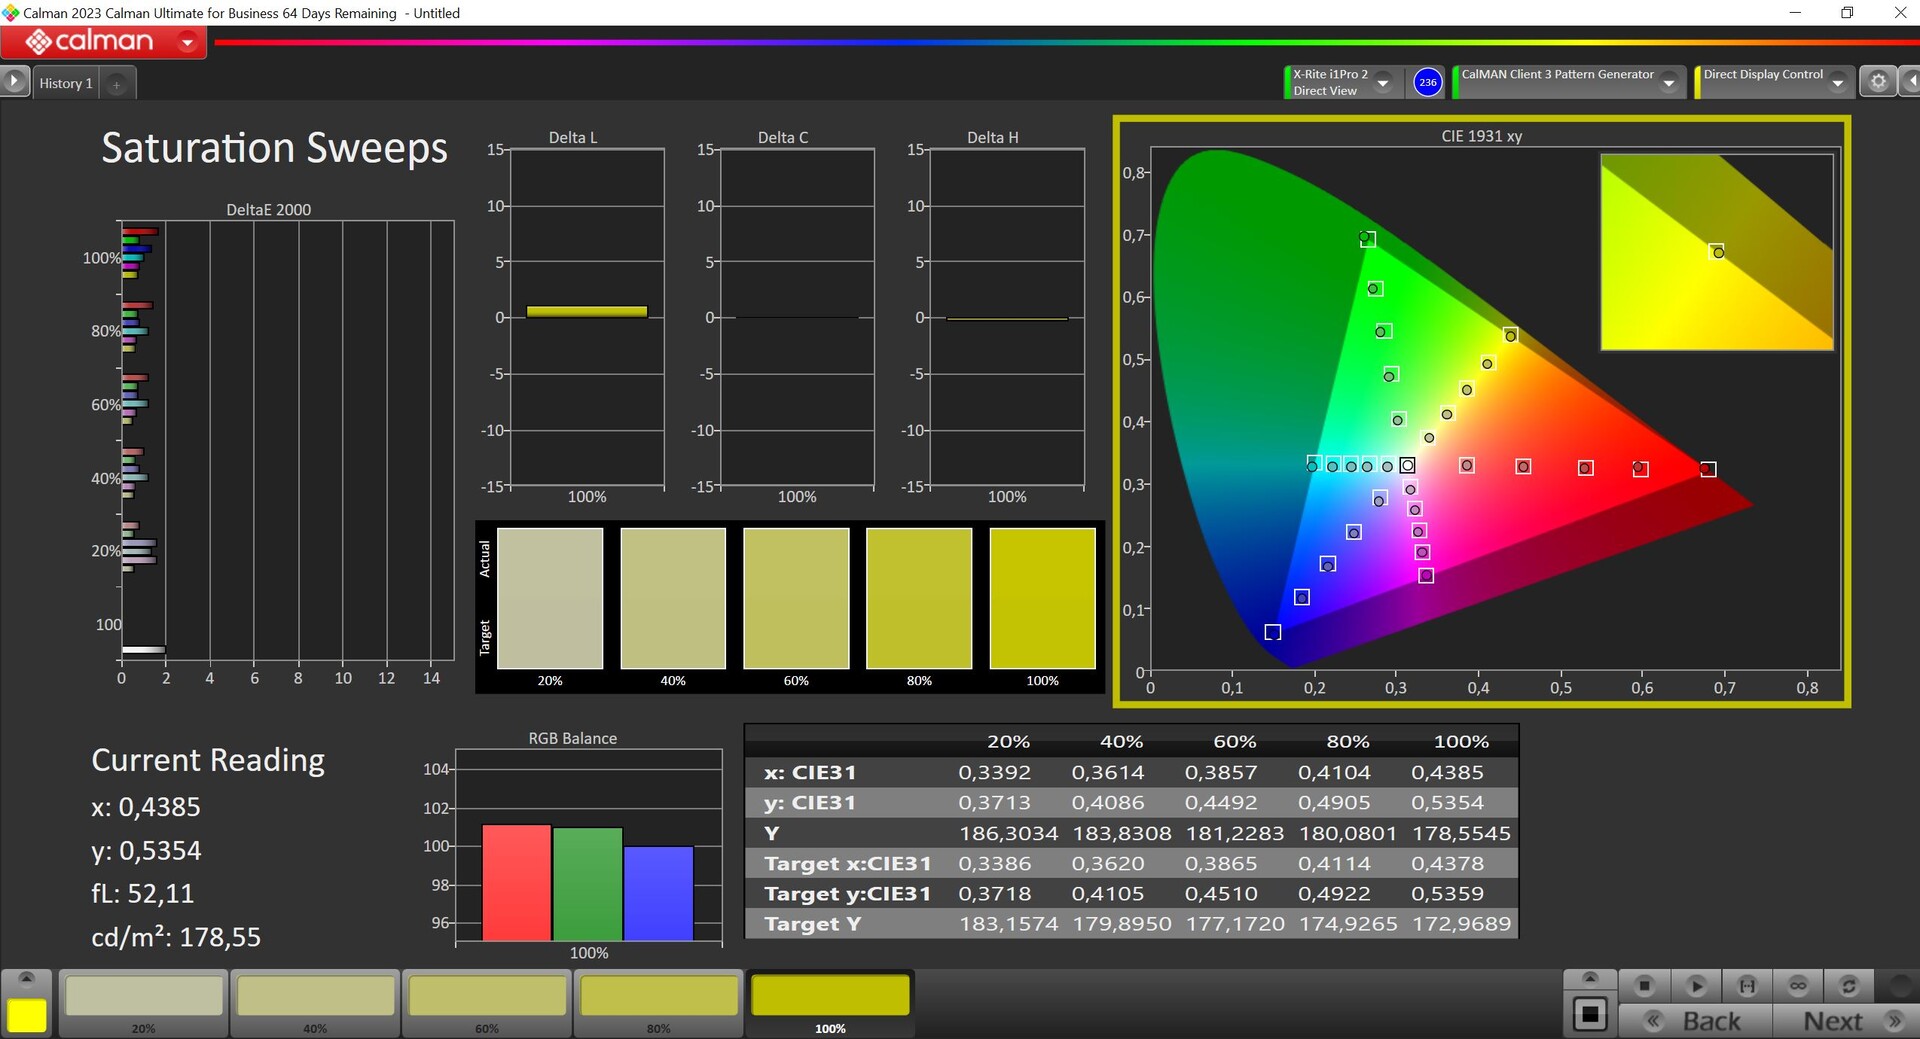

We measured the panel using the professional CalMAN software (X-Rite i1 Pro2). The standard native profile oversaturates/skews the colors somewhat. For the most color-accurate reproduction possible, you can simply select the P3 profile which should result in all of the deviations (gray scales and colors) hitting their target values. In addition, an accurate sRGB profile is also available which means you can immediately go about editing images. Using our own calibration, we were unable to further improve the image quality which is why we aren't offering a downloadable profile.


Display Response Times
| ↔ Response Time Black to White | ||
|---|---|---|
| 1.63 ms ... rise ↗ and fall ↘ combined | ↗ 0.84 ms rise | 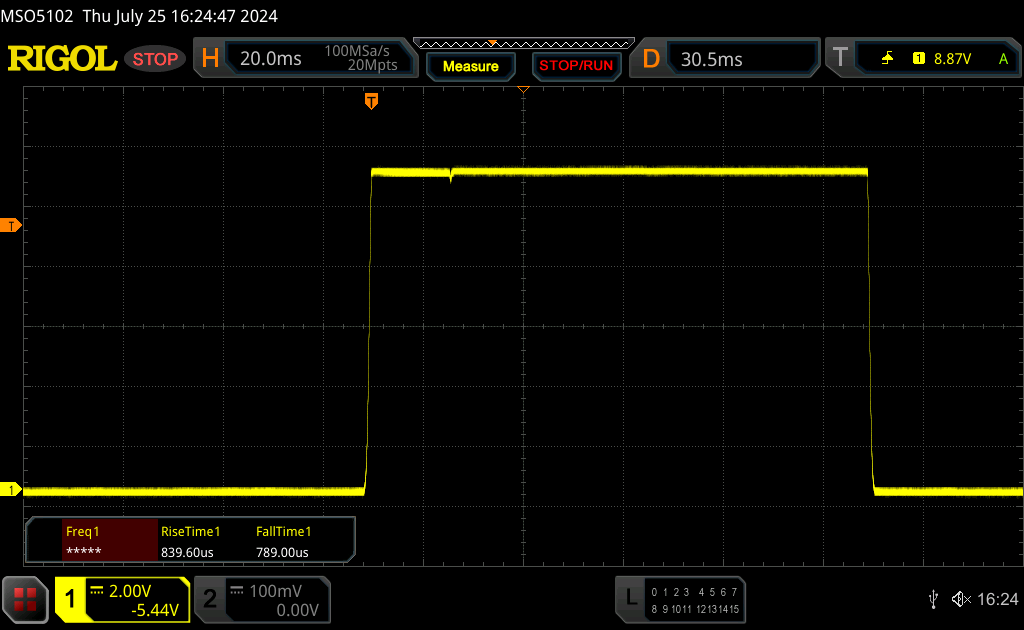 |
| ↘ 0.79 ms fall | ||
| The screen shows very fast response rates in our tests and should be very well suited for fast-paced gaming. In comparison, all tested devices range from 0.1 (minimum) to 240 (maximum) ms. » 10 % of all devices are better. This means that the measured response time is better than the average of all tested devices (19.9 ms). | ||
| ↔ Response Time 50% Grey to 80% Grey | ||
| 1.94 ms ... rise ↗ and fall ↘ combined | ↗ 0.99 ms rise | 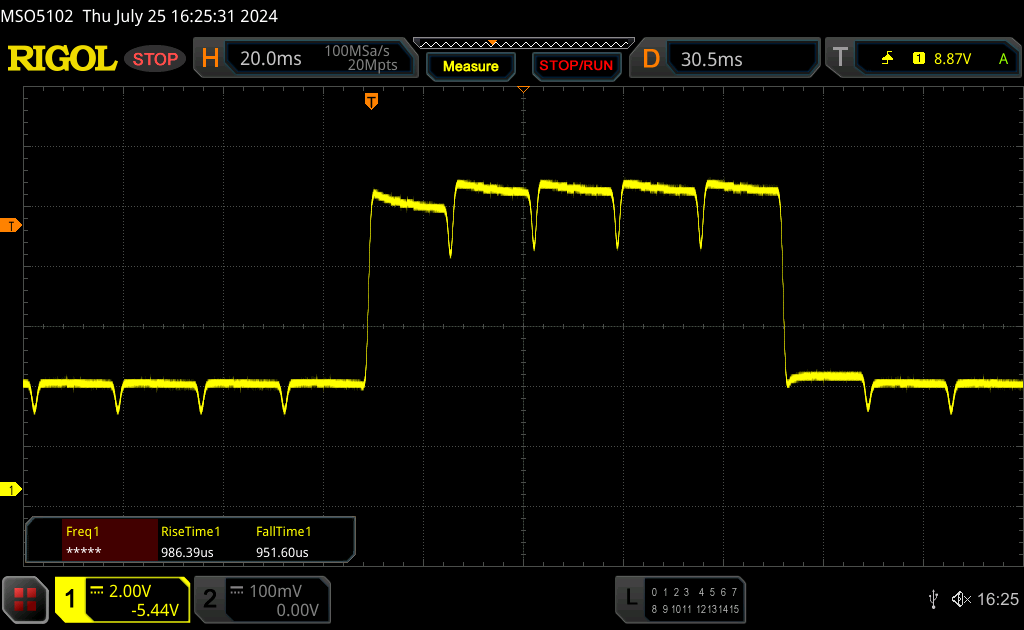 |
| ↘ 0.95 ms fall | ||
| The screen shows very fast response rates in our tests and should be very well suited for fast-paced gaming. In comparison, all tested devices range from 0.165 (minimum) to 636 (maximum) ms. » 9 % of all devices are better. This means that the measured response time is better than the average of all tested devices (31.1 ms). | ||
Screen Flickering / PWM (Pulse-Width Modulation)
| Screen flickering / PWM detected | 240 Hz Amplitude: 50 % | ≤ 53 % brightness setting | 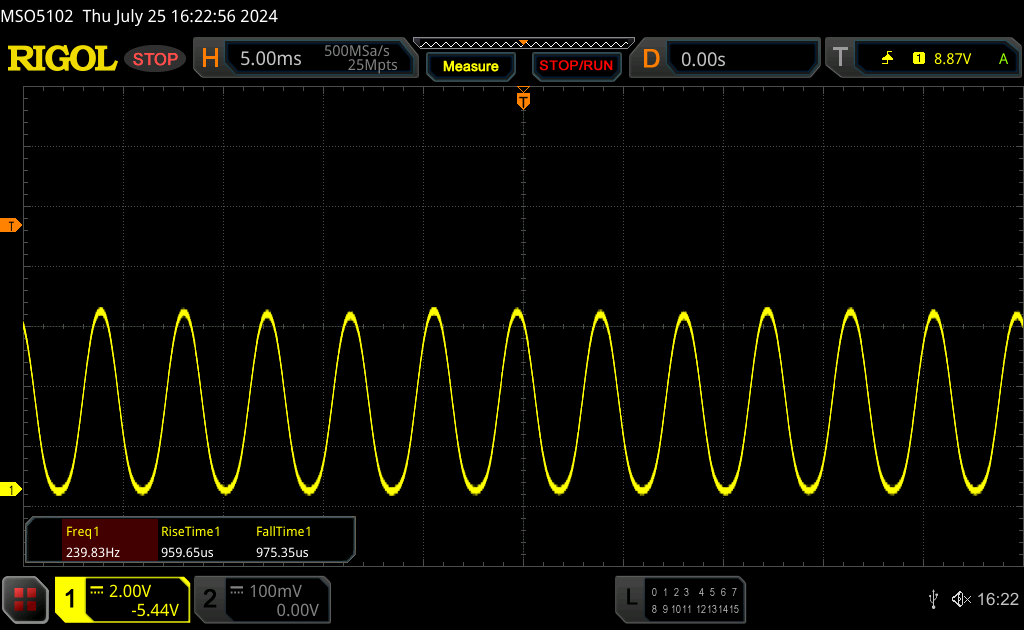 |
The display backlight flickers at 240 Hz (worst case, e.g., utilizing PWM) Flickering detected at a brightness setting of 53 % and below. There should be no flickering or PWM above this brightness setting. The frequency of 240 Hz is relatively low, so sensitive users will likely notice flickering and experience eyestrain at the stated brightness setting and below. In comparison: 52 % of all tested devices do not use PWM to dim the display. If PWM was detected, an average of 7801 (minimum: 5 - maximum: 343500) Hz was measured. | |||
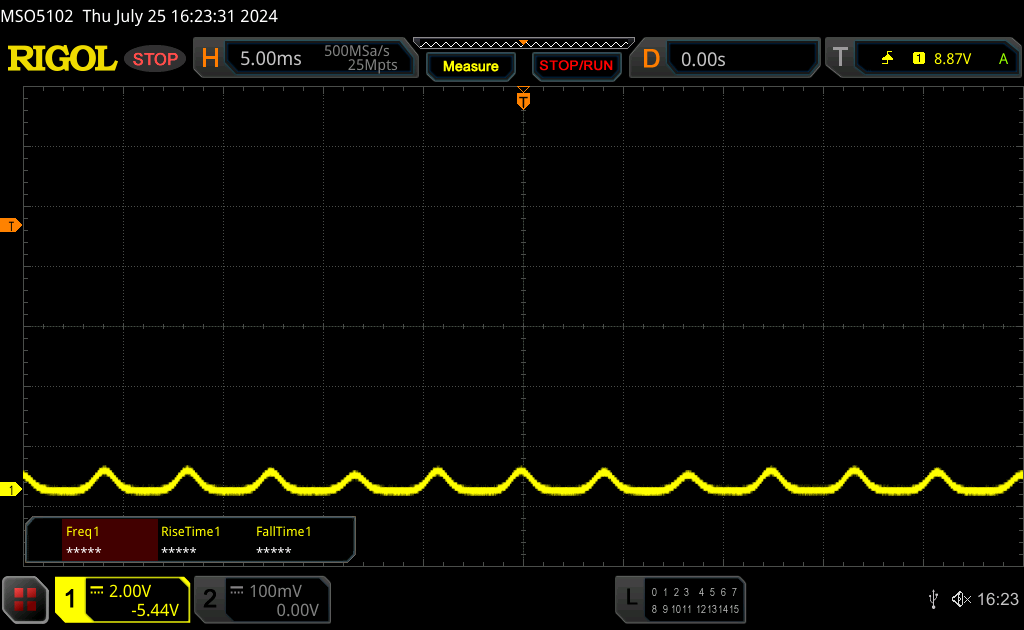
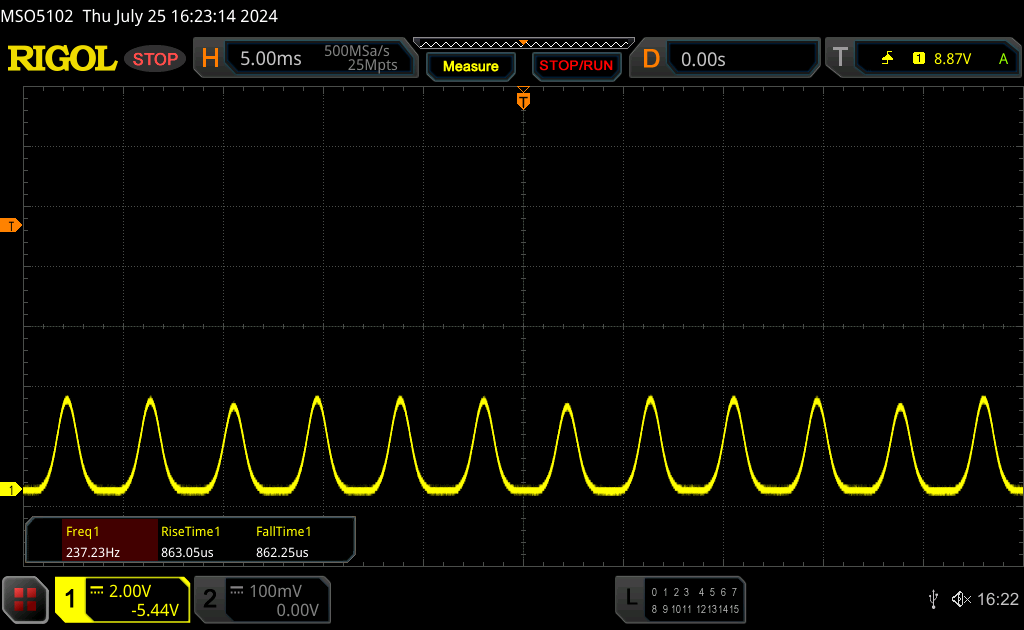
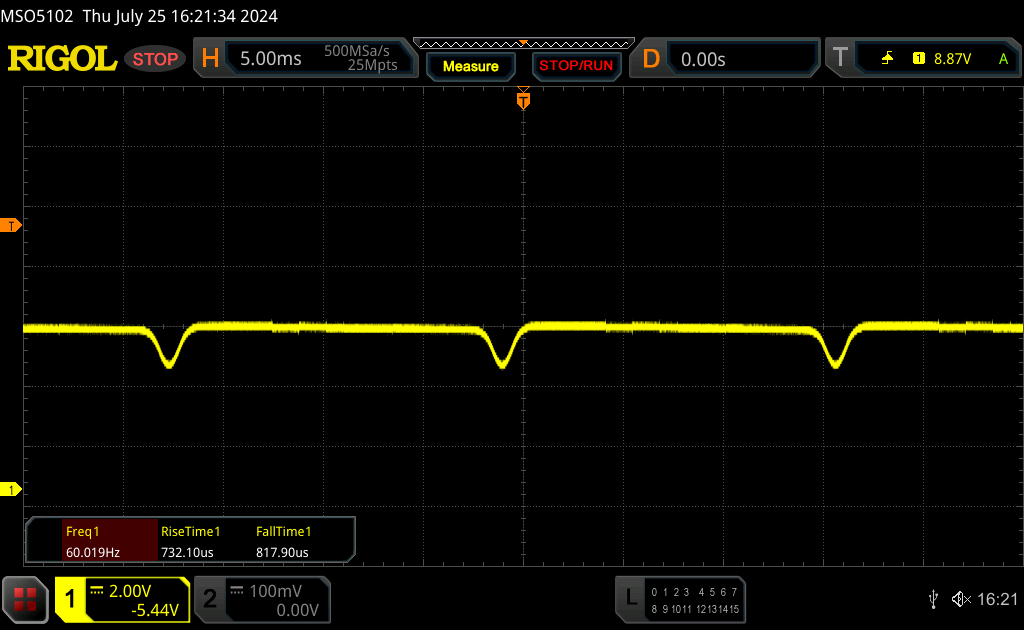
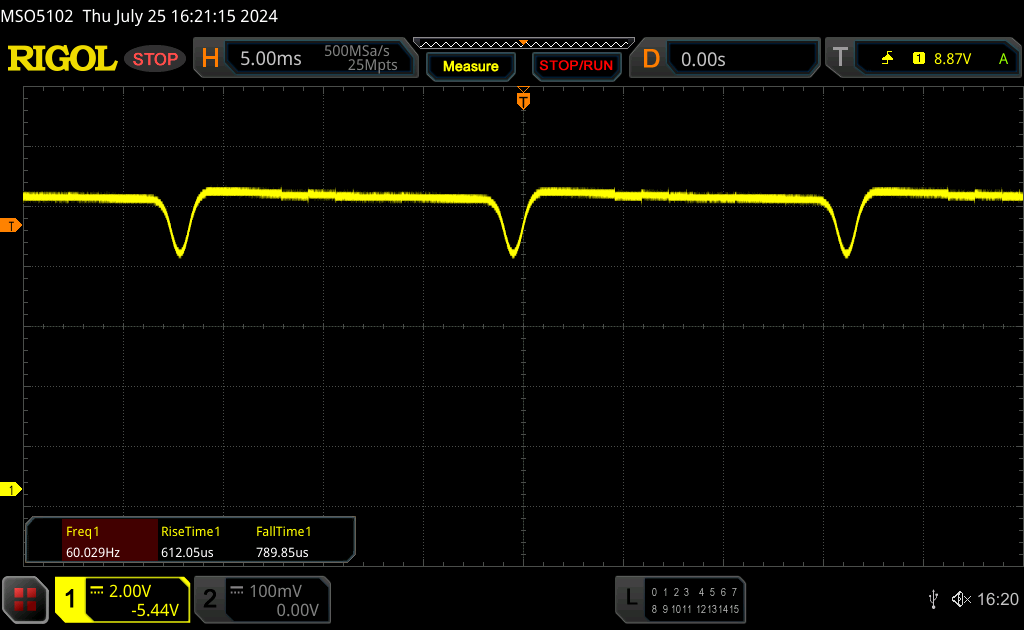
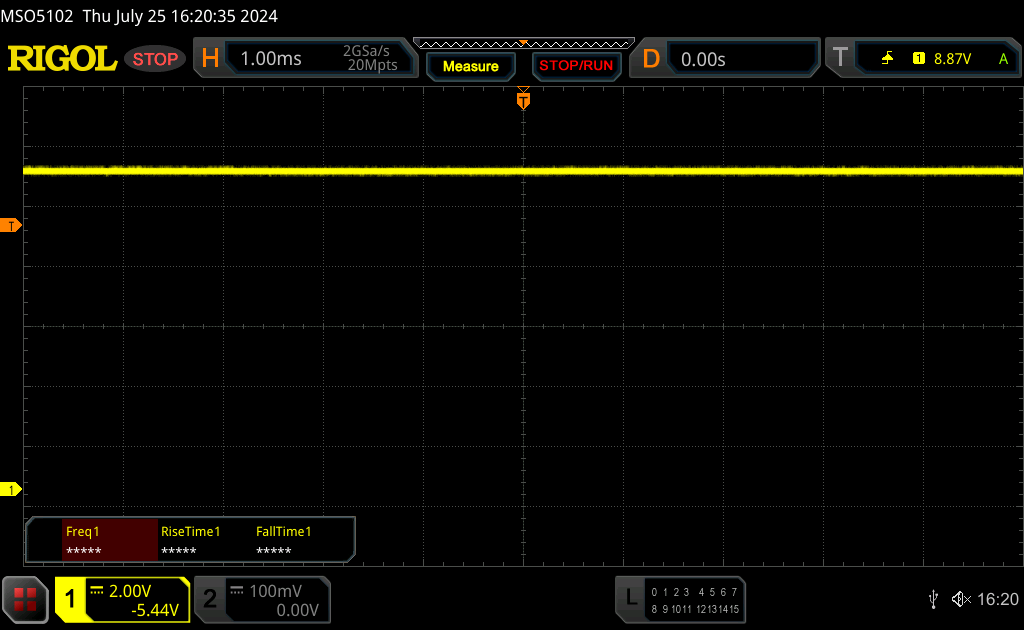
In a brightness range of 100-54 %, Asus uses DC dimming at a frequency of 60 Hz. From a brightness of 53 % and lower, we then have the classic PWM at a frequency of 240 Hz. As is the case with all other Asus OLED panels, so-called flicker-free OLED dimming is available via the MyAsus software. With DC dimming, the amplitude is longer and more limited (cut off at the top). Below this, you can see the entire oscillation curve. With software-based dimming (select high brightness and use the software dimming), you can avoid getting into this range.


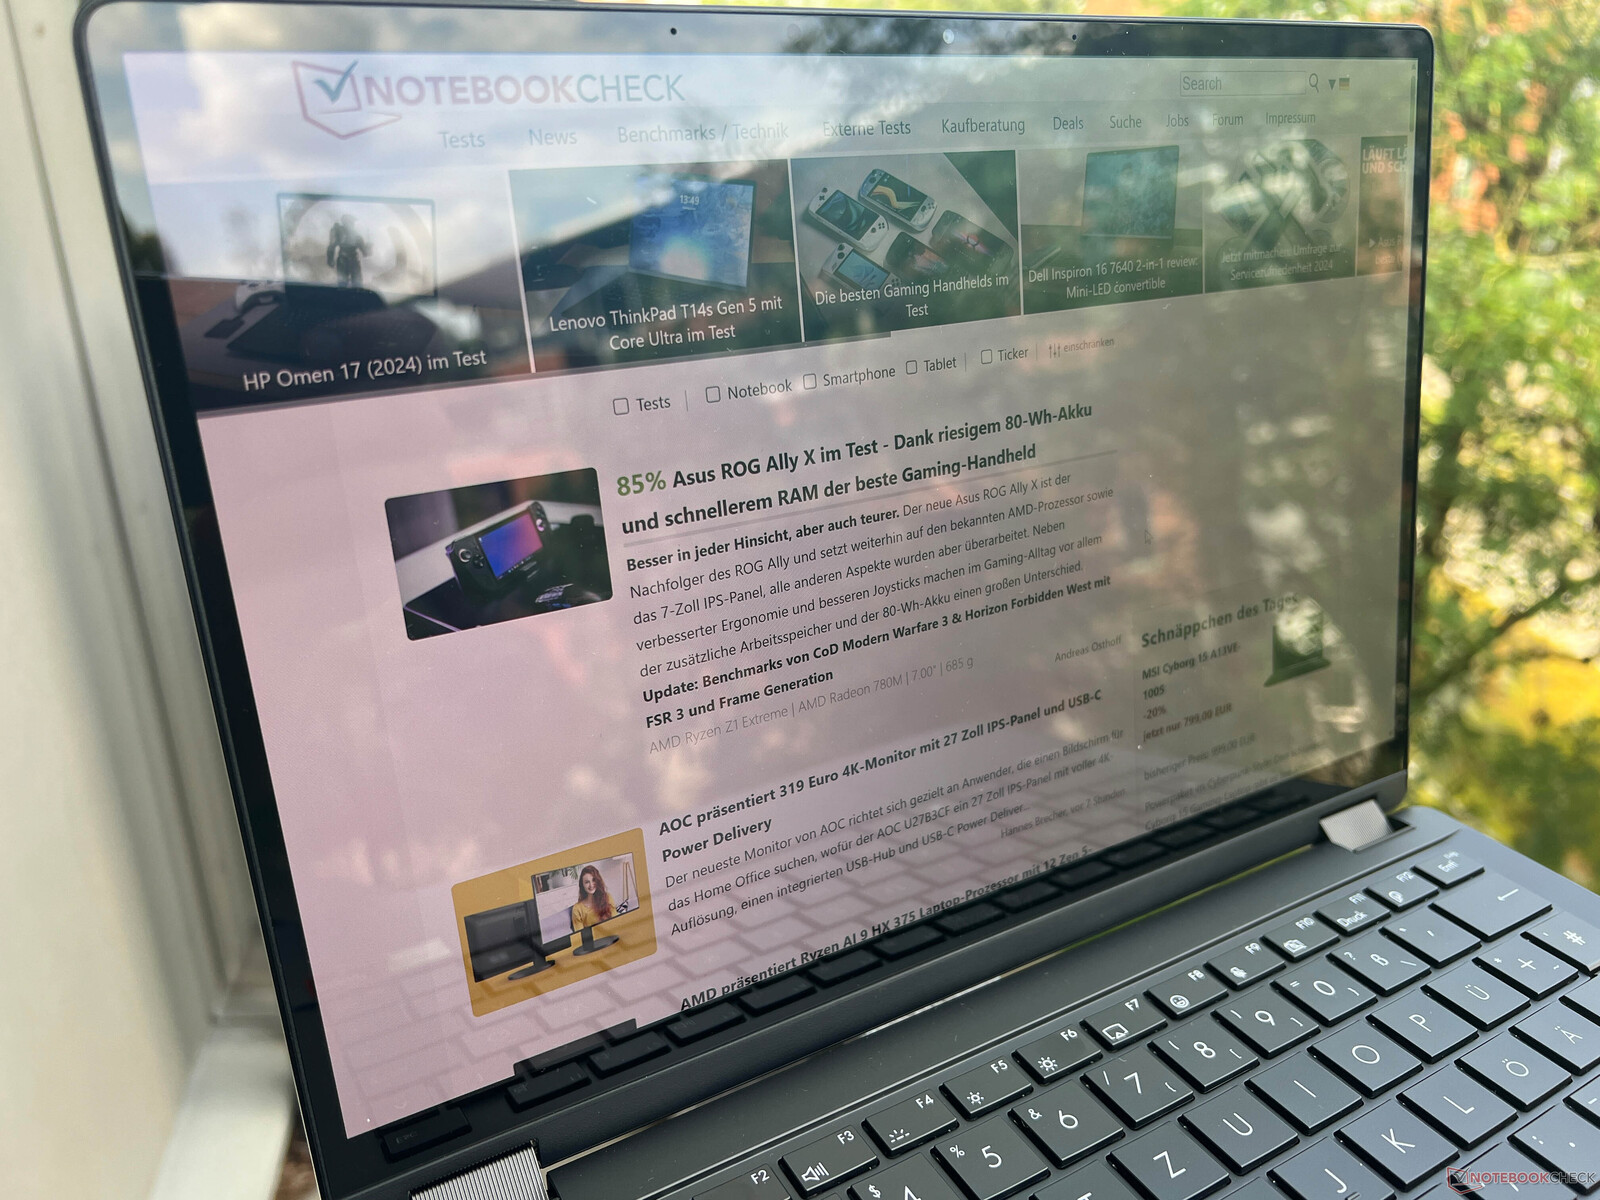
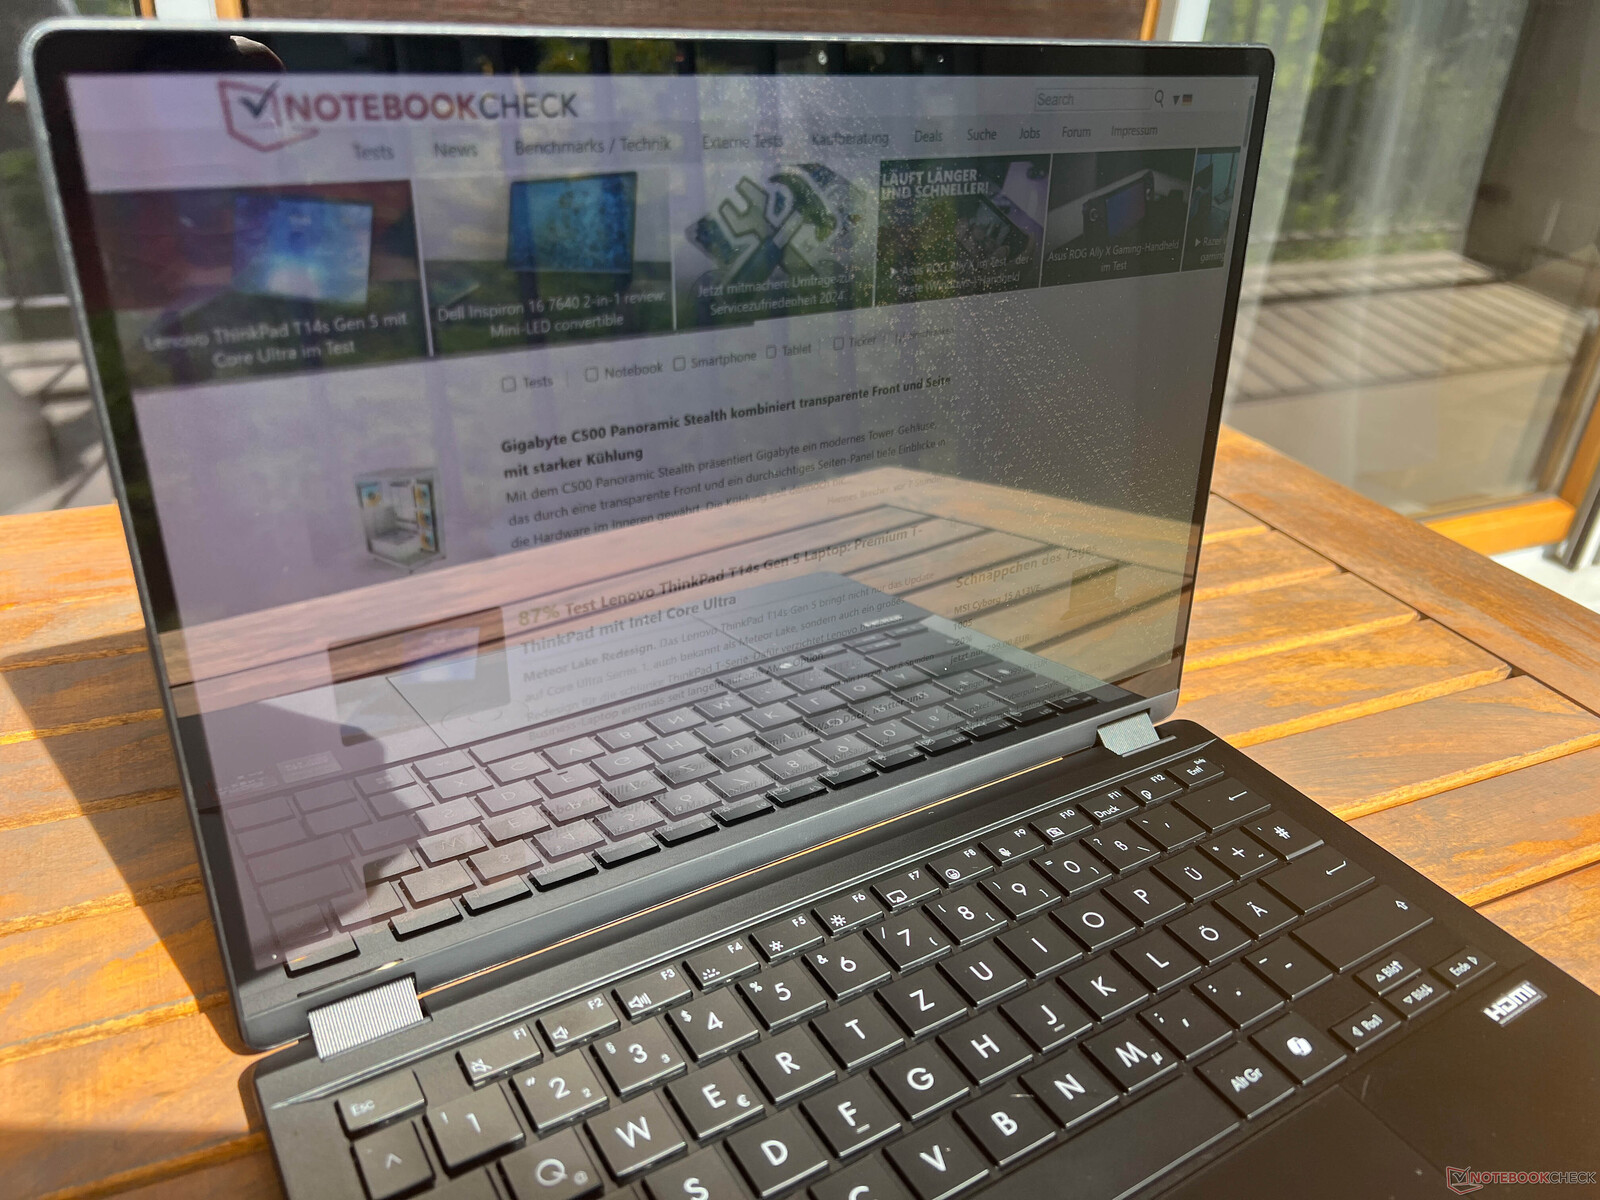
Outdoors, the highly reflective touchscreen is problematic since you are constantly battling with reflections. There are no complaints when it comes to the viewing angle stability.

Performance - Zen 5 meets Ada Lovelace
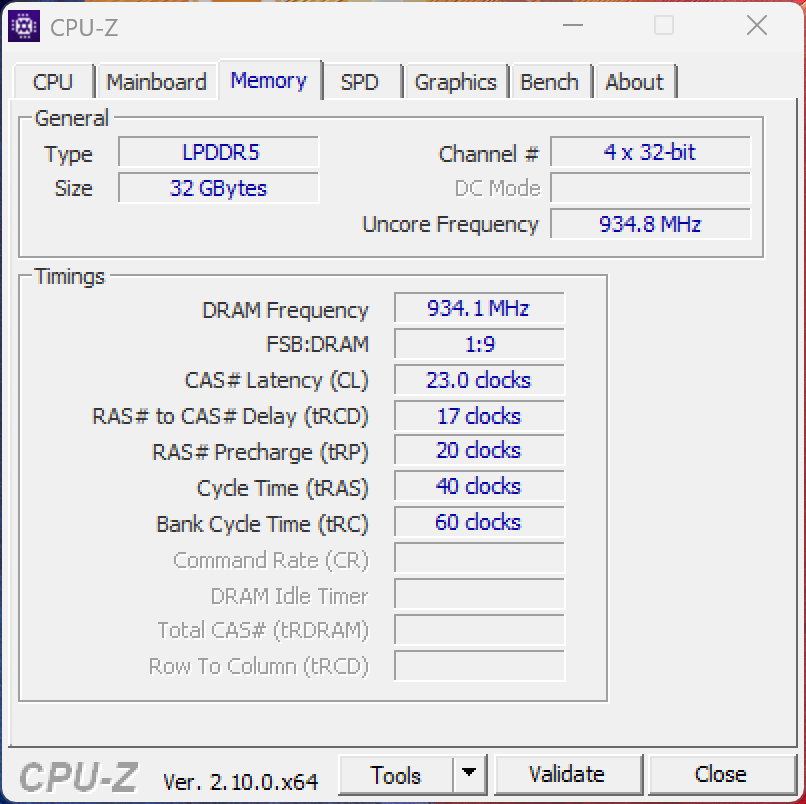
Every configuration of the ProArt PX13 is equipped with the new AMD Ryzen AI 9 HX 370. The base model gets 24 GB of RAM (LPDDR5x 7500) and the GeForce RTX 4050 laptop, versions with the RTX 4060 laptop or 4070 laptop get 32 GB of RAM. The RAM isn't expandable.
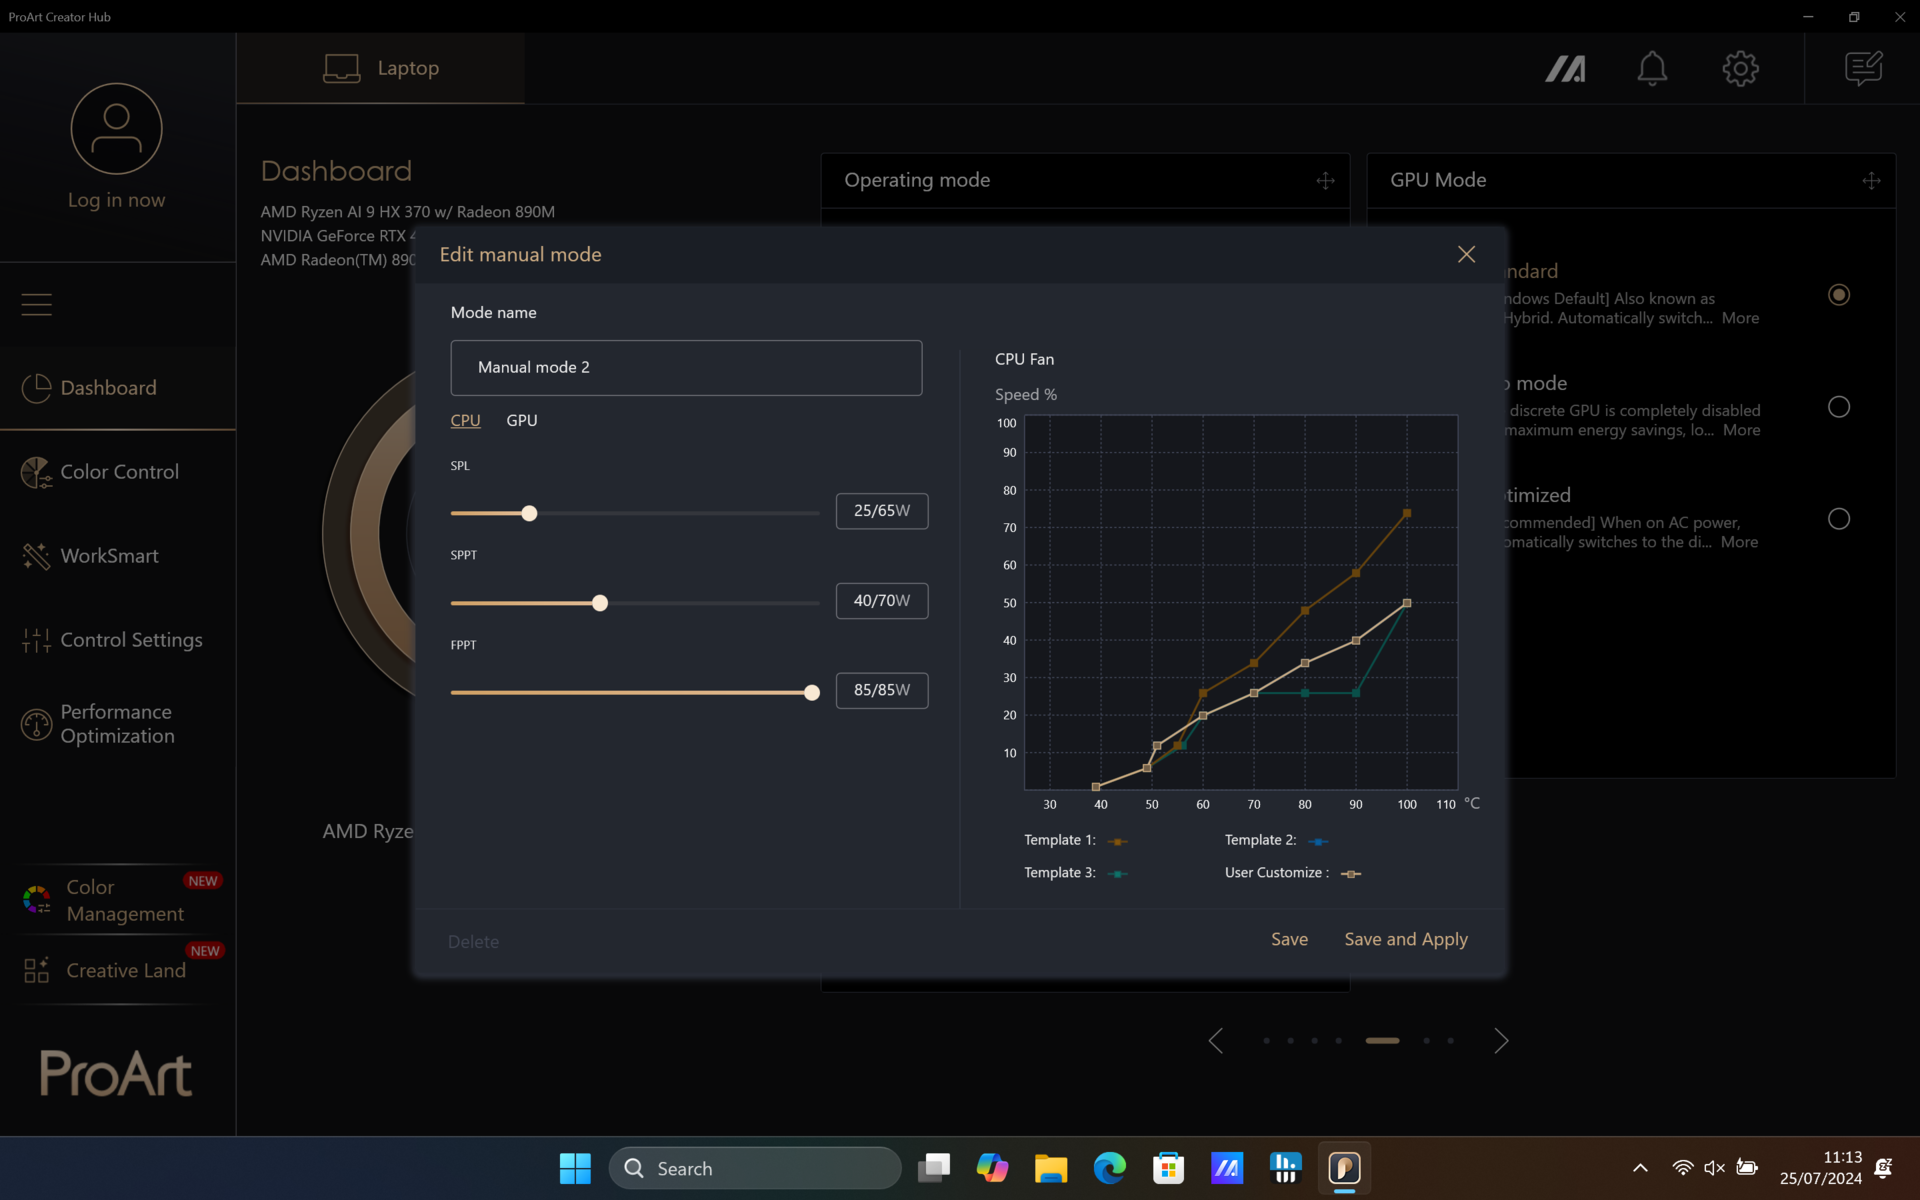
Test conditions
Asus offers various performance profiles which can be selected via the MyAsus software or the ProArt creator hub software. In the following table, we have listed the different profiles together with their related performance values.
| Energy mode | CPU TDP | CBR 23 Multi | GPU TGP | Time Spy graphics | stress test TDP/TGP | CP 2077 1080p Ultra | maximum fan volume |
|---|---|---|---|---|---|---|---|
| Whisper | 80/50 watts | 20,010 points | 58 watts | 8,856 points | CPU: 20 watts GPU: 33 watts |
62.7fps | 40.1 dB(A) |
| Standard | 80/55 watts | 20,247 points | 65 watts | 9,680 points | CPU: 20 watts GPU: 55 watts |
69.1fps | 47.5 dB(A) |
| Performance | 80/65 watts | 23,236 points | 75 watts | 10,693 points | CPU: 25 watts GPU: 65 watts |
74.1fps | 53.3 dB(A) |
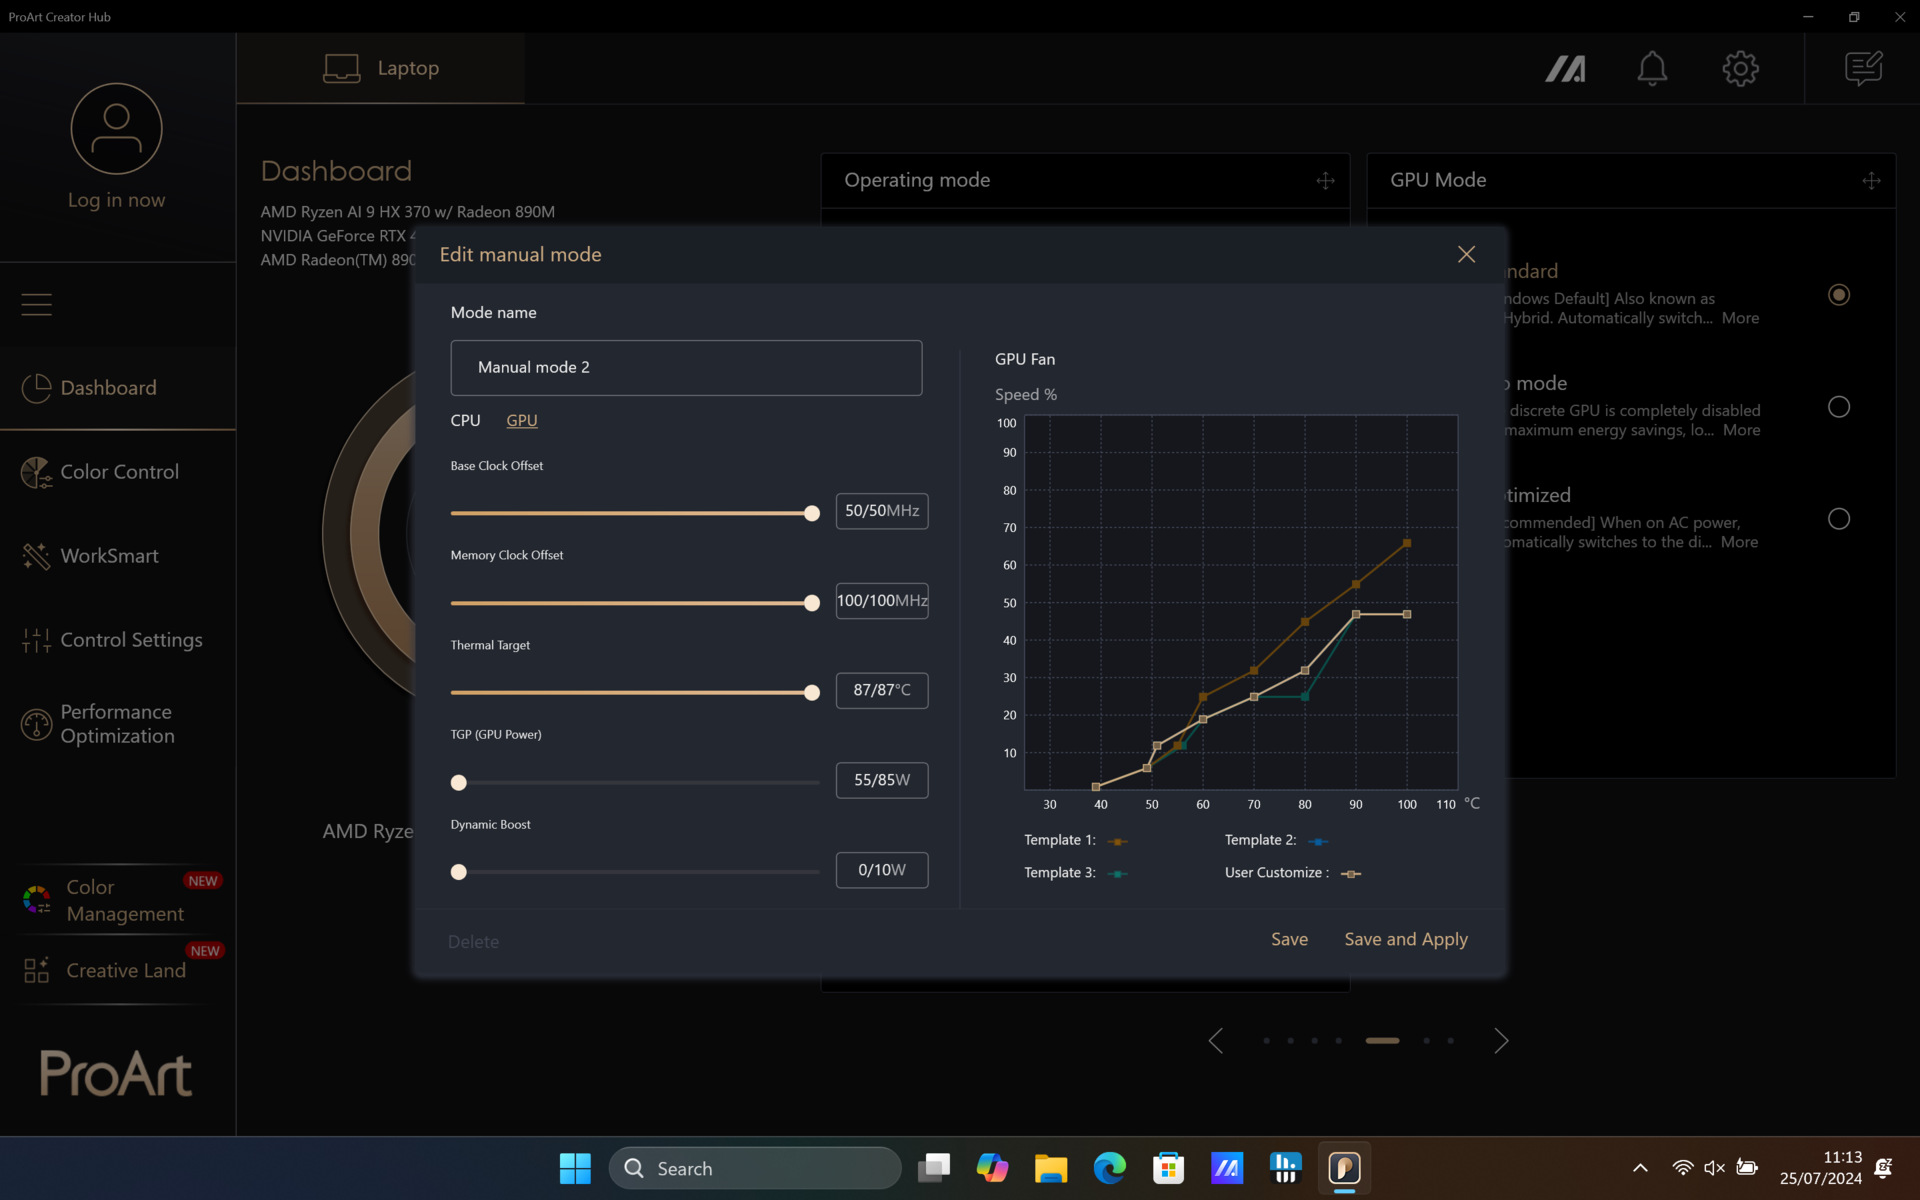
As standard, we carried out all of our benchmarks and measurements using the Performance mode which, however, is only available via mains operation. In battery mode, the system automatically switches to Standard mode. Additionally, there is also a manual mode with which the CPU and GPU can be adjusted in a variety of manners.
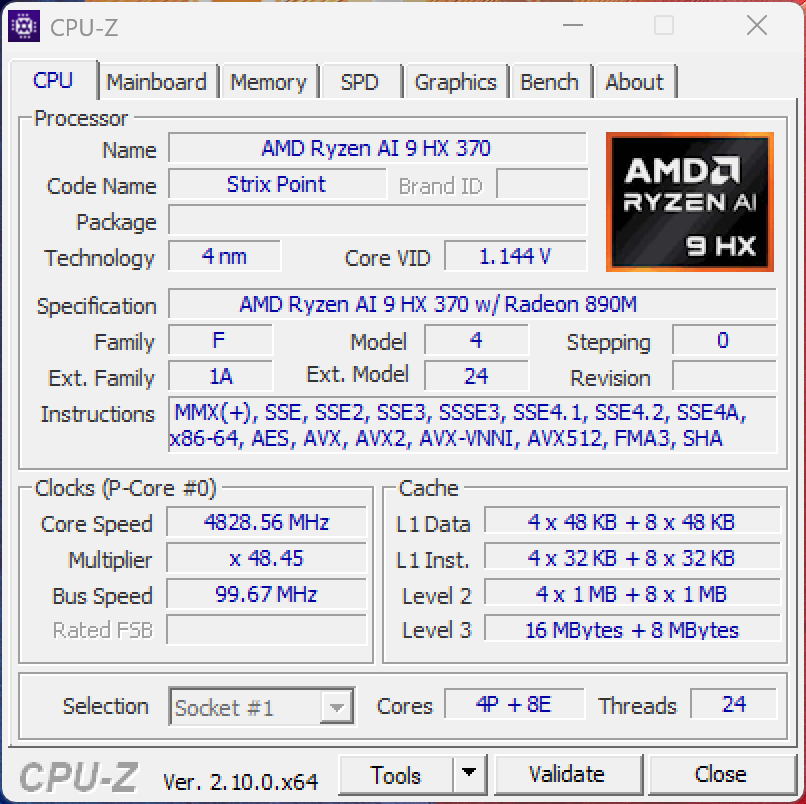
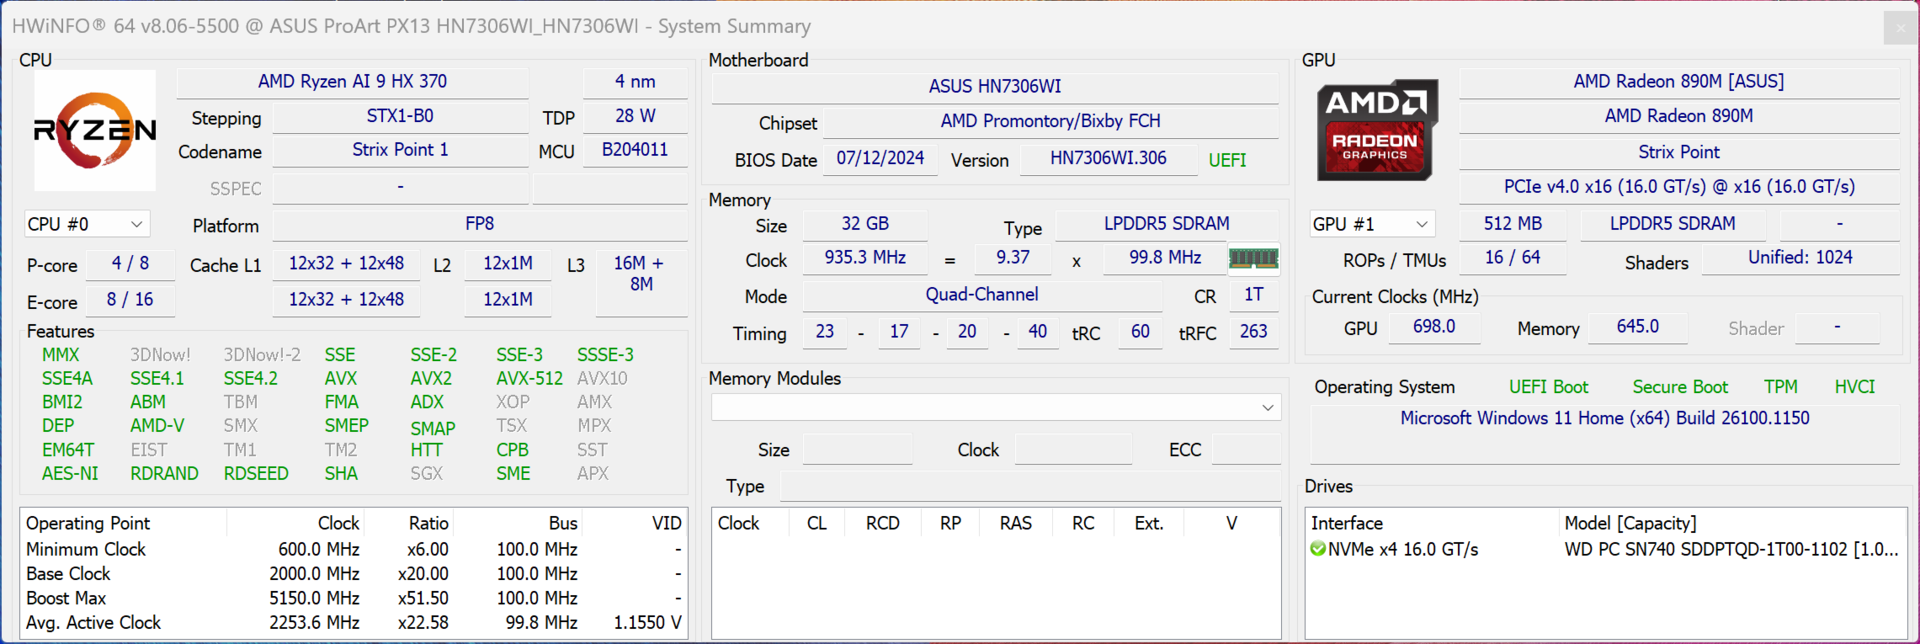
Processor - Ryzen AI 9 HX 370
The new Ryzen AI 9 HX 370 is one of three new Zen5 mobile processors in the 15-54-watt TDP class meaning the new Ryzen AI 300 chips are the successors to the previous U/HS processors, depending on the TDP configuration. The new HX 370 offers 12 Zen5 cores with a maximum clock speed of 5.1 GHz. In other words, four cores more than the old mobile processors. Additional technical details can be found in our extensive analysis article.
In the ProArt PX13, the processor is briefly allowed to consume up to 80 watts and then settles to 65 watts. In all of our CPU benchmarks, the performance figures are excellent and, on average, the new processor sits 14 % ahead of the old Ryzen 9 8945HS found in the Razer Blade 14 - although, at 90/75 watts, the processor is allowed to consume even more power. Under sustained load, the drop in performance remains low but the results fluctuate slightly. However, that is a result of the relatively short Cinebench R15 test because, depending on the run, it's simply a matter of how long the processor can use its maximum 80 watts. But, even in the "worst" case, the Ryzen AI 9 HX 370 is the fastest chip. In battery mode, the maximum power consumption is limited to 55 watts which leads to a performance drop of almost 10 % in the Cinebench R23 multi-core test (20,629 points). Nevertheless, this is still easily enough to secure the top spot. All in all, this means we are dealing with the fastest 13.3-inch computer on the market when it comes to CPU performance. Additional CPU benchmarks can be found here.
Cinebench R15 Multi Continuous Test
Cinebench R23: Multi Core | Single Core
Cinebench R20: CPU (Multi Core) | CPU (Single Core)
Cinebench R15: CPU Multi 64Bit | CPU Single 64Bit
Blender: v2.79 BMW27 CPU
7-Zip 18.03: 7z b 4 | 7z b 4 -mmt1
Geekbench 6.6: Multi-Core | Single-Core
Geekbench 5.5: Multi-Core | Single-Core
HWBOT x265 Benchmark v2.2: 4k Preset
LibreOffice : 20 Documents To PDF
R Benchmark 2.5: Overall mean
| CPU Performance rating | |
| Asus ProArt PX13 HN7306 | |
| Average AMD Ryzen AI 9 HX 370 | |
| Asus ROG Flow Z13 ACRNM | |
| Razer Blade 14 RZ09-0508 | |
| Asus ROG Zephyrus G14 2024 GA403U | |
| Average of class Multimedia | |
| Microsoft Surface Laptop Studio 2 RTX 4060 | |
| Asus ROG Flow X13 GV302XV | |
| Cinebench R23 / Multi Core | |
| Asus ProArt PX13 HN7306 | |
| Average AMD Ryzen AI 9 HX 370 (10435 - 23902, n=32) | |
| Asus ROG Flow Z13 ACRNM | |
| Razer Blade 14 RZ09-0508 | |
| Asus ROG Zephyrus G14 2024 GA403U | |
| Average of class Multimedia (4861 - 33362, n=81, last 2 years) | |
| Asus ROG Flow X13 GV302XV | |
| Microsoft Surface Laptop Studio 2 RTX 4060 | |
| Cinebench R23 / Single Core | |
| Asus ProArt PX13 HN7306 | |
| Asus ROG Flow Z13 ACRNM | |
| Average AMD Ryzen AI 9 HX 370 (1921 - 2049, n=25) | |
| Average of class Multimedia (1128 - 2459, n=73, last 2 years) | |
| Microsoft Surface Laptop Studio 2 RTX 4060 | |
| Razer Blade 14 RZ09-0508 | |
| Asus ROG Zephyrus G14 2024 GA403U | |
| Asus ROG Flow X13 GV302XV | |
| Cinebench R20 / CPU (Multi Core) | |
| Asus ProArt PX13 HN7306 | |
| Average AMD Ryzen AI 9 HX 370 (6449 - 9280, n=24) | |
| Asus ROG Flow Z13 ACRNM | |
| Razer Blade 14 RZ09-0508 | |
| Asus ROG Zephyrus G14 2024 GA403U | |
| Asus ROG Flow X13 GV302XV | |
| Average of class Multimedia (1887 - 12912, n=64, last 2 years) | |
| Microsoft Surface Laptop Studio 2 RTX 4060 | |
| Cinebench R20 / CPU (Single Core) | |
| Asus ProArt PX13 HN7306 | |
| Average AMD Ryzen AI 9 HX 370 (737 - 804, n=24) | |
| Asus ROG Flow Z13 ACRNM | |
| Microsoft Surface Laptop Studio 2 RTX 4060 | |
| Average of class Multimedia (425 - 853, n=64, last 2 years) | |
| Asus ROG Flow X13 GV302XV | |
| Razer Blade 14 RZ09-0508 | |
| Asus ROG Zephyrus G14 2024 GA403U | |
| Cinebench R15 / CPU Multi 64Bit | |
| Asus ProArt PX13 HN7306 | |
| Average AMD Ryzen AI 9 HX 370 (2498 - 3551, n=24) | |
| Asus ROG Flow Z13 ACRNM | |
| Razer Blade 14 RZ09-0508 | |
| Microsoft Surface Laptop Studio 2 RTX 4060 | |
| Asus ROG Zephyrus G14 2024 GA403U | |
| Asus ROG Flow X13 GV302XV | |
| Average of class Multimedia (856 - 5224, n=68, last 2 years) | |
| Cinebench R15 / CPU Single 64Bit | |
| Asus ProArt PX13 HN7306 | |
| Asus ROG Flow Z13 ACRNM | |
| Average AMD Ryzen AI 9 HX 370 (188.8 - 315, n=24) | |
| Asus ROG Flow X13 GV302XV | |
| Razer Blade 14 RZ09-0508 | |
| Asus ROG Zephyrus G14 2024 GA403U | |
| Average of class Multimedia (184.8 - 326, n=66, last 2 years) | |
| Microsoft Surface Laptop Studio 2 RTX 4060 | |
| Blender / v2.79 BMW27 CPU | |
| Average of class Multimedia (100 - 557, n=65, last 2 years) | |
| Microsoft Surface Laptop Studio 2 RTX 4060 | |
| Asus ROG Flow X13 GV302XV | |
| Asus ROG Zephyrus G14 2024 GA403U | |
| Razer Blade 14 RZ09-0508 | |
| Asus ROG Flow Z13 ACRNM | |
| Average AMD Ryzen AI 9 HX 370 (139 - 192, n=25) | |
| Asus ProArt PX13 HN7306 | |
| 7-Zip 18.03 / 7z b 4 | |
| Asus ProArt PX13 HN7306 | |
| Average AMD Ryzen AI 9 HX 370 (66154 - 84735, n=24) | |
| Razer Blade 14 RZ09-0508 | |
| Asus ROG Zephyrus G14 2024 GA403U | |
| Asus ROG Flow Z13 ACRNM | |
| Microsoft Surface Laptop Studio 2 RTX 4060 | |
| Asus ROG Flow X13 GV302XV | |
| Average of class Multimedia (29095 - 130368, n=62, last 2 years) | |
| 7-Zip 18.03 / 7z b 4 -mmt1 | |
| Razer Blade 14 RZ09-0508 | |
| Asus ROG Flow X13 GV302XV | |
| Asus ROG Flow Z13 ACRNM | |
| Microsoft Surface Laptop Studio 2 RTX 4060 | |
| Asus ProArt PX13 HN7306 | |
| Average AMD Ryzen AI 9 HX 370 (5859 - 6497, n=24) | |
| Asus ROG Zephyrus G14 2024 GA403U | |
| Average of class Multimedia (3666 - 7545, n=63, last 2 years) | |
| Geekbench 6.6 / Multi-Core | |
| Asus ProArt PX13 HN7306 | |
| Average of class Multimedia (4983 - 29415, n=76, last 2 years) | |
| Average AMD Ryzen AI 9 HX 370 (11973 - 16311, n=26) | |
| Asus ROG Flow Z13 ACRNM | |
| Razer Blade 14 RZ09-0508 | |
| Microsoft Surface Laptop Studio 2 RTX 4060 | |
| Asus ROG Zephyrus G14 2024 GA403U | |
| Asus ROG Flow X13 GV302XV | |
| Geekbench 6.6 / Single-Core | |
| Average of class Multimedia (1534 - 4335, n=75, last 2 years) | |
| Average AMD Ryzen AI 9 HX 370 (2780 - 2965, n=26) | |
| Asus ProArt PX13 HN7306 | |
| Asus ROG Flow Z13 ACRNM | |
| Razer Blade 14 RZ09-0508 | |
| Microsoft Surface Laptop Studio 2 RTX 4060 | |
| Asus ROG Zephyrus G14 2024 GA403U | |
| Asus ROG Flow X13 GV302XV | |
| Geekbench 5.5 / Multi-Core | |
| Asus ProArt PX13 HN7306 | |
| Average AMD Ryzen AI 9 HX 370 (11394 - 16322, n=25) | |
| Asus ROG Flow Z13 ACRNM | |
| Average of class Multimedia (4652 - 20422, n=62, last 2 years) | |
| Microsoft Surface Laptop Studio 2 RTX 4060 | |
| Razer Blade 14 RZ09-0508 | |
| Asus ROG Zephyrus G14 2024 GA403U | |
| Asus ROG Flow X13 GV302XV | |
| Geekbench 5.5 / Single-Core | |
| Average AMD Ryzen AI 9 HX 370 (1957 - 2175, n=25) | |
| Asus ProArt PX13 HN7306 | |
| Asus ROG Flow X13 GV302XV | |
| Asus ROG Flow Z13 ACRNM | |
| Razer Blade 14 RZ09-0508 | |
| Average of class Multimedia (805 - 2974, n=62, last 2 years) | |
| Microsoft Surface Laptop Studio 2 RTX 4060 | |
| Asus ROG Zephyrus G14 2024 GA403U | |
| HWBOT x265 Benchmark v2.2 / 4k Preset | |
| Asus ProArt PX13 HN7306 | |
| Average AMD Ryzen AI 9 HX 370 (20.3 - 28.7, n=24) | |
| Razer Blade 14 RZ09-0508 | |
| Asus ROG Zephyrus G14 2024 GA403U | |
| Asus ROG Flow Z13 ACRNM | |
| Asus ROG Flow X13 GV302XV | |
| Average of class Multimedia (5.26 - 36.1, n=63, last 2 years) | |
| Microsoft Surface Laptop Studio 2 RTX 4060 | |
| LibreOffice / 20 Documents To PDF | |
| Asus ROG Flow Z13 ACRNM | |
| Asus ProArt PX13 HN7306 | |
| Average AMD Ryzen AI 9 HX 370 (46.8 - 66.6, n=24) | |
| Asus ROG Zephyrus G14 2024 GA403U | |
| Asus ROG Flow X13 GV302XV | |
| Average of class Multimedia (23.9 - 146.7, n=64, last 2 years) | |
| Razer Blade 14 RZ09-0508 | |
| Microsoft Surface Laptop Studio 2 RTX 4060 | |
| R Benchmark 2.5 / Overall mean | |
| Average of class Multimedia (0.3604 - 0.947, n=63, last 2 years) | |
| Asus ROG Zephyrus G14 2024 GA403U | |
| Microsoft Surface Laptop Studio 2 RTX 4060 | |
| Asus ROG Flow X13 GV302XV | |
| Razer Blade 14 RZ09-0508 | |
| Asus ROG Flow Z13 ACRNM | |
| Average AMD Ryzen AI 9 HX 370 (0.3892 - 0.529, n=24) | |
| Asus ProArt PX13 HN7306 | |
* ... smaller is better
AIDA64: FP32 Ray-Trace | FPU Julia | CPU SHA3 | CPU Queen | FPU SinJulia | FPU Mandel | CPU AES | CPU ZLib | FP64 Ray-Trace | CPU PhotoWorxx
| Performance rating | |
| Asus ProArt PX13 HN7306 | |
| Average AMD Ryzen AI 9 HX 370 | |
| Razer Blade 14 RZ09-0508 | |
| Asus ROG Zephyrus G14 2024 GA403U | |
| Asus ROG Flow X13 GV302XV | |
| Asus ROG Flow Z13 ACRNM | |
| Average of class Multimedia | |
| Microsoft Surface Laptop Studio 2 RTX 4060 | |
| AIDA64 / FP32 Ray-Trace | |
| Asus ProArt PX13 HN7306 | |
| Average AMD Ryzen AI 9 HX 370 (24673 - 37804, n=25) | |
| Razer Blade 14 RZ09-0508 | |
| Asus ROG Zephyrus G14 2024 GA403U | |
| Asus ROG Flow X13 GV302XV | |
| Average of class Multimedia (2214 - 50388, n=60, last 2 years) | |
| Asus ROG Flow Z13 ACRNM | |
| Microsoft Surface Laptop Studio 2 RTX 4060 | |
| AIDA64 / FPU Julia | |
| Asus ProArt PX13 HN7306 | |
| Average AMD Ryzen AI 9 HX 370 (95655 - 148045, n=26) | |
| Razer Blade 14 RZ09-0508 | |
| Asus ROG Zephyrus G14 2024 GA403U | |
| Asus ROG Flow X13 GV302XV | |
| Asus ROG Flow Z13 ACRNM | |
| Average of class Multimedia (12867 - 201874, n=61, last 2 years) | |
| Microsoft Surface Laptop Studio 2 RTX 4060 | |
| AIDA64 / CPU SHA3 | |
| Asus ProArt PX13 HN7306 | |
| Average AMD Ryzen AI 9 HX 370 (4421 - 5932, n=26) | |
| Razer Blade 14 RZ09-0508 | |
| Asus ROG Zephyrus G14 2024 GA403U | |
| Asus ROG Flow X13 GV302XV | |
| Average of class Multimedia (653 - 8623, n=61, last 2 years) | |
| Asus ROG Flow Z13 ACRNM | |
| Microsoft Surface Laptop Studio 2 RTX 4060 | |
| AIDA64 / CPU Queen | |
| Razer Blade 14 RZ09-0508 | |
| Asus ROG Flow X13 GV302XV | |
| Asus ROG Zephyrus G14 2024 GA403U | |
| Asus ROG Flow Z13 ACRNM | |
| Microsoft Surface Laptop Studio 2 RTX 4060 | |
| Asus ProArt PX13 HN7306 | |
| Average AMD Ryzen AI 9 HX 370 (41744 - 99088, n=24) | |
| Average of class Multimedia (13483 - 181505, n=49, last 2 years) | |
| AIDA64 / FPU SinJulia | |
| Asus ProArt PX13 HN7306 | |
| Average AMD Ryzen AI 9 HX 370 (16445 - 19120, n=26) | |
| Razer Blade 14 RZ09-0508 | |
| Asus ROG Zephyrus G14 2024 GA403U | |
| Asus ROG Flow X13 GV302XV | |
| Asus ROG Flow Z13 ACRNM | |
| Average of class Multimedia (1240 - 28794, n=61, last 2 years) | |
| Microsoft Surface Laptop Studio 2 RTX 4060 | |
| AIDA64 / FPU Mandel | |
| Asus ProArt PX13 HN7306 | |
| Average AMD Ryzen AI 9 HX 370 (50357 - 93798, n=25) | |
| Razer Blade 14 RZ09-0508 | |
| Asus ROG Zephyrus G14 2024 GA403U | |
| Asus ROG Flow X13 GV302XV | |
| Average of class Multimedia (6395 - 105740, n=60, last 2 years) | |
| Asus ROG Flow Z13 ACRNM | |
| Microsoft Surface Laptop Studio 2 RTX 4060 | |
| AIDA64 / CPU AES | |
| Asus ROG Flow X13 GV302XV | |
| Razer Blade 14 RZ09-0508 | |
| Asus ROG Zephyrus G14 2024 GA403U | |
| Average AMD Ryzen AI 9 HX 370 (67015 - 118993, n=26) | |
| Asus ProArt PX13 HN7306 | |
| Asus ROG Flow Z13 ACRNM | |
| Average of class Multimedia (13243 - 126790, n=61, last 2 years) | |
| Microsoft Surface Laptop Studio 2 RTX 4060 | |
| AIDA64 / CPU ZLib | |
| Asus ProArt PX13 HN7306 | |
| Average AMD Ryzen AI 9 HX 370 (1077 - 1530, n=26) | |
| Asus ROG Flow Z13 ACRNM | |
| Razer Blade 14 RZ09-0508 | |
| Asus ROG Zephyrus G14 2024 GA403U | |
| Asus ROG Flow X13 GV302XV | |
| Average of class Multimedia (167.2 - 2022, n=61, last 2 years) | |
| Microsoft Surface Laptop Studio 2 RTX 4060 | |
| AIDA64 / FP64 Ray-Trace | |
| Asus ProArt PX13 HN7306 | |
| Average AMD Ryzen AI 9 HX 370 (13665 - 20648, n=26) | |
| Razer Blade 14 RZ09-0508 | |
| Asus ROG Zephyrus G14 2024 GA403U | |
| Asus ROG Flow X13 GV302XV | |
| Average of class Multimedia (1014 - 26875, n=61, last 2 years) | |
| Asus ROG Flow Z13 ACRNM | |
| Microsoft Surface Laptop Studio 2 RTX 4060 | |
| AIDA64 / CPU PhotoWorxx | |
| Average of class Multimedia (12860 - 88154, n=61, last 2 years) | |
| Asus ProArt PX13 HN7306 | |
| Average AMD Ryzen AI 9 HX 370 (36752 - 52671, n=26) | |
| Asus ROG Flow Z13 ACRNM | |
| Microsoft Surface Laptop Studio 2 RTX 4060 | |
| Razer Blade 14 RZ09-0508 | |
| Asus ROG Zephyrus G14 2024 GA403U | |
| Asus ROG Flow X13 GV302XV | |
System performance
The ProArt PX13 is a very responsive system and also offers enough reserves for demanding tasks. Some users would certainly wish for a 64 GB RAM upgrade option as was the case with the larger ProArt P16. During the tests, we were unable to boot the LatencyMon application and, in F1 24, there were reproducible blue screens. However, we assume this is a driver problem and have contacted AMD.
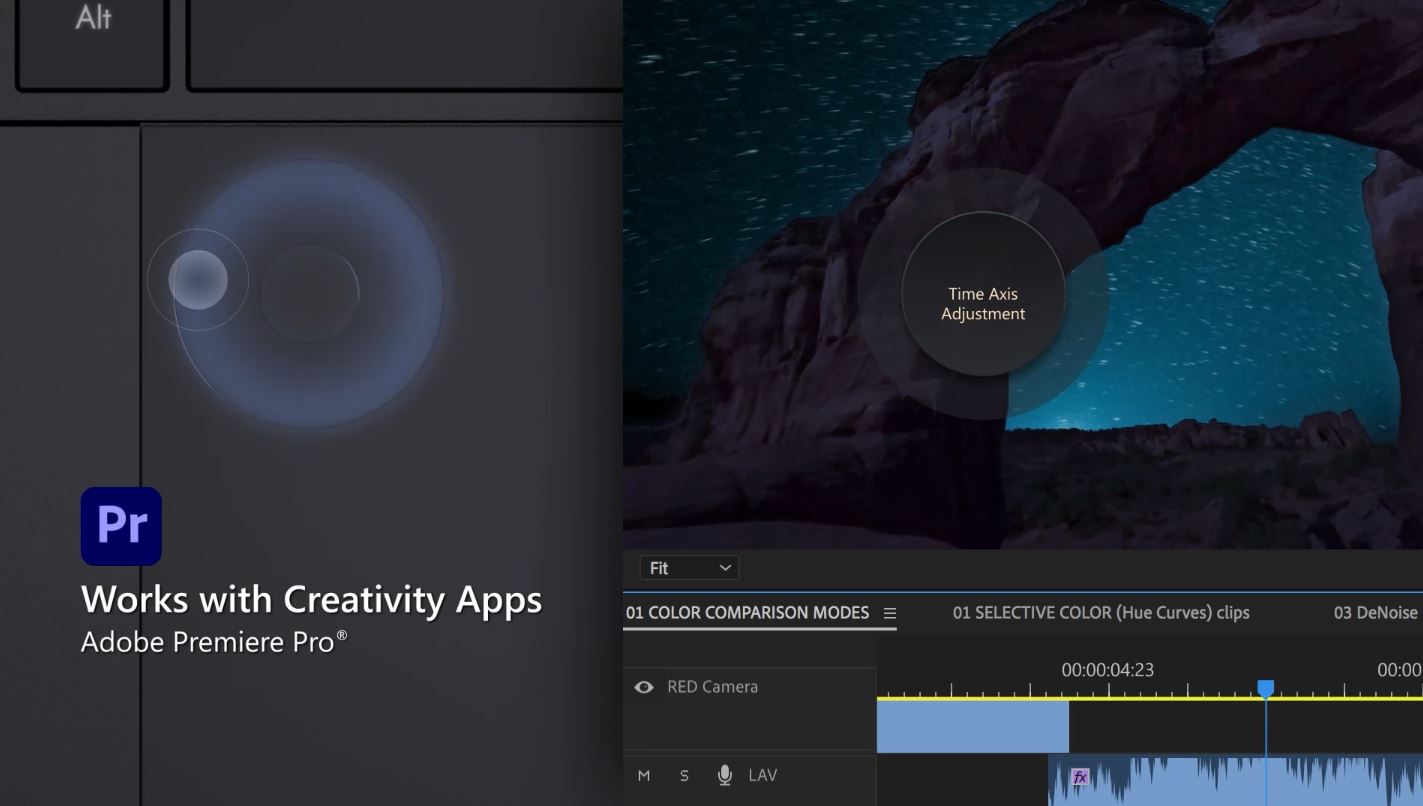
Update 08/01: We performed additional benchmark tests in combination with our video production and compared the results with the Asus ROG Zepyhrus G14. There was no difference between the two laptops in Adobe Photoshop, but you should keep in mind that 32 GB RAM can quickly become the limiting factor when you edit high-res pictures.
We usually use Capture One Pro to edit our images, but the RAW converter did not yet work with the new Ryzen chip. A photo export in Adobe Lightroom was about the same speed (15s) on both machines.
We can see differences when we export videos in Blackmagic Resolve. Even though the application is primarily very demanding for the GPU, the PX13 only required 8:10 minutes to render our video compared to 12:41 minutes on the Zephyrus g14. We also tested the Radeon 890M, but it took noticeably longer at 23:14 minutes. All in all, the subjective performance impression was very good and everything was smooth. Premiere Pro (PugetBench) does not show a difference between the two models.
CrossMark: Overall | Productivity | Creativity | Responsiveness
WebXPRT 3: Overall
WebXPRT 4: Overall
Mozilla Kraken 1.1: Total
| PCMark 10 / Score | |
| Razer Blade 14 RZ09-0508 | |
| Asus ROG Flow Z13 ACRNM | |
| Average AMD Ryzen AI 9 HX 370, NVIDIA GeForce RTX 4070 Laptop GPU (7696 - 7752, n=3) | |
| Asus ProArt PX13 HN7306 | |
| Asus ROG Flow X13 GV302XV | |
| Average of class Multimedia (4325 - 10386, n=58, last 2 years) | |
| Asus ROG Zephyrus G14 2024 GA403U | |
| Microsoft Surface Laptop Studio 2 RTX 4060 | |
| PCMark 10 / Essentials | |
| Razer Blade 14 RZ09-0508 | |
| Asus ROG Flow Z13 ACRNM | |
| Asus ROG Flow X13 GV302XV | |
| Microsoft Surface Laptop Studio 2 RTX 4060 | |
| Average of class Multimedia (8025 - 11664, n=57, last 2 years) | |
| Asus ProArt PX13 HN7306 | |
| Average AMD Ryzen AI 9 HX 370, NVIDIA GeForce RTX 4070 Laptop GPU (9856 - 10144, n=3) | |
| Asus ROG Zephyrus G14 2024 GA403U | |
| PCMark 10 / Productivity | |
| Average of class Multimedia (7323 - 18233, n=57, last 2 years) | |
| Razer Blade 14 RZ09-0508 | |
| Asus ProArt PX13 HN7306 | |
| Asus ROG Flow Z13 ACRNM | |
| Average AMD Ryzen AI 9 HX 370, NVIDIA GeForce RTX 4070 Laptop GPU (9713 - 10027, n=3) | |
| Asus ROG Flow X13 GV302XV | |
| Asus ROG Zephyrus G14 2024 GA403U | |
| Microsoft Surface Laptop Studio 2 RTX 4060 | |
| PCMark 10 / Digital Content Creation | |
| Razer Blade 14 RZ09-0508 | |
| Asus ROG Flow Z13 ACRNM | |
| Average AMD Ryzen AI 9 HX 370, NVIDIA GeForce RTX 4070 Laptop GPU (12165 - 13205, n=3) | |
| Asus ProArt PX13 HN7306 | |
| Asus ROG Zephyrus G14 2024 GA403U | |
| Asus ROG Flow X13 GV302XV | |
| Microsoft Surface Laptop Studio 2 RTX 4060 | |
| Average of class Multimedia (3651 - 16240, n=57, last 2 years) | |
| CrossMark / Overall | |
| Asus ROG Flow Z13 ACRNM | |
| Average of class Multimedia (866 - 2728, n=67, last 2 years) | |
| Razer Blade 14 RZ09-0508 | |
| Average AMD Ryzen AI 9 HX 370, NVIDIA GeForce RTX 4070 Laptop GPU (1785 - 1794, n=2) | |
| Asus ROG Flow X13 GV302XV | |
| Asus ProArt PX13 HN7306 | |
| Asus ROG Zephyrus G14 2024 GA403U | |
| Microsoft Surface Laptop Studio 2 RTX 4060 | |
| CrossMark / Productivity | |
| Asus ROG Flow Z13 ACRNM | |
| Razer Blade 14 RZ09-0508 | |
| Asus ROG Flow X13 GV302XV | |
| Average of class Multimedia (931 - 2489, n=67, last 2 years) | |
| Asus ROG Zephyrus G14 2024 GA403U | |
| Microsoft Surface Laptop Studio 2 RTX 4060 | |
| Asus ProArt PX13 HN7306 | |
| Average AMD Ryzen AI 9 HX 370, NVIDIA GeForce RTX 4070 Laptop GPU (1611 - 1611, n=2) | |
| CrossMark / Creativity | |
| Average AMD Ryzen AI 9 HX 370, NVIDIA GeForce RTX 4070 Laptop GPU (2212 - 2270, n=2) | |
| Asus ProArt PX13 HN7306 | |
| Asus ROG Flow Z13 ACRNM | |
| Average of class Multimedia (907 - 3465, n=67, last 2 years) | |
| Microsoft Surface Laptop Studio 2 RTX 4060 | |
| Asus ROG Zephyrus G14 2024 GA403U | |
| Asus ROG Flow X13 GV302XV | |
| Razer Blade 14 RZ09-0508 | |
| CrossMark / Responsiveness | |
| Razer Blade 14 RZ09-0508 | |
| Asus ROG Flow Z13 ACRNM | |
| Average of class Multimedia (605 - 2024, n=67, last 2 years) | |
| Asus ROG Flow X13 GV302XV | |
| Asus ROG Zephyrus G14 2024 GA403U | |
| Microsoft Surface Laptop Studio 2 RTX 4060 | |
| Asus ProArt PX13 HN7306 | |
| Average AMD Ryzen AI 9 HX 370, NVIDIA GeForce RTX 4070 Laptop GPU (1225 - 1274, n=2) | |
| WebXPRT 3 / Overall | |
| Average of class Multimedia (136.4 - 596, n=70, last 2 years) | |
| Razer Blade 14 RZ09-0508 | |
| Asus ROG Flow Z13 ACRNM | |
| Asus ROG Flow X13 GV302XV | |
| Microsoft Surface Laptop Studio 2 RTX 4060 | |
| Asus ROG Zephyrus G14 2024 GA403U | |
| Average AMD Ryzen AI 9 HX 370, NVIDIA GeForce RTX 4070 Laptop GPU (282 - 298, n=2) | |
| Asus ProArt PX13 HN7306 | |
| WebXPRT 4 / Overall | |
| Asus ROG Flow Z13 ACRNM | |
| Average of class Multimedia (167.3 - 402, n=71, last 2 years) | |
| Microsoft Surface Laptop Studio 2 RTX 4060 | |
| Razer Blade 14 RZ09-0508 | |
| Asus ROG Flow X13 GV302XV | |
| Asus ROG Zephyrus G14 2024 GA403U | |
| Asus ProArt PX13 HN7306 | |
| Average AMD Ryzen AI 9 HX 370, NVIDIA GeForce RTX 4070 Laptop GPU (244 - 247, n=2) | |
| Mozilla Kraken 1.1 / Total | |
| Asus ROG Zephyrus G14 2024 GA403U | |
| Microsoft Surface Laptop Studio 2 RTX 4060 | |
| Razer Blade 14 RZ09-0508 | |
| Asus ROG Flow X13 GV302XV | |
| Asus ROG Flow Z13 ACRNM | |
| Asus ProArt PX13 HN7306 | |
| Average of class Multimedia (228 - 835, n=74, last 2 years) | |
| Average AMD Ryzen AI 9 HX 370, NVIDIA GeForce RTX 4070 Laptop GPU (439 - 460, n=2) | |
* ... smaller is better
| PCMark 10 Score | 7696 points | |
Help | ||
| AIDA64 / Memory Copy | |
| Asus ProArt PX13 HN7306 | |
| Average AMD Ryzen AI 9 HX 370 (71902 - 93640, n=26) | |
| Average of class Multimedia (21158 - 132135, n=61, last 2 years) | |
| Asus ROG Flow X13 GV302XV | |
| Asus ROG Zephyrus G14 2024 GA403U | |
| Razer Blade 14 RZ09-0508 | |
| Asus ROG Flow Z13 ACRNM | |
| Microsoft Surface Laptop Studio 2 RTX 4060 | |
| AIDA64 / Memory Read | |
| Asus ProArt PX13 HN7306 | |
| Average AMD Ryzen AI 9 HX 370 (81367 - 102937, n=26) | |
| Average of class Multimedia (19699 - 174586, n=61, last 2 years) | |
| Asus ROG Flow Z13 ACRNM | |
| Microsoft Surface Laptop Studio 2 RTX 4060 | |
| Razer Blade 14 RZ09-0508 | |
| Asus ROG Flow X13 GV302XV | |
| Asus ROG Zephyrus G14 2024 GA403U | |
| AIDA64 / Memory Write | |
| Asus ProArt PX13 HN7306 | |
| Average AMD Ryzen AI 9 HX 370 (78939 - 108954, n=26) | |
| Asus ROG Zephyrus G14 2024 GA403U | |
| Asus ROG Flow X13 GV302XV | |
| Razer Blade 14 RZ09-0508 | |
| Average of class Multimedia (17733 - 134998, n=61, last 2 years) | |
| Microsoft Surface Laptop Studio 2 RTX 4060 | |
| Asus ROG Flow Z13 ACRNM | |
| AIDA64 / Memory Latency | |
| Average of class Multimedia (7 - 535, n=60, last 2 years) | |
| Asus ProArt PX13 HN7306 | |
| Asus ROG Flow X13 GV302XV | |
| Asus ROG Zephyrus G14 2024 GA403U | |
| Average AMD Ryzen AI 9 HX 370 (86.7 - 119.4, n=26) | |
| Razer Blade 14 RZ09-0508 | |
| Asus ROG Flow Z13 ACRNM | |
| Microsoft Surface Laptop Studio 2 RTX 4060 | |
* ... smaller is better
DPC latencies
As we already mentioned, we were unable to launch LatencyMon on the review device. There were, at least, no problems with dropped frames during 4K video playback (YouTube).
Mass storage
In the PX13, Asus uses a compact M.2 2230 SSD which, in principle, is not a problem but this limits the choice of possible upgrade drives with prices also being higher than common M.2 2280 SSDs. The review device is home to a Western Digital SN740 1 TB variant and, after the first installation, the user has access to 875 GB. In direct comparison to the competition, the SSD's performance is average but remains very stable throughout sustained load. Additional SSD benchmarks can be found here.

* ... smaller is better
Continuous Performance Read: DiskSpd Read Loop, Queue Depth 8
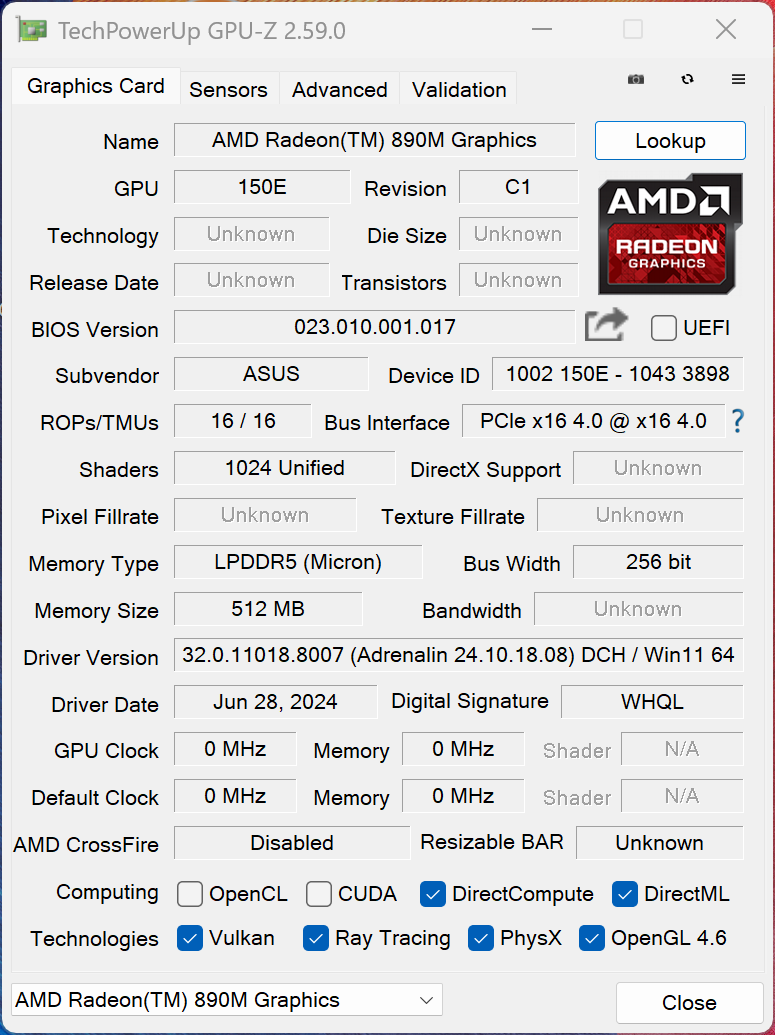
Graphics card - GeForce RTX 4070 laptop
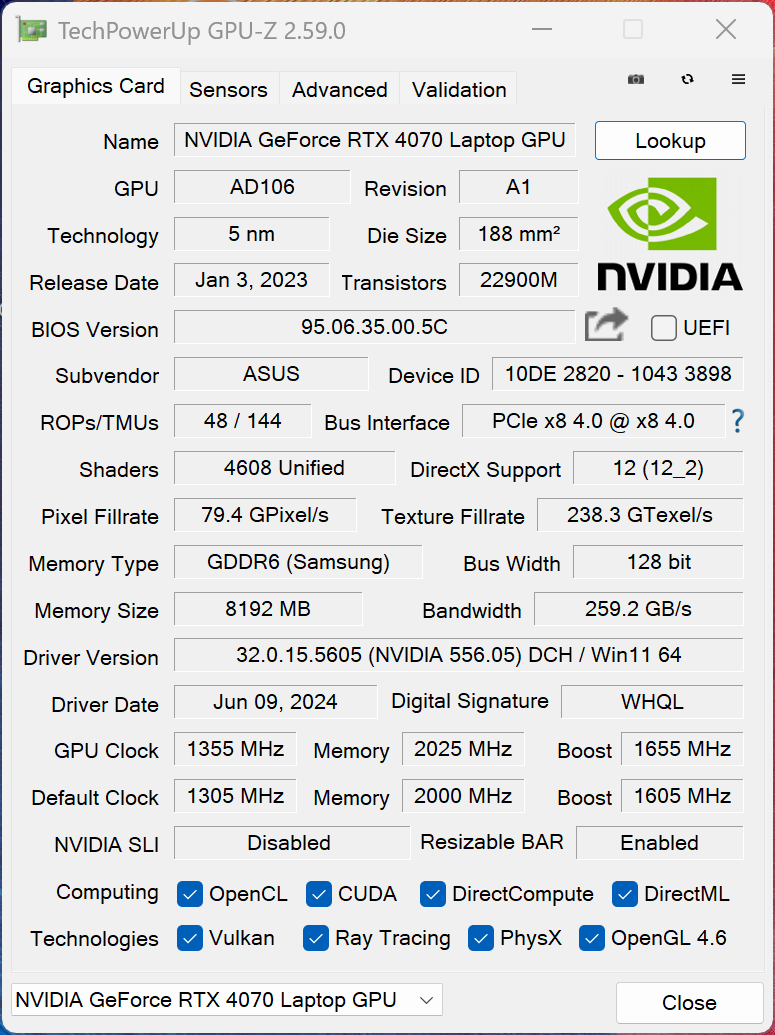
In everyday use, computational calculations are handled by the integrated Radeon 890M. Demanding tasks are aided by the dedicated GeForce RTX 4070 laptop (8 GB VRAM) via the Optimus graphics switch. This is the 75-watt variant (65-watt TGP + 10-watt Dynamic Boost) which is good performance given the compact case. Among the 13-inch competitors, the 4070 operates at a maximum of 65 watts and, in the larger Zephyrus G14 using the performance profile, this is also 75 watts.
Overall, the benchmark results are very good and are even better than most of the competition. Only the Razer Blade 14 with its 90-watt variant of the RTX 4070 laptop is around 20 % faster. What's also pleasing is that the graphics performance remains stable under continuous load and that isn't something you can take for granted given the size of the device. In battery mode, the GPU's power consumption is throttled to 45 watts leading to a performance deficit of over 20 %. Additional GPU benchmarks can be found in our technology section.
| 3DMark 11 Performance | 31157 points | |
| 3DMark Fire Strike Score | 24888 points | |
| 3DMark Time Spy Score | 10691 points | |
| 3DMark Steel Nomad Score | 2386 points | |
| 3DMark Steel Nomad Light Score | 10952 points | |
Help | ||
| Blender / v3.3 Classroom OPTIX/RTX | |
| Average of class Multimedia (12 - 105, n=24, last 2 years) | |
| Asus ROG Flow Z13 ACRNM | |
| Asus ROG Flow X13 GV302XV | |
| Microsoft Surface Laptop Studio 2 RTX 4060 | |
| Asus ROG Zephyrus G14 2024 GA403U | |
| Asus ProArt PX13 HN7306 | |
| Average NVIDIA GeForce RTX 4070 Laptop GPU (18 - 30, n=68) | |
| Razer Blade 14 RZ09-0508 | |
| Blender / v3.3 Classroom CUDA | |
| Average of class Multimedia (20 - 186, n=24, last 2 years) | |
| Asus ROG Flow X13 GV302XV | |
| Microsoft Surface Laptop Studio 2 RTX 4060 | |
| Asus ROG Flow Z13 ACRNM | |
| Average NVIDIA GeForce RTX 4070 Laptop GPU (32 - 50, n=67) | |
| Asus ROG Zephyrus G14 2024 GA403U | |
| Asus ProArt PX13 HN7306 | |
| Razer Blade 14 RZ09-0508 | |
| Blender / v3.3 Classroom CPU | |
| Average of class Multimedia (134.5 - 1042, n=68, last 2 years) | |
| Microsoft Surface Laptop Studio 2 RTX 4060 | |
| Asus ROG Flow X13 GV302XV | |
| Asus ROG Flow Z13 ACRNM | |
| Asus ROG Zephyrus G14 2024 GA403U | |
| Razer Blade 14 RZ09-0508 | |
| Average NVIDIA GeForce RTX 4070 Laptop GPU (158 - 440, n=67) | |
* ... smaller is better
Gaming performance
Of course, the ProArt PX13 can handle demanding games. The new Ryzen processor also cuts a good figure in this area with the PX13 getting very close to the Razer Blade 14 in most titles. All modern titles can be easily played in Full HD or even QHD resolution. However, in some titles, we were unable to select the QHD resolution but this is something that will certainly be corrected via a driver update. Under longer periods of load, the gaming performance remained completely stable. Additional gaming benchmarks can be found here.
| The Witcher 3 - 1920x1080 Ultra Graphics & Postprocessing (HBAO+) | |
| Razer Blade 14 RZ09-0508 | |
| Asus ProArt PX13 HN7306 | |
| Asus ROG Zephyrus G14 2024 GA403U | |
| Asus ROG Flow X13 GV302XV | |
| Asus ROG Flow Z13 ACRNM | |
| Microsoft Surface Laptop Studio 2 RTX 4060 | |
| Average of class Multimedia (11 - 121, n=13, last 2 years) | |
| Strange Brigade - 1920x1080 ultra AA:ultra AF:16 | |
| Asus ProArt PX13 HN7306 | |
| Asus ROG Zephyrus G14 2024 GA403U | |
| Asus ROG Flow Z13 ACRNM | |
| Microsoft Surface Laptop Studio 2 RTX 4060 | |
| Asus ROG Flow X13 GV302XV | |
| Average of class Multimedia (13.3 - 303, n=66, last 2 years) | |
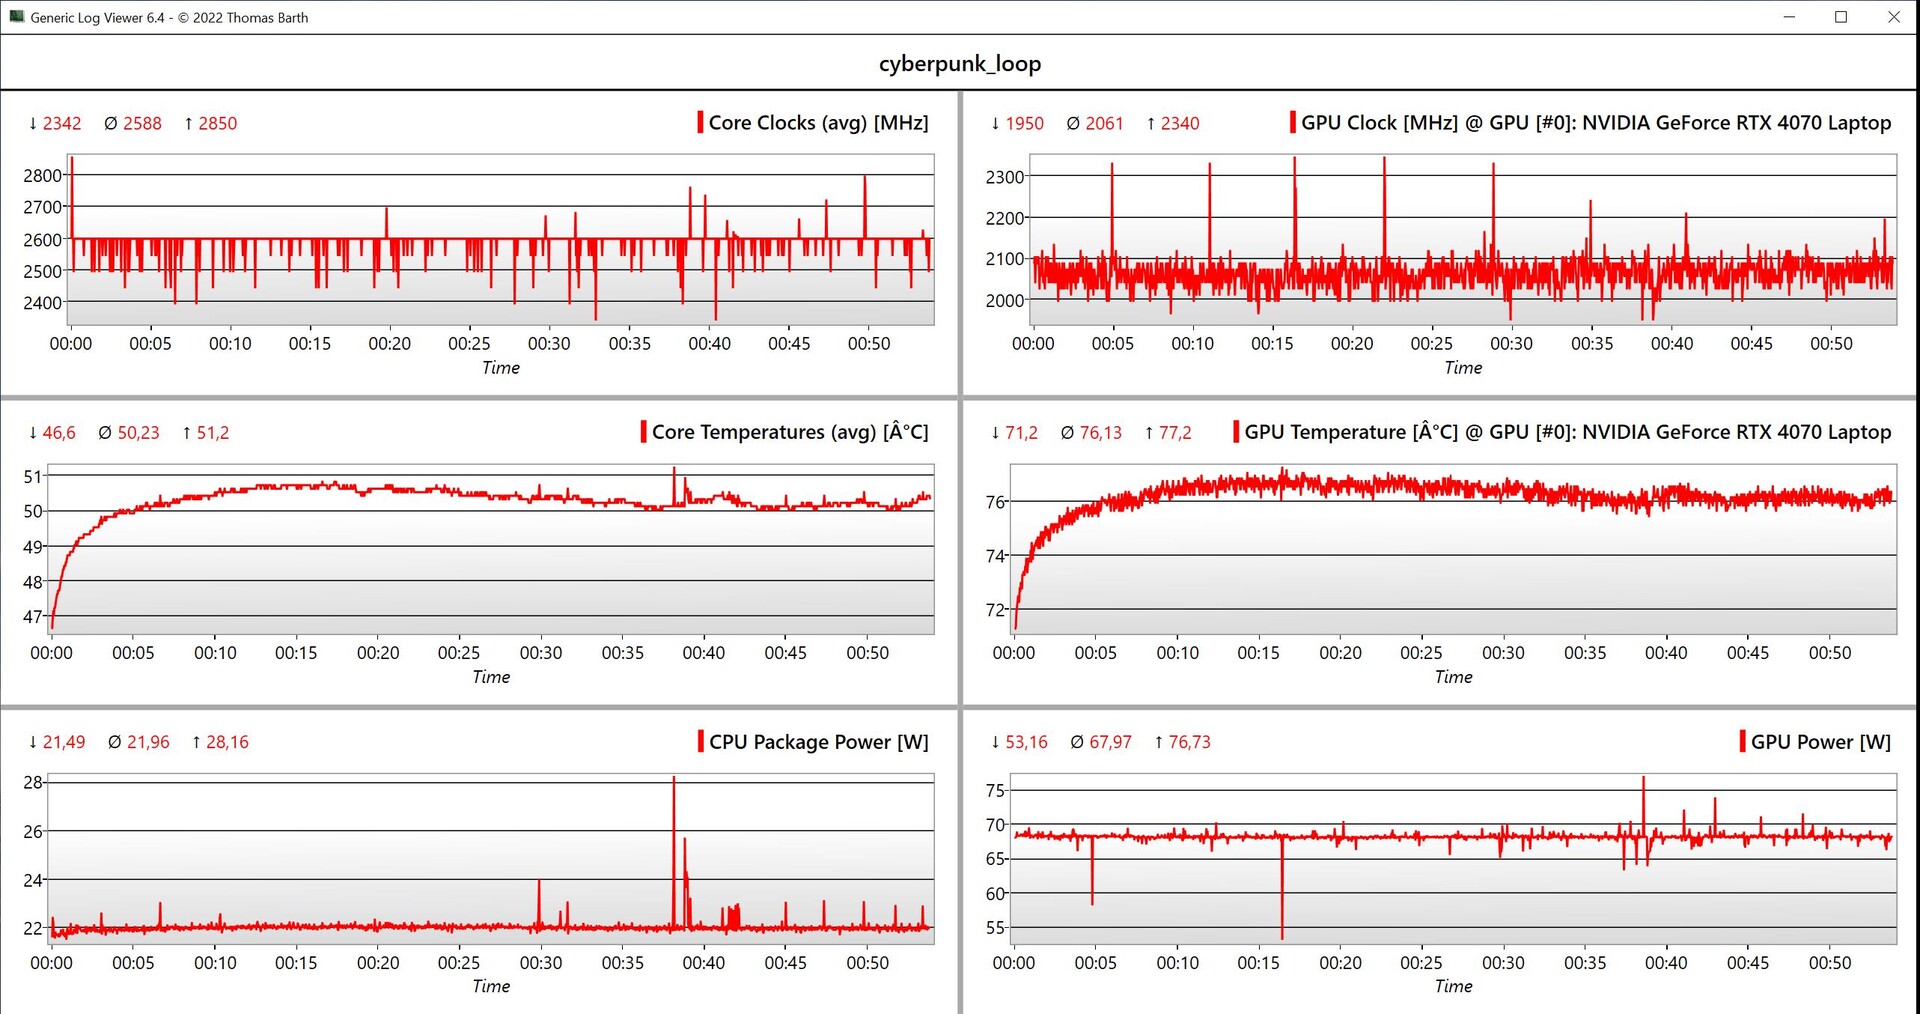
Cyberpunk 2077 ultra FPS diagram
| low | med. | high | ultra | QHD | |
|---|---|---|---|---|---|
| GTA V (2015) | 174.2 | 167.1 | 104.5 | 82.2 | |
| The Witcher 3 (2015) | 380 | 201 | 110 | ||
| Dota 2 Reborn (2015) | 157.1 | 146.7 | 131.9 | 122.8 | |
| Final Fantasy XV Benchmark (2018) | 173.8 | 140.5 | 104 | 75.3 | |
| X-Plane 11.11 (2018) | 96.5 | 90.7 | 74.1 | ||
| Far Cry 5 (2018) | 139 | 123 | 119 | 111 | |
| Strange Brigade (2018) | 357 | 268 | 217 | 191.7 | 121.8 |
| Baldur's Gate 3 (2023) | 127.4 | 109.7 | 72.7 | 66.7 | |
| Cyberpunk 2077 (2023) | 115.2 | 101.9 | 86.1 | 74.1 | |
| Call of Duty Modern Warfare 3 2023 (2023) | 145 | 130 | 99 | 92 | |
| Horizon Forbidden West (2024) | 80.5 | 79.8 | 62.4 | 54.6 |
Emissions - Loud fans but decent temperatures
Noise emissions
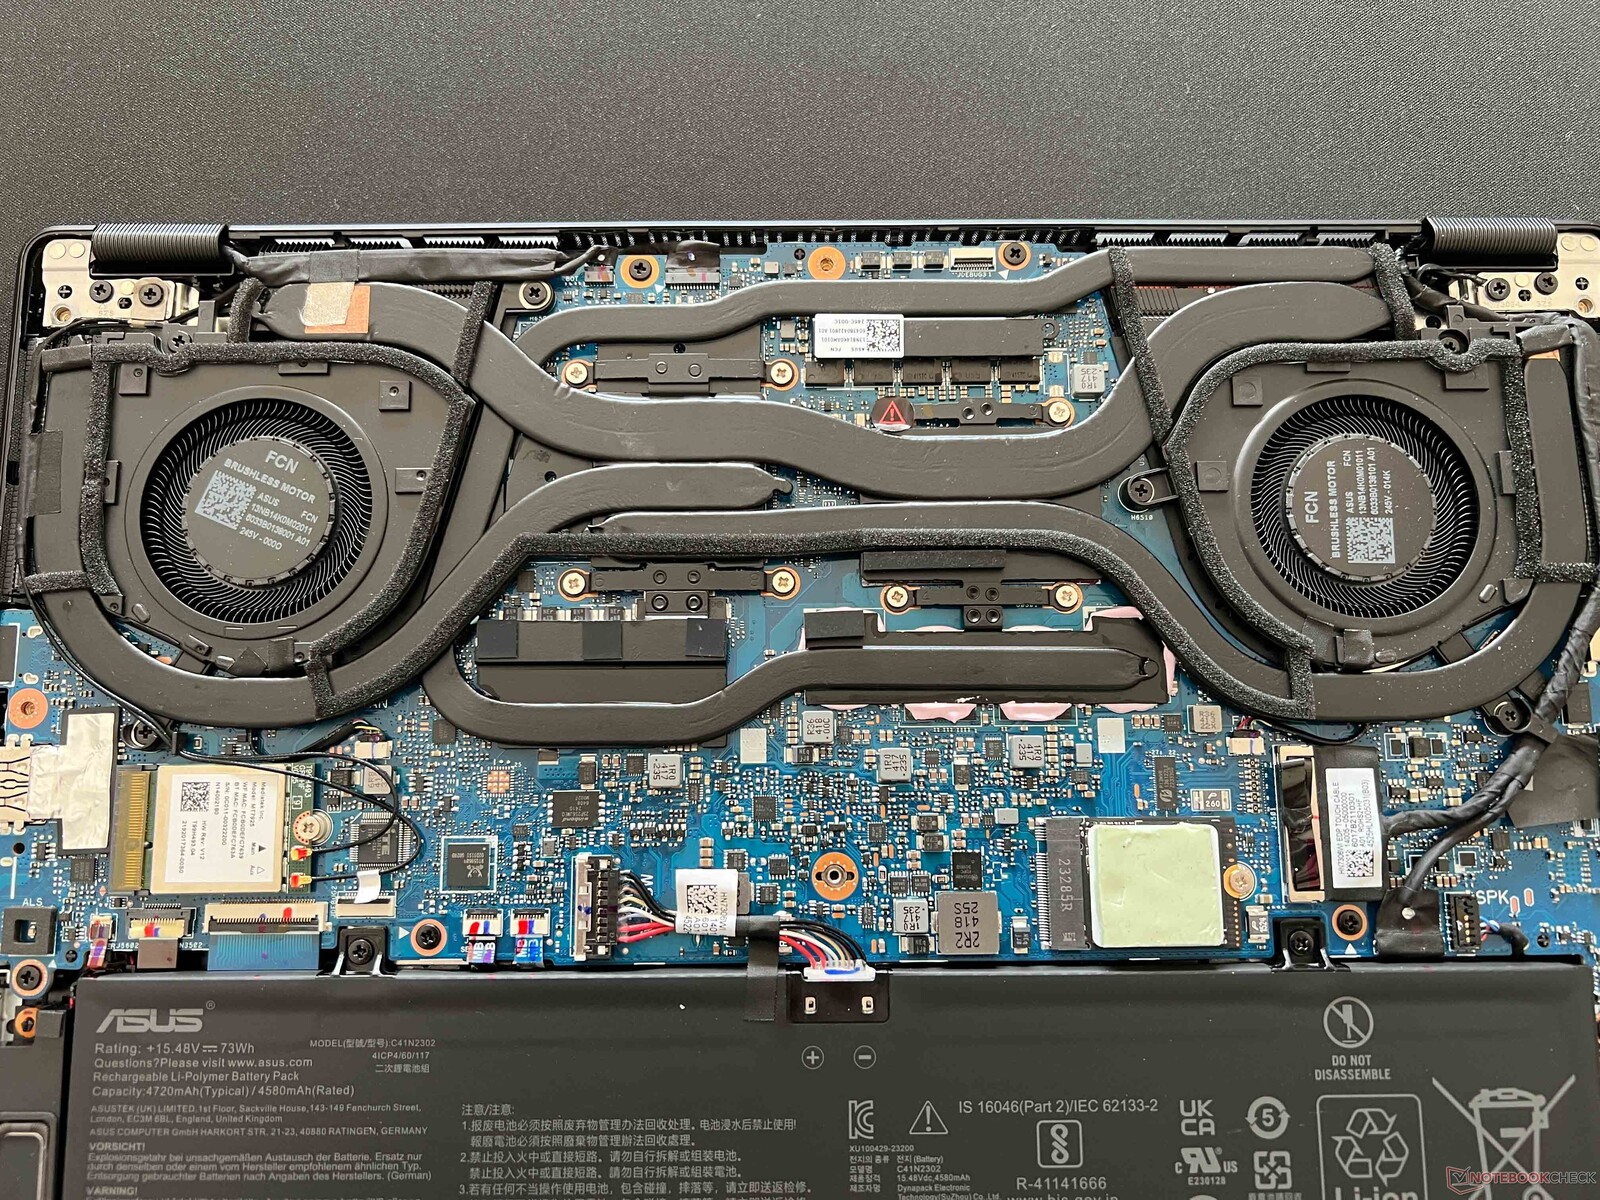
The cooling unit consists of many heat pipes and two fans which transport the waste heat out of the case at the sides and rear. What's not surprising is that the cooling system has its hands full given the compact case and fast components. Especially in performance mode, the fans kick in, even when undertaking everyday tasks. This is why you can, without hesitation, use the whisper mode for simple tasks since the CPU performance is still excellent here. At 53.3 dB(A) when gaming and in the stress test, it also gets very loud and this is why you should use headphones. However, it might also be worthwhile to test the performance using the whisper mode. In the following table, we have summarized a list of the various profile results. No other electronic noises were present in the review device.
| Energy mode | 3DMark 06 | Cyberpunk 2077 | Stress test |
|---|---|---|---|
| Whisper | 37.7 dB(A) | 40.1 dB(A) | 40.1 dB(A) |
| Standard | 43 dB(A) | 47.5 dB(A) | 47.5 dB(A) |
| Performance | 43 dB(A) | 53.3 dB(A) | 53.3 dB(A) |
Noise level
| Idle |
| 24.7 / 28.4 / 30.9 dB(A) |
| Load |
| 43 / 53.3 dB(A) |
 | ||
30 dB silent 40 dB(A) audible 50 dB(A) loud |
||
min: | ||
| Asus ProArt PX13 HN7306 GeForce RTX 4070 Laptop GPU, Ryzen AI 9 HX 370, WD PC SN740 SDDPTQD-1T00 | Asus ROG Flow X13 GV302XV GeForce RTX 4060 Laptop GPU, R9 7940HS, Micron 2400 MTFDKBK1T0QFM | Asus ROG Flow Z13 ACRNM GeForce RTX 4070 Laptop GPU, i9-13900H, WD PC SN740 SDDPTQD-1T00 | Asus ROG Zephyrus G14 2024 GA403U GeForce RTX 4070 Laptop GPU, R9 8945HS, WD PC SN560 SDDPNQE-1T00 | Razer Blade 14 RZ09-0508 GeForce RTX 4070 Laptop GPU, R9 8945HS, Samsung PM9A1 MZVL21T0HCLR | Microsoft Surface Laptop Studio 2 RTX 4060 GeForce RTX 4060 Laptop GPU, i7-13700H, Kioxia XG8 KXG80ZNV1T02 | |
|---|---|---|---|---|---|---|
| Noise | 1% | 3% | 9% | 10% | 4% | |
| off / environment * (dB) | 24.7 | 21.42 13% | 24 3% | 23.9 3% | 24.3 2% | 23.9 3% |
| Idle Minimum * (dB) | 24.7 | 29.07 -18% | 24 3% | 23.9 3% | 25 -1% | 23.9 3% |
| Idle Average * (dB) | 28.4 | 29.07 -2% | 24 15% | 23.9 16% | 25 12% | 24.4 14% |
| Idle Maximum * (dB) | 30.9 | 29.07 6% | 36.5 -18% | 23.9 23% | 25 19% | 26.9 13% |
| Load Average * (dB) | 43 | 44.54 -4% | 41.3 4% | 46.2 -7% | 33 23% | 48.5 -13% |
| Cyberpunk 2077 ultra * (dB) | 53.3 | |||||
| Load Maximum * (dB) | 53.3 | 47.08 12% | 46.9 12% | 46.2 13% | 51.9 3% | 51.8 3% |
| Witcher 3 ultra * (dB) | 45.1 | 44.7 | 46.2 | 49.5 | 51.8 |
* ... smaller is better
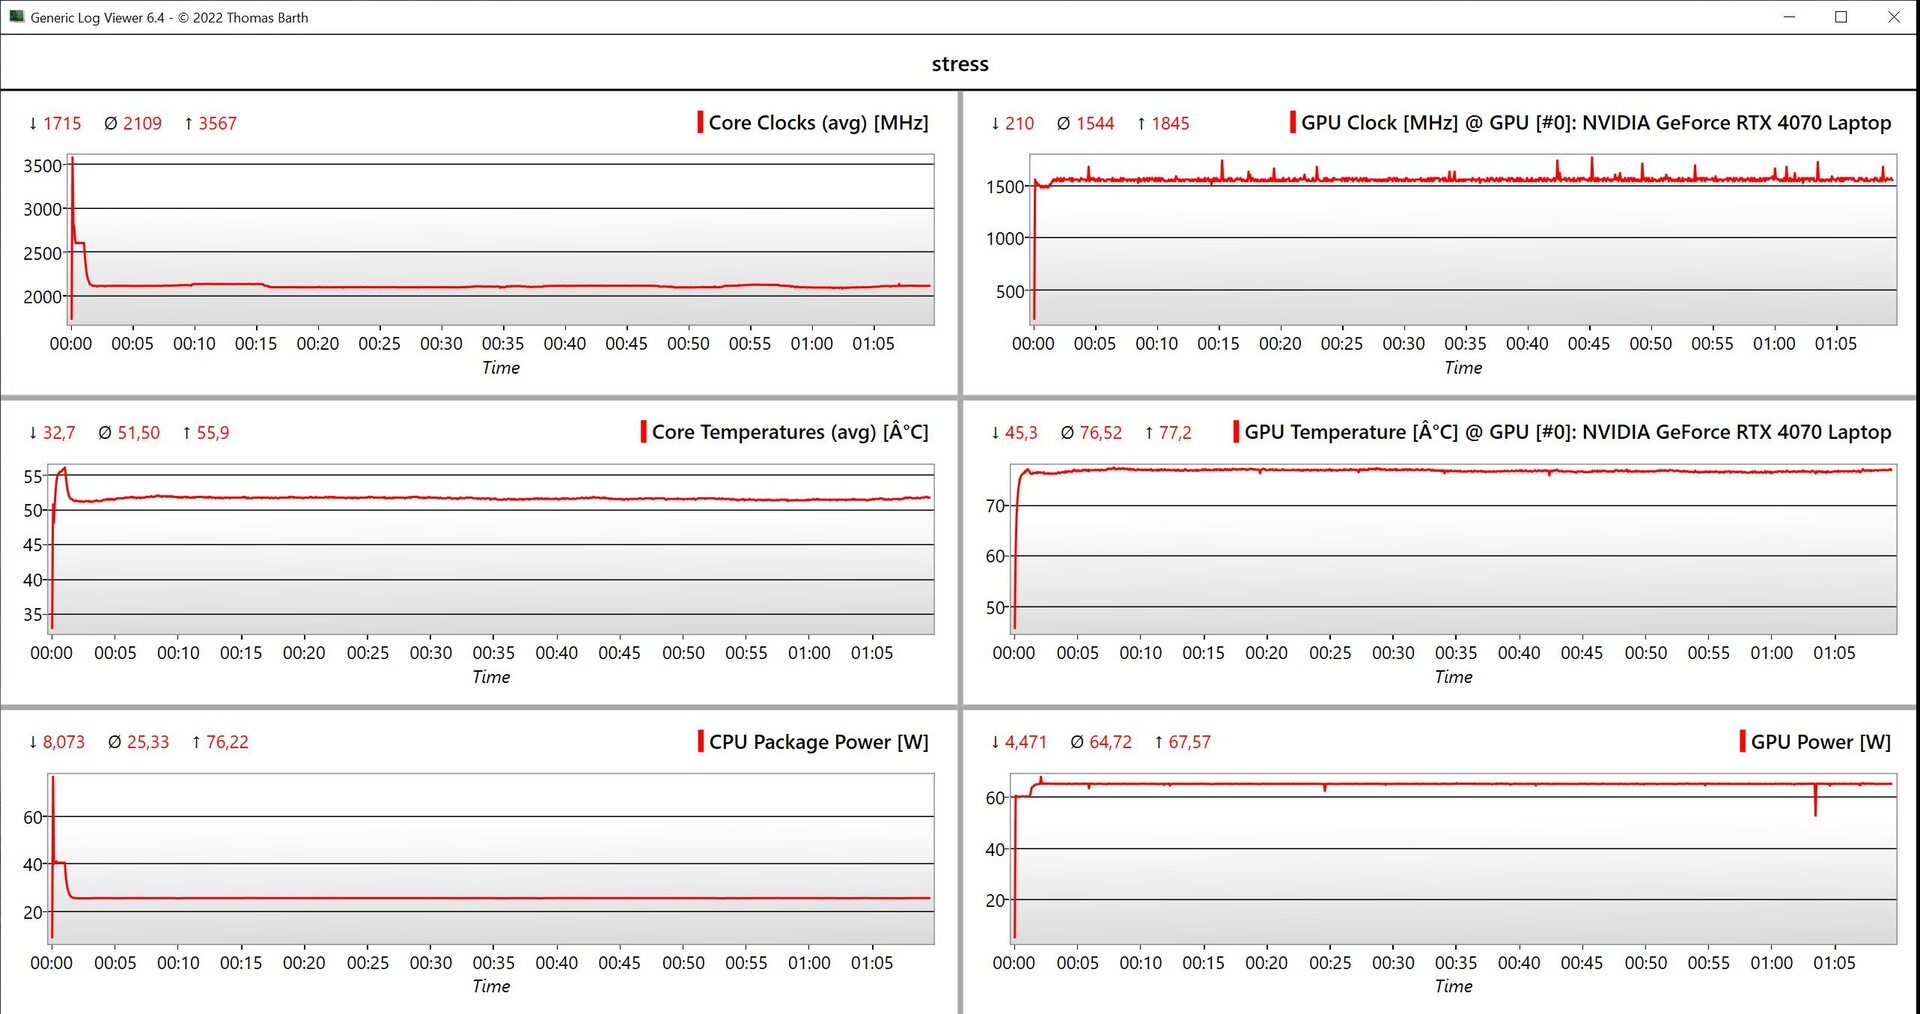
Temperature
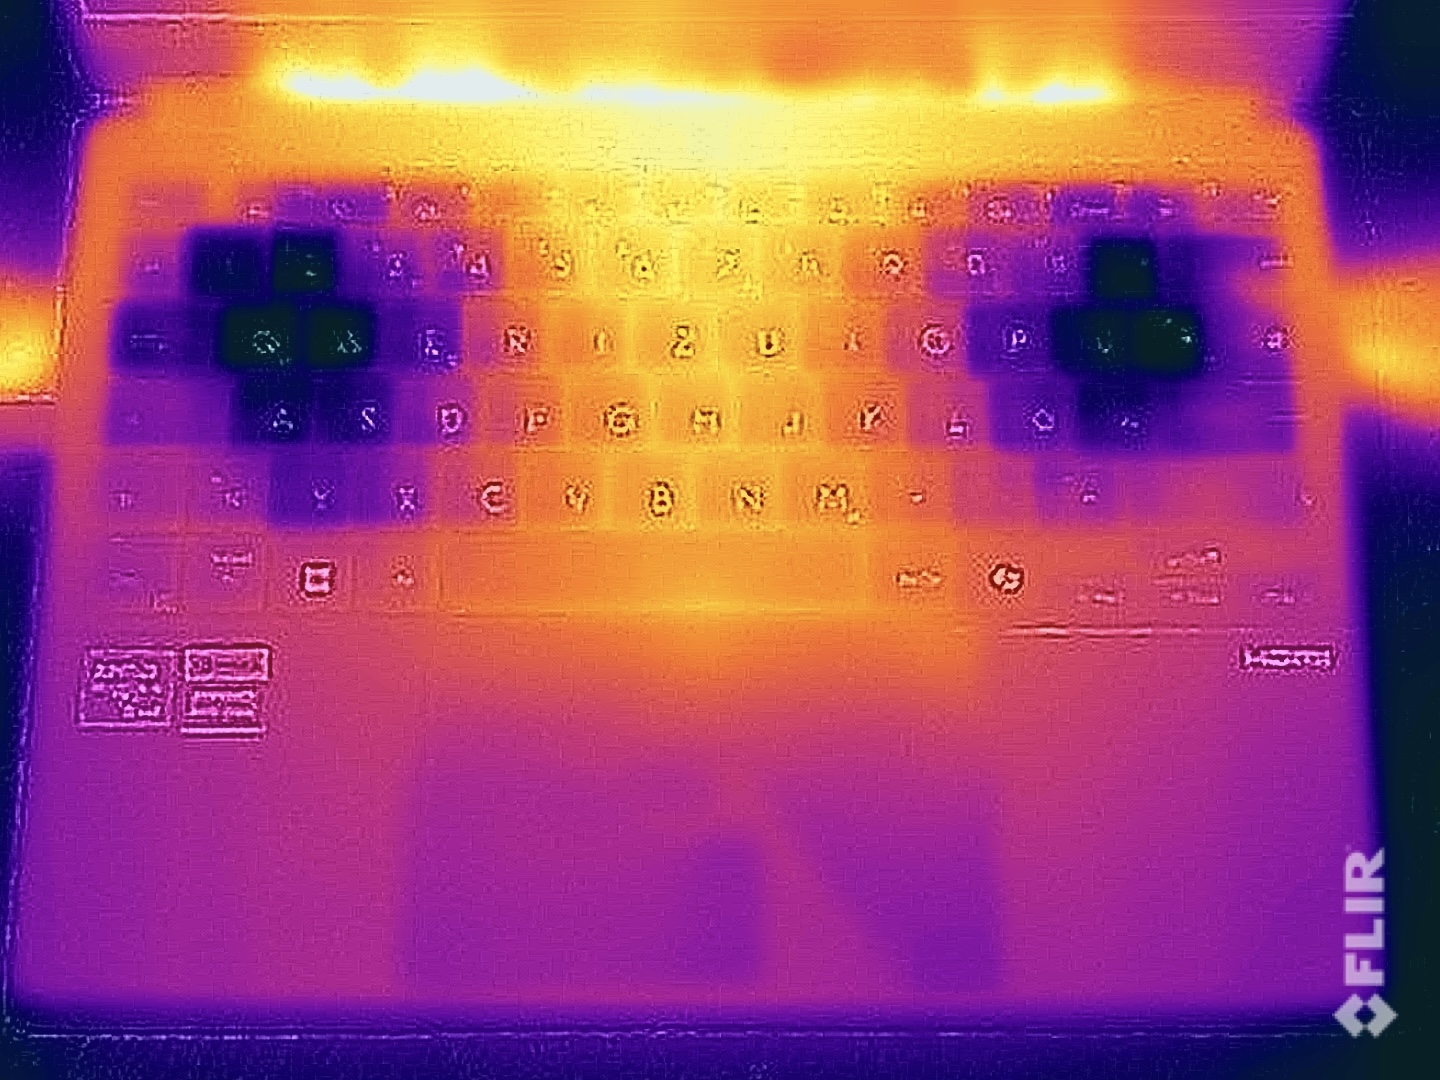
The fans might get loud but the surface temperatures remain very acceptable, even in the stress test. On one spot on the base of the device (rear middle), we measured over 47 °C but the two sides remain cooler which means you can even place the device on your lap. All in all, the upper side is considerably cooler, especially in the area above the fans. In infrared images, you can also clearly see that the WASD area stays very cool when gaming. The case also hardly heats up when performing everyday tasks.
In the stress test with combined CPU load, the processor briefly runs at 40 watts and then stabilizes at 25 watts. The graphics card initially runs at 60 watts and then at 65 watts for the rest of the stress test. All in all, these are very good figures for a 13.3-inch 2-in-1.
(-) The maximum temperature on the upper side is 45.3 °C / 114 F, compared to the average of 36.8 °C / 98 F, ranging from 21 to 71 °C for the class Multimedia.
(-) The bottom heats up to a maximum of 47.9 °C / 118 F, compared to the average of 39.1 °C / 102 F
(+) In idle usage, the average temperature for the upper side is 28.2 °C / 83 F, compared to the device average of 31.3 °C / 88 F.
(±) 3: The average temperature for the upper side is 37.1 °C / 99 F, compared to the average of 31.3 °C / 88 F for the class Multimedia.
(+) The palmrests and touchpad are reaching skin temperature as a maximum (33.2 °C / 91.8 F) and are therefore not hot.
(-) The average temperature of the palmrest area of similar devices was 28.7 °C / 83.7 F (-4.5 °C / -8.1 F).

| Asus ProArt PX13 HN7306 AMD Ryzen AI 9 HX 370, NVIDIA GeForce RTX 4070 Laptop GPU | Asus ROG Flow X13 GV302XV AMD Ryzen 9 7940HS, NVIDIA GeForce RTX 4060 Laptop GPU | Asus ROG Flow Z13 ACRNM Intel Core i9-13900H, NVIDIA GeForce RTX 4070 Laptop GPU | Asus ROG Zephyrus G14 2024 GA403U AMD Ryzen 9 8945HS, NVIDIA GeForce RTX 4070 Laptop GPU | Razer Blade 14 RZ09-0508 AMD Ryzen 9 8945HS, NVIDIA GeForce RTX 4070 Laptop GPU | Microsoft Surface Laptop Studio 2 RTX 4060 Intel Core i7-13700H, NVIDIA GeForce RTX 4060 Laptop GPU | |
|---|---|---|---|---|---|---|
| Heat | -6% | 10% | 3% | -7% | 10% | |
| Maximum Upper Side * (°C) | 45.3 | 45.6 -1% | 42.5 6% | 46.6 -3% | 41.8 8% | 40.4 11% |
| Maximum Bottom * (°C) | 47.9 | 44.2 8% | 42.6 11% | 47.8 -0% | 42.2 12% | 42.2 12% |
| Idle Upper Side * (°C) | 28.5 | 33.8 -19% | 26.2 8% | 26.7 6% | 34.8 -22% | 26.6 7% |
| Idle Bottom * (°C) | 29.9 | 32.8 -10% | 26 13% | 27.8 7% | 37.4 -25% | 27 10% |
* ... smaller is better
Speakers
The PX13's sound system uses two modules and provides decent sound that is superior to its direct 13-inch competitors. But, the wonderful sound system seen in the Zephyrus G14 is still ahead by quite some margin.
Asus ProArt PX13 HN7306 audio analysis
(±) | speaker loudness is average but good (81.5 dB)
Bass 100 - 315 Hz
(±) | reduced bass - on average 7.3% lower than median
(±) | linearity of bass is average (8.6% delta to prev. frequency)
Mids 400 - 2000 Hz
(±) | higher mids - on average 5.6% higher than median
(+) | mids are linear (5.2% delta to prev. frequency)
Highs 2 - 16 kHz
(+) | balanced highs - only 3.2% away from median
(+) | highs are linear (3.6% delta to prev. frequency)
Overall 100 - 16.000 Hz
(+) | overall sound is linear (12.9% difference to median)
Compared to same class
» 26% of all tested devices in this class were better, 4% similar, 70% worse
» The best had a delta of 5%, average was 17%, worst was 45%
Compared to all devices tested
» 12% of all tested devices were better, 3% similar, 85% worse
» The best had a delta of 4%, average was 24%, worst was 134%
Asus ROG Flow X13 GV302XV audio analysis
(-) | not very loud speakers (70.6 dB)
Bass 100 - 315 Hz
(±) | reduced bass - on average 9.6% lower than median
(±) | linearity of bass is average (9.4% delta to prev. frequency)
Mids 400 - 2000 Hz
(+) | balanced mids - only 3.6% away from median
(+) | mids are linear (2.7% delta to prev. frequency)
Highs 2 - 16 kHz
(+) | balanced highs - only 4.1% away from median
(+) | highs are linear (5.7% delta to prev. frequency)
Overall 100 - 16.000 Hz
(±) | linearity of overall sound is average (15.8% difference to median)
Compared to same class
» 28% of all tested devices in this class were better, 3% similar, 69% worse
» The best had a delta of 6%, average was 20%, worst was 57%
Compared to all devices tested
» 24% of all tested devices were better, 5% similar, 71% worse
» The best had a delta of 4%, average was 24%, worst was 134%
Asus ROG Flow Z13 ACRNM audio analysis
(±) | speaker loudness is average but good (80.3 dB)
Bass 100 - 315 Hz
(-) | nearly no bass - on average 18.3% lower than median
(±) | linearity of bass is average (10.1% delta to prev. frequency)
Mids 400 - 2000 Hz
(+) | balanced mids - only 3.4% away from median
(+) | mids are linear (4.5% delta to prev. frequency)
Highs 2 - 16 kHz
(±) | higher highs - on average 6.1% higher than median
(+) | highs are linear (3.5% delta to prev. frequency)
Overall 100 - 16.000 Hz
(±) | linearity of overall sound is average (19% difference to median)
Compared to same class
» 63% of all tested devices in this class were better, 8% similar, 29% worse
» The best had a delta of 6%, average was 18%, worst was 132%
Compared to all devices tested
» 45% of all tested devices were better, 7% similar, 48% worse
» The best had a delta of 4%, average was 24%, worst was 134%
Asus ROG Zephyrus G14 2024 GA403U audio analysis
(+) | speakers can play relatively loud (84.7 dB)
Bass 100 - 315 Hz
(+) | good bass - only 3.5% away from median
(±) | linearity of bass is average (7.3% delta to prev. frequency)
Mids 400 - 2000 Hz
(+) | balanced mids - only 3.8% away from median
(+) | mids are linear (3.6% delta to prev. frequency)
Highs 2 - 16 kHz
(+) | balanced highs - only 1.4% away from median
(+) | highs are linear (3.5% delta to prev. frequency)
Overall 100 - 16.000 Hz
(+) | overall sound is linear (5.8% difference to median)
Compared to same class
» 0% of all tested devices in this class were better, 0% similar, 100% worse
» The best had a delta of 6%, average was 18%, worst was 132%
Compared to all devices tested
» 0% of all tested devices were better, 0% similar, 100% worse
» The best had a delta of 4%, average was 24%, worst was 134%
Razer Blade 14 RZ09-0508 audio analysis
(±) | speaker loudness is average but good (79.2 dB)
Bass 100 - 315 Hz
(±) | reduced bass - on average 14% lower than median
(±) | linearity of bass is average (12.7% delta to prev. frequency)
Mids 400 - 2000 Hz
(+) | balanced mids - only 2.7% away from median
(+) | mids are linear (2.6% delta to prev. frequency)
Highs 2 - 16 kHz
(±) | higher highs - on average 6.2% higher than median
(±) | linearity of highs is average (7% delta to prev. frequency)
Overall 100 - 16.000 Hz
(±) | linearity of overall sound is average (17.1% difference to median)
Compared to same class
» 46% of all tested devices in this class were better, 12% similar, 43% worse
» The best had a delta of 6%, average was 18%, worst was 132%
Compared to all devices tested
» 31% of all tested devices were better, 8% similar, 61% worse
» The best had a delta of 4%, average was 24%, worst was 134%
Microsoft Surface Laptop Studio 2 RTX 4060 audio analysis
(±) | speaker loudness is average but good (81.8 dB)
Bass 100 - 315 Hz
(±) | reduced bass - on average 12% lower than median
(±) | linearity of bass is average (10% delta to prev. frequency)
Mids 400 - 2000 Hz
(±) | higher mids - on average 6.1% higher than median
(+) | mids are linear (2.3% delta to prev. frequency)
Highs 2 - 16 kHz
(+) | balanced highs - only 2.3% away from median
(+) | highs are linear (4.1% delta to prev. frequency)
Overall 100 - 16.000 Hz
(+) | overall sound is linear (13.9% difference to median)
Compared to same class
» 31% of all tested devices in this class were better, 4% similar, 65% worse
» The best had a delta of 5%, average was 17%, worst was 45%
Compared to all devices tested
» 16% of all tested devices were better, 4% similar, 80% worse
» The best had a delta of 4%, average was 24%, worst was 134%
Energy management - Average battery life
Power consumption
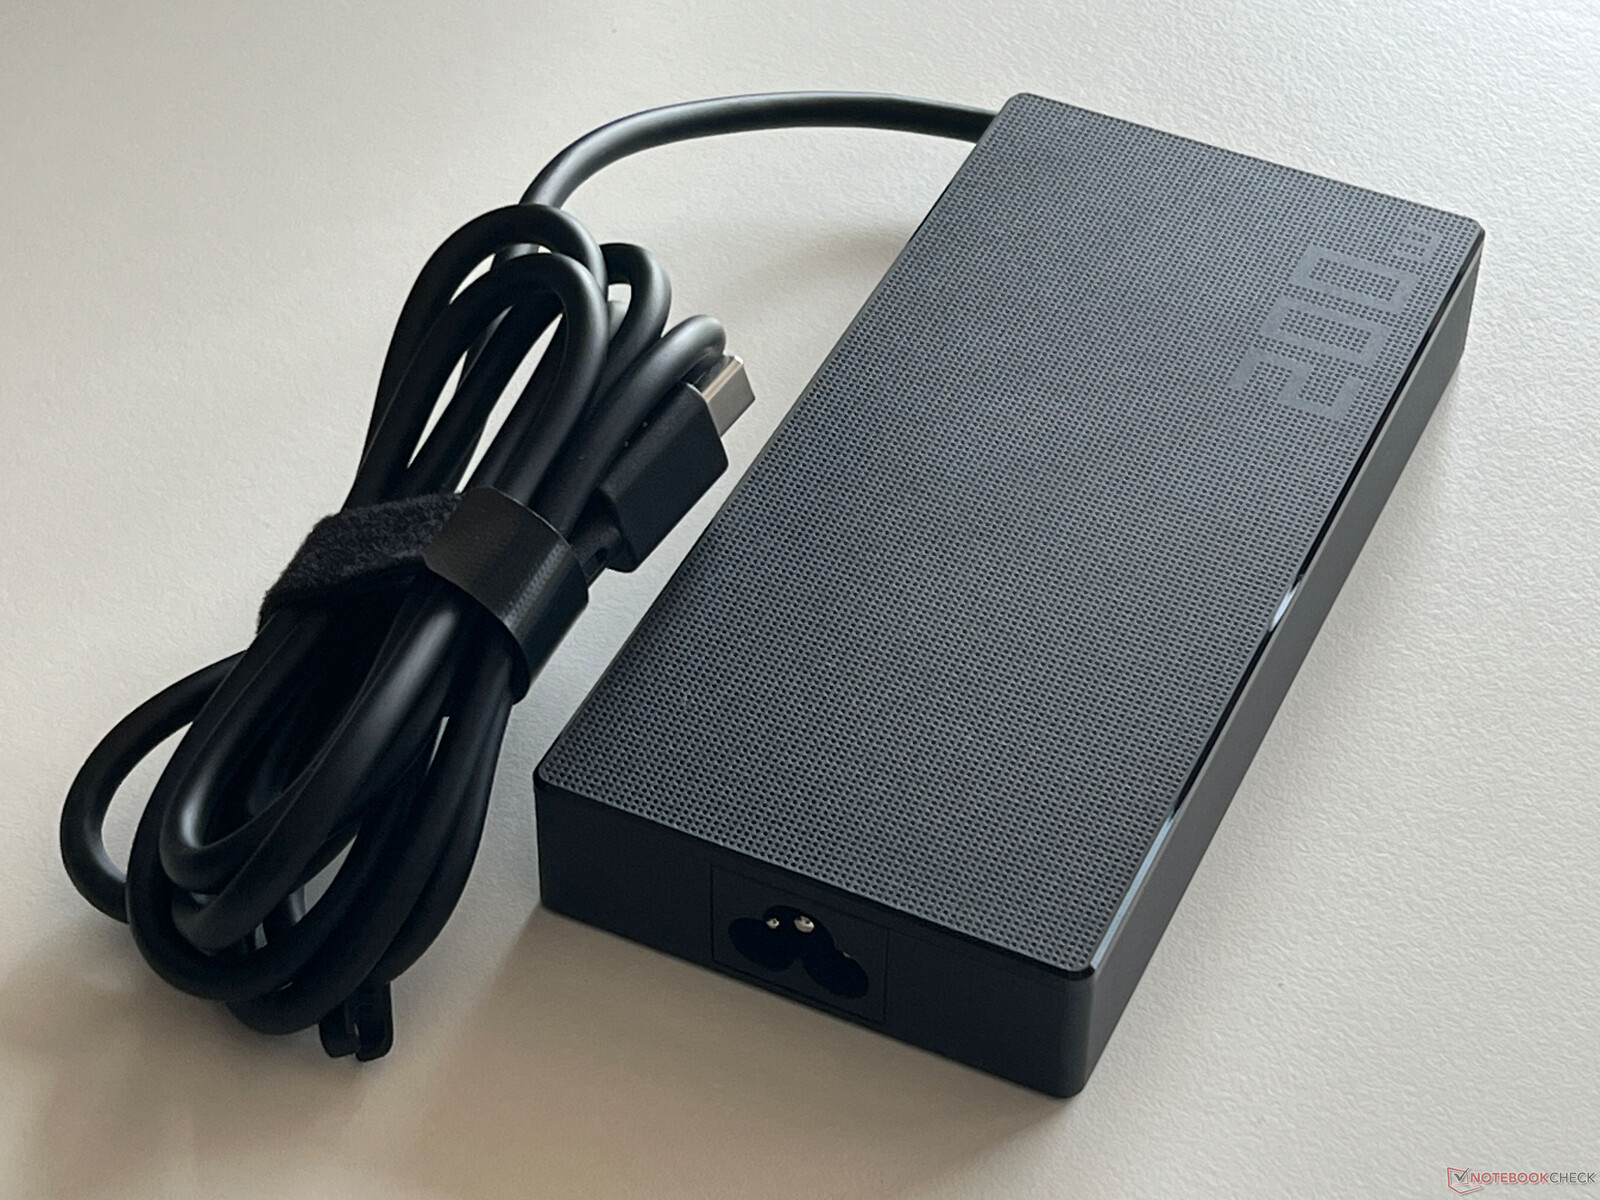
Our consumption measurements didn't uncover any surprises and, when running idle and consuming fewer than 10 watts at full brightness, the small 2-in-1 is pretty economical. When gaming, you can count on 120 watts and, in the stress test, we recorded a maximum of 185 watts which then stabilized after a few seconds to 137 watts and then to 124 watts, in the next 90 seconds. This means the supplied 200-watt PSU is more than suitably sized.
| Off / Standby | |
| Idle | |
| Load |
|
Key:
min: | |
| Asus ProArt PX13 HN7306 Ryzen AI 9 HX 370, GeForce RTX 4070 Laptop GPU, WD PC SN740 SDDPTQD-1T00, OLED, 2880x1800, 13.3" | Asus ROG Flow X13 GV302XV R9 7940HS, GeForce RTX 4060 Laptop GPU, Micron 2400 MTFDKBK1T0QFM, IPS, 2560x1600, 13.4" | Asus ROG Flow Z13 ACRNM i9-13900H, GeForce RTX 4070 Laptop GPU, WD PC SN740 SDDPTQD-1T00, IPS, 2560x1600, 13.4" | Asus ROG Zephyrus G14 2024 GA403U R9 8945HS, GeForce RTX 4070 Laptop GPU, WD PC SN560 SDDPNQE-1T00, OLED, 2880x1800, 14" | Razer Blade 14 RZ09-0508 R9 8945HS, GeForce RTX 4070 Laptop GPU, Samsung PM9A1 MZVL21T0HCLR, IPS, 2560x1600, 14" | Microsoft Surface Laptop Studio 2 RTX 4060 i7-13700H, GeForce RTX 4060 Laptop GPU, Kioxia XG8 KXG80ZNV1T02, IPS, 2400x1600, 14.4" | Average NVIDIA GeForce RTX 4070 Laptop GPU | Average of class Multimedia | |
|---|---|---|---|---|---|---|---|---|
| Power Consumption | -84% | -17% | 7% | -122% | 27% | -76% | 7% | |
| Idle Minimum * (Watt) | 7.5 | 16.63 -122% | 8.9 -19% | 6.9 8% | 20.9 -179% | 3 60% | 13.2 ? -76% | 5.71 ? 24% |
| Idle Average * (Watt) | 9.3 | 20.68 -122% | 12.6 -35% | 8.6 8% | 25.6 -175% | 7.1 24% | 18.2 ? -96% | 10.1 ? -9% |
| Idle Maximum * (Watt) | 9.6 | 29.88 -211% | 13 -35% | 9 6% | 32.1 -234% | 7.6 21% | 24.6 ? -156% | 12.4 ? -29% |
| Load Average * (Watt) | 74.1 | 75.5 -2% | 92.5 -25% | 75.2 -1% | 72.7 2% | 73.1 1% | 97 ? -31% | 65 ? 12% |
| Cyberpunk 2077 ultra * (Watt) | 121.6 | |||||||
| Cyberpunk 2077 ultra external monitor * (Watt) | 121.5 | |||||||
| Load Maximum * (Watt) | 185 | 113.3 39% | 133.6 28% | 161.6 13% | 228.4 -23% | 128.5 31% | 221 ? -19% | 112.2 ? 39% |
| Witcher 3 ultra * (Watt) | 92.6 | 104.4 | 109.7 | 182.1 | 113.9 |
* ... smaller is better
Power consumption Cyberpunk / stress test
Power consumption with an external monitor
Battery life
Overall, runtimes with the 73 Wh battery are decent and only a few of the direct competitors offer better stamina. In the Wi-Fi test at 150 cd/m² (representing 69 % of the review device's maximum SDR brightness), we recorded 8.5 hours and almost 7 hours at full brightness. Video playback at 150 cd/m² is possible for just over 10 hours.
The battery can also be charged quickly with the 200-watt PSU. With the device switched on, a full charging cycle requires around 100 minutes with 50 % of the capacity available after 24 minutes and 80 % after 49 minutes.
| Asus ProArt PX13 HN7306 Ryzen AI 9 HX 370, GeForce RTX 4070 Laptop GPU, 73 Wh | Asus ROG Flow X13 GV302XV R9 7940HS, GeForce RTX 4060 Laptop GPU, 75 Wh | Asus ROG Flow Z13 ACRNM i9-13900H, GeForce RTX 4070 Laptop GPU, 56 Wh | Asus ROG Zephyrus G14 2024 GA403U R9 8945HS, GeForce RTX 4070 Laptop GPU, 73 Wh | Razer Blade 14 RZ09-0508 R9 8945HS, GeForce RTX 4070 Laptop GPU, 68 Wh | Microsoft Surface Laptop Studio 2 RTX 4060 i7-13700H, GeForce RTX 4060 Laptop GPU, 58 Wh | Average of class Multimedia | |
|---|---|---|---|---|---|---|---|
| Battery runtime | 26% | -32% | 6% | -8% | 30% | 47% | |
| H.264 (h) | 10.3 | 11.4 11% | 5.2 -50% | 12.1 17% | 11.3 10% | 16.4 ? 59% | |
| WiFi v1.3 (h) | 8.5 | 11.9 40% | 6.6 -22% | 9.3 9% | 7.1 -16% | 8.3 -2% | 12 ? 41% |
| Load (h) | 1.2 | 0.9 -25% | 1.1 -8% | 1.2 0% | 2.2 83% | 1.675 ? 40% | |
| Witcher 3 ultra (h) | 1.5 |
Pros
Cons
Verdict - The ProArt PX13 is the world's fastest 13-inch device, albeit with a less than perfect 60 Hz OLED screen
If you are on the hunt for maximum performance in the most compact form factor, the new Asus ProArt PX13 2-in-1 is currently the fastest 13-inch device in the world. The new AMD Ryzen processor also helps and its Zen 5 cores offer a clear advantage over the old models. In terms of gaming, it also cuts a very good figure when combined with the GeForce 4070 laptop. On top of this, the performance of these two components remains fairly stable and, all in all, the cooling does a good job - even though the fans can get very loud in the performance mode. Despite this, the surface temperatures remain within acceptable limits.
The case is outstanding with an extremely stable base unit and premium build quality. There is a sufficient number of available ports and the PX13 probably offers (together with the Zephyrus G14) the best keyboard you can currently find in the mobile segment. The DialPad in the touchpad can be useful, although this will depend on the user's personal workflow with programs such as the Adobe apps. In addition, there is a very fast Wi-Fi-7 module and all of the Copilot+ AI functions such as live subtitles.
Thanks to the new AMD Zen 5 processor and the GeForce RTX 4070 laptop, the new ProArt is currently the fastest 13.3-inch device you can buy. Besides this, there is also an excellent keyboard and sufficient ports. However, we are at a loss as to why Asus opted for a 60 Hz OLED given the high price.
In principle, the OLED display's high resolution and accurate color reproduction result in very good image quality but bright areas appear slightly grainy. The 60 Hz frequency is questionable and there is a noticeable difference to 120 Hz panels. Considering the high asking price, this decision is difficult to get your head around. However, this doesn't only concern the PX13 since the larger ProArt P16 is also equipped with a 60 Hz OLED.
The biggest competition comes from Asus itself but, when it comes to other competitors, you have to take a look at the 14-inch segment to get comparable performance. For this reason, this puts the new ProArt PX13 pretty much in a league of its own.
Price and availability
The new ProArt PX13 can now be ordered directly from Asus and starts at $1,999. Our review configuration with the RTX 4070 laptop costs $2,999.
Note: We have recently updated our rating system and the results of version 8 are not comparable with the results of version 7. More information is available here.
Asus ProArt PX13 HN7306
- 07/27/2024 v8
Andreas Osthoff
 Total Sustainability Score:
 Transparency
The selection of devices to be reviewed is made by our editorial team. The test sample was provided to the author as a loan by the manufacturer or retailer for the purpose of this review. The lender had no influence on this review, nor did the manufacturer receive a copy of this review before publication. There was no obligation to publish this review. As an independent media company, Notebookcheck is not subjected to the authority of manufacturers, retailers or publishers.
This is how Notebookcheck is testing
Every year, Notebookcheck independently reviews hundreds of laptops and smartphones using standardized procedures to ensure that all results are comparable. We have continuously developed our test methods for around 20 years and set industry standards in the process. In our test labs, high-quality measuring equipment is utilized by experienced technicians and editors. These tests involve a multi-stage validation process. Our complex rating system is based on hundreds of well-founded measurements and benchmarks, which maintains objectivity. Further information on our test methods can be found here.
Price comparison

