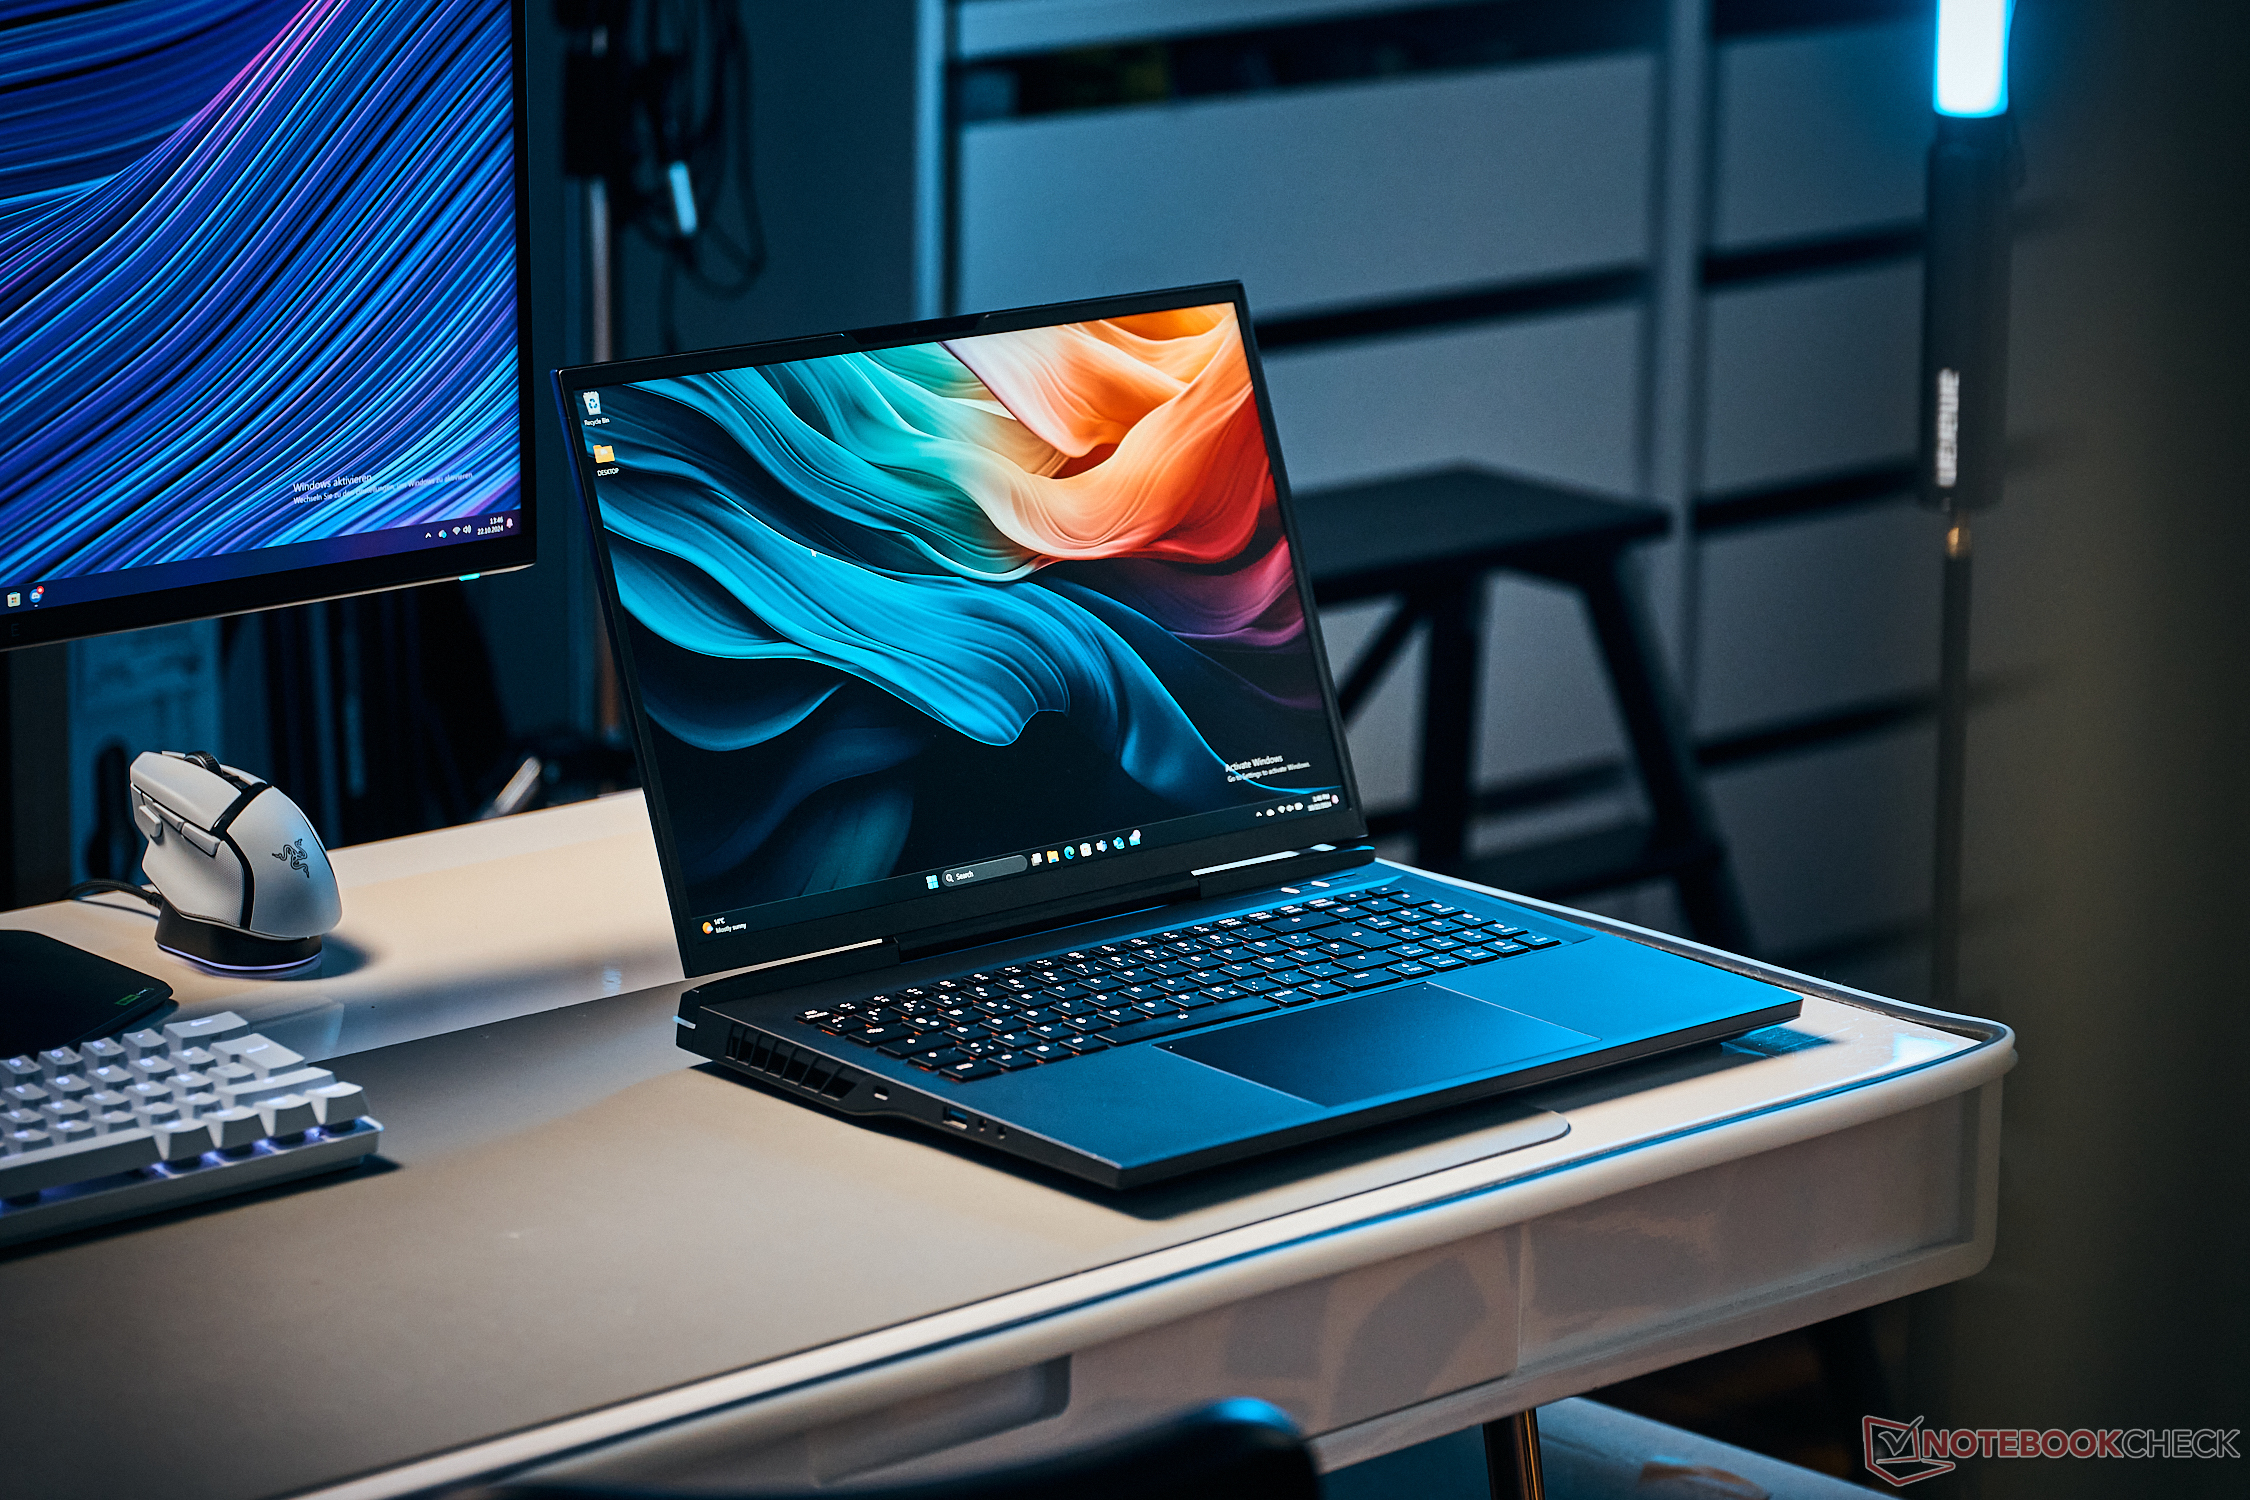
XMG Neo 17 E24 review - Fast gaming laptop with optional water cooling
RTX 4080 laptop & mechanical keyboard.
With the XMG Neo 17, you get a thoroughbred gamer that can be equipped with the fastest components on the market. A mechanical Cherry keyboard and an external water cooling system are also available as options, which not only reduces the temperatures but also the background noise.Andreas Osthoff, 👁 Andreas Osthoff, ✓ Anton Avdyushkin (translated by DeepL / Ninh Duy) Published 🇩🇪 🇫🇷 ...
Verdict - XMG Neo 17 focuses on gaming performance
The XMG Neo 17 presents itself in the test as a powerful gaming laptop with an obvious focus on the maximum performance of the components. The Intel Core i9-14900HX is used as the processor in all configurations, while the dedicated Nvidia GPUs can be overclocked. The result is one of the fastest RTX 4080 laptops we have tested to date. This provides sufficient performance for the fast 240 Hz QHD panel, which is also very suitable for gaming. The circuit for the optional external Oasis water cooling has been improved and now also covers the processor. The result is significantly lower temperatures and, therefore, a lower noise level when gaming.
The gamer also cuts a good figure in other areas: there are enough ports available, the case is of good quality and the optional mechanical Cherry keyboard is very good, but also very loud. RAM/SSD capacity can also be configured and upgrading at a later date is no problem. The 17-inch notebook is relatively large and not lightweight at just under 3 kg. The cooling unit does a good job even without the Oasis water cooling, but the fans get very loud when gaming and you should use headphones.
In terms of price, more than 3,000 euros is of course no bargain, but this is mainly due to the GeForce GPU. If you are looking for a thoroughbred gamer and also want to take advantage of the water cooling, the XMG Neo 17 is definitely a good choice.
Pros
Cons
Price and availability
The Schenker Neo 17 E24 can be configured and ordered directly from Bestware. The starting price is 1,949 euros for the configuration with the RTX 4060 laptop and 2,924 euros for the RTX 4080 laptop.
Possible competitors in comparison
Image | Model / Review | Geizhals | Weight | Height | Display |
|---|---|---|---|---|---|
1. 84.6%  | Schenker XMG Neo 17 E24 Intel Core i9-14900HX ⎘ NVIDIA GeForce RTX 4080 Laptop GPU ⎘ 32 GB Memory, 1024 GB SSD | Listenpreis 3189€ | 2.9 kg | 27 mm | 17.00" 2560x1600 178 PPI IPS |
2. 89.2% v7 (old)  | Medion Erazer Beast X40 2024 Intel Core i9-14900HX ⎘ NVIDIA GeForce RTX 4090 Laptop GPU ⎘ 32 GB Memory, 1024 GB SSD | Listenpreis 4000 Euro | 2.9 kg | 36 mm | 17.00" 2560x1600 178 PPI IPS |
3. 80.4%  | HP Omen 17-db0079ng AMD Ryzen 7 8845HS ⎘ NVIDIA GeForce RTX 4070 Laptop GPU ⎘ 32 GB Memory, 1024 GB SSD | Listenpreis 1900€ | 2.8 kg | 30.1 mm | 17.30" 2560x1440 170 PPI IPS |
4. 85.2% v7 (old)  | Eurocom Raptor X17 Core i9-14900HX Intel Core i9-14900HX ⎘ NVIDIA GeForce RTX 4090 Laptop GPU ⎘ 32 GB Memory, 2048 GB SSD | Listenpreis 4500 USD | 3.4 kg | 24.9 mm | 17.30" 3840x2160 255 PPI IPS |
5. 88.3% v7 (old)  | MSI GE78HX 13VH-070US Intel Core i9-13950HX ⎘ NVIDIA GeForce RTX 4080 Laptop GPU ⎘ 32 GB Memory, 2048 GB SSD | Listenpreis 3600 USD | 3 kg | 23 mm | 17.00" 2560x1600 178 PPI IPS |
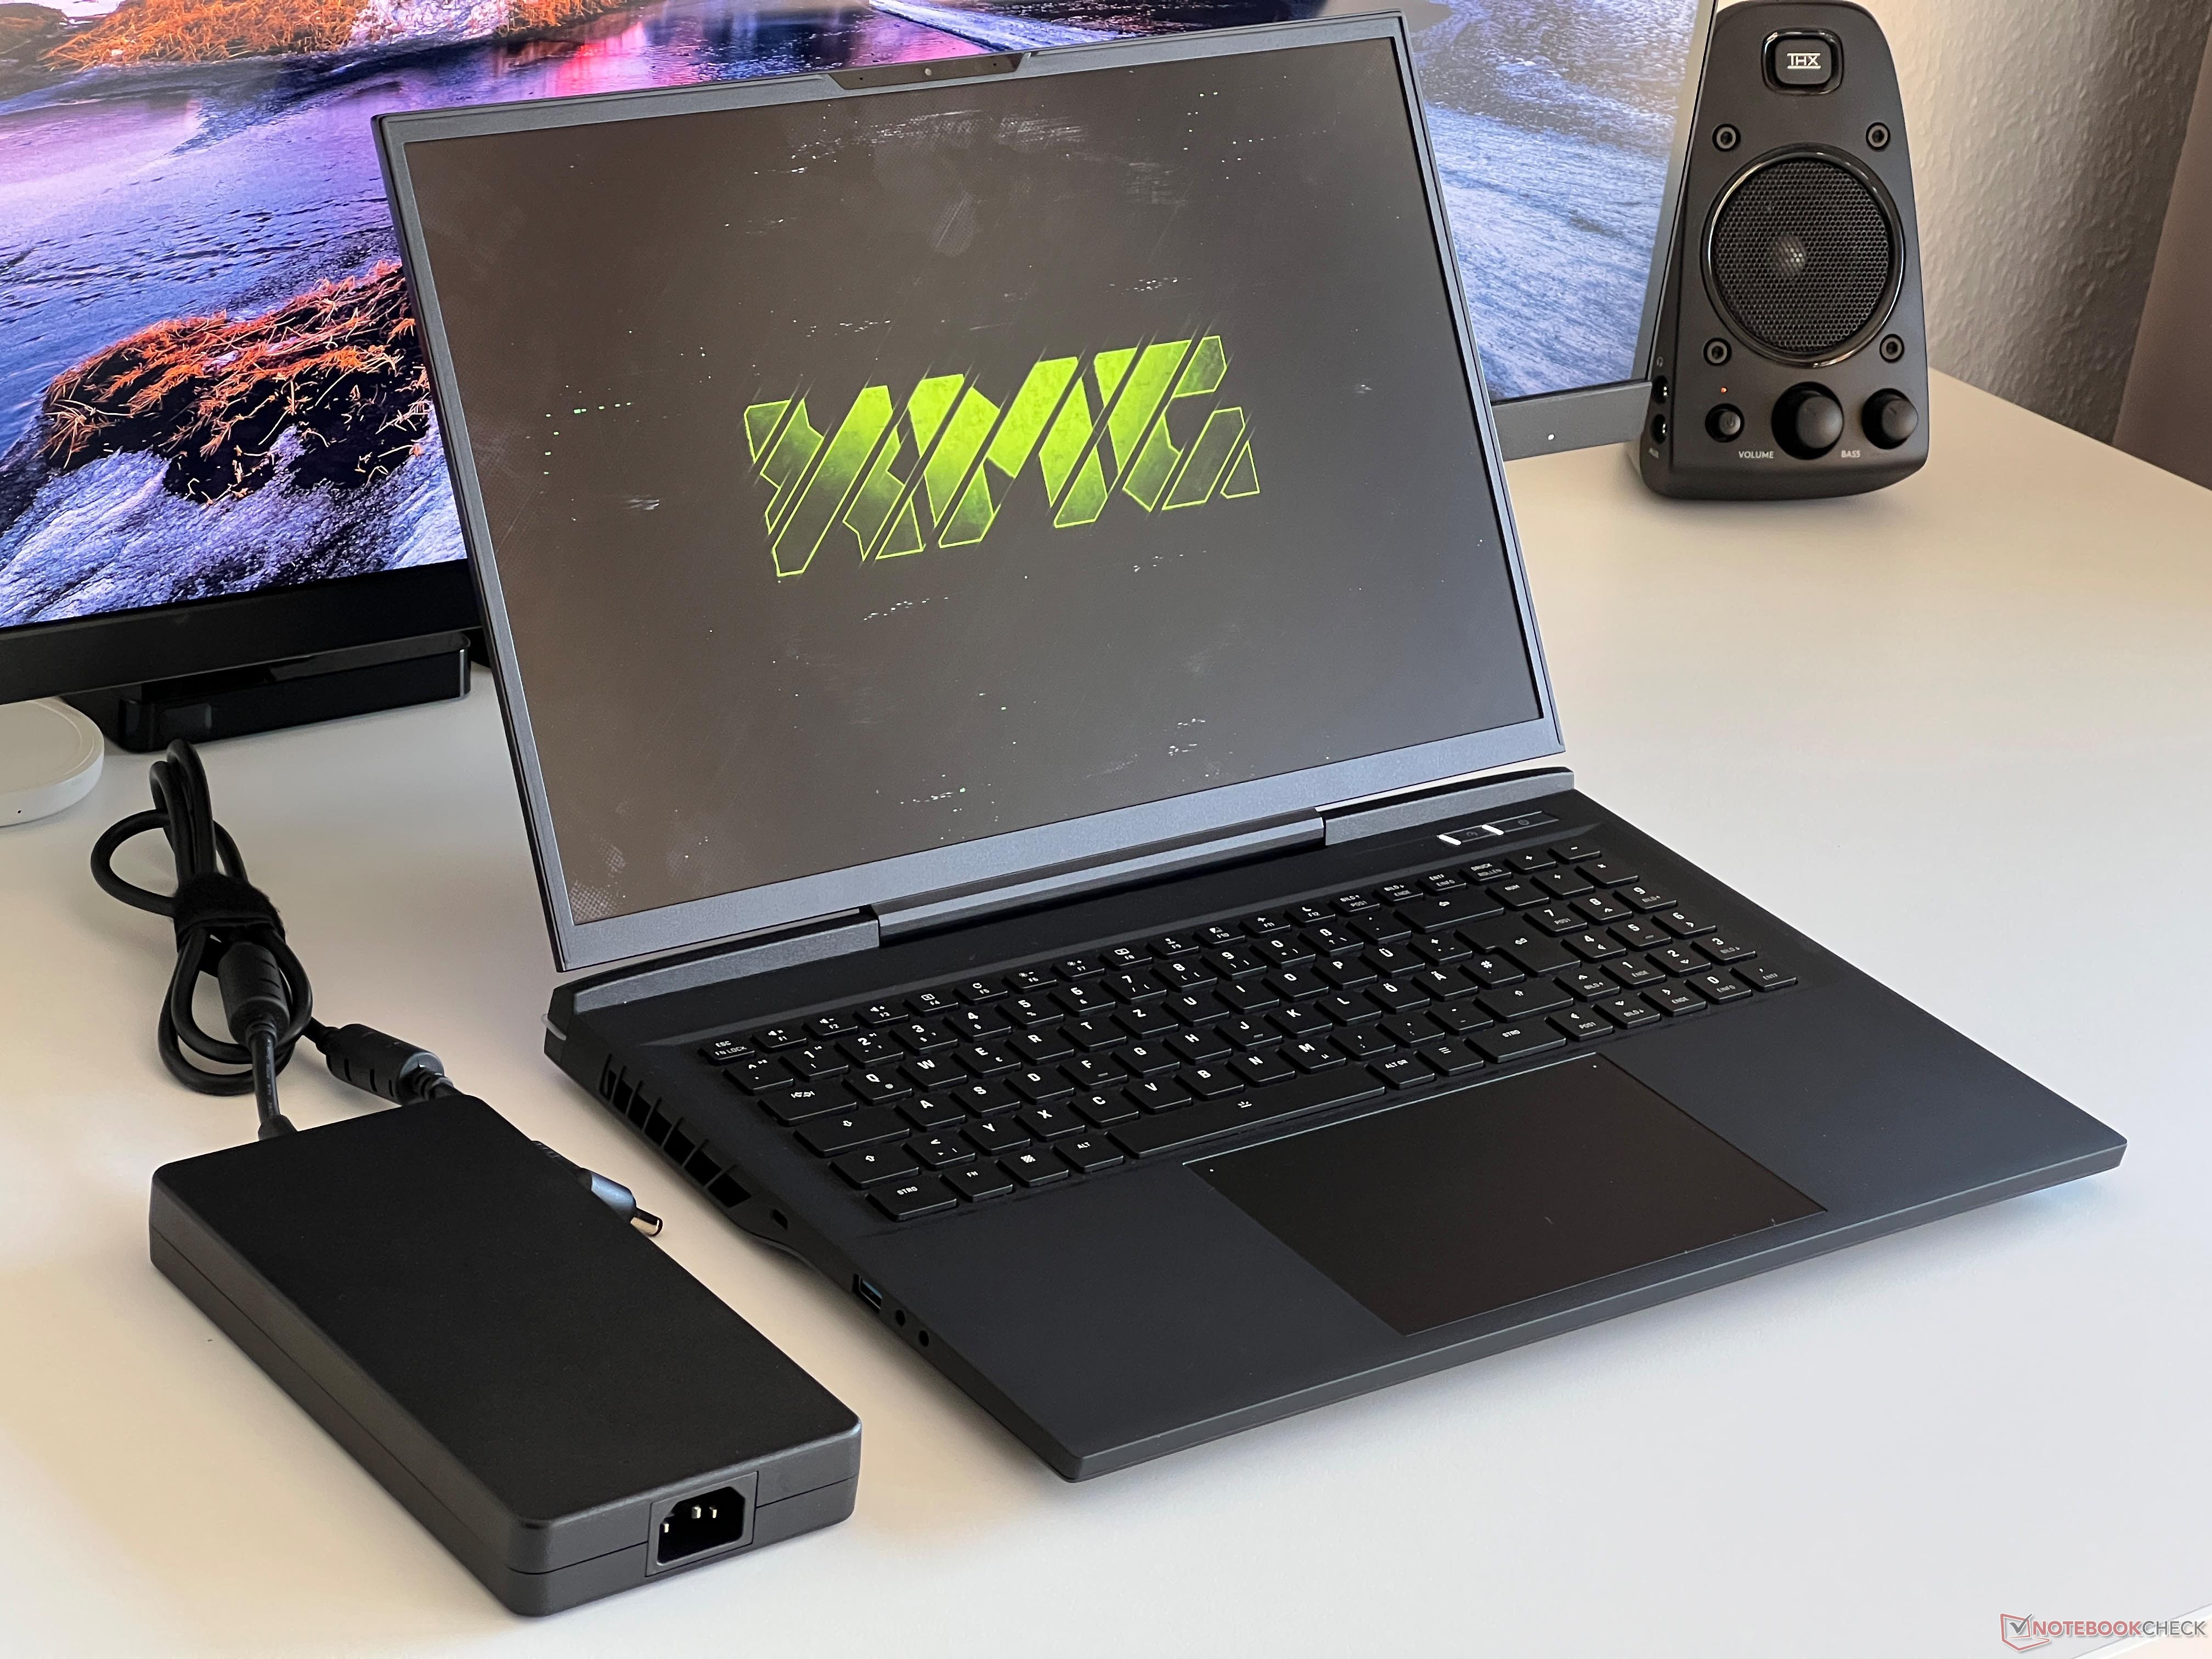
With the XMG Neo 17 E24, Schenker offers a powerful 17-inch gaming notebook with a 240 Hz QHD panel (G-Sync). The processor is always Intel's Core i9-14900HX and for the graphics card, you have the choice between the Nvidia GeForce RTX 4060 Laptop and all other models up to the GeForce RTX 4090 laptop. RAM/SSD memory can be configured extensively and, in addition to a mechanical keyboard, the external Oasis water cooling system is also available as an option, which can significantly increase the laptop's cooling capacity.
Our test device is equipped with the dedicated GeForce RTX 4080 laptop GPU, 32 GB RAM, and a 1 TB SSD from Samsung, which increases the price including the mechanical Cherry keyboard to 3,182 euros (base price 1,948 euros). We also take a look at some benchmarks of the Neo 17 with the RTX 4090 laptop in combination with the Oasis water cooling system (€199).
Specifications
Case & equipment
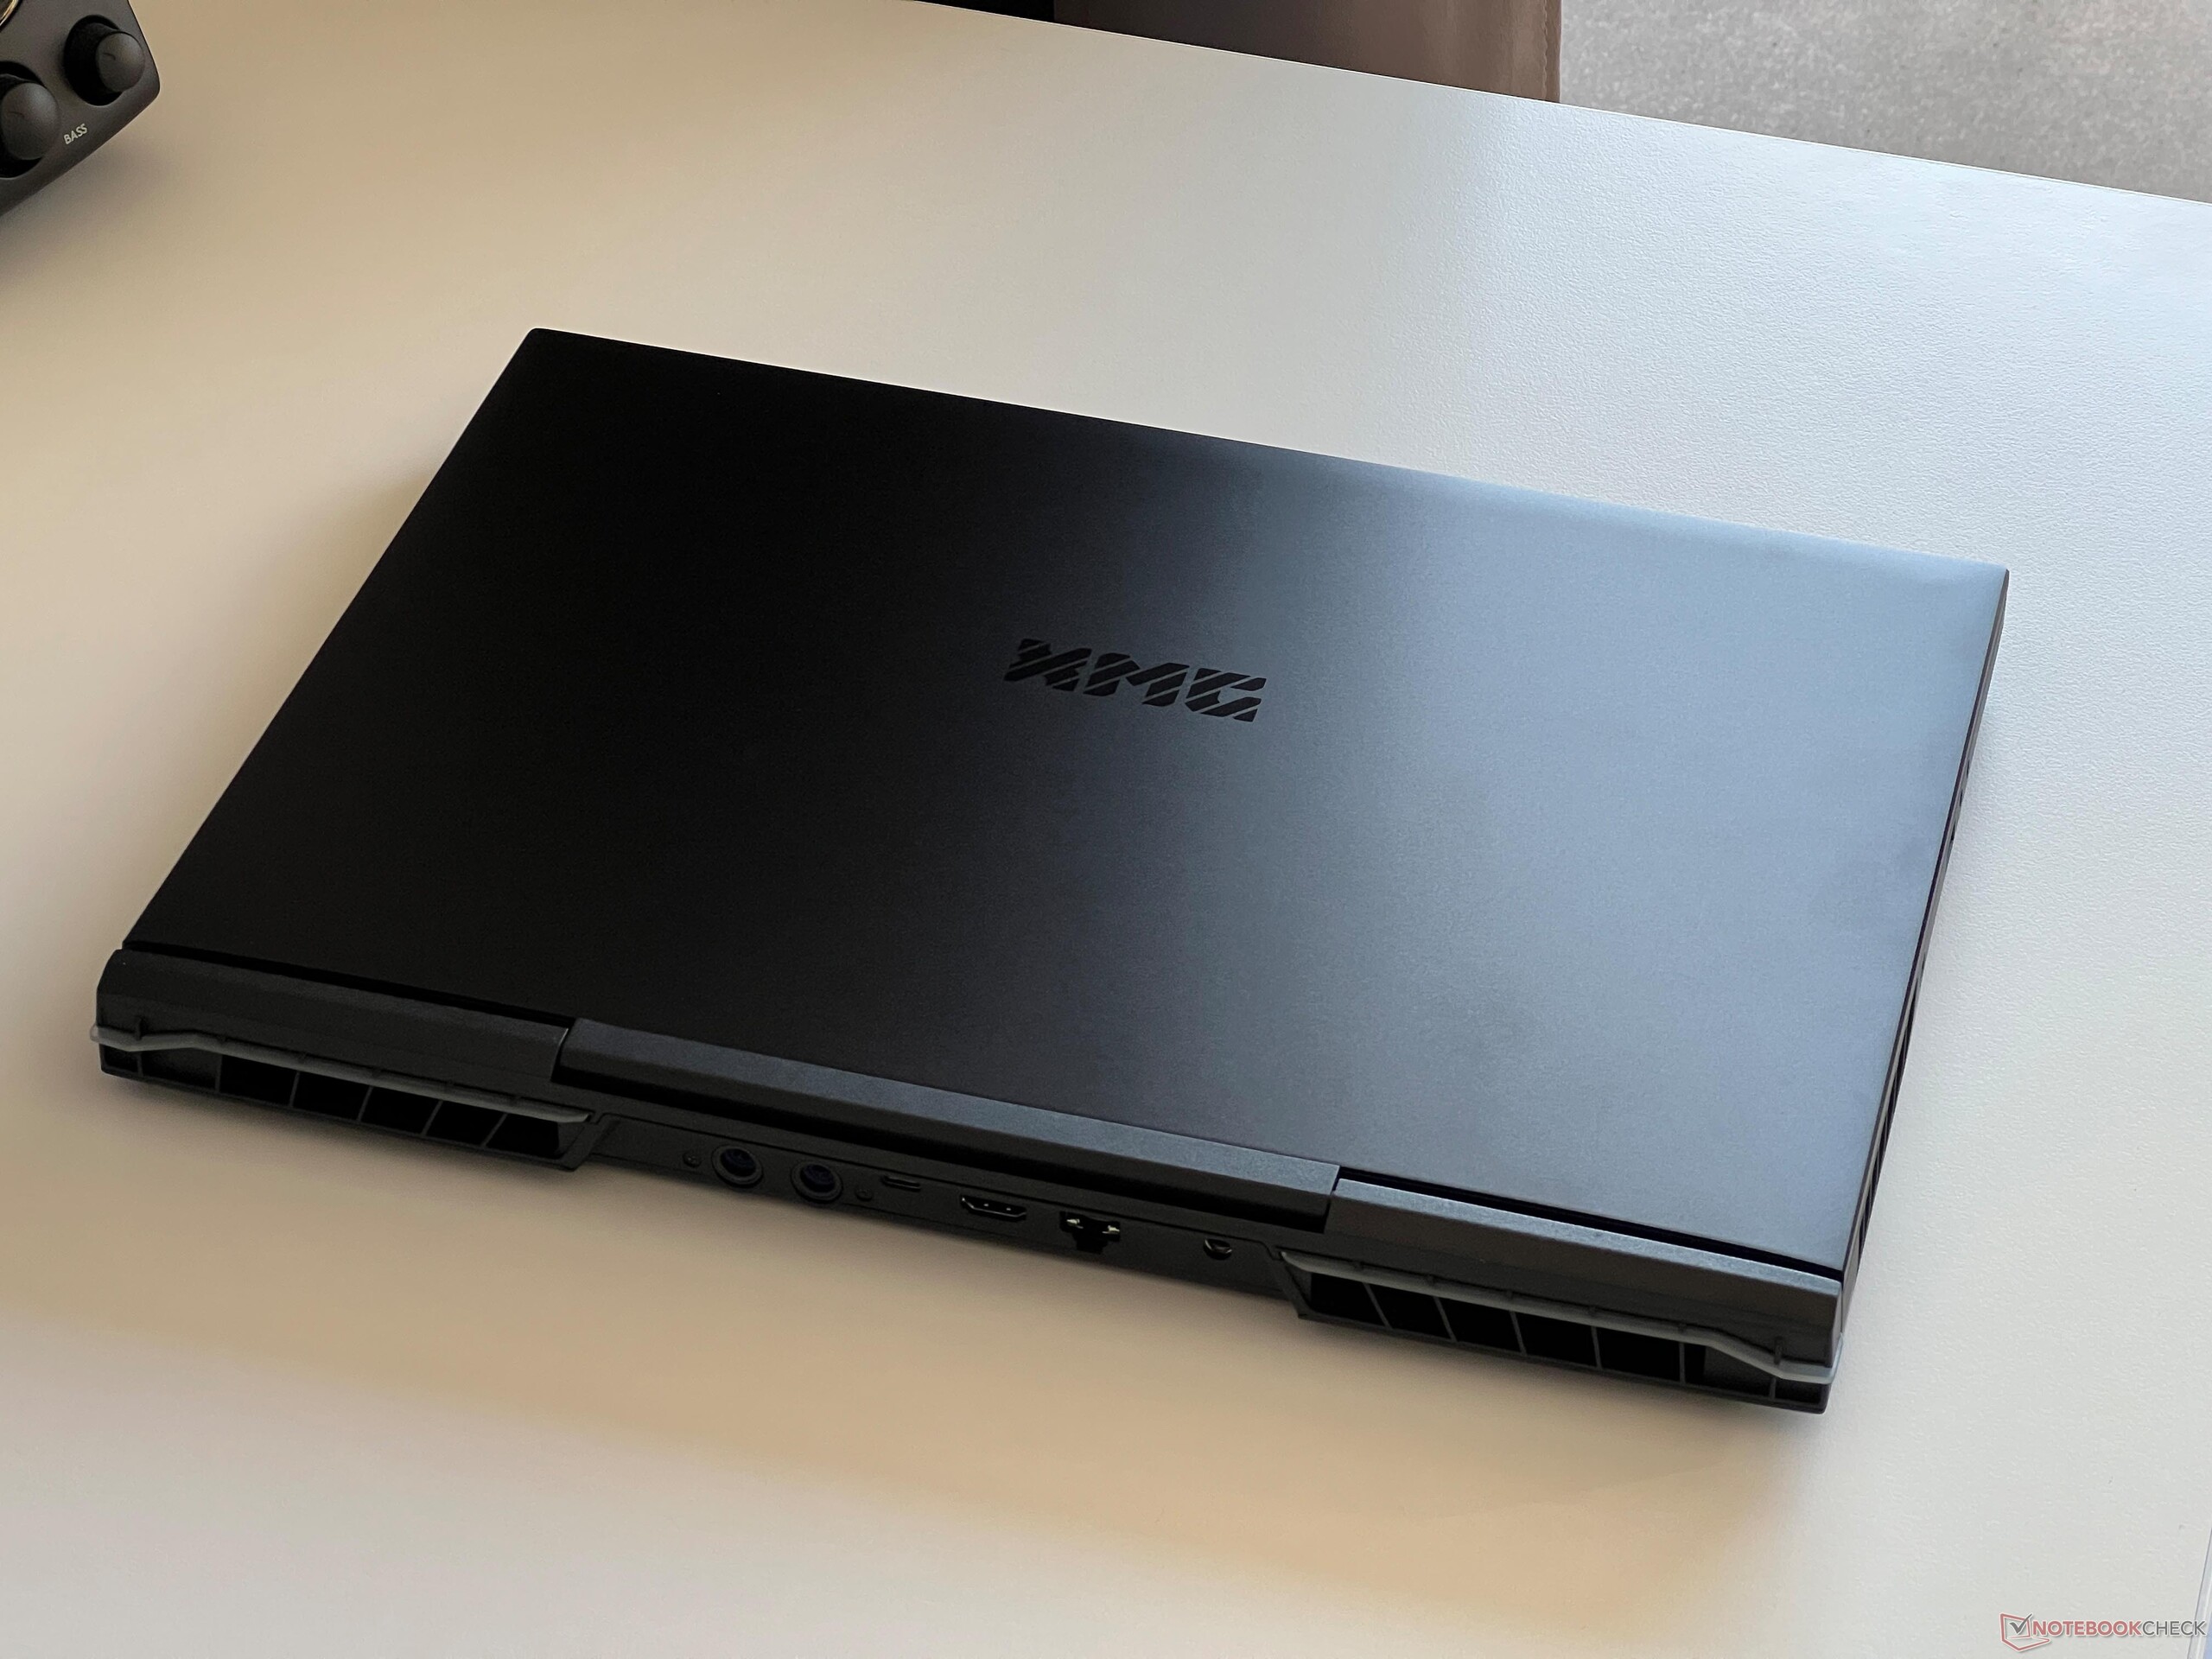
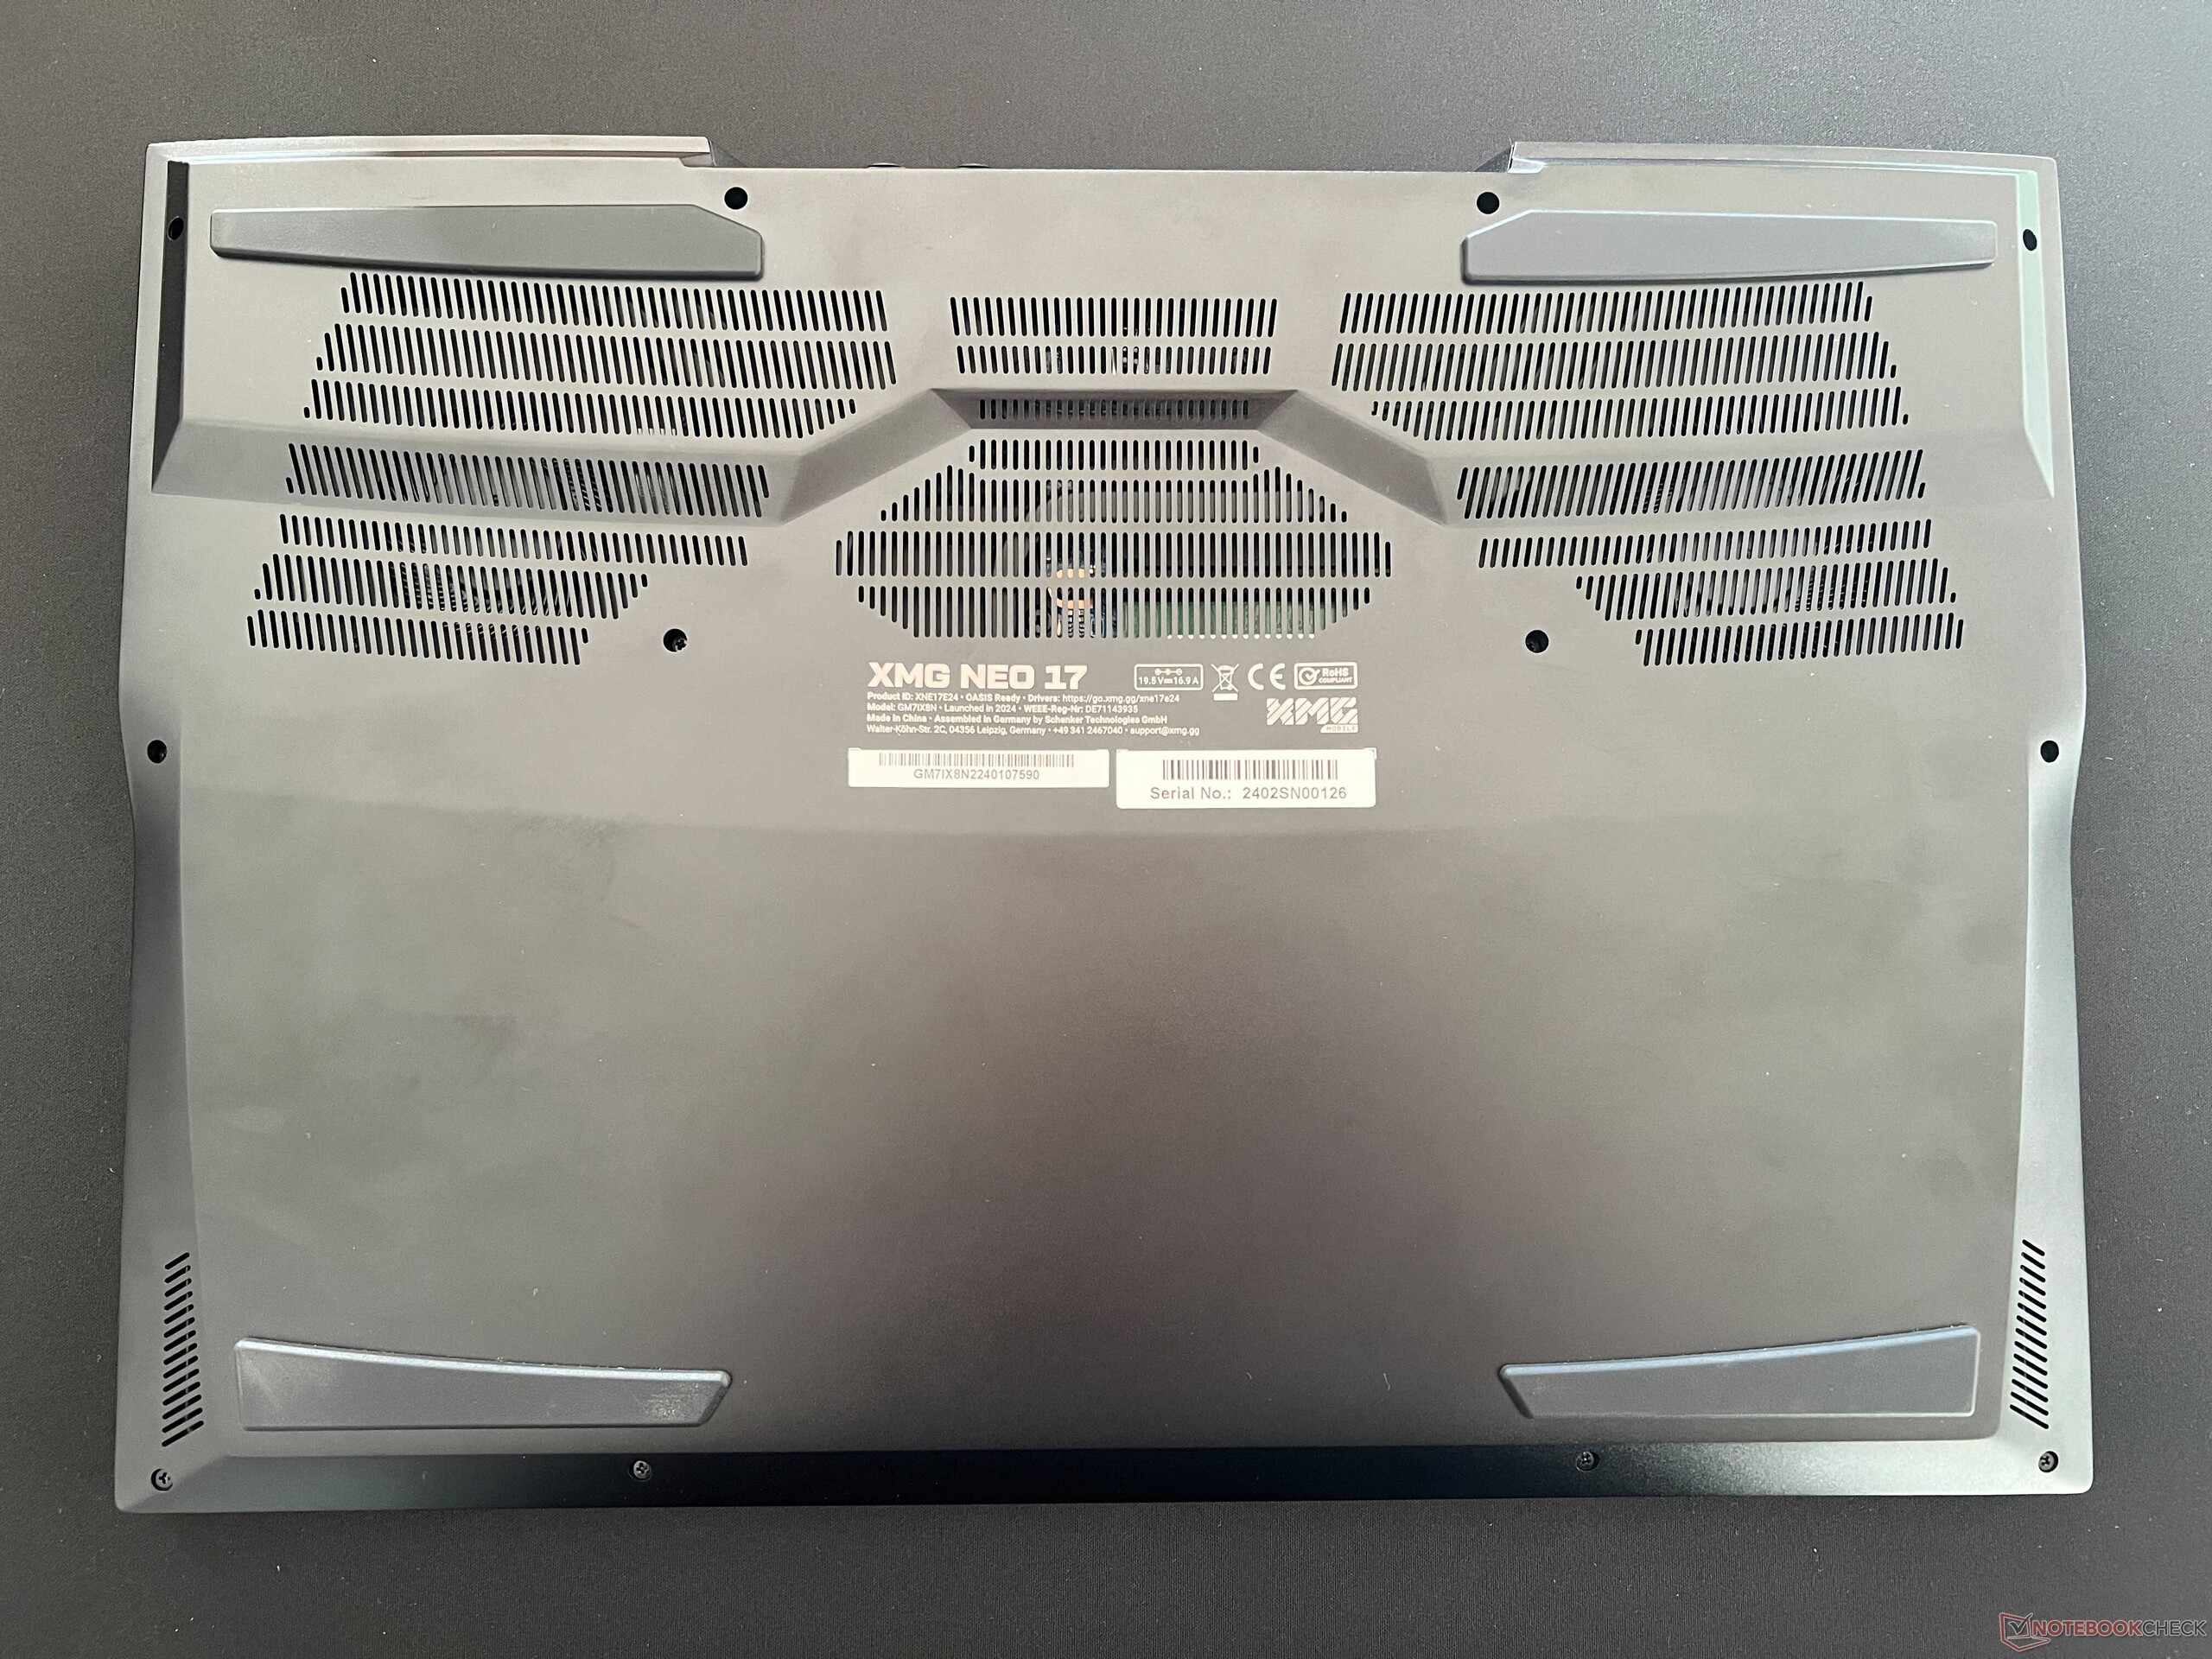
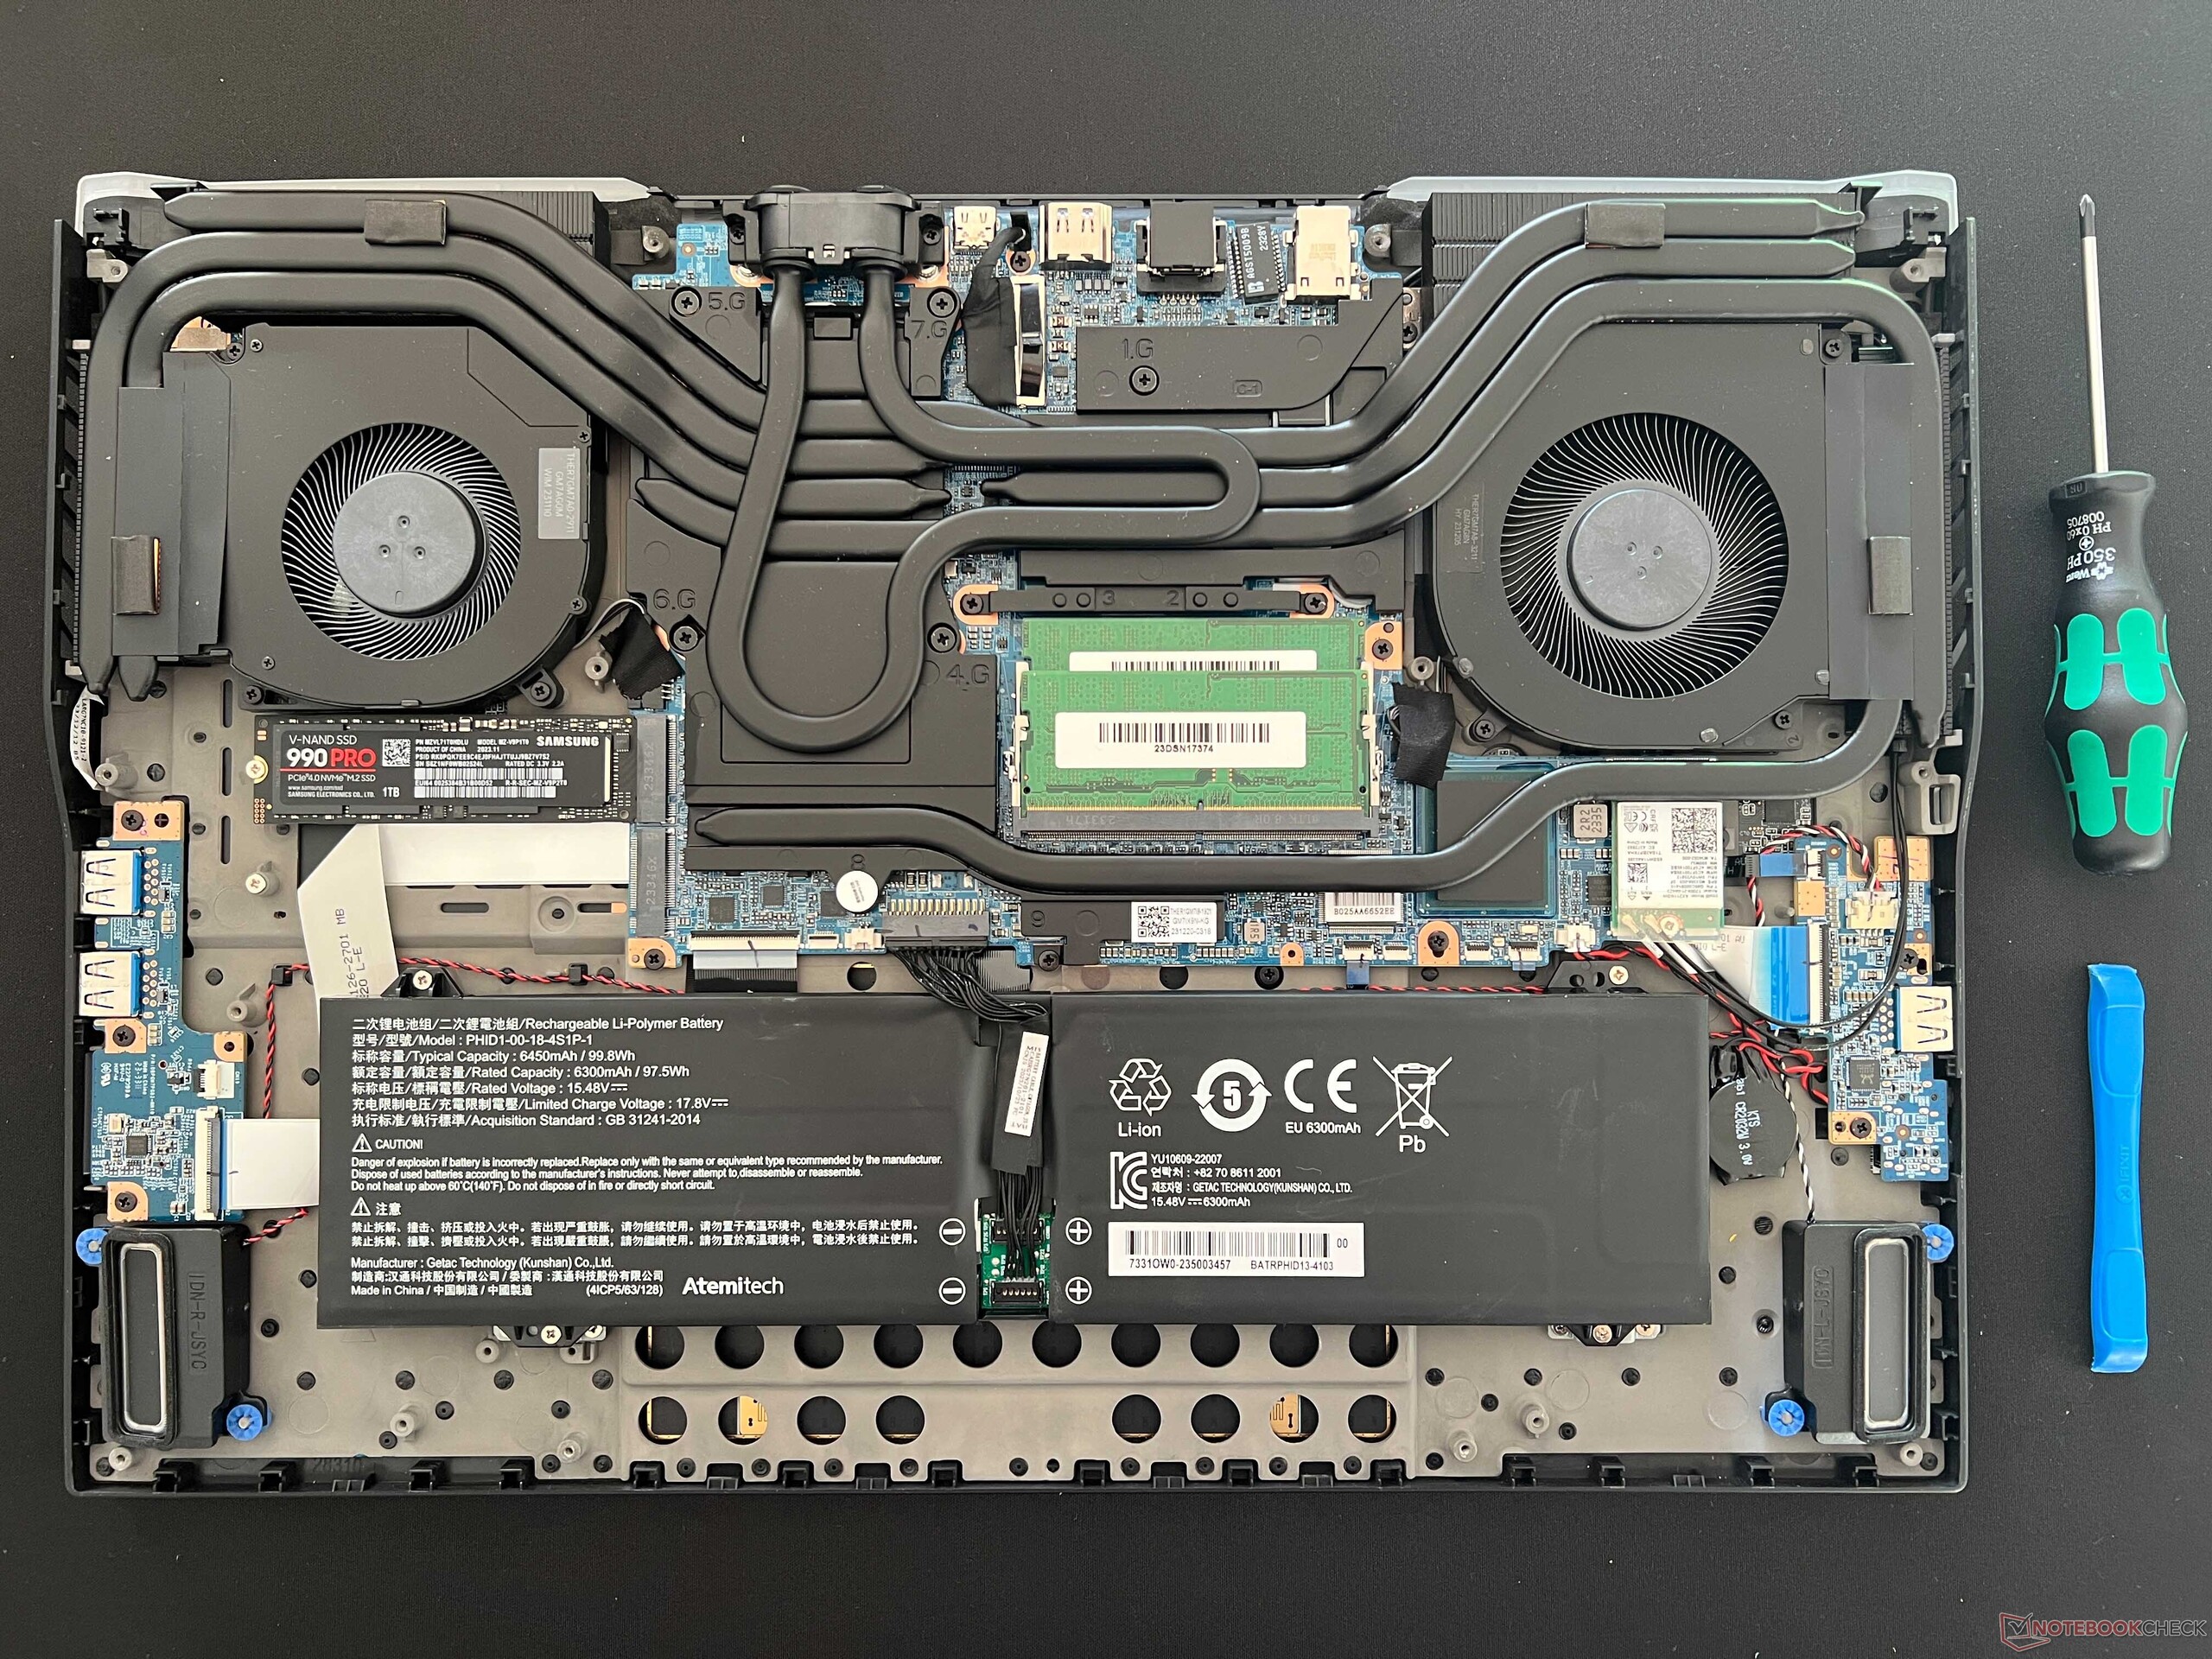
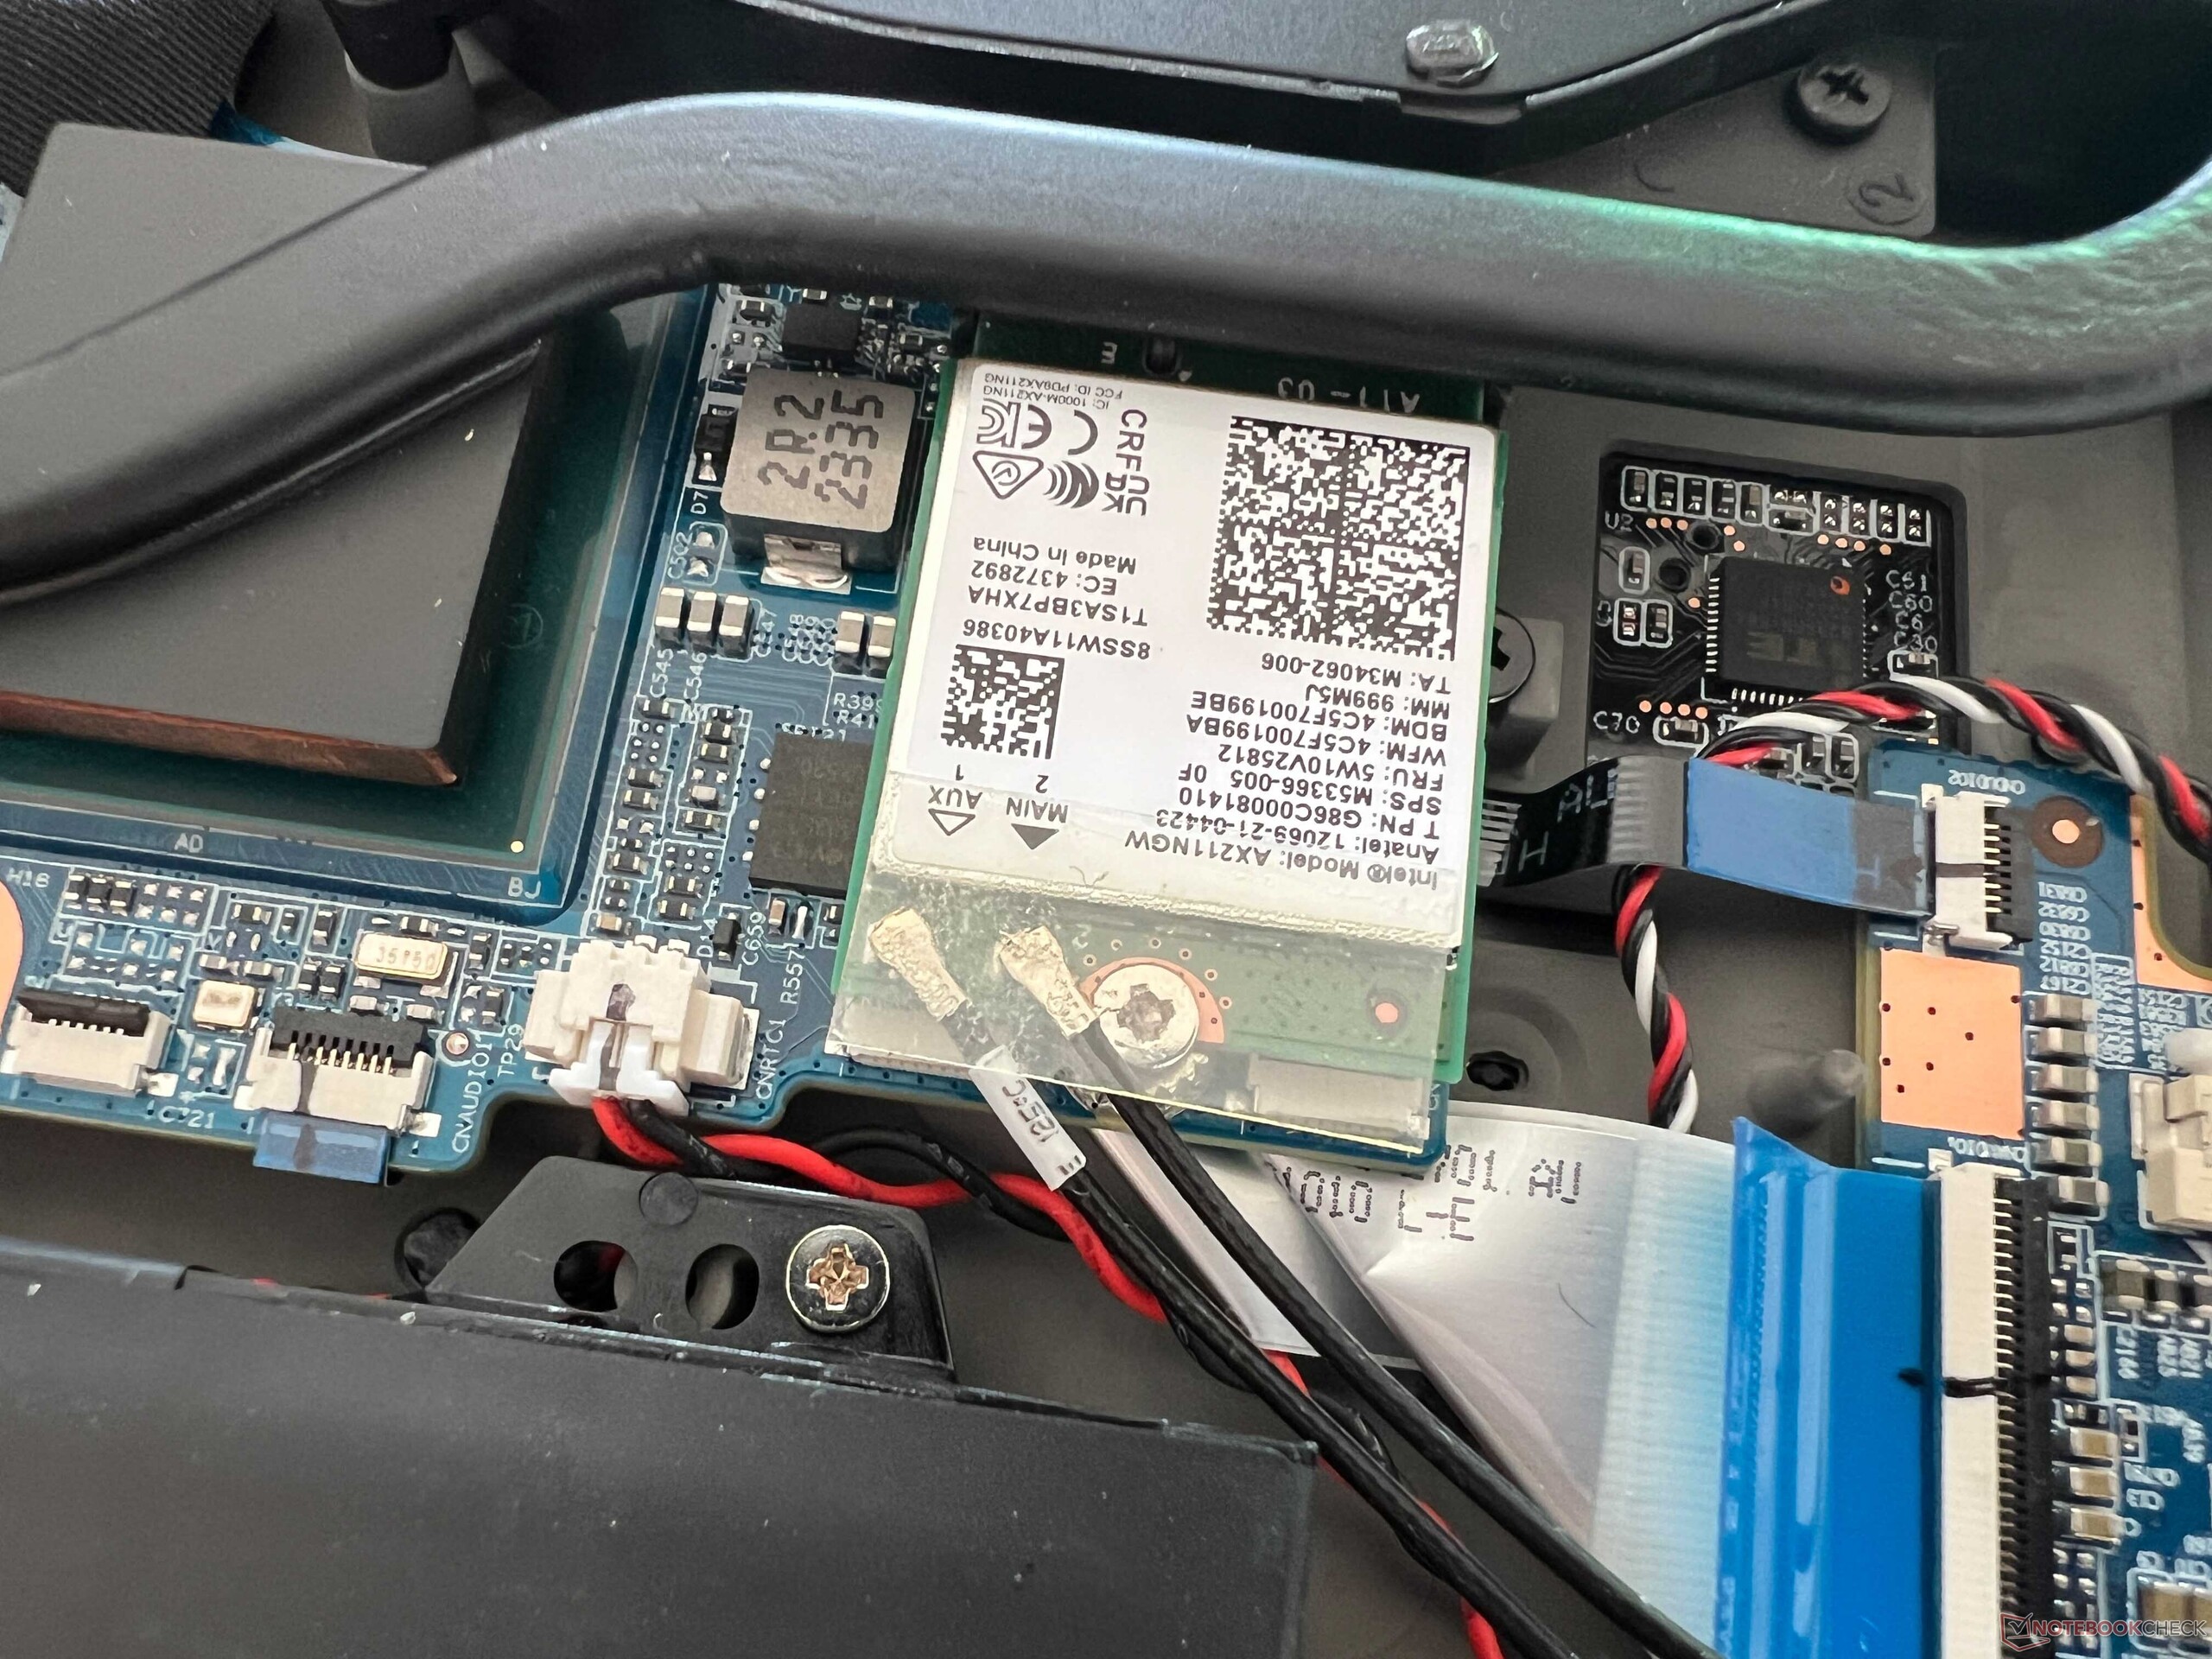
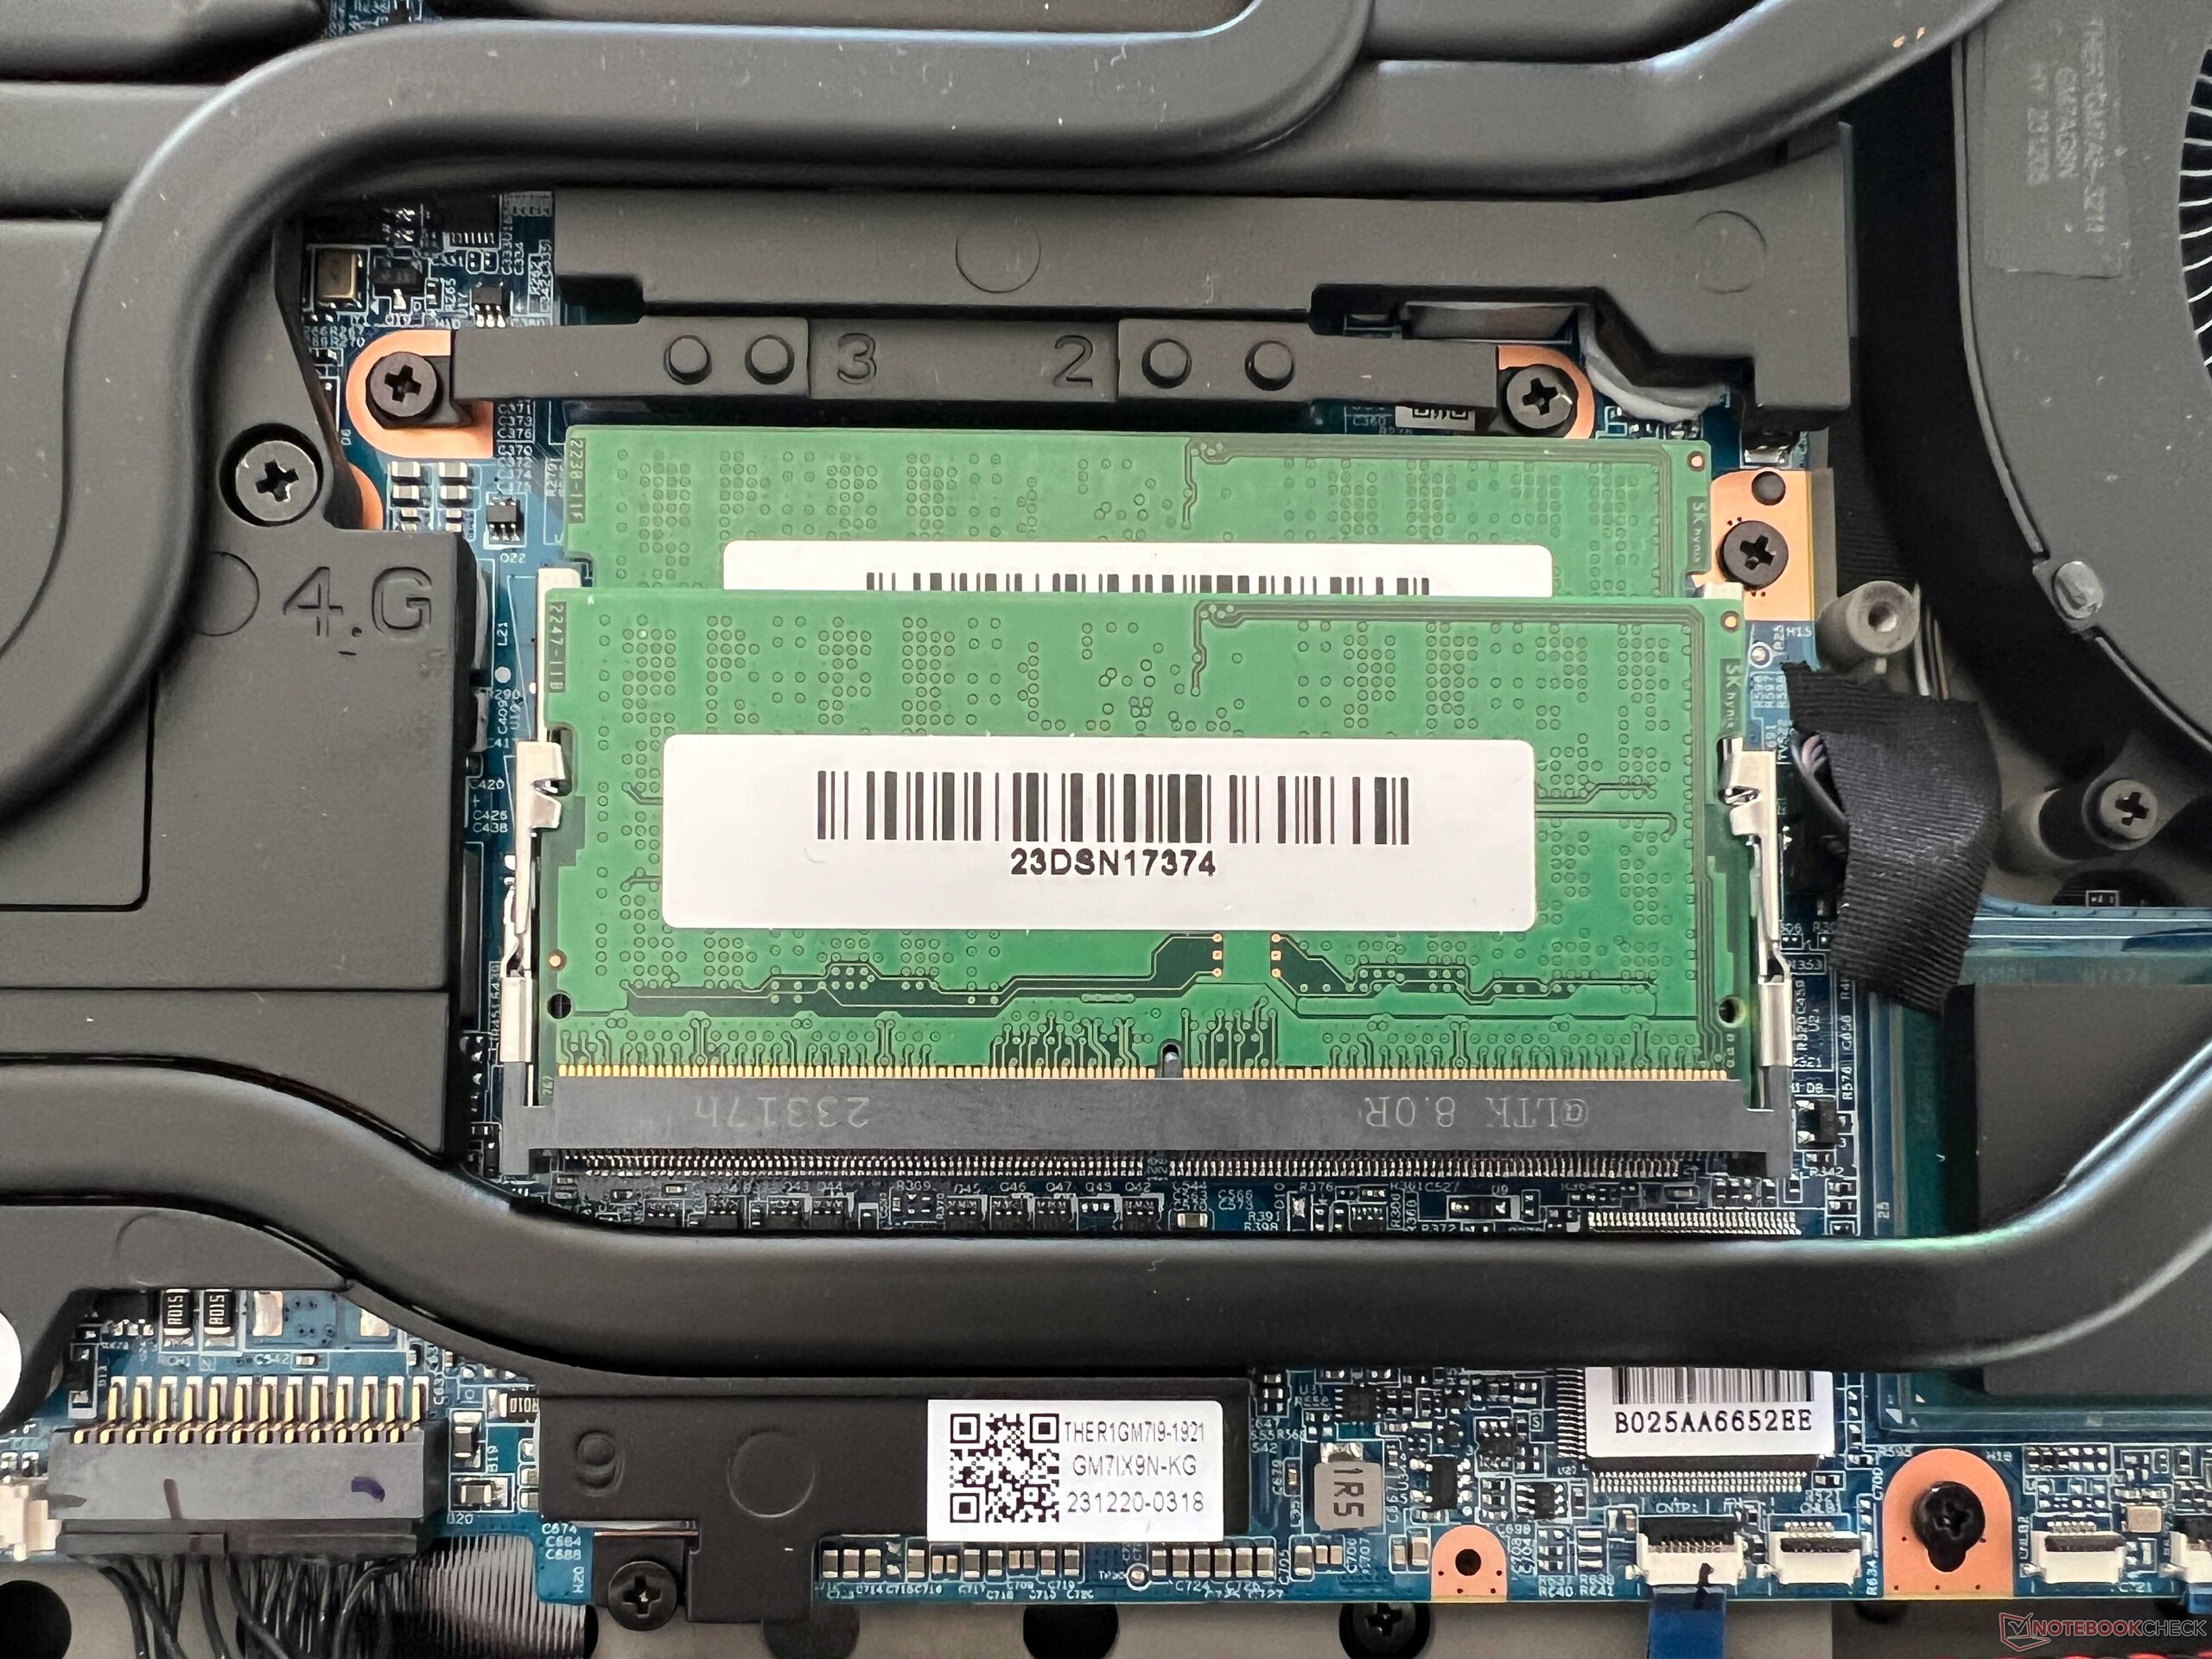
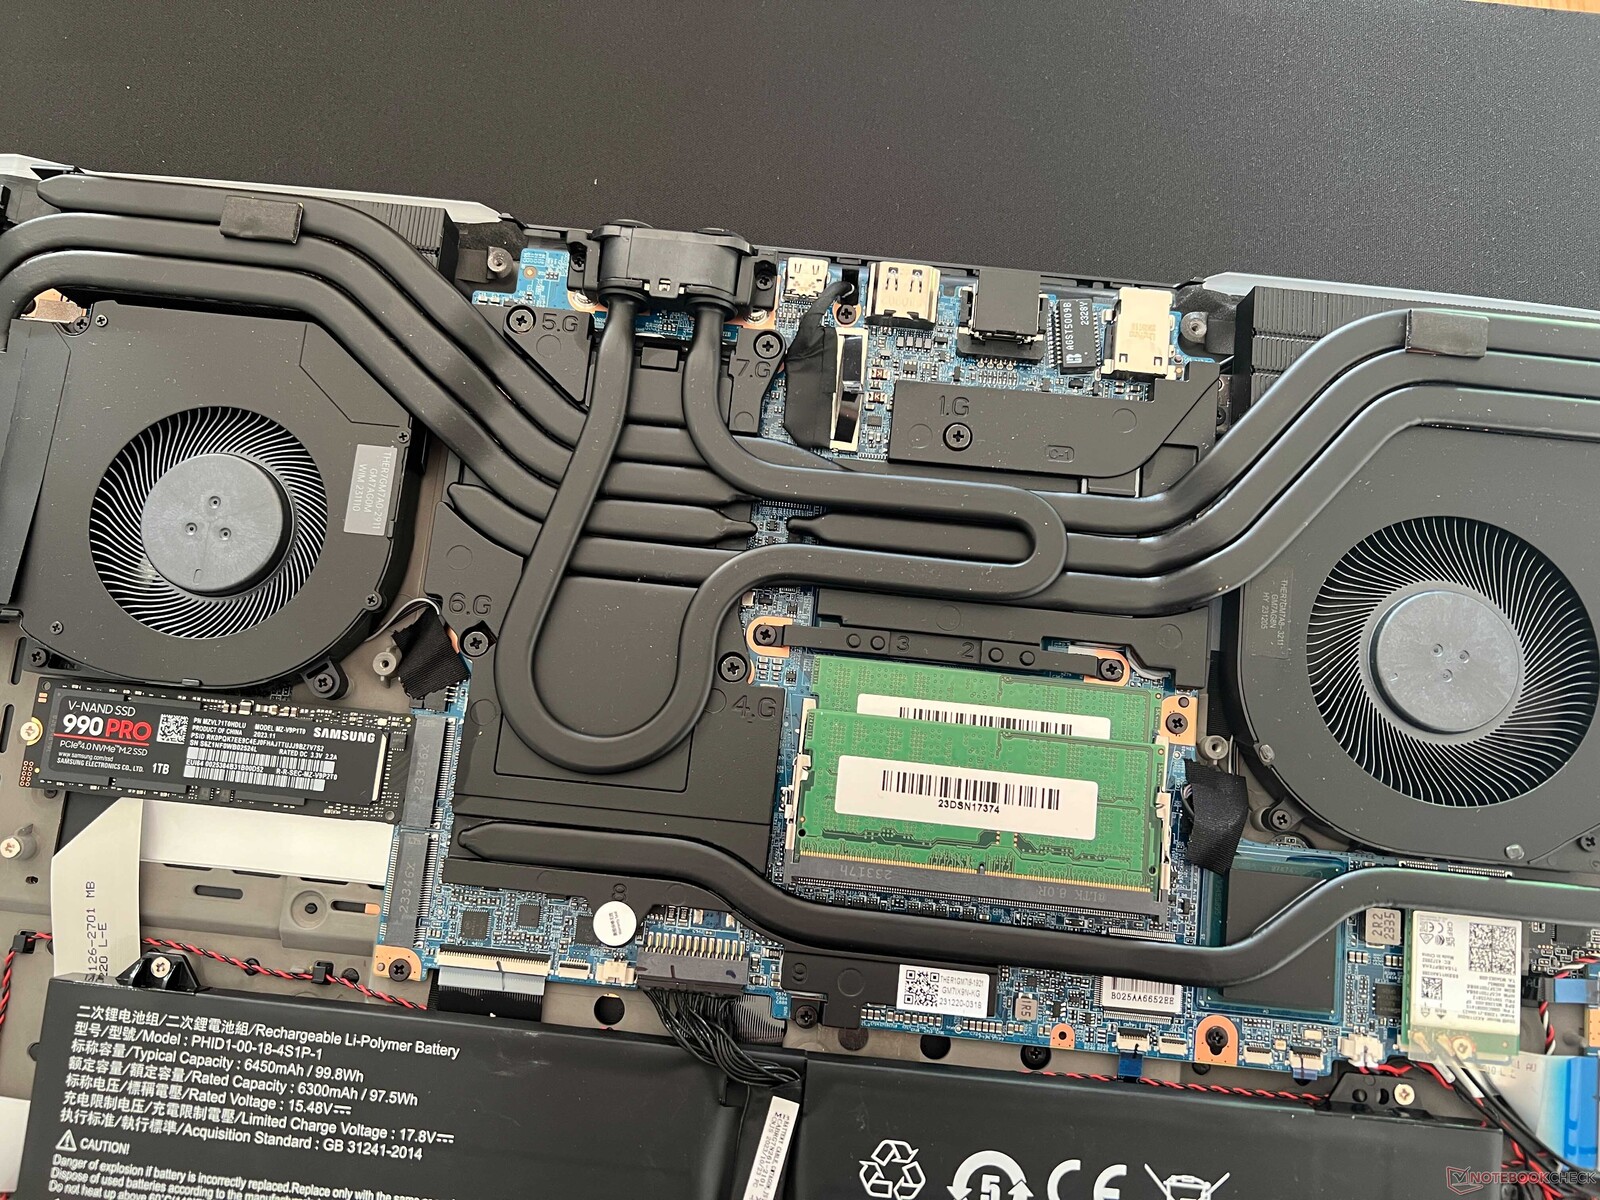
We are already familiar with the black metal chassis and rubberized base unit from the Medion Erazer Beast, which is based on the same barebone. There is an LED strip at the rear and an XMG logo on the lid, but otherwise, there are no annoying manufacturer stickers. The overall stability is very good, but with a weight of just under 2.9 kg and a height of 2.7 cm, the Neo 17 is not lightweight either. The lower case cover can be removed relatively easily (the two screws on the water cooling connection must also be loosened) and you can access all the important components including RAM, 2x M.2-2280 SSD, or the WLAN module.
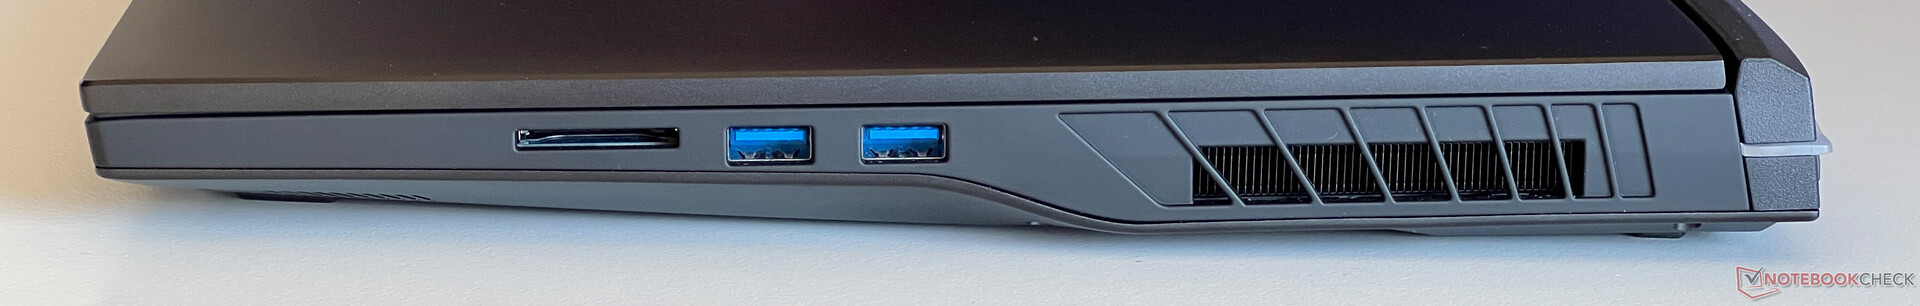
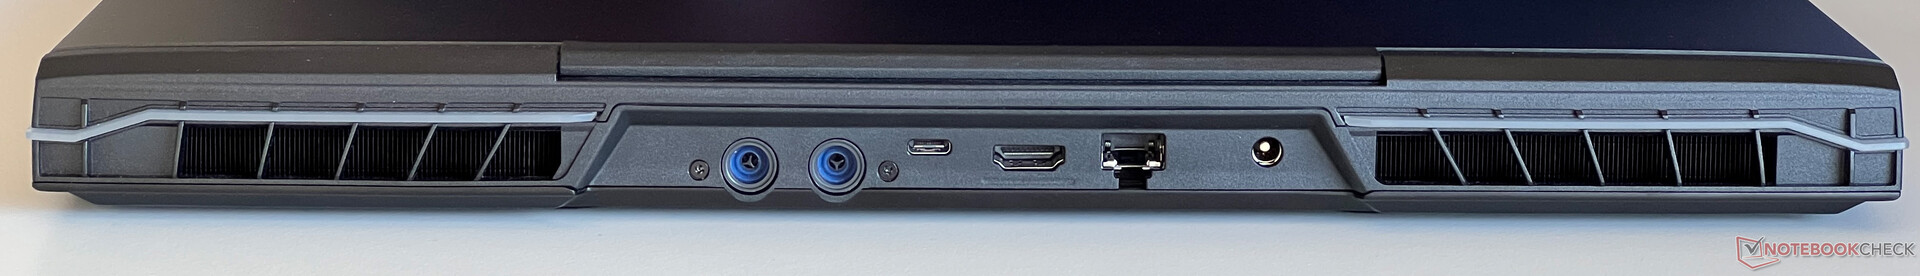
The range of connections is very extensive since, in addition to sufficient USB ports, Thunderbolt 4 and HDMI are also available. The card reader achieves average transfer rates in conjunction with our reference card (Angelbird AV Pro V60) and the 1080p webcam takes sufficiently sharp pictures. The Wi-Fi 6E module from Intel (AX211) achieves very good transfer rates in conjunction with our reference router, but the latest Wi-Fi 7 standard is not yet supported.

| SD Card Reader | |
| average JPG Copy Test (av. of 3 runs) | |
| Average of class Gaming (20.9 - 210, n=54, last 2 years) | |
| Schenker XMG Neo 17 E24 (Angelbird AV Pro V60) | |
| Medion Erazer Beast X40 2024 (AV PRO microSD 128 GB V60) | |
| MSI GE78HX 13VH-070US (Angelibird AV Pro V60) | |
| maximum AS SSD Seq Read Test (1GB) | |
| Average of class Gaming (25.5 - 261, n=51, last 2 years) | |
| Medion Erazer Beast X40 2024 (AV PRO microSD 128 GB V60) | |
| MSI GE78HX 13VH-070US (Angelibird AV Pro V60) | |
| Schenker XMG Neo 17 E24 (Angelbird AV Pro V60) | |
| Networking | |
| Schenker XMG Neo 17 E24 | |
| iperf3 transmit AXE11000 | |
| iperf3 receive AXE11000 | |
| Medion Erazer Beast X40 2024 | |
| iperf3 transmit AXE11000 | |
| iperf3 receive AXE11000 | |
| HP Omen 17-db0079ng | |
| iperf3 transmit AXE11000 | |
| iperf3 receive AXE11000 | |
| Eurocom Raptor X17 Core i9-14900HX | |
| iperf3 transmit AXE11000 | |
| iperf3 receive AXE11000 | |
| iperf3 transmit AXE11000 6GHz | |
| iperf3 receive AXE11000 6GHz | |
| MSI GE78HX 13VH-070US | |
| iperf3 transmit AXE11000 | |
| iperf3 receive AXE11000 | |
| iperf3 transmit AXE11000 6GHz | |
| iperf3 receive AXE11000 6GHz | |


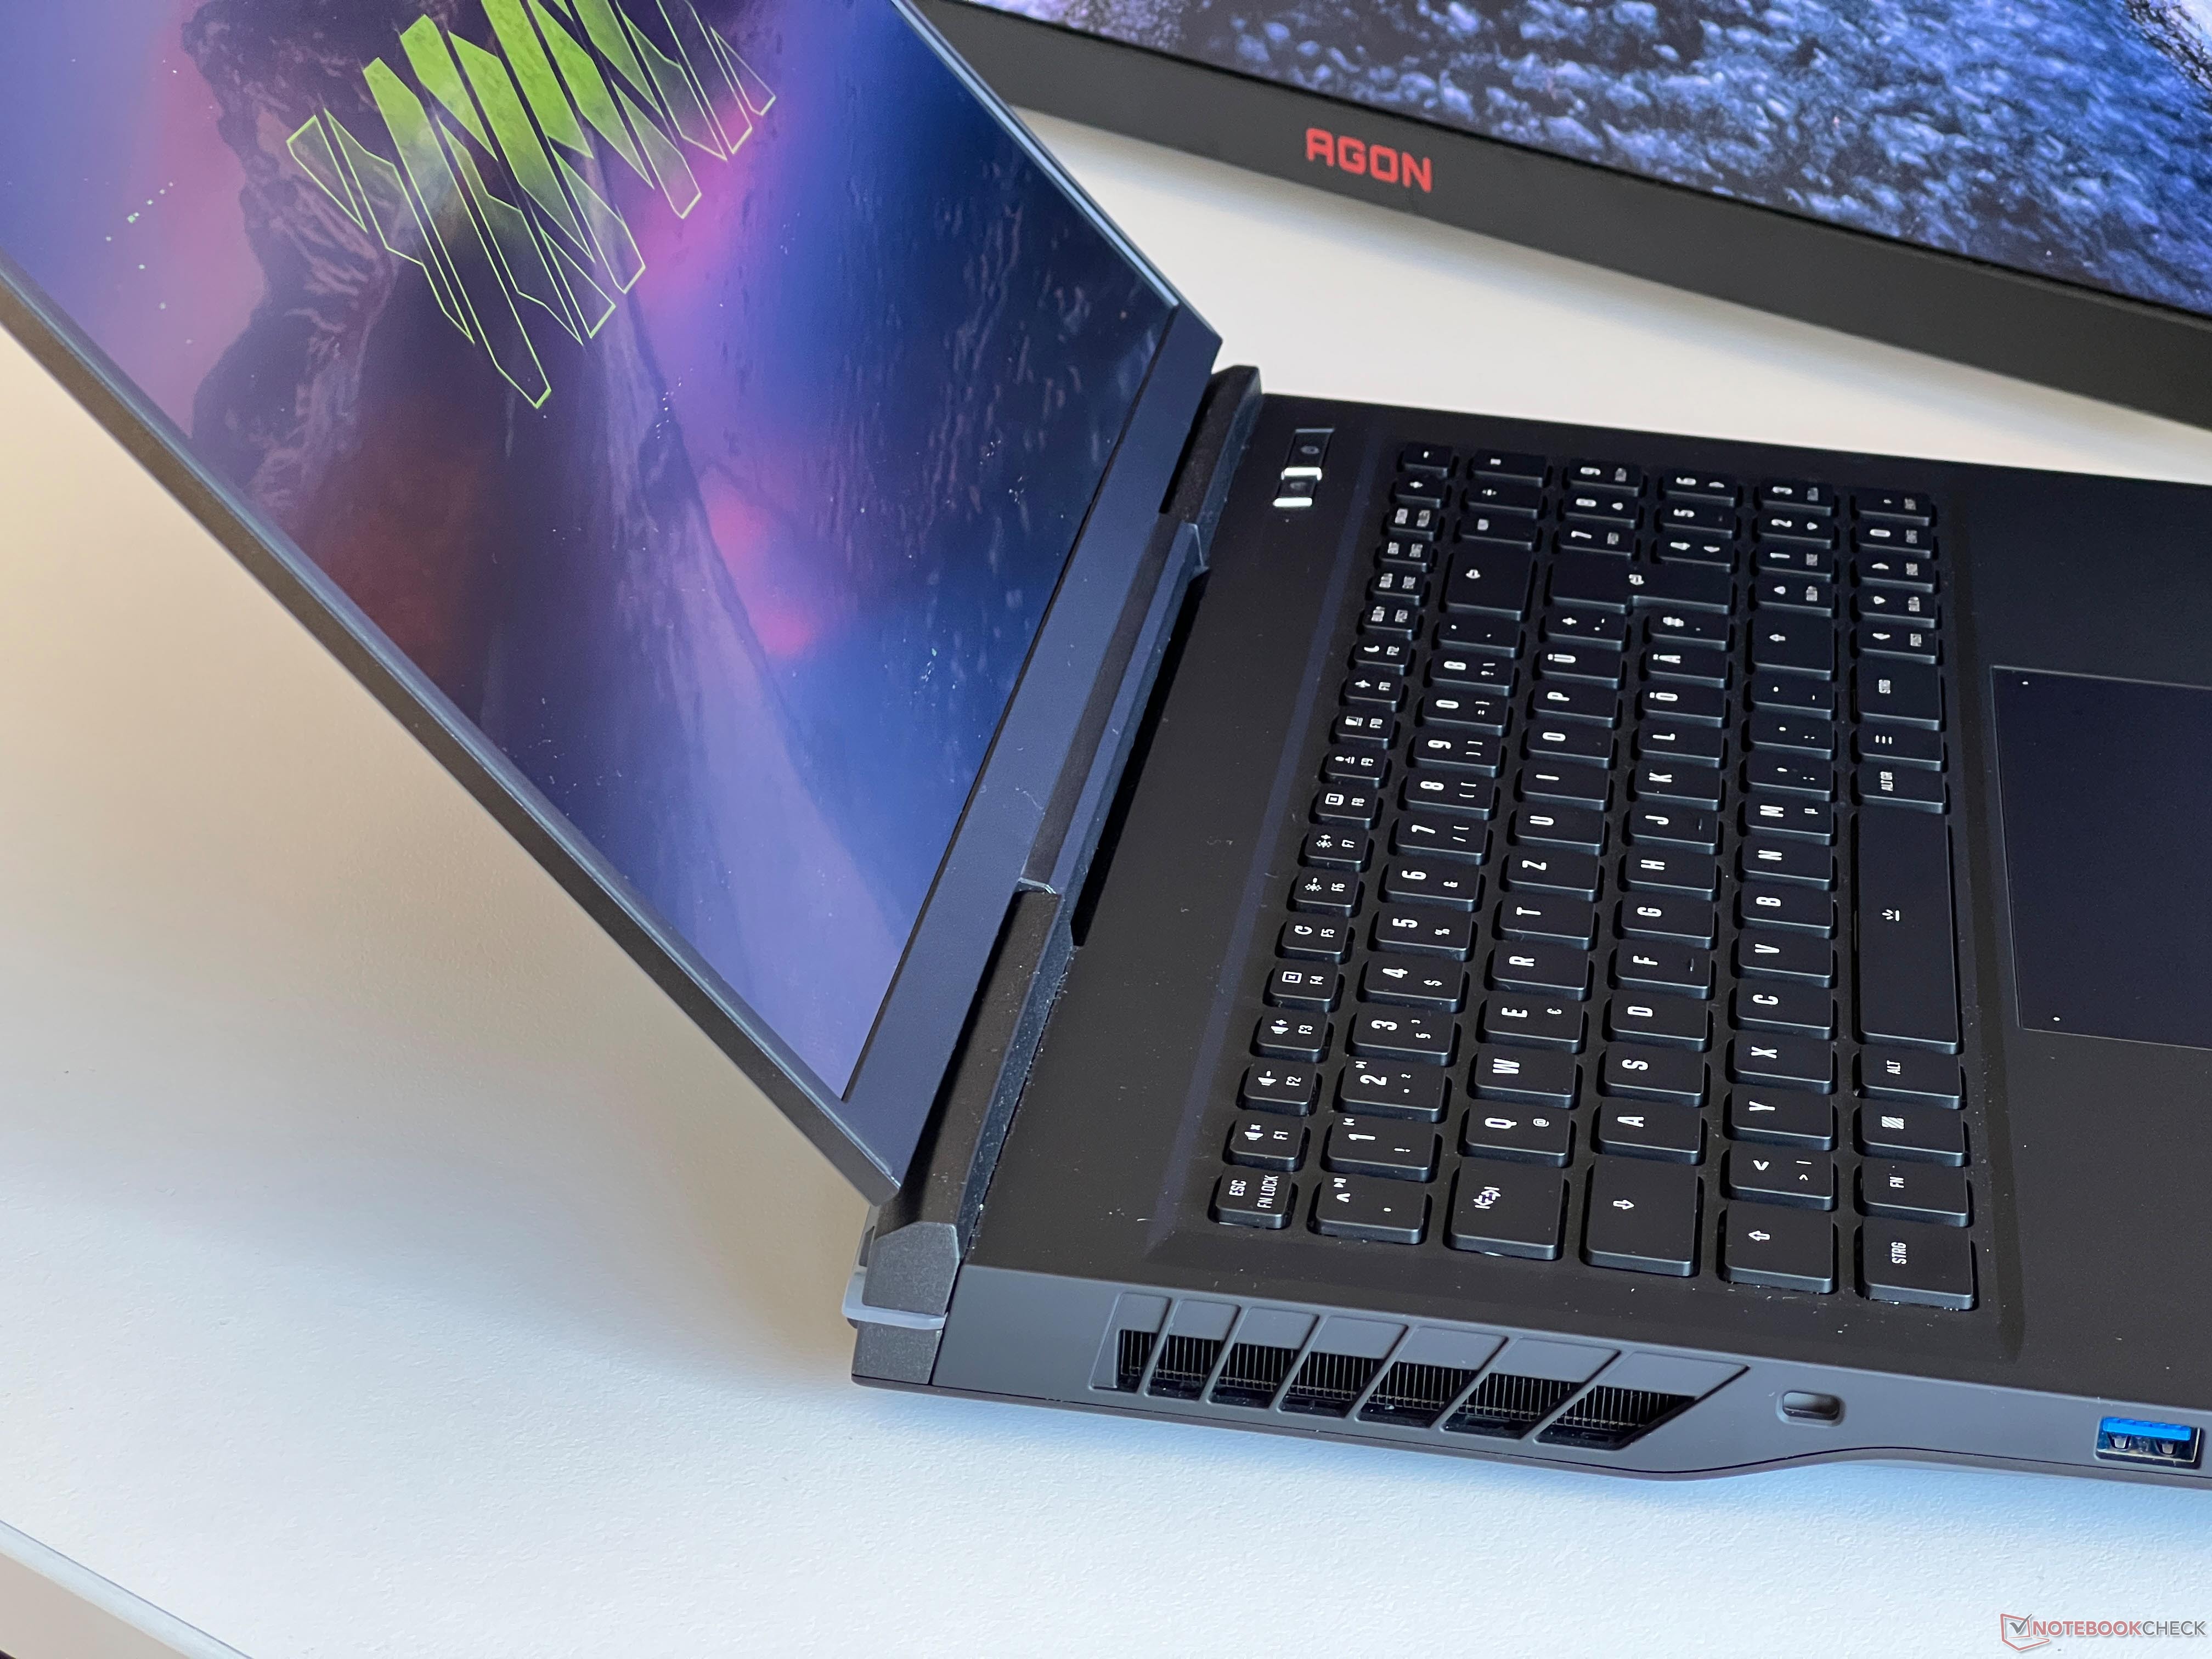
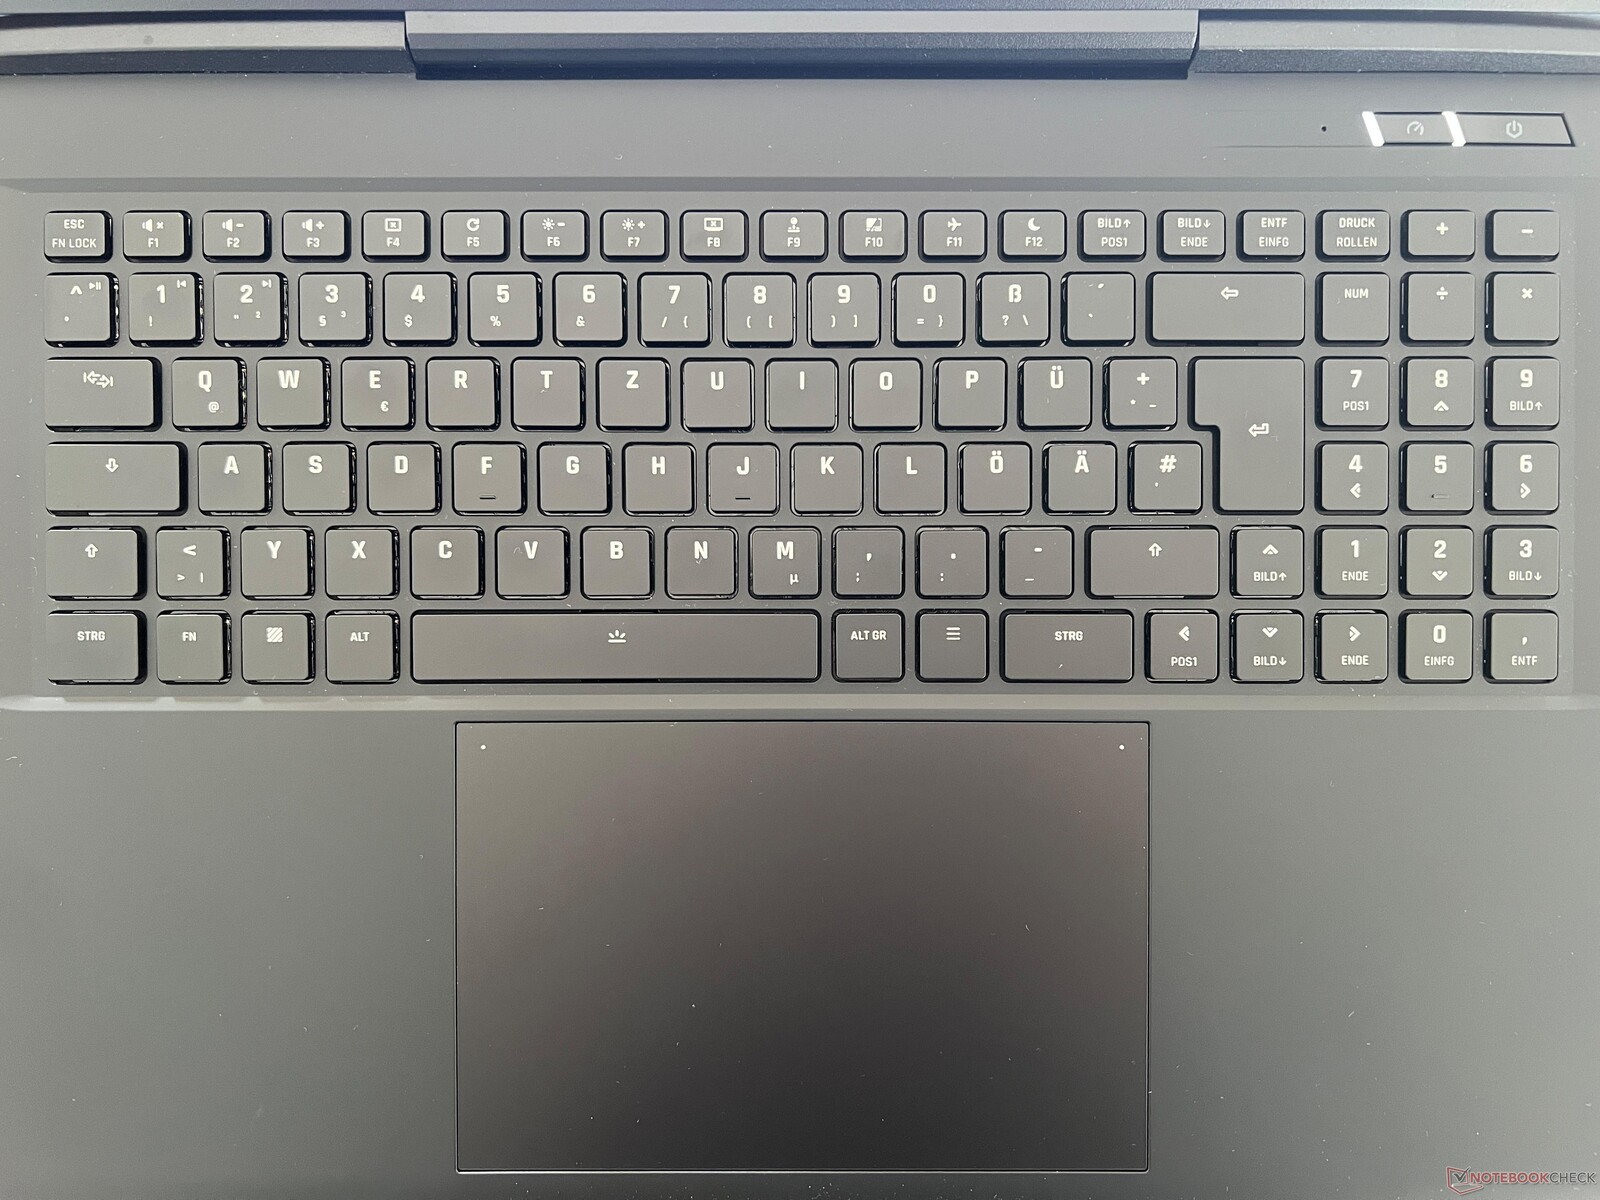
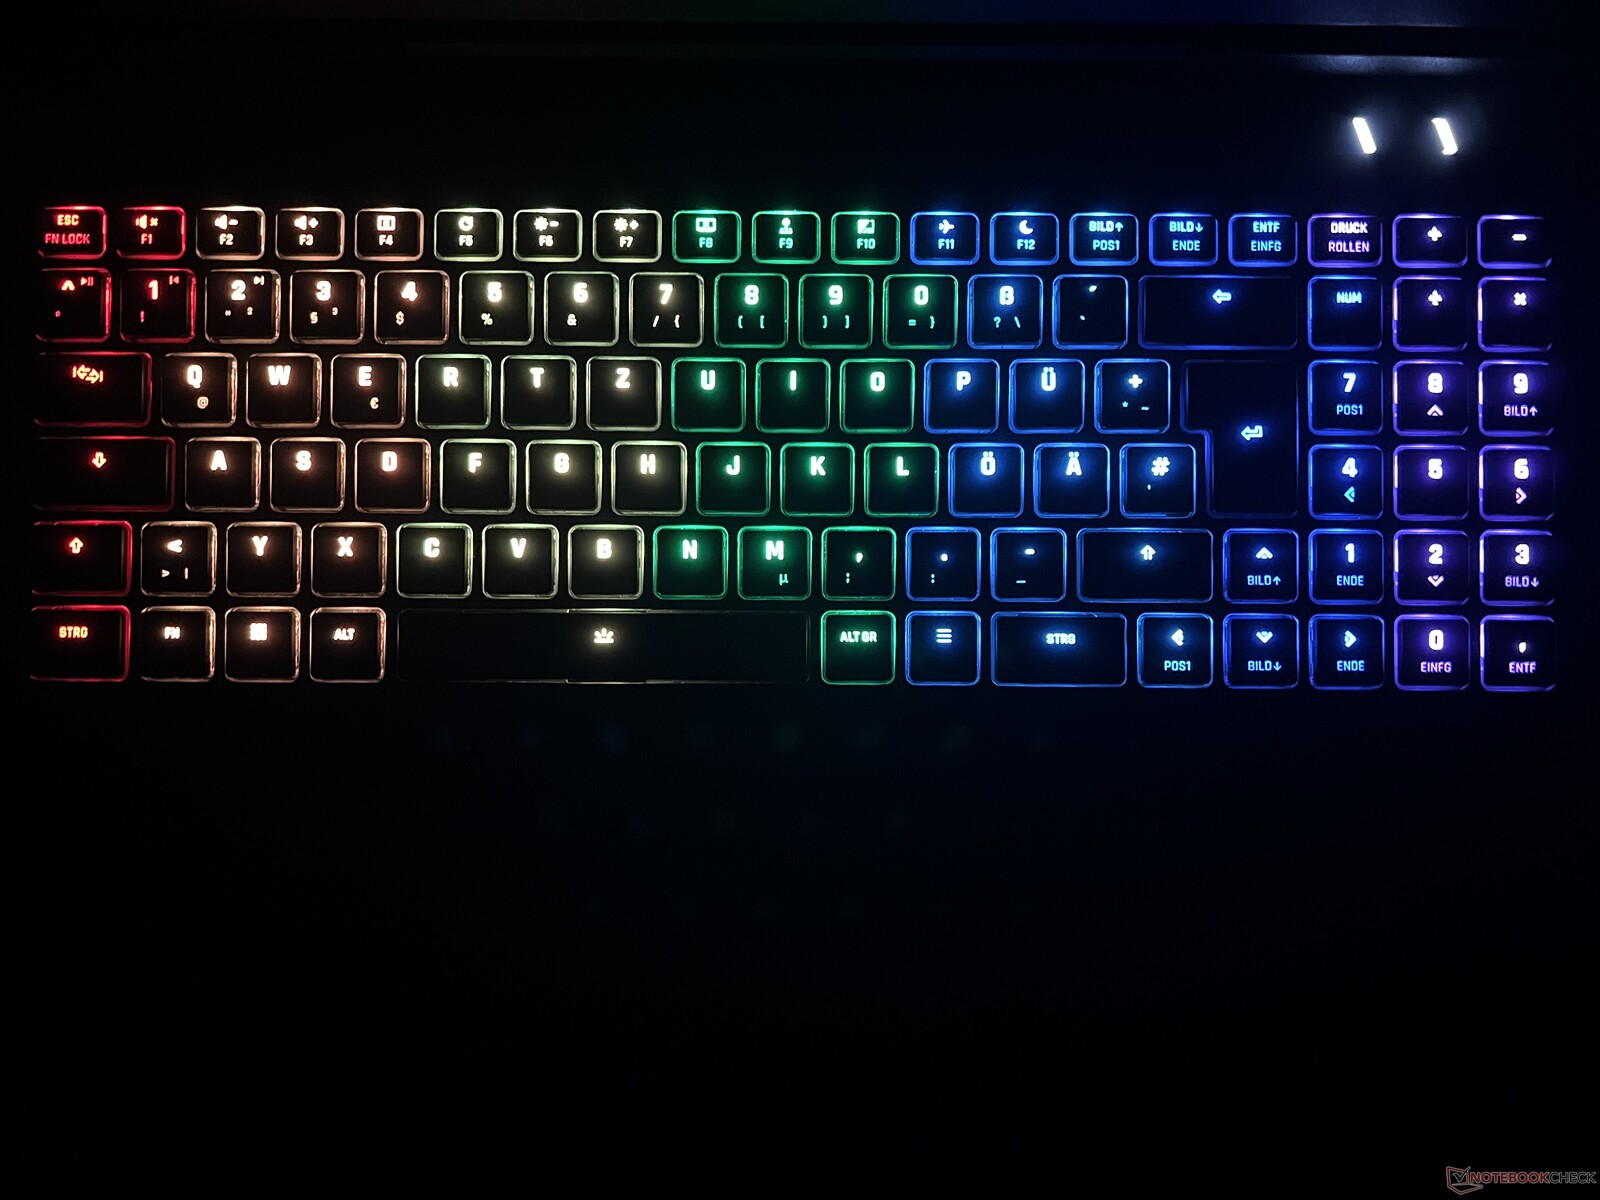
Input devices - Mechanical Cherry keyboard
The Neo 17 is available with either a conventional membrane keyboard with 4 illumination zones or a mechanical keyboard with individual key illumination (surcharge of 95 euros). This is also installed in our test device, with tactile switches from Cherry (MX ULP) being used. These live up to their name and offer a very tactile and precise typing feel, but the buttons are also very loud. This should definitely be taken into account when making your choice. The large glass ClickPad (15 x 9.5 cm) works without any problems.
Display - QHD with 240 Hz

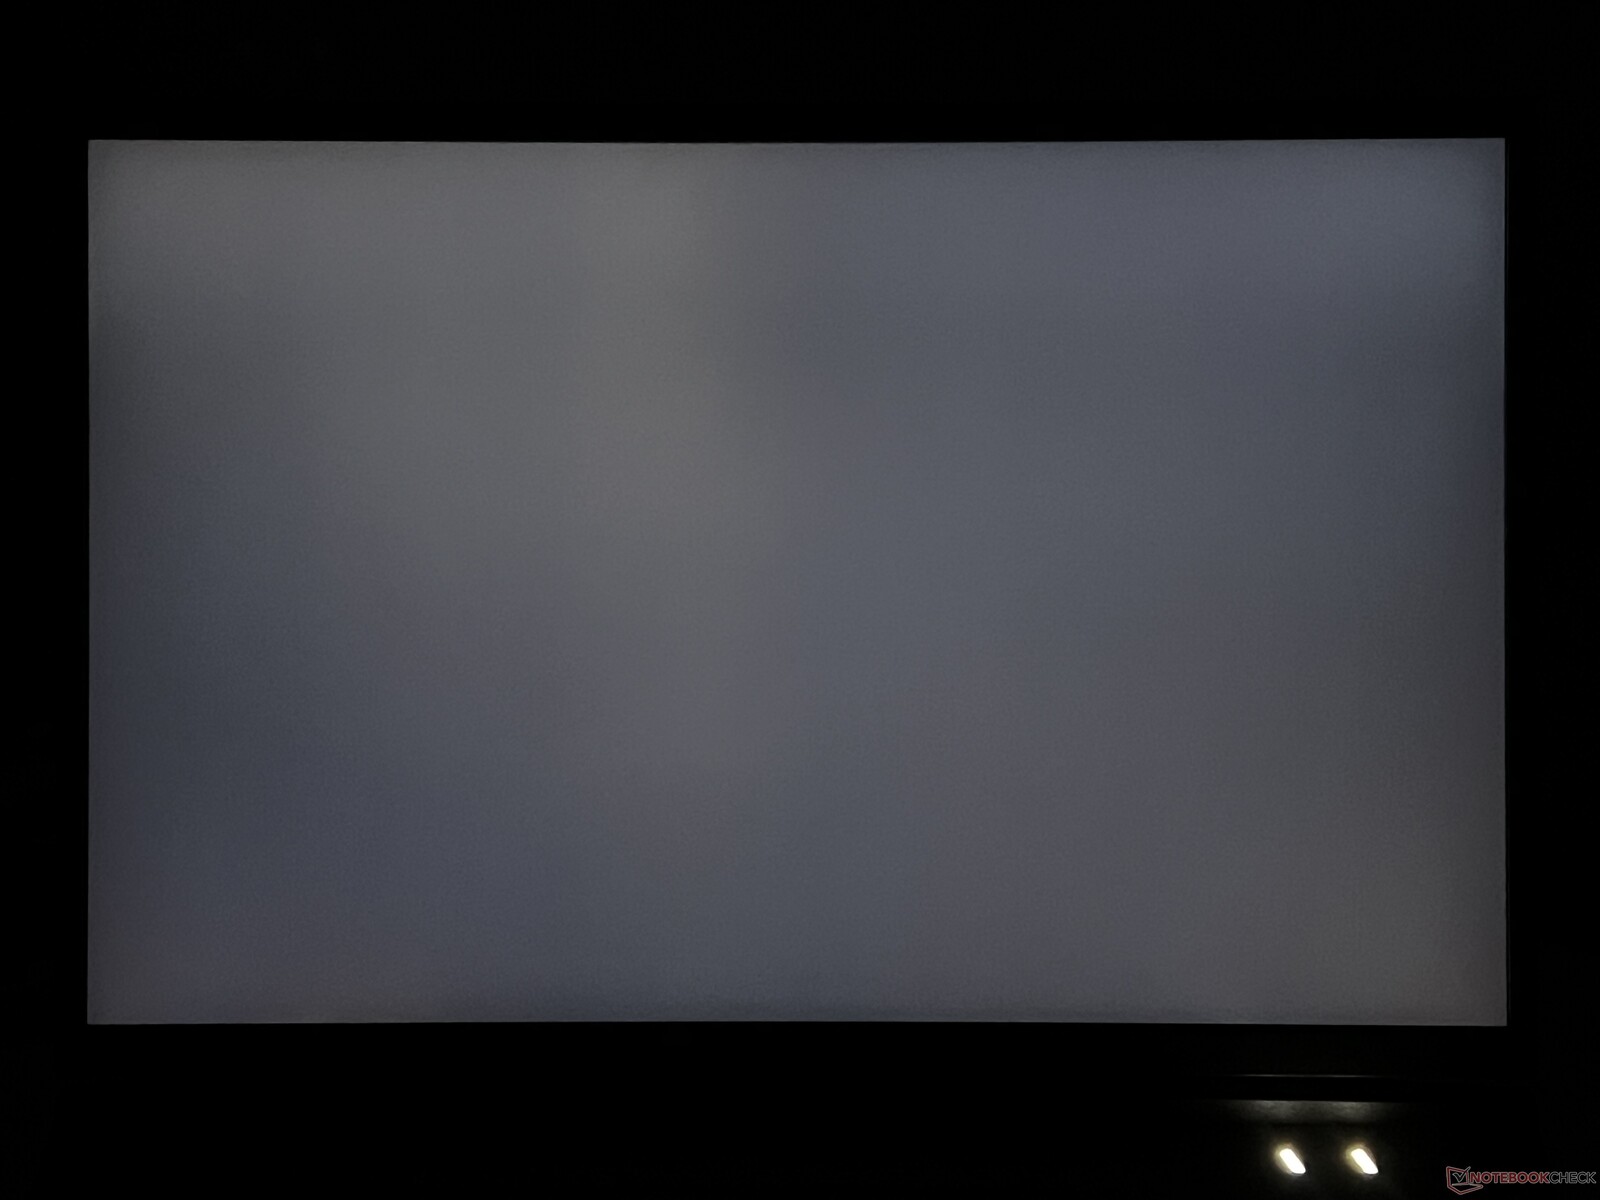
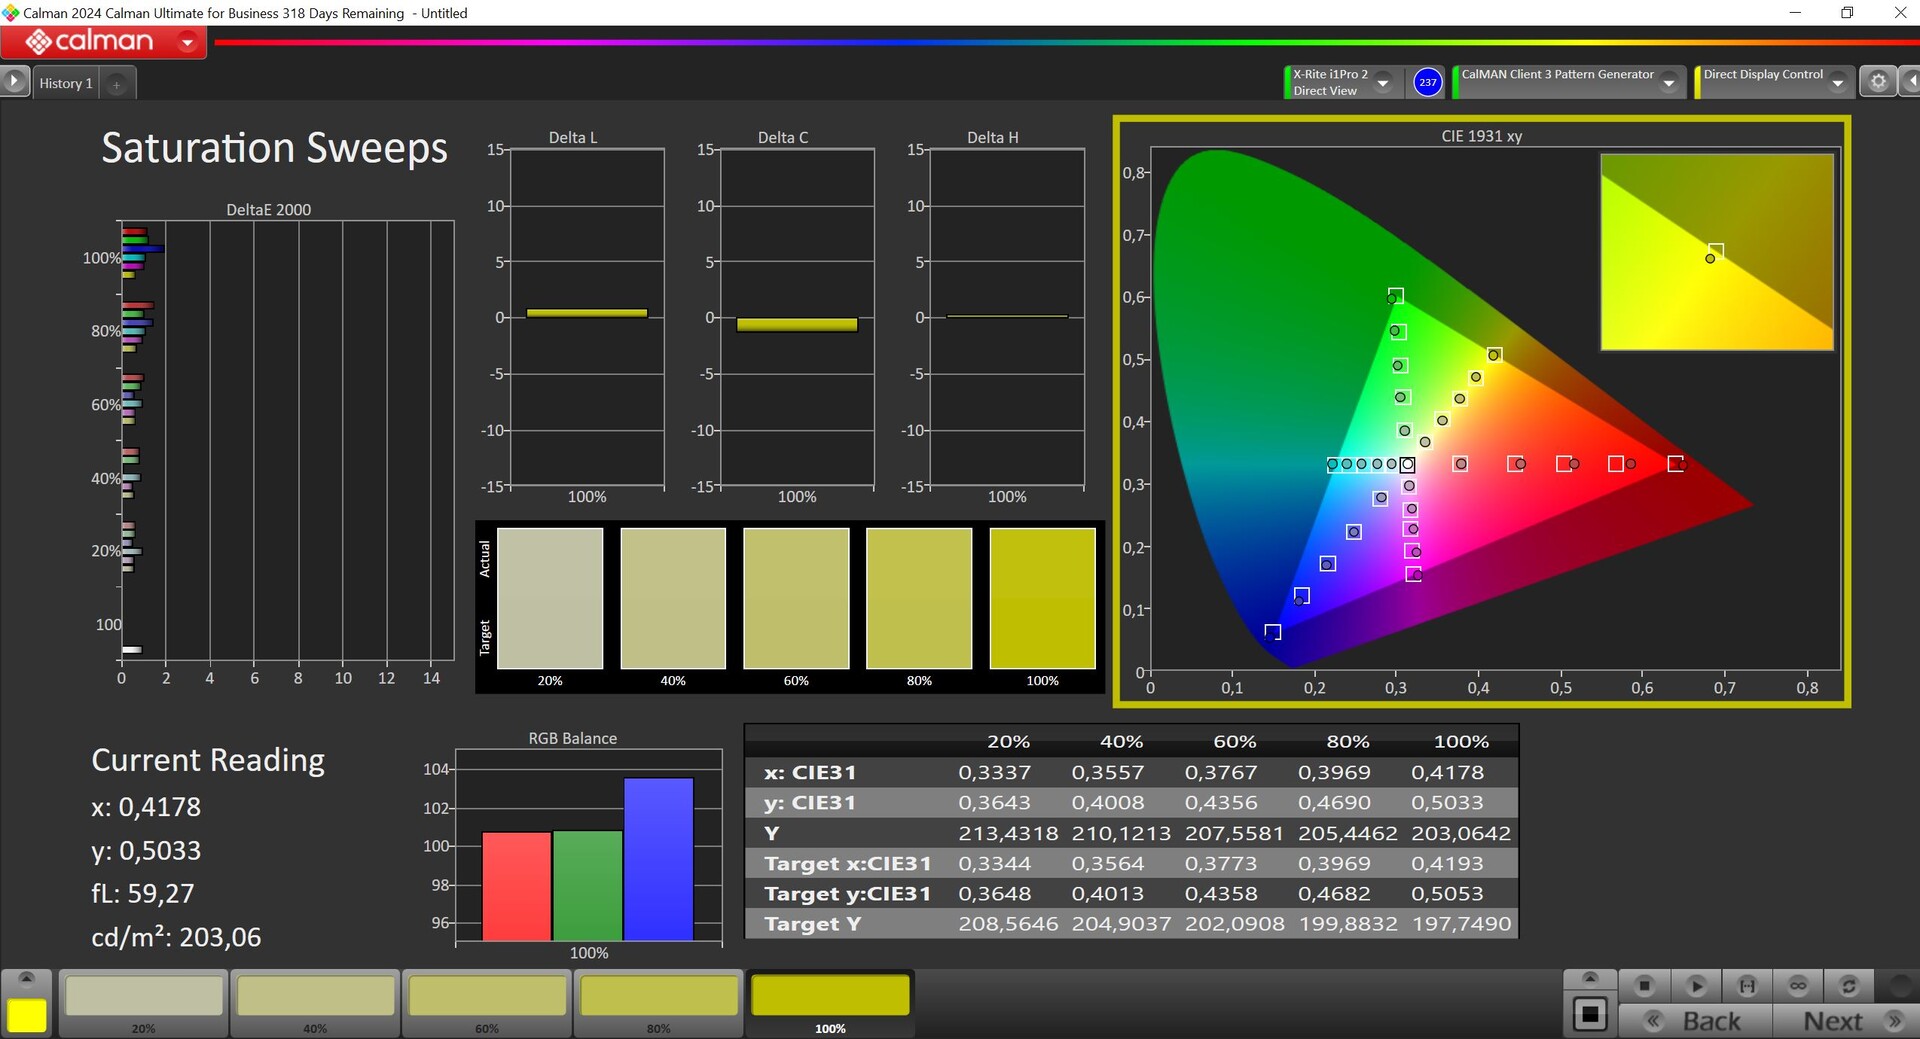
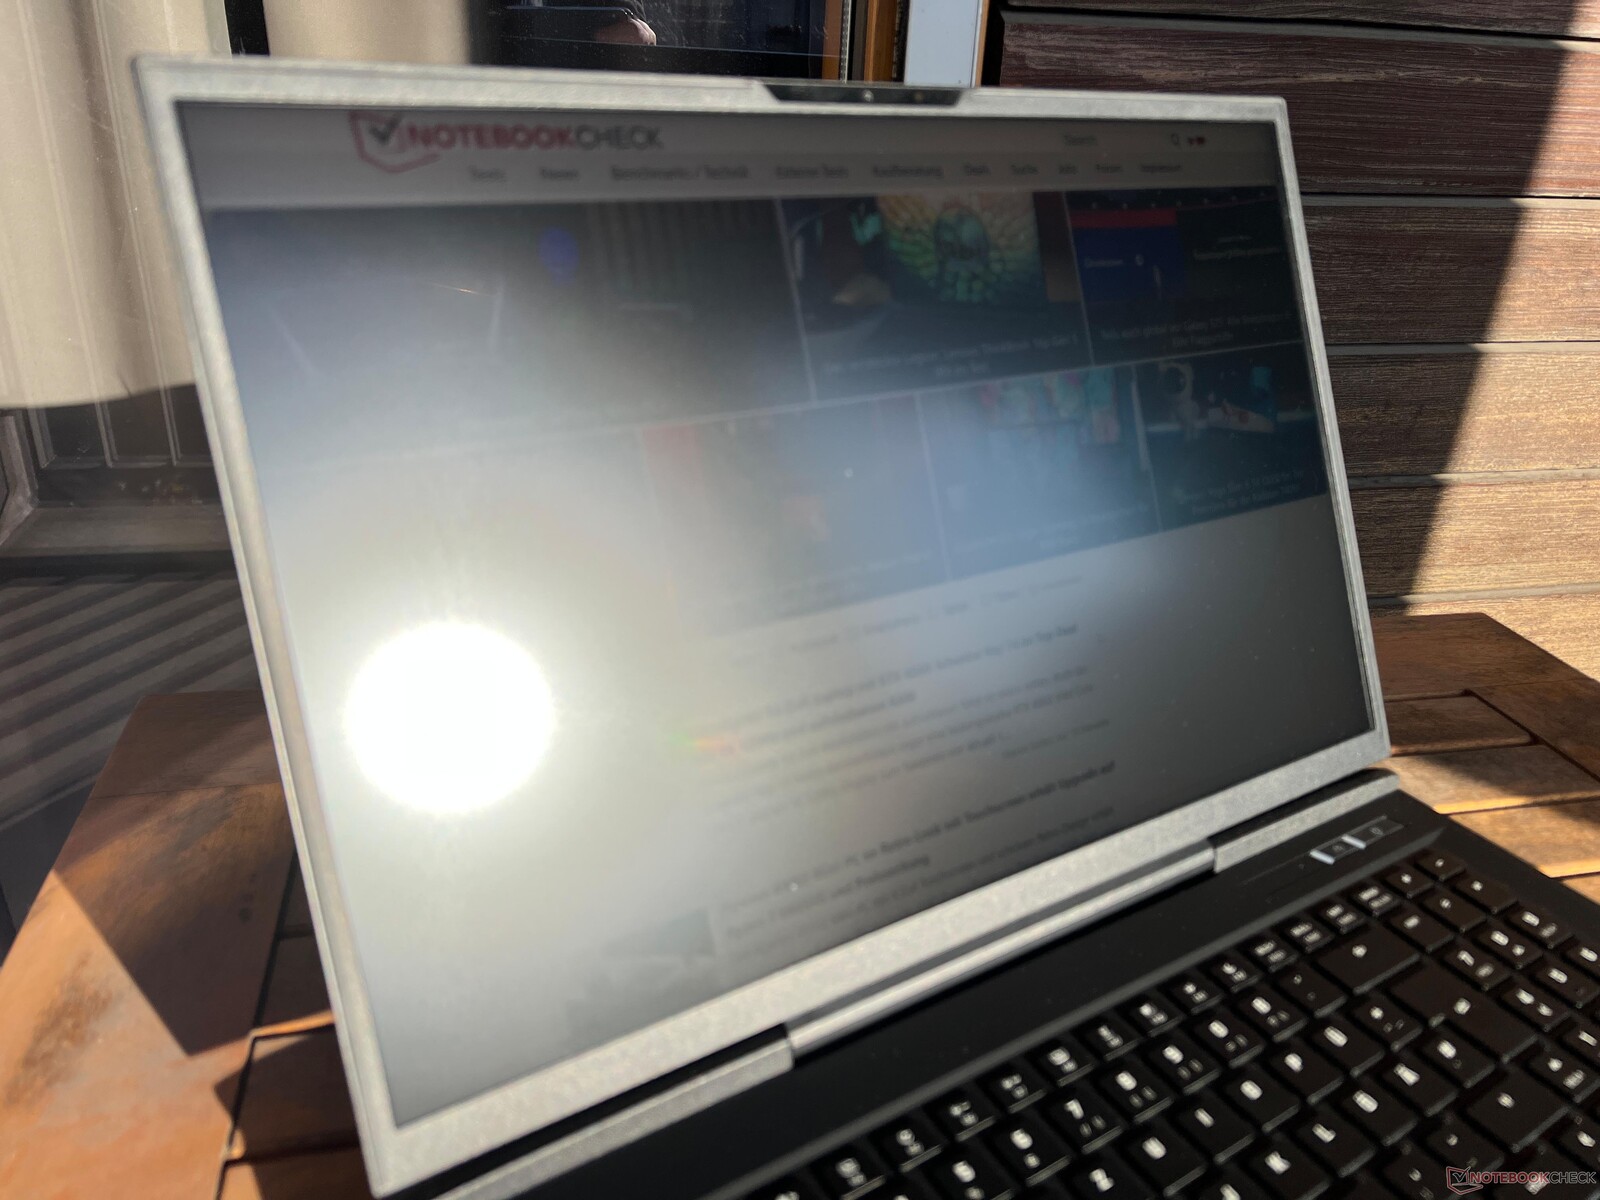
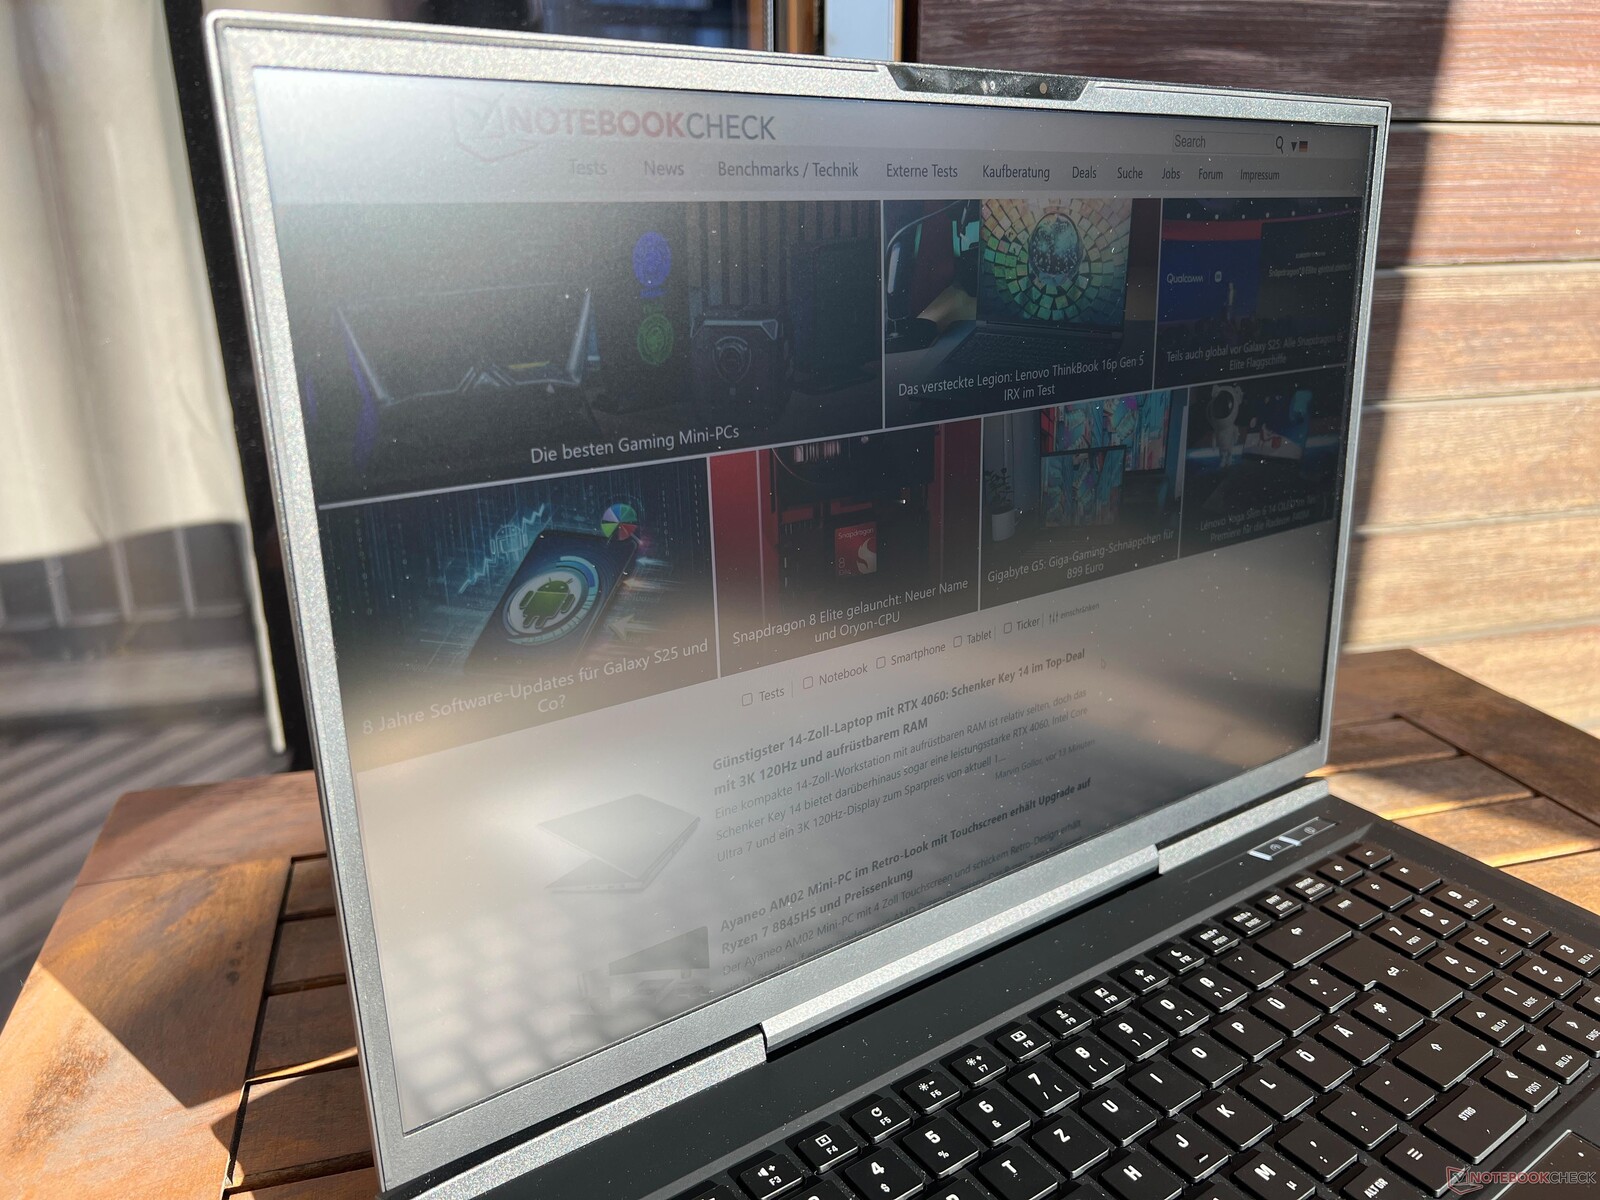
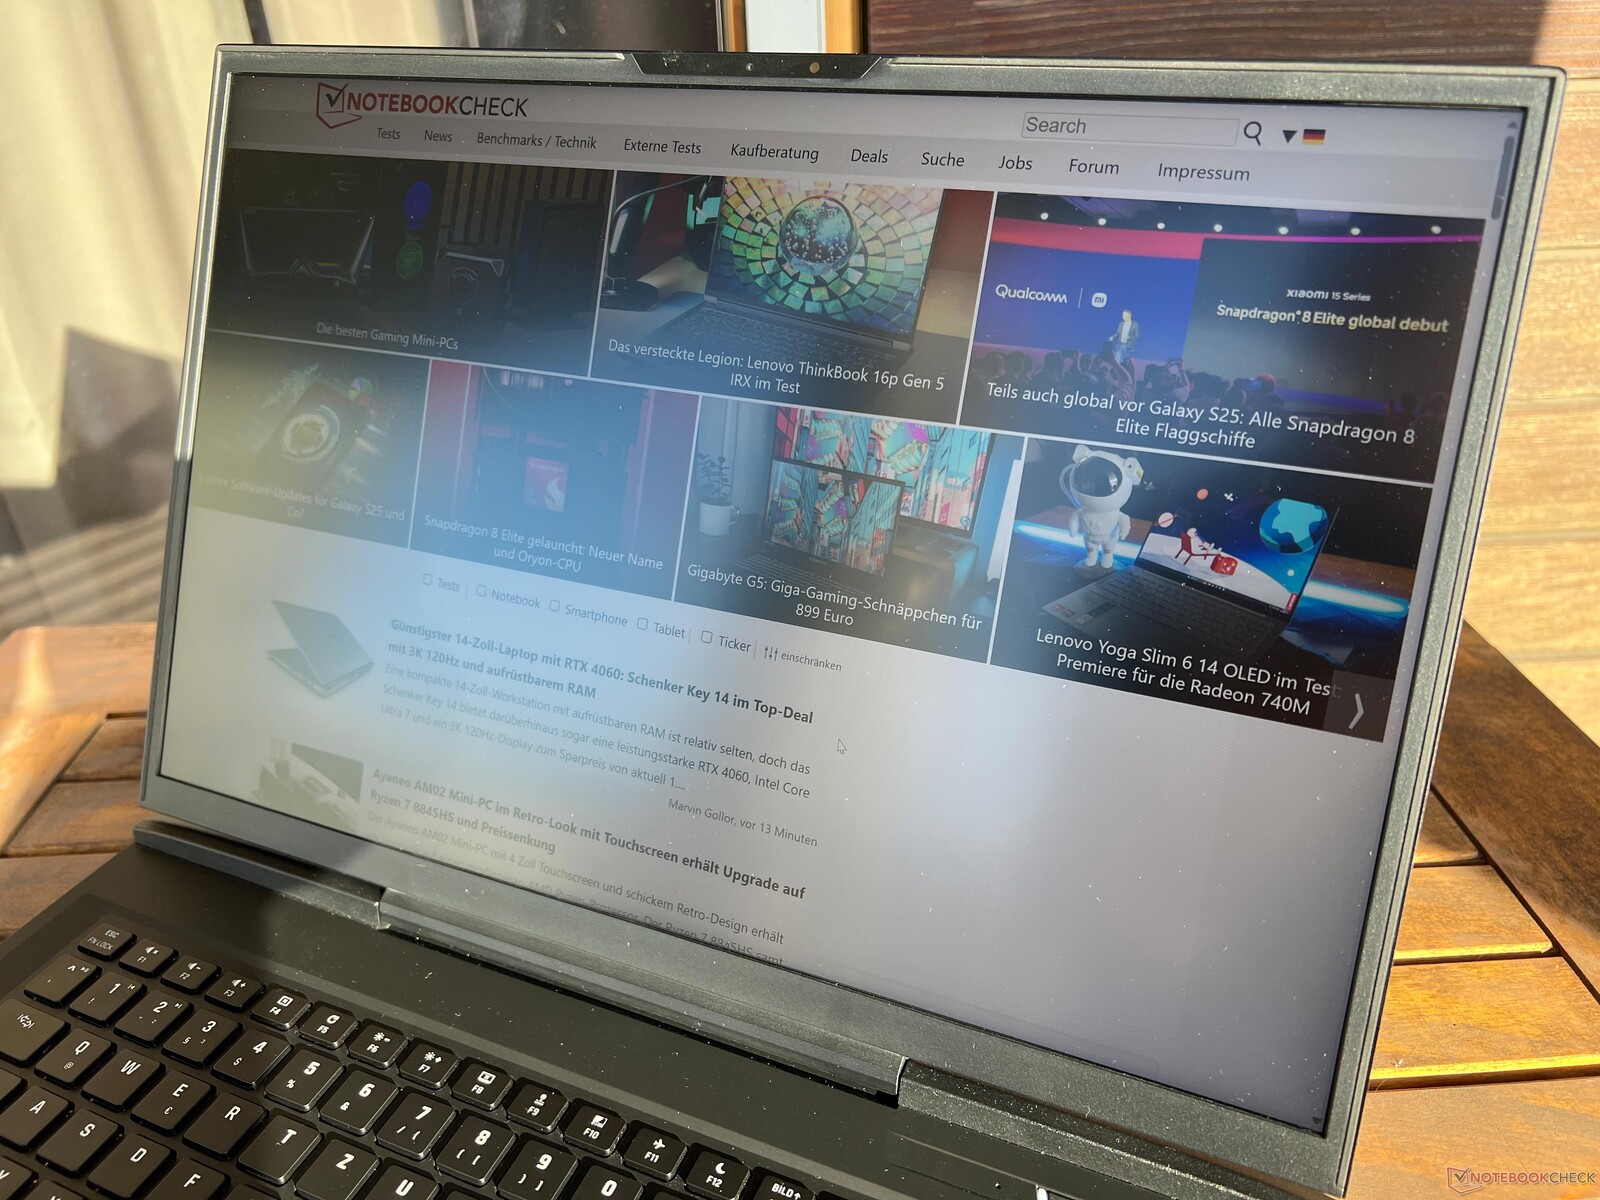
The 17-inch IPS display with a matt surface offers a resolution of 2,560 x 1,600 pixels (16:10) and is very suitable for gaming thanks to the fast response times and the frequency of 240 Hz. The subjective picture quality is also very good. PWM is not used and there are no major problems with halos.
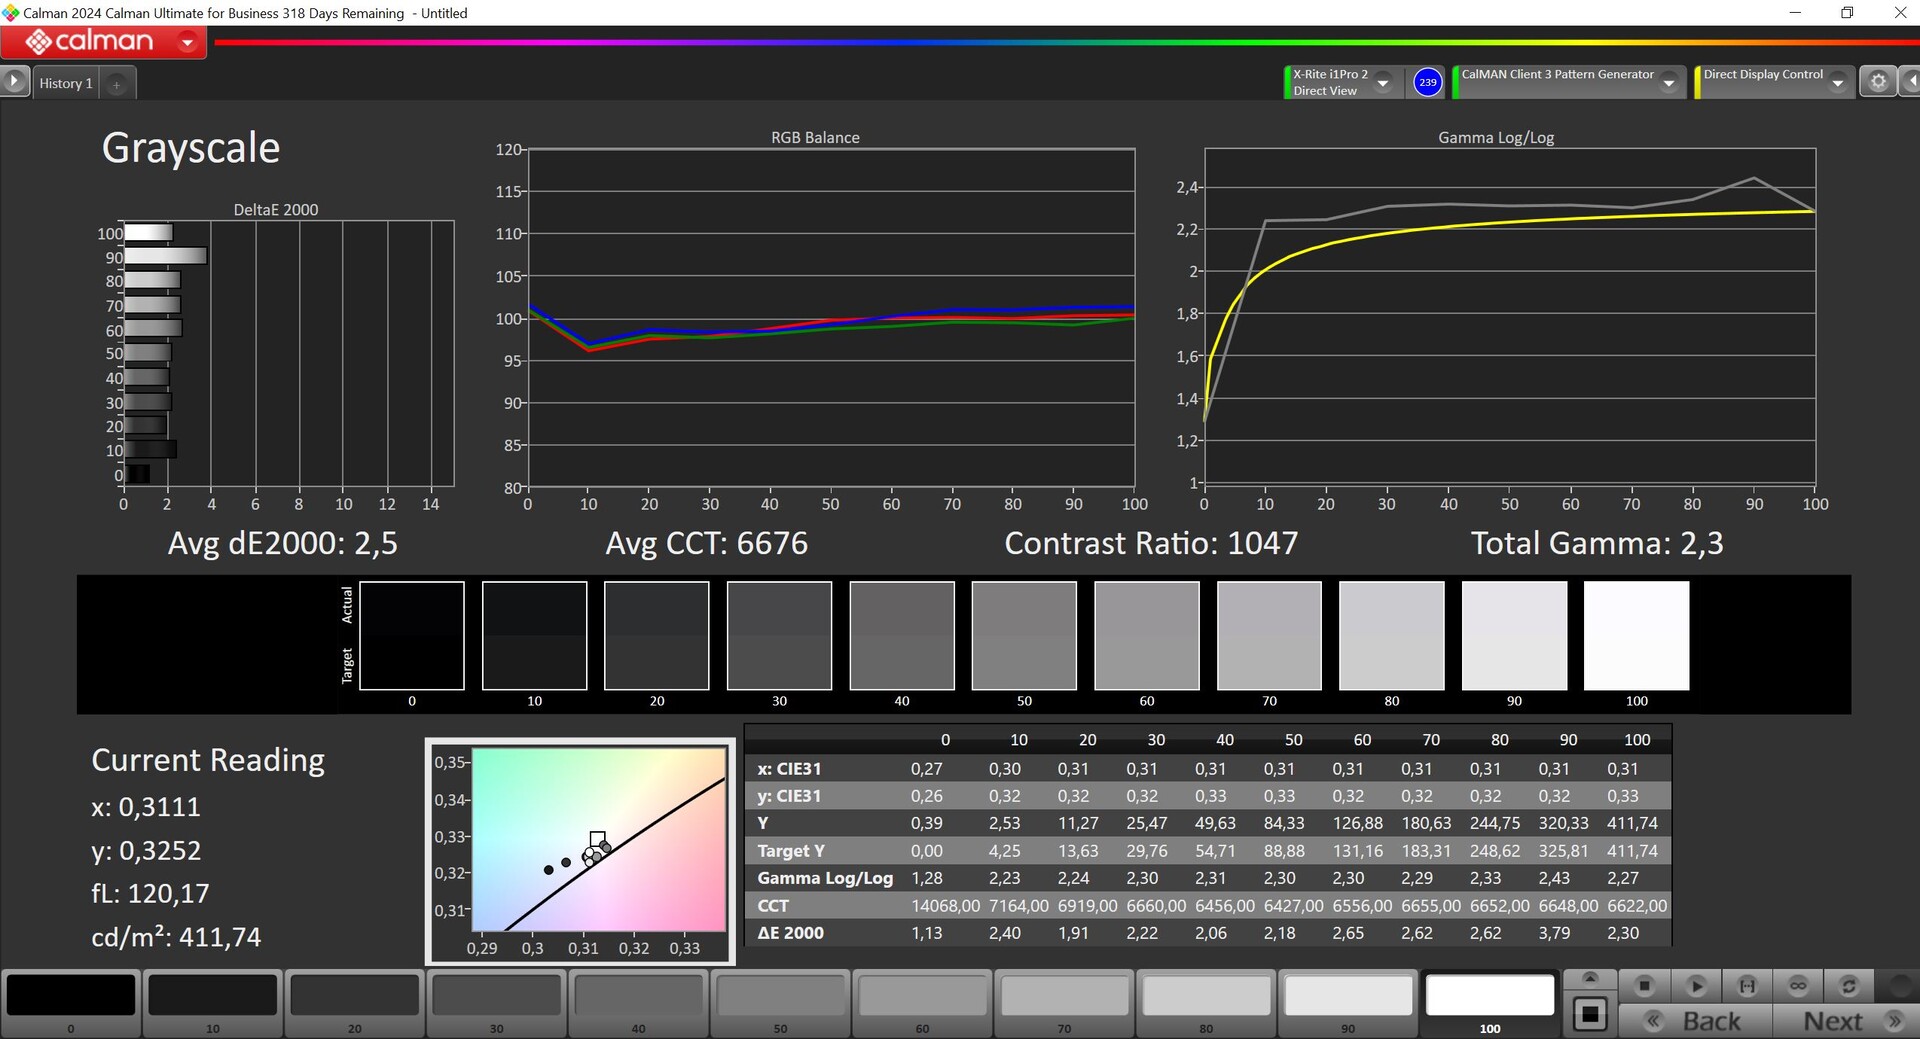
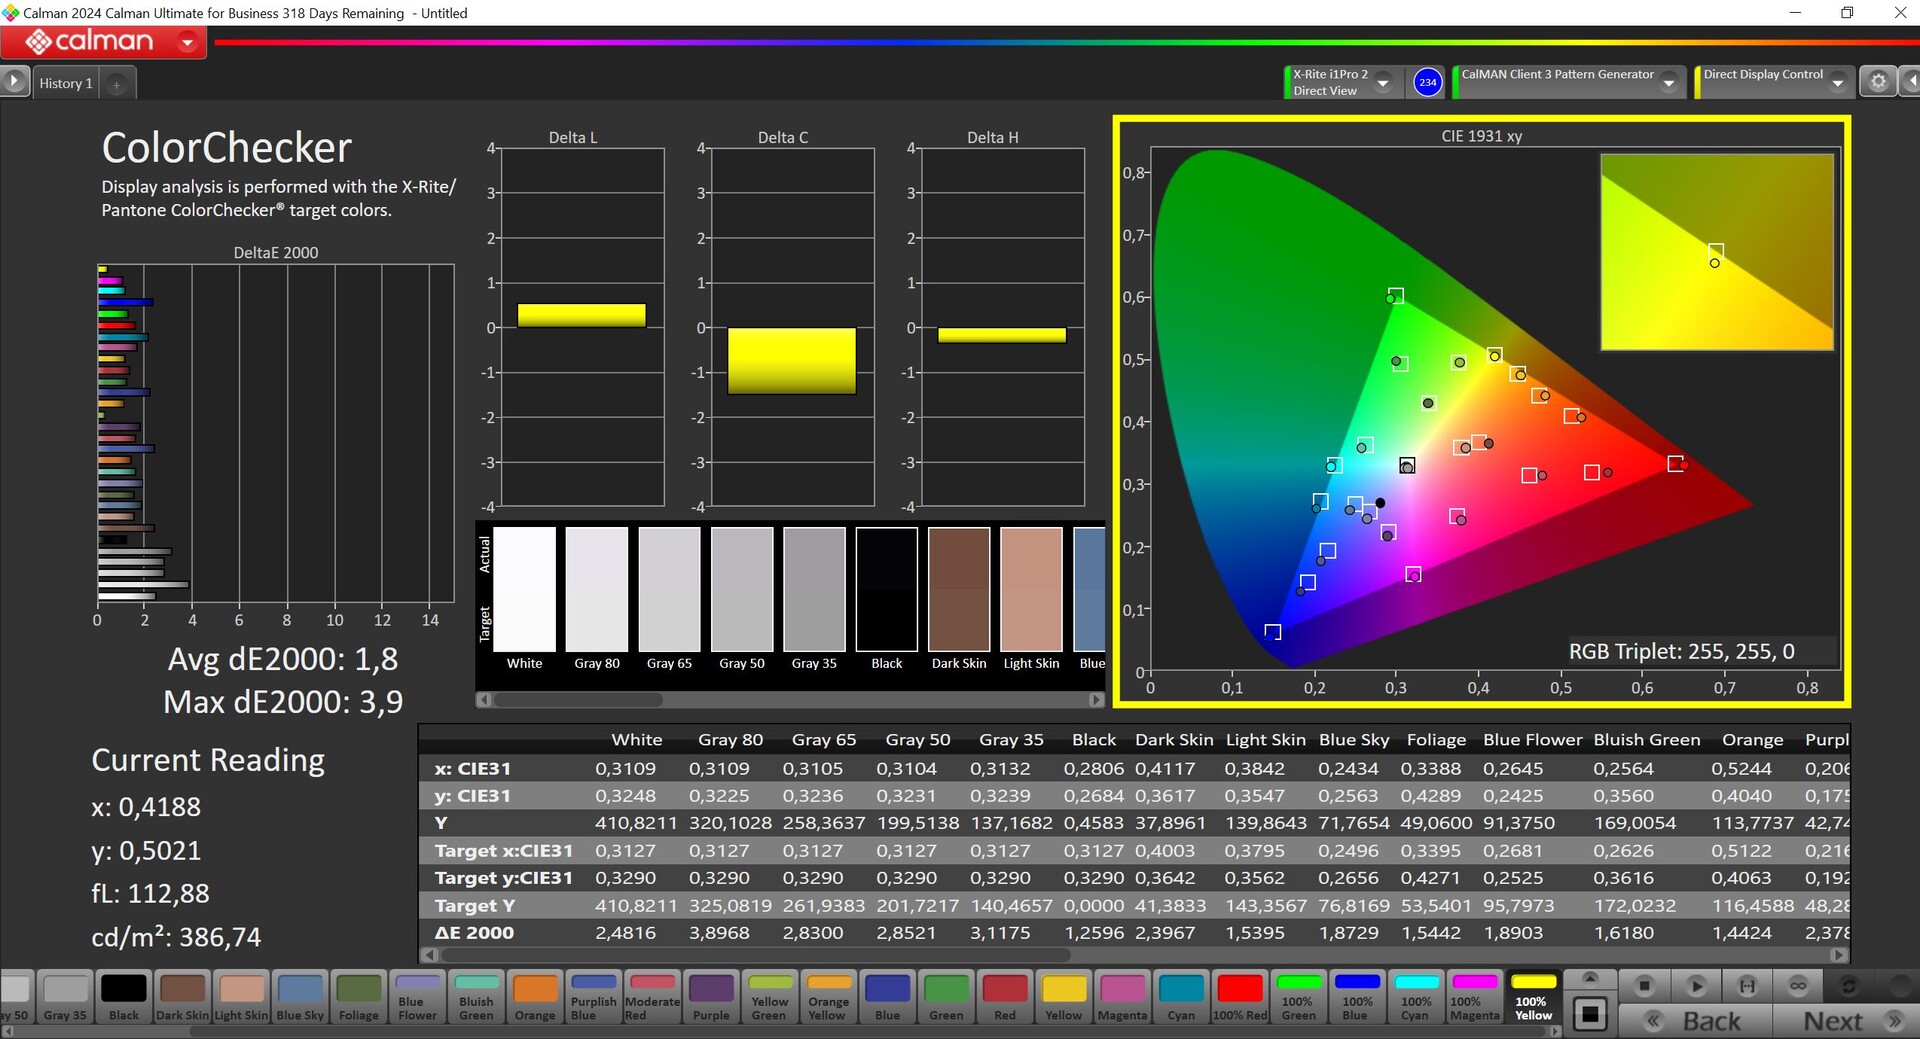
The average brightness is around 400 cd/m², although the black level is slightly higher at 0.39. This results in a maximum contrast ratio of just over 1,000:1, which is fine. The panel should be even brighter outdoors. The factory calibration is already very good, but we can optimize the display even further with our calibration. The corresponding profile is available for free download in the box on the right. Together with the full sRGB coverage, the panel is also suitable for editing images/videos.
| |||||||||||||||||||||||||
Brightness Distribution: 88 %
Center on Battery: 412 cd/m²
Contrast: 1056:1 (Black: 0.39 cd/m²)
ΔE ColorChecker Calman: 1.8 | ∀{0.5-29.43 Ø4.72}
calibrated: 0.9
ΔE Greyscale Calman: 2.5 | ∀{0.09-98 Ø4.97}
69.6% AdobeRGB 1998 (Argyll 3D)
98.4% sRGB (Argyll 3D)
69% Display P3 (Argyll 3D)
Gamma: 2.3
CCT: 6676 K
| Schenker XMG Neo 17 E24 NE170QDM-NZ1, IPS, 2560x1600, 17", 240 Hz | Medion Erazer Beast X40 2024 BOE NE170QDM-NZ1, IPS, 2560x1600, 17", 240 Hz | HP Omen 17-db0079ng BOE0B67, IPS, 2560x1440, 17.3", 240 Hz | Eurocom Raptor X17 Core i9-14900HX BOE CQ NE173QUM-NY1, IPS, 3840x2160, 17.3", 144 Hz | MSI GE78HX 13VH-070US AU Optronics B170QAN01.2, IPS, 2560x1600, 17", 240 Hz | |
|---|---|---|---|---|---|
| Display | -0% | -3% | 20% | 22% | |
| Display P3 Coverage (%) | 69 | 68.1 -1% | 66.2 -4% | 95.9 39% | 97.6 41% |
| sRGB Coverage (%) | 98.4 | 99.5 1% | 95.5 -3% | 99.8 1% | 99.9 2% |
| AdobeRGB 1998 Coverage (%) | 69.6 | 69 -1% | 68.1 -2% | 84.2 21% | 86.5 24% |
| Response Times | 4% | -17% | -40% | 38% | |
| Response Time Grey 50% / Grey 80% * (ms) | 12.1 ? | 11.7 ? 3% | 14.4 ? -19% | 14.8 ? -22% | 4.2 ? 65% |
| Response Time Black / White * (ms) | 7.2 ? | 6.9 ? 4% | 8.3 ? -15% | 11.4 ? -58% | 6.4 ? 11% |
| PWM Frequency (Hz) | |||||
| Screen | 14% | -9% | -25% | -51% | |
| Brightness middle (cd/m²) | 412 | 422 2% | 363 -12% | 544.6 32% | 398.6 -3% |
| Brightness (cd/m²) | 401 | 388 -3% | 341 -15% | 507 26% | 384 -4% |
| Brightness Distribution (%) | 88 | 87 -1% | 84 -5% | 77 -12% | 89 1% |
| Black Level * (cd/m²) | 0.39 | 0.42 -8% | 0.38 3% | 0.48 -23% | 0.46 -18% |
| Contrast (:1) | 1056 | 1005 -5% | 955 -10% | 1135 7% | 867 -18% |
| Colorchecker dE 2000 * | 1.8 | 1.42 21% | 1.74 3% | 3.38 -88% | 4.05 -125% |
| Colorchecker dE 2000 max. * | 3.9 | 1.97 49% | 5.39 -38% | 7.13 -83% | 8.68 -123% |
| Colorchecker dE 2000 calibrated * | 0.9 | 0.7 22% | 1.43 -59% | 1.03 -14% | 1.02 -13% |
| Greyscale dE 2000 * | 2.5 | 1.2 52% | 1.3 48% | 4.3 -72% | 6.5 -160% |
| Gamma | 2.3 96% | 2.078 106% | 2.235 98% | 2.42 91% | 2.11 104% |
| CCT | 6676 97% | 6581 99% | 6346 102% | 7356 88% | 7518 86% |
| Total Average (Program / Settings) | 6% /
10% | -10% /
-9% | -15% /
-18% | 3% /
-23% |
* ... smaller is better


Display Response Times
| ↔ Response Time Black to White | ||
|---|---|---|
| 7.2 ms ... rise ↗ and fall ↘ combined | ↗ 3 ms rise | 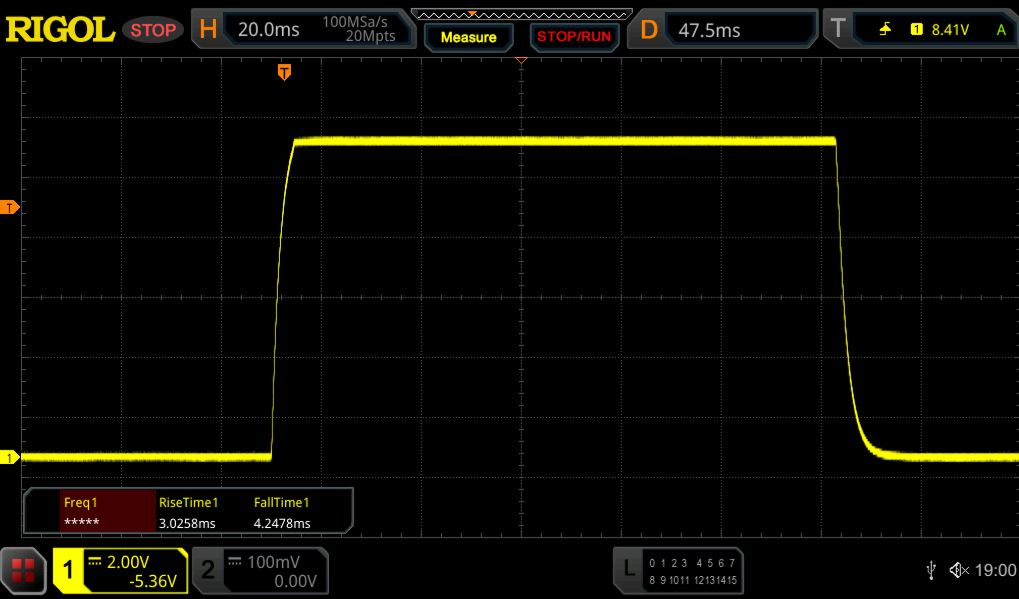 |
| ↘ 4.2 ms fall | ||
| The screen shows very fast response rates in our tests and should be very well suited for fast-paced gaming. In comparison, all tested devices range from 0.1 (minimum) to 240 (maximum) ms. » 21 % of all devices are better. This means that the measured response time is better than the average of all tested devices (19.8 ms). | ||
| ↔ Response Time 50% Grey to 80% Grey | ||
| 12.1 ms ... rise ↗ and fall ↘ combined | ↗ 5.9 ms rise | 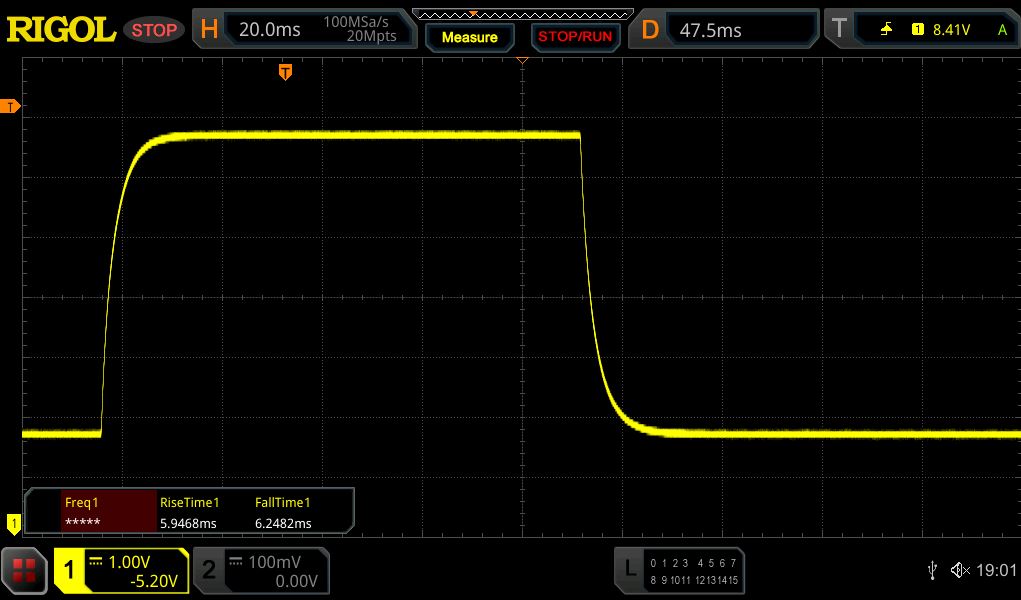 |
| ↘ 6.2 ms fall | ||
| The screen shows good response rates in our tests, but may be too slow for competitive gamers. In comparison, all tested devices range from 0.165 (minimum) to 636 (maximum) ms. » 26 % of all devices are better. This means that the measured response time is better than the average of all tested devices (31 ms). | ||
Screen Flickering / PWM (Pulse-Width Modulation)
| Screen flickering / PWM not detected |  | ||
In comparison: 52 % of all tested devices do not use PWM to dim the display. If PWM was detected, an average of 7750 (minimum: 5 - maximum: 343500) Hz was measured. | |||


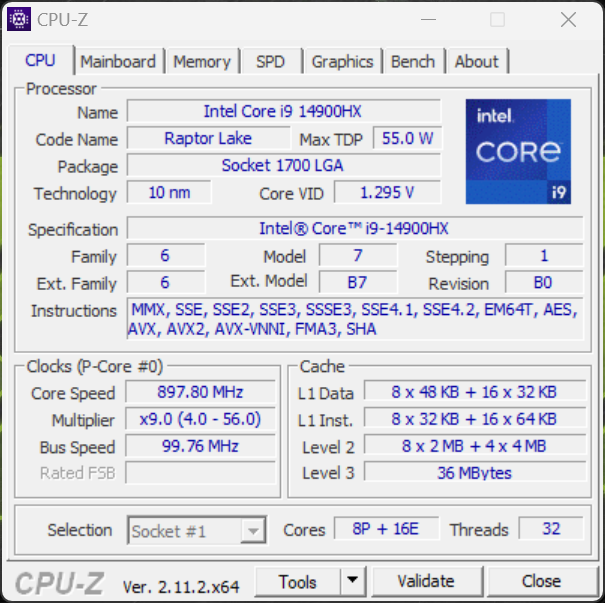
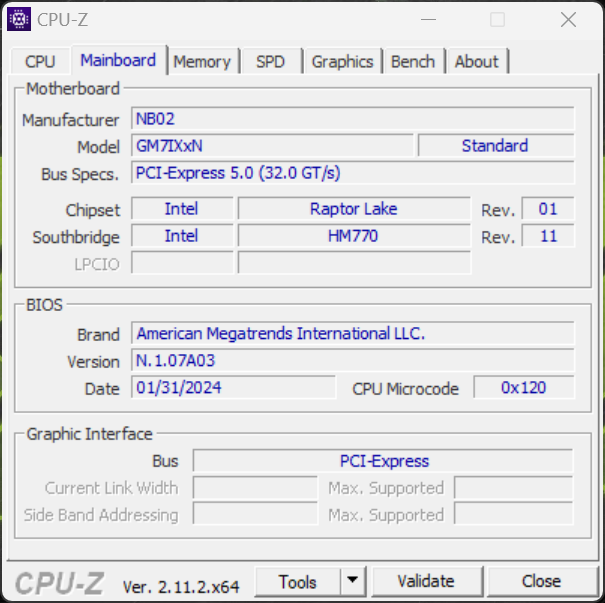
Performance - Raptor Lake-HX
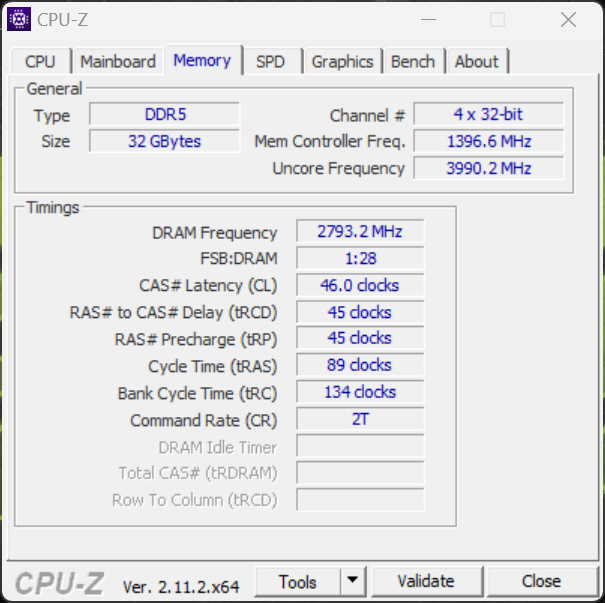
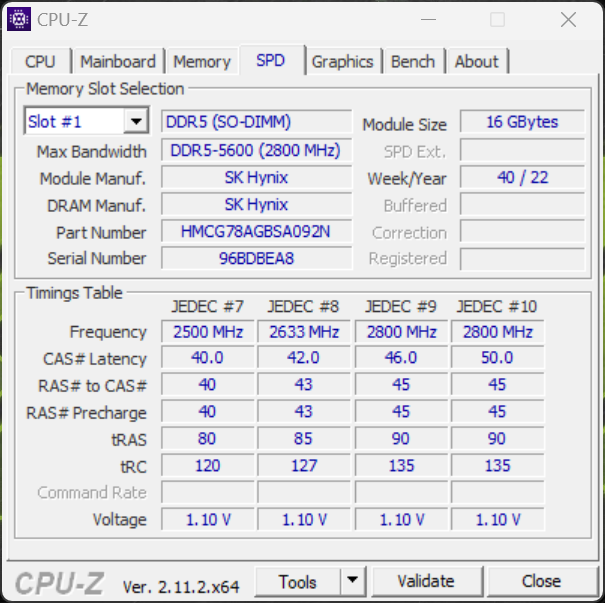
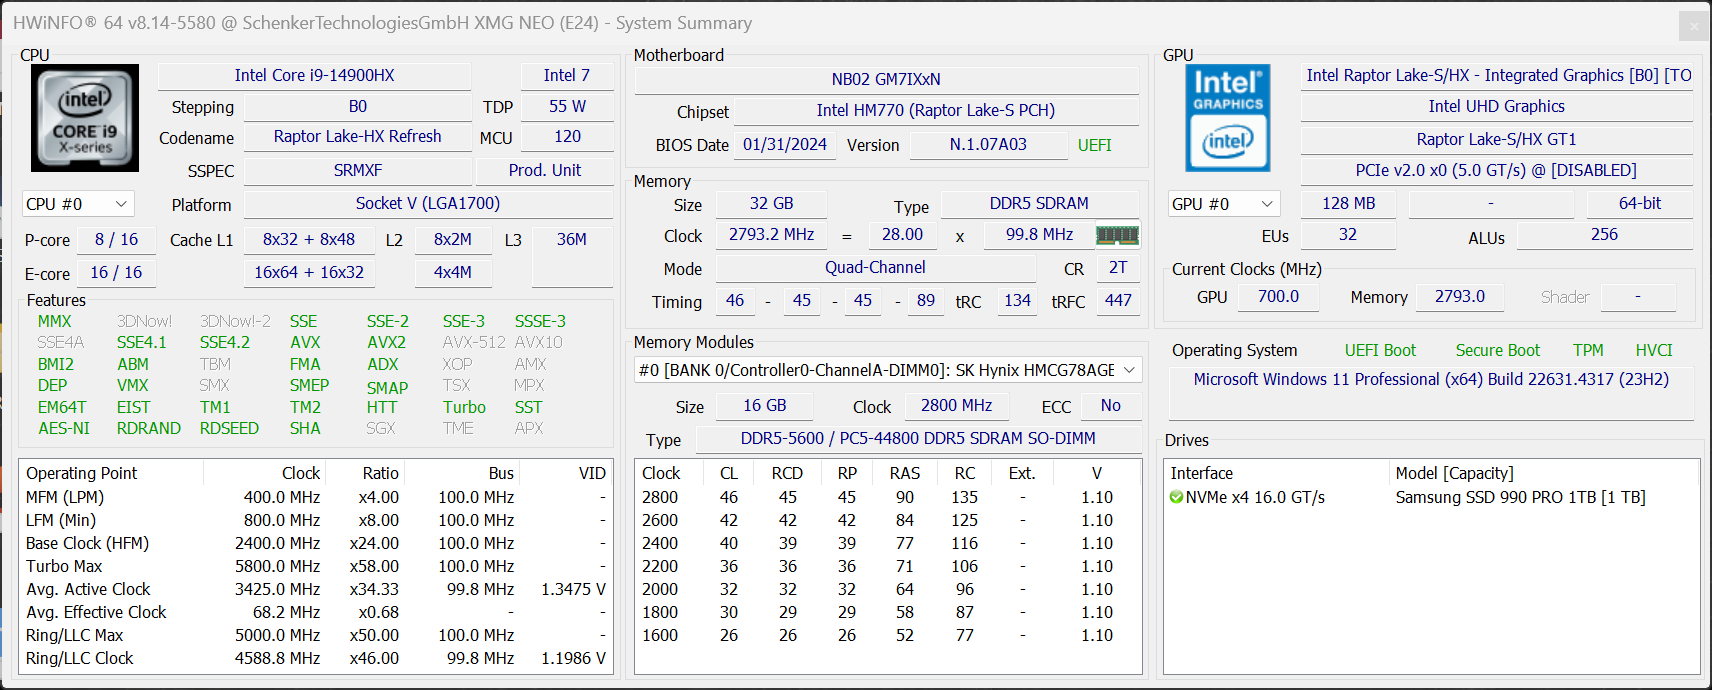
The Neo 17 is exclusively equipped with the Intel Core i9-14900HX. 16 GB RAM is installed as standard, but up to 96 GB is possible thanks to two SO-DIMM slots (surcharge 260 euros).
Test conditions
The XMG Neo 17 offers various energy profiles, which we have summarized in the following table. We used the Overboost mode for our benchmarks and measurements, as the difference in noise compared to Enthusiast mode is small. The manufacturer also provides a Deep Dive for further technical background information on the Neo 17 and the energy profiles.
| Energy profile | CPU TDP | CB R23 Multi | GPU TDP | Time Spy Graphics | CP 2077 Ultra QHD | Max. fan volume |
|---|---|---|---|---|---|---|
| Balanced | 45 W | 14,899 points | 130 W | 10,778 points | 73.9 FPS | 43.1 dB(A) |
| Enthusiast | 75 W | 22,027 points | 150 W | 18,021 points | 78.6 FPS | 49.9 dB(A) |
| Overboost | 160/140 W | 31,740 points | 175 W | 19,155 points | 80.7 FPS | 51.9 dB(A) |
Processor - Core i9-14900HX
The Intel Core i9-14900HX is still one of the fastest mobile processors and this is unlikely to change much with the upcoming Arrow Lake chips. The processor's power delivery is excellent, as it can consume 160 watts for short periods and 140 watts continuously. For the user, this means very high and constant performance. However, significant losses must be expected in battery mode, as the CPU is allowed to consume a maximum of 35 watts, which corresponds to a 65% reduction in performance in the multi-core tests. Further CPU benchmarks are available in our technology section.
Cinebench R15 Multi loop
Cinebench R23: Multi Core | Single Core
Cinebench R20: CPU (Multi Core) | CPU (Single Core)
Cinebench R15: CPU Multi 64Bit | CPU Single 64Bit
Blender: v2.79 BMW27 CPU
7-Zip 18.03: 7z b 4 | 7z b 4 -mmt1
Geekbench 6.7: Multi-Core | Single-Core
Geekbench 5.5: Multi-Core | Single-Core
HWBOT x265 Benchmark v2.2: 4k Preset
LibreOffice : 20 Documents To PDF
R Benchmark 2.5: Overall mean
| CPU Performance rating | |
| Schenker XMG Neo 17 E24 | |
| MSI GE78HX 13VH-070US -2! | |
| Average Intel Core i9-14900HX | |
| Eurocom Raptor X17 Core i9-14900HX | |
| Medion Erazer Beast X40 2024 | |
| Average of class Gaming | |
| HP Omen 17-db0079ng | |
| Cinebench R23 / Multi Core | |
| MSI GE78HX 13VH-070US | |
| Schenker XMG Neo 17 E24 | |
| Eurocom Raptor X17 Core i9-14900HX | |
| Average Intel Core i9-14900HX (17078 - 36249, n=37) | |
| Average of class Gaming (10488 - 40970, n=106, last 2 years) | |
| Medion Erazer Beast X40 2024 | |
| HP Omen 17-db0079ng | |
| Cinebench R23 / Single Core | |
| Schenker XMG Neo 17 E24 | |
| Medion Erazer Beast X40 2024 | |
| Average Intel Core i9-14900HX (1720 - 2245, n=37) | |
| MSI GE78HX 13VH-070US | |
| Eurocom Raptor X17 Core i9-14900HX | |
| Average of class Gaming (1166 - 2387, n=106, last 2 years) | |
| HP Omen 17-db0079ng | |
| Cinebench R20 / CPU (Multi Core) | |
| MSI GE78HX 13VH-070US | |
| Schenker XMG Neo 17 E24 | |
| Eurocom Raptor X17 Core i9-14900HX | |
| Average Intel Core i9-14900HX (6579 - 13832, n=37) | |
| Average of class Gaming (4029 - 16108, n=105, last 2 years) | |
| Medion Erazer Beast X40 2024 | |
| HP Omen 17-db0079ng | |
| Cinebench R20 / CPU (Single Core) | |
| Schenker XMG Neo 17 E24 | |
| Medion Erazer Beast X40 2024 | |
| Average Intel Core i9-14900HX (657 - 859, n=37) | |
| Eurocom Raptor X17 Core i9-14900HX | |
| MSI GE78HX 13VH-070US | |
| Average of class Gaming (442 - 904, n=105, last 2 years) | |
| HP Omen 17-db0079ng | |
| Cinebench R15 / CPU Multi 64Bit | |
| MSI GE78HX 13VH-070US | |
| Schenker XMG Neo 17 E24 | |
| Eurocom Raptor X17 Core i9-14900HX | |
| Average Intel Core i9-14900HX (3263 - 5589, n=38) | |
| Average of class Gaming (1578 - 6271, n=104, last 2 years) | |
| Medion Erazer Beast X40 2024 | |
| HP Omen 17-db0079ng | |
| Cinebench R15 / CPU Single 64Bit | |
| Schenker XMG Neo 17 E24 | |
| Medion Erazer Beast X40 2024 | |
| Average Intel Core i9-14900HX (247 - 323, n=37) | |
| MSI GE78HX 13VH-070US | |
| Eurocom Raptor X17 Core i9-14900HX | |
| Average of class Gaming (188.8 - 344, n=105, last 2 years) | |
| HP Omen 17-db0079ng | |
| Blender / v2.79 BMW27 CPU | |
| HP Omen 17-db0079ng | |
| Average of class Gaming (80 - 330, n=103, last 2 years) | |
| Medion Erazer Beast X40 2024 | |
| Average Intel Core i9-14900HX (91 - 206, n=37) | |
| Eurocom Raptor X17 Core i9-14900HX | |
| Schenker XMG Neo 17 E24 | |
| MSI GE78HX 13VH-070US | |
| 7-Zip 18.03 / 7z b 4 | |
| MSI GE78HX 13VH-070US | |
| Schenker XMG Neo 17 E24 | |
| Eurocom Raptor X17 Core i9-14900HX | |
| Average Intel Core i9-14900HX (66769 - 136645, n=37) | |
| Medion Erazer Beast X40 2024 | |
| Average of class Gaming (33491 - 148086, n=104, last 2 years) | |
| HP Omen 17-db0079ng | |
| 7-Zip 18.03 / 7z b 4 -mmt1 | |
| Medion Erazer Beast X40 2024 | |
| Schenker XMG Neo 17 E24 | |
| MSI GE78HX 13VH-070US | |
| Average Intel Core i9-14900HX (5452 - 7545, n=37) | |
| Eurocom Raptor X17 Core i9-14900HX | |
| Average of class Gaming (4199 - 7436, n=104, last 2 years) | |
| HP Omen 17-db0079ng | |
| Geekbench 6.7 / Multi-Core | |
| Schenker XMG Neo 17 E24 | |
| Eurocom Raptor X17 Core i9-14900HX | |
| Average Intel Core i9-14900HX (13158 - 19665, n=37) | |
| Average of class Gaming (6625 - 22104, n=105, last 2 years) | |
| Medion Erazer Beast X40 2024 | |
| HP Omen 17-db0079ng | |
| Geekbench 6.7 / Single-Core | |
| Medion Erazer Beast X40 2024 | |
| Schenker XMG Neo 17 E24 | |
| Average Intel Core i9-14900HX (2419 - 3129, n=37) | |
| Eurocom Raptor X17 Core i9-14900HX | |
| Average of class Gaming (1490 - 3259, n=105, last 2 years) | |
| HP Omen 17-db0079ng | |
| Geekbench 5.5 / Multi-Core | |
| MSI GE78HX 13VH-070US | |
| Schenker XMG Neo 17 E24 | |
| Average Intel Core i9-14900HX (8618 - 23194, n=37) | |
| Average of class Gaming (6460 - 27010, n=104, last 2 years) | |
| Medion Erazer Beast X40 2024 | |
| HP Omen 17-db0079ng | |
| Eurocom Raptor X17 Core i9-14900HX | |
| Geekbench 5.5 / Single-Core | |
| Medion Erazer Beast X40 2024 | |
| Schenker XMG Neo 17 E24 | |
| MSI GE78HX 13VH-070US | |
| Average Intel Core i9-14900HX (1669 - 2210, n=37) | |
| Average of class Gaming (986 - 2474, n=104, last 2 years) | |
| HP Omen 17-db0079ng | |
| Eurocom Raptor X17 Core i9-14900HX | |
| HWBOT x265 Benchmark v2.2 / 4k Preset | |
| MSI GE78HX 13VH-070US | |
| Eurocom Raptor X17 Core i9-14900HX | |
| Schenker XMG Neo 17 E24 | |
| Average Intel Core i9-14900HX (16.8 - 38.9, n=37) | |
| Average of class Gaming (11.5 - 44.3, n=104, last 2 years) | |
| Medion Erazer Beast X40 2024 | |
| HP Omen 17-db0079ng | |
| LibreOffice / 20 Documents To PDF | |
| HP Omen 17-db0079ng | |
| Average of class Gaming (33.2 - 88.8, n=104, last 2 years) | |
| MSI GE78HX 13VH-070US | |
| Medion Erazer Beast X40 2024 | |
| Average Intel Core i9-14900HX (19 - 85.1, n=37) | |
| Schenker XMG Neo 17 E24 | |
| Eurocom Raptor X17 Core i9-14900HX | |
| R Benchmark 2.5 / Overall mean | |
| HP Omen 17-db0079ng | |
| Average of class Gaming (0.3439 - 0.759, n=105, last 2 years) | |
| Average Intel Core i9-14900HX (0.3604 - 0.4859, n=37) | |
| Eurocom Raptor X17 Core i9-14900HX | |
| MSI GE78HX 13VH-070US | |
| Schenker XMG Neo 17 E24 | |
| Medion Erazer Beast X40 2024 | |
* ... smaller is better
AIDA64: FP32 Ray-Trace | FPU Julia | CPU SHA3 | CPU Queen | FPU SinJulia | FPU Mandel | CPU AES | CPU ZLib | FP64 Ray-Trace | CPU PhotoWorxx
| Performance rating | |
| Eurocom Raptor X17 Core i9-14900HX | |
| Schenker XMG Neo 17 E24 | |
| MSI GE78HX 13VH-070US | |
| Average of class Gaming | |
| Average Intel Core i9-14900HX | |
| HP Omen 17-db0079ng | |
| Medion Erazer Beast X40 2024 | |
| AIDA64 / FP32 Ray-Trace | |
| Average of class Gaming (10227 - 85542, n=103, last 2 years) | |
| Schenker XMG Neo 17 E24 | |
| MSI GE78HX 13VH-070US | |
| Eurocom Raptor X17 Core i9-14900HX | |
| HP Omen 17-db0079ng | |
| Average Intel Core i9-14900HX (13098 - 33474, n=36) | |
| Medion Erazer Beast X40 2024 | |
| AIDA64 / FPU Julia | |
| Schenker XMG Neo 17 E24 | |
| MSI GE78HX 13VH-070US | |
| Average of class Gaming (51376 - 238426, n=103, last 2 years) | |
| Eurocom Raptor X17 Core i9-14900HX | |
| Average Intel Core i9-14900HX (67573 - 166040, n=36) | |
| HP Omen 17-db0079ng | |
| Medion Erazer Beast X40 2024 | |
| AIDA64 / CPU SHA3 | |
| Eurocom Raptor X17 Core i9-14900HX | |
| Schenker XMG Neo 17 E24 | |
| MSI GE78HX 13VH-070US | |
| Average of class Gaming (2180 - 9817, n=103, last 2 years) | |
| Average Intel Core i9-14900HX (3589 - 7979, n=36) | |
| Medion Erazer Beast X40 2024 | |
| HP Omen 17-db0079ng | |
| AIDA64 / CPU Queen | |
| Eurocom Raptor X17 Core i9-14900HX | |
| Schenker XMG Neo 17 E24 | |
| MSI GE78HX 13VH-070US | |
| Average Intel Core i9-14900HX (118405 - 148966, n=36) | |
| Medion Erazer Beast X40 2024 | |
| Average of class Gaming (49785 - 173351, n=89, last 2 years) | |
| HP Omen 17-db0079ng | |
| AIDA64 / FPU SinJulia | |
| MSI GE78HX 13VH-070US | |
| Schenker XMG Neo 17 E24 | |
| Eurocom Raptor X17 Core i9-14900HX | |
| Average Intel Core i9-14900HX (10475 - 18517, n=36) | |
| HP Omen 17-db0079ng | |
| Average of class Gaming (4424 - 33636, n=103, last 2 years) | |
| Medion Erazer Beast X40 2024 | |
| AIDA64 / FPU Mandel | |
| Average of class Gaming (25115 - 128721, n=103, last 2 years) | |
| Schenker XMG Neo 17 E24 | |
| MSI GE78HX 13VH-070US | |
| Eurocom Raptor X17 Core i9-14900HX | |
| Average Intel Core i9-14900HX (32543 - 83662, n=36) | |
| HP Omen 17-db0079ng | |
| Medion Erazer Beast X40 2024 | |
| AIDA64 / CPU AES | |
| Eurocom Raptor X17 Core i9-14900HX | |
| Average Intel Core i9-14900HX (86964 - 241777, n=36) | |
| Schenker XMG Neo 17 E24 | |
| MSI GE78HX 13VH-070US | |
| Average of class Gaming (39258 - 247074, n=103, last 2 years) | |
| Medion Erazer Beast X40 2024 | |
| HP Omen 17-db0079ng | |
| AIDA64 / CPU ZLib | |
| MSI GE78HX 13VH-070US | |
| Eurocom Raptor X17 Core i9-14900HX | |
| Schenker XMG Neo 17 E24 | |
| Average Intel Core i9-14900HX (1054 - 2292, n=36) | |
| Average of class Gaming (574 - 2531, n=103, last 2 years) | |
| Medion Erazer Beast X40 2024 | |
| HP Omen 17-db0079ng | |
| AIDA64 / FP64 Ray-Trace | |
| Average of class Gaming (5509 - 45446, n=103, last 2 years) | |
| MSI GE78HX 13VH-070US | |
| Schenker XMG Neo 17 E24 | |
| Eurocom Raptor X17 Core i9-14900HX | |
| HP Omen 17-db0079ng | |
| Average Intel Core i9-14900HX (6809 - 18349, n=36) | |
| Medion Erazer Beast X40 2024 | |
| AIDA64 / CPU PhotoWorxx | |
| Eurocom Raptor X17 Core i9-14900HX | |
| MSI GE78HX 13VH-070US | |
| Schenker XMG Neo 17 E24 | |
| Medion Erazer Beast X40 2024 | |
| Average Intel Core i9-14900HX (23903 - 54702, n=36) | |
| Average of class Gaming (12271 - 89891, n=103, last 2 years) | |
| HP Omen 17-db0079ng | |
System performance
The Neo 17 also impresses in the synthetic system benchmarks, although the competition is generally very close here. In everyday use, this means an extremely responsive system, although there is a brief hang when switching the graphics card. However, this is completely normal and can be avoided by completely deactivating the iGPU.
CrossMark: Overall | Productivity | Creativity | Responsiveness
WebXPRT 3: Overall
WebXPRT 4: Overall
Mozilla Kraken 1.1: Total
| PCMark 10 / Score | |
| Medion Erazer Beast X40 2024 | |
| MSI GE78HX 13VH-070US | |
| Average Intel Core i9-14900HX, NVIDIA GeForce RTX 4080 Laptop GPU (7703 - 9223, n=7) | |
| Schenker XMG Neo 17 E24 | |
| Average of class Gaming (5828 - 11730, n=92, last 2 years) | |
| HP Omen 17-db0079ng | |
| PCMark 10 / Essentials | |
| Average Intel Core i9-14900HX, NVIDIA GeForce RTX 4080 Laptop GPU (11255 - 12600, n=7) | |
| MSI GE78HX 13VH-070US | |
| Schenker XMG Neo 17 E24 | |
| Medion Erazer Beast X40 2024 | |
| Average of class Gaming (8810 - 11935, n=96, last 2 years) | |
| HP Omen 17-db0079ng | |
| PCMark 10 / Productivity | |
| Medion Erazer Beast X40 2024 | |
| Average of class Gaming (6845 - 21327, n=94, last 2 years) | |
| Schenker XMG Neo 17 E24 | |
| MSI GE78HX 13VH-070US | |
| Average Intel Core i9-14900HX, NVIDIA GeForce RTX 4080 Laptop GPU (6662 - 11410, n=7) | |
| HP Omen 17-db0079ng | |
| PCMark 10 / Digital Content Creation | |
| Medion Erazer Beast X40 2024 | |
| MSI GE78HX 13VH-070US | |
| Average Intel Core i9-14900HX, NVIDIA GeForce RTX 4080 Laptop GPU (14211 - 16246, n=7) | |
| Schenker XMG Neo 17 E24 | |
| Average of class Gaming (7602 - 19954, n=94, last 2 years) | |
| HP Omen 17-db0079ng | |
| CrossMark / Overall | |
| Eurocom Raptor X17 Core i9-14900HX | |
| Average Intel Core i9-14900HX, NVIDIA GeForce RTX 4080 Laptop GPU (1992 - 2334, n=7) | |
| Medion Erazer Beast X40 2024 | |
| Schenker XMG Neo 17 E24 | |
| Average of class Gaming (1366 - 2409, n=93, last 2 years) | |
| MSI GE78HX 13VH-070US | |
| HP Omen 17-db0079ng | |
| CrossMark / Productivity | |
| Eurocom Raptor X17 Core i9-14900HX | |
| Medion Erazer Beast X40 2024 | |
| Average Intel Core i9-14900HX, NVIDIA GeForce RTX 4080 Laptop GPU (1812 - 2204, n=7) | |
| Average of class Gaming (1386 - 2254, n=93, last 2 years) | |
| MSI GE78HX 13VH-070US | |
| Schenker XMG Neo 17 E24 | |
| HP Omen 17-db0079ng | |
| CrossMark / Creativity | |
| Average Intel Core i9-14900HX, NVIDIA GeForce RTX 4080 Laptop GPU (2327 - 2500, n=7) | |
| Schenker XMG Neo 17 E24 | |
| Eurocom Raptor X17 Core i9-14900HX | |
| Medion Erazer Beast X40 2024 | |
| Average of class Gaming (1343 - 2729, n=93, last 2 years) | |
| MSI GE78HX 13VH-070US | |
| HP Omen 17-db0079ng | |
| CrossMark / Responsiveness | |
| Eurocom Raptor X17 Core i9-14900HX | |
| Average Intel Core i9-14900HX, NVIDIA GeForce RTX 4080 Laptop GPU (1520 - 2254, n=7) | |
| Medion Erazer Beast X40 2024 | |
| Average of class Gaming (1226 - 2334, n=93, last 2 years) | |
| MSI GE78HX 13VH-070US | |
| Schenker XMG Neo 17 E24 | |
| HP Omen 17-db0079ng | |
| WebXPRT 3 / Overall | |
| Eurocom Raptor X17 Core i9-14900HX | |
| Schenker XMG Neo 17 E24 | |
| Average Intel Core i9-14900HX, NVIDIA GeForce RTX 4080 Laptop GPU (310 - 345, n=7) | |
| Medion Erazer Beast X40 2024 | |
| Average of class Gaming (220 - 532, n=97, last 2 years) | |
| MSI GE78HX 13VH-070US | |
| HP Omen 17-db0079ng | |
| WebXPRT 4 / Overall | |
| Schenker XMG Neo 17 E24 | |
| Average Intel Core i9-14900HX, NVIDIA GeForce RTX 4080 Laptop GPU (300 - 321, n=7) | |
| Eurocom Raptor X17 Core i9-14900HX | |
| Medion Erazer Beast X40 2024 | |
| MSI GE78HX 13VH-070US | |
| Average of class Gaming (165 - 354, n=97, last 2 years) | |
| Mozilla Kraken 1.1 / Total | |
| HP Omen 17-db0079ng | |
| MSI GE78HX 13VH-070US | |
| Eurocom Raptor X17 Core i9-14900HX | |
| Average of class Gaming (391 - 590, n=99, last 2 years) | |
| Average Intel Core i9-14900HX, NVIDIA GeForce RTX 4080 Laptop GPU (437 - 446, n=7) | |
| Schenker XMG Neo 17 E24 | |
| Medion Erazer Beast X40 2024 | |
* ... smaller is better
| PCMark 10 Score | 8694 points | |
Help | ||
| AIDA64 / Memory Copy | |
| Medion Erazer Beast X40 2024 | |
| Schenker XMG Neo 17 E24 | |
| MSI GE78HX 13VH-070US | |
| Eurocom Raptor X17 Core i9-14900HX | |
| Average Intel Core i9-14900HX (38028 - 83392, n=36) | |
| Average of class Gaming (21750 - 129946, n=103, last 2 years) | |
| HP Omen 17-db0079ng | |
| AIDA64 / Memory Read | |
| Schenker XMG Neo 17 E24 | |
| MSI GE78HX 13VH-070US | |
| Medion Erazer Beast X40 2024 | |
| Average Intel Core i9-14900HX (43306 - 87568, n=36) | |
| Eurocom Raptor X17 Core i9-14900HX | |
| Average of class Gaming (22956 - 118858, n=103, last 2 years) | |
| HP Omen 17-db0079ng | |
| AIDA64 / Memory Write | |
| HP Omen 17-db0079ng | |
| Medion Erazer Beast X40 2024 | |
| Schenker XMG Neo 17 E24 | |
| MSI GE78HX 13VH-070US | |
| Eurocom Raptor X17 Core i9-14900HX | |
| Average of class Gaming (22297 - 135096, n=103, last 2 years) | |
| Average Intel Core i9-14900HX (37146 - 80589, n=36) | |
| AIDA64 / Memory Latency | |
| Average of class Gaming (75.3 - 259, n=103, last 2 years) | |
| HP Omen 17-db0079ng | |
| Eurocom Raptor X17 Core i9-14900HX | |
| Average Intel Core i9-14900HX (76.1 - 105, n=36) | |
| MSI GE78HX 13VH-070US | |
| Schenker XMG Neo 17 E24 | |
| Medion Erazer Beast X40 2024 | |
* ... smaller is better
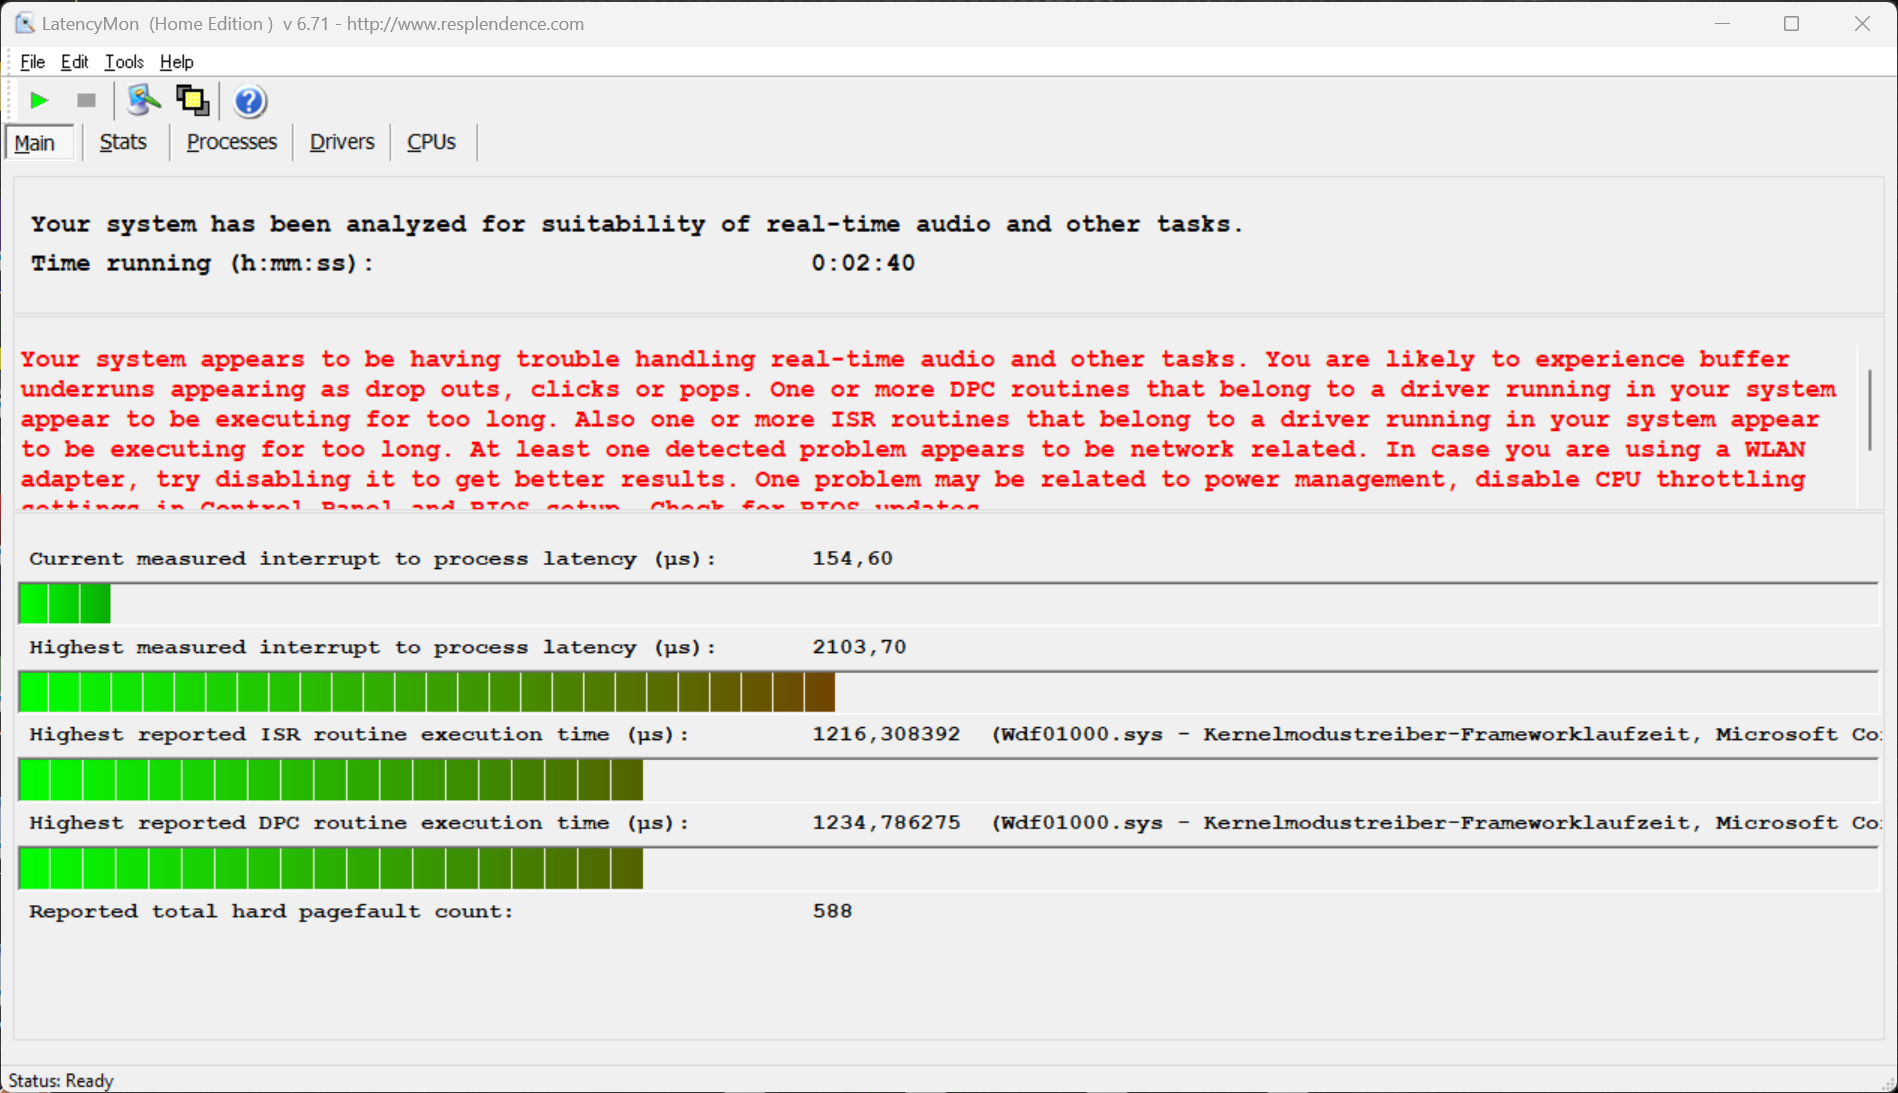
DPC latencies
In our standardized latency test (surfing the Internet, 4K YouTube playback, CPU load), the system with the tested BIOS version shows limitations when using real-time audio applications.

| DPC Latencies / LatencyMon - interrupt to process latency (max), Web, Youtube, Prime95 | |
| MSI GE78HX 13VH-070US | |
| Schenker XMG Neo 17 E24 | |
| HP Omen 17-db0079ng | |
| Medion Erazer Beast X40 2024 | |
| Eurocom Raptor X17 Core i9-14900HX | |
* ... smaller is better
Mass storage
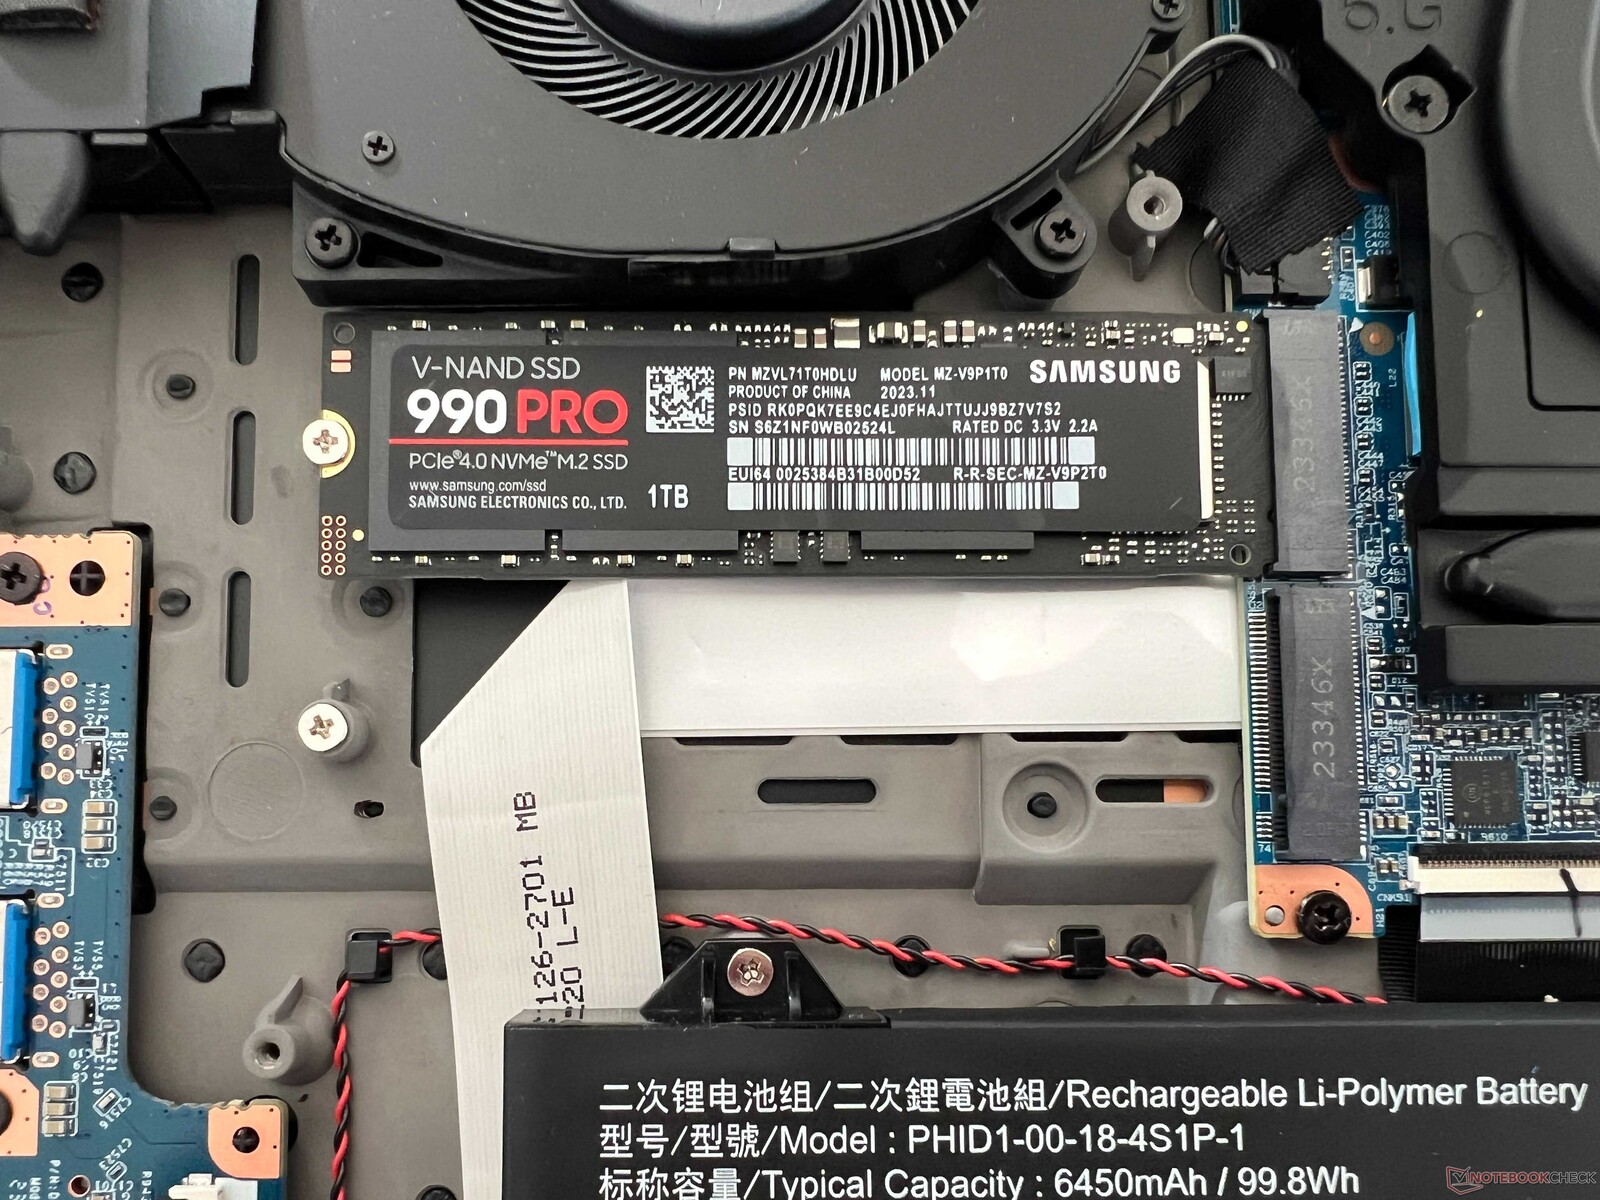
The Neo 17 offers two fast M.2-2280 slots that are connected via PCIe 4.0 x4. The 1 TB version of the Samsung 990 Pro is installed in the test device, which achieves rapid transfer rates and is one of the fastest SSDs on the market. In addition, the performance remains completely stable even under constant load. After the initial start-up, the user has 864 GB at their disposal. Further SSD benchmarks can be found here.

* ... smaller is better
Continuous read: DiskSpd Read Loop, Queue Depth 8
Graphics card
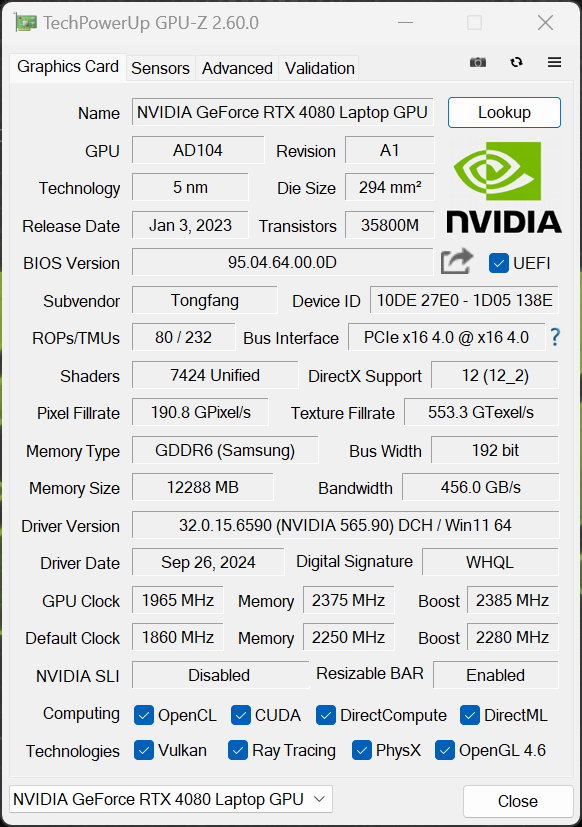
In our test device, the dedicated Nvidia GeForce RTX 4080 Laptop with 12 GB VRAM is installed. The graphics card can consume a maximum of 175 watts (150 watts TGP + 25 watts Dynamic Boost), so the Neo 17 can fully utilize the GPU. Thanks to the Advanced Optimus graphics switching, the gaming performance is outstanding and the RTX 4080 laptop is completely sufficient for the native QHD resolution. In addition, the performance remains completely stable even under constant load.
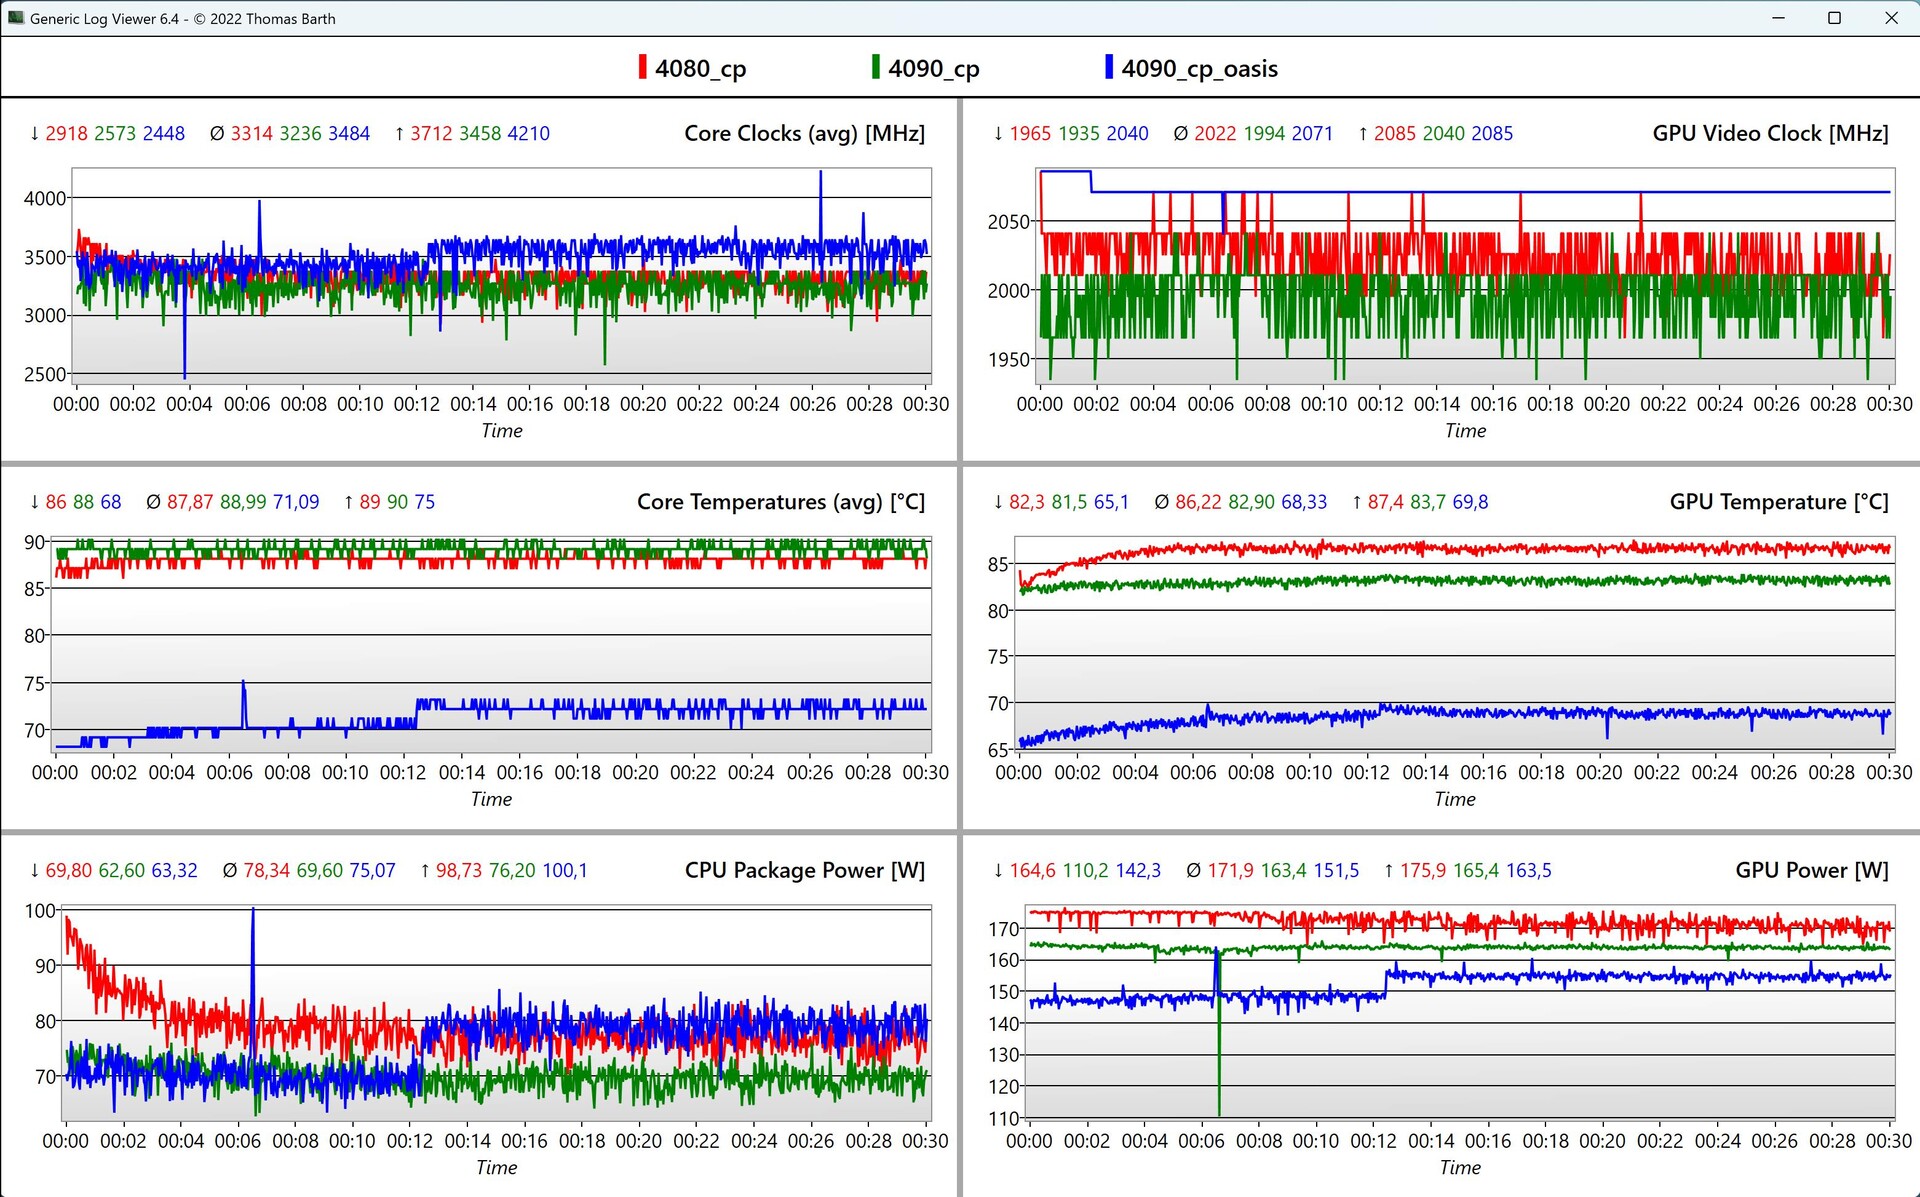
When comparing the CPU/GPU data in our Cyberpunk 2077 loop, the advantage of external water cooling becomes very clear, as the CPU/GPU temperatures are around 20 °C lower, which is why the fans also have to work less.
In battery mode, the power consumption of the GPU is limited to 52 watts, which is why the GPU performance is around 53% lower. Further GPU benchmarks are available here.
| 3DMark Performance rating - Percent | |
| Eurocom Raptor X17 Core i9-14900HX | |
| Schenker Neo 17 2024 Engineering Sample -1! | |
| Medion Erazer Beast X40 2024 | |
| Schenker XMG Neo 17 E24 | |
| MSI GE78HX 13VH-070US | |
| Average NVIDIA GeForce RTX 4080 Laptop GPU | |
| Average of class Gaming | |
| HP Omen 17-db0079ng | |
| 3DMark 11 - 1280x720 Performance GPU | |
| Schenker Neo 17 2024 Engineering Sample | |
| Medion Erazer Beast X40 2024 | |
| Eurocom Raptor X17 Core i9-14900HX | |
| Schenker XMG Neo 17 E24 | |
| MSI GE78HX 13VH-070US | |
| Average NVIDIA GeForce RTX 4080 Laptop GPU (45199 - 63128, n=24) | |
| Average of class Gaming (21841 - 80022, n=103, last 2 years) | |
| HP Omen 17-db0079ng | |
| 3DMark 11 Performance | 45722 points | |
| 3DMark Fire Strike Score | 34851 points | |
| 3DMark Time Spy Score | 18980 points | |
Help | ||
| Blender / v3.3 Classroom OPTIX/RTX | |
| HP Omen 17-db0079ng | |
| Average of class Gaming (9 - 32, n=105, last 2 years) | |
| Average NVIDIA GeForce RTX 4080 Laptop GPU (13 - 20, n=22) | |
| MSI GE78HX 13VH-070US | |
| Schenker XMG Neo 17 E24 | |
| Eurocom Raptor X17 Core i9-14900HX | |
| Medion Erazer Beast X40 2024 | |
| Blender / v3.3 Classroom CUDA | |
| HP Omen 17-db0079ng | |
| Average of class Gaming (15 - 228, n=105, last 2 years) | |
| Average NVIDIA GeForce RTX 4080 Laptop GPU (21 - 28, n=23) | |
| MSI GE78HX 13VH-070US | |
| Schenker XMG Neo 17 E24 | |
| Eurocom Raptor X17 Core i9-14900HX | |
| Medion Erazer Beast X40 2024 | |
| Blender / v3.3 Classroom CPU | |
| HP Omen 17-db0079ng | |
| Medion Erazer Beast X40 2024 | |
| Average of class Gaming (122 - 565, n=101, last 2 years) | |
| Average NVIDIA GeForce RTX 4080 Laptop GPU (177 - 337, n=23) | |
| Eurocom Raptor X17 Core i9-14900HX | |
| Schenker XMG Neo 17 E24 | |
| MSI GE78HX 13VH-070US | |
* ... smaller is better
| Performance rating - Percent | |
| Eurocom Raptor X17 Core i9-14900HX -1! | |
| Schenker Neo 17 2024 Engineering Sample -2! | |
| Medion Erazer Beast X40 2024 -1! | |
| Schenker XMG Neo 17 E24 | |
| Average of class Gaming | |
| MSI GE78HX 13VH-070US -2! | |
| HP Omen 17-db0079ng -1! | |
| Cyberpunk 2077 - 1920x1080 Ultra Preset (FSR off) | |
| Eurocom Raptor X17 Core i9-14900HX | |
| Schenker XMG Neo 17 E24 | |
| Medion Erazer Beast X40 2024 | |
| Average of class Gaming (17.7 - 169.9, n=114, last 2 years) | |
| HP Omen 17-db0079ng | |
| Baldur's Gate 3 - 1920x1080 Ultra Preset AA:T | |
| Eurocom Raptor X17 Core i9-14900HX | |
| Average of class Gaming (59.4 - 246, n=101, last 2 years) | |
| Schenker XMG Neo 17 E24 | |
| GTA V - 1920x1080 Highest AA:4xMSAA + FX AF:16x | |
| Eurocom Raptor X17 Core i9-14900HX | |
| Schenker XMG Neo 17 E24 | |
| Schenker Neo 17 2024 Engineering Sample | |
| Medion Erazer Beast X40 2024 | |
| Average of class Gaming (48.3 - 186.9, n=93, last 2 years) | |
| HP Omen 17-db0079ng | |
| MSI GE78HX 13VH-070US | |
| Final Fantasy XV Benchmark - 1920x1080 High Quality | |
| Schenker Neo 17 2024 Engineering Sample | |
| Medion Erazer Beast X40 2024 | |
| Schenker XMG Neo 17 E24 | |
| Average of class Gaming (41 - 215, n=94, last 2 years) | |
| MSI GE78HX 13VH-070US | |
| HP Omen 17-db0079ng | |
| Strange Brigade - 1920x1080 ultra AA:ultra AF:16 | |
| Eurocom Raptor X17 Core i9-14900HX | |
| Schenker Neo 17 2024 Engineering Sample | |
| Medion Erazer Beast X40 2024 | |
| Schenker XMG Neo 17 E24 | |
| Average of class Gaming (76.3 - 456, n=86, last 2 years) | |
| MSI GE78HX 13VH-070US | |
| HP Omen 17-db0079ng | |
| Dota 2 Reborn - 1920x1080 ultra (3/3) best looking | |
| Eurocom Raptor X17 Core i9-14900HX | |
| Medion Erazer Beast X40 2024 | |
| Schenker Neo 17 2024 Engineering Sample | |
| Schenker XMG Neo 17 E24 | |
| Average of class Gaming (84.8 - 248, n=106, last 2 years) | |
| MSI GE78HX 13VH-070US | |
| HP Omen 17-db0079ng | |
| X-Plane 11.11 - 1920x1080 high (fps_test=3) | |
| Eurocom Raptor X17 Core i9-14900HX | |
| Medion Erazer Beast X40 2024 | |
| Schenker XMG Neo 17 E24 | |
| MSI GE78HX 13VH-070US | |
| Schenker Neo 17 2024 Engineering Sample | |
| Average of class Gaming (55.5 - 143.5, n=108, last 2 years) | |
| HP Omen 17-db0079ng | |
Cyberpunk 2077 Ultra FPS chart
| low | med. | high | ultra | QHD DLSS | QHD | 4K | |
|---|---|---|---|---|---|---|---|
| GTA V (2015) | 181.7 | 143.4 | 135.1 | 163.7 | |||
| Dota 2 Reborn (2015) | 220 | 197.1 | 194 | 179.7 | |||
| Final Fantasy XV Benchmark (2018) | 226 | 215 | 173.9 | 134.4 | |||
| X-Plane 11.11 (2018) | 202 | 176.8 | 138.9 | ||||
| Far Cry 5 (2018) | 179 | 162 | 157 | ||||
| Strange Brigade (2018) | 381 | 347 | 239 | 122 | |||
| Shadow of the Tomb Raider (2018) | 212 | 176 | |||||
| Far Cry 6 (2021) | 156 | 141 | |||||
| F1 23 (2023) | 321 | 111.6 | 70.7 | 35.5 | |||
| Baldur's Gate 3 (2023) | 231 | 143 | 122.2 | 111.8 | 88.3 | ||
| Cyberpunk 2077 (2023) | 101.1 | 146.9 | 133.8 | 121.3 | 110.1 | 80.7 | |
| Assassin's Creed Mirage (2023) | 197 | 153 | 129 | ||||
| Call of Duty Modern Warfare 3 2023 (2023) | 180 | 171 | 123 | ||||
| Avatar Frontiers of Pandora (2023) | 125 | 97 | 66 | ||||
| F1 24 (2024) | 304 | 323 | 289 | 112.2 | 71.2 |
Emissions & Energy
Noise emissions
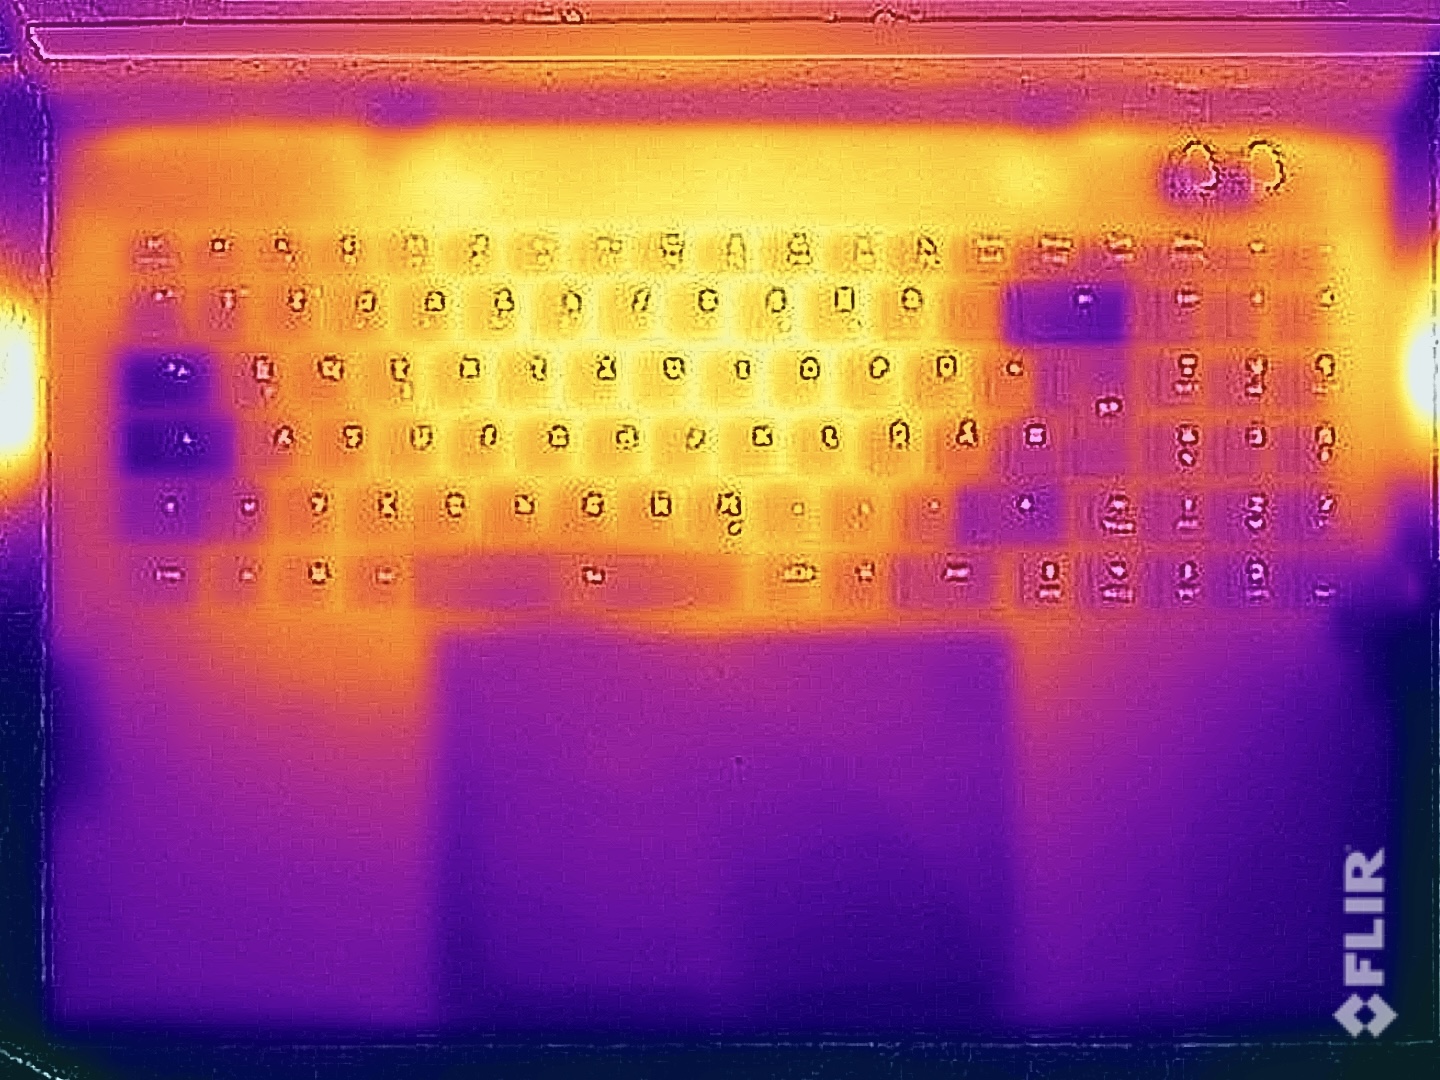
The cooling with two fans is basically the same as last year's model, but configurations of the Neo 17 with the RTX 4080/4090 laptop offer a modified channel for water cooling, which now also runs directly over the CPU. The fans are always running, but during very simple tasks (surfing the internet, emails, videos) you can only hear a very low noise. When gaming, however, it gets significantly louder at 52 dB(A). Although there are louder competitors, you should still use headphones when gaming. During the benchmarks/games, there was also some slight coil whine noise.
Noise level
| Idle |
| 28.1 / 28.1 / 28.1 dB(A) |
| HDD |
| 0 dB(A) |
| Load |
| 43.1 / 51.9 dB(A) |
 | ||
30 dB silent 40 dB(A) audible 50 dB(A) loud |
||
min: | ||
| Schenker XMG Neo 17 E24 GeForce RTX 4080 Laptop GPU, i9-14900HX, Samsung 990 Pro 1 TB | Medion Erazer Beast X40 2024 GeForce RTX 4090 Laptop GPU, i9-14900HX, Phison E18-1TB-PHISON-SSD-BICS5 | HP Omen 17-db0079ng GeForce RTX 4070 Laptop GPU, R7 8845HS, WD PC SN560 SDDPNQE-1T00 | Eurocom Raptor X17 Core i9-14900HX GeForce RTX 4090 Laptop GPU, i9-14900HX, Corsair MP700 Pro 2TB | MSI GE78HX 13VH-070US GeForce RTX 4080 Laptop GPU, i9-13950HX, Samsung PM9A1 MZVL22T0HBLB | |
|---|---|---|---|---|---|
| Noise | -6% | -2% | -7% | -0% | |
| off / environment * (dB) | 23.3 | 25 -7% | 25 -7% | 23.7 -2% | 23.4 -0% |
| Idle Minimum * (dB) | 28.1 | 28 -0% | 25 11% | 31.7 -13% | 24.2 14% |
| Idle Average * (dB) | 28.1 | 29 -3% | 29 -3% | 31.7 -13% | 25.6 9% |
| Idle Maximum * (dB) | 28.1 | 32 -14% | 33 -17% | 32.9 -17% | 31 -10% |
| Load Average * (dB) | 43.1 | 48 -11% | 45 -4% | 34 21% | 43.3 -0% |
| Cyberpunk 2077 ultra * (dB) | 51.9 | 48 8% | |||
| Load Maximum * (dB) | 51.9 | 52 -0% | 52 -0% | 61.6 -19% | 59.1 -14% |
| Witcher 3 ultra * (dB) | 50 | 61.6 | 56.3 |
* ... smaller is better
Temperature
Schenker uses a liquid metal thermal interface for both the CPU and GPU in configurations starting from the RTX 4080 laptop upwards. The case temperatures remain cool during simple tasks, but we measured more than 50 °C on the underside at certain points under load. However, due to its size, the Neo 17 will not be placed on your thighs, so these values are not problematic. The keyboard area also heats up noticeably, but there are no limitations here. In the stress test, the graphics card stabilized at 160 watts and the processor at around 70 watts.

(-) The maximum temperature on the upper side is 46.2 °C / 115 F, compared to the average of 40.4 °C / 105 F, ranging from 21.2 to 68.8 °C for the class Gaming.
(-) The bottom heats up to a maximum of 56.7 °C / 134 F, compared to the average of 43.2 °C / 110 F
(+) In idle usage, the average temperature for the upper side is 28.2 °C / 83 F, compared to the device average of 33.9 °C / 93 F.
(-) 3: The average temperature for the upper side is 39.8 °C / 104 F, compared to the average of 33.9 °C / 93 F for the class Gaming.
(+) The palmrests and touchpad are reaching skin temperature as a maximum (33.5 °C / 92.3 F) and are therefore not hot.
(-) The average temperature of the palmrest area of similar devices was 28.8 °C / 83.8 F (-4.7 °C / -8.5 F).
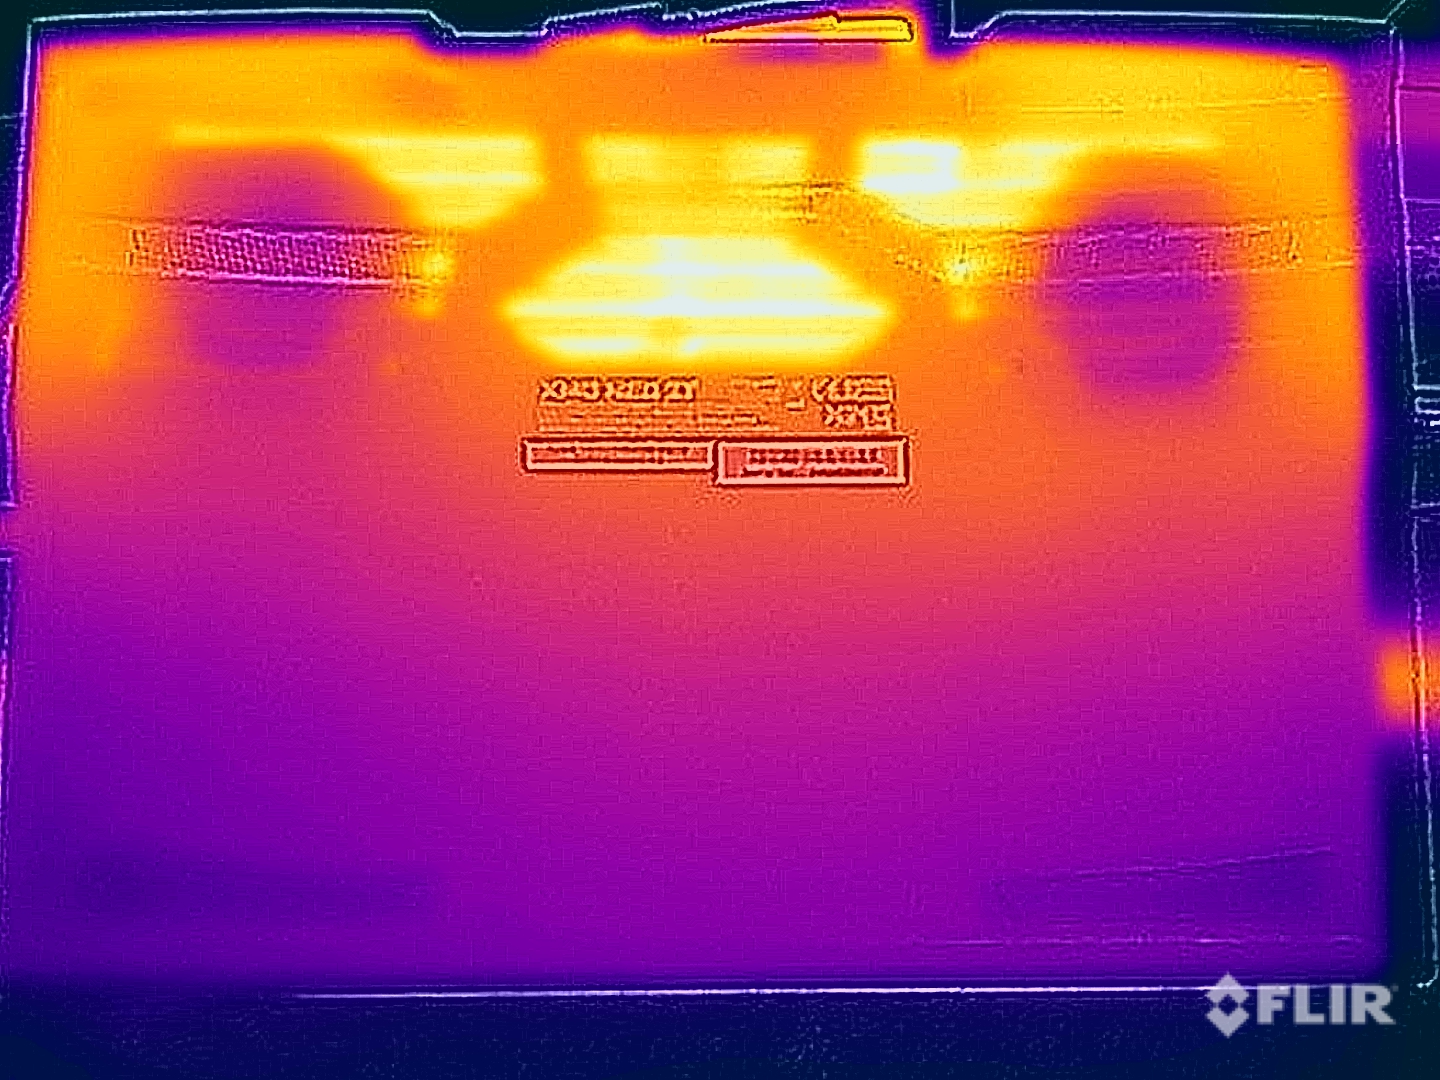
| Schenker XMG Neo 17 E24 Intel Core i9-14900HX, NVIDIA GeForce RTX 4080 Laptop GPU | Medion Erazer Beast X40 2024 Intel Core i9-14900HX, NVIDIA GeForce RTX 4090 Laptop GPU | HP Omen 17-db0079ng AMD Ryzen 7 8845HS, NVIDIA GeForce RTX 4070 Laptop GPU | Eurocom Raptor X17 Core i9-14900HX Intel Core i9-14900HX, NVIDIA GeForce RTX 4090 Laptop GPU | MSI GE78HX 13VH-070US Intel Core i9-13950HX, NVIDIA GeForce RTX 4080 Laptop GPU | |
|---|---|---|---|---|---|
| Heat | 1% | 14% | 1% | 10% | |
| Maximum Upper Side * (°C) | 46.2 | 47 -2% | 44 5% | 52.2 -13% | 37.4 19% |
| Maximum Bottom * (°C) | 56.7 | 54 5% | 45 21% | 53.2 6% | 45 21% |
| Idle Upper Side * (°C) | 29.8 | 30 -1% | 26 13% | 28.6 4% | 29.8 -0% |
| Idle Bottom * (°C) | 32 | 32 -0% | 27 16% | 29.8 7% | 32.4 -1% |
* ... smaller is better
Speaker
The stereo speakers are not particularly good but are sufficient for the occasional YouTube video. However, the speakers are not really useful for gaming anyway due to the loud fans.
Schenker XMG Neo 17 E24 audio analysis
(+) | speakers can play relatively loud (83.7 dB)
Bass 100 - 315 Hz
(-) | nearly no bass - on average 19% lower than median
(+) | bass is linear (6% delta to prev. frequency)
Mids 400 - 2000 Hz
(±) | higher mids - on average 6.6% higher than median
(±) | linearity of mids is average (9.4% delta to prev. frequency)
Highs 2 - 16 kHz
(+) | balanced highs - only 3.6% away from median
(±) | linearity of highs is average (7.1% delta to prev. frequency)
Overall 100 - 16.000 Hz
(±) | linearity of overall sound is average (18.3% difference to median)
Compared to same class
» 58% of all tested devices in this class were better, 9% similar, 33% worse
» The best had a delta of 6%, average was 18%, worst was 132%
Compared to all devices tested
» 40% of all tested devices were better, 8% similar, 52% worse
» The best had a delta of 4%, average was 23%, worst was 134%
Medion Erazer Beast X40 2024 audio analysis
(+) | speakers can play relatively loud (88 dB)
Bass 100 - 315 Hz
(±) | reduced bass - on average 14.7% lower than median
(±) | linearity of bass is average (7.2% delta to prev. frequency)
Mids 400 - 2000 Hz
(+) | balanced mids - only 3.7% away from median
(+) | mids are linear (5.8% delta to prev. frequency)
Highs 2 - 16 kHz
(+) | balanced highs - only 2.8% away from median
(+) | highs are linear (6.4% delta to prev. frequency)
Overall 100 - 16.000 Hz
(+) | overall sound is linear (12.1% difference to median)
Compared to same class
» 12% of all tested devices in this class were better, 4% similar, 84% worse
» The best had a delta of 6%, average was 18%, worst was 132%
Compared to all devices tested
» 10% of all tested devices were better, 2% similar, 88% worse
» The best had a delta of 4%, average was 23%, worst was 134%
HP Omen 17-db0079ng audio analysis
(±) | speaker loudness is average but good (80 dB)
Bass 100 - 315 Hz
(-) | nearly no bass - on average 19.1% lower than median
(±) | linearity of bass is average (10.3% delta to prev. frequency)
Mids 400 - 2000 Hz
(+) | balanced mids - only 1.9% away from median
(+) | mids are linear (4.4% delta to prev. frequency)
Highs 2 - 16 kHz
(+) | balanced highs - only 3.8% away from median
(±) | linearity of highs is average (7.8% delta to prev. frequency)
Overall 100 - 16.000 Hz
(+) | overall sound is linear (14.3% difference to median)
Compared to same class
» 26% of all tested devices in this class were better, 7% similar, 67% worse
» The best had a delta of 6%, average was 18%, worst was 132%
Compared to all devices tested
» 17% of all tested devices were better, 4% similar, 78% worse
» The best had a delta of 4%, average was 23%, worst was 134%
Eurocom Raptor X17 Core i9-14900HX audio analysis
(±) | speaker loudness is average but good (74.2 dB)
Bass 100 - 315 Hz
(±) | reduced bass - on average 13.4% lower than median
(±) | linearity of bass is average (10.1% delta to prev. frequency)
Mids 400 - 2000 Hz
(±) | higher mids - on average 6.6% higher than median
(±) | linearity of mids is average (8.6% delta to prev. frequency)
Highs 2 - 16 kHz
(+) | balanced highs - only 2% away from median
(±) | linearity of highs is average (8.5% delta to prev. frequency)
Overall 100 - 16.000 Hz
(±) | linearity of overall sound is average (24% difference to median)
Compared to same class
» 86% of all tested devices in this class were better, 4% similar, 9% worse
» The best had a delta of 6%, average was 18%, worst was 132%
Compared to all devices tested
» 72% of all tested devices were better, 6% similar, 22% worse
» The best had a delta of 4%, average was 23%, worst was 134%
MSI GE78HX 13VH-070US audio analysis
(+) | speakers can play relatively loud (84.4 dB)
Bass 100 - 315 Hz
(±) | reduced bass - on average 8.3% lower than median
(±) | linearity of bass is average (9.3% delta to prev. frequency)
Mids 400 - 2000 Hz
(±) | higher mids - on average 6.8% higher than median
(+) | mids are linear (3.4% delta to prev. frequency)
Highs 2 - 16 kHz
(+) | balanced highs - only 2% away from median
(+) | highs are linear (2.6% delta to prev. frequency)
Overall 100 - 16.000 Hz
(+) | overall sound is linear (12% difference to median)
Compared to same class
» 12% of all tested devices in this class were better, 4% similar, 84% worse
» The best had a delta of 6%, average was 18%, worst was 132%
Compared to all devices tested
» 9% of all tested devices were better, 2% similar, 88% worse
» The best had a delta of 4%, average was 23%, worst was 134%
Power consumption
The maximum idle consumption of 13 watts is very low for a large 17-inch notebook. When gaming, however, it is around 300 watts, which is not surprising given the high TDP/TGP values. The supplied 330-watt power supply unit is adequately dimensioned. However, the standby consumption of 2.1 watts is too high.
| Off / Standby | |
| Idle | |
| Load |
|
Key:
min: | |
Power consumption Cyberpunk / Stresstest
Power consumption with external monitor
Battery life
The Neo 17 is equipped with a 99 Wh battery, which achieves a decent runtime of around 6 hours in WLAN mode at 150 cd/m² (58% of the maximum brightness of the test device). This puts the large gamer in the midfield when compared to the competition. A full charge with the device switched on takes 107 minutes, whereby 80% of the battery is available again after around 45 minutes.
Notebookcheck overall rating
The XMG Neo 17 clearly focuses on gaming performance and the performance is very good. Thanks to optional water cooling, the temperatures and thus also the fan noise can be significantly reduced once again. The matte QHD panel with 240 Hz and fast response times is also very suitable for gaming.
Schenker XMG Neo 17 E24
- 11/27/2024 v8
Andreas Osthoff
 Total Sustainability Score:
 Transparency
The selection of devices to be reviewed is made by our editorial team. The test sample was provided to the author as a loan by the manufacturer or retailer for the purpose of this review. The lender had no influence on this review, nor did the manufacturer receive a copy of this review before publication. There was no obligation to publish this review. As an independent media company, Notebookcheck is not subjected to the authority of manufacturers, retailers or publishers.
This is how Notebookcheck is testing
Every year, Notebookcheck independently reviews hundreds of laptops and smartphones using standardized procedures to ensure that all results are comparable. We have continuously developed our test methods for around 20 years and set industry standards in the process. In our test labs, high-quality measuring equipment is utilized by experienced technicians and editors. These tests involve a multi-stage validation process. Our complex rating system is based on hundreds of well-founded measurements and benchmarks, which maintains objectivity. Further information on our test methods can be found here.

