Notebookcheck Logo

GeForce RTX 4070, 4060, 4050 Laptop Analysis - Nvidia's new Mainstream Laptop GPUs in Review

Perfect for QHD and 1080p. Two weeks after the launch of the new high-end models RTX 4090 and RTX 4080, Nvidia launches the new laptop versions of the RTX 4070, RTX 4060 and RTX 4050. We checked the three new models and the smaller versions also offer noticeably more performance. Update: Benchmarks at lower TDP levels

Nvidia just launched their new GeForce RTX 4090 Laptop and Geforce RTX 4080 Laptop flagship GPUs in the beginning of February. Our comprehensive analyses showed that the performance was much lower compared to their RTX 40 desktop counterparts due to TGP restrictions, but there is still a major performance improvement over the old flagship model GeForce RTX 3080 Ti Laptop. Both the MSI Titan GT77 (RTX 4090) as well as the Razer Blade 16 (RTX 4080) also showed that both GPUs can easily handle high-re screens including 4K. However, these laptops are very expensive and the new mainstream GPUs will be more interesting for many customers.

Today, Nvidia launches the new models GeForce RTX 4070 LaptopRTX 4060 Laptop as well as RTX 4050 Laptop, which are available in many gaming and multimedia laptops. In addition to synthetic benchmarks we will check the gaming performance including Ray Tracing and Nvidia's DLSS upscaling.

Update 03/02/2023: We performed additional benchmarks with the RTX 4050 Laptop and RTX 4070 Laptop at different power levels. The results are available at the end of the article.

Overview - RTX 4070, 4060 & 4050 Laptop

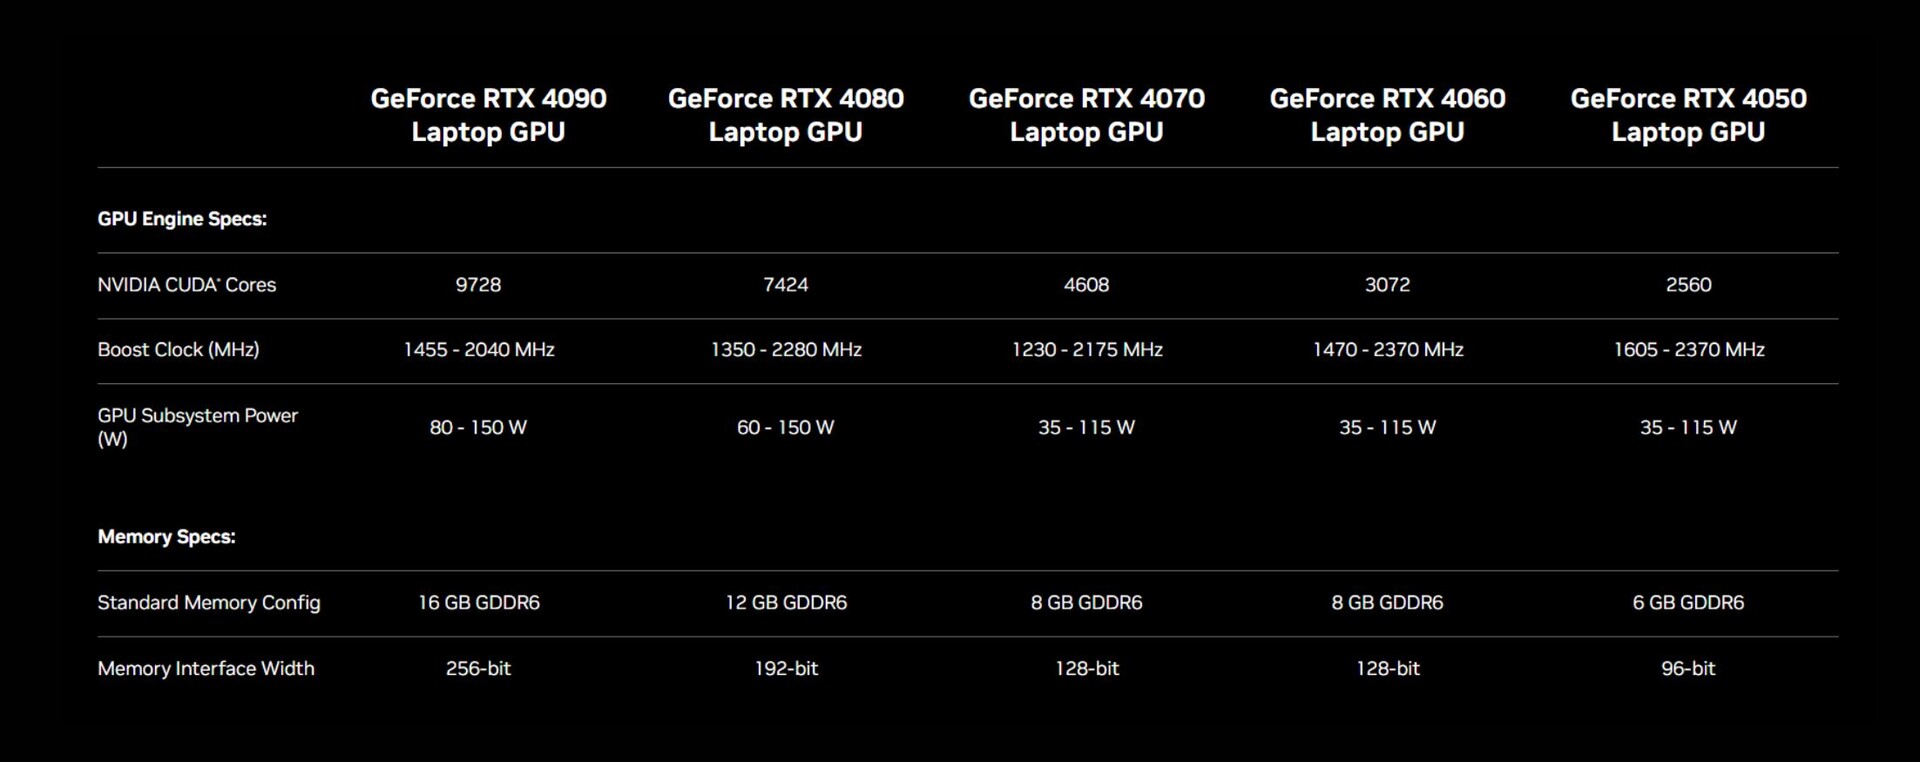
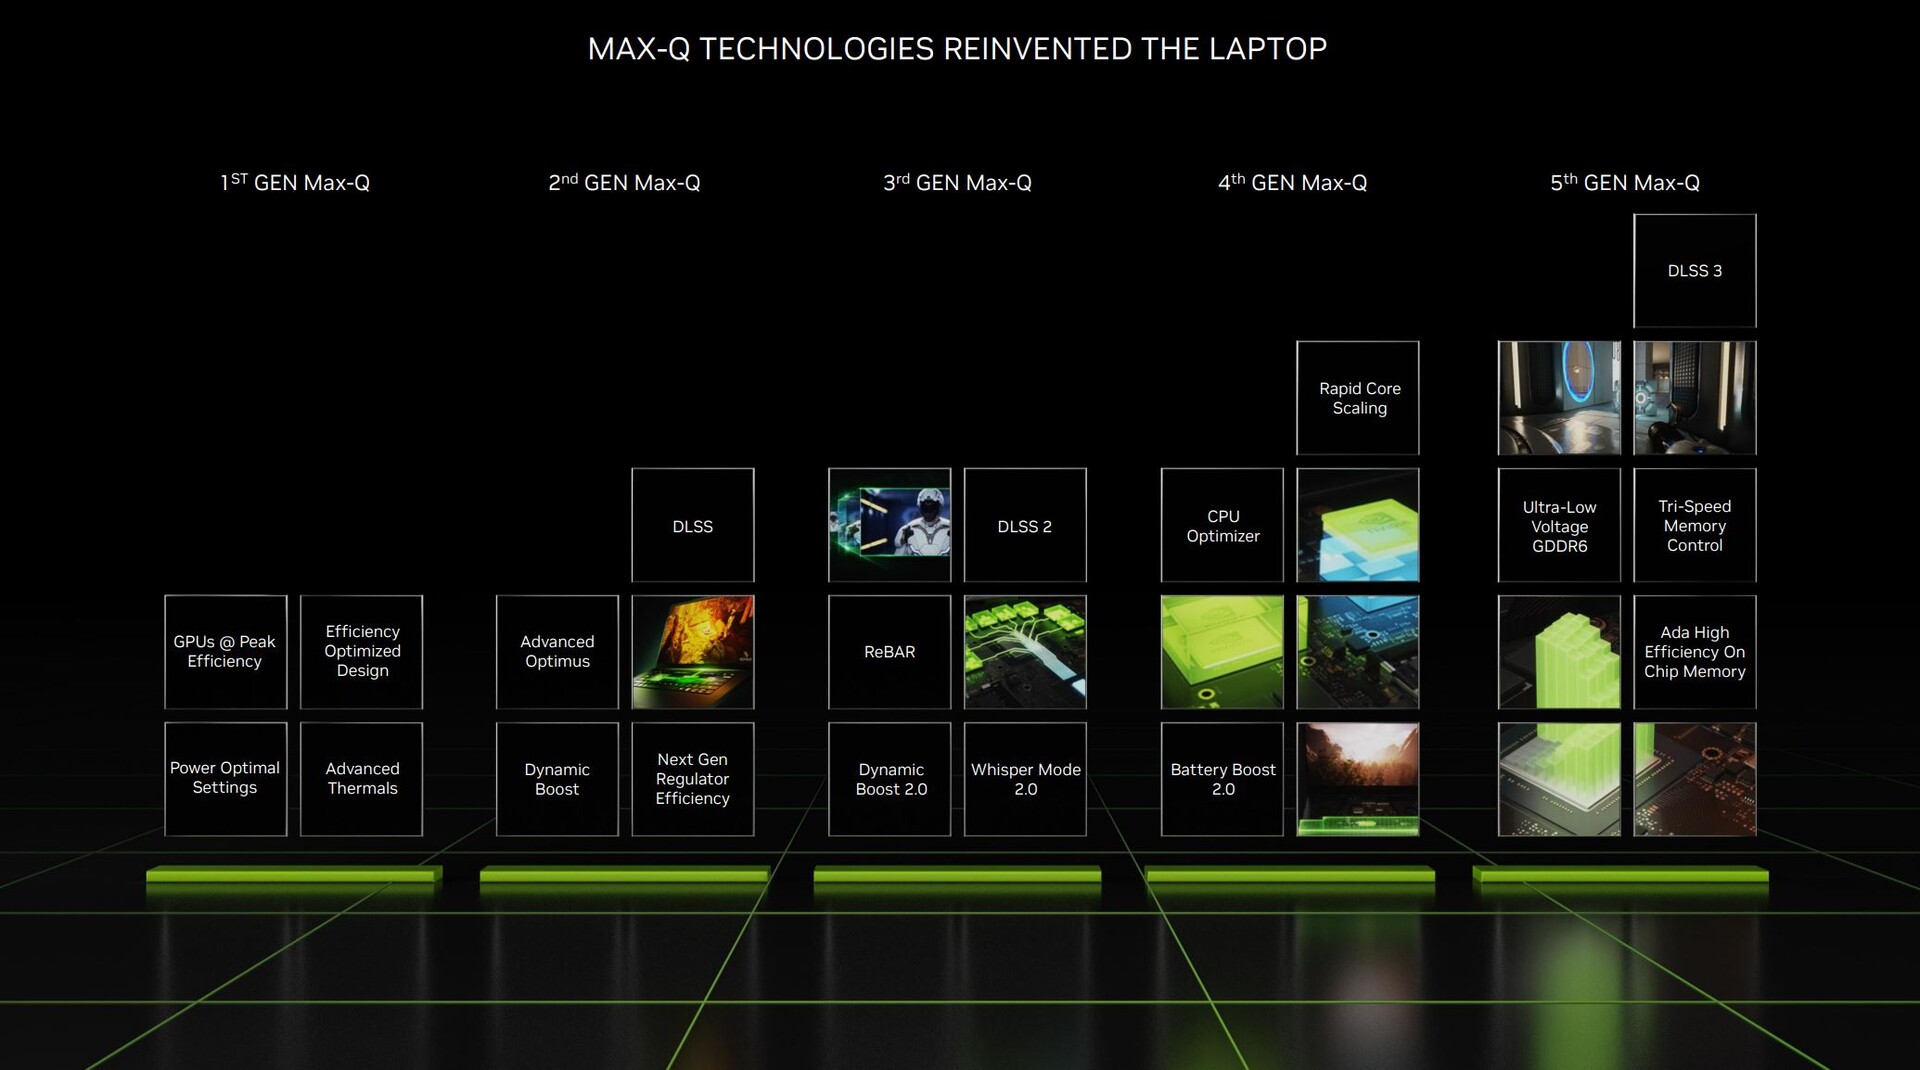
The new models GeForce RTX 4070, 4060 and 4050 are all based on the Ada Lovelace architecture and all versions support DLSS 3 as well as raytracing. There are obviously differences in terms of core counts, which is listed in the table below. The RTX 4070 Laptop is based on the AD106 chip, while both the RTX 4060 Laptop and RTX 4050 Laptop are based on the AD107 chip. All three GPUs can cover a wide range of systems with TGP settings between 35-115 Watts with an additional 25 Watts from the processor via Dynamic Boost. This means all three laptop GPUs can consume up to 140 Watts.

Overview RTX 40 Laptop (Source: Nvidia)

However, you will only see this value in synthetic workloads like FurMark, for example. The power consumption in real gaming scenarios will depend on the actual GPU load, so the consumption can be much lower. This is important when you analyze gaming benchmarks and sensor data, so you do not panic when the GPU does not hit its maximum TGP value all the time since everything works as intended by Nvidia. The wide TGP range can also be an issue for customers when laptop manufacturers do not disclose exact TGP figures for their products.

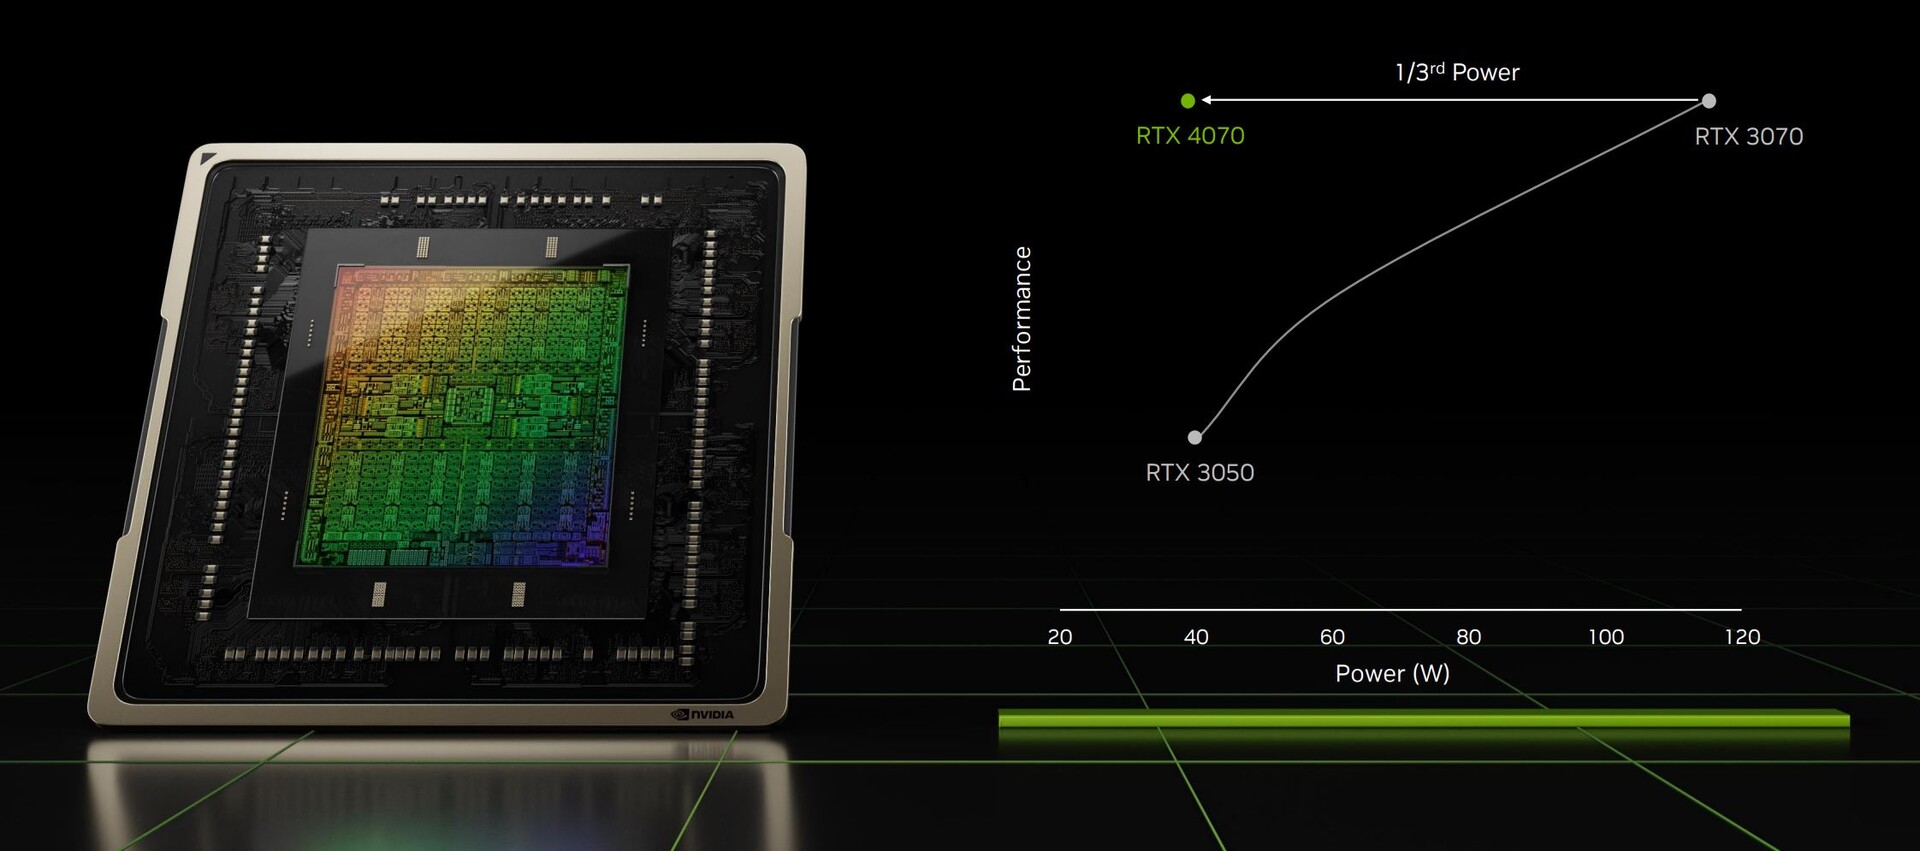
Our analysis of the RTX 4090/480 laptop showed efficiency improvements of more than 50 %, but Nvidia even advertises higher efficiency gains (3x). The press information now shows the scenario for this claim, which is not very practical. The comparison includes the new RTX 4070 Laptop running at 40W, which will offer the same performance as the old RTX 3070 Laptop. However, there are no further details on this comparison (like the application, game, settings, etc.).

The highest efficiency improvement over Ampere is possible at 40W (Source: Nvidia)

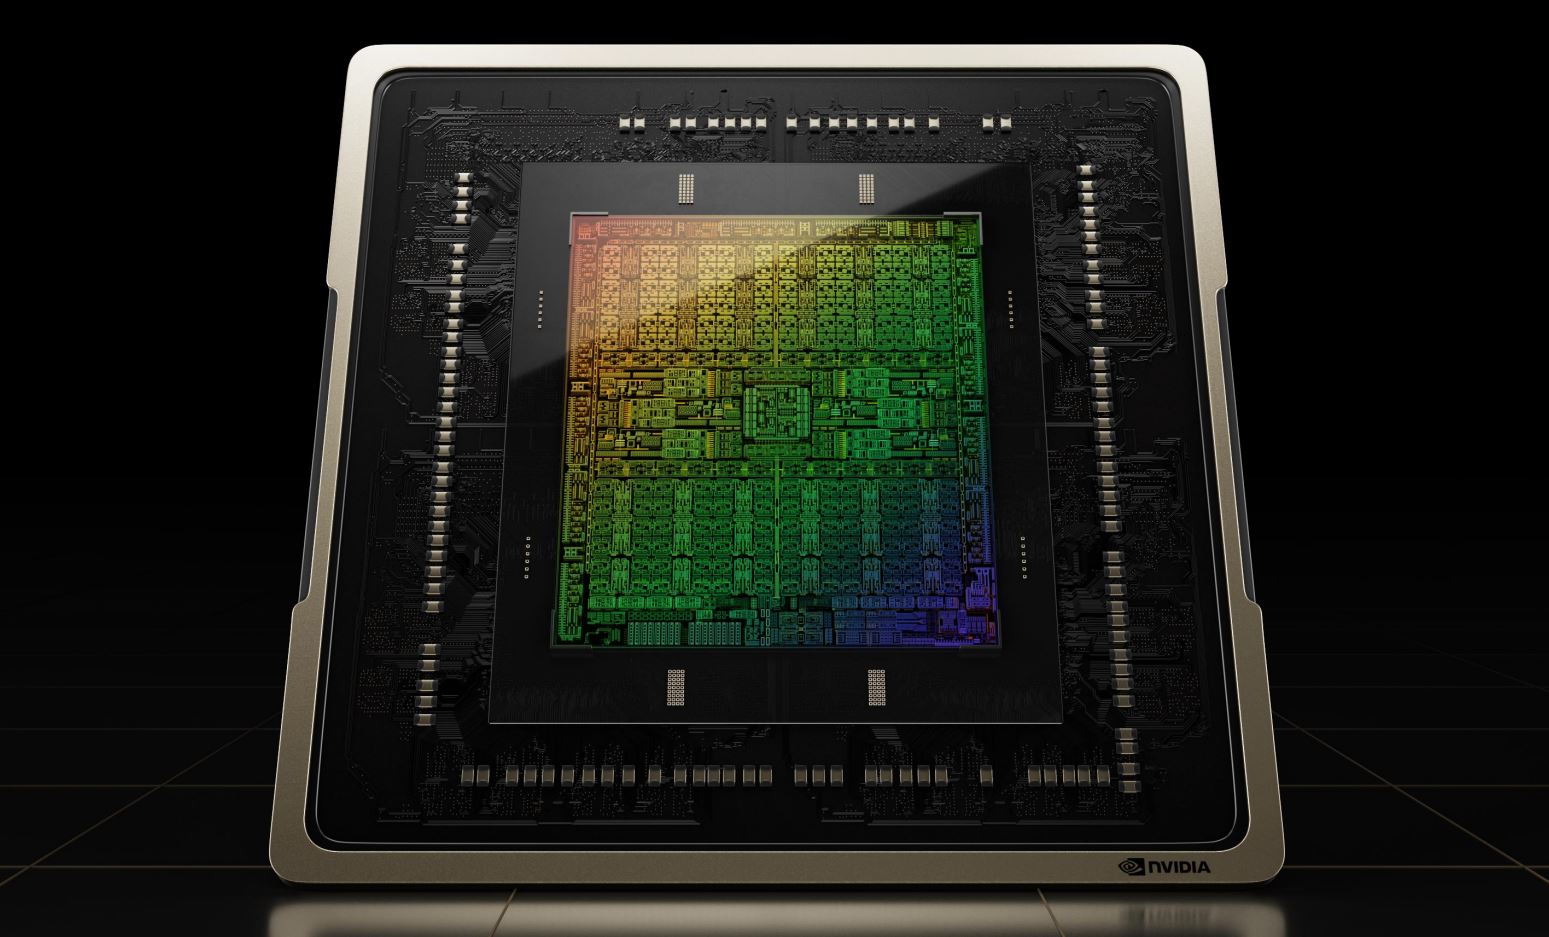
We already talked about the technical details of the Ada Lovelace architecture in our analysis of the RTX 4090/4080 Laptop. We are currently still waiting to receive for more information and pictures of the new AD106 and AD107 GPUs from Nvidia and we will update the article as soon as we can.

DLSS3 (Source: Nvidia)
5th generation Max-Q (Source: Nvidia)

Test Systems

We were able to use multiple systems to collect the following benchmark data. In addition to retail units, we also had access to engineering samples, which will not be sold to customers. This means there is no review about these systems right now, but we will test their retail counterparts as soon as we can.

All laptops were tested with the maximum performance settings and (if possible) deactivated iGPU. The two models RTX 4070 Laptop and RTX 4050 Laptop in the XMG systems as well as the Blade 18 are the fastest versions of the GPUs with the maximum TGP and the results represent the best performance you can achieve. Gigaybte and MSI use GPUs with a maximum TGP of 105W (80W TGP + 25W Dynamic Boost).

Synthetic Benchmarks

We start with synthetic 3DMark benchmarks, where the new RTX 4070 Laptop is right ahead the previous high-end GPU RTX 3080 Ti Laptop and on par with the Desktop RTX 3070. This also means there is a massive performance deficit compared to the RTX 4080 Laptop, where the most powerful version is about 40 % faster. The RTX 4070 with 105W in the Gigabyte Aero 16 on the other hand is just 4 % slower.

The 105W RTX 4060 Laptop is also just 13 % slower than the RTX 4070 Laptop in the XMG Neo 17 in the synthetic tests, but is also 33 % faster than the old GeForce RTX 3060 Laptop, so it is comparable to the RTX 3070 Ti Laptop overall.

The new RTX 4050 shows the biggest improvements with a performance advantage of 74 % over the old RTX 3050 Ti Laptop. However, we have to be a bit careful here since this is the fastest RTX 4050 Laptop (140W), but most retail units will probably have much lower TGP specifications.

Performance Rating - Percent
NVIDIA GeForce RTX 4070 Ti
TUF Gaming GeForce RTX 4070 Ti, i9-13900K
99.6 pt
NVIDIA GeForce RTX 4090 Laptop GPU
Titan GT77 HX 13VI, i9-13950HX
93.2 pt
Average NVIDIA GeForce RTX 3090
 
83.7 pt
NVIDIA GeForce RTX 4080 Laptop GPU
Blade 16 Early 2023, i9-13950HX
76.7 pt
NVIDIA GeForce RTX 4070 Laptop GPU
XMG Neo 17 2023 Engineering Sample, i9-13900HX
55.4 pt
Average AMD Radeon RX 6800M
 
54.4 pt
Average NVIDIA GeForce RTX 3070
 
54.2 pt
NVIDIA GeForce RTX 4070 Laptop GPU
AERO 16 OLED BSF, i9-13900H
53.2 pt
Average NVIDIA GeForce RTX 3080 Ti Laptop GPU
 
52.8 pt
NVIDIA GeForce RTX 4070 Laptop GPU
Blade 18 RTX 4070, i9-13950HX
52.2 pt
Average NVIDIA GeForce RTX 3080 Laptop GPU
 
49.4 pt
Average NVIDIA GeForce RTX 3070 Ti Laptop GPU
 
48.1 pt
NVIDIA GeForce RTX 4060 Laptop GPU
Katana 17 B13VFK, i7-13620H
48 pt
Average AMD Radeon RX 6700M
 
45.1 pt
NVIDIA GeForce RTX 4050 Laptop GPU
XMG Focus 15 Engineering Sample, i5-13500HX
40.6 pt
Average AMD Radeon RX 6600M
 
39.7 pt
Average NVIDIA GeForce RTX 3060
 
37.4 pt
Average NVIDIA GeForce RTX 3060 Laptop GPU
 
36.1 pt
Average NVIDIA GeForce RTX 3050
 
28 pt
Average NVIDIA GeForce RTX 3050 Ti Laptop GPU
 
23.3 pt
Average NVIDIA GeForce RTX 3050 6GB Laptop GPU
 
21.8 pt
3DMark
2560x1440 Time Spy Graphics
NVIDIA GeForce RTX 4070 Ti
TUF Gaming GeForce RTX 4070 Ti, i9-13900K
22982 Points +83%
NVIDIA GeForce RTX 4070 Ti
TUF Gaming GeForce RTX 4070 Ti, i9-13900K
22949 Points +83%
NVIDIA GeForce RTX 4090 Laptop GPU
Titan GT77 HX 13VI, i9-13950HX
22254 Points +78%
Average NVIDIA GeForce RTX 3090
  (18685 - 20433, n=17)
19266 Points +54%
NVIDIA GeForce RTX 4080 Laptop GPU
Blade 16 Early 2023, i9-13950HX
18441 Points +47%
Average NVIDIA GeForce RTX 3070
  (11043 - 13579, n=7)
12616 Points +1%
NVIDIA GeForce RTX 4070 Laptop GPU
XMG Neo 17 2023 Engineering Sample, i9-13900HX
12529 Points
Average NVIDIA GeForce RTX 3080 Ti Laptop GPU
  (4921 - 13835, n=43)
11850 Points -5%
NVIDIA GeForce RTX 4070 Laptop GPU
AERO 16 OLED BSF, i9-13900H
11798 Points -6%
NVIDIA GeForce RTX 4070 Laptop GPU
Blade 18 RTX 4070, i9-13950HX
11683 Points -7%
Average AMD Radeon RX 6800M
  (10439 - 11316, n=4)
11067 Points -12%
Average NVIDIA GeForce RTX 3080 Laptop GPU
  (6407 - 13210, n=44)
10695 Points -15%
Average NVIDIA GeForce RTX 3070 Ti Laptop GPU
  (8142 - 12324, n=37)
10478 Points -16%
NVIDIA GeForce RTX 4060 Laptop GPU
Katana 17 B13VFK, i7-13620H
10299 Points -18%
Average AMD Radeon RX 6700M
  (8654 - 9323, n=2)
8989 Points -28%
NVIDIA GeForce RTX 4050 Laptop GPU
XMG Focus 15 Engineering Sample, i5-13500HX
8536 Points -32%
Average NVIDIA GeForce RTX 3060
  (7866 - 8600, n=5)
8426 Points -33%
Average NVIDIA GeForce RTX 3060 Laptop GPU
  (6285 - 9235, n=49)
8057 Points -36%
Average AMD Radeon RX 6600M
  (7200 - 8234, n=7)
7864 Points -37%
Average NVIDIA GeForce RTX 3050
  (6102 - 6198, n=2)
6150 Points -51%
Average NVIDIA GeForce RTX 3050 Ti Laptop GPU
  (3744 - 6122, n=27)
5177 Points -59%
Average NVIDIA GeForce RTX 3050 6GB Laptop GPU
  (4501 - 4820, n=2)
4661 Points -63%
1920x1080 Fire Strike Graphics
NVIDIA GeForce RTX 4070 Ti
TUF Gaming GeForce RTX 4070 Ti, i9-13900K
53729 Points +73%
NVIDIA GeForce RTX 4070 Ti
TUF Gaming GeForce RTX 4070 Ti, i9-13900K
52903 Points +70%
NVIDIA GeForce RTX 4090 Laptop GPU
Titan GT77 HX 13VI, i9-13950HX
49247 Points +59%
Average NVIDIA GeForce RTX 3090
  (41298 - 49282, n=17)
46856 Points +51%
NVIDIA GeForce RTX 4080 Laptop GPU
Blade 16 Early 2023, i9-13950HX
40570 Points +31%
Average AMD Radeon RX 6800M
  (30507 - 34993, n=3)
33233 Points +7%
NVIDIA GeForce RTX 4070 Laptop GPU
XMG Neo 17 2023 Engineering Sample, i9-13900HX
31054 Points
Average NVIDIA GeForce RTX 3080 Ti Laptop GPU
  (6928 - 34439, n=43)
29496 Points -5%
Average NVIDIA GeForce RTX 3070
  (20357 - 33270, n=7)
28949 Points -7%
NVIDIA GeForce RTX 4070 Laptop GPU
AERO 16 OLED BSF, i9-13900H
28885 Points -7%
NVIDIA GeForce RTX 4070 Laptop GPU
Blade 18 RTX 4070, i9-13950HX
28743 Points -7%
Average AMD Radeon RX 6700M
  (27449 - 28399, n=2)
27924 Points -10%
NVIDIA GeForce RTX 4060 Laptop GPU
Katana 17 B13VFK, i7-13620H
27681 Points -11%
Average NVIDIA GeForce RTX 3070 Ti Laptop GPU
  (22612 - 32550, n=37)
27554 Points -11%
Average NVIDIA GeForce RTX 3080 Laptop GPU
  (16455 - 32366, n=45)
27464 Points -12%
Average AMD Radeon RX 6600M
  (21876 - 24788, n=7)
23563 Points -24%
NVIDIA GeForce RTX 4050 Laptop GPU
XMG Focus 15 Engineering Sample, i5-13500HX
23362 Points -25%
Average NVIDIA GeForce RTX 3060
  (18711 - 21984, n=5)
20966 Points -32%
Average NVIDIA GeForce RTX 3060 Laptop GPU
  (16354 - 23109, n=49)
20436 Points -34%
Average NVIDIA GeForce RTX 3050
  (15545 - 15824, n=2)
15685 Points -49%
Average NVIDIA GeForce RTX 3050 Ti Laptop GPU
  (7917 - 15611, n=26)
13090 Points -58%
Average NVIDIA GeForce RTX 3050 6GB Laptop GPU
  (11887 - 12618, n=3)
12155 Points -61%
3DMark 11 - 1280x720 Performance GPU
NVIDIA GeForce RTX 4070 Ti
TUF Gaming GeForce RTX 4070 Ti, i9-13900K
75990 Points +85%
NVIDIA GeForce RTX 4070 Ti
TUF Gaming GeForce RTX 4070 Ti, i9-13900K
75612 Points +84%
NVIDIA GeForce RTX 4090 Laptop GPU
Titan GT77 HX 13VI, i9-13950HX
69211 Points +69%
Average NVIDIA GeForce RTX 3090
  (55144 - 66934, n=17)
60853 Points +48%
NVIDIA GeForce RTX 4080 Laptop GPU
Blade 16 Early 2023, i9-13950HX
56565 Points +38%
NVIDIA GeForce RTX 4070 Laptop GPU
AERO 16 OLED BSF, i9-13900H
41480 Points +1%
NVIDIA GeForce RTX 4070 Laptop GPU
XMG Neo 17 2023 Engineering Sample, i9-13900HX
41027 Points
Average NVIDIA GeForce RTX 3070
  (26812 - 46878, n=9)
40835 Points 0%
Average AMD Radeon RX 6800M
  (39075 - 41706, n=2)
40391 Points -2%
NVIDIA GeForce RTX 4070 Laptop GPU
Blade 18 RTX 4070, i9-13950HX
39733 Points -3%
Average NVIDIA GeForce RTX 3080 Ti Laptop GPU
  (13920 - 45841, n=45)
39402 Points -4%
Average NVIDIA GeForce RTX 3080 Laptop GPU
  (31288 - 43744, n=39)
38345 Points -7%
NVIDIA GeForce RTX 4060 Laptop GPU
Katana 17 B13VFK, i7-13620H
36323 Points -11%
Average NVIDIA GeForce RTX 3070 Ti Laptop GPU
  (13799 - 42569, n=36)
35944 Points -12%
Average AMD Radeon RX 6700M
  ()
33497 Points -18%
NVIDIA GeForce RTX 4050 Laptop GPU
XMG Focus 15 Engineering Sample, i5-13500HX
31377 Points -24%
Average AMD Radeon RX 6600M
  (27030 - 32340, n=6)
31142 Points -24%
Average NVIDIA GeForce RTX 3060
  (24369 - 29172, n=5)
27785 Points -32%
Average NVIDIA GeForce RTX 3060 Laptop GPU
  (13799 - 30772, n=43)
26816 Points -35%
Average NVIDIA GeForce RTX 3050
  (21288 - 21427, n=2)
21358 Points -48%
Average NVIDIA GeForce RTX 3050 Ti Laptop GPU
  (7952 - 20905, n=27)
17562 Points -57%
Average NVIDIA GeForce RTX 3050 6GB Laptop GPU
  (15860 - 18059, n=3)
17113 Points -58%

Gaming Benchmarks

Our gaming benchmarks without raytracing and upscaling show a very similar situation compared to the synthetic tests. Overall, the RTX 4070 Laptop is once again very similar to the RTX 3080 Ti Laptop, only 4K settings sometimes show the limitation of the smaller VRAM. 4K gaming is still possible with the RTX 4070 Laptop in almost every modern game.

The RTX 4060 Laptop is once again comparable to the RTX 3070 Ti Laptop and is best suited for QHD and also 4K settings in many titles.

Our fast version of the RTX 4050 Laptop is on par with the GeForce RTX 3060 Laptop in many gaming benchmarks, which means it is ideal for 1080p gaming and also QHD settings in many titles.

Note: We included tables with more gaming benchmarks at the end of this article.

The Witcher 3
1920x1080 Ultra Graphics & Postprocessing (HBAO+)
Asus TUF Gaming GeForce RTX 4070 Ti
NVIDIA GeForce RTX 4070 Ti, i9-13900K
230 (207min, 208.68P1 - 258max) fps +85%
MSI Titan GT77 HX 13VI
NVIDIA GeForce RTX 4090 Laptop GPU, i9-13950HX, Samsung PM9A1 MZVL22T0HBLB
198.9 (190min, 191P1 - 214max) fps +60%
Average NVIDIA GeForce RTX 3090
  (160 - 192.6, n=16)
179.9 fps +45%
Razer Blade 16 Early 2023
NVIDIA GeForce RTX 4080 Laptop GPU, i9-13950HX, SSSTC CA6-8D1024
176.8 (159min - 192max) fps +43%
SCHENKER XMG Neo 17 2023 Engineering Sample
NVIDIA GeForce RTX 4070 Laptop GPU, i9-13900HX
124 fps
Gigabyte AERO 16 OLED BSF
NVIDIA GeForce RTX 4070 Laptop GPU, i9-13900H, Gigabyte AG470S1TB-SI B10
116 (48.5P0.1, 82.5P1) fps -6%
Razer Blade 18 RTX 4070
NVIDIA GeForce RTX 4070 Laptop GPU, i9-13950HX, SSSTC CA6-8D1024
113.9 (110min - 119max) fps -8%
Average NVIDIA GeForce RTX 3080 Ti Laptop GPU
  (30 - 130.6, n=43)
112.1 fps -10%
Average AMD Radeon RX 6800M
  (108 - 110, n=2)
109 fps -12%
Average NVIDIA GeForce RTX 3070
  (52.8 - 132.2, n=7)
106.1 fps -14%
Average NVIDIA GeForce RTX 3080 Laptop GPU
  (85.1 - 123, n=39)
105.2 fps -15%
MSI Katana 17 B13VFK
NVIDIA GeForce RTX 4060 Laptop GPU, i7-13620H, Micron 2400 MTFDKBA1T0QFM
104.7 (88min - 119max) fps -16%
Average NVIDIA GeForce RTX 3070 Ti Laptop GPU
  (76.8 - 124.1, n=39)
102.4 fps -17%
Average AMD Radeon RX 6700M
  ()
95.4 fps -23%
SCHENKER XMG Focus 15 Engineering Sample
NVIDIA GeForce RTX 4050 Laptop GPU, i5-13500HX
89 fps -28%
Average AMD Radeon RX 6600M
  (75.4 - 88.2, n=6)
84 fps -32%
Average NVIDIA GeForce RTX 3060 Laptop GPU
  (58.2 - 91.5, n=48)
76.9 fps -38%
Average NVIDIA GeForce RTX 3060
  (52.4 - 91.3, n=4)
72.3 fps -42%
Average NVIDIA GeForce RTX 3050
  (62.8 - 67.2, n=2)
65 fps -48%
Average NVIDIA GeForce RTX 3050 6GB Laptop GPU
  (43.7 - 52.9, n=3)
48.9 fps -61%
Average NVIDIA GeForce RTX 3050 Ti Laptop GPU
  (19 - 58.5, n=29)
47.5 fps -62%
3840x2160 High Graphics & Postprocessing (Nvidia HairWorks Off)
MSI Titan GT77 HX 13VI
NVIDIA GeForce RTX 4090 Laptop GPU, i9-13950HX, Samsung PM9A1 MZVL22T0HBLB
160 fps +167%
Asus TUF Gaming GeForce RTX 4070 Ti
NVIDIA GeForce RTX 4070 Ti, i9-13900K
151.9 (137min, 138.12P1 - 167max) fps +153%
Average NVIDIA GeForce RTX 3090
  (128 - 160.2, n=12)
151.5 fps +153%
Razer Blade 16 Early 2023
NVIDIA GeForce RTX 4080 Laptop GPU, i9-13950HX, SSSTC CA6-8D1024
120.6 (99min - 146max) fps +101%
Average NVIDIA GeForce RTX 3070
  (84 - 93.9, n=5)
89.3 fps +49%
Average NVIDIA GeForce RTX 3080 Ti Laptop GPU
  (62.1 - 94.3, n=8)
81.3 fps +36%
Average NVIDIA GeForce RTX 3070 Ti Laptop GPU
  (73.2 - 78, n=2)
75.6 fps +26%
Razer Blade 18 RTX 4070
NVIDIA GeForce RTX 4070 Laptop GPU, i9-13950HX, SSSTC CA6-8D1024
72.5 (66min - 80max) fps +21%
Average NVIDIA GeForce RTX 3080 Laptop GPU
  (60 - 82.2, n=10)
71.8 fps +20%
Average NVIDIA GeForce RTX 3060
  (62.1 - 90.3, n=3)
71.6 fps +19%
MSI Katana 17 B13VFK
NVIDIA GeForce RTX 4060 Laptop GPU, i7-13620H, Micron 2400 MTFDKBA1T0QFM
62.6 (55min - 70max) fps +4%
SCHENKER XMG Neo 17 2023 Engineering Sample
NVIDIA GeForce RTX 4070 Laptop GPU, i9-13900HX
60 fps
Average AMD Radeon RX 6800M
  ()
59.5 fps -1%
SCHENKER XMG Focus 15 Engineering Sample
NVIDIA GeForce RTX 4050 Laptop GPU, i5-13500HX
50 fps -17%
Average NVIDIA GeForce RTX 3060 Laptop GPU
  (26 - 59.3, n=5)
45.4 fps -24%
Average NVIDIA GeForce RTX 3050
  (43.8 - 44.1, n=2)
44 fps -27%
Average AMD Radeon RX 6600M
  (43.6 - 44.1, n=3)
43.9 fps -27%
Average NVIDIA GeForce RTX 3050 Ti Laptop GPU
  (10 - 38.4, n=4)
26.7 fps -55%
Metro Exodus
1920x1080 Ultra Quality AF:16x
Asus TUF Gaming GeForce RTX 4070 Ti
NVIDIA GeForce RTX 4070 Ti, i9-13900K
161.4 (78.05min - 296.03max) fps +77%
Average NVIDIA GeForce RTX 3090
  (108 - 145, n=12)
135.3 fps +49%
MSI Titan GT77 HX 13VI
NVIDIA GeForce RTX 4090 Laptop GPU, i9-13950HX, Samsung PM9A1 MZVL22T0HBLB
132 fps +45%
Razer Blade 16 Early 2023
NVIDIA GeForce RTX 4080 Laptop GPU, i9-13950HX, SSSTC CA6-8D1024
121.7 (54.5min - 212.1max) fps +34%
Average NVIDIA GeForce RTX 3070
  (91.3 - 97.7, n=5)
93.9 fps +3%
SCHENKER XMG Neo 17 2023 Engineering Sample
NVIDIA GeForce RTX 4070 Laptop GPU, i9-13900HX
91 fps
Average NVIDIA GeForce RTX 3080 Ti Laptop GPU
  ()
88.1 fps -3%
Razer Blade 18 RTX 4070
NVIDIA GeForce RTX 4070 Laptop GPU, i9-13950HX, SSSTC CA6-8D1024
86.8 (45.8min - 150max) fps -5%
Average AMD Radeon RX 6800M
  (78.7 - 79.3, n=3)
79 fps -13%
Average NVIDIA GeForce RTX 3080 Laptop GPU
  (68.7 - 87.9, n=5)
78.5 fps -14%
MSI Katana 17 B13VFK
NVIDIA GeForce RTX 4060 Laptop GPU, i7-13620H, Micron 2400 MTFDKBA1T0QFM
74.3 (37.14min - 137.46max) fps -18%
Average NVIDIA GeForce RTX 3070 Ti Laptop GPU
  (71 - 77.2, n=2)
74.1 fps -19%
SCHENKER XMG Focus 15 Engineering Sample
NVIDIA GeForce RTX 4050 Laptop GPU, i5-13500HX
64 fps -30%
Average NVIDIA GeForce RTX 3060 Laptop GPU
  (59.4 - 63.2, n=3)
61.6 fps -32%
Average AMD Radeon RX 6600M
  (55.6 - 62.3, n=4)
59.8 fps -34%
Average NVIDIA GeForce RTX 3060
  (37.8 - 65.3, n=5)
56.1 fps -38%
Average NVIDIA GeForce RTX 3050
  (44.8 - 47.2, n=2)
46 fps -49%
Average NVIDIA GeForce RTX 3050 Ti Laptop GPU
  (43.2 - 43.5, n=2)
43.4 fps -52%
2560x1440 Ultra Quality AF:16x
Asus TUF Gaming GeForce RTX 4070 Ti
NVIDIA GeForce RTX 4070 Ti, i9-13900K
132.1 (72.92min - 245.28max) fps +83%
MSI Titan GT77 HX 13VI
NVIDIA GeForce RTX 4090 Laptop GPU, i9-13950HX, Samsung PM9A1 MZVL22T0HBLB
116 fps +61%
Average NVIDIA GeForce RTX 3090
  (102 - 118.2, n=12)
113.2 fps +57%
Razer Blade 16 Early 2023
NVIDIA GeForce RTX 4080 Laptop GPU, i9-13950HX, SSSTC CA6-8D1024
102 (50.6min - 175.9max) fps +42%
Average NVIDIA GeForce RTX 3070
  (74.4 - 78.3, n=5)
75.8 fps +5%
Average NVIDIA GeForce RTX 3080 Ti Laptop GPU
  ()
73.2 fps +2%
SCHENKER XMG Neo 17 2023 Engineering Sample
NVIDIA GeForce RTX 4070 Laptop GPU, i9-13900HX
72 fps
Razer Blade 18 RTX 4070
NVIDIA GeForce RTX 4070 Laptop GPU, i9-13950HX, SSSTC CA6-8D1024
69 (39.5min - 112.2max) fps -4%
MSI Katana 17 B13VFK
NVIDIA GeForce RTX 4060 Laptop GPU, i7-13620H, Micron 2400 MTFDKBA1T0QFM
59 (32.33min - 97.31max) fps -18%
Average AMD Radeon RX 6800M
  (55.9 - 61.4, n=2)
58.7 fps -18%
Average NVIDIA GeForce RTX 3080 Laptop GPU
  (45.1 - 59.4, n=4)
54.1 fps -25%
Average NVIDIA GeForce RTX 3070 Ti Laptop GPU
  ()
52.7 fps -27%
SCHENKER XMG Focus 15 Engineering Sample
NVIDIA GeForce RTX 4050 Laptop GPU, i5-13500HX
50 fps -31%
Average NVIDIA GeForce RTX 3060
  (48.6 - 51.7, n=4)
49.9 fps -31%
Average NVIDIA GeForce RTX 3060 Laptop GPU
  ()
49.6 fps -31%
Average AMD Radeon RX 6600M
  (45.1 - 47.6, n=3)
46.5 fps -35%
Average NVIDIA GeForce RTX 3050
  (35.7 - 36.9, n=2)
36.3 fps -50%
Average NVIDIA GeForce RTX 3050 Ti Laptop GPU
  ()
34.2 fps -52%
3840x2160 Ultra Quality AF:16x
Asus TUF Gaming GeForce RTX 4070 Ti
NVIDIA GeForce RTX 4070 Ti, i9-13900K
84.5 (55.02min - 124.04max) fps +84%
MSI Titan GT77 HX 13VI
NVIDIA GeForce RTX 4090 Laptop GPU, i9-13950HX, Samsung PM9A1 MZVL22T0HBLB
81 fps +76%
Average NVIDIA GeForce RTX 3090
  (70.6 - 77.3, n=12)
75 fps +63%
Razer Blade 16 Early 2023
NVIDIA GeForce RTX 4080 Laptop GPU, i9-13950HX, SSSTC CA6-8D1024
67 (34min - 118.9max) fps +46%
Average NVIDIA GeForce RTX 3070
  (48.3 - 49.7, n=5)
48.9 fps +6%
Average NVIDIA GeForce RTX 3080 Ti Laptop GPU
  ()
47.6 fps +3%
SCHENKER XMG Neo 17 2023 Engineering Sample
NVIDIA GeForce RTX 4070 Laptop GPU, i9-13900HX
46 fps
SCHENKER XMG Focus 15 Engineering Sample
NVIDIA GeForce RTX 4050 Laptop GPU, i5-13500HX
45 fps -2%
Razer Blade 18 RTX 4070
NVIDIA GeForce RTX 4070 Laptop GPU, i9-13950HX, SSSTC CA6-8D1024
44 (27.9min - 66.4max) fps -4%
Average NVIDIA GeForce RTX 3080 Laptop GPU
  (35.4 - 45.1, n=4)
38.9 fps -15%
Average AMD Radeon RX 6800M
  (37.1 - 39.6, n=2)
38.4 fps -17%
MSI Katana 17 B13VFK
NVIDIA GeForce RTX 4060 Laptop GPU, i7-13620H, Micron 2400 MTFDKBA1T0QFM
36.8 (22.74min - 56max) fps -20%
Average NVIDIA GeForce RTX 3060
  (31.3 - 32.2, n=4)
31.7 fps -31%
Average NVIDIA GeForce RTX 3060 Laptop GPU
  ()
31.4 fps -32%
Average AMD Radeon RX 6600M
  (27.3 - 28.7, n=3)
28.1 fps -39%
Average NVIDIA GeForce RTX 3050
  (22.4 - 22.7, n=2)
22.6 fps -51%
Average NVIDIA GeForce RTX 3050 Ti Laptop GPU
  ()
21.1 fps -54%
Borderlands 3
1920x1080 Badass Overall Quality (DX11)
Asus TUF Gaming GeForce RTX 4070 Ti
NVIDIA GeForce RTX 4070 Ti, i9-13900K
186.9 fps +71%
MSI Titan GT77 HX 13VI
NVIDIA GeForce RTX 4090 Laptop GPU, i9-13950HX, Samsung PM9A1 MZVL22T0HBLB
151 fps +39%
Average NVIDIA GeForce RTX 3090
  (117 - 170.1, n=13)
150.7 fps +38%
Razer Blade 16 Early 2023
NVIDIA GeForce RTX 4080 Laptop GPU, i9-13950HX, SSSTC CA6-8D1024
133.5 fps +22%
SCHENKER XMG Neo 17 2023 Engineering Sample
NVIDIA GeForce RTX 4070 Laptop GPU, i9-13900HX
109 fps
Average NVIDIA GeForce RTX 3070
  (95.3 - 108.9, n=5)
100.6 fps -8%
Razer Blade 18 RTX 4070
NVIDIA GeForce RTX 4070 Laptop GPU, i9-13950HX, SSSTC CA6-8D1024
100.3 fps -8%
Average NVIDIA GeForce RTX 3080 Ti Laptop GPU
  ()
90.7 fps -17%
Average NVIDIA GeForce RTX 3080 Laptop GPU
  (76.5 - 90, n=3)
84 fps -23%
MSI Katana 17 B13VFK
NVIDIA GeForce RTX 4060 Laptop GPU, i7-13620H, Micron 2400 MTFDKBA1T0QFM
83.9 fps -23%
Average NVIDIA GeForce RTX 3070 Ti Laptop GPU
  ()
80.9 fps -26%
Average AMD Radeon RX 6800M
  (77.6 - 83.9, n=3)
80.2 fps -26%
Average NVIDIA GeForce RTX 3060
  (58.5 - 100, n=5)
79.4 fps -27%
SCHENKER XMG Focus 15 Engineering Sample
NVIDIA GeForce RTX 4050 Laptop GPU, i5-13500HX
73 fps -33%
Average NVIDIA GeForce RTX 3060 Laptop GPU
  (69.3 - 74.3, n=4)
72.2 fps -34%
Average AMD Radeon RX 6700M
  ()
71.2 fps -35%
Average AMD Radeon RX 6600M
  (59.9 - 67.3, n=5)
64.8 fps -41%
Average NVIDIA GeForce RTX 3050
  (55.7 - 57.6, n=2)
56.7 fps -48%
Average NVIDIA GeForce RTX 3050 Ti Laptop GPU
  (36.8 - 50.2, n=3)
44 fps -60%
2560x1440 Badass Overall Quality (DX11)
Asus TUF Gaming GeForce RTX 4070 Ti
NVIDIA GeForce RTX 4070 Ti, i9-13900K
140.6 fps +87%
MSI Titan GT77 HX 13VI
NVIDIA GeForce RTX 4090 Laptop GPU, i9-13950HX, Samsung PM9A1 MZVL22T0HBLB
130 fps +73%
Average NVIDIA GeForce RTX 3090
  (105 - 131.6, n=13)
123.8 fps +65%
Razer Blade 16 Early 2023
NVIDIA GeForce RTX 4080 Laptop GPU, i9-13950HX, SSSTC CA6-8D1024
108.7 fps +45%
Average NVIDIA GeForce RTX 3080 Ti Laptop GPU
  ()
78.2 fps +4%
Average NVIDIA GeForce RTX 3070
  (75.1 - 82.9, n=5)
77.7 fps +4%
SCHENKER XMG Neo 17 2023 Engineering Sample
NVIDIA GeForce RTX 4070 Laptop GPU, i9-13900HX
75 fps
Razer Blade 18 RTX 4070
NVIDIA GeForce RTX 4070 Laptop GPU, i9-13950HX, SSSTC CA6-8D1024
68.7 fps -8%
Average AMD Radeon RX 6800M
  (57 - 67.2, n=2)
62.1 fps -17%
Average NVIDIA GeForce RTX 3080 Laptop GPU
  (55.7 - 64.4, n=3)
60.9 fps -19%
Average NVIDIA GeForce RTX 3060
  (54 - 70.2, n=4)
59.9 fps -20%
Average NVIDIA GeForce RTX 3070 Ti Laptop GPU
  ()
58.7 fps -22%
Average NVIDIA GeForce RTX 3060 Laptop GPU
  (51.3 - 52.4, n=2)
51.9 fps -31%
SCHENKER XMG Focus 15 Engineering Sample
NVIDIA GeForce RTX 4050 Laptop GPU, i5-13500HX
50 fps -33%
Average AMD Radeon RX 6600M
  (44.9 - 45.7, n=3)
45.2 fps -40%
Average NVIDIA GeForce RTX 3050
  (40.3 - 40.4, n=2)
40.4 fps -46%
Average NVIDIA GeForce RTX 3050 Ti Laptop GPU
  ()
35.6 fps -53%
3840x2160 Badass Overall Quality (DX11)
MSI Titan GT77 HX 13VI
NVIDIA GeForce RTX 4090 Laptop GPU, i9-13950HX, Samsung PM9A1 MZVL22T0HBLB
76 fps +90%
Asus TUF Gaming GeForce RTX 4070 Ti
NVIDIA GeForce RTX 4070 Ti, i9-13900K
74.1 fps +85%
Average NVIDIA GeForce RTX 3090
  (68 - 75.3, n=13)
72.8 fps +82%
Razer Blade 16 Early 2023
NVIDIA GeForce RTX 4080 Laptop GPU, i9-13950HX, SSSTC CA6-8D1024
59.8 fps +50%
Average NVIDIA GeForce RTX 3080 Ti Laptop GPU
  ()
46.1 fps +15%
Average NVIDIA GeForce RTX 3070
  (42.7 - 46.3, n=5)
44.3 fps +11%
SCHENKER XMG Neo 17 2023 Engineering Sample
NVIDIA GeForce RTX 4070 Laptop GPU, i9-13900HX
40 fps
Razer Blade 18 RTX 4070
NVIDIA GeForce RTX 4070 Laptop GPU, i9-13950HX, SSSTC CA6-8D1024
35.7 fps -11%
Average NVIDIA GeForce RTX 3080 Laptop GPU
  (32.3 - 36, n=3)
34.4 fps -14%
Average AMD Radeon RX 6800M
  (30.3 - 35.8, n=2)
33.1 fps -17%
Average NVIDIA GeForce RTX 3060
  (29.5 - 36.8, n=4)
32.4 fps -19%
Average NVIDIA GeForce RTX 3060 Laptop GPU
  ()
28.5 fps -29%
SCHENKER XMG Focus 15 Engineering Sample
NVIDIA GeForce RTX 4050 Laptop GPU, i5-13500HX
26 fps -35%
Average AMD Radeon RX 6600M
  (23.7 - 24.1, n=3)
23.9 fps -40%
Average NVIDIA GeForce RTX 3050
  (21.5 - 21.8, n=2)
21.7 fps -46%
Average NVIDIA GeForce RTX 3050 Ti Laptop GPU
  ()
16.3 fps -59%
GTA V
1920x1080 Highest Settings possible AA:4xMSAA + FX AF:16x
Asus TUF Gaming GeForce RTX 4070 Ti
NVIDIA GeForce RTX 4070 Ti, i9-13900K
172.3 (5.8min, 142.9P1 - 415max) fps +32%
Average NVIDIA GeForce RTX 3090
  (104 - 165.6, n=15)
144.5 fps +11%
MSI Titan GT77 HX 13VI
NVIDIA GeForce RTX 4090 Laptop GPU, i9-13950HX, Samsung PM9A1 MZVL22T0HBLB
140.9 (3.54min, 83.3P1 - 244max) fps +8%
Razer Blade 16 Early 2023
NVIDIA GeForce RTX 4080 Laptop GPU, i9-13950HX, SSSTC CA6-8D1024
140.7 (3.02min, 100P1 - 272max) fps +8%
SCHENKER XMG Neo 17 2023 Engineering Sample
NVIDIA GeForce RTX 4070 Laptop GPU, i9-13900HX
130.5 (3.9min, 83.3P1 - 227max) fps
Gigabyte AERO 16 OLED BSF
NVIDIA GeForce RTX 4070 Laptop GPU, i9-13900H, Gigabyte AG470S1TB-SI B10
123.2 (3.96min, 76.9P1 - 222max) fps -6%
Razer Blade 18 RTX 4070
NVIDIA GeForce RTX 4070 Laptop GPU, i9-13950HX, SSSTC CA6-8D1024
121.4 (3.6min, 76.9P1 - 236max) fps -7%
MSI Katana 17 B13VFK
NVIDIA GeForce RTX 4060 Laptop GPU, i7-13620H, Micron 2400 MTFDKBA1T0QFM
112.1 (8min, 62.5P1 - 277max) fps -14%
Average NVIDIA GeForce RTX 3080 Ti Laptop GPU
  (30 - 139.2, n=42)
111 fps -15%
Average NVIDIA GeForce RTX 3070 Ti Laptop GPU
  (44 - 123.9, n=36)
106.7 fps -18%
Average NVIDIA GeForce RTX 3070
  (91.1 - 122.4, n=4)
104.3 fps -20%
Average NVIDIA GeForce RTX 3060
  (77.1 - 111, n=5)
97.3 fps -25%
Average NVIDIA GeForce RTX 3080 Laptop GPU
  (68.6 - 112, n=33)
97.2 fps -26%
SCHENKER XMG Focus 15 Engineering Sample
NVIDIA GeForce RTX 4050 Laptop GPU, i5-13500HX
92.4 (4.29min, 58.8P1 - 168.7max) fps -29%
Average NVIDIA GeForce RTX 3060 Laptop GPU
  (69.2 - 109.8, n=46)
89.7 fps -31%
Average AMD Radeon RX 6700M
  ()
86.2 fps -34%
Average AMD Radeon RX 6800M
  (75.1 - 92.8, n=2)
84 fps -36%
Average NVIDIA GeForce RTX 3050
  (78.2 - 83.6, n=2)
80.9 fps -38%
Average AMD Radeon RX 6600M
  (65.9 - 88.7, n=6)
78.6 fps -40%
Average NVIDIA GeForce RTX 3050 Ti Laptop GPU
  (27.8 - 75.6, n=26)
63.3 fps -51%
Average NVIDIA GeForce RTX 3050 6GB Laptop GPU
  (53 - 63.8, n=3)
59.8 fps -54%
2560x1440 Highest Settings possible AA:4xMSAA + FX AF:16x
Asus TUF Gaming GeForce RTX 4070 Ti
NVIDIA GeForce RTX 4070 Ti, i9-13900K
158.4 (2.83min, 111.1P1 - 308max) fps +72%
Average NVIDIA GeForce RTX 3090
  (99.3 - 156.9, n=13)
138.8 fps +51%
MSI Titan GT77 HX 13VI
NVIDIA GeForce RTX 4090 Laptop GPU, i9-13950HX, Samsung PM9A1 MZVL22T0HBLB
138.5 (3.45min, 76.9P1 - 256max) fps +50%
Razer Blade 16 Early 2023
NVIDIA GeForce RTX 4080 Laptop GPU, i9-13950HX, SSSTC CA6-8D1024
125.2 (3.73min, 83.3P1 - 206max) fps +36%
Average NVIDIA GeForce RTX 3080 Ti Laptop GPU
  (30 - 121.2, n=28)
98.2 fps +7%
Average NVIDIA GeForce RTX 3070
  (86.5 - 113.1, n=4)
97.4 fps +6%
Average NVIDIA GeForce RTX 3070 Ti Laptop GPU
  (72.7 - 108.7, n=22)
92.9 fps +1%
SCHENKER XMG Neo 17 2023 Engineering Sample
NVIDIA GeForce RTX 4070 Laptop GPU, i9-13900HX
92.2 (5.62min, 58.8P1 - 182max) fps
Average NVIDIA GeForce RTX 3080 Laptop GPU
  (82.2 - 99.1, n=11)
91 fps -1%
Gigabyte AERO 16 OLED BSF
NVIDIA GeForce RTX 4070 Laptop GPU, i9-13900H, Gigabyte AG470S1TB-SI B10
90.6 (6.42min, 55.6P1 - 175.3max) fps -2%
Razer Blade 18 RTX 4070
NVIDIA GeForce RTX 4070 Laptop GPU, i9-13950HX, SSSTC CA6-8D1024
87.6 (4.62min, 55.6P1 - 218max) fps -5%
Average AMD Radeon RX 6800M
  ()
84 fps -9%
MSI Katana 17 B13VFK
NVIDIA GeForce RTX 4060 Laptop GPU, i7-13620H, Micron 2400 MTFDKBA1T0QFM
83 (5.89min, 45.5P1 - 161.1max) fps -10%
Average NVIDIA GeForce RTX 3060
  (77.5 - 82.9, n=4)
80.8 fps -12%
Average NVIDIA GeForce RTX 3060 Laptop GPU
  (52 - 86.5, n=23)
74.3 fps -19%
SCHENKER XMG Focus 15 Engineering Sample
NVIDIA GeForce RTX 4050 Laptop GPU, i5-13500HX
64.1 (3.43min, 41.7P1 - 136.8max) fps -30%
Average AMD Radeon RX 6600M
  (49.3 - 63.8, n=4)
58.8 fps -36%
Average NVIDIA GeForce RTX 3050
  (54.7 - 59.1, n=2)
56.9 fps -38%
Average NVIDIA GeForce RTX 3050 Ti Laptop GPU
  (22.8 - 53.4, n=9)
41.4 fps -55%
Average NVIDIA GeForce RTX 3050 6GB Laptop GPU
  (36.5 - 42.7, n=2)
39.6 fps -57%
3840x2160 High/On (Advanced Graphics Off) AA:FX AF:8x
MSI Titan GT77 HX 13VI
NVIDIA GeForce RTX 4090 Laptop GPU, i9-13950HX, Samsung PM9A1 MZVL22T0HBLB
175.7 (2.91min, 111.1P1 - 424max) fps +90%
Average NVIDIA GeForce RTX 3090
  (151 - 184.2, n=13)
175.6 fps +90%
Asus TUF Gaming GeForce RTX 4070 Ti
NVIDIA GeForce RTX 4070 Ti, i9-13900K
171.8 (4.03min, 111.1P1 - 586max) fps +86%
Razer Blade 16 Early 2023
NVIDIA GeForce RTX 4080 Laptop GPU, i9-13950HX, SSSTC CA6-8D1024
143.7 (4.72min, 62.5P1 - 291max) fps +55%
Average NVIDIA GeForce RTX 3070
  (110 - 125.9, n=4)
116.2 fps +26%
Average NVIDIA GeForce RTX 3080 Ti Laptop GPU
  (78.2 - 134.4, n=12)
115.4 fps +25%
Average NVIDIA GeForce RTX 3070 Ti Laptop GPU
  (92.1 - 98, n=2)
95.1 fps +3%
SCHENKER XMG Neo 17 2023 Engineering Sample
NVIDIA GeForce RTX 4070 Laptop GPU, i9-13900HX
92.5 (11min, 62.5P1 - 233max) fps
Average NVIDIA GeForce RTX 3080 Laptop GPU
  (64.8 - 112, n=10)
91.9 fps -1%
Razer Blade 18 RTX 4070
NVIDIA GeForce RTX 4070 Laptop GPU, i9-13950HX, SSSTC CA6-8D1024
88.5 (5.15min, 58.8P1 - 280max) fps -4%
Average AMD Radeon RX 6800M
  ()
85.4 fps -8%
Average NVIDIA GeForce RTX 3060
  (82 - 82.8, n=4)
82.4 fps -11%
MSI Katana 17 B13VFK
NVIDIA GeForce RTX 4060 Laptop GPU, i7-13620H, Micron 2400 MTFDKBA1T0QFM
82.1 (5.63min, 50P1 - 264max) fps -11%
Gigabyte AERO 16 OLED BSF
NVIDIA GeForce RTX 4070 Laptop GPU, i9-13900H, Gigabyte AG470S1TB-SI B10
75 (22.1min, 47.6P1 - 242max) fps -19%
Average NVIDIA GeForce RTX 3060 Laptop GPU
  (42.8 - 80.5, n=4)
67.4 fps -27%
SCHENKER XMG Focus 15 Engineering Sample
NVIDIA GeForce RTX 4050 Laptop GPU, i5-13500HX
63.5 (7.33min, 43.5P1 - 255max) fps -31%
Average AMD Radeon RX 6600M
  (57.6 - 58.7, n=3)
58.1 fps -37%
Average NVIDIA GeForce RTX 3050
  (55.8 - 58.3, n=2)
57.1 fps -38%
Average NVIDIA GeForce RTX 3050 Ti Laptop GPU
  ()
43.9 fps -53%
Cyberpunk 2077 1.6
1920x1080 Ultra Preset
Asus TUF Gaming GeForce RTX 4070 Ti
NVIDIA GeForce RTX 4070 Ti, i9-13900K
167.4 (70.9min - 228max) fps +84%
MSI Titan GT77 HX 13VI
NVIDIA GeForce RTX 4090 Laptop GPU, i9-13950HX, Samsung PM9A1 MZVL22T0HBLB
135 fps +48%
Average NVIDIA GeForce RTX 3090
  (78.6 - 173, n=9)
128.8 fps +42%
Razer Blade 16 Early 2023
NVIDIA GeForce RTX 4080 Laptop GPU, i9-13950HX, SSSTC CA6-8D1024
106.2 (47.5min - 153.9max) fps +17%
Average NVIDIA GeForce RTX 3070
  (90.3 - 114, n=2)
102.2 fps +12%
Average AMD Radeon RX 6800M
  (76.9 - 119, n=2)
98 fps +8%
Average NVIDIA GeForce RTX 3080 Ti Laptop GPU
  (54 - 144.1, n=16)
93.6 fps +3%
Razer Blade 18 RTX 4070
NVIDIA GeForce RTX 4070 Laptop GPU, i9-13950HX, SSSTC CA6-8D1024
92.1 (17.3min - 159max) fps +1%
SCHENKER XMG Neo 17 2023 Engineering Sample
NVIDIA GeForce RTX 4070 Laptop GPU, i9-13900HX
91 fps
Gigabyte AERO 16 OLED BSF
NVIDIA GeForce RTX 4070 Laptop GPU, i9-13900H, Gigabyte AG470S1TB-SI B10
84.75 (28.94min - 126.38max) fps -7%
Average NVIDIA GeForce RTX 3080 Laptop GPU
  (75.6 - 89.8, n=2)
82.7 fps -9%
Average NVIDIA GeForce RTX 3070 Ti Laptop GPU
  (48.5 - 104, n=13)
79.2 fps -13%
MSI Katana 17 B13VFK
NVIDIA GeForce RTX 4060 Laptop GPU, i7-13620H, Micron 2400 MTFDKBA1T0QFM
73.81 (36.7min - 103.1max) fps -19%
SCHENKER XMG Focus 15 Engineering Sample
NVIDIA GeForce RTX 4050 Laptop GPU, i5-13500HX
65 fps -29%
Average NVIDIA GeForce RTX 3060
  ()
64.2 fps -29%
Average NVIDIA GeForce RTX 3060 Laptop GPU
  (40 - 78.8, n=16)
61.1 fps -33%
Average NVIDIA GeForce RTX 3050
  ()
60.5 fps -34%
Average AMD Radeon RX 6600M
  (55 - 61.2, n=3)
59 fps -35%
Average NVIDIA GeForce RTX 3050 Ti Laptop GPU
  (31 - 50.5, n=9)
40.9 fps -55%
Average NVIDIA GeForce RTX 3050 6GB Laptop GPU
  ()
38.5 fps -58%
2560x1440 Ultra Preset
Asus TUF Gaming GeForce RTX 4070 Ti
NVIDIA GeForce RTX 4070 Ti, i9-13900K
122.9 (100.2min - 174.9max) fps +116%
MSI Titan GT77 HX 13VI
NVIDIA GeForce RTX 4090 Laptop GPU, i9-13950HX, Samsung PM9A1 MZVL22T0HBLB
98 fps +72%
Average NVIDIA GeForce RTX 3090
  (78 - 96, n=7)
90.1 fps +58%
Razer Blade 16 Early 2023
NVIDIA GeForce RTX 4080 Laptop GPU, i9-13950HX, SSSTC CA6-8D1024
81.2 (32.5min - 122.6max) fps +42%
Average NVIDIA GeForce RTX 3070
  (60.6 - 62.7, n=2)
61.7 fps +8%
SCHENKER XMG Neo 17 2023 Engineering Sample
NVIDIA GeForce RTX 4070 Laptop GPU, i9-13900HX
57 fps
Average NVIDIA GeForce RTX 3080 Ti Laptop GPU
  (36 - 69.6, n=13)
55.4 fps -3%
Razer Blade 18 RTX 4070
NVIDIA GeForce RTX 4070 Laptop GPU, i9-13950HX, SSSTC CA6-8D1024
54 (35.6min - 99.5max) fps -5%
Gigabyte AERO 16 OLED BSF
NVIDIA GeForce RTX 4070 Laptop GPU, i9-13900H, Gigabyte AG470S1TB-SI B10
53.28 (28.06min - 87.11max) fps -7%
Average AMD Radeon RX 6800M
  (48.1 - 53.3, n=2)
50.7 fps -11%
Average NVIDIA GeForce RTX 3070 Ti Laptop GPU
  (40 - 62, n=10)
50.1 fps -12%
Average NVIDIA GeForce RTX 3080 Laptop GPU
  ()
47.9 fps -16%
MSI Katana 17 B13VFK
NVIDIA GeForce RTX 4060 Laptop GPU, i7-13620H, Micron 2400 MTFDKBA1T0QFM
45.9 (34.7min - 59.9max) fps -19%
Average NVIDIA GeForce RTX 3060
  ()
39.1 fps -31%
Average AMD Radeon RX 6600M
  (36 - 41.5, n=2)
38.8 fps -32%
Average NVIDIA GeForce RTX 3060 Laptop GPU
  (23 - 45.8, n=9)
36.5 fps -36%
SCHENKER XMG Focus 15 Engineering Sample
NVIDIA GeForce RTX 4050 Laptop GPU, i5-13500HX
32 fps -44%
Average NVIDIA GeForce RTX 3050
  ()
29.8 fps -48%
Average NVIDIA GeForce RTX 3050 Ti Laptop GPU
  (20 - 25, n=4)
22.2 fps -61%
3840x2160 Ultra Preset
MSI Titan GT77 HX 13VI
NVIDIA GeForce RTX 4090 Laptop GPU, i9-13950HX, Samsung PM9A1 MZVL22T0HBLB
56 fps +115%
Asus TUF Gaming GeForce RTX 4070 Ti
NVIDIA GeForce RTX 4070 Ti, i9-13900K
50.1 (42min - 64.5max) fps +93%
Average NVIDIA GeForce RTX 3090
  (43.9 - 48.6, n=7)
46.3 fps +78%
Razer Blade 16 Early 2023
NVIDIA GeForce RTX 4080 Laptop GPU, i9-13950HX, SSSTC CA6-8D1024
40 (20.8min - 74.9max) fps +54%
Average NVIDIA GeForce RTX 3070
  (29 - 30.2, n=2)
29.6 fps +14%
Average NVIDIA GeForce RTX 3080 Ti Laptop GPU
  (19.6 - 32.4, n=6)
27.1 fps +4%
Average NVIDIA GeForce RTX 3070 Ti Laptop GPU
  (24.6 - 28.1, n=2)
26.4 fps +2%
SCHENKER XMG Neo 17 2023 Engineering Sample
NVIDIA GeForce RTX 4070 Laptop GPU, i9-13900HX
26 fps
Razer Blade 18 RTX 4070
NVIDIA GeForce RTX 4070 Laptop GPU, i9-13950HX, SSSTC CA6-8D1024
23.3 (15.6min - 32.1max) fps -10%
Average NVIDIA GeForce RTX 3080 Laptop GPU
  ()
23 fps -12%
Average AMD Radeon RX 6800M
  (22.1 - 23.4, n=2)
22.8 fps -12%
MSI Katana 17 B13VFK
NVIDIA GeForce RTX 4060 Laptop GPU, i7-13620H, Micron 2400 MTFDKBA1T0QFM
21.1 (17min - 28.5max) fps -19%
Gigabyte AERO 16 OLED BSF
NVIDIA GeForce RTX 4070 Laptop GPU, i9-13900H, Gigabyte AG470S1TB-SI B10
19.59 (5.98min - 27.64max) fps -25%
Average AMD Radeon RX 6600M
  (14.4 - 23.2, n=2)
18.8 fps -28%
SCHENKER XMG Focus 15 Engineering Sample
NVIDIA GeForce RTX 4050 Laptop GPU, i5-13500HX
18 fps -31%
Average NVIDIA GeForce RTX 3060
  ()
17.7 fps -32%
Average NVIDIA GeForce RTX 3060 Laptop GPU
  (11 - 17.9, n=4)
14.6 fps -44%
Average NVIDIA GeForce RTX 3050
  ()
12.2 fps -53%
Average NVIDIA GeForce RTX 3050 Ti Laptop GPU
  ()
10.4 fps -60%
Dota 2 Reborn
1920x1080 ultra (3/3) best looking
Asus TUF Gaming GeForce RTX 4070 Ti
NVIDIA GeForce RTX 4070 Ti, i9-13900K
245.5 (204.7min) fps +36%
Average NVIDIA GeForce RTX 3090
  (134.3 - 244, n=16)
203 fps +12%
Razer Blade 16 Early 2023
NVIDIA GeForce RTX 4080 Laptop GPU, i9-13950HX, SSSTC CA6-8D1024
194.7 (160min) fps +8%
MSI Titan GT77 HX 13VI
NVIDIA GeForce RTX 4090 Laptop GPU, i9-13950HX, Samsung PM9A1 MZVL22T0HBLB
185.9 (157.5min) fps +3%
Average NVIDIA GeForce RTX 3050
  (154.7 - 208, n=2)
181.3 fps 0%
SCHENKER XMG Neo 17 2023 Engineering Sample
NVIDIA GeForce RTX 4070 Laptop GPU, i9-13900HX
180.6 (157.3min) fps
Razer Blade 18 RTX 4070
NVIDIA GeForce RTX 4070 Laptop GPU, i9-13950HX, SSSTC CA6-8D1024
178.6 (153.9min) fps -1%
SCHENKER XMG Focus 15 Engineering Sample
NVIDIA GeForce RTX 4050 Laptop GPU, i5-13500HX
161.7 (139.6min) fps -10%
MSI Katana 17 B13VFK
NVIDIA GeForce RTX 4060 Laptop GPU, i7-13620H, Micron 2400 MTFDKBA1T0QFM
156.3 (132.3min) fps -13%
Gigabyte AERO 16 OLED BSF
NVIDIA GeForce RTX 4070 Laptop GPU, i9-13900H, Gigabyte AG470S1TB-SI B10
144.5 (123.6min) fps -20%
Average NVIDIA GeForce RTX 3080 Ti Laptop GPU
  (29.9 - 170.5, n=45)
141.1 fps -22%
Average NVIDIA GeForce RTX 3060
  (110.5 - 159.7, n=5)
135.7 fps -25%
Average NVIDIA GeForce RTX 3070 Ti Laptop GPU
  (68.7 - 160.5, n=38)
135.6 fps -25%
Average NVIDIA GeForce RTX 3080 Laptop GPU
  (98 - 156, n=44)
126.1 fps -30%
Average NVIDIA GeForce RTX 3060 Laptop GPU
  (90.7 - 154.8, n=49)
125.9 fps -30%
Average NVIDIA GeForce RTX 3070
  (92.1 - 136.3, n=6)
119.2 fps -34%
Average AMD Radeon RX 6800M
  ()
114.8 fps -36%
Average NVIDIA GeForce RTX 3050 Ti Laptop GPU
  (67.3 - 145, n=27)
113 fps -37%
Average AMD Radeon RX 6700M
  ()
112 fps -38%
Average NVIDIA GeForce RTX 3050 6GB Laptop GPU
  (98 - 116.9, n=3)
104.8 fps -42%
Average AMD Radeon RX 6600M
  (91.4 - 110.1, n=8)
100.9 fps -44%
3840x2160 ultra (3/3) best looking
Asus TUF Gaming GeForce RTX 4070 Ti
NVIDIA GeForce RTX 4070 Ti, i9-13900K
231.5 (185.5min) fps +54%
Average NVIDIA GeForce RTX 3090
  (138.6 - 222, n=16)
191.3 fps +27%
MSI Titan GT77 HX 13VI
NVIDIA GeForce RTX 4090 Laptop GPU, i9-13950HX, Samsung PM9A1 MZVL22T0HBLB
178.9 (144.9min) fps +19%
Razer Blade 16 Early 2023
NVIDIA GeForce RTX 4080 Laptop GPU, i9-13950HX, SSSTC CA6-8D1024
176.7 (125min) fps +17%
SCHENKER XMG Neo 17 2023 Engineering Sample
NVIDIA GeForce RTX 4070 Laptop GPU, i9-13900HX
150.7 (130.6min) fps
Razer Blade 18 RTX 4070
NVIDIA GeForce RTX 4070 Laptop GPU, i9-13950HX, SSSTC CA6-8D1024
145.5 (109.1min) fps -3%
Gigabyte AERO 16 OLED BSF
NVIDIA GeForce RTX 4070 Laptop GPU, i9-13900H, Gigabyte AG470S1TB-SI B10
128.3 (108.4min) fps -15%
MSI Katana 17 B13VFK
NVIDIA GeForce RTX 4060 Laptop GPU, i7-13620H, Micron 2400 MTFDKBA1T0QFM
126 (105.9min) fps -16%
Average NVIDIA GeForce RTX 3070
  (122.7 - 128.5, n=4)
125.5 fps -17%
Average NVIDIA GeForce RTX 3080 Ti Laptop GPU
  (70.8 - 155.6, n=19)
124.8 fps -17%
Average NVIDIA GeForce RTX 3070 Ti Laptop GPU
  (58.3 - 148.9, n=5)
117.6 fps -22%
SCHENKER XMG Focus 15 Engineering Sample
NVIDIA GeForce RTX 4050 Laptop GPU, i5-13500HX
115.2 (100.5min) fps -24%
Average NVIDIA GeForce RTX 3060
  (109.3 - 116.1, n=4)
113.7 fps -25%
Average NVIDIA GeForce RTX 3080 Laptop GPU
  (55.2 - 128, n=16)
105.1 fps -30%
Average AMD Radeon RX 6800M
  ()
95.2 fps -37%
Average NVIDIA GeForce RTX 3050
  (93.1 - 94.4, n=2)
93.8 fps -38%
Average NVIDIA GeForce RTX 3060 Laptop GPU
  (46.9 - 107, n=11)
89 fps -41%
Average AMD Radeon RX 6600M
  (79.2 - 81.7, n=3)
80.7 fps -46%
Average NVIDIA GeForce RTX 3050 Ti Laptop GPU
  (31.9 - 76.6, n=6)
55.9 fps -63%
F1 22
1920x1080 Ultra High Preset AA:T AF:16x
Asus TUF Gaming GeForce RTX 4070 Ti
NVIDIA GeForce RTX 4070 Ti, i9-13900K
143.5 (124min, 105P1 - 166max) fps +76%
MSI Titan GT77 HX 13VI
NVIDIA GeForce RTX 4090 Laptop GPU, i9-13950HX, Samsung PM9A1 MZVL22T0HBLB
138.2 (118min, 84P1 - 161max) fps +69%
Average NVIDIA GeForce RTX 3090
  (122.6 - 136.9, n=13)
128.9 fps +58%
Average NVIDIA GeForce RTX 3080 Ti Laptop GPU
  (78.9 - 91, n=4)
82.7 fps +1%
SCHENKER XMG Neo 17 2023 Engineering Sample
NVIDIA GeForce RTX 4070 Laptop GPU, i9-13900HX
81.7 (70min, 68P1 - 97max) fps
Average NVIDIA GeForce RTX 3070
  ()
81 fps -1%
Average NVIDIA GeForce RTX 3080 Laptop GPU
  (65.2 - 70, n=2)
67.6 fps -17%
Average NVIDIA GeForce RTX 3070 Ti Laptop GPU
  (58.1 - 80, n=8)
67.3 fps -18%
Gigabyte AERO 16 OLED BSF
NVIDIA GeForce RTX 4070 Laptop GPU, i9-13900H, Gigabyte AG470S1TB-SI B10
66.6 (58min, 47P1 - 76max) fps -18%
MSI Katana 17 B13VFK
NVIDIA GeForce RTX 4060 Laptop GPU, i7-13620H, Micron 2400 MTFDKBA1T0QFM
65.4 (52min, 44P1 - 76max) fps -20%
SCHENKER XMG Focus 15 Engineering Sample
NVIDIA GeForce RTX 4050 Laptop GPU, i5-13500HX
53.8 (46min, 44P1 - 63max) fps -34%
Average AMD Radeon RX 6800M
  (49.7 - 56, n=2)
52.9 fps -35%
Average NVIDIA GeForce RTX 3060 Laptop GPU
  (36.6 - 55.9, n=8)
51 fps -38%
Average AMD Radeon RX 6600M
  (39 - 43.4, n=4)
40.8 fps -50%
Average NVIDIA GeForce RTX 3050
  ()
39.9 fps -51%
Average NVIDIA GeForce RTX 3050 6GB Laptop GPU
  (30.7 - 34, n=3)
32.8 fps -60%
Average NVIDIA GeForce RTX 3050 Ti Laptop GPU
  (16 - 35, n=7)
27.5 fps -66%
2560x1440 Ultra High Preset AA:T AF:16x
Asus TUF Gaming GeForce RTX 4070 Ti
NVIDIA GeForce RTX 4070 Ti, i9-13900K
92.4 (80min, 78P1 - 108max) fps +78%
MSI Titan GT77 HX 13VI
NVIDIA GeForce RTX 4090 Laptop GPU, i9-13950HX, Samsung PM9A1 MZVL22T0HBLB
90.1 (78min, 71P1 - 104max) fps +74%
Average NVIDIA GeForce RTX 3090
  (82.5 - 89.9, n=12)
85.3 fps +64%
Average NVIDIA GeForce RTX 3080 Ti Laptop GPU
  (52.9 - 62, n=2)
57.5 fps +11%
Average NVIDIA GeForce RTX 3070
  ()
52 fps 0%
SCHENKER XMG Neo 17 2023 Engineering Sample
NVIDIA GeForce RTX 4070 Laptop GPU, i9-13900HX
51.9 (45min, 44P1 - 61max) fps
Gigabyte AERO 16 OLED BSF
NVIDIA GeForce RTX 4070 Laptop GPU, i9-13900H, Gigabyte AG470S1TB-SI B10
44.3 (38min, 31P1 - 50max) fps -15%
Average NVIDIA GeForce RTX 3070 Ti Laptop GPU
  (36.8 - 50.5, n=7)
42.9 fps -17%
Average NVIDIA GeForce RTX 3080 Laptop GPU
  (42 - 43, n=2)
42.5 fps -18%
MSI Katana 17 B13VFK
NVIDIA GeForce RTX 4060 Laptop GPU, i7-13620H, Micron 2400 MTFDKBA1T0QFM
41 (35min, 33P1 - 48max) fps -21%
SCHENKER XMG Focus 15 Engineering Sample
NVIDIA GeForce RTX 4050 Laptop GPU, i5-13500HX
33.2 (28min, 26P1 - 38max) fps -36%
Average AMD Radeon RX 6800M
  (29.9 - 34, n=2)
32 fps -38%
Average NVIDIA GeForce RTX 3060 Laptop GPU
  (14.4 - 34.8, n=5)
27.3 fps -47%
Average AMD Radeon RX 6600M
  (24.4 - 25.9, n=3)
25.2 fps -51%
Average NVIDIA GeForce RTX 3050
  ()
24.9 fps -52%
Average NVIDIA GeForce RTX 3050 6GB Laptop GPU
  (18.1 - 20.1, n=2)
19.1 fps -63%
Average NVIDIA GeForce RTX 3050 Ti Laptop GPU
  (10 - 17.4, n=4)
14.3 fps -72%
3840x2160 Ultra High Preset AA:T AF:16x
Asus TUF Gaming GeForce RTX 4070 Ti
NVIDIA GeForce RTX 4070 Ti, i9-13900K
47 (40min, 37P1 - 54max) fps +81%
MSI Titan GT77 HX 13VI
NVIDIA GeForce RTX 4090 Laptop GPU, i9-13950HX, Samsung PM9A1 MZVL22T0HBLB
44.9 (38min, 37P1 - 52max) fps +73%
Average NVIDIA GeForce RTX 3090
  (41.8 - 45.7, n=12)
43.1 fps +66%
Average NVIDIA GeForce RTX 3080 Ti Laptop GPU
  ()
32 fps +24%
SCHENKER XMG Neo 17 2023 Engineering Sample
NVIDIA GeForce RTX 4070 Laptop GPU, i9-13900HX
25.9 (21min, 21P1 - 31max) fps
Average NVIDIA GeForce RTX 3070
  ()
25 fps -3%
Gigabyte AERO 16 OLED BSF
NVIDIA GeForce RTX 4070 Laptop GPU, i9-13900H, Gigabyte AG470S1TB-SI B10
21.5 (18min, 15P1 - 24max) fps -17%
Average NVIDIA GeForce RTX 3080 Laptop GPU
  (20.1 - 22, n=2)
21.1 fps -19%
MSI Katana 17 B13VFK
NVIDIA GeForce RTX 4060 Laptop GPU, i7-13620H, Micron 2400 MTFDKBA1T0QFM
19.7 (17min, 16P1 - 23max) fps -24%
SCHENKER XMG Focus 15 Engineering Sample
NVIDIA GeForce RTX 4050 Laptop GPU, i5-13500HX
15.9 (14min, 13P1 - 18max) fps -39%
Average AMD Radeon RX 6800M
  (13.8 - 16, n=2)
14.9 fps -42%
Average NVIDIA GeForce RTX 3060 Laptop GPU
  (10.6 - 16, n=2)
13.3 fps -49%
Average NVIDIA GeForce RTX 3050
  ()
12 fps -54%
Average AMD Radeon RX 6600M
  (11.3 - 12.1, n=3)
11.7 fps -55%
Average NVIDIA GeForce RTX 3050 Ti Laptop GPU
  ()
4 fps -85%
F1 2021
1920x1080 Ultra High Preset + Raytracing AA:T AF:16x
Asus TUF Gaming GeForce RTX 4070 Ti
NVIDIA GeForce RTX 4070 Ti, i9-13900K
263 (218min, 204P1 - 293max) fps +67%
Average NVIDIA GeForce RTX 3090
  (154 - 244, n=13)
218 fps +38%
MSI Titan GT77 HX 13VI
NVIDIA GeForce RTX 4090 Laptop GPU, i9-13950HX, Samsung PM9A1 MZVL22T0HBLB
209 (170min, 105P1 - 225max) fps +33%
SCHENKER XMG Neo 17 2023 Engineering Sample
NVIDIA GeForce RTX 4070 Laptop GPU, i9-13900HX
157.5 (131min, 123P1 - 175max) fps
Average NVIDIA GeForce RTX 3070
  (148 - 158, n=2)
153 fps -3%
MSI Katana 17 B13VFK
NVIDIA GeForce RTX 4060 Laptop GPU, i7-13620H, Micron 2400 MTFDKBA1T0QFM
128.9 (106min, 81P1 - 145max) fps -18%
Average NVIDIA GeForce RTX 3080 Ti Laptop GPU
  (30.2 - 160.6, n=30)
126.1 fps -20%
Average AMD Radeon RX 6800M
  (114 - 124.1, n=2)
119.1 fps -24%
Average NVIDIA GeForce RTX 3070 Ti Laptop GPU
  (67.3 - 134.2, n=13)
110.2 fps -30%
SCHENKER XMG Focus 15 Engineering Sample
NVIDIA GeForce RTX 4050 Laptop GPU, i5-13500HX
109.7 (92min, 90P1 - 123max) fps -30%
Average NVIDIA GeForce RTX 3080 Laptop GPU
  (74.9 - 123.7, n=8)
106.7 fps -32%
Average AMD Radeon RX 6700M
  ()
100 fps -37%
Average NVIDIA GeForce RTX 3060
  (75.1 - 105.9, n=5)
95.8 fps -39%
Average NVIDIA GeForce RTX 3060 Laptop GPU
  (67 - 112.8, n=9)
92.4 fps -41%
Average AMD Radeon RX 6600M
  (80.9 - 95.9, n=5)
91.8 fps -42%
Average NVIDIA GeForce RTX 3050
  (81.6 - 82.2, n=2)
81.9 fps -48%
Average NVIDIA GeForce RTX 3050 6GB Laptop GPU
  ()
61.9 fps -61%
Average NVIDIA GeForce RTX 3050 Ti Laptop GPU
  (44.4 - 69, n=11)
54 fps -66%
2560x1440 Ultra High Preset + Raytracing AA:T AF:16x
Asus TUF Gaming GeForce RTX 4070 Ti
NVIDIA GeForce RTX 4070 Ti, i9-13900K
199.8 (168min, 154P1 - 221max) fps +74%
MSI Titan GT77 HX 13VI
NVIDIA GeForce RTX 4090 Laptop GPU, i9-13950HX, Samsung PM9A1 MZVL22T0HBLB
192.4 (146min, 114P1 - 209max) fps +68%
Average NVIDIA GeForce RTX 3090
  (153 - 186.2, n=13)
172.4 fps +50%
Average NVIDIA GeForce RTX 3070
  (113 - 118, n=2)
115.5 fps +1%
SCHENKER XMG Neo 17 2023 Engineering Sample
NVIDIA GeForce RTX 4070 Laptop GPU, i9-13900HX
114.7 (98min, 95P1 - 127max) fps
Average NVIDIA GeForce RTX 3080 Ti Laptop GPU
  (30 - 120.1, n=19)
94.1 fps -18%
MSI Katana 17 B13VFK
NVIDIA GeForce RTX 4060 Laptop GPU, i7-13620H, Micron 2400 MTFDKBA1T0QFM
93 (78min, 64P1 - 103max) fps -19%
Average AMD Radeon RX 6800M
  ()
88.2 fps -23%
Average NVIDIA GeForce RTX 3080 Laptop GPU
  (84 - 90.4, n=3)
87.3 fps -24%
Average NVIDIA GeForce RTX 3070 Ti Laptop GPU
  (47.5 - 99.2, n=11)
82.9 fps -28%
SCHENKER XMG Focus 15 Engineering Sample
NVIDIA GeForce RTX 4050 Laptop GPU, i5-13500HX
76.1 (64min, 63P1 - 87max) fps -34%
Average NVIDIA GeForce RTX 3060
  (72 - 78.8, n=4)
75.2 fps -34%
Average AMD Radeon RX 6600M
  (63 - 66.1, n=3)
64.9 fps -43%
Average NVIDIA GeForce RTX 3050
  (59 - 59.2, n=2)
59.1 fps -48%
Average NVIDIA GeForce RTX 3060 Laptop GPU
  (47.5 - 70.2, n=2)
58.9 fps -49%
Average NVIDIA GeForce RTX 3050 6GB Laptop GPU
  ()
40 fps -65%
Average NVIDIA GeForce RTX 3050 Ti Laptop GPU
  (30.9 - 43.1, n=5)
37.9 fps -67%
3840x2160 Ultra High Preset + Raytracing AA:T AF:16x
Asus TUF Gaming GeForce RTX 4070 Ti
NVIDIA GeForce RTX 4070 Ti, i9-13900K
114.4 (98min, 97P1 - 129max) fps +80%
MSI Titan GT77 HX 13VI
NVIDIA GeForce RTX 4090 Laptop GPU, i9-13950HX, Samsung PM9A1 MZVL22T0HBLB
114.4 (99min, 96P1 - 129max) fps +80%
Average NVIDIA GeForce RTX 3090
  (100.4 - 110, n=13)
103.5 fps +63%
Average NVIDIA GeForce RTX 3070
  (64 - 67.3, n=2)
65.7 fps +4%
SCHENKER XMG Neo 17 2023 Engineering Sample
NVIDIA GeForce RTX 4070 Laptop GPU, i9-13900HX
63.4 (46min, 53P1 - 73max) fps
Average NVIDIA GeForce RTX 3080 Ti Laptop GPU
  (41.1 - 70.2, n=18)
60.9 fps -4%
Average NVIDIA GeForce RTX 3070 Ti Laptop GPU
  (47 - 56.8, n=3)
52.4 fps -17%
MSI Katana 17 B13VFK
NVIDIA GeForce RTX 4060 Laptop GPU, i7-13620H, Micron 2400 MTFDKBA1T0QFM
50.2 (42min, 42P1 - 57max) fps -21%
Average AMD Radeon RX 6800M
  ()
47.6 fps -25%
Average NVIDIA GeForce RTX 3080 Laptop GPU
  (32.5 - 51.5, n=6)
45 fps -29%
Average NVIDIA GeForce RTX 3060
  (40.9 - 44.4, n=4)
42.6 fps -33%
SCHENKER XMG Focus 15 Engineering Sample
NVIDIA GeForce RTX 4050 Laptop GPU, i5-13500HX
38 (31min, 30P1 - 45max) fps -40%
Average AMD Radeon RX 6600M
  (31.6 - 35.4, n=3)
33.2 fps -48%
Average NVIDIA GeForce RTX 3050
  (32 - 32.4, n=2)
32.2 fps -49%
Average NVIDIA GeForce RTX 3060 Laptop GPU
  (25.9 - 38, n=2)
32 fps -50%
Average NVIDIA GeForce RTX 3050 Ti Laptop GPU
  ()
14.4 fps -77%
Final Fantasy XV Benchmark
1920x1080 High Quality
Asus TUF Gaming GeForce RTX 4070 Ti
NVIDIA GeForce RTX 4070 Ti, i9-13900K
209 fps +75%
MSI Titan GT77 HX 13VI
NVIDIA GeForce RTX 4090 Laptop GPU, i9-13950HX, Samsung PM9A1 MZVL22T0HBLB
187.4 fps +57%
Average NVIDIA GeForce RTX 3090
  (153 - 229, n=16)
184.1 fps +54%
Razer Blade 16 Early 2023
NVIDIA GeForce RTX 4080 Laptop GPU, i9-13950HX, SSSTC CA6-8D1024
157.8 fps +32%
SCHENKER XMG Focus 15 Engineering Sample
NVIDIA GeForce RTX 4050 Laptop GPU, i5-13500HX
122.3 fps +2%
Average NVIDIA GeForce RTX 3070
  (112 - 129.7, n=4)
119.7 fps 0%
SCHENKER XMG Neo 17 2023 Engineering Sample
NVIDIA GeForce RTX 4070 Laptop GPU, i9-13900HX
119.4 fps
Gigabyte AERO 16 OLED BSF
NVIDIA GeForce RTX 4070 Laptop GPU, i9-13900H, Gigabyte AG470S1TB-SI B10
116.2 fps -3%
Razer Blade 18 RTX 4070
NVIDIA GeForce RTX 4070 Laptop GPU, i9-13950HX, SSSTC CA6-8D1024
115.2 fps -4%
Average NVIDIA GeForce RTX 3080 Ti Laptop GPU
  (30.7 - 140.6, n=42)
113.8 fps -5%
Average NVIDIA GeForce RTX 3080 Laptop GPU
  (55.5 - 115, n=33)
98.9 fps -17%
Average AMD Radeon RX 6800M
  (97.5 - 99.7, n=2)
98.6 fps -17%
Average NVIDIA GeForce RTX 3070 Ti Laptop GPU
  (49.5 - 122.4, n=35)
98.5 fps -18%
MSI Katana 17 B13VFK
NVIDIA GeForce RTX 4060 Laptop GPU, i7-13620H, Micron 2400 MTFDKBA1T0QFM
96.1 fps -20%
Average NVIDIA GeForce RTX 3060
  (70.8 - 88.6, n=5)
84.3 fps -29%
Average AMD Radeon RX 6700M
  ()
83.8 fps -30%
Average NVIDIA GeForce RTX 3060 Laptop GPU
  (55 - 100.9, n=42)
79.4 fps -34%
Average AMD Radeon RX 6600M
  (72.1 - 82, n=6)
78.8 fps -34%
Average NVIDIA GeForce RTX 3050
  (66.5 - 67.3, n=2)
66.9 fps -44%
Average NVIDIA GeForce RTX 3050 Ti Laptop GPU
  (23.5 - 106, n=24)
51.2 fps -57%
Average NVIDIA GeForce RTX 3050 6GB Laptop GPU
  (44.2 - 52, n=3)
49.1 fps -59%
2560x1440 High Quality
Asus TUF Gaming GeForce RTX 4070 Ti
NVIDIA GeForce RTX 4070 Ti, i9-13900K
167 fps +94%
MSI Titan GT77 HX 13VI
NVIDIA GeForce RTX 4090 Laptop GPU, i9-13950HX, Samsung PM9A1 MZVL22T0HBLB
162.9 fps +89%
Average NVIDIA GeForce RTX 3090
  (128 - 153, n=15)
143.1 fps +66%
Razer Blade 16 Early 2023
NVIDIA GeForce RTX 4080 Laptop GPU, i9-13950HX, SSSTC CA6-8D1024
120.1 fps +39%
Average NVIDIA GeForce RTX 3070
  (89.2 - 99.3, n=4)
94.1 fps +9%
SCHENKER XMG Neo 17 2023 Engineering Sample
NVIDIA GeForce RTX 4070 Laptop GPU, i9-13900HX
86.1 fps
Average NVIDIA GeForce RTX 3080 Ti Laptop GPU
  (30.8 - 105.8, n=34)
85.9 fps 0%
Gigabyte AERO 16 OLED BSF
NVIDIA GeForce RTX 4070 Laptop GPU, i9-13900H, Gigabyte AG470S1TB-SI B10
84.7 fps -2%
Razer Blade 18 RTX 4070
NVIDIA GeForce RTX 4070 Laptop GPU, i9-13950HX, SSSTC CA6-8D1024
82 fps -5%
Average NVIDIA GeForce RTX 3080 Laptop GPU
  (61.6 - 90.3, n=17)
79.4 fps -8%
Average NVIDIA GeForce RTX 3070 Ti Laptop GPU
  (57.9 - 93, n=24)
76 fps -12%
Average AMD Radeon RX 6800M
  ()
71 fps -18%
MSI Katana 17 B13VFK
NVIDIA GeForce RTX 4060 Laptop GPU, i7-13620H, Micron 2400 MTFDKBA1T0QFM
70.1 fps -19%
Average NVIDIA GeForce RTX 3060
  (63.6 - 64.8, n=4)
64.3 fps -25%
SCHENKER XMG Focus 15 Engineering Sample
NVIDIA GeForce RTX 4050 Laptop GPU, i5-13500HX
60 fps -30%
Average NVIDIA GeForce RTX 3060 Laptop GPU
  (41.1 - 73.7, n=25)
59.5 fps -31%
Average AMD Radeon RX 6600M
  (54.8 - 58.2, n=4)
56.4 fps -34%
Average NVIDIA GeForce RTX 3050
  (48.6 - 48.9, n=2)
48.8 fps -43%
Average NVIDIA GeForce RTX 3050 6GB Laptop GPU
  (32 - 37.4, n=2)
34.7 fps -60%
Average NVIDIA GeForce RTX 3050 Ti Laptop GPU
  (18.4 - 53.1, n=11)
33.9 fps -61%
3840x2160 High Quality
MSI Titan GT77 HX 13VI
NVIDIA GeForce RTX 4090 Laptop GPU, i9-13950HX, Samsung PM9A1 MZVL22T0HBLB
94.7 fps +99%
Asus TUF Gaming GeForce RTX 4070 Ti
NVIDIA GeForce RTX 4070 Ti, i9-13900K
90.5 fps +91%
Average NVIDIA GeForce RTX 3090
  (81.5 - 92.4, n=15)
87.5 fps +84%
Razer Blade 16 Early 2023
NVIDIA GeForce RTX 4080 Laptop GPU, i9-13950HX, SSSTC CA6-8D1024
74.1 fps +56%
Average NVIDIA GeForce RTX 3070
  (54.8 - 58.2, n=4)
56.9 fps +20%
Average NVIDIA GeForce RTX 3080 Ti Laptop GPU
  (35.1 - 61.2, n=18)
52.7 fps +11%
SCHENKER XMG Neo 17 2023 Engineering Sample
NVIDIA GeForce RTX 4070 Laptop GPU, i9-13900HX
47.5 fps
Razer Blade 18 RTX 4070
NVIDIA GeForce RTX 4070 Laptop GPU, i9-13950HX, SSSTC CA6-8D1024
46.6 fps -2%
Gigabyte AERO 16 OLED BSF
NVIDIA GeForce RTX 4070 Laptop GPU, i9-13900H, Gigabyte AG470S1TB-SI B10
46.1 fps -3%
Average NVIDIA GeForce RTX 3070 Ti Laptop GPU
  (39.6 - 46.6, n=5)
43.9 fps -8%
Average NVIDIA GeForce RTX 3080 Laptop GPU
  (28.4 - 53.2, n=15)
43.4 fps -9%
Average AMD Radeon RX 6800M
  ()
41.3 fps -13%
MSI Katana 17 B13VFK
NVIDIA GeForce RTX 4060 Laptop GPU, i7-13620H, Micron 2400 MTFDKBA1T0QFM
40.2 fps -15%
Average NVIDIA GeForce RTX 3060
  (37 - 38.2, n=4)
37.8 fps -20%
SCHENKER XMG Focus 15 Engineering Sample
NVIDIA GeForce RTX 4050 Laptop GPU, i5-13500HX
33.3 fps -30%
Average NVIDIA GeForce RTX 3060 Laptop GPU
  (22.9 - 37.8, n=11)
33.2 fps -30%
Average AMD Radeon RX 6600M
  (30.2 - 30.6, n=3)
30.5 fps -36%
Average NVIDIA GeForce RTX 3050
  (28.2 - 28.2, n=2)
28.2 fps -41%
Average NVIDIA GeForce RTX 3050 Ti Laptop GPU
  (12.8 - 21.4, n=3)
16.9 fps -64%

Raytracing Benchmarks

The results shift a bit once you start to use raytracing and the RTX 4070 Laptop is slightly behind the RTX 3080 Ti Laptop. You are basically limited to the 1080p resolution if you want to activate raytracing; 4K settings often suffer from low fps numbers.

The raytracing capabilities of the RTX 4050 are even more limited and even 1080p settings are sometimes too challenging, so you ave to use upscaling to get smooth frame rates (we will cover that in the next section).

Note: We will add raytracing benchmarks for the RTX 4060 Laptop shortly.

Performance Rating - Percent
Asus TUF Gaming GeForce RTX 4070 Ti
NVIDIA GeForce RTX 4070 Ti, i9-13900K
99.8 pt
MSI Titan GT77 HX 13VI
NVIDIA GeForce RTX 4090 Laptop GPU, i9-13950HX, Samsung PM9A1 MZVL22T0HBLB
86.3 pt
Average NVIDIA GeForce RTX 3090
 
83.6 pt
Razer Blade 16 Early 2023
NVIDIA GeForce RTX 4080 Laptop GPU, i9-13950HX, SSSTC CA6-8D1024
82.3 pt
Average NVIDIA GeForce RTX 3080 Ti Laptop GPU
 
55 pt
Average NVIDIA GeForce RTX 3070
 
54.3 pt
SCHENKER XMG Neo 17 2023 Engineering Sample
NVIDIA GeForce RTX 4070 Laptop GPU, i9-13900HX
52.3 pt
Average NVIDIA GeForce RTX 3080 Laptop GPU
 
46.9 pt
Average NVIDIA GeForce RTX 3070 Ti Laptop GPU
 
44 pt
Average NVIDIA GeForce RTX 3060
 
41.8 pt
SCHENKER XMG Focus 15 Engineering Sample -1!
NVIDIA GeForce RTX 4050 Laptop GPU, i5-13500HX
32.6 pt
Average NVIDIA GeForce RTX 3060 Laptop GPU
 
31.8 pt
Average AMD Radeon RX 6800M -1!
 
31.3 pt
Average NVIDIA GeForce RTX 3050 -1!
 
31 pt
Average AMD Radeon RX 6600M -2!
 
29.4 pt
Average AMD Radeon RX 6700M -4!
 
27.6 pt
Average NVIDIA GeForce RTX 3050 Ti Laptop GPU
 
15.6 pt
Metro Exodus - 1920x1080 Ultra Quality DXR AF:16x
Asus TUF Gaming GeForce RTX 4070 Ti
NVIDIA GeForce RTX 4070 Ti, i9-13900K
128.8 (62.96min - 211.1max) fps +65%
Average NVIDIA GeForce RTX 3090
  (68.6 - 122.2, n=12)
111.4 fps +43%
MSI Titan GT77 HX 13VI
NVIDIA GeForce RTX 4090 Laptop GPU, i9-13950HX, Samsung PM9A1 MZVL22T0HBLB
108 fps +38%
Razer Blade 16 Early 2023
NVIDIA GeForce RTX 4080 Laptop GPU, i9-13950HX, SSSTC CA6-8D1024
104.4 (50.2min - 162.5max) fps +34%
Average NVIDIA GeForce RTX 3070
  (80.4 - 83, n=5)
81.6 fps +5%
SCHENKER XMG Neo 17 2023 Engineering Sample
NVIDIA GeForce RTX 4070 Laptop GPU, i9-13900HX
78 fps
Average NVIDIA GeForce RTX 3080 Ti Laptop GPU
  ()
77.9 fps 0%
Average NVIDIA GeForce RTX 3080 Laptop GPU
  (59.1 - 74.5, n=5)
69 fps -12%
Average NVIDIA GeForce RTX 3070 Ti Laptop GPU
  (61.3 - 65.1, n=2)
63.2 fps -19%
Average AMD Radeon RX 6800M
  (54.9 - 57.4, n=3)
56.1 fps -28%
SCHENKER XMG Focus 15 Engineering Sample
NVIDIA GeForce RTX 4050 Laptop GPU, i5-13500HX
54 fps -31%
Average NVIDIA GeForce RTX 3060
  (52.1 - 55.1, n=4)
53.4 fps -32%
Average NVIDIA GeForce RTX 3060 Laptop GPU
  (50.9 - 54.4, n=3)
52.9 fps -32%
Average AMD Radeon RX 6600M
  (43.8 - 54.4, n=3)
47.5 fps -39%
Average NVIDIA GeForce RTX 3050
  (37.9 - 39.2, n=2)
38.6 fps -51%
Average NVIDIA GeForce RTX 3050 Ti Laptop GPU
  ()
36.8 fps -53%
Watch Dogs Legion - 1920x1080 Ultra Preset + Ultra Ray Tracing (DX12)
Asus TUF Gaming GeForce RTX 4070 Ti
NVIDIA GeForce RTX 4070 Ti, i9-13900K
98.9 (72.06min, 82.17P1 - 137.41max) fps +120%
Average NVIDIA GeForce RTX 3090
  (75.7 - 110, n=3)
88 fps +96%
MSI Titan GT77 HX 13VI
NVIDIA GeForce RTX 4090 Laptop GPU, i9-13950HX, Samsung PM9A1 MZVL22T0HBLB
84 fps +87%
Razer Blade 16 Early 2023
NVIDIA GeForce RTX 4080 Laptop GPU, i9-13950HX, SSSTC CA6-8D1024
80 (58min - 115max) fps +78%
Average NVIDIA GeForce RTX 3080 Ti Laptop GPU
  (50 - 70, n=3)
58.6 fps +30%
Average NVIDIA GeForce RTX 3070
  (51.7 - 61, n=4)
55.1 fps +22%
Average NVIDIA GeForce RTX 3060
  ()
49.9 fps +11%
Average NVIDIA GeForce RTX 3080 Laptop GPU
  (41 - 59.5, n=5)
46.2 fps +3%
SCHENKER XMG Neo 17 2023 Engineering Sample
NVIDIA GeForce RTX 4070 Laptop GPU, i9-13900HX
45 fps
Average NVIDIA GeForce RTX 3050
  ()
44 fps -2%
Average NVIDIA GeForce RTX 3070 Ti Laptop GPU
  (36 - 41.2, n=2)
38.6 fps -14%
Average AMD Radeon RX 6800M
  ()
29 fps -36%
Average NVIDIA GeForce RTX 3060 Laptop GPU
  (15.4 - 27, n=2)
21.2 fps -53%
SCHENKER XMG Focus 15 Engineering Sample
NVIDIA GeForce RTX 4050 Laptop GPU, i5-13500HX
18 fps -60%
Average AMD Radeon RX 6700M
  ()
18 fps -60%
Average AMD Radeon RX 6600M
  ()
17.5 fps -61%
Average NVIDIA GeForce RTX 3050 Ti Laptop GPU
  ()
11 fps -76%
Far Cry 6 - 1920x1080 Ultra Graphics Quality + HD Textures + DXR AA:T
Asus TUF Gaming GeForce RTX 4070 Ti
NVIDIA GeForce RTX 4070 Ti, i9-13900K
146 (122min - 194max) fps +87%
Razer Blade 16 Early 2023
NVIDIA GeForce RTX 4080 Laptop GPU, i9-13950HX, SSSTC CA6-8D1024
119 (88min - 165max) fps +53%
MSI Titan GT77 HX 13VI
NVIDIA GeForce RTX 4090 Laptop GPU, i9-13950HX, Samsung PM9A1 MZVL22T0HBLB
116 fps +49%
Average NVIDIA GeForce RTX 3090
  (76 - 138.2, n=8)
112.6 fps +44%
Average NVIDIA GeForce RTX 3080 Ti Laptop GPU
  (91 - 92, n=3)
91.3 fps +17%
SCHENKER XMG Neo 17 2023 Engineering Sample
NVIDIA GeForce RTX 4070 Laptop GPU, i9-13900HX
78 fps
Average NVIDIA GeForce RTX 3070
  ()
71 fps -9%
Average NVIDIA GeForce RTX 3060
  ()
71 fps -9%
Average NVIDIA GeForce RTX 3070 Ti Laptop GPU
  (59 - 77.7, n=2)
68.4 fps -12%
Average NVIDIA GeForce RTX 3080 Laptop GPU
  (59 - 84, n=3)
68 fps -13%
Average AMD Radeon RX 6700M
  ()
54 fps -31%
Average AMD Radeon RX 6600M
  (45.6 - 66.8, n=4)
53.8 fps -31%
Average NVIDIA GeForce RTX 3060 Laptop GPU
  (34 - 66, n=2)
50 fps -36%
SCHENKER XMG Focus 15 Engineering Sample
NVIDIA GeForce RTX 4050 Laptop GPU, i5-13500HX
48 fps -38%
Average NVIDIA GeForce RTX 3050
  (25.8 - 53.1, n=2)
39.5 fps -49%
Average NVIDIA GeForce RTX 3050 Ti Laptop GPU
  ()
8 fps -90%
Dying Light 2 - 1920x1080 High Quality Raytracing
Razer Blade 16 Early 2023
NVIDIA GeForce RTX 4080 Laptop GPU, i9-13950HX, SSSTC CA6-8D1024
83.9 (66.4min - 121.8max) fps +100%
Asus TUF Gaming GeForce RTX 4070 Ti
NVIDIA GeForce RTX 4070 Ti, i9-13900K
82.9 (36.6min, 45.4P0.1, 69.2P1 - 247max) fps +97%
Average NVIDIA GeForce RTX 3090
  (67.9 - 80.2, n=2)
74.1 fps +76%
MSI Titan GT77 HX 13VI
NVIDIA GeForce RTX 4090 Laptop GPU, i9-13950HX, Samsung PM9A1 MZVL22T0HBLB
73 fps +74%
Average NVIDIA GeForce RTX 3070
  ()
42.2 fps 0%
SCHENKER XMG Neo 17 2023 Engineering Sample
NVIDIA GeForce RTX 4070 Laptop GPU, i9-13900HX
42 fps
Average NVIDIA GeForce RTX 3080 Ti Laptop GPU
  (33.4 - 42.3, n=5)
38.5 fps -8%
Average NVIDIA GeForce RTX 3070 Ti Laptop GPU
  (28.7 - 54.9, n=6)
36.6 fps -13%
Average NVIDIA GeForce RTX 3080 Laptop GPU
  ()
36 fps -14%
Average NVIDIA GeForce RTX 3060
  ()
34.2 fps -19%
Average NVIDIA GeForce RTX 3060 Laptop GPU
  ()
26.1 fps -38%
Average AMD Radeon RX 6800M
  ()
17.8 fps -58%
Average NVIDIA GeForce RTX 3050 Ti Laptop GPU
  ()
6.75 fps -84%
Cyberpunk 2077 1.6 - 1920x1080 Ray Tracing Ultra Preset (DLSS off)
Asus TUF Gaming GeForce RTX 4070 Ti
NVIDIA GeForce RTX 4070 Ti, i9-13900K
81 (62.6min - 103.6max) fps +93%
MSI Titan GT77 HX 13VI
NVIDIA GeForce RTX 4090 Laptop GPU, i9-13950HX, Samsung PM9A1 MZVL22T0HBLB
74 fps +76%
Average NVIDIA GeForce RTX 3090
  (61.3 - 68, n=5)
65.5 fps +56%
Razer Blade 16 Early 2023
NVIDIA GeForce RTX 4080 Laptop GPU, i9-13950HX, SSSTC CA6-8D1024
65.3 (31.7min - 96.9max) fps +55%
Average NVIDIA GeForce RTX 3080 Ti Laptop GPU
  (39.2 - 49.9, n=7)
43.3 fps +3%
Average NVIDIA GeForce RTX 3070
  (41.6 - 43.9, n=2)
42.8 fps +2%
SCHENKER XMG Neo 17 2023 Engineering Sample
NVIDIA GeForce RTX 4070 Laptop GPU, i9-13900HX
42 fps
Average NVIDIA GeForce RTX 3070 Ti Laptop GPU
  (27.9 - 63, n=7)
36.8 fps -12%
Average NVIDIA GeForce RTX 3080 Laptop GPU
  (34.6 - 37.8, n=2)
36.2 fps -14%
Average NVIDIA GeForce RTX 3060
  ()
28.3 fps -33%
SCHENKER XMG Focus 15 Engineering Sample
NVIDIA GeForce RTX 4050 Laptop GPU, i5-13500HX
27 fps -36%
Average NVIDIA GeForce RTX 3060 Laptop GPU
  (12.6 - 28.9, n=7)
23.9 fps -43%
Average AMD Radeon RX 6800M
  ()
23.5 fps -44%
Average NVIDIA GeForce RTX 3050
  ()
21.2 fps -50%
Average AMD Radeon RX 6600M
  (15.6 - 26.6, n=2)
21.1 fps -50%
Average NVIDIA GeForce RTX 3050 Ti Laptop GPU
  ()
14.1 fps -66%
Ghostwire Tokyo - 1920x1080 Highest Settings + Maximum Ray Tracing
Asus TUF Gaming GeForce RTX 4070 Ti
NVIDIA GeForce RTX 4070 Ti, i9-13900K
139.3 (31.3min, 53.2P0.1, 89.7P1 - 236max) fps +91%
MSI Titan GT77 HX 13VI
NVIDIA GeForce RTX 4090 Laptop GPU, i9-13950HX, Samsung PM9A1 MZVL22T0HBLB
127 fps +74%
Average NVIDIA GeForce RTX 3090
  (106 - 122, n=3)
111.6 fps +53%
Razer Blade 16 Early 2023
NVIDIA GeForce RTX 4080 Laptop GPU, i9-13950HX, SSSTC CA6-8D1024
97 fps +33%
Average NVIDIA GeForce RTX 3070
  ()
76.3 fps +5%
SCHENKER XMG Neo 17 2023 Engineering Sample
NVIDIA GeForce RTX 4070 Laptop GPU, i9-13900HX
73 fps
Average NVIDIA GeForce RTX 3080 Ti Laptop GPU
  (66.1 - 68.3, n=2)
67.2 fps -8%
Average NVIDIA GeForce RTX 3080 Laptop GPU
  (64.7 - 65.9, n=2)
65.3 fps -11%
Average NVIDIA GeForce RTX 3070 Ti Laptop GPU
  (48.9 - 59.9, n=3)
55.3 fps -24%
SCHENKER XMG Focus 15 Engineering Sample
NVIDIA GeForce RTX 4050 Laptop GPU, i5-13500HX
51 fps -30%
Average NVIDIA GeForce RTX 3060
  ()
48.5 fps -34%
Average NVIDIA GeForce RTX 3060 Laptop GPU
  ()
46.6 fps -36%
Average AMD Radeon RX 6800M
  ()
46.6 fps -36%
Average NVIDIA GeForce RTX 3050
  ()
38.1 fps -48%
Average NVIDIA GeForce RTX 3050 Ti Laptop GPU
  ()
32.2 fps -56%

DLSS Benchmarks

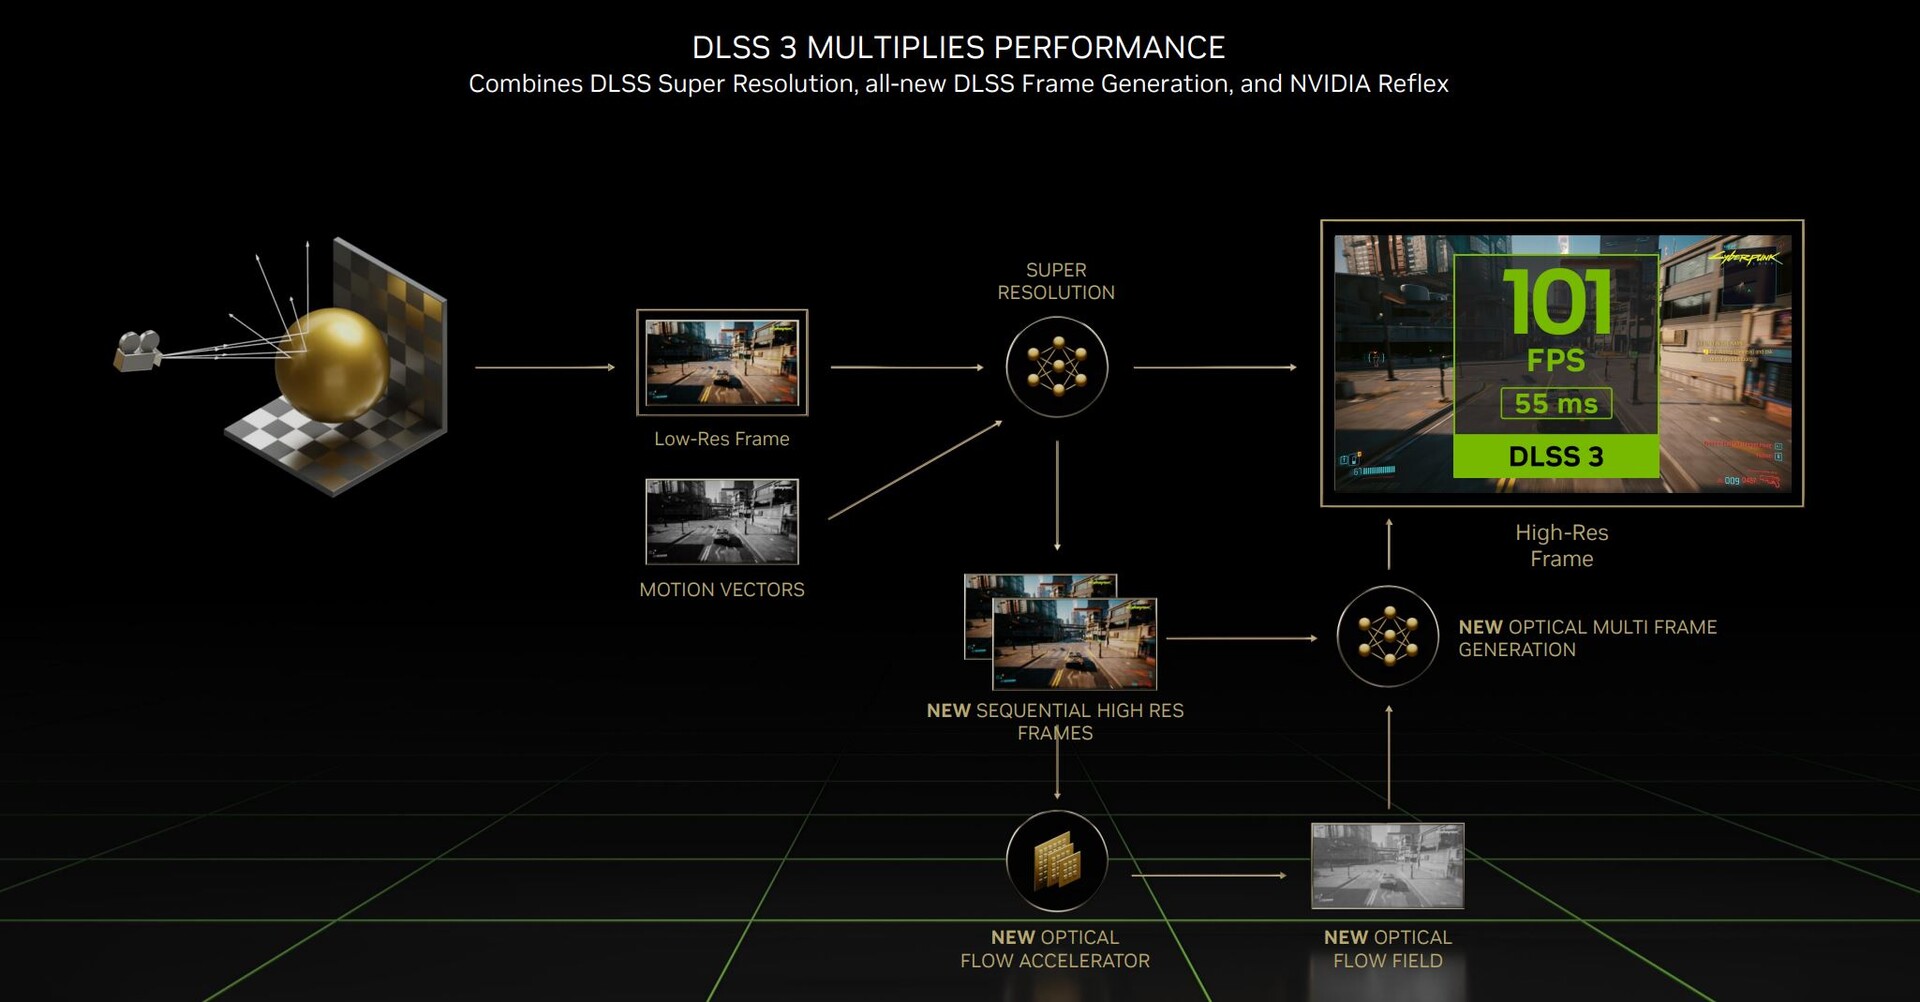
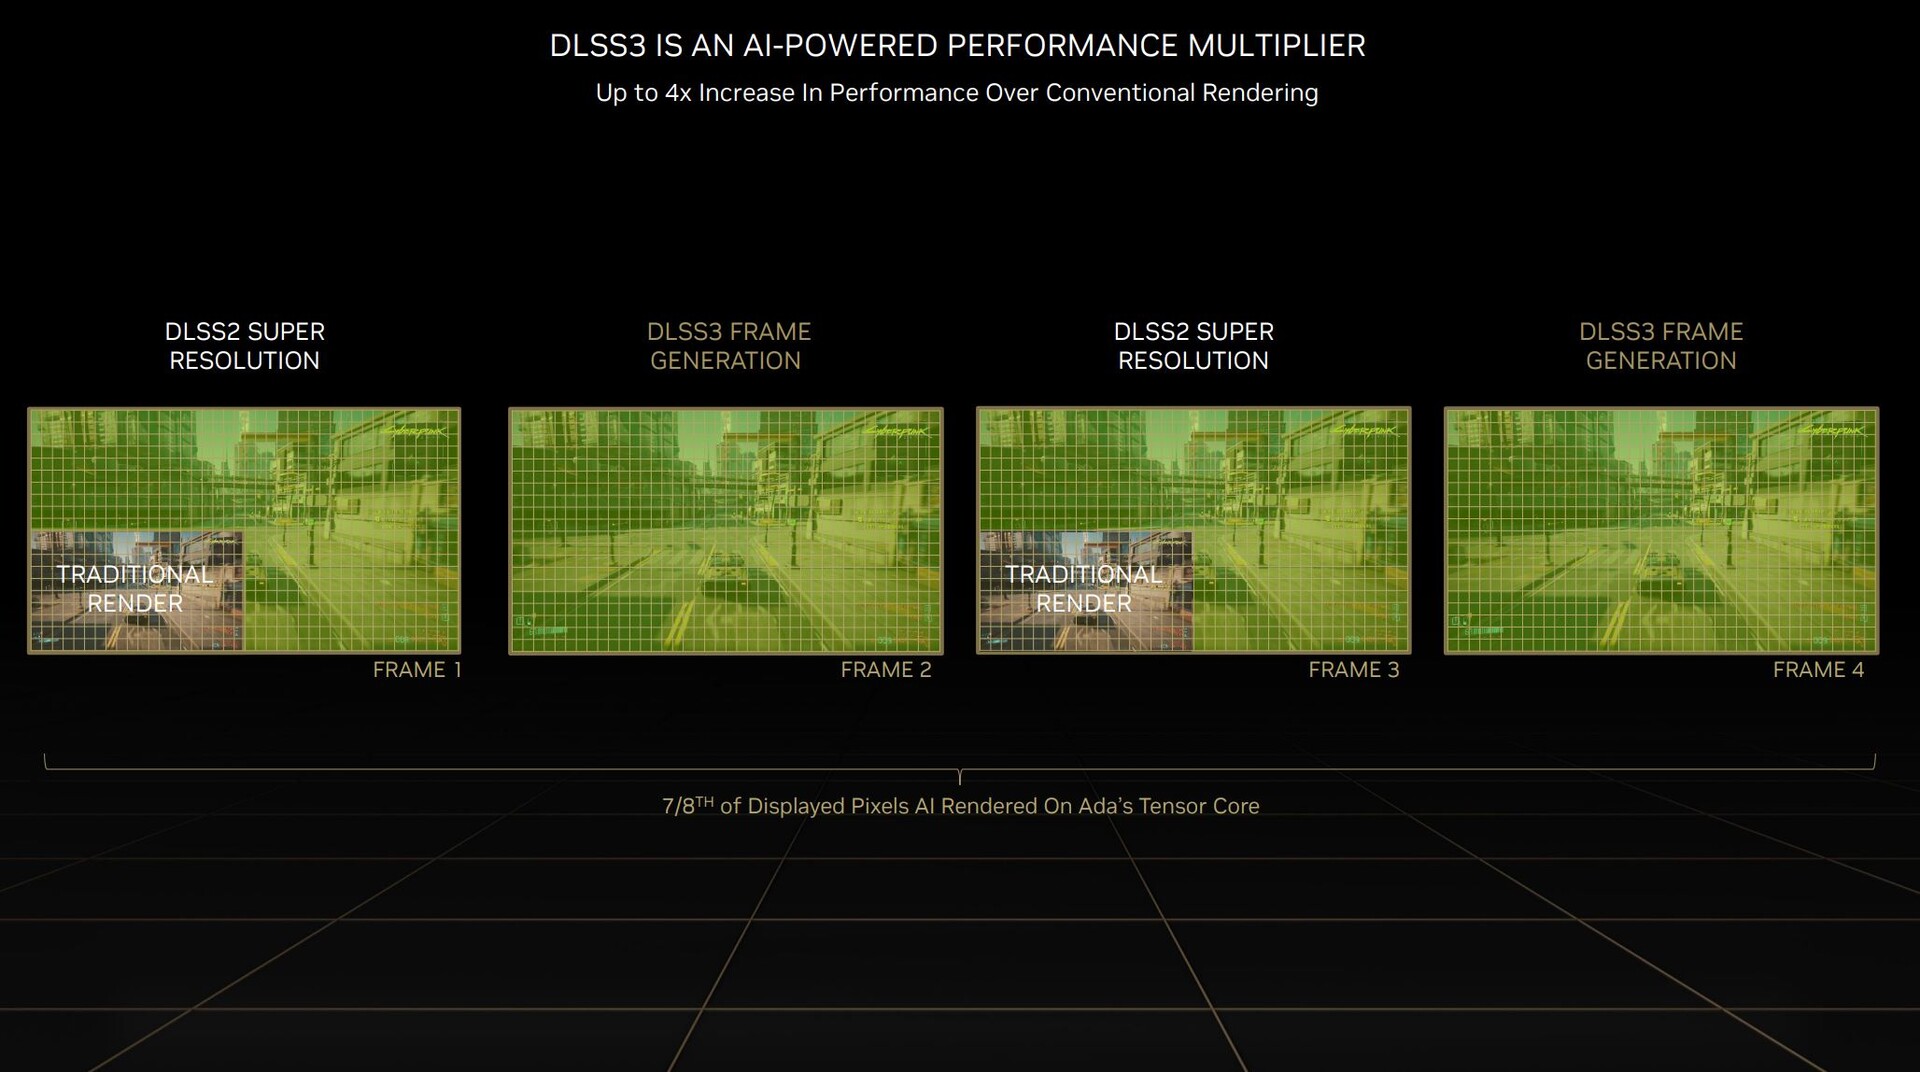
We usually perform our gaming benchmarks without upscaling technologies like Nvidia DLSS or AMD FSR. However, the performance can benefit a lot when the title supports it and we noticed some major improvements with activated DLSS 3.0 without any visual deficits. We listed the results for the three new Laptop GPUs in the following tables.

DLSS Benchmarks RTX 4070 Laptop

Title Settings DLSS off DLSS on (Balanced) Difference
Spider-Man Miles Morales 4K Ultra 44 FPS 57 FPS +30 %
The Witcher 3 4.00 1080p RT Ultra 36 FPS 45 FPS +25 %
Cyberpunk 2077 1.5 1080p RT Ultra 42 FPS 115 FPS +157 %
God of War 4K Ultra 43 FPS 59 FPS +37 %
Horizon Zero Dawn 4K Ultra 52 FPS 83 FPS +60 %

DLSS Benchmarks RTX 4060 Laptop

Title Settings DLSS off DLSS on (Balanced) Difference
Spider-Man Miles Morales 4K Ultra 35 FPS 55 FPS +57 %
The Witcher 3 4.00 4K Ultra 21 FPS 32 FPS +52 %
Cyberpunk 2077 1.5 4K Ultra 21 FPS 43 FPS +104 %
God of War 4K Ultra 35 FPS 51 FPS +46 %
Horizon Zero Dawn 4K Ultra 47 FPS 74 FPS +57 %

DLSS Benchmarks RTX 4050 Laptop

Title Settings DLSS off DLSS on (Balanced) Difference
Spider-Man Miles Morales 4K Ultra 26 FPS 36 FPS +38 %
Spider-Man Miles Morales 1080p RT Ultra 44 FPS 55 FPS +25 %
The Witcher 3 4.00 1080p RT Ultra 21 FPS 29 FPS +38 %
Cyberpunk 2077 1.5 1080p RT Ultra 27 FPS 85 FPS +214 %
God of War 4K Ultra 28 FPS 41 FPS + 46%
Horizon Zero Dawn 4K Ultra 39 FPS 62 FPS +58 %
Call of Duty Modern Warfare 2 4K Ultra 31 FPS 50 FPS +61 %
Dying Light 2 1080p RT Ultra 52 FPS 77 FPS +48 %

OpenGL, OpenCL & Compute

Our OpenGL, OpenCL, and compute benchmarks do not reveal any surprises and the ranking is roughly similar to the synthetic and gaming tests. The consumer models also perform really well in some of the professional SPECviewperf scenarios and can keep up with professional GPUs.

Unigine Valley 1.0
1920x1080 Extreme HD Preset OpenGL AA:x8
MSI Titan GT77 HX 13VI
NVIDIA GeForce RTX 4090 Laptop GPU, i9-13950HX, Samsung PM9A1 MZVL22T0HBLB
216.6 fps +93%
Asus TUF Gaming GeForce RTX 4070 Ti
NVIDIA GeForce RTX 4070 Ti, i9-13900K
206.8 (64.6min - 374.1max) fps +84%
Average NVIDIA GeForce RTX 3090
  (158.8 - 226, n=10)
203 fps +80%
Average NVIDIA GeForce RTX 3080 Laptop GPU
  (117.1 - 117.7, n=3)
117.5 fps +4%
SCHENKER XMG Neo 17 2023 Engineering Sample
NVIDIA GeForce RTX 4070 Laptop GPU, i9-13900HX
112.5 fps
Average AMD Radeon RX 6800M
  (92.4 - 93.7, n=2)
93.1 fps -17%
Average NVIDIA GeForce RTX 3060 Laptop GPU
  ()
92.6 fps -18%
Average AMD Radeon RX 6600M
  (64.8 - 93.8, n=4)
85.5 fps -24%
1920x1080 Extreme HD DirectX AA:x8
MSI Titan GT77 HX 13VI
NVIDIA GeForce RTX 4090 Laptop GPU, i9-13950HX, Samsung PM9A1 MZVL22T0HBLB
232 fps +91%
Asus TUF Gaming GeForce RTX 4070 Ti
NVIDIA GeForce RTX 4070 Ti, i9-13900K
230.3 (78.9min - 451.1max) fps +89%
Average NVIDIA GeForce RTX 3090
  (184.2 - 247, n=11)
225 fps +85%
Average NVIDIA GeForce RTX 3080 Laptop GPU
  (124.6 - 129.5, n=3)
127.8 fps +5%
SCHENKER XMG Neo 17 2023 Engineering Sample
NVIDIA GeForce RTX 4070 Laptop GPU, i9-13900HX
121.7 fps
Average AMD Radeon RX 6800M
  (117.2 - 117.7, n=2)
117.5 fps -3%
Average NVIDIA GeForce RTX 3060 Laptop GPU
  ()
97.4 fps -20%
Average AMD Radeon RX 6600M
  (83.6 - 94.5, n=4)
91.1 fps -25%
Unigine Heaven 4.0
Extreme Preset OpenGL
MSI Titan GT77 HX 13VI
NVIDIA GeForce RTX 4090 Laptop GPU, i9-13950HX, Samsung PM9A1 MZVL22T0HBLB
305.1 fps +91%
Asus TUF Gaming GeForce RTX 4070 Ti
NVIDIA GeForce RTX 4070 Ti, i9-13900K
292.6 (15.2min - 600.3max) fps +84%
Average NVIDIA GeForce RTX 3090
  (188.2 - 284, n=10)
270 fps +69%
SCHENKER XMG Neo 17 2023 Engineering Sample
NVIDIA GeForce RTX 4070 Laptop GPU, i9-13900HX
159.4 fps
Average NVIDIA GeForce RTX 3080 Laptop GPU
  (149.1 - 150.2, n=3)
149.6 fps -6%
MSI Katana 17 B13VFK
NVIDIA GeForce RTX 4060 Laptop GPU, i7-13620H, Micron 2400 MTFDKBA1T0QFM
142.6 fps -11%
Average AMD Radeon RX 6600M
  (92.2 - 140.4, n=4)
126.3 fps -21%
Average AMD Radeon RX 6800M
  (122.6 - 125.8, n=2)
124.2 fps -22%
Average NVIDIA GeForce RTX 3060 Laptop GPU
  ()
119.4 fps -25%
SCHENKER XMG Focus 15 Engineering Sample
NVIDIA GeForce RTX 4050 Laptop GPU, i5-13500HX
118.1 fps -26%
Extreme Preset DX11
MSI Titan GT77 HX 13VI
NVIDIA GeForce RTX 4090 Laptop GPU, i9-13950HX, Samsung PM9A1 MZVL22T0HBLB
324.1 fps +98%
Asus TUF Gaming GeForce RTX 4070 Ti
NVIDIA GeForce RTX 4070 Ti, i9-13900K
317.6 (57.8min - 692.1max) fps +94%
Average NVIDIA GeForce RTX 3090
  (272 - 315, n=11)
300 fps +83%
Lenovo Legion Pro 7 16IRX8H
NVIDIA GeForce RTX 4080 Laptop GPU, i9-13900HX, Samsung PM9A1 MZVL21T0HCLR
249.4 fps +52%
Average NVIDIA GeForce RTX 3080 Ti Laptop GPU
  ()
205 fps +25%
SCHENKER XMG Neo 17 2023 Engineering Sample
NVIDIA GeForce RTX 4070 Laptop GPU, i9-13900HX
164 fps
Average NVIDIA GeForce RTX 3080 Laptop GPU
  (158.2 - 160.5, n=3)
159.4 fps -3%
Average AMD Radeon RX 6800M
  (150.4 - 159.5, n=2)
155 fps -5%
Average NVIDIA GeForce RTX 3070 Ti Laptop GPU
  ()
148.8 fps -9%
MSI Katana 17 B13VFK
NVIDIA GeForce RTX 4060 Laptop GPU, i7-13620H, Micron 2400 MTFDKBA1T0QFM
137.6 fps -16%
Average AMD Radeon RX 6600M
  (114.8 - 130.2, n=4)
125.4 fps -24%
Average NVIDIA GeForce RTX 3060 Laptop GPU
  ()
121.6 fps -26%
Average AMD Radeon RX 6700M
  ()
118.9 fps -27%
SCHENKER XMG Focus 15 Engineering Sample
NVIDIA GeForce RTX 4050 Laptop GPU, i5-13500HX
114.6 fps -30%
Asus TUF Gaming A16 FA617
Radeon RX 7600S, R7 7735HS, Micron 2400 MTFDKBA1T0QFM
107.8 fps -34%
LuxMark v2.0 64Bit
Room GPUs-only
MSI Titan GT77 HX 13VI
NVIDIA GeForce RTX 4090 Laptop GPU, i9-13950HX, Samsung PM9A1 MZVL22T0HBLB
8614 Samples/s +82%
Asus TUF Gaming GeForce RTX 4070 Ti
NVIDIA GeForce RTX 4070 Ti, i9-13900K
8413 Samples/s +78%
Lenovo Legion Pro 7 16IRX8H
NVIDIA GeForce RTX 4080 Laptop GPU, i9-13900HX, Samsung PM9A1 MZVL21T0HCLR
7487 Samples/s +58%
Average NVIDIA GeForce RTX 3090
  (5727 - 5985, n=9)
5893 Samples/s +25%
Razer Blade 16 Early 2023
NVIDIA GeForce RTX 4080 Laptop GPU, i9-13950HX, SSSTC CA6-8D1024
5882 Samples/s +24%
Average NVIDIA GeForce RTX 3080 Laptop GPU
  (4895 - 5062, n=5)
4935 Samples/s +4%
SCHENKER XMG Neo 17 2023 Engineering Sample
NVIDIA GeForce RTX 4070 Laptop GPU, i9-13900HX
4727 Samples/s
Average NVIDIA GeForce RTX 3080 Ti Laptop GPU
  ()
4296 Samples/s -9%
Average NVIDIA GeForce RTX 3070 Ti Laptop GPU
  ()
3623 Samples/s -23%
Average AMD Radeon RX 6800M
  ()
3360 Samples/s -29%
SCHENKER XMG Focus 15 Engineering Sample
NVIDIA GeForce RTX 4050 Laptop GPU, i5-13500HX
2967 Samples/s -37%
Average AMD Radeon RX 6700M
  ()
2847 Samples/s -40%
Average AMD Radeon RX 6600M
  ()
2294 Samples/s -51%
MSI Katana 17 B13VFK
NVIDIA GeForce RTX 4060 Laptop GPU, i7-13620H, Micron 2400 MTFDKBA1T0QFM
Samples/s -100%
Sala GPUs-only
Asus TUF Gaming GeForce RTX 4070 Ti
NVIDIA GeForce RTX 4070 Ti, i9-13900K
20171 Samples/s +87%
MSI Titan GT77 HX 13VI
NVIDIA GeForce RTX 4090 Laptop GPU, i9-13950HX, Samsung PM9A1 MZVL22T0HBLB
20001 Samples/s +85%
Lenovo Legion Pro 7 16IRX8H
NVIDIA GeForce RTX 4080 Laptop GPU, i9-13900HX, Samsung PM9A1 MZVL21T0HCLR
17111 Samples/s +58%
Average NVIDIA GeForce RTX 3090
  (14590 - 15242, n=9)
14945 Samples/s +38%
Average AMD Radeon RX 6800M
  ()
14770 Samples/s +37%
Razer Blade 16 Early 2023
NVIDIA GeForce RTX 4080 Laptop GPU, i9-13950HX, SSSTC CA6-8D1024
12572 Samples/s +16%
Average AMD Radeon RX 6700M
  ()
12486 Samples/s +16%
Average NVIDIA GeForce RTX 3080 Laptop GPU
  (11081 - 11844, n=5)
11414 Samples/s +6%
SCHENKER XMG Neo 17 2023 Engineering Sample
NVIDIA GeForce RTX 4070 Laptop GPU, i9-13900HX
10800 Samples/s
Average NVIDIA GeForce RTX 3080 Ti Laptop GPU
  ()
10333 Samples/s -4%
SCHENKER XMG Focus 15 Engineering Sample
NVIDIA GeForce RTX 4050 Laptop GPU, i5-13500HX
8036 Samples/s -26%
Average NVIDIA GeForce RTX 3070 Ti Laptop GPU
  ()
8022 Samples/s -26%
Average AMD Radeon RX 6600M
  ()
5564 Samples/s -48%
MSI Katana 17 B13VFK
NVIDIA GeForce RTX 4060 Laptop GPU, i7-13620H, Micron 2400 MTFDKBA1T0QFM
Samples/s -100%
Blender
v3.3 Classroom OPTIX/RTX
Average NVIDIA GeForce RTX 3050 6GB Laptop GPU
  (68 - 72, n=3)
69.3 Seconds * -230%
Average NVIDIA GeForce RTX 3050 Ti Laptop GPU
  (48 - 60, n=7)
52.3 Seconds * -149%
Average NVIDIA GeForce RTX 3060 Laptop GPU
  (30 - 56, n=15)
34.2 Seconds * -63%
Asus ROG Zephyrus M16 GU603Z
GeForce RTX 3070 Ti Laptop GPU, i9-12900H, Micron 3400 1TB MTFDKBA1T0TFH
28 Seconds * -33%
SCHENKER XMG Focus 15 Engineering Sample
NVIDIA GeForce RTX 4050 Laptop GPU, i5-13500HX
27 Seconds * -29%
Average NVIDIA GeForce RTX 3070 Ti Laptop GPU
  (22 - 30, n=15)
25.3 Seconds * -20%
MSI Katana 17 B13VFK
NVIDIA GeForce RTX 4060 Laptop GPU, i7-13620H, Micron 2400 MTFDKBA1T0QFM
25 Seconds * -19%
Average NVIDIA GeForce RTX 3080 Laptop GPU
  (23 - 24, n=3)
23.3 Seconds * -11%
Average NVIDIA GeForce RTX 3080 Ti Laptop GPU
  (20 - 28, n=13)
23.1 Seconds * -10%
Lenovo ThinkPad P16 G1 RTX A5500
RTX A5500 Laptop GPU, i9-12950HX, WDC PC SN810 2TB
21 Seconds * -0%
Gigabyte AERO 16 OLED BSF
NVIDIA GeForce RTX 4070 Laptop GPU, i9-13900H, Gigabyte AG470S1TB-SI B10
21 Seconds * -0%
SCHENKER XMG Neo 17 2023 Engineering Sample
NVIDIA GeForce RTX 4070 Laptop GPU, i9-13900HX
21 Seconds *
Razer Blade 18 RTX 4070
NVIDIA GeForce RTX 4070 Laptop GPU, i9-13950HX, SSSTC CA6-8D1024
20 Seconds * +5%
Razer Blade 16 Early 2023
NVIDIA GeForce RTX 4080 Laptop GPU, i9-13950HX, SSSTC CA6-8D1024
15 Seconds * +29%
Lenovo Legion Pro 7 16IRX8H
NVIDIA GeForce RTX 4080 Laptop GPU, i9-13900HX, Samsung PM9A1 MZVL21T0HCLR
15 Seconds * +29%
Average NVIDIA GeForce RTX 3090
  (13 - 14, n=11)
13.4 Seconds * +36%
Asus TUF Gaming GeForce RTX 4070 Ti
NVIDIA GeForce RTX 4070 Ti, i9-13900K
12 Seconds * +43%
MSI Titan GT77 HX 13VI
NVIDIA GeForce RTX 4090 Laptop GPU, i9-13950HX, Samsung PM9A1 MZVL22T0HBLB
11 Seconds * +48%
v3.3 Classroom CUDA
Average NVIDIA GeForce RTX 3050 6GB Laptop GPU
  (107 - 115, n=3)
110.7 Seconds * -220%
Average NVIDIA GeForce RTX 3050 Ti Laptop GPU
  (83 - 104, n=7)
90 Seconds * -160%
Average NVIDIA GeForce RTX 3060 Laptop GPU
  (51 - 89, n=15)
57.6 Seconds * -66%
SCHENKER XMG Focus 15 Engineering Sample
NVIDIA GeForce RTX 4050 Laptop GPU, i5-13500HX
53.4 Seconds * -54%
Asus ROG Zephyrus M16 GU603Z
GeForce RTX 3070 Ti Laptop GPU, i9-12900H, Micron 3400 1TB MTFDKBA1T0TFH
45 Seconds * -30%
MSI Katana 17 B13VFK
NVIDIA GeForce RTX 4060 Laptop GPU, i7-13620H, Micron 2400 MTFDKBA1T0QFM
44 Seconds * -27%
Average NVIDIA GeForce RTX 3070 Ti Laptop GPU
  (36 - 46, n=16)
41.4 Seconds * -20%
Average NVIDIA GeForce RTX 3080 Laptop GPU
  (41 - 41, n=3)
41 Seconds * -18%
Razer Blade 18 RTX 4070
NVIDIA GeForce RTX 4070 Laptop GPU, i9-13950HX, SSSTC CA6-8D1024
36 Seconds * -4%
Lenovo ThinkPad P16 G1 RTX A5500
RTX A5500 Laptop GPU, i9-12950HX, WDC PC SN810 2TB
35 Seconds * -1%
Average NVIDIA GeForce RTX 3080 Ti Laptop GPU
  (32 - 41, n=13)
35 Seconds * -1%
SCHENKER XMG Neo 17 2023 Engineering Sample
NVIDIA GeForce RTX 4070 Laptop GPU, i9-13900HX
34.6 Seconds *
Gigabyte AERO 16 OLED BSF
NVIDIA GeForce RTX 4070 Laptop GPU, i9-13900H, Gigabyte AG470S1TB-SI B10
34 Seconds * +2%
Lenovo Legion Pro 7 16IRX8H
NVIDIA GeForce RTX 4080 Laptop GPU, i9-13900HX, Samsung PM9A1 MZVL21T0HCLR
23 Seconds * +34%
Razer Blade 16 Early 2023
NVIDIA GeForce RTX 4080 Laptop GPU, i9-13950HX, SSSTC CA6-8D1024
22 Seconds * +36%
Average NVIDIA GeForce RTX 3090
  (20 - 22, n=11)
21.4 Seconds * +38%
MSI Titan GT77 HX 13VI
NVIDIA GeForce RTX 4090 Laptop GPU, i9-13950HX, Samsung PM9A1 MZVL22T0HBLB
17 Seconds * +51%
v3.3 Classroom HIP/AMD
Average NVIDIA GeForce RTX 3060 Laptop GPU
  (393 - 481, n=2)
437 Seconds *
Average NVIDIA GeForce RTX 3070 Ti Laptop GPU
  ()
380 Seconds *
Asus TUF Gaming A16 FA617
Radeon RX 7600S, R7 7735HS, Micron 2400 MTFDKBA1T0QFM
74 Seconds *
Average AMD Radeon RX 6800M
  ()
63 Seconds *
Average AMD Radeon RX 6600M
  (4 - 87, n=3)
52 Seconds *
v3.3 Classroom METAL
Apple MacBook Pro 16 2023 M2 Max
M2 Max 38-Core GPU, M2 Max, Apple SSD AP2048Z
51.2 Seconds *
GFXBench
3840x2160 4K Aztec Ruins High Tier Offscreen
MSI Titan GT77 HX 13VI
NVIDIA GeForce RTX 4090 Laptop GPU, i9-13950HX, Samsung PM9A1 MZVL22T0HBLB
239.5 fps +88%
Razer Blade 16 Early 2023
NVIDIA GeForce RTX 4080 Laptop GPU, i9-13950HX, SSSTC CA6-8D1024
212 fps +66%
Lenovo Legion Pro 7 16IRX8H
NVIDIA GeForce RTX 4080 Laptop GPU, i9-13900HX, Samsung PM9A1 MZVL21T0HCLR
197.2 fps +55%
Apple MacBook Pro 16 2023 M2 Max
M2 Max 38-Core GPU, M2 Max, Apple SSD AP2048Z
179.9 fps +41%
SCHENKER XMG Neo 17 2023 Engineering Sample
NVIDIA GeForce RTX 4070 Laptop GPU, i9-13900HX
127.6 fps
MSI Katana 17 B13VFK
NVIDIA GeForce RTX 4060 Laptop GPU, i7-13620H, Micron 2400 MTFDKBA1T0QFM
107 fps -16%
SCHENKER XMG Focus 15 Engineering Sample
NVIDIA GeForce RTX 4050 Laptop GPU, i5-13500HX
90 fps -29%
Asus TUF Gaming A16 FA617
Radeon RX 7600S, R7 7735HS, Micron 2400 MTFDKBA1T0QFM
16.3 fps -87%
2560x1440 Aztec Ruins High Tier Offscreen
MSI Titan GT77 HX 13VI
NVIDIA GeForce RTX 4090 Laptop GPU, i9-13950HX, Samsung PM9A1 MZVL22T0HBLB
522 fps +81%
Razer Blade 16 Early 2023
NVIDIA GeForce RTX 4080 Laptop GPU, i9-13950HX, SSSTC CA6-8D1024
485 fps +68%
Lenovo Legion Pro 7 16IRX8H
NVIDIA GeForce RTX 4080 Laptop GPU, i9-13900HX, Samsung PM9A1 MZVL21T0HCLR
446.1 fps +55%
Apple MacBook Pro 16 2023 M2 Max
M2 Max 38-Core GPU, M2 Max, Apple SSD AP2048Z
397.6 fps +38%
SCHENKER XMG Neo 17 2023 Engineering Sample
NVIDIA GeForce RTX 4070 Laptop GPU, i9-13900HX
288.5 fps
Average NVIDIA GeForce RTX 3080 Ti Laptop GPU
  ()
262 fps -9%
MSI Katana 17 B13VFK
NVIDIA GeForce RTX 4060 Laptop GPU, i7-13620H, Micron 2400 MTFDKBA1T0QFM
248.5 fps -14%
SCHENKER XMG Focus 15 Engineering Sample
NVIDIA GeForce RTX 4050 Laptop GPU, i5-13500HX
208 fps -28%
Average NVIDIA GeForce RTX 3050 Ti Laptop GPU
  ()
108 fps -63%
Asus TUF Gaming A16 FA617
Radeon RX 7600S, R7 7735HS, Micron 2400 MTFDKBA1T0QFM
45 fps -84%
1920x1080 Car Chase Offscreen
MSI Titan GT77 HX 13VI
NVIDIA GeForce RTX 4090 Laptop GPU, i9-13950HX, Samsung PM9A1 MZVL22T0HBLB
888 fps +44%
SCHENKER XMG Neo 17 2023 Engineering Sample
NVIDIA GeForce RTX 4070 Laptop GPU, i9-13900HX
616.7 fps
Apple MacBook Pro 16 2023 M2 Max
M2 Max 38-Core GPU, M2 Max, Apple SSD AP2048Z
585.2 fps -5%
MSI Katana 17 B13VFK
NVIDIA GeForce RTX 4060 Laptop GPU, i7-13620H, Micron 2400 MTFDKBA1T0QFM
547.5 fps -11%
SCHENKER XMG Focus 15 Engineering Sample
NVIDIA GeForce RTX 4050 Laptop GPU, i5-13500HX
470 fps -24%
Average NVIDIA GeForce RTX 3050 Ti Laptop GPU
  ()
252 fps -59%
SPECviewperf 13
Solidworks (sw-04)
Lenovo ThinkPad P16 G1 RTX A5500
RTX A5500 Laptop GPU, i9-12950HX, WDC PC SN810 2TB
206.94 fps +79%
Average AMD Radeon RX 6600M
  (127 - 201, n=4)
170.8 fps +48%
Average AMD Radeon RX 6800M
  (143 - 179, n=2)
161 fps +39%
MSI Titan GT77 HX 13VI
NVIDIA GeForce RTX 4090 Laptop GPU, i9-13950HX, Samsung PM9A1 MZVL22T0HBLB
159.12 fps +38%
Razer Blade 16 Early 2023
NVIDIA GeForce RTX 4080 Laptop GPU, i9-13950HX, SSSTC CA6-8D1024
134.49 fps +17%
Average NVIDIA GeForce RTX 3090
  (82.9 - 155, n=10)
133.9 fps +16%
SCHENKER XMG Neo 17 2023 Engineering Sample
NVIDIA GeForce RTX 4070 Laptop GPU, i9-13900HX
115.44 fps
Average NVIDIA GeForce RTX 3080 Ti Laptop GPU
  (62.9 - 133.4, n=8)
108.8 fps -6%
MSI Katana 17 B13VFK
NVIDIA GeForce RTX 4060 Laptop GPU, i7-13620H, Micron 2400 MTFDKBA1T0QFM
108.18 fps -6%
Average NVIDIA GeForce RTX 3070 Ti Laptop GPU
  ()
103.4 fps -10%
Average NVIDIA GeForce RTX 3080 Laptop GPU
  (98.6 - 102, n=3)
100.5 fps -13%
SCHENKER XMG Focus 15 Engineering Sample
NVIDIA GeForce RTX 4050 Laptop GPU, i5-13500HX
93.4 fps -19%
Average NVIDIA GeForce RTX 3060 Laptop GPU
  (87.4 - 97.6, n=3)
92.7 fps -20%
Average NVIDIA GeForce RTX 3050 Ti Laptop GPU
  ()
79.5 fps -31%
Siemens NX (snx-03)
Lenovo ThinkPad P16 G1 RTX A5500
RTX A5500 Laptop GPU, i9-12950HX, WDC PC SN810 2TB
413.09 fps +1698%
Average AMD Radeon RX 6600M
  (64.2 - 344, n=4)
263 fps +1045%
Average AMD Radeon RX 6800M
  (65.6 - 79.4, n=2)
72.5 fps +216%
MSI Titan GT77 HX 13VI
NVIDIA GeForce RTX 4090 Laptop GPU, i9-13950HX, Samsung PM9A1 MZVL22T0HBLB
34.38 fps +50%
Razer Blade 16 Early 2023
NVIDIA GeForce RTX 4080 Laptop GPU, i9-13950HX, SSSTC CA6-8D1024
28.76 fps +25%
Average NVIDIA GeForce RTX 3090
  (15.6 - 30.7, n=10)
27.6 fps +20%
Average NVIDIA GeForce RTX 3080 Laptop GPU
  (23 - 23.1, n=3)
23 fps 0%
SCHENKER XMG Neo 17 2023 Engineering Sample
NVIDIA GeForce RTX 4070 Laptop GPU, i9-13900HX
22.97 fps
Average NVIDIA GeForce RTX 3080 Ti Laptop GPU
  (18.3 - 25.3, n=8)
22.3 fps -3%
MSI Katana 17 B13VFK
NVIDIA GeForce RTX 4060 Laptop GPU, i7-13620H, Micron 2400 MTFDKBA1T0QFM
21.83 fps -5%
SCHENKER XMG Focus 15 Engineering Sample
NVIDIA GeForce RTX 4050 Laptop GPU, i5-13500HX
21 fps -9%
Average NVIDIA GeForce RTX 3070 Ti Laptop GPU
  ()
19.2 fps -16%
Average NVIDIA GeForce RTX 3060 Laptop GPU
  (16.2 - 17.7, n=3)
16.9 fps -26%
Average NVIDIA GeForce RTX 3050 Ti Laptop GPU
  ()
13.3 fps -42%
Showcase (showcase-02)
MSI Titan GT77 HX 13VI
NVIDIA GeForce RTX 4090 Laptop GPU, i9-13950HX, Samsung PM9A1 MZVL22T0HBLB
281.1 fps +130%
Average NVIDIA GeForce RTX 3090
  (114 - 268, n=10)
244 fps +100%
Razer Blade 16 Early 2023
NVIDIA GeForce RTX 4080 Laptop GPU, i9-13950HX, SSSTC CA6-8D1024
203.33 fps +66%
Average NVIDIA GeForce RTX 3080 Ti Laptop GPU
  (110 - 175, n=8)
146.6 fps +20%
Lenovo ThinkPad P16 G1 RTX A5500
RTX A5500 Laptop GPU, i9-12950HX, WDC PC SN810 2TB
142.9 fps +17%
Average AMD Radeon RX 6800M
  (132 - 149, n=2)
140.5 fps +15%
Average NVIDIA GeForce RTX 3070 Ti Laptop GPU
  ()
130.4 fps +7%
SCHENKER XMG Neo 17 2023 Engineering Sample
NVIDIA GeForce RTX 4070 Laptop GPU, i9-13900HX
122.16 fps
Average NVIDIA GeForce RTX 3080 Laptop GPU
  (120 - 120, n=3)
120 fps -2%
Average AMD Radeon RX 6600M
  (98.5 - 129, n=4)
117.6 fps -4%
Average NVIDIA GeForce RTX 3060 Laptop GPU
  (98.1 - 110, n=3)
105.7 fps -13%
MSI Katana 17 B13VFK
NVIDIA GeForce RTX 4060 Laptop GPU, i7-13620H, Micron 2400 MTFDKBA1T0QFM
105.23 fps -14%
SCHENKER XMG Focus 15 Engineering Sample
NVIDIA GeForce RTX 4050 Laptop GPU, i5-13500HX
78.3 fps -36%
Average NVIDIA GeForce RTX 3050 Ti Laptop GPU
  ()
68.9 fps -44%
Medical (medical-02)
Lenovo ThinkPad P16 G1 RTX A5500
RTX A5500 Laptop GPU, i9-12950HX, WDC PC SN810 2TB
140.01 fps +75%
MSI Titan GT77 HX 13VI
NVIDIA GeForce RTX 4090 Laptop GPU, i9-13950HX, Samsung PM9A1 MZVL22T0HBLB
122.82 fps +53%
Razer Blade 16 Early 2023
NVIDIA GeForce RTX 4080 Laptop GPU, i9-13950HX, SSSTC CA6-8D1024
107.84 fps +35%
Average NVIDIA GeForce RTX 3090
  (49.3 - 109, n=10)
100.7 fps +26%
Average AMD Radeon RX 6600M
  (63 - 130, n=4)
85.4 fps +7%
SCHENKER XMG Neo 17 2023 Engineering Sample
NVIDIA GeForce RTX 4070 Laptop GPU, i9-13900HX
80.13 fps
Average NVIDIA GeForce RTX 3080 Ti Laptop GPU
  (65.3 - 79.1, n=8)
74.5 fps -7%
Average AMD Radeon RX 6800M
  (69.4 - 78.7, n=2)
74.1 fps -8%
MSI Katana 17 B13VFK
NVIDIA GeForce RTX 4060 Laptop GPU, i7-13620H, Micron 2400 MTFDKBA1T0QFM
67.75 fps -15%
Average NVIDIA GeForce RTX 3070 Ti Laptop GPU
  ()
67.4 fps -16%
SCHENKER XMG Focus 15 Engineering Sample
NVIDIA GeForce RTX 4050 Laptop GPU, i5-13500HX
59.9 fps -25%
Average NVIDIA GeForce RTX 3080 Laptop GPU
  (58.9 - 59, n=3)
58.9 fps -26%
Average NVIDIA GeForce RTX 3060 Laptop GPU
  (57.2 - 58.6, n=3)
57.8 fps -28%
Average NVIDIA GeForce RTX 3050 Ti Laptop GPU
  ()
42.2 fps -47%
Maya (maya-05)
MSI Titan GT77 HX 13VI
NVIDIA GeForce RTX 4090 Laptop GPU, i9-13950HX, Samsung PM9A1 MZVL22T0HBLB
600.78 fps +69%
Average NVIDIA GeForce RTX 3090
  (253 - 580, n=10)
515 fps +45%
Razer Blade 16 Early 2023
NVIDIA GeForce RTX 4080 Laptop GPU, i9-13950HX, SSSTC CA6-8D1024
494.88 fps +39%
Lenovo ThinkPad P16 G1 RTX A5500
RTX A5500 Laptop GPU, i9-12950HX, WDC PC SN810 2TB
362.87 fps +2%
SCHENKER XMG Neo 17 2023 Engineering Sample
NVIDIA GeForce RTX 4070 Laptop GPU, i9-13900HX
356.37 fps
Average NVIDIA GeForce RTX 3080 Ti Laptop GPU
  (212 - 430, n=8)
321 fps -10%
Average NVIDIA GeForce RTX 3080 Laptop GPU
  (304 - 311, n=3)
308 fps -14%
MSI Katana 17 B13VFK
NVIDIA GeForce RTX 4060 Laptop GPU, i7-13620H, Micron 2400 MTFDKBA1T0QFM
299.64 fps -16%
Average AMD Radeon RX 6600M
  (187 - 340, n=4)
283 fps -21%
Average NVIDIA GeForce RTX 3070 Ti Laptop GPU
  ()
270 fps -24%
Average AMD Radeon RX 6800M
  (228 - 279, n=2)
254 fps -29%
SCHENKER XMG Focus 15 Engineering Sample
NVIDIA GeForce RTX 4050 Laptop GPU, i5-13500HX
253.7 fps -29%
Average NVIDIA GeForce RTX 3060 Laptop GPU
  (198 - 264, n=3)
234 fps -34%
Average NVIDIA GeForce RTX 3050 Ti Laptop GPU
  ()
157 fps -56%
Energy (energy-02)
MSI Titan GT77 HX 13VI
NVIDIA GeForce RTX 4090 Laptop GPU, i9-13950HX, Samsung PM9A1 MZVL22T0HBLB
74.73 fps +78%
Lenovo ThinkPad P16 G1 RTX A5500
RTX A5500 Laptop GPU, i9-12950HX, WDC PC SN810 2TB
69.02 fps +65%
Razer Blade 16 Early 2023
NVIDIA GeForce RTX 4080 Laptop GPU, i9-13950HX, SSSTC CA6-8D1024
61.32 fps +46%
Average NVIDIA GeForce RTX 3090
  (26.6 - 45.2, n=10)
42.7 fps +2%
SCHENKER XMG Neo 17 2023 Engineering Sample
NVIDIA GeForce RTX 4070 Laptop GPU, i9-13900HX
41.89 fps
MSI Katana 17 B13VFK
NVIDIA GeForce RTX 4060 Laptop GPU, i7-13620H, Micron 2400 MTFDKBA1T0QFM
35.21 fps -16%
Average AMD Radeon RX 6600M
  (2.05 - 43.5, n=4)
32.2 fps -23%
SCHENKER XMG Focus 15 Engineering Sample
NVIDIA GeForce RTX 4050 Laptop GPU, i5-13500HX
31.8 fps -24%
Average NVIDIA GeForce RTX 3080 Laptop GPU
  (24.6 - 24.6, n=3)
24.6 fps -41%
Average NVIDIA GeForce RTX 3080 Ti Laptop GPU
  (19.3 - 27.3, n=8)
24.5 fps -42%
Average NVIDIA GeForce RTX 3070 Ti Laptop GPU
  ()
23 fps -45%
Average NVIDIA GeForce RTX 3060 Laptop GPU
  (20.3 - 20.7, n=3)
20.6 fps -51%
Average AMD Radeon RX 6800M
  (2.98 - 35.1, n=2)
19 fps -55%
Average NVIDIA GeForce RTX 3050 Ti Laptop GPU
  ()
12.8 fps -69%
Creo (creo-02)
MSI Titan GT77 HX 13VI
NVIDIA GeForce RTX 4090 Laptop GPU, i9-13950HX, Samsung PM9A1 MZVL22T0HBLB
461.26 fps +75%
Razer Blade 16 Early 2023
NVIDIA GeForce RTX 4080 Laptop GPU, i9-13950HX, SSSTC CA6-8D1024
377.58 fps +43%
Average NVIDIA GeForce RTX 3090
  (176 - 403, n=10)
361 fps +37%
Lenovo ThinkPad P16 G1 RTX A5500
RTX A5500 Laptop GPU, i9-12950HX, WDC PC SN810 2TB
330.97 fps +26%
SCHENKER XMG Neo 17 2023 Engineering Sample
NVIDIA GeForce RTX 4070 Laptop GPU, i9-13900HX
263.41 fps
Average NVIDIA GeForce RTX 3080 Ti Laptop GPU
  (177.4 - 311, n=8)
249 fps -5%
Average AMD Radeon RX 6600M
  (166 - 273, n=4)
228 fps -13%
Average NVIDIA GeForce RTX 3080 Laptop GPU
  (215 - 216, n=3)
216 fps -18%
Average AMD Radeon RX 6800M
  (179 - 247, n=2)
213 fps -19%
Average NVIDIA GeForce RTX 3070 Ti Laptop GPU
  ()
205 fps -22%
MSI Katana 17 B13VFK
NVIDIA GeForce RTX 4060 Laptop GPU, i7-13620H, Micron 2400 MTFDKBA1T0QFM
199.33 fps -24%
Average NVIDIA GeForce RTX 3060 Laptop GPU
  (156.6 - 192, n=3)
175.9 fps -33%
SCHENKER XMG Focus 15 Engineering Sample
NVIDIA GeForce RTX 4050 Laptop GPU, i5-13500HX
173 fps -34%
Average NVIDIA GeForce RTX 3050 Ti Laptop GPU
  ()
120 fps -54%
Catia (catia-05)
Lenovo ThinkPad P16 G1 RTX A5500
RTX A5500 Laptop GPU, i9-12950HX, WDC PC SN810 2TB
369.46 fps +133%
Average AMD Radeon RX 6600M
  (211 - 381, n=4)
318 fps +100%
Average AMD Radeon RX 6800M
  (260 - 344, n=2)
302 fps +90%
MSI Titan GT77 HX 13VI
NVIDIA GeForce RTX 4090 Laptop GPU, i9-13950HX, Samsung PM9A1 MZVL22T0HBLB
281.44 fps +77%
Razer Blade 16 Early 2023
NVIDIA GeForce RTX 4080 Laptop GPU, i9-13950HX, SSSTC CA6-8D1024
233.27 fps +47%
Average NVIDIA GeForce RTX 3090
  (111 - 260, n=10)
229 fps +44%
Average NVIDIA GeForce RTX 3080 Ti Laptop GPU
  (130.4 - 190.3, n=8)
170 fps +7%
Average NVIDIA GeForce RTX 3080 Laptop GPU
  (159 - 159, n=3)
159 fps 0%
SCHENKER XMG Neo 17 2023 Engineering Sample
NVIDIA GeForce RTX 4070 Laptop GPU, i9-13900HX
158.82 fps
Average NVIDIA GeForce RTX 3070 Ti Laptop GPU
  ()
150.6 fps -5%
MSI Katana 17 B13VFK
NVIDIA GeForce RTX 4060 Laptop GPU, i7-13620H, Micron 2400 MTFDKBA1T0QFM
145.49 fps -8%
SCHENKER XMG Focus 15 Engineering Sample
NVIDIA GeForce RTX 4050 Laptop GPU, i5-13500HX
124.6 fps -22%
Average NVIDIA GeForce RTX 3060 Laptop GPU
  (47.7 - 118.1, n=3)
94.3 fps -41%
Average NVIDIA GeForce RTX 3050 Ti Laptop GPU
  ()
82.8 fps -48%
3ds Max (3dsmax-06)
MSI Titan GT77 HX 13VI
NVIDIA GeForce RTX 4090 Laptop GPU, i9-13950HX, Samsung PM9A1 MZVL22T0HBLB
372.51 fps +53%
Razer Blade 16 Early 2023
NVIDIA GeForce RTX 4080 Laptop GPU, i9-13950HX, SSSTC CA6-8D1024
346.23 fps +42%
Average NVIDIA GeForce RTX 3090
  (180 - 387, n=10)
346 fps +42%
SCHENKER XMG Neo 17 2023 Engineering Sample
NVIDIA GeForce RTX 4070 Laptop GPU, i9-13900HX
243.42 fps
Lenovo ThinkPad P16 G1 RTX A5500
RTX A5500 Laptop GPU, i9-12950HX, WDC PC SN810 2TB
241.24 fps -1%
Average AMD Radeon RX 6800M
  (226 - 231, n=2)
229 fps -6%
Average NVIDIA GeForce RTX 3080 Ti Laptop GPU
  (161 - 260, n=8)
223 fps -8%
Average NVIDIA GeForce RTX 3080 Laptop GPU
  (215 - 216, n=3)
215 fps -12%
MSI Katana 17 B13VFK
NVIDIA GeForce RTX 4060 Laptop GPU, i7-13620H, Micron 2400 MTFDKBA1T0QFM
206.17 fps -15%
Average NVIDIA GeForce RTX 3070 Ti Laptop GPU
  ()
195.1 fps -20%
Average AMD Radeon RX 6600M
  (156 - 246, n=4)
194.5 fps -20%
SCHENKER XMG Focus 15 Engineering Sample
NVIDIA GeForce RTX 4050 Laptop GPU, i5-13500HX
164.7 fps -32%
Average NVIDIA GeForce RTX 3060 Laptop GPU
  (49.1 - 193.9, n=3)
141 fps -42%
Average NVIDIA GeForce RTX 3050 Ti Laptop GPU
  ()
133 fps -45%
SPECviewperf 2020
1920x1080 Solidworks (solidworks-05)
MSI Titan GT77 HX 13VI
NVIDIA GeForce RTX 4090 Laptop GPU, i9-13950HX, Samsung PM9A1 MZVL22T0HBLB
499.25 fps +90%
Razer Blade 16 Early 2023
NVIDIA GeForce RTX 4080 Laptop GPU, i9-13950HX, SSSTC CA6-8D1024
420.83 fps +60%
SCHENKER XMG Neo 17 2023 Engineering Sample
NVIDIA GeForce RTX 4070 Laptop GPU, i9-13900HX
262.82 fps
Lenovo ThinkPad P16 G1 RTX A5500
RTX A5500 Laptop GPU, i9-12950HX, WDC PC SN810 2TB
258.01 fps -2%
MSI Katana 17 B13VFK
NVIDIA GeForce RTX 4060 Laptop GPU, i7-13620H, Micron 2400 MTFDKBA1T0QFM
235 fps -11%
Average NVIDIA GeForce RTX 3070 Ti Laptop GPU
  ()
226 fps -14%
Average NVIDIA GeForce RTX 3080 Ti Laptop GPU
  (174.7 - 211, n=3)
198.6 fps -24%
Average NVIDIA GeForce RTX 3060 Laptop GPU
  ()
196 fps -25%
SCHENKER XMG Focus 15 Engineering Sample
NVIDIA GeForce RTX 4050 Laptop GPU, i5-13500HX
188.3 fps -28%
1920x1080 Siemens NX (snx-04)
Lenovo ThinkPad P16 G1 RTX A5500
RTX A5500 Laptop GPU, i9-12950HX, WDC PC SN810 2TB
410.78 fps +1718%
MSI Titan GT77 HX 13VI
NVIDIA GeForce RTX 4090 Laptop GPU, i9-13950HX, Samsung PM9A1 MZVL22T0HBLB
34.28 fps +52%
Razer Blade 16 Early 2023
NVIDIA GeForce RTX 4080 Laptop GPU, i9-13950HX, SSSTC CA6-8D1024
30 fps +33%
SCHENKER XMG Neo 17 2023 Engineering Sample
NVIDIA GeForce RTX 4070 Laptop GPU, i9-13900HX
22.59 fps
Average NVIDIA GeForce RTX 3080 Ti Laptop GPU
  (18.1 - 25, n=6)
21.8 fps -3%
MSI Katana 17 B13VFK
NVIDIA GeForce RTX 4060 Laptop GPU, i7-13620H, Micron 2400 MTFDKBA1T0QFM
21.7 fps -4%
SCHENKER XMG Focus 15 Engineering Sample
NVIDIA GeForce RTX 4050 Laptop GPU, i5-13500HX
21.4 fps -5%
Average NVIDIA GeForce RTX 3070 Ti Laptop GPU
  (19.9 - 20.4, n=2)
20.2 fps -11%
Average NVIDIA GeForce RTX 3060 Laptop GPU
  (16.2 - 17.5, n=2)
16.9 fps -25%
1920x1080 Medical (medical-03)
Lenovo ThinkPad P16 G1 RTX A5500
RTX A5500 Laptop GPU, i9-12950HX, WDC PC SN810 2TB
68.3 fps +85%
MSI Titan GT77 HX 13VI
NVIDIA GeForce RTX 4090 Laptop GPU, i9-13950HX, Samsung PM9A1 MZVL22T0HBLB
56.7 fps +54%
Razer Blade 16 Early 2023
NVIDIA GeForce RTX 4080 Laptop GPU, i9-13950HX, SSSTC CA6-8D1024
49.97 fps +35%
Average NVIDIA GeForce RTX 3080 Ti Laptop GPU
  (33 - 40.2, n=6)
37.4 fps +1%
SCHENKER XMG Neo 17 2023 Engineering Sample
NVIDIA GeForce RTX 4070 Laptop GPU, i9-13900HX
36.9 fps
Average NVIDIA GeForce RTX 3070 Ti Laptop GPU
  (32.1 - 33.1, n=2)
32.6 fps -12%
MSI Katana 17 B13VFK
NVIDIA GeForce RTX 4060 Laptop GPU, i7-13620H, Micron 2400 MTFDKBA1T0QFM
32.2 fps -13%
Average NVIDIA GeForce RTX 3060 Laptop GPU
  (27.6 - 30, n=2)
28.8 fps -22%
SCHENKER XMG Focus 15 Engineering Sample
NVIDIA GeForce RTX 4050 Laptop GPU, i5-13500HX
28.7 fps -22%
1920x1080 Maya (maya-06)
MSI Titan GT77 HX 13VI
NVIDIA GeForce RTX 4090 Laptop GPU, i9-13950HX, Samsung PM9A1 MZVL22T0HBLB
610.71 fps +50%
Razer Blade 16 Early 2023
NVIDIA GeForce RTX 4080 Laptop GPU, i9-13950HX, SSSTC CA6-8D1024
555.93 fps +36%
SCHENKER XMG Neo 17 2023 Engineering Sample
NVIDIA GeForce RTX 4070 Laptop GPU, i9-13900HX
407.77 fps
Lenovo ThinkPad P16 G1 RTX A5500
RTX A5500 Laptop GPU, i9-12950HX, WDC PC SN810 2TB
403.83 fps -1%
MSI Katana 17 B13VFK
NVIDIA GeForce RTX 4060 Laptop GPU, i7-13620H, Micron 2400 MTFDKBA1T0QFM
371 fps -9%
Average NVIDIA GeForce RTX 3080 Ti Laptop GPU
  (248 - 456, n=6)
351 fps -14%
Average NVIDIA GeForce RTX 3070 Ti Laptop GPU
  ()
334 fps -18%
SCHENKER XMG Focus 15 Engineering Sample
NVIDIA GeForce RTX 4050 Laptop GPU, i5-13500HX
333.9 fps -18%
Average NVIDIA GeForce RTX 3060 Laptop GPU
  (202 - 299, n=2)
250 fps -39%
1920x1080 Energy (energy-03)
MSI Titan GT77 HX 13VI
NVIDIA GeForce RTX 4090 Laptop GPU, i9-13950HX, Samsung PM9A1 MZVL22T0HBLB
74.95 fps +80%
Lenovo ThinkPad P16 G1 RTX A5500
RTX A5500 Laptop GPU, i9-12950HX, WDC PC SN810 2TB
69.15 fps +66%
Razer Blade 16 Early 2023
NVIDIA GeForce RTX 4080 Laptop GPU, i9-13950HX, SSSTC CA6-8D1024
62.41 fps +50%
SCHENKER XMG Neo 17 2023 Engineering Sample
NVIDIA GeForce RTX 4070 Laptop GPU, i9-13900HX
41.73 fps
MSI Katana 17 B13VFK
NVIDIA GeForce RTX 4060 Laptop GPU, i7-13620H, Micron 2400 MTFDKBA1T0QFM
34.1 fps -18%
SCHENKER XMG Focus 15 Engineering Sample
NVIDIA GeForce RTX 4050 Laptop GPU, i5-13500HX
28.7 fps -31%
Average NVIDIA GeForce RTX 3080 Ti Laptop GPU
  (19.6 - 27, n=6)
23.7 fps -43%
Average NVIDIA GeForce RTX 3070 Ti Laptop GPU
  (23.6 - 23.8, n=2)
23.7 fps -43%
Average NVIDIA GeForce RTX 3060 Laptop GPU
  (20.6 - 20.7, n=2)
20.7 fps -50%
1920x1080 Creo (creo-03)
Lenovo ThinkPad P16 G1 RTX A5500
RTX A5500 Laptop GPU, i9-12950HX, WDC PC SN810 2TB
165.08 fps +41%
MSI Titan GT77 HX 13VI
NVIDIA GeForce RTX 4090 Laptop GPU, i9-13950HX, Samsung PM9A1 MZVL22T0HBLB
138.99 fps +18%
Razer Blade 16 Early 2023
NVIDIA GeForce RTX 4080 Laptop GPU, i9-13950HX, SSSTC CA6-8D1024
130.27 fps +11%
SCHENKER XMG Neo 17 2023 Engineering Sample
NVIDIA GeForce RTX 4070 Laptop GPU, i9-13900HX
117.49 fps
MSI Katana 17 B13VFK
NVIDIA GeForce RTX 4060 Laptop GPU, i7-13620H, Micron 2400 MTFDKBA1T0QFM
100 fps -15%
Average NVIDIA GeForce RTX 3070 Ti Laptop GPU
  ()
95 fps -19%
SCHENKER XMG Focus 15 Engineering Sample
NVIDIA GeForce RTX 4050 Laptop GPU, i5-13500HX
94.5 fps -20%
Average NVIDIA GeForce RTX 3080 Ti Laptop GPU
  (55.3 - 114.7, n=6)
92.3 fps -21%
Average NVIDIA GeForce RTX 3060 Laptop GPU
  (81.5 - 86.5, n=2)
84 fps -29%
1920x1080 CATIA (catia-06)
MSI Titan GT77 HX 13VI
NVIDIA GeForce RTX 4090 Laptop GPU, i9-13950HX, Samsung PM9A1 MZVL22T0HBLB
116.64 fps +70%
Lenovo ThinkPad P16 G1 RTX A5500
RTX A5500 Laptop GPU, i9-12950HX, WDC PC SN810 2TB
109.77 fps +60%
Razer Blade 16 Early 2023
NVIDIA GeForce RTX 4080 Laptop GPU, i9-13950HX, SSSTC CA6-8D1024
98.79 fps +44%
SCHENKER XMG Neo 17 2023 Engineering Sample
NVIDIA GeForce RTX 4070 Laptop GPU, i9-13900HX
68.6 fps
Average NVIDIA GeForce RTX 3080 Ti Laptop GPU
  (51.8 - 78.7, n=6)
67.4 fps -2%
Average NVIDIA GeForce RTX 3070 Ti Laptop GPU
  (63.6 - 65.5, n=2)
64.5 fps -6%
MSI Katana 17 B13VFK
NVIDIA GeForce RTX 4060 Laptop GPU, i7-13620H, Micron 2400 MTFDKBA1T0QFM
61 fps -11%
Average NVIDIA GeForce RTX 3060 Laptop GPU
  (51.7 - 53.9, n=2)
52.8 fps -23%
SCHENKER XMG Focus 15 Engineering Sample
NVIDIA GeForce RTX 4050 Laptop GPU, i5-13500HX
50.7 fps -26%
1920x1080 3ds Max (3dsmax-07)
MSI Titan GT77 HX 13VI
NVIDIA GeForce RTX 4090 Laptop GPU, i9-13950HX, Samsung PM9A1 MZVL22T0HBLB
212.6 fps +113%
Razer Blade 16 Early 2023
NVIDIA GeForce RTX 4080 Laptop GPU, i9-13950HX, SSSTC CA6-8D1024
177.9 fps +78%
Lenovo ThinkPad P16 G1 RTX A5500
RTX A5500 Laptop GPU, i9-12950HX, WDC PC SN810 2TB
144.56 fps +45%
Average NVIDIA GeForce RTX 3080 Ti Laptop GPU
  (99.2 - 153, n=6)
128.4 fps +29%
SCHENKER XMG Neo 17 2023 Engineering Sample
NVIDIA GeForce RTX 4070 Laptop GPU, i9-13900HX
99.85 fps
Average NVIDIA GeForce RTX 3070 Ti Laptop GPU
  (95.6 - 98.5, n=2)
97 fps -3%
MSI Katana 17 B13VFK
NVIDIA GeForce RTX 4060 Laptop GPU, i7-13620H, Micron 2400 MTFDKBA1T0QFM
89.6 fps -10%
Average NVIDIA GeForce RTX 3060 Laptop GPU
  (85.3 - 89.4, n=2)
87.4 fps -12%
SCHENKER XMG Focus 15 Engineering Sample
NVIDIA GeForce RTX 4050 Laptop GPU, i5-13500HX
79.7 fps -20%
3840x2160 Solidworks (solidworks-05)
MSI Titan GT77 HX 13VI
NVIDIA GeForce RTX 4090 Laptop GPU, i9-13950HX, Samsung PM9A1 MZVL22T0HBLB
207.55 fps +80%
Average NVIDIA GeForce RTX 3060 Laptop GPU
  ()
182 fps +58%
Average NVIDIA GeForce RTX 3090
  (93.1 - 194, n=8)
178 fps +55%
Razer Blade 16 Early 2023
NVIDIA GeForce RTX 4080 Laptop GPU, i9-13950HX, SSSTC CA6-8D1024
164.32 fps +43%
Average AMD Radeon RX 6800M
  ()
146 fps +27%
Average NVIDIA GeForce RTX 3080 Ti Laptop GPU
  (87.9 - 255, n=4)
137.6 fps +20%
SCHENKER XMG Neo 17 2023 Engineering Sample
NVIDIA GeForce RTX 4070 Laptop GPU, i9-13900HX
115.11 fps
Average NVIDIA GeForce RTX 3050 Ti Laptop GPU
  (113 - 113, n=2)
113 fps -2%
Lenovo ThinkPad P16 G1 RTX A5500
RTX A5500 Laptop GPU, i9-12950HX, WDC PC SN810 2TB
109.04 fps -5%
Average NVIDIA GeForce RTX 3080 Laptop GPU
  (104 - 105, n=3)
104.7 fps -9%
Average AMD Radeon RX 6600M
  (71 - 129, n=5)
101 fps -12%
MSI Katana 17 B13VFK
NVIDIA GeForce RTX 4060 Laptop GPU, i7-13620H, Micron 2400 MTFDKBA1T0QFM
97.2 fps -16%
SCHENKER XMG Focus 15 Engineering Sample
NVIDIA GeForce RTX 4050 Laptop GPU, i5-13500HX
73.4 fps -36%
3840x2160 Siemens NX (snx-04)
Lenovo ThinkPad P16 G1 RTX A5500
RTX A5500 Laptop GPU, i9-12950HX, WDC PC SN810 2TB
301.3 fps +1578%
Average AMD Radeon RX 6600M
  (62.5 - 226, n=6)
143.3 fps +698%
Average AMD Radeon RX 6800M
  (64.4 - 67.8, n=2)
66.1 fps +268%
MSI Titan GT77 HX 13VI
NVIDIA GeForce RTX 4090 Laptop GPU, i9-13950HX, Samsung PM9A1 MZVL22T0HBLB
28.23 fps +57%
Razer Blade 16 Early 2023
NVIDIA GeForce RTX 4080 Laptop GPU, i9-13950HX, SSSTC CA6-8D1024
23.93 fps +33%
Average NVIDIA GeForce RTX 3090
  (13.2 - 25.6, n=9)
23.3 fps +30%
Average NVIDIA GeForce RTX 3080 Ti Laptop GPU
  (15.5 - 21.1, n=7)
18.9 fps +5%
Average NVIDIA GeForce RTX 3080 Laptop GPU
  (18.5 - 18.8, n=3)
18.7 fps +4%
SCHENKER XMG Neo 17 2023 Engineering Sample
NVIDIA GeForce RTX 4070 Laptop GPU, i9-13900HX
17.96 fps
MSI Katana 17 B13VFK
NVIDIA GeForce RTX 4060 Laptop GPU, i7-13620H, Micron 2400 MTFDKBA1T0QFM
17.5 fps -3%
Average NVIDIA GeForce RTX 3060 Laptop GPU
  ()
16.8 fps -6%
SCHENKER XMG Focus 15 Engineering Sample
NVIDIA GeForce RTX 4050 Laptop GPU, i5-13500HX
16.2 fps -10%
Average NVIDIA GeForce RTX 3050 Ti Laptop GPU
  (13.2 - 13.2, n=2)
13.2 fps -27%
3840x2160 Medical (medical-03)
Average AMD Radeon RX 6800M
  (16.9 - 42.6, n=2)
29.8 fps +115%
Average NVIDIA GeForce RTX 3060 Laptop GPU
  ()
26.5 fps +91%
Lenovo ThinkPad P16 G1 RTX A5500
RTX A5500 Laptop GPU, i9-12950HX, WDC PC SN810 2TB
25.78 fps +86%
Average AMD Radeon RX 6600M
  (18.1 - 34, n=6)
25 fps +80%
MSI Titan GT77 HX 13VI
NVIDIA GeForce RTX 4090 Laptop GPU, i9-13950HX, Samsung PM9A1 MZVL22T0HBLB
24.42 fps +76%
Average NVIDIA GeForce RTX 3050 Ti Laptop GPU
  (20.2 - 20.2, n=2)
20.2 fps +46%
Average NVIDIA GeForce RTX 3090
  (9.95 - 23, n=9)
19.6 fps +41%
Razer Blade 16 Early 2023
NVIDIA GeForce RTX 4080 Laptop GPU, i9-13950HX, SSSTC CA6-8D1024
19.3 fps +39%
Average NVIDIA GeForce RTX 3080 Ti Laptop GPU
  (13.2 - 34.3, n=7)
17.9 fps +29%
SCHENKER XMG Neo 17 2023 Engineering Sample
NVIDIA GeForce RTX 4070 Laptop GPU, i9-13900HX
13.87 fps
MSI Katana 17 B13VFK
NVIDIA GeForce RTX 4060 Laptop GPU, i7-13620H, Micron 2400 MTFDKBA1T0QFM
10.9 fps -21%
Average NVIDIA GeForce RTX 3080 Laptop GPU
  (10.4 - 10.5, n=3)
10.5 fps -24%
SCHENKER XMG Focus 15 Engineering Sample
NVIDIA GeForce RTX 4050 Laptop GPU, i5-13500HX
9.2 fps -34%
3840x2160 Maya (maya-06)
MSI Titan GT77 HX 13VI
NVIDIA GeForce RTX 4090 Laptop GPU, i9-13950HX, Samsung PM9A1 MZVL22T0HBLB
371.75 fps +74%
Average NVIDIA GeForce RTX 3090
  (181 - 369, n=9)
336 fps +57%
Razer Blade 16 Early 2023
NVIDIA GeForce RTX 4080 Laptop GPU, i9-13950HX, SSSTC CA6-8D1024
302.82 fps +42%
Average NVIDIA GeForce RTX 3060 Laptop GPU
  ()
264 fps +23%
Lenovo ThinkPad P16 G1 RTX A5500
RTX A5500 Laptop GPU, i9-12950HX, WDC PC SN810 2TB
218.16 fps +2%
SCHENKER XMG Neo 17 2023 Engineering Sample
NVIDIA GeForce RTX 4070 Laptop GPU, i9-13900HX
213.77 fps
Average NVIDIA GeForce RTX 3080 Ti Laptop GPU
  (137.4 - 345, n=7)
208 fps -3%
MSI Katana 17 B13VFK
NVIDIA GeForce RTX 4060 Laptop GPU, i7-13620H, Micron 2400 MTFDKBA1T0QFM
188 fps -12%
Average NVIDIA GeForce RTX 3080 Laptop GPU
  (186 - 189, n=3)
187 fps -13%
Average AMD Radeon RX 6600M
  (143 - 266, n=6)
186.5 fps -13%
Average AMD Radeon RX 6800M
  (137 - 229, n=2)
183 fps -14%
Average NVIDIA GeForce RTX 3050 Ti Laptop GPU
  (180 - 180, n=2)
180 fps -16%
SCHENKER XMG Focus 15 Engineering Sample
NVIDIA GeForce RTX 4050 Laptop GPU, i5-13500HX
154.4 fps -28%
3840x2160 Energy (energy-03)
MSI Titan GT77 HX 13VI
NVIDIA GeForce RTX 4090 Laptop GPU, i9-13950HX, Samsung PM9A1 MZVL22T0HBLB
112.25 fps +297%
Average NVIDIA GeForce RTX 3080 Ti Laptop GPU
  (27.7 - 118.7, n=7)
65.1 fps +130%
Average NVIDIA GeForce RTX 3090
  (22.3 - 101, n=9)
63.7 fps +125%
Razer Blade 16 Early 2023
NVIDIA GeForce RTX 4080 Laptop GPU, i9-13950HX, SSSTC CA6-8D1024
30.03 fps +6%
Average NVIDIA GeForce RTX 3080 Laptop GPU
  (29.5 - 29.6, n=3)
29.6 fps +5%
SCHENKER XMG Neo 17 2023 Engineering Sample
NVIDIA GeForce RTX 4070 Laptop GPU, i9-13900HX
28.25 fps
Lenovo ThinkPad P16 G1 RTX A5500
RTX A5500 Laptop GPU, i9-12950HX, WDC PC SN810 2TB
24.11 fps -15%
Average NVIDIA GeForce RTX 3060 Laptop GPU
  ()
20.4 fps -28%
Average AMD Radeon RX 6600M
  (2.05 - 47.9, n=6)
20.4 fps -28%
MSI Katana 17 B13VFK
NVIDIA GeForce RTX 4060 Laptop GPU, i7-13620H, Micron 2400 MTFDKBA1T0QFM
20 fps -29%
SCHENKER XMG Focus 15 Engineering Sample
NVIDIA GeForce RTX 4050 Laptop GPU, i5-13500HX
17.2 fps -39%
Average NVIDIA GeForce RTX 3050 Ti Laptop GPU
  (12.8 - 12.8, n=2)
12.8 fps -55%
Average AMD Radeon RX 6800M
  (1.83 - 2.77, n=2)
2.3 fps -92%
3840x2160 Creo (creo-03)
MSI Titan GT77 HX 13VI
NVIDIA GeForce RTX 4090 Laptop GPU, i9-13950HX, Samsung PM9A1 MZVL22T0HBLB
117.51 fps +29%
Lenovo ThinkPad P16 G1 RTX A5500
RTX A5500 Laptop GPU, i9-12950HX, WDC PC SN810 2TB
117.5 fps +29%
Average NVIDIA GeForce RTX 3090
  (68.1 - 118, n=9)
105.5 fps +16%
Razer Blade 16 Early 2023
NVIDIA GeForce RTX 4080 Laptop GPU, i9-13950HX, SSSTC CA6-8D1024
105.26 fps +16%
SCHENKER XMG Neo 17 2023 Engineering Sample
NVIDIA GeForce RTX 4070 Laptop GPU, i9-13900HX
90.79 fps
Average NVIDIA GeForce RTX 3060 Laptop GPU
  ()
84.5 fps -7%
MSI Katana 17 B13VFK
NVIDIA GeForce RTX 4060 Laptop GPU, i7-13620H, Micron 2400 MTFDKBA1T0QFM
78 fps -14%
Average NVIDIA GeForce RTX 3080 Ti Laptop GPU
  (49 - 93.3, n=7)
77.4 fps -15%
Average NVIDIA GeForce RTX 3080 Laptop GPU
  (75.7 - 78.5, n=3)
77 fps -15%
Average AMD Radeon RX 6600M
  (65 - 88.4, n=6)
72.9 fps -20%
SCHENKER XMG Focus 15 Engineering Sample
NVIDIA GeForce RTX 4050 Laptop GPU, i5-13500HX
70 fps -23%
Average NVIDIA GeForce RTX 3050 Ti Laptop GPU
  (69.2 - 69.2, n=2)
69.2 fps -24%
Average AMD Radeon RX 6800M
  (60.8 - 64.3, n=2)
62.6 fps -31%
3840x2160 CATIA (catia-06)
Lenovo ThinkPad P16 G1 RTX A5500
RTX A5500 Laptop GPU, i9-12950HX, WDC PC SN810 2TB
68.64 fps +82%
MSI Titan GT77 HX 13VI
NVIDIA GeForce RTX 4090 Laptop GPU, i9-13950HX, Samsung PM9A1 MZVL22T0HBLB
65.16 fps +73%
Average NVIDIA GeForce RTX 3090
  (32.3 - 60.4, n=9)
56.3 fps +49%
Razer Blade 16 Early 2023
NVIDIA GeForce RTX 4080 Laptop GPU, i9-13950HX, SSSTC CA6-8D1024
52.5 fps +39%
Average NVIDIA GeForce RTX 3060 Laptop GPU
  ()
52.3 fps +39%
Average NVIDIA GeForce RTX 3080 Ti Laptop GPU
  (30.3 - 69.6, n=7)
43.7 fps +16%
Average NVIDIA GeForce RTX 3080 Laptop GPU
  (37.7 - 38.1, n=3)
37.9 fps 0%
SCHENKER XMG Neo 17 2023 Engineering Sample
NVIDIA GeForce RTX 4070 Laptop GPU, i9-13900HX
37.72 fps
Average AMD Radeon RX 6600M
  (16.8 - 57.9, n=6)
37.7 fps 0%
Average NVIDIA GeForce RTX 3050 Ti Laptop GPU
  (37.6 - 37.6, n=2)
37.6 fps 0%
MSI Katana 17 B13VFK
NVIDIA GeForce RTX 4060 Laptop GPU, i7-13620H, Micron 2400 MTFDKBA1T0QFM
33.8 fps -10%
SCHENKER XMG Focus 15 Engineering Sample
NVIDIA GeForce RTX 4050 Laptop GPU, i5-13500HX
27.9 fps -26%
Average AMD Radeon RX 6800M
  (13.5 - 15.6, n=2)
14.6 fps -61%
3840x2160 3ds Max (3dsmax-07)
MSI Titan GT77 HX 13VI
NVIDIA GeForce RTX 4090 Laptop GPU, i9-13950HX, Samsung PM9A1 MZVL22T0HBLB
147.71 fps +111%
Average NVIDIA GeForce RTX 3090
  (70.2 - 143, n=9)
133.5 fps +91%
Razer Blade 16 Early 2023
NVIDIA GeForce RTX 4080 Laptop GPU, i9-13950HX, SSSTC CA6-8D1024
117.66 fps +68%
Average AMD Radeon RX 6800M
  (69.2 - 127, n=2)
98.1 fps +40%
Average NVIDIA GeForce RTX 3080 Ti Laptop GPU
  (69.5 - 144, n=7)
95.7 fps +37%
Average NVIDIA GeForce RTX 3080 Laptop GPU
  (86.8 - 87.5, n=3)
87.1 fps +25%
Average NVIDIA GeForce RTX 3060 Laptop GPU
  ()
82.5 fps +18%
Lenovo ThinkPad P16 G1 RTX A5500
RTX A5500 Laptop GPU, i9-12950HX, WDC PC SN810 2TB
79.63 fps +14%
SCHENKER XMG Neo 17 2023 Engineering Sample
NVIDIA GeForce RTX 4070 Laptop GPU, i9-13900HX
69.84 fps
MSI Katana 17 B13VFK
NVIDIA GeForce RTX 4060 Laptop GPU, i7-13620H, Micron 2400 MTFDKBA1T0QFM
61.6 fps -12%
Average NVIDIA GeForce RTX 3050 Ti Laptop GPU
  (58.9 - 58.9, n=2)
58.9 fps -16%
Average AMD Radeon RX 6600M
  (37.5 - 66.5, n=6)
53.7 fps -23%
SCHENKER XMG Focus 15 Engineering Sample
NVIDIA GeForce RTX 4050 Laptop GPU, i5-13500HX
52.2 fps -25%

* ... smaller is better

GPU Efficiency

We use the Witcher 3 test running with an external screen for our efficiency test, so we can eliminate the influence of the integrated panel. Witcher 3 is also not very demanding for the processor, so the CPU impact is also very small, We see the new RTX 40 models leading the chart with the RTX 4090 Laptop at top , followed by the new RTX 4060 Laptop. We expect versions of the new GPUs with lower TGP settings will be even better in this regard. The only outlier is the GeForce RTX 4050 Laptop, which is right between previous Ampere GPUs. This clearly shows that high TGP values do not make much sense for the RTX 4050.

There is a noticeable efficiency improvement in general for the new Ada chips compared to previous Ampere GPUs. The comparison between the RTX 4070 Laptop/RTX 3080 Ti Laptop and RTX 4060 Laptop/RTX 3070 Ti laptop shows an efficiency improvement of 23-24 %, which means the advantage of the slower Ada GPUs is lower compared to the high-end models, where we noticed efficiency improvements of up to 53 %.

Power Consumption - Witcher 3 ultra Efficiency (external Monitor)
MSI Titan GT77 HX 13VI
NVIDIA GeForce RTX 4090 Laptop GPU, i9-13950HX, Samsung PM9A1 MZVL22T0HBLB
0.796 fps per Watt +17%
Gigabyte AERO 16 OLED BSF
NVIDIA GeForce RTX 4070 Laptop GPU, i9-13900H, Gigabyte AG470S1TB-SI B10
0.73 fps per Watt +7%
MSI Katana 17 B13VFK
NVIDIA GeForce RTX 4060 Laptop GPU, i7-13620H, Micron 2400 MTFDKBA1T0QFM
0.717 fps per Watt +5%
Razer Blade 16 Early 2023
NVIDIA GeForce RTX 4080 Laptop GPU, i9-13950HX, SSSTC CA6-8D1024
0.71 fps per Watt +4%
SCHENKER XMG Neo 17 2023 Engineering Sample
NVIDIA GeForce RTX 4070 Laptop GPU, i9-13900HX
0.68 fps per Watt
Razer Blade 18 RTX 4070
NVIDIA GeForce RTX 4070 Laptop GPU, i9-13950HX, SSSTC CA6-8D1024
0.587 fps per Watt -14%
Average NVIDIA GeForce RTX 3080 Laptop GPU
  (0.4696 - 0.736, n=23)
0.583 fps per Watt -14%
Average NVIDIA GeForce RTX 3070 Ti Laptop GPU
  (0.4399 - 0.97, n=24)
0.579 fps per Watt -15%
Average NVIDIA GeForce RTX 3080 Ti Laptop GPU
  (0.4432 - 0.69, n=26)
0.555 fps per Watt -18%
SCHENKER XMG Focus 15 Engineering Sample
NVIDIA GeForce RTX 4050 Laptop GPU, i5-13500HX
0.548 fps per Watt -19%
Asus TUF Gaming GeForce RTX 4070 Ti
NVIDIA GeForce RTX 4070 Ti, i9-13900K
0.545 fps per Watt -20%
Average NVIDIA GeForce RTX 3060 Laptop GPU
  (0.4181 - 0.651, n=33)
0.538 fps per Watt -21%
Average AMD Radeon RX 6700M
  ()
0.524 fps per Watt -23%
Average AMD Radeon RX 6600M
  (0.4398 - 0.608, n=6)
0.519 fps per Watt -24%
Average NVIDIA GeForce RTX 3090
  (0.268 - 0.3954, n=14)
0.3429 fps per Watt -50%

Overview Gaming Benchmarks

Schenker XMG Neo 17 Engineering Sample RTX 4070 Laptop

low med. high ultraQHD4K DLSS4K
GTA V (2015) 187.1 184.1 182.9 130.5 92.2 92.5
The Witcher 3 (2015) 258 124 60
Dota 2 Reborn (2015) 233 206 195.4 180.6 150.7
Final Fantasy XV Benchmark (2018) 227 173.7 119.4 86.1 47.5
X-Plane 11.11 (2018) 212 187.1 144.4 122.7
Far Cry 5 (2018) 179 169 158 118 60
Strange Brigade (2018) 476 326 252 214 139.8 74.7
Shadow of the Tomb Raider (2018) 172 158 107 53
Metro Exodus (2019) 117 91 72 46
Borderlands 3 (2019) 139 109 75 40
Horizon Zero Dawn (2020) 143 126 98 52
Watch Dogs Legion (2020) 130 89 64 33
F1 2021 (2021) 520 407 306 157.5 114.7 63.4
Far Cry 6 (2021) 144 126 91
God of War (2022) 109 80 65 43
Rainbow Six Extraction (2022) 253 240 188 125 64
Dying Light 2 (2022) 95 64 32
Cyberpunk 2077 1.6 (2022) 98 91 57 26
Ghostwire Tokyo (2022)
F1 22 (2022) 275 275 222 81.7 51.9 25.9
Call of Duty Modern Warfare 2 2022 (2022) 111 105 76 71 47
Spider-Man Miles Morales (2022) 115 110 86 44
The Witcher 3 v4.00 (2023) 101 85 54 28
Dead Space Remake (2023) 97 94 81 80 51 26

Razer Blade 18 RTX 4070 Laptop

low med. high ultraQHD4K
GTA V (2015) 186.1 184.7 181.6 121.4 87.6 88.5
The Witcher 3 (2015) 617 405.9 240.9 113.9 72.5
Dota 2 Reborn (2015) 225 200 191 178.6 145.5
Final Fantasy XV Benchmark (2018) 231 166.9 115.2 82 46.6
X-Plane 11.11 (2018) 203 178.9 137.9 117.7
Strange Brigade (2018) 464 315 243 208 136.7 71.9
Metro Exodus (2019) 208.9 139.8 109.7 86.8 69 44
Borderlands 3 (2019) 258.5 200.1 131.8 100.3 68.7 35.7
Hitman 3 (2021) 294.3 234 208.4 197.4 129.9 68.5
Cyberpunk 2077 1.6 (2022) 147.8 125.7 111.5 92.1 54 23.3

Gigabyte Aero 16 RTX 4070 Laptop

low med. high ultraQHD4K
GTA V (2015) 185.3 186.4 183.1 123.2 90.6 75
The Witcher 3 (2015) 236 116
Dota 2 Reborn (2015) 164.7 157 150.9 144.5 128.3
Final Fantasy XV Benchmark (2018) 132.3 116.2 84.7 46.1
X-Plane 11.11 (2018) 169.3 148 115.3 98.5
Far Cry 5 (2018) 202 168 159 149 115 55
Strange Brigade (2018) 481 300 237 204 138.8 67.6
Shadow of the Tomb Raider (2018) 158 129 70
Assassin´s Creed Valhalla (2020) 106 78 41
Cyberpunk 2077 1.6 (2022) 84.75 53.28 19.59
F1 22 (2022) 220 214 173.8 66.6 44.3 21.5
Call of Duty Modern Warfare 2 2022 (2022) 101 72 39
Spider-Man Miles Morales (2022) 90.5 68.9 40.5
The Callisto Protocol (2022) 78.86 59.07 32.96

MSI Katana 17 RTX 4060 Laptop

low med. high ultraQHD4K DLSS4K
GTA V (2015) 186.1 184.7 180.2 112.1 83 82.1
The Witcher 3 (2015) 435 322 206 104.7 62.6
Dota 2 Reborn (2015) 184.6 171 164.1 156.3 126
Final Fantasy XV Benchmark (2018) 204 135.1 96.1 70.1 40.2
X-Plane 11.11 (2018) 178.6 154.9 118.9 98.9
Far Cry 5 (2018) 134 99 51
Strange Brigade (2018) 508 270 216 185.1 126.4 67.2
Shadow of the Tomb Raider (2018) 155.6 120.7 67.2
Metro Exodus (2019) 74.3 59 36.8
Control (2019) 238 119 89
Borderlands 3 (2019) 171.3 144.6 106.5 83.9
Death Stranding (2020) 200 158.9 150.3 146.7
Horizon Zero Dawn (2020) 108.3 85.9 46.5
Flight Simulator 2020 (2020) 96.9 69.4 52.5
Crysis Remastered (2020) 312 224 85.9 72.5
Watch Dogs Legion (2020) 65 44 25
Dirt 5 (2020) 218 147.2 116.1 89.5
Assassin´s Creed Valhalla (2020) 135 111 96
Yakuza Like a Dragon (2020) 131.7 123.2 117.4 109.6
Hitman 3 (2021) 267.5 197.7 172.7 163.5
Days Gone (2021) 148 131.4 100.2
F1 2021 (2021) 389 312 244 128.9 93 50.2
Alan Wake Remastered (2021) 149.8 144.9
Far Cry 6 (2021) 97.2 32.6 3.38
Back 4 Blood (2021) 245 197.5 188.2
Guardians of the Galaxy (2021) 134 135 133
Riders Republic (2021) 177 145 122 112
Forza Horizon 5 (2021) 137 125 84
Battlefield 2042 (2021) 145.6 123 106.1
Halo Infinite (2021) 144.9 123.6 114.2
God of War (2022) 67.5 55.6 34.7
Rainbow Six Extraction (2022) 149.1 106 52.4
Dying Light 2 (2022) 64.7 43.8 23
GRID Legends (2022) 126.4 102.2 63.9
Elden Ring (2022) 59.5
Cyberpunk 2077 1.6 (2022) 73.81 45.9 21.1
Elex 2 (2022) 115.4 115.4 113.5 96
Ghostwire Tokyo (2022) 68.6 65.9 36.8 29.6
Tiny Tina's Wonderlands (2022) 198.6 164.9 110 85.2
Vampire Bloodhunt (2022) 220 201 185.7
F1 22 (2022) 247 240 179.2 65.4 41 19.7
The Quarry (2022) 154.8 121.3 100.5 77.9
A Plague Tale Requiem (2022) 100.7 84.9 73 63.3
Uncharted Legacy of Thieves Collection (2022) 87.9 85.1 79.1 76.9
Call of Duty Modern Warfare 2 2022 (2022) 87 59 55 34
Spider-Man Miles Morales (2022) 77.3 59.7 35.3
The Callisto Protocol (2022) 68.9 48.6 27
Need for Speed Unbound (2022) 127.4 117.2 98.9 98.6
High On Life (2023) 220 165.8 125.6 99.9
The Witcher 3 v4.00 (2023) 66.3 40.5 21.4
Dead Space Remake (2023) 67 43.4 20.6
Hogwarts Legacy (2023) 150 126.7 107.7 91.6
Returnal (2023)
Atomic Heart (2023) 167.3 129.2 81.6 66.8
Company of Heroes 3 (2023) 202.7 182.1 133.3 131.3
Sons of the Forest (2023) 82 79.1 73.3 71.8

Schenker XMG Focus 15 Engineering Sample RTX 4050 Laptop

low med. high ultraQHD4K DLSS4K
GTA V (2015) 186.6 184.2 177.3 92.4 64.1 63.5
The Witcher 3 (2015) 465 319 175 89 50
Dota 2 Reborn (2015) 192.6 176.1 169.1 161.7 115.2
Final Fantasy XV Benchmark (2018) 214 122.3 122.3 60 33.3
X-Plane 11.11 (2018) 161 142.3 113.1 97.9
Far Cry 5 (2018) 197 146 135 127 87 43
Strange Brigade (2018) 481 221 178 153 100 53
Shadow of the Tomb Raider (2018) 215 150 134 116 73 33
Metro Exodus (2019) 199 109 82 64 50 45
Control (2019) 100 74 48 24
Borderlands 3 (2019) 171 139 96 73 50 26
Horizon Zero Dawn (2020) 170 131 114 98 72 39
Watch Dogs Legion (2020) 138 120 105 49 37 26
F1 2021 (2021) 377 292 219 109.7 76.1 38
Far Cry 6 (2021) 166 133 114 82 58
God of War (2022) 121 102 81 55 44 28
Dying Light 2 (2022) 88 74 62 41 21
Cyberpunk 2077 1.6 (2022) 108 83 72 65 32 18
Ghostwire Tokyo (2022)
F1 22 (2022) 232 223 167.3 53.8 33.2 15.9
Call of Duty Modern Warfare 2 2022 (2022) 128 109 81 77 53 50 31
Spider-Man Miles Morales (2022) 112 101 96 85 53 26
The Callisto Protocol (2022) 137 97 60 59 42 21
The Witcher 3 v4.00 (2023) 106 76 68 59 37 17
Dead Space Remake (2023) 67 64 55 54 35 17

Update: Performance at difference TDP levels

We used the freeware MSI Afterburner to adjust the power limits of the new RTX 40 GPUs. The application takes 115W as 100 % and then you can adjust the percentage. The maximum value is 121 % for 140 Watts (including Dynamic Boost) and down to 4 % for 6 Watts. We repeated some tests with the RTX 4070 and RTX 4050 in the two engineering samples from the manufacturer Schenker.

3DMark Time Spy Graphics Score
GPU 35 Watts 50 Watts 65 Watts 80 Watts 100 Watts 115 Watts
GeForce RTX 4050 Laptop 5272 points 6784 points 7528 points 8156 points 8497 points 8508 points
GeForce RTX 4070 Laptop 6844 points 8752 points 9668 points 10878 points 11811 points 12140 points
Time Spy Graphics
Time Spy Graphics

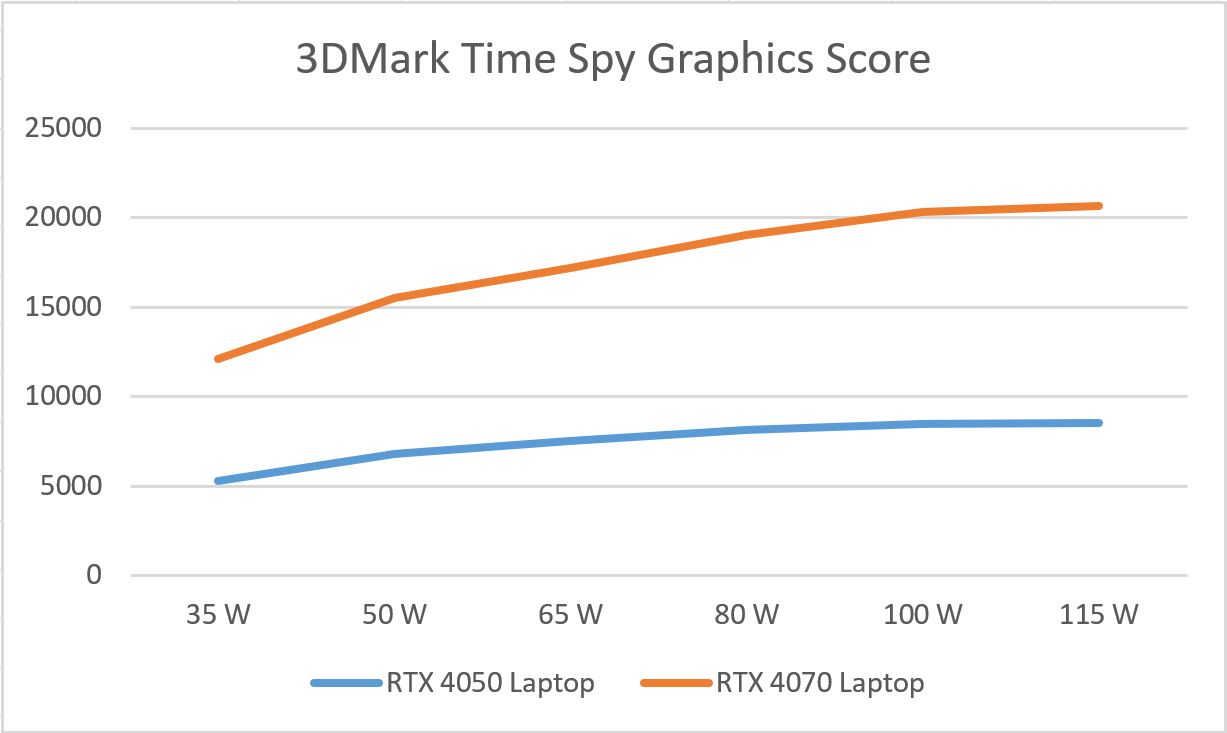
At the beginning of this article, we already mentioned that the power consumption depends on the actual load scenario and we can see the maximum consumption for both GPUs in the FurMark stress test. However, other synthetic tests like 3DMark only result in 115 Watts in certain scenarios. The performance curve of the RTX 4050 Laptop flattens at 80 Watts, the RTX 4070 Laptop does not see performance improvements above 100 Watts.

Gaming Benchmarks RTX 4050 Laptop
Game 35 Watts 50 Watts 65 Watts 80 Watts 100 Watts 115 Watts
Witcher 3 Ultra 1080p 61 FPS 73 FPS 80 FPS 86 FPS 89 FPS 89 FPS
Cyberpunk 2077 1.5 Ultra 1080p 43 FPS 52 FPS 58 FPS 63 FPS 65 FPS 65 FPS
Gaming Benchmarks RTX 4070 Laptop
Game 35 Watts 50 Watts 65 Watts 80 Watts 100 Watts 115 Watts
Witcher 3 Ultra 1080p 75 FPS 94 FPS 103 FPS 116 FPS 124 FPS 124 FPS
Cyberpunk 2077 1.5 Ultra 1080p 53 FPS 66 FPS 73 FPS 79 FPS 91 FPS 91 FPS

The power consumption is even lower while gaming with the RTX 4050 Laptop consuming up to ~90 Watts and the RTX 4070 Laptop ~100 Watts. This is a problem since we are not sure why Nvidia even advertises higher power limits for these models and why Nvidia uses the full power in certain tests like FurMark, but not during gaming.

Buyers of new gaming laptops could feel pretty mislead when the RTX 4070 is advertised at 140 Watts in a high-end device (which requires a better cooling solution), but it only achieves this value in certain situation and is limited to 100 Watts while gaming.

Verdict - Mainstream Ada GPUs with significant performance gains

Nvidia RTX 40 Laptop in review.

Our verdict of the new (upper) mainstream GPUs based on the Ada Lovelace architecture is not quite as good as it was on the high-end version. Nvidia was able to improve the performance and the new RTX 4070 Laptop GPU at high TGP values is roughly on par with the old RTX 3080 Ti Laptop. There are some exceptions in 4K titles where the smaller VRAM of the RTX 4070 Laptop has an impact. The RTX 4060 laptop is comparable to the old RTX 3070 Ti Laptop and the testest RTX 4050 Laptop is similar to a RTX 3060 Laptop or even a little bit faster.

More performance for mainstream GPUs: Nvidia's new RTX 4070 Laptop and RTX 4060 Laptop replace the old GeForce RTX 3080 Ti Laptop and RTX 3070 Ti Laptop, respectively. They offer plenty of performance for QHD panels and even 4K in some games, but the raytracing performance is still limited and you often have to reduce settings or use DLSS upscaling to achieve smooth frame rates.

These are good news, but the efficiency improvements are smaller compared to the high-end models RTX 4090 Laptop/RTX 4080 Laptop. We see an improvement of 23-24 % for the RTX 4070Laptop/RTX 4060 Laptop, but we can also clearly  see that the high TGP version of the RTX 4050 Laptop does not make much sense and the efficiency drops to Ampere levels. We simple do not have sufficient data for slower version of the GPU to rate the efficiency. Nvidia's announcement with 3x higher efficiency is limited to a very specific scenario according to the press information, so we cannot confirm this statement.

The new GeForce RTX 4050 laptop offers the gaming performance of the old GeForce RTX 3060 and is best suited for 1080p displays. The raytracing capabilities, however, are limited.

The biggest issue with the new laptop GPU is the wide TGP range and manufacturers can configure all three GPUs (RTX 4070, RTX 4060 und RTX 4050) between 35-115 Watts or 140W considering up to 25W Dynamic Boost, respectively. It will be extremely important that manufacturer disclose exact TGP figures for their products, otherwise there can be spec sheet heroes that will be disappointing in practice, especially in slim laptops with limited cooling capabilities.

We expect that RTX 4070 Laptop and RTX 4060 Laptop will offer very similar performance figures and you can usually save the additional money for the RTX 4070 Laptop, especially on devices with 1080p or QHD screens.

Read all 13 comments / answer
static version load dynamic
Loading comments
Comment on this article
Please share our article, every link counts!
> Expert Reviews and News on Laptops, Smartphones and Tech Innovations > Reviews > GeForce RTX 4070, 4060, 4050 Laptop Analysis - Nvidia's new Mainstream Laptop GPUs in Review
Andreas Osthoff, 2023-02-21 (Update: 2023-03- 2)