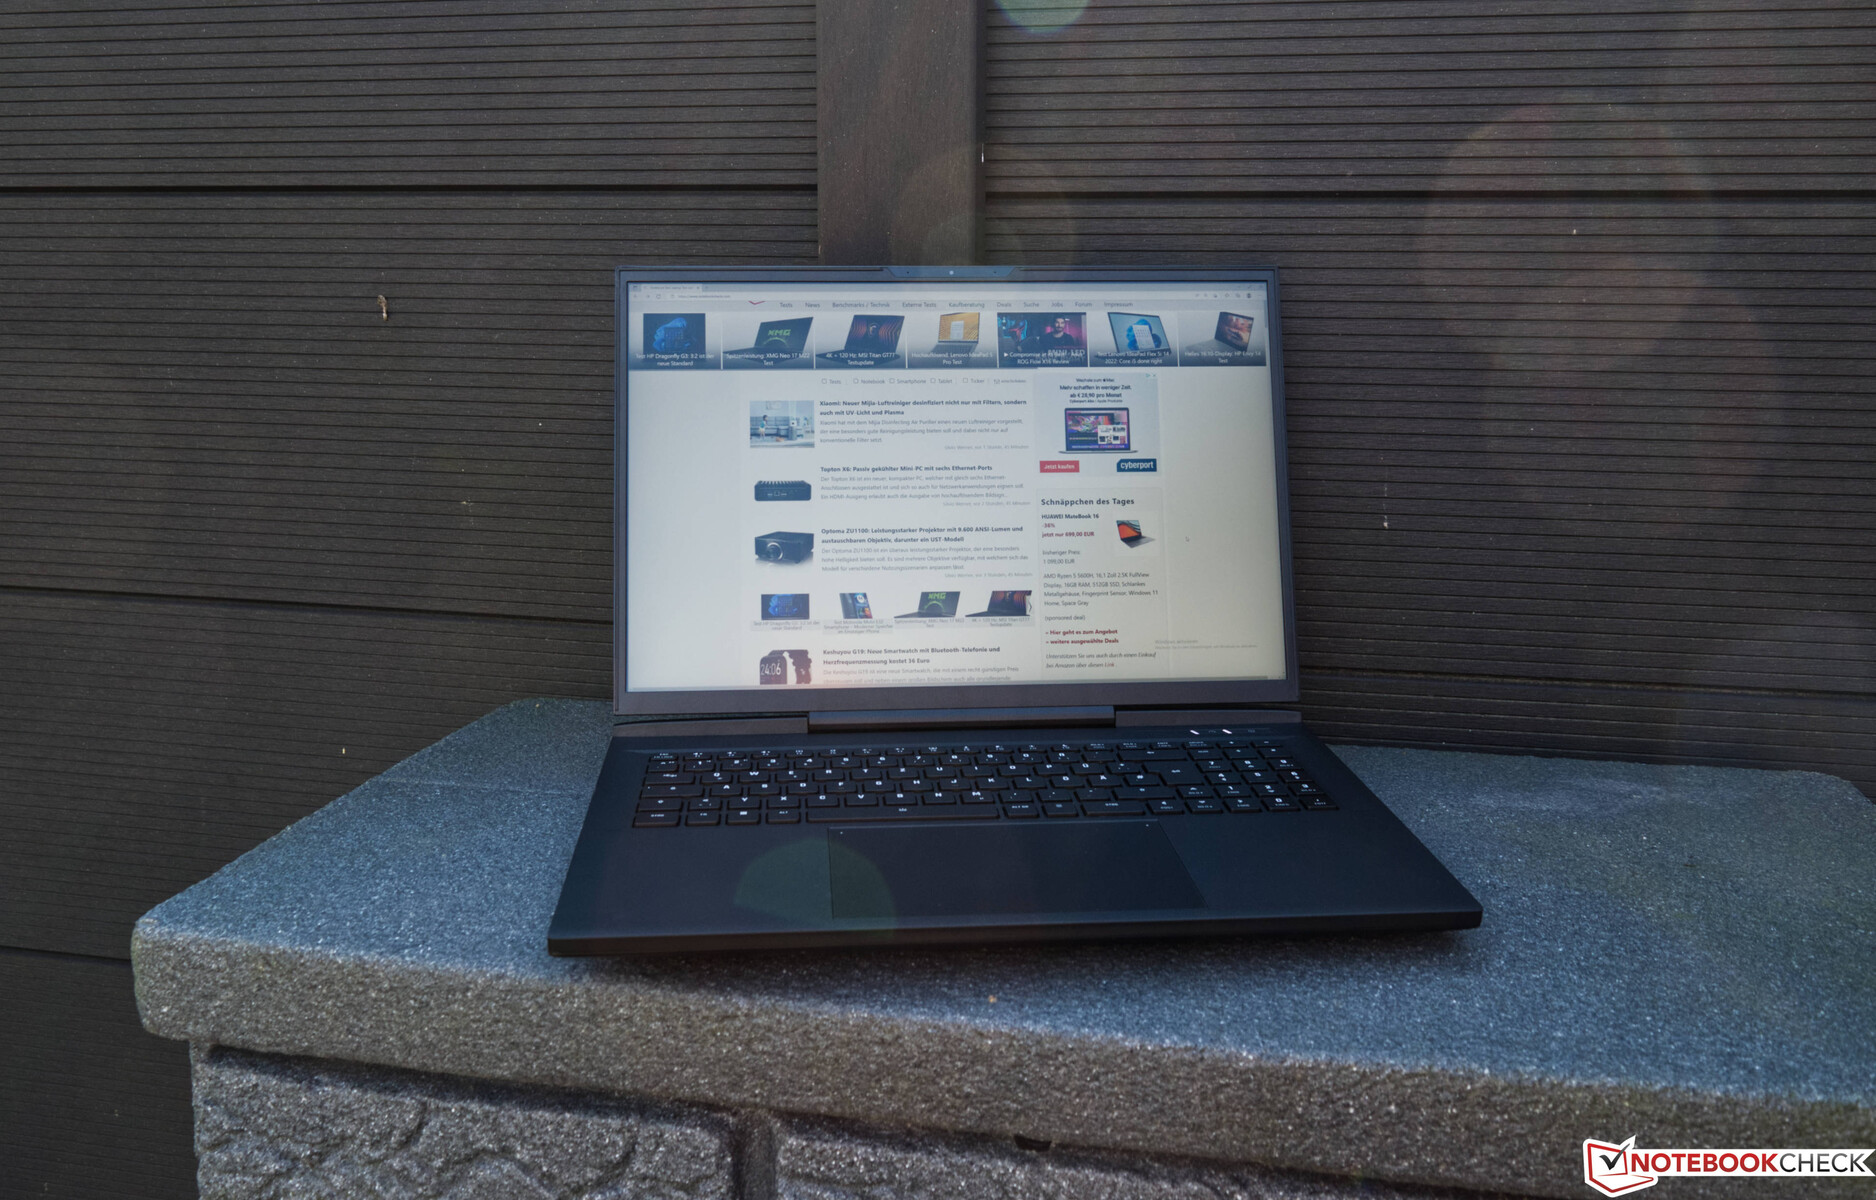
Schenker XMG Neo 17 M22 in review: High performance gaming laptop with mechanical Cherry MX keys

XMG are the three letters that denote the flagship Schenker gaming laptops. The latest Schenker XMG Neo 17, which as the name suggests, is a 17-inch laptop, is also part of this series. Many will be pleased to find that unlike many other gaming laptops, the Schenker uses a 16:10 display that lends itself slightly better to work-focused tasks. In order to ensure an appropriate performance level, the manufacturer installs AMD's brand-new Ryzen 9 6900HX in combination with an Nvidia GeForce RTX 3080 Ti Laptop GPU in the modern chassis. Thus, it is one of the absolute fastest models currently available. With 32 GB of DDR5 RAM and a 1-TB SSD, the system is well rounded. However, with a price of about 4200 USD, our configuration of the Schenker XMG Neo 17 is not exactly cheap.
Readers who are familiar with Schenker will know how many configuration options the manufactuere usually offers. This also applies to this model, for which the base model starts with the same CPU and a GeForce RTX 3070 Ti laptop GPU at around 2950 USD.
For comparison purposes, we also included devices with similar specifications. The following table shows a list of these laptops.
Potential Competitors in Comparison
Rating | Date | Model | Weight | Height | Size | Resolution | Price |
|---|---|---|---|---|---|---|---|
| 87.6 % v7 (old) | 08 / 2022 | Schenker XMG Neo 17 M22 R9 6900HX, GeForce RTX 3080 Ti Laptop GPU | 2.8 kg | 27 mm | 17.00" | 2560x1600 | |
| 88.3 % v7 (old) | 08 / 2022 | MSI Titan GT77 12UHS i9-12900HX, GeForce RTX 3080 Ti Laptop GPU | 3.3 kg | 23 mm | 17.30" | 1920x1080 | |
| 89.9 % v7 (old) | 07 / 2022 | Razer Blade 17 Early 2022 i9-12900H, GeForce RTX 3080 Ti Laptop GPU | 2.8 kg | 19.9 mm | 17.30" | 3840x2160 | |
| 87.2 % v7 (old) | 06 / 2022 | Acer Predator Triton 500 SE PT516-52s-70KX i7-12700H, GeForce RTX 3080 Ti Laptop GPU | 2.3 kg | 19.9 mm | 16.00" | 2560x1600 | |
| 88.2 % v7 (old) | 05 / 2022 | Asus ROG Zephyrus Duo 16 GX650RX R9 6900HX, GeForce RTX 3080 Ti Laptop GPU | 2.6 kg | 20.5 mm | 16.00" | 3840x2400 | |
| 86.8 % v7 (old) | 07 / 2022 | MSI Raider GE77 HX 12UHS i9-12900HX, GeForce RTX 3080 Ti Laptop GPU | 3.1 kg | 25.9 mm | 17.30" | 3840x2160 |
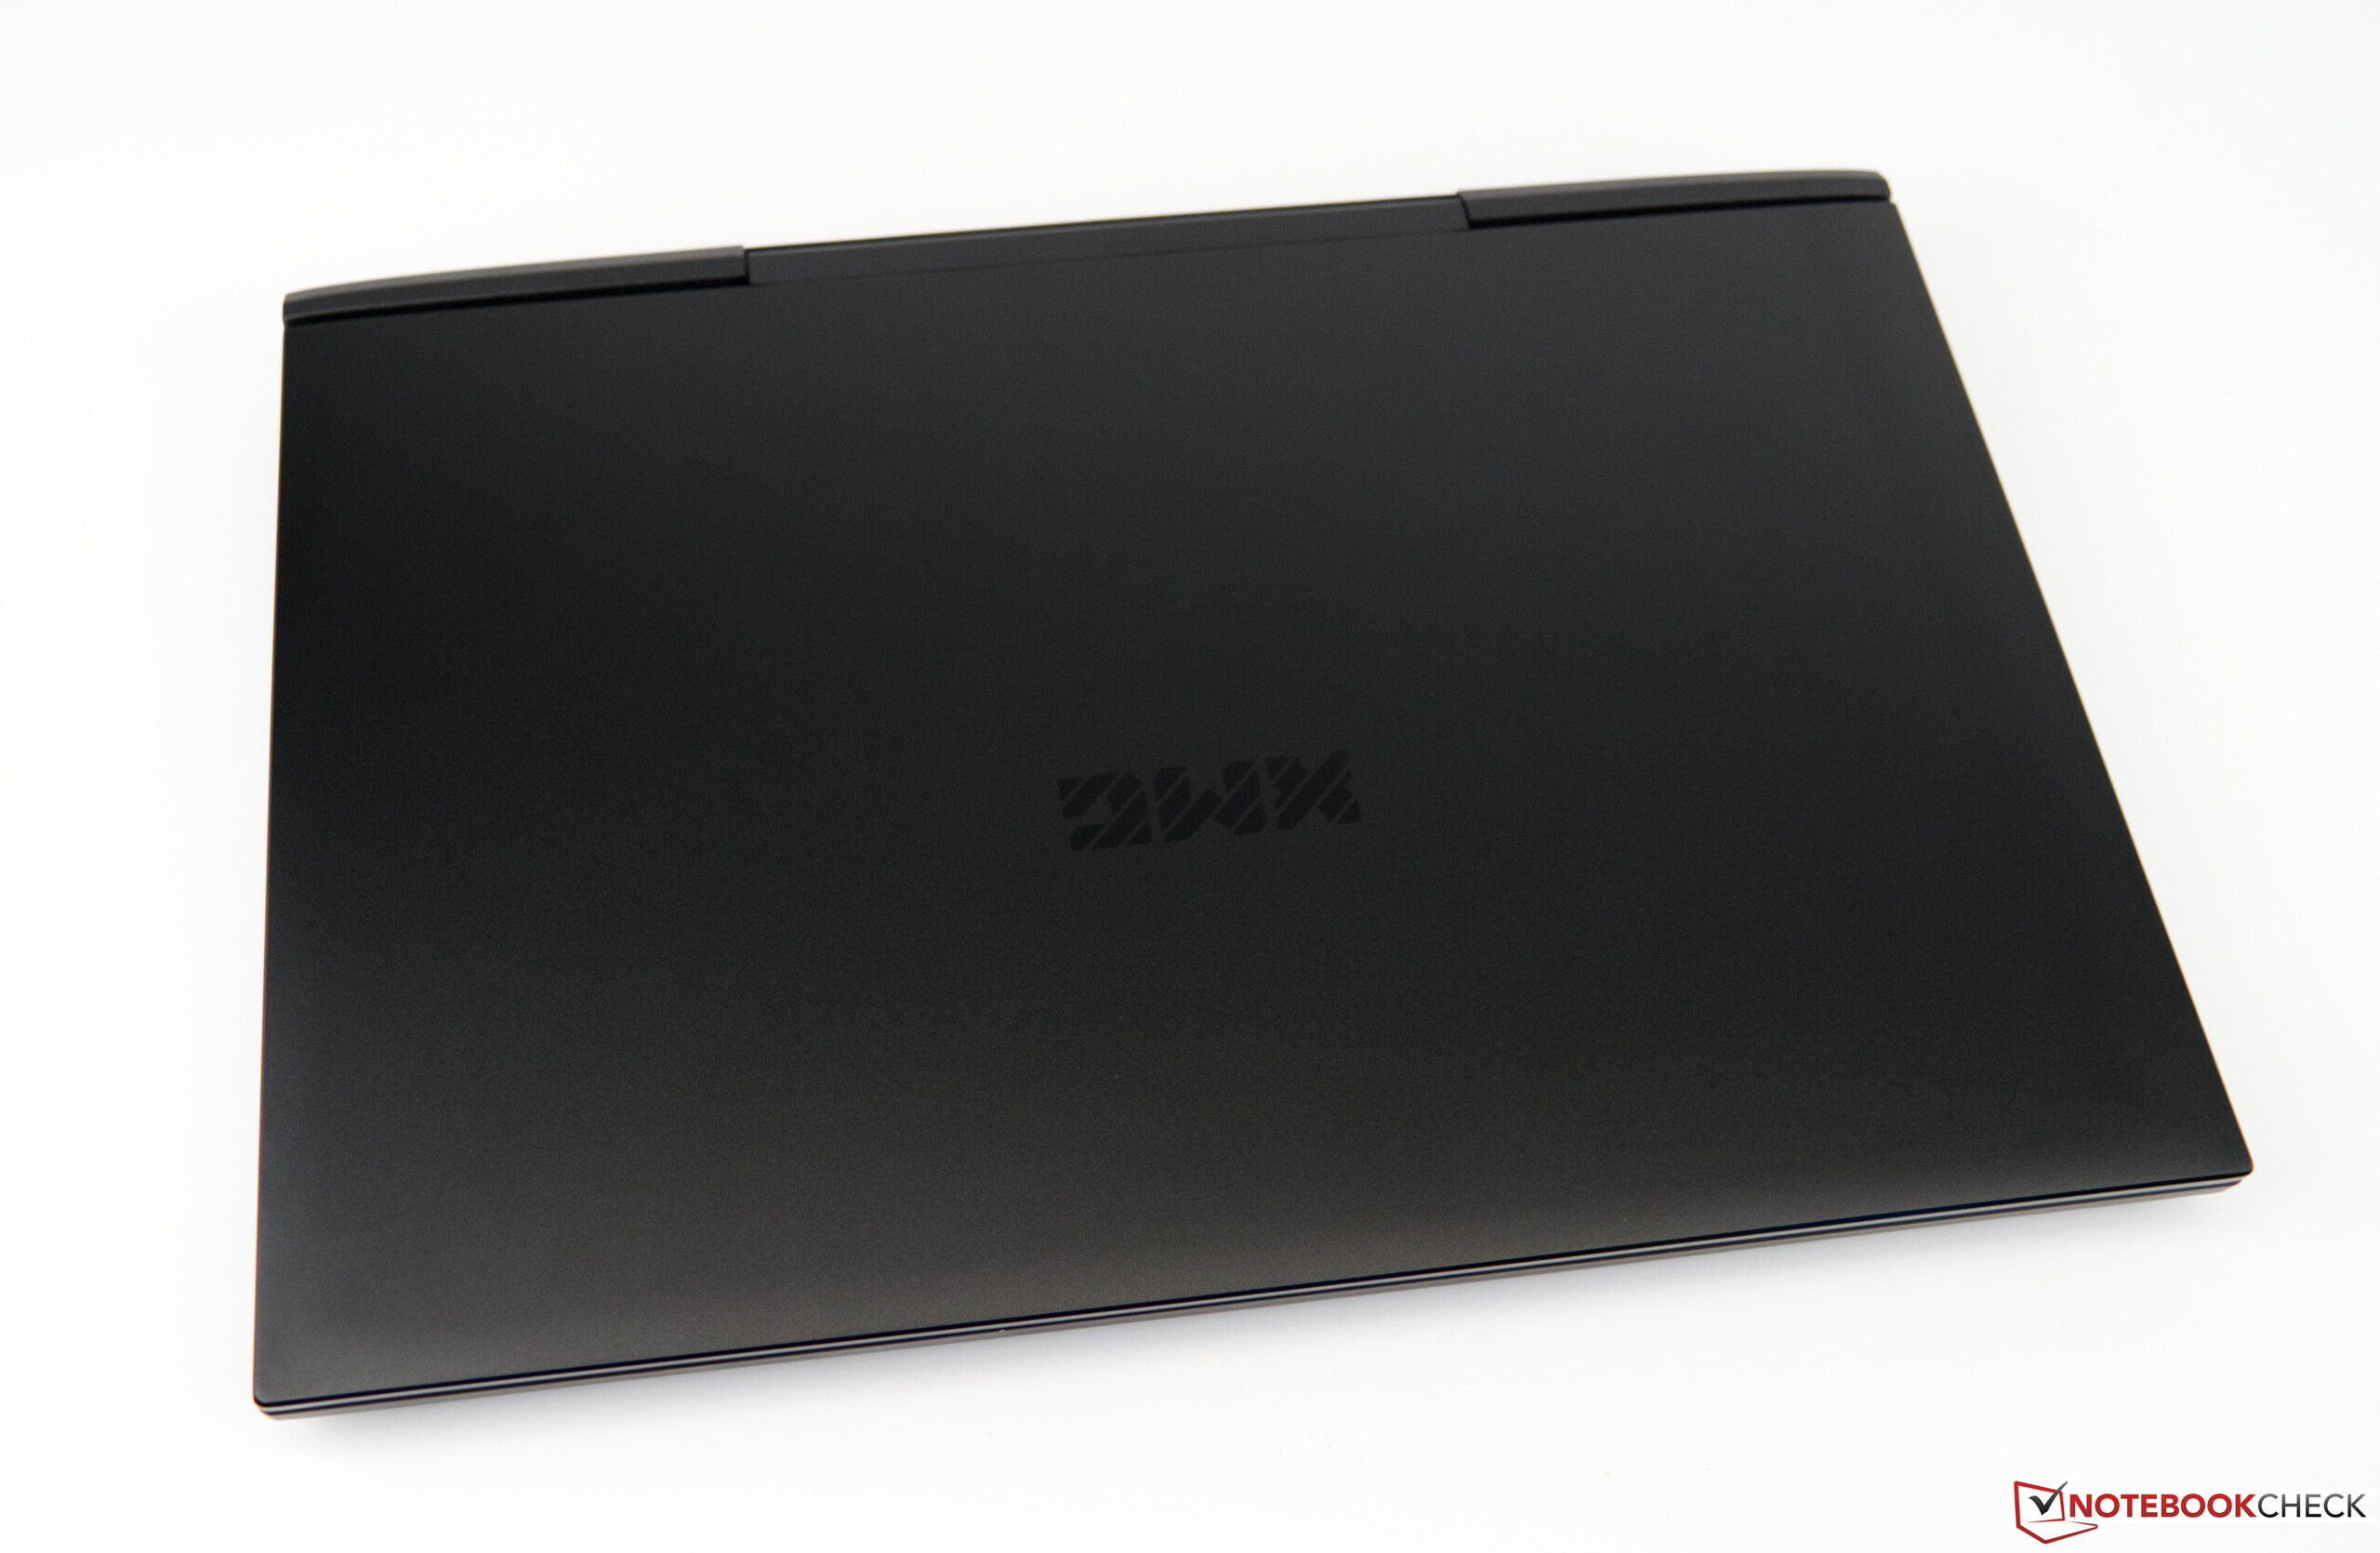
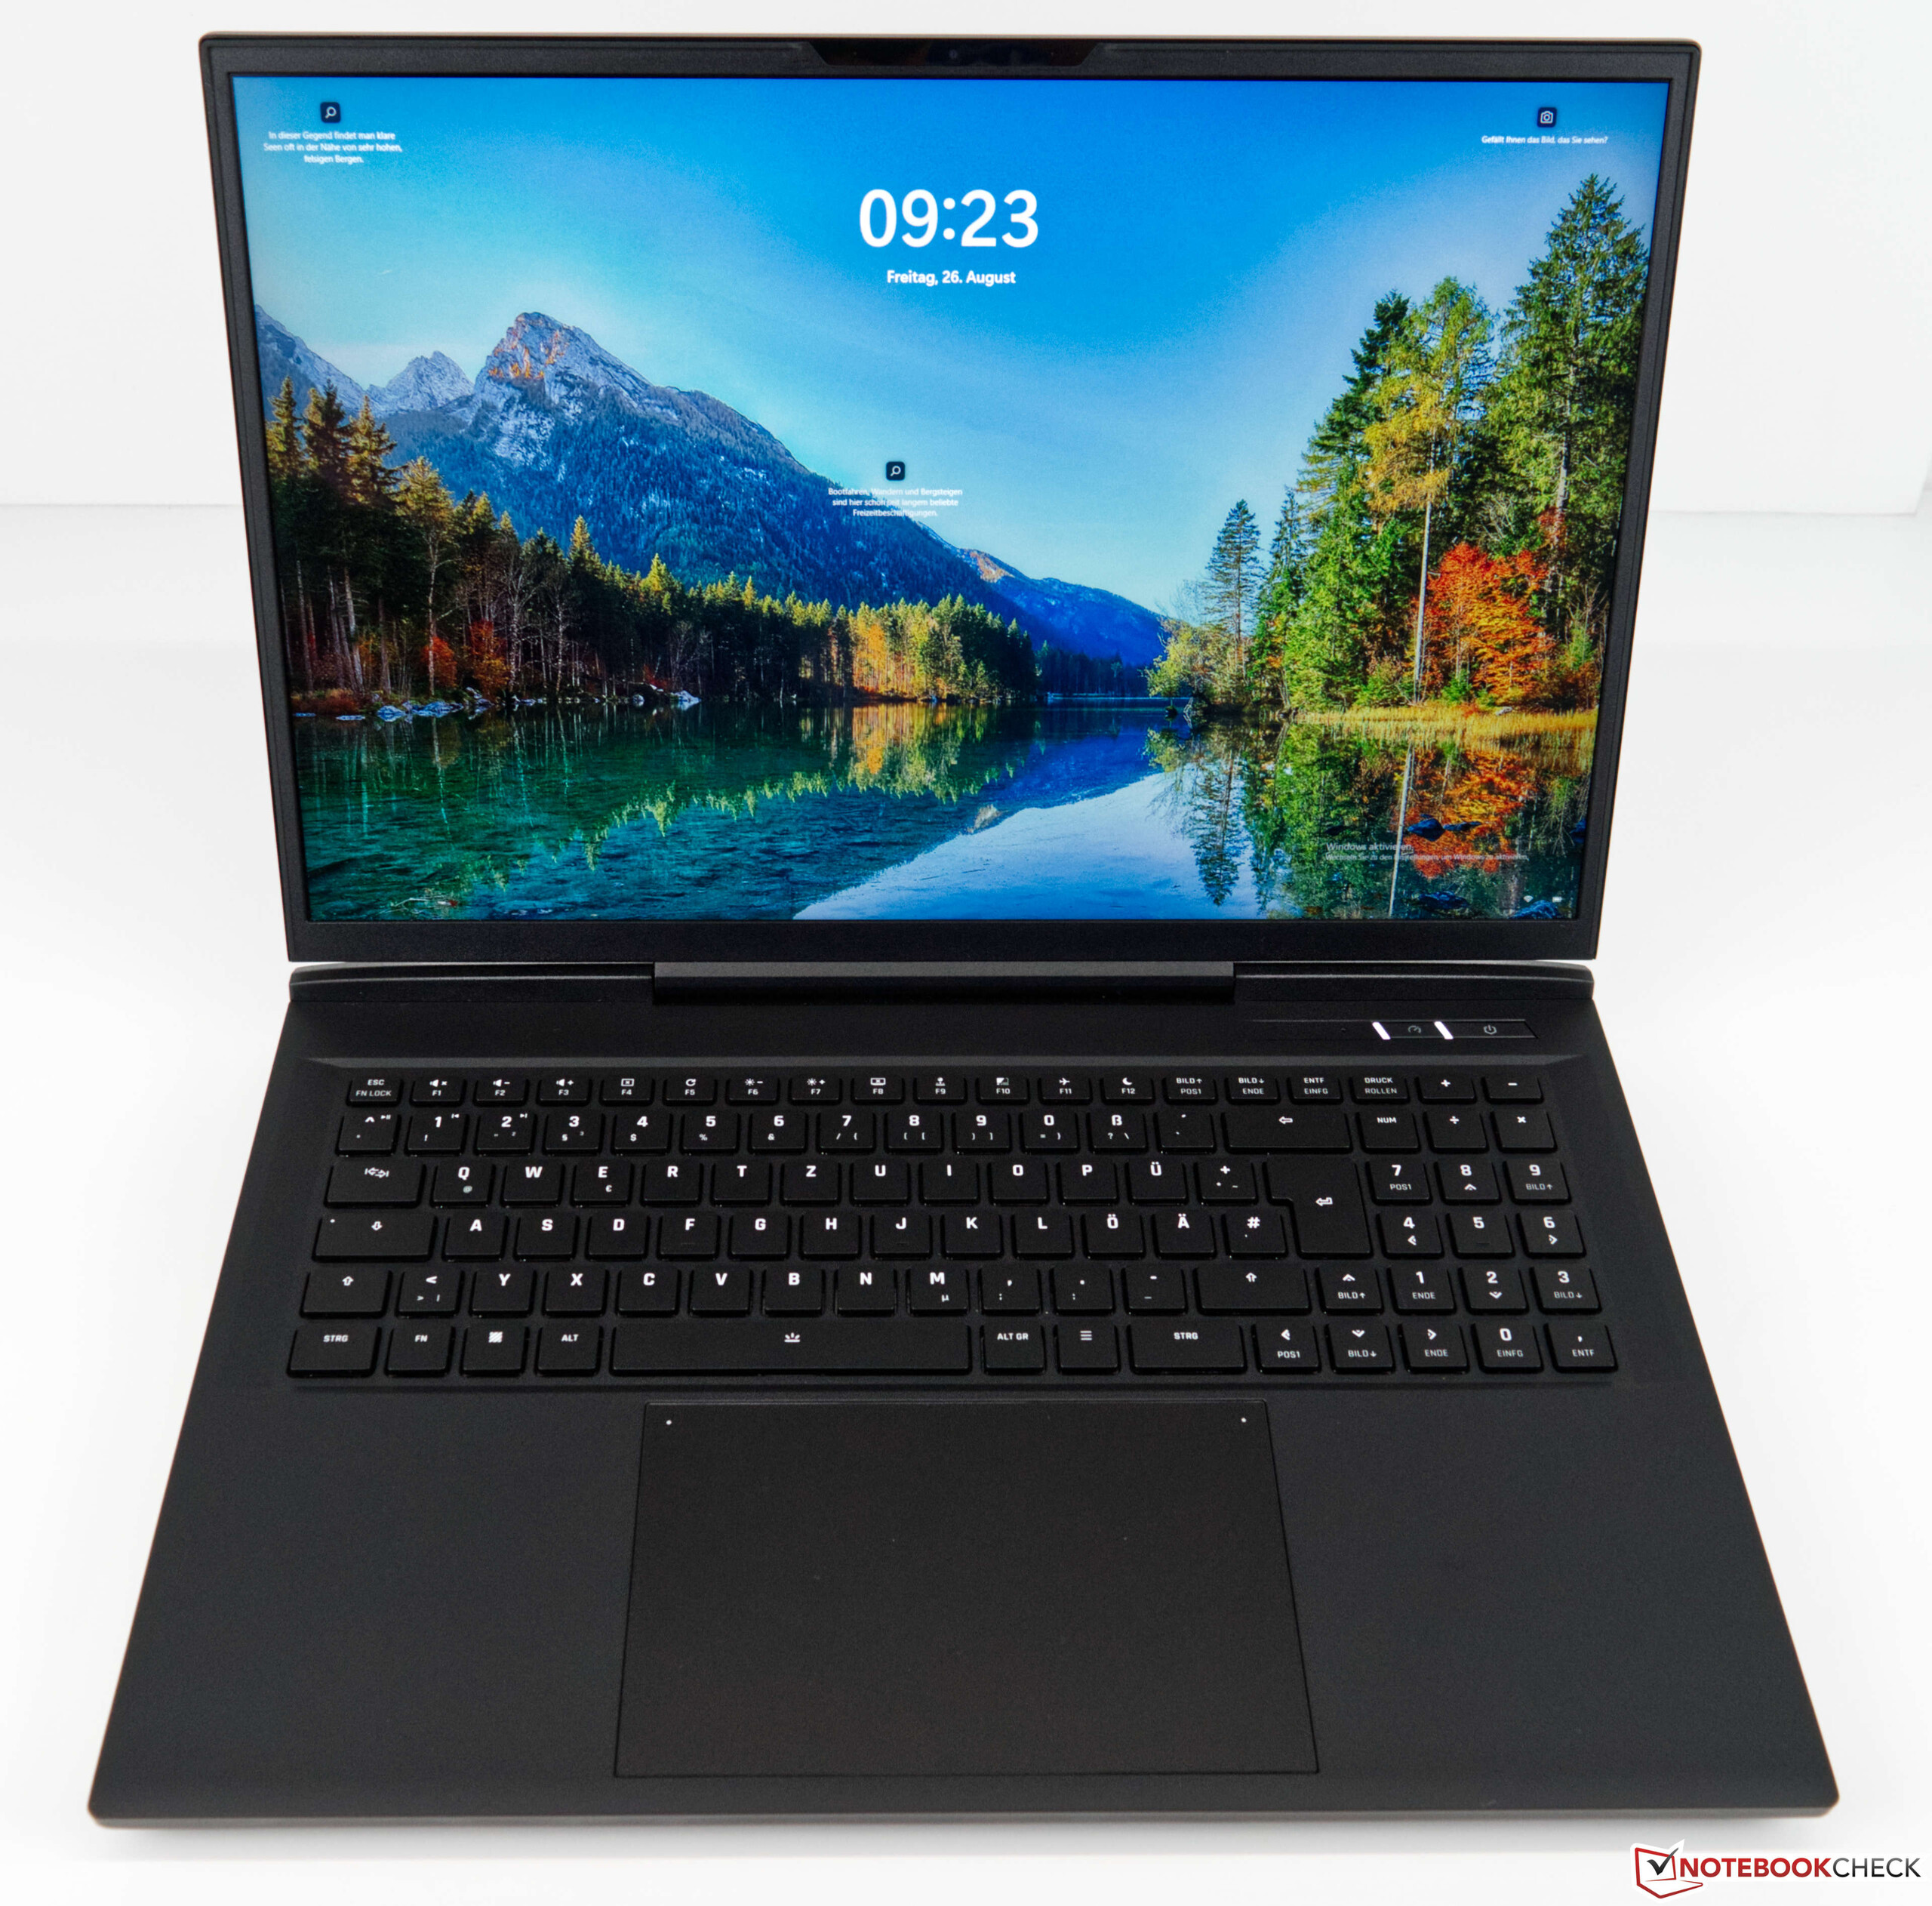
Chassis - Very Robust Base
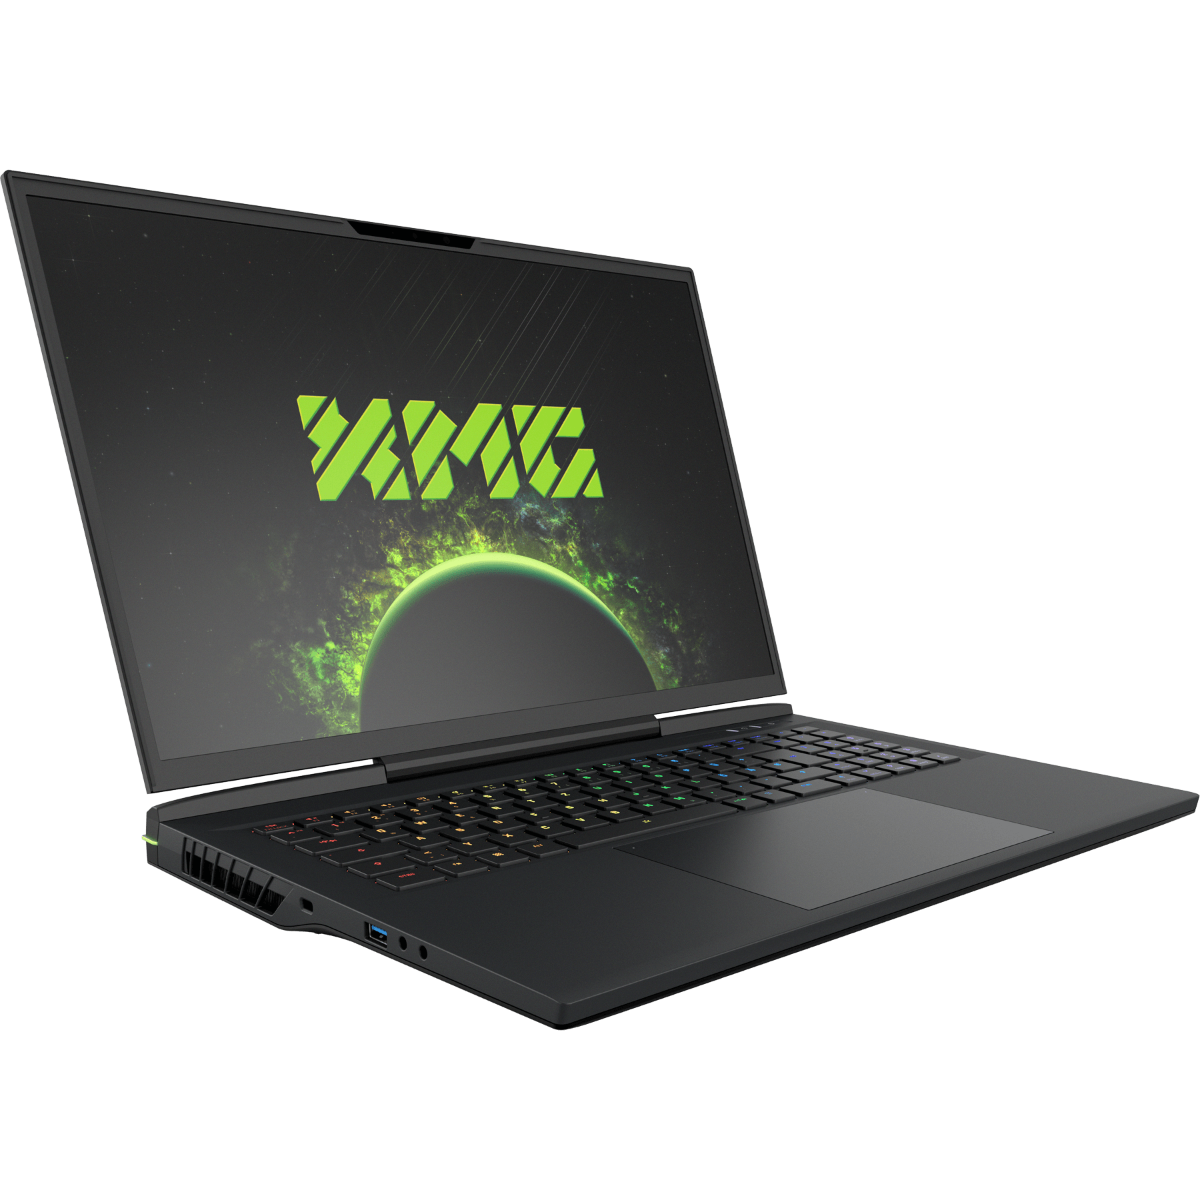
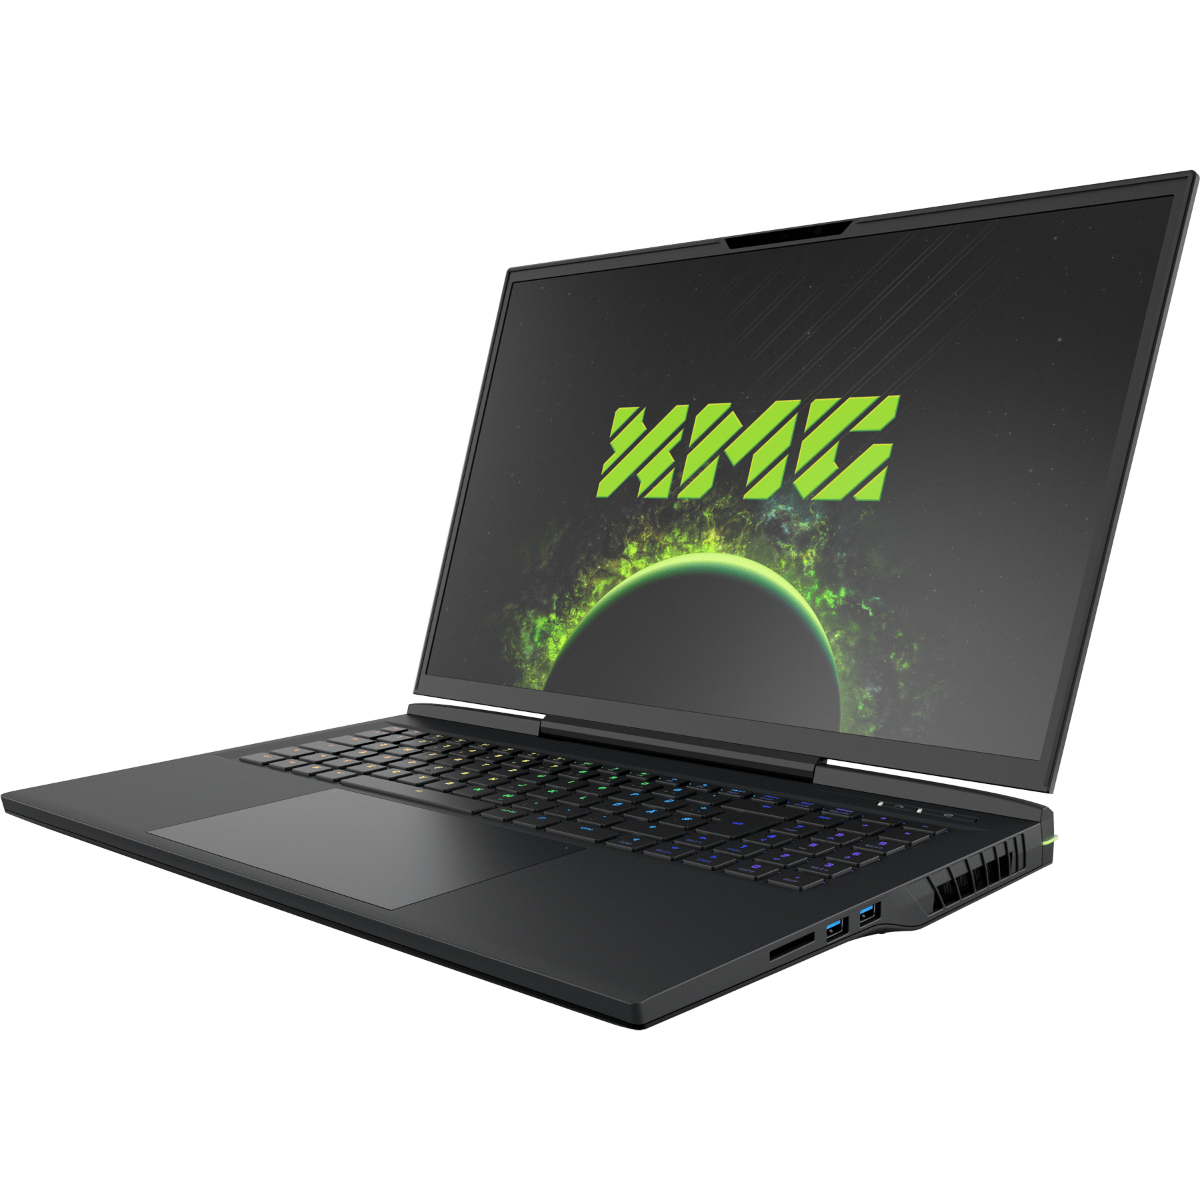
Visually, the Schenker XMG Neo 17 is quite obviously a Schenker gaming laptop. It appears subtle and omits flashy RGB lighting. The matte metal surfaces offer premium aesthetics, although fingerprints become visible on them after a very short amount of time. Plastic is the material of choice for the display bezels and the base unit. The latter is coated with a soft touch layer. Thankfully, it is slightly less susceptible to fingerprints. In spite of the size, the base is fairly rigid. Under pressure the Neo 17 shows itself to be robust and only yields slightly under a large amount of pressure. The same holds true for the lid. The centered hinges are up to the task and prevent excessive teetering well.

Size Comparison
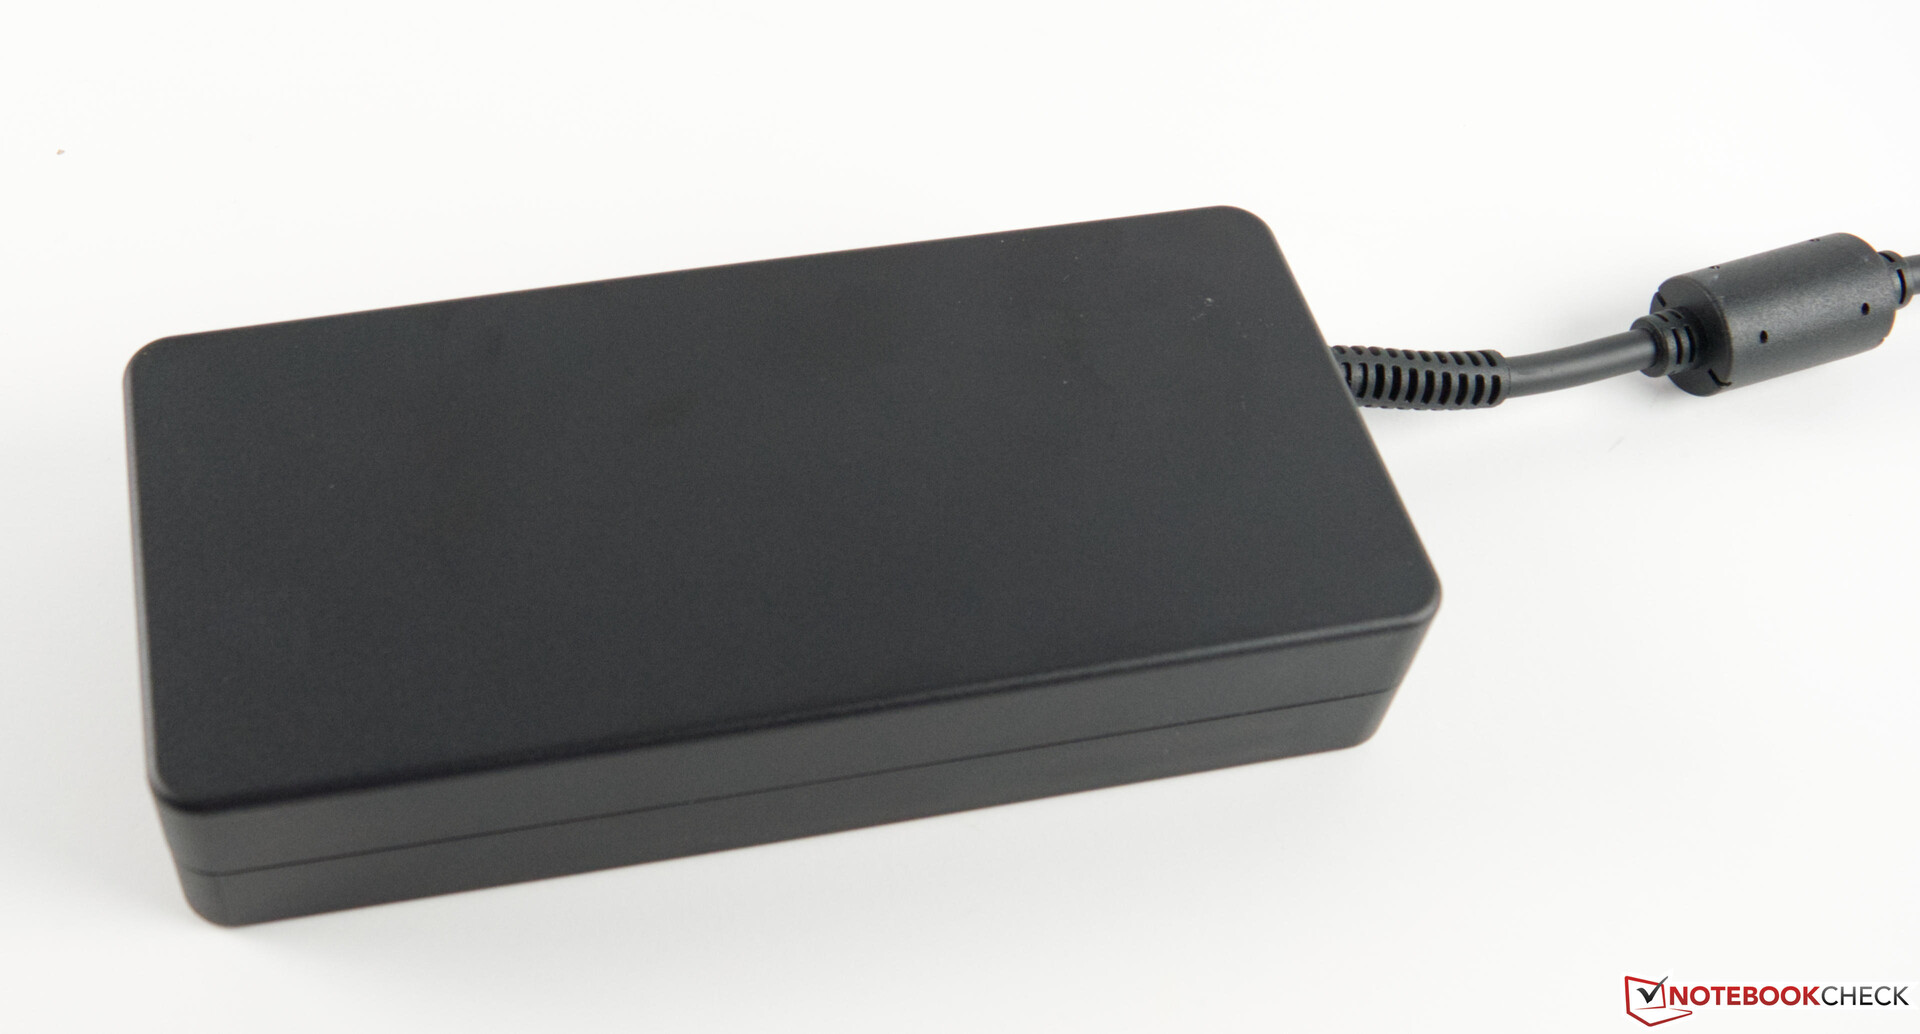
With 2.8 kg (6.17 lbs), the Schenker XMG Neo 17 falls into the middle range in terms of the weight. The powerful 330-watt AC adapter almost weighs an additional kilogram (980 grams/2.16 lbs).
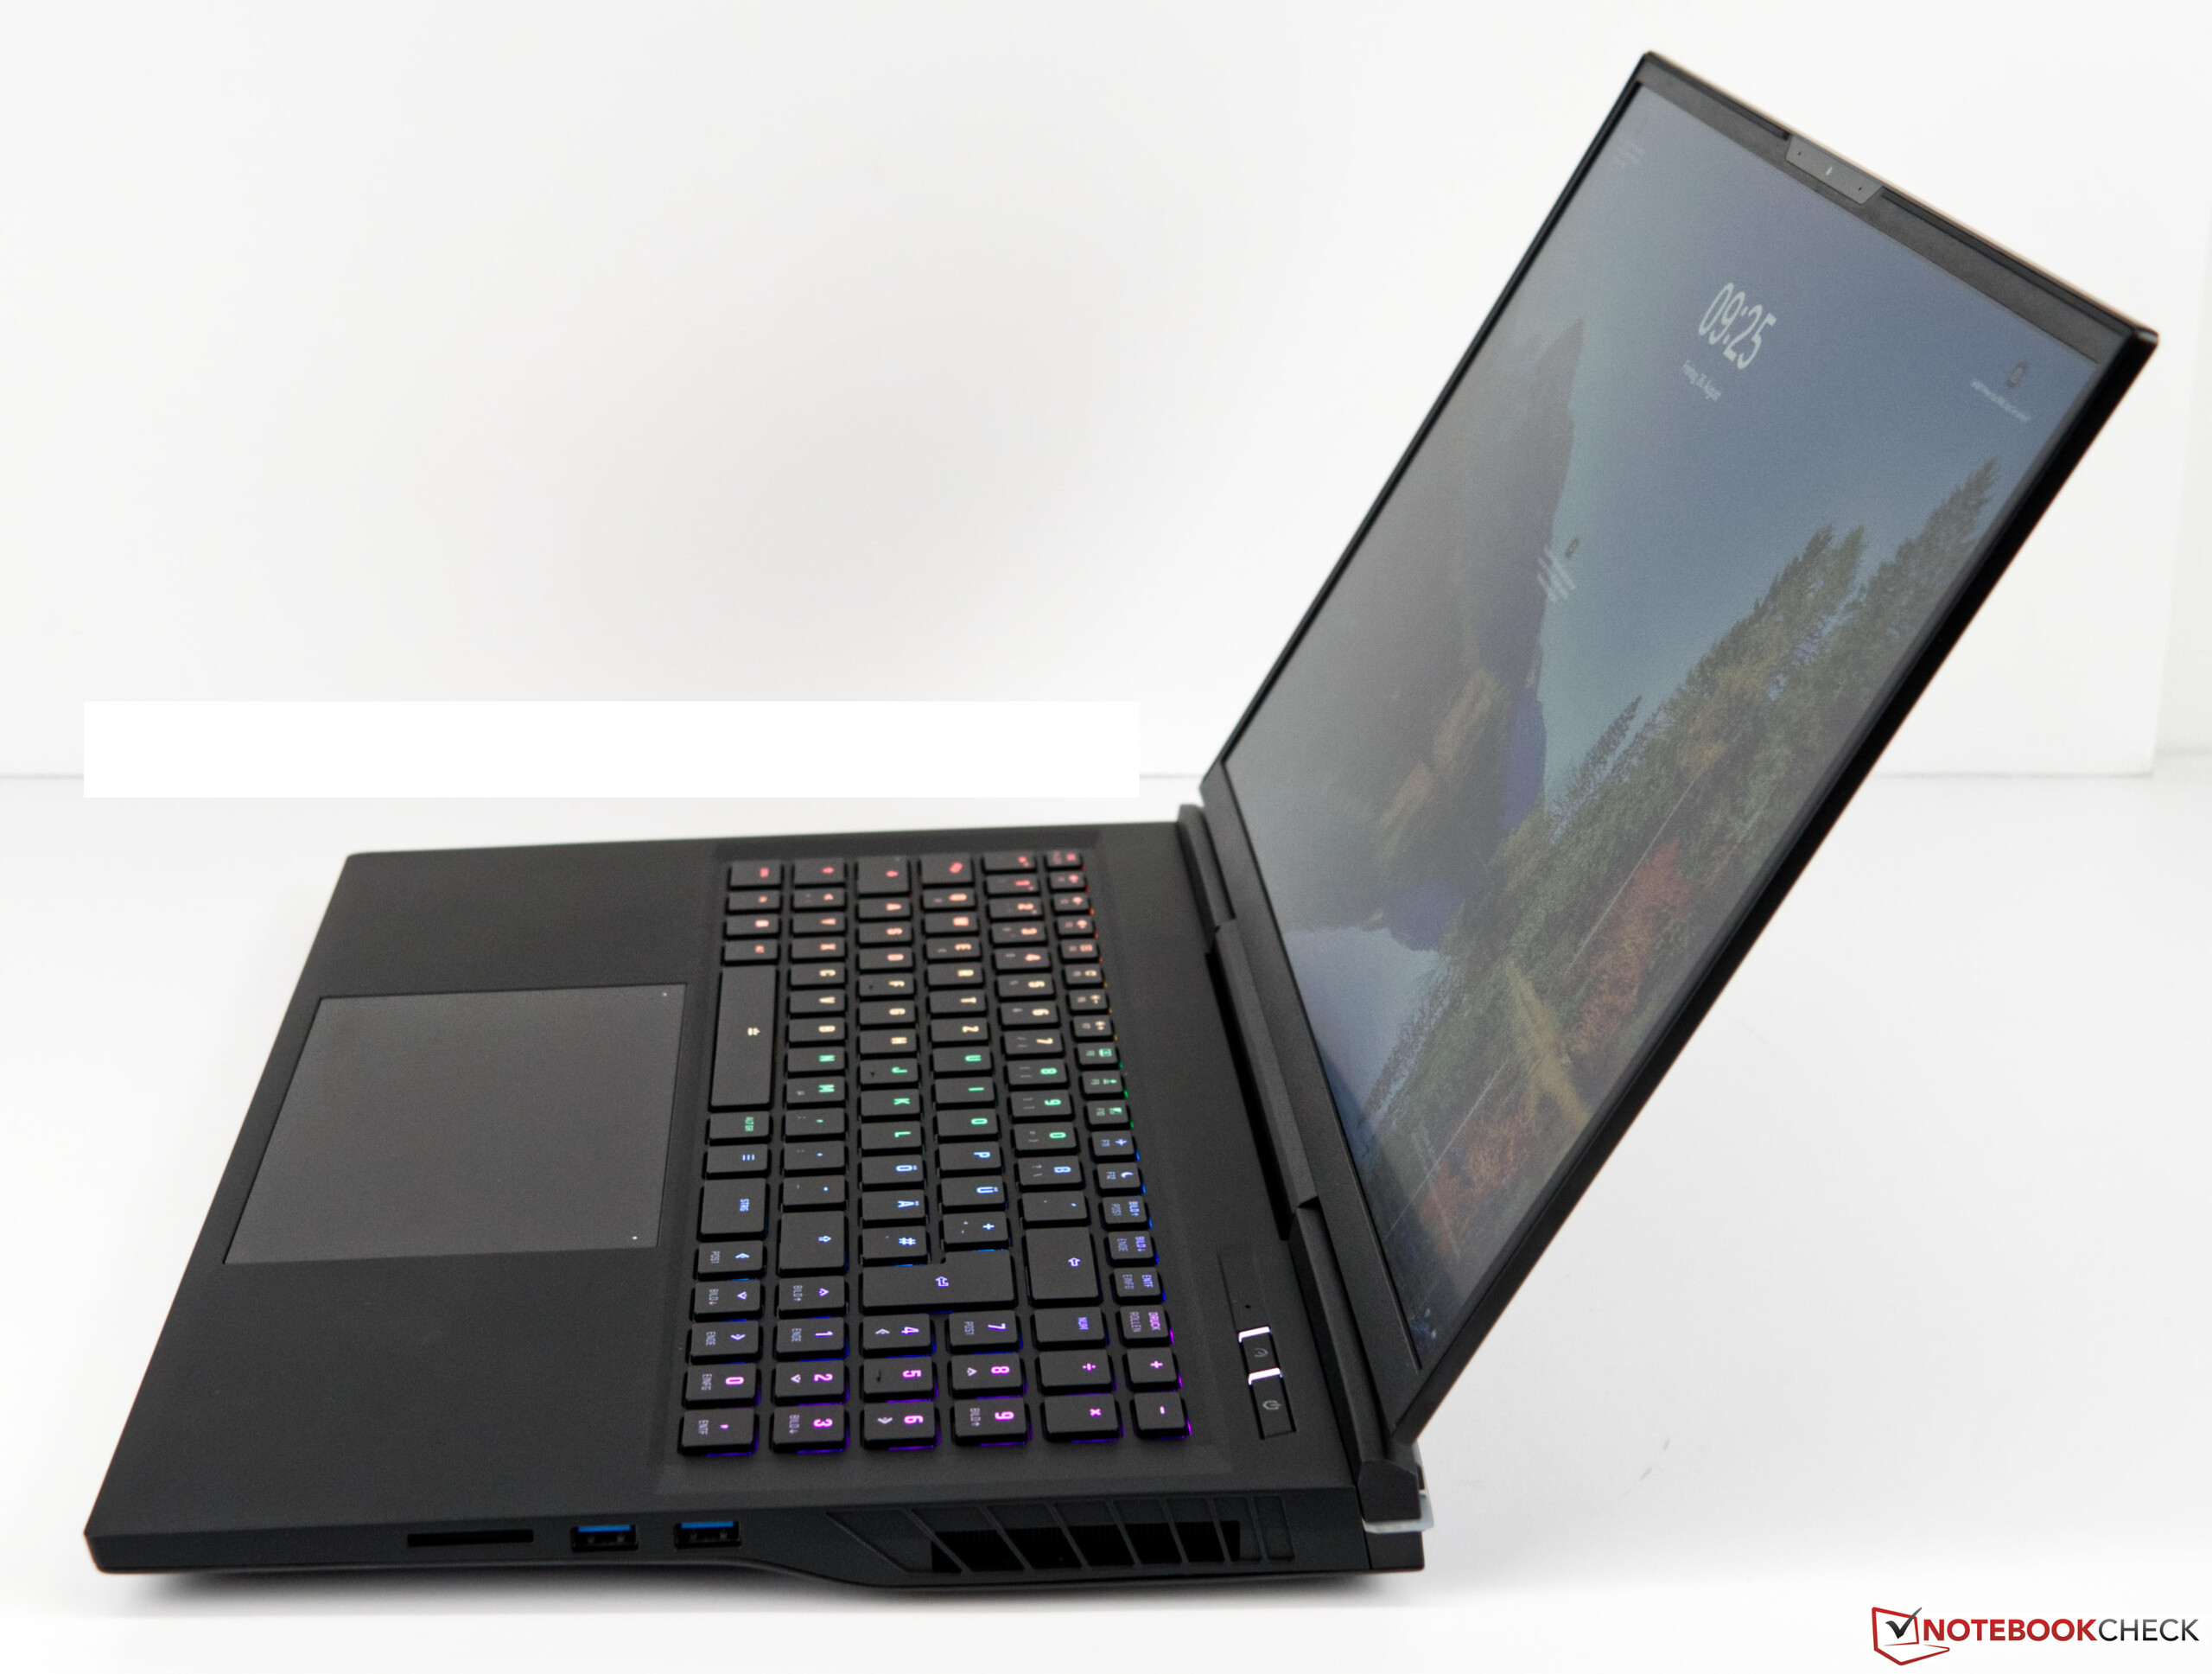
Connectivity - Unfortunately no Thunderbolt 4
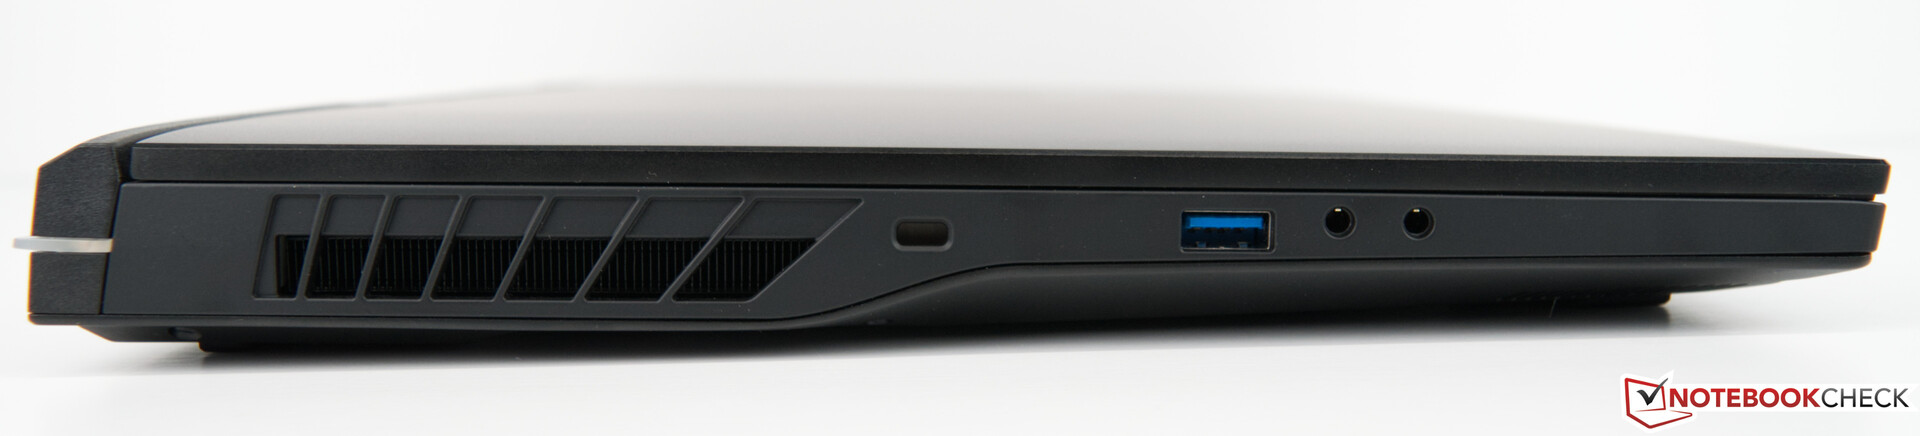
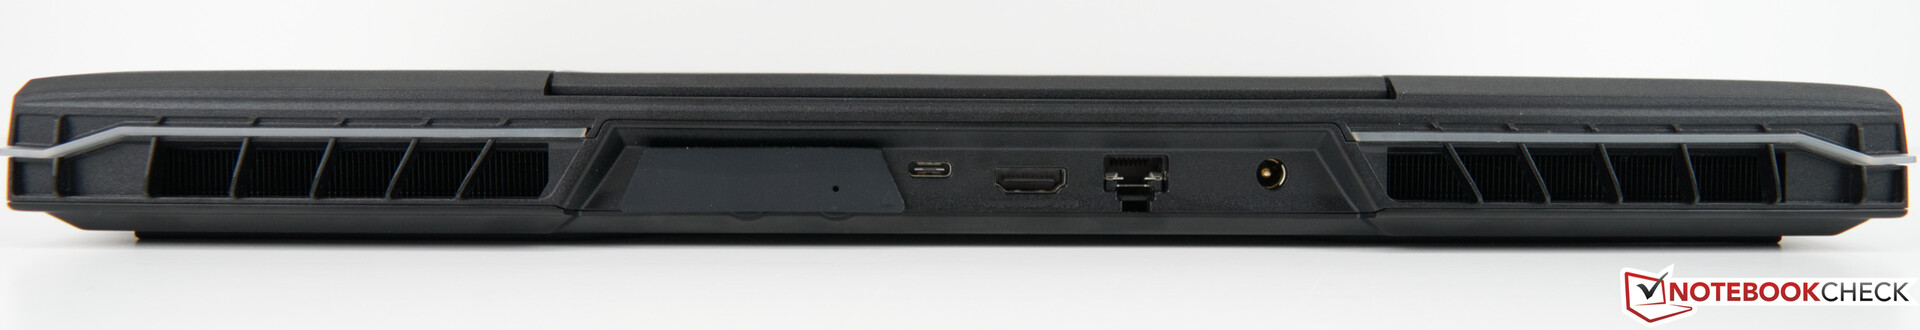
The Schenker XMG Neo 17 M22 offers a good variety of external interfaces. The three USB-A ports are distributed across both sides for comfortably day-to-day use. Meanwhile, ports that are used less frequently such as HDMI or LAN are located on the back. The AC adapter is also plugged in here and thus does not interfere with the peripherals while on mains. Unfortunately, since the AC adapter's plug is angled, using the adjacent ports requires more patience when the power cord is routed toward the right side behind the device. Additionally, the barrel plug can be plugged in very easily making it prone to accidental unplugging.
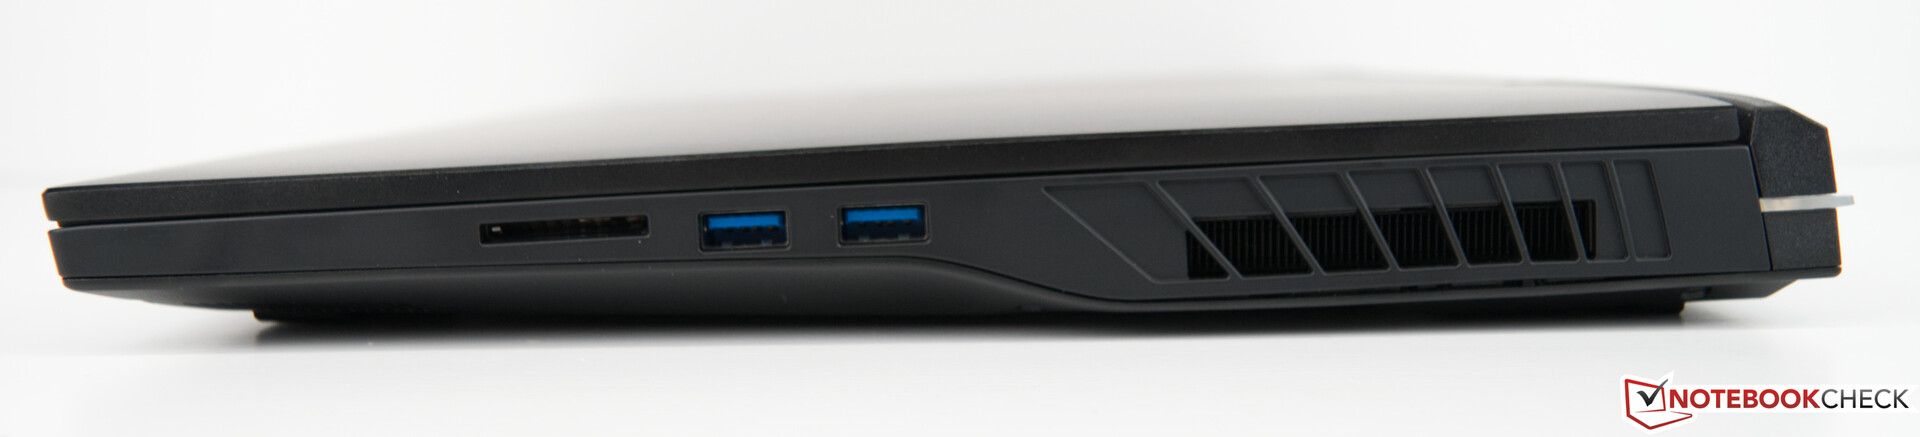
SD Card Reader
The Schenker XMG Neo 17 M22 is equipped with an SD card reader that supports USB-3 speeds. At 69 MB/s, its performance is still just on par with similar devices. Both the Asus ROG Zephyrus Duo and the Razer Blade 17 demonstrate the speeds of which our reference card (Angelbird AV Pro V60) is capable of with the UHS-II standard.
| SD Card Reader - average JPG Copy Test (av. of 3 runs) | |
| Asus ROG Zephyrus Duo 16 GX650RX (AV PRO microSD 128 GB V60) | |
| Razer Blade 17 Early 2022 (AV PRO microSD 128 GB V60) | |
| Average of class Gaming (20.9 - 210, n=55, last 2 years) | |
| MSI Titan GT77 12UHS (AV PRO microSD 128 GB V60) | |
| Schenker XMG Neo 17 M22 (AV PRO microSD 128 GB V60) | |
| Acer Predator Triton 500 SE PT516-52s-70KX (AV PRO microSD 128 GB V60) | |
| MSI Raider GE77 HX 12UHS (AV PRO microSD 128 GB V60) | |
Communication
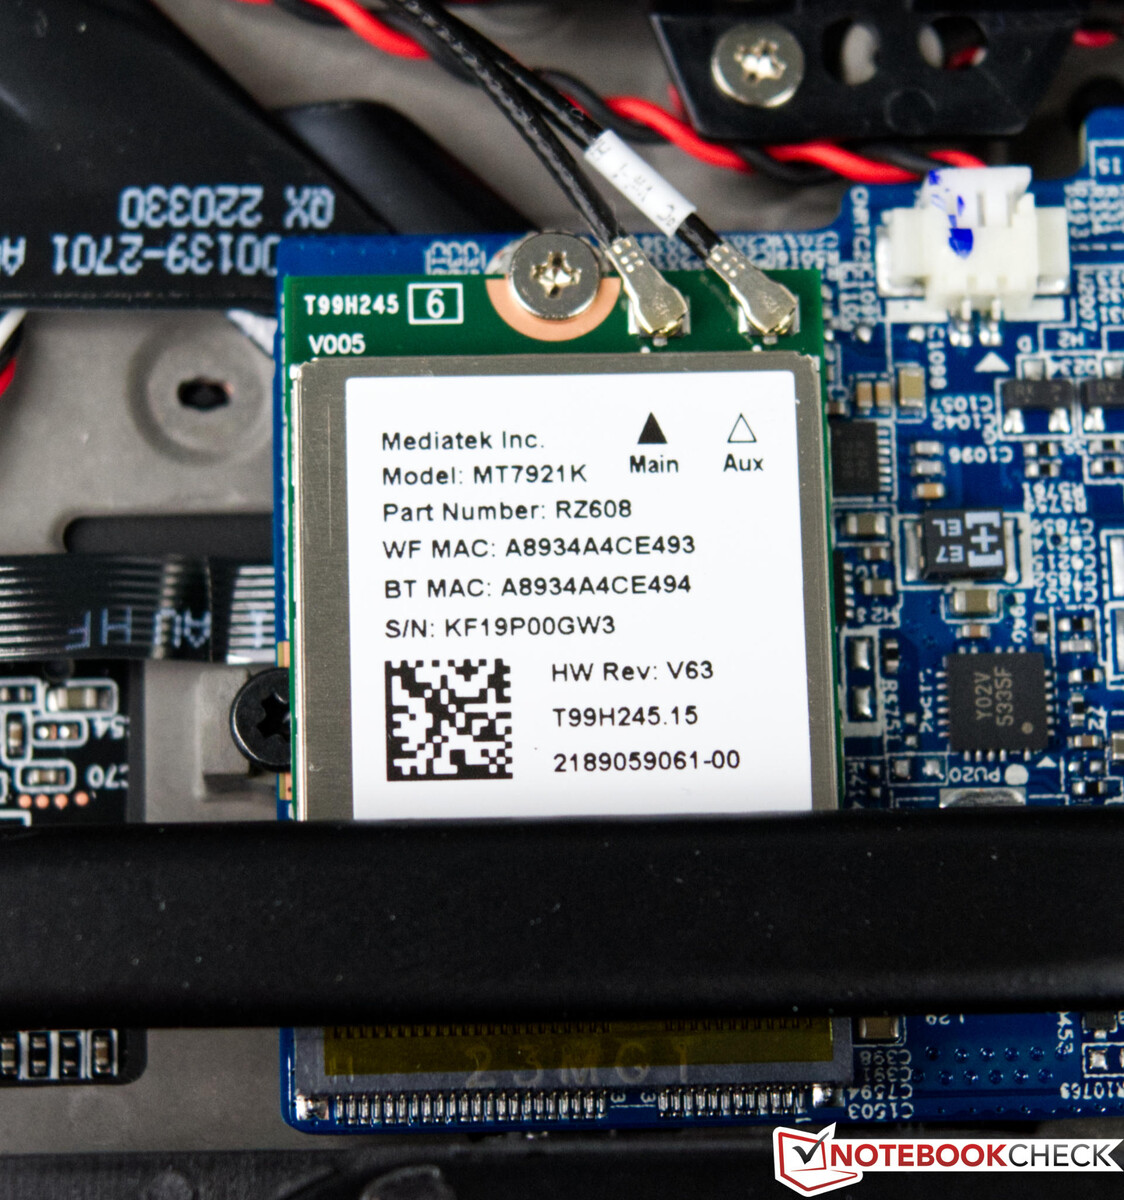
Schenker uses an AMD RZ608 as the Wi-Fi module of choice in our device. The base option is not able to outperform its competitors in our testing. The Intel Wi-Fi 6 AX200 and the Rivet Networks Killer Wi-Fi 6 AX1650x are available as alternative configuration options. We would have also liked to see a Wi-Fi 6E option. Wired networking is possible at up to 2.5 Gb/s - a good choice.
Webcam
There are not many gaming laptops with good webcams. Similarly, the Schenker XMG Neo 17's webcam is lacking both in terms of the color accuracy and the sharpness, as our pictures show. Since the integrated camera supports "Windows Hello", it can be used as an authentication method.


Accessories
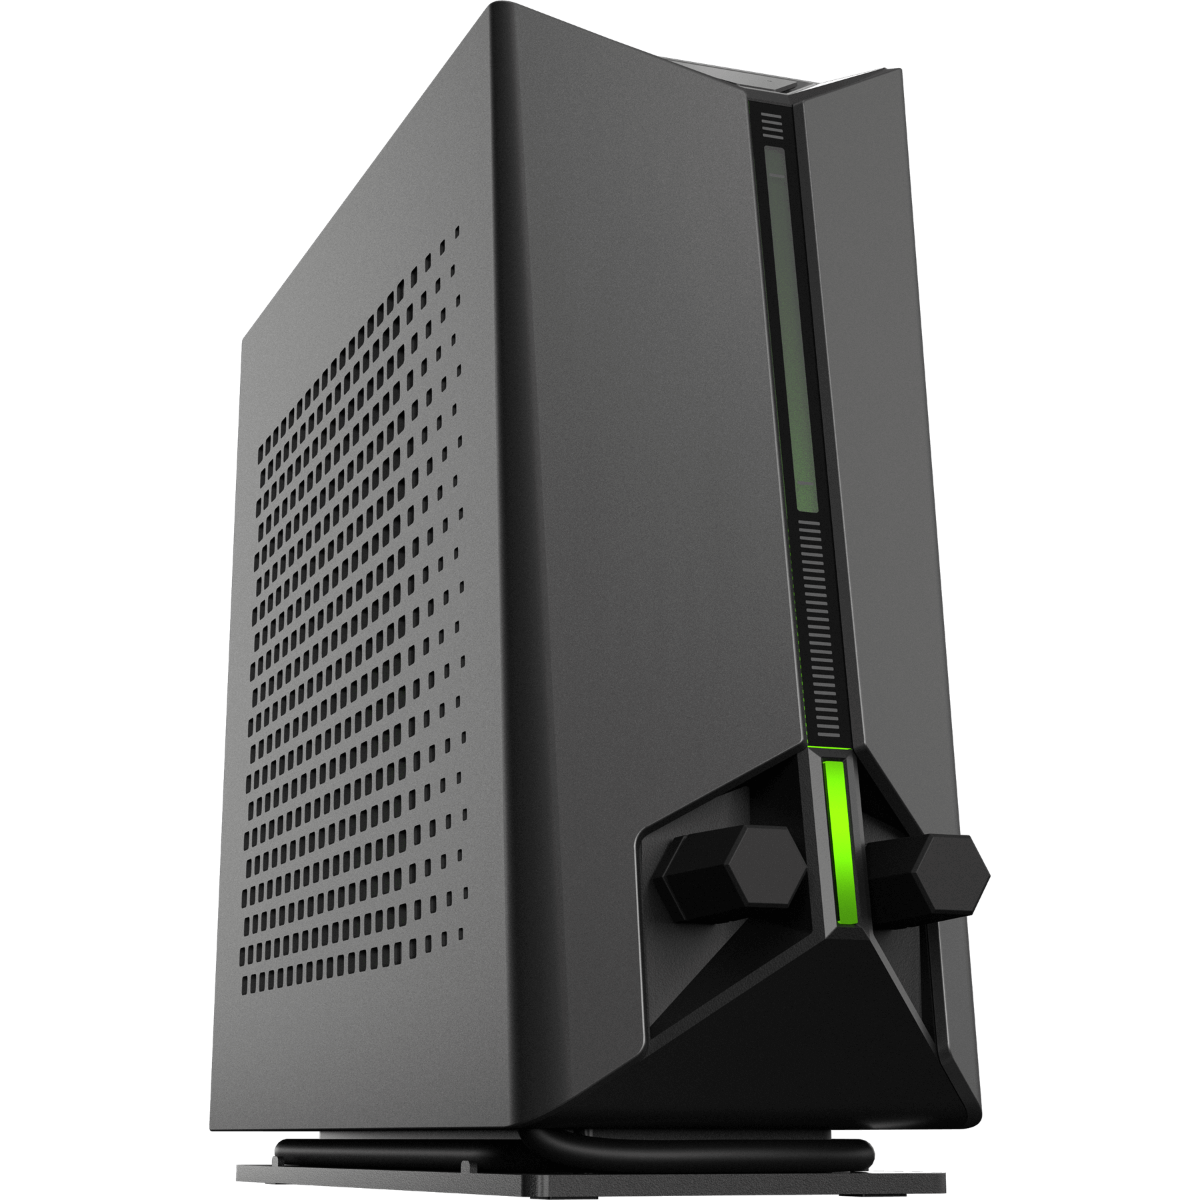
The scope of delivery includes the device itself, a 330-watt AC adapter, and a USB thumbdrive with drivers. With the Schenker Oasis, the XMG Neo 17 M22 offers an optional, external watercooling solution. It is available separately for approximately 200 USD on Schenker's online store.
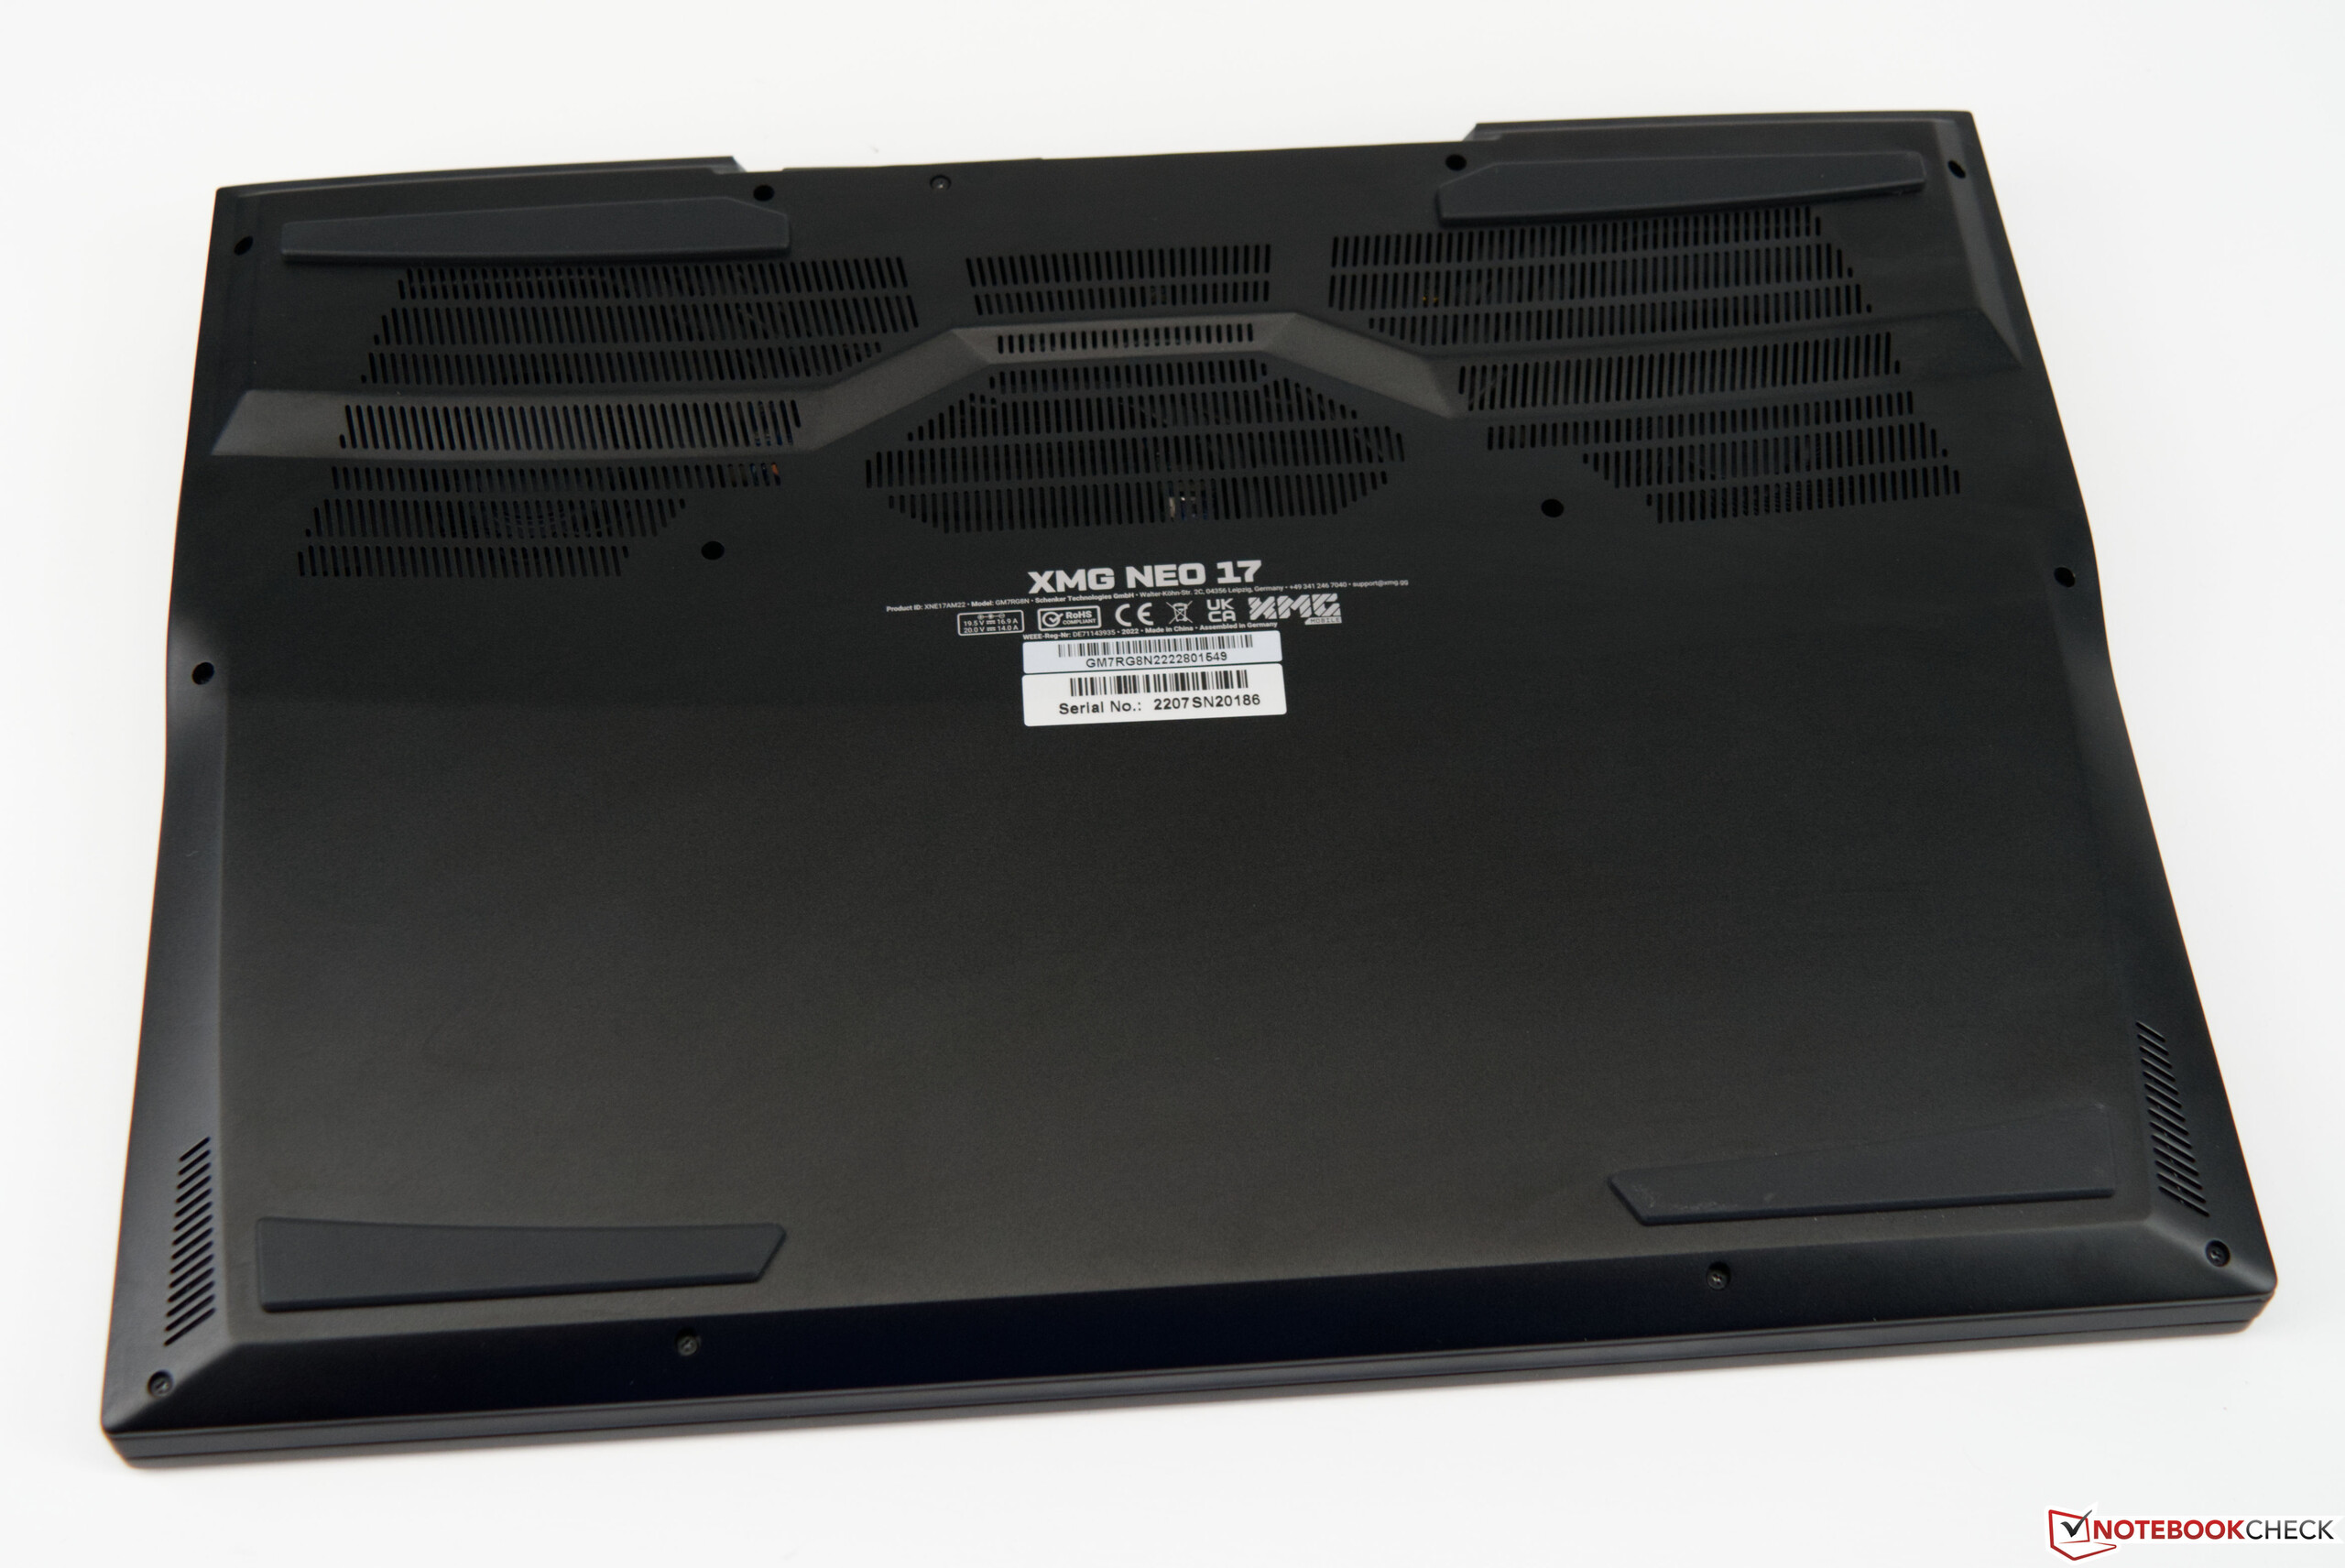
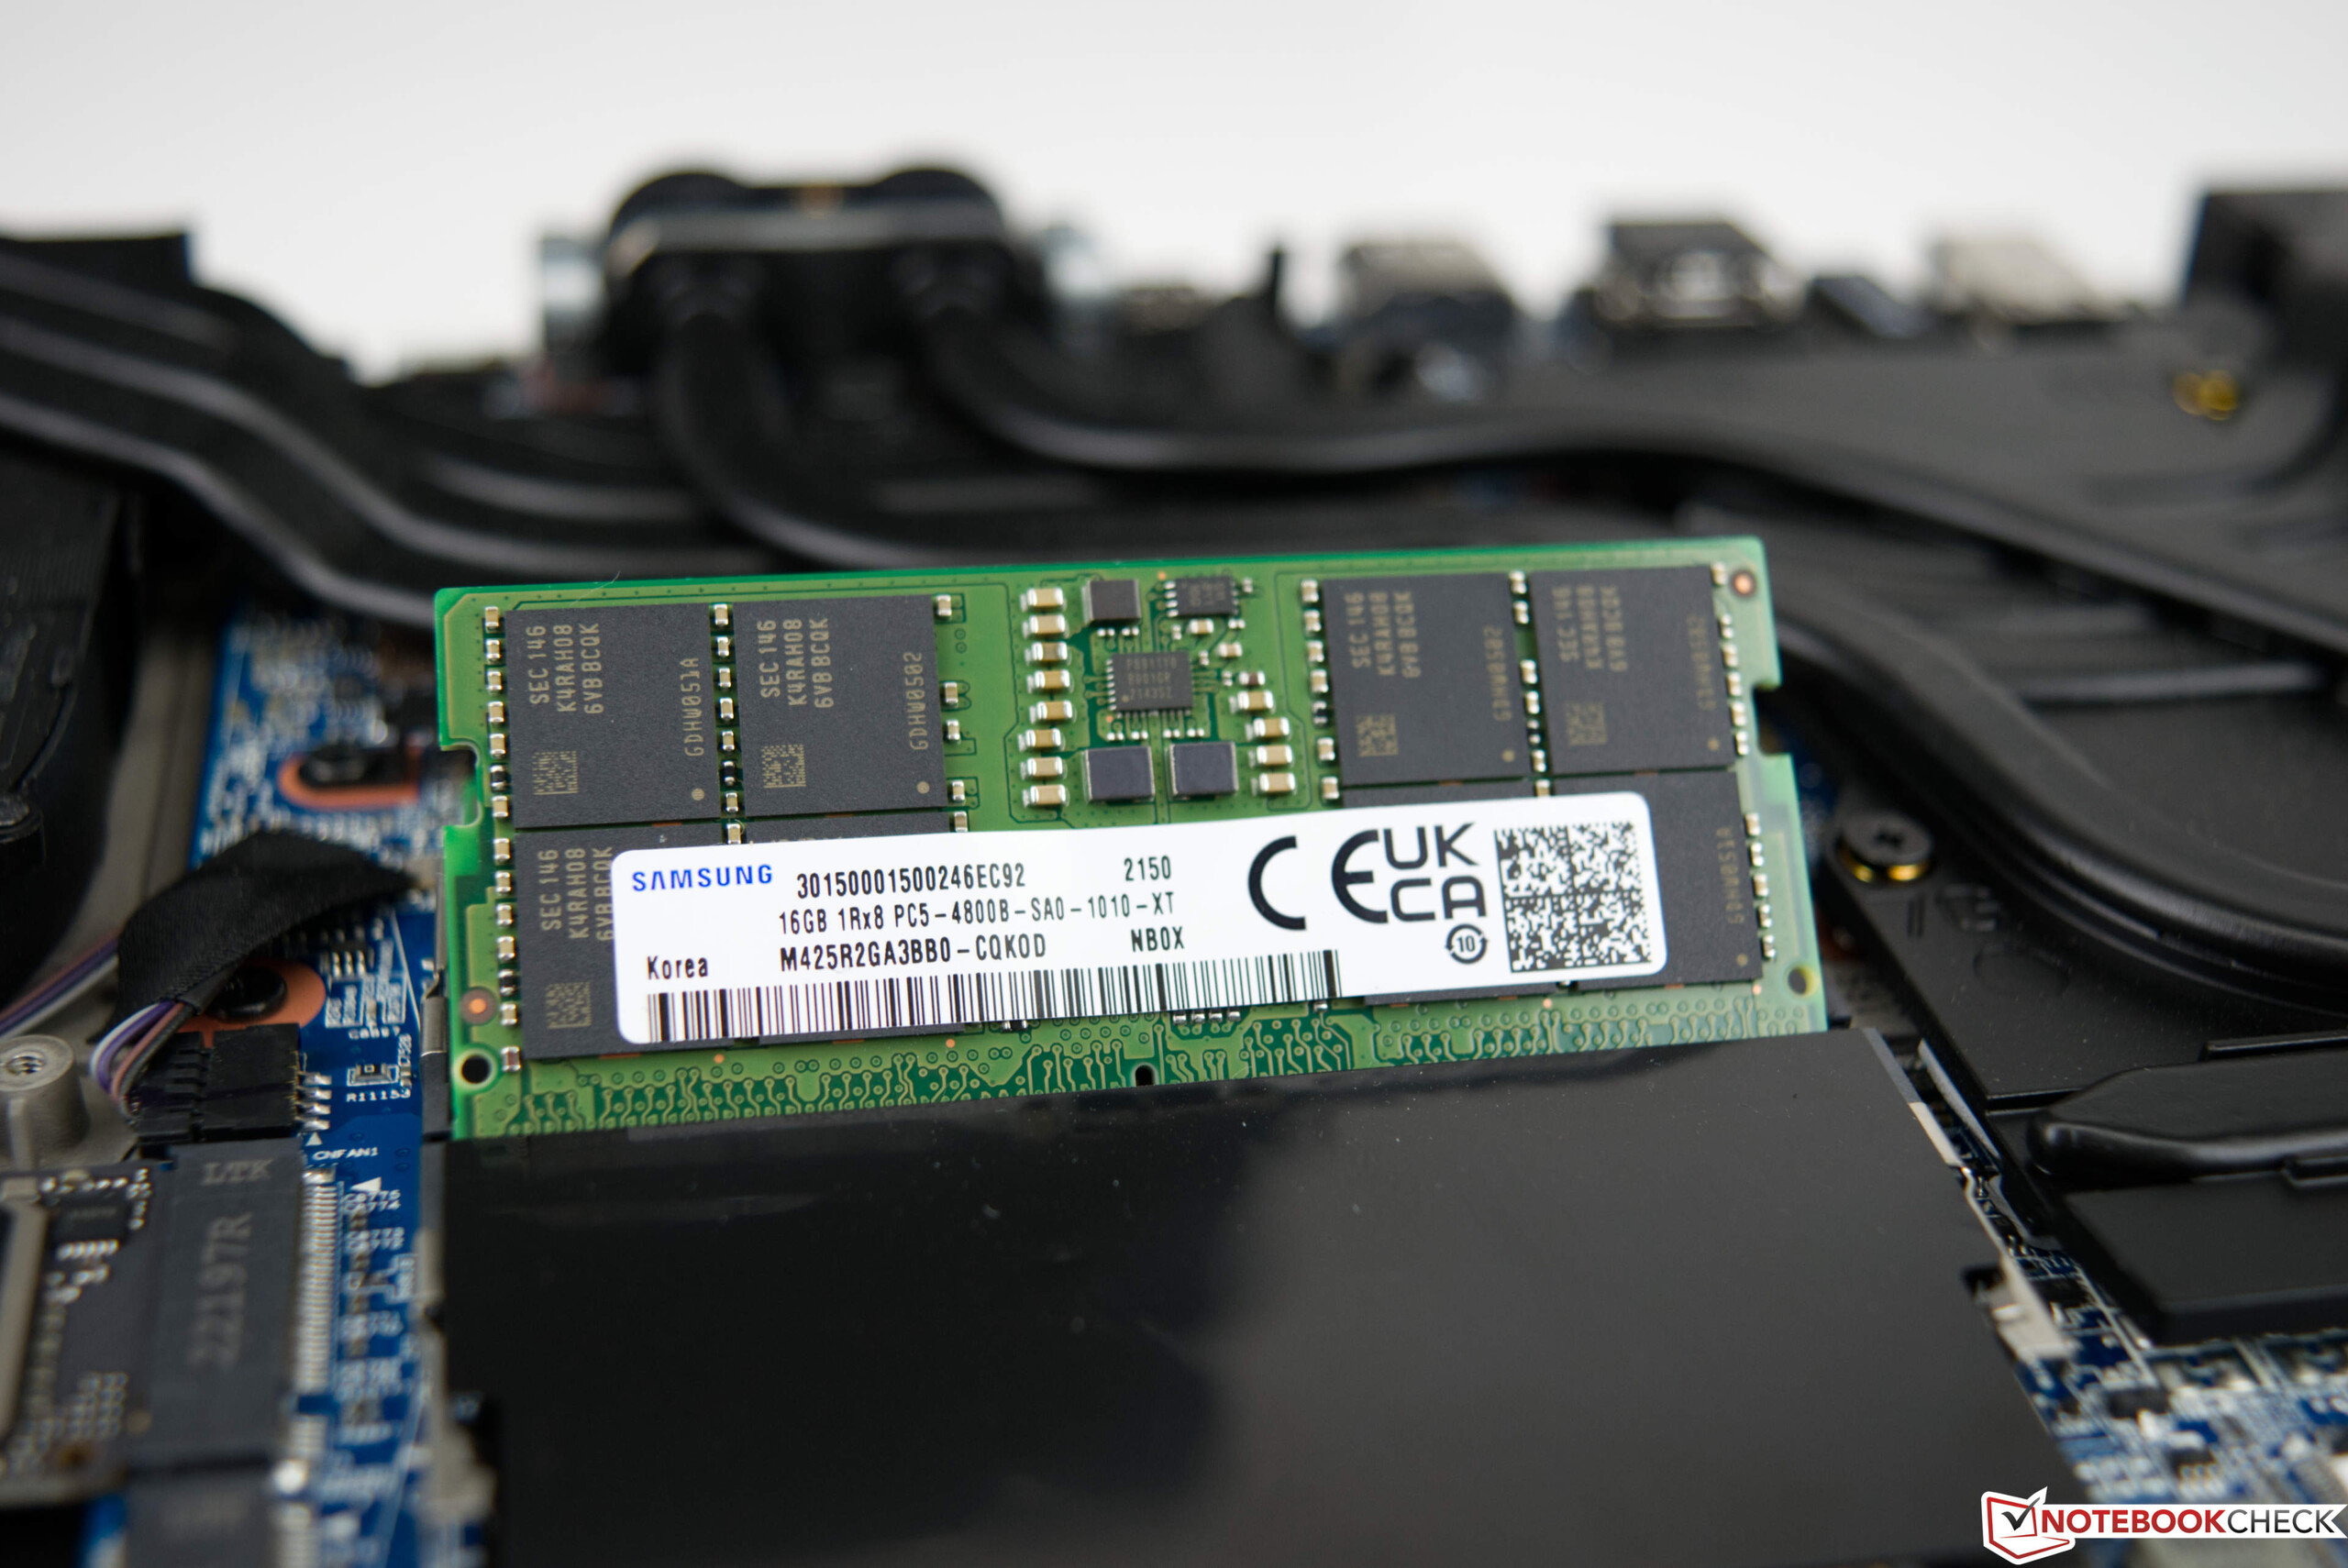
Maintenance
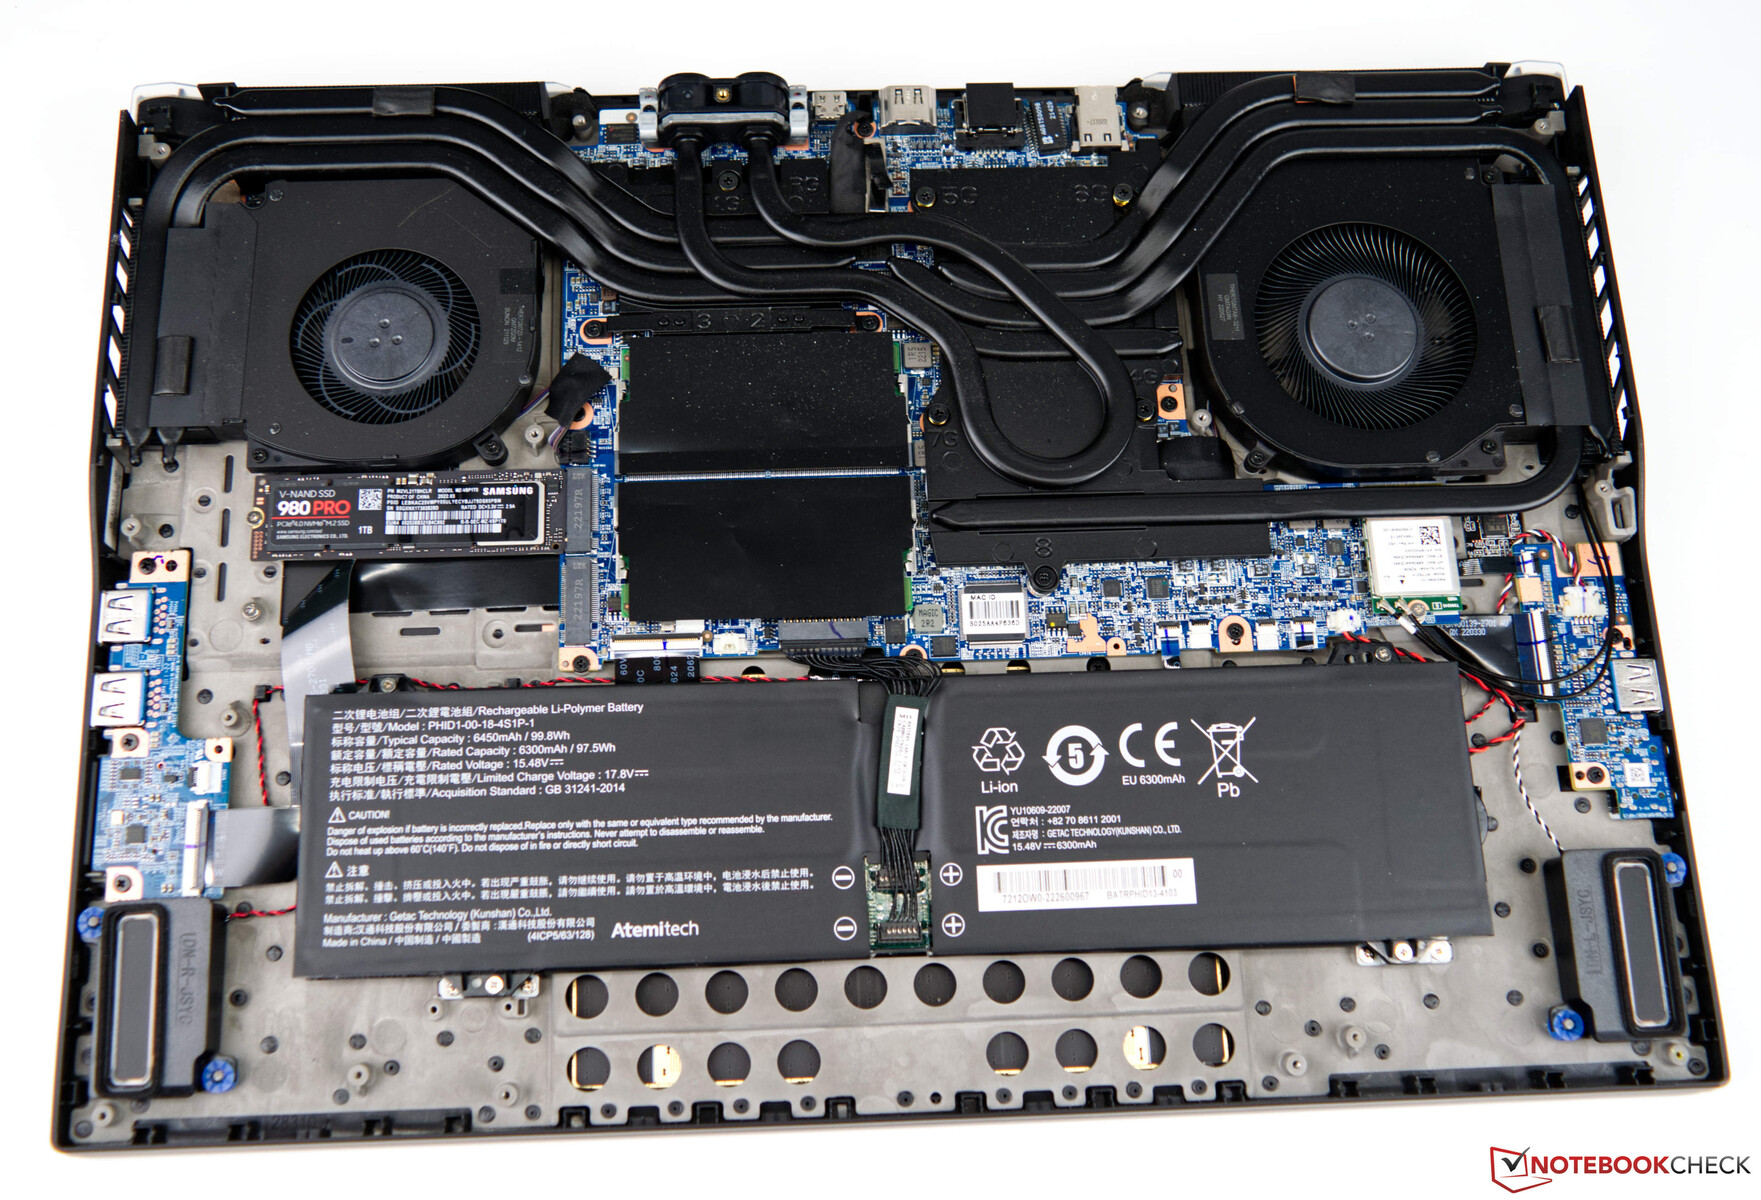
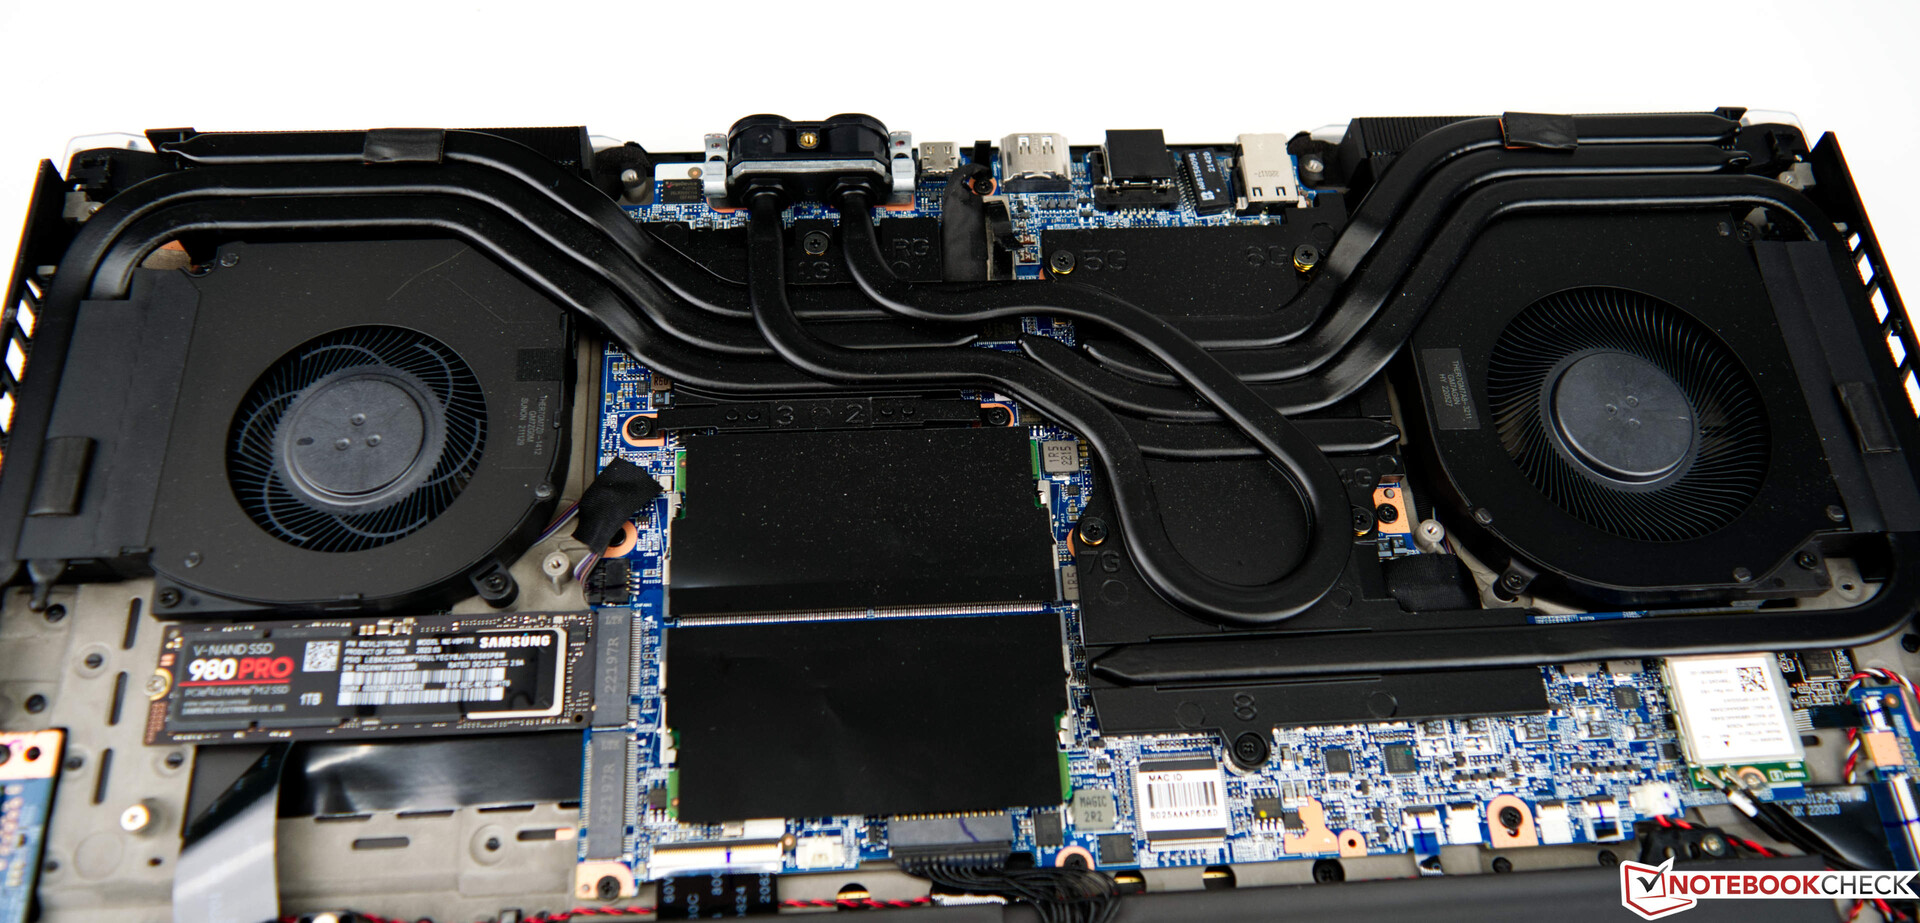
Since there is no maintenance hatch on the Schenker XMG Neo 17 for quick access to the RAM and SSD, swapping these components is somewhat difficult. As a result, the bottom plate has to be removed, which is not a simple task due to the many plastic clips that further secure it. Regardless, the bottom cover can be removed with a firm yank from below near the air vents.
Warranty
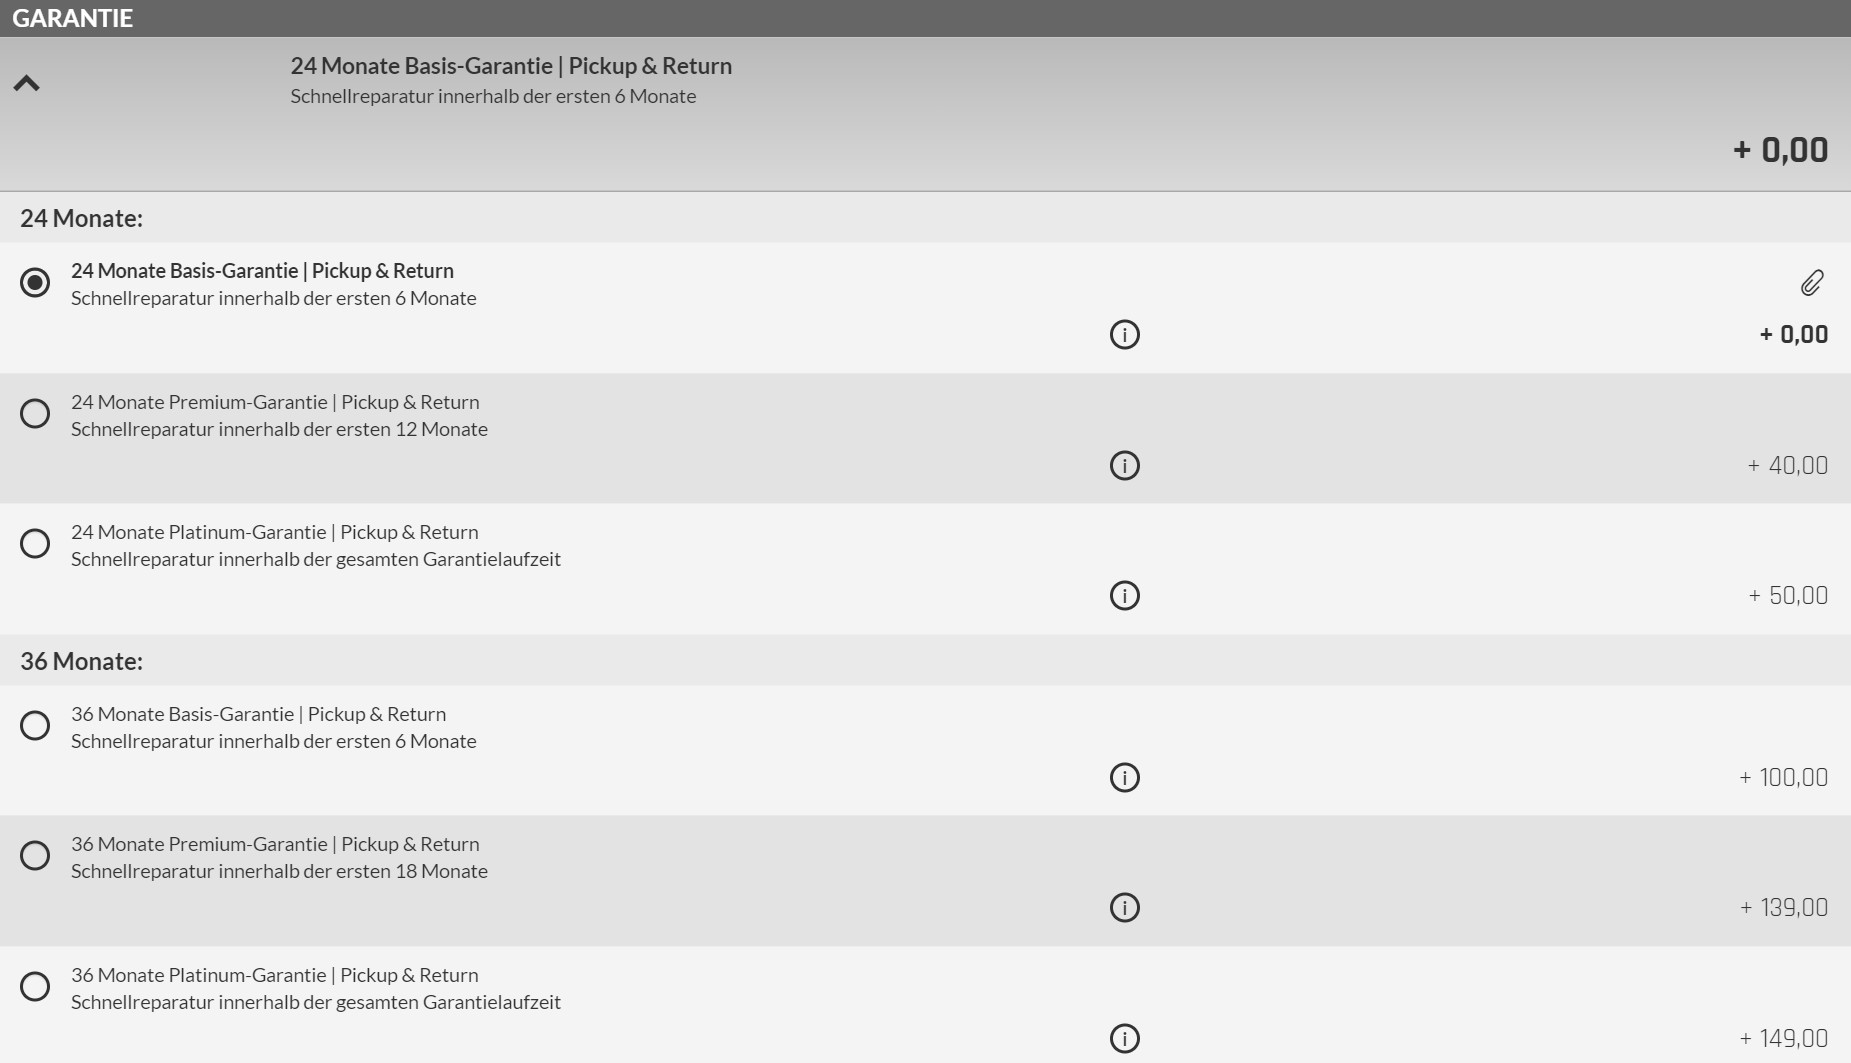
The Schenker XMG Neo 17 comes with a 24-month base warranty including 6-month quick repair with pick-up and return service. During the ordering process, there are various other options. For a premium of around 150 USD, the warranty can be extended to 36 months including the fast repair service for the entire duration.
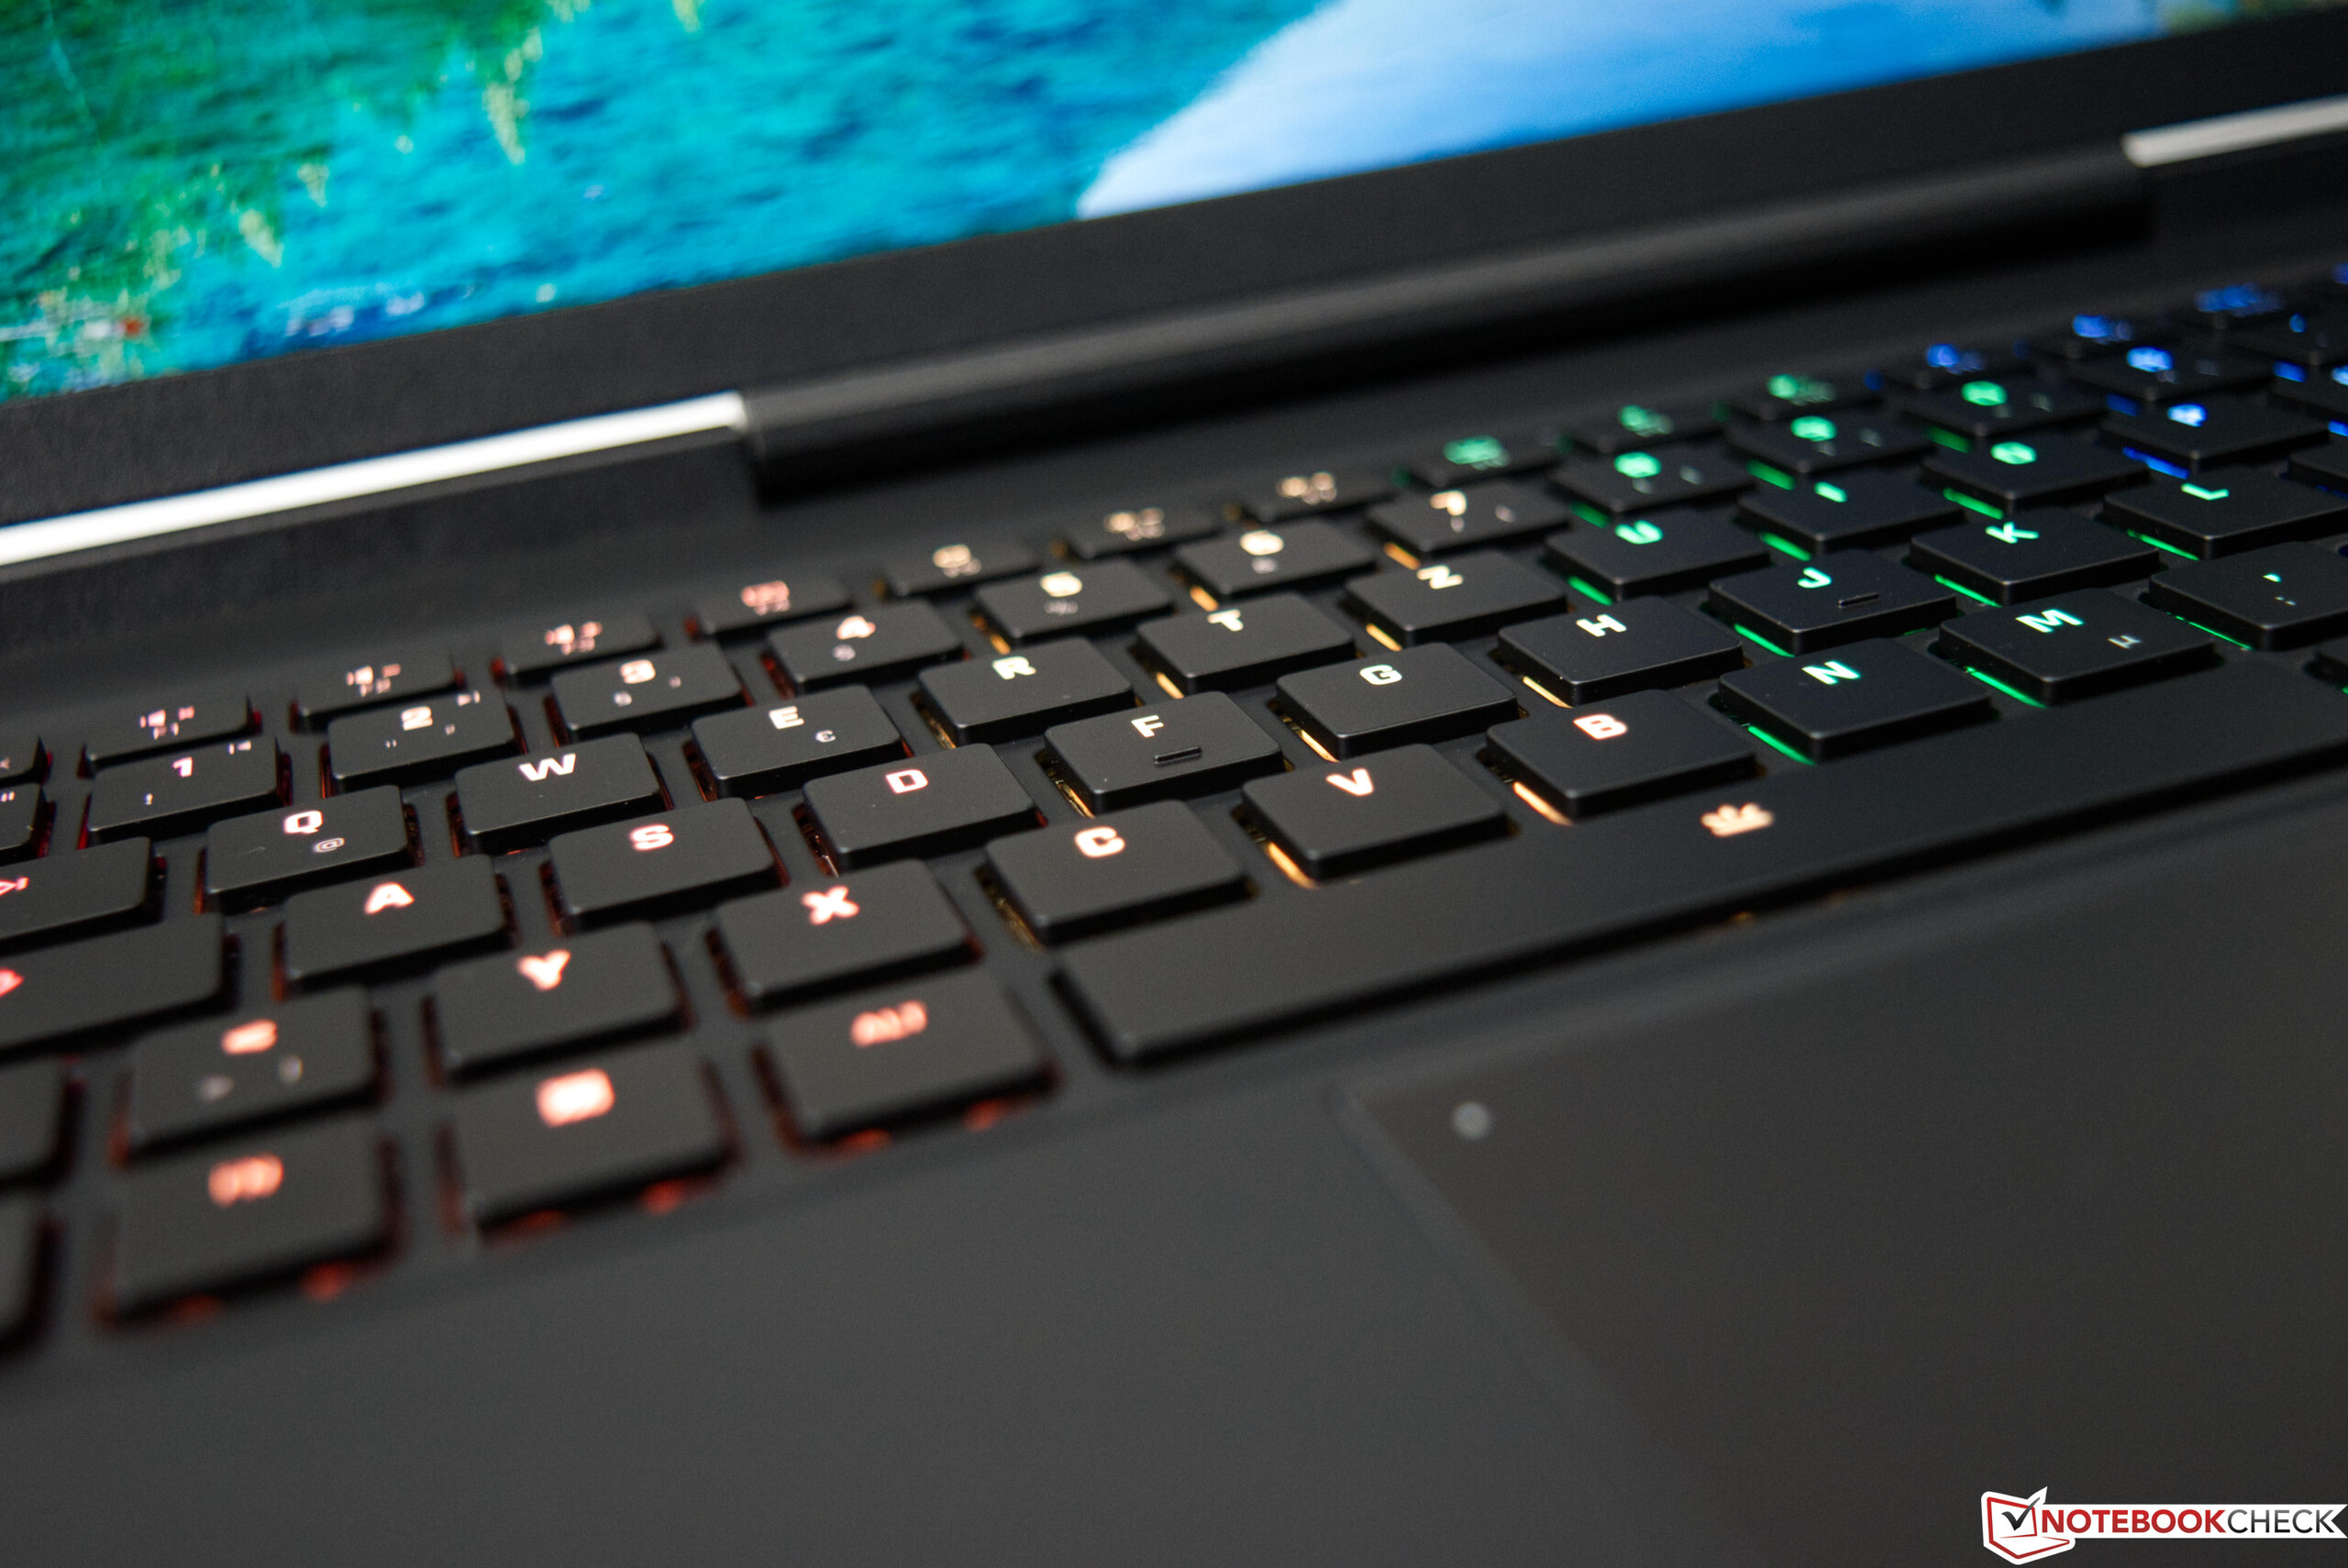
Input Devices - Cherry MX Switches - but not for all keys?
Keyboard
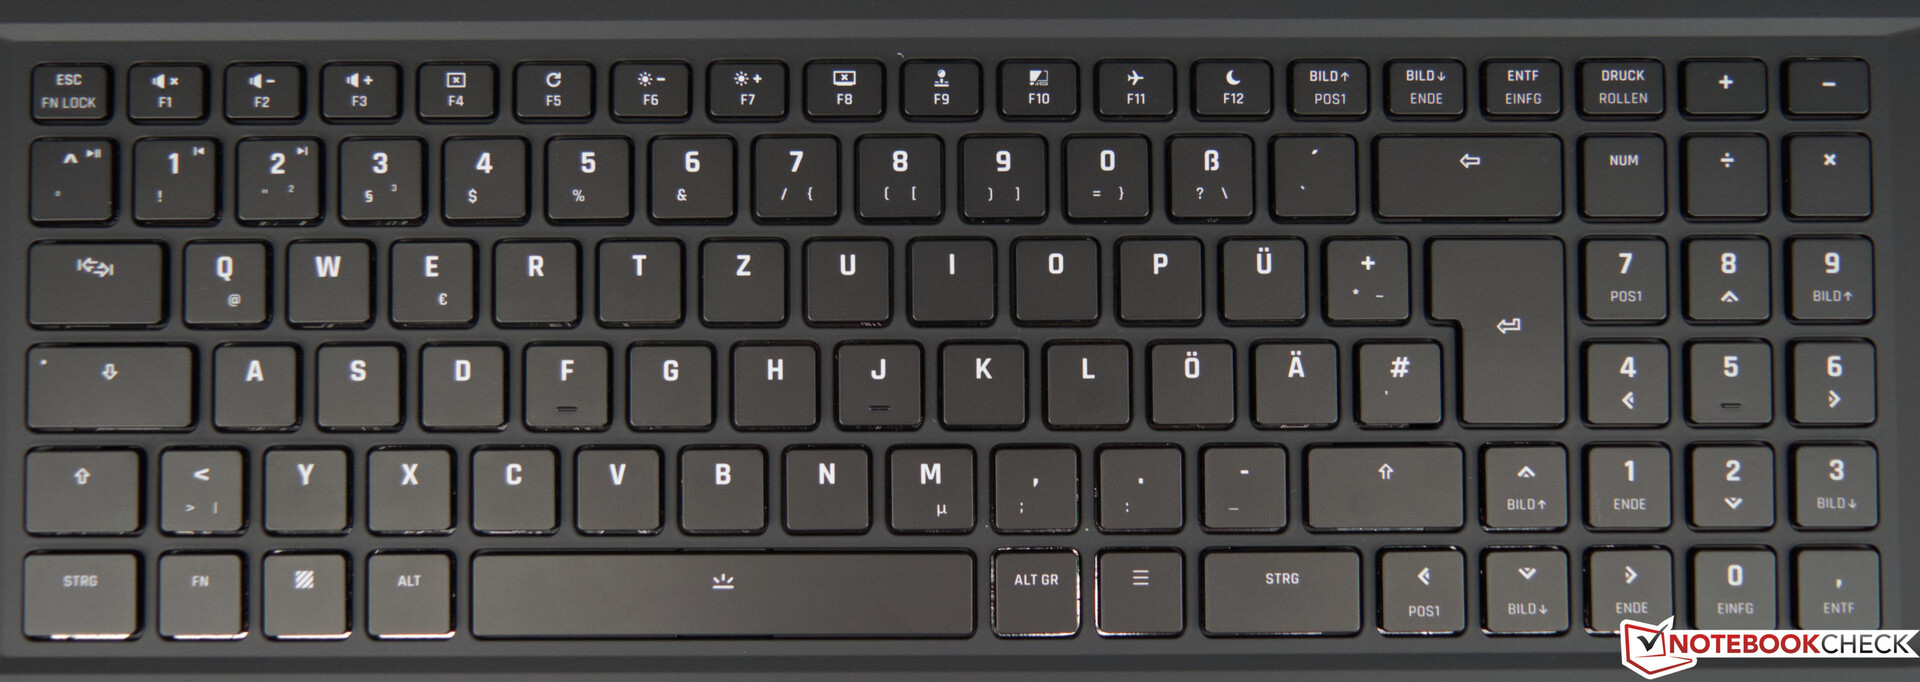
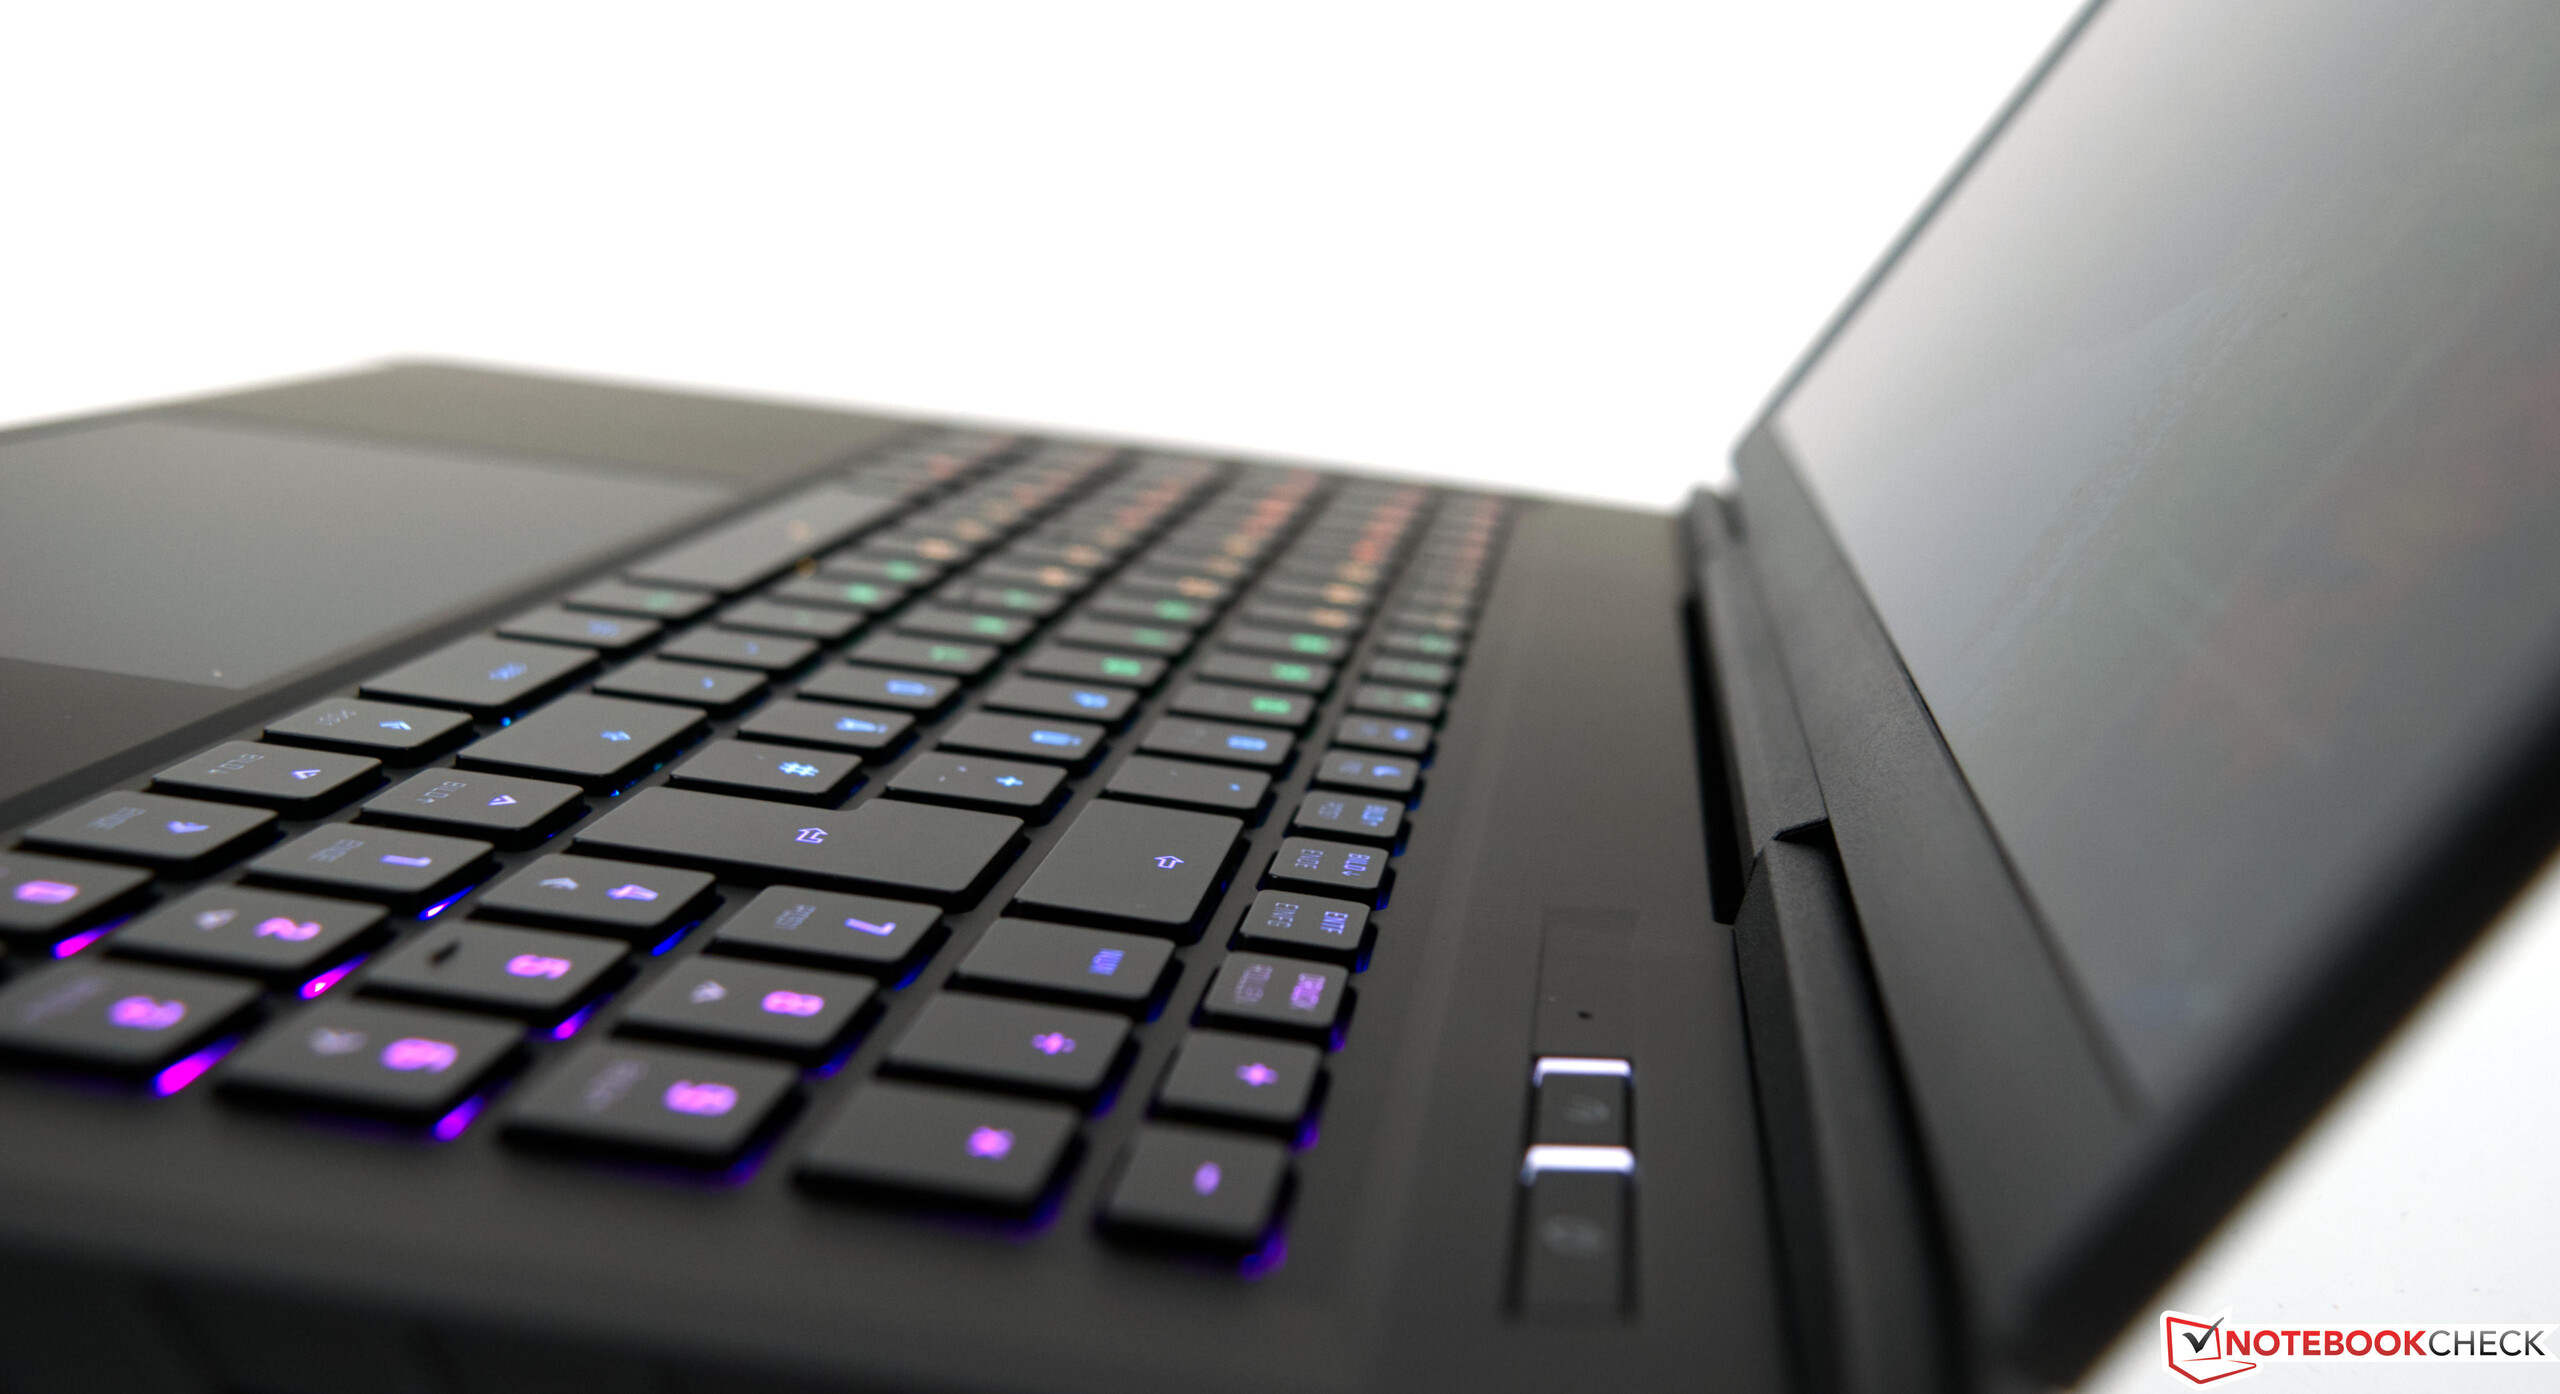
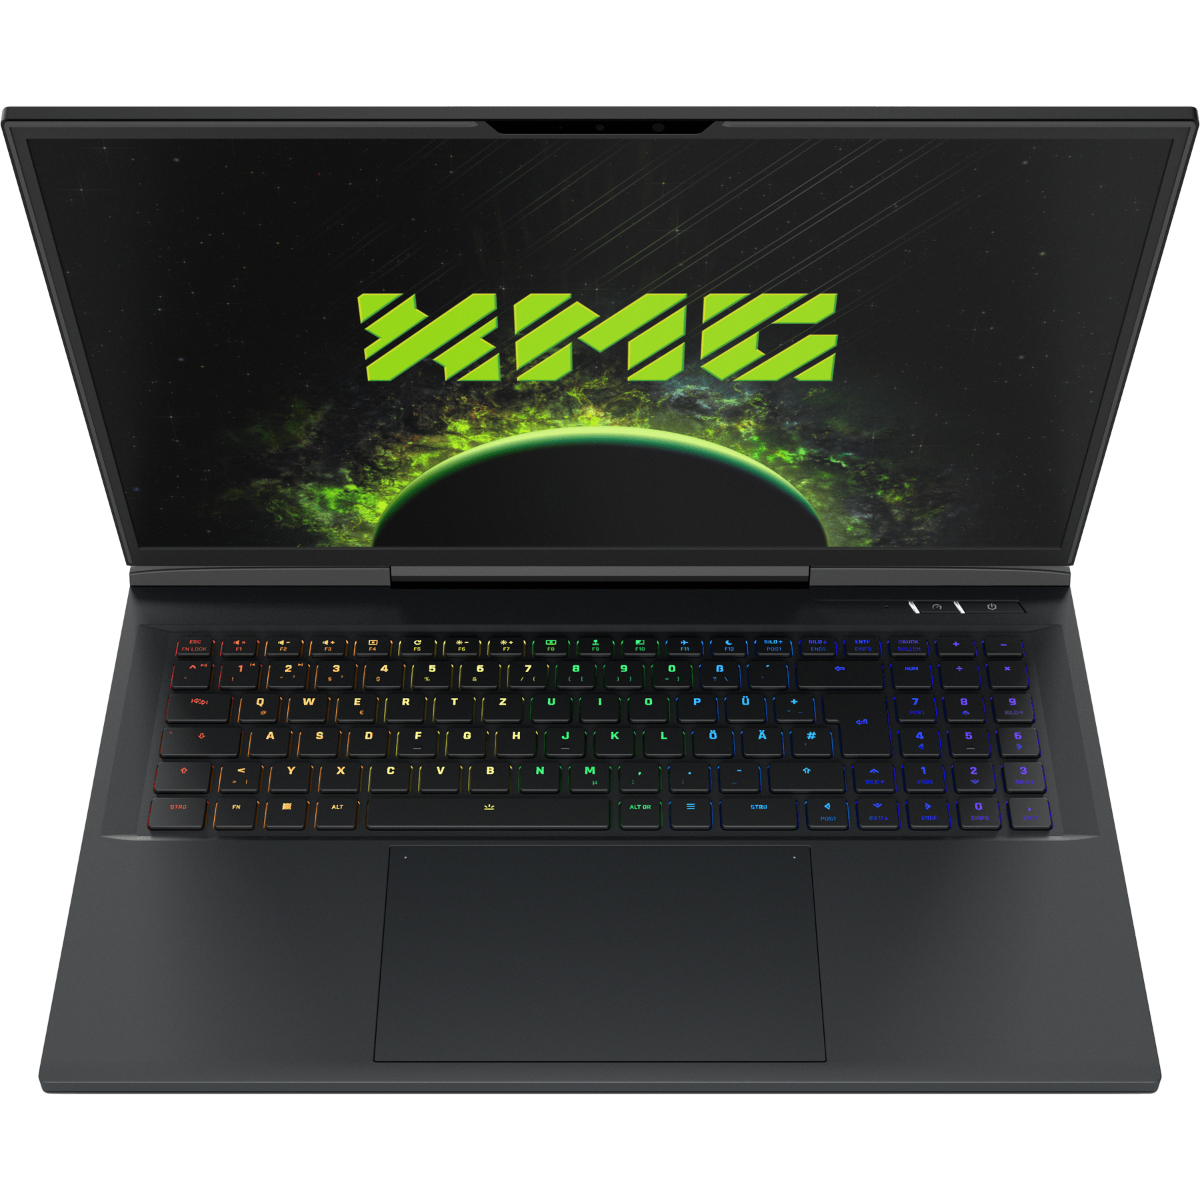
The 17-inch laptop boasts a mechanical keyboard based on Cherry MX switches. They are known for their robustness and extreme longevity. They offer a shallow travel of just 1.8 mm and a distinct actuation point for a good overall feedback. Since the keys are not dampened, there is no spongy feeling while typing. Mechanical keyboards rarely offer quiet key clatter. This also holds true for the XMG Neo 17. Users should be sure of their preference for and tolerance of distinct audible clicking. Those who prefer quiet keyboards may want to look elsewhere.
There is a plausible explanation as to why Schenker does not use Cherry MX switches for all the keys. Due to space constraints, the half-height keys of the first row cannot use mechanical switches. This leaves the numpad, which also relies on standard rubber dome switches. According to the manufacturer, this decision was made to lower the weight and costs. Acoustically, the traditional switches are significantly quieter and the characteristic rubber dome key presses feel somewhat dampened, although this behavior is not too pronounced in this case.
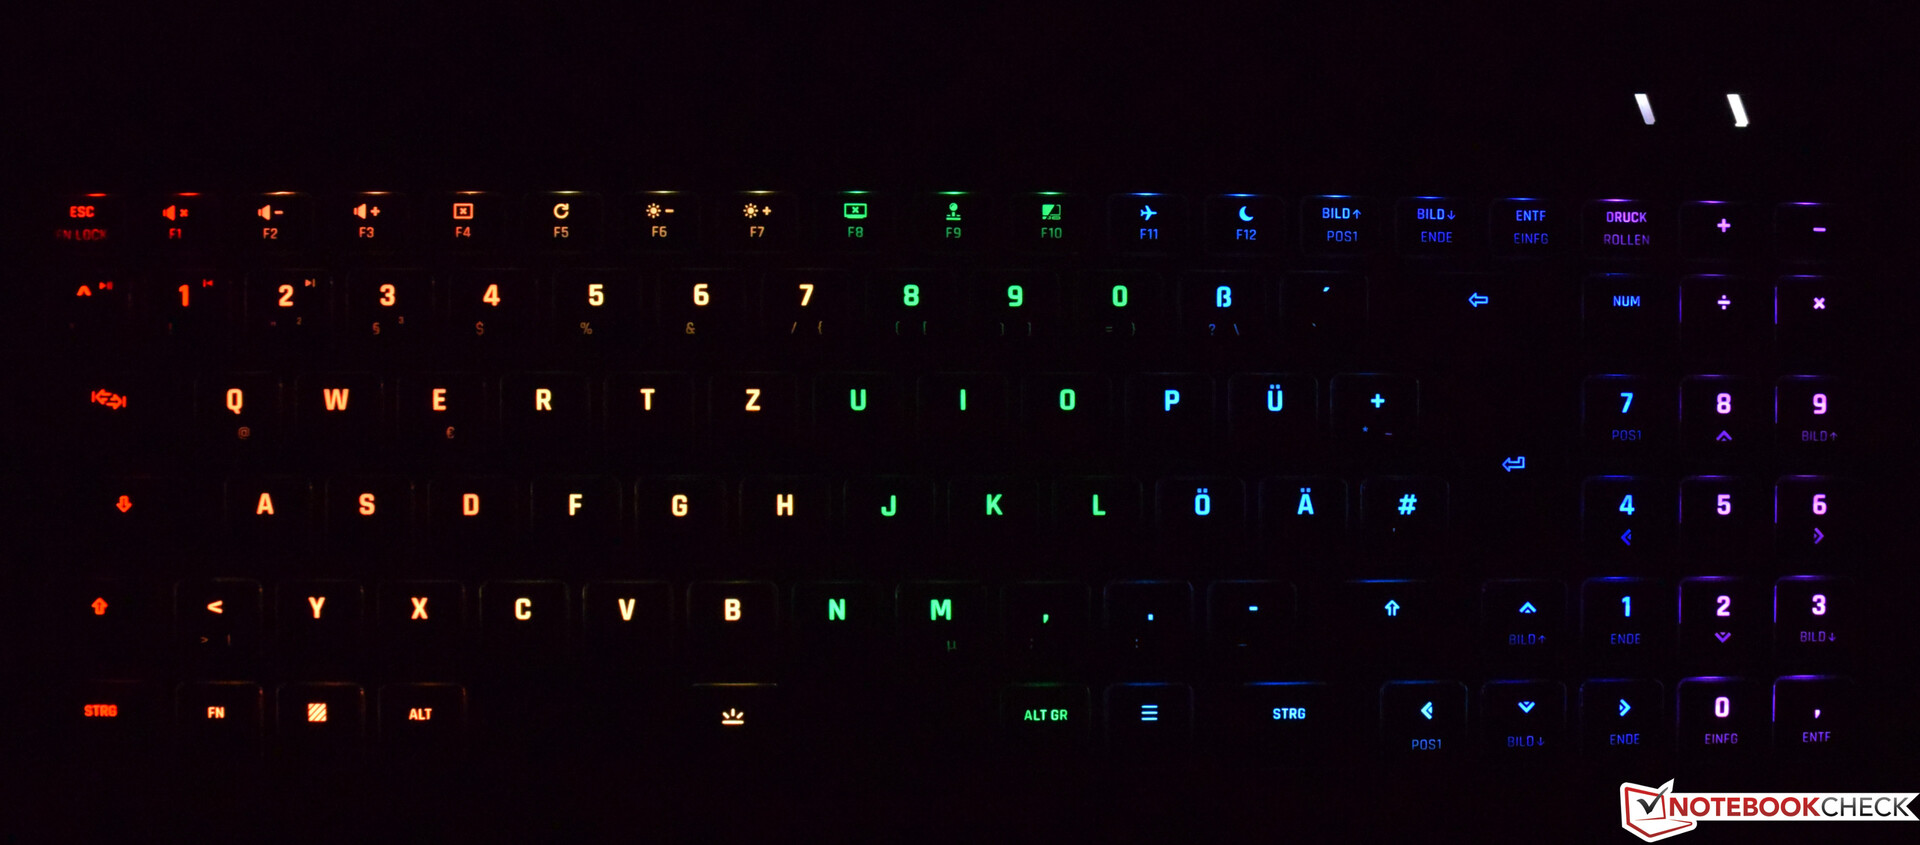
The backlight of the keyboard can be adjusted via the Control Center. Users are able to choose between various effects and the entire color palette.
Touchpad
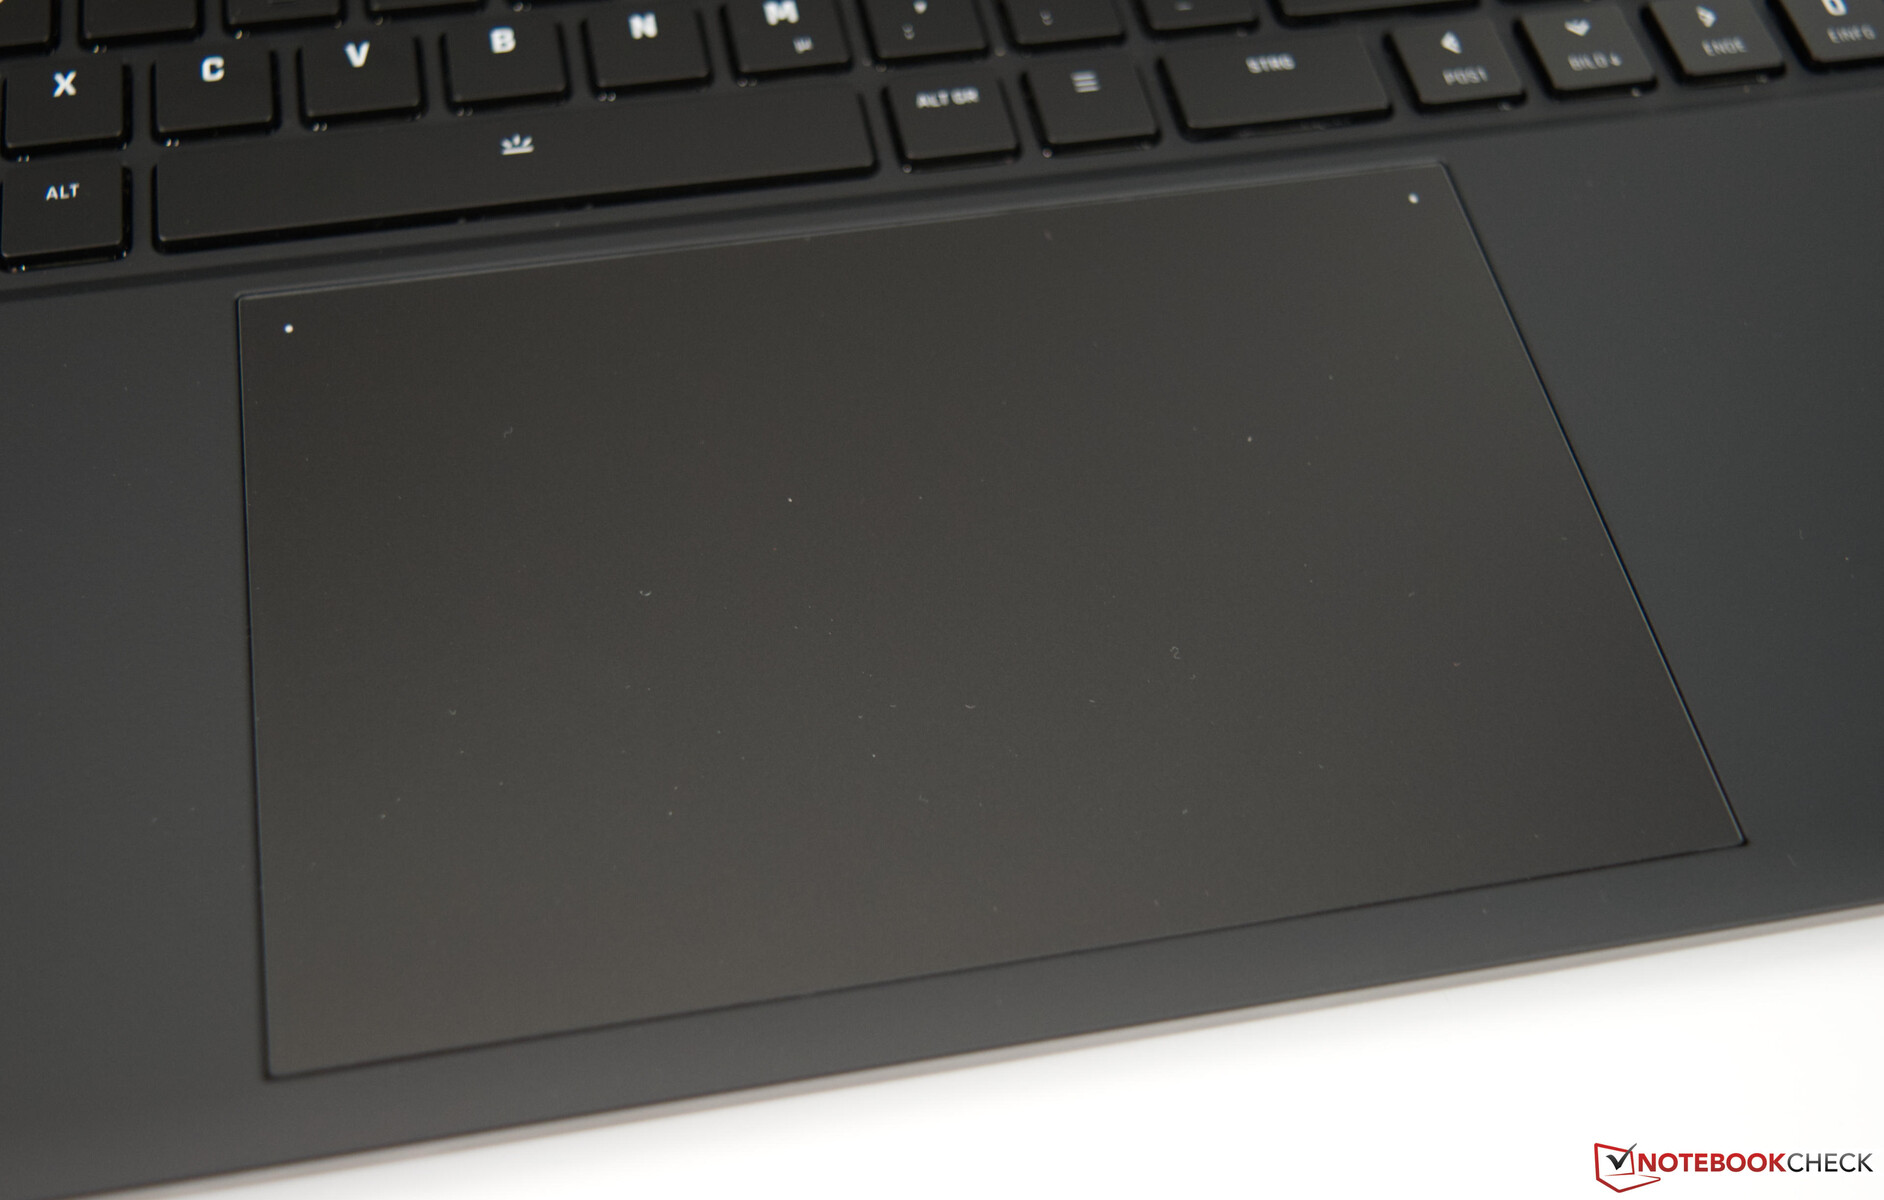
With 15.5 x 10 centimeters, the touchpad is very large and potentially even too large for some users. In order to counteract this, the right side of the input surface can be disabled. In this case, there is no visual or haptic clue that shows where the touchpad ends. Users who do not need the clickpad at all may also disable it entirely. This can be accomplished by pressing the white dot near the top left corner twice. The glass surface is slightly satinized for a slightly more comfortable user experience with sweaty fingers. We encountered a minor issue with the clickpad's responsiveness near the edges. Although it would then respond in a more sluggish manner, its large size mostly compensates for this. The two buttons in the bottom part of the pad work well and offer relatively quiet clicks.
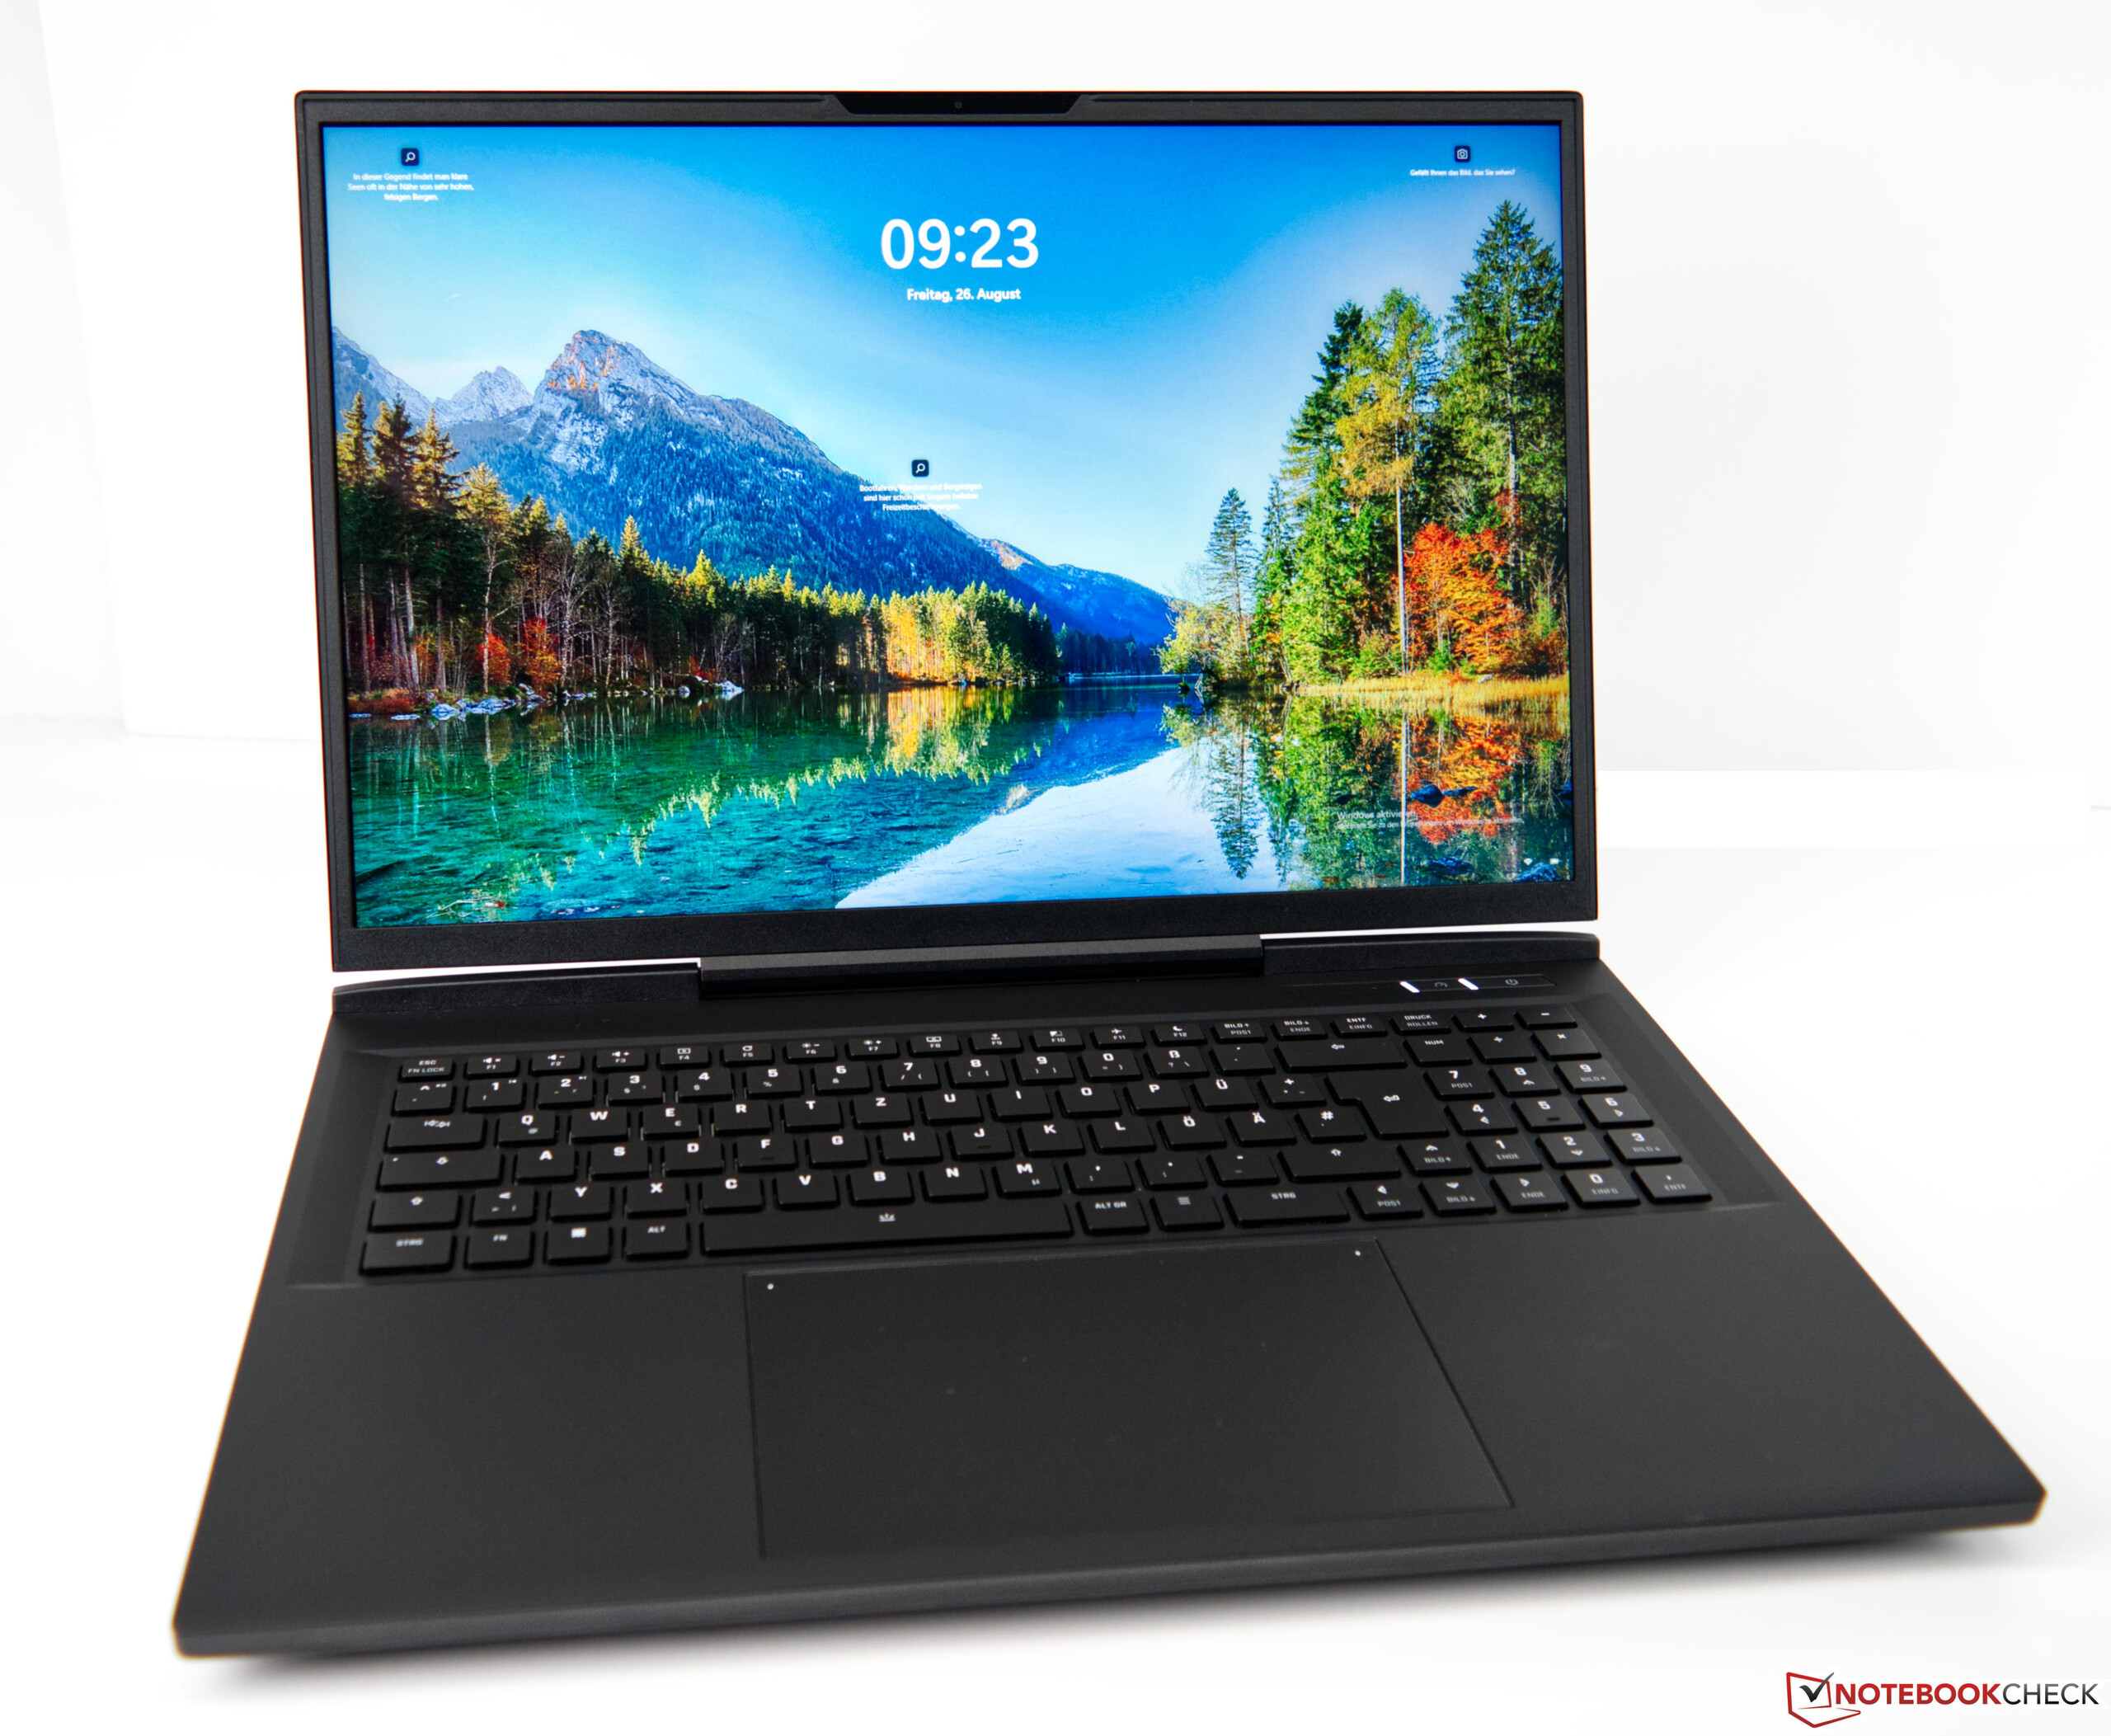
Display - 240 Hz and 16:10 Form Factor
The 17-inch 240-Hz IPS panel is fixed on the Schenker XMG Neo 17. The 16:10 form factor offers a few advantages over the more common 16:9 form factor particularly when it comes to productivity.
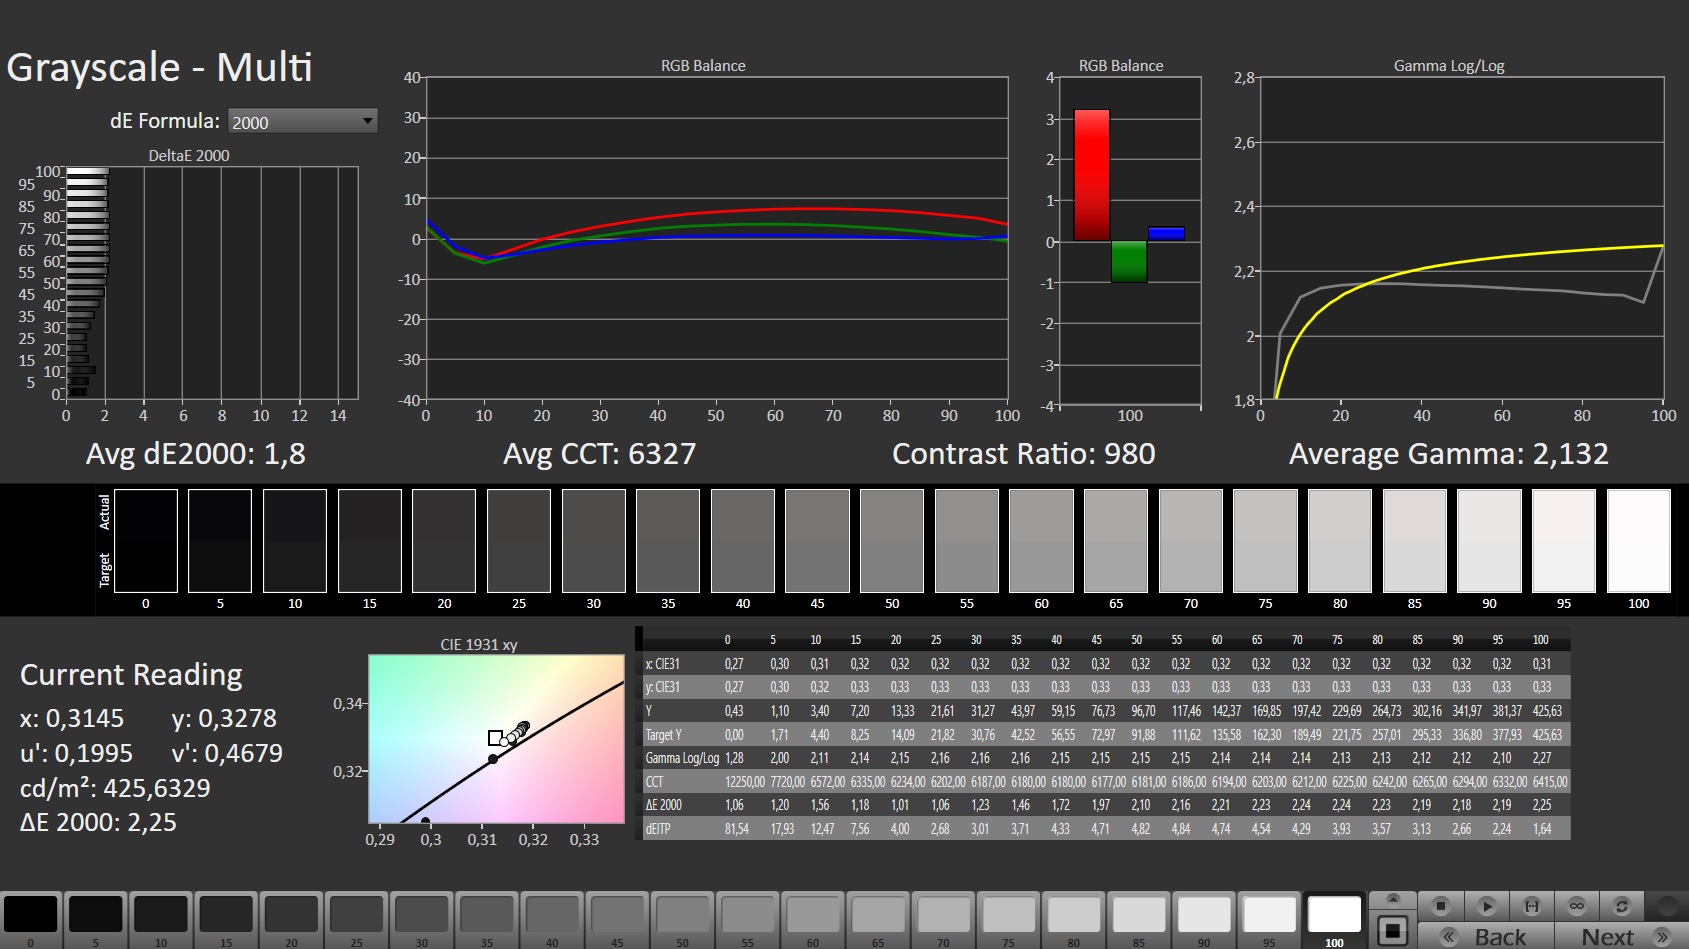
While according to our measurements, the panel reaches a good brightness level of 399 nits, some competitors are able to produce even better results. In fairness, our measured value slightly exceeds the specifications of the XMG Neo 17 (data sheet: 380 nits). The contrast somewhat suffers from a combination of the brightness and black value, resulting in a ratio of just 965:1. This is still significantly better compared to the two MSI competitors.
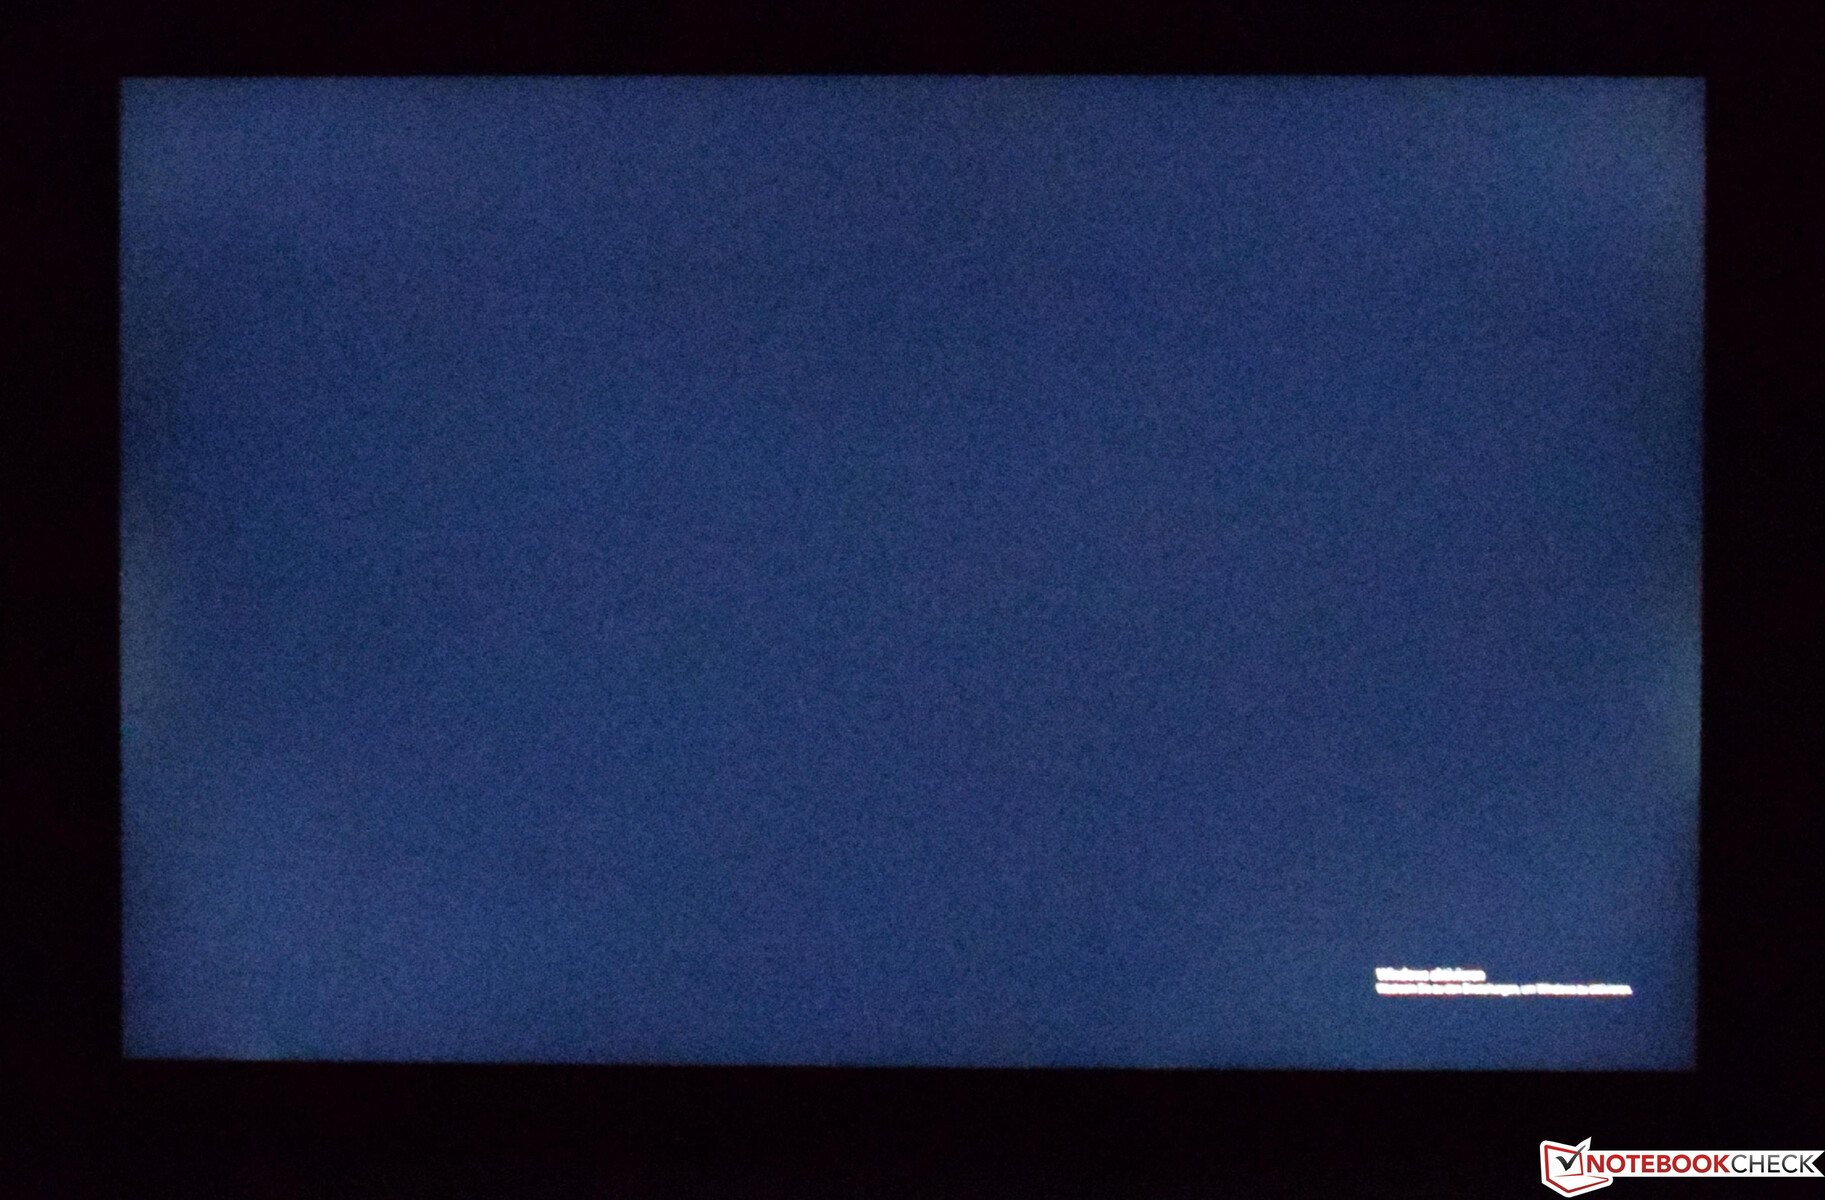
Users are unlikely to experience eye strain due to PWM with the Schenker XMG Neo 17. However, there is some minor backlight bleeding. It only becomes apparent in dark scenes near the edges, however.
| |||||||||||||||||||||||||
Brightness Distribution: 90 %
Center on Battery: 415 cd/m²
Contrast: 965:1 (Black: 0.43 cd/m²)
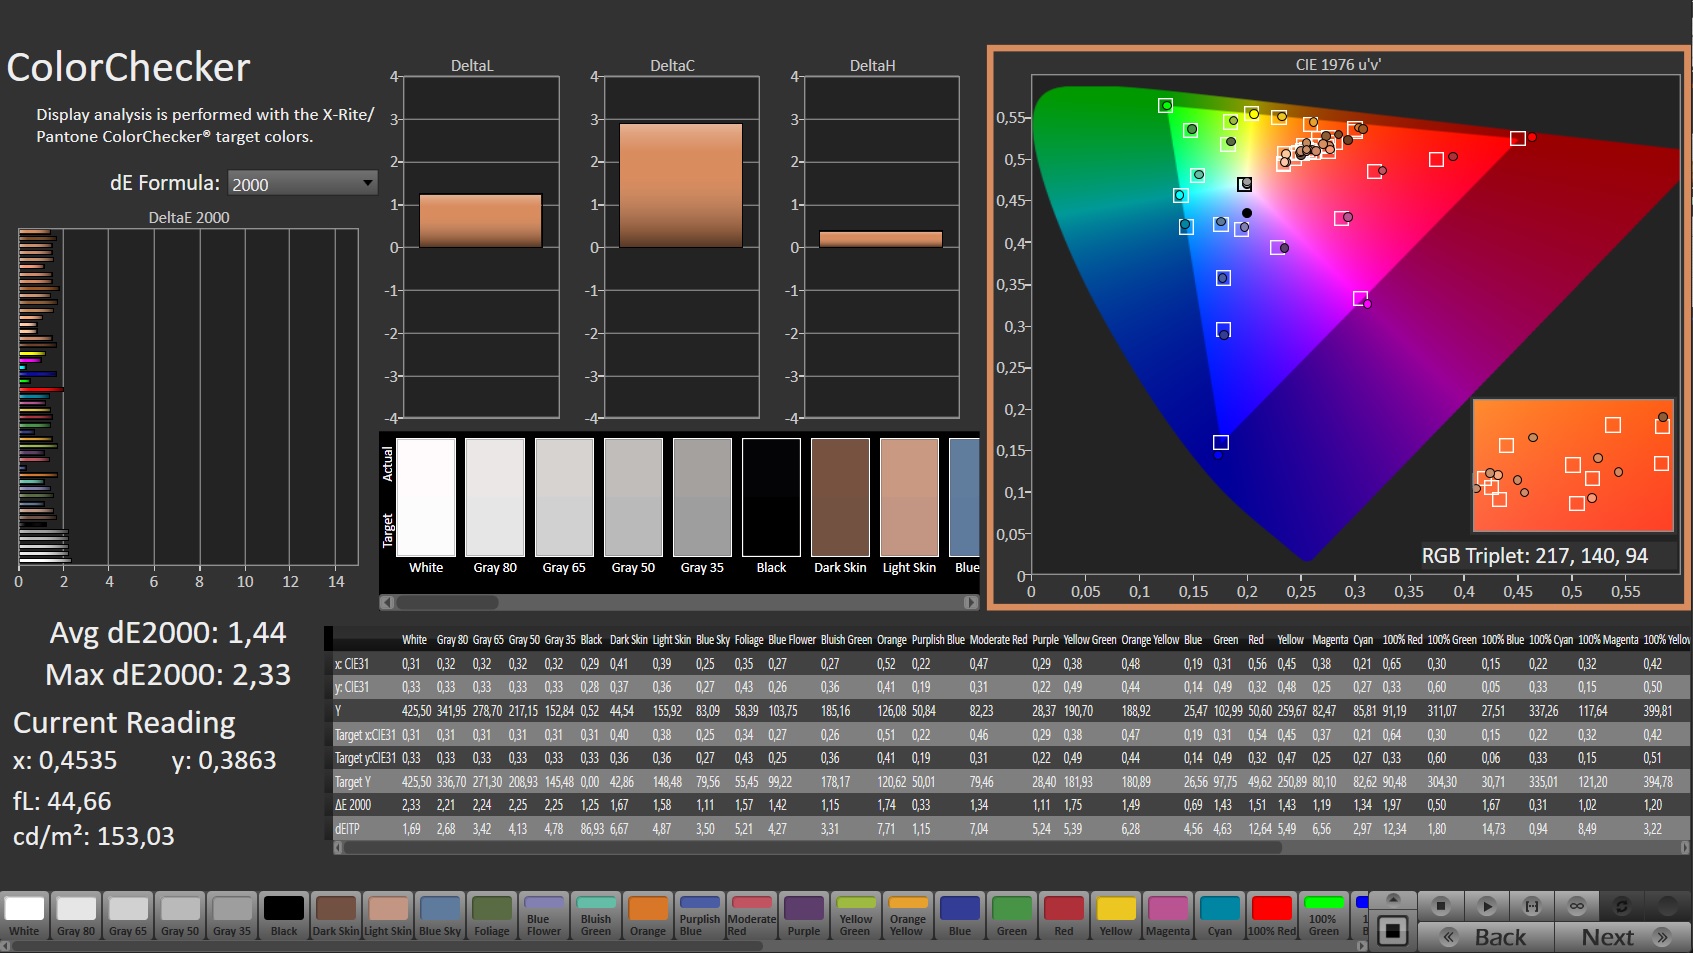
ΔE ColorChecker Calman: 1.44 | ∀{0.5-29.43 Ø4.73}
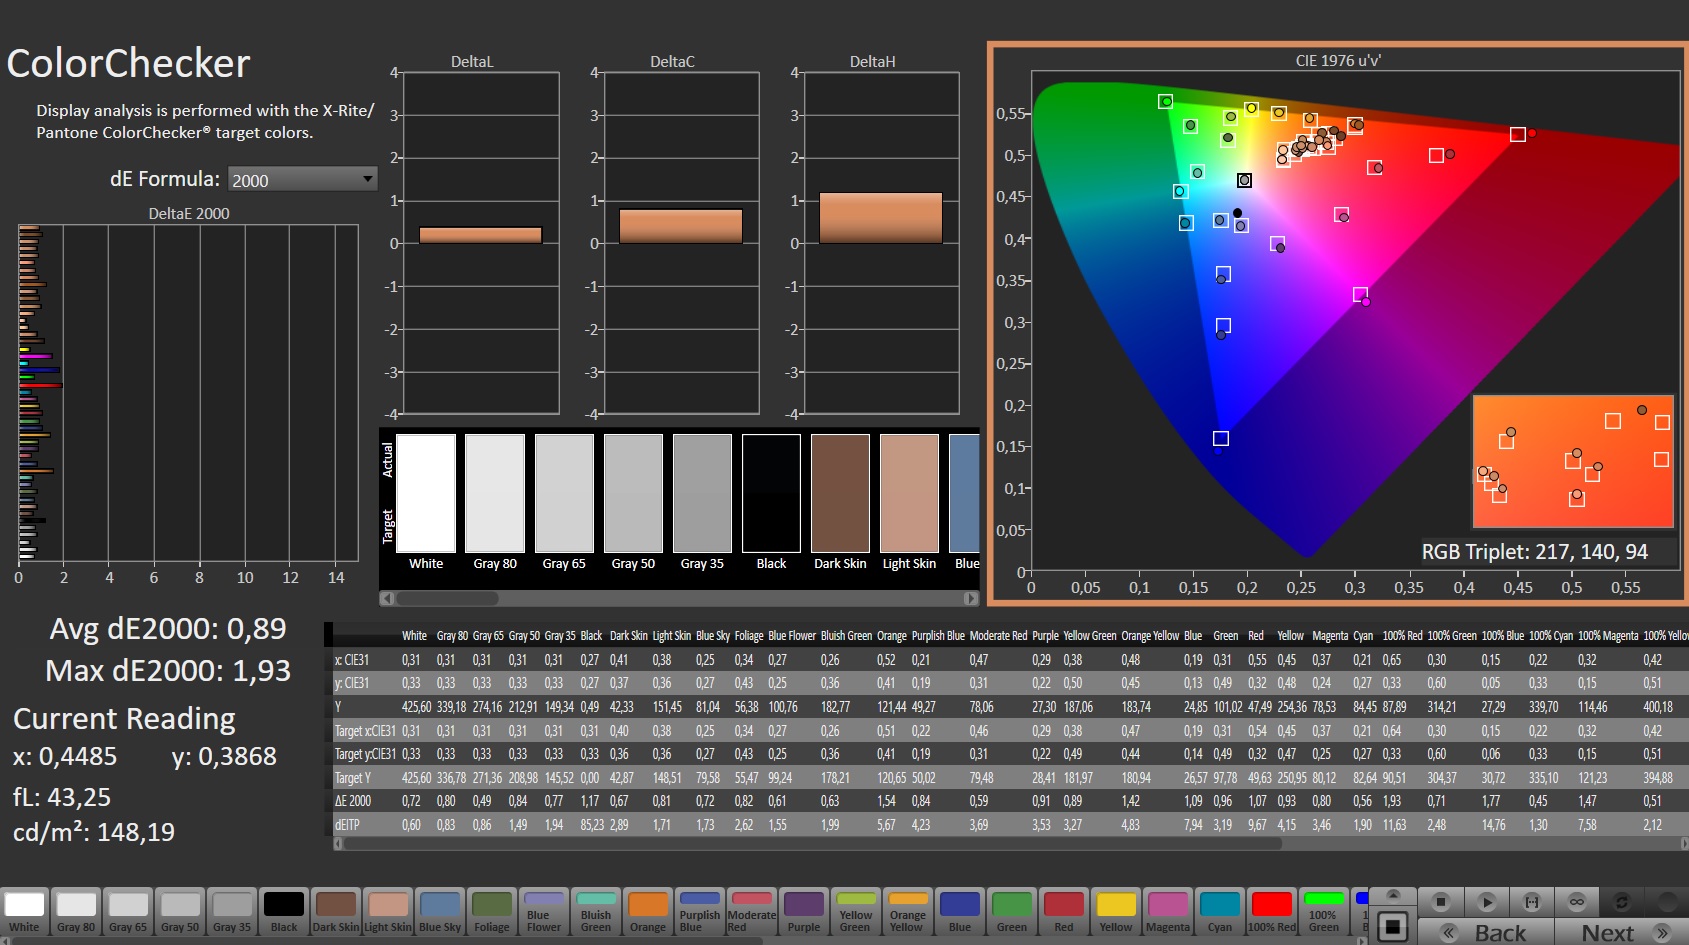
calibrated: 0.89
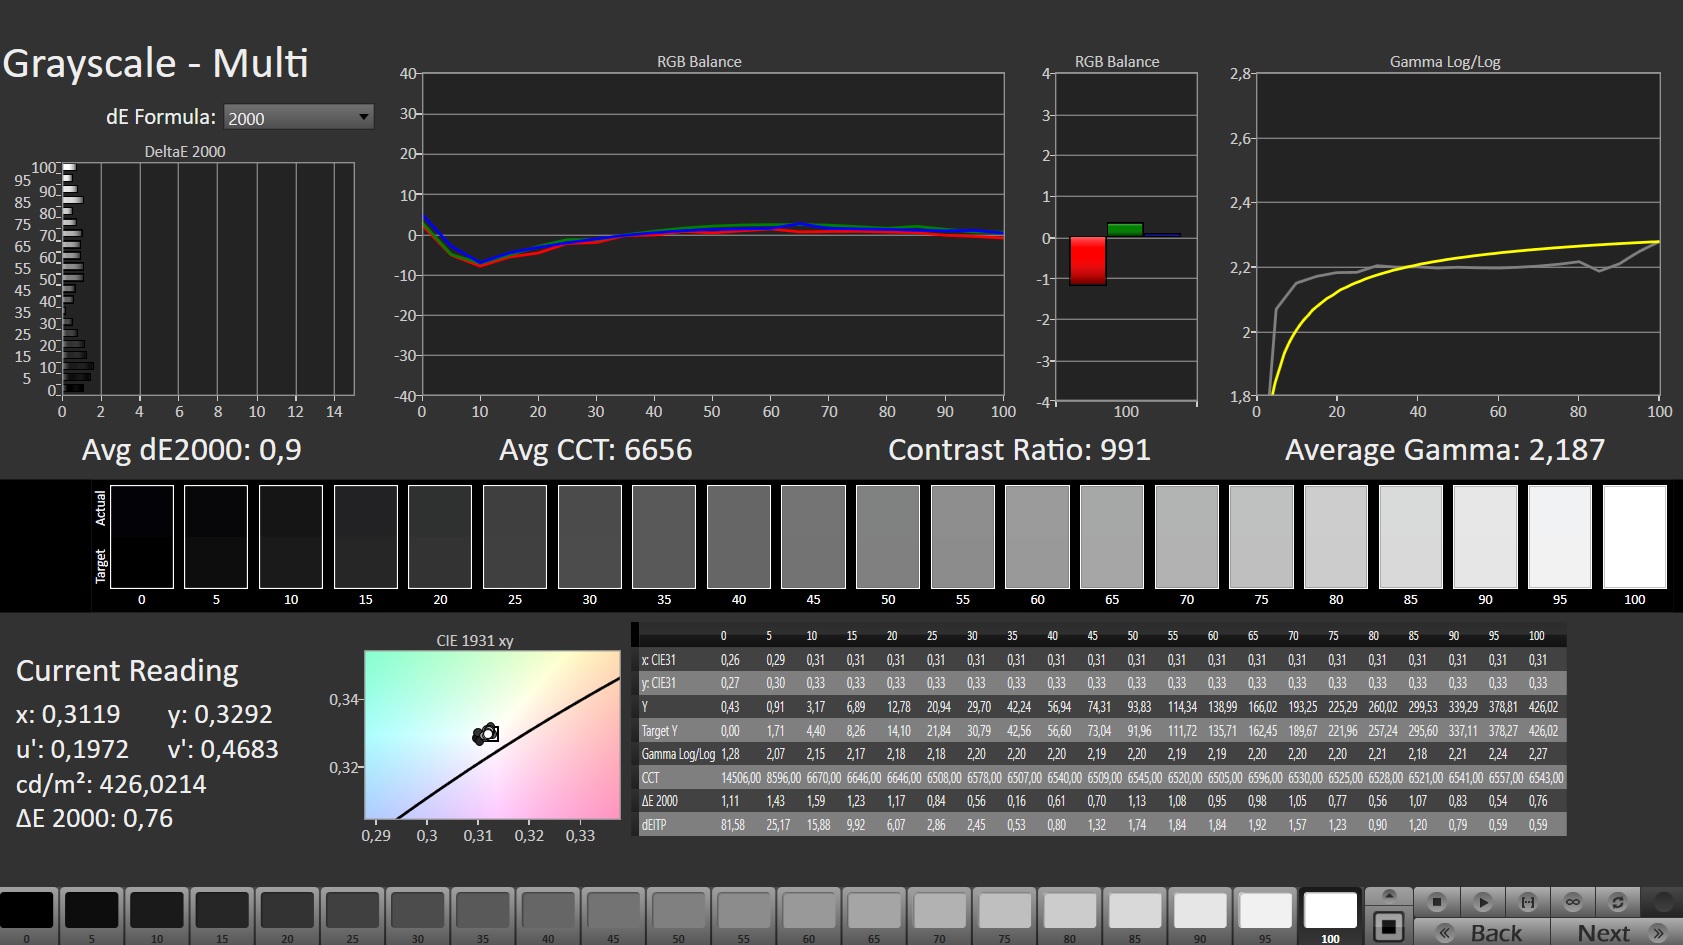
ΔE Greyscale Calman: 1.8 | ∀{0.09-98 Ø4.97}
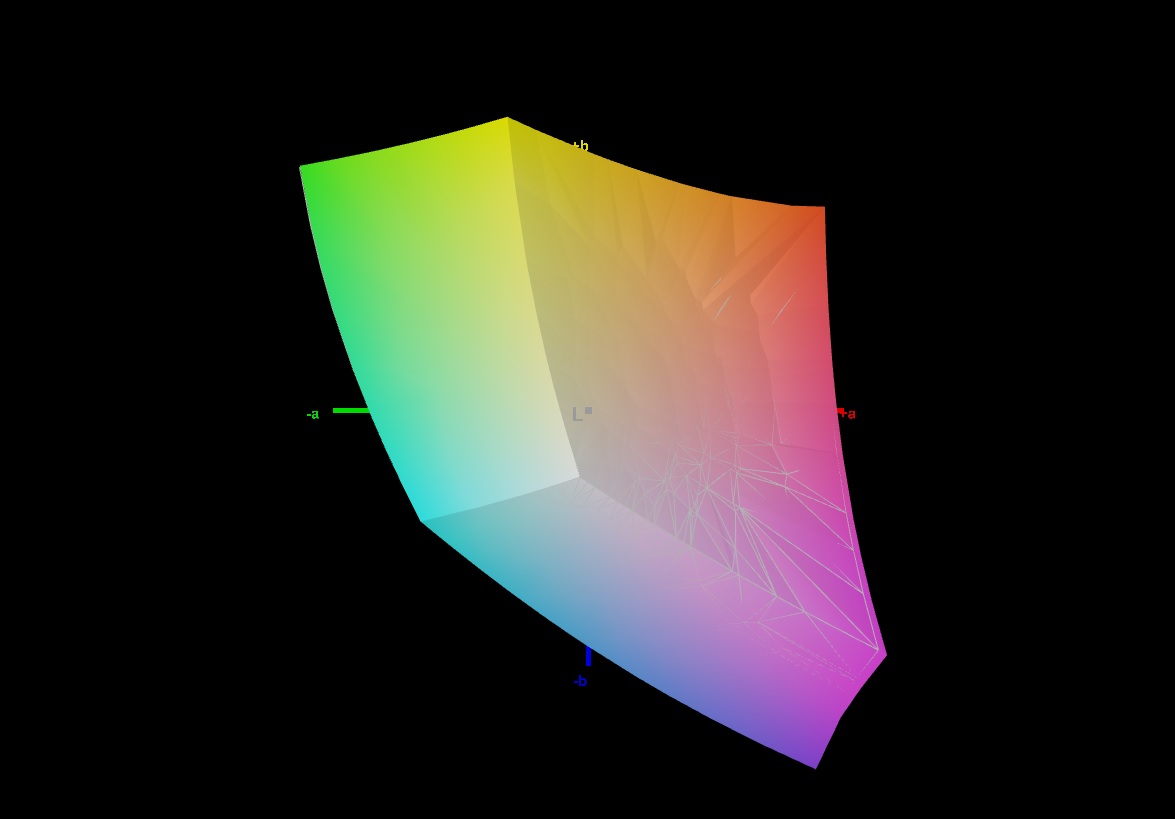
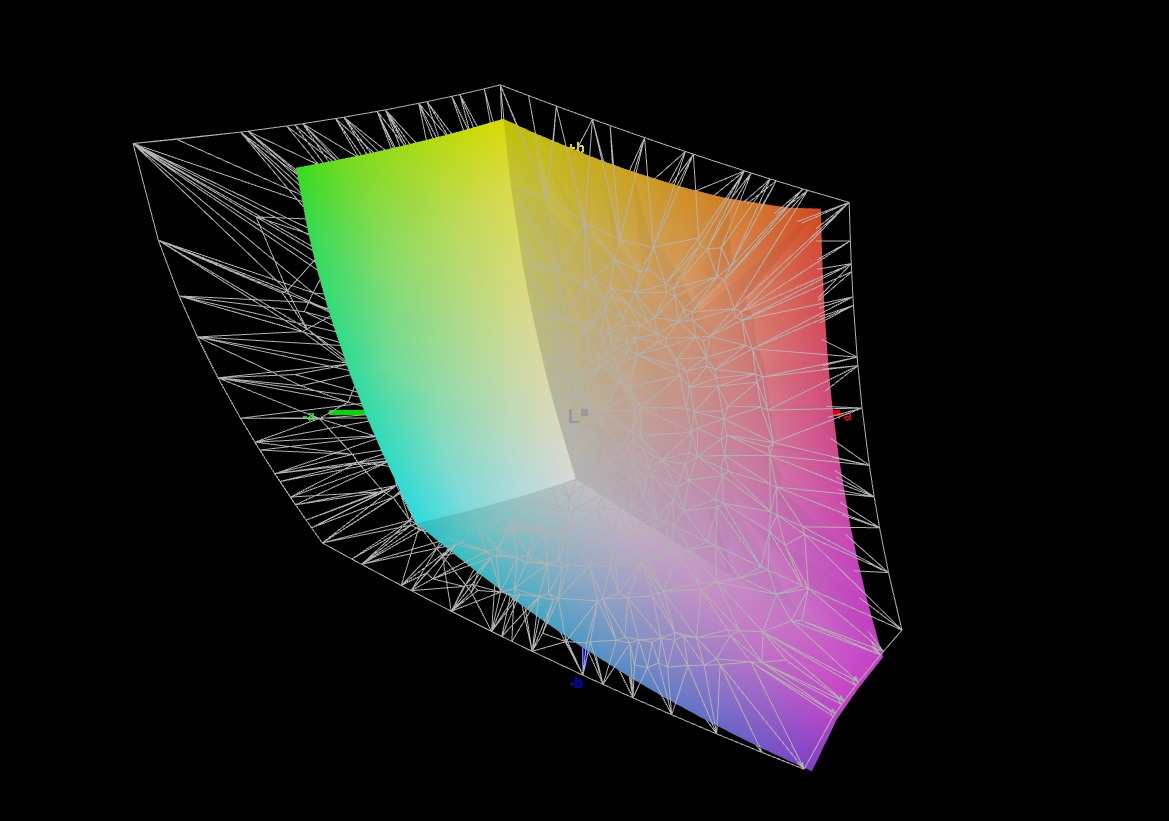
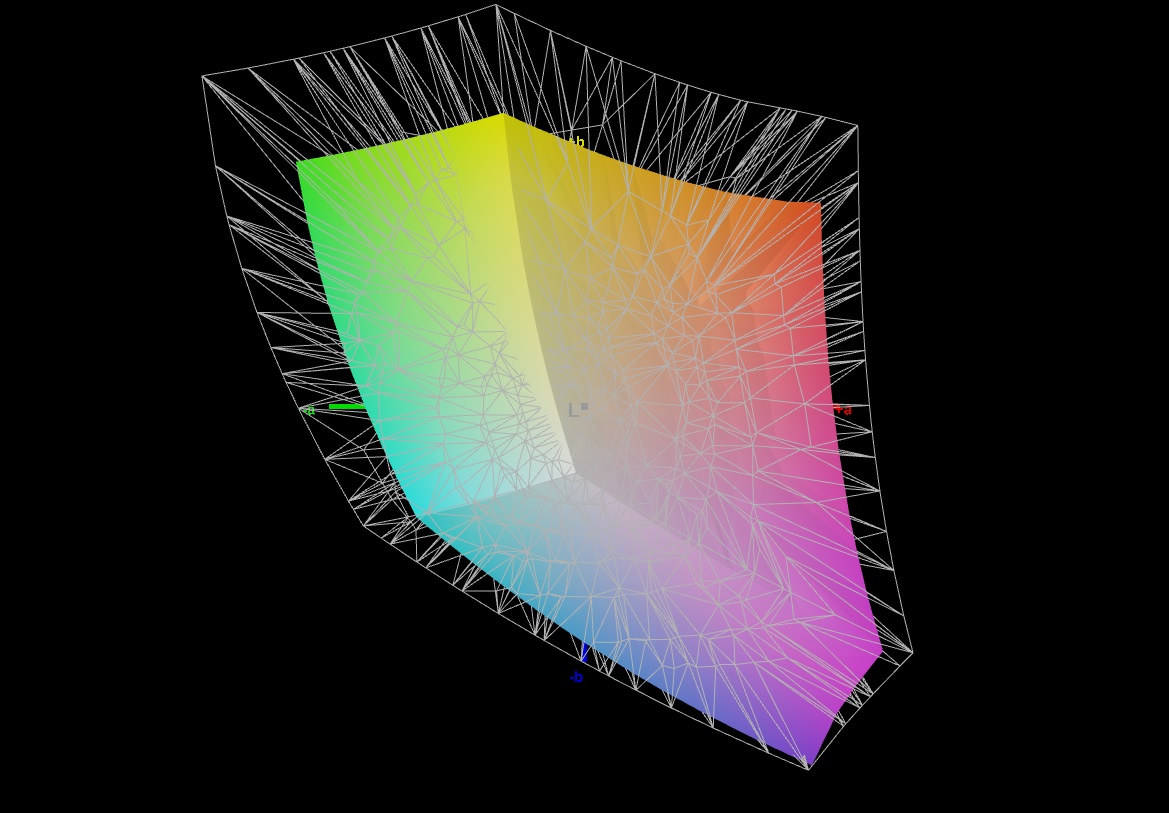
69.6% AdobeRGB 1998 (Argyll 3D)
99.8% sRGB (Argyll 3D)
69% Display P3 (Argyll 3D)
Gamma: 2.132
CCT: 6327 K
| Schenker XMG Neo 17 M22 BOE0A99, IPS, 2560x1600, 17" | MSI Titan GT77 12UHS Sharp SHP1544 LQ173M1JW08, IPS-Level, 1920x1080, 17.3" | Razer Blade 17 Early 2022 AU Optronics B173ZAN06.9, IPS, 3840x2160, 17.3" | Acer Predator Triton 500 SE PT516-52s-70KX NE160QDM-NZ2, IPS LED, 2560x1600, 16" | Asus ROG Zephyrus Duo 16 GX650RX BOE NE160QAM-NX1, IPS-Level, 3840x2400, 16" | MSI Raider GE77 HX 12UHS AU Optronics B173ZAN06.1, IPS, 3840x2160, 17.3" | |
|---|---|---|---|---|---|---|
| Display | 2% | 23% | 21% | 22% | 21% | |
| Display P3 Coverage (%) | 69 | 70.8 3% | 99.4 44% | 97.3 41% | 98 42% | 96.6 40% |
| sRGB Coverage (%) | 99.8 | 98.9 -1% | 100 0% | 100 0% | 99.9 0% | 99.8 0% |
| AdobeRGB 1998 Coverage (%) | 69.6 | 73 5% | 87.3 25% | 84.9 22% | 86.3 24% | 85.8 23% |
| Response Times | 43% | 20% | -17% | -14% | 27% | |
| Response Time Grey 50% / Grey 80% * (ms) | 10.8 ? | 3.03 ? 72% | 7.5 ? 31% | 13.8 ? -28% | 14.6 ? -35% | 5.8 ? 46% |
| Response Time Black / White * (ms) | 6.1 ? | 5.28 ? 13% | 5.6 ? 8% | 6.4 ? -5% | 5.6 ? 8% | 5.6 ? 8% |
| PWM Frequency (Hz) | ||||||
| Screen | -50% | 5% | -7% | -58% | -42% | |
| Brightness middle (cd/m²) | 415 | 280 -33% | 503 21% | 498 20% | 459 11% | 381 -8% |
| Brightness (cd/m²) | 399 | 275 -31% | 486 22% | 468 17% | 434 9% | 371 -7% |
| Brightness Distribution (%) | 90 | 79 -12% | 84 -7% | 80 -11% | 88 -2% | 84 -7% |
| Black Level * (cd/m²) | 0.43 | 0.4 7% | 0.44 -2% | 0.36 16% | 0.44 -2% | 0.52 -21% |
| Contrast (:1) | 965 | 700 -27% | 1143 18% | 1383 43% | 1043 8% | 733 -24% |
| Colorchecker dE 2000 * | 1.44 | 2.1 -46% | 1.08 25% | 1.77 -23% | 2.97 -106% | |
| Colorchecker dE 2000 max. * | 2.33 | 5.83 -150% | 4.54 -95% | 5.24 -125% | 8.13 -249% | |
| Colorchecker dE 2000 calibrated * | 0.89 | 1.58 -78% | 0.6 33% | 0.63 29% | 1.03 -16% | 2.53 -184% |
| Greyscale dE 2000 * | 1.8 | 3.3 -83% | 1.3 28% | 2.4 -33% | 4.9 -172% | |
| Gamma | 2.132 103% | 2.13 103% | 2.151 102% | 2.14 103% | 2.235 98% | |
| CCT | 6327 103% | 7060 92% | 6541 99% | 7046 92% | 6775 96% | |
| Total Average (Program / Settings) | -2% /
-26% | 16% /
11% | -1% /
-3% | -17% /
-34% | 2% /
-12% |
* ... smaller is better
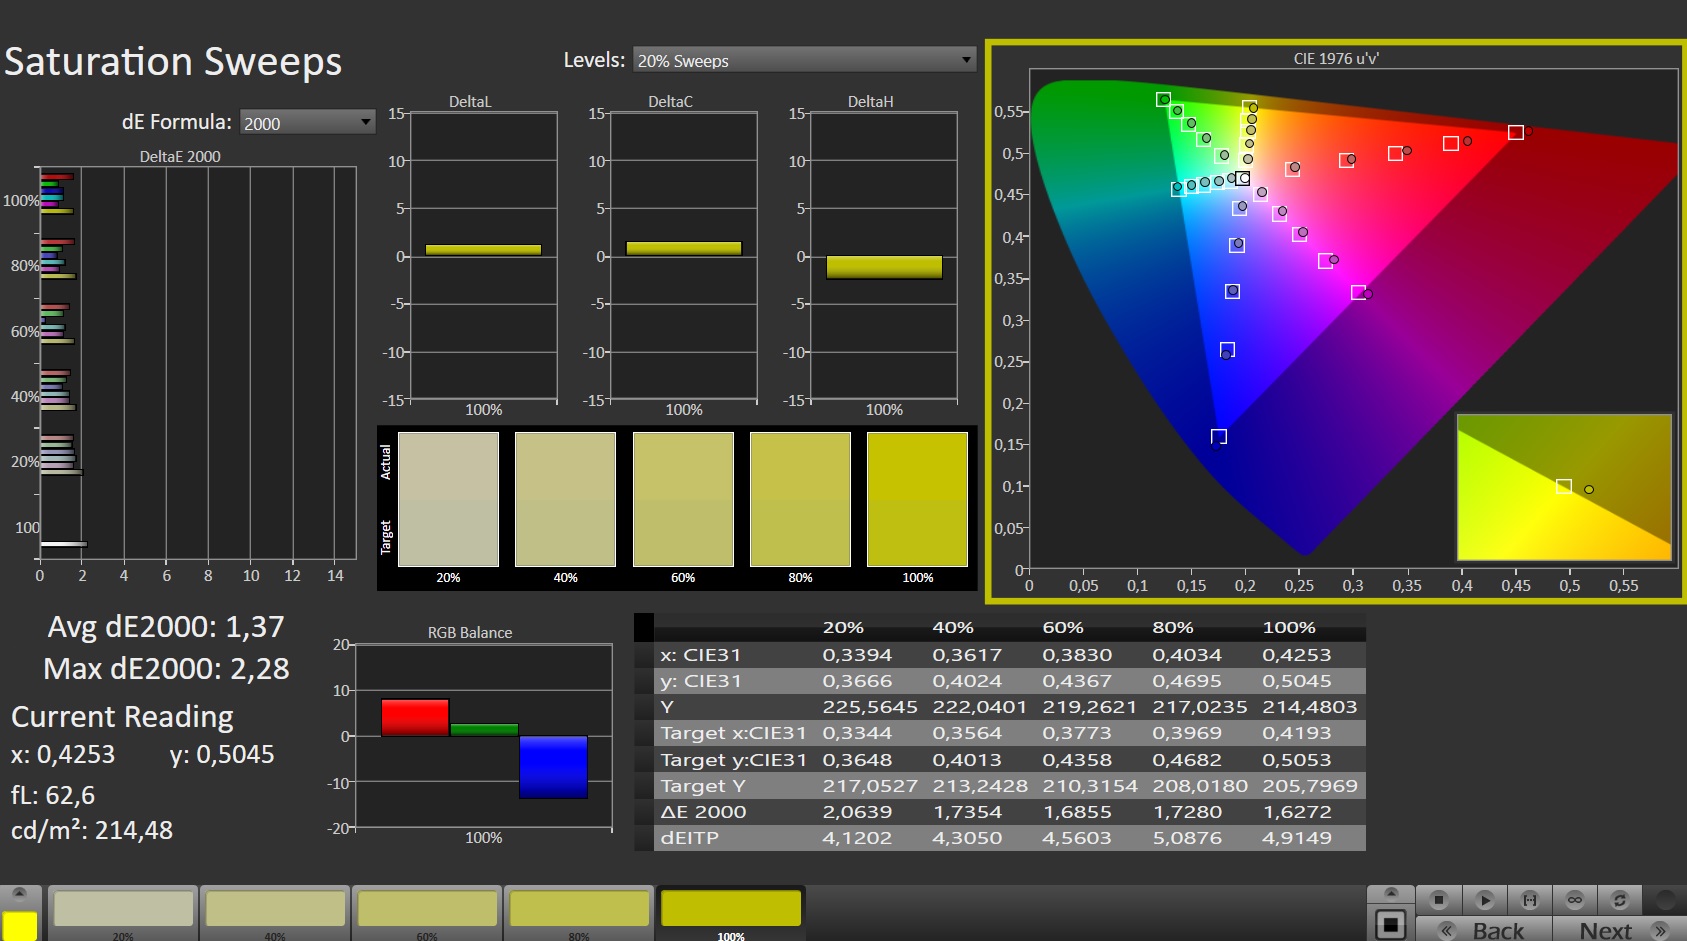
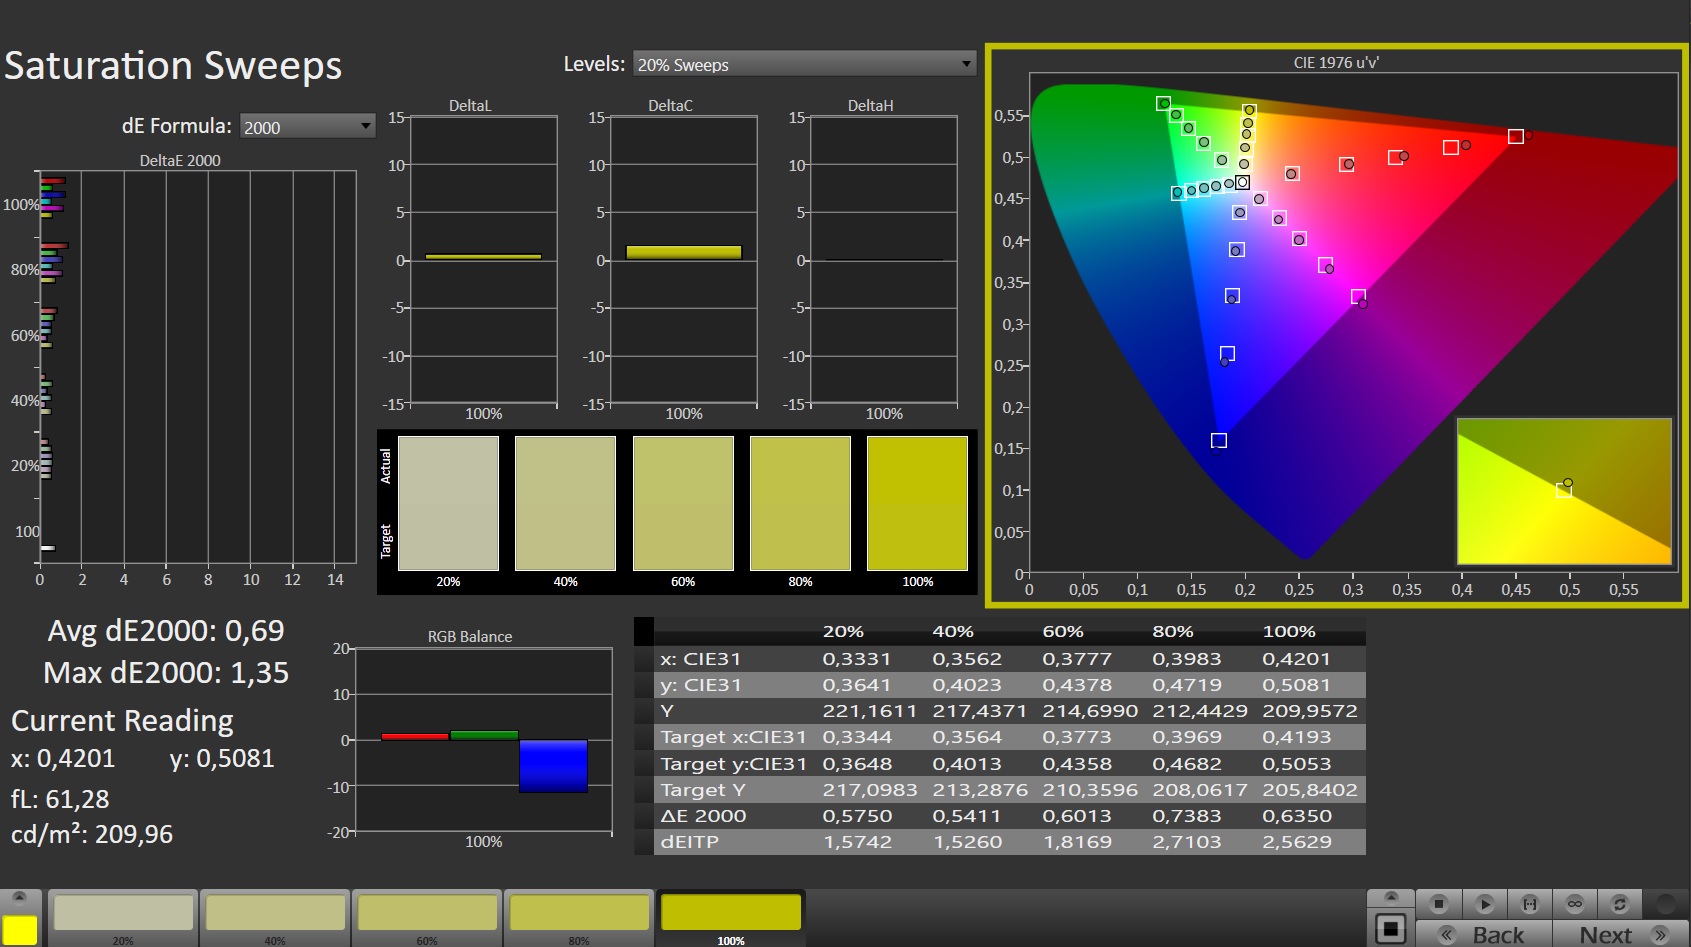
The display quality is good across the board and we did not observe graininess due to the matte display layer. Furthermore, our measurements indicate that Schenker precalibrates the display of the Schenker Neo 17. Ex-factory, we record grayscale and color deltaE-2000 values of less than 3 each, which is the ideal range. Regardless, we were able to further improve these results by manually calibrating the display. The Neo 17 reaches the advertised sRGB color space coverage of 99 percent. However, it only covers 69 percent of the extended color spaces AdobeRGB and P3, making it unsuitable for anything beyond non-professional photo and video editing.
Display Response Times
| ↔ Response Time Black to White | ||
|---|---|---|
| 6.1 ms ... rise ↗ and fall ↘ combined | ↗ 2.5 ms rise | 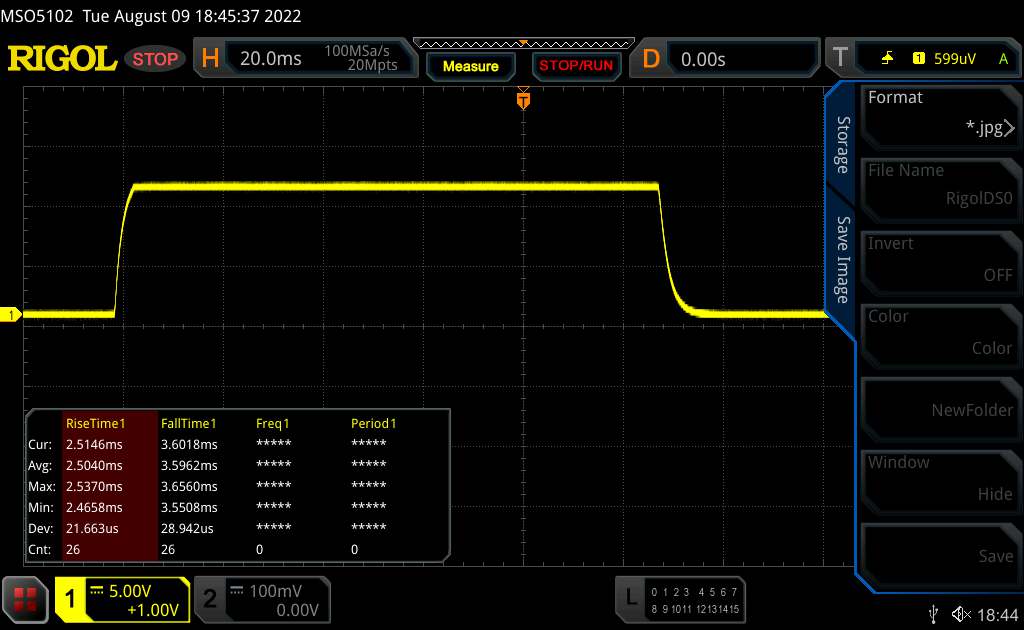 |
| ↘ 3.6 ms fall | ||
| The screen shows very fast response rates in our tests and should be very well suited for fast-paced gaming. In comparison, all tested devices range from 0.1 (minimum) to 240 (maximum) ms. » 20 % of all devices are better. This means that the measured response time is better than the average of all tested devices (19.9 ms). | ||
| ↔ Response Time 50% Grey to 80% Grey | ||
| 10.8 ms ... rise ↗ and fall ↘ combined | ↗ 5.1 ms rise | 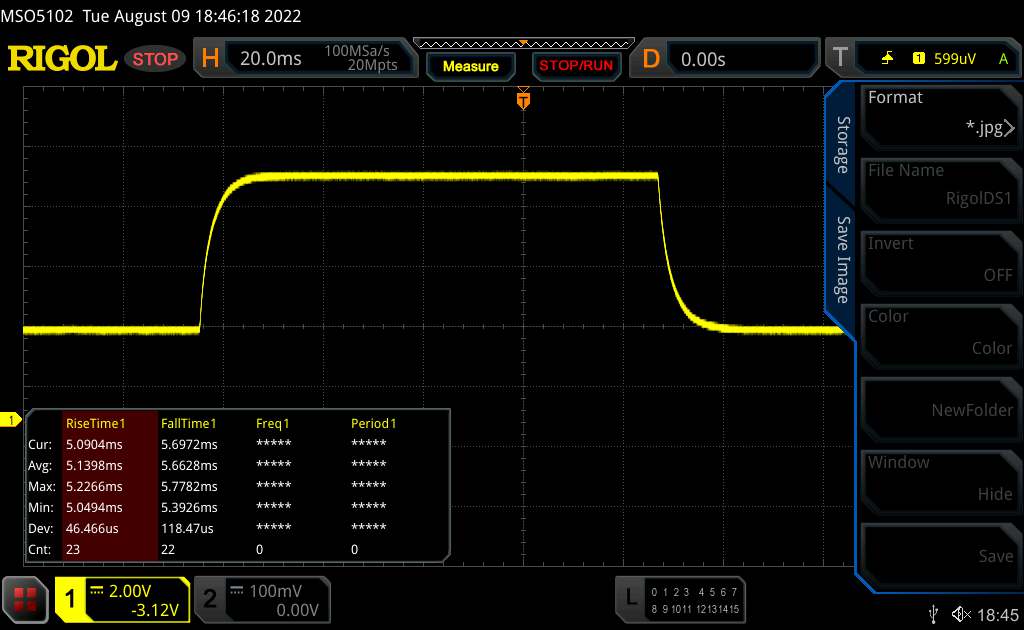 |
| ↘ 5.7 ms fall | ||
| The screen shows good response rates in our tests, but may be too slow for competitive gamers. In comparison, all tested devices range from 0.165 (minimum) to 636 (maximum) ms. » 24 % of all devices are better. This means that the measured response time is better than the average of all tested devices (31.1 ms). | ||
Screen Flickering / PWM (Pulse-Width Modulation)
| Screen flickering / PWM not detected | 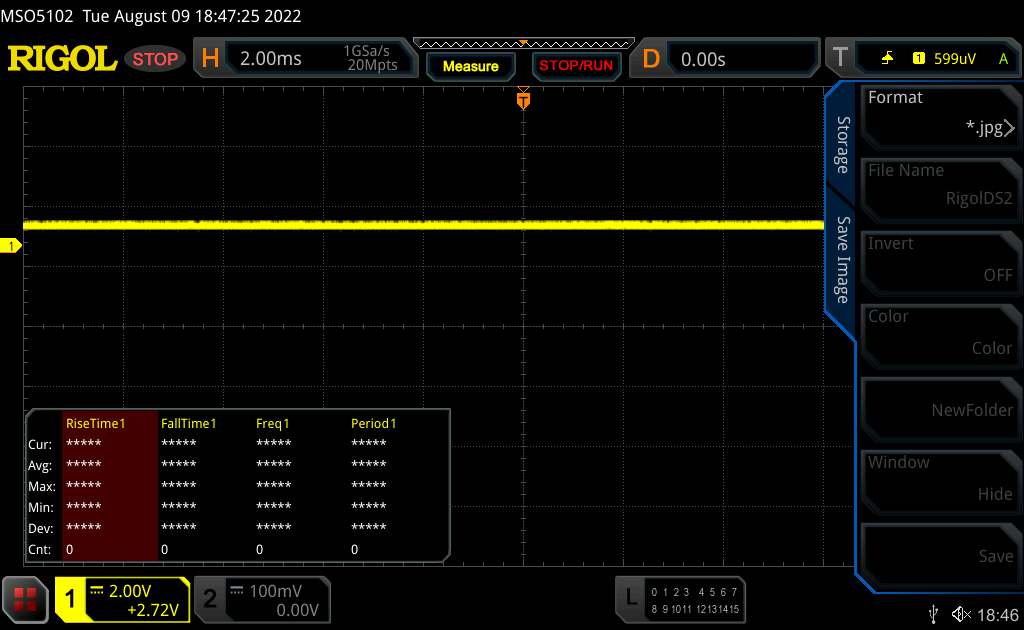 | ||
In comparison: 52 % of all tested devices do not use PWM to dim the display. If PWM was detected, an average of 7801 (minimum: 5 - maximum: 343500) Hz was measured. | |||
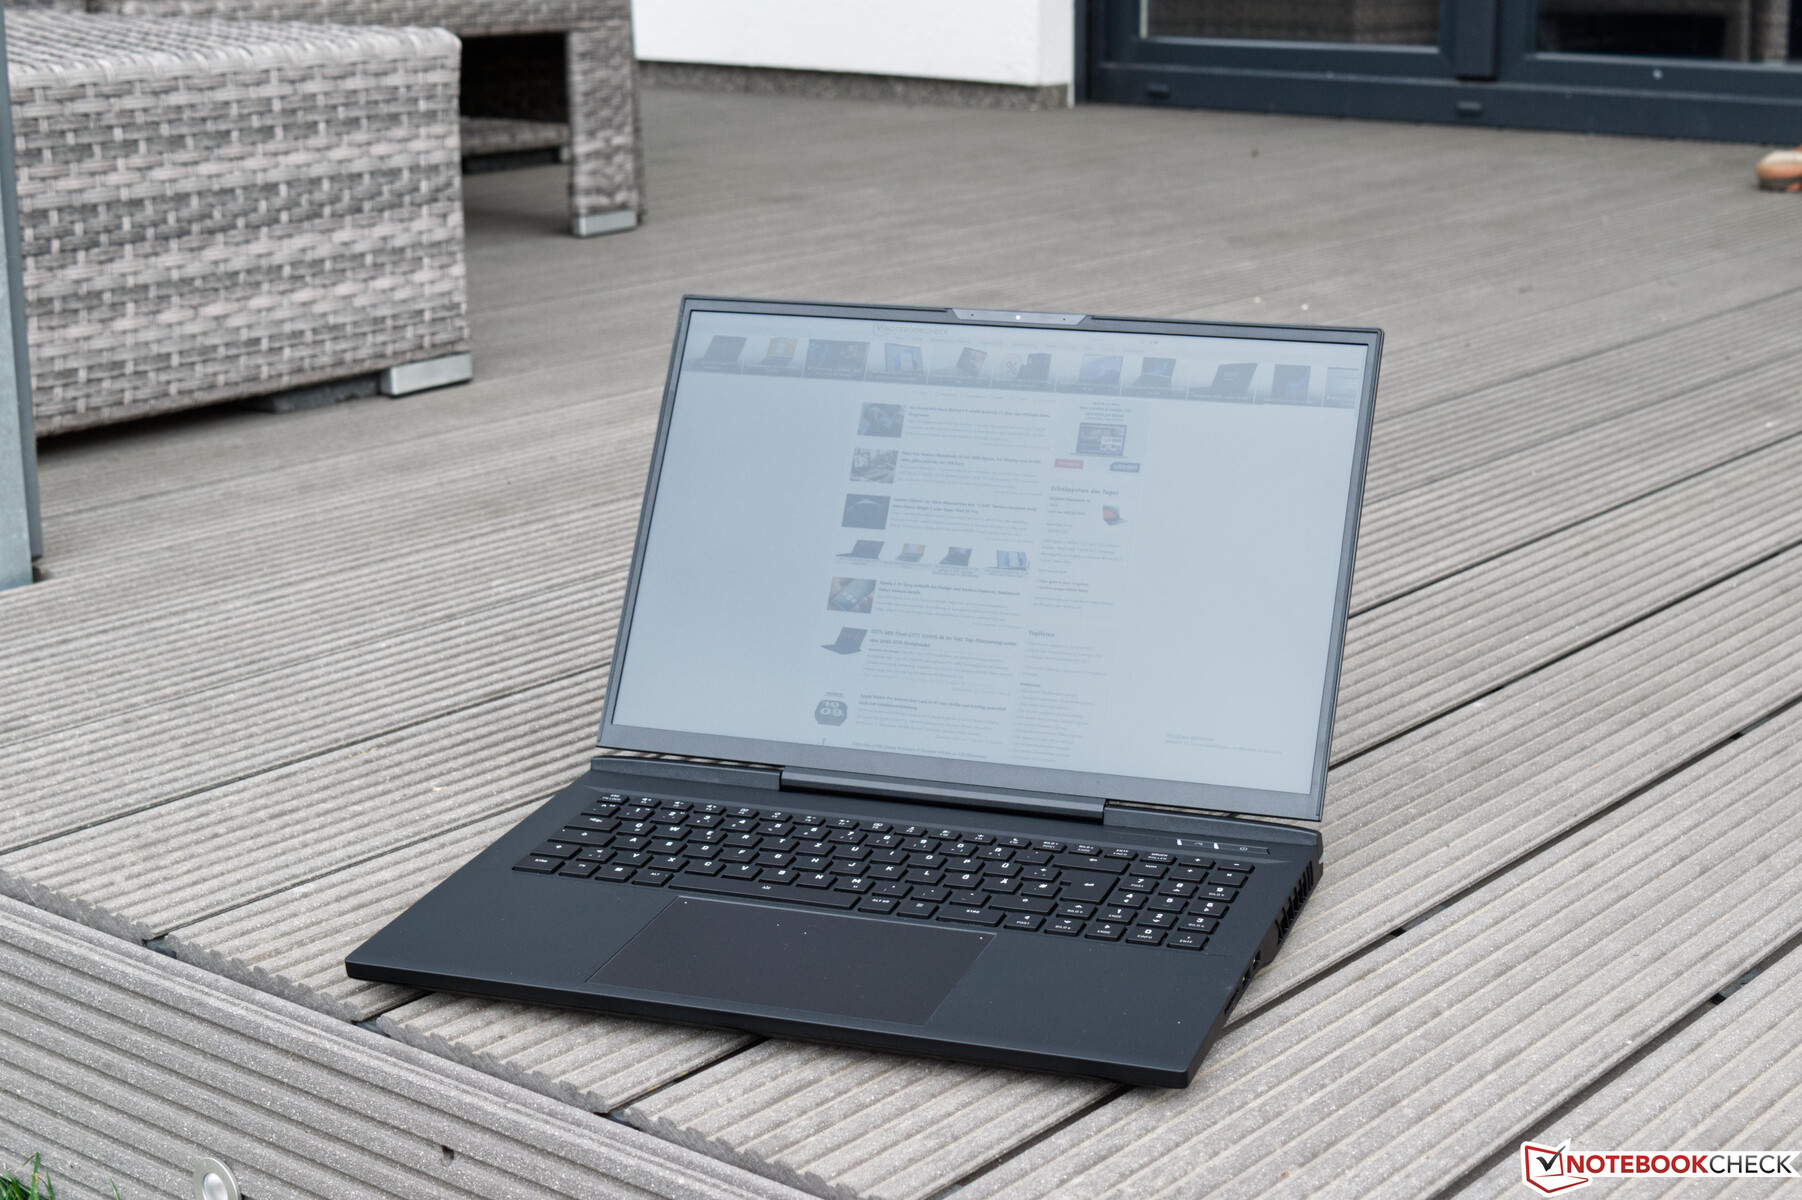
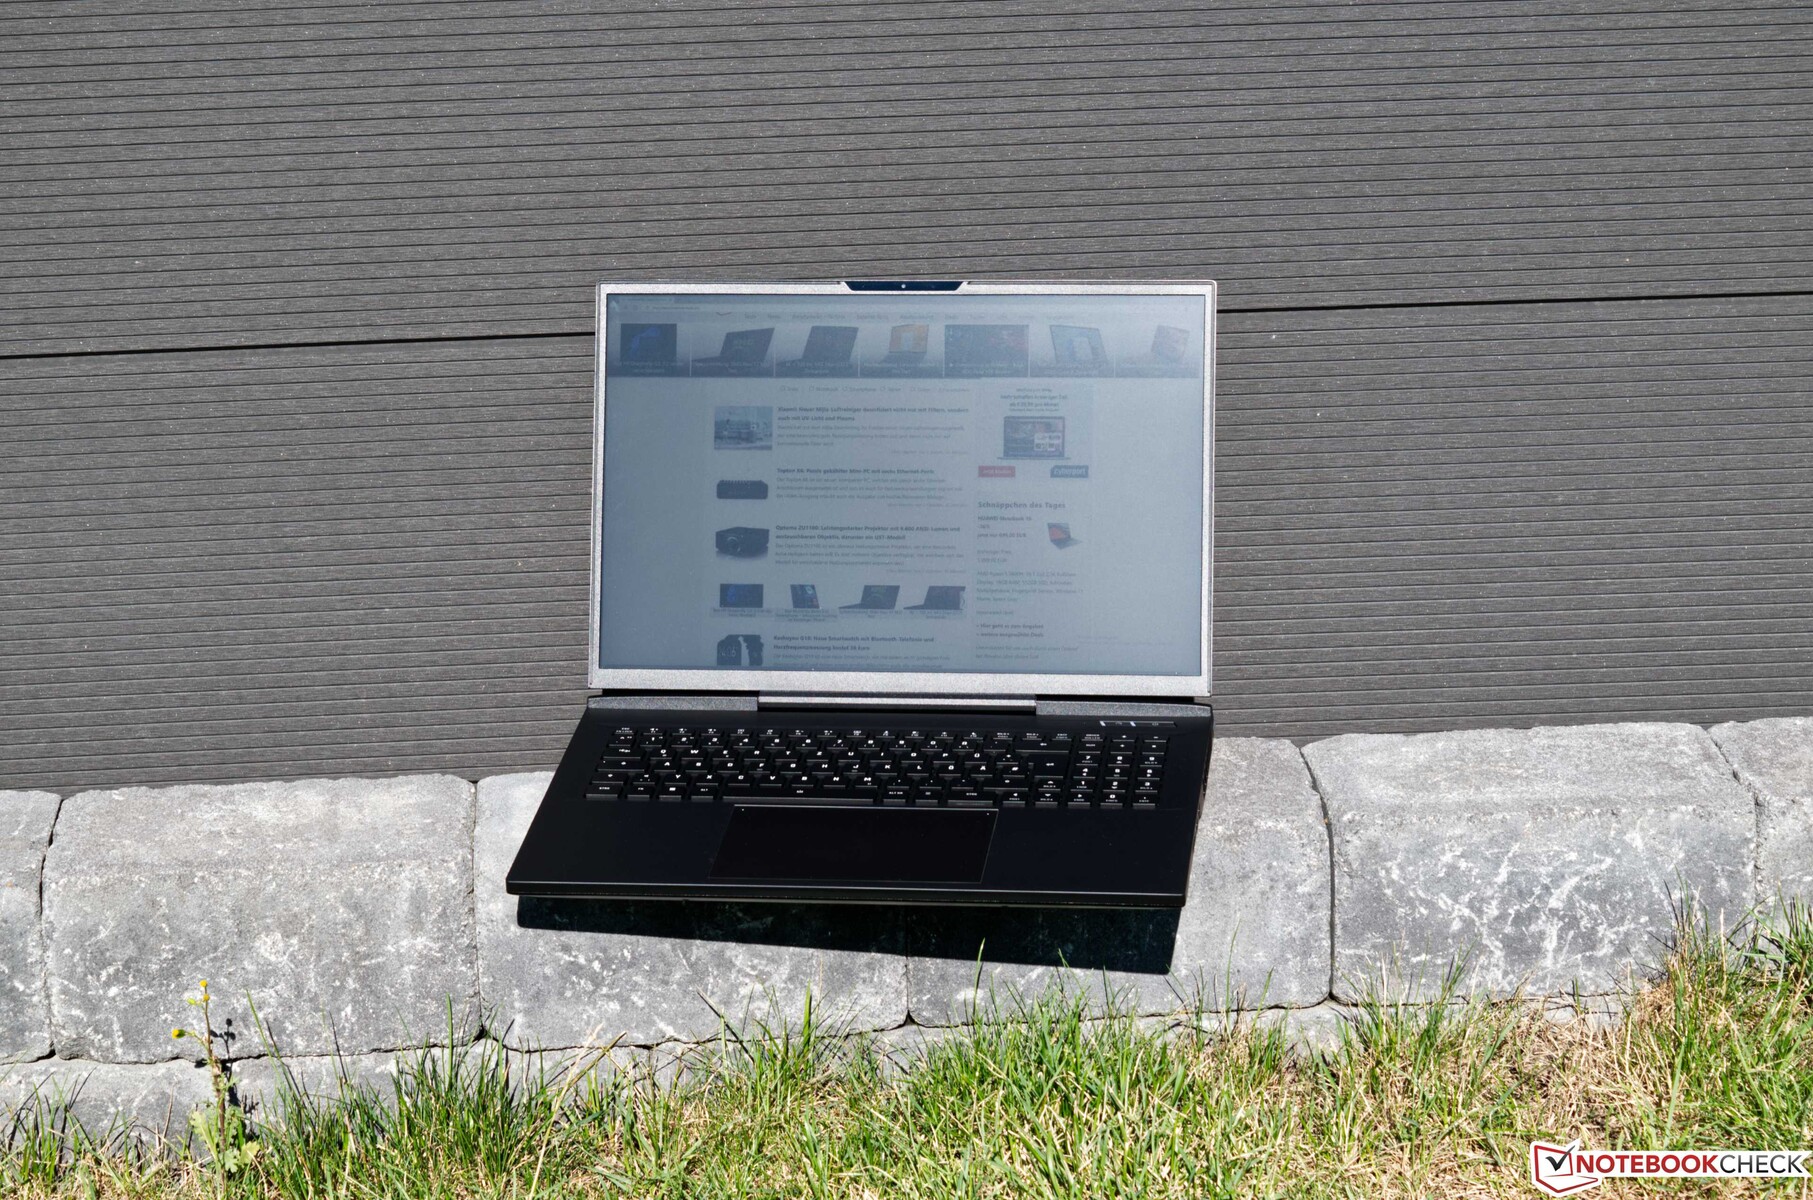
The matte display coating is well suited to outdoor use. Regardless, the readability is limited outside of the shade. In particular, users should avoid using the screen under direct sunlight.
The viewing angle test shows a result that is characteristic for an IPS panel. Only the four corner images show minor color deviations that will not be present during normal use.

Performance - AMD and Nvidia United
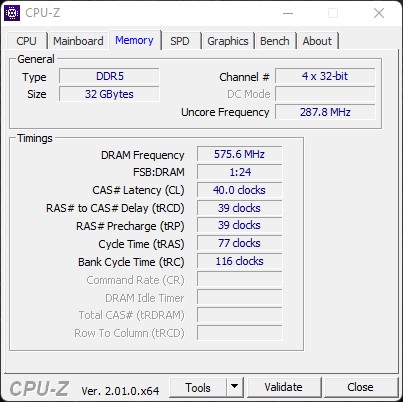
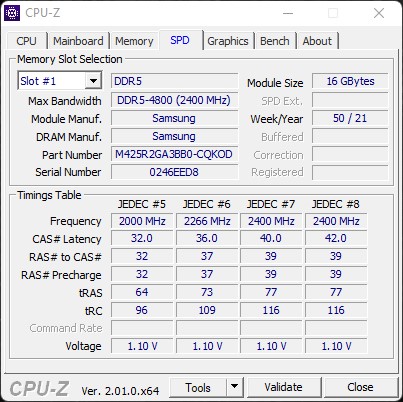
With the AMD Ryzen 9 6900HX and the Nvidia GeForce RTX 3080 Ti laptop GPU, our test device is ready for the latest games at the maximum detail settings on a laptop. The generous system memory configuration of 32 GB leaves users more than enough wiggle room and supports the new DDR5 standard. In typical Schenker fashion, users can adjust the configuration according to their preferences and create an optimal system. The CPU and the 17-inch panel are fixed, however.
Test Conditions
Schenker's own Control Center includes predefined fan profiles, which also affect the long-term fan behavior. In order to achieve the best scores, we set the Schenker XMG Neo 17 M22 to "Overboost" before running any of the following benchmarks.
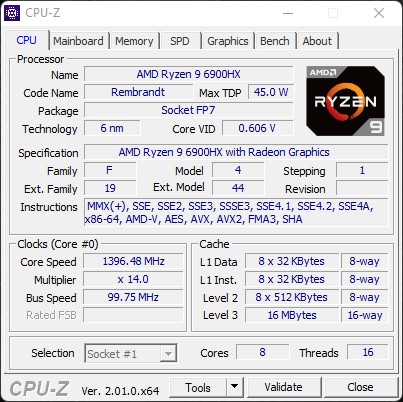
Processor
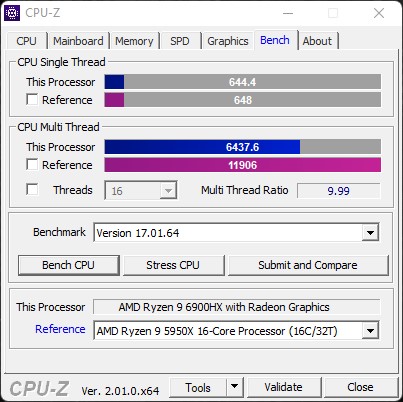
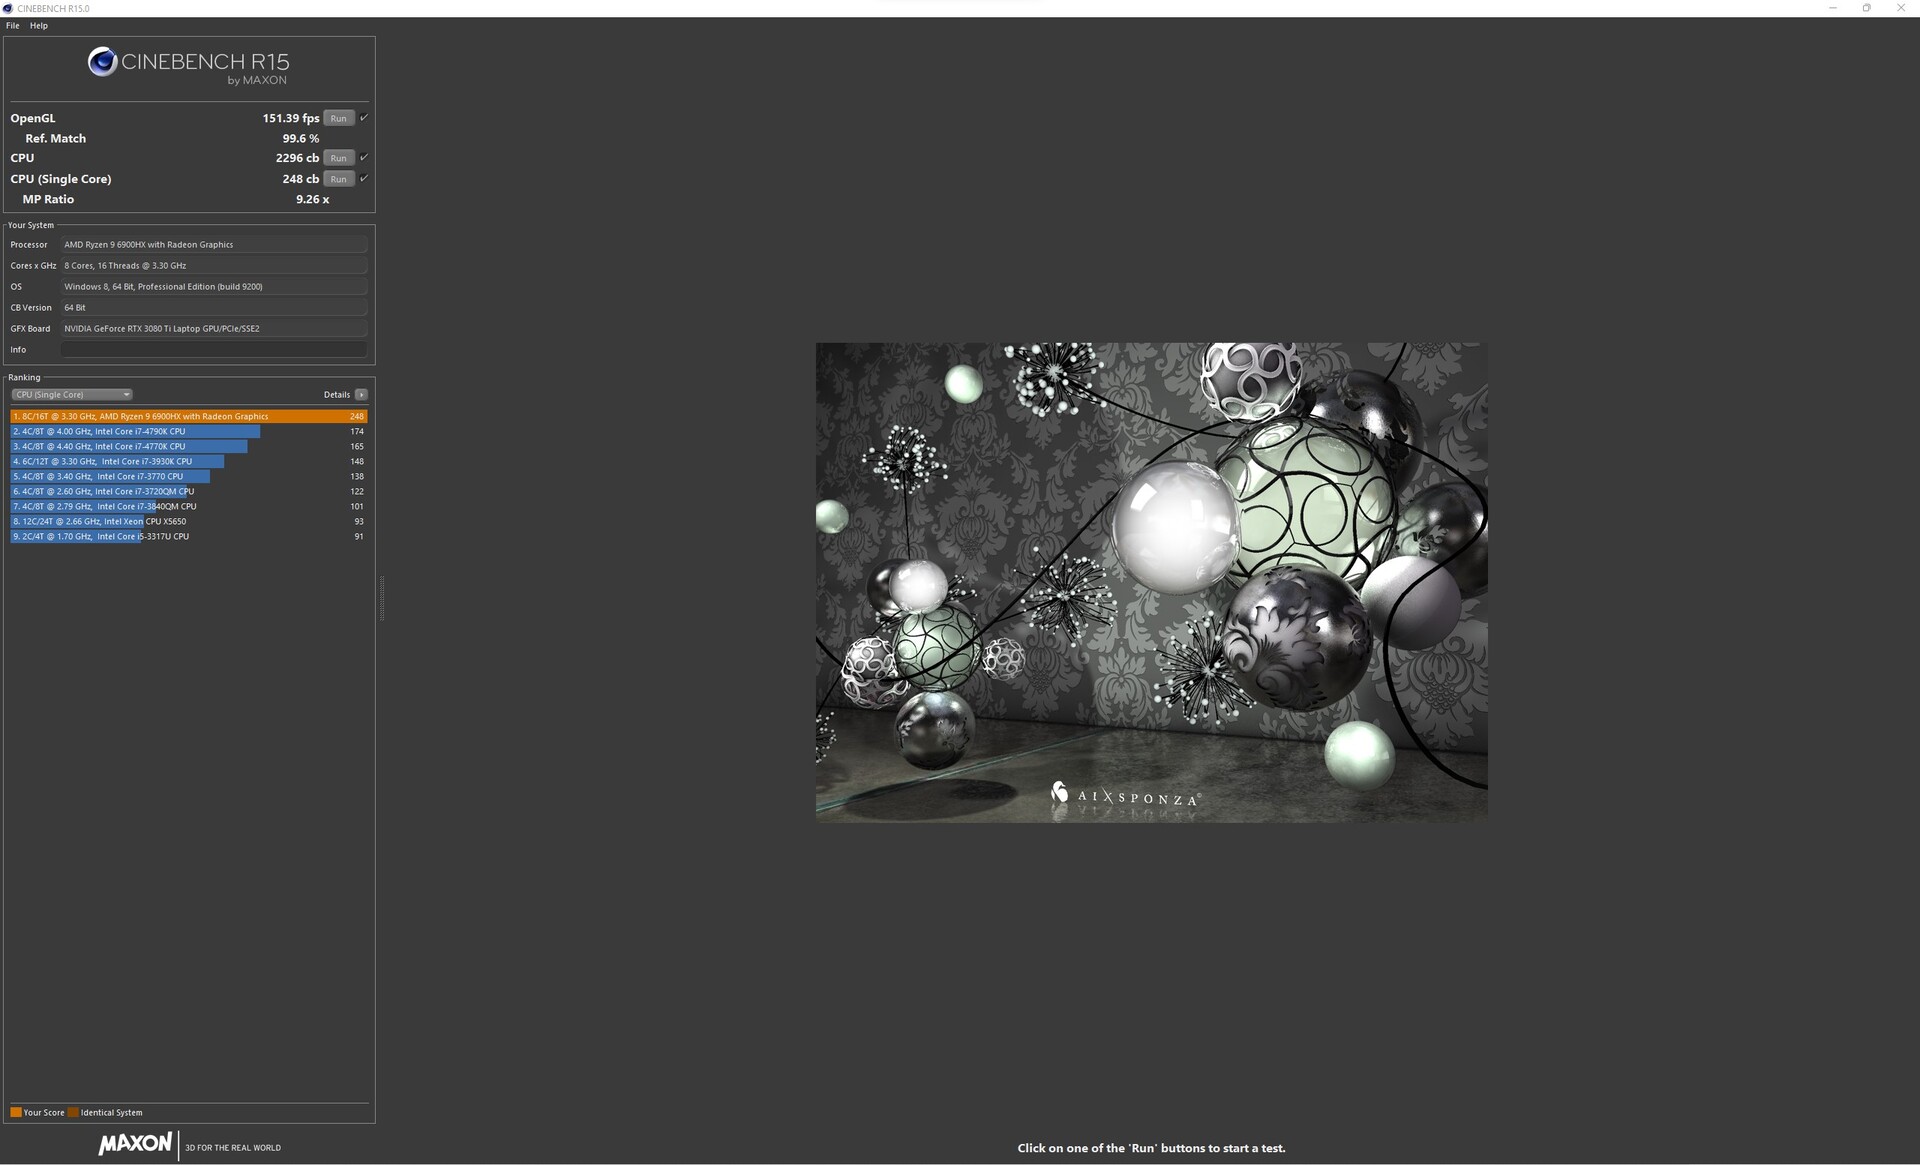
The AMD Ryzen 9 6900HX is an octa-core CPU based on the latest Zen-3 architecture. The SoC has a clock speed of 3.3-4.9 GHz boost and supports SMT for a total of 16 threads. However, the AMD Ryzen 9 6900HX faces tough competition with Intel 12th Gen, which can be significantly faster in a direct comparison.
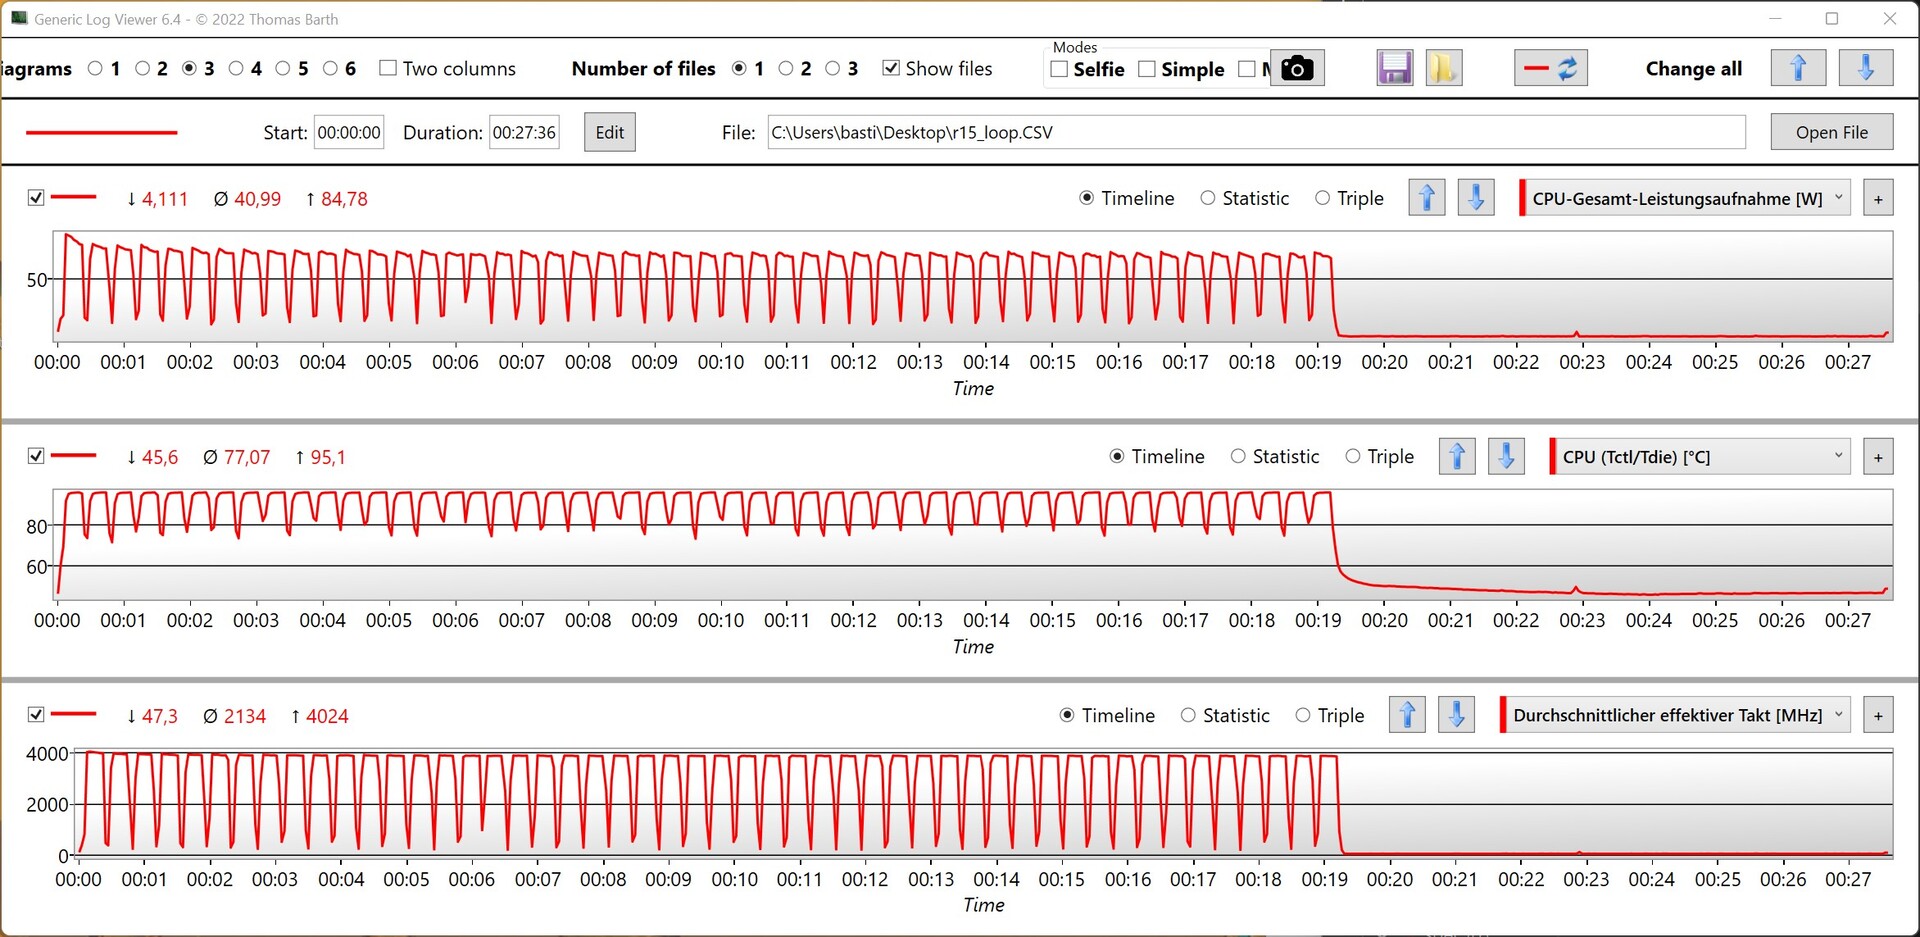
The AMD Ryzen 9 6900HX in the Schenker XMG Neo 17 M22 is able to maintain a consistent performance level during our test. It should be noted that the CPU performance dropps by about 10 percent in battery mode.
More benchmarks can be found in our CPU comparison table.
Cinebench R15 Multi Loop
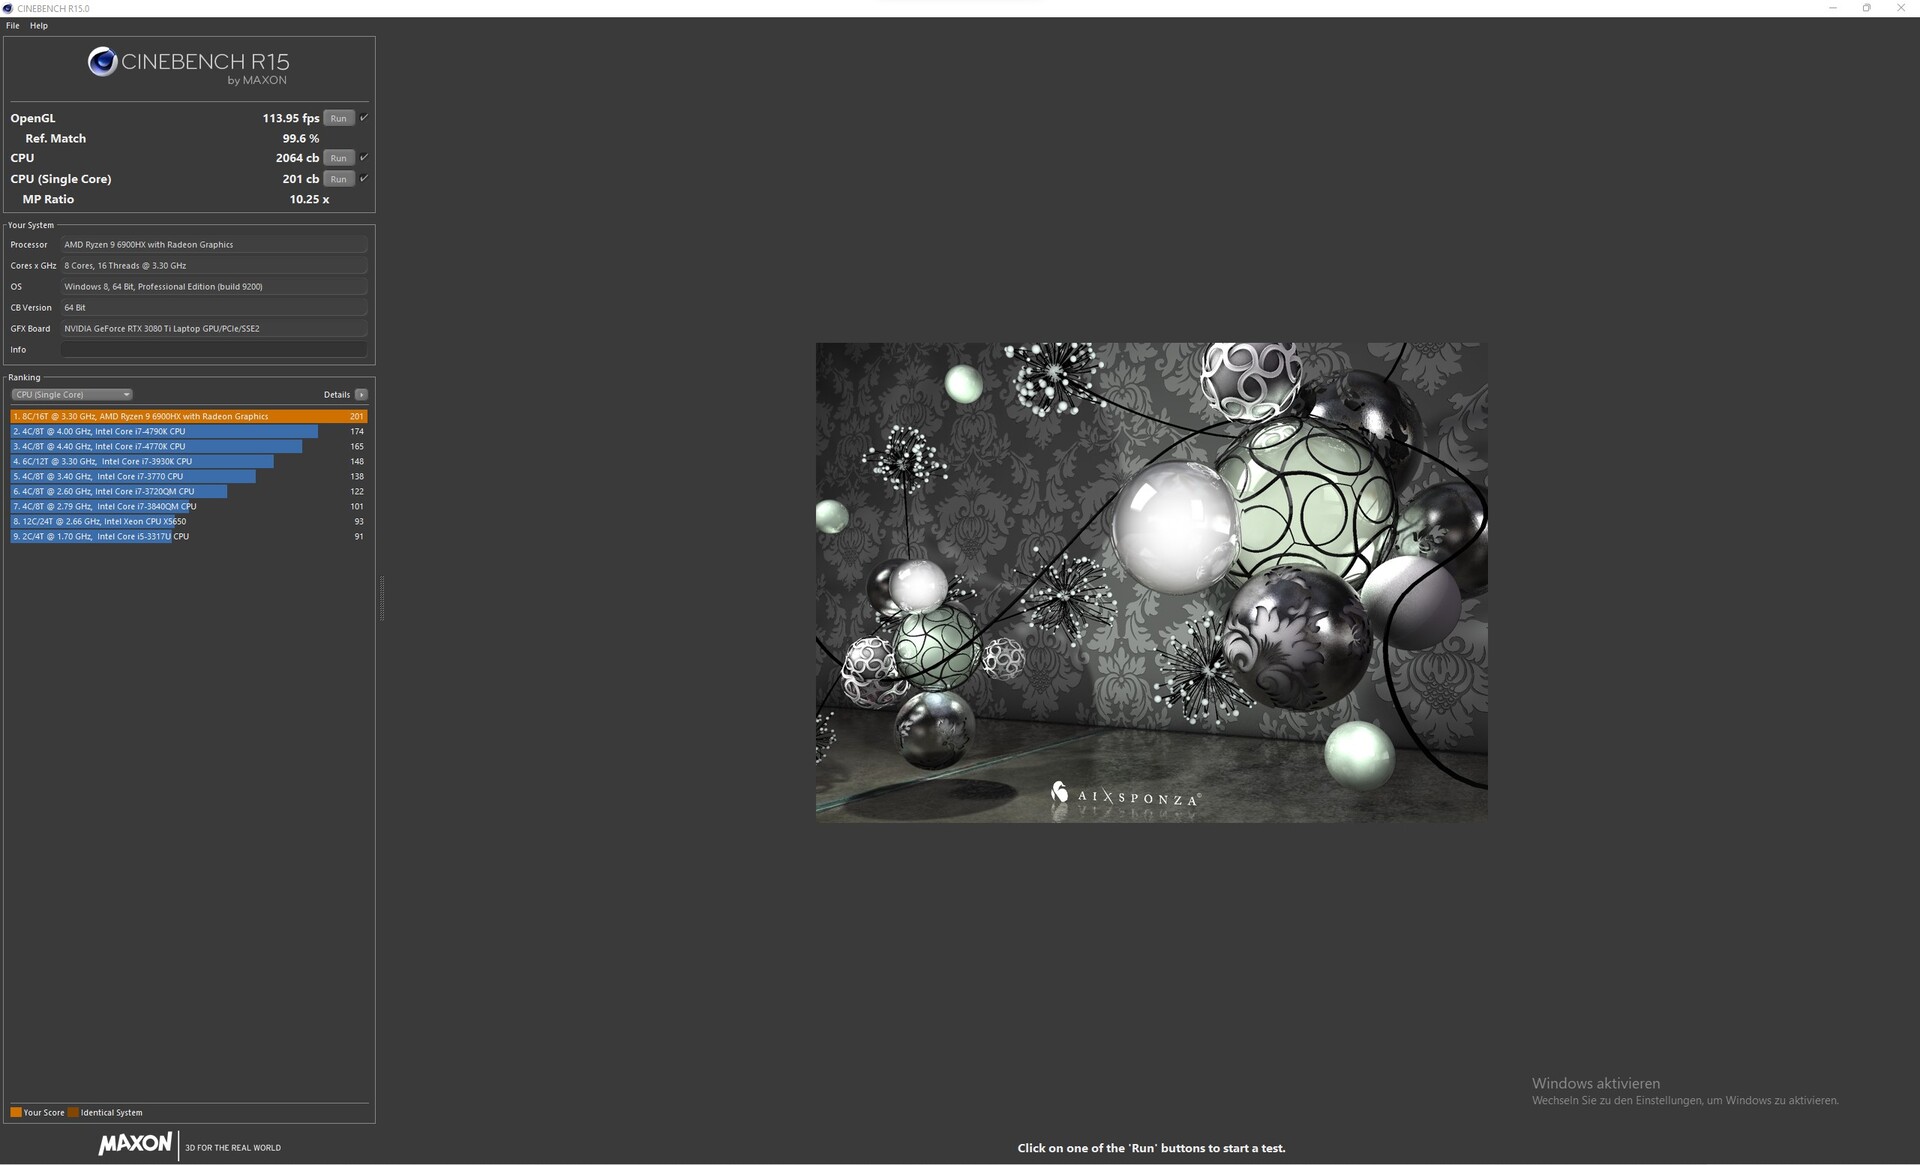
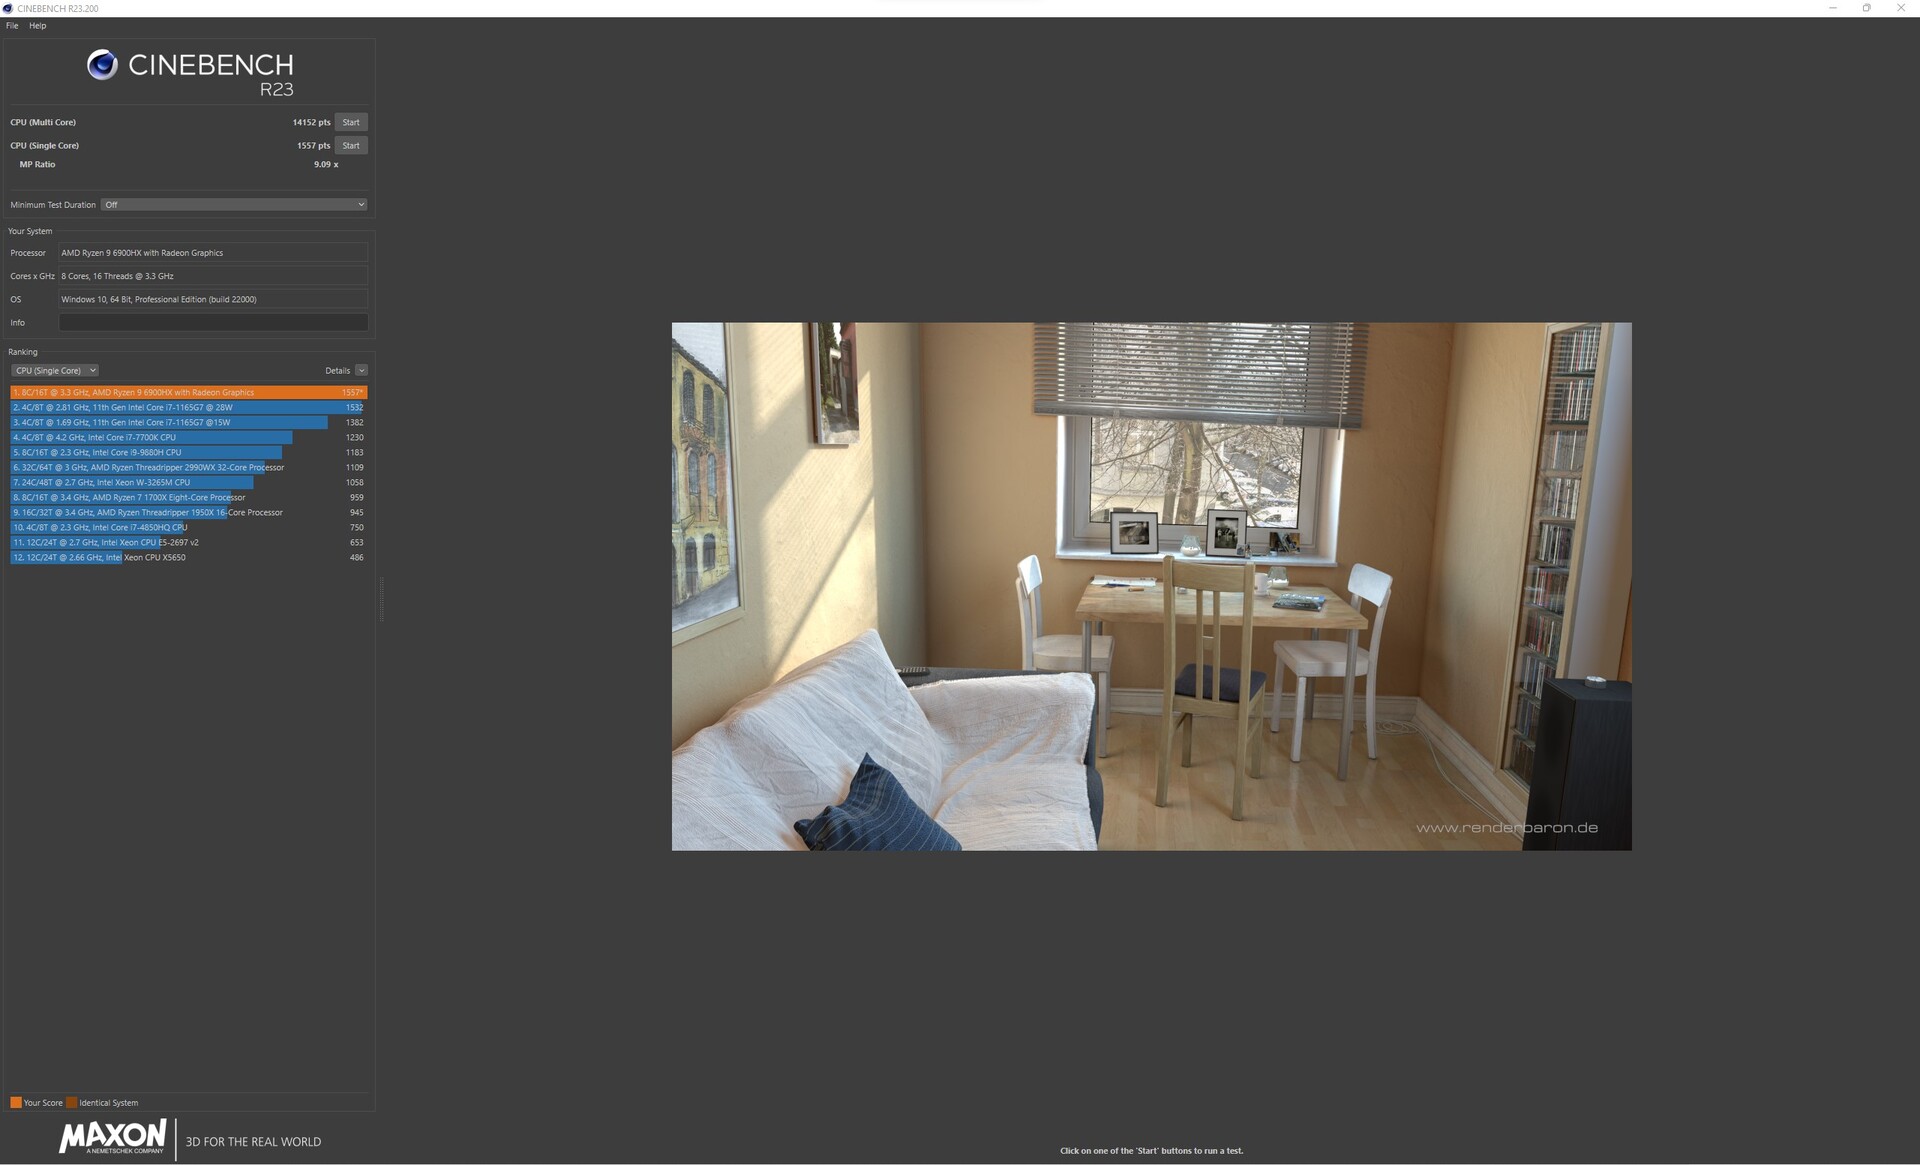
Cinebench R23: Multi Core | Single Core
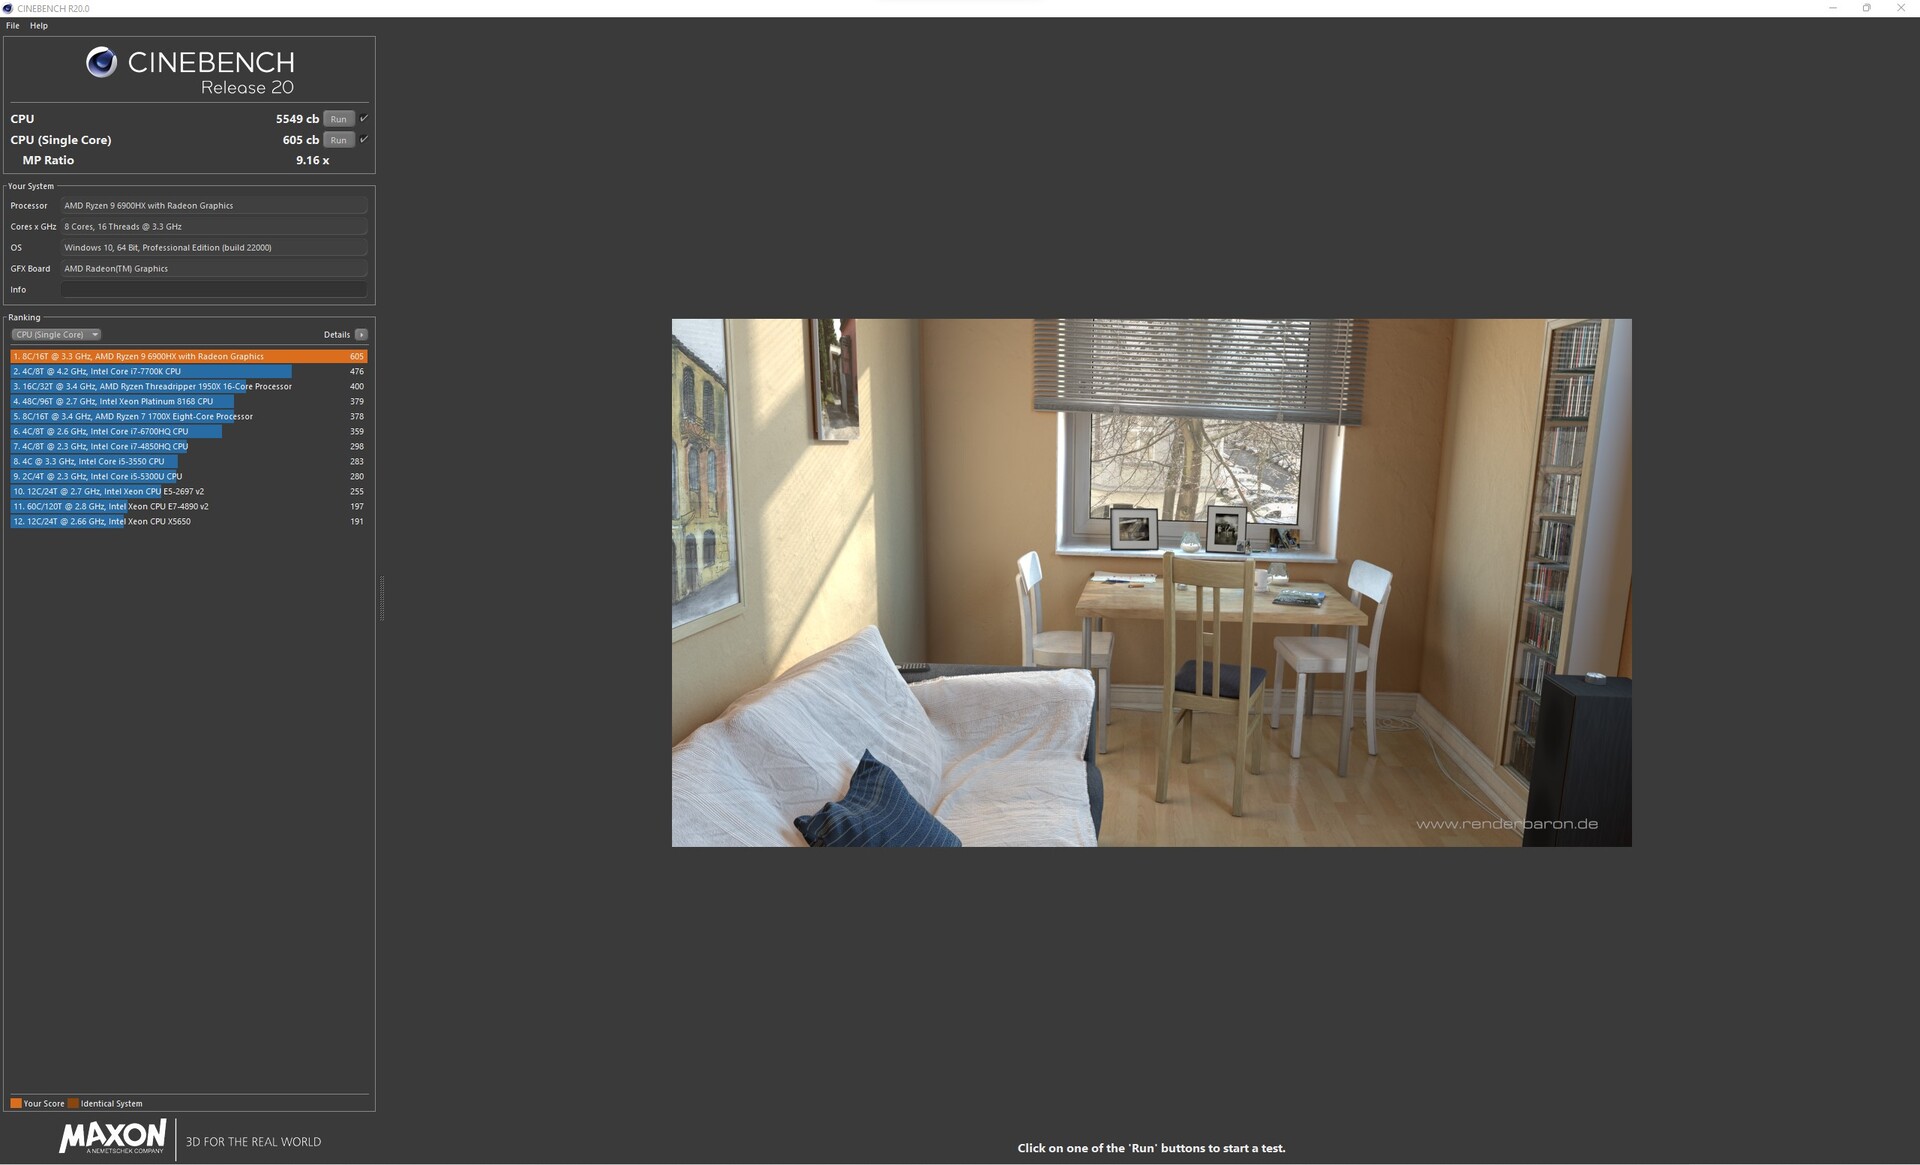
Cinebench R20: CPU (Multi Core) | CPU (Single Core)
Cinebench R15: CPU Multi 64Bit | CPU Single 64Bit
Blender: v2.79 BMW27 CPU
7-Zip 18.03: 7z b 4 | 7z b 4 -mmt1
Geekbench 5.5: Multi-Core | Single-Core
HWBOT x265 Benchmark v2.2: 4k Preset
LibreOffice : 20 Documents To PDF
R Benchmark 2.5: Overall mean
| CPU Performance rating | |
| Average of class Gaming | |
| MSI Raider GE77 HX 12UHS | |
| MSI Titan GT77 12UHS | |
| Acer Predator Triton 500 SE PT516-52s-70KX | |
| Asus ROG Zephyrus Duo 16 GX650RX | |
| Schenker XMG Neo 17 M22 | |
| Average AMD Ryzen 9 6900HX | |
| Razer Blade 17 Early 2022 | |
| Cinebench R23 / Multi Core | |
| Average of class Gaming (10488 - 40970, n=113, last 2 years) | |
| MSI Raider GE77 HX 12UHS | |
| MSI Titan GT77 12UHS | |
| Acer Predator Triton 500 SE PT516-52s-70KX | |
| Schenker XMG Neo 17 M22 | |
| Asus ROG Zephyrus Duo 16 GX650RX | |
| Average AMD Ryzen 9 6900HX (9709 - 15100, n=19) | |
| Razer Blade 17 Early 2022 | |
| Cinebench R23 / Single Core | |
| Average of class Gaming (1166 - 2356, n=113, last 2 years) | |
| MSI Titan GT77 12UHS | |
| Razer Blade 17 Early 2022 | |
| MSI Raider GE77 HX 12UHS | |
| Acer Predator Triton 500 SE PT516-52s-70KX | |
| Asus ROG Zephyrus Duo 16 GX650RX | |
| Average AMD Ryzen 9 6900HX (1516 - 1616, n=19) | |
| Schenker XMG Neo 17 M22 | |
| Cinebench R20 / CPU (Multi Core) | |
| Average of class Gaming (4029 - 16108, n=112, last 2 years) | |
| MSI Raider GE77 HX 12UHS | |
| MSI Titan GT77 12UHS | |
| Acer Predator Triton 500 SE PT516-52s-70KX | |
| Schenker XMG Neo 17 M22 | |
| Asus ROG Zephyrus Duo 16 GX650RX | |
| Average AMD Ryzen 9 6900HX (3742 - 5813, n=19) | |
| Razer Blade 17 Early 2022 | |
| Cinebench R20 / CPU (Single Core) | |
| Average of class Gaming (442 - 895, n=112, last 2 years) | |
| MSI Raider GE77 HX 12UHS | |
| MSI Titan GT77 12UHS | |
| Razer Blade 17 Early 2022 | |
| Acer Predator Triton 500 SE PT516-52s-70KX | |
| Average AMD Ryzen 9 6900HX (595 - 631, n=19) | |
| Schenker XMG Neo 17 M22 | |
| Asus ROG Zephyrus Duo 16 GX650RX | |
| Cinebench R15 / CPU Multi 64Bit | |
| Average of class Gaming (1578 - 6271, n=113, last 2 years) | |
| MSI Titan GT77 12UHS | |
| MSI Raider GE77 HX 12UHS | |
| Acer Predator Triton 500 SE PT516-52s-70KX | |
| Schenker XMG Neo 17 M22 | |
| Asus ROG Zephyrus Duo 16 GX650RX | |
| Average AMD Ryzen 9 6900HX (1588 - 2411, n=19) | |
| Razer Blade 17 Early 2022 | |
| Cinebench R15 / CPU Single 64Bit | |
| Average of class Gaming (188.8 - 343, n=112, last 2 years) | |
| MSI Raider GE77 HX 12UHS | |
| MSI Titan GT77 12UHS | |
| Razer Blade 17 Early 2022 | |
| Average AMD Ryzen 9 6900HX (241 - 261, n=19) | |
| Asus ROG Zephyrus Duo 16 GX650RX | |
| Schenker XMG Neo 17 M22 | |
| Acer Predator Triton 500 SE PT516-52s-70KX | |
| Blender / v2.79 BMW27 CPU | |
| Razer Blade 17 Early 2022 | |
| Average AMD Ryzen 9 6900HX (212 - 357, n=21) | |
| Asus ROG Zephyrus Duo 16 GX650RX | |
| Schenker XMG Neo 17 M22 | |
| Acer Predator Triton 500 SE PT516-52s-70KX | |
| Average of class Gaming (80 - 330, n=110, last 2 years) | |
| MSI Raider GE77 HX 12UHS | |
| MSI Titan GT77 12UHS | |
| 7-Zip 18.03 / 7z b 4 | |
| Average of class Gaming (33491 - 148086, n=111, last 2 years) | |
| MSI Raider GE77 HX 12UHS | |
| MSI Titan GT77 12UHS | |
| Acer Predator Triton 500 SE PT516-52s-70KX | |
| Asus ROG Zephyrus Duo 16 GX650RX | |
| Schenker XMG Neo 17 M22 | |
| Average AMD Ryzen 9 6900HX (49526 - 65336, n=20) | |
| Razer Blade 17 Early 2022 | |
| 7-Zip 18.03 / 7z b 4 -mmt1 | |
| Average of class Gaming (4199 - 7436, n=111, last 2 years) | |
| MSI Raider GE77 HX 12UHS | |
| MSI Titan GT77 12UHS | |
| Razer Blade 17 Early 2022 | |
| Schenker XMG Neo 17 M22 | |
| Average AMD Ryzen 9 6900HX (5090 - 6070, n=20) | |
| Asus ROG Zephyrus Duo 16 GX650RX | |
| Acer Predator Triton 500 SE PT516-52s-70KX | |
| Geekbench 5.5 / Multi-Core | |
| Average of class Gaming (6460 - 27010, n=111, last 2 years) | |
| MSI Raider GE77 HX 12UHS | |
| MSI Titan GT77 12UHS | |
| Acer Predator Triton 500 SE PT516-52s-70KX | |
| Asus ROG Zephyrus Duo 16 GX650RX | |
| Schenker XMG Neo 17 M22 | |
| Razer Blade 17 Early 2022 | |
| Average AMD Ryzen 9 6900HX (8313 - 10490, n=21) | |
| Geekbench 5.5 / Single-Core | |
| Average of class Gaming (986 - 2474, n=111, last 2 years) | |
| MSI Raider GE77 HX 12UHS | |
| MSI Titan GT77 12UHS | |
| Razer Blade 17 Early 2022 | |
| Acer Predator Triton 500 SE PT516-52s-70KX | |
| Asus ROG Zephyrus Duo 16 GX650RX | |
| Schenker XMG Neo 17 M22 | |
| Average AMD Ryzen 9 6900HX (1523 - 1652, n=21) | |
| HWBOT x265 Benchmark v2.2 / 4k Preset | |
| Average of class Gaming (11.5 - 44.3, n=111, last 2 years) | |
| MSI Raider GE77 HX 12UHS | |
| MSI Titan GT77 12UHS | |
| Acer Predator Triton 500 SE PT516-52s-70KX | |
| Asus ROG Zephyrus Duo 16 GX650RX | |
| Schenker XMG Neo 17 M22 | |
| Average AMD Ryzen 9 6900HX (12.6 - 18.7, n=20) | |
| Razer Blade 17 Early 2022 | |
| LibreOffice / 20 Documents To PDF | |
| Schenker XMG Neo 17 M22 | |
| Average AMD Ryzen 9 6900HX (44.8 - 81.7, n=20) | |
| Average of class Gaming (19 - 88.8, n=111, last 2 years) | |
| Asus ROG Zephyrus Duo 16 GX650RX | |
| MSI Raider GE77 HX 12UHS | |
| Acer Predator Triton 500 SE PT516-52s-70KX | |
| Razer Blade 17 Early 2022 | |
| MSI Titan GT77 12UHS | |
| R Benchmark 2.5 / Overall mean | |
| Average AMD Ryzen 9 6900HX (0.4627 - 0.4974, n=20) | |
| Schenker XMG Neo 17 M22 | |
| Asus ROG Zephyrus Duo 16 GX650RX | |
| Acer Predator Triton 500 SE PT516-52s-70KX | |
| Razer Blade 17 Early 2022 | |
| Average of class Gaming (0.3439 - 0.759, n=112, last 2 years) | |
| MSI Raider GE77 HX 12UHS | |
| MSI Titan GT77 12UHS | |
* ... smaller is better
AIDA64: FP32 Ray-Trace | FPU Julia | CPU SHA3 | CPU Queen | FPU SinJulia | FPU Mandel | CPU AES | CPU ZLib | FP64 Ray-Trace | CPU PhotoWorxx
| Performance rating | |
| Average of class Gaming | |
| MSI Raider GE77 HX 12UHS | |
| MSI Titan GT77 12UHS | |
| Asus ROG Zephyrus Duo 16 GX650RX | |
| Schenker XMG Neo 17 M22 | |
| Average AMD Ryzen 9 6900HX | |
| Acer Predator Triton 500 SE PT516-52s-70KX | |
| Razer Blade 17 Early 2022 | |
| AIDA64 / FP32 Ray-Trace | |
| Average of class Gaming (10227 - 85542, n=110, last 2 years) | |
| MSI Titan GT77 12UHS | |
| MSI Raider GE77 HX 12UHS | |
| Asus ROG Zephyrus Duo 16 GX650RX | |
| Schenker XMG Neo 17 M22 | |
| Average AMD Ryzen 9 6900HX (10950 - 17963, n=20) | |
| Acer Predator Triton 500 SE PT516-52s-70KX | |
| Razer Blade 17 Early 2022 | |
| AIDA64 / FPU Julia | |
| Average of class Gaming (51376 - 238426, n=110, last 2 years) | |
| MSI Raider GE77 HX 12UHS | |
| MSI Titan GT77 12UHS | |
| Asus ROG Zephyrus Duo 16 GX650RX | |
| Schenker XMG Neo 17 M22 | |
| Average AMD Ryzen 9 6900HX (71414 - 110797, n=20) | |
| Acer Predator Triton 500 SE PT516-52s-70KX | |
| Razer Blade 17 Early 2022 | |
| AIDA64 / CPU SHA3 | |
| Average of class Gaming (2180 - 9817, n=110, last 2 years) | |
| MSI Raider GE77 HX 12UHS | |
| MSI Titan GT77 12UHS | |
| Asus ROG Zephyrus Duo 16 GX650RX | |
| Schenker XMG Neo 17 M22 | |
| Acer Predator Triton 500 SE PT516-52s-70KX | |
| Average AMD Ryzen 9 6900HX (2471 - 3804, n=20) | |
| Razer Blade 17 Early 2022 | |
| AIDA64 / CPU Queen | |
| Average of class Gaming (49785 - 173351, n=101, last 2 years) | |
| Asus ROG Zephyrus Duo 16 GX650RX | |
| MSI Titan GT77 12UHS | |
| Schenker XMG Neo 17 M22 | |
| MSI Raider GE77 HX 12UHS | |
| Average AMD Ryzen 9 6900HX (84185 - 107544, n=20) | |
| Acer Predator Triton 500 SE PT516-52s-70KX | |
| Razer Blade 17 Early 2022 | |
| AIDA64 / FPU SinJulia | |
| Average of class Gaming (4424 - 33636, n=110, last 2 years) | |
| MSI Titan GT77 12UHS | |
| Asus ROG Zephyrus Duo 16 GX650RX | |
| MSI Raider GE77 HX 12UHS | |
| Schenker XMG Neo 17 M22 | |
| Average AMD Ryzen 9 6900HX (10970 - 13205, n=20) | |
| Acer Predator Triton 500 SE PT516-52s-70KX | |
| Razer Blade 17 Early 2022 | |
| AIDA64 / FPU Mandel | |
| Average of class Gaming (25115 - 128721, n=110, last 2 years) | |
| Asus ROG Zephyrus Duo 16 GX650RX | |
| Schenker XMG Neo 17 M22 | |
| Average AMD Ryzen 9 6900HX (39164 - 61370, n=20) | |
| MSI Titan GT77 12UHS | |
| MSI Raider GE77 HX 12UHS | |
| Acer Predator Triton 500 SE PT516-52s-70KX | |
| Razer Blade 17 Early 2022 | |
| AIDA64 / CPU AES | |
| MSI Raider GE77 HX 12UHS | |
| MSI Titan GT77 12UHS | |
| Asus ROG Zephyrus Duo 16 GX650RX | |
| Schenker XMG Neo 17 M22 | |
| Average AMD Ryzen 9 6900HX (54613 - 142360, n=20) | |
| Average of class Gaming (39258 - 247074, n=110, last 2 years) | |
| Acer Predator Triton 500 SE PT516-52s-70KX | |
| Razer Blade 17 Early 2022 | |
| AIDA64 / CPU ZLib | |
| Average of class Gaming (574 - 2531, n=110, last 2 years) | |
| MSI Raider GE77 HX 12UHS | |
| MSI Titan GT77 12UHS | |
| Acer Predator Triton 500 SE PT516-52s-70KX | |
| Asus ROG Zephyrus Duo 16 GX650RX | |
| Schenker XMG Neo 17 M22 | |
| Average AMD Ryzen 9 6900HX (578 - 911, n=20) | |
| Razer Blade 17 Early 2022 | |
| AIDA64 / FP64 Ray-Trace | |
| Average of class Gaming (5509 - 45446, n=110, last 2 years) | |
| MSI Titan GT77 12UHS | |
| MSI Raider GE77 HX 12UHS | |
| Asus ROG Zephyrus Duo 16 GX650RX | |
| Schenker XMG Neo 17 M22 | |
| Average AMD Ryzen 9 6900HX (5798 - 9540, n=20) | |
| Acer Predator Triton 500 SE PT516-52s-70KX | |
| Razer Blade 17 Early 2022 | |
| AIDA64 / CPU PhotoWorxx | |
| MSI Raider GE77 HX 12UHS | |
| Average of class Gaming (12271 - 89891, n=110, last 2 years) | |
| MSI Titan GT77 12UHS | |
| Razer Blade 17 Early 2022 | |
| Acer Predator Triton 500 SE PT516-52s-70KX | |
| Schenker XMG Neo 17 M22 | |
| Asus ROG Zephyrus Duo 16 GX650RX | |
| Average AMD Ryzen 9 6900HX (26873 - 30604, n=20) | |
System Performance
In the system performance benchmarks, the Schenker XMG Neo 17 M22's results are similar to those of the pure CPU benchmarks. The performance level is still good and about 10 percent higher compared to the Asus ROG Zephyrus Duo. Subjectively, the XMG Neo 17 feels very fast and there are barely any loading times during daily use.
CrossMark: Overall | Productivity | Creativity | Responsiveness
| PCMark 10 / Score | |
| Average of class Gaming (5828 - 11574, n=96, last 2 years) | |
| MSI Titan GT77 12UHS | |
| Acer Predator Triton 500 SE PT516-52s-70KX | |
| Razer Blade 17 Early 2022 | |
| MSI Raider GE77 HX 12UHS | |
| Schenker XMG Neo 17 M22 | |
| Average AMD Ryzen 9 6900HX, NVIDIA GeForce RTX 3080 Ti Laptop GPU (6351 - 6966, n=2) | |
| Asus ROG Zephyrus Duo 16 GX650RX | |
| PCMark 10 / Essentials | |
| MSI Titan GT77 12UHS | |
| Acer Predator Triton 500 SE PT516-52s-70KX | |
| Average of class Gaming (8810 - 12600, n=100, last 2 years) | |
| Razer Blade 17 Early 2022 | |
| MSI Raider GE77 HX 12UHS | |
| Schenker XMG Neo 17 M22 | |
| Average AMD Ryzen 9 6900HX, NVIDIA GeForce RTX 3080 Ti Laptop GPU (9374 - 9740, n=2) | |
| Asus ROG Zephyrus Duo 16 GX650RX | |
| PCMark 10 / Productivity | |
| Average of class Gaming (6845 - 18766, n=98, last 2 years) | |
| MSI Titan GT77 12UHS | |
| MSI Raider GE77 HX 12UHS | |
| Acer Predator Triton 500 SE PT516-52s-70KX | |
| Schenker XMG Neo 17 M22 | |
| Razer Blade 17 Early 2022 | |
| Average AMD Ryzen 9 6900HX, NVIDIA GeForce RTX 3080 Ti Laptop GPU (7704 - 9564, n=2) | |
| Asus ROG Zephyrus Duo 16 GX650RX | |
| PCMark 10 / Digital Content Creation | |
| Average of class Gaming (7602 - 19657, n=98, last 2 years) | |
| MSI Titan GT77 12UHS | |
| Acer Predator Triton 500 SE PT516-52s-70KX | |
| Razer Blade 17 Early 2022 | |
| Schenker XMG Neo 17 M22 | |
| MSI Raider GE77 HX 12UHS | |
| Average AMD Ryzen 9 6900HX, NVIDIA GeForce RTX 3080 Ti Laptop GPU (9626 - 9848, n=2) | |
| Asus ROG Zephyrus Duo 16 GX650RX | |
| CrossMark / Overall | |
| MSI Raider GE77 HX 12UHS | |
| MSI Titan GT77 12UHS | |
| Average of class Gaming (1366 - 2409, n=98, last 2 years) | |
| Acer Predator Triton 500 SE PT516-52s-70KX | |
| Razer Blade 17 Early 2022 | |
| Asus ROG Zephyrus Duo 16 GX650RX | |
| Average AMD Ryzen 9 6900HX, NVIDIA GeForce RTX 3080 Ti Laptop GPU (1699 - 1711, n=2) | |
| Schenker XMG Neo 17 M22 | |
| CrossMark / Productivity | |
| MSI Raider GE77 HX 12UHS | |
| MSI Titan GT77 12UHS | |
| Average of class Gaming (1386 - 2254, n=98, last 2 years) | |
| Acer Predator Triton 500 SE PT516-52s-70KX | |
| Razer Blade 17 Early 2022 | |
| Asus ROG Zephyrus Duo 16 GX650RX | |
| Average AMD Ryzen 9 6900HX, NVIDIA GeForce RTX 3080 Ti Laptop GPU (1646 - 1698, n=2) | |
| Schenker XMG Neo 17 M22 | |
| CrossMark / Creativity | |
| MSI Raider GE77 HX 12UHS | |
| MSI Titan GT77 12UHS | |
| Average of class Gaming (1343 - 2729, n=98, last 2 years) | |
| Acer Predator Triton 500 SE PT516-52s-70KX | |
| Razer Blade 17 Early 2022 | |
| Schenker XMG Neo 17 M22 | |
| Average AMD Ryzen 9 6900HX, NVIDIA GeForce RTX 3080 Ti Laptop GPU (1724 - 1867, n=2) | |
| Asus ROG Zephyrus Duo 16 GX650RX | |
| CrossMark / Responsiveness | |
| MSI Raider GE77 HX 12UHS | |
| MSI Titan GT77 12UHS | |
| Acer Predator Triton 500 SE PT516-52s-70KX | |
| Asus ROG Zephyrus Duo 16 GX650RX | |
| Average of class Gaming (1226 - 2334, n=98, last 2 years) | |
| Razer Blade 17 Early 2022 | |
| Average AMD Ryzen 9 6900HX, NVIDIA GeForce RTX 3080 Ti Laptop GPU (1405 - 1715, n=2) | |
| Schenker XMG Neo 17 M22 | |
| PCMark 10 Score | 6966 points | |
Help | ||
| AIDA64 / Memory Copy | |
| Average of class Gaming (21750 - 129946, n=110, last 2 years) | |
| MSI Raider GE77 HX 12UHS | |
| MSI Titan GT77 12UHS | |
| Acer Predator Triton 500 SE PT516-52s-70KX | |
| Razer Blade 17 Early 2022 | |
| Asus ROG Zephyrus Duo 16 GX650RX | |
| Average AMD Ryzen 9 6900HX (47938 - 53345, n=20) | |
| Schenker XMG Neo 17 M22 | |
| AIDA64 / Memory Read | |
| Average of class Gaming (22956 - 118858, n=110, last 2 years) | |
| MSI Raider GE77 HX 12UHS | |
| Acer Predator Triton 500 SE PT516-52s-70KX | |
| Razer Blade 17 Early 2022 | |
| MSI Titan GT77 12UHS | |
| Asus ROG Zephyrus Duo 16 GX650RX | |
| Schenker XMG Neo 17 M22 | |
| Average AMD Ryzen 9 6900HX (43892 - 53321, n=20) | |
| AIDA64 / Memory Write | |
| Average of class Gaming (22297 - 135096, n=110, last 2 years) | |
| MSI Raider GE77 HX 12UHS | |
| MSI Titan GT77 12UHS | |
| Razer Blade 17 Early 2022 | |
| Asus ROG Zephyrus Duo 16 GX650RX | |
| Schenker XMG Neo 17 M22 | |
| Average AMD Ryzen 9 6900HX (51085 - 57202, n=20) | |
| Acer Predator Triton 500 SE PT516-52s-70KX | |
| AIDA64 / Memory Latency | |
| Acer Predator Triton 500 SE PT516-52s-70KX | |
| Average of class Gaming (75.3 - 259, n=110, last 2 years) | |
| Asus ROG Zephyrus Duo 16 GX650RX | |
| Schenker XMG Neo 17 M22 | |
| MSI Titan GT77 12UHS | |
| Average AMD Ryzen 9 6900HX (80.7 - 120.6, n=20) | |
| MSI Raider GE77 HX 12UHS | |
* ... smaller is better
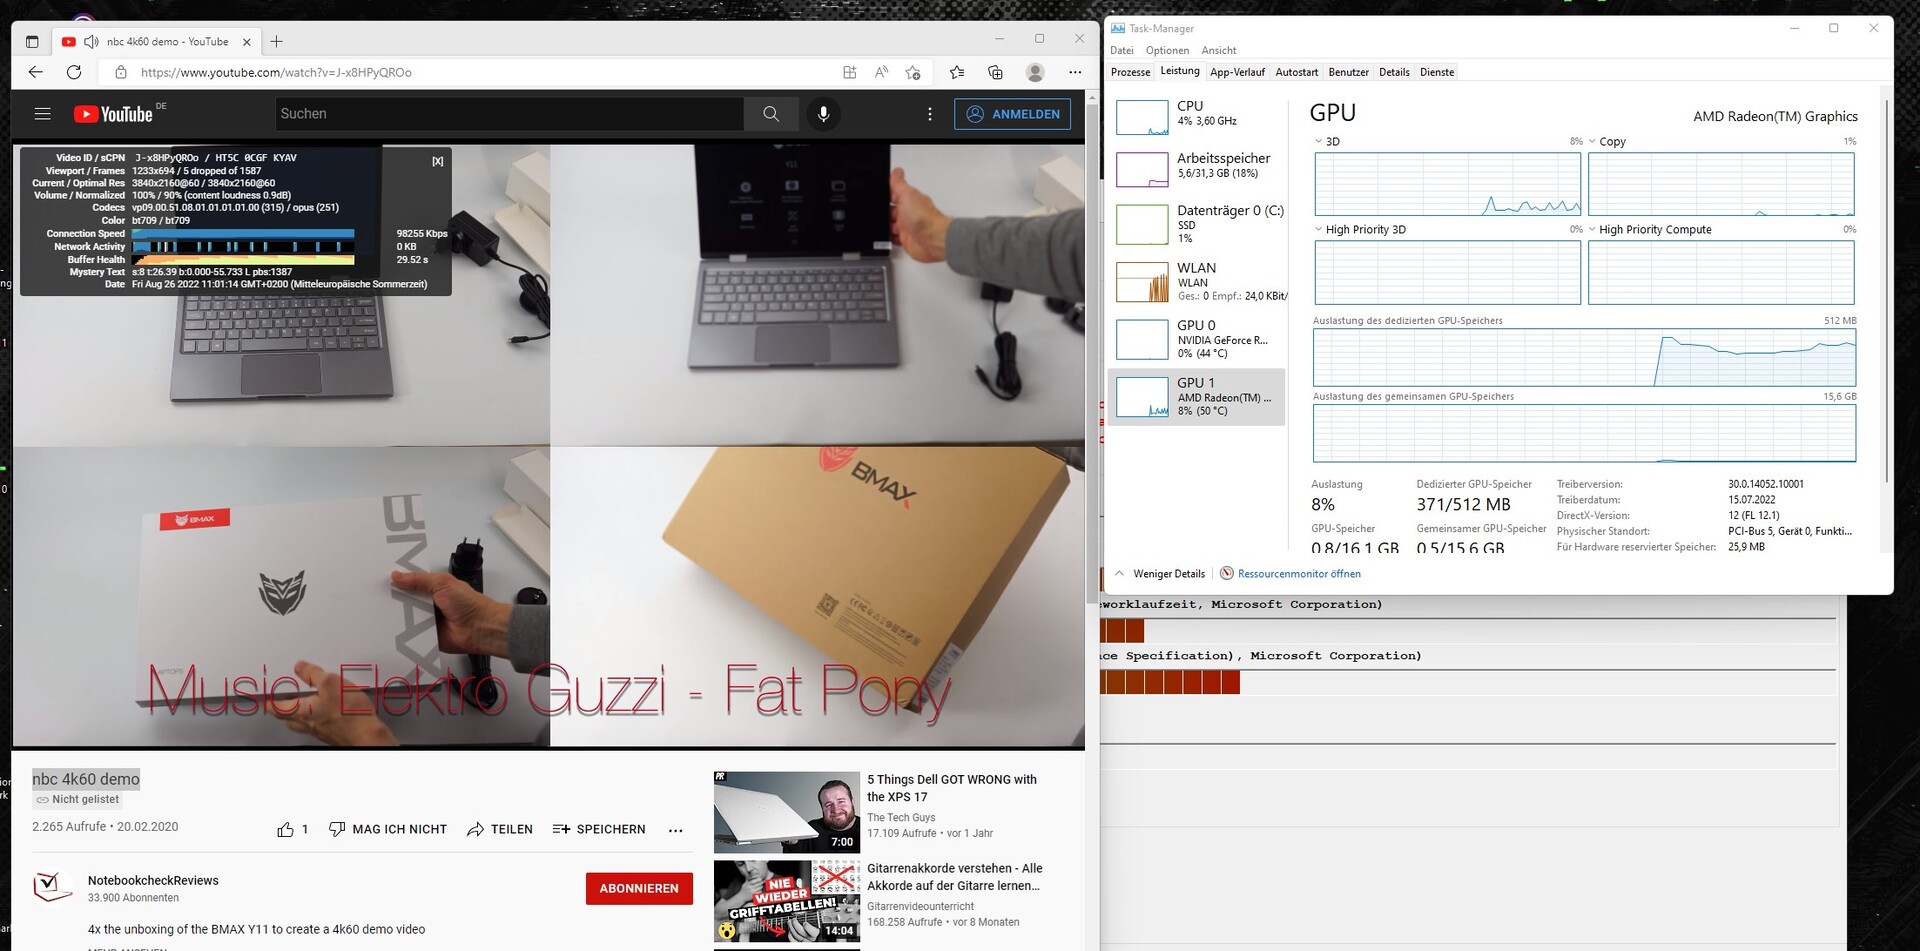
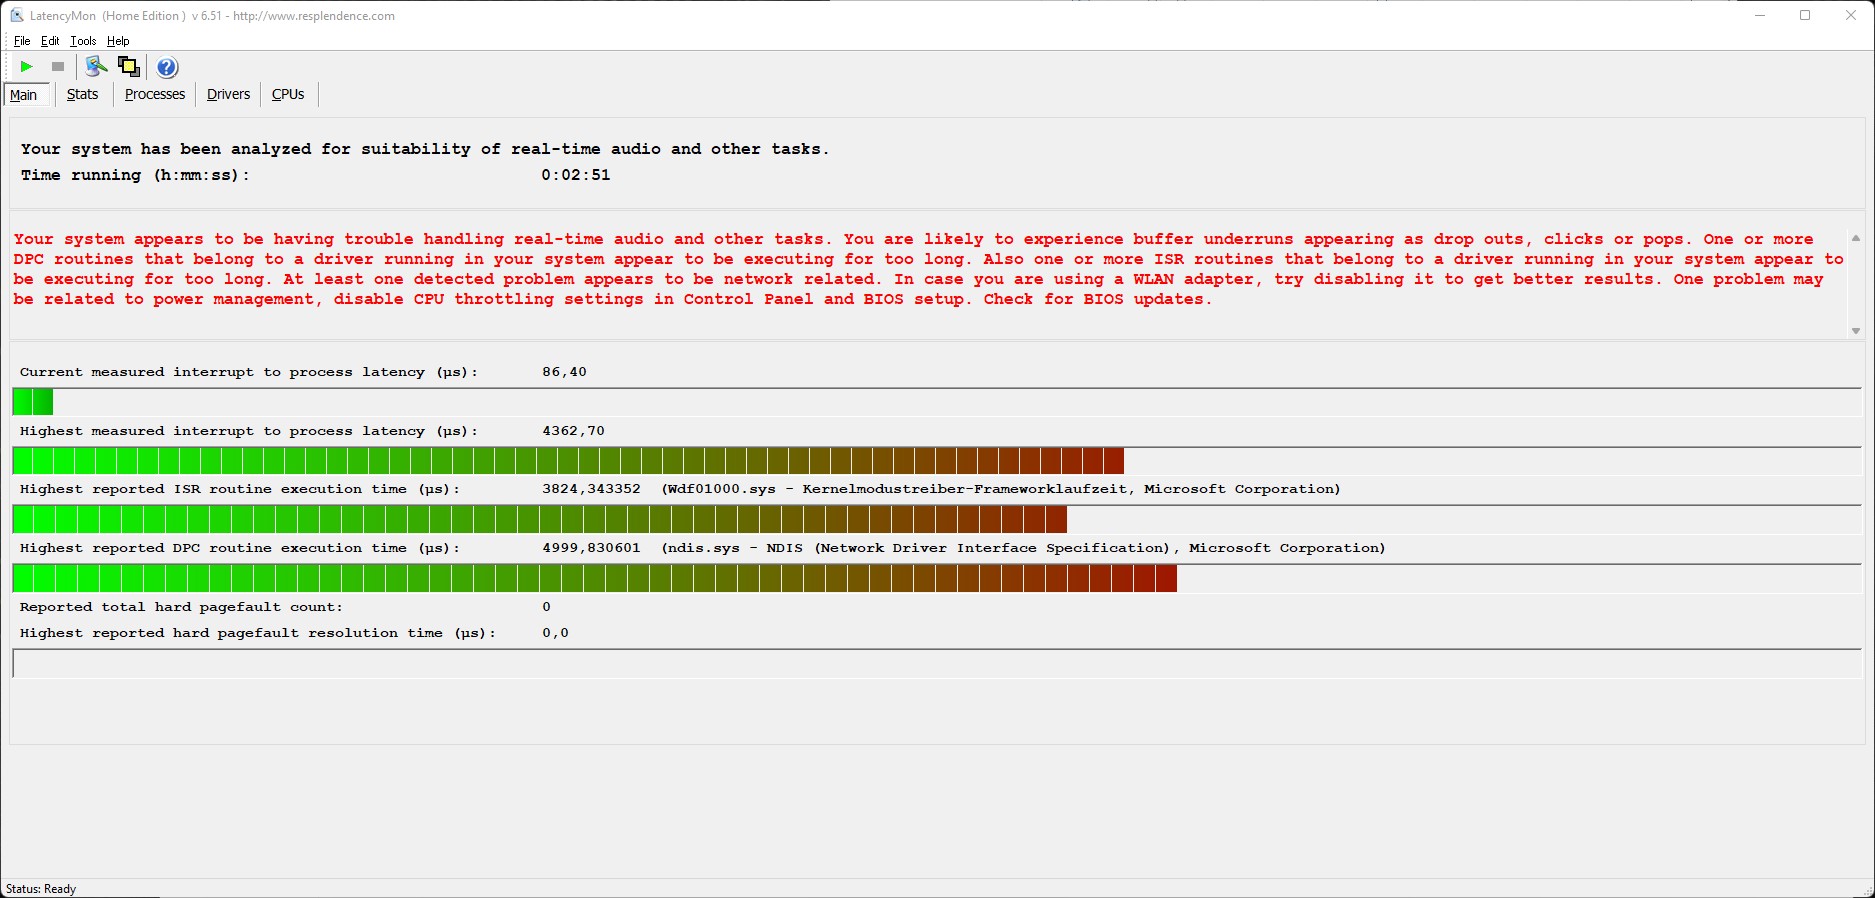
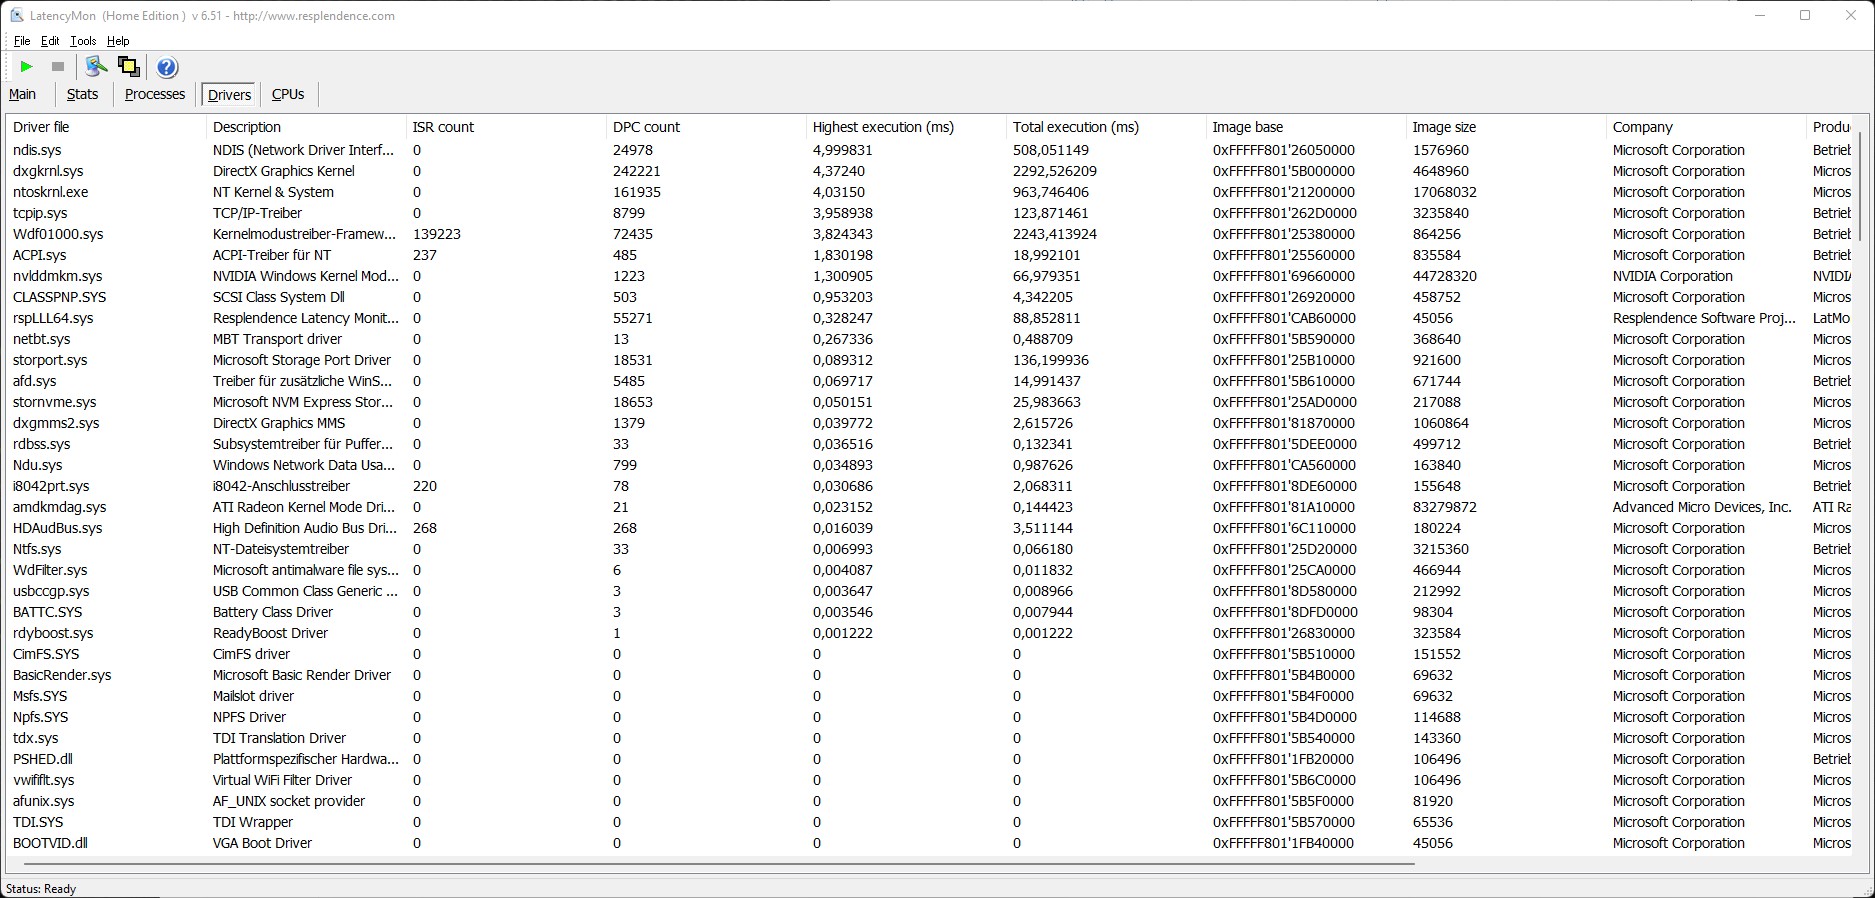
DPC Latency
LatencyMon shows increased latencies after opening multiple browser tabs in Edge. The latencies increase slightly after playing a 4K YouTube video and initializing Prime95. Future driver or BIOS optimizations may improve the issue. Playing our 4K test video uses about 10 percent of the AMD Ryzen 9 6900HX' iGPU.
| DPC Latencies / LatencyMon - interrupt to process latency (max), Web, Youtube, Prime95 | |
| Schenker XMG Neo 17 M22 | |
| MSI Titan GT77 12UHS | |
| MSI Titan GT77 12UHS | |
| Acer Predator Triton 500 SE PT516-52s-70KX | |
| MSI Raider GE77 HX 12UHS | |
| Asus ROG Zephyrus Duo 16 GX650RX | |
| Razer Blade 17 Early 2022 | |
* ... smaller is better
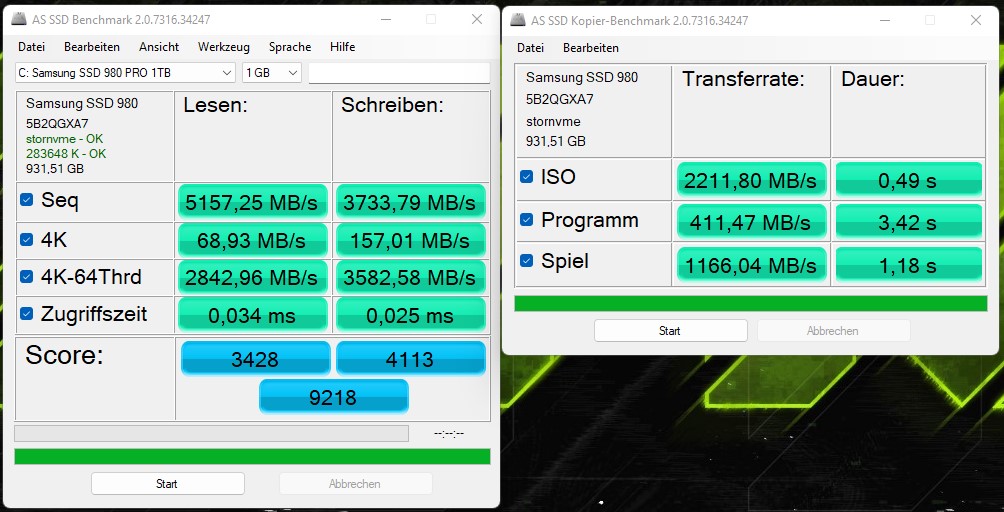
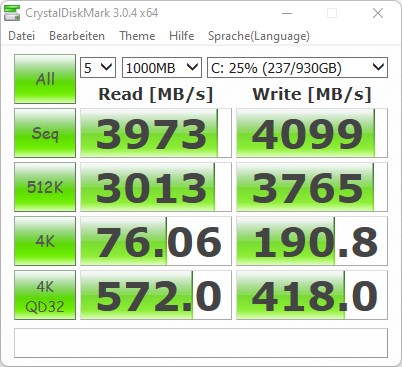
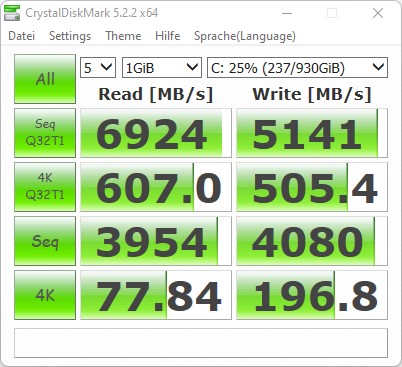
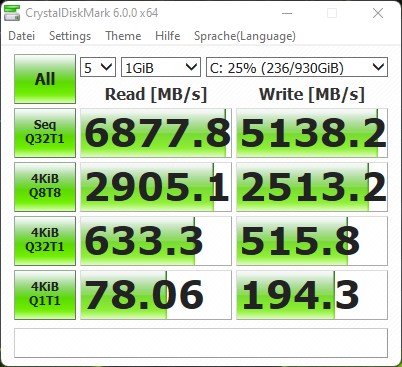
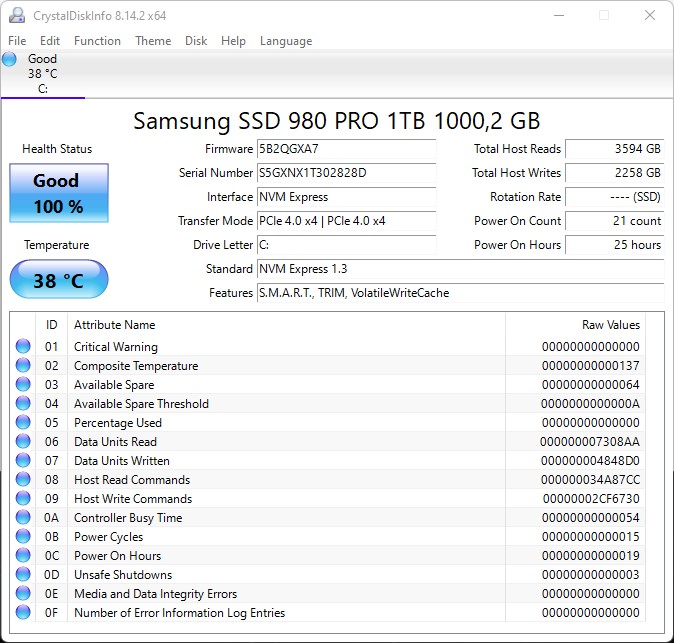
Storage Solution
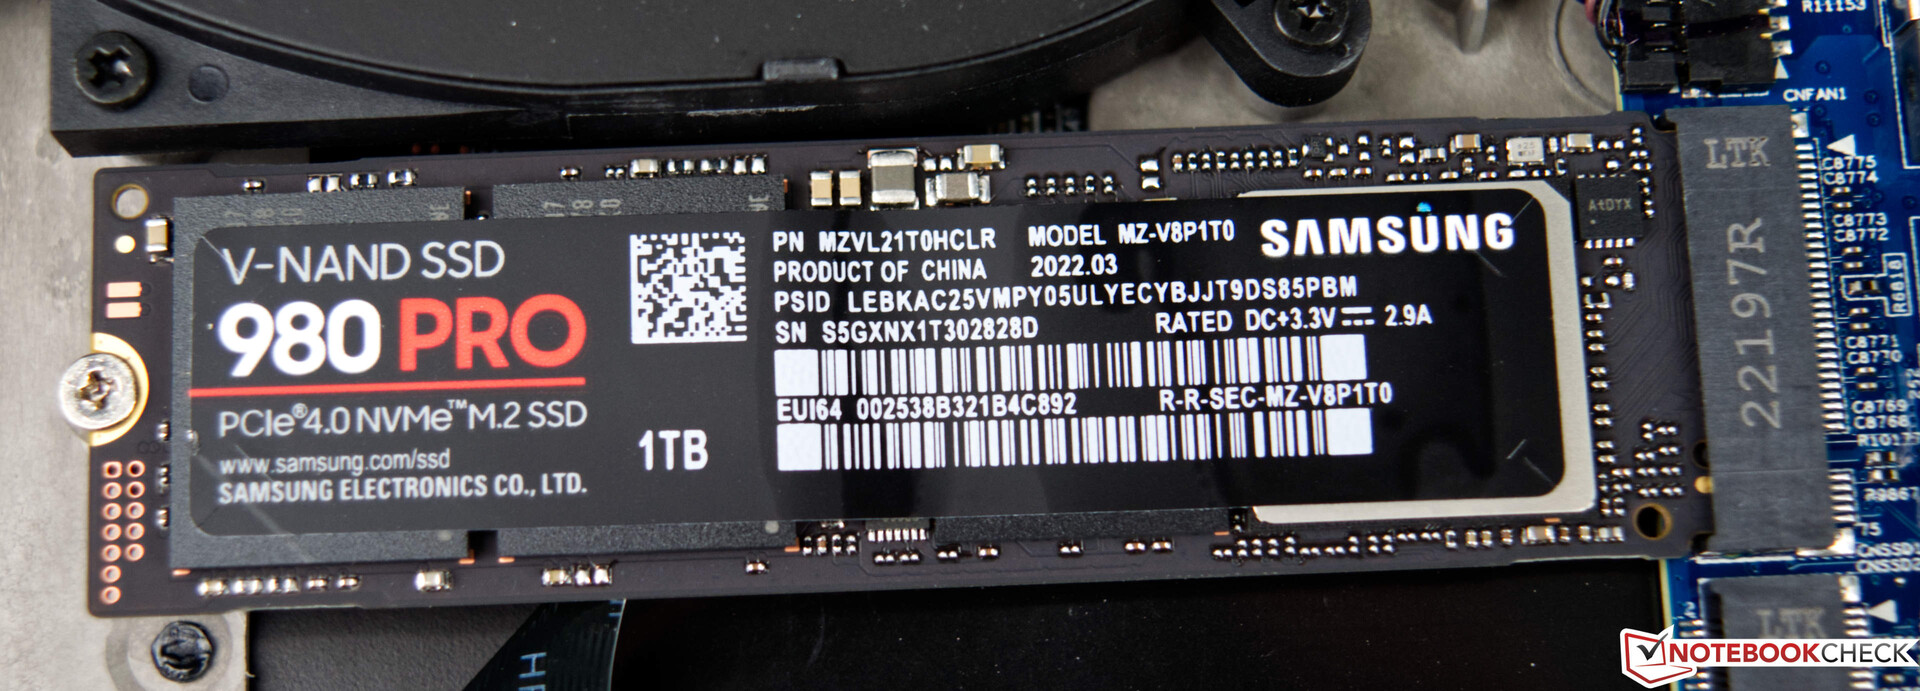
Our test sample comes with a Samsung 980 Pro. However, users may choose between Seagate, Crucial, and Corsair models for the XMG Neo 17. While ordering, users will have to decide between the various models. While the SSD of our test device is sufficiently large at 1 TB, we advise against choosing a smaller capacity to prevent constantly running out of storage space. Under load, the sequential read and write performance is excellent, netting the Schenker XMG Neo 17 a good overall result in this category.
The XMG Neo 17 can be equipped with up to two M.2 SSDs.
More comparisons and benchmarks can be found in our comparison table.

* ... smaller is better
Disk Throttling: DiskSpd Read Loop, Queue Depth 8
GPU Performance
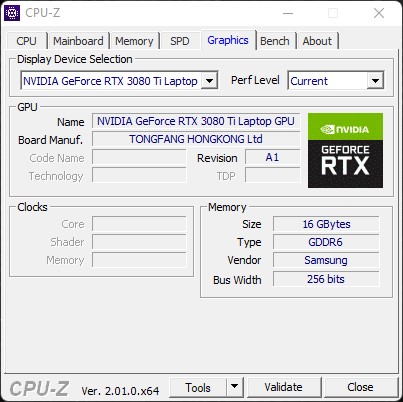
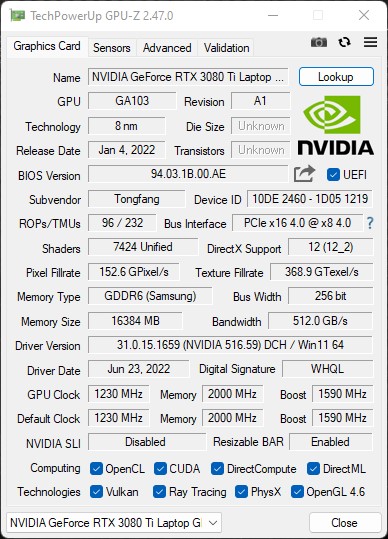
With the GeForce RTX 3080 Ti laptop GPU, Nvidia's fastest Ampere skew serves as the graphics card. With 16 GB of VRAM, users have nothing to worry about and the GPU has access to a maximum power budget of 175 watts. Our model performs very well and comes in second after the MSI Titan GT77. Additionally, the deficit of 4 percent is vanishingly small and despite the different CPU configurations of the devices, they perform very similarly.
More comparisons and benchmarks can be found in our GPU comparison table.
| 3DMark 11 Performance | 33102 points | |
| 3DMark Fire Strike Score | 27946 points | |
| 3DMark Fire Strike Extreme Score | 15762 points | |
| 3DMark Time Spy Score | 12300 points | |
Help | ||
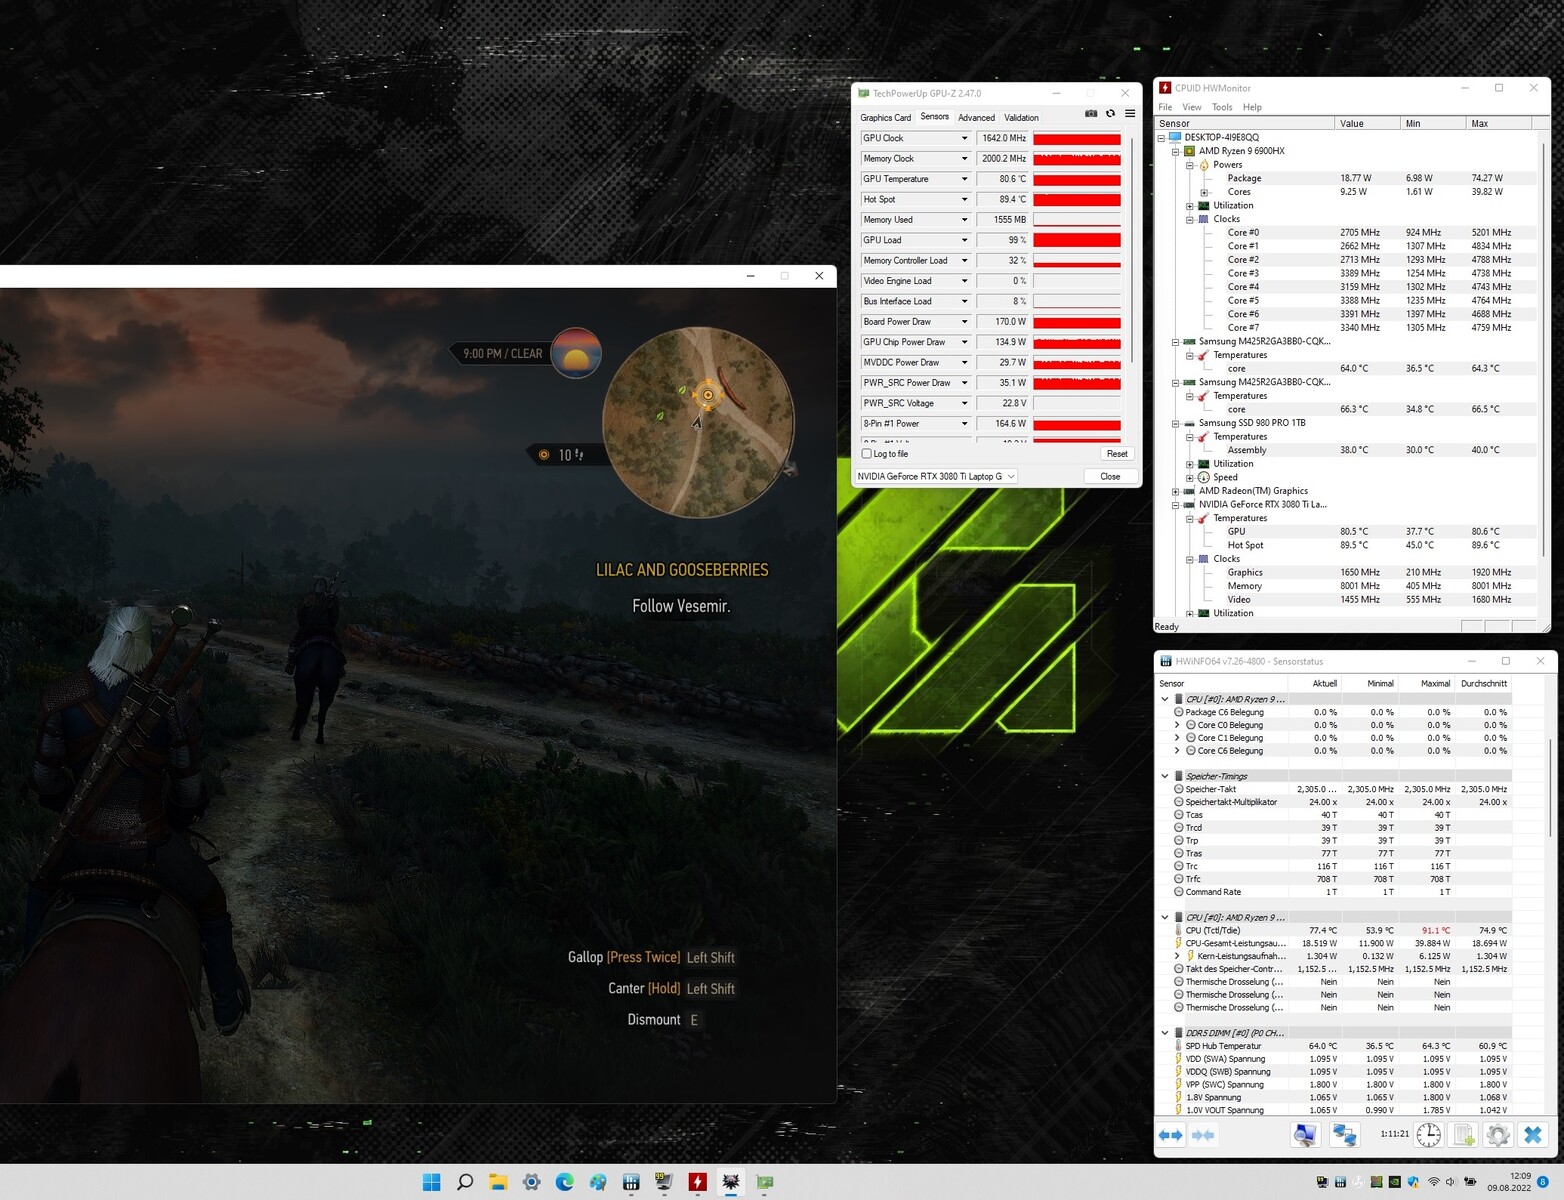
Gaming Performance
The Schenker XMG Neo 17 offers an outstanding gaming performance. In a nutshell, all current titles run smoothly at the native resolution and maximum detail settings. The frame rates are consistently high and thanks to the large VRAM, users will not have to worry about upgrading for quite a while.
In our stress test, which consists of running The Witcher 3 on the Ultra preset, the system shows a consistent performance. We did not observe frame rate dips to unplayable levels during the test or after prolonged gaming.
Witcher 3 FPS Graph
| low | med. | high | ultra | QHD | 4K | |
|---|---|---|---|---|---|---|
| GTA V (2015) | 181.2 | 176.1 | 163.8 | 101.8 | 101.1 | 121 |
| The Witcher 3 (2015) | 386 | 335 | 236 | 121 | 90.5 | |
| Dota 2 Reborn (2015) | 146.5 | 133.9 | 129.3 | 121.4 | 122.7 | |
| Final Fantasy XV Benchmark (2018) | 190.8 | 161.5 | 122.8 | 96.4 | 57.9 | |
| X-Plane 11.11 (2018) | 113.7 | 102 | 80.3 | 86.4 | ||
| Far Cry 5 (2018) | 142 | 125 | 118 | 113 | 110 | 70 |
| Strange Brigade (2018) | 205 | 277 | 229 | 201 | 154.4 | 95 |
| Shadow of the Tomb Raider (2018) | 175.2 | 152.9 | 152.6 | 156.5 | 123.9 | 72.4 |
| Far Cry New Dawn (2019) | 125 | 112 | 108 | 96 | 93 | 73 |
| Metro Exodus (2019) | 172.4 | 134.4 | 108.6 | 88.1 | 73.2 | 47.6 |
| Borderlands 3 (2019) | 123.6 | 106.4 | 99.8 | 90.7 | 78.2 | 46.1 |
| F1 2020 (2020) | 304 | 271 | 255 | 197.9 | 153.6 | 88.1 |
| F1 2021 (2021) | 354 | 314 | 269 | 148.5 | 114.2 | 65.3 |
| New World (2021) | 126.4 | 106.5 | 97 | 94.5 | 85.9 | 50.3 |
| Far Cry 6 (2021) | 118.6 | 104 | 95 | 99.4 | 86.6 | 54.2 |
| God of War (2022) | 129.9 | 127.9 | 111.1 | 78.9 | 64.7 | 46.5 |
| Tiny Tina's Wonderlands (2022) | 222 | 185.4 | 137.1 | 110.5 | 79.3 | 43.9 |
| F1 22 (2022) | 193 | 184 | 172 | 91 | 62 | 32 |
Emissions - Relatively Loud under Load
System Noise
Under load, the cooling solution has its work cut out for itself, resulting in a maximum noise level of up to 54 dB(A). Since the other devices in our comparison are not significantly quieter, the Schenker XMG Neo 17's values are nothing out of the ordinary. The system can be connected to an XMG Oasis for potentially quieter noise levels. However, we are not able to verify this at this time.
Noise level
| Idle |
| 26 / 29 / 40 dB(A) |
| Load |
| 47 / 54 dB(A) |
 | ||
30 dB silent 40 dB(A) audible 50 dB(A) loud |
||
min: | ||
| Schenker XMG Neo 17 M22 R9 6900HX, GeForce RTX 3080 Ti Laptop GPU | MSI Titan GT77 12UHS i9-12900HX, GeForce RTX 3080 Ti Laptop GPU | Razer Blade 17 Early 2022 i9-12900H, GeForce RTX 3080 Ti Laptop GPU | Acer Predator Triton 500 SE PT516-52s-70KX i7-12700H, GeForce RTX 3080 Ti Laptop GPU | Asus ROG Zephyrus Duo 16 GX650RX R9 6900HX, GeForce RTX 3080 Ti Laptop GPU | MSI Raider GE77 HX 12UHS i9-12900HX, GeForce RTX 3080 Ti Laptop GPU | |
|---|---|---|---|---|---|---|
| Noise | 10% | 4% | 0% | 9% | -7% | |
| off / environment * (dB) | 26 | 21.9 16% | 26 -0% | 26 -0% | 26 -0% | 26 -0% |
| Idle Minimum * (dB) | 26 | 24.53 6% | 26 -0% | 26 -0% | 26 -0% | 26 -0% |
| Idle Average * (dB) | 29 | 24.53 15% | 27 7% | 29 -0% | 27 7% | 34 -17% |
| Idle Maximum * (dB) | 40 | 24.53 39% | 32 20% | 34 15% | 29 27% | 46 -15% |
| Load Average * (dB) | 47 | 46.25 2% | 50 -6% | 50 -6% | 41 13% | 50 -6% |
| Witcher 3 ultra * (dB) | 52 | 56.86 -9% | 51 2% | 53 -2% | 48 8% | 55 -6% |
| Load Maximum * (dB) | 54 | 54.25 -0% | 51 6% | 56 -4% | 50 7% | 57 -6% |
* ... smaller is better
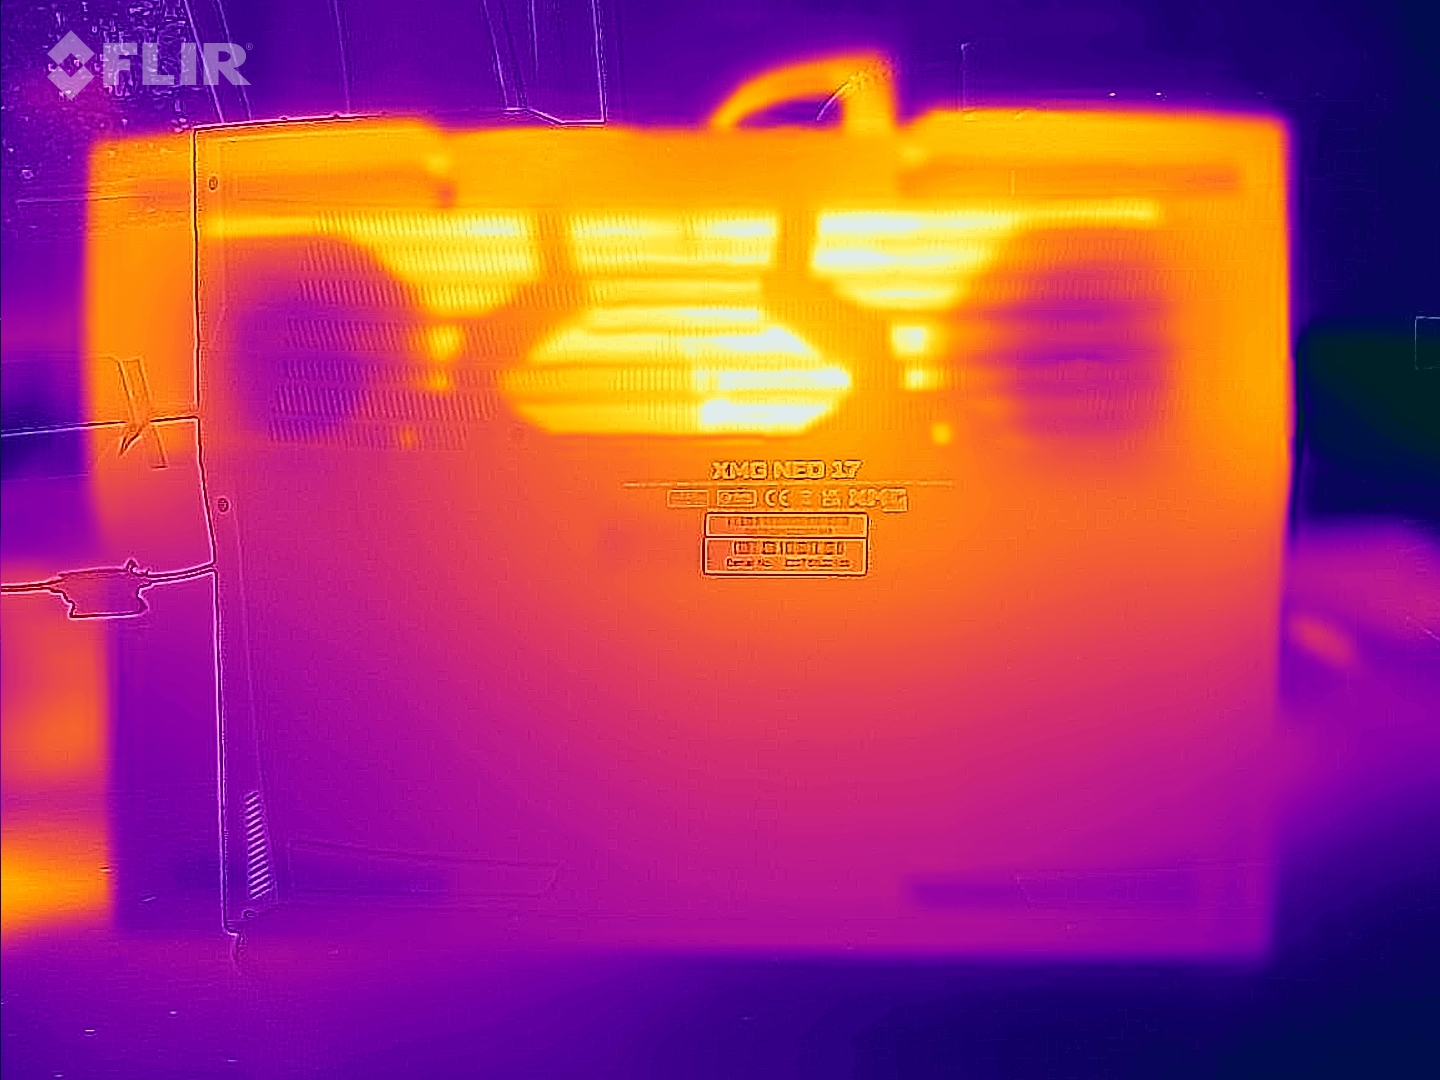
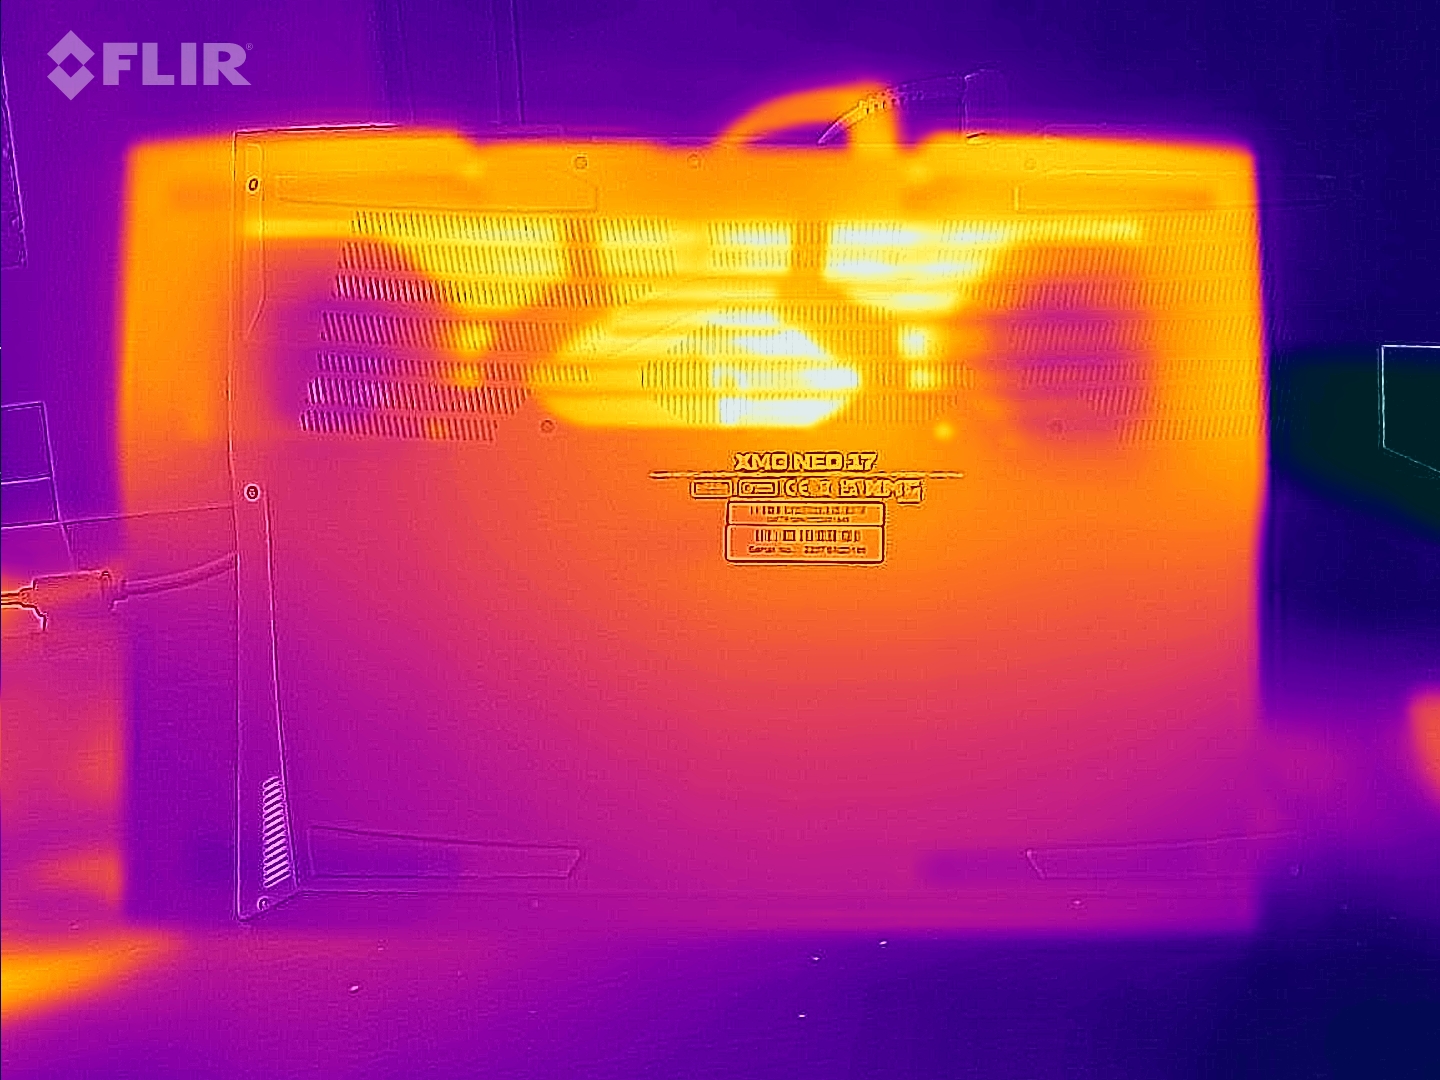
Temperature
With up to 52 °C (125.6 °F), the bottom of the chassis becomes noticeably warm. However, the other devices in our comparison reach similar temperatures. Since we also measured similar temperatures while gaming, we advise against using the system on your lap. There are no issues during idle. The peak temperatures then drop to 30 °C (86 °F) and 33 °C (91.4 °F), respectively.
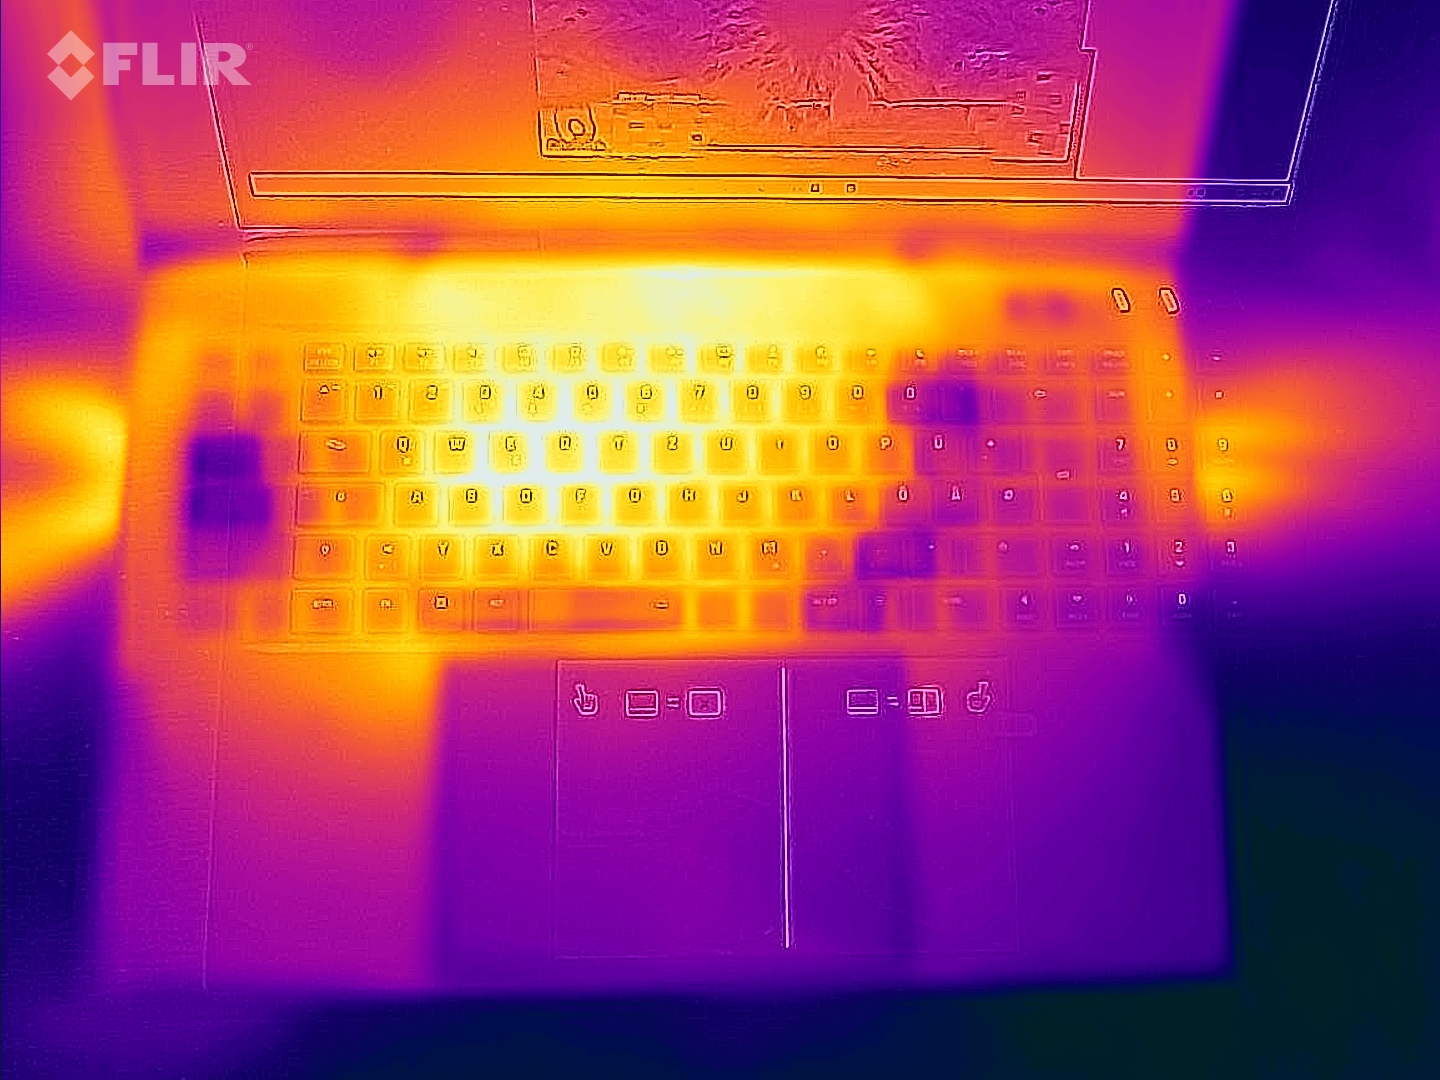
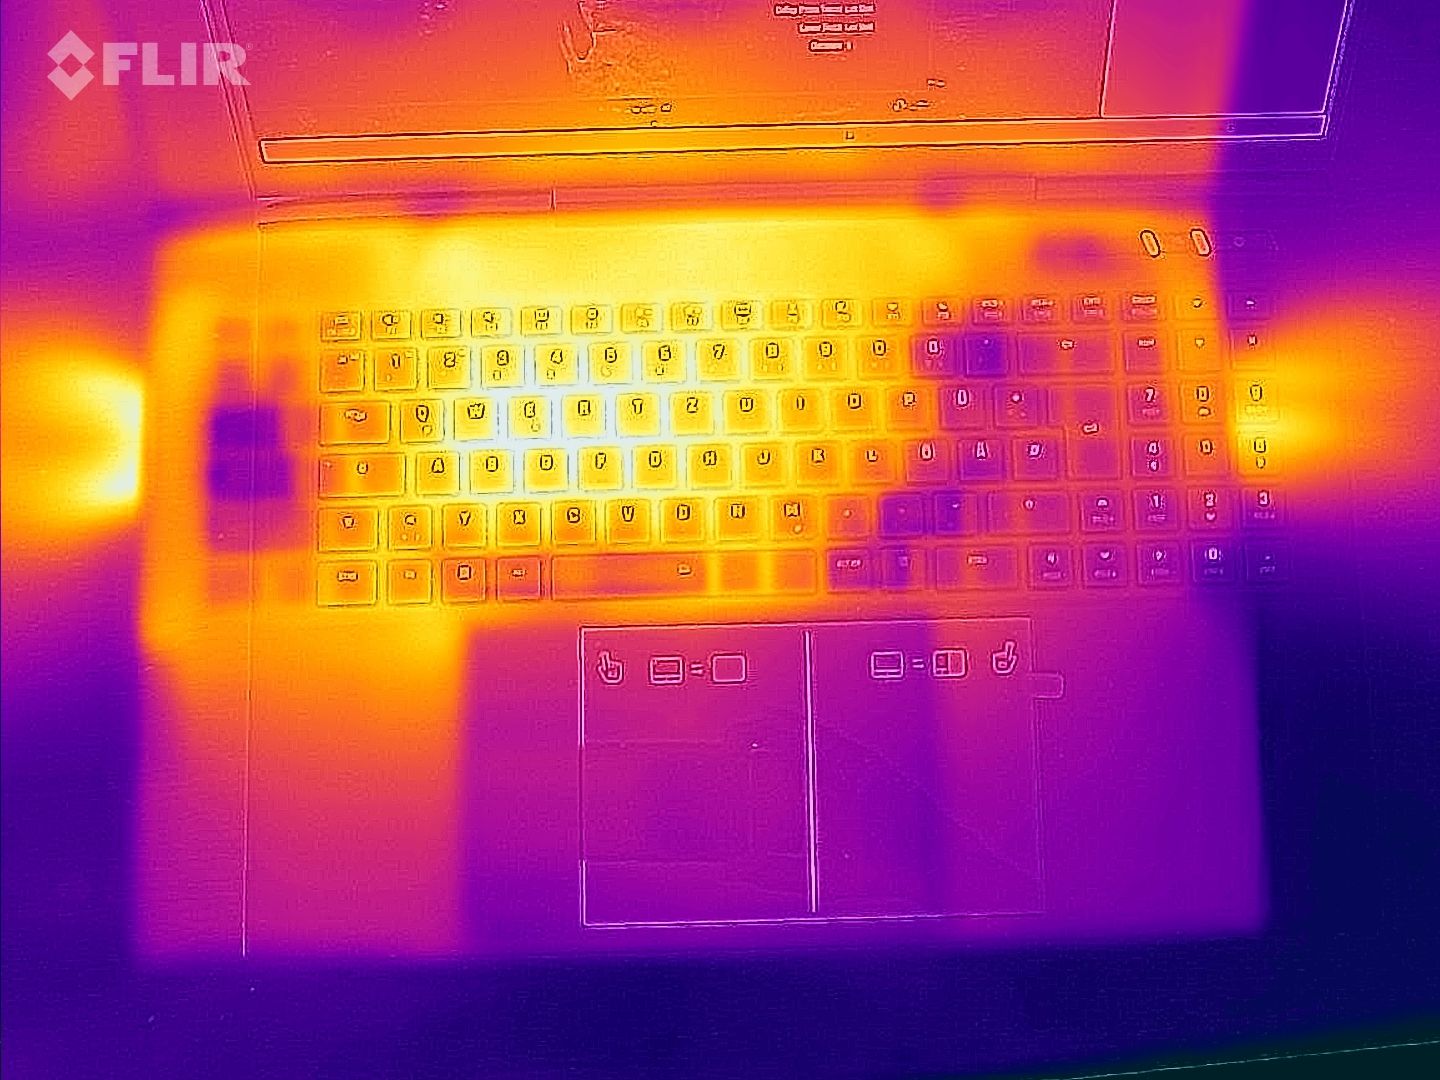
(-) The maximum temperature on the upper side is 49 °C / 120 F, compared to the average of 40.4 °C / 105 F, ranging from 21.2 to 68.8 °C for the class Gaming.
(-) The bottom heats up to a maximum of 52 °C / 126 F, compared to the average of 43.2 °C / 110 F
(+) In idle usage, the average temperature for the upper side is 29.7 °C / 85 F, compared to the device average of 33.9 °C / 93 F.
(-) Playing The Witcher 3, the average temperature for the upper side is 41.9 °C / 107 F, compared to the device average of 33.9 °C / 93 F.
(±) The palmrests and touchpad can get very hot to the touch with a maximum of 39 °C / 102.2 F.
(-) The average temperature of the palmrest area of similar devices was 28.8 °C / 83.8 F (-10.2 °C / -18.4 F).
| Schenker XMG Neo 17 M22 AMD Ryzen 9 6900HX, NVIDIA GeForce RTX 3080 Ti Laptop GPU | MSI Titan GT77 12UHS Intel Core i9-12900HX, NVIDIA GeForce RTX 3080 Ti Laptop GPU | Razer Blade 17 Early 2022 Intel Core i9-12900H, NVIDIA GeForce RTX 3080 Ti Laptop GPU | Acer Predator Triton 500 SE PT516-52s-70KX Intel Core i7-12700H, NVIDIA GeForce RTX 3080 Ti Laptop GPU | Asus ROG Zephyrus Duo 16 GX650RX AMD Ryzen 9 6900HX, NVIDIA GeForce RTX 3080 Ti Laptop GPU | MSI Raider GE77 HX 12UHS Intel Core i9-12900HX, NVIDIA GeForce RTX 3080 Ti Laptop GPU | |
|---|---|---|---|---|---|---|
| Heat | -4% | -11% | 3% | 1% | -19% | |
| Maximum Upper Side * (°C) | 49 | 40.8 17% | 50 -2% | 47 4% | 45 8% | 53 -8% |
| Maximum Bottom * (°C) | 52 | 52.4 -1% | 56 -8% | 49 6% | 50 4% | 58 -12% |
| Idle Upper Side * (°C) | 30 | 34.6 -15% | 36 -20% | 31 -3% | 33 -10% | 38 -27% |
| Idle Bottom * (°C) | 33 | 38.4 -16% | 38 -15% | 32 3% | 33 -0% | 43 -30% |
* ... smaller is better
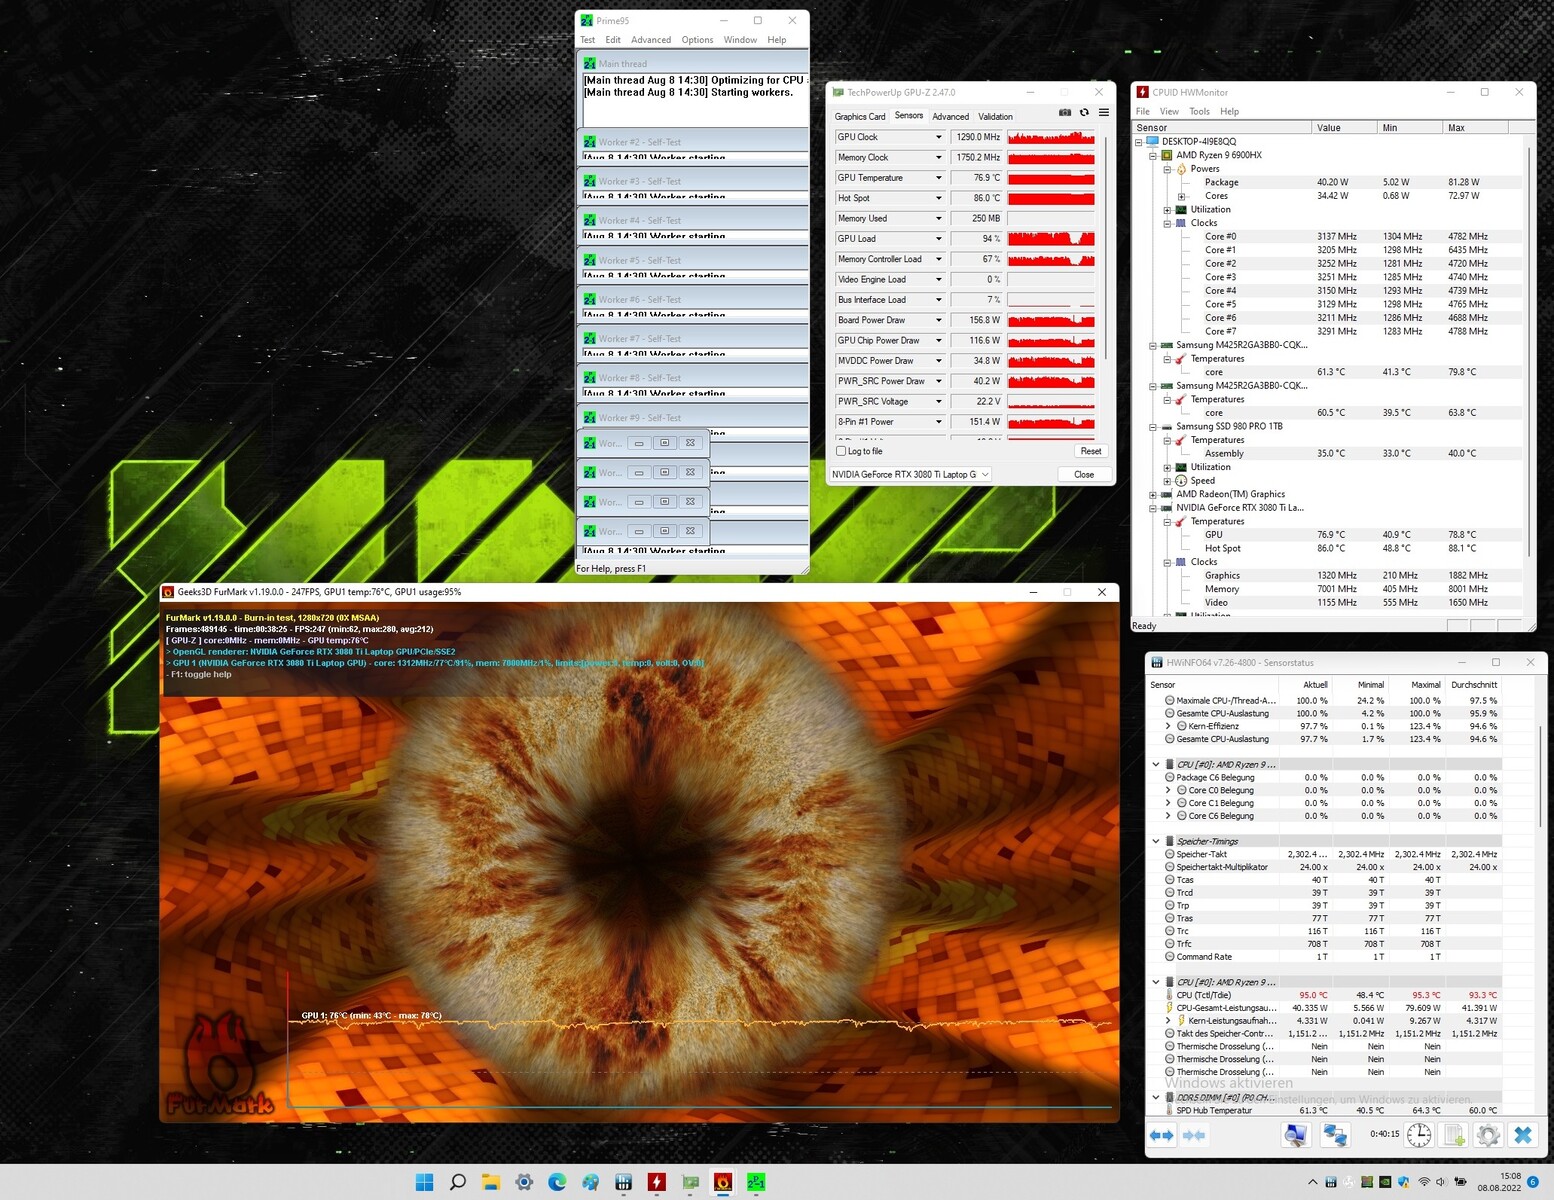
Stress test
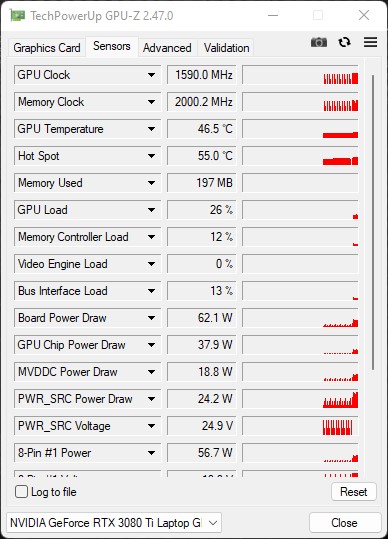
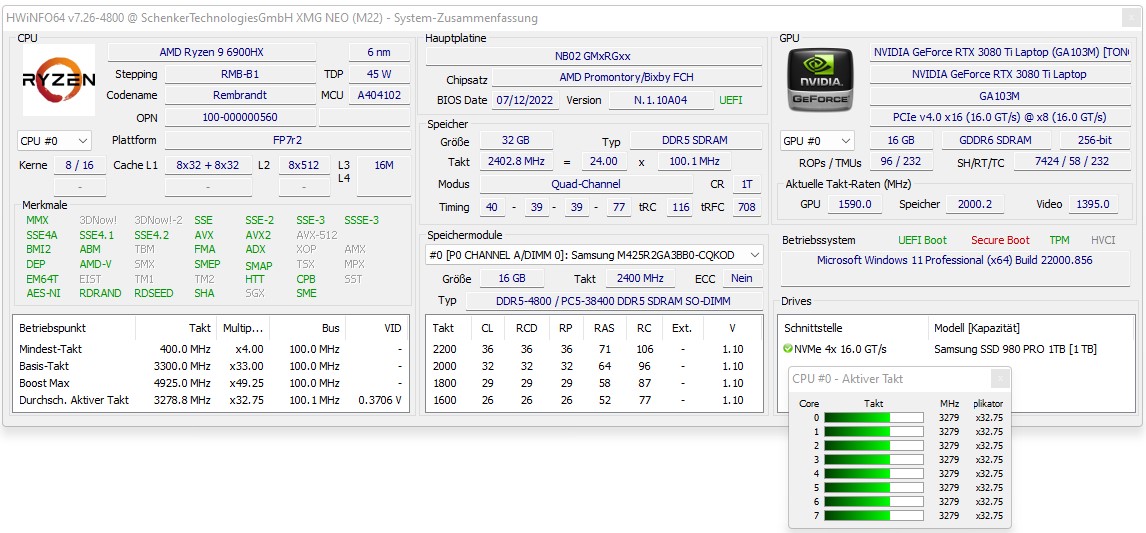
Schenker manages the heat of the CPU and GPU fairly well, although the Ryzen 9 6900HX's peak temperature of almost 95 °C (203 °F) is very close to the 100-°C (212 °F) mark. Nonetheless, the SoC's performance is consistent and without any major dips. The SoC reaches a peak power consumption of 80 watts, which then drops and stabilizes at 40 watts over time. The GPU temperatures look significantly better. Despite reaching a peak consumption of up to 170 watts, we recorded a maximum temperature of just 77 °C (170.6 °F) during our stress test.
Speakers
There are two downfiring speakers below the palm rests. Unfortunately, they are lacking in terms of the bass with the mids and treble being a significantly more dominant part of the sound. For gaming, users will likely opt for a headset anyway. An appropriate model can be connected to the laptop via the 3.5-mm headphone jack or USB.
Schenker XMG Neo 17 M22 audio analysis
(±) | speaker loudness is average but good (80 dB)
Bass 100 - 315 Hz
(-) | nearly no bass - on average 18.4% lower than median
(±) | linearity of bass is average (8.2% delta to prev. frequency)
Mids 400 - 2000 Hz
(+) | balanced mids - only 4.4% away from median
(±) | linearity of mids is average (7% delta to prev. frequency)
Highs 2 - 16 kHz
(+) | balanced highs - only 2.6% away from median
(+) | highs are linear (6.2% delta to prev. frequency)
Overall 100 - 16.000 Hz
(±) | linearity of overall sound is average (17.3% difference to median)
Compared to same class
» 47% of all tested devices in this class were better, 12% similar, 41% worse
» The best had a delta of 6%, average was 18%, worst was 132%
Compared to all devices tested
» 32% of all tested devices were better, 8% similar, 59% worse
» The best had a delta of 4%, average was 24%, worst was 134%
Asus ROG Zephyrus Duo 16 GX650RX audio analysis
(±) | speaker loudness is average but good (80 dB)
Bass 100 - 315 Hz
(±) | reduced bass - on average 8.9% lower than median
(±) | linearity of bass is average (12.4% delta to prev. frequency)
Mids 400 - 2000 Hz
(±) | higher mids - on average 6.8% higher than median
(+) | mids are linear (4.3% delta to prev. frequency)
Highs 2 - 16 kHz
(±) | reduced highs - on average 6% lower than median
(±) | linearity of highs is average (7.3% delta to prev. frequency)
Overall 100 - 16.000 Hz
(±) | linearity of overall sound is average (16.5% difference to median)
Compared to same class
» 42% of all tested devices in this class were better, 7% similar, 51% worse
» The best had a delta of 6%, average was 18%, worst was 132%
Compared to all devices tested
» 28% of all tested devices were better, 6% similar, 66% worse
» The best had a delta of 4%, average was 24%, worst was 134%
Energy Management - Good Consumption Values
Energy Consumption
The Schenker XMG Neo 17 has some surprises in store when it comes to the energy consumption, since it is very efficient during idle and under low load. No other device is able to match our Schenker in this regard. Under maximum load, the system demands up to 306 watts from AC adapter, which is not an issue due to the power brick's 330-watt rating.
| Off / Standby | |
| Idle | |
| Load |
|
Key:
min: | |
| Schenker XMG Neo 17 M22 R9 6900HX, GeForce RTX 3080 Ti Laptop GPU | MSI Titan GT77 12UHS i9-12900HX, GeForce RTX 3080 Ti Laptop GPU | Razer Blade 17 Early 2022 i9-12900H, GeForce RTX 3080 Ti Laptop GPU | Acer Predator Triton 500 SE PT516-52s-70KX i7-12700H, GeForce RTX 3080 Ti Laptop GPU | Asus ROG Zephyrus Duo 16 GX650RX R9 6900HX, GeForce RTX 3080 Ti Laptop GPU | MSI Raider GE77 HX 12UHS i9-12900HX, GeForce RTX 3080 Ti Laptop GPU | Average NVIDIA GeForce RTX 3080 Ti Laptop GPU | Average of class Gaming | |
|---|---|---|---|---|---|---|---|---|
| Power Consumption | -114% | -61% | -18% | -59% | -52% | -72% | -42% | |
| Idle Minimum * (Watt) | 7 | 30.21 -332% | 17 -143% | 7 -0% | 19 -171% | 13 -86% | 17.2 ? -146% | 13.3 ? -90% |
| Idle Average * (Watt) | 11 | 32.42 -195% | 23 -109% | 19 -73% | 24 -118% | 19 -73% | 23.3 ? -112% | 19 ? -73% |
| Idle Maximum * (Watt) | 17 | 33.7 -98% | 34 -100% | 28 -65% | 31 -82% | 29 -71% | 30.8 ? -81% | 24.5 ? -44% |
| Load Average * (Watt) | 92 | 125.09 -36% | 120 -30% | 114 -24% | 104 -13% | 143 -55% | 121.2 ? -32% | 108.1 ? -18% |
| Witcher 3 ultra * (Watt) | 221 | 256 -16% | 229 -4% | 159 28% | 186.5 16% | 247 -12% | ||
| Load Maximum * (Watt) | 306 | 321.88 -5% | 243 21% | 227 26% | 256 16% | 352 -15% | 276 ? 10% | 254 ? 17% |
* ... smaller is better
Consumption Witcher 3 / Stress Test
Consumption external Monitor
Battery Life
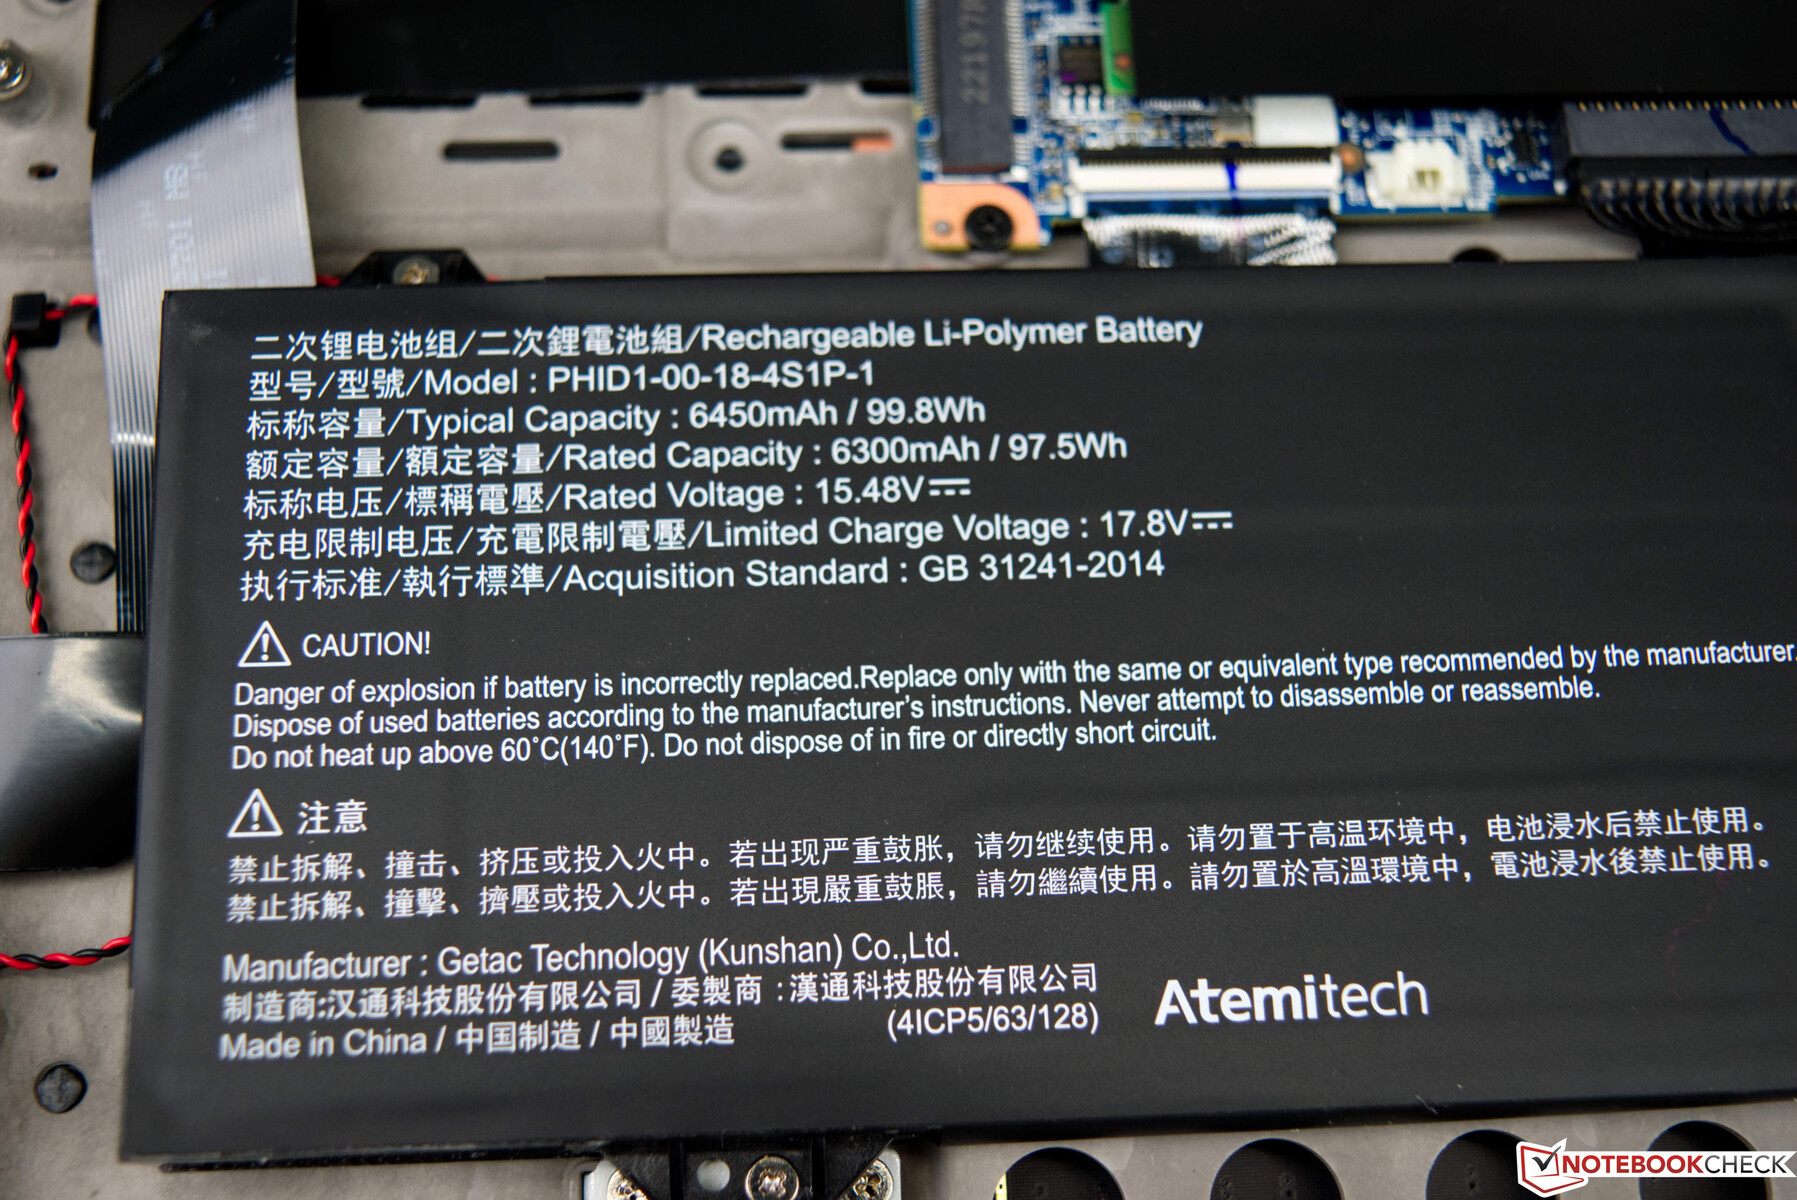
Schenker equips the XMG Neo 17 with a large 99-Wh battery, which is able to power our test sample for almost 9 hours in our Wi-Fi test. This is an excellent result especially compared to its competitors. The video playback runtime is slightly lower and the device has to be recharged after only about 6.5 hours. Fully recharging the large battery is surprisingly quick at just 102 minutes.
It should be noted that the CPU and GPU performance are limited in battery mode. However, this behavior is not unique to the Schenker XMG Neo 17 and present on almost all current gaming laptops.

| Schenker XMG Neo 17 M22 R9 6900HX, GeForce RTX 3080 Ti Laptop GPU, 99 Wh | MSI Titan GT77 12UHS i9-12900HX, GeForce RTX 3080 Ti Laptop GPU, 99.9 Wh | Razer Blade 17 Early 2022 i9-12900H, GeForce RTX 3080 Ti Laptop GPU, 82 Wh | Acer Predator Triton 500 SE PT516-52s-70KX i7-12700H, GeForce RTX 3080 Ti Laptop GPU, 99.98 Wh | Asus ROG Zephyrus Duo 16 GX650RX R9 6900HX, GeForce RTX 3080 Ti Laptop GPU, 90 Wh | MSI Raider GE77 HX 12UHS i9-12900HX, GeForce RTX 3080 Ti Laptop GPU, 99.99 Wh | Average of class Gaming | |
|---|---|---|---|---|---|---|---|
| Battery runtime | -12% | -33% | 3% | -3% | -12% | -11% | |
| Reader / Idle (h) | 12 | 7.1 -41% | 12.5 4% | 9.8 -18% | 8.71 ? -27% | ||
| H.264 (h) | 6.6 | 7.2 9% | 4.8 -27% | 8.2 24% | 9.3 41% | 6.5 -2% | 8.26 ? 25% |
| WiFi v1.3 (h) | 9 | 6.9 -23% | 3.8 -58% | 5.7 -37% | 7.8 -13% | 5.4 -40% | 7.01 ? -22% |
| Load (h) | 1.8 | 1.4 -22% | 1.7 -6% | 2.2 22% | 1 -44% | 2 11% | 1.47 ? -18% |
| Witcher 3 ultra (h) | 1.5 |
Pros
Cons
Verdict - Fast Gaming Notebook with Optional Watercooling

A robust and sleek case, near unlimited performance during daily use, and Nvidia's fastest laptop GPU, combined with the possibility to liquid cool the device make the Schenker XMG Neo 17 a compelling offer on paper. The manufacturer barely compromises on anything and allows the hardware to unleash its full potential, which for the most part results in excellent benchmark results.
The AMD Ryzen 9 6900HX in our Neo 17 performs well and is able to maintain its performance for prolonged periods of time. The same holds true for the Nvidia GeForce RTX 3080 Ti. These are our observations without the optional XMG Oasis, since the integrated cooling solution already facilitates stable performance. For users who prefer a quieter system, the optional watercooler may be worth considering. We are pleased to see a display with the 16:10 form factor. Its only drawback is the somewhat narrow AdobeRGB and P3 color space coverage, which is not quite good enough for professional photo and video editing. That being said, this is a non-issue if you are using the XMG Neo 17 as a gaming laptop.
The Schenker XMG Neo 17 is a fast gaming notebook that does not have to artificially throttle its performance. Thanks to the optional XMG Oasis accessory, the laptop even supports liquid cooling.
Overall, the Schenker XMG Neo 17 is a solid gaming laptop that offers plenty in terms of the performance. We also found no major drawbacks. The Neo 17 does well when it comes to the battery life as well. If we were to criticize anything, it would be the keyboard, which comes with a numpad that unfortunately does not use Cherry MX switches. Furthermore, the angled AC adapter plug is suboptimal, since a straight plug would not obstruct nearby ports unnecessarily. There is room for improvement in terms of the Wi-Fi performance. At least, users can opt for a more modern/faster Wi-Fi module during the configuration process. Speaking of which - the latter is characteristically Schenker and well organized. The device can be customized according to your preferences and there is a wide range of options. Aside from the base unit, both the CPU and the display are fixed and cannot be changed.
The Schenker XMG Neo 17 has a lot of competition. As previously mentioned, some Laptops powered by Intel Alder Lake can offer even faster performance. The MSI Titan GT77 12UHS is an example of one such device, although it is (even) more expensive than our configuration of the Neo 17, which costs around 4200 USD.
Price and Availability
The Schenker XMG Neo 17 is available directly from the manufacturer's online store with many different configuration options. The base model costs around 2950 USD, while our configuration retails for about 4200 USD.
Schenker XMG Neo 17 M22
- 08/31/2022 v7 (old)
Sebastian Bade
Price comparison

