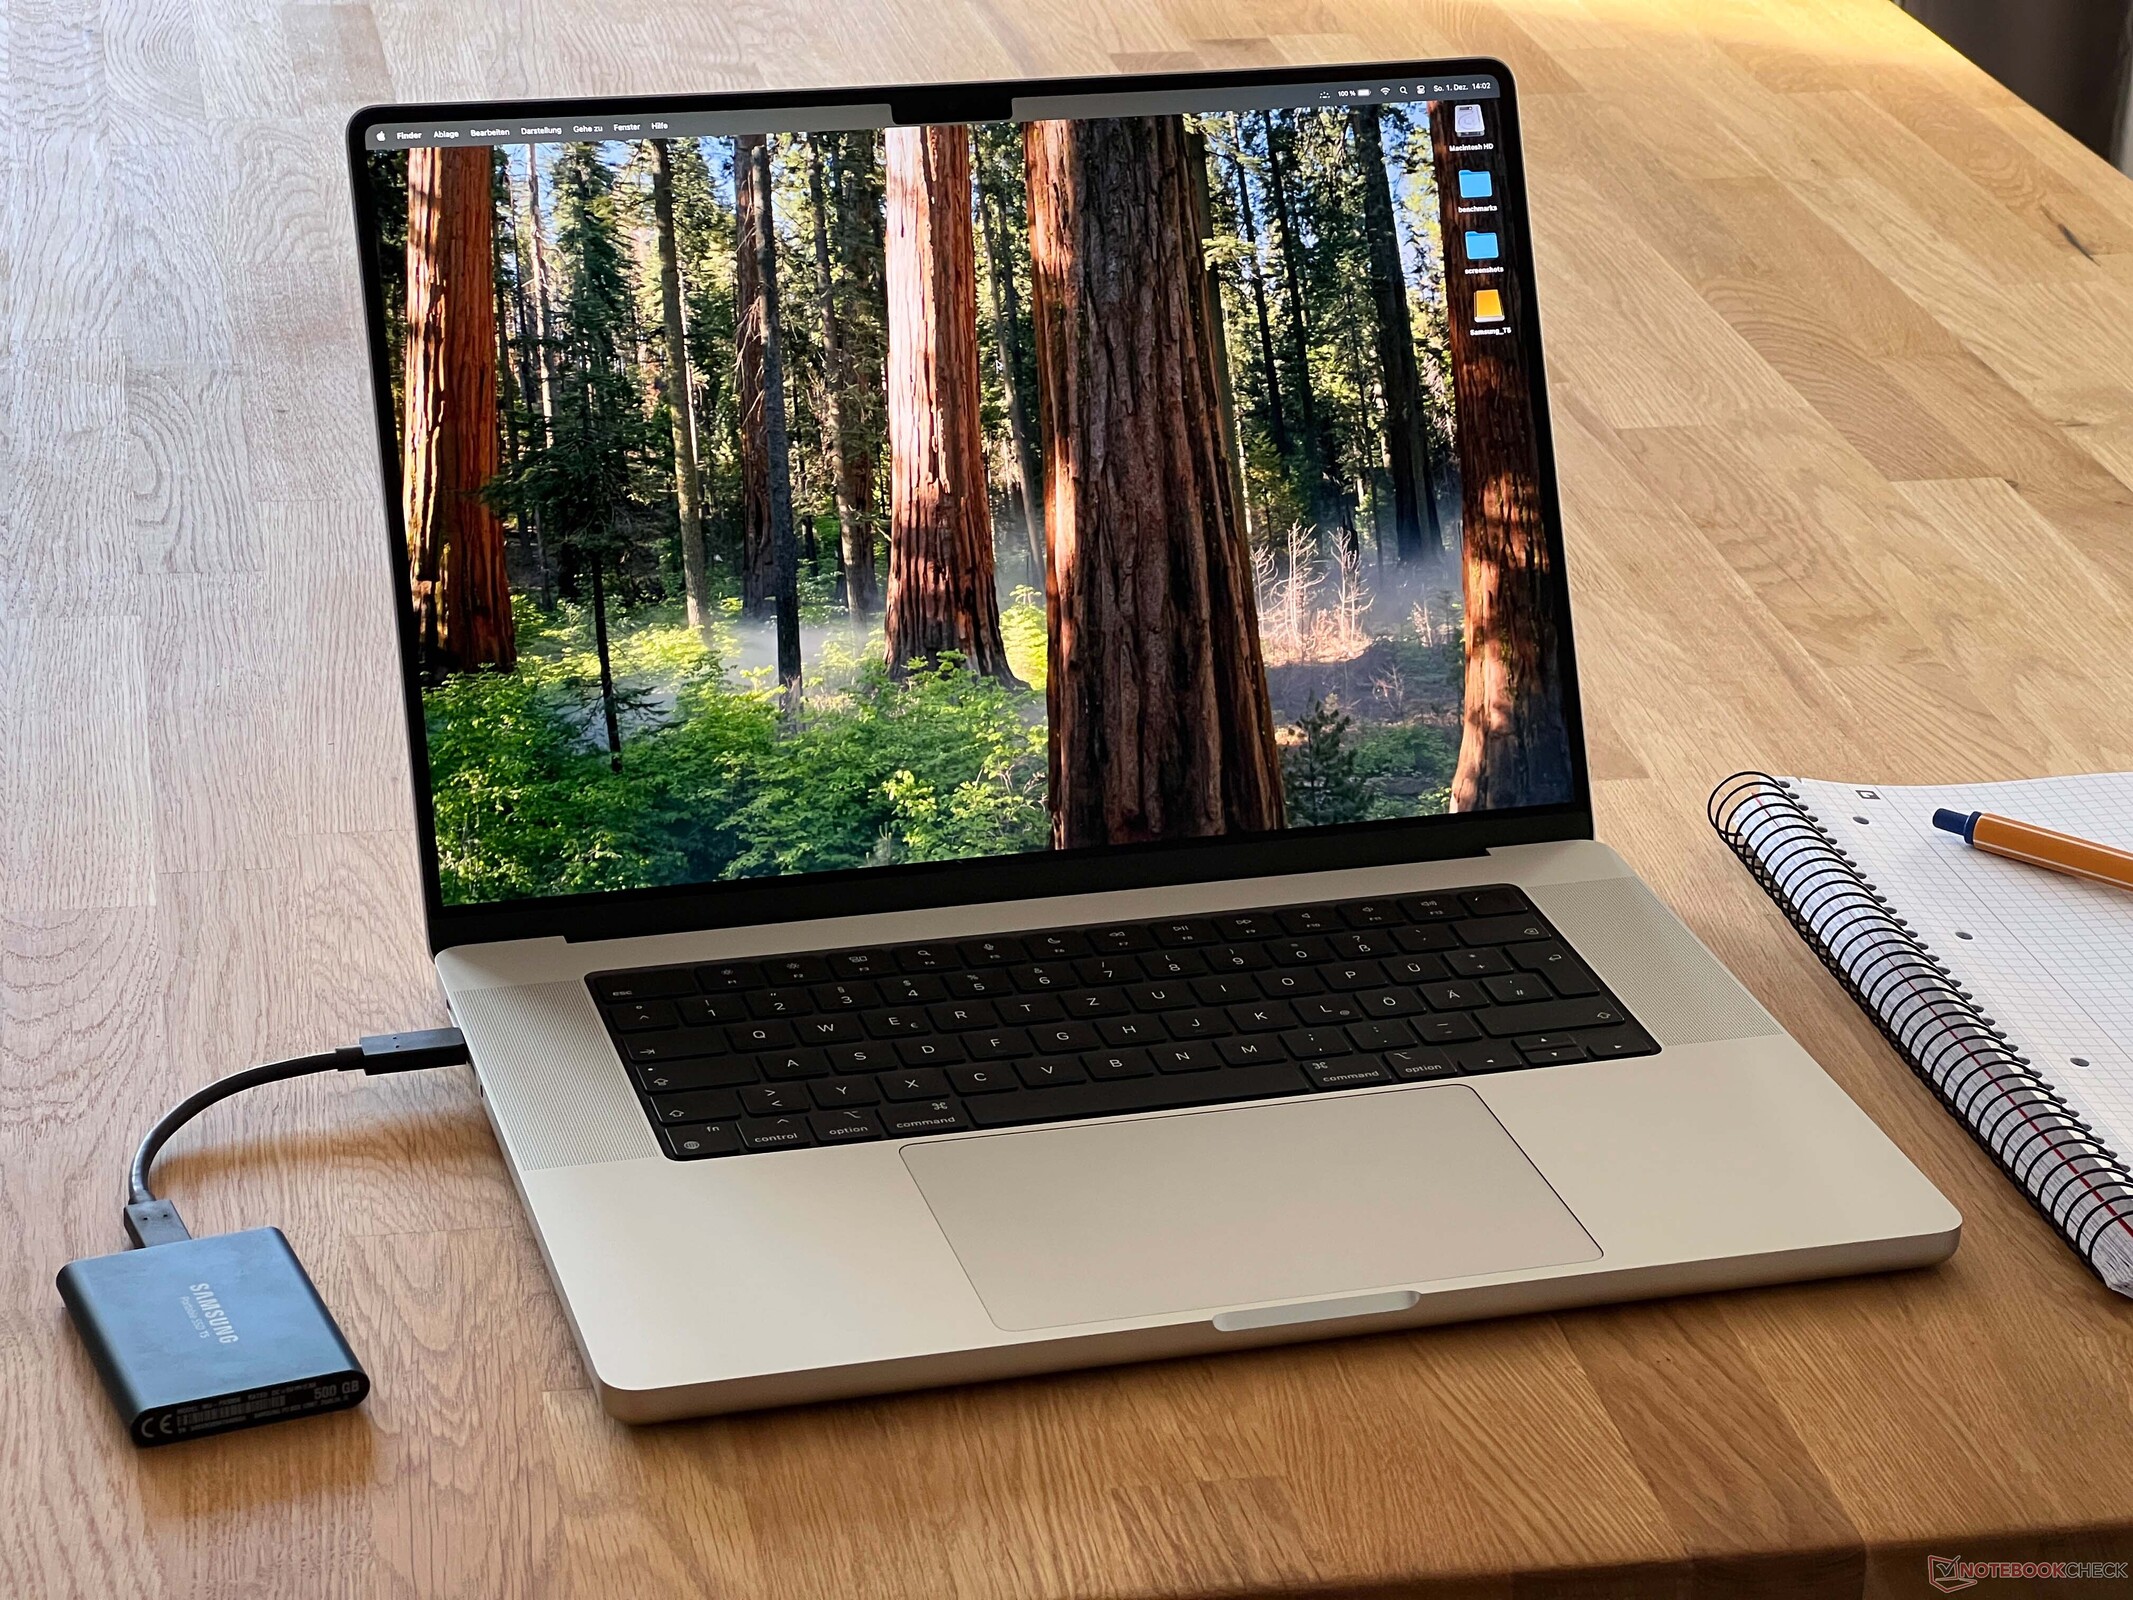
Apple MacBook Pro 16 M4 Max review - The M4 Max is one of the fastest mobile processors
Cooling at its limit.
The top-of-the-range configuration of Apple's new M4 Max has been given two additional performance cores and a very fast graphics card. However, the M4 Max is slowed down by the MacBook Pro 16's cooling and can't make use of its full potential. Is it slowly time for a new case design?Andreas Osthoff, 👁 Andreas Osthoff (translated by Daisy Dickson) Published 🇩🇪 🇫🇷 ...
Verdict - Apple extends its performance lead with the M4 Max
With the release of its new M4 generation, Apple has further extended its performance lead over the competition. Its single-core performance is unrivaled and the high-end version of the M4 Max is one of the fastest mobile processors on the market under multi-core load—plus, it stays super stable (even in battery mode). Its graphics performance, on the other hand, could do with being better and, for the most part, is on par with the competition featuring dedicated GeForce RTX 4070 Laptop GPUs and, in some cases, it even beats lower variants of the 4080 Laptop.
Under simultaneous CPU/GPU load, however, the MacBook Pro 16's cooling clearly limits the performance of the M4 Max and, in fact, the chip's power consumption is even slightly lower than that of the M4 Pro. Power supply is also a limiting factor in this case and the fast Max configuration in particular could benefit from stronger cooling. The 14-inch model is probably even weaker in this aspect if you take the 14-inch model with the M4 Pro as a reference.
Apart from this, the same advantages and disadvantages of the M4 Pro model apply to this version. These include its high-quality case, extensive features, brilliant mini LED panel with increased brightness and an optional matte finish, excellent sound system and long battery life. Disadvantages include its lack of upgrade/maintenance options in conjunction with the massive surcharges Apple charges for more RAM/SSD capacity.
Pros
Cons
Price and availability

A configuration of the MacBook Pro 16 M4 Max with 36 GB RAM and a 1-TB SSD can currently be found on Amazon for $3,209.
Possible alternatives compared
Image | Model / Review | Price | Weight | Height | Display |
|---|---|---|---|---|---|
1. 91.7%  | Apple MacBook Pro 16 M4 Max Apple M4 Max 16-Core ⎘ Apple M4 Max 40-Core GPU ⎘ 48 GB Memory, 1024 GB SSD | Amazon: List Price: 4699€ | 2.1 kg | 16.8 mm | 16.20" 3456x2234 254 PPI Mini-LED |
2. 93.2% v7 (old)  | Apple MacBook Pro 16 2023 M3 Max Apple M3 Max 16-Core ⎘ Apple M3 Max 40-Core GPU ⎘ 128 GB Memory, 8192 GB SSD | Amazon: List Price: 8529€ | 2.1 kg | 16.9 mm | 16.00" 3456x2234 257 PPI Mini-LED |
3. 84.2%  | HP ZBook Studio 16 G11 Intel Core Ultra 9 185H ⎘ NVIDIA RTX 3000 Ada Generation Laptop ⎘ 64 GB Memory, 1024 GB SSD | Amazon: List Price: 4300 USD | 1.8 kg | 19 mm | 16.00" 3840x2400 283 PPI IPS |
4. 83.5%  | Lenovo ThinkPad P1 Gen 7 21KV001SGE Intel Core Ultra 7 155H ⎘ NVIDIA GeForce RTX 4060 Laptop GPU ⎘ 32 GB Memory, 1024 GB SSD | Amazon: List Price: 3239 Euro | 2 kg | 20.5 mm | 16.00" 2560x1600 189 PPI IPS LED |
5. 87.8%  | Asus ProArt P16 H7606WI AMD Ryzen AI 9 HX 370 ⎘ NVIDIA GeForce RTX 4070 Laptop GPU ⎘ 64 GB Memory, 1024 GB SSD | Amazon: List Price: 4000€ | 1.8 kg | 17.3 mm | 16.00" 3840x2400 283 PPI OLED |
6. 81.2%  | Schenker XMG Pro 16 Studio (Mid 24) Intel Core i9-14900HX ⎘ NVIDIA GeForce RTX 4070 Laptop GPU ⎘ 32 GB Memory, 1024 GB SSD | Amazon: 1. $155.00 16.0" WQXGA 2560(RGB)×1600 ... 2. $155.00 Replacement Screen 16.0" for... List Price: 2300 Euro | 2.3 kg | 19.9 mm | 16.00" 2560x1600 189 PPI IPS |
7. 88.7% v7 (old)  | Lenovo Yoga Pro 9 16IMH9 Intel Core Ultra 9 185H ⎘ NVIDIA GeForce RTX 4070 Laptop GPU ⎘ 32 GB Memory, 1024 GB SSD | Amazon: List Price: 2700€ | 2.1 kg | 18.3 mm | 16.00" 3200x2000 236 PPI Mini-LED |
8. 88.6% v7 (old)  | Dell XPS 16 9640 Intel Core Ultra 7 155H ⎘ NVIDIA GeForce RTX 4070 Laptop GPU ⎘ 32 GB Memory, 1024 GB SSD | Amazon: 1. $2,499.00 Dell XPS 16 9640 16.3" Touch... 2. $2,199.00 New XPS 16 9640 Business Lap... 3. $2,199.00 New XPS 16 9640 Powerful AI ... | 2.3 kg | 18.7 mm | 16.30" 3840x2400 139 PPI OLED |
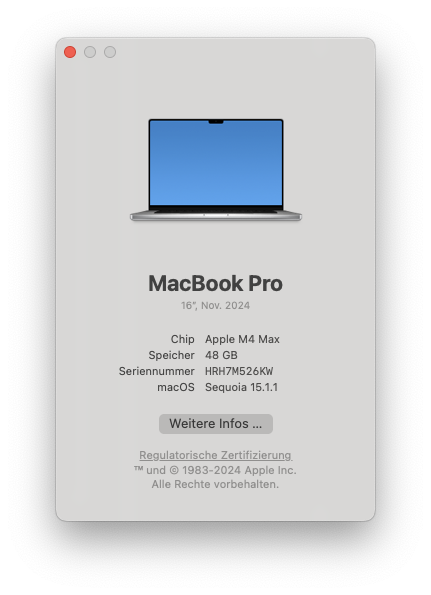
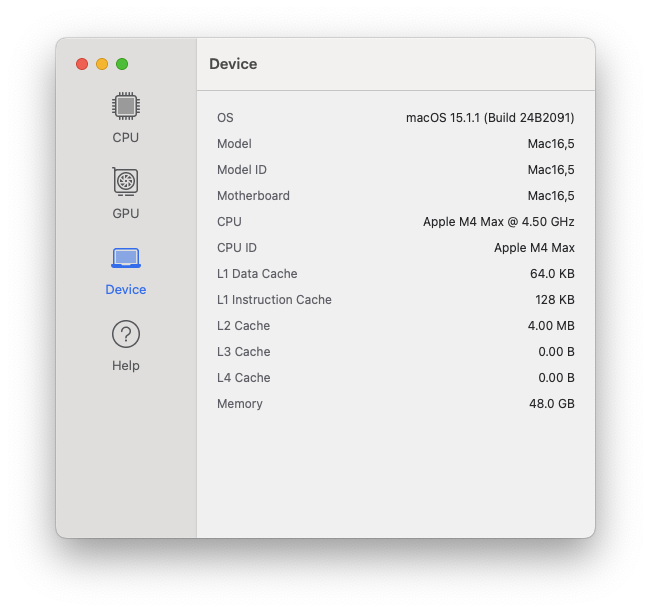
The MacBook Pro 16 2024 comes either with the full version of the new M4 Pro SoC (as in this detailed review) or two variants of the more powerful M4 Max SoC. With 14 CPU cores, the "small" M4 Max delivers the same CPU performance as the M4 Pro, but has a more powerful GPU with 32 cores for prices starting at $3,499. The full version of the M4 Max with 16 CPU cores and 40 GPU cores starts at $3,999 and it is precisely this variant with 48 GB RAM and a 1-TB SSD that we are testing today. If you choose 128 GB RAM (+$1,000), an 8-TB SSD (+$2,200) and a matte panel (+$150), the price increases up to $7,349.
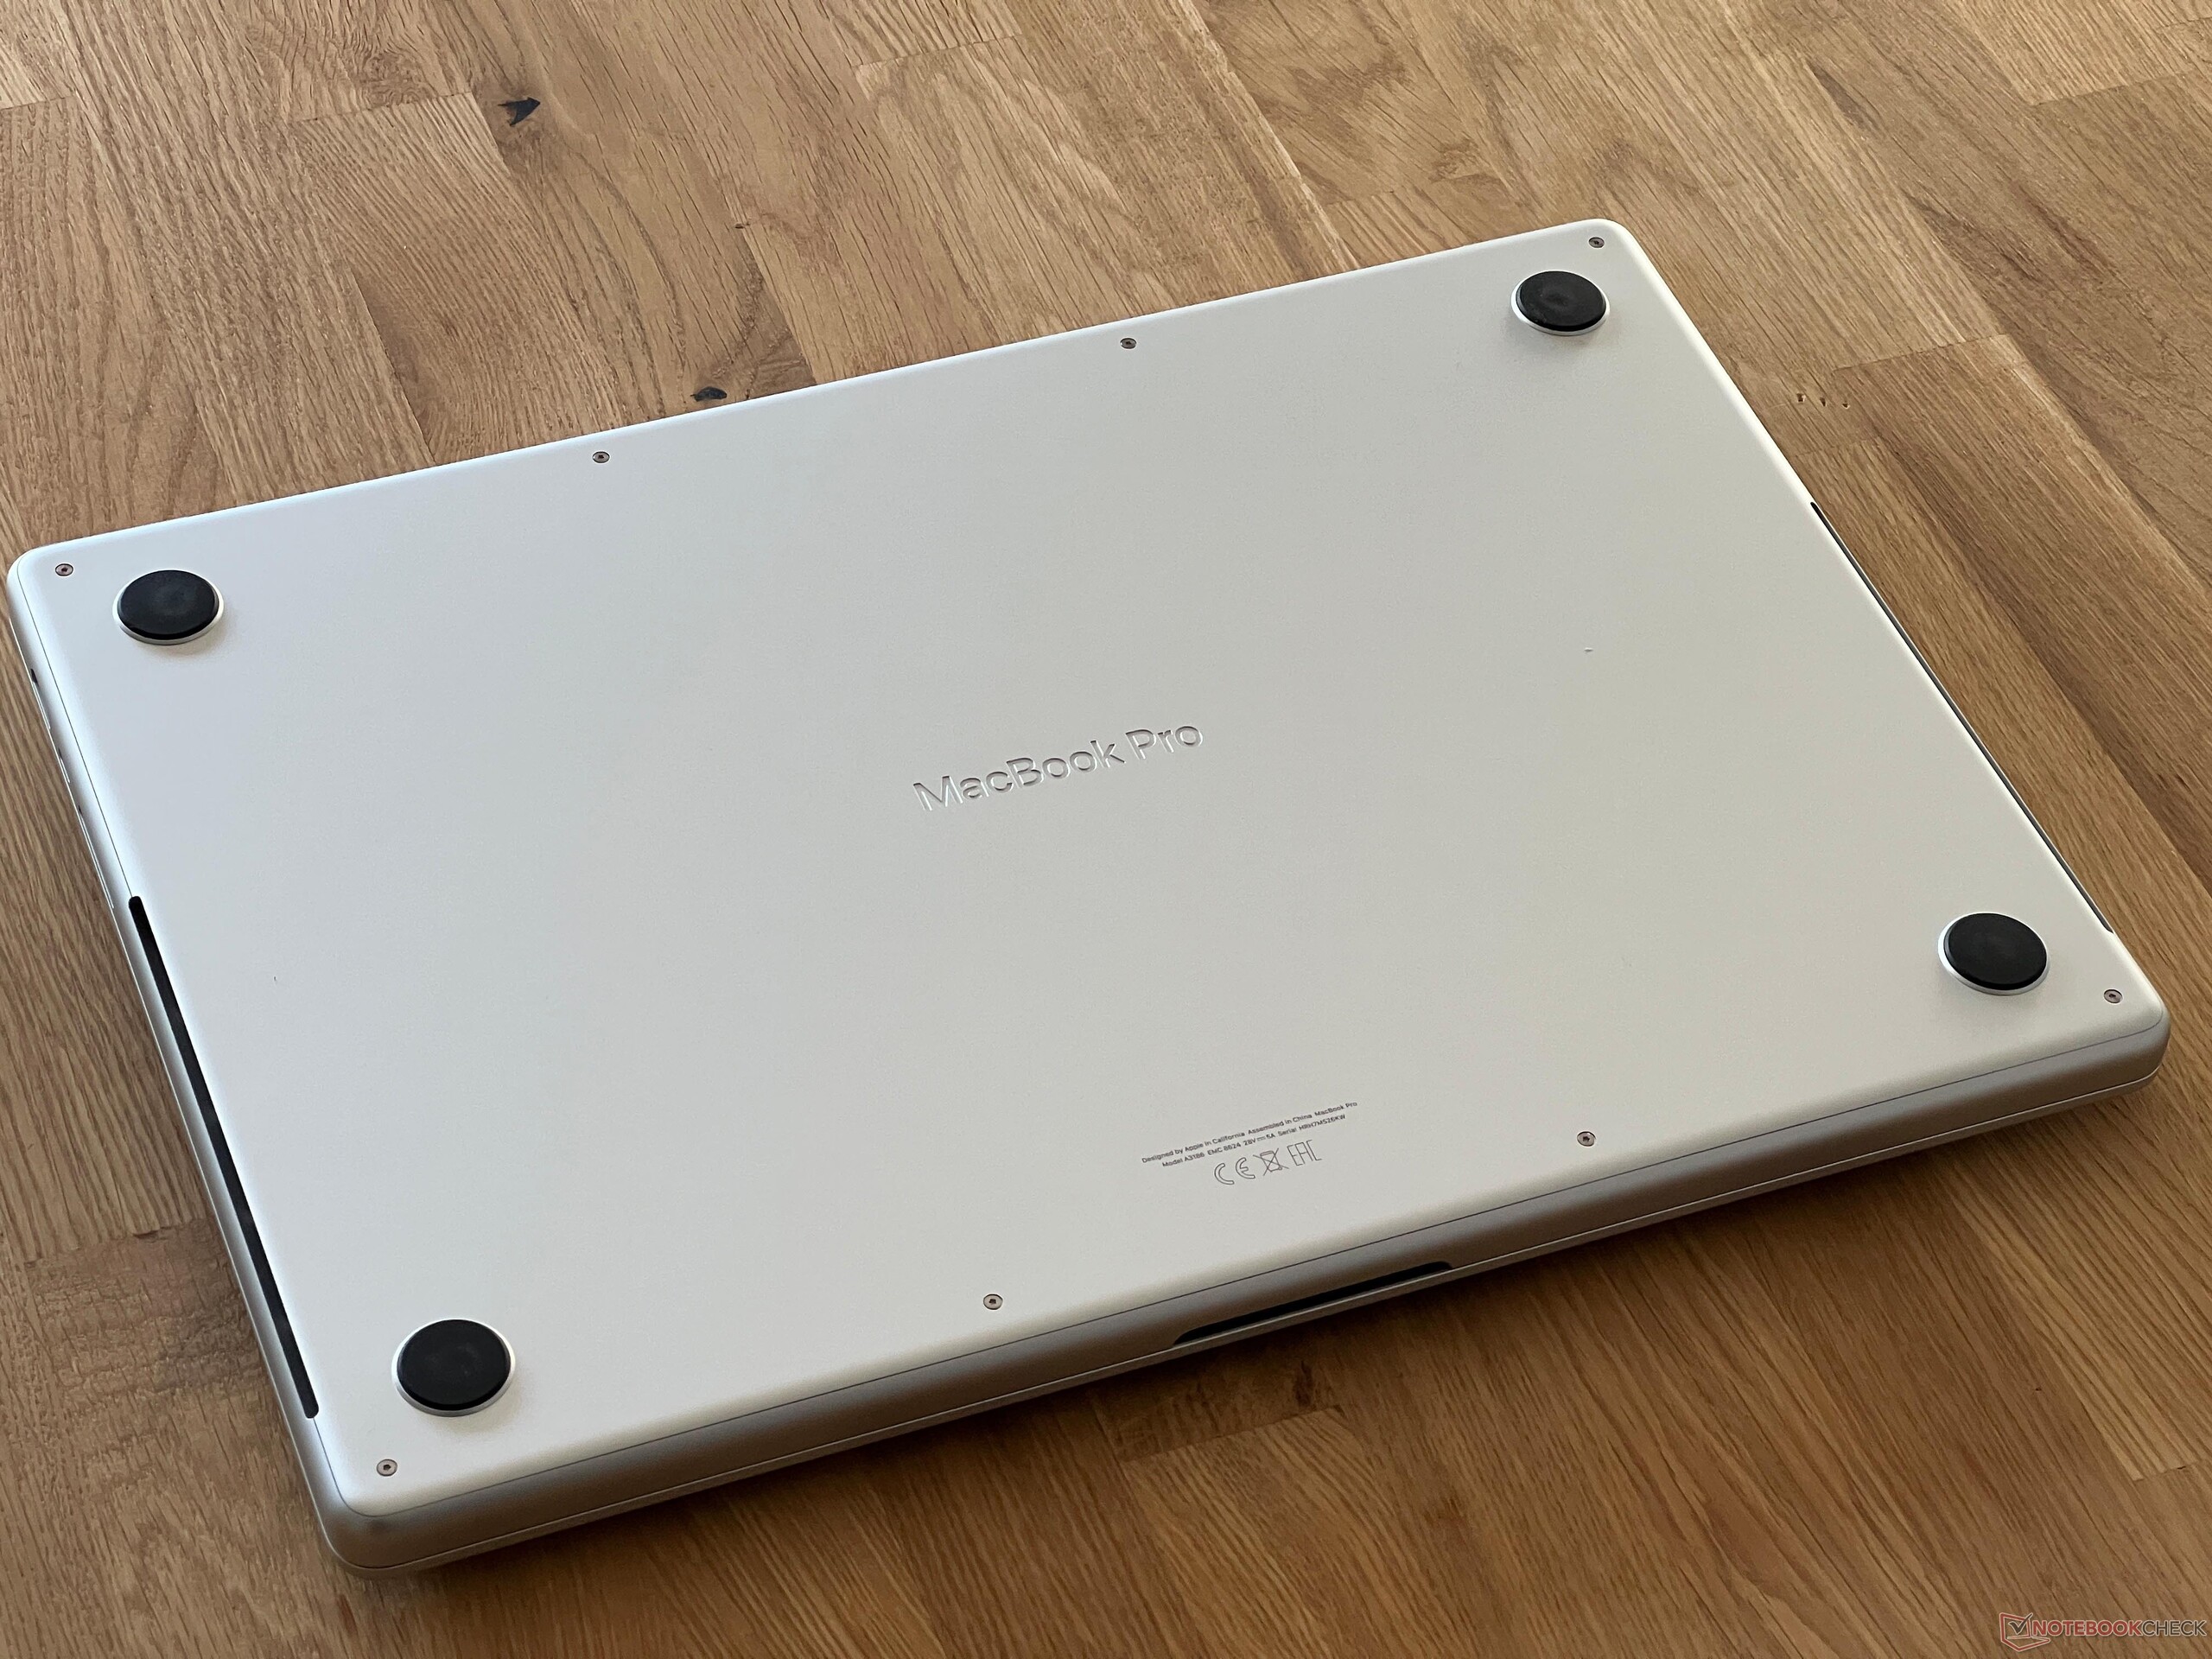
As there are no differences in its case, connections, input devices, display or speakers compared to the M4 Pro model we have already tested, so we won't cover these sections again here and will instead focus on the performance of the new M4 Max processor.
Specifications
Differences compared to the MacBook Pro 16 M4 Pro
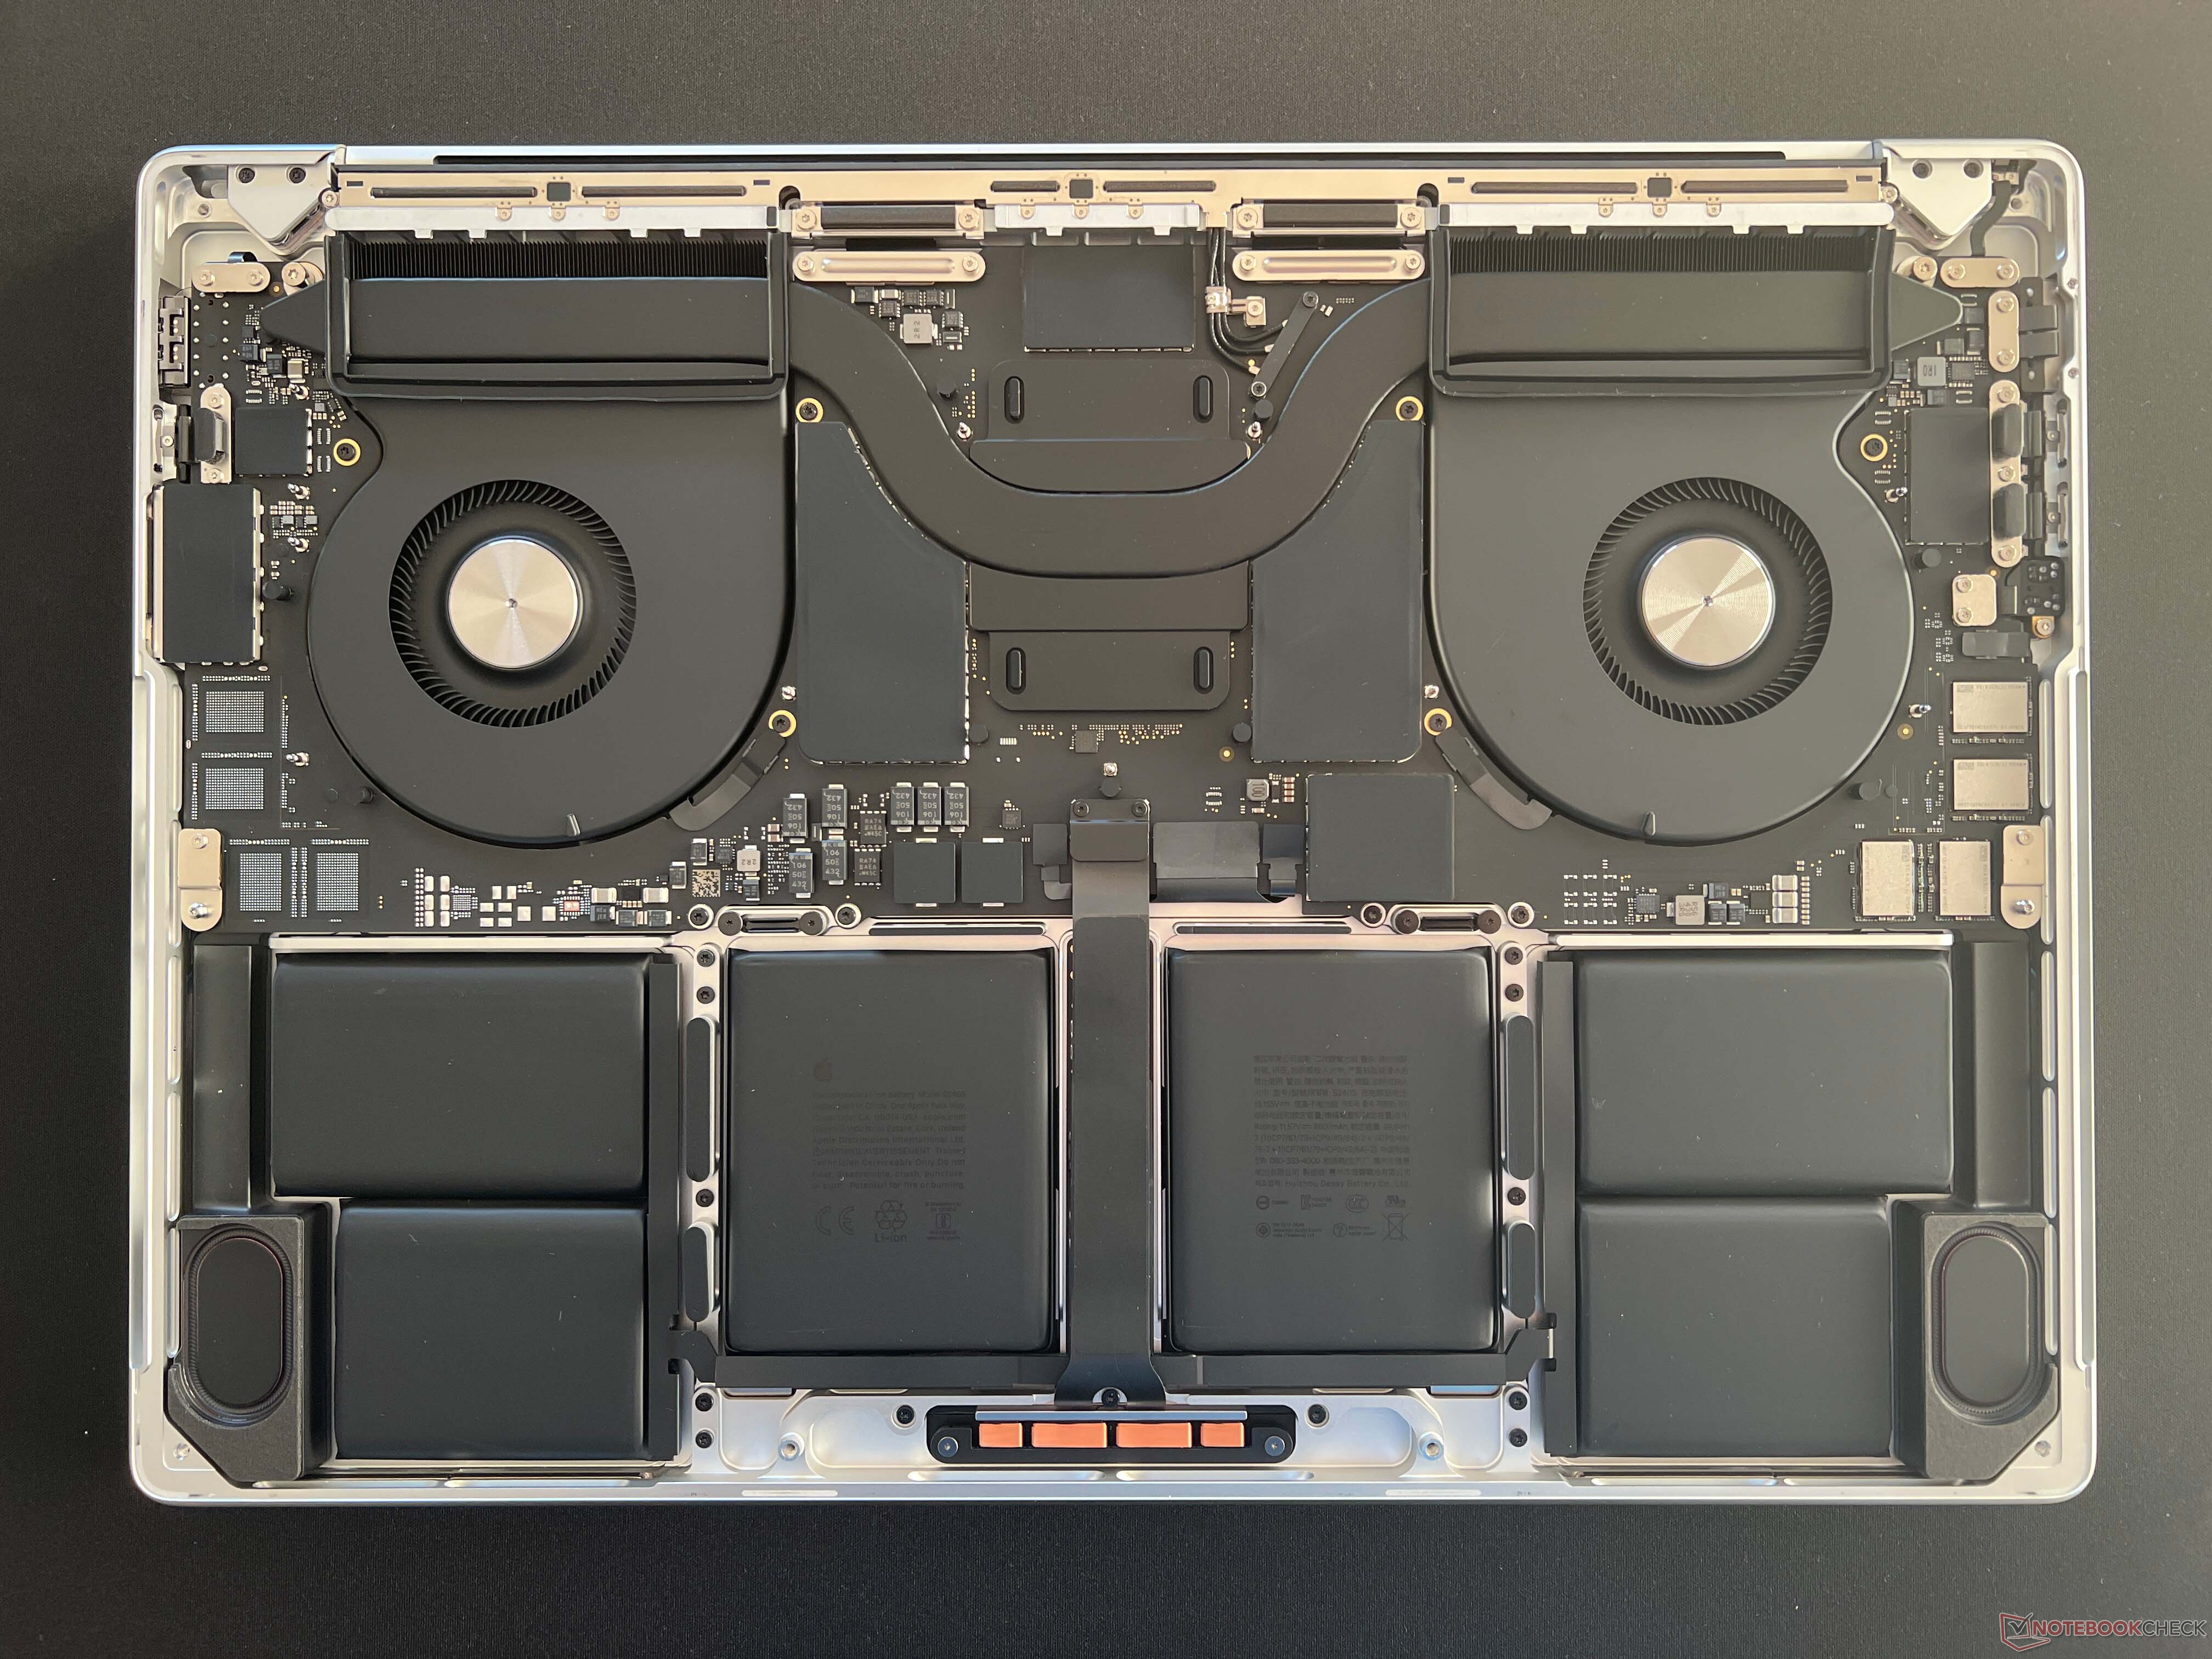
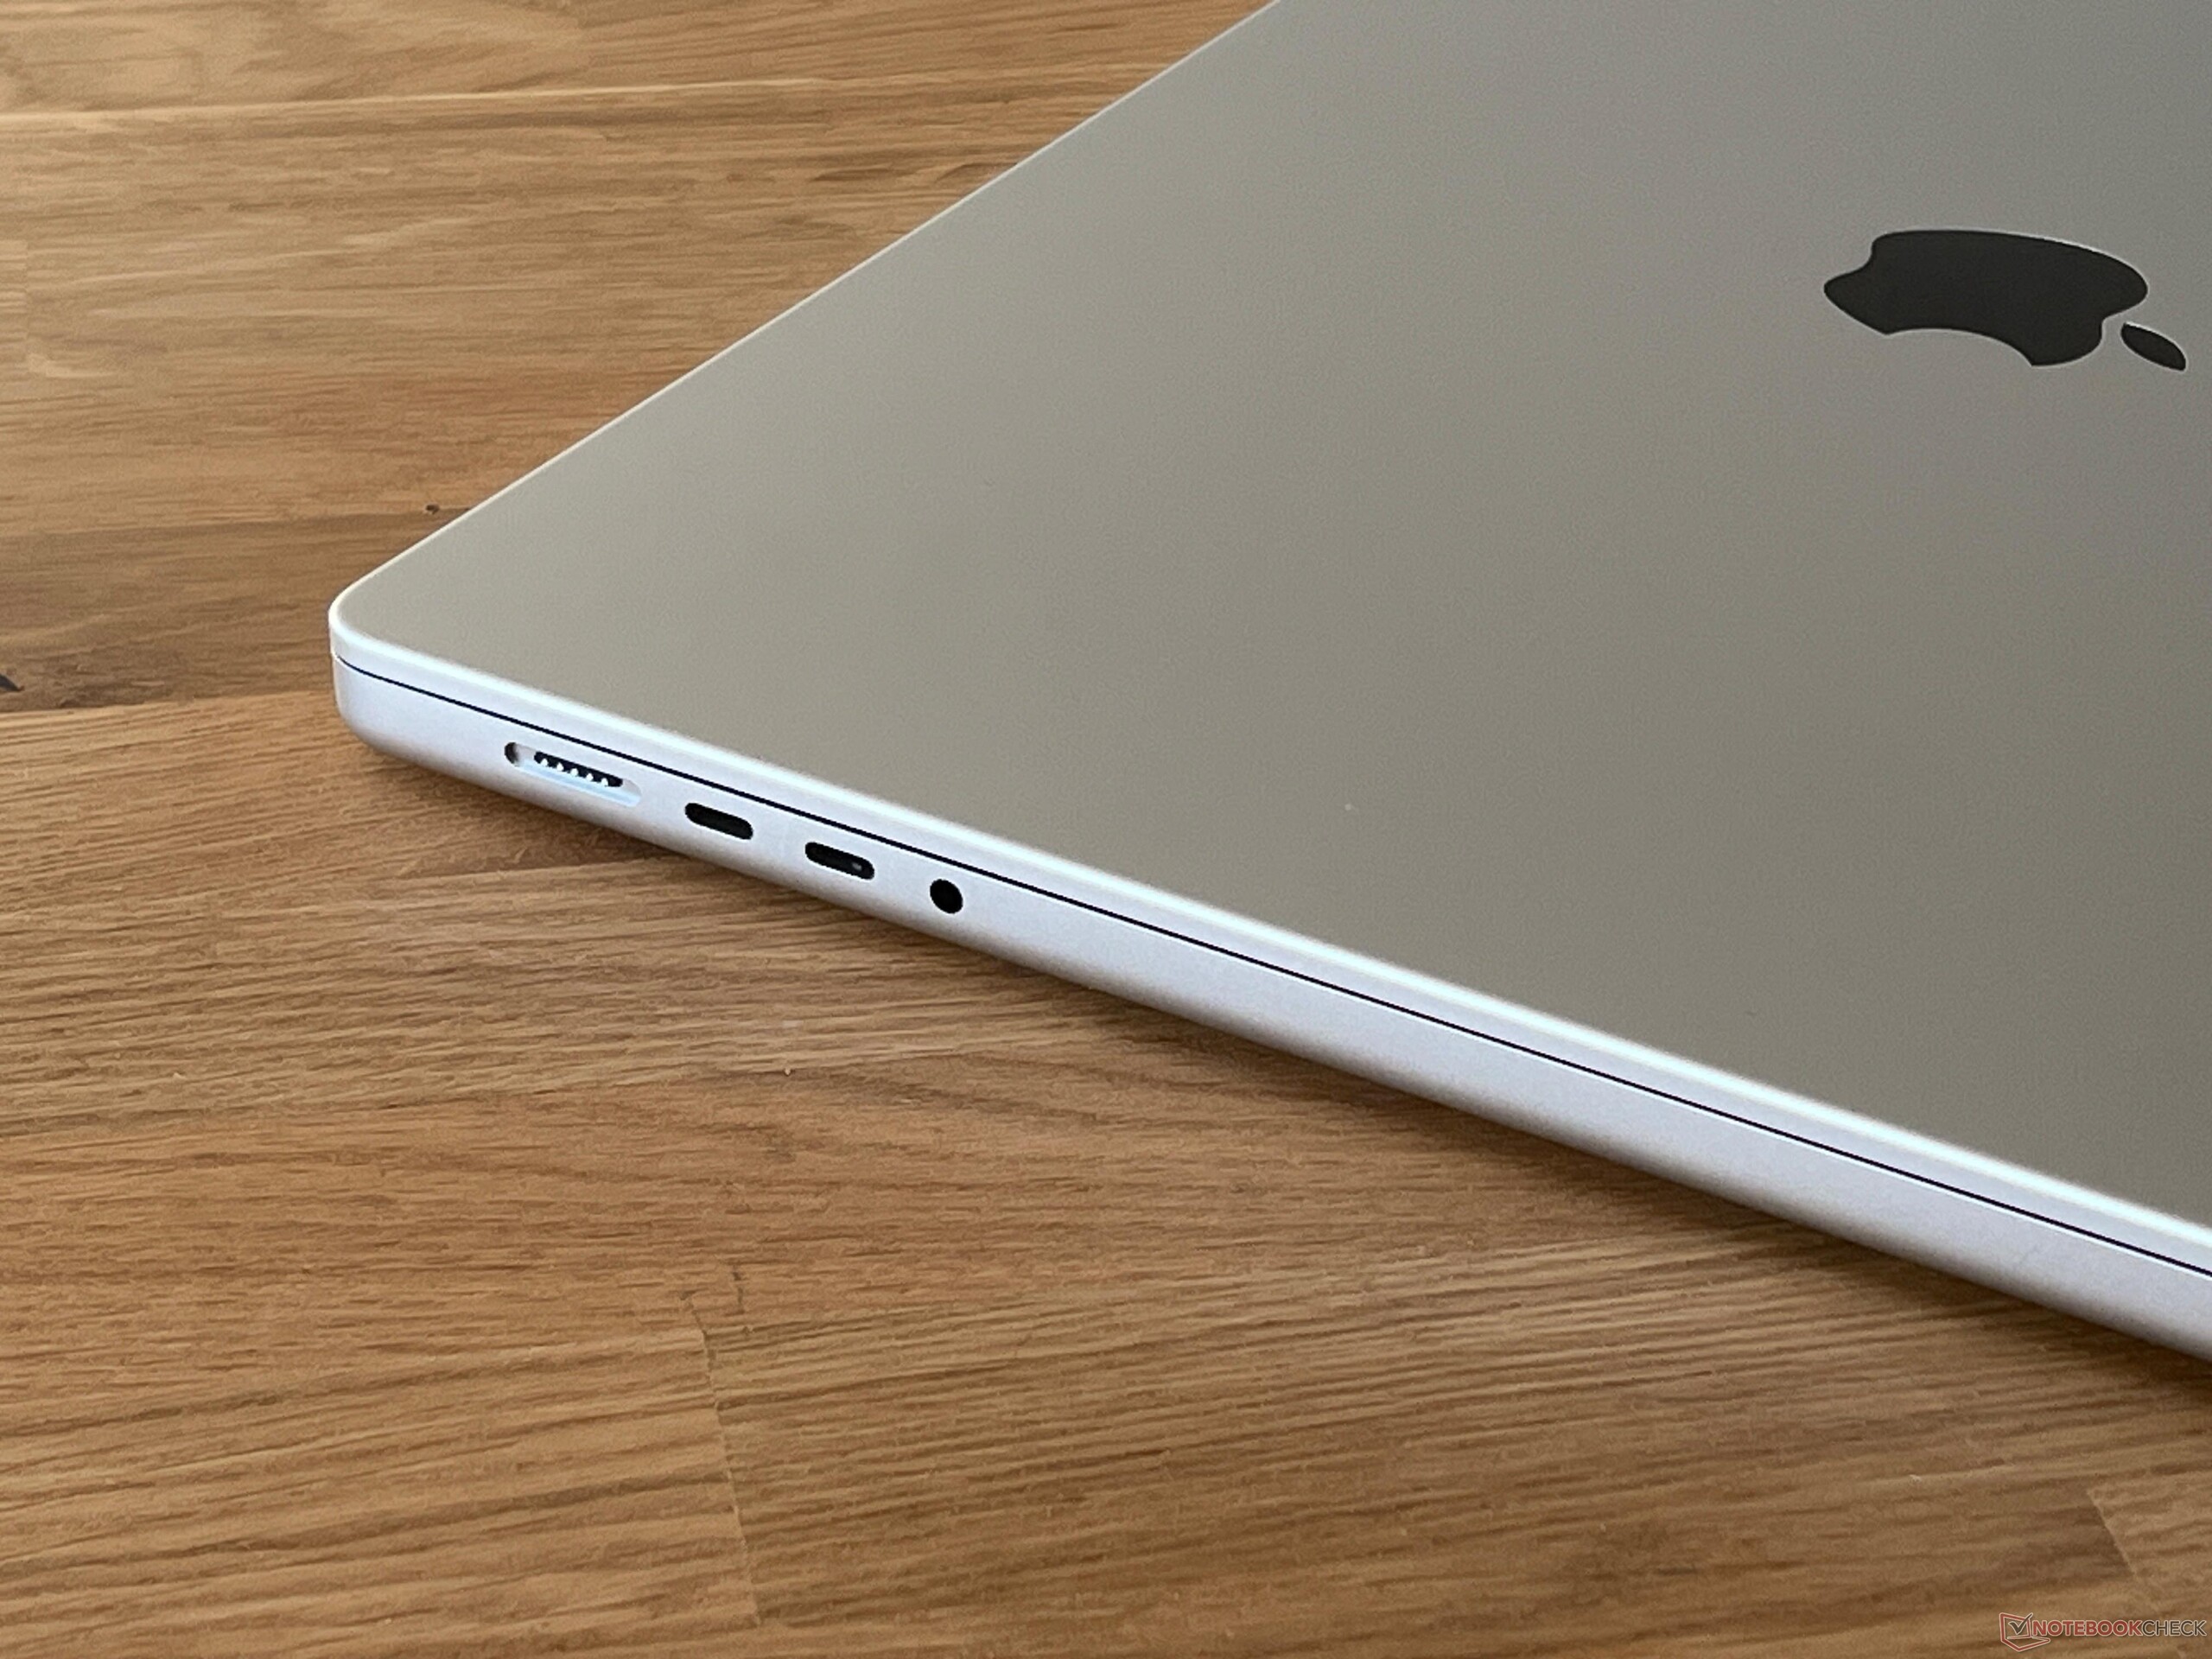
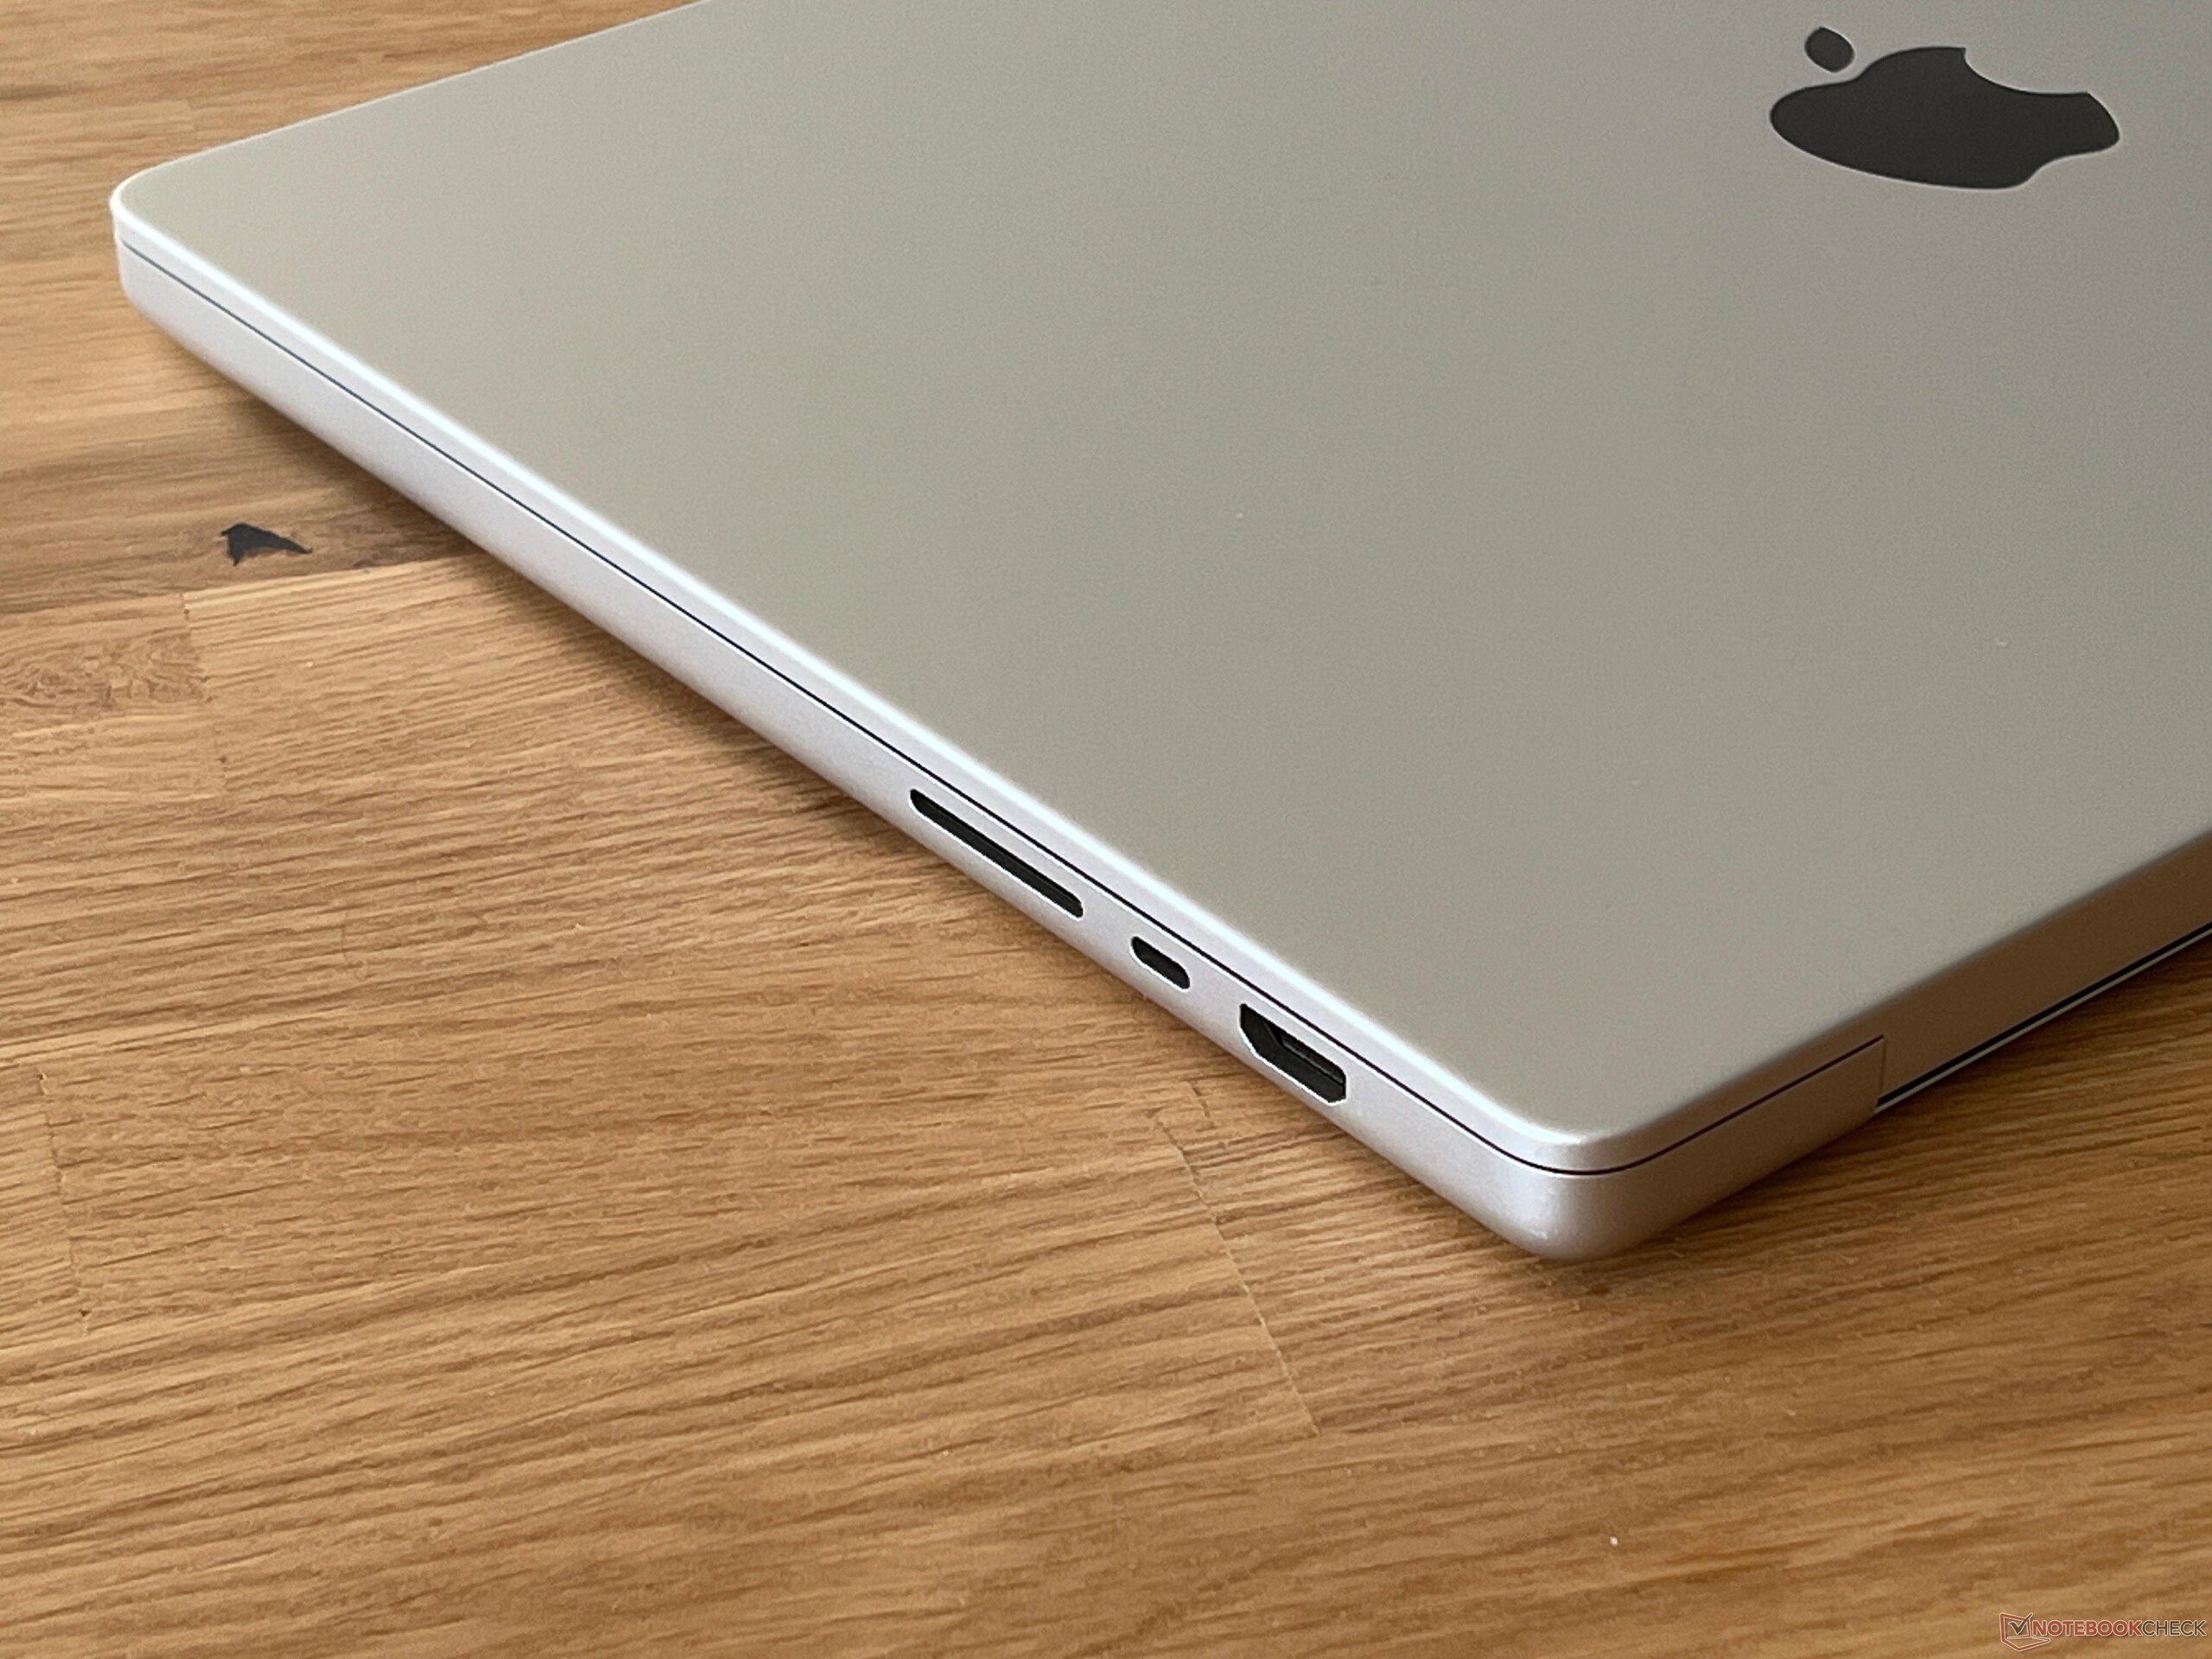
The 16-inch version of the 2024 MacBook Pro is available with either the M4 Pro SoC or the M4 Max SoC and all versions are very similar in terms of both case and features. This includes Thunderbolt 5 support (up to 120 GBit/s) for all USB-C ports and a cooling unit consisting of two fans; only the heat sinks themselves differ slightly. On the flip side, the M4 Max can control two additional external displays, i.e. a maximum of four external displays at the same time in addition to the internal screen.


Sustainability
Apple has provided an environmental report for the MacBook Pro 16 on its product page. Lots of recycled materials are used for both the device itself and its packaging. A CO2 footprint of 303 kg is stated for our test configuration.
Performance - The M4 Max with up to 128 GB RAM
Inside the MacBook Pro 16, the top-of-the-range version of the new M4 Max can be configured with a maximum of 128 GB RAM, which is a major advantage over almost all comparable devices. Plus, as it is unified RAM, the GPU can also benefit fully from this. However, there will soon be a direct competitor in this respect with the release of the new Strix Halo APUs from AMD, which—according to rumors—will be available with up to 96 GB.
Testing conditions
The MacBook Pro 16 features three power modes: Low Charge, Automatic and High Performance. By default, the MacBook works using Automatic mode, which we also used for the following benchmarks and measurements. The High Performance mode didn't always provide an advantage during our tests, but we will take a closer look at this in the individual sections.
Processor - The M4 Max with 16 cores
Apple has once again changed its CPU strategy with its new M4 chips compared to the old M3 generation. While both M3 Max CPUs were significantly faster than the M3 Pro, the full version of the M4 Pro and the small M4 Max are now on par, as both have 14 CPU cores (10x performance, 4x efficiency) with identical clock rates. Only the top-of-the-range model of the M4 Max is equipped with two additional performance cores, which is of course additionally reflected in its power consumption. While the M4 Pro consumed a maximum of 46 watts under full multi-core load, the M4 Max now consumes up to 57 watts, although this value was only reached very briefly during our test and then leveled off at ~50 watts. In High Performance mode, we noted 57-59 watts and this value was maintained throughout, which is why its multi-core performance in CB 2024, for example, proved to be slightly better.
Its multi-core performance is impressive. In the native Cinebench 2024 and Geekbench tests, its advantage over the old M3 Max was 17-21% and even the full version of the M4 Pro was outperformed by 14-17%. During the Cinebench 2024 test, it was even one of the fastest mobile processors ever—only the overclocked Core i9-14900HX in the XMG Neo 16 with a connected water cooling unit was slightly faster still. The new M4 Max was also only beaten by the Core i9-14900HX and the AMD Ryzen 9 7945HX3D in the Blender CPU test.
Geekbench 6.7: Multi-Core | Single-Core
Blender: v3.3 Classroom CPU
| Cinebench 2024 / CPU Multi Core | |
| Schenker XMG Neo 16 (Early 24) (v6.92.6600, Overboost, Oasis) | |
| Apple MacBook Pro 16 M4 Max (High Performance) | |
| Apple MacBook Pro 16 M4 Max | |
| Asus ROG Strix Scar 17 G733PYV-LL053X | |
| Apple MacBook Pro 16 2024 M4 Pro | |
| Apple MacBook Pro 16 2023 M3 Max | |
| Schenker XMG Pro 16 Studio (Mid 24) | |
| Asus ProArt P16 H7606WI | |
| Dell XPS 16 9640 | |
| Lenovo ThinkPad P1 Gen 7 21KV001SGE | |
| HP ZBook Studio 16 G11 | |
| Cinebench 2024 / CPU Single Core | |
| Apple MacBook Pro 16 2024 M4 Pro | |
| Apple MacBook Pro 16 M4 Max | |
| Apple MacBook Pro 16 2023 M3 Max | |
| Schenker XMG Neo 16 (Early 24) (v6.92.6600, Overboost, Oasis) | |
| Schenker XMG Pro 16 Studio (Mid 24) | |
| Asus ProArt P16 H7606WI | |
| Asus ROG Strix Scar 17 G733PYV-LL053X | |
| HP ZBook Studio 16 G11 | |
| Dell XPS 16 9640 | |
| Lenovo ThinkPad P1 Gen 7 21KV001SGE | |
| Geekbench 6.7 / Multi-Core | |
| Apple MacBook Pro 16 M4 Max | |
| Apple MacBook Pro 16 2024 M4 Pro | |
| Apple MacBook Pro 16 2023 M3 Max | |
| Schenker XMG Neo 16 (Early 24) (6.2.1, Overboost, Oasis) | |
| Schenker XMG Pro 16 Studio (Mid 24) (6.2.1) | |
| Asus ROG Strix Scar 17 G733PYV-LL053X | |
| Asus ProArt P16 H7606WI (6.2.1) | |
| Lenovo Yoga Pro 9 16IMH9 (6.2.1) | |
| HP ZBook Studio 16 G11 (6.2.1) | |
| Dell XPS 16 9640 (6.2.1) | |
| Lenovo ThinkPad P1 Gen 7 21KV001SGE (6.2.1) | |
| Geekbench 6.7 / Single-Core | |
| Apple MacBook Pro 16 M4 Max | |
| Apple MacBook Pro 16 2024 M4 Pro | |
| Schenker XMG Neo 16 (Early 24) (6.2.1, Overboost, Oasis) | |
| Apple MacBook Pro 16 2023 M3 Max | |
| Asus ROG Strix Scar 17 G733PYV-LL053X | |
| Asus ProArt P16 H7606WI (6.2.1) | |
| Schenker XMG Pro 16 Studio (Mid 24) (6.2.1) | |
| Lenovo Yoga Pro 9 16IMH9 (6.2.1) | |
| HP ZBook Studio 16 G11 (6.2.1) | |
| Dell XPS 16 9640 (6.2.1) | |
| Lenovo ThinkPad P1 Gen 7 21KV001SGE (6.2.1) | |
| Blender / v3.3 Classroom CPU | |
| HP ZBook Studio 16 G11 (3.3.3) | |
| Dell XPS 16 9640 (3.3.3) | |
| Lenovo ThinkPad P1 Gen 7 21KV001SGE (3.3.3) | |
| Lenovo Yoga Pro 9 16IMH9 (3.3.3) | |
| Schenker XMG Pro 16 Studio (Mid 24) (3.3.3) | |
| Asus ProArt P16 H7606WI (3.3.3) | |
| Apple MacBook Pro 16 2023 M3 Max | |
| Apple MacBook Pro 16 M4 Max | |
| Schenker XMG Neo 16 (Early 24) (3.3.3, Overboost, Oasis) | |
| Asus ROG Strix Scar 17 G733PYV-LL053X (3.3.3) | |
* ... smaller is better
Regardless, the new M4 SoCs' single-core performance is beyond any doubt and Apple has been able to further extend its lead over the competition. The old M3 Max was outperformed by a whopping 25-28% and the other competitors simply didn't stand a chance in this scenario. However, its power consumption during the single-core tests was slightly higher than the M4 Pro at 6.2-6.5 watts.
The M4 Max easily passed the Cinebench 2024 Multi stress test (30 minutes) using both energy profiles and its performance remained completely constant. During the old Cinebench R15 Multi loop, its performance fluctuated minimally in Automatic mode, but this was just due to the very short test duration (a few seconds). The brief higher limit of 57 watts and the drop to 50 watts therefore had an effect here. However, we are still only talking about a reduction of ~3-4 %.
In battery mode, its performance remained stable until the battery level reached 4%. Only from this point did we note a significant reduction in performance. Further CPU benchmarks can be found here.
Cinebench R15 Multi continuous test
System performance
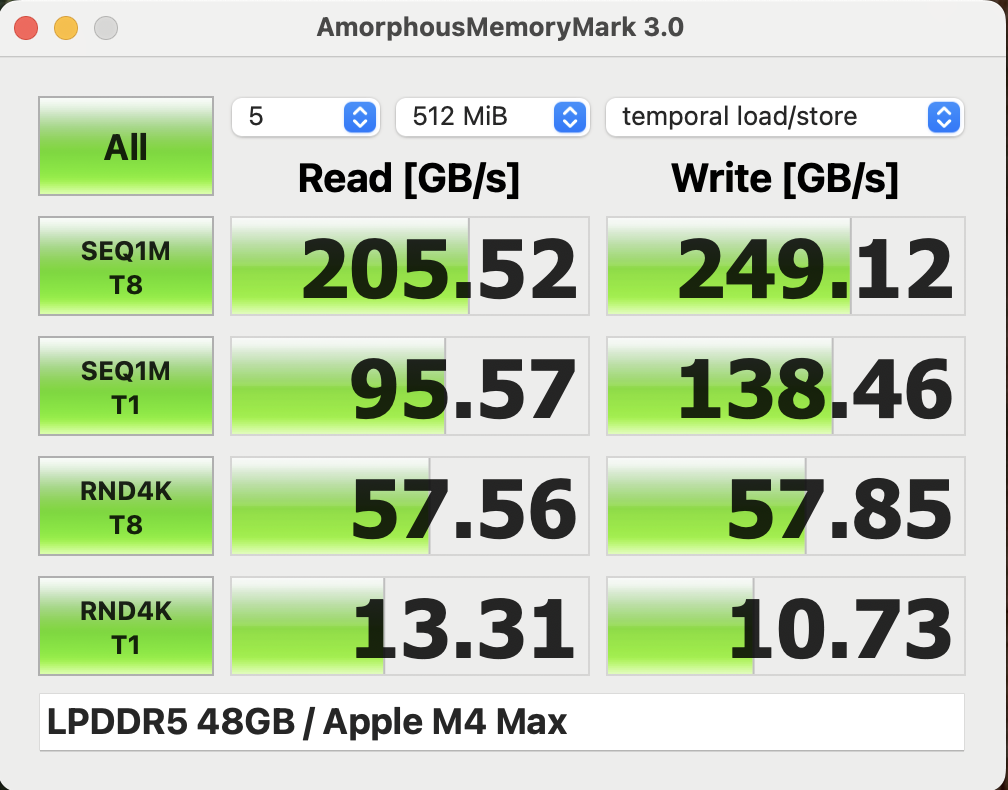
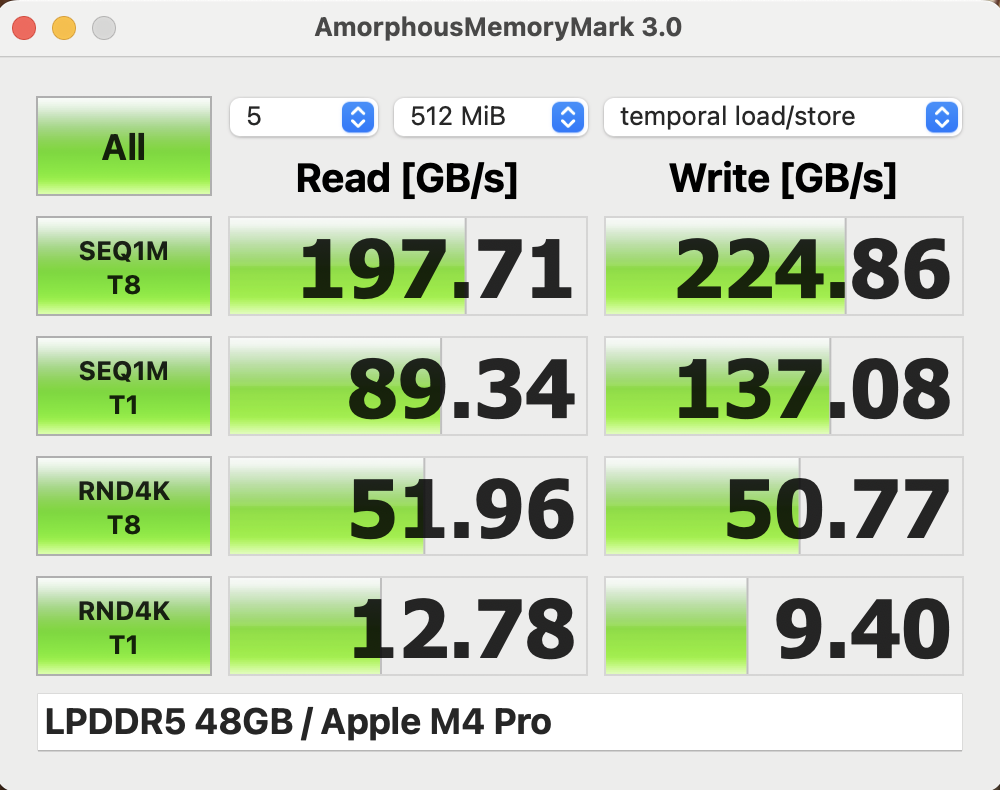
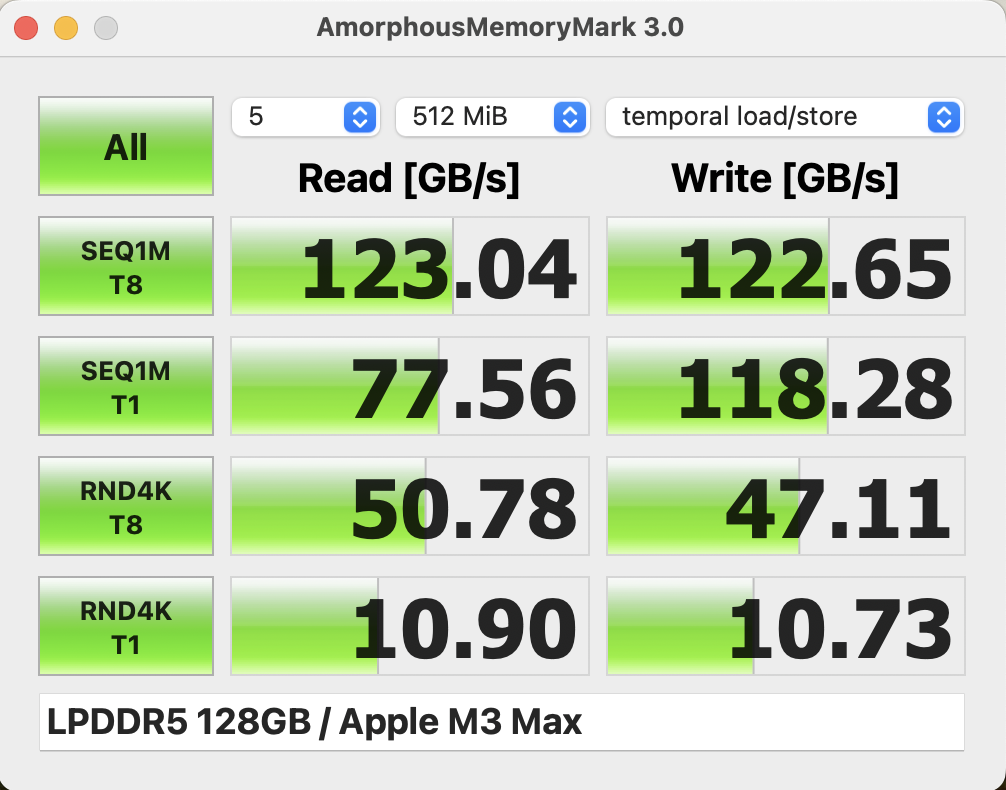
During the cross-system CrossMark benchmark, the MacBook Pro 16 M4 Max came clearly ahead of its direct competitors, and this lead also became clear in the browser tests. Its subjective performance is also very high, although the same can be said for the competition. We also noted no problems with stability during our test. Its RAM speed was significantly higher compared to the M3 Max, but the differences compared to the M4 Pro were only slight.
WebXPRT 3: Overall
WebXPRT 4: Overall
Mozilla Kraken 1.1: Total
| CrossMark / Overall | |
| Apple MacBook Pro 16 M4 Max | |
| Average Apple M4 Max 16-Core, Apple M4 Max 40-Core GPU (n=1) | |
| Schenker XMG Pro 16 Studio (Mid 24) | |
| Apple MacBook Pro 16 2023 M3 Max | |
| Average of class Multimedia (866 - 2728, n=59, last 2 years) | |
| Dell XPS 16 9640 | |
| Asus ProArt P16 H7606WI | |
| HP ZBook Studio 16 G11 | |
| Lenovo Yoga Pro 9 16IMH9 | |
| Lenovo ThinkPad P1 Gen 7 21KV001SGE | |
| CrossMark / Productivity | |
| Apple MacBook Pro 16 M4 Max | |
| Average Apple M4 Max 16-Core, Apple M4 Max 40-Core GPU (n=1) | |
| Schenker XMG Pro 16 Studio (Mid 24) | |
| Apple MacBook Pro 16 2023 M3 Max | |
| Average of class Multimedia (931 - 2489, n=59, last 2 years) | |
| Dell XPS 16 9640 | |
| HP ZBook Studio 16 G11 | |
| Lenovo ThinkPad P1 Gen 7 21KV001SGE | |
| Lenovo Yoga Pro 9 16IMH9 | |
| Asus ProArt P16 H7606WI | |
| CrossMark / Creativity | |
| Apple MacBook Pro 16 M4 Max | |
| Average Apple M4 Max 16-Core, Apple M4 Max 40-Core GPU (n=1) | |
| Apple MacBook Pro 16 2023 M3 Max | |
| Schenker XMG Pro 16 Studio (Mid 24) | |
| Asus ProArt P16 H7606WI | |
| Average of class Multimedia (907 - 3465, n=59, last 2 years) | |
| Dell XPS 16 9640 | |
| Lenovo Yoga Pro 9 16IMH9 | |
| HP ZBook Studio 16 G11 | |
| Lenovo ThinkPad P1 Gen 7 21KV001SGE | |
| CrossMark / Responsiveness | |
| Schenker XMG Pro 16 Studio (Mid 24) | |
| Dell XPS 16 9640 | |
| Apple MacBook Pro 16 M4 Max | |
| Average Apple M4 Max 16-Core, Apple M4 Max 40-Core GPU (n=1) | |
| Average of class Multimedia (605 - 2024, n=59, last 2 years) | |
| Apple MacBook Pro 16 2023 M3 Max | |
| HP ZBook Studio 16 G11 | |
| Lenovo ThinkPad P1 Gen 7 21KV001SGE | |
| Lenovo Yoga Pro 9 16IMH9 | |
| Asus ProArt P16 H7606WI | |
| WebXPRT 3 / Overall | |
| Apple MacBook Pro 16 M4 Max | |
| Average Apple M4 Max 16-Core, Apple M4 Max 40-Core GPU (n=1) | |
| Apple MacBook Pro 16 2023 M3 Max | |
| Average of class Multimedia (136.4 - 596, n=62, last 2 years) | |
| Schenker XMG Pro 16 Studio (Mid 24) | |
| Asus ProArt P16 H7606WI | |
| Lenovo Yoga Pro 9 16IMH9 | |
| HP ZBook Studio 16 G11 | |
| Lenovo ThinkPad P1 Gen 7 21KV001SGE | |
| Dell XPS 16 9640 | |
| WebXPRT 4 / Overall | |
| Apple MacBook Pro 16 M4 Max | |
| Average Apple M4 Max 16-Core, Apple M4 Max 40-Core GPU (n=1) | |
| Schenker XMG Pro 16 Studio (Mid 24) | |
| Average of class Multimedia (167.3 - 402, n=64, last 2 years) | |
| Lenovo Yoga Pro 9 16IMH9 | |
| HP ZBook Studio 16 G11 | |
| Lenovo ThinkPad P1 Gen 7 21KV001SGE | |
| Dell XPS 16 9640 | |
| Asus ProArt P16 H7606WI | |
| Mozilla Kraken 1.1 / Total | |
| Lenovo ThinkPad P1 Gen 7 21KV001SGE | |
| HP ZBook Studio 16 G11 | |
| Lenovo Yoga Pro 9 16IMH9 | |
| Schenker XMG Pro 16 Studio (Mid 24) | |
| Average of class Multimedia (228 - 835, n=65, last 2 years) | |
| Asus ProArt P16 H7606WI | |
| Apple MacBook Pro 16 2023 M3 Max | |
| Apple MacBook Pro 16 M4 Max | |
| Average Apple M4 Max 16-Core, Apple M4 Max 40-Core GPU (n=1) | |
* ... smaller is better
Storage device
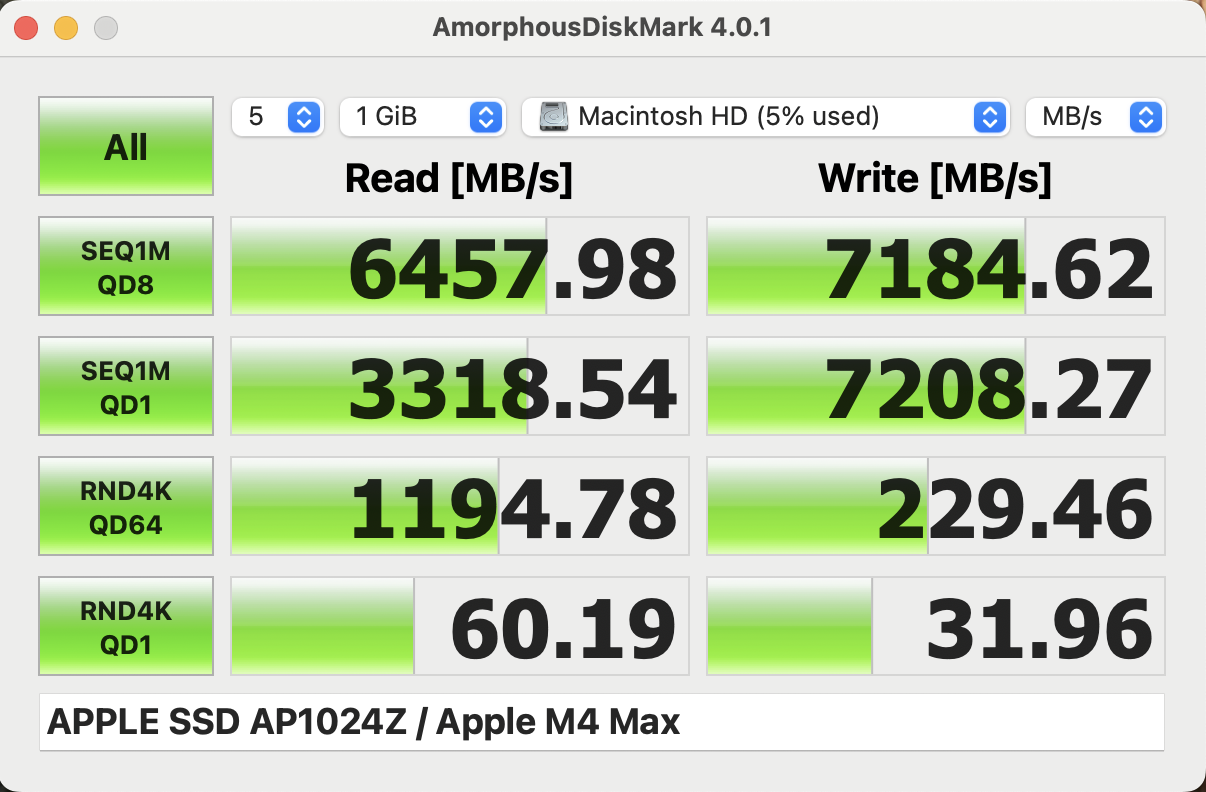
Despite the very high price of our test configuration, it only has a 1-TB SSD installed that can't be replaced or upgraded. Straight out of the box, 962 GB are available to use and the PCIe 4.0 SSD's transfer rates are very good. The MBP 16 can be equipped with a maximum of an 8 TB SSD, but at $2,200, Apple charges quite a price for this. Further SSD benchmarks are listed here.
| Blackmagic Disk Speed Test / 5GB Read | |
| Average of class Multimedia (3028 - 13870, n=8, last 2 years) | |
| Apple MacBook Pro 16 2024 M4 Pro | |
| Apple MacBook Pro 14 2023 M3 Max | |
| Apple MacBook Pro 14 2024 M4 Pro Entry | |
| Apple MacBook Pro 16 M4 Max | |
| Average Apple SSD AP1024Z (2797 - 6752, n=9) | |
| Blackmagic Disk Speed Test / 5GB Write | |
| Average of class Multimedia (3426 - 15183, n=8, last 2 years) | |
| Apple MacBook Pro 16 2024 M4 Pro | |
| Apple MacBook Pro 14 2023 M3 Max | |
| Apple MacBook Pro 14 2024 M4 Pro Entry | |
| Apple MacBook Pro 16 M4 Max | |
| Average Apple SSD AP1024Z (2873 - 6431, n=9) | |
Graphics card - The M4 Max with 40 GPU cores
The fast M4 Max SoC is equipped with a 40-core GPU, making it the current top-of-the-range model from Apple. We were able to elicit a maximum of 75 watts from the GPU, but in lots of tests, we noted a maximum of 60 watts. Turbo mode had no direct influence on its power consumption in this case, but we were still able to achieve a better result in the Cinebench 2024 GPU test (+4.7 %). The GPU can access the entire RAM.
Depending on the benchmark, its advantage over the old M3 Max GPU was 14-27% and during cross-system tests, its results were generally slightly better than the GeForce RTX 4070 Laptop inside direct competitors such as the Asus ProArt P16. In the GFX-Bench tests and the CB-2024 GPU test, even slower variants of the RTX 4080 Laptop were beaten. During the Blender test with Metal, the M4 Max SoC took around 18 seconds, making it on par with dedicated Nvidia GPUs (OPTIX or CUDA). The GPU's performance remains stable both in battery mode and under continuous load.
Geekbench 6.7: GPU Metal | GPU OpenCL
GFXBench: 3840x2160 4K Aztec Ruins High Tier Offscreen | 2560x1440 Aztec Ruins High Tier Offscreen | 1920x1080 Car Chase Offscreen
Cinebench 2024: GPU
Blender: v3.3 Classroom METAL | v3.3 Classroom OPTIX/RTX | v3.3 Classroom CUDA
| 3DMark / Steel Nomad Light Score | |
| Razer Blade 16 Early 2023 (DX12) | |
| Razer Blade 16 Early 2023 (Vulkan) | |
| Average Apple M4 Max 40-Core GPU (13989 - 14432, n=2) | |
| Apple MacBook Pro 16 M4 Max | |
| Asus ProArt P16 H7606WI | |
| Apple MacBook Pro 16 2024 M4 Pro | |
| Average of class Multimedia (1147 - 21012, n=40, last 2 years) | |
| Apple MacBook Pro 14 2024 M4 Pro Entry (1.0.6.1 Metal) | |
| 3DMark / Wild Life Extreme Unlimited | |
| Apple MacBook Pro 16 M4 Max | |
| Average Apple M4 Max 40-Core GPU (n=1) | |
| Apple MacBook Pro 16 2023 M3 Max | |
| Asus ProArt P16 H7606WI | |
| Lenovo Yoga Pro 9 16IMH9 | |
| Apple MacBook Pro 16 2024 M4 Pro | |
| Average of class Multimedia (3164 - 37434, n=11, last 2 years) | |
| Dell XPS 16 9640 | |
| Geekbench 6.7 / GPU Metal | |
| Apple MacBook Pro 16 M4 Max | |
| Average Apple M4 Max 40-Core GPU (n=1) | |
| Apple MacBook Pro 16 2023 M3 Max | |
| Average of class Multimedia (57998 - 222275, n=9, last 2 years) | |
| Apple MacBook Pro 16 2024 M4 Pro | |
| Apple MacBook Pro 14 2024 M4 Pro Entry | |
| Geekbench 6.7 / GPU OpenCL | |
| Razer Blade 16 Early 2023 (6.4.0 Pro) | |
| Razer Blade 16 Early 2023 (6.3) | |
| Asus Zenbook Pro 16X UX7602BZ-MY005W | |
| Lenovo ThinkPad P1 G6 21FV001KUS (6.2.1) | |
| Schenker XMG Pro 16 Studio (Mid 24) (6.2.1) | |
| Apple MacBook Pro 16 M4 Max | |
| Average Apple M4 Max 40-Core GPU (n=1) | |
| Lenovo Yoga Pro 9 16IMH9 (6.2.1) | |
| Asus ProArt P16 H7606WI (6.2.1) | |
| Dell XPS 16 9640 (6.2.1) | |
| HP ZBook Studio 16 G11 (6.2.1) | |
| Lenovo ThinkPad P1 Gen 7 21KV001SGE (6.2.1) | |
| Apple MacBook Pro 16 2023 M3 Max | |
| Apple MacBook Pro 16 2024 M4 Pro | |
| Apple MacBook Pro 14 2024 M4 Pro Entry | |
| Average of class Multimedia (9994 - 187922, n=65, last 2 years) | |
| GFXBench / 4K Aztec Ruins High Tier Offscreen | |
| Average Apple M4 Max 40-Core GPU (n=1) | |
| Apple MacBook Pro 16 M4 Max | |
| Razer Blade 16 Early 2023 | |
| Apple MacBook Pro 16 2023 M3 Max | |
| Lenovo Legion Pro 7 16IRX8H | |
| Apple MacBook Pro 16 2024 M4 Pro | |
| Asus ProArt P16 H7606WI | |
| Average of class Multimedia (36.4 - 232, n=10, last 2 years) | |
| Apple MacBook Pro 14 2024 M4 Pro Entry | |
| Lenovo ThinkPad P1 Gen 7 21KV001SGE | |
| GFXBench / Aztec Ruins High Tier Offscreen | |
| Average Apple M4 Max 40-Core GPU (n=1) | |
| Apple MacBook Pro 16 M4 Max | |
| Razer Blade 16 Early 2023 | |
| Lenovo Legion Pro 7 16IRX8H | |
| Apple MacBook Pro 16 2023 M3 Max | |
| Apple MacBook Pro 16 2024 M4 Pro | |
| Asus ProArt P16 H7606WI | |
| Apple MacBook Pro 14 2024 M4 Pro Entry | |
| Average of class Multimedia (73.3 - 516, n=9, last 2 years) | |
| Lenovo ThinkPad P1 Gen 7 21KV001SGE | |
| GFXBench / Car Chase Offscreen | |
| Average Apple M4 Max 40-Core GPU (n=1) | |
| Apple MacBook Pro 16 M4 Max | |
| Apple MacBook Pro 16 2024 M4 Pro | |
| Apple MacBook Pro 16 2023 M3 Max | |
| Lenovo ThinkPad P1 Gen 7 21KV001SGE | |
| Average of class Multimedia (174.6 - 941, n=9, last 2 years) | |
| Apple MacBook Pro 14 2024 M4 Pro Entry | |
| Cinebench 2024 / GPU | |
| Razer Blade 16 Early 2023 | |
| Apple MacBook Pro 16 M4 Max (High Performance) | |
| Apple MacBook Pro 16 M4 Max | |
| Average Apple M4 Max 40-Core GPU (15804 - 16546, n=2) | |
| Lenovo ThinkPad P1 G6 21FV001KUS | |
| Apple MacBook Pro 16 2023 M3 Max | |
| Average of class Multimedia (4201 - 22878, n=12, last 2 years) | |
| Schenker XMG Pro 16 Studio (Mid 24) | |
| Dell XPS 16 9640 | |
| Lenovo ThinkPad P1 Gen 7 21KV001SGE | |
| Asus ProArt P16 H7606WI | |
| Apple MacBook Pro 16 2024 M4 Pro | |
| Apple MacBook Pro 14 2024 M4 Pro Entry | |
| Blender / v3.3 Classroom METAL | |
| Apple MacBook Pro 14 2024 M4 Pro Entry (3.3.21) | |
| Average of class Multimedia (17.8 - 68, n=5, last 2 years) | |
| Apple MacBook Pro 16 2023 M3 Max | |
| Apple MacBook Pro 16 M4 Max | |
| Average Apple M4 Max 40-Core GPU (n=1) | |
| Blender / v3.3 Classroom OPTIX/RTX | |
| Average of class Multimedia (12 - 105, n=21, last 2 years) | |
| Lenovo ThinkPad P1 Gen 7 21KV001SGE (3.3.3) | |
| Schenker XMG Pro 16 Studio (Mid 24) (3.3.3) | |
| HP ZBook Studio 16 G11 (3.3.3) | |
| Asus ProArt P16 H7606WI (3.3.3) | |
| Dell XPS 16 9640 (3.3.3) | |
| Lenovo Yoga Pro 9 16IMH9 (3.3.3) | |
| Asus Zenbook Pro 16X UX7602BZ-MY005W (3.3.3) | |
| Lenovo ThinkPad P1 G6 21FV001KUS (3.3.3) | |
| Razer Blade 16 Early 2023 (3.3.3) | |
| Lenovo Legion Pro 7 16IRX8H (3.3.3) | |
| Blender / v3.3 Classroom CUDA | |
| Average of class Multimedia (20 - 186, n=21, last 2 years) | |
| Lenovo ThinkPad P1 Gen 7 21KV001SGE (3.3.3) | |
| HP ZBook Studio 16 G11 (3.3.3) | |
| Dell XPS 16 9640 (3.3.3) | |
| Schenker XMG Pro 16 Studio (Mid 24) (3.3.3) | |
| Asus ProArt P16 H7606WI (3.3.3) | |
| Lenovo Yoga Pro 9 16IMH9 (3.3.3) | |
| Lenovo ThinkPad P1 G6 21FV001KUS (3.3.3) | |
| Asus Zenbook Pro 16X UX7602BZ-MY005W (3.3.3) | |
| Lenovo Legion Pro 7 16IRX8H (3.3.3) | |
| Razer Blade 16 Early 2023 (3.3.3) | |
Geekbench 6.7: GPU Metal | GPU OpenCL
GFXBench: 3840x2160 4K Aztec Ruins High Tier Offscreen | 2560x1440 Aztec Ruins High Tier Offscreen | 1920x1080 Car Chase Offscreen
Cinebench 2024: GPU
Blender: v3.3 Classroom METAL | v3.3 Classroom OPTIX/RTX | v3.3 Classroom CUDA
* ... smaller is better
| 3DMark Steel Nomad Light Score | 13989 points | |
| 3DMark Steel Nomad Light Unlimited Score | 14212 points | |
Help | ||
It is still difficult to evaluate its gaming performance, as the number of native games available for macOS is limited. Currently, we can only use Baldur's Gate 3 to compare its performance with Windows laptops. In 1080p and with maximum details, the M4 Max GPU placed between the competitors with the GeForce RTX 4070 Laptop. However, the other games we tested had to be emulated, in turn making the laptop's performance limitations very visible. The game Cyberpunk 2077, which is being released natively for macOS next year, will be interesting to try out.
| Total War Pharaoh - 1920x1080 Ultra Preset | |
| Apple MacBook Pro 16 2023 M3 Max | |
| Apple MacBook Pro 16 M4 Max | |
| Average of class Multimedia (23.4 - 84.1, n=11, last 2 years) | |
| Apple MacBook Pro 16 2024 M4 Pro | |
| The Witcher 3 - 1920x1080 Ultra Graphics & Postprocessing (HBAO+) | |
| Asus ProArt P16 H7606WI | |
| Lenovo Yoga Pro 9 16IMH9 | |
| Apple MacBook Pro 16 M4 Max | |
| Dell XPS 16 9640 | |
| Apple MacBook Pro 16 2023 M3 Max | |
| Average of class Multimedia (11 - 107, n=5, last 2 years) | |
| Shadow of the Tomb Raider - 1920x1080 Highest Preset AA:T | |
| Apple MacBook Pro 16 M4 Max | |
| Apple MacBook Pro 16 2023 M3 Max | |
| Apple MacBook Pro 16 2024 M4 Pro | |
| Average of class Multimedia (23 - 129, n=8, last 2 years) | |
| low | med. | high | ultra | QHD | 4K | |
|---|---|---|---|---|---|---|
| The Witcher 3 (2015) | 157 | 107 | 78 | 61 | ||
| Shadow of the Tomb Raider (2018) | 167 | 143 | 129 | 94 | 51 | |
| Baldur's Gate 3 (2023) | 164 | 131 | 101 | 99 | 69 | 35 |
| Cyberpunk 2077 (2023) | 49.1 | 48.7 | 48.5 | 47.4 | 43 | 21.3 |
| Total War Pharaoh (2023) | 74.1 | 61.8 | 56.1 | 56 | 56 | 50 |
Emissions & power
Noise emissions
Its cooling is practically no different from the model we already tested featuring the M4 Pro. When idling and performing simple tasks, the MacBook usually remains completely quiet or you only hear a very low-frequency noise. Still, the M4 Max reaches its maximum volume of ~42.2 dB(A) in Automatic mode much faster as soon as the device is put under a little more load. Using High Performance mode, the fan speed fluctuates significantly more than was the case with the M4 Pro model. In the stress test, we measured a maximum of 54.7 dB(A) and 50.2 dB(A) when running Baldur's Gate 3. We could hear some slight coil whirring during certain GPU benchmarks.
Noise level
| Idle |
| 24.1 / 24.1 / 24.1 dB(A) |
| Load |
| 42.2 / 42.2 dB(A) |
 | ||
30 dB silent 40 dB(A) audible 50 dB(A) loud |
||
min: | ||
| Apple MacBook Pro 16 M4 Max M4 Max 40-Core GPU, M4 Max 16-Core, Apple SSD AP1024Z | Apple MacBook Pro 16 2023 M3 Max M3 Max 40-Core GPU, Apple M3 Max 16-Core, Apple SSD AP8192Z | HP ZBook Studio 16 G11 RTX 3000 Ada Generation Laptop, Ultra 9 185H, Kioxia XG8 KXG80ZNV1T02 | Lenovo ThinkPad P1 Gen 7 21KV001SGE GeForce RTX 4060 Laptop GPU, Ultra 7 155H, Kioxia XG8 KXG8AZNV1T02 | Asus ProArt P16 H7606WI GeForce RTX 4070 Laptop GPU, Ryzen AI 9 HX 370, Micron 2400 MTFDKBA1T0QFM | Schenker XMG Pro 16 Studio (Mid 24) GeForce RTX 4070 Laptop GPU, i9-14900HX, Samsung 990 Pro 1 TB | Lenovo Yoga Pro 9 16IMH9 GeForce RTX 4070 Laptop GPU, Ultra 9 185H, SK Hynix HFS001TEJ9X115N | Dell XPS 16 9640 GeForce RTX 4070 Laptop GPU, Ultra 7 155H, Kioxia XG8 KXG80ZNV1T02 | |
|---|---|---|---|---|---|---|---|---|
| Noise | 2% | -5% | -9% | -15% | -24% | -9% | -5% | |
| off / environment * (dB) | 24.1 | 23.7 2% | 23.8 1% | 24.7 -2% | 24.4 -1% | 25 -4% | 24.3 -1% | 24.5 -2% |
| Idle Minimum * (dB) | 24.1 | 23.7 2% | 23.8 1% | 24.7 -2% | 24.4 -1% | 28 -16% | 24.3 -1% | 24.5 -2% |
| Idle Average * (dB) | 24.1 | 23.7 2% | 26.4 -10% | 24.7 -2% | 27.7 -15% | 31 -29% | 24.3 -1% | 24.5 -2% |
| Idle Maximum * (dB) | 24.1 | 23.7 2% | 26.4 -10% | 24.7 -2% | 32.3 -34% | 35 -45% | 25.8 -7% | 27.5 -14% |
| Load Average * (dB) | 42.2 | 40.8 3% | 33.7 20% | 43.7 -4% | 42.2 -0% | 52 -23% | 48.1 -14% | 39.6 6% |
| Cyberpunk 2077 ultra * (dB) | 42.2 | 46.1 -9% | 53.2 -26% | 53.2 -26% | 53 -26% | |||
| Load Maximum * (dB) | 42.2 | 42.8 -1% | 53.2 -26% | 53.3 -26% | 53.2 -26% | 52 -23% | 53.9 -28% | 49.7 -18% |
| Witcher 3 ultra * (dB) | 42.8 | 49.7 | 49.7 |
* ... smaller is better
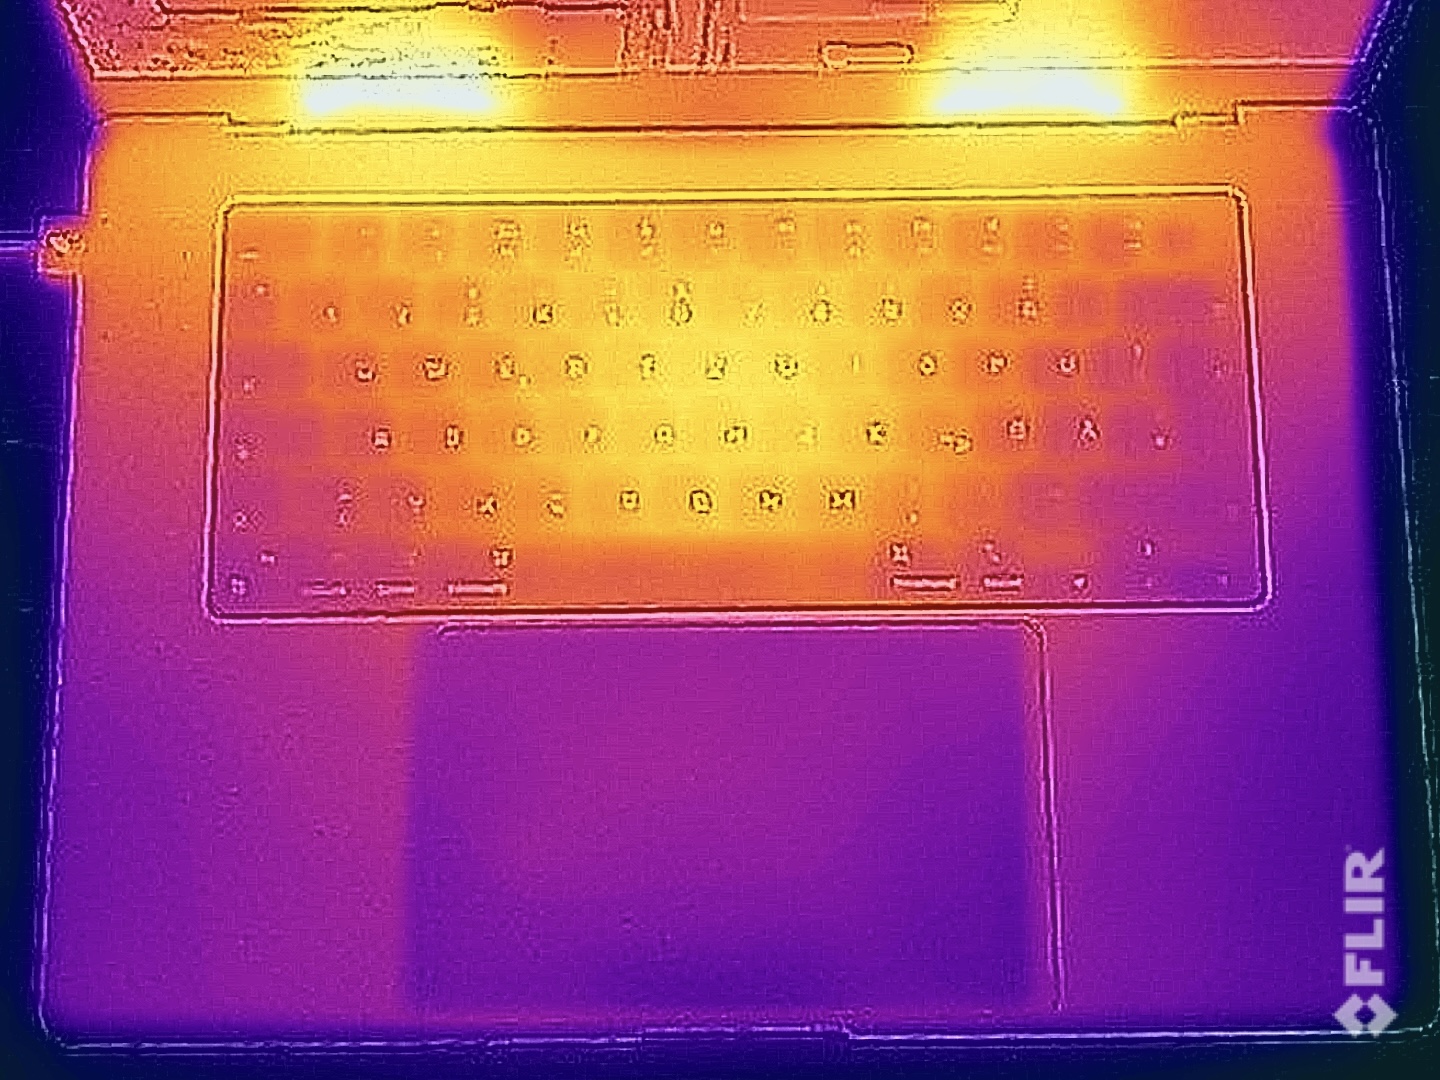
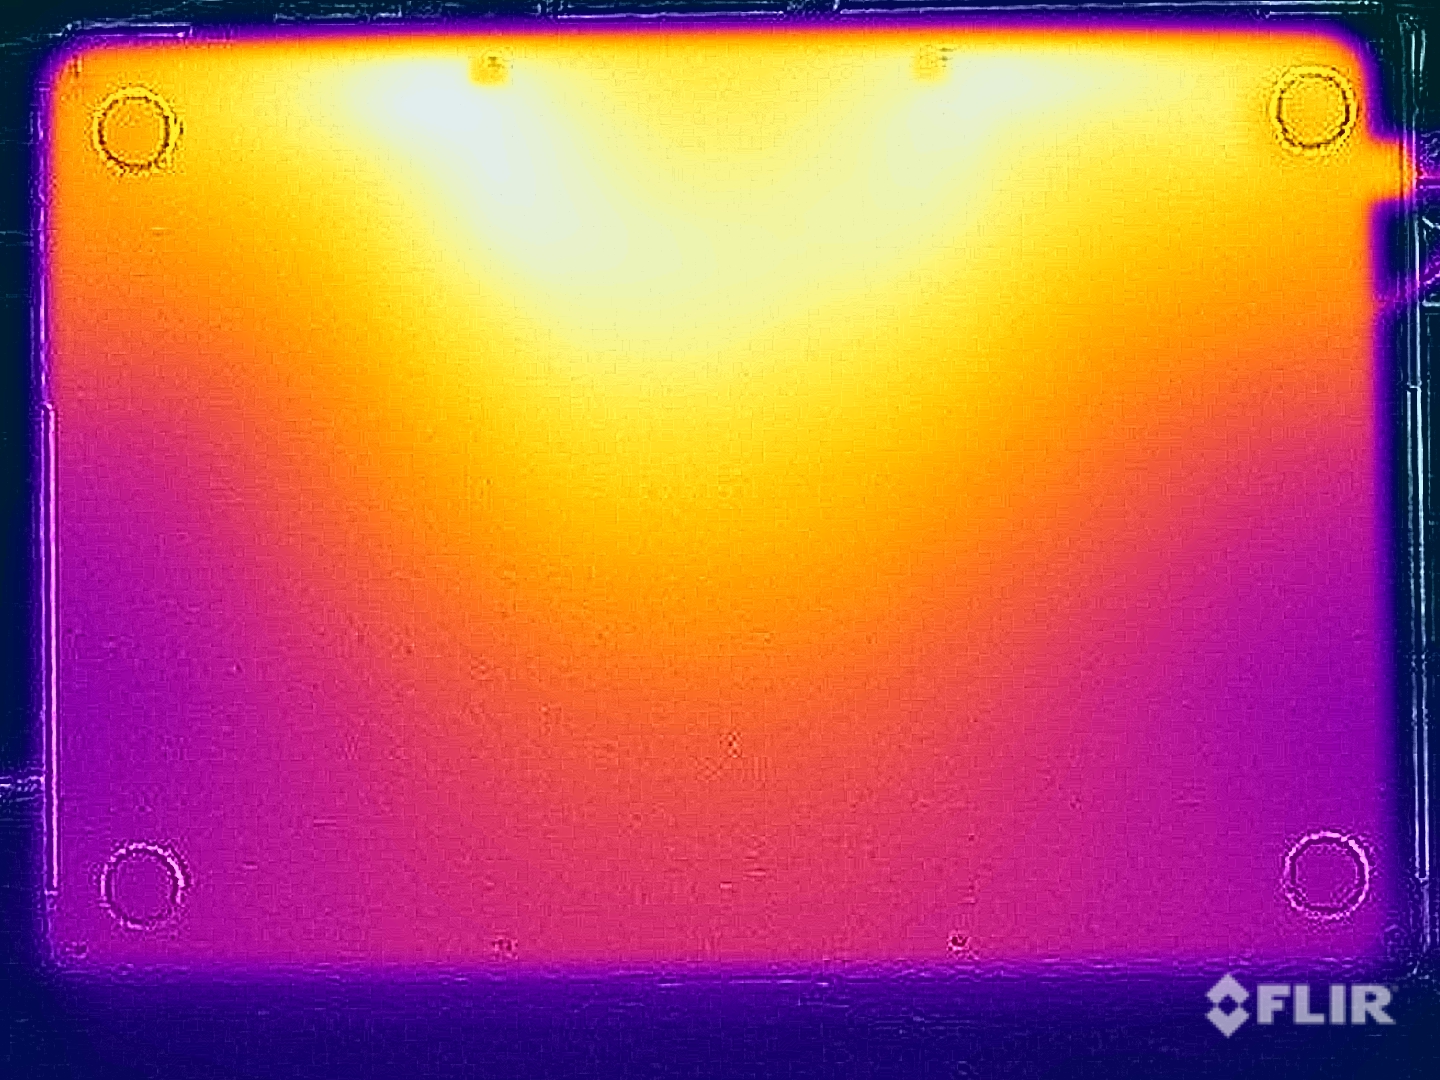
Temperature
Apple has the MacBook Pro 16's surface temperatures very well under control. Its case practically doesn't heat up at all under low load and we measured a maximum of just under 43 °C even when gaming or during the stress test. This means that the device can still be placed on your thighs without any problems. The keyboard area also heats up noticeably and it can cause warm fingers, but there are no limitations in this respect.
(±) The maximum temperature on the upper side is 42.8 °C / 109 F, compared to the average of 36.8 °C / 98 F, ranging from 21 to 71 °C for the class Multimedia.
(±) The bottom heats up to a maximum of 42.3 °C / 108 F, compared to the average of 39.1 °C / 102 F
(+) In idle usage, the average temperature for the upper side is 23.2 °C / 74 F, compared to the device average of 31.3 °C / 88 F.
(±) 3: The average temperature for the upper side is 37.2 °C / 99 F, compared to the average of 31.3 °C / 88 F for the class Multimedia.
(+) The palmrests and touchpad are cooler than skin temperature with a maximum of 30.8 °C / 87.4 F and are therefore cool to the touch.
(-) The average temperature of the palmrest area of similar devices was 28.7 °C / 83.7 F (-2.1 °C / -3.7 F).
| Apple MacBook Pro 16 M4 Max Apple M4 Max 16-Core, Apple M4 Max 40-Core GPU | Apple MacBook Pro 16 2023 M3 Max Apple M3 Max 16-Core, Apple M3 Max 40-Core GPU | HP ZBook Studio 16 G11 Intel Core Ultra 9 185H, NVIDIA RTX 3000 Ada Generation Laptop | Lenovo ThinkPad P1 Gen 7 21KV001SGE Intel Core Ultra 7 155H, NVIDIA GeForce RTX 4060 Laptop GPU | Asus ProArt P16 H7606WI AMD Ryzen AI 9 HX 370, NVIDIA GeForce RTX 4070 Laptop GPU | Schenker XMG Pro 16 Studio (Mid 24) Intel Core i9-14900HX, NVIDIA GeForce RTX 4070 Laptop GPU | Lenovo Yoga Pro 9 16IMH9 Intel Core Ultra 9 185H, NVIDIA GeForce RTX 4070 Laptop GPU | Dell XPS 16 9640 Intel Core Ultra 7 155H, NVIDIA GeForce RTX 4070 Laptop GPU | |
|---|---|---|---|---|---|---|---|---|
| Heat | 3% | -21% | -11% | -20% | -47% | -8% | -4% | |
| Maximum Upper Side * (°C) | 42.8 | 42.3 1% | 36.6 14% | 50.3 -18% | 46.9 -10% | 51 -19% | 41.7 3% | 39.4 8% |
| Maximum Bottom * (°C) | 42.3 | 42 1% | 47.8 -13% | 38 10% | 50.9 -20% | 66 -56% | 46.3 -9% | 36.9 13% |
| Idle Upper Side * (°C) | 23.6 | 22.5 5% | 31.4 -33% | 28.3 -20% | 28.9 -22% | 35 -48% | 26.2 -11% | 28.2 -19% |
| Idle Bottom * (°C) | 23.5 | 22.9 3% | 35.6 -51% | 27.3 -16% | 30 -28% | 39 -66% | 27.2 -16% | 27.4 -17% |
* ... smaller is better
Stress test
The stress test revealed a slightly different behavior of the M4 Max test device compared to the M4 Pro variant, which surprised us a little. In addition, High Performance mode had no noticeable influence here either. Its CPU/GPU consumption leveled off at around 28 watts in each case, i.e. only around 56 watts in total. The M4 Pro variant measured in at around 60 watts in Automatic mode and even 66 watts in High Performance mode. Under combined load, the MacBook Pro 16's cooling unit cannot utilize the performance potential of the new M4 Max at all.
Power consumption
With the M4 Max, the MacBook Pro 16's power consumption is limited by the 140-watt power supply under very high load—but only for a very short time and no power is tapped from its battery. We measured a maximum of around 144 watts, after which its consumption dropped quickly and was then only around 120 watts. When gaming, we noted around 116 watts, which is around 30 watts more than the M4 Pro configuration.
| Off / Standby | |
| Idle | |
| Load |
|
Key:
min: | |
| Apple MacBook Pro 16 M4 Max M4 Max 40-Core GPU, M4 Max 16-Core, Apple SSD AP1024Z | Apple MacBook Pro 16 2023 M3 Max M3 Max 40-Core GPU, Apple M3 Max 16-Core, Apple SSD AP8192Z | Apple MacBook Pro 16 2024 M4 Pro M4 Pro 20-Core GPU, M4 Pro 14-Core, Apple SSD AP2048Z | HP ZBook Studio 16 G11 RTX 3000 Ada Generation Laptop, Ultra 9 185H, Kioxia XG8 KXG80ZNV1T02 | Lenovo ThinkPad P1 Gen 7 21KV001SGE GeForce RTX 4060 Laptop GPU, Ultra 7 155H, Kioxia XG8 KXG8AZNV1T02 | Asus ProArt P16 H7606WI GeForce RTX 4070 Laptop GPU, Ryzen AI 9 HX 370, Micron 2400 MTFDKBA1T0QFM | Schenker XMG Pro 16 Studio (Mid 24) GeForce RTX 4070 Laptop GPU, i9-14900HX, Samsung 990 Pro 1 TB | Lenovo Yoga Pro 9 16IMH9 GeForce RTX 4070 Laptop GPU, Ultra 9 185H, SK Hynix HFS001TEJ9X115N | Dell XPS 16 9640 GeForce RTX 4070 Laptop GPU, Ultra 7 155H, Kioxia XG8 KXG80ZNV1T02 | |
|---|---|---|---|---|---|---|---|---|---|
| Power Consumption | -1% | 12% | -43% | -6% | -14% | -153% | -41% | 9% | |
| Idle Minimum * (Watt) | 4.7 | 5.2 -11% | 4.6 2% | 14 -198% | 7.3 -55% | 8 -70% | 31 -560% | 10.3 -119% | 7.7 -64% |
| Idle Average * (Watt) | 15.5 | 16.9 -9% | 16.8 -8% | 22.4 -45% | 12.3 21% | 9.9 36% | 33 -113% | 21.9 -41% | 10.3 34% |
| Idle Maximum * (Watt) | 15.6 | 17.2 -10% | 17.1 -10% | 25.7 -65% | 17.9 -15% | 11.6 26% | 41 -163% | 22.4 -44% | 10.6 32% |
| Load Average * (Watt) | 125 | 90.5 28% | 76.4 39% | 90.2 28% | 78.2 37% | 76.9 38% | 114 9% | 96.9 22% | 76.5 39% |
| Cyberpunk 2077 ultra * (Watt) | 116.2 | 83.4 28% | 125.4 -8% | 123.5 -6% | 157.7 -36% | 218 -88% | |||
| Cyberpunk 2077 ultra external monitor * (Watt) | 107.2 | 79.3 26% | 120.3 -12% | 117.7 -10% | 156.6 -46% | 196.8 -84% | |||
| Load Maximum * (Watt) | 143.7 | 145.2 -1% | 138.1 4% | 142 1% | 167.5 -17% | 212.6 -48% | 250 -74% | 173.8 -21% | 138.5 4% |
| Witcher 3 ultra * (Watt) | 109 | 159.6 | 126.4 |
* ... smaller is better
Power consumption Cyberpunk / stress test
Power consumption with external monitor
Runtimes
Its battery life has been improved compared to the M3 Max predecessor model, but the M4 Pro version manages even better runtimes. The direct Windows competition stood no chance against runtimes of 18 hours during the WLAN test and just under 22 hours in the video test (both at 150 cd/m²)—only the Dell XPS 16 9640 and the Asus ProArt P16 could keep up well in the video test.
During the WLAN test at full SDR brightness, its runtime was still 6:45 hours, which is a decent performance considering its bright panel. Under full load, however, you'll pay the price that the laptop's performance isn't throttled. In the worst-case scenario, the test ended after 65 minutes, whereby Low Charge mode was activated after 56 minutes.
| Apple MacBook Pro 16 M4 Max M4 Max 16-Core, M4 Max 40-Core GPU, 99.6 Wh | Apple MacBook Pro 16 2023 M3 Max Apple M3 Max 16-Core, M3 Max 40-Core GPU, 99.6 Wh | Apple MacBook Pro 16 2024 M4 Pro M4 Pro 14-Core, M4 Pro 20-Core GPU, 99.6 Wh | HP ZBook Studio 16 G11 Ultra 9 185H, RTX 3000 Ada Generation Laptop, 86 Wh | Lenovo ThinkPad P1 Gen 7 21KV001SGE Ultra 7 155H, GeForce RTX 4060 Laptop GPU, 90 Wh | Asus ProArt P16 H7606WI Ryzen AI 9 HX 370, GeForce RTX 4070 Laptop GPU, 90 Wh | Schenker XMG Pro 16 Studio (Mid 24) i9-14900HX, GeForce RTX 4070 Laptop GPU, 73 Wh | Lenovo Yoga Pro 9 16IMH9 Ultra 9 185H, GeForce RTX 4070 Laptop GPU, 84 Wh | Dell XPS 16 9640 Ultra 7 155H, GeForce RTX 4070 Laptop GPU, 99.5 Wh | Average of class Multimedia | |
|---|---|---|---|---|---|---|---|---|---|---|
| Battery runtime | -1% | 11% | -73% | 14% | 5% | -69% | -30% | -10% | -2% | |
| H.264 (h) | 21.8 | 20.4 -6% | 24.6 13% | 21 -4% | 11.5 -47% | 16.5 -24% | 16.8 ? -23% | |||
| WiFi v1.3 (h) | 18 | 16.7 -7% | 19.6 9% | 4.8 -73% | 9.9 -45% | 8.3 -54% | 5.6 -69% | 8.8 -51% | 10.5 -42% | 12.3 ? -32% |
| Load (h) | 1.1 | 1.2 9% | 1.9 73% | 1.9 73% | 1.2 9% | 1.5 36% | 1.645 ? 50% |
Notebookcheck total rating
The new Apple M4 Max impressed us with significantly better performance, and its processor in particular is one of the fastest models on the market in many ways. There are currently no faster CPUs in the single-core range, but even in the multi-core range, you'd have to use the Core i9-14900HX or desktop CPUs to get more performance. However, its power consumption also increases with its performance, and the MacBook Pro 16's cooling cannot completely exploit the potential of the new M4 Max, especially under combined load. Nevertheless, even with the M4 Max, the MacBook Pro 16 is one of the best multimedia laptops on the market.
Apple MacBook Pro 16 M4 Max
- 12/08/2024 v8
Andreas Osthoff
 Total Sustainability Score:
 Transparency
The selection of devices to be reviewed is made by our editorial team. The test sample was provided to the author as a loan by the manufacturer or retailer for the purpose of this review. The lender had no influence on this review, nor did the manufacturer receive a copy of this review before publication. There was no obligation to publish this review. As an independent media company, Notebookcheck is not subjected to the authority of manufacturers, retailers or publishers.
This is how Notebookcheck is testing
Every year, Notebookcheck independently reviews hundreds of laptops and smartphones using standardized procedures to ensure that all results are comparable. We have continuously developed our test methods for around 20 years and set industry standards in the process. In our test labs, high-quality measuring equipment is utilized by experienced technicians and editors. These tests involve a multi-stage validation process. Our complex rating system is based on hundreds of well-founded measurements and benchmarks, which maintains objectivity. Further information on our test methods can be found here.

