
Lenovo ThinkBook 16 G7+ review - A 16-inch multimedia laptop with AMD Zen 5 and a 3.2K display upgrade
A ton of improvements.
With the ThinkBook 16 G7+, Lenovo is offering an upgraded version of the normal ThinkBook 16 with an AMD Zen 5 processor, significantly improved cooling, a larger battery, and a better 3.2K display with P3 coverage and 165 Hz.Andreas Osthoff, 👁 Andreas Osthoff (translated by Andrew Dickson) Published 🇩🇪 🇫🇷 ...
Verdict - The ThinkBook 16 G7+ is better in almost every regard
With the ThinkBook 16 G7+, Lenovo is offering a significantly improved version of its 16-inch multimedia laptop. This starts with the more compact and stable metal case and continues with the better input devices, including a great haptic touchpad, improved connectivity with Wi-Fi 7 and a considerably more powerful cooling system for the new AMD Zen 5 processor. Offering bags of power, a fast iGPU and an NPU, this is a Copilot+ laptop with all the advanced AI functions.
Although the display was one of the regular ThinkBook 16 G7's weak areas, the new matte 3.2K IPS panel is impressive in almost every respect: P3 color space including an sRGB mode, a matte surface, good image quality, no PWM flickering, fast response times and a frequency of 165 Hz. The only improvement could have been in the brightness area (around 400 cd/m²). With battery capacity having seen an increase in capacity, the running times are decent, even with the high-resolution display.
The case offers two full SSD slots, but the RAM is soldered and cannot be expanded. Most users should be able to get by with 32 GB without any problems. We are a touch disappointed by the stereo speakers, which seem quite thin and are not particularly powerful. All in all, the ThinkBook 16 G7+ is still a good overall package, with the positive aspects outweighing the negative ones.
Pros
Cons
Price and availability
Our Lenovo ThinkBook 16 G7+ review model is currently unavailable on Amazon.
Possible alternatives compared
Image | Model / Review | Price | Weight | Height | Display |
|---|---|---|---|---|---|
1. 86.6%  | Lenovo ThinkBook 16 G7+ AMD AMD Ryzen AI 9 365 ⎘ AMD Radeon 880M ⎘ 32 GB Memory, 1024 GB SSD | Amazon: 1. $999.95 Lenovo ThinkBook 16 G7 Busin... 2. $749.99 Lenovo ThinkBook 16 Gen 7 Bu... 3. $1,199.95 Lenovo ThinkBook 16 G7 Busin... List Price: 1399€ | 1.9 kg | 16.9 mm | 16.00" 3200x2000 236 PPI IPS |
2. 81.9%  | MSI Prestige A16 AI+ A3HMG-036 AMD Ryzen AI 9 365 ⎘ AMD Radeon 880M ⎘ 32 GB Memory, 1024 GB SSD | Amazon: List Price: 1599 Euro | 2 kg | 17.35 mm | 16.00" 2560x1600 189 PPI IPS |
3. 84.1% 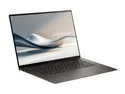 | Asus Zenbook S 16 UM5606WA-RK052W AMD Ryzen AI 9 365 ⎘ AMD Radeon 880M ⎘ 24 GB Memory, 1024 GB SSD | Amazon: List Price: 1700 EUR | 1.5 kg | 12.9 mm | 16.00" 2880x1800 212 PPI OLED |
4. 76.7%  | Medion S10 OLED Intel Core Ultra 7 155H ⎘ Intel Arc 8-Core iGPU ⎘ 16 GB Memory, 1024 GB SSD | Amazon: 1. $12.99 Vaxson 2-Pack Protector Film... 2. $12.98 Puccy 2 Pack Touch Pad Film ... 3. $15.98 Puccy 2 Pack Film Protector,... List Price: 1299 Euro | 1.6 kg | 17.8 mm | 16.00" 3840x2400 283 PPI OLED |
5. 89.7% v7 (old)  | Xiaomi RedmiBook Pro 16 2024 Intel Core Ultra 7 155H ⎘ Intel Arc 8-Core iGPU ⎘ 32 GB Memory, 1024 GB SSD | Amazon: 1. $24.00 FRUPART for Xiaomi RedmiBook... 2. $24.00 FRUPART for Xiaomi RedmiBook... 3. $315.00 XIAOMI Redmi Note 15 Pro 5G ... List Price: 957€ | 1.9 kg | 15.9 mm | 16.00" 3072x1920 226 PPI IPS |
With the ThinkBook 16 G7+, Lenovo offers an improved version of its large multimedia notebook. The design is the same, but practically every other component has been improved. This includes AMD's Strix Point processor, a high-resolution 3.2K display, a better case with better cooling and a larger battery. Our review device comes equipped with the AMD Ryzen AI 9 365 and includes the Radeon 880M, 32 GB of RAM, a 1 TB SSD and a 3.2K IPS display.
Specifications
Case & features
From a design point of view, the ThinkBook 16 G7+ is only marginally different to the regular ThinkBook 16 G7, however, the base unit found in the Plus model is also made of aluminum. This lends the device a higher quality feel as well as improved stability. The Plus model is also a bit more compact because the case is not as deep. The entire internal structure is also different because, in addition to stronger cooling (which includes a second fan), a significantly larger battery has been installed. There is space for two M.2 2280 SSDs, but the RAM is soldered.

The ThinkBook offers a sufficient number of ports, including Thunderbolt 4 and HDMI 2.1. The Plus model has an additional USB 2.0 port behind a flap intended for USB dongles (for example, from external mice). The Wi-Fi module now supports Wi-Fi 7 as well as Bluetooth 5.4, and the transfer speeds recorded in our standardized Wi-Fi test are excellent.
The AMD processor's NPU makes this a Copilot+ PC, which includes additional AI functions such as live subtitles and studio effects for the webcam. The 1080p webcam's image quality is still only average. In addition to an IR sensor for facial recognition, a mechanical shutter is also installed.


| SD Card Reader | |
| average JPG Copy Test (av. of 3 runs) | |
| Asus Zenbook S 16 UM5606WA-RK052W (AV PRO microSD 128 GB V60) | |
| Average of class Multimedia (23 - 531, n=43, last 2 years) | |
| MSI Prestige A16 AI+ A3HMG-036 | |
| Lenovo ThinkBook 16 G7+ AMD (Angelbird AV Pro V60) | |
| maximum AS SSD Seq Read Test (1GB) | |
| Asus Zenbook S 16 UM5606WA-RK052W (AV PRO microSD 128 GB V60) | |
| MSI Prestige A16 AI+ A3HMG-036 | |
| Average of class Multimedia (27.9 - 1455, n=42, last 2 years) | |
| Lenovo ThinkBook 16 G7+ AMD (Angelbird AV Pro V60) | |
| Networking | |
| Lenovo ThinkBook 16 G7+ AMD | |
| iperf3 transmit AXE11000 | |
| iperf3 receive AXE11000 | |
| MSI Prestige A16 AI+ A3HMG-036 | |
| iperf3 transmit AXE11000 | |
| iperf3 receive AXE11000 | |
| iperf3 transmit AXE11000 6GHz | |
| iperf3 receive AXE11000 6GHz | |
| Asus Zenbook S 16 UM5606WA-RK052W | |
| iperf3 transmit AXE11000 | |
| iperf3 receive AXE11000 | |
| Medion S10 OLED | |
| iperf3 transmit AXE11000 | |
| iperf3 receive AXE11000 | |
| Xiaomi RedmiBook Pro 16 2024 | |
| iperf3 transmit AXE11000 | |
| iperf3 receive AXE11000 | |


Sustainability
The ThinkBook 16 G7+ offers several environmental certifications, such as Energy Star or EPEAT Gold, but Lenovo has not provided any information regarding the carbon footprint. In addition, the packaging is environmentally friendly and recycled materials are also used in some parts of the device. A maintenance manual is not available.
Input devices - A haptic touchpad
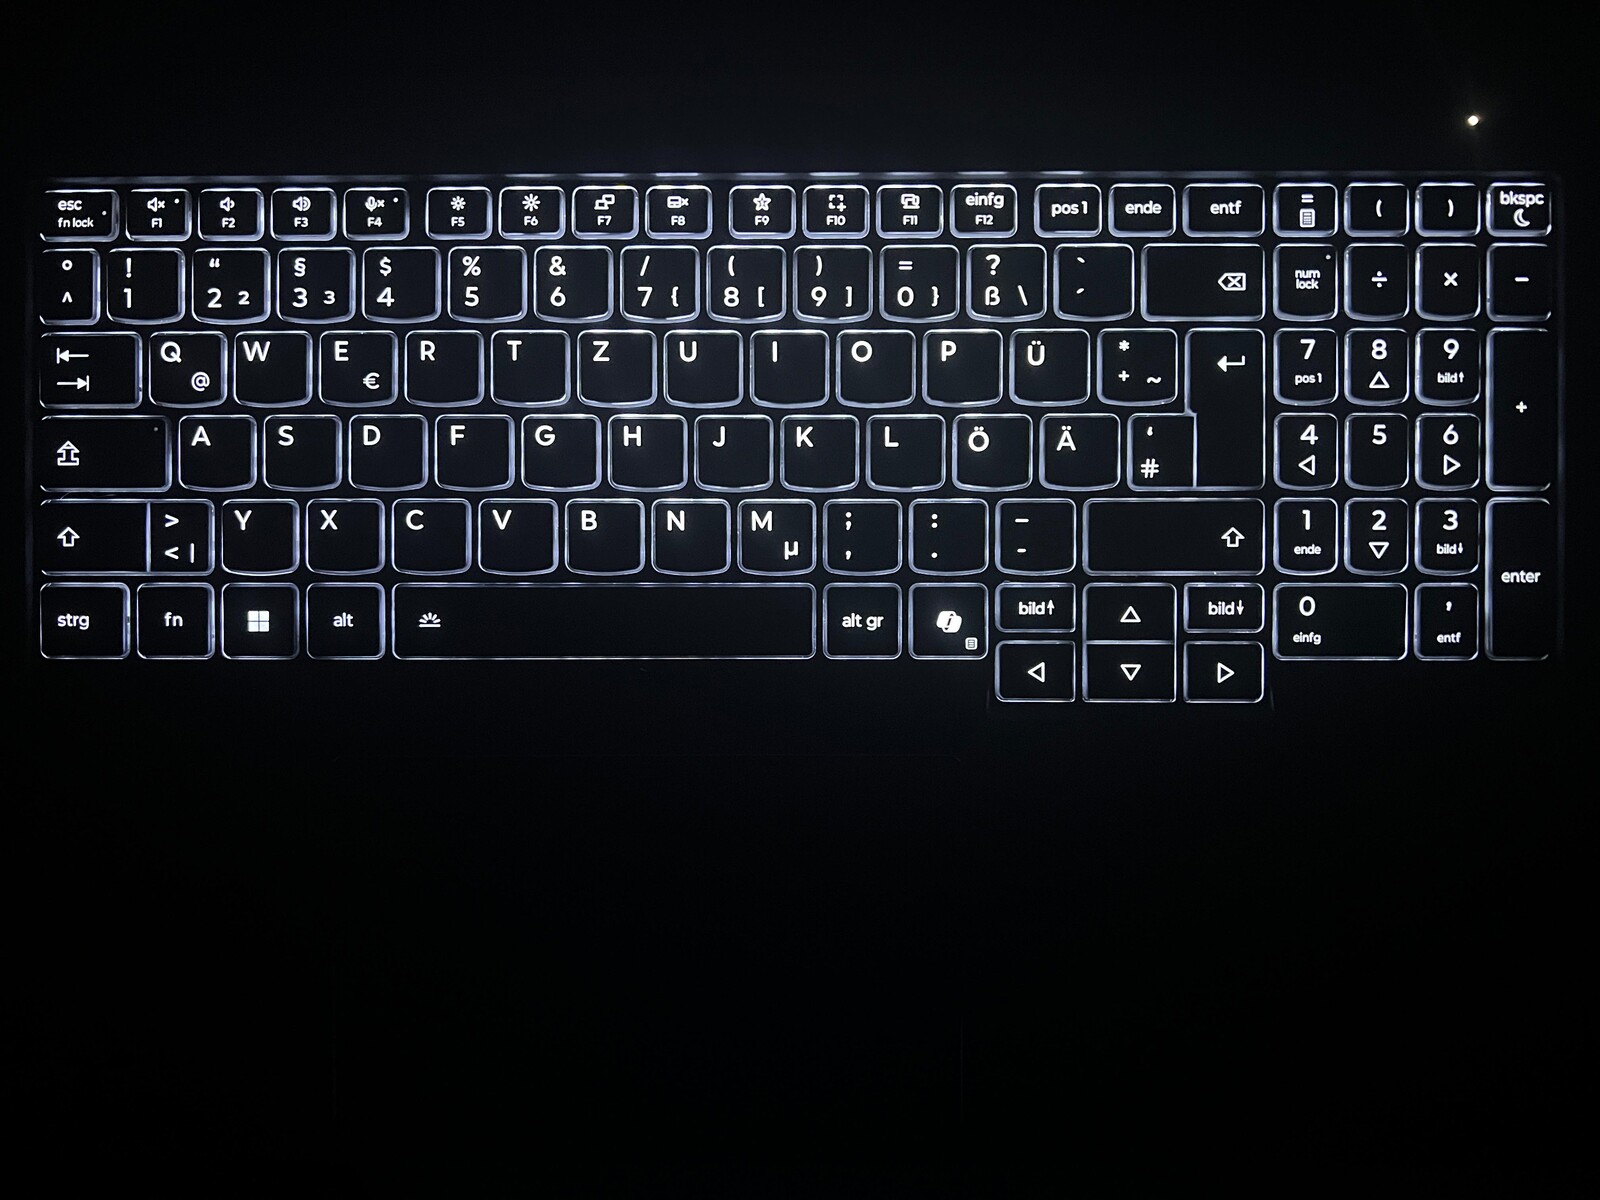
Basically, the illuminated keyboard (also via a sensor) corresponds to the normal ThinkBook 16 G7, however, the typing comfort benefits from the more stable base unit. The feedback is precise and crisp, meaning even longer texts are easy to type. The layout has dedicated keys for page up/down, large arrow keys, and the dedicated numerical pad doesn't raise any questions. The power button is located to the right above the keyboard and also serves as a fingerprint scanner.
The touchpad has also been upgraded in the form of a larger haptic touchpad (13.5 x 8 cm) with a glass surface. Swiping gestures are implemented beautifully, and every area of the pad can be clicked with the feedback and volume always remaining the same.

Display - A 165 Hz, 3.2K IPS panel with P3 coverage

The display is a 16-inch, 16:10 aspect ratio, IPS panel with a resolution of 3,200 x 2,000 pixels. The matte screen's image quality is very good (even bright areas only appear minimally grainy) and is a massive improvement over the regular ThinkBook 16 G7. All content is displayed very clearly, and the colors appear vibrant, even if a little brilliance is lacking compared to OLED panels. However, there are no problems when it comes to reflections or PWM flickering. The response times are fast, and thanks to the 165 Hz frequency, motion is also very smooth. On dark surfaces, a slight light bleed can be seen at the edges.
We can confirm Lenovo's specified brightness of 400 nits, however, the competition from MSI or Xiaomi offers better values in this regard. The black value is 0.3 cd/m², which leads to a good contrast ratio of ~1,400:1. The brightness can be automatically adjusted to suit the environment, but the color temperature can't.
| |||||||||||||||||||||||||
Brightness Distribution: 93 %
Center on Battery: 422 cd/m²
Contrast: 1407:1 (Black: 0.3 cd/m²)
ΔE ColorChecker Calman: 1.7 | ∀{0.5-29.43 Ø4.73}
calibrated: 0.7
ΔE Greyscale Calman: 2.4 | ∀{0.09-98 Ø4.97}
86.9% AdobeRGB 1998 (Argyll 3D)
100% sRGB (Argyll 3D)
96.3% Display P3 (Argyll 3D)
Gamma: 2.19
CCT: 6989 K
| Lenovo ThinkBook 16 G7+ AMD LEN160-3.2K, IPS, 3200x2000, 16", 165 Hz | MSI Prestige A16 AI+ A3HMG-036 AUO28B2 (B160QAN02.N), IPS, 2560x1600, 16", 165 Hz | Asus Zenbook S 16 UM5606WA-RK052W ATNA60CL10-0, OLED, 2880x1800, 16", 120 Hz | Medion S10 OLED Samsung SDC4174, OLED, 3840x2400, 16", 60 Hz | Xiaomi RedmiBook Pro 16 2024 TL160MDMP03_0, IPS, 3072x1920, 16", 165 Hz | Lenovo ThinkBook 16 G7 IML LEN160WUXGA, IPS, 1920x1200, 16", 60 Hz | |
|---|---|---|---|---|---|---|
| Display | -2% | 4% | 6% | 2% | -49% | |
| Display P3 Coverage (%) | 96.3 | 94.6 -2% | 99.8 4% | 99.9 4% | 98.8 3% | 41.6 -57% |
| sRGB Coverage (%) | 100 | 99.7 0% | 100 0% | 100 0% | 100 0% | 61.2 -39% |
| AdobeRGB 1998 Coverage (%) | 86.9 | 83.4 -4% | 94.6 9% | 98.6 13% | 89.9 3% | 43 -51% |
| Response Times | -9% | 94% | 83% | -157% | -97% | |
| Response Time Grey 50% / Grey 80% * (ms) | 13.9 ? | 5.6 ? 60% | 0.4 ? 97% | 1.7 ? 88% | 39.2 ? -182% | 18.4 ? -32% |
| Response Time Black / White * (ms) | 6.3 ? | 11.2 ? -78% | 0.6 ? 90% | 1.4 ? 78% | 14.6 ? -132% | 16.5 ? -162% |
| PWM Frequency (Hz) | 480 | 60 ? | ||||
| PWM Amplitude * (%) | 30 | 90 | ||||
| Screen | -42% | 142% | 214% | -28% | -161% | |
| Brightness middle (cd/m²) | 422 | 488 16% | 391 -7% | 307 -27% | 520 23% | 321.2 -24% |
| Brightness (cd/m²) | 403 | 444 10% | 391 -3% | 307 -24% | 510 27% | 319 -21% |
| Brightness Distribution (%) | 93 | 86 -8% | 98 5% | 96 3% | 93 0% | 92 -1% |
| Black Level * (cd/m²) | 0.3 | 0.36 -20% | 0.02 93% | 0.01 97% | 0.35 -17% | 0.37 -23% |
| Contrast (:1) | 1407 | 1356 -4% | 19550 1289% | 30700 2082% | 1486 6% | 868 -38% |
| Colorchecker dE 2000 * | 1.7 | 3.45 -103% | 1.42 16% | 2.1 -24% | 2.9 -71% | 8.7 -412% |
| Colorchecker dE 2000 max. * | 3.4 | 6.77 -99% | 4.69 -38% | 4.87 -43% | 6.2 -82% | 19.85 -484% |
| Colorchecker dE 2000 calibrated * | 0.7 | 1.35 -93% | 1.49 -113% | 2.08 -197% | 1.1 -57% | 1.82 -160% |
| Greyscale dE 2000 * | 2.4 | 4.16 -73% | 1.5 37% | 0.9 62% | 4.3 -79% | 9.2 -283% |
| Gamma | 2.19 100% | 2.52 87% | 2.199 100% | 2.197 100% | 2.19 100% | 2.83 78% |
| CCT | 6989 93% | 6832 95% | 6684 97% | 6513 100% | 7422 88% | 6200 105% |
| Total Average (Program / Settings) | -18% /
-28% | 80% /
106% | 101% /
151% | -61% /
-40% | -102% /
-128% |
* ... smaller is better


We analyzed the panel using the professional CalMAN software, and Lenovo provided us with various profiles. Both the P3 and the sRGB profiles offer good image quality with minor color deviations, but the color temperature is a bit too cool, and a slight blue tint is also visible. Using our own calibration (the profile is available for free download above), we were able to significantly improve the display. Together with the complete coverage of the P3 and sRGB color spaces, the panel is also suitable for editing images.


Display Response Times
| ↔ Response Time Black to White | ||
|---|---|---|
| 6.3 ms ... rise ↗ and fall ↘ combined | ↗ 2.5 ms rise |  |
| ↘ 3.8 ms fall | ||
| The screen shows very fast response rates in our tests and should be very well suited for fast-paced gaming. In comparison, all tested devices range from 0.1 (minimum) to 240 (maximum) ms. » 20 % of all devices are better. This means that the measured response time is better than the average of all tested devices (19.9 ms). | ||
| ↔ Response Time 50% Grey to 80% Grey | ||
| 13.9 ms ... rise ↗ and fall ↘ combined | ↗ 6.7 ms rise |  |
| ↘ 7.2 ms fall | ||
| The screen shows good response rates in our tests, but may be too slow for competitive gamers. In comparison, all tested devices range from 0.165 (minimum) to 636 (maximum) ms. » 27 % of all devices are better. This means that the measured response time is better than the average of all tested devices (31.1 ms). | ||
Screen Flickering / PWM (Pulse-Width Modulation)
| Screen flickering / PWM not detected |  | ||
In comparison: 52 % of all tested devices do not use PWM to dim the display. If PWM was detected, an average of 7791 (minimum: 5 - maximum: 343500) Hz was measured. | |||


Outdoors, the matte panel performs very well, but the brightness could be higher for very bright environments. Reflections from direct light sources or the sun should be avoided but the viewing angle stability is very good.

Performance - AMD Zen 5 with 32 GB of RAM
For the time being, the ThinkBook 16 G7+ is only available with the AMD Ryzen AI 9 365 paired with 32 GB of RAM (LPDDR5x-7500) that cannot be expanded. The integrated Radeon 880M GPU is responsible for the graphical computations; dedicated GPUs are not offered.


Test conditions
Lenovo has provided various energy profiles, which are also synchronized with the Windows settings. We carried out the following benchmarks and measurements using Adaptive Energy mode (Auto), which is also active by default. If you require maximum CPU multi-core performance, the performance mode is worth it. However, for everyday tasks, the battery-saving mode is perfectly sufficient and also results in significantly quieter fans.
| Energy Profile | CPU TDP | CB R23 Multi | Time Spy Graphics | max. fan volume |
|---|---|---|---|---|
| Battery Saving Mode | 29 watts | 14,868 points | 3,131 points | 32.5 dB(A) |
| Adaptive Energy Mode (Auto) | 65/50 watts | 17,414 points | 3,464 points | 40.1 dB(A) |
| Performance | 71/65 watts | 20,210 points | 3,429 points | 45.2 dB(A) |
Processor
The AMD Ryzen AI 9 365 belongs to the current Strix Point generation, and a total of 10 Zen 5 cores with a maximum clock speed of 5 GHz are used (4x Zen 5 + 6x Zen 5c). The CPU performance is very good and, above all, stable, meaning the review device also places itself ahead of the other competitors in auto mode. The Core Ultra 7 155H found in the RedmiBook clearly outperforms the benchmark in terms of multi-core performance. When running on battery power, the processor can draw a maximum of 52/35 watts, which is why the multi-core performance drops by around 7%. Additional CPU benchmarks are available in our technology section.
Cinebench R15 Multi Continuous Test
Cinebench R23: Multi Core | Single Core
Cinebench R20: CPU (Multi Core) | CPU (Single Core)
Cinebench R15: CPU Multi 64Bit | CPU Single 64Bit
Blender: v2.79 BMW27 CPU
7-Zip 18.03: 7z b 4 | 7z b 4 -mmt1
Geekbench 6.7: Multi-Core | Single-Core
Geekbench 5.5: Multi-Core | Single-Core
HWBOT x265 Benchmark v2.2: 4k Preset
LibreOffice : 20 Documents To PDF
R Benchmark 2.5: Overall mean
| CPU Performance rating | |
| Lenovo ThinkBook 16 G7+ AMD | |
| Average AMD Ryzen AI 9 365 | |
| MSI Prestige A16 AI+ A3HMG-036 | |
| Average of class Multimedia | |
| Xiaomi RedmiBook Pro 16 2024 | |
| Medion S10 OLED | |
| Asus Zenbook S 16 UM5606WA-RK052W | |
| Lenovo ThinkBook 16 G7 IML | |
| Cinebench R23 / Multi Core | |
| MSI Prestige A16 AI+ A3HMG-036 | |
| Average AMD Ryzen AI 9 365 (11462 - 20649, n=7) | |
| Lenovo ThinkBook 16 G7+ AMD | |
| Xiaomi RedmiBook Pro 16 2024 | |
| Average of class Multimedia (4861 - 33362, n=81, last 2 years) | |
| Medion S10 OLED | |
| Asus Zenbook S 16 UM5606WA-RK052W | |
| Lenovo ThinkBook 16 G7 IML | |
| Cinebench R23 / Single Core | |
| Lenovo ThinkBook 16 G7+ AMD | |
| MSI Prestige A16 AI+ A3HMG-036 | |
| Average AMD Ryzen AI 9 365 (1942 - 2001, n=7) | |
| Asus Zenbook S 16 UM5606WA-RK052W | |
| Average of class Multimedia (1128 - 2459, n=73, last 2 years) | |
| Medion S10 OLED | |
| Xiaomi RedmiBook Pro 16 2024 | |
| Lenovo ThinkBook 16 G7 IML | |
| Cinebench R20 / CPU (Multi Core) | |
| Lenovo ThinkBook 16 G7+ AMD | |
| Average AMD Ryzen AI 9 365 (5247 - 8070, n=7) | |
| MSI Prestige A16 AI+ A3HMG-036 | |
| Xiaomi RedmiBook Pro 16 2024 | |
| Average of class Multimedia (1887 - 12912, n=64, last 2 years) | |
| Medion S10 OLED | |
| Asus Zenbook S 16 UM5606WA-RK052W | |
| Lenovo ThinkBook 16 G7 IML | |
| Cinebench R20 / CPU (Single Core) | |
| Lenovo ThinkBook 16 G7+ AMD | |
| MSI Prestige A16 AI+ A3HMG-036 | |
| Average AMD Ryzen AI 9 365 (758 - 787, n=7) | |
| Asus Zenbook S 16 UM5606WA-RK052W | |
| Average of class Multimedia (425 - 853, n=64, last 2 years) | |
| Medion S10 OLED | |
| Xiaomi RedmiBook Pro 16 2024 | |
| Lenovo ThinkBook 16 G7 IML | |
| Cinebench R15 / CPU Multi 64Bit | |
| Lenovo ThinkBook 16 G7+ AMD | |
| MSI Prestige A16 AI+ A3HMG-036 | |
| Average AMD Ryzen AI 9 365 (1950 - 3075, n=7) | |
| Xiaomi RedmiBook Pro 16 2024 | |
| Average of class Multimedia (856 - 5224, n=68, last 2 years) | |
| Medion S10 OLED | |
| Asus Zenbook S 16 UM5606WA-RK052W | |
| Lenovo ThinkBook 16 G7 IML | |
| Cinebench R15 / CPU Single 64Bit | |
| Lenovo ThinkBook 16 G7+ AMD | |
| MSI Prestige A16 AI+ A3HMG-036 | |
| Asus Zenbook S 16 UM5606WA-RK052W | |
| Average AMD Ryzen AI 9 365 (195.7 - 306, n=7) | |
| Average of class Multimedia (184.8 - 326, n=66, last 2 years) | |
| Medion S10 OLED | |
| Xiaomi RedmiBook Pro 16 2024 | |
| Lenovo ThinkBook 16 G7 IML | |
| Blender / v2.79 BMW27 CPU | |
| Lenovo ThinkBook 16 G7 IML | |
| Asus Zenbook S 16 UM5606WA-RK052W | |
| Average of class Multimedia (100 - 557, n=65, last 2 years) | |
| MSI Prestige A16 AI+ A3HMG-036 | |
| Medion S10 OLED | |
| Average AMD Ryzen AI 9 365 (160 - 270, n=7) | |
| Xiaomi RedmiBook Pro 16 2024 | |
| Lenovo ThinkBook 16 G7+ AMD | |
| 7-Zip 18.03 / 7z b 4 | |
| Lenovo ThinkBook 16 G7+ AMD | |
| Xiaomi RedmiBook Pro 16 2024 | |
| Average AMD Ryzen AI 9 365 (47754 - 71722, n=7) | |
| MSI Prestige A16 AI+ A3HMG-036 | |
| Average of class Multimedia (29095 - 130368, n=62, last 2 years) | |
| Medion S10 OLED | |
| Asus Zenbook S 16 UM5606WA-RK052W | |
| Lenovo ThinkBook 16 G7 IML | |
| 7-Zip 18.03 / 7z b 4 -mmt1 | |
| MSI Prestige A16 AI+ A3HMG-036 | |
| Lenovo ThinkBook 16 G7+ AMD | |
| Asus Zenbook S 16 UM5606WA-RK052W | |
| Average AMD Ryzen AI 9 365 (5790 - 6062, n=7) | |
| Average of class Multimedia (3666 - 7545, n=63, last 2 years) | |
| Medion S10 OLED | |
| Xiaomi RedmiBook Pro 16 2024 | |
| Lenovo ThinkBook 16 G7 IML | |
| Geekbench 6.7 / Multi-Core | |
| Average of class Multimedia (4983 - 29415, n=76, last 2 years) | |
| Average AMD Ryzen AI 9 365 (12627 - 15137, n=7) | |
| Lenovo ThinkBook 16 G7+ AMD | |
| MSI Prestige A16 AI+ A3HMG-036 | |
| Xiaomi RedmiBook Pro 16 2024 | |
| Asus Zenbook S 16 UM5606WA-RK052W | |
| Medion S10 OLED | |
| Lenovo ThinkBook 16 G7 IML | |
| Geekbench 6.7 / Single-Core | |
| Average of class Multimedia (1534 - 4335, n=75, last 2 years) | |
| Average AMD Ryzen AI 9 365 (2778 - 2920, n=7) | |
| MSI Prestige A16 AI+ A3HMG-036 | |
| Lenovo ThinkBook 16 G7+ AMD | |
| Asus Zenbook S 16 UM5606WA-RK052W | |
| Medion S10 OLED | |
| Xiaomi RedmiBook Pro 16 2024 | |
| Lenovo ThinkBook 16 G7 IML | |
| Geekbench 5.5 / Multi-Core | |
| Xiaomi RedmiBook Pro 16 2024 | |
| Lenovo ThinkBook 16 G7+ AMD | |
| Average of class Multimedia (4652 - 20422, n=62, last 2 years) | |
| Average AMD Ryzen AI 9 365 (9599 - 14182, n=7) | |
| MSI Prestige A16 AI+ A3HMG-036 | |
| Medion S10 OLED | |
| Asus Zenbook S 16 UM5606WA-RK052W | |
| Lenovo ThinkBook 16 G7 IML | |
| Geekbench 5.5 / Single-Core | |
| Average AMD Ryzen AI 9 365 (2062 - 2104, n=7) | |
| Lenovo ThinkBook 16 G7+ AMD | |
| MSI Prestige A16 AI+ A3HMG-036 | |
| Asus Zenbook S 16 UM5606WA-RK052W | |
| Average of class Multimedia (805 - 2974, n=62, last 2 years) | |
| Xiaomi RedmiBook Pro 16 2024 | |
| Medion S10 OLED | |
| Lenovo ThinkBook 16 G7 IML | |
| HWBOT x265 Benchmark v2.2 / 4k Preset | |
| Lenovo ThinkBook 16 G7+ AMD | |
| Average AMD Ryzen AI 9 365 (18.6 - 24.5, n=7) | |
| Xiaomi RedmiBook Pro 16 2024 | |
| MSI Prestige A16 AI+ A3HMG-036 | |
| Asus Zenbook S 16 UM5606WA-RK052W | |
| Average of class Multimedia (5.26 - 36.1, n=63, last 2 years) | |
| Medion S10 OLED | |
| Lenovo ThinkBook 16 G7 IML | |
| LibreOffice / 20 Documents To PDF | |
| MSI Prestige A16 AI+ A3HMG-036 | |
| Lenovo ThinkBook 16 G7+ AMD | |
| Average AMD Ryzen AI 9 365 (50.8 - 60, n=7) | |
| Asus Zenbook S 16 UM5606WA-RK052W | |
| Average of class Multimedia (23.9 - 146.7, n=64, last 2 years) | |
| Medion S10 OLED | |
| Lenovo ThinkBook 16 G7 IML | |
| Xiaomi RedmiBook Pro 16 2024 | |
| R Benchmark 2.5 / Overall mean | |
| Lenovo ThinkBook 16 G7 IML | |
| Xiaomi RedmiBook Pro 16 2024 | |
| Medion S10 OLED | |
| Average of class Multimedia (0.3604 - 0.947, n=63, last 2 years) | |
| Asus Zenbook S 16 UM5606WA-RK052W | |
| Lenovo ThinkBook 16 G7+ AMD | |
| Average AMD Ryzen AI 9 365 (0.4091 - 0.4272, n=7) | |
| MSI Prestige A16 AI+ A3HMG-036 | |
* ... smaller is better
AIDA64: FP32 Ray-Trace | FPU Julia | CPU SHA3 | CPU Queen | FPU SinJulia | FPU Mandel | CPU AES | CPU ZLib | FP64 Ray-Trace | CPU PhotoWorxx
| Performance rating | |
| Lenovo ThinkBook 16 G7+ AMD | |
| Average AMD Ryzen AI 9 365 | |
| MSI Prestige A16 AI+ A3HMG-036 | |
| Average of class Multimedia | |
| Xiaomi RedmiBook Pro 16 2024 | |
| Medion S10 OLED | |
| Asus Zenbook S 16 UM5606WA-RK052W | |
| AIDA64 / FP32 Ray-Trace | |
| Lenovo ThinkBook 16 G7+ AMD | |
| MSI Prestige A16 AI+ A3HMG-036 | |
| Average AMD Ryzen AI 9 365 (17096 - 32742, n=7) | |
| Average of class Multimedia (2214 - 50388, n=60, last 2 years) | |
| Asus Zenbook S 16 UM5606WA-RK052W | |
| Medion S10 OLED | |
| Xiaomi RedmiBook Pro 16 2024 | |
| AIDA64 / FPU Julia | |
| Lenovo ThinkBook 16 G7+ AMD | |
| MSI Prestige A16 AI+ A3HMG-036 | |
| Average AMD Ryzen AI 9 365 (61976 - 126955, n=7) | |
| Average of class Multimedia (12867 - 201874, n=61, last 2 years) | |
| Xiaomi RedmiBook Pro 16 2024 | |
| Medion S10 OLED | |
| Asus Zenbook S 16 UM5606WA-RK052W | |
| AIDA64 / CPU SHA3 | |
| Lenovo ThinkBook 16 G7+ AMD | |
| MSI Prestige A16 AI+ A3HMG-036 | |
| Average AMD Ryzen AI 9 365 (2951 - 5178, n=7) | |
| Average of class Multimedia (653 - 8623, n=61, last 2 years) | |
| Xiaomi RedmiBook Pro 16 2024 | |
| Medion S10 OLED | |
| Asus Zenbook S 16 UM5606WA-RK052W | |
| AIDA64 / CPU Queen | |
| Average AMD Ryzen AI 9 365 (85333 - 93045, n=7) | |
| Xiaomi RedmiBook Pro 16 2024 | |
| MSI Prestige A16 AI+ A3HMG-036 | |
| Lenovo ThinkBook 16 G7+ AMD | |
| Asus Zenbook S 16 UM5606WA-RK052W | |
| Medion S10 OLED | |
| Average of class Multimedia (13483 - 181505, n=49, last 2 years) | |
| AIDA64 / FPU SinJulia | |
| Lenovo ThinkBook 16 G7+ AMD | |
| MSI Prestige A16 AI+ A3HMG-036 | |
| Average AMD Ryzen AI 9 365 (11586 - 16342, n=7) | |
| Asus Zenbook S 16 UM5606WA-RK052W | |
| Xiaomi RedmiBook Pro 16 2024 | |
| Average of class Multimedia (1240 - 28794, n=61, last 2 years) | |
| Medion S10 OLED | |
| AIDA64 / FPU Mandel | |
| Lenovo ThinkBook 16 G7+ AMD | |
| MSI Prestige A16 AI+ A3HMG-036 | |
| Average AMD Ryzen AI 9 365 (33409 - 67374, n=7) | |
| Average of class Multimedia (6395 - 105740, n=60, last 2 years) | |
| Medion S10 OLED | |
| Xiaomi RedmiBook Pro 16 2024 | |
| Asus Zenbook S 16 UM5606WA-RK052W | |
| AIDA64 / CPU AES | |
| Xiaomi RedmiBook Pro 16 2024 | |
| Average AMD Ryzen AI 9 365 (47468 - 99502, n=7) | |
| Medion S10 OLED | |
| Lenovo ThinkBook 16 G7+ AMD | |
| MSI Prestige A16 AI+ A3HMG-036 | |
| Average of class Multimedia (13243 - 126790, n=61, last 2 years) | |
| Asus Zenbook S 16 UM5606WA-RK052W | |
| AIDA64 / CPU ZLib | |
| Lenovo ThinkBook 16 G7+ AMD | |
| Average AMD Ryzen AI 9 365 (706 - 1343, n=7) | |
| MSI Prestige A16 AI+ A3HMG-036 | |
| Xiaomi RedmiBook Pro 16 2024 | |
| Medion S10 OLED | |
| Average of class Multimedia (167.2 - 2022, n=61, last 2 years) | |
| Asus Zenbook S 16 UM5606WA-RK052W | |
| AIDA64 / FP64 Ray-Trace | |
| Lenovo ThinkBook 16 G7+ AMD | |
| MSI Prestige A16 AI+ A3HMG-036 | |
| Average AMD Ryzen AI 9 365 (9061 - 17848, n=7) | |
| Average of class Multimedia (1014 - 26875, n=61, last 2 years) | |
| Asus Zenbook S 16 UM5606WA-RK052W | |
| Medion S10 OLED | |
| Xiaomi RedmiBook Pro 16 2024 | |
| AIDA64 / CPU PhotoWorxx | |
| Xiaomi RedmiBook Pro 16 2024 | |
| Average AMD Ryzen AI 9 365 (47654 - 53550, n=7) | |
| Average of class Multimedia (12860 - 88154, n=61, last 2 years) | |
| MSI Prestige A16 AI+ A3HMG-036 | |
| Lenovo ThinkBook 16 G7+ AMD | |
| Asus Zenbook S 16 UM5606WA-RK052W | |
| Medion S10 OLED | |
System performance
In everyday situations, the ThinkBook 16 G7+ is very responsive, and this is also reflected in the benchmark results. We encountered no system stability problems during the test.
CrossMark: Overall | Productivity | Creativity | Responsiveness
WebXPRT 3: Overall
WebXPRT 4: Overall
Mozilla Kraken 1.1: Total
| PCMark 10 / Score | |
| Average of class Multimedia (4325 - 10386, n=58, last 2 years) | |
| MSI Prestige A16 AI+ A3HMG-036 | |
| Lenovo ThinkBook 16 G7+ AMD | |
| Average AMD Ryzen AI 9 365, AMD Radeon 880M (7045 - 7641, n=5) | |
| Asus Zenbook S 16 UM5606WA-RK052W | |
| Xiaomi RedmiBook Pro 16 2024 | |
| Medion S10 OLED | |
| PCMark 10 / Essentials | |
| MSI Prestige A16 AI+ A3HMG-036 | |
| Xiaomi RedmiBook Pro 16 2024 | |
| Average AMD Ryzen AI 9 365, AMD Radeon 880M (10421 - 11140, n=5) | |
| Lenovo ThinkBook 16 G7+ AMD | |
| Average of class Multimedia (8025 - 11664, n=57, last 2 years) | |
| Asus Zenbook S 16 UM5606WA-RK052W | |
| Medion S10 OLED | |
| PCMark 10 / Productivity | |
| Average of class Multimedia (7323 - 18233, n=57, last 2 years) | |
| MSI Prestige A16 AI+ A3HMG-036 | |
| Asus Zenbook S 16 UM5606WA-RK052W | |
| Average AMD Ryzen AI 9 365, AMD Radeon 880M (9841 - 10293, n=5) | |
| Lenovo ThinkBook 16 G7+ AMD | |
| Xiaomi RedmiBook Pro 16 2024 | |
| Medion S10 OLED | |
| PCMark 10 / Digital Content Creation | |
| Lenovo ThinkBook 16 G7+ AMD | |
| MSI Prestige A16 AI+ A3HMG-036 | |
| Average of class Multimedia (3651 - 16240, n=57, last 2 years) | |
| Average AMD Ryzen AI 9 365, AMD Radeon 880M (8973 - 10976, n=5) | |
| Xiaomi RedmiBook Pro 16 2024 | |
| Asus Zenbook S 16 UM5606WA-RK052W | |
| Medion S10 OLED | |
| CrossMark / Overall | |
| Average of class Multimedia (866 - 2728, n=67, last 2 years) | |
| Xiaomi RedmiBook Pro 16 2024 | |
| Lenovo ThinkBook 16 G7+ AMD | |
| MSI Prestige A16 AI+ A3HMG-036 | |
| Average AMD Ryzen AI 9 365, AMD Radeon 880M (1658 - 1743, n=4) | |
| Medion S10 OLED | |
| CrossMark / Productivity | |
| Average of class Multimedia (931 - 2489, n=67, last 2 years) | |
| Xiaomi RedmiBook Pro 16 2024 | |
| Medion S10 OLED | |
| Lenovo ThinkBook 16 G7+ AMD | |
| MSI Prestige A16 AI+ A3HMG-036 | |
| Average AMD Ryzen AI 9 365, AMD Radeon 880M (1508 - 1599, n=4) | |
| CrossMark / Creativity | |
| Average of class Multimedia (907 - 3465, n=67, last 2 years) | |
| MSI Prestige A16 AI+ A3HMG-036 | |
| Lenovo ThinkBook 16 G7+ AMD | |
| Average AMD Ryzen AI 9 365, AMD Radeon 880M (2044 - 2074, n=4) | |
| Xiaomi RedmiBook Pro 16 2024 | |
| Medion S10 OLED | |
| CrossMark / Responsiveness | |
| Xiaomi RedmiBook Pro 16 2024 | |
| Medion S10 OLED | |
| Average of class Multimedia (605 - 2024, n=67, last 2 years) | |
| Lenovo ThinkBook 16 G7+ AMD | |
| MSI Prestige A16 AI+ A3HMG-036 | |
| Average AMD Ryzen AI 9 365, AMD Radeon 880M (1124 - 1360, n=4) | |
| WebXPRT 3 / Overall | |
| Average of class Multimedia (136.4 - 596, n=70, last 2 years) | |
| Average AMD Ryzen AI 9 365, AMD Radeon 880M (309 - 336, n=4) | |
| Lenovo ThinkBook 16 G7+ AMD | |
| MSI Prestige A16 AI+ A3HMG-036 | |
| Xiaomi RedmiBook Pro 16 2024 | |
| Medion S10 OLED | |
| WebXPRT 4 / Overall | |
| MSI Prestige A16 AI+ A3HMG-036 | |
| Average of class Multimedia (167.3 - 402, n=71, last 2 years) | |
| Average AMD Ryzen AI 9 365, AMD Radeon 880M (255 - 330, n=6) | |
| Lenovo ThinkBook 16 G7+ AMD | |
| Asus Zenbook S 16 UM5606WA-RK052W | |
| Asus Zenbook S 16 UM5606WA-RK052W | |
| Xiaomi RedmiBook Pro 16 2024 | |
| Medion S10 OLED | |
| Mozilla Kraken 1.1 / Total | |
| Medion S10 OLED | |
| Medion S10 OLED | |
| Xiaomi RedmiBook Pro 16 2024 | |
| Average of class Multimedia (228 - 835, n=74, last 2 years) | |
| Asus Zenbook S 16 UM5606WA-RK052W | |
| Asus Zenbook S 16 UM5606WA-RK052W | |
| Average AMD Ryzen AI 9 365, AMD Radeon 880M (430 - 456, n=6) | |
| MSI Prestige A16 AI+ A3HMG-036 | |
| Lenovo ThinkBook 16 G7+ AMD | |
* ... smaller is better
| PCMark 10 Score | 7504 points | |
Help | ||
| AIDA64 / Memory Copy | |
| Xiaomi RedmiBook Pro 16 2024 | |
| Average AMD Ryzen AI 9 365 (87648 - 94710, n=7) | |
| Asus Zenbook S 16 UM5606WA-RK052W | |
| MSI Prestige A16 AI+ A3HMG-036 | |
| Lenovo ThinkBook 16 G7+ AMD | |
| Average of class Multimedia (21158 - 132135, n=61, last 2 years) | |
| Medion S10 OLED | |
| AIDA64 / Memory Read | |
| Average AMD Ryzen AI 9 365 (89012 - 104349, n=7) | |
| Lenovo ThinkBook 16 G7+ AMD | |
| MSI Prestige A16 AI+ A3HMG-036 | |
| Asus Zenbook S 16 UM5606WA-RK052W | |
| Xiaomi RedmiBook Pro 16 2024 | |
| Average of class Multimedia (19699 - 174586, n=61, last 2 years) | |
| Medion S10 OLED | |
| AIDA64 / Memory Write | |
| Asus Zenbook S 16 UM5606WA-RK052W | |
| Average AMD Ryzen AI 9 365 (93627 - 106646, n=7) | |
| Lenovo ThinkBook 16 G7+ AMD | |
| MSI Prestige A16 AI+ A3HMG-036 | |
| Average of class Multimedia (17733 - 134998, n=61, last 2 years) | |
| Xiaomi RedmiBook Pro 16 2024 | |
| Medion S10 OLED | |
| AIDA64 / Memory Latency | |
| Medion S10 OLED | |
| Xiaomi RedmiBook Pro 16 2024 | |
| MSI Prestige A16 AI+ A3HMG-036 | |
| Average of class Multimedia (7 - 535, n=60, last 2 years) | |
| Asus Zenbook S 16 UM5606WA-RK052W | |
| Lenovo ThinkBook 16 G7+ AMD | |
| Average AMD Ryzen AI 9 365 (103.6 - 129.8, n=7) | |
* ... smaller is better
DPC latencies
In our standardized latency test (surfing the internet, 4K YouTube playback, CPU load), the review device with the current BIOS version displayed slight limitations when using real-time audio applications.


| DPC Latencies / LatencyMon - interrupt to process latency (max), Web, Youtube, Prime95 | |
| Asus Zenbook S 16 UM5606WA-RK052W | |
| Medion S10 OLED | |
| Lenovo ThinkBook 16 G7+ AMD | |
| Xiaomi RedmiBook Pro 16 2024 | |
| MSI Prestige A16 AI+ A3HMG-036 | |
* ... smaller is better
Mass storage
The ThinkBook 16 G7+ offers two fully-fledged M.2 2280 slots with PCIe 4.0 x4 connection. The review device is equipped with a compact Samsung M.2 2242 SSD (PM9C1a), which comes with a storage capacity of 1 TB. After the initial start-up, the user has 890 GB at their disposal. The Samsung SSD's transfer speeds are average and remain stable even under longer loads. Other SSD benchmarks are listed here.


* ... smaller is better
Continuous Performance Read: DiskSpd Read Loop, Queue Depth 8
Graphics card
The Radeon-880M-GPU is a fast, integrated graphics card and is very well suited to everyday tasks, including playing high-resolution videos. The synthetic benchmark results meet expectations, and the performance remains stable both under continuous load and when running on battery power.
The 880M GPU is also suitable for gaming, but of course, you shouldn't expect too much in this area. Current games like Cyberpunk 2077 run quite smoothly, but you have to reduce the resolution and the details.
| 3DMark 11 Performance | 14998 points | |
| 3DMark Fire Strike Score | 8919 points | |
| 3DMark Time Spy Score | 3856 points | |
| 3DMark Steel Nomad Score | 572 points | |
| 3DMark Steel Nomad Light Score | 3281 points | |
Help | ||
| Blender / v3.3 Classroom CPU | |
| Asus Zenbook S 16 UM5606WA-RK052W | |
| Average of class Multimedia (134.5 - 1042, n=68, last 2 years) | |
| Medion S10 OLED | |
| Xiaomi RedmiBook Pro 16 2024 | |
| MSI Prestige A16 AI+ A3HMG-036 | |
| Average AMD Radeon 880M (269 - 429, n=7) | |
| Lenovo ThinkBook 16 G7+ AMD | |
* ... smaller is better
| Performance rating - Percent | |
| Average of class Multimedia | |
| Lenovo ThinkBook 16 G7+ AMD | |
| MSI Prestige A16 AI+ A3HMG-036 | |
| Xiaomi RedmiBook Pro 16 2024 -1! | |
| Asus Zenbook S 16 UM5606WA-RK052W | |
| Medion S10 OLED | |
| Cyberpunk 2077 - 1920x1080 Ultra Preset (FSR off) | |
| Average of class Multimedia (6.41 - 112.3, n=78, last 2 years) | |
| Lenovo ThinkBook 16 G7+ AMD | |
| MSI Prestige A16 AI+ A3HMG-036 | |
| Xiaomi RedmiBook Pro 16 2024 | |
| Asus Zenbook S 16 UM5606WA-RK052W | |
| Medion S10 OLED | |
| Baldur's Gate 3 - 1920x1080 Ultra Preset AA:T | |
| Average of class Multimedia (7.8 - 158.7, n=72, last 2 years) | |
| Lenovo ThinkBook 16 G7+ AMD | |
| MSI Prestige A16 AI+ A3HMG-036 | |
| Asus Zenbook S 16 UM5606WA-RK052W | |
| Medion S10 OLED | |
| GTA V - 1920x1080 Highest AA:4xMSAA + FX AF:16x | |
| Average of class Multimedia (7.92 - 141.6, n=63, last 2 years) | |
| Lenovo ThinkBook 16 G7+ AMD | |
| MSI Prestige A16 AI+ A3HMG-036 | |
| Asus Zenbook S 16 UM5606WA-RK052W | |
| Xiaomi RedmiBook Pro 16 2024 | |
| Medion S10 OLED | |
| Final Fantasy XV Benchmark - 1920x1080 High Quality | |
| Average of class Multimedia (7.61 - 144.4, n=66, last 2 years) | |
| Lenovo ThinkBook 16 G7+ AMD | |
| Xiaomi RedmiBook Pro 16 2024 | |
| MSI Prestige A16 AI+ A3HMG-036 | |
| Asus Zenbook S 16 UM5606WA-RK052W | |
| Medion S10 OLED | |
| Strange Brigade - 1920x1080 ultra AA:ultra AF:16 | |
| Average of class Multimedia (13.3 - 303, n=66, last 2 years) | |
| Lenovo ThinkBook 16 G7+ AMD | |
| Xiaomi RedmiBook Pro 16 2024 | |
| MSI Prestige A16 AI+ A3HMG-036 | |
| Asus Zenbook S 16 UM5606WA-RK052W | |
| Medion S10 OLED | |
| Dota 2 Reborn - 1920x1080 ultra (3/3) best looking | |
| Lenovo ThinkBook 16 G7+ AMD | |
| Average of class Multimedia (29 - 179.9, n=68, last 2 years) | |
| Xiaomi RedmiBook Pro 16 2024 | |
| Medion S10 OLED | |
| MSI Prestige A16 AI+ A3HMG-036 | |
| Asus Zenbook S 16 UM5606WA-RK052W | |
Cyberpunk 2077 ultra FPS diagram
| low | med. | high | ultra | |
|---|---|---|---|---|
| GTA V (2015) | 164.2 | 160.9 | 81 | 33.3 |
| Dota 2 Reborn (2015) | 167.9 | 137.5 | 110.8 | 92.5 |
| Final Fantasy XV Benchmark (2018) | 91.8 | 46 | 32.9 | |
| X-Plane 11.11 (2018) | 86 | 67 | 50.4 | |
| Strange Brigade (2018) | 196 | 80.3 | 68.2 | 57.1 |
| Baldur's Gate 3 (2023) | 49.3 | 38.2 | 31.2 | 30.9 |
| Cyberpunk 2077 (2023) | 50.6 | 39.3 | 30.1 | 26.1 |
Emissions & energy
Noise emissions

The ThinkBook is a very quiet device when running simple tasks, and the two fan's noise remains very unobtrusive even under load. In auto mode, we measured 40 dB(A) both when playing games and in the stress test, which was audible but not distracting. In performance mode, this was a much louder 45.2 dB(A), and using battery saving mode, we measured a maximum of 32.5 dB(A). No additional noises emanated from the review device.
Noise level
| Idle |
| 24.5 / 24.5 / 25.9 dB(A) |
| Load |
| 36.2 / 40.1 dB(A) |
 | ||
30 dB silent 40 dB(A) audible 50 dB(A) loud |
||
min: | ||
| Lenovo ThinkBook 16 G7+ AMD Radeon 880M, Ryzen AI 9 365, Samsung PM9C1a MZAL81T0HDLB | MSI Prestige A16 AI+ A3HMG-036 Radeon 880M, Ryzen AI 9 365, Samsung PM9C1 MZVL81T0HELB-00BTW | Asus Zenbook S 16 UM5606WA-RK052W Radeon 880M, Ryzen AI 9 365, Micron 2400 MTFDKBA1T0QFM | Medion S10 OLED Arc 8-Core, Ultra 7 155H, Phison PS5019-E19 SSO1TBITC4-E19-V7 | Xiaomi RedmiBook Pro 16 2024 Arc 8-Core, Ultra 7 155H, YMTC PC300-1TB | |
|---|---|---|---|---|---|
| Noise | 0% | 4% | -10% | 3% | |
| off / environment * (dB) | 24.5 | 23 6% | 24 2% | 25 -2% | 24.4 -0% |
| Idle Minimum * (dB) | 24.5 | 23 6% | 24 2% | 26 -6% | 24.4 -0% |
| Idle Average * (dB) | 24.5 | 23 6% | 25 -2% | 27 -10% | 24.4 -0% |
| Idle Maximum * (dB) | 25.9 | 25.02 3% | 26 -0% | 28 -8% | 24.4 6% |
| Load Average * (dB) | 36.2 | 41.88 -16% | 35 3% | 43 -19% | 32 12% |
| Cyberpunk 2077 ultra * (dB) | 40.1 | 39.79 1% | 36 10% | 42 -5% | |
| Load Maximum * (dB) | 40.1 | 41.88 -4% | 36 10% | 48 -20% | 39.7 1% |
| Witcher 3 ultra * (dB) | 30.6 |
* ... smaller is better
Temperature
Lenovo has managed to keep the surface temperatures under control. When running idle or doing simple tasks, the surfaces hardly heat up - even when gaming or in our stress test - and although we never recorded more than 38 °C, the fans could spin a little slower. In the stress test, the processor quickly settled to 50 watts and remained stable at this level.

(+) The maximum temperature on the upper side is 38.2 °C / 101 F, compared to the average of 36.8 °C / 98 F, ranging from 21 to 71 °C for the class Multimedia.
(+) The bottom heats up to a maximum of 37.9 °C / 100 F, compared to the average of 39.1 °C / 102 F
(+) In idle usage, the average temperature for the upper side is 24.8 °C / 77 F, compared to the device average of 31.3 °C / 88 F.
(±) 3: The average temperature for the upper side is 33.4 °C / 92 F, compared to the average of 31.3 °C / 88 F for the class Multimedia.
(+) The palmrests and touchpad are cooler than skin temperature with a maximum of 31.5 °C / 88.7 F and are therefore cool to the touch.
(-) The average temperature of the palmrest area of similar devices was 28.7 °C / 83.7 F (-2.8 °C / -5 F).


| Lenovo ThinkBook 16 G7+ AMD AMD Ryzen AI 9 365, AMD Radeon 880M | MSI Prestige A16 AI+ A3HMG-036 AMD Ryzen AI 9 365, AMD Radeon 880M | Asus Zenbook S 16 UM5606WA-RK052W AMD Ryzen AI 9 365, AMD Radeon 880M | Medion S10 OLED Intel Core Ultra 7 155H, Intel Arc 8-Core iGPU | Xiaomi RedmiBook Pro 16 2024 Intel Core Ultra 7 155H, Intel Arc 8-Core iGPU | |
|---|---|---|---|---|---|
| Heat | -18% | -28% | -36% | -10% | |
| Maximum Upper Side * (°C) | 38.2 | 52 -36% | 48 -26% | 55 -44% | 40.3 -5% |
| Maximum Bottom * (°C) | 37.9 | 44 -16% | 53 -40% | 55 -45% | 45.9 -21% |
| Idle Upper Side * (°C) | 25.4 | 28 -10% | 31 -22% | 32 -26% | 26.3 -4% |
| Idle Bottom * (°C) | 25.7 | 28 -9% | 32 -25% | 33 -28% | 27.9 -9% |
* ... smaller is better
Speakers
The stereo speakers are one of the few weaknesses you'll find in the ThinkBook 16 G7+. The highs and mids are clear, which helps with voice reproduction, but the modules lack punch and bass. This makes the sound seem quite thin, especially regarding music and films.
Lenovo ThinkBook 16 G7+ AMD audio analysis
(±) | speaker loudness is average but good (74.8 dB)
Bass 100 - 315 Hz
(-) | nearly no bass - on average 16.5% lower than median
(±) | linearity of bass is average (13.1% delta to prev. frequency)
Mids 400 - 2000 Hz
(+) | balanced mids - only 3.5% away from median
(+) | mids are linear (5.9% delta to prev. frequency)
Highs 2 - 16 kHz
(+) | balanced highs - only 1.6% away from median
(+) | highs are linear (5% delta to prev. frequency)
Overall 100 - 16.000 Hz
(±) | linearity of overall sound is average (16% difference to median)
Compared to same class
» 41% of all tested devices in this class were better, 6% similar, 53% worse
» The best had a delta of 5%, average was 17%, worst was 45%
Compared to all devices tested
» 25% of all tested devices were better, 5% similar, 70% worse
» The best had a delta of 4%, average was 24%, worst was 134%
MSI Prestige A16 AI+ A3HMG-036 audio analysis
(+) | speakers can play relatively loud (82.02 dB)
Bass 100 - 315 Hz
(-) | nearly no bass - on average 23.7% lower than median
(±) | linearity of bass is average (12.3% delta to prev. frequency)
Mids 400 - 2000 Hz
(±) | higher mids - on average 6.2% higher than median
(±) | linearity of mids is average (7.5% delta to prev. frequency)
Highs 2 - 16 kHz
(±) | higher highs - on average 5.6% higher than median
(+) | highs are linear (5.1% delta to prev. frequency)
Overall 100 - 16.000 Hz
(±) | linearity of overall sound is average (21.7% difference to median)
Compared to same class
» 77% of all tested devices in this class were better, 4% similar, 19% worse
» The best had a delta of 5%, average was 17%, worst was 45%
Compared to all devices tested
» 61% of all tested devices were better, 7% similar, 31% worse
» The best had a delta of 4%, average was 24%, worst was 134%
Asus Zenbook S 16 UM5606WA-RK052W audio analysis
(±) | speaker loudness is average but good (81 dB)
Bass 100 - 315 Hz
(±) | reduced bass - on average 6.1% lower than median
(±) | linearity of bass is average (7.5% delta to prev. frequency)
Mids 400 - 2000 Hz
(+) | balanced mids - only 1.9% away from median
(+) | mids are linear (3.3% delta to prev. frequency)
Highs 2 - 16 kHz
(+) | balanced highs - only 3% away from median
(+) | highs are linear (6.1% delta to prev. frequency)
Overall 100 - 16.000 Hz
(+) | overall sound is linear (8.1% difference to median)
Compared to same class
» 8% of all tested devices in this class were better, 1% similar, 90% worse
» The best had a delta of 5%, average was 17%, worst was 45%
Compared to all devices tested
» 2% of all tested devices were better, 1% similar, 98% worse
» The best had a delta of 4%, average was 24%, worst was 134%
Medion S10 OLED audio analysis
(+) | speakers can play relatively loud (85 dB)
Bass 100 - 315 Hz
(-) | nearly no bass - on average 17.3% lower than median
(±) | linearity of bass is average (9.5% delta to prev. frequency)
Mids 400 - 2000 Hz
(+) | balanced mids - only 4.3% away from median
(+) | mids are linear (4.3% delta to prev. frequency)
Highs 2 - 16 kHz
(+) | balanced highs - only 1.2% away from median
(+) | highs are linear (5% delta to prev. frequency)
Overall 100 - 16.000 Hz
(+) | overall sound is linear (12.9% difference to median)
Compared to same class
» 26% of all tested devices in this class were better, 4% similar, 70% worse
» The best had a delta of 5%, average was 17%, worst was 45%
Compared to all devices tested
» 12% of all tested devices were better, 3% similar, 85% worse
» The best had a delta of 4%, average was 24%, worst was 134%
Xiaomi RedmiBook Pro 16 2024 audio analysis
(+) | speakers can play relatively loud (83.8 dB)
Bass 100 - 315 Hz
(±) | reduced bass - on average 13.6% lower than median
(±) | linearity of bass is average (7.9% delta to prev. frequency)
Mids 400 - 2000 Hz
(±) | higher mids - on average 5.3% higher than median
(+) | mids are linear (5% delta to prev. frequency)
Highs 2 - 16 kHz
(+) | balanced highs - only 2.8% away from median
(+) | highs are linear (5.3% delta to prev. frequency)
Overall 100 - 16.000 Hz
(+) | overall sound is linear (13% difference to median)
Compared to same class
» 26% of all tested devices in this class were better, 5% similar, 70% worse
» The best had a delta of 5%, average was 17%, worst was 45%
Compared to all devices tested
» 13% of all tested devices were better, 2% similar, 85% worse
» The best had a delta of 4%, average was 24%, worst was 134%
Power consumption
Having a high-resolution screen can be seen in idle measurements because, at full brightness, we measured around 14 watts. In our stress test, we briefly measured 103 watts, but this quickly levelled off to around 83 watts. Even when gaming, we recorded around 80 watts. The 100-watt power supply is, therefore, suitably sized.
| Off / Standby | |
| Idle | |
| Load |
|
Key:
min: | |
| Lenovo ThinkBook 16 G7+ AMD Radeon 880M, Ryzen AI 9 365, Samsung PM9C1a MZAL81T0HDLB | MSI Prestige A16 AI+ A3HMG-036 Radeon 880M, Ryzen AI 9 365, Samsung PM9C1 MZVL81T0HELB-00BTW | Asus Zenbook S 16 UM5606WA-RK052W Radeon 880M, Ryzen AI 9 365, Micron 2400 MTFDKBA1T0QFM | Medion S10 OLED Arc 8-Core, Ultra 7 155H, Phison PS5019-E19 SSO1TBITC4-E19-V7 | Xiaomi RedmiBook Pro 16 2024 Arc 8-Core, Ultra 7 155H, YMTC PC300-1TB | |
|---|---|---|---|---|---|
| Power Consumption | 8% | 33% | 15% | 11% | |
| Idle Minimum * (Watt) | 6.4 | 6.9 -8% | 6 6% | 7 -9% | 4.2 34% |
| Idle Average * (Watt) | 14.1 | 12 15% | 7 50% | 10 29% | 11.6 18% |
| Idle Maximum * (Watt) | 14.3 | 12.5 13% | 13 9% | 19 -33% | 12.3 14% |
| Load Average * (Watt) | 83.4 | 79.8 4% | 44 47% | 52 38% | 61.9 26% |
| Cyberpunk 2077 ultra * (Watt) | 79.8 | 62.5 22% | 44.6 44% | 53.2 33% | |
| Cyberpunk 2077 ultra external monitor * (Watt) | 77.5 | 74.5 4% | 49.2 37% | ||
| Load Maximum * (Watt) | 102.9 | 96 7% | 58 44% | 95 8% | 140.6 -37% |
| Witcher 3 ultra * (Watt) | 57 |
* ... smaller is better
Power consumption Cyberpunk / stress test
Power consumption with an external monitor
Battery life
The battery capacity has increased from 45 Wh in the ThinkBook 16 G7 to 85 Wh in the Plus model. Therefore, the 3.2K display's higher power consumption can be more than compensated for. In the Wi-Fi test at 150 cd/m² (which corresponds to 69% of the maximum brightness in the review device), we measured almost 11 hours, which is 2 hours more than the normal model. We recorded 7.5 hours at full brightness and almost 14 hours in the video test. Only the RedmiBook 16 offers significantly better endurance within the comparison group.


| Lenovo ThinkBook 16 G7+ AMD Ryzen AI 9 365, Radeon 880M, 85 Wh | MSI Prestige A16 AI+ A3HMG-036 Ryzen AI 9 365, Radeon 880M, 82 Wh | Asus Zenbook S 16 UM5606WA-RK052W Ryzen AI 9 365, Radeon 880M, 78 Wh | Medion S10 OLED Ultra 7 155H, Arc 8-Core, 70 Wh | Xiaomi RedmiBook Pro 16 2024 Ultra 7 155H, Arc 8-Core, 99 Wh | Lenovo ThinkBook 16 G7 IML Ultra 5 125U, Graphics 4-Core iGPU (Arrow Lake), 45 Wh | Average of class Multimedia | |
|---|---|---|---|---|---|---|---|
| Battery runtime | -11% | 11% | -32% | 55% | -19% | 15% | |
| H.264 (h) | 13.9 | 10.2 -27% | 21.8 57% | 16.4 ? 18% | |||
| WiFi v1.3 (h) | 10.8 | 11.4 6% | 12 11% | 7.3 -32% | 16.4 52% | 8.8 -19% | 12 ? 11% |
Notebookcheck overall rating
Lenovo ThinkBook 16 G7+ AMD
- 01/19/2025 v8
Andreas Osthoff
 Total Sustainability Score:
 Transparency
The selection of devices to be reviewed is made by our editorial team. The test sample was provided to the author as a loan by the manufacturer or retailer for the purpose of this review. The lender had no influence on this review, nor did the manufacturer receive a copy of this review before publication. There was no obligation to publish this review. As an independent media company, Notebookcheck is not subjected to the authority of manufacturers, retailers or publishers.
This is how Notebookcheck is testing
Every year, Notebookcheck independently reviews hundreds of laptops and smartphones using standardized procedures to ensure that all results are comparable. We have continuously developed our test methods for around 20 years and set industry standards in the process. In our test labs, high-quality measuring equipment is utilized by experienced technicians and editors. These tests involve a multi-stage validation process. Our complex rating system is based on hundreds of well-founded measurements and benchmarks, which maintains objectivity. Further information on our test methods can be found here.

