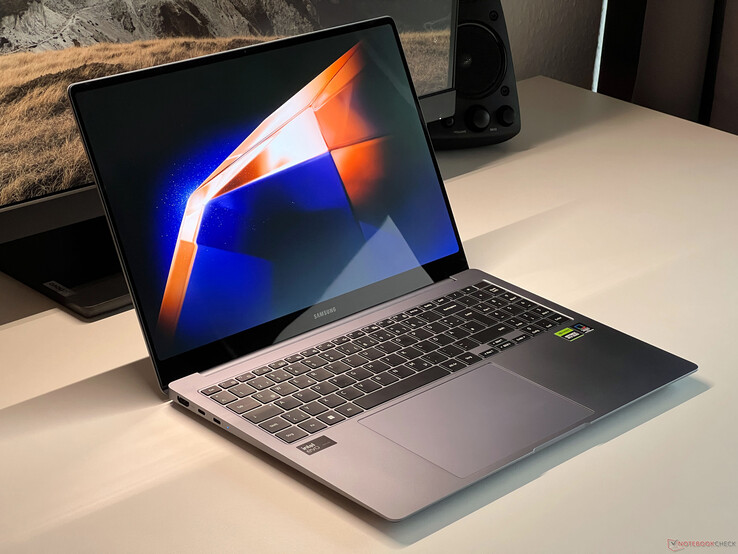
Samsung Galaxy Book4 Ultra review - A multimedia laptop with 120 Hz OLED & RTX 4050
Samsung is updating its Galaxy Book series to its fourth generation and with the Galaxy Book 4 Ultra, Samsung would like to compete directly with Apple's MacBook Pro 16. In comparison to the previous year's model, not much has changed with only the Core i7-13700H being replaced by the Meteor Lake Core Ultra 7 155H chip.
Nothing has also changed when it comes to the price with the base model and its Core Ultra 7 155H and GeForce RTX 4050 laptop costing $2,399. This continues to be very ambitious, especially given the meagre storage specs (16 GB of RAM, 512 GB SSD). For $2,999, you can get the top variant with the Core Ultra 9 185H, the GeForce RTX 4070 laptop as well as more memory and storage (32 GB of RAM, 1 TB SSD).
Possible competitors compared
Rating | Date | Model | Weight | Height | Size | Resolution | Price |
|---|---|---|---|---|---|---|---|
| 90.4 % v7 (old) | 03 / 2024 | Samsung Galaxy Book4 Ultra Ultra 7 155H, GeForce RTX 4050 Laptop GPU | 1.8 kg | 17 mm | 16.00" | 2880x1800 | |
| 88.6 % v7 (old) | 12 / 2023 | Lenovo ThinkPad Z16 Gen 2 R9 PRO 7940HS, Radeon RX 6550M | 1.8 kg | 15.8 mm | 16.00" | 3840x2400 | |
| 93.7 % v7 (old) | 11 / 2023 | Apple MacBook Pro 16 2023 M3 Pro Apple M3 Pro 12-Core, M3 Pro 18-Core GPU | 2.1 kg | 16.9 mm | 16.20" | 3456x2234 | |
| 88 % v7 (old) | 08 / 2023 | Lenovo Slim Pro 9i 16IRP8 i9-13905H, GeForce RTX 4050 Laptop GPU | 2.2 kg | 18.2 mm | 16.00" | 3200x2000 | |
| 91.1 % v7 (old) | 03 / 2024 | HP Spectre x360 16 RTX 4050 Ultra 7 155H, GeForce RTX 4050 Laptop GPU | 2 kg | 19.8 mm | 16.00" | 2880x1800 | |
| 88.6 % v7 (old) | 07 / 2023 | Schenker VISION 16 Pro (M23) i7-13700H, GeForce RTX 4070 Laptop GPU | 1.6 kg | 17.1 mm | 16.00" | 2560x1600 | |
| 89.4 % v7 (old) | 04 / 2023 | Samsung Galaxy Book3 Ultra 16 i7-13700H, GeForce RTX 4050 Laptop GPU | 1.8 kg | 16.5 mm | 16.00" | 2880x1800 |
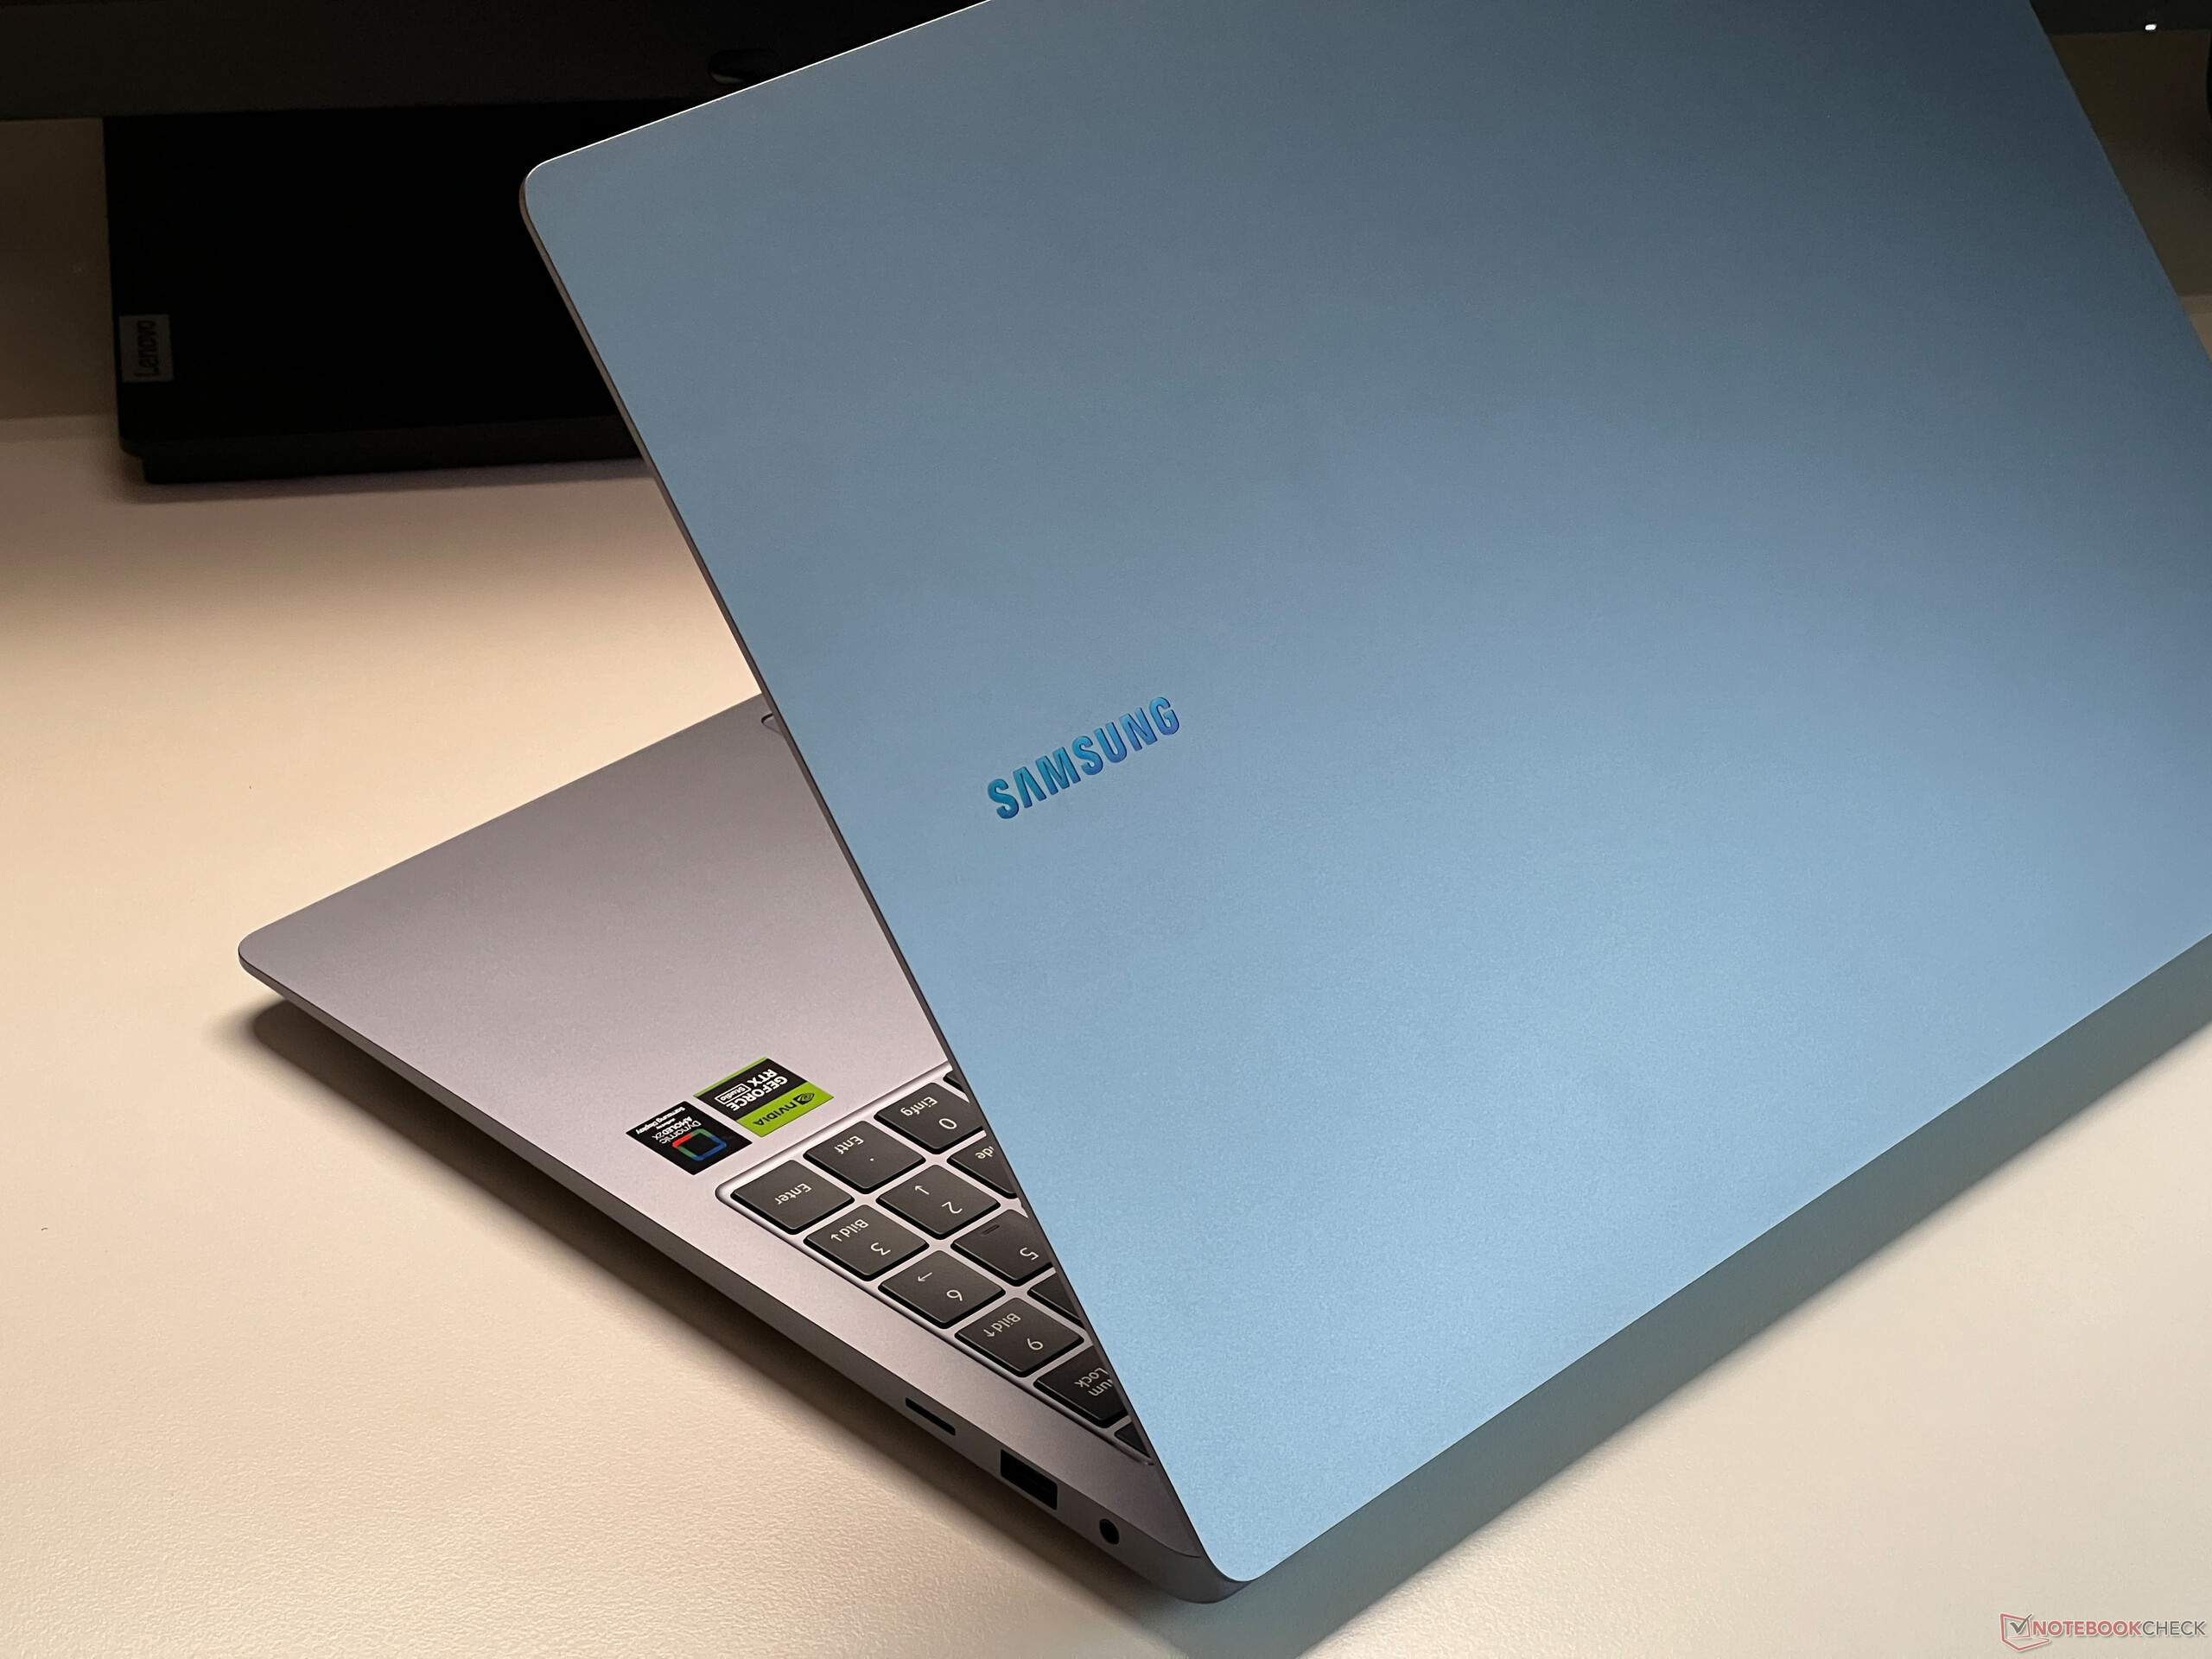
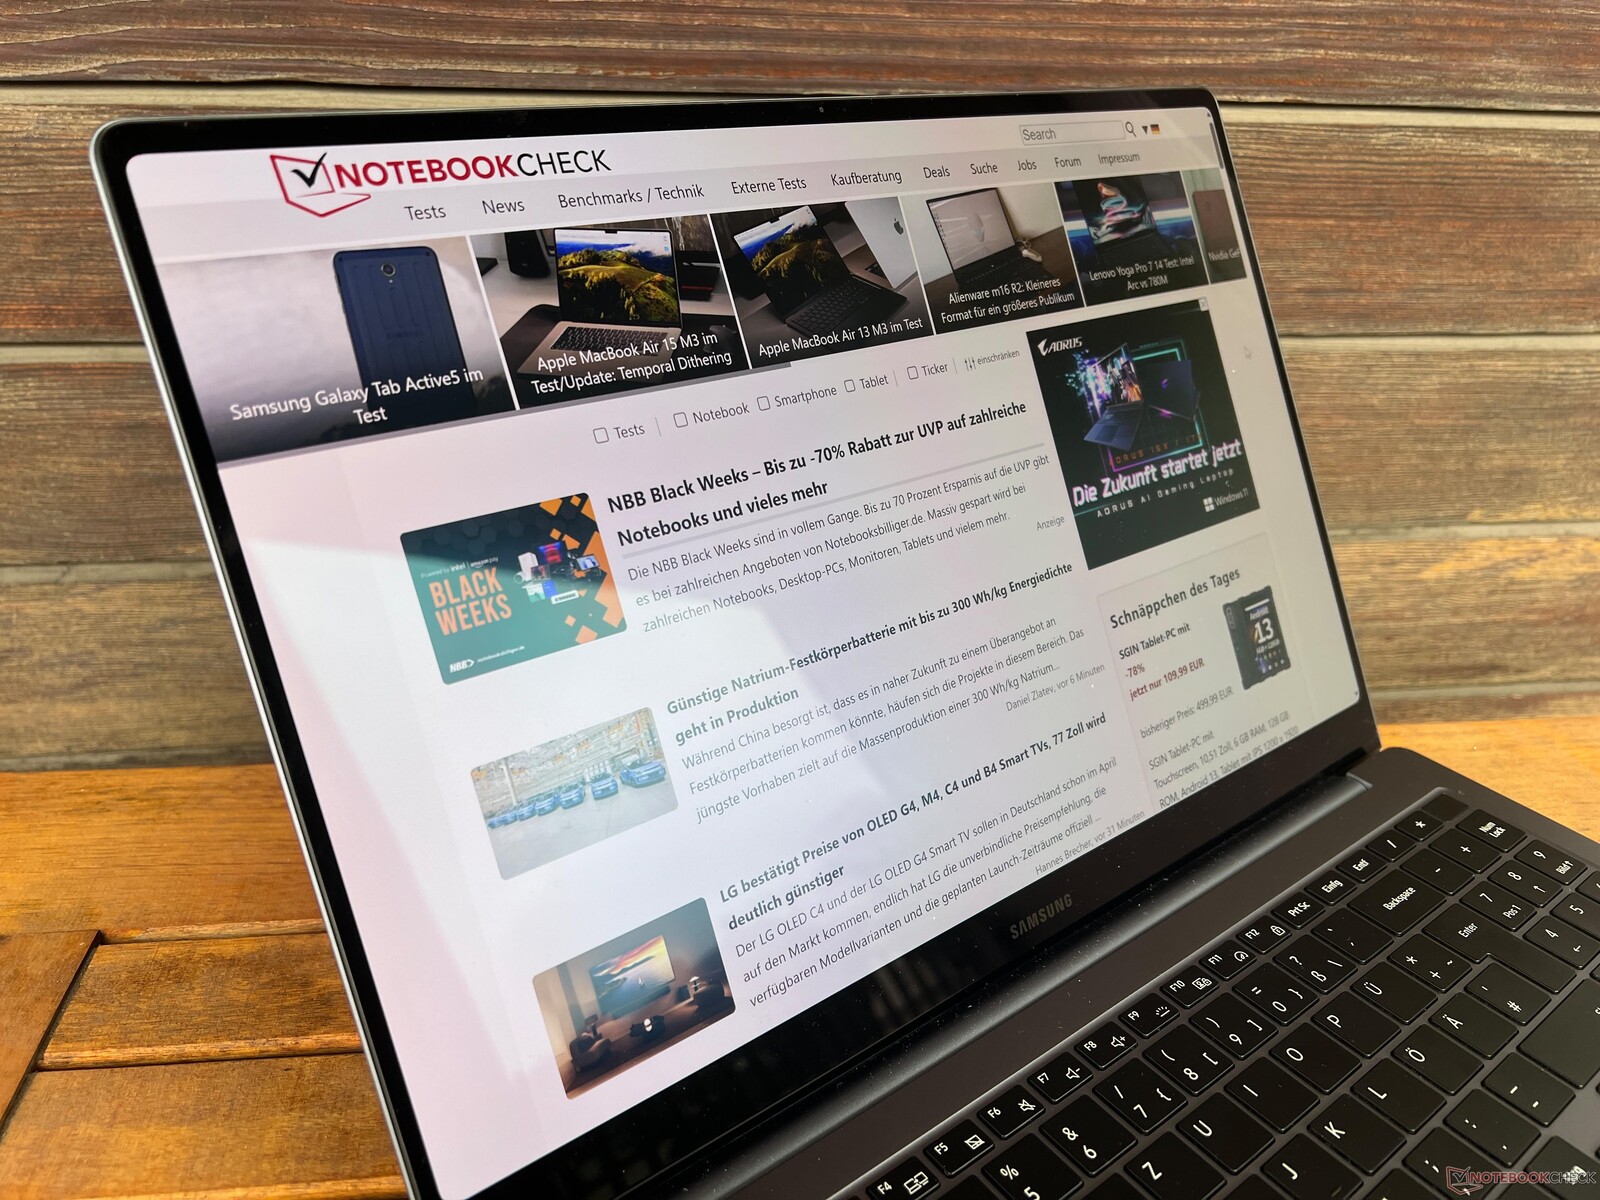
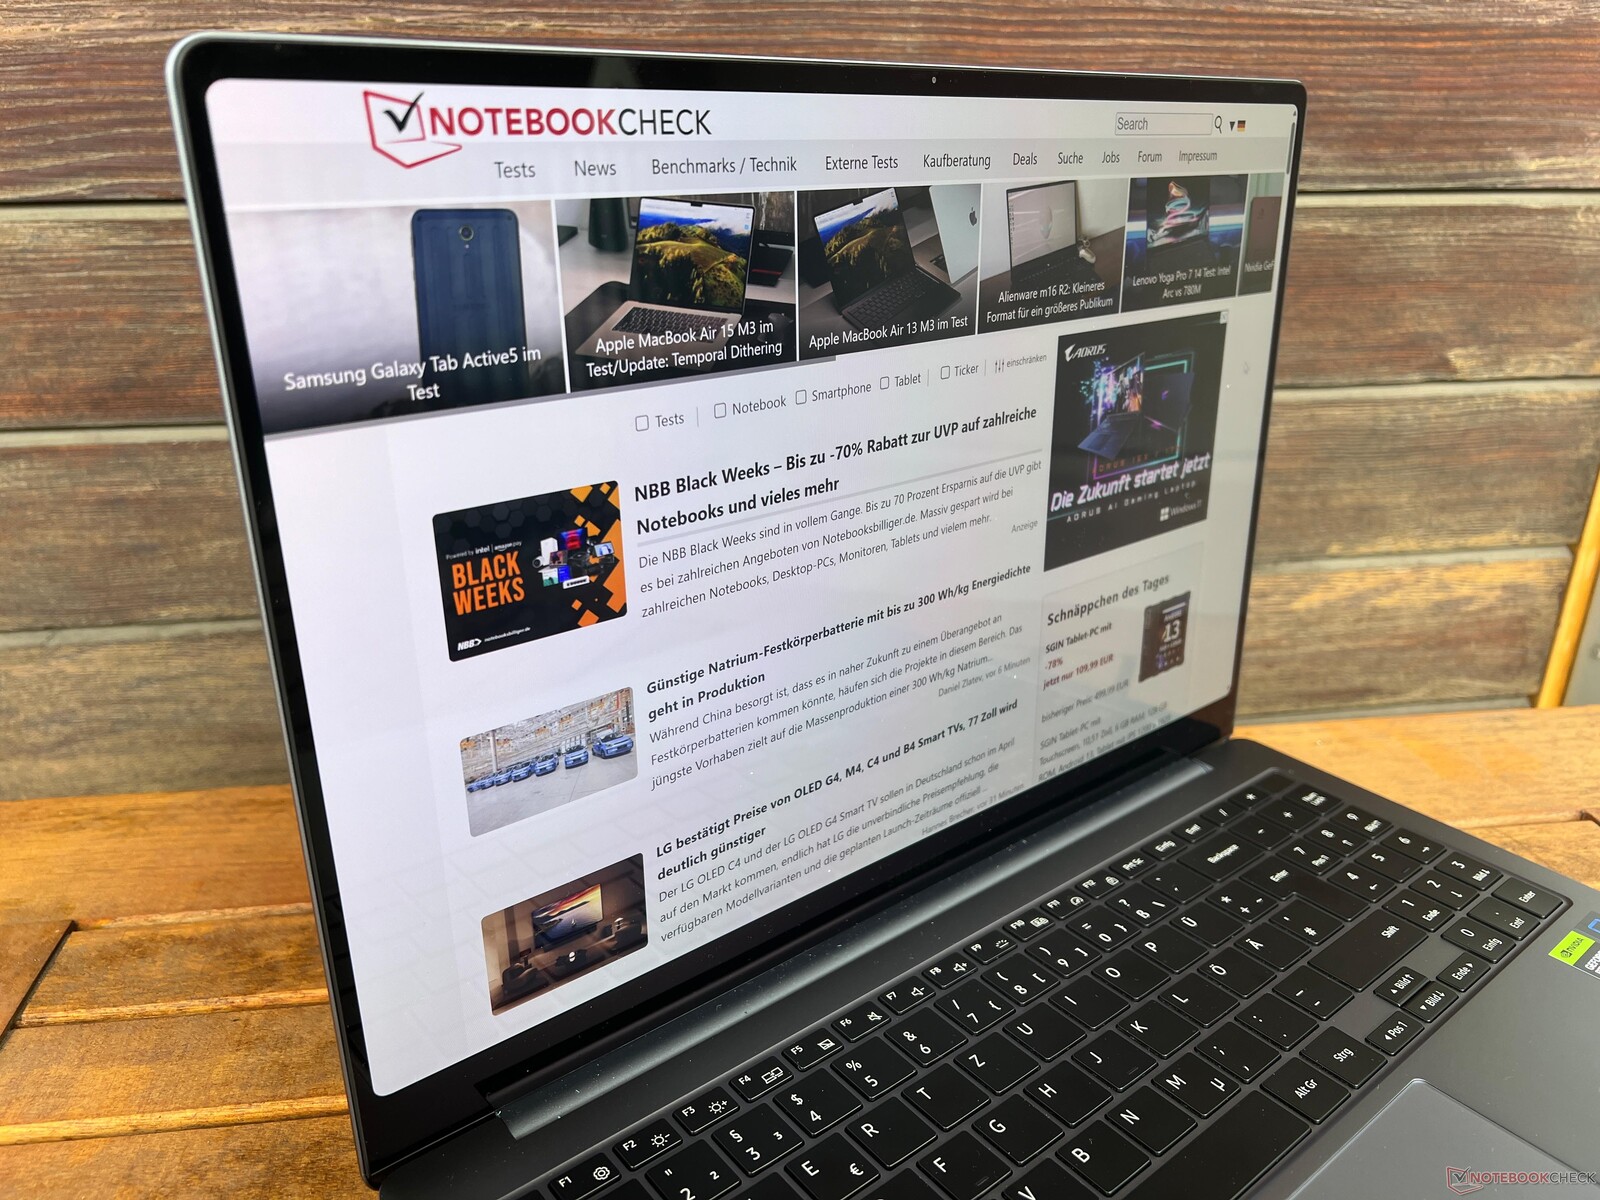
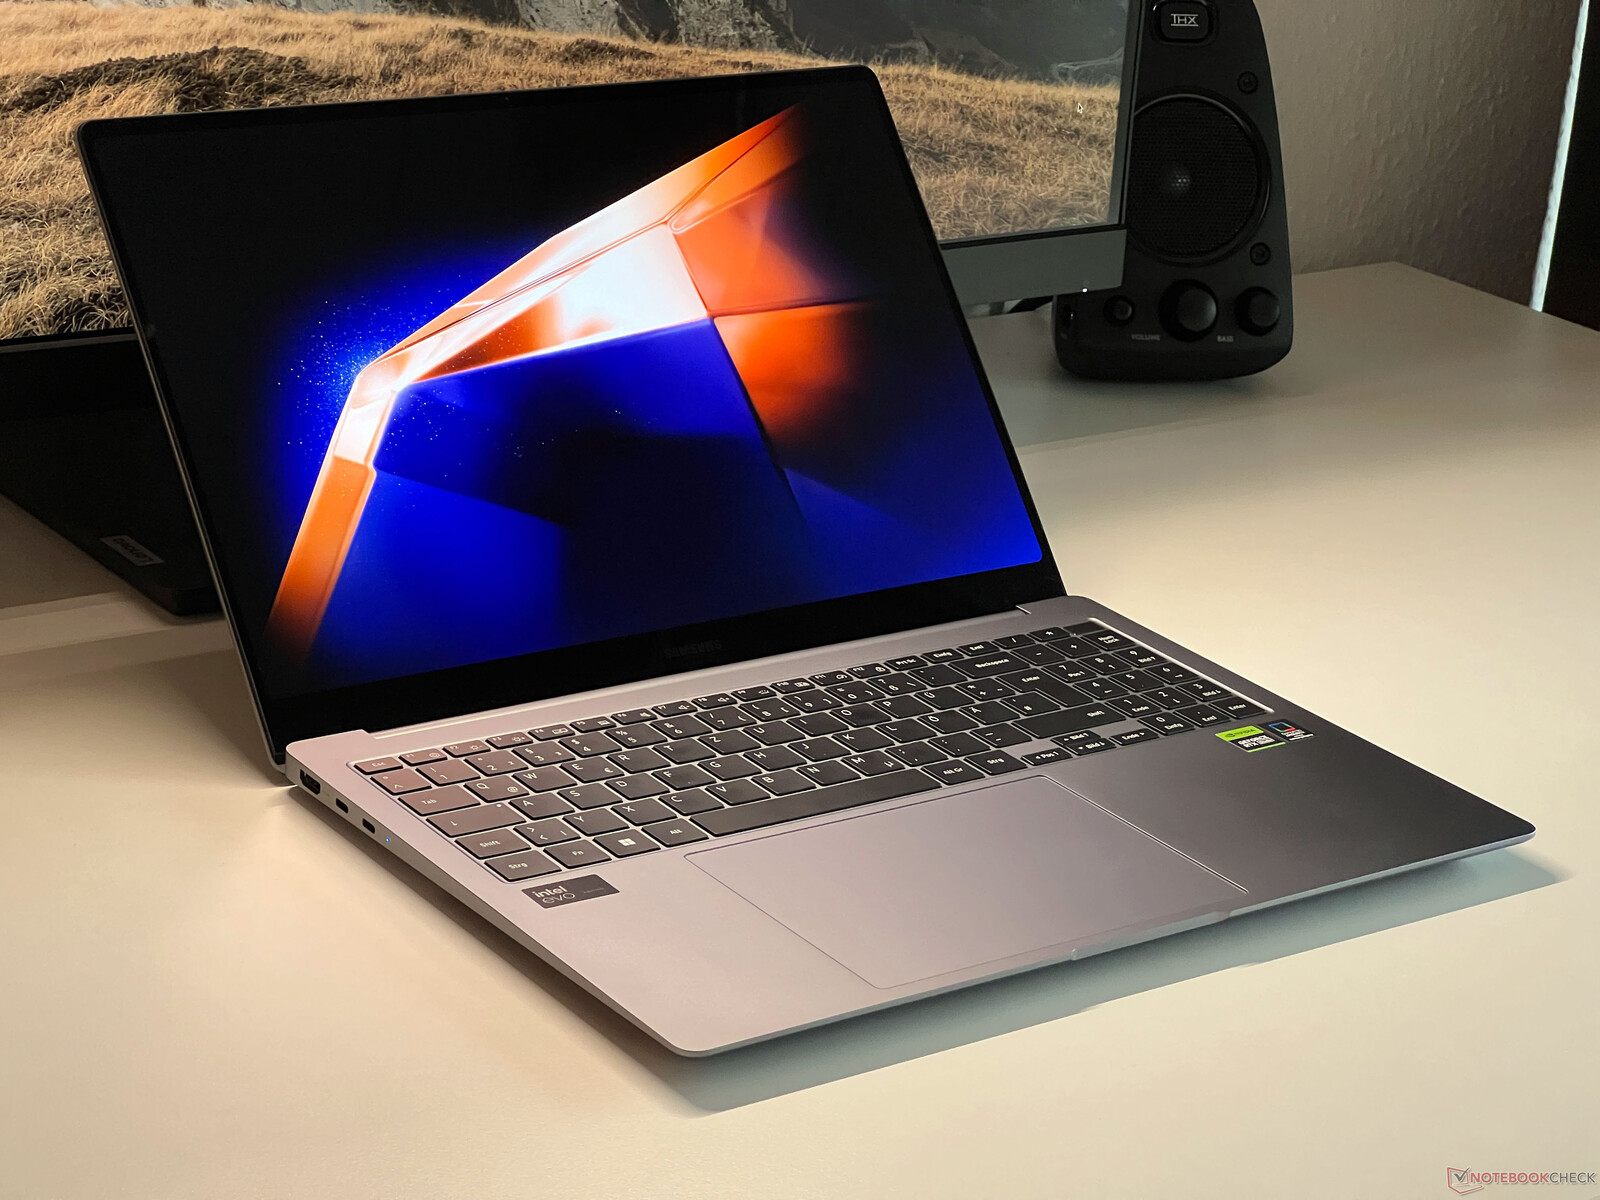
Case - The Galaxy Book comes with a metal case
The case design is unchanged compared to the old model. The dark gray aluminum casing (Moonstone Gray) is very premium and the surfaces not only provide pleasant feedback but are also not sensitive to fingerprints and can be easily cleaned. However, the thick bottom screen bezel is noticeable (1.7 cm) and somewhat spoils the overall appearance.
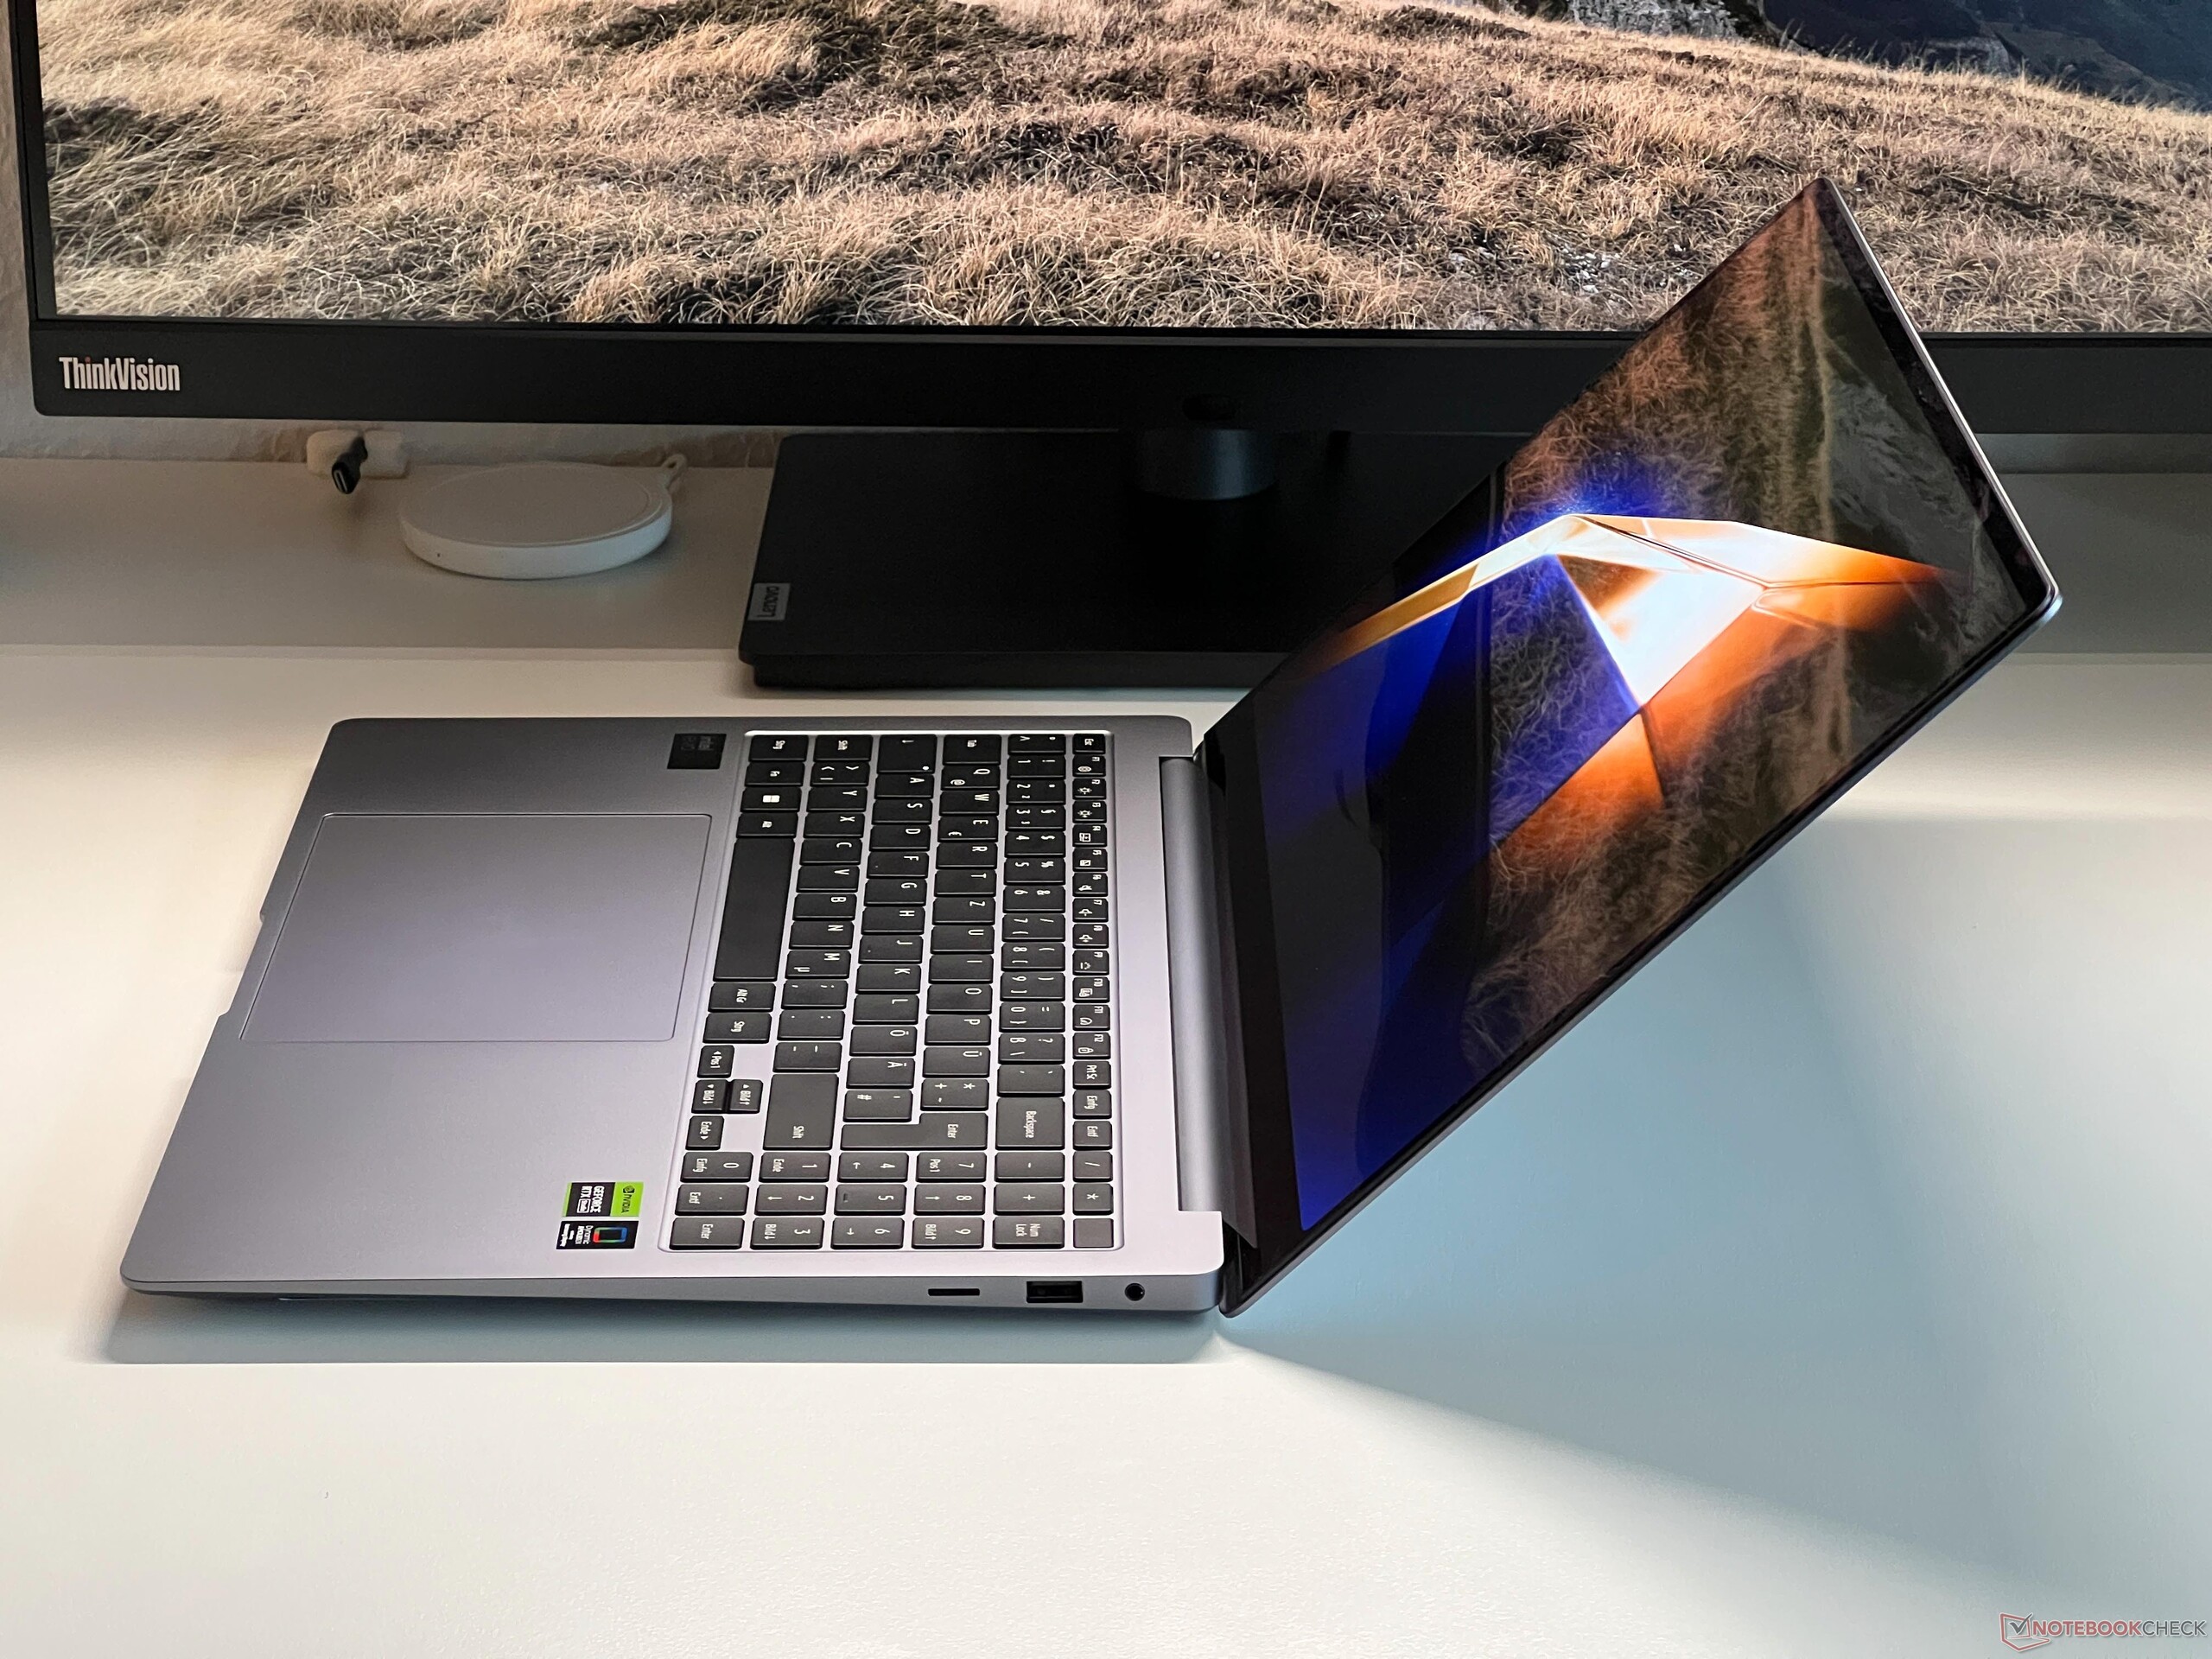
The Galaxy Book4 Ultra makes a good impression both in terms of build quality as well as stability. The keyboard area only gives slightly and the whole base unit is torsion-resistant. On top of that, there are no creaking noises to speak of. The display lid itself is significantly thinner and similarly very stable. The hinges are well adjusted and mostly manage to help prevent any wobble and the lid can also be comfortably opened with one hand. The maximum opening angle sits at 135 degrees.
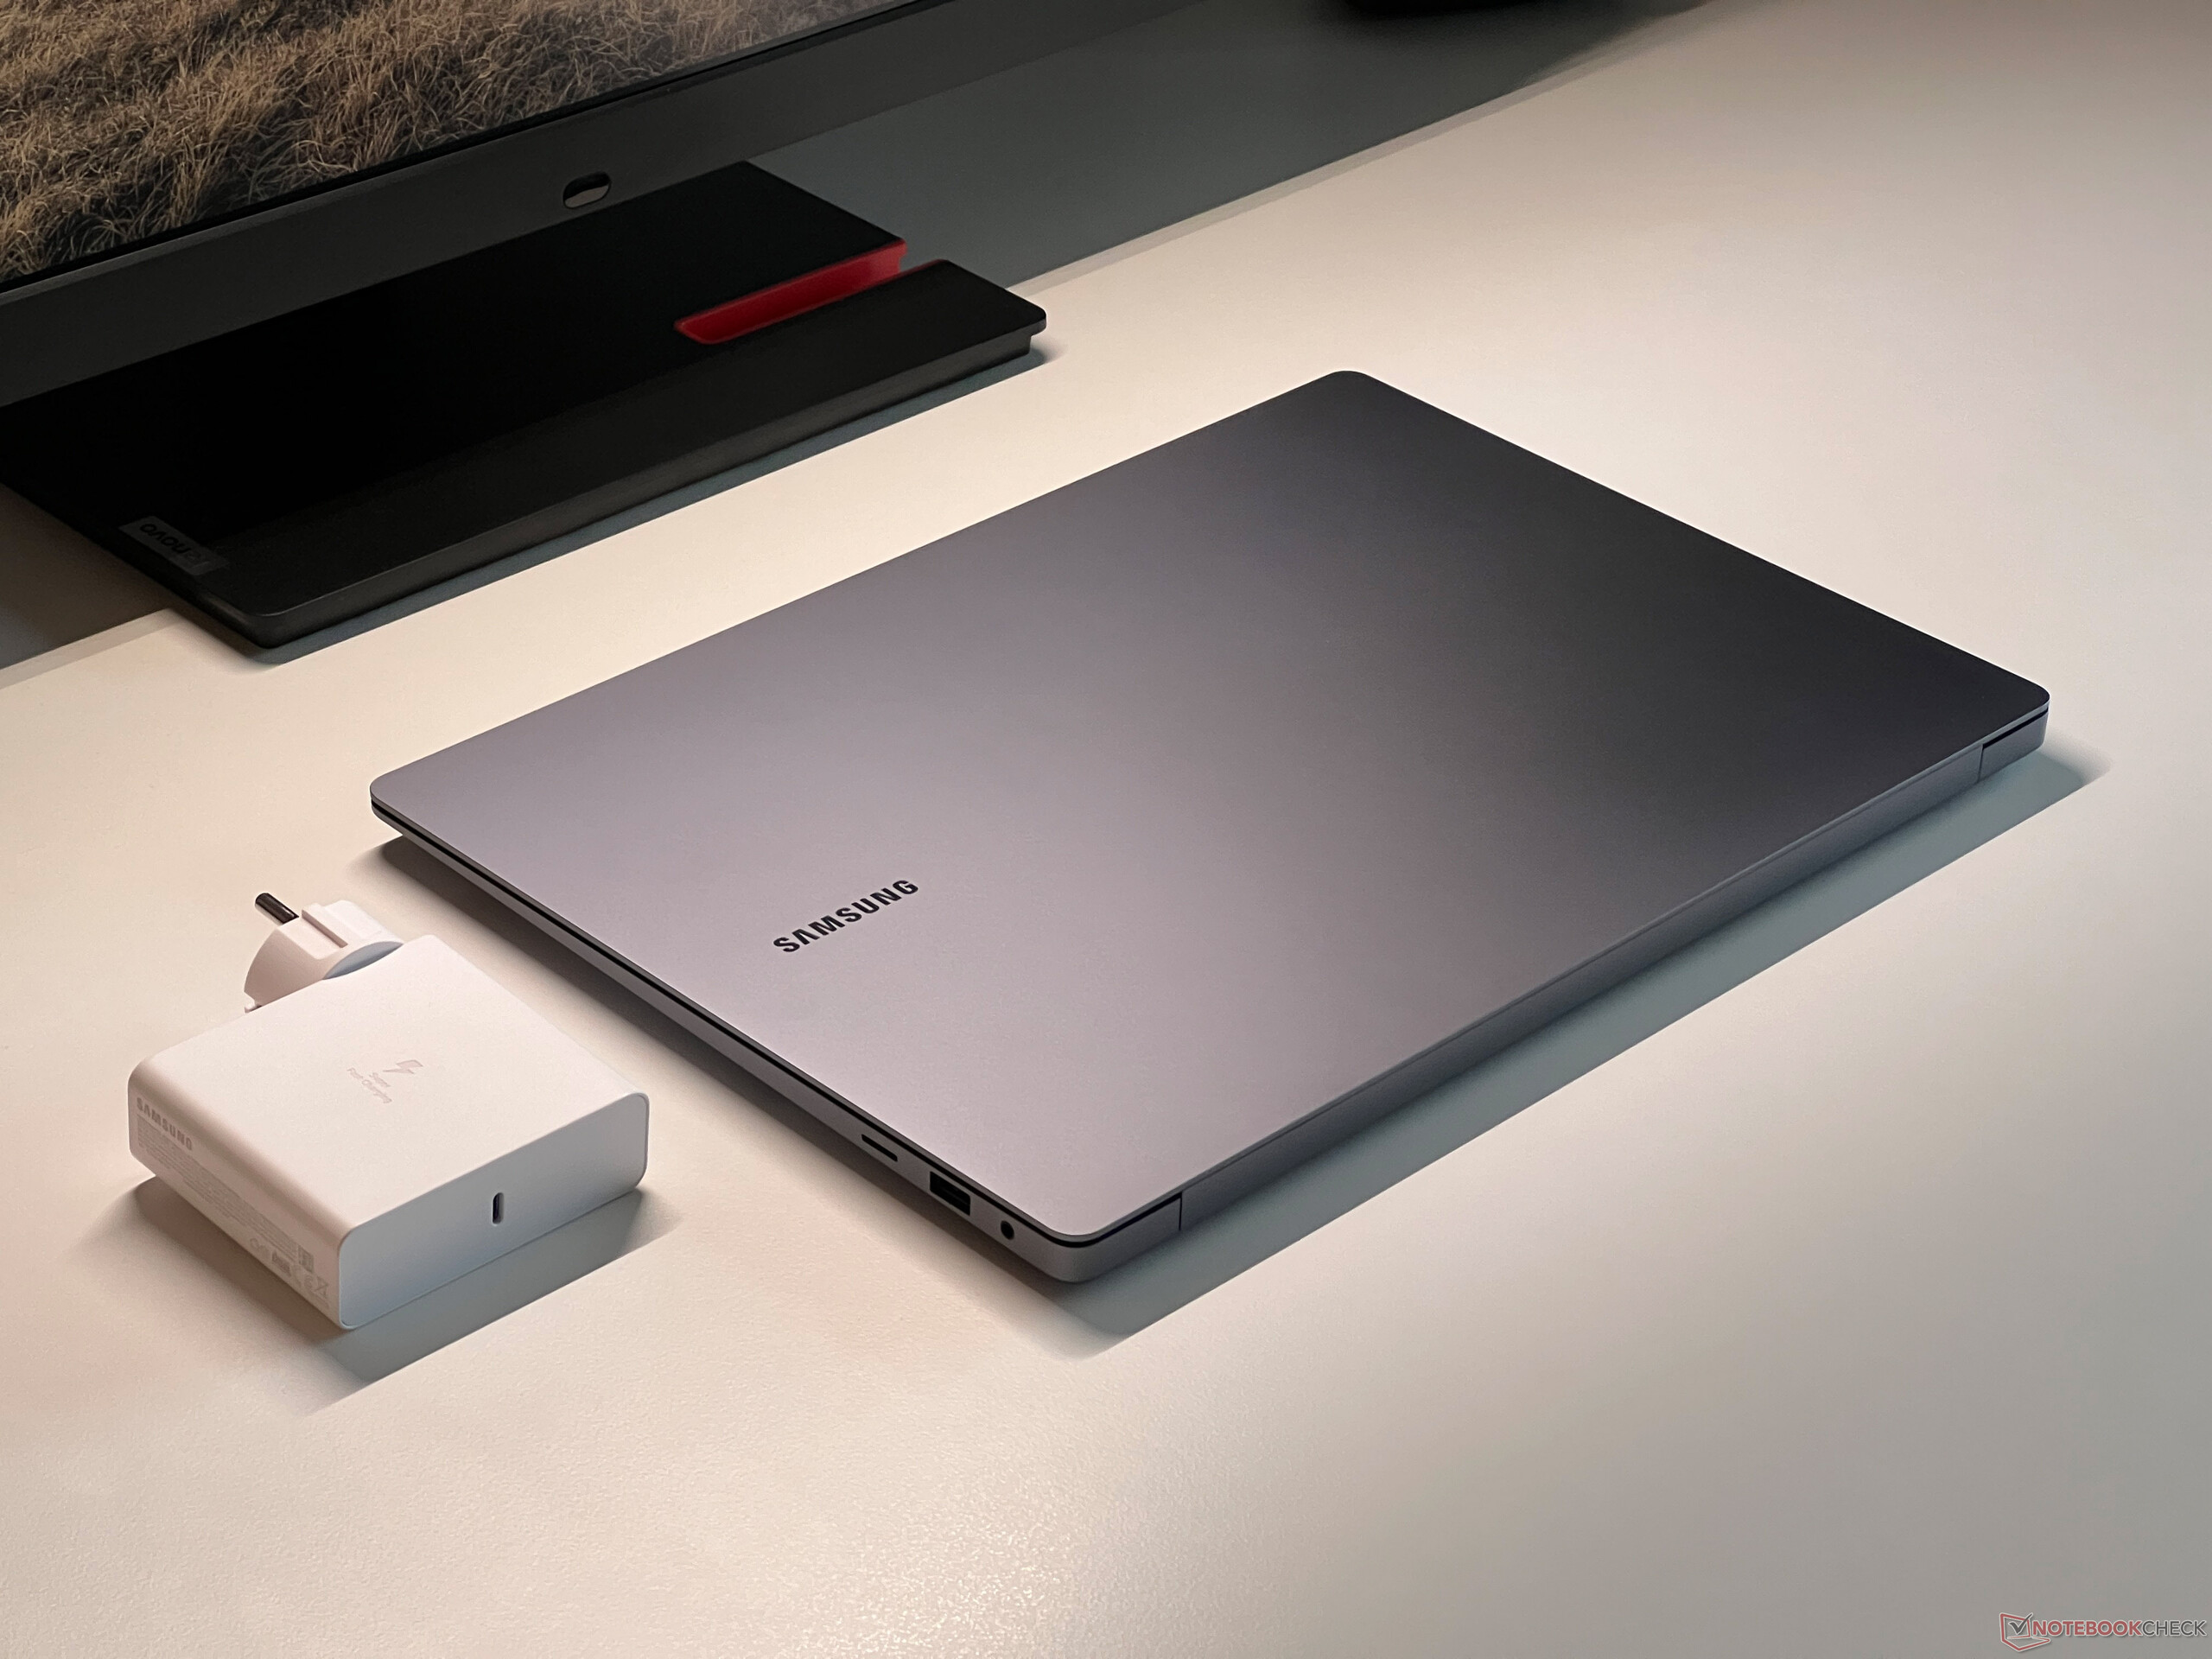
The thick screen bezel is also noticeable in terms of the thickness of the device with the Book4 Ultra taking up the most space compared to its piers. With a height of 16.5 mm and a weight of 1.82 kg, the review device sits in the middle of the pack. The supplied 140-watt PSU brings another 351 grams to the scales.
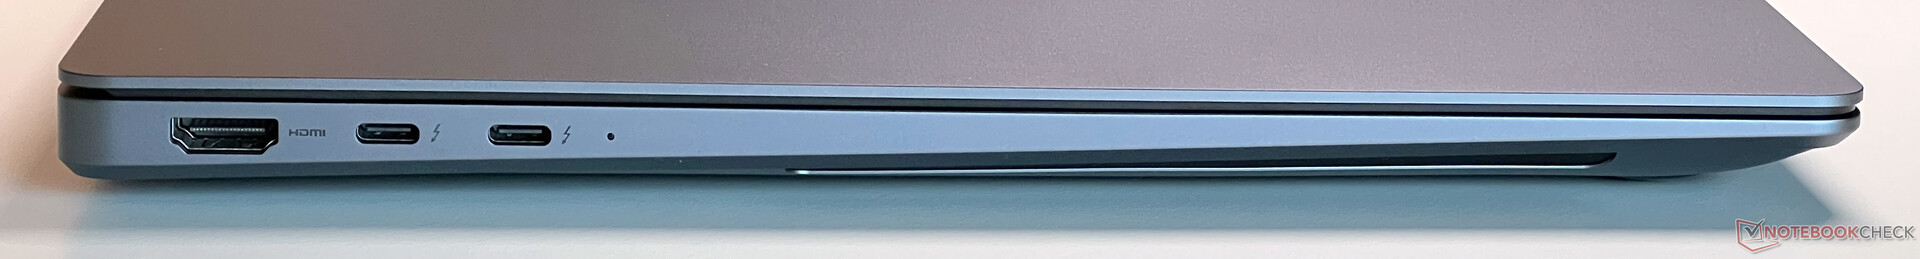
Features - Thunderbolt 4 & HDMI 2.1
In addition to the modern USB-C interfaces which include Thunderbolt 4, the Galaxy Book4 Ultra also offers a regular USB-A port as well as HDMI 2.1. However, one of the USB interfaces can also be used for the PSU. No complaints can be made regarding the port location on both of the rear sides of the device. The HDMI connector is connected directly to the Nvidia GPU but not both USB-C ports. When using an external monitor, the dGPU doesn't always automatically operate simultaneously.
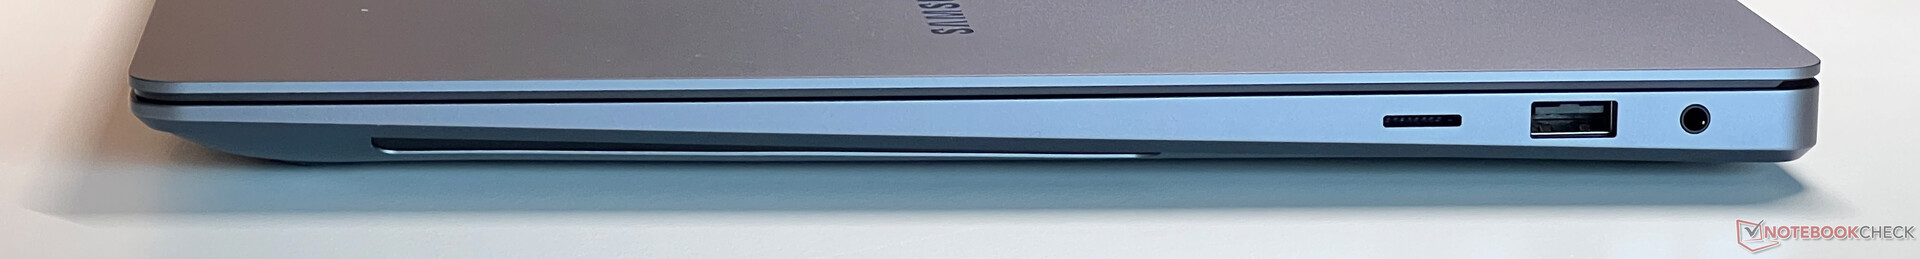
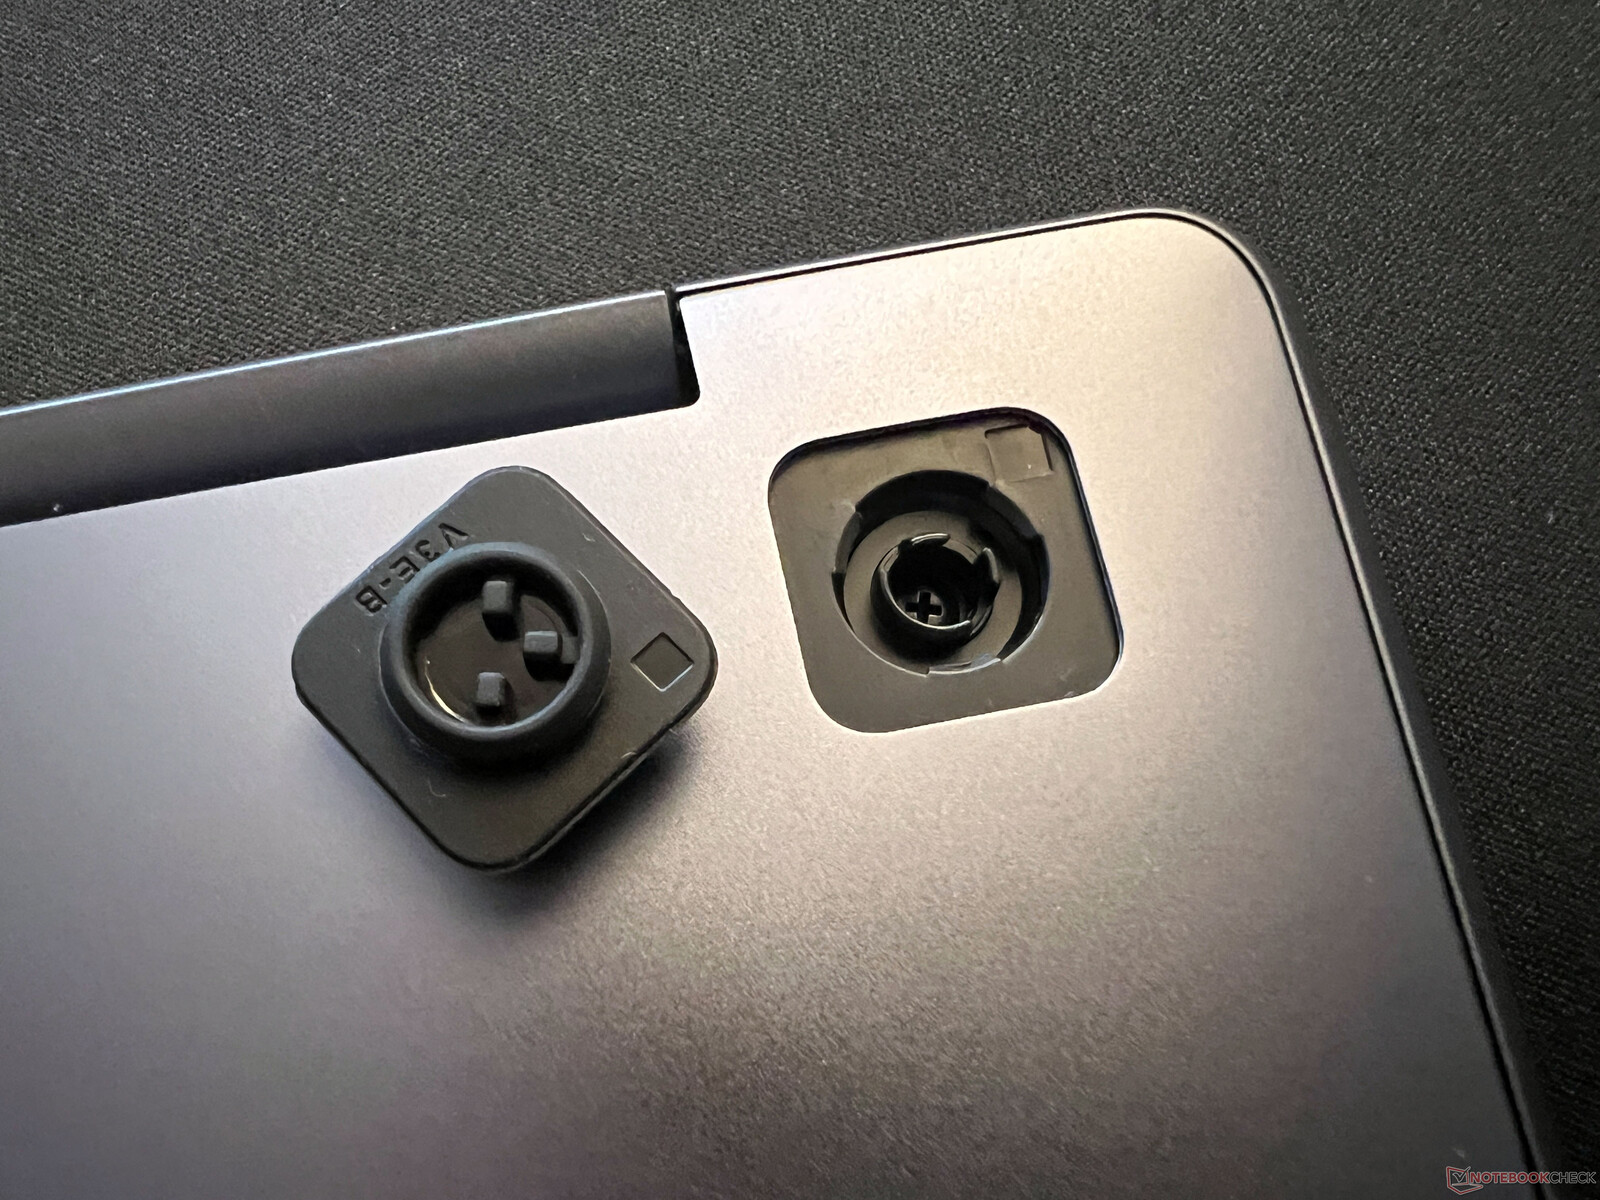
SD card reader
In our test, the microSD card reader on the right-hand side achieved averaged speeds of ~80 to 90 MB/s paired with our reference card, the Angelbird AV Pro V60. However, the reader itself is problematic (spring mechanism) because the connection point sits very deep inside the case thereby making it difficult to either easily install or remove the card without the help of a tool/aid.
| SD Card Reader | |
| average JPG Copy Test (av. of 3 runs) | |
| Lenovo ThinkPad Z16 Gen 2 (Toshiba Exceria Pro SDXC 64 GB UHS-II) | |
| Average of class Multimedia (23 - 531, n=43, last 2 years) | |
| Samsung Galaxy Book4 Ultra (Angelbird AV Pro V60) | |
| Lenovo Slim Pro 9i 16IRP8 (PNY EliteX-Pro60 V60 256 GB) | |
| Samsung Galaxy Book3 Ultra 16 (AV PRO microSD 128 GB V60) | |
| Schenker VISION 16 Pro (M23) (Angelbird AV Pro V60) | |
| maximum AS SSD Seq Read Test (1GB) | |
| Lenovo ThinkPad Z16 Gen 2 (Toshiba Exceria Pro SDXC 64 GB UHS-II) | |
| Average of class Multimedia (27.9 - 1455, n=42, last 2 years) | |
| Samsung Galaxy Book4 Ultra (Angelbird AV Pro V60) | |
| Lenovo Slim Pro 9i 16IRP8 (PNY EliteX-Pro60 V60 256 GB) | |
| Samsung Galaxy Book3 Ultra 16 (AV PRO microSD 128 GB V60) | |
| Schenker VISION 16 Pro (M23) (Angelbird AV Pro V60) | |
Communication
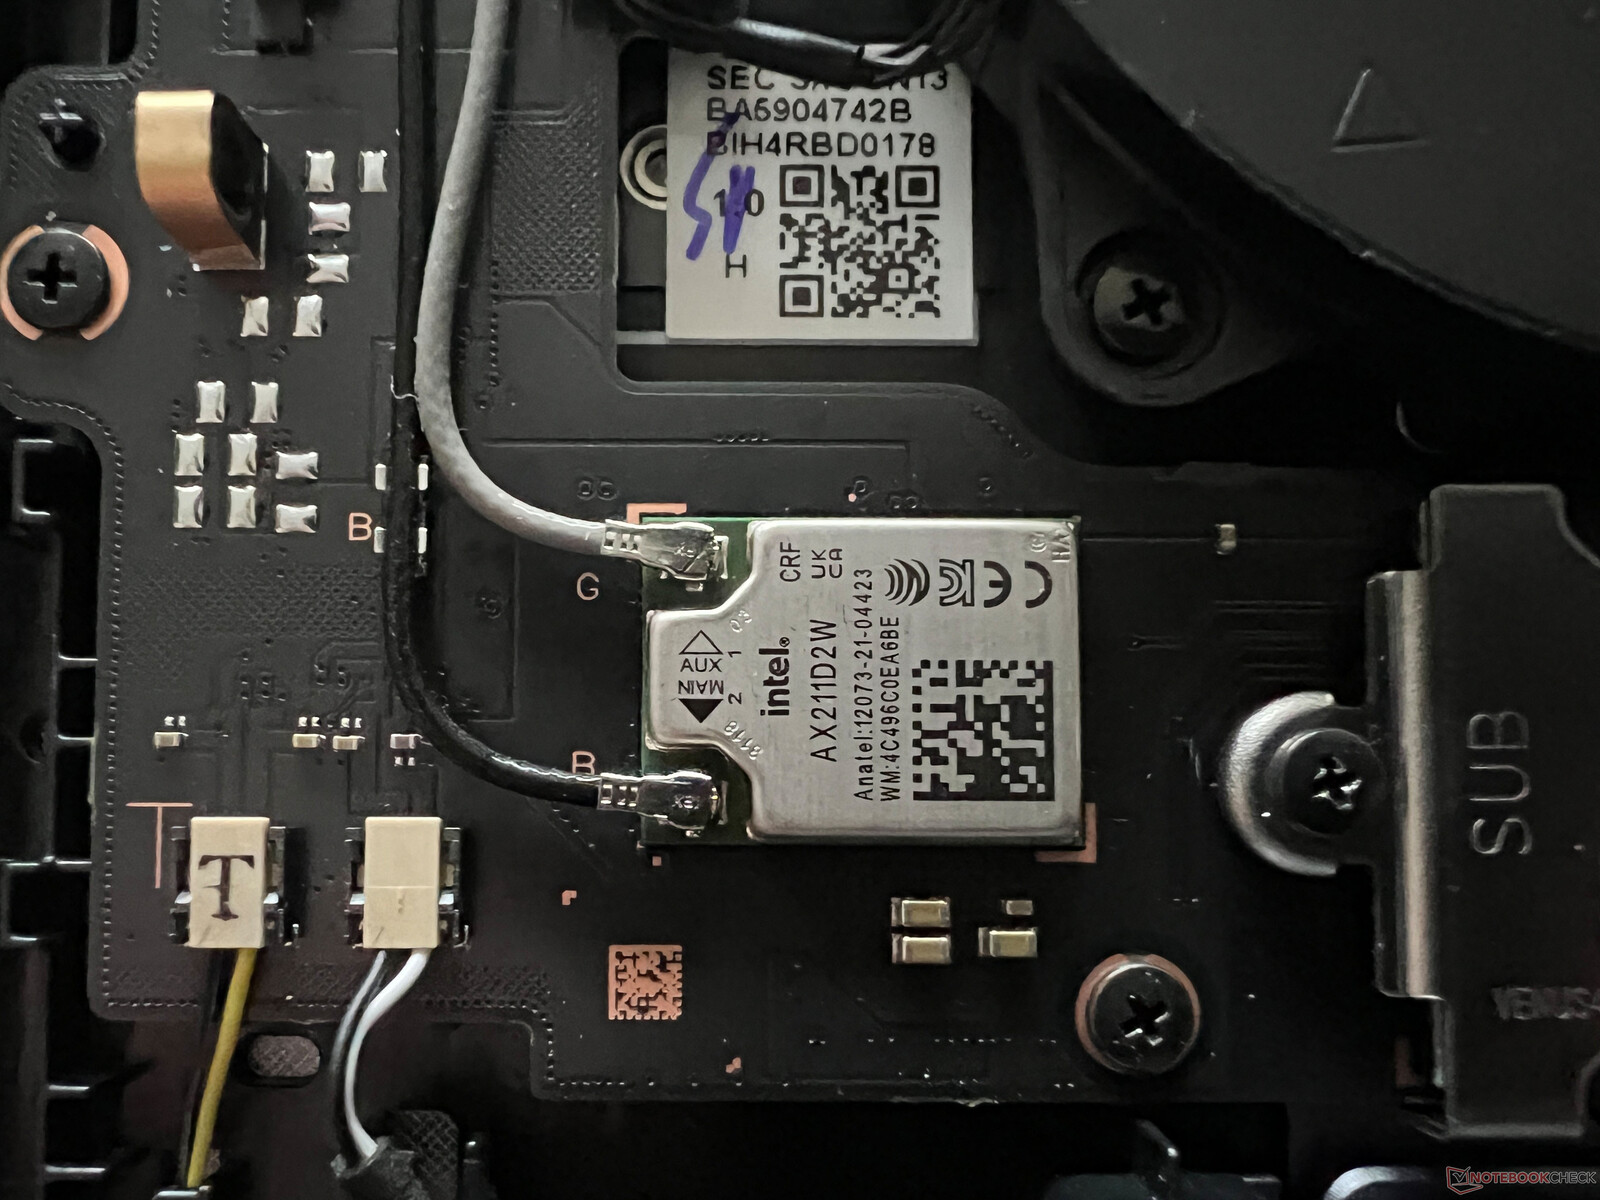
Samsung uses the familiar Intel AX211 module which supports the Wi-Fi 6E standard in 6 GHz networks as well as Bluetooth 5.3. Working in tandem with our Asus reference router, the transfer speeds are very good and stable. Despite this, the new Galaxy Book4 Ultra doesn't support Wi-Fi 7.
| Networking | |
| Samsung Galaxy Book4 Ultra | |
| iperf3 transmit AXE11000 | |
| iperf3 receive AXE11000 | |
| Lenovo ThinkPad Z16 Gen 2 | |
| iperf3 transmit AXE11000 | |
| iperf3 receive AXE11000 | |
| iperf3 transmit AXE11000 6GHz | |
| iperf3 receive AXE11000 6GHz | |
| Lenovo Slim Pro 9i 16IRP8 | |
| iperf3 transmit AXE11000 | |
| iperf3 receive AXE11000 | |
| iperf3 transmit AXE11000 6GHz | |
| iperf3 receive AXE11000 6GHz | |
| Schenker VISION 16 Pro (M23) | |
| iperf3 transmit AXE11000 | |
| iperf3 receive AXE11000 | |
| Samsung Galaxy Book3 Ultra 16 | |
| iperf3 transmit AXE11000 | |
| iperf3 receive AXE11000 | |
| Apple MacBook Pro 16 2023 M3 Max | |
| iperf3 transmit AXE11000 | |
| iperf3 receive AXE11000 | |
| HP Spectre x360 16 RTX 4050 | |
| iperf3 transmit AXE11000 | |
| iperf3 receive AXE11000 | |
| iperf3 transmit AXE11000 6GHz | |
| iperf3 receive AXE11000 6GHz | |
Webcam
When it comes to the 1080p webcam, there are no changes and the quality remains average. The device lacks both a mechanical shutter as well as an IR module for face recognition. Thanks to the Meteor Lake chip's new NPU, Studio Effects (background blur, eye contact, head tracking) for the webcam is supported directly from the operating system, regardless of the app used.


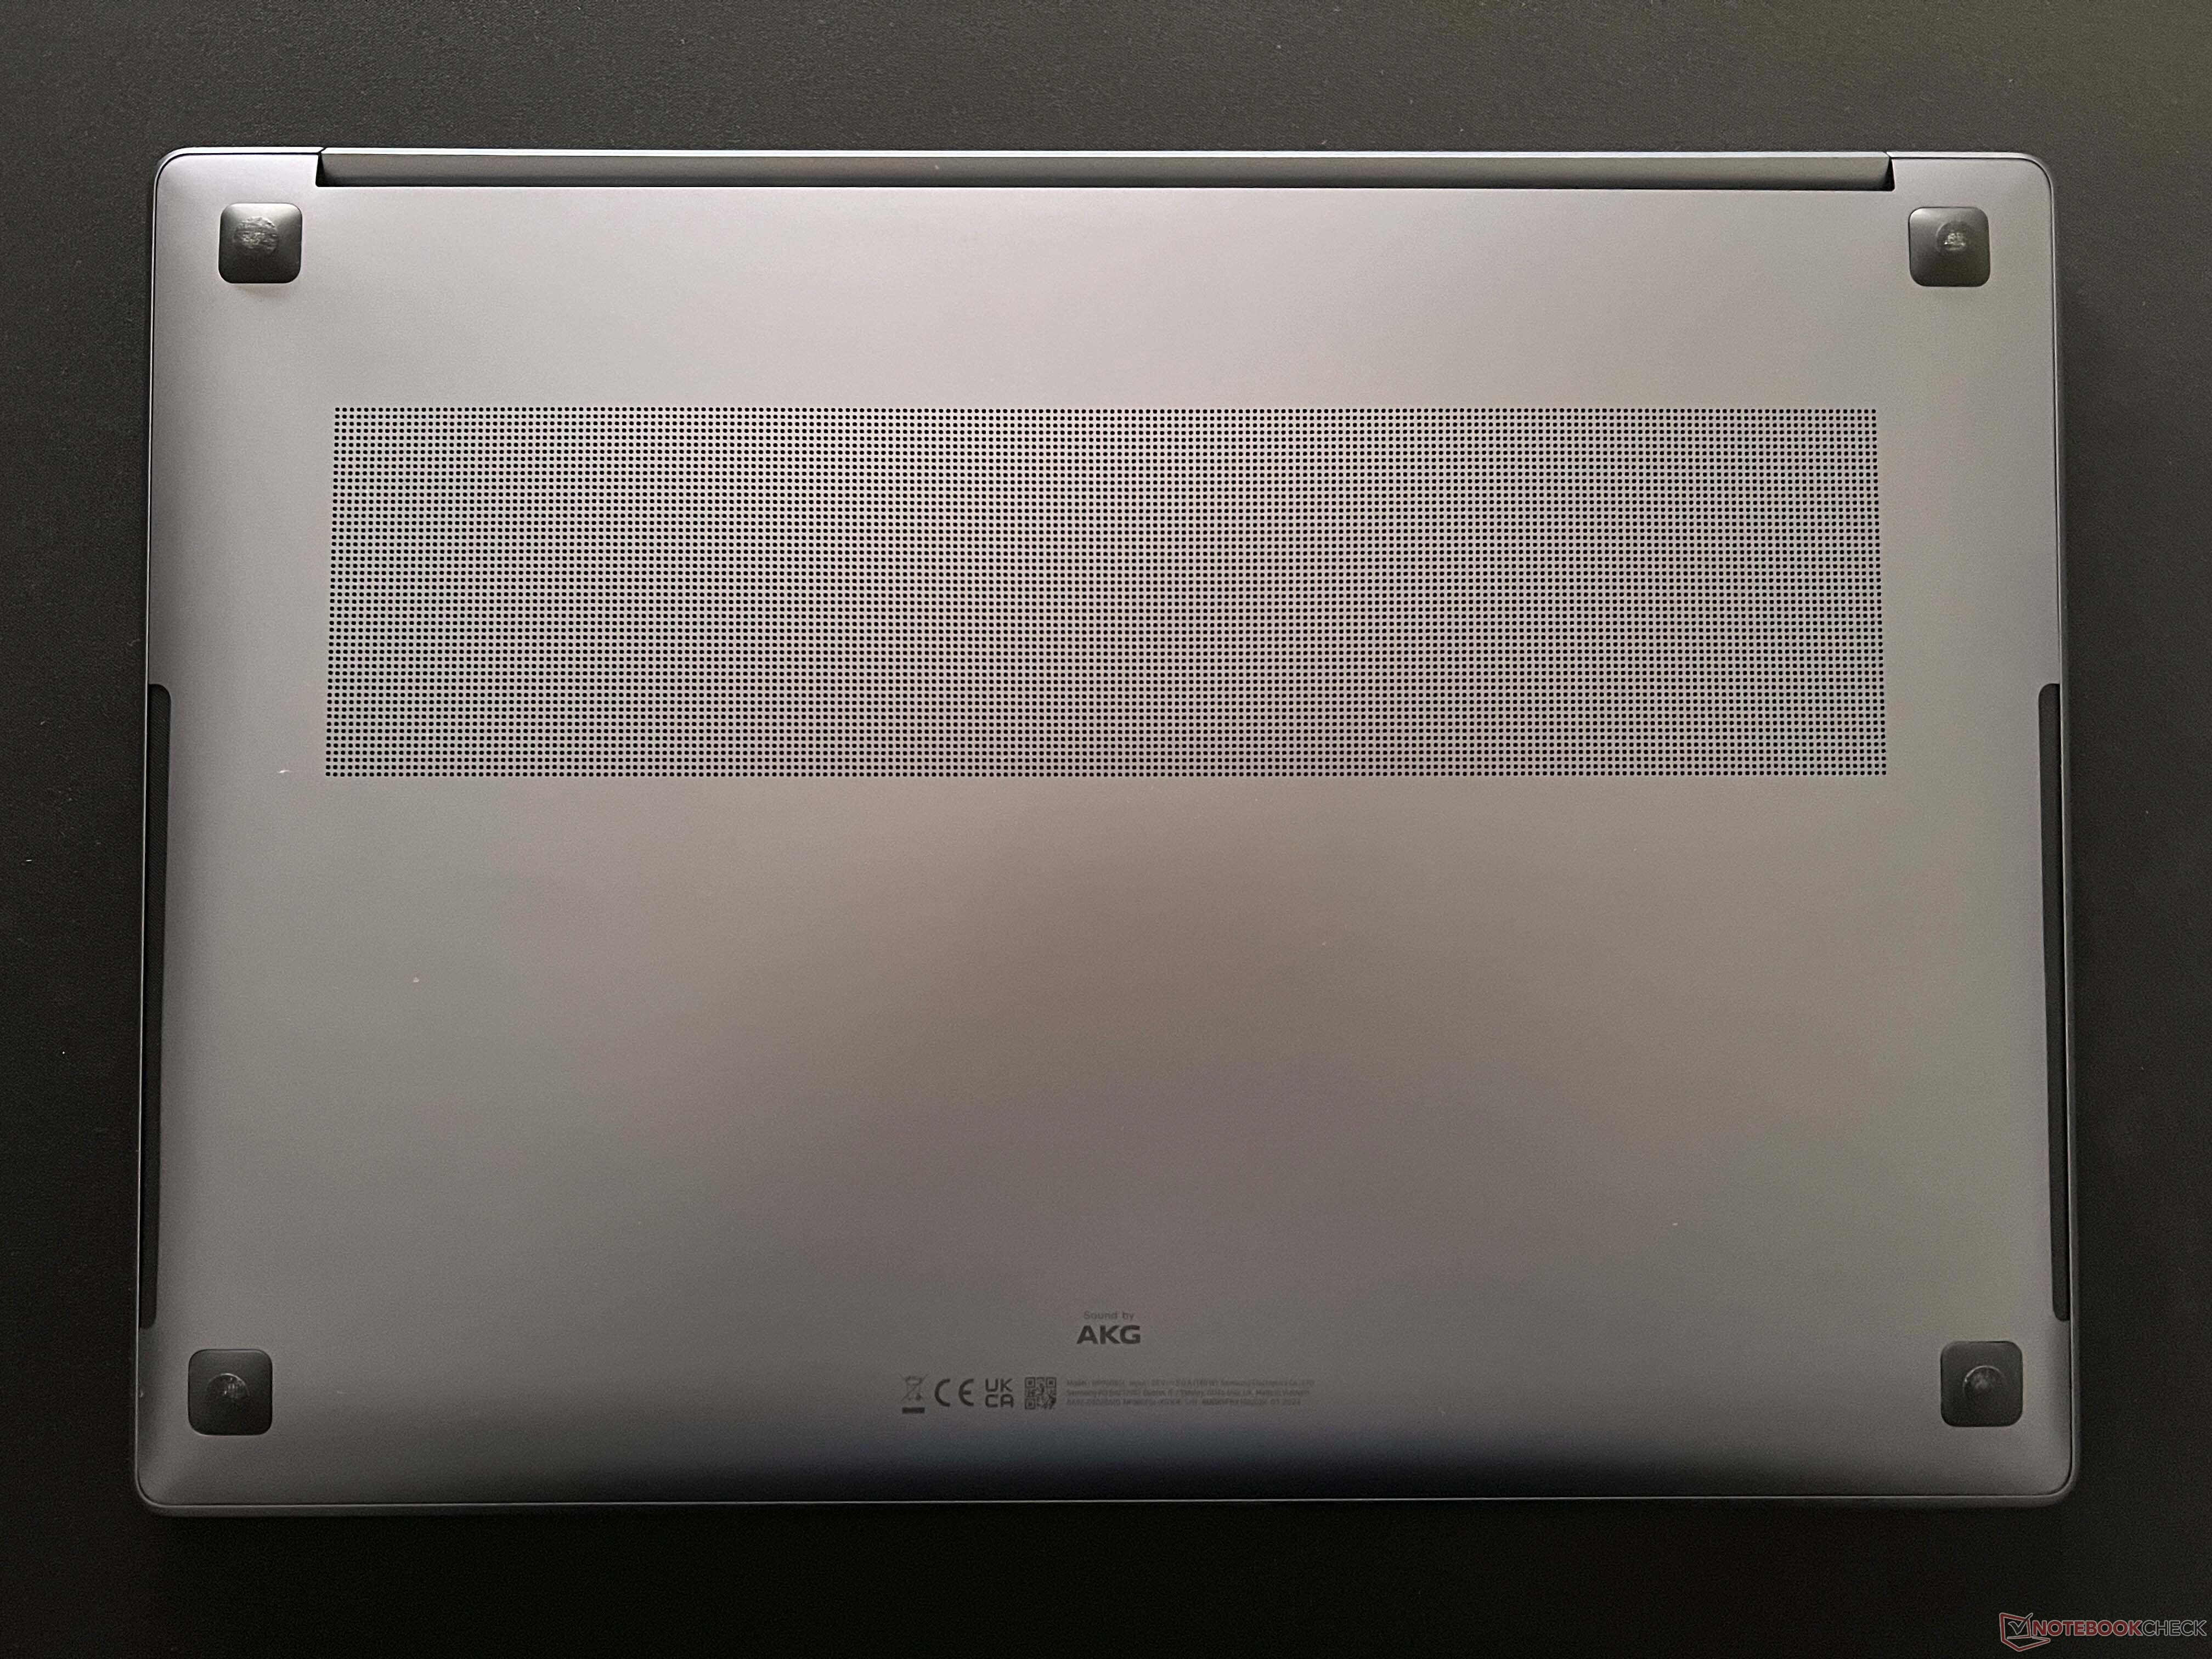
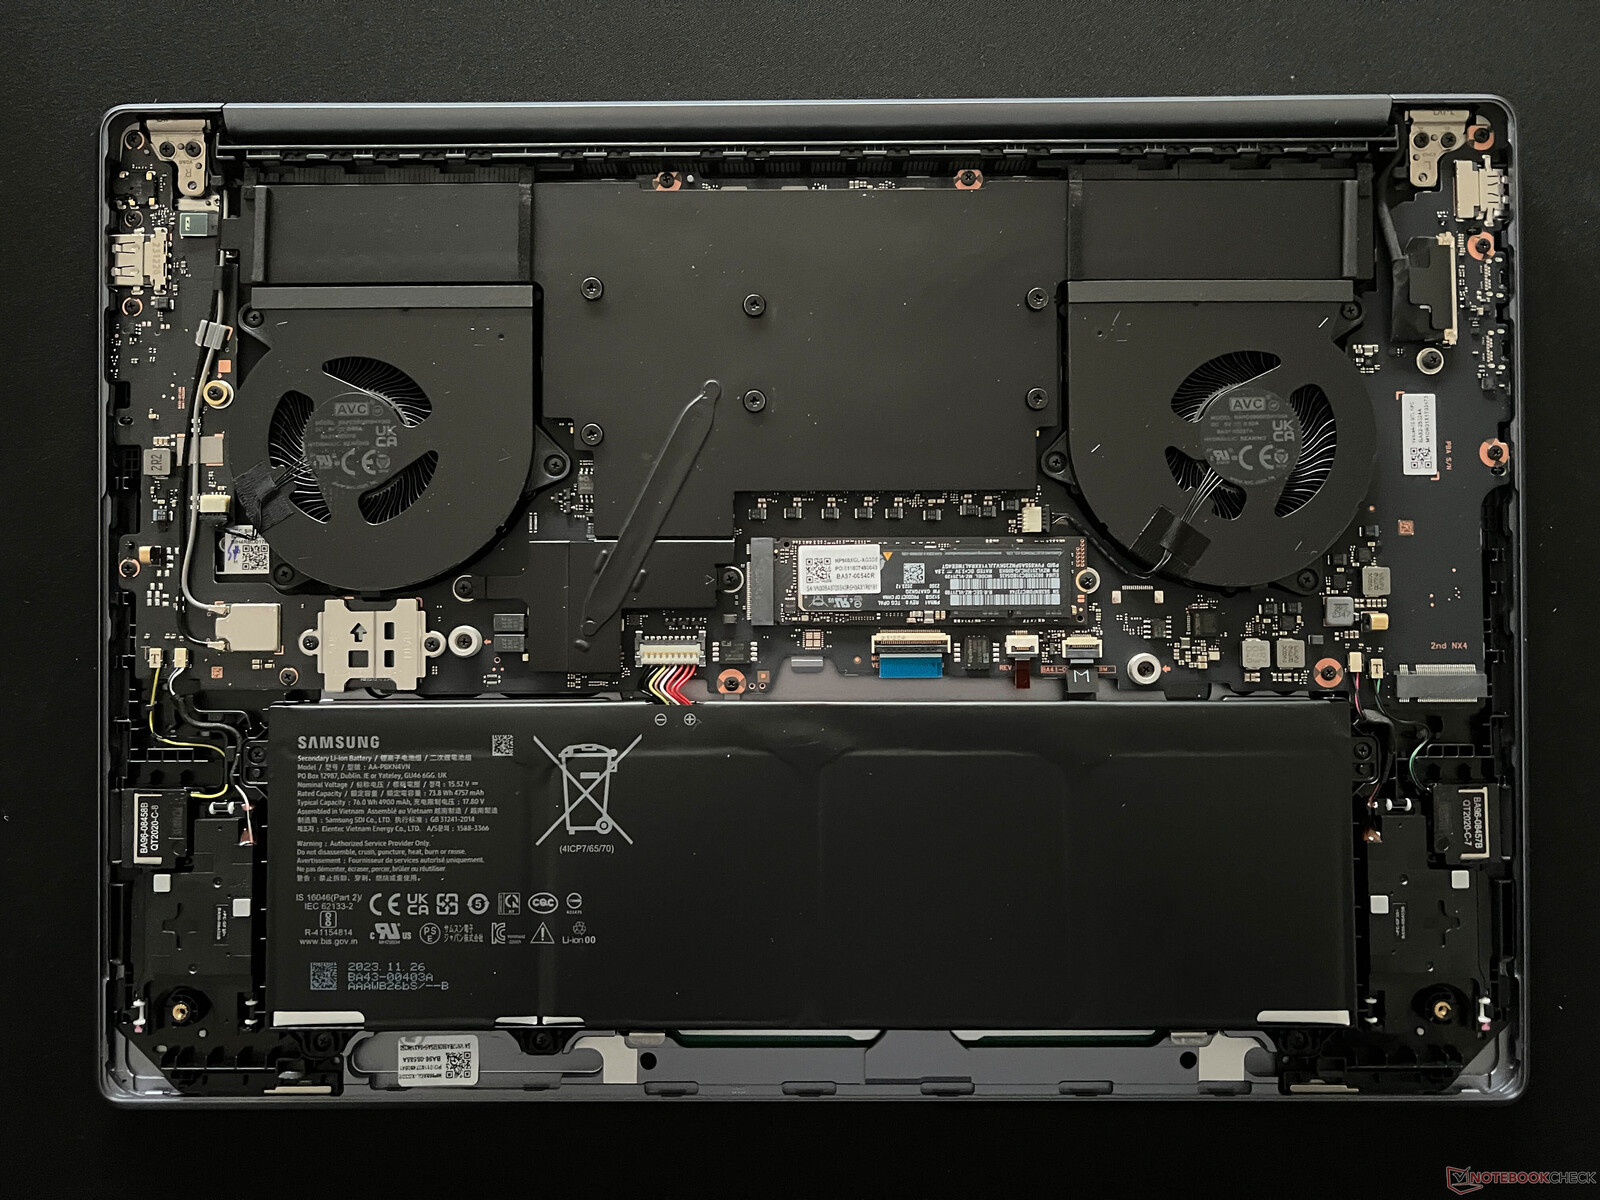
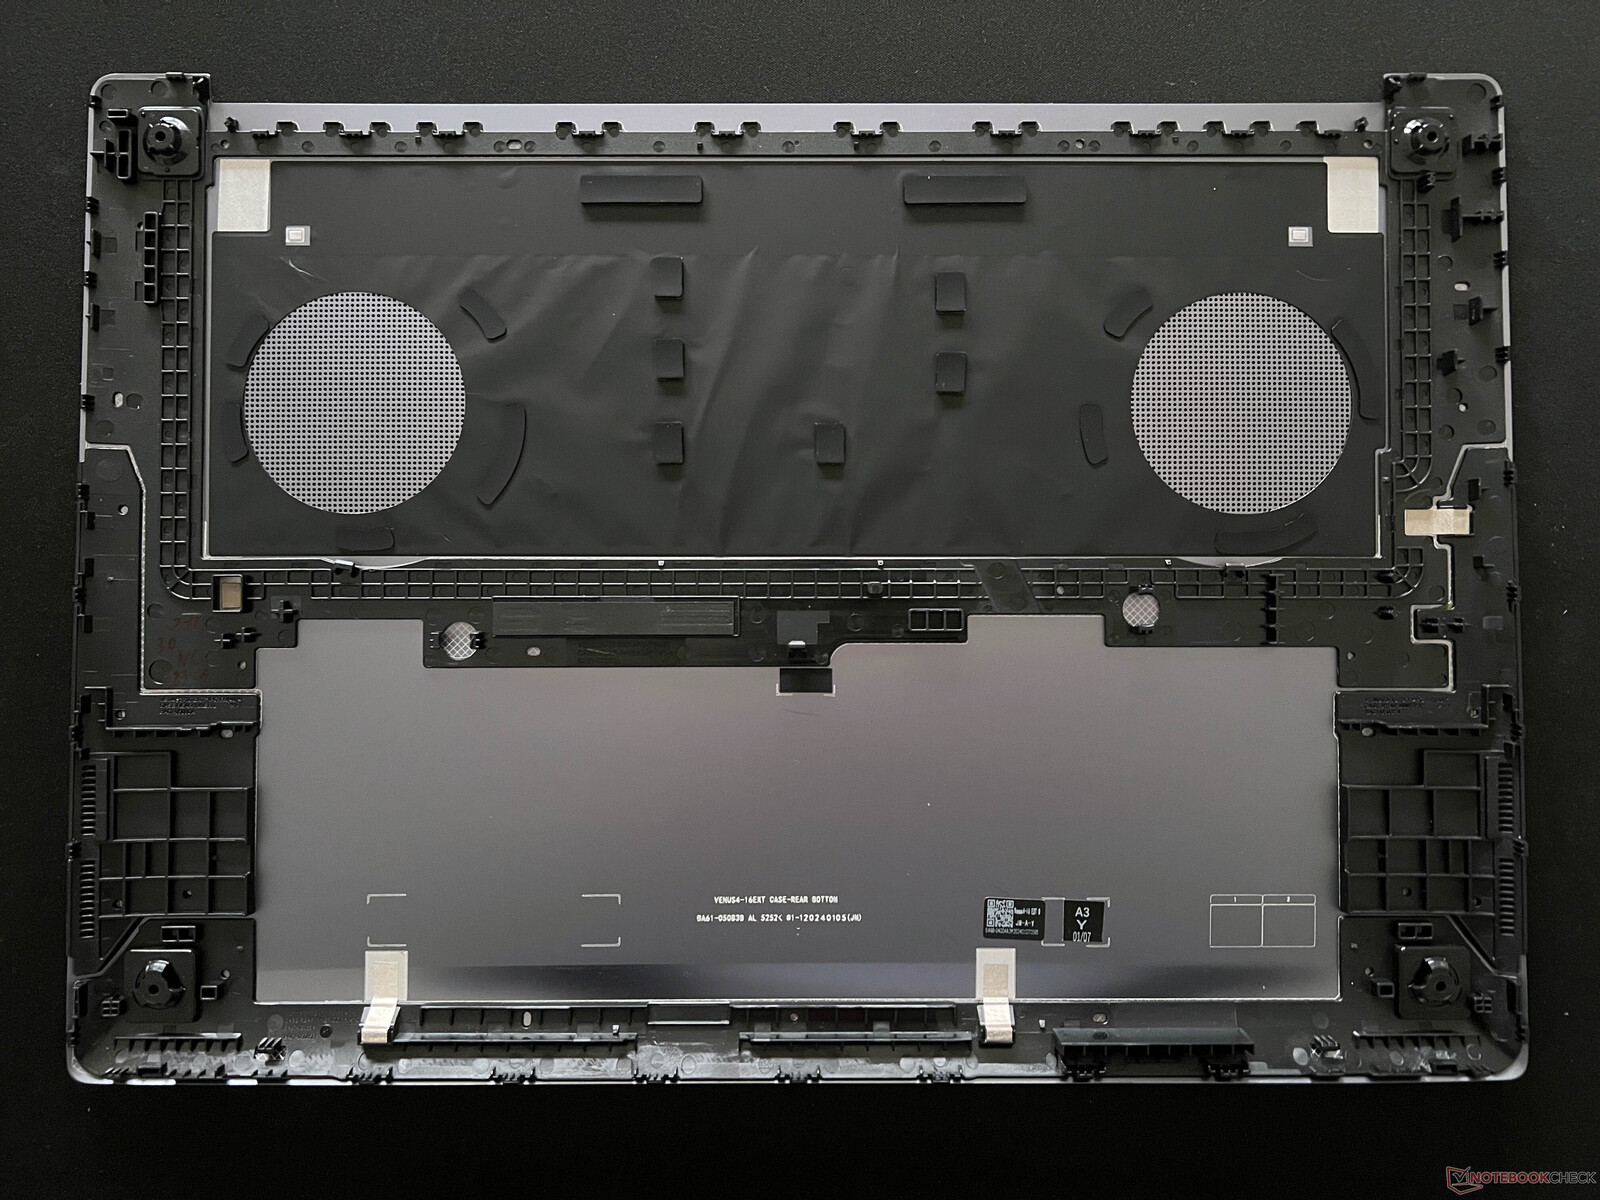
Maintenance
On the base of the unit, four screws are hidden under the fitted rubber feet. But, even without the screws, the base lid is secured very firmly since there are additional fixing clips in the middle. Inside the device, you are confronted by both fans and the large vapor chamber. There are two slots for M.2 2280 SSDs and although the screwed-in battery can be replaced, all the other components are soldered.
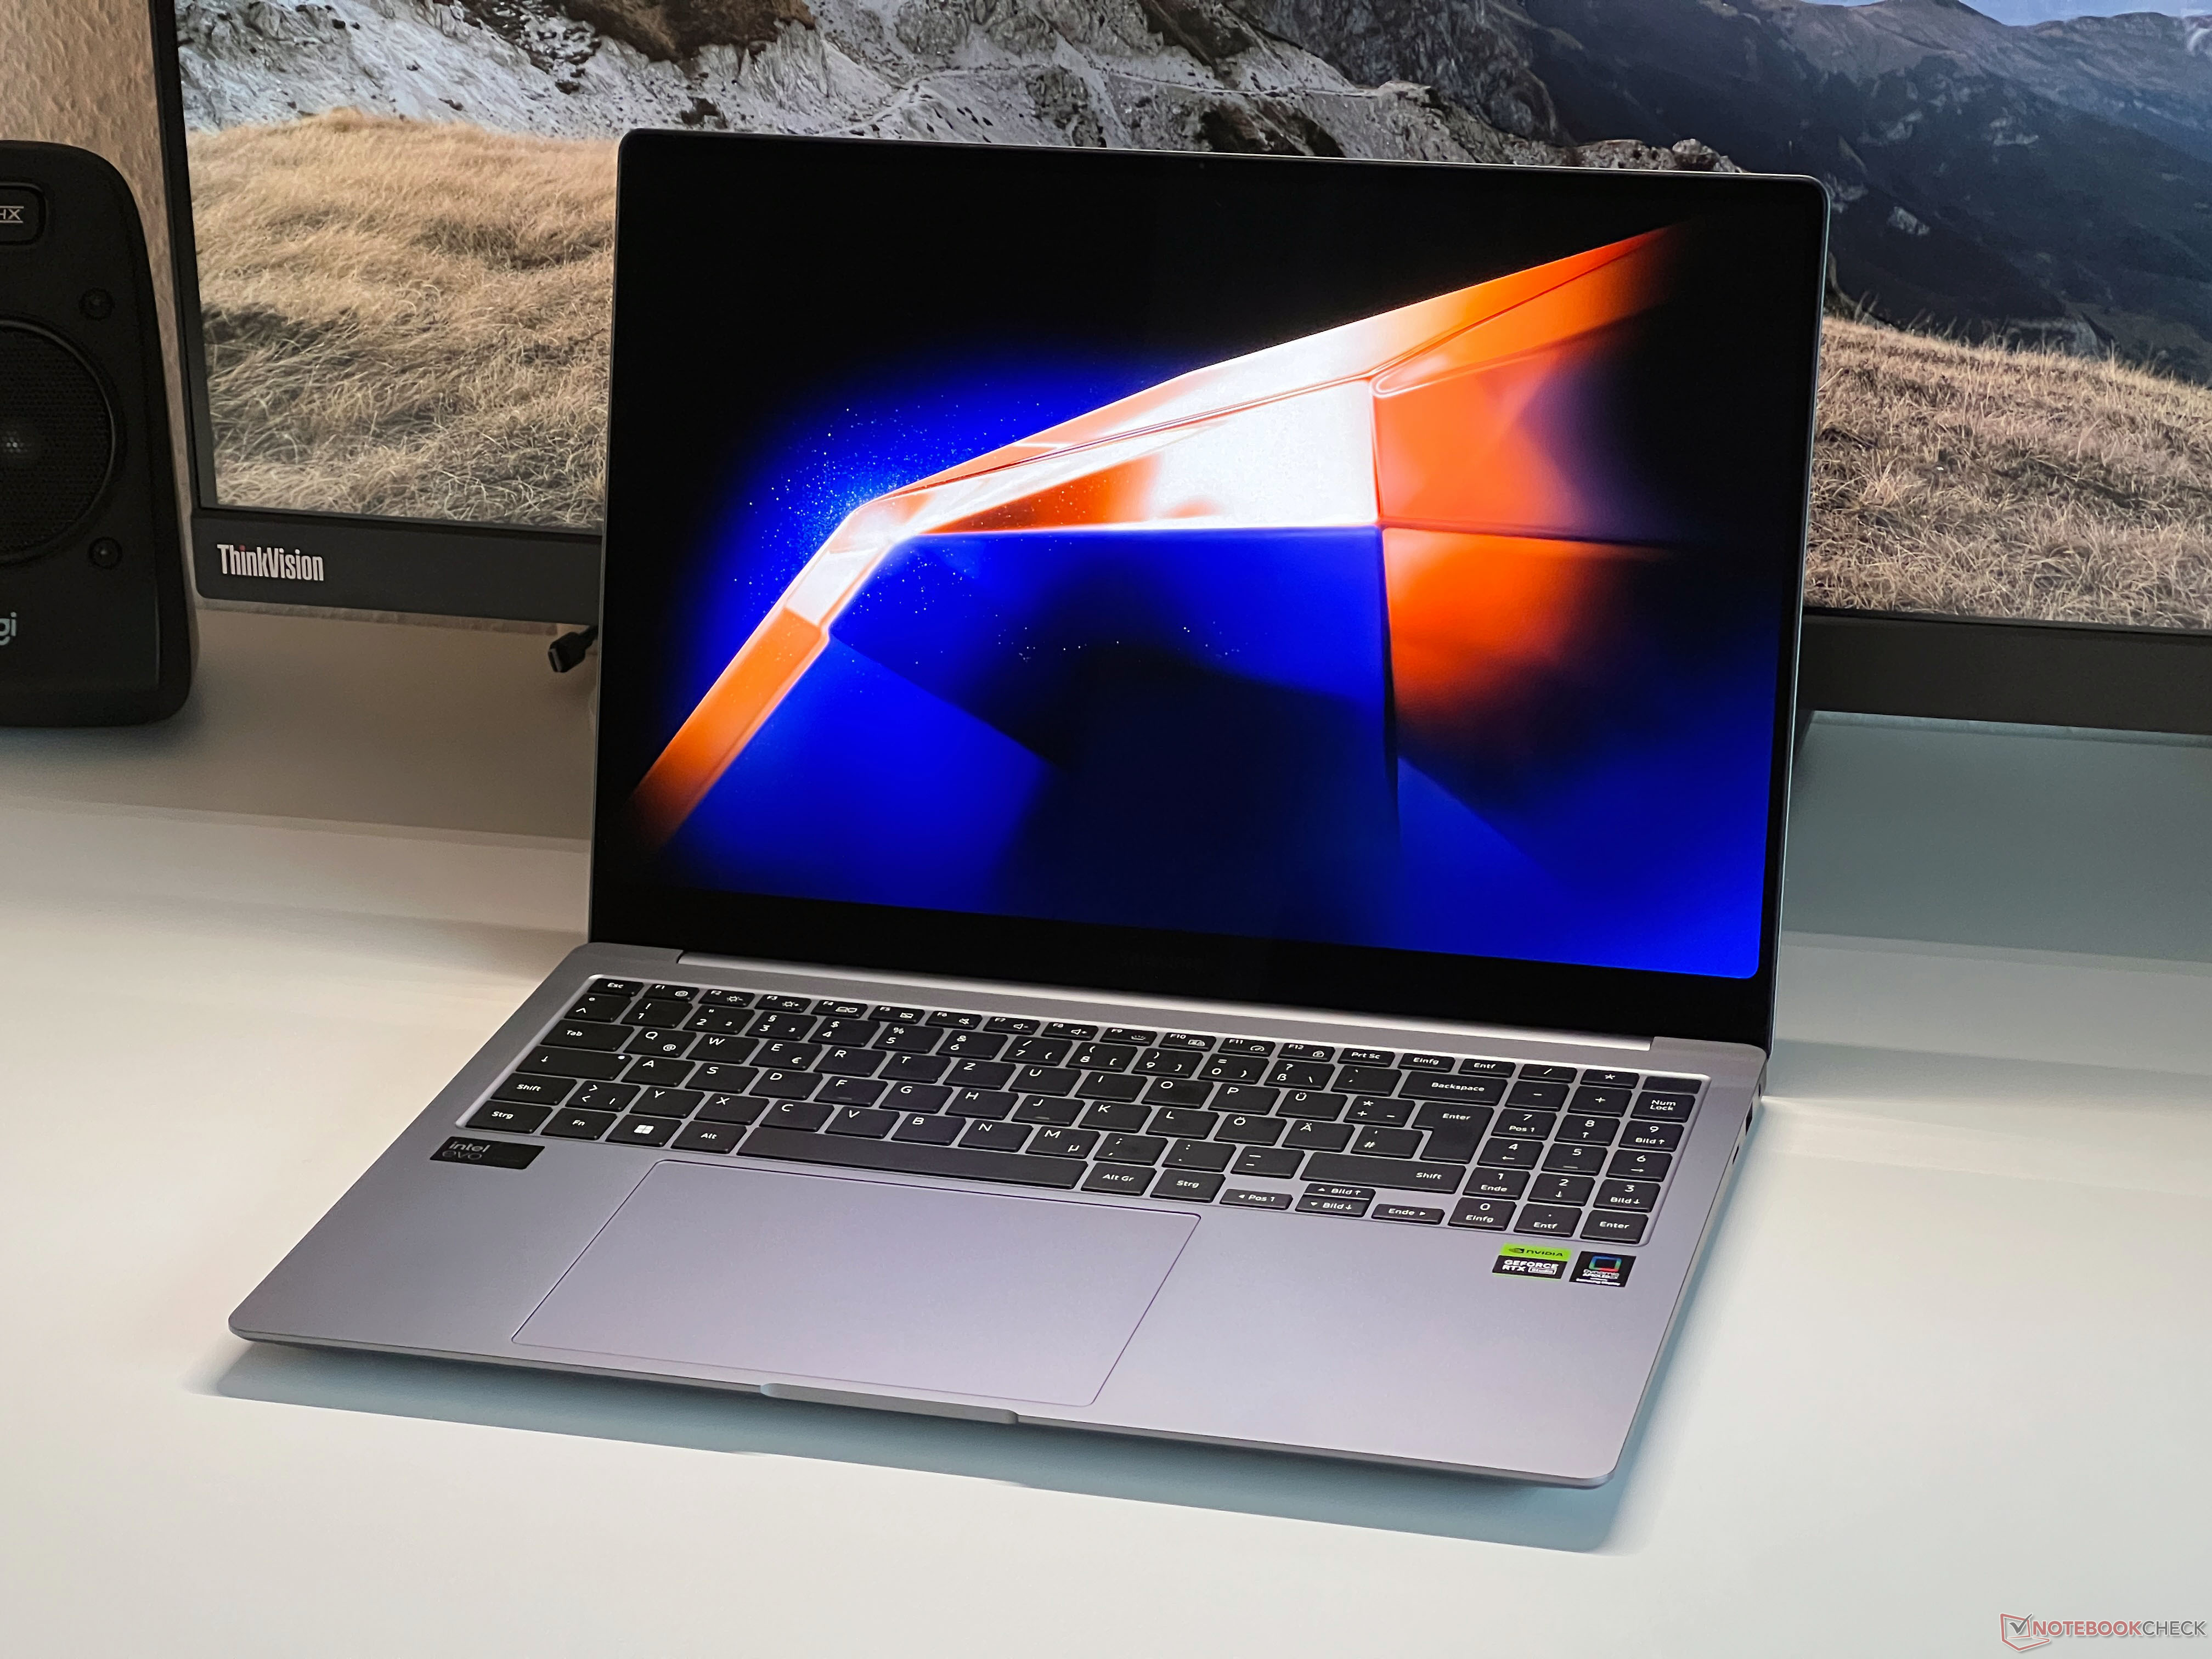
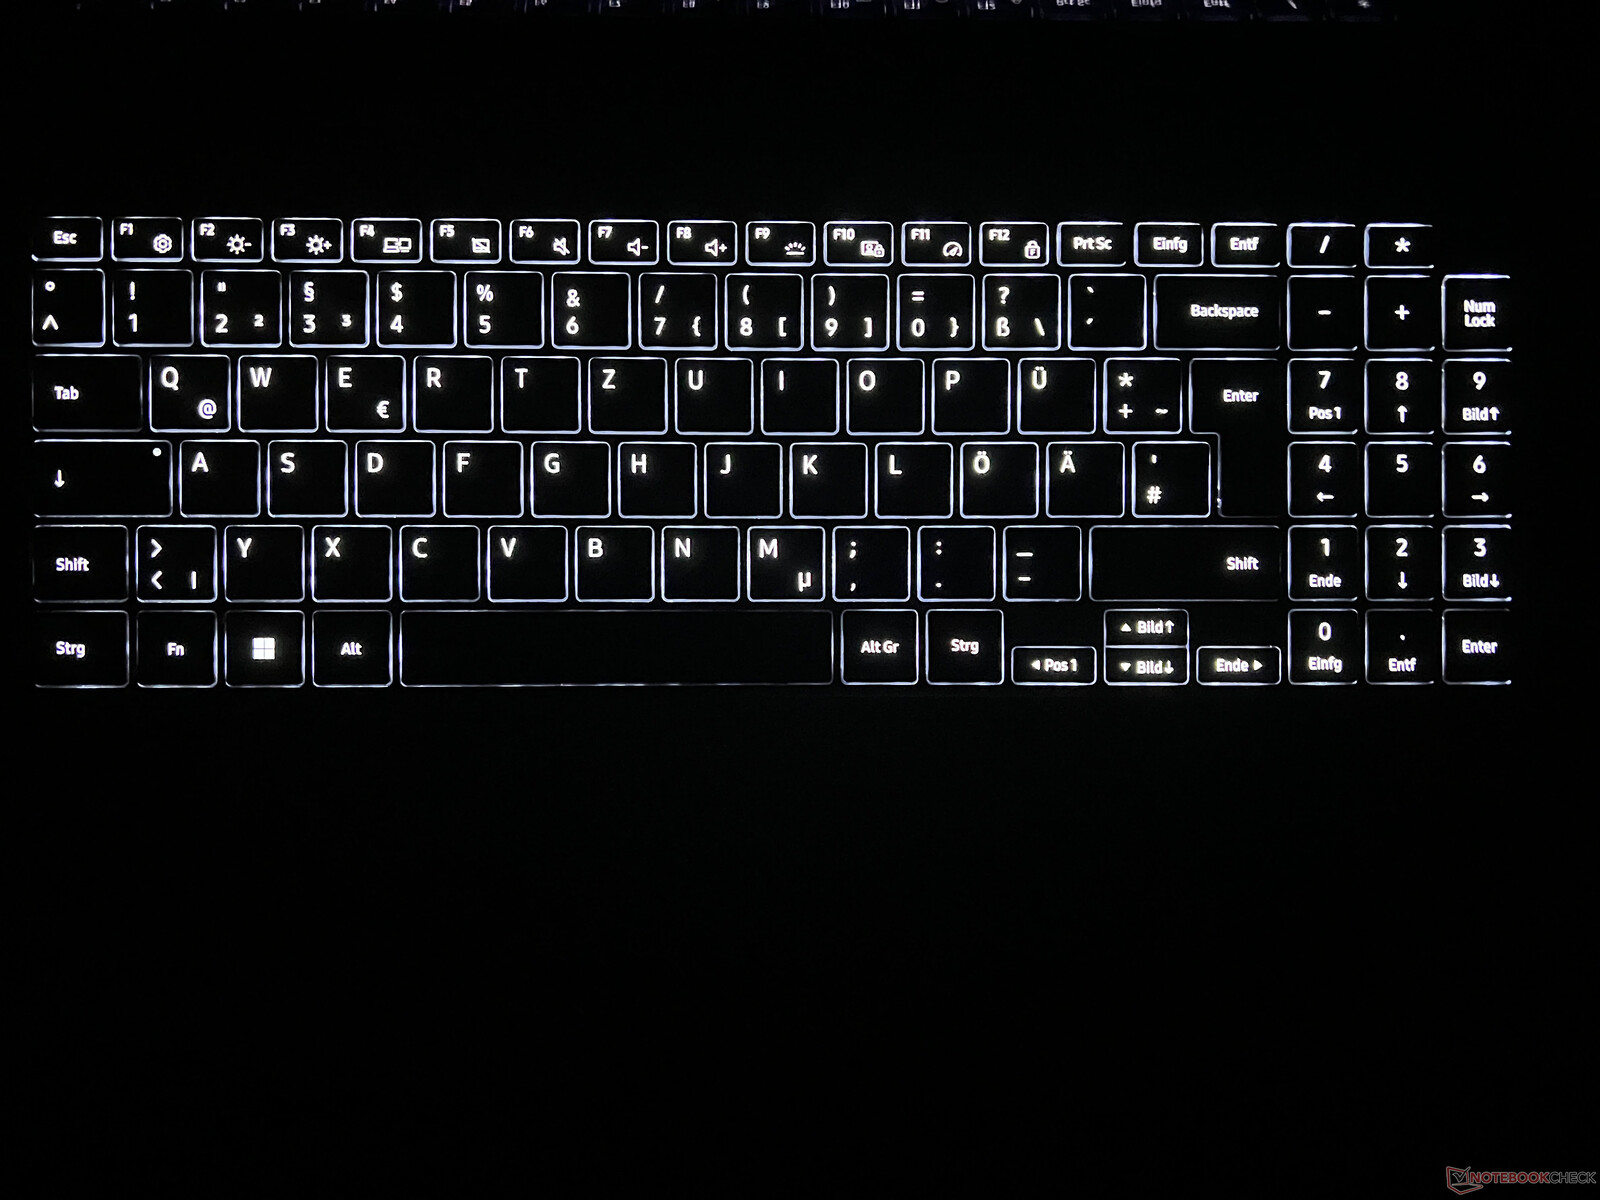
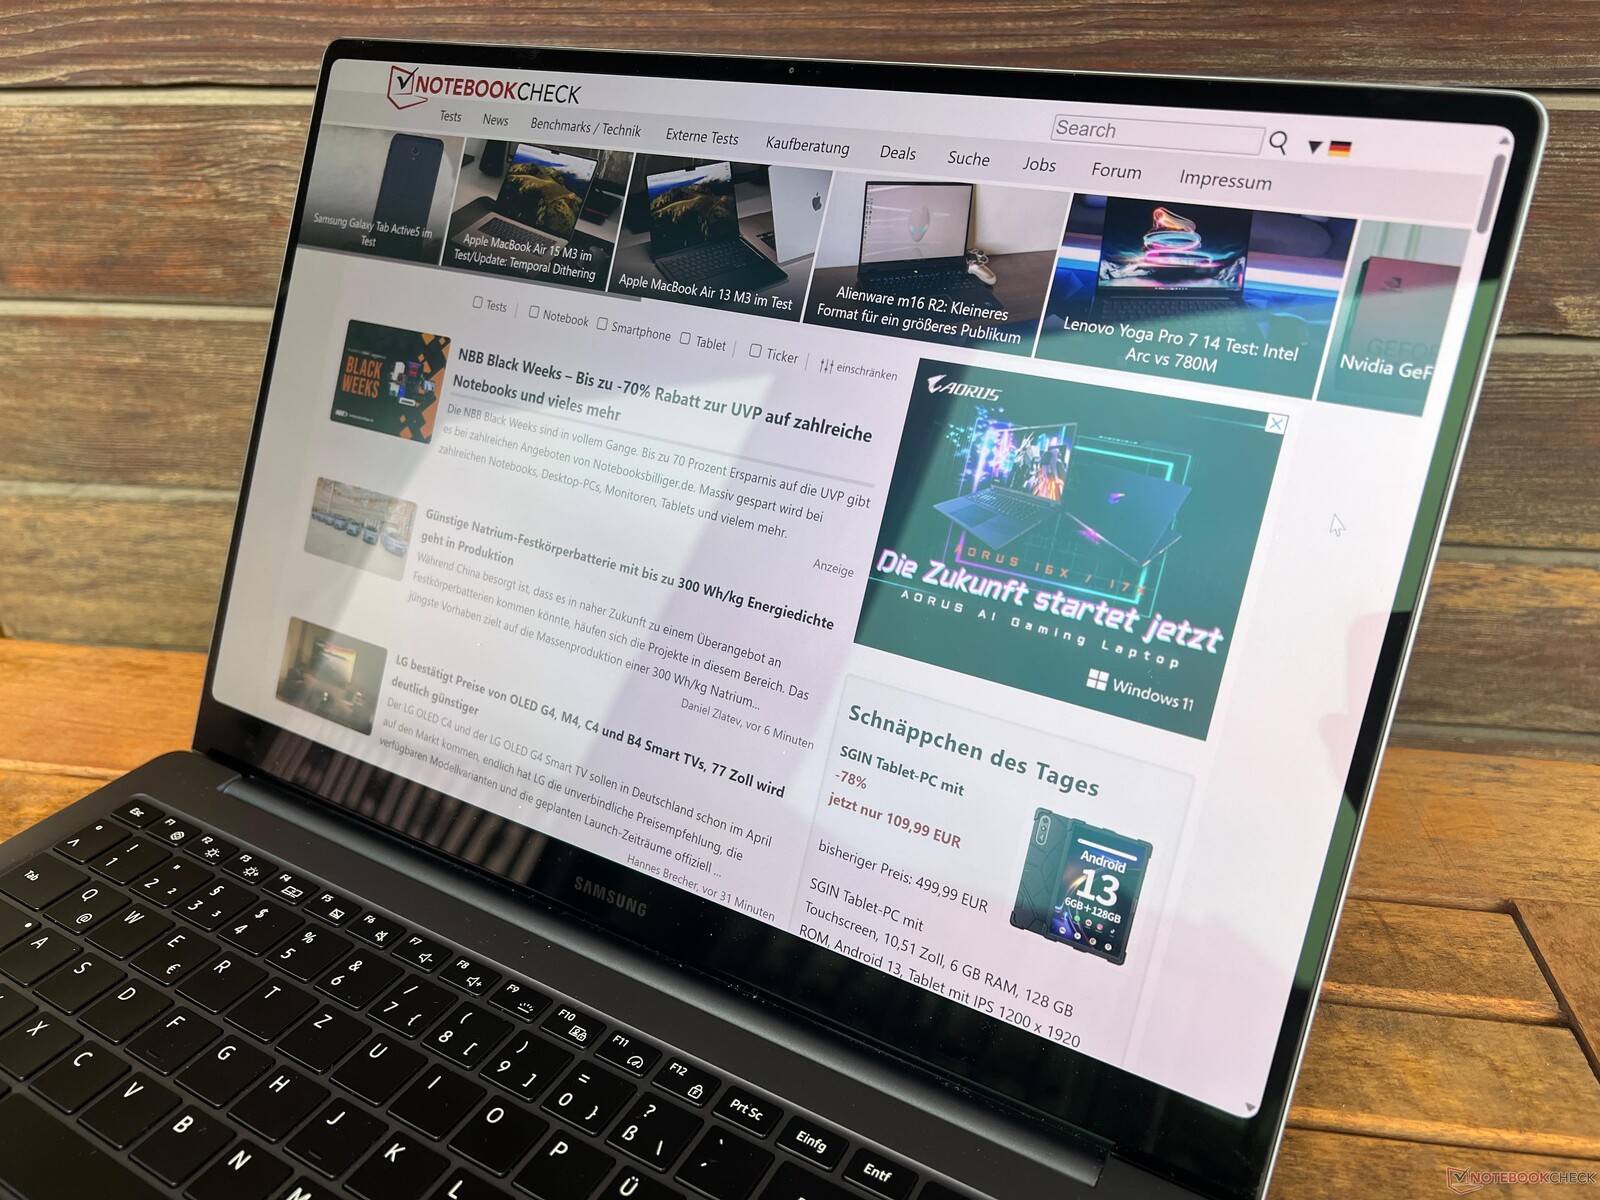
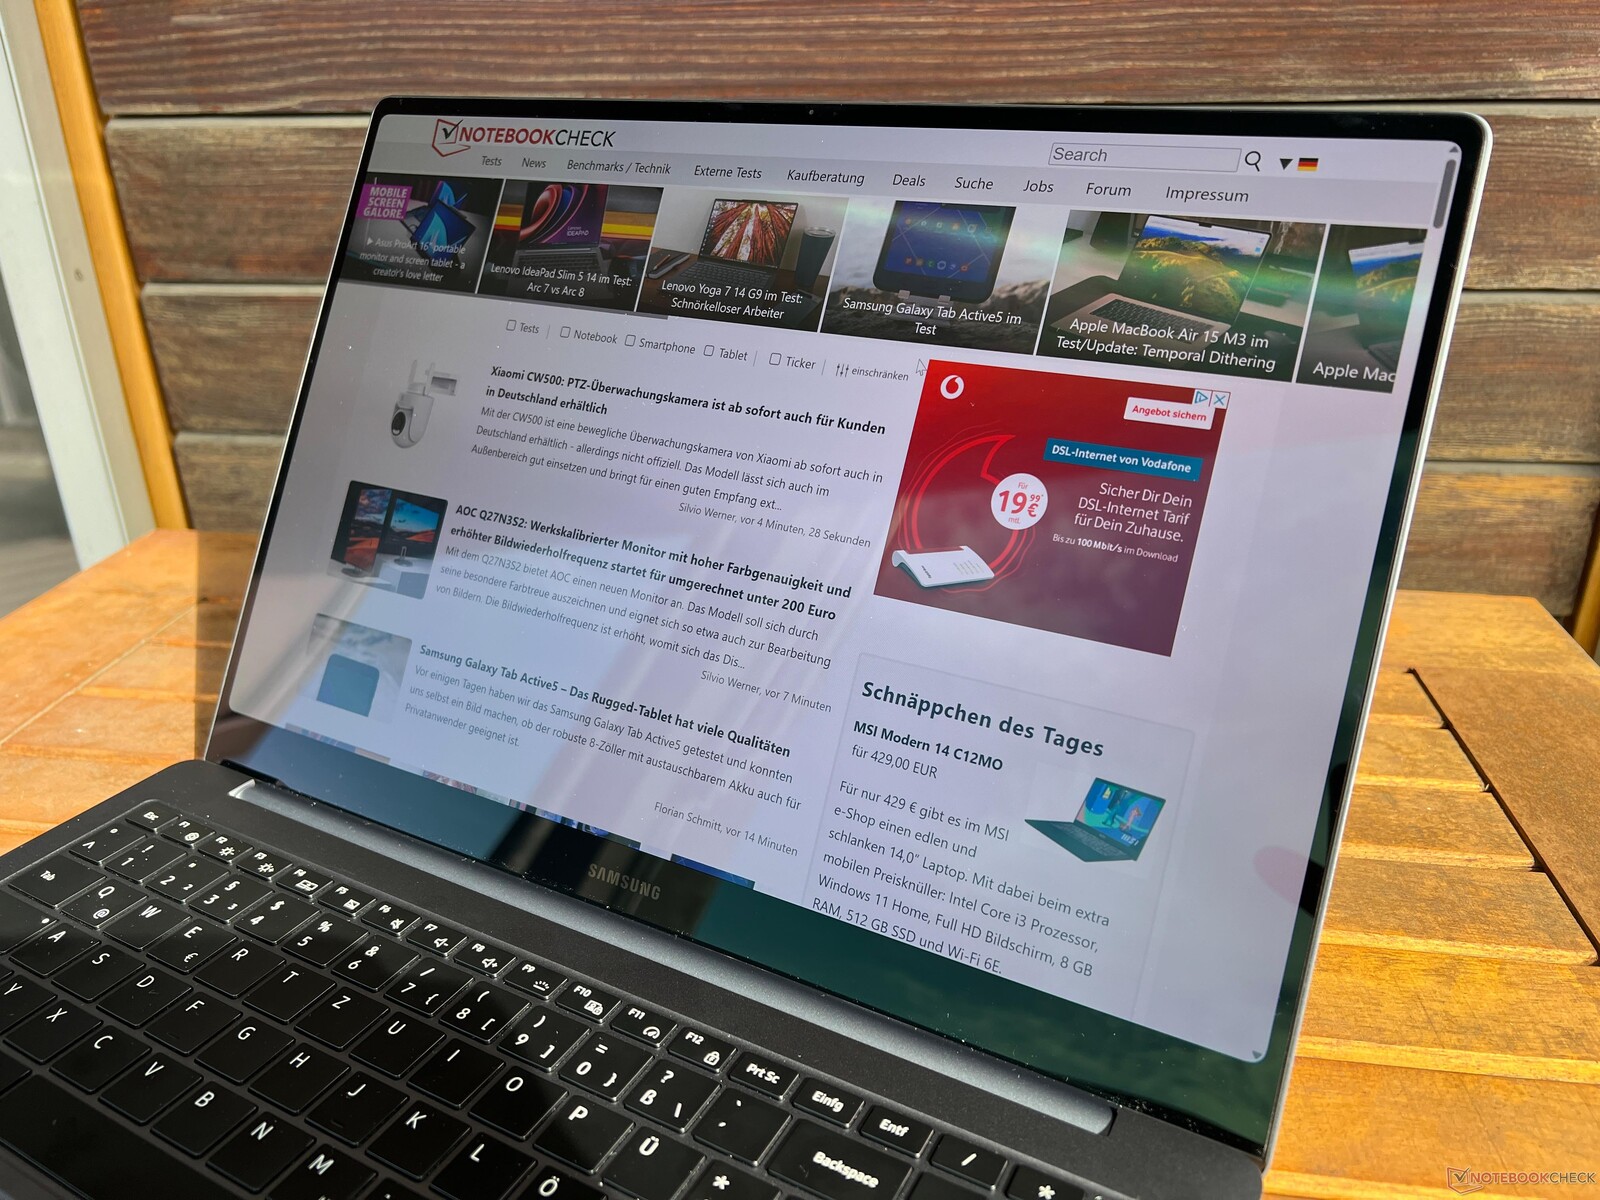
Input devices - Huge touchpad, average keyboard
Samsung has equipped the Galaxy Book4 Ultra with a keyboard and a numerical keypad. The typing experience suffers slightly from key travel that is too shallow as well as an audible keystroke noise and, in direct comparison to the regular Galaxy Book4 Pro, the strikes are not as precise. In this discipline, the Samsung laptop also lags behind the competition. Anyone who types a lot should try the keyboard beforehand. The power button located at the top right also serves as a fingerprint sensor. The white backlighting offers three levels of intensity and can be activated automatically.
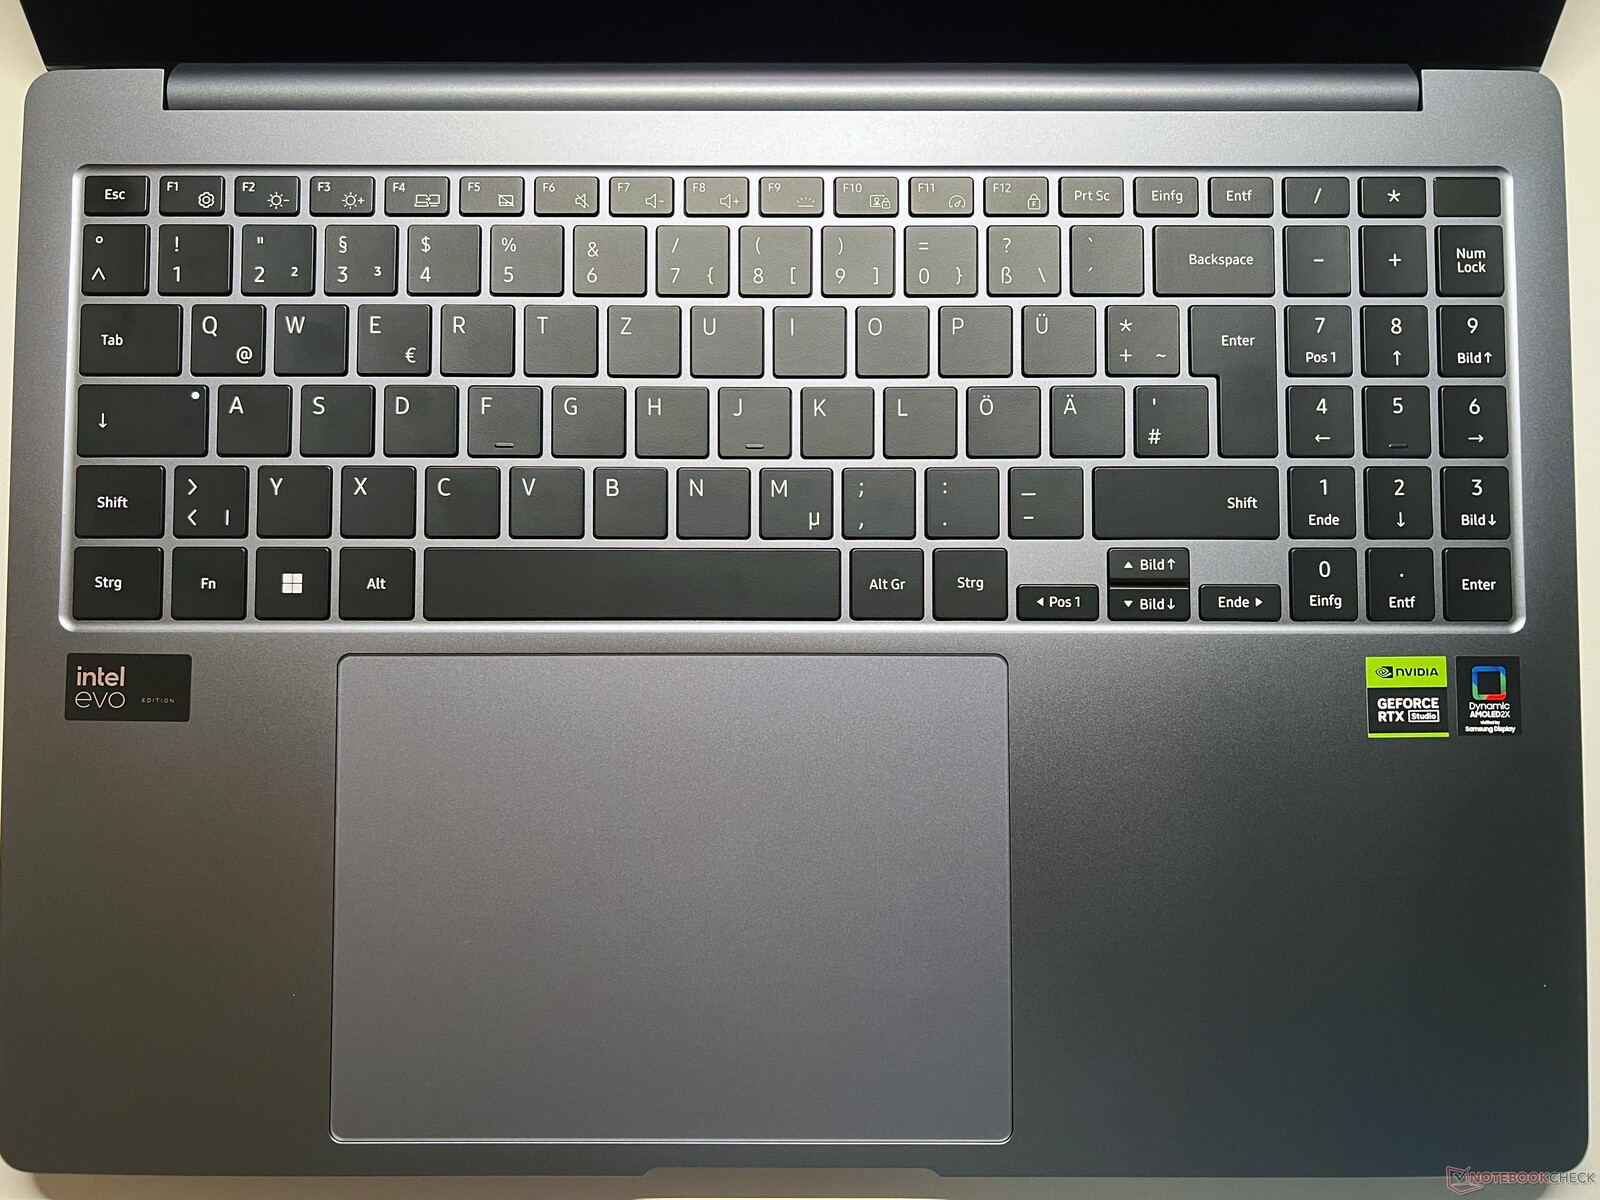
Swiping gestures made on the huge clickpad (15.1 x 10.8 cm) are very good despite it sitting a touch left of center. When it comes to typing, the ball of the left hand is almost always on the touchpad but this didn't prove to be a problem during testing. The lower part of the pad can be clicked but this comes at the cost of a relatively loud and cheap-sounding noise.
Display - 120 Hz AMOLED
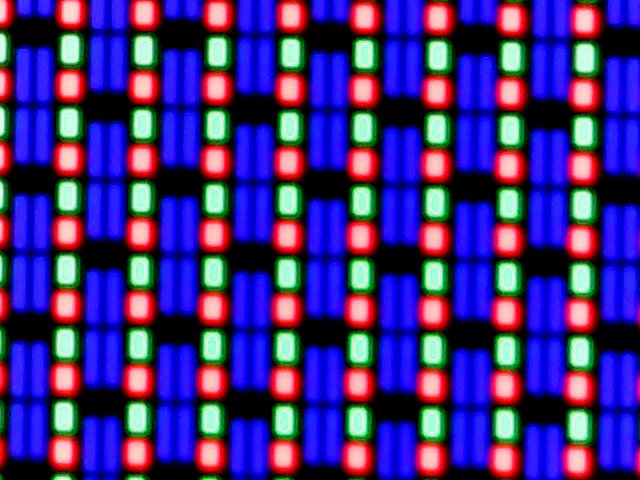
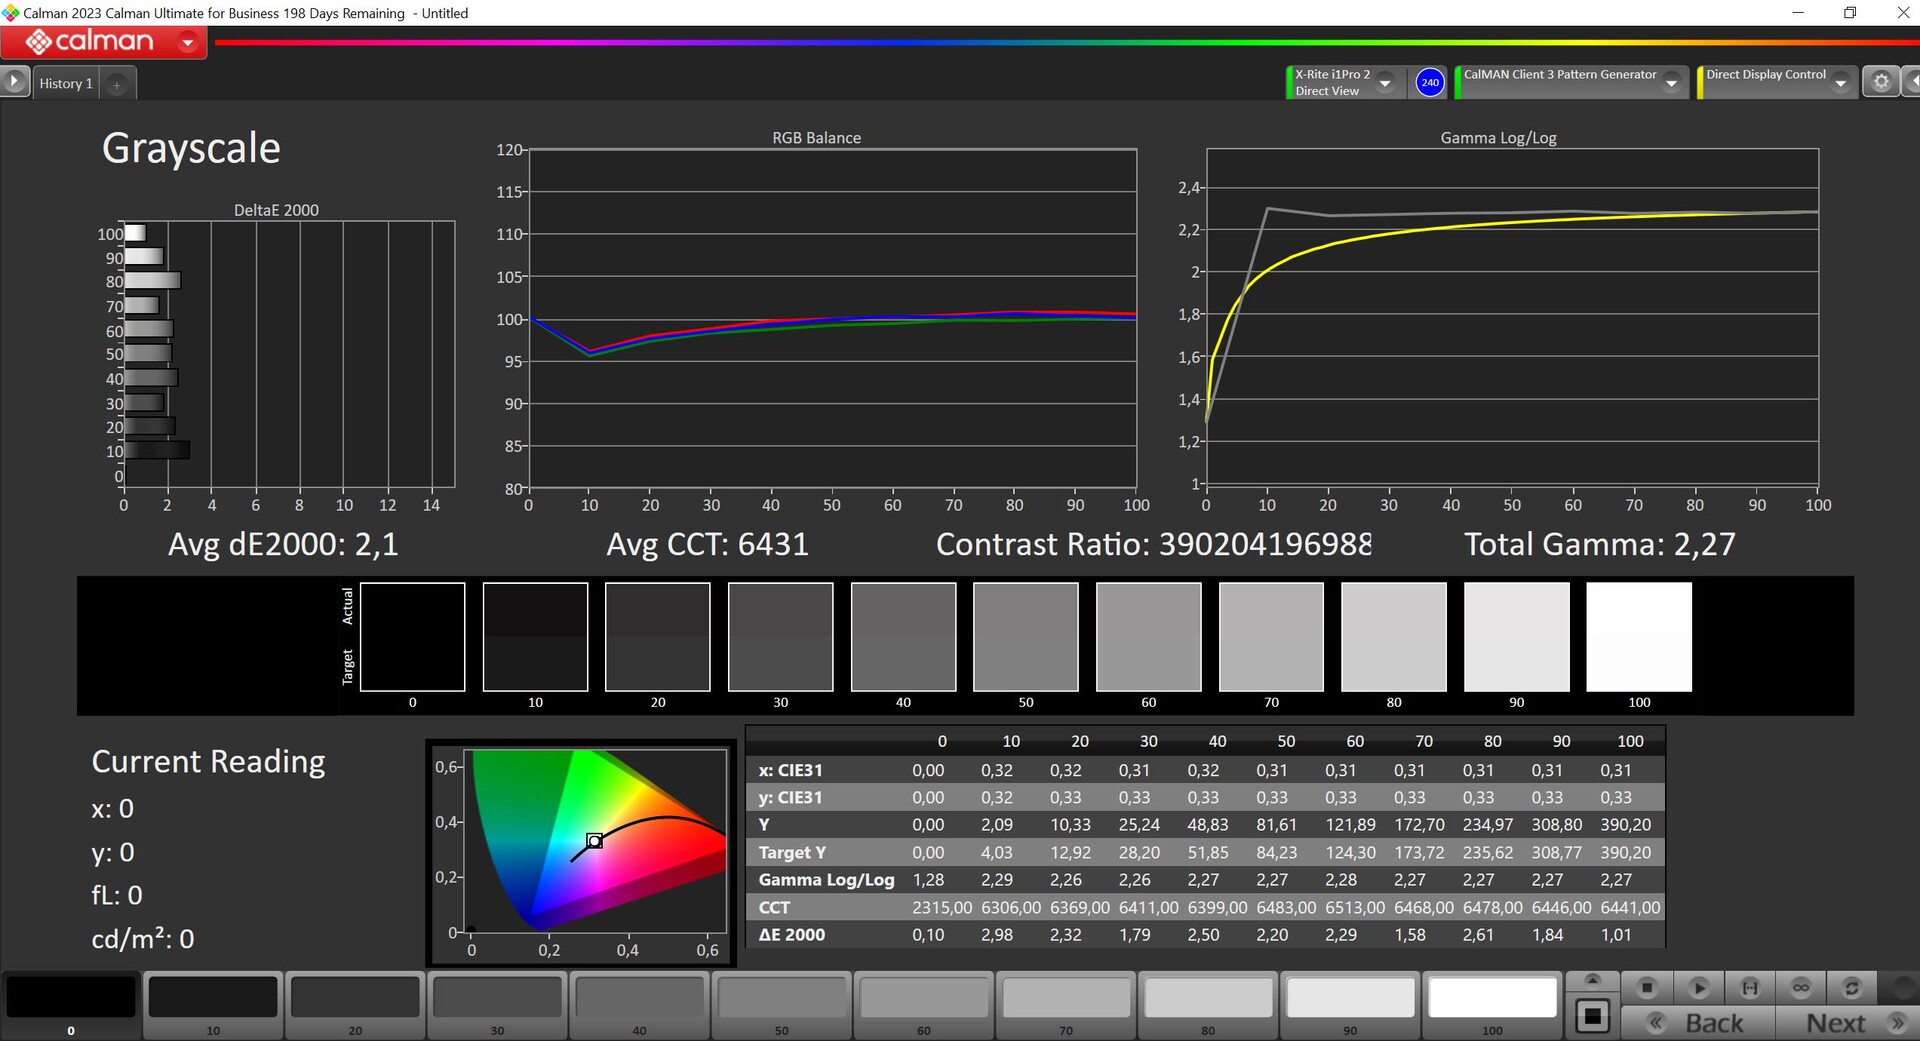
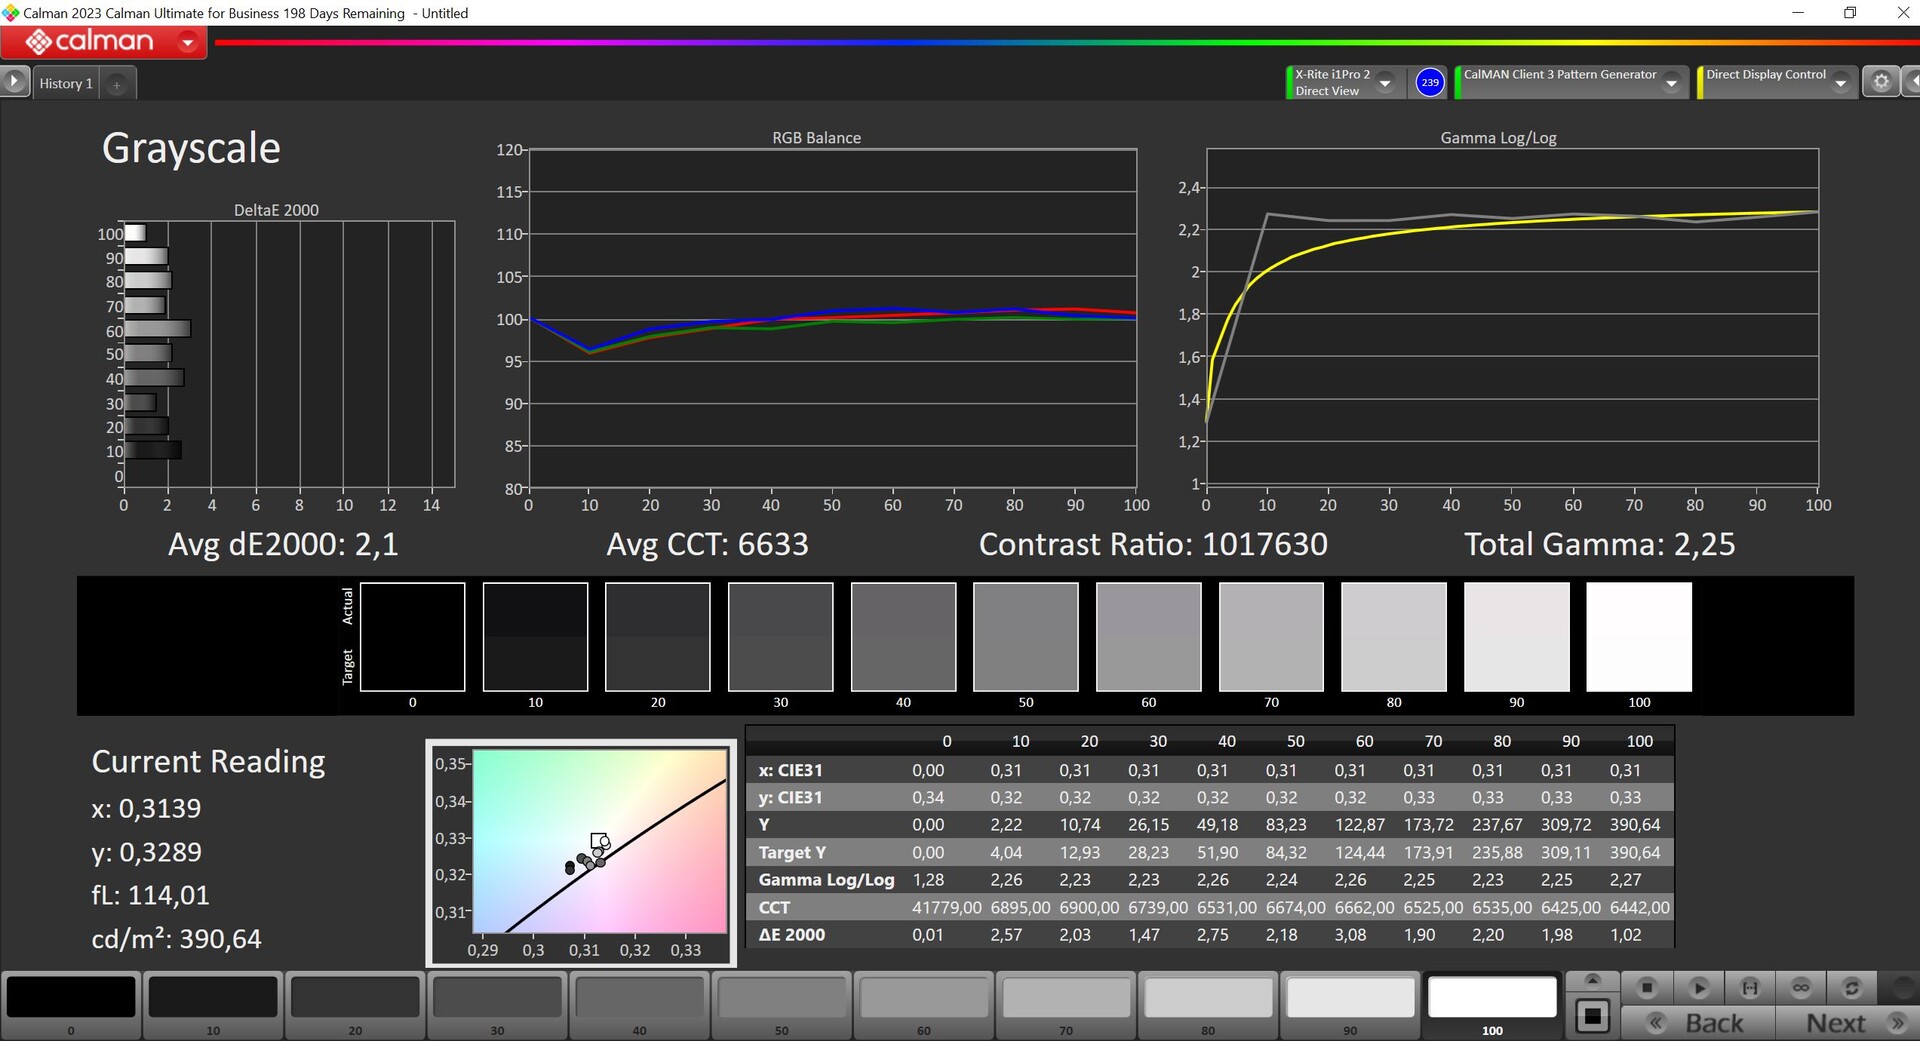
Samsung only retails the Galaxy Book4 Ultra with a 16-inch OLED touchscreen (2,880 x 1,800 pixels, 16:10). The subjective image quality impresses with vivid colors and deep blacks. The response times are extremely fast and HDR content is supported. In addition, movement is very smooth thanks to the 120 Hz refresh rate. As with all Windows devices, the HDR mode can be activated manually but color management is no longer available. Both the brightness and the color temperature can be adjusted automatically via the sensor.
The maximum SDR mode brightness sits at an average of 393 cd/m² and the black value is 0 cd/m² with this leading to a very high contrast ratio. We measured an HDR brightness of 564 cd/m² for image sections or 540 cd/m² with an almost completely white image. This means the HDR capabilities are significantly more limited compared to mini LED panels and, coupled with better macOS handling, the MacBook Pro 16 is considerably superior when it comes to the area of HDR.
| |||||||||||||||||||||||||
Brightness Distribution: 98 %
Center on Battery: 389 cd/m²
Contrast: ∞:1 (Black: 0 cd/m²)
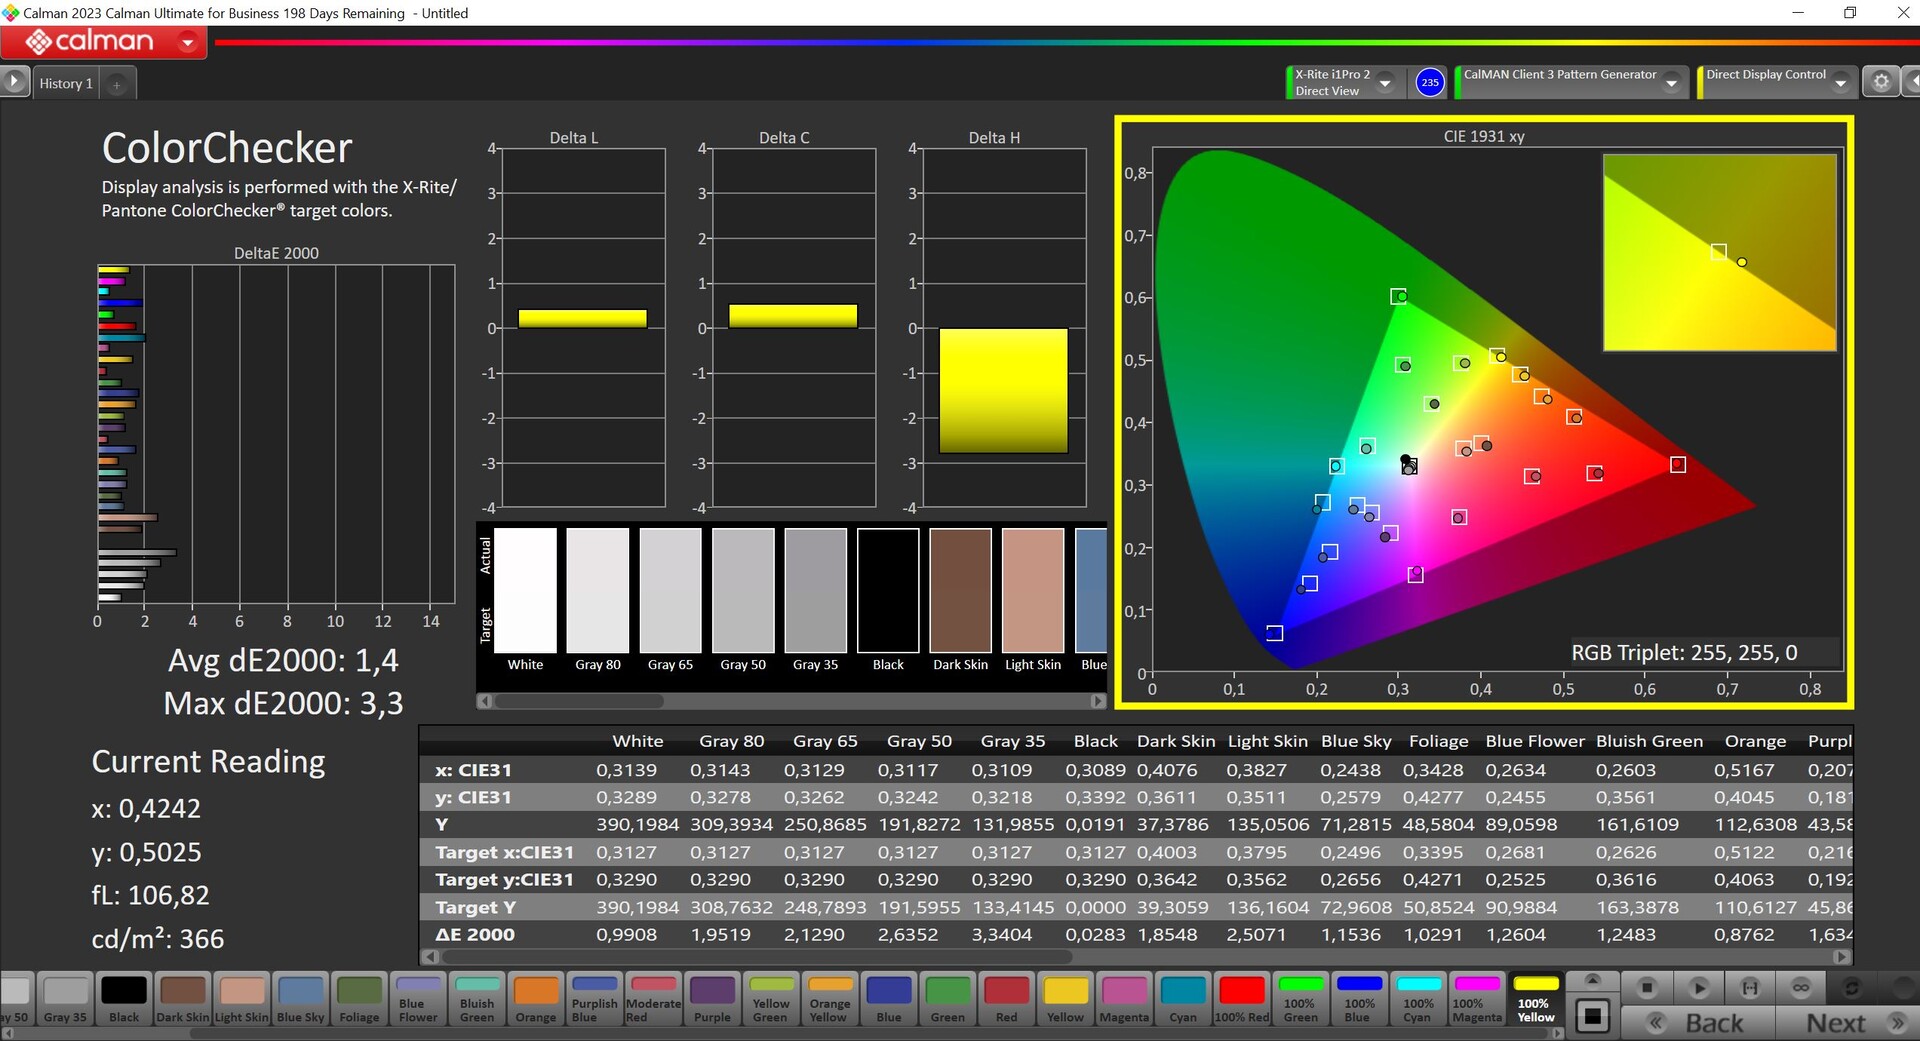
ΔE ColorChecker Calman: 1.4 | ∀{0.5-29.43 Ø4.73}
ΔE Greyscale Calman: 2.1 | ∀{0.09-98 Ø4.97}
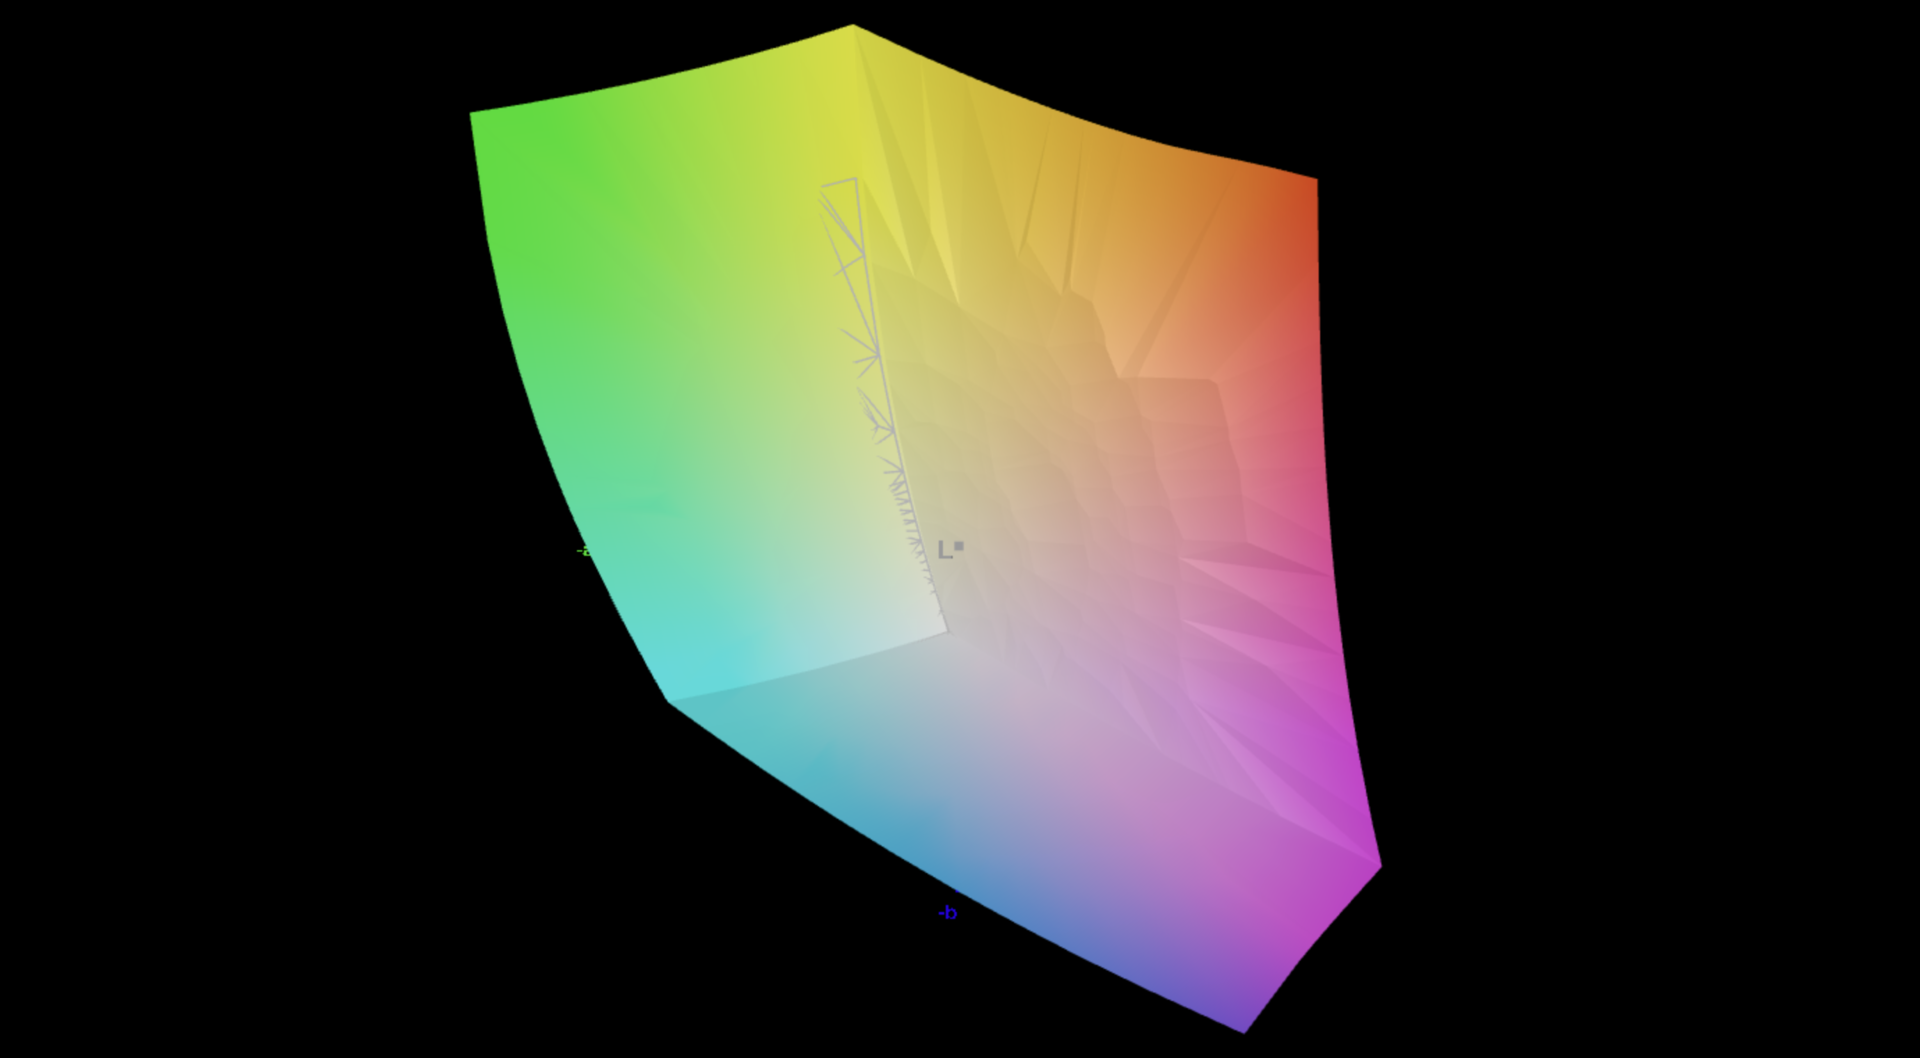
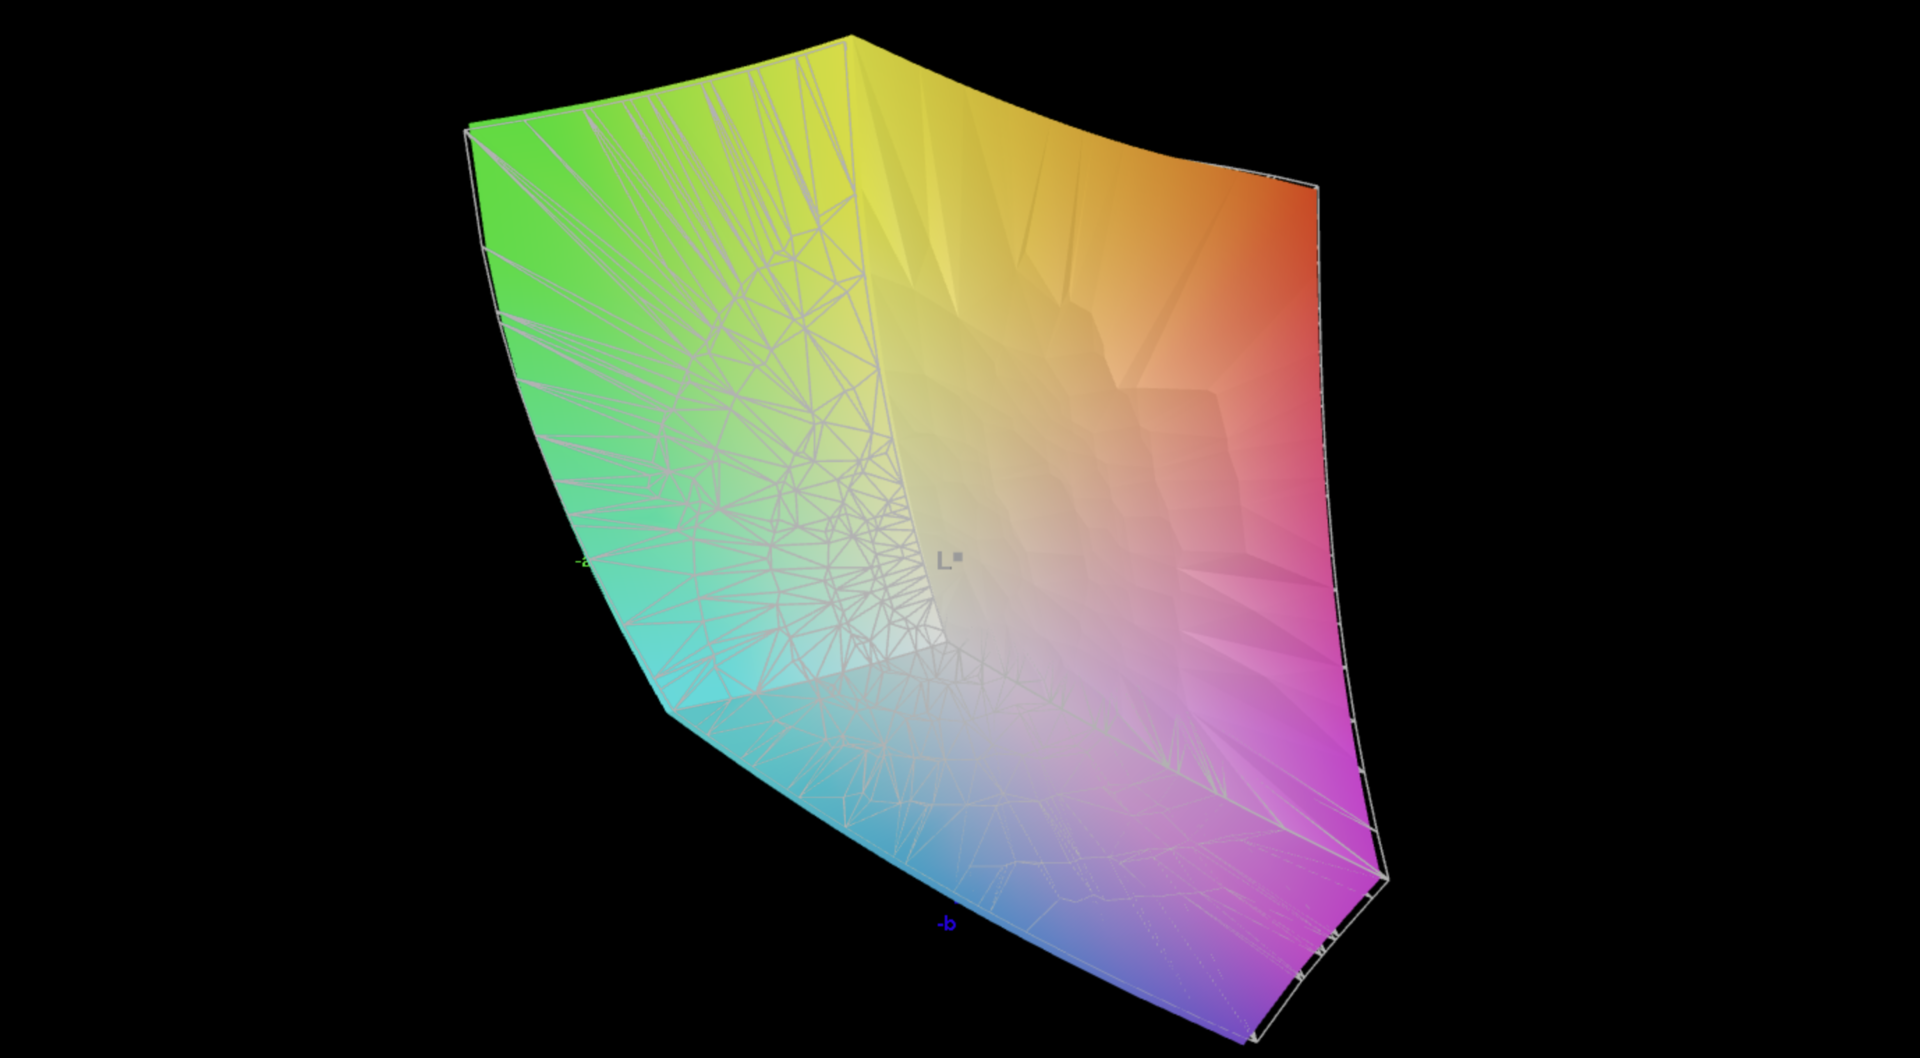
88.5% AdobeRGB 1998 (Argyll 3D)
99.9% sRGB (Argyll 3D)
98.6% Display P3 (Argyll 3D)
Gamma: 2.27
CCT: 6431 K
| Samsung Galaxy Book4 Ultra ATNA60CL07-0, OLED, 2880x1800, 16" | Lenovo ThinkPad Z16 Gen 2 Samsung ATNA60YV04-0, OLED, 3840x2400, 16" | Lenovo Slim Pro 9i 16IRP8 LEN160-3.2K, Mini-LED, 3200x2000, 16" | Schenker VISION 16 Pro (M23) NE160QDM-NZ1, IPS, 2560x1600, 16" | Samsung Galaxy Book3 Ultra 16 Samsung ATNA60CL03-0, AMOLED, 2880x1800, 16" | Apple MacBook Pro 16 2023 M3 Max Mini-LED, 3456x2234, 16" | HP Spectre x360 16 RTX 4050 Samsung SDC41A6, OLED, 2880x1800, 16" | |
|---|---|---|---|---|---|---|---|
| Display | 3% | -3% | -17% | 3% | 1% | 3% | |
| Display P3 Coverage (%) | 98.6 | 99.7 1% | 95.1 -4% | 68.8 -30% | 99.9 1% | 99.2 1% | 99.6 1% |
| sRGB Coverage (%) | 99.9 | 100 0% | 99.9 0% | 98.8 -1% | 100 0% | 100 0% | |
| AdobeRGB 1998 Coverage (%) | 88.5 | 96.7 9% | 84.6 -4% | 70 -21% | 96.3 9% | 96.7 9% | |
| Response Times | -209% | -1863% | -1756% | 8% | -9254% | -35% | |
| Response Time Grey 50% / Grey 80% * (ms) | 0.54 ? | 1.86 ? -244% | 14 ? -2493% | 13.7 ? -2437% | 0.49 ? 9% | 66.9 ? -12289% | 0.78 ? -44% |
| Response Time Black / White * (ms) | 0.69 ? | 1.89 ? -174% | 9.2 ? -1233% | 8.1 ? -1074% | 0.65 ? 6% | 43.6 ? -6219% | 0.86 ? -25% |
| PWM Frequency (Hz) | 240 ? | 60 ? | 5784 ? | 240 ? | 14877 | 480 ? | |
| Screen | -4% | -117% | -77% | -25% | 22% | -16% | |
| Brightness middle (cd/m²) | 390 | 390.1 0% | 627.4 61% | 384 -2% | 400 3% | 630 62% | 385.2 -1% |
| Brightness (cd/m²) | 393 | 393 0% | 618 57% | 371 -6% | 399 2% | 604 54% | 387 -2% |
| Brightness Distribution (%) | 98 | 97 -1% | 95 -3% | 88 -10% | 93 -5% | 94 -4% | 99 1% |
| Black Level * (cd/m²) | 0.19 | 0.3 | 0.03 | ||||
| Colorchecker dE 2000 * | 1.4 | 1.41 -1% | 5.84 -317% | 3.4 -143% | 2.3 -64% | 1.2 14% | 1.73 -24% |
| Colorchecker dE 2000 max. * | 2.7 | 3.43 -27% | 10.22 -279% | 9.2 -241% | 4.15 -54% | 2.8 -4% | 3.95 -46% |
| Greyscale dE 2000 * | 2.1 | 2 5% | 6.7 -219% | 3.4 -62% | 2.7 -29% | 1.9 10% | 2.6 -24% |
| Gamma | 2.27 97% | 2.22 99% | 2.77 79% | 2.16 102% | 2.266 97% | 2.29 96% | 2.17 101% |
| CCT | 6431 101% | 6324 103% | 5795 112% | 7462 87% | 7047 92% | 6812 95% | 6133 106% |
| Contrast (:1) | 3302 | 1280 | 13333 | ||||
| Colorchecker dE 2000 calibrated * | 4.45 | 1.3 | 1.66 | ||||
| Total Average (Program / Settings) | -70% /
-39% | -661% /
-403% | -617% /
-366% | -5% /
-11% | -3077% /
-2042% | -16% /
-14% |
* ... smaller is better
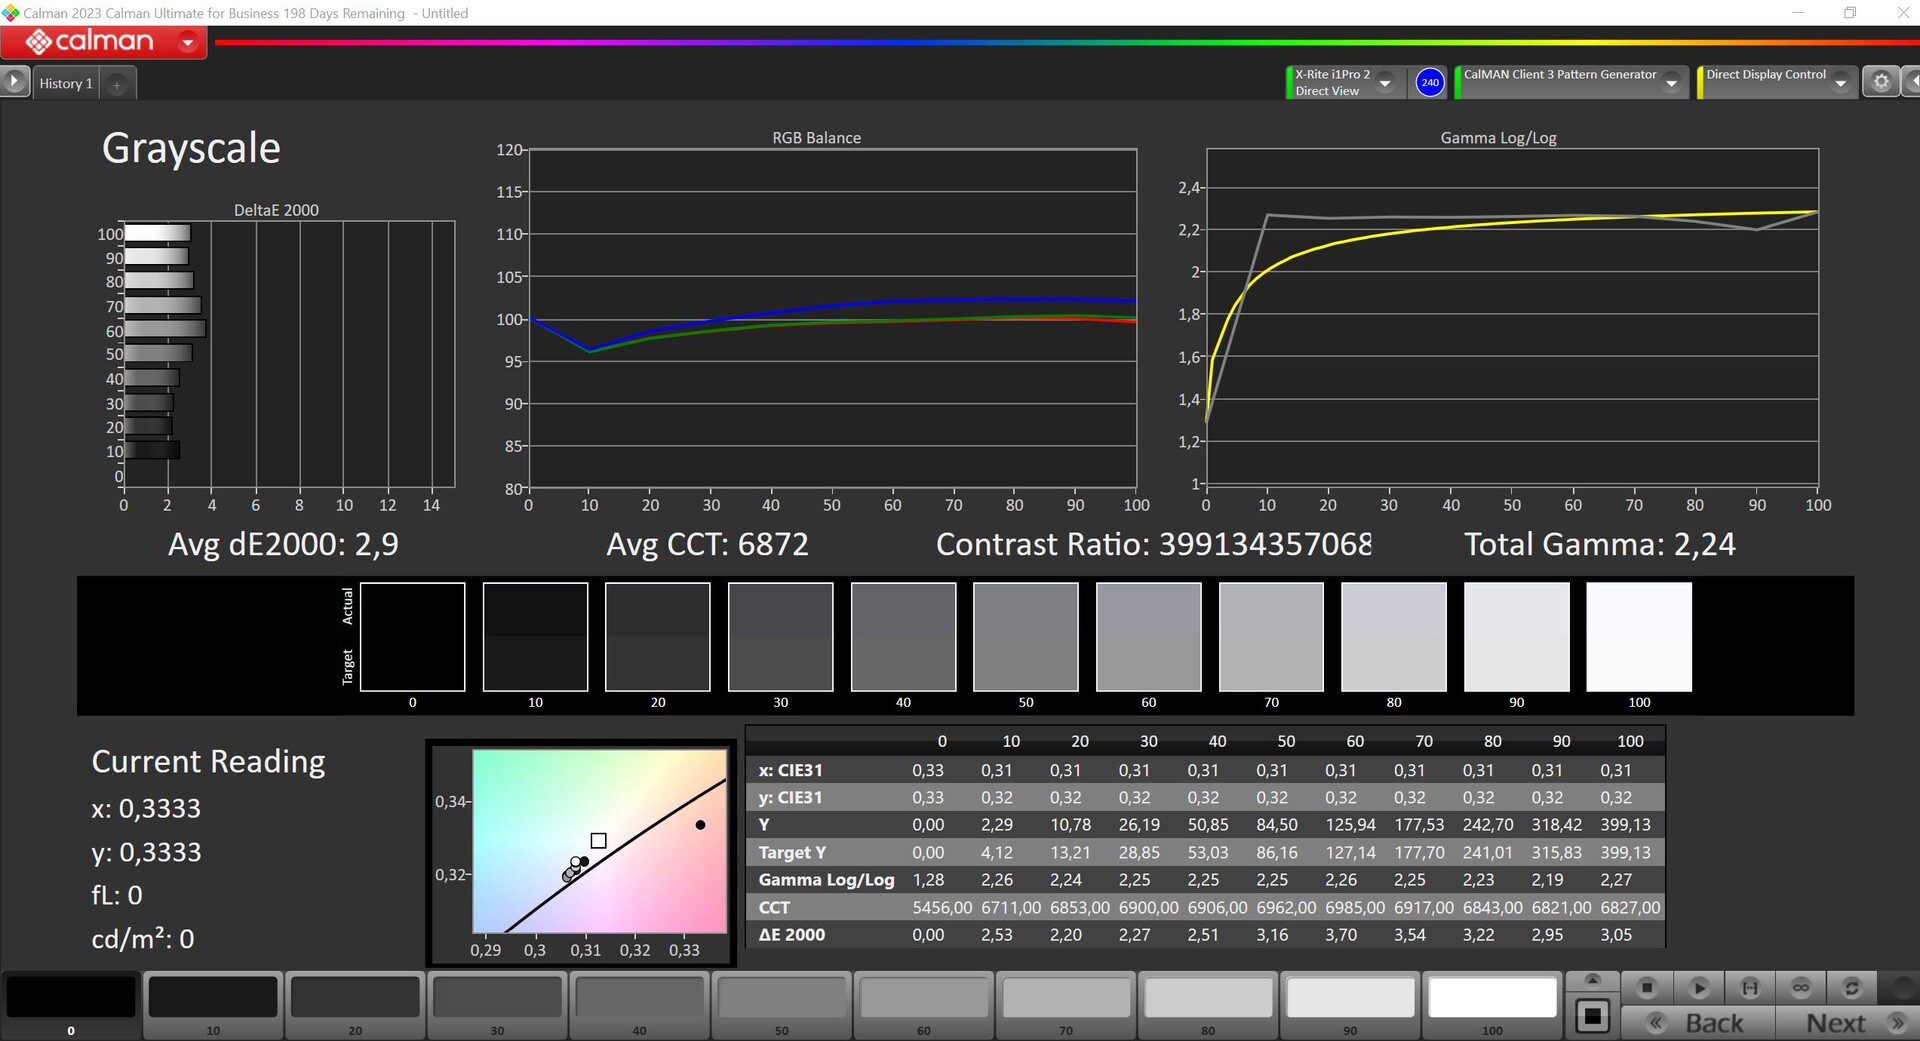

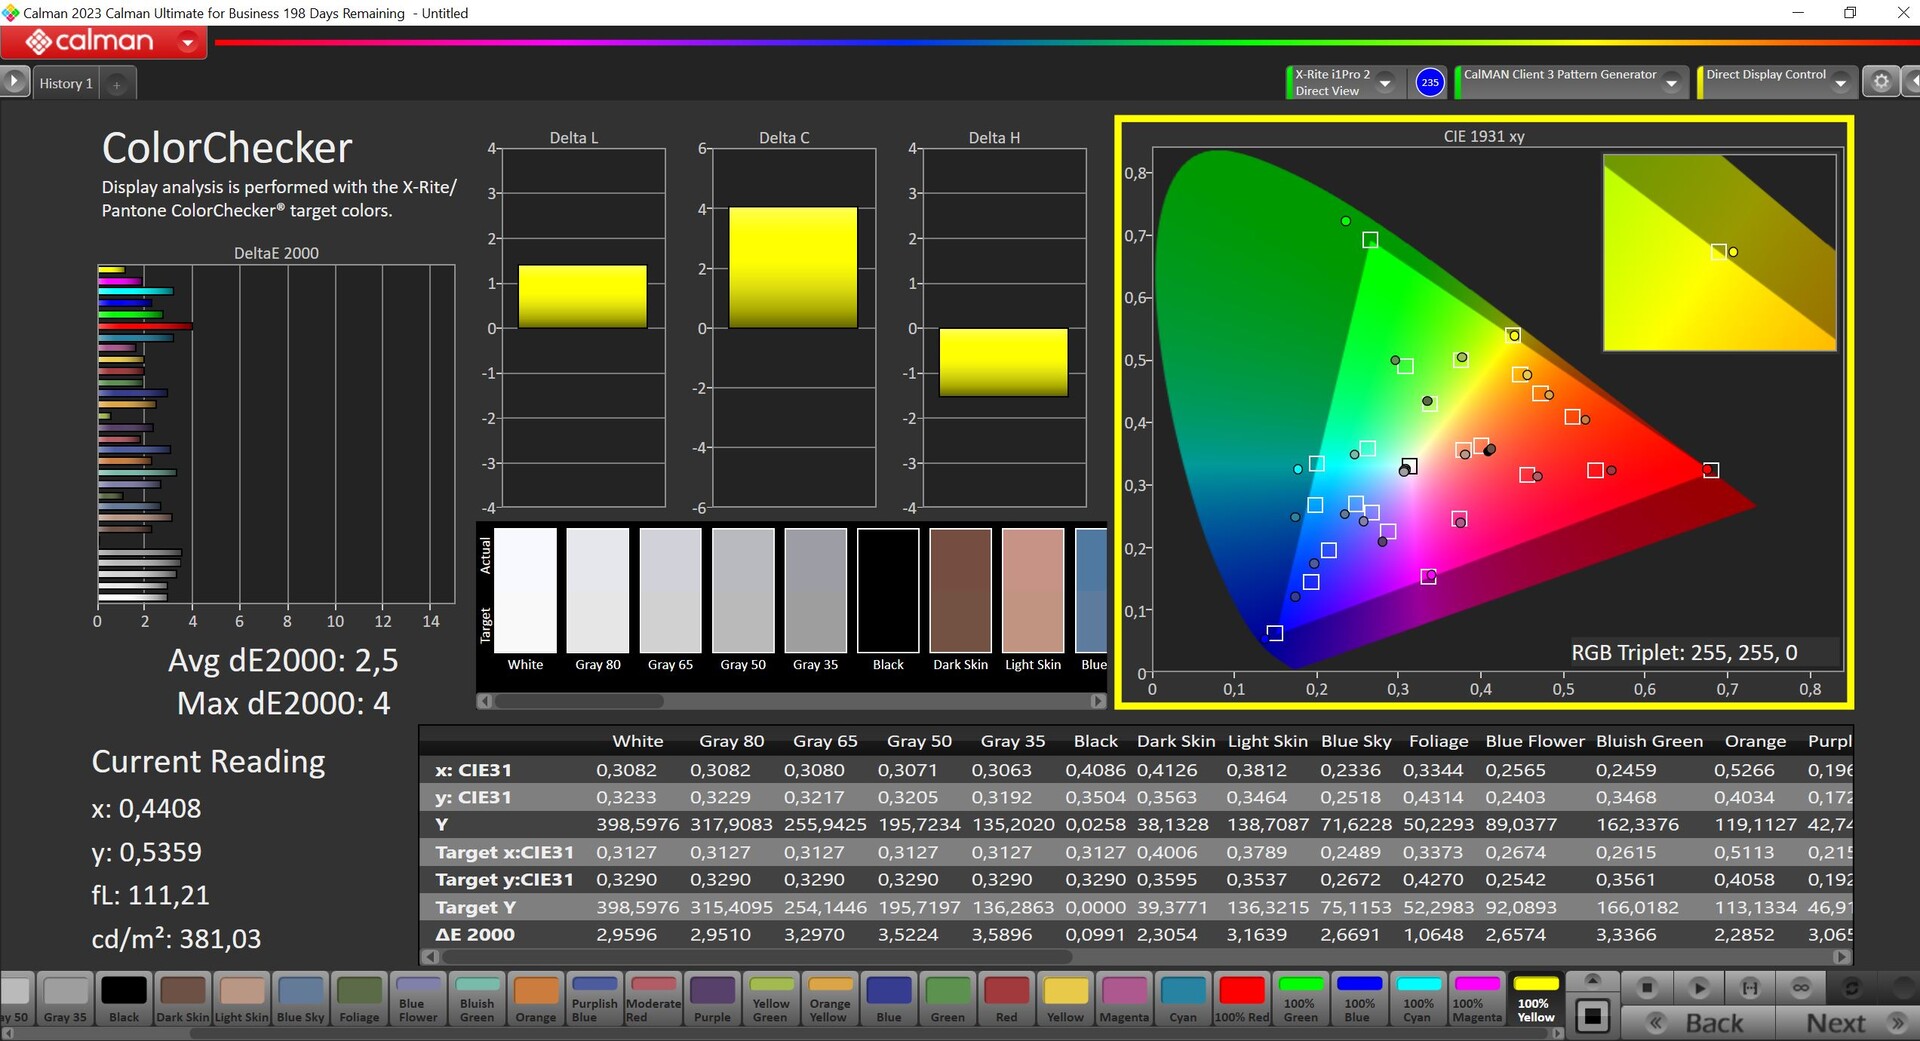
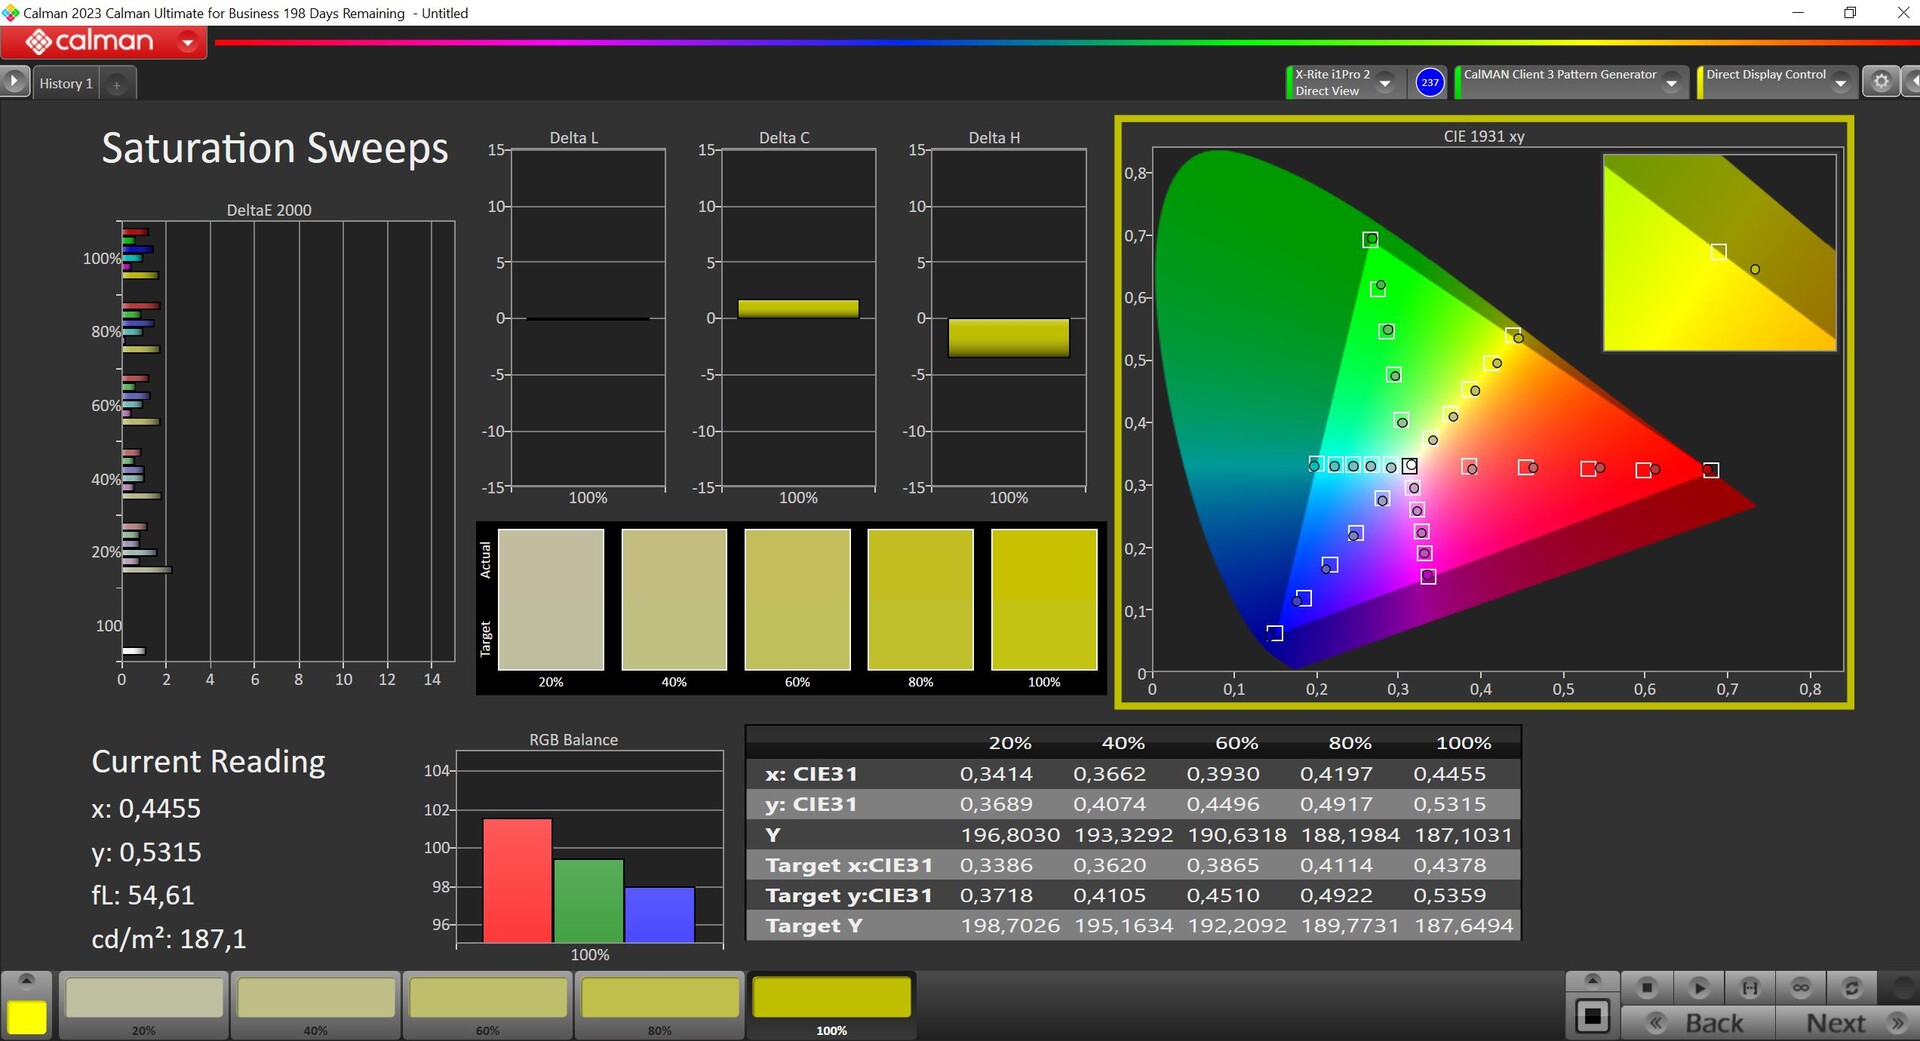
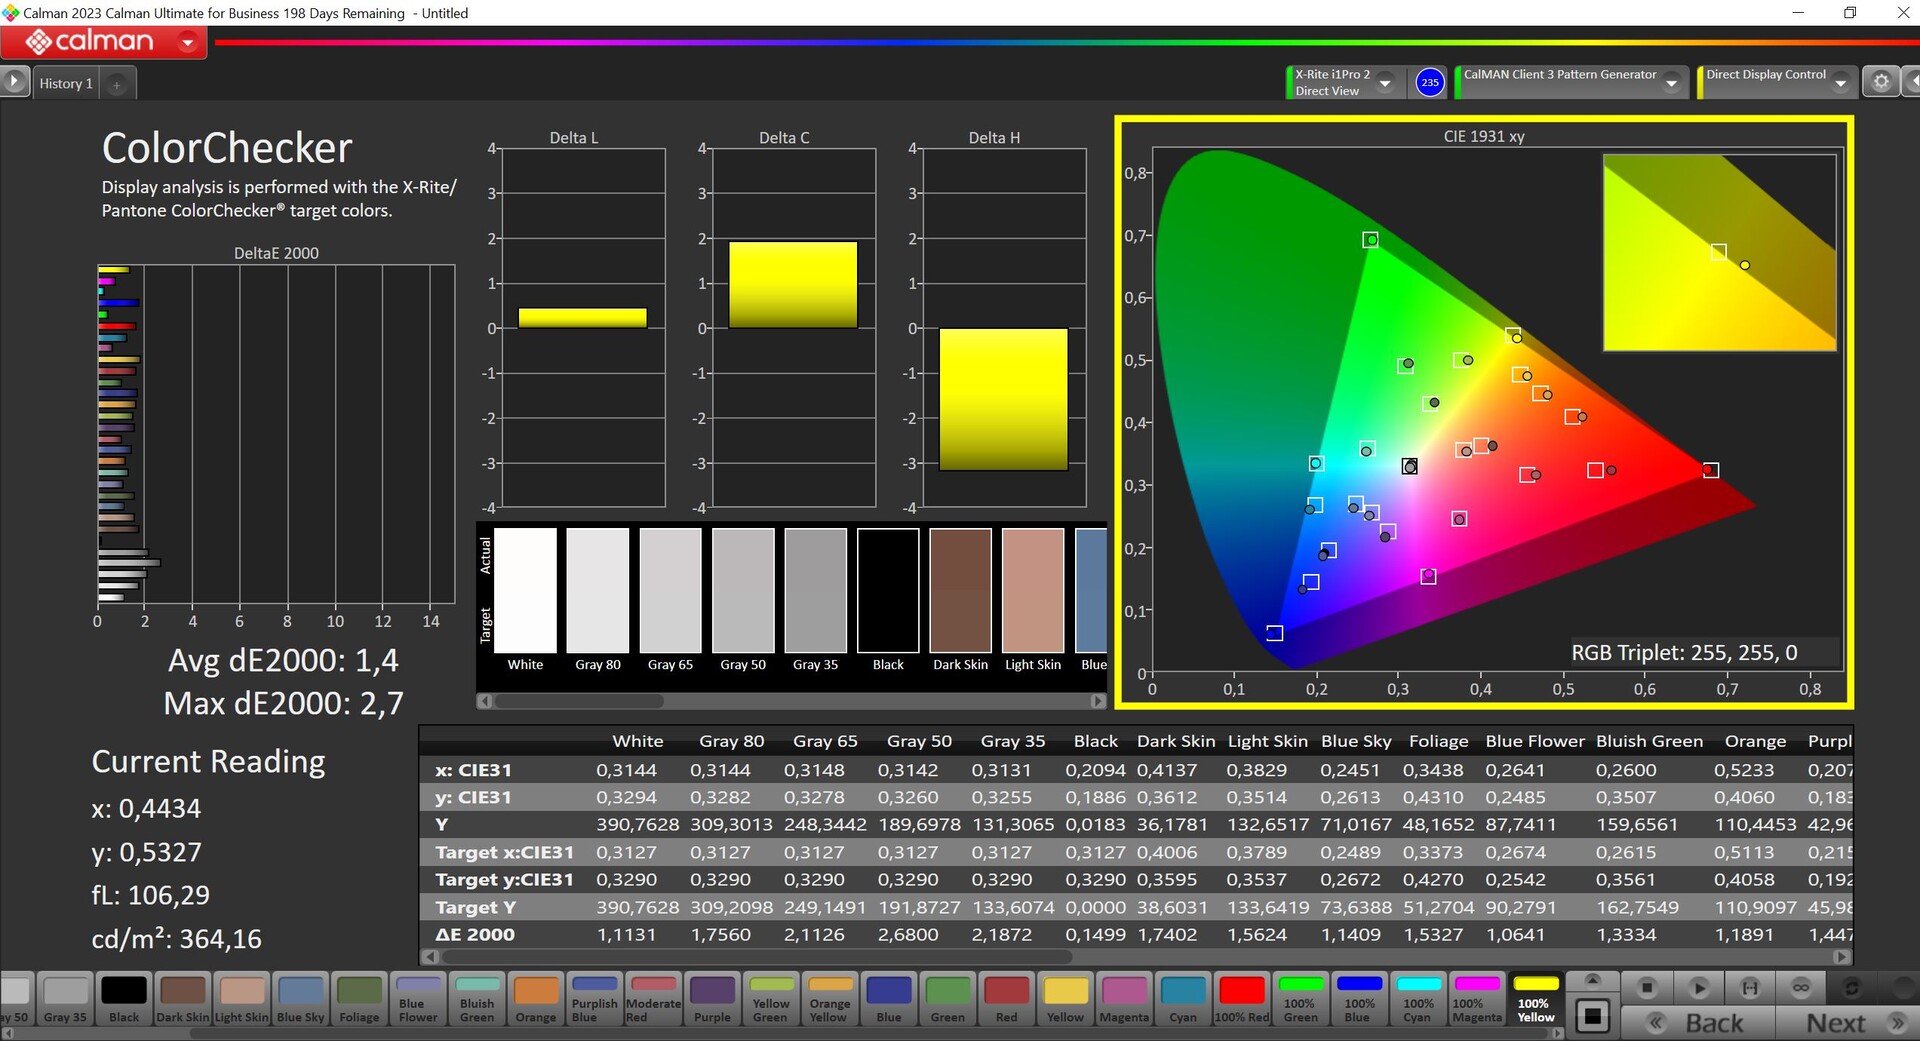
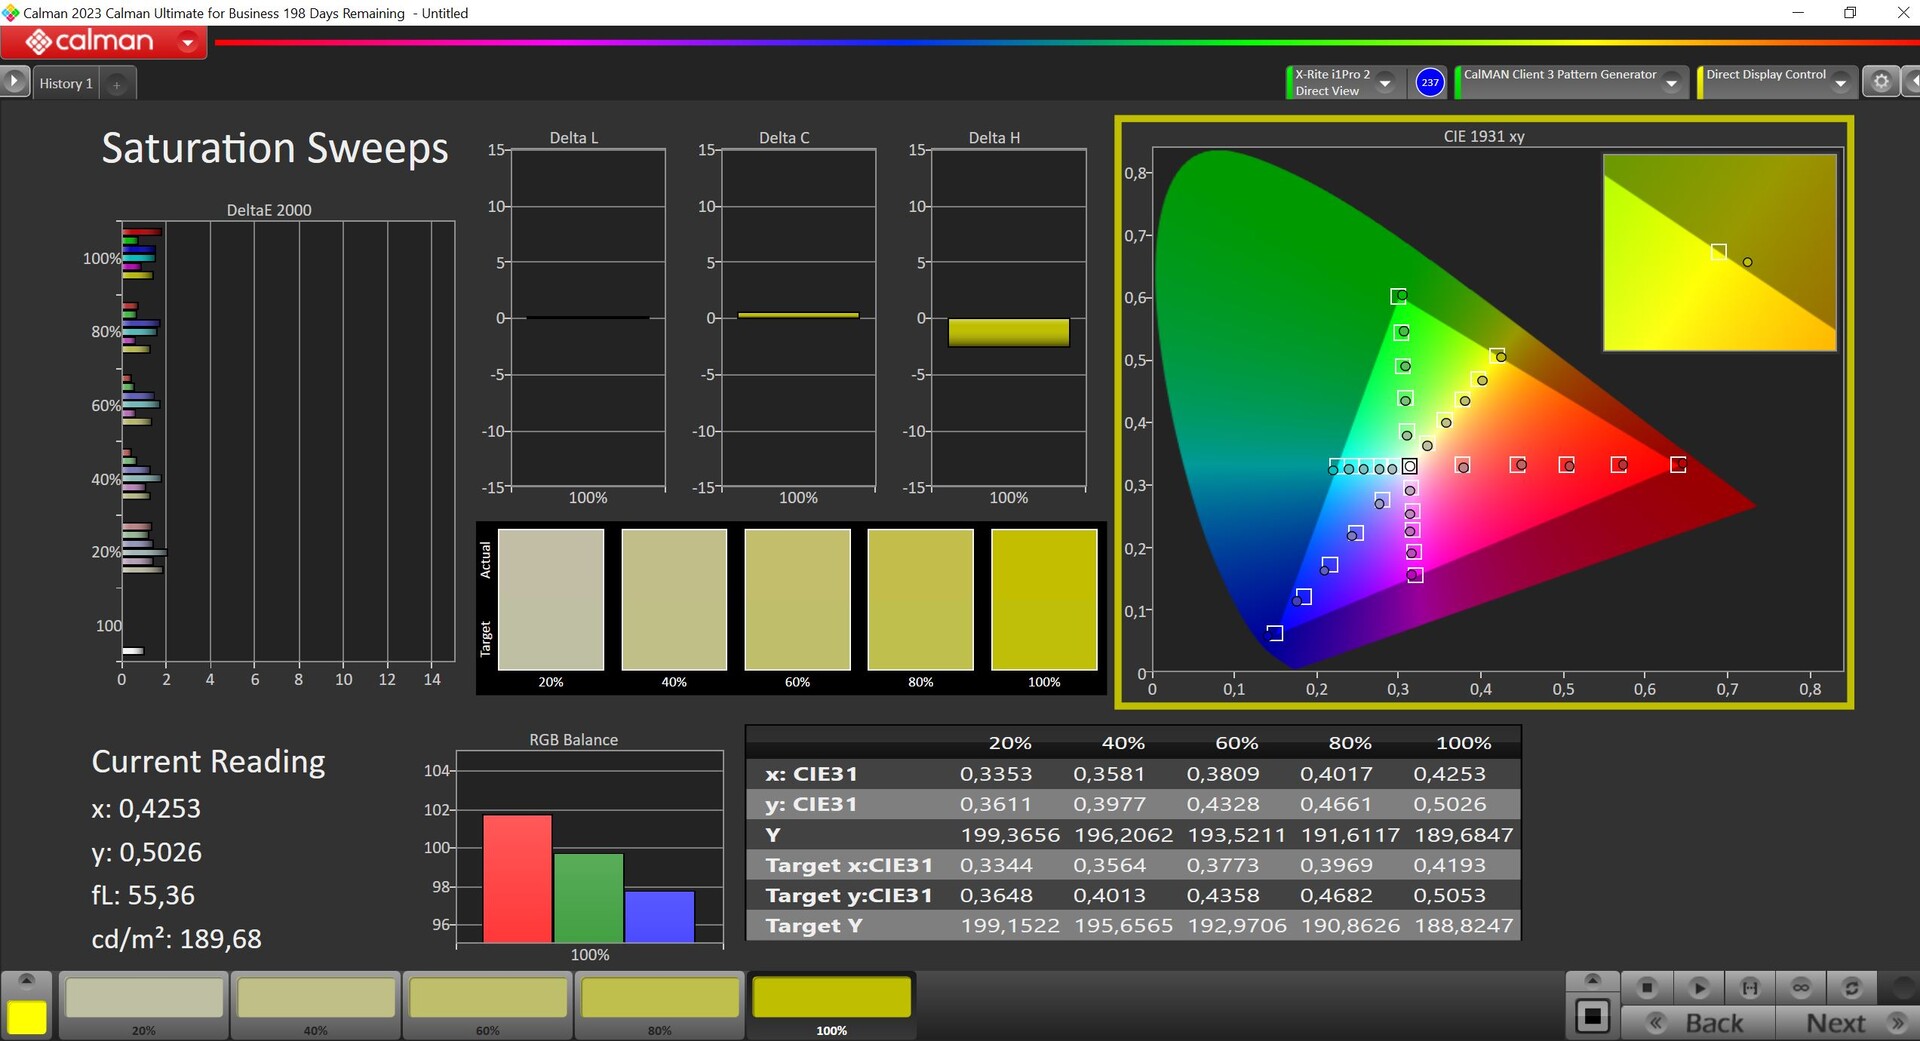
In Samsung's settings app, there are various color profiles with the standard active one being "Vivid". As usual, the colors here are a little oversaturated and this makes images appear more vibrant. However, out of the box, there is also the P3 mode which mostly offers accurate colors and this is the one we used for our measurements. Using our own calibration, we were unable to further improve on this performance. The panel covers both the sRGB as well as the P3 color spaces completely and anyone who enjoys editing images will be satisfied with the similarly accurate sRGB mode.

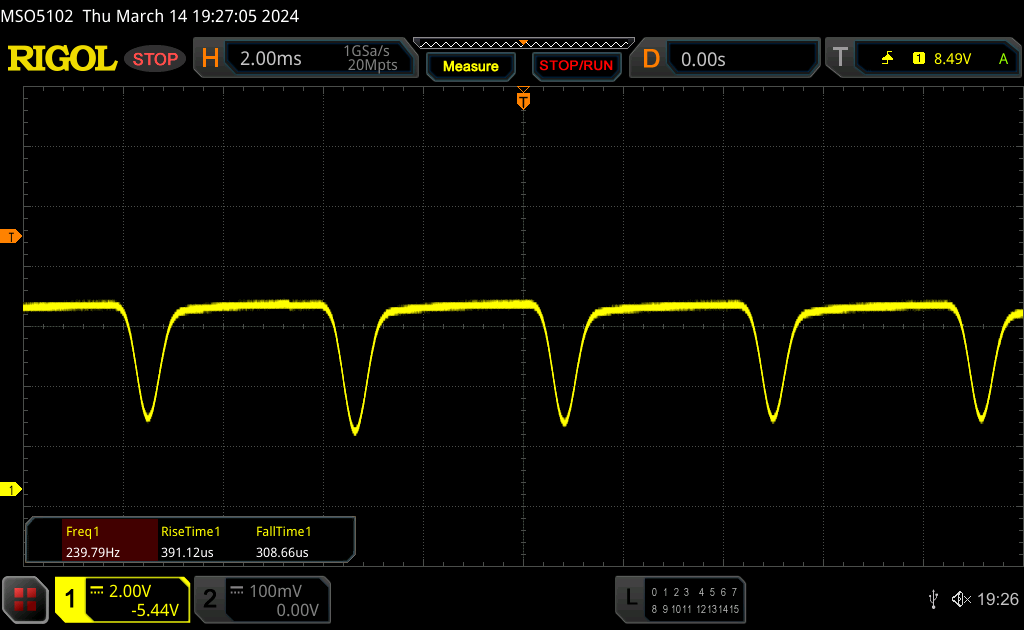
Display Response Times
| ↔ Response Time Black to White | ||
|---|---|---|
| 0.69 ms ... rise ↗ and fall ↘ combined | ↗ 0.39 ms rise | 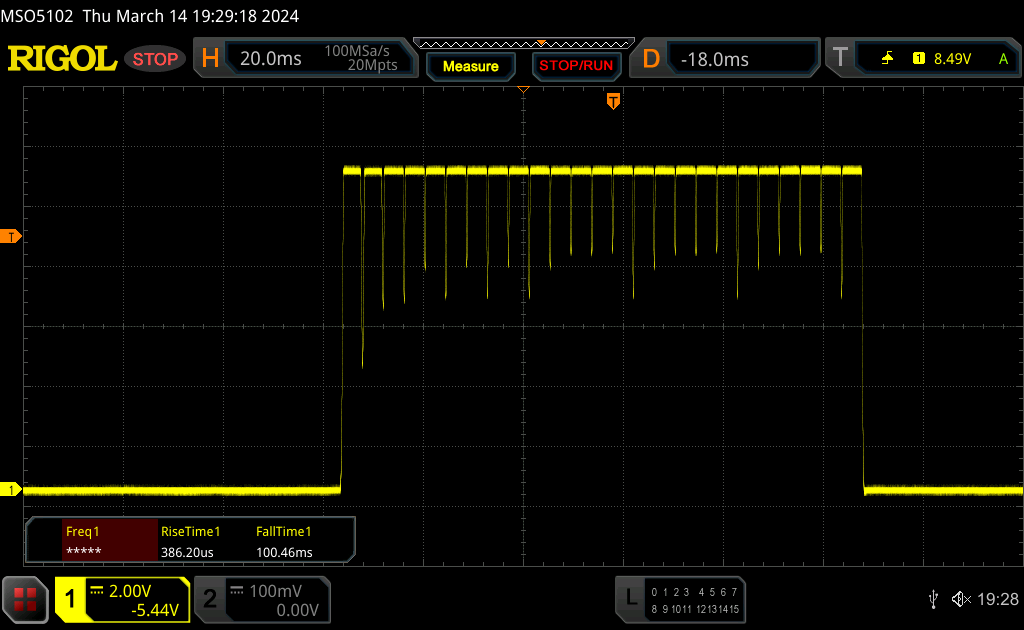 |
| ↘ 0.3 ms fall | ||
| The screen shows very fast response rates in our tests and should be very well suited for fast-paced gaming. In comparison, all tested devices range from 0.1 (minimum) to 240 (maximum) ms. » 2 % of all devices are better. This means that the measured response time is better than the average of all tested devices (19.9 ms). | ||
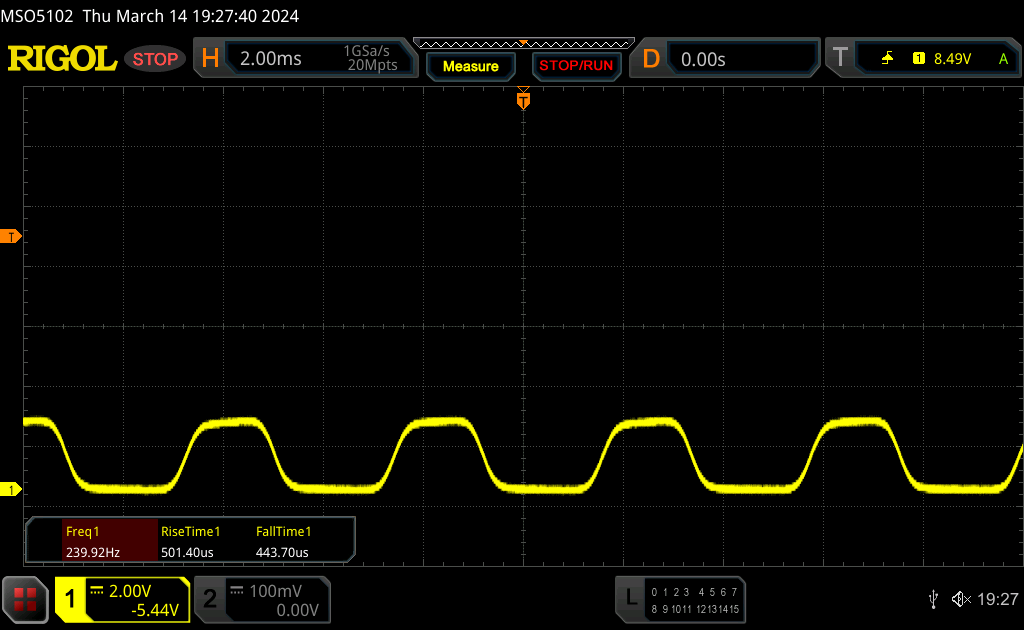
| ↔ Response Time 50% Grey to 80% Grey | ||
| 0.54 ms ... rise ↗ and fall ↘ combined | ↗ 0.29 ms rise | 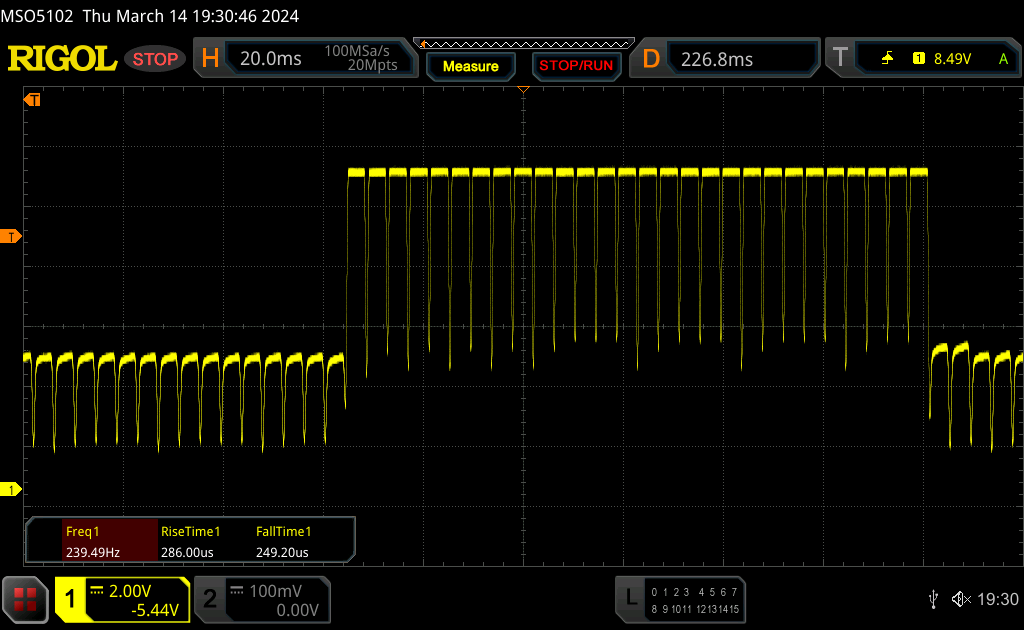 |
| ↘ 0.25 ms fall | ||
| The screen shows very fast response rates in our tests and should be very well suited for fast-paced gaming. In comparison, all tested devices range from 0.165 (minimum) to 636 (maximum) ms. » 1 % of all devices are better. This means that the measured response time is better than the average of all tested devices (31.1 ms). | ||
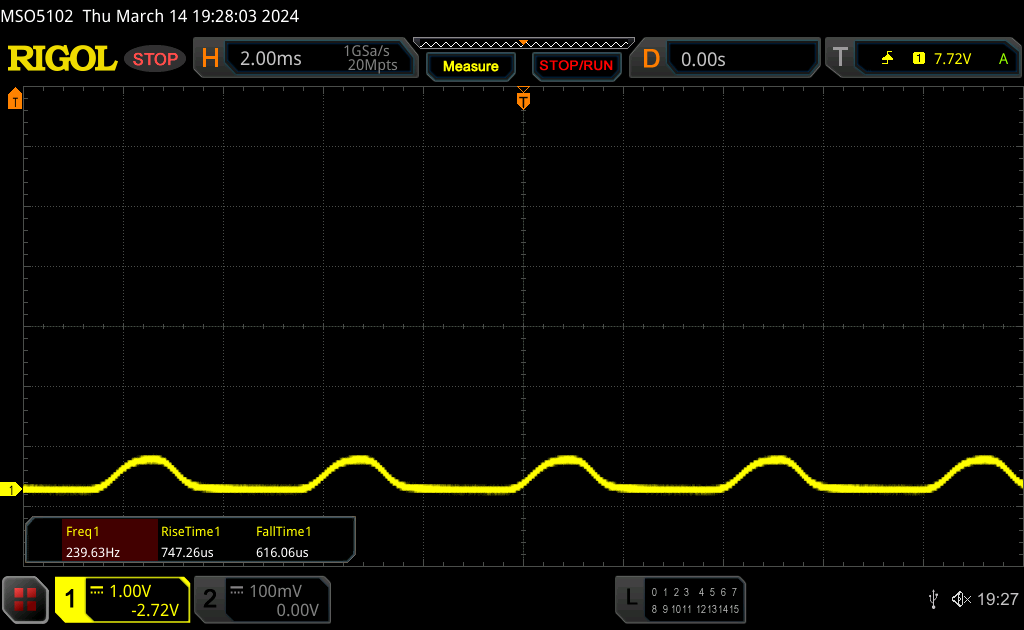
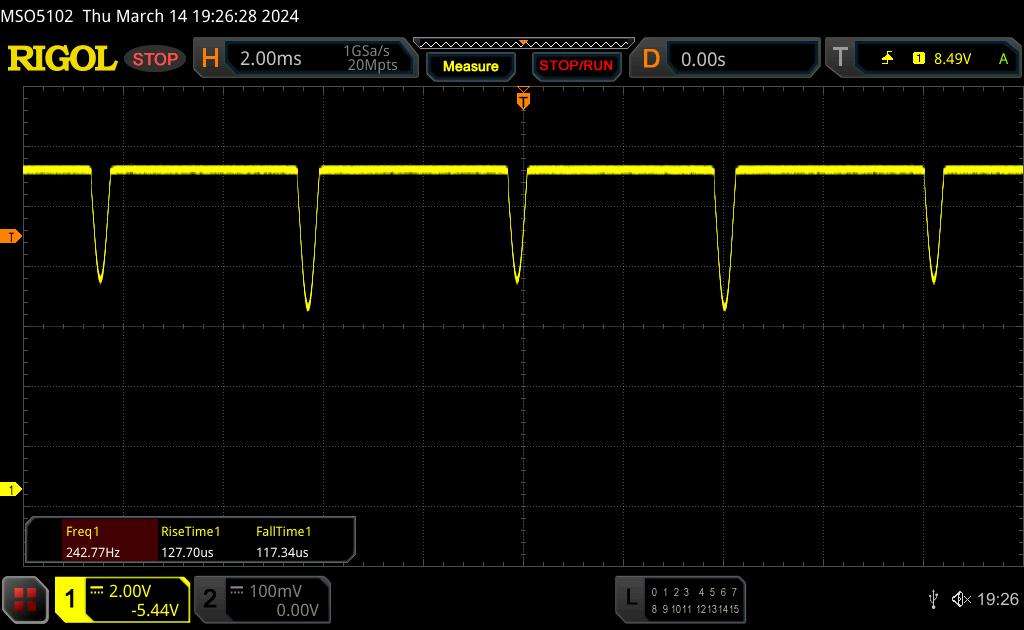
Screen Flickering / PWM (Pulse-Width Modulation)
| Screen flickering / PWM detected | 240 Hz | ≤ 100 % brightness setting | 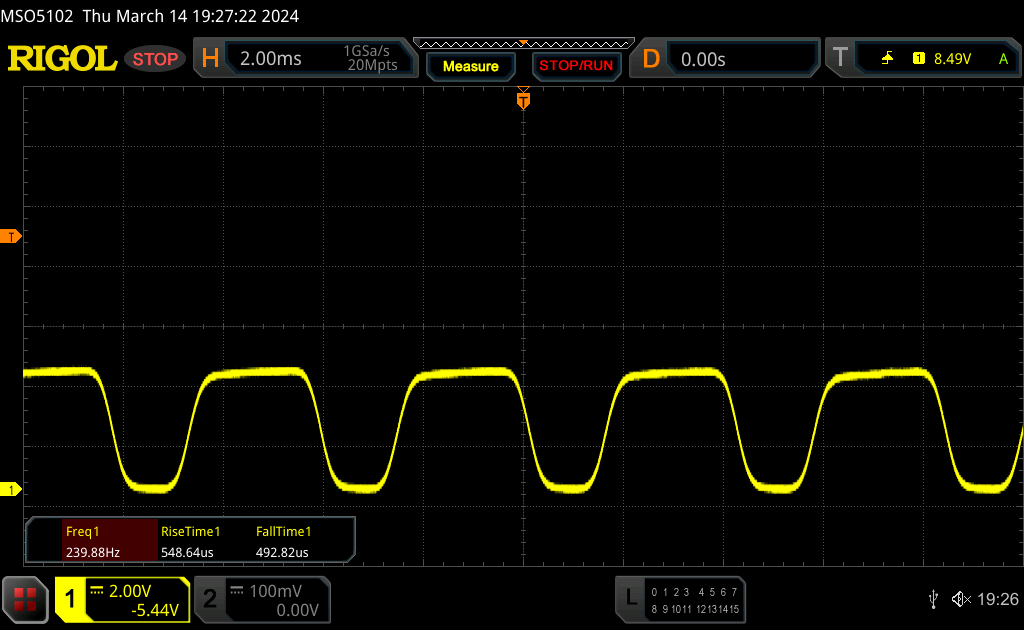 |
The display backlight flickers at 240 Hz (worst case, e.g., utilizing PWM) Flickering detected at a brightness setting of 100 % and below. There should be no flickering or PWM above this brightness setting. The frequency of 240 Hz is relatively low, so sensitive users will likely notice flickering and experience eyestrain at the stated brightness setting and below. In comparison: 52 % of all tested devices do not use PWM to dim the display. If PWM was detected, an average of 7810 (minimum: 5 - maximum: 343500) Hz was measured. | |||
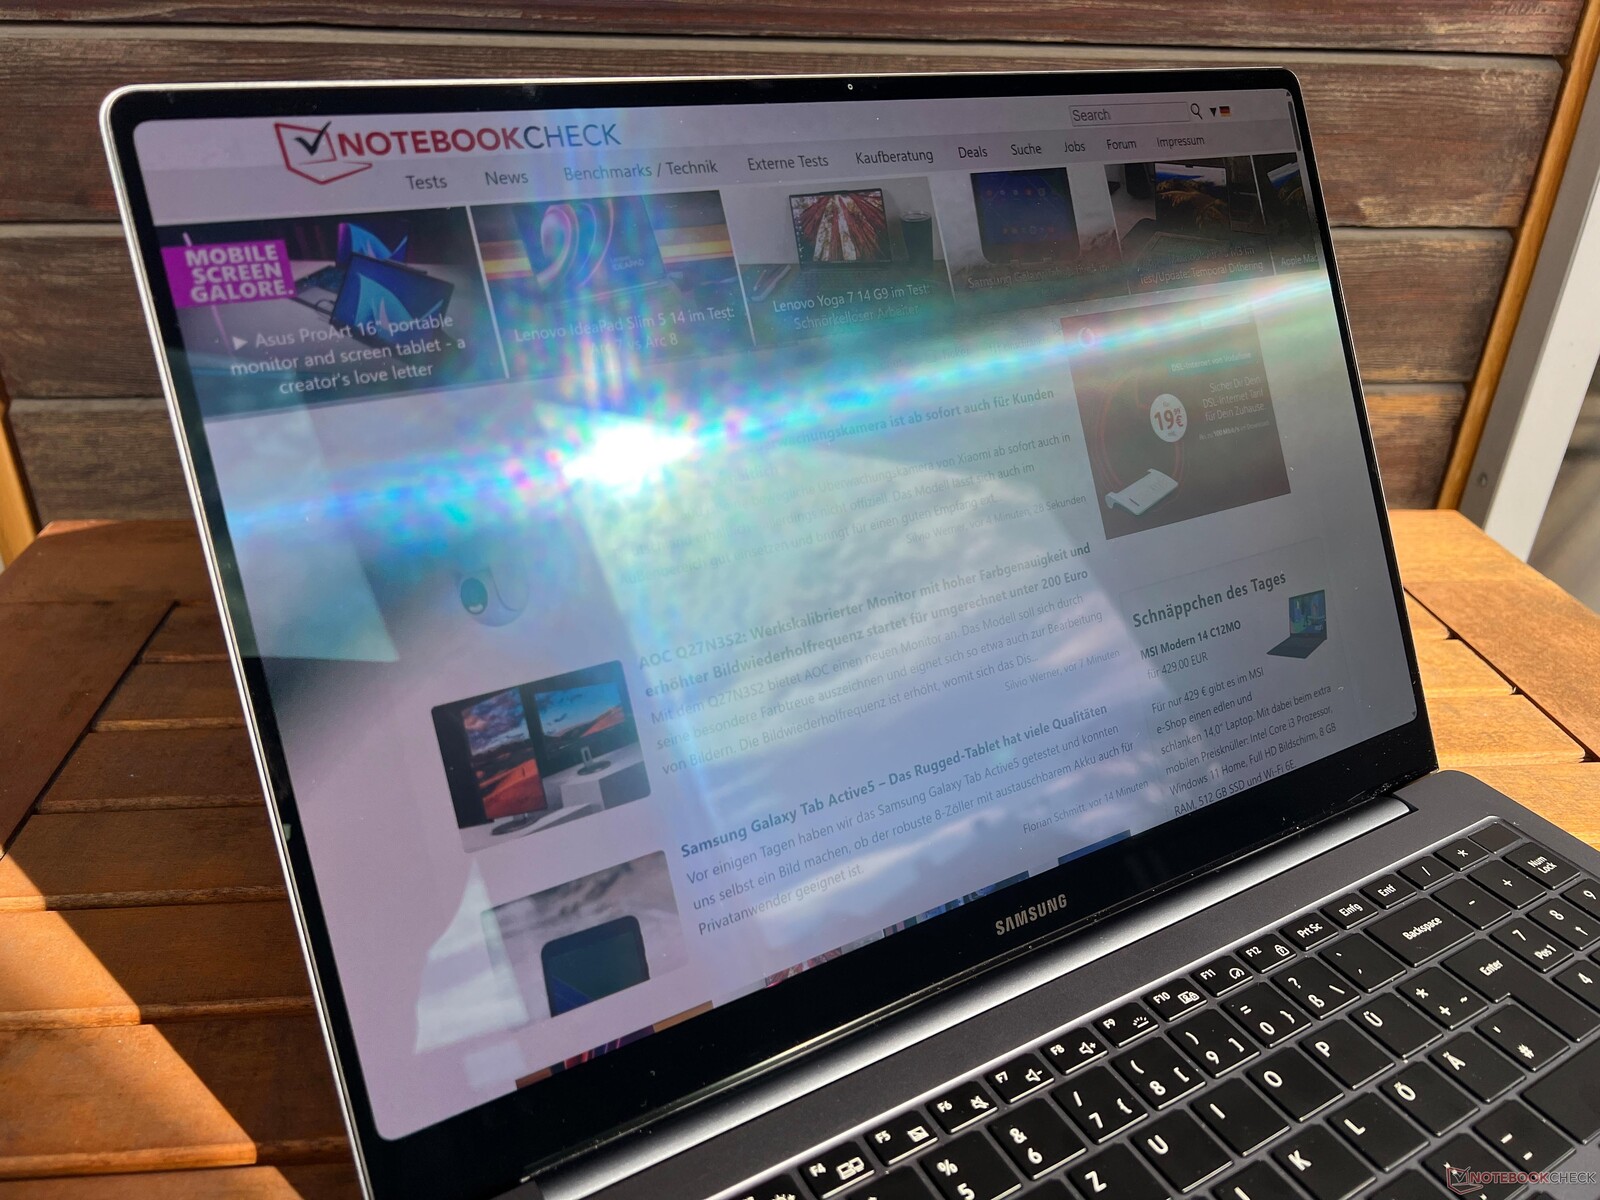
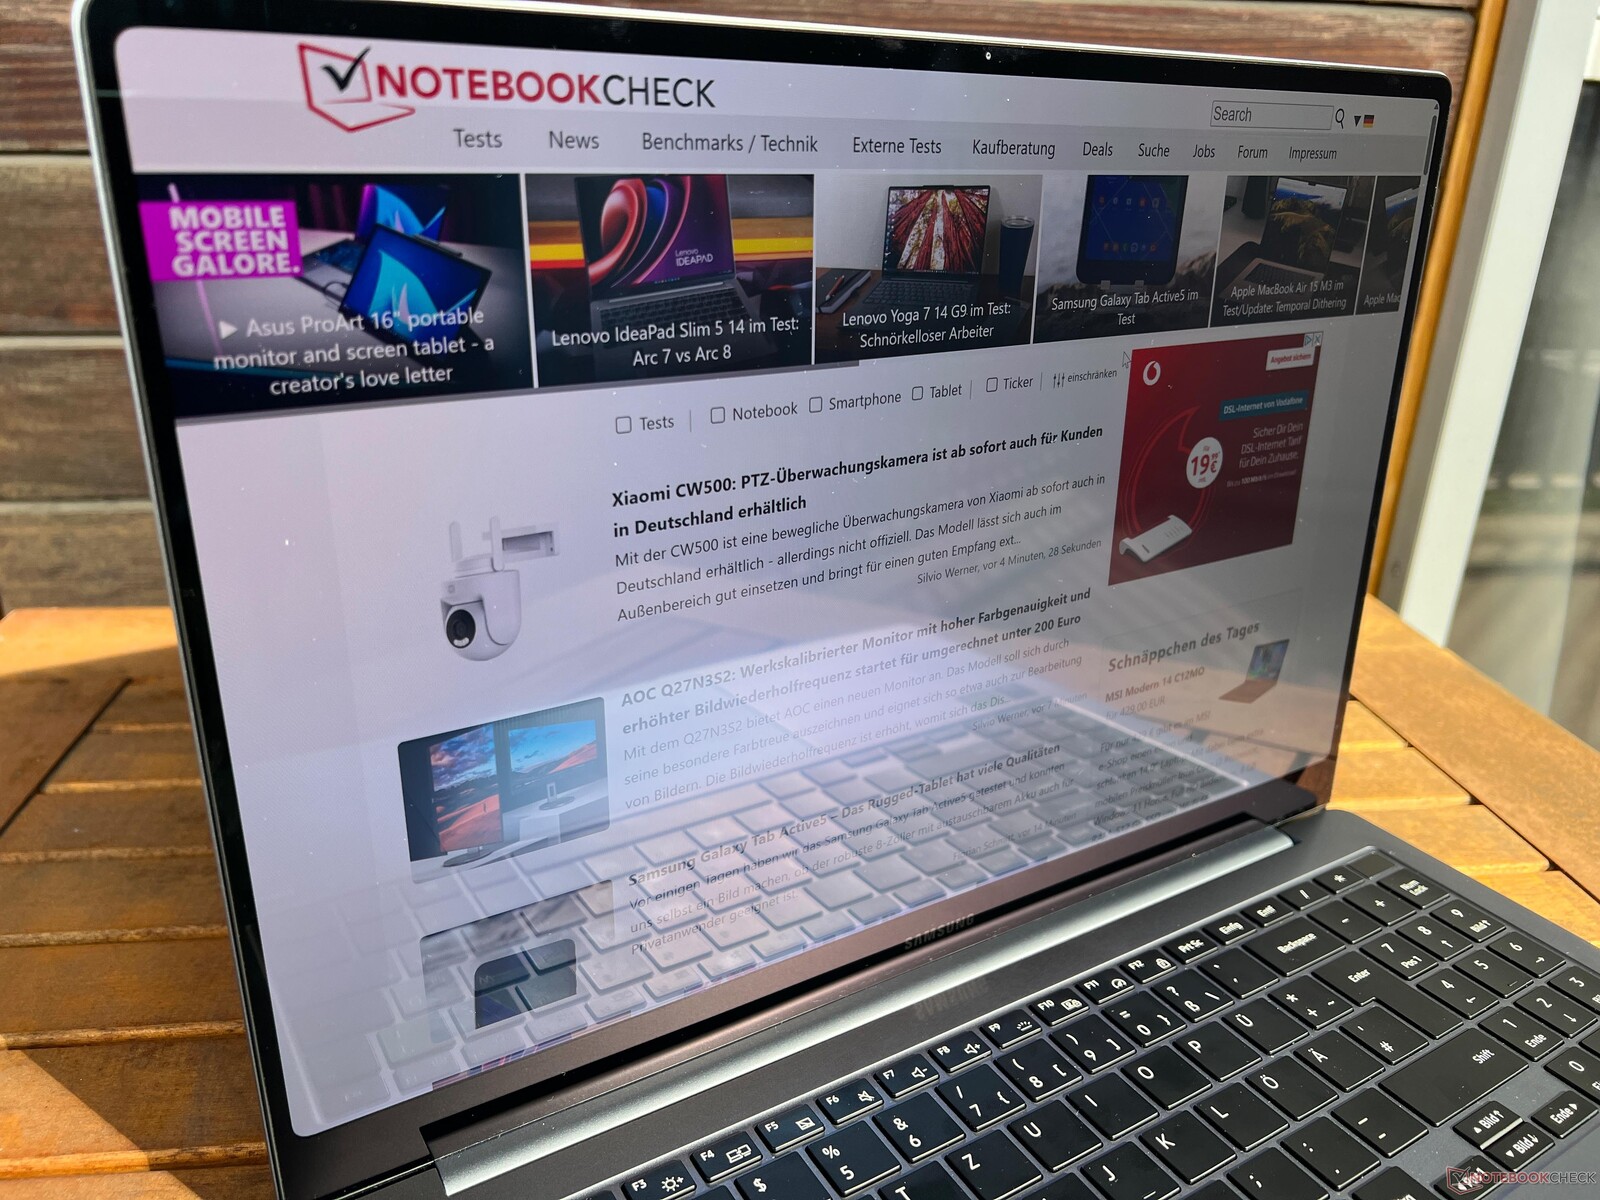
The OLED touchscreen is basically reflective but, thanks to the implementation of Corning Gorilla Glass DX, the level thereof is lower compared to other glossy panels and, in this regard, Samsung is on par with Apple's MacBooks. In principle, you can also use the device outdoors on bright days as long as you avoid reflections from light sources. The viewing angle stability is very good but, with large deviations, you will find the typical OLED blue shimmer.

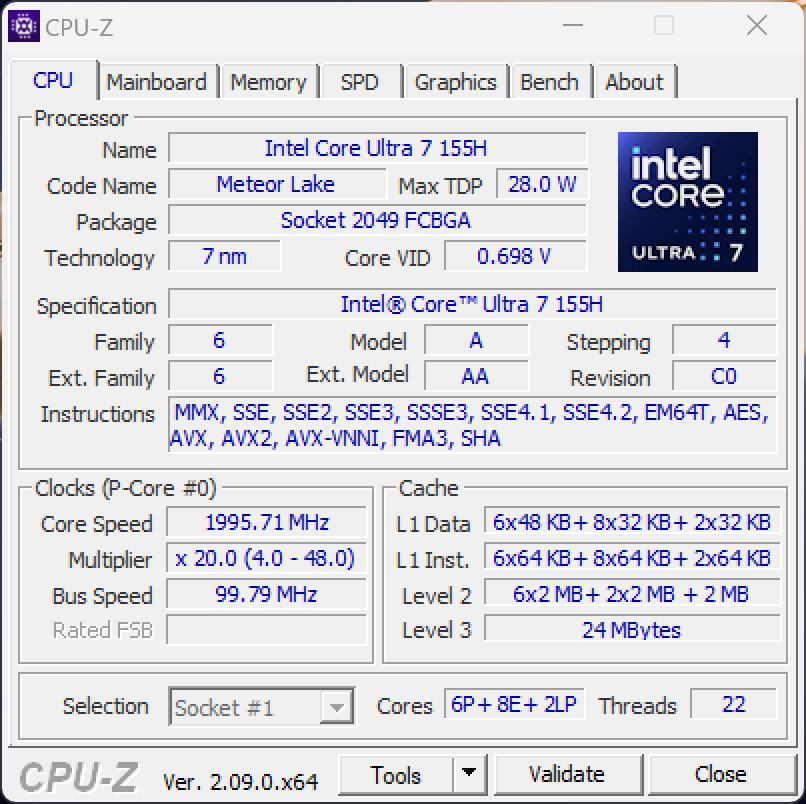
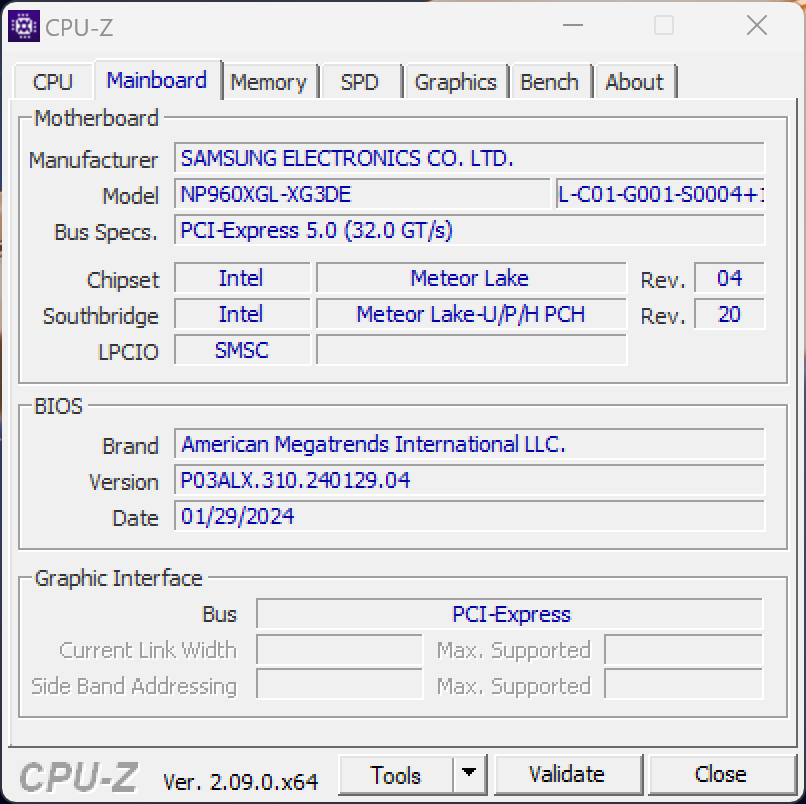
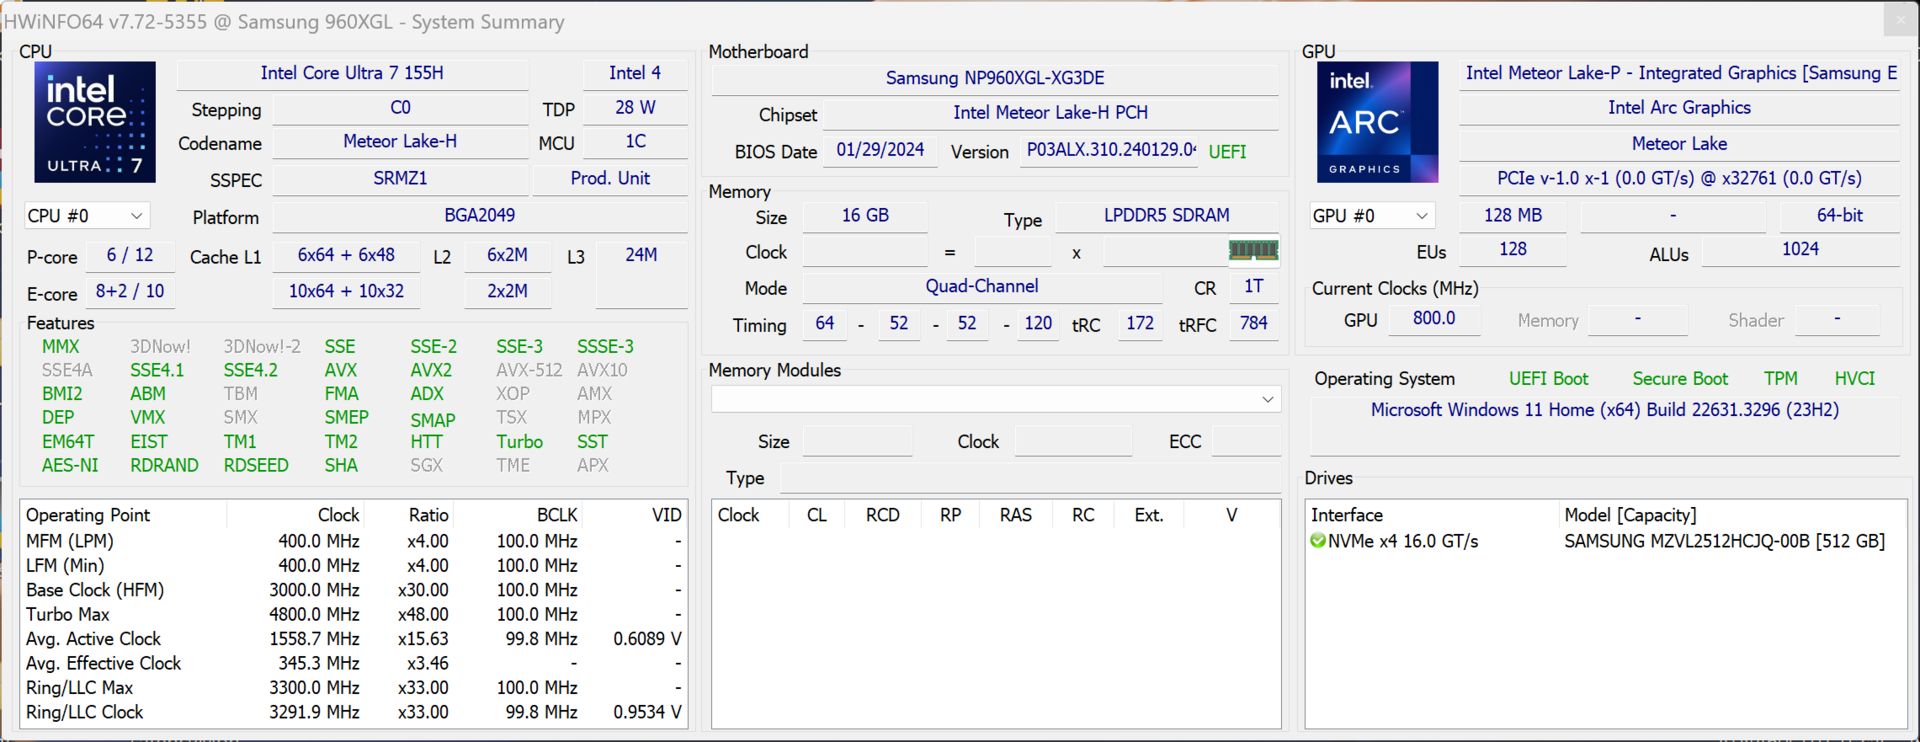
Performance - Meteor Lake replaces Raptor Lake
Samsung has replaced the old Intel Raptor Lake chips with the new Meteor Lake processors and you either get the Core Ultra 7 155H or the Core Ultra 9 185H. Regardless of the processor, you will also either get 16 or 32 GB of soldered RAM and, in terms of the GPUs, you have the choice between the GeForce RTX 4050 laptop or the faster RTX 4070 laptop.

Test conditions
In the Samsung settings app, there are various energy profiles but the standard selection is the Optimized mode. We also used this mode for the following benchmarks and measurements. Optionally, you can also choose from either Silent as well as High Performance. We have summarised the corresponding TDP/TGP values in the following table below.
| Energy profile | CPU TDP | R23 Multi | GPU TGP | Time Spy Graphics | Stress test | Cyberpunk 2077 1080p Ultra |
max. fan strength |
|---|---|---|---|---|---|---|---|
| Silent | 35/25 watts | 11,327 points | 55 watts | 1,529 points | CPU: 20 watts GPU: 20 watts |
12fps | 32 dB(A) |
| Optimized | 65/40 watts | 15,342 points | 55 watts | 6,073 points | CPU: 25 watts GPU: 33 watts |
39.4fps | 41.7 dB(A) |
| High performance | 80/70 watts | 17,088 points | 80 watts | 7,849 points | CPU: 30 watts GPU: 80 watts |
55.4fps | 51.3 dB(A) |
Processor
The Core Ultra 7 155H is the successor to the well-loved Core i7-13700H and offers a total of 16 cores/22 threads (6x performance, 10x efficiency). With power limits of 65/40 watts, the processor offers decent performance even if there are hardly any differences compared to the old Raptor Lake generation. This means it isn't a worthwhile upgrade. With the Ryzen 9 Pro 7940HS, AMD has its nose marginally in front. The normal M3 Pro also finds itself on this level and enjoys an advantage when it comes to single-core tests. Under sustained load, the multi-core performance drops by around ~15 %. In battery mode, the processor is allowed to draw a maximum of 45 watts, leading to a small deficit of 7 %. Additional CPU benchmarks can be found in our technology section.
Cinebench R15 Multi Continuous Test
Cinebench R23: Multi Core | Single Core
Cinebench R20: CPU (Multi Core) | CPU (Single Core)
Cinebench R15: CPU Multi 64Bit | CPU Single 64Bit
Blender: v2.79 BMW27 CPU
7-Zip 18.03: 7z b 4 | 7z b 4 -mmt1
Geekbench 6.6: Multi-Core | Single-Core
Geekbench 5.5: Multi-Core | Single-Core
HWBOT x265 Benchmark v2.2: 4k Preset
LibreOffice : 20 Documents To PDF
R Benchmark 2.5: Overall mean
| CPU Performance rating | |
| Lenovo Slim Pro 9i 16IRP8 -2! | |
| Apple MacBook Pro 16 2023 M3 Pro -8! | |
| Lenovo ThinkPad Z16 Gen 2 | |
| Average of class Multimedia | |
| Samsung Galaxy Book4 Ultra | |
| Schenker VISION 16 Pro (M23) -2! | |
| HP Spectre x360 16 RTX 4050 -1! | |
| Average Intel Core Ultra 7 155H | |
| Samsung Galaxy Book3 Ultra 16 -2! | |
| Cinebench R23 / Multi Core | |
| Lenovo Slim Pro 9i 16IRP8 | |
| Lenovo ThinkPad Z16 Gen 2 | |
| Average of class Multimedia (4861 - 33362, n=81, last 2 years) | |
| Samsung Galaxy Book4 Ultra | |
| Samsung Galaxy Book3 Ultra 16 | |
| HP Spectre x360 16 RTX 4050 | |
| Apple MacBook Pro 16 2023 M3 Pro | |
| Average Intel Core Ultra 7 155H (9769 - 19007, n=52) | |
| Schenker VISION 16 Pro (M23) | |
| Cinebench R23 / Single Core | |
| Lenovo Slim Pro 9i 16IRP8 | |
| Apple MacBook Pro 16 2023 M3 Pro | |
| Average of class Multimedia (1128 - 2459, n=73, last 2 years) | |
| Schenker VISION 16 Pro (M23) | |
| Lenovo ThinkPad Z16 Gen 2 | |
| Samsung Galaxy Book4 Ultra | |
| Average Intel Core Ultra 7 155H (1496 - 1815, n=52) | |
| HP Spectre x360 16 RTX 4050 | |
| Samsung Galaxy Book3 Ultra 16 | |
| Cinebench R20 / CPU (Multi Core) | |
| Lenovo Slim Pro 9i 16IRP8 | |
| Lenovo ThinkPad Z16 Gen 2 | |
| Average of class Multimedia (1887 - 12912, n=64, last 2 years) | |
| Samsung Galaxy Book4 Ultra | |
| Samsung Galaxy Book3 Ultra 16 | |
| Average Intel Core Ultra 7 155H (3798 - 7409, n=50) | |
| Schenker VISION 16 Pro (M23) | |
| HP Spectre x360 16 RTX 4050 | |
| Cinebench R20 / CPU (Single Core) | |
| Lenovo Slim Pro 9i 16IRP8 | |
| Schenker VISION 16 Pro (M23) | |
| Average of class Multimedia (425 - 853, n=64, last 2 years) | |
| Lenovo ThinkPad Z16 Gen 2 | |
| Samsung Galaxy Book4 Ultra | |
| Average Intel Core Ultra 7 155H (601 - 696, n=50) | |
| HP Spectre x360 16 RTX 4050 | |
| Samsung Galaxy Book3 Ultra 16 | |
| Cinebench R15 / CPU Multi 64Bit | |
| Lenovo Slim Pro 9i 16IRP8 | |
| Lenovo ThinkPad Z16 Gen 2 | |
| Average of class Multimedia (856 - 5224, n=68, last 2 years) | |
| Samsung Galaxy Book4 Ultra | |
| Samsung Galaxy Book3 Ultra 16 | |
| Average Intel Core Ultra 7 155H (1932 - 2880, n=56) | |
| HP Spectre x360 16 RTX 4050 | |
| Schenker VISION 16 Pro (M23) | |
| Apple MacBook Pro 16 2023 M3 Pro | |
| Cinebench R15 / CPU Single 64Bit | |
| Lenovo Slim Pro 9i 16IRP8 | |
| Lenovo ThinkPad Z16 Gen 2 | |
| Average of class Multimedia (184.8 - 326, n=66, last 2 years) | |
| Schenker VISION 16 Pro (M23) | |
| Samsung Galaxy Book4 Ultra | |
| HP Spectre x360 16 RTX 4050 | |
| Average Intel Core Ultra 7 155H (99.6 - 268, n=52) | |
| Samsung Galaxy Book3 Ultra 16 | |
| Blender / v2.79 BMW27 CPU | |
| Apple MacBook Pro 16 2023 M3 Pro | |
| Average of class Multimedia (100 - 557, n=65, last 2 years) | |
| Average Intel Core Ultra 7 155H (175 - 381, n=47) | |
| Schenker VISION 16 Pro (M23) | |
| Samsung Galaxy Book3 Ultra 16 | |
| Samsung Galaxy Book4 Ultra | |
| Lenovo ThinkPad Z16 Gen 2 | |
| Lenovo Slim Pro 9i 16IRP8 | |
| 7-Zip 18.03 / 7z b 4 | |
| Lenovo Slim Pro 9i 16IRP8 | |
| Lenovo ThinkPad Z16 Gen 2 | |
| Samsung Galaxy Book4 Ultra | |
| Schenker VISION 16 Pro (M23) | |
| Samsung Galaxy Book3 Ultra 16 | |
| HP Spectre x360 16 RTX 4050 | |
| Average of class Multimedia (29095 - 130368, n=62, last 2 years) | |
| Average Intel Core Ultra 7 155H (41739 - 70254, n=50) | |
| 7-Zip 18.03 / 7z b 4 -mmt1 | |
| Schenker VISION 16 Pro (M23) | |
| Lenovo ThinkPad Z16 Gen 2 | |
| Lenovo Slim Pro 9i 16IRP8 | |
| Average of class Multimedia (3666 - 7545, n=63, last 2 years) | |
| Samsung Galaxy Book4 Ultra | |
| Samsung Galaxy Book3 Ultra 16 | |
| Average Intel Core Ultra 7 155H (4594 - 5621, n=50) | |
| HP Spectre x360 16 RTX 4050 | |
| Geekbench 6.6 / Multi-Core | |
| Apple MacBook Pro 16 2023 M3 Pro | |
| Average of class Multimedia (4983 - 29415, n=76, last 2 years) | |
| Lenovo ThinkPad Z16 Gen 2 | |
| Samsung Galaxy Book4 Ultra | |
| Average Intel Core Ultra 7 155H (7732 - 13656, n=55) | |
| HP Spectre x360 16 RTX 4050 | |
| Geekbench 6.6 / Single-Core | |
| Apple MacBook Pro 16 2023 M3 Pro | |
| Average of class Multimedia (1534 - 4335, n=75, last 2 years) | |
| Lenovo ThinkPad Z16 Gen 2 | |
| Samsung Galaxy Book4 Ultra | |
| Average Intel Core Ultra 7 155H (1901 - 2473, n=52) | |
| HP Spectre x360 16 RTX 4050 | |
| Geekbench 5.5 / Multi-Core | |
| Apple MacBook Pro 16 2023 M3 Pro | |
| Lenovo Slim Pro 9i 16IRP8 | |
| Average of class Multimedia (4652 - 20422, n=62, last 2 years) | |
| Samsung Galaxy Book4 Ultra | |
| HP Spectre x360 16 RTX 4050 | |
| Lenovo ThinkPad Z16 Gen 2 | |
| Average Intel Core Ultra 7 155H (10017 - 13556, n=52) | |
| Schenker VISION 16 Pro (M23) | |
| Samsung Galaxy Book3 Ultra 16 | |
| Geekbench 5.5 / Single-Core | |
| Apple MacBook Pro 16 2023 M3 Pro | |
| Lenovo Slim Pro 9i 16IRP8 | |
| Average of class Multimedia (805 - 2974, n=62, last 2 years) | |
| Lenovo ThinkPad Z16 Gen 2 | |
| Schenker VISION 16 Pro (M23) | |
| Samsung Galaxy Book4 Ultra | |
| Average Intel Core Ultra 7 155H (1462 - 1824, n=52) | |
| HP Spectre x360 16 RTX 4050 | |
| Samsung Galaxy Book3 Ultra 16 | |
| HWBOT x265 Benchmark v2.2 / 4k Preset | |
| Lenovo Slim Pro 9i 16IRP8 | |
| Lenovo ThinkPad Z16 Gen 2 | |
| Average of class Multimedia (5.26 - 36.1, n=63, last 2 years) | |
| Samsung Galaxy Book4 Ultra | |
| Samsung Galaxy Book3 Ultra 16 | |
| Schenker VISION 16 Pro (M23) | |
| Average Intel Core Ultra 7 155H (9.93 - 21.2, n=50) | |
| HP Spectre x360 16 RTX 4050 | |
| LibreOffice / 20 Documents To PDF | |
| Average of class Multimedia (23.9 - 146.7, n=64, last 2 years) | |
| Samsung Galaxy Book3 Ultra 16 | |
| Average Intel Core Ultra 7 155H (37.5 - 79.2, n=49) | |
| Schenker VISION 16 Pro (M23) | |
| Samsung Galaxy Book4 Ultra | |
| Lenovo ThinkPad Z16 Gen 2 | |
| HP Spectre x360 16 RTX 4050 | |
| Lenovo Slim Pro 9i 16IRP8 | |
| R Benchmark 2.5 / Overall mean | |
| HP Spectre x360 16 RTX 4050 | |
| Samsung Galaxy Book3 Ultra 16 | |
| Average Intel Core Ultra 7 155H (0.4457 - 0.53, n=49) | |
| Samsung Galaxy Book4 Ultra | |
| Average of class Multimedia (0.3604 - 0.947, n=63, last 2 years) | |
| Lenovo ThinkPad Z16 Gen 2 | |
| Schenker VISION 16 Pro (M23) | |
| Lenovo Slim Pro 9i 16IRP8 | |
* ... smaller is better
AIDA64: FP32 Ray-Trace | FPU Julia | CPU SHA3 | CPU Queen | FPU SinJulia | FPU Mandel | CPU AES | CPU ZLib | FP64 Ray-Trace | CPU PhotoWorxx
| Performance rating | |
| Lenovo ThinkPad Z16 Gen 2 | |
| Lenovo Slim Pro 9i 16IRP8 | |
| Average of class Multimedia | |
| Samsung Galaxy Book3 Ultra 16 | |
| HP Spectre x360 16 RTX 4050 | |
| Samsung Galaxy Book4 Ultra | |
| Average Intel Core Ultra 7 155H | |
| Schenker VISION 16 Pro (M23) | |
| AIDA64 / FP32 Ray-Trace | |
| Lenovo ThinkPad Z16 Gen 2 | |
| Lenovo Slim Pro 9i 16IRP8 | |
| Average of class Multimedia (2214 - 50388, n=60, last 2 years) | |
| Samsung Galaxy Book3 Ultra 16 | |
| HP Spectre x360 16 RTX 4050 | |
| Samsung Galaxy Book4 Ultra | |
| Schenker VISION 16 Pro (M23) | |
| Average Intel Core Ultra 7 155H (6670 - 18470, n=50) | |
| AIDA64 / FPU Julia | |
| Lenovo ThinkPad Z16 Gen 2 | |
| Lenovo Slim Pro 9i 16IRP8 | |
| Average of class Multimedia (12867 - 201874, n=61, last 2 years) | |
| HP Spectre x360 16 RTX 4050 | |
| Samsung Galaxy Book4 Ultra | |
| Schenker VISION 16 Pro (M23) | |
| Average Intel Core Ultra 7 155H (40905 - 93181, n=50) | |
| Samsung Galaxy Book3 Ultra 16 | |
| AIDA64 / CPU SHA3 | |
| Lenovo ThinkPad Z16 Gen 2 | |
| Lenovo Slim Pro 9i 16IRP8 | |
| Average of class Multimedia (653 - 8623, n=61, last 2 years) | |
| HP Spectre x360 16 RTX 4050 | |
| Samsung Galaxy Book4 Ultra | |
| Average Intel Core Ultra 7 155H (1940 - 4436, n=50) | |
| Samsung Galaxy Book3 Ultra 16 | |
| Schenker VISION 16 Pro (M23) | |
| AIDA64 / CPU Queen | |
| Lenovo ThinkPad Z16 Gen 2 | |
| Lenovo Slim Pro 9i 16IRP8 | |
| Samsung Galaxy Book3 Ultra 16 | |
| Schenker VISION 16 Pro (M23) | |
| Samsung Galaxy Book4 Ultra | |
| Average Intel Core Ultra 7 155H (64698 - 94181, n=50) | |
| HP Spectre x360 16 RTX 4050 | |
| Average of class Multimedia (13483 - 181505, n=49, last 2 years) | |
| AIDA64 / FPU SinJulia | |
| Lenovo ThinkPad Z16 Gen 2 | |
| Lenovo Slim Pro 9i 16IRP8 | |
| Samsung Galaxy Book4 Ultra | |
| HP Spectre x360 16 RTX 4050 | |
| Average Intel Core Ultra 7 155H (5639 - 10647, n=50) | |
| Average of class Multimedia (1240 - 28794, n=61, last 2 years) | |
| Samsung Galaxy Book3 Ultra 16 | |
| Schenker VISION 16 Pro (M23) | |
| AIDA64 / FPU Mandel | |
| Lenovo ThinkPad Z16 Gen 2 | |
| Lenovo Slim Pro 9i 16IRP8 | |
| Average of class Multimedia (6395 - 105740, n=60, last 2 years) | |
| HP Spectre x360 16 RTX 4050 | |
| Samsung Galaxy Book4 Ultra | |
| Samsung Galaxy Book3 Ultra 16 | |
| Average Intel Core Ultra 7 155H (18236 - 47685, n=50) | |
| Schenker VISION 16 Pro (M23) | |
| AIDA64 / CPU AES | |
| Lenovo ThinkPad Z16 Gen 2 | |
| Lenovo Slim Pro 9i 16IRP8 | |
| Average Intel Core Ultra 7 155H (45713 - 152179, n=50) | |
| HP Spectre x360 16 RTX 4050 | |
| Samsung Galaxy Book4 Ultra | |
| Samsung Galaxy Book3 Ultra 16 | |
| Average of class Multimedia (13243 - 126790, n=61, last 2 years) | |
| Schenker VISION 16 Pro (M23) | |
| AIDA64 / CPU ZLib | |
| Lenovo Slim Pro 9i 16IRP8 | |
| Lenovo ThinkPad Z16 Gen 2 | |
| Samsung Galaxy Book3 Ultra 16 | |
| HP Spectre x360 16 RTX 4050 | |
| Average of class Multimedia (167.2 - 2022, n=61, last 2 years) | |
| Samsung Galaxy Book4 Ultra | |
| Average Intel Core Ultra 7 155H (557 - 1250, n=50) | |
| Schenker VISION 16 Pro (M23) | |
| AIDA64 / FP64 Ray-Trace | |
| Lenovo ThinkPad Z16 Gen 2 | |
| Lenovo Slim Pro 9i 16IRP8 | |
| Average of class Multimedia (1014 - 26875, n=61, last 2 years) | |
| Samsung Galaxy Book3 Ultra 16 | |
| HP Spectre x360 16 RTX 4050 | |
| Schenker VISION 16 Pro (M23) | |
| Samsung Galaxy Book4 Ultra | |
| Average Intel Core Ultra 7 155H (3569 - 9802, n=50) | |
| AIDA64 / CPU PhotoWorxx | |
| Lenovo Slim Pro 9i 16IRP8 | |
| Samsung Galaxy Book4 Ultra | |
| Average of class Multimedia (12860 - 88154, n=61, last 2 years) | |
| HP Spectre x360 16 RTX 4050 | |
| Samsung Galaxy Book3 Ultra 16 | |
| Average Intel Core Ultra 7 155H (32719 - 54223, n=50) | |
| Schenker VISION 16 Pro (M23) | |
| Lenovo ThinkPad Z16 Gen 2 | |
System performance
In the synthetic benchmarks, the Galaxy Book4 Ultra scored well and we are dealing with a fast, responsive computer. We didn't detect any kind of problems during our test.
CrossMark: Overall | Productivity | Creativity | Responsiveness
WebXPRT 3: Overall
WebXPRT 4: Overall
Mozilla Kraken 1.1: Total
| PCMark 10 / Score | |
| Lenovo ThinkPad Z16 Gen 2 | |
| Average of class Multimedia (4325 - 10386, n=58, last 2 years) | |
| Lenovo Slim Pro 9i 16IRP8 | |
| Schenker VISION 16 Pro (M23) | |
| Samsung Galaxy Book4 Ultra | |
| Average Intel Core Ultra 7 155H, NVIDIA GeForce RTX 4050 Laptop GPU (6537 - 6973, n=5) | |
| Samsung Galaxy Book3 Ultra 16 | |
| HP Spectre x360 16 RTX 4050 | |
| PCMark 10 / Essentials | |
| Lenovo ThinkPad Z16 Gen 2 | |
| Lenovo Slim Pro 9i 16IRP8 | |
| Schenker VISION 16 Pro (M23) | |
| Samsung Galaxy Book3 Ultra 16 | |
| Average of class Multimedia (8025 - 11664, n=57, last 2 years) | |
| Samsung Galaxy Book4 Ultra | |
| HP Spectre x360 16 RTX 4050 | |
| Average Intel Core Ultra 7 155H, NVIDIA GeForce RTX 4050 Laptop GPU (9463 - 10446, n=5) | |
| PCMark 10 / Productivity | |
| Average of class Multimedia (7323 - 18233, n=57, last 2 years) | |
| Lenovo ThinkPad Z16 Gen 2 | |
| Lenovo Slim Pro 9i 16IRP8 | |
| Schenker VISION 16 Pro (M23) | |
| HP Spectre x360 16 RTX 4050 | |
| Samsung Galaxy Book4 Ultra | |
| Average Intel Core Ultra 7 155H, NVIDIA GeForce RTX 4050 Laptop GPU (8769 - 9272, n=5) | |
| Samsung Galaxy Book3 Ultra 16 | |
| PCMark 10 / Digital Content Creation | |
| Lenovo Slim Pro 9i 16IRP8 | |
| Lenovo ThinkPad Z16 Gen 2 | |
| Schenker VISION 16 Pro (M23) | |
| Average of class Multimedia (3651 - 16240, n=57, last 2 years) | |
| Samsung Galaxy Book4 Ultra | |
| Samsung Galaxy Book3 Ultra 16 | |
| Average Intel Core Ultra 7 155H, NVIDIA GeForce RTX 4050 Laptop GPU (8602 - 10622, n=5) | |
| HP Spectre x360 16 RTX 4050 | |
| CrossMark / Overall | |
| Apple MacBook Pro 16 2023 M3 Pro | |
| Schenker VISION 16 Pro (M23) | |
| Average of class Multimedia (866 - 2728, n=67, last 2 years) | |
| Lenovo Slim Pro 9i 16IRP8 | |
| Samsung Galaxy Book4 Ultra | |
| Average Intel Core Ultra 7 155H, NVIDIA GeForce RTX 4050 Laptop GPU (1552 - 1740, n=5) | |
| HP Spectre x360 16 RTX 4050 | |
| Samsung Galaxy Book3 Ultra 16 | |
| Lenovo ThinkPad Z16 Gen 2 | |
| CrossMark / Productivity | |
| Schenker VISION 16 Pro (M23) | |
| Apple MacBook Pro 16 2023 M3 Pro | |
| Average of class Multimedia (931 - 2489, n=67, last 2 years) | |
| Samsung Galaxy Book4 Ultra | |
| Lenovo Slim Pro 9i 16IRP8 | |
| Average Intel Core Ultra 7 155H, NVIDIA GeForce RTX 4050 Laptop GPU (1459 - 1659, n=5) | |
| HP Spectre x360 16 RTX 4050 | |
| Lenovo ThinkPad Z16 Gen 2 | |
| Samsung Galaxy Book3 Ultra 16 | |
| CrossMark / Creativity | |
| Apple MacBook Pro 16 2023 M3 Pro | |
| Average of class Multimedia (907 - 3465, n=67, last 2 years) | |
| Lenovo Slim Pro 9i 16IRP8 | |
| Schenker VISION 16 Pro (M23) | |
| Samsung Galaxy Book4 Ultra | |
| Average Intel Core Ultra 7 155H, NVIDIA GeForce RTX 4050 Laptop GPU (1811 - 1943, n=5) | |
| HP Spectre x360 16 RTX 4050 | |
| Lenovo ThinkPad Z16 Gen 2 | |
| Samsung Galaxy Book3 Ultra 16 | |
| CrossMark / Responsiveness | |
| Schenker VISION 16 Pro (M23) | |
| Average of class Multimedia (605 - 2024, n=67, last 2 years) | |
| Samsung Galaxy Book3 Ultra 16 | |
| Samsung Galaxy Book4 Ultra | |
| Apple MacBook Pro 16 2023 M3 Pro | |
| Lenovo Slim Pro 9i 16IRP8 | |
| Lenovo ThinkPad Z16 Gen 2 | |
| Average Intel Core Ultra 7 155H, NVIDIA GeForce RTX 4050 Laptop GPU (1167 - 1467, n=5) | |
| HP Spectre x360 16 RTX 4050 | |
| WebXPRT 3 / Overall | |
| Apple MacBook Pro 16 2023 M3 Pro | |
| Lenovo Slim Pro 9i 16IRP8 | |
| Average of class Multimedia (136.4 - 596, n=70, last 2 years) | |
| Lenovo ThinkPad Z16 Gen 2 | |
| Schenker VISION 16 Pro (M23) | |
| Samsung Galaxy Book4 Ultra | |
| HP Spectre x360 16 RTX 4050 | |
| Average Intel Core Ultra 7 155H, NVIDIA GeForce RTX 4050 Laptop GPU (262 - 285, n=5) | |
| Samsung Galaxy Book3 Ultra 16 | |
| WebXPRT 4 / Overall | |
| Lenovo Slim Pro 9i 16IRP8 | |
| Average of class Multimedia (167.3 - 402, n=71, last 2 years) | |
| Schenker VISION 16 Pro (M23) | |
| Samsung Galaxy Book4 Ultra | |
| Lenovo ThinkPad Z16 Gen 2 | |
| HP Spectre x360 16 RTX 4050 | |
| Average Intel Core Ultra 7 155H, NVIDIA GeForce RTX 4050 Laptop GPU (247 - 260, n=5) | |
| Samsung Galaxy Book3 Ultra 16 | |
| Mozilla Kraken 1.1 / Total | |
| Samsung Galaxy Book3 Ultra 16 | |
| Lenovo ThinkPad Z16 Gen 2 | |
| HP Spectre x360 16 RTX 4050 | |
| Average Intel Core Ultra 7 155H, NVIDIA GeForce RTX 4050 Laptop GPU (416 - 561, n=5) | |
| Schenker VISION 16 Pro (M23) | |
| Lenovo Slim Pro 9i 16IRP8 | |
| Average of class Multimedia (228 - 835, n=74, last 2 years) | |
| Samsung Galaxy Book4 Ultra | |
| Apple MacBook Pro 16 2023 M3 Pro | |
* ... smaller is better
| PCMark 10 Score | 6973 points | |
Help | ||
| AIDA64 / Memory Copy | |
| Samsung Galaxy Book4 Ultra | |
| HP Spectre x360 16 RTX 4050 | |
| Average Intel Core Ultra 7 155H (62397 - 96791, n=50) | |
| Average of class Multimedia (21158 - 132135, n=61, last 2 years) | |
| Lenovo Slim Pro 9i 16IRP8 | |
| Samsung Galaxy Book3 Ultra 16 | |
| Lenovo ThinkPad Z16 Gen 2 | |
| Schenker VISION 16 Pro (M23) | |
| AIDA64 / Memory Read | |
| Samsung Galaxy Book4 Ultra | |
| HP Spectre x360 16 RTX 4050 | |
| Average of class Multimedia (19699 - 174586, n=61, last 2 years) | |
| Average Intel Core Ultra 7 155H (60544 - 90647, n=50) | |
| Lenovo Slim Pro 9i 16IRP8 | |
| Schenker VISION 16 Pro (M23) | |
| Samsung Galaxy Book3 Ultra 16 | |
| Lenovo ThinkPad Z16 Gen 2 | |
| AIDA64 / Memory Write | |
| HP Spectre x360 16 RTX 4050 | |
| Lenovo ThinkPad Z16 Gen 2 | |
| Lenovo Slim Pro 9i 16IRP8 | |
| Samsung Galaxy Book3 Ultra 16 | |
| Average of class Multimedia (17733 - 134998, n=61, last 2 years) | |
| Samsung Galaxy Book4 Ultra | |
| Average Intel Core Ultra 7 155H (58692 - 93451, n=50) | |
| Schenker VISION 16 Pro (M23) | |
| AIDA64 / Memory Latency | |
| Average Intel Core Ultra 7 155H (116.2 - 233, n=50) | |
| Samsung Galaxy Book4 Ultra | |
| HP Spectre x360 16 RTX 4050 | |
| Lenovo ThinkPad Z16 Gen 2 | |
| Average of class Multimedia (7 - 535, n=60, last 2 years) | |
| Lenovo Slim Pro 9i 16IRP8 | |
| Samsung Galaxy Book3 Ultra 16 | |
| Schenker VISION 16 Pro (M23) | |
* ... smaller is better
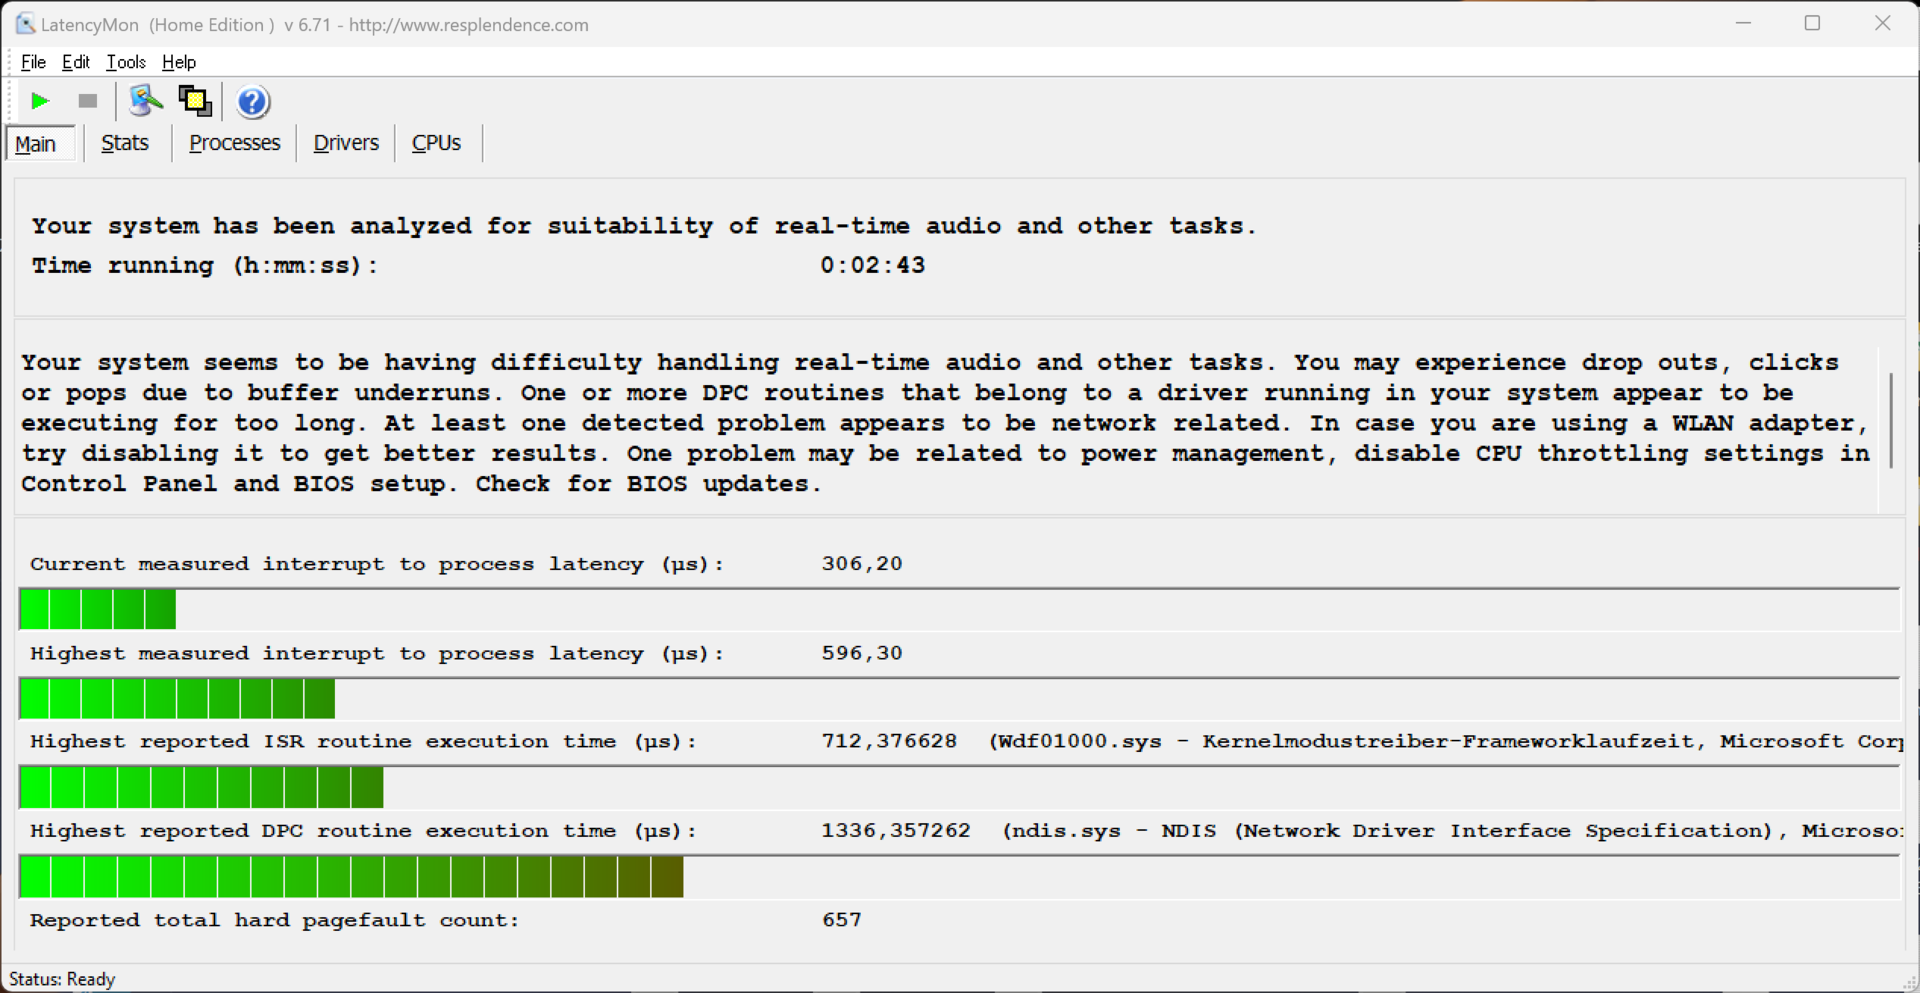
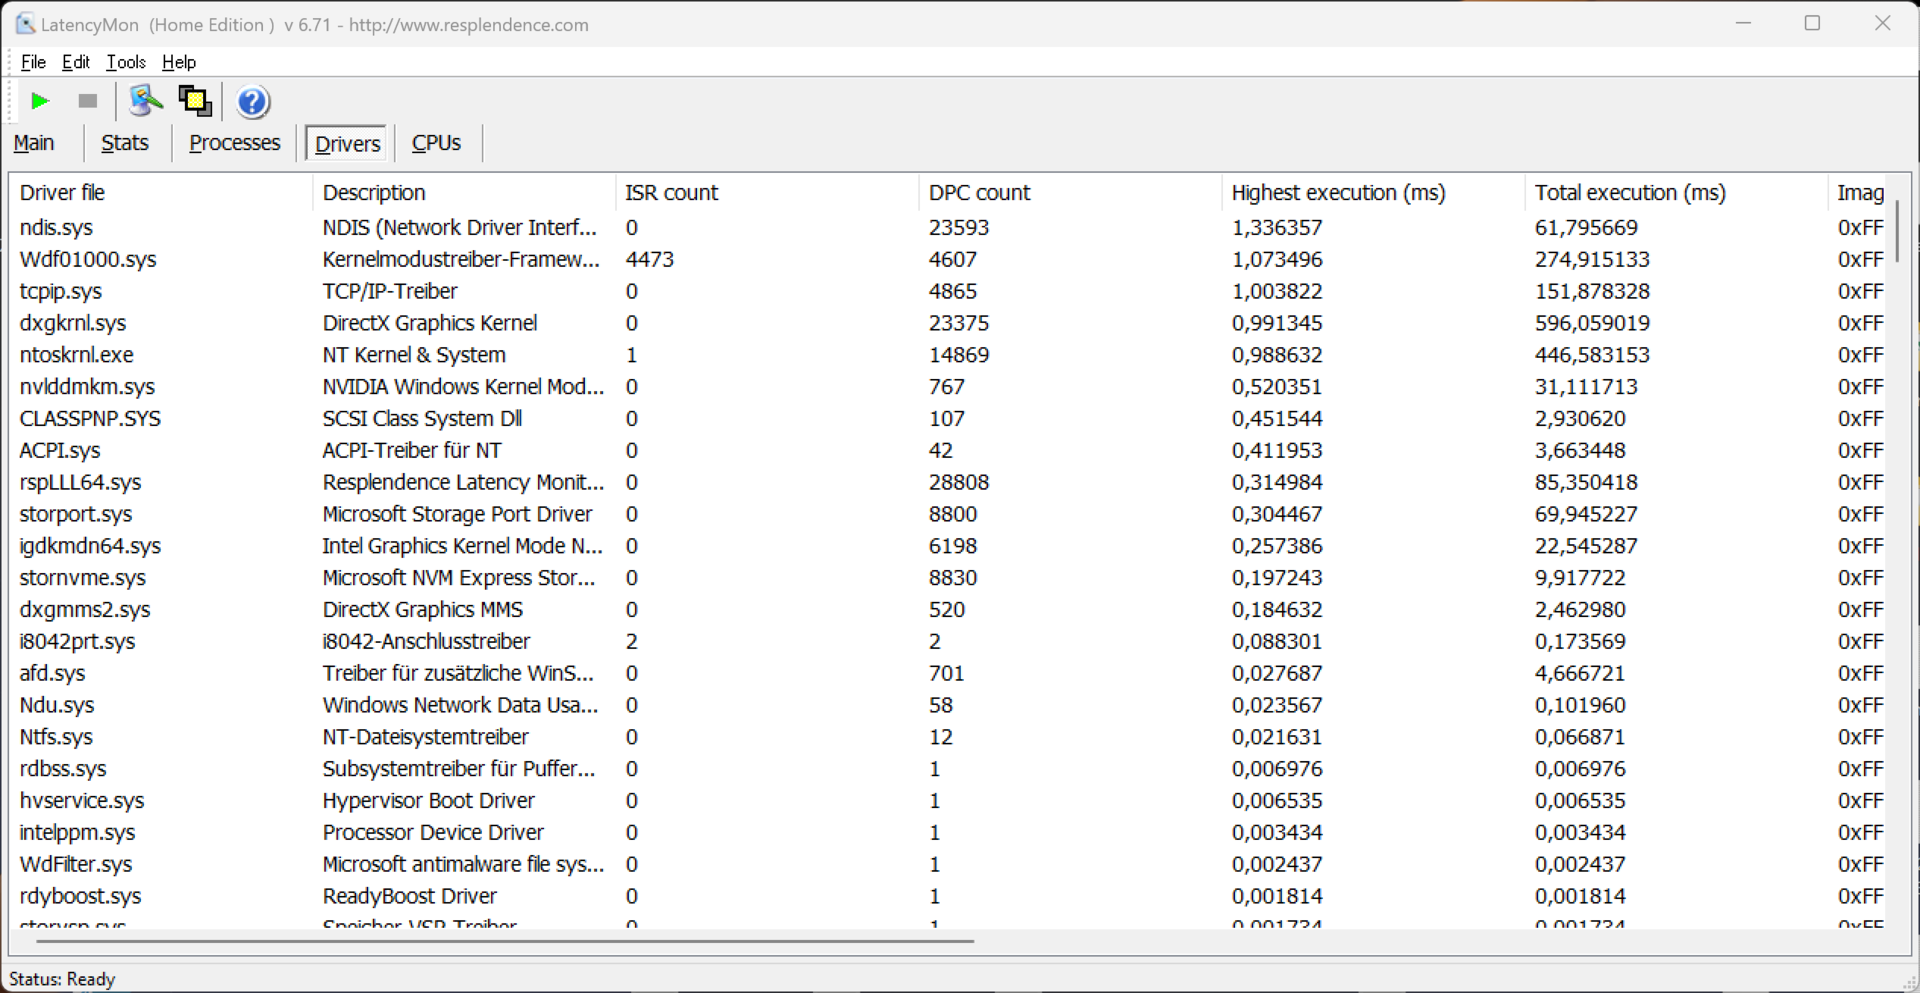
DPC latencies
In our standardized latency test (surfing the internet, 4K YouTube playback, CPU load), the review device and its current BIOS version performed very well. A driver did show a spike but the important "interrupt to process latency" value was very low.
| DPC Latencies / LatencyMon - interrupt to process latency (max), Web, Youtube, Prime95 | |
| HP Spectre x360 16 RTX 4050 | |
| Samsung Galaxy Book3 Ultra 16 | |
| Lenovo Slim Pro 9i 16IRP8 | |
| Lenovo ThinkPad Z16 Gen 2 | |
| Schenker VISION 16 Pro (M23) | |
| Samsung Galaxy Book4 Ultra | |
* ... smaller is better
Mass storage
Unsurprisingly, Samsung has installed one of its own SSDs (PM9A1), however, it only has a 512 GB capacity. After the first installation, the user has 403 GB at their disposal. At least the storage capacity can be easily and affordably expanded thanks to the second M.2 2280 slot. There is no cause for criticism regarding the SSD's performance and, even under longer periods of load, there are no dips in performance. Additional SSD benchmarks are listed here.

* ... smaller is better
Continuous Performance Read : DiskSpd Read Loop, Queue Depth 8
Graphics card
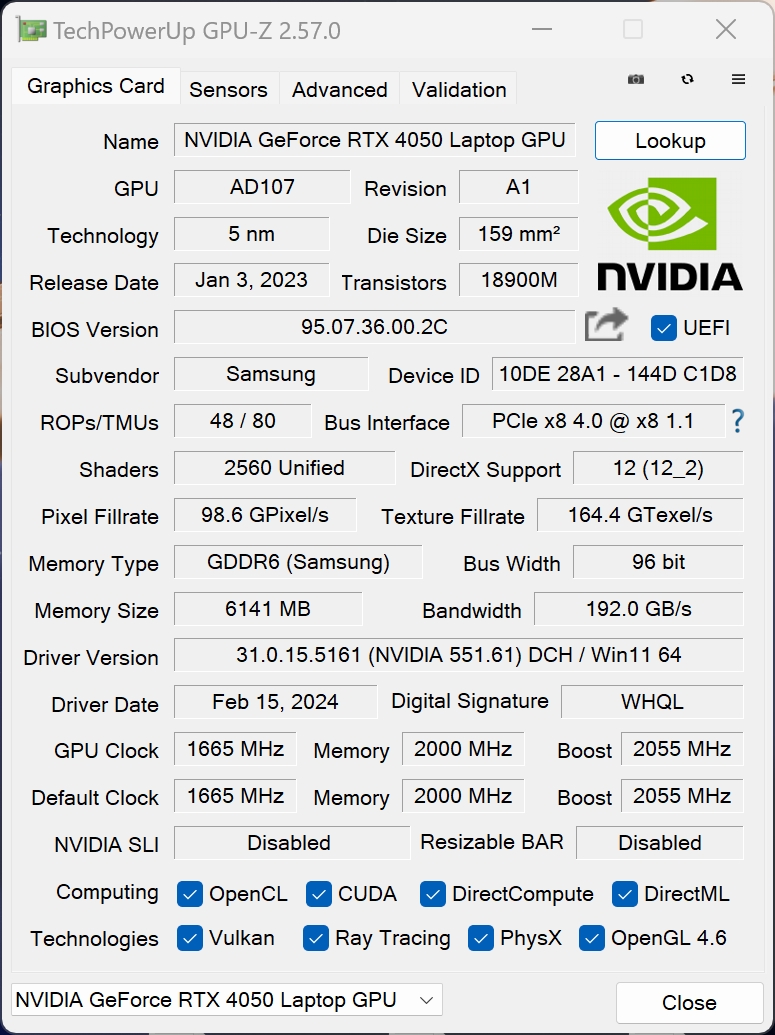
In everyday situations, the integrated Arc GPU takes care of the graphics computations and, for demanding applications, the Nvidia GPU automatically switches on. The regular Optimus graphics switch is used but neither an MUX switch nor Advanced Optimus are available. The RTX 4050 laptop housed inside the Galaxy Book4 Ultra, consumes a maximum of 80 watts in the high-performance mode and 55 watts in the optimized mode.
The benchmark results are on the same level as the old Galaxy Book3 Ultra which also used an RTX 4050 laptop at 55 watts. This beats the Radeon RX 6550M but the M3 Pro GPU is sometimes faster. For a multimedia laptop, the RTX 4050 laptop continues to be a good choice. However, the Galaxy Book4 Ultra failed the 3DMark stress test (Time Spy) with drops in performance of 7 % under sustained load.
In battery mode, the Nvidia GPU draws a maximum of 35 watts which is why the GPU performance is around 13 % lower. Additional GPU benchmarks are available here.
| 3DMark 11 Performance | 21479 points | |
| 3DMark Fire Strike Score | 14587 points | |
| 3DMark Time Spy Score | 6449 points | |
Help | ||
| Blender / v3.3 Classroom OPTIX/RTX | |
| Average of class Multimedia (12 - 105, n=24, last 2 years) | |
| Samsung Galaxy Book3 Ultra 16 | |
| Samsung Galaxy Book4 Ultra | |
| HP Spectre x360 16 RTX 4050 | |
| Average NVIDIA GeForce RTX 4050 Laptop GPU (25 - 37, n=40) | |
| Lenovo Slim Pro 9i 16IRP8 | |
| Schenker VISION 16 Pro (M23) | |
| Blender / v3.3 Classroom CUDA | |
| Samsung Galaxy Book3 Ultra 16 | |
| Average of class Multimedia (20 - 186, n=24, last 2 years) | |
| Samsung Galaxy Book4 Ultra | |
| HP Spectre x360 16 RTX 4050 | |
| Average NVIDIA GeForce RTX 4050 Laptop GPU (47 - 68, n=39) | |
| Lenovo Slim Pro 9i 16IRP8 | |
| Schenker VISION 16 Pro (M23) | |
| Blender / v3.3 Classroom METAL | |
| Apple MacBook Pro 16 2023 M3 Pro | |
| Average of class Multimedia (17.8 - 68, n=5, last 2 years) | |
| Blender / v3.3 Classroom CPU | |
| Average of class Multimedia (134.5 - 1042, n=68, last 2 years) | |
| HP Spectre x360 16 RTX 4050 | |
| Average NVIDIA GeForce RTX 4050 Laptop GPU (243 - 907, n=40) | |
| Schenker VISION 16 Pro (M23) | |
| Samsung Galaxy Book3 Ultra 16 | |
| Samsung Galaxy Book4 Ultra | |
| Apple MacBook Pro 16 2023 M3 Pro | |
| Lenovo Slim Pro 9i 16IRP8 | |
| Lenovo ThinkPad Z16 Gen 2 | |
* ... smaller is better
Gaming performance
Games look wonderful on the Galaxy Book4 Ultra's OLED display and even fast-paced shooters are a delight thanks to the extremely short response times. By contrast, in terms of gaming performance, you have to accept compromises with the RTX 4050 laptop and current titles are hardly playable in the device's native resolution. The sweet spot is Full HD resolution, with which you generally want to play games on maximum details. With very demanding games or ray tracing, you can't avoid using upscaling technologies such as DLSS.
| The Witcher 3 - 1920x1080 Ultra Graphics & Postprocessing (HBAO+) | |
| Schenker VISION 16 Pro (M23) | |
| Lenovo Slim Pro 9i 16IRP8 | |
| HP Spectre x360 16 RTX 4050 | |
| Samsung Galaxy Book3 Ultra 16 | |
| Samsung Galaxy Book4 Ultra | |
| Lenovo ThinkPad Z16 Gen 2 | |
| Average of class Multimedia (11 - 121, n=13, last 2 years) | |
| GTA V - 1920x1080 Highest AA:4xMSAA + FX AF:16x | |
| Lenovo Slim Pro 9i 16IRP8 | |
| Schenker VISION 16 Pro (M23) | |
| HP Spectre x360 16 RTX 4050 | |
| Samsung Galaxy Book4 Ultra | |
| Samsung Galaxy Book3 Ultra 16 | |
| Average of class Multimedia (7.92 - 141.6, n=63, last 2 years) | |
| Final Fantasy XV Benchmark - 1920x1080 High Quality | |
| Schenker VISION 16 Pro (M23) | |
| Lenovo Slim Pro 9i 16IRP8 | |
| HP Spectre x360 16 RTX 4050 | |
| Samsung Galaxy Book3 Ultra 16 | |
| Samsung Galaxy Book4 Ultra | |
| Average of class Multimedia (7.61 - 144.4, n=66, last 2 years) | |
| Lenovo ThinkPad Z16 Gen 2 | |
| F1 23 - 1920x1080 Ultra High Preset AA:T AF:16x | |
| Average NVIDIA GeForce RTX 4050 Laptop GPU (25.7 - 60.8, n=14) | |
| Samsung Galaxy Book4 Ultra | |
| Average of class Multimedia (11 - 70.3, n=6, last 2 years) | |
Witcher 3 FPS diagram
| low | med. | high | ultra | QHD | |
|---|---|---|---|---|---|
| GTA V (2015) | 142.8 | 67.6 | 48.1 | ||
| The Witcher 3 (2015) | 121 | 54.5 | 46 | ||
| Dota 2 Reborn (2015) | 162.2 | 147.6 | 141.3 | 126.8 | |
| Final Fantasy XV Benchmark (2018) | 130.2 | 77.8 | 56.7 | 40.7 | |
| X-Plane 11.11 (2018) | 122.4 | 104.2 | 81.5 | ||
| Far Cry 5 (2018) | 132 | 93 | 88 | 80 | 58 |
| Strange Brigade (2018) | 321 | 158 | 127 | 113 | 77 |
| F1 23 (2023) | 145.5 | 137 | 93.7 | 25.7 | 16.7 |
| Cyberpunk 2077 (2023) | 74.2 | 54.3 | 45.7 | 39.4 | 23.3 |
Emissions - Vapor chamber in every model
Noise emissions
Samsung has fitted vapor chamber cooling with two fans in both Galaxy Book4 Ultra models and, overall, it is very impressive. During simple tasks, the fans generally remain completely deactivated and short load peaks are achieved without the fans kicking in. Under load, things get significantly louder, however, at a maximum of 41.7 dB(A), the laptop is tolerable even without headphones. Conversely, at 51 dB(A) in the High Performance mode, it is considerably louder. No other electronic noises were present in the review device
| Energy profile | 3DMark 06 | Witcher 3 | Cyberpunk 2077 | stress test |
|---|---|---|---|---|
| Silent | 36.2 dB(A) | 36.2 dB(A) | 36.2 dB(A) | 32 dB(A) |
| Optimized | 37.9 dB(A) | 41.7 dB(A) | 41.7 dB(A) | 41.7 dB(A) |
| High performance | 41.7 dB(A) | 50.5 dB(A) | 51.3 dB(A) | 51.3 dB(A) |
Noise level
| Idle |
| 24.2 / 24.2 / 24.2 dB(A) |
| Load |
| 37.9 / 41.7 dB(A) |
 | ||
30 dB silent 40 dB(A) audible 50 dB(A) loud |
||
min: | ||
| Samsung Galaxy Book4 Ultra GeForce RTX 4050 Laptop GPU, Ultra 7 155H, Samsung PM9A1 MZVL2512HCJQ | Lenovo ThinkPad Z16 Gen 2 Radeon RX 6550M, R9 PRO 7940HS, Kioxia XG8 KXG8AZNV1T02 | Apple MacBook Pro 16 2023 M3 Pro M3 Pro 18-Core GPU, Apple M3 Pro 12-Core, Apple SSD AP0512Z | Lenovo Slim Pro 9i 16IRP8 GeForce RTX 4050 Laptop GPU, i9-13905H, Samsung PM9A1 MZVL21T0HCLR | HP Spectre x360 16 RTX 4050 GeForce RTX 4050 Laptop GPU, Ultra 7 155H, SK hynix PC801 HFS001TEJ9X101N | Schenker VISION 16 Pro (M23) GeForce RTX 4070 Laptop GPU, i7-13700H, Samsung 990 Pro 1 TB | Samsung Galaxy Book3 Ultra 16 GeForce RTX 4050 Laptop GPU, i7-13700H, Samsung PM9A1 MZVL2512HCJQ | |
|---|---|---|---|---|---|---|---|
| Noise | -8% | 6% | -3% | 11% | -19% | -5% | |
| off / environment * (dB) | 24.2 | 22.6 7% | 24.4 -1% | 22.7 6% | 23.3 4% | 25.9 -7% | 25 -3% |
| Idle Minimum * (dB) | 24.2 | 22.9 5% | 24.4 -1% | 22.7 6% | 23.6 2% | 25.9 -7% | 26 -7% |
| Idle Average * (dB) | 24.2 | 29.4 -21% | 24.4 -1% | 22.7 6% | 23.6 2% | 25.9 -7% | 27 -12% |
| Idle Maximum * (dB) | 24.2 | 29.4 -21% | 24.4 -1% | 27.5 -14% | 23.6 2% | 32 -32% | 28 -16% |
| Load Average * (dB) | 37.9 | 29.5 22% | 26.9 29% | 28.9 24% | 29.2 23% | 47.2 -25% | 40 -6% |
| Witcher 3 ultra * (dB) | 41.7 | 52 -25% | 25.1 40% | 52.6 -26% | 32.1 23% | 53.1 -27% | 39 6% |
| Load Maximum * (dB) | 41.7 | 52 -25% | 50.4 -21% | 52.5 -26% | 32.1 23% | 53.1 -27% | 41 2% |
* ... smaller is better
Temperature
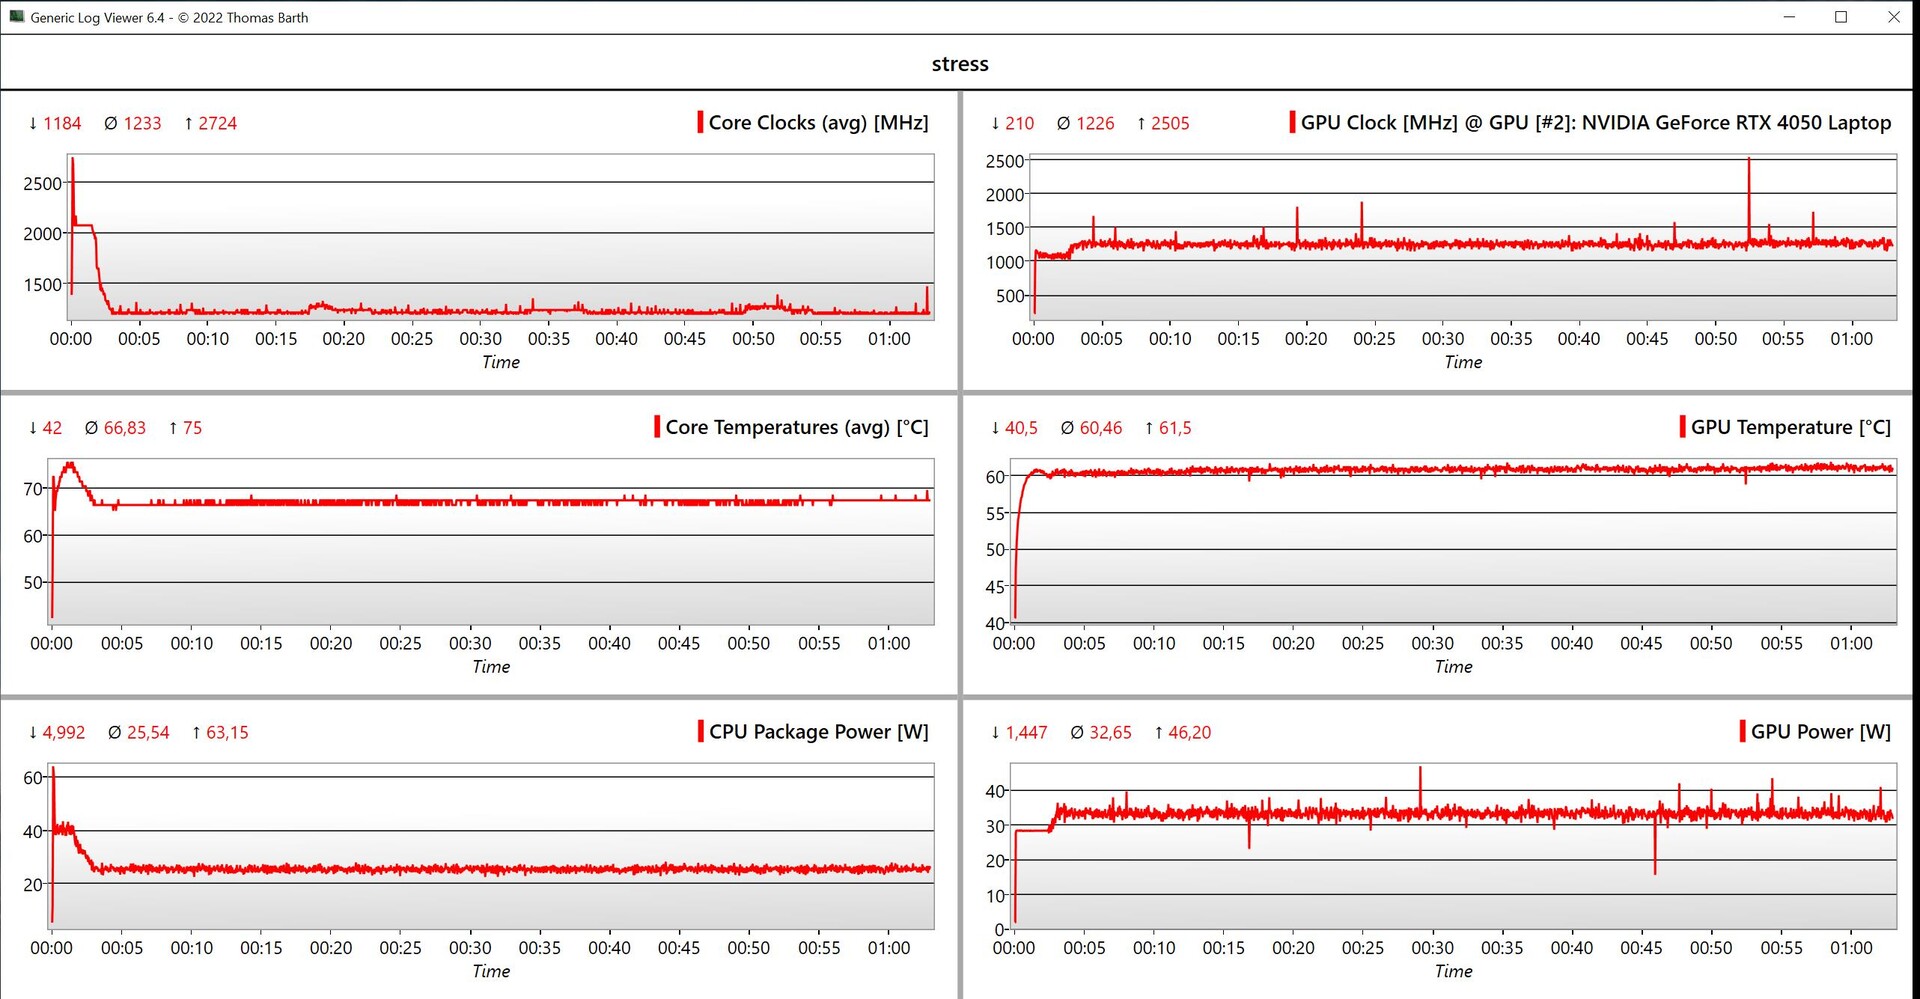
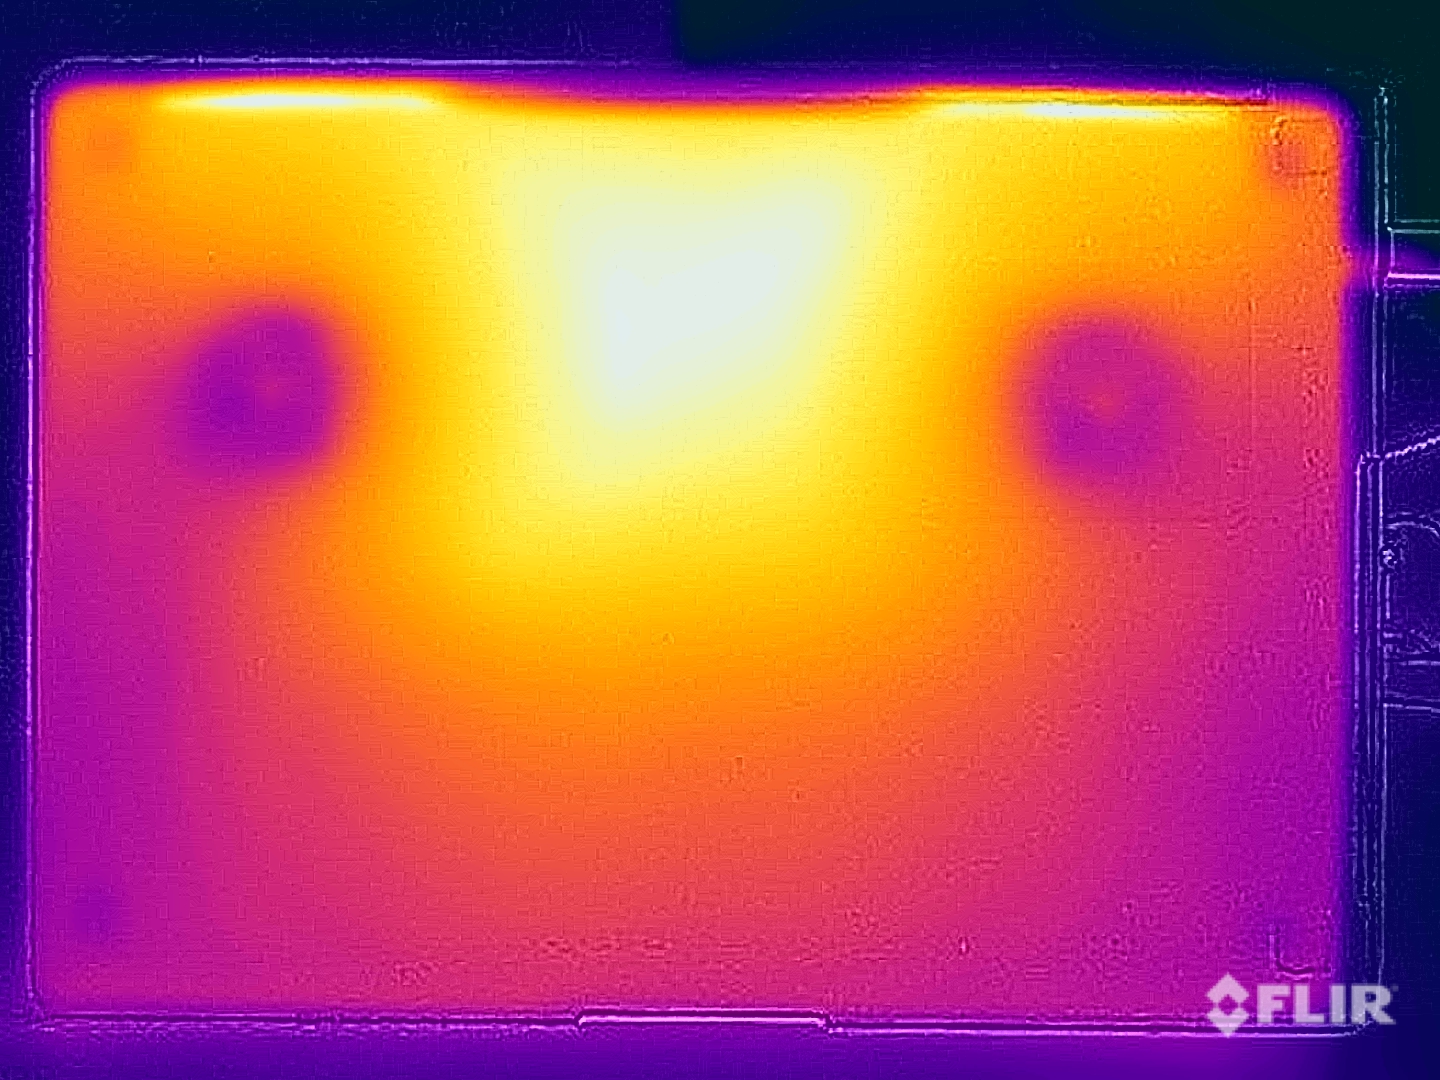
The Galaxy Book4 Ultra's metal case almost doesn't heat up at all both during idle use or when running straightforward tasks. Even in the stress test, the surface temperatures remain fully within limits since we only measured just short of 39 °C on the top side of the base unit and a maximum of 41,2 °C on the bottom, in the middle of the rear area. This means you can use the device without restrictions. In the stress test, the processor and the graphics card quickly settled to values of 25/33 watts.
(+) The maximum temperature on the upper side is 38.5 °C / 101 F, compared to the average of 36.8 °C / 98 F, ranging from 21 to 71 °C for the class Multimedia.
(±) The bottom heats up to a maximum of 41.2 °C / 106 F, compared to the average of 39.1 °C / 102 F
(+) In idle usage, the average temperature for the upper side is 23.2 °C / 74 F, compared to the device average of 31.3 °C / 88 F.
(±) Playing The Witcher 3, the average temperature for the upper side is 35 °C / 95 F, compared to the device average of 31.3 °C / 88 F.
(+) The palmrests and touchpad are cooler than skin temperature with a maximum of 31.9 °C / 89.4 F and are therefore cool to the touch.
(-) The average temperature of the palmrest area of similar devices was 28.7 °C / 83.7 F (-3.2 °C / -5.7 F).

| Samsung Galaxy Book4 Ultra Intel Core Ultra 7 155H, NVIDIA GeForce RTX 4050 Laptop GPU | Lenovo ThinkPad Z16 Gen 2 AMD Ryzen 9 PRO 7940HS, AMD Radeon RX 6550M | Apple MacBook Pro 16 2023 M3 Pro Apple M3 Pro 12-Core, Apple M3 Pro 18-Core GPU | Lenovo Slim Pro 9i 16IRP8 Intel Core i9-13905H, NVIDIA GeForce RTX 4050 Laptop GPU | HP Spectre x360 16 RTX 4050 Intel Core Ultra 7 155H, NVIDIA GeForce RTX 4050 Laptop GPU | Schenker VISION 16 Pro (M23) Intel Core i7-13700H, NVIDIA GeForce RTX 4070 Laptop GPU | Samsung Galaxy Book3 Ultra 16 Intel Core i7-13700H, NVIDIA GeForce RTX 4050 Laptop GPU | |
|---|---|---|---|---|---|---|---|
| Heat | 2% | 2% | -17% | -13% | -19% | -5% | |
| Maximum Upper Side * (°C) | 38.5 | 43 -12% | 38.1 1% | 37.8 2% | 39.6 -3% | 46.7 -21% | 41 -6% |
| Maximum Bottom * (°C) | 41.2 | 41.6 -1% | 37 10% | 44.8 -9% | 39.2 5% | 54.1 -31% | 44 -7% |
| Idle Upper Side * (°C) | 23.5 | 21.2 10% | 24.2 -3% | 30.6 -30% | 29 -23% | 26.5 -13% | 23 2% |
| Idle Bottom * (°C) | 24.1 | 21.4 11% | 24.6 -2% | 31 -29% | 31.6 -31% | 26.8 -11% | 26 -8% |
* ... smaller is better
Speakers
Samsung has installed a speaker system with 4 modules and although, all in all, the quality is good, the Galaxy Book4 Ultra is unable to keep pace with the best 16-inch multimedia laptops such as the MacBook Pro, Yoga Pro 9i or HP Spectre x360 16. In particular, in direct comparison, the modules could be a touch more emphatic.
Samsung Galaxy Book4 Ultra audio analysis
(+) | speakers can play relatively loud (85 dB)
Bass 100 - 315 Hz
(±) | reduced bass - on average 14.4% lower than median
(±) | linearity of bass is average (11.3% delta to prev. frequency)
Mids 400 - 2000 Hz
(+) | balanced mids - only 3.4% away from median
(+) | mids are linear (3.4% delta to prev. frequency)
Highs 2 - 16 kHz
(+) | balanced highs - only 3% away from median
(+) | highs are linear (5.6% delta to prev. frequency)
Overall 100 - 16.000 Hz
(+) | overall sound is linear (11.5% difference to median)
Compared to same class
» 18% of all tested devices in this class were better, 4% similar, 78% worse
» The best had a delta of 5%, average was 17%, worst was 45%
Compared to all devices tested
» 8% of all tested devices were better, 2% similar, 90% worse
» The best had a delta of 4%, average was 24%, worst was 134%
Lenovo Slim Pro 9i 16IRP8 audio analysis
(±) | speaker loudness is average but good (79.7 dB)
Bass 100 - 315 Hz
(+) | good bass - only 2.8% away from median
(±) | linearity of bass is average (8.9% delta to prev. frequency)
Mids 400 - 2000 Hz
(+) | balanced mids - only 2.4% away from median
(+) | mids are linear (4.9% delta to prev. frequency)
Highs 2 - 16 kHz
(+) | balanced highs - only 3.6% away from median
(+) | highs are linear (4.3% delta to prev. frequency)
Overall 100 - 16.000 Hz
(+) | overall sound is linear (7.3% difference to median)
Compared to same class
» 6% of all tested devices in this class were better, 1% similar, 94% worse
» The best had a delta of 5%, average was 17%, worst was 45%
Compared to all devices tested
» 1% of all tested devices were better, 0% similar, 99% worse
» The best had a delta of 4%, average was 24%, worst was 134%
Apple MacBook Pro 16 2023 M3 Max audio analysis
(+) | speakers can play relatively loud (84.3 dB)
Bass 100 - 315 Hz
(±) | reduced bass - on average 5% lower than median
(+) | bass is linear (5.6% delta to prev. frequency)
Mids 400 - 2000 Hz
(+) | balanced mids - only 1.2% away from median
(+) | mids are linear (3.1% delta to prev. frequency)
Highs 2 - 16 kHz
(+) | balanced highs - only 2.4% away from median
(+) | highs are linear (2.4% delta to prev. frequency)
Overall 100 - 16.000 Hz
(+) | overall sound is linear (5.3% difference to median)
Compared to same class
» 1% of all tested devices in this class were better, 1% similar, 98% worse
» The best had a delta of 5%, average was 17%, worst was 45%
Compared to all devices tested
» 0% of all tested devices were better, 0% similar, 100% worse
» The best had a delta of 4%, average was 24%, worst was 134%
HP Spectre x360 16 RTX 4050 audio analysis
(+) | speakers can play relatively loud (89.5 dB)
Bass 100 - 315 Hz
(±) | reduced bass - on average 13.2% lower than median
(±) | linearity of bass is average (7.9% delta to prev. frequency)
Mids 400 - 2000 Hz
(+) | balanced mids - only 3.2% away from median
(+) | mids are linear (3% delta to prev. frequency)
Highs 2 - 16 kHz
(+) | balanced highs - only 1.6% away from median
(+) | highs are linear (3.5% delta to prev. frequency)
Overall 100 - 16.000 Hz
(+) | overall sound is linear (9.2% difference to median)
Compared to same class
» 4% of all tested devices in this class were better, 1% similar, 95% worse
» The best had a delta of 6%, average was 20%, worst was 57%
Compared to all devices tested
» 3% of all tested devices were better, 1% similar, 96% worse
» The best had a delta of 4%, average was 24%, worst was 134%
Energy management - Improved endurance
Power consumption
Running idle, the OLED display shows itself to be very economical but Samsung's dark, standard wallpaper helps. When gaming and depending on the title, you can expect around 80 to 90 watts and in the stress test it was briefly 125 watts before this value also quickly settled to 90 watts. In the high-performance mode, the maximum consumption sat at 141.6 watts and was later 128 watts. This means the supplied 140-watt PSU is suitably sized.
| Off / Standby | |
| Idle | |
| Load |
|
Key:
min: | |
| Samsung Galaxy Book4 Ultra Ultra 7 155H, GeForce RTX 4050 Laptop GPU, Samsung PM9A1 MZVL2512HCJQ, OLED, 2880x1800, 16" | Lenovo ThinkPad Z16 Gen 2 R9 PRO 7940HS, Radeon RX 6550M, Kioxia XG8 KXG8AZNV1T02, OLED, 3840x2400, 16" | Apple MacBook Pro 16 2023 M3 Pro Apple M3 Pro 12-Core, M3 Pro 18-Core GPU, Apple SSD AP0512Z, Mini-LED, 3456x2234, 16.2" | Lenovo Slim Pro 9i 16IRP8 i9-13905H, GeForce RTX 4050 Laptop GPU, Samsung PM9A1 MZVL21T0HCLR, Mini-LED, 3200x2000, 16" | Schenker VISION 16 Pro (M23) i7-13700H, GeForce RTX 4070 Laptop GPU, Samsung 990 Pro 1 TB, IPS, 2560x1600, 16" | Samsung Galaxy Book3 Ultra 16 i7-13700H, GeForce RTX 4050 Laptop GPU, Samsung PM9A1 MZVL2512HCJQ, AMOLED, 2880x1800, 16" | Average NVIDIA GeForce RTX 4050 Laptop GPU | Average of class Multimedia | |
|---|---|---|---|---|---|---|---|---|
| Power Consumption | -40% | -25% | -160% | -54% | 11% | -85% | -17% | |
| Idle Minimum * (Watt) | 4.8 | 7.5 -56% | 4.5 6% | 16 -233% | 8.6 -79% | 3 37% | 9.95 ? -107% | 5.71 ? -19% |
| Idle Average * (Watt) | 7.5 | 9.6 -28% | 16.5 -120% | 30 -300% | 12 -60% | 5 33% | 15.8 ? -111% | 10.1 ? -35% |
| Idle Maximum * (Watt) | 7.9 | 18.5 -134% | 16.7 -111% | 30.4 -285% | 12.4 -57% | 11 -39% | 20.1 ? -154% | 12.4 ? -57% |
| Load Average * (Watt) | 79.3 | 57.1 28% | 60.4 24% | 78.9 1% | 80 -1% | 72 9% | 88 ? -11% | 65 ? 18% |
| Witcher 3 ultra * (Watt) | 79.2 | 115.8 -46% | 52.1 34% | 155.3 -96% | 147.7 -86% | 69.7 12% | ||
| Load Maximum * (Watt) | 125 | 131.7 -5% | 102.9 18% | 180.4 -44% | 173.1 -38% | 108 14% | 176.3 ? -41% | 112.2 ? 10% |
* ... smaller is better
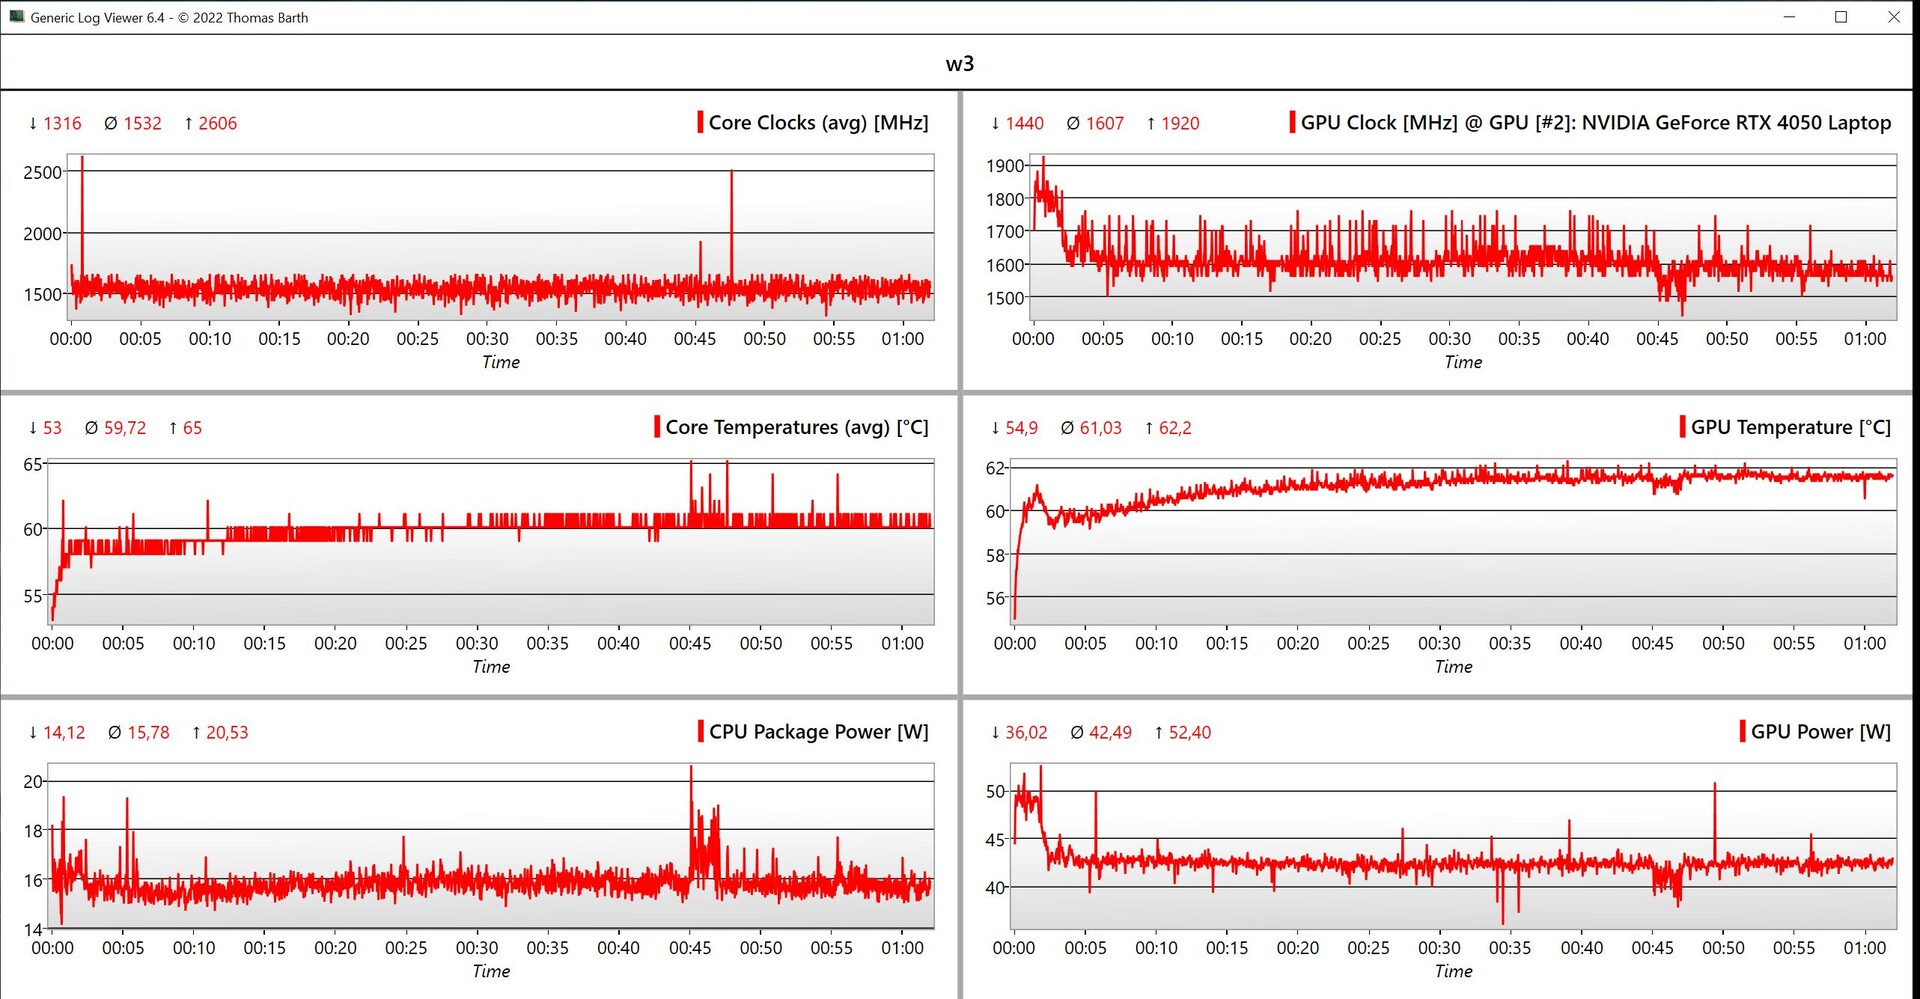
Power consumption Witcher 3 / stress test
Power consumption with an external monitor
Battery life
At 76 Wh, the battery capacity remains unchanged but, thanks to the new Meteor Lake processor, the battery life is better. Incidentally, we were only able to perform the battery test at 120 Hz because, despite selecting 60 Hz in the active signal mode, it remained at 120 Hz. This is a problem we have also discovered in the other models in the Galaxy Book4 series.
In the Wi-Fi test at 150 cd/m² (representing 66 % of the review device's maximum SDR brightness), we recorded almost 11 hours which is almost 1.5 longer than the predecessor. At full brightness, the Wi-Fi test ran for a little more than 7 hours. The video test running time (likewise 150 cd/m²) increased from ~13.5 hours to nearly 18 hours. This is where the new Meteor Lake processor and its low-power efficiency cores pay off.
Under load, it's possible to drain the battery after around 80 minutes and an HDR video at full brightness will play for approximately 5.5 hours. A charging cycle with the 140-watt PSU almost takes around 2.5 hours and there is no quick charge function.
| Samsung Galaxy Book4 Ultra Ultra 7 155H, GeForce RTX 4050 Laptop GPU, 76 Wh | Lenovo ThinkPad Z16 Gen 2 R9 PRO 7940HS, Radeon RX 6550M, 72 Wh | Apple MacBook Pro 16 2023 M3 Pro Apple M3 Pro 12-Core, M3 Pro 18-Core GPU, 99.6 Wh | Lenovo Slim Pro 9i 16IRP8 i9-13905H, GeForce RTX 4050 Laptop GPU, 75 Wh | HP Spectre x360 16 RTX 4050 Ultra 7 155H, GeForce RTX 4050 Laptop GPU, 83 Wh | Schenker VISION 16 Pro (M23) i7-13700H, GeForce RTX 4070 Laptop GPU, 80 Wh | Samsung Galaxy Book3 Ultra 16 i7-13700H, GeForce RTX 4050 Laptop GPU, 76 Wh | Average of class Multimedia | |
|---|---|---|---|---|---|---|---|---|
| Battery runtime | -7% | 43% | -39% | 1% | -28% | 0% | 10% | |
| H.264 (h) | 17.9 | 24.7 38% | 7.8 -56% | 13.4 -25% | 16.4 ? -8% | |||
| WiFi v1.3 (h) | 10.9 | 6 -45% | 20.1 84% | 6.6 -39% | 11 1% | 7.8 -28% | 9.6 -12% | 12 ? 10% |
| Load (h) | 1.3 | 1.7 31% | 1.4 8% | 1.3 0% | 1.8 38% | 1.675 ? 29% | ||
| Reader / Idle (h) | 10.2 | 18.2 | 25.2 ? |
Pros
Cons
Verdict - The Galaxy Book4 Ultra only has small improvements
Fundamentally, Samsung has made life easy for itself with its current Galaxy Book4 Ultra because the 16-inch multimedia computer has gotten a new Meteor Lake processor, however, apart from that, it's as you were. There are two different configurations and the Core Ultra 7 155H and GeForce RTX 4050 laptop review variant is suitable as a multimedia machine. The components' performance is decent and the various energy profiles are also well-balanced. In addition, the new Meteor Lake processor improves the battery life.
With its 120 Hz, the display also offers very good image quality with various color profiles which include very accurate ones for the P3 and sRGB color spaces. Despite this, there are problems such as constant 240 Hz PWM flickering and the device's HDR capabilities are also heavily limited, especially when compared to mini LED competitors such as the Lenovo Yoga Pro 9i or the Apple MacBook Pro 16.
The Galaxy Book4 Ultra is a very good multimedia computer that combines an AMOLED display with a premium case which houses an effective vapor chamber, decent performance and long battery life. Unfortunately, Samsung has cut corners when it comes to memory and storage. For $2,399, you only get 16 GB of RAM and a 512 GB SSD.
The case is impressively stable and well-finished, however, there are also disadvantages such as the wide bottom bezel and the soldered RAM. In particular, the 16 GB in our review configuration is not especially generous. You also only get an average keyboard which is mostly due to the limited key travel.
But, the biggest problem is the price with Samsung asking a hefty $2,399 for our 16 GB of RAM and 512 GB SSD review model. Even the MacBook Pro 16 with the M3 Pro and significantly better HDR capabilities is around $200 cheaper in stores. The Windows competition is also cheaper and comes with other benefits. The Lenovo Yoga Pro 9i offers a better keyboard, a brighter mini LED panel and better speakers. With its Vision 16 Pro, Schenker still offers a very portable 16-inch device with the faster RTX 4070 and a PWM-free IPS panel. The Galaxy Book4 Ultra is in no way a bad machine but its price-performance ratio is not particularly good considering how strong the competing devices are in this segment and soon it will get another competitor in the marketplace in the form of the new Dell XPS 16.
Price and availability
The GalaxyBook4 Ultra can be ordered directly from Samsung starting at $2,399.
Samsung Galaxy Book4 Ultra
- 03/16/2024 v7 (old)
Andreas Osthoff
Transparency
The selection of devices to be reviewed is made by our editorial team. The test sample was provided to the author as a loan by the manufacturer or retailer for the purpose of this review. The lender had no influence on this review, nor did the manufacturer receive a copy of this review before publication. There was no obligation to publish this review. As an independent media company, Notebookcheck is not subjected to the authority of manufacturers, retailers or publishers.
This is how Notebookcheck is testing
Every year, Notebookcheck independently reviews hundreds of laptops and smartphones using standardized procedures to ensure that all results are comparable. We have continuously developed our test methods for around 20 years and set industry standards in the process. In our test labs, high-quality measuring equipment is utilized by experienced technicians and editors. These tests involve a multi-stage validation process. Our complex rating system is based on hundreds of well-founded measurements and benchmarks, which maintains objectivity. Further information on our test methods can be found here.
Price comparison

