Verdict – Budget device with creative ambitions?
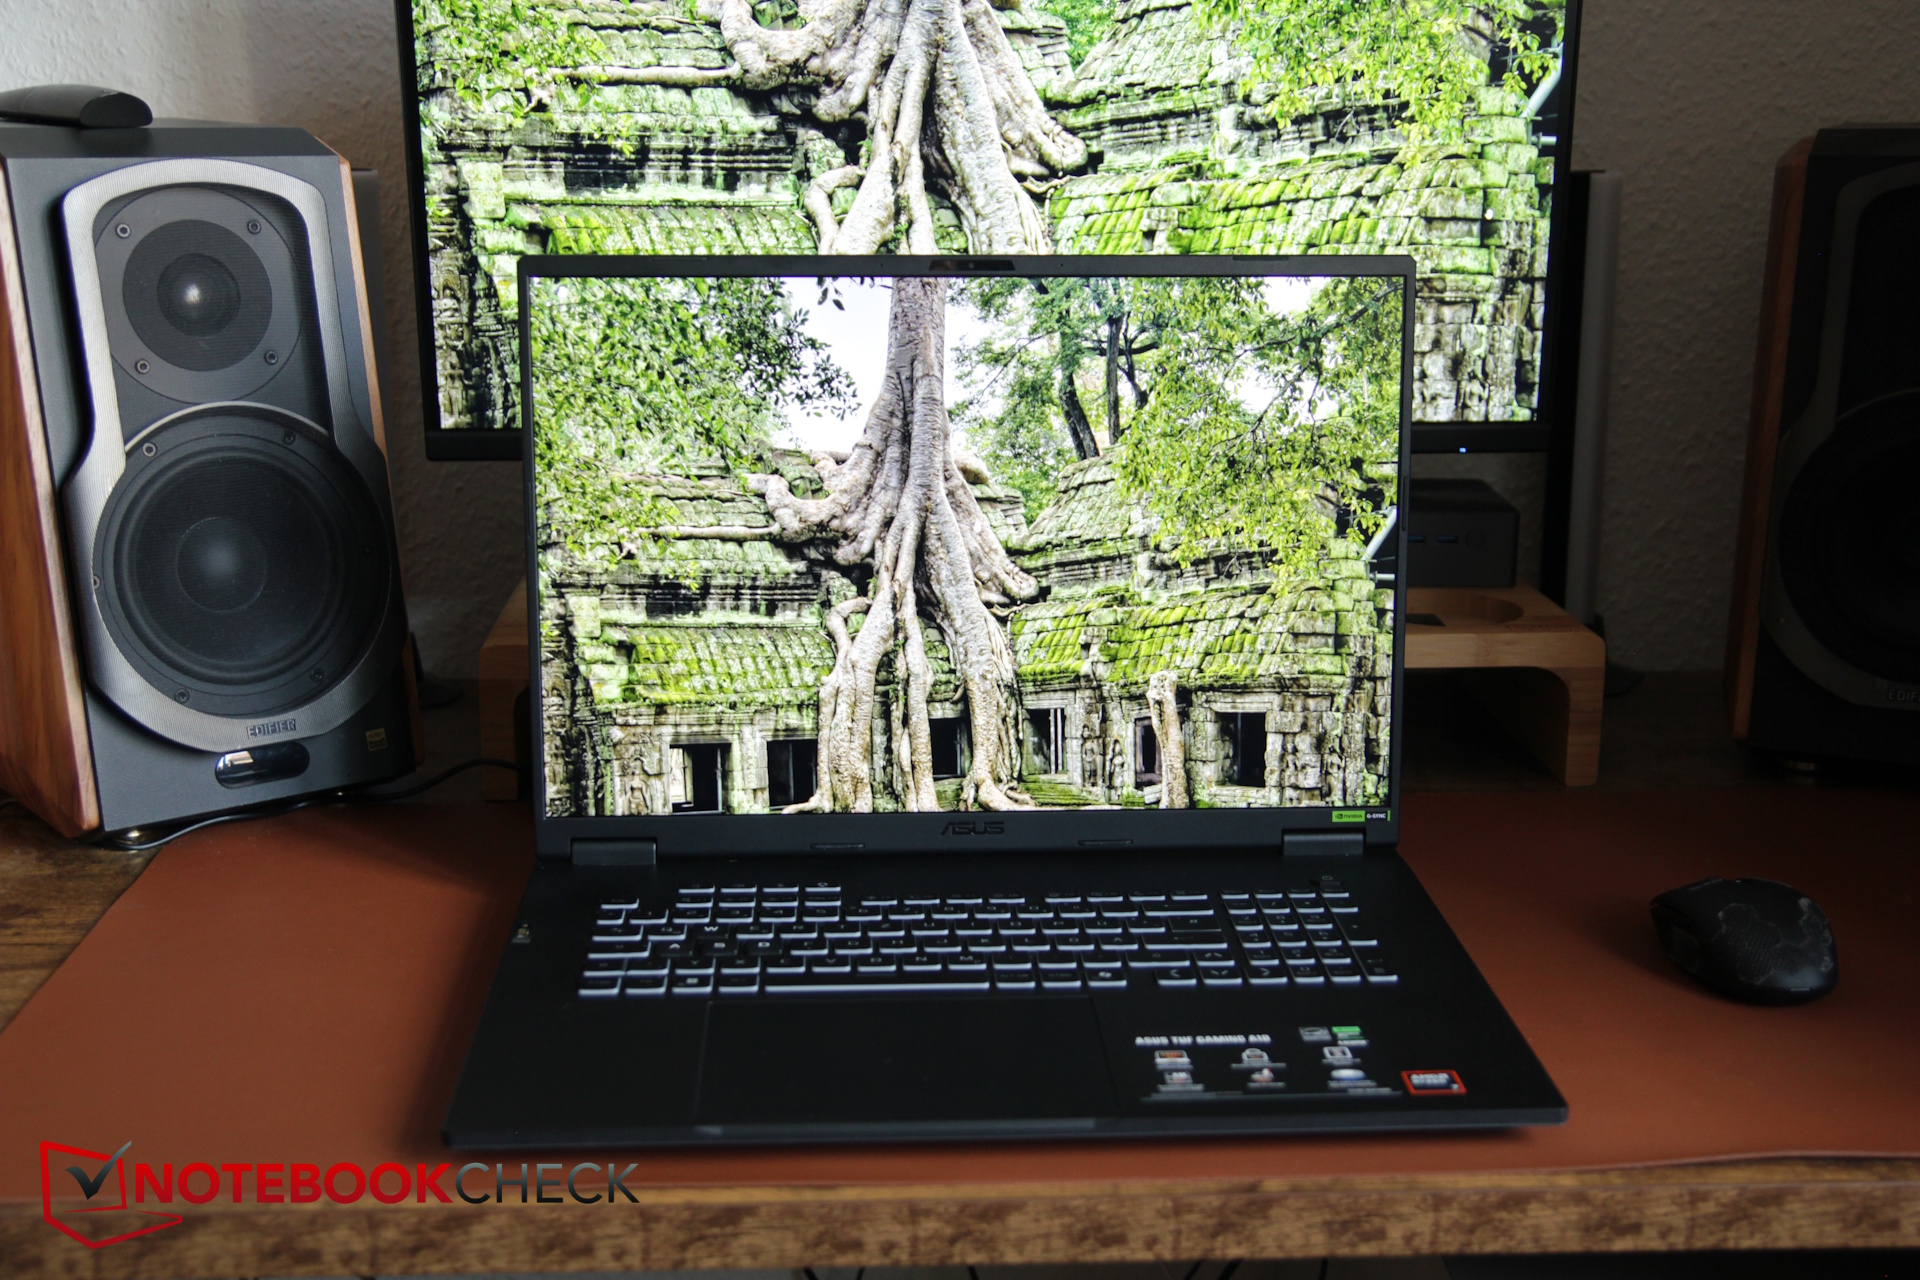
It’s interesting what Asus has pulled off with the A18: for an 18-inch gaming laptop, it’s relatively slim and light, with a clean design, excellent battery life, and impressively low noise levels even in Performance mode. The display leaves us somewhat torn — the 300-nit sRGB panel isn’t exactly exciting, but it calibrates beautifully. Is Asus trying to appeal to creatives despite the budget TUF branding?
If you want the same 3D performance as competing models, switching to Turbo mode is necessary — but that will also spike noise and power draw. If you’re willing to give up a few FPS, you’ll get a very quiet and efficient desktop-replacement machine that, however, doesn’t manage to hide its budget roots in every area.
Pros
Cons
Preis und Verfügbarkeit
- $1,649.00EXCaliberPC [2025] ASUS TUF Gaming A18 FA808UP-NS74 (AMD Ryzen 7 260, 16GB RAM, 1TB NVMe SSD, NVIDIA GeForce RTX 5070, 18" 2.5K 240Hz, Windows 11) Gaming Laptop
- $1,168.99TUF Gaming A18 FA808 FA808UH-RS74 18" Gaming Notebook - Full HD Plus - 144 Hz - AMD Ryzen 7 260 - 16 GB - 1 TB SSD - AMD Chip - 1920 x 1200 - Windows 11 Home - NVIDIA GeForce RTX 5050 with 8 GB - In-p
- $1,479.99ASUS TUF A18 Gaming Laptop, 18" FHD+ 144Hz Display, AMD Ryzen 7 260(>i7-14650HX), NVIDIA GeForce RTX 5060, 32GB D5 RAM, 1TB SSD, Backlit Keyboard, Wi-Fi 6E, FHD Camera, Win 11 Pro, w/BWE Accessories
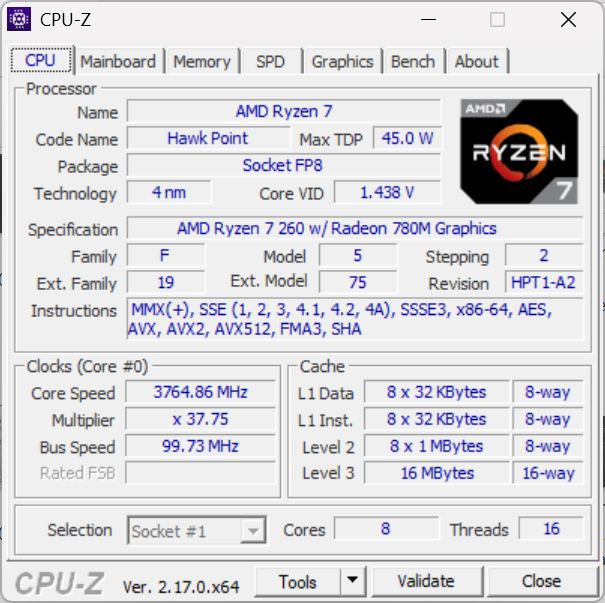
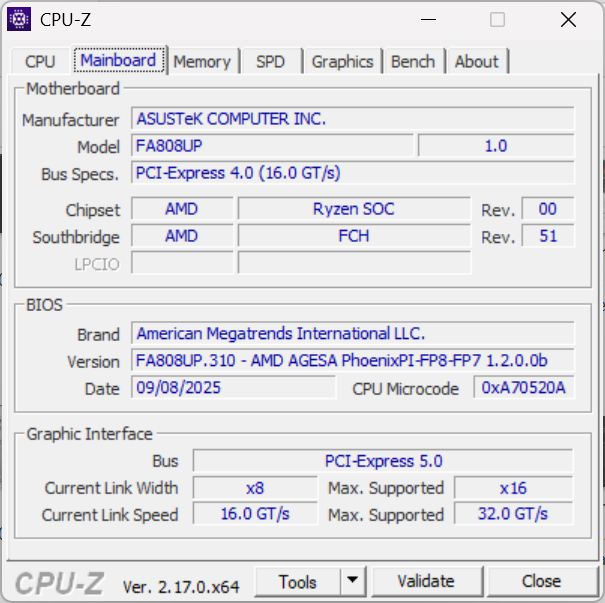
The Asus TUF Gaming A18 is entirely new this year and replaces last year's A17. For just over €2,000, Asus packs an RTX 5070 and an AMD Ryzen 7 260 into a large 18-inch chassis.
Specifications
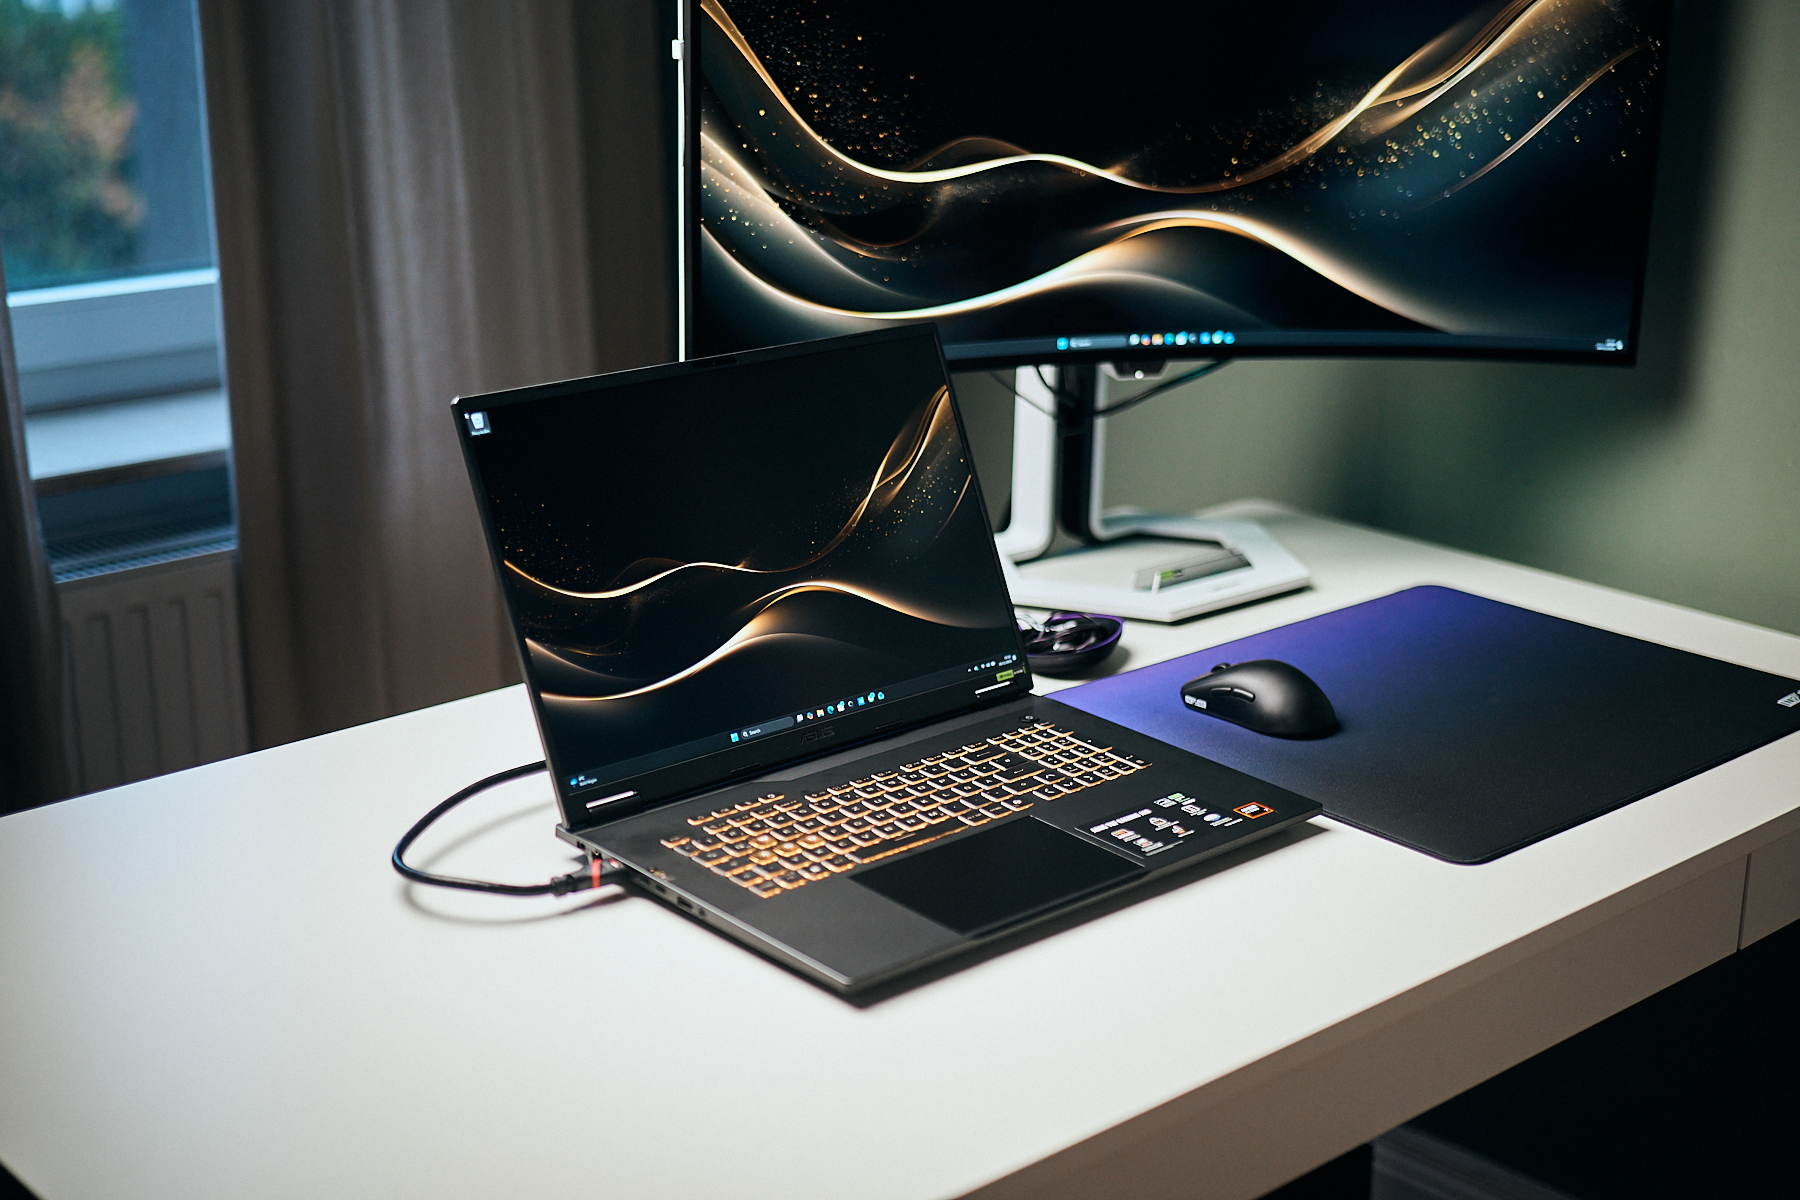
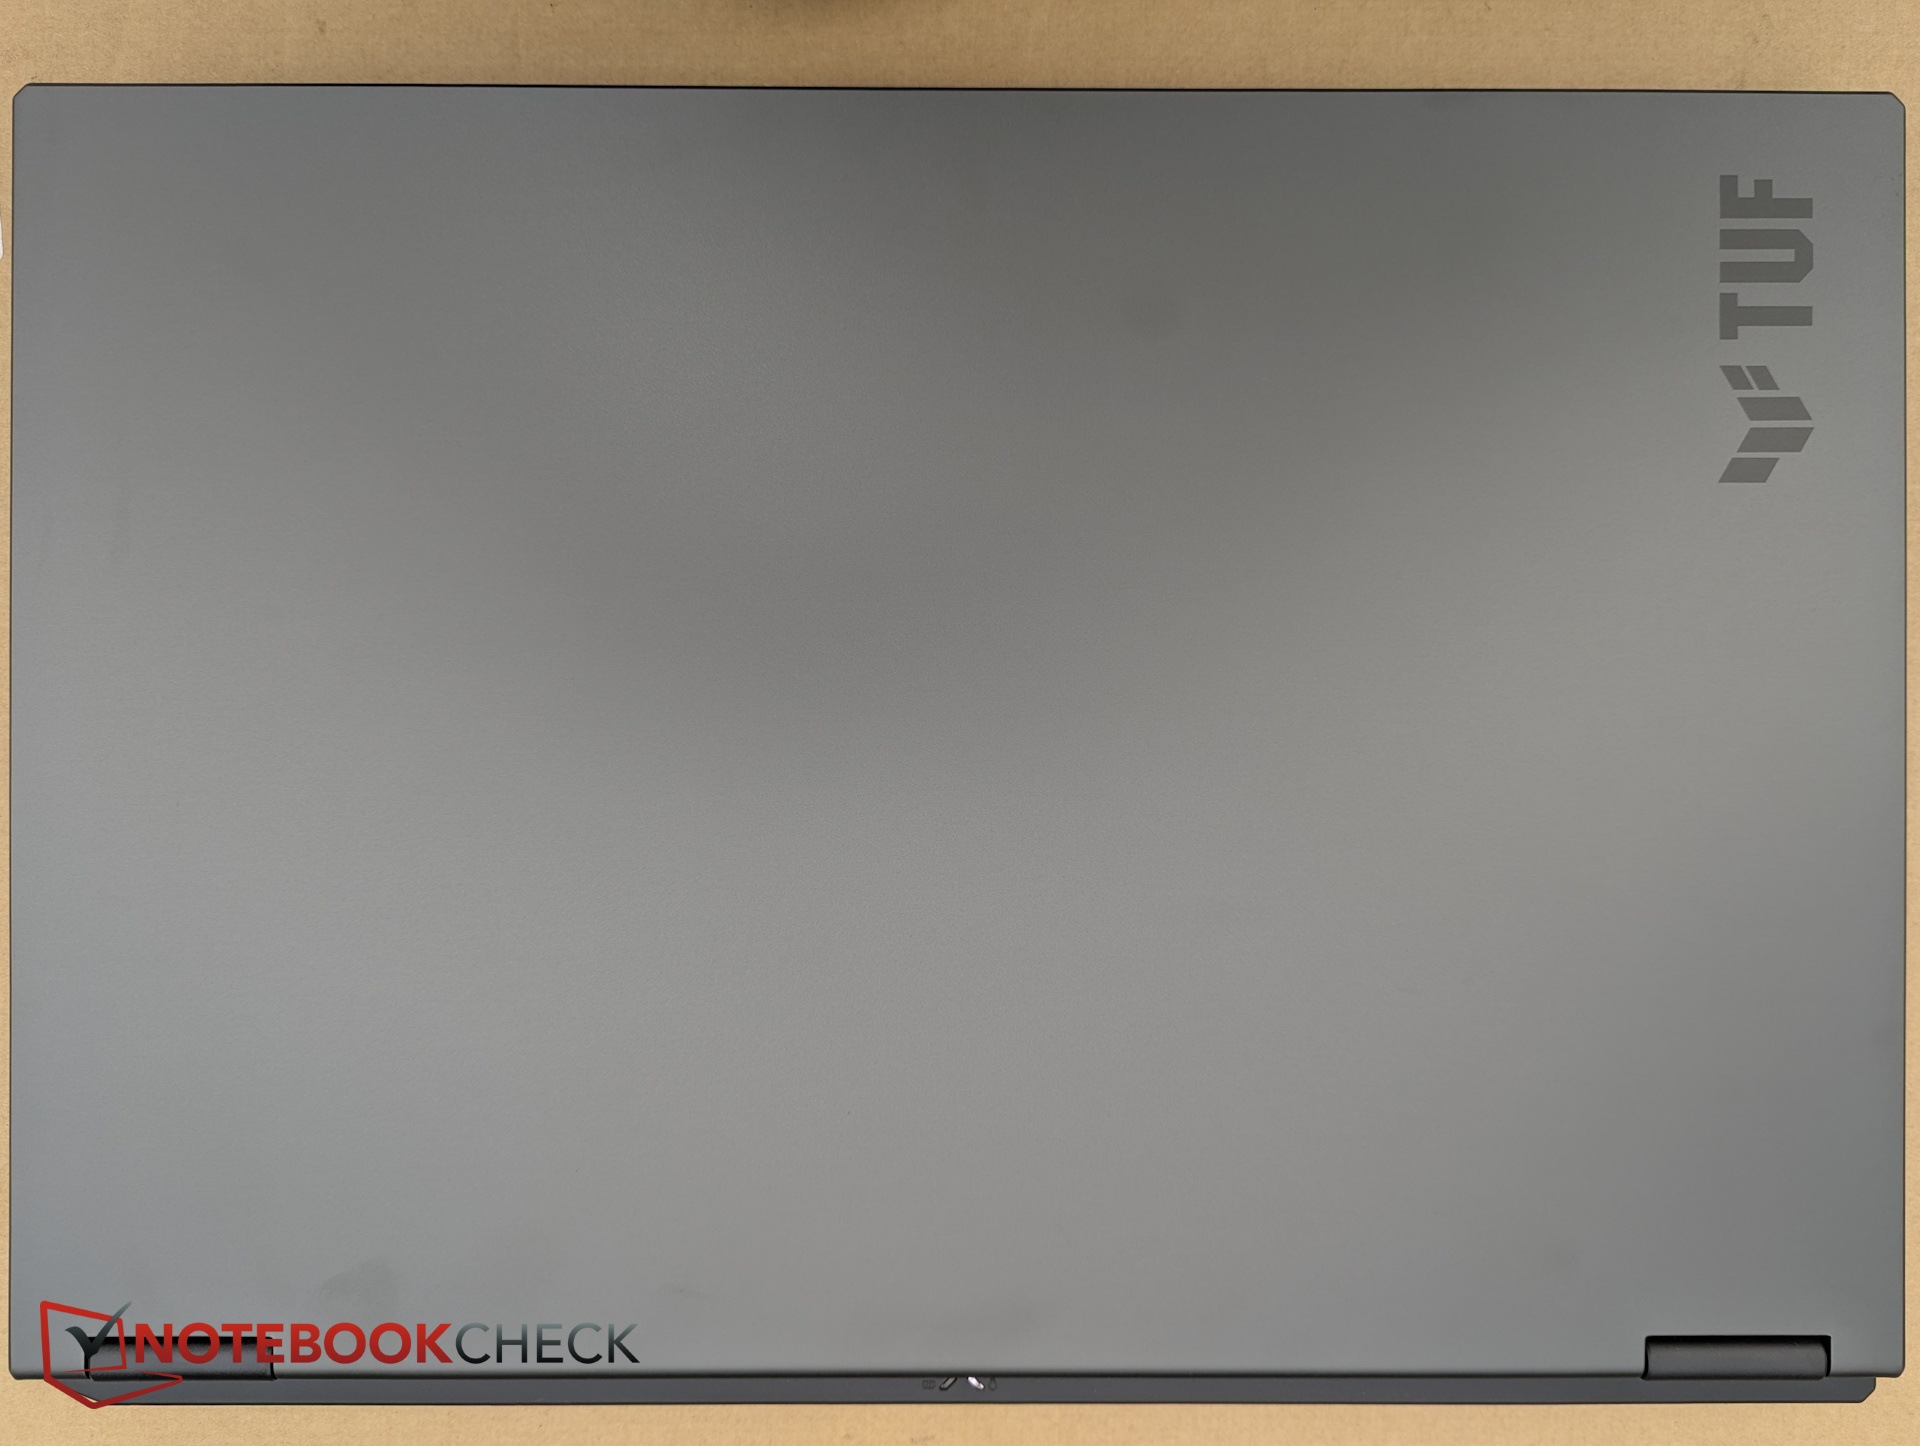
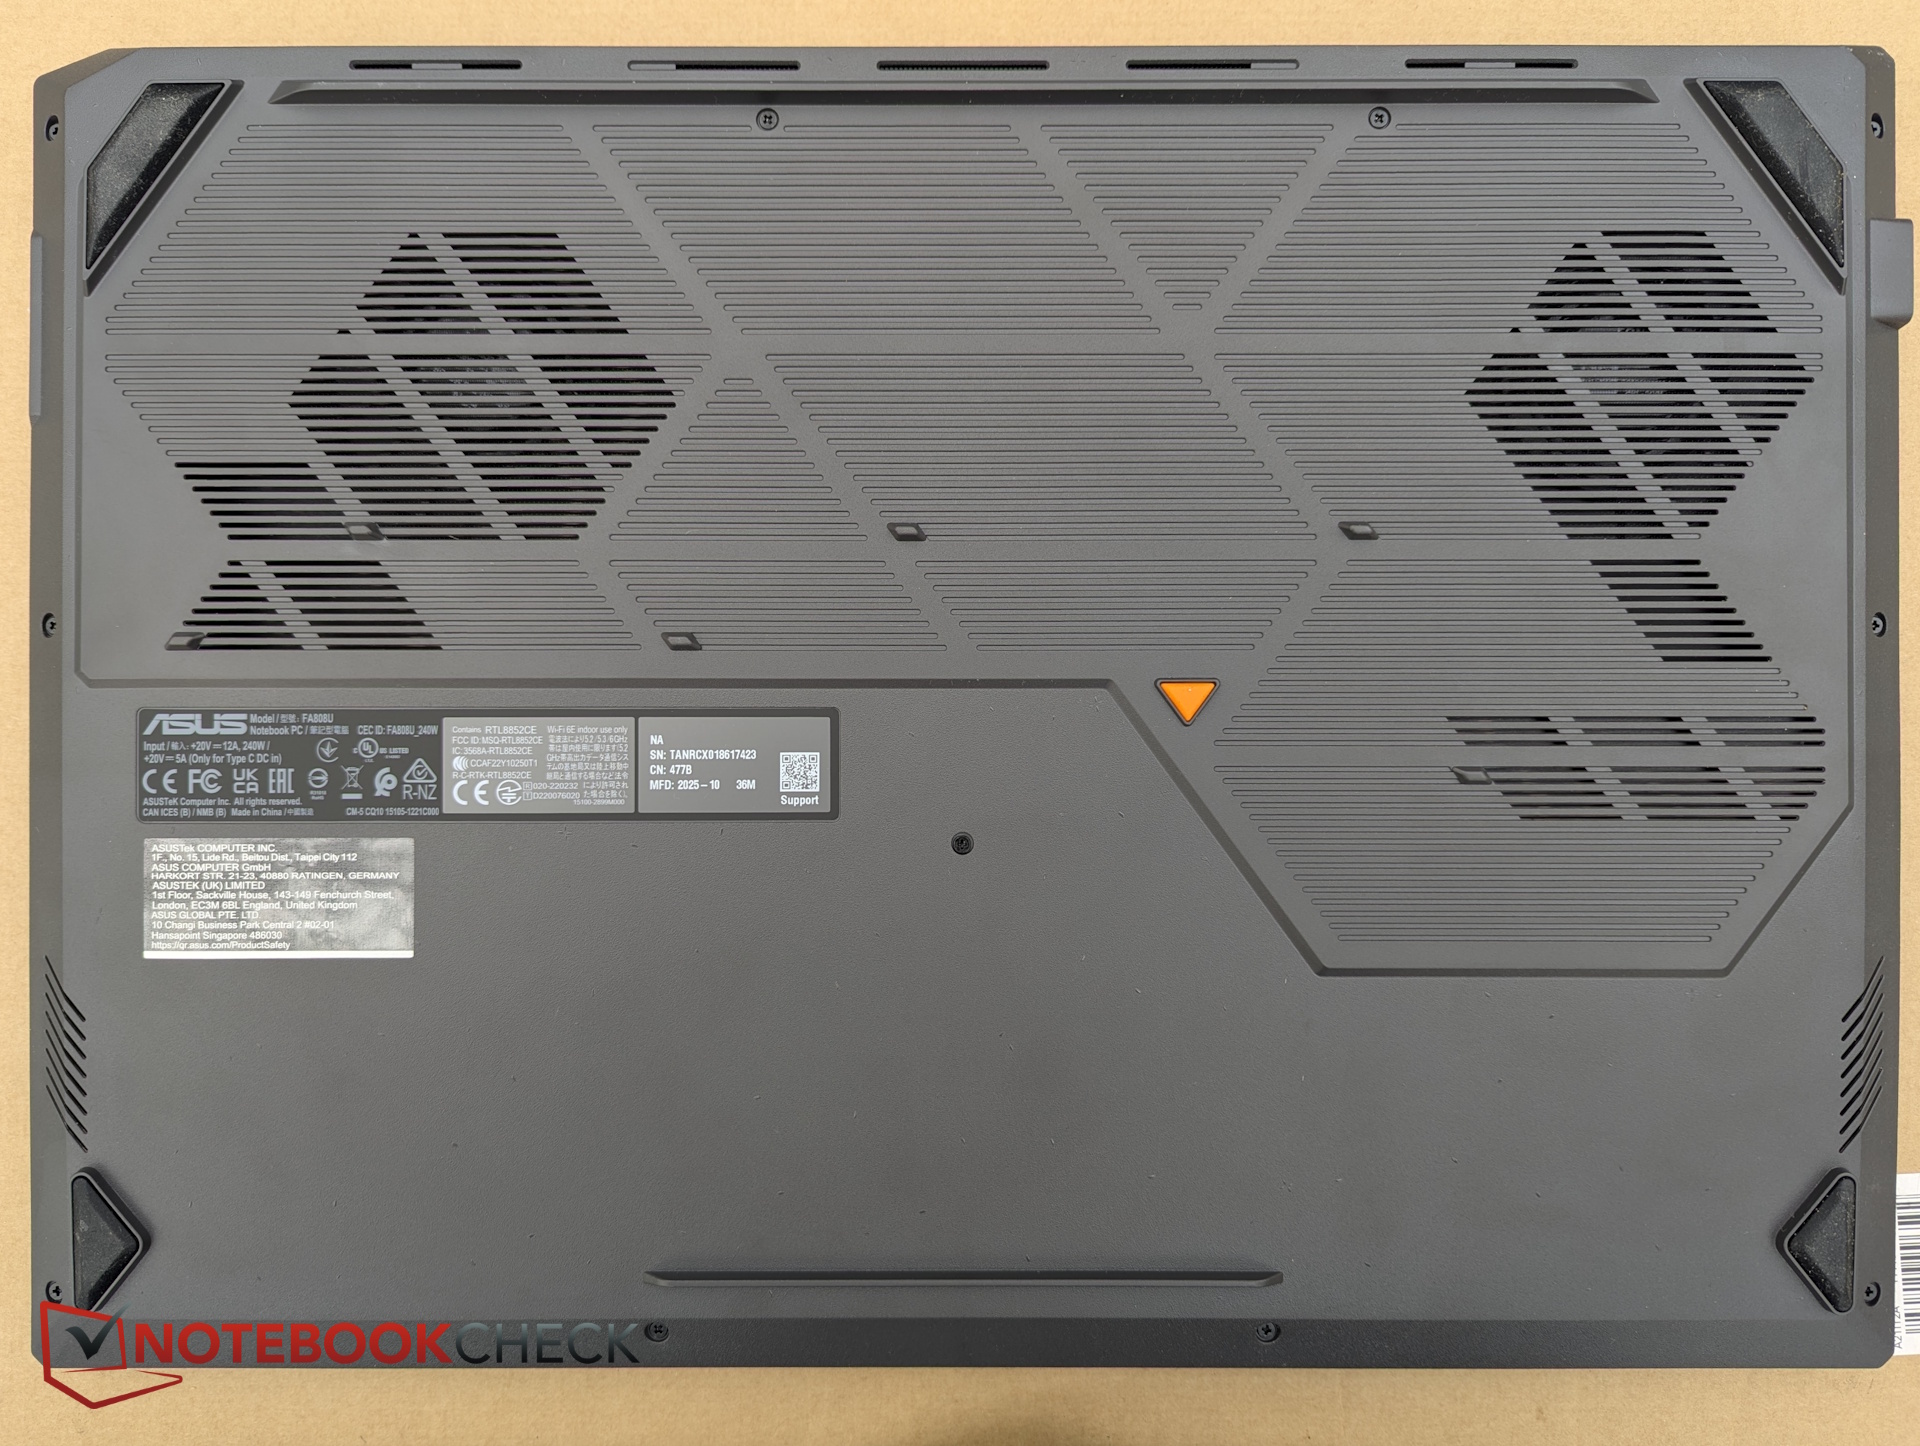
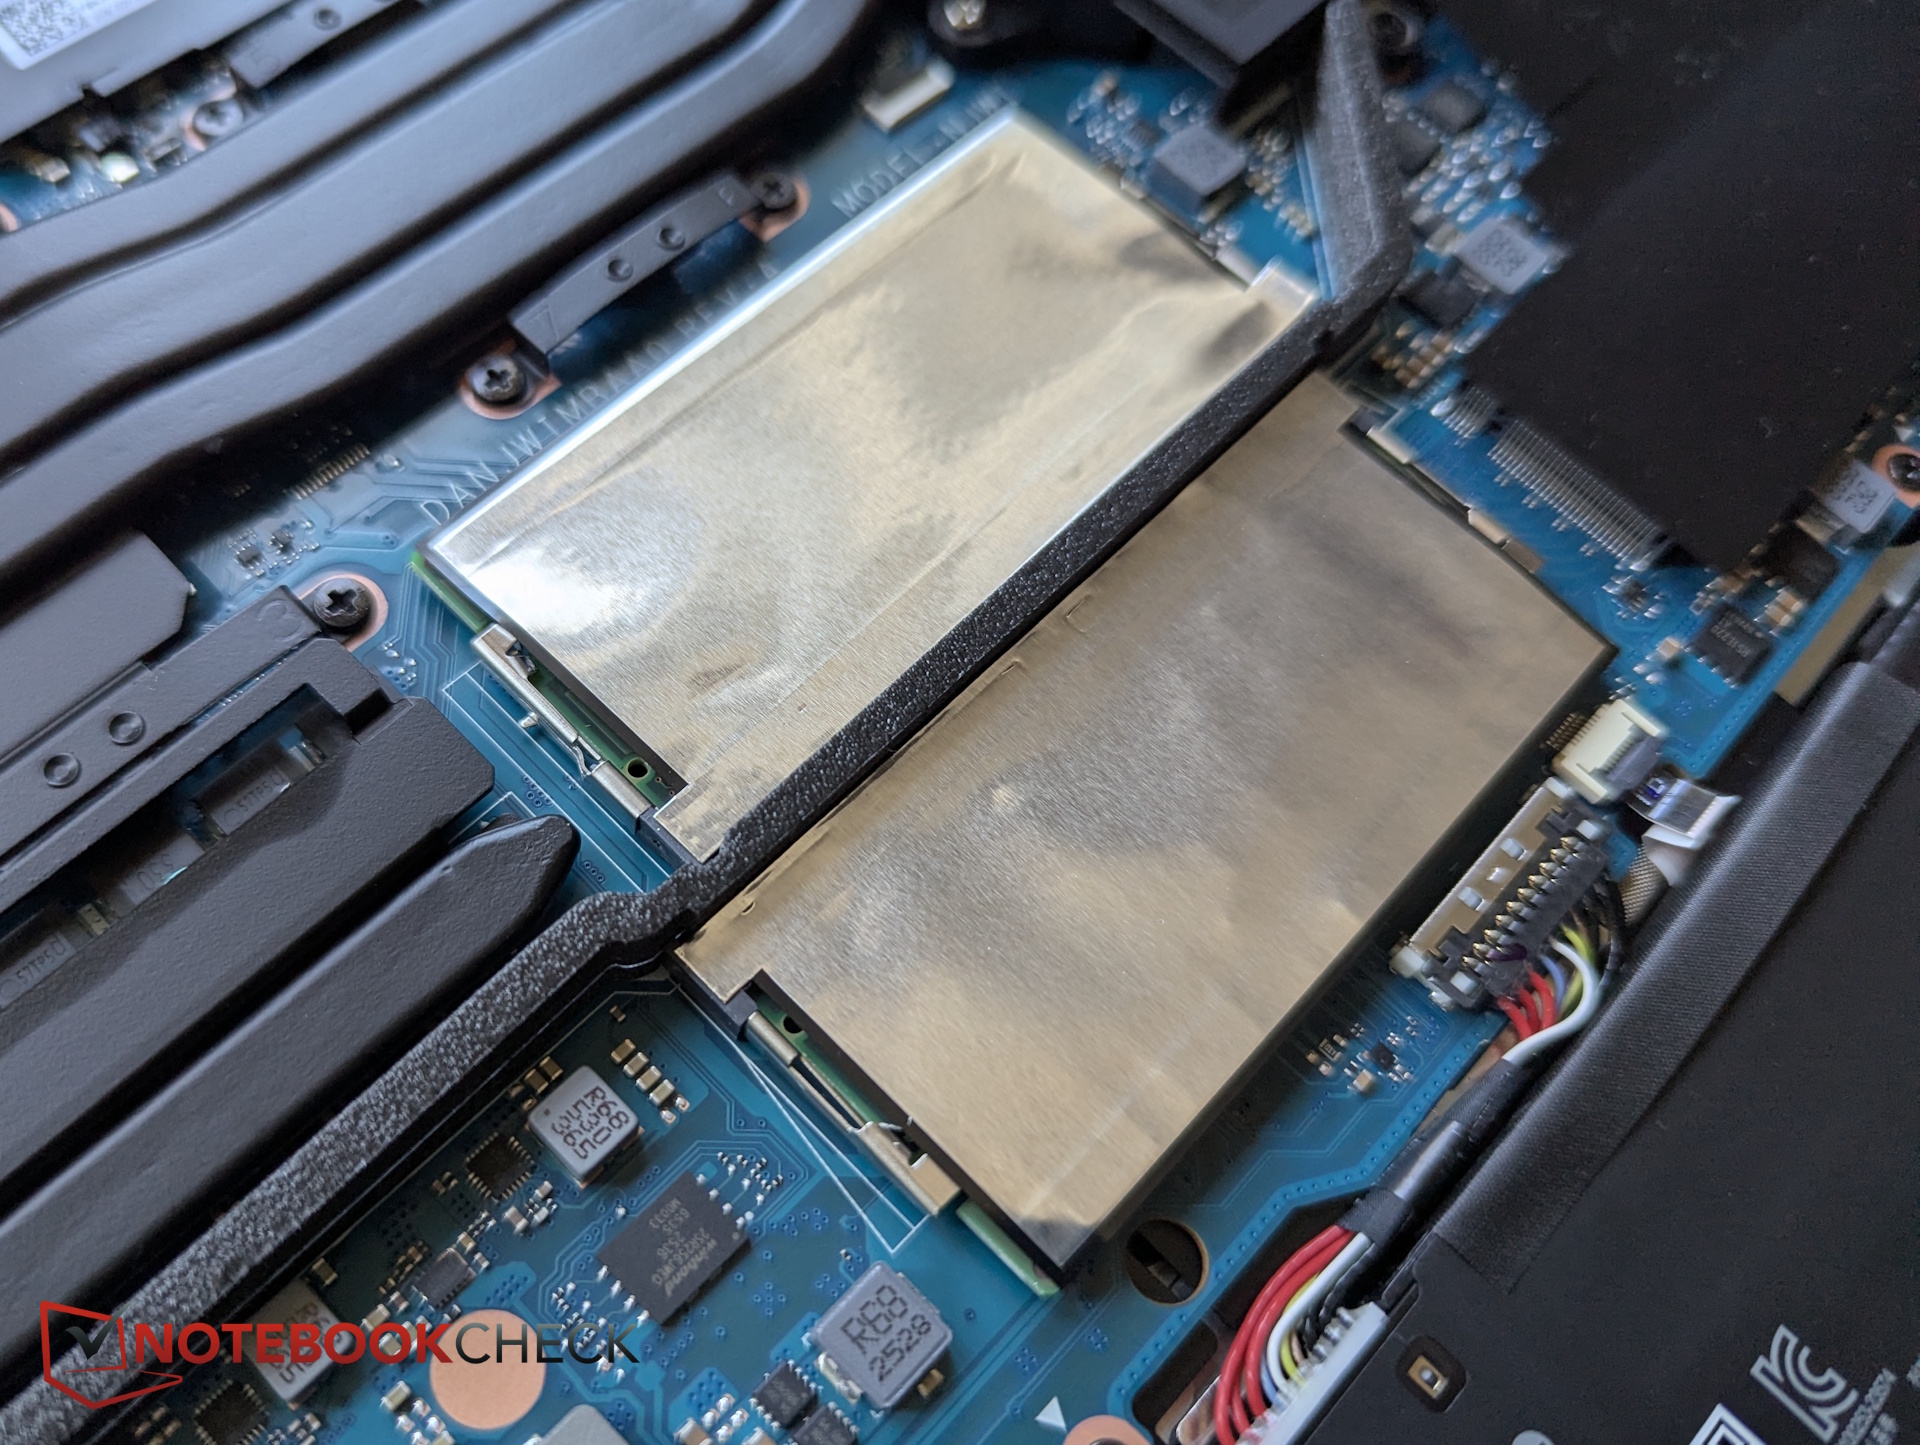
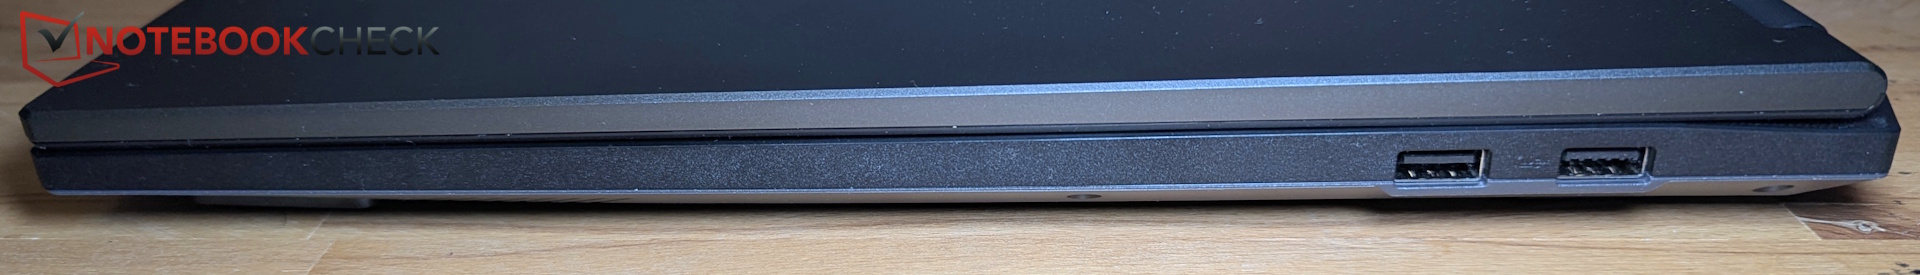
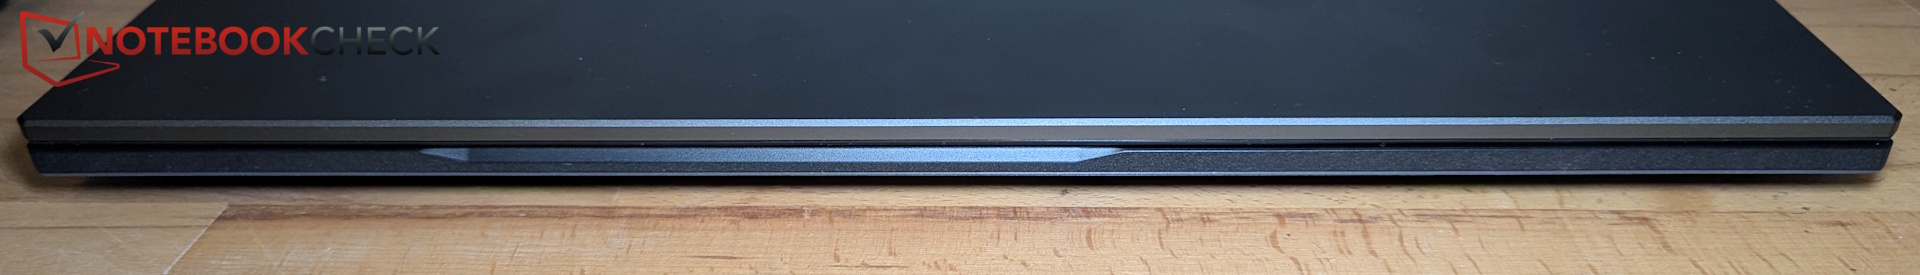
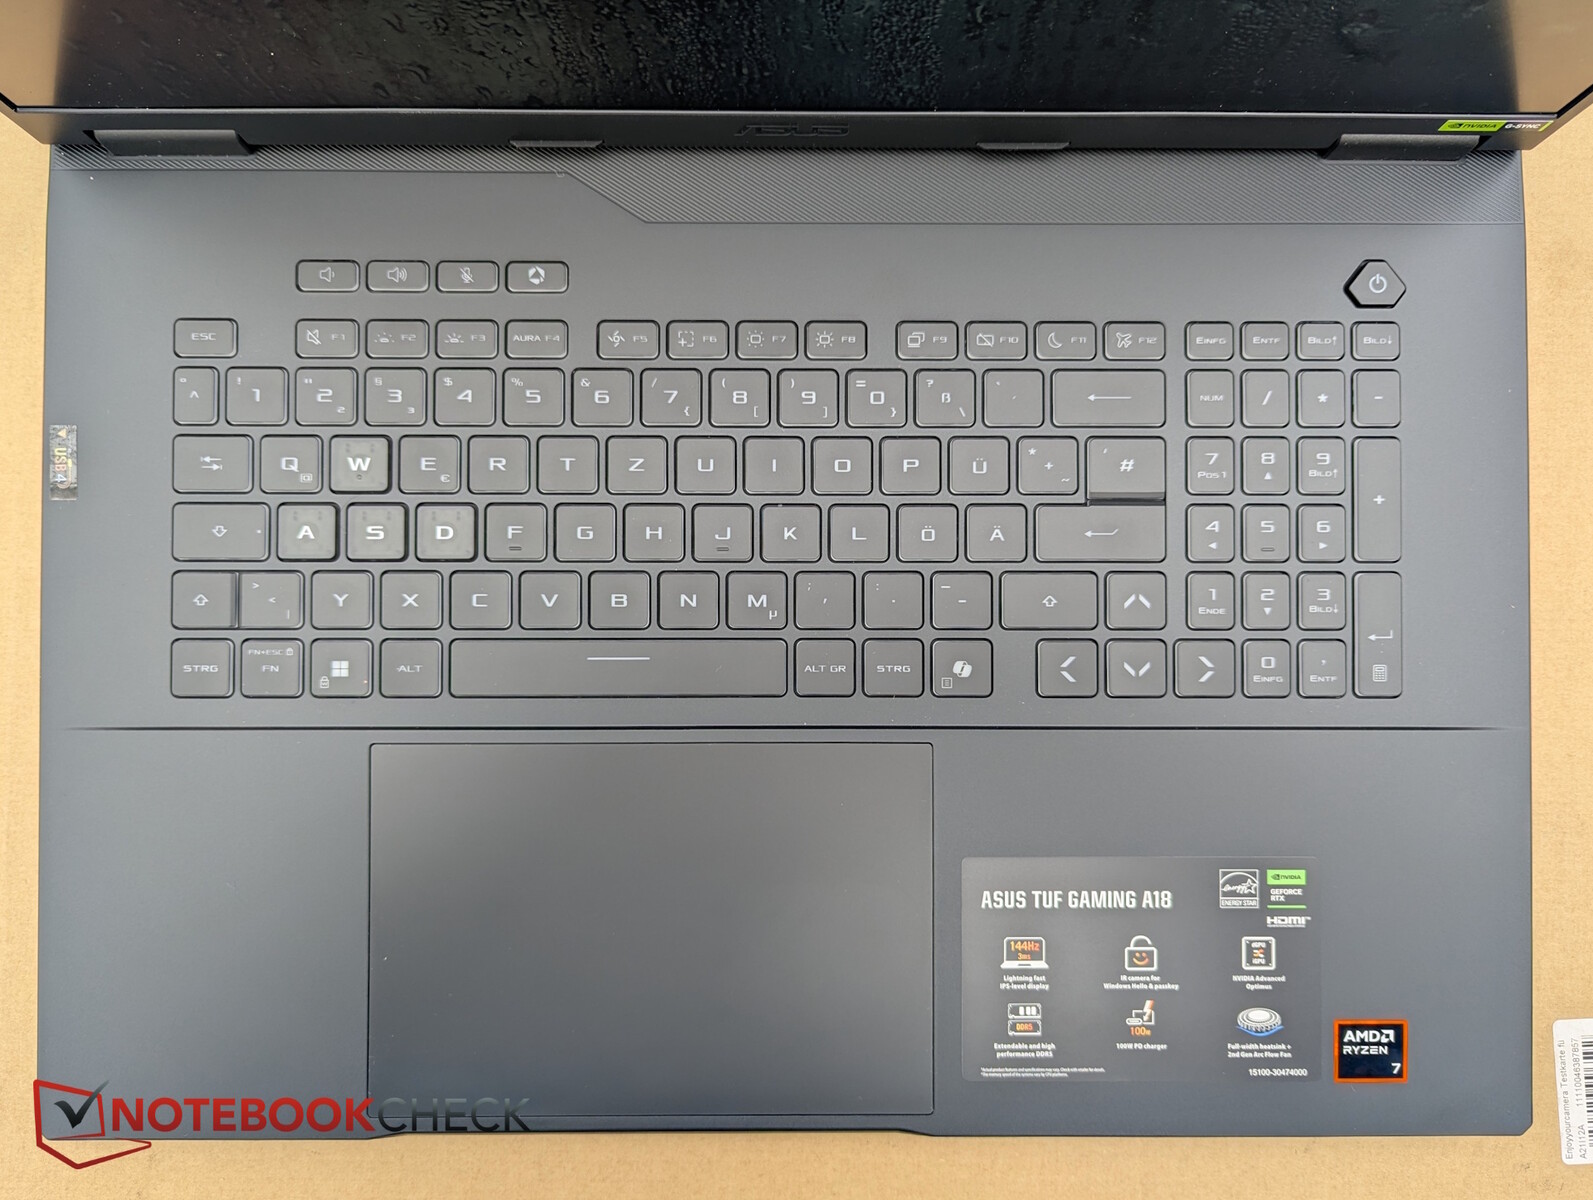
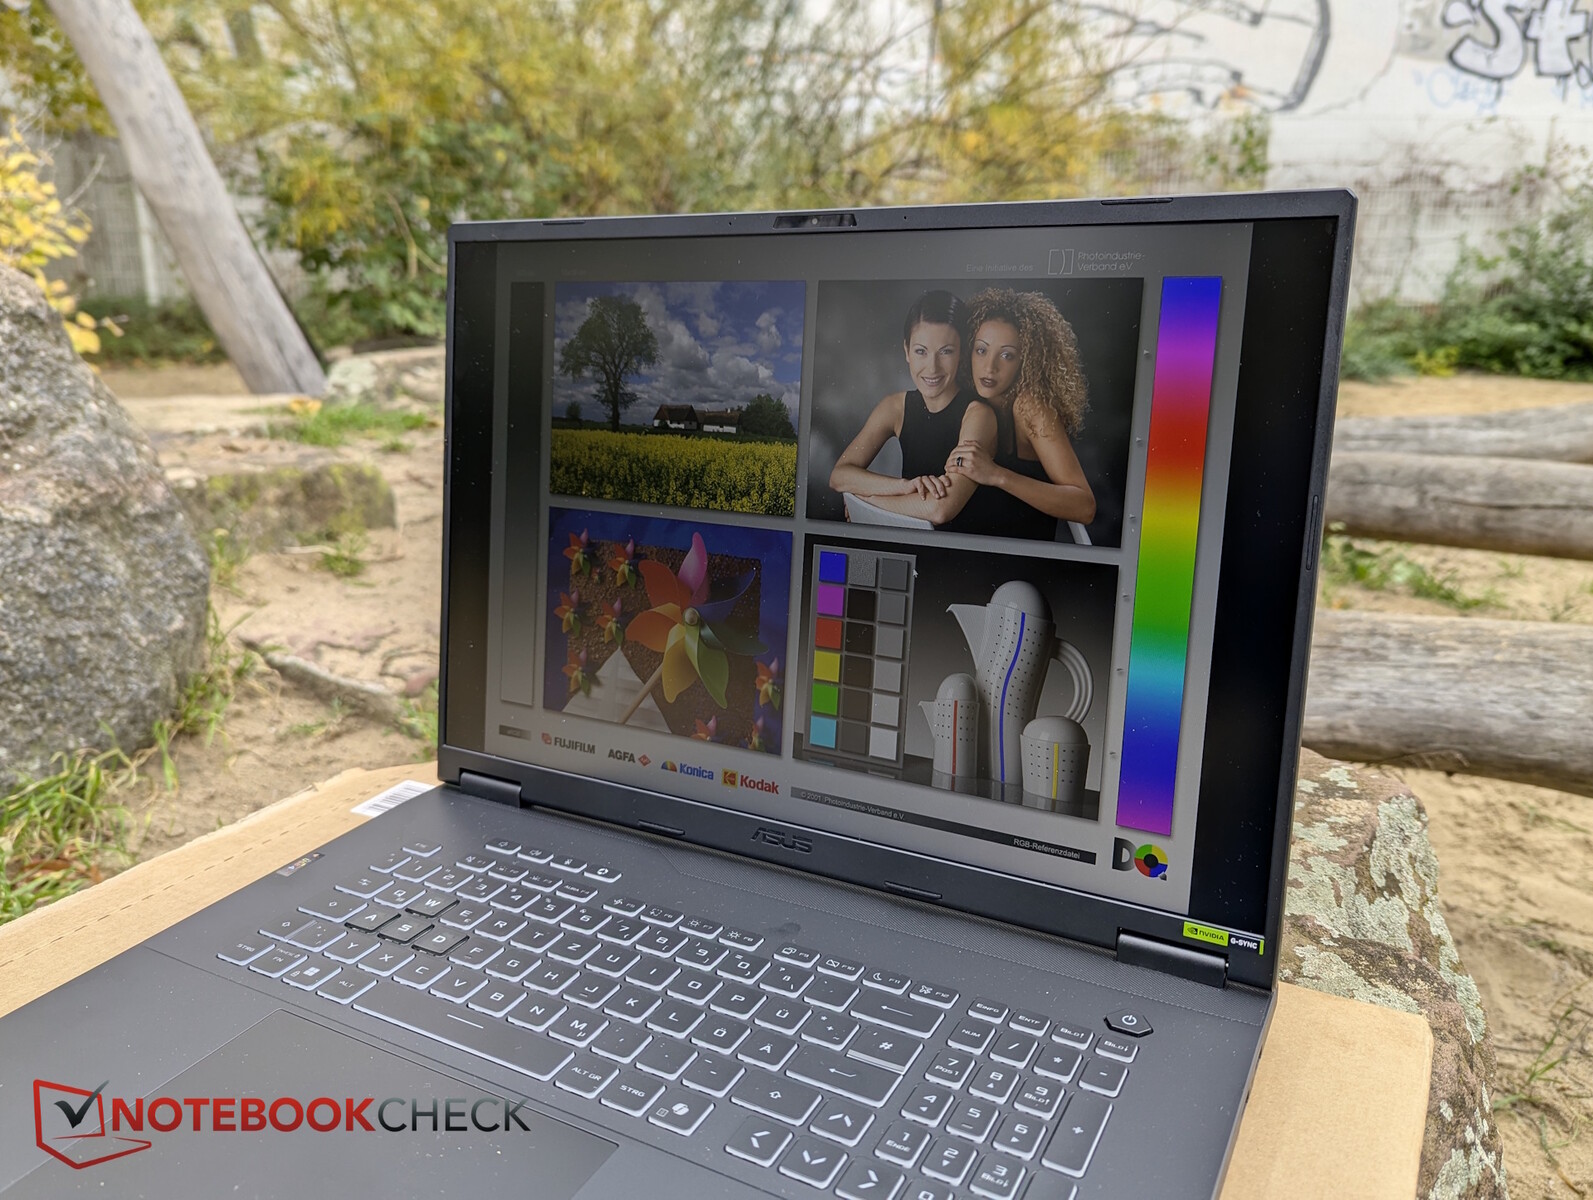
Chassis & features – Slimmer than the Blade 18
Asus uses a silver-gray plastic shell. The black base isn’t perfectly rigid, but it remains stable while typing. The design is understated, the body is quite thin, and considering the 18-inch form factor, it’s relatively light. The lid opens a full 180 degrees.

Webcam
The FHD webcam delivers noticeably mushy images, although colors are fine.


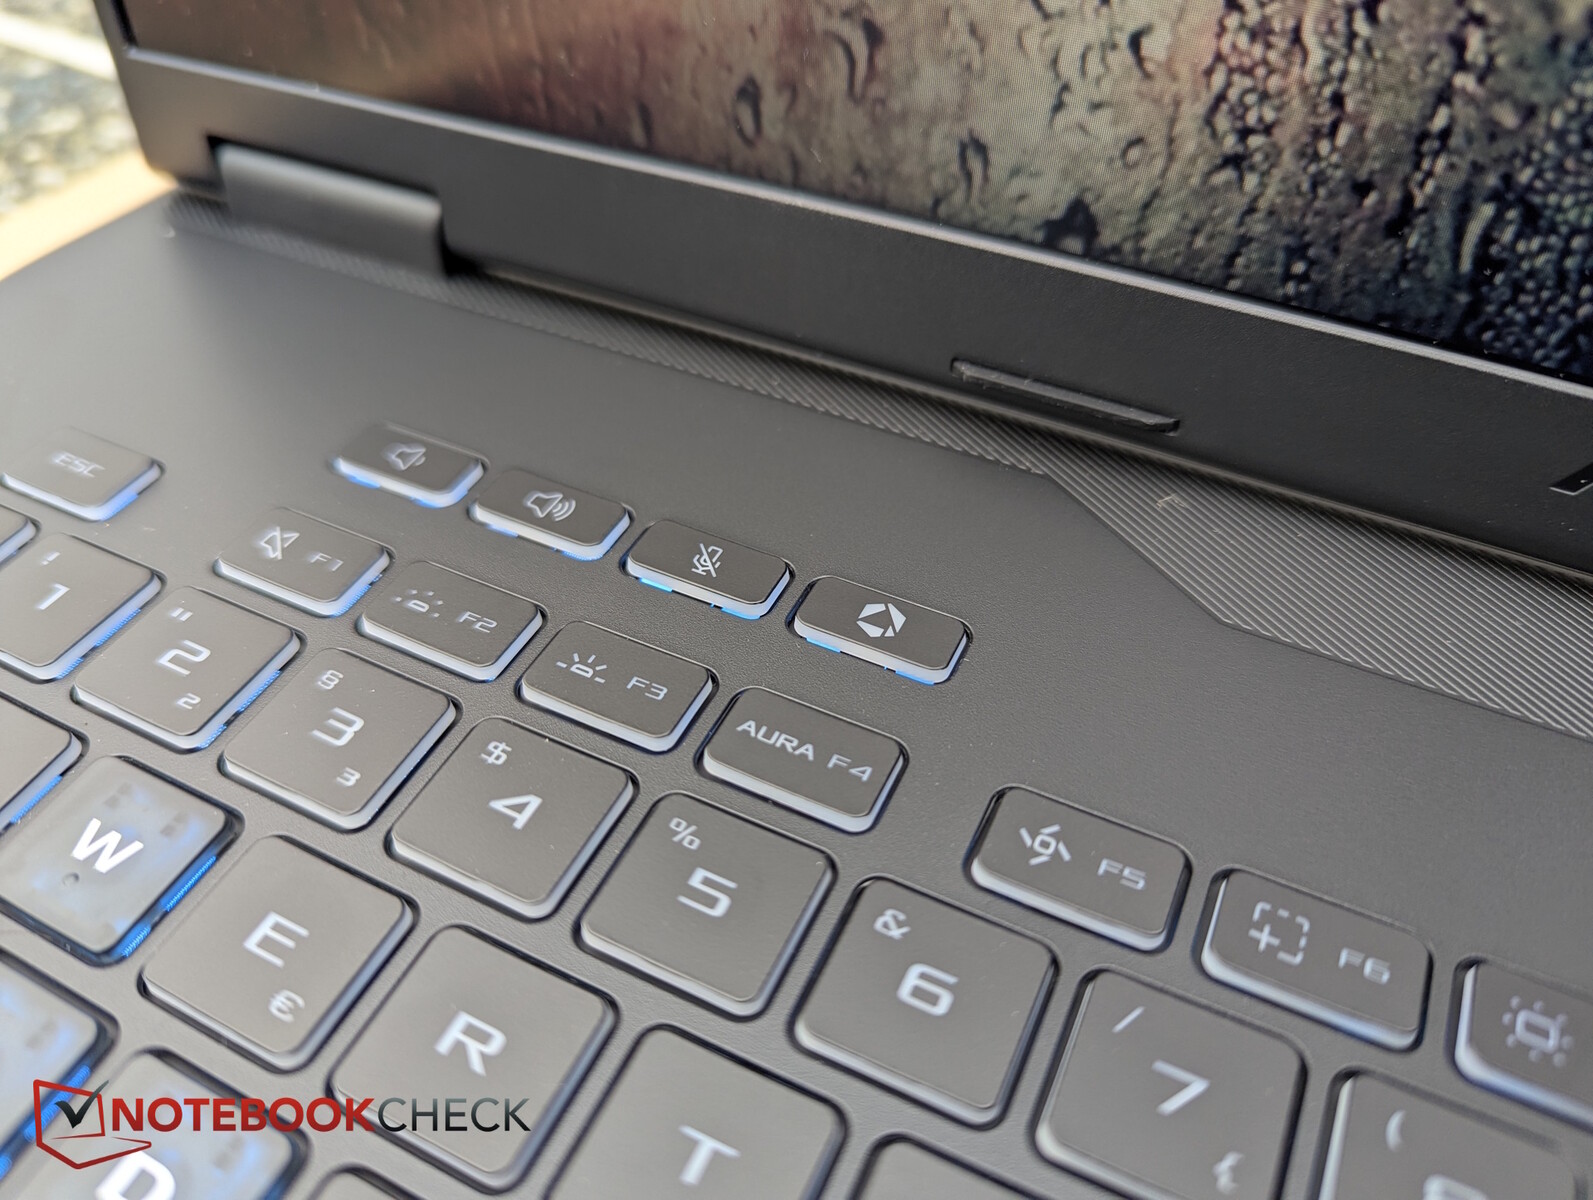
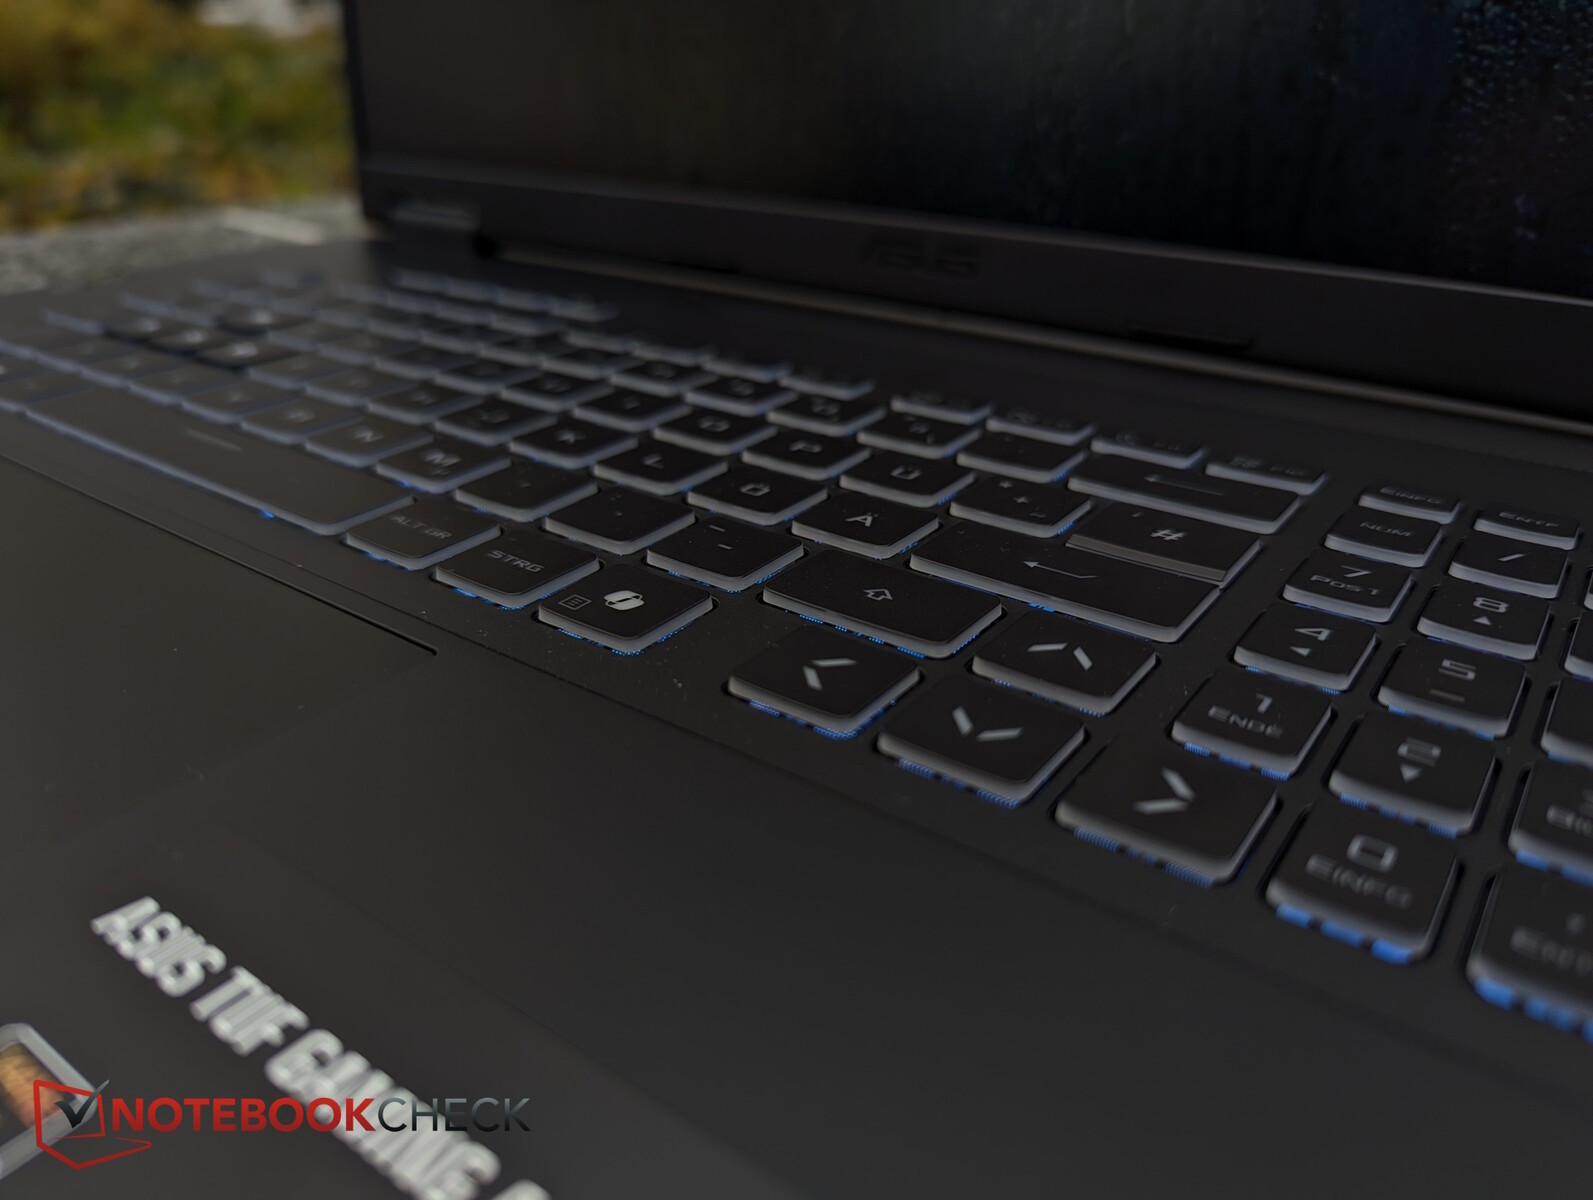
Input devices – A mixed bag
Despite the generous size, the quiet keys are on the small side. At least the arrow keys aren’t half-height, though they are slightly cramped. The placement of the frequently used delete key feels awkward, while the four dedicated function keys are a nice touch. Key travel is very shallow, but feedback is acceptable.
The large touchpad (approx. 15 × 9.9 cm) offers smooth gliding, but the physical buttons are both stiff and a bit mushy, which hurts usability.

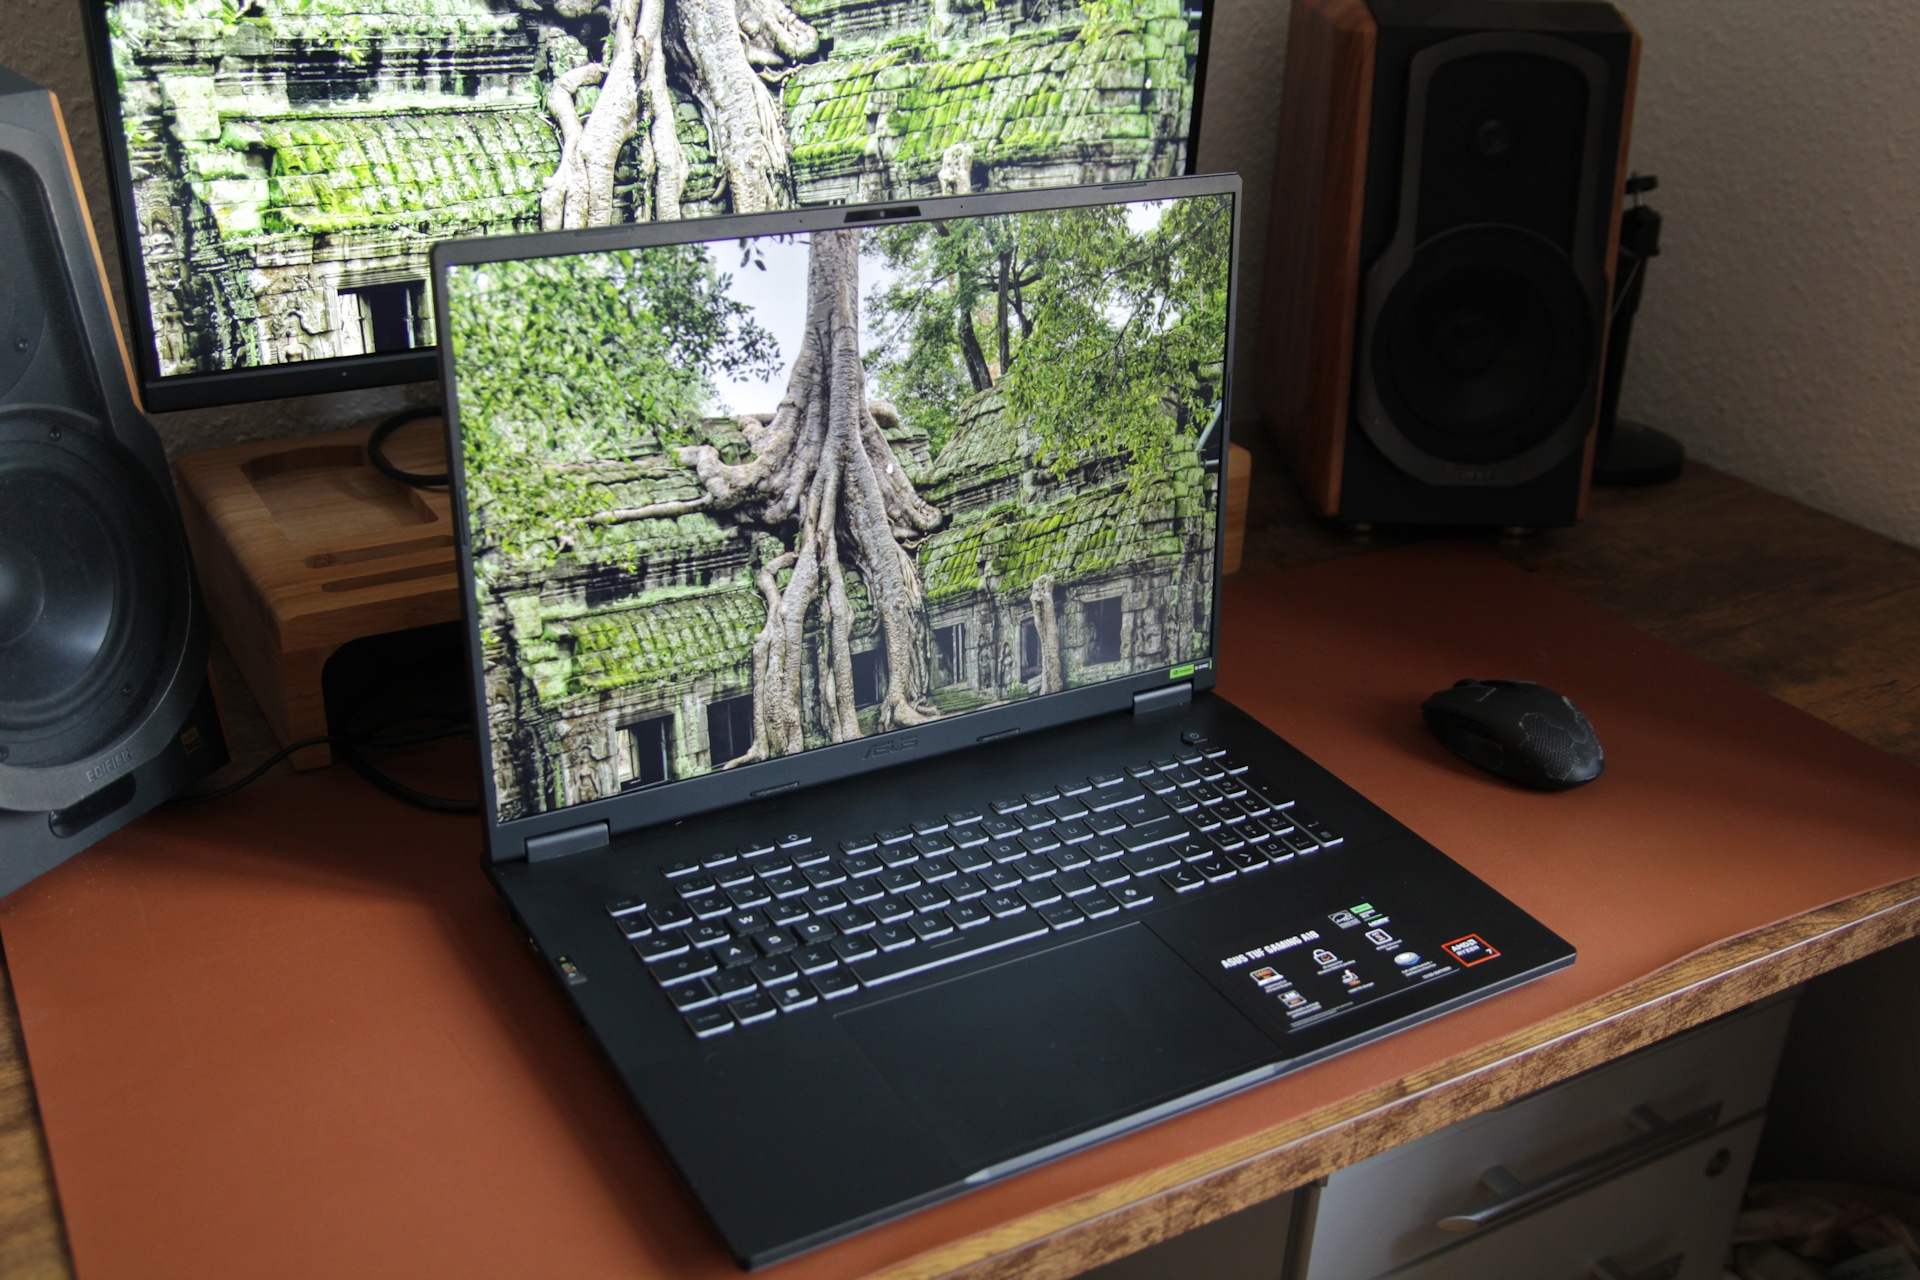
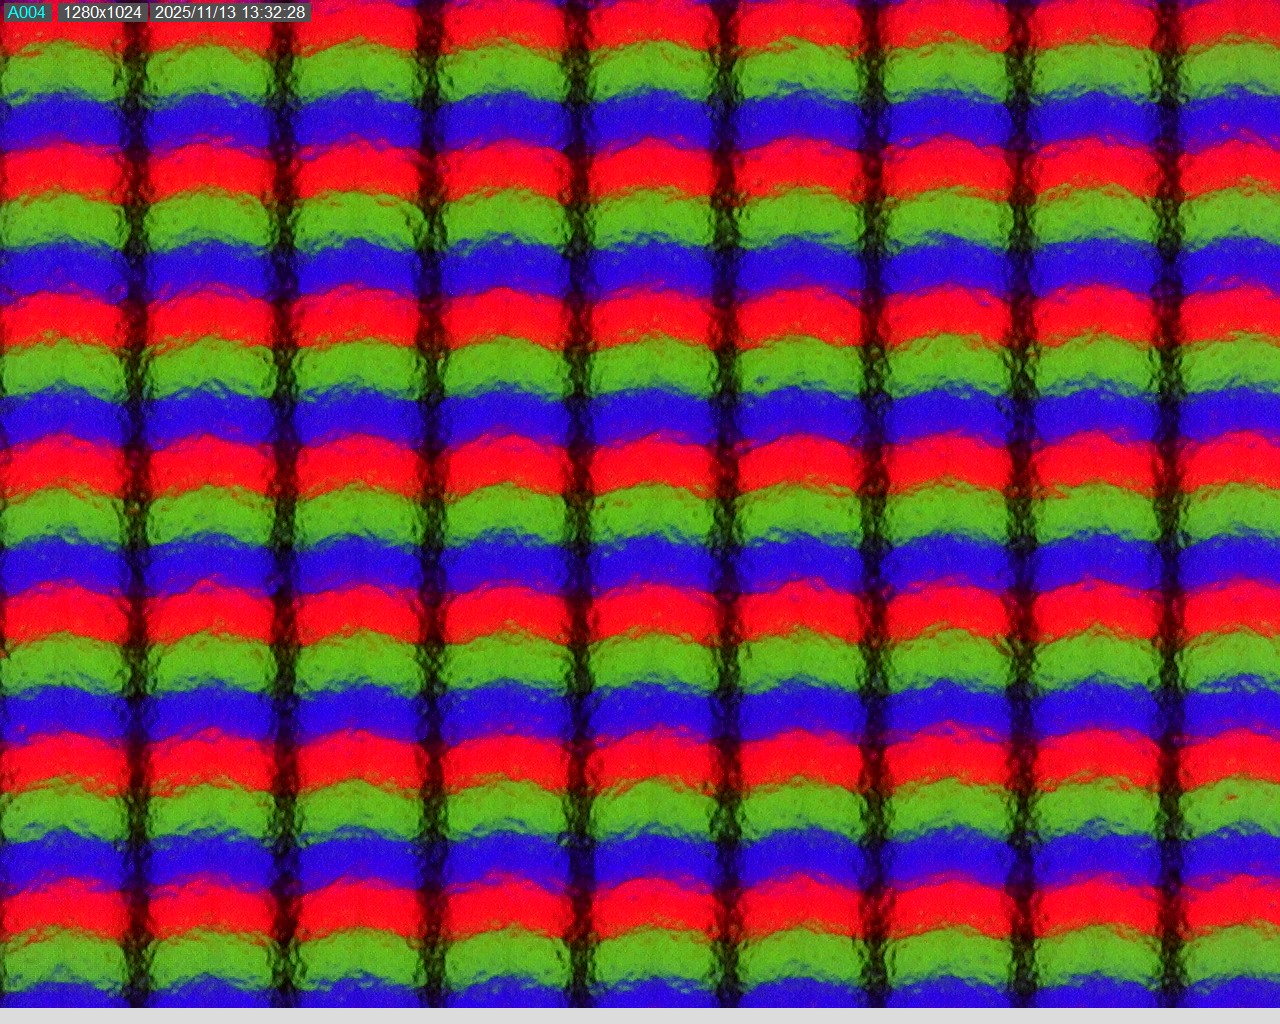
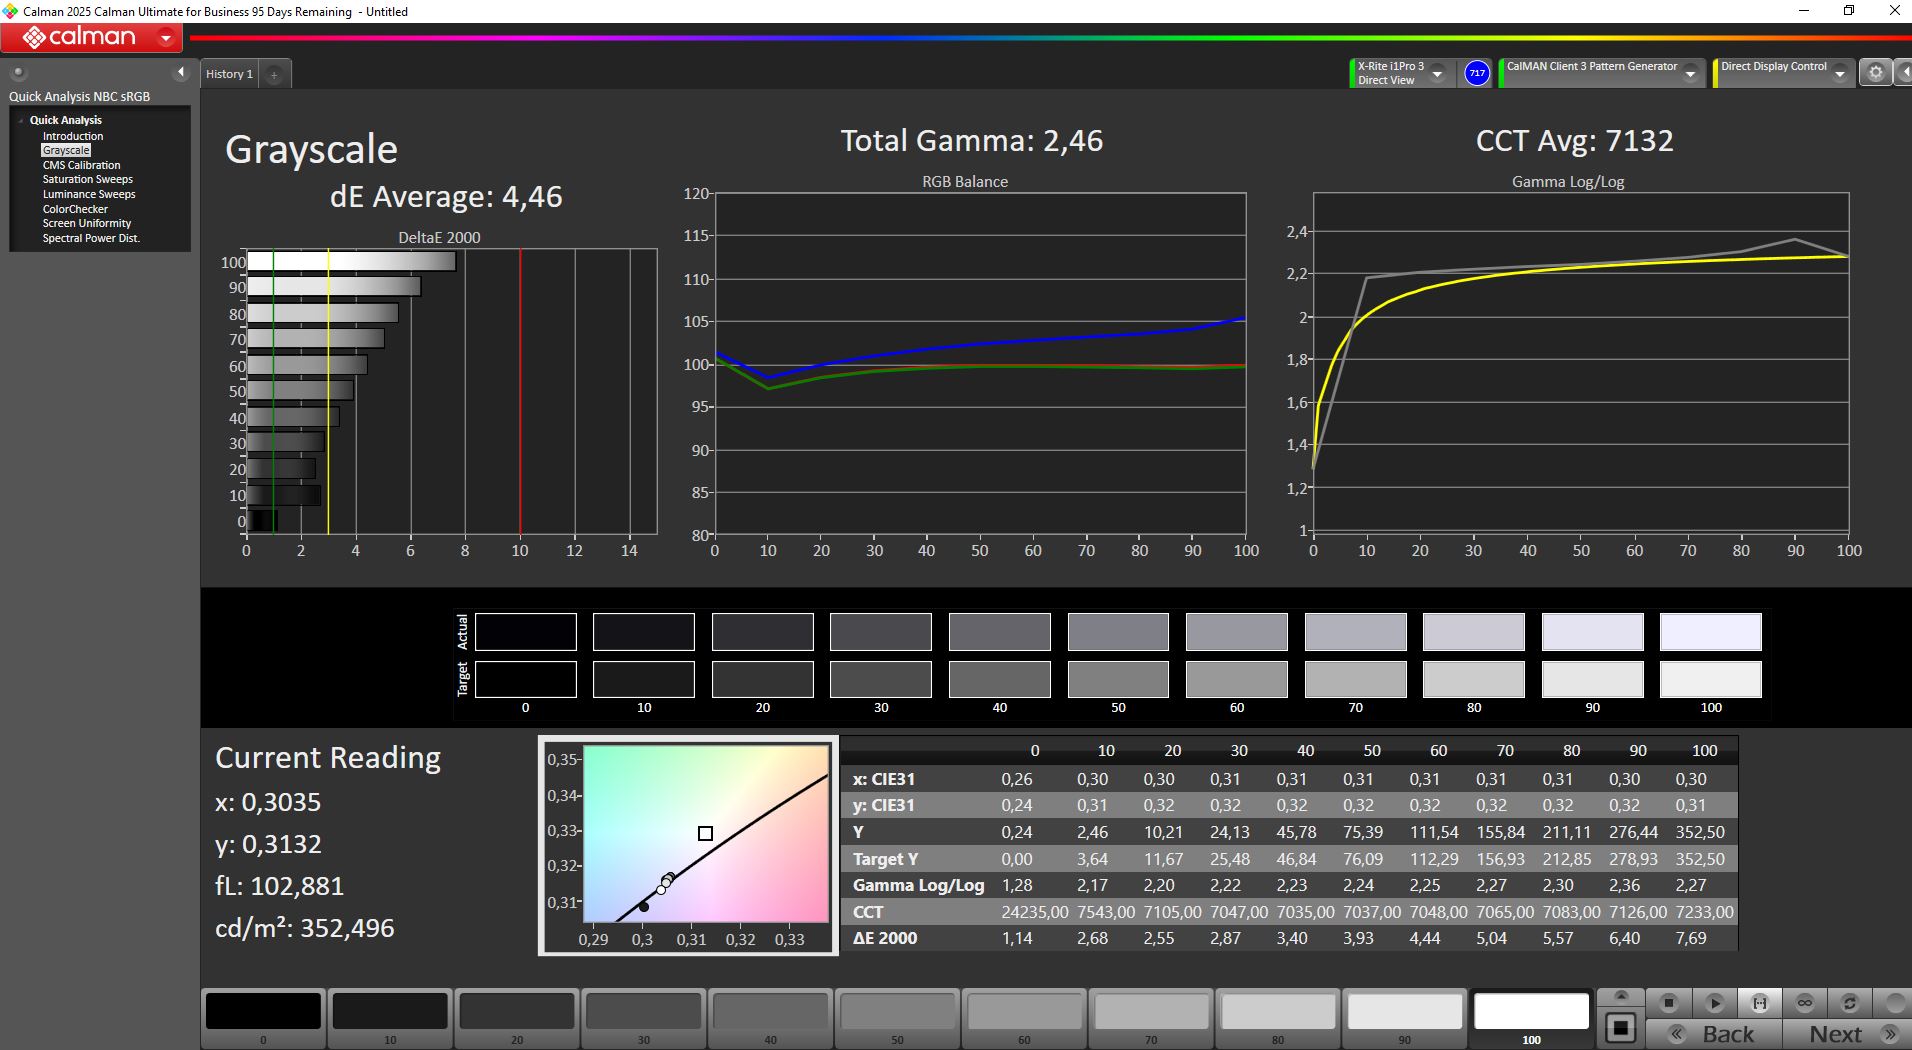
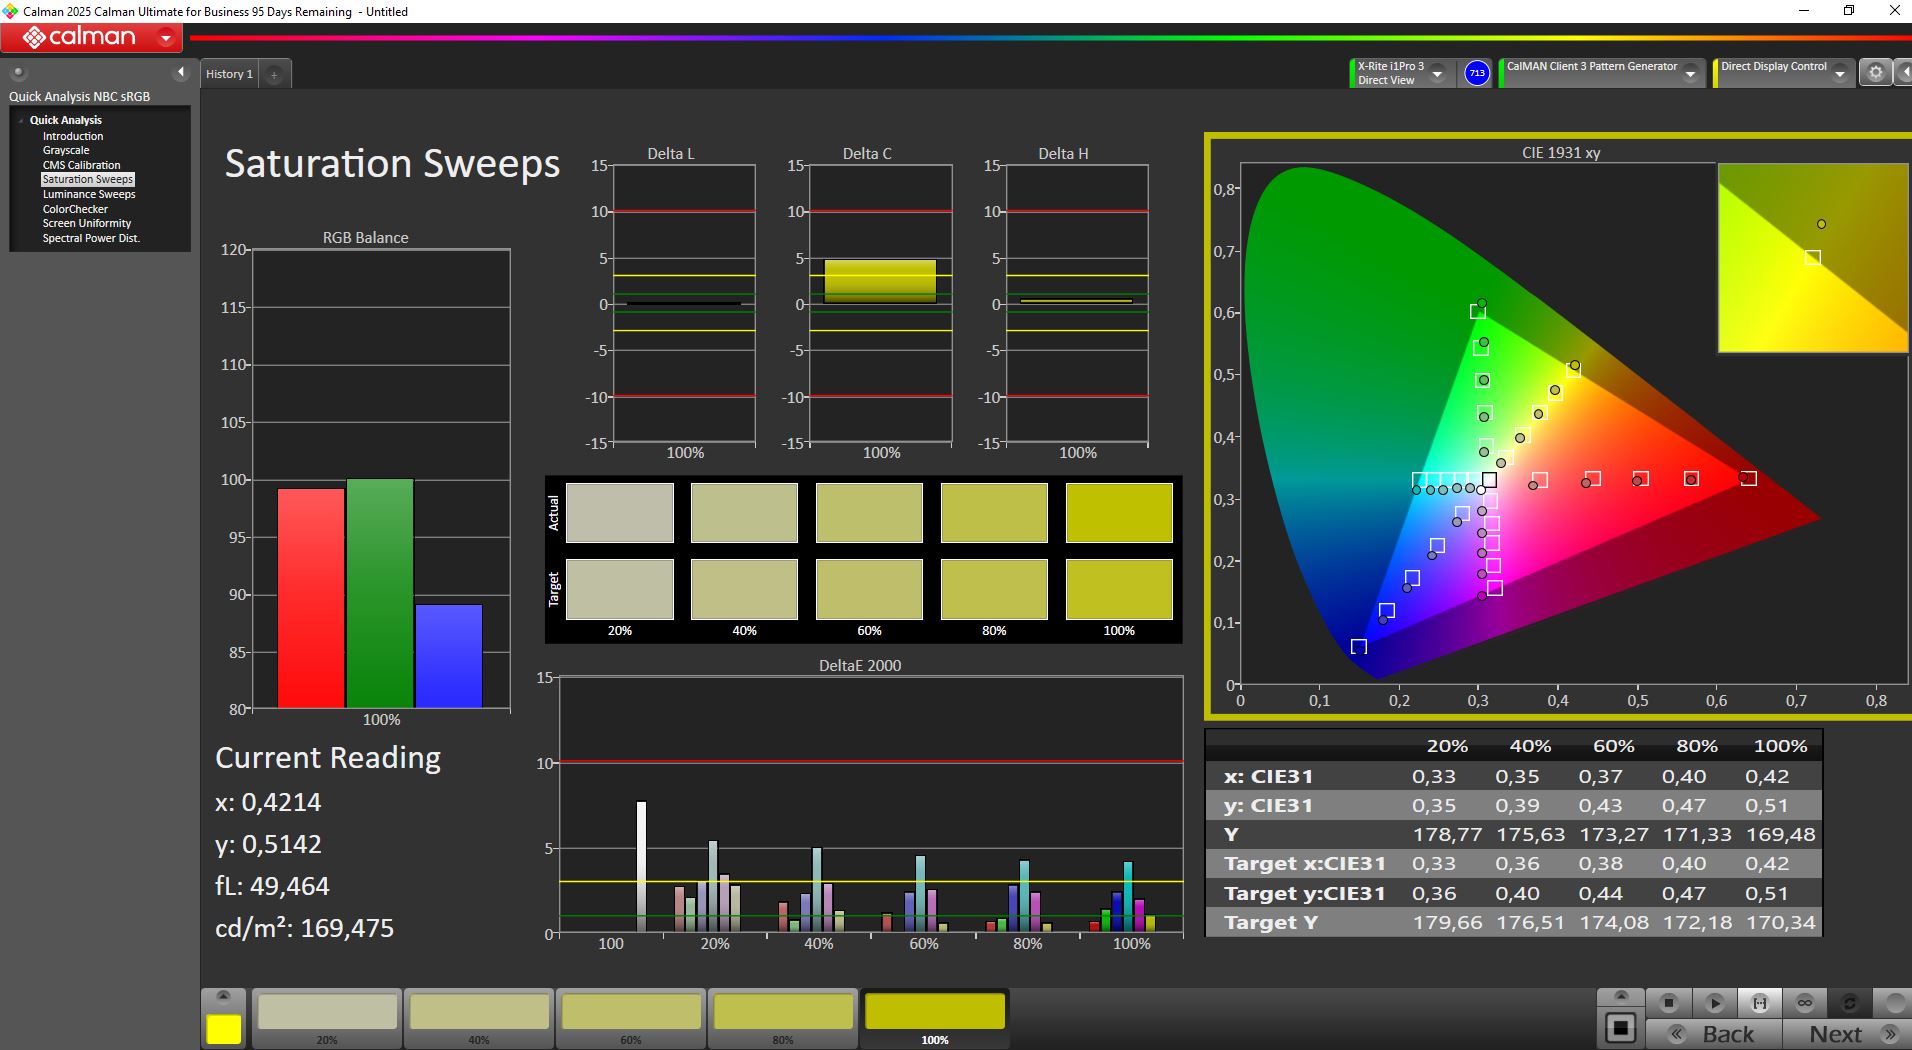
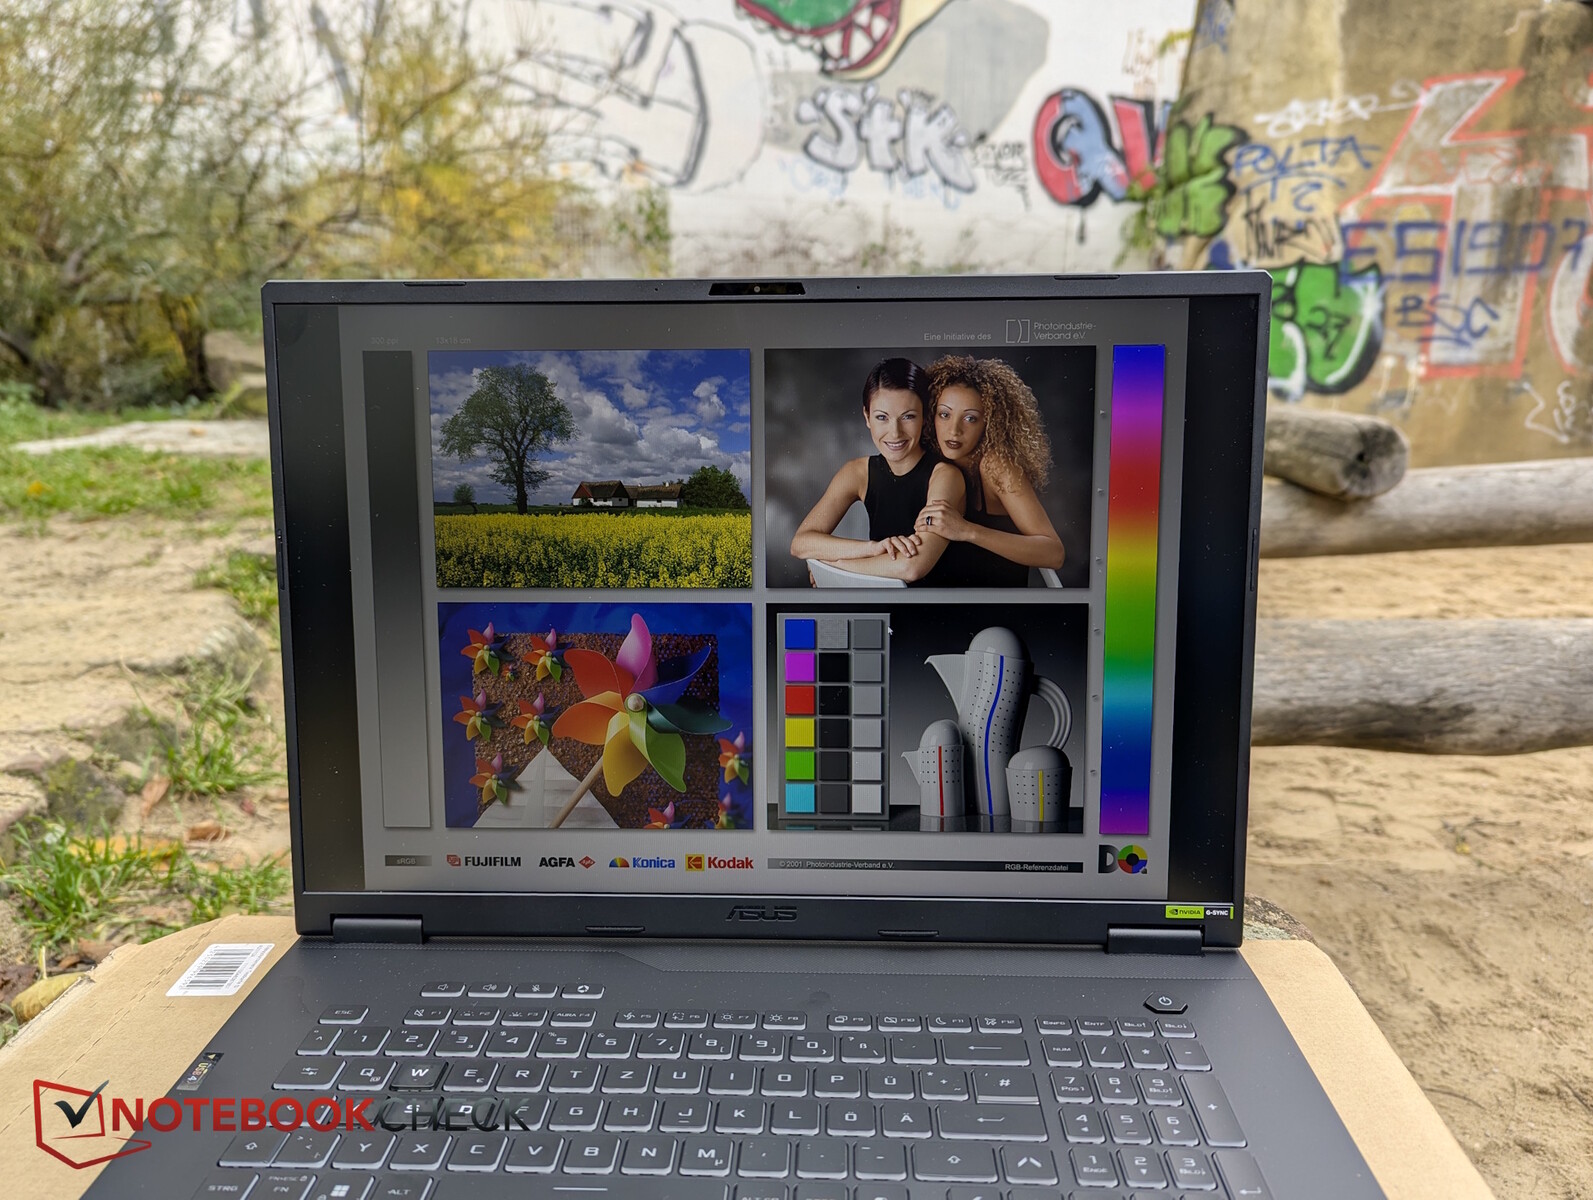
Display - 300-nit IPS
The matte 300-nit IPS panel barely covers the sRGB color space. Even other budget devices like the Katana 17 offer higher resolution than the A18’s 1,920 × 1,200 and are usually brighter as well.

| |||||||||||||||||||||||||
Brightness Distribution: 89 %
Center on Battery: 345 cd/m²
Contrast: 1350:1 (Black: 0.26 cd/m²)
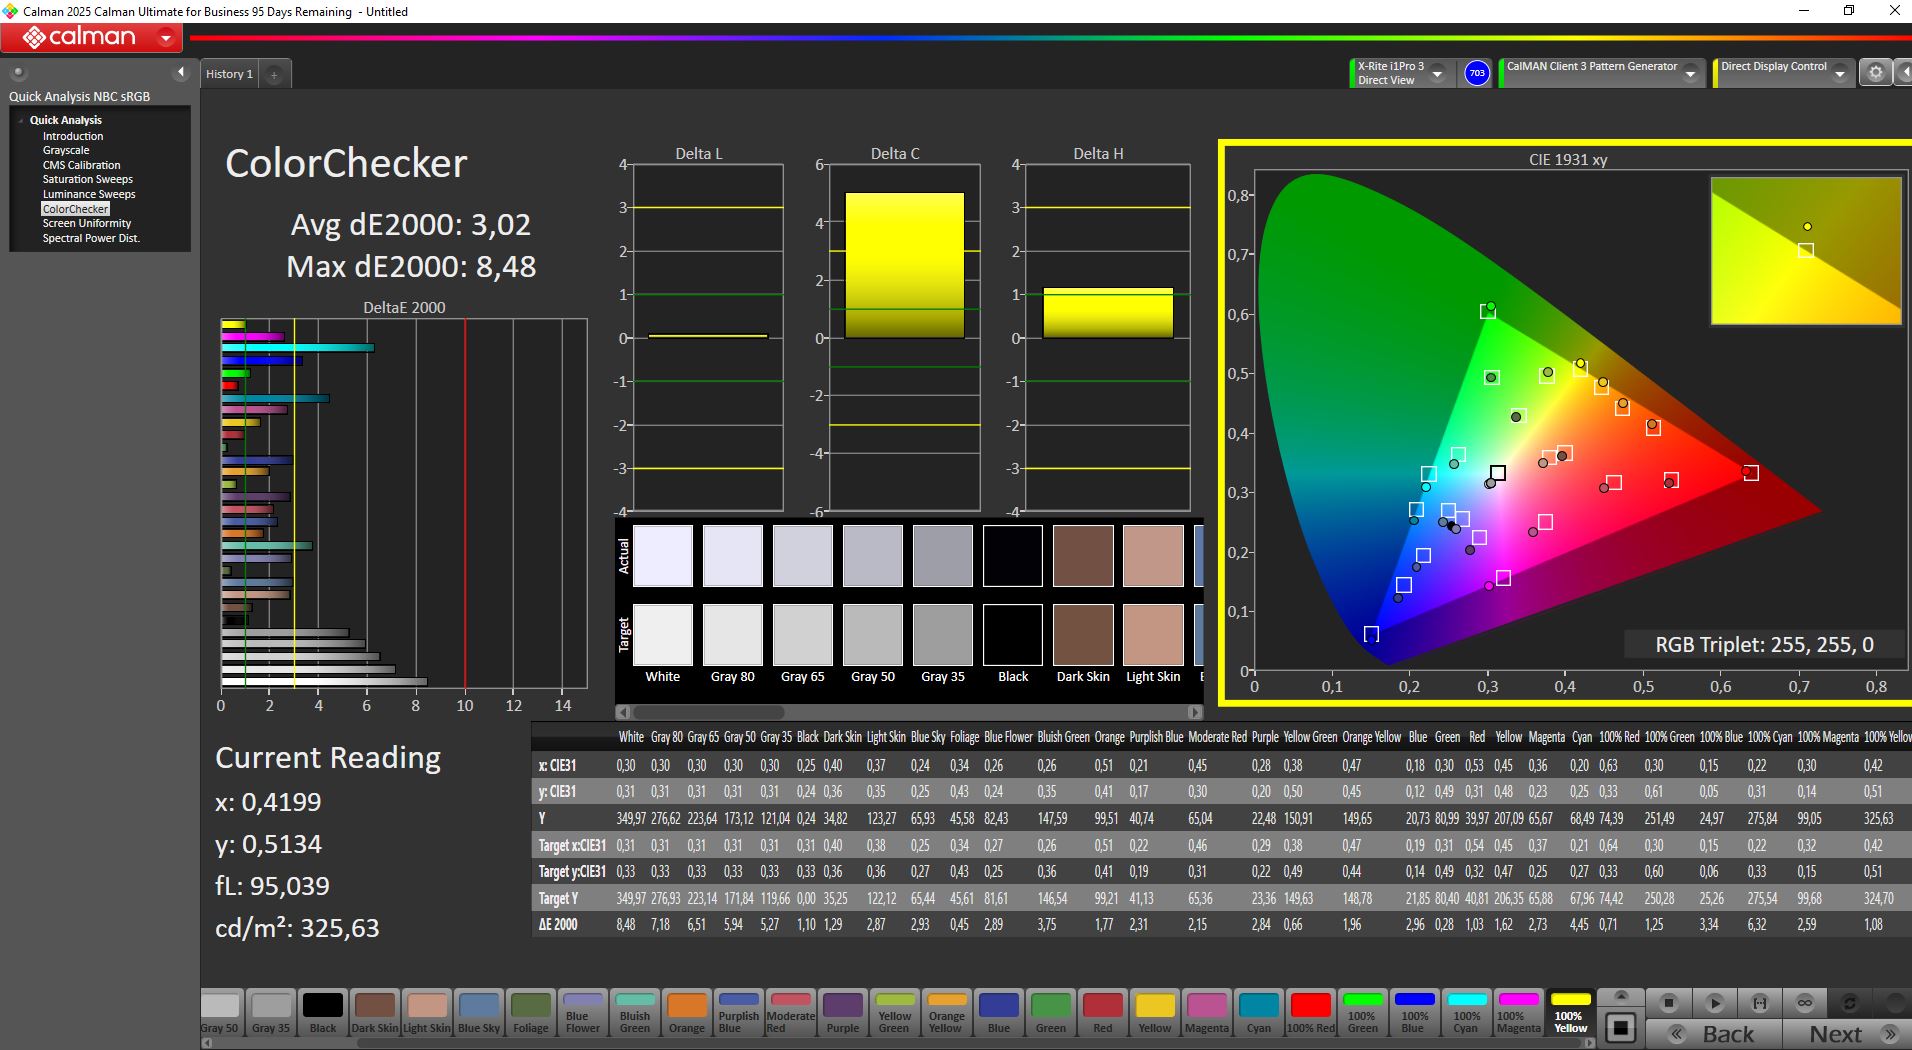
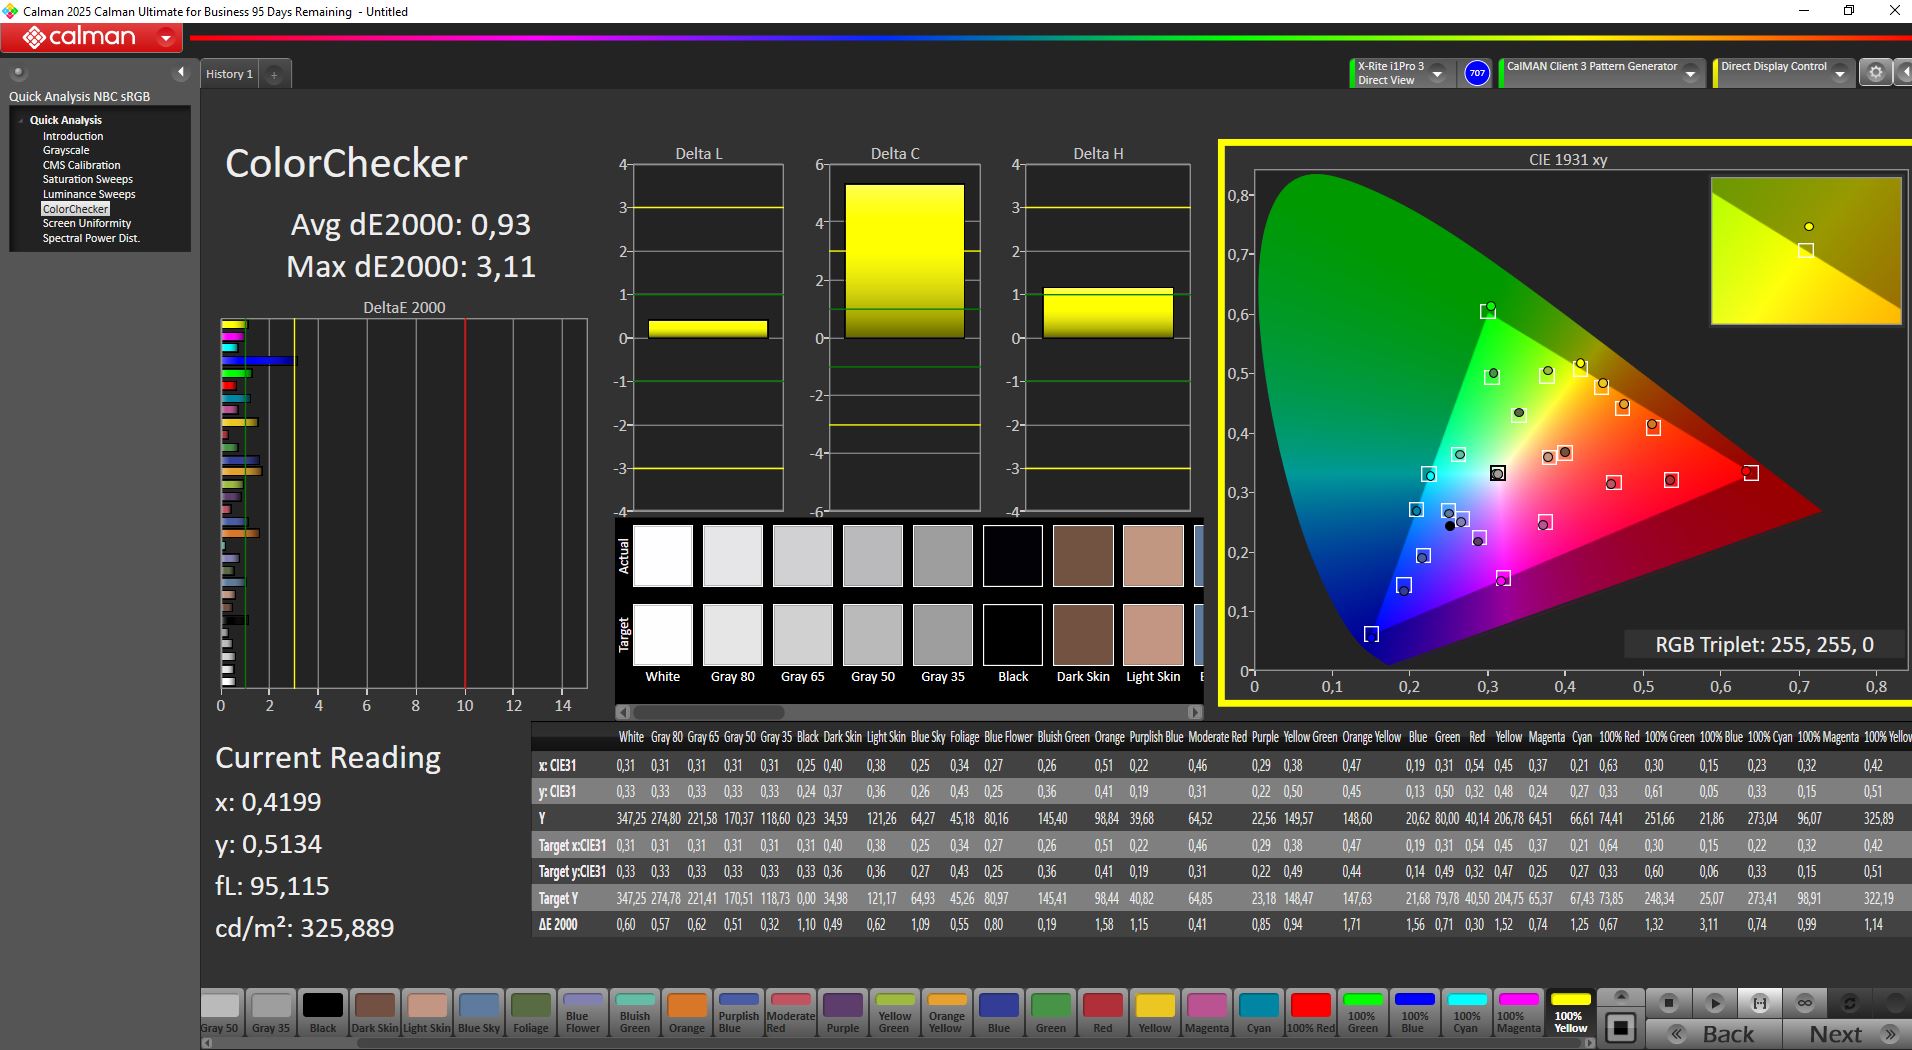
ΔE ColorChecker Calman: 2.89 | ∀{0.5-29.43 Ø4.74}
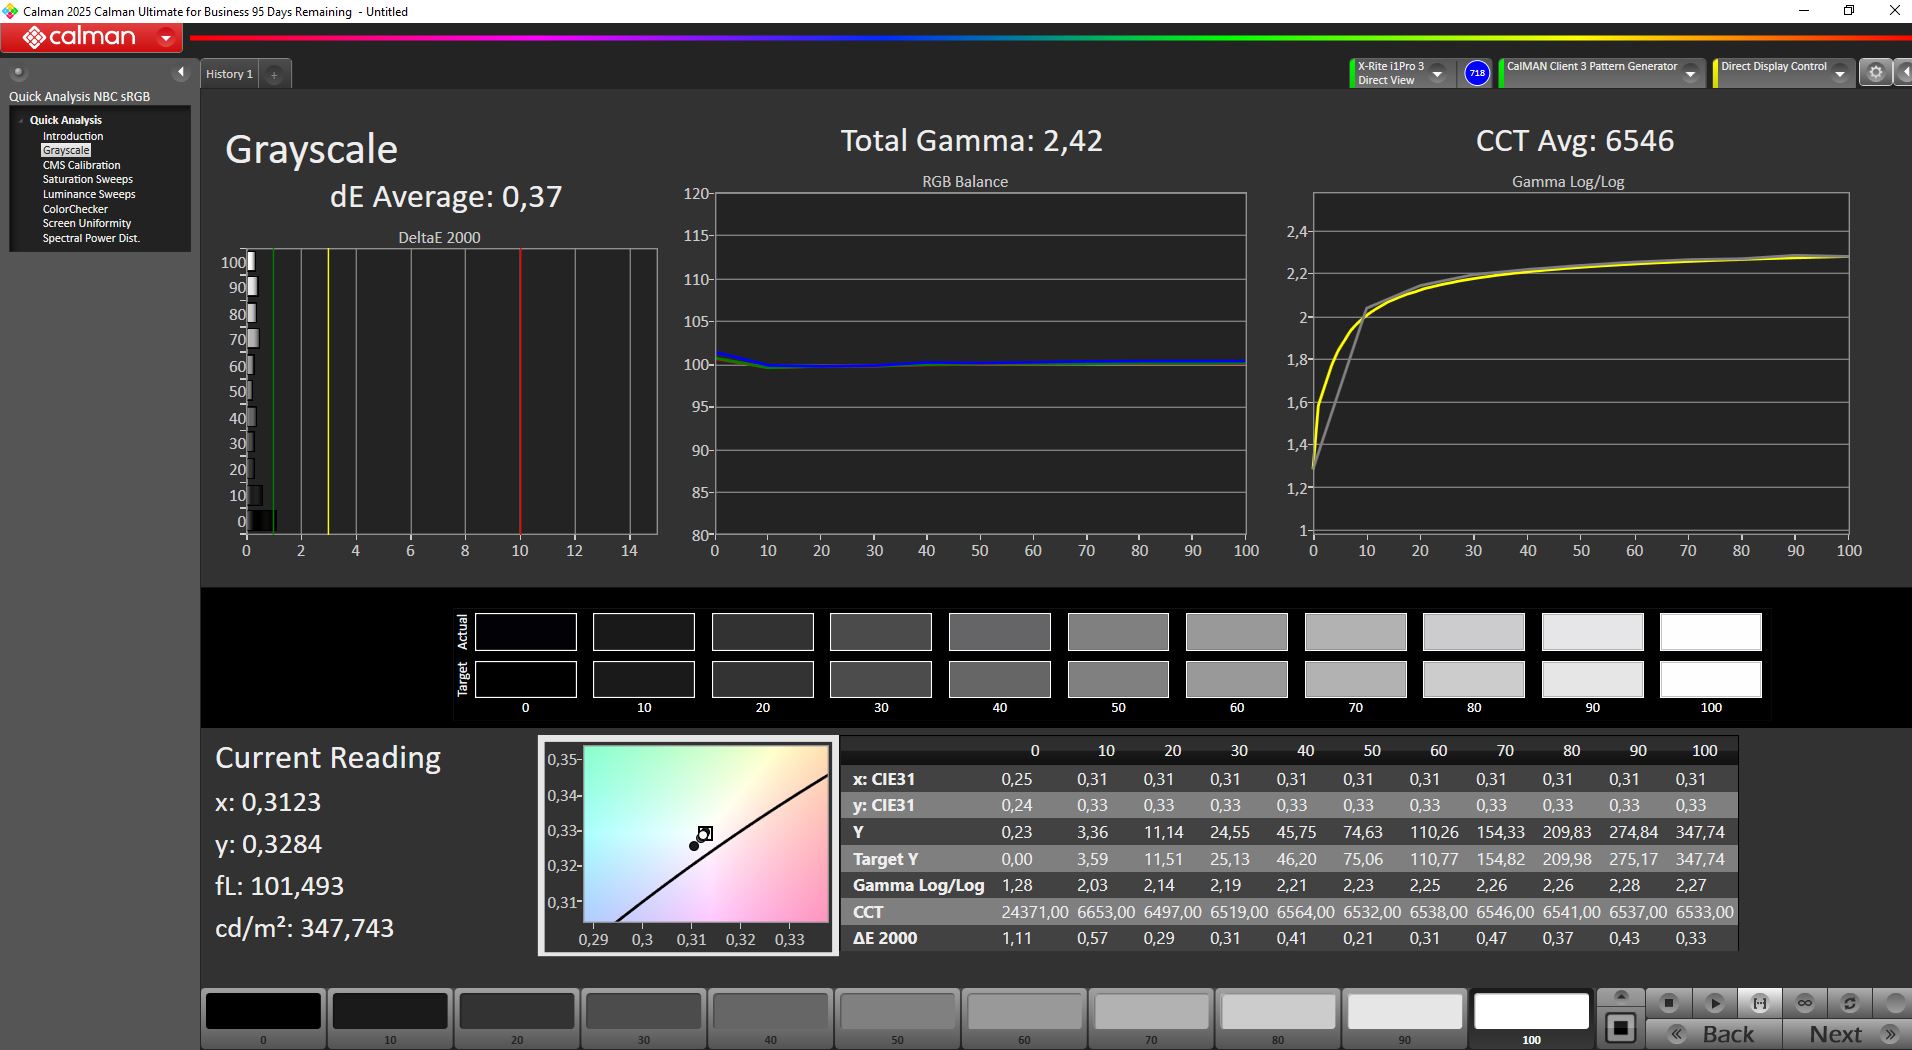
calibrated: 0.93
ΔE Greyscale Calman: 4.46 | ∀{0.09-98 Ø4.99}
67.9% AdobeRGB 1998 (Argyll 3D)
98.1% sRGB (Argyll 3D)
69.3% Display P3 (Argyll 3D)
Gamma: 2.46
CCT: 7132 K
| Asus TUF Gaming A18 FA808UP-S8022W NE180WUM-NY3 (BOE0CEF), IPS, 1920x1200, 18", 144 Hz | Asus ROG Strix G18 2025 G814 NE180QDM-NZC, IPS, 2560x1600, 18", 240 Hz | MSI Crosshair 18 HX AI A2XW BOE NE180QDM-NZ4, IPS, 2560x1600, 18", 240 Hz | Lenovo Legion 9 18IAX10 BOE NE180QAM-NZ2, IPS, 3840x2400, 18", 240 Hz | Razer Blade 18 2025 RTX 5090 Laptop NE180QAM-NZ1, IPS, 3840x2400, 18", 240 Hz | MSI Katana 17 HX B14WGK CSOT MNH301CA3-1, IPS, 2560x1440, 17.3", 240 Hz | HP Omen 17z-db100 BOE0B67, IPS, 2560x1440, 17.3", 240 Hz | |
|---|---|---|---|---|---|---|---|
| Display | 25% | 23% | 24% | 24% | 24% | -1% | |
| Display P3 Coverage (%) | 69.3 | 99.4 43% | 98 41% | 96 39% | 97 40% | 97.3 40% | 66.6 -4% |
| sRGB Coverage (%) | 98.1 | 100 2% | 100 2% | 100 2% | 100 2% | 99.6 2% | 96.8 -1% |
| AdobeRGB 1998 Coverage (%) | 67.9 | 87.7 29% | 86.1 27% | 88.8 31% | 89 31% | 89 31% | 68.6 1% |
| Response Times | 48% | 21% | 2% | 46% | 24% | -49% | |
| Response Time Grey 50% / Grey 80% * (ms) | 8 ? | 3.8 ? 52% | 4.7 ? 41% | 9.7 ? -21% | 5.1 ? 36% | 5.2 ? 35% | 15.1 ? -89% |
| Response Time Black / White * (ms) | 10.4 ? | 5.8 ? 44% | 10.3 ? 1% | 7.8 ? 25% | 4.6 ? 56% | 9.2 ? 12% | 11.3 ? -9% |
| PWM Frequency (Hz) | |||||||
| PWM Amplitude * (%) | |||||||
| Screen | 32% | -3% | 11% | 11% | 10% | -20% | |
| Brightness middle (cd/m²) | 351 | 582 66% | 581.4 66% | 479.7 37% | 545 55% | 296 -16% | 373.2 6% |
| Brightness (cd/m²) | 332 | 557 68% | 534 61% | 465 40% | 510 54% | 272 -18% | 341 3% |
| Brightness Distribution (%) | 89 | 93 4% | 84 -6% | 86 -3% | 86 -3% | 87 -2% | 84 -6% |
| Black Level * (cd/m²) | 0.26 | 0.4 -54% | 0.46 -77% | 0.27 -4% | 0.41 -58% | 0.27 -4% | 0.62 -138% |
| Contrast (:1) | 1350 | 1455 8% | 1264 -6% | 1777 32% | 1329 -2% | 1096 -19% | 602 -55% |
| Colorchecker dE 2000 * | 2.89 | 1.4 52% | 3.89 -35% | 3.14 -9% | 2.2 24% | 1.35 53% | 2.53 12% |
| Colorchecker dE 2000 max. * | 7.91 | 3.4 57% | 7.94 -0% | 6.48 18% | 5.8 27% | 4.76 40% | 5.03 36% |
| Colorchecker dE 2000 calibrated * | 0.93 | 0.7 25% | 0.97 -4% | 1.17 -26% | 1.1 -18% | 0.78 16% | 1.39 -49% |
| Greyscale dE 2000 * | 4.46 | 1.8 60% | 5.6 -26% | 3.8 15% | 3.5 22% | 2.7 39% | 4.1 8% |
| Gamma | 2.46 89% | 2.24 98% | 2.1 105% | 2.18 101% | 2.18 101% | 2.201 100% | 2.23 99% |
| CCT | 7132 91% | 6633 98% | 6835 95% | 7301 89% | 7027 93% | 6770 96% | 6257 104% |
| Total Average (Program / Settings) | 35% /
33% | 14% /
6% | 12% /
13% | 27% /
19% | 19% /
15% | -23% /
-20% |
* ... smaller is better
Out of the box, color and grayscale accuracy are far off. Fortunately, the panel calibrates extremely well, bringing DeltaE values under 1.

Display Response Times
| ↔ Response Time Black to White | ||
|---|---|---|
| 10.4 ms ... rise ↗ and fall ↘ combined | ↗ 5 ms rise | 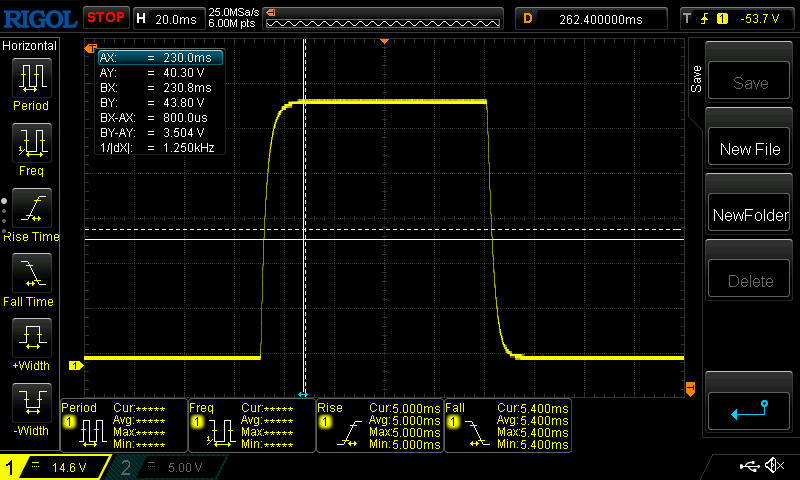 |
| ↘ 5.4 ms fall | ||
| The screen shows good response rates in our tests, but may be too slow for competitive gamers. In comparison, all tested devices range from 0.1 (minimum) to 240 (maximum) ms. » 28 % of all devices are better. This means that the measured response time is better than the average of all tested devices (20 ms). | ||
| ↔ Response Time 50% Grey to 80% Grey | ||
| 8 ms ... rise ↗ and fall ↘ combined | ↗ 3.4 ms rise | 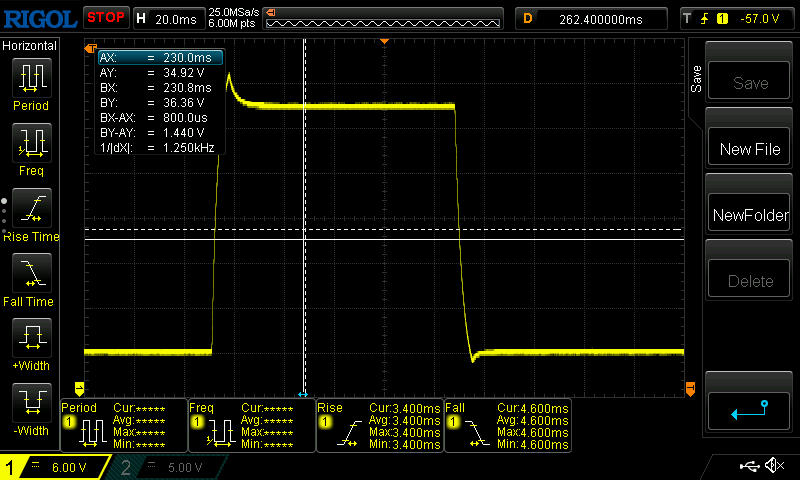 |
| ↘ 4.6 ms fall | ||
| The screen shows fast response rates in our tests and should be suited for gaming. In comparison, all tested devices range from 0.165 (minimum) to 636 (maximum) ms. » 20 % of all devices are better. This means that the measured response time is better than the average of all tested devices (31.3 ms). | ||
Screen Flickering / PWM (Pulse-Width Modulation)
| Screen flickering / PWM not detected | 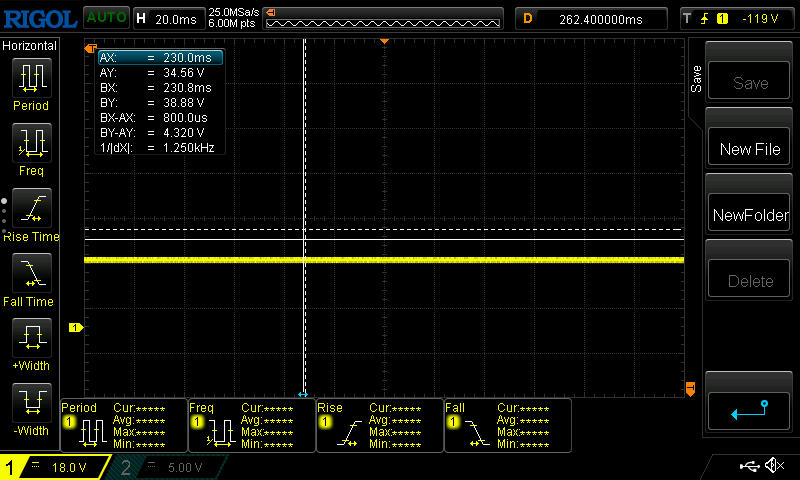 | ||
In comparison: 52 % of all tested devices do not use PWM to dim the display. If PWM was detected, an average of 7914 (minimum: 5 - maximum: 343500) Hz was measured. | |||

Outdoor visibility would benefit from more brightness and contrast, but it’s usable in the shade.


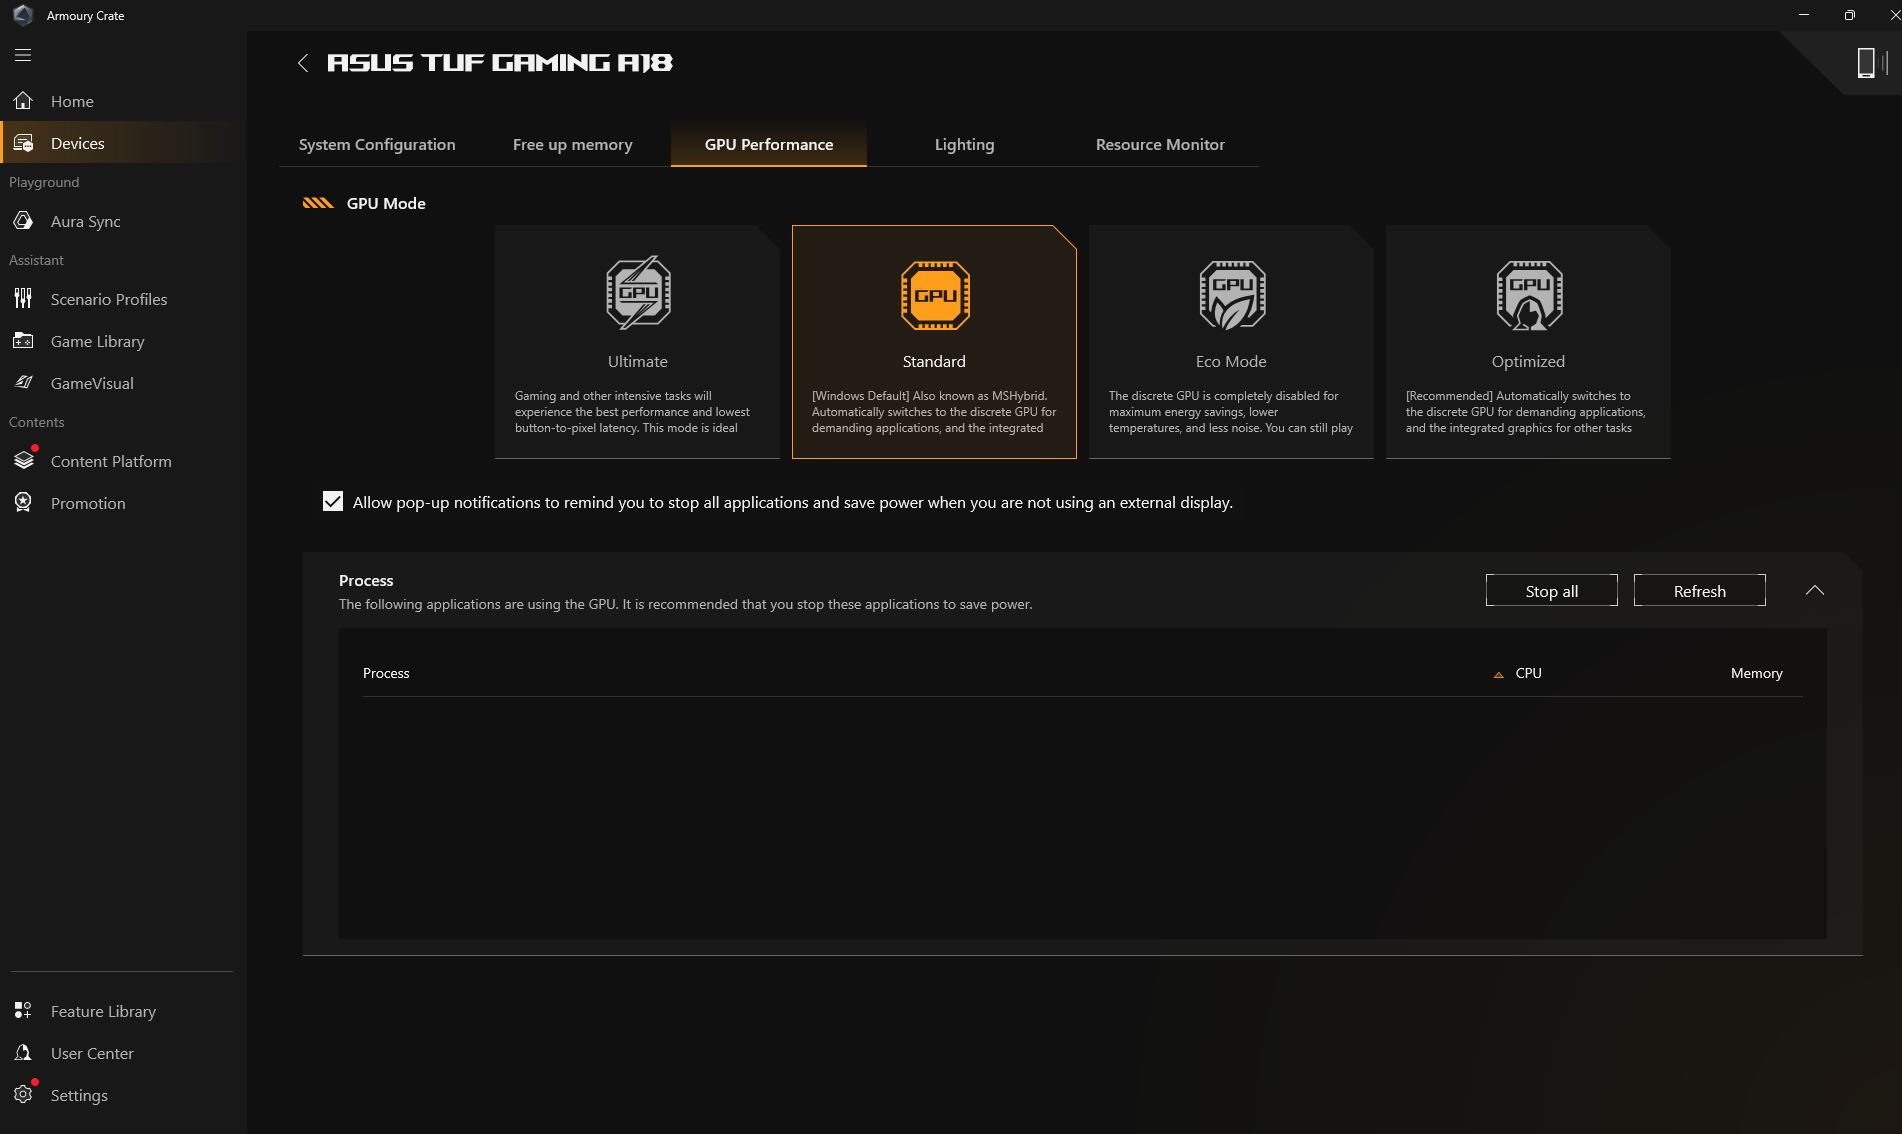
Performance – Weak performance mode
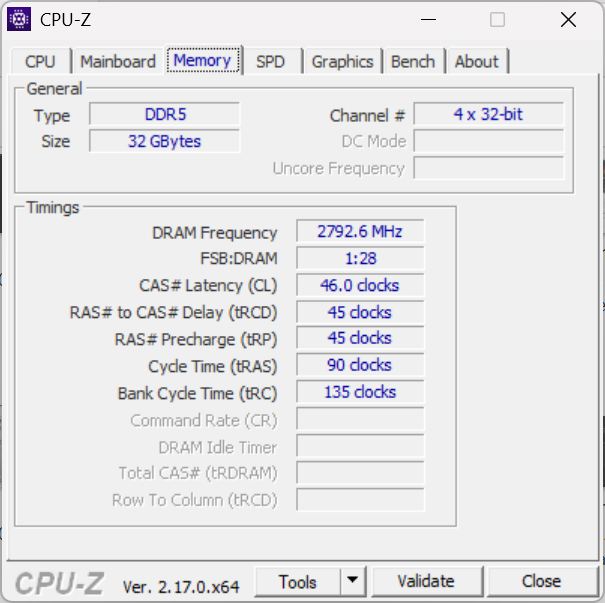
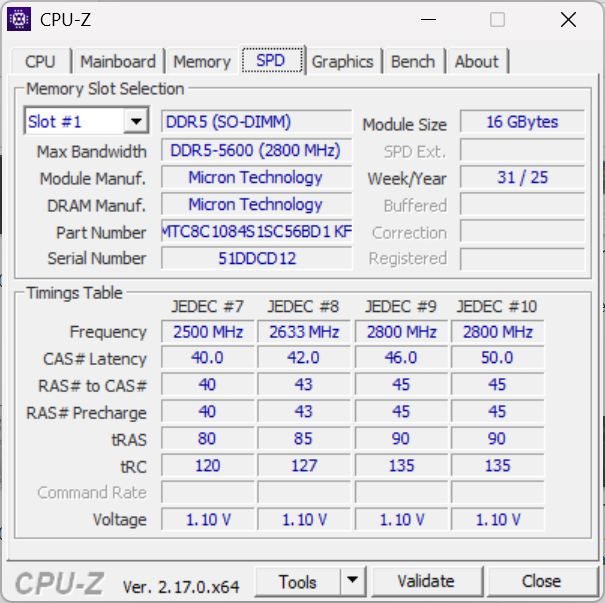
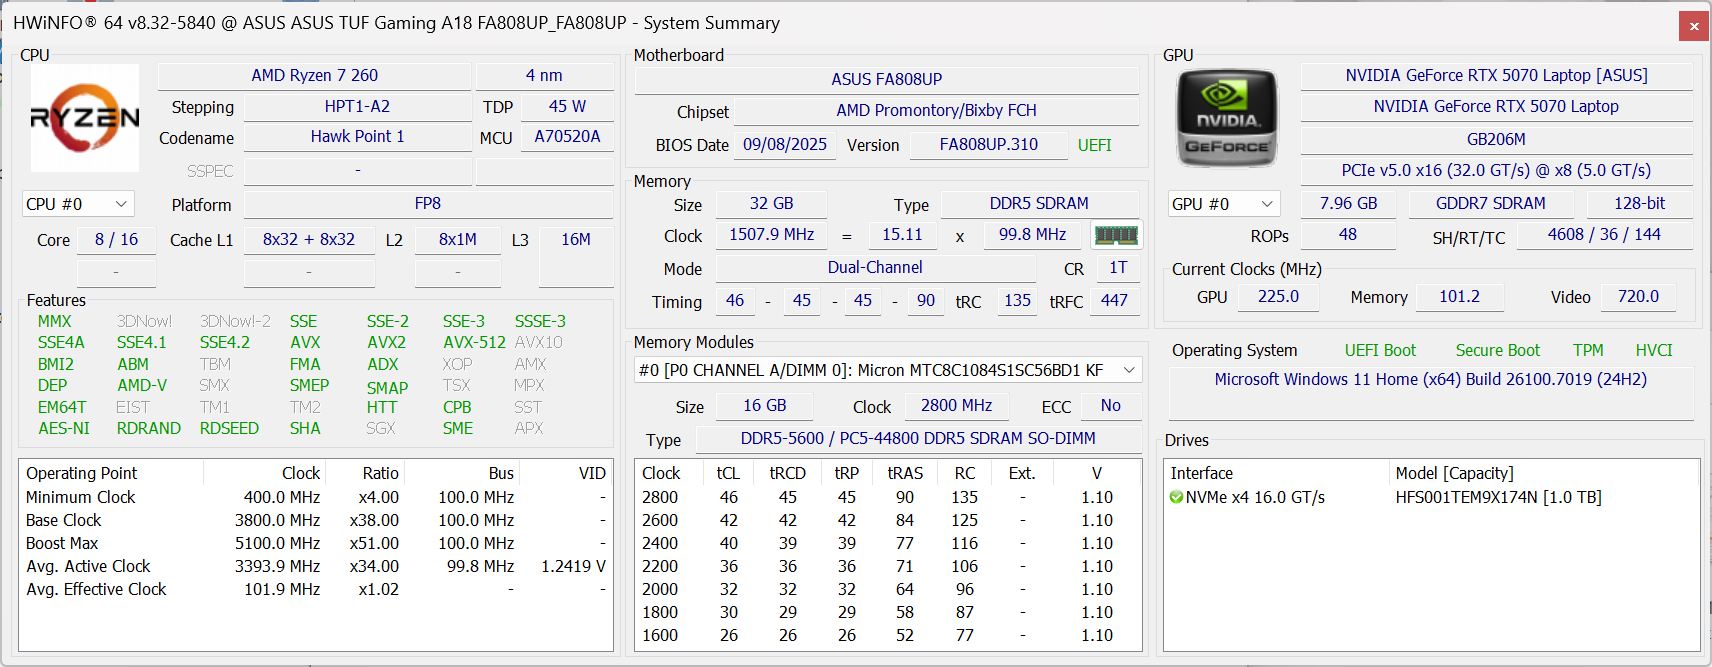
With an AMD Ryzen 7 260, RTX 5070, 32 GB RAM, and an sRGB display, the A18 is designed as a gaming laptop and should run all current titles smoothly at native resolution and high settings.
Test conditions
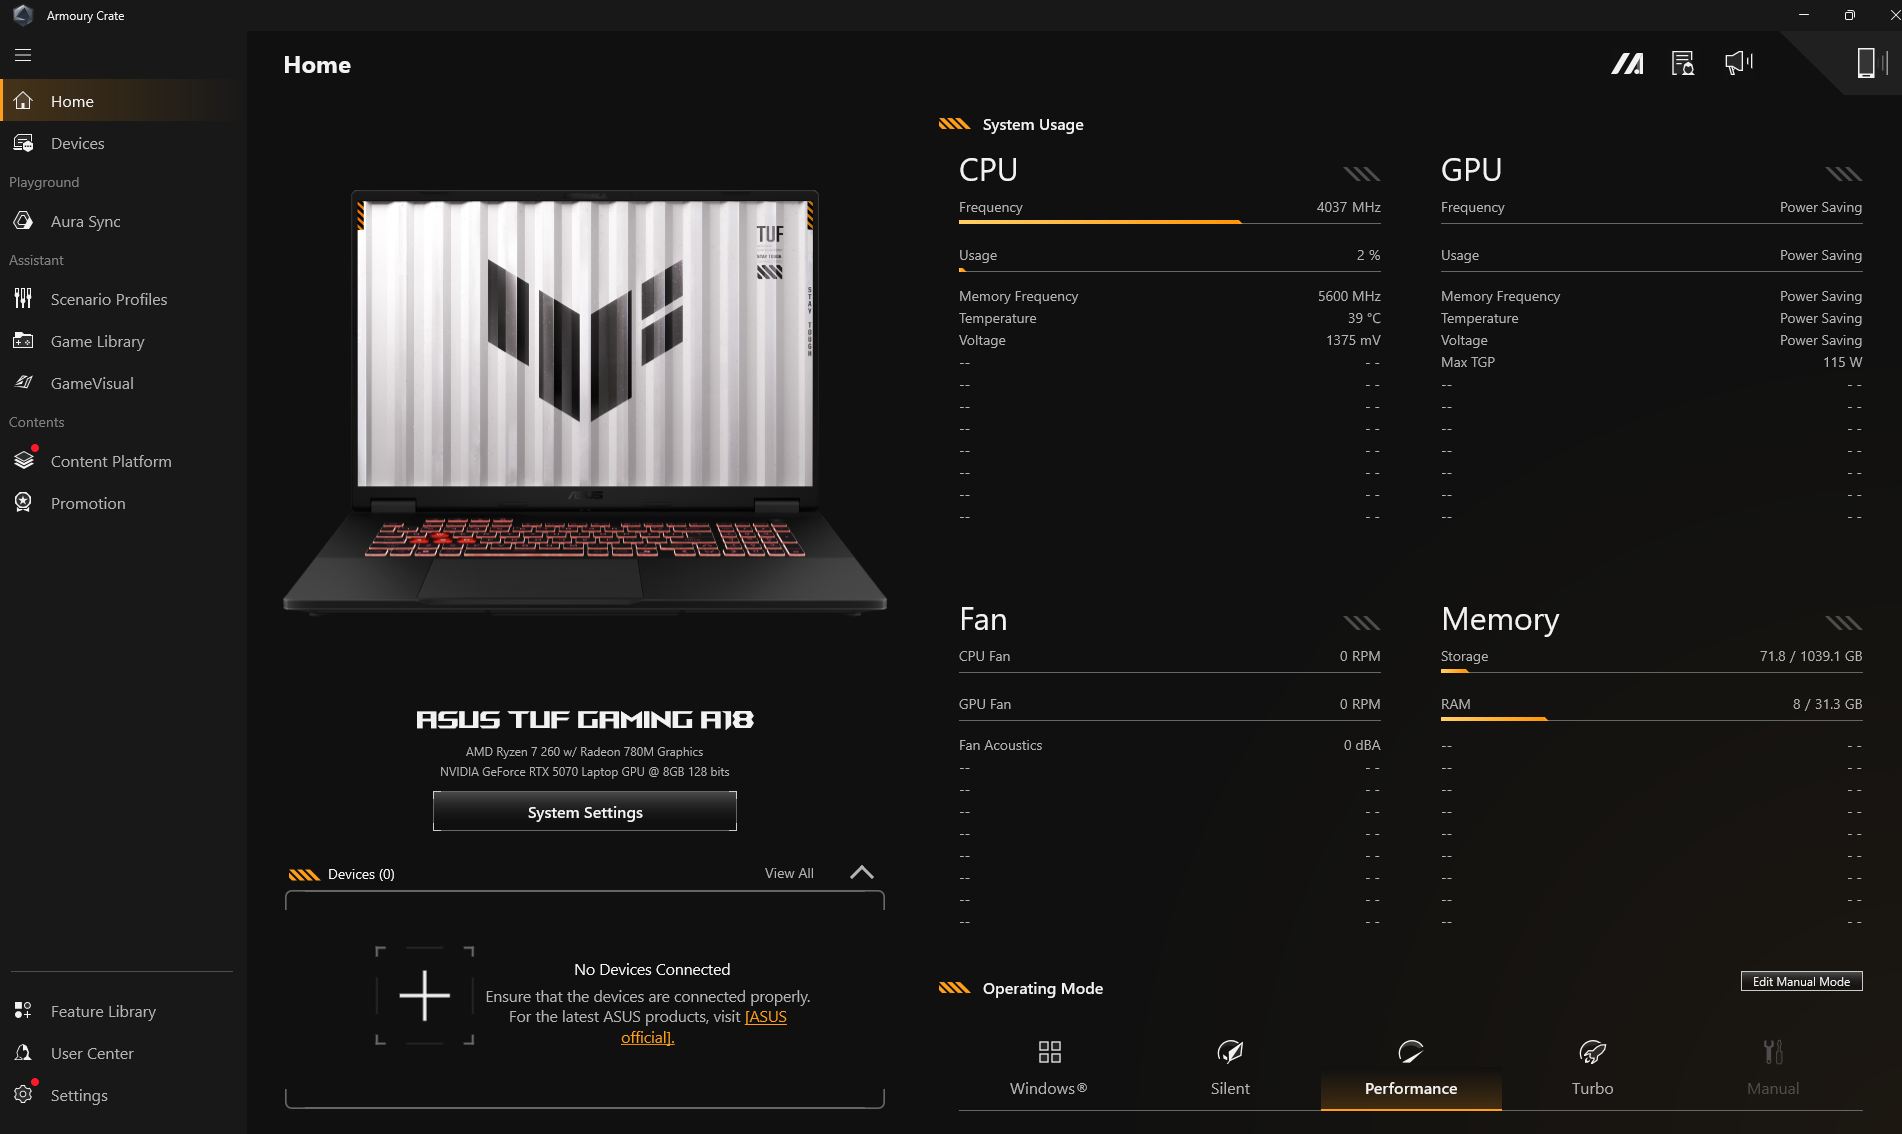
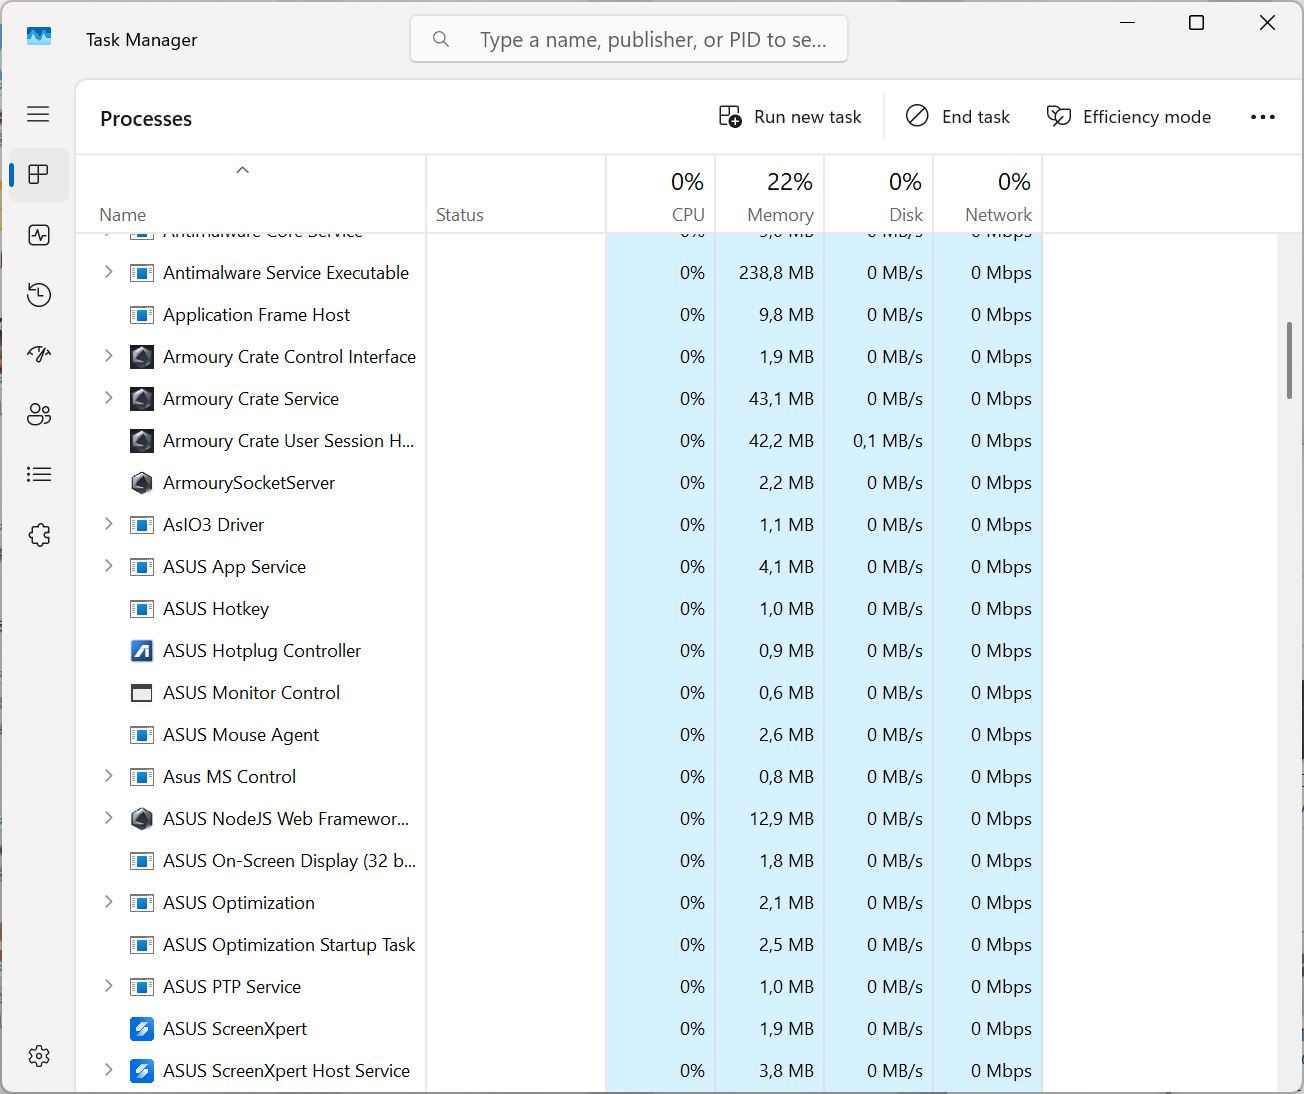
We used the “Performance” mode preset in Armoury Crate (Silent, Performance, Turbo, Manual). More on that below. Asus has quite a few background processes and apps running by default.
| Leistungsmodus | Cinebench R15 | CPU-Leistungsaufnahme | Cyberpunk 2077 Ultra | GPU-Leistungsaufnahme | Lautstärke Cyberpunk |
|---|---|---|---|---|---|
| Turbo | 2,783 | 80 W | 91.7 fps | 82 W | 54.79 dB |
| Performance | 2,756 | 80, falls to 70 W | 90.7 fps | 83 W | 45.13 dB |
| Quiet | 2,554 | 65, falls to 55 W | 87.8 fps | 77 W | 33.43 dB |
Processor
The AMD Ryzen 7 260 features 8 cores and 16 threads. Performance is consistent, but it’s easily beaten by the Ryzen 9 9955HX in the G18 or Intel’s Core Ultra 200 lineup. Turbo mode barely improves CPU output.
On battery, the system automatically switches to Silent mode with a 60 Hz refresh rate. Switching back to Performance manually results in the same Cinebench R15 scores as when plugged in.
Cinebench R15 Multi loop
Cinebench R23: Multi Core | Single Core
Cinebench R20: CPU (Multi Core) | CPU (Single Core)
Cinebench R15: CPU Multi 64Bit | CPU Single 64Bit
Blender: v2.79 BMW27 CPU
7-Zip 18.03: 7z b 4 | 7z b 4 -mmt1
Geekbench 6.6: Multi-Core | Single-Core
Geekbench 5.5: Multi-Core | Single-Core
HWBOT x265 Benchmark v2.2: 4k Preset
LibreOffice : 20 Documents To PDF
R Benchmark 2.5: Overall mean
| CPU Performance rating | |
| Asus ROG Strix G18 2025 G814 | |
| MSI Crosshair 18 HX AI A2XW | |
| Lenovo Legion Pro 5 16IAX10, RTX 5070 | |
| Lenovo LOQ 17IRX10 | |
| Average of class Gaming | |
| Lenovo Legion 5 15AHP G10 | |
| Asus TUF Gaming A 18 Turbo Mode | |
| Asus TUF Gaming A18 FA808UP-S8022W | |
| HP Omen 17z-db100 | |
| Average AMD Ryzen 7 260 | |
| Cinebench R23 / Multi Core | |
| Asus ROG Strix G18 2025 G814 | |
| MSI Crosshair 18 HX AI A2XW | |
| Lenovo Legion Pro 5 16IAX10, RTX 5070 | |
| Lenovo LOQ 17IRX10 | |
| Average of class Gaming (10488 - 40970, n=125, last 2 years) | |
| HP Omen 17z-db100 | |
| Lenovo Legion 5 15AHP G10 | |
| Asus TUF Gaming A 18 Turbo Mode | |
| Asus TUF Gaming A18 FA808UP-S8022W | |
| Average AMD Ryzen 7 260 (15864 - 17712, n=5) | |
| Cinebench R23 / Single Core | |
| Asus ROG Strix G18 2025 G814 | |
| Lenovo Legion Pro 5 16IAX10, RTX 5070 | |
| MSI Crosshair 18 HX AI A2XW | |
| Lenovo LOQ 17IRX10 | |
| Average of class Gaming (1166 - 2267, n=125, last 2 years) | |
| HP Omen 17z-db100 | |
| Lenovo Legion 5 15AHP G10 | |
| Asus TUF Gaming A 18 Turbo Mode | |
| Average AMD Ryzen 7 260 (1760 - 1801, n=5) | |
| Asus TUF Gaming A18 FA808UP-S8022W | |
| Cinebench R20 / CPU (Multi Core) | |
| Asus ROG Strix G18 2025 G814 | |
| MSI Crosshair 18 HX AI A2XW | |
| Lenovo Legion Pro 5 16IAX10, RTX 5070 | |
| Lenovo LOQ 17IRX10 | |
| Average of class Gaming (4029 - 16108, n=124, last 2 years) | |
| Lenovo Legion 5 15AHP G10 | |
| HP Omen 17z-db100 | |
| Asus TUF Gaming A 18 Turbo Mode | |
| Asus TUF Gaming A18 FA808UP-S8022W | |
| Average AMD Ryzen 7 260 (6161 - 6969, n=5) | |
| Cinebench R20 / CPU (Single Core) | |
| Asus ROG Strix G18 2025 G814 | |
| Lenovo Legion Pro 5 16IAX10, RTX 5070 | |
| MSI Crosshair 18 HX AI A2XW | |
| Lenovo LOQ 17IRX10 | |
| HP Omen 17z-db100 | |
| Average of class Gaming (442 - 870, n=124, last 2 years) | |
| Lenovo Legion 5 15AHP G10 | |
| Asus TUF Gaming A18 FA808UP-S8022W | |
| Asus TUF Gaming A 18 Turbo Mode | |
| Average AMD Ryzen 7 260 (679 - 697, n=5) | |
| Cinebench R15 / CPU Multi 64Bit | |
| Asus ROG Strix G18 2025 G814 | |
| MSI Crosshair 18 HX AI A2XW | |
| Lenovo Legion Pro 5 16IAX10, RTX 5070 | |
| Lenovo LOQ 17IRX10 | |
| Average of class Gaming (1578 - 6271, n=125, last 2 years) | |
| Lenovo Legion 5 15AHP G10 | |
| Asus TUF Gaming A 18 Turbo Mode | |
| Asus TUF Gaming A18 FA808UP-S8022W | |
| Average AMD Ryzen 7 260 (2543 - 2831, n=5) | |
| HP Omen 17z-db100 | |
| Cinebench R15 / CPU Single 64Bit | |
| Asus ROG Strix G18 2025 G814 | |
| Lenovo Legion Pro 5 16IAX10, RTX 5070 | |
| MSI Crosshair 18 HX AI A2XW | |
| HP Omen 17z-db100 | |
| Lenovo LOQ 17IRX10 | |
| Average of class Gaming (188.8 - 343, n=124, last 2 years) | |
| Lenovo Legion 5 15AHP G10 | |
| Asus TUF Gaming A 18 Turbo Mode | |
| Average AMD Ryzen 7 260 (275 - 283, n=5) | |
| Asus TUF Gaming A18 FA808UP-S8022W | |
| Blender / v2.79 BMW27 CPU | |
| Average AMD Ryzen 7 260 (182 - 204, n=5) | |
| HP Omen 17z-db100 | |
| Asus TUF Gaming A18 FA808UP-S8022W | |
| Lenovo Legion 5 15AHP G10 | |
| Asus TUF Gaming A 18 Turbo Mode | |
| Average of class Gaming (80 - 330, n=121, last 2 years) | |
| Lenovo LOQ 17IRX10 | |
| Lenovo Legion Pro 5 16IAX10, RTX 5070 | |
| MSI Crosshair 18 HX AI A2XW | |
| Asus ROG Strix G18 2025 G814 | |
| 7-Zip 18.03 / 7z b 4 | |
| Asus ROG Strix G18 2025 G814 | |
| MSI Crosshair 18 HX AI A2XW | |
| Lenovo Legion Pro 5 16IAX10, RTX 5070 | |
| Lenovo LOQ 17IRX10 | |
| Average of class Gaming (33491 - 148086, n=122, last 2 years) | |
| Asus TUF Gaming A 18 Turbo Mode | |
| Asus TUF Gaming A18 FA808UP-S8022W | |
| Lenovo Legion 5 15AHP G10 | |
| Average AMD Ryzen 7 260 (63076 - 73490, n=5) | |
| HP Omen 17z-db100 | |
| 7-Zip 18.03 / 7z b 4 -mmt1 | |
| Asus ROG Strix G18 2025 G814 | |
| Lenovo LOQ 17IRX10 | |
| Lenovo Legion Pro 5 16IAX10, RTX 5070 | |
| Asus TUF Gaming A18 FA808UP-S8022W | |
| Lenovo Legion 5 15AHP G10 | |
| Asus TUF Gaming A 18 Turbo Mode | |
| Average AMD Ryzen 7 260 (6101 - 6566, n=5) | |
| Average of class Gaming (4199 - 7508, n=122, last 2 years) | |
| MSI Crosshair 18 HX AI A2XW | |
| HP Omen 17z-db100 | |
| Geekbench 6.6 / Multi-Core | |
| Lenovo Legion Pro 5 16IAX10, RTX 5070 | |
| Asus ROG Strix G18 2025 G814 | |
| MSI Crosshair 18 HX AI A2XW | |
| Average of class Gaming (6625 - 22104, n=123, last 2 years) | |
| Lenovo LOQ 17IRX10 | |
| Asus TUF Gaming A 18 Turbo Mode | |
| Lenovo Legion 5 15AHP G10 | |
| Asus TUF Gaming A18 FA808UP-S8022W | |
| HP Omen 17z-db100 | |
| Average AMD Ryzen 7 260 (9977 - 13349, n=5) | |
| Geekbench 6.6 / Single-Core | |
| Asus ROG Strix G18 2025 G814 | |
| Lenovo Legion Pro 5 16IAX10, RTX 5070 | |
| MSI Crosshair 18 HX AI A2XW | |
| Lenovo LOQ 17IRX10 | |
| Average of class Gaming (1490 - 3259, n=123, last 2 years) | |
| Asus TUF Gaming A 18 Turbo Mode | |
| Asus TUF Gaming A18 FA808UP-S8022W | |
| Lenovo Legion 5 15AHP G10 | |
| Average AMD Ryzen 7 260 (2622 - 2686, n=5) | |
| HP Omen 17z-db100 | |
| Geekbench 5.5 / Multi-Core | |
| MSI Crosshair 18 HX AI A2XW | |
| Asus ROG Strix G18 2025 G814 | |
| Lenovo Legion Pro 5 16IAX10, RTX 5070 | |
| Average of class Gaming (6460 - 27010, n=122, last 2 years) | |
| Lenovo LOQ 17IRX10 | |
| Lenovo Legion 5 15AHP G10 | |
| Asus TUF Gaming A18 FA808UP-S8022W | |
| Asus TUF Gaming A 18 Turbo Mode | |
| HP Omen 17z-db100 | |
| Average AMD Ryzen 7 260 (9837 - 12597, n=5) | |
| Geekbench 5.5 / Single-Core | |
| Asus ROG Strix G18 2025 G814 | |
| Lenovo Legion Pro 5 16IAX10, RTX 5070 | |
| MSI Crosshair 18 HX AI A2XW | |
| Lenovo LOQ 17IRX10 | |
| Average of class Gaming (986 - 2474, n=122, last 2 years) | |
| Lenovo Legion 5 15AHP G10 | |
| Asus TUF Gaming A 18 Turbo Mode | |
| Average AMD Ryzen 7 260 (1836 - 1986, n=5) | |
| Asus TUF Gaming A18 FA808UP-S8022W | |
| HP Omen 17z-db100 | |
| HWBOT x265 Benchmark v2.2 / 4k Preset | |
| Asus ROG Strix G18 2025 G814 | |
| Lenovo Legion Pro 5 16IAX10, RTX 5070 | |
| MSI Crosshair 18 HX AI A2XW | |
| Average of class Gaming (11.5 - 44.3, n=122, last 2 years) | |
| Lenovo LOQ 17IRX10 | |
| Lenovo Legion 5 15AHP G10 | |
| HP Omen 17z-db100 | |
| Asus TUF Gaming A 18 Turbo Mode | |
| Asus TUF Gaming A18 FA808UP-S8022W | |
| Average AMD Ryzen 7 260 (17.6 - 22.4, n=5) | |
| LibreOffice / 20 Documents To PDF | |
| Asus TUF Gaming A18 FA808UP-S8022W | |
| Average AMD Ryzen 7 260 (49.6 - 63.5, n=5) | |
| Lenovo LOQ 17IRX10 | |
| Asus TUF Gaming A 18 Turbo Mode | |
| HP Omen 17z-db100 | |
| Lenovo Legion 5 15AHP G10 | |
| Average of class Gaming (19 - 88.8, n=122, last 2 years) | |
| Asus ROG Strix G18 2025 G814 | |
| Lenovo Legion Pro 5 16IAX10, RTX 5070 | |
| MSI Crosshair 18 HX AI A2XW | |
| R Benchmark 2.5 / Overall mean | |
| Asus TUF Gaming A 18 Turbo Mode | |
| MSI Crosshair 18 HX AI A2XW | |
| Average AMD Ryzen 7 260 (0.4432 - 0.4479, n=5) | |
| Lenovo Legion 5 15AHP G10 | |
| Asus TUF Gaming A18 FA808UP-S8022W | |
| Average of class Gaming (0.3439 - 0.759, n=123, last 2 years) | |
| Lenovo Legion Pro 5 16IAX10, RTX 5070 | |
| HP Omen 17z-db100 | |
| Lenovo LOQ 17IRX10 | |
| Asus ROG Strix G18 2025 G814 | |
* ... smaller is better
AIDA64: FP32 Ray-Trace | FPU Julia | CPU SHA3 | CPU Queen | FPU SinJulia | FPU Mandel | CPU AES | CPU ZLib | FP64 Ray-Trace | CPU PhotoWorxx
| Performance rating | |
| Asus ROG Strix G18 2025 G814 | |
| MSI Crosshair 18 HX AI A2XW | |
| Lenovo Legion Pro 5 16IAX10, RTX 5070 | |
| Average of class Gaming | |
| Asus TUF Gaming A18 FA808UP-S8022W | |
| Lenovo Legion 5 15AHP G10 | |
| Lenovo LOQ 17IRX10 | |
| Average AMD Ryzen 7 260 | |
| HP Omen 17z-db100 | |
| AIDA64 / FP32 Ray-Trace | |
| Asus ROG Strix G18 2025 G814 | |
| MSI Crosshair 18 HX AI A2XW | |
| Lenovo Legion Pro 5 16IAX10, RTX 5070 | |
| Average of class Gaming (10227 - 85542, n=122, last 2 years) | |
| Lenovo Legion 5 15AHP G10 | |
| Average AMD Ryzen 7 260 (25995 - 29330, n=5) | |
| HP Omen 17z-db100 | |
| Asus TUF Gaming A18 FA808UP-S8022W | |
| Lenovo LOQ 17IRX10 | |
| AIDA64 / FPU Julia | |
| Asus ROG Strix G18 2025 G814 | |
| MSI Crosshair 18 HX AI A2XW | |
| Lenovo Legion Pro 5 16IAX10, RTX 5070 | |
| Average of class Gaming (51376 - 238426, n=122, last 2 years) | |
| Lenovo Legion 5 15AHP G10 | |
| Asus TUF Gaming A18 FA808UP-S8022W | |
| Average AMD Ryzen 7 260 (106250 - 121427, n=5) | |
| Lenovo LOQ 17IRX10 | |
| HP Omen 17z-db100 | |
| AIDA64 / CPU SHA3 | |
| Asus ROG Strix G18 2025 G814 | |
| MSI Crosshair 18 HX AI A2XW | |
| Lenovo Legion Pro 5 16IAX10, RTX 5070 | |
| Average of class Gaming (2180 - 9817, n=122, last 2 years) | |
| Lenovo LOQ 17IRX10 | |
| Asus TUF Gaming A18 FA808UP-S8022W | |
| Lenovo Legion 5 15AHP G10 | |
| Average AMD Ryzen 7 260 (4636 - 5026, n=5) | |
| HP Omen 17z-db100 | |
| AIDA64 / CPU Queen | |
| Asus ROG Strix G18 2025 G814 | |
| Lenovo LOQ 17IRX10 | |
| Lenovo Legion Pro 5 16IAX10, RTX 5070 | |
| MSI Crosshair 18 HX AI A2XW | |
| Lenovo Legion 5 15AHP G10 | |
| Asus TUF Gaming A18 FA808UP-S8022W | |
| Average AMD Ryzen 7 260 (115108 - 123832, n=5) | |
| Average of class Gaming (49785 - 173351, n=119, last 2 years) | |
| HP Omen 17z-db100 | |
| AIDA64 / FPU SinJulia | |
| Asus ROG Strix G18 2025 G814 | |
| Asus TUF Gaming A18 FA808UP-S8022W | |
| Lenovo Legion 5 15AHP G10 | |
| Average AMD Ryzen 7 260 (14810 - 15497, n=5) | |
| Average of class Gaming (4424 - 33636, n=122, last 2 years) | |
| Lenovo LOQ 17IRX10 | |
| HP Omen 17z-db100 | |
| MSI Crosshair 18 HX AI A2XW | |
| Lenovo Legion Pro 5 16IAX10, RTX 5070 | |
| AIDA64 / FPU Mandel | |
| Asus ROG Strix G18 2025 G814 | |
| MSI Crosshair 18 HX AI A2XW | |
| Lenovo Legion Pro 5 16IAX10, RTX 5070 | |
| Average of class Gaming (25115 - 128721, n=122, last 2 years) | |
| Lenovo Legion 5 15AHP G10 | |
| Asus TUF Gaming A18 FA808UP-S8022W | |
| Average AMD Ryzen 7 260 (56974 - 65308, n=5) | |
| HP Omen 17z-db100 | |
| Lenovo LOQ 17IRX10 | |
| AIDA64 / CPU AES | |
| Asus ROG Strix G18 2025 G814 | |
| MSI Crosshair 18 HX AI A2XW | |
| Lenovo Legion Pro 5 16IAX10, RTX 5070 | |
| Average of class Gaming (39258 - 247074, n=122, last 2 years) | |
| Lenovo LOQ 17IRX10 | |
| Asus TUF Gaming A18 FA808UP-S8022W | |
| HP Omen 17z-db100 | |
| Average AMD Ryzen 7 260 (66825 - 91093, n=5) | |
| Lenovo Legion 5 15AHP G10 | |
| AIDA64 / CPU ZLib | |
| Asus ROG Strix G18 2025 G814 | |
| MSI Crosshair 18 HX AI A2XW | |
| Lenovo Legion Pro 5 16IAX10, RTX 5070 | |
| Average of class Gaming (574 - 2531, n=122, last 2 years) | |
| Lenovo LOQ 17IRX10 | |
| Asus TUF Gaming A18 FA808UP-S8022W | |
| Lenovo Legion 5 15AHP G10 | |
| HP Omen 17z-db100 | |
| Average AMD Ryzen 7 260 (1039 - 1133, n=5) | |
| AIDA64 / FP64 Ray-Trace | |
| Asus ROG Strix G18 2025 G814 | |
| MSI Crosshair 18 HX AI A2XW | |
| Lenovo Legion Pro 5 16IAX10, RTX 5070 | |
| Average of class Gaming (5509 - 45446, n=122, last 2 years) | |
| Lenovo Legion 5 15AHP G10 | |
| Asus TUF Gaming A18 FA808UP-S8022W | |
| HP Omen 17z-db100 | |
| Average AMD Ryzen 7 260 (13944 - 15751, n=5) | |
| Lenovo LOQ 17IRX10 | |
| AIDA64 / CPU PhotoWorxx | |
| Lenovo Legion Pro 5 16IAX10, RTX 5070 | |
| MSI Crosshair 18 HX AI A2XW | |
| HP Omen 17z-db100 | |
| Average of class Gaming (12271 - 62916, n=122, last 2 years) | |
| Asus ROG Strix G18 2025 G814 | |
| Lenovo Legion 5 15AHP G10 | |
| Asus TUF Gaming A18 FA808UP-S8022W | |
| Average AMD Ryzen 7 260 (23097 - 40796, n=5) | |
| Lenovo LOQ 17IRX10 | |
System Performance
In our benchmark ranking, the A18 finishes last. Subjectively, the system usually feels smooth, but not always — we experienced an unintended reboot when plugging in HDMI, and twice during testing the system became unresponsive.
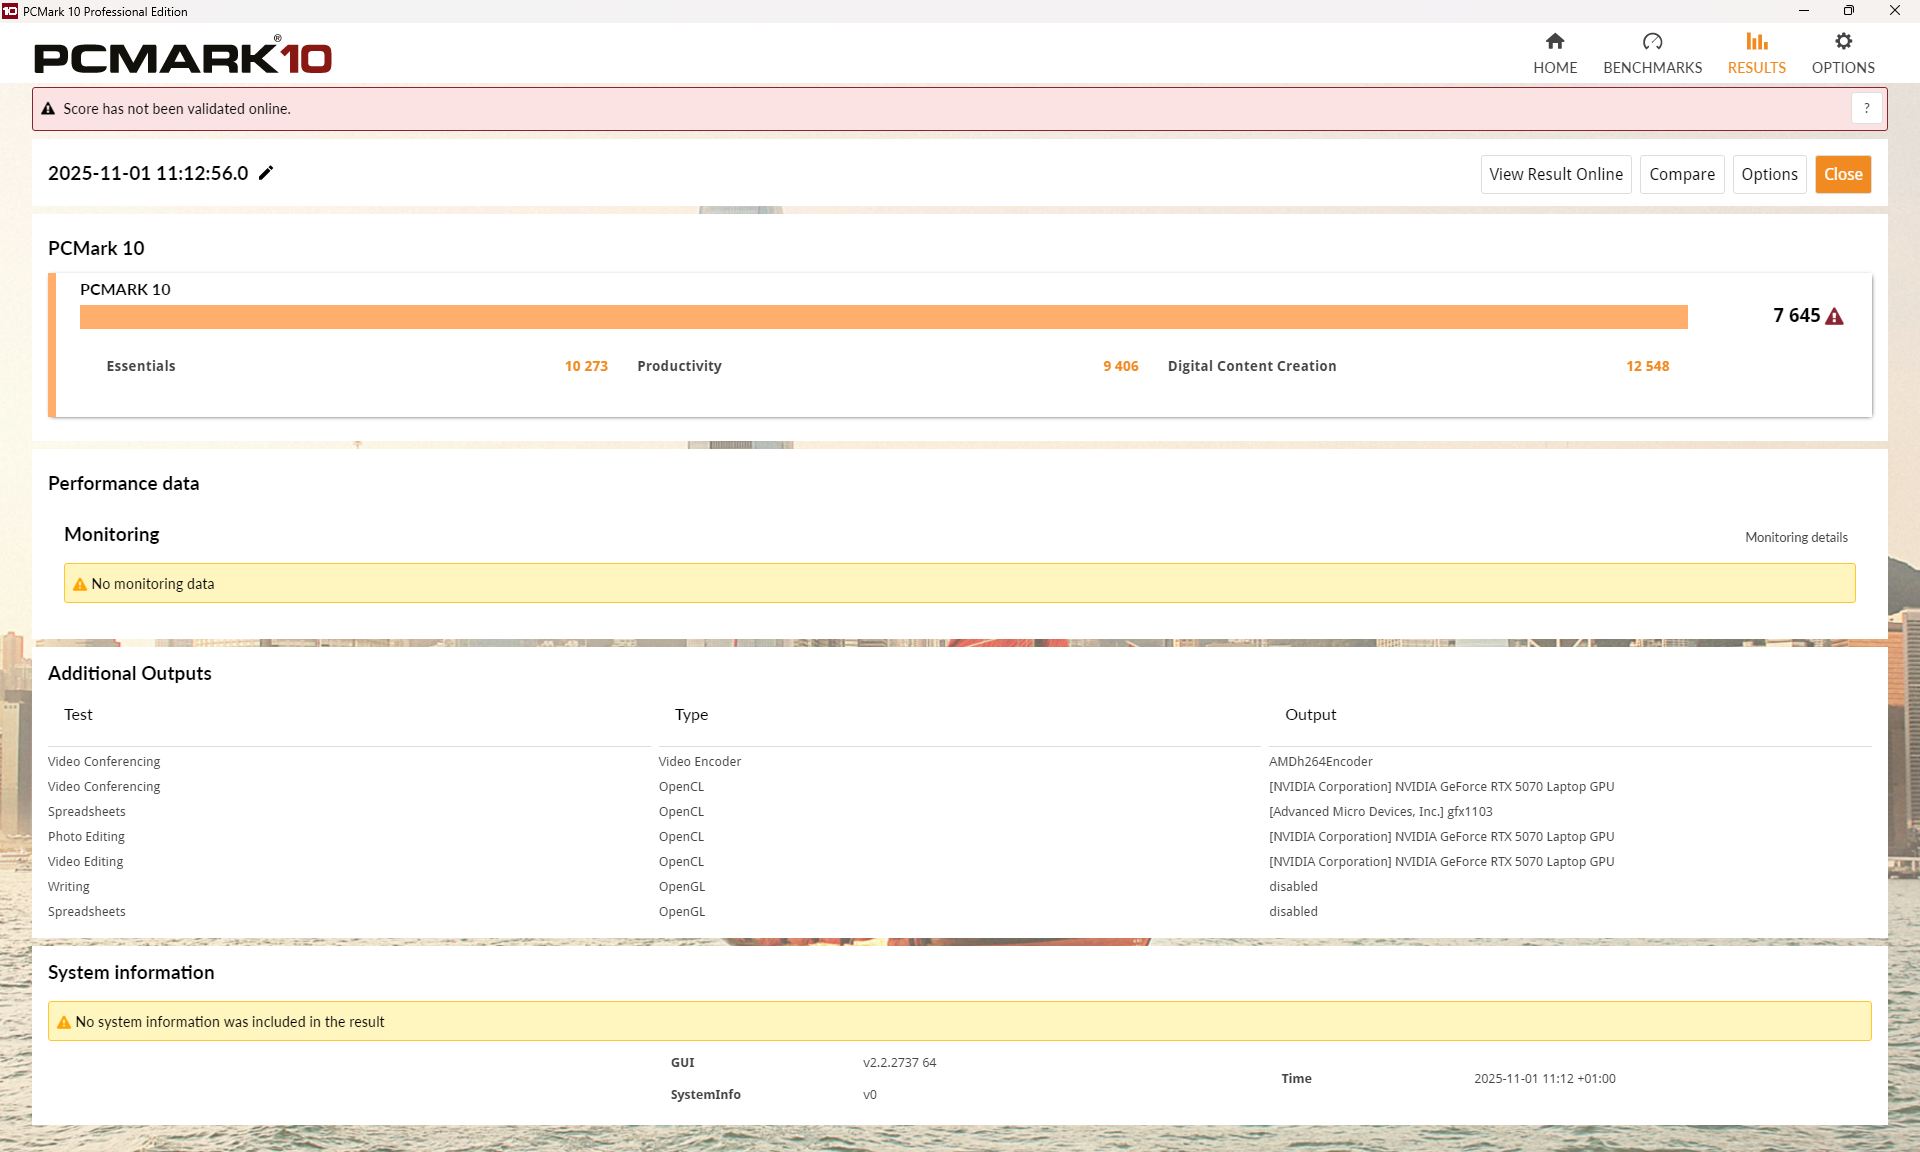
PCMark 10: Score | Essentials | Productivity | Digital Content Creation
CrossMark: Overall | Productivity | Creativity | Responsiveness
WebXPRT 3: Overall
WebXPRT 4: Overall
Mozilla Kraken 1.1: Total
| Performance rating | |
| Asus ROG Strix G18 2025 G814 | |
| Lenovo Legion Pro 5 16IAX10, RTX 5070 | |
| MSI Crosshair 18 HX AI A2XW | |
| Lenovo LOQ 17IRX10 -3! | |
| Average of class Gaming | |
| Lenovo Legion 5 15AHP G10 | |
| HP Omen 17z-db100 | |
| Average AMD Ryzen 7 260, NVIDIA GeForce RTX 5070 Laptop | |
| Asus TUF Gaming A 18 Turbo Mode -4! | |
| Asus TUF Gaming A18 FA808UP-S8022W | |
| PCMark 10 / Score | |
| Lenovo Legion Pro 5 16IAX10, RTX 5070 | |
| Asus ROG Strix G18 2025 G814 | |
| Lenovo Legion 5 15AHP G10 | |
| Average of class Gaming (5828 - 10060, n=104, last 2 years) | |
| Asus TUF Gaming A 18 Turbo Mode | |
| MSI Crosshair 18 HX AI A2XW | |
| Average AMD Ryzen 7 260, NVIDIA GeForce RTX 5070 Laptop (7645 - 7988, n=2) | |
| HP Omen 17z-db100 | |
| Asus TUF Gaming A18 FA808UP-S8022W | |
| PCMark 10 / Essentials | |
| HP Omen 17z-db100 | |
| Asus ROG Strix G18 2025 G814 | |
| Lenovo Legion Pro 5 16IAX10, RTX 5070 | |
| MSI Crosshair 18 HX AI A2XW | |
| Lenovo LOQ 17IRX10 | |
| Lenovo Legion 5 15AHP G10 | |
| Average of class Gaming (8810 - 12600, n=108, last 2 years) | |
| Asus TUF Gaming A 18 Turbo Mode | |
| Asus TUF Gaming A18 FA808UP-S8022W | |
| Average AMD Ryzen 7 260, NVIDIA GeForce RTX 5070 Laptop (9639 - 10273, n=2) | |
| PCMark 10 / Productivity | |
| Asus ROG Strix G18 2025 G814 | |
| Average AMD Ryzen 7 260, NVIDIA GeForce RTX 5070 Laptop (9406 - 12566, n=2) | |
| HP Omen 17z-db100 | |
| Average of class Gaming (6662 - 16716, n=106, last 2 years) | |
| Lenovo Legion 5 15AHP G10 | |
| Lenovo Legion Pro 5 16IAX10, RTX 5070 | |
| Asus TUF Gaming A 18 Turbo Mode | |
| MSI Crosshair 18 HX AI A2XW | |
| Asus TUF Gaming A18 FA808UP-S8022W | |
| PCMark 10 / Digital Content Creation | |
| Lenovo Legion Pro 5 16IAX10, RTX 5070 | |
| Asus TUF Gaming A 18 Turbo Mode | |
| Asus ROG Strix G18 2025 G814 | |
| Lenovo Legion 5 15AHP G10 | |
| Average of class Gaming (7602 - 19351, n=106, last 2 years) | |
| MSI Crosshair 18 HX AI A2XW | |
| Asus TUF Gaming A18 FA808UP-S8022W | |
| Average AMD Ryzen 7 260, NVIDIA GeForce RTX 5070 Laptop (11417 - 12548, n=2) | |
| HP Omen 17z-db100 | |
| CrossMark / Overall | |
| Asus ROG Strix G18 2025 G814 | |
| MSI Crosshair 18 HX AI A2XW | |
| Lenovo Legion Pro 5 16IAX10, RTX 5070 | |
| Lenovo LOQ 17IRX10 | |
| Average of class Gaming (1366 - 2344, n=106, last 2 years) | |
| HP Omen 17z-db100 | |
| Lenovo Legion 5 15AHP G10 | |
| Asus TUF Gaming A18 FA808UP-S8022W | |
| Average AMD Ryzen 7 260, NVIDIA GeForce RTX 5070 Laptop (1712 - 1758, n=3) | |
| CrossMark / Productivity | |
| Asus ROG Strix G18 2025 G814 | |
| MSI Crosshair 18 HX AI A2XW | |
| Lenovo Legion Pro 5 16IAX10, RTX 5070 | |
| Lenovo LOQ 17IRX10 | |
| Average of class Gaming (1386 - 2211, n=106, last 2 years) | |
| HP Omen 17z-db100 | |
| Lenovo Legion 5 15AHP G10 | |
| Average AMD Ryzen 7 260, NVIDIA GeForce RTX 5070 Laptop (1648 - 1725, n=3) | |
| Asus TUF Gaming A18 FA808UP-S8022W | |
| CrossMark / Creativity | |
| Asus ROG Strix G18 2025 G814 | |
| MSI Crosshair 18 HX AI A2XW | |
| Lenovo Legion Pro 5 16IAX10, RTX 5070 | |
| Lenovo LOQ 17IRX10 | |
| Average of class Gaming (1343 - 2729, n=106, last 2 years) | |
| HP Omen 17z-db100 | |
| Asus TUF Gaming A18 FA808UP-S8022W | |
| Lenovo Legion 5 15AHP G10 | |
| Average AMD Ryzen 7 260, NVIDIA GeForce RTX 5070 Laptop (1782 - 1986, n=3) | |
| CrossMark / Responsiveness | |
| MSI Crosshair 18 HX AI A2XW | |
| Asus ROG Strix G18 2025 G814 | |
| Lenovo LOQ 17IRX10 | |
| Lenovo Legion Pro 5 16IAX10, RTX 5070 | |
| Average of class Gaming (1226 - 2330, n=106, last 2 years) | |
| HP Omen 17z-db100 | |
| Lenovo Legion 5 15AHP G10 | |
| Average AMD Ryzen 7 260, NVIDIA GeForce RTX 5070 Laptop (1441 - 1578, n=3) | |
| Asus TUF Gaming A18 FA808UP-S8022W | |
| WebXPRT 3 / Overall | |
| Asus ROG Strix G18 2025 G814 | |
| Lenovo Legion Pro 5 16IAX10, RTX 5070 | |
| MSI Crosshair 18 HX AI A2XW | |
| Average of class Gaming (237 - 532, n=109, last 2 years) | |
| Lenovo LOQ 17IRX10 | |
| Lenovo Legion 5 15AHP G10 | |
| Average AMD Ryzen 7 260, NVIDIA GeForce RTX 5070 Laptop (288 - 297, n=3) | |
| Asus TUF Gaming A 18 Turbo Mode | |
| HP Omen 17z-db100 | |
| Asus TUF Gaming A18 FA808UP-S8022W | |
| WebXPRT 4 / Overall | |
| Lenovo Legion Pro 5 16IAX10, RTX 5070 | |
| MSI Crosshair 18 HX AI A2XW | |
| Lenovo LOQ 17IRX10 | |
| Asus ROG Strix G18 2025 G814 | |
| Average of class Gaming (176.4 - 345, n=107, last 2 years) | |
| Lenovo Legion 5 15AHP G10 | |
| HP Omen 17z-db100 | |
| Asus TUF Gaming A18 FA808UP-S8022W | |
| Asus TUF Gaming A 18 Turbo Mode | |
| Average AMD Ryzen 7 260, NVIDIA GeForce RTX 5070 Laptop (237 - 239, n=3) | |
| Mozilla Kraken 1.1 / Total | |
| Asus TUF Gaming A18 FA808UP-S8022W | |
| Average AMD Ryzen 7 260, NVIDIA GeForce RTX 5070 Laptop (522 - 565, n=3) | |
| Asus TUF Gaming A 18 Turbo Mode | |
| Lenovo Legion 5 15AHP G10 | |
| HP Omen 17z-db100 | |
| Average of class Gaming (397 - 594, n=115, last 2 years) | |
| Lenovo LOQ 17IRX10 | |
| MSI Crosshair 18 HX AI A2XW | |
| Asus ROG Strix G18 2025 G814 | |
| Lenovo Legion Pro 5 16IAX10, RTX 5070 | |
* ... smaller is better
| PCMark 10 Score | 7645 points | |
Help | ||
| AIDA64 / Memory Copy | |
| Lenovo Legion Pro 5 16IAX10, RTX 5070 | |
| MSI Crosshair 18 HX AI A2XW | |
| HP Omen 17z-db100 | |
| Average of class Gaming (21750 - 108104, n=122, last 2 years) | |
| Lenovo Legion 5 15AHP G10 | |
| Asus TUF Gaming A18 FA808UP-S8022W | |
| Asus ROG Strix G18 2025 G814 | |
| Average AMD Ryzen 7 260 (35762 - 69413, n=5) | |
| Lenovo LOQ 17IRX10 | |
| AIDA64 / Memory Read | |
| Lenovo Legion Pro 5 16IAX10, RTX 5070 | |
| MSI Crosshair 18 HX AI A2XW | |
| Average of class Gaming (22956 - 104349, n=122, last 2 years) | |
| Asus ROG Strix G18 2025 G814 | |
| HP Omen 17z-db100 | |
| Asus TUF Gaming A18 FA808UP-S8022W | |
| Lenovo Legion 5 15AHP G10 | |
| Average AMD Ryzen 7 260 (30070 - 61170, n=5) | |
| Lenovo LOQ 17IRX10 | |
| AIDA64 / Memory Write | |
| Lenovo Legion 5 15AHP G10 | |
| Asus TUF Gaming A18 FA808UP-S8022W | |
| Lenovo Legion Pro 5 16IAX10, RTX 5070 | |
| HP Omen 17z-db100 | |
| MSI Crosshair 18 HX AI A2XW | |
| Average of class Gaming (22297 - 133486, n=122, last 2 years) | |
| Asus ROG Strix G18 2025 G814 | |
| Average AMD Ryzen 7 260 (42757 - 87114, n=5) | |
| Lenovo LOQ 17IRX10 | |
| AIDA64 / Memory Latency | |
| MSI Crosshair 18 HX AI A2XW | |
| Average of class Gaming (75.3 - 259, n=122, last 2 years) | |
| Lenovo Legion Pro 5 16IAX10, RTX 5070 | |
| Asus ROG Strix G18 2025 G814 | |
| HP Omen 17z-db100 | |
| Average AMD Ryzen 7 260 (91.5 - 94.1, n=5) | |
| Asus TUF Gaming A18 FA808UP-S8022W | |
| Lenovo Legion 5 15AHP G10 | |
| Lenovo LOQ 17IRX10 | |
* ... smaller is better
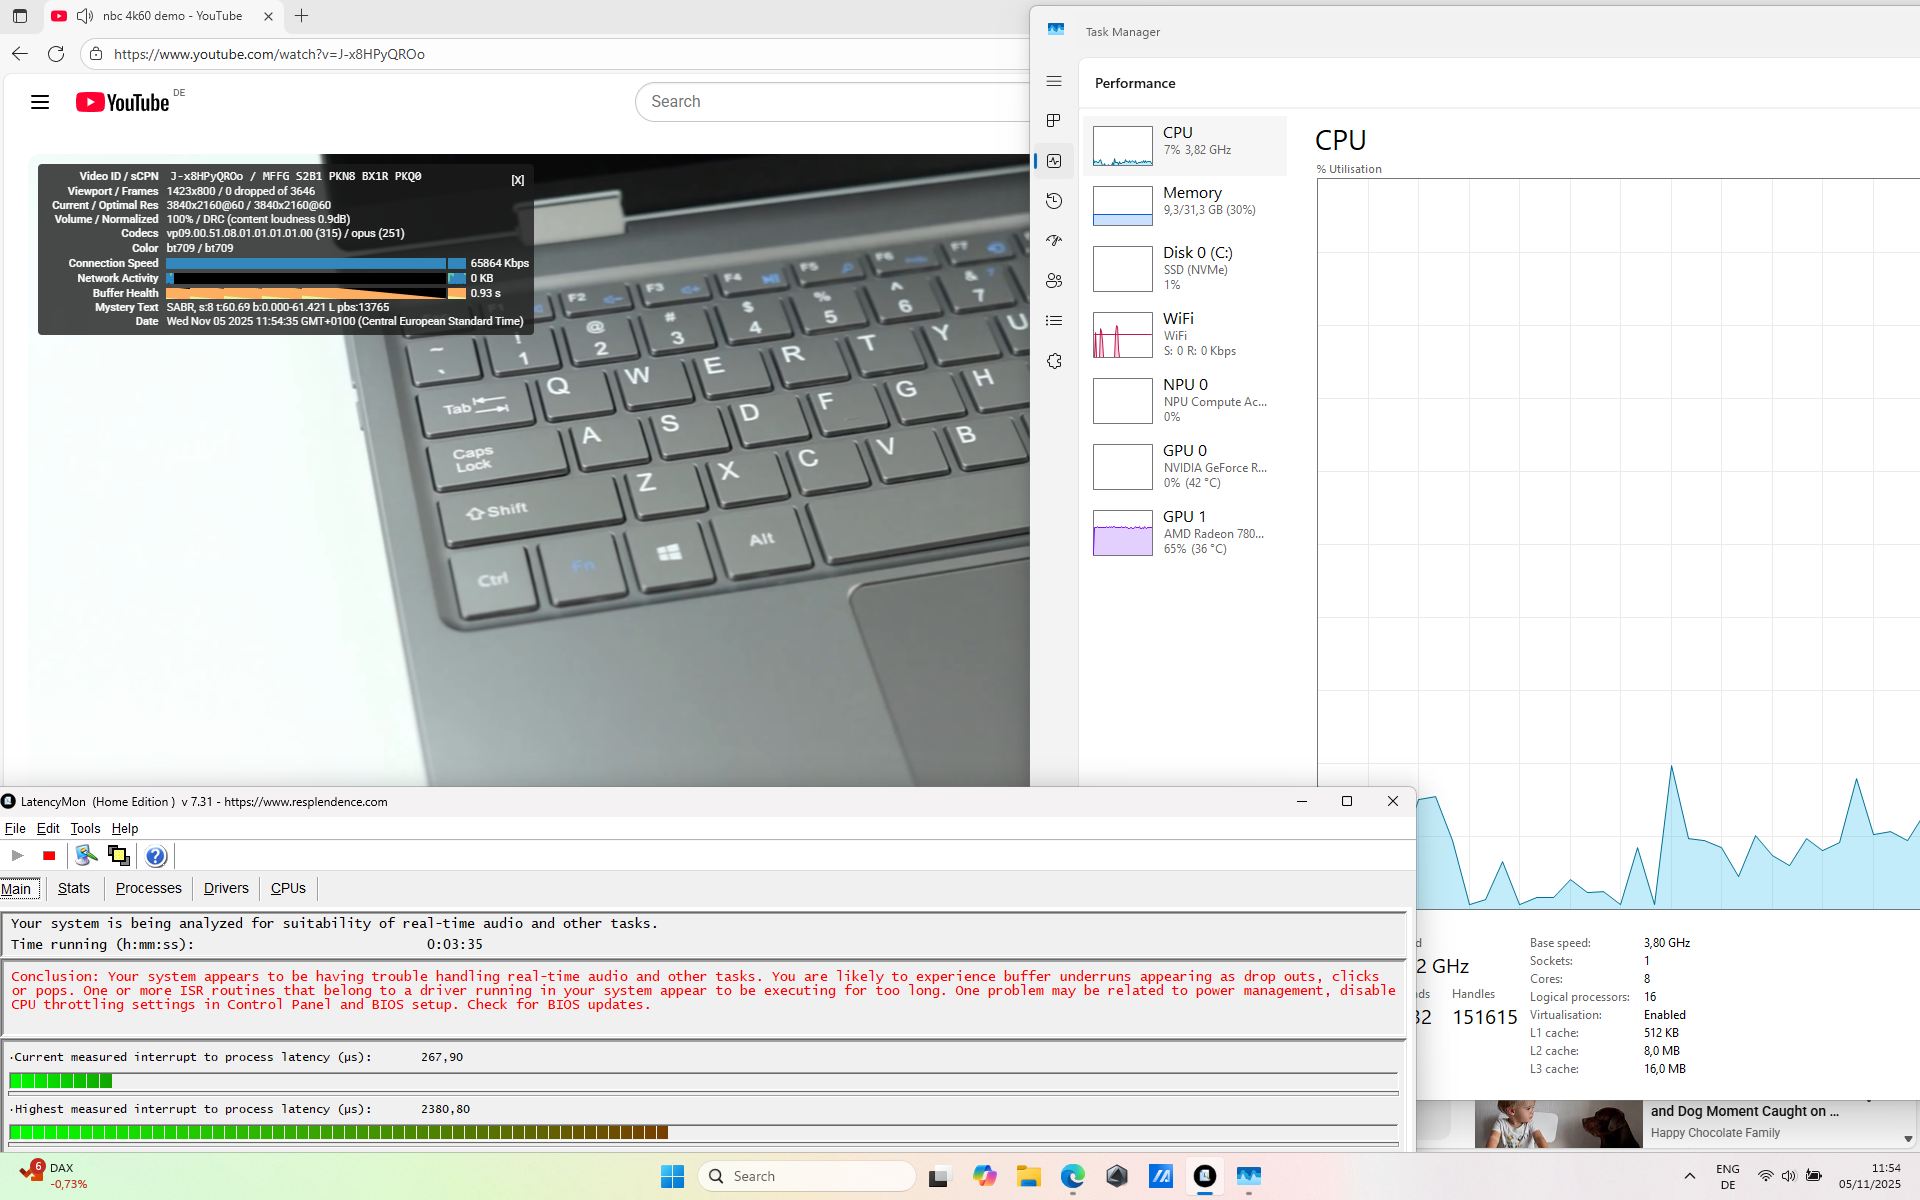
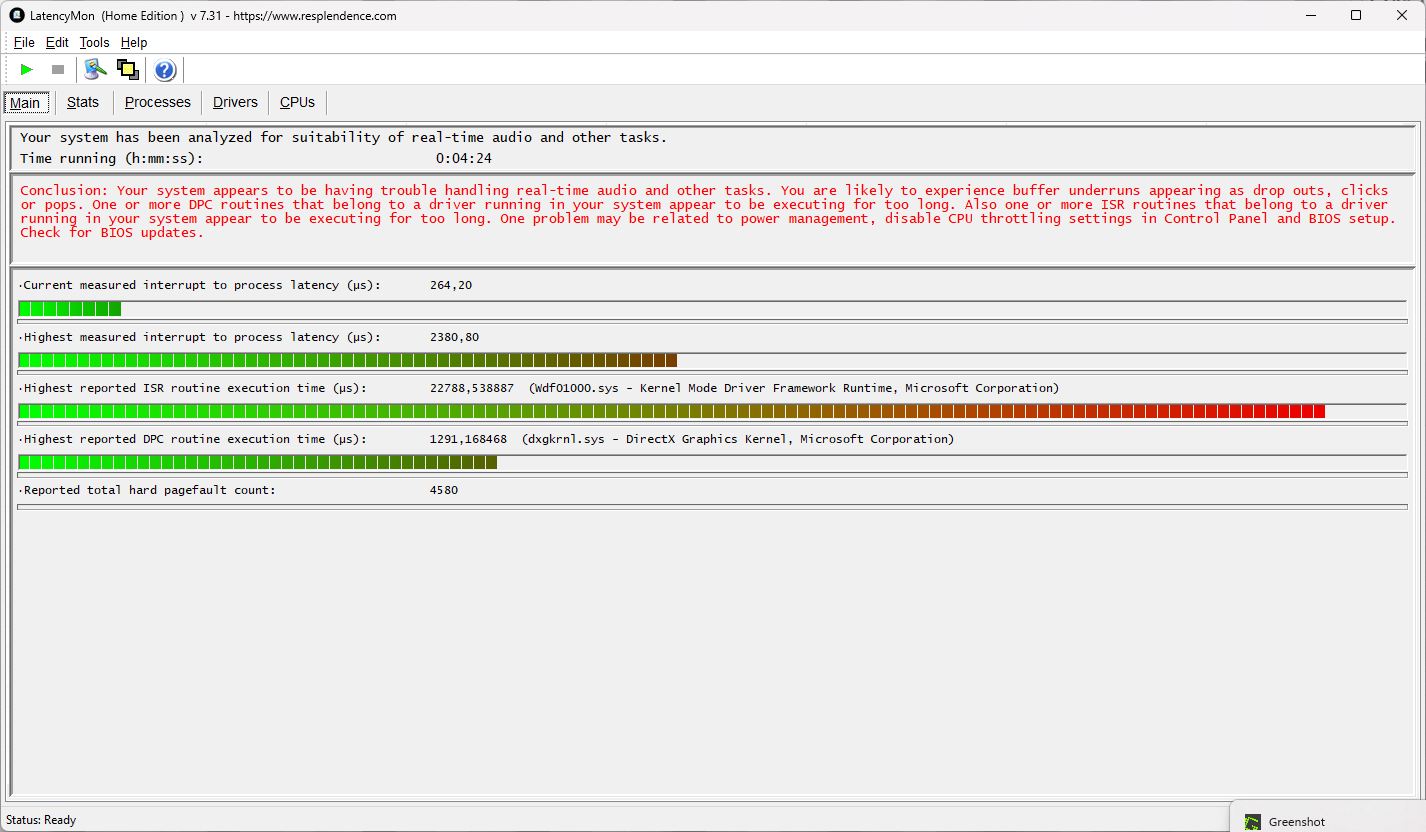
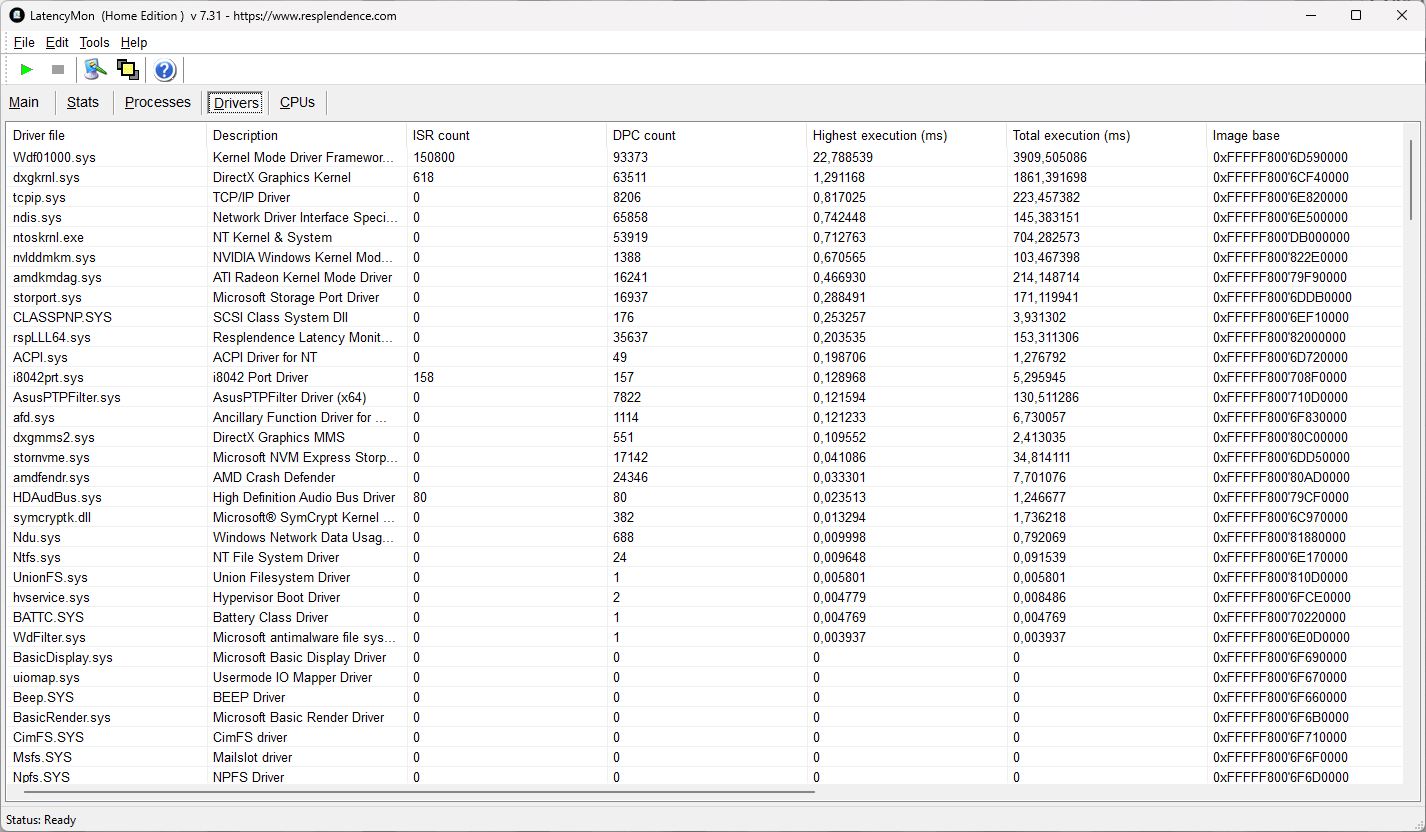
DPC latenzy
Opening the browser, multiple tabs, and YouTube each increased latency. The final numbers are high, but our YouTube test showed 0 dropped frames.
| DPC Latencies / LatencyMon - interrupt to process latency (max), Web, Youtube, Prime95 | |
| HP Omen 17z-db100 | |
| Asus TUF Gaming A18 FA808UP-S8022W | |
| Lenovo Legion 5 15AHP G10 | |
| Lenovo LOQ 17IRX10 | |
| MSI Crosshair 18 HX AI A2XW | |
| Lenovo Legion Pro 5 16IAX10, RTX 5070 | |
| Asus ROG Strix G18 2025 G814 | |
* ... smaller is better
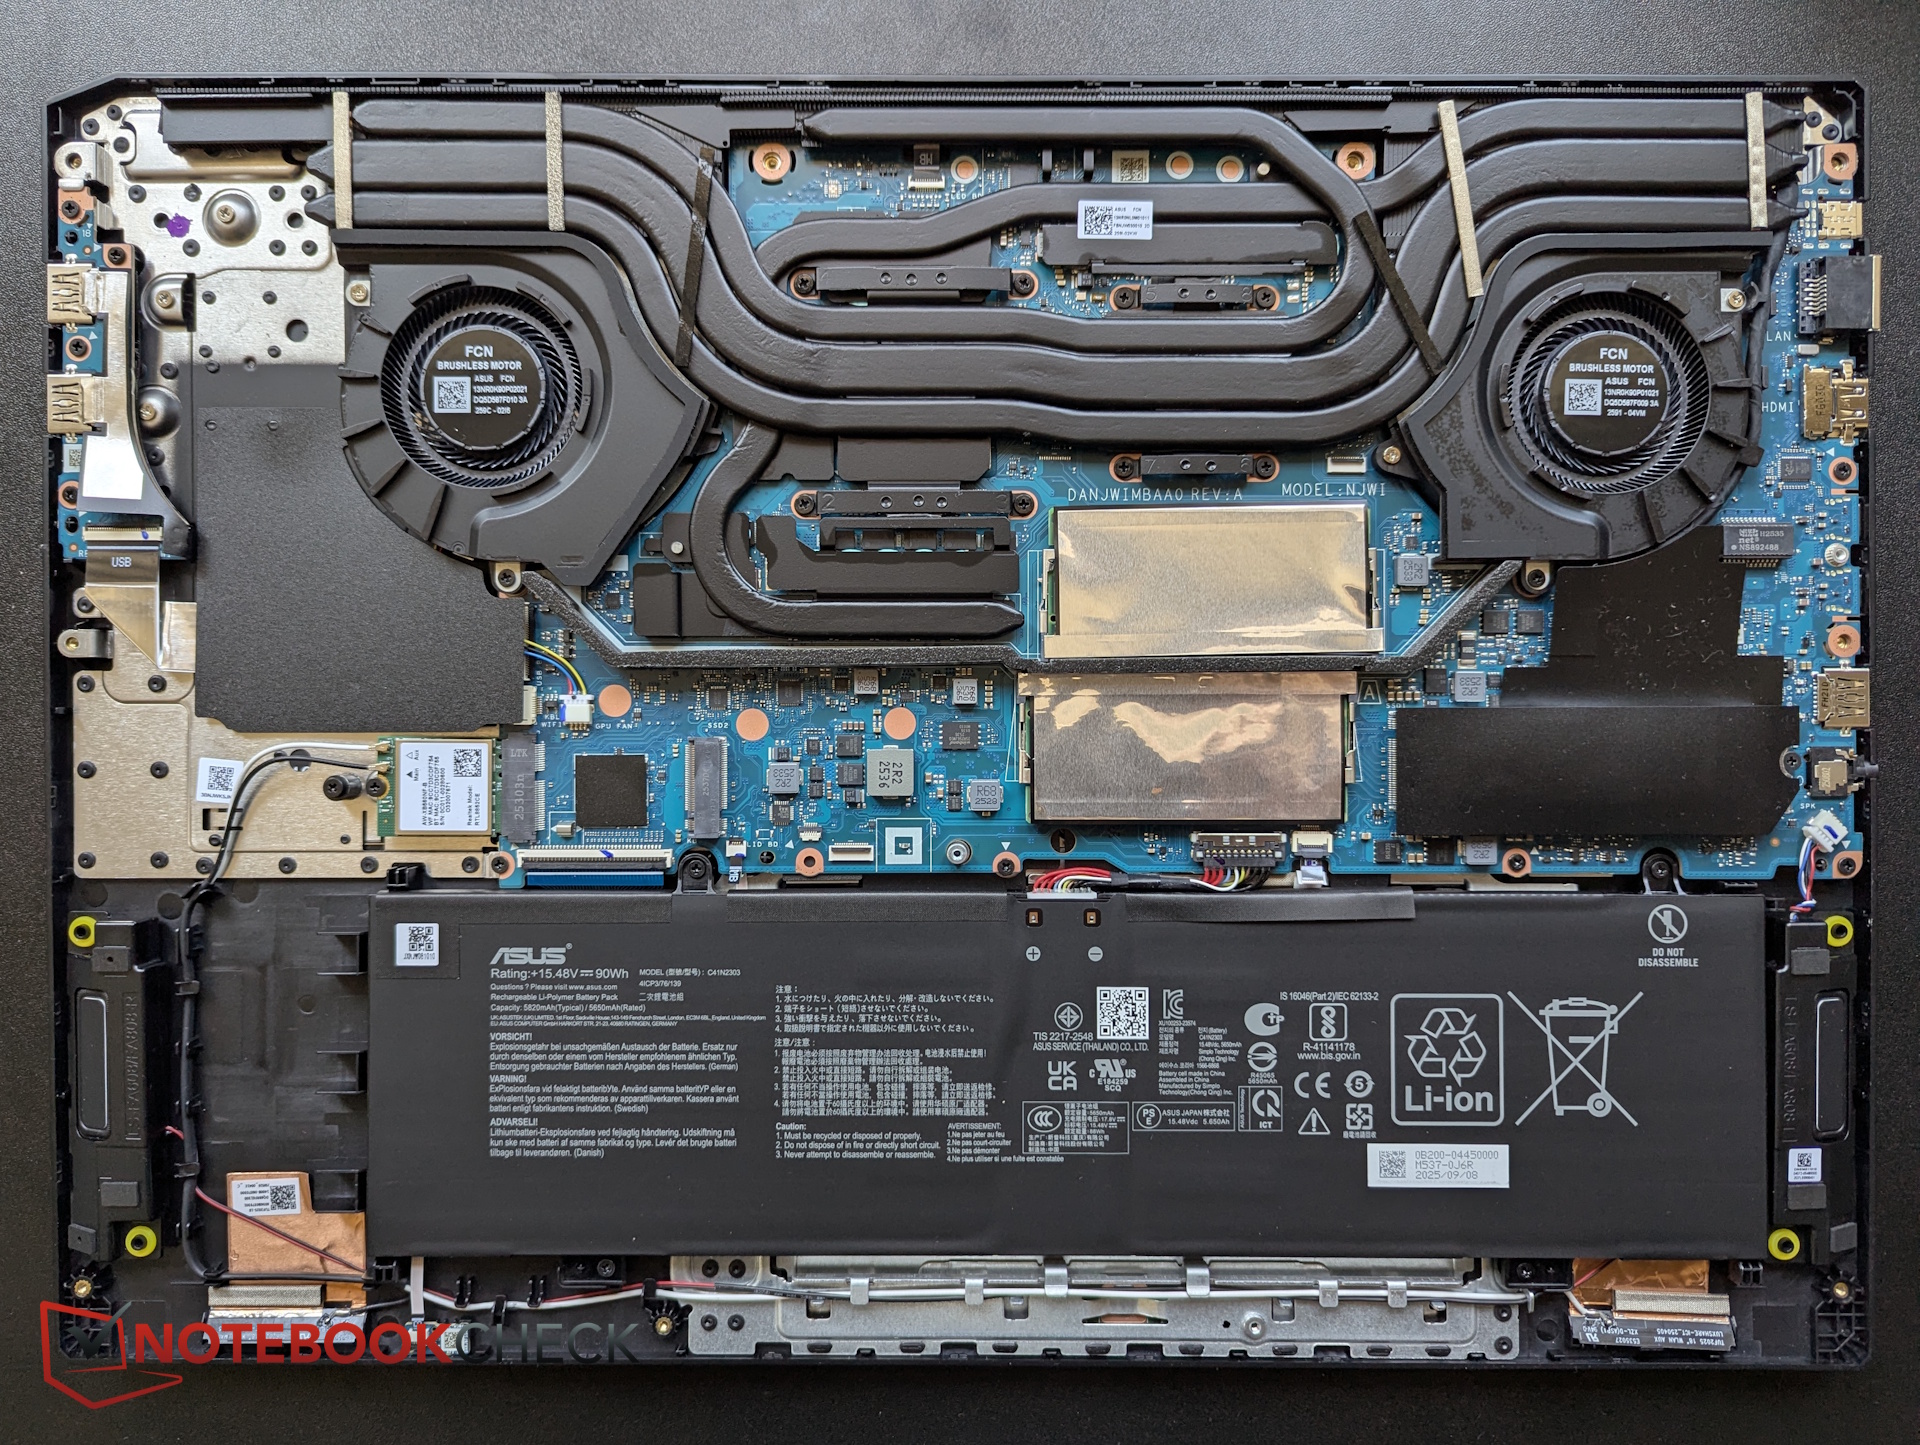
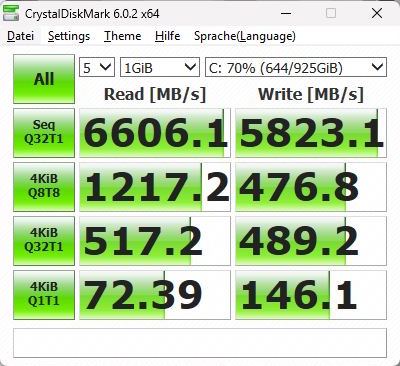
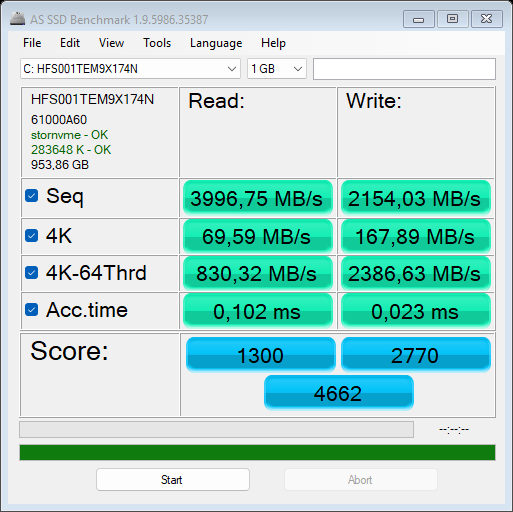
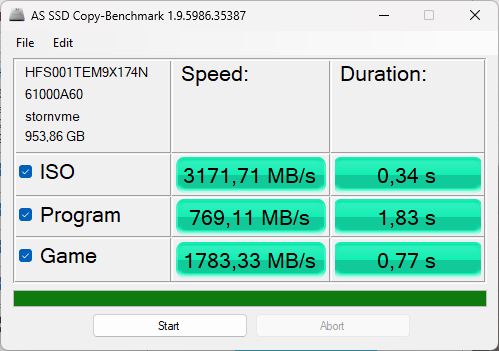
Mass storage
The 1 TB Hynix SSD is reasonably fast initially but quickly begins thermal throttling. Overall, it’s a relatively slow drive.

* ... smaller is better
Read continuous performance: DiskSpd Read Loop, Queue Depth 8
GPU performance
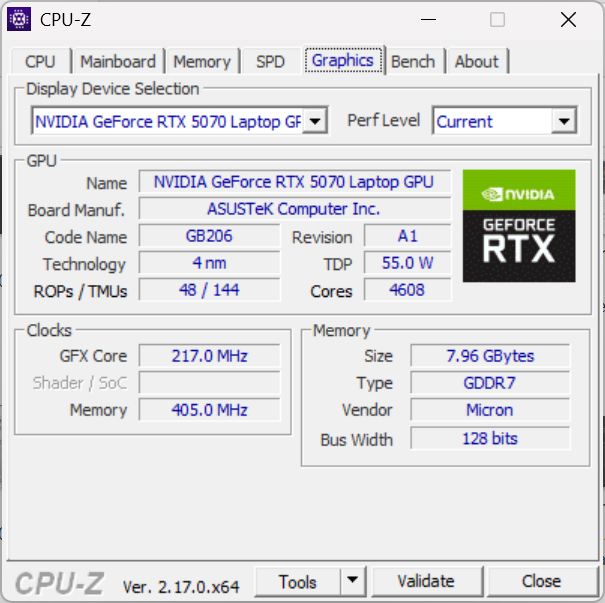
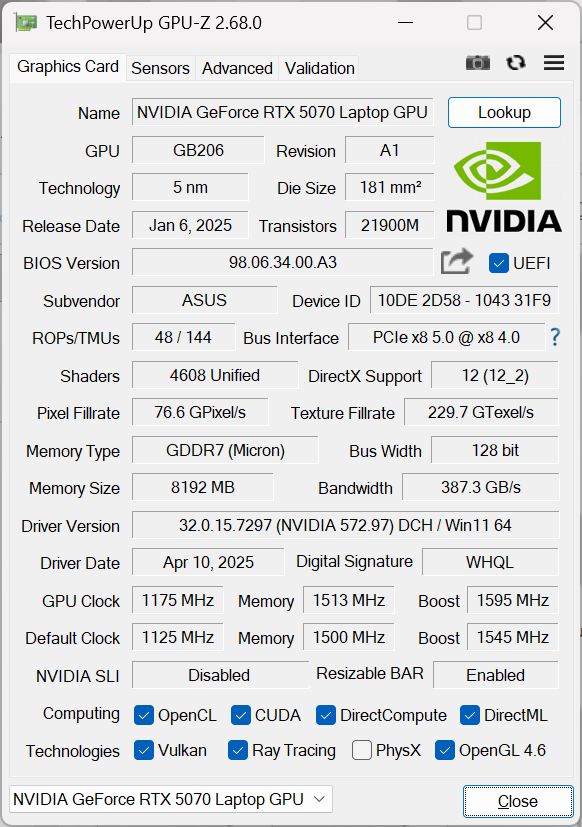
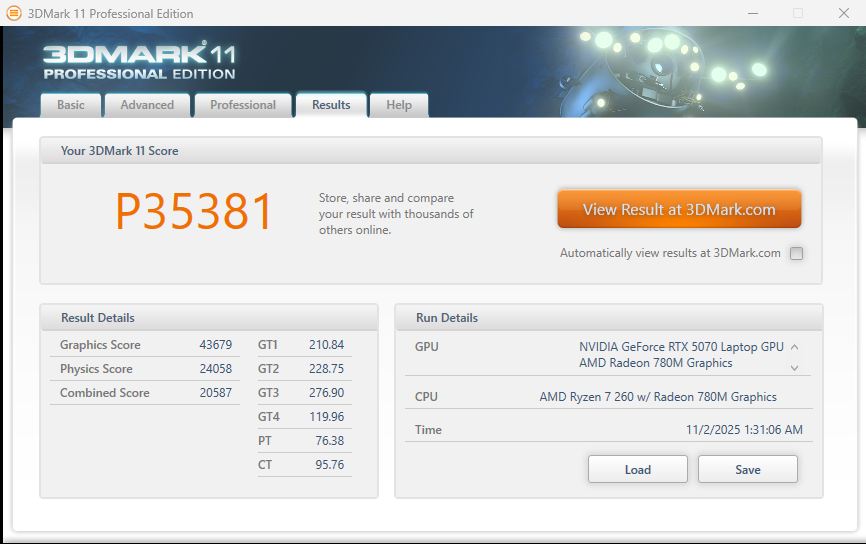
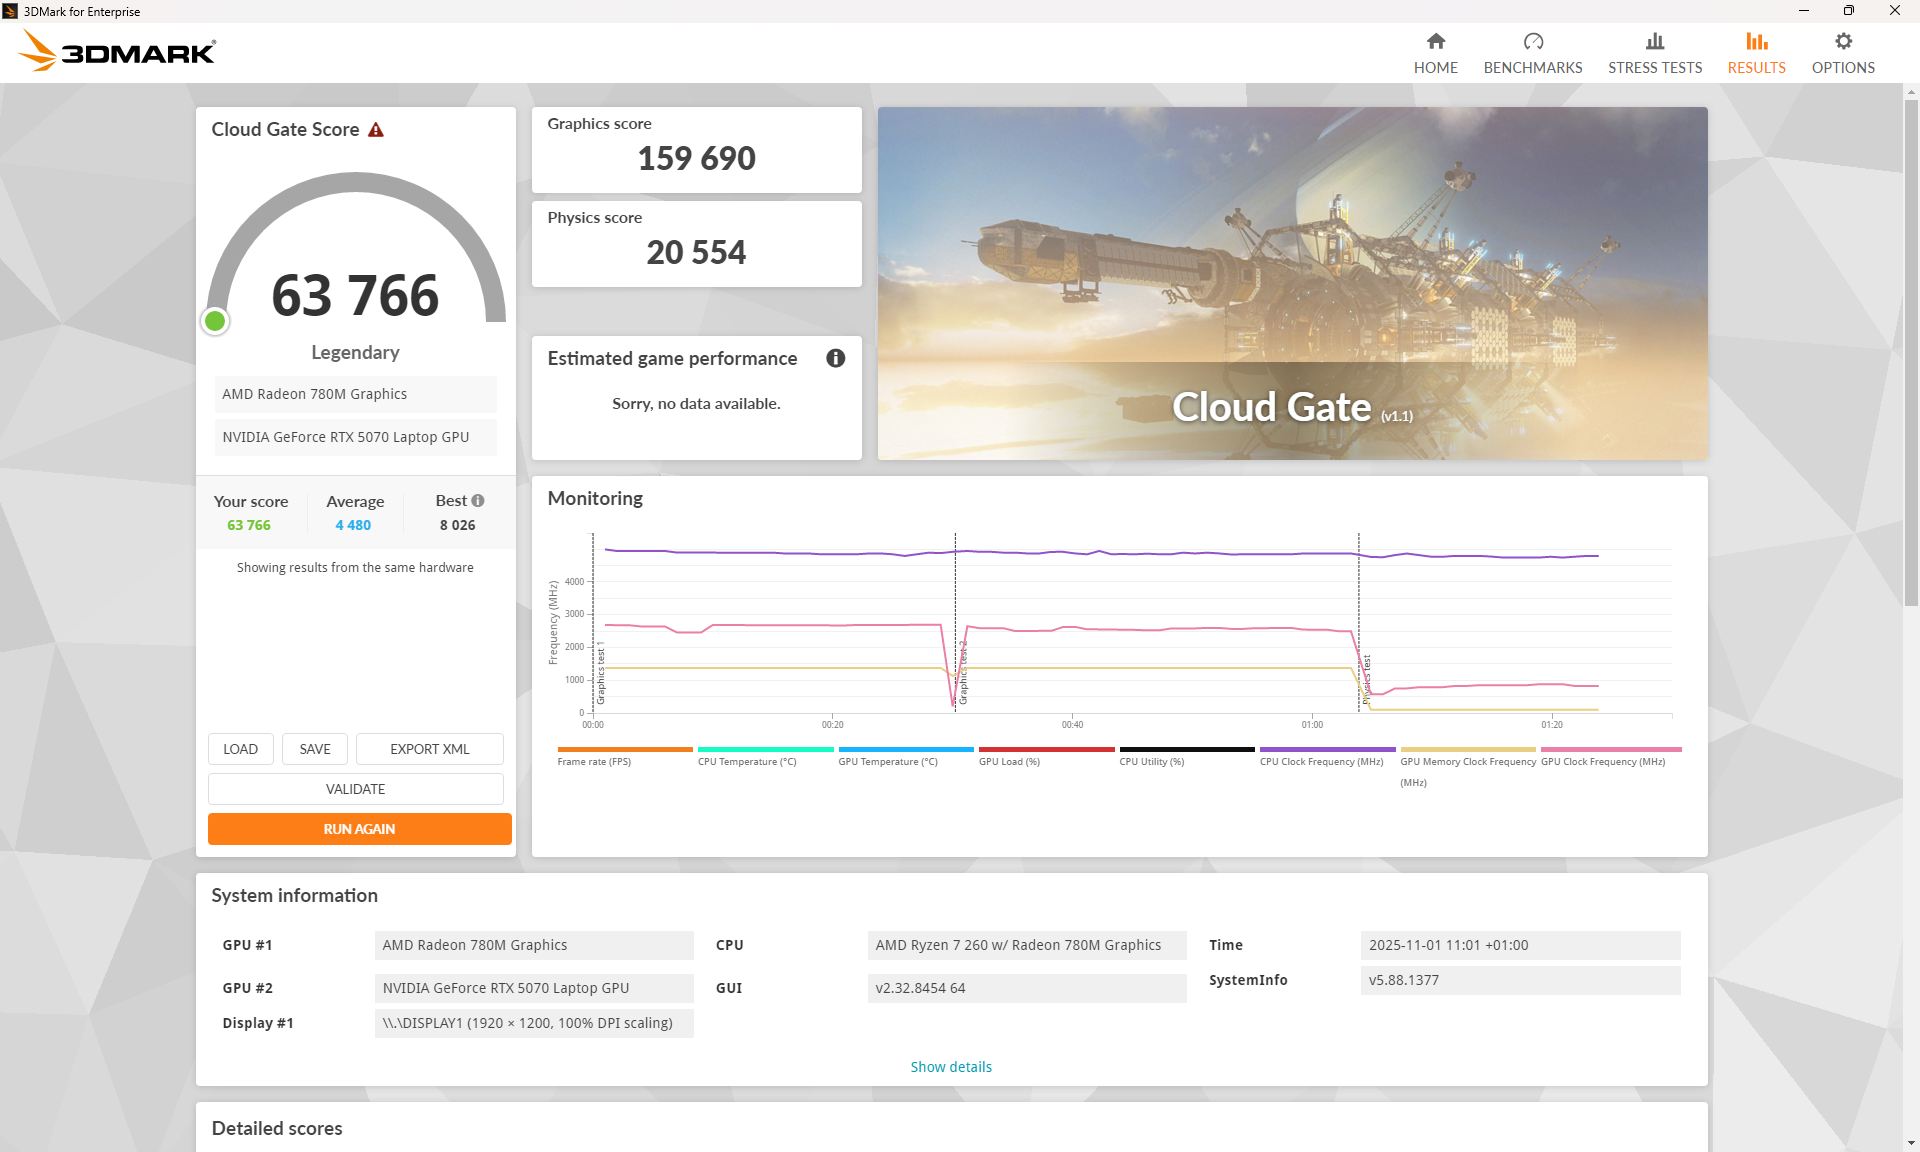
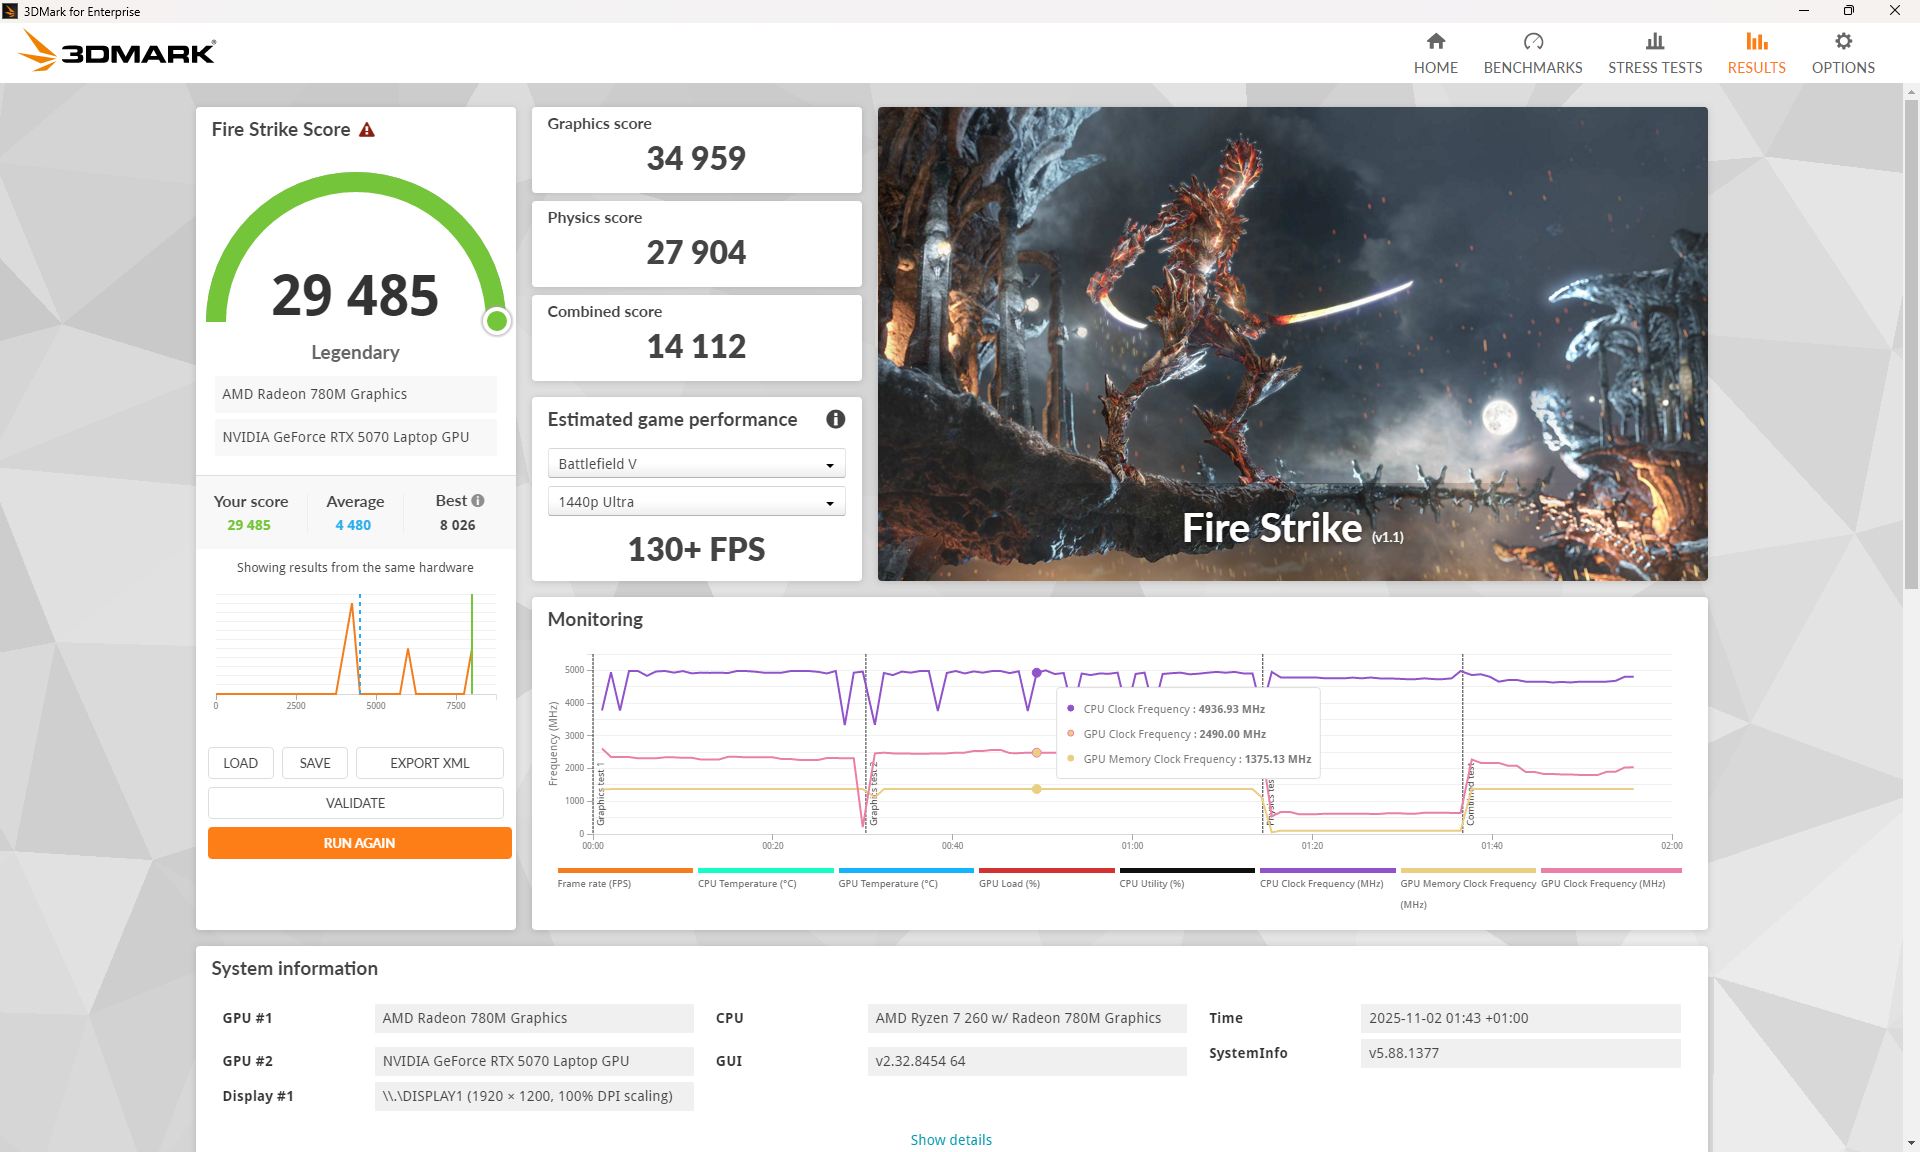
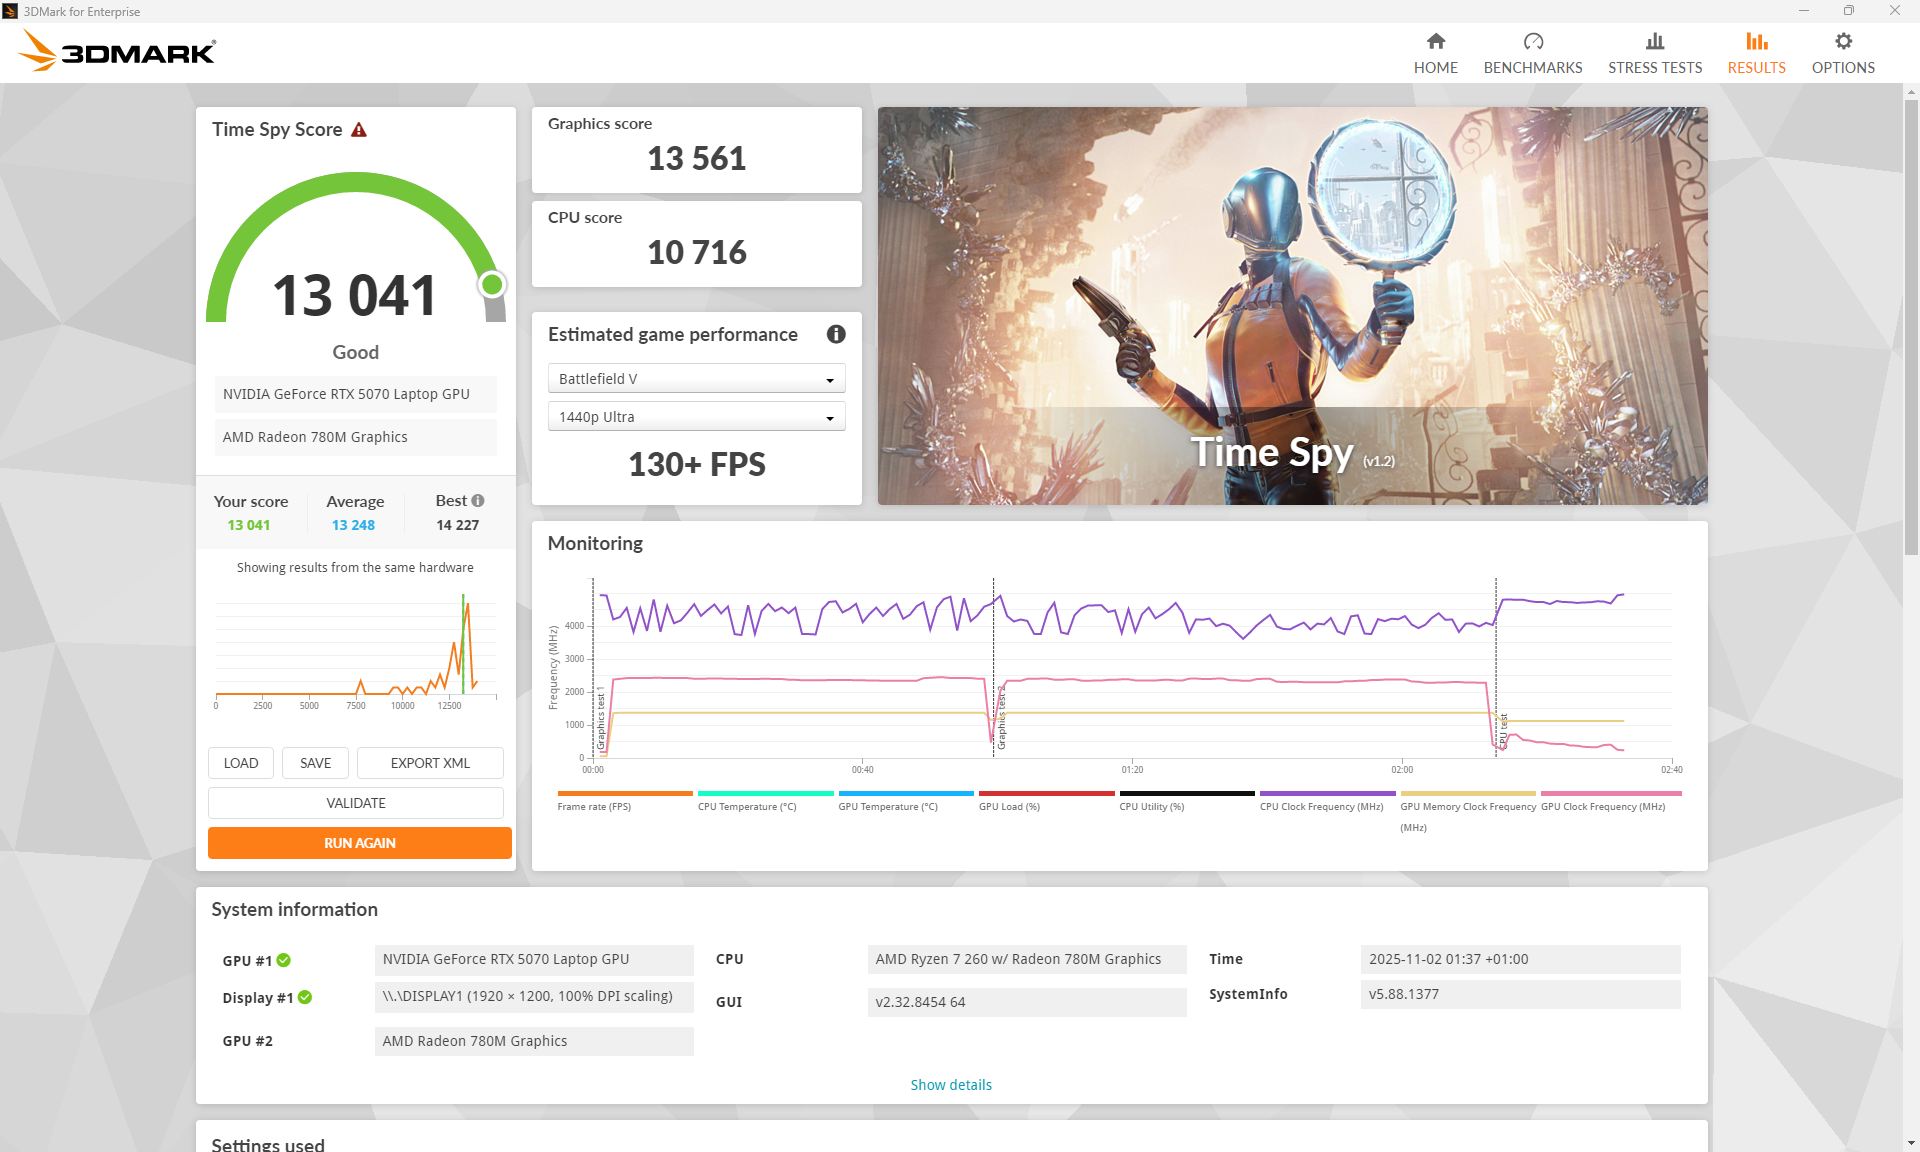
In theory, the RTX 5070 in the A18 can run at 100 W plus a 15 W boost. Still, 3DMark scores end up merely average. Turbo mode improves scores by around 8%.
In games, performance is stable, but in Performance mode the A18 falls behind other RTX 5070 laptops. Turbo mode boosts frame rates by about 12–16%, bringing it in line with the competition. CPU-heavy games continue to show a noticeable gap.
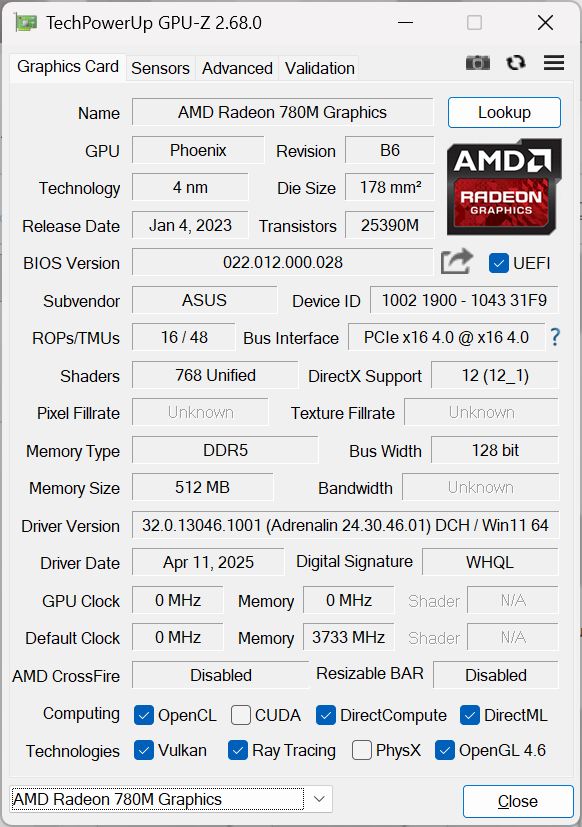
At this relatively low native resolution, though, it’s not a major issue. One annoyance: the palm often touches the touchpad when resting on WASD, making it essential to disable it. You also need to ensure games switch to the dGPU — sometimes the integrated 780M stays active, so the MUX switch is helpful.
On battery, 3D performance drops by about 30% in Performance mode.
| 3DMark Performance rating - Percent | |
| HP Omen 17z-db100 | |
| Asus TUF Gaming A 18 Turbo Mode | |
| Average of class Gaming | |
| Asus ROG Strix G18 2025 G814 -1! | |
| Lenovo LOQ 17IRX10 | |
| Asus TUF Gaming A18 FA808UP-S8022W | |
| Average NVIDIA GeForce RTX 5070 Laptop | |
| MSI Crosshair 18 HX AI A2XW | |
| MSI Katana 17 HX B14WGK | |
| 3DMark 11 - 1280x720 Performance GPU | |
| Average of class Gaming (21841 - 80022, n=120, last 2 years) | |
| Asus TUF Gaming A 18 Turbo Mode | |
| Lenovo LOQ 17IRX10 | |
| HP Omen 17z-db100 | |
| Average NVIDIA GeForce RTX 5070 Laptop (36721 - 49568, n=27) | |
| MSI Crosshair 18 HX AI A2XW | |
| MSI Katana 17 HX B14WGK | |
| Asus TUF Gaming A18 FA808UP-S8022W | |
| Asus ROG Strix G18 2025 G814 | |
| 3DMark | |
| 1280x720 Cloud Gate Standard Graphics | |
| HP Omen 17z-db100 | |
| Asus TUF Gaming A 18 Turbo Mode | |
| Asus TUF Gaming A18 FA808UP-S8022W | |
| Average NVIDIA GeForce RTX 5070 Laptop (119532 - 188061, n=14) | |
| MSI Katana 17 HX B14WGK | |
| Lenovo LOQ 17IRX10 | |
| Average of class Gaming (86886 - 223650, n=63, last 2 years) | |
| MSI Crosshair 18 HX AI A2XW | |
| 1920x1080 Fire Strike Graphics | |
| HP Omen 17z-db100 | |
| Asus TUF Gaming A 18 Turbo Mode | |
| Average of class Gaming (12242 - 62849, n=132, last 2 years) | |
| MSI Crosshair 18 HX AI A2XW | |
| Lenovo LOQ 17IRX10 | |
| Asus ROG Strix G18 2025 G814 | |
| MSI Katana 17 HX B14WGK | |
| Average NVIDIA GeForce RTX 5070 Laptop (28759 - 38680, n=29) | |
| Asus TUF Gaming A18 FA808UP-S8022W | |
| 2560x1440 Time Spy Graphics | |
| Average of class Gaming (5012 - 25984, n=130, last 2 years) | |
| Asus ROG Strix G18 2025 G814 | |
| Asus TUF Gaming A 18 Turbo Mode | |
| HP Omen 17z-db100 | |
| Lenovo LOQ 17IRX10 | |
| MSI Crosshair 18 HX AI A2XW | |
| Asus TUF Gaming A18 FA808UP-S8022W | |
| Average NVIDIA GeForce RTX 5070 Laptop (10851 - 14771, n=29) | |
| MSI Katana 17 HX B14WGK | |
| 3DMark 11 Performance | 35381 points | |
| 3DMark Cloud Gate Standard Score | 63766 points | |
| 3DMark Fire Strike Score | 29485 points | |
| 3DMark Time Spy Score | 13041 points | |
Help | ||
* ... smaller is better
| Performance rating - Percent | |
| Asus ROG Strix G18 2025 G814 | |
| Lenovo Legion Pro 5 16IAX10, RTX 5070 | |
| MSI Crosshair 18 HX AI A2XW | |
| Average of class Gaming | |
| Lenovo LOQ 17IRX10 | |
| Asus TUF Gaming A 18 Turbo Mode | |
| HP Omen 17z-db100 | |
| Lenovo Legion 5 15AHP G10 | |
| Asus TUF Gaming A18 FA808UP-S8022W | |
| Cyberpunk 2077 - 1920x1080 Ultra Preset (FSR off) | |
| Lenovo Legion Pro 5 16IAX10, RTX 5070 | |
| Asus ROG Strix G18 2025 G814 | |
| Asus TUF Gaming A 18 Turbo Mode | |
| HP Omen 17z-db100 | |
| Average of class Gaming (17.7 - 169.9, n=131, last 2 years) | |
| MSI Crosshair 18 HX AI A2XW | |
| Lenovo LOQ 17IRX10 | |
| Asus TUF Gaming A18 FA808UP-S8022W | |
| Lenovo Legion 5 15AHP G10 | |
| Baldur's Gate 3 - 1920x1080 Ultra Preset AA:T | |
| HP Omen 17z-db100 | |
| Asus TUF Gaming A 18 Turbo Mode | |
| Average of class Gaming (59.4 - 246, n=112, last 2 years) | |
| Lenovo Legion Pro 5 16IAX10, RTX 5070 | |
| MSI Crosshair 18 HX AI A2XW | |
| Asus TUF Gaming A18 FA808UP-S8022W | |
| Asus ROG Strix G18 2025 G814 | |
| Lenovo Legion 5 15AHP G10 | |
| Lenovo LOQ 17IRX10 | |
| GTA V - 1920x1080 Highest AA:4xMSAA + FX AF:16x | |
| Asus ROG Strix G18 2025 G814 | |
| Lenovo Legion Pro 5 16IAX10, RTX 5070 | |
| MSI Crosshair 18 HX AI A2XW | |
| Lenovo LOQ 17IRX10 | |
| Average of class Gaming (48.3 - 186.9, n=112, last 2 years) | |
| Asus TUF Gaming A 18 Turbo Mode | |
| Lenovo Legion 5 15AHP G10 | |
| HP Omen 17z-db100 | |
| Asus TUF Gaming A18 FA808UP-S8022W | |
| Final Fantasy XV Benchmark - 1920x1080 High Quality | |
| MSI Crosshair 18 HX AI A2XW | |
| Lenovo Legion Pro 5 16IAX10, RTX 5070 | |
| HP Omen 17z-db100 | |
| Asus ROG Strix G18 2025 G814 | |
| Average of class Gaming (41 - 215, n=116, last 2 years) | |
| Asus TUF Gaming A 18 Turbo Mode | |
| Lenovo LOQ 17IRX10 | |
| Lenovo Legion 5 15AHP G10 | |
| Asus TUF Gaming A18 FA808UP-S8022W | |
| Strange Brigade - 1920x1080 ultra AA:ultra AF:16 | |
| Average of class Gaming (76.3 - 456, n=106, last 2 years) | |
| Asus TUF Gaming A 18 Turbo Mode | |
| Asus ROG Strix G18 2025 G814 | |
| HP Omen 17z-db100 | |
| Lenovo LOQ 17IRX10 | |
| Lenovo Legion Pro 5 16IAX10, RTX 5070 | |
| MSI Crosshair 18 HX AI A2XW | |
| Lenovo Legion 5 15AHP G10 | |
| Asus TUF Gaming A18 FA808UP-S8022W | |
| Dota 2 Reborn - 1920x1080 ultra (3/3) best looking | |
| Asus ROG Strix G18 2025 G814 | |
| Lenovo LOQ 17IRX10 | |
| MSI Crosshair 18 HX AI A2XW | |
| Lenovo Legion Pro 5 16IAX10, RTX 5070 | |
| Average of class Gaming (84.8 - 248, n=124, last 2 years) | |
| HP Omen 17z-db100 | |
| Lenovo Legion 5 15AHP G10 | |
| Asus TUF Gaming A 18 Turbo Mode | |
| Asus TUF Gaming A18 FA808UP-S8022W | |
| X-Plane 11.11 - 1920x1080 high (fps_test=3) | |
| Asus ROG Strix G18 2025 G814 | |
| Lenovo LOQ 17IRX10 | |
| Lenovo Legion Pro 5 16IAX10, RTX 5070 | |
| Average of class Gaming (52.1 - 144.5, n=127, last 2 years) | |
| MSI Crosshair 18 HX AI A2XW | |
| Lenovo Legion 5 15AHP G10 | |
| HP Omen 17z-db100 | |
| Asus TUF Gaming A18 FA808UP-S8022W | |
| Asus TUF Gaming A 18 Turbo Mode | |
Cyberpunk 2077 ultra FPS chart
| low | med. | high | ultra | QHD DLSS | QHD | 4K DLSS | 4K | |
|---|---|---|---|---|---|---|---|---|
| GTA V (2015) | 175.7 | 159 | 107.8 | 107 | ||||
| Dota 2 Reborn (2015) | 150.9 | 147.5 | 131.2 | 124.9 | ||||
| Final Fantasy XV Benchmark (2018) | 204 | 156.2 | 123.3 | 93.7 | 53 | |||
| X-Plane 11.11 (2018) | 110 | 97.2 | 80.9 | |||||
| Strange Brigade (2018) | 324 | 274 | 260 | 234 | 229.6 | 89.8 | ||
| Baldur's Gate 3 (2023) | 172 | 146.6 | 126.7 | 125.7 | 97.7 | 61 | 58.1 | 43.2 |
| Cyberpunk 2077 (2023) | 140.8 | 120.3 | 104.1 | 93.6 | 68.5 | 60.8 | 26.9 | |
| Indiana Jones and the Great Circle (2024) | 125.9 | 39.1 | ||||||
| Assassin's Creed Shadows (2025) | 100 | 93 | 77 | 53 | 40 | 35 | ||
| F1 25 (2025) | 163.8 | 160.3 | 151.5 | 27.2 | 30.9 | 14.3 | 8.3 | 3.07 |
| Anno 117: Pax Romana (2025) | 107.6 | 85.5 | 66.2 | 34.3 | 38.2 | 25.3 | 23.2 |
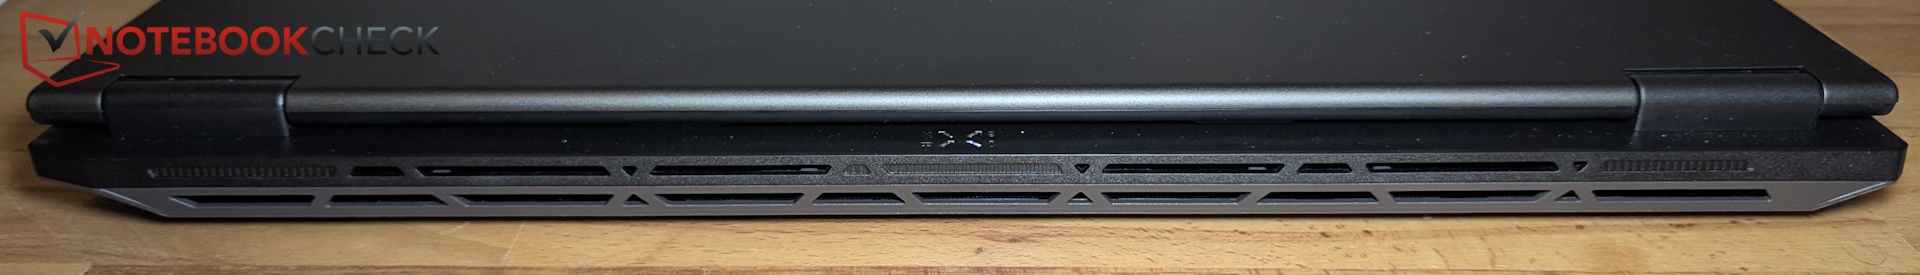
Emissions & Energy – Quiet & efficient
Noise
At idle, the fans remain completely off and settle down quickly after load.
Overall, the A18 remains very quiet in Performance mode, even under stress. If you’re willing to give up some performance, your ears will thank you. Turbo mode, however, ramps noise from about 45 dB to nearly 55 dB, which is a big jump.
Noise level
| Idle |
| 23 / 23 / 23 dB(A) |
| Load |
| 32.58 / dB(A) |
 | ||
30 dB silent 40 dB(A) audible 50 dB(A) loud |
||
min: | ||
| Asus TUF Gaming A18 FA808UP-S8022W R7 260, GeForce RTX 5070 Laptop | Asus ROG Strix G18 2025 G814 R9 9955HX, GeForce RTX 5070 Laptop | MSI Crosshair 18 HX AI A2XW Ultra 9 275HX, GeForce RTX 5070 Laptop | HP Omen 17z-db100 Ryzen AI 7 350, GeForce RTX 5070 Laptop | Lenovo LOQ 17IRX10 i7-14700HX, GeForce RTX 5070 Laptop | MSI Katana 17 HX B14WGK i7-14650HX, GeForce RTX 5070 Laptop | |
|---|---|---|---|---|---|---|
| Noise | -15% | -12% | -6% | -27% | -36% | |
| off / environment * (dB) | 23 | 24.6 -7% | 23.1 -0% | 23.4 -2% | 24 -4% | 25 -9% |
| Idle Minimum * (dB) | 23 | 24.6 -7% | 27.3 -19% | 23.7 -3% | 25 -9% | 31 -35% |
| Idle Average * (dB) | 23 | 30 -30% | 27.3 -19% | 23.7 -3% | 26 -13% | 32 -39% |
| Idle Maximum * (dB) | 23 | 30 -30% | 27.6 -20% | 26.4 -15% | 32 -39% | 34 -48% |
| Load Average * (dB) | 32.58 | 34.4 -6% | 30.1 8% | 33.7 -3% | 56 -72% | 50 -53% |
| Cyberpunk 2077 ultra * (dB) | 45.13 | 49.7 -10% | 54.4 -21% | 49.8 -10% | 55 -22% | 58 -29% |
| Load Maximum * (dB) | 49.7 | 58.6 | 52.5 | 56 | 59 |
* ... smaller is better
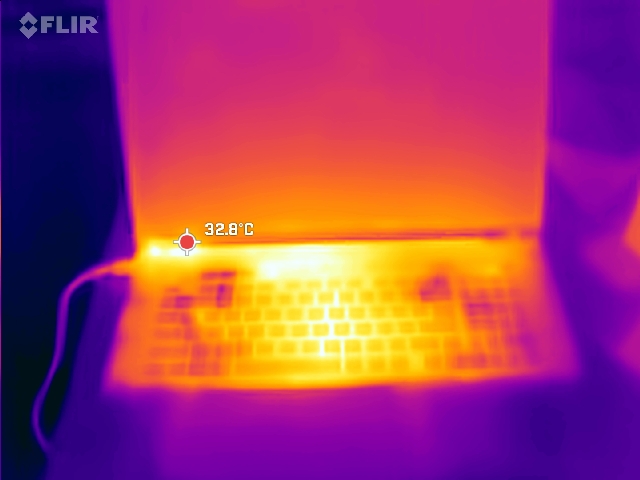
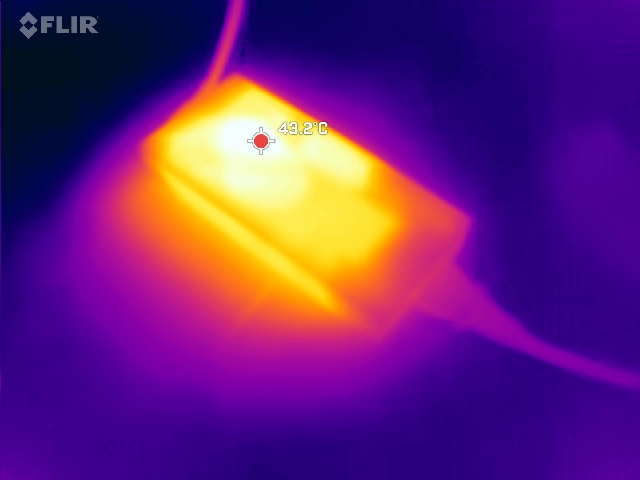
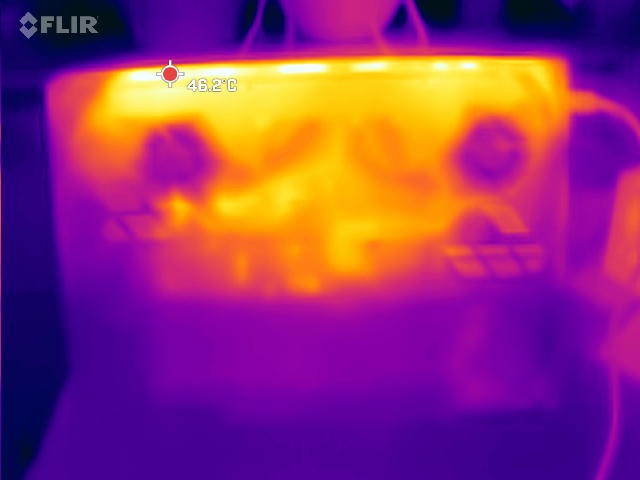
Temperature
We measured hot spots around 40°C under load, especially on the underside and near the central hinge area.
(+) The maximum temperature on the upper side is 39 °C / 102 F, compared to the average of 40.4 °C / 105 F, ranging from 21.2 to 68.8 °C for the class Gaming.
(±) The bottom heats up to a maximum of 41 °C / 106 F, compared to the average of 43.3 °C / 110 F
(+) In idle usage, the average temperature for the upper side is 24.2 °C / 76 F, compared to the device average of 33.9 °C / 93 F.
(+) 3: The average temperature for the upper side is 30.7 °C / 87 F, compared to the average of 33.9 °C / 93 F for the class Gaming.
(+) The palmrests and touchpad are cooler than skin temperature with a maximum of 23 °C / 73.4 F and are therefore cool to the touch.
(+) The average temperature of the palmrest area of similar devices was 28.8 °C / 83.8 F (+5.8 °C / 10.4 F).
| Asus TUF Gaming A18 FA808UP-S8022W R7 260, GeForce RTX 5070 Laptop | Asus ROG Strix G18 2025 G814 R9 9955HX, GeForce RTX 5070 Laptop | MSI Crosshair 18 HX AI A2XW Ultra 9 275HX, GeForce RTX 5070 Laptop | HP Omen 17z-db100 Ryzen AI 7 350, GeForce RTX 5070 Laptop | Lenovo LOQ 17IRX10 i7-14700HX, GeForce RTX 5070 Laptop | MSI Katana 17 HX B14WGK i7-14650HX, GeForce RTX 5070 Laptop | |
|---|---|---|---|---|---|---|
| Heat | -2% | 1% | 4% | -15% | -26% | |
| Maximum Upper Side * (°C) | 39 | 42.8 -10% | 40.2 -3% | 39.8 -2% | 45 -15% | 52 -33% |
| Maximum Bottom * (°C) | 41 | 43.1 -5% | 44 -7% | 47 -15% | 49 -20% | 56 -37% |
| Idle Upper Side * (°C) | 27 | 26.8 1% | 25.6 5% | 23.2 14% | 32 -19% | 33 -22% |
| Idle Bottom * (°C) | 29 | 26.6 8% | 26.8 8% | 23.2 20% | 31 -7% | 32 -10% |
* ... smaller is better
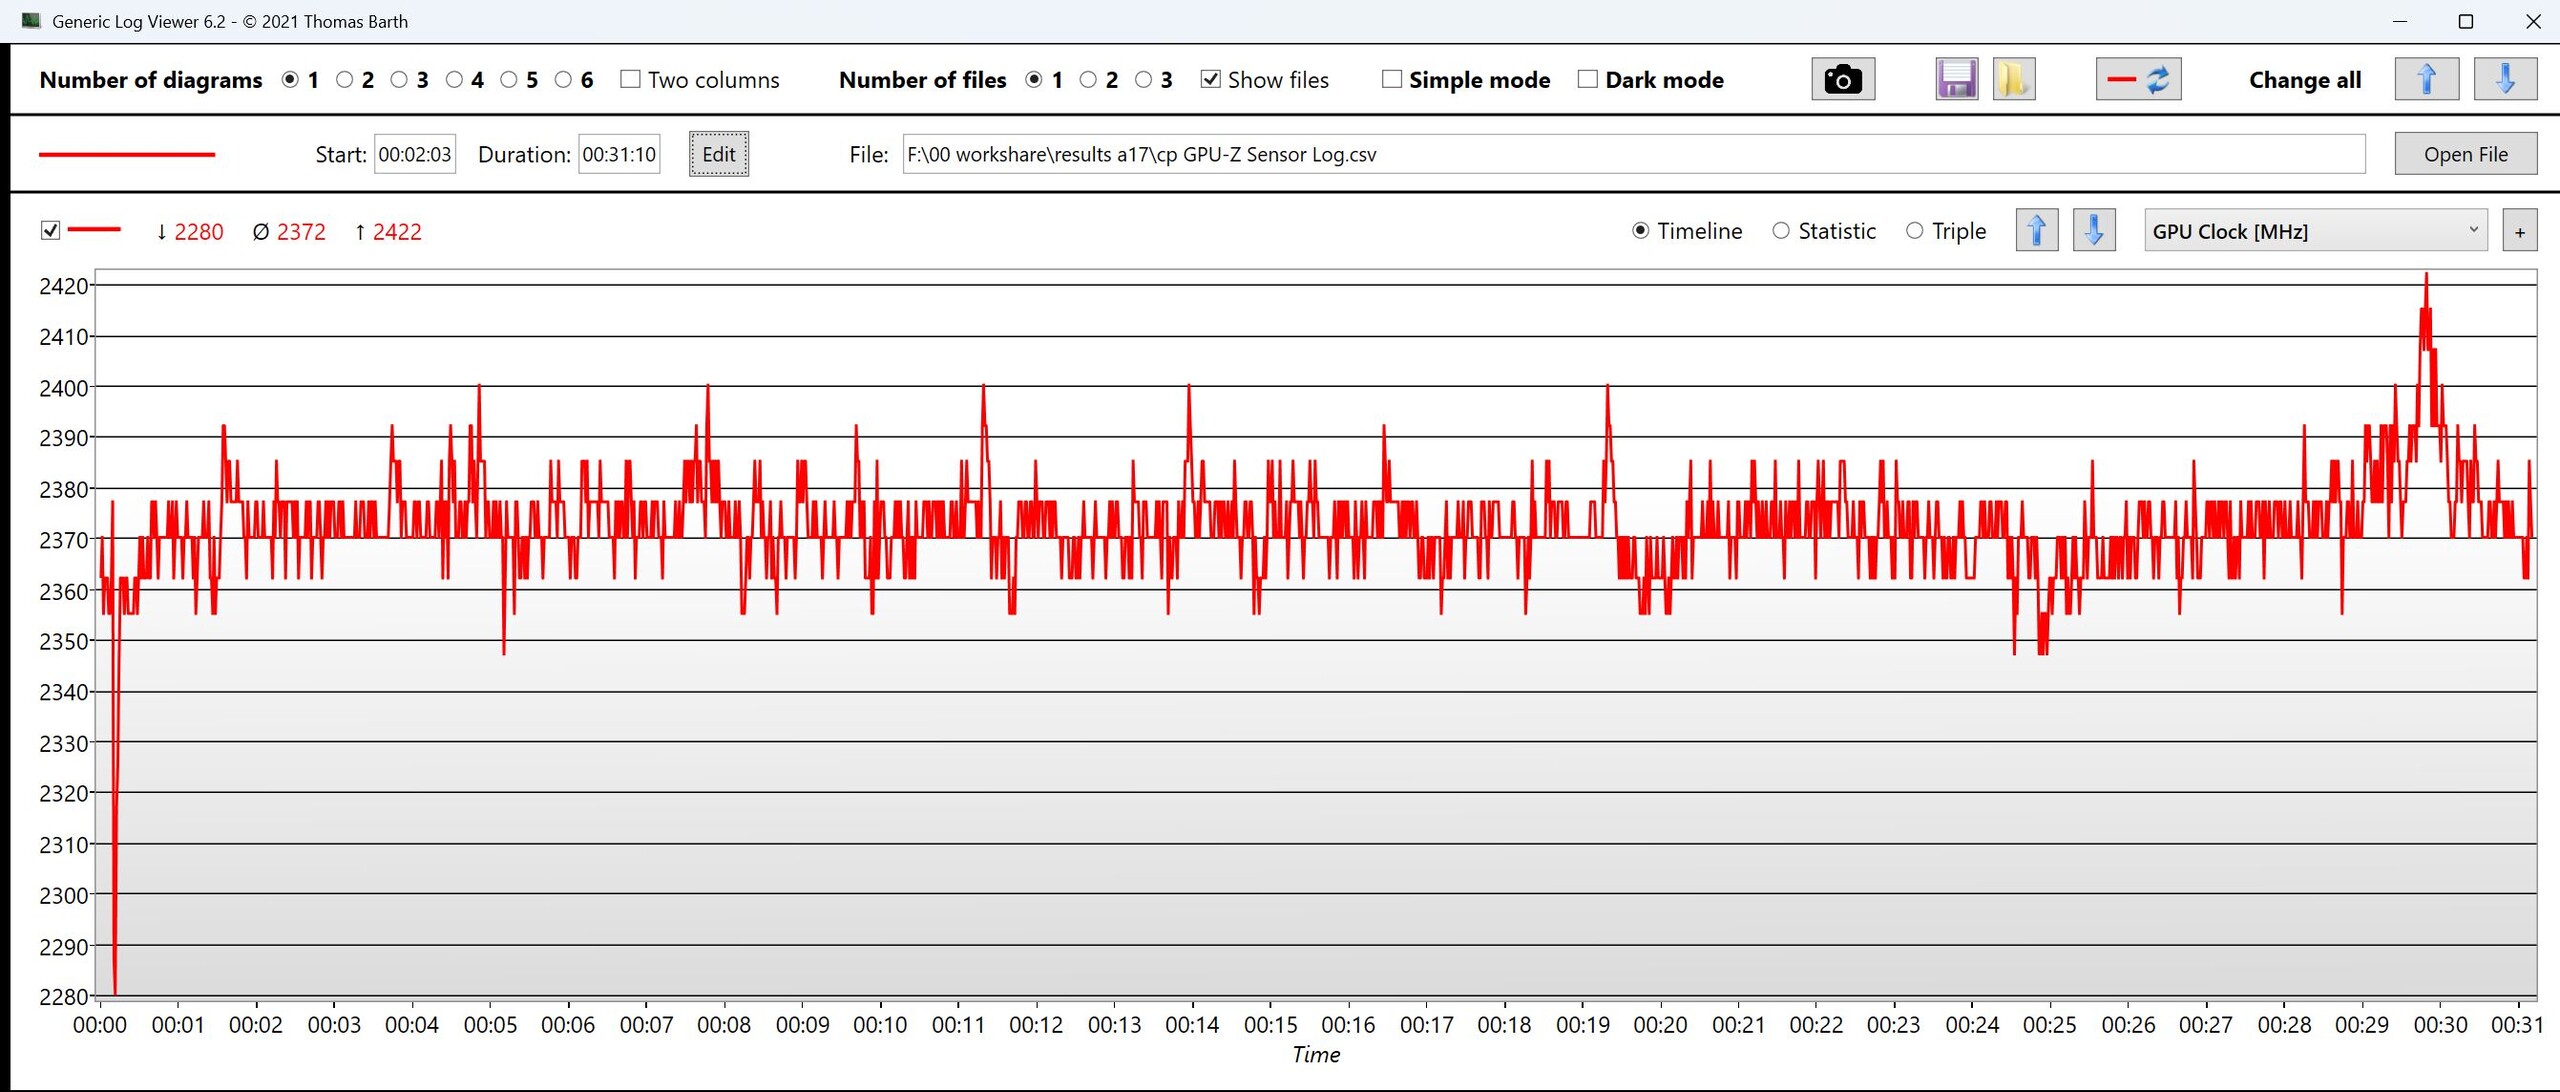
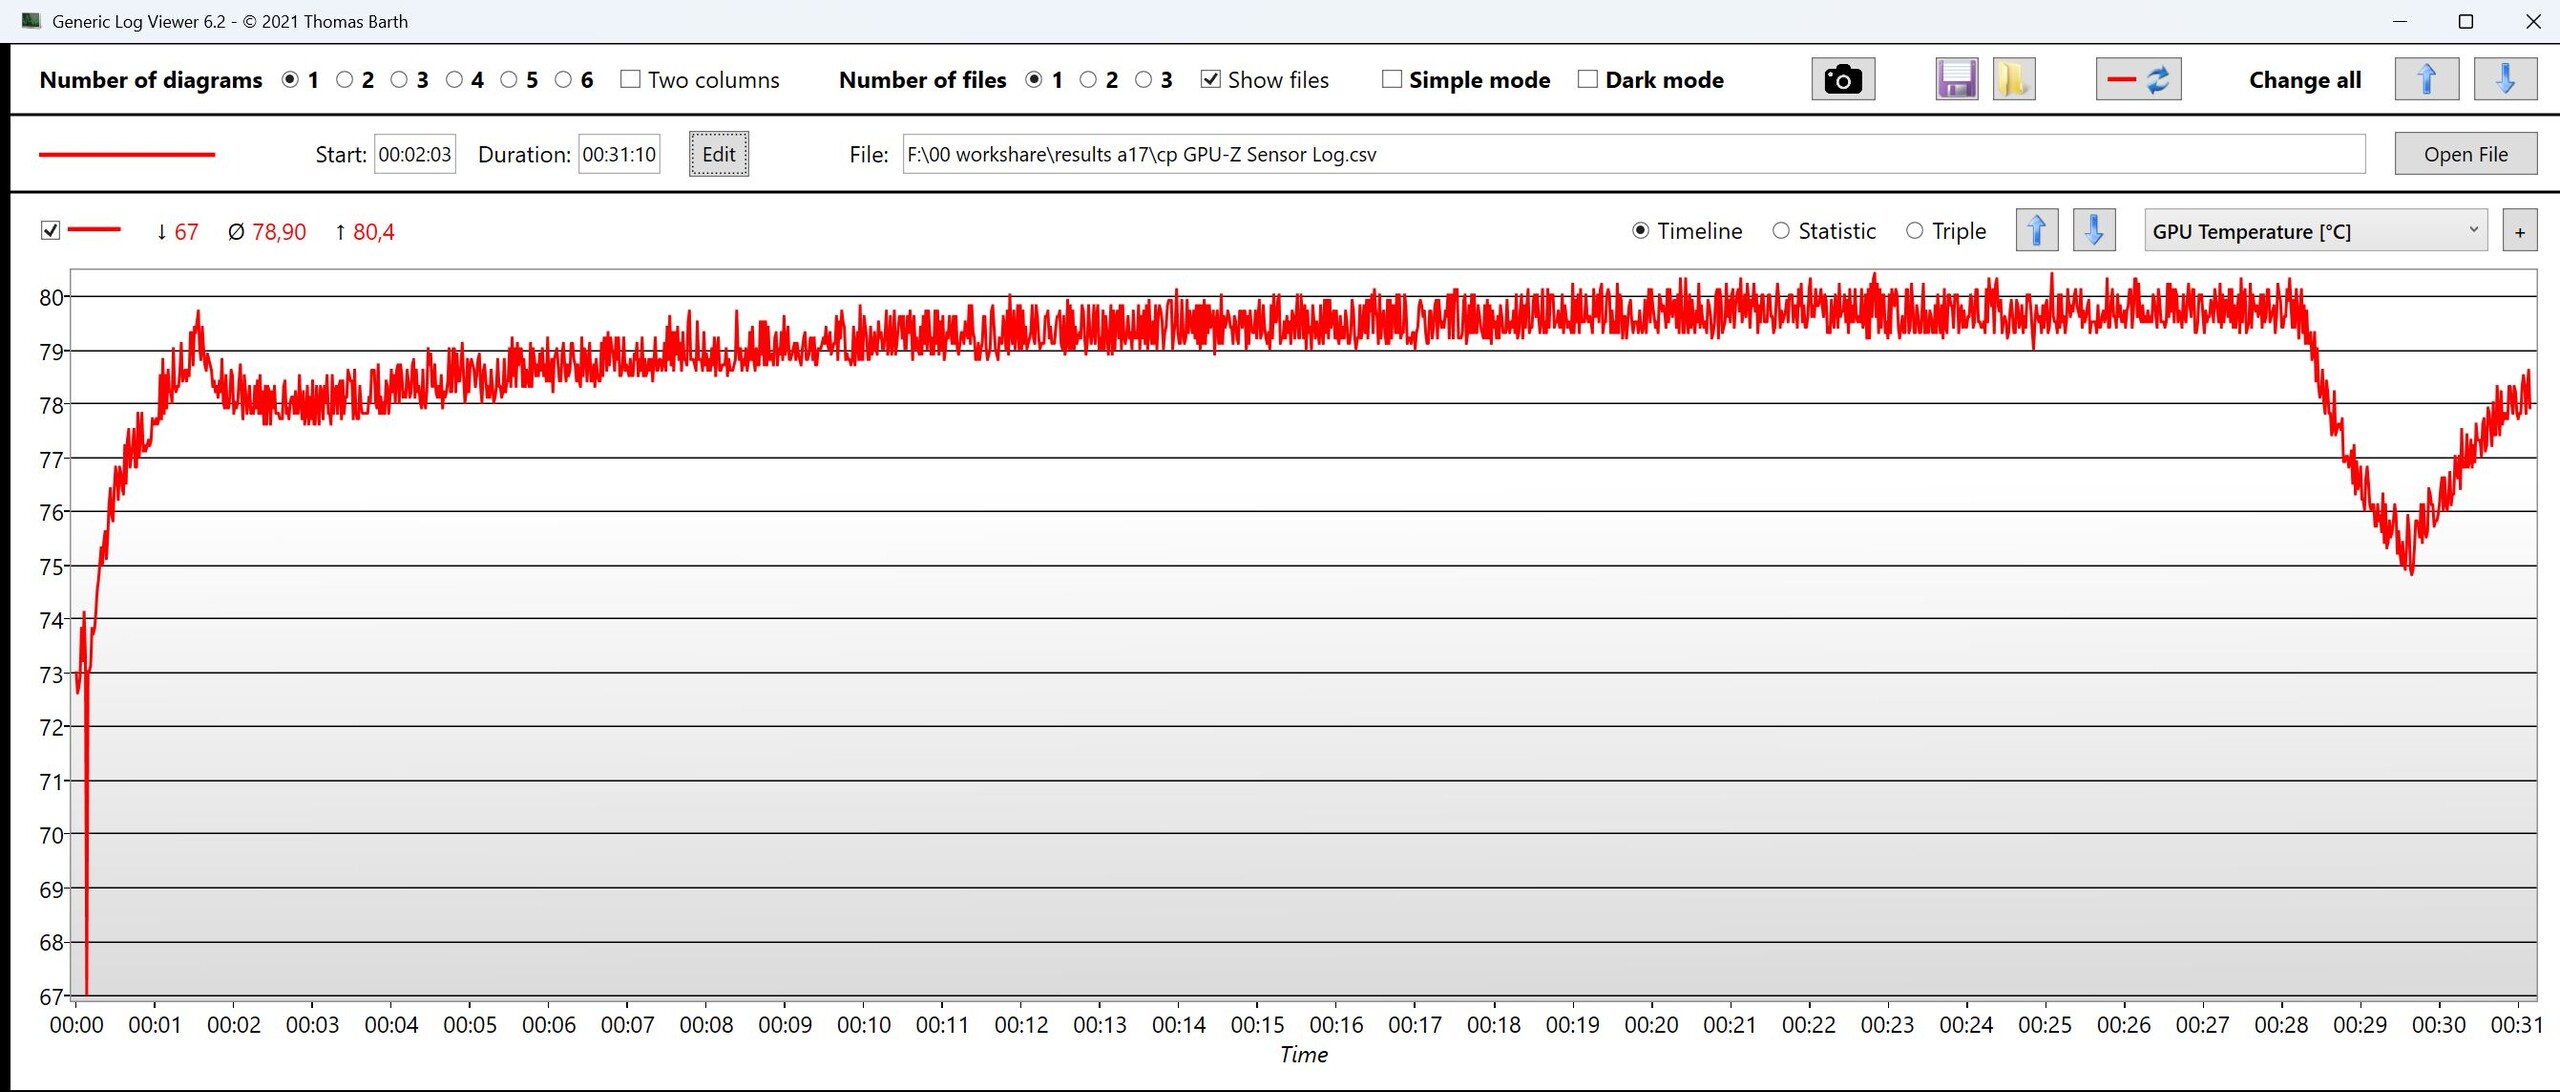
| CPU Clock (GHz) | GPU Clock (MHz) | Average CPU Temperature (°C) | Average GPU Temperature (°C) | |
| Prime95 + FurMark Stress | 3.3 | 1,700 | 68 | 77 |
| Cyberpunk 2077 Stress | 2.3 | 2,372 | 69 | 79 |
Speakers
For an 18-inch laptop, the speakers are fairly quiet, with balanced highs but not much else.
Asus TUF Gaming A18 FA808UP-S8022W audio analysis
(±) | speaker loudness is average but good (74.53 dB)
Bass 100 - 315 Hz
(±) | reduced bass - on average 12.9% lower than median
(±) | linearity of bass is average (7.5% delta to prev. frequency)
Mids 400 - 2000 Hz
(±) | higher mids - on average 5.1% higher than median
(+) | mids are linear (5.9% delta to prev. frequency)
Highs 2 - 16 kHz
(+) | balanced highs - only 4.1% away from median
(+) | highs are linear (6.9% delta to prev. frequency)
Overall 100 - 16.000 Hz
(±) | linearity of overall sound is average (16.9% difference to median)
Compared to same class
» 44% of all tested devices in this class were better, 11% similar, 45% worse
» The best had a delta of 6%, average was 18%, worst was 132%
Compared to all devices tested
» 30% of all tested devices were better, 8% similar, 63% worse
» The best had a delta of 4%, average was 24%, worst was 134%
Apple MacBook Pro 16 2021 M1 Pro audio analysis
(+) | speakers can play relatively loud (84.7 dB)
Bass 100 - 315 Hz
(+) | good bass - only 3.8% away from median
(+) | bass is linear (5.2% delta to prev. frequency)
Mids 400 - 2000 Hz
(+) | balanced mids - only 1.3% away from median
(+) | mids are linear (2.1% delta to prev. frequency)
Highs 2 - 16 kHz
(+) | balanced highs - only 1.9% away from median
(+) | highs are linear (2.7% delta to prev. frequency)
Overall 100 - 16.000 Hz
(+) | overall sound is linear (4.6% difference to median)
Compared to same class
» 0% of all tested devices in this class were better, 0% similar, 100% worse
» The best had a delta of 5%, average was 17%, worst was 45%
Compared to all devices tested
» 0% of all tested devices were better, 0% similar, 100% worse
» The best had a delta of 4%, average was 24%, worst was 134%
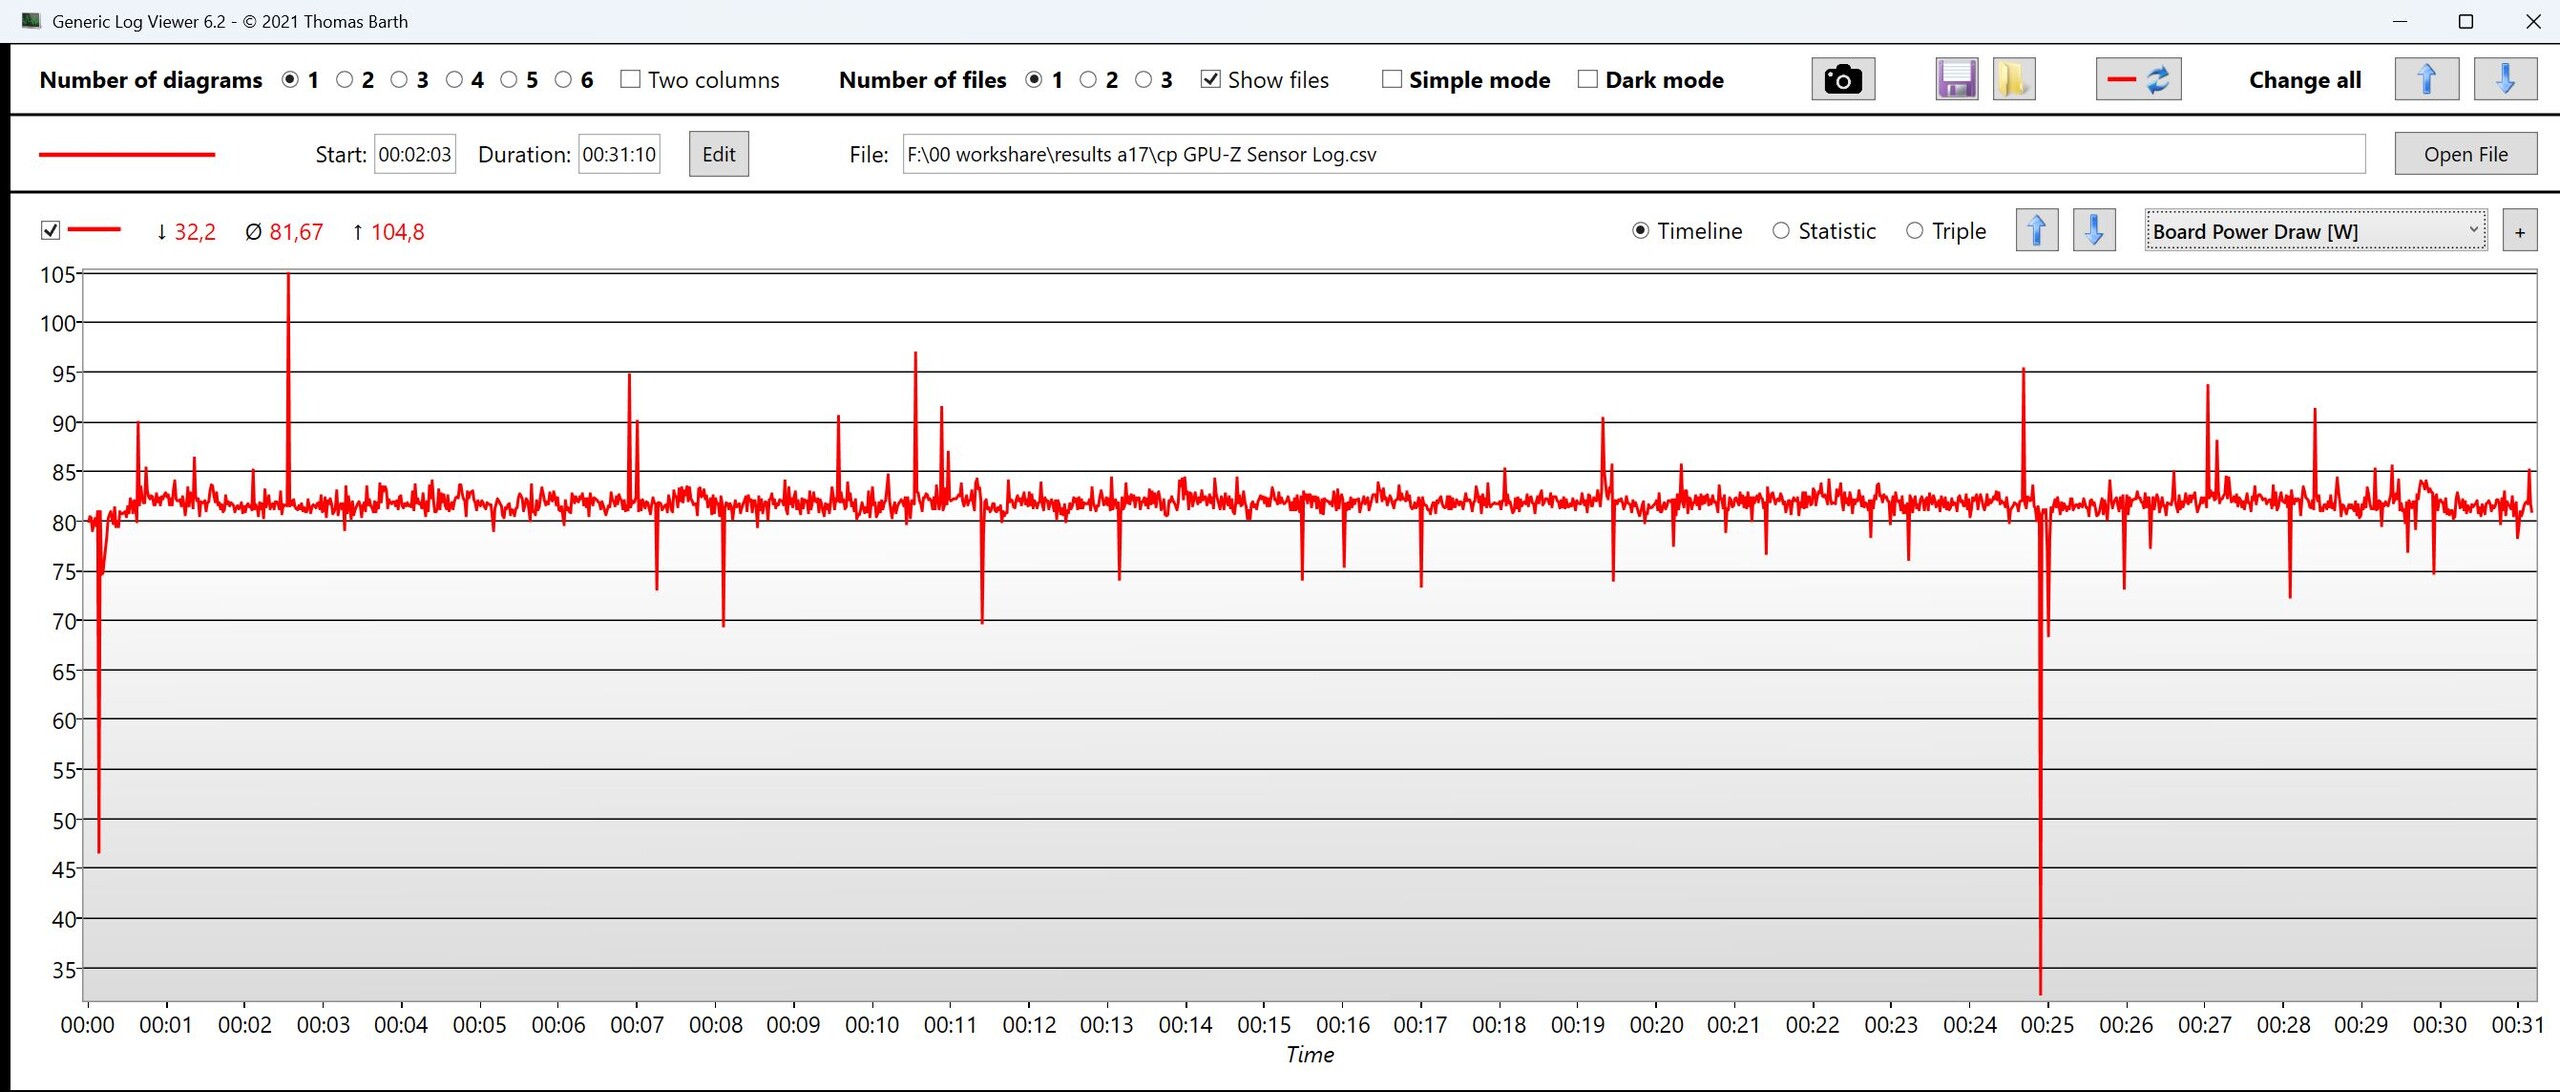
Power consumption
With HDMI connected, the dGPU stays active and idle power jumps to 21 W. In gaming, the A18 is very power-efficient; in Turbo mode, consumption aligns with other RTX 5070 models.
| Off / Standby | |
| Idle | |
| Load |
|
Key:
min: | |
| Asus TUF Gaming A18 FA808UP-S8022W R7 260, GeForce RTX 5070 Laptop, SK hynix HFS001TEM9X174N, IPS, 1920x1200, 18" | Asus ROG Strix G18 2025 G814 R9 9955HX, GeForce RTX 5070 Laptop, Micron 2500 1TB MTFDKBA1T0QGN, IPS, 2560x1600, 18" | MSI Crosshair 18 HX AI A2XW Ultra 9 275HX, GeForce RTX 5070 Laptop, Micron 2500 1TB MTFDKBA1T0QGN, IPS, 2560x1600, 18" | HP Omen 17z-db100 Ryzen AI 7 350, GeForce RTX 5070 Laptop, TeamGroup T-Force G50 TM8FFE004T, IPS, 2560x1440, 17.3" | Lenovo LOQ 17IRX10 i7-14700HX, GeForce RTX 5070 Laptop, WD PC SN7100S SDFPMSL-1T00-1101, IPS, 1920x1080, 17.3" | MSI Katana 17 HX B14WGK i7-14650HX, GeForce RTX 5070 Laptop, Micron 2500 1TB MTFDKBA1T0QGN, IPS, 2560x1440, 17.3" | Average NVIDIA GeForce RTX 5070 Laptop | Average of class Gaming | |
|---|---|---|---|---|---|---|---|---|
| Power Consumption | -50% | -53% | -20% | -59% | -38% | -27% | -54% | |
| Idle Minimum * (Watt) | 6.7 | 13.1 -96% | 8.8 -31% | 6.2 7% | 14.4 -115% | 9.7 -45% | 10.7 ? -60% | 13.5 ? -101% |
| Idle Average * (Watt) | 11.6 | 20.6 -78% | 14.1 -22% | 19.1 -65% | 17.2 -48% | 15 -29% | 15.3 ? -32% | 19.2 ? -66% |
| Idle Maximum * (Watt) | 17.7 | 21.1 -19% | 35.4 -100% | 19.3 -9% | 28 -58% | 23.7 -34% | 20.2 ? -14% | 24.6 ? -39% |
| Load Average * (Watt) | 85 | 123.4 -45% | 106.2 -25% | 91 -7% | 158 -86% | 126 -48% | 97.5 ? -15% | 108.4 ? -28% |
| Cyberpunk 2077 ultra * (Watt) | 144 | 215 -49% | 233 -62% | 175.9 -22% | 203 -41% | 205 -42% | ||
| Cyberpunk 2077 ultra external monitor * (Watt) | 139 | 179.2 -29% | 225 -62% | 173 -24% | 199.3 -43% | 202 -45% | ||
| Load Maximum * (Watt) | 187 | 249.7 -34% | 322.3 -72% | 227.9 -22% | 232 -24% | 227 -21% | 216 ? -16% | 254 ? -36% |
* ... smaller is better
Consumption Cyberpunk / Stress test
Consumption with external monitor
Battery life
The large 90 Wh battery provides roughly 10 to 12 hours of Wi-Fi usage at reduced brightness.
| Asus TUF Gaming A18 FA808UP-S8022W R7 260, GeForce RTX 5070 Laptop, 90 Wh | Asus ROG Strix G18 2025 G814 R9 9955HX, GeForce RTX 5070 Laptop, 90 Wh | MSI Crosshair 18 HX AI A2XW Ultra 9 275HX, GeForce RTX 5070 Laptop, 90 Wh | HP Omen 17z-db100 Ryzen AI 7 350, GeForce RTX 5070 Laptop, 83 Wh | Lenovo LOQ 17IRX10 i7-14700HX, GeForce RTX 5070 Laptop, 60 Wh | MSI Katana 17 HX B14WGK i7-14650HX, GeForce RTX 5070 Laptop, 75 Wh | Average of class Gaming | |
|---|---|---|---|---|---|---|---|
| Battery runtime | |||||||
| WiFi v1.3 (h) | 11.9 | 7.1 -40% | 10.9 -8% | 8 -33% | 3.1 -74% | 5.1 -57% | 6.83 ? -43% |
Asus TUF Gaming A18 FA808UP-S8022W
- 11/14/2025 v8
Christian Hintze
 Total Sustainability Score:
 Possible alternatives in comparison
Image | Model / Review | Price | Weight | Height | Display |
|---|---|---|---|---|---|
1. 83.8%  | Asus TUF Gaming A18 FA808UP-S8022W AMD Ryzen 7 260 ⎘ NVIDIA GeForce RTX 5070 Laptop ⎘ 32 GB Memory, 1024 GB SSD | Amazon: List Price: 2199 Euro | 2.6 kg | 26.7 mm | 18.00" 1920x1200 126 PPI IPS |
2. 86.4%  | Asus ROG Strix G18 2025 G814 AMD Ryzen 9 9955HX ⎘ NVIDIA GeForce RTX 5070 Laptop ⎘ 32 GB Memory, 1024 GB SSD | Amazon: List Price: 2299€ | 2.9 kg | 30.8 mm | 18.00" 2560x1600 168 PPI IPS |
3. 81.7%  | MSI Crosshair 18 HX AI A2XW Intel Core Ultra 9 275HX ⎘ NVIDIA GeForce RTX 5070 Laptop ⎘ 32 GB Memory, 1024 GB SSD | Amazon: 1. $1,729.99 msi Crosshair 18 HX AI 18" 2... 2. $2,069.00 msi Crosshair 18 HX AI 18" 2... 3. $3,069.00 msi 2025 Crosshair 18 HX AI ... List Price: 1700 USD | 3.1 kg | 29.9 mm | 18.00" 2560x1600 168 PPI IPS |
4. 81.8%  | HP Omen 17z-db100 AMD Ryzen AI 7 350 ⎘ NVIDIA GeForce RTX 5070 Laptop ⎘ 96 GB Memory, 4000 GB SSD | List Price: 1550 USD | 2.9 kg | 30.1 mm | 17.30" 2560x1440 170 PPI IPS |
5. 79.8%  | Lenovo LOQ 17IRX10 Intel Core i7-14700HX ⎘ NVIDIA GeForce RTX 5070 Laptop ⎘ 16 GB Memory, 1024 GB SSD | List Price: 1500 EUR | 2.9 kg | 25 mm | 17.30" 1920x1080 127 PPI IPS |
6. 77.3%  | MSI Katana 17 HX B14WGK Intel Core i7-14650HX ⎘ NVIDIA GeForce RTX 5070 Laptop ⎘ 16 GB Memory, 1024 GB SSD | List Price: 1800 EUR | 2.7 kg | 28 mm | 17.30" 2560x1440 170 PPI IPS |
Transparency
The selection of devices to be reviewed is made by our editorial team. The test sample was provided to the author as a loan by the manufacturer or retailer for the purpose of this review. The lender had no influence on this review, nor did the manufacturer receive a copy of this review before publication. There was no obligation to publish this review. As an independent media company, Notebookcheck is not subjected to the authority of manufacturers, retailers or publishers.
This is how Notebookcheck is testing
Every year, Notebookcheck independently reviews hundreds of laptops and smartphones using standardized procedures to ensure that all results are comparable. We have continuously developed our test methods for around 20 years and set industry standards in the process. In our test labs, high-quality measuring equipment is utilized by experienced technicians and editors. These tests involve a multi-stage validation process. Our complex rating system is based on hundreds of well-founded measurements and benchmarks, which maintains objectivity. Further information on our test methods can be found here.
