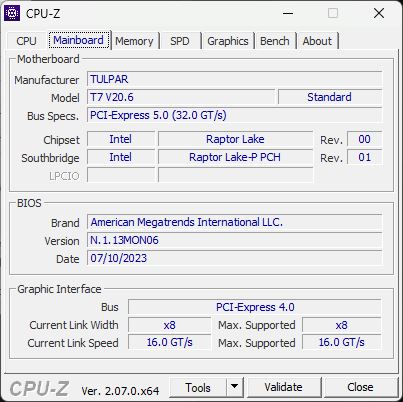
Tulpar T7 V20.6 (Tongfang GM7PG0R) laptop review: Currently one of the cheapest RTX 4060 gamers

The originally Turkish company—which technically trades under the name Monster Notebook—changed its brand name to Tulpar Notebook for the European market in 2022. Tulpar has its DACH headquarters in the center of Berlin on the Alexanderplatz, where you can try out various products and have your device serviced—more on the latter later.
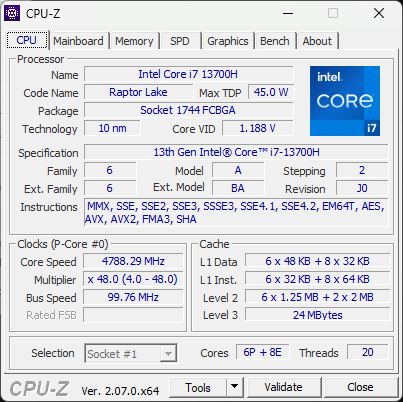
The laptops from Tulpar have been receiving increasing interest lately, which means we finally have the chance to test our first Tulpar laptop. "The A series includes more affordable basic models for occasional gamers. The T series is aimed at frequent gamers with high demands," says the manufacturer's website. We're testing the T7, a model for heavy gamers with high demands—but although the "A and T notebook series were designed according to the latest technological standards", there are currently only two models of the T6 with the latest Gen14 CPU from Intel. Our T7 is still equipped with an i7-13700H from the last Intel generation. In addition, there is an RTX 4060 inside the Tonfang GM7PG0R case.
The current appeal of a Tulpar laptop is above all its low price. Low price? On the website, the model with 1 TB of storage costs around US$1,800! But at the same time, you can also get the T7 laptop from certain online retailers who demand a lot less for it.
Fewer and fewer 17-inch gamers are being released this year due to the rise of 18-inch models. As a result, we will be comparing the T7 with other budget to mid-range gamers from last year such as the XMG Apex 17, Acer Nitro 17, Medion Erazer Defender P40 and the MSI Katana 17. In addition, we will be throwing the 16-inch Lenovo Legion 5i 16 G9 with a current CPU into the ring to see how far ahead the latest technology can come.
Possible competitors compared
Rating | Date | Model | Weight | Height | Size | Resolution | Price |
|---|---|---|---|---|---|---|---|
| 86.3 % v7 (old) | 05 / 2024 | Tulpar T7 V20.6 i7-13700H, GeForce RTX 4060 Laptop GPU | 2.6 kg | 30.05 mm | 17.30" | 1920x1080 | |
| 87.1 % v7 (old) | 10 / 2023 | Schenker XMG Apex 17 (Late 23) R7 7840HS, GeForce RTX 4060 Laptop GPU | 2.5 kg | 24.9 mm | 17.30" | 2560x1440 | |
| 87.2 % v7 (old) | 07 / 2023 | Acer Nitro 17 AN17-51-71ER i7-13700H, GeForce RTX 4060 Laptop GPU | 3 kg | 30.3 mm | 17.30" | 2560x1440 | |
| 84.6 % v7 (old) | 05 / 2023 | Medion Erazer Defender P40 i7-13700HX, GeForce RTX 4060 Laptop GPU | 2.9 kg | 33 mm | 17.30" | 2560x1440 | |
| 82.1 % v7 (old) | 02 / 2023 | MSI Katana 17 B13VFK i7-13620H, GeForce RTX 4060 Laptop GPU | 2.8 kg | 25.2 mm | 17.30" | 1920x1080 | |
| 89.1 % v7 (old) | 01 / 2024 | Lenovo Legion 5 16IRX G9 i7-14650HX, GeForce RTX 4060 Laptop GPU | 2.4 kg | 25.2 mm | 16.00" | 2560x1600 |
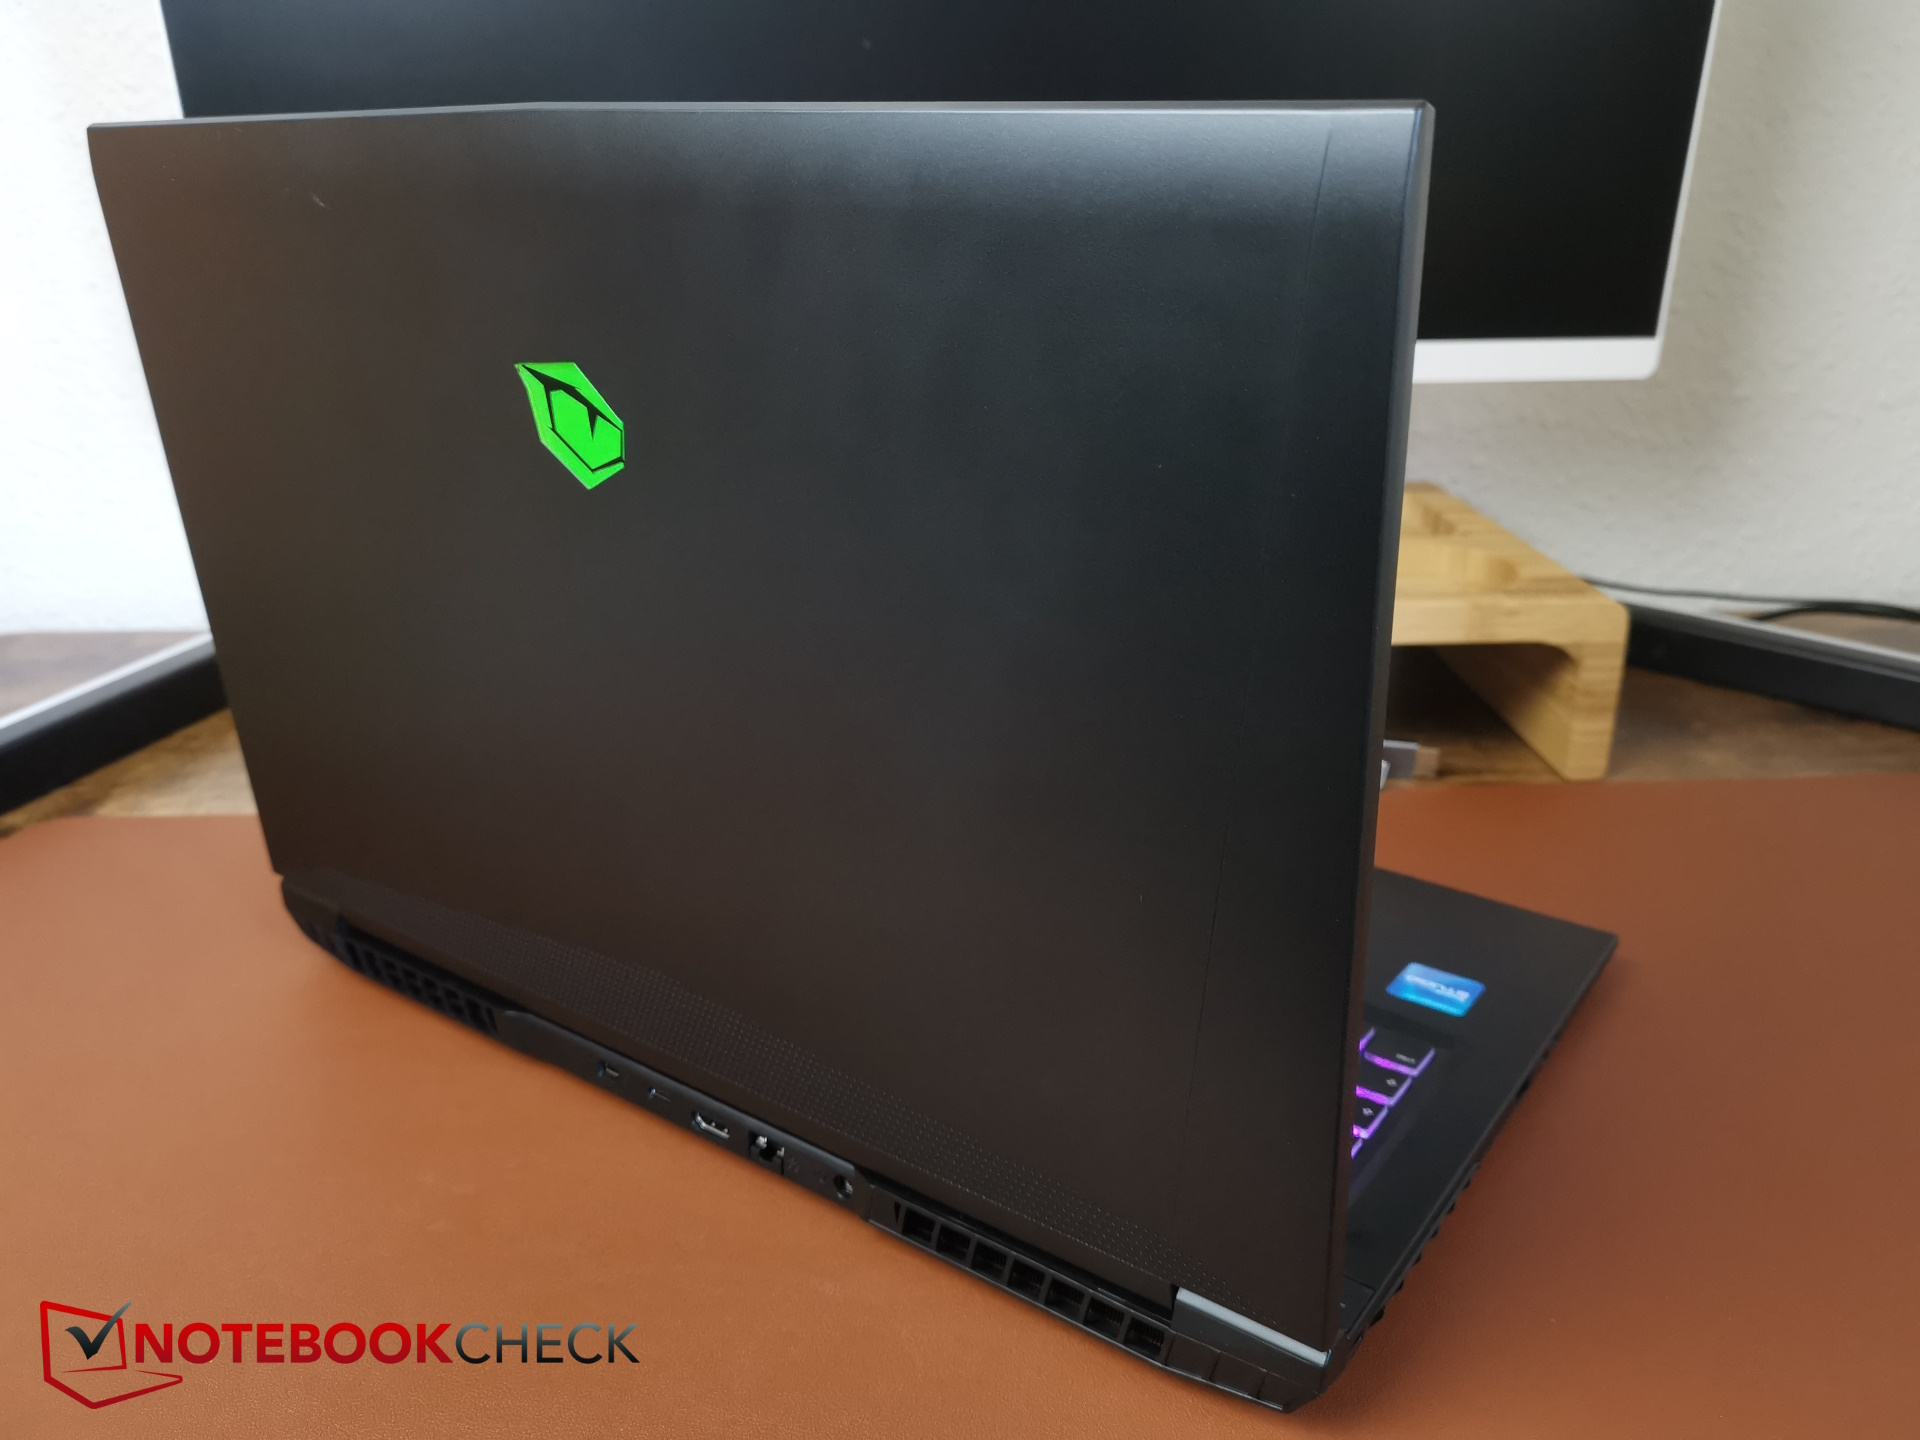
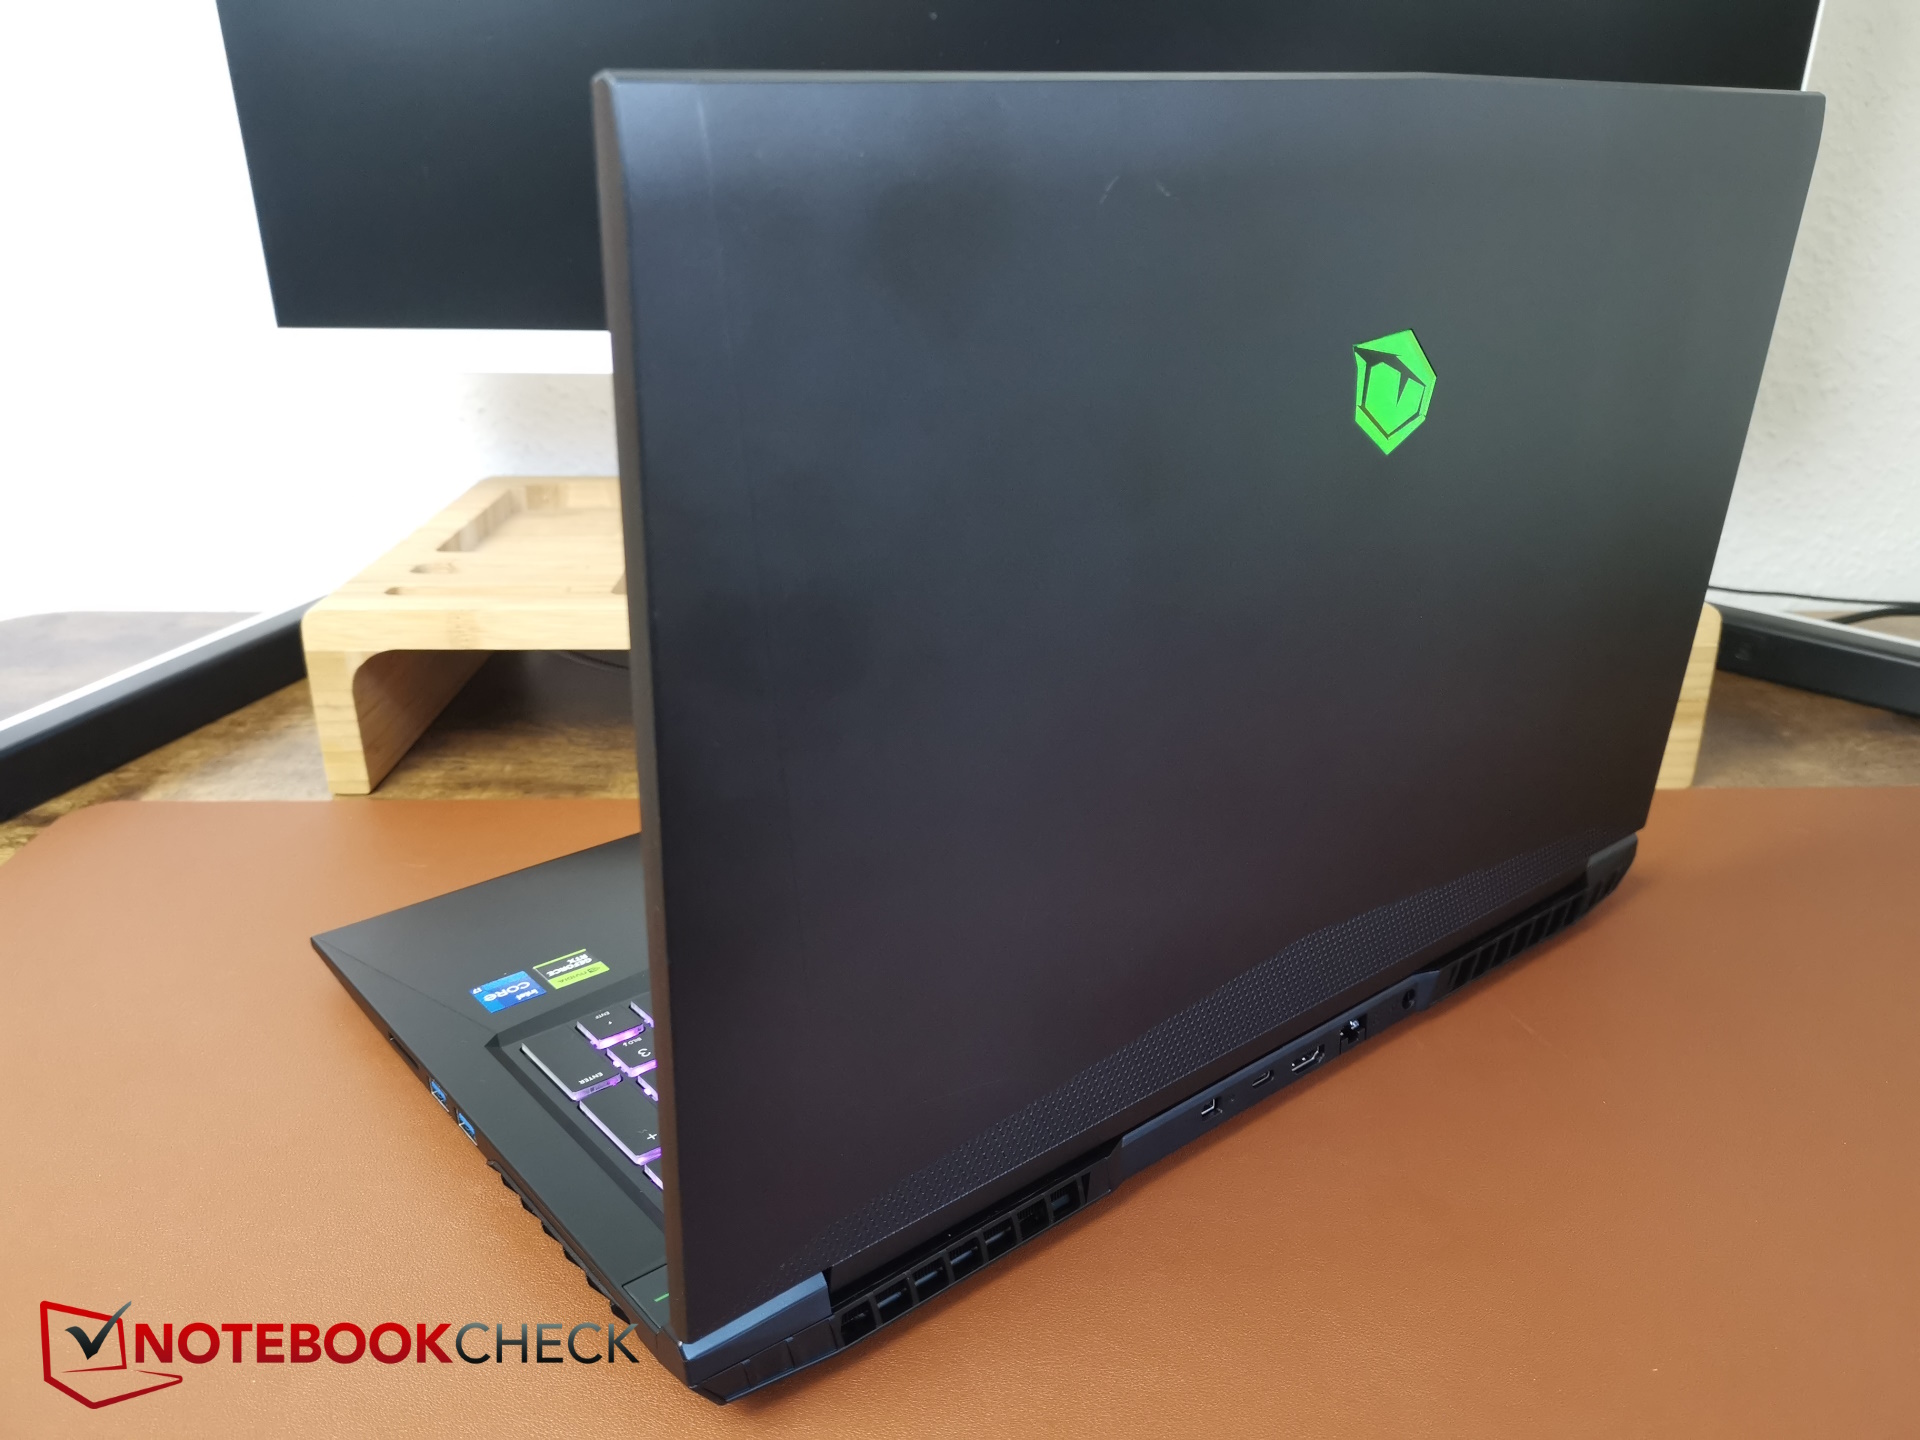
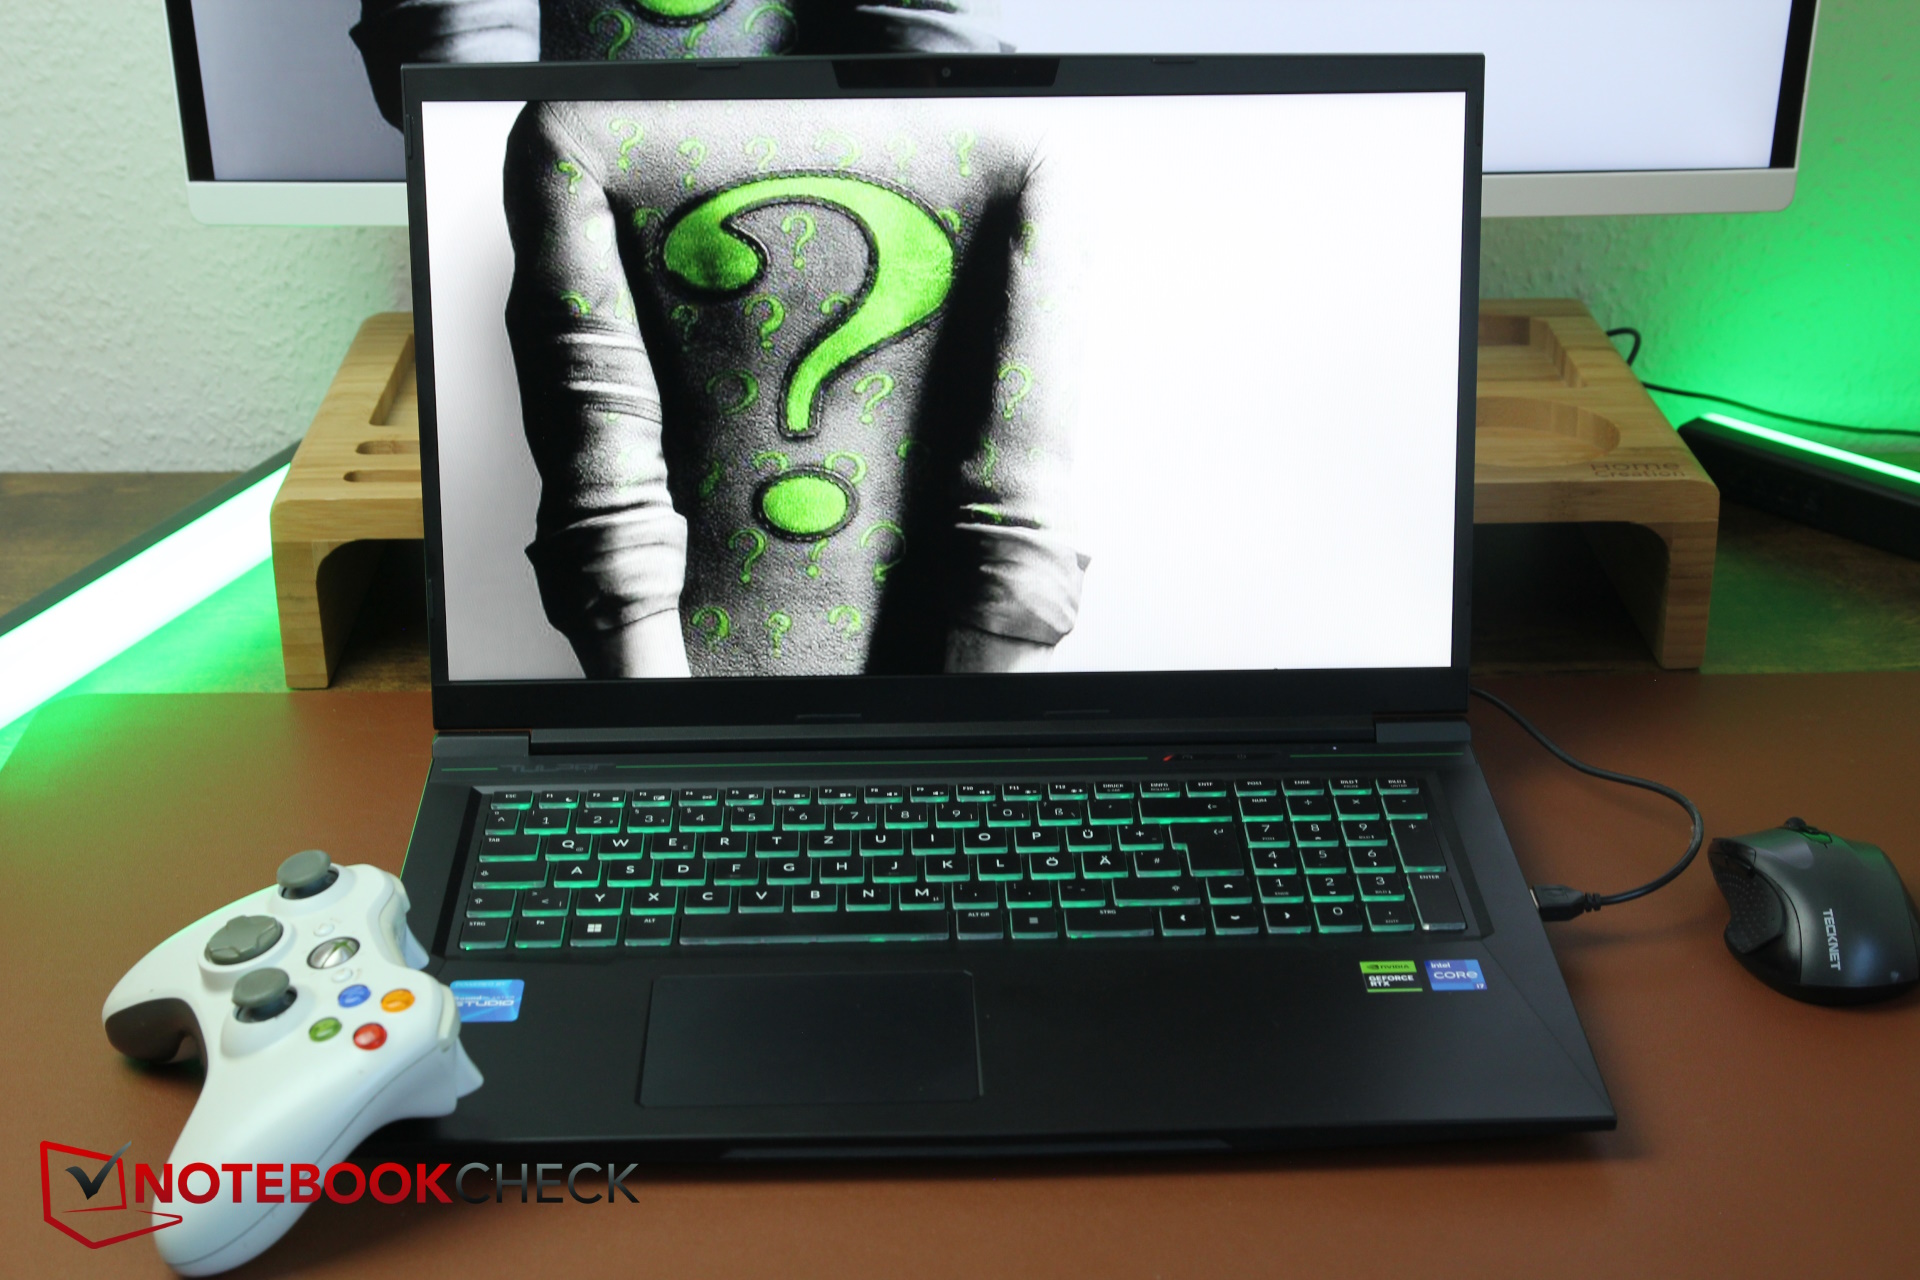
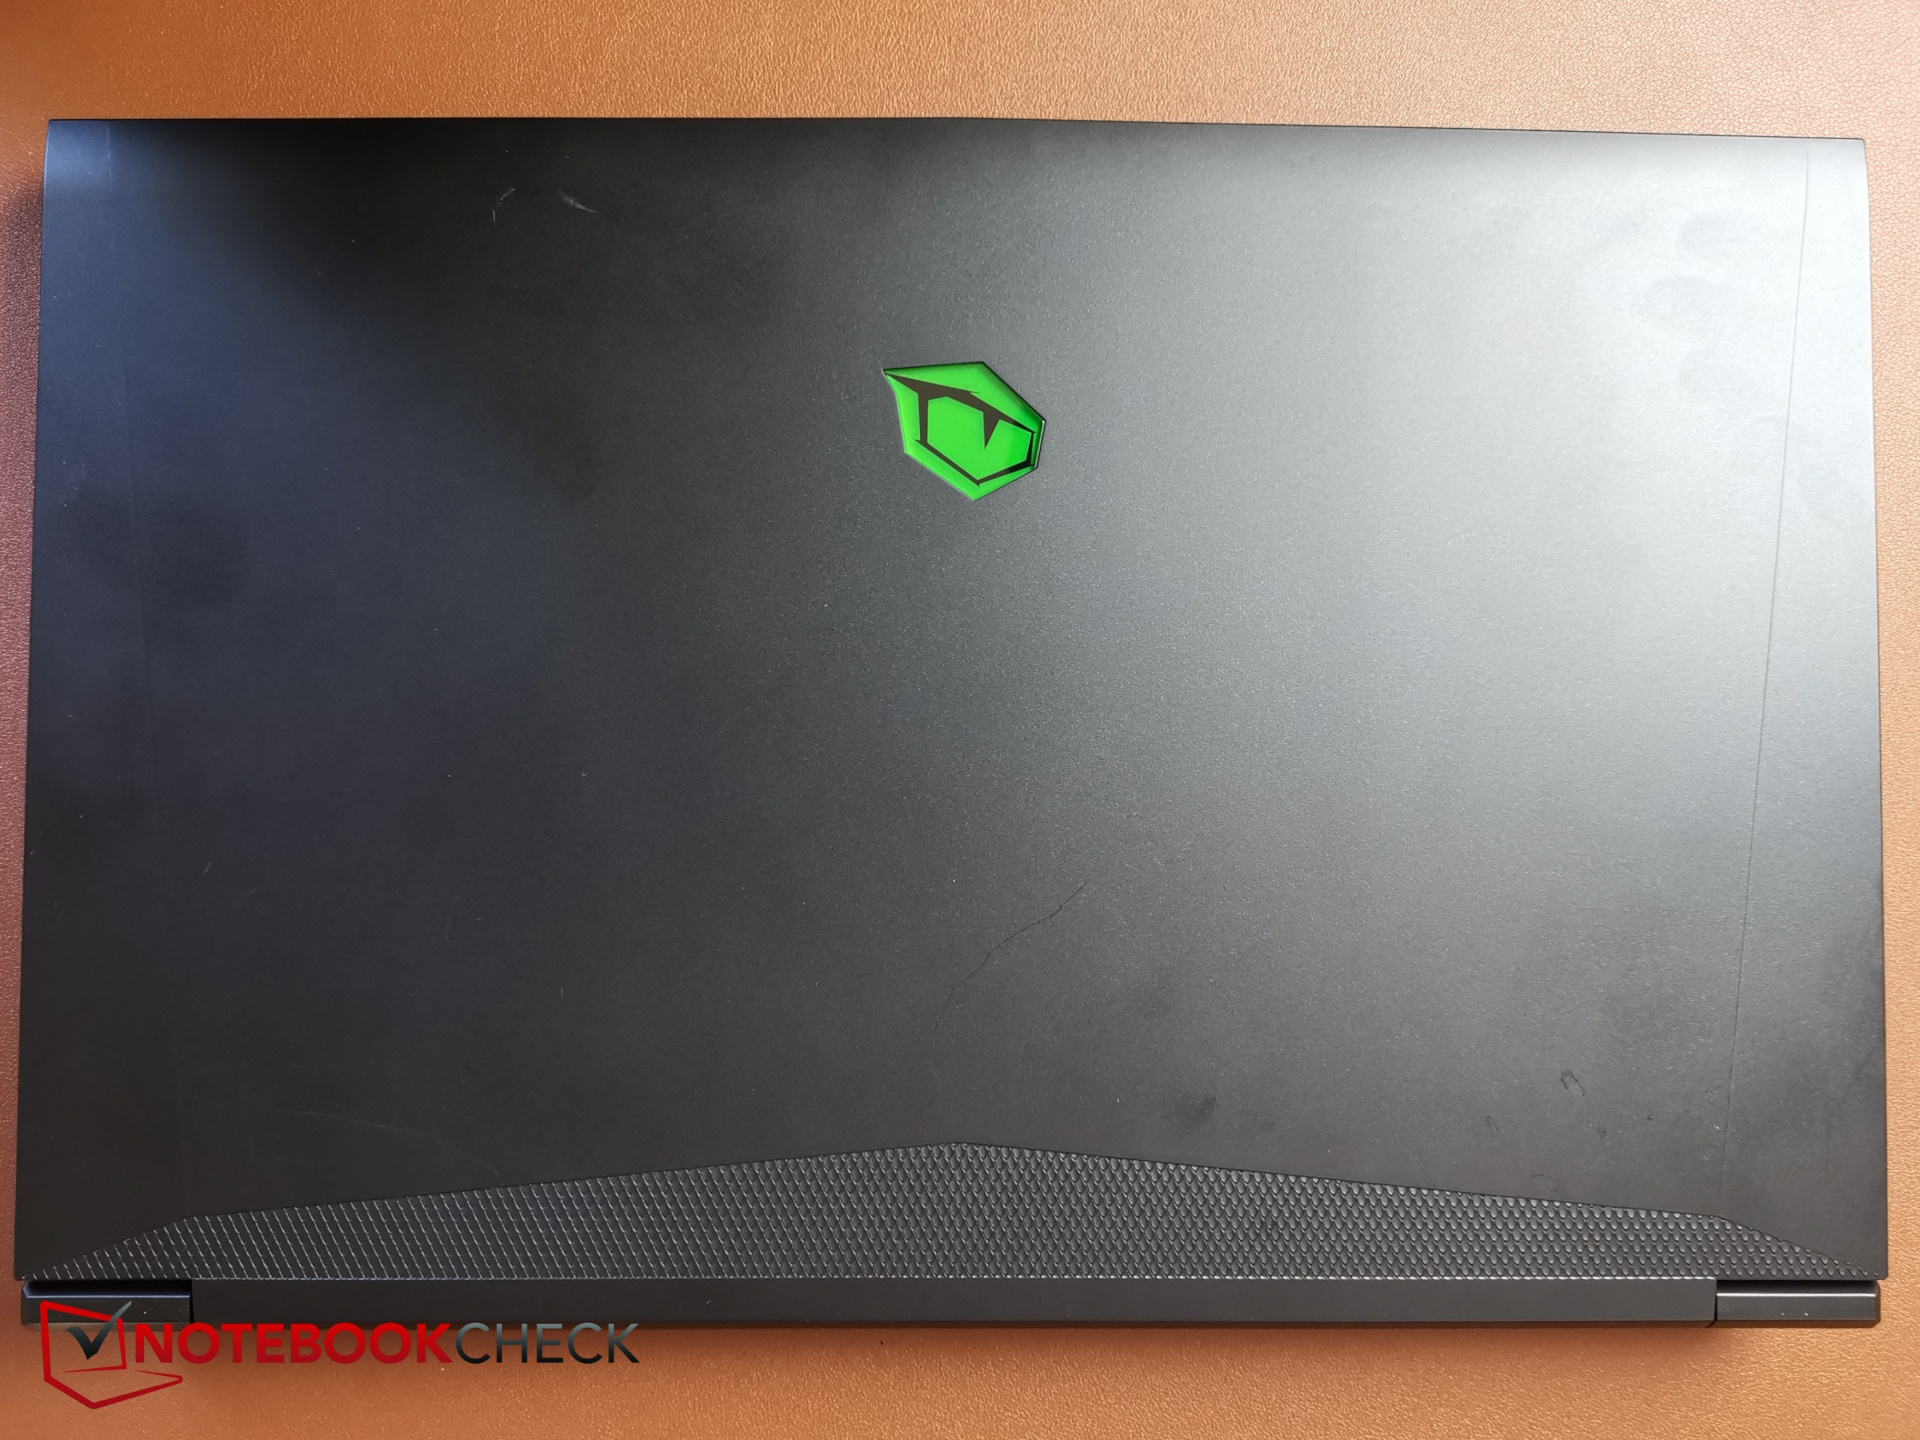
Case - A Tongfang with a green gamer eye
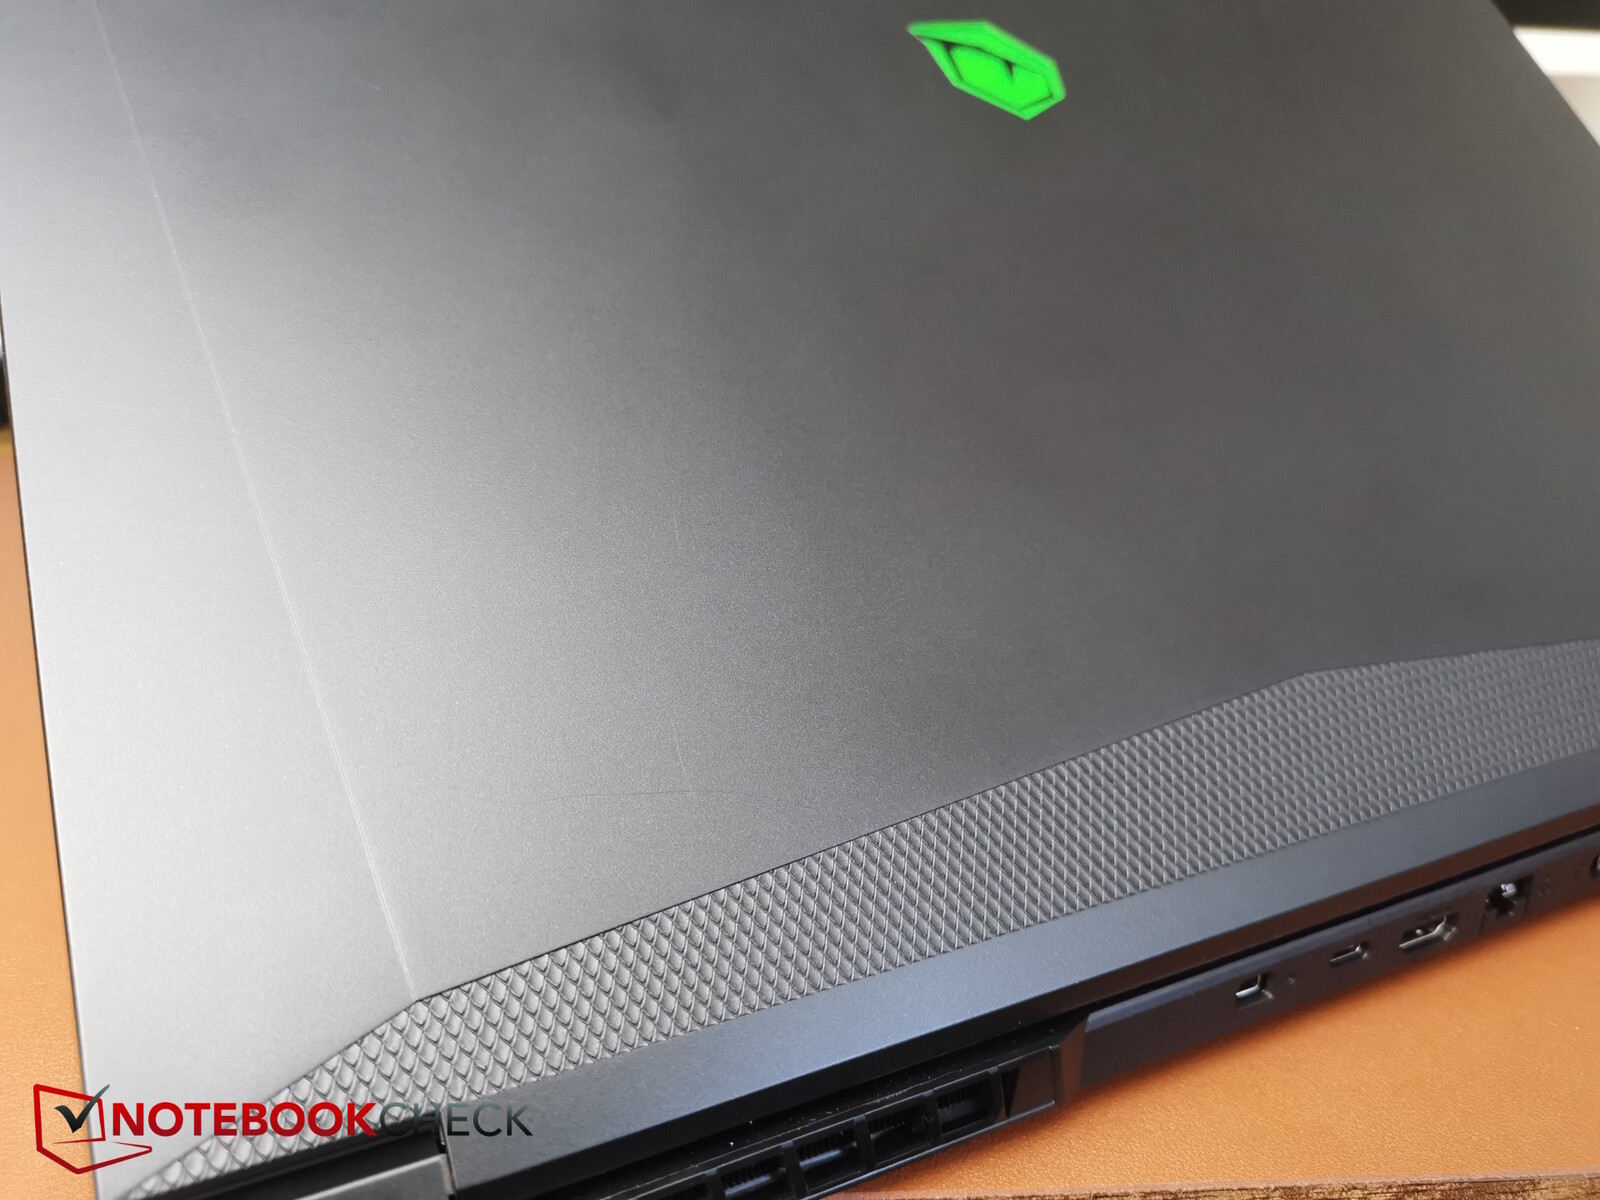

The Tongfang case is made completely from black plastic. The green logo on the front, the wide strip with a honeycomb pattern underneath and the Tulpar branding with a green stripe on the base above the keyboard provide accents to the device. The slightly textured surface attracts grease and fingerprint marks.
In our torsion tests, the base could be bent quite easily and the side edges in particular made stronger cracking noises. Apart from that, the base is sufficiently stable, and the same can be said for the display. The hinges hold the display in place well, but they can't prevent a certain amount of rocking when adjusting its opening angle. The latter is around 145 degrees.
We only noted some small gaps along the front edge where the base meets the bottom plate and the latter is slightly curved. The bottom is made from a slightly softer plastic and the plastic can easily be pressed against the internal cooling elements—especially the heat pipes—from the outside at the air grilles in particular, which are even softer due to their slits. However, this should not normally happen thanks to the four rubber feet.
All-in-all, its build quality is fine, but there are definitely more stable and better-quality devices on the market.
Within the comparison field, the T7 has an average size and weight. It is about the same size as the Medion or the XMG, while the Nitro and the Katana are larger. Its 2.6-kg weight is only just undercut by the Schenker, whereas the rest of the comparison devices are heavier—especially the Nitro which weighs around 3 kg.
With a maximum thickness of 30 mm, the T7 doesn't look terribly slim, but the Acer Nitro is just as thick and the Medion even has 3 mm more on its (cooling) ribs—especially since the T7 is thinner than its specified maximum value in most places. The Katana and the XMG are slimmer.
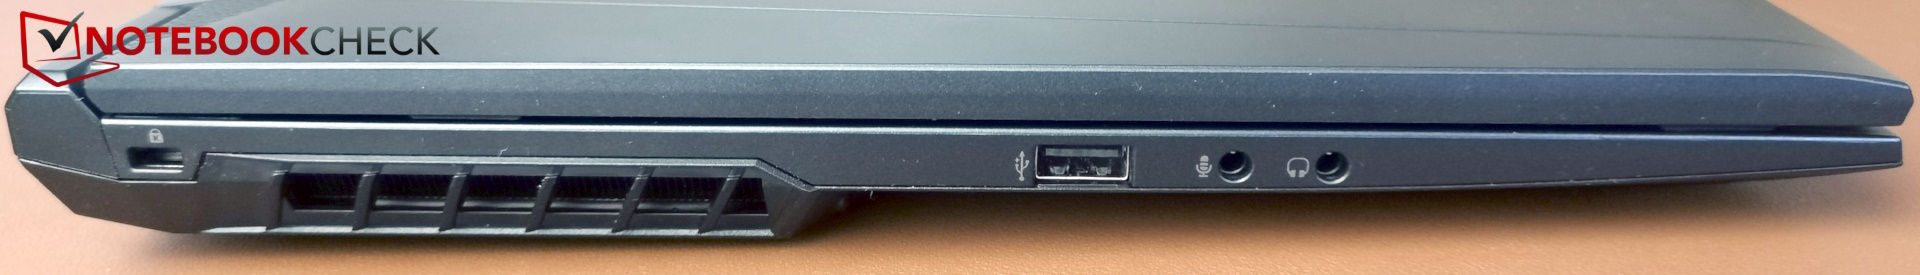
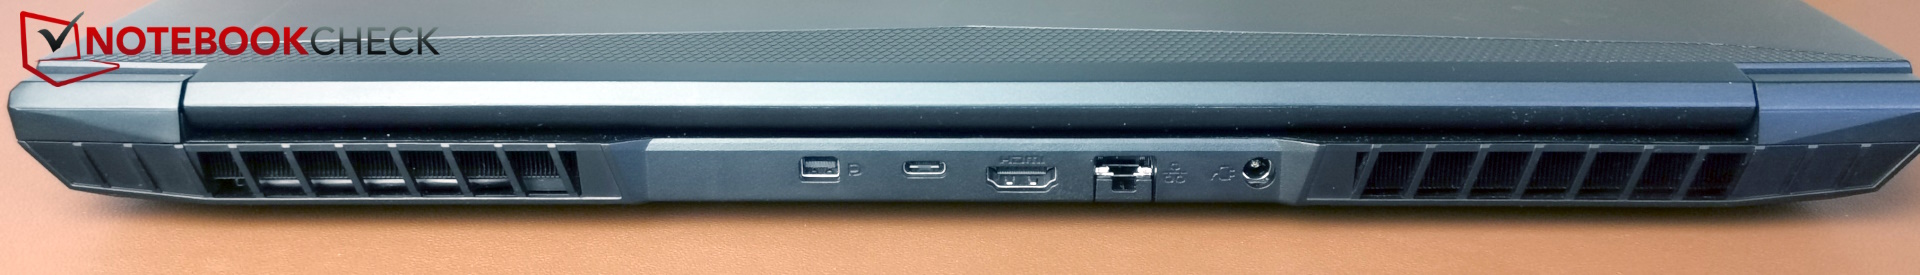
Connectivity - No Thunderbolt, but USB 2.0
The Tulpar gamer features all the most necessary connectivity options and one big positive is its dedicated MiniDP port at the back which could be especially important for VR headsets. In turn, its USB-C port unfortunately doesn't support Thunderbolt and one of its three USB-A ports (left) is still type 2.0. Even so, it at least has a full-sized SD card reader and two separate audio ports.
Its layout is fine, at least the connections are well distributed on both sides and at the back. Above all, potentially rigid and thick cables—such as LAN, HDMI, MiniDP and power—run out the back, so you'll only have to deal with USB devices on the sides. On the right-hand side, the two USB-A ports could be a little further apart but otherwise, the laptop's distribution is good.
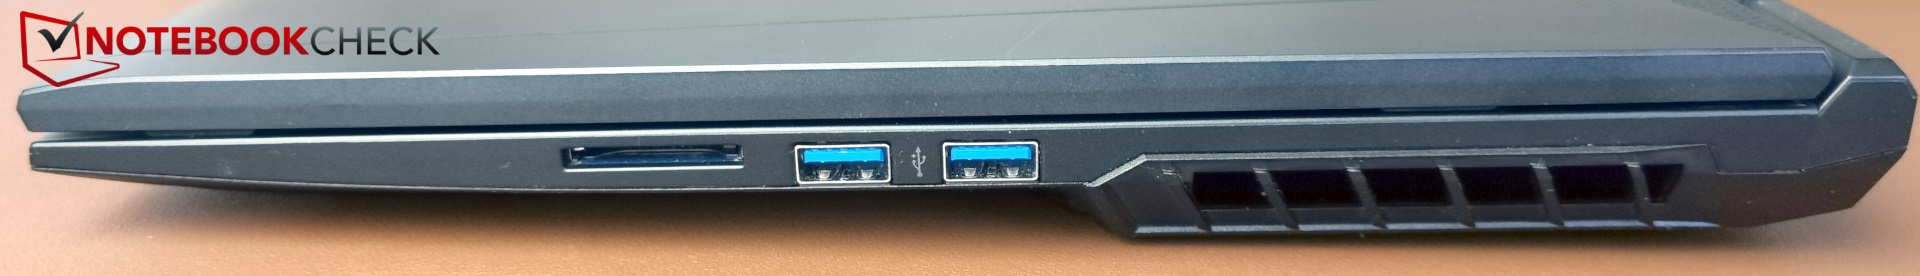
SD card reader
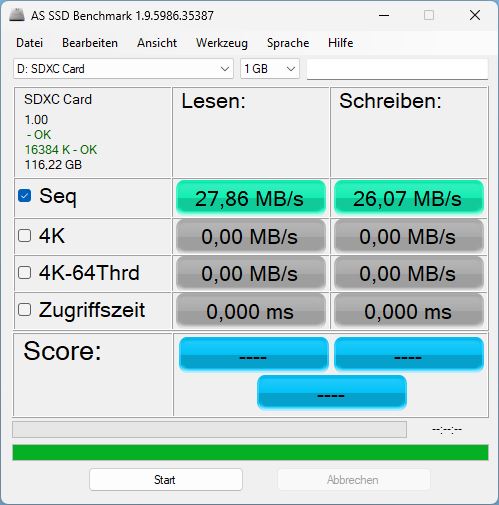
We like that the laptop is fitted with a full-sized SD card reader. Less impressive is how slow the card reader's speeds are. There is no latching mechanism and the cards stick out halfway.
We measured sequential read and write rates of only around 27 MB/s, which is anything but up to speed with our AV PRO MicroSD 128 GB V60 reference card. Copying 1 GB of image material from the card to the desktop takes a whopping 48 seconds! The competition is much faster, although the Legion 5 and the XMG are not decisive.
| SD Card Reader | |
| average JPG Copy Test (av. of 3 runs) | |
| Average of class Gaming (20.9 - 210, n=54, last 2 years) | |
| Medion Erazer Defender P40 (AV PRO microSD 128 GB V60) | |
| Acer Nitro 17 AN17-51-71ER | |
| Schenker XMG Apex 17 (Late 23) (AV PRO microSD 128 GB V60) | |
| Lenovo Legion 5 16IRX G9 | |
| Tulpar T7 V20.6 | |
| maximum AS SSD Seq Read Test (1GB) | |
| Average of class Gaming (25.5 - 261, n=51, last 2 years) | |
| Medion Erazer Defender P40 (AV PRO microSD 128 GB V60) | |
| Acer Nitro 17 AN17-51-71ER | |
| Schenker XMG Apex 17 (Late 23) (AV PRO microSD 128 GB V60) | |
| Lenovo Legion 5 16IRX G9 | |
| Tulpar T7 V20.6 | |
Communication
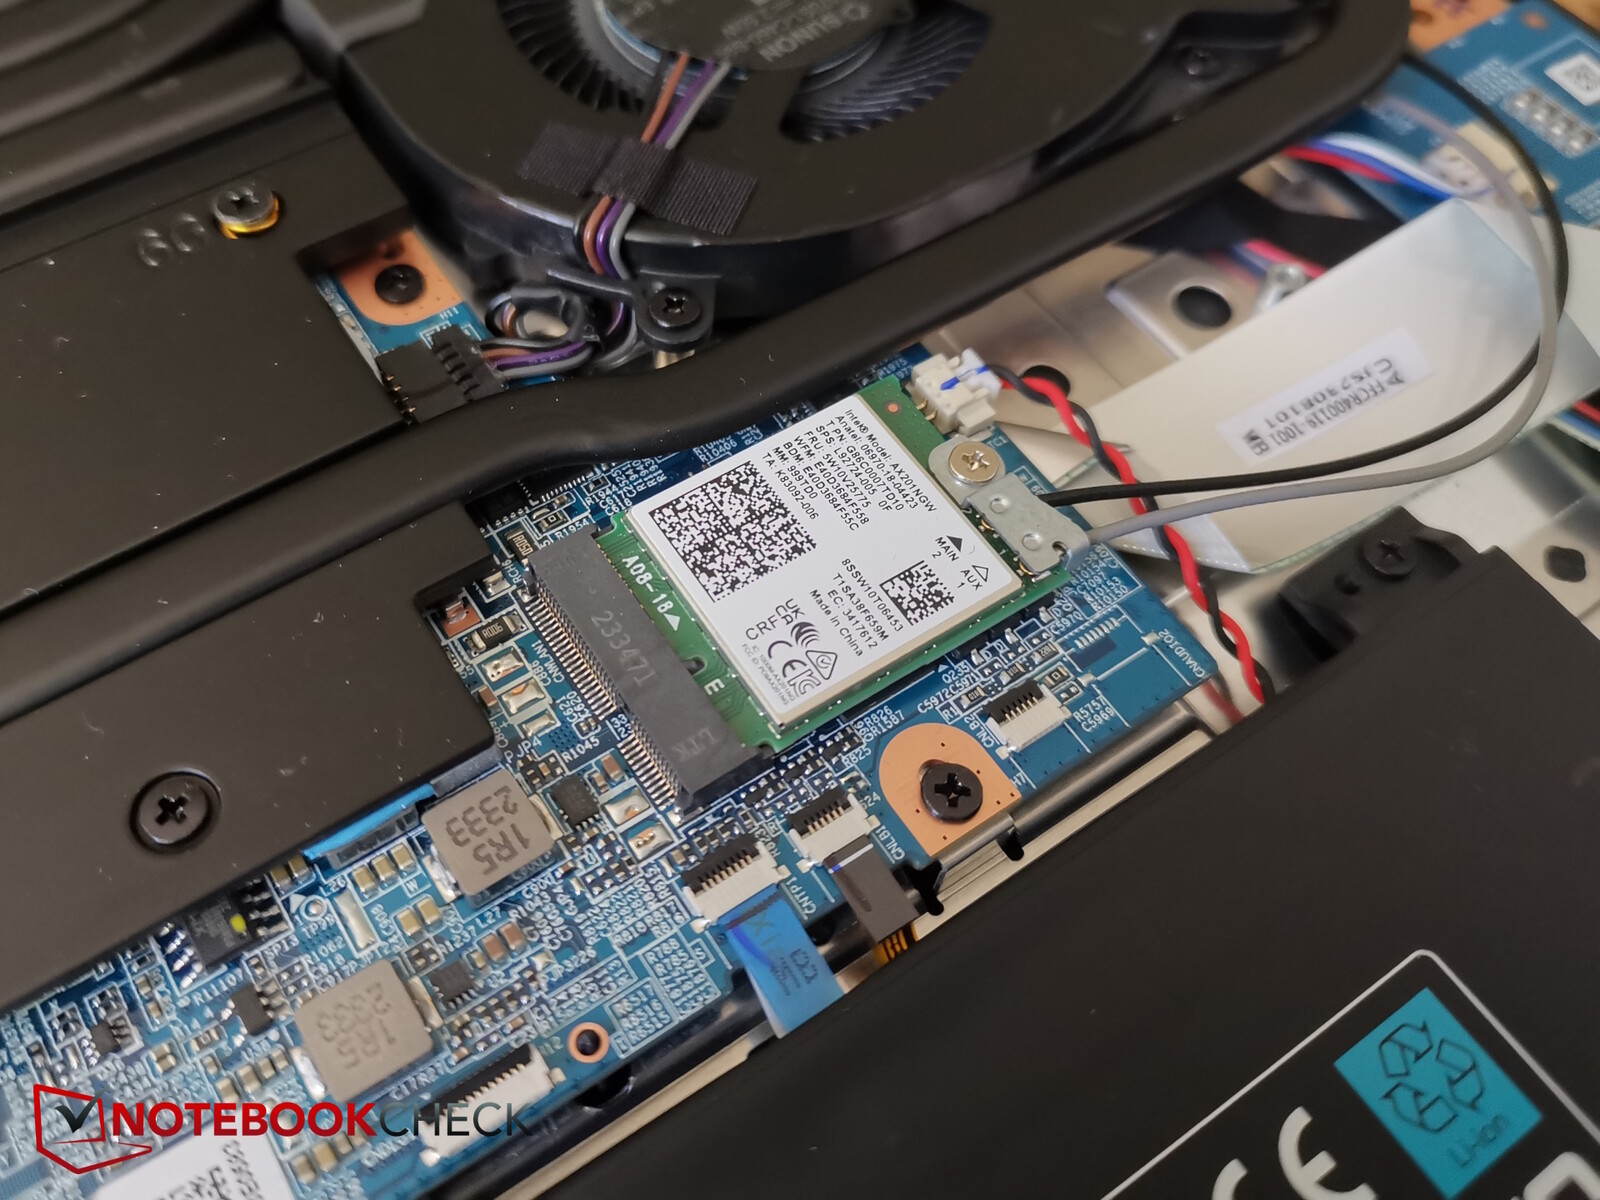
The device has an RJ45 LAN connection. For WLAN, Tulpar has installed the Intel Wi-Fi 6 AX201 module, which supports Wi-Fi 6 but not Wi-Fi 6E.
Its transmission rates are high and very constant when sending and receiving.
Webcam
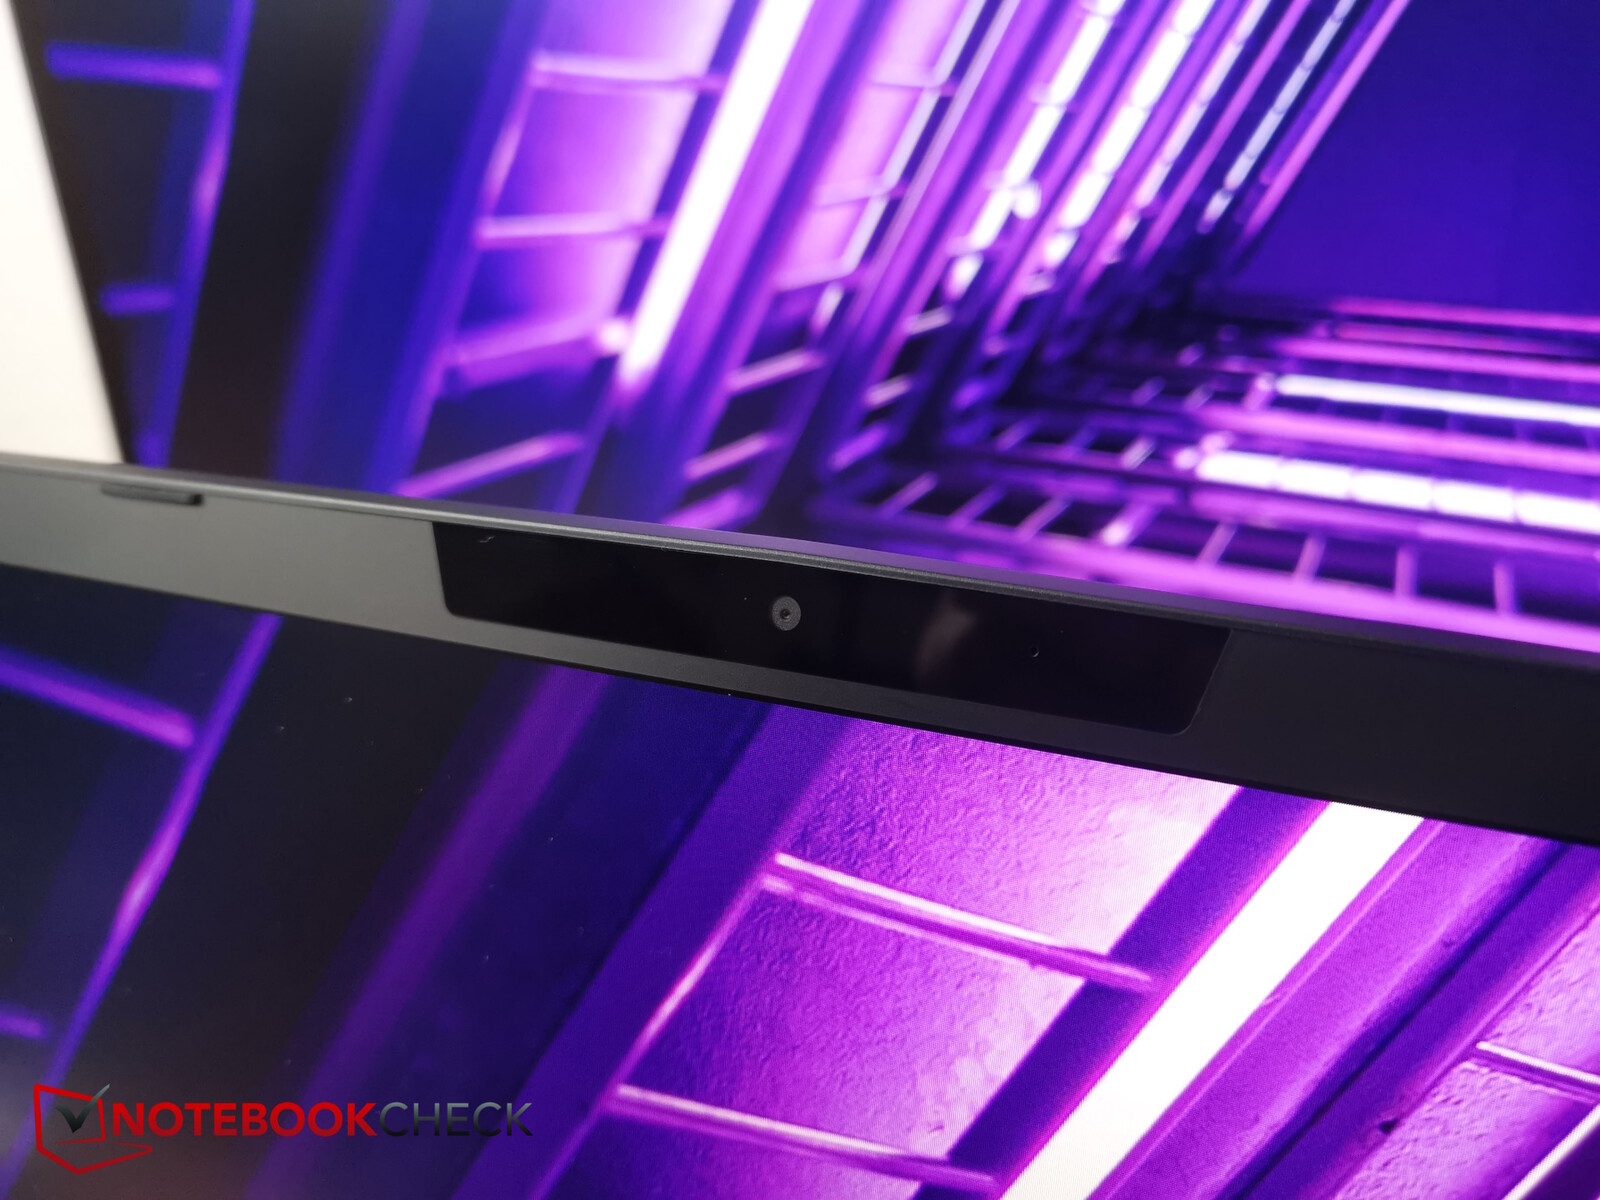
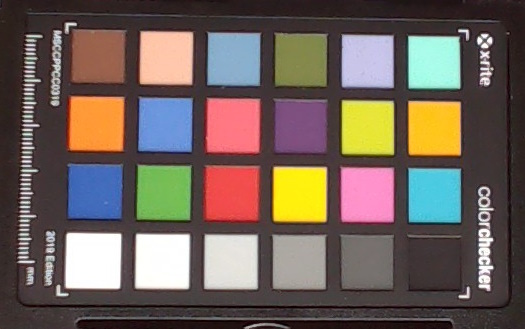
While at least the XMG and the Legion 5 already rely on Full HD webcams, the Tulpar, like the other competitors, still has a 720p camera.
This also has to contend with quite high color deviations and poor sharpness, resulting in it not transmitting a very nice image of the user.


Security
A Kensington slot is available and TPM is integrated into the Intel CPU. There are no additional security features such as a fingerprint sensor or a webcam cover at the least.
Accessories and warranty
No extra accessories come with the affordable Tulpar laptop. However, there is the promise of lifelong, annual, free maintenance in addition to a statutory warranty of 12 months. This includes cleaning the fans, replacing the thermal paste on the CPU and GPU and removing dust from the case. But be careful: If the customer does anything themselves (e.g. changes the thermal paste), the free maintenance expires, so it is best to read the exact terms and conditions on Tulpar's website.
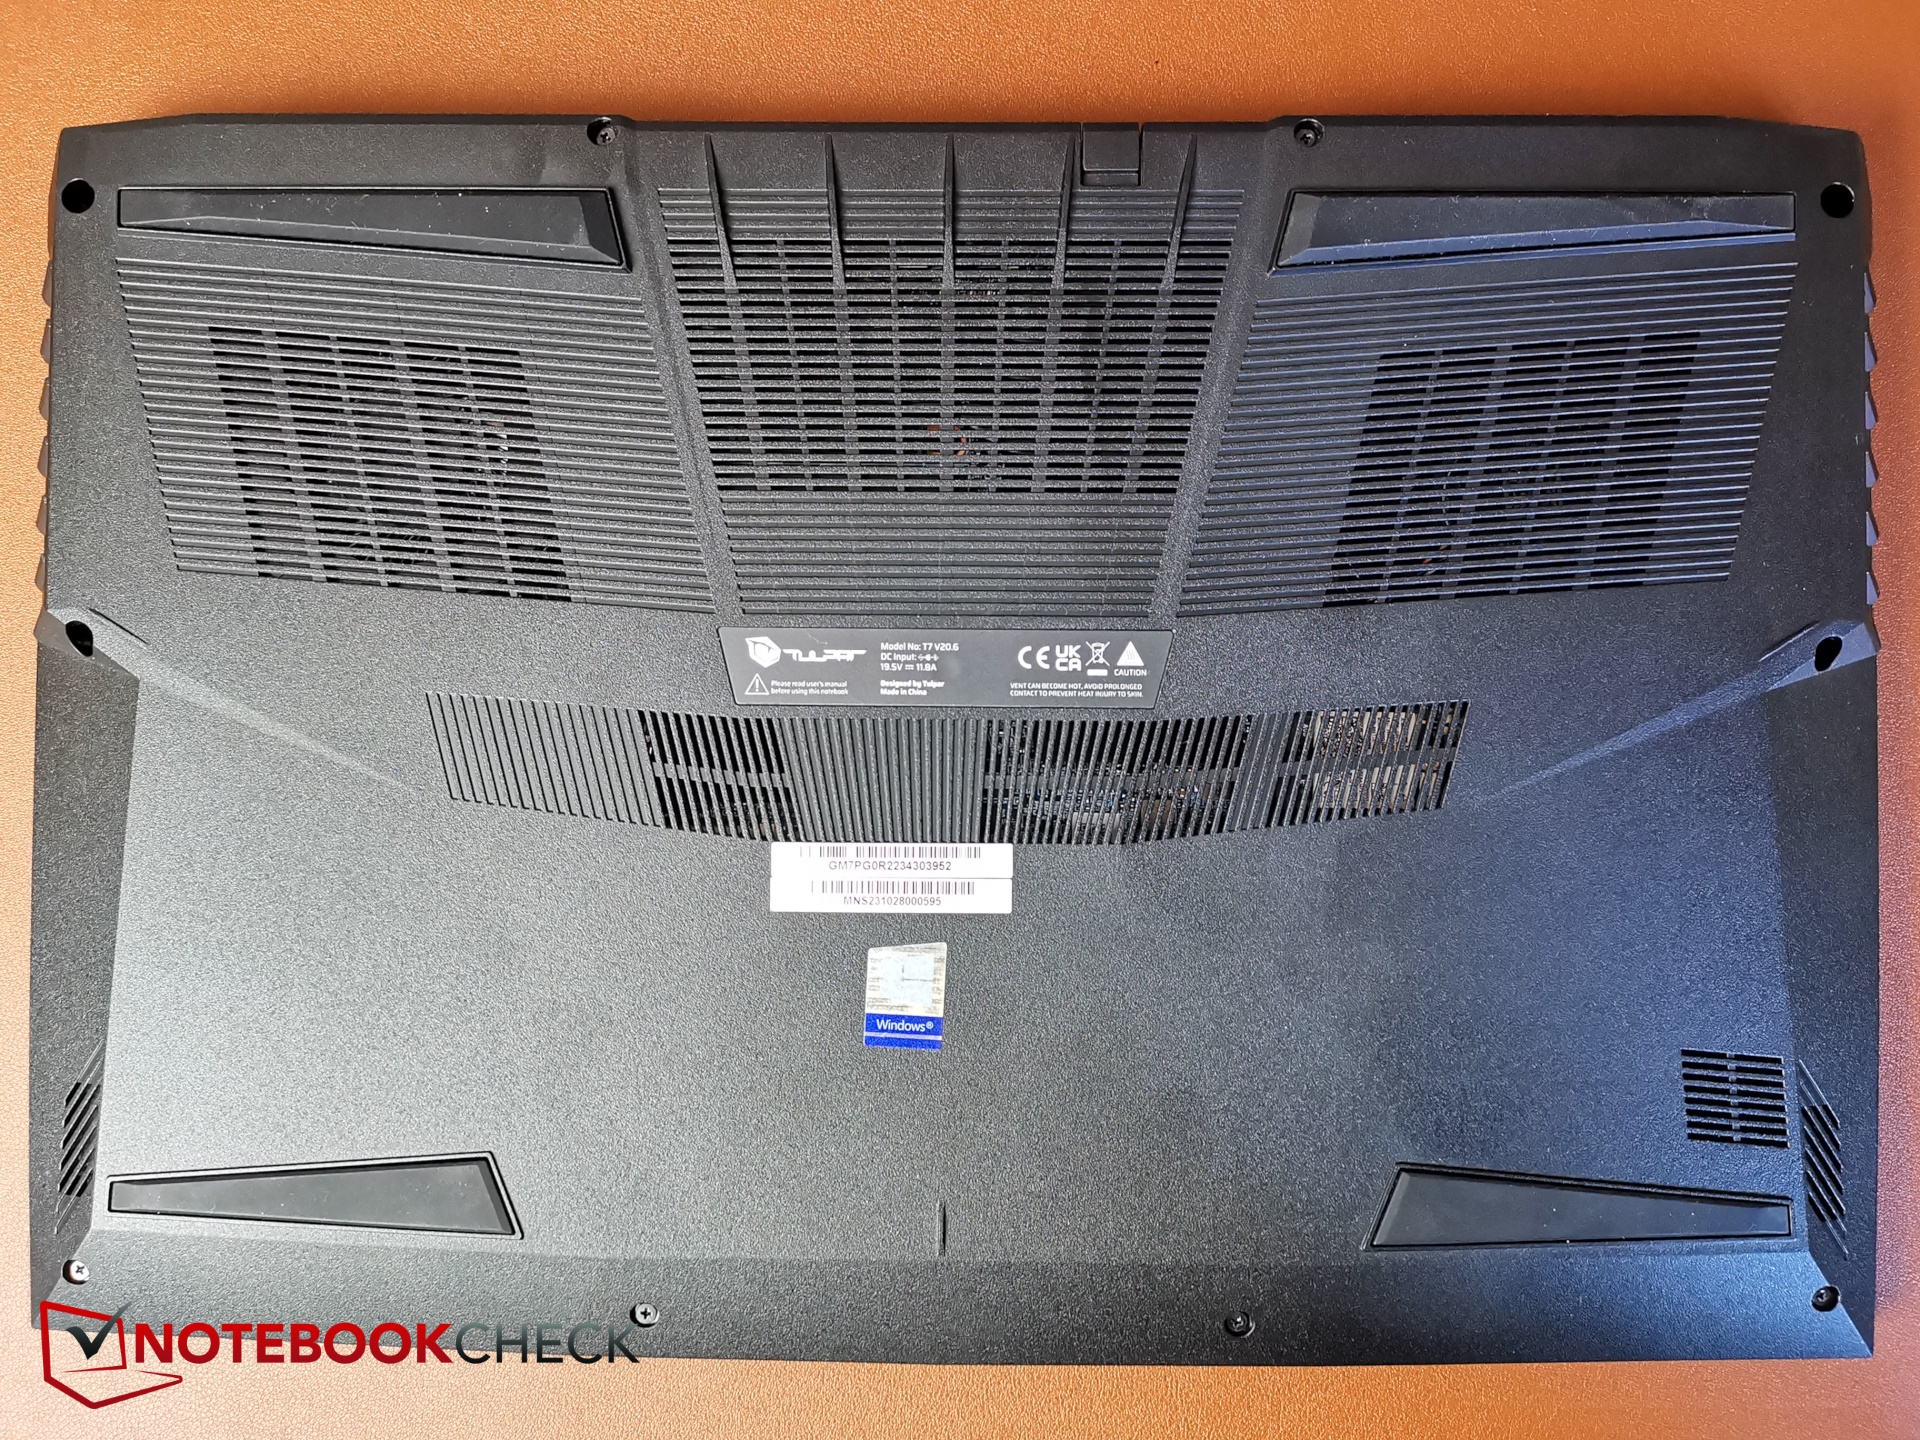
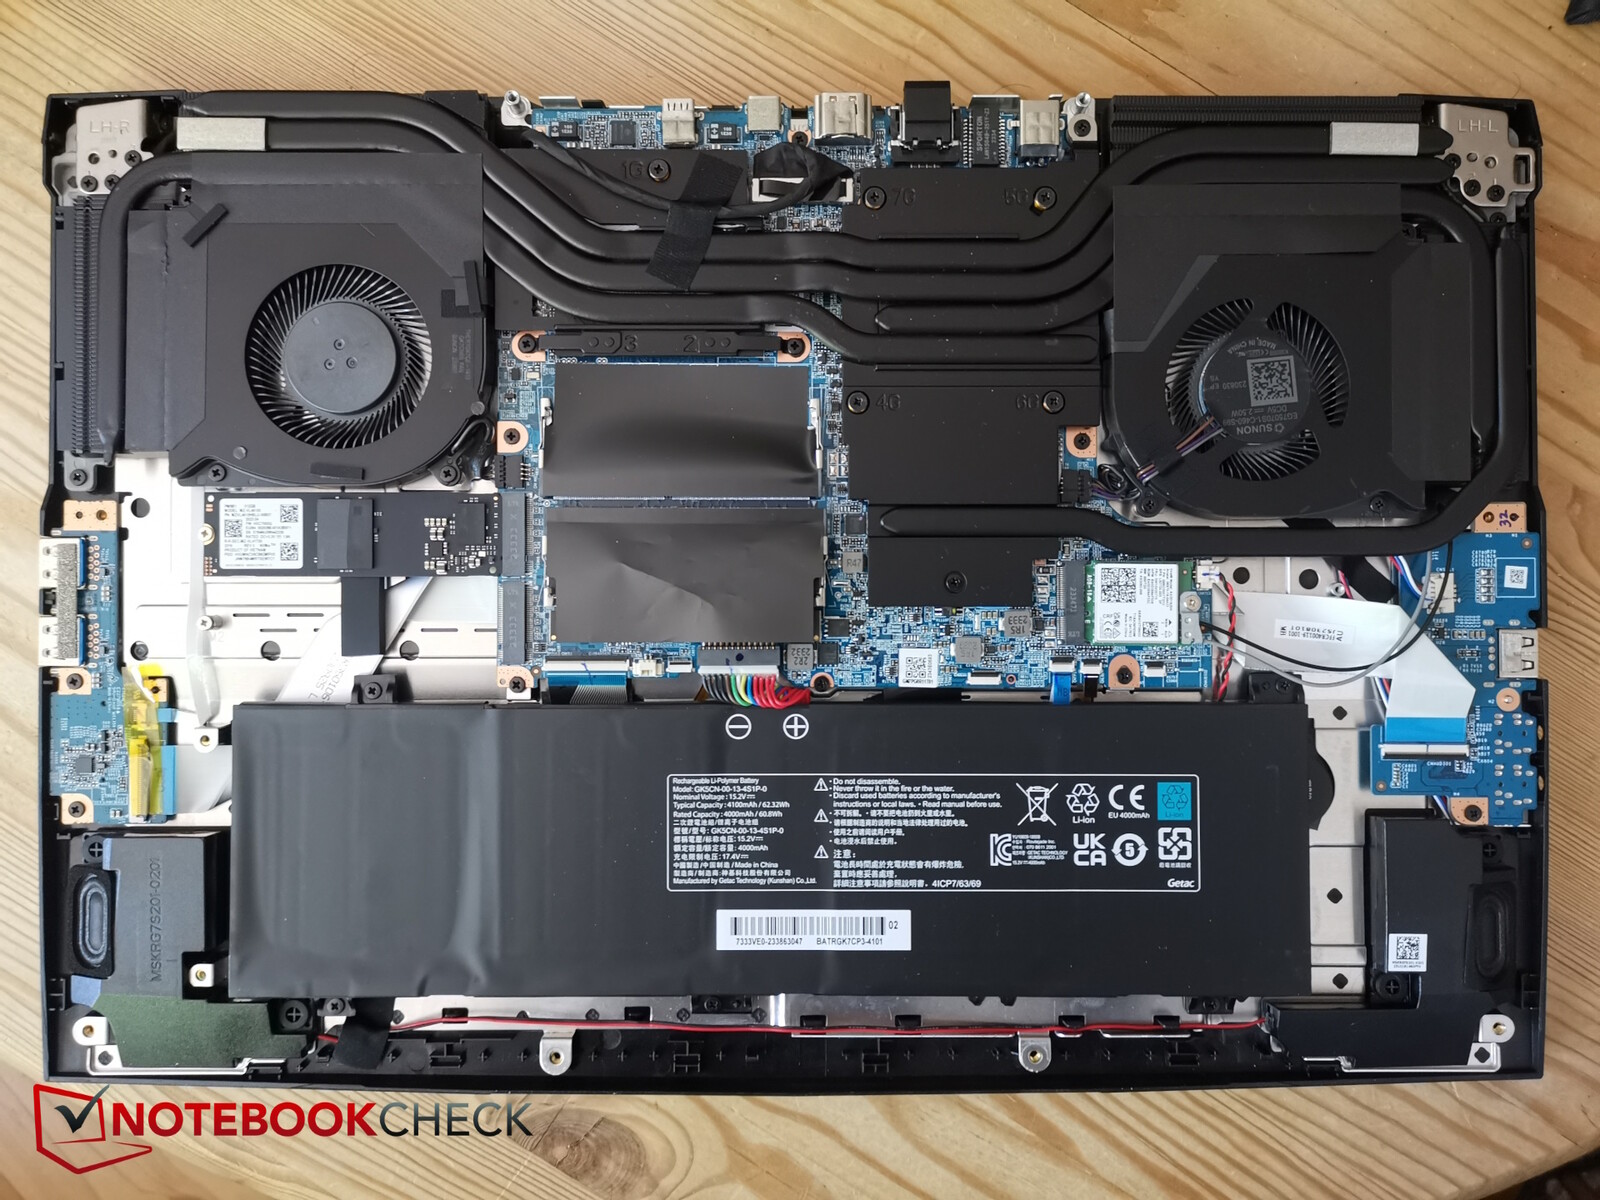
Maintenance
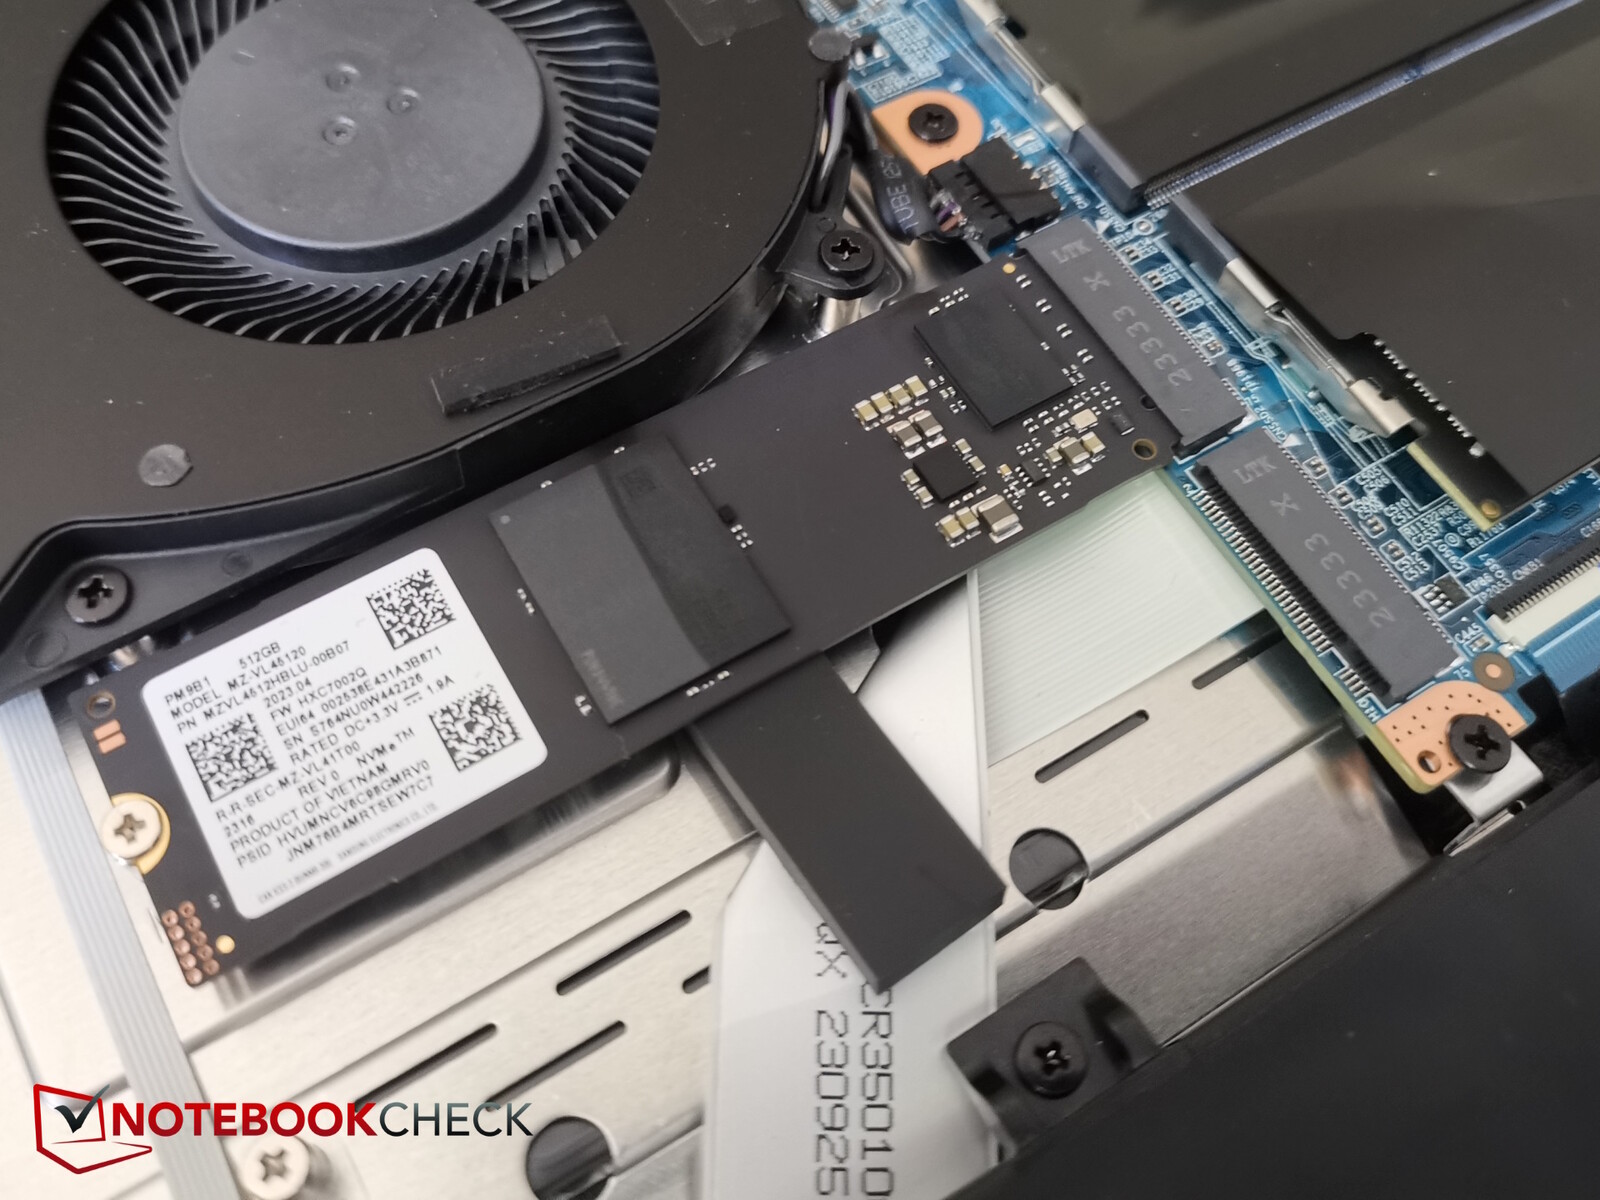
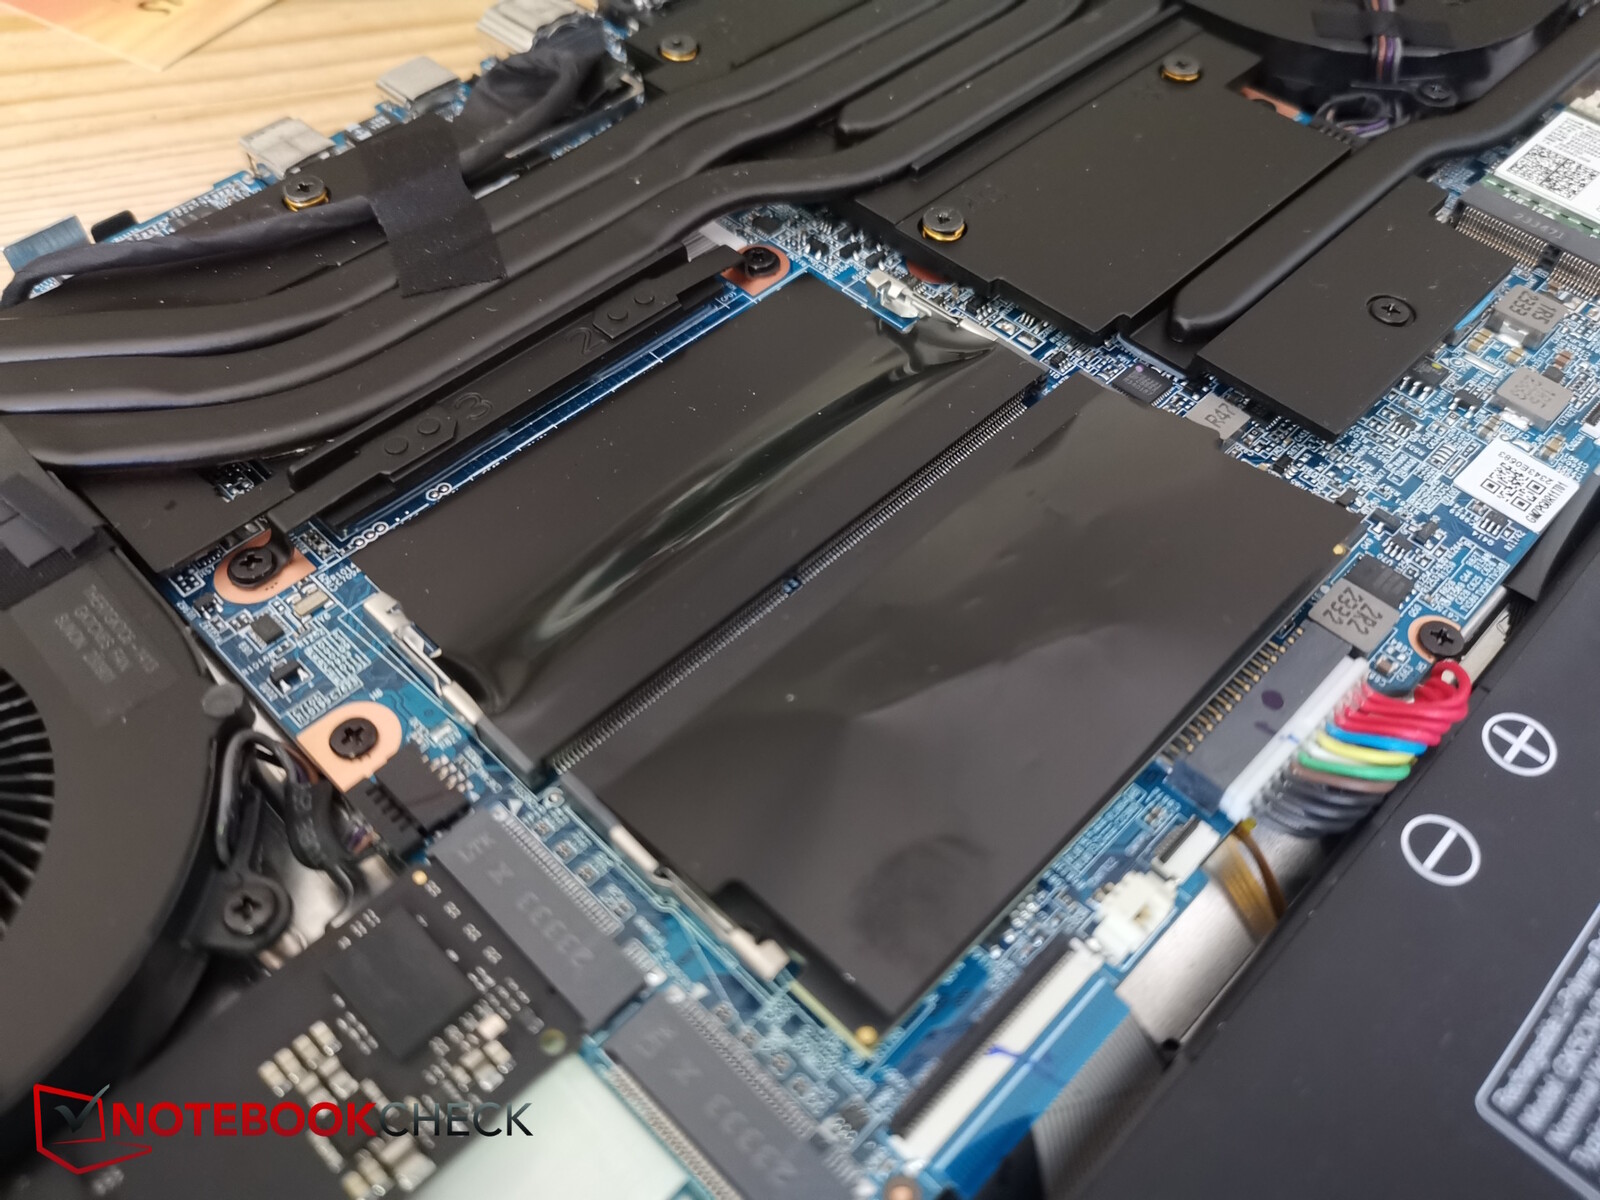
The bottom case part is held in place by 10 Phillips screws of the same length and lots of plastic clips. As a result, you should take care when levering it but in general, it is quite easy to open. There are no hidden screws.
Inside, you will gain access to the cooling system, the two RAM slots (only one occupied), the two M.2 SSD slots (one free), the Wi-Fi module and the battery.
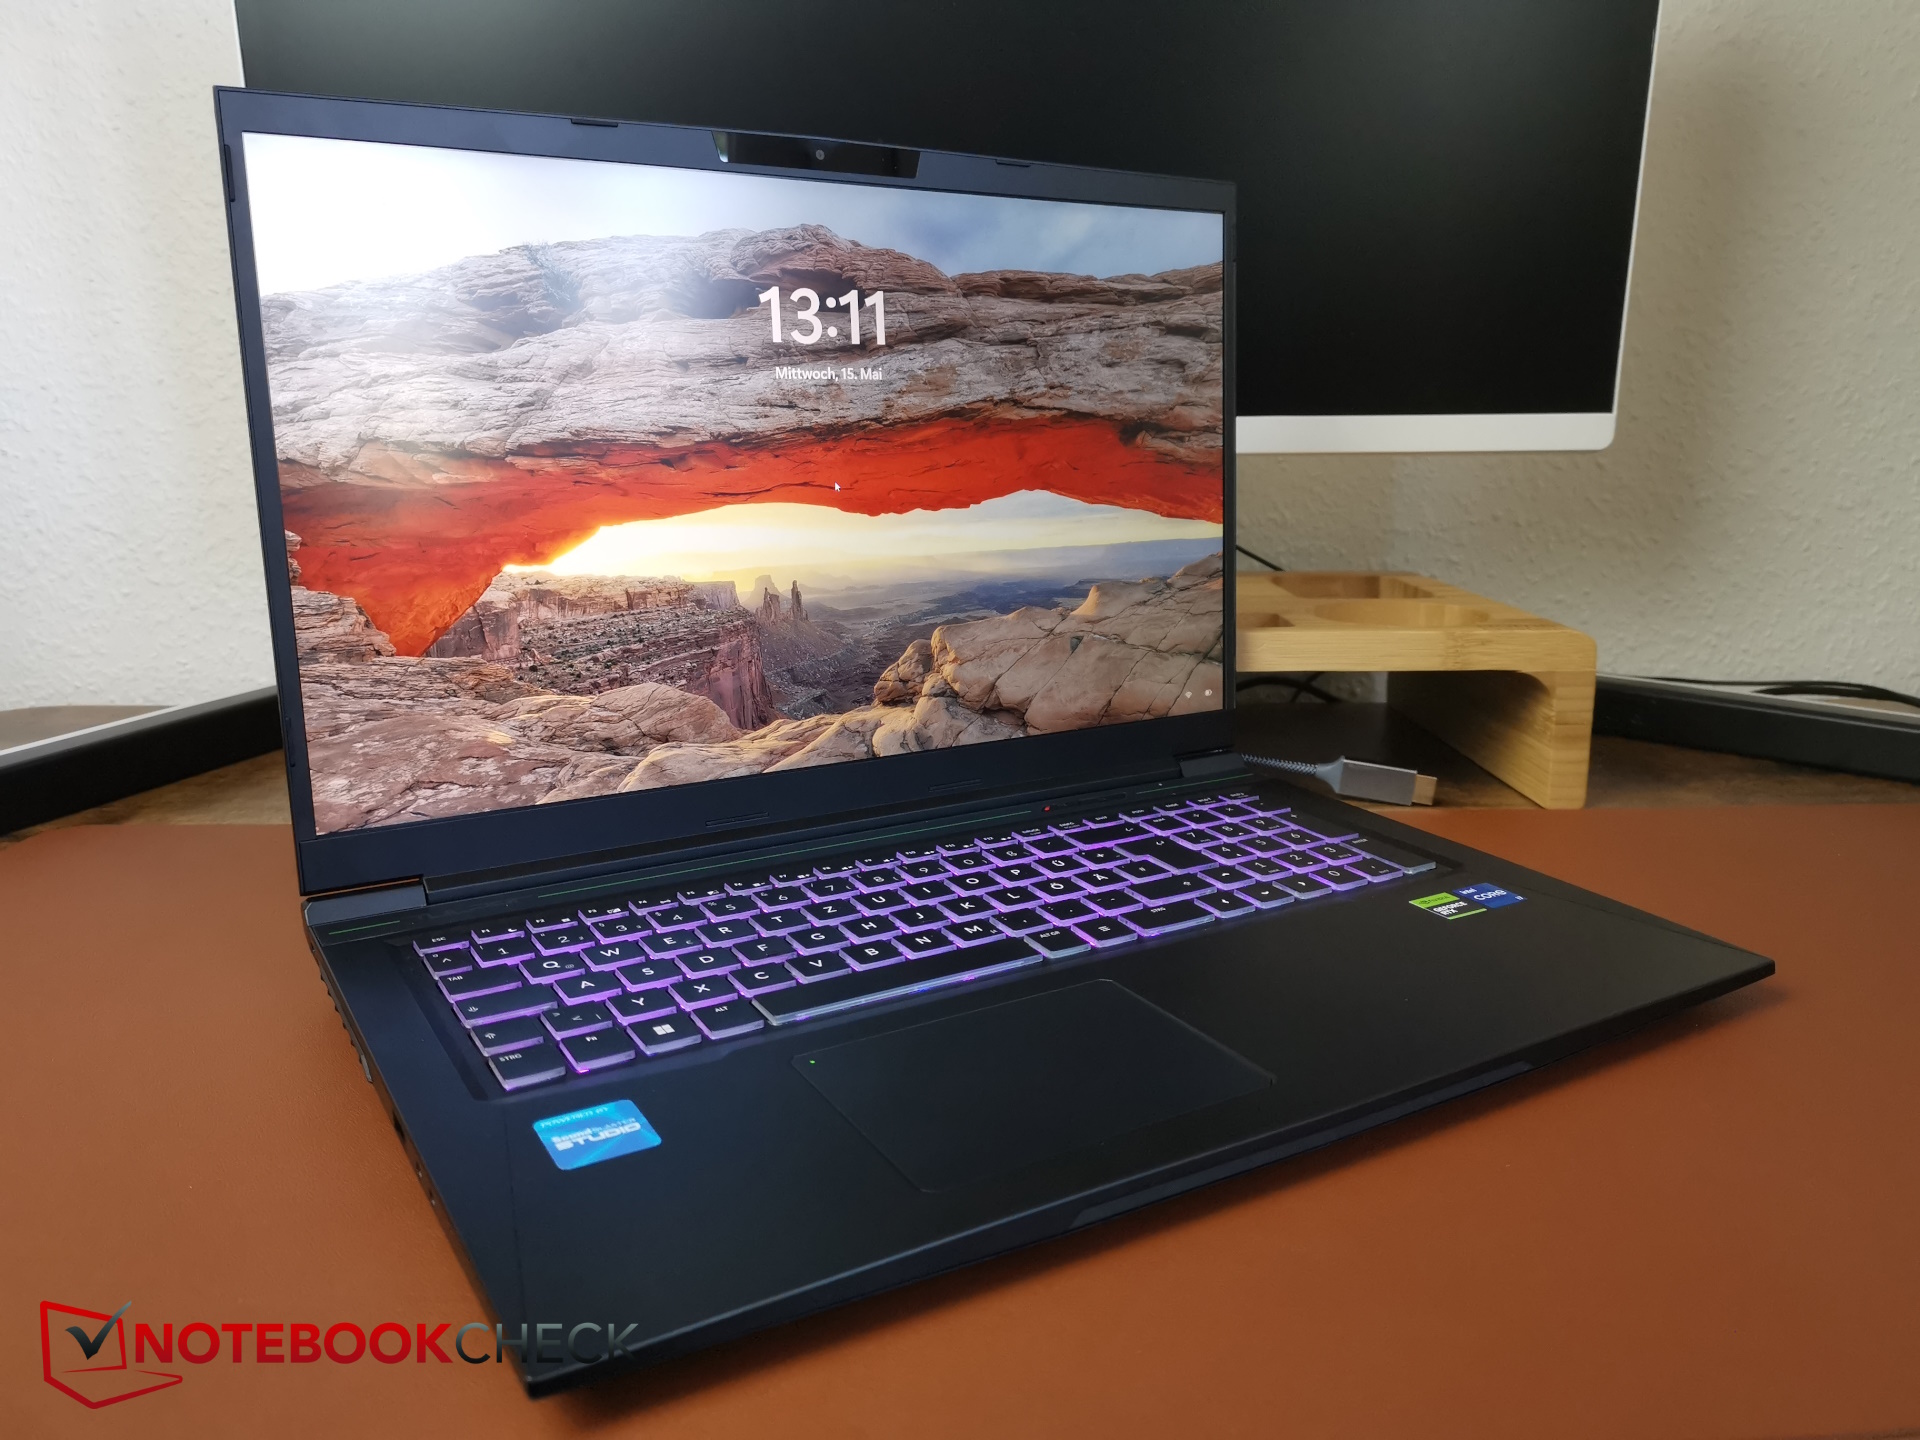
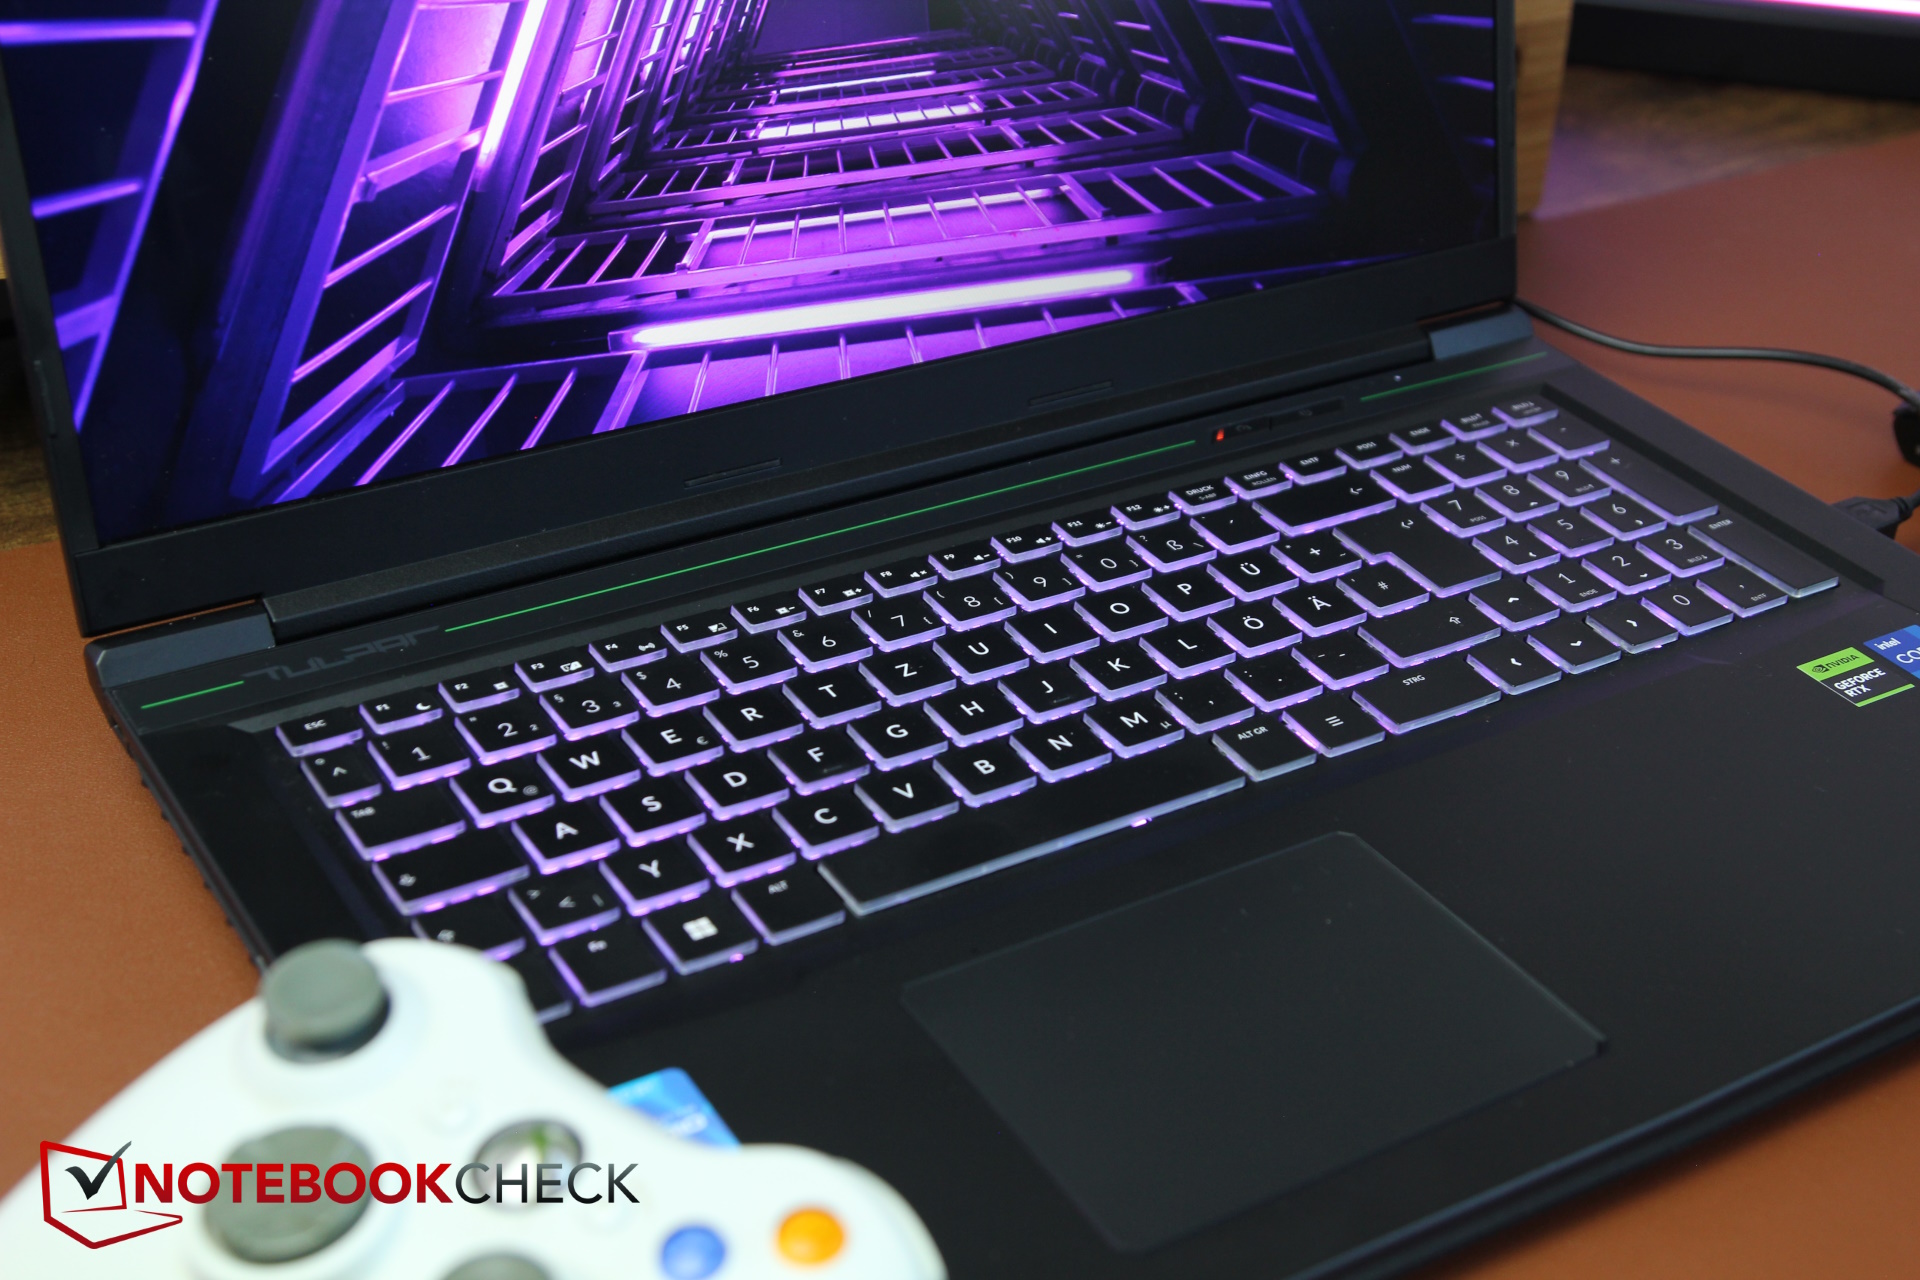
Input devices - Keyboard is better than expected
Keyboard
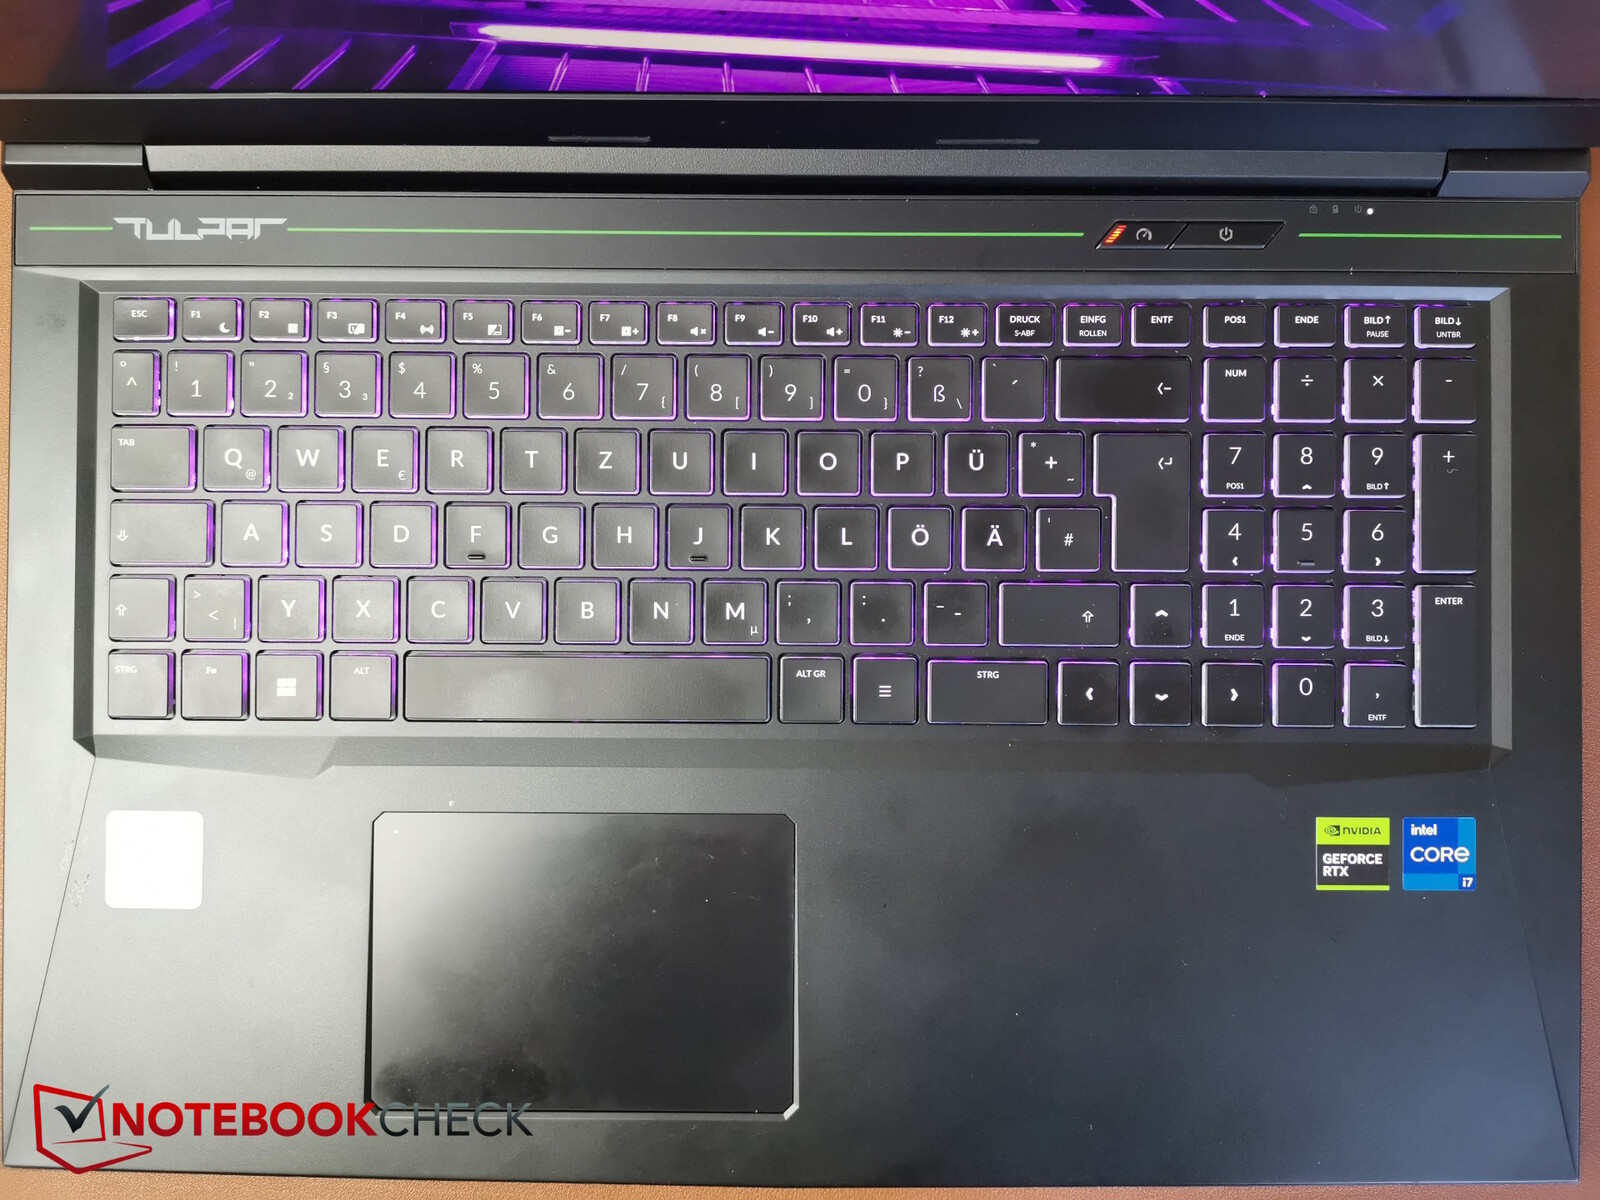
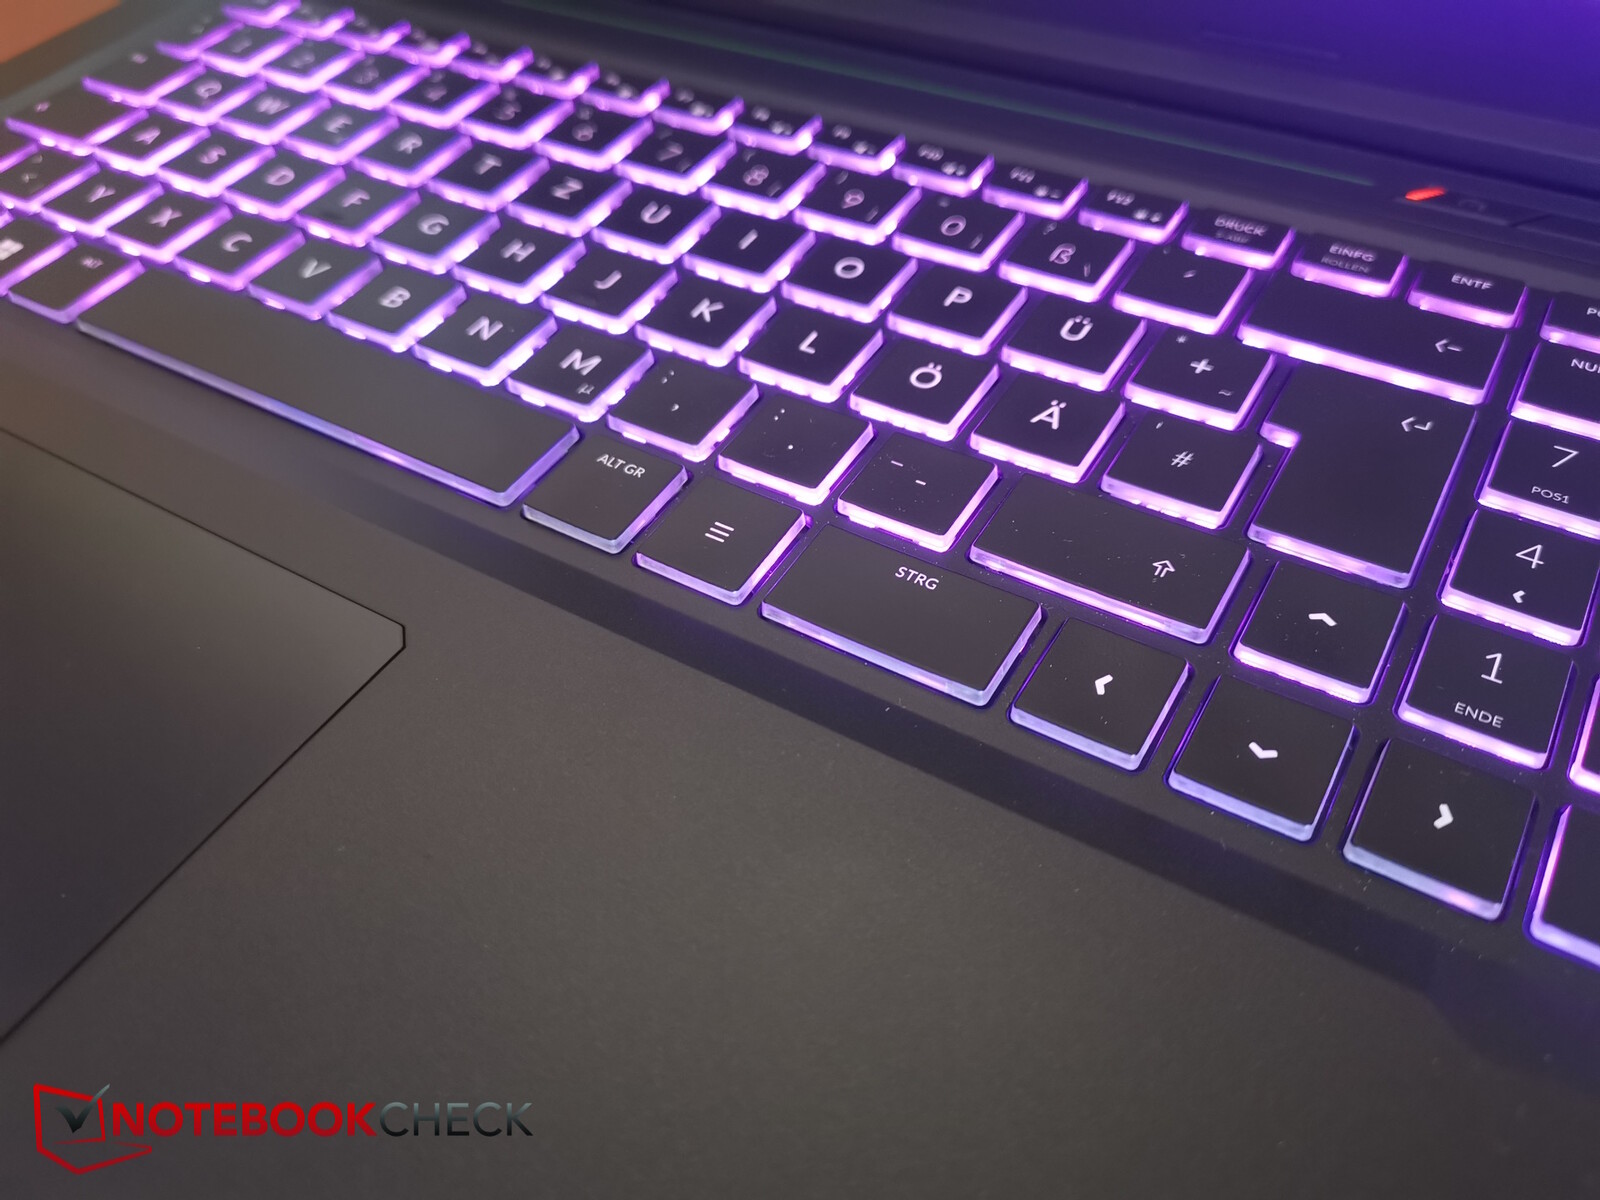
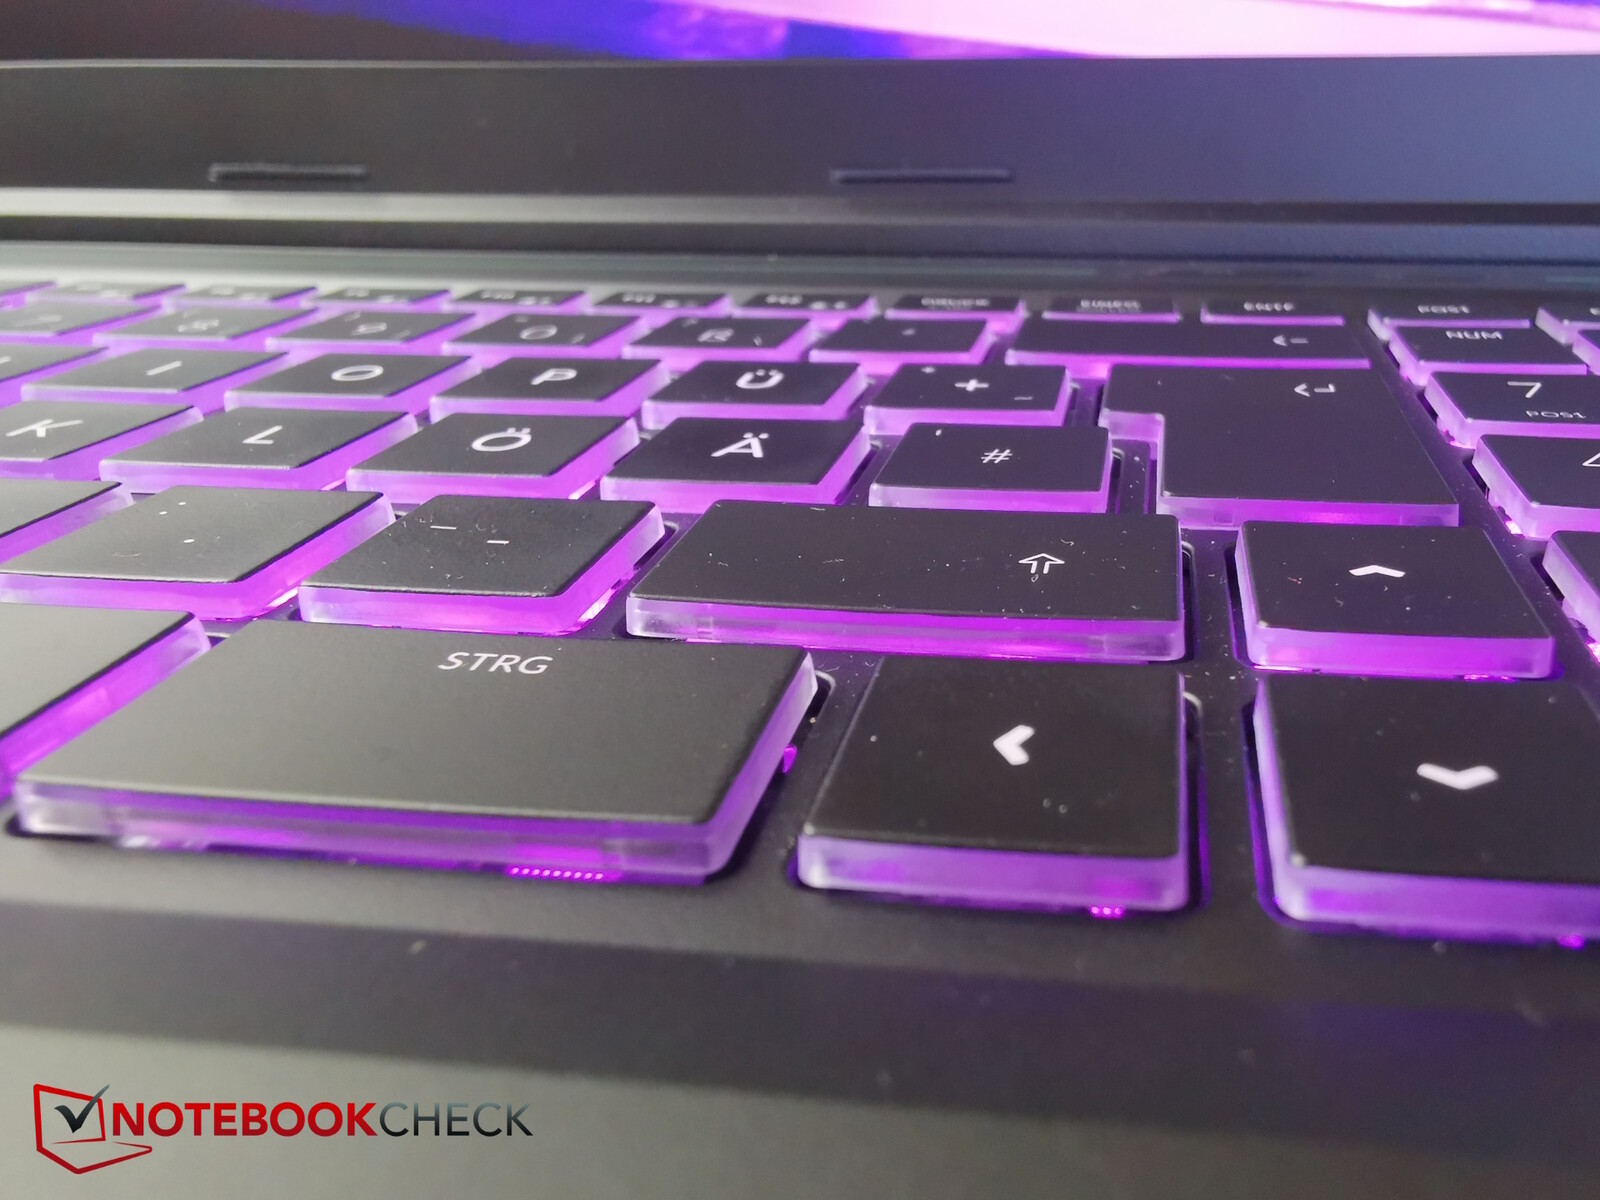
The keyboard has a standard layout; everything is spread over six rows and nothing deviates toward the top of bottom of the device. There is a number pad on the right-hand side. The base of the three-level backlit (1-zone) keyboard is slightly recessed and the keys measure 1.5 x 1.5 cm in size. Their pressure path is slightly longer and softer than on many other laptops, but their feedback is crisp enough. As a result, the keyboard feels less flat than some of its competitors and typing on it is quite comfortable and fast. The typing noise is moderate to medium loud and the key labelling is easy to read.
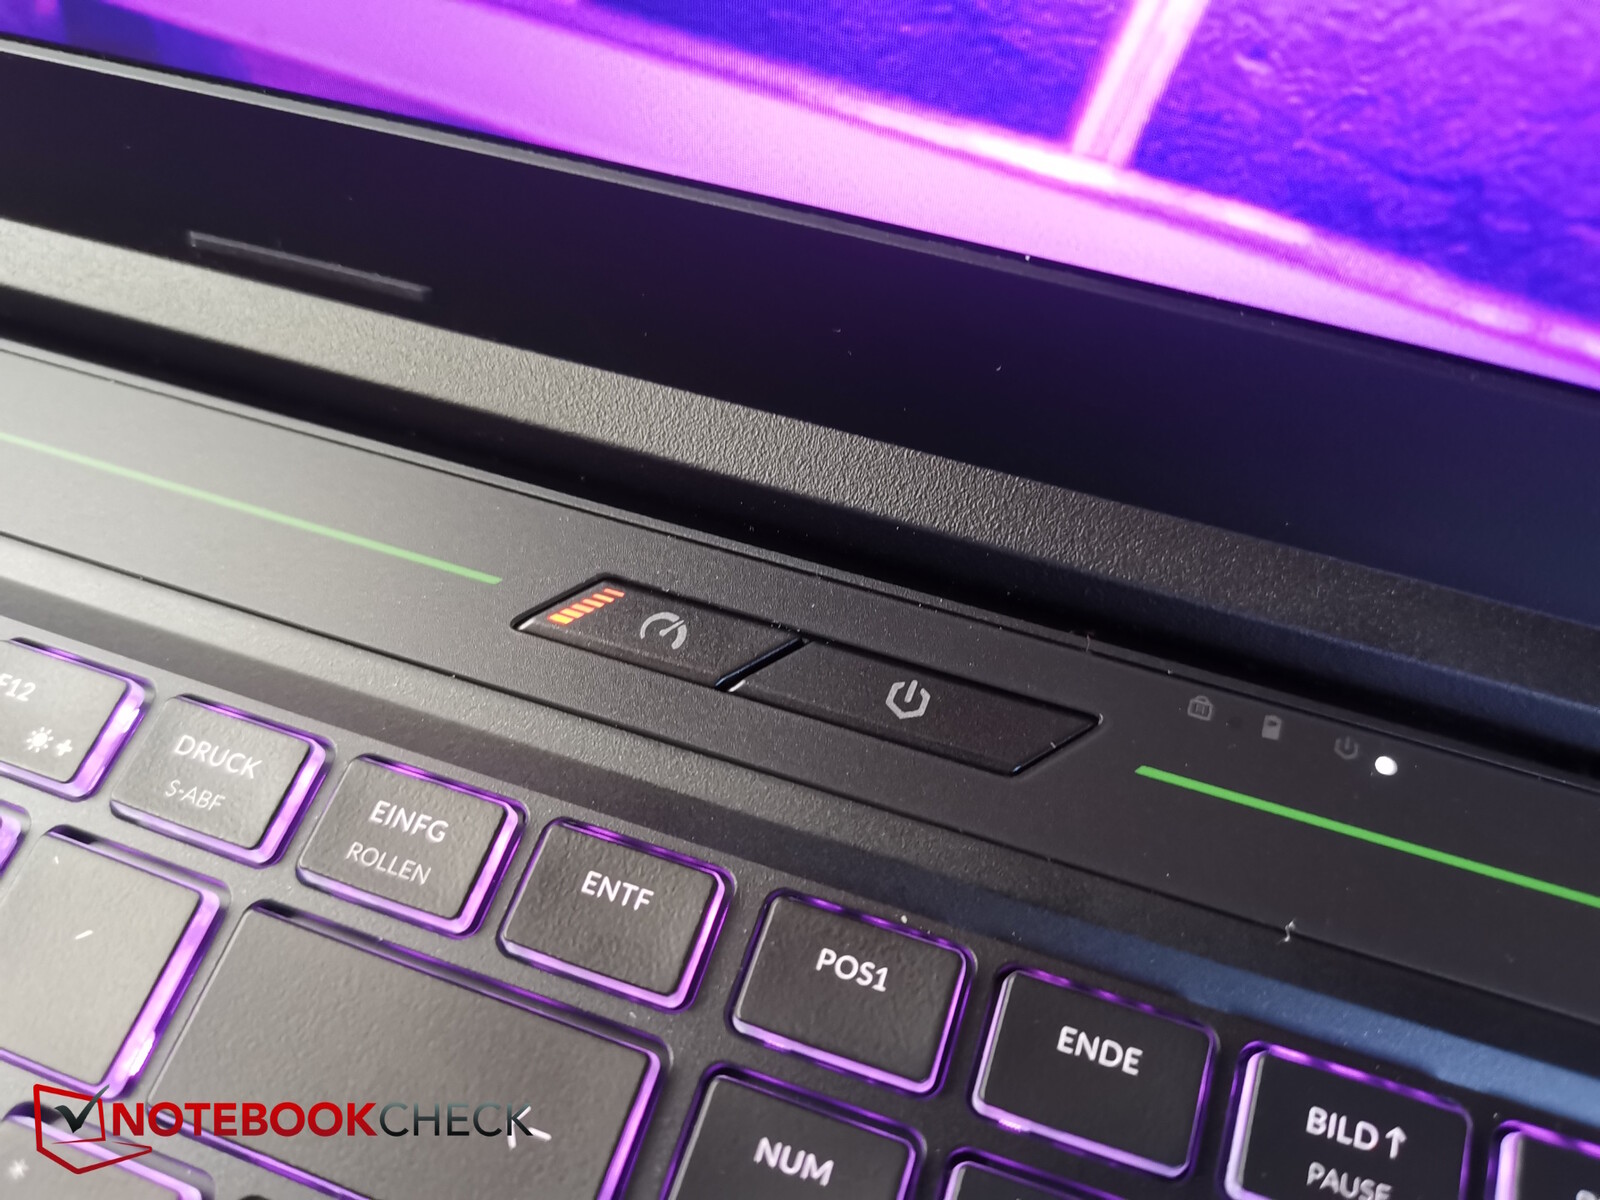
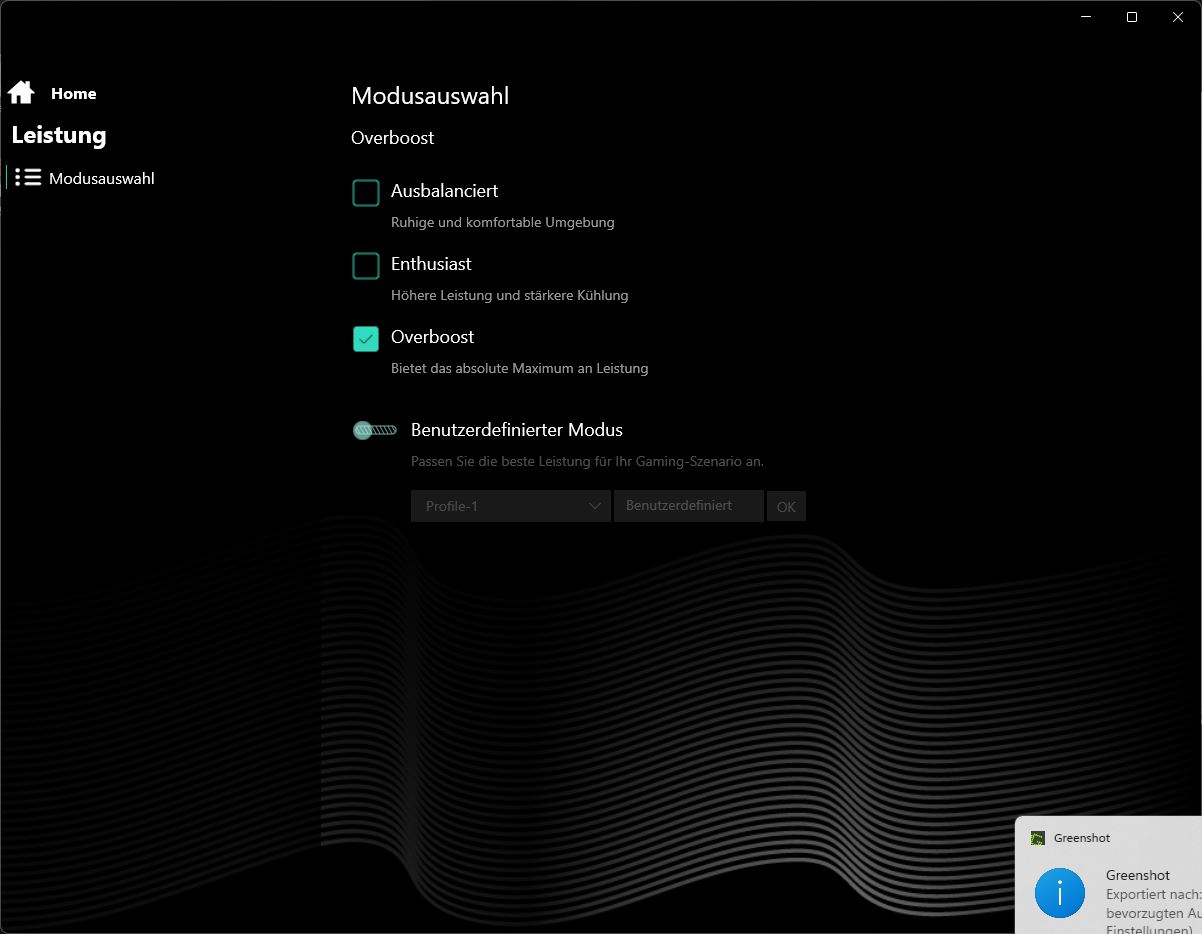
There is a separate power button above the rest of the keyboard and next to it sits another button to switch between performance profiles. Unfortunately, they have different names compared to what is listed in the Control Center, but they control exactly these ones. Office is balanced, gaming is enthusiast and turbo is actually called overboost. A small LED on the button shows which mode is in use (off = office, orange = gaming, lighter orange = turbo).
Touchpad
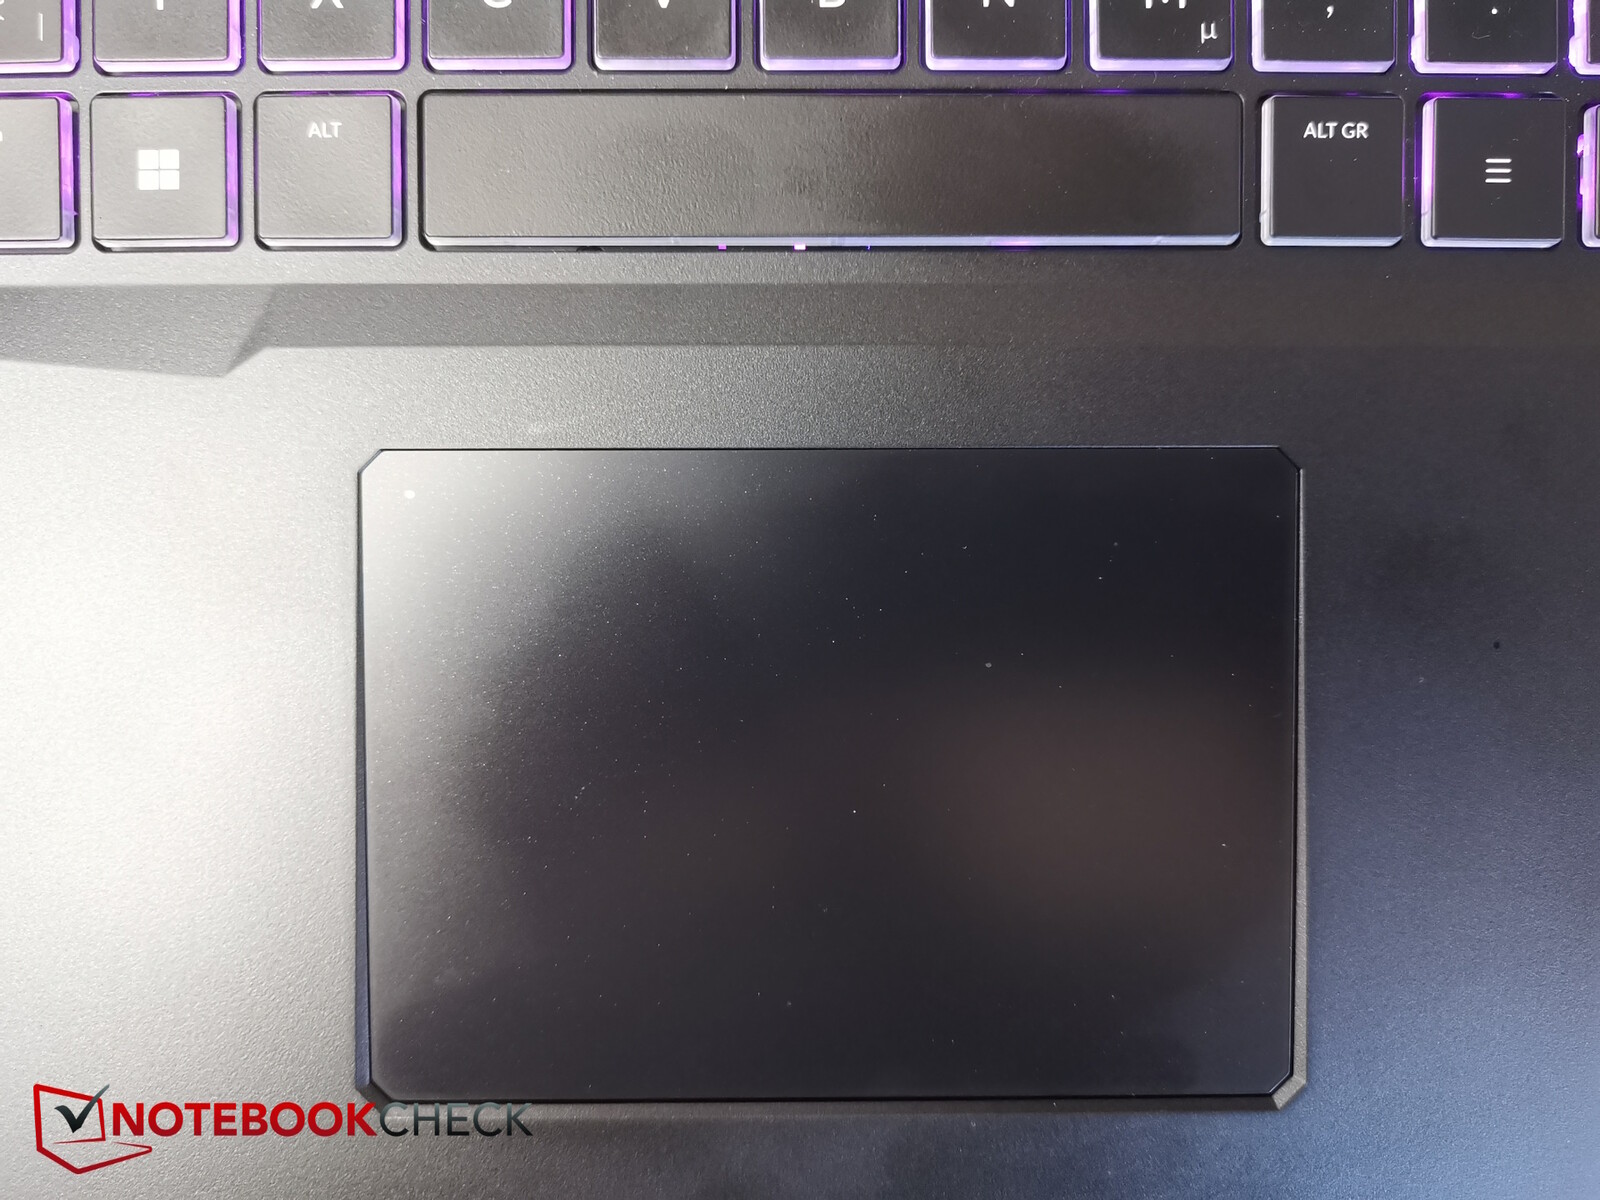
The Tulpar is clearly marketed toward gamers, and its relatively small touchpad (approx. 10.6 x 7.35 cm) makes this obvious, despite the laptop being a 17-inch model. As a result of the number pad, it isn't totally centred—instead, it sits slightly over to the left, meaning it is right beneath the space bar.
Its surface is only nice and smooth under optimum conditions—in other words, as soon as your hands are a little moist, they catch on its surface. You can (de)activate the touchpad by double tapping the top left part and a small LED shows its current status.
Its click noises are a little louder and don't give the device a very high-quality feel, but they are okay. All-in-all, the touchpad responds very well, delivering a solid total performance. Gamers will likely reach for a mouse, anyway.
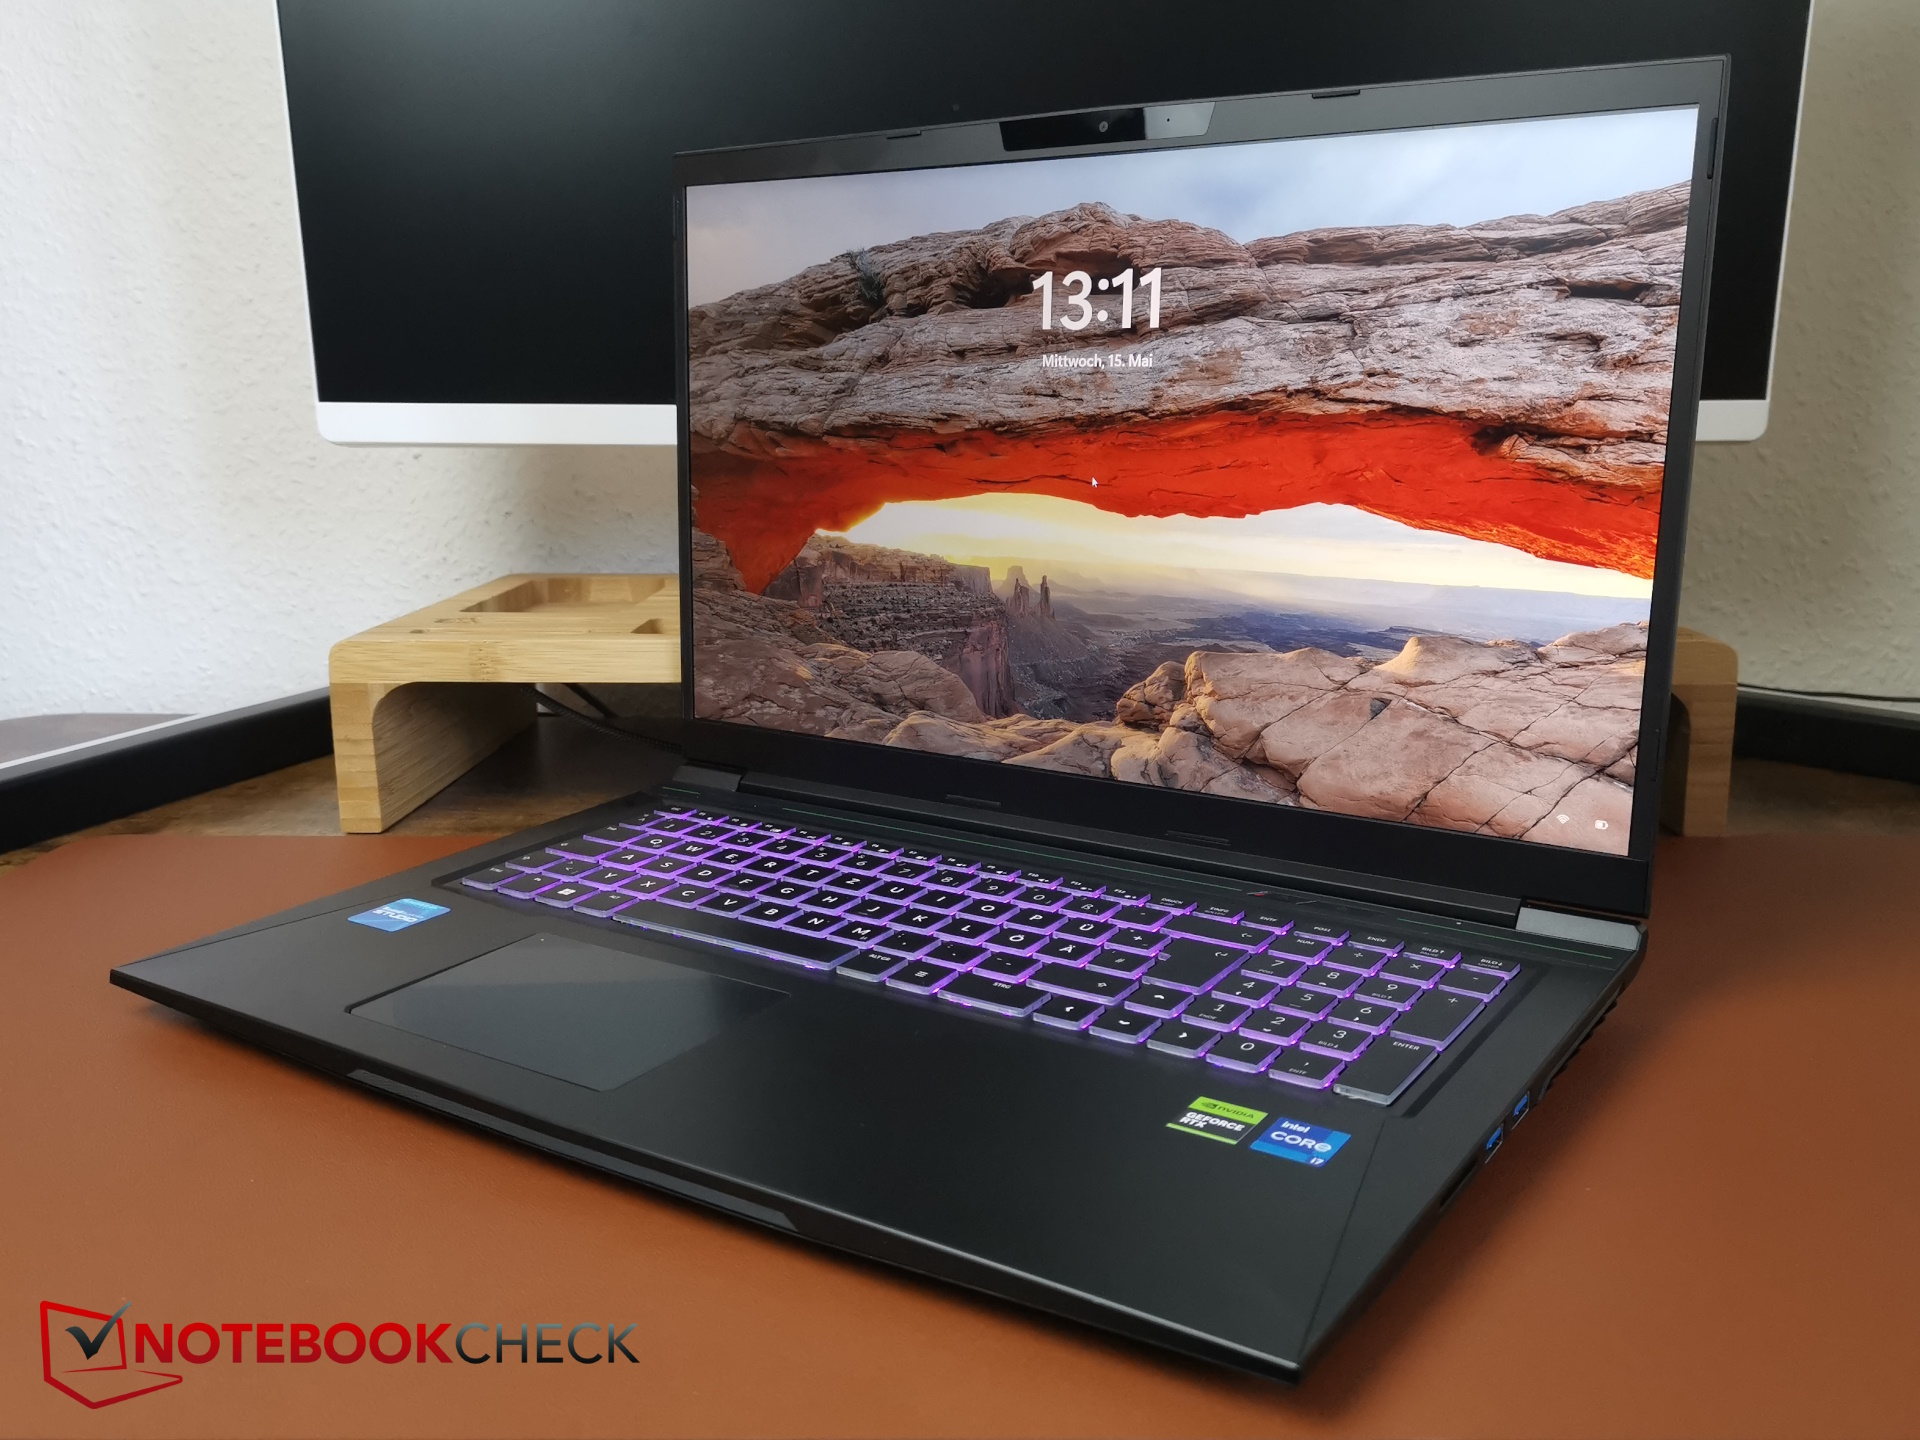
Display - Decent Full HD from 2019
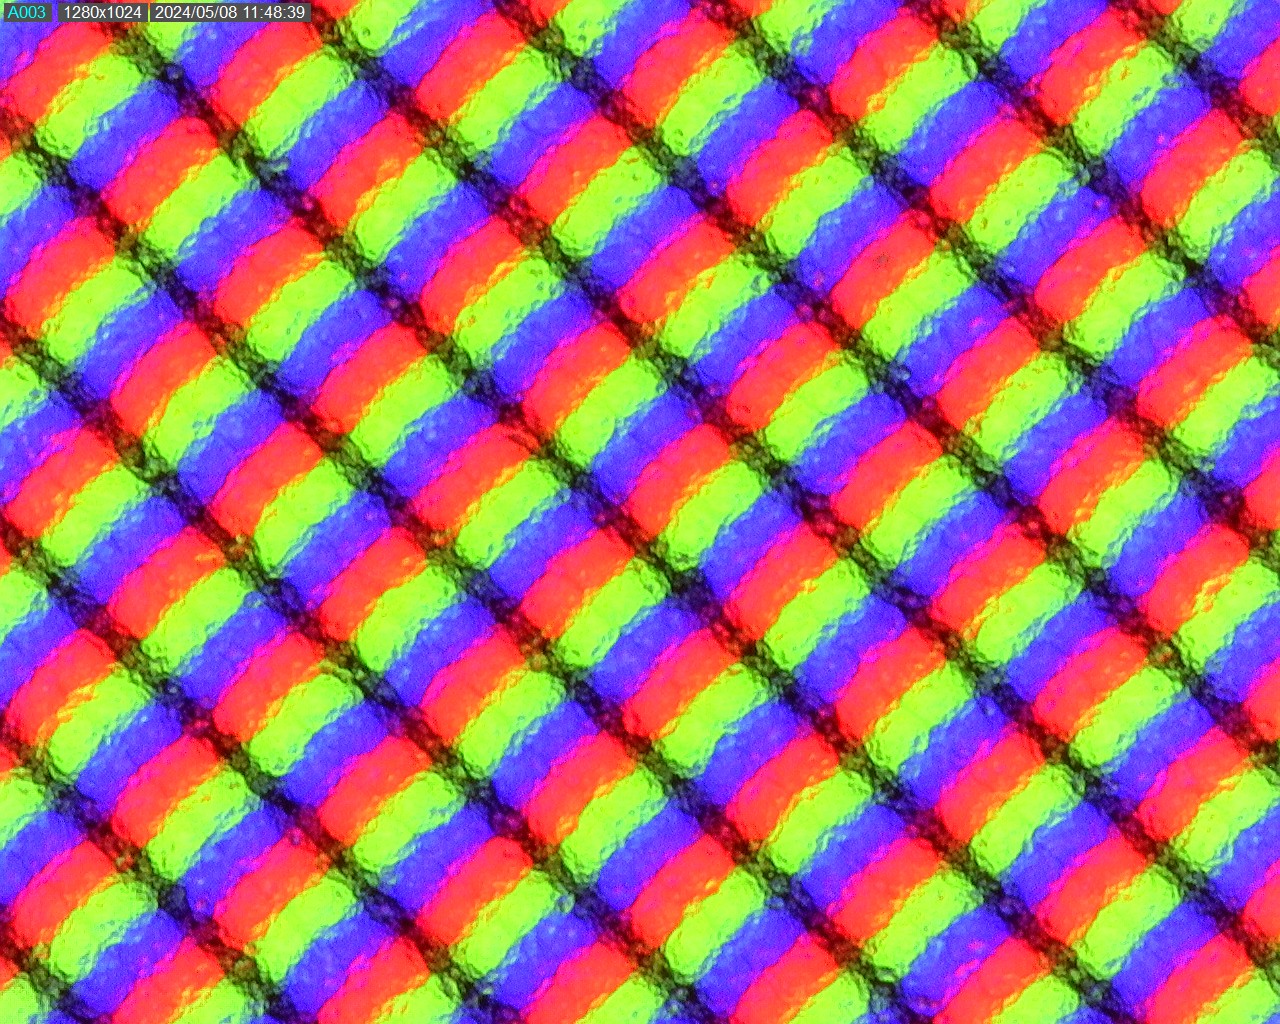
The matte Full HD IPS display from Chi Mei is an old acquaintance, also finding its home in several cheaper MSI G-series laptops, including the MSI GP75 Leopard 9SD (2019) which we previously tested, as well as the MSI GT76 9SG (2019) and the MSI GE75 9SG. Of course, age is not really a sign of quality in this case. With the exception of the Katana, none of the competitors rely on Full HD at 17 inches, but instead on higher-resolution screens with 2,560 x 1,440 pixels.
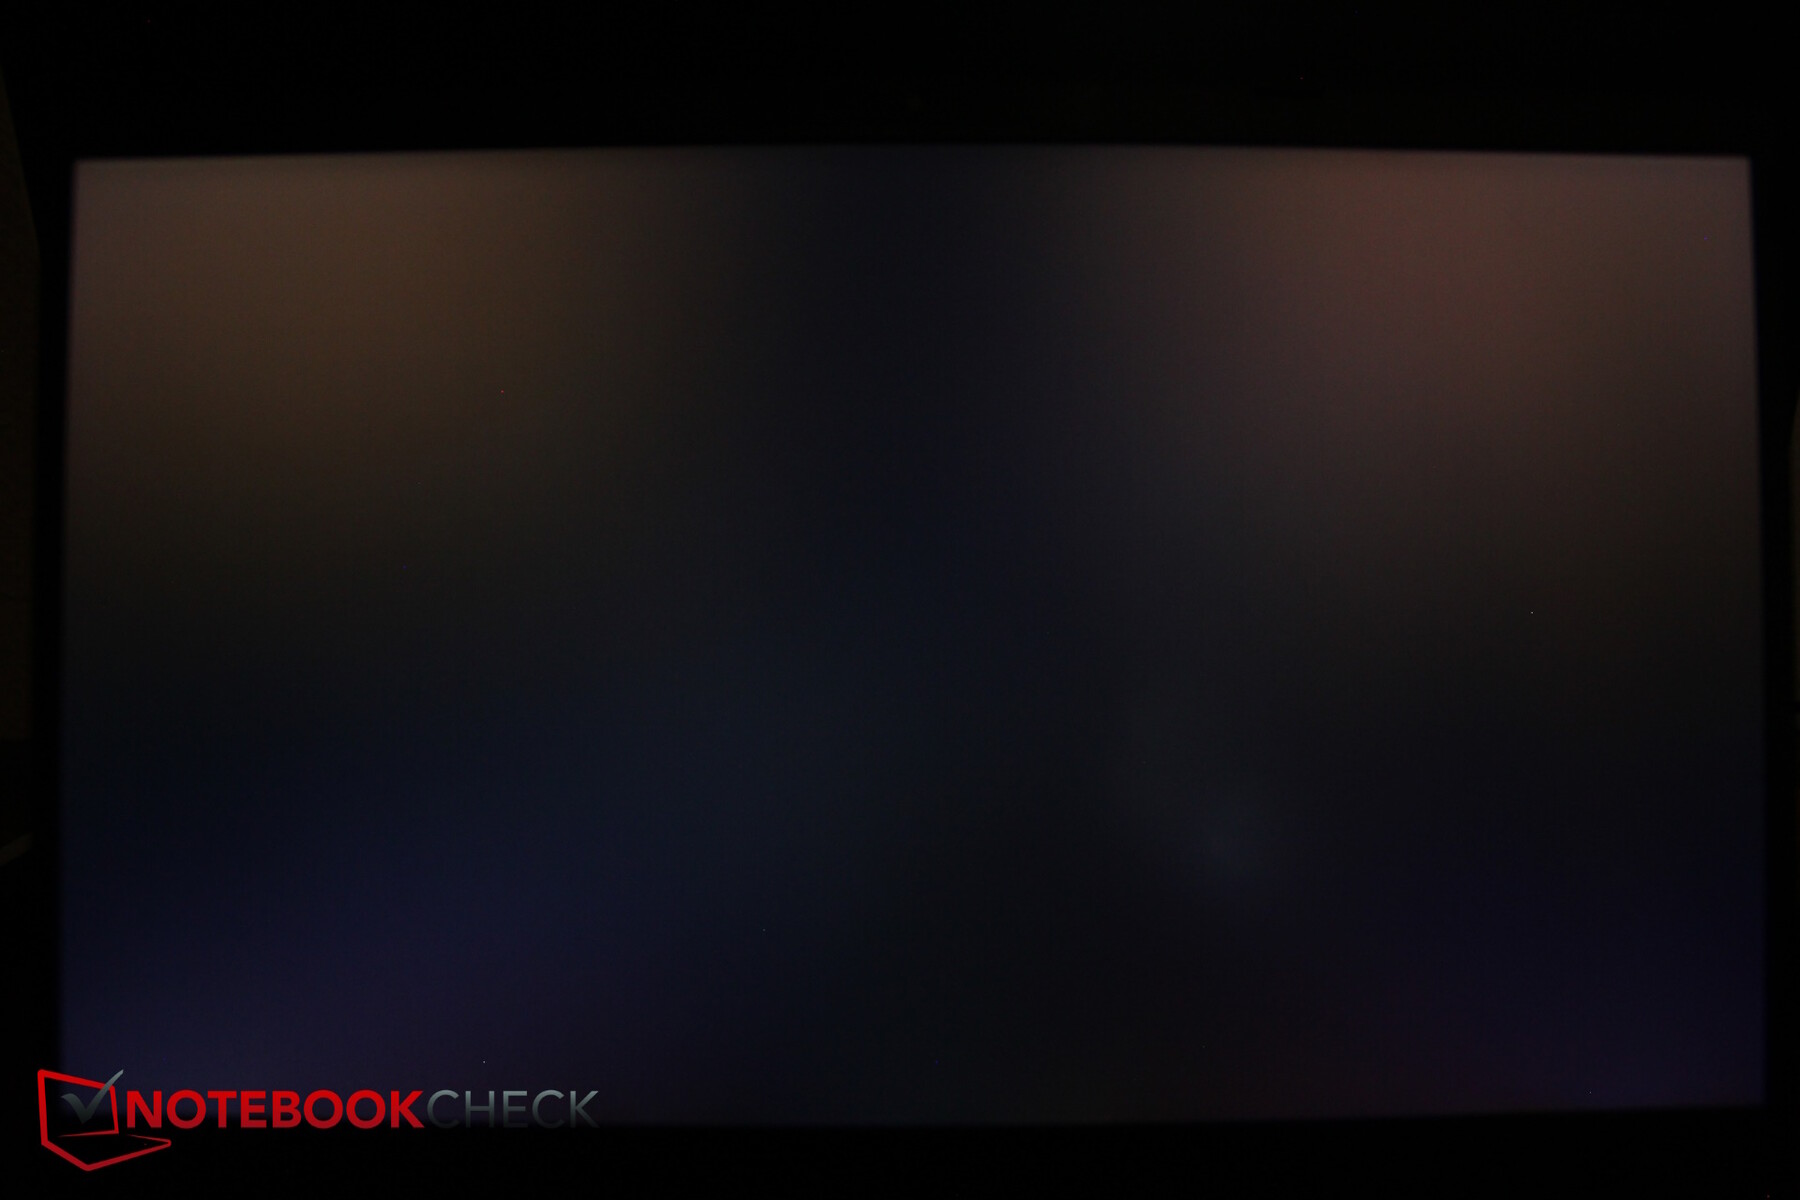
Even so, the panel isn't necessarily bad. Its average brightness of around 350 nits is fine, but its illumination could do with being more even. In turn, its contrast is higher than that of the comparison devices thanks to its black value which is good for a budget device. Backlight bleeding is barely noticeable and should definitely not get in your way.
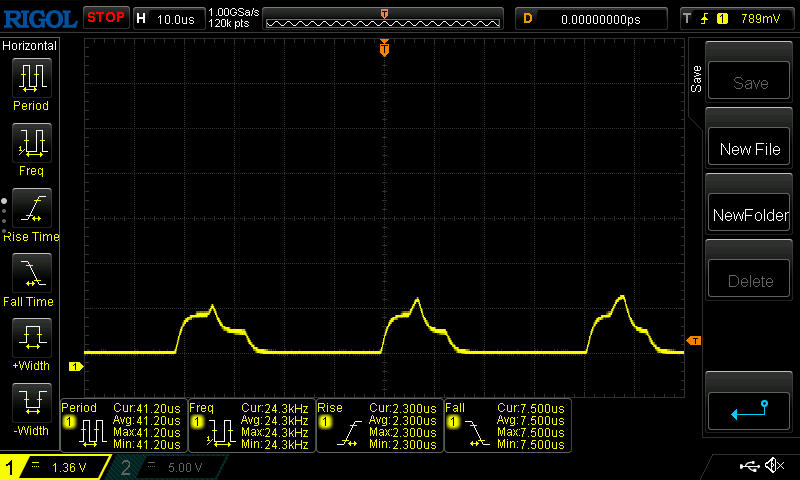
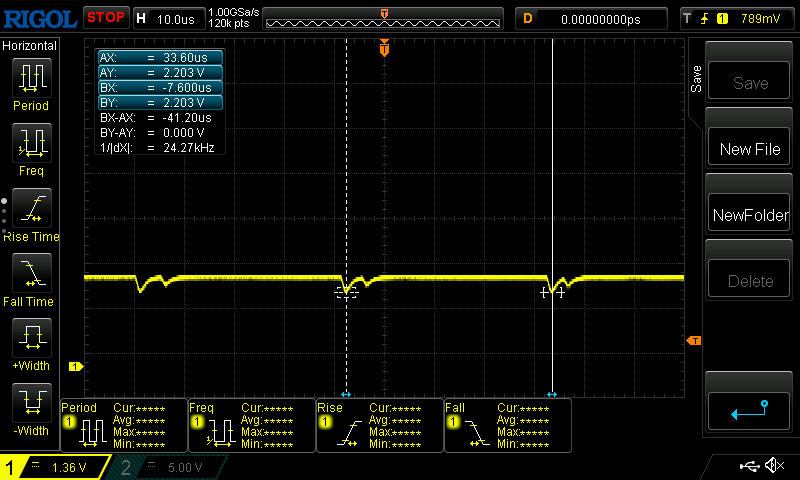
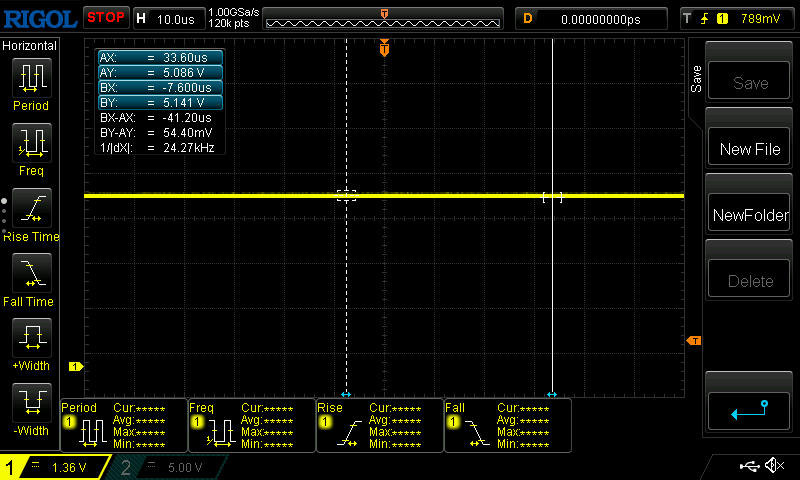
The screen flickers at brightness levels below 25 per cent, however, at a high frequency of 25 kHz to 42 kHz, meaning even sensitive users should barely have any issues with it. Its response times are approx. 11 (black to white) to 15 ms (gray to gray).
| |||||||||||||||||||||||||
Brightness Distribution: 83 %
Center on Battery: 373 cd/m²
Contrast: 1639:1 (Black: 0.23 cd/m²)
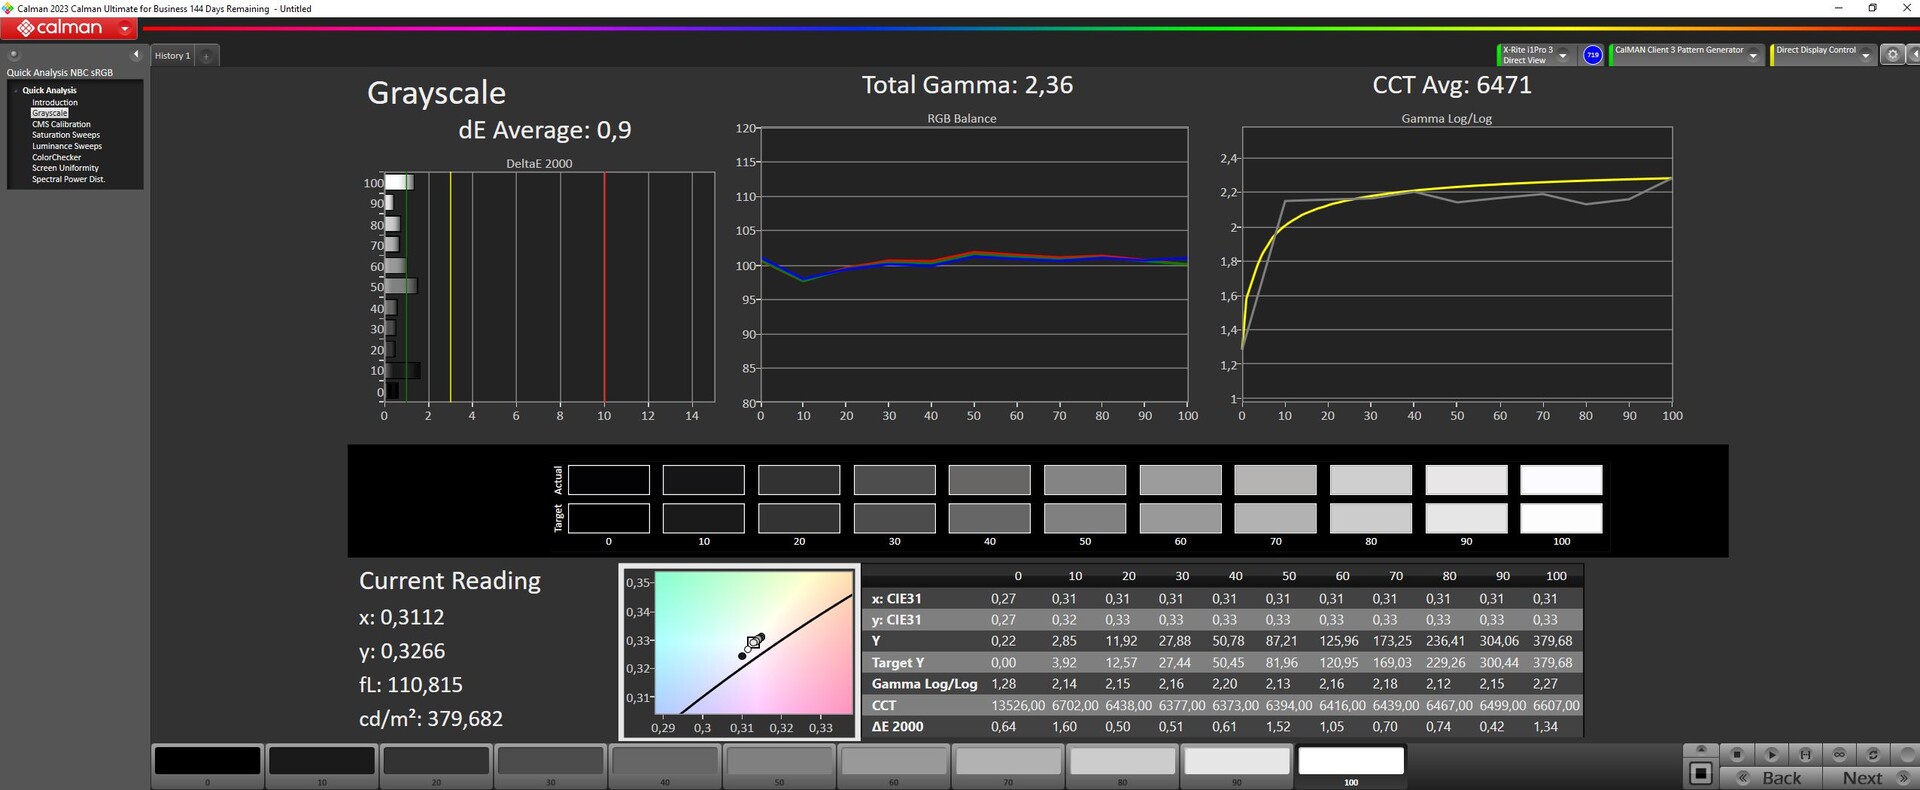
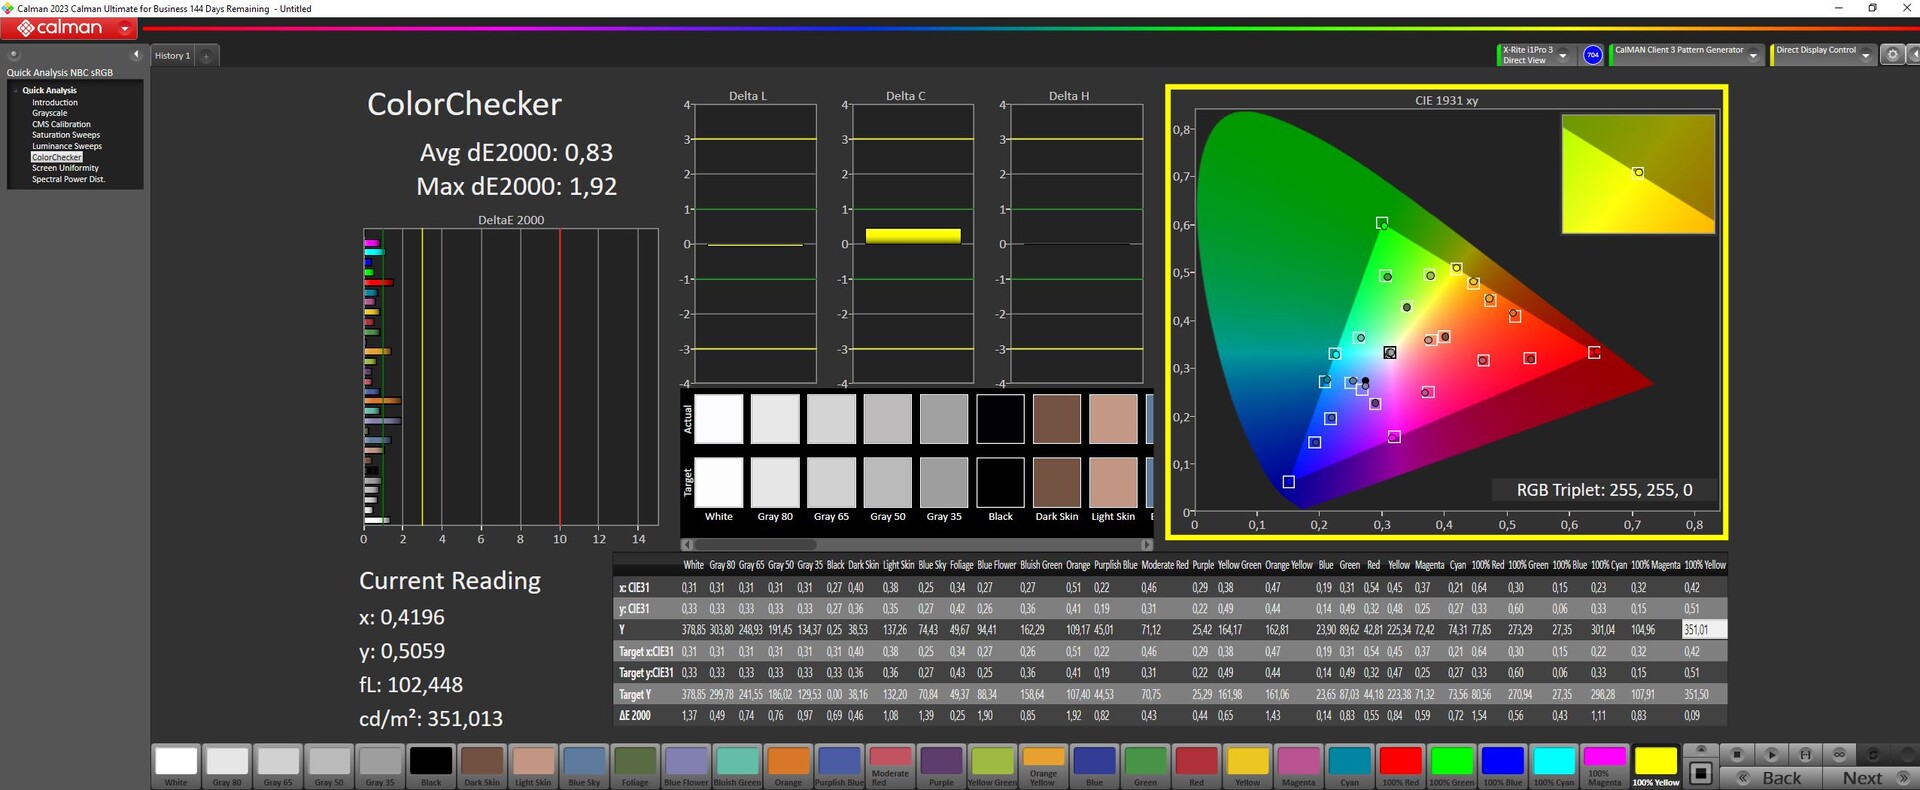
ΔE ColorChecker Calman: 0.83 | ∀{0.5-29.43 Ø4.71}
calibrated: 0.83
ΔE Greyscale Calman: 0.9 | ∀{0.09-98 Ø4.96}
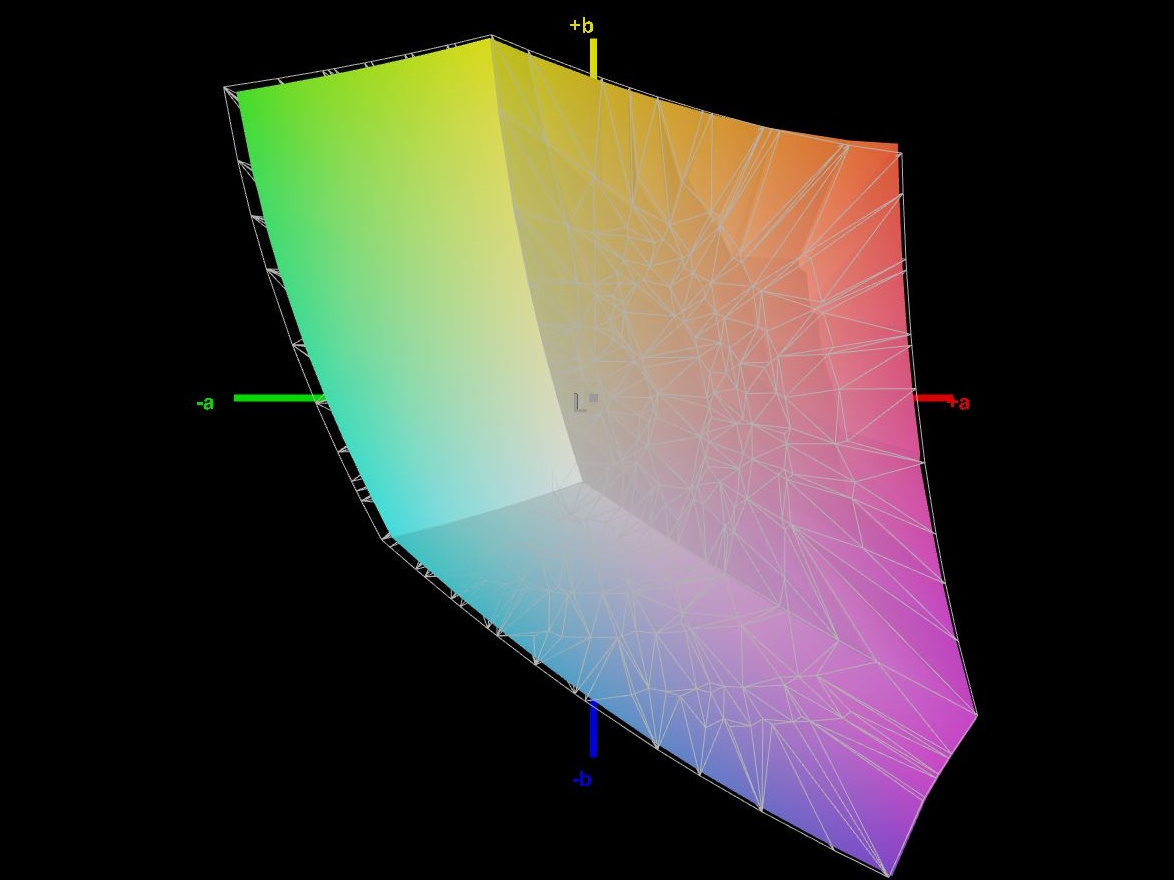
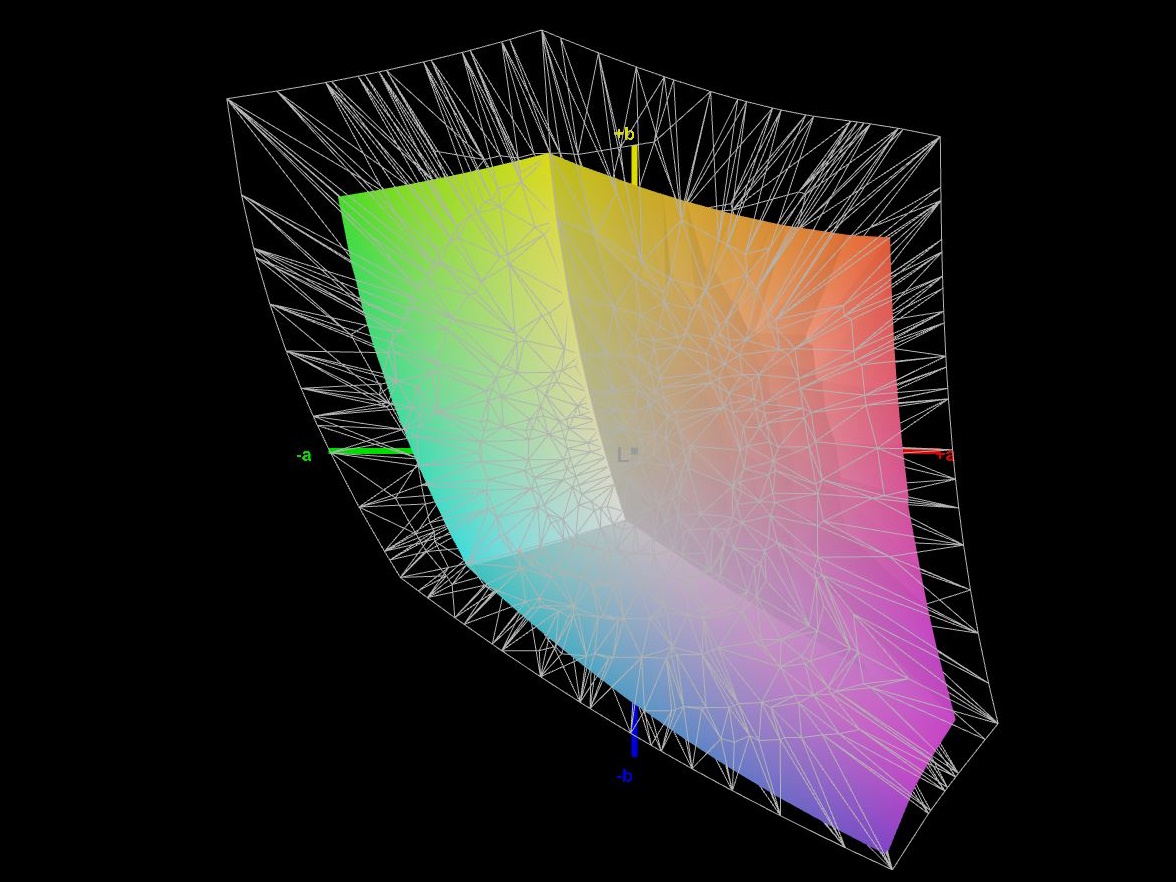
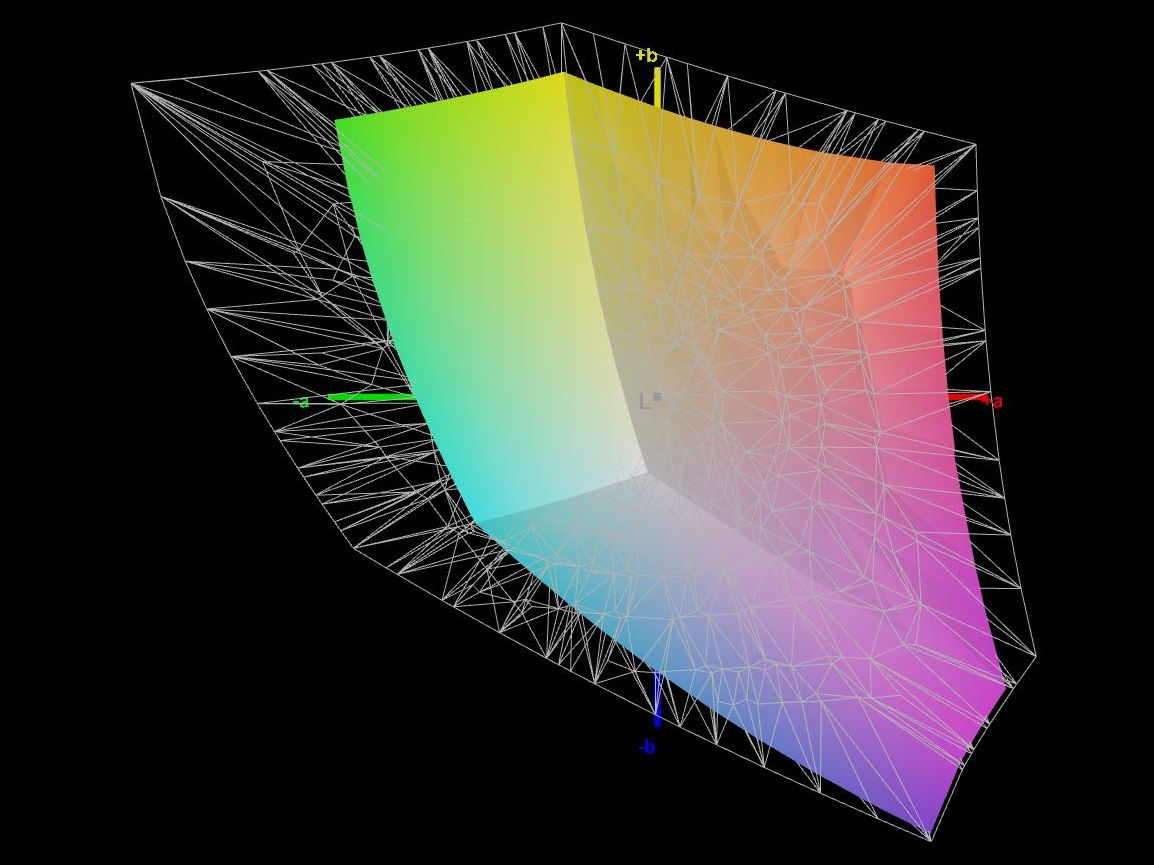
66.1% AdobeRGB 1998 (Argyll 3D)
96.2% sRGB (Argyll 3D)
64.2% Display P3 (Argyll 3D)
Gamma: 2.36
CCT: 6471 K
| Tulpar T7 V20.6 Chi Mei CMN175C (CMN N173HCE-G33), IPS, 1920x1080, 17.3" | Schenker XMG Apex 17 (Late 23) BOE CQ NE173QHM-NZ3, IPS, 2560x1440, 17.3" | Acer Nitro 17 AN17-51-71ER BOE0B7C NE173QHM-NY6, , 2560x1440, 17.3" | Medion Erazer Defender P40 BOE CQ NE173QHM-NZ3, IPS, 2560x1440, 17.3" | MSI Katana 17 B13VFK B173HAN04.9, IPS LED, 1920x1080, 17.3" | Lenovo Legion 5 16IRX G9 NE160QDM-NZ3, IPS, 2560x1600, 16" | |
|---|---|---|---|---|---|---|
| Display | 4% | 29% | 5% | -36% | 10% | |
| Display P3 Coverage (%) | 64.2 | 68.1 6% | 98.3 53% | 68.3 6% | 40.8 -36% | 72.4 13% |
| sRGB Coverage (%) | 96.2 | 97.7 2% | 100 4% | 98.1 2% | 61 -37% | 100 4% |
| AdobeRGB 1998 Coverage (%) | 66.1 | 69.5 5% | 85.7 30% | 69.8 6% | 42.2 -36% | 74.1 12% |
| Response Times | 19% | 14% | 12% | -129% | 19% | |
| Response Time Grey 50% / Grey 80% * (ms) | 14.7 ? | 13.5 ? 8% | 14.8 ? -1% | 14.6 ? 1% | 33 ? -124% | 12.5 ? 15% |
| Response Time Black / White * (ms) | 11.1 ? | 7.9 ? 29% | 8 ? 28% | 8.7 ? 22% | 26 ? -134% | 8.7 ? 22% |
| PWM Frequency (Hz) | 25000 | |||||
| PWM Amplitude * (%) | 27 | |||||
| Screen | -55% | -153% | -32% | -222% | -9% | |
| Brightness middle (cd/m²) | 377 | 403 7% | 361 -4% | 364 -3% | 267 -29% | 526 40% |
| Brightness (cd/m²) | 353 | 381 8% | 326 -8% | 343 -3% | 256 -27% | 500 42% |
| Brightness Distribution (%) | 83 | 90 8% | 87 5% | 86 4% | 93 12% | 87 5% |
| Black Level * (cd/m²) | 0.23 | 0.37 -61% | 0.6 -161% | 0.28 -22% | 0.21 9% | 0.33 -43% |
| Contrast (:1) | 1639 | 1089 -34% | 602 -63% | 1300 -21% | 1271 -22% | 1594 -3% |
| Colorchecker dE 2000 * | 0.83 | 2.22 -167% | 3.83 -361% | 1.67 -101% | 4.7 -466% | 1.2 -45% |
| Colorchecker dE 2000 max. * | 1.92 | 3.76 -96% | 5.71 -197% | 2.78 -45% | 20.4 -963% | 2.1 -9% |
| Colorchecker dE 2000 calibrated * | 0.83 | 1.22 -47% | 3.48 -319% | 1.14 -37% | 4.5 -442% | 1 -20% |
| Greyscale dE 2000 * | 0.9 | 1.9 -111% | 3.29 -266% | 1.4 -56% | 1.5 -67% | 1.3 -44% |
| Gamma | 2.36 93% | 2.046 108% | 2.29 96% | 2.091 105% | 2.12 104% | 2.23 99% |
| CCT | 6471 100% | 6656 98% | 6679 97% | 6568 99% | 6552 99% | 6391 102% |
| Total Average (Program / Settings) | -11% /
-32% | -37% /
-90% | -5% /
-18% | -129% /
-169% | 7% /
-1% |
* ... smaller is better
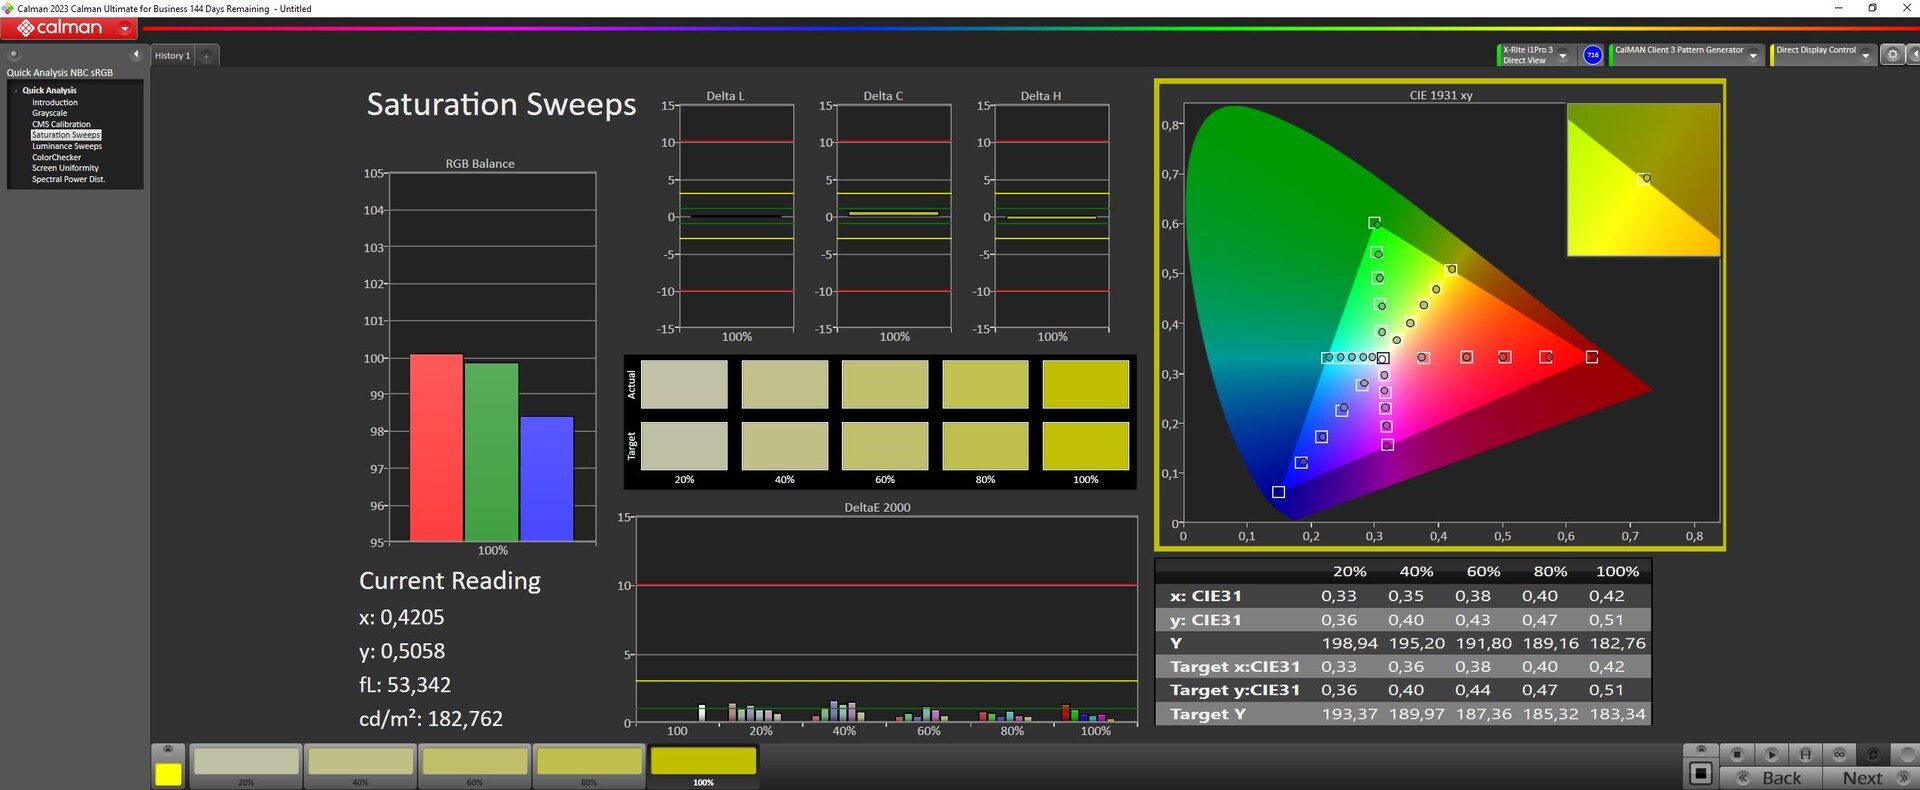
The somewhat outdated panel cannot quite keep up with current displays when it comes to color space coverage. If you are looking for more color space coverage than sRGB, then you should look elsewhere.
The panel is astoundingly well-calibrated straight out of the box, especially within this price class. Its average grayscale and ColorChecker DeltaE values are only 0.9 and 0.83 (measured against sRGB), so users won't need to calibrate the screen further.
Display Response Times
| ↔ Response Time Black to White | ||
|---|---|---|
| 11.1 ms ... rise ↗ and fall ↘ combined | ↗ 5.7 ms rise | |
| ↘ 5.4 ms fall | ||
| The screen shows good response rates in our tests, but may be too slow for competitive gamers. In comparison, all tested devices range from 0.1 (minimum) to 240 (maximum) ms. » 30 % of all devices are better. This means that the measured response time is better than the average of all tested devices (19.8 ms). | ||
| ↔ Response Time 50% Grey to 80% Grey | ||
| 14.7 ms ... rise ↗ and fall ↘ combined | ↗ 6.8 ms rise | |
| ↘ 7.9 ms fall | ||
| The screen shows good response rates in our tests, but may be too slow for competitive gamers. In comparison, all tested devices range from 0.165 (minimum) to 636 (maximum) ms. » 29 % of all devices are better. This means that the measured response time is better than the average of all tested devices (31 ms). | ||
Screen Flickering / PWM (Pulse-Width Modulation)
| Screen flickering / PWM detected | 25000 Hz Amplitude: 27 % | 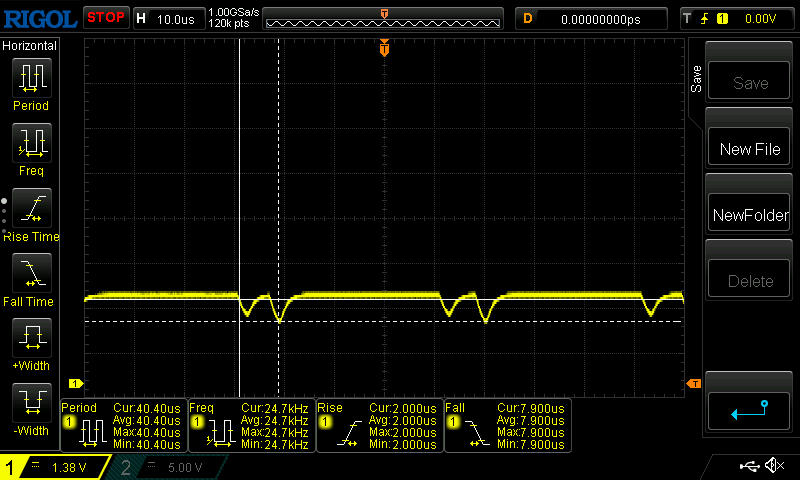 | |
The display backlight flickers at 25000 Hz (worst case, e.g., utilizing PWM) . The frequency of 25000 Hz is quite high, so most users sensitive to PWM should not notice any flickering. In comparison: 52 % of all tested devices do not use PWM to dim the display. If PWM was detected, an average of 7747 (minimum: 5 - maximum: 343500) Hz was measured. | |||
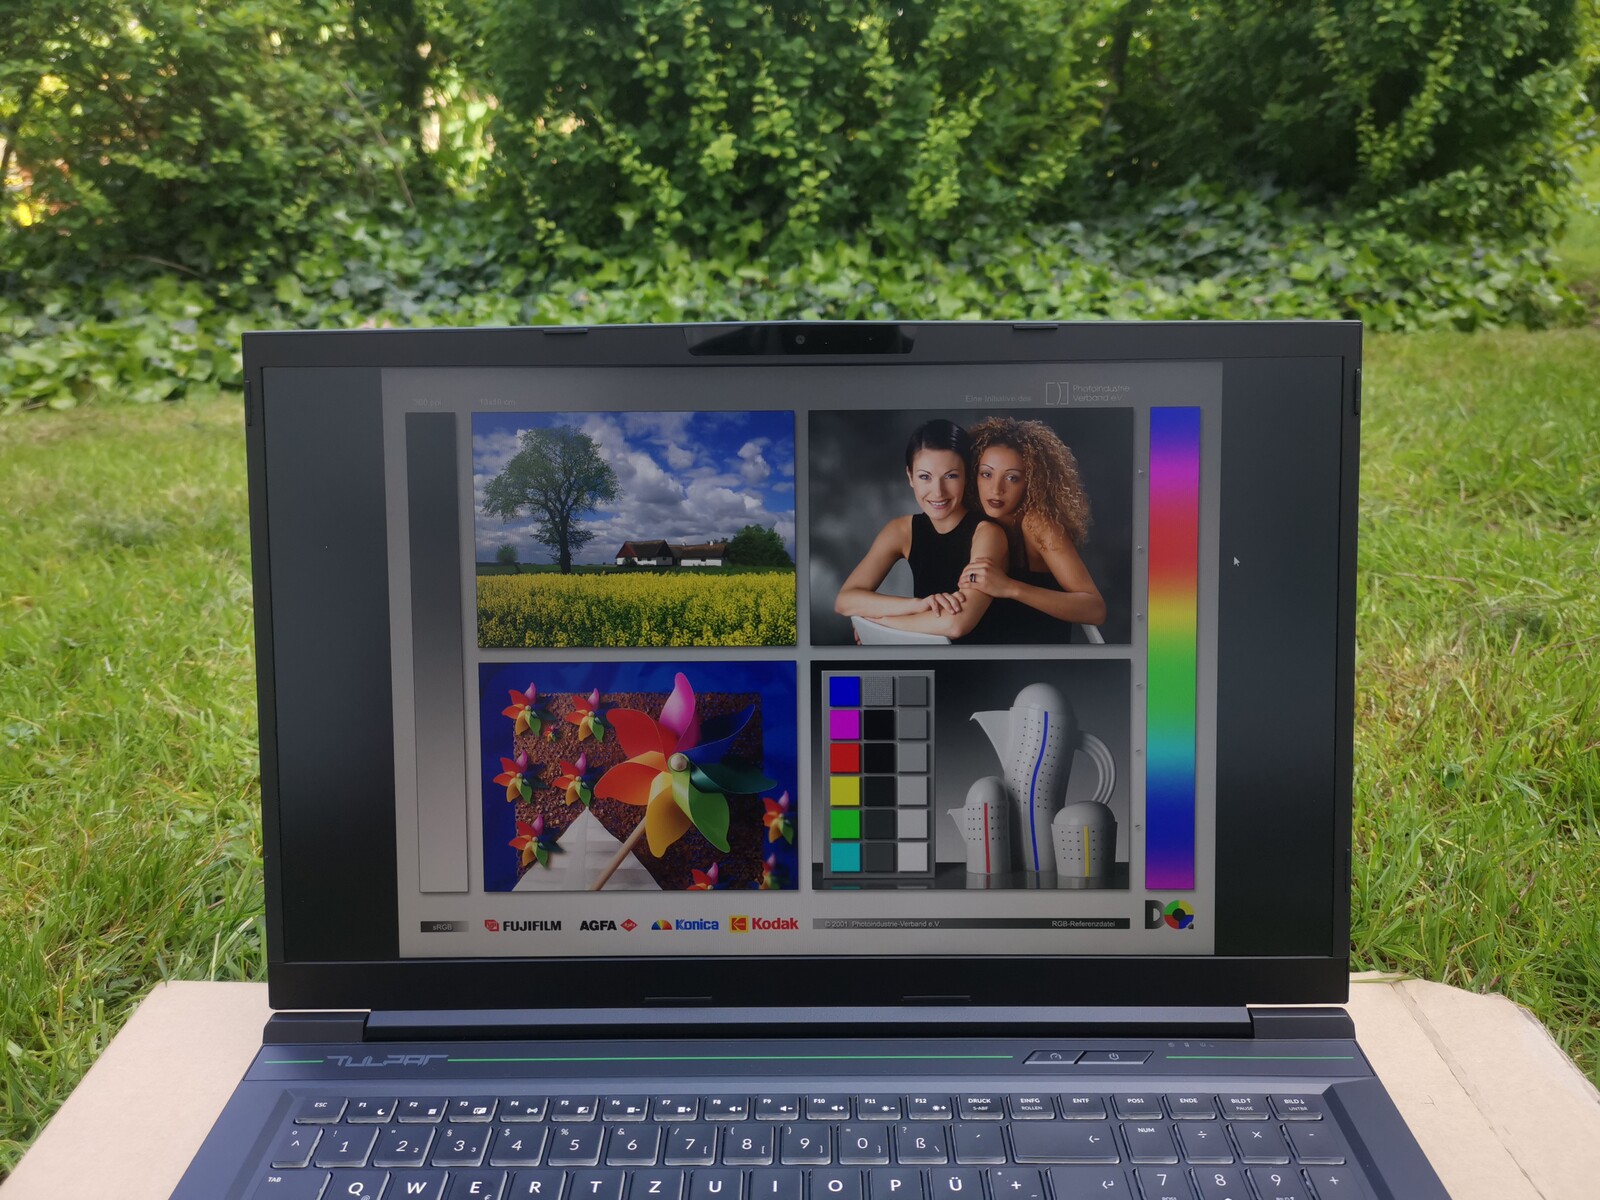
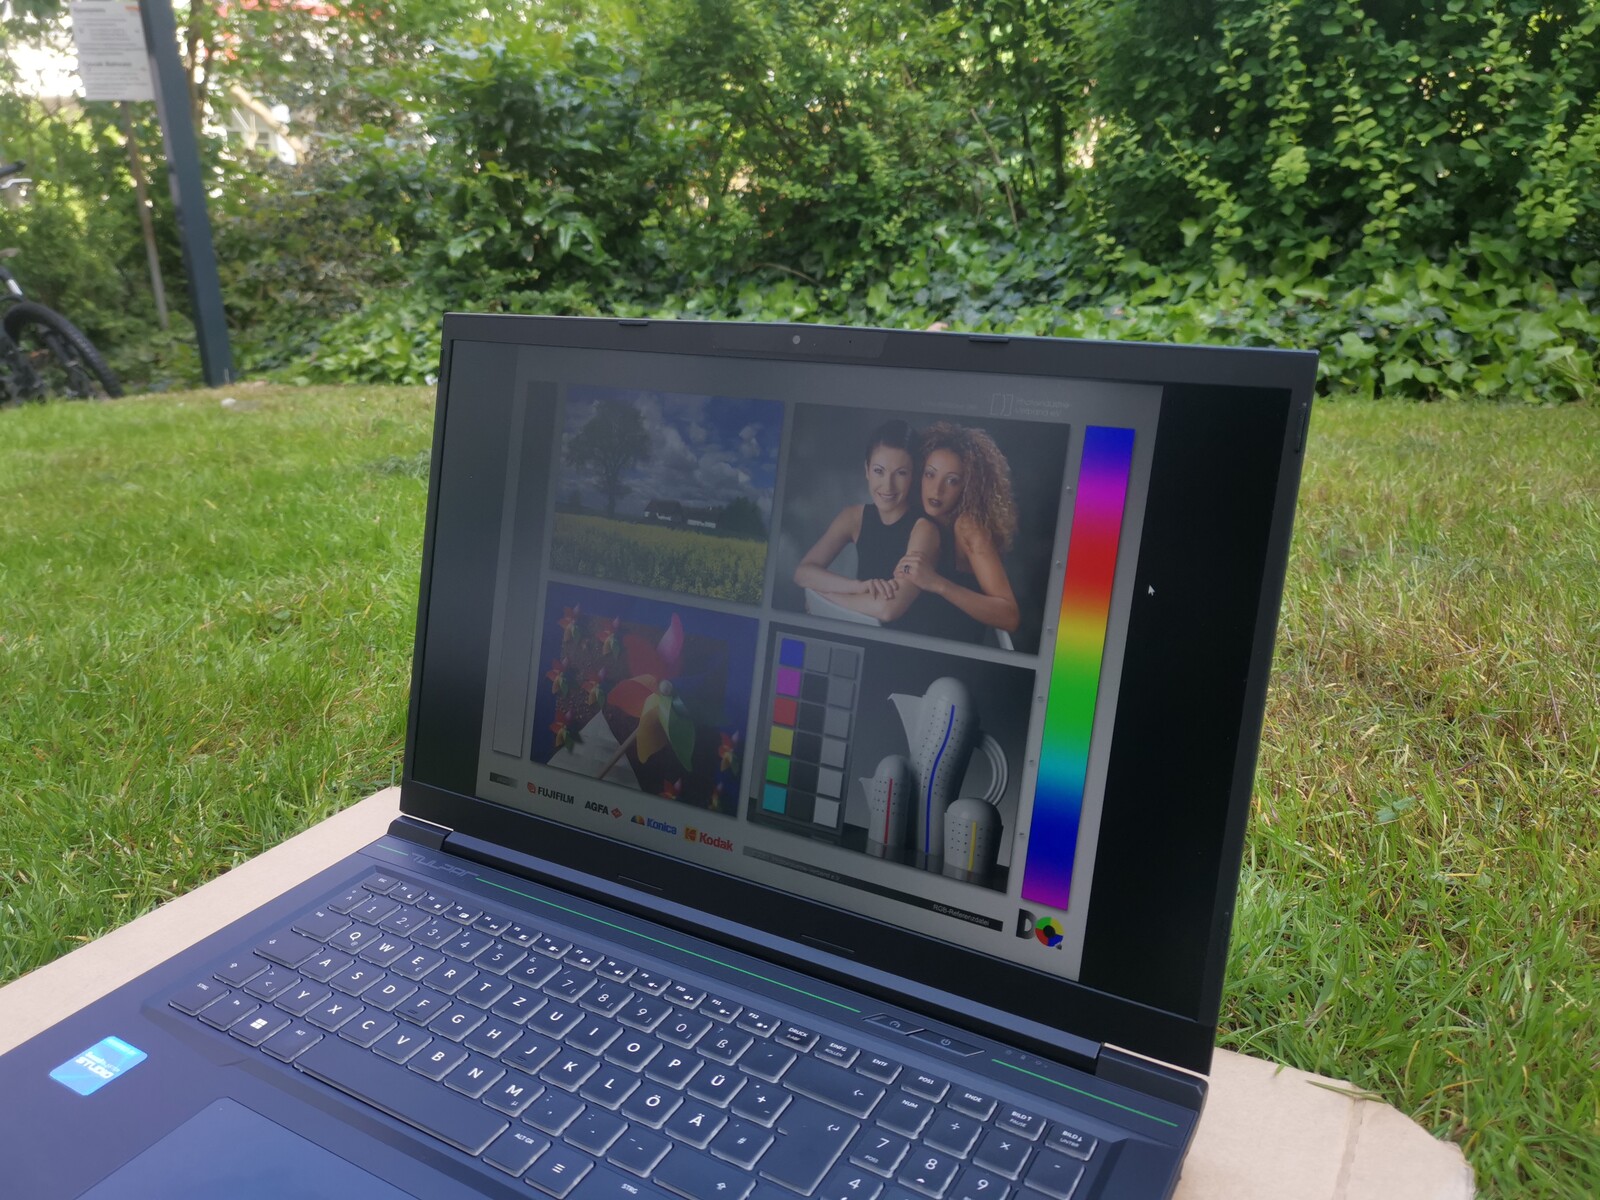
Outside, the display's matte surface prevents most reflections. In the shade, you can work well when looking directly at the T7—its brightness of 350 nits is just enough to be able to do this. You should just avoid direct sunlight and slanted viewing angles.

Performance - Intel Gen13 is not old news
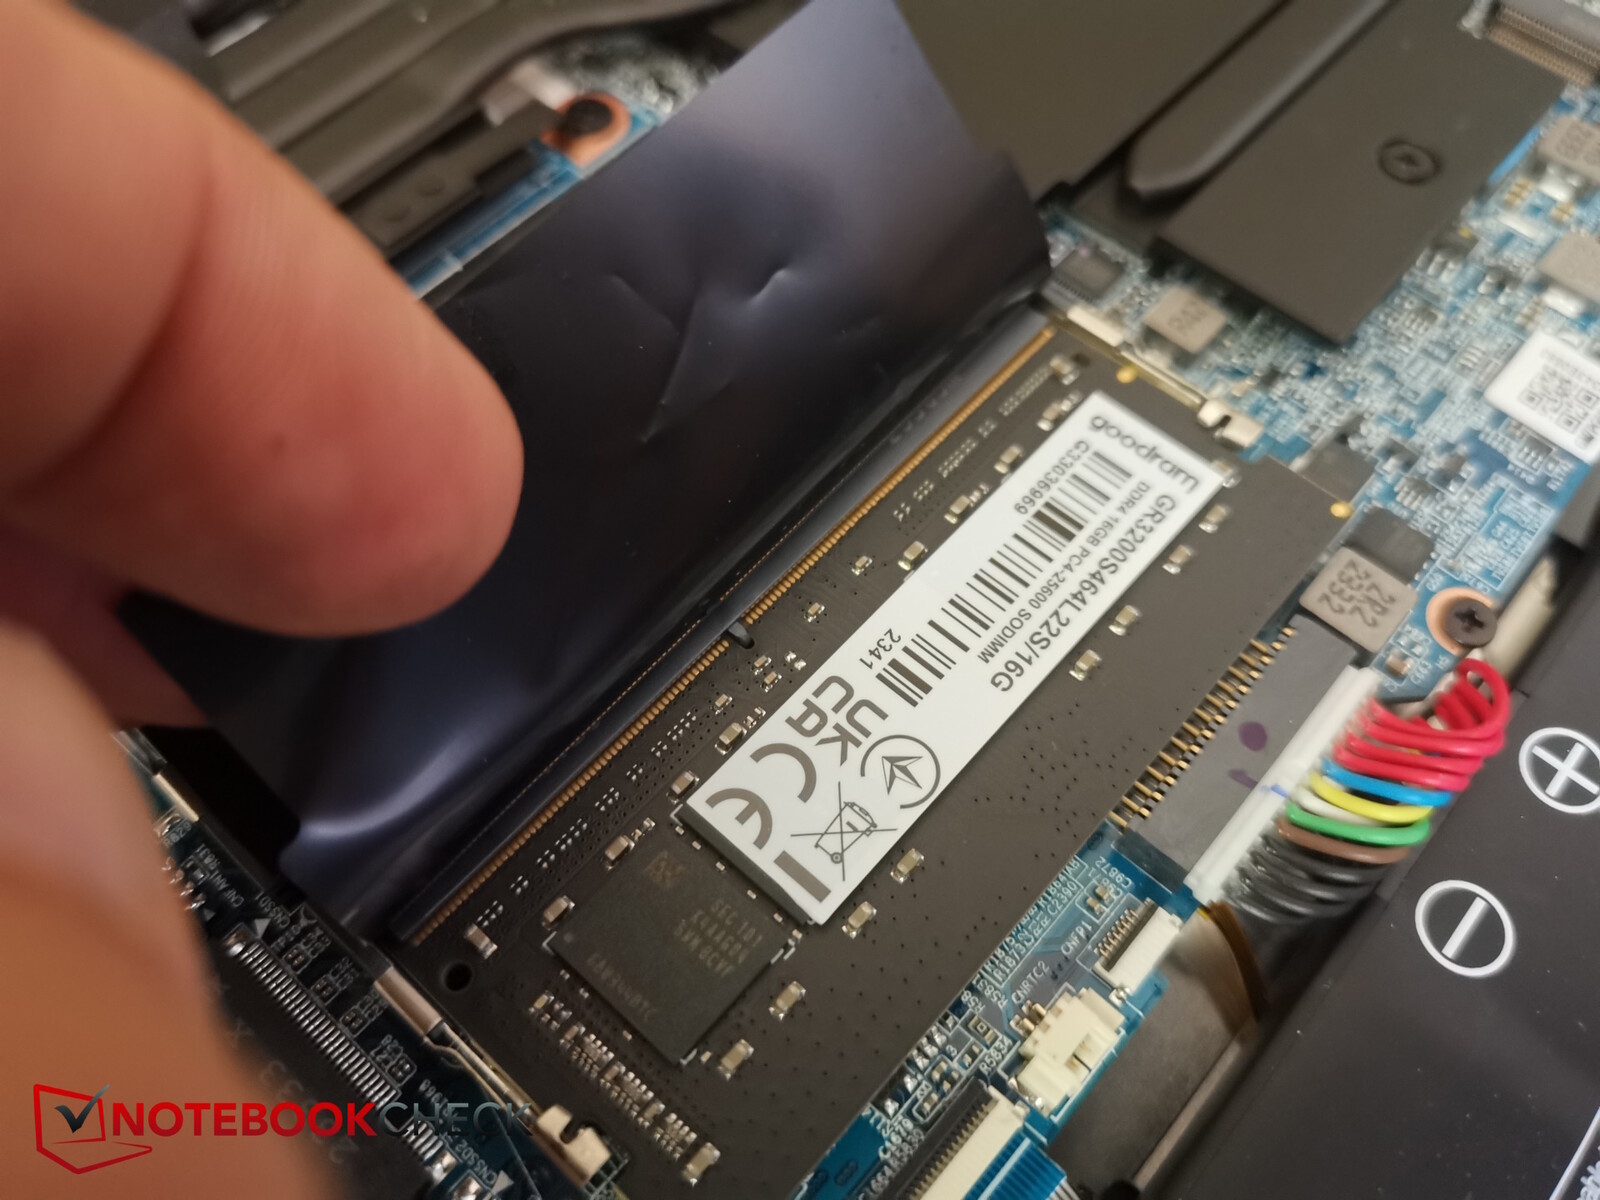
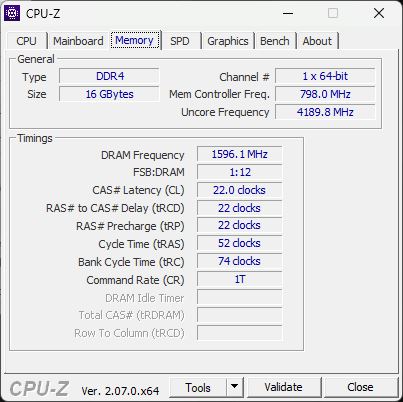
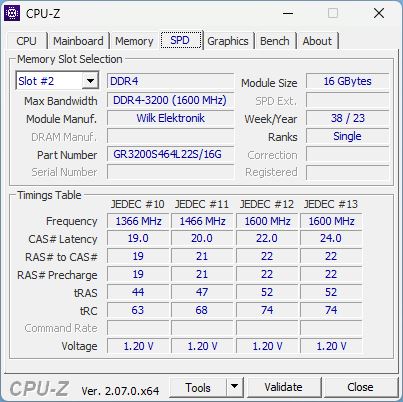
There are several configurations of the Tulpar T7 available, all of which feature the RTX 4060. Our T7 20.6 is equipped with the Raptor Lake CPU i7-13700H, whereas models around the T7 20.7 still use a 12th-gen Alder Lake CPU—despite the supposedly higher "number" in the name. Then there are also different RAM and SSD configurations, which are usually followed by a number, for example the T7 20.6.1 (1 TB SSD) versus the T7 20.2 (500 GB SSD)—both models have 32 GB RAM. The memory and storage configuration of our test device (16 GB RAM and 500 GB SSD) cannot be found on Tulpar's website or the comparison portals.
The Tulpar T7 is clearly aimed at gamers on a tighter budget. Its Intel Gen13 CPU and RTX 4060 promise good gaming performance at a low price. Creators, on the other hand, are not directly addressed by its obvious gamer design, thick case, small touchpad and decent screen which isn't the best suited for editing.
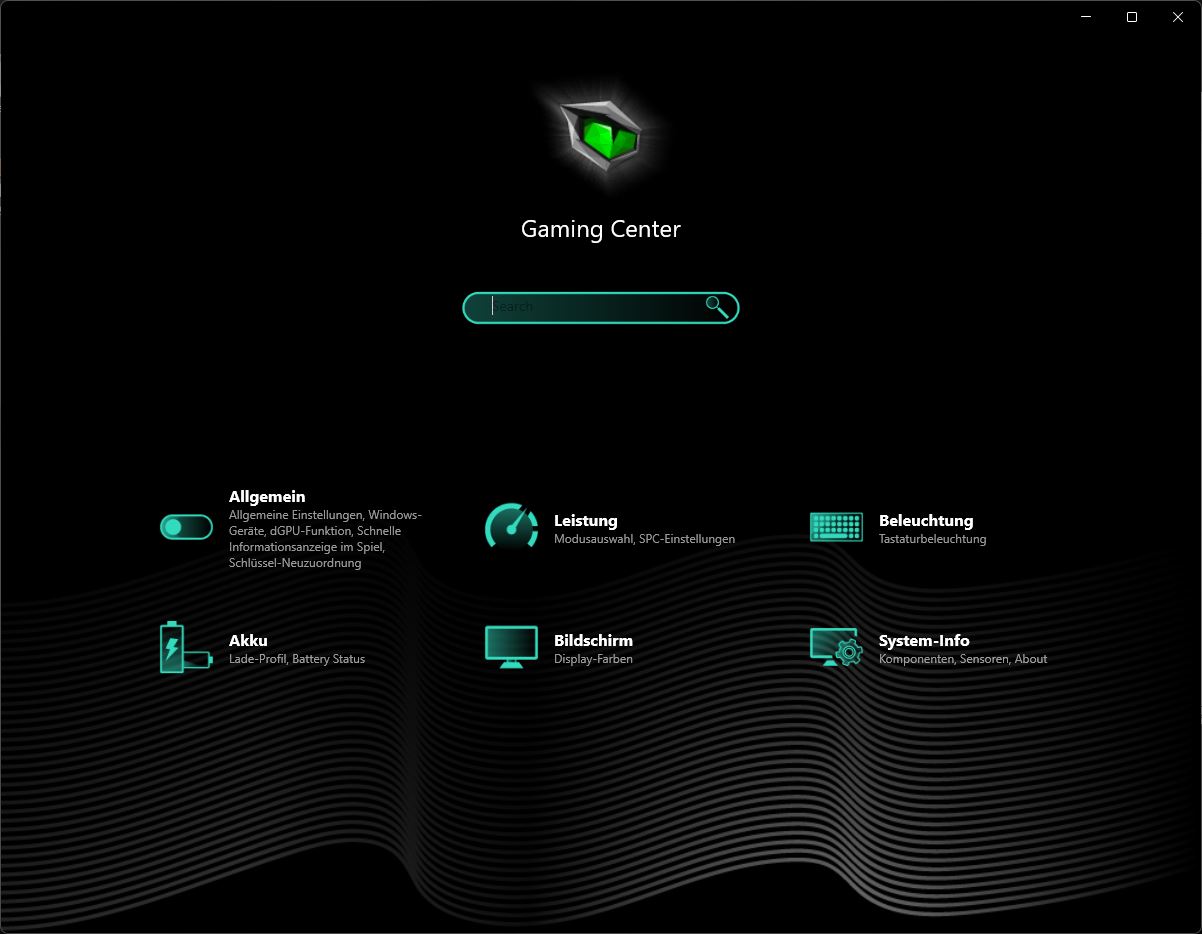
Testing conditions
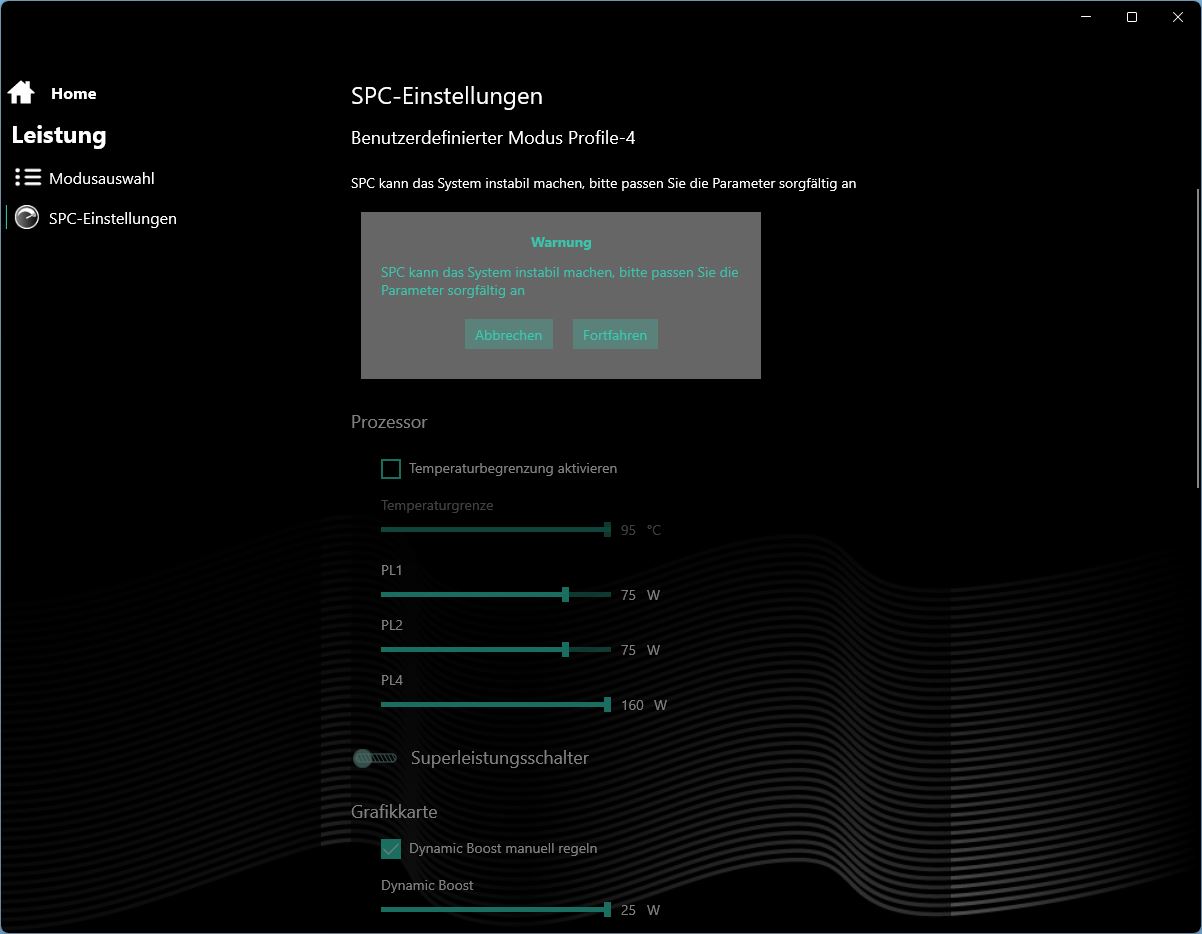
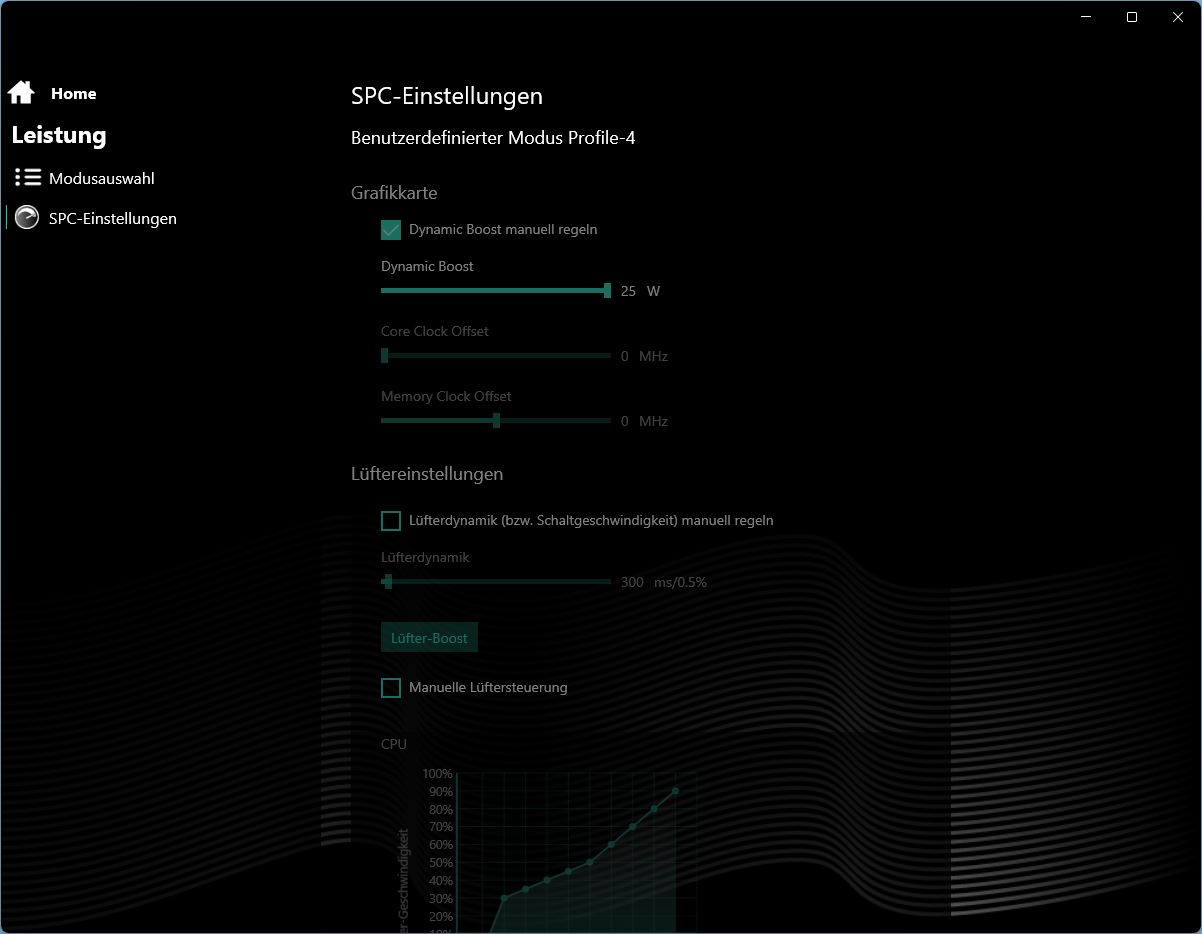
Tulpar relies on a generic, slightly adapted Control Center, the design of which is exactly the same as that used in the XMG models from Schenker and certain others. It is simple but clear and offers various setting options.
The performance tab offers three default profiles (balanced, enthusiast, overboost) as well as a manual mode with all kinds of customization options. We carried out our performance benchmarks using overboost mode unless otherwise stated.
In addition to the performance profiles, there is also a MUX switch, general settings, display options, keyboard lighting settings and battery settings.
A word about battery mode: Although the laptop's performance is of course greatly reduced, the power mode set does not change visually, so if you have previously activated overboost mode and unplug the power plug, it is still active in the Control Center. This suggests that you also have the choice between various power modes when you are away from an outlet. However, this is most likely not the case, as our battery mode results were always the same (within the tolerance), regardless of the selected power mode.
Processor
The Intel Gen13 Core i7-13700H CPU, which was found in many gaming computers from the major manufacturers last year, is used in this gaming laptop. The latest Gen14 is currently only available in the T6 series from Tulpar. However, as Gen14 offers hardly any speed advantages, the newer laptops' lead is likely to be small at best.
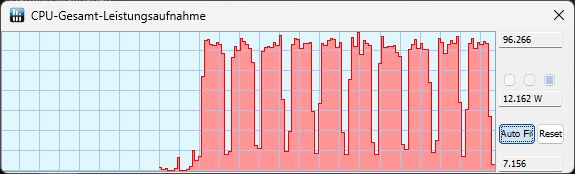
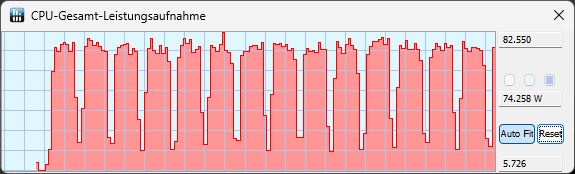
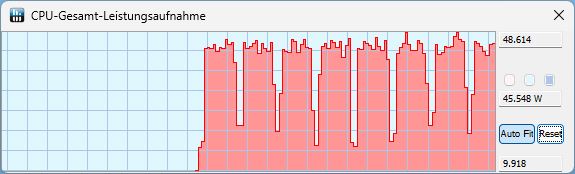
Our Tulpar performed well during the Cinebench R15 loop, delivering a high and—above all—very constant performance without any drops after the first few runs. In overboost, it called up a fairly constant TDP of 95 to 96 watts, in enthusiast mode it was still 82 watts and in balanced mode we noted only 48 watts. In battery mode, it is automatically set to balanced. Here, the CPU's performance drops by around 27 per cent.
In general and across all benchmarks, the T7 was pretty much on the same performance level as the average laptop fitted with the same CPU in our database. It was even faster in many tests, but its unusually low Geekbench multi-thread scores spoil its overall score slightly. During the Cinebench tests, it was around 11 per cent faster than the average i7-13700H.
This put it right in the middle of the comparison devices in terms of performance—only the Legion 5 was noticeably faster, and all other competitors were within a few percentage points of our test device.
Its unusually low multi-core scores in the Geekbench tests are quite interesting. Its scores remained very low even after various repetitions (overboost, dGPU and hybrid mode tested). In the Cinebench tests, however, its multi-thread scores were normal to good.
| Performance profile/measurement value | CB15 multi score | TDP (in watts) |
|---|---|---|
| Turbo | 2,763 | 95 |
| Enthusiast | 2,538 | 82 |
| Balanced | 1,990 | 48 |
| Battery | 1,760 | 35 |
Cinebench R15 Multi continuous test
Cinebench R23: Multi Core | Single Core
Cinebench R20: CPU (Multi Core) | CPU (Single Core)
Cinebench R15: CPU Multi 64Bit | CPU Single 64Bit
Blender: v2.79 BMW27 CPU
7-Zip 18.03: 7z b 4 | 7z b 4 -mmt1
Geekbench 6.7: Multi-Core | Single-Core
Geekbench 5.5: Multi-Core | Single-Core
HWBOT x265 Benchmark v2.2: 4k Preset
LibreOffice : 20 Documents To PDF
R Benchmark 2.5: Overall mean
| CPU Performance rating | |
| Average of class Gaming | |
| Lenovo Legion 5 16IRX G9 | |
| Schenker XMG Apex 17 (Late 23) | |
| Medion Erazer Defender P40 -2! | |
| Tulpar T7 V20.6 | |
| Average Intel Core i7-13700H | |
| Acer Nitro 17 AN17-51-71ER -2! | |
| MSI Katana 17 B13VFK -2! | |
| Cinebench R23 / Multi Core | |
| Average of class Gaming (10488 - 42661, n=107, last 2 years) | |
| Lenovo Legion 5 16IRX G9 | |
| Medion Erazer Defender P40 | |
| Acer Nitro 17 AN17-51-71ER | |
| Tulpar T7 V20.6 | |
| Schenker XMG Apex 17 (Late 23) | |
| MSI Katana 17 B13VFK | |
| Average Intel Core i7-13700H (5890 - 20034, n=29) | |
| Cinebench R23 / Single Core | |
| Average of class Gaming (1166 - 2415, n=107, last 2 years) | |
| Lenovo Legion 5 16IRX G9 | |
| Tulpar T7 V20.6 | |
| MSI Katana 17 B13VFK | |
| Average Intel Core i7-13700H (1323 - 1914, n=29) | |
| Schenker XMG Apex 17 (Late 23) | |
| Medion Erazer Defender P40 | |
| Acer Nitro 17 AN17-51-71ER | |
| Cinebench R20 / CPU (Multi Core) | |
| Average of class Gaming (4029 - 16433, n=106, last 2 years) | |
| Lenovo Legion 5 16IRX G9 | |
| Medion Erazer Defender P40 | |
| Acer Nitro 17 AN17-51-71ER | |
| Tulpar T7 V20.6 | |
| Schenker XMG Apex 17 (Late 23) | |
| MSI Katana 17 B13VFK | |
| Average Intel Core i7-13700H (2322 - 7674, n=29) | |
| Cinebench R20 / CPU (Single Core) | |
| Average of class Gaming (442 - 913, n=106, last 2 years) | |
| Lenovo Legion 5 16IRX G9 | |
| Tulpar T7 V20.6 | |
| Average Intel Core i7-13700H (508 - 741, n=29) | |
| MSI Katana 17 B13VFK | |
| Schenker XMG Apex 17 (Late 23) | |
| Medion Erazer Defender P40 | |
| Acer Nitro 17 AN17-51-71ER | |
| Cinebench R15 / CPU Multi 64Bit | |
| Average of class Gaming (1578 - 6330, n=105, last 2 years) | |
| Lenovo Legion 5 16IRX G9 | |
| Medion Erazer Defender P40 | |
| Acer Nitro 17 AN17-51-71ER | |
| Tulpar T7 V20.6 | |
| Schenker XMG Apex 17 (Late 23) | |
| Average Intel Core i7-13700H (905 - 2982, n=29) | |
| MSI Katana 17 B13VFK | |
| Cinebench R15 / CPU Single 64Bit | |
| Average of class Gaming (188.8 - 350, n=106, last 2 years) | |
| Lenovo Legion 5 16IRX G9 | |
| Tulpar T7 V20.6 | |
| Schenker XMG Apex 17 (Late 23) | |
| Average Intel Core i7-13700H (213 - 278, n=29) | |
| MSI Katana 17 B13VFK | |
| Medion Erazer Defender P40 | |
| Acer Nitro 17 AN17-51-71ER | |
| Blender / v2.79 BMW27 CPU | |
| Average Intel Core i7-13700H (169 - 555, n=29) | |
| MSI Katana 17 B13VFK | |
| Schenker XMG Apex 17 (Late 23) | |
| Medion Erazer Defender P40 | |
| Acer Nitro 17 AN17-51-71ER | |
| Tulpar T7 V20.6 | |
| Average of class Gaming (79 - 330, n=104, last 2 years) | |
| Lenovo Legion 5 16IRX G9 | |
| 7-Zip 18.03 / 7z b 4 | |
| Lenovo Legion 5 16IRX G9 | |
| Average of class Gaming (33491 - 148086, n=105, last 2 years) | |
| Medion Erazer Defender P40 | |
| Acer Nitro 17 AN17-51-71ER | |
| Schenker XMG Apex 17 (Late 23) | |
| MSI Katana 17 B13VFK | |
| Average Intel Core i7-13700H (27322 - 76344, n=29) | |
| Tulpar T7 V20.6 | |
| 7-Zip 18.03 / 7z b 4 -mmt1 | |
| Schenker XMG Apex 17 (Late 23) | |
| Lenovo Legion 5 16IRX G9 | |
| Average of class Gaming (4199 - 7436, n=105, last 2 years) | |
| Tulpar T7 V20.6 | |
| Average Intel Core i7-13700H (4825 - 6238, n=29) | |
| MSI Katana 17 B13VFK | |
| Medion Erazer Defender P40 | |
| Acer Nitro 17 AN17-51-71ER | |
| Geekbench 6.7 / Multi-Core | |
| Lenovo Legion 5 16IRX G9 | |
| Average of class Gaming (6625 - 22850, n=106, last 2 years) | |
| Schenker XMG Apex 17 (Late 23) | |
| Average Intel Core i7-13700H (8415 - 13832, n=13) | |
| Tulpar T7 V20.6 | |
| Geekbench 6.7 / Single-Core | |
| Average of class Gaming (1490 - 3259, n=106, last 2 years) | |
| Lenovo Legion 5 16IRX G9 | |
| Schenker XMG Apex 17 (Late 23) | |
| Tulpar T7 V20.6 | |
| Average Intel Core i7-13700H (2316 - 2639, n=13) | |
| Geekbench 5.5 / Multi-Core | |
| Average of class Gaming (6460 - 28263, n=105, last 2 years) | |
| Lenovo Legion 5 16IRX G9 | |
| Medion Erazer Defender P40 | |
| Acer Nitro 17 AN17-51-71ER | |
| Schenker XMG Apex 17 (Late 23) | |
| Average Intel Core i7-13700H (6165 - 14215, n=29) | |
| MSI Katana 17 B13VFK | |
| Tulpar T7 V20.6 | |
| Geekbench 5.5 / Single-Core | |
| Average of class Gaming (986 - 2474, n=105, last 2 years) | |
| Schenker XMG Apex 17 (Late 23) | |
| Lenovo Legion 5 16IRX G9 | |
| Average Intel Core i7-13700H (1362 - 1919, n=29) | |
| MSI Katana 17 B13VFK | |
| Tulpar T7 V20.6 | |
| Medion Erazer Defender P40 | |
| Acer Nitro 17 AN17-51-71ER | |
| HWBOT x265 Benchmark v2.2 / 4k Preset | |
| Average of class Gaming (11.5 - 44.4, n=105, last 2 years) | |
| Lenovo Legion 5 16IRX G9 | |
| Medion Erazer Defender P40 | |
| Schenker XMG Apex 17 (Late 23) | |
| Acer Nitro 17 AN17-51-71ER | |
| Tulpar T7 V20.6 | |
| MSI Katana 17 B13VFK | |
| Average Intel Core i7-13700H (6.72 - 21.2, n=29) | |
| LibreOffice / 20 Documents To PDF | |
| MSI Katana 17 B13VFK | |
| Acer Nitro 17 AN17-51-71ER | |
| Tulpar T7 V20.6 | |
| Medion Erazer Defender P40 | |
| Average of class Gaming (33.2 - 88.8, n=105, last 2 years) | |
| Average Intel Core i7-13700H (31.3 - 62.4, n=29) | |
| Schenker XMG Apex 17 (Late 23) | |
| Lenovo Legion 5 16IRX G9 | |
| R Benchmark 2.5 / Overall mean | |
| Acer Nitro 17 AN17-51-71ER | |
| Medion Erazer Defender P40 | |
| Average Intel Core i7-13700H (0.4308 - 0.607, n=29) | |
| Tulpar T7 V20.6 | |
| MSI Katana 17 B13VFK | |
| Schenker XMG Apex 17 (Late 23) | |
| Average of class Gaming (0.3439 - 0.759, n=106, last 2 years) | |
| Lenovo Legion 5 16IRX G9 | |
* ... smaller is better
AIDA64: FP32 Ray-Trace | FPU Julia | CPU SHA3 | CPU Queen | FPU SinJulia | FPU Mandel | CPU AES | CPU ZLib | FP64 Ray-Trace | CPU PhotoWorxx
| Performance rating | |
| Average of class Gaming | |
| Schenker XMG Apex 17 (Late 23) | |
| Acer Nitro 17 AN17-51-71ER | |
| Lenovo Legion 5 16IRX G9 | |
| Medion Erazer Defender P40 | |
| Tulpar T7 V20.6 | |
| Average Intel Core i7-13700H | |
| MSI Katana 17 B13VFK | |
| AIDA64 / FP32 Ray-Trace | |
| Average of class Gaming (10227 - 85542, n=105, last 2 years) | |
| Schenker XMG Apex 17 (Late 23) | |
| Lenovo Legion 5 16IRX G9 | |
| Acer Nitro 17 AN17-51-71ER | |
| Tulpar T7 V20.6 | |
| Medion Erazer Defender P40 | |
| Average Intel Core i7-13700H (4986 - 18908, n=29) | |
| MSI Katana 17 B13VFK | |
| AIDA64 / FPU Julia | |
| Average of class Gaming (51376 - 238426, n=105, last 2 years) | |
| Schenker XMG Apex 17 (Late 23) | |
| Lenovo Legion 5 16IRX G9 | |
| Tulpar T7 V20.6 | |
| Acer Nitro 17 AN17-51-71ER | |
| Medion Erazer Defender P40 | |
| Average Intel Core i7-13700H (25360 - 92359, n=29) | |
| MSI Katana 17 B13VFK | |
| AIDA64 / CPU SHA3 | |
| Average of class Gaming (2180 - 10115, n=105, last 2 years) | |
| Schenker XMG Apex 17 (Late 23) | |
| Acer Nitro 17 AN17-51-71ER | |
| Lenovo Legion 5 16IRX G9 | |
| Tulpar T7 V20.6 | |
| Medion Erazer Defender P40 | |
| Average Intel Core i7-13700H (1339 - 4224, n=29) | |
| MSI Katana 17 B13VFK | |
| AIDA64 / CPU Queen | |
| Average of class Gaming (49785 - 173351, n=90, last 2 years) | |
| Schenker XMG Apex 17 (Late 23) | |
| Medion Erazer Defender P40 | |
| Tulpar T7 V20.6 | |
| Lenovo Legion 5 16IRX G9 | |
| Acer Nitro 17 AN17-51-71ER | |
| Average Intel Core i7-13700H (59324 - 107159, n=29) | |
| MSI Katana 17 B13VFK | |
| AIDA64 / FPU SinJulia | |
| Schenker XMG Apex 17 (Late 23) | |
| Average of class Gaming (4424 - 33636, n=105, last 2 years) | |
| Lenovo Legion 5 16IRX G9 | |
| Tulpar T7 V20.6 | |
| Acer Nitro 17 AN17-51-71ER | |
| Medion Erazer Defender P40 | |
| Average Intel Core i7-13700H (4800 - 11050, n=29) | |
| MSI Katana 17 B13VFK | |
| AIDA64 / FPU Mandel | |
| Average of class Gaming (25115 - 128721, n=105, last 2 years) | |
| Schenker XMG Apex 17 (Late 23) | |
| Lenovo Legion 5 16IRX G9 | |
| Acer Nitro 17 AN17-51-71ER | |
| Tulpar T7 V20.6 | |
| Medion Erazer Defender P40 | |
| Average Intel Core i7-13700H (12321 - 45118, n=29) | |
| MSI Katana 17 B13VFK | |
| AIDA64 / CPU AES | |
| Schenker XMG Apex 17 (Late 23) | |
| Acer Nitro 17 AN17-51-71ER | |
| Average of class Gaming (39258 - 247074, n=105, last 2 years) | |
| Lenovo Legion 5 16IRX G9 | |
| Tulpar T7 V20.6 | |
| Average Intel Core i7-13700H (28769 - 151254, n=29) | |
| Medion Erazer Defender P40 | |
| MSI Katana 17 B13VFK | |
| AIDA64 / CPU ZLib | |
| Average of class Gaming (574 - 2531, n=105, last 2 years) | |
| Lenovo Legion 5 16IRX G9 | |
| Acer Nitro 17 AN17-51-71ER | |
| Tulpar T7 V20.6 | |
| Schenker XMG Apex 17 (Late 23) | |
| Medion Erazer Defender P40 | |
| Average Intel Core i7-13700H (389 - 1215, n=29) | |
| MSI Katana 17 B13VFK | |
| AIDA64 / FP64 Ray-Trace | |
| Average of class Gaming (5509 - 45446, n=105, last 2 years) | |
| Schenker XMG Apex 17 (Late 23) | |
| Lenovo Legion 5 16IRX G9 | |
| Acer Nitro 17 AN17-51-71ER | |
| Tulpar T7 V20.6 | |
| Medion Erazer Defender P40 | |
| Average Intel Core i7-13700H (2540 - 10135, n=29) | |
| MSI Katana 17 B13VFK | |
| AIDA64 / CPU PhotoWorxx | |
| Average of class Gaming (12271 - 89891, n=105, last 2 years) | |
| Average Intel Core i7-13700H (12872 - 52727, n=29) | |
| Acer Nitro 17 AN17-51-71ER | |
| Schenker XMG Apex 17 (Late 23) | |
| Medion Erazer Defender P40 | |
| MSI Katana 17 B13VFK | |
| Lenovo Legion 5 16IRX G9 | |
| Tulpar T7 V20.6 | |
System performance
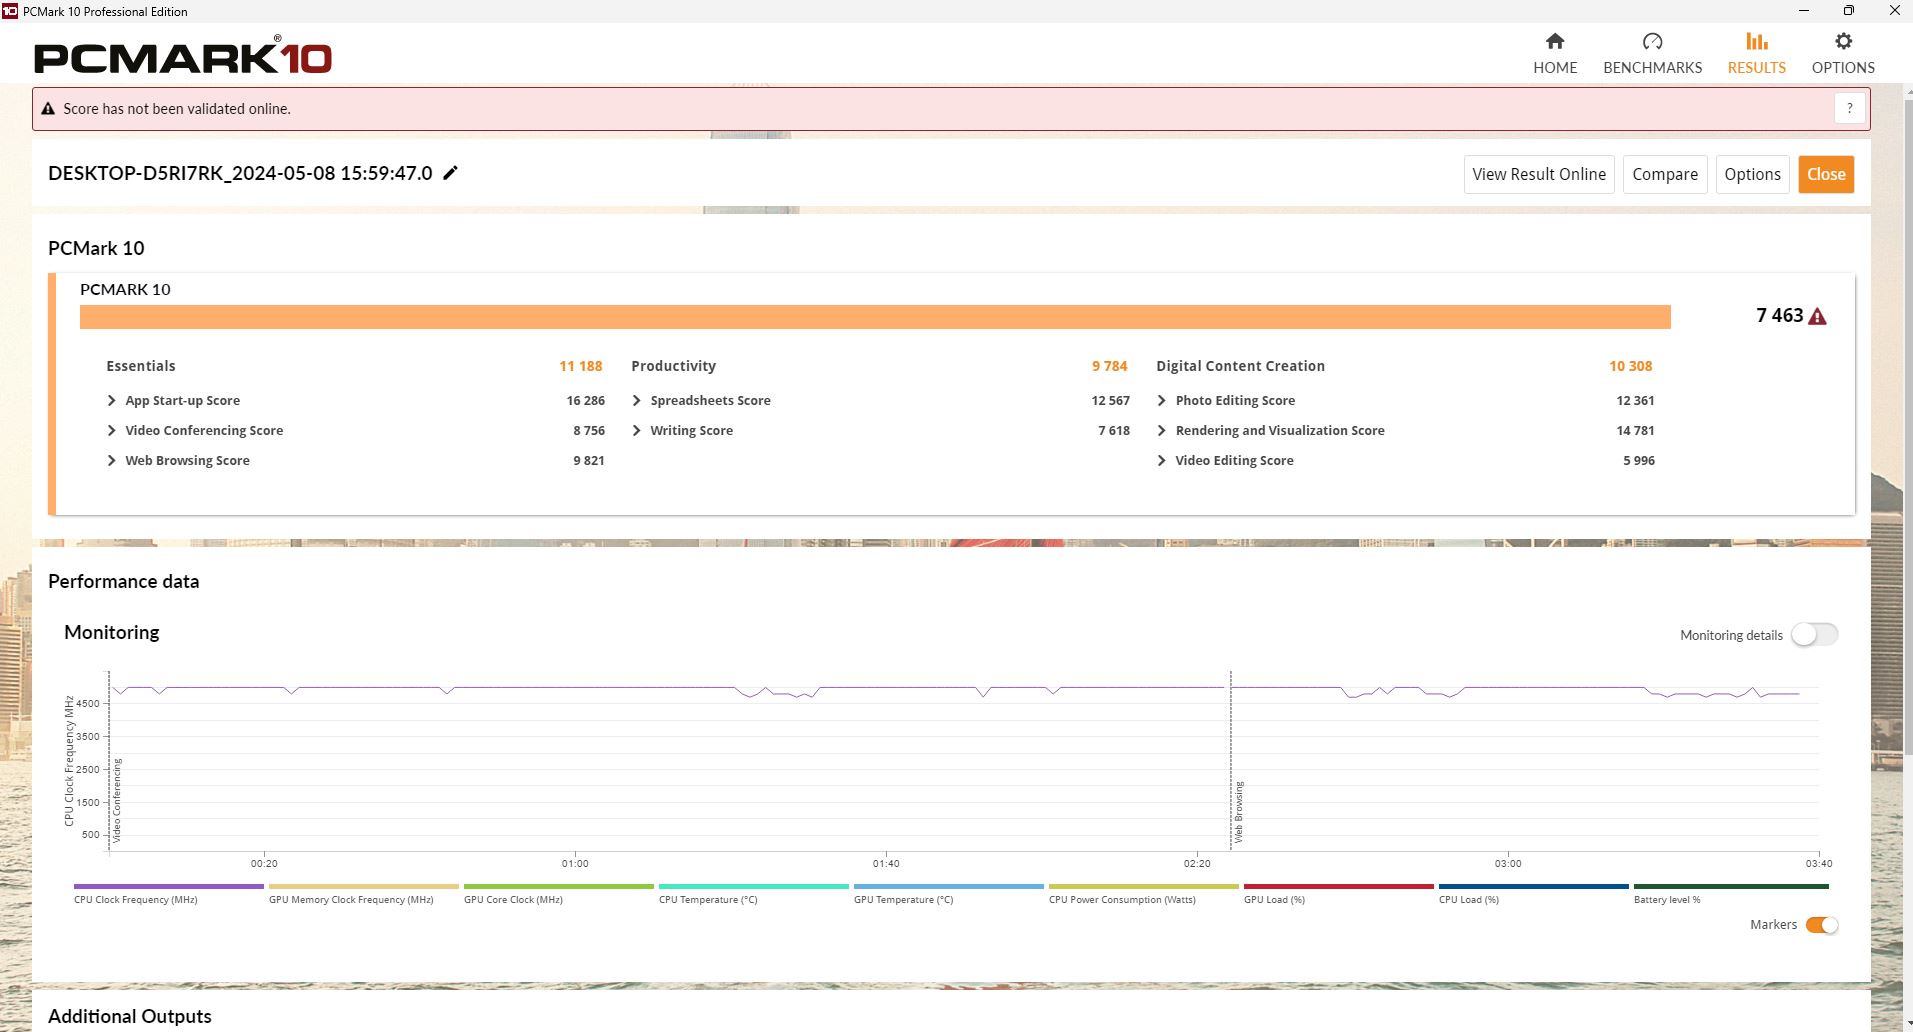
When it comes to system performance, the T7 ranks in the upper midfield. During PCMark 10, it achieved the exact average level for this hardware combination. Its CrossMark results are a little on the low side.
It's not the best that only one RAM slot is occupied—at least in our configuration of the T7. The AIDA memory test below shows the disadvantage of single-channel RAM. For dual-channel, you would have to insert another bar, as one slot is still free.
CrossMark: Overall | Productivity | Creativity | Responsiveness
WebXPRT 3: Overall
WebXPRT 4: Overall
Mozilla Kraken 1.1: Total
| PCMark 10 / Score | |
| Average of class Gaming (5828 - 12414, n=93, last 2 years) | |
| Schenker XMG Apex 17 (Late 23) | |
| Lenovo Legion 5 16IRX G9 | |
| Tulpar T7 V20.6 | |
| Average Intel Core i7-13700H, NVIDIA GeForce RTX 4060 Laptop GPU (7157 - 7661, n=5) | |
| MSI Katana 17 B13VFK | |
| Acer Nitro 17 AN17-51-71ER | |
| Medion Erazer Defender P40 | |
| PCMark 10 / Essentials | |
| Tulpar T7 V20.6 | |
| MSI Katana 17 B13VFK | |
| Lenovo Legion 5 16IRX G9 | |
| Average Intel Core i7-13700H, NVIDIA GeForce RTX 4060 Laptop GPU (10179 - 11200, n=5) | |
| Schenker XMG Apex 17 (Late 23) | |
| Average of class Gaming (8810 - 11935, n=97, last 2 years) | |
| Acer Nitro 17 AN17-51-71ER | |
| Medion Erazer Defender P40 | |
| PCMark 10 / Productivity | |
| Average of class Gaming (6845 - 25323, n=95, last 2 years) | |
| Schenker XMG Apex 17 (Late 23) | |
| Tulpar T7 V20.6 | |
| Medion Erazer Defender P40 | |
| Average Intel Core i7-13700H, NVIDIA GeForce RTX 4060 Laptop GPU (8238 - 10249, n=5) | |
| MSI Katana 17 B13VFK | |
| Lenovo Legion 5 16IRX G9 | |
| Acer Nitro 17 AN17-51-71ER | |
| PCMark 10 / Digital Content Creation | |
| Average of class Gaming (7602 - 19954, n=95, last 2 years) | |
| Schenker XMG Apex 17 (Late 23) | |
| Lenovo Legion 5 16IRX G9 | |
| Acer Nitro 17 AN17-51-71ER | |
| Average Intel Core i7-13700H, NVIDIA GeForce RTX 4060 Laptop GPU (10308 - 11862, n=5) | |
| Tulpar T7 V20.6 | |
| MSI Katana 17 B13VFK | |
| Medion Erazer Defender P40 | |
| CrossMark / Overall | |
| Lenovo Legion 5 16IRX G9 | |
| Average of class Gaming (1366 - 2409, n=94, last 2 years) | |
| MSI Katana 17 B13VFK | |
| Schenker XMG Apex 17 (Late 23) | |
| Medion Erazer Defender P40 | |
| Tulpar T7 V20.6 | |
| Average Intel Core i7-13700H, NVIDIA GeForce RTX 4060 Laptop GPU (1629 - 1849, n=5) | |
| Acer Nitro 17 AN17-51-71ER | |
| CrossMark / Productivity | |
| Lenovo Legion 5 16IRX G9 | |
| Average of class Gaming (1386 - 2254, n=94, last 2 years) | |
| MSI Katana 17 B13VFK | |
| Schenker XMG Apex 17 (Late 23) | |
| Tulpar T7 V20.6 | |
| Medion Erazer Defender P40 | |
| Average Intel Core i7-13700H, NVIDIA GeForce RTX 4060 Laptop GPU (1561 - 1743, n=5) | |
| Acer Nitro 17 AN17-51-71ER | |
| CrossMark / Creativity | |
| Lenovo Legion 5 16IRX G9 | |
| Average of class Gaming (1343 - 2786, n=94, last 2 years) | |
| MSI Katana 17 B13VFK | |
| Medion Erazer Defender P40 | |
| Schenker XMG Apex 17 (Late 23) | |
| Average Intel Core i7-13700H, NVIDIA GeForce RTX 4060 Laptop GPU (1691 - 2064, n=5) | |
| Tulpar T7 V20.6 | |
| Acer Nitro 17 AN17-51-71ER | |
| CrossMark / Responsiveness | |
| Lenovo Legion 5 16IRX G9 | |
| MSI Katana 17 B13VFK | |
| Average of class Gaming (1226 - 2334, n=94, last 2 years) | |
| Schenker XMG Apex 17 (Late 23) | |
| Acer Nitro 17 AN17-51-71ER | |
| Medion Erazer Defender P40 | |
| Average Intel Core i7-13700H, NVIDIA GeForce RTX 4060 Laptop GPU (1381 - 1656, n=5) | |
| Tulpar T7 V20.6 | |
| WebXPRT 3 / Overall | |
| Average of class Gaming (220 - 532, n=98, last 2 years) | |
| Lenovo Legion 5 16IRX G9 | |
| Schenker XMG Apex 17 (Late 23) | |
| Tulpar T7 V20.6 | |
| MSI Katana 17 B13VFK | |
| Medion Erazer Defender P40 | |
| Average Intel Core i7-13700H, NVIDIA GeForce RTX 4060 Laptop GPU (215 - 314, n=4) | |
| Acer Nitro 17 AN17-51-71ER | |
| WebXPRT 4 / Overall | |
| Average of class Gaming (165 - 354, n=98, last 2 years) | |
| Lenovo Legion 5 16IRX G9 | |
| Tulpar T7 V20.6 | |
| MSI Katana 17 B13VFK | |
| Average Intel Core i7-13700H, NVIDIA GeForce RTX 4060 Laptop GPU (228 - 274, n=4) | |
| Medion Erazer Defender P40 | |
| Schenker XMG Apex 17 (Late 23) | |
| Acer Nitro 17 AN17-51-71ER | |
| Mozilla Kraken 1.1 / Total | |
| Acer Nitro 17 AN17-51-71ER | |
| Medion Erazer Defender P40 | |
| MSI Katana 17 B13VFK | |
| Schenker XMG Apex 17 (Late 23) | |
| Average Intel Core i7-13700H, NVIDIA GeForce RTX 4060 Laptop GPU (495 - 570, n=4) | |
| Tulpar T7 V20.6 | |
| Lenovo Legion 5 16IRX G9 | |
| Average of class Gaming (391 - 590, n=100, last 2 years) | |
* ... smaller is better
| PCMark 10 Score | 7463 points | |
Help | ||
| AIDA64 / Memory Copy | |
| Average of class Gaming (21750 - 129946, n=105, last 2 years) | |
| Schenker XMG Apex 17 (Late 23) | |
| Average Intel Core i7-13700H (24334 - 78081, n=29) | |
| Lenovo Legion 5 16IRX G9 | |
| Acer Nitro 17 AN17-51-71ER | |
| Medion Erazer Defender P40 | |
| MSI Katana 17 B13VFK | |
| Tulpar T7 V20.6 | |
| AIDA64 / Memory Read | |
| Average of class Gaming (22956 - 118858, n=105, last 2 years) | |
| Lenovo Legion 5 16IRX G9 | |
| Medion Erazer Defender P40 | |
| Acer Nitro 17 AN17-51-71ER | |
| Average Intel Core i7-13700H (23681 - 79656, n=29) | |
| Schenker XMG Apex 17 (Late 23) | |
| MSI Katana 17 B13VFK | |
| Tulpar T7 V20.6 | |
| AIDA64 / Memory Write | |
| Schenker XMG Apex 17 (Late 23) | |
| Average of class Gaming (22297 - 135096, n=105, last 2 years) | |
| Average Intel Core i7-13700H (22986 - 99898, n=29) | |
| Acer Nitro 17 AN17-51-71ER | |
| Medion Erazer Defender P40 | |
| Lenovo Legion 5 16IRX G9 | |
| MSI Katana 17 B13VFK | |
| Tulpar T7 V20.6 | |
| AIDA64 / Memory Latency | |
| Acer Nitro 17 AN17-51-71ER | |
| Average of class Gaming (75.3 - 259, n=105, last 2 years) | |
| MSI Katana 17 B13VFK | |
| Average Intel Core i7-13700H (82.4 - 136.8, n=29) | |
| Medion Erazer Defender P40 | |
| Lenovo Legion 5 16IRX G9 | |
| Tulpar T7 V20.6 | |
| Schenker XMG Apex 17 (Late 23) | |
* ... smaller is better
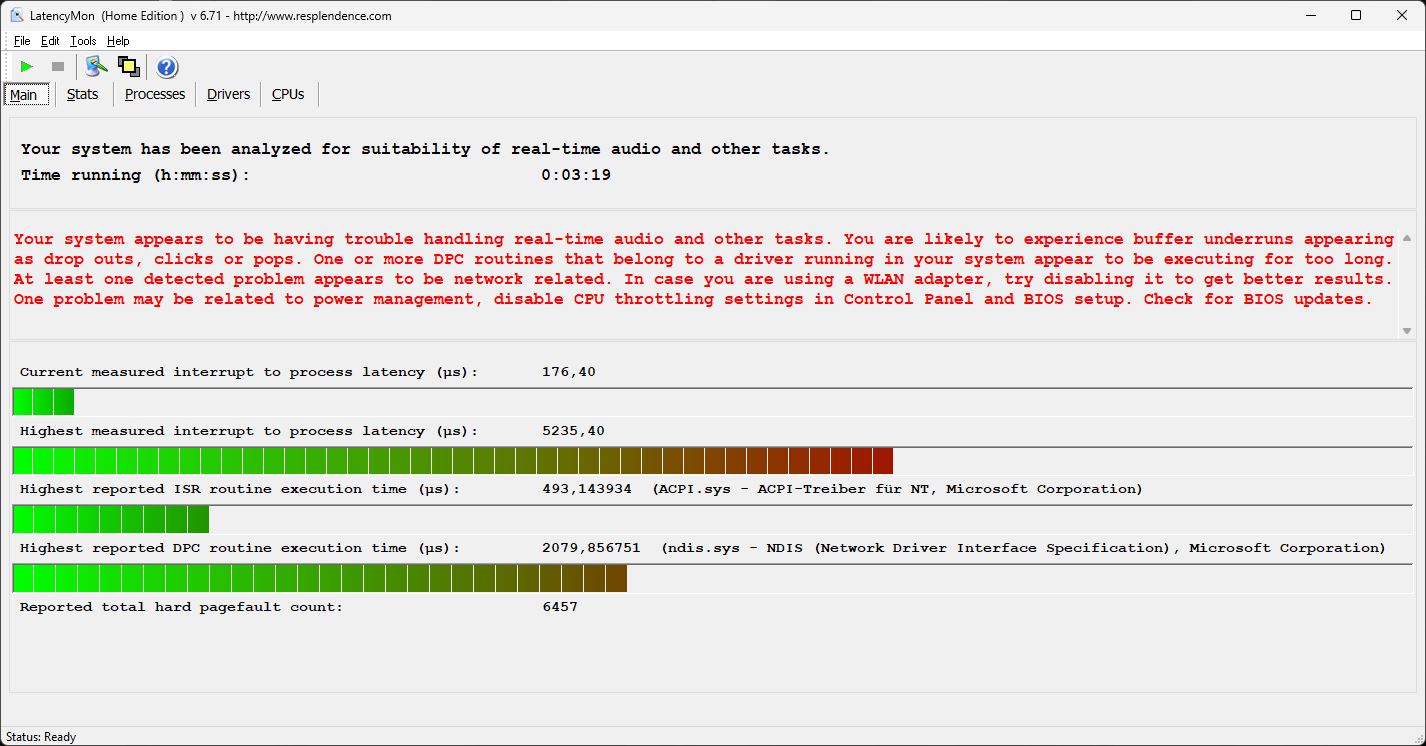
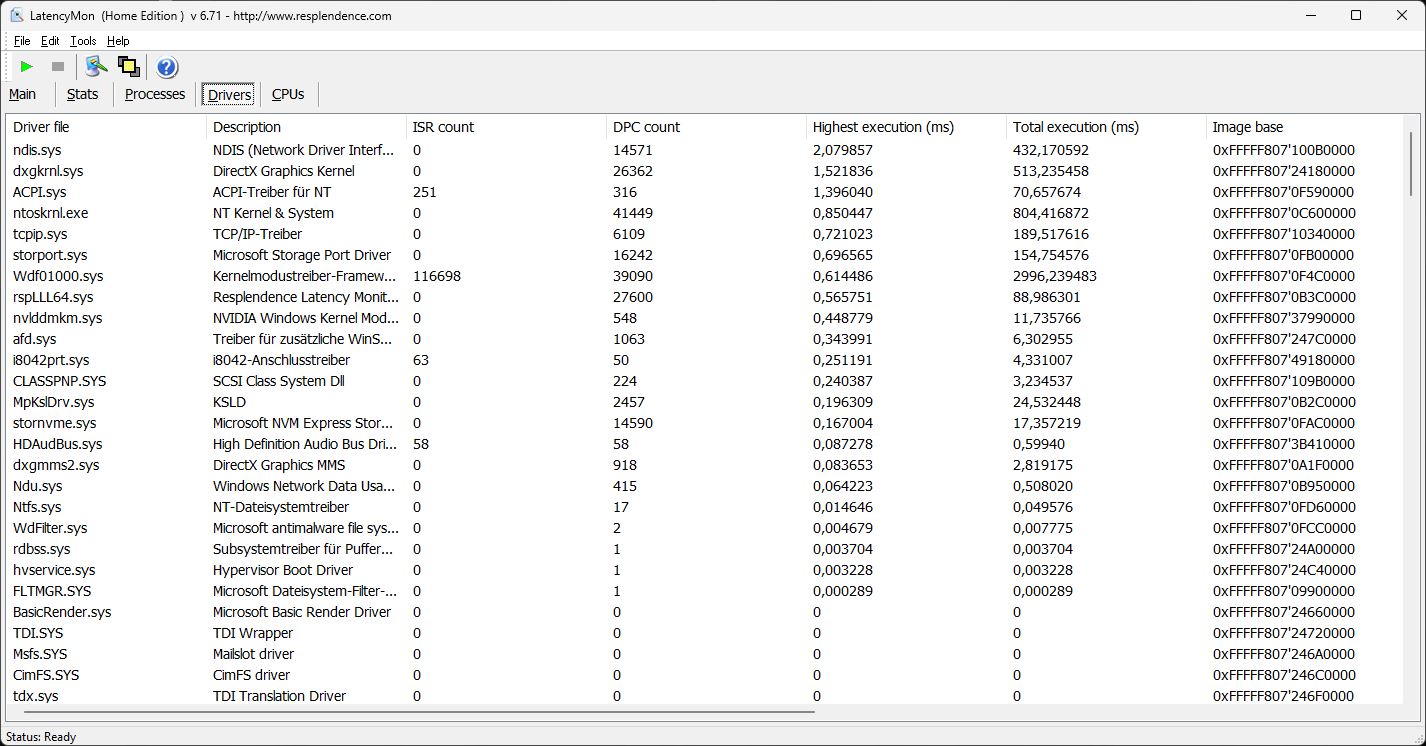
DPC latencies
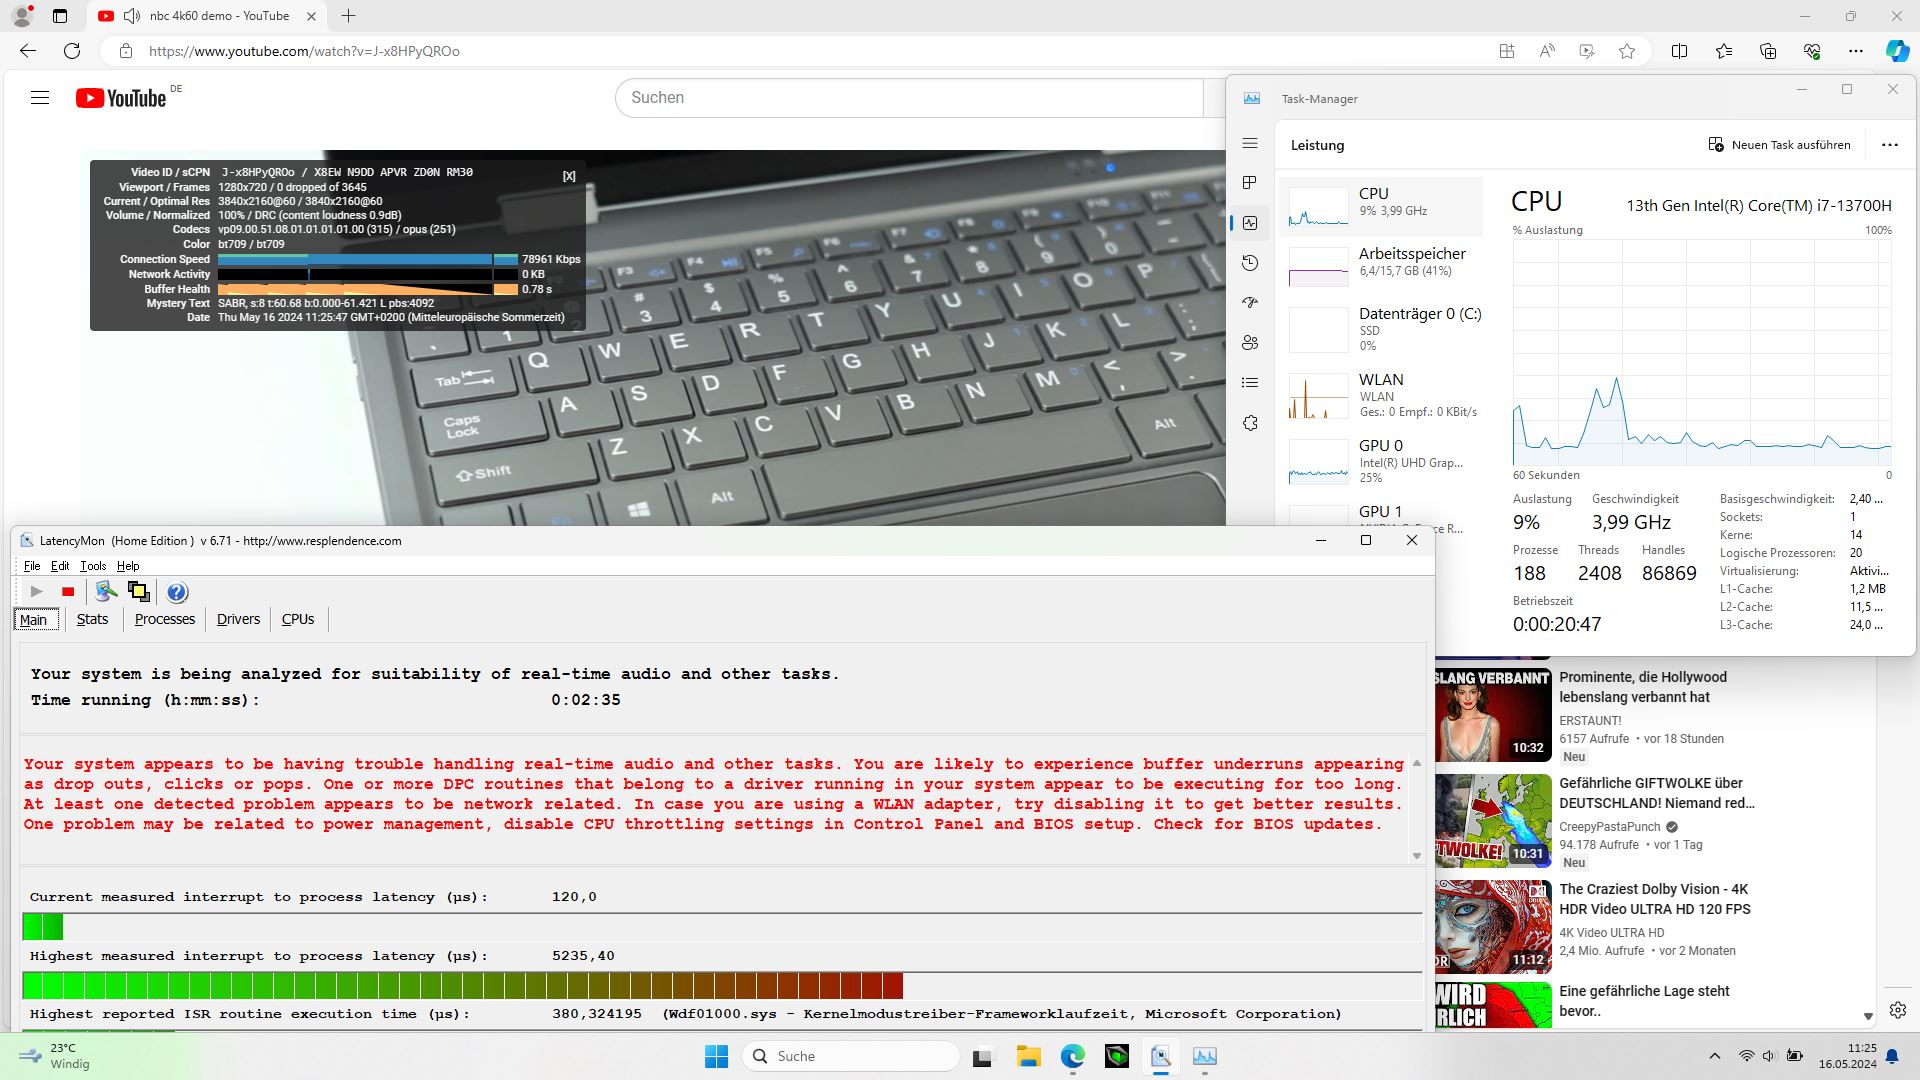
Unfortunately, we already noted the first latency problems when moving the window of the LatencyMon software. Opening the browser increased the latency value further, whereas opening several tabs afterwards did not. Up to this point, the value of around 500 μs which we measured is still within a tolerable range.
However, when playing our 4K/60fps YouTube video, the delay value rose to over 5,000 μs! At least there were no dropped frames but still, this value is still clearly too high.
| DPC Latencies / LatencyMon - interrupt to process latency (max), Web, Youtube, Prime95 | |
| Tulpar T7 V20.6 | |
| Medion Erazer Defender P40 | |
| MSI Katana 17 B13VFK | |
| Lenovo Legion 5 16IRX G9 | |
| Acer Nitro 17 AN17-51-71ER | |
| Schenker XMG Apex 17 (Late 23) | |
* ... smaller is better
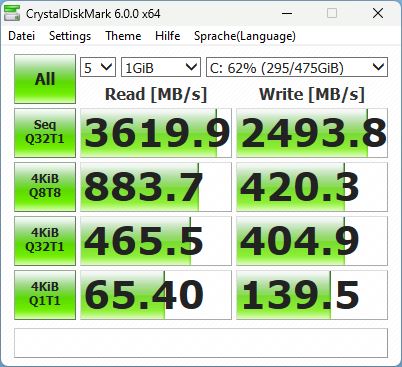
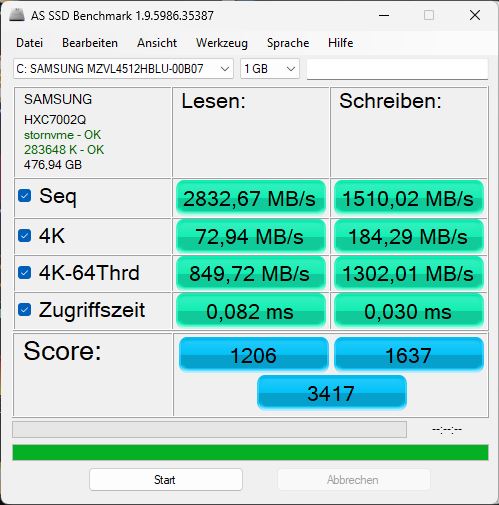
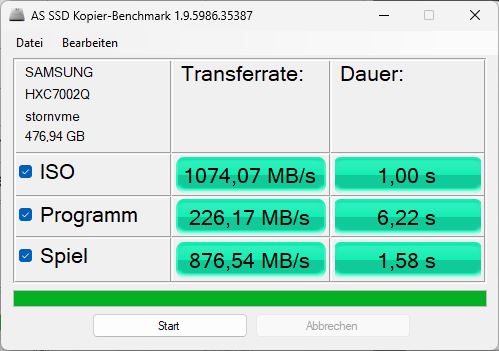
Storage devices
The installed Samsung NVMe SSD with only 500 GB of storage is a bit older and, as a result, not particularly fast, also because it underperforms slightly inside the T7. The competition is clearly faster in this aspect. You should definitely opt for a T7 configuration with 1 TB of storage. However, there is no need to worry, as its speed should be sufficient enough for everyday work and gaming, and it also performed slightly better in the Crystaldiskmark test. After all, its performance remained constant over a longer period of time.

* ... smaller is better
Reading continuous performance: DiskSpd Read Loop, Queue Depth 8
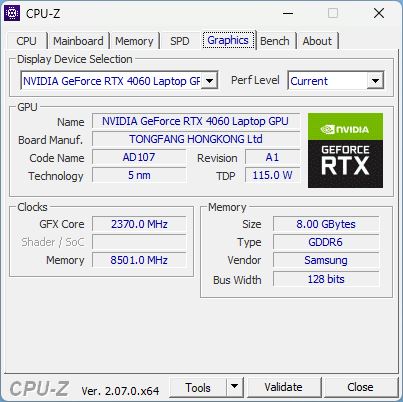
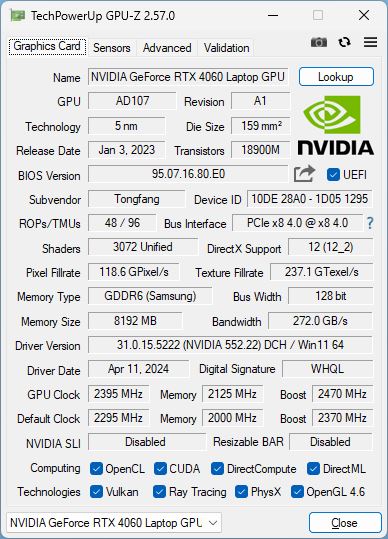
Graphics card
All T7 models are equipped with an Nvidia Geforce RTX 4060. Tulpar has not provided any information about its performance, but the Nvidia control panel states 140 watts. The RTX 4060 should be able to run almost all current games in Full HD with medium to high details, which is just right given the installed panel’s resolution.
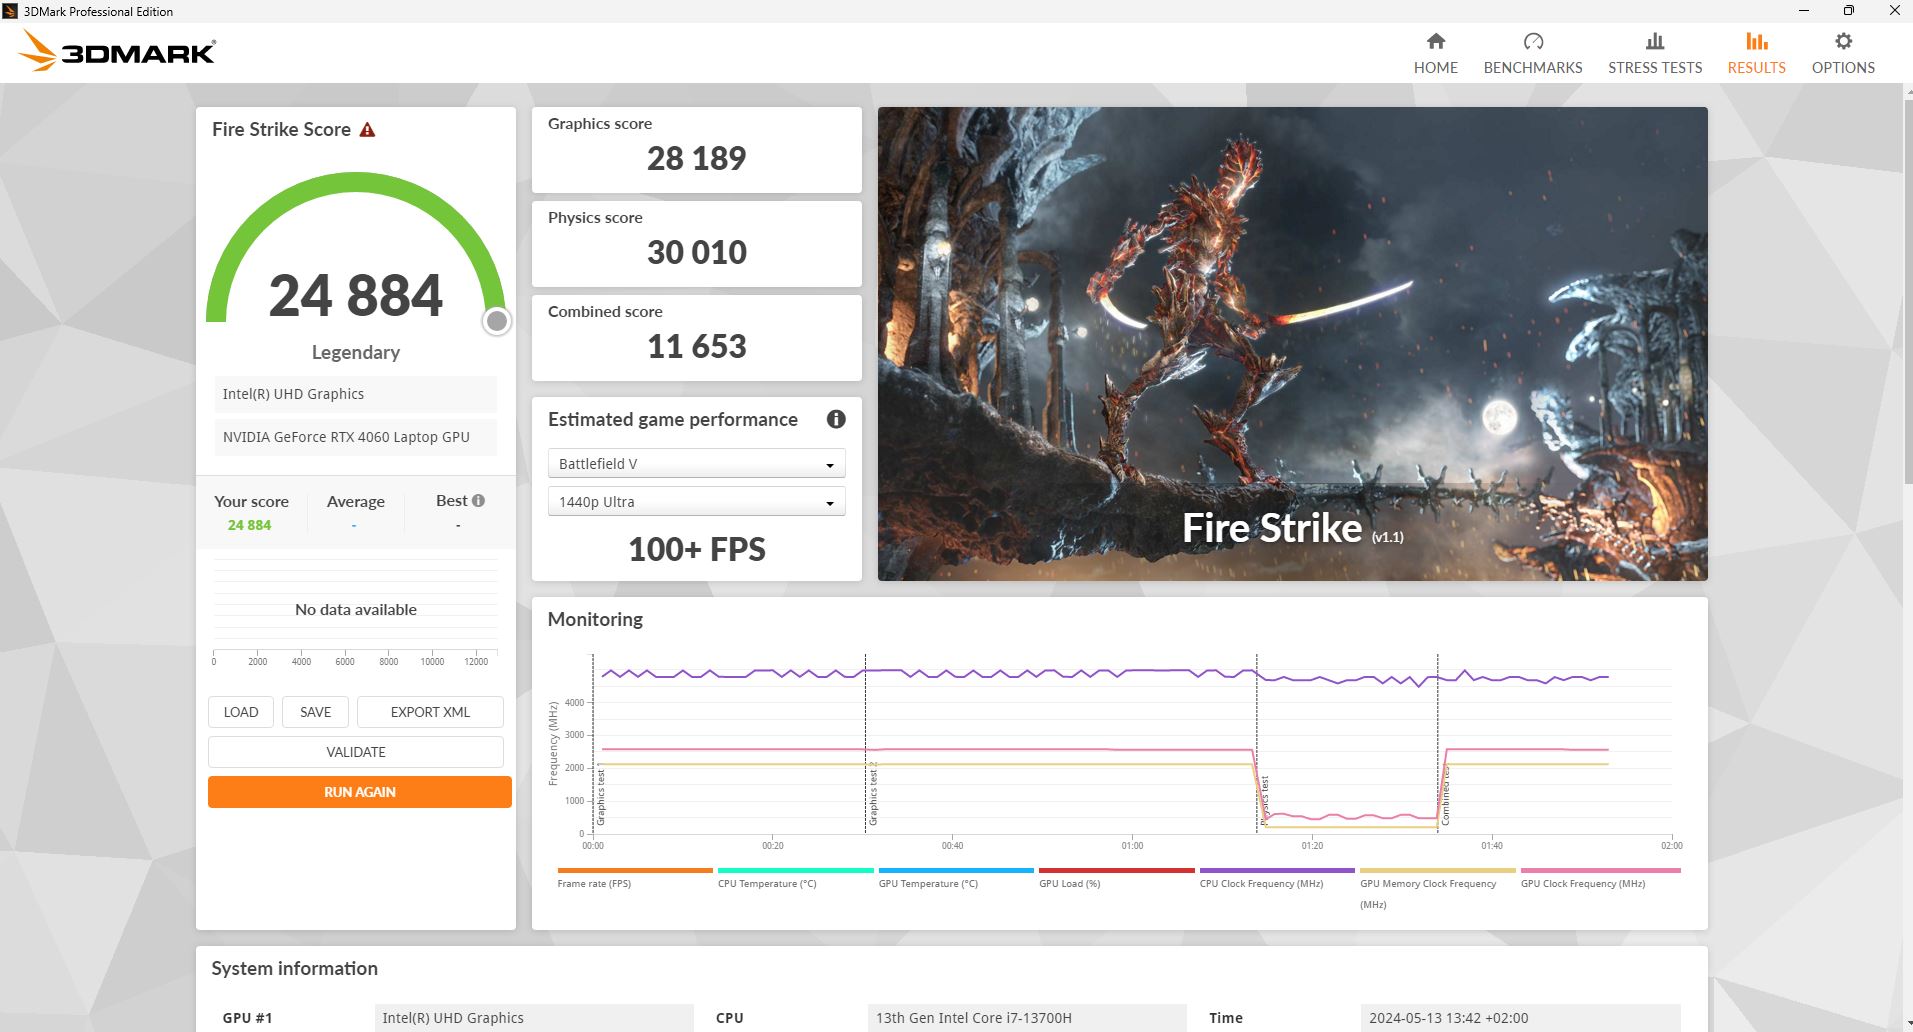
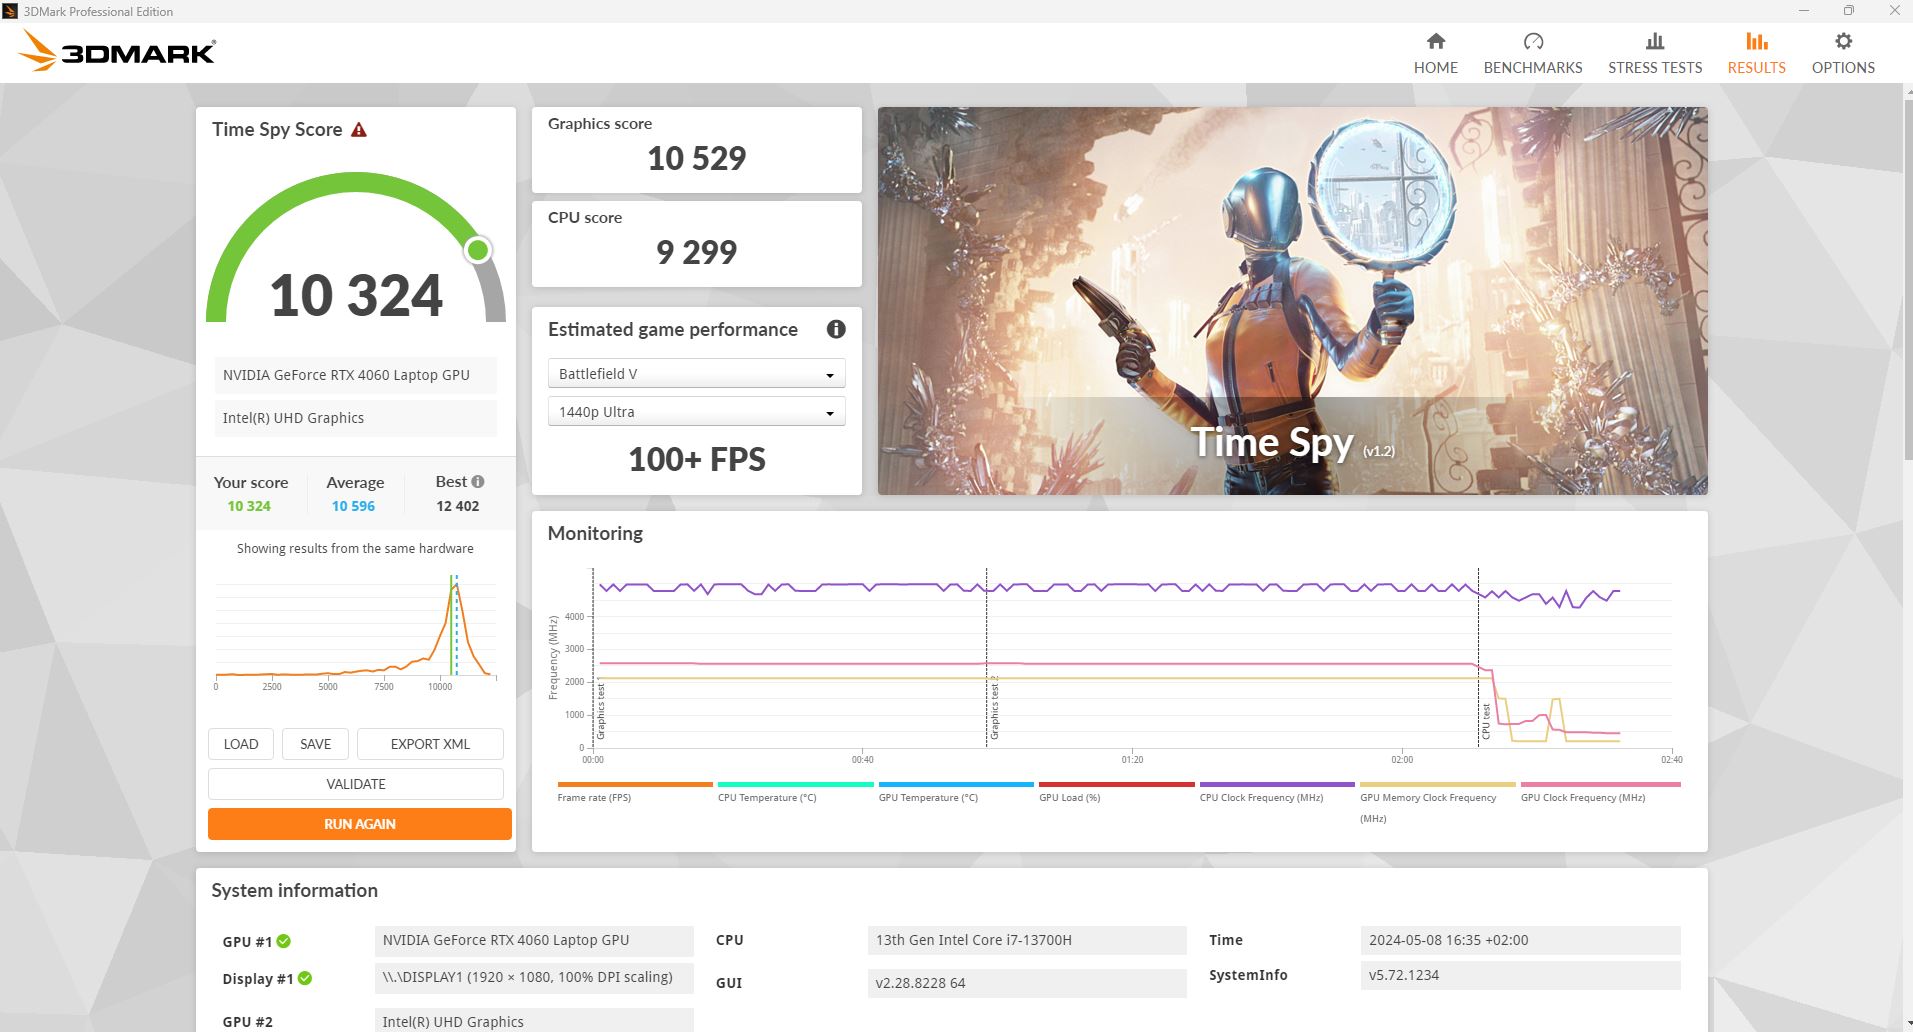
In the synthetic 3DMark tests, its 3D performance was very good and about 10 per cent better than the average laptop with the same GPU.
A repeated Fire Strike run in battery mode resulted in a 3D performance loss of around 85 per cent, which is a massive drop! Apparently, only the integrated GPU is at work here. If Optimus is deactivated (only dGPU active), its score increases significantly and its performance loss is then minimized to around 56 per cent.
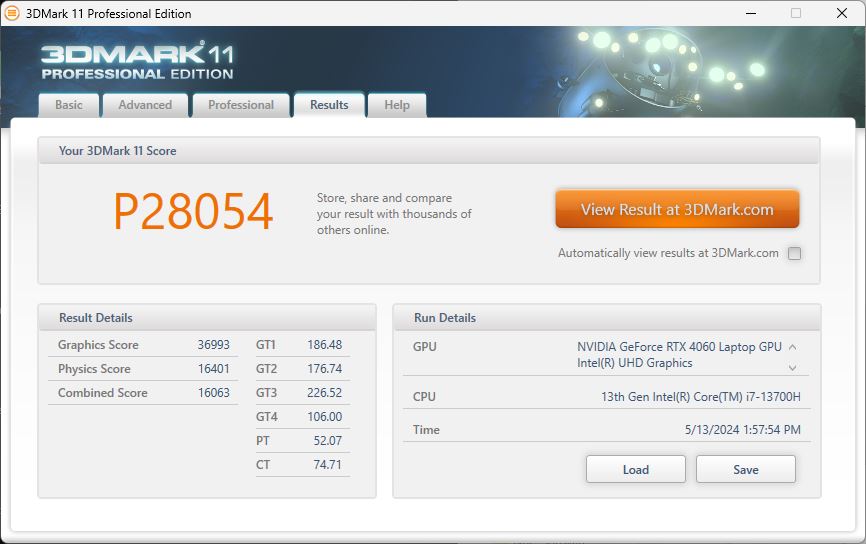
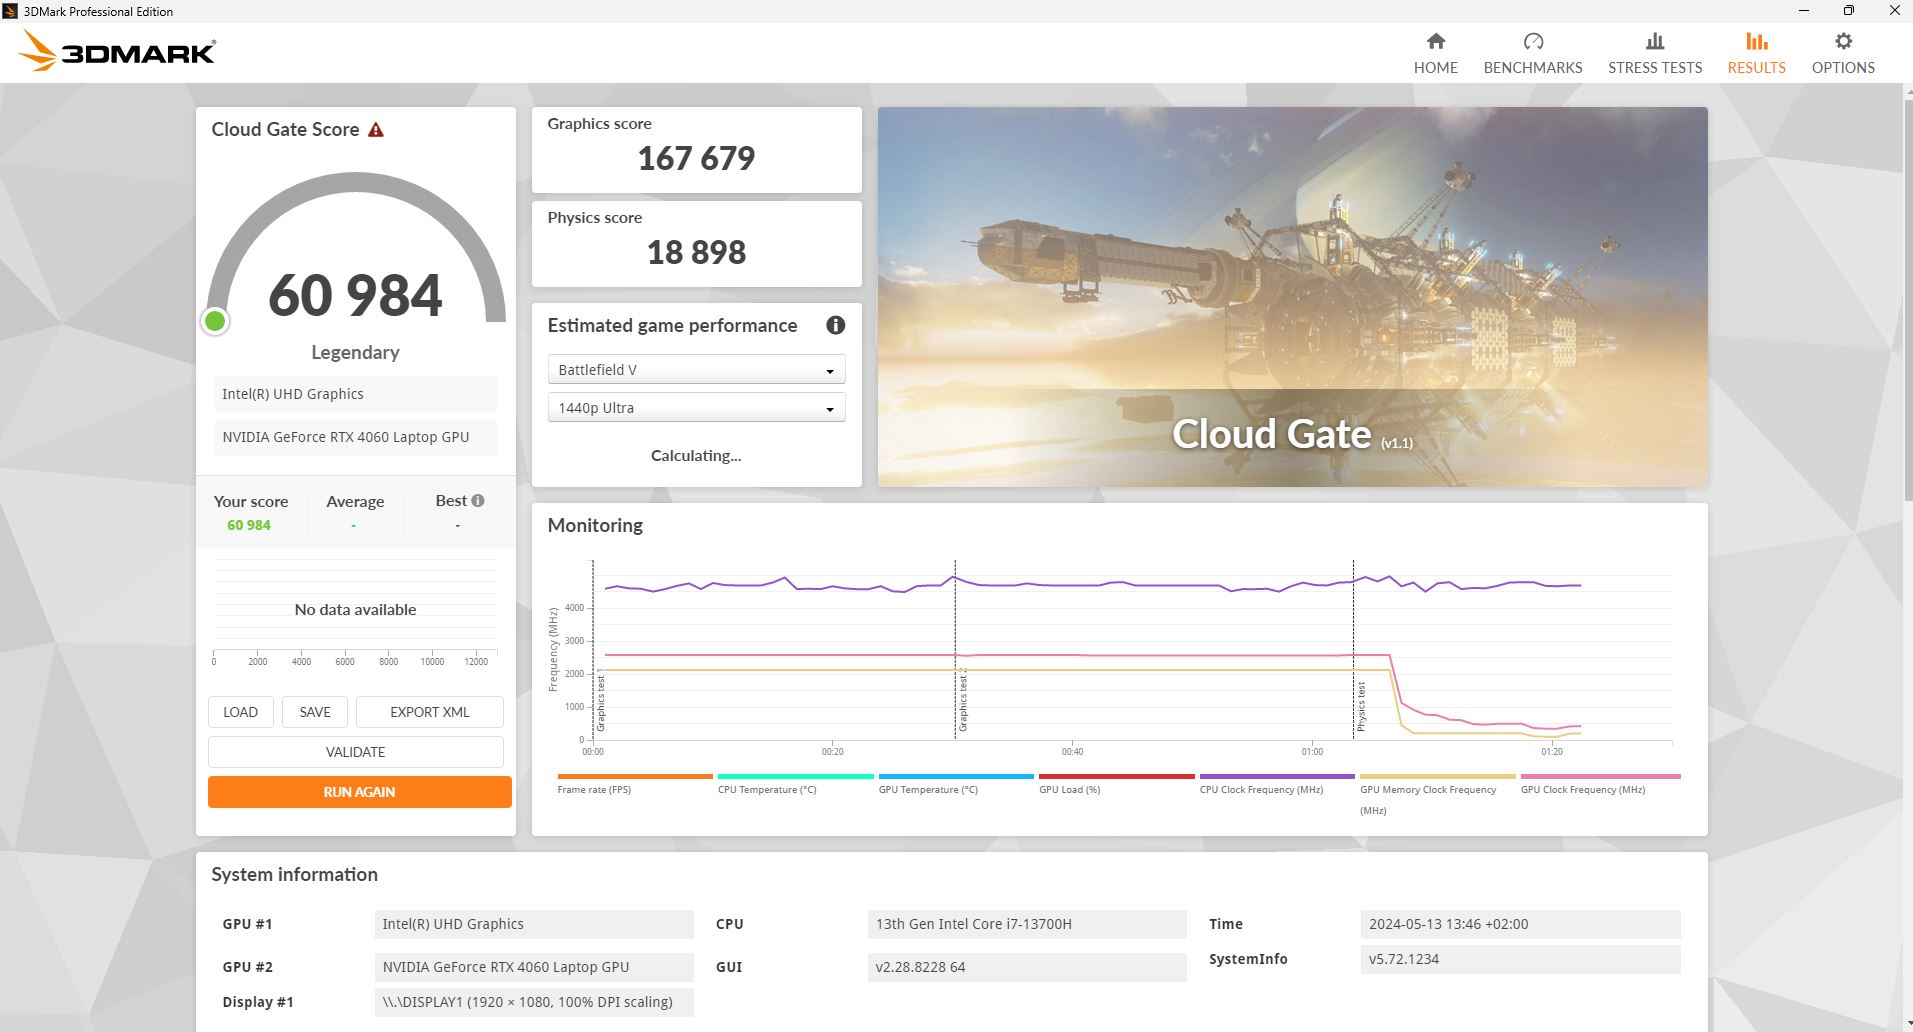
| 3DMark 11 Performance | 28054 points | |
| 3DMark Cloud Gate Standard Score | 60984 points | |
| 3DMark Fire Strike Score | 24884 points | |
| 3DMark Time Spy Score | 10324 points | |
Help | ||
* ... smaller is better
Gaming performance
Unfortunately, the Tulpar laptop couldn't quite keep up with its good 3DMark results in the gaming comparison, as it often lost out to the competition and ended up at the bottom of the rankings. The XMG was on a similar level, but many of its competitors were 10 per cent faster.
When running the current game Skull & Bones, the T7 still achieves a playable 65fps on average in Full HD and with ultra details.
| Performance rating - Percent | |
| Average of class Gaming | |
| Lenovo Legion 5 16IRX G9 | |
| MSI Katana 17 B13VFK | |
| Acer Nitro 17 AN17-51-71ER | |
| Medion Erazer Defender P40 | |
| Schenker XMG Apex 17 (Late 23) -1! | |
| Tulpar T7 V20.6 | |
| The Witcher 3 - 1920x1080 Ultra Graphics & Postprocessing (HBAO+) | |
| Average of class Gaming (104.7 - 240, n=6, last 2 years) | |
| Acer Nitro 17 AN17-51-71ER | |
| MSI Katana 17 B13VFK | |
| Schenker XMG Apex 17 (Late 23) | |
| Medion Erazer Defender P40 | |
| Tulpar T7 V20.6 | |
| Lenovo Legion 5 16IRX G9 | |
| GTA V - 1920x1080 Highest AA:4xMSAA + FX AF:16x | |
| Average of class Gaming (48.3 - 186.9, n=93, last 2 years) | |
| Lenovo Legion 5 16IRX G9 | |
| Acer Nitro 17 AN17-51-71ER | |
| Medion Erazer Defender P40 | |
| MSI Katana 17 B13VFK | |
| Tulpar T7 V20.6 | |
| Final Fantasy XV Benchmark - 1920x1080 High Quality | |
| Average of class Gaming (41 - 215, n=95, last 2 years) | |
| Lenovo Legion 5 16IRX G9 | |
| Schenker XMG Apex 17 (Late 23) | |
| Acer Nitro 17 AN17-51-71ER | |
| Medion Erazer Defender P40 | |
| MSI Katana 17 B13VFK | |
| Tulpar T7 V20.6 | |
| Strange Brigade - 1920x1080 ultra AA:ultra AF:16 | |
| Average of class Gaming (76.3 - 456, n=86, last 2 years) | |
| Lenovo Legion 5 16IRX G9 | |
| Tulpar T7 V20.6 | |
| Acer Nitro 17 AN17-51-71ER | |
| Schenker XMG Apex 17 (Late 23) | |
| Medion Erazer Defender P40 | |
| MSI Katana 17 B13VFK | |
| Dota 2 Reborn - 1920x1080 ultra (3/3) best looking | |
| Lenovo Legion 5 16IRX G9 | |
| MSI Katana 17 B13VFK | |
| Average of class Gaming (84.8 - 248, n=107, last 2 years) | |
| Medion Erazer Defender P40 | |
| Schenker XMG Apex 17 (Late 23) | |
| Acer Nitro 17 AN17-51-71ER | |
| Tulpar T7 V20.6 | |
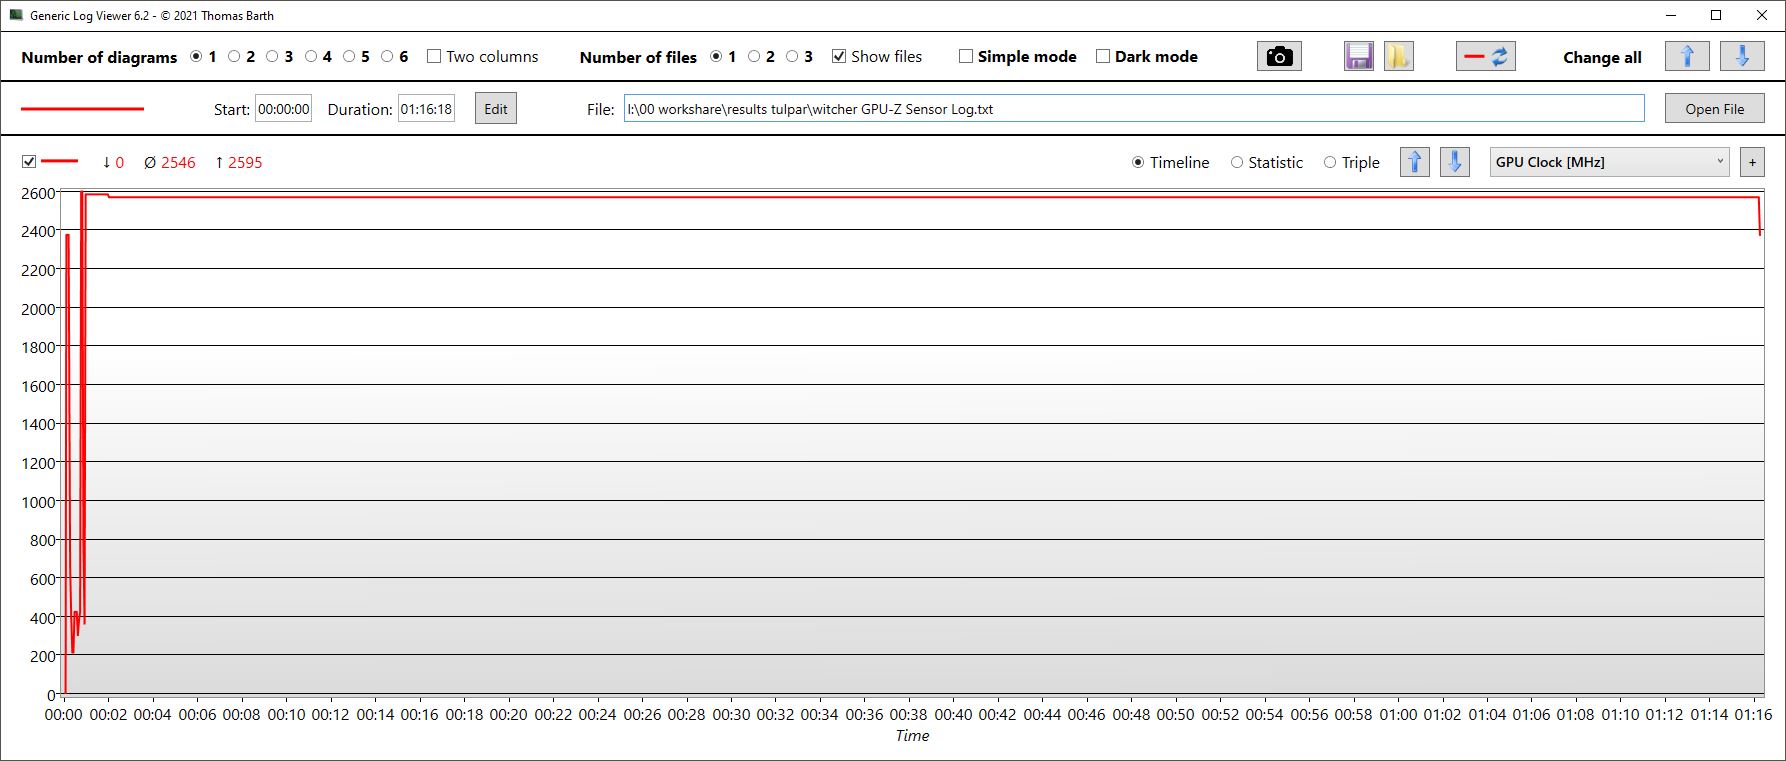
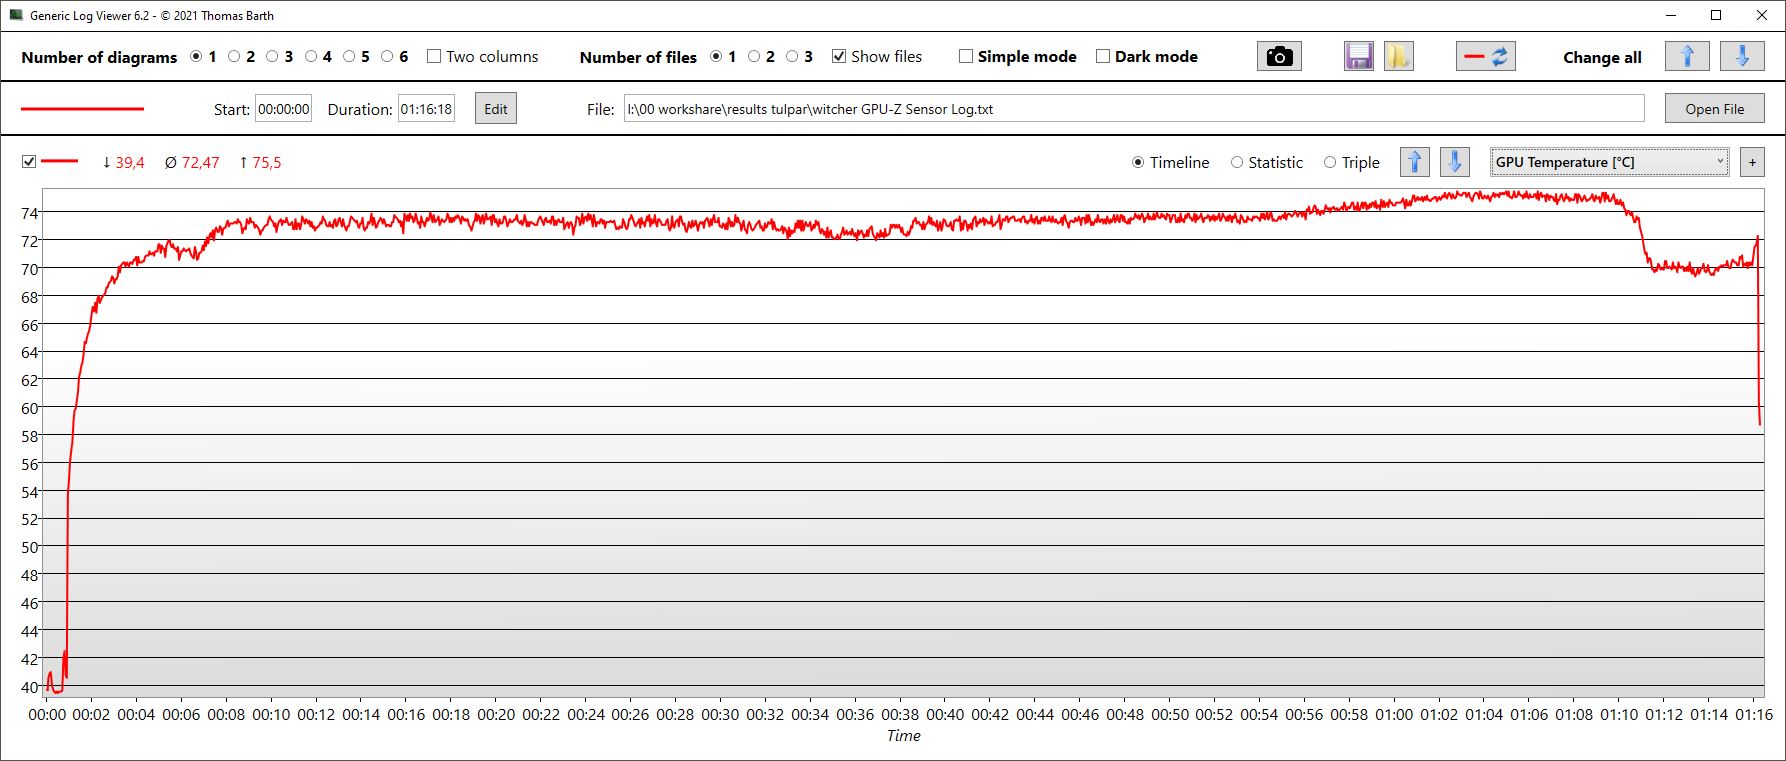
The Witcher 3 graph follows the usual day/night curve and otherwise, its performance is very consistent. The T7 is not quite as fast as some of its competitors, but the gap isn't too big.
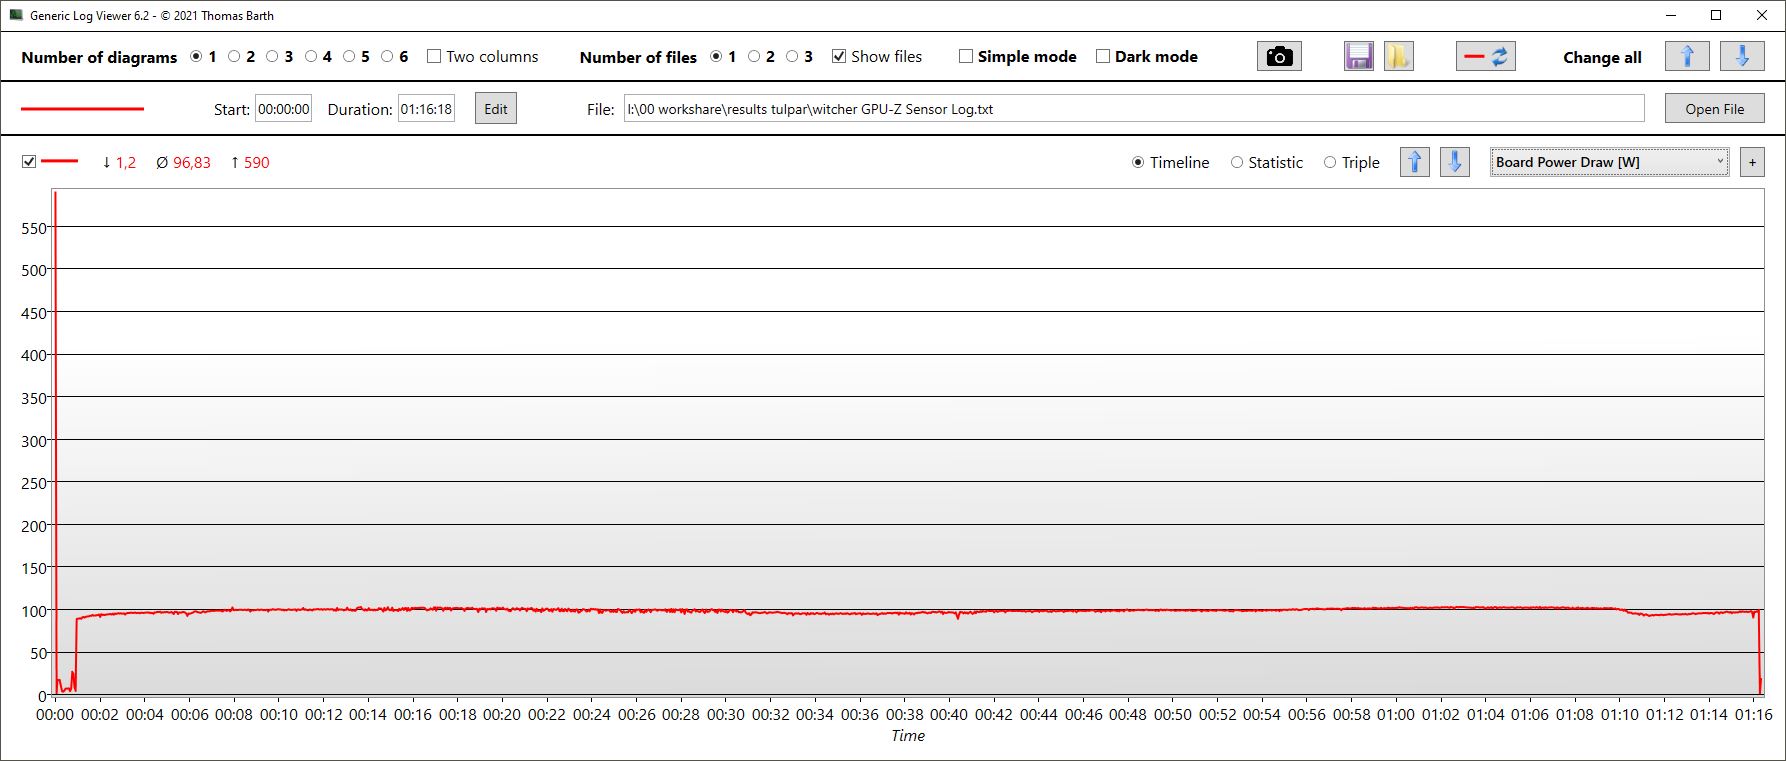
Its GPU clock rate is constant at around 2.6 GHz, while its memory clock is 2.1 GHz. The GPU heats up to 72 °C and to a maximum of 75.5 °C. The graphics board's consumption is around 97 watts, which is still some way off the 140 possible watts.
In enthusiast mode, its clock rate drops by 100 to 150 MHz, but its temperature development is similar. Its power consumption is around 94 watts.
| Performance mode/measurement value | Witcher 3 fps | GPU clock (in GHz) | GPU temperature (in °C) | GPU power consumption (in watts) |
|---|---|---|---|---|
| Overboost | 97 | 2.6 | 73 | 97 |
| Enthusiast | 90 | 2.45 | 72 | 94 |
| Balanced | 64 | 1.7 | 57 | 49 |
Witcher 3 FPS diagram
| low | med. | high | ultra | |
|---|---|---|---|---|
| GTA V (2015) | 178.3 | 172.1 | 163 | 97.8 |
| The Witcher 3 (2015) | 339 | 287 | 198 | 99.6 |
| Dota 2 Reborn (2015) | 148 | 130 | 124 | 115 |
| Final Fantasy XV Benchmark (2018) | 149.5 | 125.8 | 93.3 | |
| X-Plane 11.11 (2018) | 141.69 | 126.82 | 99.32 | |
| Far Cry 5 (2018) | 135 | 113 | 109 | 103 |
| Strange Brigade (2018) | 432 | 291 | 230 | 198.7 |
| Skull & Bones (2024) | 82 | 82 | 78 | 65 |
Emissions - Moderate values
Noise emissions
When idling on the desktop, the laptop's fans are usually off. This also applies to overdrive mode but using this, the fans sometimes briefly rev up to 40 dB. The latter can also be achieved when undertaking less demanding tasks away from idle mode.
In the 3DMark06 test, the fans' noise slowly increased to up to 40 dB. However, they got quieter again during the course of the run and in the end, the fans whirred along at a fairly constant 38 dB. The 40 dB we measured should therefore rather be understood as the fans' maximum value under average load.
During The Witcher 3, the fans constantly ranged between around 47.5 dB and just under 50 dB. These are typical values for a gamer, but the competitors represented in this test are even louder when gaming. Overall, the T7 performs quite well in terms of noise, but it can't quite reach the performance of the other comparison devices.
Noise level
| Idle |
| 23 / 23 / 30.84 dB(A) |
| Load |
| 40.14 / 50.69 dB(A) |
 | ||
30 dB silent 40 dB(A) audible 50 dB(A) loud |
||
min: | ||
| Tulpar T7 V20.6 GeForce RTX 4060 Laptop GPU, i7-13700H, Samsung PM9B1 512GB MZVL4512HBLU | Schenker XMG Apex 17 (Late 23) GeForce RTX 4060 Laptop GPU, R7 7840HS, Samsung 990 Pro 1 TB | Acer Nitro 17 AN17-51-71ER GeForce RTX 4060 Laptop GPU, i7-13700H, Samsung PM9A1 MZVL21T0HCLR | Medion Erazer Defender P40 GeForce RTX 4060 Laptop GPU, i7-13700HX, Phison PS5021-E21 1TB | MSI Katana 17 B13VFK GeForce RTX 4060 Laptop GPU, i7-13620H, Micron 2400 MTFDKBA1T0QFM | Lenovo Legion 5 16IRX G9 GeForce RTX 4060 Laptop GPU, i7-14650HX, Samsung PM9A1 MZVL21T0HCLR | |
|---|---|---|---|---|---|---|
| Noise | -6% | -3% | -16% | -14% | -9% | |
| off / environment * (dB) | 23 | 24 -4% | 24 -4% | 25 -9% | 24.5 -7% | 24 -4% |
| Idle Minimum * (dB) | 23 | 25 -9% | 24 -4% | 26 -13% | 24.5 -7% | 24 -4% |
| Idle Average * (dB) | 23 | 29 -26% | 24 -4% | 27 -17% | 24.5 -7% | 28.8 -25% |
| Idle Maximum * (dB) | 30.84 | 33 -7% | 32.32 -5% | 32 -4% | 40 -30% | 32 -4% |
| Load Average * (dB) | 40.14 | 37 8% | 35.18 12% | 53 -32% | 48.3 -20% | 45.5 -13% |
| Witcher 3 ultra * (dB) | 50.69 | 50 1% | 54.78 -8% | 56 -10% | 56 -10% | 53.1 -5% |
| Load Maximum * (dB) | 50.69 | 54 -7% | 54.78 -8% | 64 -26% | 59.1 -17% | 55.7 -10% |
* ... smaller is better
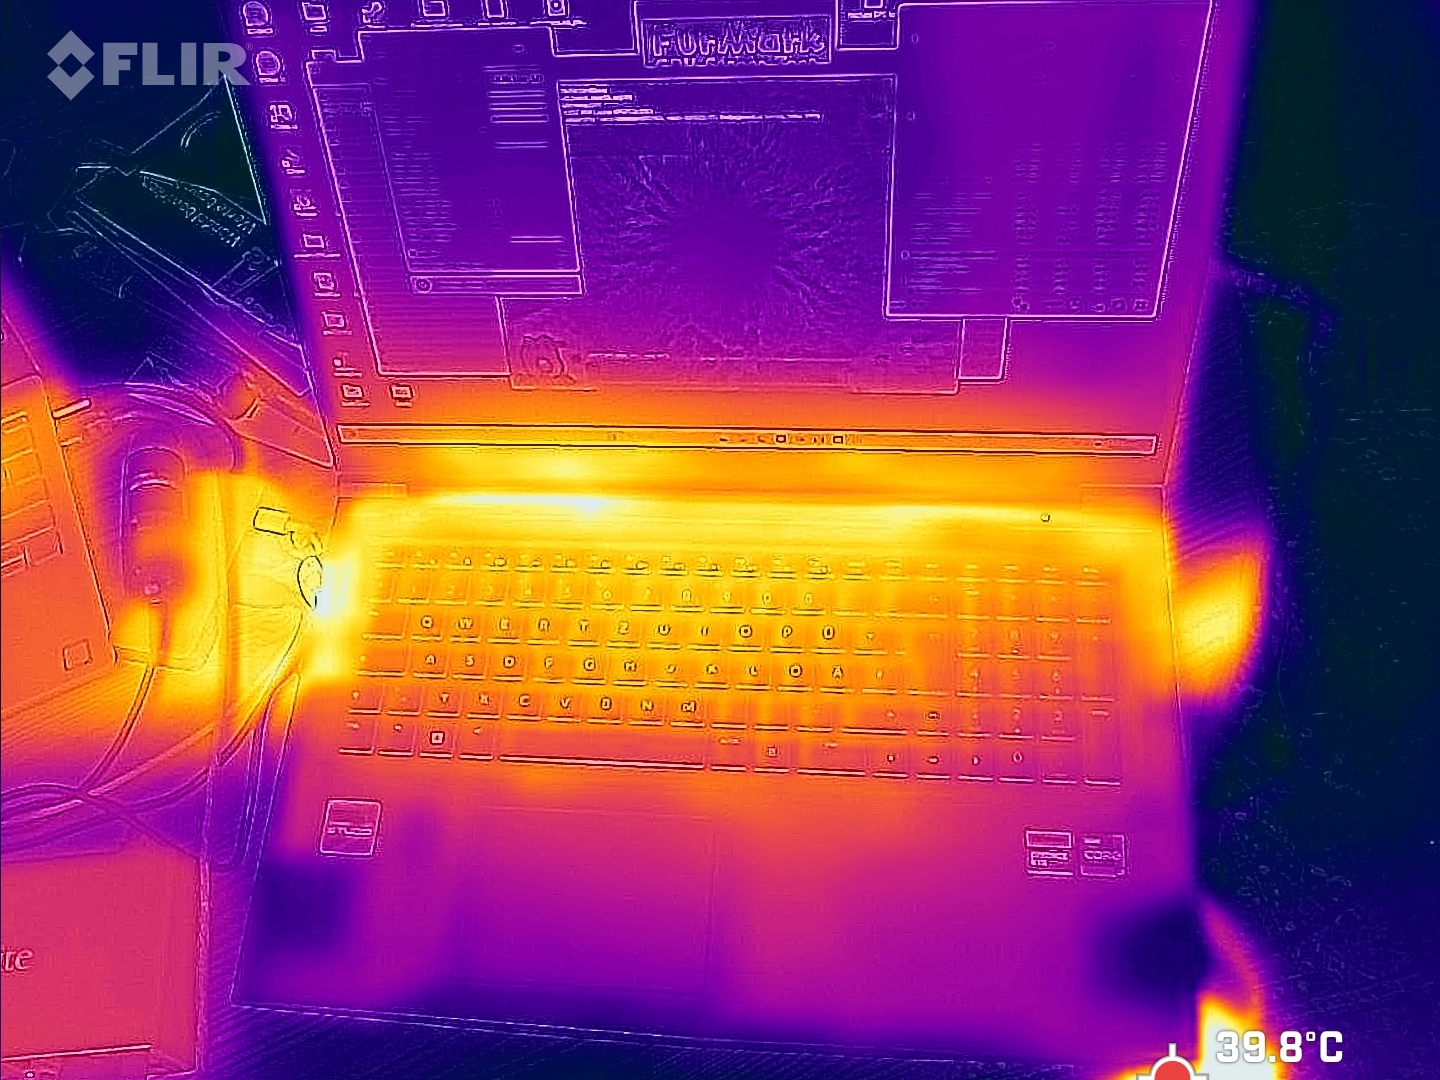
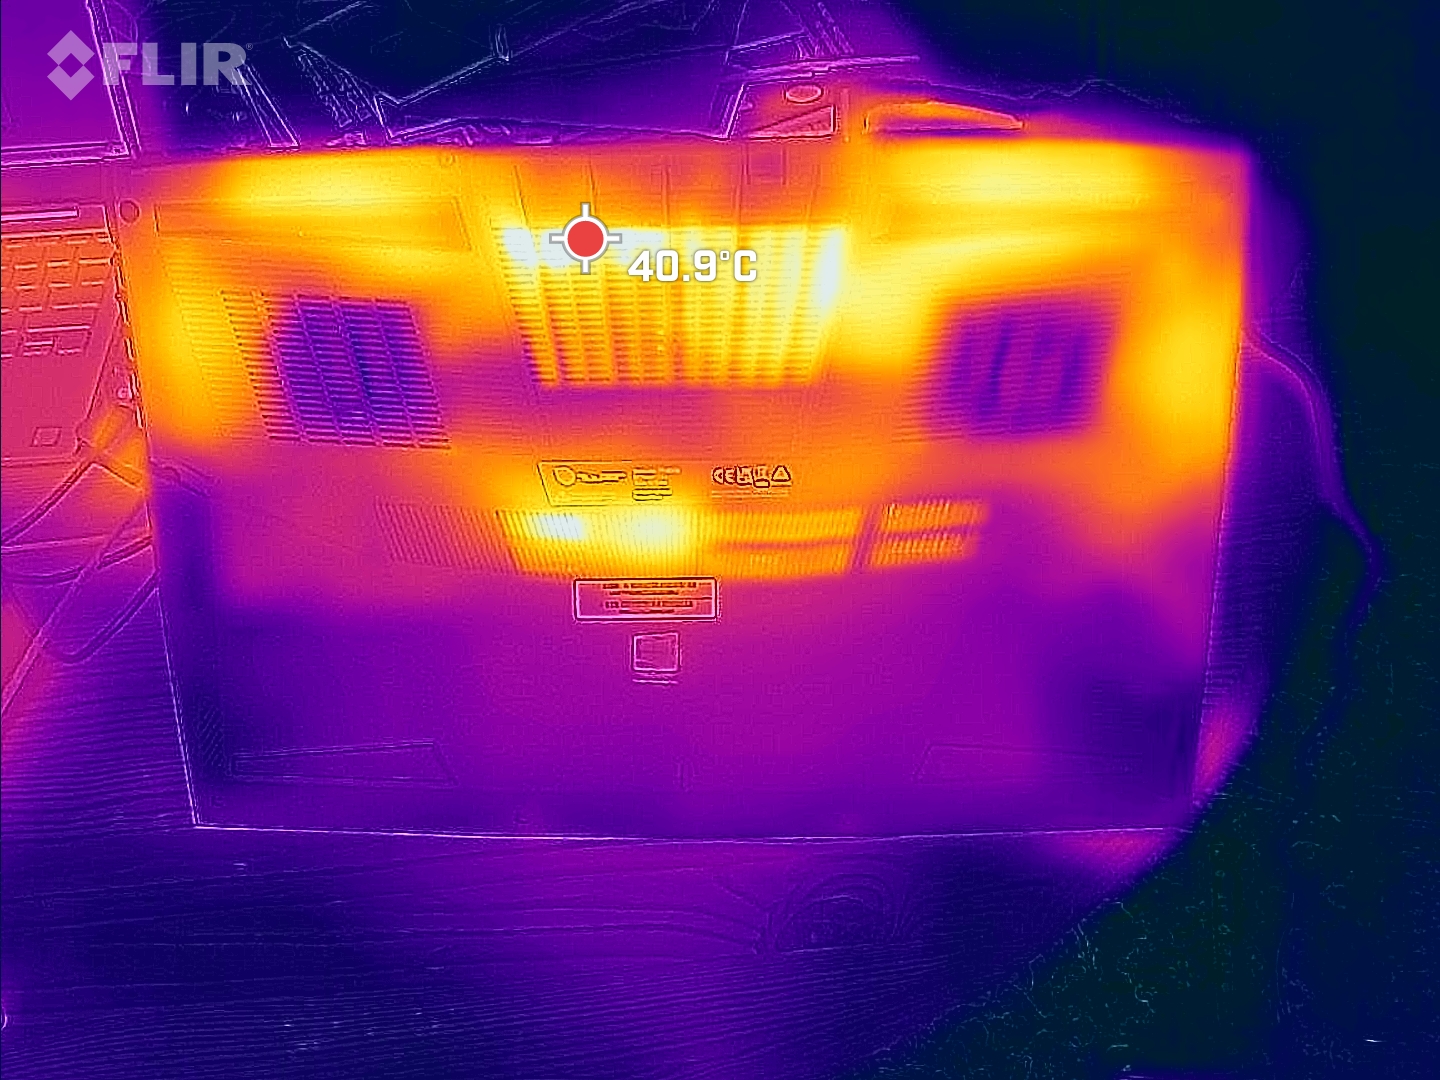
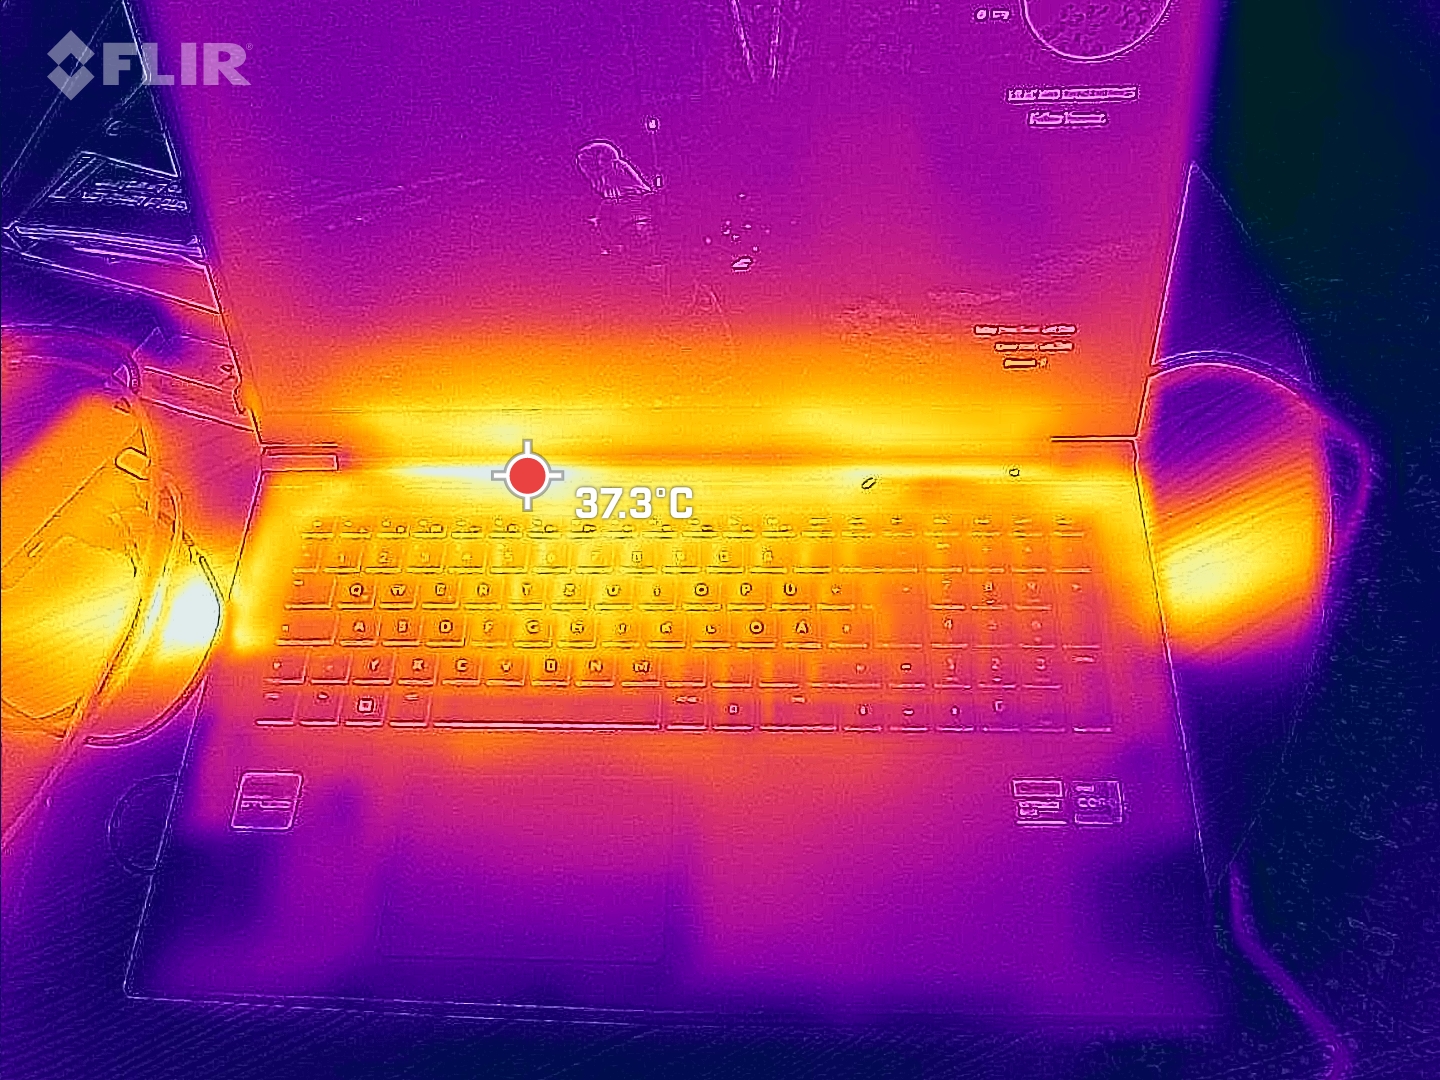
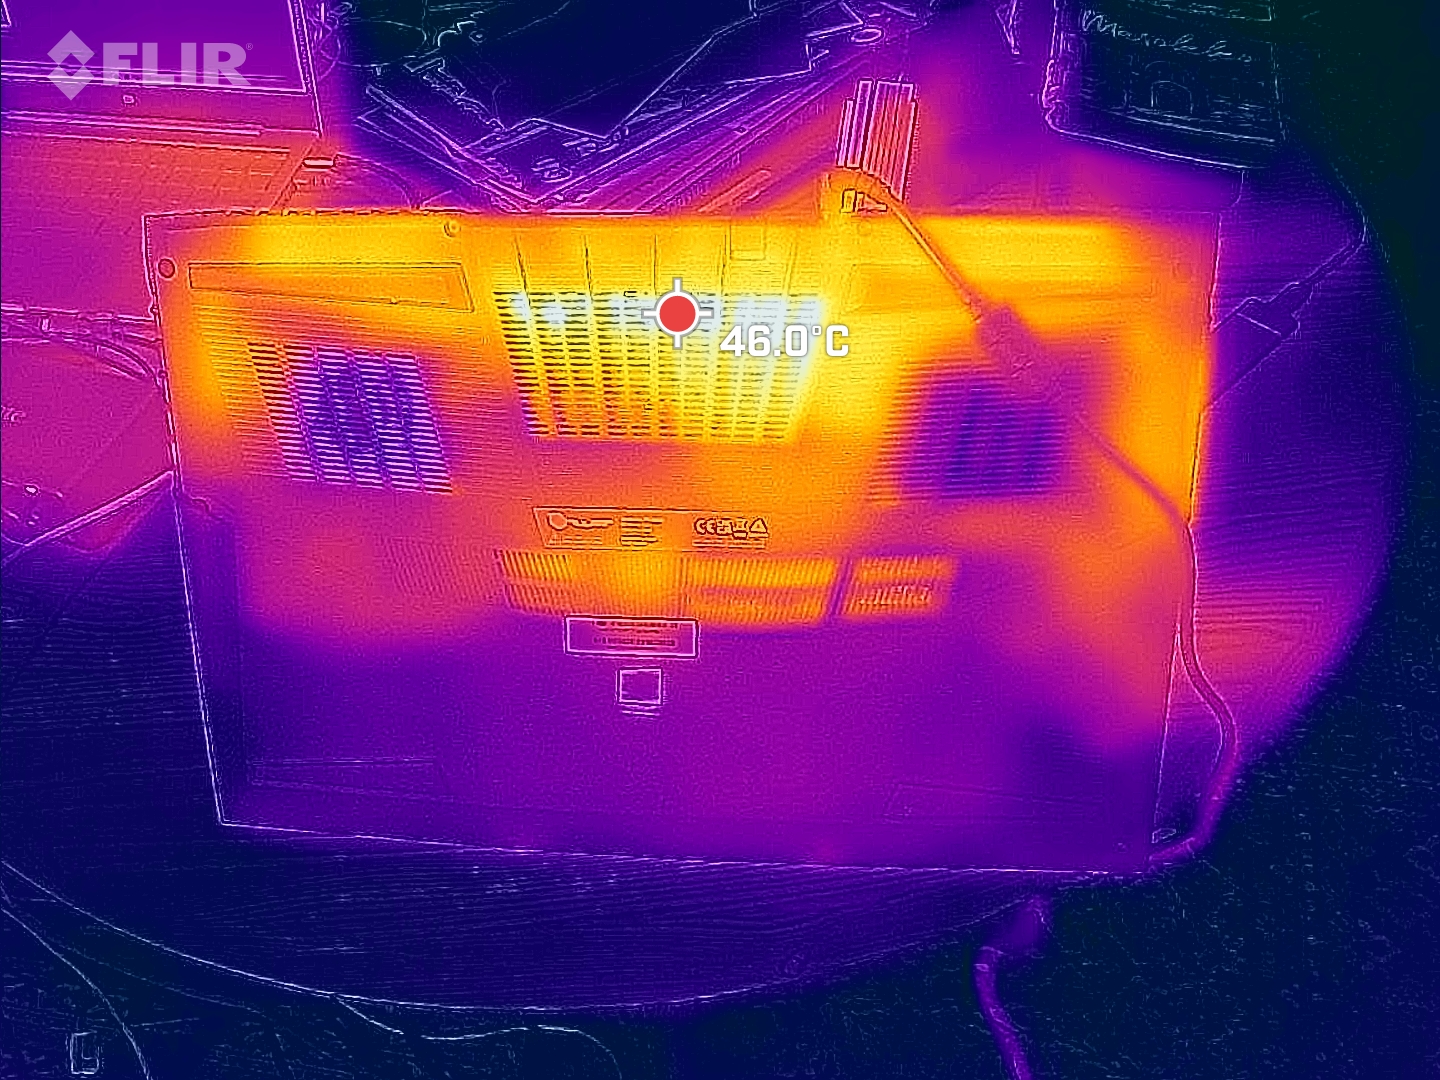
Temperature
The T7's surface temperatures also remained moderate, with its hot spots only heating up to 44 °C during the stress test.
When we ran the same stress test in balanced mode, we measured average surface temperatures of only 32 °C at the top and 33 °C at the bottom.
(+) The maximum temperature on the upper side is 38 °C / 100 F, compared to the average of 40.4 °C / 105 F, ranging from 21.2 to 68.8 °C for the class Gaming.
(±) The bottom heats up to a maximum of 44 °C / 111 F, compared to the average of 43.2 °C / 110 F
(+) In idle usage, the average temperature for the upper side is 30 °C / 86 F, compared to the device average of 33.9 °C / 93 F.
(±) Playing The Witcher 3, the average temperature for the upper side is 34.3 °C / 94 F, compared to the device average of 33.9 °C / 93 F.
(+) The palmrests and touchpad are reaching skin temperature as a maximum (35 °C / 95 F) and are therefore not hot.
(-) The average temperature of the palmrest area of similar devices was 28.8 °C / 83.8 F (-6.2 °C / -11.2 F).
| Tulpar T7 V20.6 Intel Core i7-13700H, NVIDIA GeForce RTX 4060 Laptop GPU | Schenker XMG Apex 17 (Late 23) AMD Ryzen 7 7840HS, NVIDIA GeForce RTX 4060 Laptop GPU | Acer Nitro 17 AN17-51-71ER Intel Core i7-13700H, NVIDIA GeForce RTX 4060 Laptop GPU | Medion Erazer Defender P40 Intel Core i7-13700HX, NVIDIA GeForce RTX 4060 Laptop GPU | MSI Katana 17 B13VFK Intel Core i7-13620H, NVIDIA GeForce RTX 4060 Laptop GPU | Lenovo Legion 5 16IRX G9 Intel Core i7-14650HX, NVIDIA GeForce RTX 4060 Laptop GPU | |
|---|---|---|---|---|---|---|
| Heat | -16% | -11% | 2% | -4% | -2% | |
| Maximum Upper Side * (°C) | 38 | 51 -34% | 46 -21% | 42 -11% | 41.6 -9% | 40.4 -6% |
| Maximum Bottom * (°C) | 44 | 54 -23% | 51 -16% | 45 -2% | 43.1 2% | 43.8 -0% |
| Idle Upper Side * (°C) | 32 | 33 -3% | 34 -6% | 28 12% | 32 -0% | 30.3 5% |
| Idle Bottom * (°C) | 33 | 34 -3% | 33 -0% | 30 9% | 35.8 -8% | 35.3 -7% |
* ... smaller is better
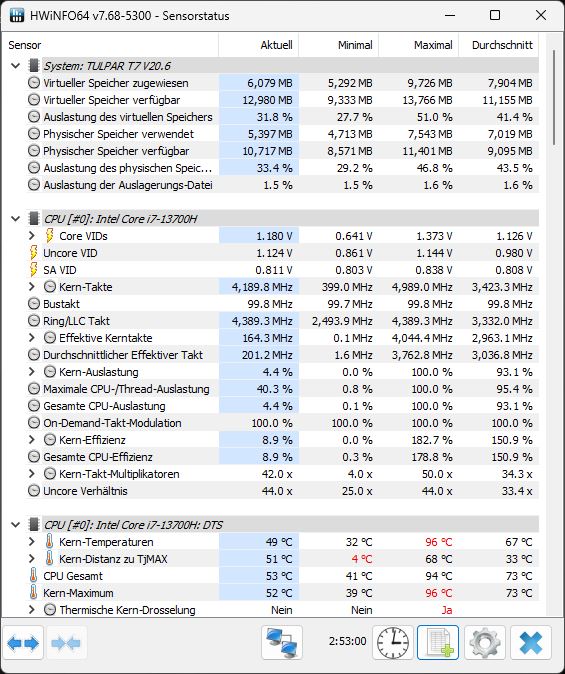
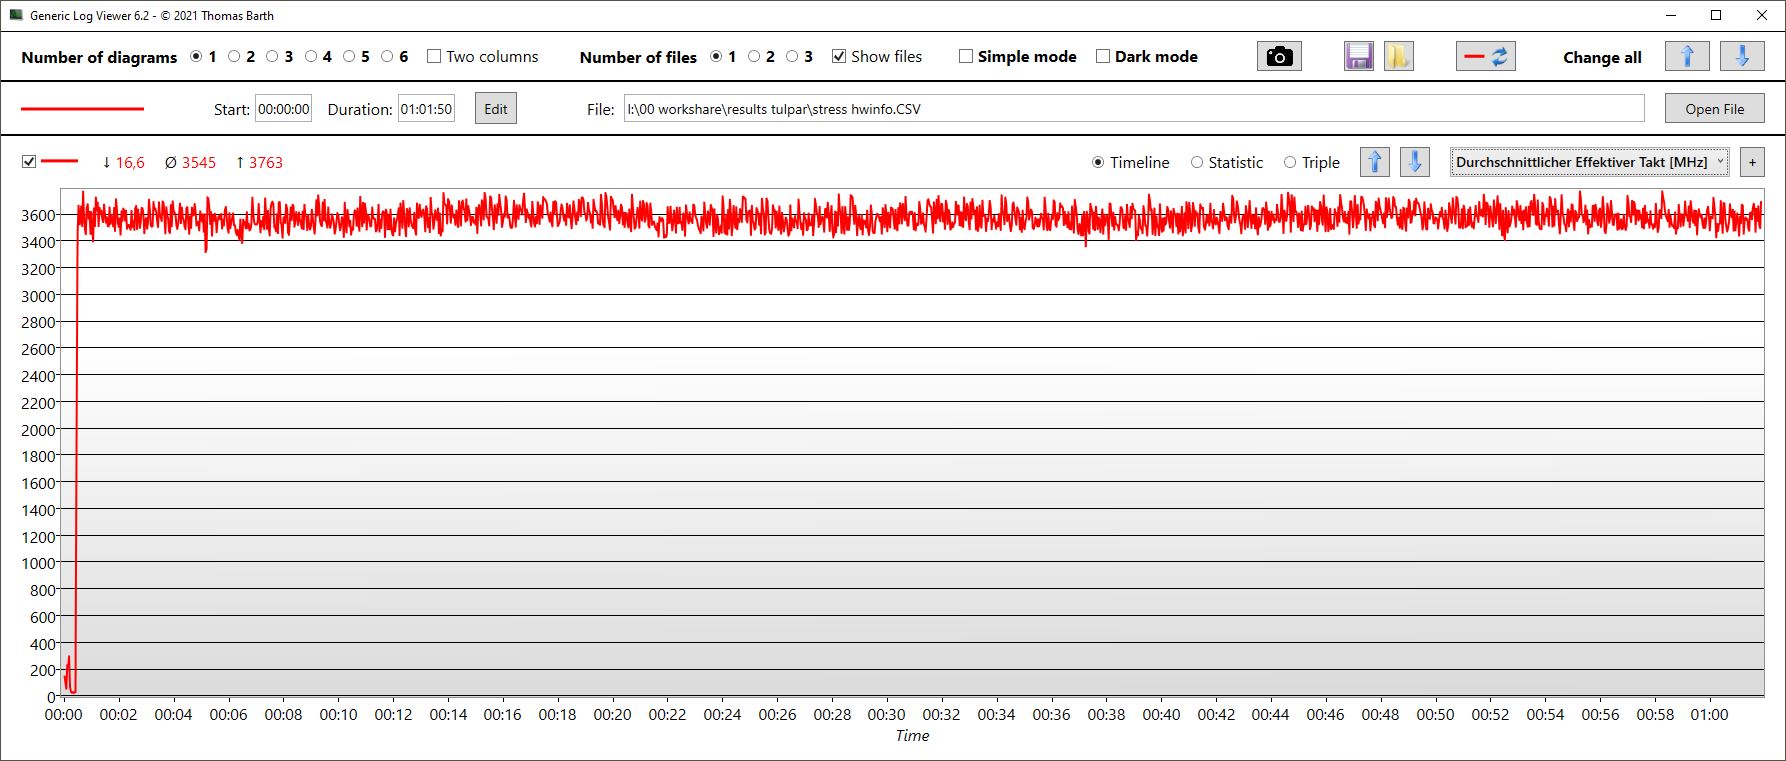
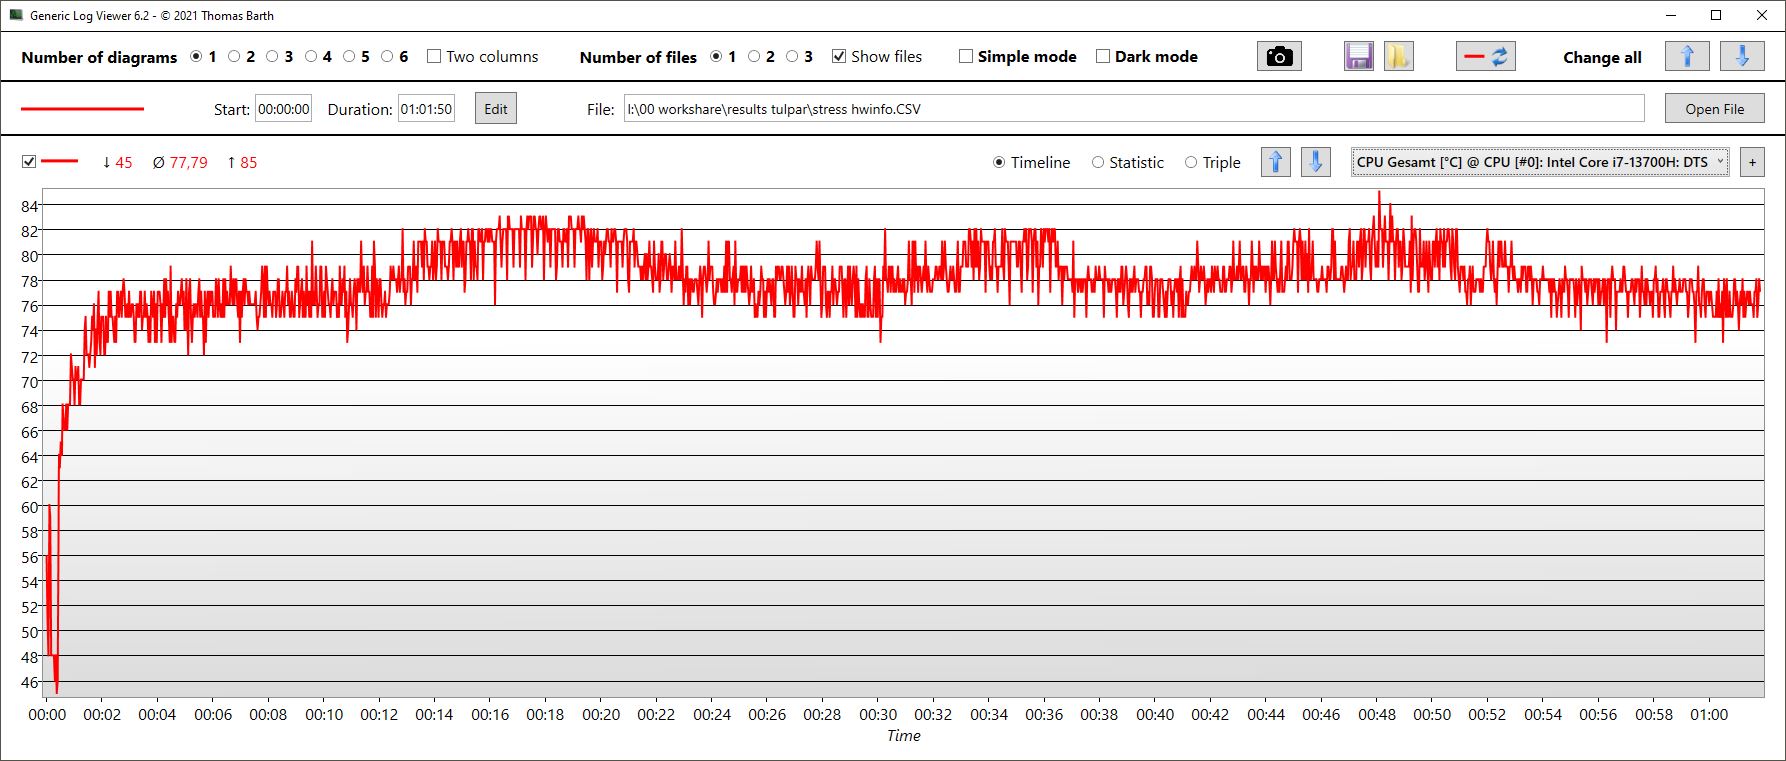
Stress test
In the stress test, the cores clocked up to around 3.5 - 3.7 GHz at the beginning and remained in this range until the end of the one-hour test. Its core temperatures averaged 78 °C, and it didn't get any hotter than 85 °C. The CPU's power consumption fluctuated between 60 and 80 watts, with an average of 67 watts.
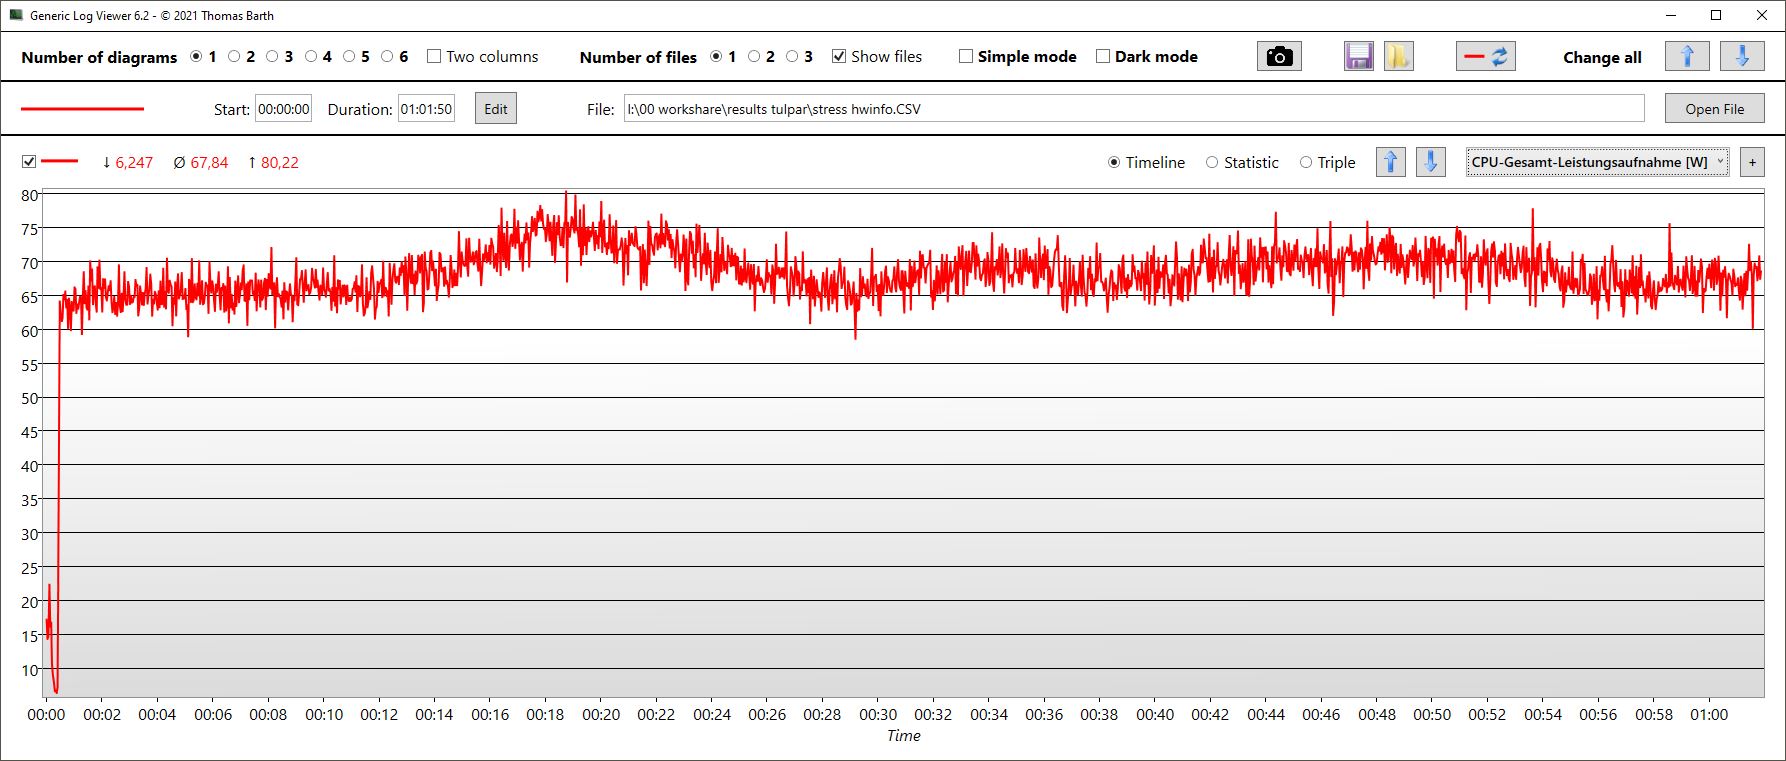
| CPU clock (GHz) | GPU clock (MHz) | Average CPU temperature (°C) | Average GPU temperature (°C) | |
| System idle | 4.2 | / | 41 | / |
| Prime95 + FurMark stress | 3.5 | 1,264 | 80 | 54 |
| Witcher 3 stress | 0.64 | 2,600 | 77 | 71 |
Speakers
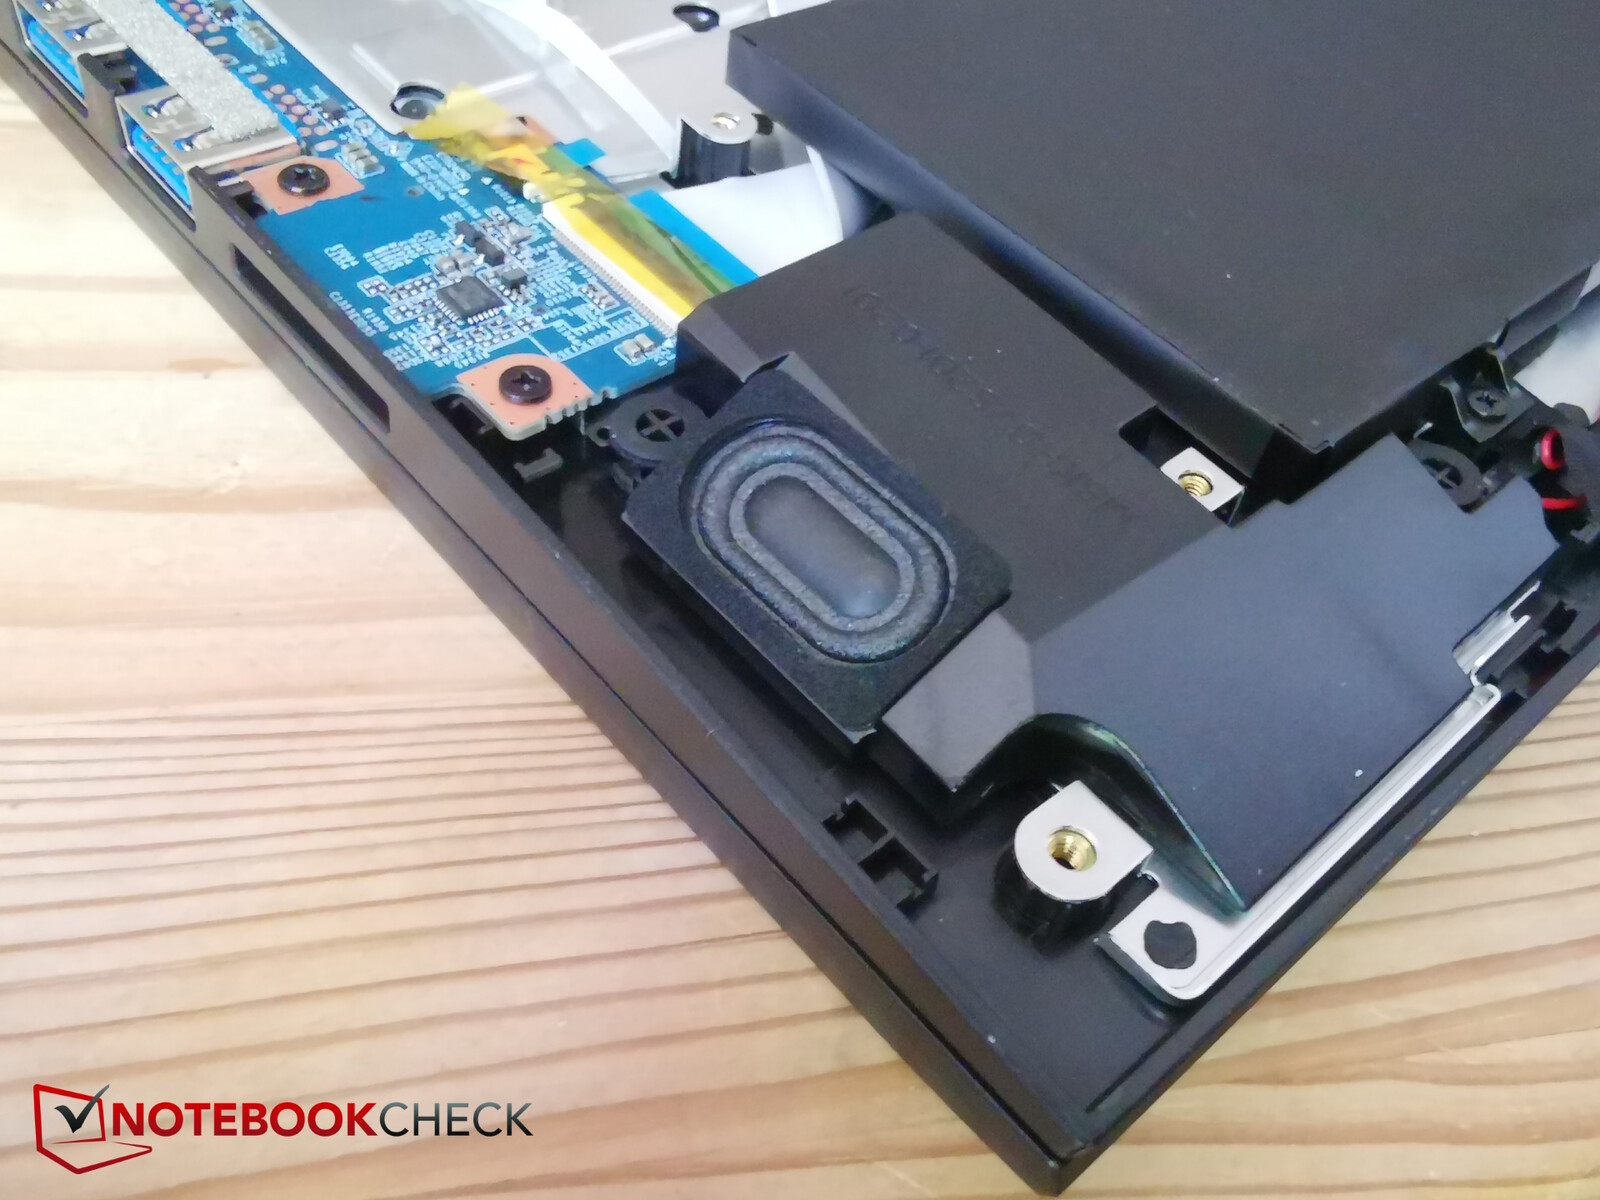
The stereo speakers are housed in the front corners of the laptop; they are quite small and radiate downwards. Accordingly, they could be louder, and they are missing bass. At least the mids and highs are balanced.
A microphone input and a headphone output—both 3.5 mm—are available for connecting analogue audio devices.
Tulpar T7 V20.6 audio analysis
(±) | speaker loudness is average but good (78.88 dB)
Bass 100 - 315 Hz
(-) | nearly no bass - on average 20.7% lower than median
(±) | linearity of bass is average (12% delta to prev. frequency)
Mids 400 - 2000 Hz
(+) | balanced mids - only 4.8% away from median
(+) | mids are linear (6.5% delta to prev. frequency)
Highs 2 - 16 kHz
(+) | balanced highs - only 2.7% away from median
(+) | highs are linear (5.7% delta to prev. frequency)
Overall 100 - 16.000 Hz
(±) | linearity of overall sound is average (17% difference to median)
Compared to same class
» 45% of all tested devices in this class were better, 12% similar, 43% worse
» The best had a delta of 6%, average was 18%, worst was 132%
Compared to all devices tested
» 30% of all tested devices were better, 8% similar, 62% worse
» The best had a delta of 4%, average was 23%, worst was 134%
Lenovo Legion 5 16IRX G9 audio analysis
(+) | speakers can play relatively loud (84.4 dB)
Bass 100 - 315 Hz
(-) | nearly no bass - on average 25.7% lower than median
(±) | linearity of bass is average (8.3% delta to prev. frequency)
Mids 400 - 2000 Hz
(+) | balanced mids - only 4.3% away from median
(+) | mids are linear (5.2% delta to prev. frequency)
Highs 2 - 16 kHz
(+) | balanced highs - only 1.9% away from median
(+) | highs are linear (2.1% delta to prev. frequency)
Overall 100 - 16.000 Hz
(±) | linearity of overall sound is average (16.1% difference to median)
Compared to same class
» 39% of all tested devices in this class were better, 6% similar, 54% worse
» The best had a delta of 6%, average was 18%, worst was 132%
Compared to all devices tested
» 26% of all tested devices were better, 5% similar, 69% worse
» The best had a delta of 4%, average was 23%, worst was 134%
Power management - Last year's efficiency
Power consumption
The T7 isn't particularly frugal. There are already more frugal competitors when the laptop is idling—even if the difference isn't all too large. When running The Witcher 3, its consumption is too high especially when you consider its slightly low performance. Although the Medion and Lenovo consume a little more, the XMG and the Acer are a little more frugal while delivering slightly better performance.
If you connect an external monitor via HDMI, the laptop's dGPU is active, resulting in its idle consumption, for example, increasing by about 5 watts (see graph).
| Off / Standby | |
| Idle | |
| Load |
|
Key:
min: | |
| Tulpar T7 V20.6 i7-13700H, GeForce RTX 4060 Laptop GPU, Samsung PM9B1 512GB MZVL4512HBLU, IPS, 1920x1080, 17.3" | Schenker XMG Apex 17 (Late 23) R7 7840HS, GeForce RTX 4060 Laptop GPU, Samsung 990 Pro 1 TB, IPS, 2560x1440, 17.3" | Acer Nitro 17 AN17-51-71ER i7-13700H, GeForce RTX 4060 Laptop GPU, Samsung PM9A1 MZVL21T0HCLR, , 2560x1440, 17.3" | Medion Erazer Defender P40 i7-13700HX, GeForce RTX 4060 Laptop GPU, Phison PS5021-E21 1TB, IPS, 2560x1440, 17.3" | MSI Katana 17 B13VFK i7-13620H, GeForce RTX 4060 Laptop GPU, Micron 2400 MTFDKBA1T0QFM, IPS LED, 1920x1080, 17.3" | Lenovo Legion 5 16IRX G9 i7-14650HX, GeForce RTX 4060 Laptop GPU, Samsung PM9A1 MZVL21T0HCLR, IPS, 2560x1600, 16" | Average NVIDIA GeForce RTX 4060 Laptop GPU | Average of class Gaming | |
|---|---|---|---|---|---|---|---|---|
| Power Consumption | 16% | 9% | -2% | 3% | -21% | -5% | -24% | |
| Idle Minimum * (Watt) | 12 | 9 25% | 8.3 31% | 8 33% | 12.2 -2% | 15.4 -28% | 11.5 ? 4% | 13 ? -8% |
| Idle Average * (Watt) | 17 | 12 29% | 13.5 21% | 12 29% | 14.9 12% | 19.7 -16% | 16 ? 6% | 18.7 ? -10% |
| Idle Maximum * (Watt) | 17.5 | 14 20% | 14.8 15% | 18 -3% | 15.8 10% | 20.7 -18% | 20.3 ? -16% | 24.3 ? -39% |
| Load Average * (Watt) | 78.5 | 67 15% | 77 2% | 101 -29% | 85.22 -9% | 102.6 -31% | 92.9 ? -18% | 110.2 ? -40% |
| Witcher 3 ultra * (Watt) | 169 | 147.6 13% | 154 9% | 180.8 -7% | 151.1 11% | 191.3 -13% | ||
| Load Maximum * (Watt) | 209 | 223 -7% | 263 -26% | 284 -36% | 212.8 -2% | 246.6 -18% | 210 ? -0% | 258 ? -23% |
* ... smaller is better
Power consumption Witcher 3 / stress test
Power consumption with external monitor
Runtimes
Tulpar has installed a 62-Wh battery into the 17-inch case. With regards to the laptop's size, this isn't very much for a gamer and you can clearly tell that the manufacturer has saved a bit of money—although the XMG Apex is fitted with the same one and the MSI Katana even has to make do with only 54 Wh. The three other competitors are equipped with larger batteries ranging between 73 and 90 Wh.
As a result, the T7 achieved runtimes of around 3.5 hours during the WLAN test and the video test at a reduced brightness of 150 nits. Only the Katana did worse here, while the rest of the comparison devices held on for much longer at times, for example the Apex despite it being fitted with the same sized battery. This is perhaps due to it having better energy-saving measures put in place.
| Tulpar T7 V20.6 i7-13700H, GeForce RTX 4060 Laptop GPU, 62.32 Wh | Schenker XMG Apex 17 (Late 23) R7 7840HS, GeForce RTX 4060 Laptop GPU, 62.32 Wh | Acer Nitro 17 AN17-51-71ER i7-13700H, GeForce RTX 4060 Laptop GPU, 90 Wh | Medion Erazer Defender P40 i7-13700HX, GeForce RTX 4060 Laptop GPU, 73 Wh | MSI Katana 17 B13VFK i7-13620H, GeForce RTX 4060 Laptop GPU, 53.5 Wh | Lenovo Legion 5 16IRX G9 i7-14650HX, GeForce RTX 4060 Laptop GPU, 80 Wh | Average of class Gaming | |
|---|---|---|---|---|---|---|---|
| Battery runtime | 46% | 110% | 39% | -25% | 74% | 79% | |
| H.264 (h) | 3.7 | 6.9 86% | 6.9 86% | 5.7 54% | 9.6 159% | 8.64 ? 134% | |
| WiFi v1.3 (h) | 3.5 | 5.1 46% | 8.2 134% | 6.2 77% | 2.9 -17% | 7.4 111% | 7.11 ? 103% |
| Load (h) | 1.5 | 1.6 7% | 1.3 -13% | 1 -33% | 0.8 -47% | 1.502 ? 0% | |
| Reader / Idle (h) | 7.8 | 8.8 | 8.71 ? | ||||
| Witcher 3 ultra (h) | 2.5 |
Pros
Cons
Verdict - Affordable, solid, but the core competence!
Aside from its currently attractive price, we especially like the Tulpar T7's keyboard, fast WLAN and of course its lifelong, yearly and free servicing. Furthermore, the T7 remains quite cool under stress.
However, the latter has its price, as the affordable gamer unfortunately doesn't take full advantage of its power when playing games. Of course, you can forgive an inexpensive gaming laptop for a weak webcam or for not supporting Thunderbolt. But in turn, it should deliver on its core discipline, namely gaming. And the Tulpar laptop simply doesn't do this. The fact that the manufacturer sent us a configuration with 16 GB single-channel RAM of all things, although there are various SKUs with 32 GB (hopefully dual-channel?), has unfortunately had a negative effect on our benchmark results. As a result, the T7 trails behind the competition when it comes to gaming—even though it certainly shouldn't. Its battery life could also disappoint some users, even though it may not be all too important for a 17-inch gamer.
The Tulpar T7 is an affordable gaming laptop with a generous promise of lifelong, yearly, free servicing. You should just make sure to select a configuration with dual-channel RAM because otherwise, its performance can't keep up with the competition.
If you just take into account its MRSP, then there are lots of alternatives. However, the T7 with an RTX 4060 is currently available at a particularly low price of under US$1,000 in some cases. If you are prepared to spend more, then the Lenovo Legion 5 may well be a better alternative in many areas.
Price and availability
Currently, the Tulpar T7 is not yet available in the US. Apparently, the manufacturer is set to launch its products in the United States later this year.
Tulpar T7 V20.6
- 05/24/2024 v7 (old)
Christian Hintze
Transparency
The selection of devices to be reviewed is made by our editorial team. The test sample was provided to the author as a loan by the manufacturer or retailer for the purpose of this review. The lender had no influence on this review, nor did the manufacturer receive a copy of this review before publication. There was no obligation to publish this review. As an independent media company, Notebookcheck is not subjected to the authority of manufacturers, retailers or publishers.
This is how Notebookcheck is testing
Every year, Notebookcheck independently reviews hundreds of laptops and smartphones using standardized procedures to ensure that all results are comparable. We have continuously developed our test methods for around 20 years and set industry standards in the process. In our test labs, high-quality measuring equipment is utilized by experienced technicians and editors. These tests involve a multi-stage validation process. Our complex rating system is based on hundreds of well-founded measurements and benchmarks, which maintains objectivity. Further information on our test methods can be found here.
Price comparison

