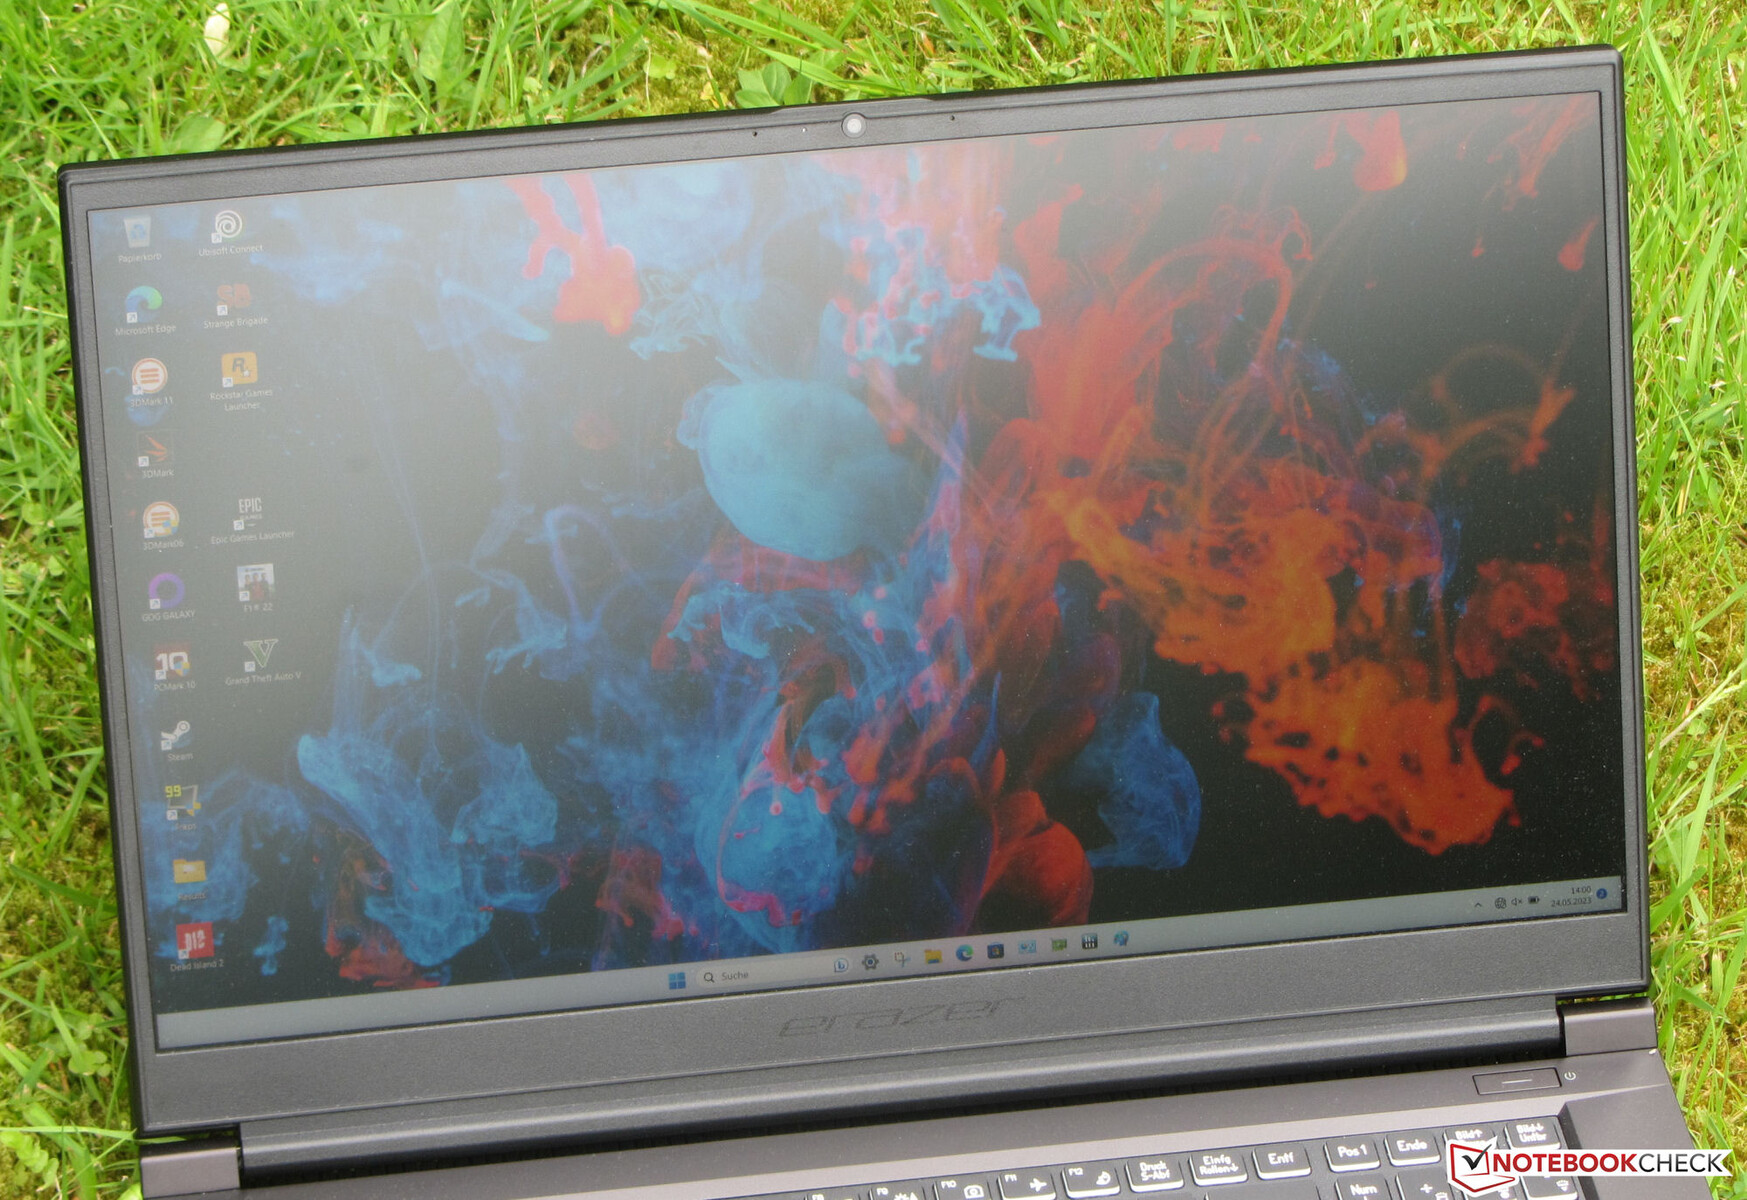
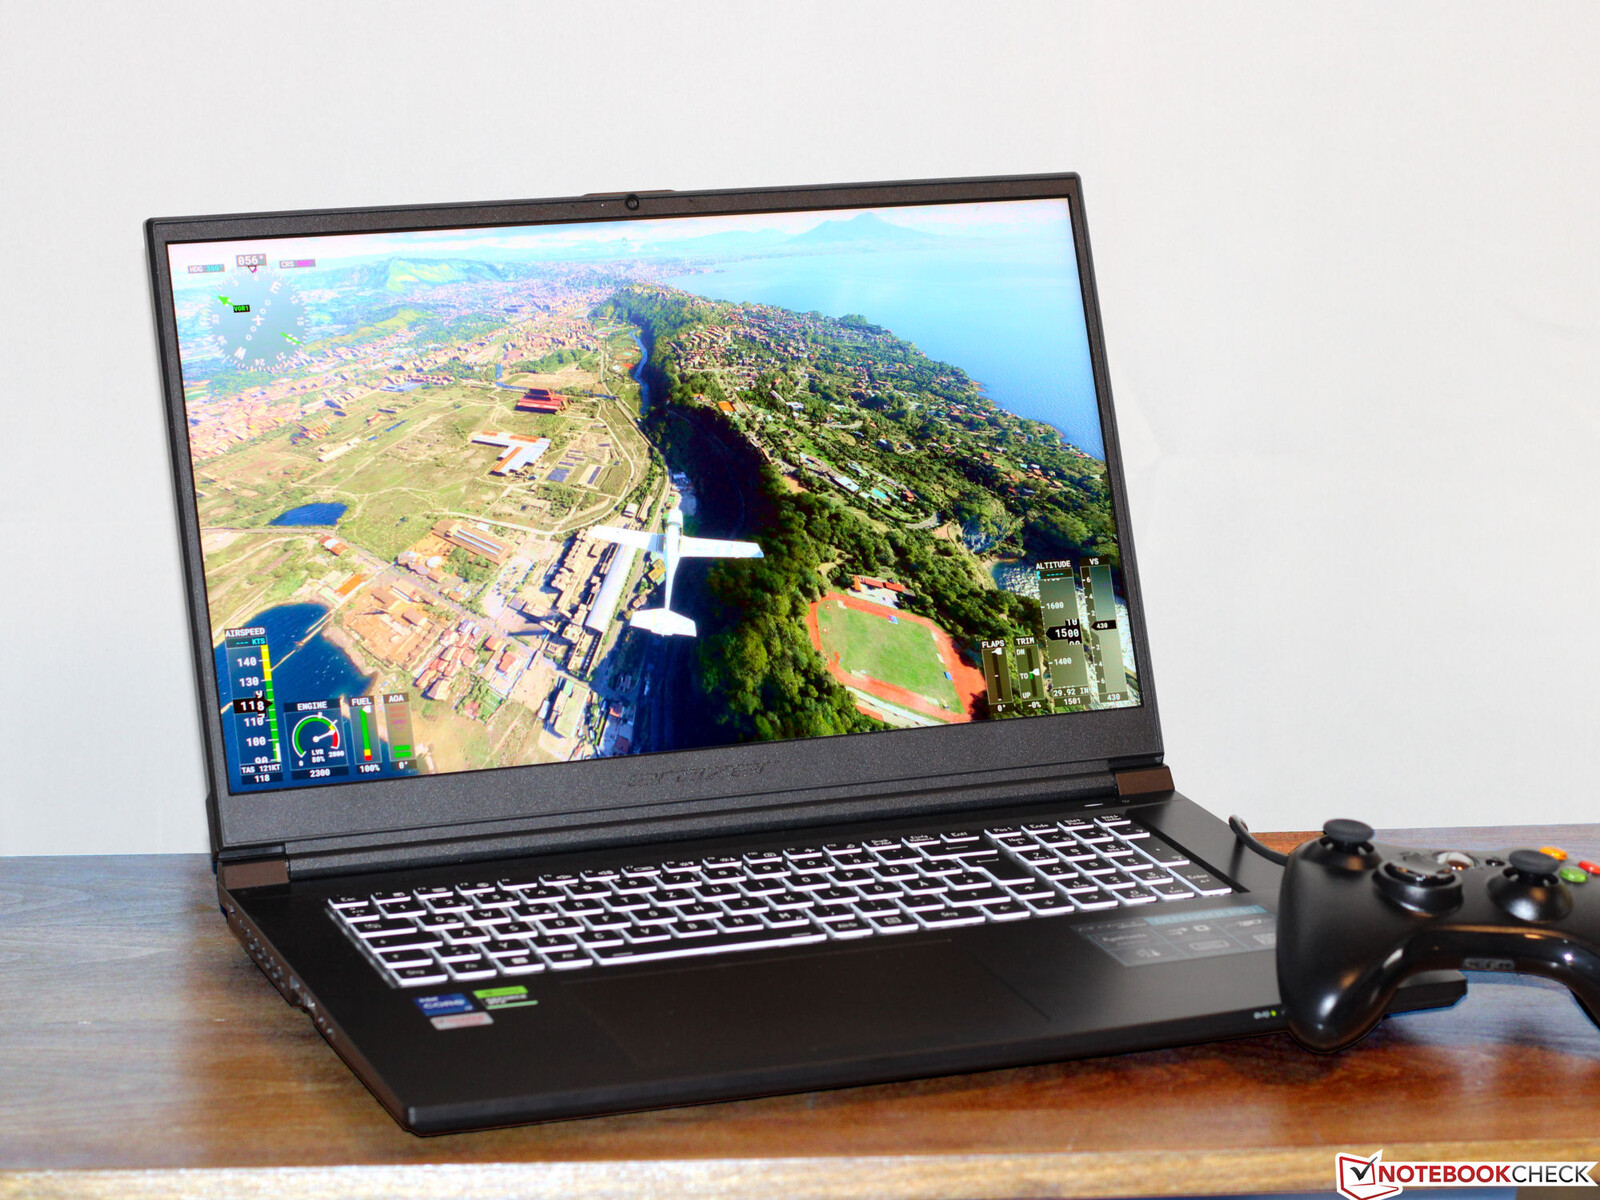
Medion Erazer Defender P40 review: The affordable QHD gaming laptop with an RTX 4060
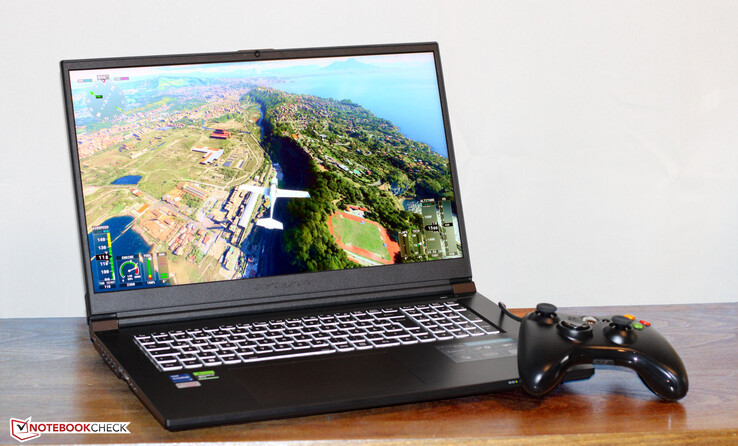
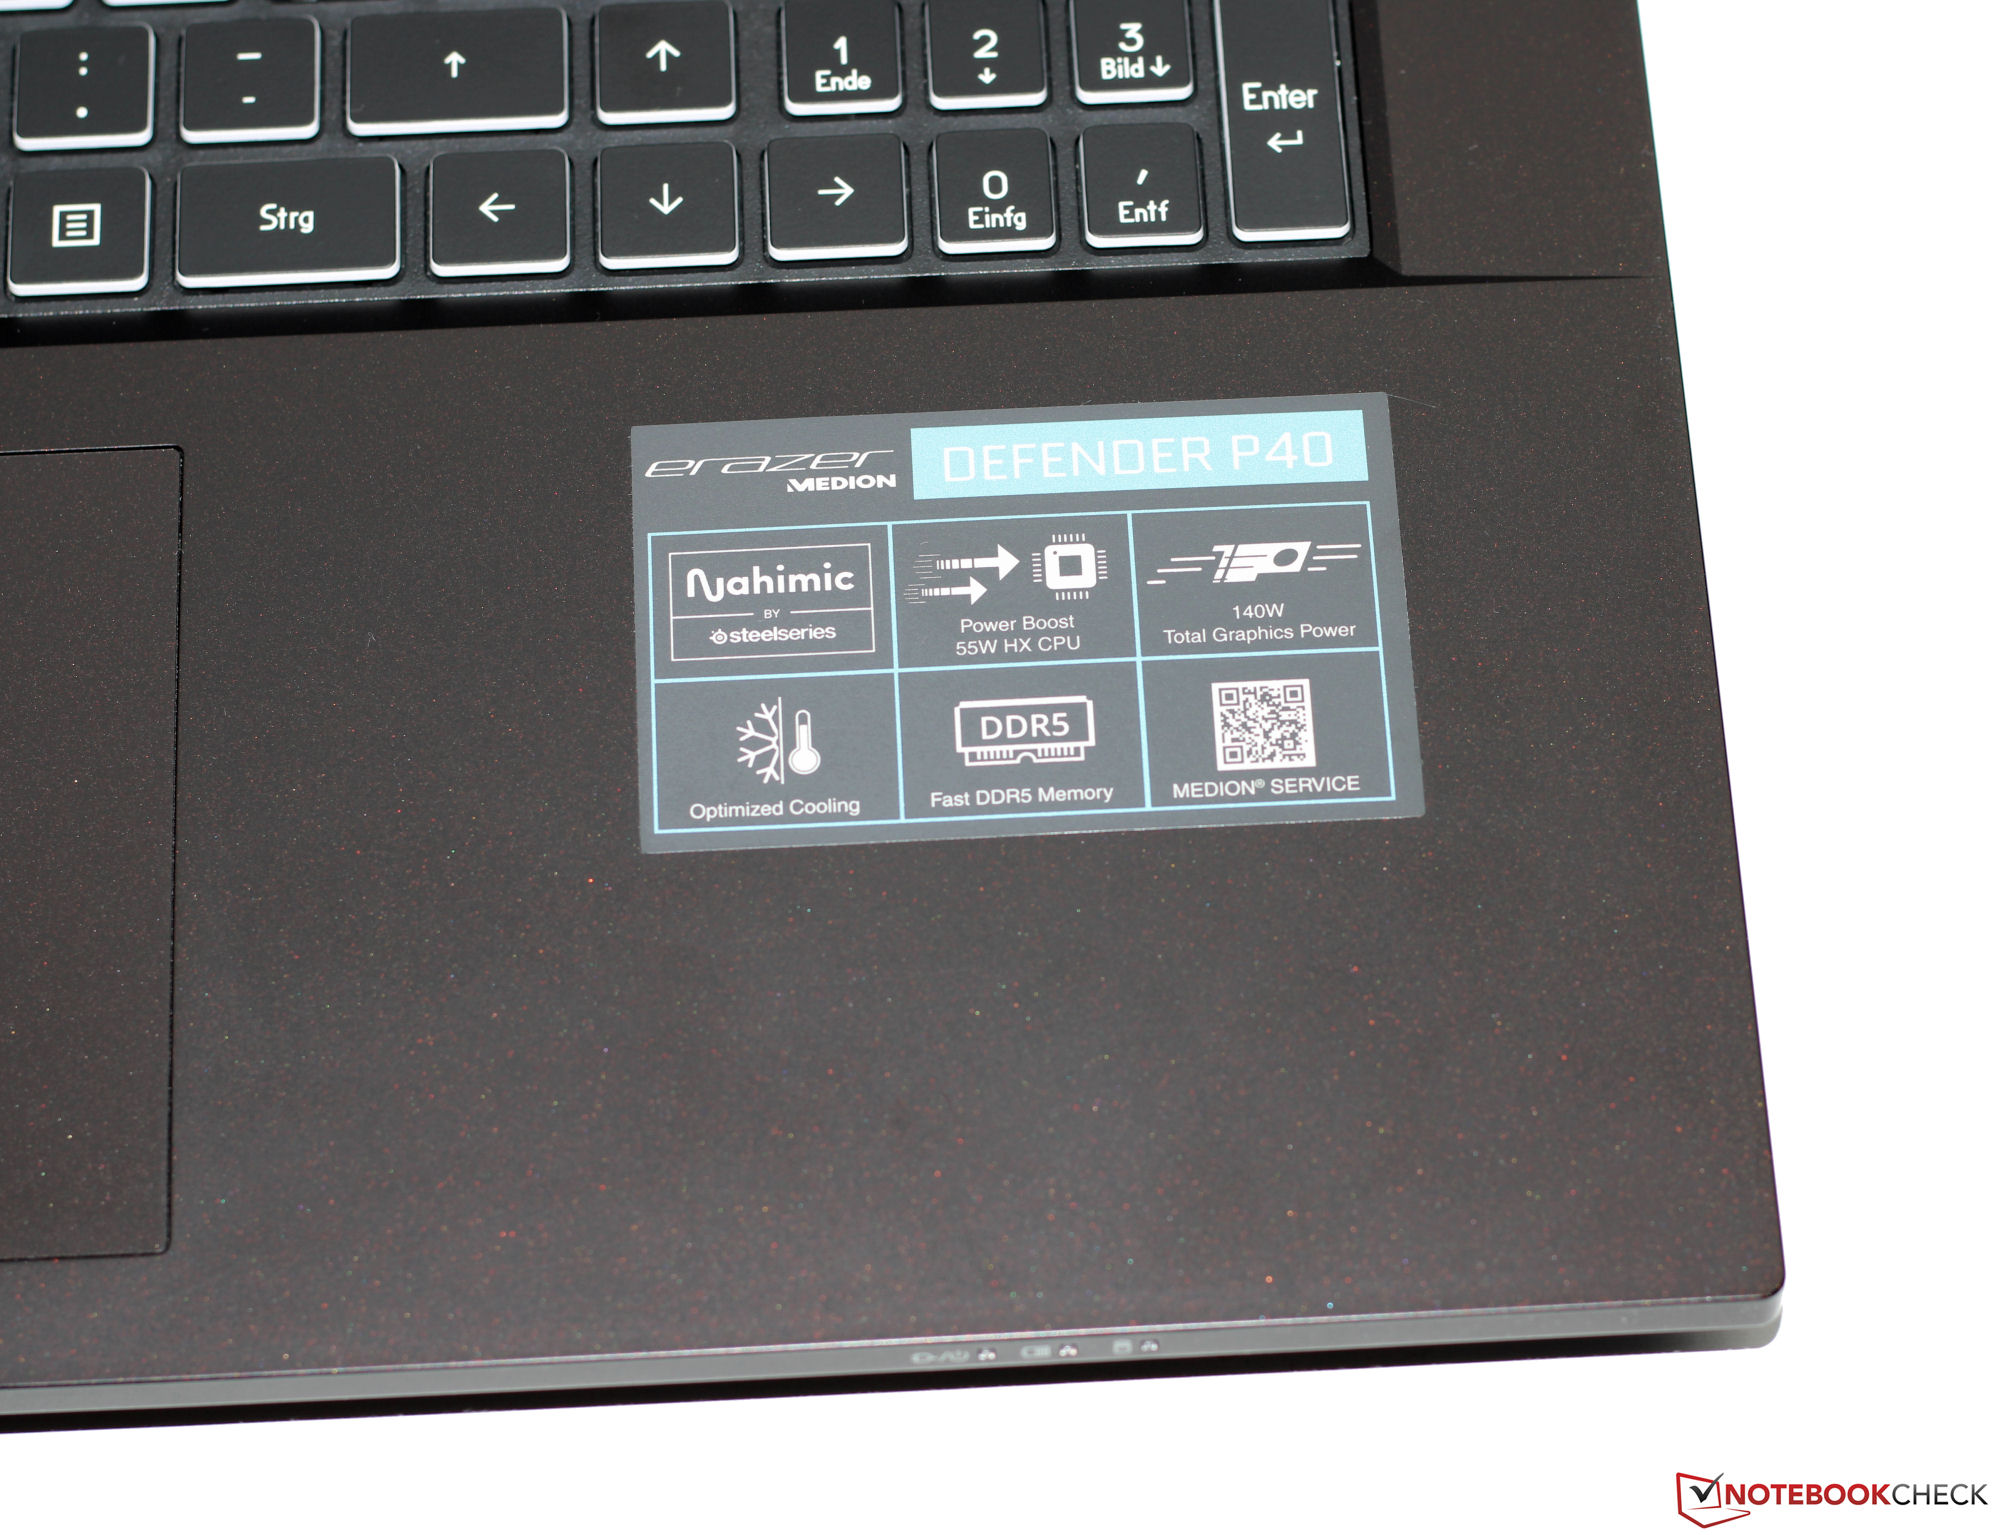
Medion have introduced the Erazer Defender P40, a mid-range QHD gaming laptop powered by a Core-i7-13700HX processor and a GeForce-RTX-4060 Laptop GPU. It is based on a barebone (NP70SND) made by the company Clevo and is available for around $1,900. Competitors include devices such as the MSI Katana 17, Acer Predator Helios 300, Lenovo Legion Pro 5 16IRX8, Asus TUF Gaming A16 FA617 and the Gigabyte G7 KE.
possible competitors compared
Rating | Date | Model | Weight | Height | Size | Resolution | Price |
|---|---|---|---|---|---|---|---|
| 84.6 % v7 (old) | 05 / 2023 | Medion Erazer Defender P40 i7-13700HX, GeForce RTX 4060 Laptop GPU | 2.9 kg | 33 mm | 17.30" | 2560x1440 | |
| 82.1 % v7 (old) | 02 / 2023 | MSI Katana 17 B13VFK i7-13620H, GeForce RTX 4060 Laptop GPU | 2.8 kg | 25.2 mm | 17.30" | 1920x1080 | |
| 86.5 % v7 (old) | 11 / 2022 | Acer Predator Helios 300 (i7-12700H, RTX 3070 Ti) i7-12700H, GeForce RTX 3070 Ti Laptop GPU | 3 kg | 27.65 mm | 17.30" | 2560x1440 | |
| 87.9 % v7 (old) | 05 / 2023 | Lenovo Legion Pro 5 16IRX8 i7-13700HX, GeForce RTX 4060 Laptop GPU | 2.5 kg | 26.8 mm | 16.00" | 2560x1600 | |
| 86.2 % v7 (old) | 02 / 2023 | Asus TUF Gaming A16 FA617 R7 7735HS, Radeon RX 7600S | 2.2 kg | 27 mm | 16.00" | 1920x1200 | |
| 83.3 % v7 (old) | 01 / 2023 | Gigabyte G7 KE i5-12500H, GeForce RTX 3060 Laptop GPU | 2.6 kg | 25 mm | 17.30" | 1920x1080 |
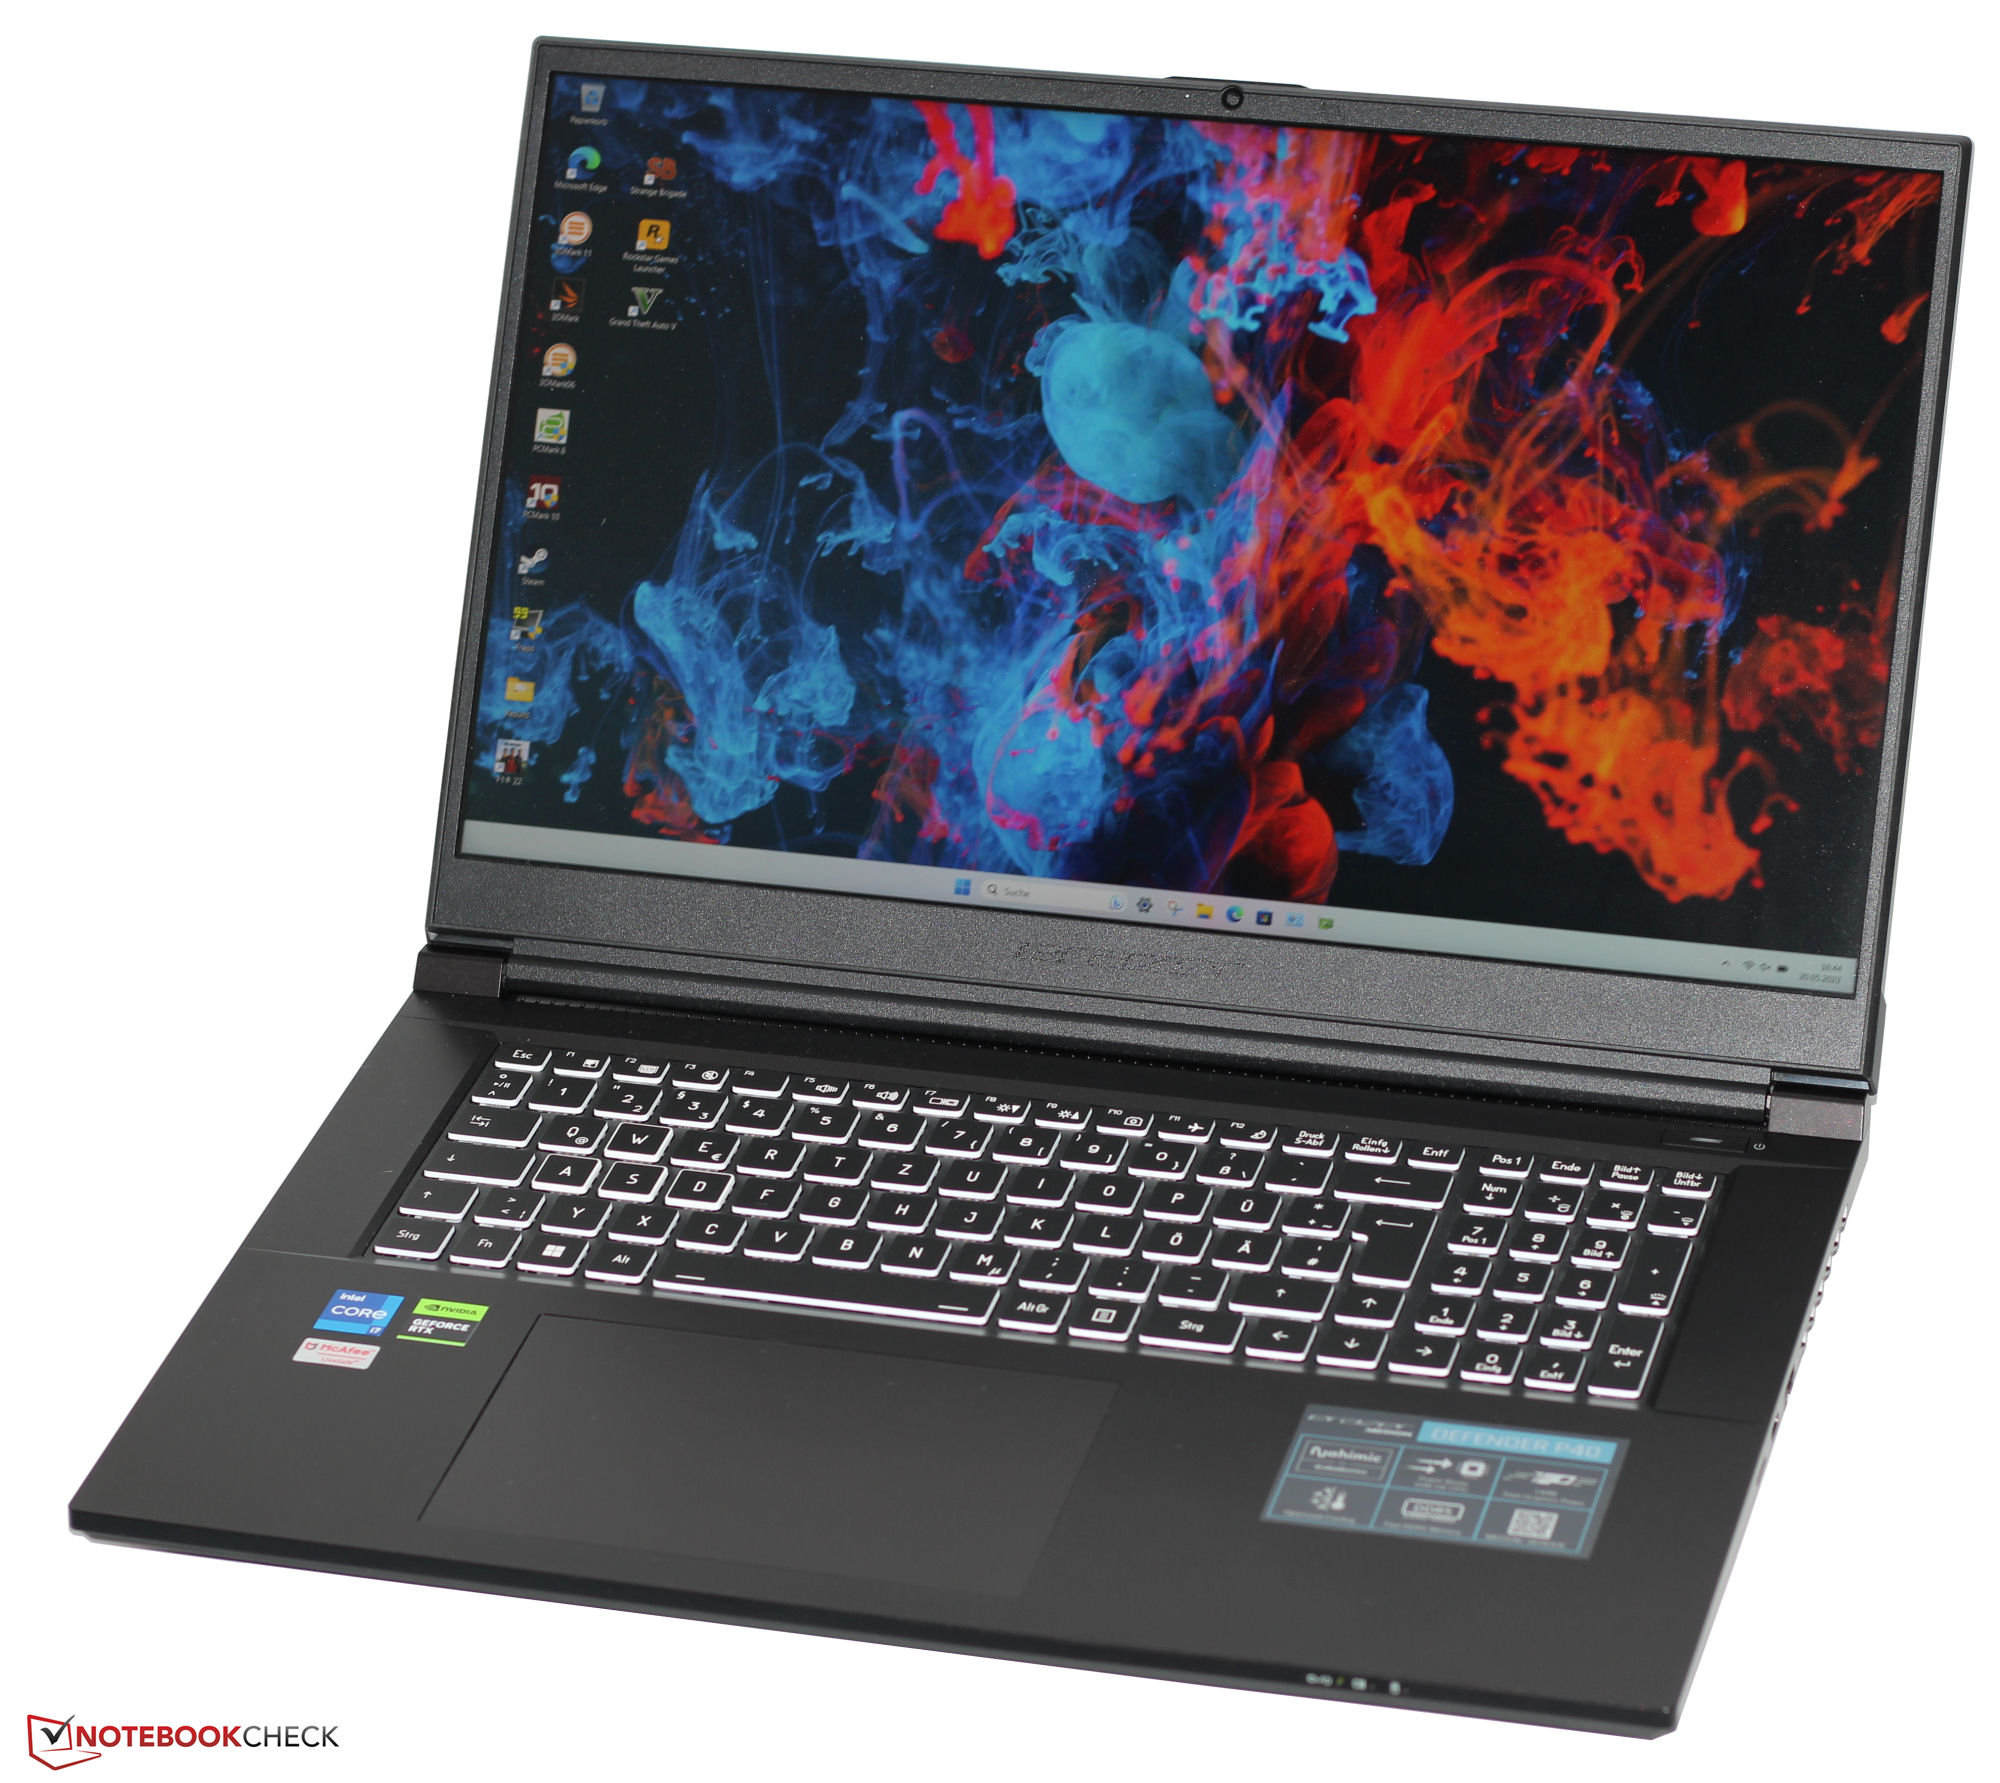
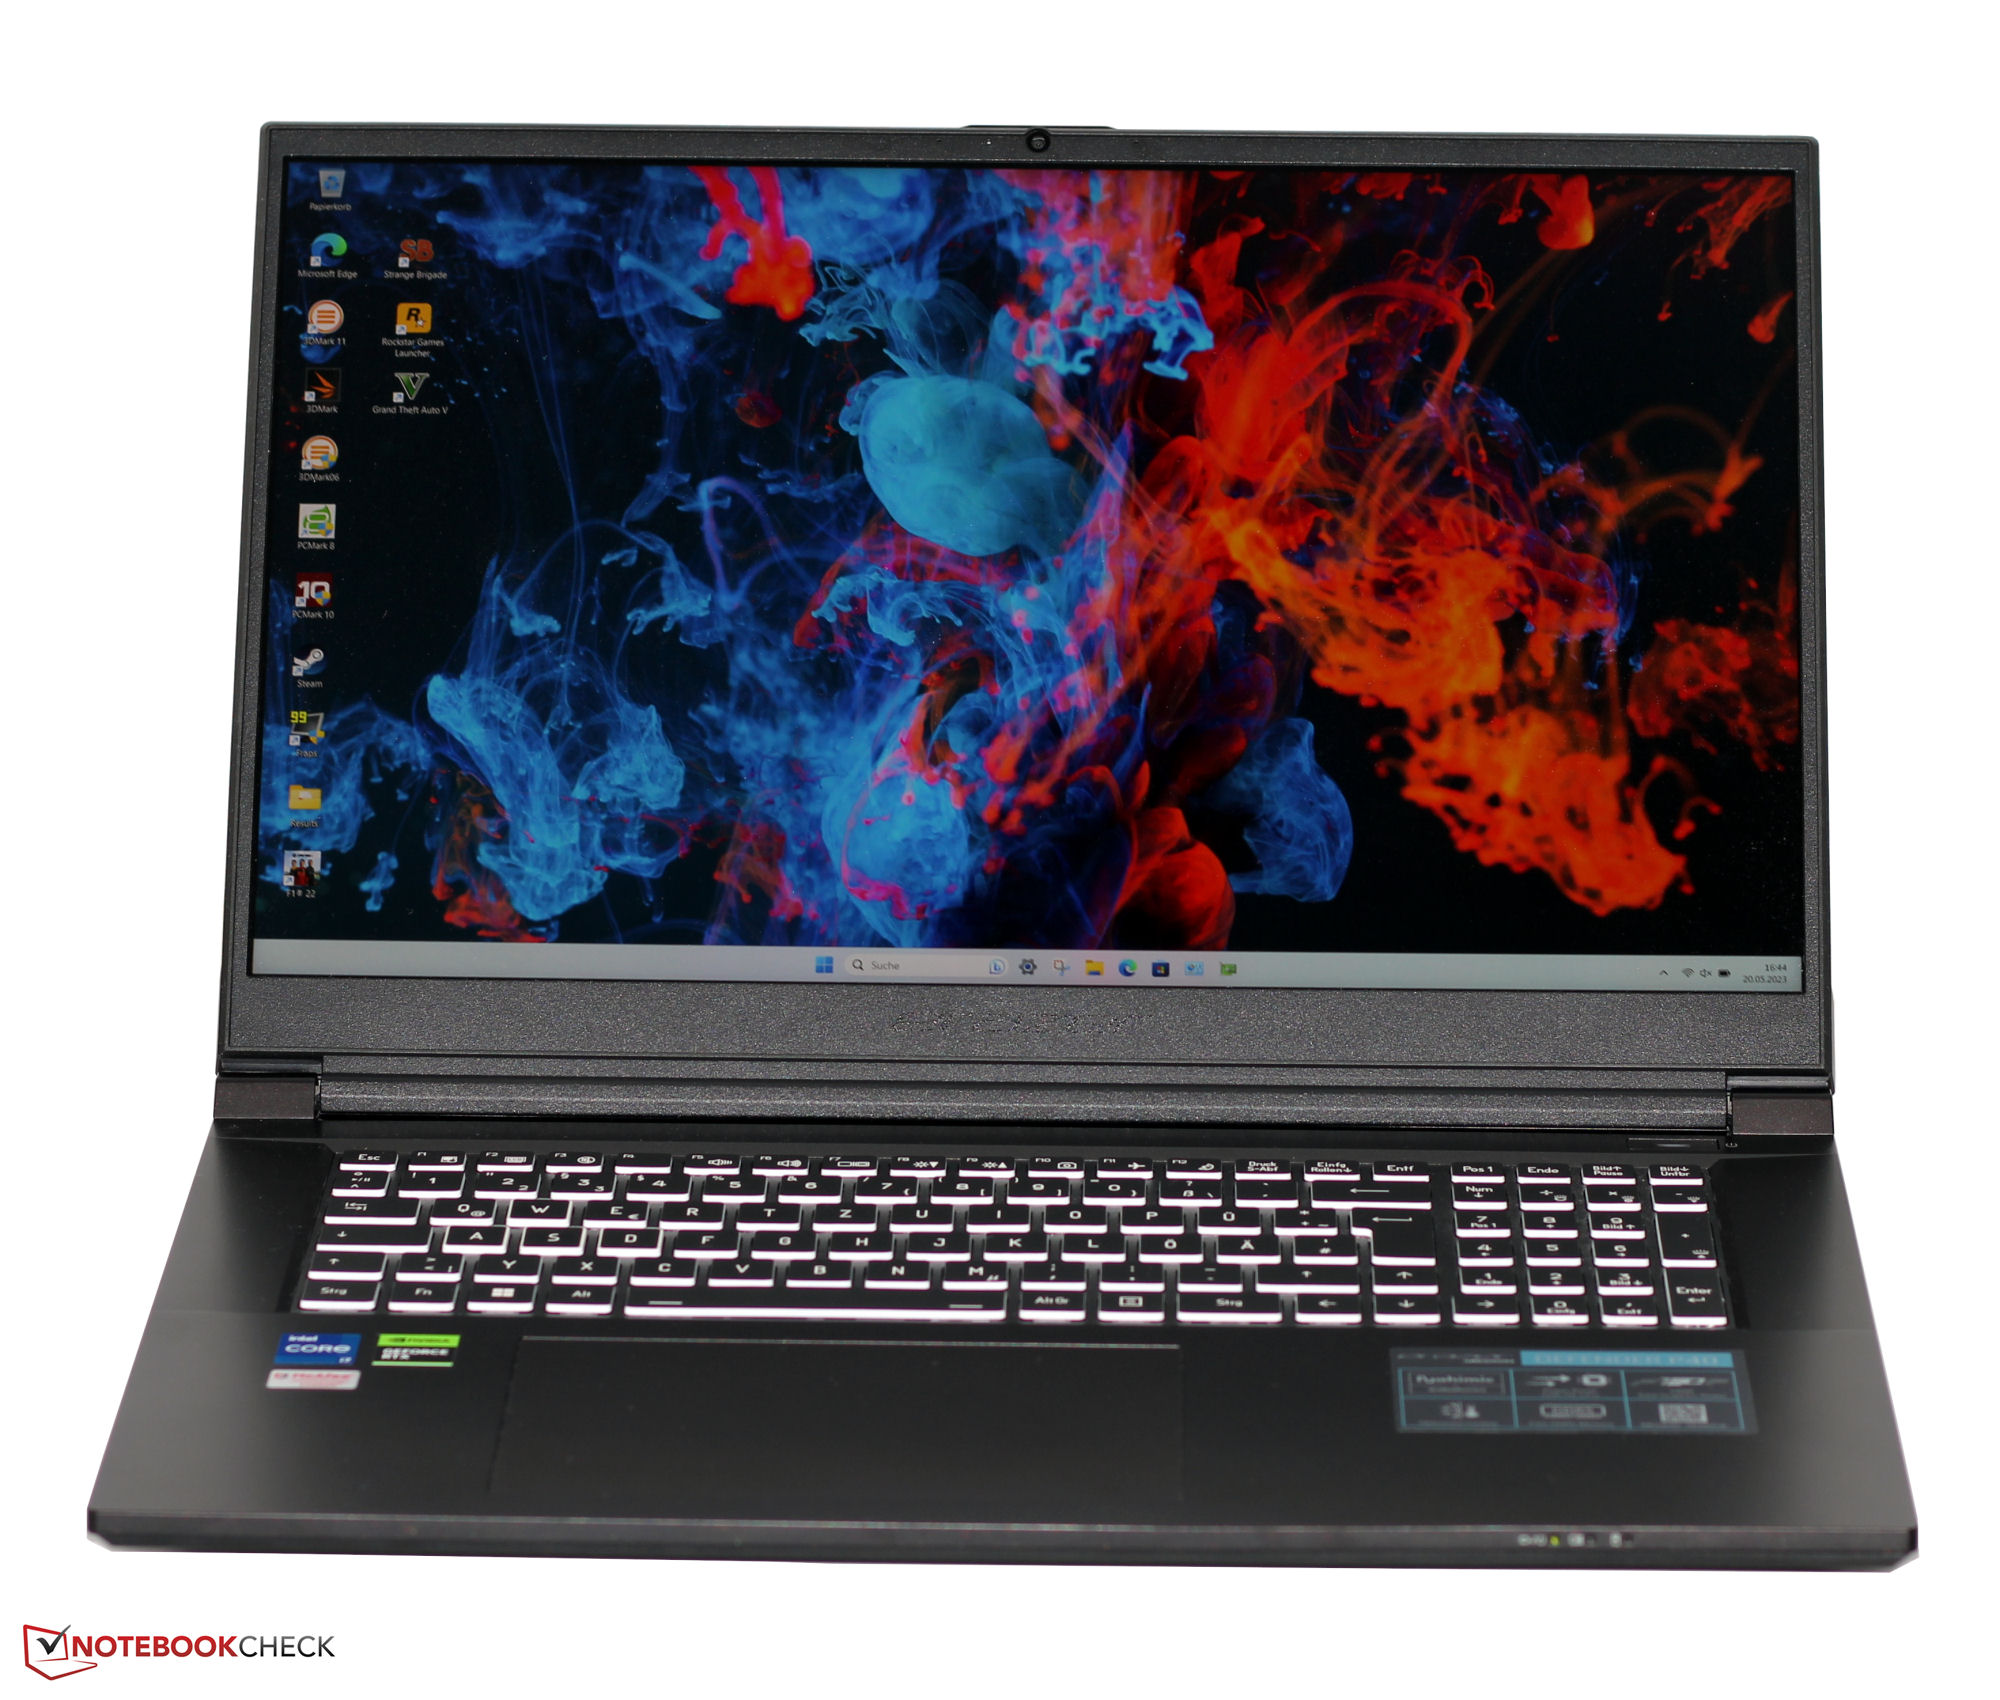
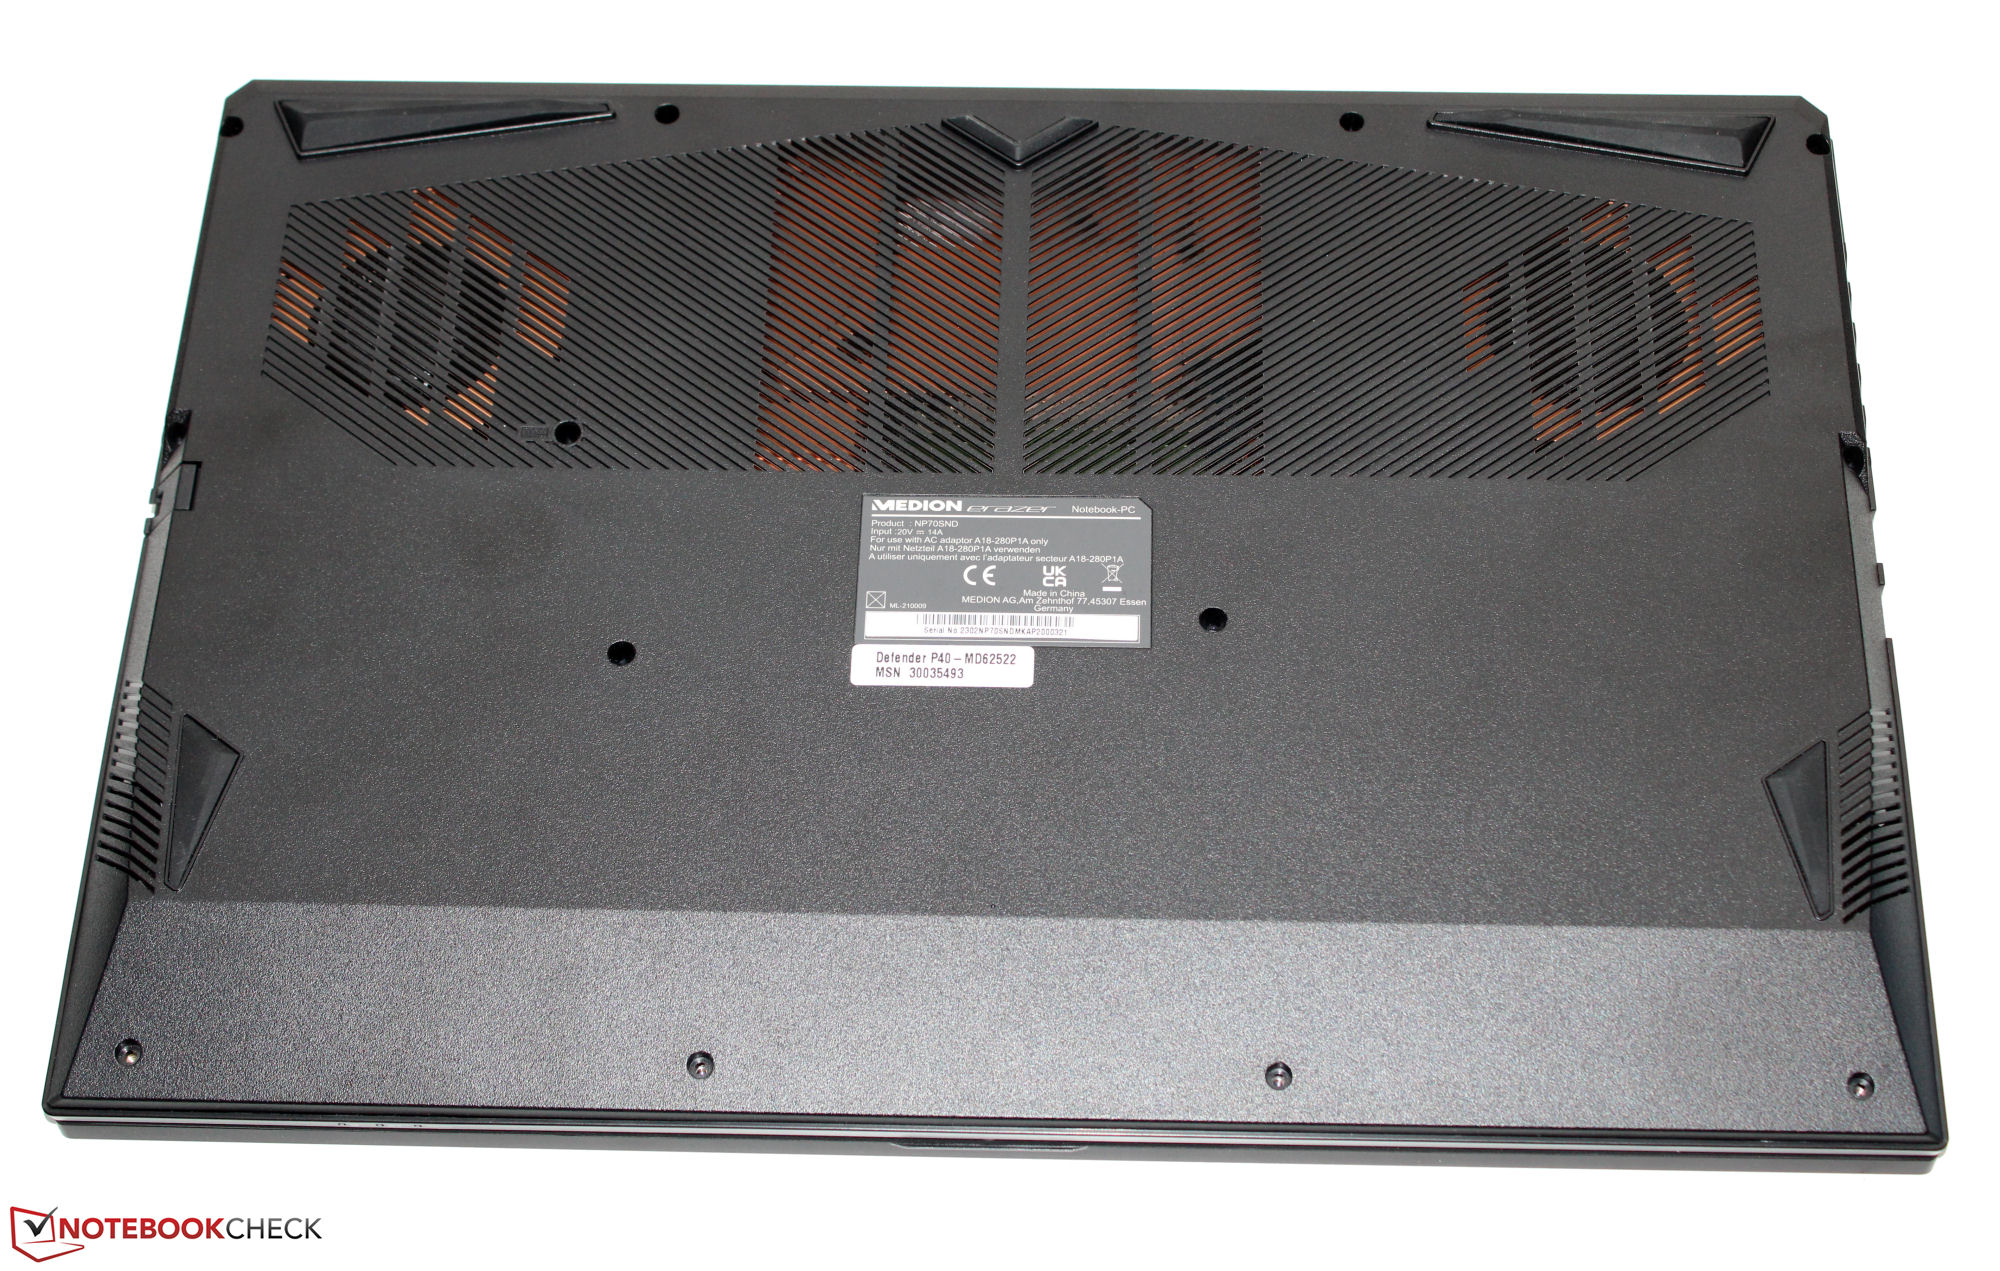
Case - The P40 has a plastic case
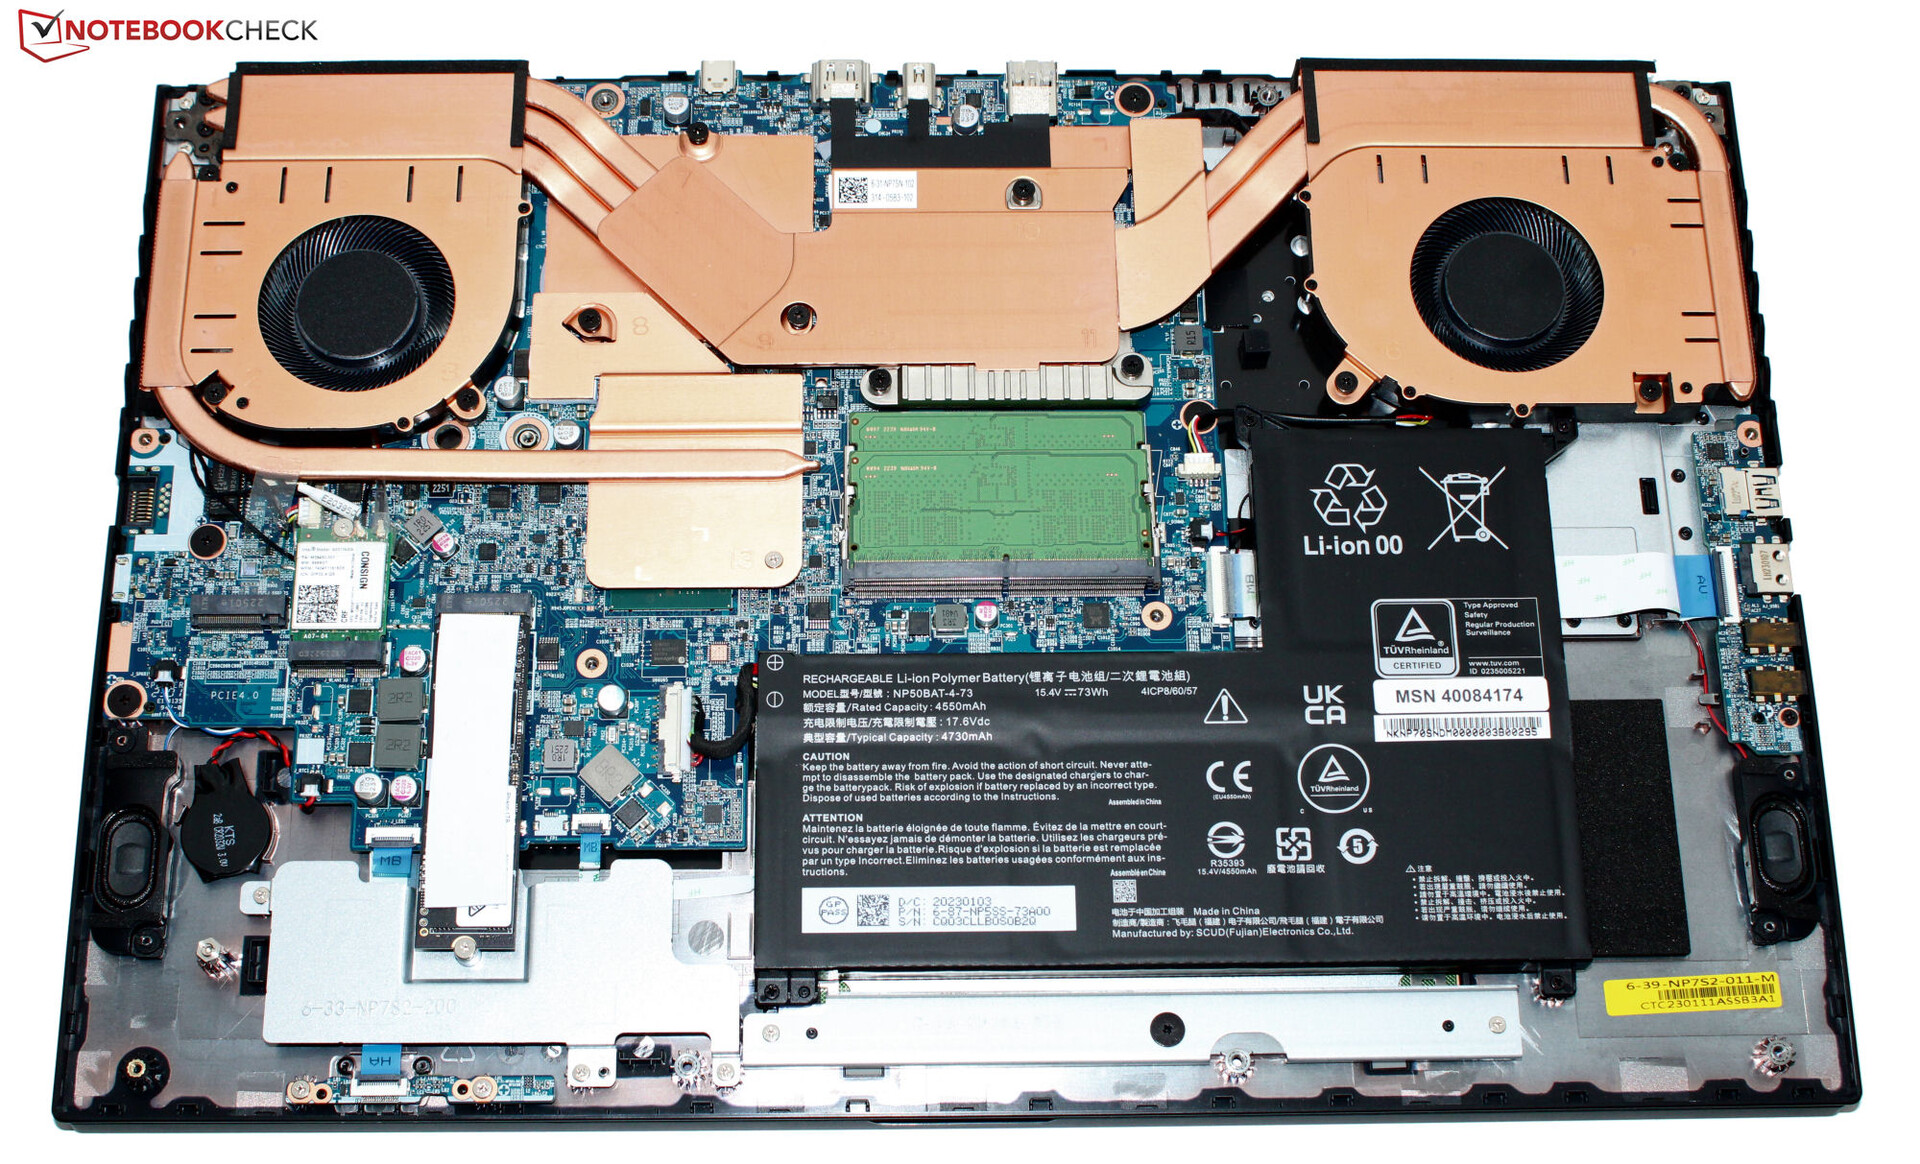
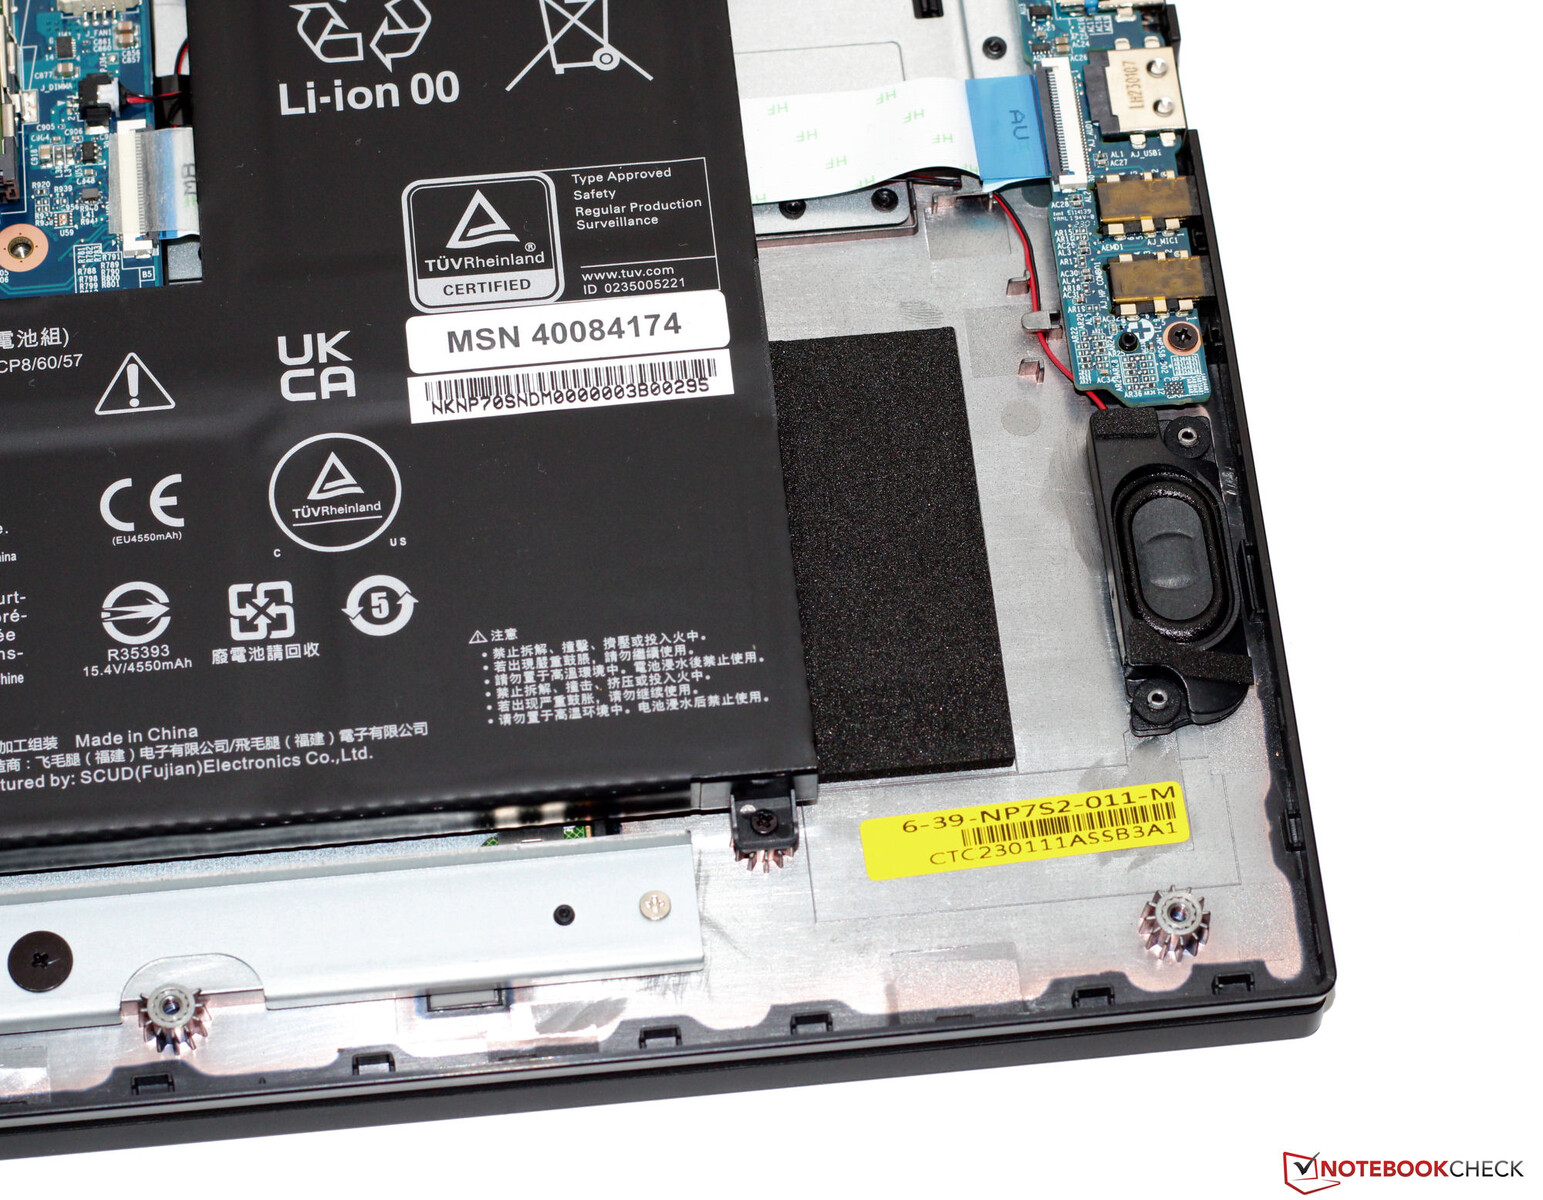
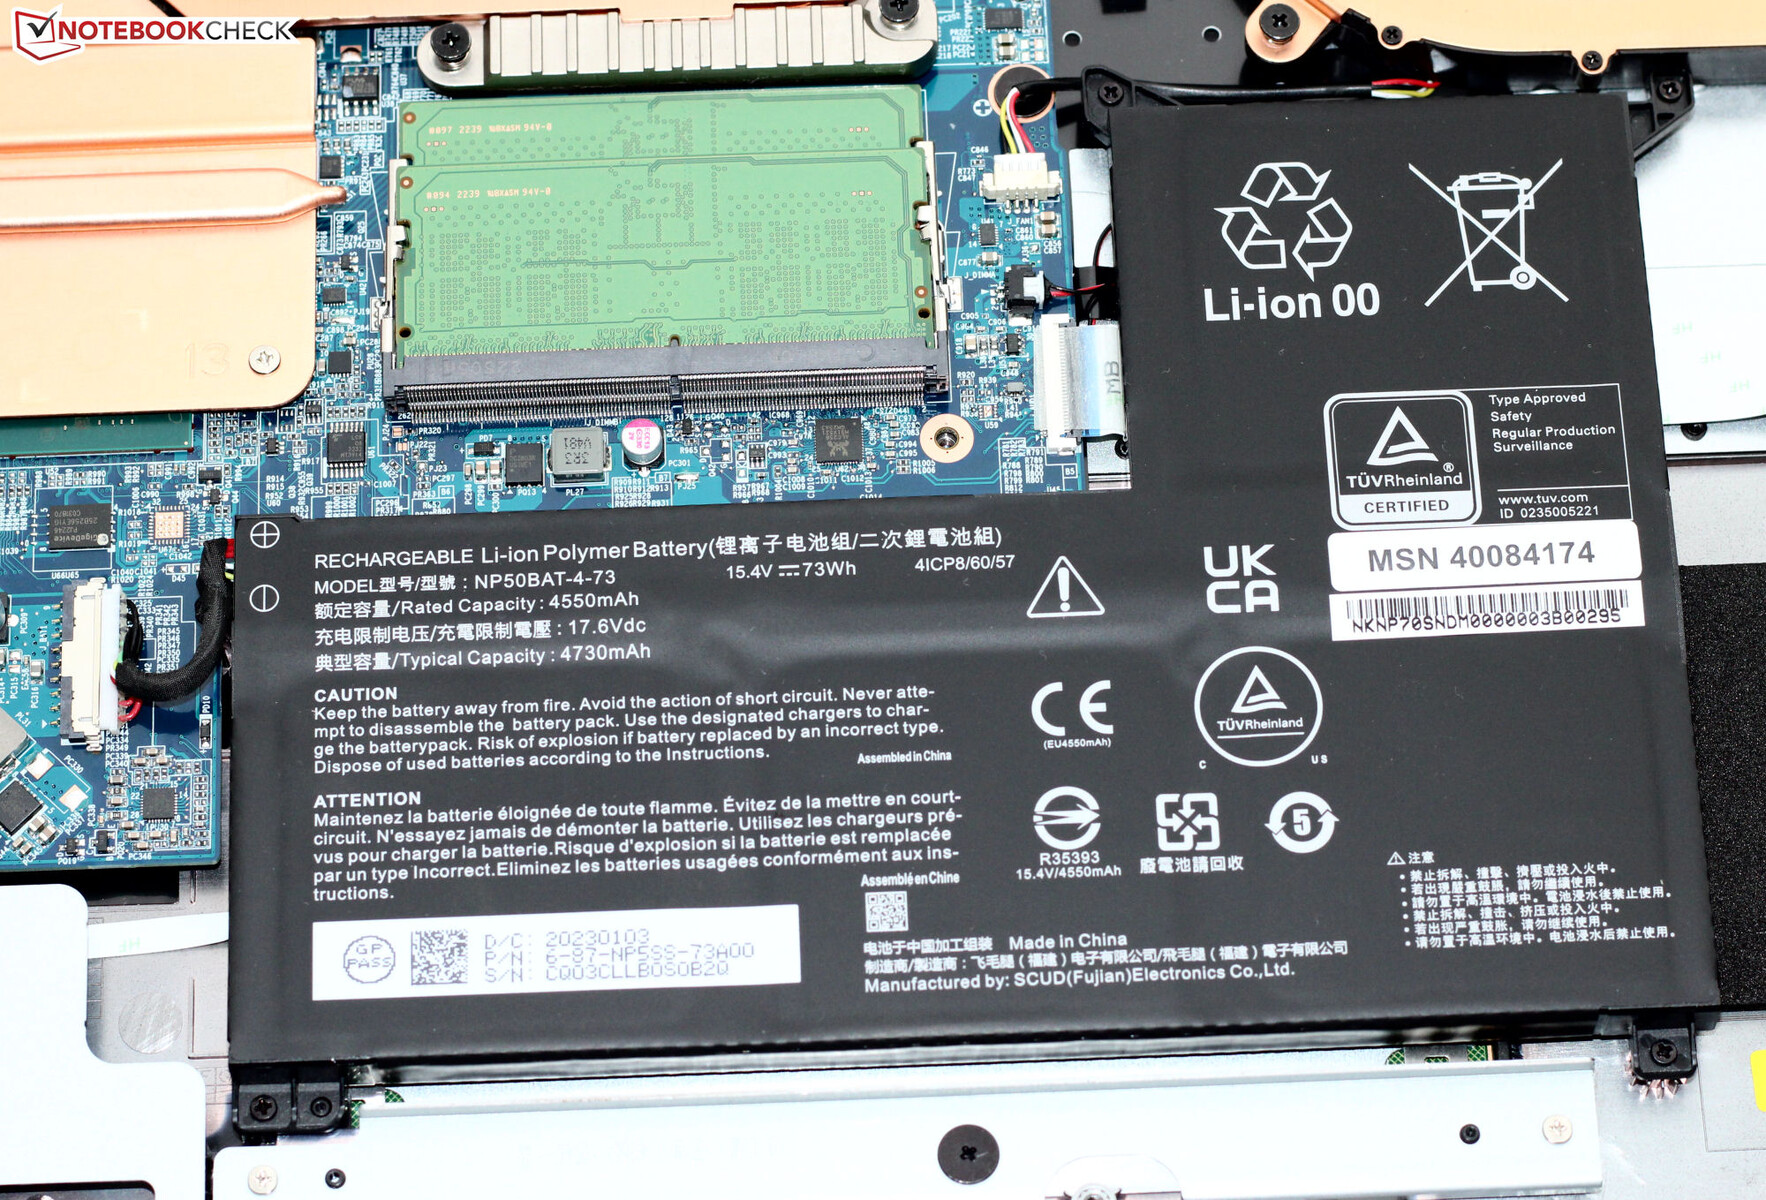
Medion have chosen a black case for the P40 with smooth, matte-reflecting surfaces. The sleek-looking laptop has no extravagant design features. Apart from its illuminated keyboard, the laptop features no LED elements. The battery (screwed in, not glued on) as well as the rest of the laptop's innards can be easily accessed after the bottom of the case is removed.
There are no build issues - all the gaps match up and there are no sharp edges. The base unit and lid can be twisted ever so slightly, but this is nothing out of the ordinary. Hinges hold the laptop's lid firmly in place and its maximum opening angle is around 135 degrees. The laptop can be opened using one hand.
The P40 is a little more compact than the Katana 17, but it weighs around 100 grams more. Both devices are beaten by the Gigabyte G7 KE in these categories.
Connectivity - The Medion Defender has Thunderbolt but no Power Delivery
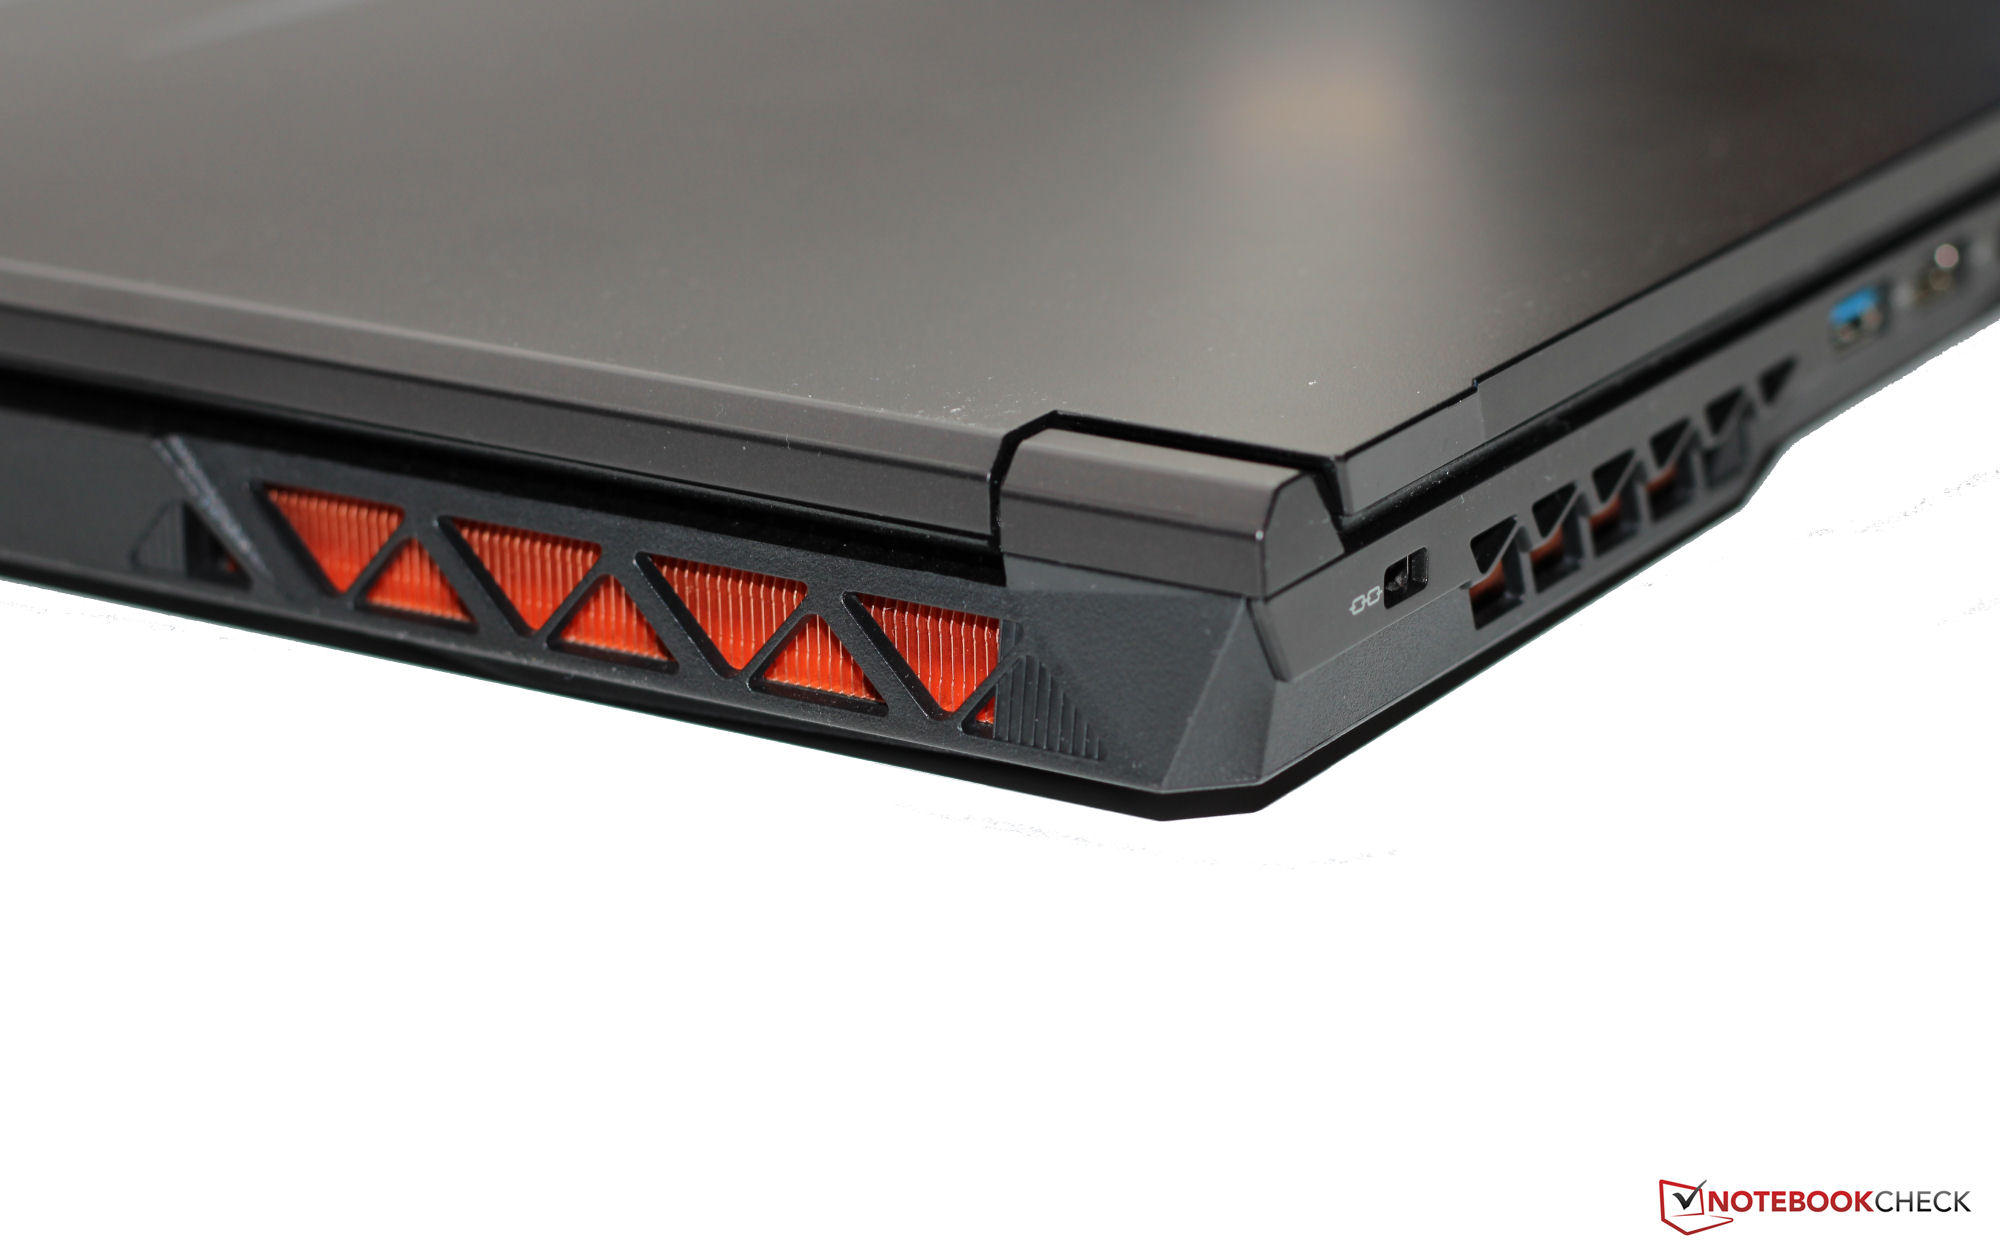
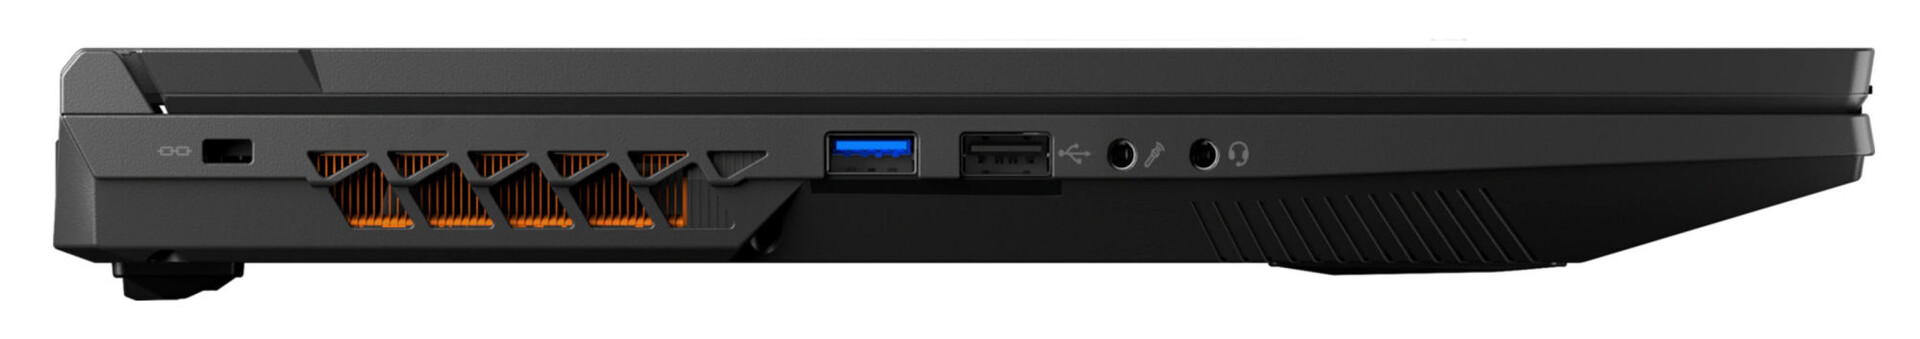
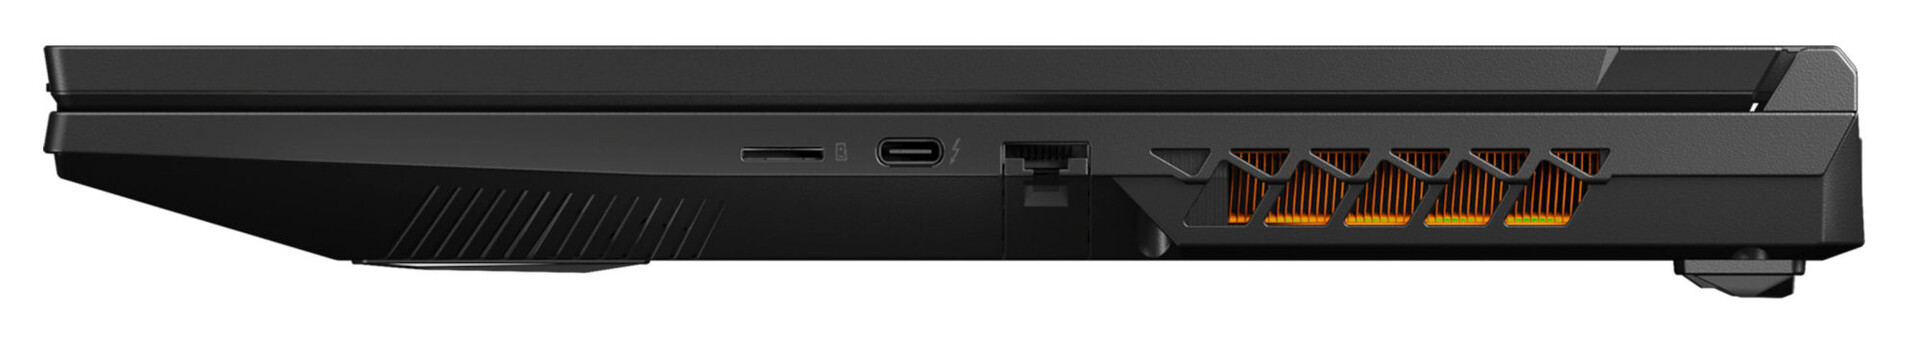
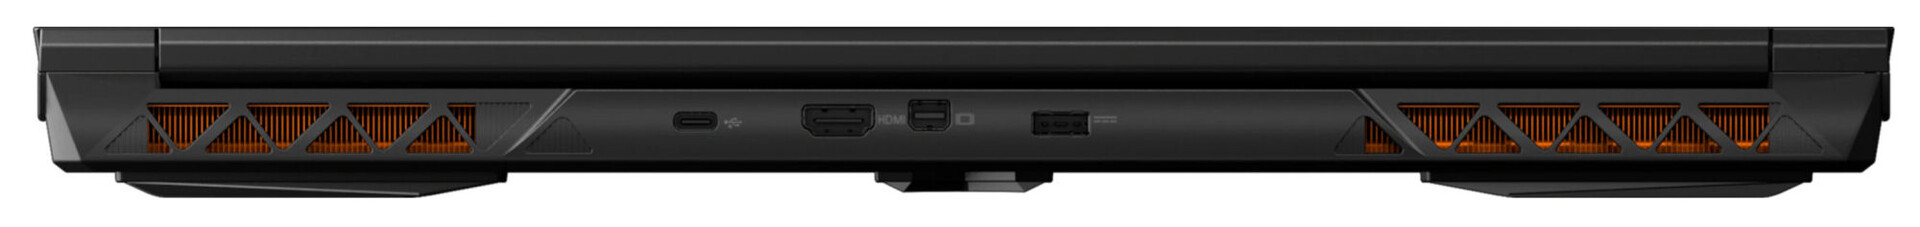
Despite its 17.3-inch size, the laptop only has two USB-A connections (1x USB 3.2 Gen 1, 1x USB 2.0) - a third port on the right side of the laptop would be really handy. Neither USB-C port (1x Thunderbolt 4, 1x USB 3.2 Gen 2) supports Power Delivery, but the TB4 port can output a DisplayPort signal. In total, the device has three video outputs (2x DP, 1x HDMI), two audio ports and a Gigabit Ethernet port.
Two video outputs and the power connection are on the back of the laptop. The corresponding cables will run away from the back of the device - meaning they won't get in your way. Unfortunately, the same can't be said for an Ethernet cable, if this is in use.
SD card reader
The SD card reader (reference card: AV PRO microSD 128 GB V60) has maximum transfer rates of 86 MB/s (transferring 250 jpg images - around 5 MB each) and 91 MB/s (copying large blocks of data) - making this a model with average speeds.
| SD Card Reader | |
| average JPG Copy Test (av. of 3 runs) | |
| Average of class Gaming (20.9 - 210, n=54, last 2 years) | |
| HP Omen 17-ck1075ng (AV Pro SD microSD 128 GB V60) | |
| Medion Erazer Defender P40 (AV PRO microSD 128 GB V60) | |
| MSI GE78HX 13VH-070US (Angelibird AV Pro V60) | |
| maximum AS SSD Seq Read Test (1GB) | |
| Average of class Gaming (25.5 - 261, n=51, last 2 years) | |
| HP Omen 17-ck1075ng (AV Pro SD microSD 128 GB V60) | |
| Medion Erazer Defender P40 (AV PRO microSD 128 GB V60) | |
| Gigabyte G7 KE (AV PRO microSD 128 GB V60) | |
| MSI GE78HX 13VH-070US (Angelibird AV Pro V60) | |
Communication
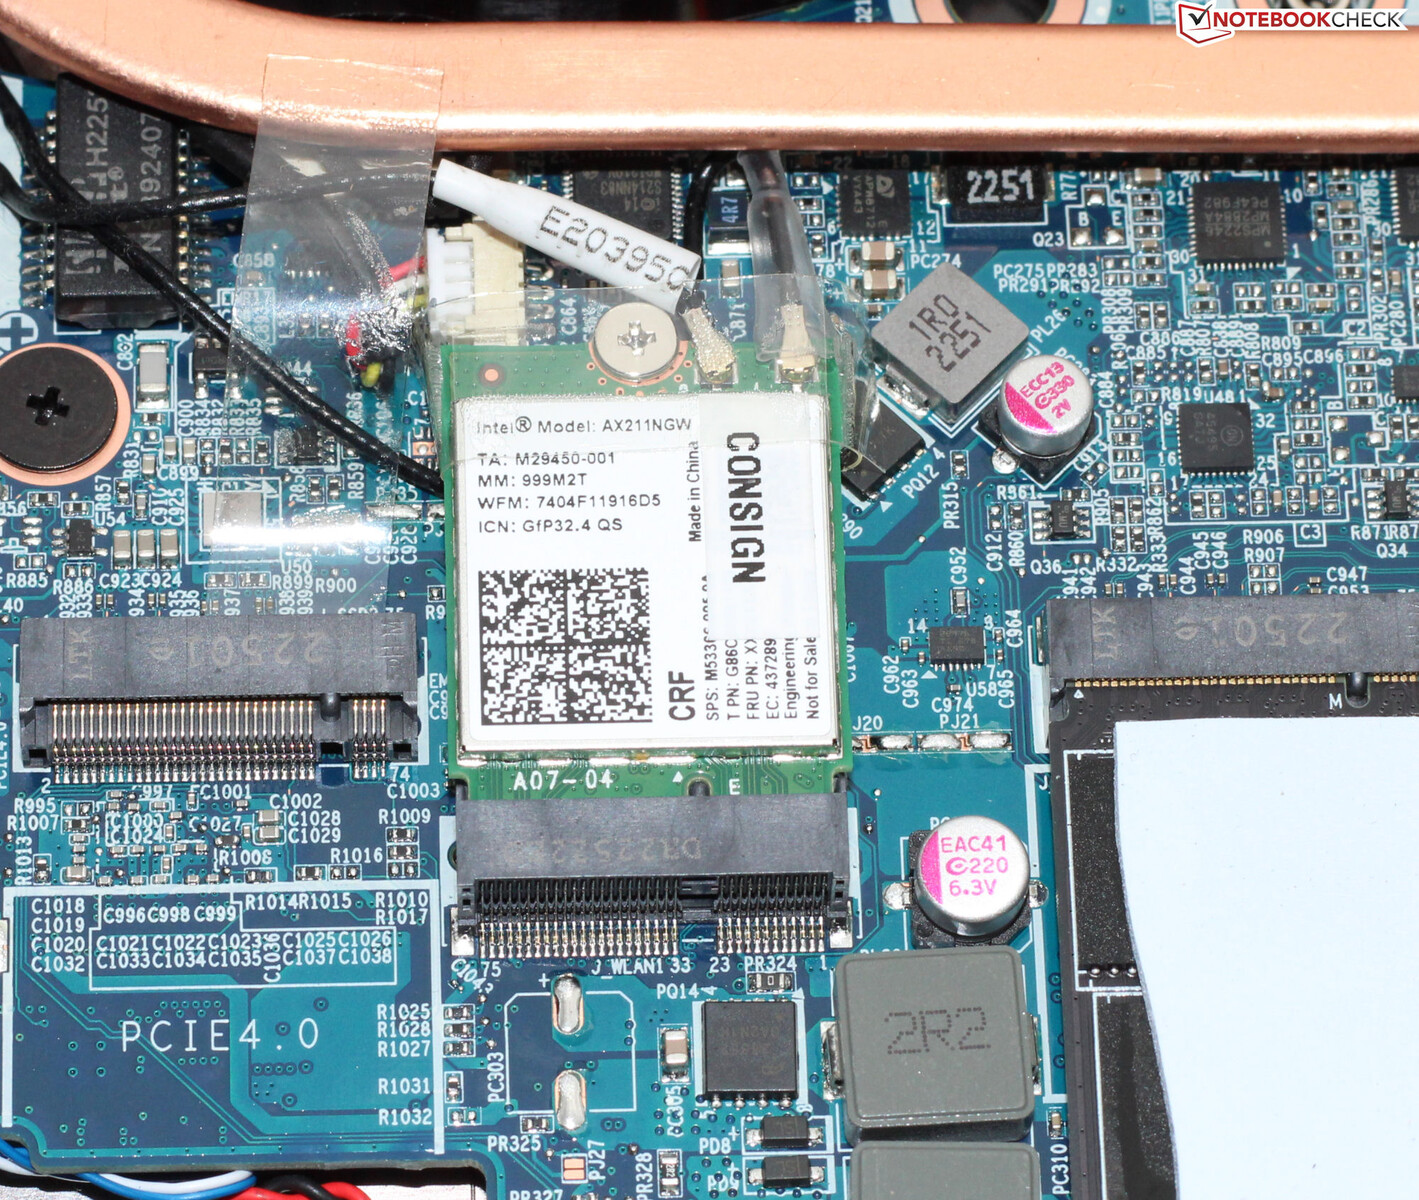
Under optimal conditions (no WLAN devices in close vicinity, short distance between laptop and server PC), the laptop was able to achieve impressive WiFi data rates. The Medion laptop uses a WiFi 6E chip (Intel AX211). Wired connections are also taken care of by an Intel chip (I219-V; 1 GBit/s).
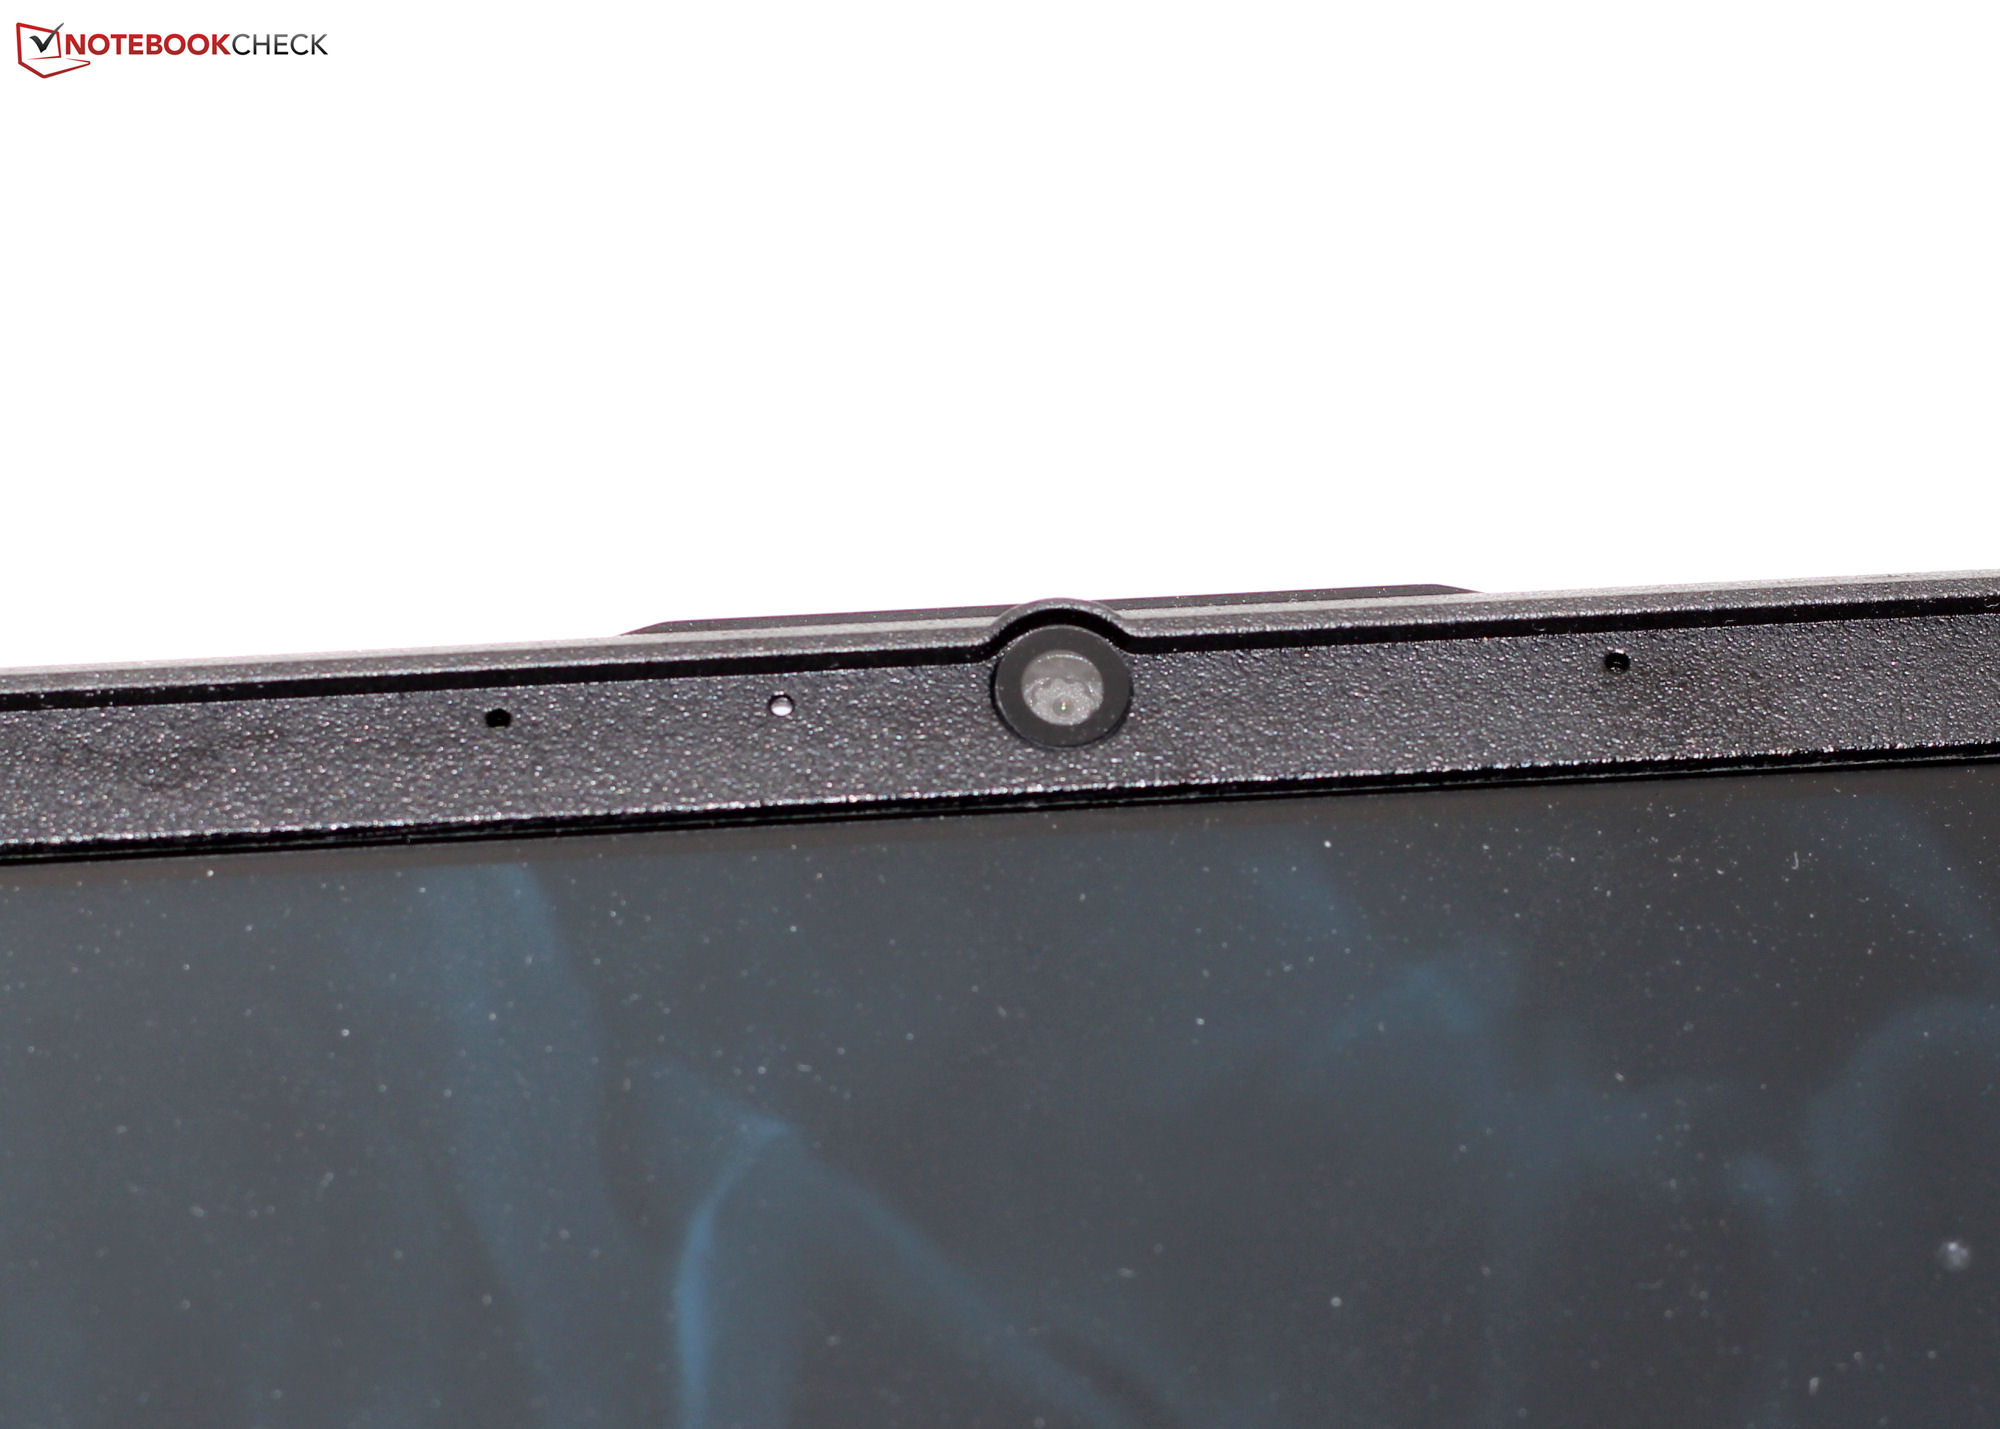
Webcam
The webcam (0.9 MP, max. 1,280 x 720 pixels) doesn't have a mechanical cover. Its quality, unfortunately, isn't the best - however, in comparison, its color deviation is actually minimal.


Accessories
Aside from the usual documents (quick start guide and warranty information), the laptop doesn't come with any additional accessories.
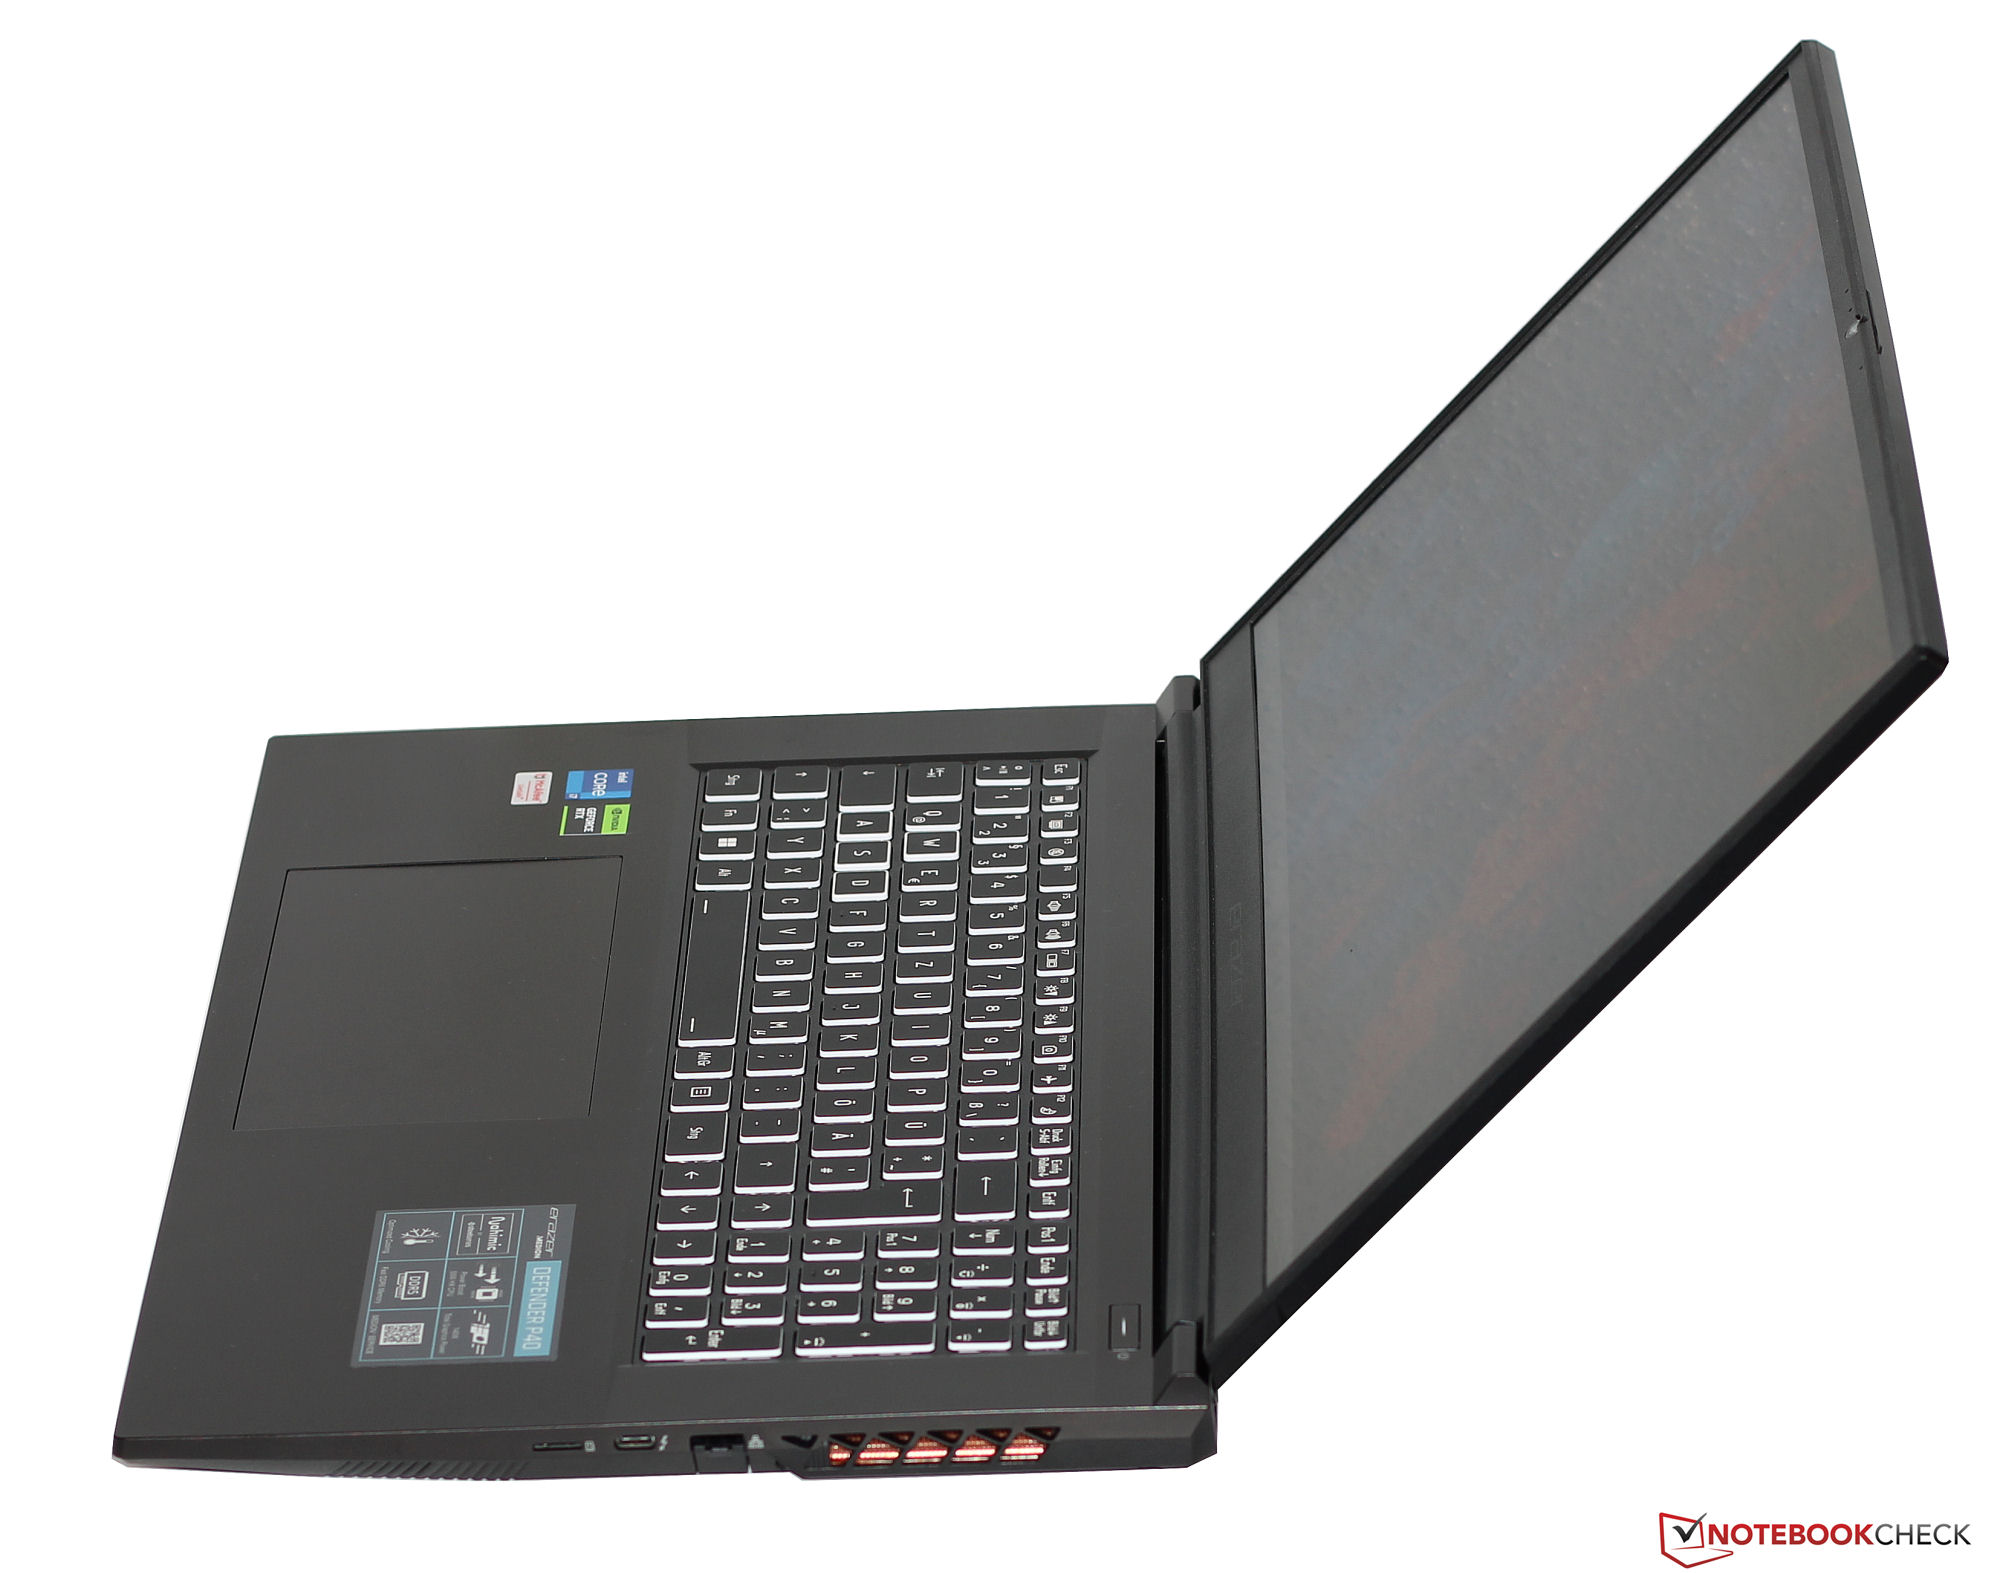
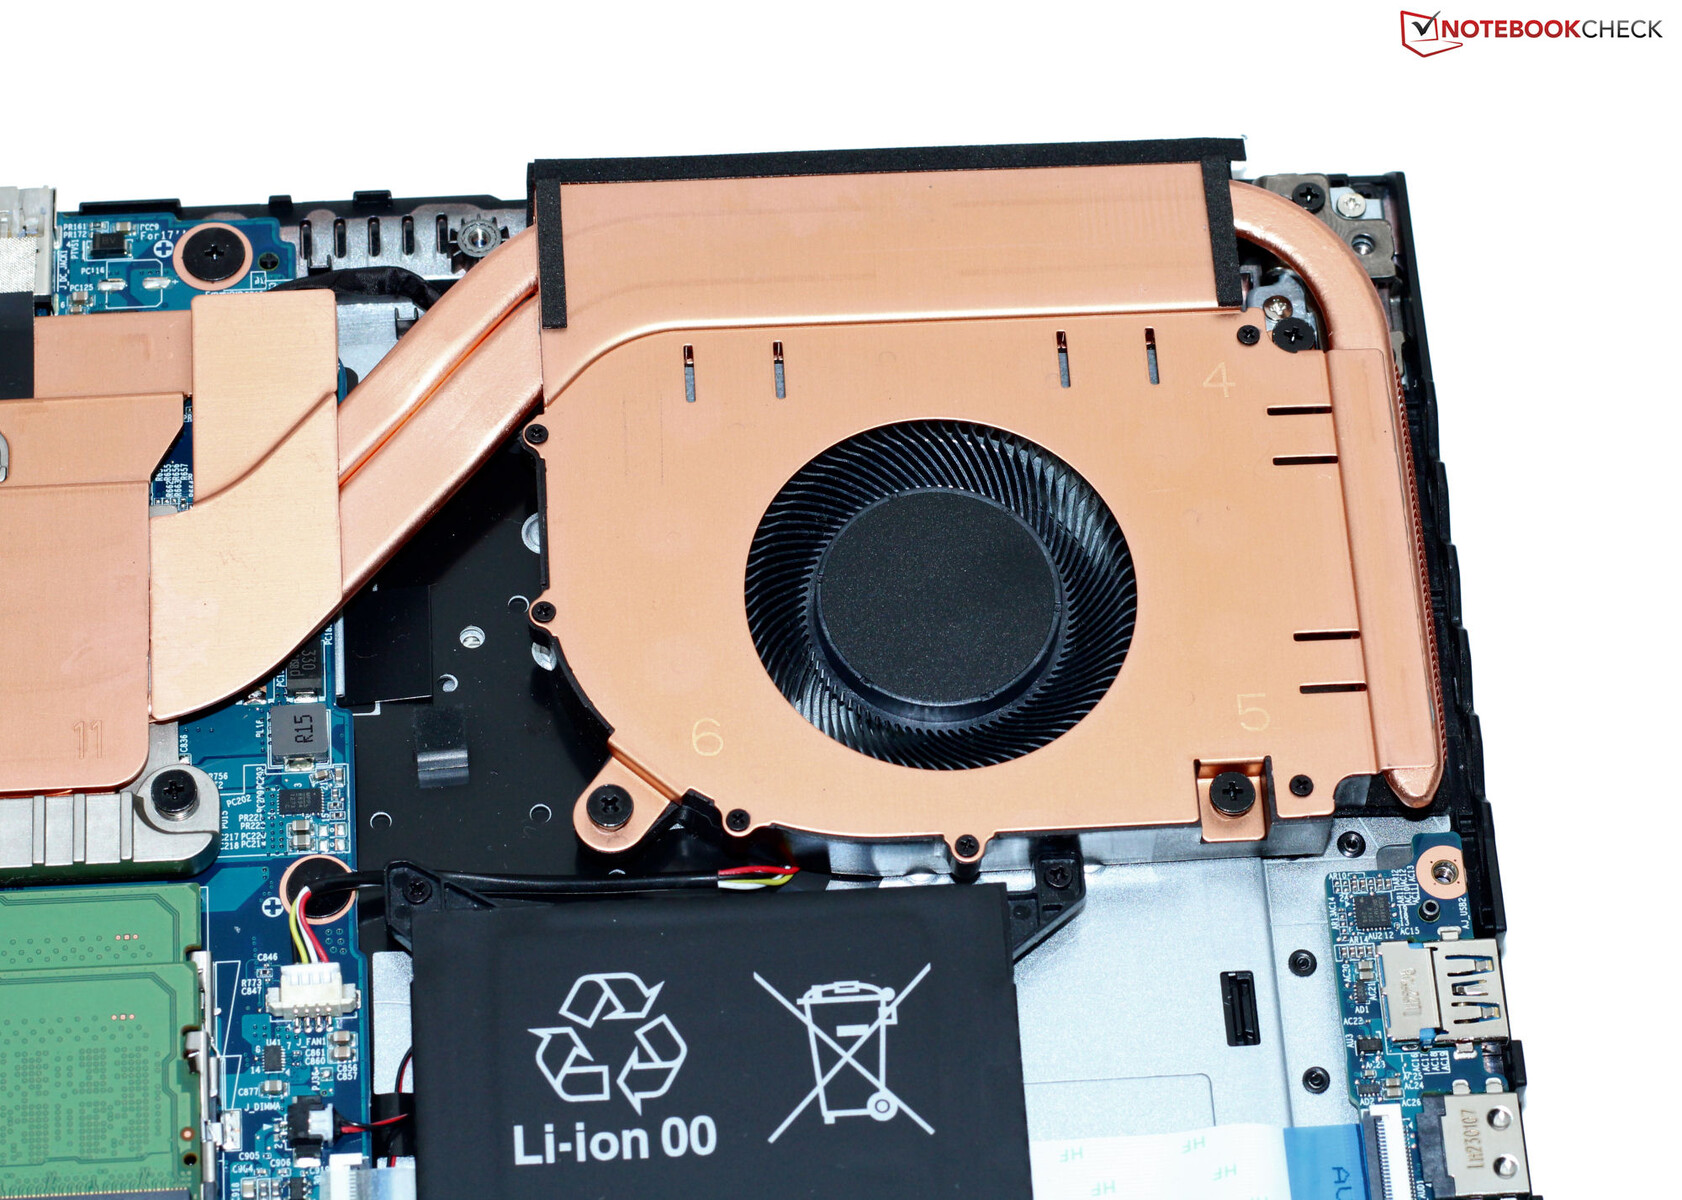
Maintenance
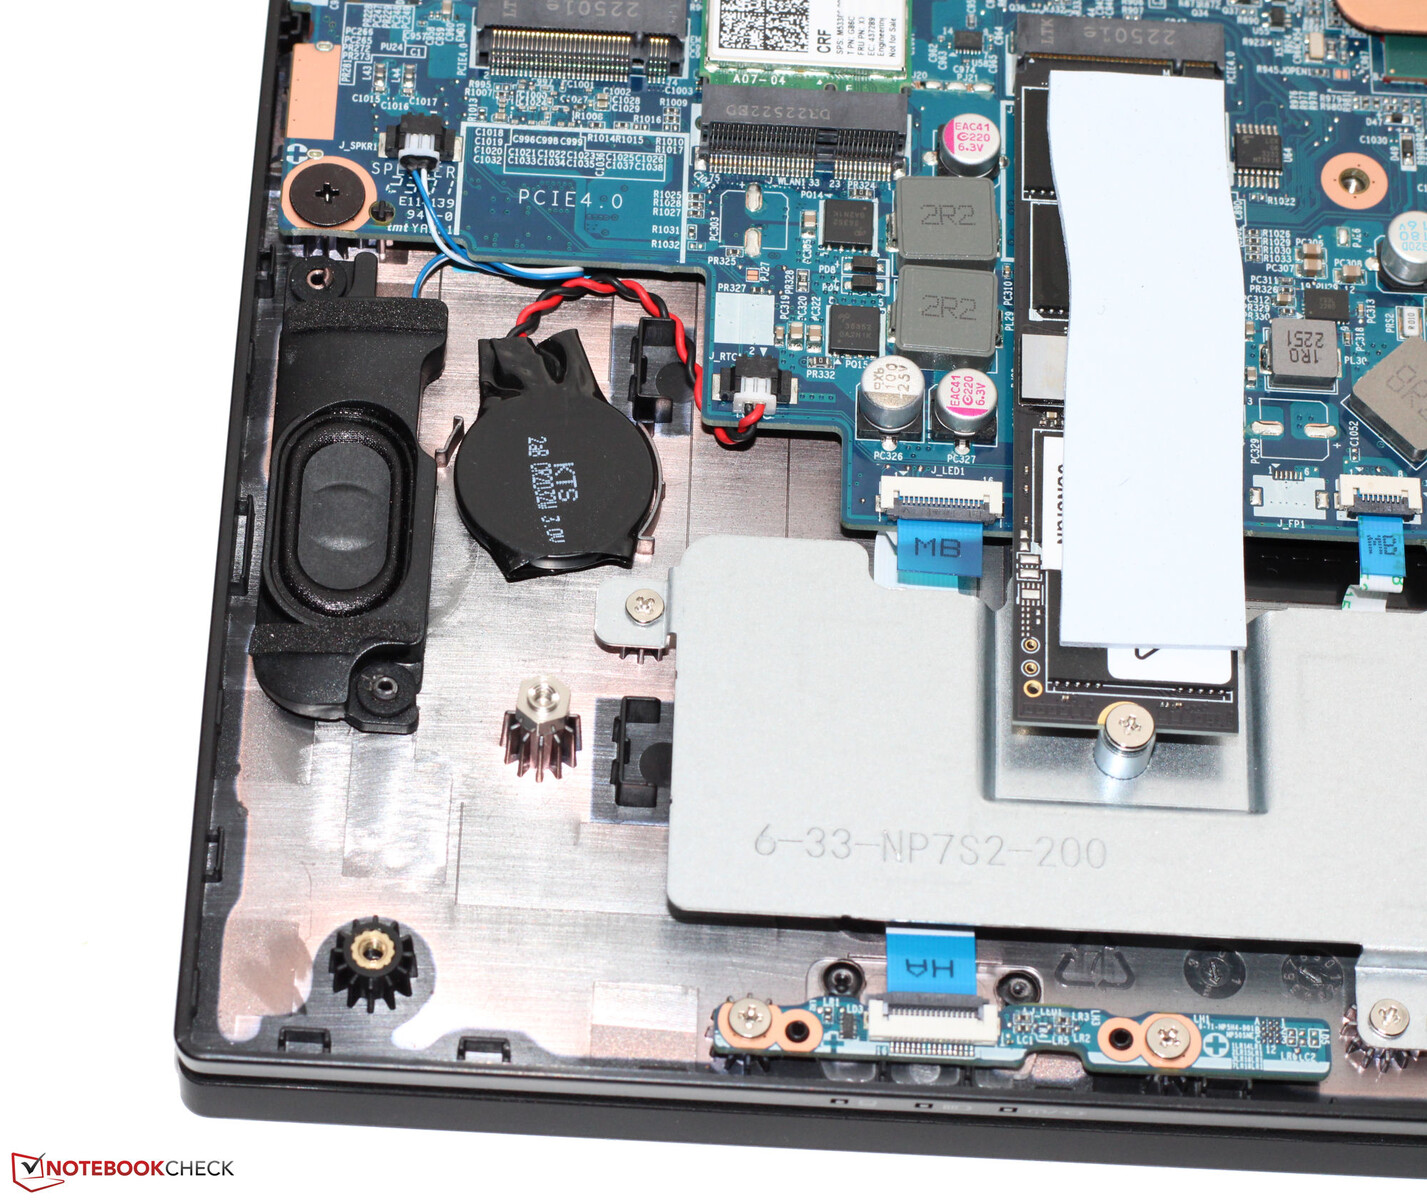
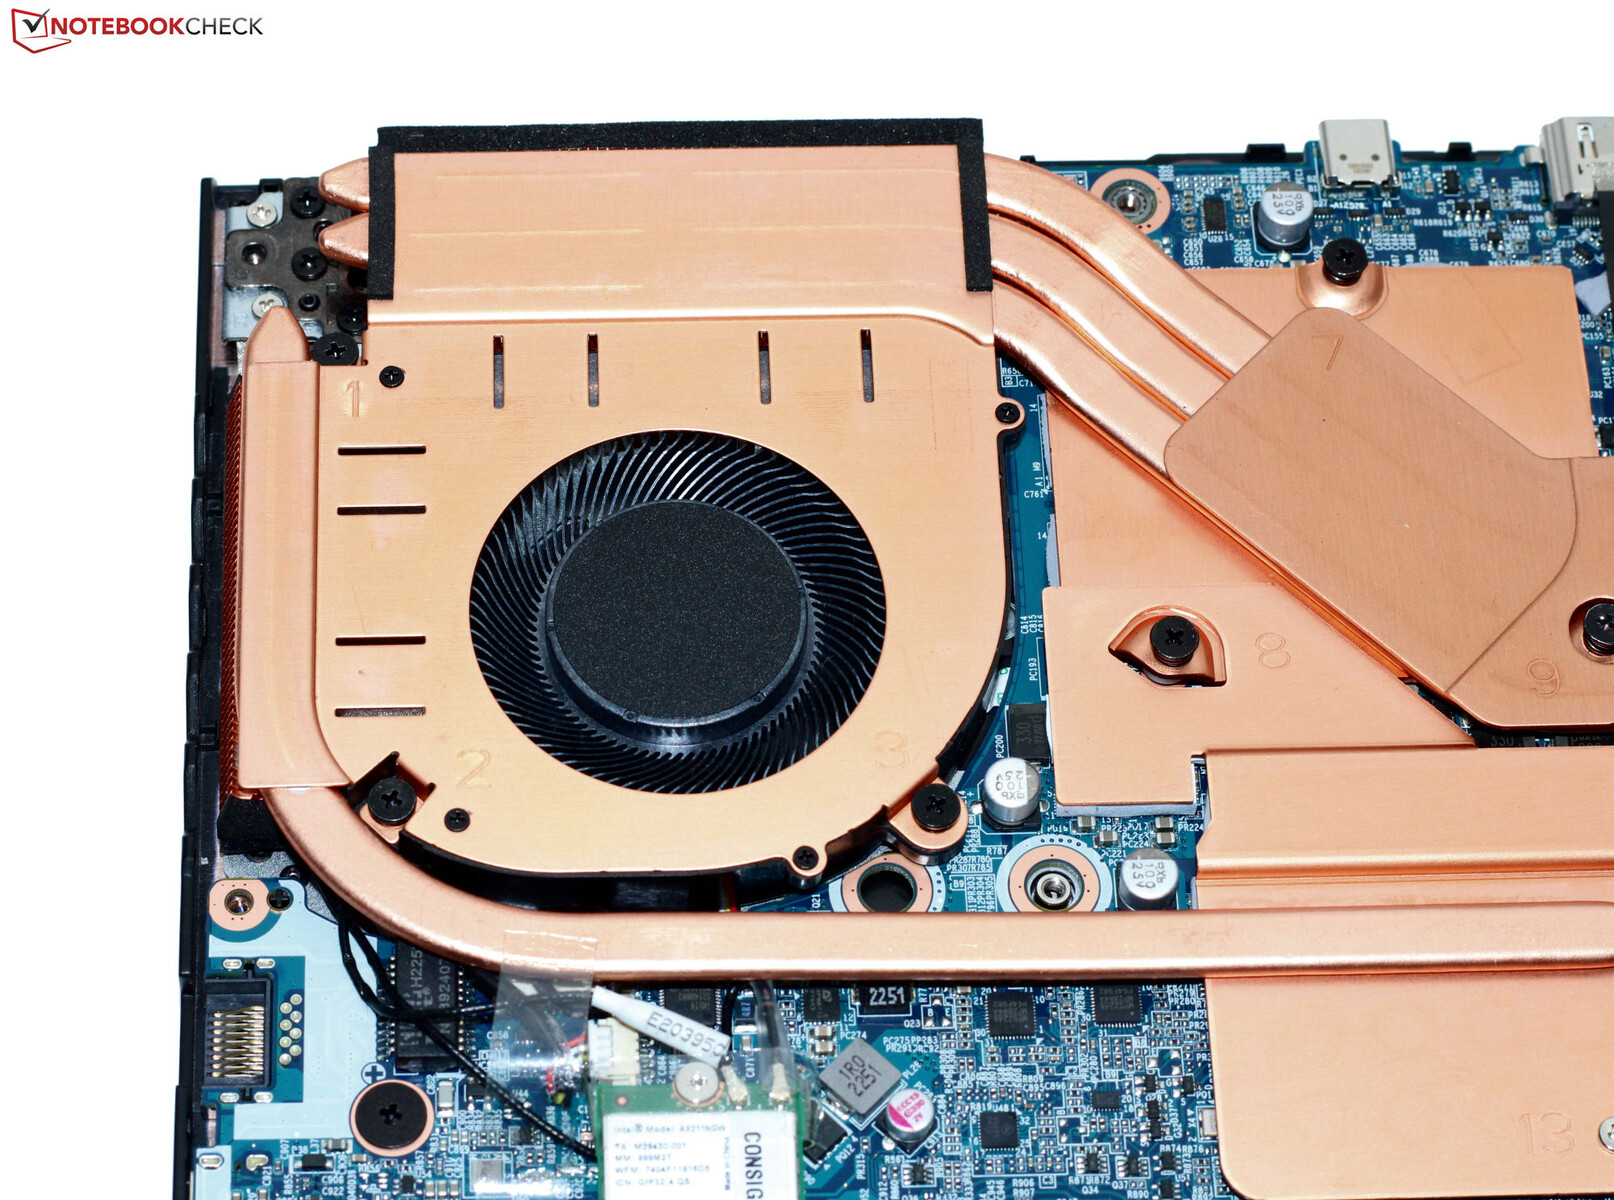
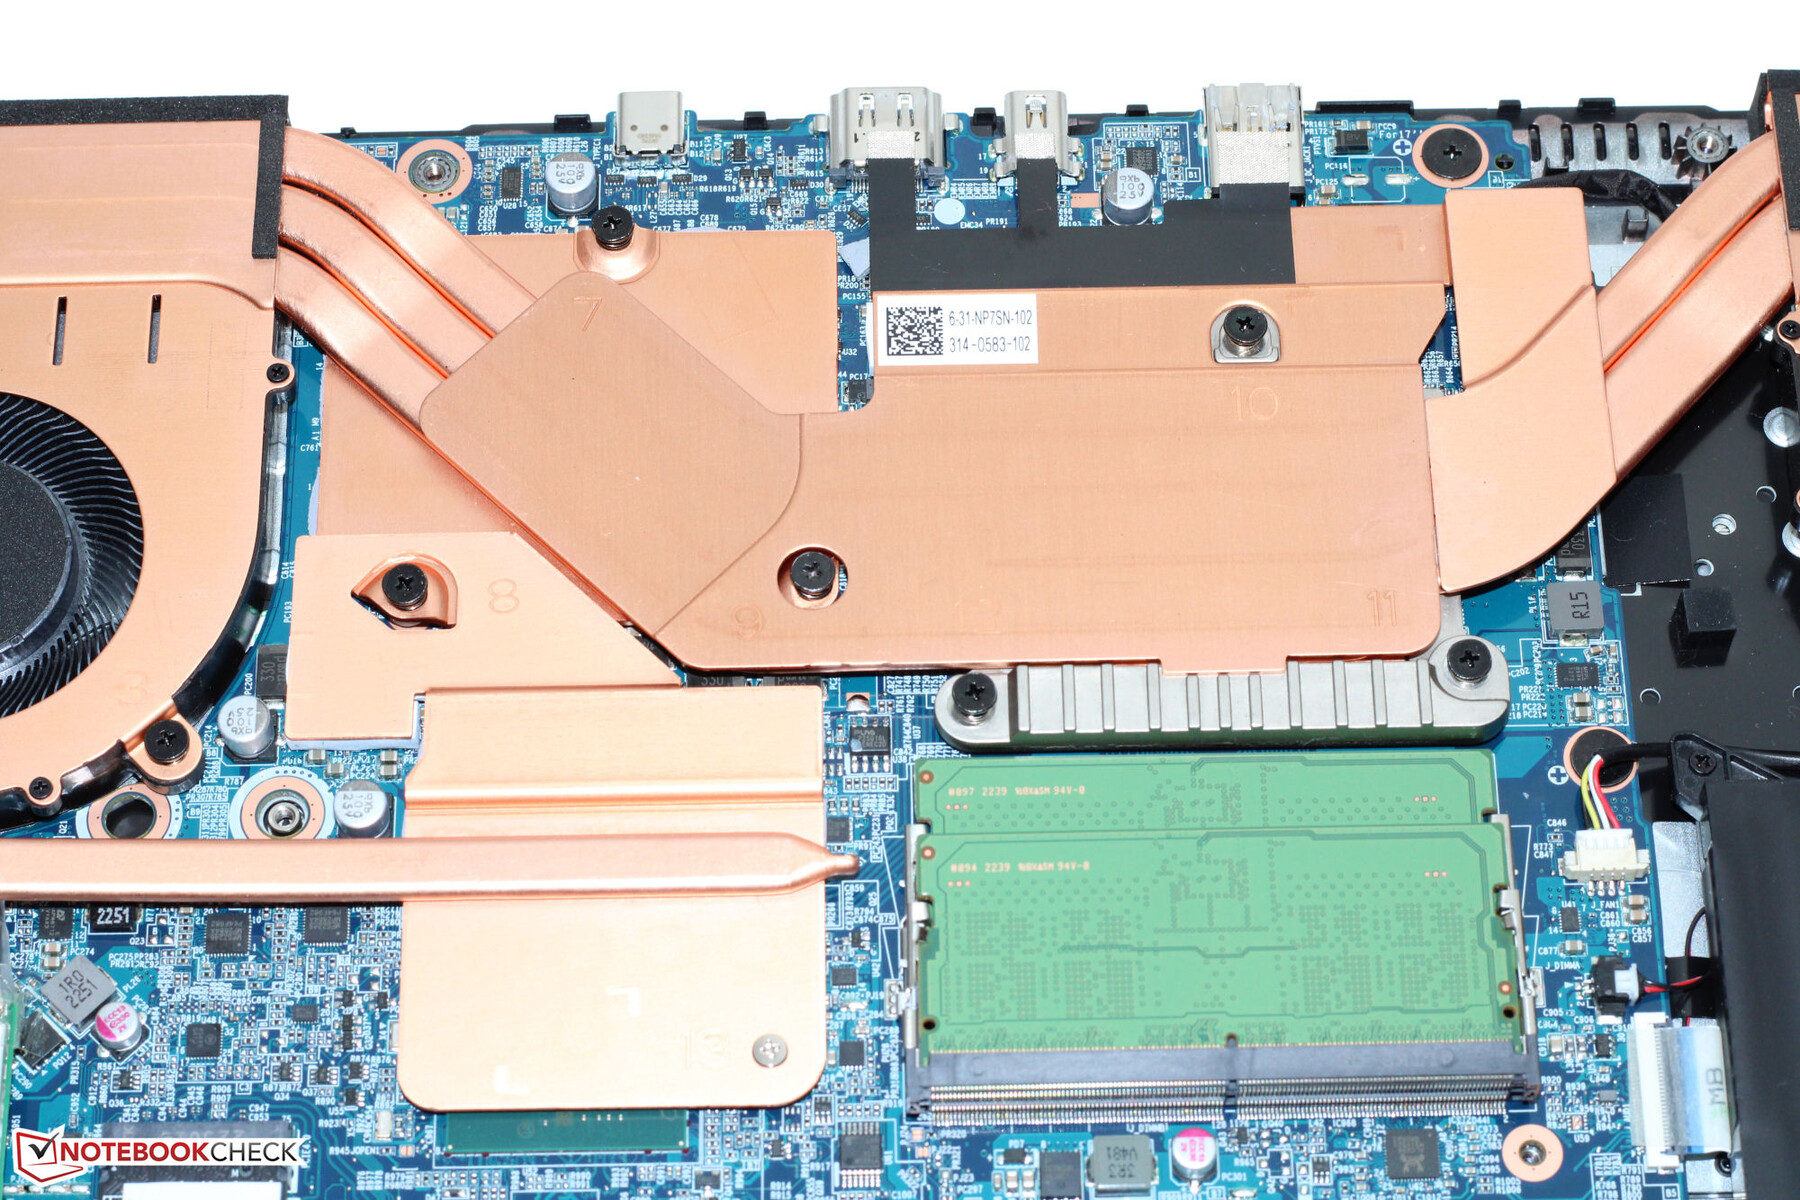
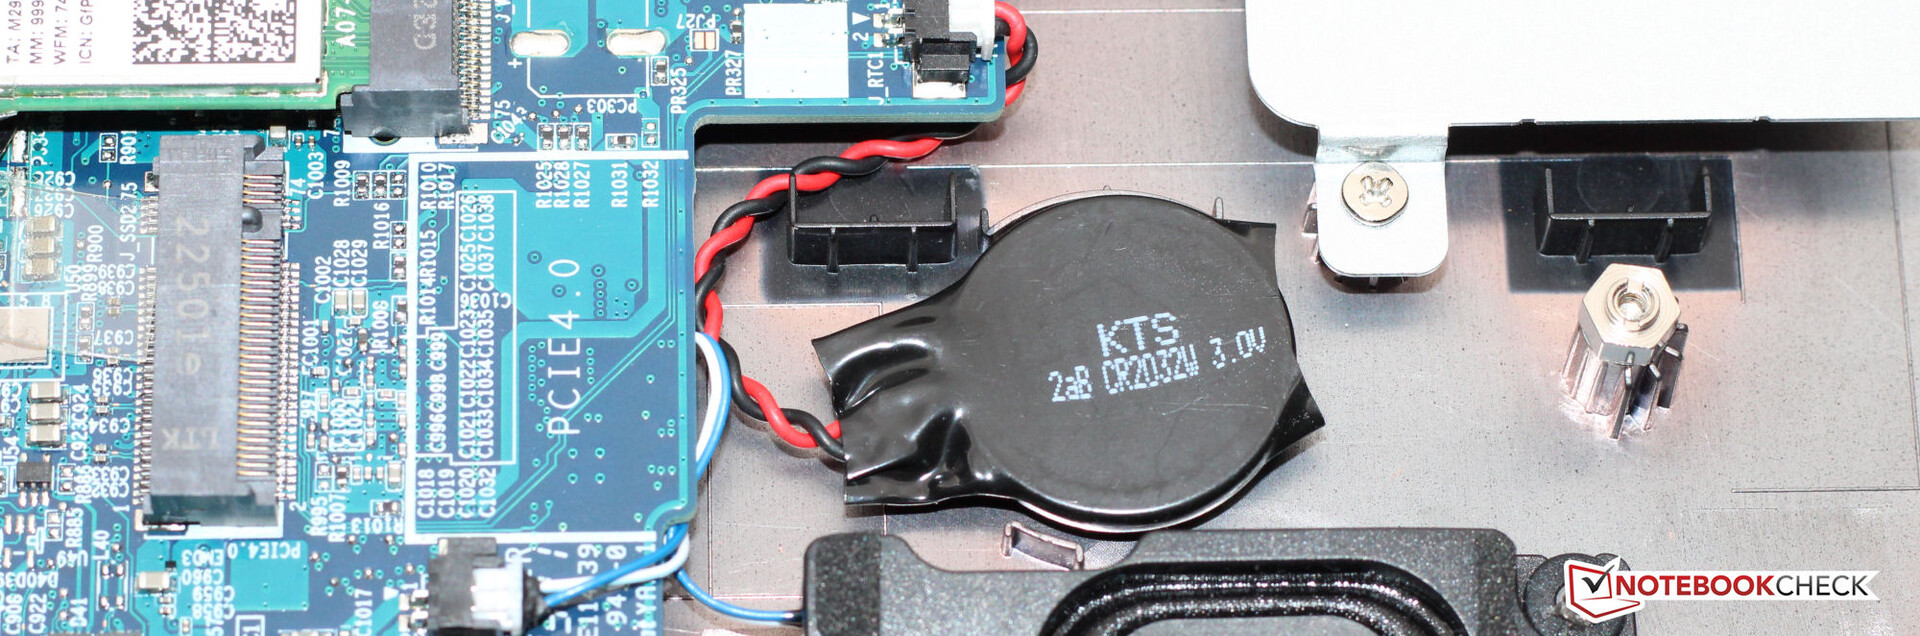
After removing all the screws on the bottom of the device, the bottom plate can be removed using a flat spatula or a plectrum. You can then access both memory banks (in use), the second SSD slot (PCIe 4, M.2-2280), the WLAN module, the BIOS battery, the fans and the battery.
Warranty
Medion's Erazer comes with a two-year warranty. Warranty extensions are available, however, these must be purchased alongside the laptop from Medion's online shop - you aren't available to purchase an extension retroactively.
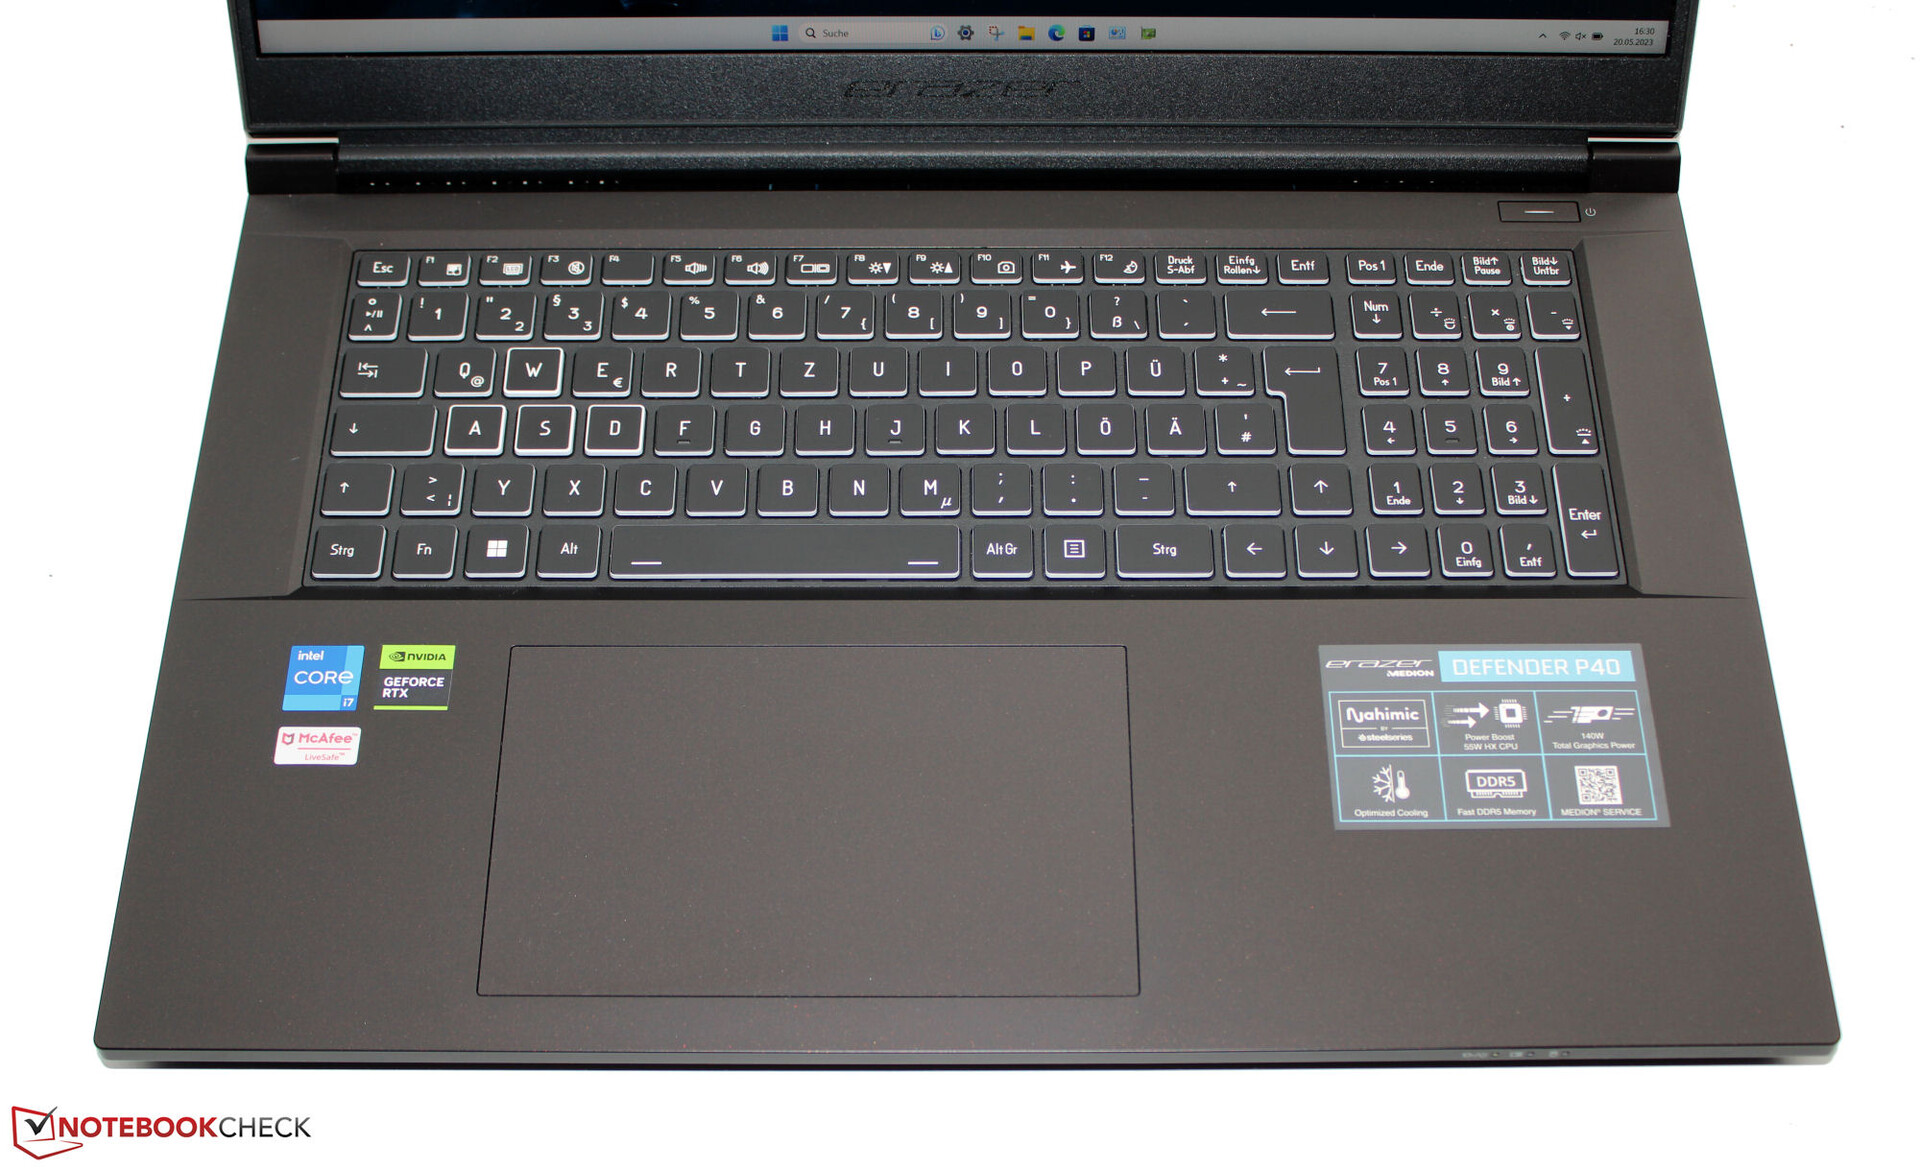
Input devices - The P40's keyboard is RGB-backlit
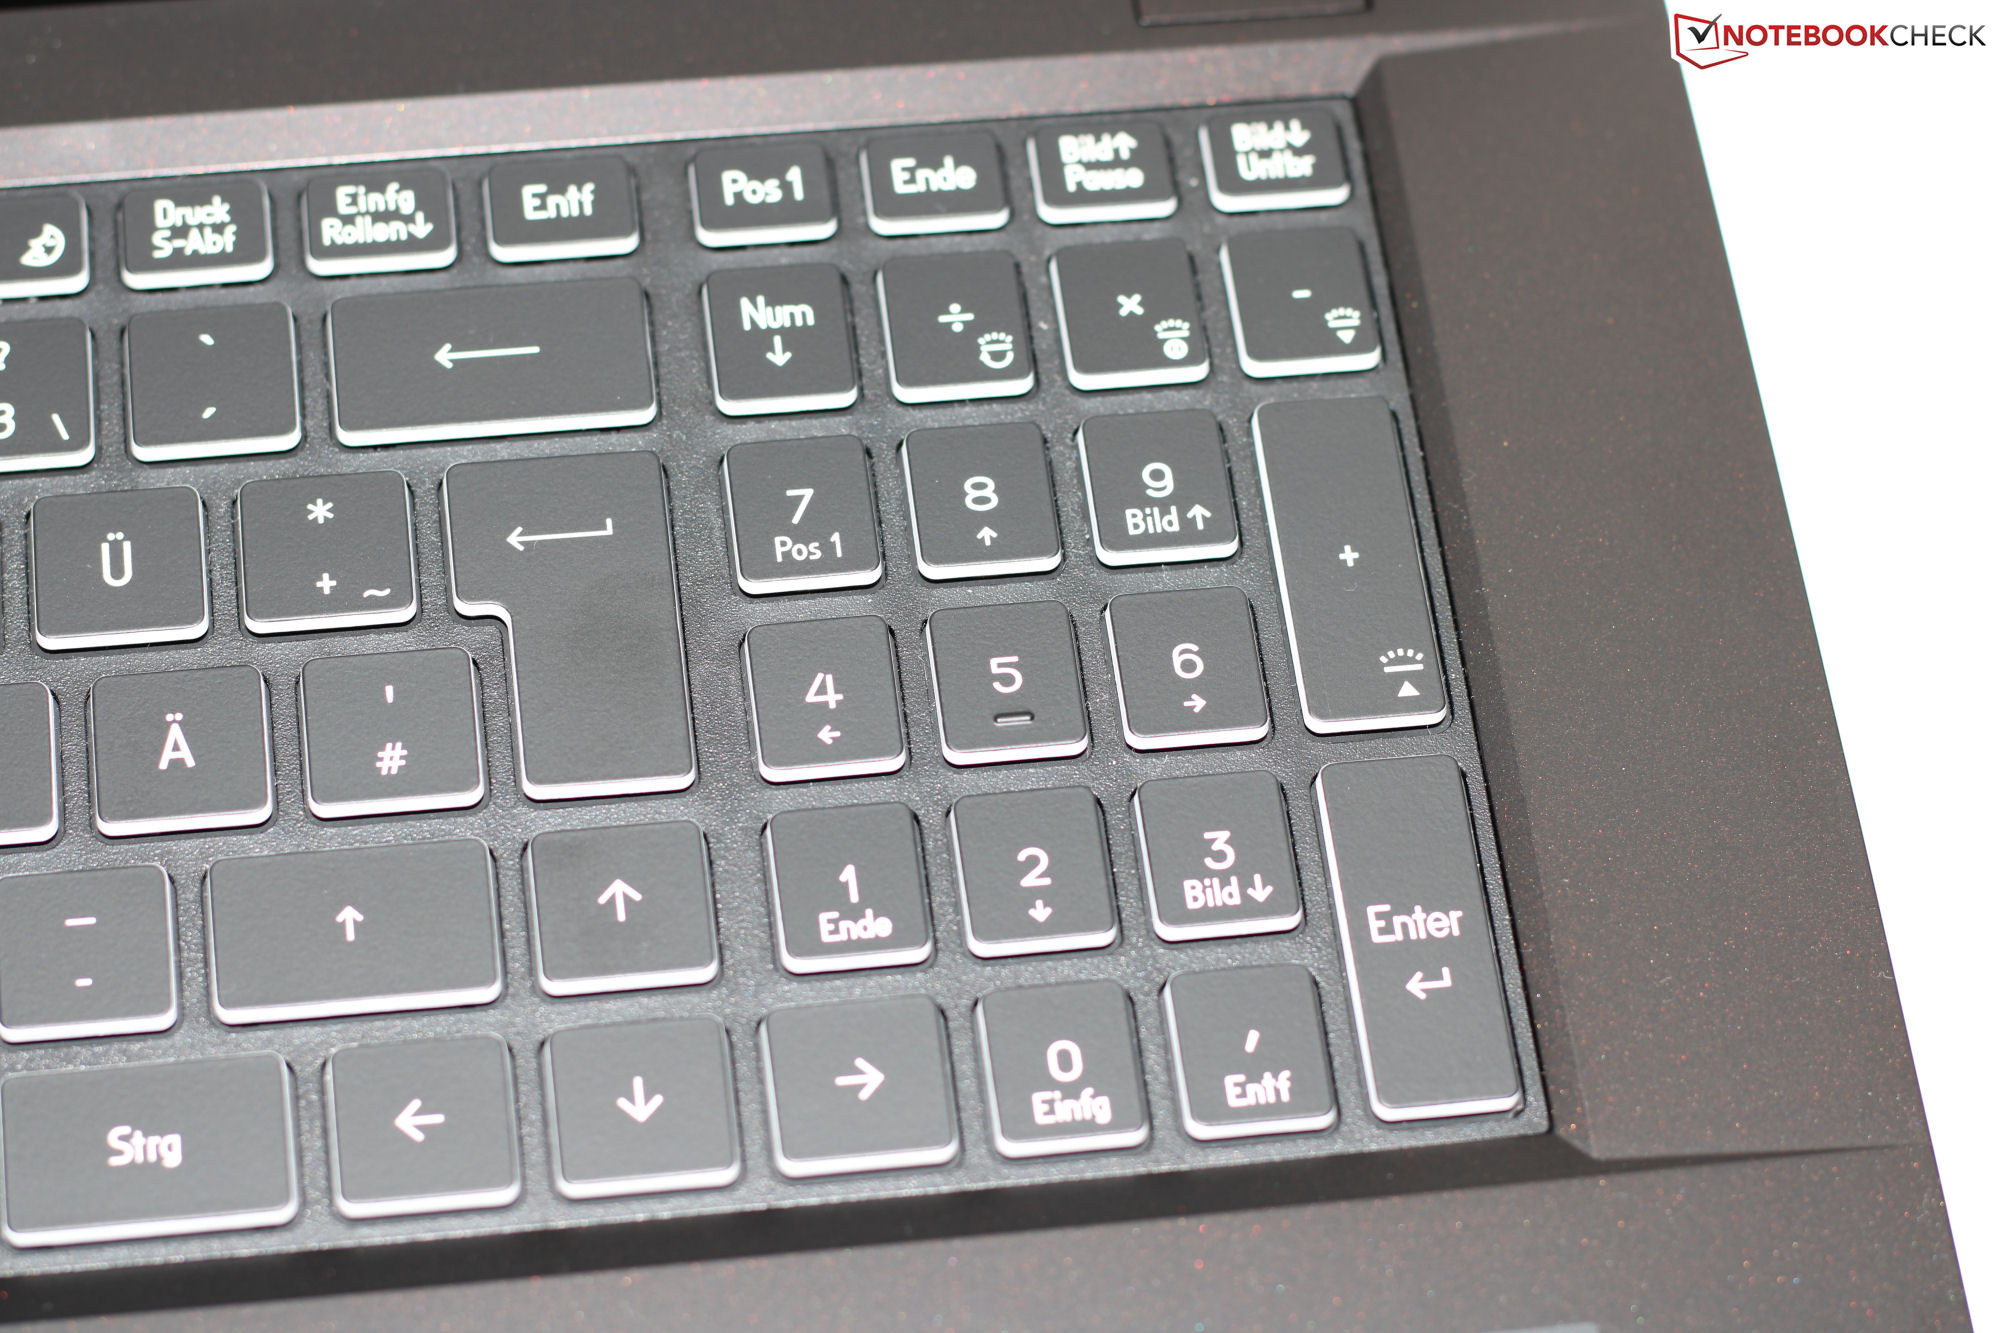
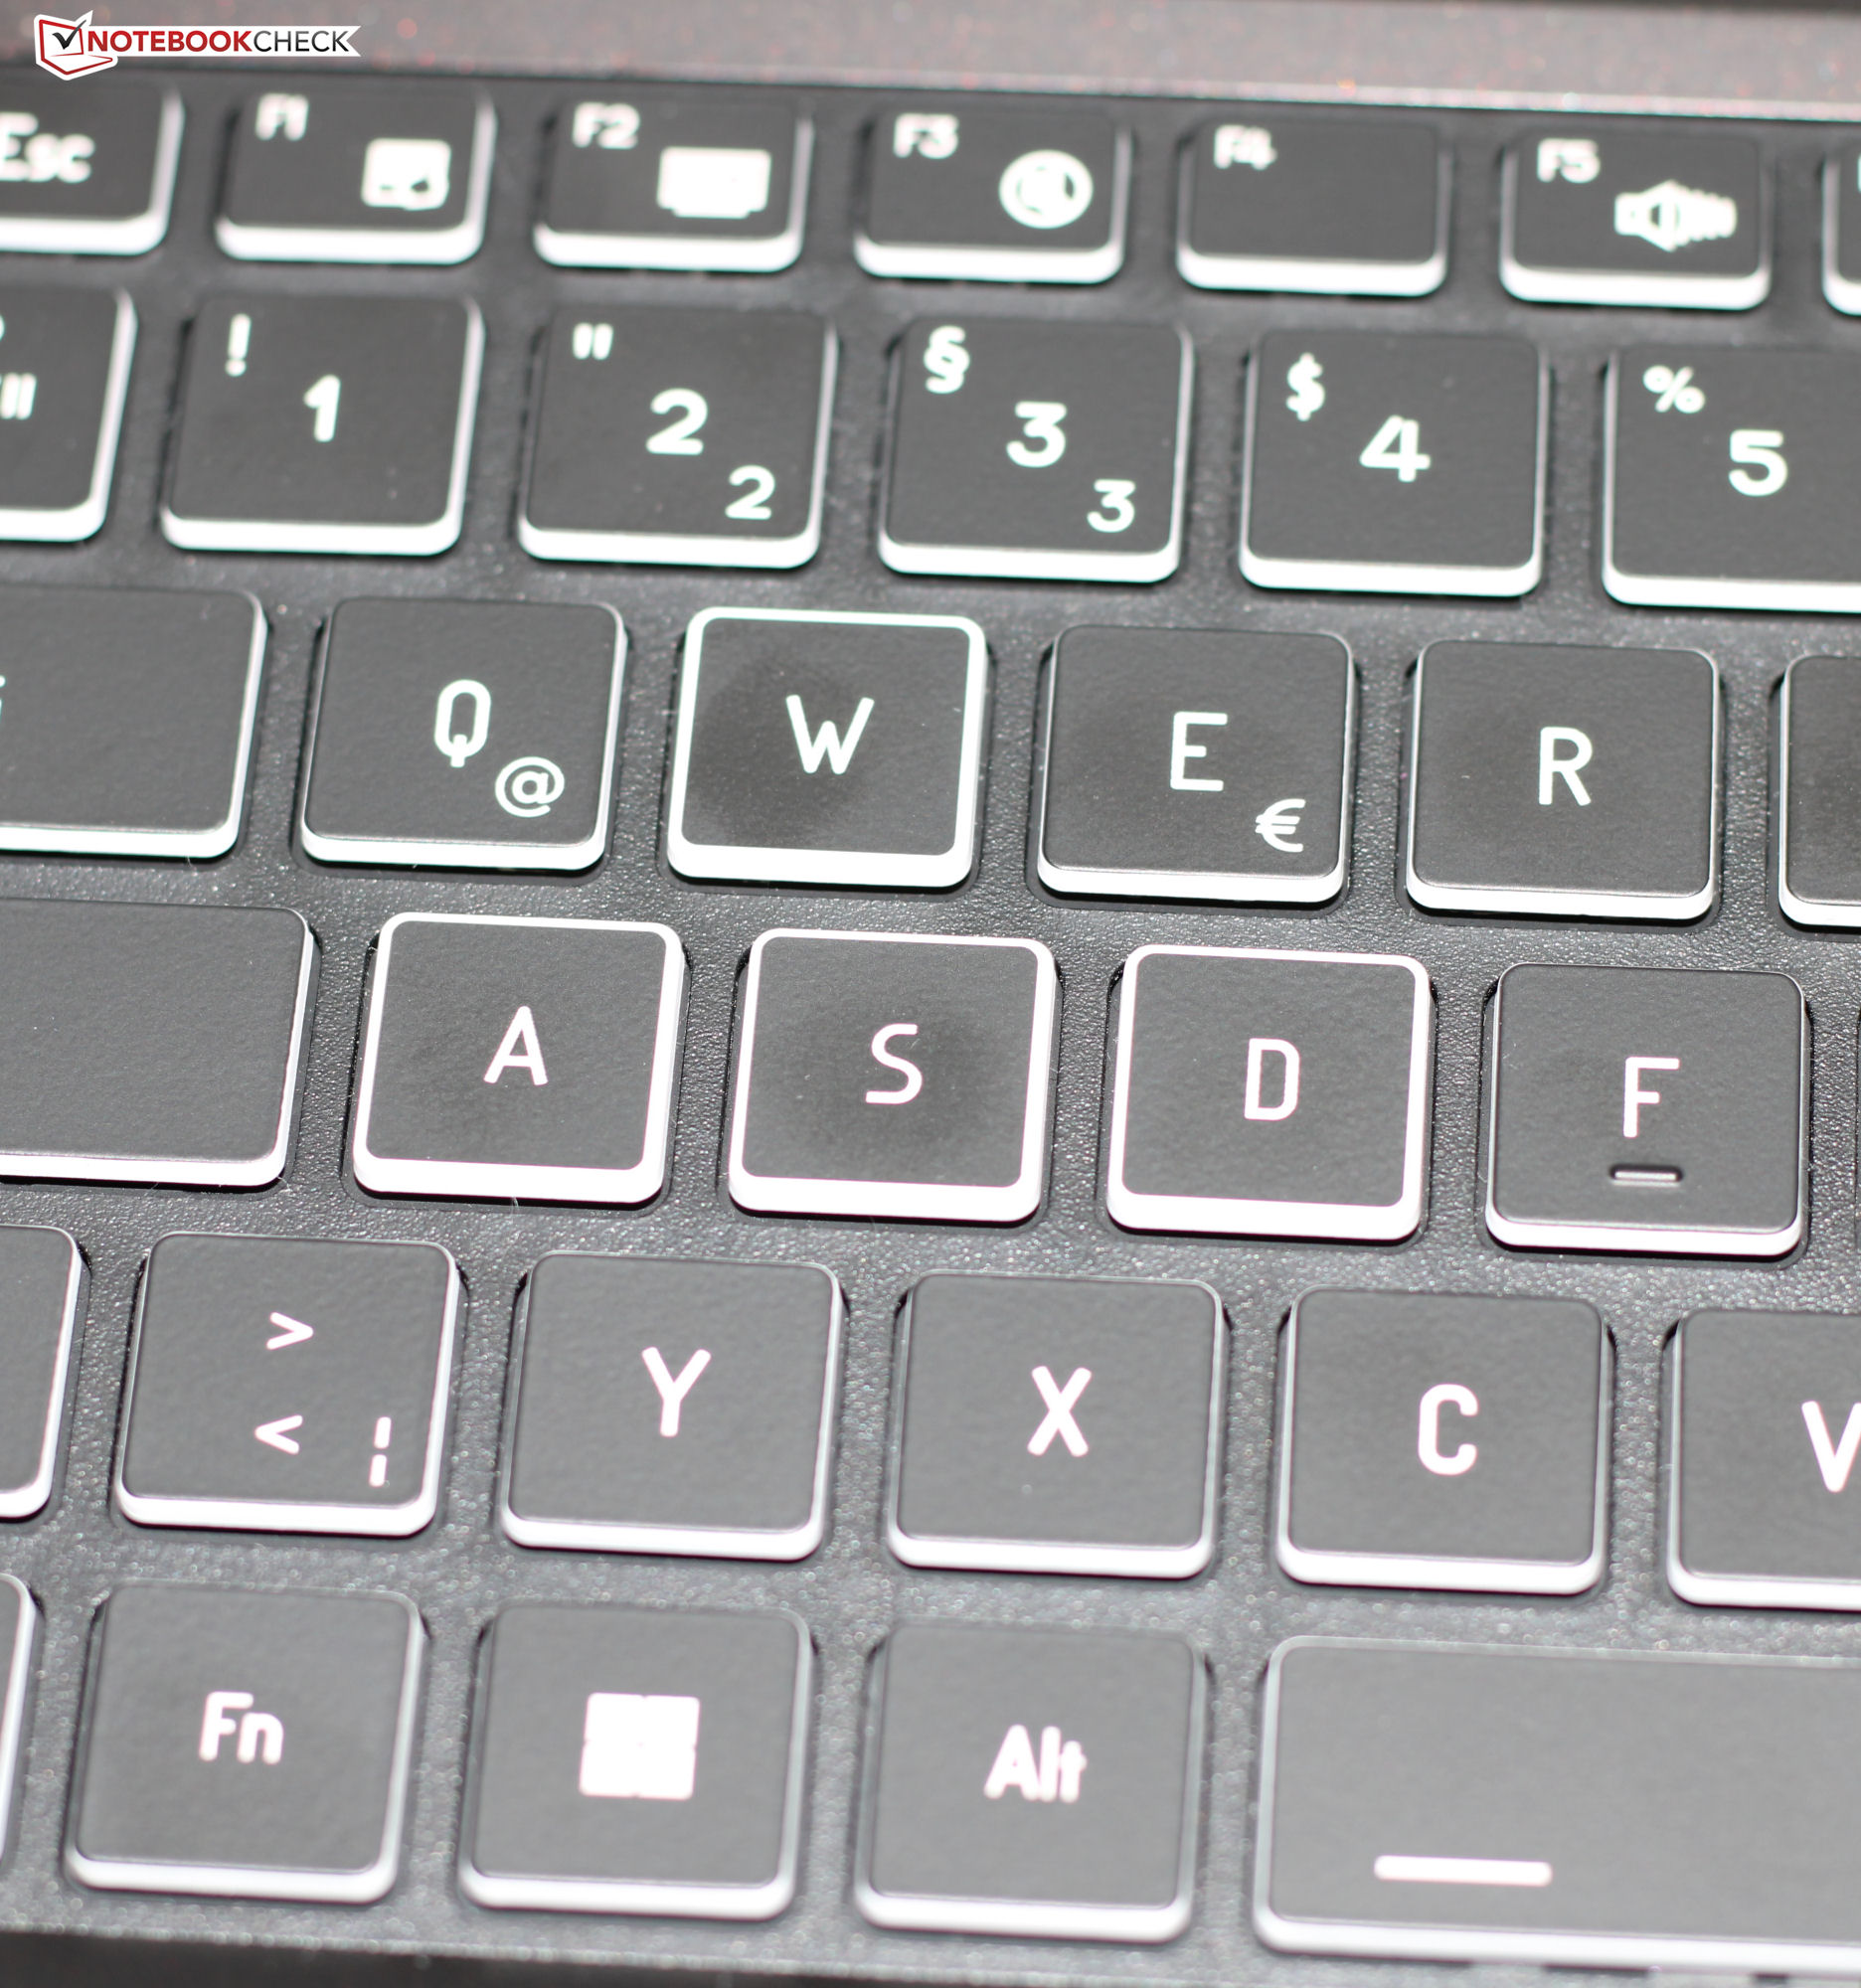
Keyboard
The laptop's illuminated (4 levels) chiclet keyboard (including a numeric keypad) consists of smooth and even keys. These have a short lift, a clear pressure point and a nice level of resistance. When you type, the keys have a slight give - this shouldn't be too bothersome, though. All-in-all, Medion have delivered a keyboard fit for everyday use.
Touchpad
A click pad (around 15.1 x 9.2 cm) replaces the need for a mouse - it has a smooth surface which your fingers can glide over easily. It has a short lift and a clear pressure point.
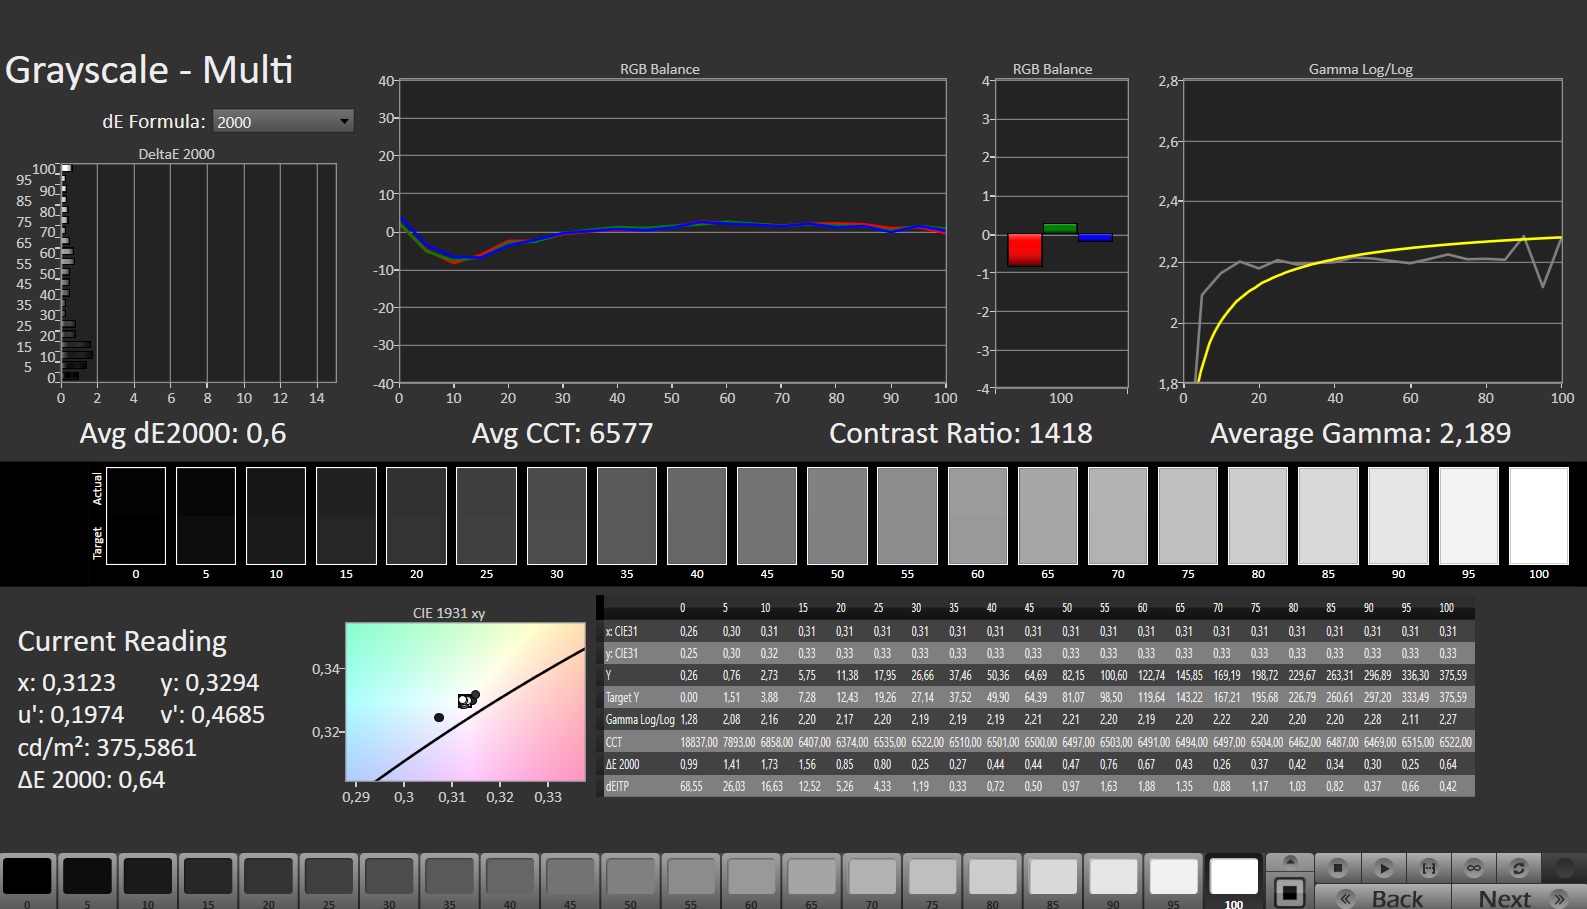
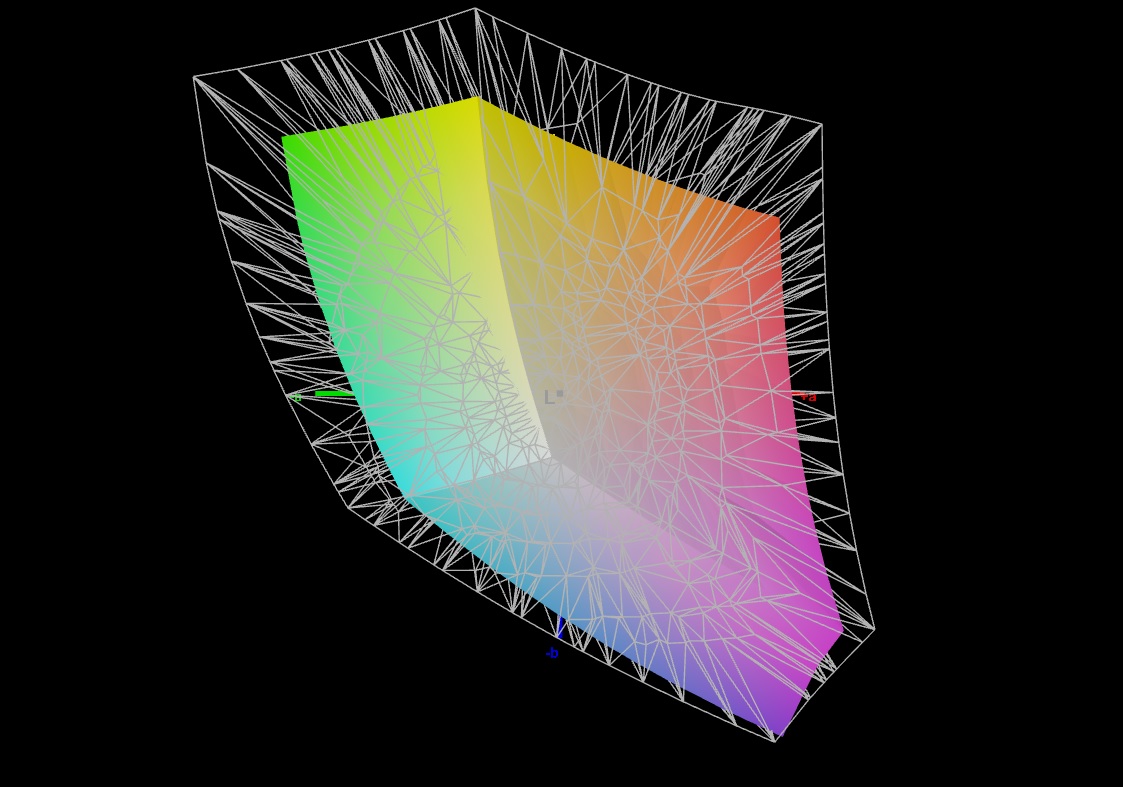
Display - QHD screen with sRGB coverage
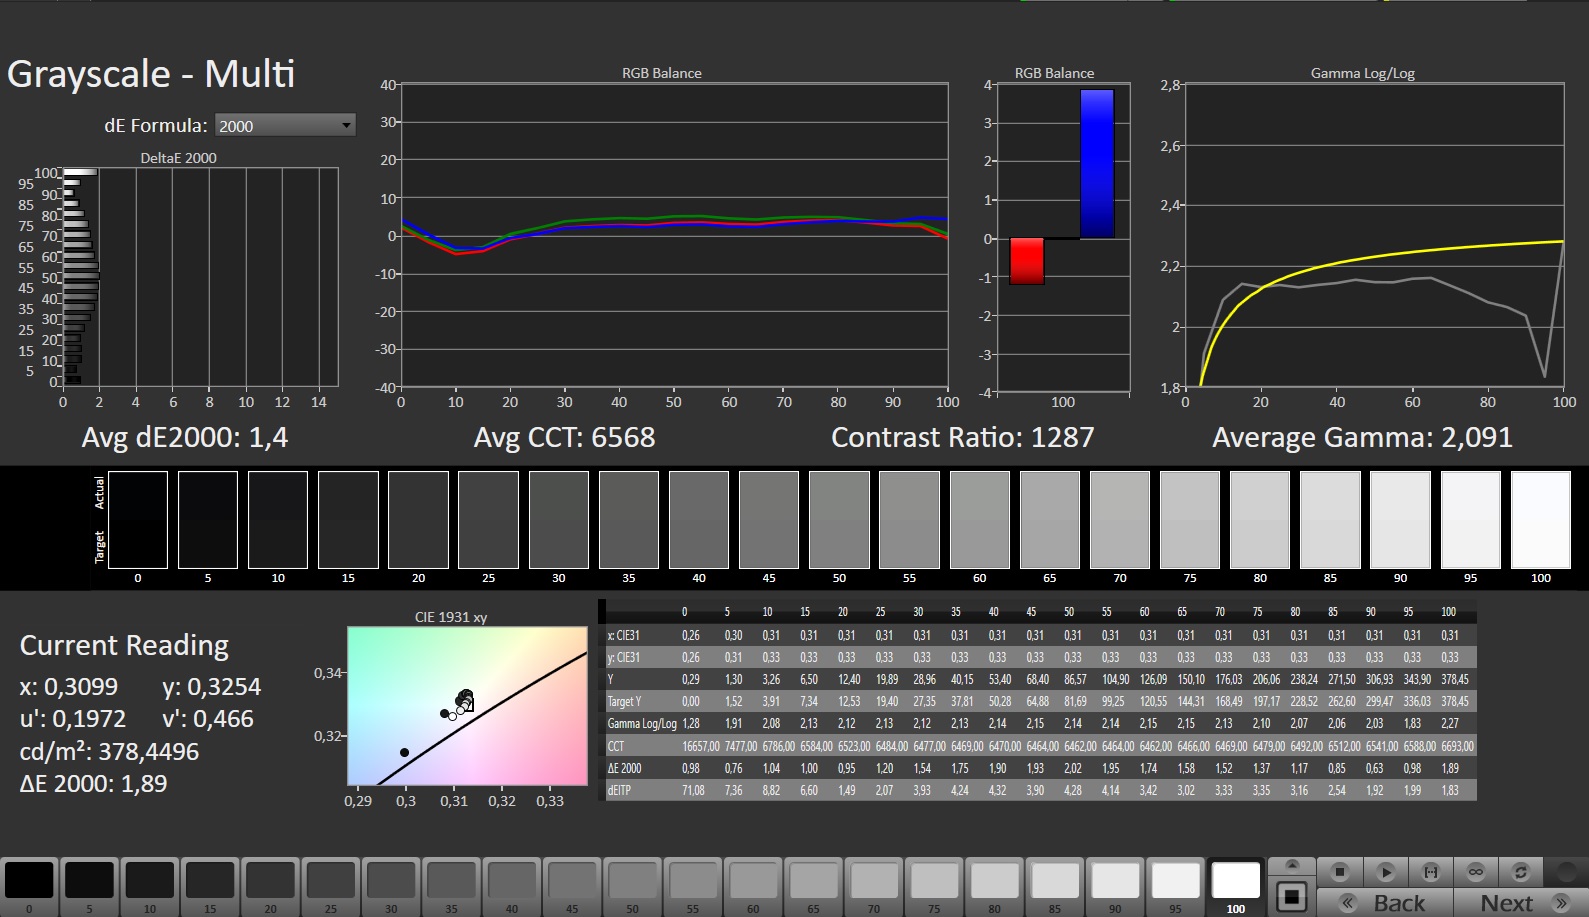
The swift 240-Hz panel with a 16:9 format shows no PWM flickering at any brightness level. The 17.3-inch display's (2,560 x 1,440 pixels) brightness and contrast are exactly as they should be (> 300 cd/m² or 1,000:1). Medion do not offer any other display options.
| |||||||||||||||||||||||||
Brightness Distribution: 86 %
Center on Battery: 364 cd/m²
Contrast: 1300:1 (Black: 0.28 cd/m²)
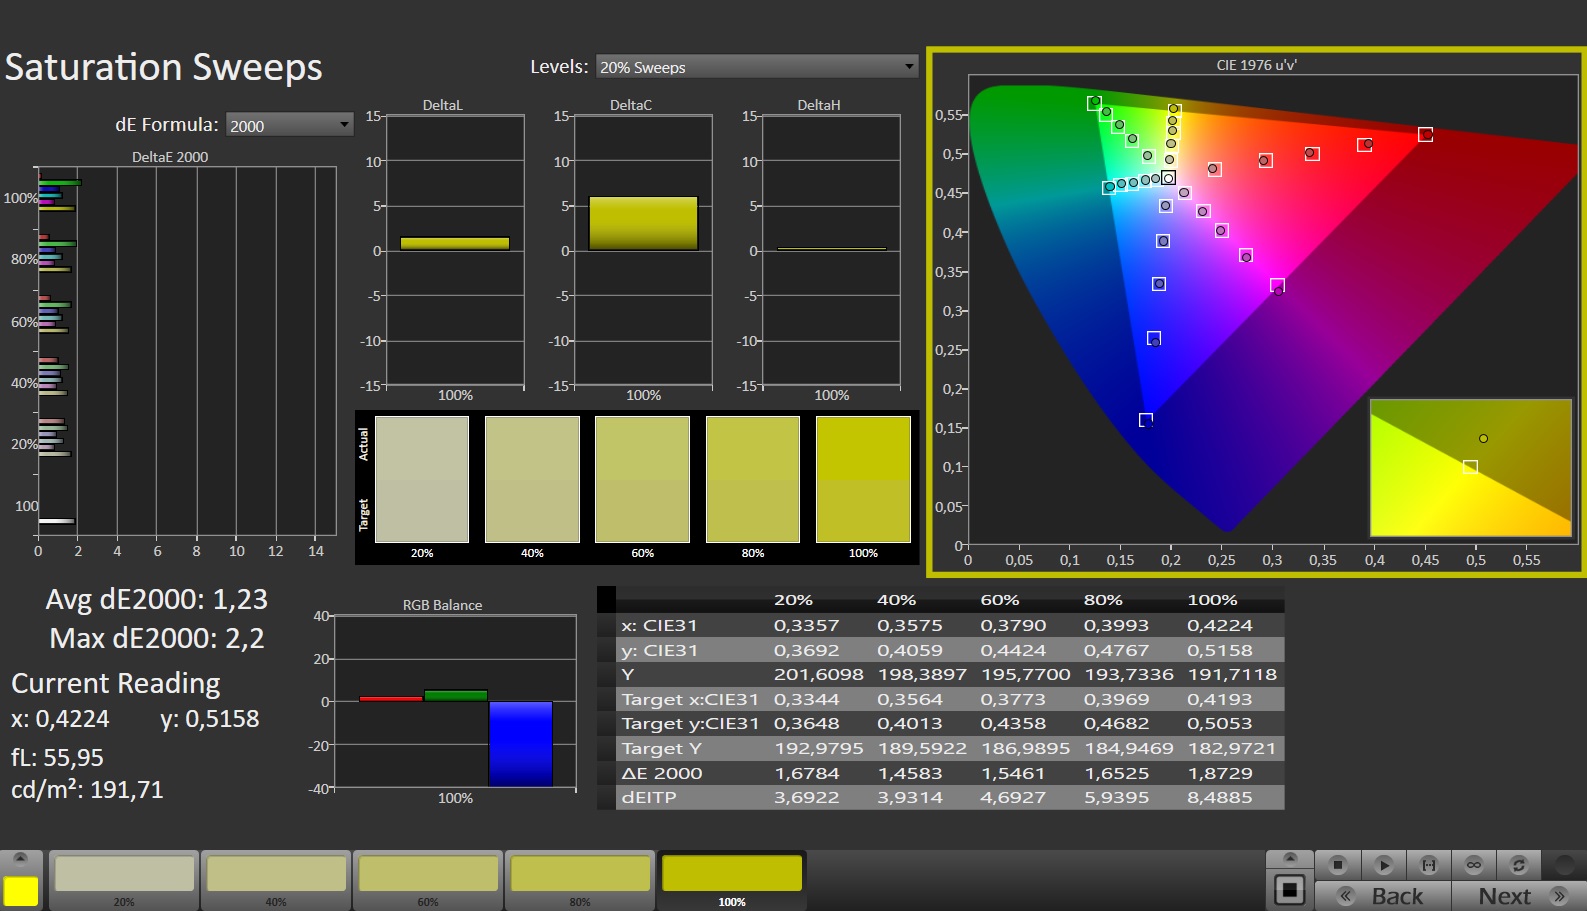
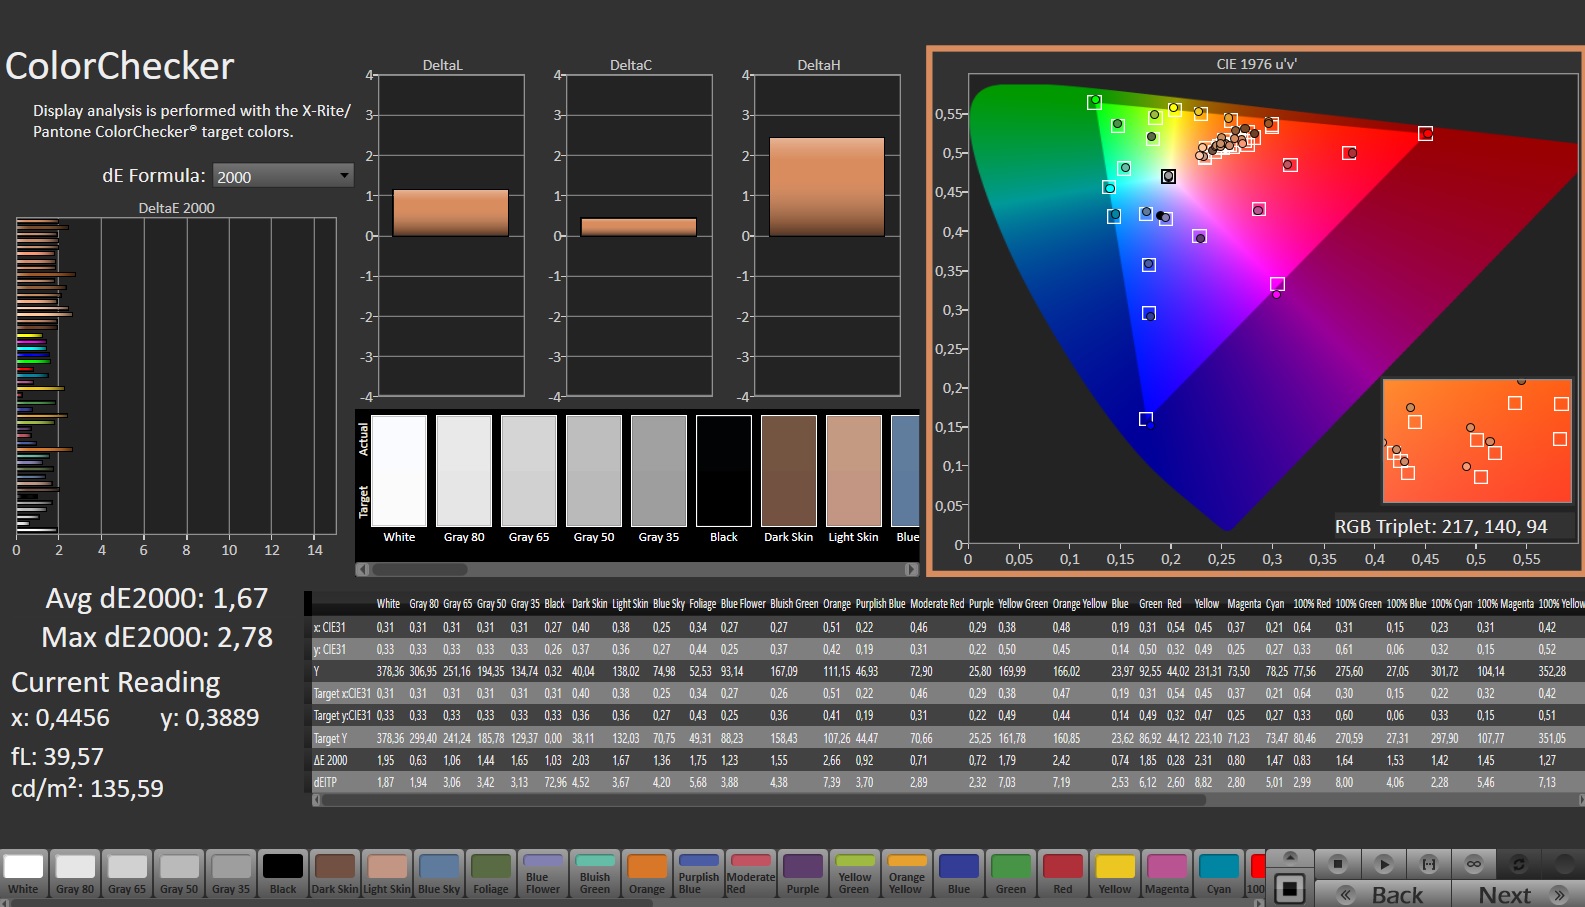
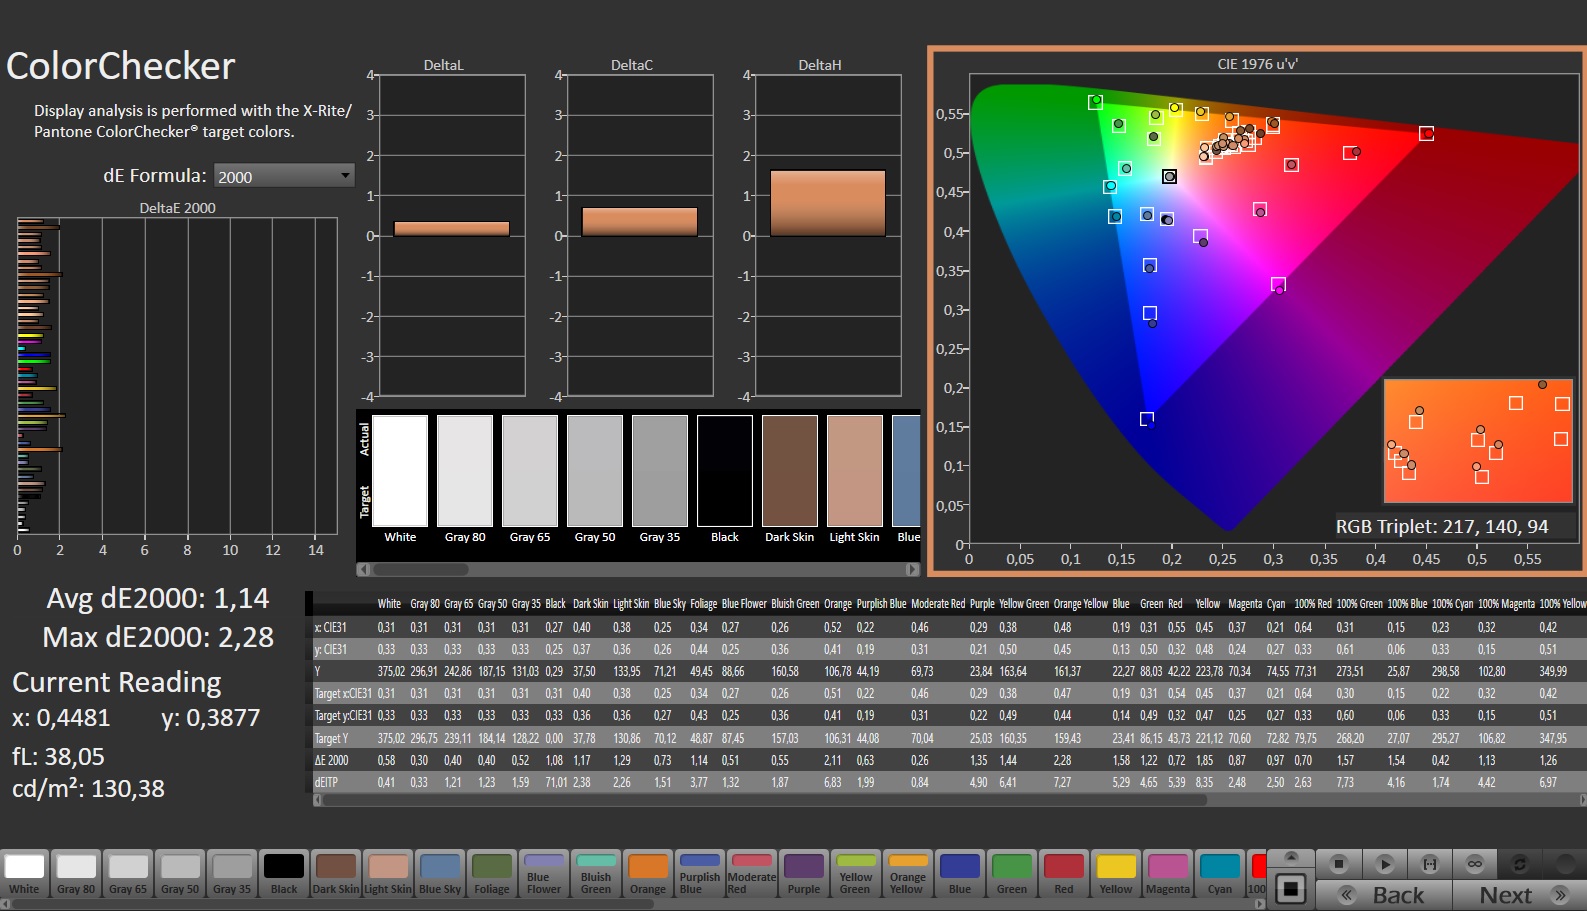
ΔE ColorChecker Calman: 1.67 | ∀{0.5-29.43 Ø4.71}
calibrated: 1.14
ΔE Greyscale Calman: 1.4 | ∀{0.09-98 Ø4.96}
69.8% AdobeRGB 1998 (Argyll 3D)
98.1% sRGB (Argyll 3D)
68.3% Display P3 (Argyll 3D)
Gamma: 2.091
CCT: 6568 K
| Medion Erazer Defender P40 BOE CQ NE173QHM-NZ3, IPS, 2560x1440, 17.3" | MSI Katana 17 B13VFK B173HAN04.9, IPS LED, 1920x1080, 17.3" | Acer Predator Helios 300 (i7-12700H, RTX 3070 Ti) BOE0A1A, IPS, 2560x1440, 17.3" | Lenovo Legion Pro 5 16IRX8 AU Optronics B160QAN03.1, IPS, 2560x1600, 16" | Asus TUF Gaming A16 FA617 NE160WUM-NX2 (BOE0B33), IPS-Level, 1920x1200, 16" | Gigabyte G7 KE AU Optronics B173HAN05.1, IPS, 1920x1080, 17.3" | |
|---|---|---|---|---|---|---|
| Display | -39% | 22% | 3% | 1% | 3% | |
| Display P3 Coverage (%) | 68.3 | 40.8 -40% | 96.8 42% | 71.2 4% | 69.4 2% | 70.4 3% |
| sRGB Coverage (%) | 98.1 | 61 -38% | 99.9 2% | 98.8 1% | 97.8 0% | 99.8 2% |
| AdobeRGB 1998 Coverage (%) | 69.8 | 42.2 -40% | 84.8 21% | 73.3 5% | 70.9 2% | 71.7 3% |
| Response Times | -163% | -21% | -10% | -16% | 36% | |
| Response Time Grey 50% / Grey 80% * (ms) | 14.6 ? | 33 ? -126% | 16.4 ? -12% | 14.5 ? 1% | 17 ? -16% | 5 ? 66% |
| Response Time Black / White * (ms) | 8.7 ? | 26 ? -199% | 11.2 ? -29% | 10.4 ? -20% | 10.1 ? -16% | 8.3 ? 5% |
| PWM Frequency (Hz) | ||||||
| Screen | -126% | -59% | -2% | -5% | -6% | |
| Brightness middle (cd/m²) | 364 | 267 -27% | 366 1% | 405.7 11% | 308 -15% | 307 -16% |
| Brightness (cd/m²) | 343 | 256 -25% | 340 -1% | 368 7% | 293 -15% | 301 -12% |
| Brightness Distribution (%) | 86 | 93 8% | 85 -1% | 87 1% | 90 5% | 93 8% |
| Black Level * (cd/m²) | 0.28 | 0.21 25% | 0.31 -11% | 0.38 -36% | 0.23 18% | 0.2 29% |
| Contrast (:1) | 1300 | 1271 -2% | 1181 -9% | 1068 -18% | 1339 3% | 1535 18% |
| Colorchecker dE 2000 * | 1.67 | 4.7 -181% | 3.56 -113% | 1.65 1% | 1.47 12% | 1.32 21% |
| Colorchecker dE 2000 max. * | 2.78 | 20.4 -634% | 5.66 -104% | 4.2 -51% | 2.98 -7% | 4.6 -65% |
| Colorchecker dE 2000 calibrated * | 1.14 | 4.5 -295% | 3.31 -190% | 0.53 54% | 1.02 11% | 1.03 10% |
| Greyscale dE 2000 * | 1.4 | 1.5 -7% | 2.84 -103% | 1.2 14% | 2.2 -57% | 2.1 -50% |
| Gamma | 2.091 105% | 2.12 104% | 2.29 96% | 2.3 96% | 2.228 99% | 2.247 98% |
| CCT | 6568 99% | 6552 99% | 6835 95% | 6453 101% | 6228 104% | 6815 95% |
| Total Average (Program / Settings) | -109% /
-113% | -19% /
-36% | -3% /
-2% | -7% /
-5% | 11% /
2% |
* ... smaller is better
Ex works, the screen already has great color depiction: A deviation of about 1.7 is acceptable (DeltaE < 3). Calibration leads to a smaller deviation of 1.13 and more balanced gray tones.
The panel covers the entire sRGB color space - but not AdobeRGB or DCI P3. This isn't all too different from the device's competitors. Only the Acer Predator's screen can depict the P3 space.

Display Response Times
| ↔ Response Time Black to White | ||
|---|---|---|
| 8.7 ms ... rise ↗ and fall ↘ combined | ↗ 3.6 ms rise | 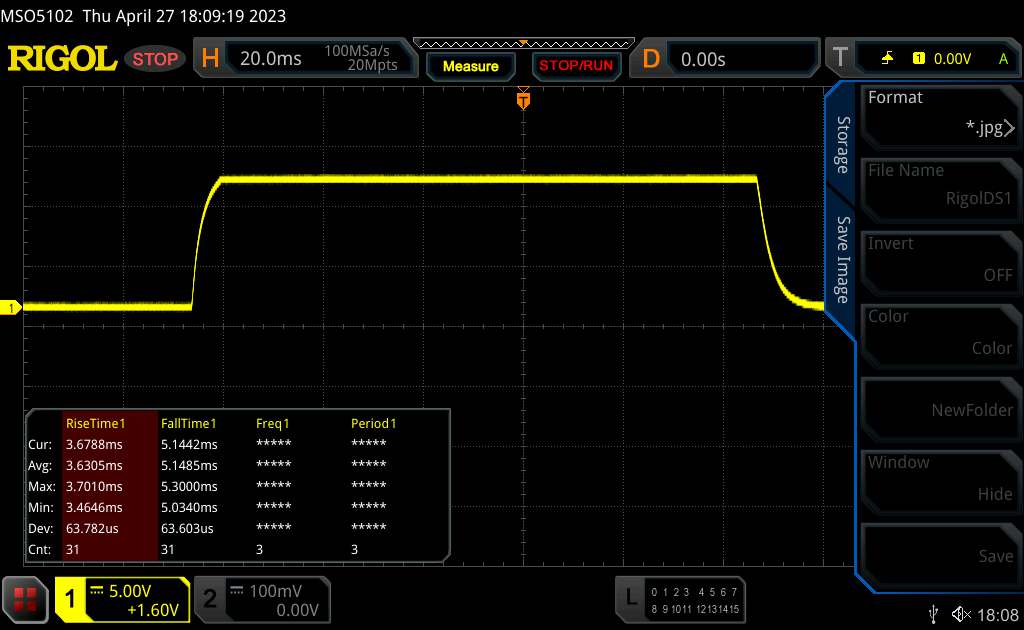 |
| ↘ 5.1 ms fall | ||
| The screen shows fast response rates in our tests and should be suited for gaming. In comparison, all tested devices range from 0.1 (minimum) to 240 (maximum) ms. » 24 % of all devices are better. This means that the measured response time is better than the average of all tested devices (19.8 ms). | ||
| ↔ Response Time 50% Grey to 80% Grey | ||
| 14.6 ms ... rise ↗ and fall ↘ combined | ↗ 7.1 ms rise | 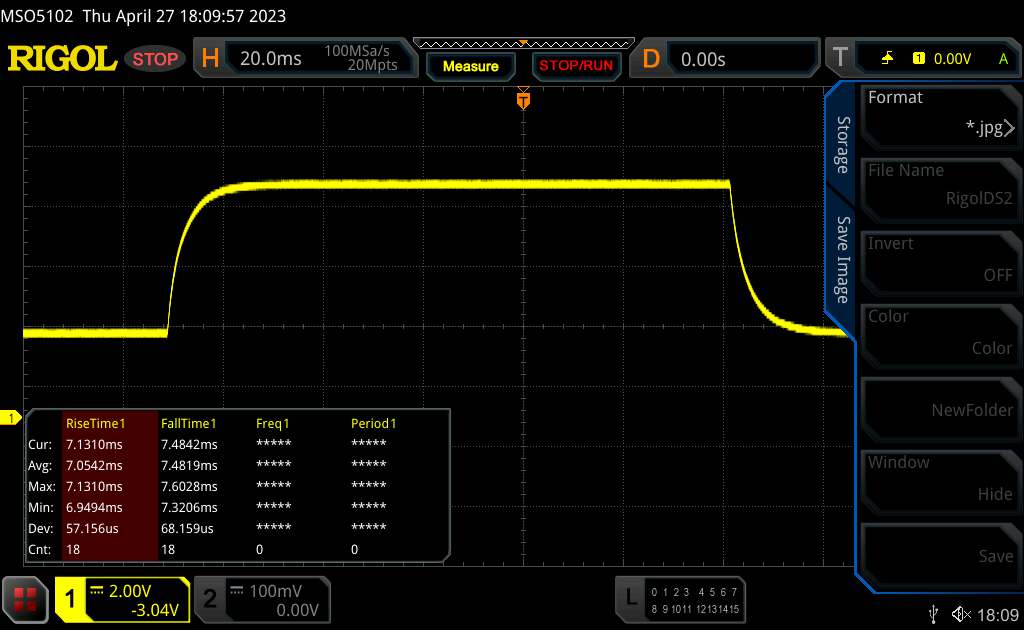 |
| ↘ 7.5 ms fall | ||
| The screen shows good response rates in our tests, but may be too slow for competitive gamers. In comparison, all tested devices range from 0.165 (minimum) to 636 (maximum) ms. » 29 % of all devices are better. This means that the measured response time is better than the average of all tested devices (30.9 ms). | ||
Screen Flickering / PWM (Pulse-Width Modulation)
| Screen flickering / PWM not detected |  | ||
In comparison: 52 % of all tested devices do not use PWM to dim the display. If PWM was detected, an average of 7741 (minimum: 5 - maximum: 343500) Hz was measured. | |||
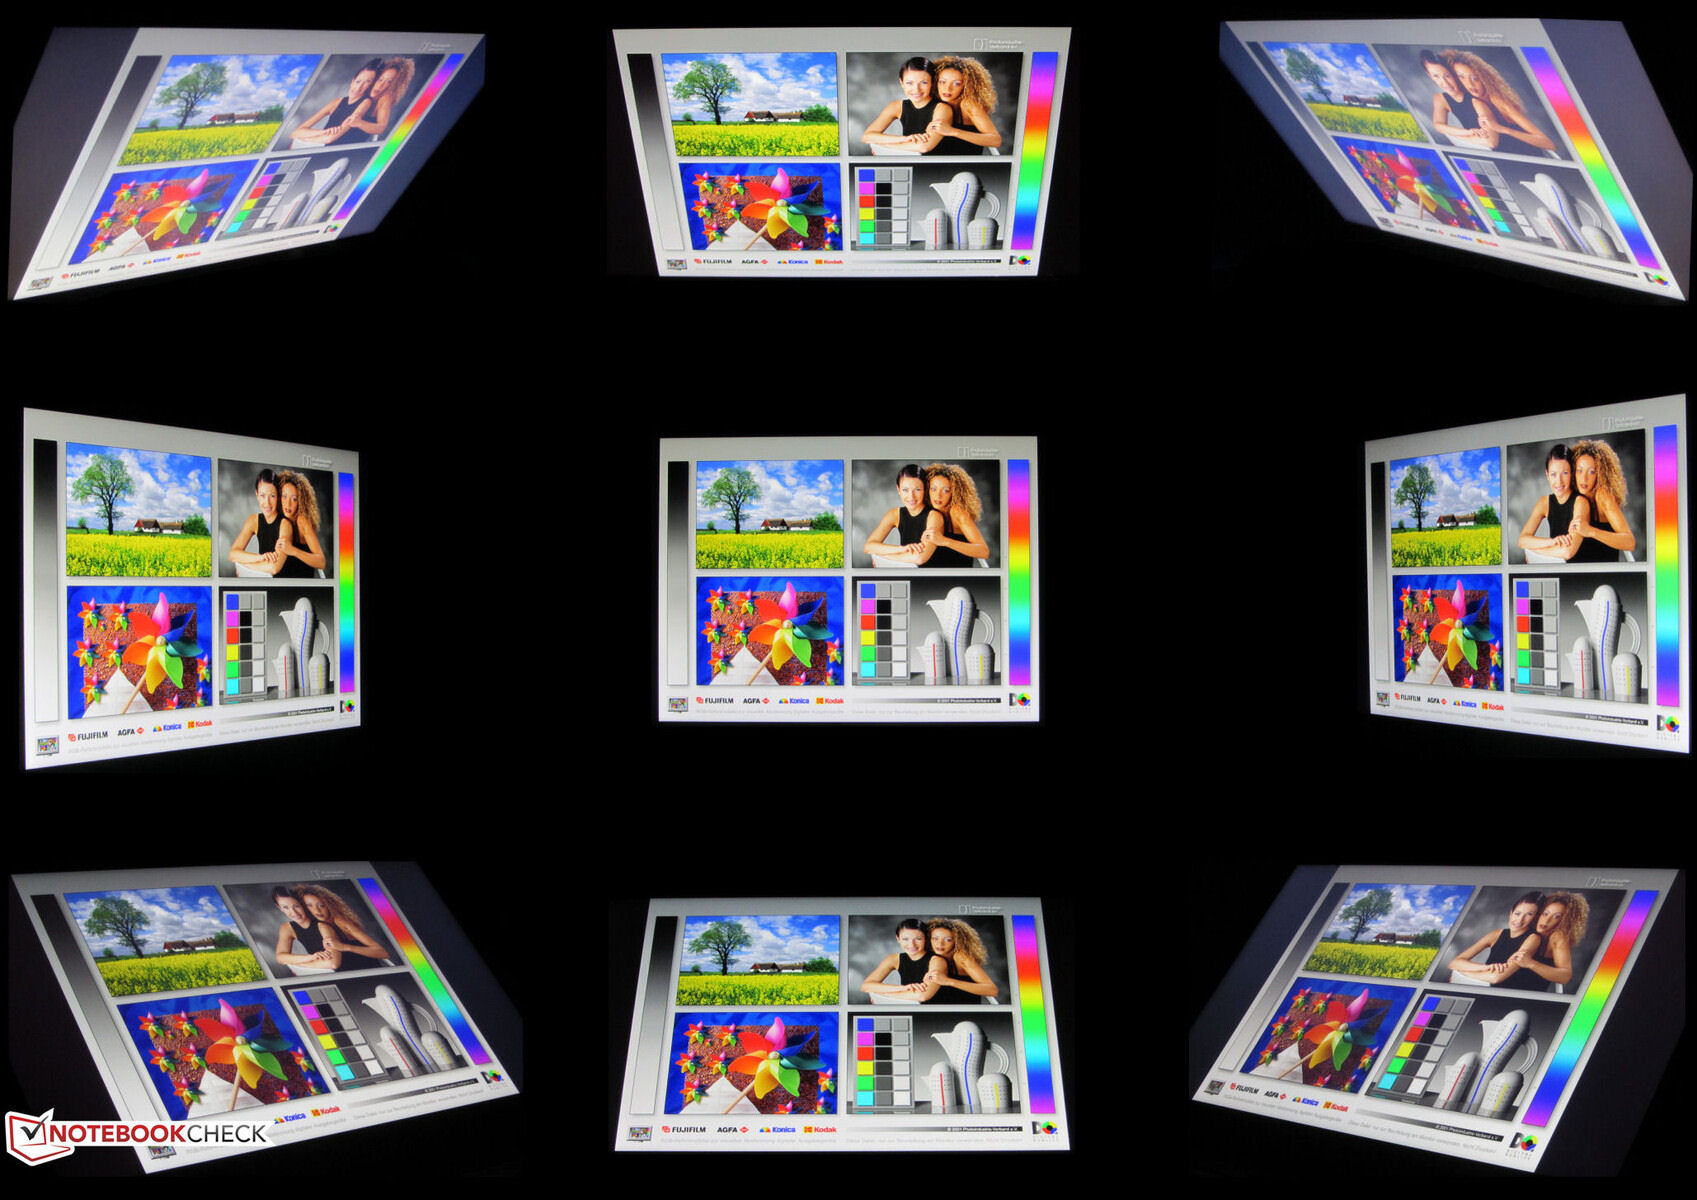
The viewing angle stable IBS panel remains legible from any position. Outdoors, the screen remains legible as long as the sun isn't shining too brightly.
Performance - The Erazer computer features mid-range hardware
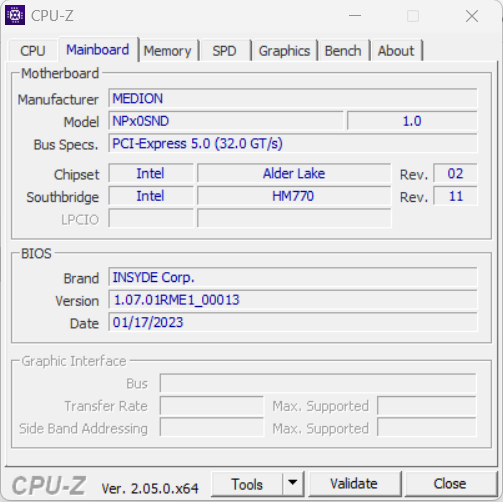
Medion's Erazer Defender P40 is a mid-range QHD gaming laptop. Raptor Lake and Ada Lovelace deliver the necessary processing performance. The present model can be purchased for around $1,900 - other models with differing features are not available.
Testing conditions
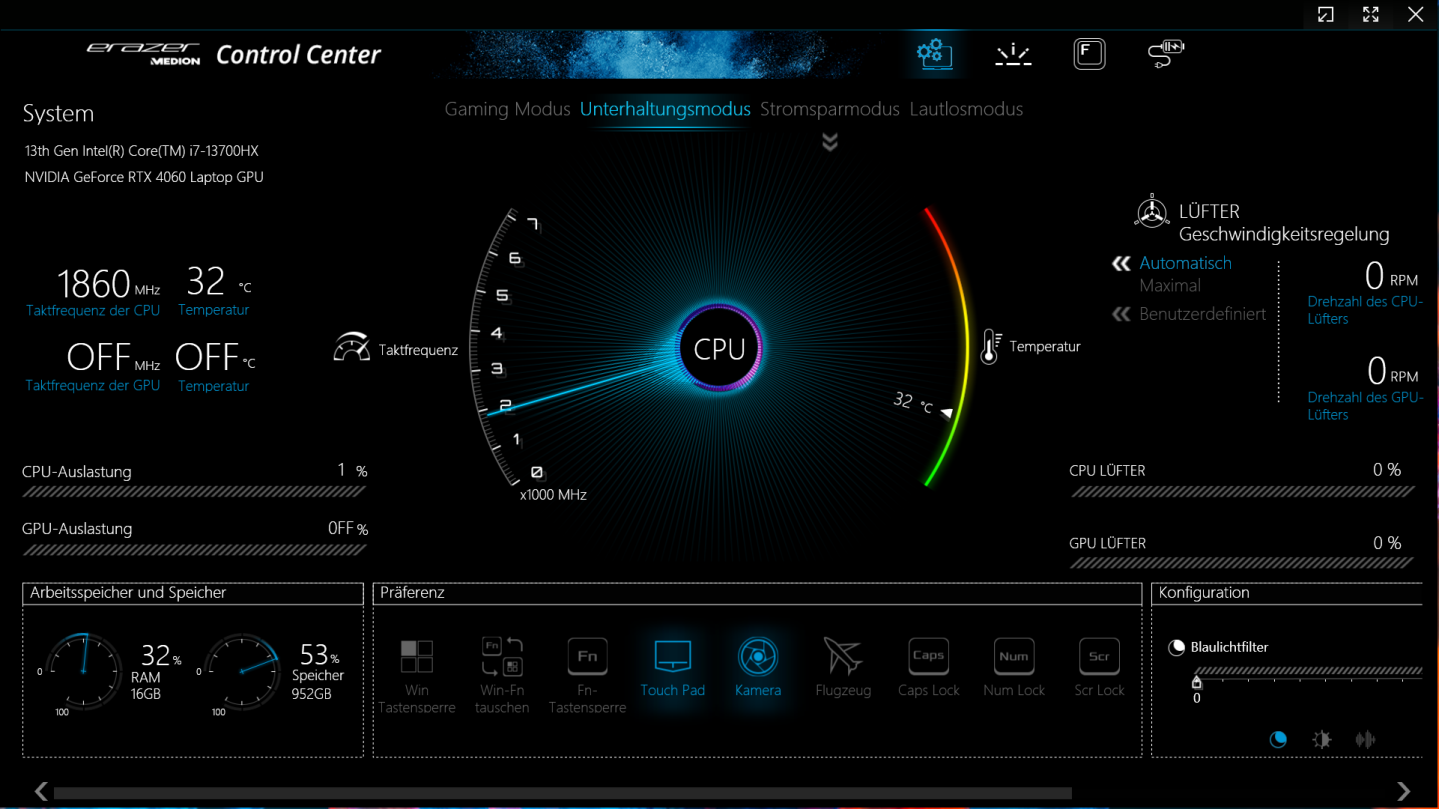
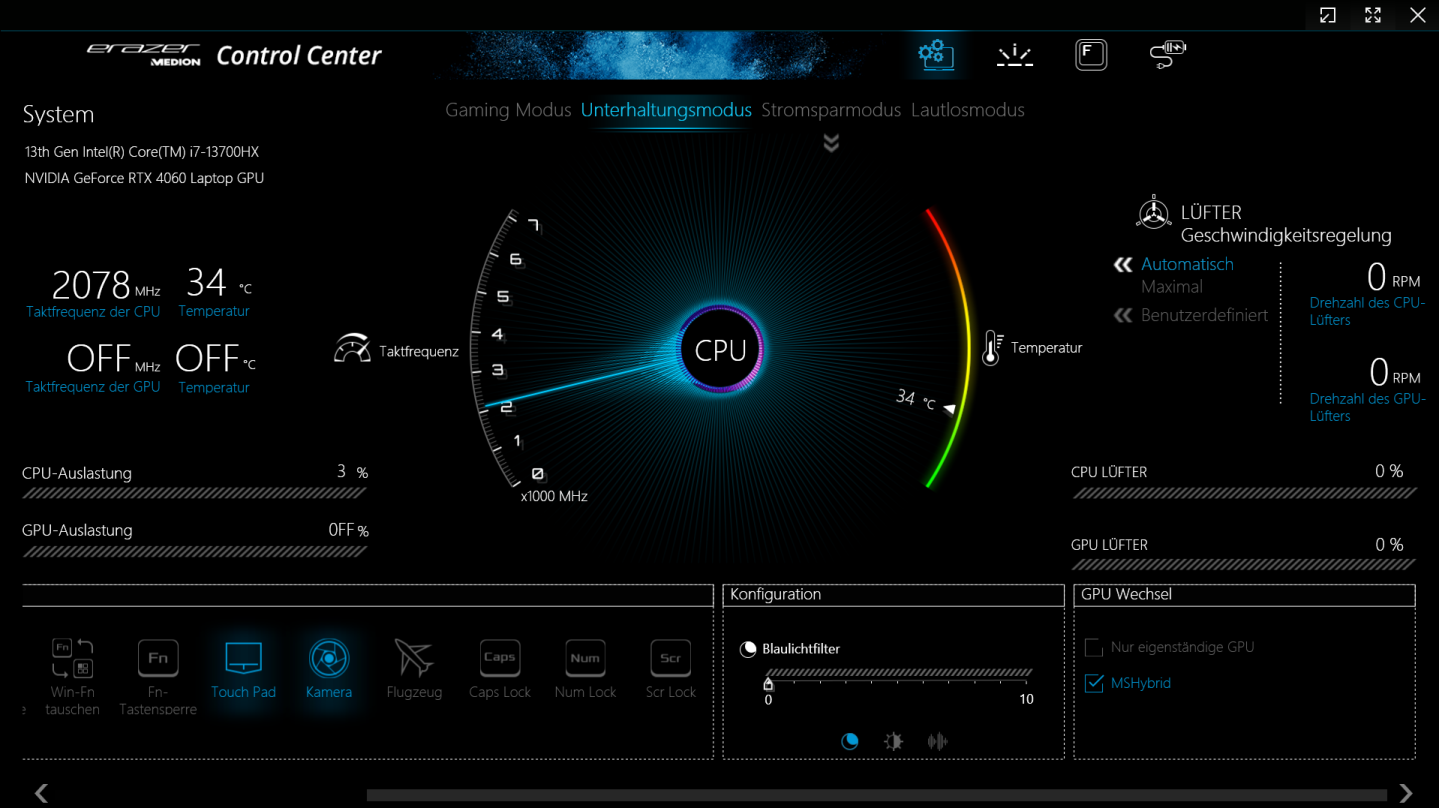
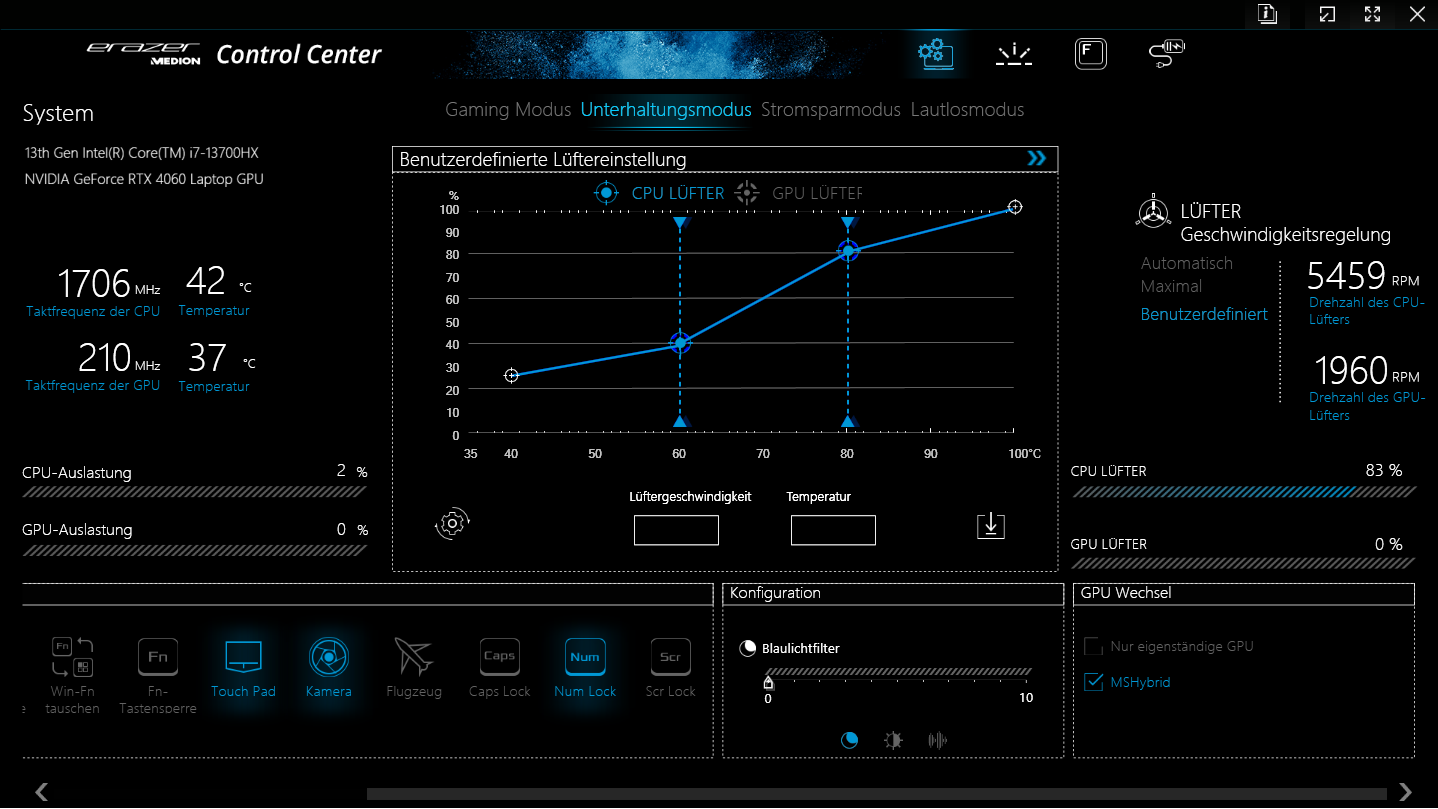
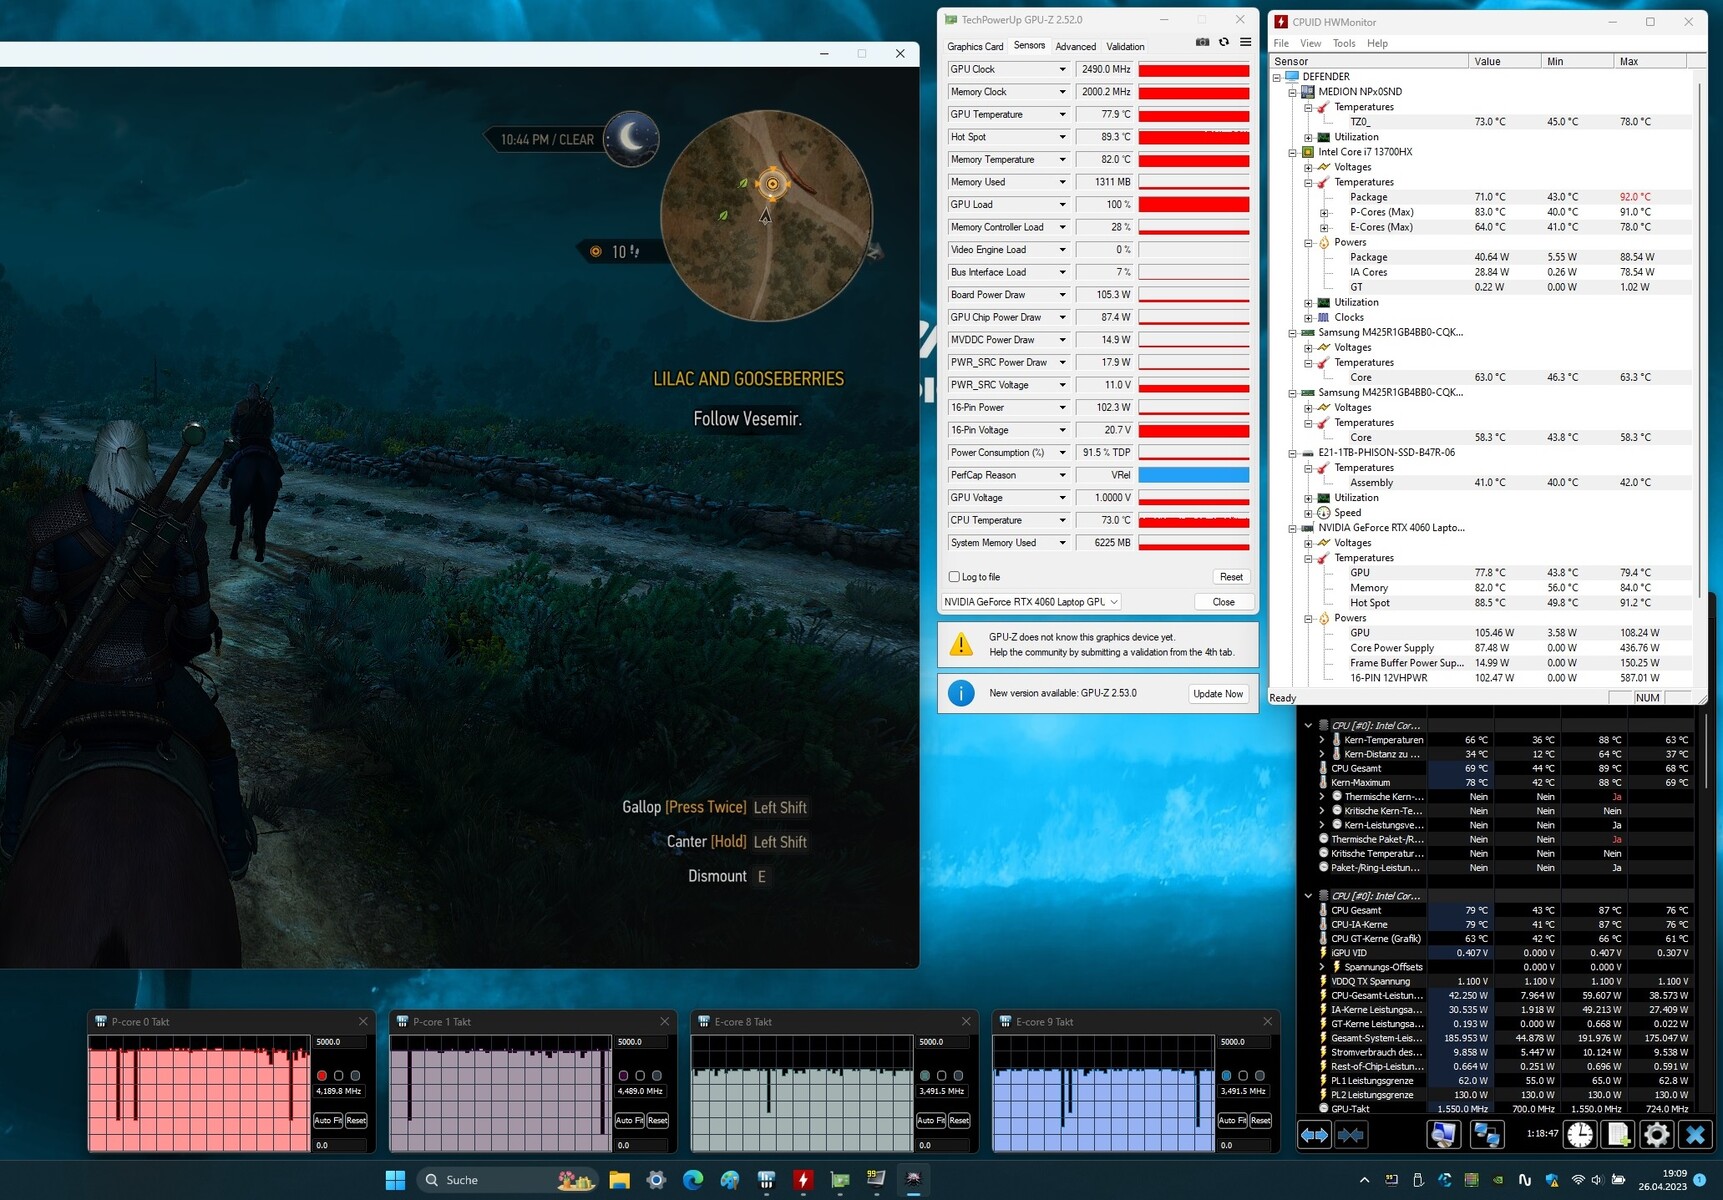
The P40 has four manufacturer-specific performance modes (see table) which can be switched between via the laptop's control centre software. We used "entertainment mode" (benchmarks) and "power saving mode" (battery tests; deactivates the RTX 4060). Optimus was activated. We also tested both of the other modes: "Gaming mode" leads to improvements in CPU performance and "silent mode" allows for gaming with lower noise emissions.
According to HWInfo, the "power saving mode" sets the CPU's PL 1 (45 watts) to a higher level than PL 2 (30 watts). This is most likely a bug. During the execution of the CB15 loop, the CPU's power consumption is 15 watts.
| Gaming mode | Entertainment mode | Power saving mode | Silent mode | |
|---|---|---|---|---|
| CPU PL1 (HWInfo) | 135 watts | 65 watts | 45 watts | 15 watts |
| CPU PL2 (HWInfo) | 162 watts | 130 watts | 30 watts | 30 watts |
| Noise (Witcher 3) | 62 dB(A) | 56 dB(A) | - | 36 dB(A) |
| Performance (Witcher 3) | ~102 fps | ~100 fps | - | 30 - 50 fps |

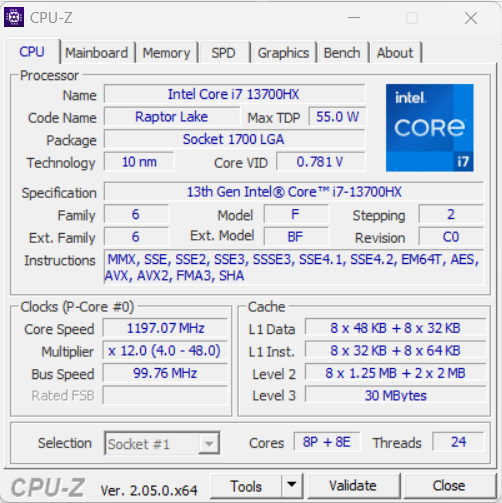
Processor
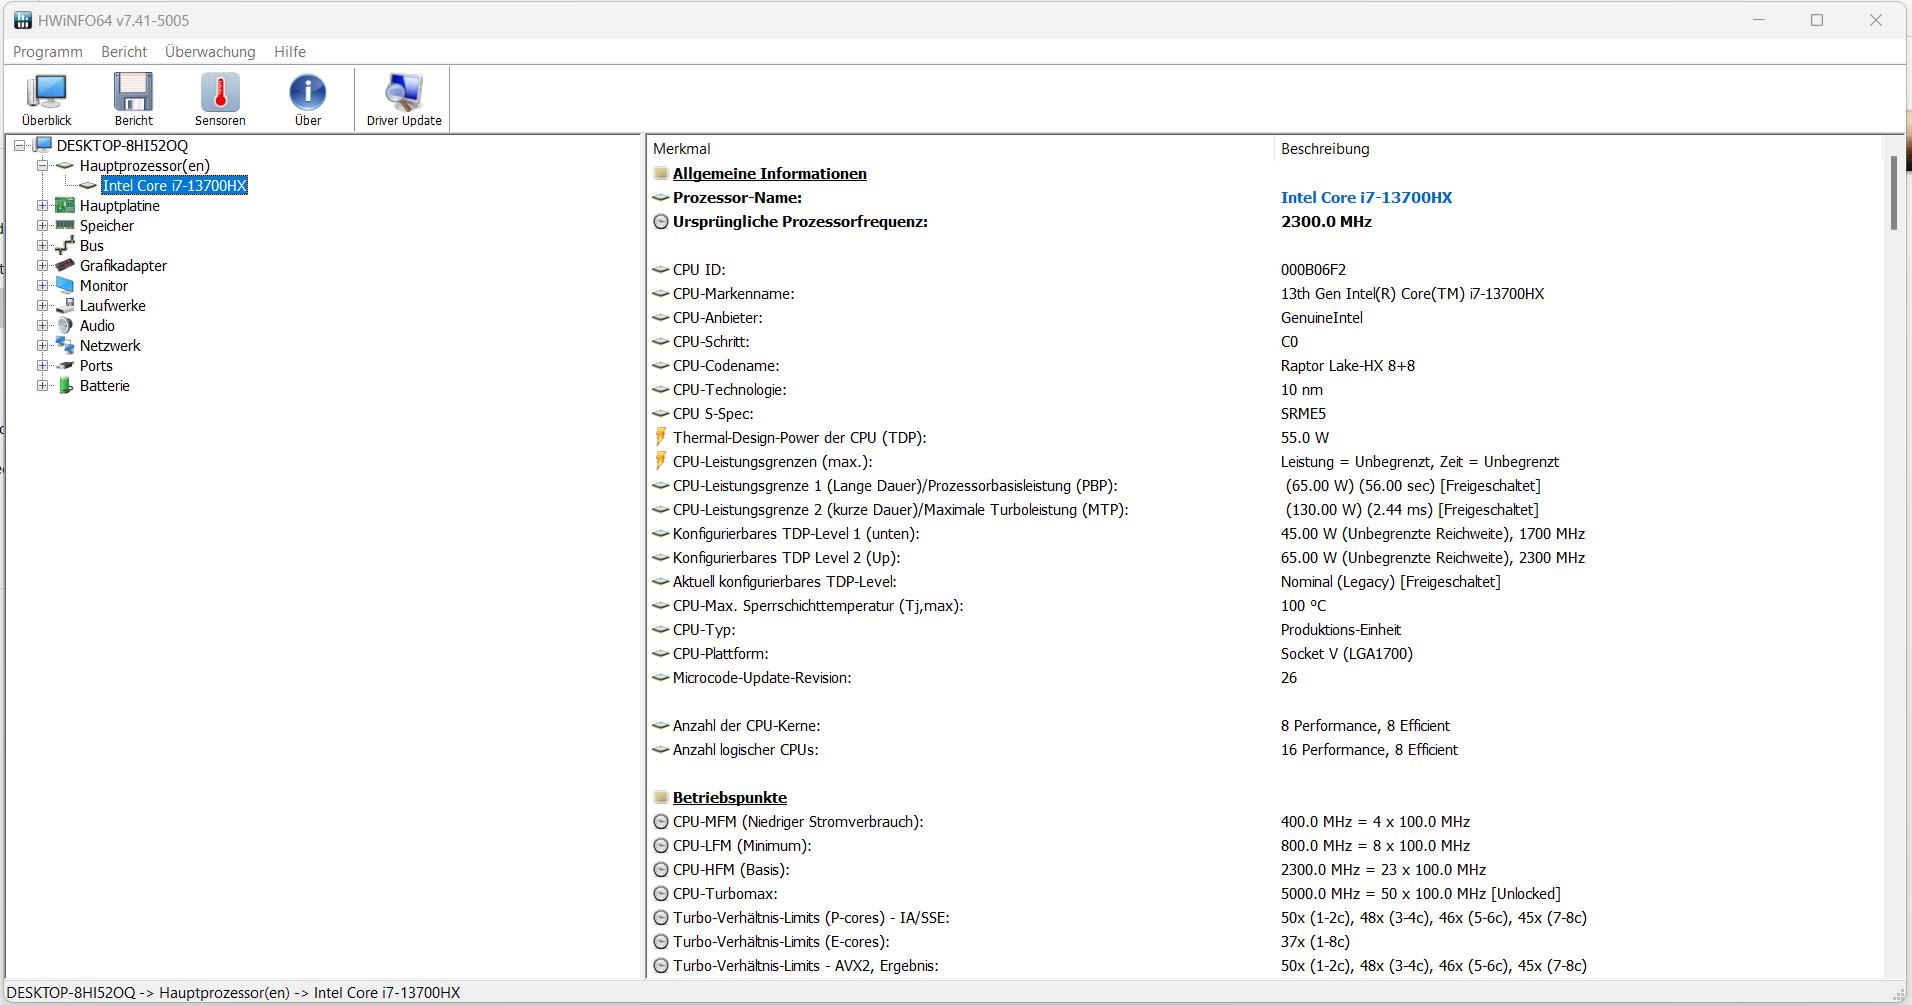
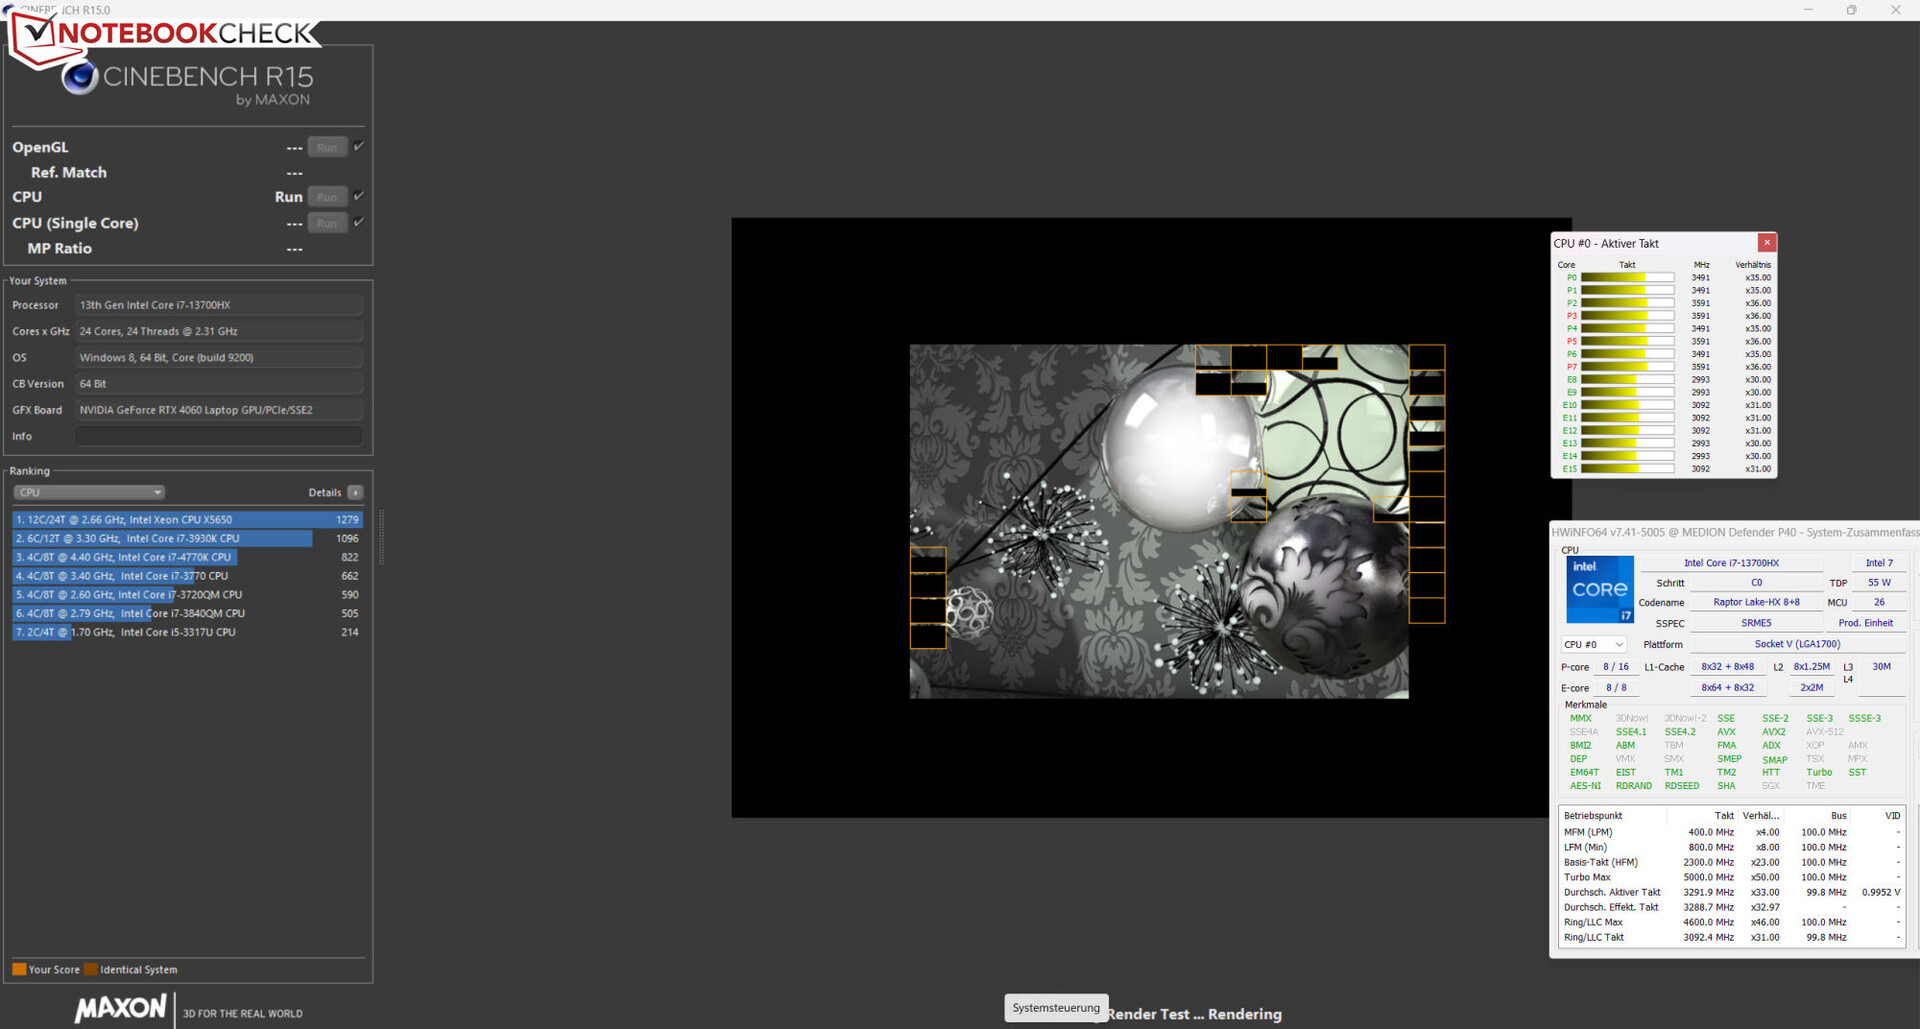
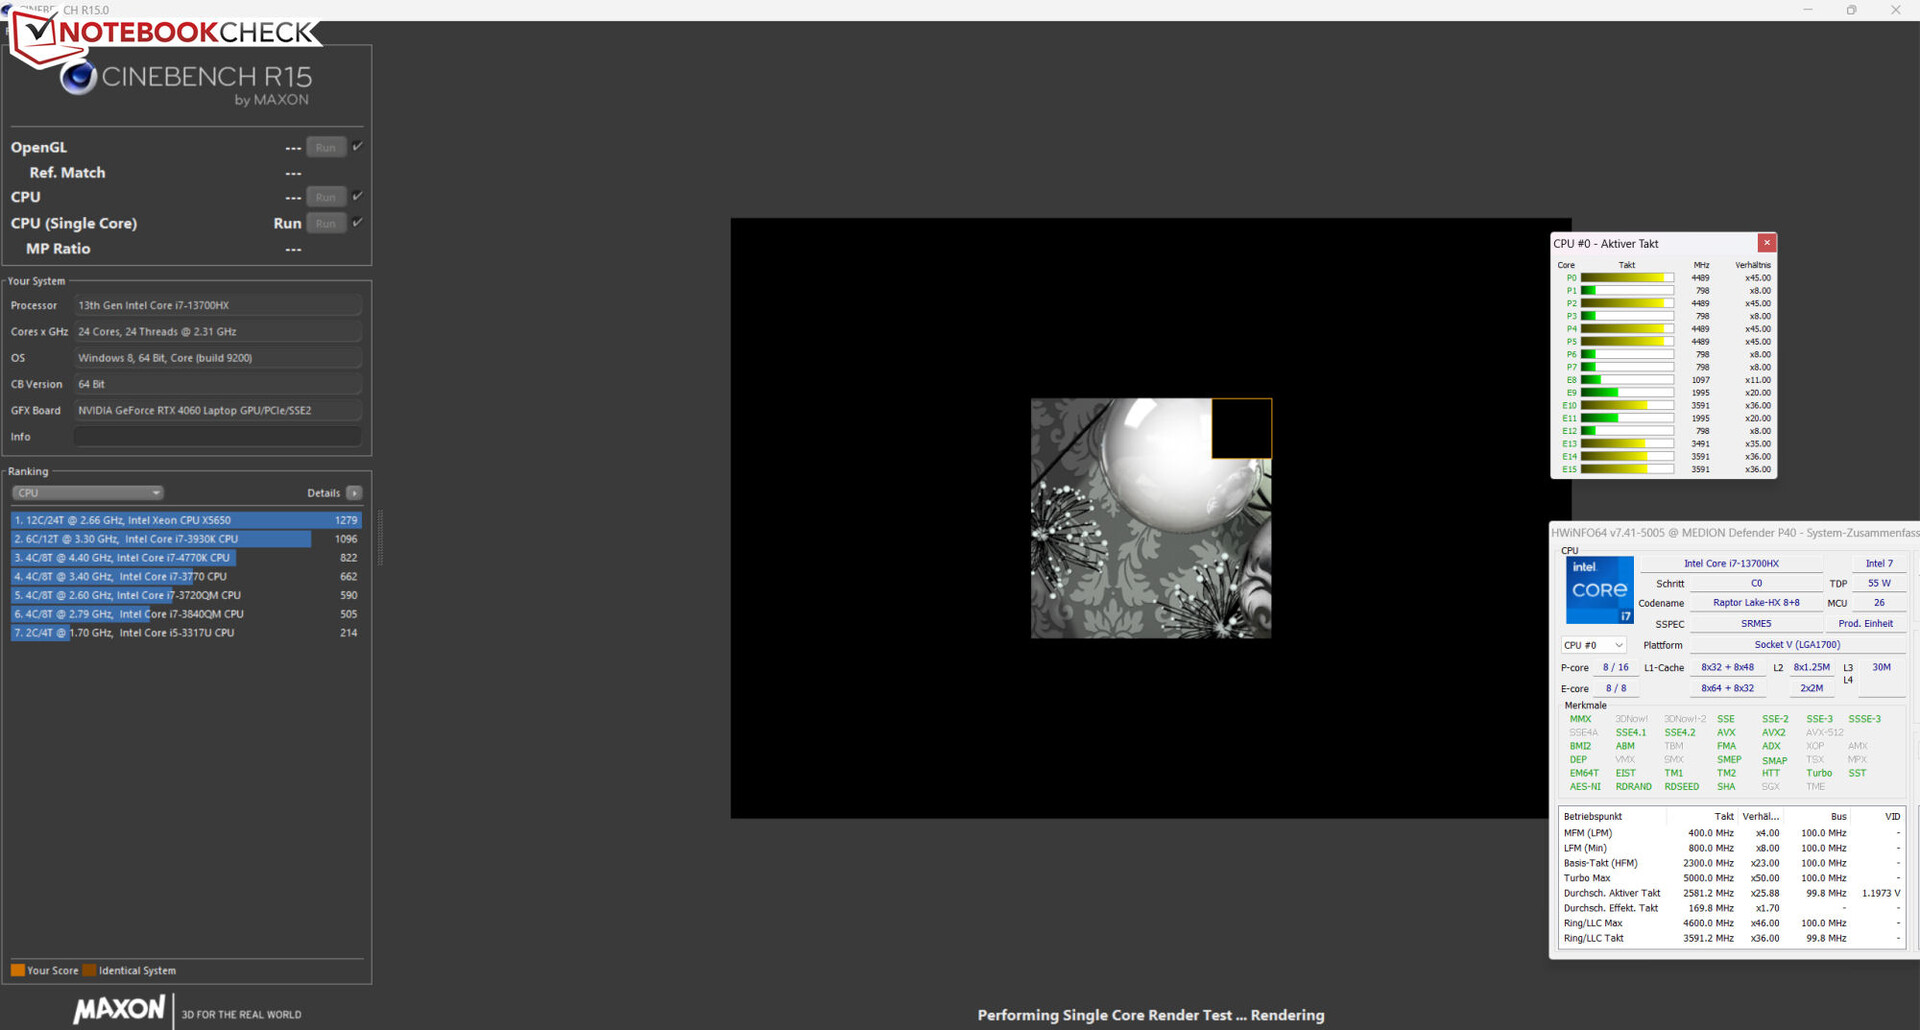
The Core-i7-13700HX processor (Raptor Lake) consists of eight efficiency cores (no hyperthreading, 1.5 - 3.7 GHz) and eight performance cores (hyperthreading, 2.1 - 5 GHz). This adds up to 24 logical CPU cores in total.
The benchmarks delivered results just below the previous CPU average ("entertainment mode"). "Gaming mode" usually only led to minimal performance increase - with the exception of the AIDA64 benchmarks. It could only show its improved qualities at continuous load. The laptop's more relevant single-thread performance (205 points) was reduced less in battery mode than its multi-core performance (1,619 points).
The CB15 loop test showed: Permanent multi-thread load led the turbo clock rate to drop from the first to the fourth run. Subsequently, it held consistent rates. "Gaming mode" led to continuously higher clock rates.
Cinebench R15 Multi continuous test

* ... smaller is better
AIDA64: FP32 Ray-Trace | FPU Julia | CPU SHA3 | CPU Queen | FPU SinJulia | FPU Mandel | CPU AES | CPU ZLib | FP64 Ray-Trace | CPU PhotoWorxx
| Performance rating | |
| Average of class Gaming | |
| Lenovo Legion Pro 5 16IRX8 | |
| Average Intel Core i7-13700HX | |
| Acer Predator Helios 300 (i7-12700H, RTX 3070 Ti) | |
| Asus TUF Gaming A16 FA617 | |
| Medion Erazer Defender P40 | |
| Gigabyte G7 KE | |
| MSI Katana 17 B13VFK | |
| AIDA64 / FP32 Ray-Trace | |
| Average of class Gaming (10227 - 85542, n=102, last 2 years) | |
| Lenovo Legion Pro 5 16IRX8 (v6.85.6300) | |
| Average Intel Core i7-13700HX (14261 - 21999, n=11) | |
| Acer Predator Helios 300 (i7-12700H, RTX 3070 Ti) (v6.75.6100) | |
| Asus TUF Gaming A16 FA617 (v6.85.6300) | |
| Medion Erazer Defender P40 (v6.75.6100) | |
| MSI Katana 17 B13VFK (v6.85.6300) | |
| Gigabyte G7 KE (v6.75.6100) | |
| AIDA64 / FPU Julia | |
| Average of class Gaming (51376 - 372155, n=102, last 2 years) | |
| Lenovo Legion Pro 5 16IRX8 (v6.85.6300) | |
| Asus TUF Gaming A16 FA617 (v6.85.6300) | |
| Average Intel Core i7-13700HX (74636 - 109364, n=11) | |
| Acer Predator Helios 300 (i7-12700H, RTX 3070 Ti) (v6.75.6100) | |
| Medion Erazer Defender P40 (v6.75.6100) | |
| MSI Katana 17 B13VFK (v6.85.6300) | |
| Gigabyte G7 KE (v6.75.6100) | |
| AIDA64 / CPU SHA3 | |
| Average of class Gaming (2180 - 10115, n=102, last 2 years) | |
| Lenovo Legion Pro 5 16IRX8 (v6.85.6300) | |
| Average Intel Core i7-13700HX (3359 - 5053, n=11) | |
| Acer Predator Helios 300 (i7-12700H, RTX 3070 Ti) (v6.75.6100) | |
| Asus TUF Gaming A16 FA617 (v6.85.6300) | |
| Medion Erazer Defender P40 (v6.75.6100) | |
| Gigabyte G7 KE (v6.75.6100) | |
| MSI Katana 17 B13VFK (v6.85.6300) | |
| AIDA64 / CPU Queen | |
| Average of class Gaming (49785 - 173351, n=86, last 2 years) | |
| Lenovo Legion Pro 5 16IRX8 (v6.85.6300) | |
| Medion Erazer Defender P40 (v6.75.6100) | |
| Average Intel Core i7-13700HX (86532 - 114717, n=11) | |
| Asus TUF Gaming A16 FA617 (v6.85.6300) | |
| Acer Predator Helios 300 (i7-12700H, RTX 3070 Ti) (v6.75.6100) | |
| Gigabyte G7 KE (v6.75.6100) | |
| MSI Katana 17 B13VFK | |
| AIDA64 / FPU SinJulia | |
| Average of class Gaming (4424 - 33636, n=102, last 2 years) | |
| Lenovo Legion Pro 5 16IRX8 (v6.85.6300) | |
| Asus TUF Gaming A16 FA617 (v6.85.6300) | |
| Average Intel Core i7-13700HX (9290 - 13519, n=11) | |
| Medion Erazer Defender P40 (v6.75.6100) | |
| Acer Predator Helios 300 (i7-12700H, RTX 3070 Ti) (v6.75.6100) | |
| MSI Katana 17 B13VFK | |
| Gigabyte G7 KE (v6.75.6100) | |
| AIDA64 / FPU Mandel | |
| Average of class Gaming (25115 - 196829, n=102, last 2 years) | |
| Asus TUF Gaming A16 FA617 (v6.85.6300) | |
| Lenovo Legion Pro 5 16IRX8 (v6.85.6300) | |
| Average Intel Core i7-13700HX (35751 - 53484, n=11) | |
| Acer Predator Helios 300 (i7-12700H, RTX 3070 Ti) (v6.75.6100) | |
| Medion Erazer Defender P40 (v6.75.6100) | |
| MSI Katana 17 B13VFK (v6.85.6300) | |
| Gigabyte G7 KE (v6.75.6100) | |
| AIDA64 / CPU AES | |
| Average Intel Core i7-13700HX (67846 - 182575, n=11) | |
| Gigabyte G7 KE (v6.75.6100) | |
| Average of class Gaming (39258 - 247074, n=102, last 2 years) | |
| Lenovo Legion Pro 5 16IRX8 (v6.85.6300) | |
| Acer Predator Helios 300 (i7-12700H, RTX 3070 Ti) (v6.75.6100) | |
| Medion Erazer Defender P40 (v6.75.6100) | |
| Asus TUF Gaming A16 FA617 (v6.85.6300) | |
| MSI Katana 17 B13VFK (v6.85.6300) | |
| AIDA64 / CPU ZLib | |
| Average of class Gaming (574 - 2531, n=102, last 2 years) | |
| Lenovo Legion Pro 5 16IRX8 (v6.85.6300) | |
| Average Intel Core i7-13700HX (981 - 1451, n=11) | |
| Acer Predator Helios 300 (i7-12700H, RTX 3070 Ti) (v6.75.6100) | |
| Medion Erazer Defender P40 (v6.75.6100) | |
| Gigabyte G7 KE (v6.75.6100) | |
| Asus TUF Gaming A16 FA617 (v6.85.6300) | |
| MSI Katana 17 B13VFK (v6.85.6300) | |
| AIDA64 / FP64 Ray-Trace | |
| Average of class Gaming (5509 - 45446, n=102, last 2 years) | |
| Lenovo Legion Pro 5 16IRX8 (v6.85.6300) | |
| Average Intel Core i7-13700HX (7728 - 11837, n=11) | |
| Acer Predator Helios 300 (i7-12700H, RTX 3070 Ti) (v6.75.6100) | |
| Asus TUF Gaming A16 FA617 (v6.85.6300) | |
| Medion Erazer Defender P40 (v6.75.6100) | |
| MSI Katana 17 B13VFK (v6.85.6300) | |
| Gigabyte G7 KE (v6.75.6100) | |
| AIDA64 / CPU PhotoWorxx | |
| Average of class Gaming (12271 - 89891, n=102, last 2 years) | |
| Acer Predator Helios 300 (i7-12700H, RTX 3070 Ti) (v6.75.6100) | |
| Lenovo Legion Pro 5 16IRX8 (v6.85.6300) | |
| Medion Erazer Defender P40 (v6.75.6100) | |
| Average Intel Core i7-13700HX (19678 - 42415, n=11) | |
| MSI Katana 17 B13VFK (v6.85.6300) | |
| Gigabyte G7 KE (v6.75.6100) | |
| Asus TUF Gaming A16 FA617 (v6.85.6300) | |
System performance
Its smoothly running system is prepared for performance-hungry application areas such as rendering and gaming - the laptop's good PCMark results confirm this. The RAM's transfer rates are on a normal level for DDR5 4800 RAM.
CrossMark: Overall | Productivity | Creativity | Responsiveness
| PCMark 10 / Score | |
| Average of class Gaming (5828 - 12414, n=93, last 2 years) | |
| Acer Predator Helios 300 (i7-12700H, RTX 3070 Ti) | |
| Lenovo Legion Pro 5 16IRX8 | |
| Average Intel Core i7-13700HX, NVIDIA GeForce RTX 4060 Laptop GPU (6909 - 7743, n=5) | |
| Asus TUF Gaming A16 FA617 | |
| MSI Katana 17 B13VFK | |
| Medion Erazer Defender P40 | |
| Gigabyte G7 KE | |
| PCMark 10 / Essentials | |
| Lenovo Legion Pro 5 16IRX8 | |
| MSI Katana 17 B13VFK | |
| Acer Predator Helios 300 (i7-12700H, RTX 3070 Ti) | |
| Average of class Gaming (8810 - 11935, n=97, last 2 years) | |
| Average Intel Core i7-13700HX, NVIDIA GeForce RTX 4060 Laptop GPU (9760 - 11313, n=5) | |
| Asus TUF Gaming A16 FA617 | |
| Gigabyte G7 KE | |
| Medion Erazer Defender P40 | |
| PCMark 10 / Productivity | |
| Average of class Gaming (6845 - 25323, n=95, last 2 years) | |
| Acer Predator Helios 300 (i7-12700H, RTX 3070 Ti) | |
| Medion Erazer Defender P40 | |
| Average Intel Core i7-13700HX, NVIDIA GeForce RTX 4060 Laptop GPU (9131 - 11018, n=5) | |
| Asus TUF Gaming A16 FA617 | |
| MSI Katana 17 B13VFK | |
| Lenovo Legion Pro 5 16IRX8 | |
| Gigabyte G7 KE | |
| PCMark 10 / Digital Content Creation | |
| Average of class Gaming (7602 - 19954, n=95, last 2 years) | |
| Acer Predator Helios 300 (i7-12700H, RTX 3070 Ti) | |
| Lenovo Legion Pro 5 16IRX8 | |
| Average Intel Core i7-13700HX, NVIDIA GeForce RTX 4060 Laptop GPU (9393 - 12434, n=5) | |
| Asus TUF Gaming A16 FA617 | |
| MSI Katana 17 B13VFK | |
| Medion Erazer Defender P40 | |
| Gigabyte G7 KE | |
| CrossMark / Overall | |
| Average of class Gaming (1366 - 2409, n=94, last 2 years) | |
| Acer Predator Helios 300 (i7-12700H, RTX 3070 Ti) | |
| Average Intel Core i7-13700HX, NVIDIA GeForce RTX 4060 Laptop GPU (1663 - 2105, n=5) | |
| MSI Katana 17 B13VFK | |
| Gigabyte G7 KE | |
| Medion Erazer Defender P40 | |
| Lenovo Legion Pro 5 16IRX8 | |
| CrossMark / Productivity | |
| Average of class Gaming (1386 - 2254, n=94, last 2 years) | |
| Gigabyte G7 KE | |
| Acer Predator Helios 300 (i7-12700H, RTX 3070 Ti) | |
| Average Intel Core i7-13700HX, NVIDIA GeForce RTX 4060 Laptop GPU (1618 - 1989, n=5) | |
| MSI Katana 17 B13VFK | |
| Medion Erazer Defender P40 | |
| Lenovo Legion Pro 5 16IRX8 | |
| CrossMark / Creativity | |
| Average of class Gaming (1343 - 2786, n=94, last 2 years) | |
| Acer Predator Helios 300 (i7-12700H, RTX 3070 Ti) | |
| Average Intel Core i7-13700HX, NVIDIA GeForce RTX 4060 Laptop GPU (1710 - 2274, n=5) | |
| MSI Katana 17 B13VFK | |
| Medion Erazer Defender P40 | |
| Gigabyte G7 KE | |
| Lenovo Legion Pro 5 16IRX8 | |
| CrossMark / Responsiveness | |
| Gigabyte G7 KE | |
| MSI Katana 17 B13VFK | |
| Acer Predator Helios 300 (i7-12700H, RTX 3070 Ti) | |
| Average of class Gaming (1226 - 2334, n=94, last 2 years) | |
| Average Intel Core i7-13700HX, NVIDIA GeForce RTX 4060 Laptop GPU (1269 - 1983, n=5) | |
| Lenovo Legion Pro 5 16IRX8 | |
| Medion Erazer Defender P40 | |
| PCMark 8 Home Score Accelerated v2 | 4659 points | |
| PCMark 8 Work Score Accelerated v2 | 5797 points | |
| PCMark 10 Score | 6909 points | |
Help | ||
| AIDA64 / Memory Copy | |
| Average of class Gaming (21750 - 129946, n=102, last 2 years) | |
| Lenovo Legion Pro 5 16IRX8 | |
| Medion Erazer Defender P40 | |
| Acer Predator Helios 300 (i7-12700H, RTX 3070 Ti) | |
| Average Intel Core i7-13700HX (36125 - 63990, n=11) | |
| MSI Katana 17 B13VFK | |
| Asus TUF Gaming A16 FA617 | |
| Gigabyte G7 KE | |
| AIDA64 / Memory Read | |
| Average of class Gaming (22956 - 118858, n=102, last 2 years) | |
| Lenovo Legion Pro 5 16IRX8 | |
| Medion Erazer Defender P40 | |
| MSI Katana 17 B13VFK | |
| Average Intel Core i7-13700HX (36510 - 69729, n=11) | |
| Acer Predator Helios 300 (i7-12700H, RTX 3070 Ti) | |
| Asus TUF Gaming A16 FA617 | |
| Gigabyte G7 KE | |
| AIDA64 / Memory Write | |
| Average of class Gaming (22297 - 135096, n=102, last 2 years) | |
| Lenovo Legion Pro 5 16IRX8 | |
| Average Intel Core i7-13700HX (33598 - 85675, n=11) | |
| Medion Erazer Defender P40 | |
| Acer Predator Helios 300 (i7-12700H, RTX 3070 Ti) | |
| Asus TUF Gaming A16 FA617 | |
| MSI Katana 17 B13VFK | |
| Gigabyte G7 KE | |
| AIDA64 / Memory Latency | |
| Average of class Gaming (75.3 - 165.4, n=102, last 2 years) | |
| MSI Katana 17 B13VFK | |
| Medion Erazer Defender P40 | |
| Acer Predator Helios 300 (i7-12700H, RTX 3070 Ti) | |
| Gigabyte G7 KE | |
| Average Intel Core i7-13700HX (81.5 - 97.9, n=11) | |
| Asus TUF Gaming A16 FA617 | |
| Lenovo Legion Pro 5 16IRX8 | |
* ... smaller is better
DPC latency
The standardized latency monitor test (web surfing, 4k video playback, Prime95 high-load) revealed some anomalies. The system does not seem to be suitable for real-time video and audio editing. Future software updates could lead to improvements or even degradations.
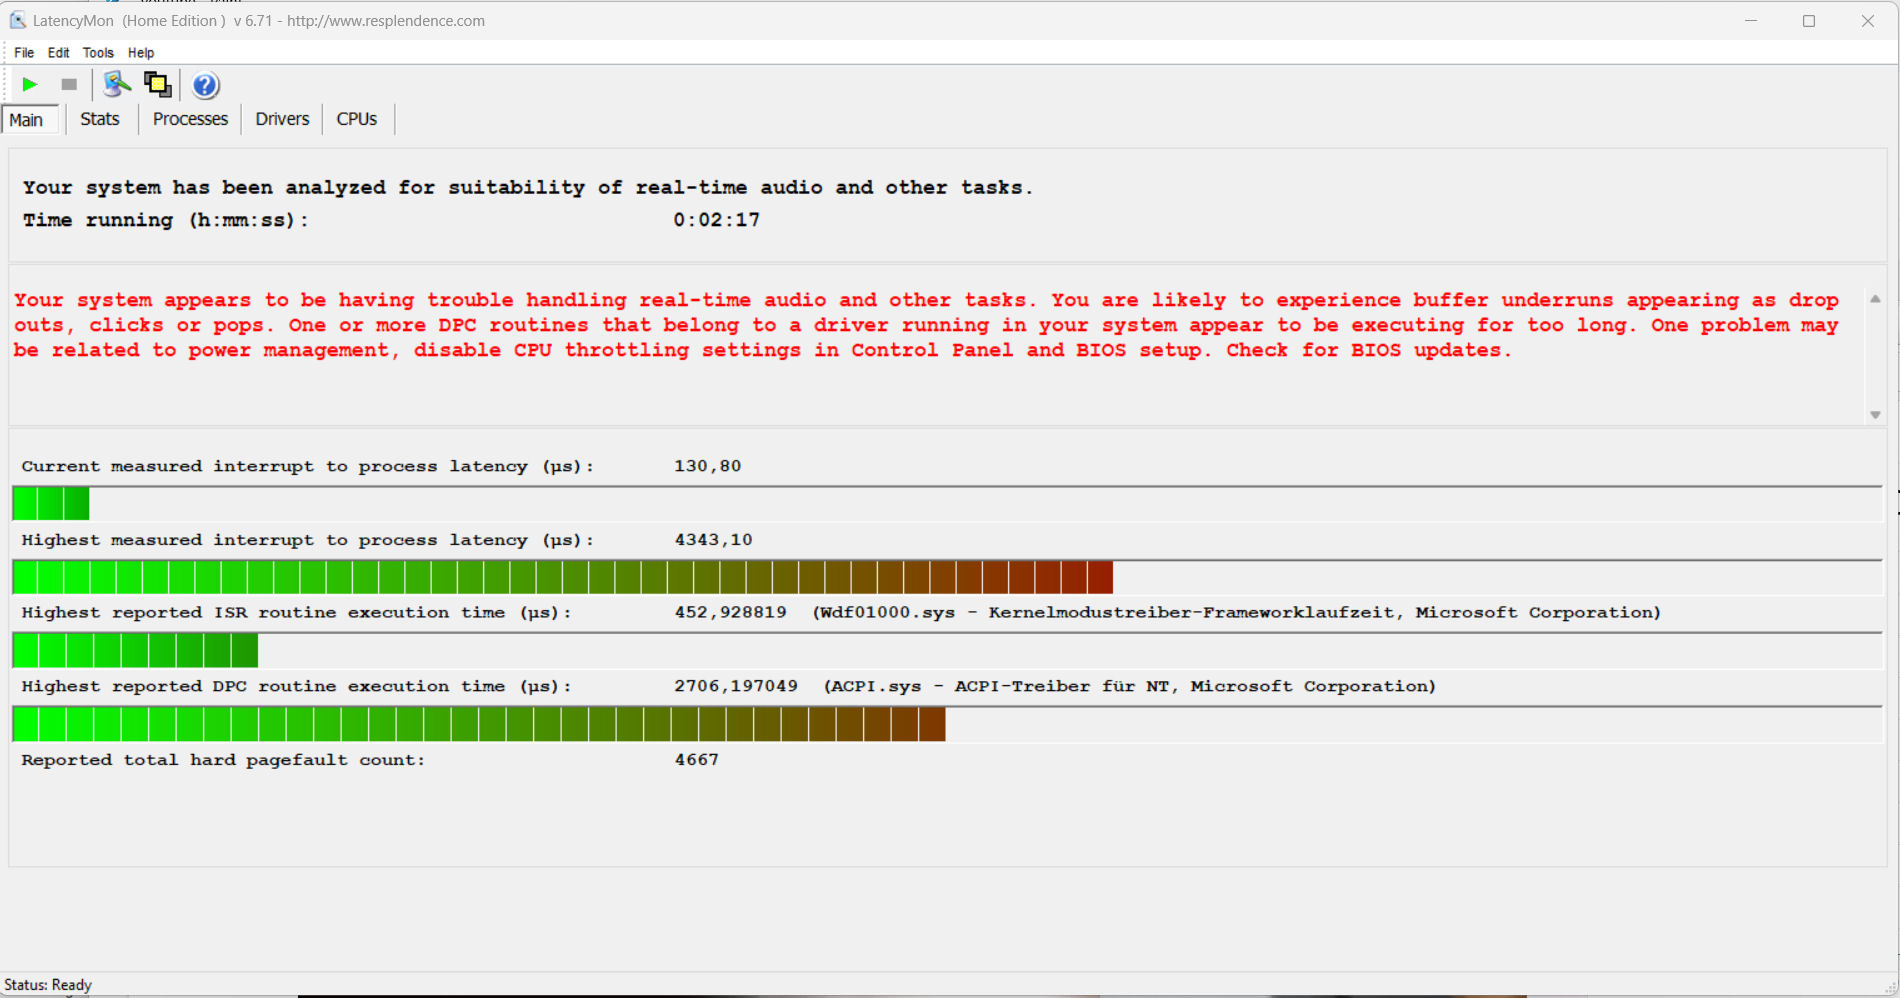
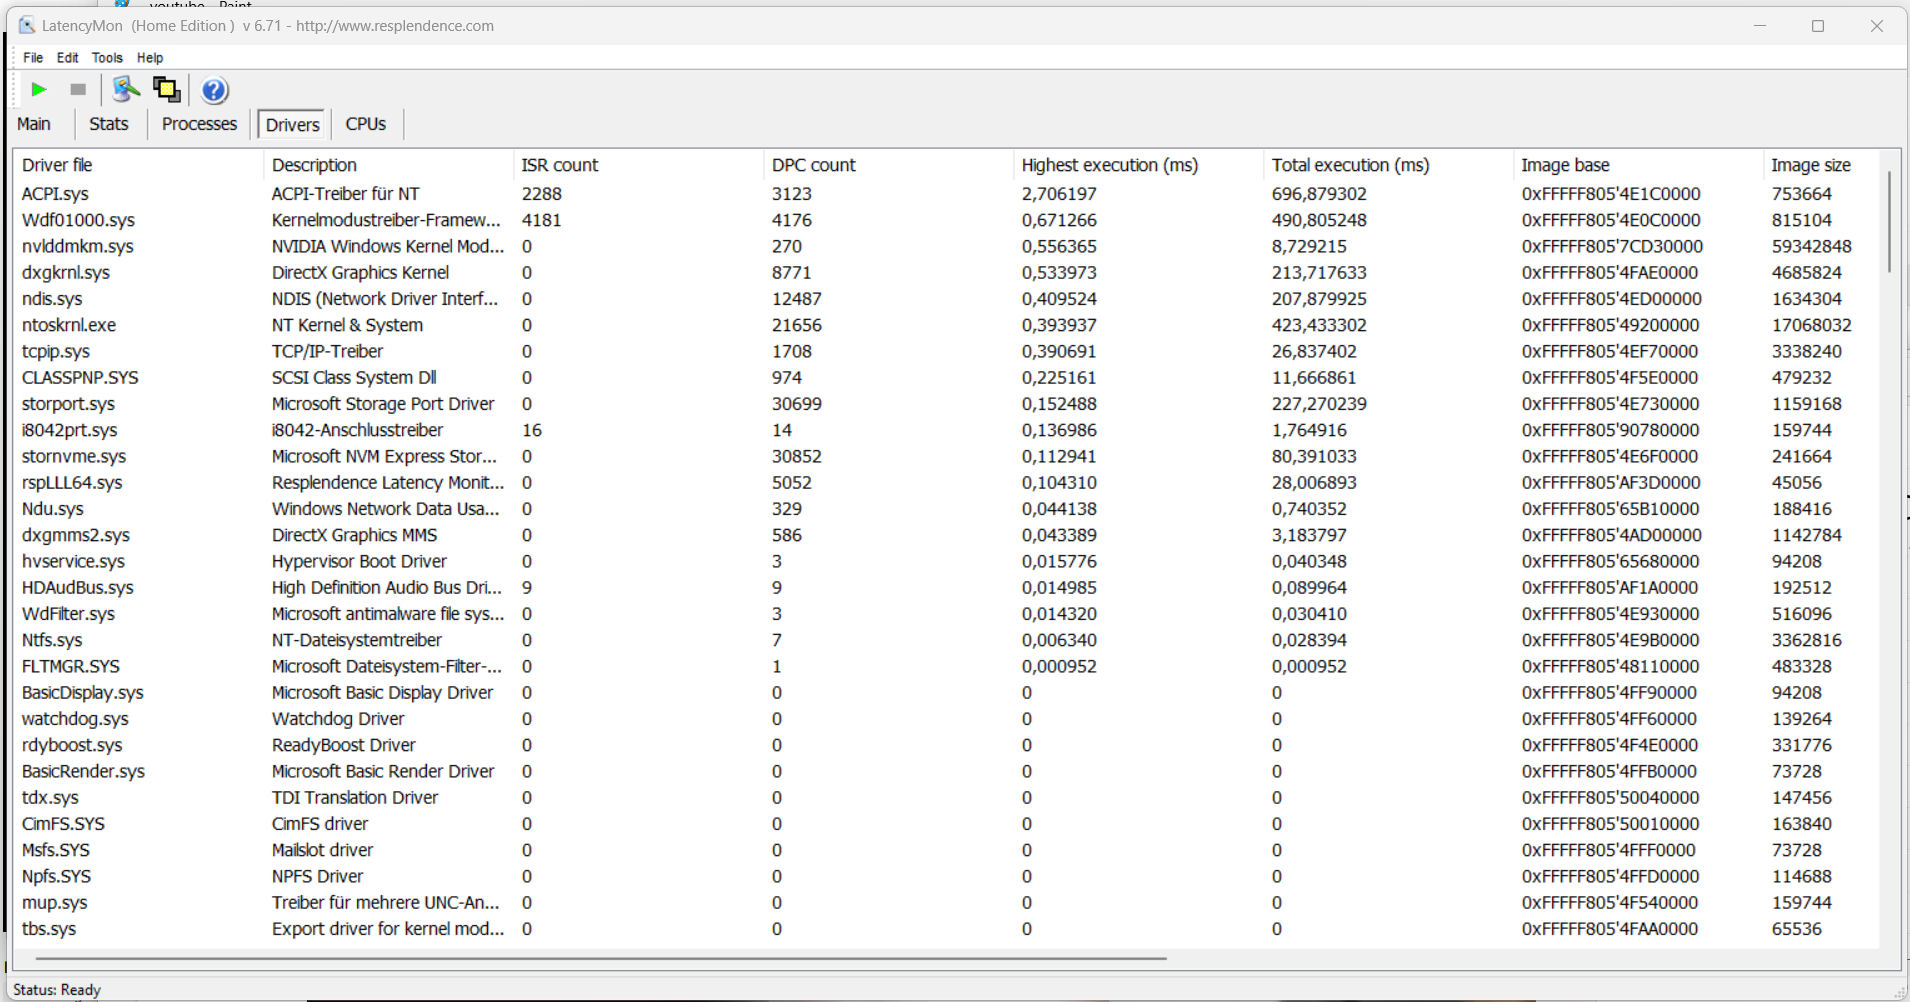
| DPC Latencies / LatencyMon - interrupt to process latency (max), Web, Youtube, Prime95 | |
| Medion Erazer Defender P40 | |
| MSI Katana 17 B13VFK | |
| Gigabyte G7 KE | |
| Acer Predator Helios 300 (i7-12700H, RTX 3070 Ti) | |
| Lenovo Legion Pro 5 16IRX8 | |
| Asus TUF Gaming A16 FA617 | |
* ... smaller is better
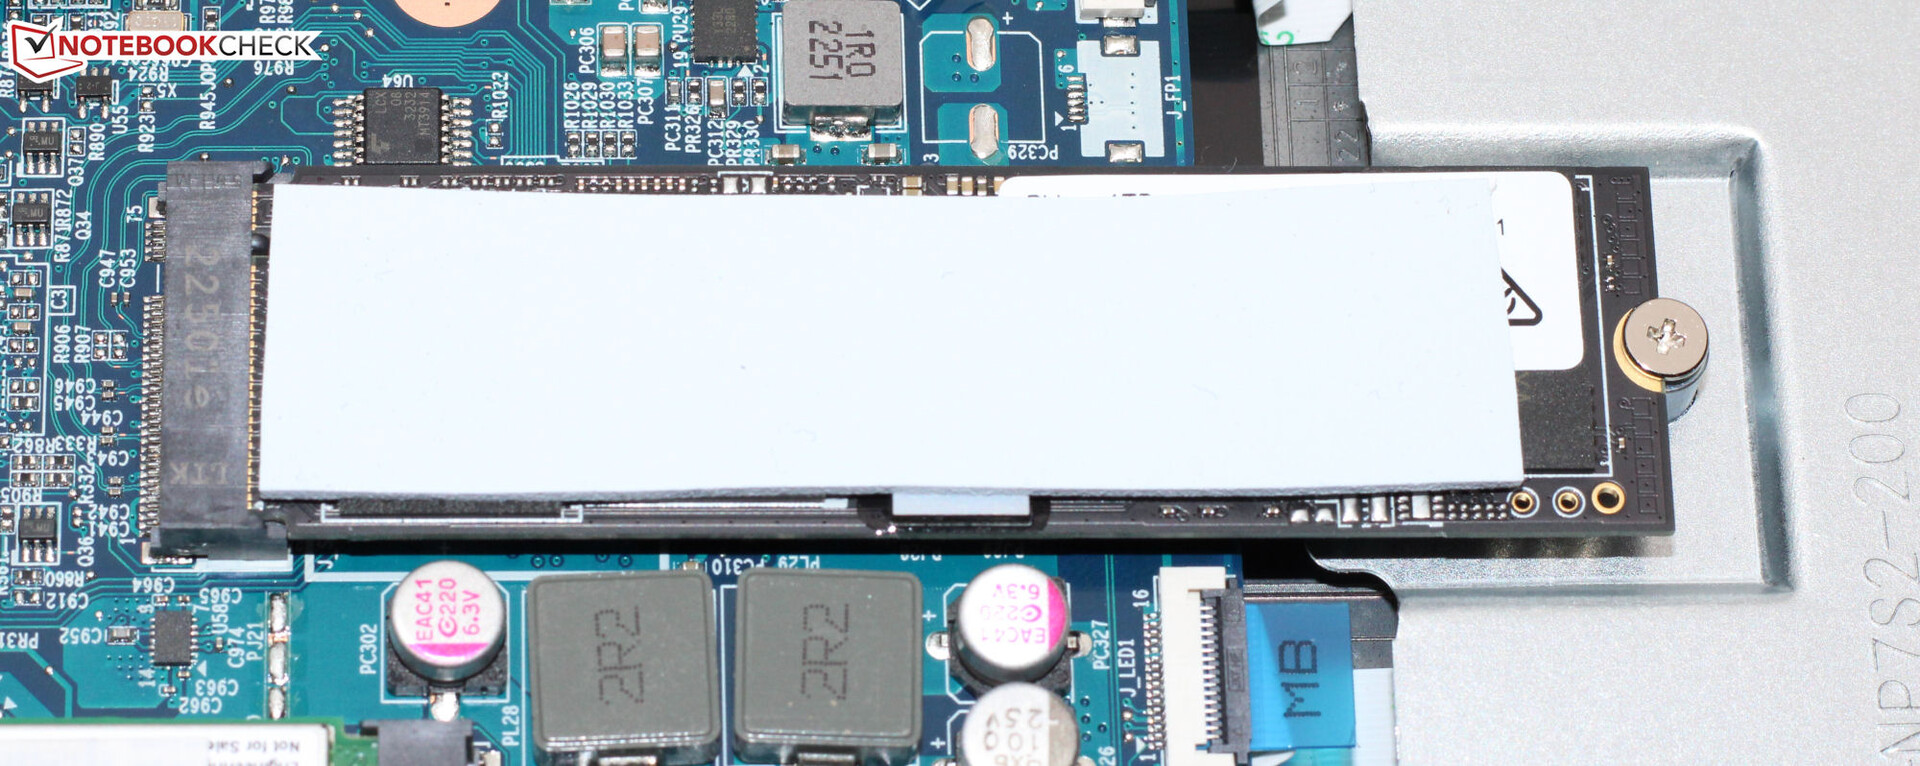
Storage devices
The P40 has a PCIe-4 SSD (1 TB) in M.2-2280 format from Phison. It delivers very good transfer rates but is not one of the top SSDs. Performance drops due to thermal throttling do not occur. The laptop has room for a second PCIe-4 SSD.

* ... smaller is better
Reading continuous performance: DiskSpd Read Loop, Queue Depth 8
Graphics card
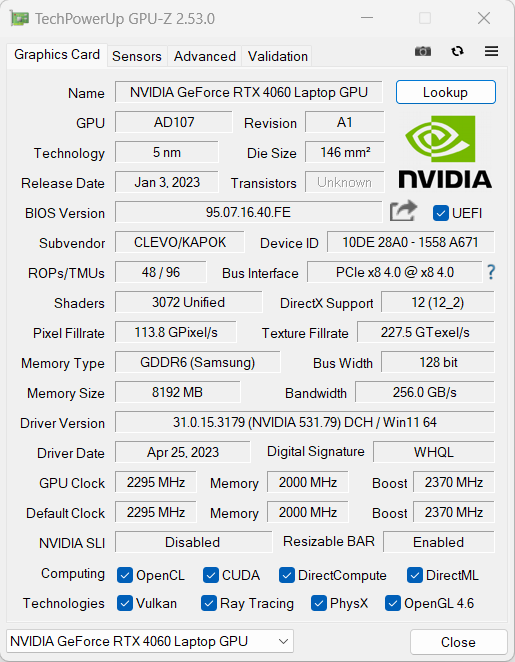
Within Nvidia's current RTX 4000 laptop GPU range, the GeForce-RTX-4060 laptop graphics core used here takes the fourth position - and thus can be classed as a mid-range model. It offers 3,072 shaders, a 128-bit wide bus and fast GDDR6 memory (8,192 MB). It has a maximum TGP of 140 watts (115 watts + 25 watts Dynamic Boost) - more is not possible. The TGP is not fully utilized according to the Witcher 3 test.
The benchmark results are above the previously determined RTX 4060 average ("entertainment mode") - on par with the rates of the MSI Katana 17 (RTX 4060, 140 watts). Neither the "gaming mode" nor the direct image output via GeForce GPU (dGPU mode) led to a performance increase. Switching between Optimus and dGPU mode can be done via the BIOS or via Control Center. Advanced Optimus is not supported.
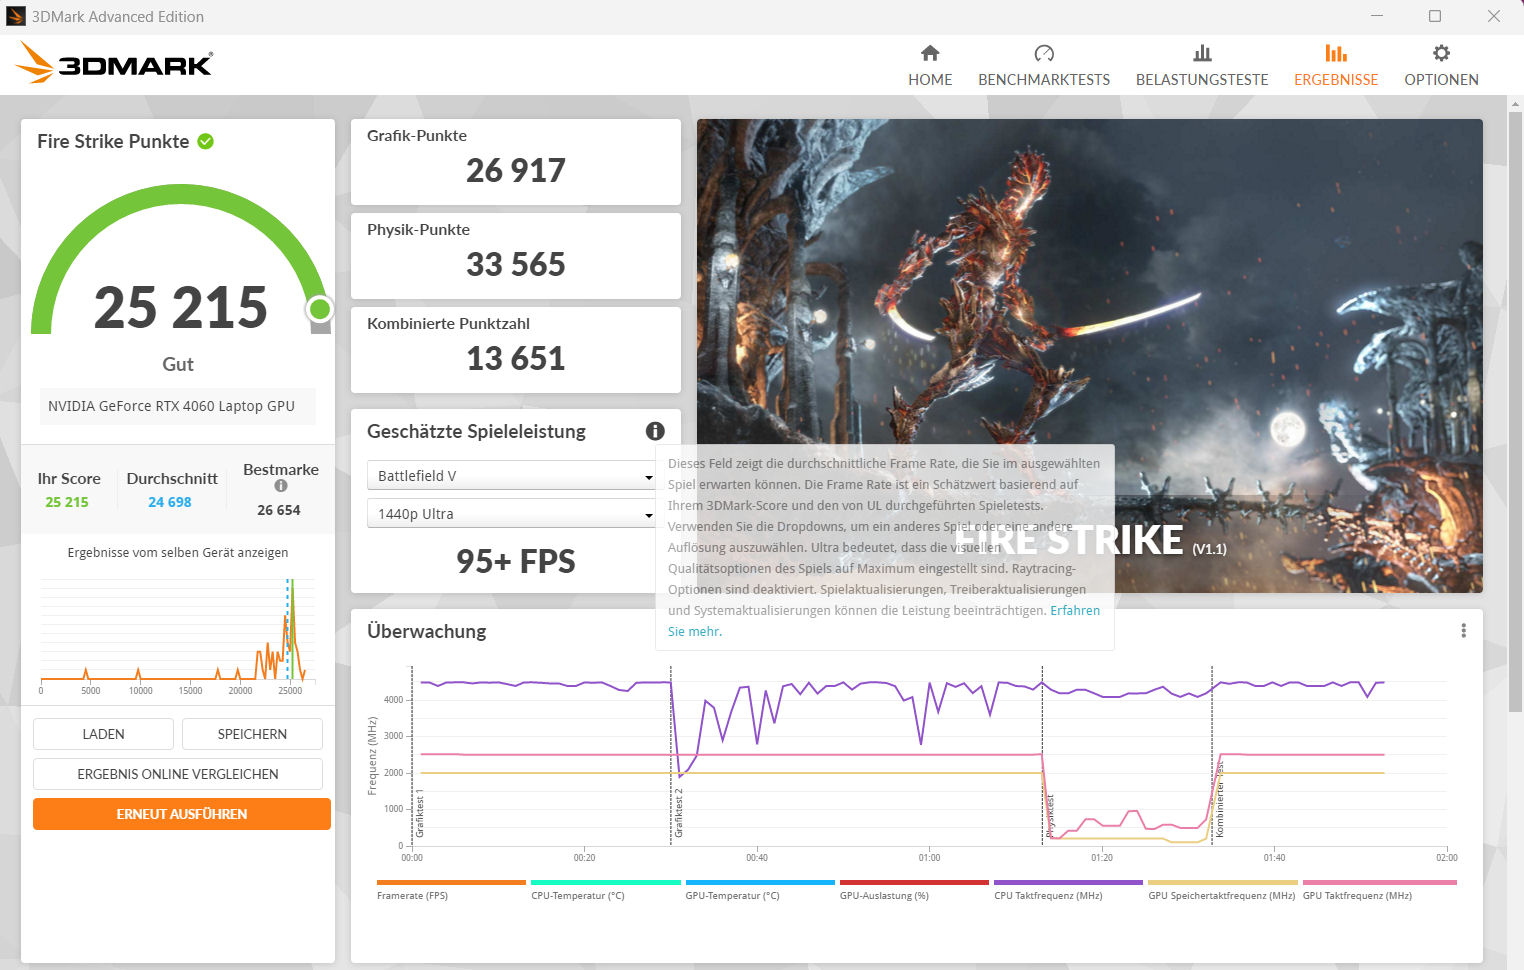
| 3DMark 06 Standard Score | 50480 points | |
| 3DMark 11 Performance | 31939 points | |
| 3DMark Cloud Gate Standard Score | 57165 points | |
| 3DMark Fire Strike Score | 25286 points | |
| 3DMark Time Spy Score | 10764 points | |
Help | ||
| V-Ray Benchmark Next 4.10 | |
| GPU | |
| Average of class Gaming (427 - 1627, n=96, last 2 years) | |
| MSI Katana 17 B13VFK (v4.10.07 ) | |
| Average NVIDIA GeForce RTX 4060 Laptop GPU (483 - 715, n=46) | |
| Medion Erazer Defender P40 (v4.10.07 ) | |
| Acer Predator Helios 300 (i7-12700H, RTX 3070 Ti) (v4.10.07 ) | |
| Gigabyte G7 KE (v4.10.07 ) | |
| Asus TUF Gaming A16 FA617 (v4.10.07 ) | |
| CPU | |
| Average of class Gaming (10048 - 45327, n=94, last 2 years) | |
| Average NVIDIA GeForce RTX 4060 Laptop GPU (12680 - 32360, n=46) | |
| Medion Erazer Defender P40 (v4.10.07 ) | |
| Acer Predator Helios 300 (i7-12700H, RTX 3070 Ti) (v4.10.07 ) | |
| MSI Katana 17 B13VFK (v4.10.07 ) | |
| Asus TUF Gaming A16 FA617 (v4.10.07 ) | |
| Gigabyte G7 KE (v4.10.07 ) | |
* ... smaller is better
Gaming performance
The Medion Defender is designed for QHD gaming at high to maximum settings. Higher resolutions could be achieved with an external monitor - with partly reduced settings. Frame rates above the RTX 4060 average are achieved. The dGPU mode can - depending on the game - lead to a minimal increase in frame rates.
The "silent mode" enables gaming at low operating noise. However, playable frame rates are usually only achieved at reduced settings because the hardware's computing power is significantly reduced.
| The Witcher 3 - 1920x1080 Ultra Graphics & Postprocessing (HBAO+) | |
| Average of class Gaming (104.7 - 240, n=7, last 2 years) | |
| Acer Predator Helios 300 (i7-12700H, RTX 3070 Ti) | |
| Lenovo Legion Pro 5 16IRX8 | |
| MSI Katana 17 B13VFK | |
| Medion Erazer Defender P40 | |
| Average NVIDIA GeForce RTX 4060 Laptop GPU (77 - 159.7, n=42) | |
| Asus TUF Gaming A16 FA617 | |
| Gigabyte G7 KE | |
| Final Fantasy XV Benchmark - 1920x1080 High Quality | |
| Average of class Gaming (64.2 - 215, n=91, last 2 years) | |
| Acer Predator Helios 300 (i7-12700H, RTX 3070 Ti) (1.3) | |
| Lenovo Legion Pro 5 16IRX8 (1.3) | |
| Medion Erazer Defender P40 (1.3) | |
| Average NVIDIA GeForce RTX 4060 Laptop GPU (75.1 - 109.8, n=51) | |
| MSI Katana 17 B13VFK (1.3) | |
| Gigabyte G7 KE (1.3) | |
| Asus TUF Gaming A16 FA617 (1.3) | |
| Strange Brigade - 1920x1080 ultra AA:ultra AF:16 | |
| Average of class Gaming (113.6 - 458, n=83, last 2 years) | |
| Acer Predator Helios 300 (i7-12700H, RTX 3070 Ti) (1.47.22.14 D3D12) | |
| Medion Erazer Defender P40 (1.47.22.14 D3D12) | |
| MSI Katana 17 B13VFK (1.47.22.14 D3D12) | |
| Average NVIDIA GeForce RTX 4060 Laptop GPU (135.3 - 210, n=50) | |
| Asus TUF Gaming A16 FA617 (1.47.22.14 D3D12) | |
| Gigabyte G7 KE (1.47.22.14 D3D12) | |
| Dead Space Remake | |
| 1920x1080 Ultra Preset AA:T | |
| Medion Erazer Defender P40 | |
| MSI Katana 17 B13VFK | |
| Average NVIDIA GeForce RTX 4060 Laptop GPU (53.3 - 70.4, n=3) | |
| Gigabyte G7 KE | |
| Asus TUF Gaming A16 FA617 | |
| Average of class Gaming (n=1last 2 years) | |
| 2560x1440 Ultra Preset AA:T | |
| Medion Erazer Defender P40 | |
| Average NVIDIA GeForce RTX 4060 Laptop GPU (43.4 - 44.5, n=2) | |
| MSI Katana 17 B13VFK | |
| Asus TUF Gaming A16 FA617 | |
| The Witcher 3 v4 | |
| 1920x1080 Ultra Preset / On AA:FX | |
| Asus TUF Gaming A16 FA617 | |
| Gigabyte G7 KE | |
| Medion Erazer Defender P40 | |
| MSI Katana 17 B13VFK | |
| Average NVIDIA GeForce RTX 4060 Laptop GPU (50.3 - 72.8, n=3) | |
| 2560x1440 Ultra Preset / On AA:FX | |
| Asus TUF Gaming A16 FA617 | |
| Medion Erazer Defender P40 | |
| Average NVIDIA GeForce RTX 4060 Laptop GPU (40.5 - 44.8, n=2) | |
| MSI Katana 17 B13VFK | |
| Resident Evil 4 Remake | |
| 1920x1080 Max Preset | |
| Medion Erazer Defender P40 | |
| Average NVIDIA GeForce RTX 4060 Laptop GPU (50.9 - 72.7, n=3) | |
| 2560x1440 Max Preset | |
| Average NVIDIA GeForce RTX 4060 Laptop GPU (52.1 - 55.1, n=2) | |
| Medion Erazer Defender P40 | |
| Dead Island 2 | |
| 1920x1080 Ultra Preset AA:High T | |
| XMG Pro 15 E23 | |
| Average NVIDIA GeForce RTX 4060 Laptop GPU (148.5 - 158.8, n=2) | |
| Medion Erazer Defender P40 | |
| 2560x1440 Ultra Preset AA:High T | |
| XMG Pro 15 E23 | |
| Average NVIDIA GeForce RTX 4060 Laptop GPU (98 - 101.9, n=2) | |
| Medion Erazer Defender P40 | |
| Star Wars Jedi Survivor | |
| 1920x1080 Epic Preset | |
| XMG Pro 15 E23 | |
| Medion Erazer Defender P40 | |
| Average NVIDIA GeForce RTX 4060 Laptop GPU (45.5 - 66.7, n=10) | |
| 2560x1440 Epic Preset | |
| XMG Pro 15 E23 | |
| Medion Erazer Defender P40 | |
| Average NVIDIA GeForce RTX 4060 Laptop GPU (30.3 - 41.7, n=10) | |
To check whether the frame rates remain largely constant over a longer period, we ran the game The Witcher 3 for about 60 minutes in Full HD resolution and maximum quality settings. The game character was not moved. A drop in frame rates only occurred when "silent mode" was active.
Witcher 3 FPS diagram
| low | med. | high | ultra | QHD | |
|---|---|---|---|---|---|
| GTA V (2015) | 186.3 | 183.1 | 176 | 113.9 | 83.1 |
| The Witcher 3 (2015) | 459.5 | 318.2 | 195.9 | 103 | |
| Dota 2 Reborn (2015) | 178.7 | 163.1 | 151.3 | 144.3 | |
| Final Fantasy XV Benchmark (2018) | 188.5 | 141.9 | 100.8 | 74 | |
| X-Plane 11.11 (2018) | 159.8 | 139.1 | 109.3 | ||
| Far Cry 5 (2018) | 167 | 142 | 136 | 128 | 102 |
| Strange Brigade (2018) | 473 | 279 | 221 | 188.3 | 126.4 |
| F1 22 (2022) | 243 | 232 | 178 | 65.7 | 42 |
| The Witcher 3 v4 (2023) | 210 | 171.6 | 85.4 | 72.8 | 44.8 |
| Dead Space Remake (2023) | 88.5 | 83.2 | 71.1 | 70.4 | 44.5 |
| Resident Evil 4 Remake (2023) | 141.5 | 107.2 | 97.3 | 72.7 | 52.1 |
| Dead Island 2 (2023) | 189.9 | 181.7 | 153.5 | 148.5 | 98 |
| Star Wars Jedi Survivor (2023) | 77.2 | 69.1 | 64.8 | 61.7 | 38.5 |
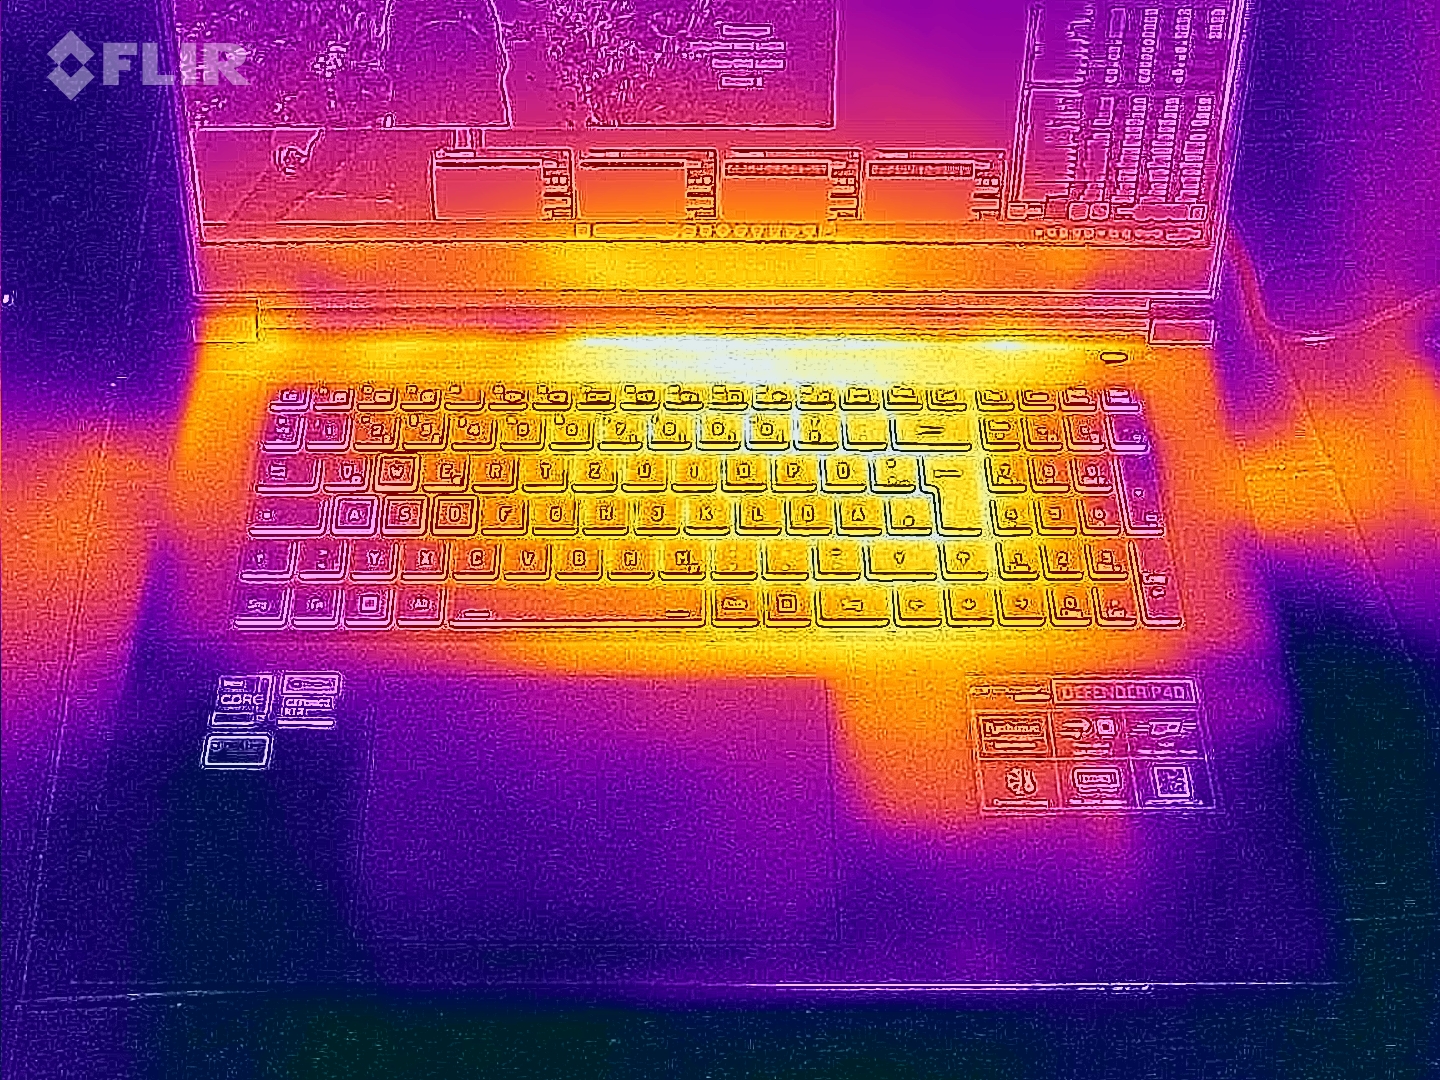
Emissions - A Medion laptop with moderate temperature increases
Noise emissions
At load, the Erazer Defender can produce a lot of noise. "Gaming mode" led the sound pressure level to rise up to 62 dB(A), and a maximum of 56 dB(A) was reached with "entertainment mode" activated - still very loud.
The two other modes greatly curbed the noise at the expense of computing power - probably a first choice for everyday use. However, the "silent mode" doesn't live up to its name. Nevertheless: It enables gaming at a low operating volume (Witcher 3: 36 dB(A)).
| HD Low | FHD Low | FHD Medium | FHD High | FHD Ultra | |
|---|---|---|---|---|---|
| Dota 2 Reborn | 85.8 fps | - | - | 51.7 fps | 45.1 fps |
| X-Plane 11.11 | 52.1 fps | - | 41.2 fps | 35.9 fps | - |
| Strange Brigade | - | - | - | - | 60 fps |
The notebook often works quietly, sometimes silently, in idle mode as well as in everyday use (office, Internet). However, the fans occasionally speed up unnecessarily (a typical phenomenon for Clevo barebones).
Noise level
| Idle |
| 26 / 27 / 32 dB(A) |
| Load |
| 53 / 64 dB(A) |
 | ||
30 dB silent 40 dB(A) audible 50 dB(A) loud |
||
min: | ||
| Medion Erazer Defender P40 GeForce RTX 4060 Laptop GPU, i7-13700HX, Phison PS5021-E21 1TB | MSI Katana 17 B13VFK GeForce RTX 4060 Laptop GPU, i7-13620H, Micron 2400 MTFDKBA1T0QFM | Acer Predator Helios 300 (i7-12700H, RTX 3070 Ti) GeForce RTX 3070 Ti Laptop GPU, i7-12700H, Samsung PM9A1 MZVL21T0HCLR | Lenovo Legion Pro 5 16IRX8 GeForce RTX 4060 Laptop GPU, i7-13700HX, SK hynix PC801 HFS512GEJ9X115N | Asus TUF Gaming A16 FA617 Radeon RX 7600S, R7 7735HS, Micron 2400 MTFDKBA1T0QFM | Gigabyte G7 KE GeForce RTX 3060 Laptop GPU, i5-12500H, Gigabyte AG470S1TB-SI B10 | |
|---|---|---|---|---|---|---|
| Noise | 1% | 1% | 16% | 12% | -7% | |
| off / environment * (dB) | 25 | 24.5 2% | 23 8% | 23 8% | 24 4% | 27 -8% |
| Idle Minimum * (dB) | 26 | 24.5 6% | 23 12% | 23.1 11% | 24 8% | 27 -4% |
| Idle Average * (dB) | 27 | 24.5 9% | 25.92 4% | 23.1 14% | 25 7% | 35 -30% |
| Idle Maximum * (dB) | 32 | 40 -25% | 40.67 -27% | 26.6 17% | 28 12% | 38 -19% |
| Load Average * (dB) | 53 | 48.3 9% | 42.7 19% | 34.7 35% | 42 21% | 52 2% |
| Witcher 3 ultra * (dB) | 56 | 56 -0% | 62.48 -12% | 47.6 15% | 50 11% | 56 -0% |
| Load Maximum * (dB) | 64 | 59.1 8% | 62.67 2% | 54.8 14% | 50 22% | 59 8% |
* ... smaller is better
Temperature
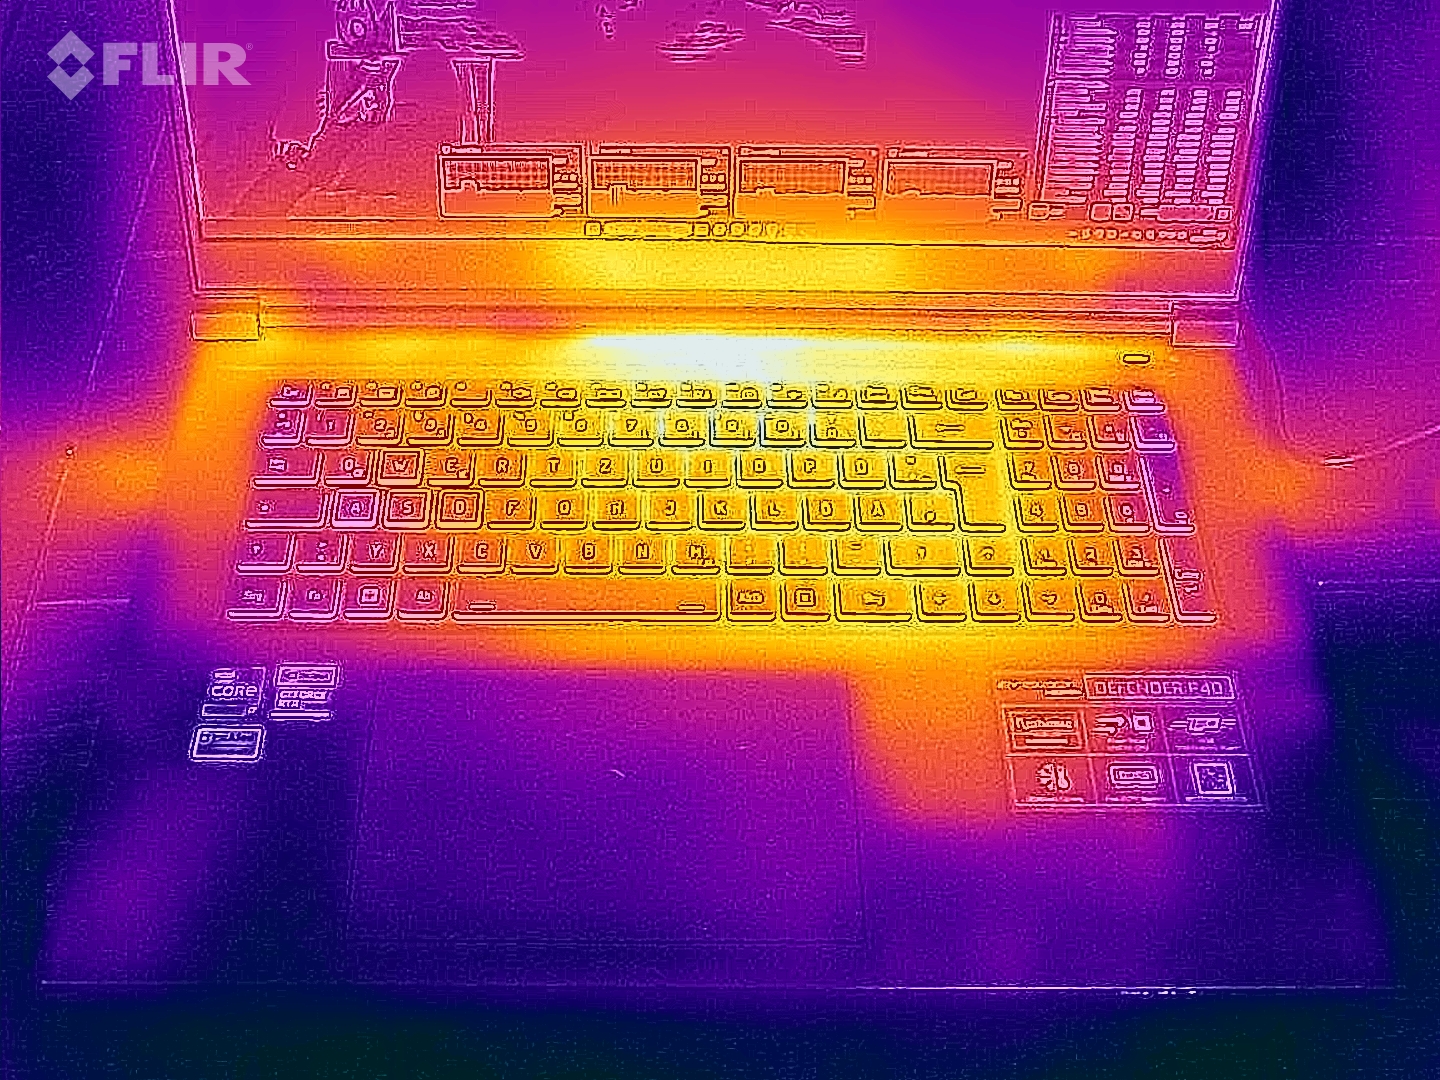
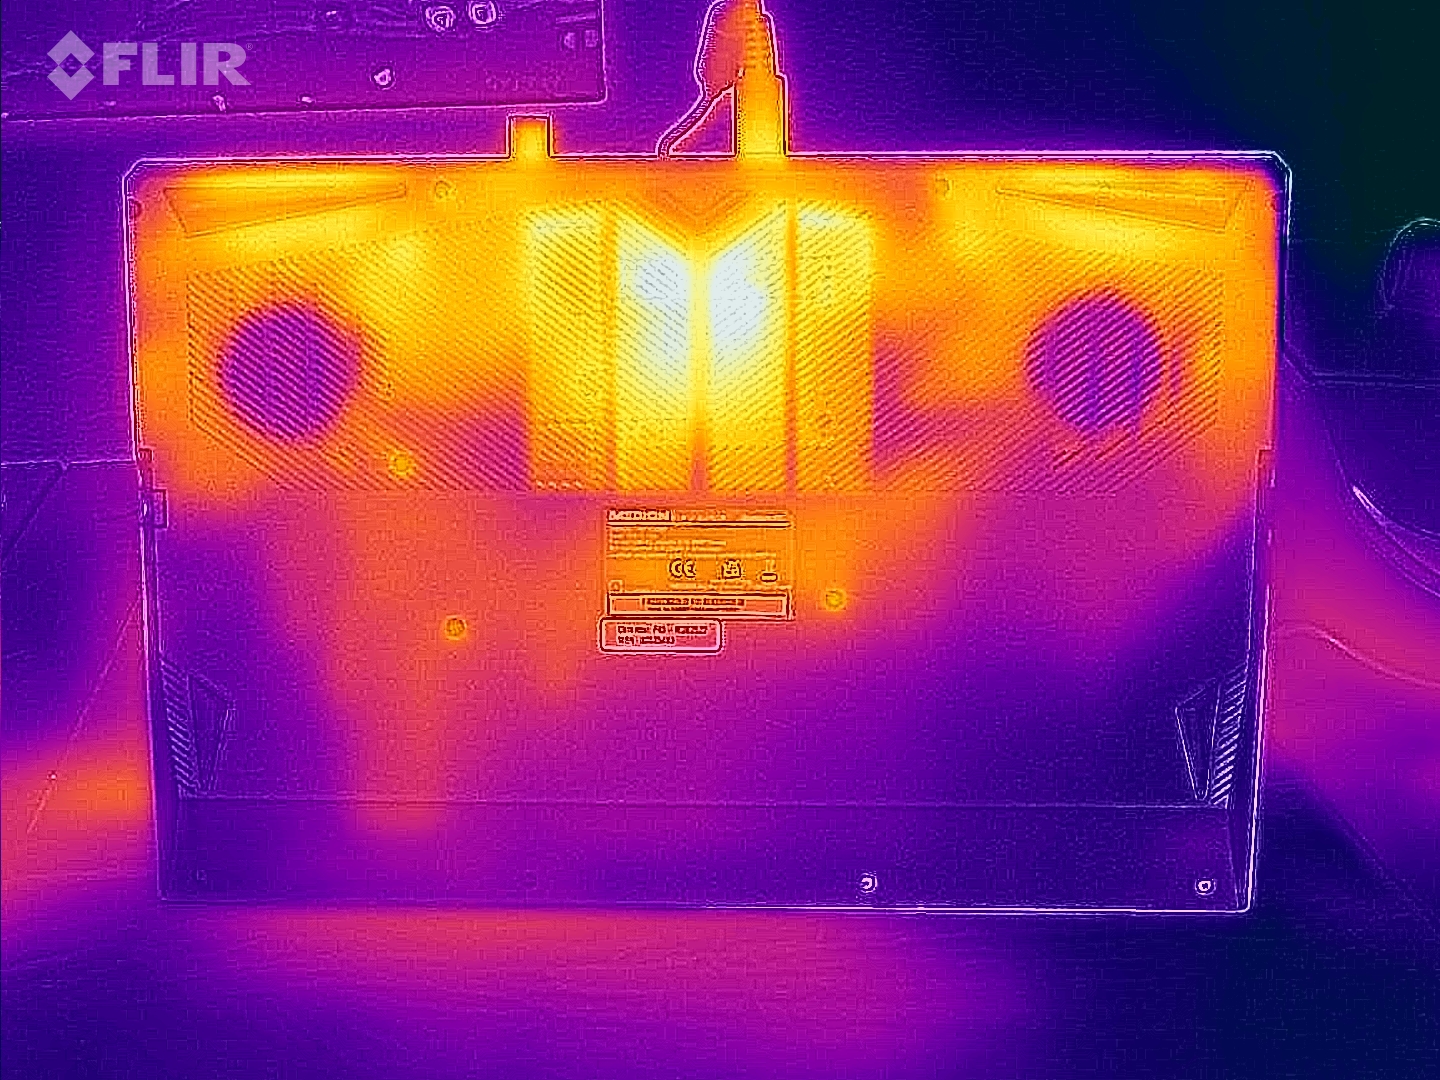
The notebook doesn't heat up very much. Temperatures well below 50°C are registered at all measuring points. The rates are within the green zone in everyday use.
(±) The maximum temperature on the upper side is 42 °C / 108 F, compared to the average of 40.4 °C / 105 F, ranging from 21.2 to 68.8 °C for the class Gaming.
(±) The bottom heats up to a maximum of 45 °C / 113 F, compared to the average of 43.2 °C / 110 F
(+) In idle usage, the average temperature for the upper side is 26.6 °C / 80 F, compared to the device average of 33.9 °C / 93 F.
(±) Playing The Witcher 3, the average temperature for the upper side is 37.1 °C / 99 F, compared to the device average of 33.9 °C / 93 F.
(+) The palmrests and touchpad are cooler than skin temperature with a maximum of 31 °C / 87.8 F and are therefore cool to the touch.
(-) The average temperature of the palmrest area of similar devices was 28.8 °C / 83.8 F (-2.2 °C / -4 F).
| Medion Erazer Defender P40 Intel Core i7-13700HX, NVIDIA GeForce RTX 4060 Laptop GPU | MSI Katana 17 B13VFK Intel Core i7-13620H, NVIDIA GeForce RTX 4060 Laptop GPU | Acer Predator Helios 300 (i7-12700H, RTX 3070 Ti) Intel Core i7-12700H, NVIDIA GeForce RTX 3070 Ti Laptop GPU | Lenovo Legion Pro 5 16IRX8 Intel Core i7-13700HX, NVIDIA GeForce RTX 4060 Laptop GPU | Asus TUF Gaming A16 FA617 AMD Ryzen 7 7735HS, AMD Radeon RX 7600S | Gigabyte G7 KE Intel Core i5-12500H, NVIDIA GeForce RTX 3060 Laptop GPU | |
|---|---|---|---|---|---|---|
| Heat | -7% | -5% | -8% | -27% | -13% | |
| Maximum Upper Side * (°C) | 42 | 41.6 1% | 35 17% | 42.8 -2% | 54 -29% | 52 -24% |
| Maximum Bottom * (°C) | 45 | 43.1 4% | 53 -18% | 50 -11% | 47 -4% | 54 -20% |
| Idle Upper Side * (°C) | 28 | 32 -14% | 29 -4% | 29.6 -6% | 40 -43% | 28 -0% |
| Idle Bottom * (°C) | 30 | 35.8 -19% | 34 -13% | 34 -13% | 40 -33% | 32 -7% |
* ... smaller is better
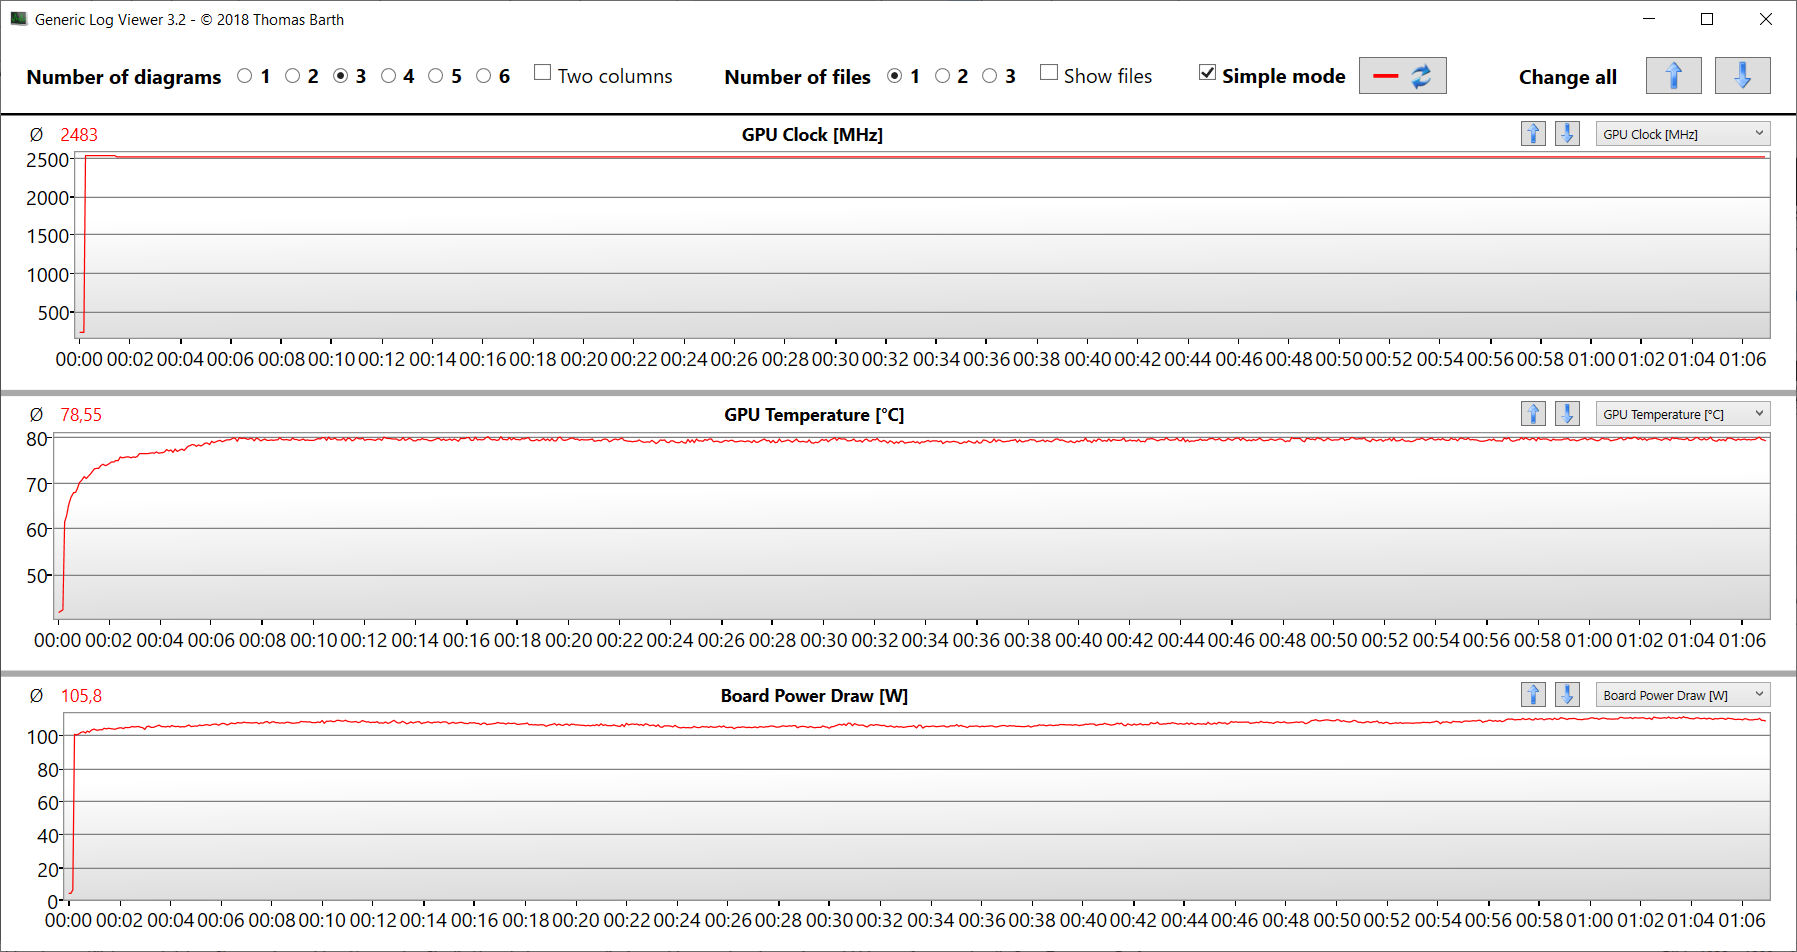
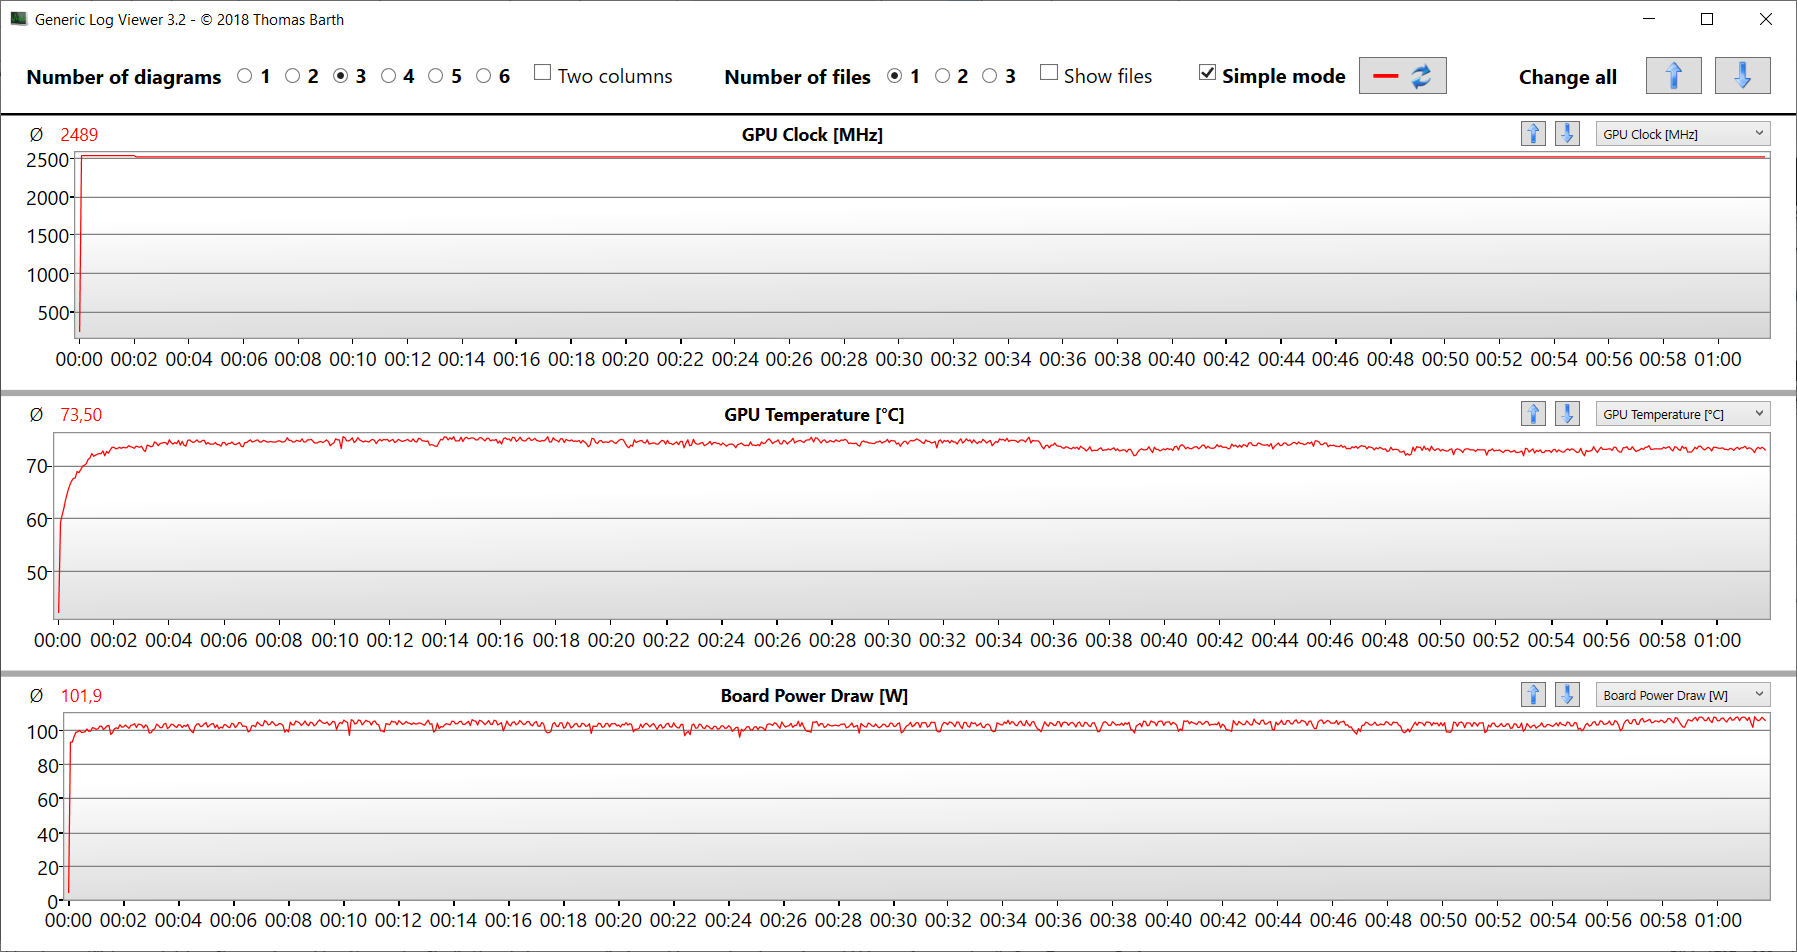
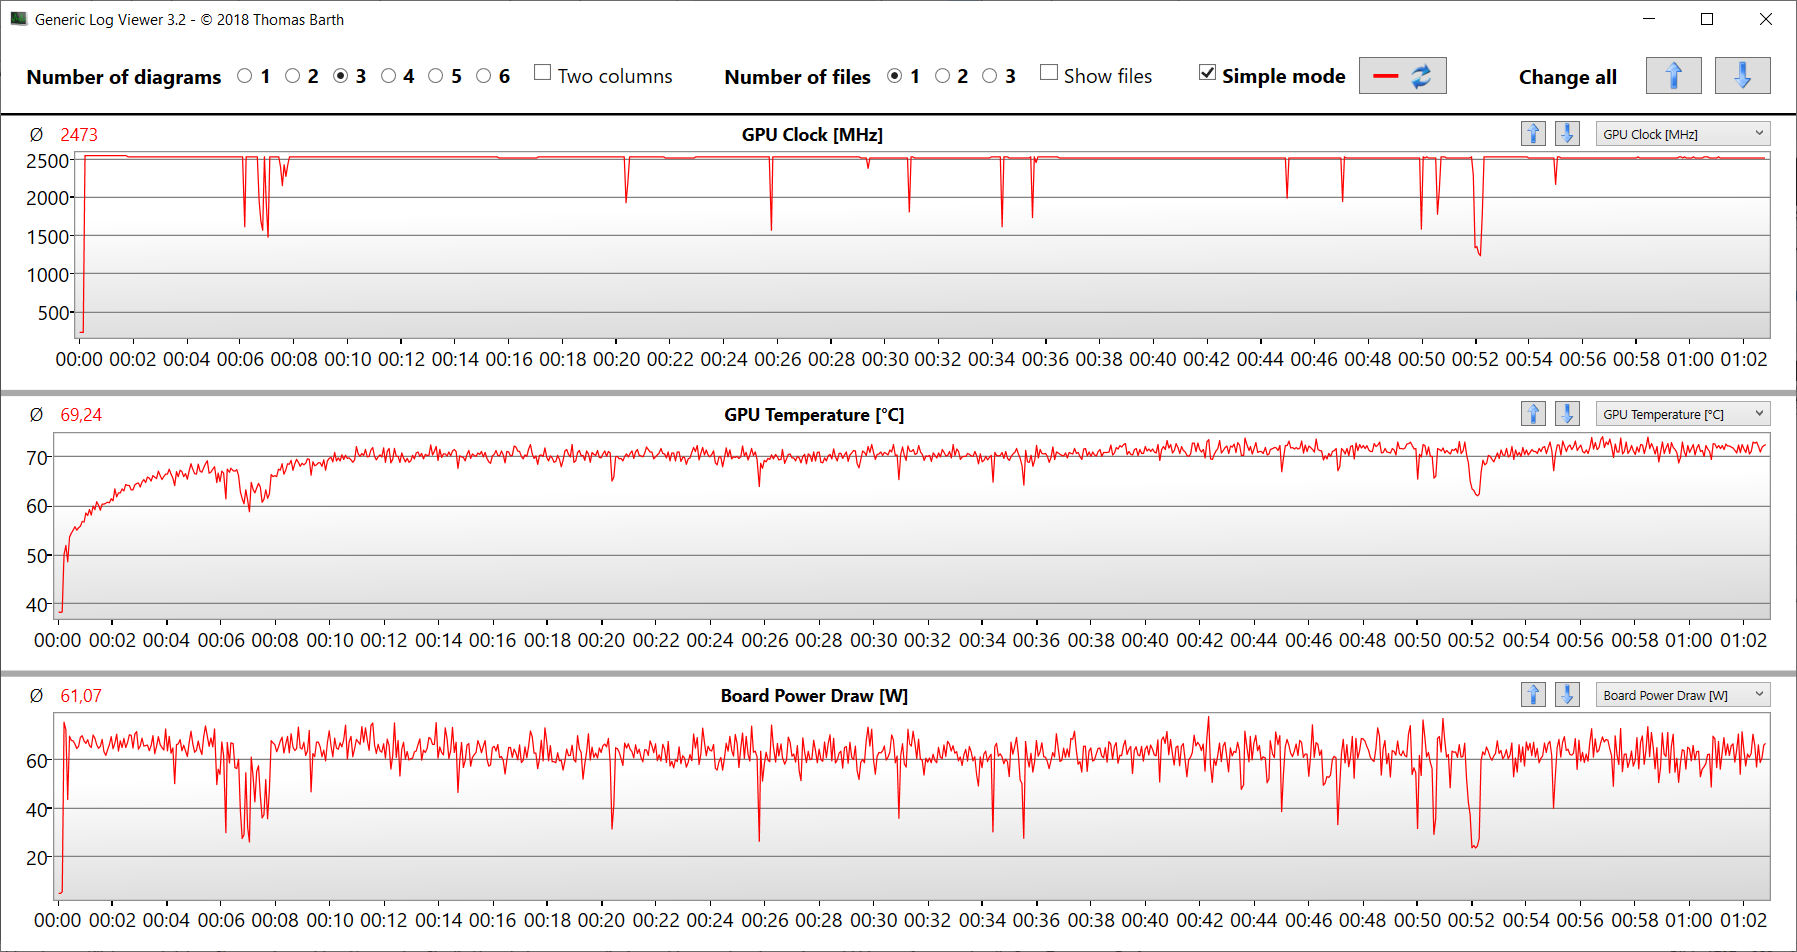
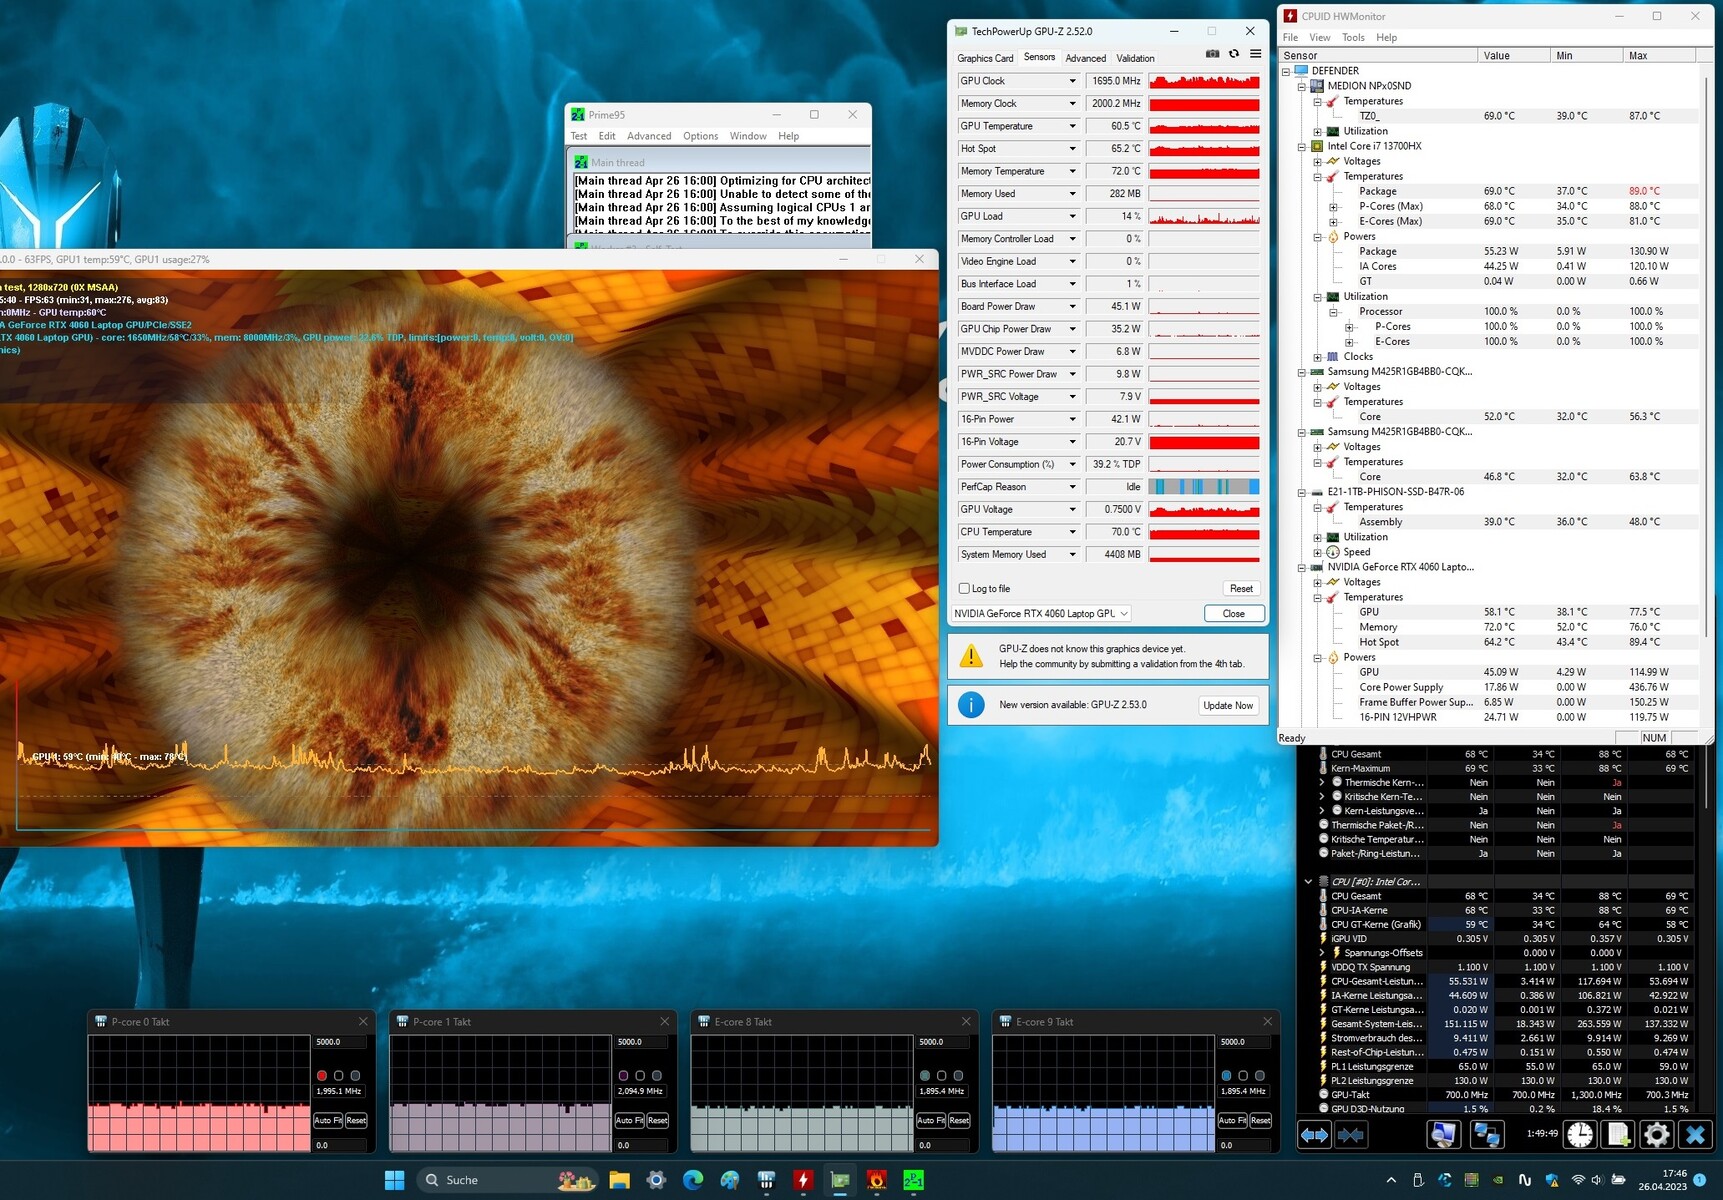
Stress test
The stress test (Prime95 and Furmark in continuous operation) simulates an extreme scenario in order to test the system's stability at full load. The CPU started the test with high clock rates (P: 3.5 to 3.8 GHz, E: 3.1 to 3.2 GHz) with the GPU running at 2.4 to 2.5 GHz. While the CPU clock was reduced after just under a minute, the GPU worked at full power throughout.
Speakers
The stereo speakers produce a decent sound that, unfortunately, hardly has any bass to offer. A better sound experience would be achievable using headphones or external speakers.
Medion Erazer Defender P40 audio analysis
(±) | speaker loudness is average but good (81 dB)
Bass 100 - 315 Hz
(-) | nearly no bass - on average 29.9% lower than median
(±) | linearity of bass is average (12.4% delta to prev. frequency)
Mids 400 - 2000 Hz
(±) | higher mids - on average 6.4% higher than median
(±) | linearity of mids is average (8.1% delta to prev. frequency)
Highs 2 - 16 kHz
(+) | balanced highs - only 2.4% away from median
(+) | highs are linear (3.6% delta to prev. frequency)
Overall 100 - 16.000 Hz
(±) | linearity of overall sound is average (22.4% difference to median)
Compared to same class
» 80% of all tested devices in this class were better, 6% similar, 14% worse
» The best had a delta of 6%, average was 18%, worst was 132%
Compared to all devices tested
» 66% of all tested devices were better, 6% similar, 29% worse
» The best had a delta of 4%, average was 23%, worst was 134%
MSI Katana 17 B13VFK audio analysis
(±) | speaker loudness is average but good (78.5 dB)
Bass 100 - 315 Hz
(-) | nearly no bass - on average 17.7% lower than median
(±) | linearity of bass is average (11.7% delta to prev. frequency)
Mids 400 - 2000 Hz
(±) | higher mids - on average 6.8% higher than median
(+) | mids are linear (6.7% delta to prev. frequency)
Highs 2 - 16 kHz
(+) | balanced highs - only 3.2% away from median
(±) | linearity of highs is average (7.2% delta to prev. frequency)
Overall 100 - 16.000 Hz
(±) | linearity of overall sound is average (19.4% difference to median)
Compared to same class
» 67% of all tested devices in this class were better, 7% similar, 26% worse
» The best had a delta of 6%, average was 18%, worst was 132%
Compared to all devices tested
» 48% of all tested devices were better, 7% similar, 45% worse
» The best had a delta of 4%, average was 23%, worst was 134%
Power management - The gaming laptop with decent runtimes
Power consumption
The Medion laptop's power consumption is at a normal level for the installed hardware. The Witcher 3 test and stress test were run with constant or relatively constant power consumption. The power supply (280 watts) is sufficiently sized.
| Off / Standby | |
| Idle | |
| Load |
|
Key:
min: | |
| Medion Erazer Defender P40 i7-13700HX, GeForce RTX 4060 Laptop GPU, Phison PS5021-E21 1TB, IPS, 2560x1440, 17.3" | MSI Katana 17 B13VFK i7-13620H, GeForce RTX 4060 Laptop GPU, Micron 2400 MTFDKBA1T0QFM, IPS LED, 1920x1080, 17.3" | Acer Predator Helios 300 (i7-12700H, RTX 3070 Ti) i7-12700H, GeForce RTX 3070 Ti Laptop GPU, Samsung PM9A1 MZVL21T0HCLR, IPS, 2560x1440, 17.3" | Lenovo Legion Pro 5 16IRX8 i7-13700HX, GeForce RTX 4060 Laptop GPU, SK hynix PC801 HFS512GEJ9X115N, IPS, 2560x1600, 16" | Asus TUF Gaming A16 FA617 R7 7735HS, Radeon RX 7600S, Micron 2400 MTFDKBA1T0QFM, IPS-Level, 1920x1200, 16" | Gigabyte G7 KE i5-12500H, GeForce RTX 3060 Laptop GPU, Gigabyte AG470S1TB-SI B10, IPS, 1920x1080, 17.3" | Average NVIDIA GeForce RTX 4060 Laptop GPU | Average of class Gaming | |
|---|---|---|---|---|---|---|---|---|
| Power Consumption | -1% | -40% | -71% | 13% | -24% | -11% | -32% | |
| Idle Minimum * (Watt) | 8 | 12.2 -53% | 15 -88% | 24.5 -206% | 8 -0% | 15 -88% | 11.5 ? -44% | 13.1 ? -64% |
| Idle Average * (Watt) | 12 | 14.9 -24% | 20 -67% | 29.2 -143% | 11 8% | 17 -42% | 16 ? -33% | 19 ? -58% |
| Idle Maximum * (Watt) | 18 | 15.8 12% | 22.3 -24% | 34.3 -91% | 16 11% | 24 -33% | 20.3 ? -13% | 24.6 ? -37% |
| Load Average * (Watt) | 101 | 85.22 16% | 133 -32% | 98.7 2% | 97 4% | 111 -10% | 92.9 ? 8% | 111.3 ? -10% |
| Witcher 3 ultra * (Watt) | 180.8 | 151.1 16% | 231 -28% | 178.6 1% | 161.5 11% | 174.1 4% | ||
| Load Maximum * (Watt) | 284 | 212.8 25% | 290 -2% | 249.6 12% | 168 41% | 208 27% | 210 ? 26% | 260 ? 8% |
* ... smaller is better
Power consumption Witcher 3 / stress test
Power consumption with external monitor
Battery life
The 17.3-inch laptop achieved runtimes of 6:13 h and 5:39 h in the WLAN test (calling up websites via a script) and video test (short movie Big Buck Bunny (H.264 encoding, FHD) in a loop), respectively. During both tests, the device's energy-saving features were disabled and the display brightness was set to about 150 cd/m². The wireless modules were also disabled for the video test.
All-in-all, the P40 achieved very decent endurance rates. It placed itself in the midfield of the comparison devices. None of the computers could live up to the excellent runtimes of the Asus TUF Gaming A16. The latter benefits from the combination of a frugal APU and large battery capacity.
| Medion Erazer Defender P40 i7-13700HX, GeForce RTX 4060 Laptop GPU, 73 Wh | MSI Katana 17 B13VFK i7-13620H, GeForce RTX 4060 Laptop GPU, 53.5 Wh | Acer Predator Helios 300 (i7-12700H, RTX 3070 Ti) i7-12700H, GeForce RTX 3070 Ti Laptop GPU, 90 Wh | Lenovo Legion Pro 5 16IRX8 i7-13700HX, GeForce RTX 4060 Laptop GPU, 80 Wh | Asus TUF Gaming A16 FA617 R7 7735HS, Radeon RX 7600S, 90 Wh | Gigabyte G7 KE i5-12500H, GeForce RTX 3060 Laptop GPU, 54 Wh | Average of class Gaming | |
|---|---|---|---|---|---|---|---|
| Battery runtime | -38% | 13% | -38% | 80% | -24% | 16% | |
| Reader / Idle (h) | 8.8 | 6.7 -24% | 20.2 130% | 7.1 -19% | 7.84 ? -11% | ||
| H.264 (h) | 5.7 | 5.9 4% | 2.2 -61% | 8.27 ? 45% | |||
| WiFi v1.3 (h) | 6.2 | 2.9 -53% | 6 -3% | 3.4 -45% | 12.1 95% | 5.3 -15% | 7.08 ? 14% |
| Load (h) | 1.3 | 1 -23% | 1.8 38% | 0.7 -46% | 1.5 15% | 1.3 0% | 1.496 ? 15% |
Pros
Cons
Verdict - A well-rounded affair
The P40 is fit for QHD gaming at high to maximum settings - but the laptop should be great for use in many other areas (video editing, rendering) thanks to its Core i7-13700HX and GeForce RTX 4060. The CPU and GPU run with consistently high clock rates and a fast PCIe 4 SSD (1 TB) means quick loading times.
Medion's Erazer Defender P40 is a well-equipped mid-range QHD gaming laptop.
The laptop doesn't get particularly warm at load - but it can get loud. To make up for this, the device has a "silent mode" - at the cost of its processing performance. It allows for quieter gaming (but not quite silent).
One battery charge (73 Wh) means you can realistically get runtimes of 5.5 - 6.5 hours - pretty decent. The battery can't be charged via a USB-C charger - instead, you have to use the bulky power supply included with the laptop. All-in-all, its matte, 17.3-inch display (QHD, IPS, 240 Hz, sRGB) left a good impression on us.
The MSI Katana 17 comes to mind as a possible alternative to the P40. It offers similar performance, but worse runtimes. The Gigabyte G7 KE is a slightly cheaper alternative: at around $1,000 (without Windows), it allows for FHD gaming at high to maximum settings.
Price and availability
The Medion Erazer Defender P40 retails for around $1,900. At the time of purchasing, we were not able to find the laptop for sale at major online retailers in the US, however, you can check out similar devices such as the MSI Katana 17 or the Acer Predator Helios 300 on Amazon.
Medion Erazer Defender P40
- 05/24/2023 v7 (old)
Sascha Mölck
Transparency
The selection of devices to be reviewed is made by our editorial team. The test sample was provided to the author as a loan by the manufacturer or retailer for the purpose of this review. The lender had no influence on this review, nor did the manufacturer receive a copy of this review before publication. There was no obligation to publish this review. As an independent media company, Notebookcheck is not subjected to the authority of manufacturers, retailers or publishers.
This is how Notebookcheck is testing
Every year, Notebookcheck independently reviews hundreds of laptops and smartphones using standardized procedures to ensure that all results are comparable. We have continuously developed our test methods for around 20 years and set industry standards in the process. In our test labs, high-quality measuring equipment is utilized by experienced technicians and editors. These tests involve a multi-stage validation process. Our complex rating system is based on hundreds of well-founded measurements and benchmarks, which maintains objectivity. Further information on our test methods can be found here.
Price comparison

