Verdict
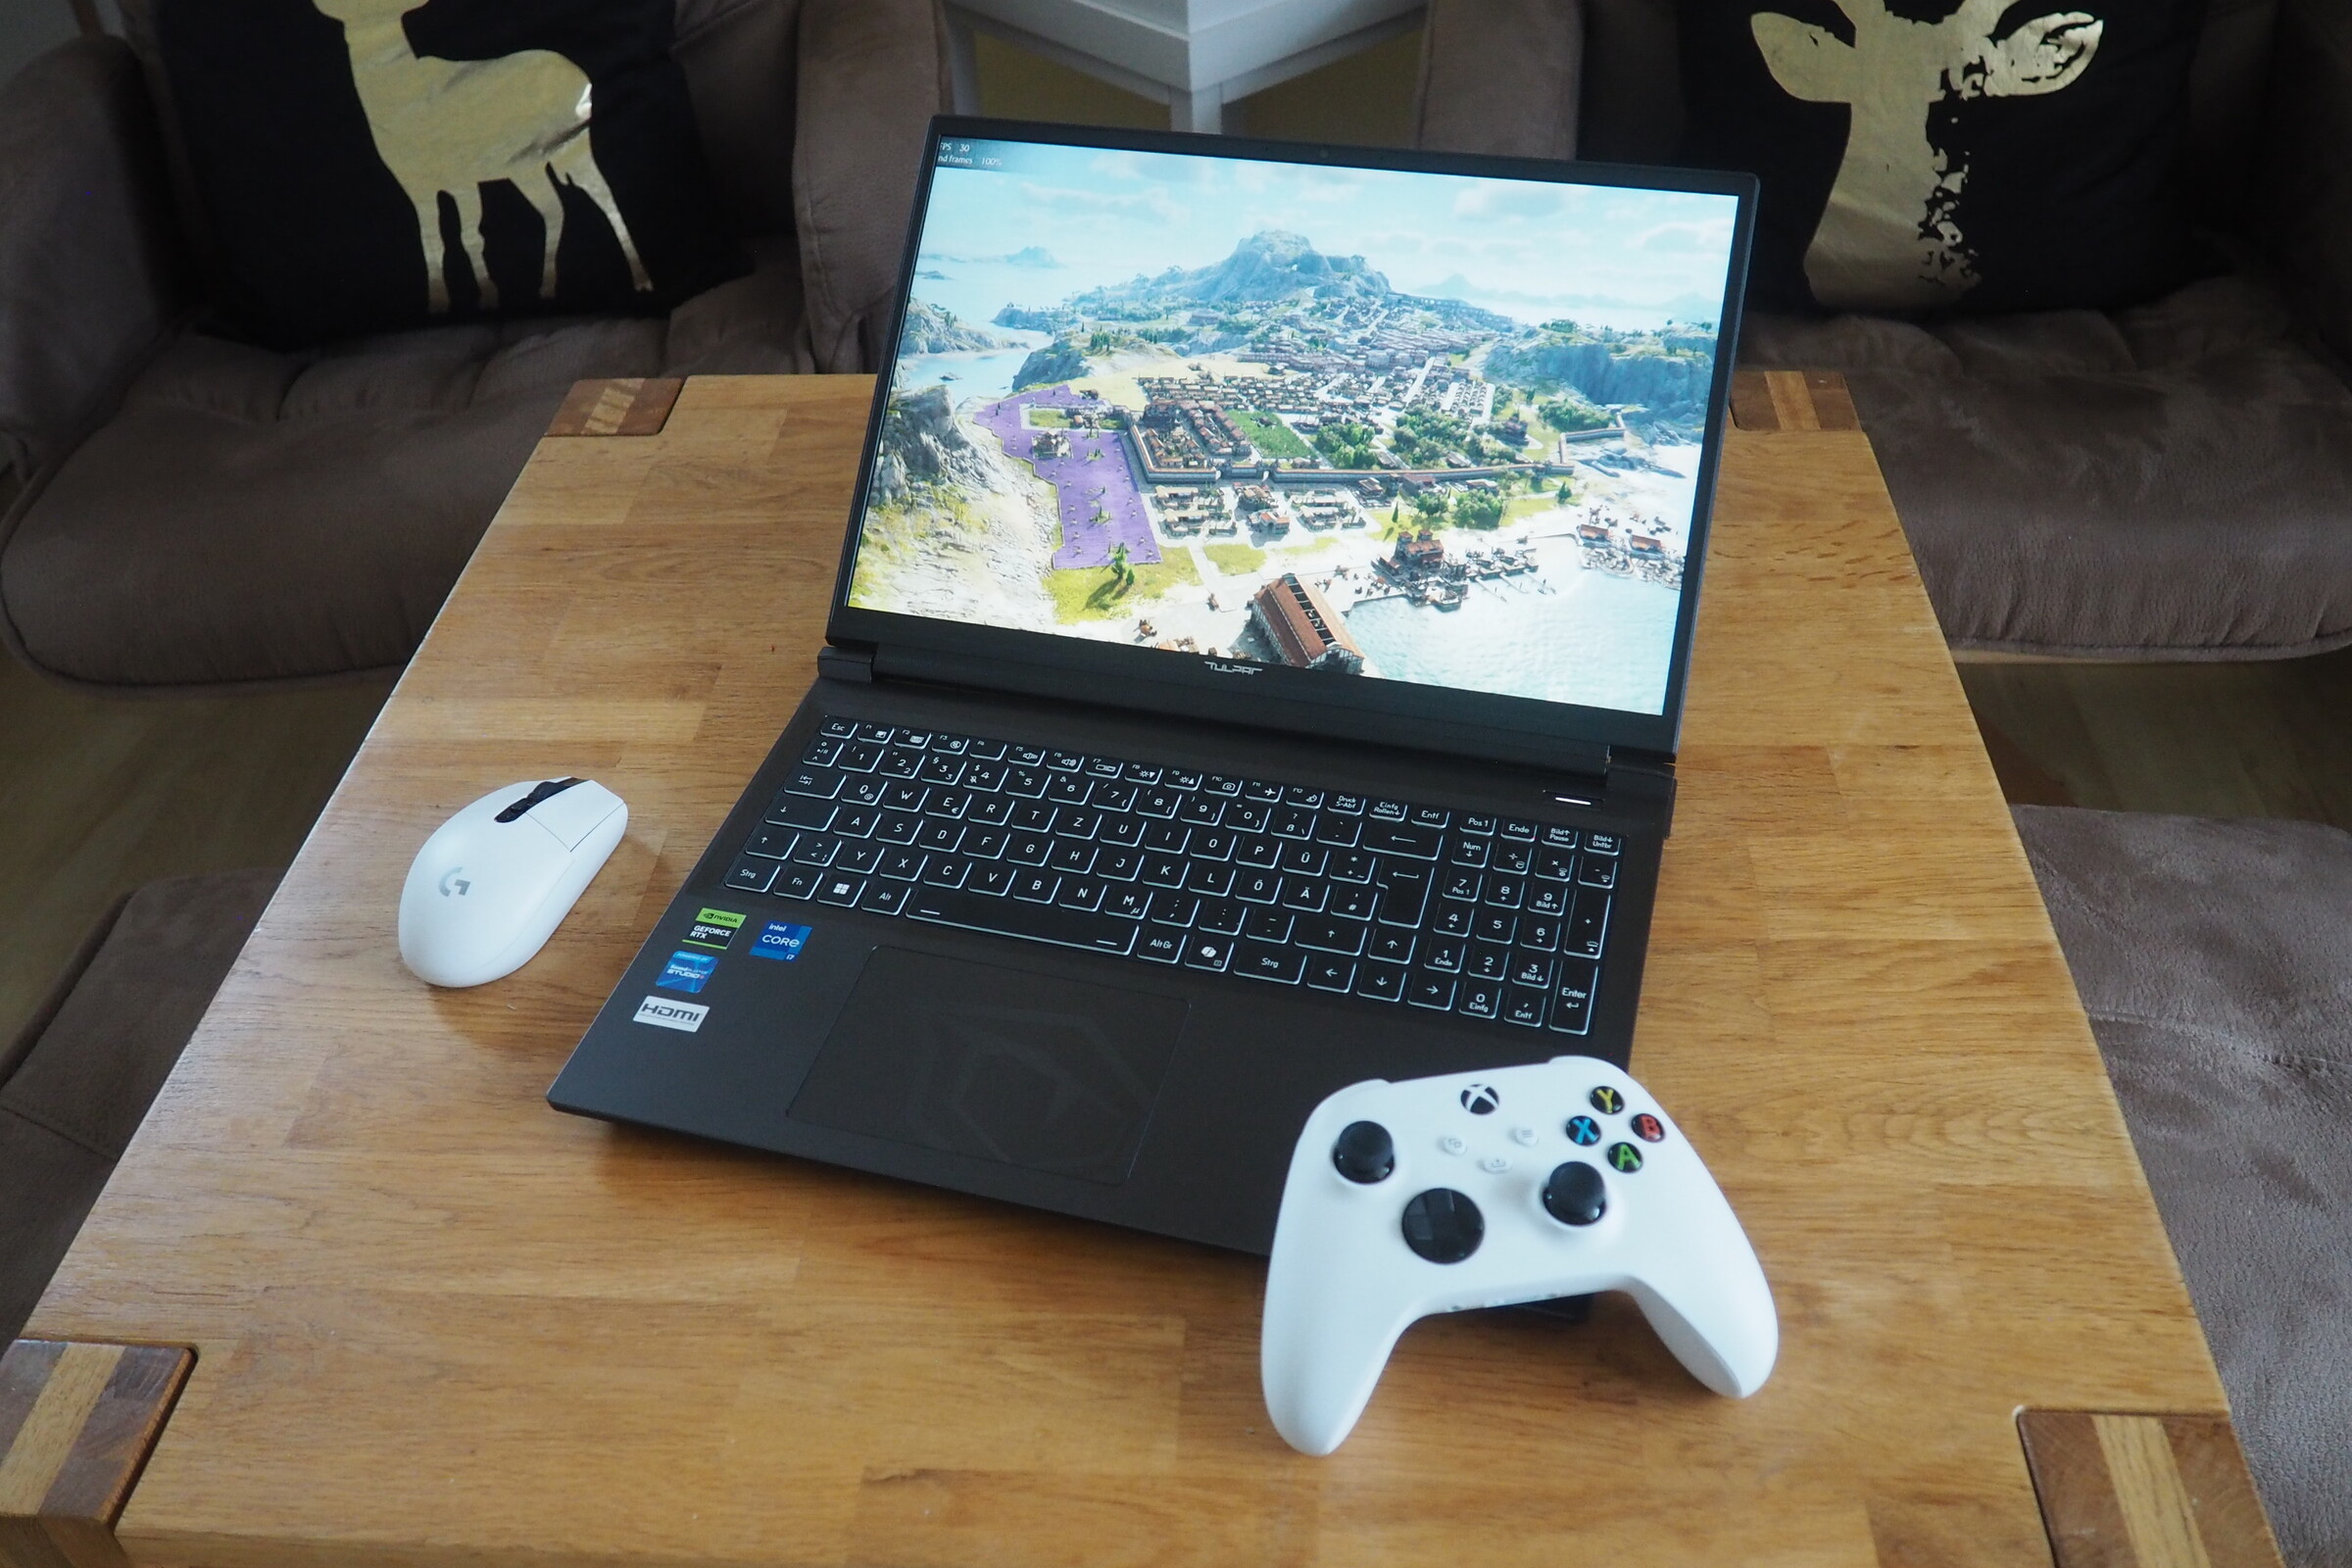
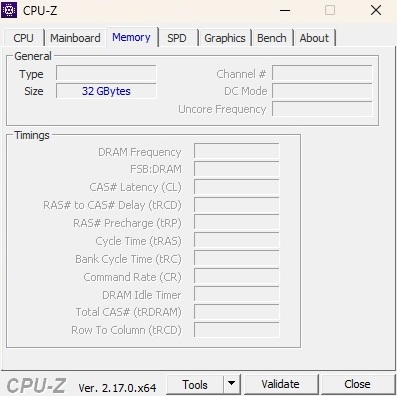
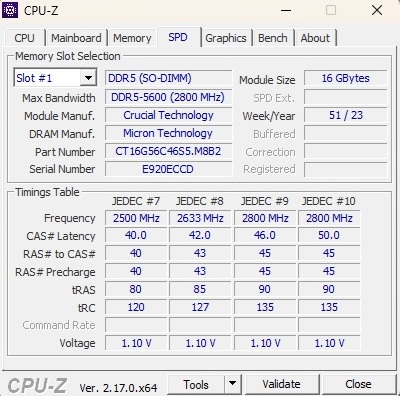
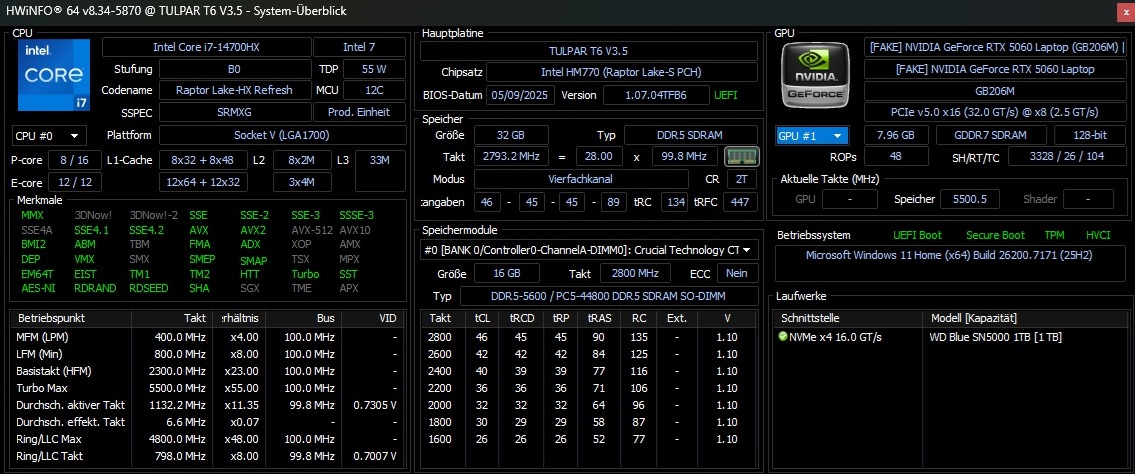
If you’re looking for a current gaming laptop in the 1,000-euro range, the T6 V3.5 from Tulpar Notebook might be a good fit. With the GeForce RTX 5060, the 16-inch model offers a solid mid-range GPU paired with a fast Core i7-14700HX (which, however, loses some performance under sustained load). Our test unit also included 32 GB of DDR5 RAM (2×16 GB) and a 1 TB NVMe SSD.
Buyers can expect standard fare when it comes to the casing. The chassis is made entirely of plastic and has a rather understated design. There is also room for improvement in terms of connectivity (no card reader, no USB4). The display meets the expectations for this price segment. The 165 Hz IPS-based panel (1,920 × 1,200 pixels) offers usable brightness and fairly good color space coverage, which isn’t something all competitors can claim (more on that in a moment). Emissions, including temperature and noise levels, are generally in line with other gaming laptops, although the fan control could be better.
Overall, the Tulpar T6 V3.5 remains competitive with more well-known brands, making it worth considering.
Pros
Cons
Price and availability
The Tulpar T6 V3.5 is currently available starting at around €1,160 (approx. $1,345) on the manufacturer’s website.
Translator’s note: These laptops are not yet officially available in North America.
Competitors to the Tulpar T6 V3.5 include the Acer Nitro V 16 AI, the Alienware 16 Aurora and the HP Omen 16, all of which are also reasonably priced. The slightly more expensive Gigabyte Gaming A16 with an RTX 5070 and the current RTX 5060 reference model, the Lenovo Legion 5, also appear in our comparison tables.
Specifications
Case
The plastic housing offers more than decent stability and is neatly finished in most areas. The hinges work unobtrusively for the most part, although the maximum opening angle of approximately 135° is not particularly generous. The dark gray surfaces give the laptop a fairly discreet appearance as long as the keyboard backlighting is turned off.
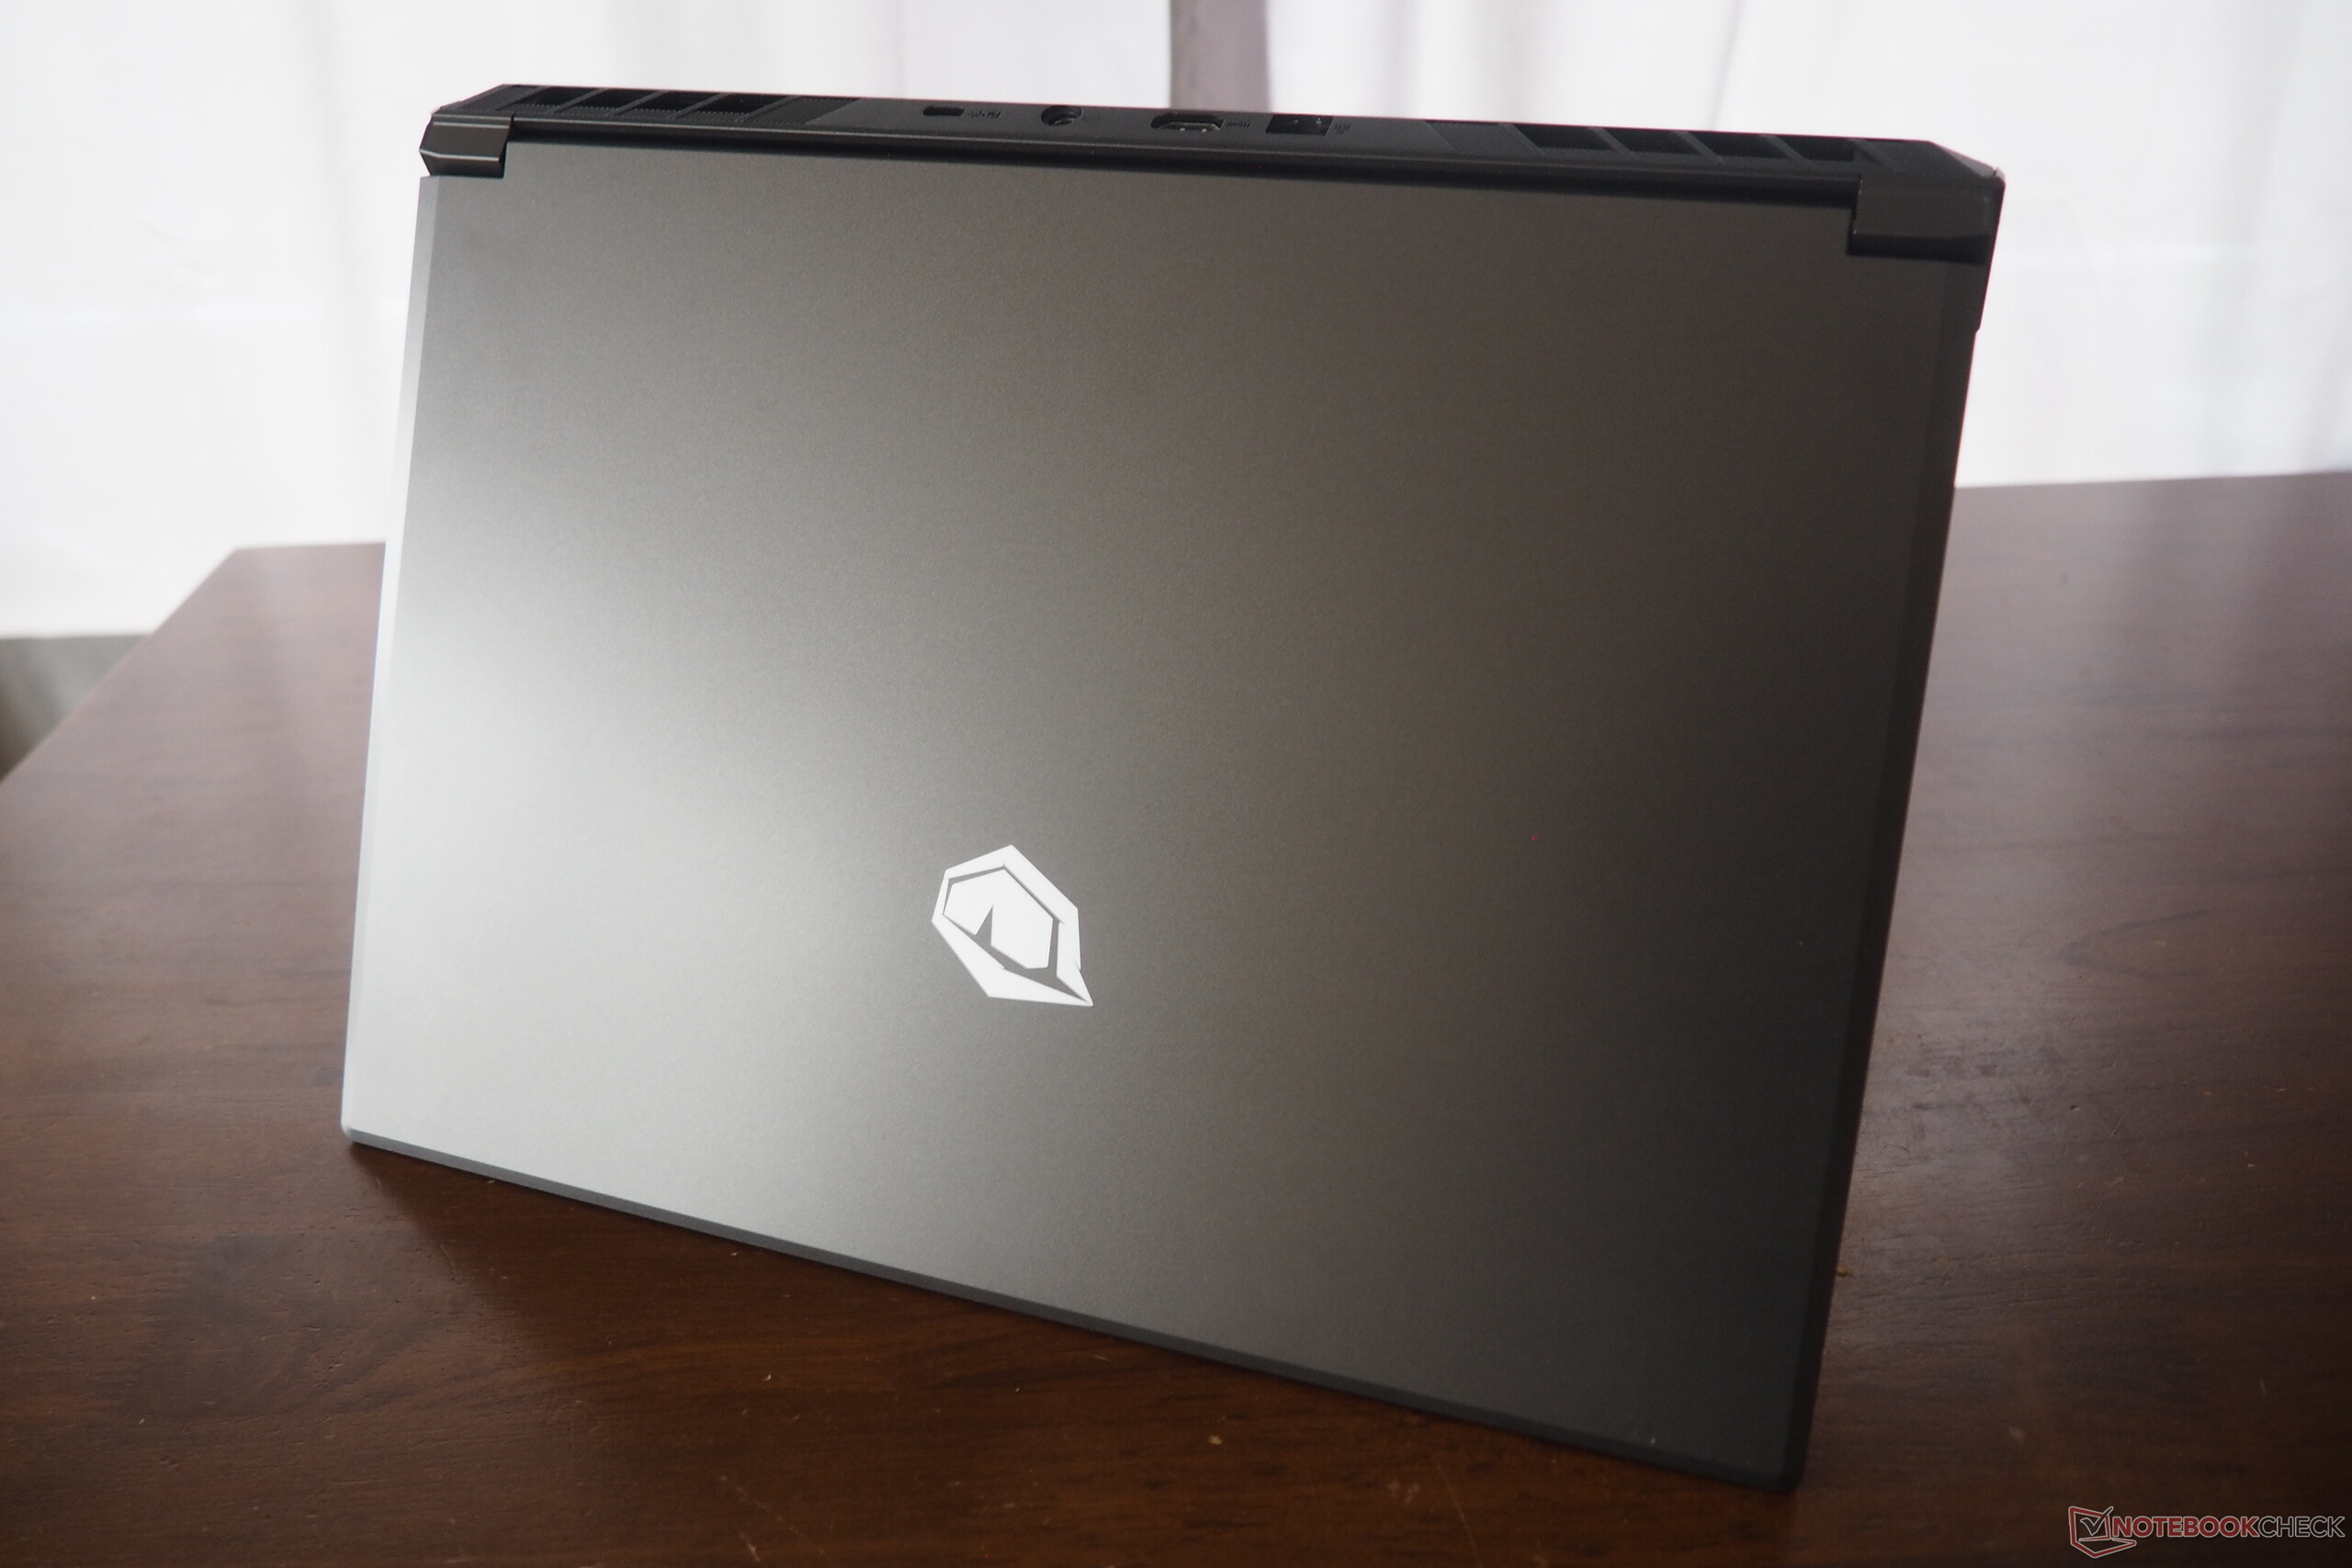
With a weight of 2.4 kg, the T6 V3.5 is right in line with other 16-inch competitors, which range from 2.3 to 2.6 kg, aside from the lighter Legion 5. Its 2.5 cm thickness is also typical for this class.
Equipment
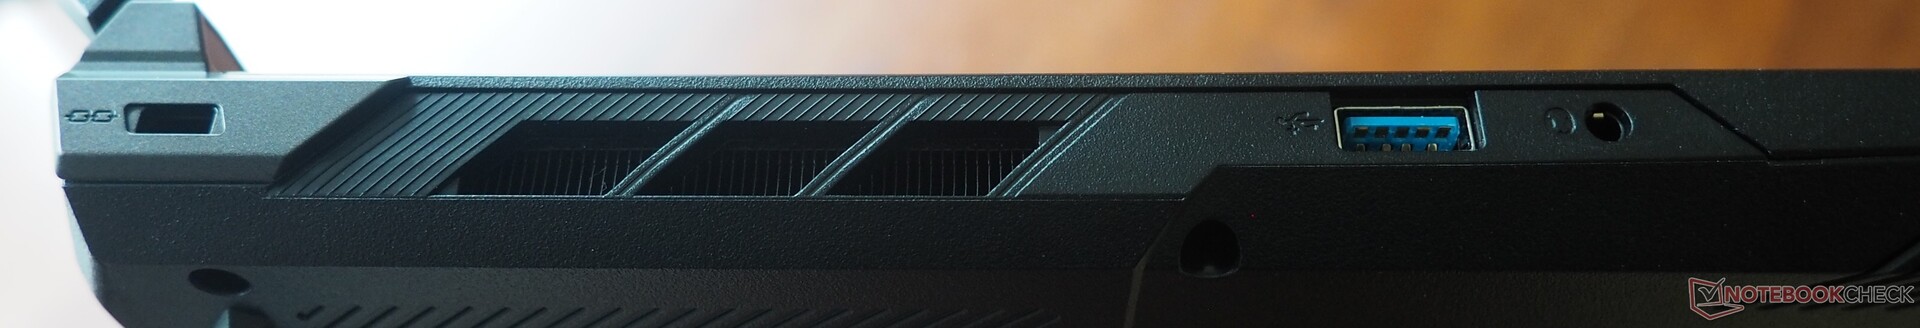
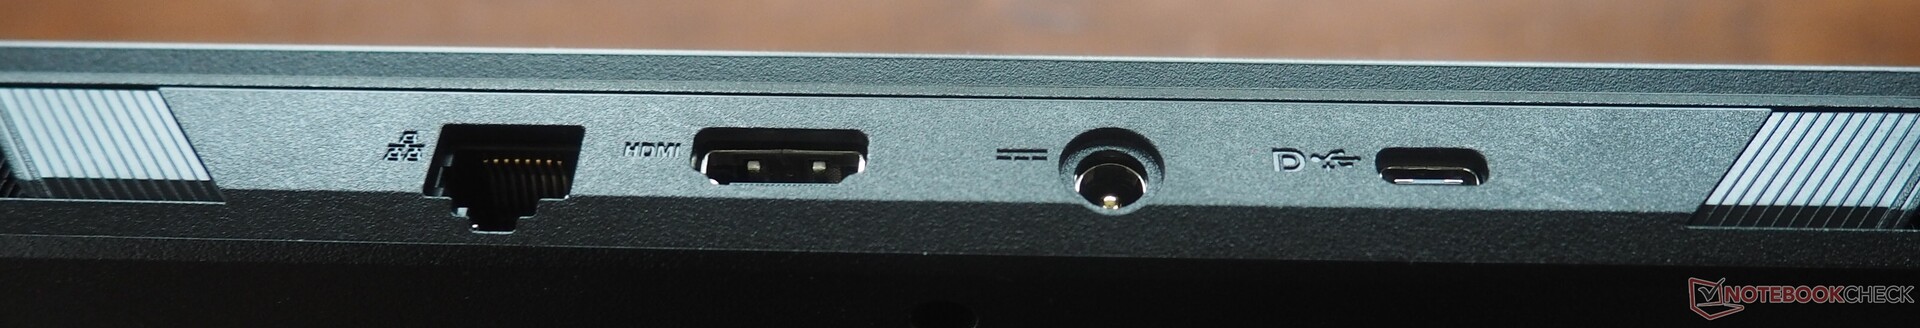
Connections
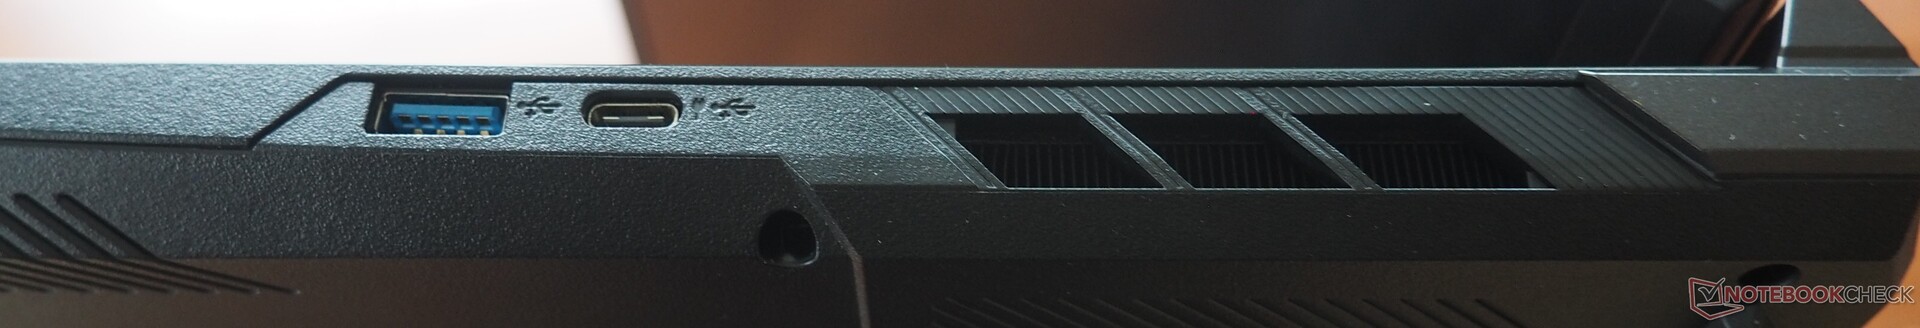
The ports are spread across nearly every side of the chassis. While it lacks USB 4 or Thunderbolt, the system still provides four USB ports (two Type-A and two Type-C). External displays are easiest to connect via HDMI. A Gigabit LAN port, a headphone jack, and a Kensington lock slot are also included.
Communication
The built-in wireless module is a faster option. Intel’s Wi-Fi 6E AX211 delivers solid to excellent performance in both transmit and receive tests.
Webcam
The image quality of the webcam is less impressive, which - as with many laptops - could have done with a higher resolution.


Accessories
The notebook comes with a few information booklets, a cleaning cloth and a medium-sized 230-watt power supply unit.
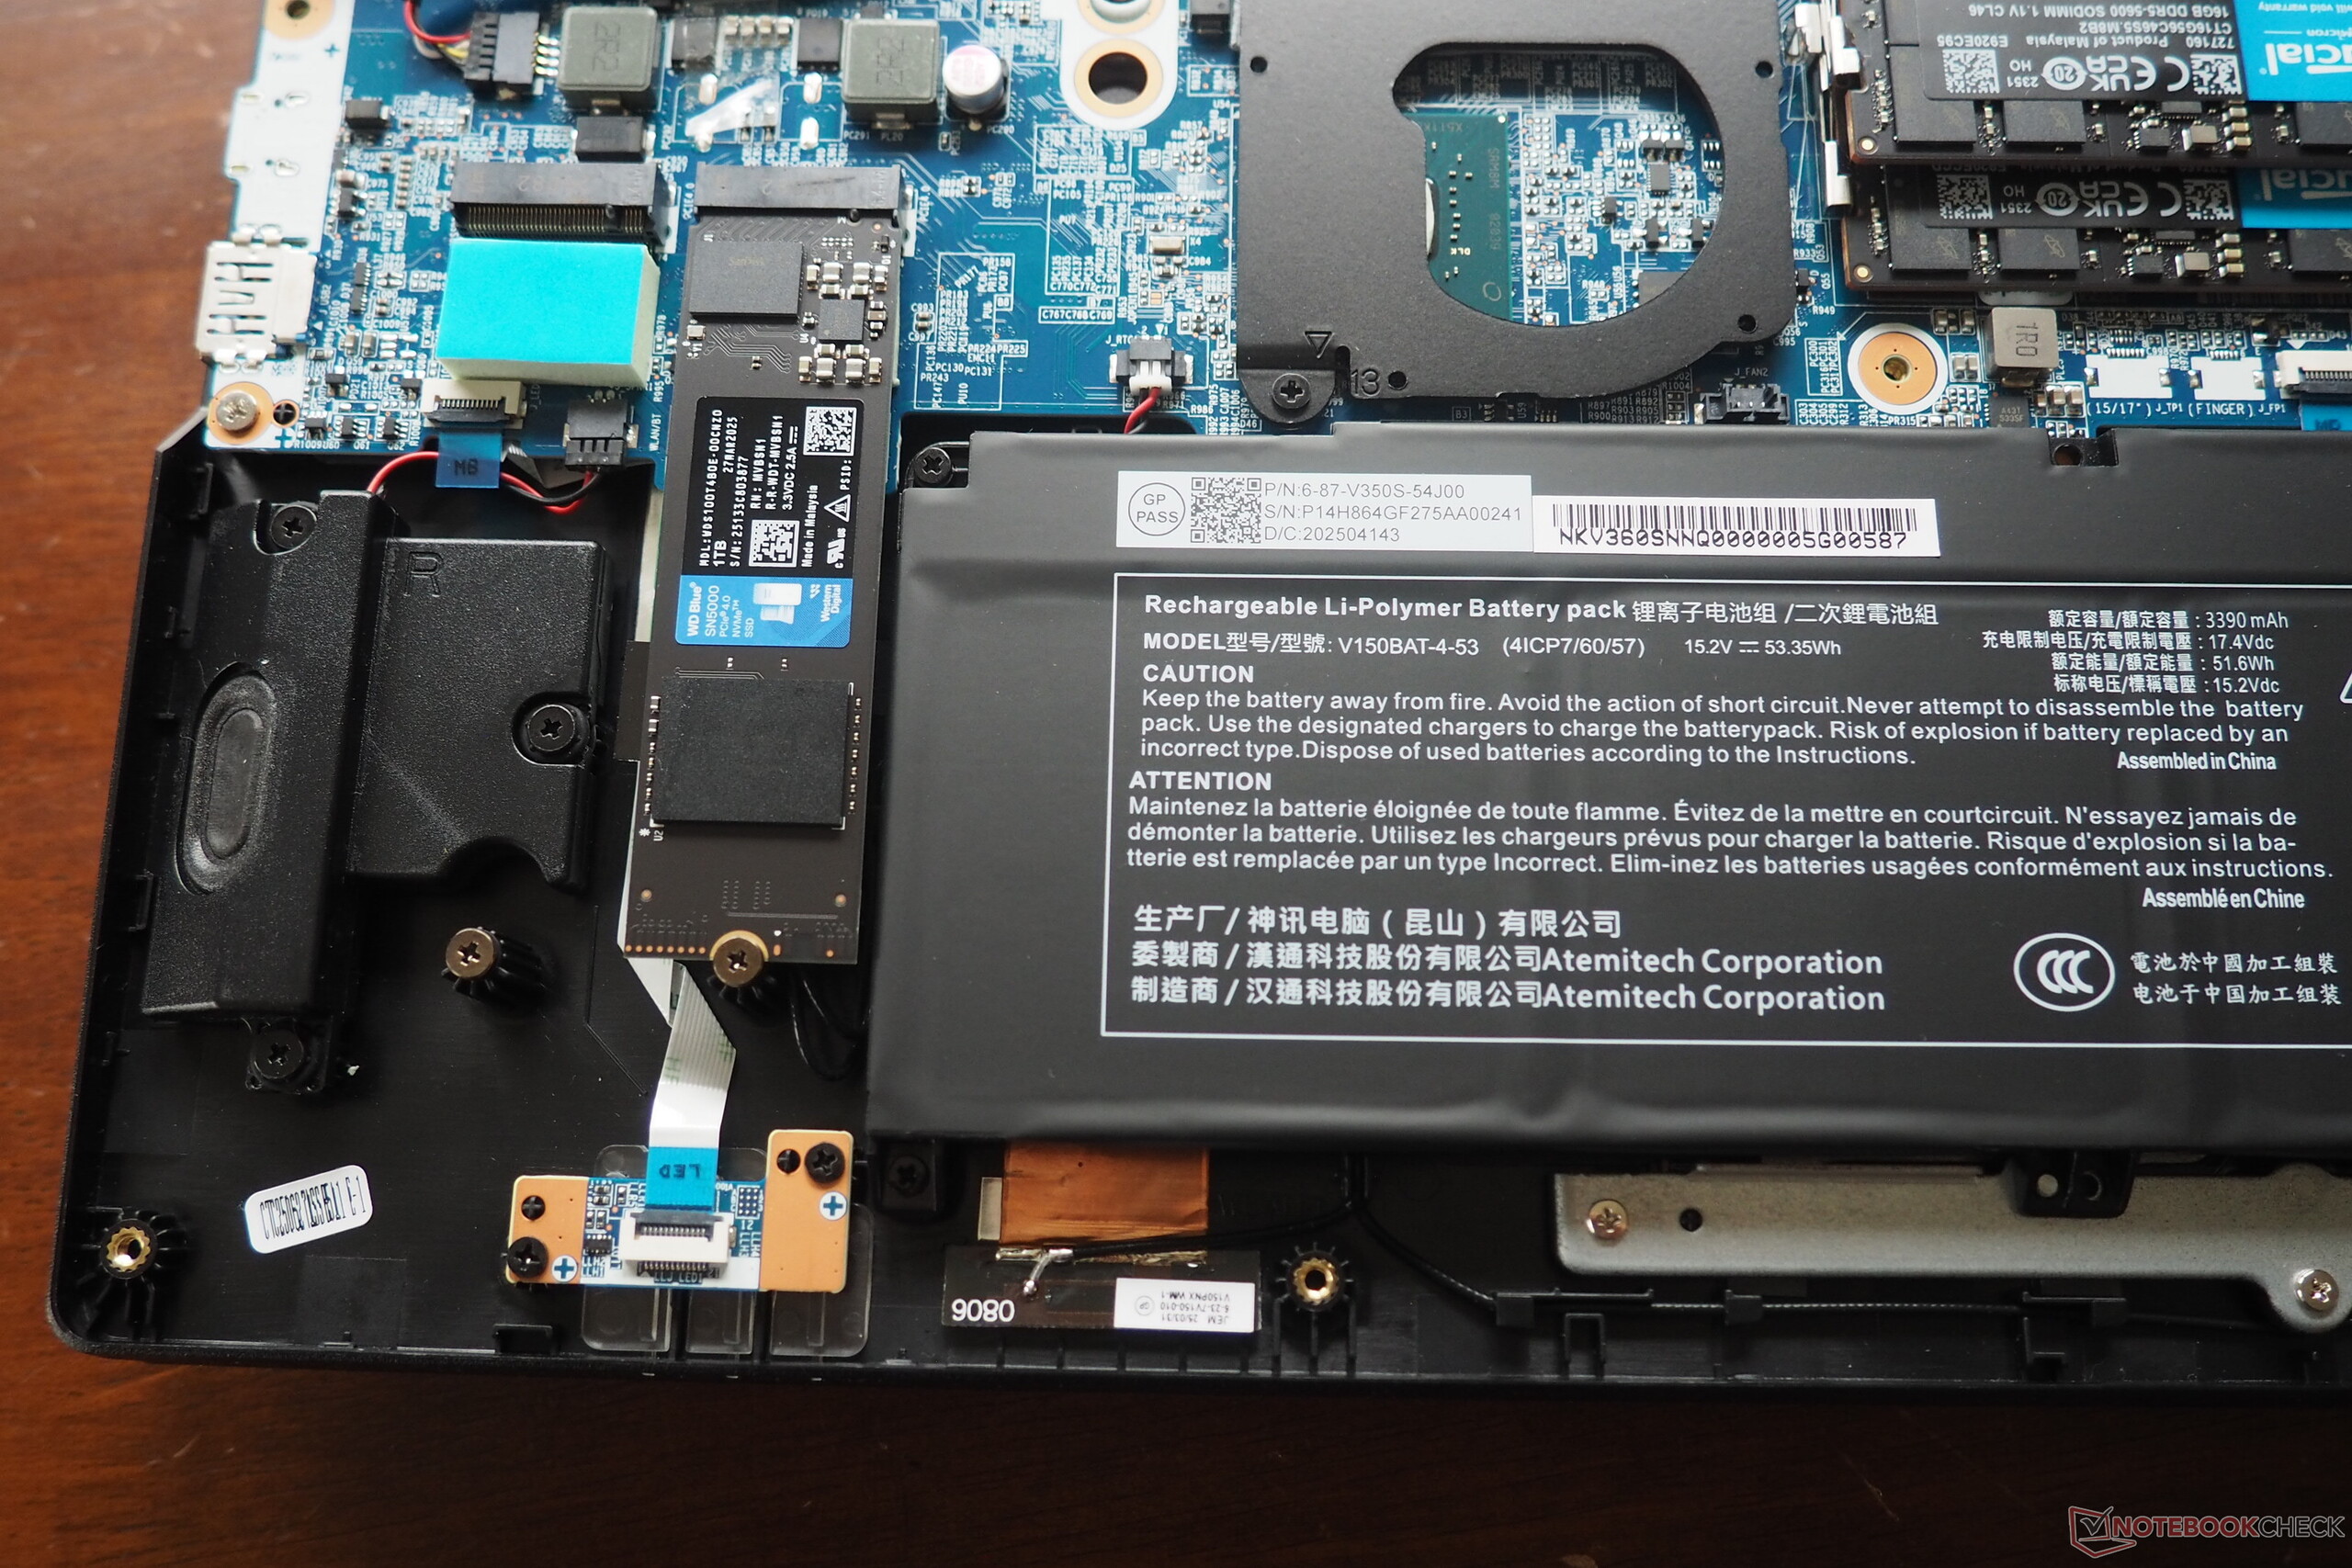
Maintenance
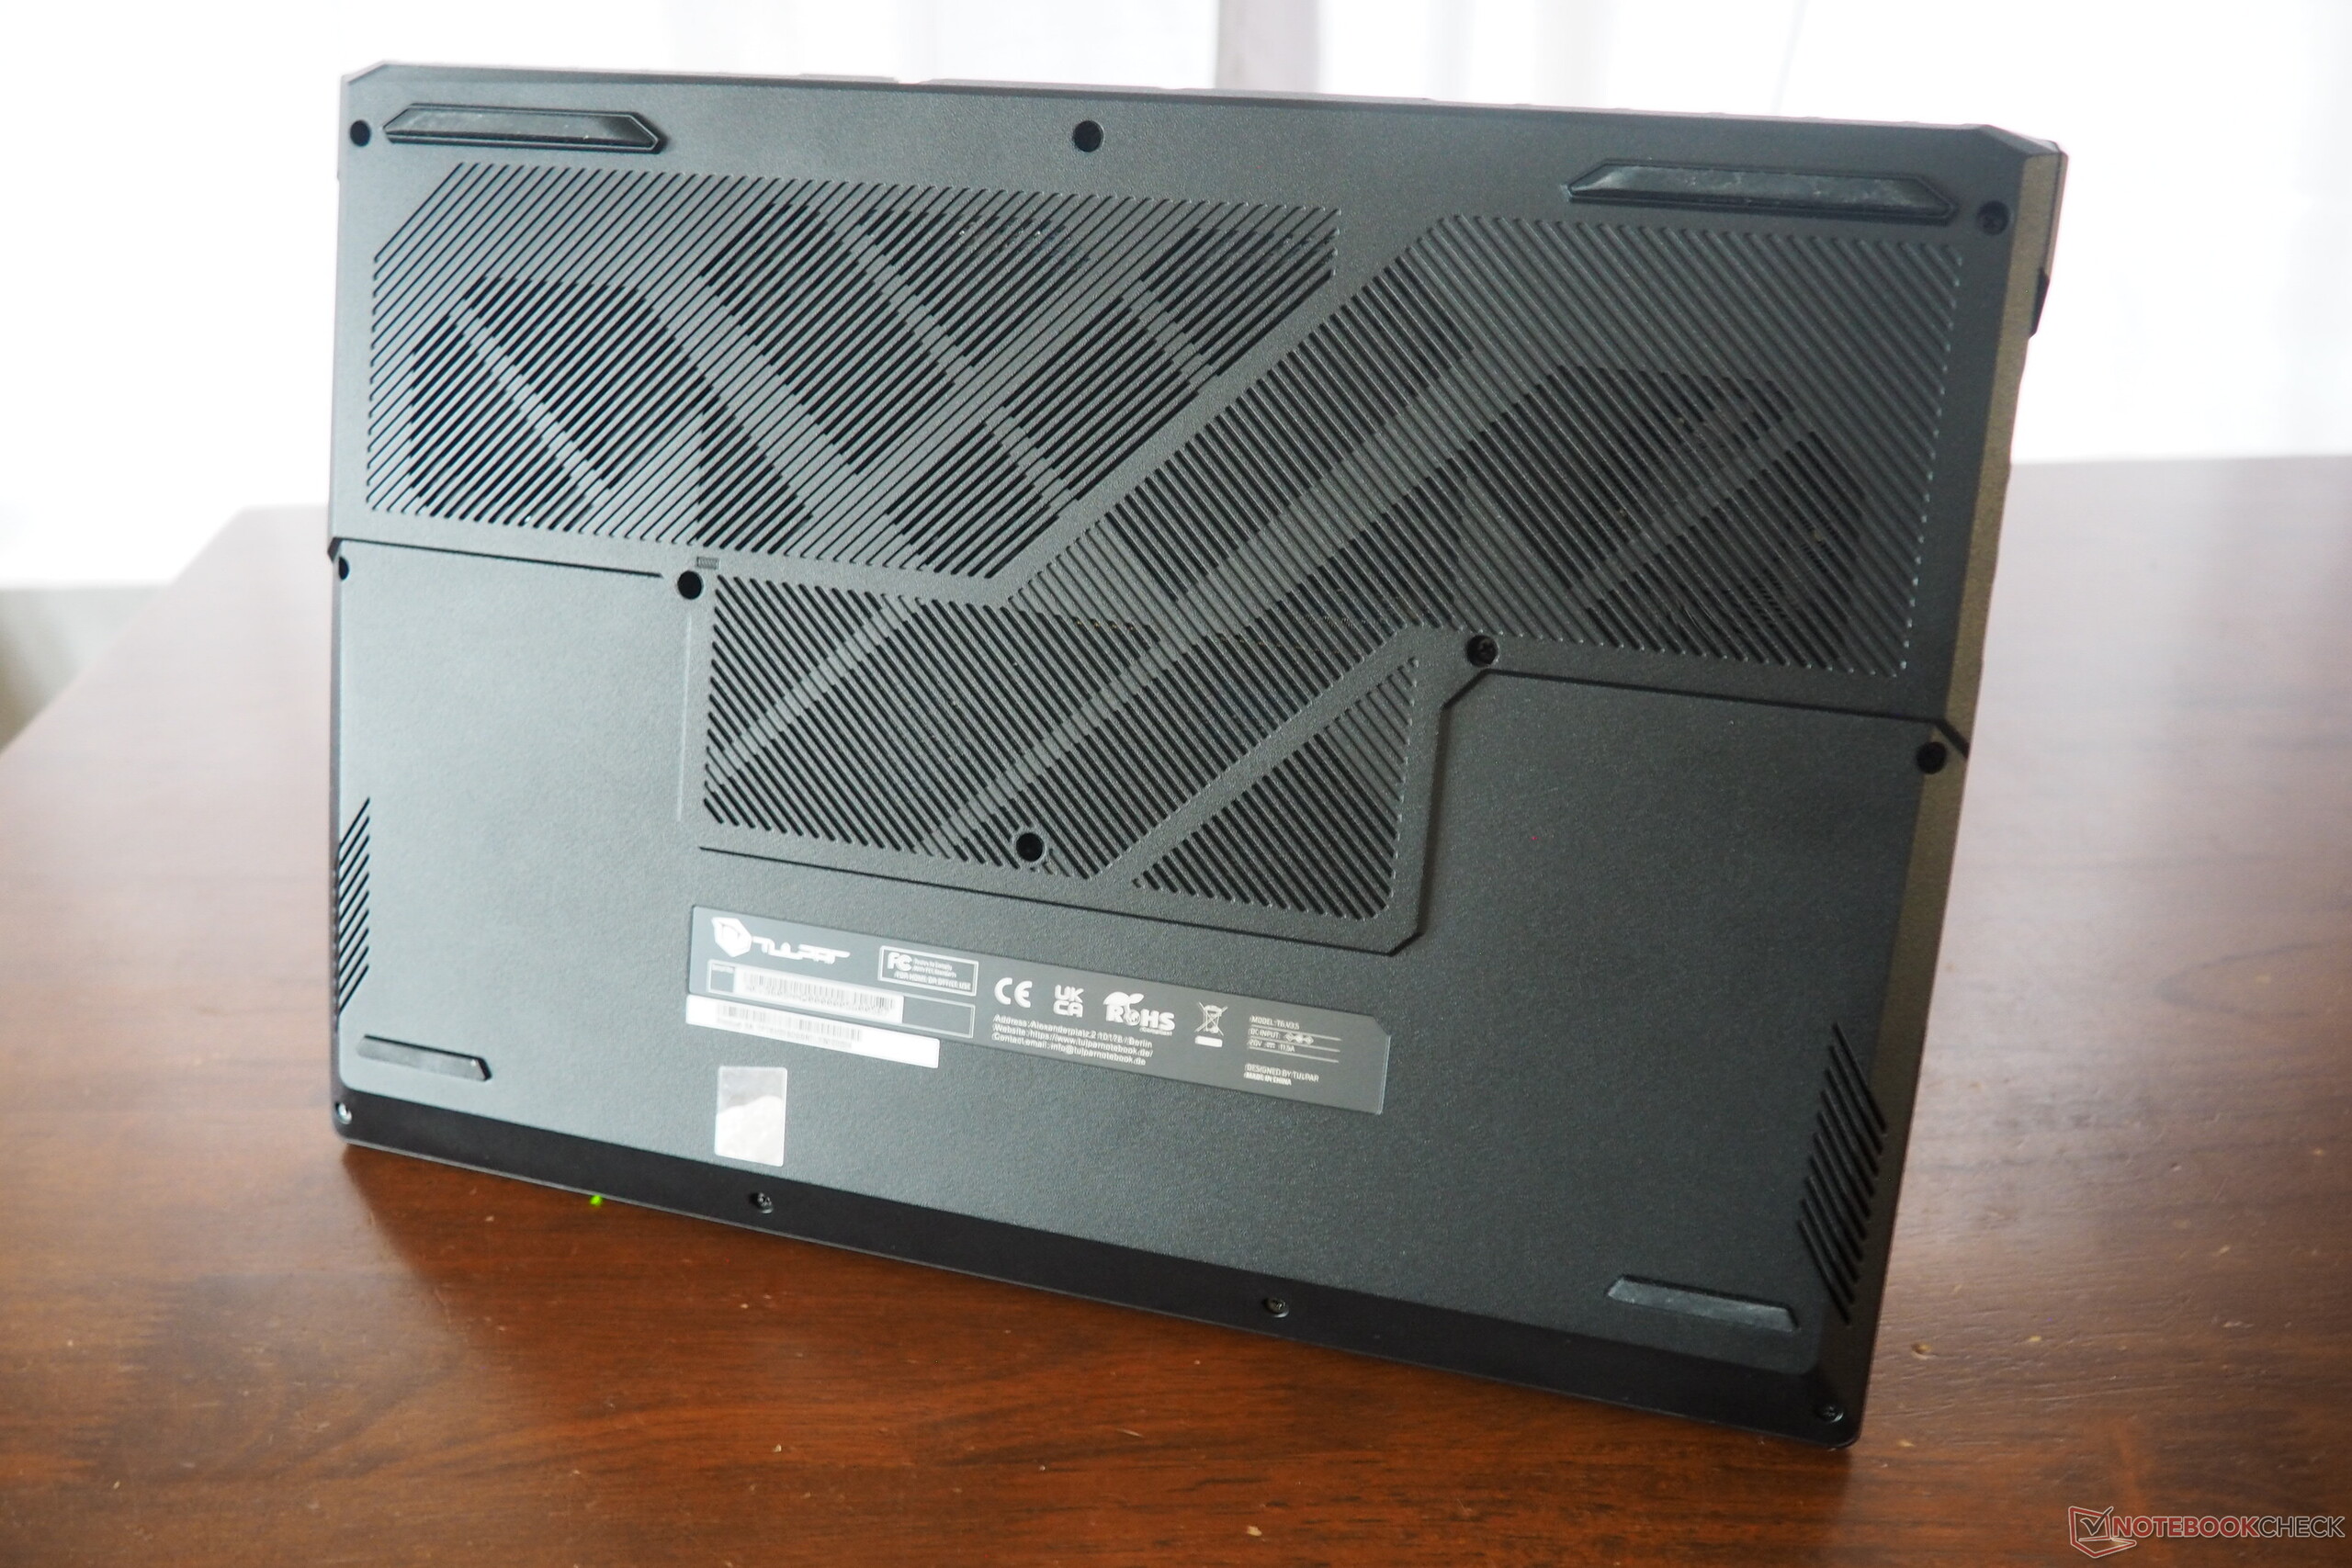
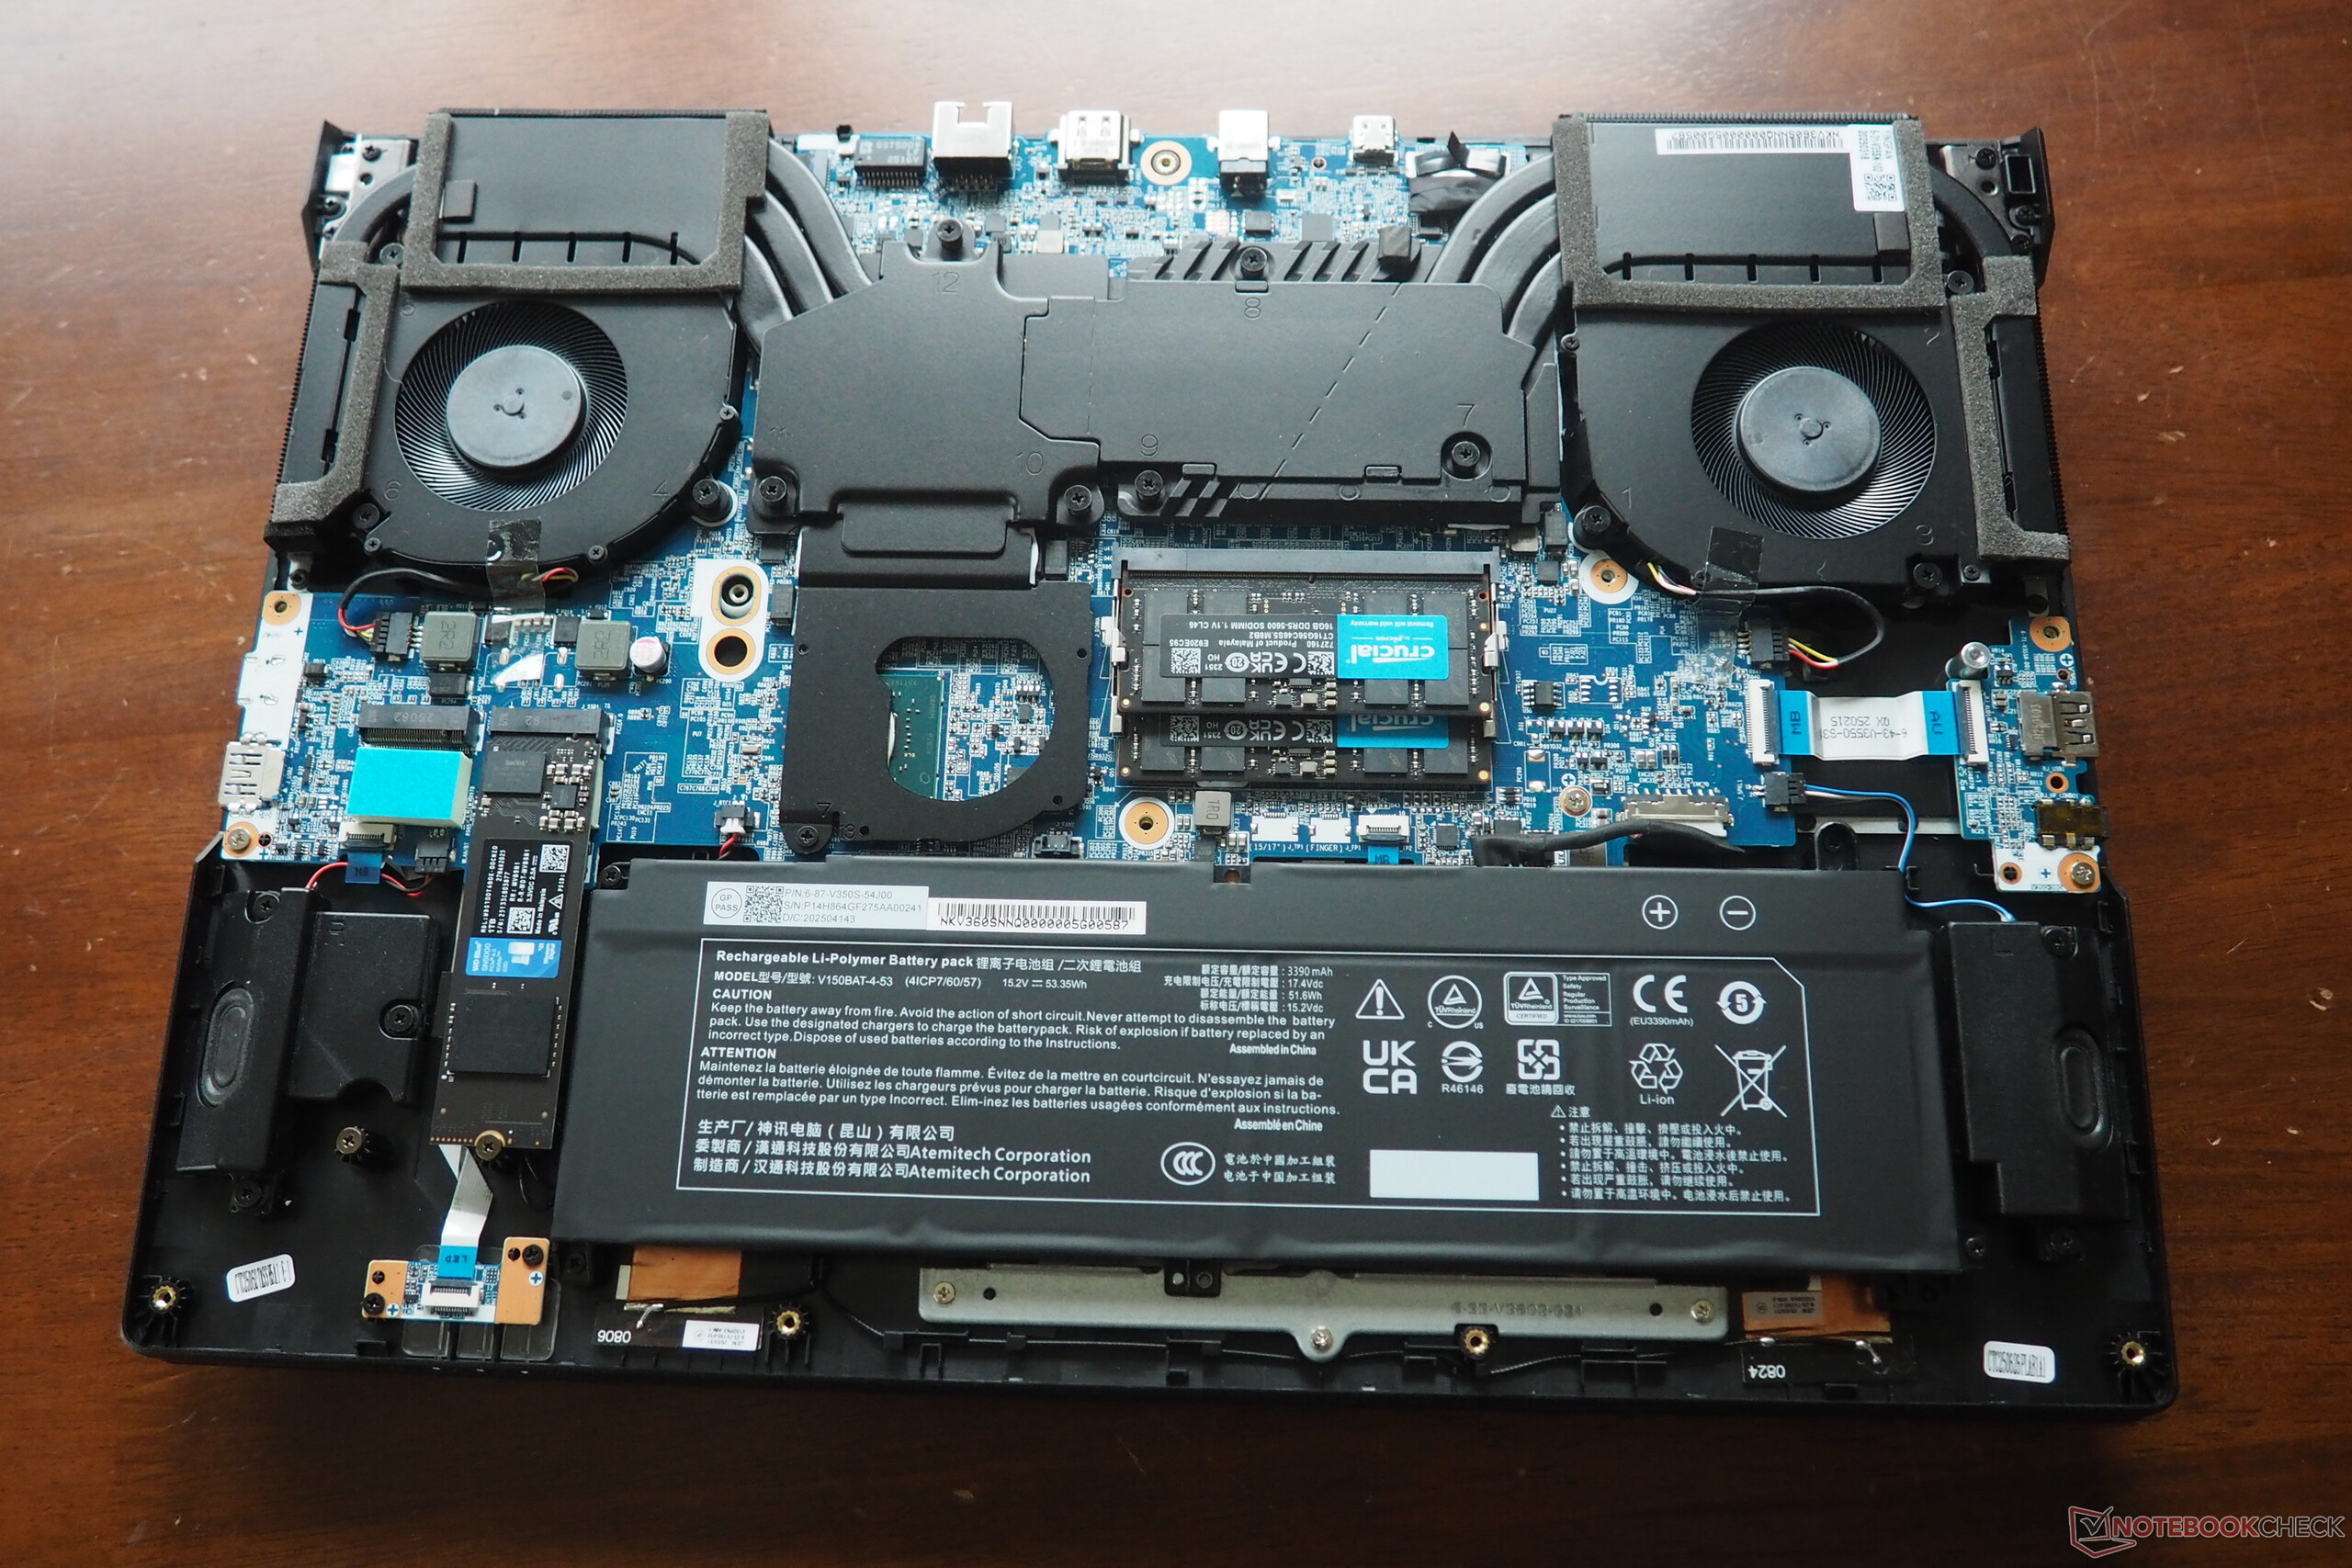
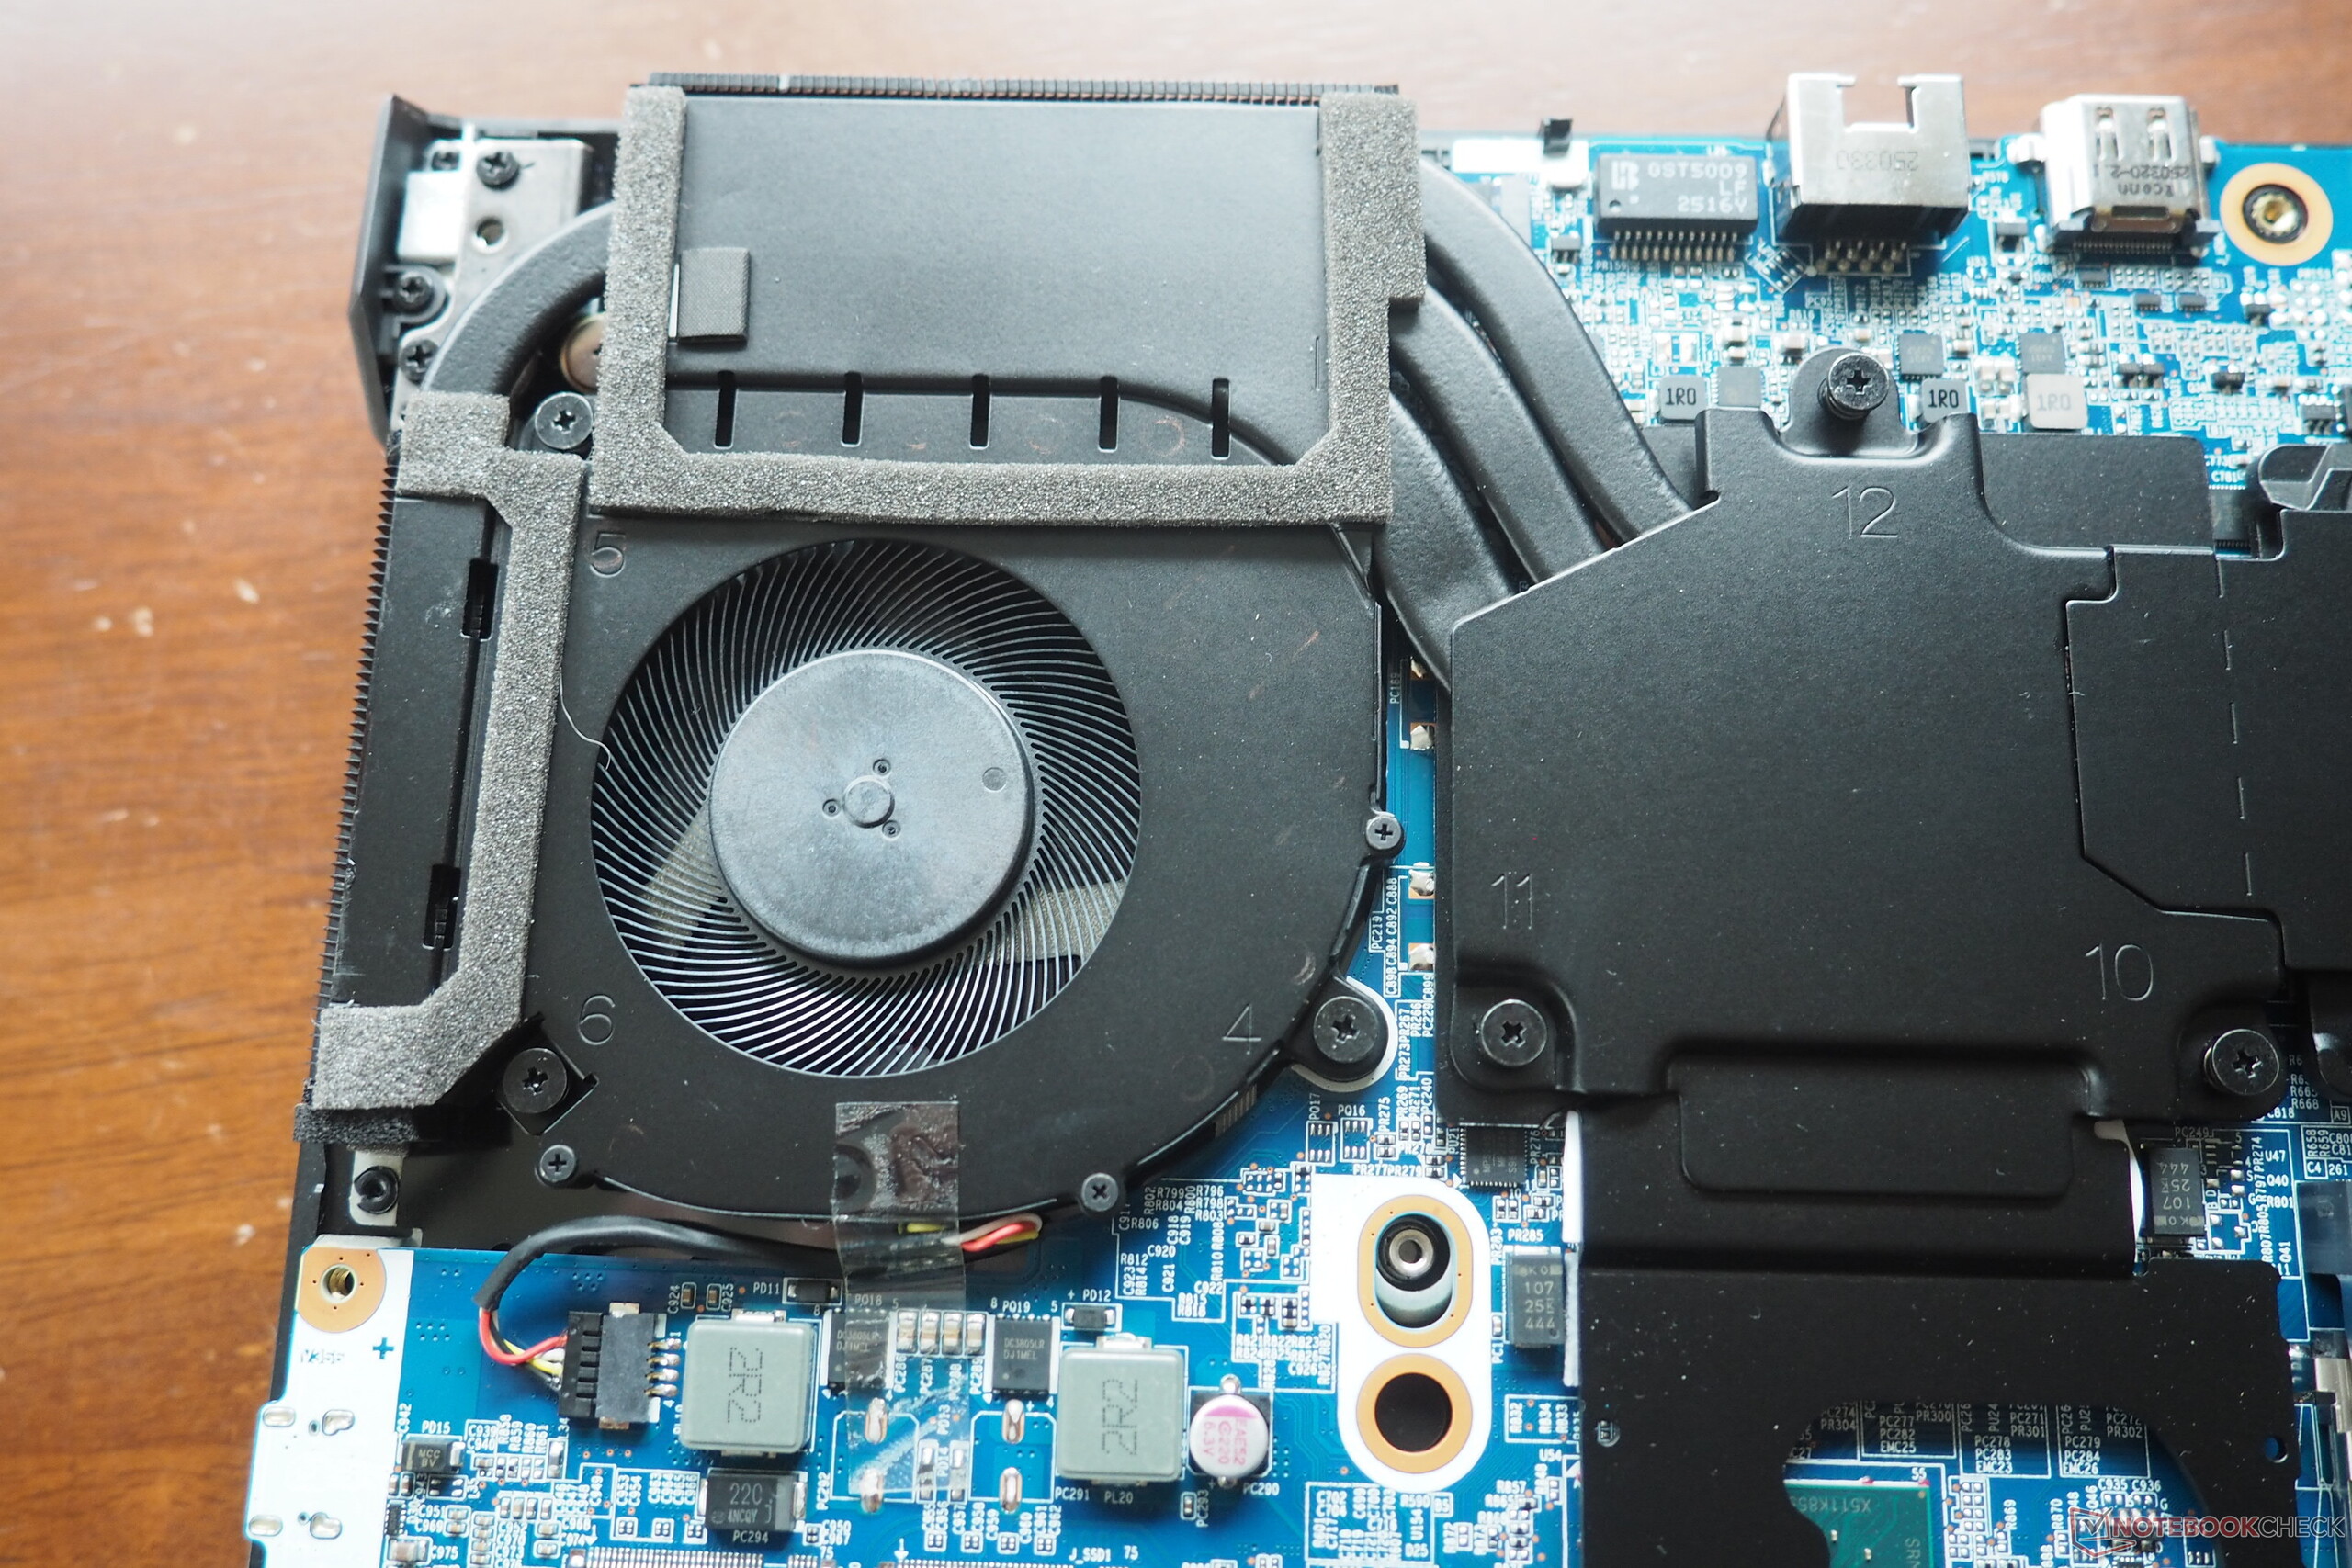
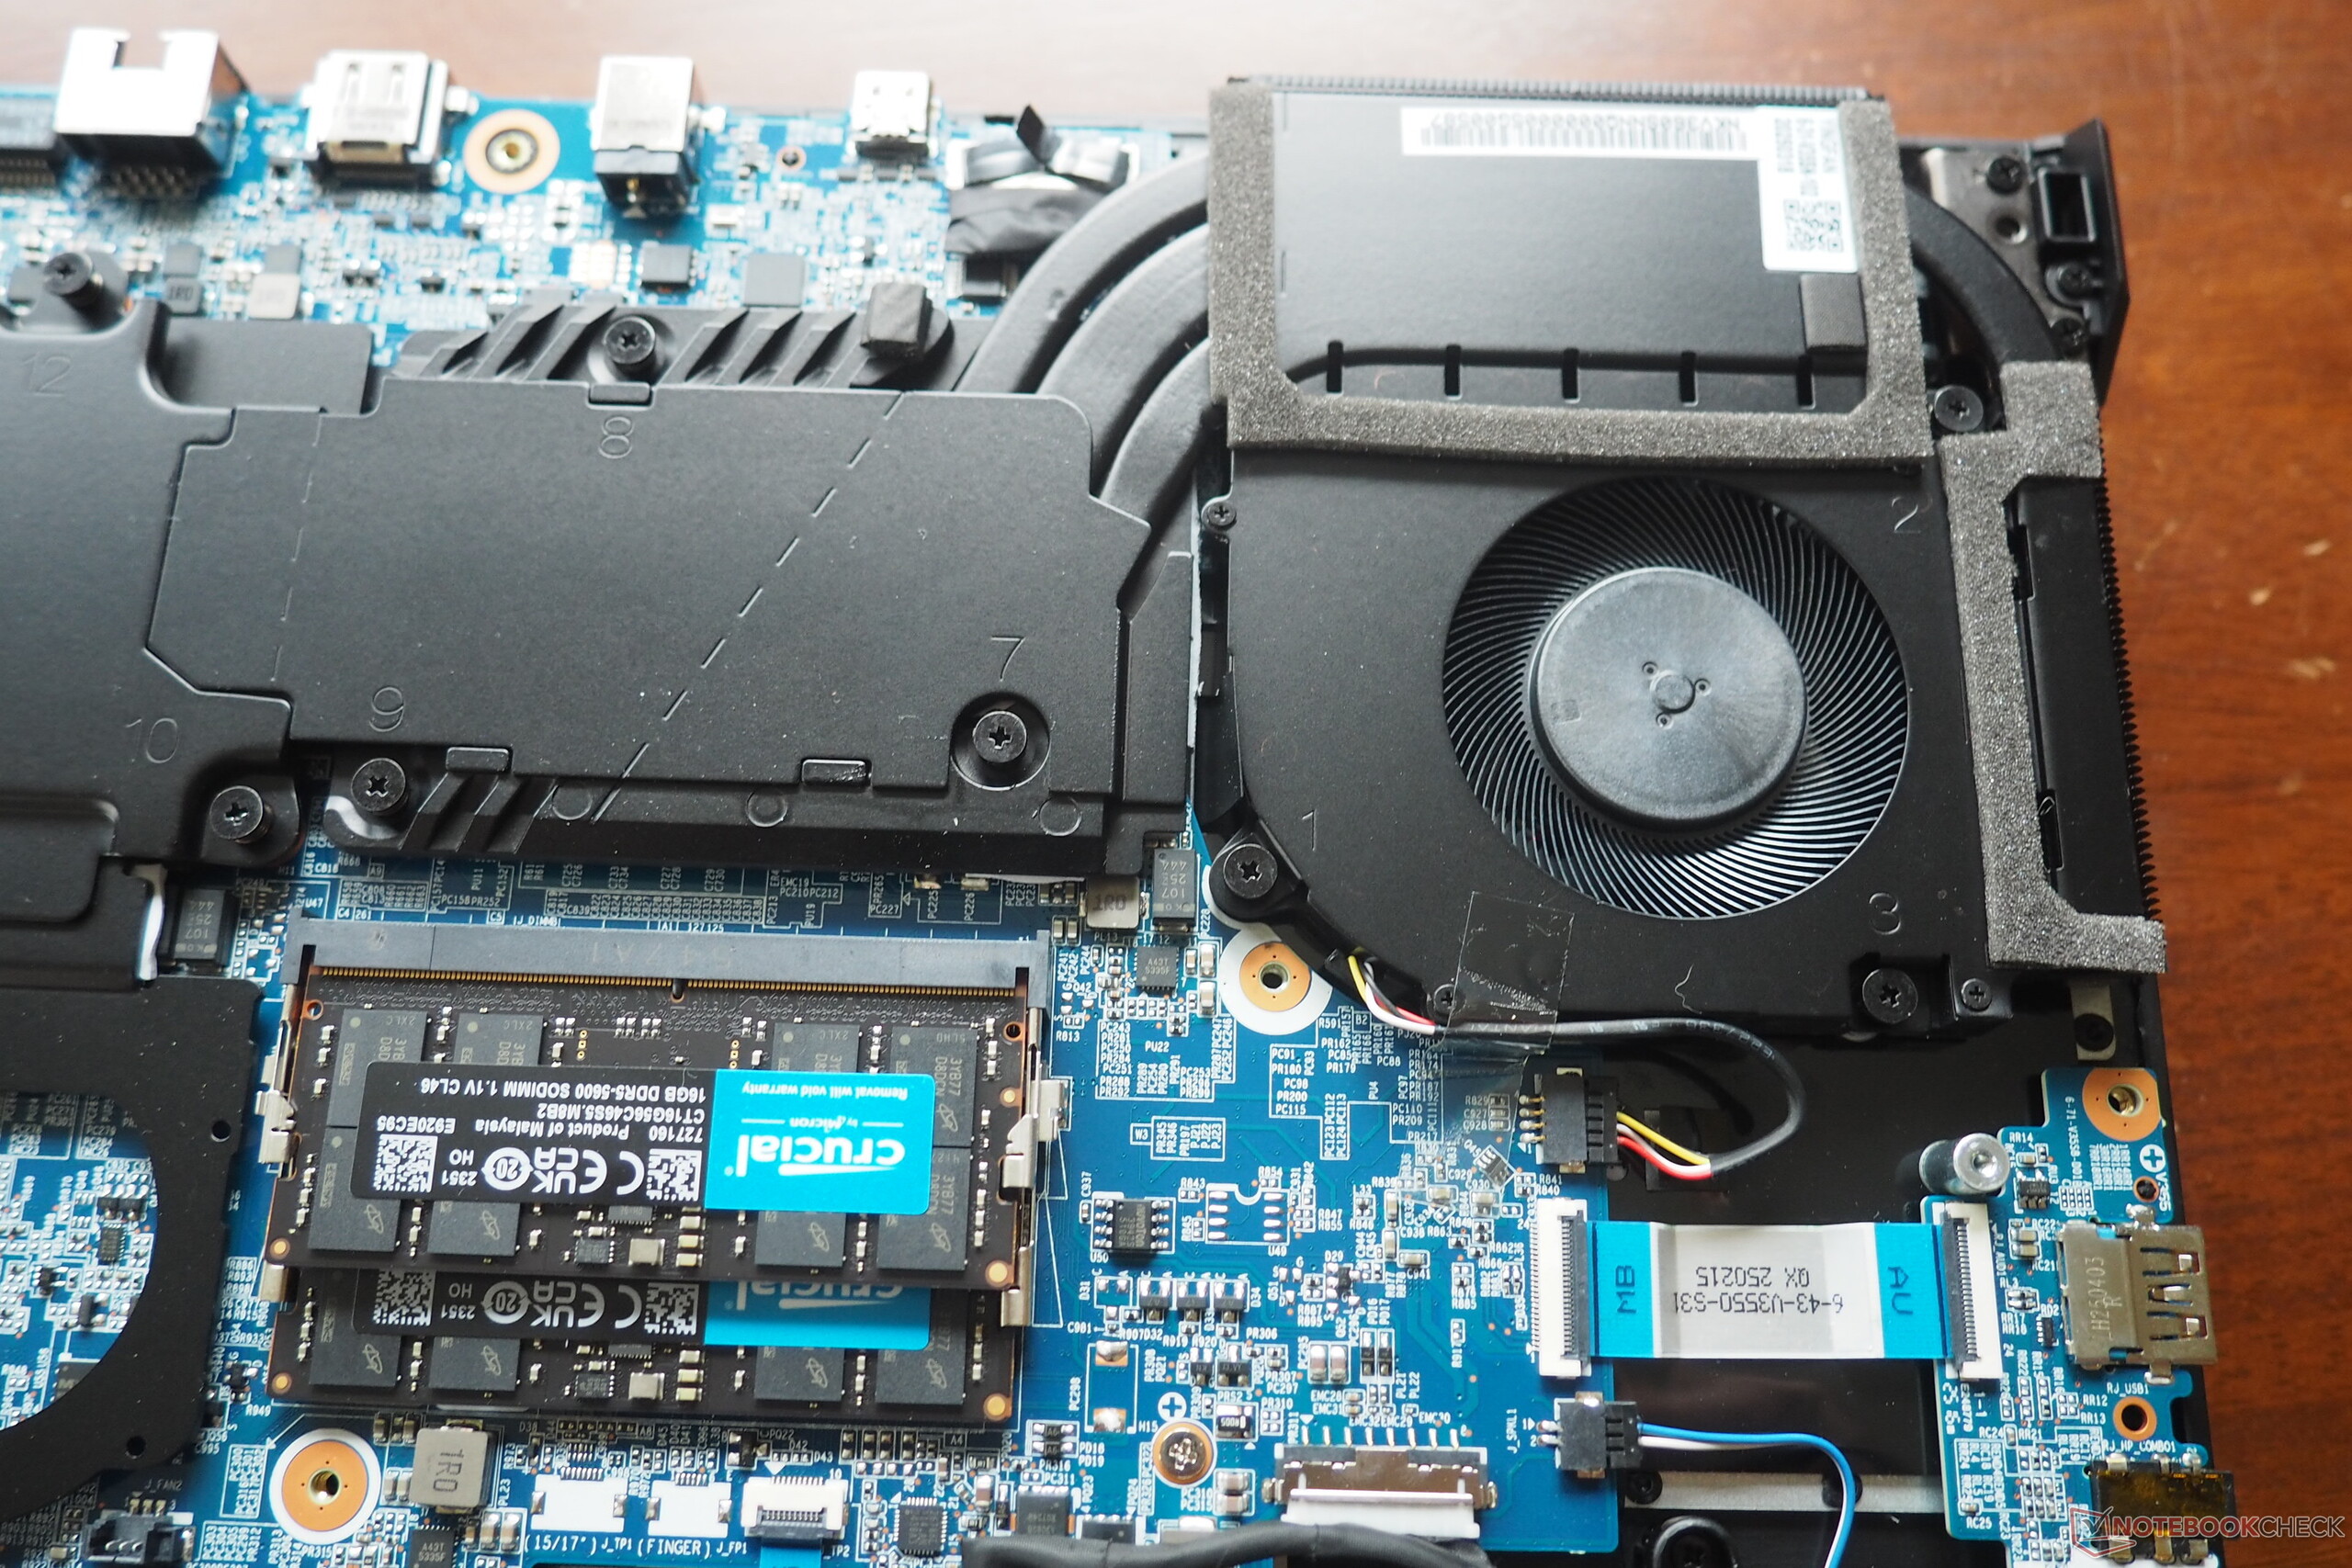
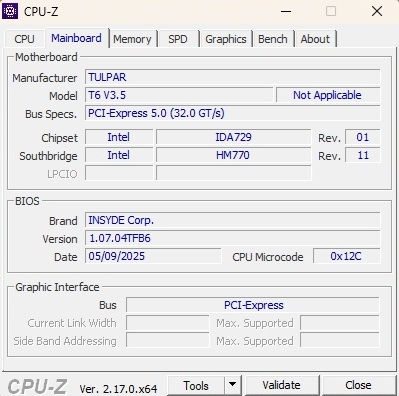
A total of twelve Phillips screws have to be removed before you can pry the bottom cover out of its mounts. Under the hood, you’ll find a cooling system with two fans, along with two RAM slots and two SSD slots. The battery is also accessible from here.
Sustainability
Unfortunately, the packaging uses a large amount of plastic.
Guarantee
Tulpar Notebook provides a 24-month warranty on the device and advertises a “lifetime free maintenance service.” We visited the manufacturer in Berlin some time ago, and the related article covers this maintenance service in detail.
Tulpar S8 V1.1 18" gaming laptop: Pure Power for the Ultimate Gaming Experience
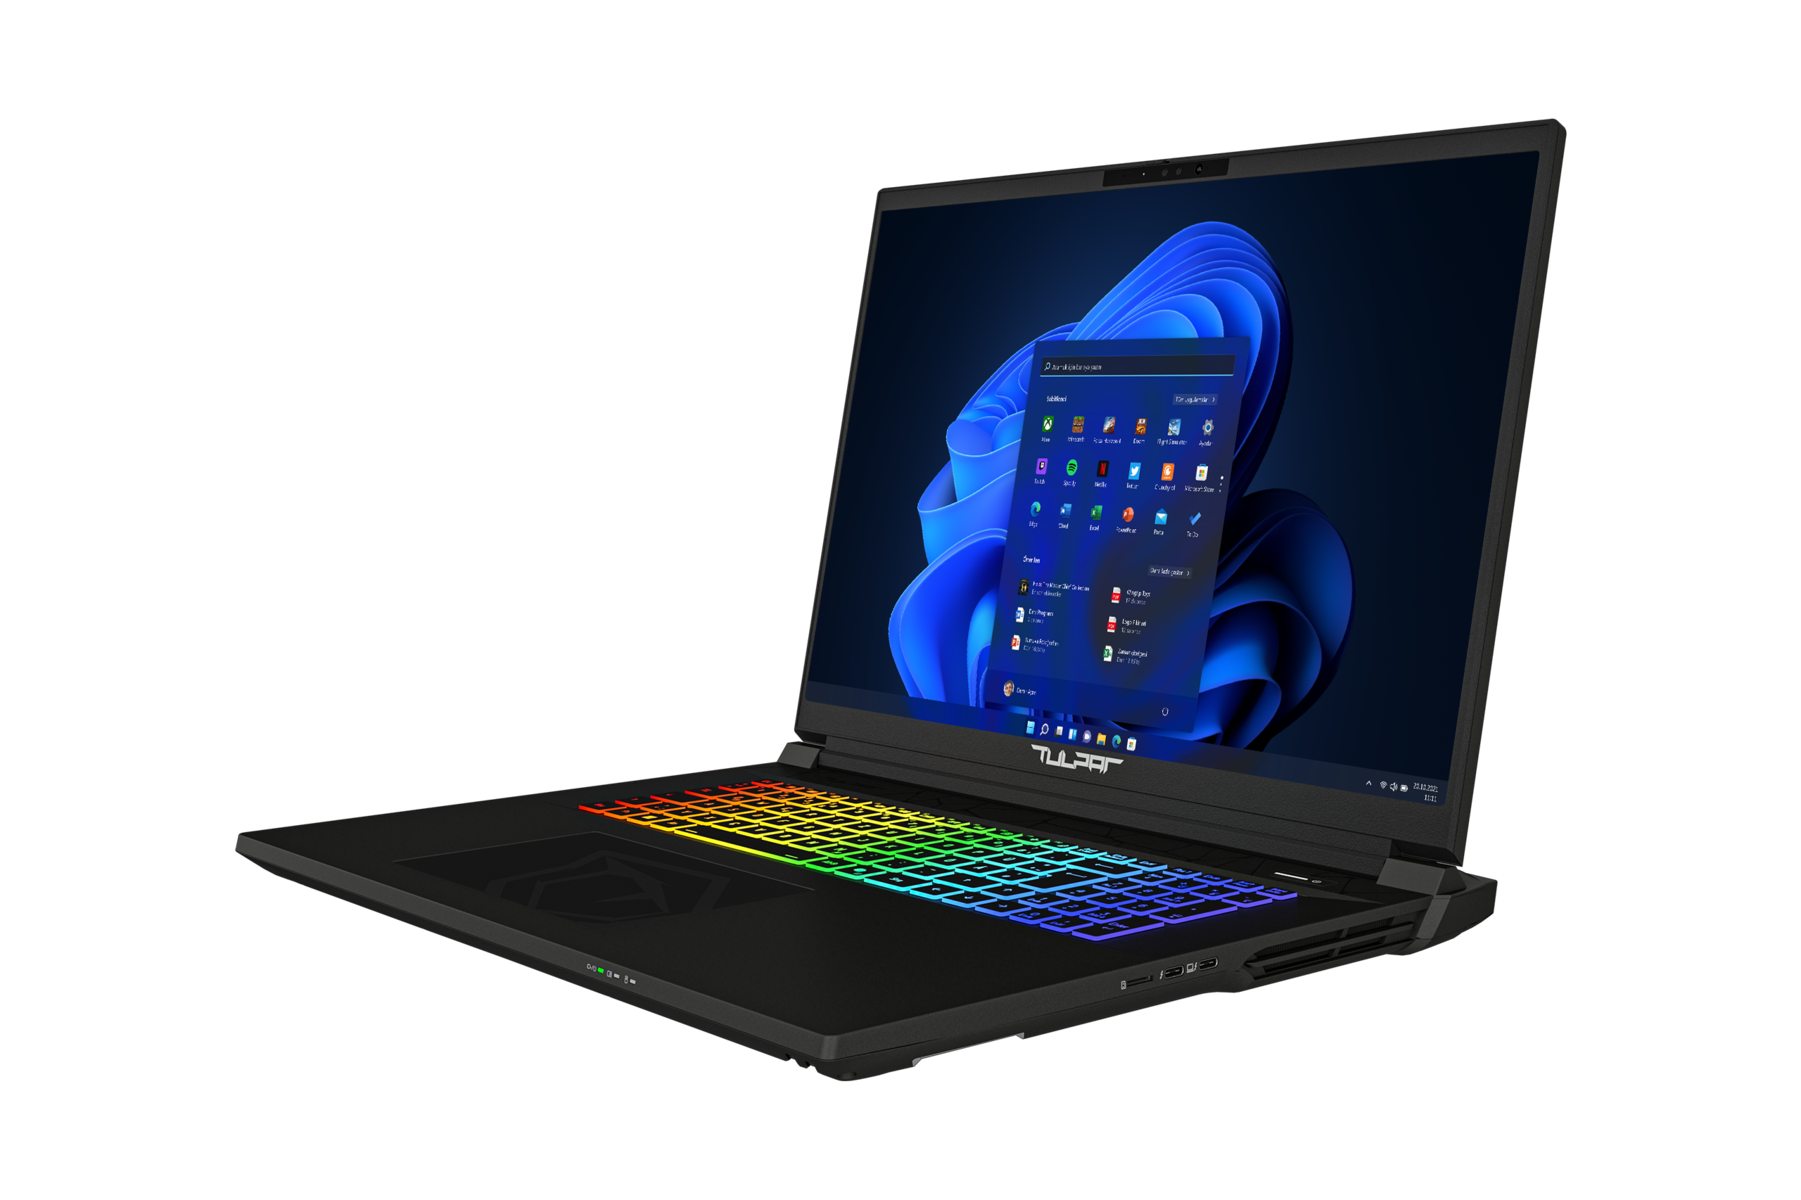
The Tulpar S8 V1.1 is a high-end gaming laptop where exceptional performance meets an extensive feature set and a massive 18-inch display. The combination of an NVIDIA GeForce RTX 5080 and an Intel Core Ultra 9 275HX delivers maximum power for gaming and demanding workloads. A robust cooling system ensures consistently stable performance without compromise.
A standout feature of the Tulpar S8 V1.1 is its IPS LED panel, designed specifically for gamers. With a 2560×1600 resolution and a 240 Hz refresh rate, the huge 18-inch screen provides vivid, ultra-smooth gameplay. The display also supports NVIDIA G-SYNC and covers 100% of the DCI-P3 color space, making it well-suited for creative professionals.
Fully equipped like a desktop PC, the Tulpar S8 V1.1 supports up to 192 GB of DDR5-4400 RAM and offers four M.2 SSD slots, eliminating any concerns about memory or storage limitations. The laptop also includes dual RJ45 ports, HDMI 2.1, and two Thunderbolt 5 (DisplayPort 2.1) ports. A powerful five-speaker audio system rounds out the premium experience.
The Tulpar S8 V1.1 can be fully customized in the Tulpar online store to match your exact requirements.
Input devices
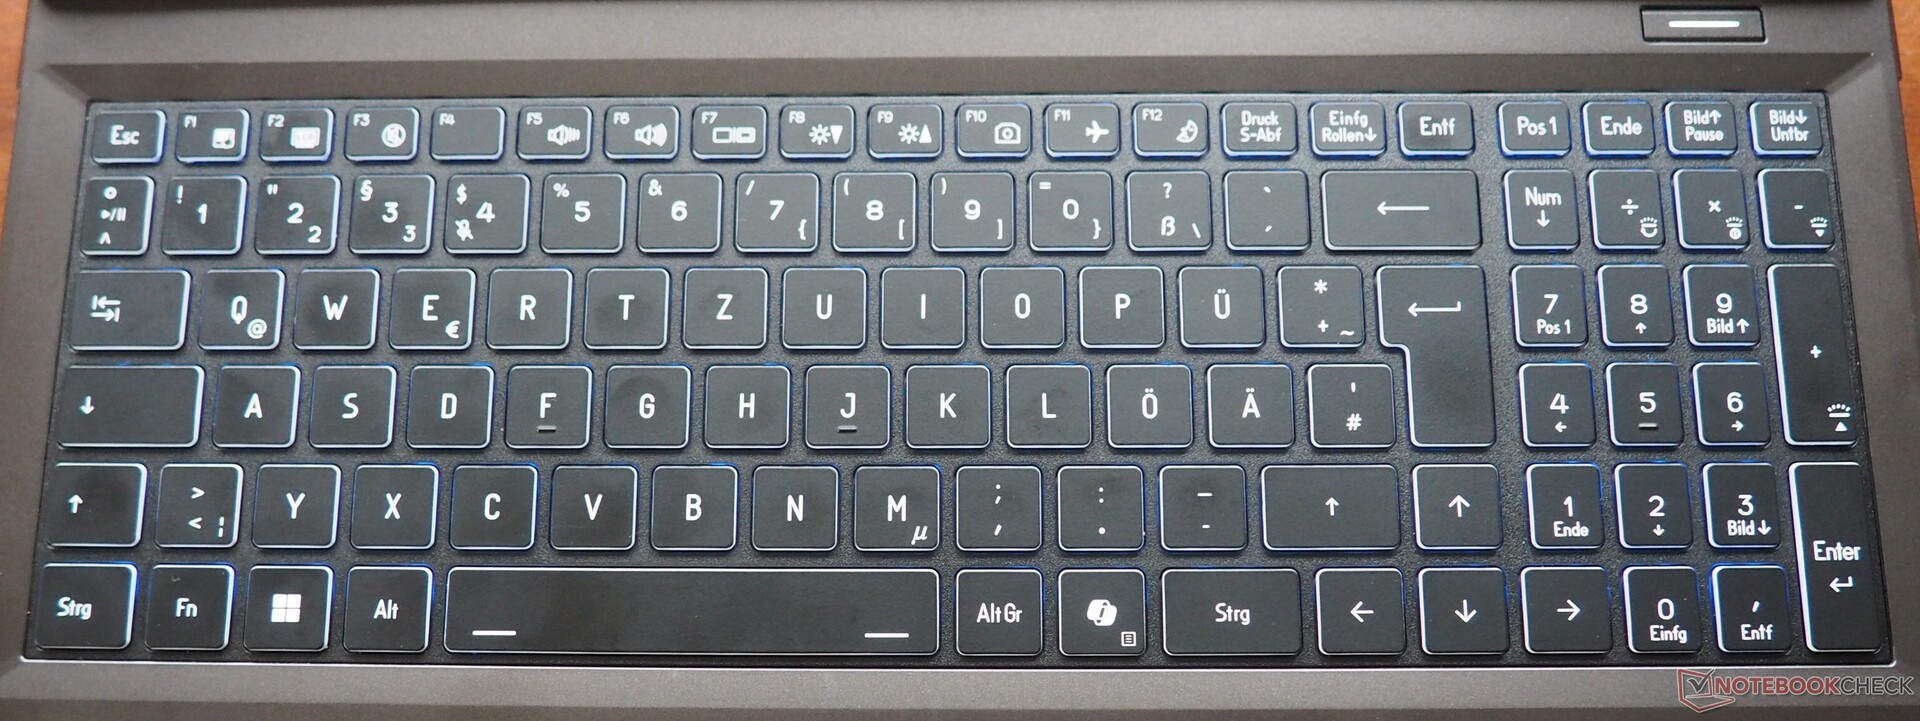
Keyboard
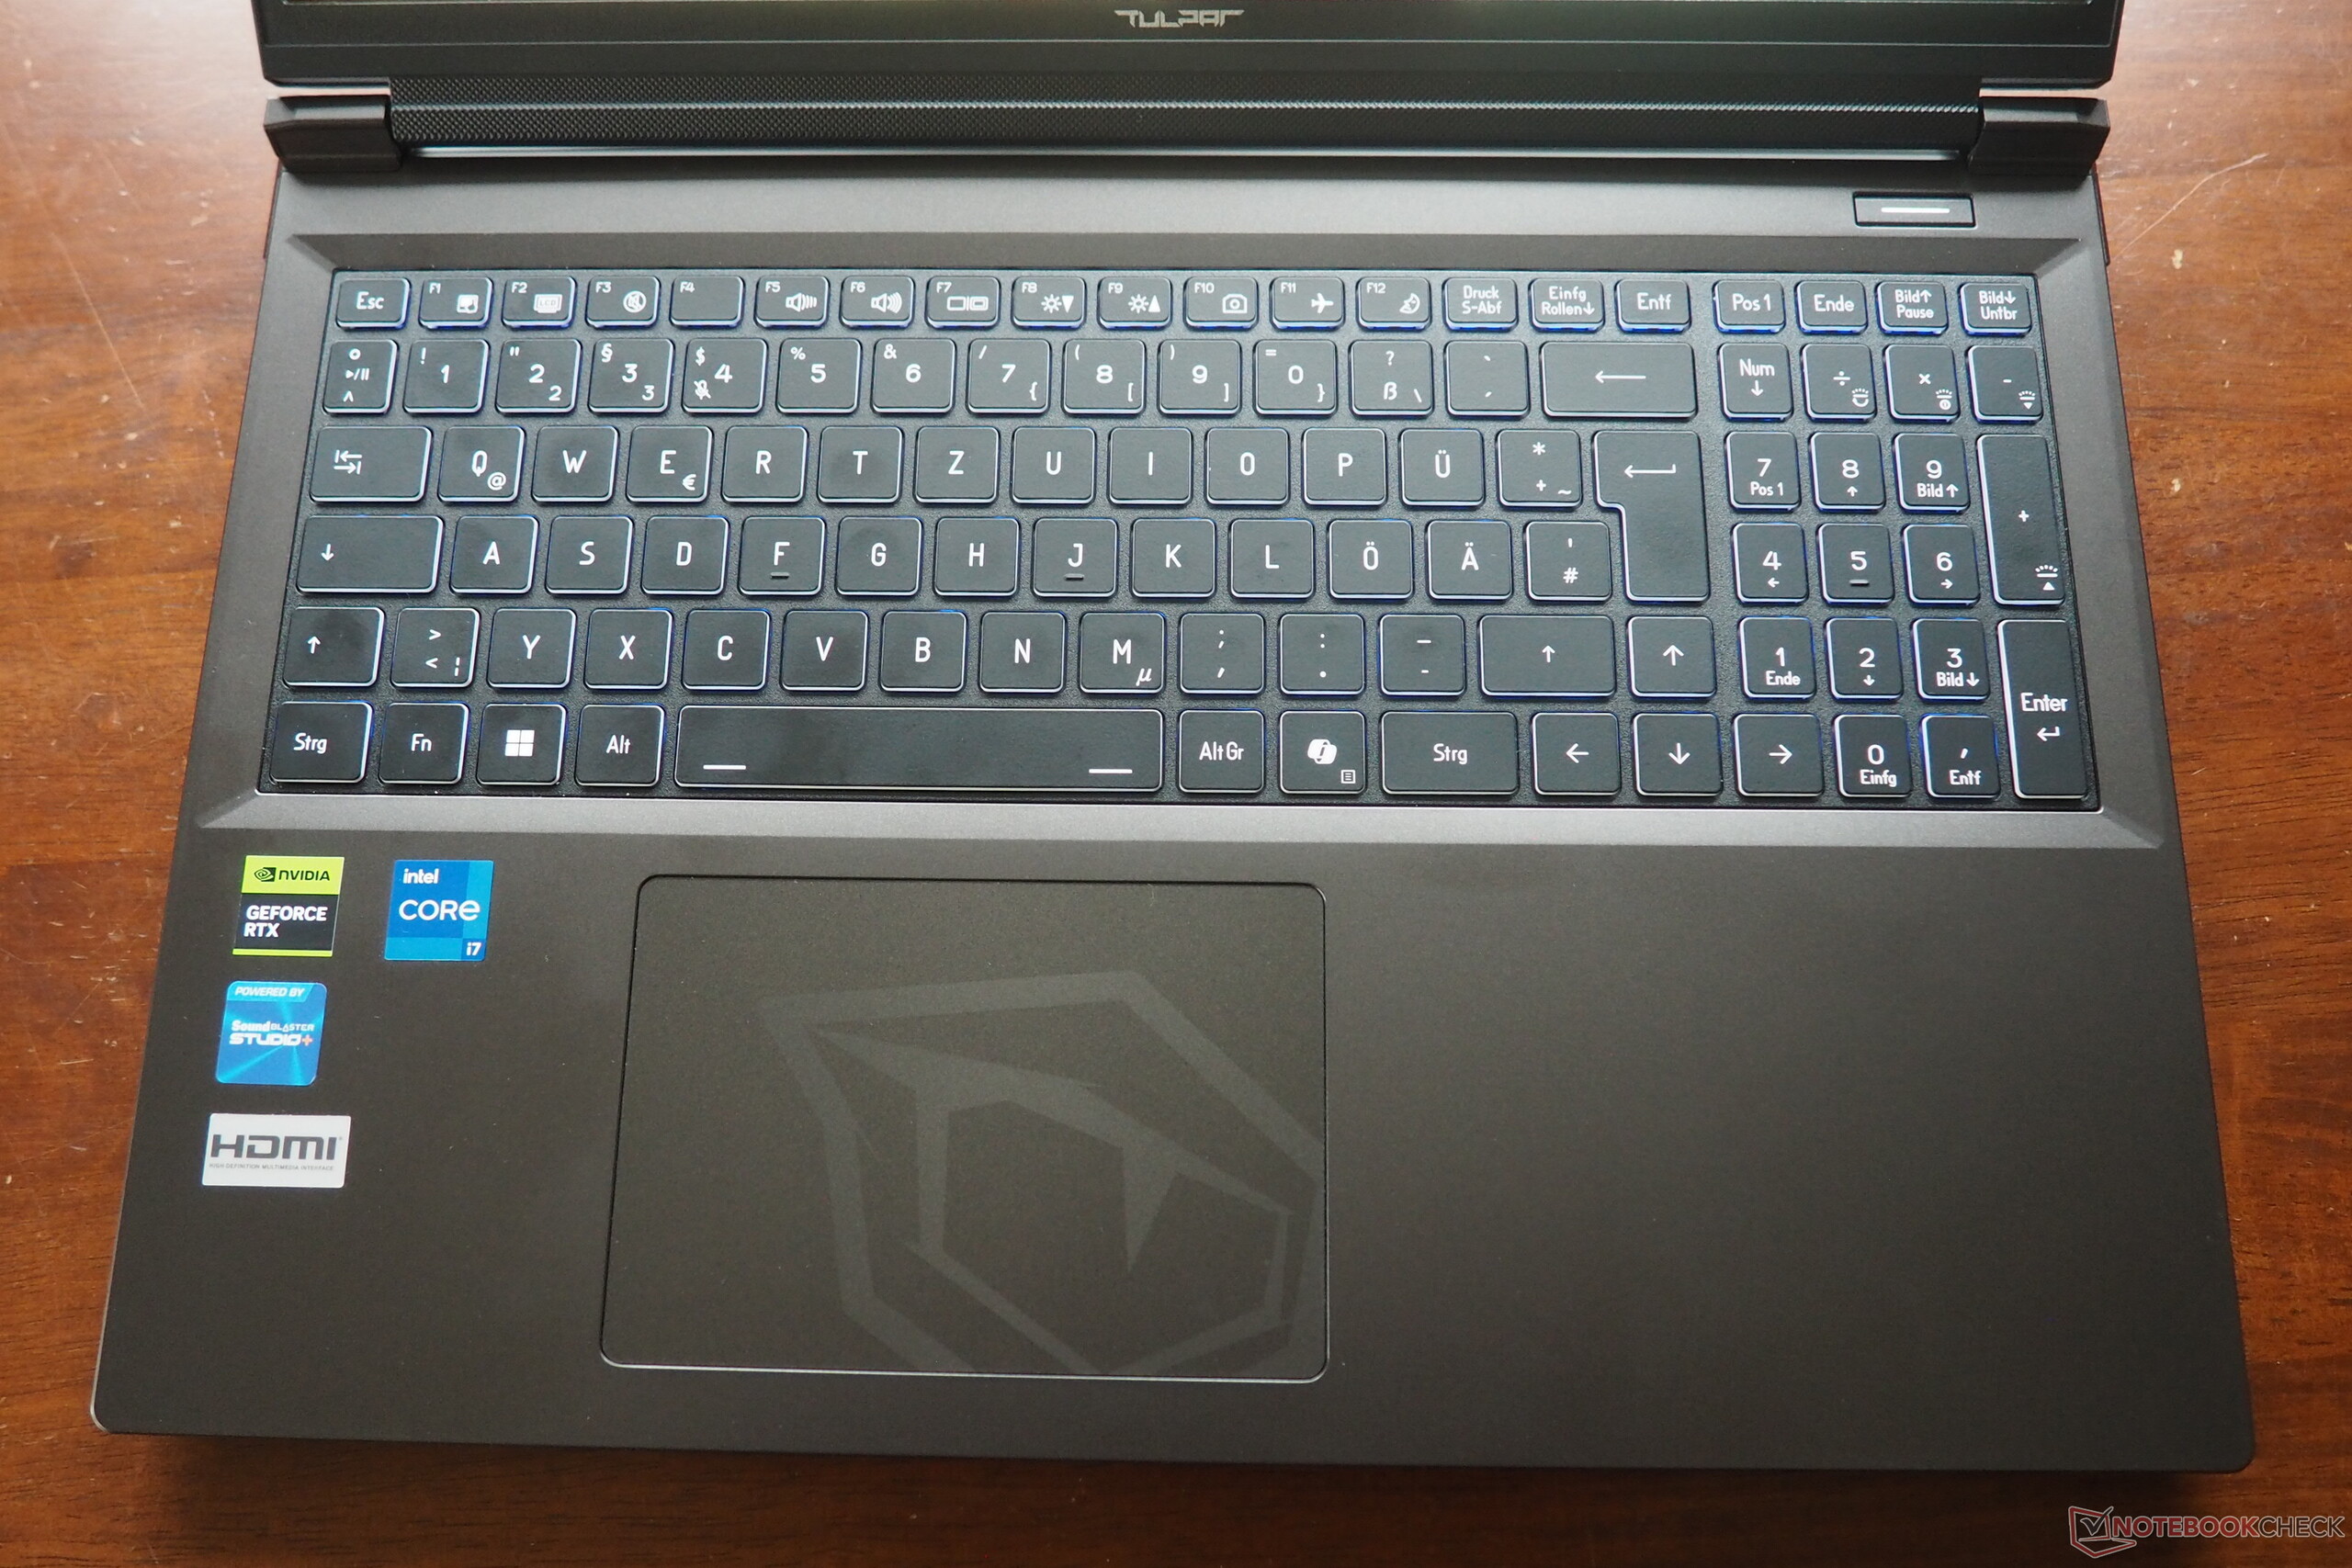
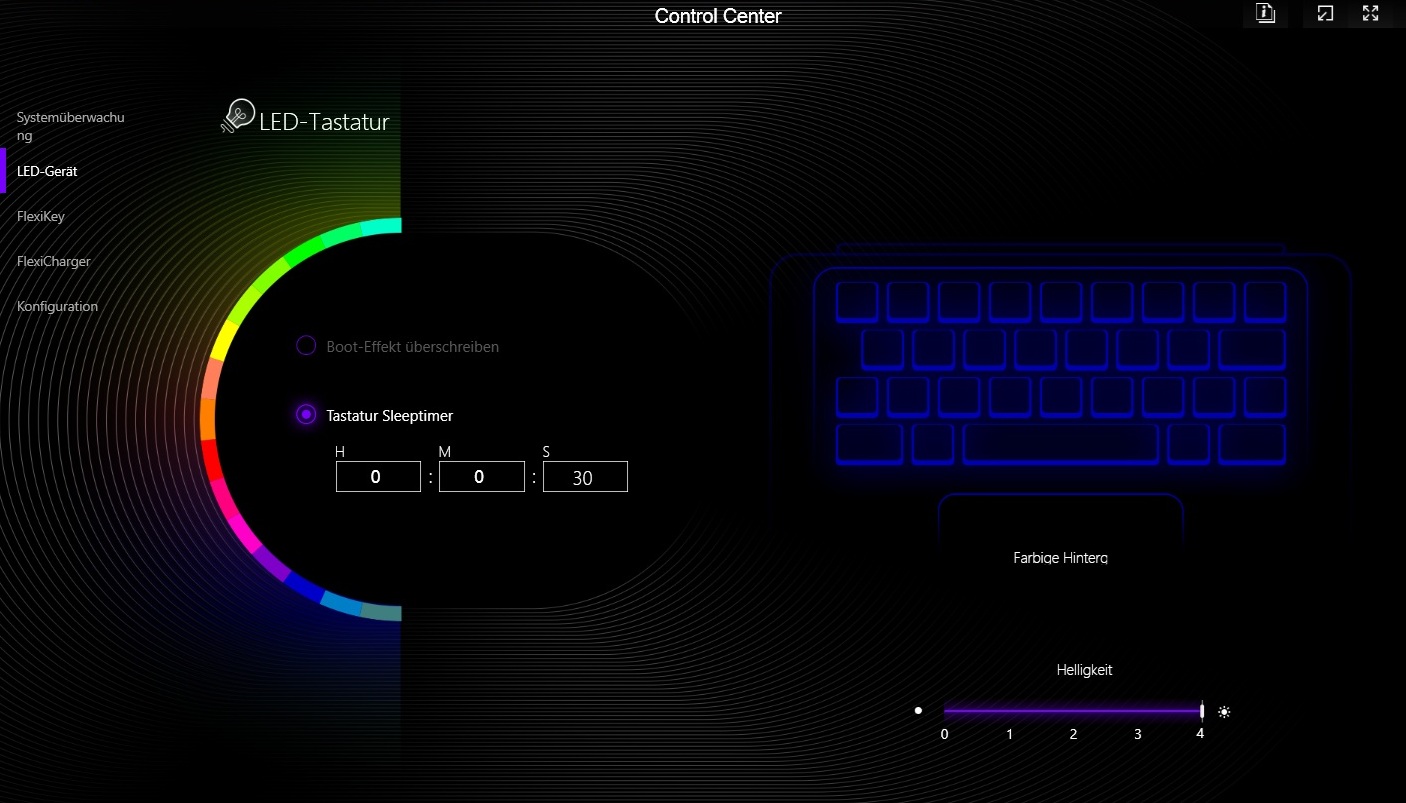
The keyboard doesn’t stand out in most areas, for better or worse. The layout is a strong point, though, as it sticks closely to a standard arrangement and offers well-sized arrow keys. Typing feel is acceptable, but the backlighting could be brighter even at its highest setting.
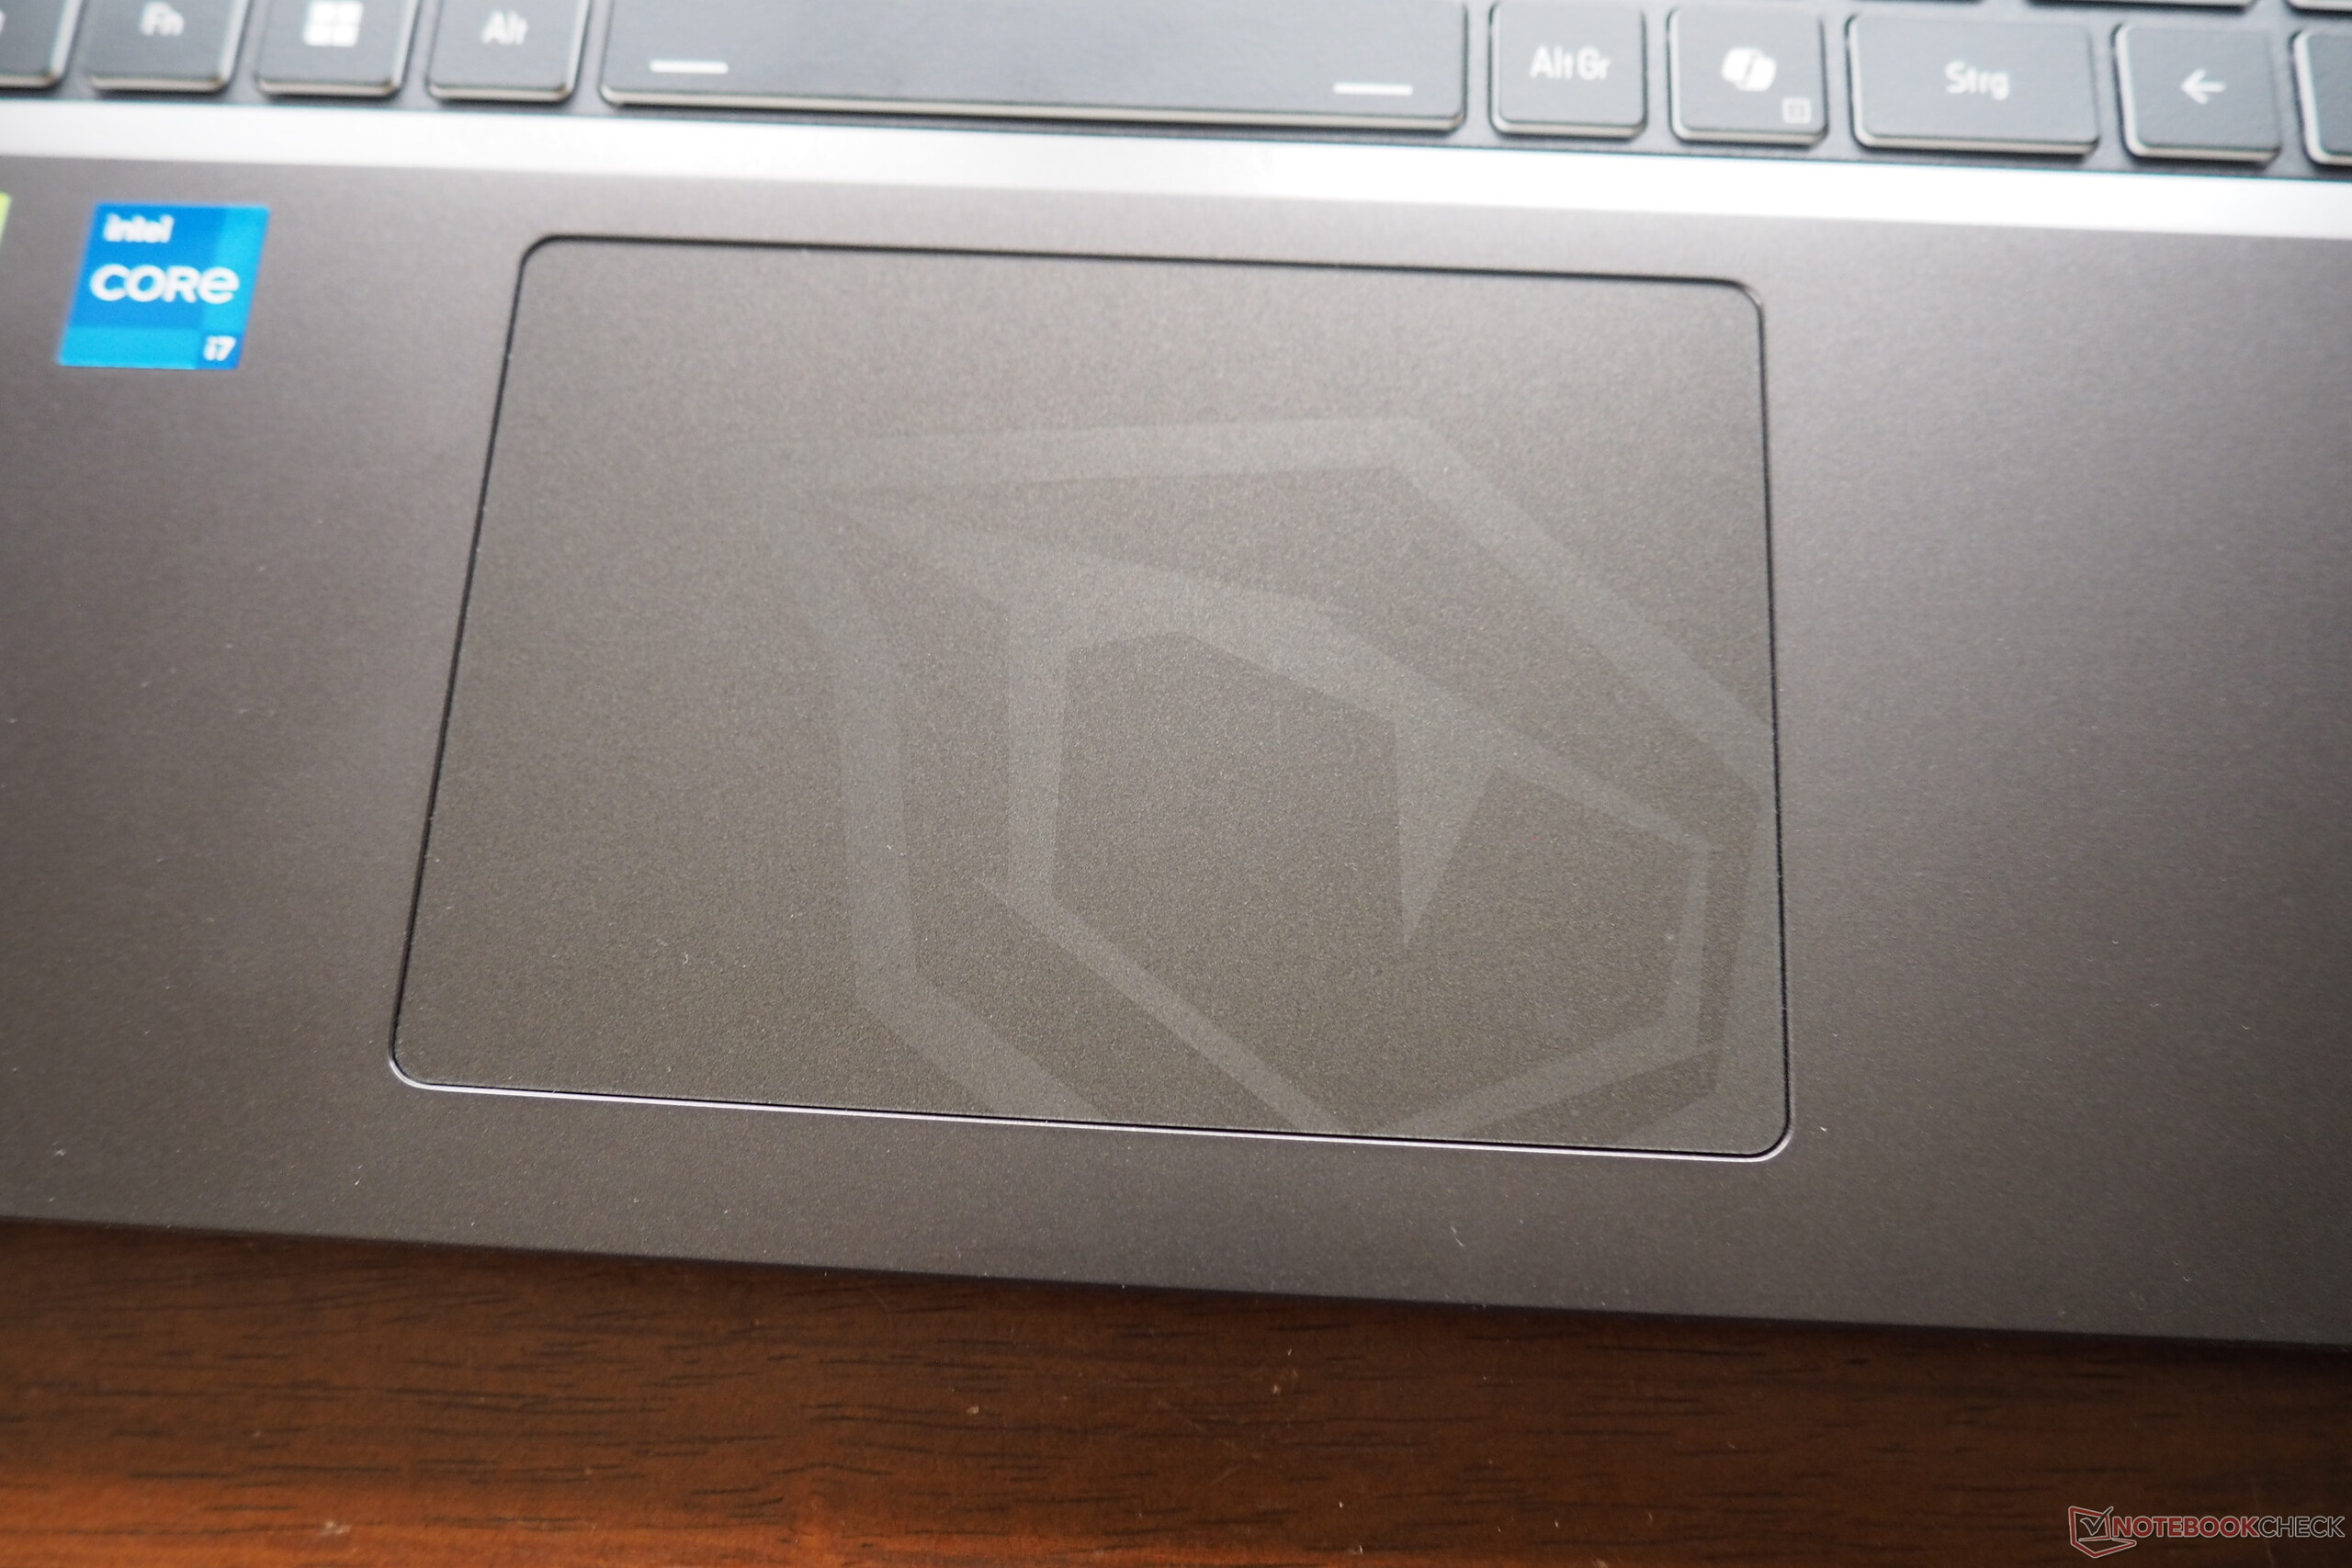
Touchpad
There’s still room for improvement with the touchpad, as gesture recognition isn’t always reliable. Otherwise, it offers solid precision and smooth gliding. The surface area of roughly 12.1 by 8.3 cm is more than adequate for a 16-inch laptop. As with several competitors, the click mechanisms sound a bit rattly.
Display
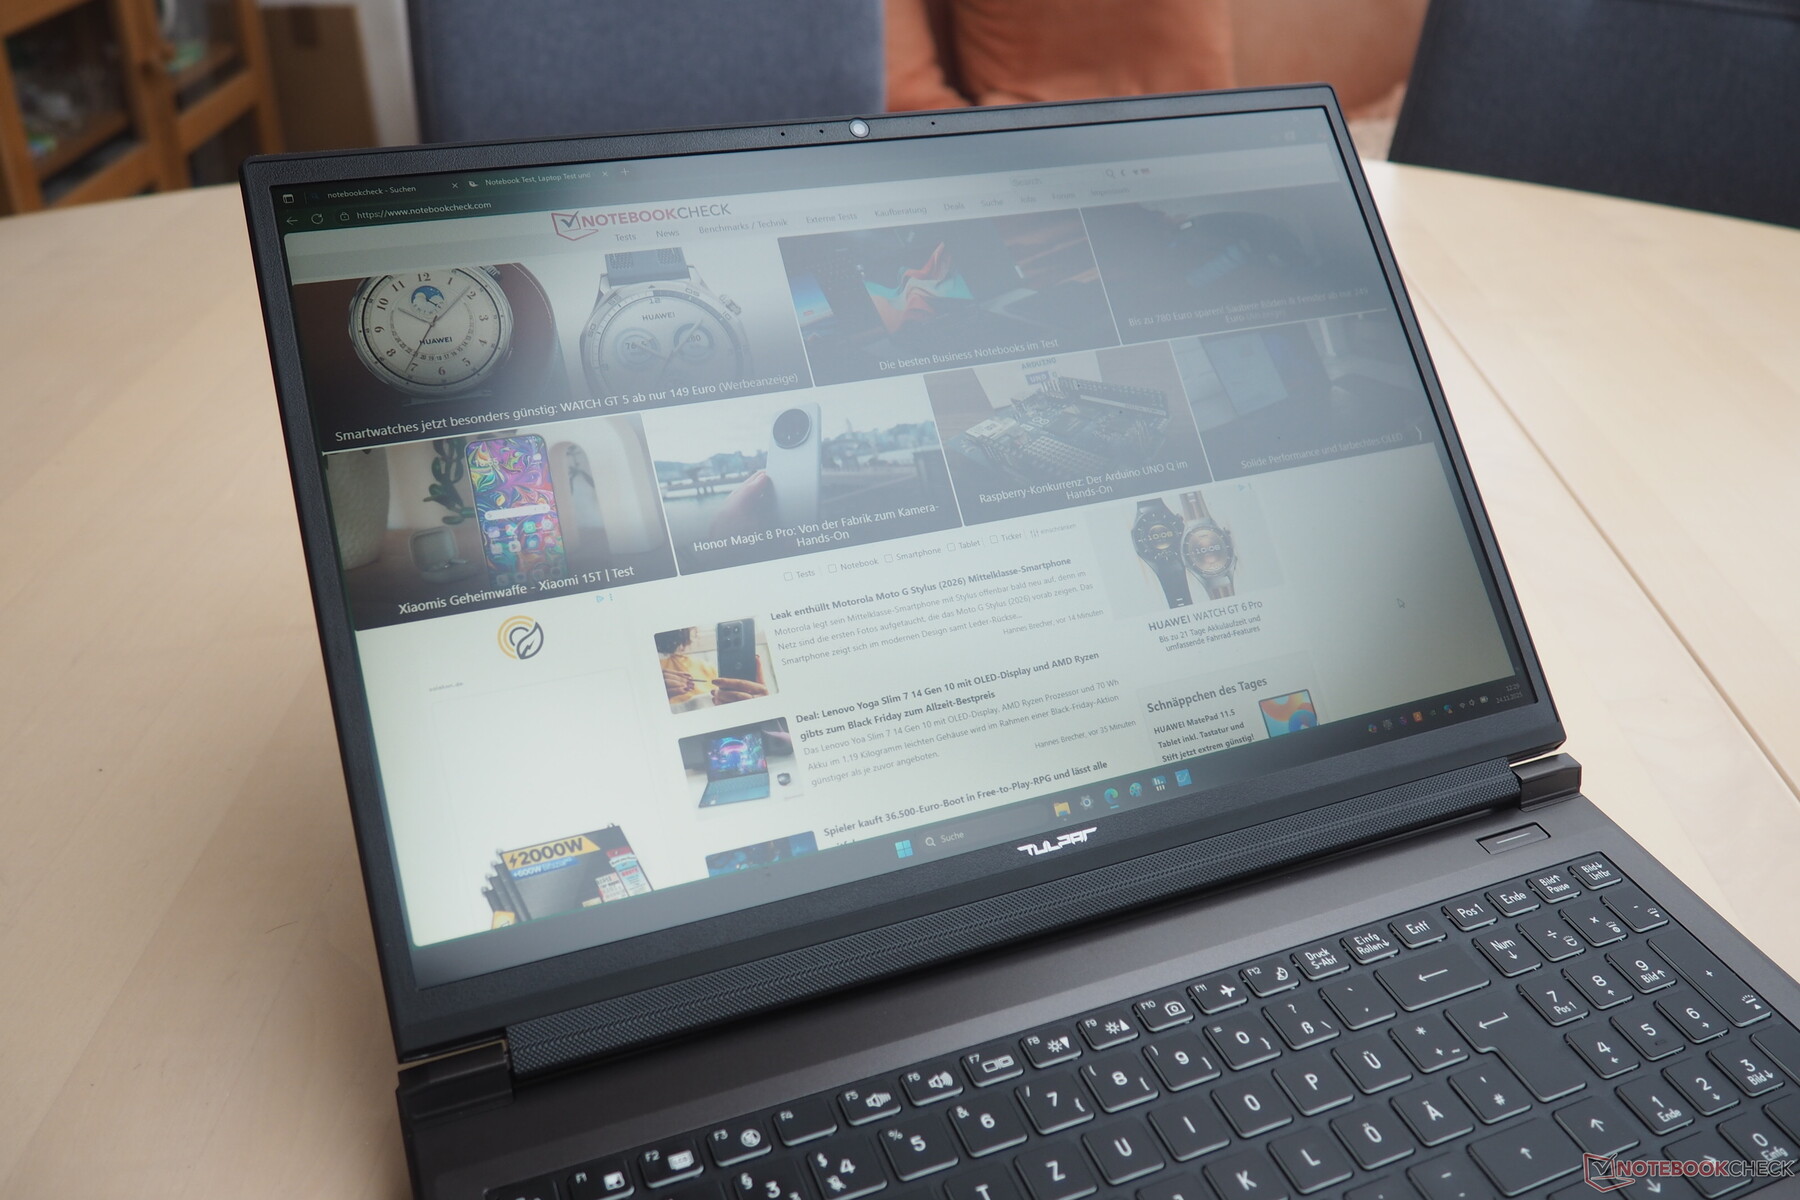
The T6 V3.5 features a matte 165 Hz panel. Its average brightness of 403 cd/m² is solid for an IPS display and makes the laptop usable in brighter environments, as long as the sunlight isn’t too strong or hitting the screen directly.
| |||||||||||||||||||||||||
Brightness Distribution: 79 %
Center on Battery: 456 cd/m²
Contrast: 1169:1 (Black: 0.39 cd/m²)
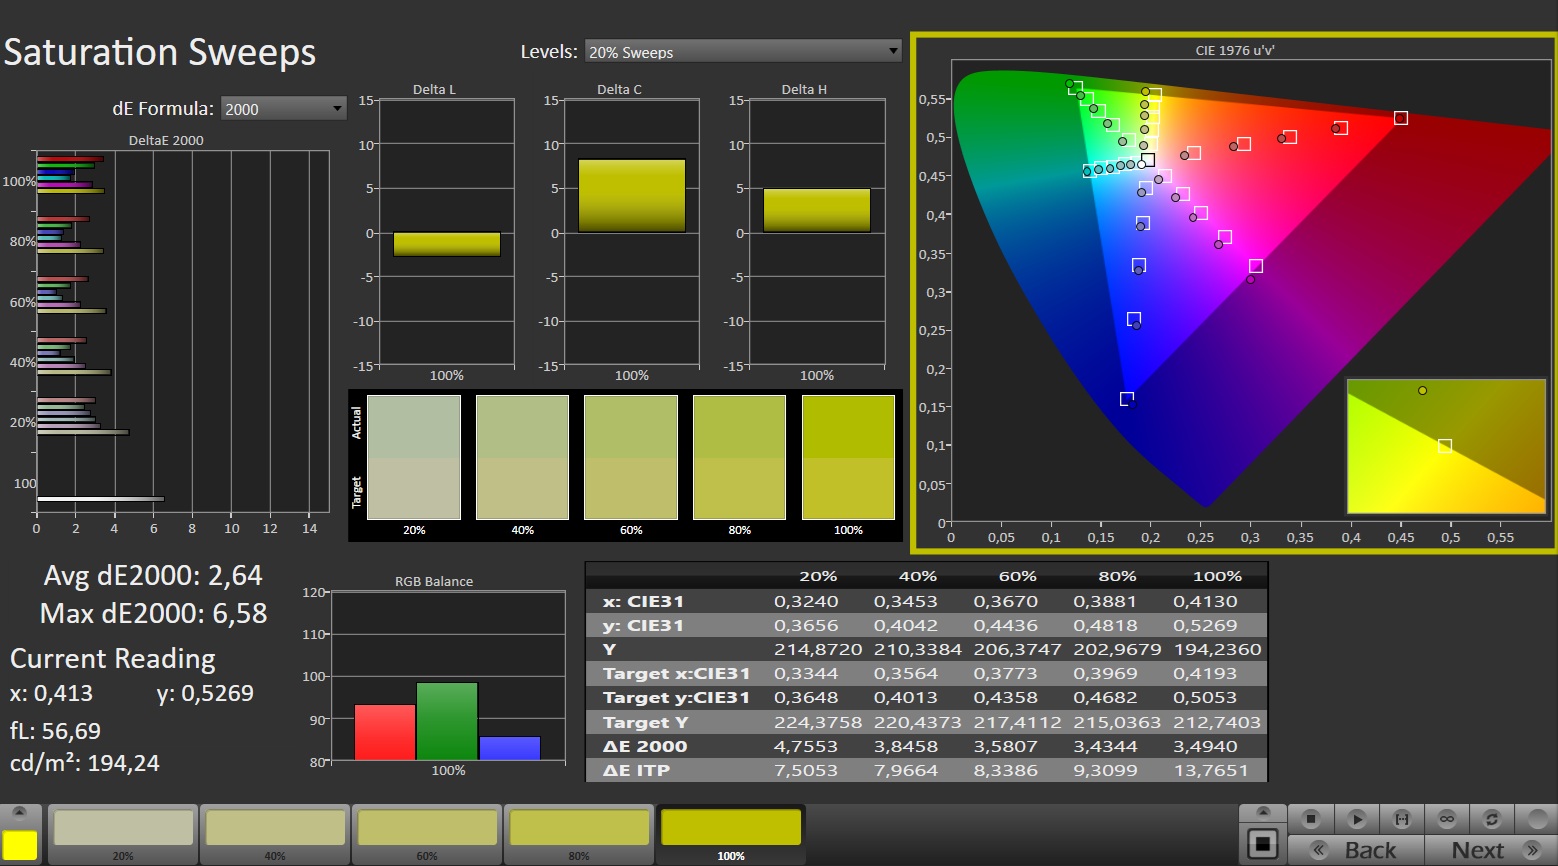
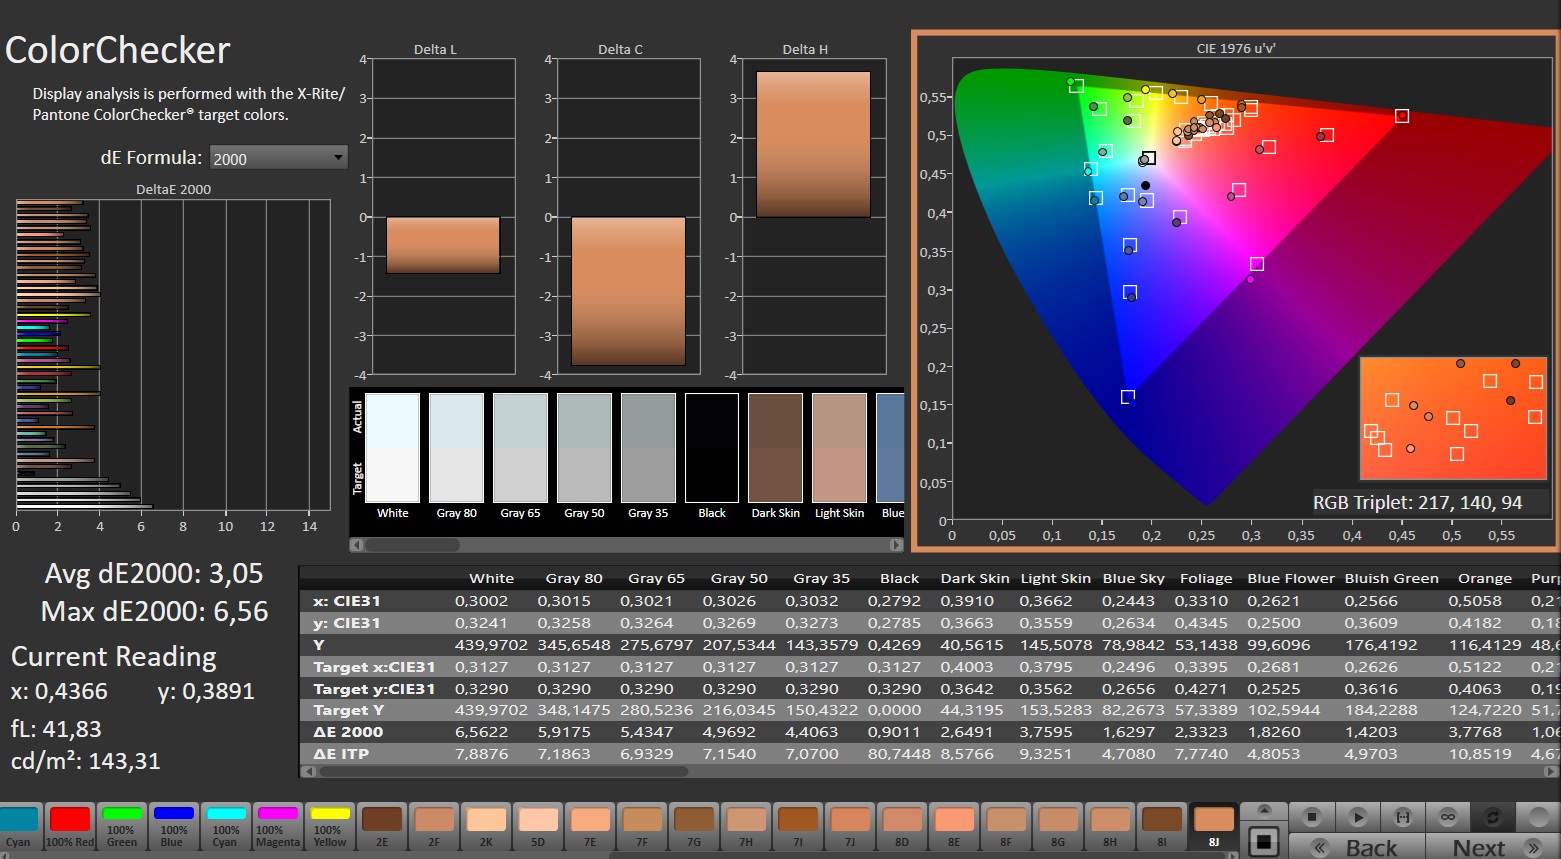
ΔE ColorChecker Calman: 3.05 | ∀{0.5-29.43 Ø4.72}
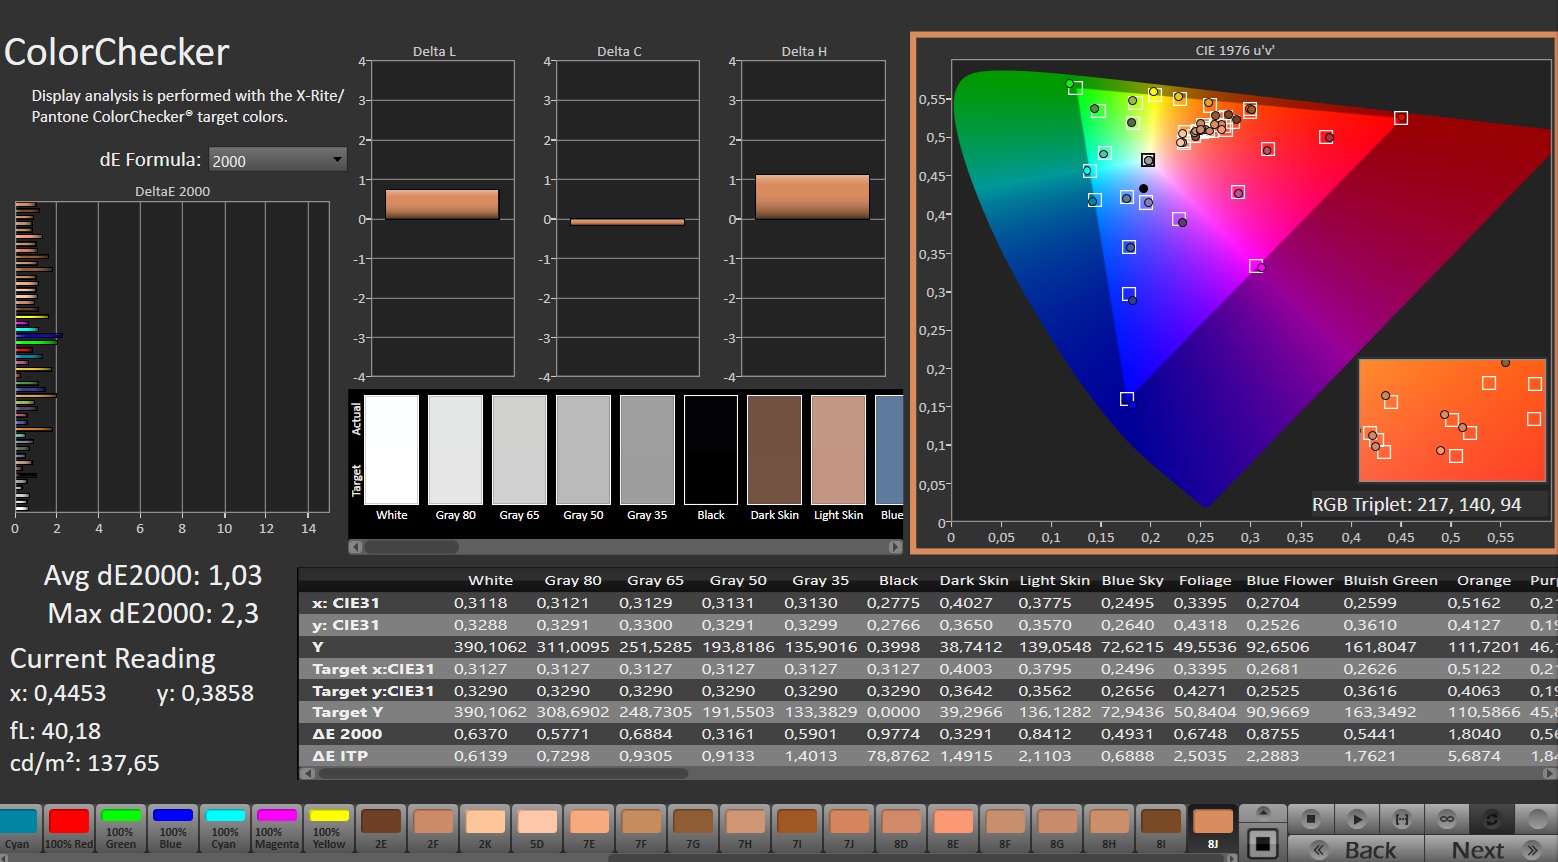
calibrated: 1.03
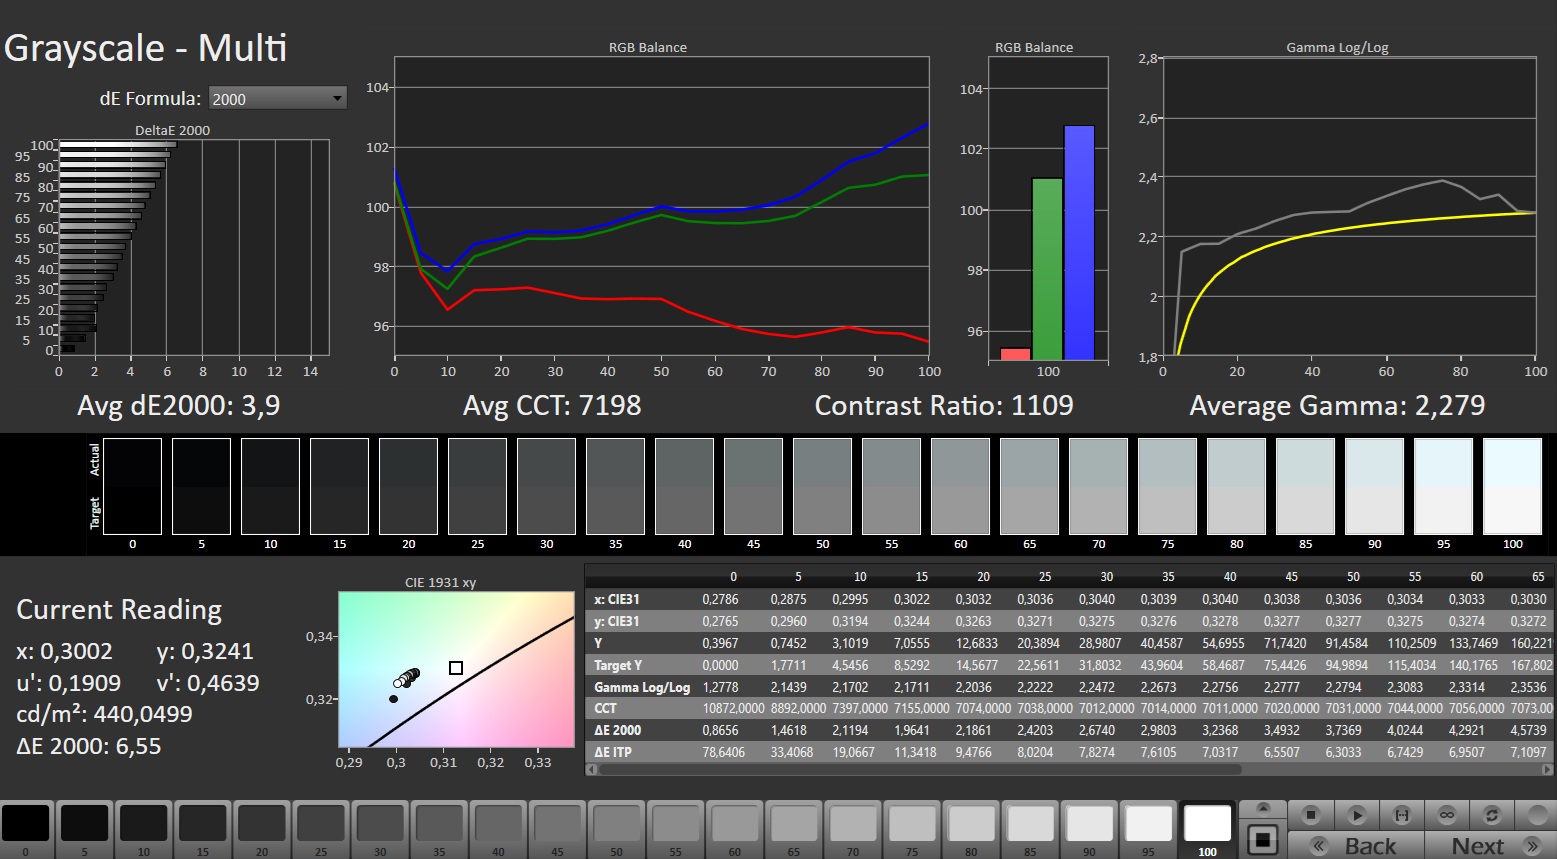
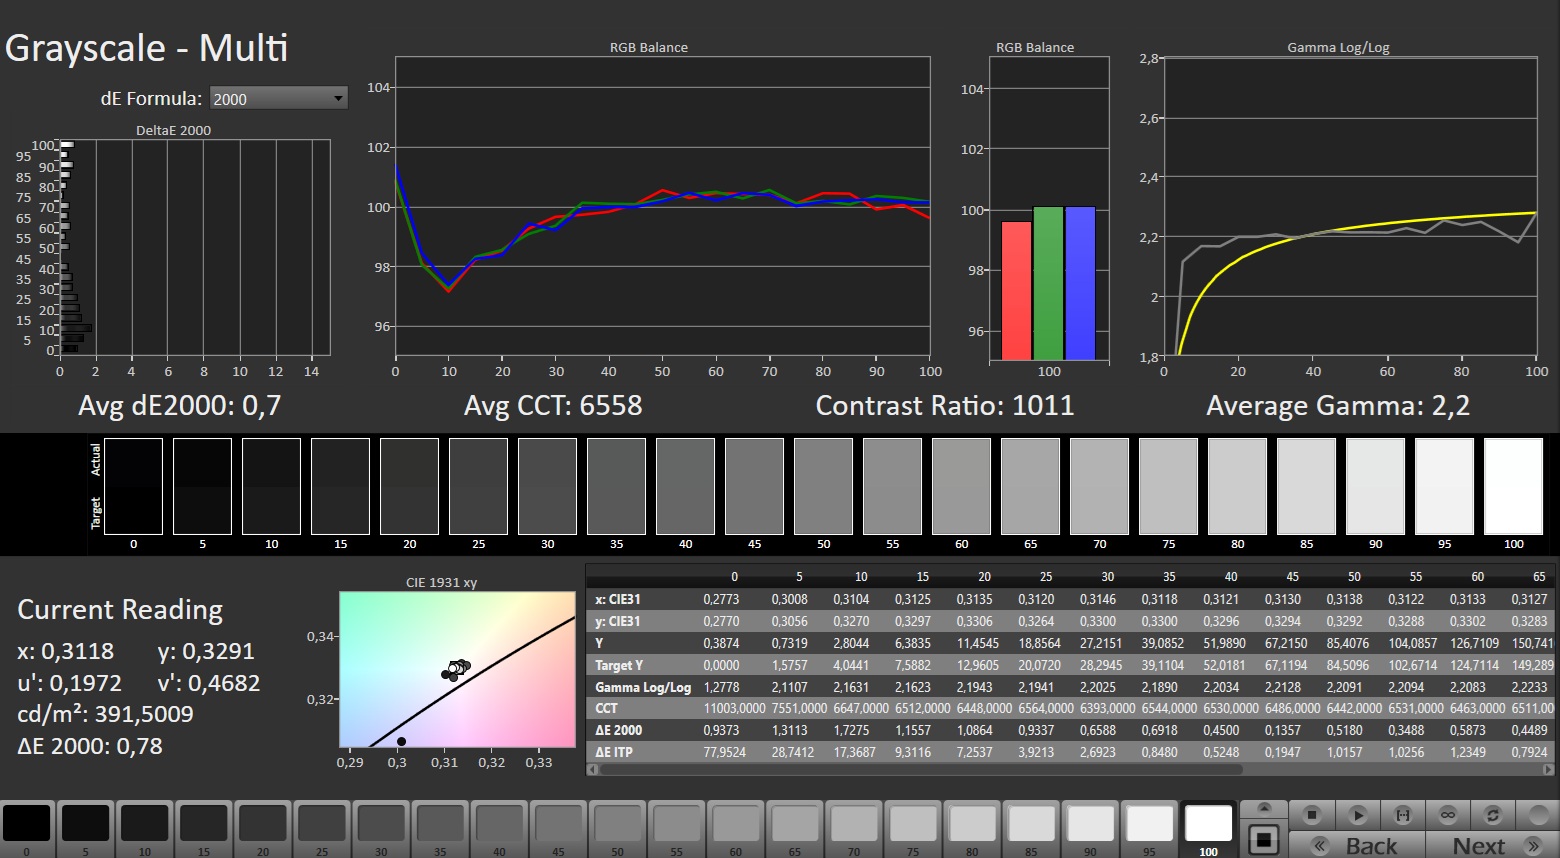
ΔE Greyscale Calman: 3.9 | ∀{0.09-98 Ø4.97}
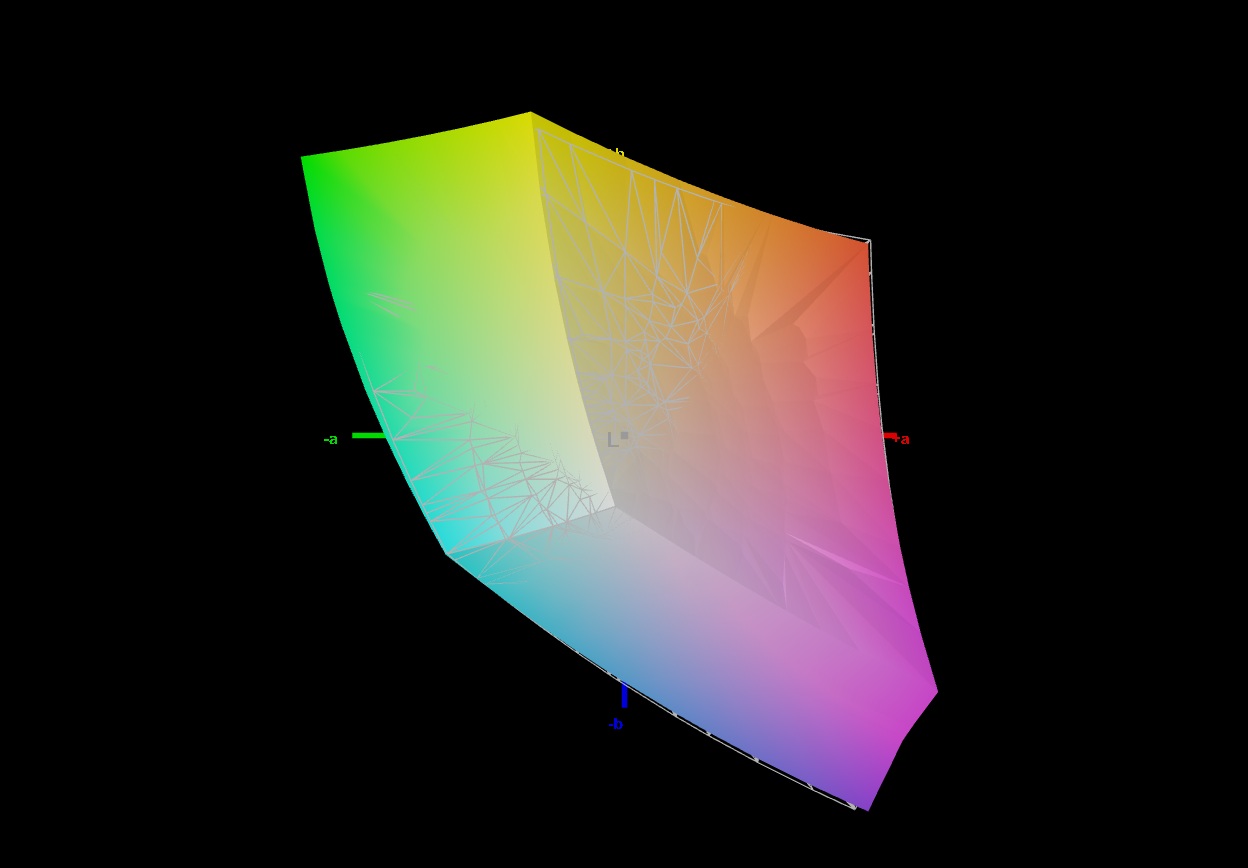
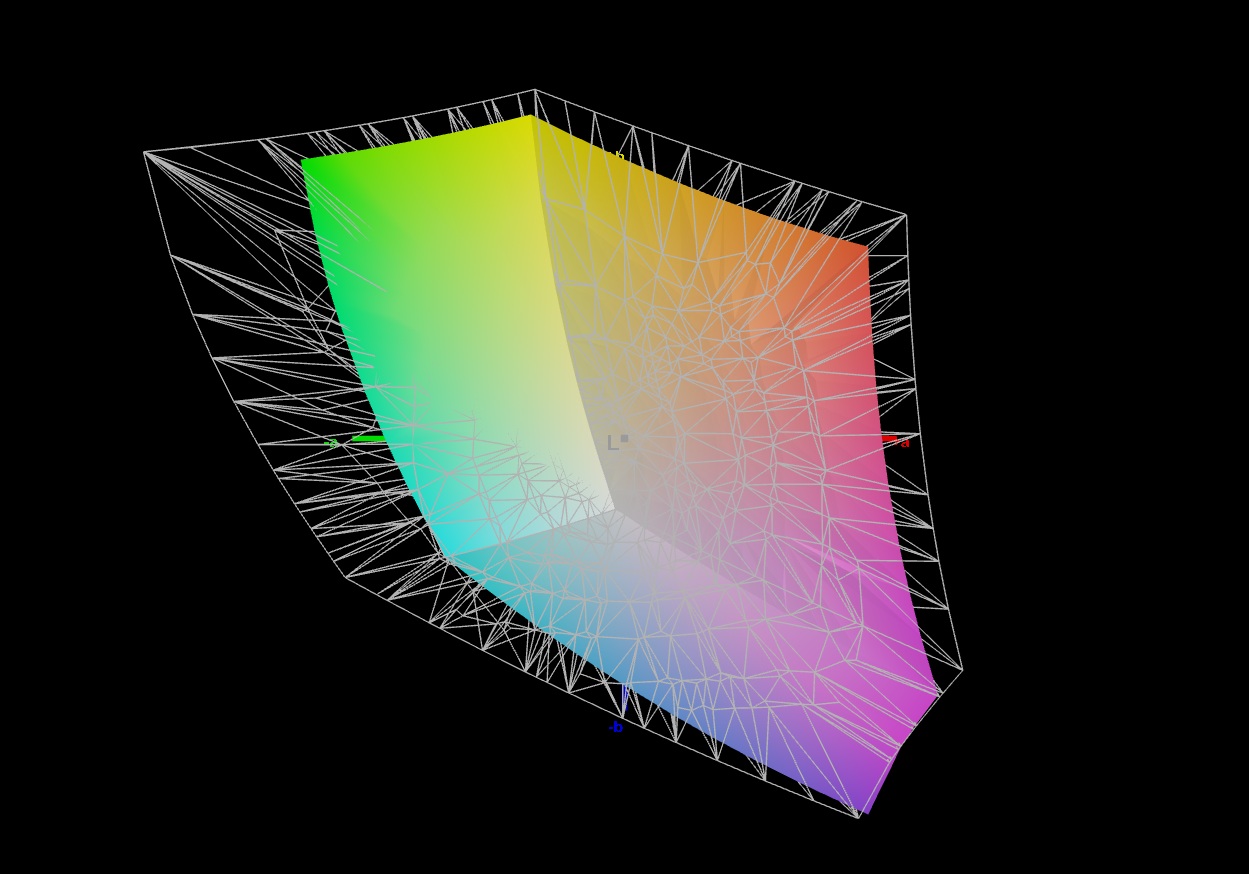
70.6% AdobeRGB 1998 (Argyll 3D)
98.7% sRGB (Argyll 3D)
68.6% Display P3 (Argyll 3D)
Gamma: 2.279
CCT: 7198 K
| Tulpar T6 V3.5 B160UANAC.J (AUO33B7), IPS, 1920x1200, 16", 165 Hz | Acer Nitro V 16 AI ANV16-42-R860 B160UAN08.3 (AUO2CB8), IPS, 1920x1200, 16", 180 Hz | no name Hz | HP Omen 16-ap0091ng AUODBB2, IPS, 1920x1200, 16", 144 Hz | Lenovo Legion 5 15AHP G10 LEN151WQXGA, OLED, 2560x1600, 15.1", 165 Hz | Gigabyte Gaming A16 GA6H NE160QDM-NYJ (BOE0C80), IPS, 2560x1600, 16", 165 Hz | |
|---|---|---|---|---|---|---|
| Display | -42% | -43% | 29% | 1% | ||
| Display P3 Coverage (%) | 68.6 | 39.2 -43% | 40 -42% | 99.9 46% | 69.4 1% | |
| sRGB Coverage (%) | 98.7 | 58.2 -41% | 58.1 -41% | 100 1% | 99.5 1% | |
| AdobeRGB 1998 Coverage (%) | 70.6 | 40.5 -43% | 38.7 -45% | 98.3 39% | 71.6 1% | |
| Response Times | 8% | -132% | 96% | -1% | ||
| Response Time Grey 50% / Grey 80% * (ms) | 12.4 ? | 11.6 ? 6% | 27.6 ? -123% | 0.42 ? 97% | 14.3 ? -15% | |
| Response Time Black / White * (ms) | 8.1 ? | 7.4 ? 9% | 19.4 ? -140% | 0.4 ? 95% | 7 ? 14% | |
| PWM Frequency (Hz) | 1152 ? | |||||
| PWM Amplitude * (%) | 11 | |||||
| Screen | -70% | 4% | -53% | 43% | -16% | |
| Brightness middle (cd/m²) | 456 | 384 -16% | 345.3 -24% | 328 -28% | 492 8% | 432 -5% |
| Brightness (cd/m²) | 403 | 372 -8% | 324 -20% | 313 -22% | 495 23% | 425 5% |
| Brightness Distribution (%) | 79 | 92 16% | 88 11% | 91 15% | 92 16% | 91 15% |
| Black Level * (cd/m²) | 0.39 | 0.36 8% | 0.23 41% | 0.26 33% | 0.37 5% | |
| Contrast (:1) | 1169 | 1067 -9% | 1501 28% | 1262 8% | 1168 0% | |
| Colorchecker dE 2000 * | 3.05 | 5.82 -91% | 3.22 -6% | 4.73 -55% | 0.9 70% | 4.76 -56% |
| Colorchecker dE 2000 max. * | 6.56 | 20.34 -210% | 5.68 13% | 17.47 -166% | 1.8 73% | 8.59 -31% |
| Colorchecker dE 2000 calibrated * | 1.03 | 3.95 -283% | 0.93 10% | 4.22 -310% | 1.18 -15% | |
| Greyscale dE 2000 * | 3.9 | 5.4 -38% | 4.5 -15% | 2.05 47% | 1.2 69% | 6.2 -59% |
| Gamma | 2.279 97% | 2.174 101% | 2.1 105% | 2.63 84% | 2.16 102% | 2.079 106% |
| CCT | 7198 90% | 6067 107% | 7041 92% | 6718 97% | 6291 103% | 6690 97% |
| Total Average (Program / Settings) | -35% /
-53% | 4% /
4% | -76% /
-62% | 56% /
49% | -5% /
-10% |
* ... smaller is better
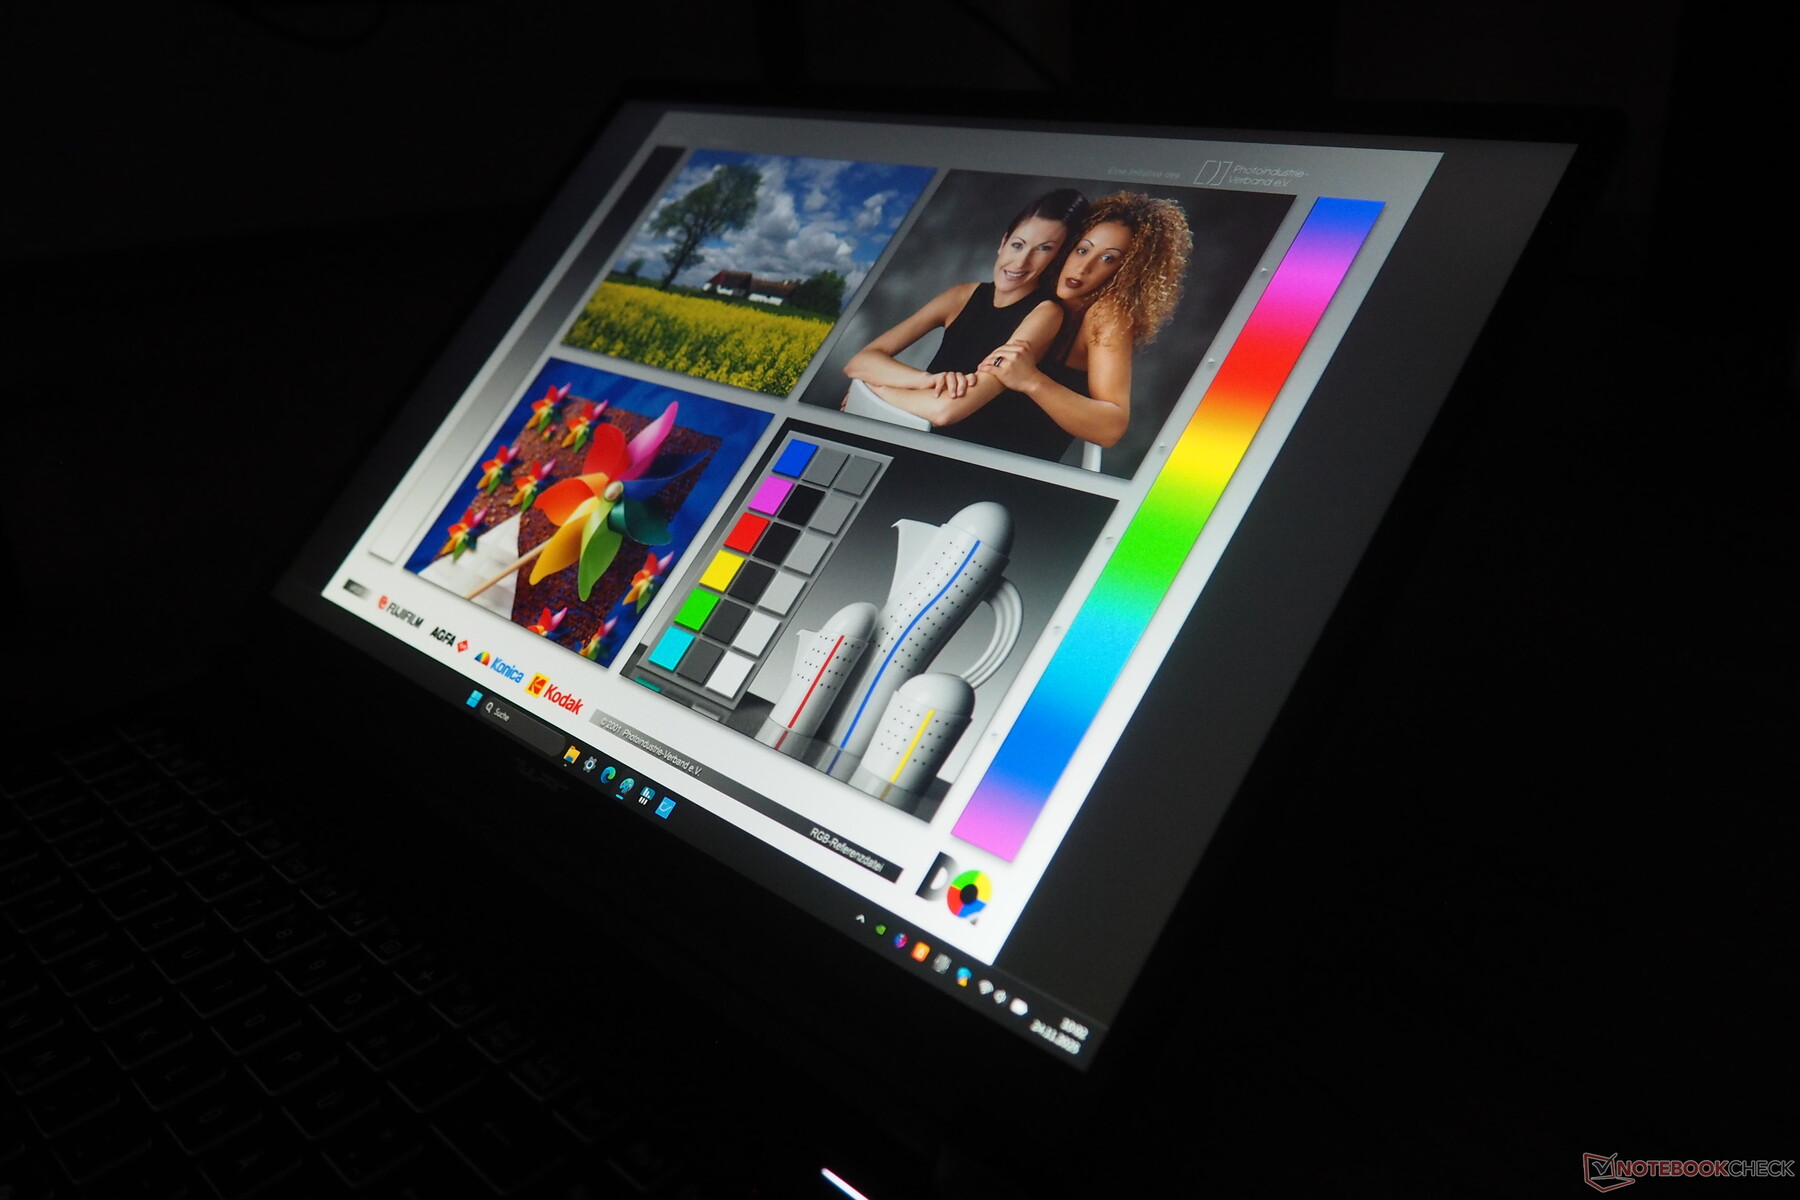
Although the 16-inch display falls short of AdobeRGB and DCI-P3 coverage, it nearly fully covers the sRGB space, which is what matters for most gamers. Out of the box, there’s a noticeable blue tint, but calibration fixes it easily.

The black level could be better at 0.39 cd/m², but the contrast still exceeds 1,000:1, which is typical for this class.

Response times are also strong compared with competing models. However, our test unit showed noticeable screen bleeding, mainly along the sides and in the corners.
Display Response Times
| ↔ Response Time Black to White | ||
|---|---|---|
| 8.1 ms ... rise ↗ and fall ↘ combined | ↗ 4.7 ms rise | 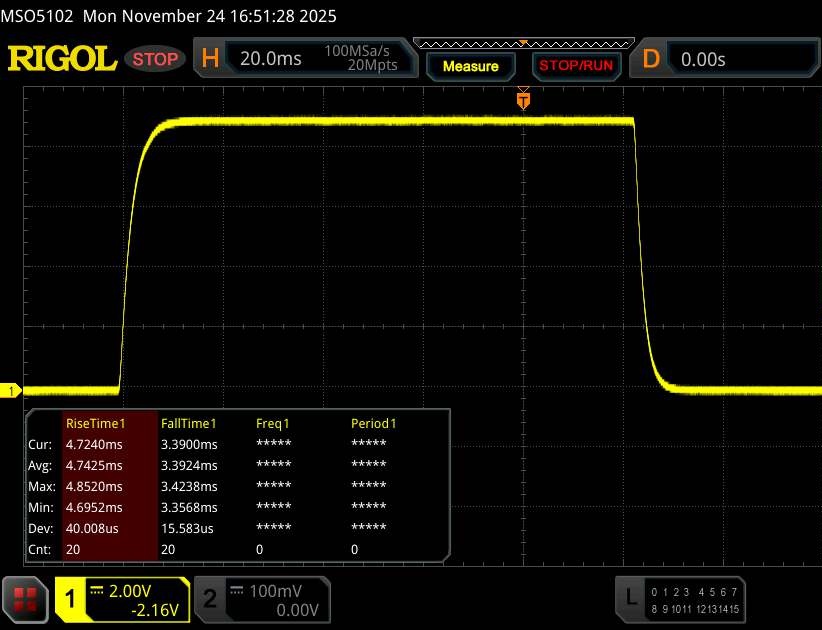 |
| ↘ 3.4 ms fall | ||
| The screen shows fast response rates in our tests and should be suited for gaming. In comparison, all tested devices range from 0.1 (minimum) to 240 (maximum) ms. » 24 % of all devices are better. This means that the measured response time is better than the average of all tested devices (19.8 ms). | ||
| ↔ Response Time 50% Grey to 80% Grey | ||
| 12.4 ms ... rise ↗ and fall ↘ combined | ↗ 6.2 ms rise | 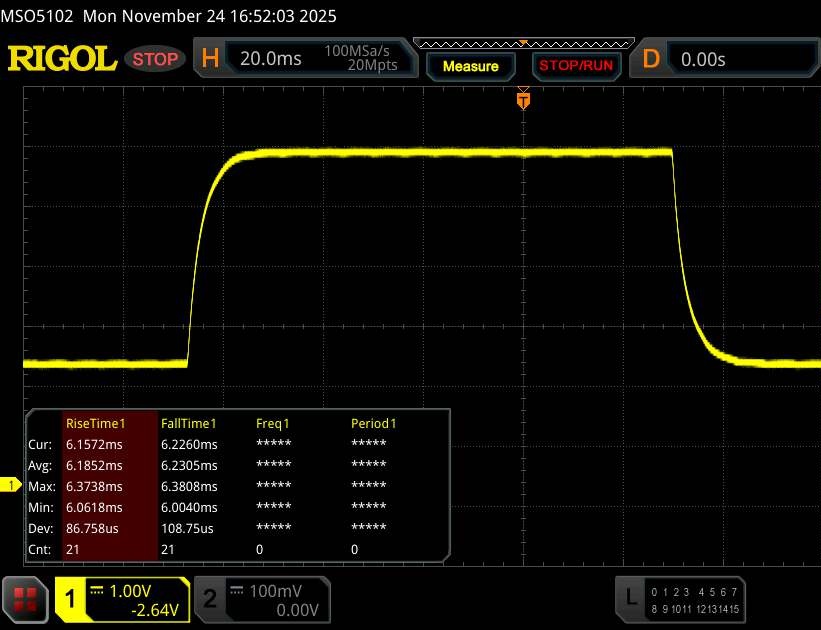 |
| ↘ 6.2 ms fall | ||
| The screen shows good response rates in our tests, but may be too slow for competitive gamers. In comparison, all tested devices range from 0.165 (minimum) to 636 (maximum) ms. » 26 % of all devices are better. This means that the measured response time is better than the average of all tested devices (31 ms). | ||
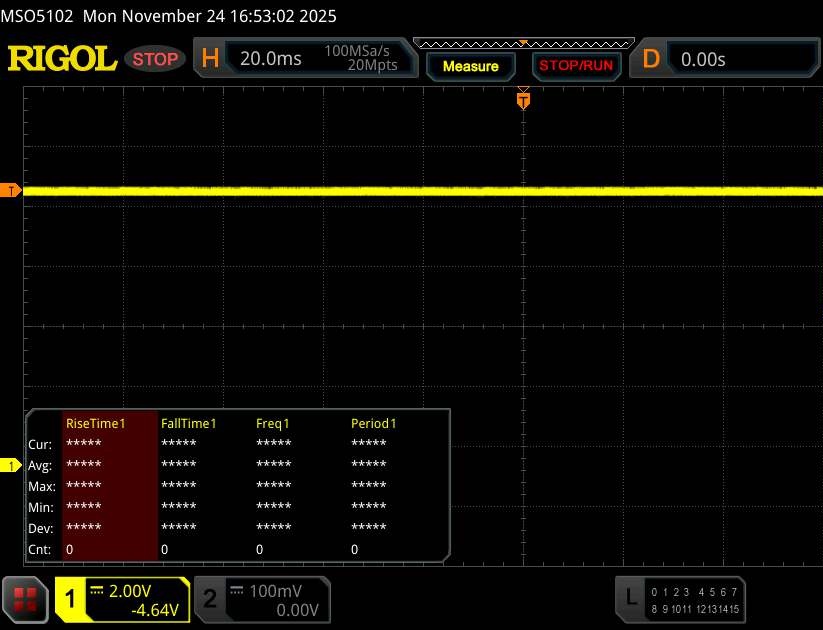
Screen Flickering / PWM (Pulse-Width Modulation)
| Screen flickering / PWM not detected | 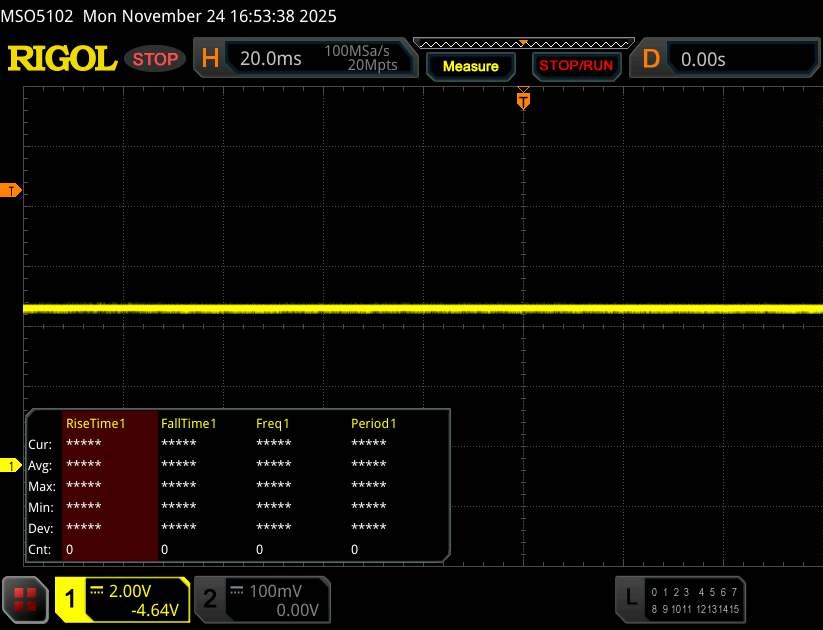 | ||
In comparison: 52 % of all tested devices do not use PWM to dim the display. If PWM was detected, an average of 7750 (minimum: 5 - maximum: 343500) Hz was measured. | |||
Performance
The Tulpar T6 V3.5 is a mid-range system that’s capable of handling almost any task. Aside from the operating system, RAM capacity, and M.2 storage configuration, the manufacturer’s website doesn’t offer additional customization options.
Test conditions
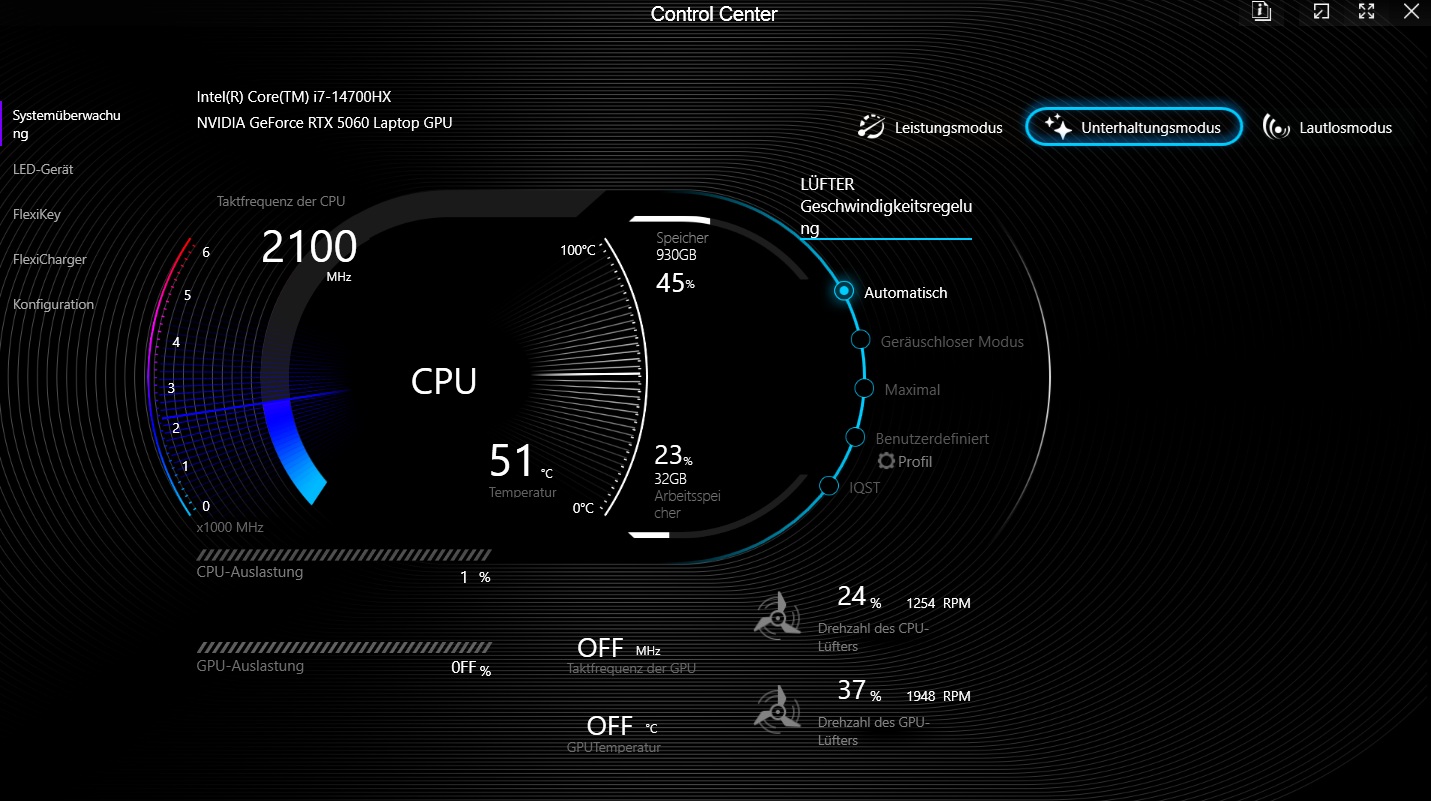
The preinstalled Control Center provides three operating modes. Since the performance mode didn’t meaningfully increase CPU or GPU output in our testing but did increase noise, all of our benchmarks were run in Entertainment mode.
| Mode | Silent | Entertainment | Performance |
| Cyberpunk 2077 Noise | 34 dB(A) | 52 dB(A) | 56 dB(A) |
| Cyberpunk 2077 frame rate (FHD/Ultra) | 62.4 fps | 81.8 fps | 82.3 fps |
| CPU PL1 | 28 W | 46 W | 55 W |
| CPU PL2 | 30 W | 115 W | 155 W |
| Cinebench R15 Multi Score | 1441 Points | 3743 Points | 3794 Points |
Processor
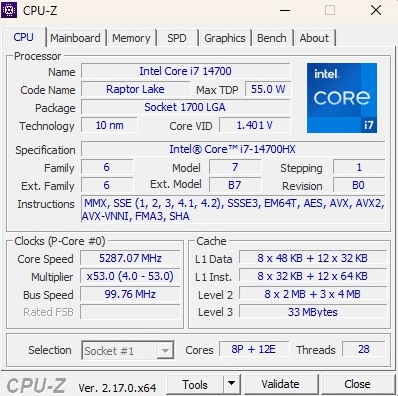
The Core i7-14700HX is a fast processor from the now-familiar Raptor Lake generation (10 nm). It offers eight performance cores with Hyper-Threading and twelve efficiency cores without it, for a total of up to 28 parallel threads. In our benchmarks, the T6 V3.5 performed slightly below the typical average for this CPU. More concerning is that in the Cinebench loop, performance dropped sharply after only a few runs. This doesn’t reflect well on the system’s power management or cooling performance, and the issue persisted even in Performance mode.
Cinebench R15 Multi endurance test
| CPU Performance rating - Percent | |
| Average of class Gaming | |
| HP Omen 16-ap0091ng | |
| Average Intel Core i7-14700HX | |
| Tulpar T6 V3.5 | |
| Lenovo Legion 5 15AHP G10 | |
| Gigabyte Gaming A16 GA6H | |
| Acer Nitro V 16 AI ANV16-42-R860 | |
* ... smaller is better
AIDA64: FP32 Ray-Trace | FPU Julia | CPU SHA3 | CPU Queen | FPU SinJulia | FPU Mandel | CPU AES | CPU ZLib | FP64 Ray-Trace | CPU PhotoWorxx
| Performance rating | |
| HP Omen 16-ap0091ng | |
| Average of class Gaming | |
| Lenovo Legion 5 15AHP G10 | |
| Average Intel Core i7-14700HX | |
| Acer Nitro V 16 AI ANV16-42-R860 | |
| Tulpar T6 V3.5 | |
| Gigabyte Gaming A16 GA6H | |
| AIDA64 / FP32 Ray-Trace | |
| HP Omen 16-ap0091ng | |
| Average of class Gaming (10227 - 85542, n=103, last 2 years) | |
| Lenovo Legion 5 15AHP G10 | |
| Acer Nitro V 16 AI ANV16-42-R860 | |
| Average Intel Core i7-14700HX (14147 - 23676, n=9) | |
| Tulpar T6 V3.5 | |
| Gigabyte Gaming A16 GA6H | |
| AIDA64 / FPU Julia | |
| HP Omen 16-ap0091ng | |
| Average of class Gaming (51376 - 238426, n=103, last 2 years) | |
| Lenovo Legion 5 15AHP G10 | |
| Average Intel Core i7-14700HX (71875 - 116556, n=9) | |
| Acer Nitro V 16 AI ANV16-42-R860 | |
| Tulpar T6 V3.5 | |
| Gigabyte Gaming A16 GA6H | |
| AIDA64 / CPU SHA3 | |
| HP Omen 16-ap0091ng | |
| Average of class Gaming (2180 - 9817, n=103, last 2 years) | |
| Lenovo Legion 5 15AHP G10 | |
| Average Intel Core i7-14700HX (3388 - 5567, n=9) | |
| Acer Nitro V 16 AI ANV16-42-R860 | |
| Tulpar T6 V3.5 | |
| Gigabyte Gaming A16 GA6H | |
| AIDA64 / CPU Queen | |
| HP Omen 16-ap0091ng | |
| Average Intel Core i7-14700HX (129134 - 152200, n=9) | |
| Tulpar T6 V3.5 | |
| Lenovo Legion 5 15AHP G10 | |
| Average of class Gaming (49785 - 173351, n=89, last 2 years) | |
| Acer Nitro V 16 AI ANV16-42-R860 | |
| Gigabyte Gaming A16 GA6H | |
| AIDA64 / FPU SinJulia | |
| HP Omen 16-ap0091ng | |
| Lenovo Legion 5 15AHP G10 | |
| Average of class Gaming (4424 - 33636, n=103, last 2 years) | |
| Average Intel Core i7-14700HX (10266 - 14434, n=9) | |
| Acer Nitro V 16 AI ANV16-42-R860 | |
| Tulpar T6 V3.5 | |
| Gigabyte Gaming A16 GA6H | |
| AIDA64 / FPU Mandel | |
| HP Omen 16-ap0091ng | |
| Average of class Gaming (25115 - 128721, n=103, last 2 years) | |
| Lenovo Legion 5 15AHP G10 | |
| Average Intel Core i7-14700HX (35155 - 58380, n=9) | |
| Acer Nitro V 16 AI ANV16-42-R860 | |
| Tulpar T6 V3.5 | |
| Gigabyte Gaming A16 GA6H | |
| AIDA64 / CPU AES | |
| HP Omen 16-ap0091ng | |
| Average of class Gaming (39258 - 247074, n=103, last 2 years) | |
| Average Intel Core i7-14700HX (68616 - 113157, n=9) | |
| Tulpar T6 V3.5 | |
| Lenovo Legion 5 15AHP G10 | |
| Acer Nitro V 16 AI ANV16-42-R860 | |
| Gigabyte Gaming A16 GA6H | |
| AIDA64 / CPU ZLib | |
| HP Omen 16-ap0091ng | |
| Average of class Gaming (574 - 2531, n=103, last 2 years) | |
| Average Intel Core i7-14700HX (1003 - 1682, n=9) | |
| Lenovo Legion 5 15AHP G10 | |
| Tulpar T6 V3.5 | |
| Acer Nitro V 16 AI ANV16-42-R860 | |
| Gigabyte Gaming A16 GA6H | |
| AIDA64 / FP64 Ray-Trace | |
| HP Omen 16-ap0091ng | |
| Average of class Gaming (5509 - 45446, n=103, last 2 years) | |
| Lenovo Legion 5 15AHP G10 | |
| Acer Nitro V 16 AI ANV16-42-R860 | |
| Average Intel Core i7-14700HX (7585 - 12928, n=9) | |
| Tulpar T6 V3.5 | |
| Gigabyte Gaming A16 GA6H | |
| AIDA64 / CPU PhotoWorxx | |
| Tulpar T6 V3.5 | |
| Average of class Gaming (12271 - 89891, n=103, last 2 years) | |
| Average Intel Core i7-14700HX (24276 - 49671, n=9) | |
| Lenovo Legion 5 15AHP G10 | |
| Acer Nitro V 16 AI ANV16-42-R860 | |
| Gigabyte Gaming A16 GA6H | |
| HP Omen 16-ap0091ng | |
System performance
System performance, by contrast, is unremarkable. Aside from the relatively slow SSD, which we’ll get to shortly, there’s nothing particularly noteworthy here.
PCMark 10: Score | Essentials | Productivity | Digital Content Creation
CrossMark: Overall | Productivity | Creativity | Responsiveness
WebXPRT 3: Overall
WebXPRT 4: Overall
Mozilla Kraken 1.1: Total
| Performance rating | |
| Average of class Gaming | |
| HP Omen 16-ap0091ng | |
| Lenovo Legion 5 15AHP G10 | |
| Tulpar T6 V3.5 | |
| Average Intel Core i7-14700HX, NVIDIA GeForce RTX 5060 Laptop | |
| Gigabyte Gaming A16 GA6H | |
| Acer Nitro V 16 AI ANV16-42-R860 | |
| PCMark 10 / Score | |
| Average of class Gaming (5828 - 11730, n=92, last 2 years) | |
| Lenovo Legion 5 15AHP G10 | |
| HP Omen 16-ap0091ng | |
| Tulpar T6 V3.5 | |
| Average Intel Core i7-14700HX, NVIDIA GeForce RTX 5060 Laptop (n=1) | |
| Acer Nitro V 16 AI ANV16-42-R860 | |
| Gigabyte Gaming A16 GA6H | |
| PCMark 10 / Essentials | |
| Lenovo Legion 5 15AHP G10 | |
| HP Omen 16-ap0091ng | |
| Average of class Gaming (8810 - 11935, n=96, last 2 years) | |
| Tulpar T6 V3.5 | |
| Average Intel Core i7-14700HX, NVIDIA GeForce RTX 5060 Laptop (n=1) | |
| Gigabyte Gaming A16 GA6H | |
| Acer Nitro V 16 AI ANV16-42-R860 | |
| PCMark 10 / Productivity | |
| Average of class Gaming (6845 - 21327, n=94, last 2 years) | |
| Lenovo Legion 5 15AHP G10 | |
| HP Omen 16-ap0091ng | |
| Acer Nitro V 16 AI ANV16-42-R860 | |
| Tulpar T6 V3.5 | |
| Average Intel Core i7-14700HX, NVIDIA GeForce RTX 5060 Laptop (n=1) | |
| Gigabyte Gaming A16 GA6H | |
| PCMark 10 / Digital Content Creation | |
| Average of class Gaming (7602 - 19954, n=94, last 2 years) | |
| Lenovo Legion 5 15AHP G10 | |
| HP Omen 16-ap0091ng | |
| Tulpar T6 V3.5 | |
| Average Intel Core i7-14700HX, NVIDIA GeForce RTX 5060 Laptop (n=1) | |
| Gigabyte Gaming A16 GA6H | |
| Acer Nitro V 16 AI ANV16-42-R860 | |
| CrossMark / Overall | |
| Average of class Gaming (1366 - 2409, n=93, last 2 years) | |
| HP Omen 16-ap0091ng | |
| Tulpar T6 V3.5 | |
| Average Intel Core i7-14700HX, NVIDIA GeForce RTX 5060 Laptop (n=1) | |
| Gigabyte Gaming A16 GA6H | |
| Lenovo Legion 5 15AHP G10 | |
| Acer Nitro V 16 AI ANV16-42-R860 | |
| CrossMark / Productivity | |
| Average of class Gaming (1386 - 2254, n=93, last 2 years) | |
| HP Omen 16-ap0091ng | |
| Gigabyte Gaming A16 GA6H | |
| Lenovo Legion 5 15AHP G10 | |
| Tulpar T6 V3.5 | |
| Average Intel Core i7-14700HX, NVIDIA GeForce RTX 5060 Laptop (n=1) | |
| Acer Nitro V 16 AI ANV16-42-R860 | |
| CrossMark / Creativity | |
| Tulpar T6 V3.5 | |
| Average Intel Core i7-14700HX, NVIDIA GeForce RTX 5060 Laptop (n=1) | |
| Average of class Gaming (1343 - 2729, n=93, last 2 years) | |
| HP Omen 16-ap0091ng | |
| Lenovo Legion 5 15AHP G10 | |
| Gigabyte Gaming A16 GA6H | |
| Acer Nitro V 16 AI ANV16-42-R860 | |
| CrossMark / Responsiveness | |
| Gigabyte Gaming A16 GA6H | |
| Average of class Gaming (1226 - 2334, n=93, last 2 years) | |
| Lenovo Legion 5 15AHP G10 | |
| HP Omen 16-ap0091ng | |
| Acer Nitro V 16 AI ANV16-42-R860 | |
| Tulpar T6 V3.5 | |
| Average Intel Core i7-14700HX, NVIDIA GeForce RTX 5060 Laptop (n=1) | |
| WebXPRT 3 / Overall | |
| HP Omen 16-ap0091ng | |
| Average of class Gaming (220 - 532, n=97, last 2 years) | |
| Lenovo Legion 5 15AHP G10 | |
| Tulpar T6 V3.5 | |
| Average Intel Core i7-14700HX, NVIDIA GeForce RTX 5060 Laptop (n=1) | |
| Acer Nitro V 16 AI ANV16-42-R860 | |
| Gigabyte Gaming A16 GA6H | |
| WebXPRT 4 / Overall | |
| Tulpar T6 V3.5 | |
| Average Intel Core i7-14700HX, NVIDIA GeForce RTX 5060 Laptop (n=1) | |
| Average of class Gaming (165 - 354, n=97, last 2 years) | |
| Lenovo Legion 5 15AHP G10 | |
| Gigabyte Gaming A16 GA6H | |
| HP Omen 16-ap0091ng | |
| Acer Nitro V 16 AI ANV16-42-R860 | |
| Mozilla Kraken 1.1 / Total | |
| Acer Nitro V 16 AI ANV16-42-R860 | |
| Gigabyte Gaming A16 GA6H | |
| HP Omen 16-ap0091ng | |
| Lenovo Legion 5 15AHP G10 | |
| Tulpar T6 V3.5 | |
| Average Intel Core i7-14700HX, NVIDIA GeForce RTX 5060 Laptop (n=1) | |
| Average of class Gaming (391 - 590, n=99, last 2 years) | |
* ... smaller is better
| PCMark 10 Score | 7269 points | |
Help | ||
| AIDA64 / Memory Copy | |
| Tulpar T6 V3.5 | |
| Average of class Gaming (21750 - 129946, n=103, last 2 years) | |
| Lenovo Legion 5 15AHP G10 | |
| Average Intel Core i7-14700HX (41617 - 78742, n=9) | |
| Acer Nitro V 16 AI ANV16-42-R860 | |
| Gigabyte Gaming A16 GA6H | |
| HP Omen 16-ap0091ng | |
| AIDA64 / Memory Read | |
| Tulpar T6 V3.5 | |
| Average Intel Core i7-14700HX (46627 - 86175, n=9) | |
| Average of class Gaming (22956 - 118858, n=103, last 2 years) | |
| Acer Nitro V 16 AI ANV16-42-R860 | |
| Lenovo Legion 5 15AHP G10 | |
| HP Omen 16-ap0091ng | |
| Gigabyte Gaming A16 GA6H | |
| AIDA64 / Memory Write | |
| Lenovo Legion 5 15AHP G10 | |
| Acer Nitro V 16 AI ANV16-42-R860 | |
| Tulpar T6 V3.5 | |
| Average of class Gaming (22297 - 135096, n=103, last 2 years) | |
| Average Intel Core i7-14700HX (39155 - 76976, n=9) | |
| HP Omen 16-ap0091ng | |
| Gigabyte Gaming A16 GA6H | |
| AIDA64 / Memory Latency | |
| Average of class Gaming (75.3 - 259, n=103, last 2 years) | |
| Gigabyte Gaming A16 GA6H | |
| Acer Nitro V 16 AI ANV16-42-R860 | |
| Lenovo Legion 5 15AHP G10 | |
| Average Intel Core i7-14700HX (82.7 - 96.4, n=9) | |
| Tulpar T6 V3.5 | |
| HP Omen 16-ap0091ng | |
* ... smaller is better
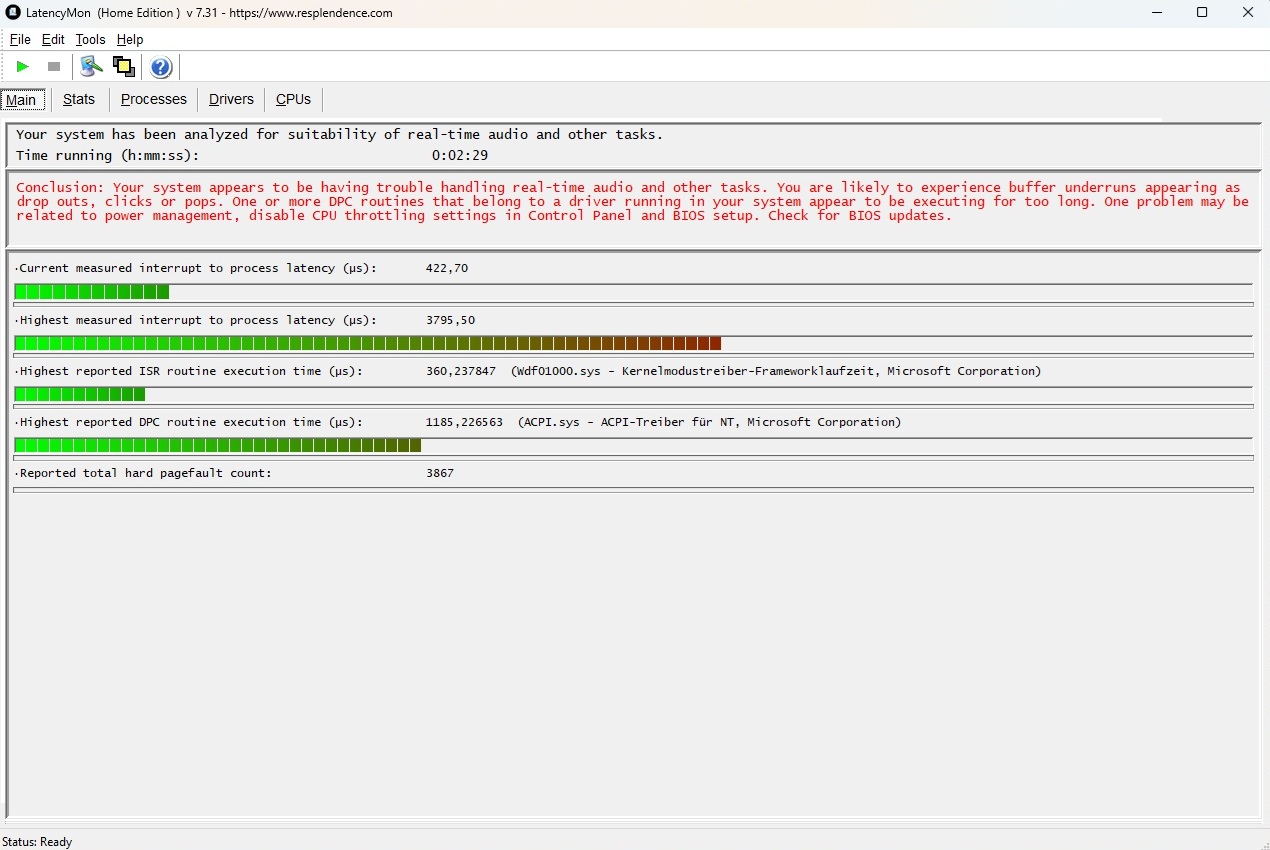
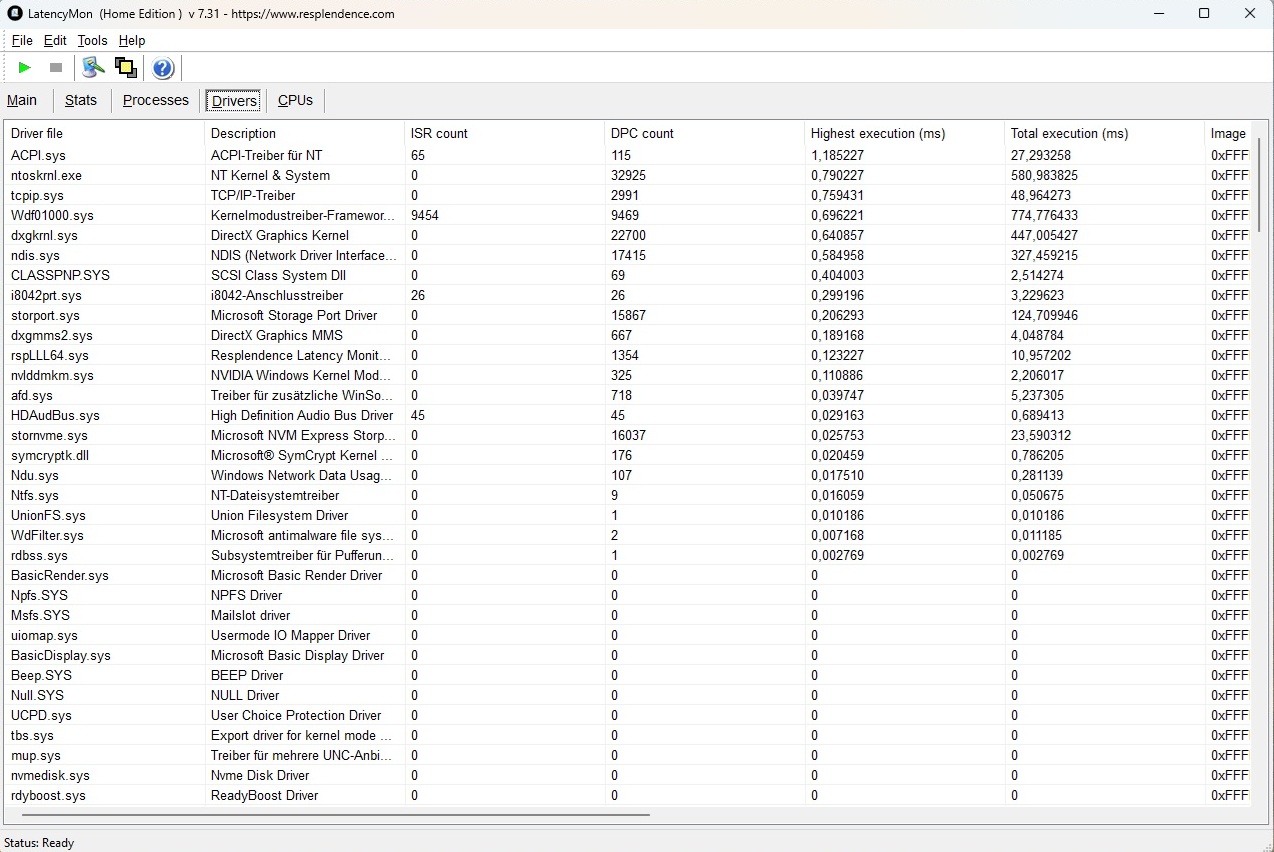
DPC latencies
Latency results could be better, but they’re in the same range as comparable models from Gigabyte and Acer.
| DPC Latencies / LatencyMon - interrupt to process latency (max), Web, Youtube, Prime95 | |
| Gigabyte Gaming A16 GA6H | |
| Acer Nitro V 16 AI ANV16-42-R860 | |
| Tulpar T6 V3.5 | |
| Lenovo Legion 5 15AHP G10 | |
| HP Omen 16-ap0091ng | |
* ... smaller is better
Storage devices
Unlike the CPU, the storage system maintains its full performance over time, which can’t be said for all competitors. Even so, the built-in 1 TB Western Digital drive lands on the lower end in SSD benchmarks, with especially weak write speeds.

* ... smaller is better
Read continuous performance: DiskSpd Read Loop, Queue Depth 8
GPU performance
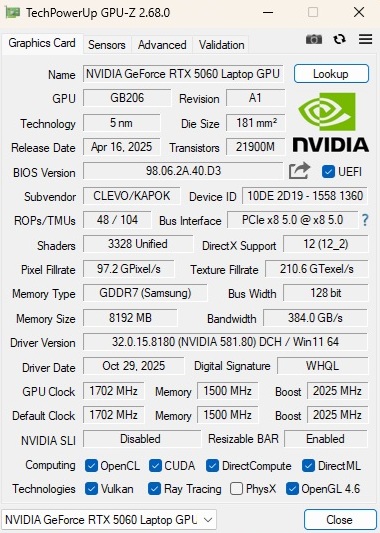
The graphics card also fails to reach its full potential. Although the GeForce RTX 5060 is rated for its full 115-watt TGP on paper (including 15 watts of Dynamic Boost), real-world performance comes in slightly below the typical RTX 5060 average and sits roughly at the level of the Alienware 16 Aurora.
| 3DMark 11 Performance | 31398 points | |
| 3DMark Cloud Gate Standard Score | 47731 points | |
| 3DMark Fire Strike Score | 26286 points | |
| 3DMark Time Spy Score | 11164 points | |
Help | ||
* ... smaller is better
Gaming performance
In gaming benchmarks, the performance gap narrows, and the Tulpar T6 V3.5 generally delivers what you’d expect. Older or less demanding titles run very smoothly at max settings, but newer, CPU-heavy games like Borderlands 4 sometimes require upscaling even at the native Full HD+ resolution.
With DLSS Balanced Transformer enabled, for example, Black Ops 7 improved from 32 to 49 fps at the Extreme preset with high ray tracing. With quadruple frame generation added, the system reached 141 fps, although the perceived improvement isn’t a direct 1:1 match with the numbers.
| Final Fantasy XV Benchmark - 1920x1080 High Quality | |
| Average of class Gaming (41 - 215, n=94, last 2 years) | |
| Lenovo Legion 5 15AHP G10 | |
| Average NVIDIA GeForce RTX 5060 Laptop (107 - 133.6, n=12) | |
| HP Omen 16-ap0091ng | |
| Tulpar T6 V3.5 | |
| Acer Nitro V 16 AI ANV16-42-R860 | |
| Gigabyte Gaming A16 GA6H | |
| Strange Brigade - 1920x1080 ultra AA:ultra AF:16 | |
| Average of class Gaming (76.3 - 456, n=86, last 2 years) | |
| Lenovo Legion 5 15AHP G10 | |
| Average NVIDIA GeForce RTX 5060 Laptop (195 - 240, n=11) | |
| HP Omen 16-ap0091ng | |
| Gigabyte Gaming A16 GA6H | |
| Tulpar T6 V3.5 | |
| Acer Nitro V 16 AI ANV16-42-R860 | |
| Dota 2 Reborn - 1920x1080 ultra (3/3) best looking | |
| HP Omen 16-ap0091ng | |
| Average of class Gaming (84.8 - 248, n=106, last 2 years) | |
| Tulpar T6 V3.5 | |
| Gigabyte Gaming A16 GA6H | |
| Average NVIDIA GeForce RTX 5060 Laptop (111.5 - 201, n=18) | |
| Lenovo Legion 5 15AHP G10 | |
| Acer Nitro V 16 AI ANV16-42-R860 | |
| low | med. | high | ultra | |
|---|---|---|---|---|
| GTA V (2015) | 178.9 | 176.1 | 123.8 | |
| Dota 2 Reborn (2015) | 168.2 | 163.6 | 150.6 | |
| Final Fantasy XV Benchmark (2018) | 143.7 | 110 | ||
| X-Plane 11.11 (2018) | 118.3 | 102.8 | ||
| Strange Brigade (2018) | 288 | 227 | 195 | |
| Baldur's Gate 3 (2023) | 95 | 93 | 90 | |
| Cyberpunk 2077 (2023) | 107.4 | 93.2 | 81.8 | |
| Borderlands 4 (2025) | 40.3 | 31.6 | 16.3 | |
| The Outer Worlds 2 (2025) | 82.1 | 65 | 35.7 | |
| ARC Raiders (2025) | 118.4 | 93.5 | 59.8 | |
| Anno 117: Pax Romana (2025) | 73.8 | 55.4 | 28.4 | |
| Call of Duty Black Ops 7 (2025) | 130 | 95 | 32 |
| The Outer Worlds 2 | |
| 1920x1080 High Preset AA:T | |
| Average of class Gaming (51.1 - 94.5, n=11, last 2 years) | |
| Average NVIDIA GeForce RTX 5060 Laptop (58.3 - 72.7, n=4) | |
| Tulpar T6 V3.5 | |
| Acer Nitro V 16 AI ANV16-42-R860 | |
| 1920x1080 Very High Preset AA:T | |
| Average of class Gaming (26.4 - 58.4, n=11, last 2 years) | |
| Average NVIDIA GeForce RTX 5060 Laptop (31.1 - 40.9, n=4) | |
| Tulpar T6 V3.5 | |
| Acer Nitro V 16 AI ANV16-42-R860 | |
| Borderlands 4 | |
| 1920x1080 High Preset AA:FX | |
| Average of class Gaming (28.7 - 76.6, n=13, last 2 years) | |
| Average NVIDIA GeForce RTX 5060 Laptop (28.7 - 39.3, n=4) | |
| Tulpar T6 V3.5 | |
| Acer Nitro V 16 AI ANV16-42-R860 | |
| 1920x1080 Badass Preset AA:FX | |
| Average of class Gaming (16 - 54, n=13, last 2 years) | |
| Average NVIDIA GeForce RTX 5060 Laptop (16.3 - 24.8, n=4) | |
| Acer Nitro V 16 AI ANV16-42-R860 | |
| Tulpar T6 V3.5 | |
| Call of Duty Black Ops 7 | |
| 1920x1080 Ultra Preset | |
| Average of class Gaming (70 - 157, n=11, last 2 years) | |
| Average NVIDIA GeForce RTX 5060 Laptop (95 - 103, n=4) | |
| Tulpar T6 V3.5 | |
| 1920x1080 Extreme Preset + Raytracing | |
| Average of class Gaming (24 - 60, n=11, last 2 years) | |
| Average NVIDIA GeForce RTX 5060 Laptop (32 - 38, n=4) | |
| Tulpar T6 V3.5 | |
| ARC Raiders | |
| 1920x1080 High Preset AA:TSR | |
| Average of class Gaming (64.5 - 144.4, n=11, last 2 years) | |
| Tulpar T6 V3.5 | |
| Average NVIDIA GeForce RTX 5060 Laptop (79.9 - 104.9, n=4) | |
| 1920x1080 Epic Preset + Epic Raytracing AA:TSR | |
| Average of class Gaming (43.5 - 98.6, n=11, last 2 years) | |
| Average NVIDIA GeForce RTX 5060 Laptop (55 - 70.2, n=4) | |
| Tulpar T6 V3.5 | |
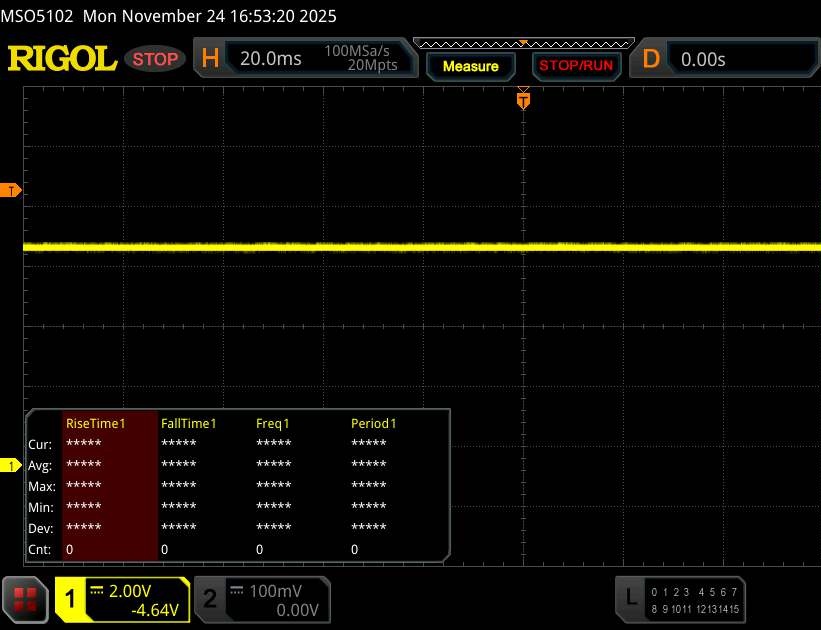
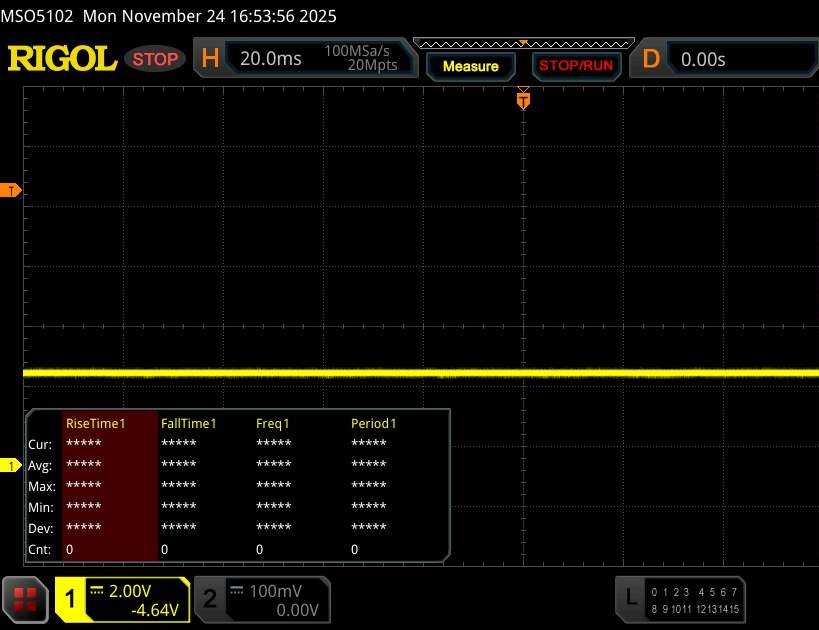
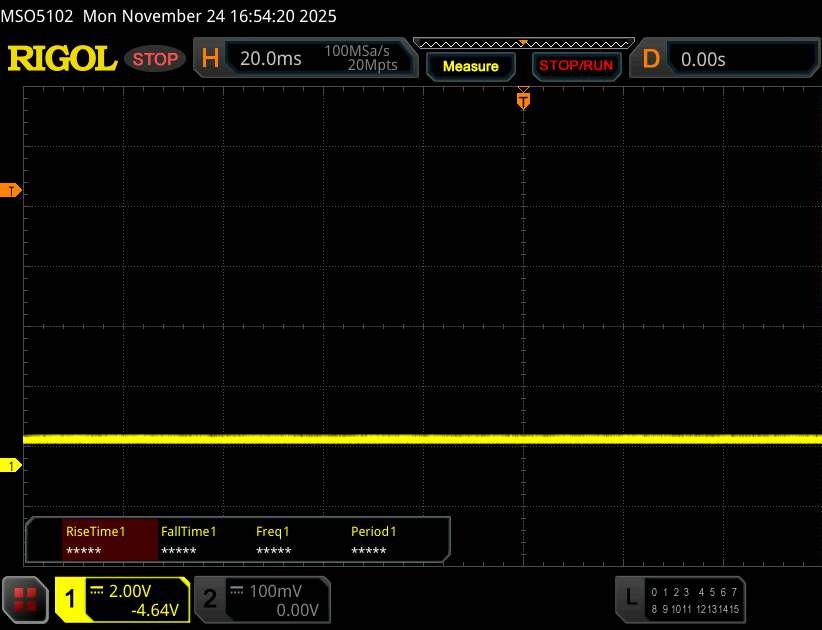
In a 30-minute Cyberpunk 2077 stress test, the frame rate remained largely stable.
Cyberpunk 2077 ultra FPS chart
Emissions
System noise
The fan control could use some work. Even when the system is idle, the fans occasionally ramp up, which can be irritating. Under load, the 16-inch laptop becomes clearly audible, with noise levels of 52 to 53 dB(A) making a headset the sensible choice.
Noise level
| Idle |
| 26 / 29 / 31 dB(A) |
| Load |
| 52 / 53 dB(A) |
 | ||
30 dB silent 40 dB(A) audible 50 dB(A) loud |
||
min: | ||
| Tulpar T6 V3.5 i7-14700HX, GeForce RTX 5060 Laptop | Acer Nitro V 16 AI ANV16-42-R860 R5 240, GeForce RTX 5050 Laptop | no name | HP Omen 16-ap0091ng R9 8940HX, GeForce RTX 5060 Laptop | Lenovo Legion 5 15AHP G10 R7 260, GeForce RTX 5060 Laptop | Gigabyte Gaming A16 GA6H i7-13620H, GeForce RTX 5070 Laptop | |
|---|---|---|---|---|---|---|
| Noise | 4% | 7% | 8% | 9% | 2% | |
| off / environment * (dB) | 24 | 25 -4% | 22.9 5% | 23 4% | 25.5 -6% | 24 -0% |
| Idle Minimum * (dB) | 26 | 25 4% | 24 8% | 23 12% | 25.5 2% | 25 4% |
| Idle Average * (dB) | 29 | 30 -3% | 25.6 12% | 23 21% | 25.5 12% | 26 10% |
| Idle Maximum * (dB) | 31 | 33 -6% | 25.6 17% | 27.64 11% | 26.9 13% | 27 13% |
| Load Average * (dB) | 52 | 38 27% | 46.8 10% | 49.5 5% | 34.6 33% | 54 -4% |
| Cyberpunk 2077 ultra * (dB) | 52 | 49 6% | 49.9 4% | 49.5 5% | 50.1 4% | 54 -4% |
| Load Maximum * (dB) | 53 | 50 6% | 55.6 -5% | 52.73 1% | 50.1 5% | 55 -4% |
* ... smaller is better
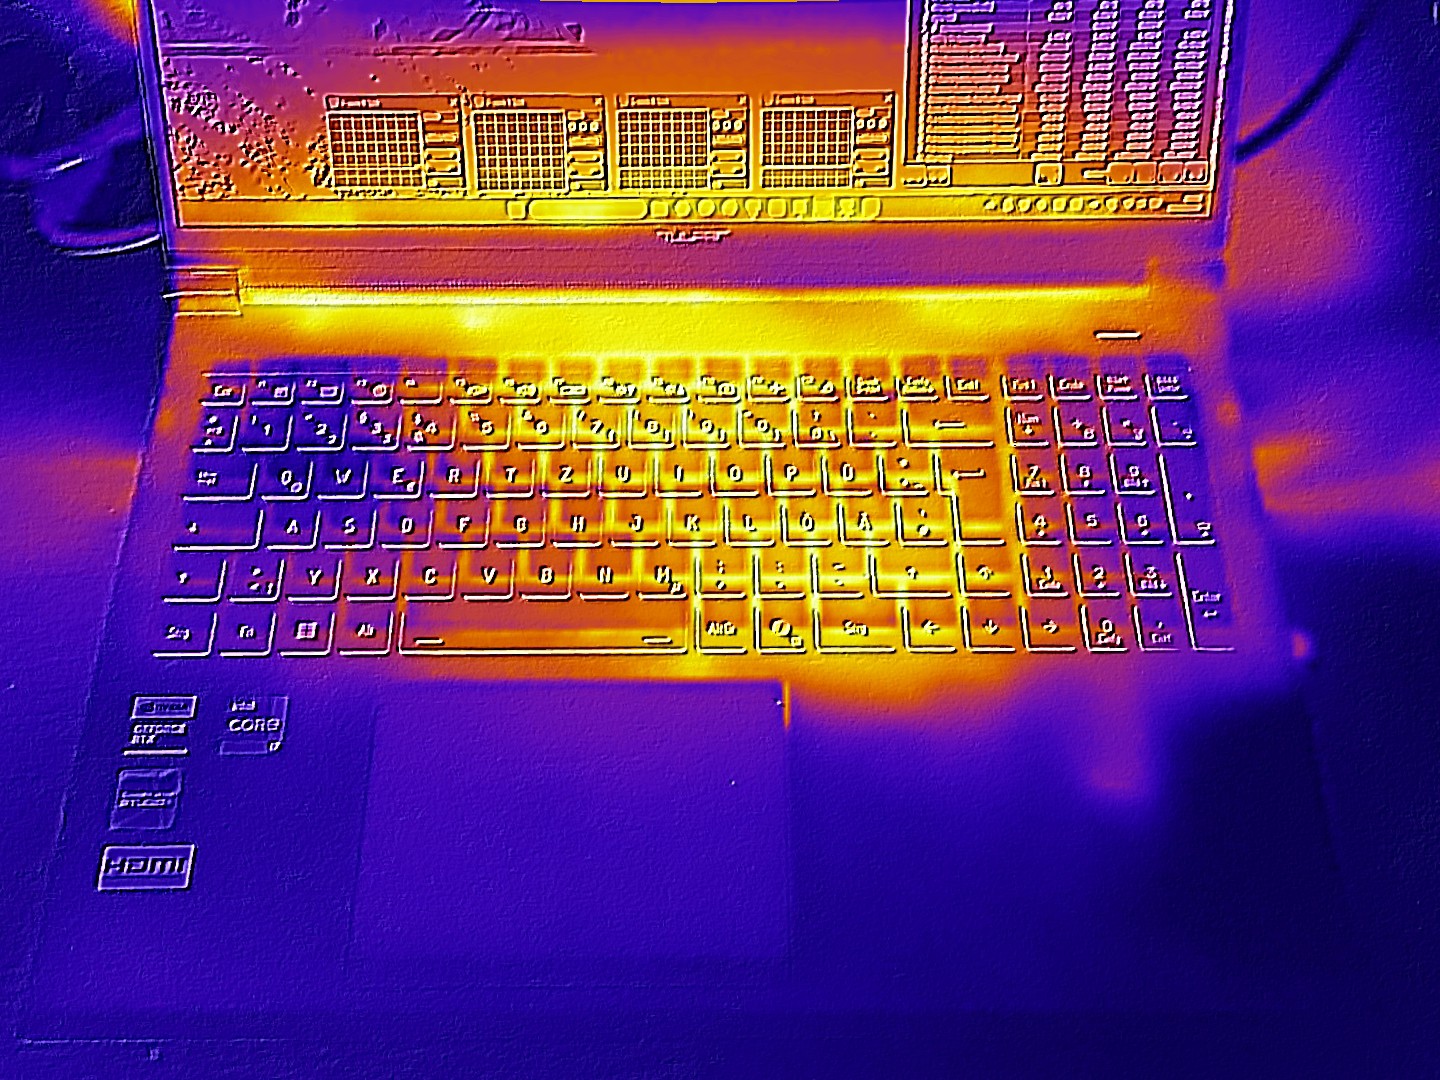
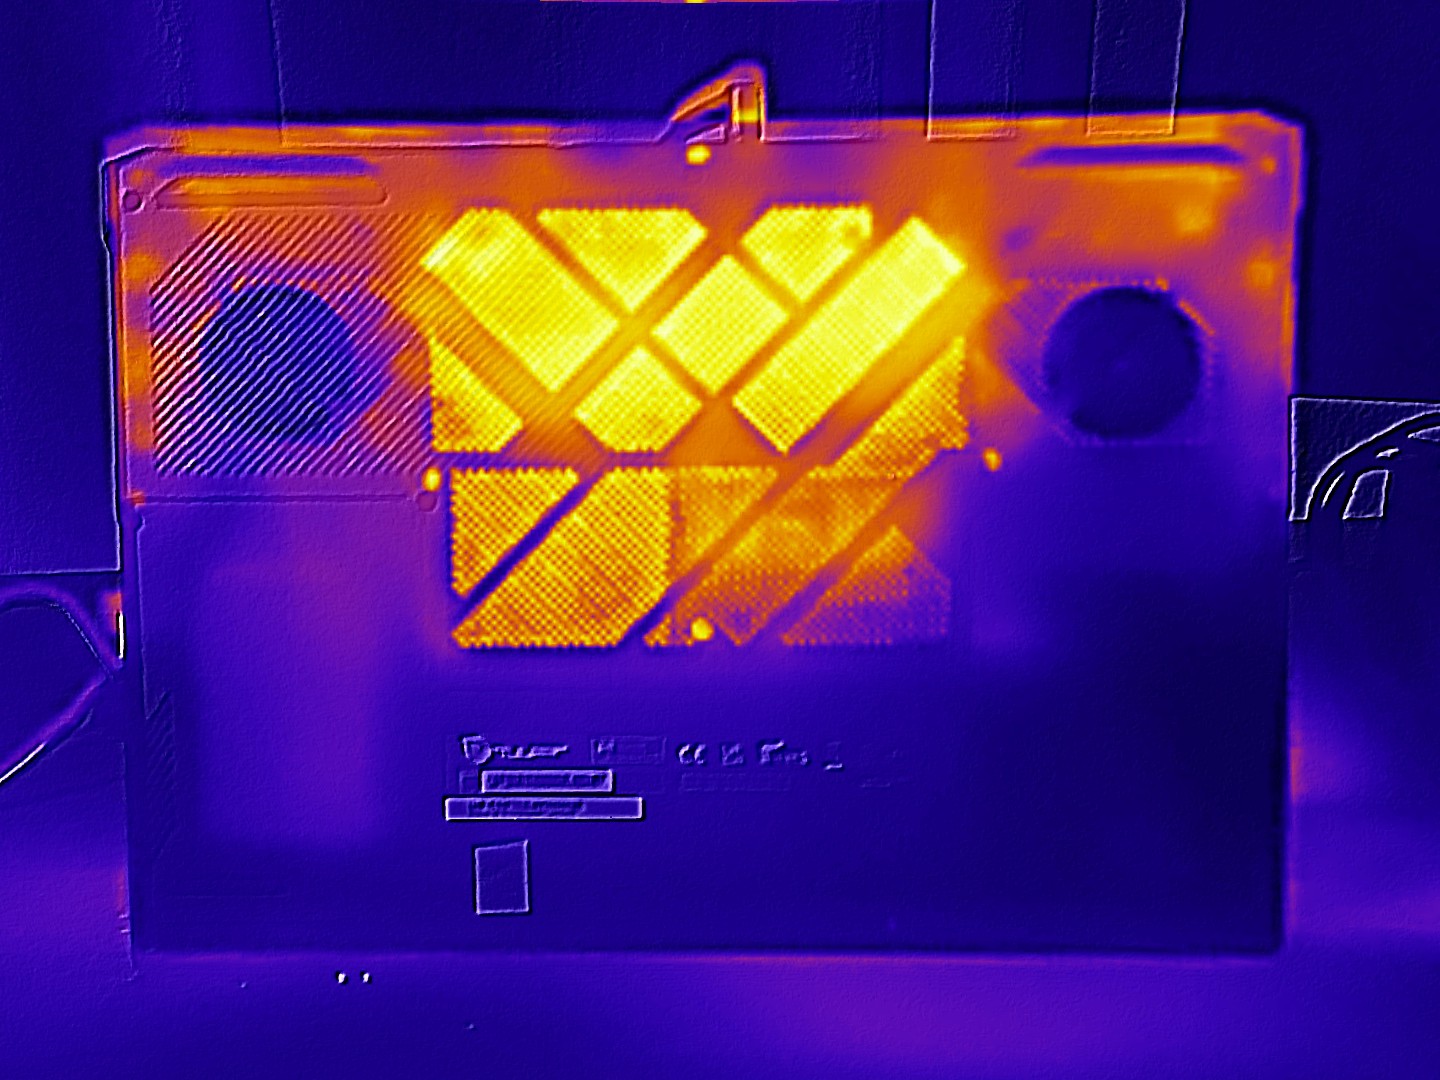
Temperature
Surface temperatures stay reasonable in 3D workloads, with the top reaching a maximum of 40 °C. However, the bottom can warm up to 47 °C. In idle, the chassis settles at a moderate 24 to 35 °C.
(±) The maximum temperature on the upper side is 40 °C / 104 F, compared to the average of 40.4 °C / 105 F, ranging from 21.2 to 68.8 °C for the class Gaming.
(-) The bottom heats up to a maximum of 47 °C / 117 F, compared to the average of 43.2 °C / 110 F
(+) In idle usage, the average temperature for the upper side is 27.4 °C / 81 F, compared to the device average of 33.9 °C / 93 F.
(±) 3: The average temperature for the upper side is 34.8 °C / 95 F, compared to the average of 33.9 °C / 93 F for the class Gaming.
(+) The palmrests and touchpad are cooler than skin temperature with a maximum of 27 °C / 80.6 F and are therefore cool to the touch.
(±) The average temperature of the palmrest area of similar devices was 28.8 °C / 83.8 F (+1.8 °C / 3.2 F).
| Tulpar T6 V3.5 i7-14700HX, GeForce RTX 5060 Laptop | Acer Nitro V 16 AI ANV16-42-R860 R5 240, GeForce RTX 5050 Laptop | no name | HP Omen 16-ap0091ng R9 8940HX, GeForce RTX 5060 Laptop | Lenovo Legion 5 15AHP G10 R7 260, GeForce RTX 5060 Laptop | Gigabyte Gaming A16 GA6H i7-13620H, GeForce RTX 5070 Laptop | |
|---|---|---|---|---|---|---|
| Heat | -10% | 10% | 2% | -11% | ||
| Maximum Upper Side * (°C) | 40 | 45 -13% | 36 10% | 42.2 -6% | 50 -25% | |
| Maximum Bottom * (°C) | 47 | 59 -26% | 37 21% | 51.7 -10% | 49 -4% | |
| Idle Upper Side * (°C) | 30 | 29 3% | 30 -0% | 28.5 5% | 35 -17% | |
| Idle Bottom * (°C) | 35 | 36 -3% | 32 9% | 29.2 17% | 34 3% |
* ... smaller is better
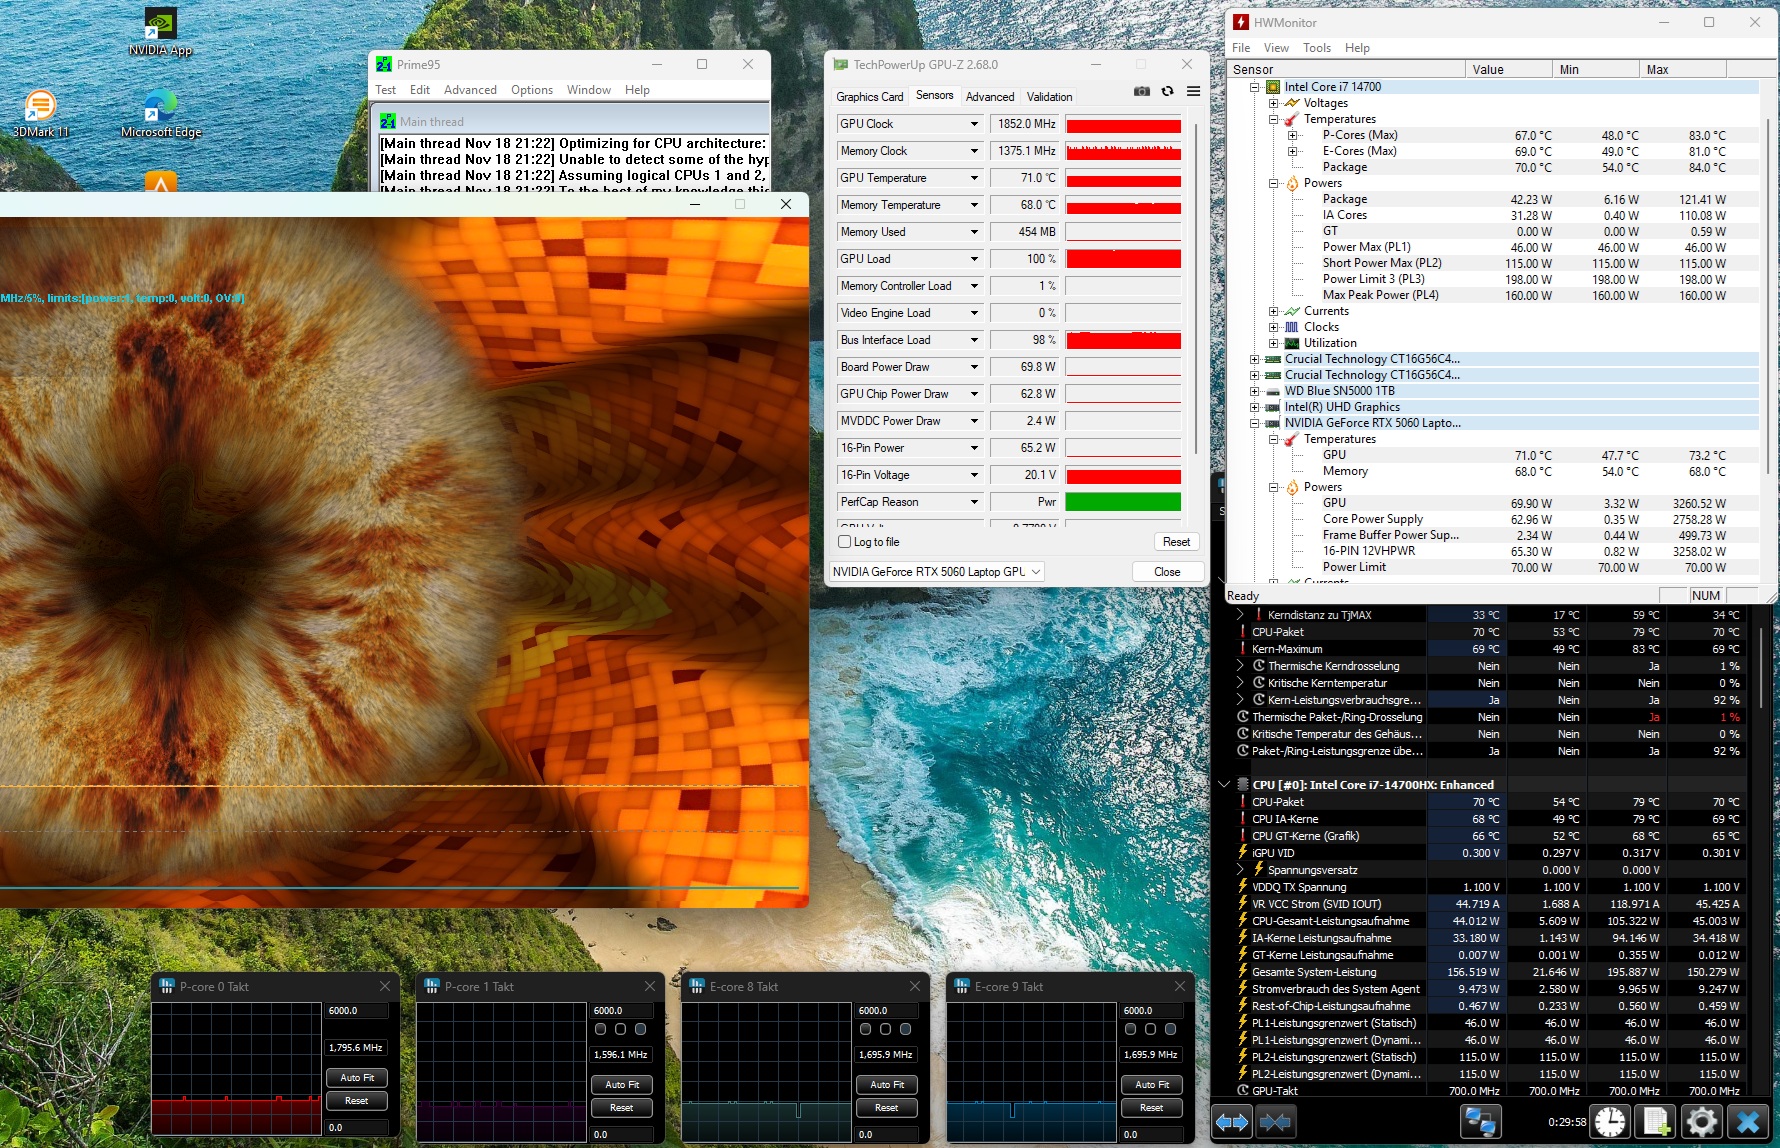
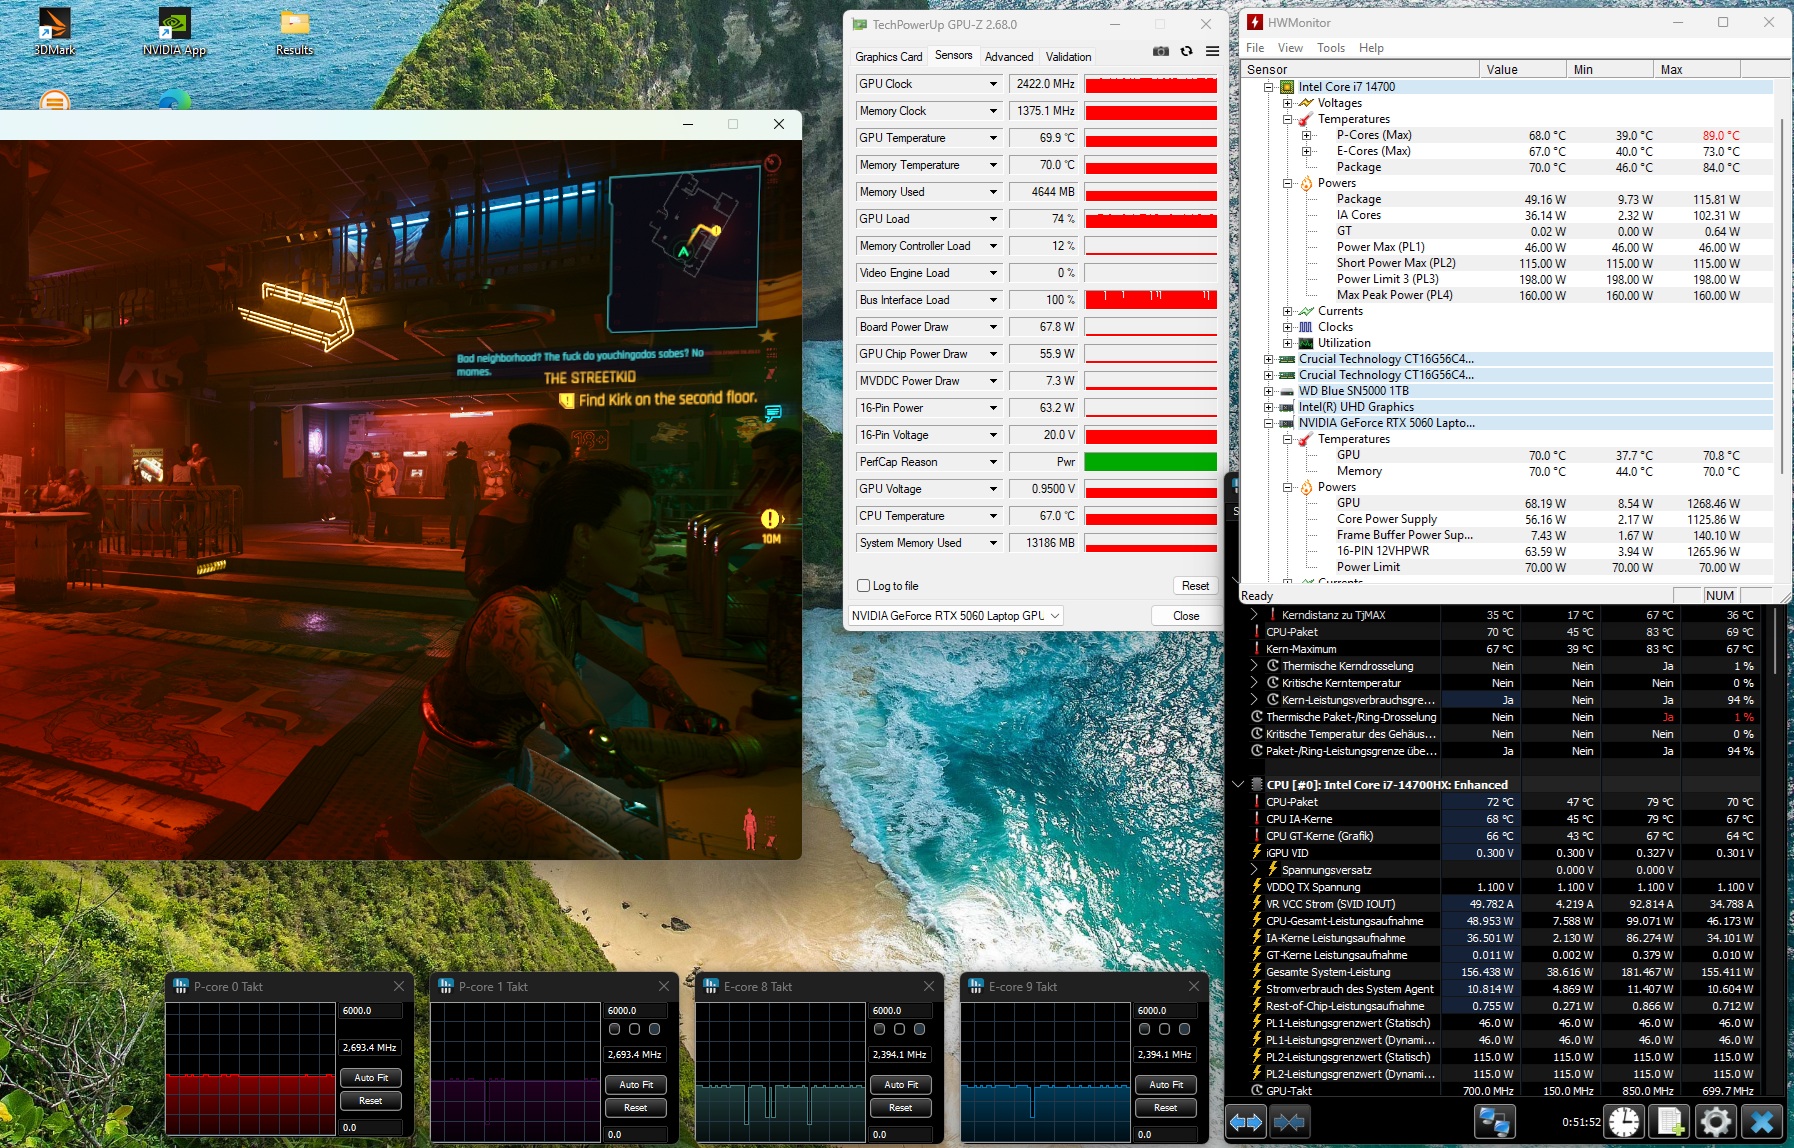
Stress test
The throttling Core i7-14700HX completed the combined Furmark and Prime95 stress test at around 70 °C, which is completely harmless. The GeForce RTX 5060 also leveled out at roughly 70 °C.


Speakers
Because the built-in 2.0 speakers offer limited sound quality, especially in the bass range, using an external audio system is recommended for long-term use.
Tulpar T6 V3.5 audio analysis
(+) | speakers can play relatively loud (82 dB)
Bass 100 - 315 Hz
(-) | nearly no bass - on average 22.4% lower than median
(±) | linearity of bass is average (14.4% delta to prev. frequency)
Mids 400 - 2000 Hz
(±) | higher mids - on average 10.7% higher than median
(+) | mids are linear (6.6% delta to prev. frequency)
Highs 2 - 16 kHz
(+) | balanced highs - only 3.5% away from median
(±) | linearity of highs is average (7.4% delta to prev. frequency)
Overall 100 - 16.000 Hz
(±) | linearity of overall sound is average (24% difference to median)
Compared to same class
» 86% of all tested devices in this class were better, 4% similar, 9% worse
» The best had a delta of 6%, average was 18%, worst was 132%
Compared to all devices tested
» 72% of all tested devices were better, 6% similar, 22% worse
» The best had a delta of 4%, average was 23%, worst was 134%
HP Omen 16-ap0091ng audio analysis
(±) | speaker loudness is average but good (79.91 dB)
Bass 100 - 315 Hz
(-) | nearly no bass - on average 18% lower than median
(±) | linearity of bass is average (11.1% delta to prev. frequency)
Mids 400 - 2000 Hz
(±) | higher mids - on average 6.9% higher than median
(±) | linearity of mids is average (7.5% delta to prev. frequency)
Highs 2 - 16 kHz
(+) | balanced highs - only 2.1% away from median
(±) | linearity of highs is average (7.5% delta to prev. frequency)
Overall 100 - 16.000 Hz
(±) | linearity of overall sound is average (17.8% difference to median)
Compared to same class
» 53% of all tested devices in this class were better, 10% similar, 37% worse
» The best had a delta of 6%, average was 18%, worst was 132%
Compared to all devices tested
» 36% of all tested devices were better, 8% similar, 56% worse
» The best had a delta of 4%, average was 23%, worst was 134%
Energy management
Power Consumption
Power consumption is reasonable overall, though the T6 V3.5 could be a bit more efficient compared with some competing models. Its 230-watt power adapter is rarely pushed anywhere near its limit.
| Off / Standby | |
| Idle | |
| Load |
|
Key:
min: | |
| Tulpar T6 V3.5 i7-14700HX, GeForce RTX 5060 Laptop | Acer Nitro V 16 AI ANV16-42-R860 R5 240, GeForce RTX 5050 Laptop | no name | HP Omen 16-ap0091ng R9 8940HX, GeForce RTX 5060 Laptop | Lenovo Legion 5 15AHP G10 R7 260, GeForce RTX 5060 Laptop | Gigabyte Gaming A16 GA6H i7-13620H, GeForce RTX 5070 Laptop | Average of class Gaming | |
|---|---|---|---|---|---|---|---|
| Power Consumption | 38% | 17% | 1% | 15% | 10% | -27% | |
| Idle Minimum * (Watt) | 6.7 | 4.2 37% | 4.4 34% | 7.8 -16% | 6.9 -3% | 9 -34% | 13 ? -94% |
| Idle Average * (Watt) | 13.7 | 6.8 50% | 18 -31% | 8.8 36% | 10.7 22% | 11 20% | 18.7 ? -36% |
| Idle Maximum * (Watt) | 21.8 | 9.8 55% | 18.2 17% | 21.5 1% | 11.3 48% | 23 -6% | 24.3 ? -11% |
| Load Average * (Watt) | 127 | 62 51% | 87.1 31% | 119 6% | 69.7 45% | 91 28% | 110.2 ? 13% |
| Cyberpunk 2077 ultra external monitor * (Watt) | 151.9 | 129.6 15% | 120.6 21% | 164.5 -8% | 165 -9% | 130 14% | |
| Cyberpunk 2077 ultra * (Watt) | 156.7 | 130.3 17% | 123 22% | 192 -23% | 162.6 -4% | 132.5 15% | |
| Load Maximum * (Watt) | 242 | 135 44% | 183 24% | 208 14% | 233.6 3% | 155 36% | 258 ? -7% |
* ... smaller is better
energy consumption Cyberpunk / Stress test
energy consumption with external monitor
Battery life
In our Wi-Fi test with the display brightness set to 150 cd/m², the 53 Wh battery lasted just under 4.5 hours, which is a mediocre result. For comparison, competitors with larger 70 to 96 Wh batteries range from about 5 hours (HP Omen 16) to 11 hours (Acer Nitro V 16 AI).
| Tulpar T6 V3.5 i7-14700HX, GeForce RTX 5060 Laptop, 53.35 Wh | Acer Nitro V 16 AI ANV16-42-R860 R5 240, GeForce RTX 5050 Laptop, 76 Wh | no name Wh | HP Omen 16-ap0091ng R9 8940HX, GeForce RTX 5060 Laptop, 70 Wh | Lenovo Legion 5 15AHP G10 R7 260, GeForce RTX 5060 Laptop, 80 Wh | Gigabyte Gaming A16 GA6H i7-13620H, GeForce RTX 5070 Laptop, 76 Wh | Average of class Gaming | |
|---|---|---|---|---|---|---|---|
| Battery runtime | 155% | 70% | 14% | 120% | 75% | 63% | |
| WiFi v1.3 (h) | 4.4 | 11.2 155% | 7.5 70% | 5 14% | 9.7 120% | 7.7 75% | 7.15 ? 63% |
| H.264 (h) | 5.1 | 11.5 | 8.64 ? | ||||
| Load (h) | 1.3 | 1.2 | 1.502 ? | ||||
| Cyberpunk 2077 ultra 150cd (h) | 0.9 |
Notebookcheck overall rating
Overall, the Tulpar T6 V3.5 is a solid gaming laptop with an RTX 5060 and a balanced price-to-performance ratio.
Tulpar T6 V3.5
- 11/25/2025 v8
Florian Glaser
 Total Sustainability Score:
 Possible alternatives in comparison
Image | Model / Review | Price | Weight | Height | Display |
|---|---|---|---|---|---|
1. 77.8%  | Tulpar T6 V3.5 Intel Core i7-14700HX ⎘ NVIDIA GeForce RTX 5060 Laptop ⎘ 32 GB Memory, 1000 GB SSD | Amazon: List Price: 1160 EUR | 2.4 kg | 25 mm | 16.00" 1920x1200 142 PPI IPS |
2. 77.5%  | Acer Nitro V 16 AI ANV16-42-R860 AMD Ryzen 5 240 ⎘ NVIDIA GeForce RTX 5050 Laptop ⎘ 16 GB Memory, 1024 GB SSD | Amazon: 1. $949.99 Acer Nitro V 16in Gaming Lap... 2. $1,019.00 Acer Nitro V 16 AI Gaming La... 3. $1,059.00 Acer Nitro V 16 AI Gaming La... List Price: 1100 EUR | 2.4 kg | 24.5 mm | 16.00" 1920x1200 142 PPI IPS |
| no name ⎘ ⎘ | Amazon: 1. $22.03 No Name 2. $9.99 Hobby Lobby No Name School S... 3. No Name | ||||
4. 82.5%  | HP Omen 16-ap0091ng AMD Ryzen 9 8940HX ⎘ NVIDIA GeForce RTX 5060 Laptop ⎘ 16 GB Memory, 1000 GB SSD | Amazon: List Price: 1500 Euro | 2.4 kg | 23.7 mm | 16.00" 1920x1200 162 PPI IPS |
5. 87.2%  | Lenovo Legion 5 15AHP G10 AMD Ryzen 7 260 ⎘ NVIDIA GeForce RTX 5060 Laptop ⎘ 32 GB Memory, 1024 GB SSD | Amazon: List Price: 1449€ | 1.9 kg | 21.5 mm | 15.10" 2560x1600 200 PPI OLED |
6. 80.1%  | Gigabyte Gaming A16 GA6H Intel Core i7-13620H ⎘ NVIDIA GeForce RTX 5070 Laptop ⎘ 16 GB Memory, 1024 GB SSD | Amazon: 1. $1,087.18 GIGABYTE - Gaming A16 Gaming... 2. $1,227.99 GIGABYTE - Gaming A16 Gaming... 3. $1,078.54 GIGABYTE - Gaming A16 Gaming... List Price: 1700 EUR | 2.3 kg | 23 mm | 16.00" 2560x1600 189 PPI IPS |
Transparency
The selection of devices to be reviewed is made by our editorial team. The test sample was provided to the author as a loan by the manufacturer or retailer for the purpose of this review. The lender had no influence on this review, nor did the manufacturer receive a copy of this review before publication. There was no obligation to publish this review. As an independent media company, Notebookcheck is not subjected to the authority of manufacturers, retailers or publishers.
This is how Notebookcheck is testing
Every year, Notebookcheck independently reviews hundreds of laptops and smartphones using standardized procedures to ensure that all results are comparable. We have continuously developed our test methods for around 20 years and set industry standards in the process. In our test labs, high-quality measuring equipment is utilized by experienced technicians and editors. These tests involve a multi-stage validation process. Our complex rating system is based on hundreds of well-founded measurements and benchmarks, which maintains objectivity. Further information on our test methods can be found here.

