Verdict — Much Thinner Than The 16X Aurora
The Alienware 16 Aurora makes a few compromises when compared to the pricier 16X Aurora. While the performance cutbacks are to be expected, the hit to black-white response times is harder to take in for gamers as the ghosting can become noticeable when playing fast-paced titles. This is a key aspect that competitors like the Gigabyte Gaming A16 or Asus TUF Gaming A16 perform better on. Other smaller omissions include RGB keys and support for G-Sync and Thunderbolt, but the target budget to mid-range gamer are less likely to miss such niceties.
There are some noticeable advantages to the model. Since it ships with less demanding hardware than the 16X Aurora, the 16 Aurora is thinner with both longer battery life and a smaller AC adapter for easier transporting. These advantages are notable as the 16X Aurora can be somewhat bulky.
As for its gaming capabilities, the 16 Aurora can struggle running demanding titles at the native 2K resolution as the mobile RTX 5060 GPU is geared more towards 1080p. Enabling DLSS and frame generation while on lower settings is key to maximizing the potential of the RTX 5060 GPU. Otherwise, gaming performance is only a marginal improvement over older RTX 4060 options.
Pros
Cons
Price and Availability
Dell is now shipping the Alienware 16 Aurora for $1100 as reviewed. Lesser configurations with the RTX 4050 or RTX 5050 are also available. Configurations are also available on Amazon starting for $1300.
- $1,222.28Alienware 16 Aurora Laptop AC16250-16-inch 16:10 WQXGA Display, Intel Core 7-240H Series 2, 16GB DDR5 RAM, 1TB SSD, NVIDIA GeForce RTX 5060 8GB GDDR7, Windows 11 Home, Onsite Service - Blue
- $2,349.99Alienware 16 Aurora Gaming Laptop AC16250-16-inch WQXGA 120Hz Display, Intel Core 9-270H Processor, 32GB DDR5 RAM, 1TB SSD, NVIDIA GeForce RTX 5070 Graphics, Windows 11 Home - Blue
- $1,398.99Dell Alienware 16 Aurora Gaming Laptop AC16250, 16" WQXGA Display, NVIDIA GeForce RTX 5050, Intel Core 7-240H, 16GB RAM, 1TB SSD, Backlit Keyboard, with Lifetime MS Office, Wins 11 Pro
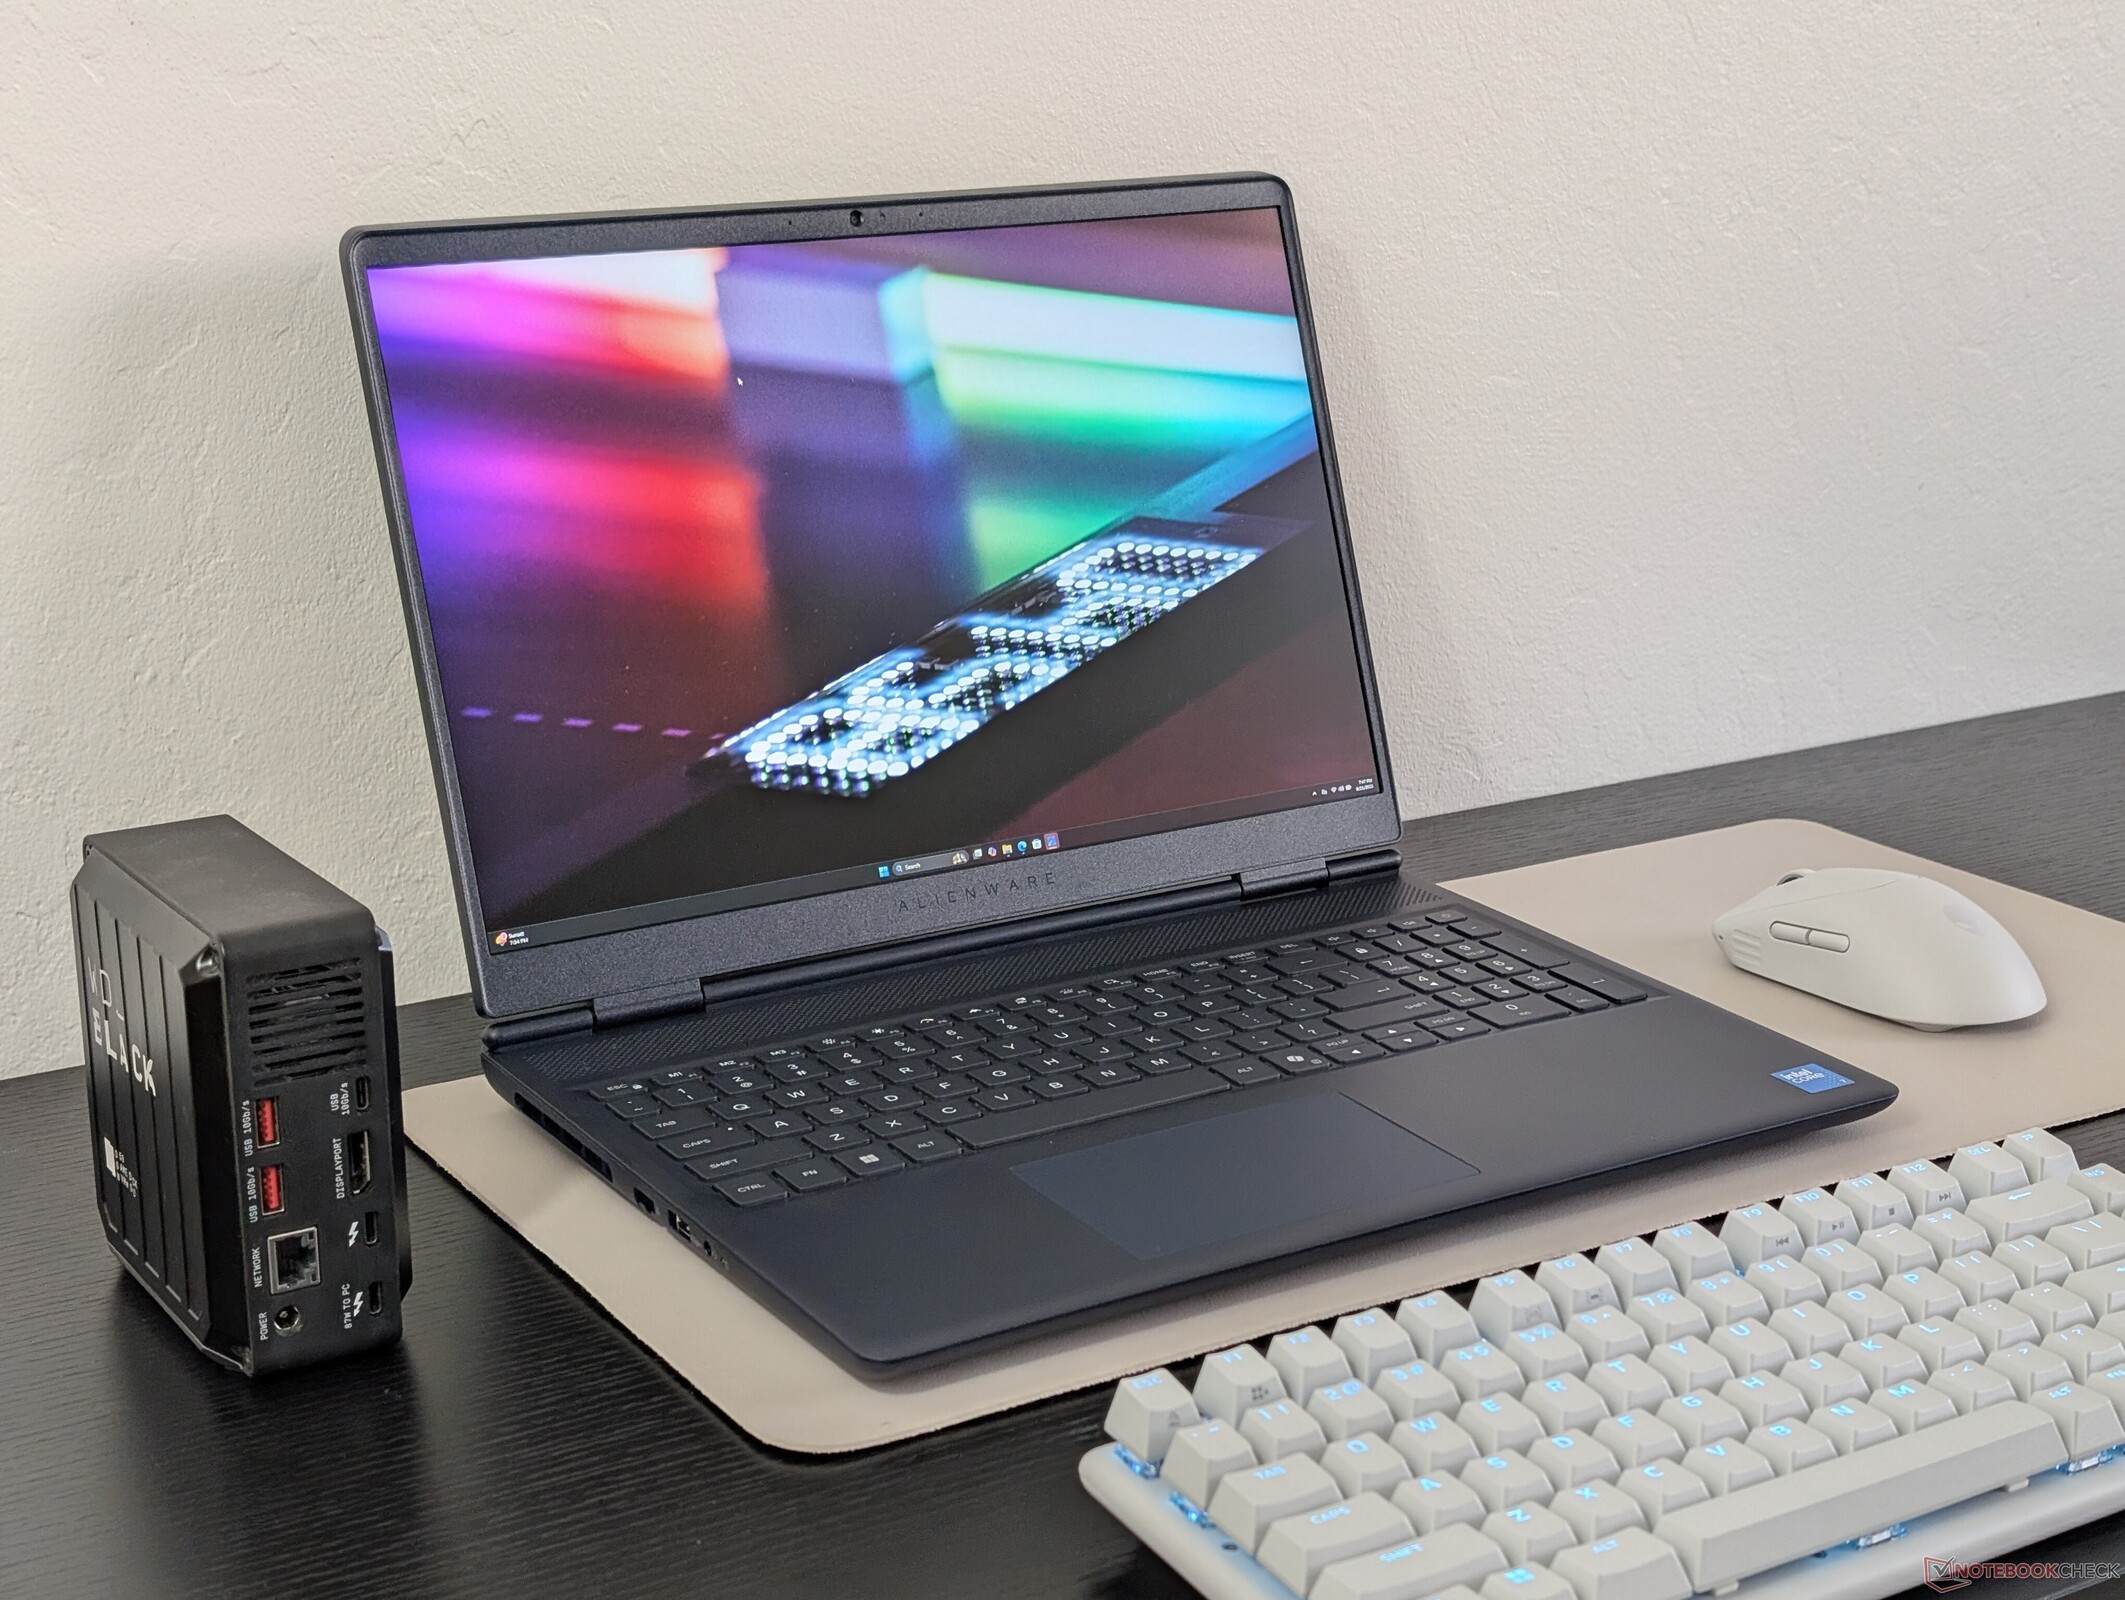
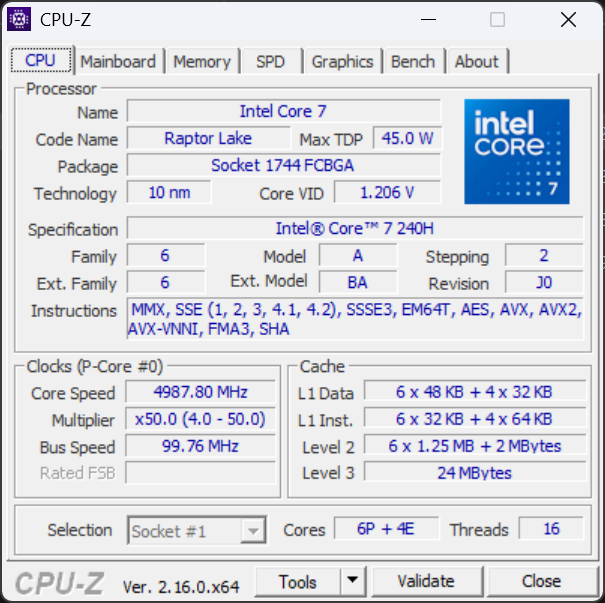
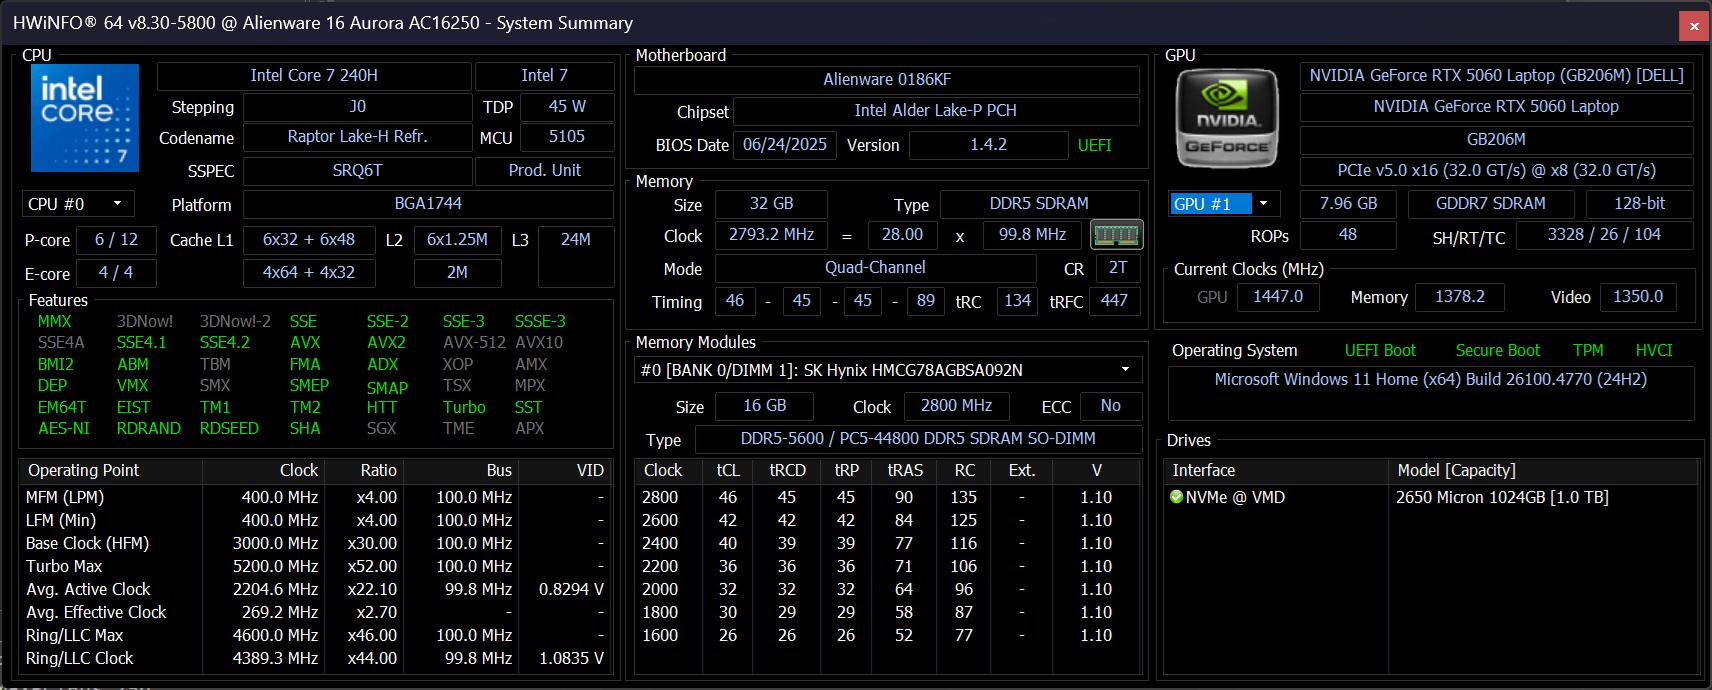
The Alienware 16 Aurora is the more affordable version of the Alienware 16X Aurora. It ships with the Raptor Lake Core 7 240H CPU, 80 W GeForce RTX 5060 GPU, and 1600p120 sRGB display instead of the Arrow Lake Core Ultra 9 275HX, 115 W RTX 5070, and 1600p240 P3 display of the 16X Aurora. The system is otherwise almost visually identical to the 16X Aurora.
We recommend checking out our existing review on the 16X Aurora to learn more about the physical features of the 16 Aurora. This page focuses on the major differences between the two configurations that users can expect.
Competitors to the Alienware 16 Aurora include other budget 16-inch gaming laptops like the Lenovo Legion 5 16, MSI Sword 16, or Asus ROG TUF series.
More Dell reviews:
Specifications
Case
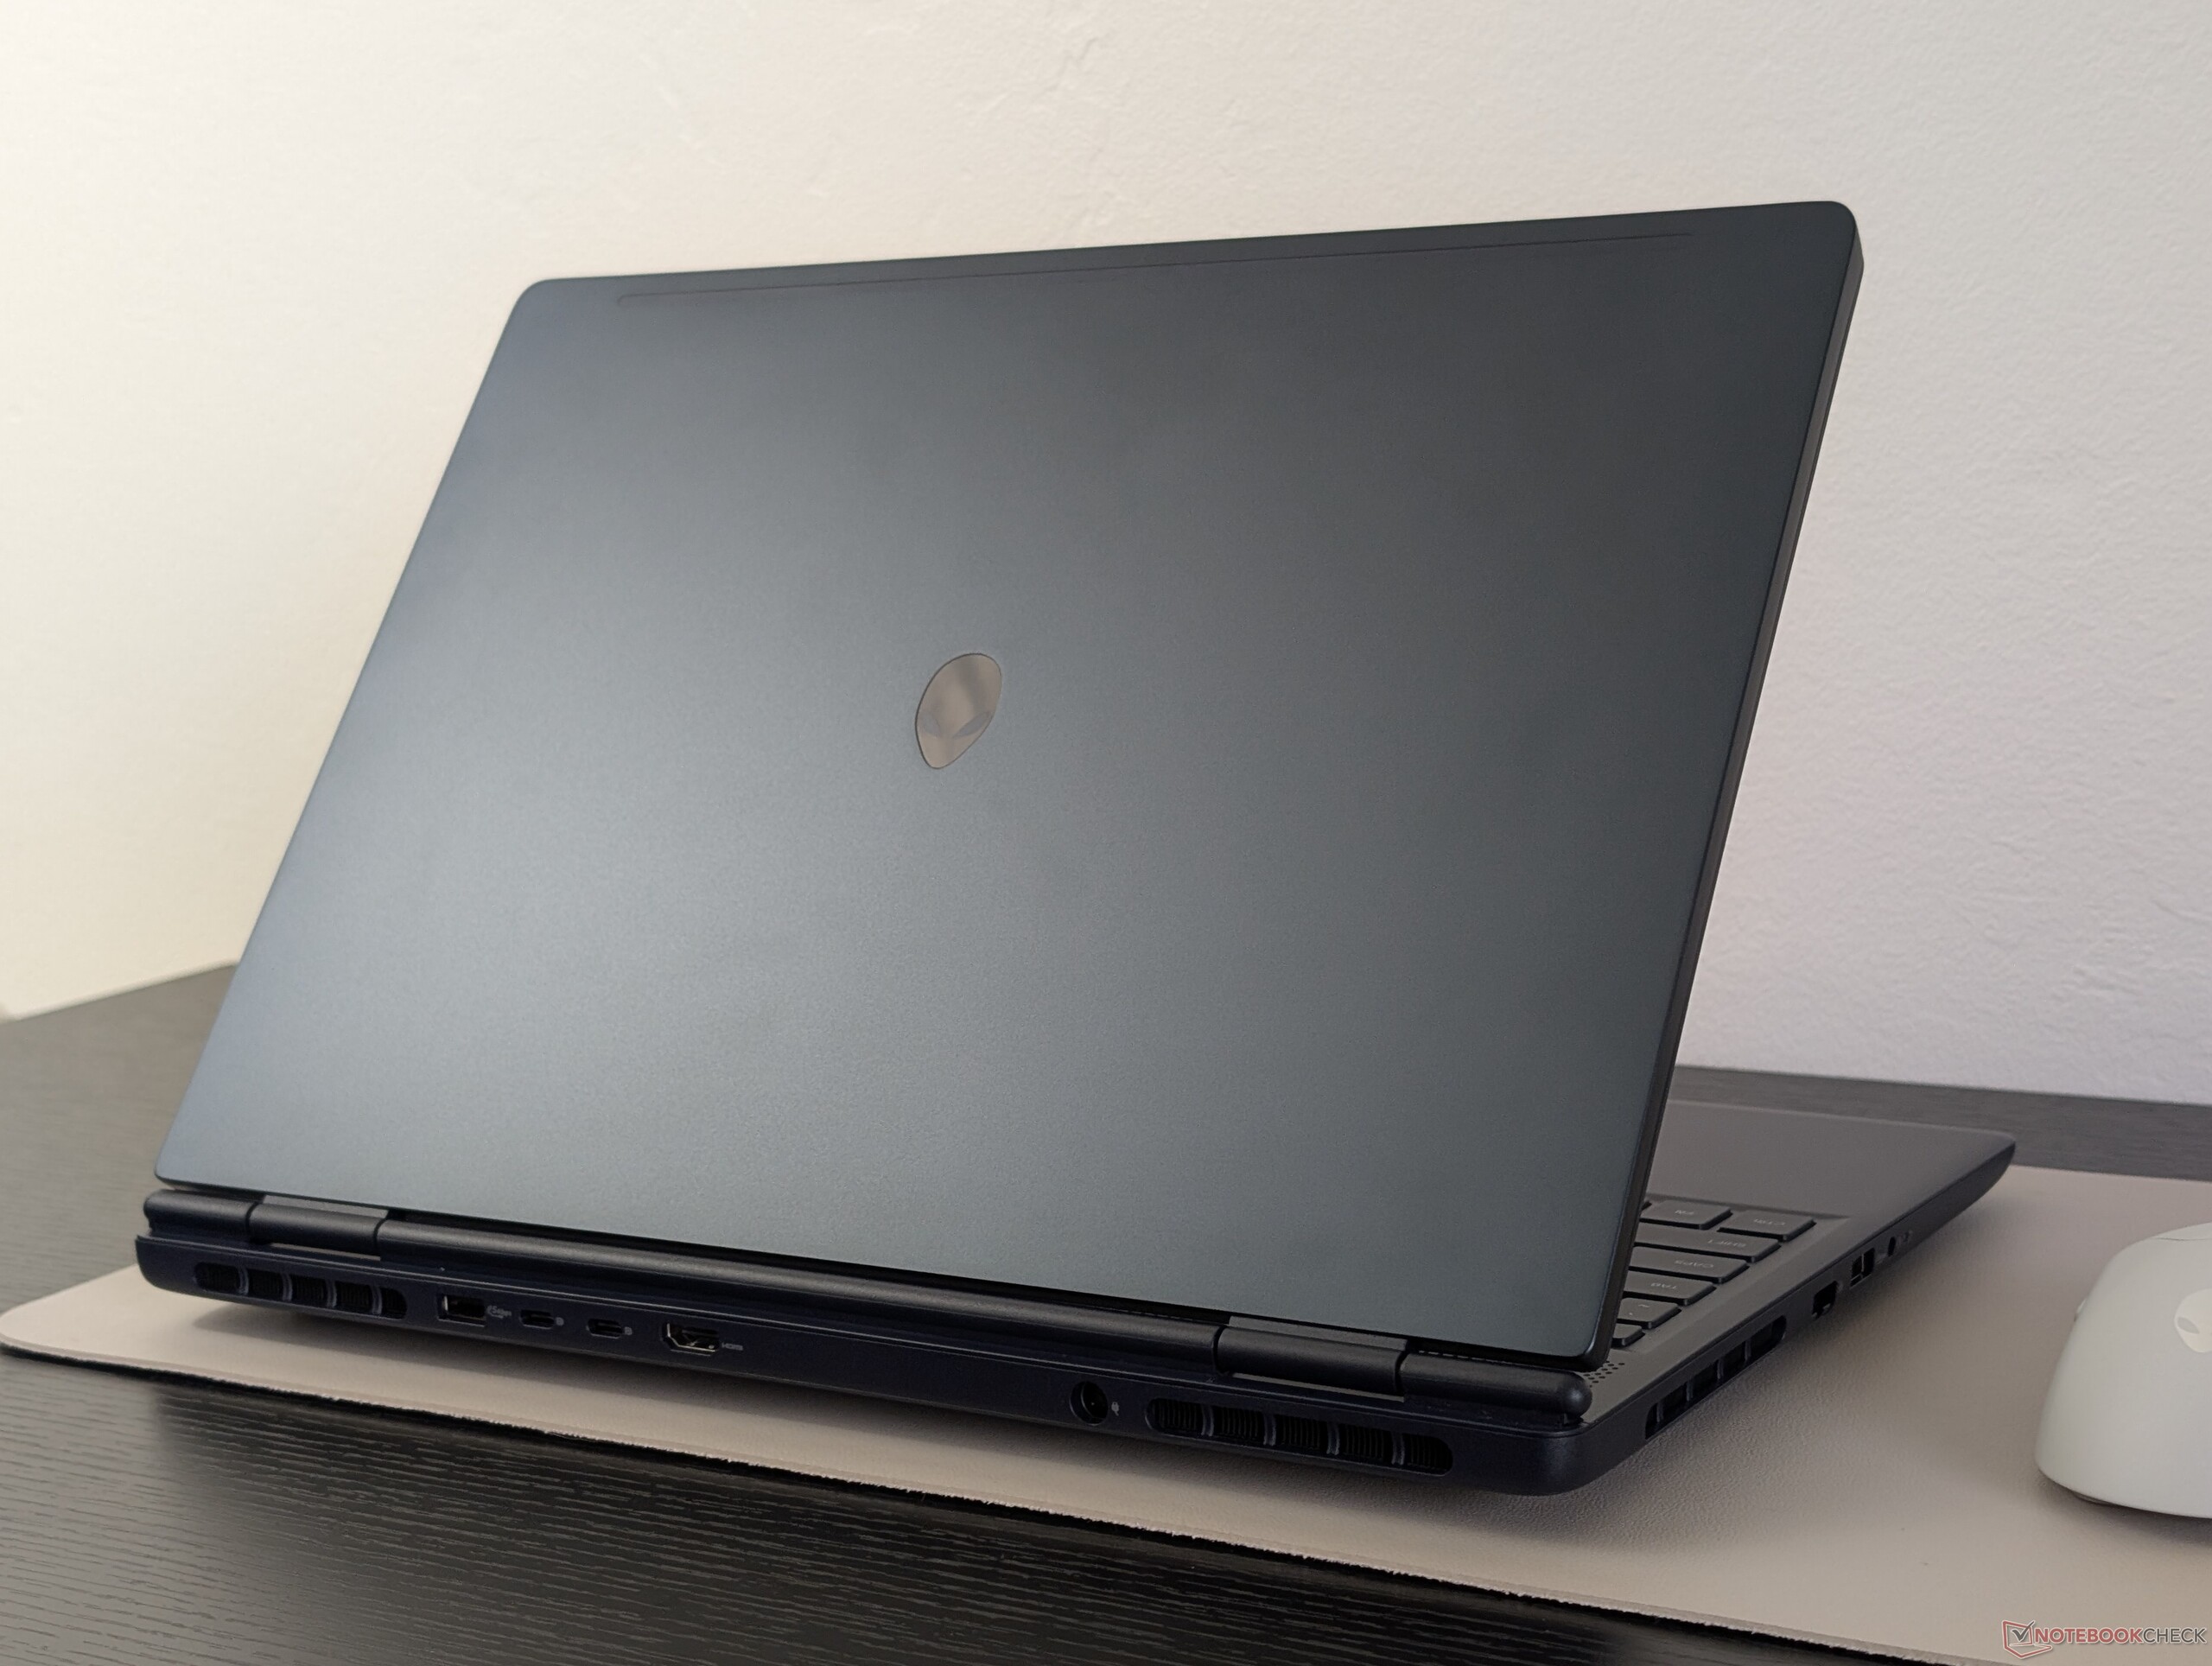
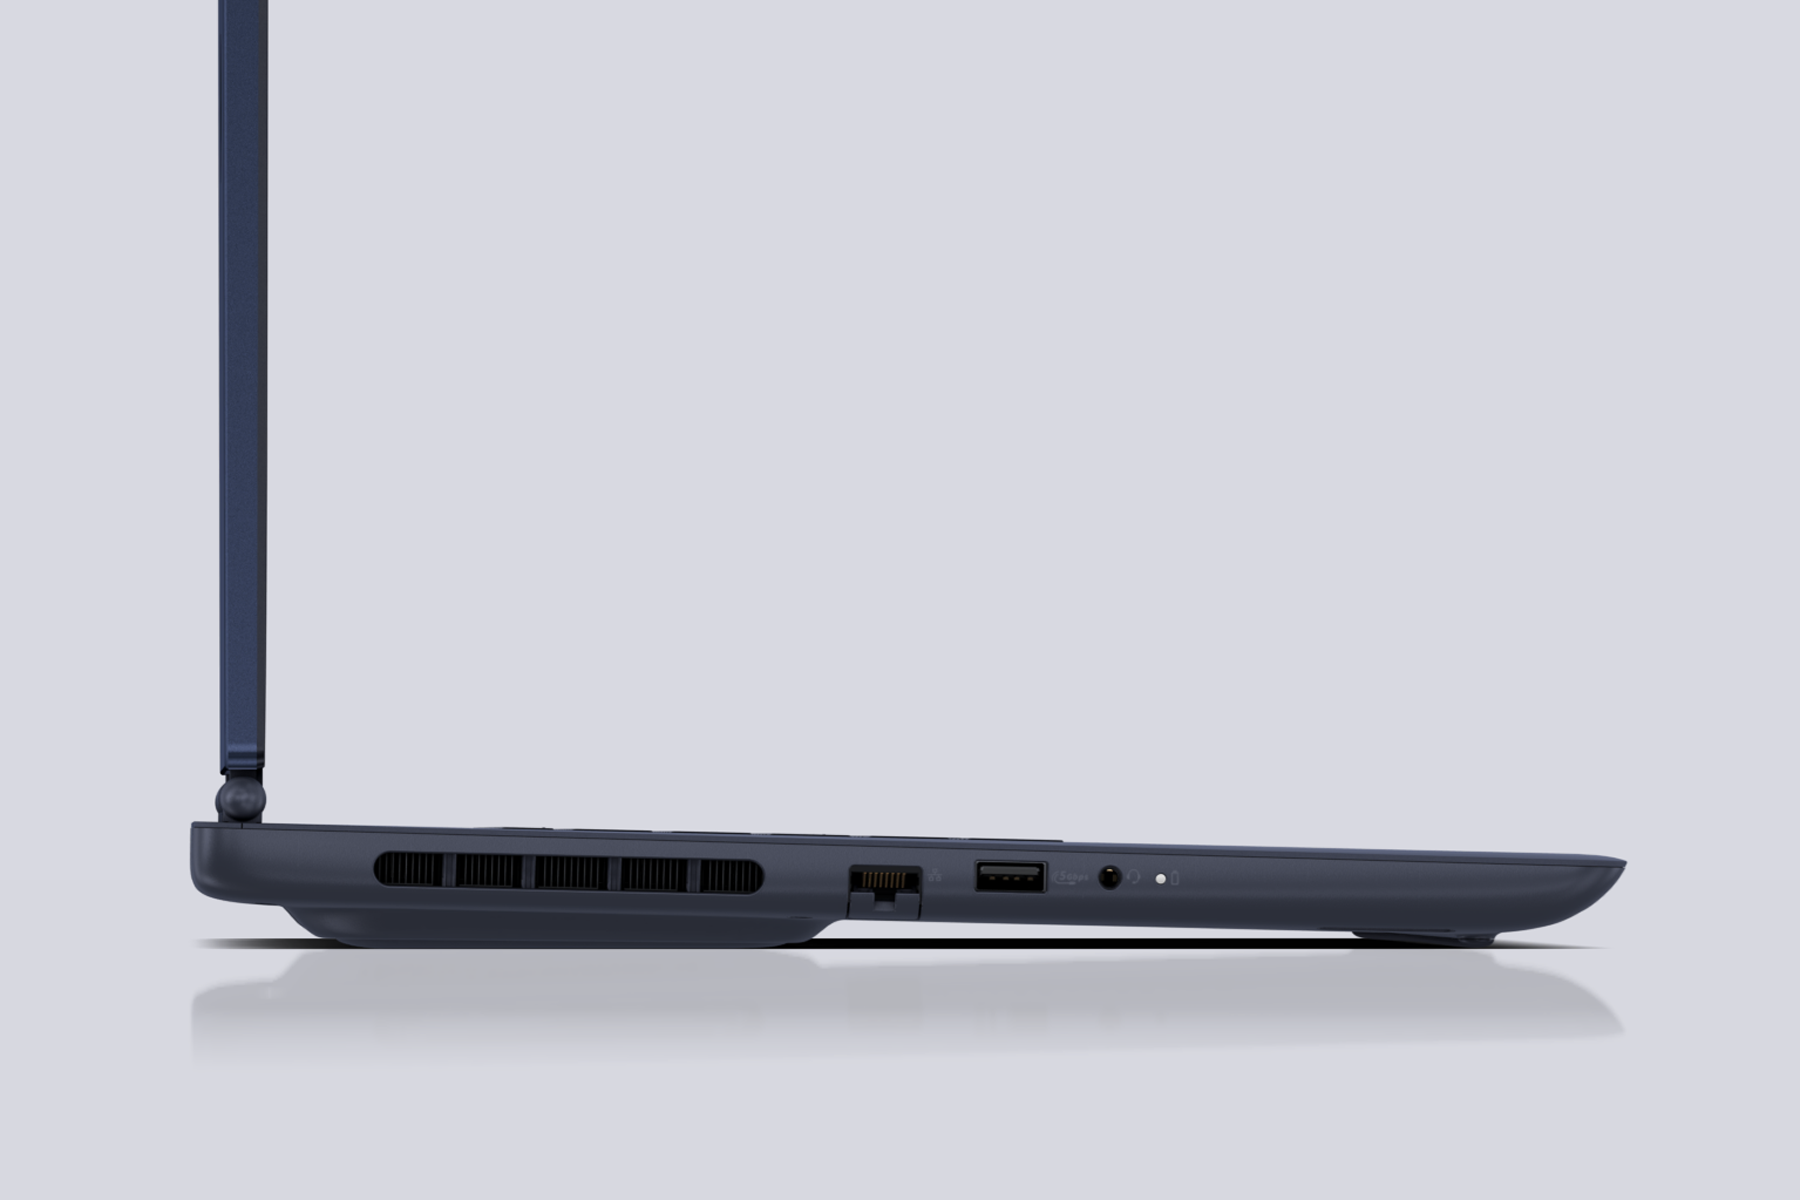
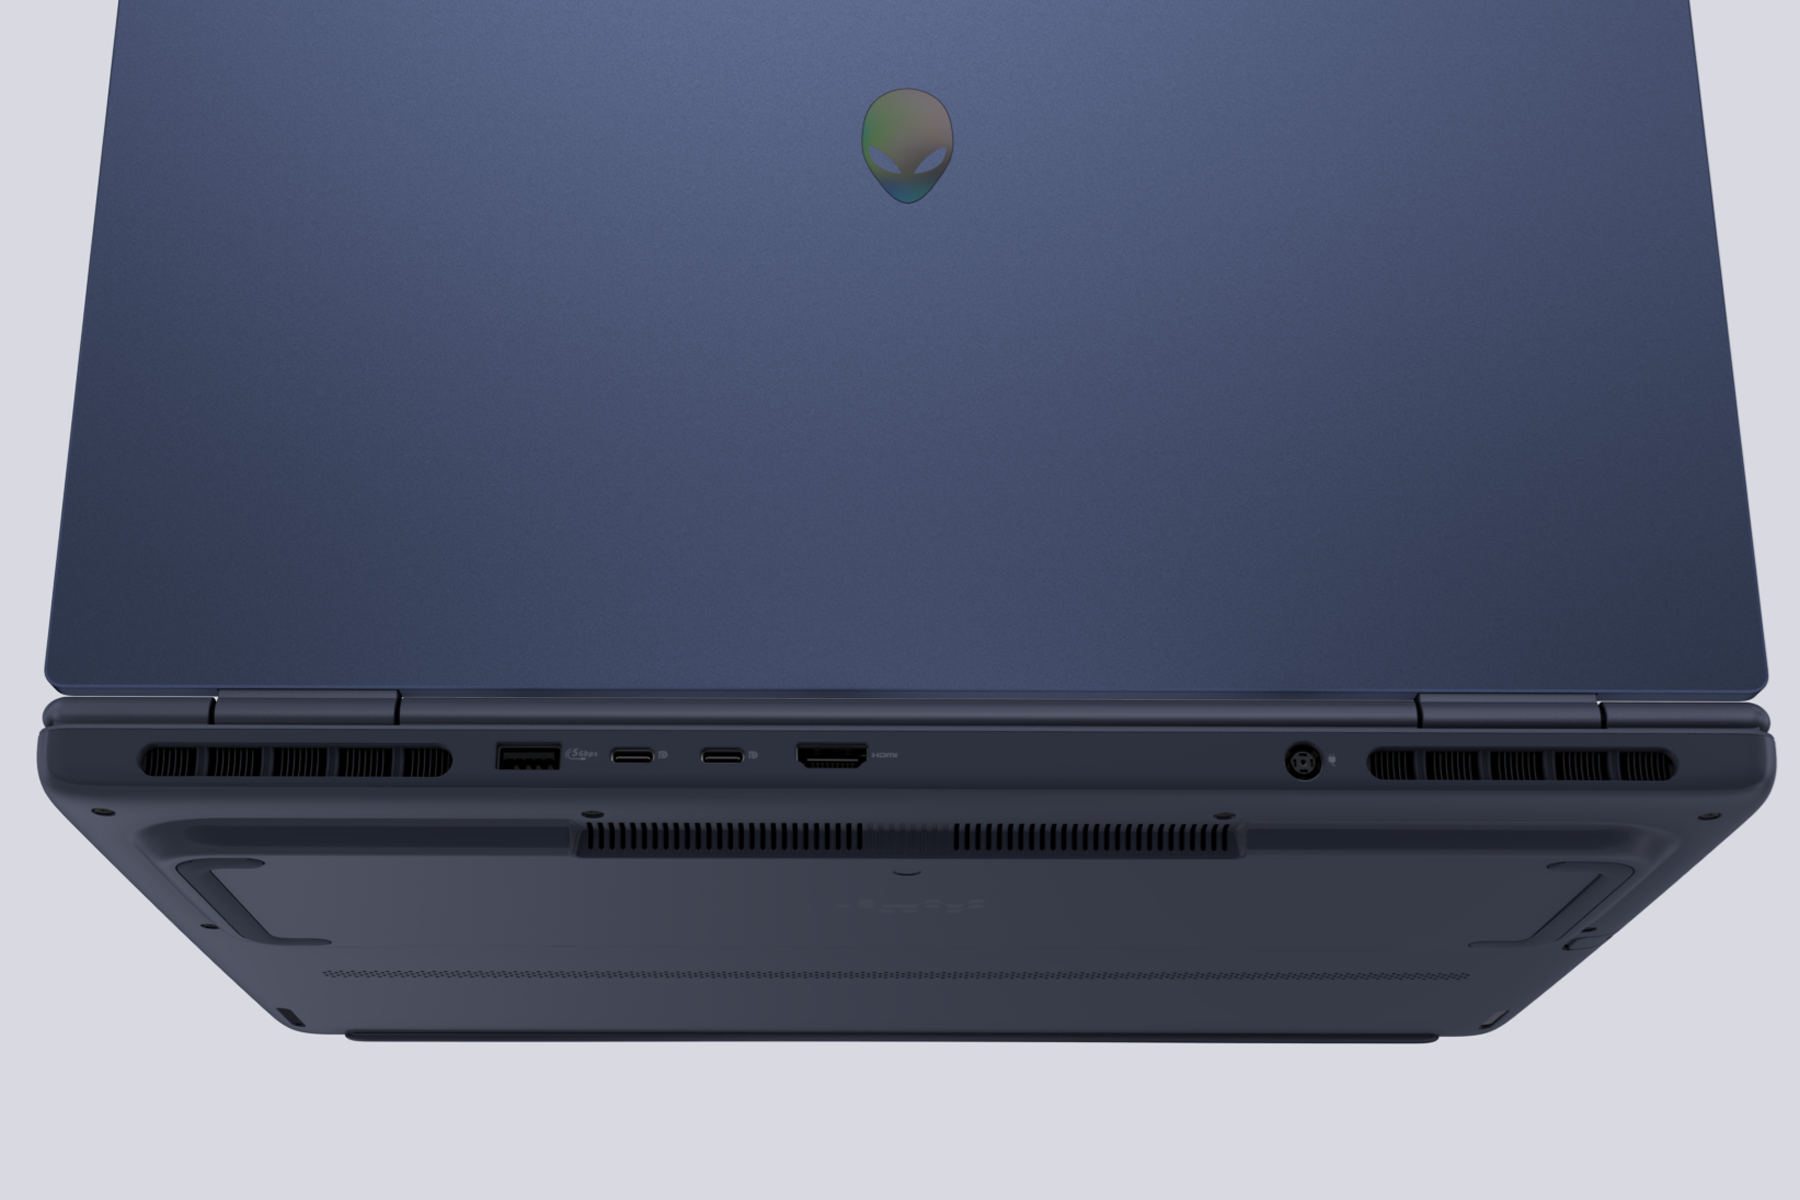
While the chassis and weight are almost identical to the 16X Aurora, note that the 16 Aurora is much thinner (15.2 mm vs. 23.4 mm). Users will also want to keep in mind that the 16 Aurora loses Thunderbolt support for more limited docking capabilities.
Connectivity
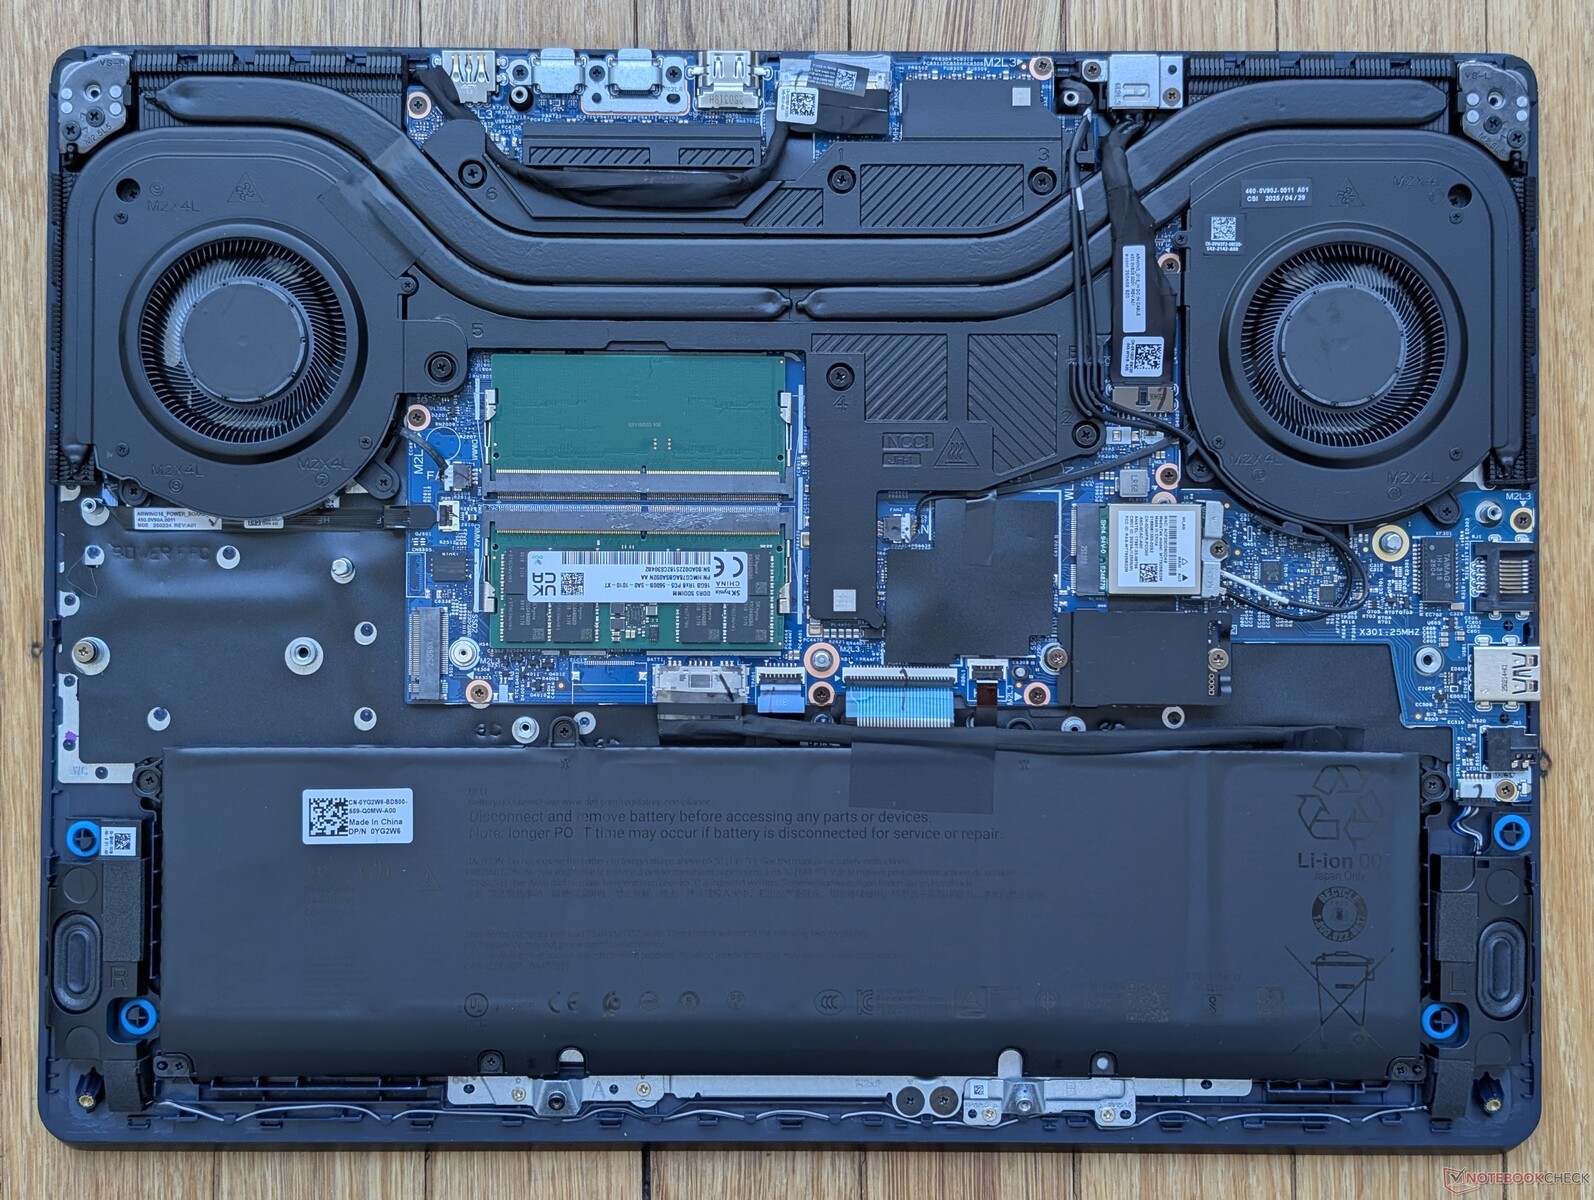
Maintenance
Servicing is identical to the 16X Aurora albeit with moderate changes to the cooling solution.
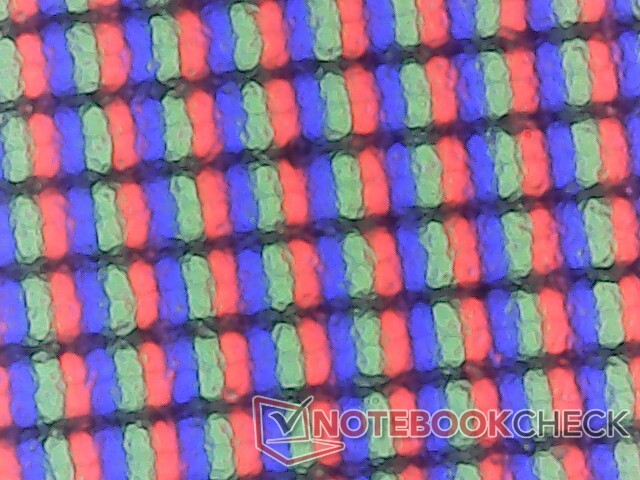
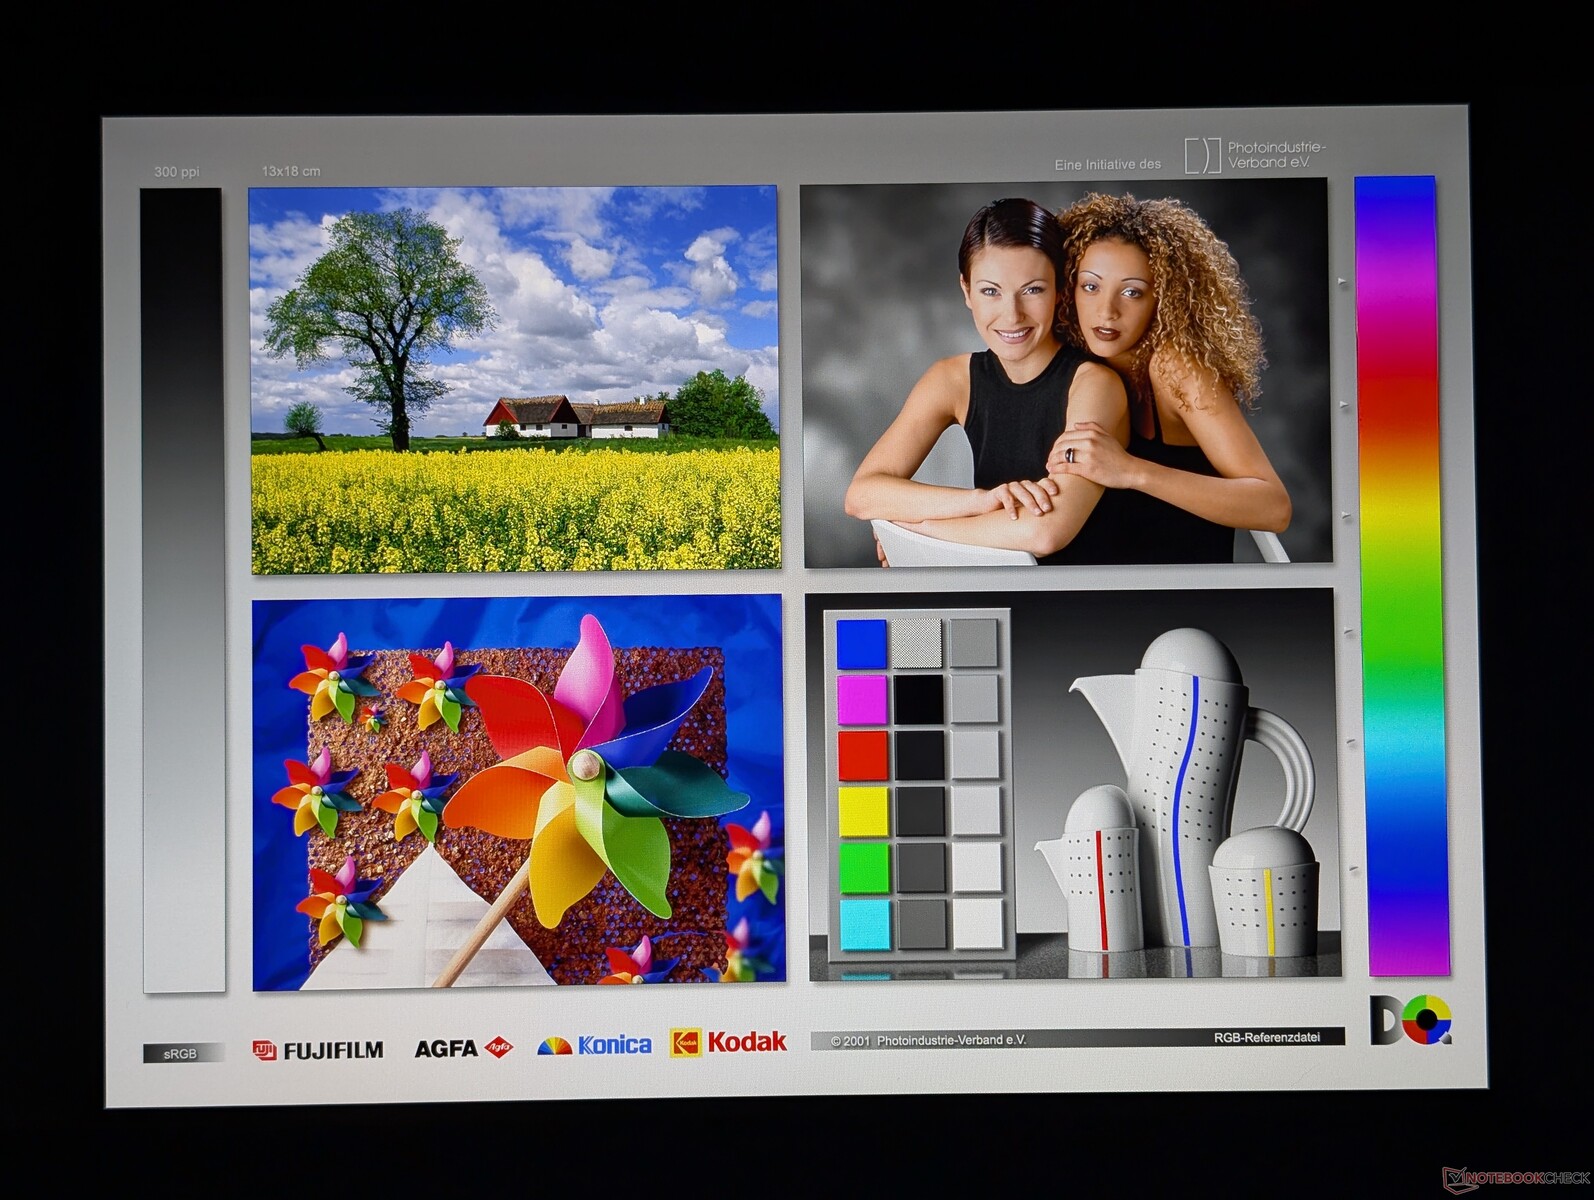
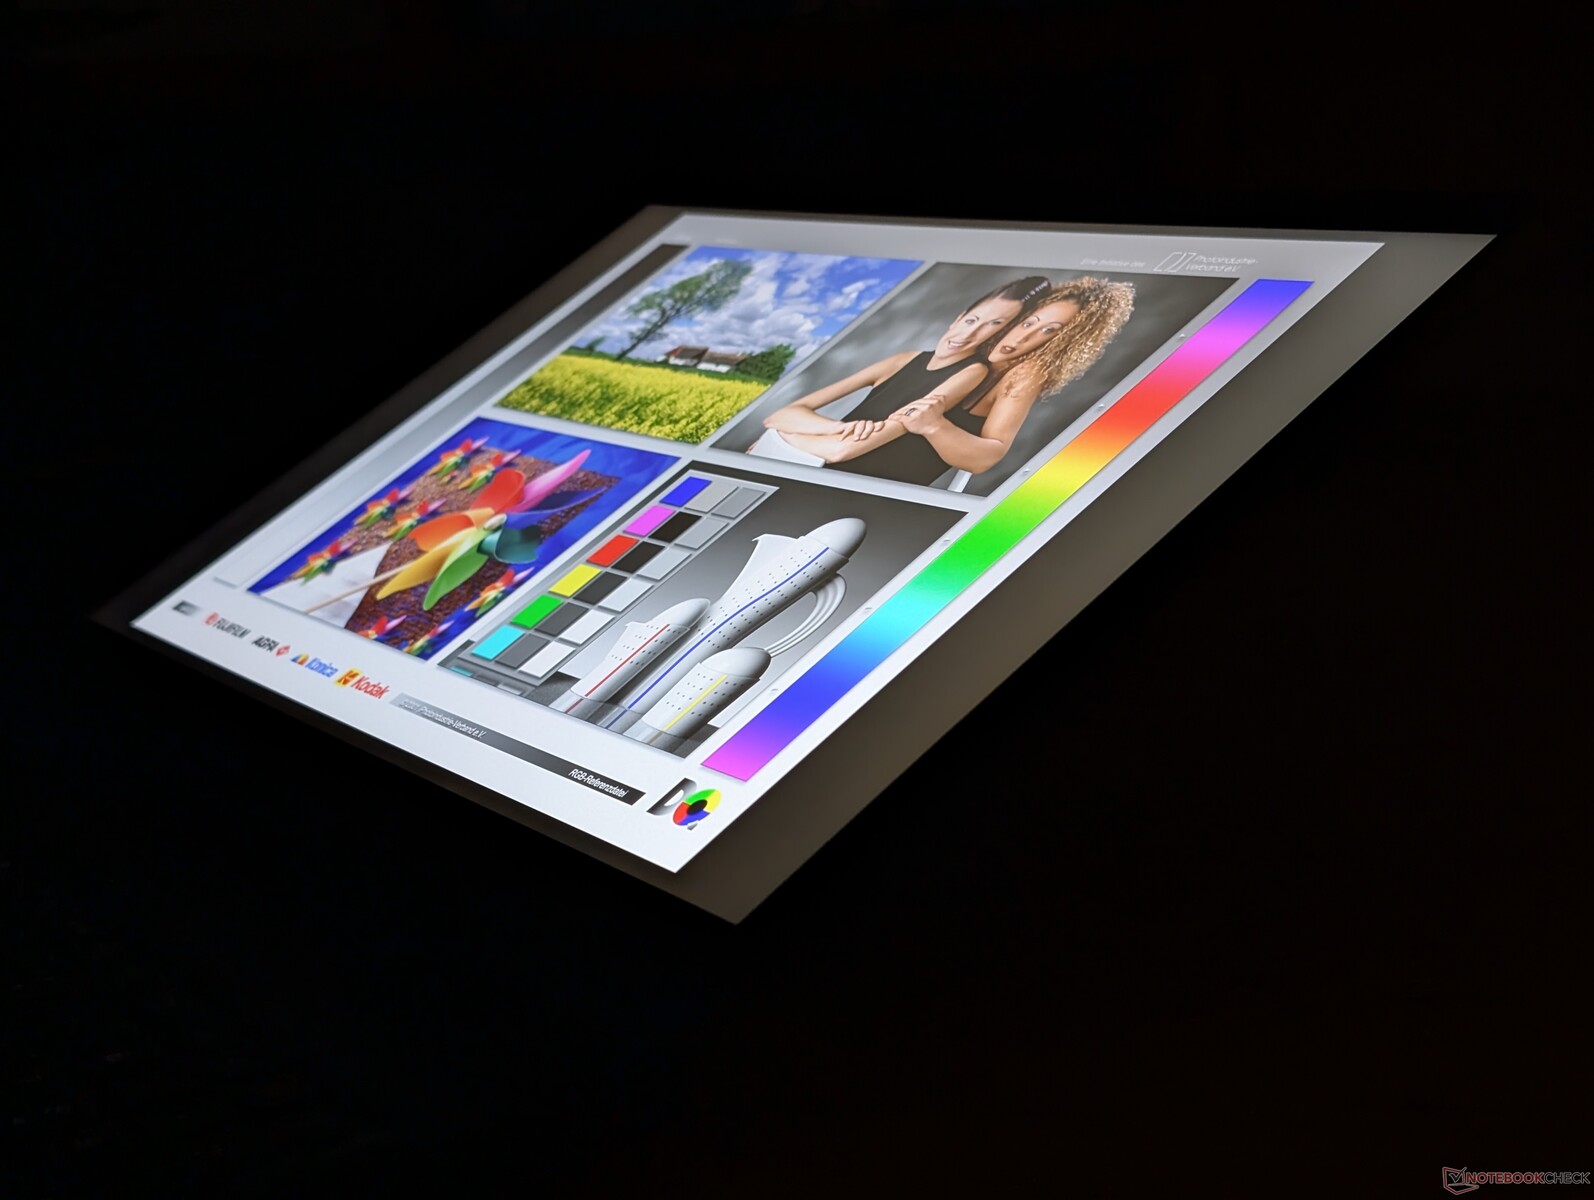
Display
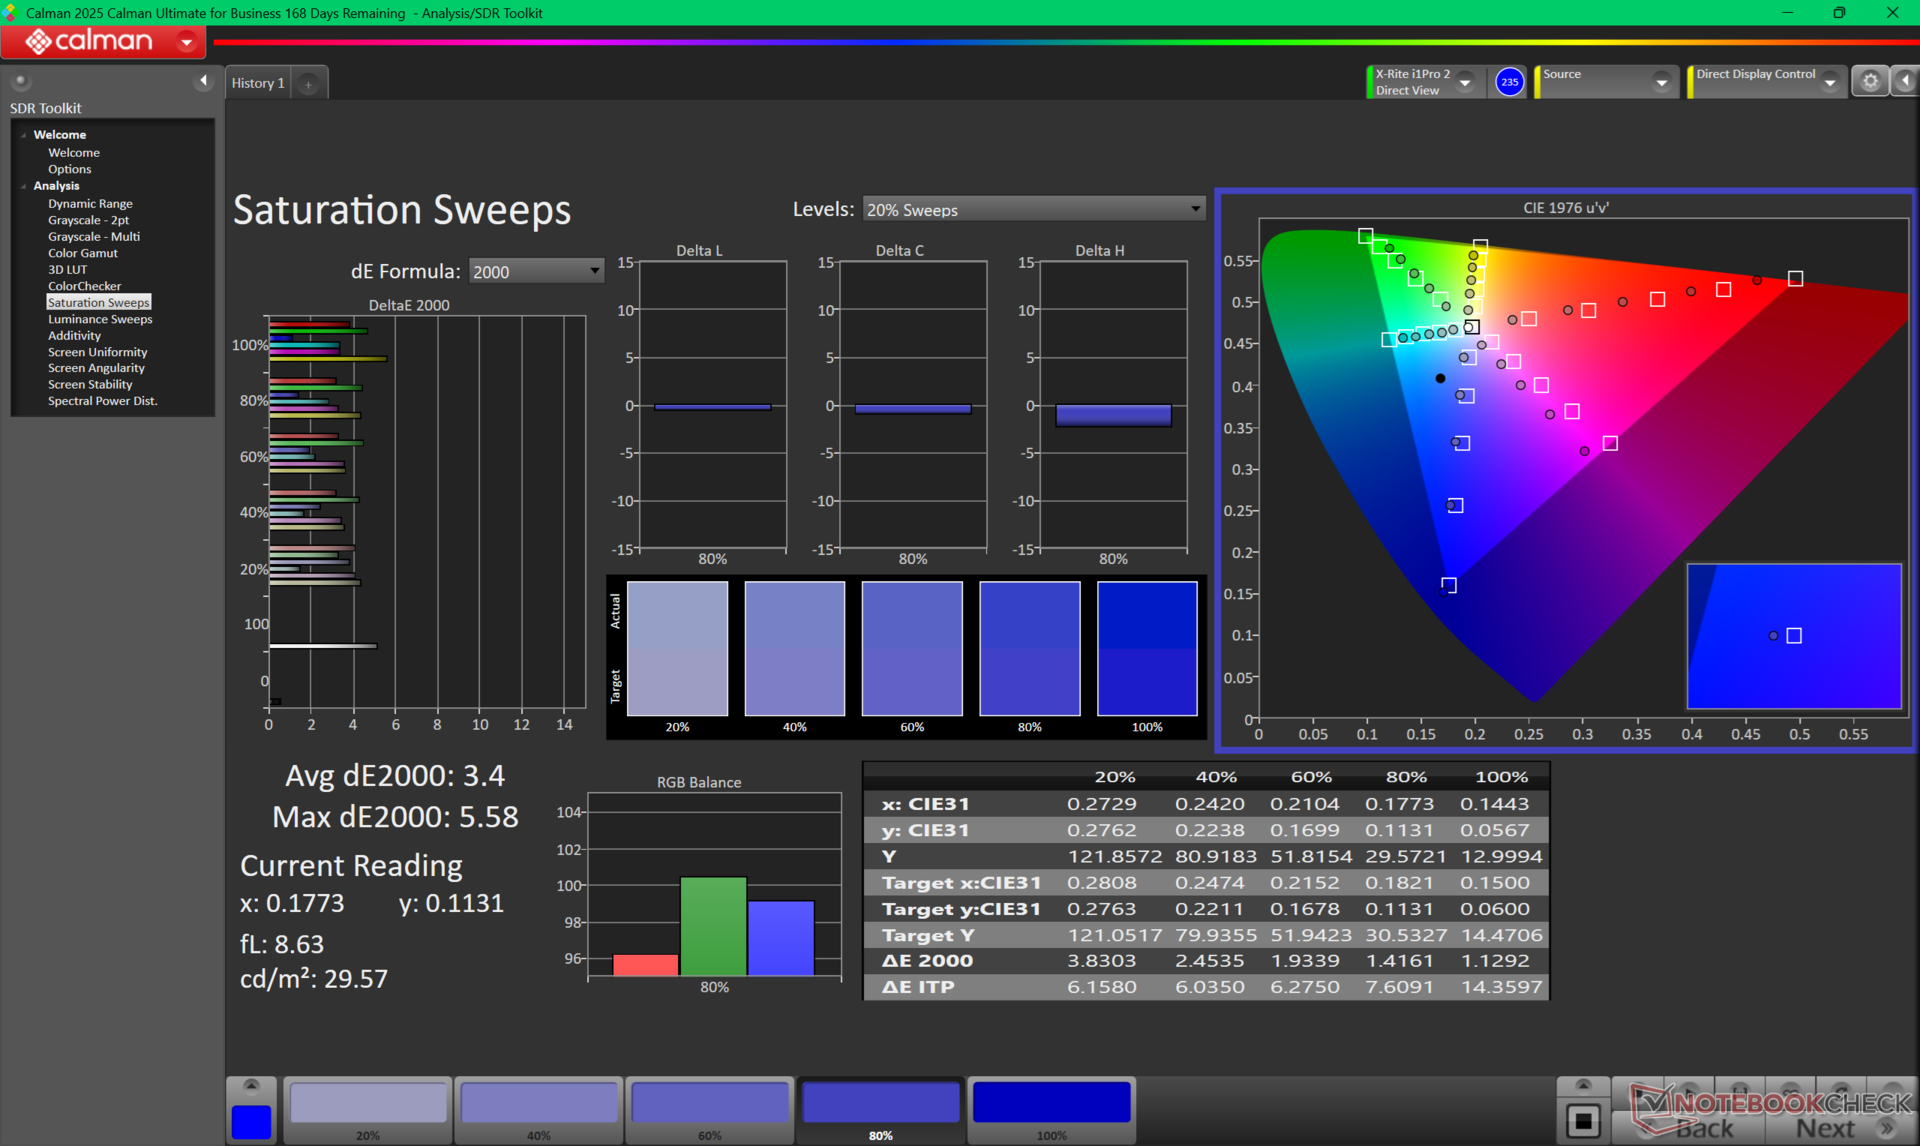
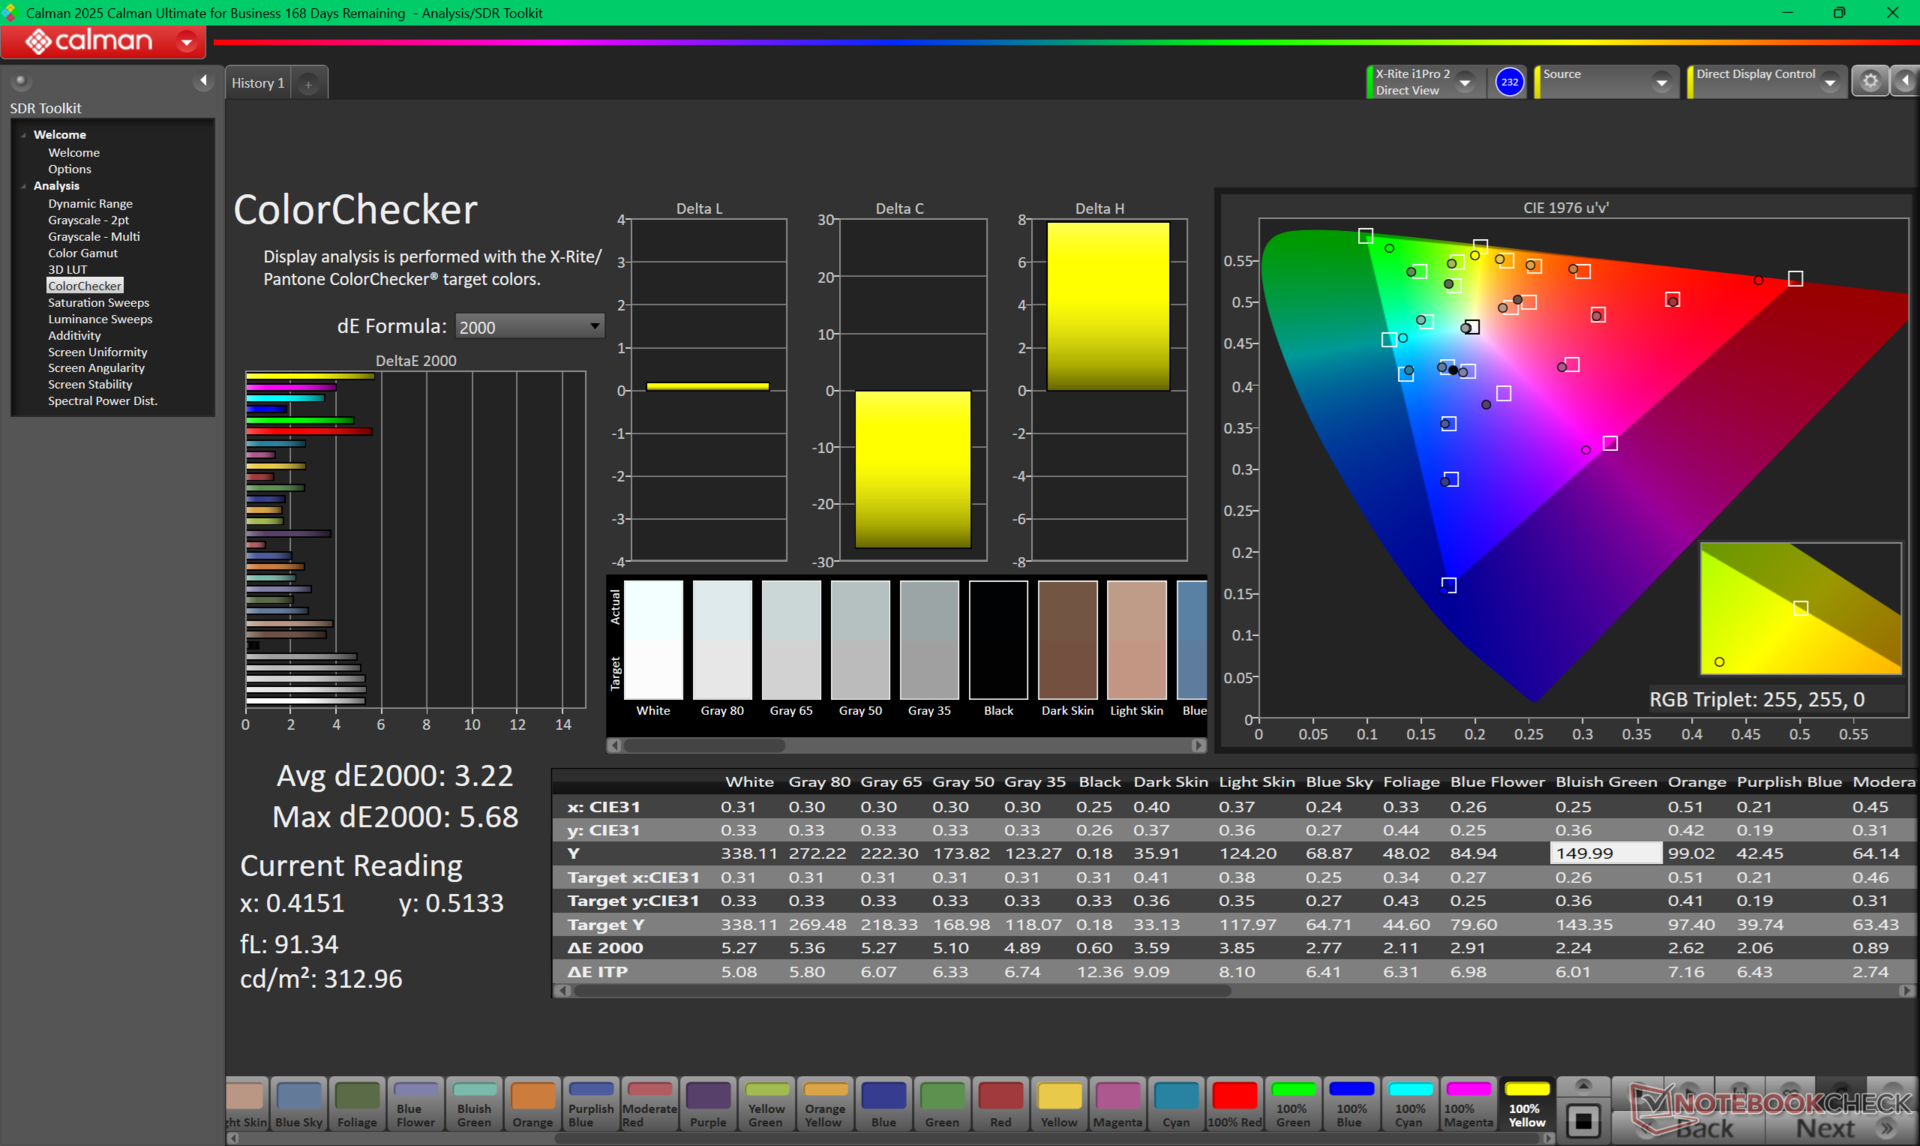
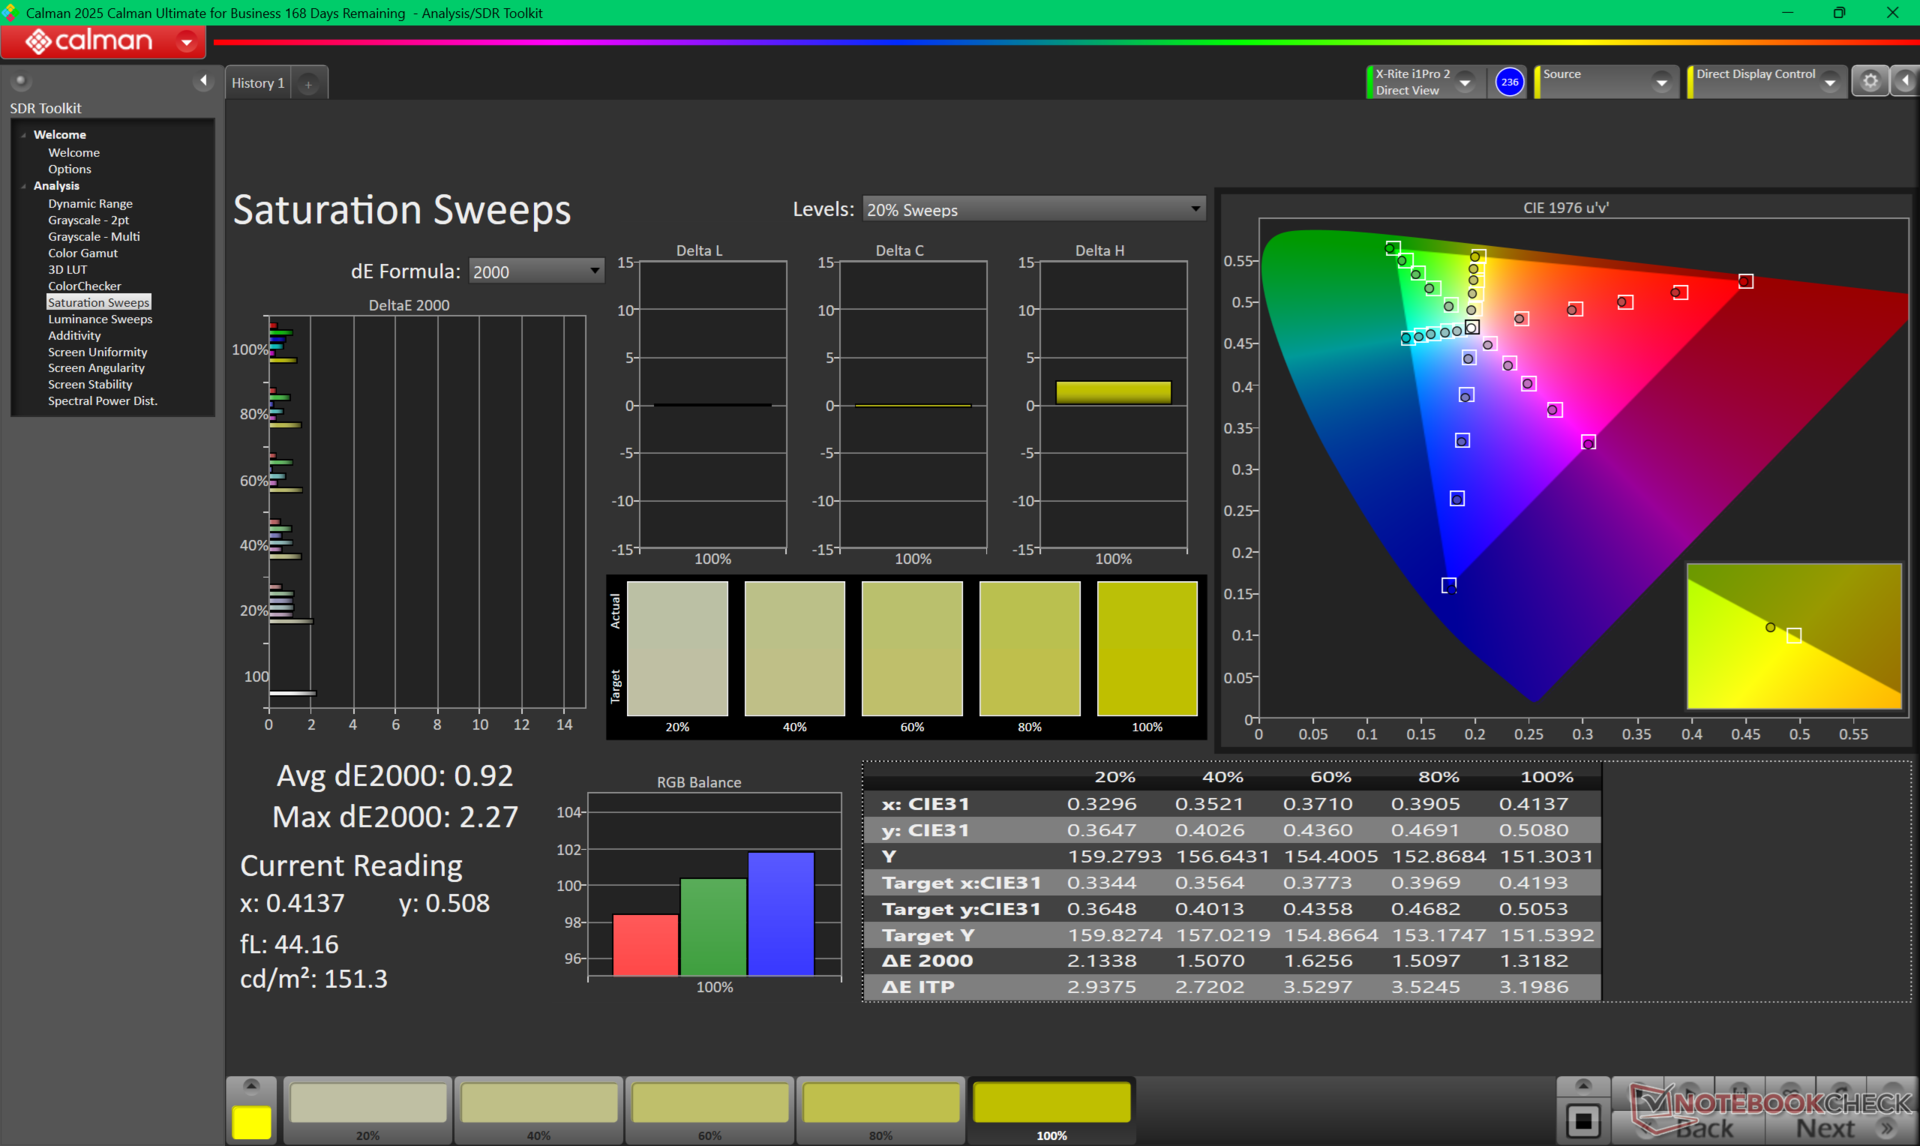
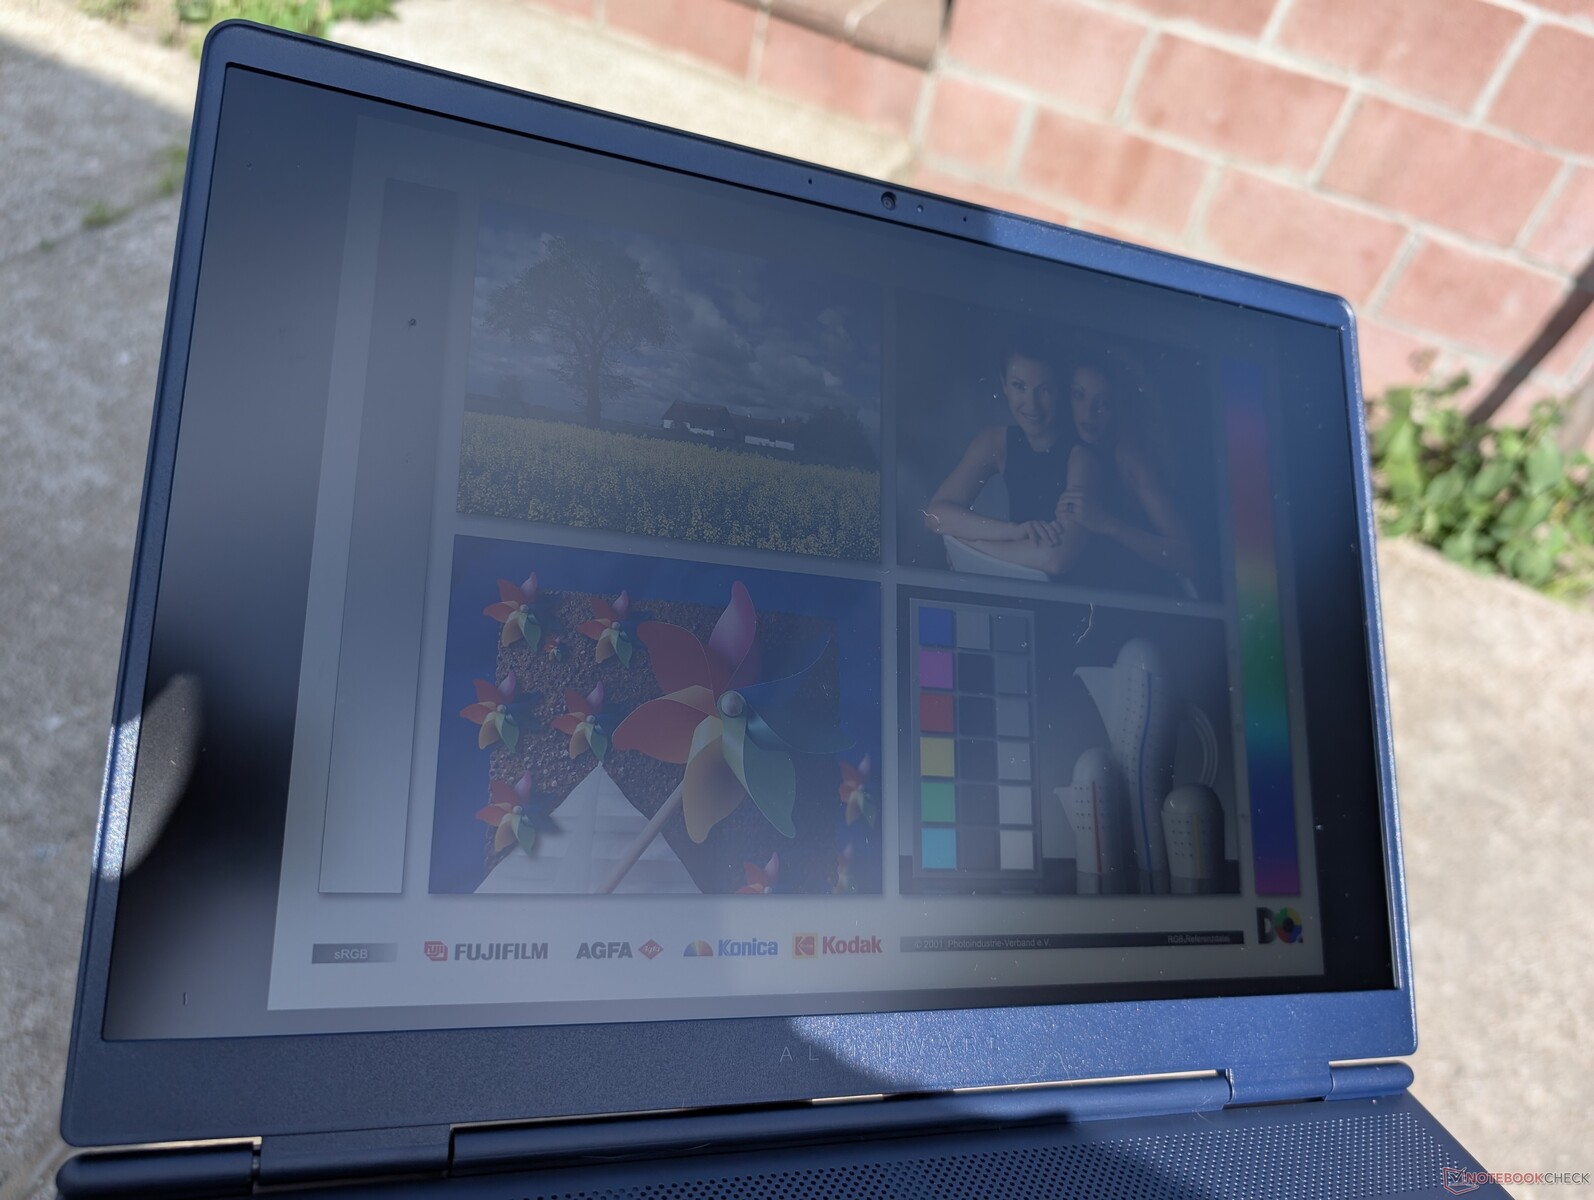
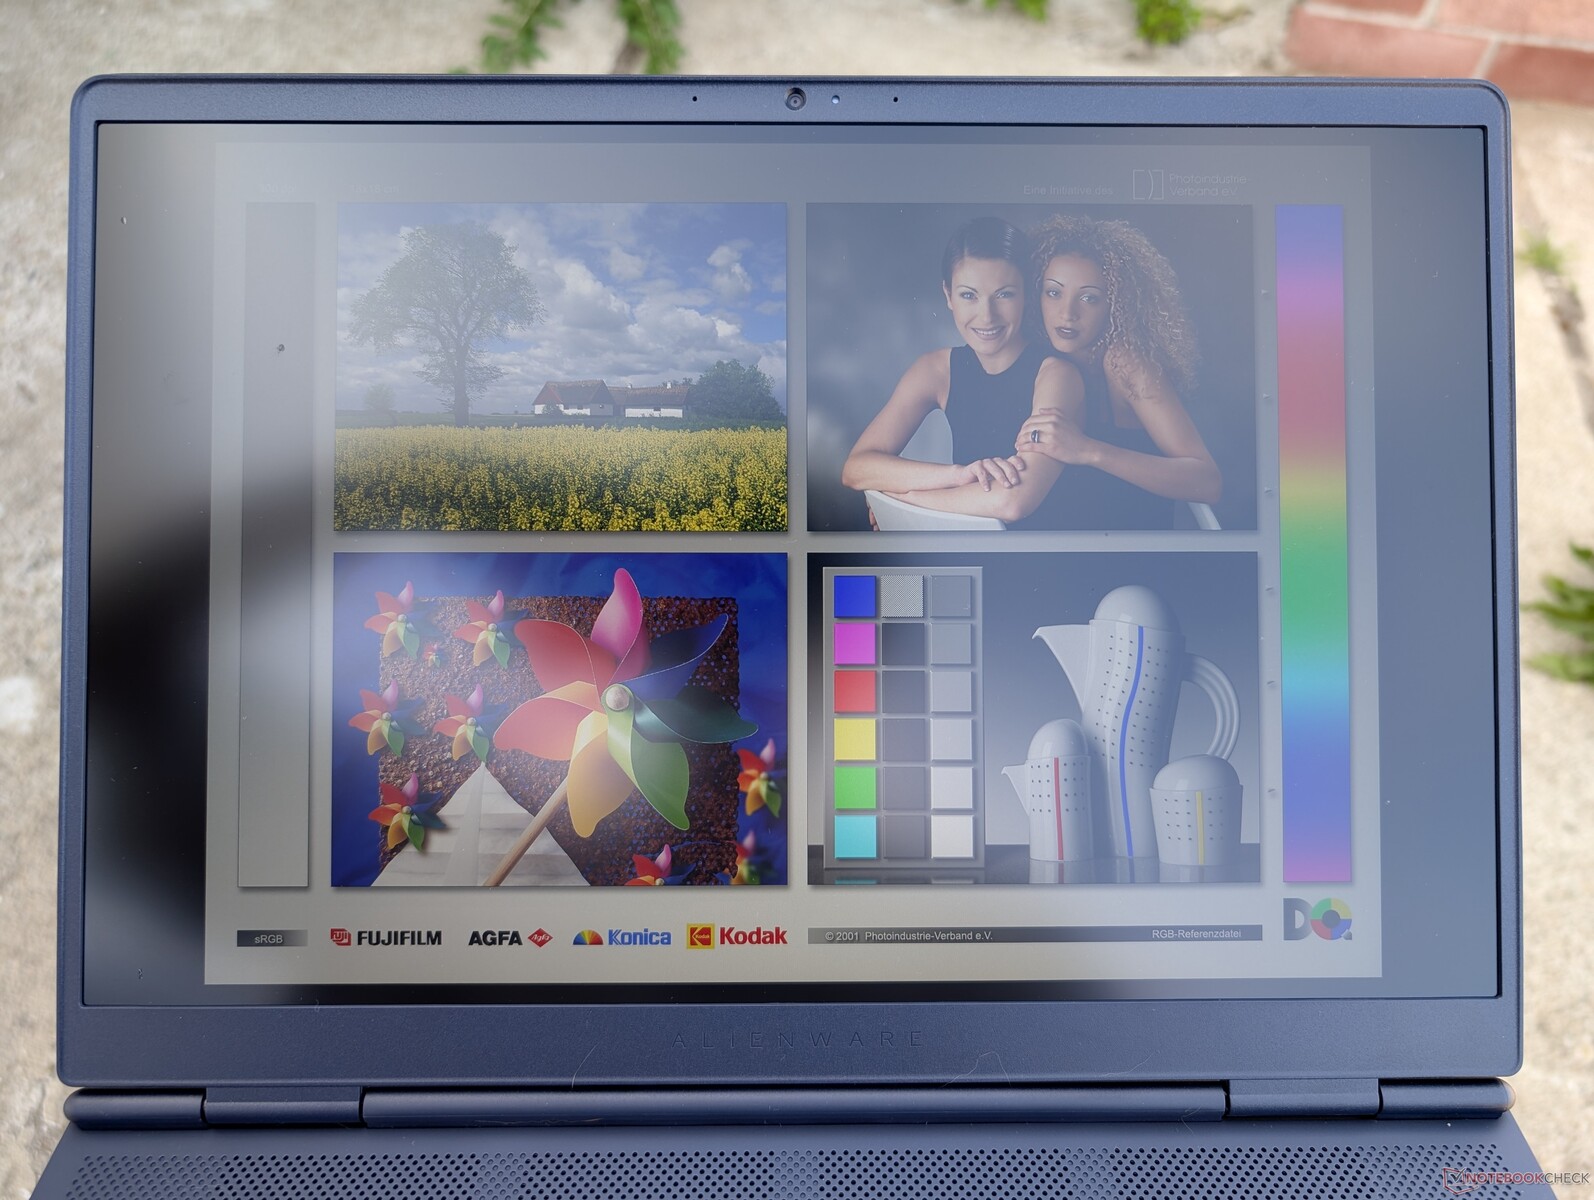
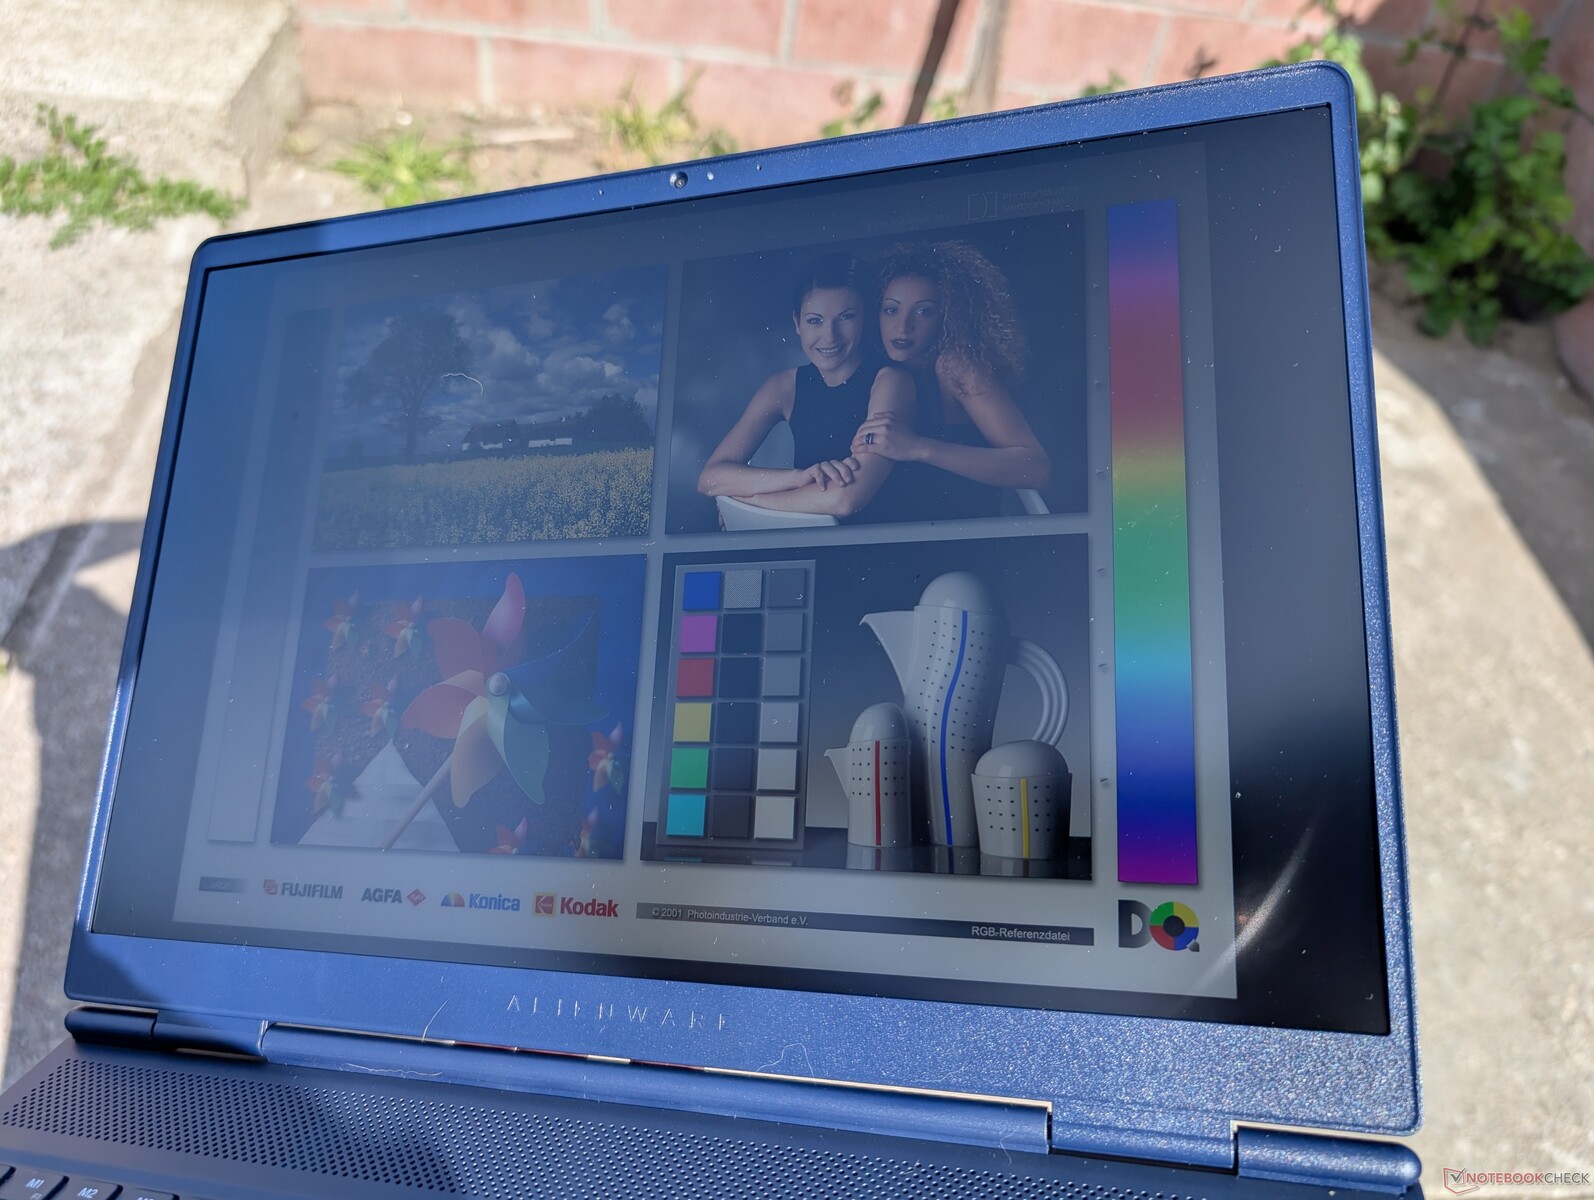
Whereas the 16X Aurora ships with a 1600p 240 Hz G-Sync display with full P3 colors, the 16 Aurora ships with a 1600p 120 Hz display with sRGB colors and no G-Sync. Other hidden downgrades include a dimmer screen (~500 nits vs. ~350 nits) with significantly slower black-white and gray-gray response times for more ghosting when gaming. The latter is unfortunately noticeable if playing fast-moving racing games like F1 24 or FPS titles.

| |||||||||||||||||||||||||
Brightness Distribution: 88 %
Center on Battery: 345.3 cd/m²
Contrast: 1501:1 (Black: 0.23 cd/m²)
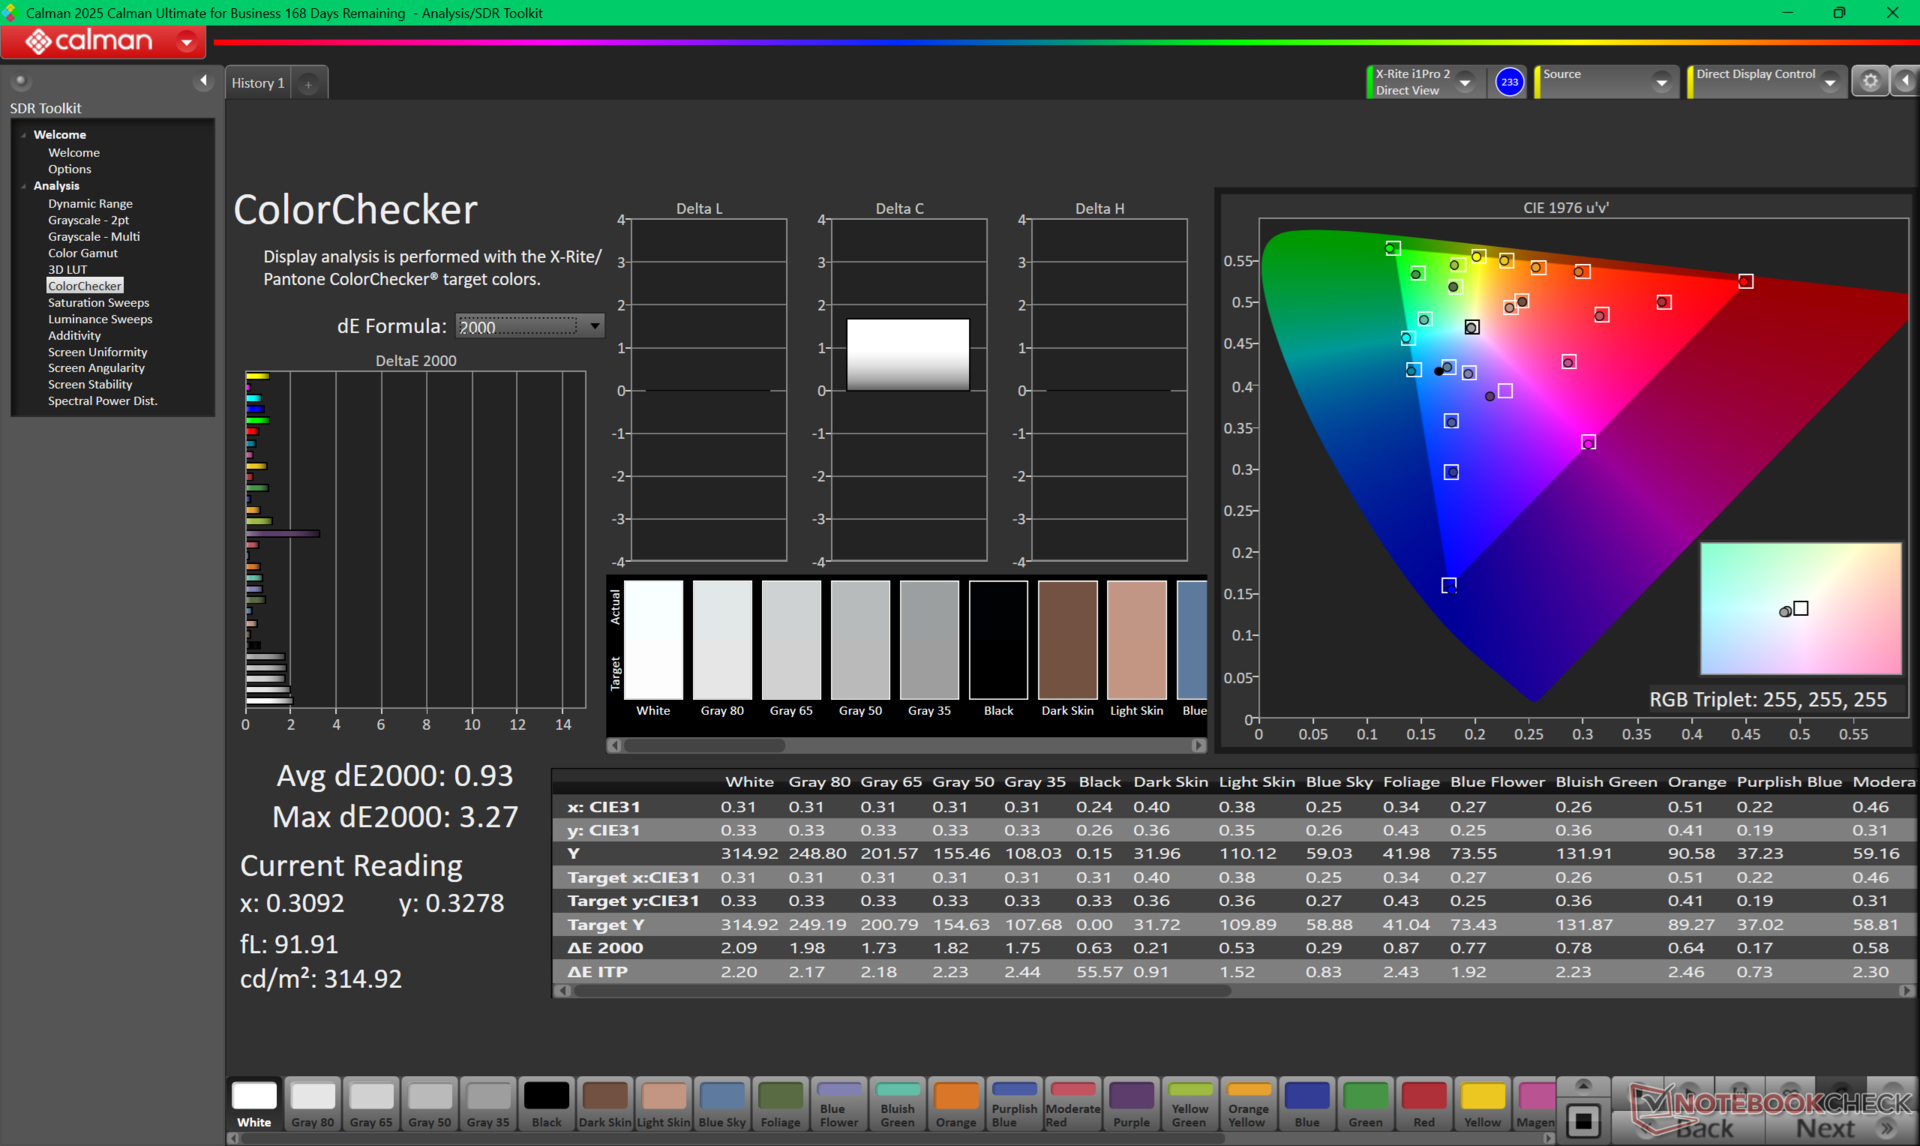
ΔE ColorChecker Calman: 3.22 | ∀{0.5-29.43 Ø4.72}
calibrated: 0.93
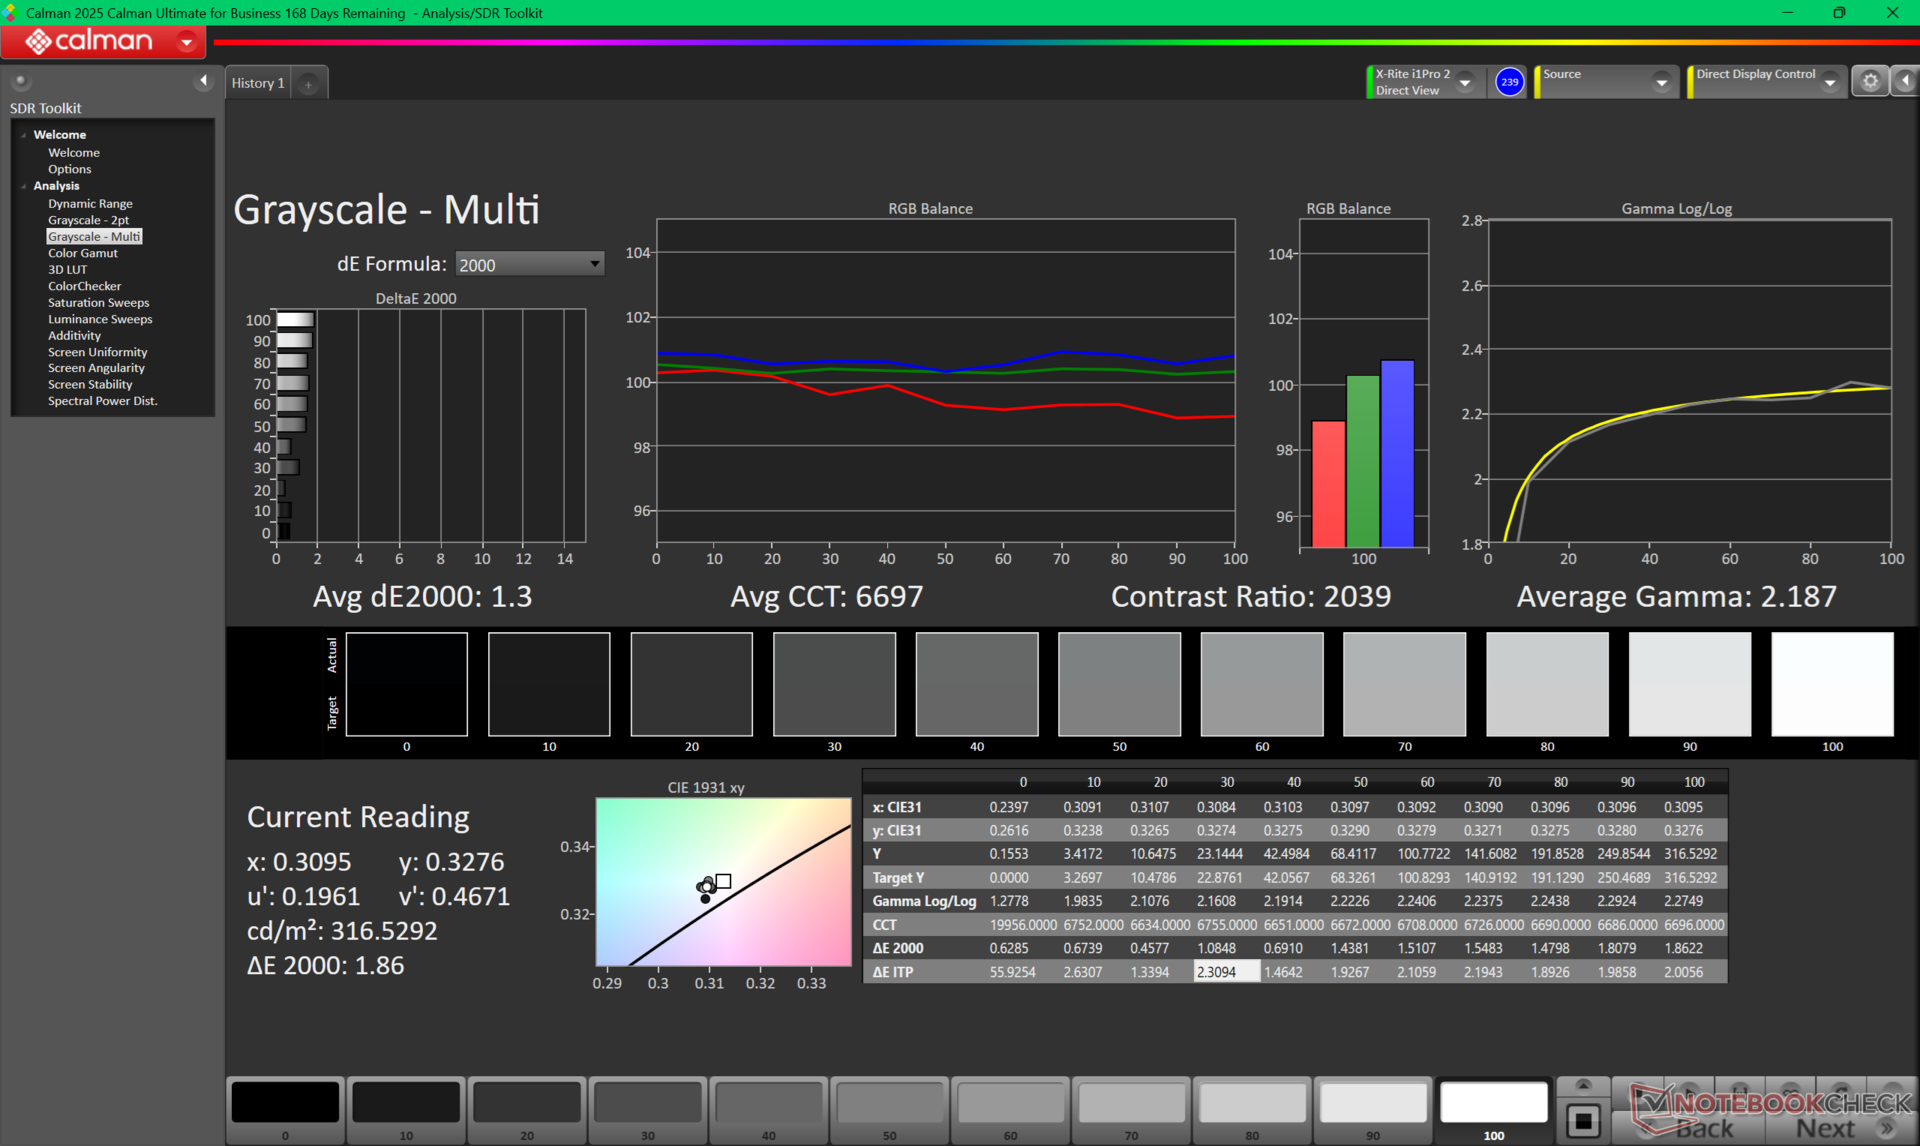
ΔE Greyscale Calman: 4.5 | ∀{0.09-98 Ø4.97}
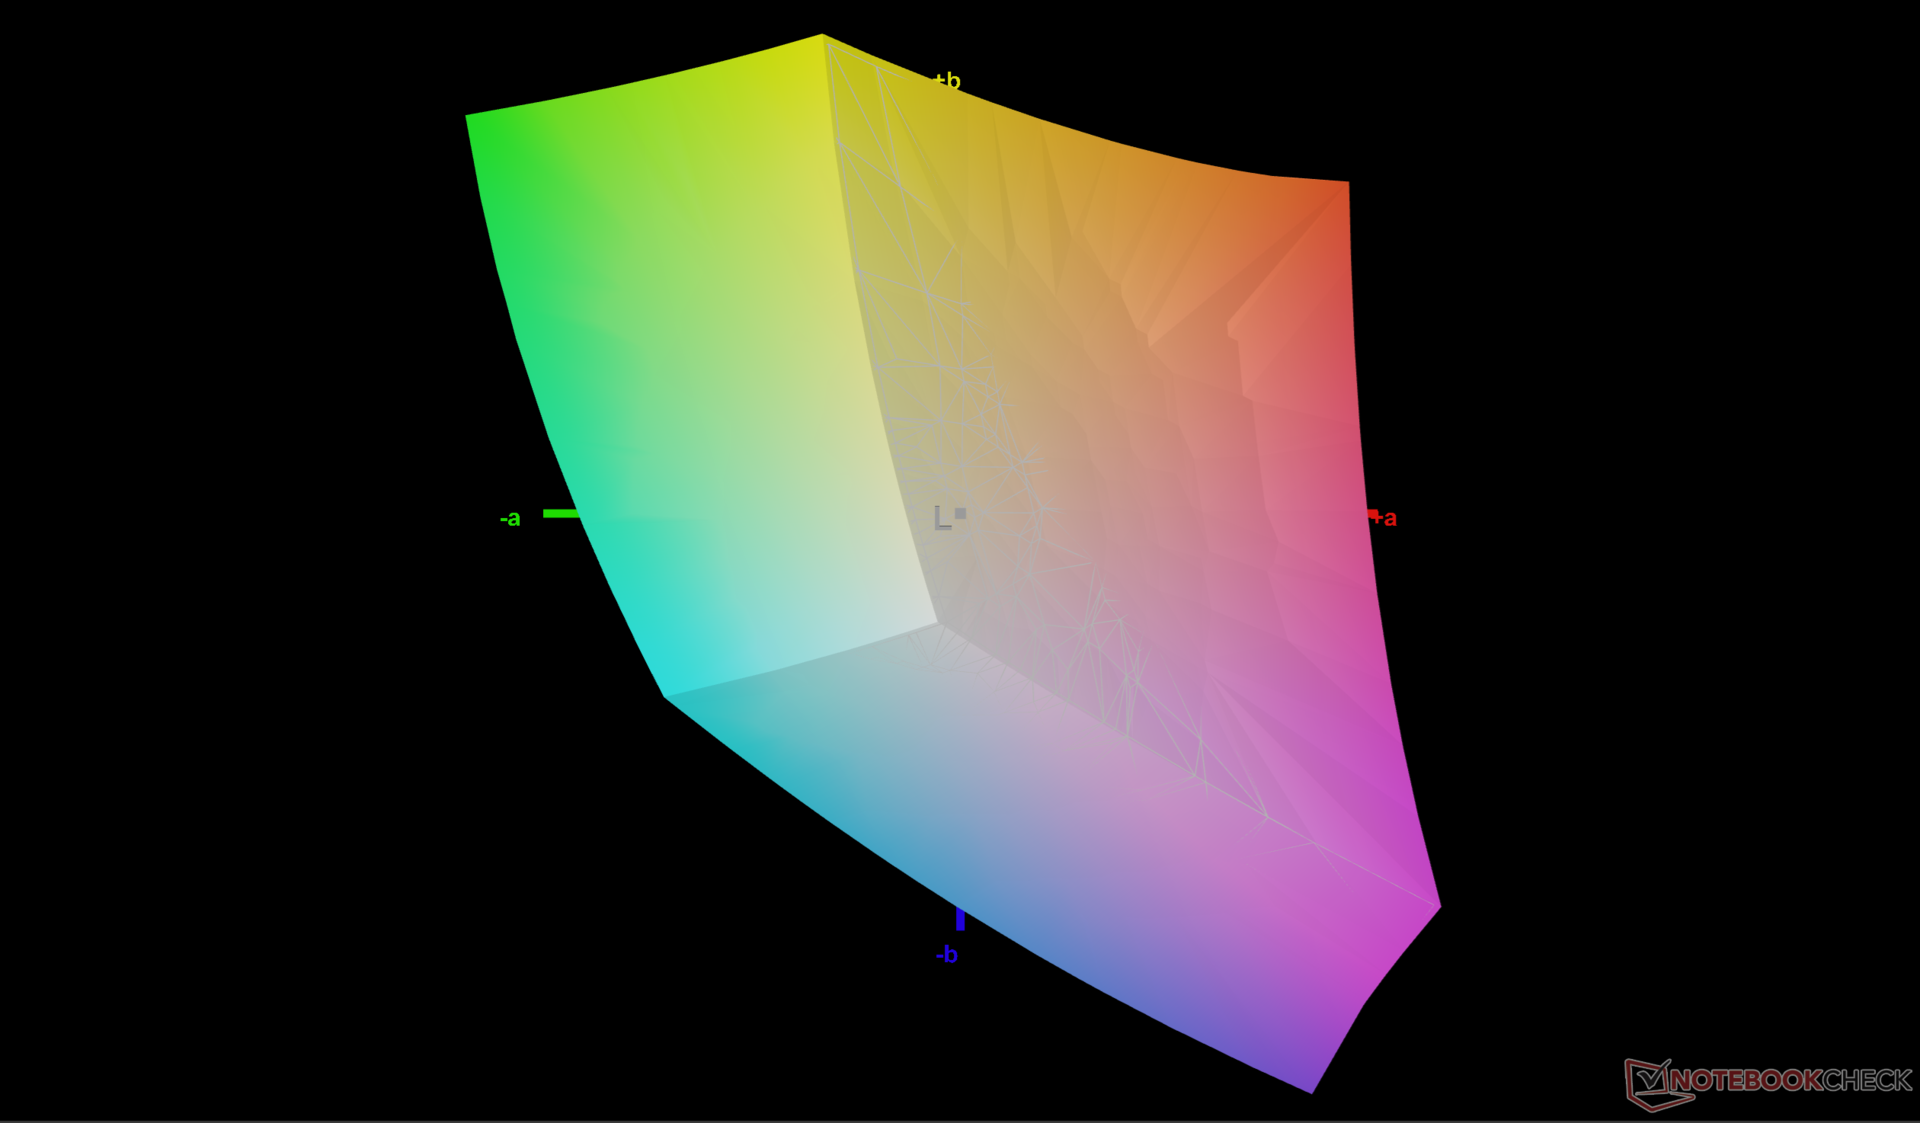
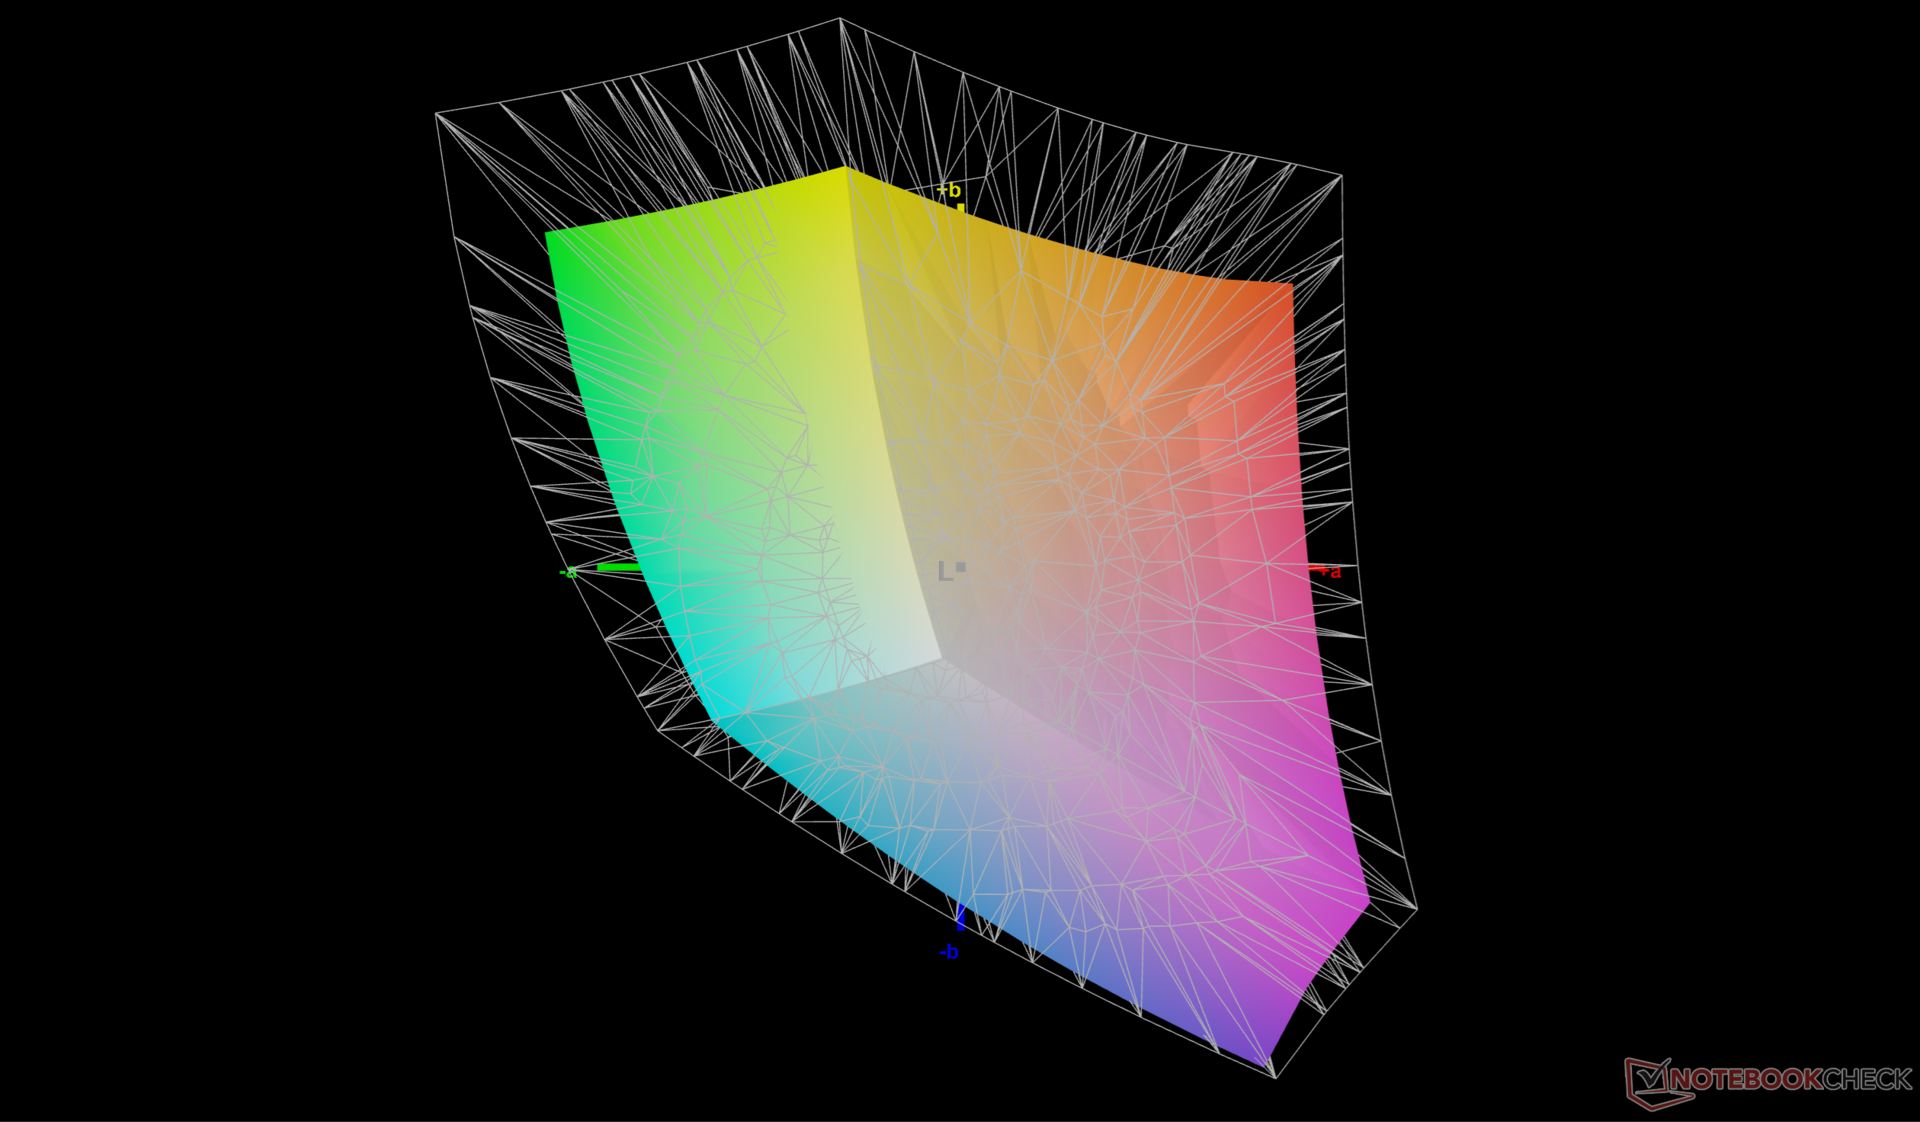
72.1% AdobeRGB 1998 (Argyll 3D)
99.9% sRGB (Argyll 3D)
70.8% Display P3 (Argyll 3D)
Gamma: 2.1
CCT: 7041 K
| Alienware 16 Aurora BOE NE16N41, IPS, 2560x1600, 16", 120 Hz | Alienware 16X Aurora, RTX 5070 LG Philips 160WQG, IPS, 2560x1600, 16", 240 Hz | Lenovo LOQ 15AHP10 CSOT MNF601BA1-4, IPS, 1920x1080, 15.6", 144 Hz | Gigabyte Gaming A16 GA6H NE160QDM-NYJ (BOE0C80), IPS, 2560x1600, 16", 165 Hz | Asus TUF Gaming A16 FA608WV B160UAN08.1 (AUO9BB0), IPS, 1920x1200, 16", 144 Hz | HP Victus 16 (2024) Chi Mei CMN163E, IPS, 1920x1080, 16.1", 144 Hz | |
|---|---|---|---|---|---|---|
| Display | 20% | -3% | -1% | -42% | -40% | |
| Display P3 Coverage (%) | 70.8 | 96.9 37% | 67.3 -5% | 69.4 -2% | 39.8 -44% | 41.3 -42% |
| sRGB Coverage (%) | 99.9 | 99.8 0% | 99.2 -1% | 99.5 0% | 59.7 -40% | 61.7 -38% |
| AdobeRGB 1998 Coverage (%) | 72.1 | 89.7 24% | 69.1 -4% | 71.6 -1% | 41.1 -43% | 42.7 -41% |
| Response Times | 81% | 30% | 74% | 72% | 39% | |
| Response Time Grey 50% / Grey 80% * (ms) | 49.5 ? | 4.3 ? 91% | 33.9 ? 32% | 14.3 ? 71% | 13.6 ? 73% | 28.6 ? 42% |
| Response Time Black / White * (ms) | 29.3 ? | 8.7 ? 70% | 21.2 ? 28% | 7 ? 76% | 8.4 ? 71% | 18.7 ? 36% |
| PWM Frequency (Hz) | ||||||
| Screen | -5% | 16% | -21% | -81% | -69% | |
| Brightness middle (cd/m²) | 345.3 | 493.2 43% | 318 -8% | 432 25% | 347 0% | 287 -17% |
| Brightness (cd/m²) | 324 | 477 47% | 300 -7% | 425 31% | 321 -1% | 288 -11% |
| Brightness Distribution (%) | 88 | 93 6% | 89 1% | 91 3% | 88 0% | 86 -2% |
| Black Level * (cd/m²) | 0.23 | 0.5 -117% | 0.2 13% | 0.37 -61% | 0.3 -30% | 0.19 17% |
| Contrast (:1) | 1501 | 986 -34% | 1590 6% | 1168 -22% | 1157 -23% | 1511 1% |
| Colorchecker dE 2000 * | 3.22 | 3.57 -11% | 1.33 59% | 4.76 -48% | 5.89 -83% | 5.46 -70% |
| Colorchecker dE 2000 max. * | 5.68 | 7.03 -24% | 4.42 22% | 8.59 -51% | 19.26 -239% | 20.36 -258% |
| Colorchecker dE 2000 calibrated * | 0.93 | 0.68 27% | 0.94 -1% | 1.18 -27% | 4.3 -362% | 3.52 -278% |
| Greyscale dE 2000 * | 4.5 | 3.7 18% | 1.9 58% | 6.2 -38% | 4.27 5% | 4.8 -7% |
| Gamma | 2.1 105% | 2.16 102% | 2.187 101% | 2.079 106% | 2.47 89% | 2.108 104% |
| CCT | 7041 92% | 5876 111% | 6678 97% | 6690 97% | 7158 91% | 6442 101% |
| Total Average (Program / Settings) | 32% /
13% | 14% /
14% | 17% /
-3% | -17% /
-51% | -23% /
-48% |
* ... smaller is better

Display Response Times
| ↔ Response Time Black to White | ||
|---|---|---|
| 29.3 ms ... rise ↗ and fall ↘ combined | ↗ 14.2 ms rise | 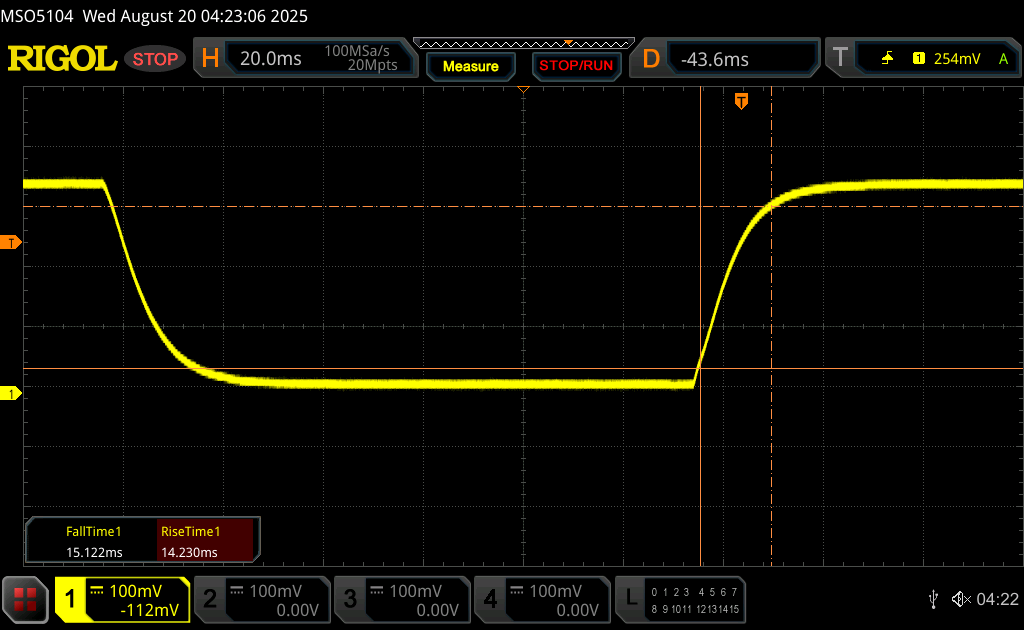 |
| ↘ 15.1 ms fall | ||
| The screen shows relatively slow response rates in our tests and may be too slow for gamers. In comparison, all tested devices range from 0.1 (minimum) to 240 (maximum) ms. » 79 % of all devices are better. This means that the measured response time is worse than the average of all tested devices (19.8 ms). | ||
| ↔ Response Time 50% Grey to 80% Grey | ||
| 49.5 ms ... rise ↗ and fall ↘ combined | ↗ 23.1 ms rise | 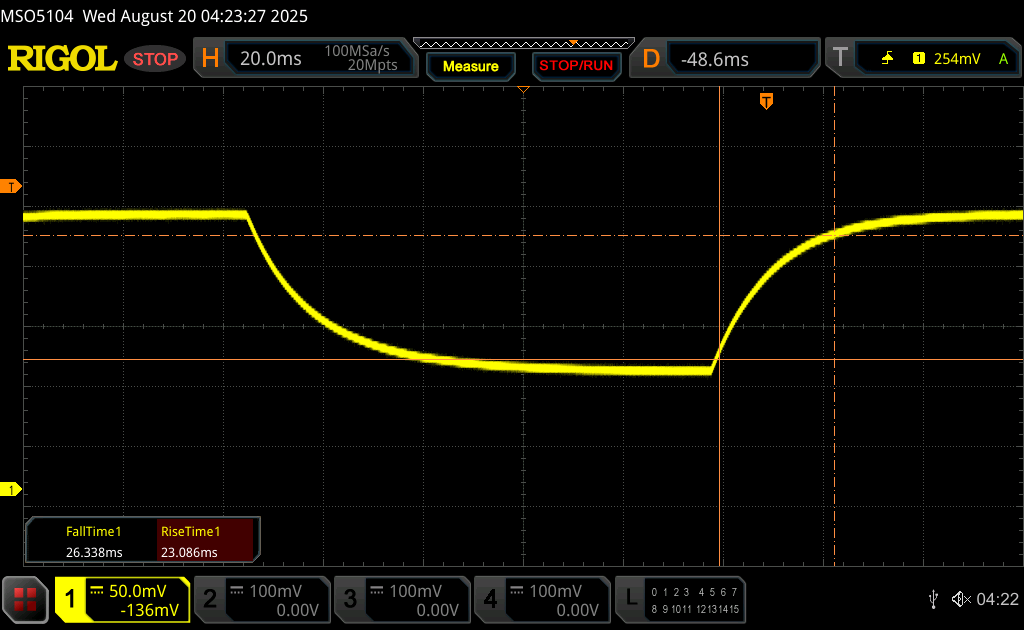 |
| ↘ 26.4 ms fall | ||
| The screen shows slow response rates in our tests and will be unsatisfactory for gamers. In comparison, all tested devices range from 0.165 (minimum) to 636 (maximum) ms. » 85 % of all devices are better. This means that the measured response time is worse than the average of all tested devices (31 ms). | ||
Screen Flickering / PWM (Pulse-Width Modulation)
| Screen flickering / PWM not detected | 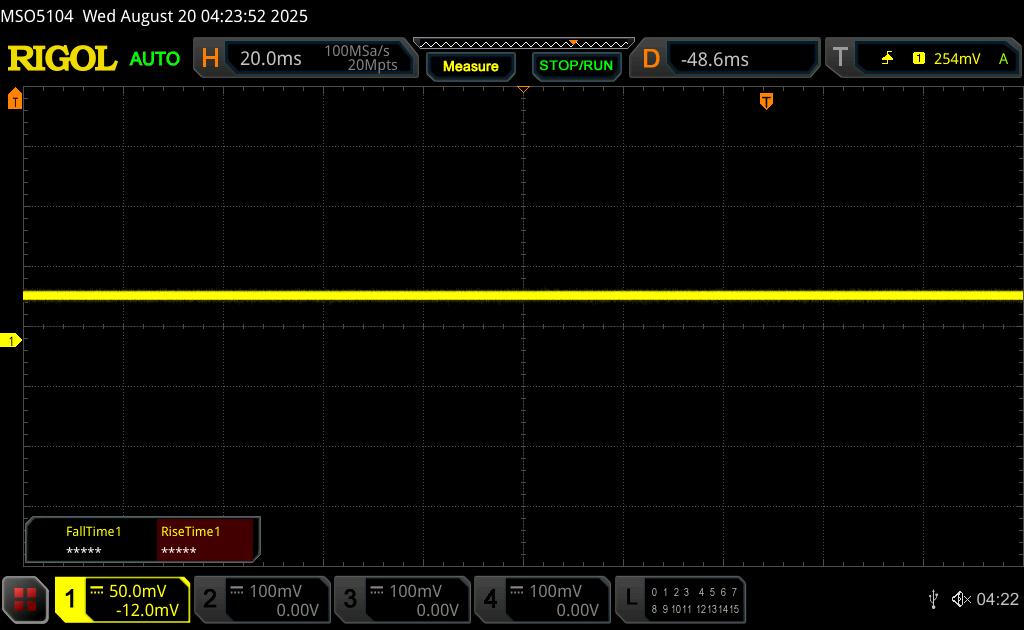 | ||
In comparison: 52 % of all tested devices do not use PWM to dim the display. If PWM was detected, an average of 7763 (minimum: 5 - maximum: 343500) Hz was measured. | |||
Performance
Testing Conditions
We set both Windows and Alienware Command Center to Performance mode prior to running the benchmarks below.
Processor
Dropping down from the Core Ultra 9 275HX in the 16X Aurora to the Core 7 240H in our 16 Aurora entails a significant multi-thread performance drop of almost 55 percent. Raw performance is slightly slower than the years old Core i7-12700H.
Cinebench R15 Multi Loop
Cinebench R23: Multi Core | Single Core
Cinebench R20: CPU (Multi Core) | CPU (Single Core)
Cinebench R15: CPU Multi 64Bit | CPU Single 64Bit
Blender: v2.79 BMW27 CPU
7-Zip 18.03: 7z b 4 | 7z b 4 -mmt1
Geekbench 6.7: Multi-Core | Single-Core
Geekbench 5.5: Multi-Core | Single-Core
HWBOT x265 Benchmark v2.2: 4k Preset
LibreOffice : 20 Documents To PDF
R Benchmark 2.5: Overall mean
* ... smaller is better
AIDA64: FP32 Ray-Trace | FPU Julia | CPU SHA3 | CPU Queen | FPU SinJulia | FPU Mandel | CPU AES | CPU ZLib | FP64 Ray-Trace | CPU PhotoWorxx
| Performance rating | |
| Alienware 16X Aurora, RTX 5070 | |
| Asus TUF Gaming A16 FA608WV | |
| Lenovo LOQ 15AHP10 | |
| HP Victus 16 (2024) | |
| Alienware 16 Aurora | |
| Average Intel Core 7 240H | |
| Gigabyte Gaming A16 GA6H | |
| AIDA64 / FP32 Ray-Trace | |
| Asus TUF Gaming A16 FA608WV | |
| Alienware 16X Aurora, RTX 5070 | |
| Lenovo LOQ 15AHP10 | |
| HP Victus 16 (2024) | |
| Alienware 16 Aurora | |
| Average Intel Core 7 240H (11867 - 15972, n=5) | |
| Gigabyte Gaming A16 GA6H | |
| AIDA64 / FPU Julia | |
| Alienware 16X Aurora, RTX 5070 | |
| Asus TUF Gaming A16 FA608WV | |
| Lenovo LOQ 15AHP10 | |
| HP Victus 16 (2024) | |
| Alienware 16 Aurora | |
| Average Intel Core 7 240H (59260 - 80238, n=5) | |
| Gigabyte Gaming A16 GA6H | |
| AIDA64 / CPU SHA3 | |
| Alienware 16X Aurora, RTX 5070 | |
| Asus TUF Gaming A16 FA608WV | |
| Lenovo LOQ 15AHP10 | |
| HP Victus 16 (2024) | |
| Alienware 16 Aurora | |
| Average Intel Core 7 240H (2455 - 3287, n=5) | |
| Gigabyte Gaming A16 GA6H | |
| AIDA64 / CPU Queen | |
| Alienware 16X Aurora, RTX 5070 | |
| HP Victus 16 (2024) | |
| Lenovo LOQ 15AHP10 | |
| Asus TUF Gaming A16 FA608WV | |
| Alienware 16 Aurora | |
| Average Intel Core 7 240H (75356 - 86602, n=3) | |
| Gigabyte Gaming A16 GA6H | |
| AIDA64 / FPU SinJulia | |
| Asus TUF Gaming A16 FA608WV | |
| Lenovo LOQ 15AHP10 | |
| Alienware 16X Aurora, RTX 5070 | |
| HP Victus 16 (2024) | |
| Alienware 16 Aurora | |
| Average Intel Core 7 240H (7777 - 9366, n=5) | |
| Gigabyte Gaming A16 GA6H | |
| AIDA64 / FPU Mandel | |
| Alienware 16X Aurora, RTX 5070 | |
| Asus TUF Gaming A16 FA608WV | |
| Lenovo LOQ 15AHP10 | |
| HP Victus 16 (2024) | |
| Alienware 16 Aurora | |
| Average Intel Core 7 240H (29381 - 39967, n=5) | |
| Gigabyte Gaming A16 GA6H | |
| AIDA64 / CPU AES | |
| Alienware 16X Aurora, RTX 5070 | |
| HP Victus 16 (2024) | |
| Asus TUF Gaming A16 FA608WV | |
| Lenovo LOQ 15AHP10 | |
| Alienware 16 Aurora | |
| Average Intel Core 7 240H (50528 - 67855, n=5) | |
| Gigabyte Gaming A16 GA6H | |
| AIDA64 / CPU ZLib | |
| Alienware 16X Aurora, RTX 5070 | |
| Asus TUF Gaming A16 FA608WV | |
| HP Victus 16 (2024) | |
| Lenovo LOQ 15AHP10 | |
| Alienware 16 Aurora | |
| Average Intel Core 7 240H (725 - 951, n=5) | |
| Gigabyte Gaming A16 GA6H | |
| AIDA64 / FP64 Ray-Trace | |
| Asus TUF Gaming A16 FA608WV | |
| Alienware 16X Aurora, RTX 5070 | |
| Lenovo LOQ 15AHP10 | |
| HP Victus 16 (2024) | |
| Alienware 16 Aurora | |
| Average Intel Core 7 240H (6389 - 8569, n=5) | |
| Gigabyte Gaming A16 GA6H | |
| AIDA64 / CPU PhotoWorxx | |
| Alienware 16X Aurora, RTX 5070 | |
| Alienware 16 Aurora | |
| HP Victus 16 (2024) | |
| Average Intel Core 7 240H (21710 - 44874, n=5) | |
| Asus TUF Gaming A16 FA608WV | |
| Lenovo LOQ 15AHP10 | |
| Gigabyte Gaming A16 GA6H | |
| AIDA64 / Memory Copy | |
| Asus TUF Gaming A16 FA608WV | |
| Alienware 16X Aurora, RTX 5070 | |
| HP Victus 16 (2024) | |
| Alienware 16 Aurora | |
| Average Intel Core 7 240H (34965 - 69215, n=5) | |
| Lenovo LOQ 15AHP10 | |
| Gigabyte Gaming A16 GA6H | |
| AIDA64 / Memory Read | |
| Asus TUF Gaming A16 FA608WV | |
| Alienware 16X Aurora, RTX 5070 | |
| HP Victus 16 (2024) | |
| Alienware 16 Aurora | |
| Average Intel Core 7 240H (39706 - 71870, n=5) | |
| Gigabyte Gaming A16 GA6H | |
| Lenovo LOQ 15AHP10 | |
| AIDA64 / Memory Write | |
| Asus TUF Gaming A16 FA608WV | |
| Alienware 16X Aurora, RTX 5070 | |
| HP Victus 16 (2024) | |
| Average Intel Core 7 240H (33560 - 80488, n=5) | |
| Alienware 16 Aurora | |
| Lenovo LOQ 15AHP10 | |
| Gigabyte Gaming A16 GA6H | |
| AIDA64 / Memory Latency | |
| Alienware 16X Aurora, RTX 5070 | |
| Asus TUF Gaming A16 FA608WV | |
| Alienware 16 Aurora | |
| Average Intel Core 7 240H (97.1 - 125.6, n=5) | |
| Gigabyte Gaming A16 GA6H | |
| Lenovo LOQ 15AHP10 | |
| HP Victus 16 (2024) | |
* ... smaller is better
Stress Test
The CPU would boost to 4.3 GHz and 120 W when initiating Prime95 stress before steadily falling to 3.7 GHz and 95 W. Core temperature would also stabilize at 100 C and so the CPU doesn't run any cooler than on the 16X Aurora despite the wide performance deltas.
GPU board power draw when running Cyberpunk 2077 would average 31 W, 58 W, and 51 W when on Balanced mode, Performance mode, and Overdrive mode, respectively. The discrepancy between Performance and Overdrive modes seems to indicate that Overdrive mode doesn't necessarily improve performance by all that much as clock rates are still very dynamic.
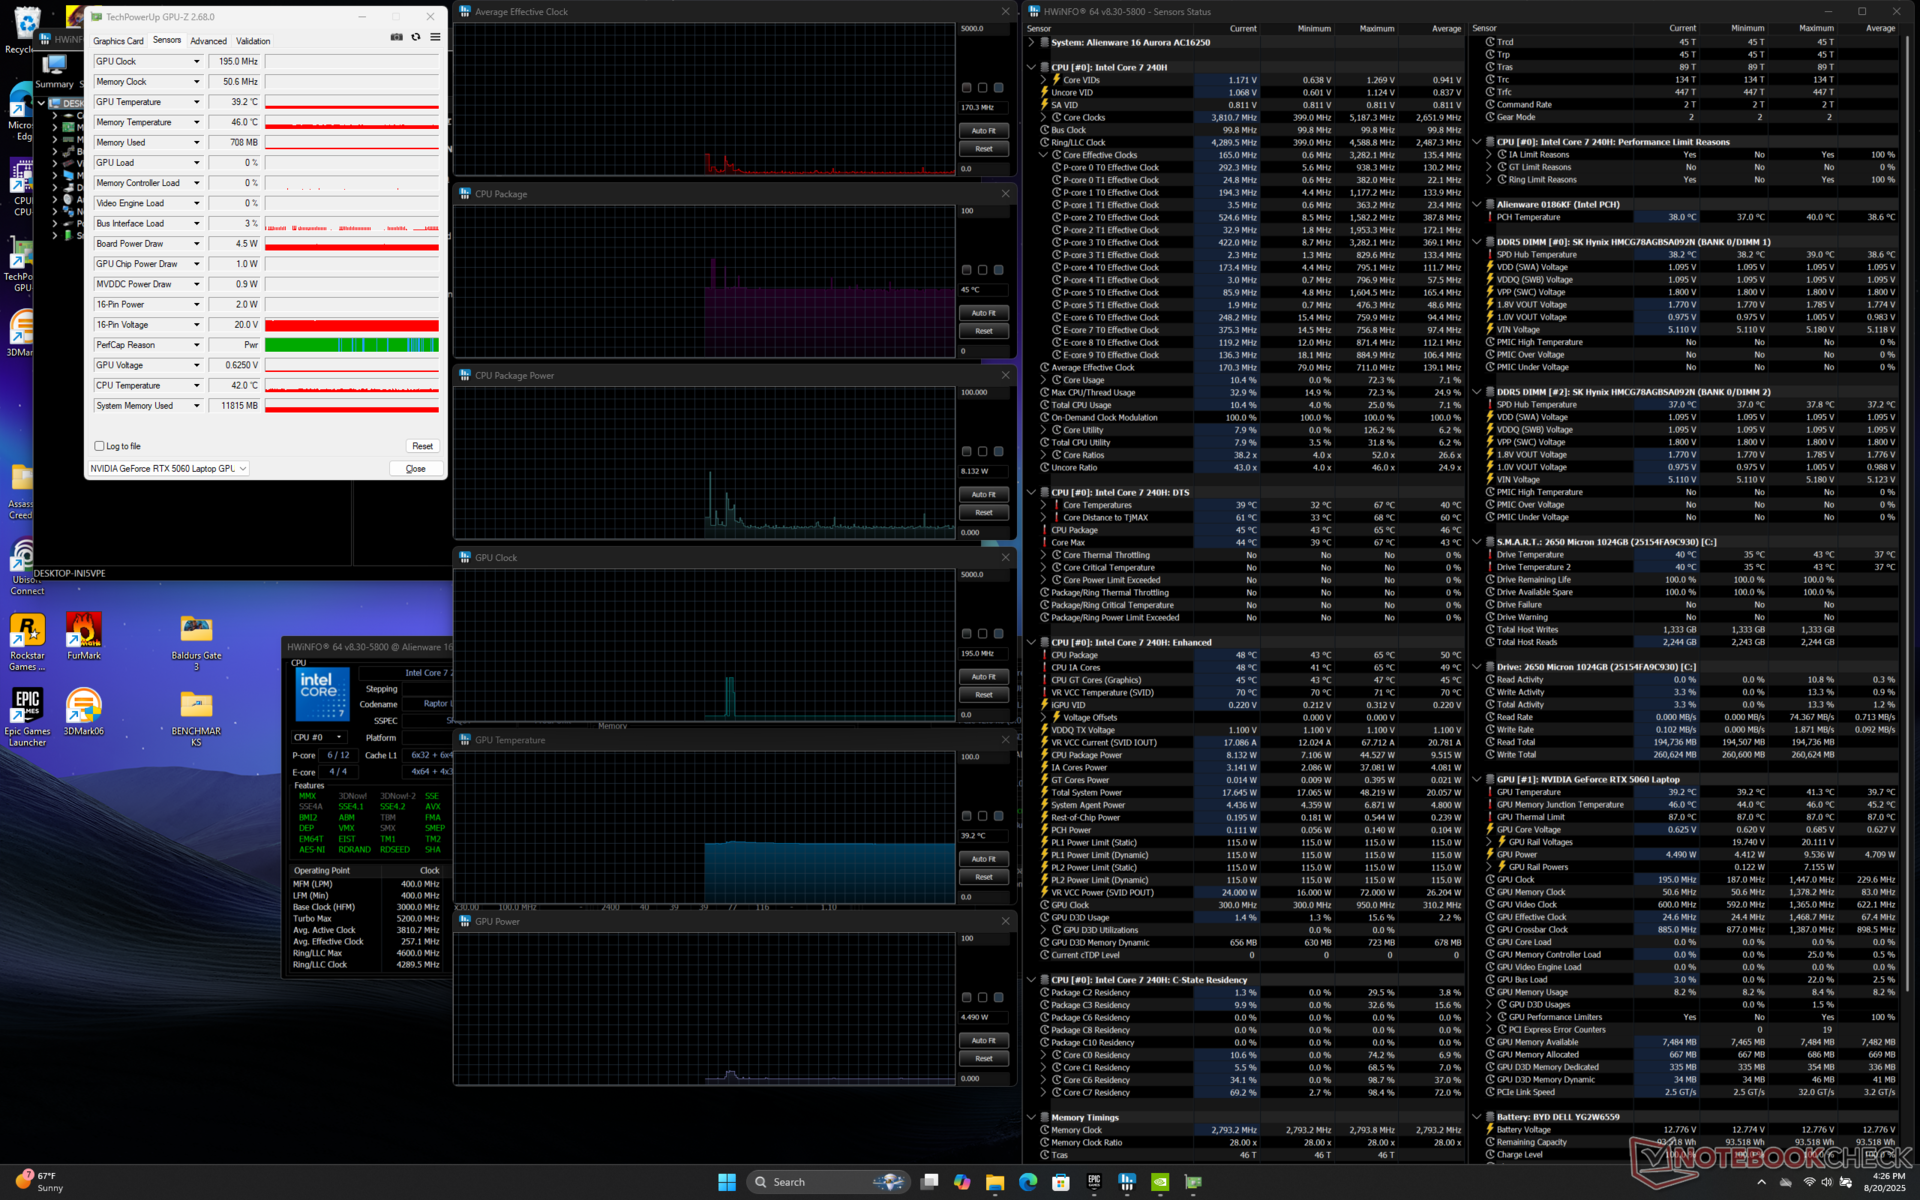
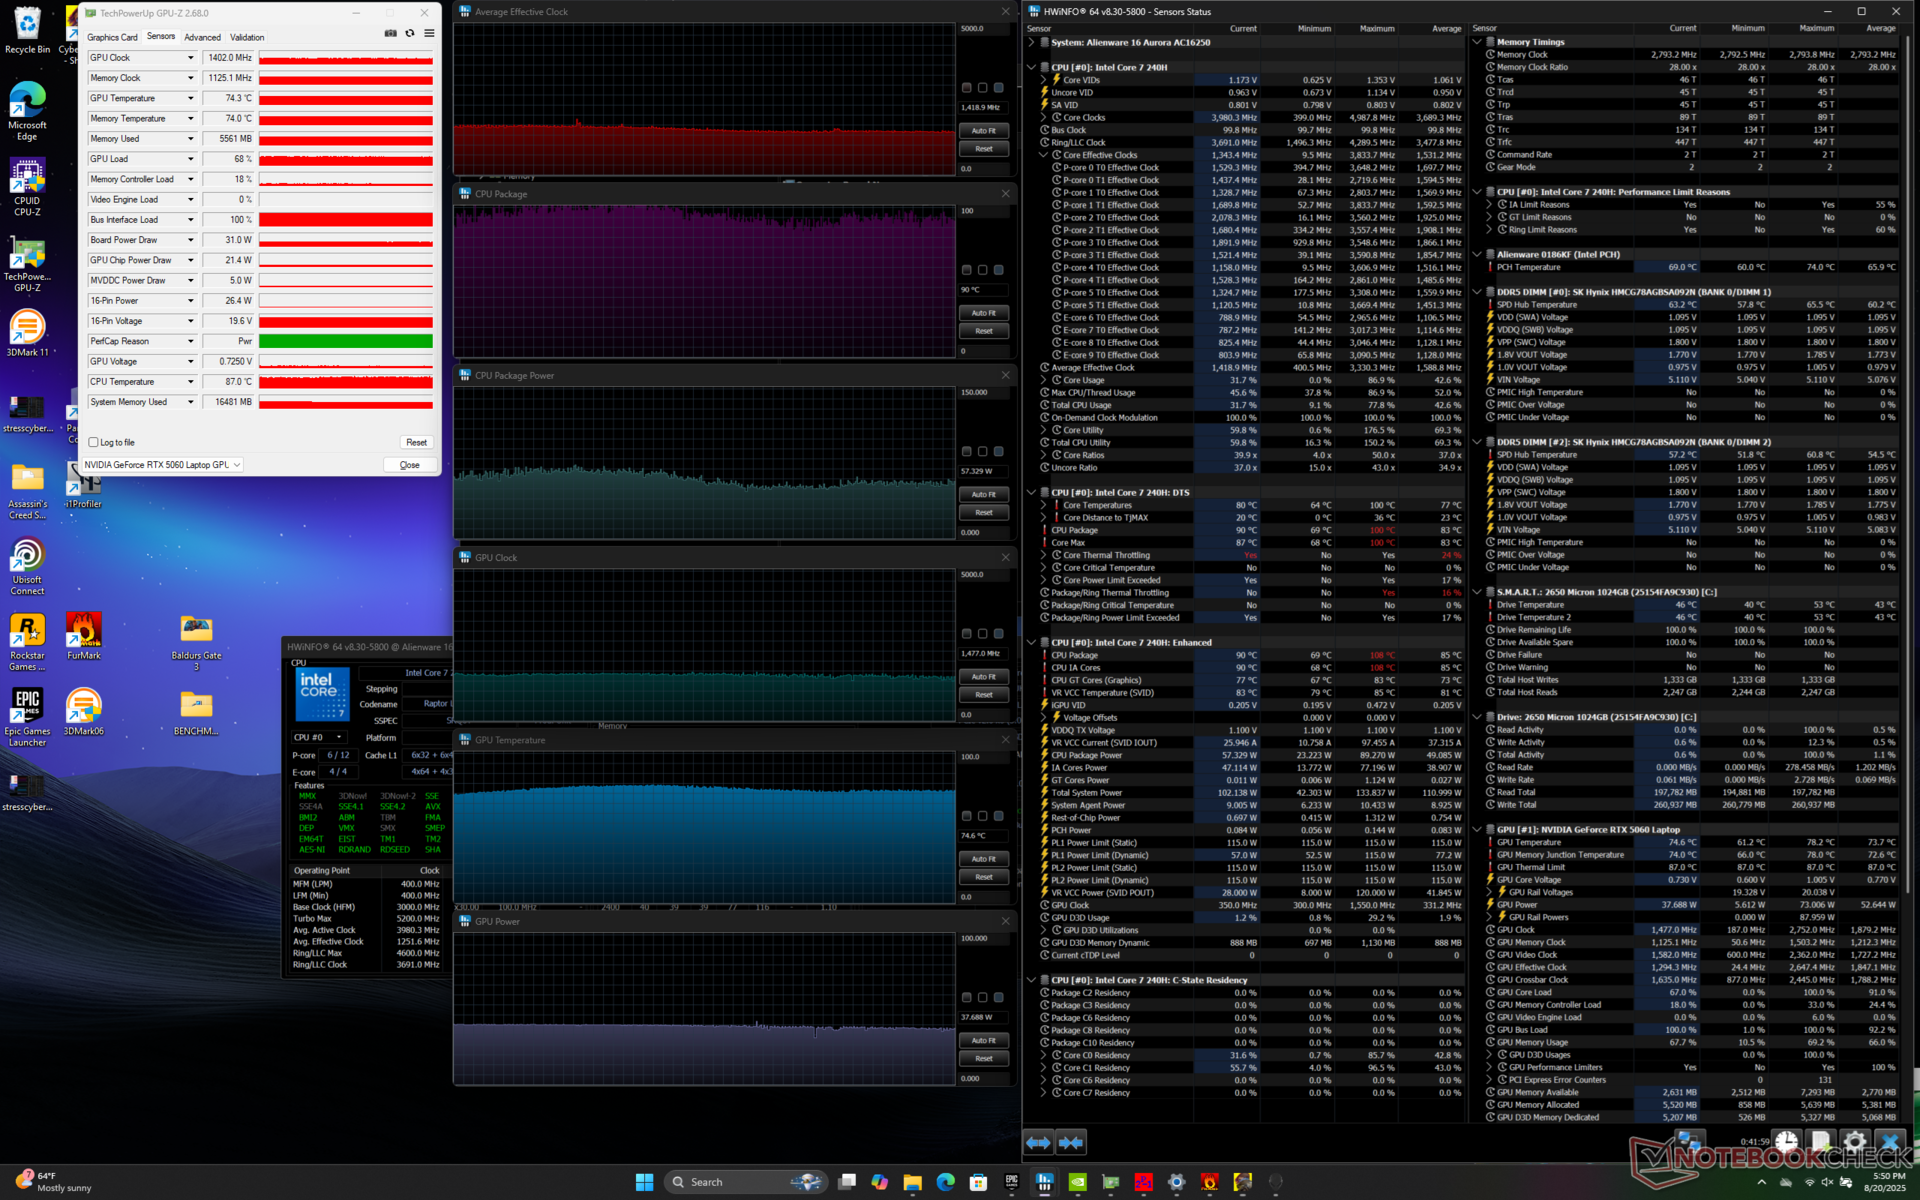
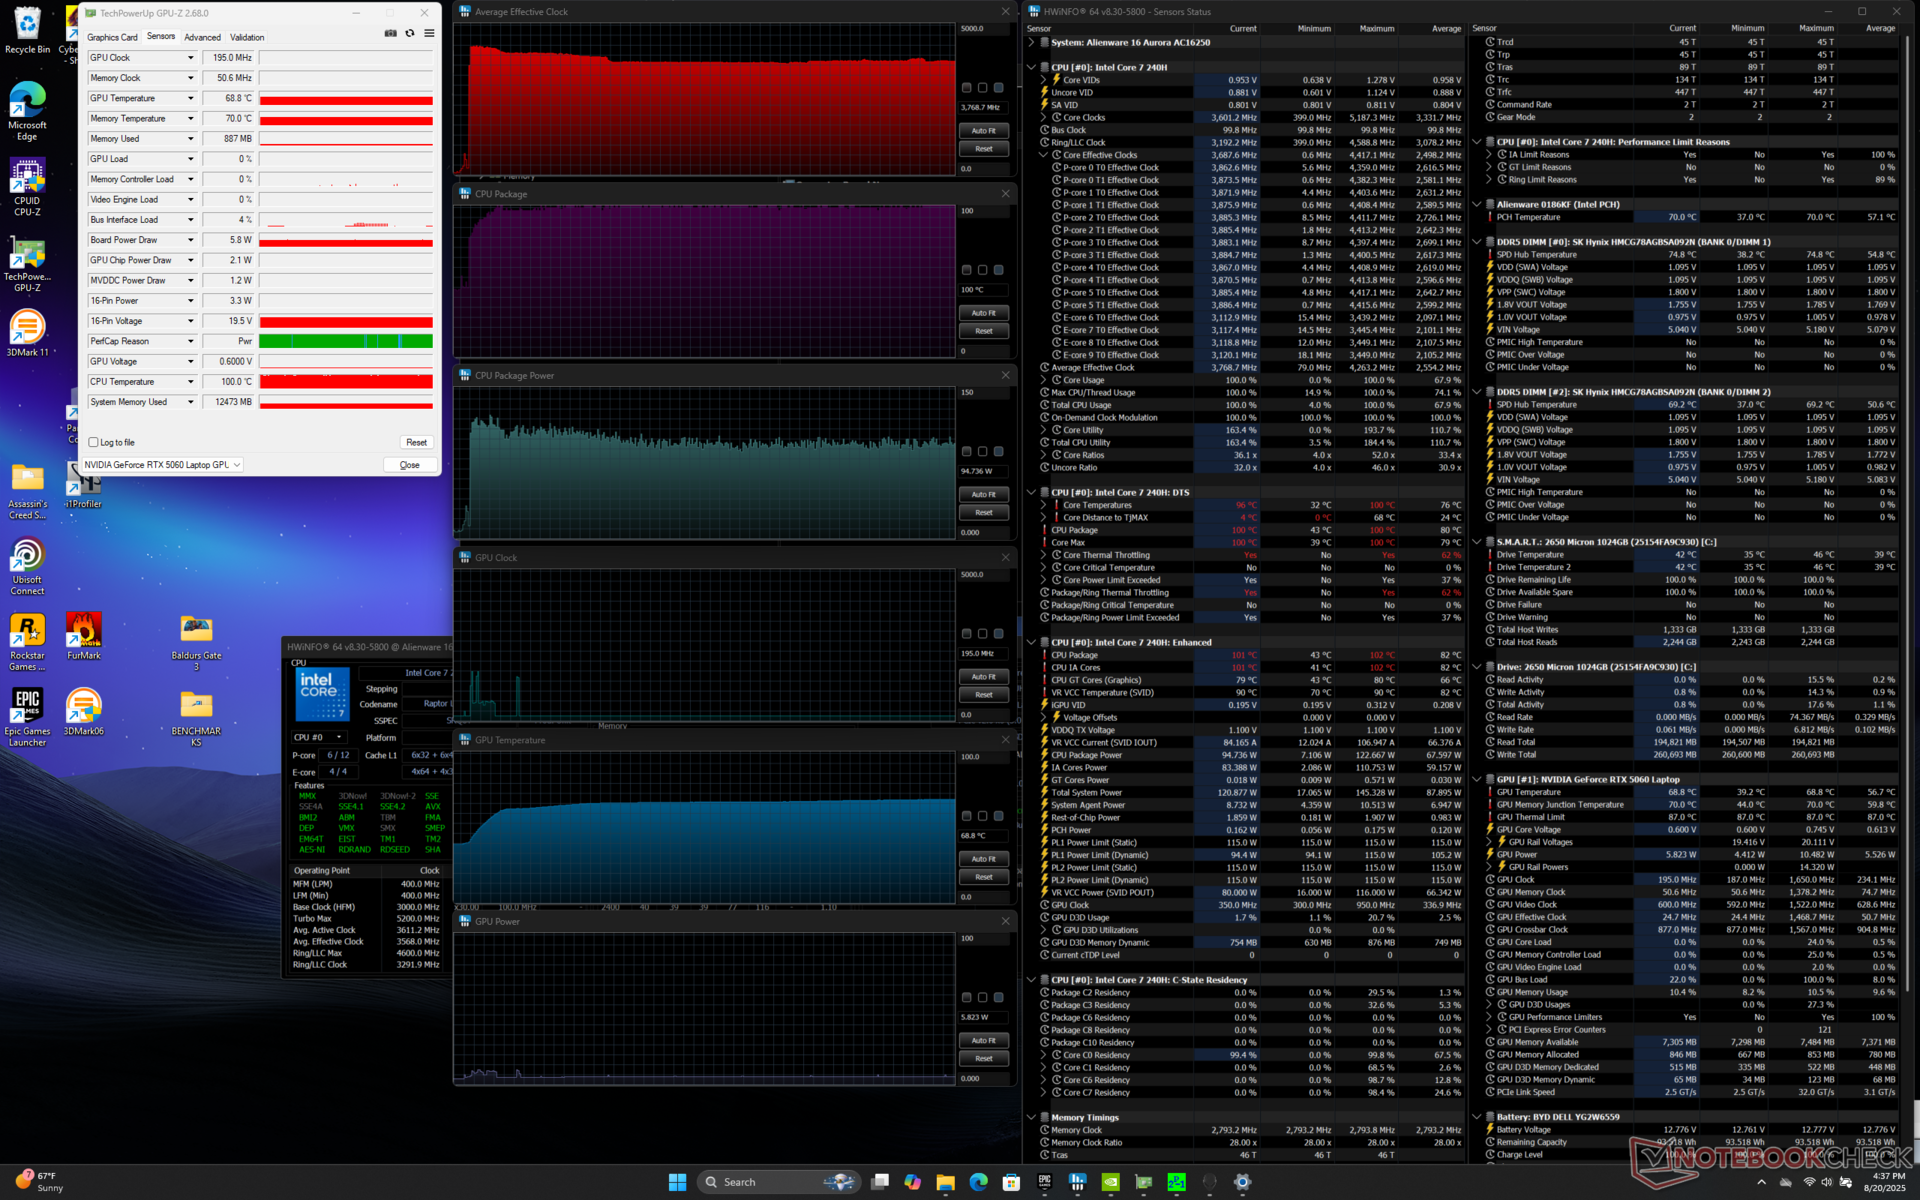
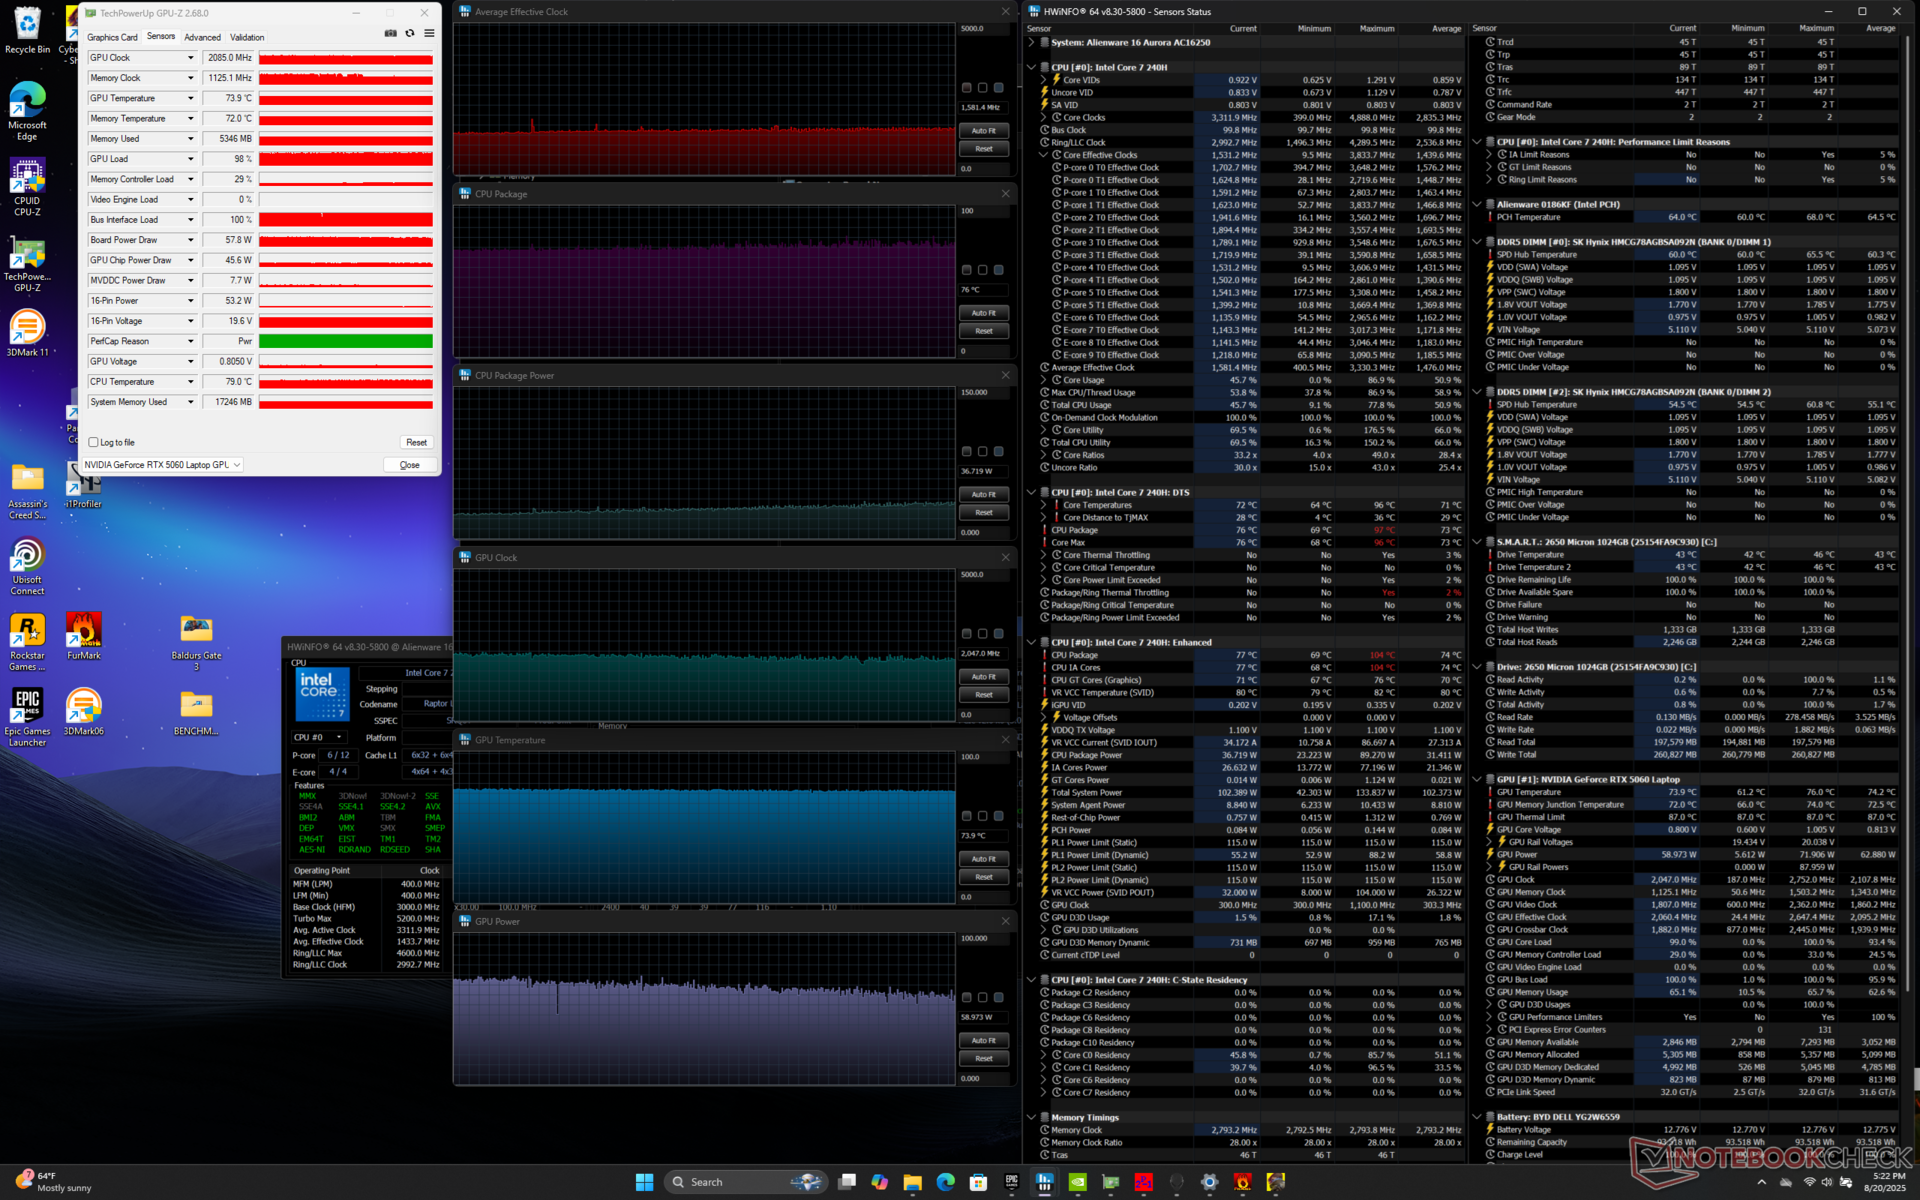
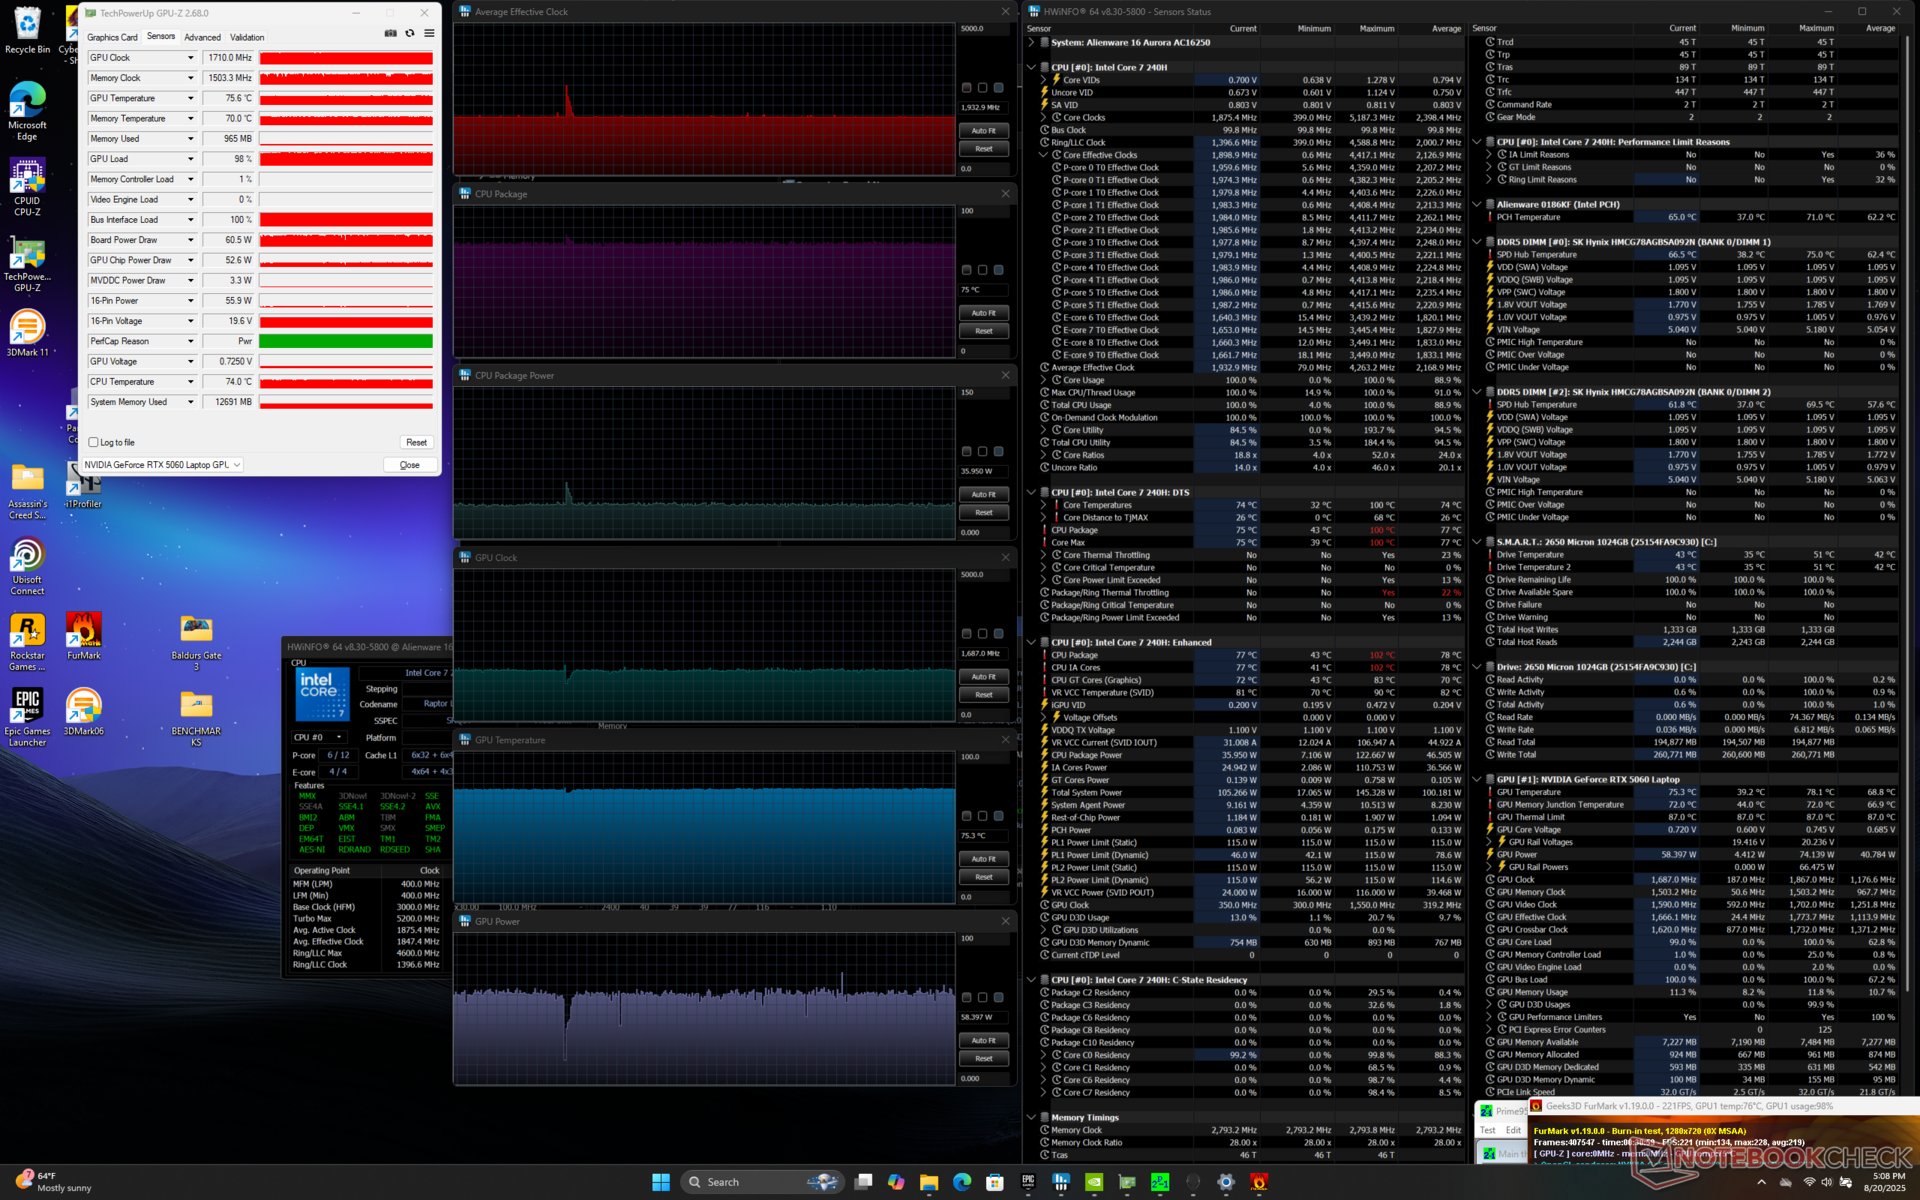
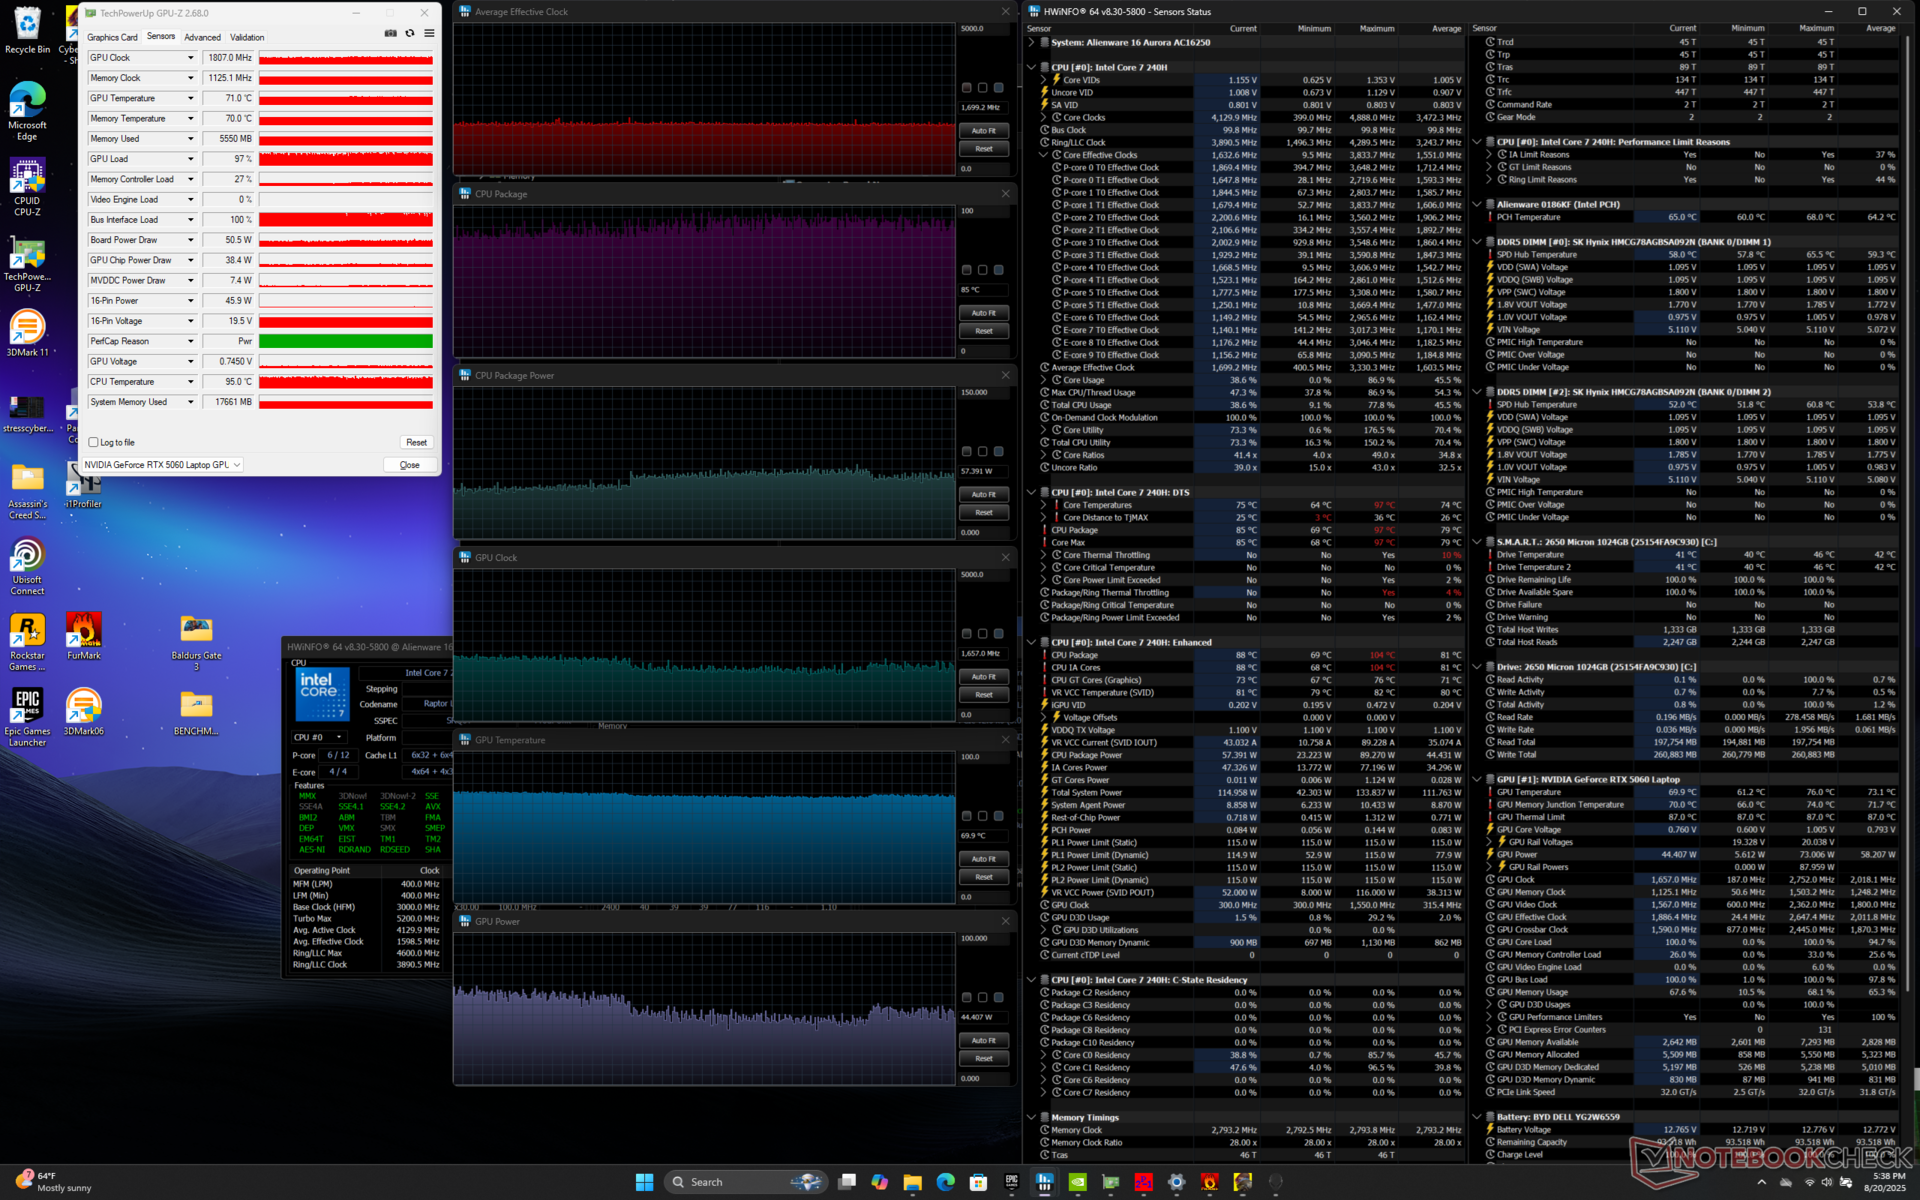
| Average CPU Clock (GHz) | GPU Clock (MHz) | Average CPU Temperature (°C) | Average GPU Temperature (°C) | |
| System Idle | -- | -- | 45 | 39 |
| Prime95 Stress | 3.8 | -- | 100 | 69 |
| Prime95 + FurMark Stress | 1.9 | 1710 | 75 | 75 |
| Cyberpunk 2077 Stress (Balanced mode) | 1.4 | 1402 | 90 | 75 |
| Cyberpunk 2077 Stress (Performance mode) | 1.6 | 2085 | 76 | 74 |
| Cyberpunk 2077 Stress (Turbo mode) | 1.7 | 1807 | 85 | 70 |
GPU Performance
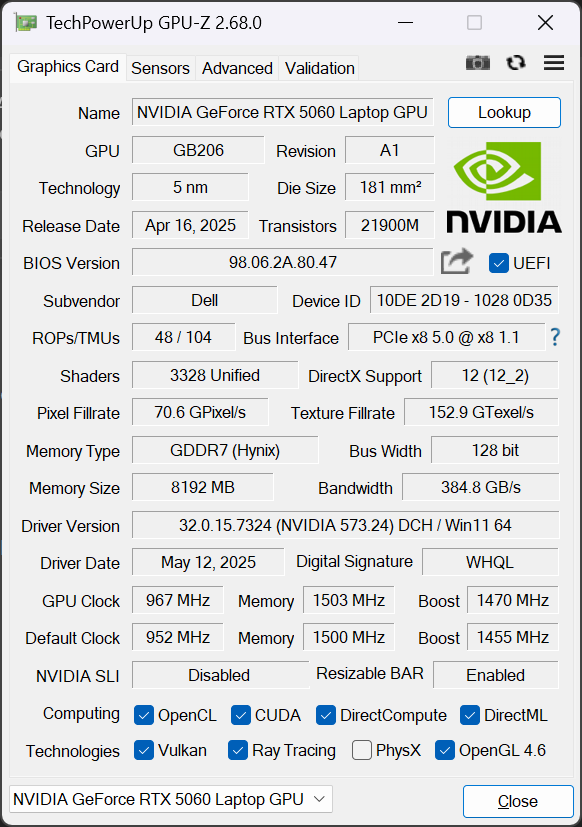
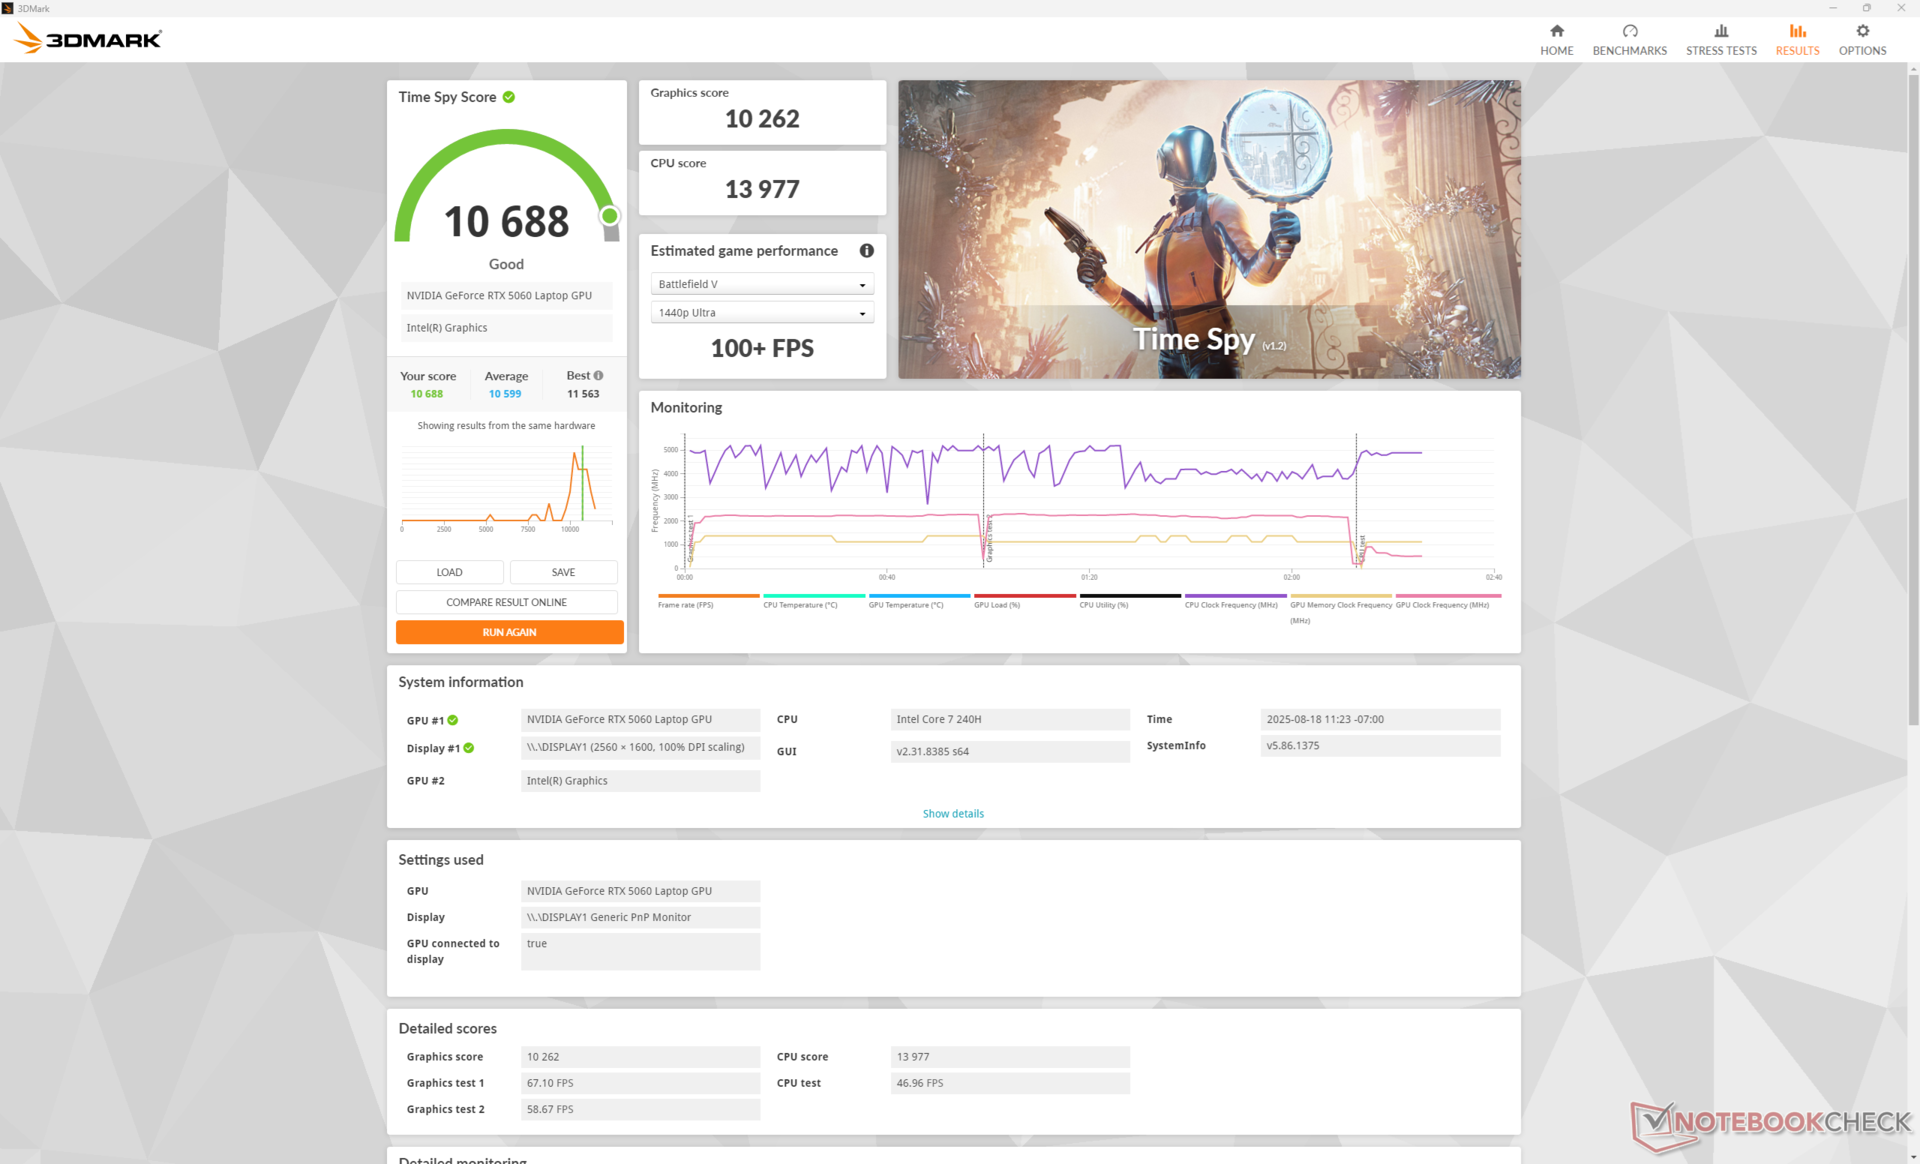
Raw graphics performance from our mobile RTX 5060 is about 20 to 30 percent slower than the mobile RTX 5070 in the 16X Aurora. The performance deficit between the mobile RTX 5060 and desktop RTX 5060 is also similar at up to 30 percent.
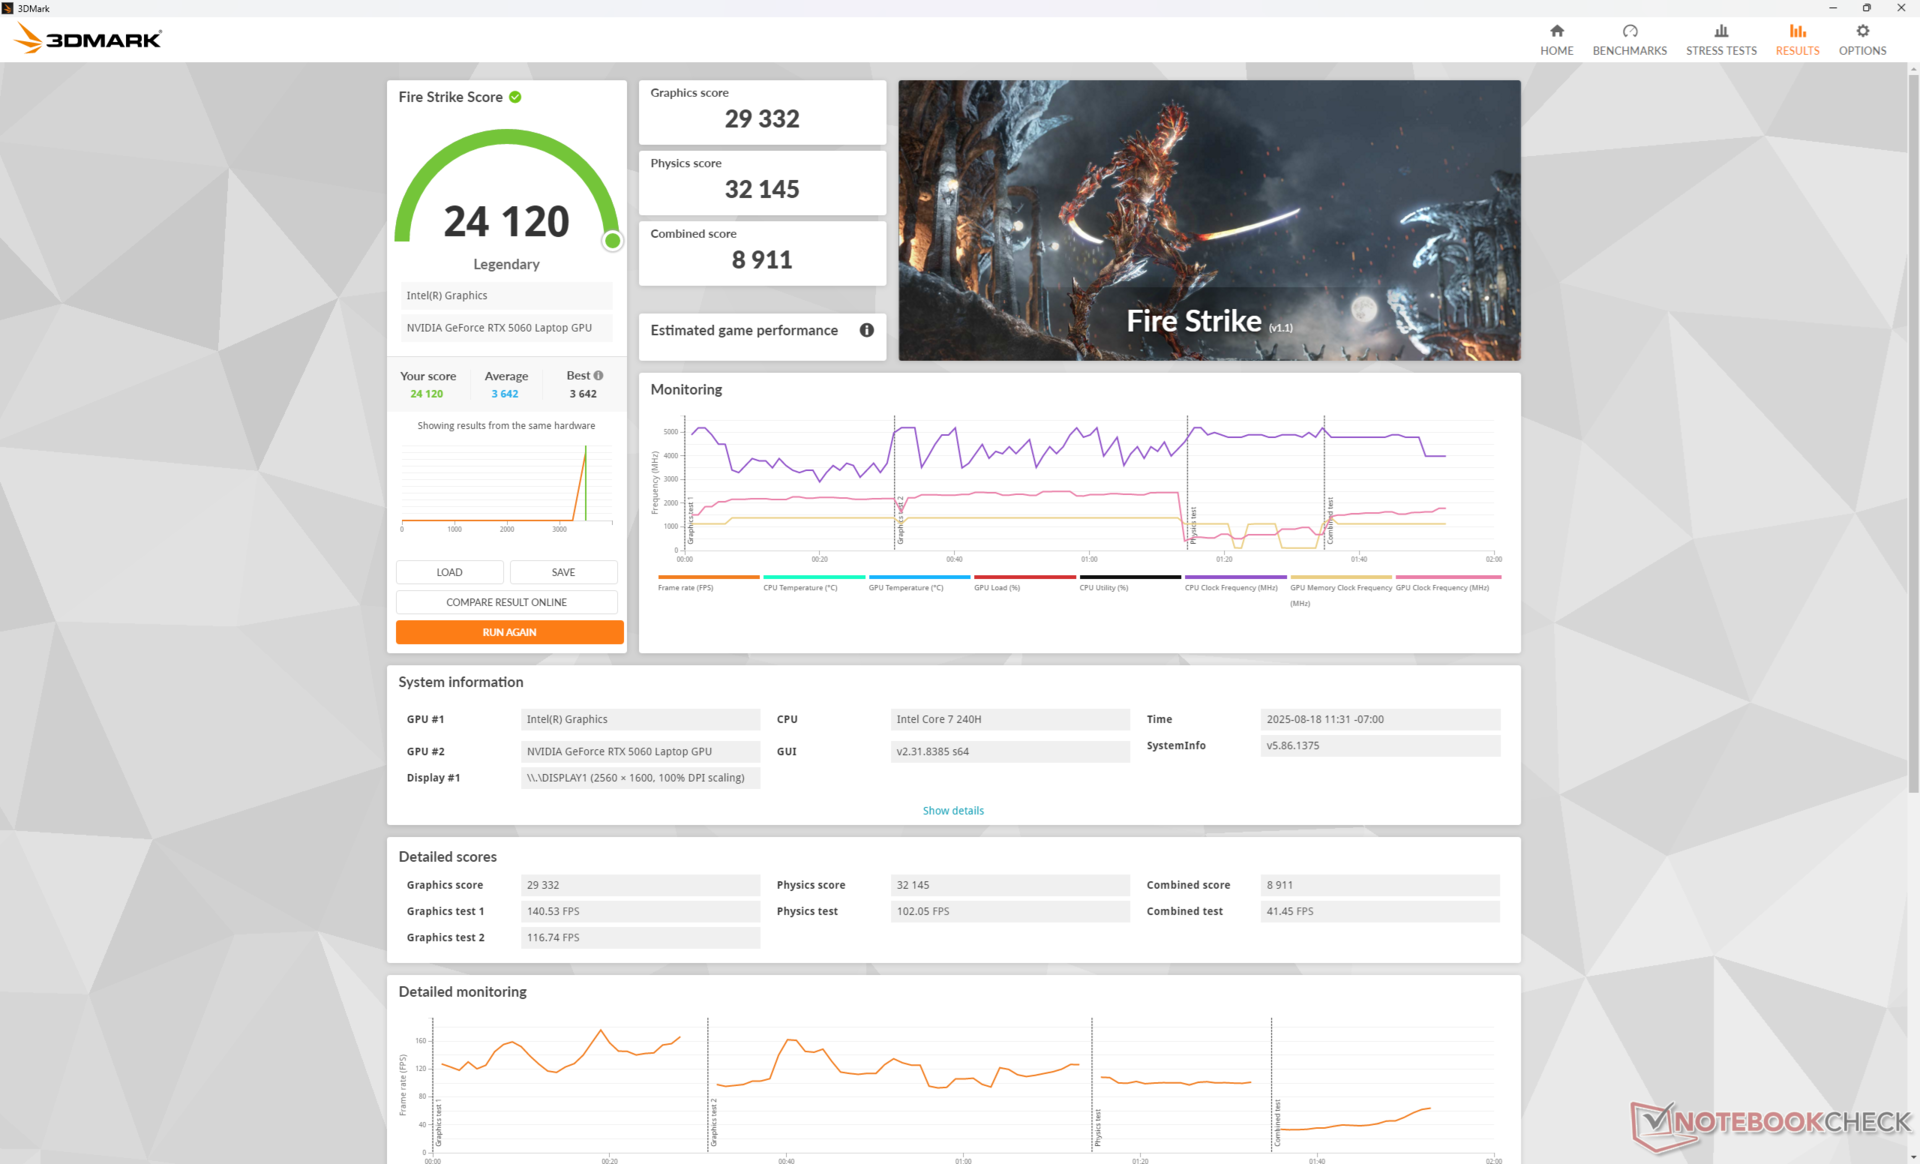
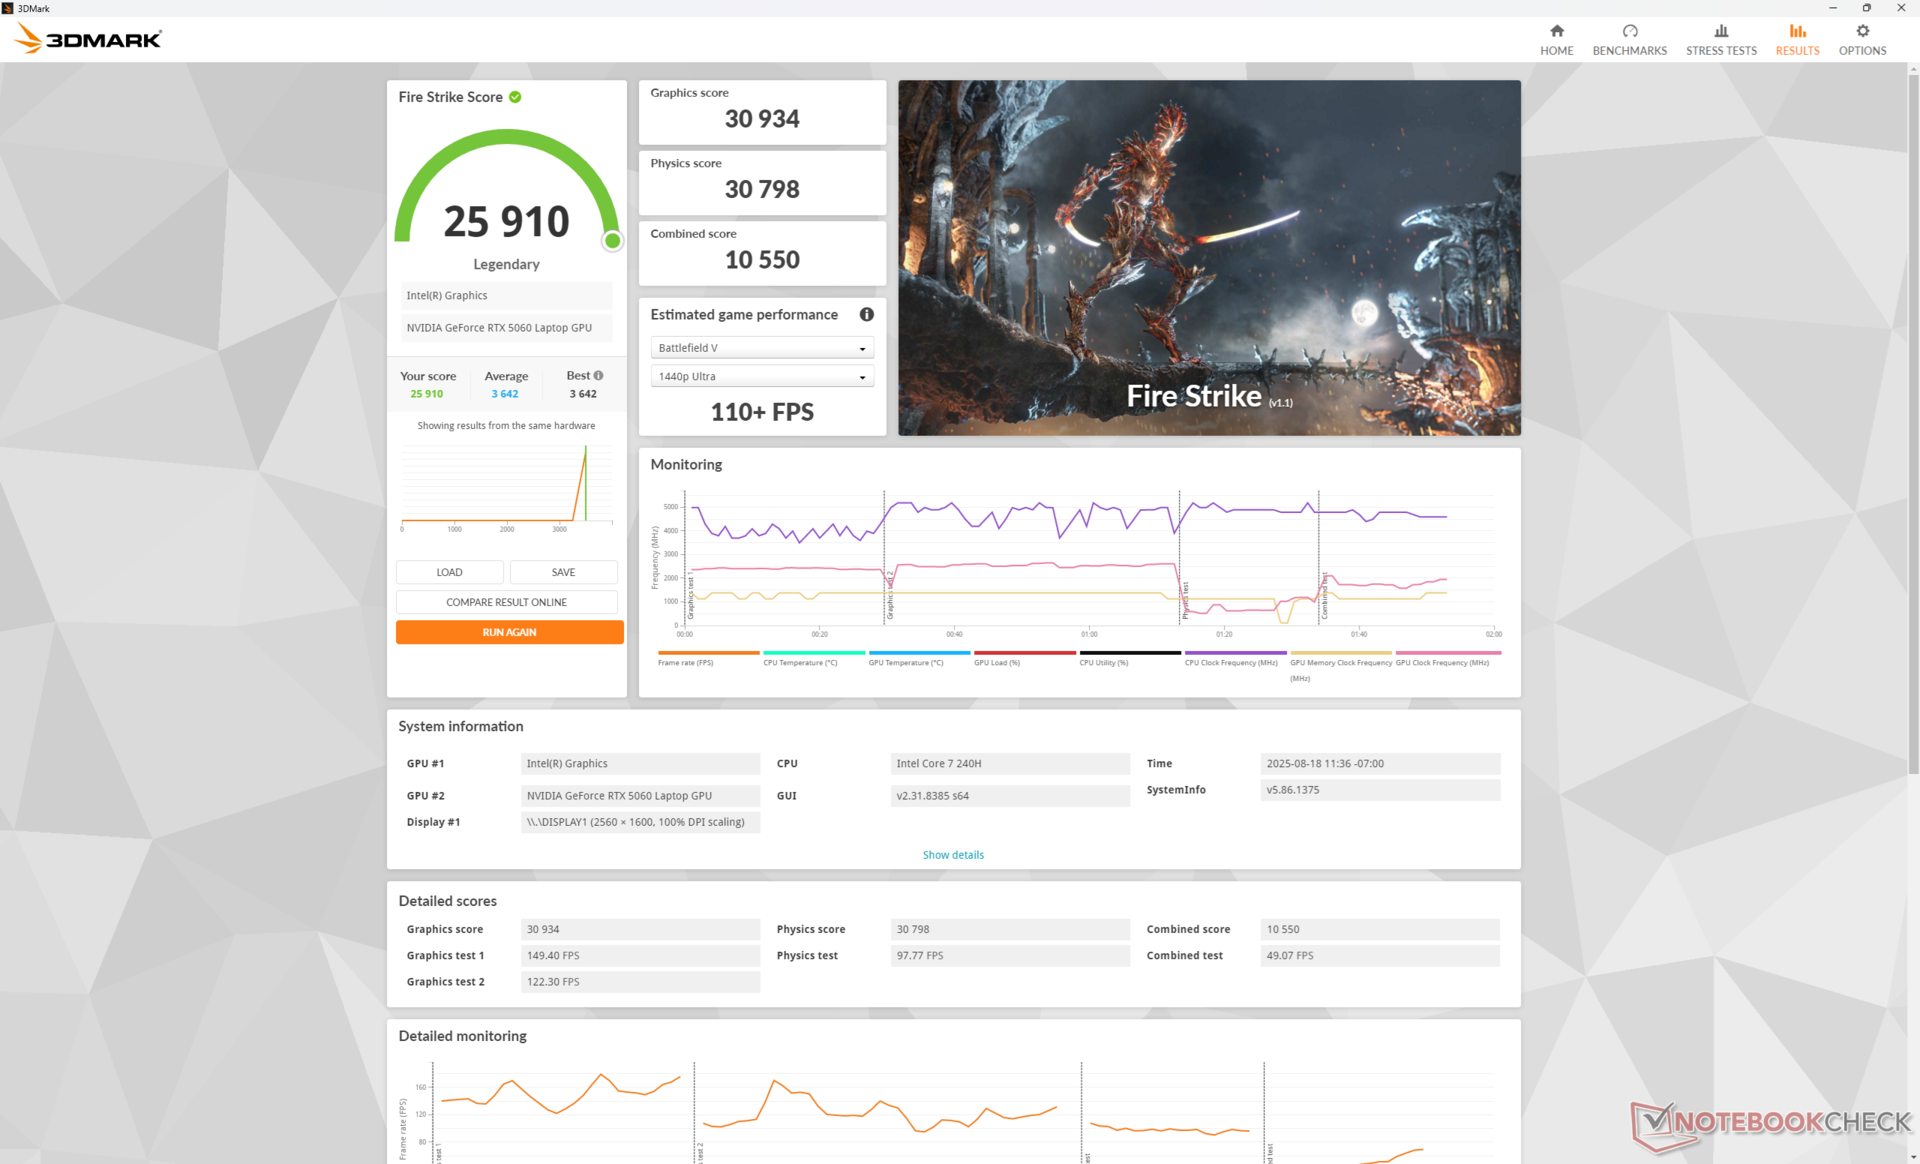
Running on Overdrive mode may slightly improve graphics performance at the cost of processor performance as shown by our Fire Strike results table below.
| Power Profile | Graphics Score | Physics Score | Combined Score |
| Overdrive Mode | 30934 | 30798 | 10550 |
| Performance Mode | 29332 (-5%) | 32145 (+4%) | 8911 (-16%) |
| Balanced Mode | 28162 (-9%) | 31743 (+3%) | 9795 (-7%) |
| Battery Power | 27155 (-12%) | 21692 (-30%) | 9020 (-15%) |
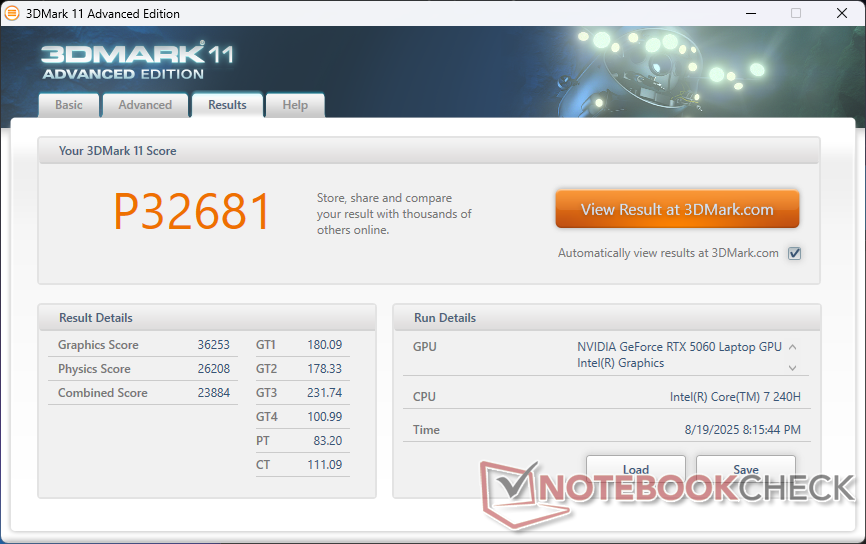
| 3DMark 11 Performance | 32681 points | |
| 3DMark Fire Strike Score | 24120 points | |
| 3DMark Time Spy Score | 10688 points | |
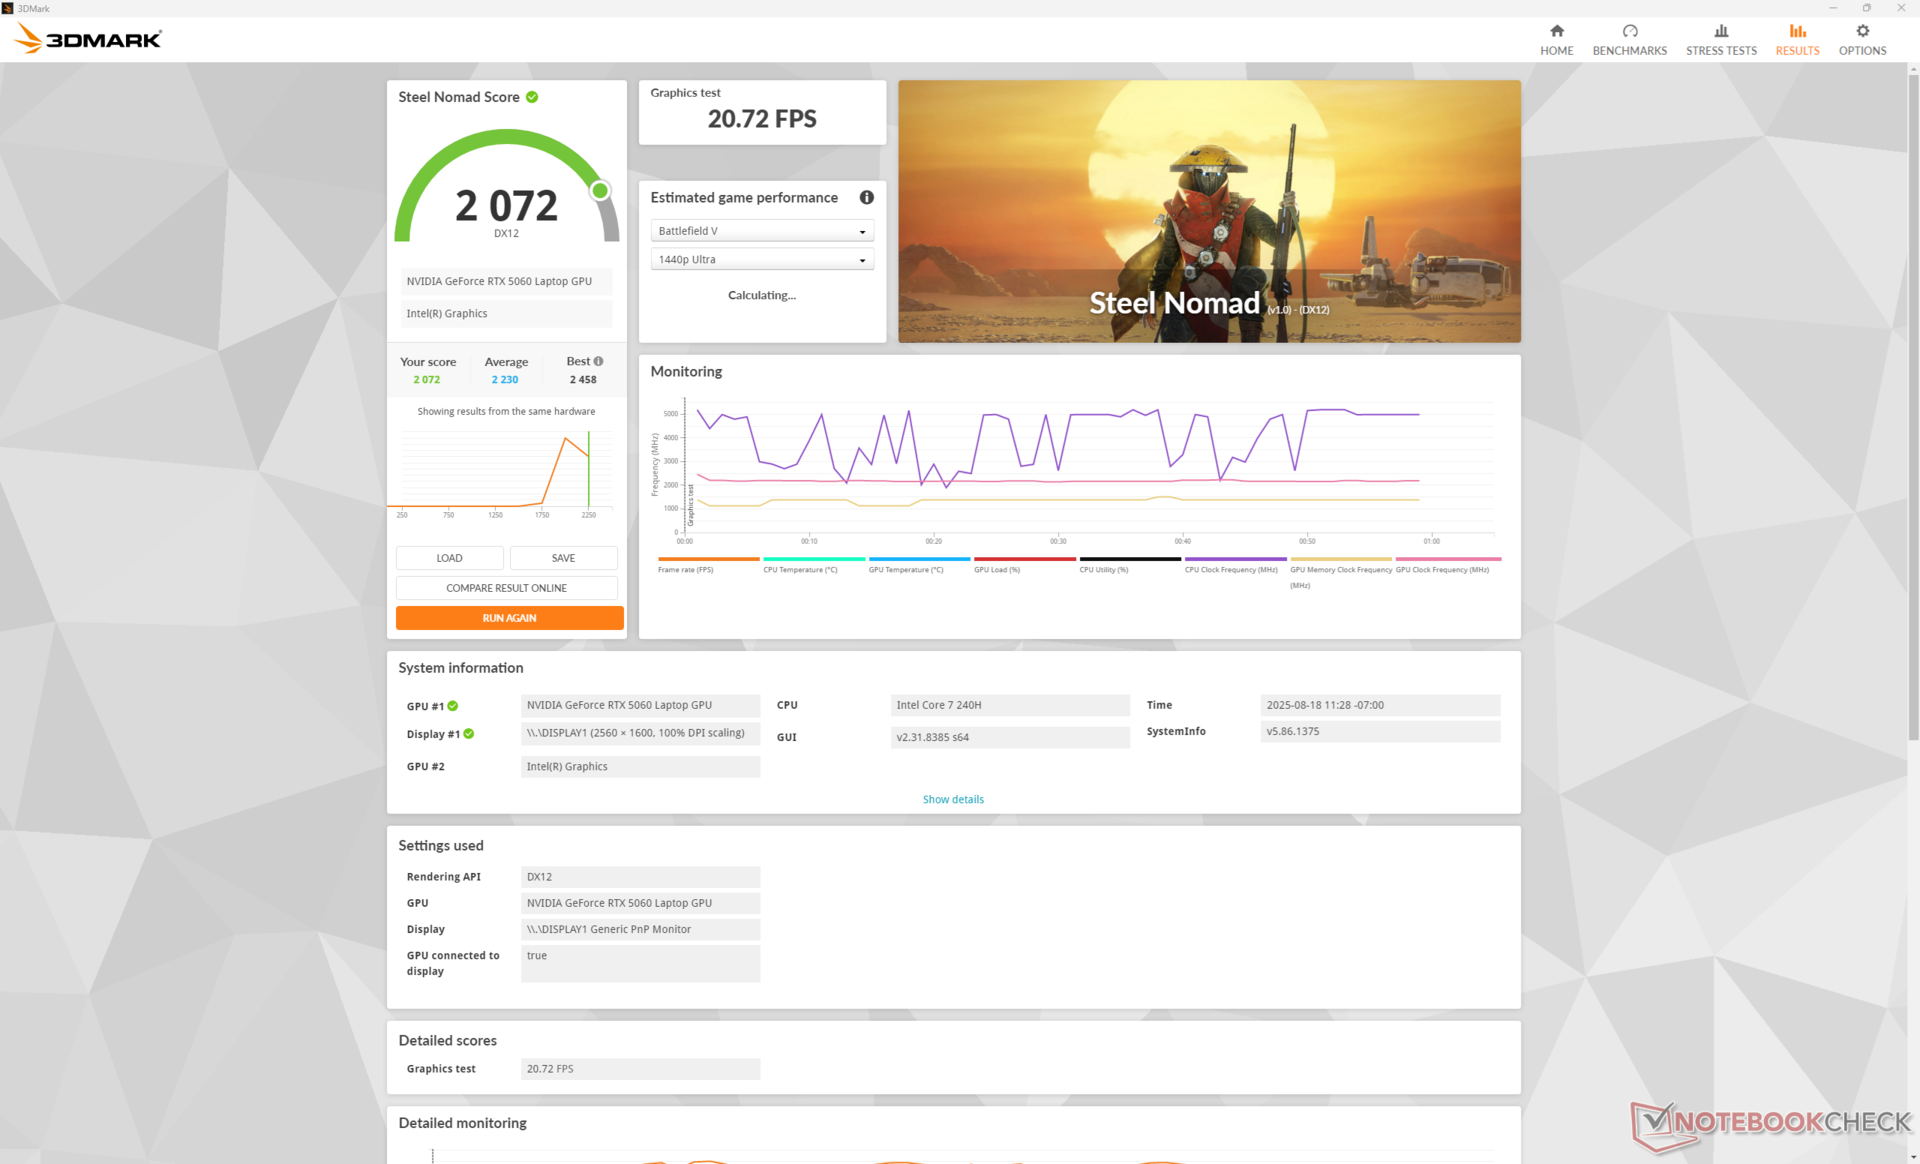
| 3DMark Steel Nomad Score | 2072 points | |
Help | ||
* ... smaller is better
Gaming Performance
The mobile GeForce RTX 5060 is almost strictly for high 1080p or medium 1440p gaming if playing more demanding titles. For example, simply jumping from 1080p to just 1440p on Alan Wake 2 while keeping graphical settings the same would cut frame rates by almost half. Be prepared to reduce settings more significantly if gaming at higher resolutions.
DLSS and frame generation are recommended at 1080p if high graphical settings are desired. For example, running Alan Wake 2 on high 1080p ray-trace settings would result in an average frame rate of only 24. Enabling DLSS Quality mode and 2x FG would boost the average frame rate to 76 albeit with notable input delay. You'll want to keep most settings around medium if aiming for the native 2K resolution of the display.
| Performance rating - Percent | |
| Alienware 16X Aurora, RTX 5070 | |
| Alienware 16 Aurora | |
| Gigabyte Gaming A16 GA6H | |
| Lenovo LOQ 15AHP10 | |
| HP Victus 16 (2024) -1! | |
| Asus TUF Gaming A16 FA608WV | |
| Cyberpunk 2077 - 1920x1080 Ultra Preset (FSR off) | |
| Alienware 16X Aurora, RTX 5070 | |
| Lenovo LOQ 15AHP10 | |
| Gigabyte Gaming A16 GA6H | |
| Alienware 16 Aurora | |
| Asus TUF Gaming A16 FA608WV | |
| HP Victus 16 (2024) | |
| Baldur's Gate 3 - 1920x1080 Ultra Preset AA:T | |
| Alienware 16X Aurora, RTX 5070 | |
| Alienware 16 Aurora | |
| Gigabyte Gaming A16 GA6H | |
| Lenovo LOQ 15AHP10 | |
| Asus TUF Gaming A16 FA608WV | |
| GTA V - 1920x1080 Highest AA:4xMSAA + FX AF:16x | |
| Alienware 16X Aurora, RTX 5070 | |
| Alienware 16 Aurora | |
| Asus TUF Gaming A16 FA608WV | |
| HP Victus 16 (2024) | |
| Lenovo LOQ 15AHP10 | |
| Gigabyte Gaming A16 GA6H | |
| Final Fantasy XV Benchmark - 1920x1080 High Quality | |
| Alienware 16X Aurora, RTX 5070 | |
| Lenovo LOQ 15AHP10 | |
| Alienware 16 Aurora | |
| Asus TUF Gaming A16 FA608WV | |
| HP Victus 16 (2024) | |
| Gigabyte Gaming A16 GA6H | |
| Strange Brigade - 1920x1080 ultra AA:ultra AF:16 | |
| Alienware 16X Aurora, RTX 5070 | |
| Lenovo LOQ 15AHP10 | |
| Gigabyte Gaming A16 GA6H | |
| Asus TUF Gaming A16 FA608WV | |
| Alienware 16 Aurora | |
| HP Victus 16 (2024) | |
| Dota 2 Reborn - 1920x1080 ultra (3/3) best looking | |
| Alienware 16X Aurora, RTX 5070 | |
| Alienware 16 Aurora | |
| HP Victus 16 (2024) | |
| Gigabyte Gaming A16 GA6H | |
| Asus TUF Gaming A16 FA608WV | |
| Lenovo LOQ 15AHP10 | |
| X-Plane 11.11 - 1920x1080 high (fps_test=3) | |
| Alienware 16X Aurora, RTX 5070 | |
| HP Victus 16 (2024) | |
| Gigabyte Gaming A16 GA6H | |
| Alienware 16 Aurora | |
| Lenovo LOQ 15AHP10 | |
| Asus TUF Gaming A16 FA608WV | |
| F1 24 | |
| 1920x1080 Ultra High Preset AA:T AF:16x | |
| Chuwi Gamebook, R9 9955HX | |
| Alienware 16X Aurora, RTX 5070 | |
| Zotac GeForce RTX 5060 AMP | |
| Average NVIDIA GeForce RTX 5060 Laptop (46.1 - 77.5, n=9) | |
| Alienware 16 Aurora | |
| 2560x1440 Ultra High Preset AA:T AF:16x | |
| Chuwi Gamebook, R9 9955HX | |
| Alienware 16X Aurora, RTX 5070 | |
| Zotac GeForce RTX 5060 AMP | |
| Average NVIDIA GeForce RTX 5060 Laptop (29.8 - 49.1, n=9) | |
| Alienware 16 Aurora | |
| 3840x2160 Ultra High Preset AA:T AF:16x | |
| Zotac GeForce RTX 5060 AMP | |
| Alienware 16X Aurora, RTX 5070 | |
| Alienware 16 Aurora | |
| Average NVIDIA GeForce RTX 5060 Laptop (n=1) | |
| 3840x2160 Ultra High Preset + Quality DLSS AF:16x | |
| Zotac GeForce RTX 5060 AMP | |
| Alienware 16X Aurora, RTX 5070 | |
| Alienware 16 Aurora | |
| Average NVIDIA GeForce RTX 5060 Laptop (n=1) | |
| 2560x1440 Ultra High Preset + Quality DLSS AF:16x | |
| Chuwi Gamebook, R9 9955HX | |
| Alienware 16X Aurora, RTX 5070 | |
| Zotac GeForce RTX 5060 AMP | |
| Average NVIDIA GeForce RTX 5060 Laptop (46 - 74.5, n=8) | |
| Alienware 16 Aurora | |
| Indiana Jones and the Great Circle | |
| 1920x1080 High Preset | |
| Chuwi Gamebook, R9 9955HX | |
| Zotac GeForce RTX 5060 AMP | |
| Average NVIDIA GeForce RTX 5060 Laptop (52.8 - 68.1, n=3) | |
| Alienware 16X Aurora, RTX 5070 | |
| Alienware 16 Aurora | |
| 1920x1080 Very Ultra Preset | |
| Chuwi Gamebook, R9 9955HX | |
| Zotac GeForce RTX 5060 AMP | |
| Alienware 16 Aurora | |
| Average NVIDIA GeForce RTX 5060 Laptop (6.3 - 15.6, n=3) | |
| Alienware 16X Aurora, RTX 5070 | |
| 2560x1440 Very Ultra Preset | |
| Chuwi Gamebook, R9 9955HX | |
| Alienware 16 Aurora | |
| Average NVIDIA GeForce RTX 5060 Laptop (4.2 - 10.1, n=3) | |
| Alienware 16X Aurora, RTX 5070 | |
| Zotac GeForce RTX 5060 AMP | |
| Monster Hunter Wilds | |
| 1920x1080 medium, no upscaling | |
| Chuwi Gamebook, R9 9955HX | |
| Alienware 16X Aurora, RTX 5070 | |
| Zotac GeForce RTX 5060 AMP | |
| Average NVIDIA GeForce RTX 5060 Laptop (45.2 - 68.3, n=4) | |
| Alienware 16 Aurora | |
| 1920x1080 ultra, RT: high, no upscaling | |
| Chuwi Gamebook, R9 9955HX | |
| Zotac GeForce RTX 5060 AMP | |
| Alienware 16X Aurora, RTX 5070 | |
| Alienware 16 Aurora | |
| Average NVIDIA GeForce RTX 5060 Laptop (16.6 - 36.5, n=4) | |
| 2560x1440 ultra, RT: high, no upscaling | |
| Chuwi Gamebook, R9 9955HX | |
| Alienware 16X Aurora, RTX 5070 | |
| Alienware 16 Aurora | |
| Average NVIDIA GeForce RTX 5060 Laptop (13.9 - 20.9, n=3) | |
Cyberpunk 2077 ultra FPS Chart
| low | med. | high | ultra | QHD DLSS | QHD | 4K DLSS | 4K | |
|---|---|---|---|---|---|---|---|---|
| GTA V (2015) | 186.8 | 186.2 | 179.7 | 120 | 96.7 | 90.2 | ||
| Dota 2 Reborn (2015) | 195.1 | 178.3 | 171.9 | 156.1 | 105.2 | |||
| Final Fantasy XV Benchmark (2018) | 212 | 142 | 109.5 | 79.1 | 45 | |||
| X-Plane 11.11 (2018) | 125.4 | 105.2 | 93.6 | 62.9 | ||||
| Strange Brigade (2018) | 356 | 260 | 219 | 191.1 | 133.7 | 72.8 | ||
| Baldur's Gate 3 (2023) | 135.9 | 117 | 106 | 105.3 | 101.3 | 70.2 | 56.5 | 34.8 |
| Cyberpunk 2077 (2023) | 123.9 | 104.3 | 86.7 | 80.1 | 58.9 | 48.5 | 21.5 | |
| Alan Wake 2 (2023) | 66.2 | 59.1 | 54.6 | 31.2 | 12.1 | |||
| F1 24 (2024) | 181.2 | 176.8 | 154.3 | 46.1 | 46 | 29.8 | 9.21 | 10.7 |
| Black Myth: Wukong (2024) | 83 | 63 | 48 | 26 | 30 | 19 | 9 | |
| Indiana Jones and the Great Circle (2024) | 102.1 | 54.9 | 14.1 | 10.1 | 5.3 | |||
| Monster Hunter Wilds (2025) | 49.4 | 45.2 | 33.5 | 17.8 | 10.6 | |||
| Assassin's Creed Shadows (2025) | 50 | 47 | 45 | 31 | 24 | 26 | 14 |
Emissions
System Noise
Fan noise when running Cyberpunk 2077 stabilizes at 46.8 dB(A), 49.9 dB(A), and 55.6 dB(A) when on Balanced mode, Performance mode, and Overdrive mode, respectively. Levels are close to what we observed on the 16X Aurora.
Noise level
| Idle |
| 24 / 25.6 / 25.6 dB(A) |
| Load |
| 46.8 / 55.6 dB(A) |
 | ||
30 dB silent 40 dB(A) audible 50 dB(A) loud |
||
min: | ||
| Alienware 16 Aurora GeForce RTX 5060 Laptop, Core 7 240H | Alienware 16X Aurora, RTX 5070 GeForce RTX 5070 Laptop, Ultra 9 275HX | Lenovo LOQ 15AHP10 GeForce RTX 5060 Laptop, R7 250, Micron 2500 1TB MTFDKBA1T0QGN | Gigabyte Gaming A16 GA6H GeForce RTX 5070 Laptop, i7-13620H, Kingston OM8PGP41024Q-A0 | Asus TUF Gaming A16 FA608WV GeForce RTX 4060 Laptop GPU, Ryzen AI 9 HX 370, Micron 2400 MTFDKBA1T0QFM | HP Victus 16 (2024) GeForce RTX 4060 Laptop GPU, i7-14700HX, Kioxia XG8 KXG80ZNV512G | |
|---|---|---|---|---|---|---|
| Noise | 5% | -37% | -5% | 13% | -8% | |
| off / environment * (dB) | 22.9 | 23.7 -3% | 25 -9% | 24 -5% | 23 -0% | 25 -9% |
| Idle Minimum * (dB) | 24 | 23.9 -0% | 43 -79% | 25 -4% | 23 4% | 28 -17% |
| Idle Average * (dB) | 25.6 | 23.9 7% | 45 -76% | 26 -2% | 23 10% | 29 -13% |
| Idle Maximum * (dB) | 25.6 | 26.1 -2% | 48 -88% | 27 -5% | 29.11 -14% | 33 -29% |
| Load Average * (dB) | 46.8 | 26.8 43% | 53 -13% | 54 -15% | 31 34% | 45 4% |
| Cyberpunk 2077 ultra * (dB) | 49.9 | 51.8 -4% | 51 -2% | 54 -8% | 36.23 27% | |
| Load Maximum * (dB) | 55.6 | 58 -4% | 53 5% | 55 1% | 39.44 29% | 48 14% |
| Witcher 3 ultra * (dB) | 43 |
* ... smaller is better
Energy Management
Power Consumption
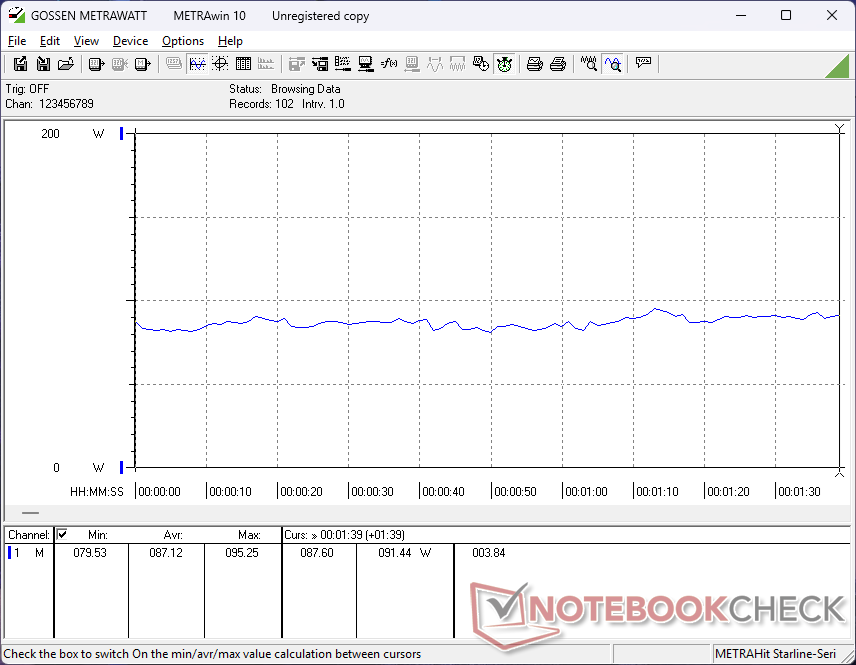
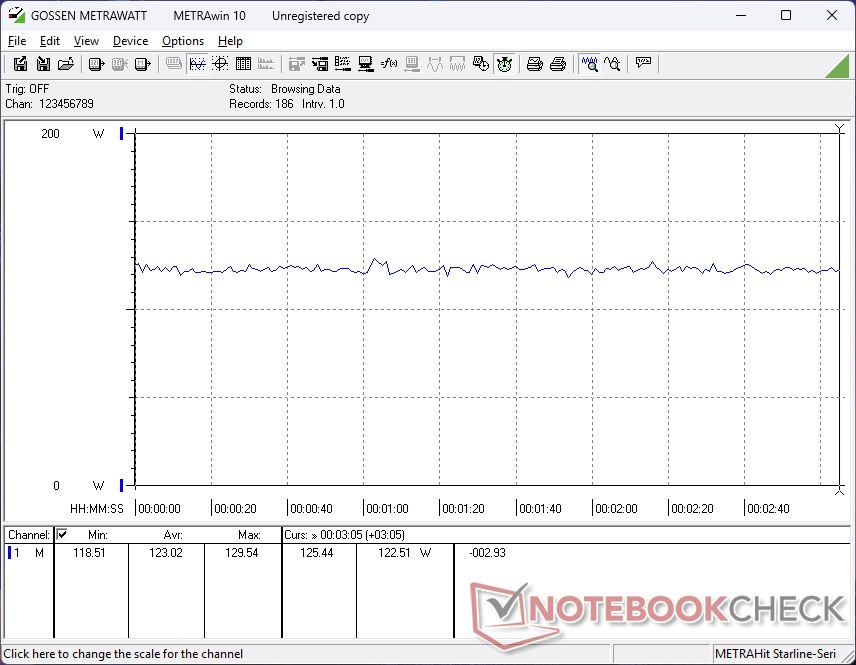
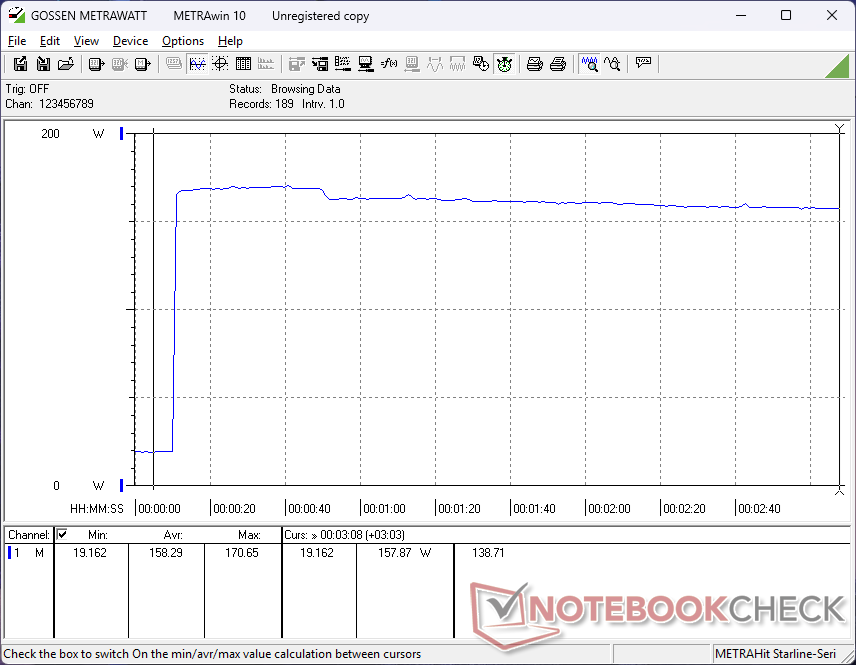
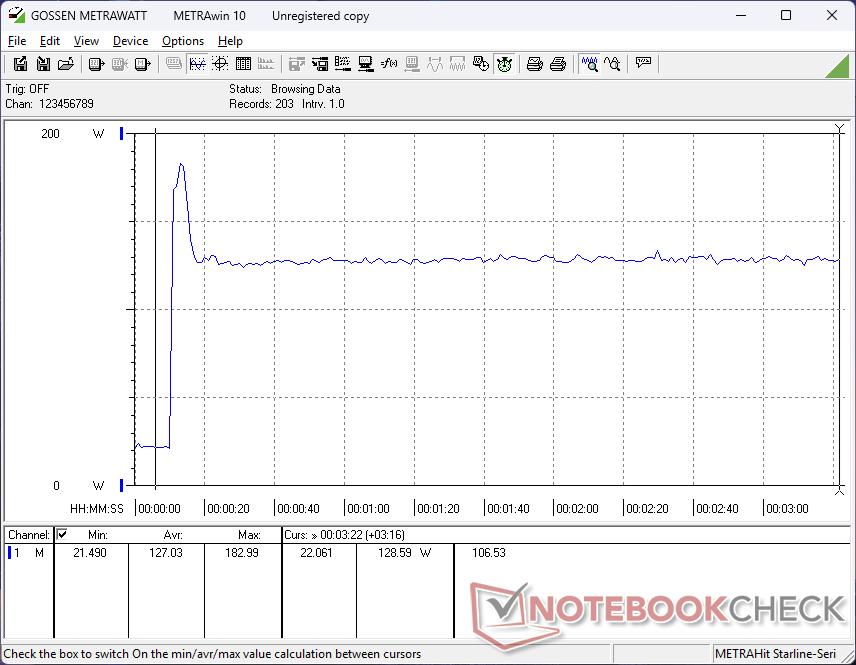
The slower components of the 16 Aurora have resulted in notably lower power consumption overall when compared to the 16X Aurora. Of course, the drawback is 30 percent slower graphics performance than the 16X Aurora RTX 5070 option when gaming.
Perhaps most notably, running Prime95 on the 16 Aurora demands just as much power as the 16X Aurora even though the CPU in the 16 Aurora is about 50 percent slower. This is because the 16 Aurora utilizes an older generation processor with less than half the cores of the 16X Aurora.
It's also worth noting that the 16 Aurora ships with a more compact 180 W AC adapter compared to the larger 280 W AC adapter that ships with the 16X Aurora (~15.5 x 7.5 x 3 cm ~20.5 x 10.5 x 2.5 cm).
| Off / Standby | |
| Idle | |
| Load |
|
Key:
min: | |
| Alienware 16 Aurora Core 7 240H, GeForce RTX 5060 Laptop, , IPS, 2560x1600, 16" | Alienware 16X Aurora, RTX 5070 Ultra 9 275HX, GeForce RTX 5070 Laptop, , IPS, 2560x1600, 16" | Lenovo LOQ 15AHP10 R7 250, GeForce RTX 5060 Laptop, Micron 2500 1TB MTFDKBA1T0QGN, IPS, 1920x1080, 15.6" | Gigabyte Gaming A16 GA6H i7-13620H, GeForce RTX 5070 Laptop, Kingston OM8PGP41024Q-A0, IPS, 2560x1600, 16" | Asus TUF Gaming A16 FA608WV Ryzen AI 9 HX 370, GeForce RTX 4060 Laptop GPU, Micron 2400 MTFDKBA1T0QFM, IPS, 1920x1200, 16" | HP Victus 16 (2024) i7-14700HX, GeForce RTX 4060 Laptop GPU, Kioxia XG8 KXG80ZNV512G, IPS, 1920x1080, 16.1" | |
|---|---|---|---|---|---|---|
| Power Consumption | -100% | -60% | -14% | -8% | -37% | |
| Idle Minimum * (Watt) | 4.4 | 20.1 -357% | 20 -355% | 9 -105% | 6.8 -55% | 9 -105% |
| Idle Average * (Watt) | 18 | 27.6 -53% | 20.7 -15% | 11 39% | 12.7 29% | 15 17% |
| Idle Maximum * (Watt) | 18.2 | 31.8 -75% | 22.7 -25% | 23 -26% | 15.2 16% | 23 -26% |
| Load Average * (Watt) | 87.1 | 102.7 -18% | 71 18% | 91 -4% | 85 2% | 123 -41% |
| Cyberpunk 2077 ultra external monitor * (Watt) | 120.6 | 192.3 -59% | 151.1 -25% | 130 -8% | 143 -19% | |
| Cyberpunk 2077 ultra * (Watt) | 123 | 217 -76% | 153.1 -24% | 132.5 -8% | 145 -18% | |
| Load Maximum * (Watt) | 183 | 292 -60% | 172 6% | 155 15% | 199 -9% | 241 -32% |
| Witcher 3 ultra * (Watt) | 143.7 |
* ... smaller is better
Power Consumption Cyberpunk / Stress Test
Power Consumption external Monitor
Battery Life
WLAN runtimes have increased by over three hours due to the power savings mentioned above.
| Alienware 16 Aurora Core 7 240H, GeForce RTX 5060 Laptop, 96 Wh | Alienware 16X Aurora, RTX 5070 Ultra 9 275HX, GeForce RTX 5070 Laptop, 96 Wh | Lenovo LOQ 15AHP10 R7 250, GeForce RTX 5060 Laptop, 60 Wh | Gigabyte Gaming A16 GA6H i7-13620H, GeForce RTX 5070 Laptop, 76 Wh | Asus TUF Gaming A16 FA608WV Ryzen AI 9 HX 370, GeForce RTX 4060 Laptop GPU, 90 Wh | HP Victus 16 (2024) i7-14700HX, GeForce RTX 4060 Laptop GPU, 83 Wh | |
|---|---|---|---|---|---|---|
| Battery runtime | -43% | -40% | 3% | 89% | 13% | |
| WiFi v1.3 (h) | 7.5 | 4.3 -43% | 4.5 -40% | 7.7 3% | 14.2 89% | 8.5 13% |
| Reader / Idle (h) | 6.9 | |||||
| Load (h) | 1.3 | 2.1 | ||||
| H.264 (h) | 14.7 |
Notebookcheck Rating
The Alienware 16 Aurora balances back-to-school needs like battery life and thinness with the performance required for running the latest titles comfortably at 1080p.
Alienware 16 Aurora
- 08/27/2025 v8
Allen Ngo
 Total Sustainability Score:
 Potential Competitors in Comparison
Image | Model / Review | Price | Weight | Height | Display |
|---|---|---|---|---|---|
1. 76.2%  | Alienware 16 Aurora Intel Core 7 240H ⎘ NVIDIA GeForce RTX 5060 Laptop ⎘ 32 GB Memory | Amazon: List Price: 1100 USD | 2.6 kg | 15.2 mm | 16.00" 2560x1600 189 PPI IPS |
2. 84.9%  | Alienware 16X Aurora, RTX 5070 Intel Core Ultra 9 275HX ⎘ NVIDIA GeForce RTX 5070 Laptop ⎘ 32 GB Memory | Amazon: List Price: 1800 USD | 2.5 kg | 23.4 mm | 16.00" 2560x1600 189 PPI IPS |
3. 85.9%  | Asus ROG Zephyrus G16 GA605WV AMD Ryzen AI 9 HX 370 ⎘ NVIDIA GeForce RTX 4060 Laptop GPU ⎘ 32 GB Memory, 1024 GB SSD | Amazon: List Price: 2599€ | 1.8 kg | 17.2 mm | 16.00" 2560x1600 189 PPI OLED |
4. 89% v7 (old)  | Lenovo Legion Pro 5 16ARX8 (R5 7645HX, RTX 4050) AMD Ryzen 5 7645HX ⎘ NVIDIA GeForce RTX 4050 Laptop GPU ⎘ 16 GB Memory, 512 GB SSD | Amazon: 1. $1,799.00 Lenovo Legion Pro 5 16Arx8 1... 2. $1,779.00 Lenovo Legion Pro 5 16" WQXG... 3. $1,368.99 Lenovo Legion 5 Gen 10 Gamin... List Price: 1500€ | 2.5 kg | 27.3 mm | 16.00" 2560x1600 189 PPI IPS |
5. 89.5% v7 (old)  | Acer Predator Helios 16 PH16-71-731Q Intel Core i7-13700HX ⎘ NVIDIA GeForce RTX 4060 Laptop GPU ⎘ 16 GB Memory, 1024 GB SSD | Amazon: 1. $139.99 HOULISE Replacement for Acer... 2. $90.33 LCDBros Screen for Acer Pred... 3. $129.99 PEHDPVS Replacement for Acer... List Price: 2099€ | 2.6 kg | 26.9 mm | 16.00" 2560x1600 189 PPI IPS-LED |
6. 81.9%  | HP Omen Max 16 ah000 Intel Core Ultra 9 275HX ⎘ NVIDIA GeForce RTX 5090 Laptop ⎘ 32 GB Memory, 2048 GB SSD | Amazon: List Price: 3800 USD | 2.8 kg | 24.9 mm | 16.00" 2560x1600 189 PPI OLED |
Transparency
The selection of devices to be reviewed is made by our editorial team. The test sample was provided to the author as a loan by the manufacturer or retailer for the purpose of this review. The lender had no influence on this review, nor did the manufacturer receive a copy of this review before publication. There was no obligation to publish this review. As an independent media company, Notebookcheck is not subjected to the authority of manufacturers, retailers or publishers.
This is how Notebookcheck is testing
Every year, Notebookcheck independently reviews hundreds of laptops and smartphones using standardized procedures to ensure that all results are comparable. We have continuously developed our test methods for around 20 years and set industry standards in the process. In our test labs, high-quality measuring equipment is utilized by experienced technicians and editors. These tests involve a multi-stage validation process. Our complex rating system is based on hundreds of well-founded measurements and benchmarks, which maintains objectivity. Further information on our test methods can be found here.
