Verdict
The QHD+ option doesn't just offer a higher resolution picture than the FHD+ option, but also reduced ghosting and a slightly brighter display for an overall better visual experience. Color coverage and contrast haven't changed very much, but the latter is still quite good for an IPS panel at over 1500:1.
Of course, battery life has taken a hit by a few hours when compared to the FHD+ configuration. It's nevertheless still quite long at just over 17 hours of real-world WLAN browsing to be an arguably small tradeoff for the visual benefits mentioned above.
It's unfortunate that OLED options or even high refresh rate options aren't available here given that the Dell Pro 13 Premium is a "Premium" model in Dell's lineup. OLED would have provided superior HDR support while higher refresh rates would have improved the user experience even further.
Price and Availability
The Dell Pro 13 Premium is now shipping directly from the manufacturer for $2340 USD when configured with the QHD+ touchscreen.
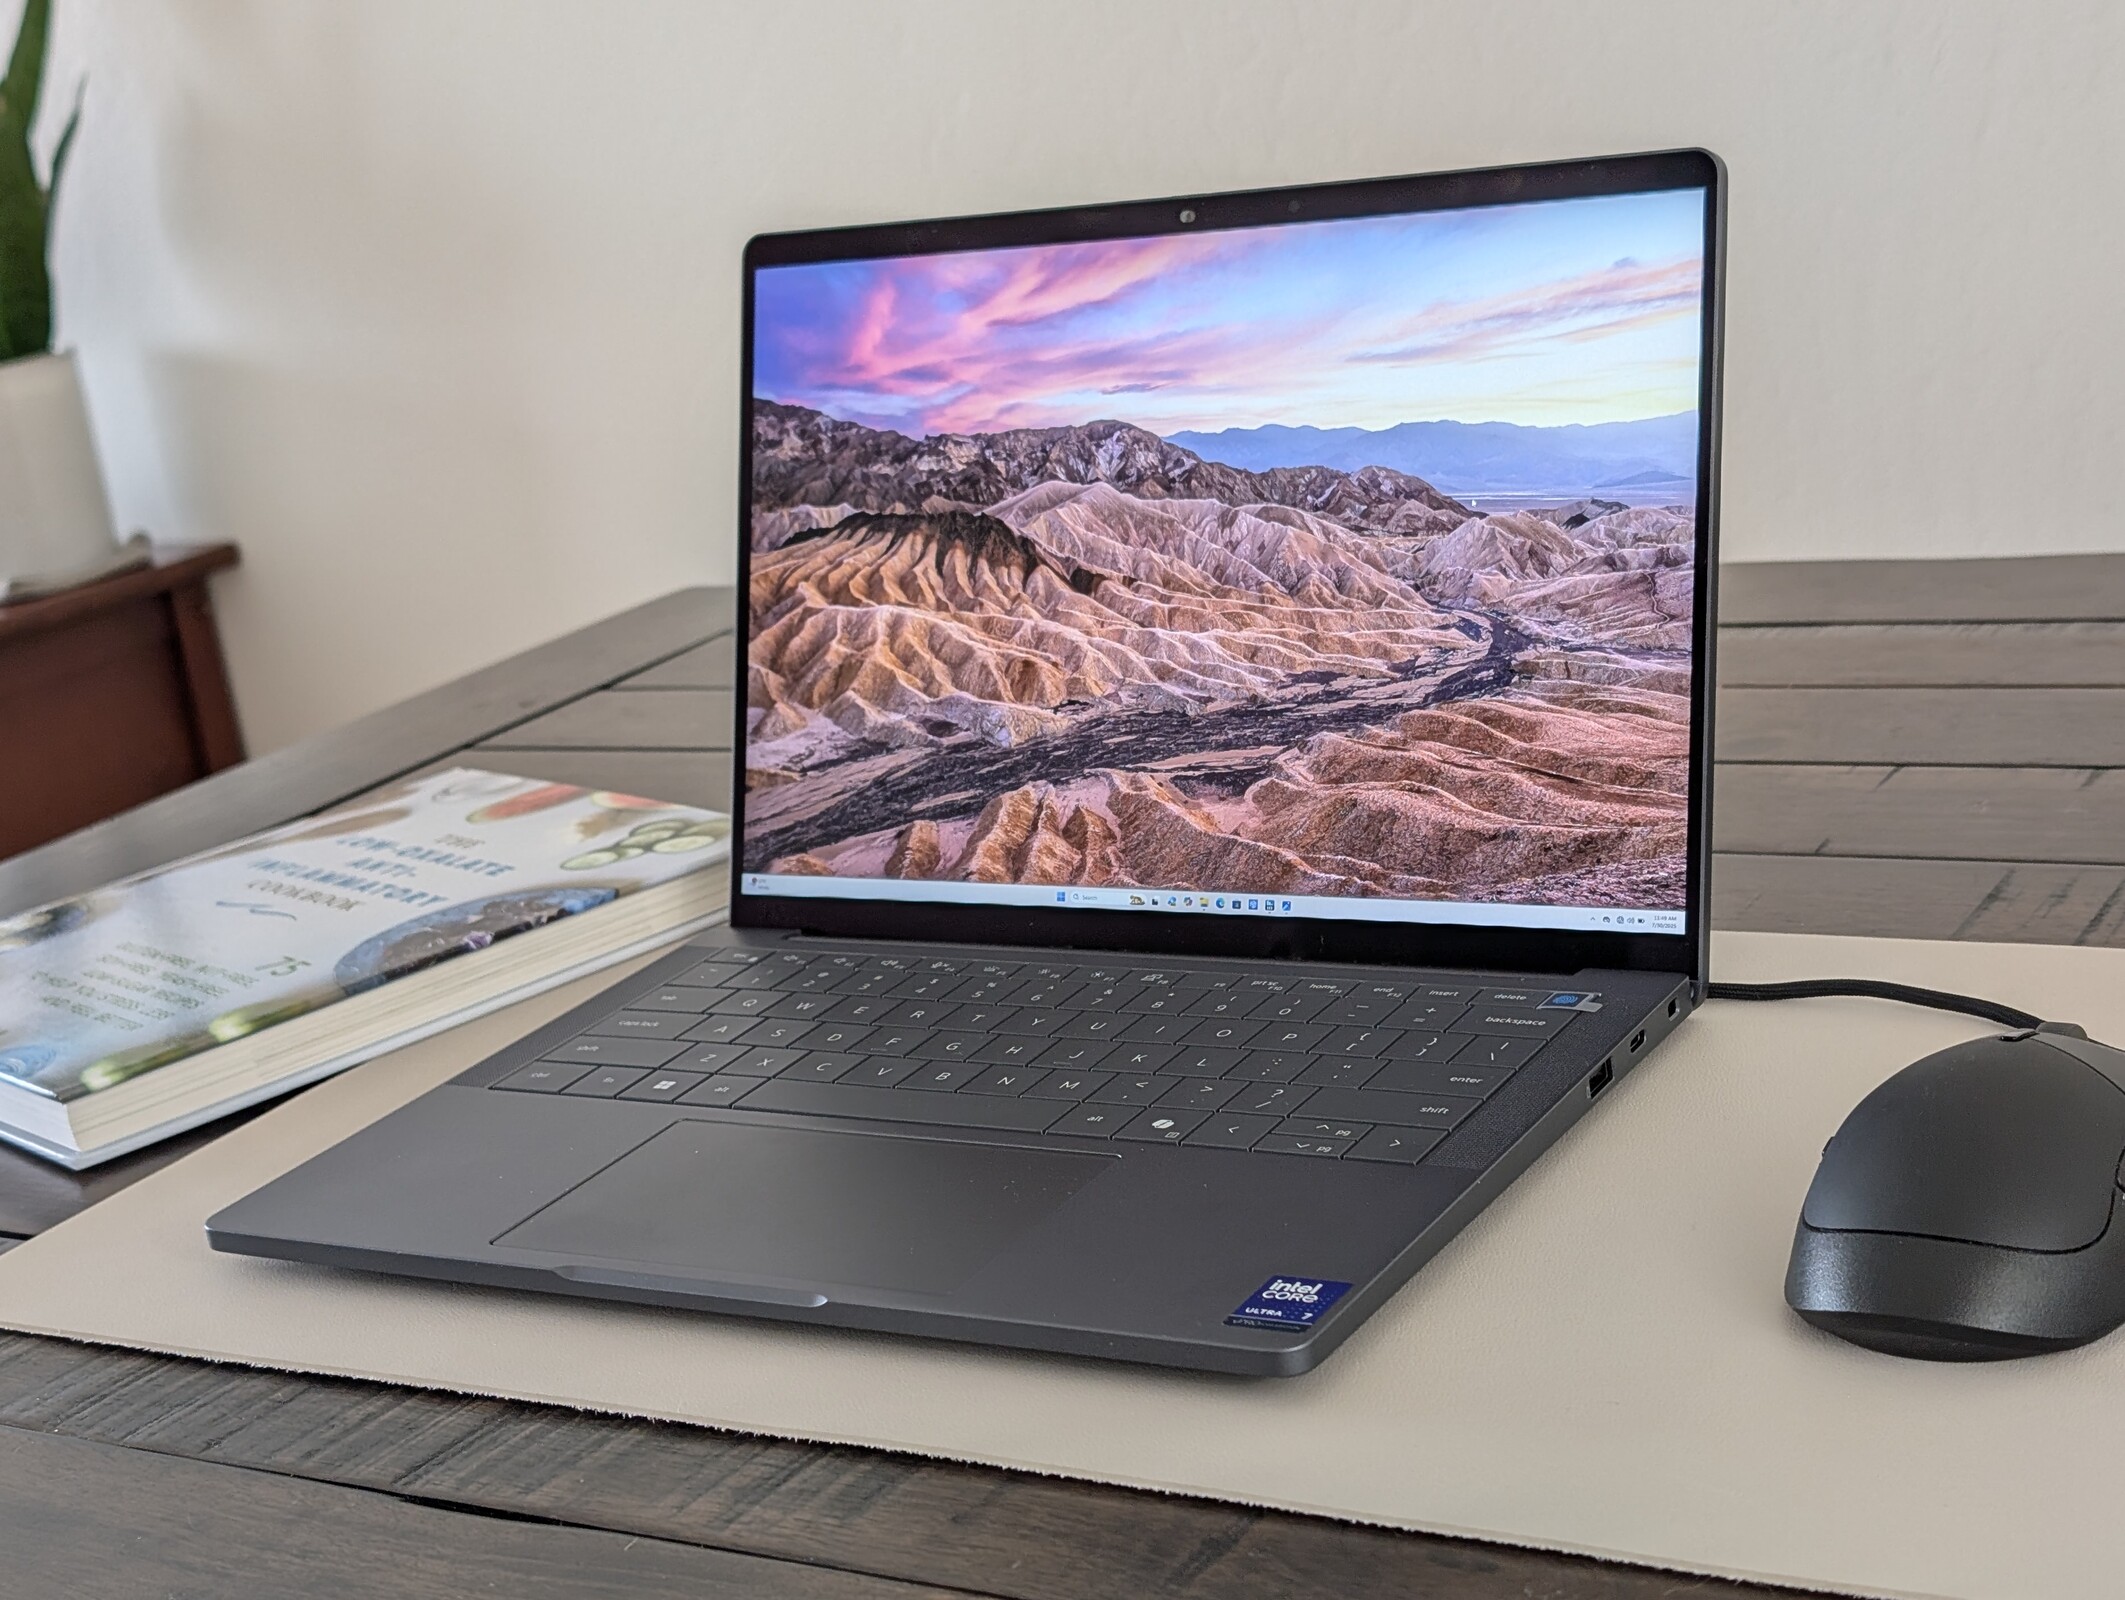
The 2025 Dell Pro 13 Premium succeeds last year's Latitude 7000 or 9000 series. The model is currently available with FHD+ (1200p) and QHD+ (1600p) display options. Readers can see our full review of the FHD+ configuration here for more benchmarks and information. This review page focuses on the QHD+ configuration which otherwise ships with the same Core Ultra 7 268V processor as our FHD+ test unit.
More Dell reviews:
Specifications
Display
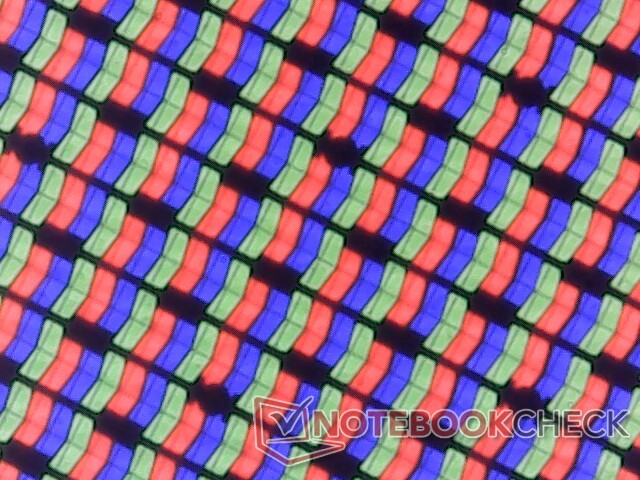
Whereas the FHD+ non-touch configuration ships with an AU Optronics panel, our QHD+ touch configuration ships with a panel from BOE instead. This higher resolution option offers both slightly faster response times and a slightly brighter backlight while being nearly identical in terms of color reproduction and contrast ratio as shown by our table below.
Keep in mind that both the FHD+ and QHD+ options are IPS only with no OLED options. HDR and P3 gamut support are therefore weaker when compared to OLED PCs like the MSI Prestige 13 AI Plus Evo or the Microsoft Surface Pro.
| |||||||||||||||||||||||||
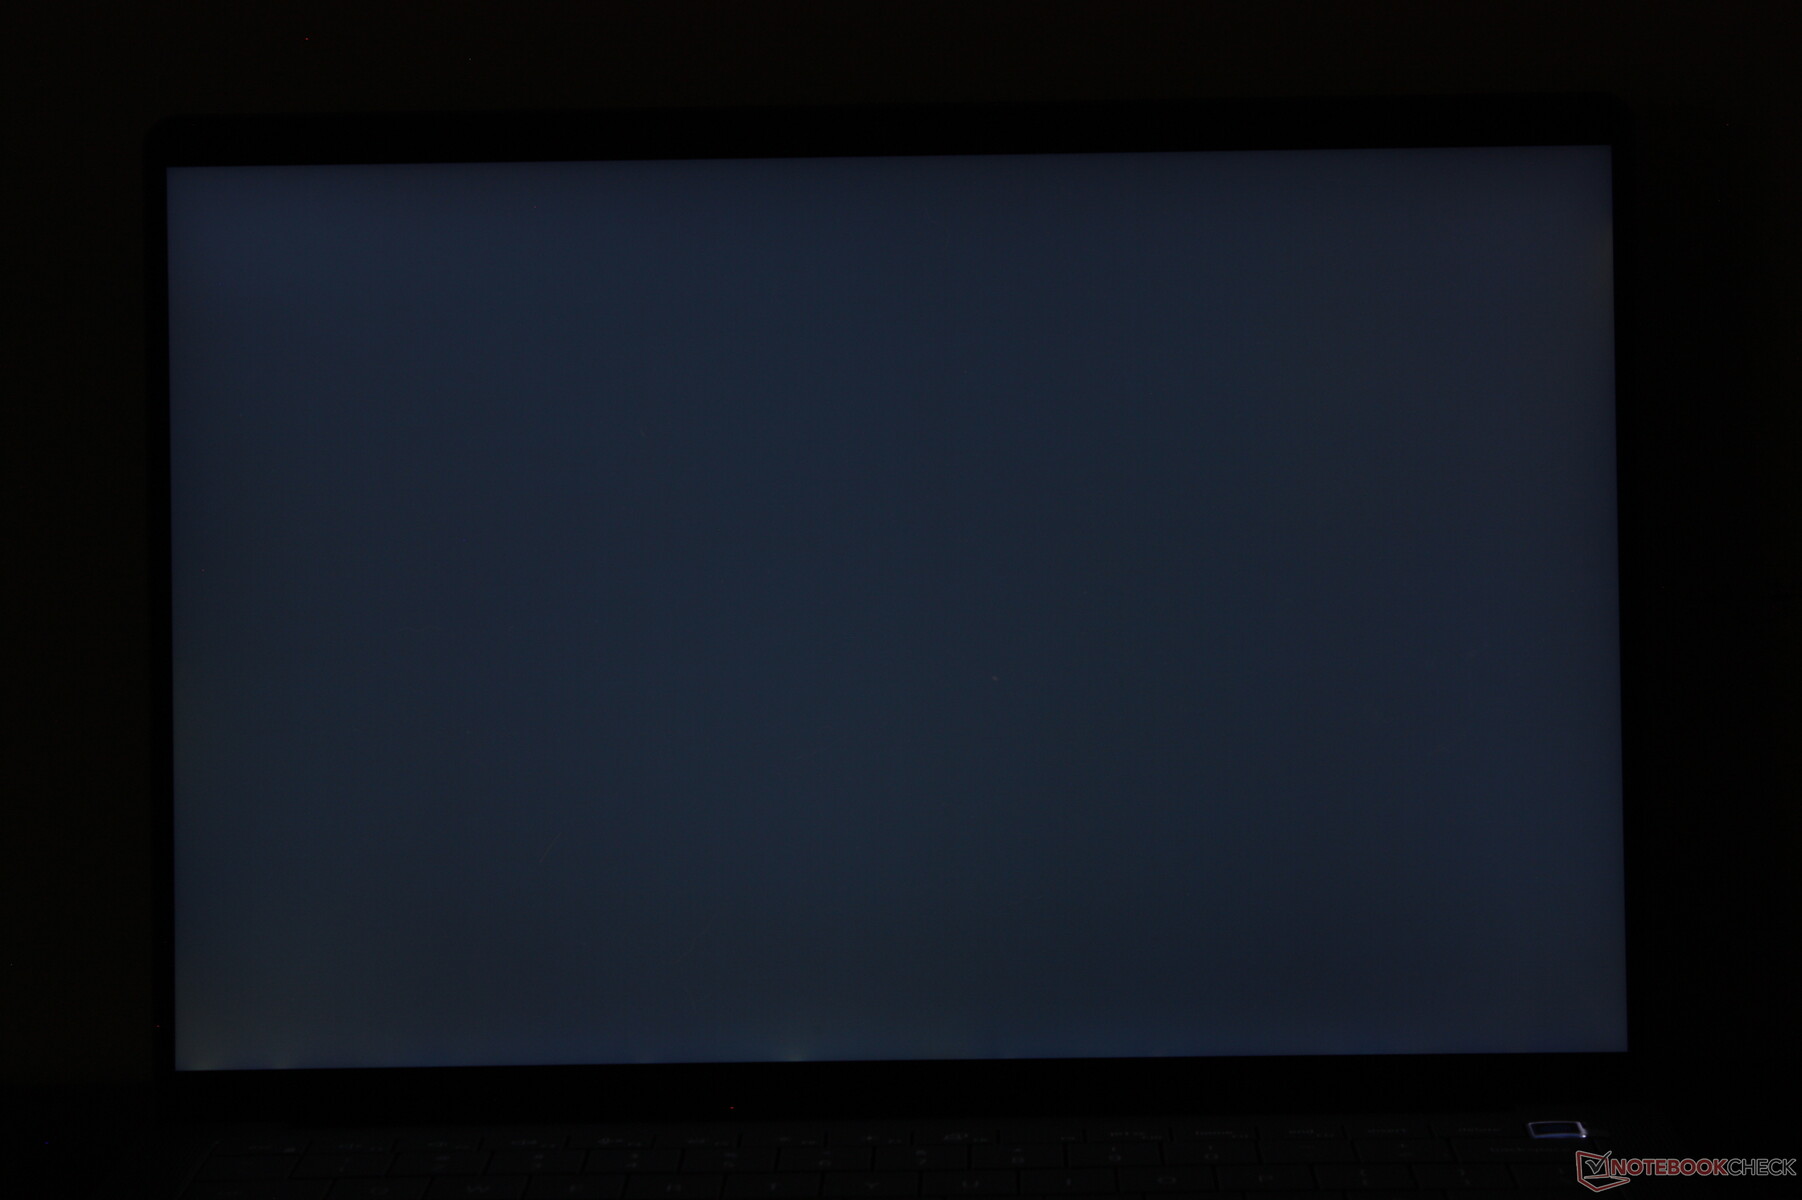
Brightness Distribution: 88 %
Center on Battery: 527.9 cd/m²
Contrast: 1703:1 (Black: 0.31 cd/m²)
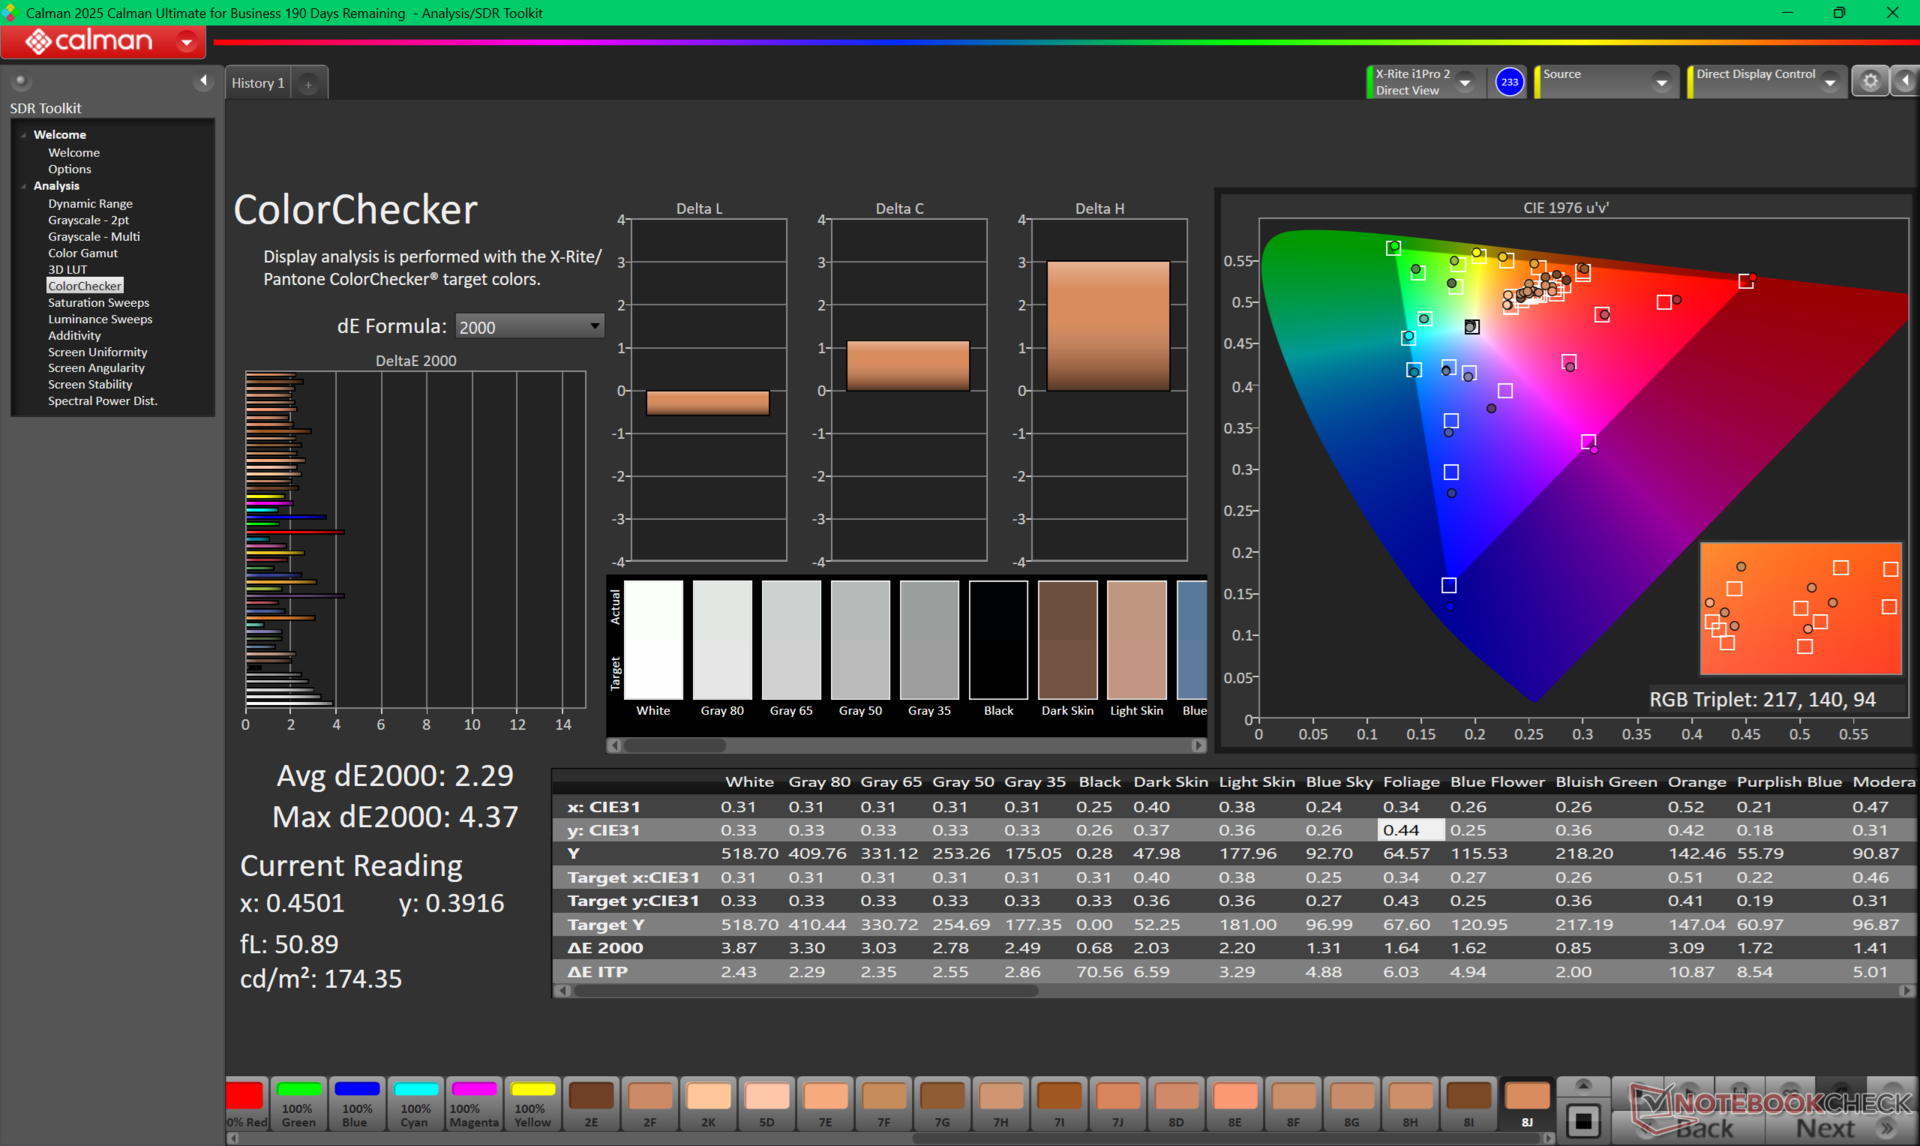
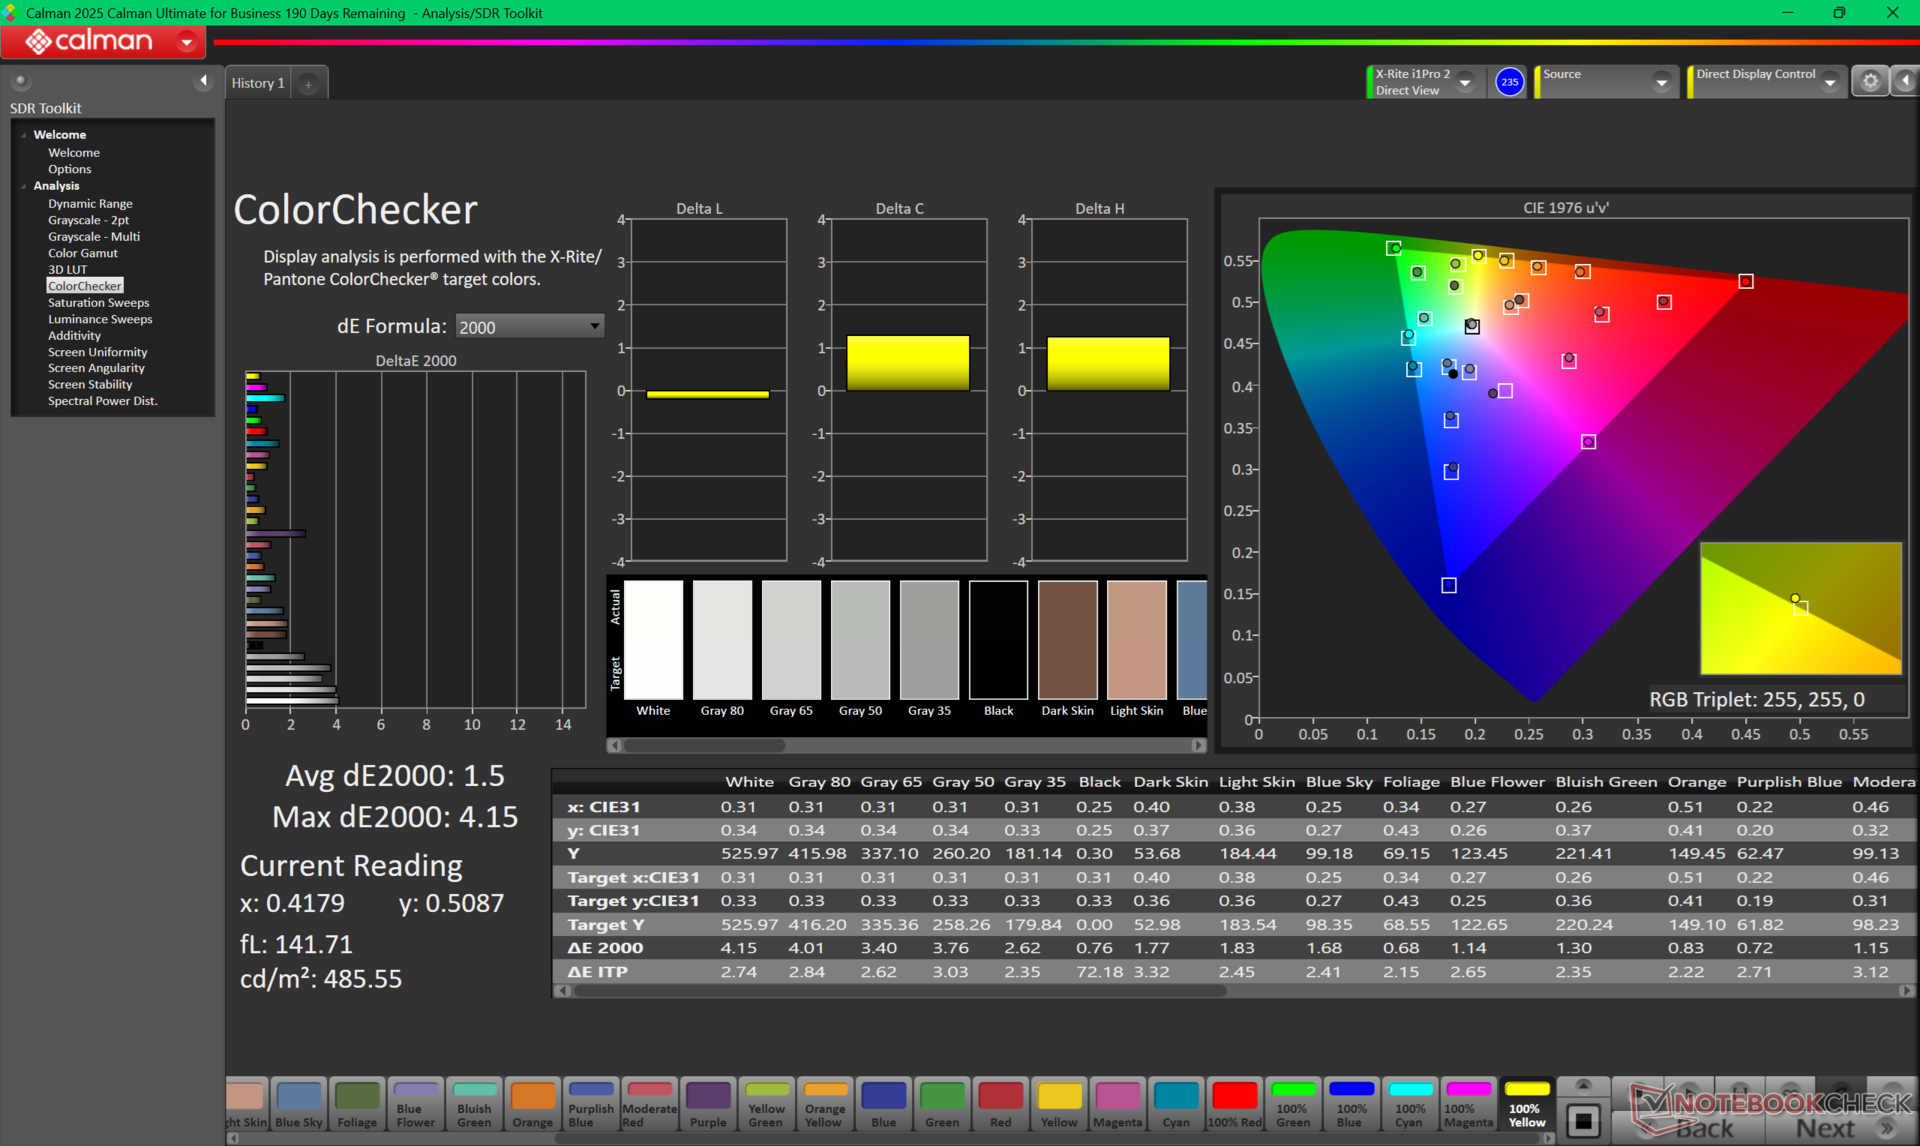
ΔE ColorChecker Calman: 2.29 | ∀{0.5-29.43 Ø4.73}
calibrated: 1.5
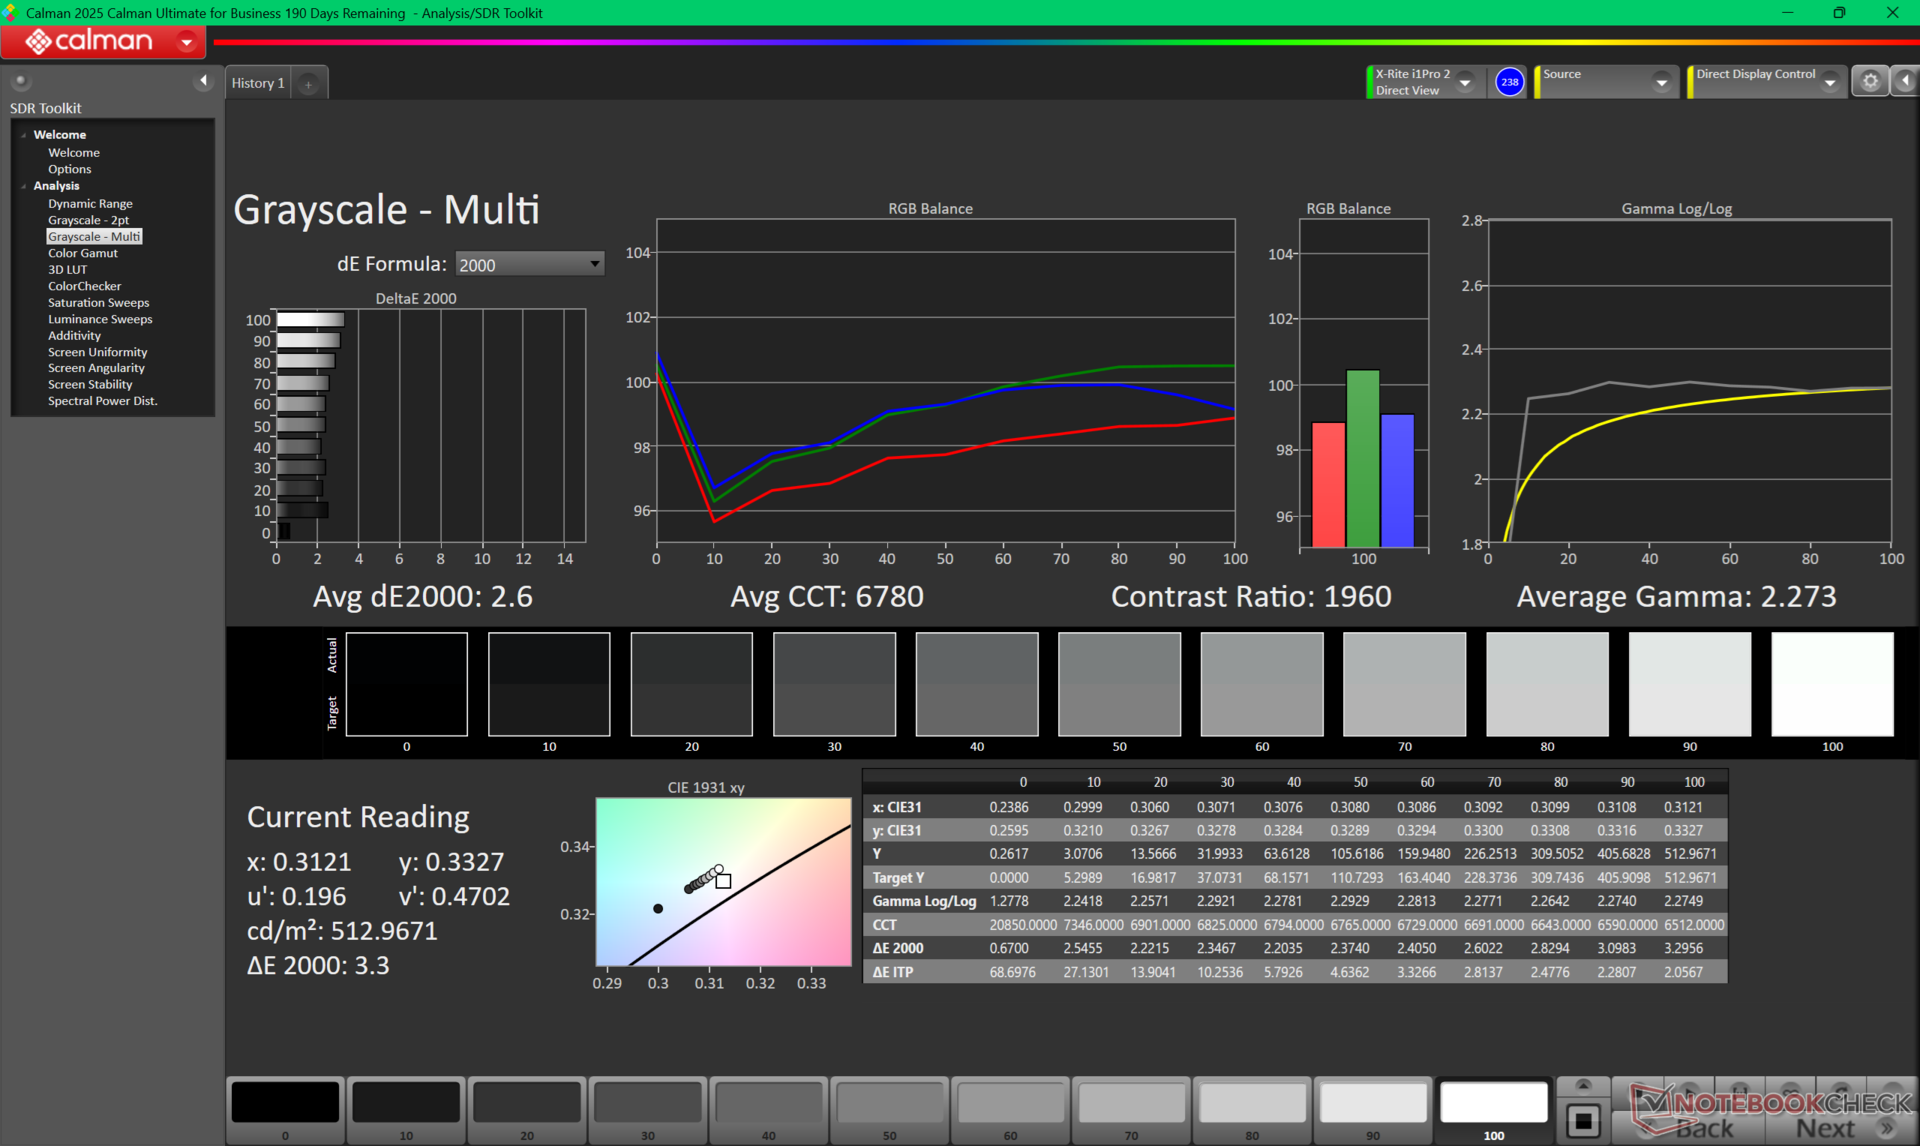
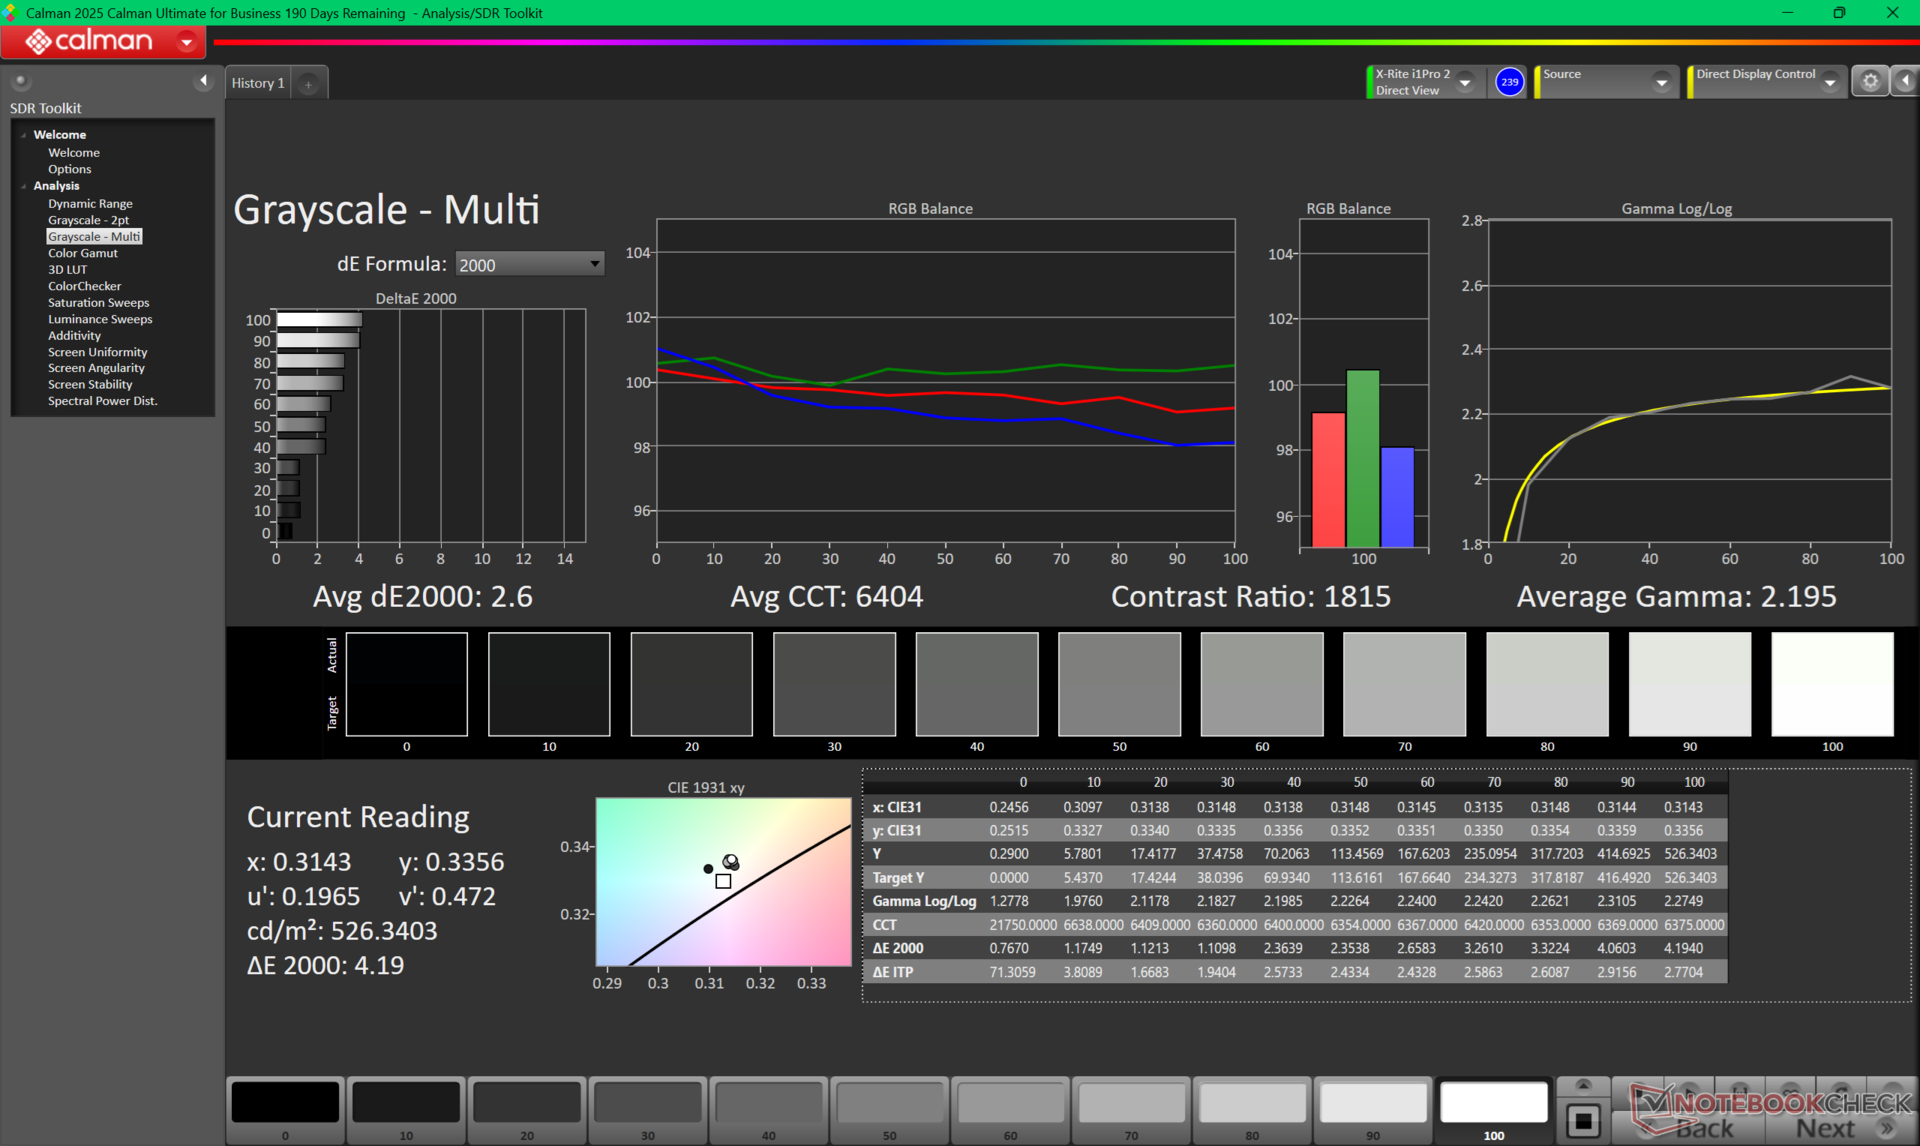
ΔE Greyscale Calman: 2.6 | ∀{0.09-98 Ø4.97}
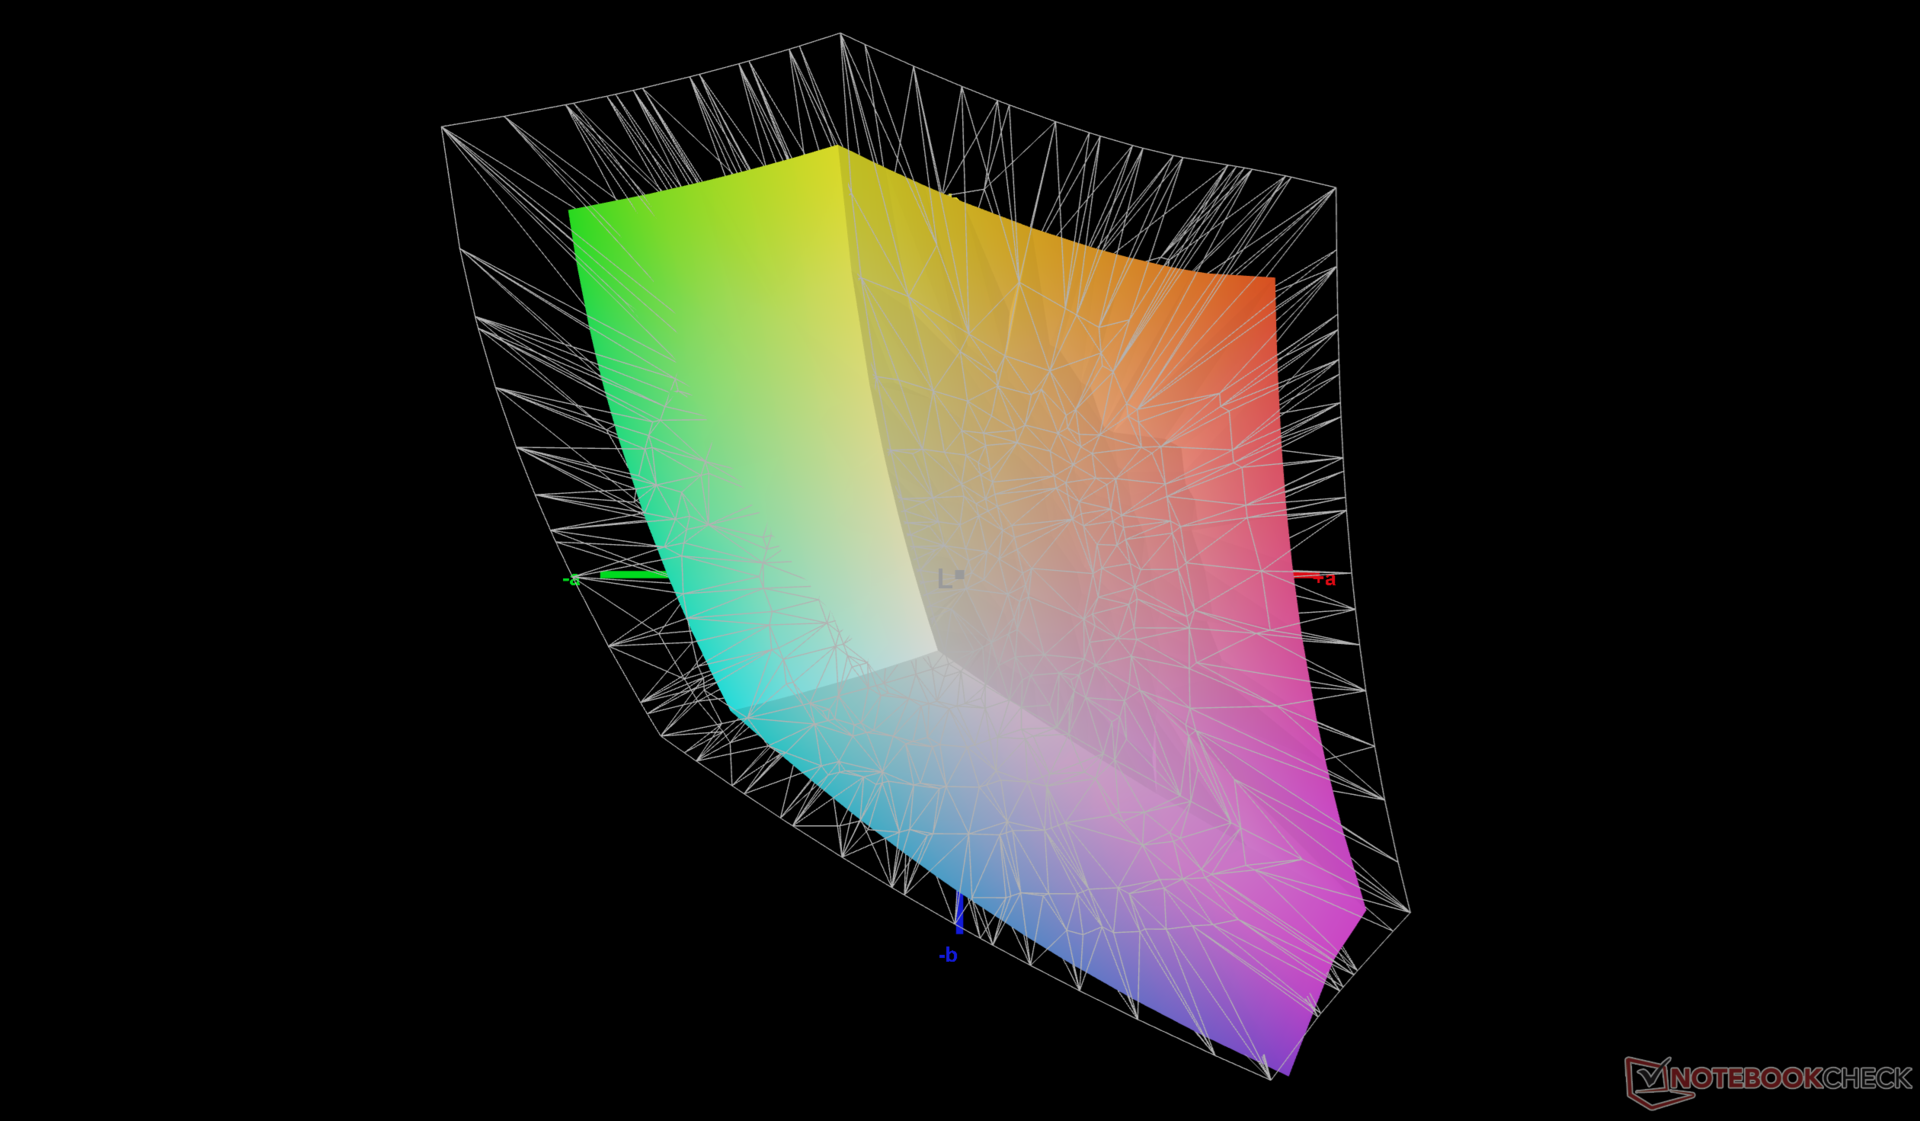
69.5% AdobeRGB 1998 (Argyll 3D)
97% sRGB (Argyll 3D)
69.3% Display P3 (Argyll 3D)
Gamma: 2.27
CCT: 6780 K
| Dell Pro 13 Premium 1600p BOE NS13QDM, IPS, 2560x1600, 13.3", 60 Hz | Dell Pro 13 Premium PA13250 B133UAN (AUOBEB0), IPS, 1920x1200, 13.3", 60 Hz | Framework Laptop 13.5 Ryzen AI 9 HX 370 BOE NE135A1M-NY1, IPS, 2880x1920, 13.5", 120 Hz | Microsoft Surface Pro OLED Lunar Lake ATNA30DW02-0, OLED, 2880x1920, 13", 120 Hz | MSI Prestige 13 AI Plus Evo A2VMG ATNA33AA07-0, OLED, 2880x1800, 13.3", 60 Hz | Lenovo ThinkPad X13 Gen 4 21J3001VGE R133NW4K R0, IPS LED, 1920x1200, 13.3", 60 Hz | HP EliteBook x360 830 G10 7L7U1ET LGD06E5, IPS LED, 1920x1200, 13.3", Hz | |
|---|---|---|---|---|---|---|---|
| Display | 6% | 2% | 25% | 28% | -4% | -6% | |
| Display P3 Coverage (%) | 69.3 | 74.3 7% | 71.9 4% | 99.5 44% | 99.9 44% | 65.3 -6% | 63.2 -9% |
| sRGB Coverage (%) | 97 | 99.1 2% | 95.9 -1% | 100 3% | 100 3% | 96.1 -1% | 92.7 -4% |
| AdobeRGB 1998 Coverage (%) | 69.5 | 75.9 9% | 70.8 2% | 89.7 29% | 95.8 38% | 66.8 -4% | 65.1 -6% |
| Response Times | -29% | -3% | 99% | 93% | -29% | -13% | |
| Response Time Grey 50% / Grey 80% * (ms) | 37.5 ? | 52.8 ? -41% | 40 ? -7% | 0.43 ? 99% | 1.94 ? 95% | 48.9 ? -30% | 39.8 ? -6% |
| Response Time Black / White * (ms) | 22.6 ? | 26.4 ? -17% | 22.3 ? 1% | 0.54 ? 98% | 2.02 ? 91% | 28.6 ? -27% | 26.8 ? -19% |
| PWM Frequency (Hz) | 480 ? | 60 ? | |||||
| PWM Amplitude * (%) | 25 | 21.9 | |||||
| Screen | -17% | -52% | 37% | -2% | -26% | -37% | |
| Brightness middle (cd/m²) | 527.9 | 456 -14% | 529.9 0% | 574 9% | 382.4 -28% | 373 -29% | 394 -25% |
| Brightness (cd/m²) | 500 | 460 -8% | 506 1% | 578 16% | 383 -23% | 354 -29% | 372 -26% |
| Brightness Distribution (%) | 88 | 89 1% | 94 7% | 99 13% | 99 13% | 86 -2% | 84 -5% |
| Black Level * (cd/m²) | 0.31 | 0.23 26% | 0.3 3% | 0.28 10% | 0.17 45% | ||
| Contrast (:1) | 1703 | 1983 16% | 1766 4% | 1332 -22% | 2318 36% | ||
| Colorchecker dE 2000 * | 2.29 | 3.3 -44% | 5.7 -149% | 0.9 61% | 3.84 -68% | 3.1 -35% | 4.1 -79% |
| Colorchecker dE 2000 max. * | 4.37 | 6.47 -48% | 10.6 -143% | 2.3 47% | 6.66 -52% | 7 -60% | 8.3 -90% |
| Colorchecker dE 2000 calibrated * | 1.5 | 1.7 -13% | 1.5 -0% | 0.41 73% | 0.9 40% | ||
| Greyscale dE 2000 * | 2.6 | 4.35 -67% | 7.5 -188% | 0.6 77% | 0.7 73% | 5.4 -108% | 6.6 -154% |
| Gamma | 2.27 97% | 2.51 88% | 2.07 106% | 2.16 102% | 2.23 99% | 2.19 100% | 2.17 101% |
| CCT | 6780 96% | 6215 105% | 6967 93% | 6482 100% | 6475 100% | 6750 96% | 6019 108% |
| Total Average (Program / Settings) | -13% /
-14% | -18% /
-33% | 54% /
45% | 40% /
22% | -20% /
-22% | -19% /
-26% |
* ... smaller is better
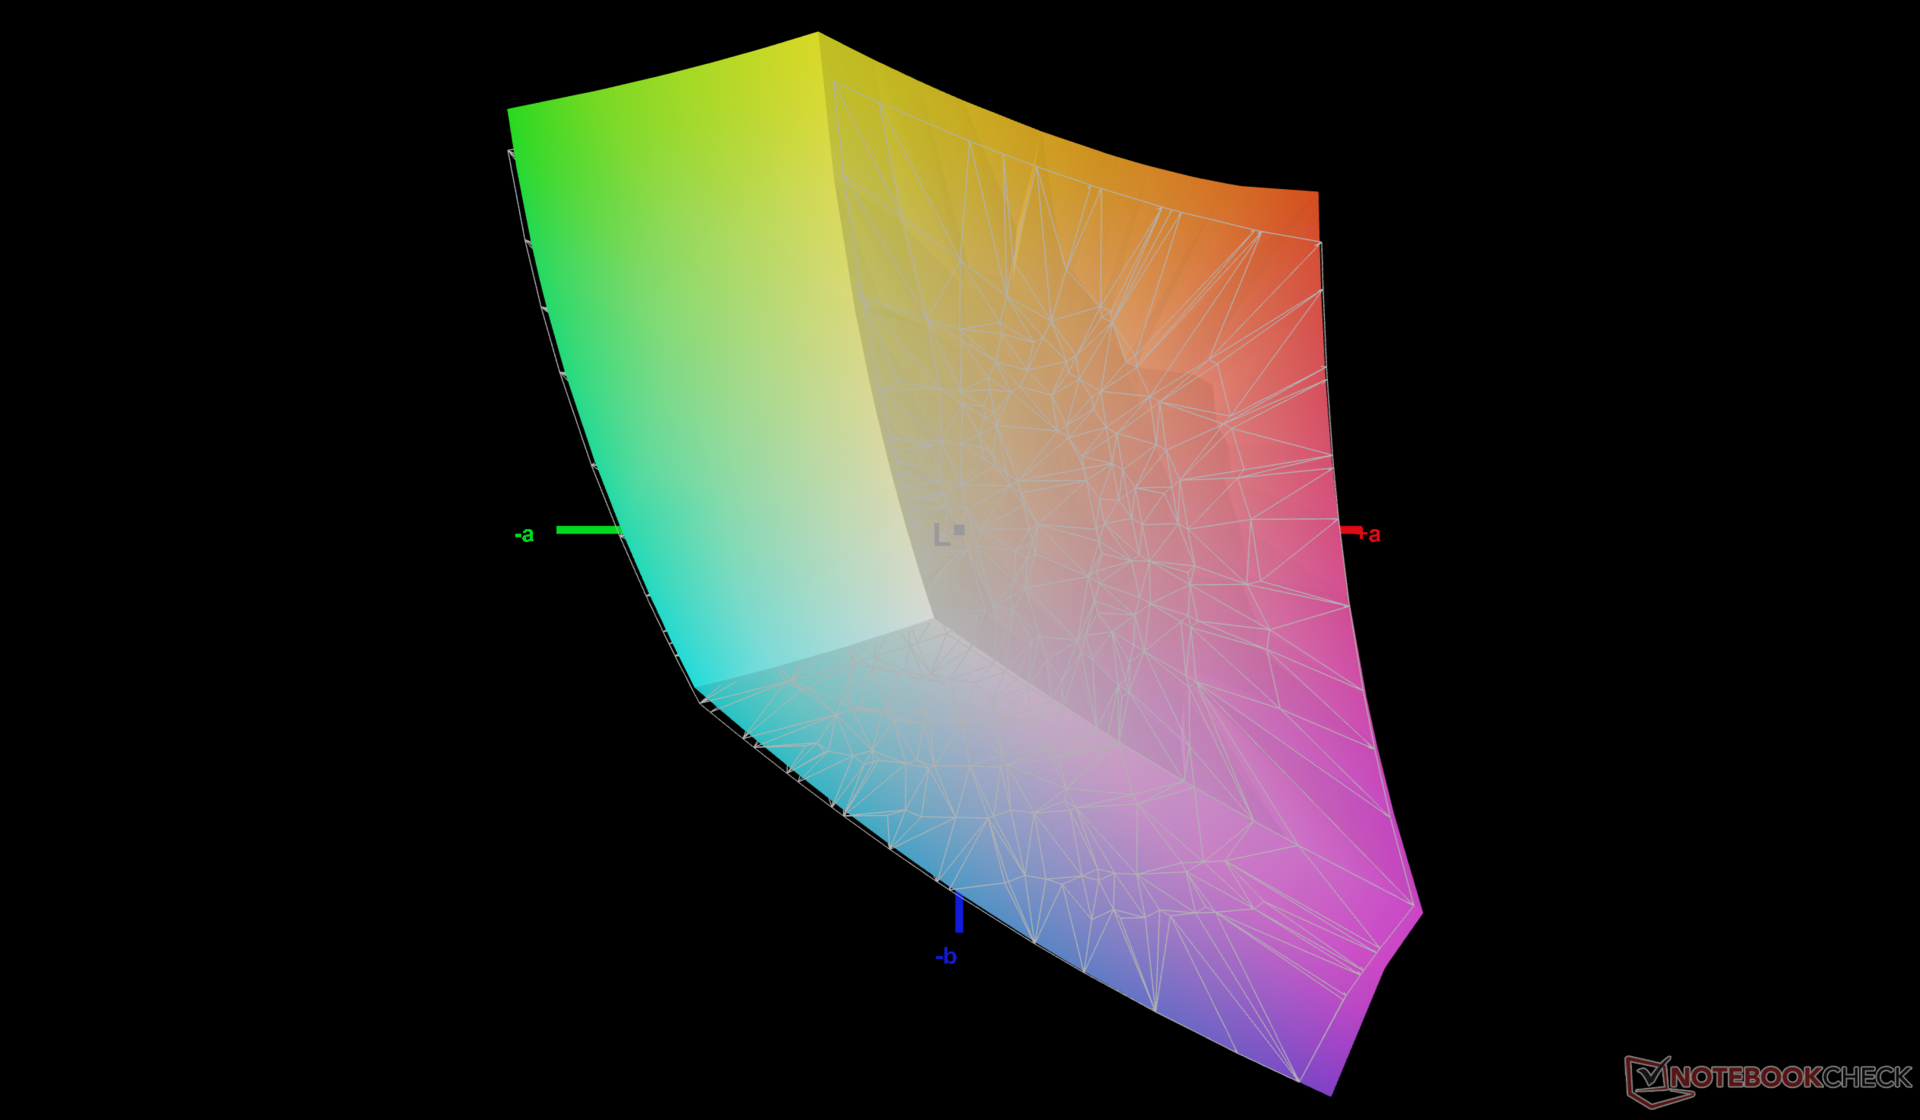
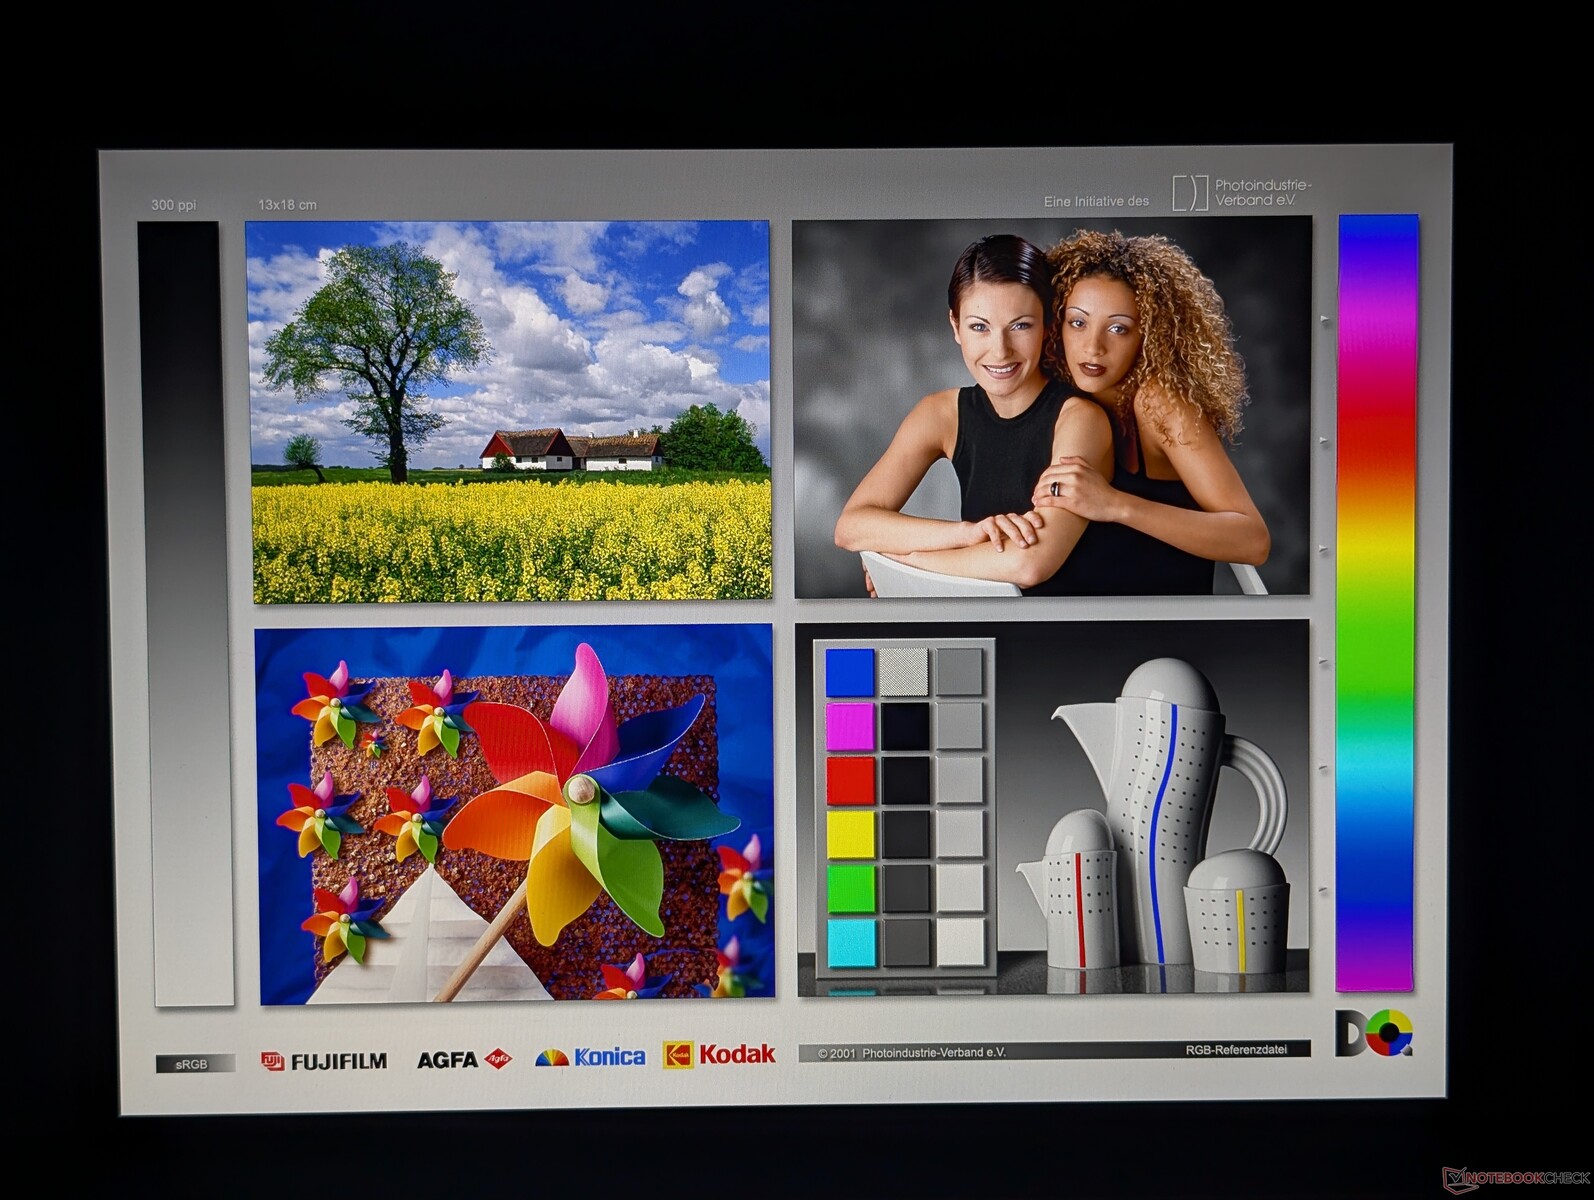
The display comes well-calibrated out of the box with relatively low average grayscale and color deltaE values of just 2.6 and 2.29, respectively.
Display Response Times
| ↔ Response Time Black to White | ||
|---|---|---|
| 22.6 ms ... rise ↗ and fall ↘ combined | ↗ 9.7 ms rise | 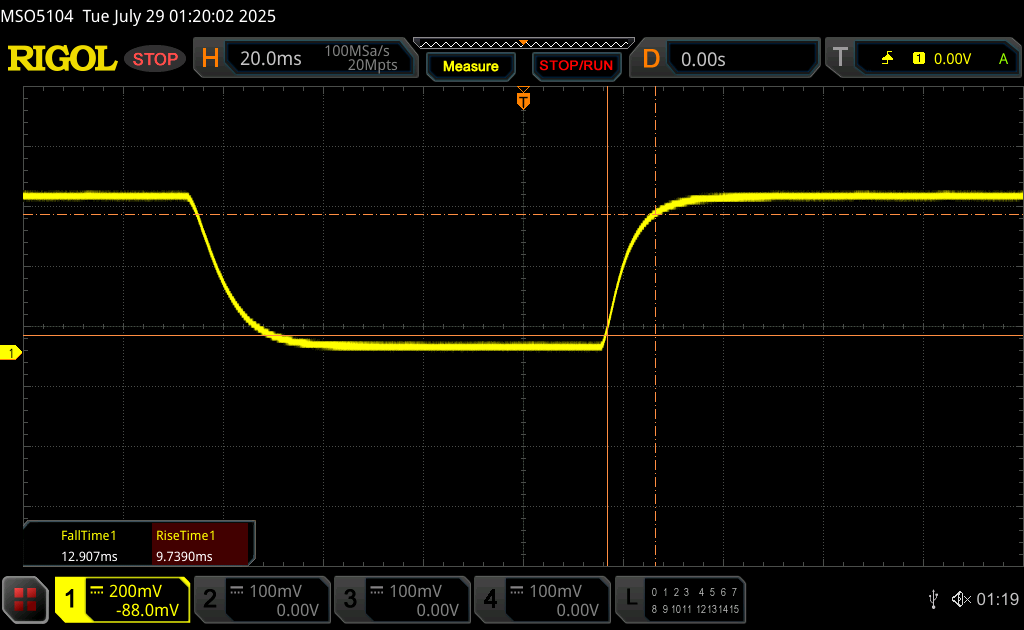 |
| ↘ 12.9 ms fall | ||
| The screen shows good response rates in our tests, but may be too slow for competitive gamers. In comparison, all tested devices range from 0.1 (minimum) to 240 (maximum) ms. » 51 % of all devices are better. This means that the measured response time is worse than the average of all tested devices (19.9 ms). | ||
| ↔ Response Time 50% Grey to 80% Grey | ||
| 37.5 ms ... rise ↗ and fall ↘ combined | ↗ 17.4 ms rise | 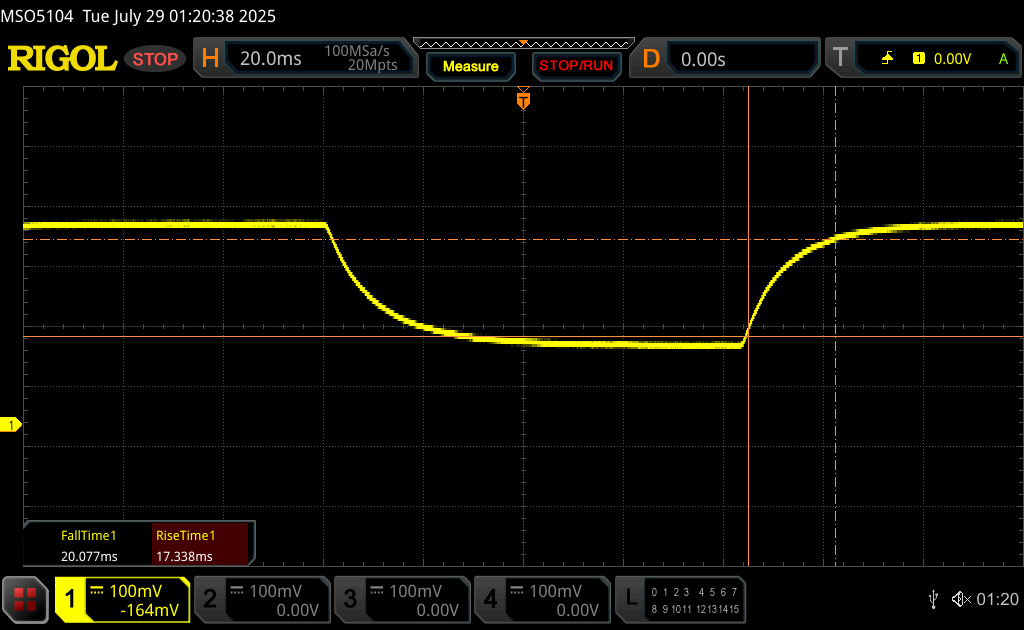 |
| ↘ 20.1 ms fall | ||
| The screen shows slow response rates in our tests and will be unsatisfactory for gamers. In comparison, all tested devices range from 0.165 (minimum) to 636 (maximum) ms. » 54 % of all devices are better. This means that the measured response time is worse than the average of all tested devices (31.1 ms). | ||
Screen Flickering / PWM (Pulse-Width Modulation)
| Screen flickering / PWM not detected | 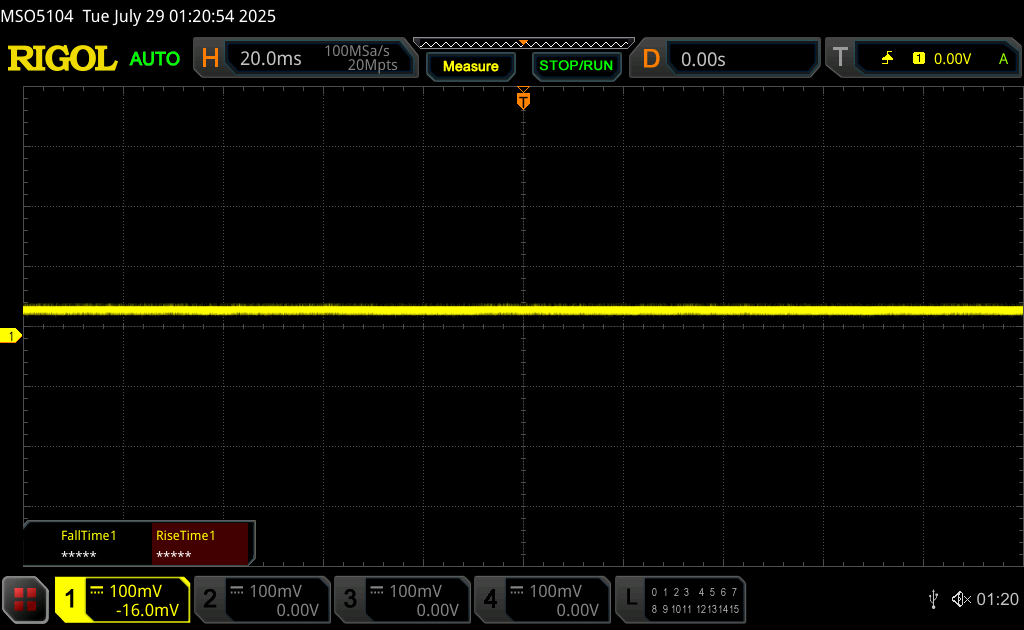 | ||
In comparison: 52 % of all tested devices do not use PWM to dim the display. If PWM was detected, an average of 7794 (minimum: 5 - maximum: 343500) Hz was measured. | |||
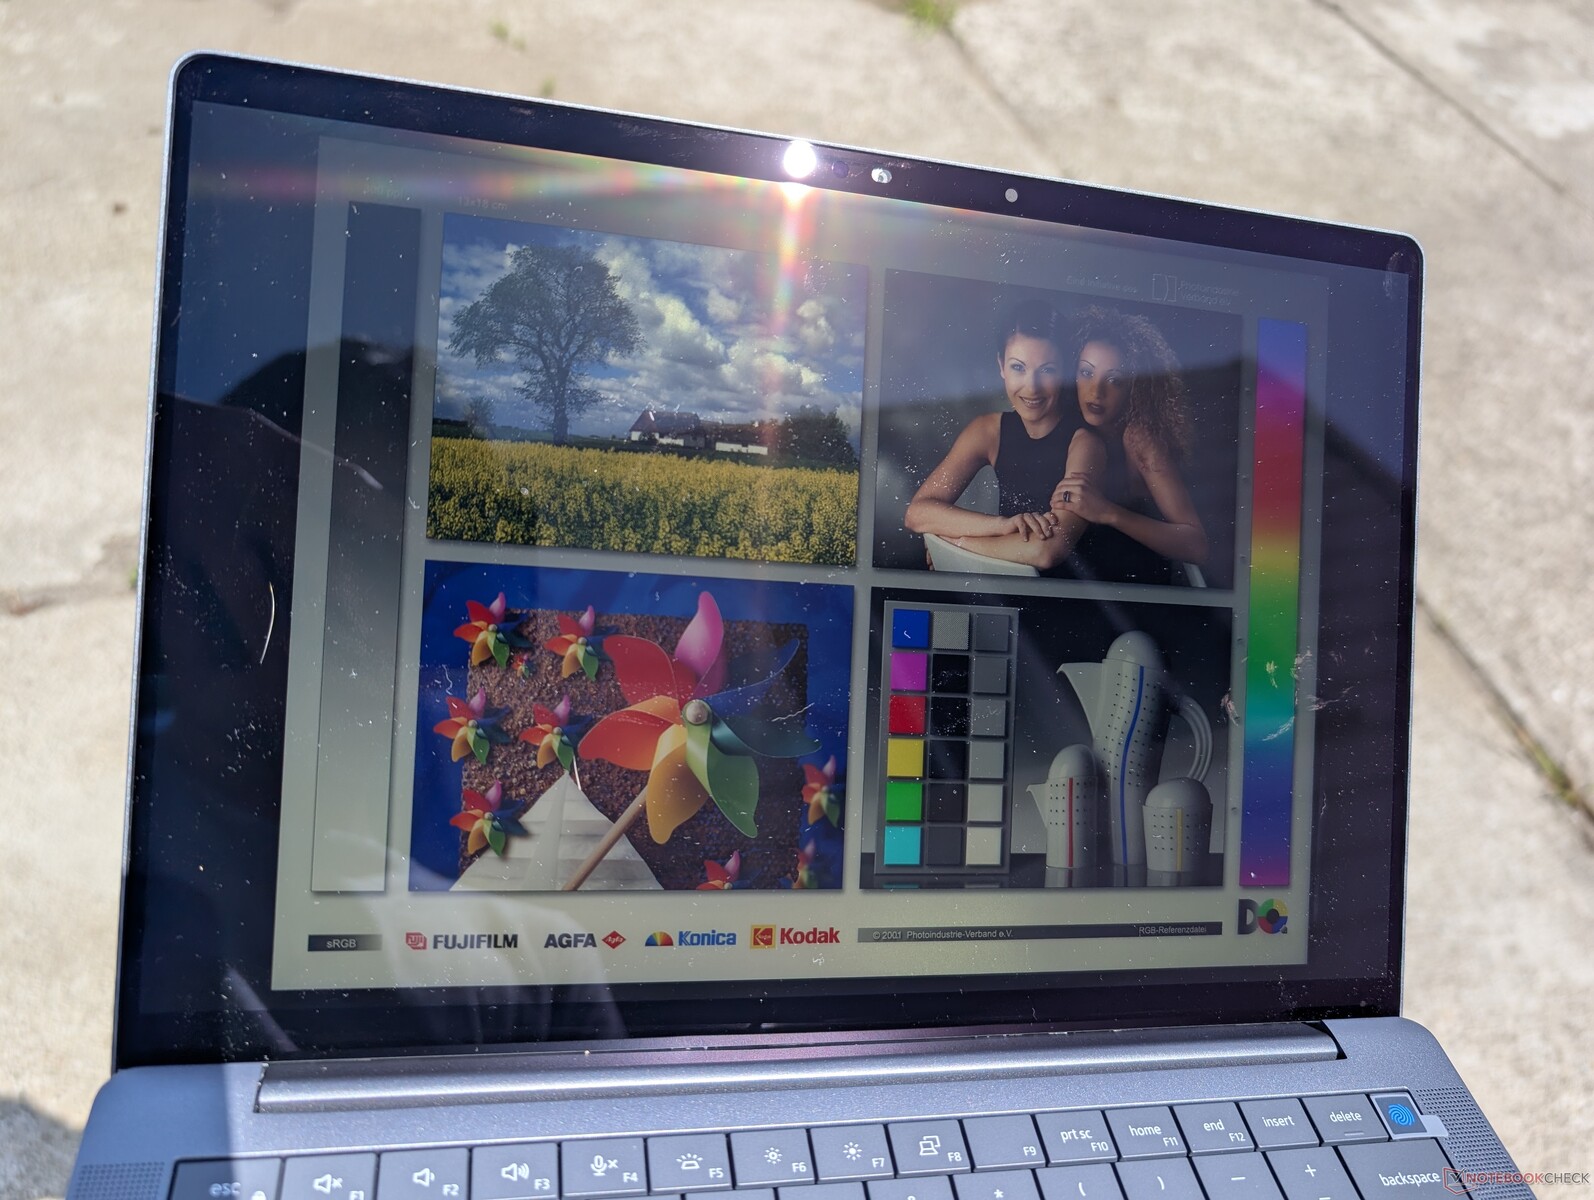
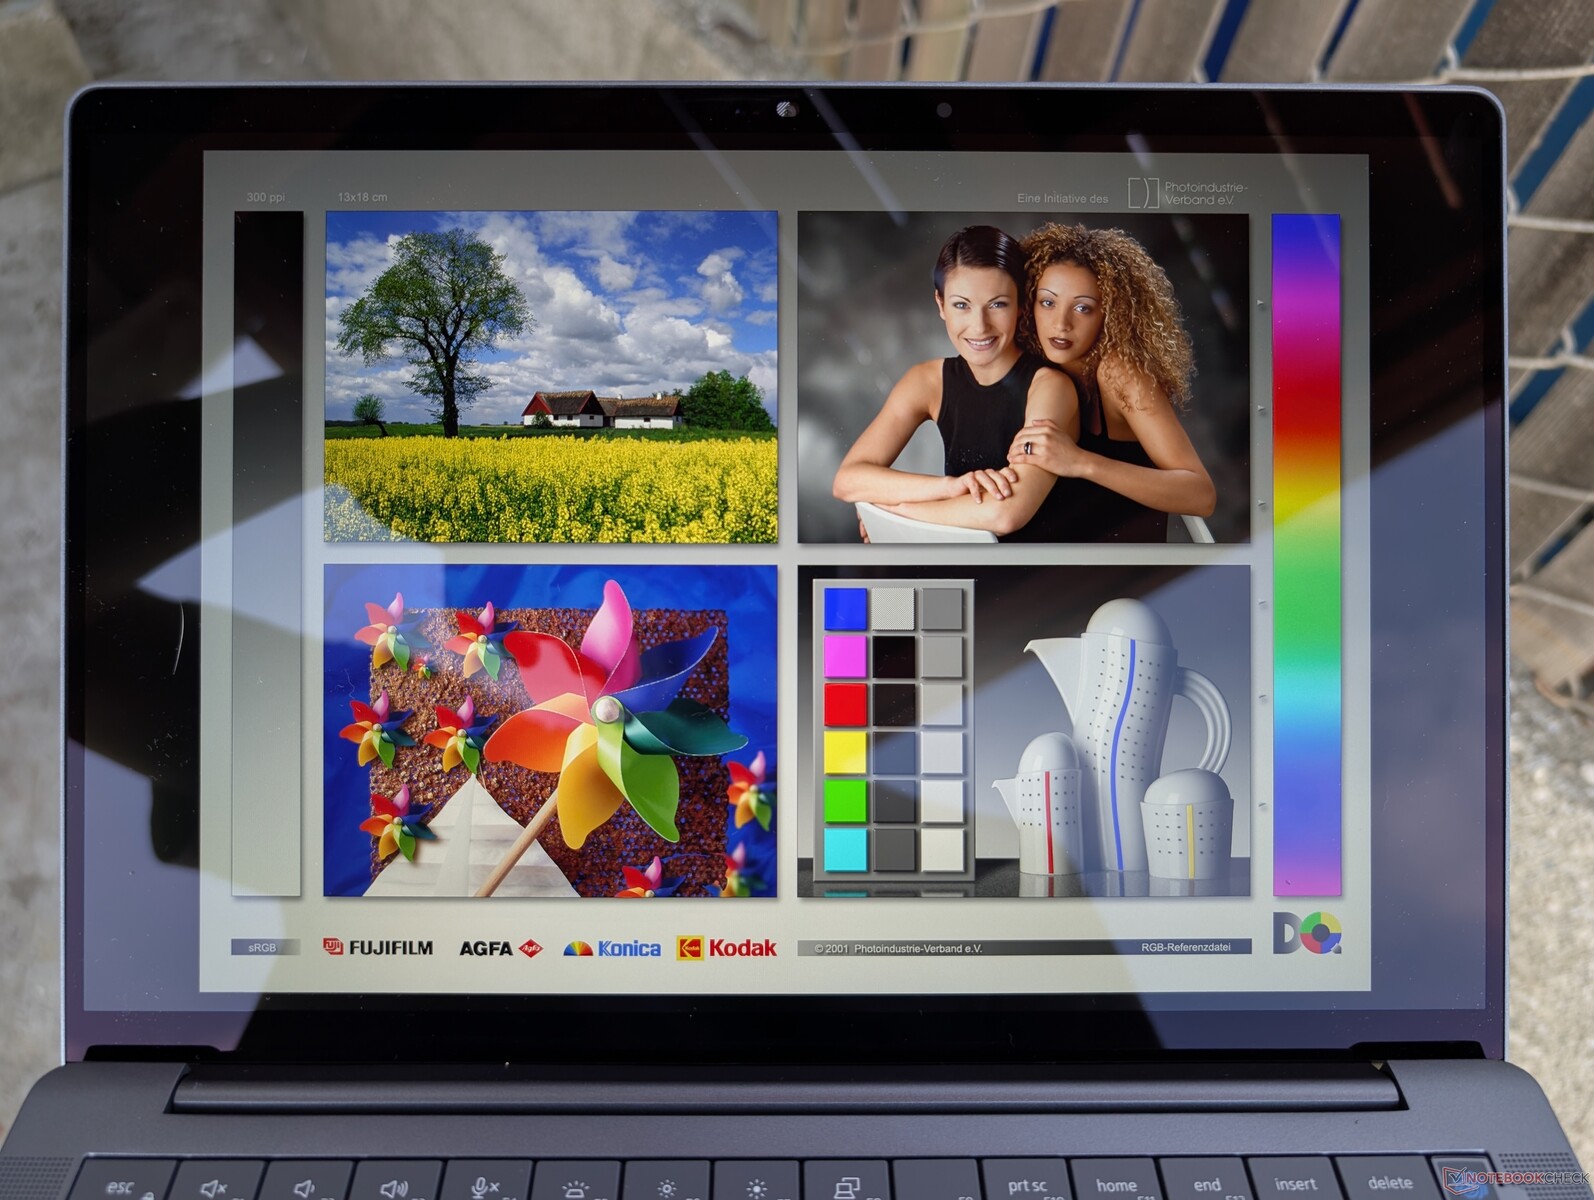
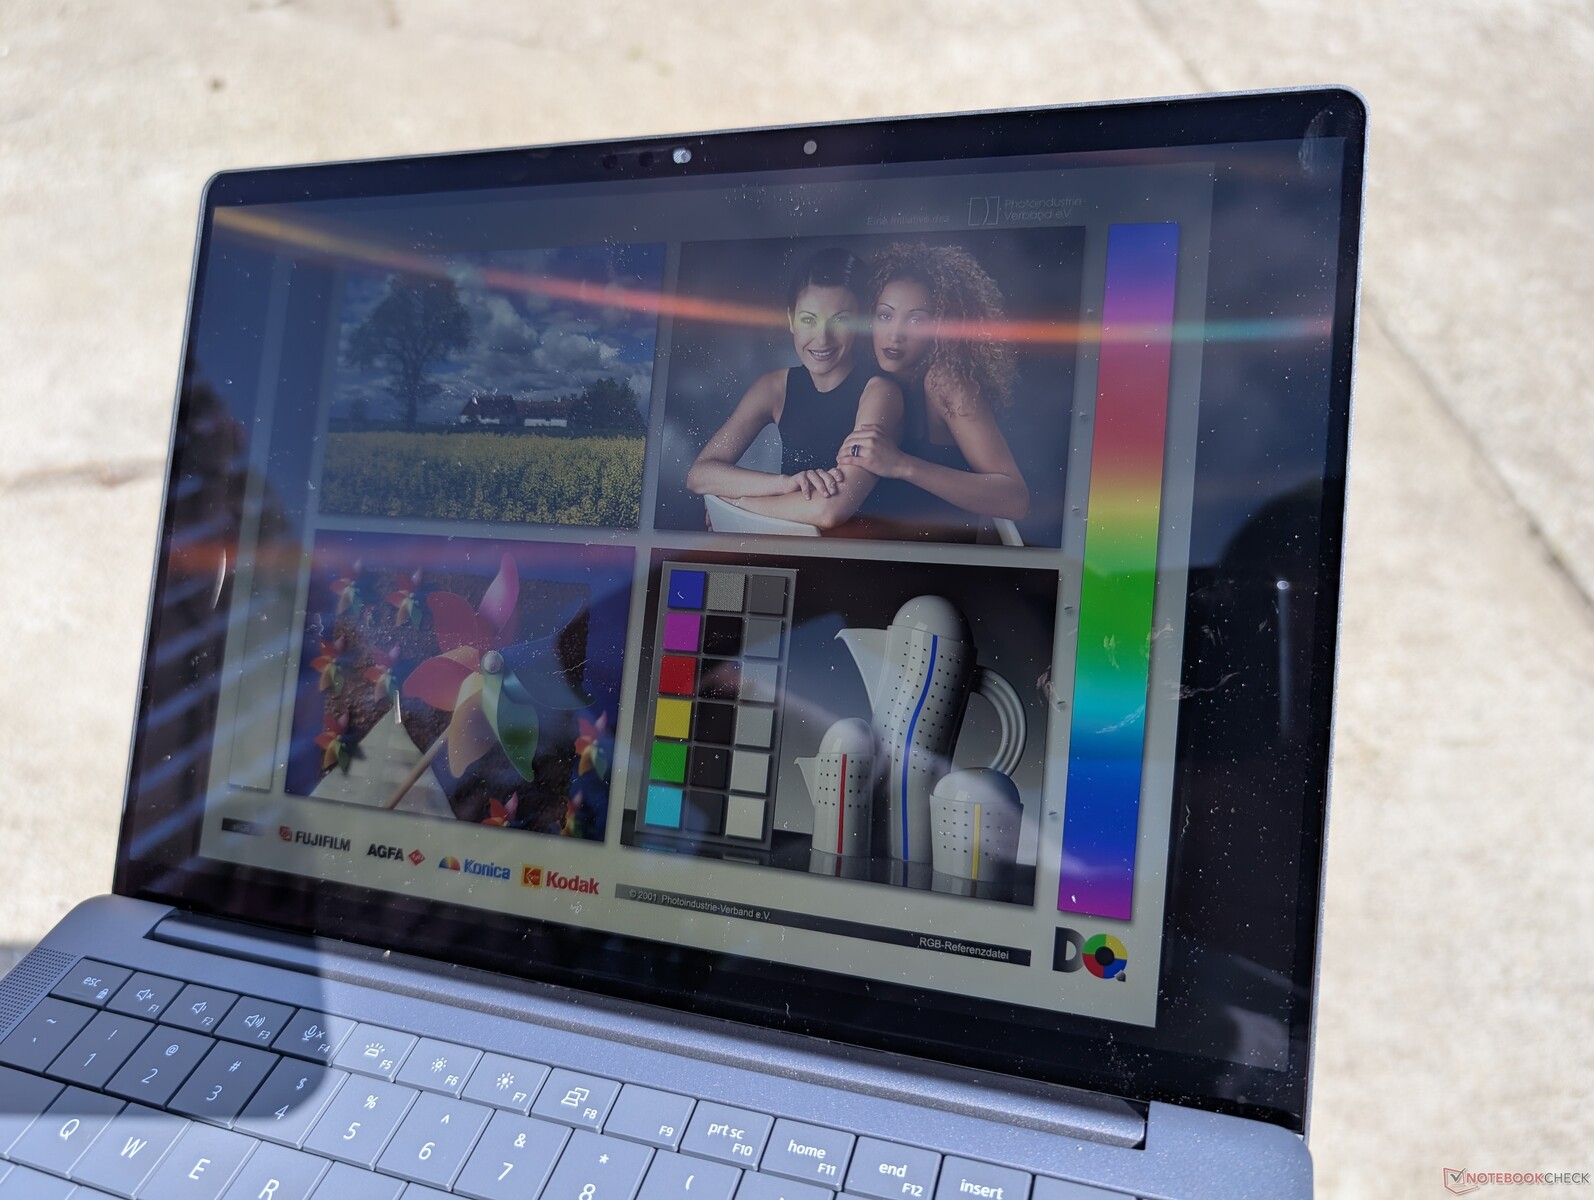
The QHD+ configuration is glossier than the FHD+ configuration and so glare is more noticeable under most ambient conditions. The display may be slightly brighter, but it's not enough to overcome the additional glare.


Energy Management
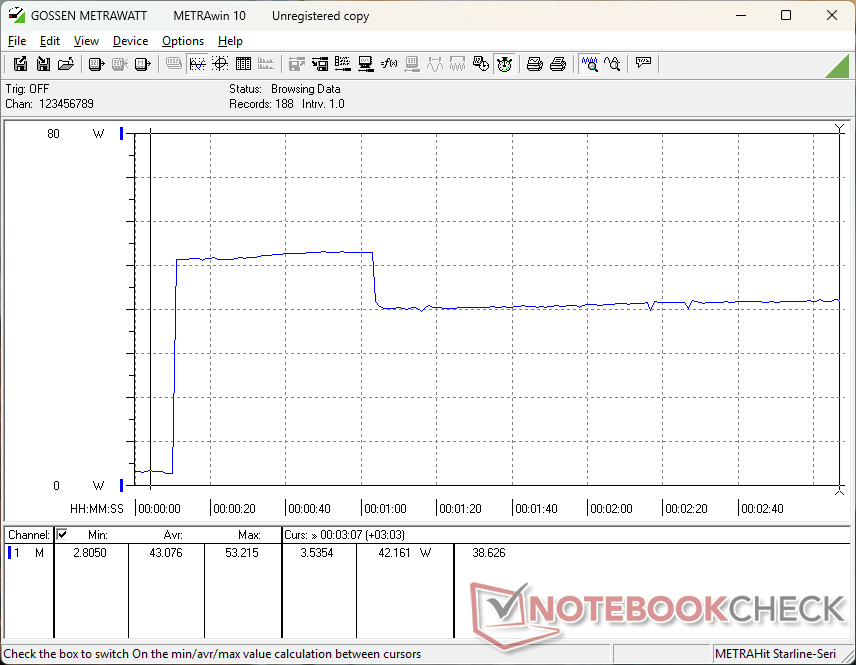
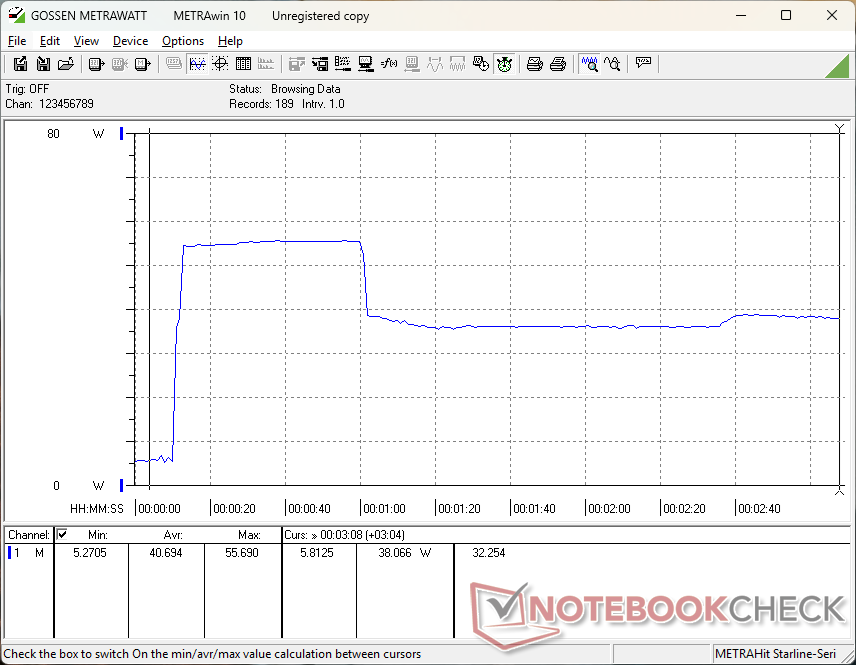
Power Consumption
The QHD+ configuration is slightly more demanding than the FHD+ configuration when idling on desktop as to be expected. However, the difference is quite marginal at just a couple of watts at most.
| Off / Standby | |
| Idle | |
| Load |
|
Key:
min: | |
| Dell Pro 13 Premium 1600p Core Ultra 7 268V, Arc 140V, , IPS, 2560x1600, 13.3" | Dell Pro 13 Premium PA13250 Core Ultra 7 268V, Arc 140V, Micron 2550 1TB, IPS, 1920x1200, 13.3" | Framework Laptop 13.5 Ryzen AI 9 HX 370 Ryzen AI 9 HX 370, Radeon 890M, , IPS, 2880x1920, 13.5" | Microsoft Surface Pro OLED Lunar Lake Core Ultra 7 268V, Arc 140V, Kioxia BG6 KBG60ZNS1T02, OLED, 2880x1920, 13" | MSI Prestige 13 AI Plus Evo A2VMG Core Ultra 7 258V, Arc 140V, , OLED, 2880x1800, 13.3" | Lenovo ThinkPad X13 Gen 4 21J3001VGE R7 PRO 7840U, Radeon 780M, Samsung PM9B1 512GB MZVL4512HBLU, IPS LED, 1920x1200, 13.3" | HP EliteBook x360 830 G10 7L7U1ET i5-1335U, Iris Xe G7 80EUs, Samsung PM991 MZVLQ512HBLU, IPS LED, 1920x1200, 13.3" | |
|---|---|---|---|---|---|---|---|
| Power Consumption | 4% | -87% | -17% | -31% | -3% | -28% | |
| Idle Minimum * (Watt) | 2.4 | 2 17% | 7.6 -217% | 4.5 -88% | 3.5 -46% | 3 -25% | 4.5 -88% |
| Idle Average * (Watt) | 4.8 | 4.3 10% | 11.3 -135% | 6 -25% | 5.9 -23% | 5.2 -8% | 6 -25% |
| Idle Maximum * (Watt) | 5.5 | 4.75 14% | 11.5 -109% | 6.7 -22% | 10 -82% | 6.5 -18% | 6.5 -18% |
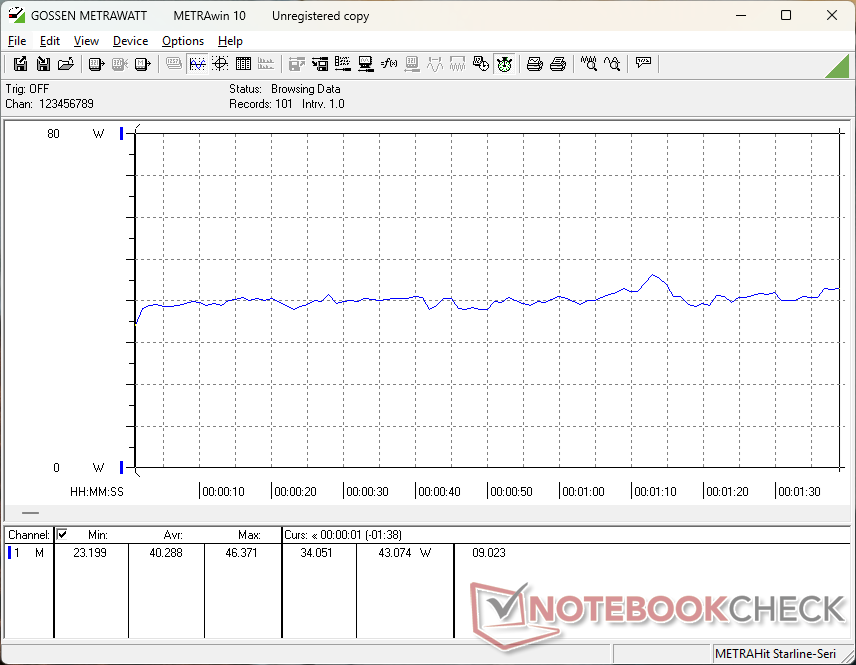
| Load Average * (Watt) | 40.3 | 40 1% | 54.7 -36% | 34.9 13% | 38.7 4% | 27 33% | 36.7 9% |
| Cyberpunk 2077 ultra external monitor * (Watt) | 34 | 38 -12% | 51.3 -51% | 39 -15% | 45.6 -34% | 36.8 -8% | |
| Cyberpunk 2077 ultra * (Watt) | 36.3 | 36.4 -0% | 54.6 -50% | 39.4 -9% | 46.3 -28% | 37.6 -4% | |
| Load Maximum * (Watt) | 55.7 | 57 -2% | 60.9 -9% | 41.6 25% | 61.5 -10% | 52.3 6% | 66.3 -19% |
| Witcher 3 ultra * (Watt) | 40.2 |
* ... smaller is better
Power Consumption Cyberpunk / Stress Test
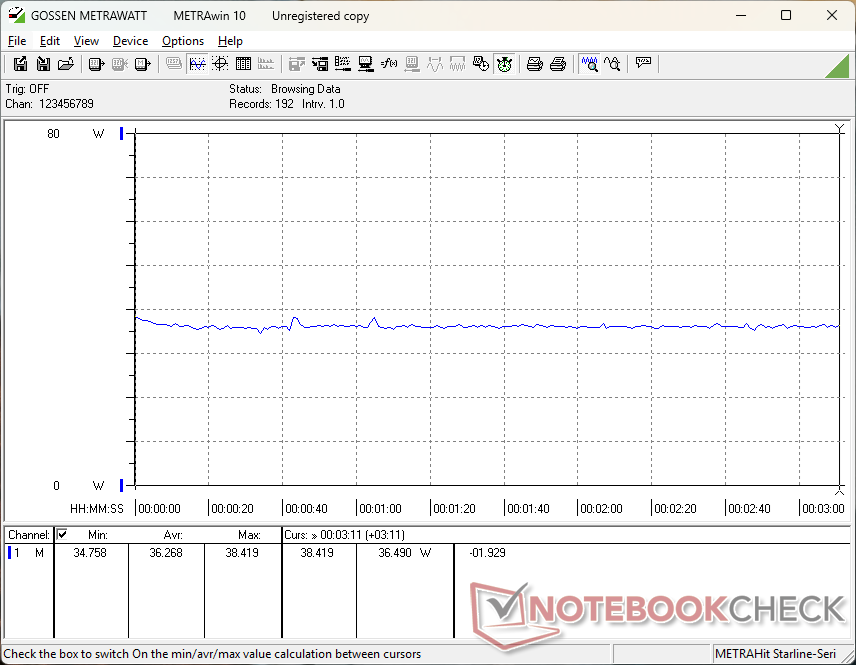
Power Consumption external Monitor
Battery Life
| Dell Pro 13 Premium 1600p Core Ultra 7 268V, Arc 140V, 60 Wh | Dell Pro 13 Premium PA13250 Core Ultra 7 268V, Arc 140V, 60 Wh | Framework Laptop 13.5 Ryzen AI 9 HX 370 Ryzen AI 9 HX 370, Radeon 890M, 61 Wh | Microsoft Surface Pro OLED Lunar Lake Core Ultra 7 268V, Arc 140V, 53 Wh | MSI Prestige 13 AI Plus Evo A2VMG Core Ultra 7 258V, Arc 140V, 75 Wh | Lenovo ThinkPad X13 Gen 4 21J3001VGE R7 PRO 7840U, Radeon 780M, 54.7 Wh | HP EliteBook x360 830 G10 7L7U1ET i5-1335U, Iris Xe G7 80EUs, 51.3 Wh | |
|---|---|---|---|---|---|---|---|
| Battery runtime | 40% | -53% | -35% | -22% | -41% | -46% | |
| WiFi v1.3 (h) | 17.1 | 24 40% | 8 -53% | 11.1 -35% | 13.4 -22% | 10.1 -41% | 9.2 -46% |
| H.264 (h) | 23.8 | 14.6 | |||||
| Load (h) | 2.8 | 1.6 | 1.9 |
Potential Competitors in Comparison
Image | Model / Review | Price | Weight | Height | Display |
|---|---|---|---|---|---|
1.  | Dell Pro 13 Premium 1600p Intel Core Ultra 7 268V ⎘ Intel Arc Graphics 140V ⎘ 32 GB Memory | Amazon: | 1.1 kg | 17.95 mm | 13.30" 2560x1600 227 PPI IPS |
2. 90%  | Dell Pro 13 Premium PA13250 Intel Core Ultra 7 268V ⎘ Intel Arc Graphics 140V ⎘ 32 GB Memory, 1024 GB SSD | Amazon: List Price: 2700 Euro | 1.1 kg | 17.2 mm | 13.30" 1920x1200 170 PPI IPS |
3. 83.8%  | Framework Laptop 13.5 Ryzen AI 9 HX 370 AMD Ryzen AI 9 HX 370 ⎘ AMD Radeon 890M ⎘ 32 GB Memory | Amazon: 1. $1,499.00 msi Katana A15 AI Gaming Lap... List Price: 2100 USD | 1.3 kg | 15.85 mm | 13.50" 2880x1920 256 PPI IPS |
4. 84.2%  | Microsoft Surface Pro OLED Lunar Lake Intel Core Ultra 7 268V ⎘ Intel Arc Graphics 140V ⎘ 32 GB Memory, 512 GB SSD | Amazon: 1. $869.99 Microsoft Surface Pro 2-in-1... 2. $1,549.99 Microsoft Surface Pro Copilo... 3. $1,669.99 Microsoft Surface Pro 11 Bun... List Price: 2640€ | 882 g | 9.3 mm | 13.00" 2880x1920 266 PPI OLED |
5. 85%  | MSI Prestige 13 AI Plus Evo A2VMG Intel Core Ultra 7 258V ⎘ Intel Arc Graphics 140V ⎘ 32 GB Memory | Amazon: 1. $31.99 CPU Cooling Fan Replacement ... 2. $1,479.00 MSI Prestige 16 AI+ Evo 16" ... 3. $1,349.00 HIDevolution [2024] MSI Pres... List Price: 1400 USD | 970 g | 16.9 mm | 13.30" 2880x1800 255 PPI OLED |
6. 86.9%  | Lenovo ThinkPad X13 Gen 4 21J3001VGE AMD Ryzen 7 PRO 7840U ⎘ AMD Radeon 780M ⎘ 32 GB Memory, 512 GB SSD | Amazon: List Price: 1575 Euro | 1.3 kg | 18.5 mm | 13.30" 1920x1200 170 PPI IPS LED |
7. 89.4% v7 (old)  | HP EliteBook x360 830 G10 7L7U1ET Intel Core i5-1335U ⎘ Intel Iris Xe Graphics G7 80EUs ⎘ 16 GB Memory, 512 GB SSD | Amazon: List Price: 1300 Euro | 1.3 kg | 19.2 mm | 13.30" 1920x1200 170 PPI IPS LED |
Transparency
The selection of devices to be reviewed is made by our editorial team. The test sample was provided to the author as a loan by the manufacturer or retailer for the purpose of this review. The lender had no influence on this review, nor did the manufacturer receive a copy of this review before publication. There was no obligation to publish this review. As an independent media company, Notebookcheck is not subjected to the authority of manufacturers, retailers or publishers.
This is how Notebookcheck is testing
Every year, Notebookcheck independently reviews hundreds of laptops and smartphones using standardized procedures to ensure that all results are comparable. We have continuously developed our test methods for around 20 years and set industry standards in the process. In our test labs, high-quality measuring equipment is utilized by experienced technicians and editors. These tests involve a multi-stage validation process. Our complex rating system is based on hundreds of well-founded measurements and benchmarks, which maintains objectivity. Further information on our test methods can be found here.
