Verdict — Leaner And More Efficient With OLED To Boot
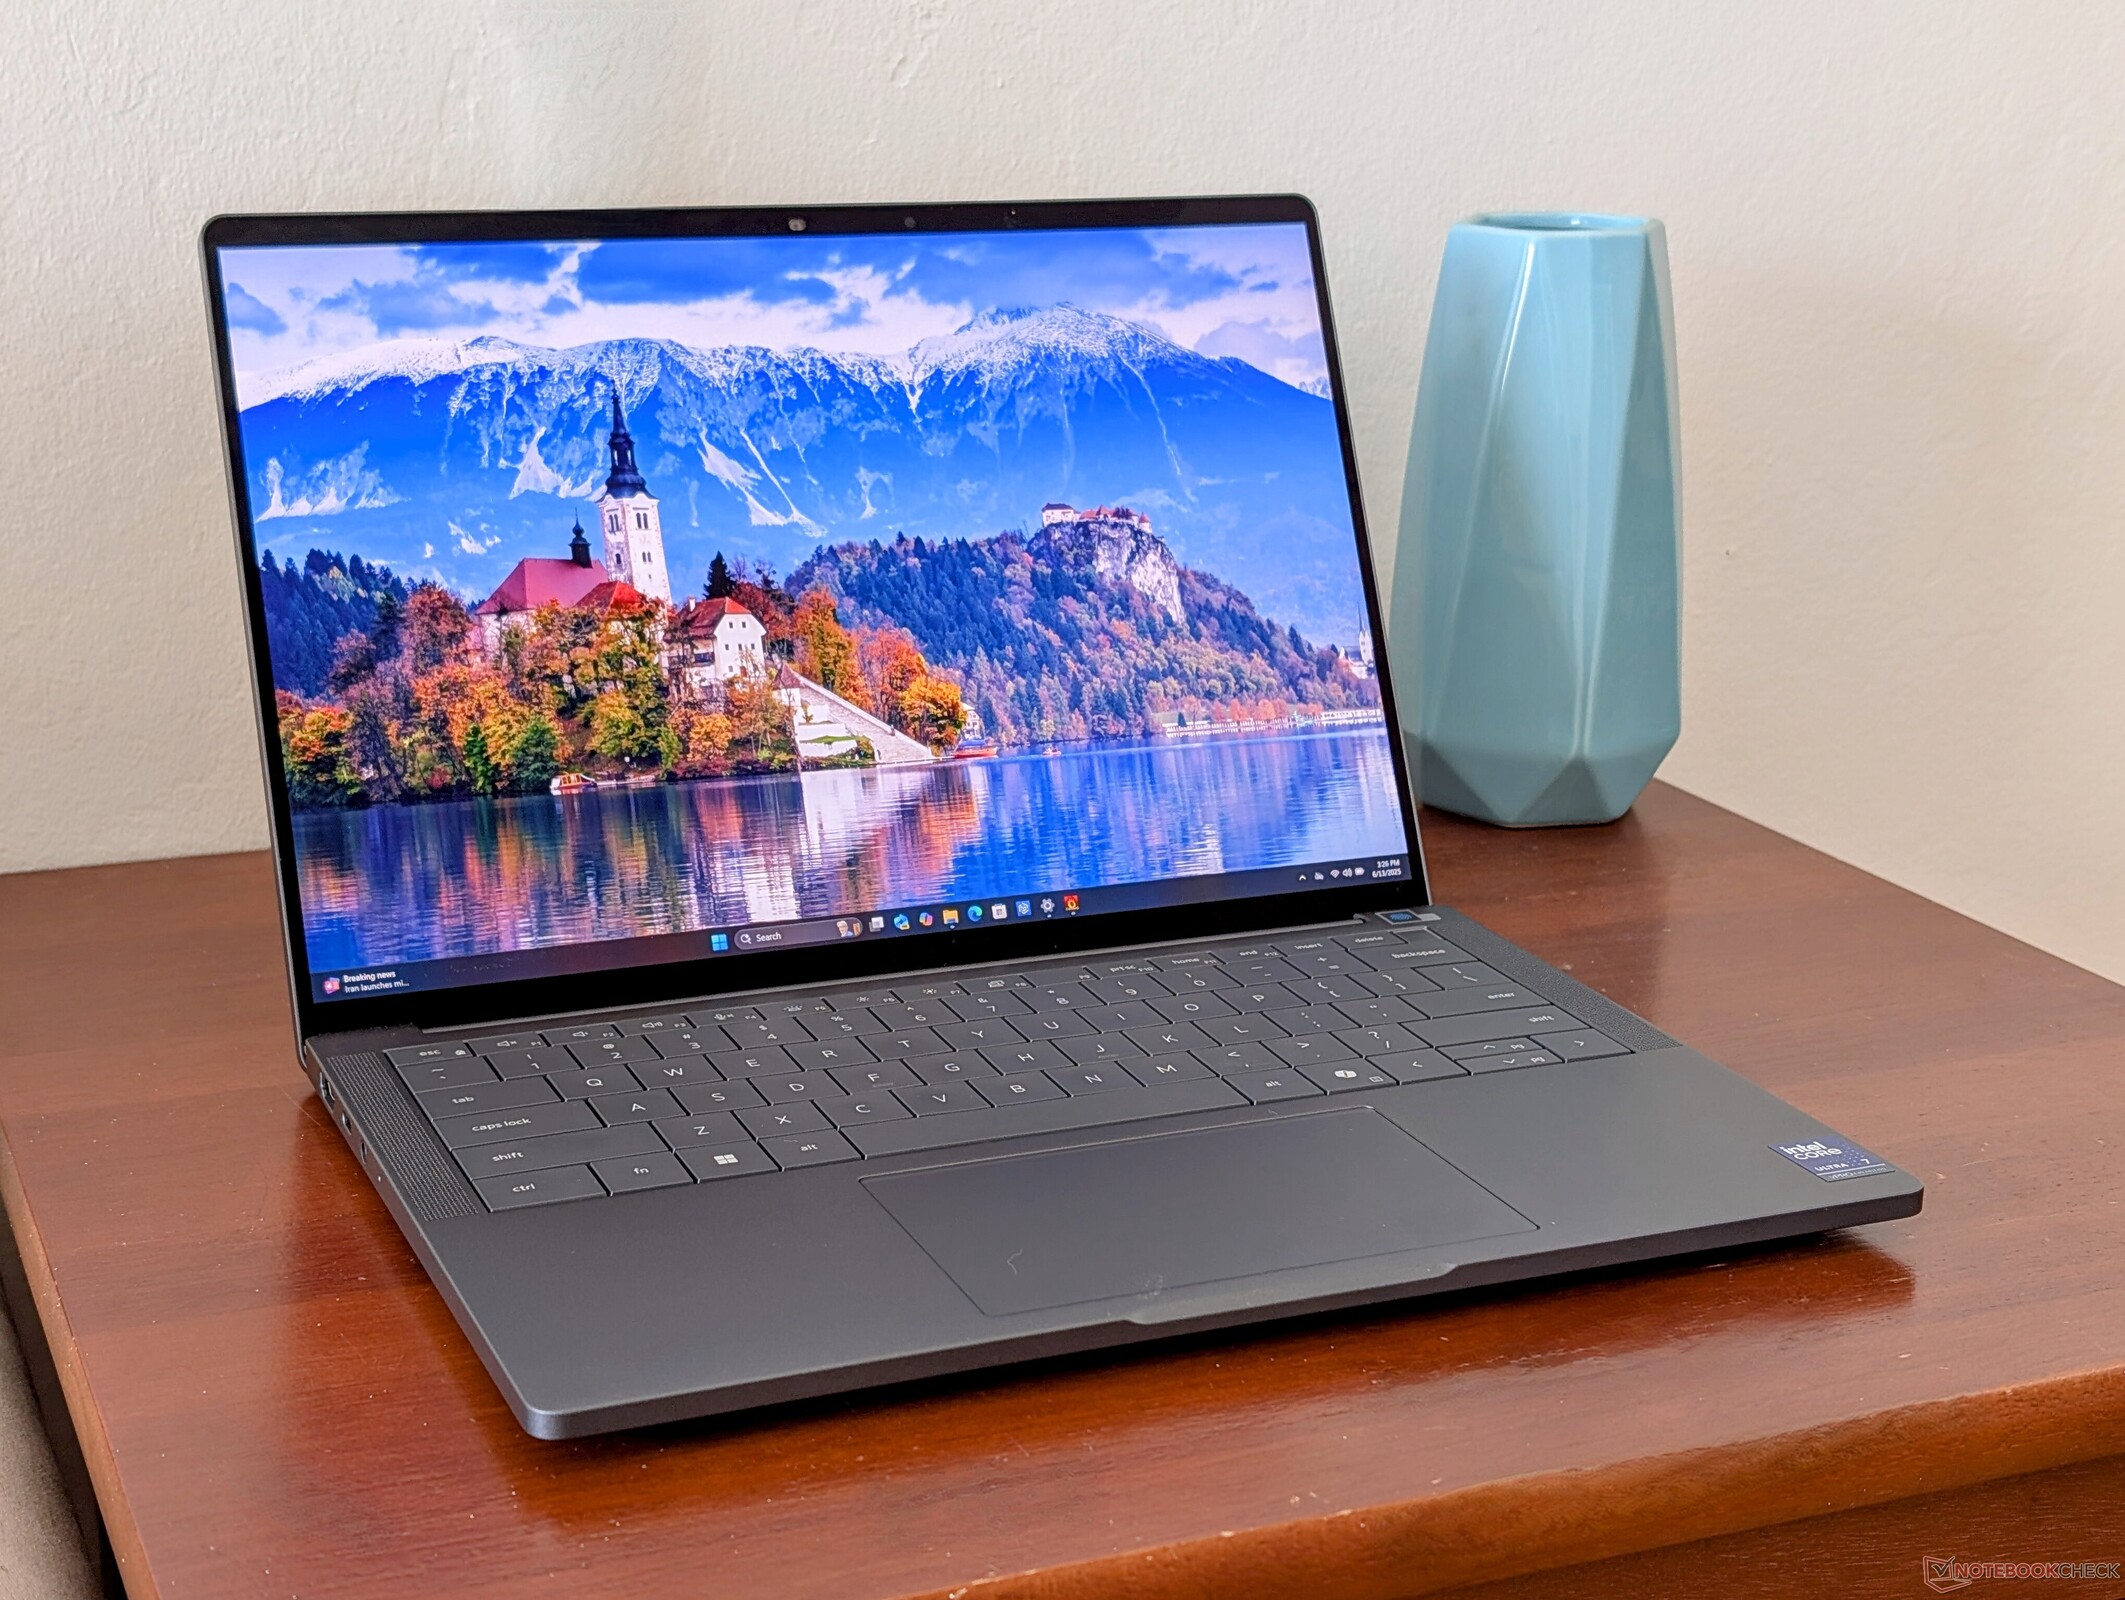
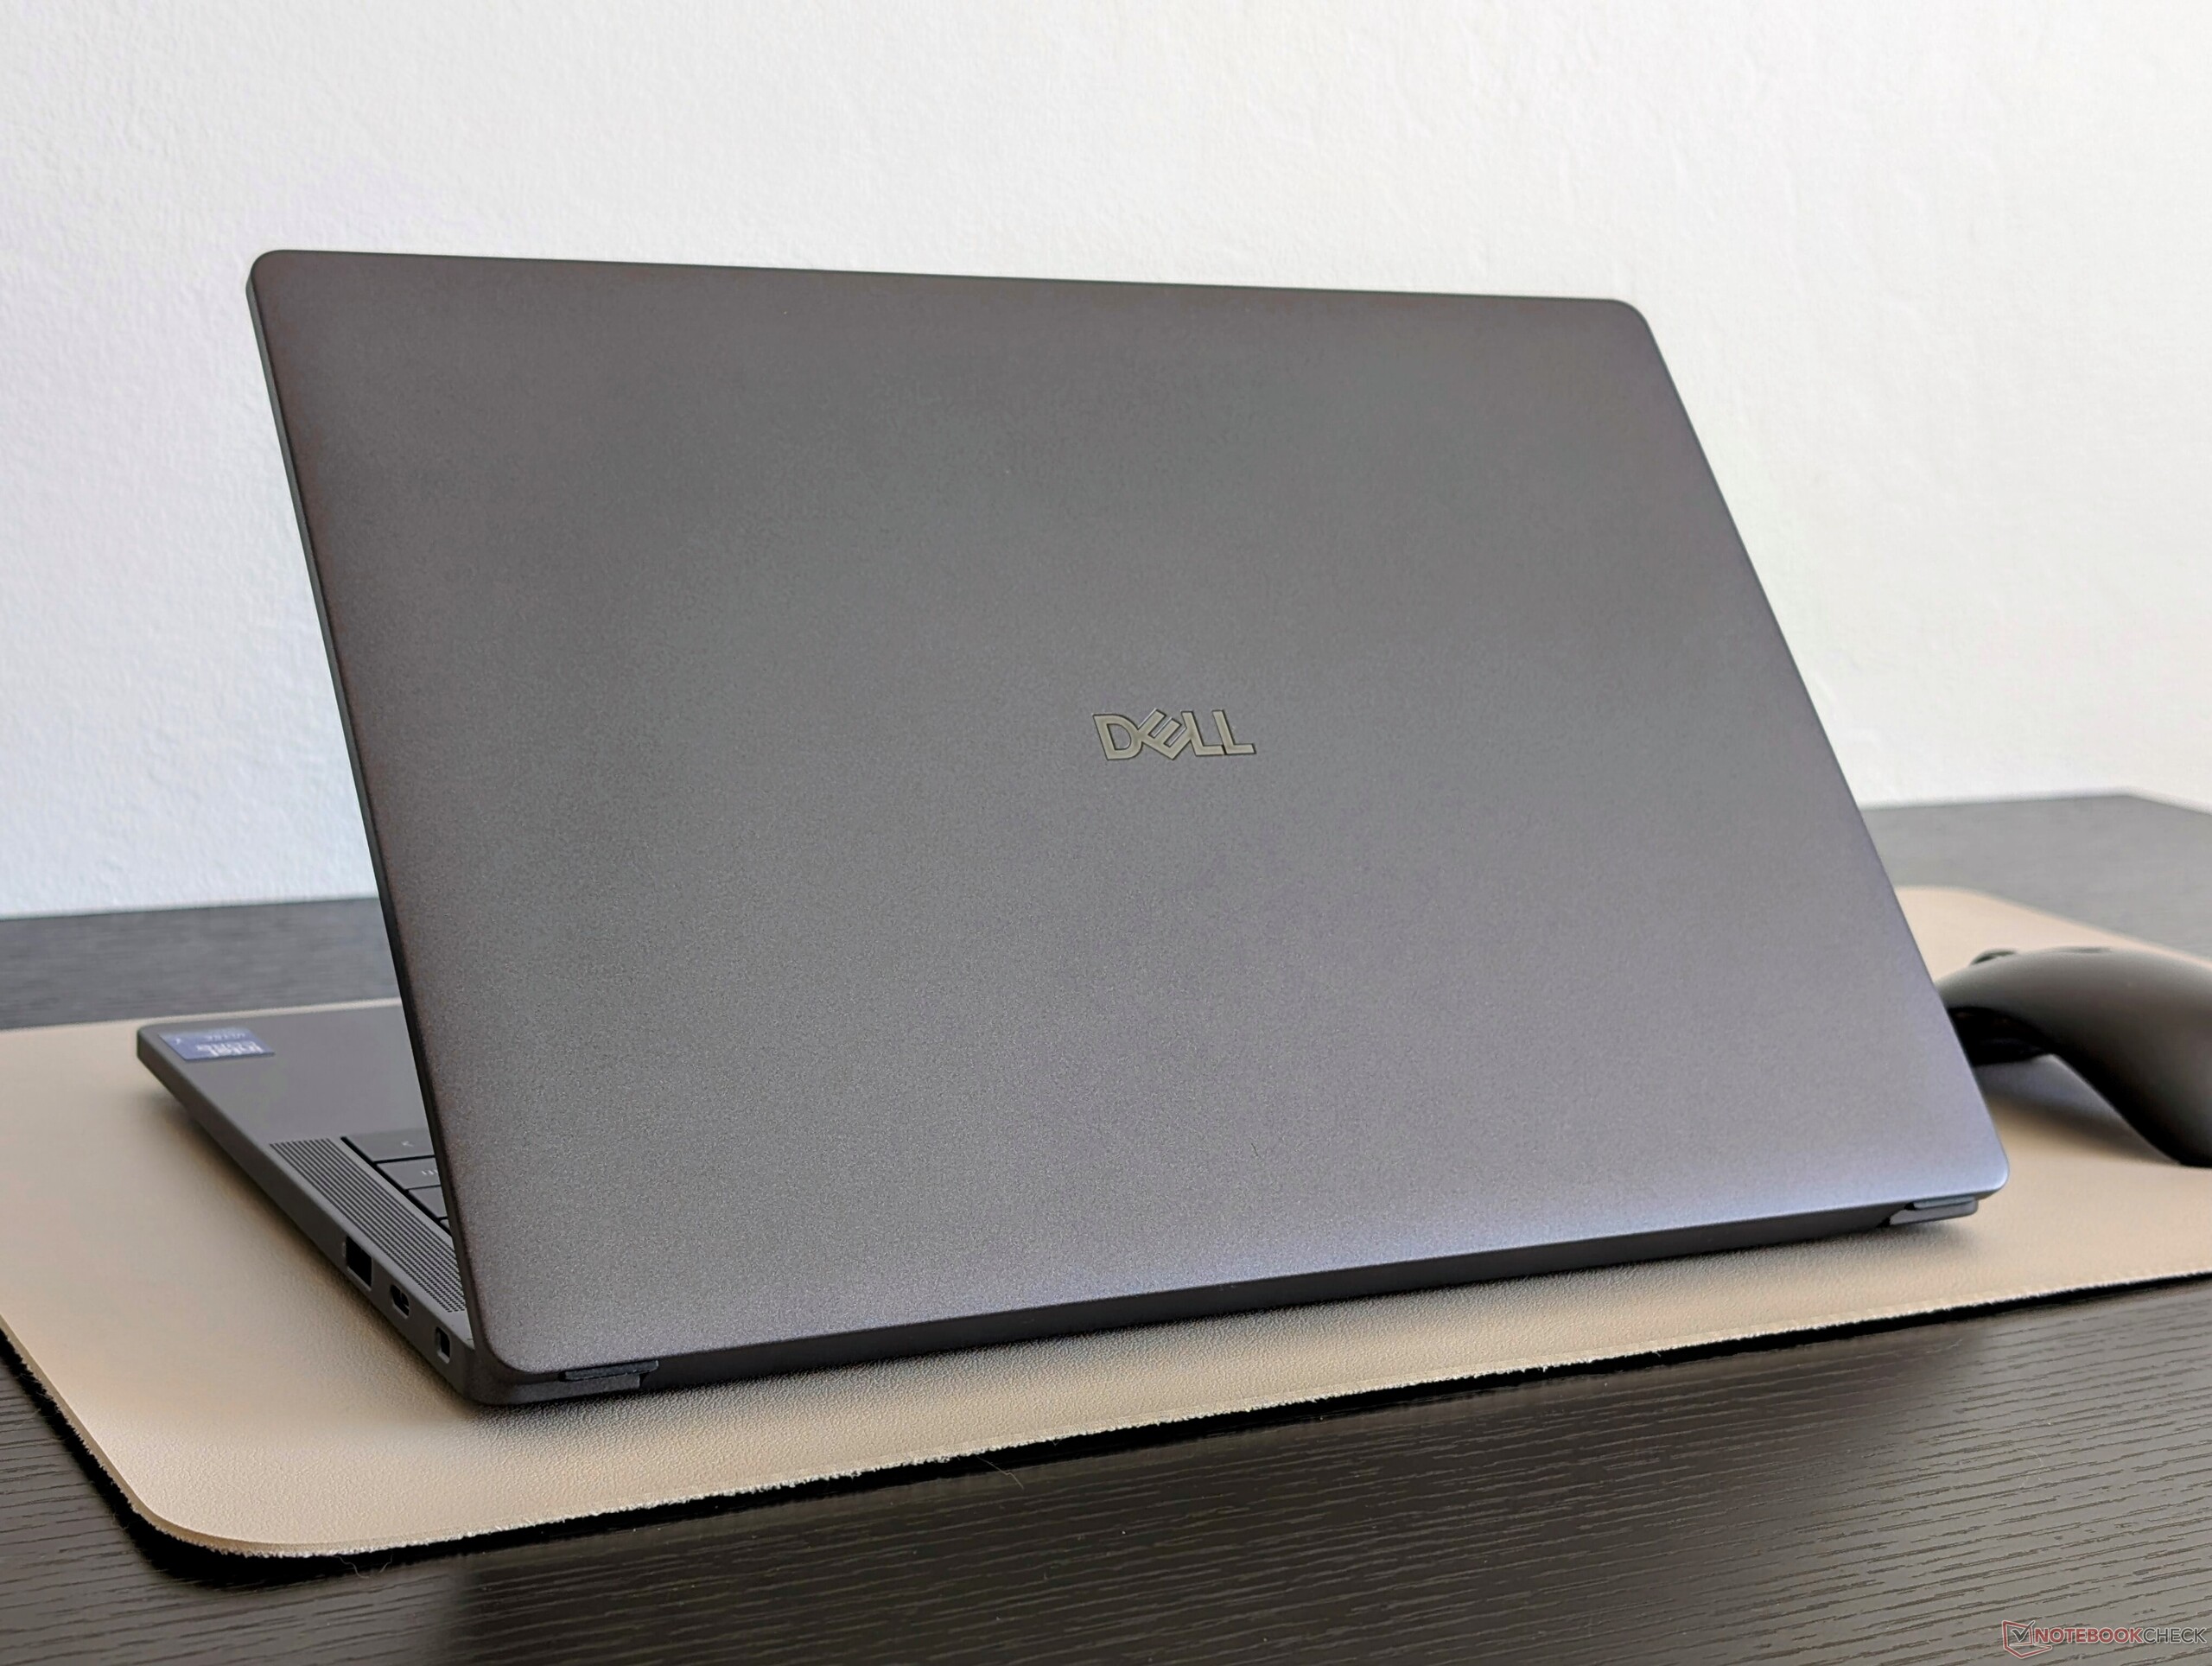
You can't really tell from its dull matte gray exterior, but the Dell Pro 14 Premium hides tons of upgrades and changes from last year's Latitude 7440 or Latitude 9440 series. Its most notable feature is arguably the new OLED touchscreen which brings a level of fidelity that was previously unavailable on the older Latitude 14. Meanwhile, the Lunar Lake CPU offers significant improvements when it comes to both graphics performance and power efficiency to the point where battery life is noticeably longer than the previous generation despite the overall faster performance and more demanding OLED panel.
While there are no major setbacks, a handful of minor ones are worth mentioning. As nice as the OLED panel may be, its 60 Hz refresh rate feels out-of-date when 90 Hz or greater is becoming commonplace. Upgrade options are limited when it comes to storage and photographers or editors in particular may loathe the absence of an integrated SD card reader to better take advantage of the OLED colors and faster integrated graphics power. The typing experience is slightly shallower and spongier than on an HP EliteBook Ultra G1i 14 which also happens to be thinner and lighter (albeit less repairable) than our Dell while carrying faster 120 Hz OLED options. The Dell Pro 14 Premium is still one of Dell's best subnoteooks for businesses and an improvement over the Latitude 14 predecessors, but it could use some extra oomph to push it past competitors even further.
Pros
Cons
Price and Availability
The Dell Pro 14 Premium is now shipping at Dell starting at $1800 for the base Core Ultra 5 FHD+ configuration up to $2500 for the Core Ultra 7 QHD+ OLED configuration as reviewed.
- $2,499.00Dell Pro 14 Premium PA14250 Laptop - 14 inch FHD+ 400 Nits Display -Intel Core Ultra 7 268V vPro 8-Core - 32GB RAM - 256GB SSD - Win11 pro
- $1,021.49Dell Pro 14 Premium PA14250 14" Laptop, Intel Core Ultra 7 266V, 512 GB TLC SSD, 16 GB LPDDR5x, Intel Arc Graphics, Windows 11 Pro, Copilot+ PC
- $1,249.99Dell Latitude 7450 7000 Business AI PC Laptop (14" FHD+, Intel 16-Core Ultra 7 165H (> i7-1355U), 16GB DDR5, 1TB SSD), Thunderbolt 4, QHD IR Webcam, Wi-Fi 7, Win 11 Pro, Prev-Gen Dell Pro 14 Premium
The Dell Pro 14 Premium is a brand new business-centric series introduced this year to replace the older 14-inch Latitude 14 7400 or 9400 series. While the naming convention has changed, the model still shares many features with last year's Latitude 7440 or 9440 2-in-1 for that familiar Latitude feel.
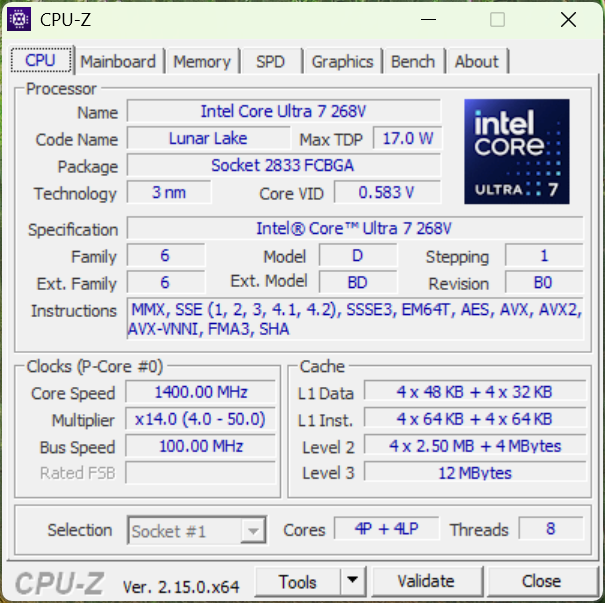
Our test unit is a higher-end configuration with the Lunar Lake Core Ultra 7 268V CPU, 32 GB of RAM, and an OLED 1800p touchscreen for approximately $2500 USD. Lower-end options include the Core Ultra 5 236V and 1200p IPS non-touch display for $1800.
Alternatives to the Dell Pro 14 Premium include other flagship office subnotebooks like the HP EliteBook Ultra G1i 14 or Lenovo ThinkPad T14s Gen 6.
More Dell reviews:
Specifications
Case
The skeleton is largely magnesium alloy with excellent rigidity and resistance to twisting and depressions. The issues we observed on the Latitude 7440 are not present on the Dell Pro 14 Premium and so overall impressions are more similar to the Latitude 9440.
The system doesn't feel particularly weaker or stronger than competing models like the HP EliteBook Ultra G1i 14 or Lenovo ThinkPad T14s Gen 6, but we do prefer the stiffer hinges of the Dell when compared to the HP.
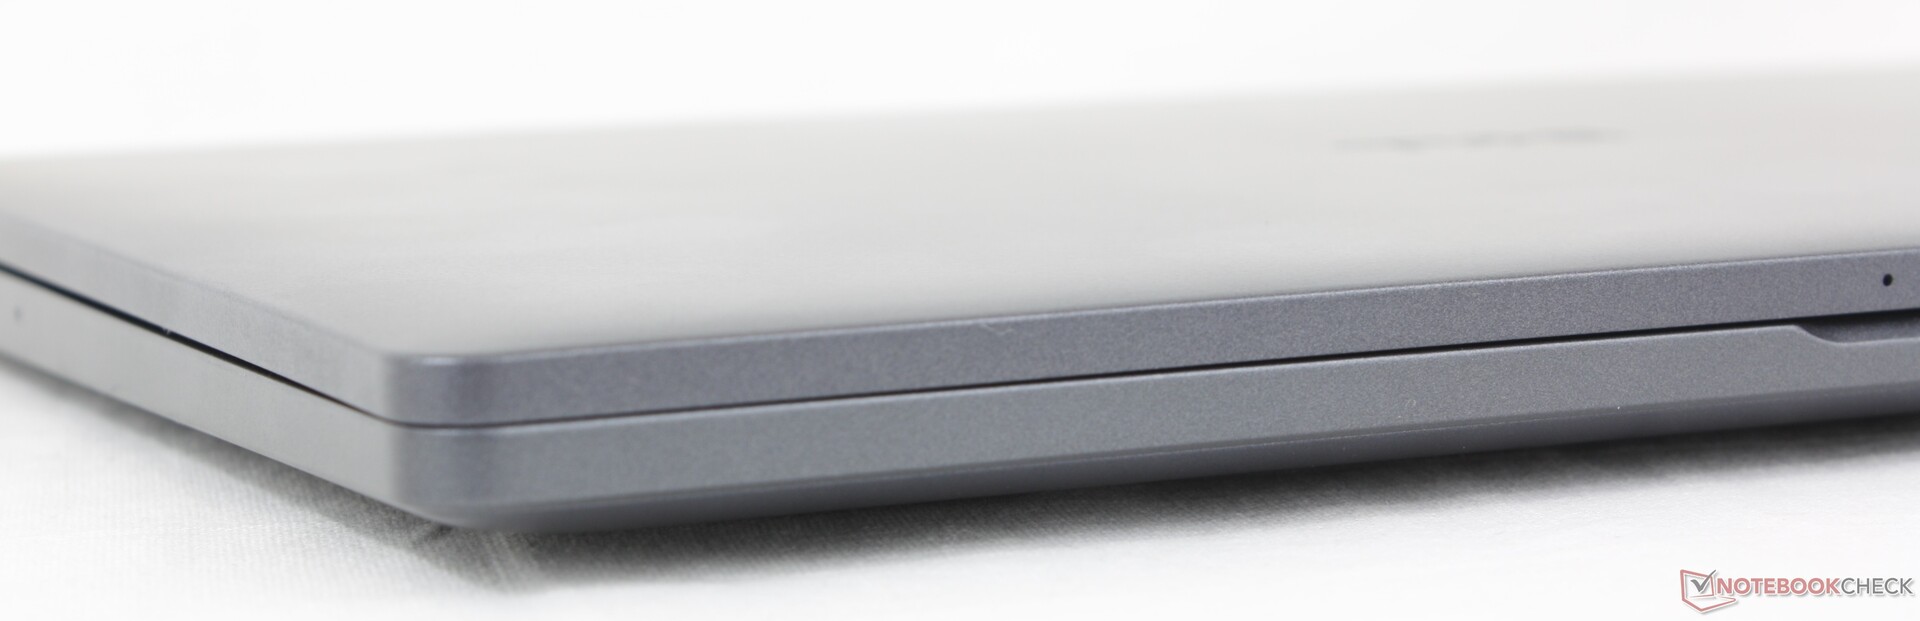
Dimensions and weight are nearly identical to the Latitude 7440. The Dell Pro 14 Premium may be ever-so-slightly smaller and heavier if we are to nitpick, but thickness is otherwise the same.
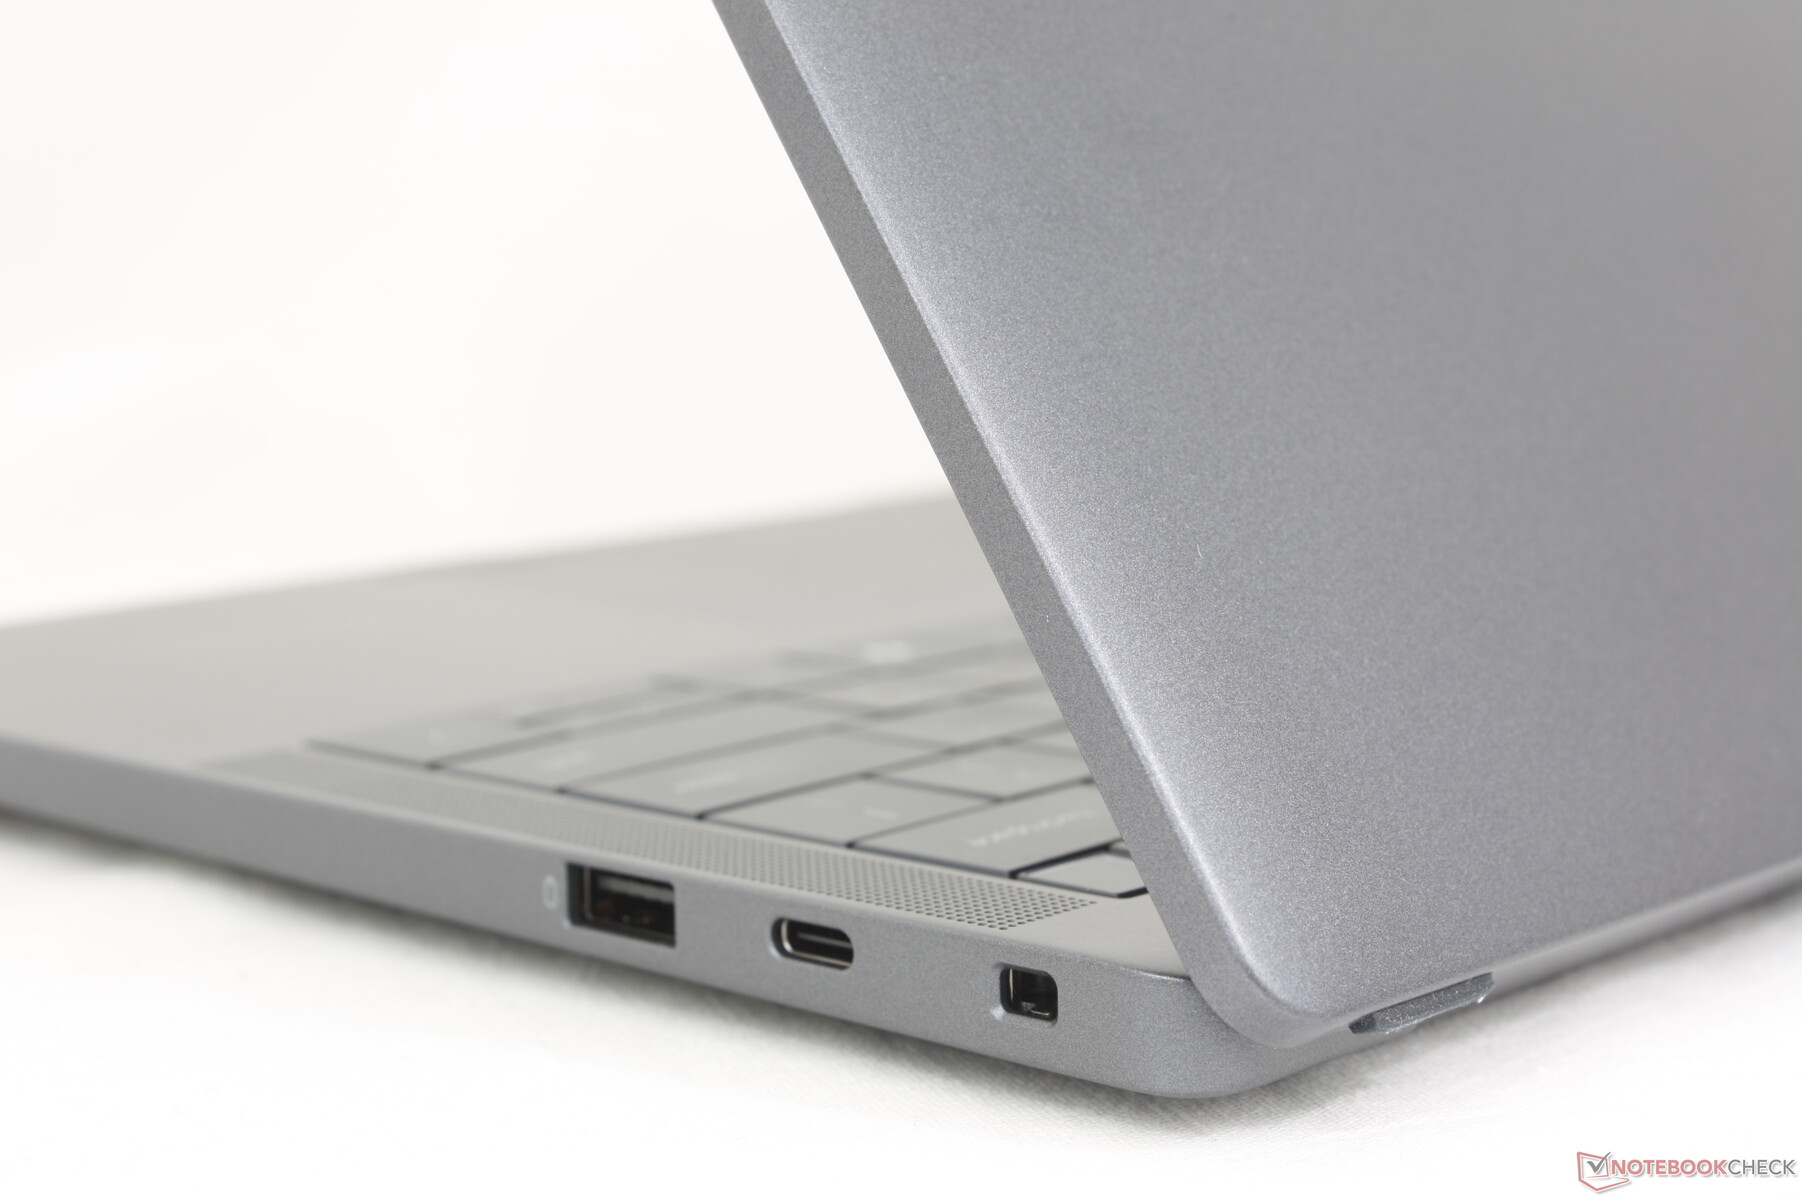
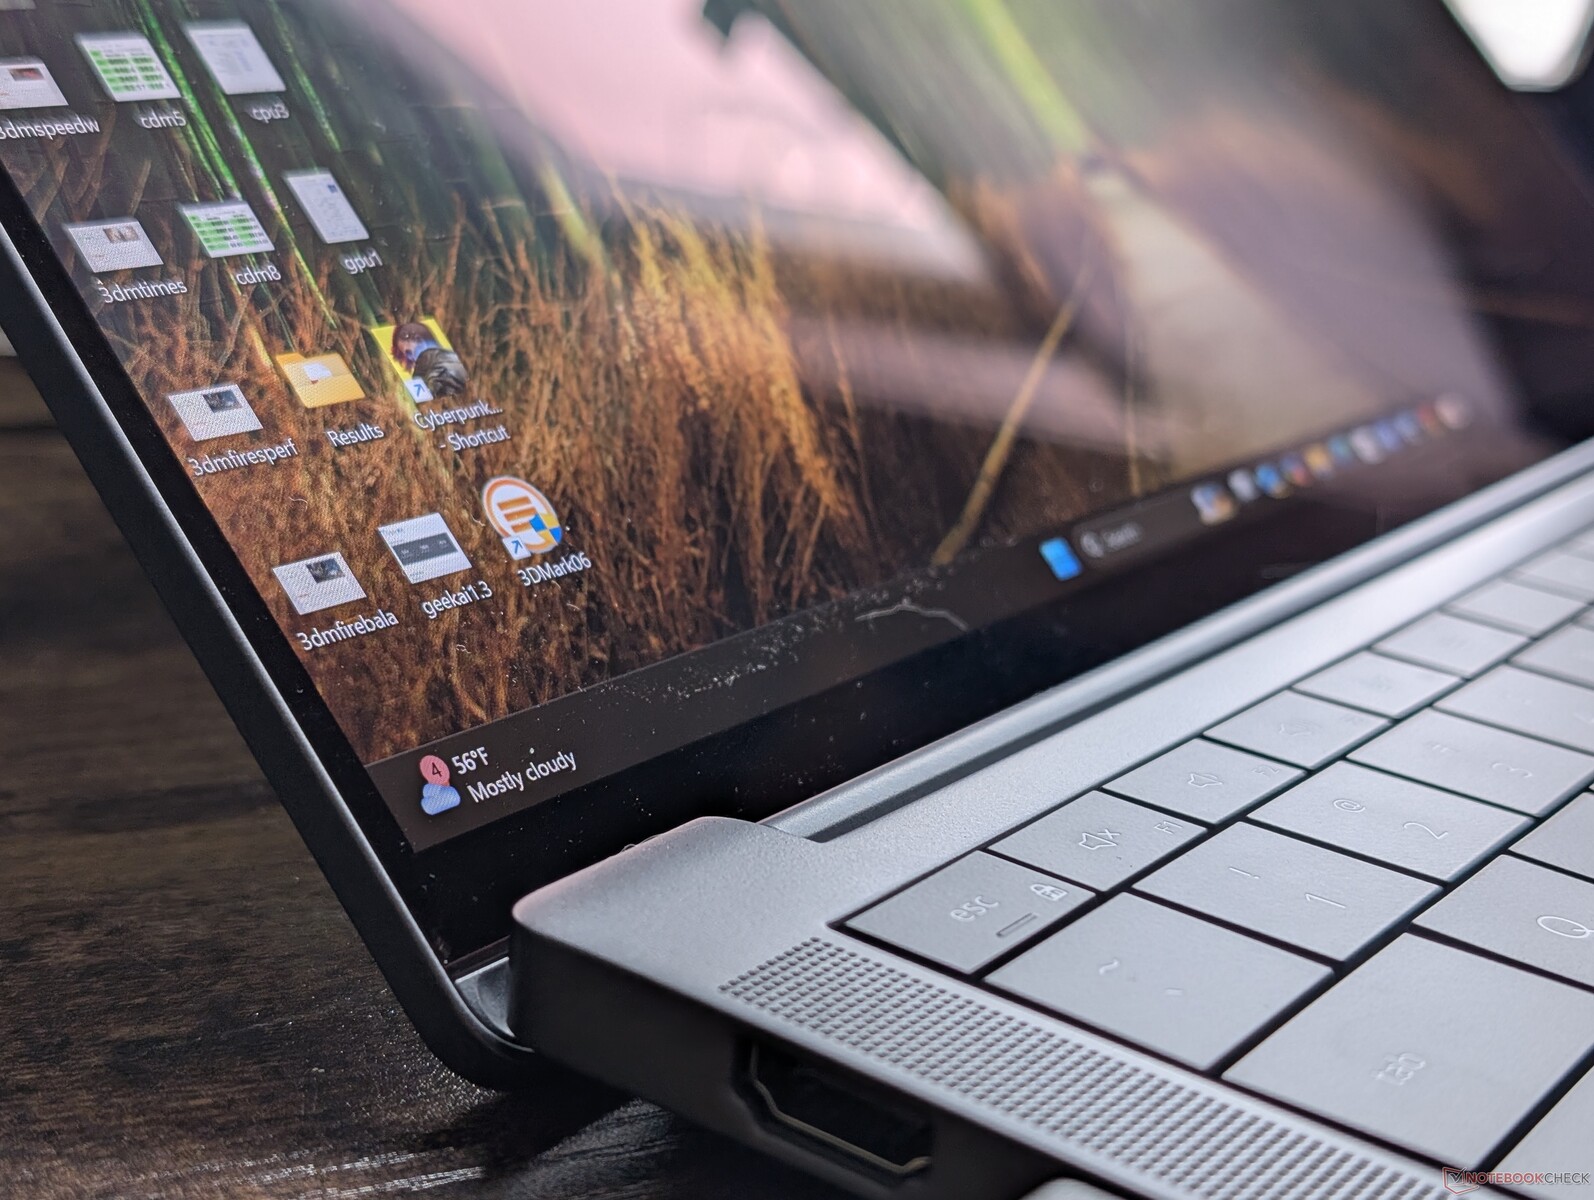
Connectivity
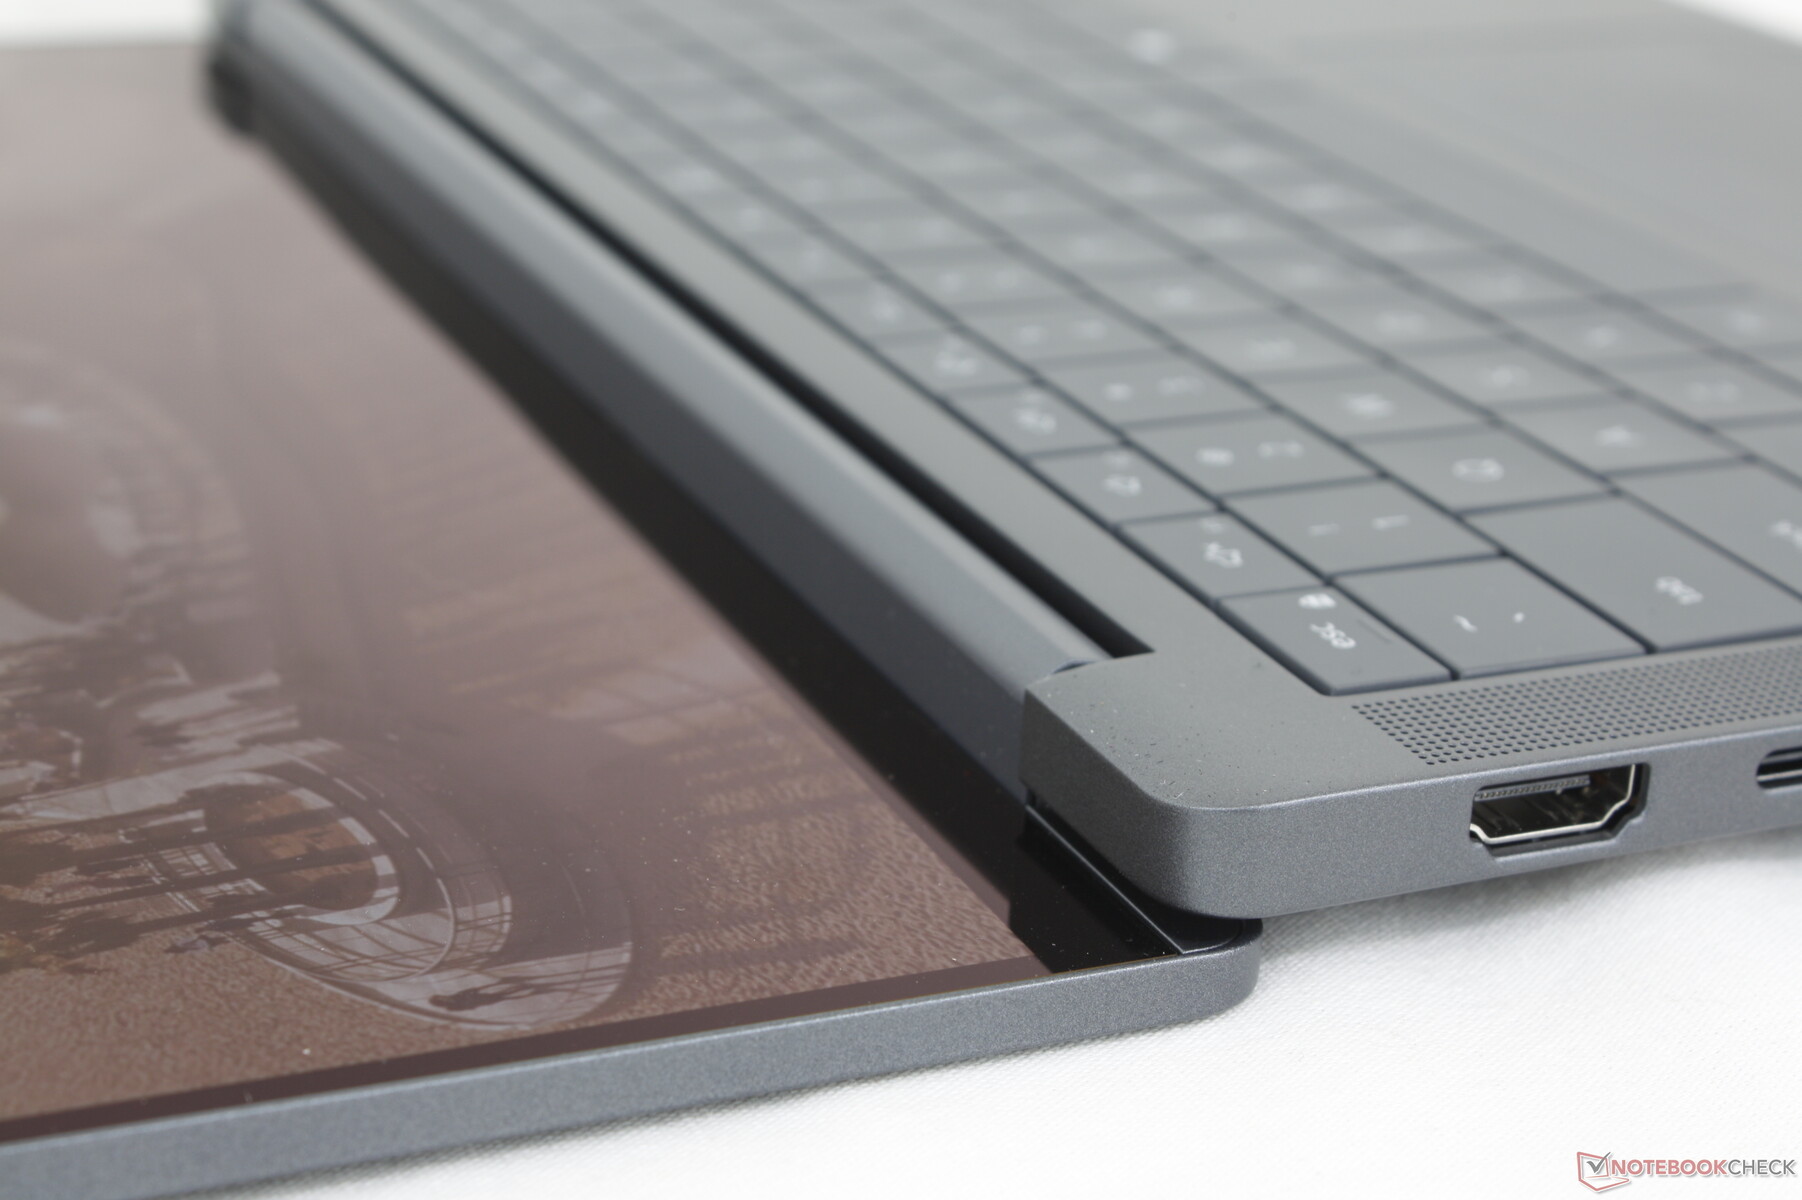
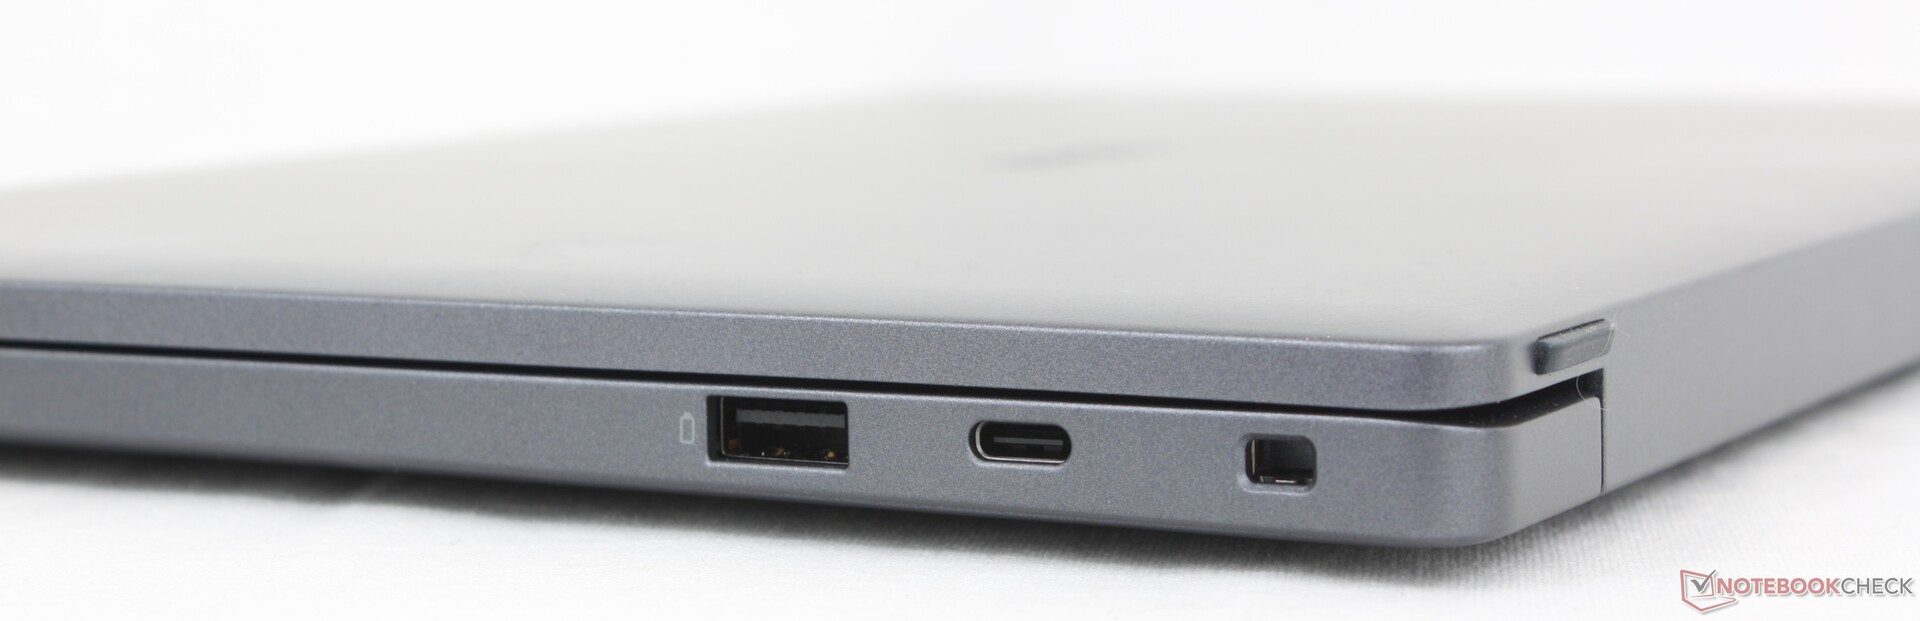
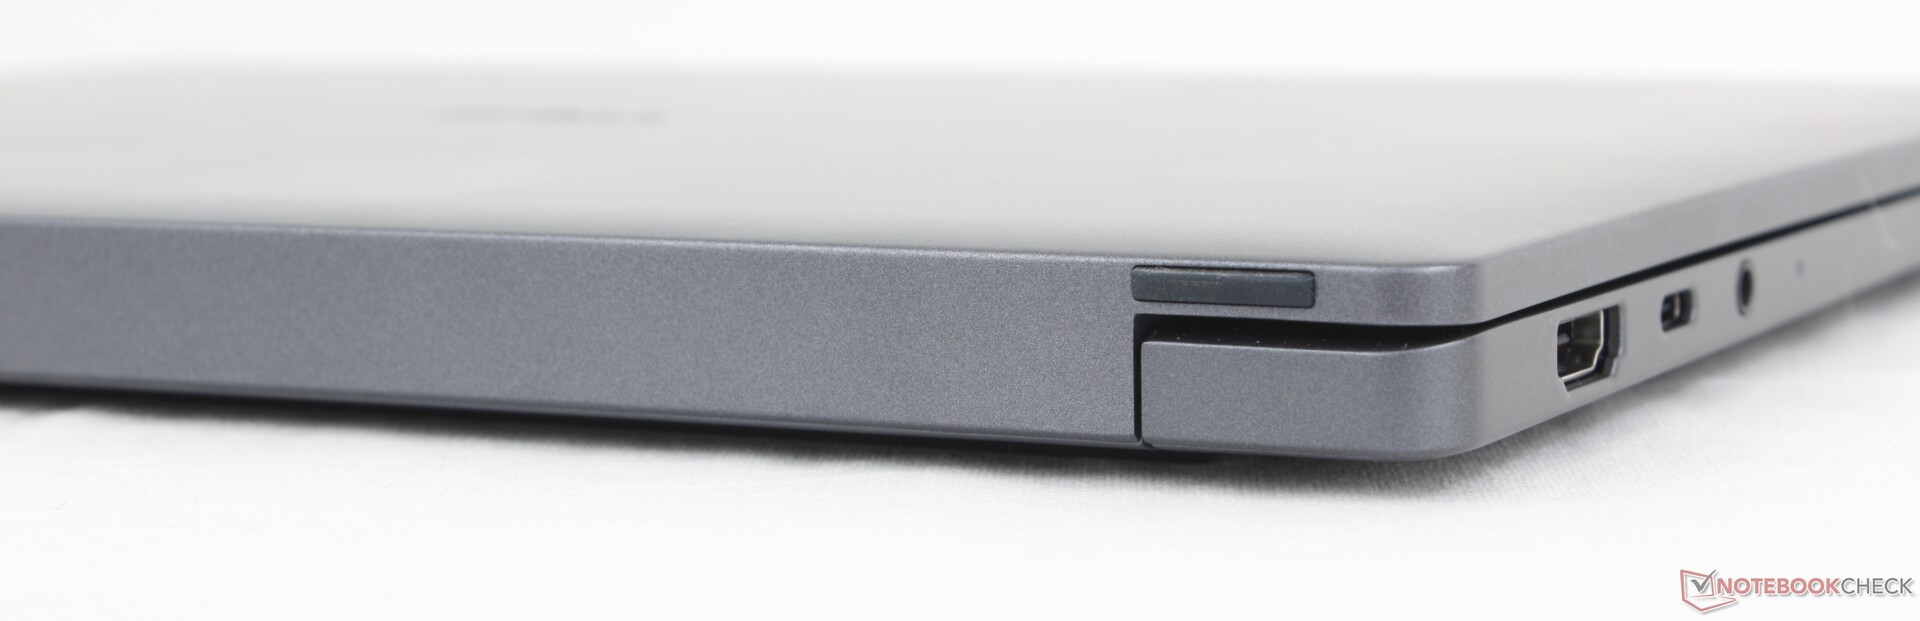
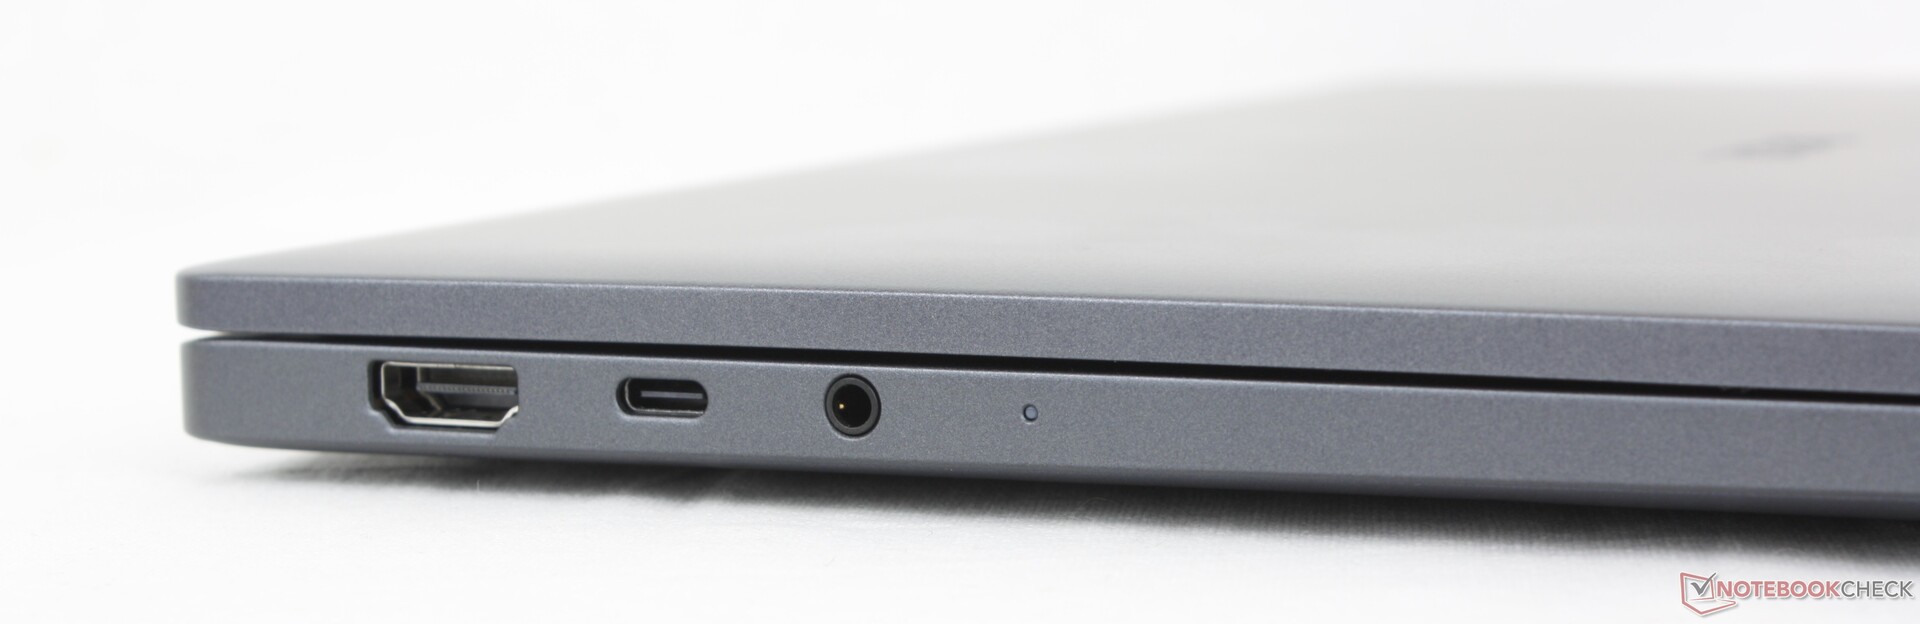
There is one less USB-A port than on the Latitude 7440. To make up for this, one of the two USB-C ports has been moved to the right edge of the chassis for more ergonomic charging or docking.
Communication
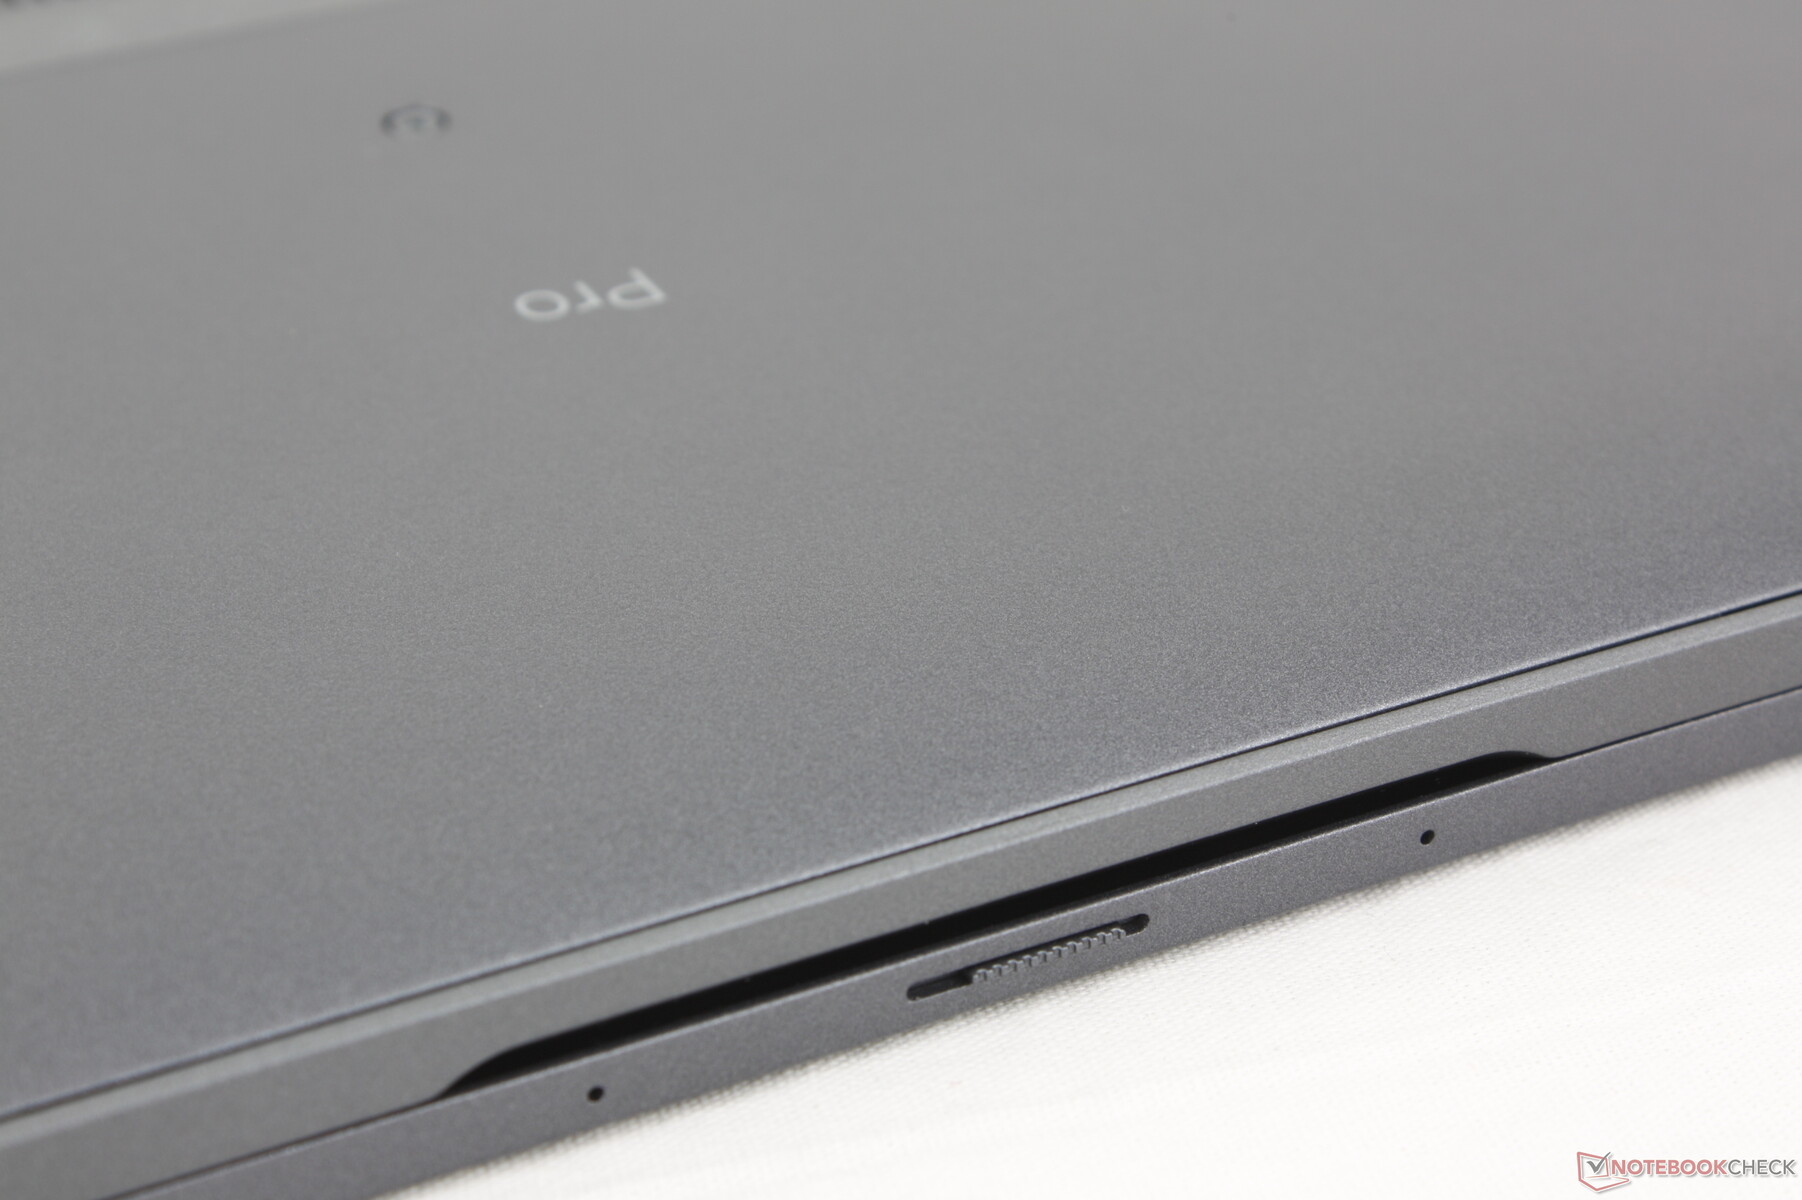
An Intel BE201 comes standard for Wi-Fi 7 and Bluetooth 5.4 connectivity. WAN is an optional configuration alongside a nanoSIM slot.
| Networking | |
| iperf3 transmit AXE11000 | |
| Dell XPS 14 2024 OLED | |
| HP EliteBook Ultra G1i 14 | |
| Asus ExpertBook B1 B1403CVA | |
| Lenovo ThinkPad T14s Gen 6 Intel | |
| Dell Pro 14 Premium | |
| Dell Latitude 7440 | |
| iperf3 receive AXE11000 | |
| Dell XPS 14 2024 OLED | |
| Asus ExpertBook B1 B1403CVA | |
| HP EliteBook Ultra G1i 14 | |
| Lenovo ThinkPad T14s Gen 6 Intel | |
| Dell Latitude 7440 | |
| Dell Pro 14 Premium | |
| iperf3 transmit AXE11000 6GHz | |
| Lenovo ThinkPad T14s Gen 6 Intel | |
| Dell Pro 14 Premium | |
| Dell Latitude 7440 | |
| iperf3 receive AXE11000 6GHz | |
| Lenovo ThinkPad T14s Gen 6 Intel | |
| Dell Pro 14 Premium | |
| Dell Latitude 7440 | |
Webcam
An 8 MP webcam comes standard alongside IR and a physical shutter. Presence Detection is optional.


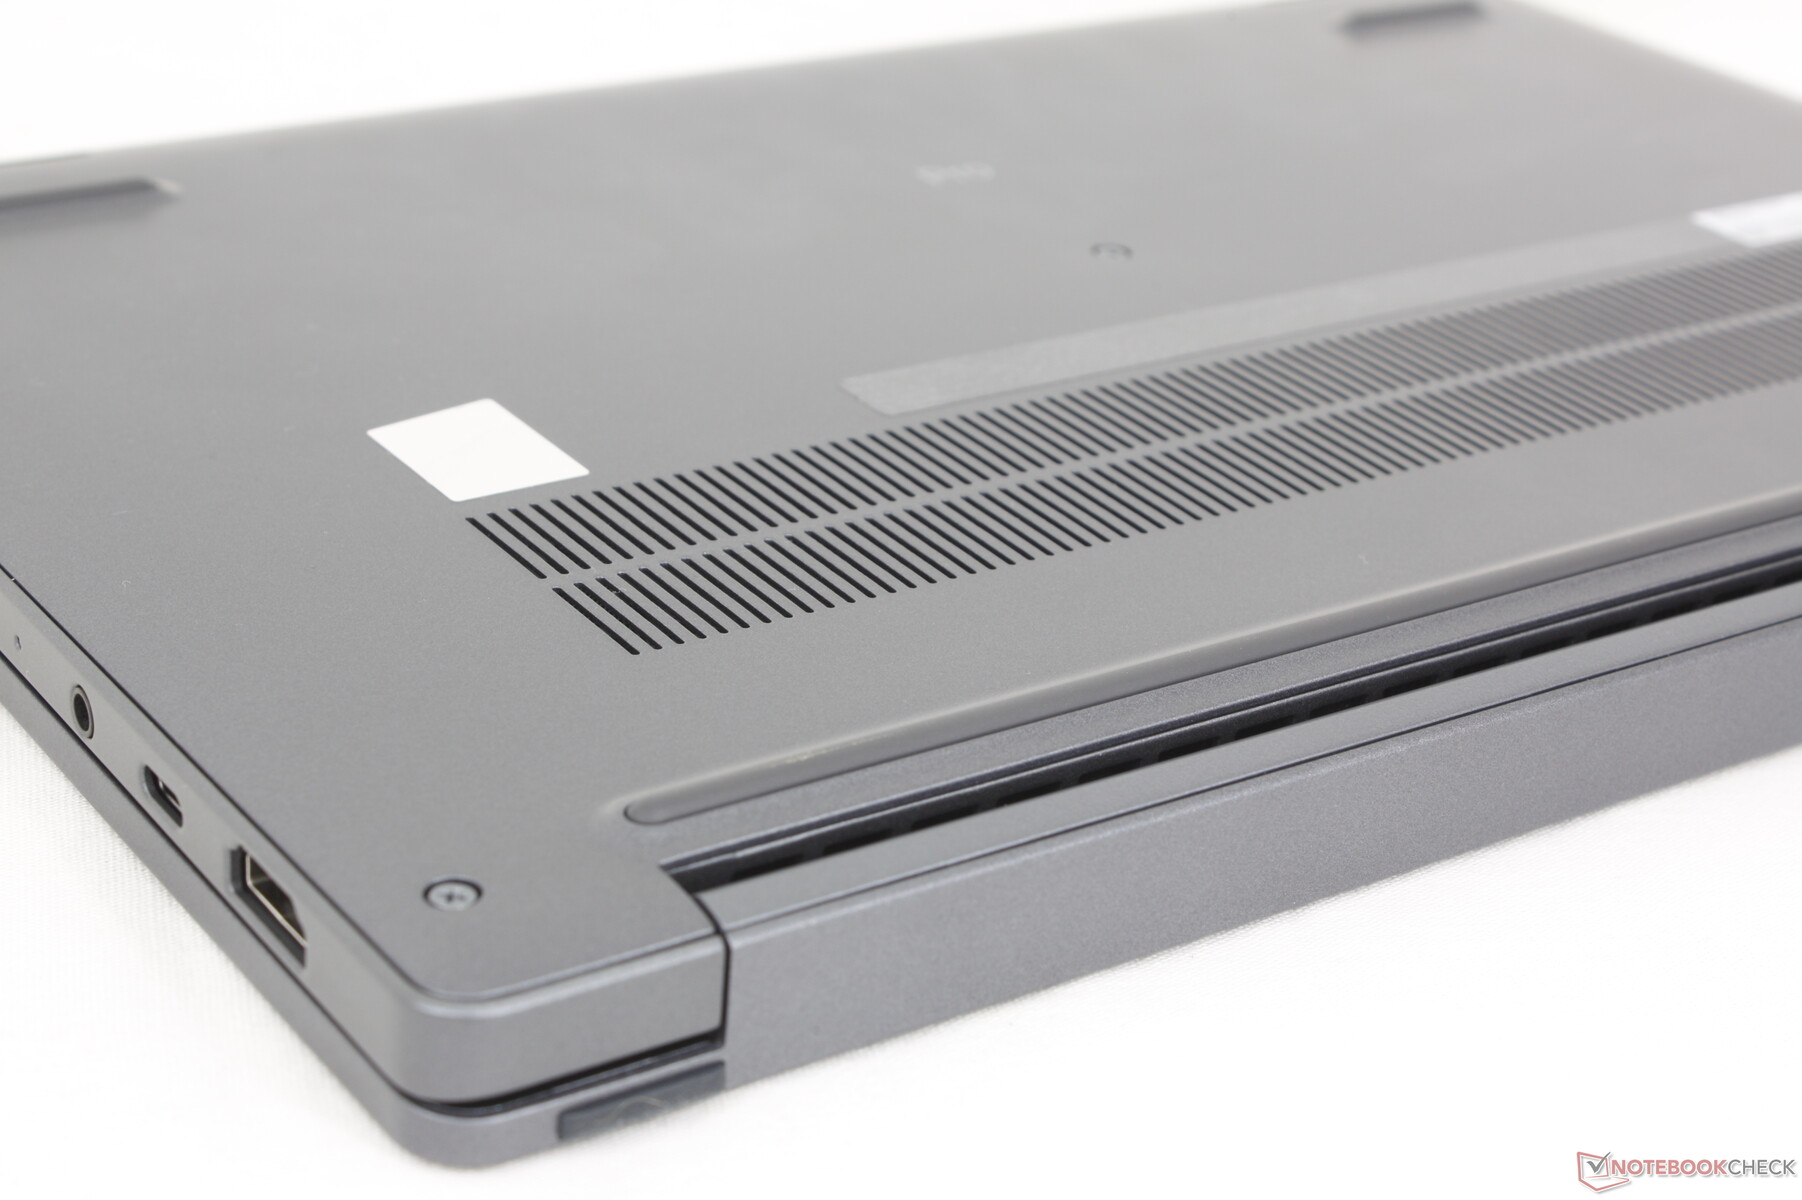
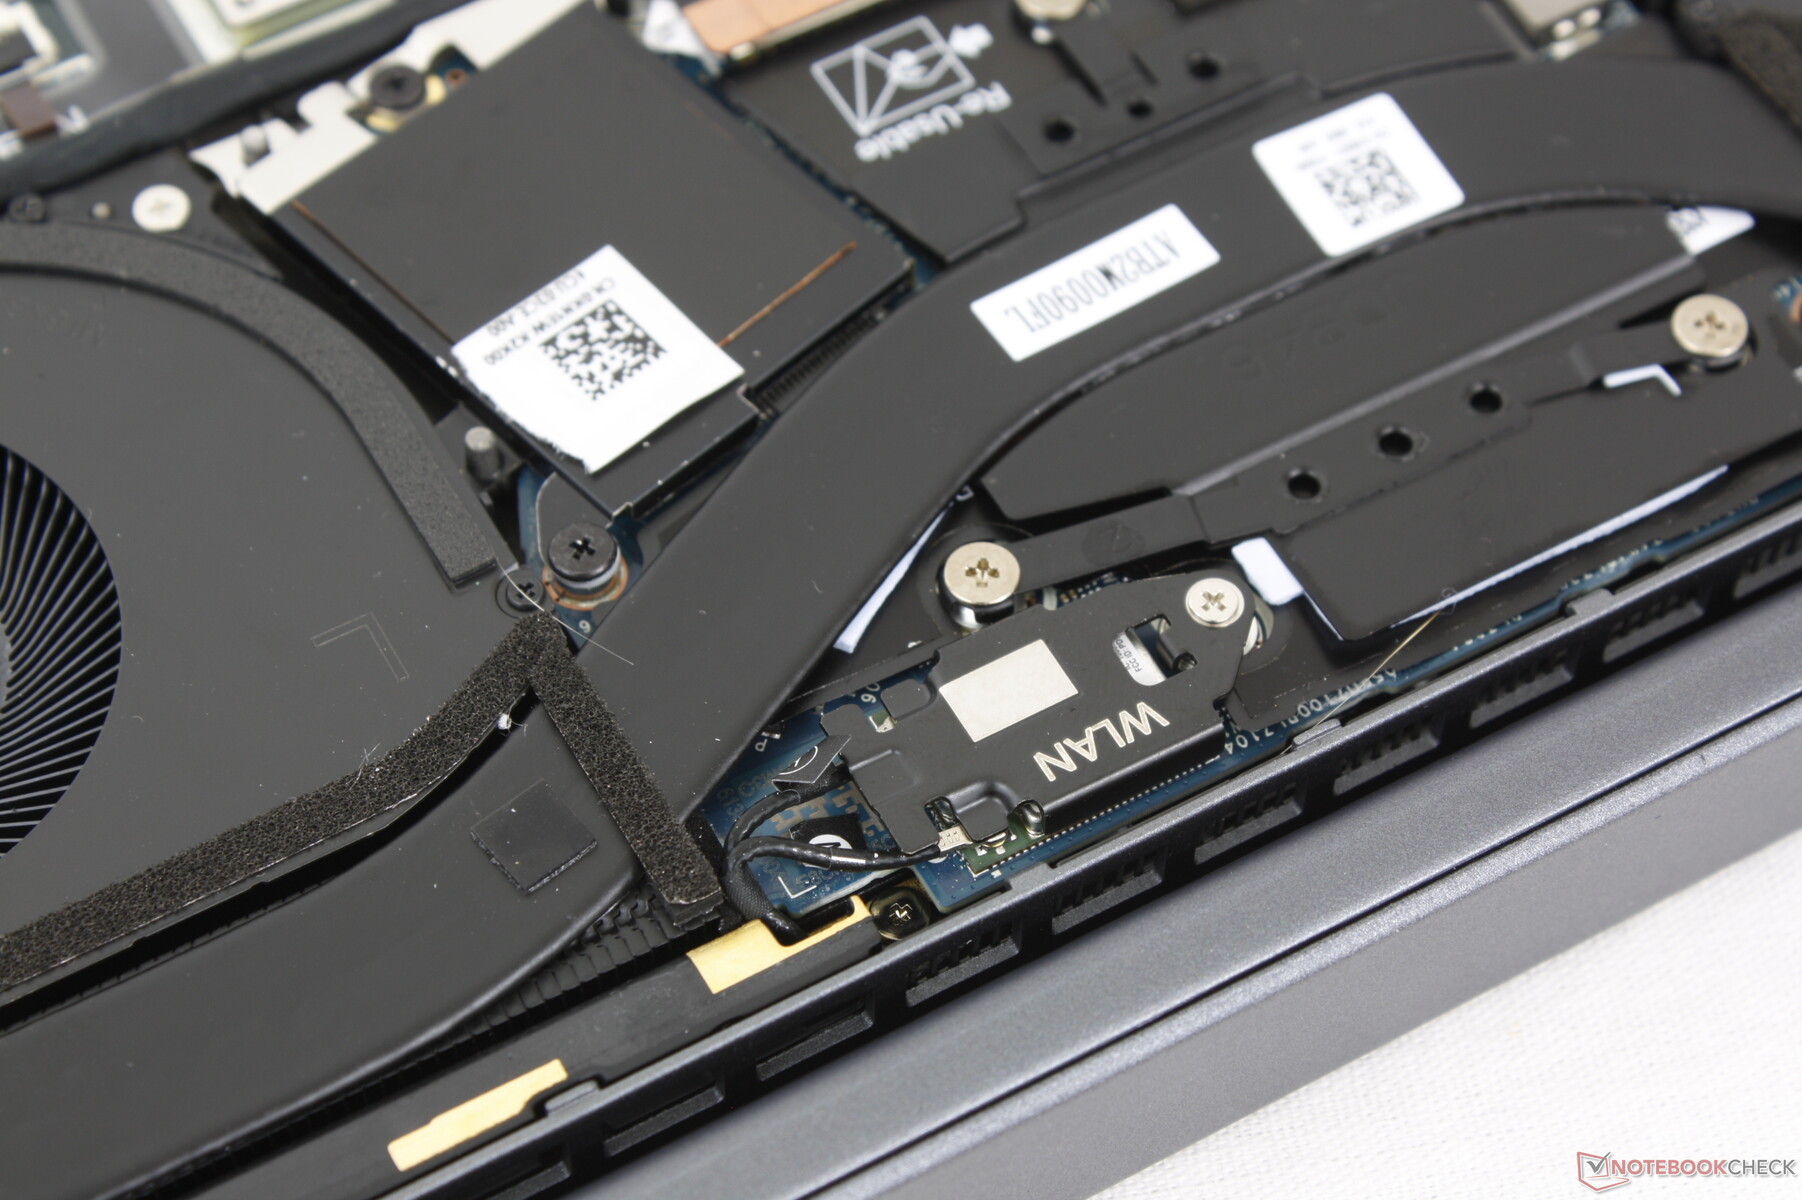
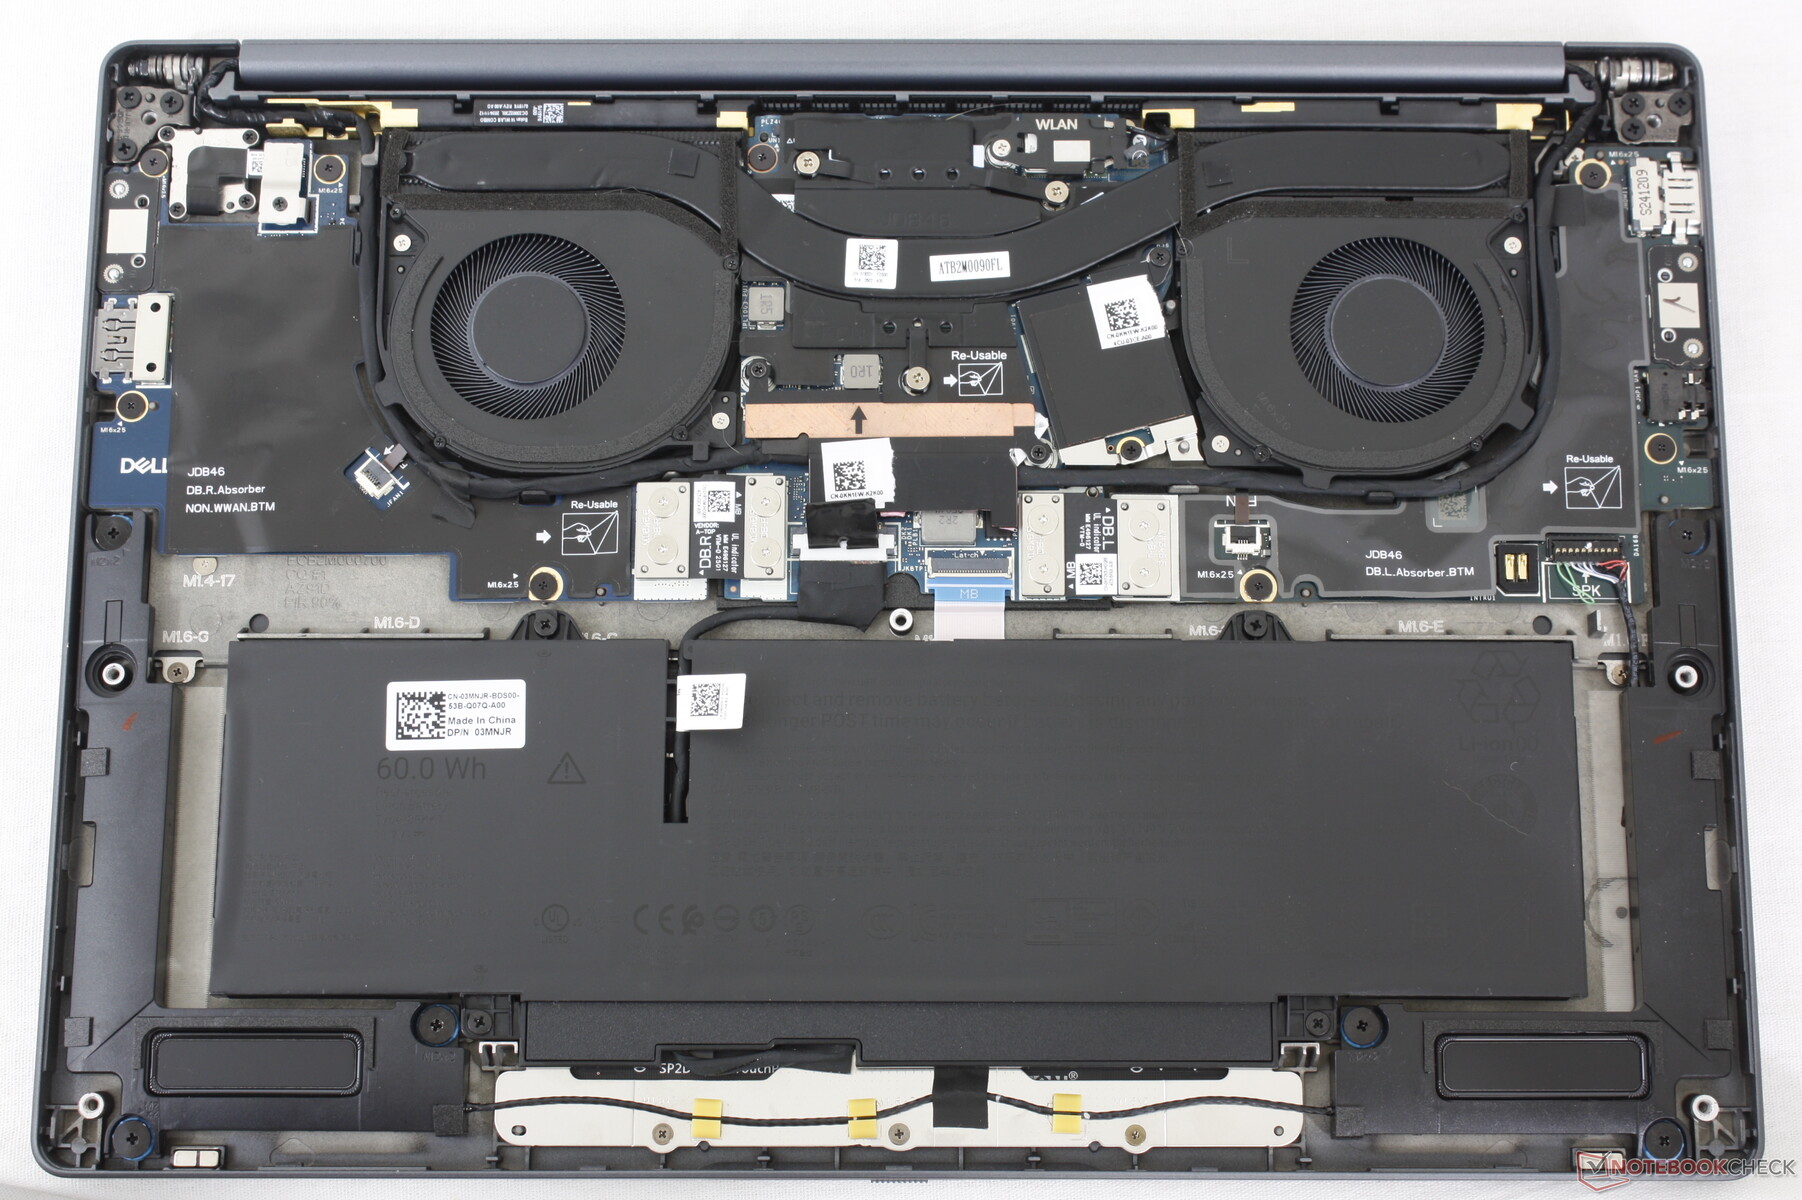
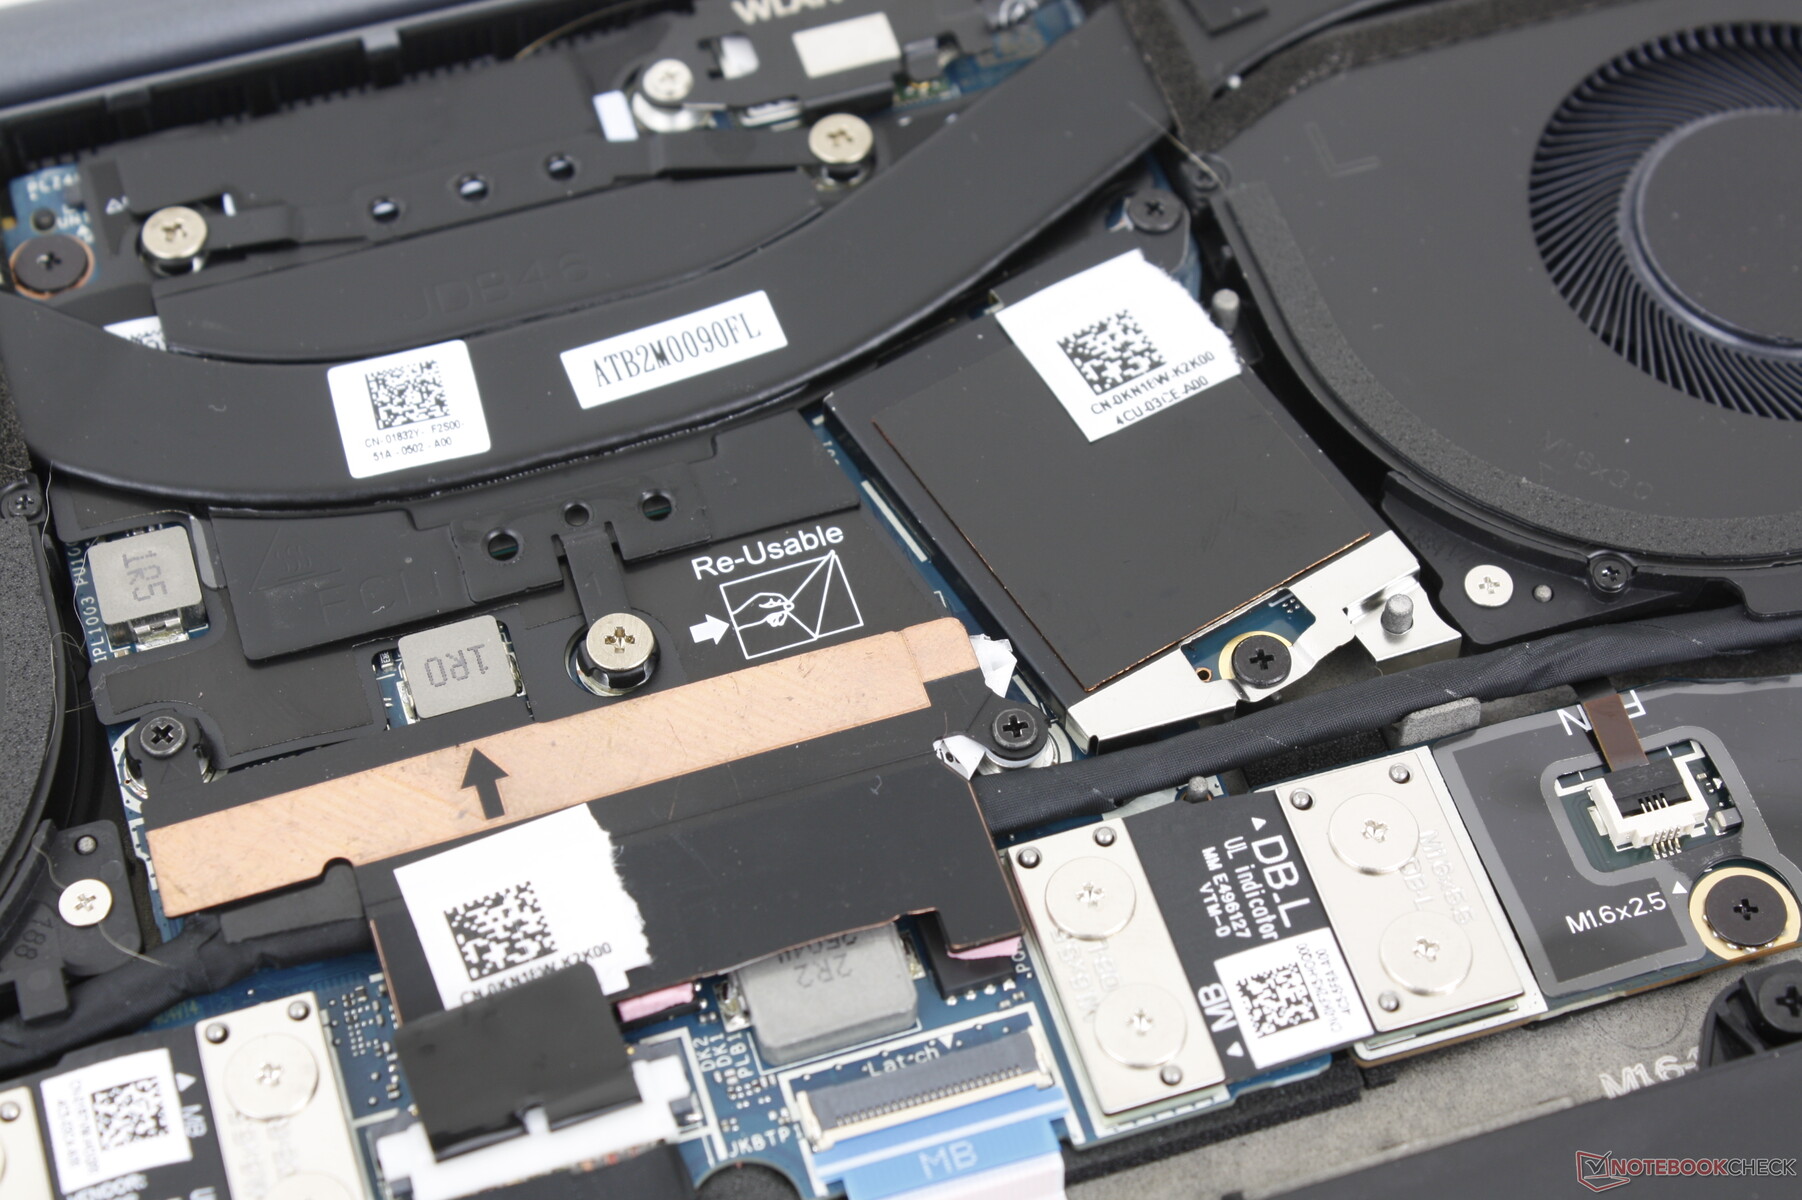
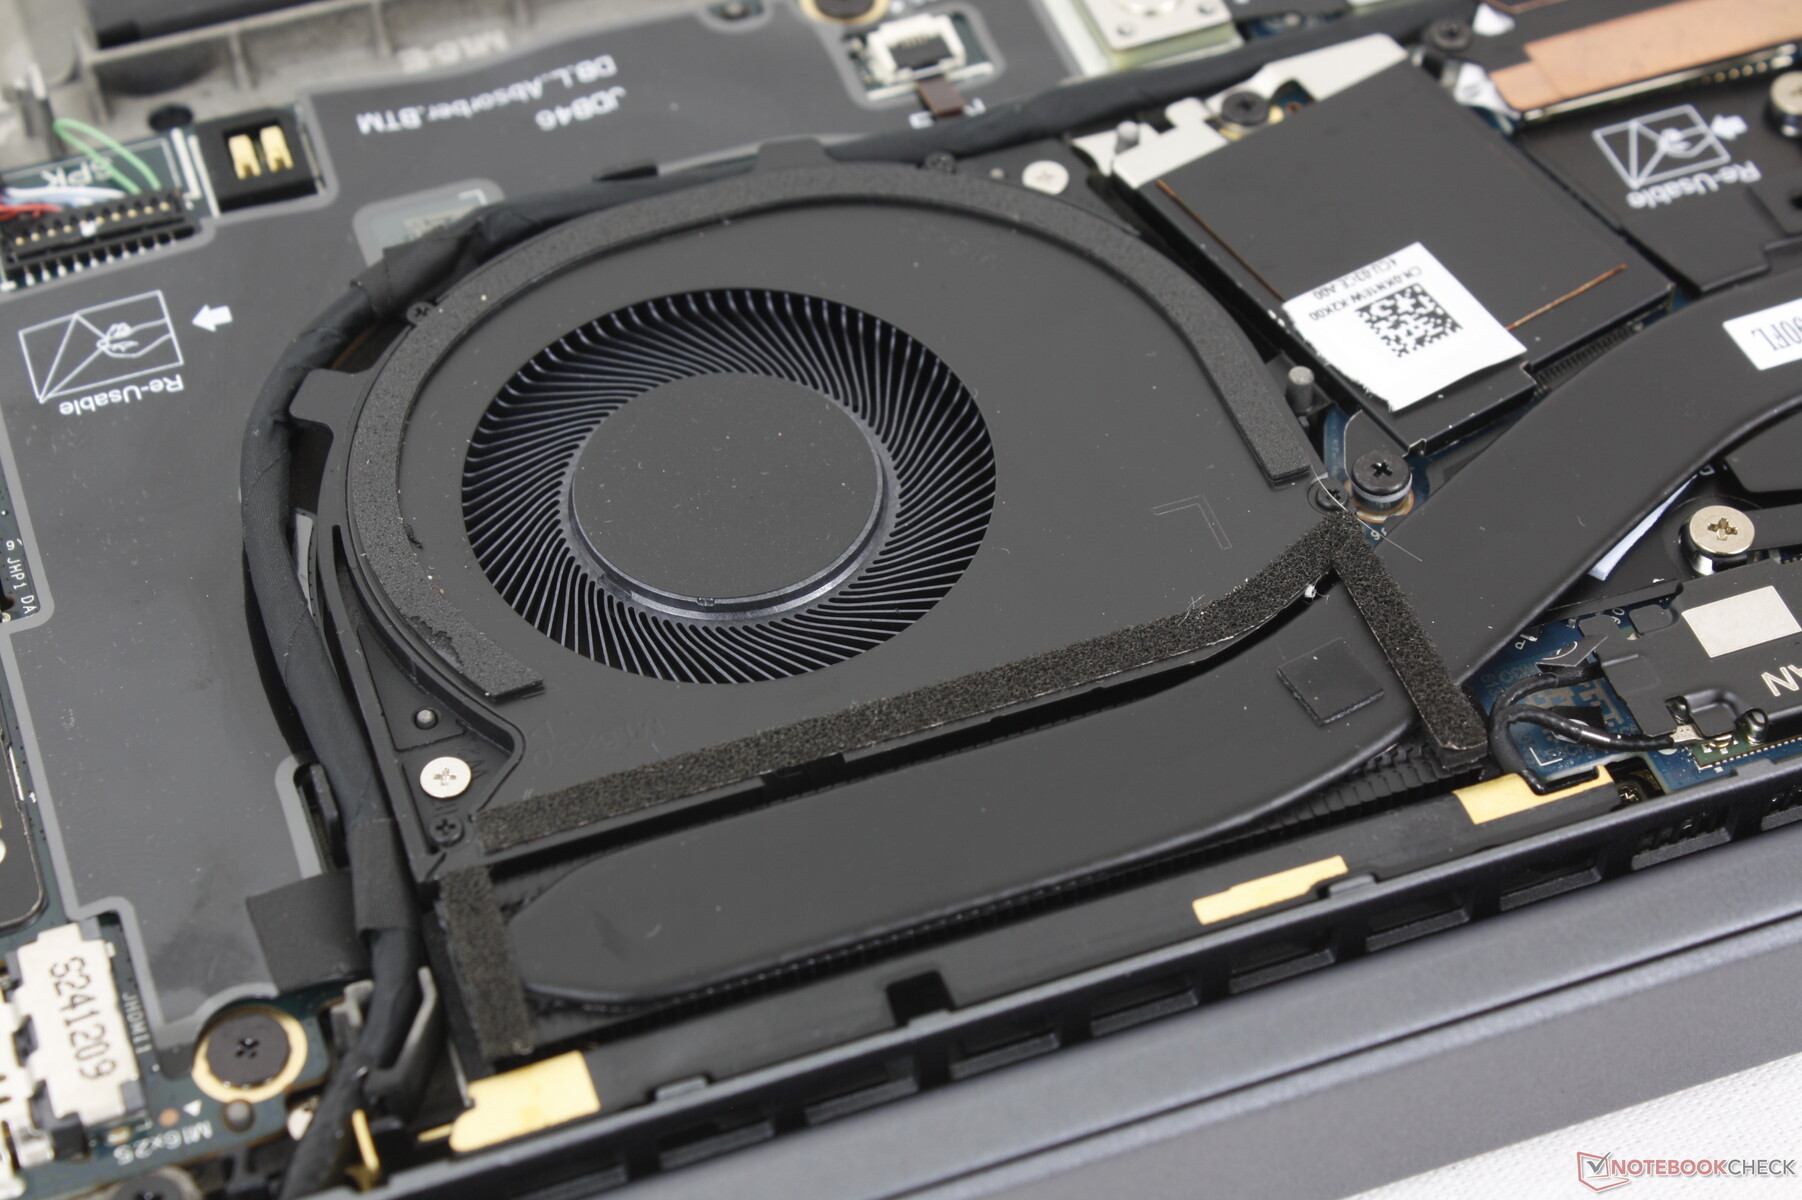
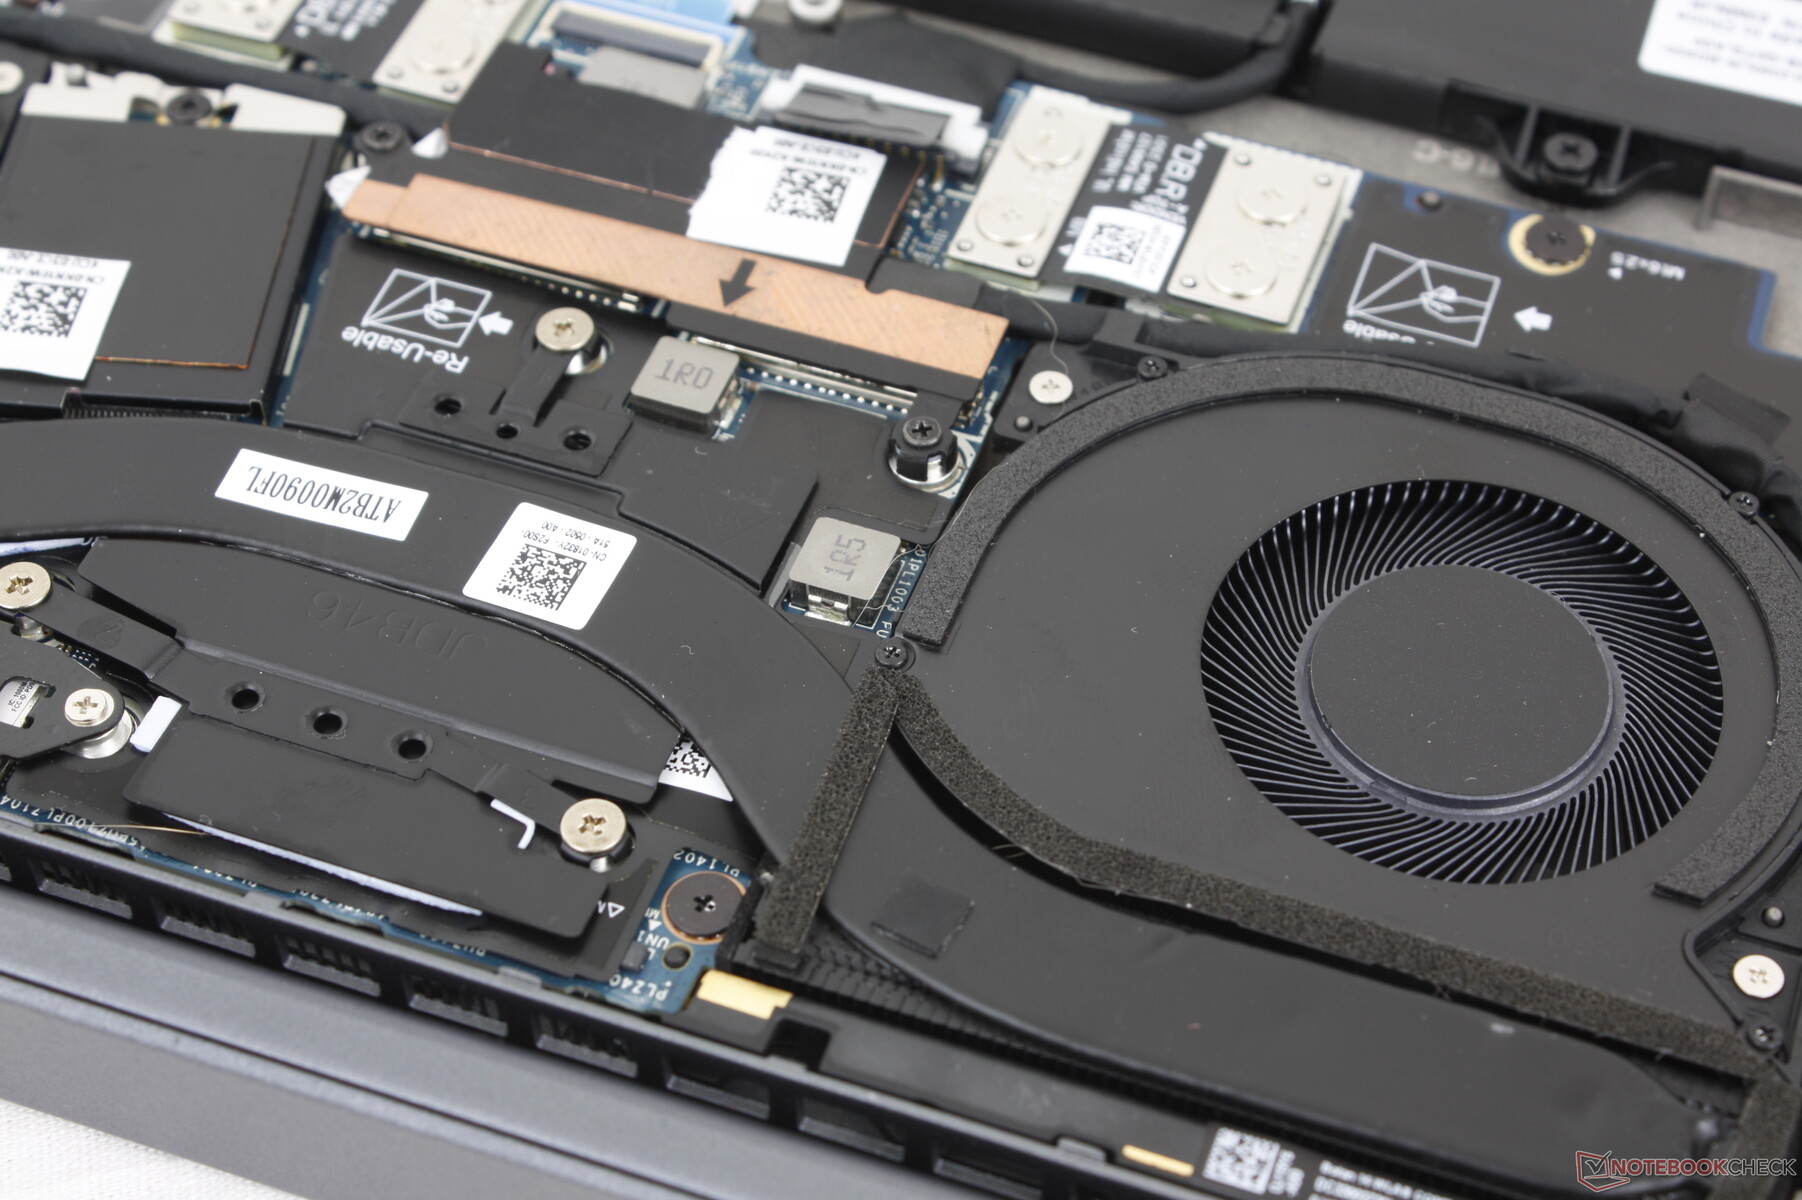
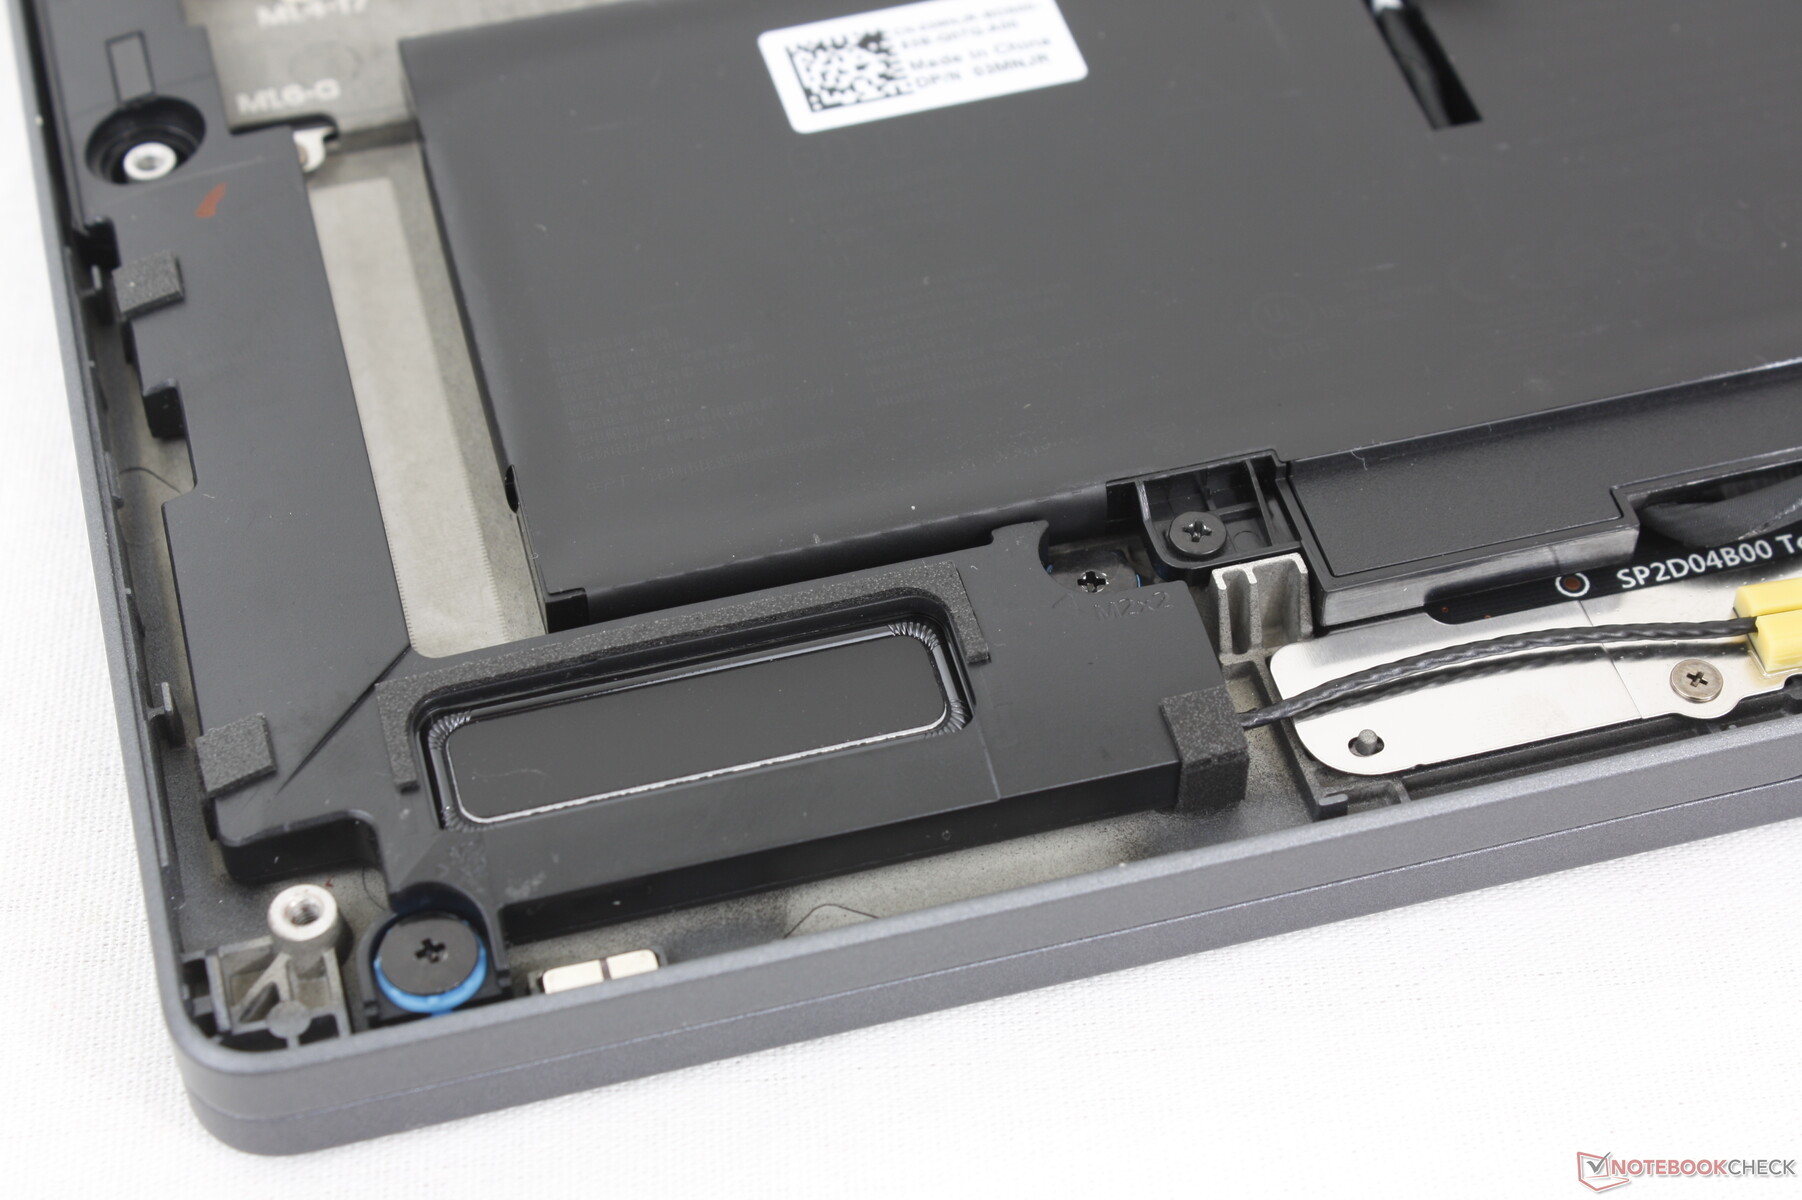
Maintenance
The bottom panel is secured by seven Phillips screws for easy servicing. Once inside, only the battery and primary M.2 SSD are removable as the WLAN and RAM modules are soldered. Note that the dual fans are slightly larger than the ones for the Latitude 9440 2-in-1.
Sustainability
This is one of the first business PCs to ship with modular USB-C ports designed to be easily replaced if required. In comparison, USB-C ports are highly integrated onto the motherboards of most other laptops which can make repairs or replacements more difficult should they ever break.
The model itself consists of 90 percent recycled magnesium by weight while the packaging consists of 100 percent recycled or renewed materials.
Accessories And Warranty
There are no extras in the retail box aside form the AC adapter and paperwork. A 3-year warranty with next business day on-site repair comes standard.
Input Devices
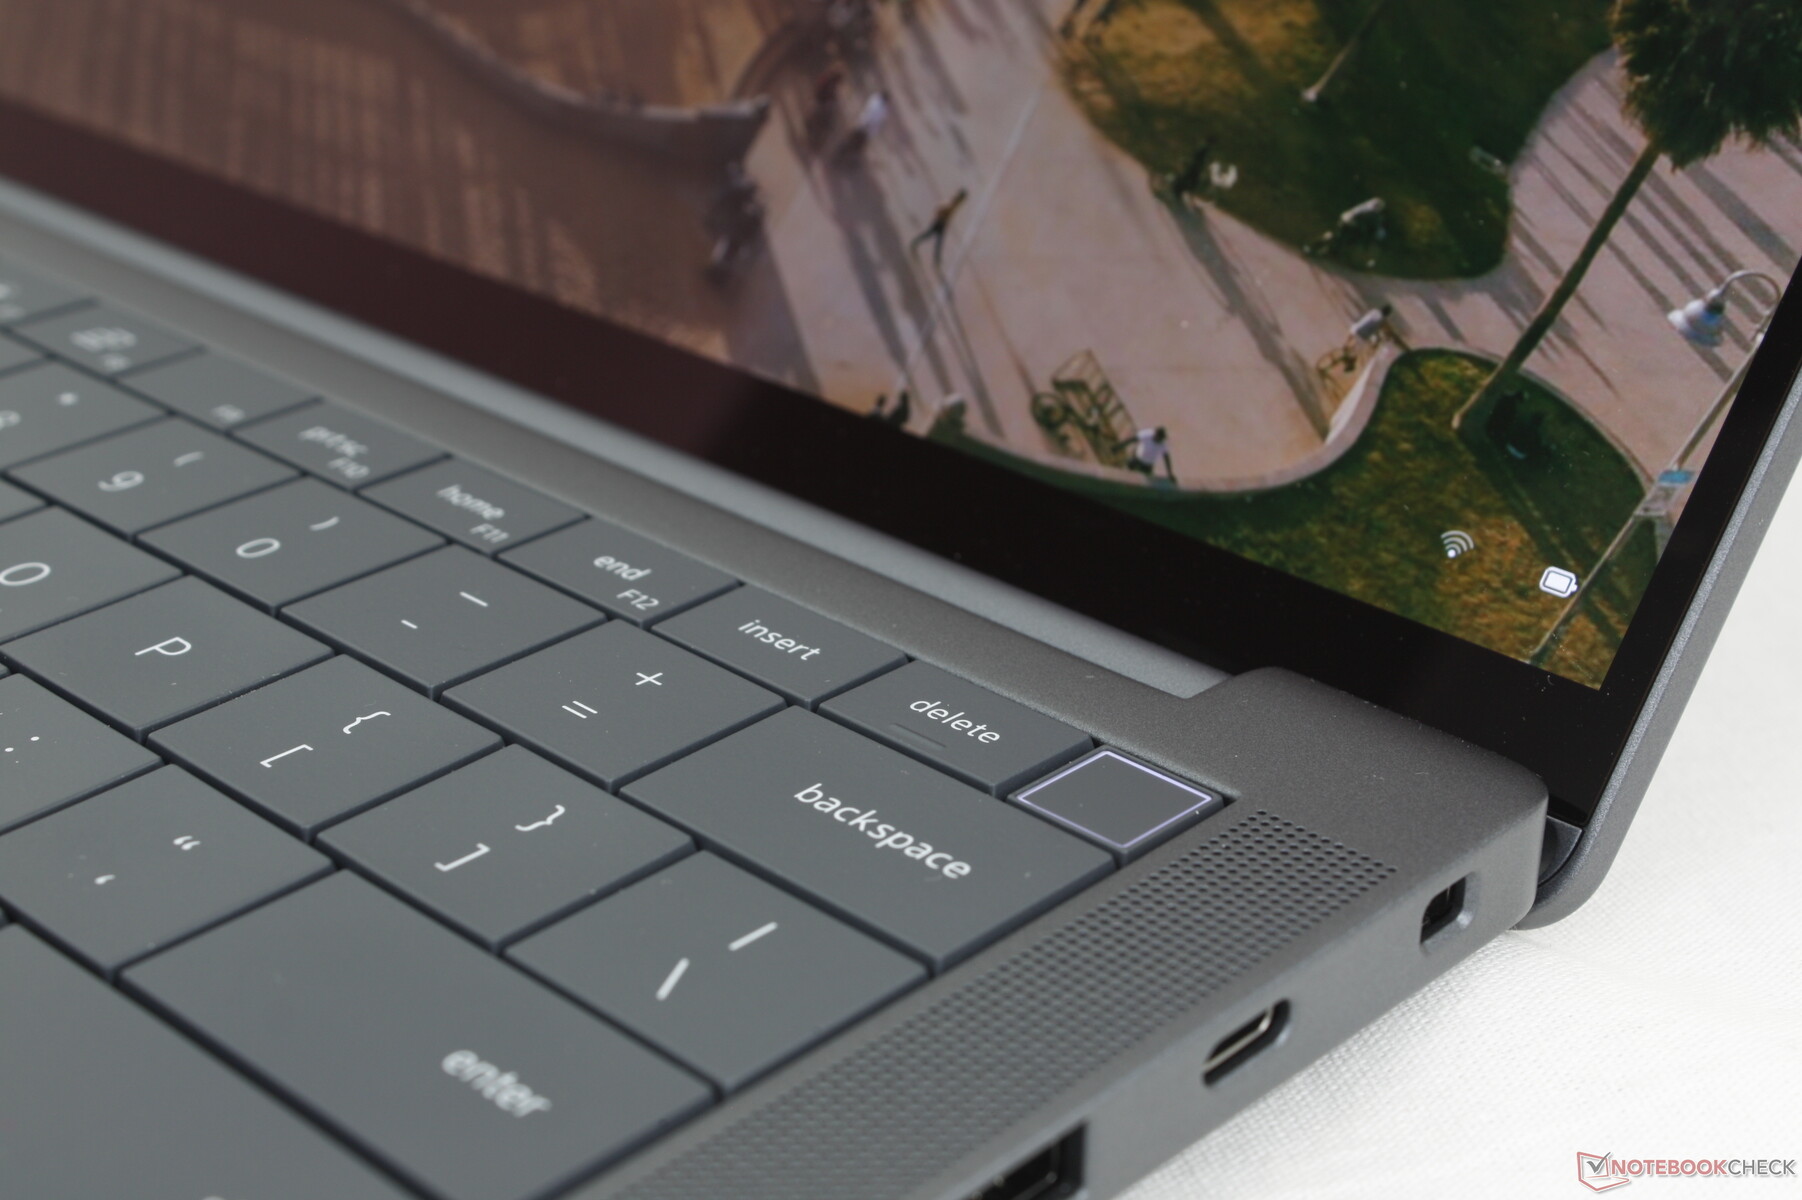
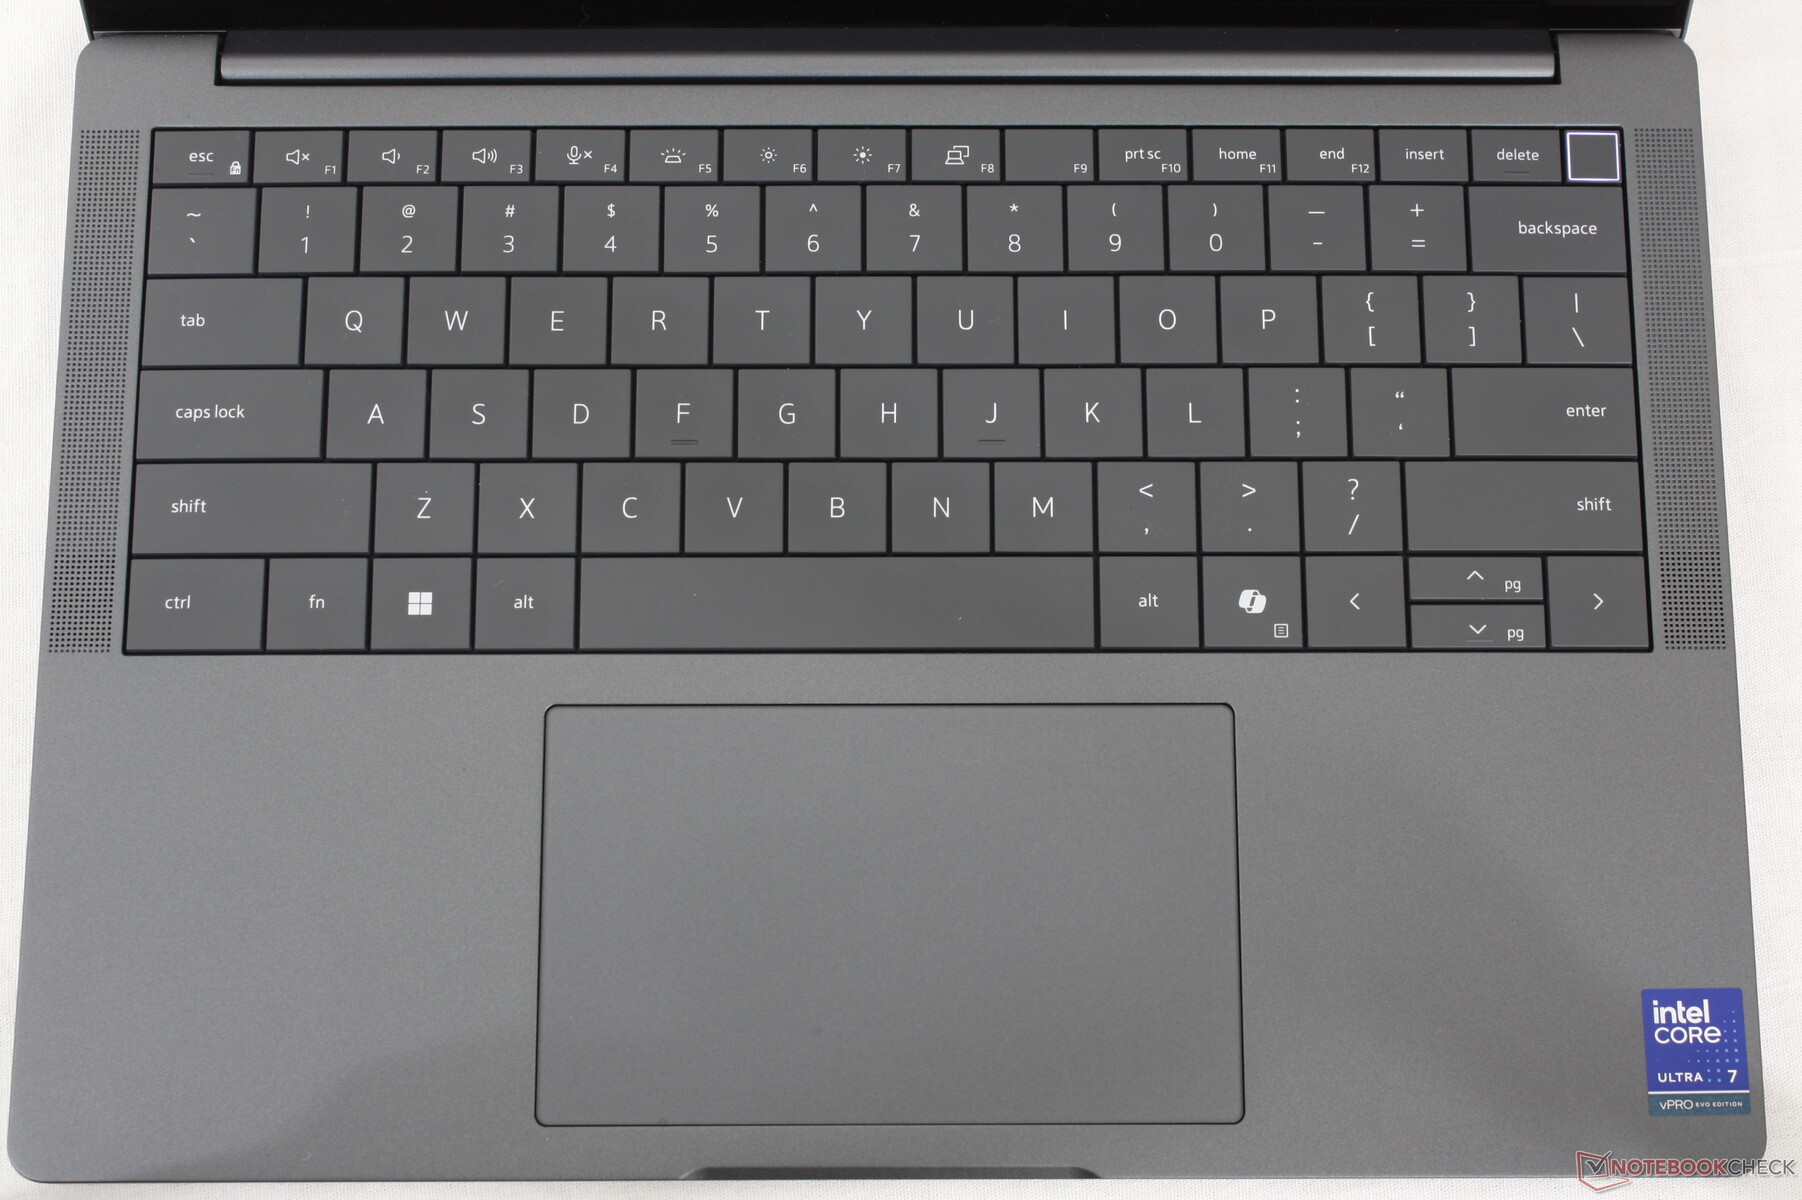
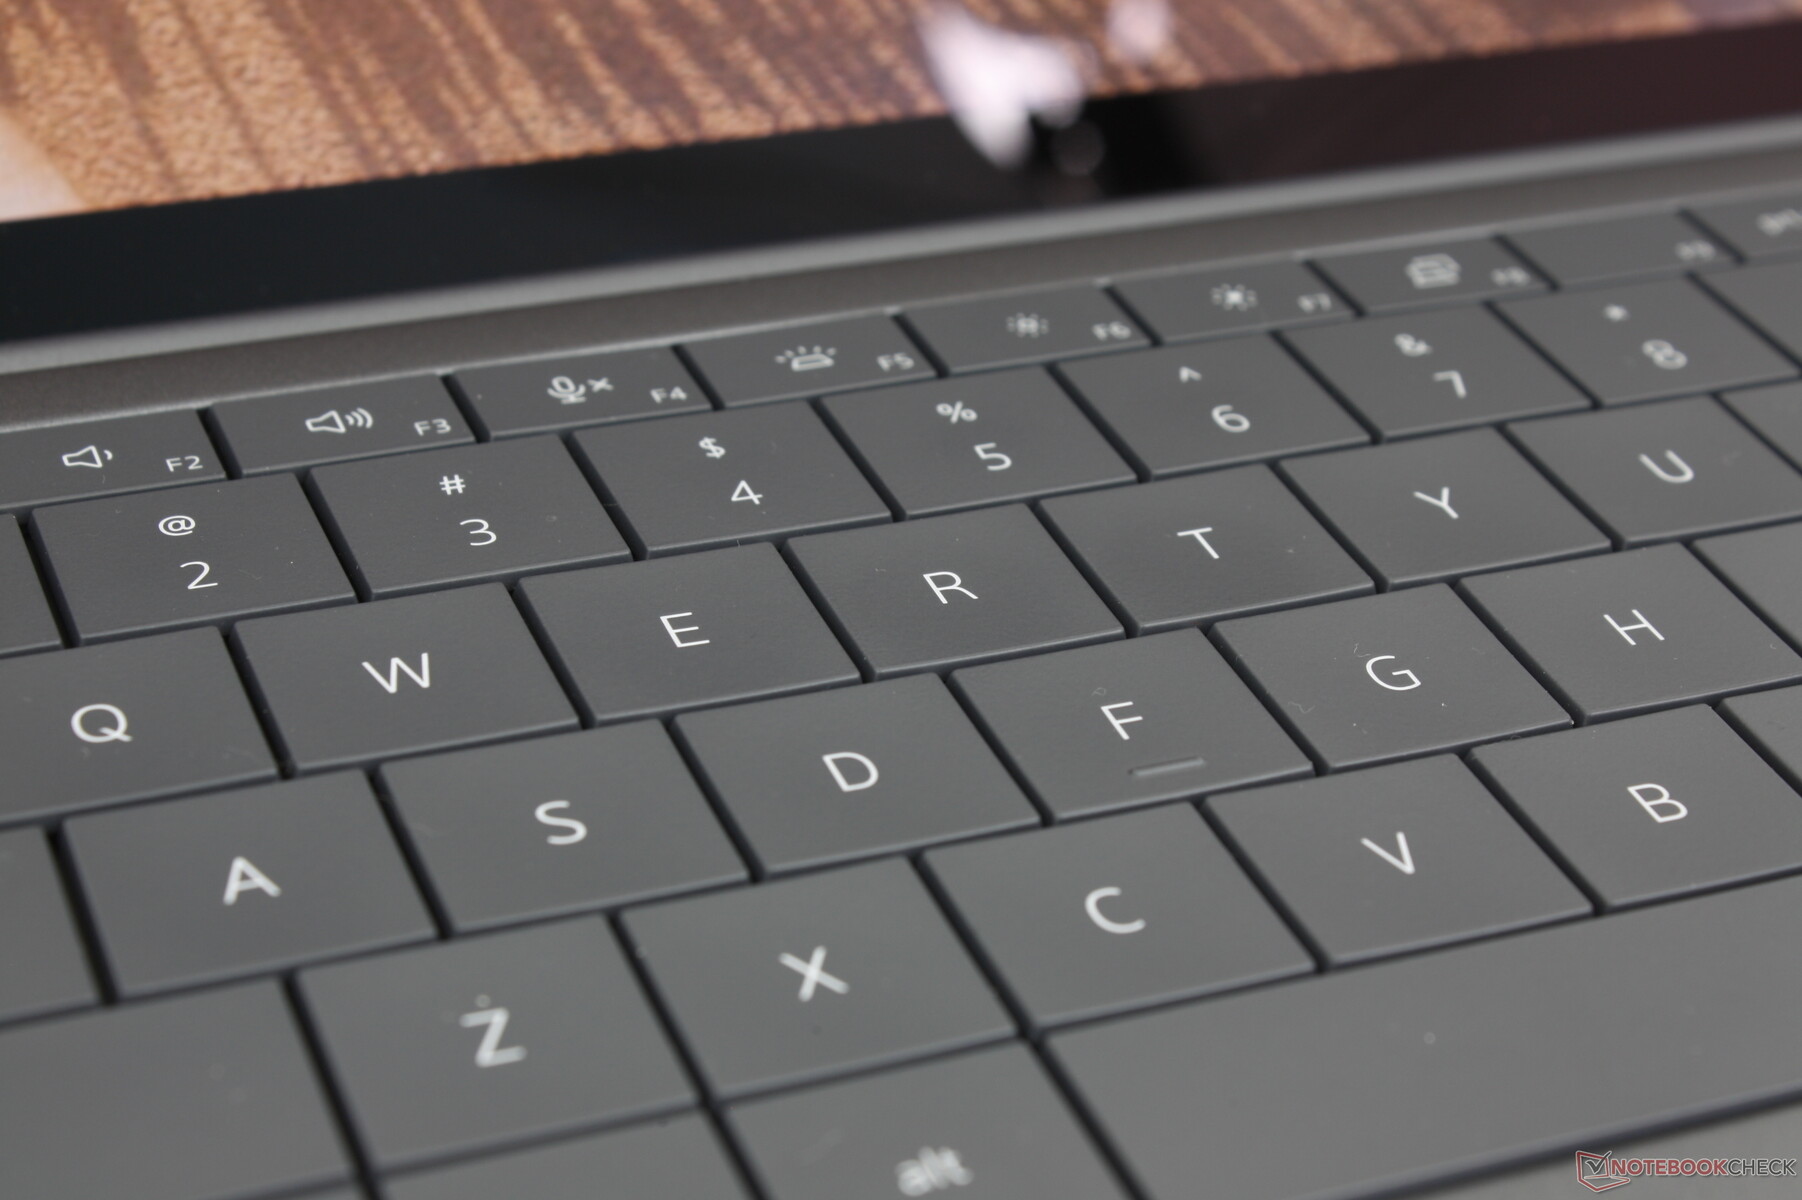
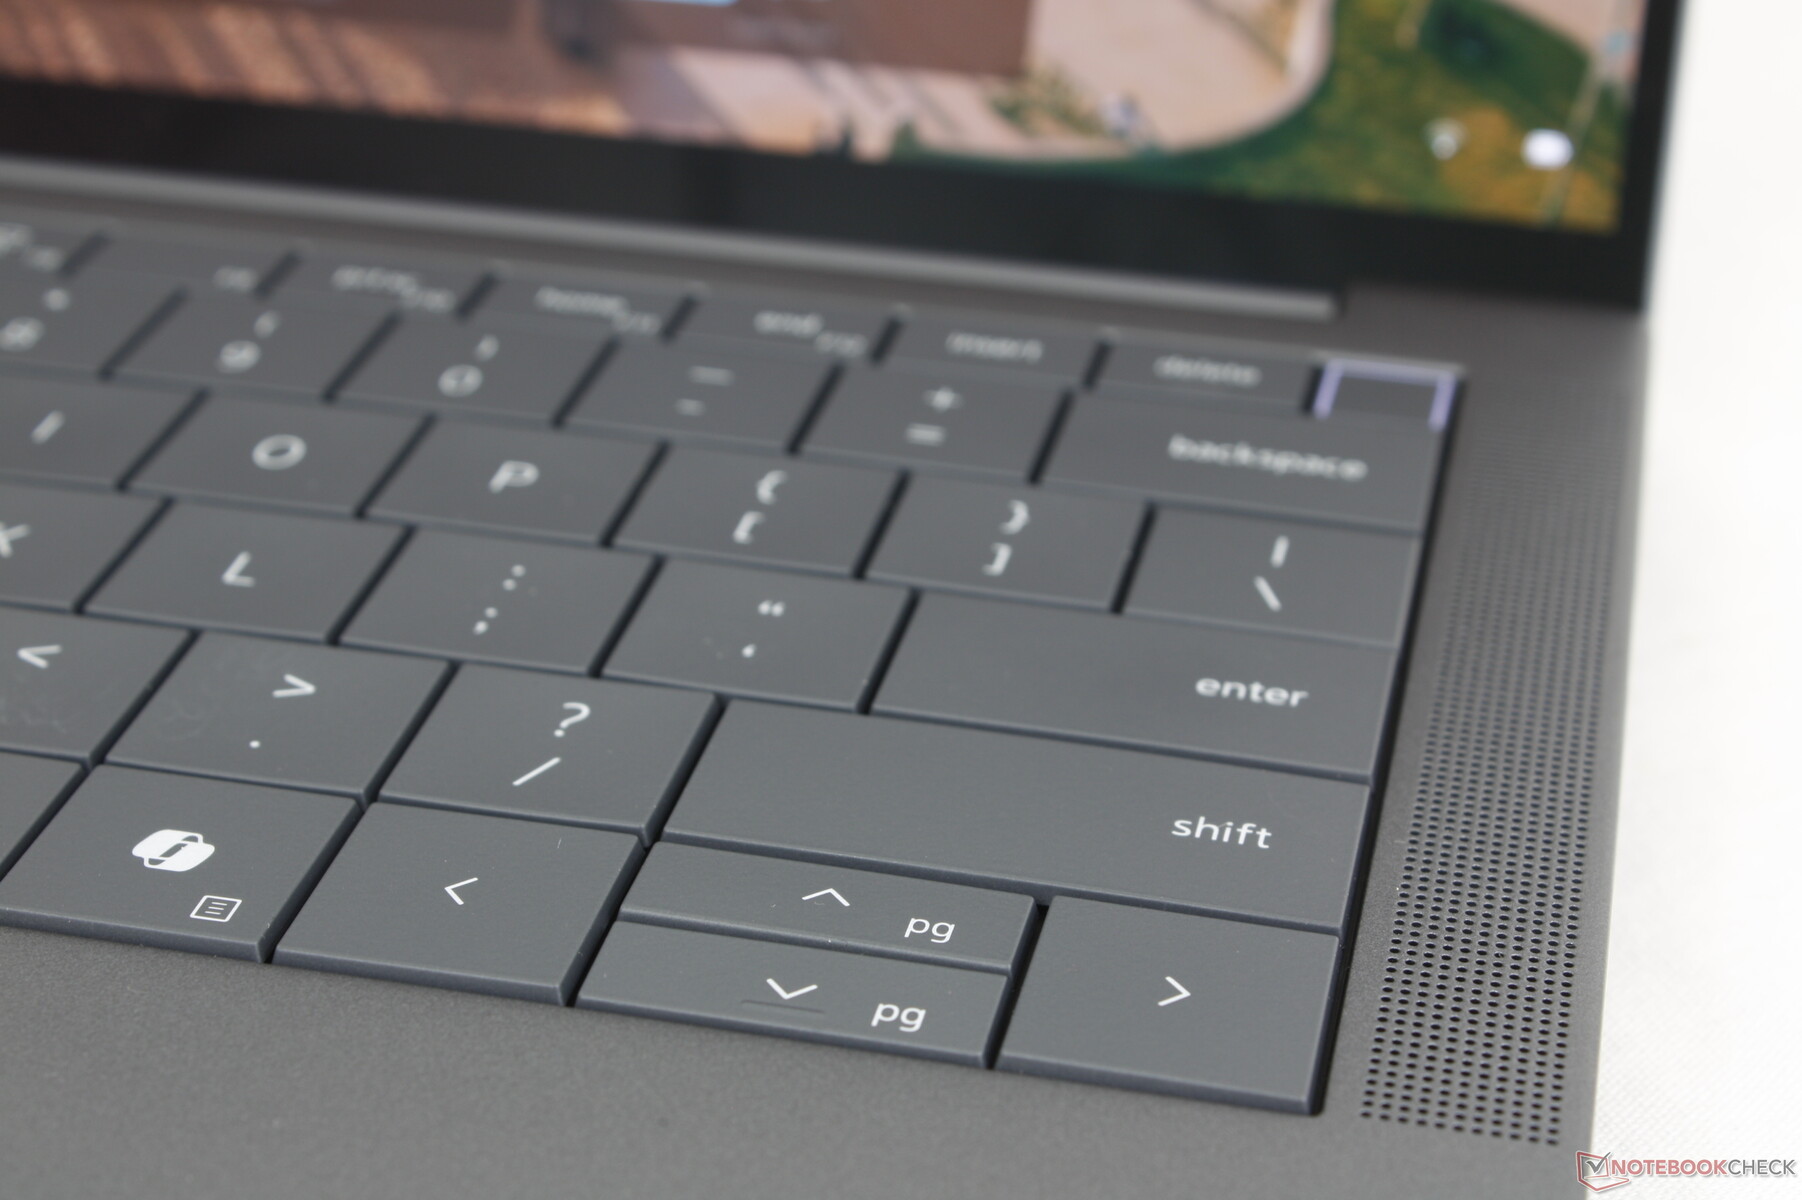
Keyboard
The zero-lattice keyboard is exactly the same here as it was on the Latitude 9440 2-in-1 for an identical typing experience. While aesthetically appealing, feedback could have been greater for the Enter key while travel is arguably on the shallow side.
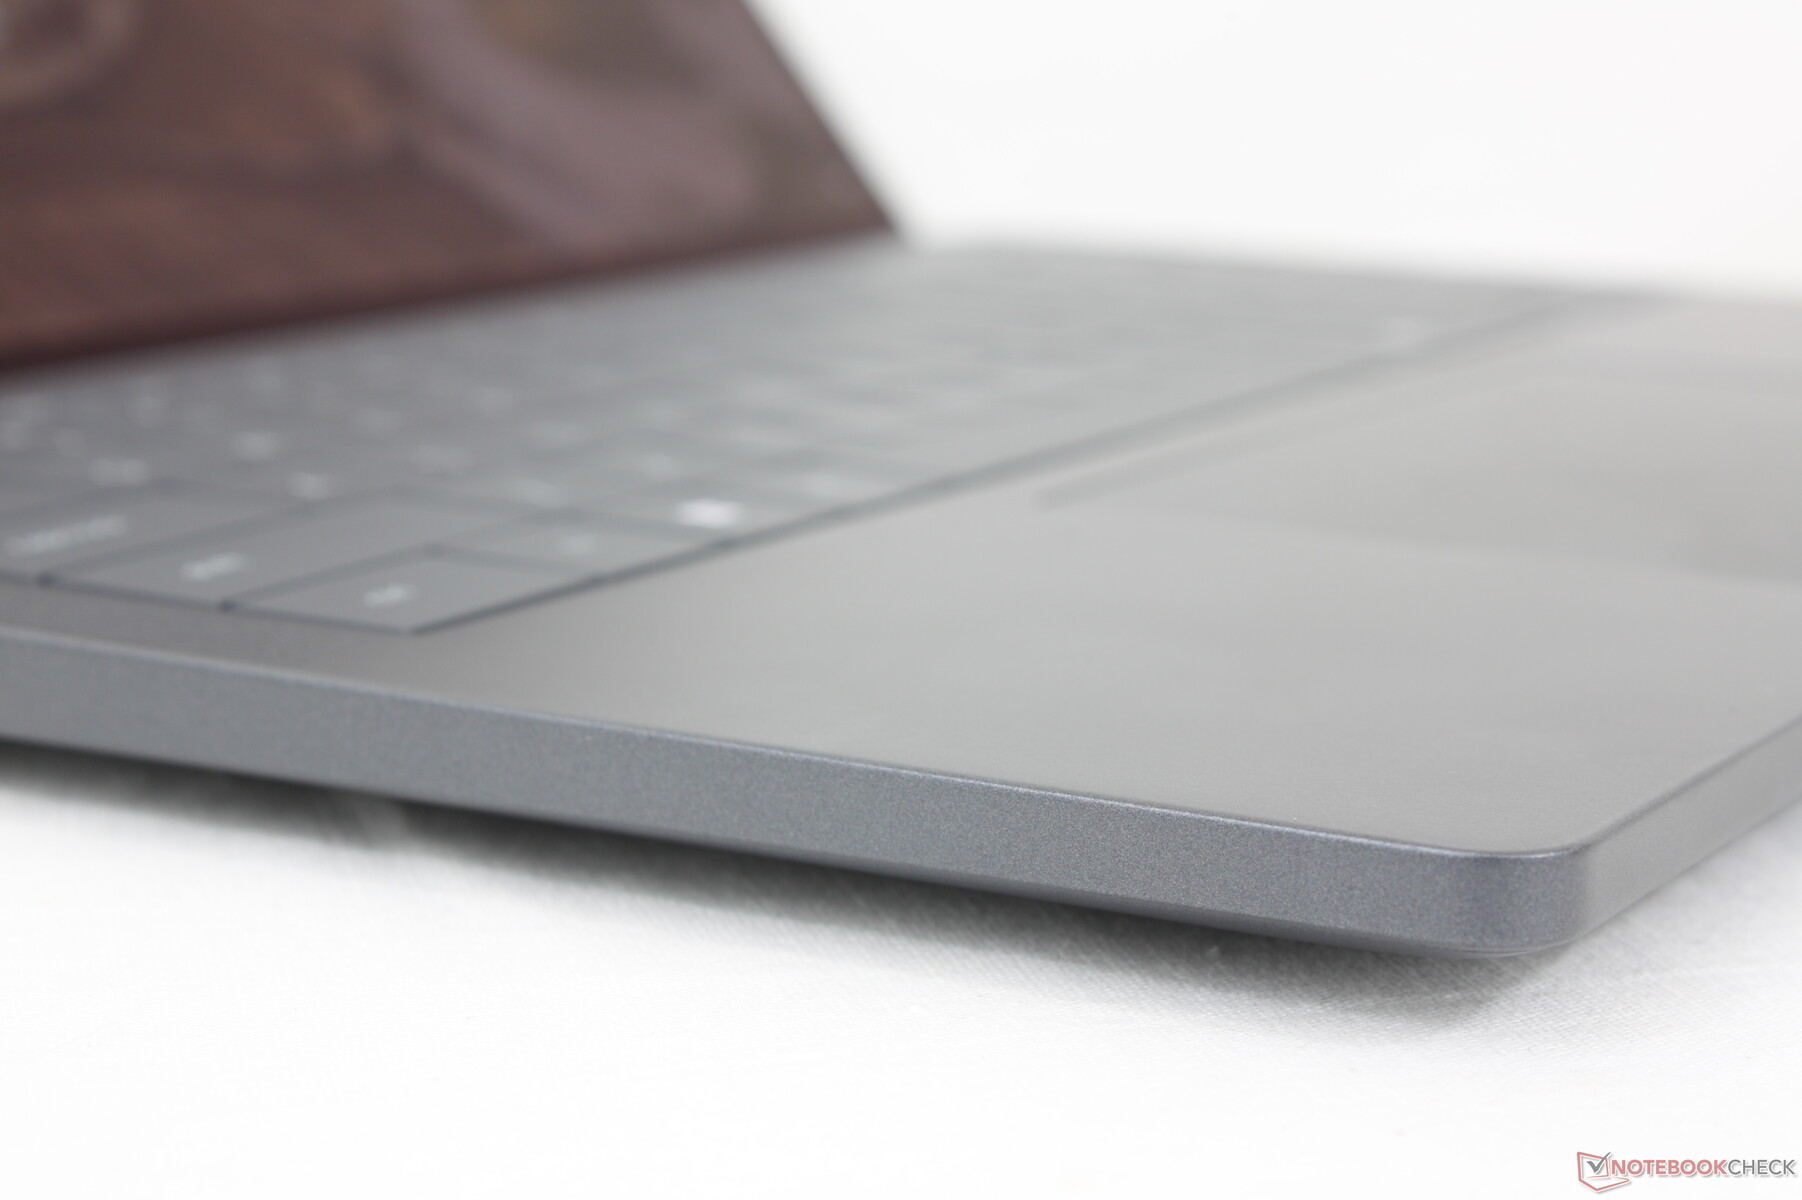
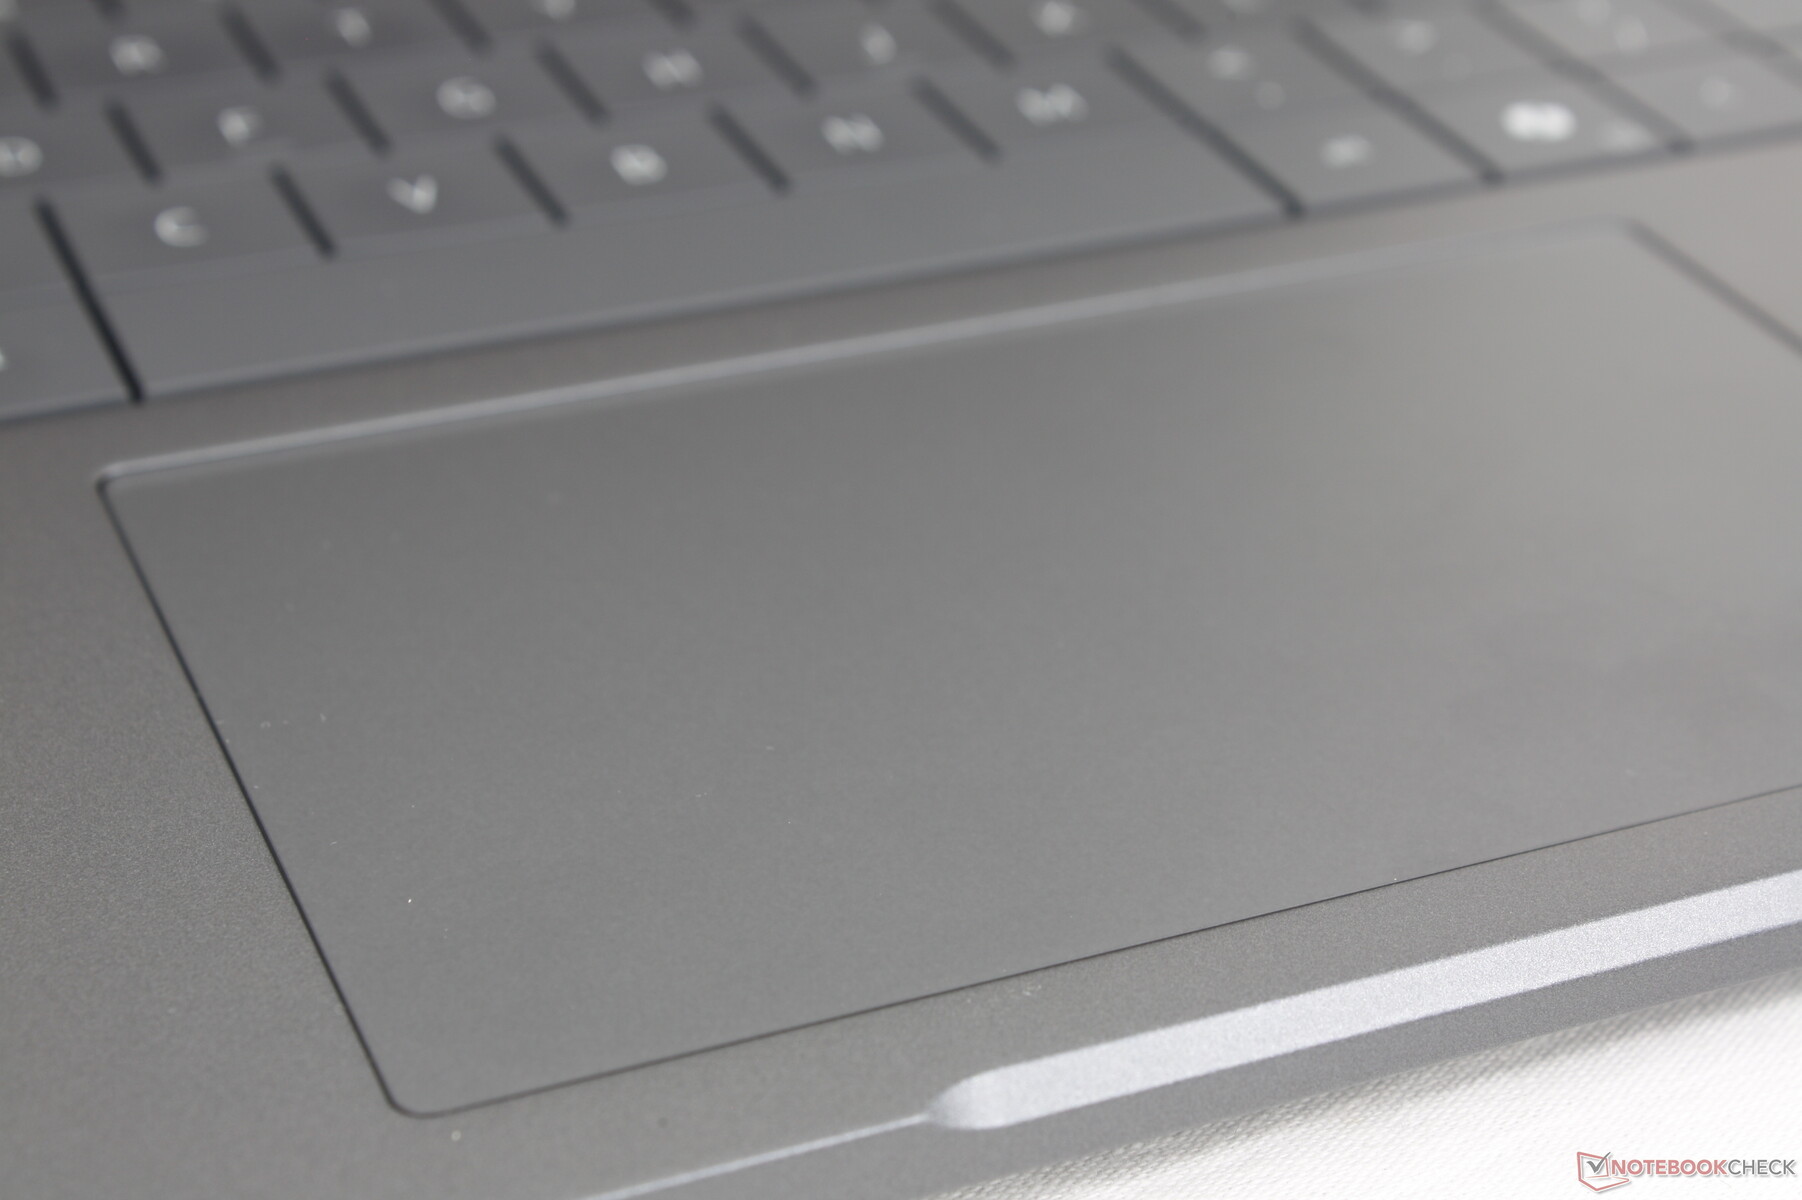
Touchpad
The clickpad has changed from the Latitude 9440 2-in-1 to appear more traditional. It's slightly smaller as a result (12.5 x 7.5 cm vs. 13.5 x 9 cm) and so it feels a bit more cramped than before, but it otherwise functions without issues. Clatter is notably very quiet and arguably on the spongy side when pushing down on its surface.
Display — Beautiful OLED But Only 60 Hz
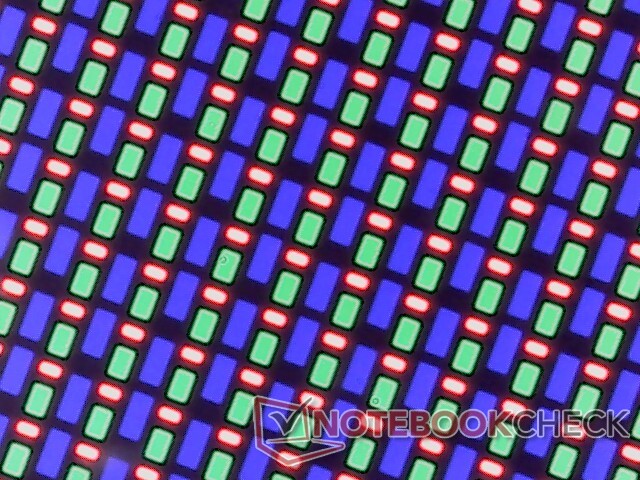
The 1800p OLED touchscreen is a unique feature of the model that wasn't available on previous generation Latitude 14 options. It offers the usual benefits over the base IPS configuration like deeper colors, pitch-black contrast ratio, HDR support, higher resolution, and faster black-white response times for a much better viewing experience.
The main drawbacks of the display are the base 60 Hz refresh rate and just average brightness for an OLED panel. In comparison, the OLED option for the XPS 14 has a smoother 120 Hz refresh rate while competing models like the Lenovo ThinkPad T14s or MacBook Pro 14 each have brighter displays. Maximum brightness is limited to 400 nits on SDR mode or 512 nits on HDR mode according to our measurements.

| |||||||||||||||||||||||||
Brightness Distribution: 95 %
Center on Battery: 392.3 cd/m²
Contrast: ∞:1 (Black: 0 cd/m²)
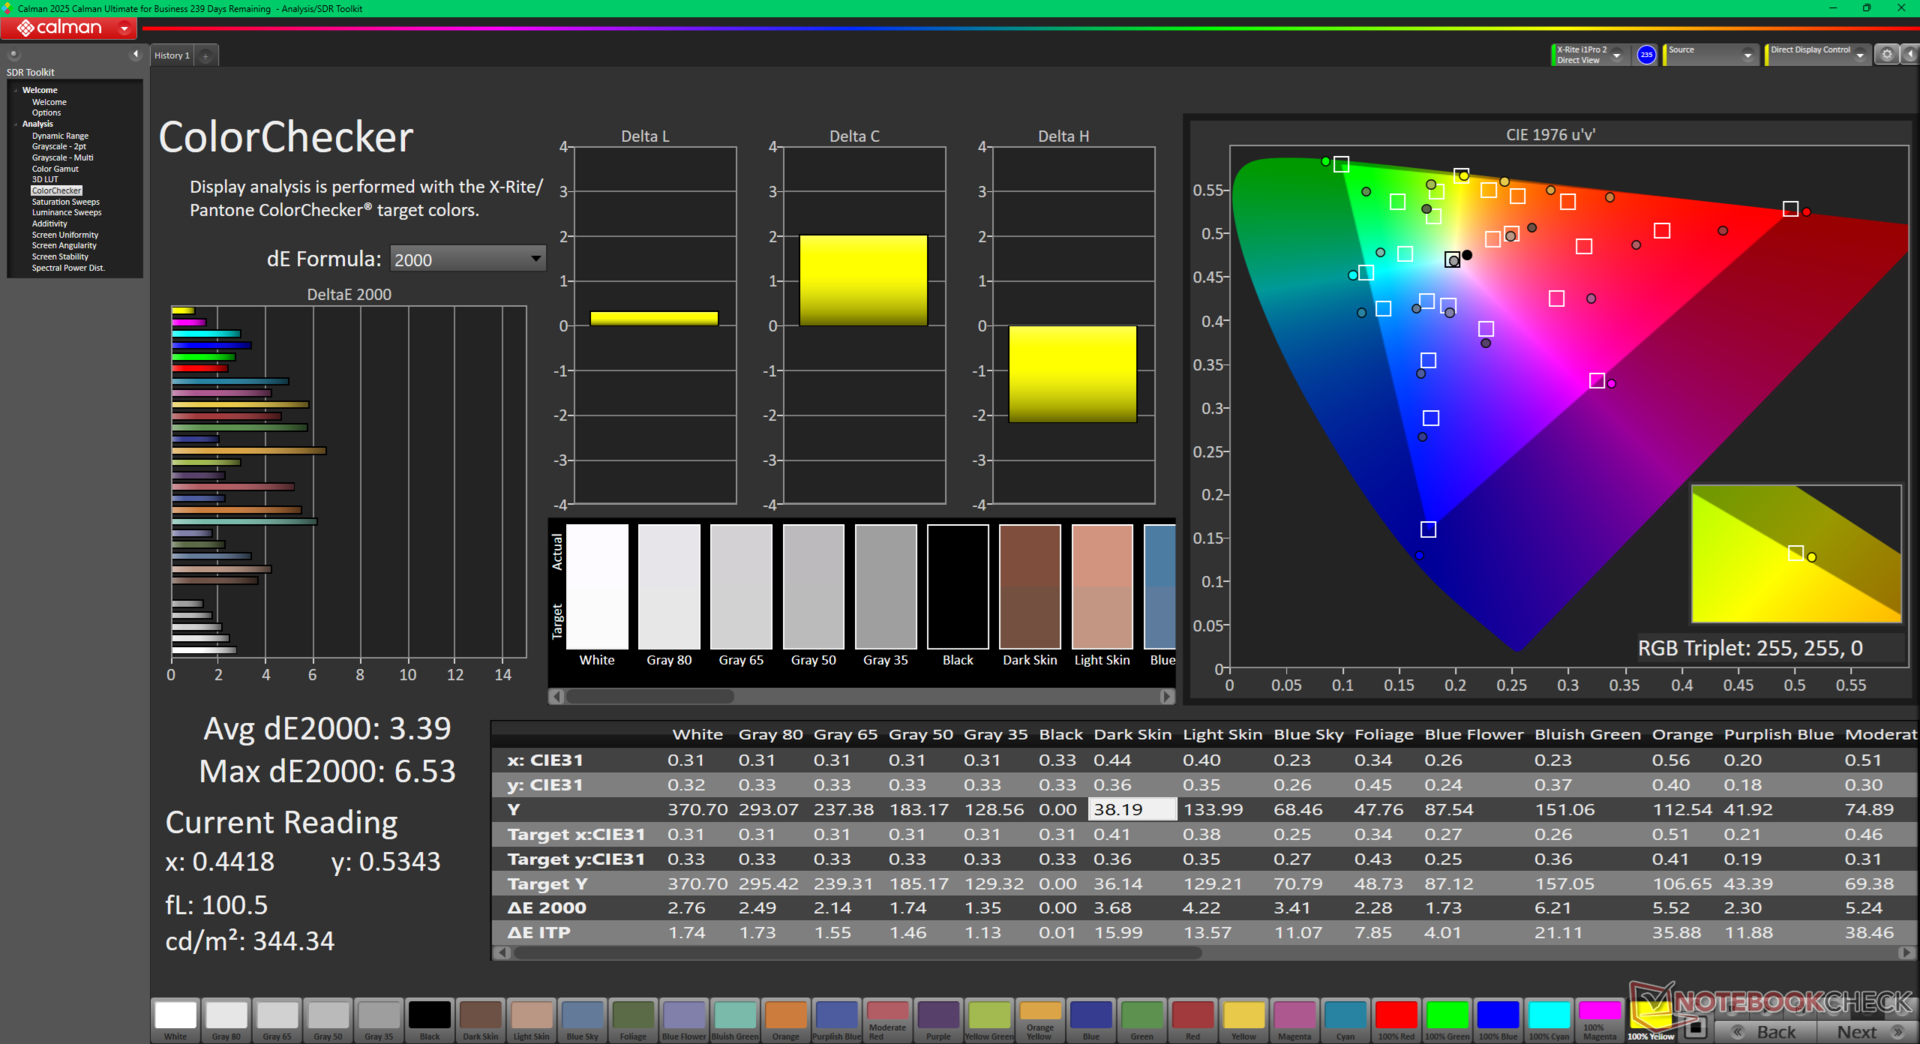
ΔE ColorChecker Calman: 3.39 | ∀{0.5-29.43 Ø4.73}
calibrated: 0.99
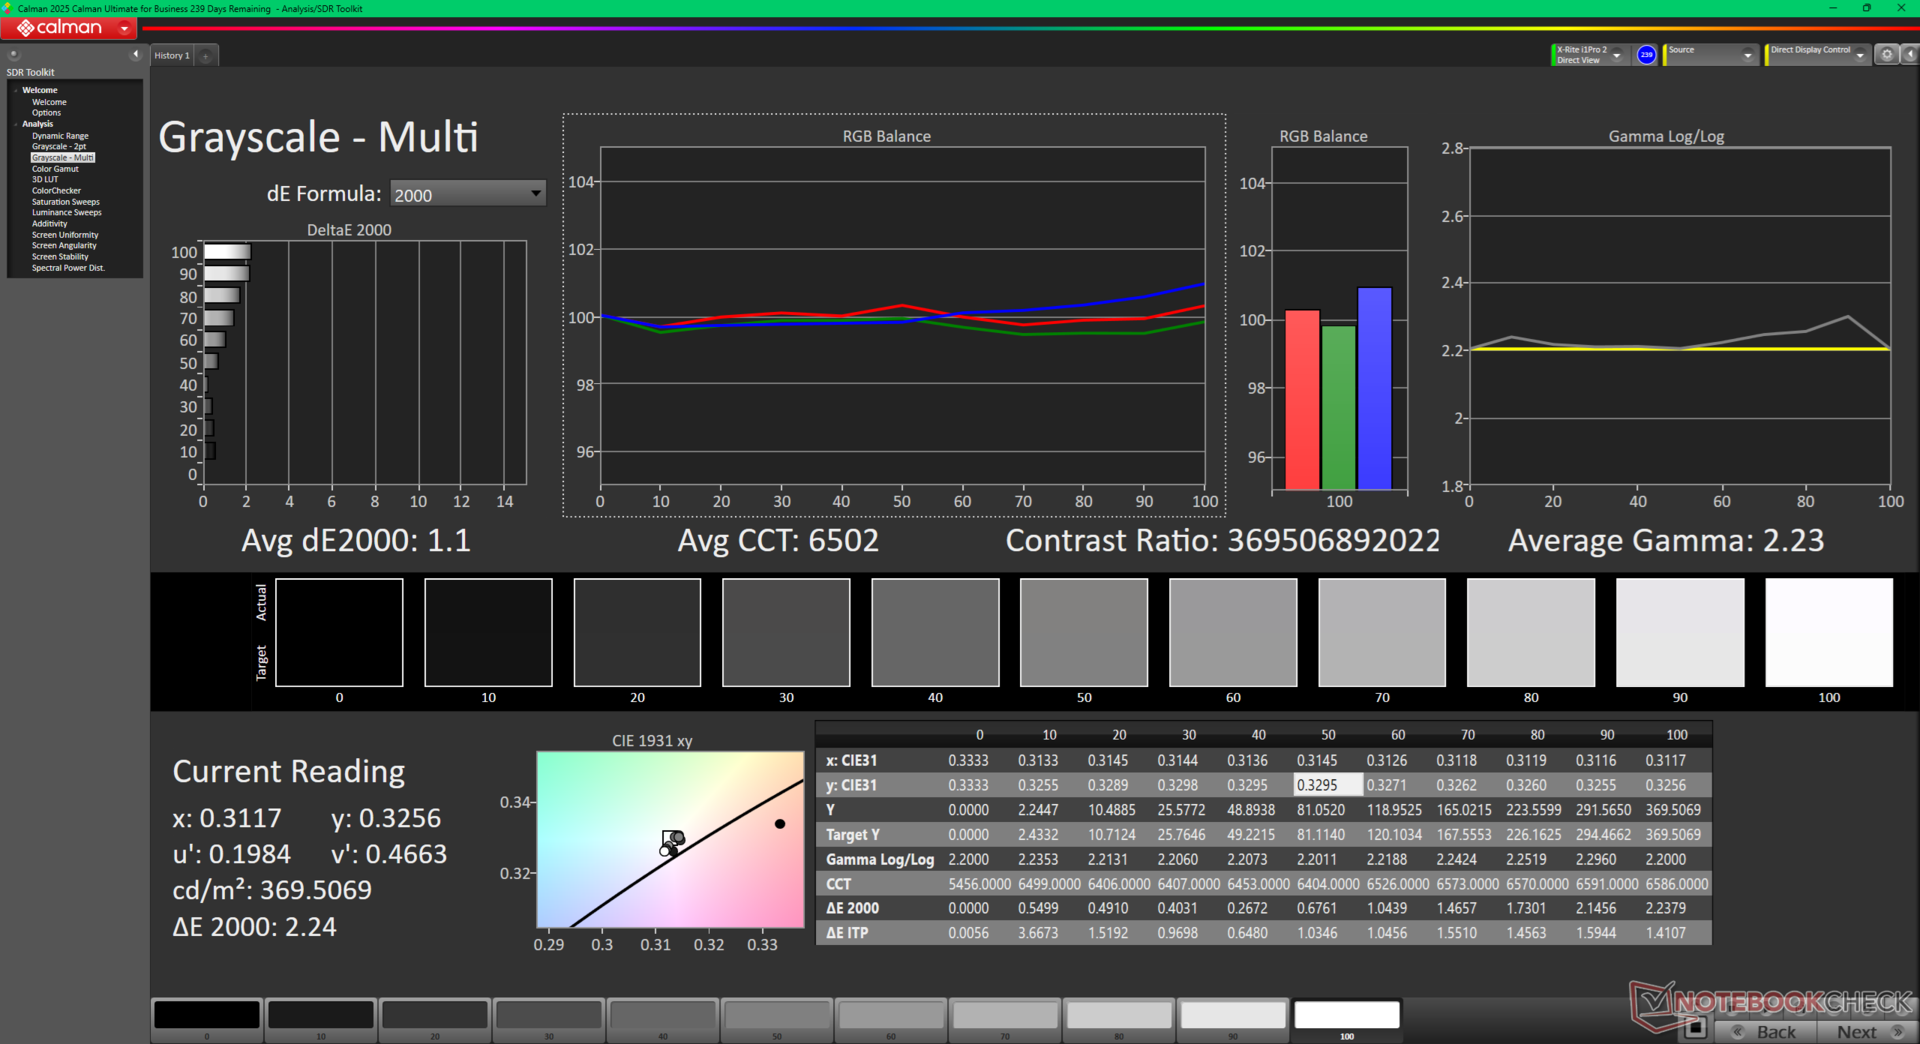
ΔE Greyscale Calman: 1.1 | ∀{0.09-98 Ø4.97}
95.8% AdobeRGB 1998 (Argyll 3D)
100% sRGB (Argyll 3D)
99% Display P3 (Argyll 3D)
Gamma: 2.23
CCT: 6502 K
| Dell Pro 14 Premium LG Phillips 140WT1, OLED, 2880x1800, 14", 60 Hz | Dell Latitude 7440 AU Optronics B140QAX, IPS, 2560x1600, 14", 60 Hz | Dell XPS 14 2024 OLED SDC41A2, OLED, 3200x2000, 14.5", 120 Hz | Lenovo ThinkPad T14s Gen 6 Intel B140UAN02.7, IPS LED, 1920x1200, 14", 60 Hz | HP EliteBook Ultra G1i 14 SDC41AA, OLED, 2880x1800, 14", 120 Hz | Asus ExpertBook B1 B1403CVA MNE001BS1-4, IPS, 1920x1080, 14", 60 Hz | |
|---|---|---|---|---|---|---|
| Display | -15% | -3% | -14% | 1% | -53% | |
| Display P3 Coverage (%) | 99 | 75.4 -24% | 98.5 -1% | 76.6 -23% | 99.7 1% | 39.6 -60% |
| sRGB Coverage (%) | 100 | 99.9 0% | 100 0% | 97 -3% | 100 0% | 58.9 -41% |
| AdobeRGB 1998 Coverage (%) | 95.8 | 76.2 -20% | 87.2 -9% | 80.7 -16% | 98 2% | 40.9 -57% |
| Response Times | -2471% | 61% | -1676% | 47% | -1135% | |
| Response Time Grey 50% / Grey 80% * (ms) | 1.4 ? | 56 ? -3900% | 0.7 ? 50% | 36.8 ? -2529% | 0.74 ? 47% | 26.6 ? -1800% |
| Response Time Black / White * (ms) | 2.7 ? | 30.8 ? -1041% | 0.77 ? 71% | 24.9 ? -822% | 0.7 ? 74% | 15.4 ? -470% |
| PWM Frequency (Hz) | 241.1 ? | 480 | 480 ? | |||
| PWM Amplitude * (%) | 32 | 26 19% | ||||
| Screen | -54% | -9% | -59% | -8% | -172% | |
| Brightness middle (cd/m²) | 392.3 | 517.3 32% | 351 -11% | 509 30% | 392 0% | 331 -16% |
| Brightness (cd/m²) | 392 | 488 24% | 353 -10% | 475 21% | 378 -4% | 331 -16% |
| Brightness Distribution (%) | 95 | 88 -7% | 97 2% | 87 -8% | 95 0% | 91 -4% |
| Black Level * (cd/m²) | 0.34 | 0.26 | 0.23 | |||
| Colorchecker dE 2000 * | 3.39 | 3.3 3% | 1.7 50% | 3.2 6% | 2.4 29% | 6.8 -101% |
| Colorchecker dE 2000 max. * | 6.53 | 7.81 -20% | 2.2 66% | 7.7 -18% | 6.6 -1% | 19.9 -205% |
| Colorchecker dE 2000 calibrated * | 0.99 | 1.02 -3% | 0.8 19% | 1.7 -72% | 4.9 -395% | |
| Greyscale dE 2000 * | 1.1 | 5.6 -409% | 3.1 -182% | 5.2 -373% | 1.9 -73% | 6.2 -464% |
| Gamma | 2.23 99% | 2.37 93% | 2.12 104% | 2.2 100% | 2.21 100% | 2.22 99% |
| CCT | 6502 100% | 6804 96% | 6616 98% | 6702 97% | 6463 101% | 6387 102% |
| Contrast (:1) | 1521 | 1958 | 1439 | |||
| Total Average (Program / Settings) | -847% /
-447% | 16% /
4% | -583% /
-317% | 13% /
8% | -453% /
-302% |
* ... smaller is better
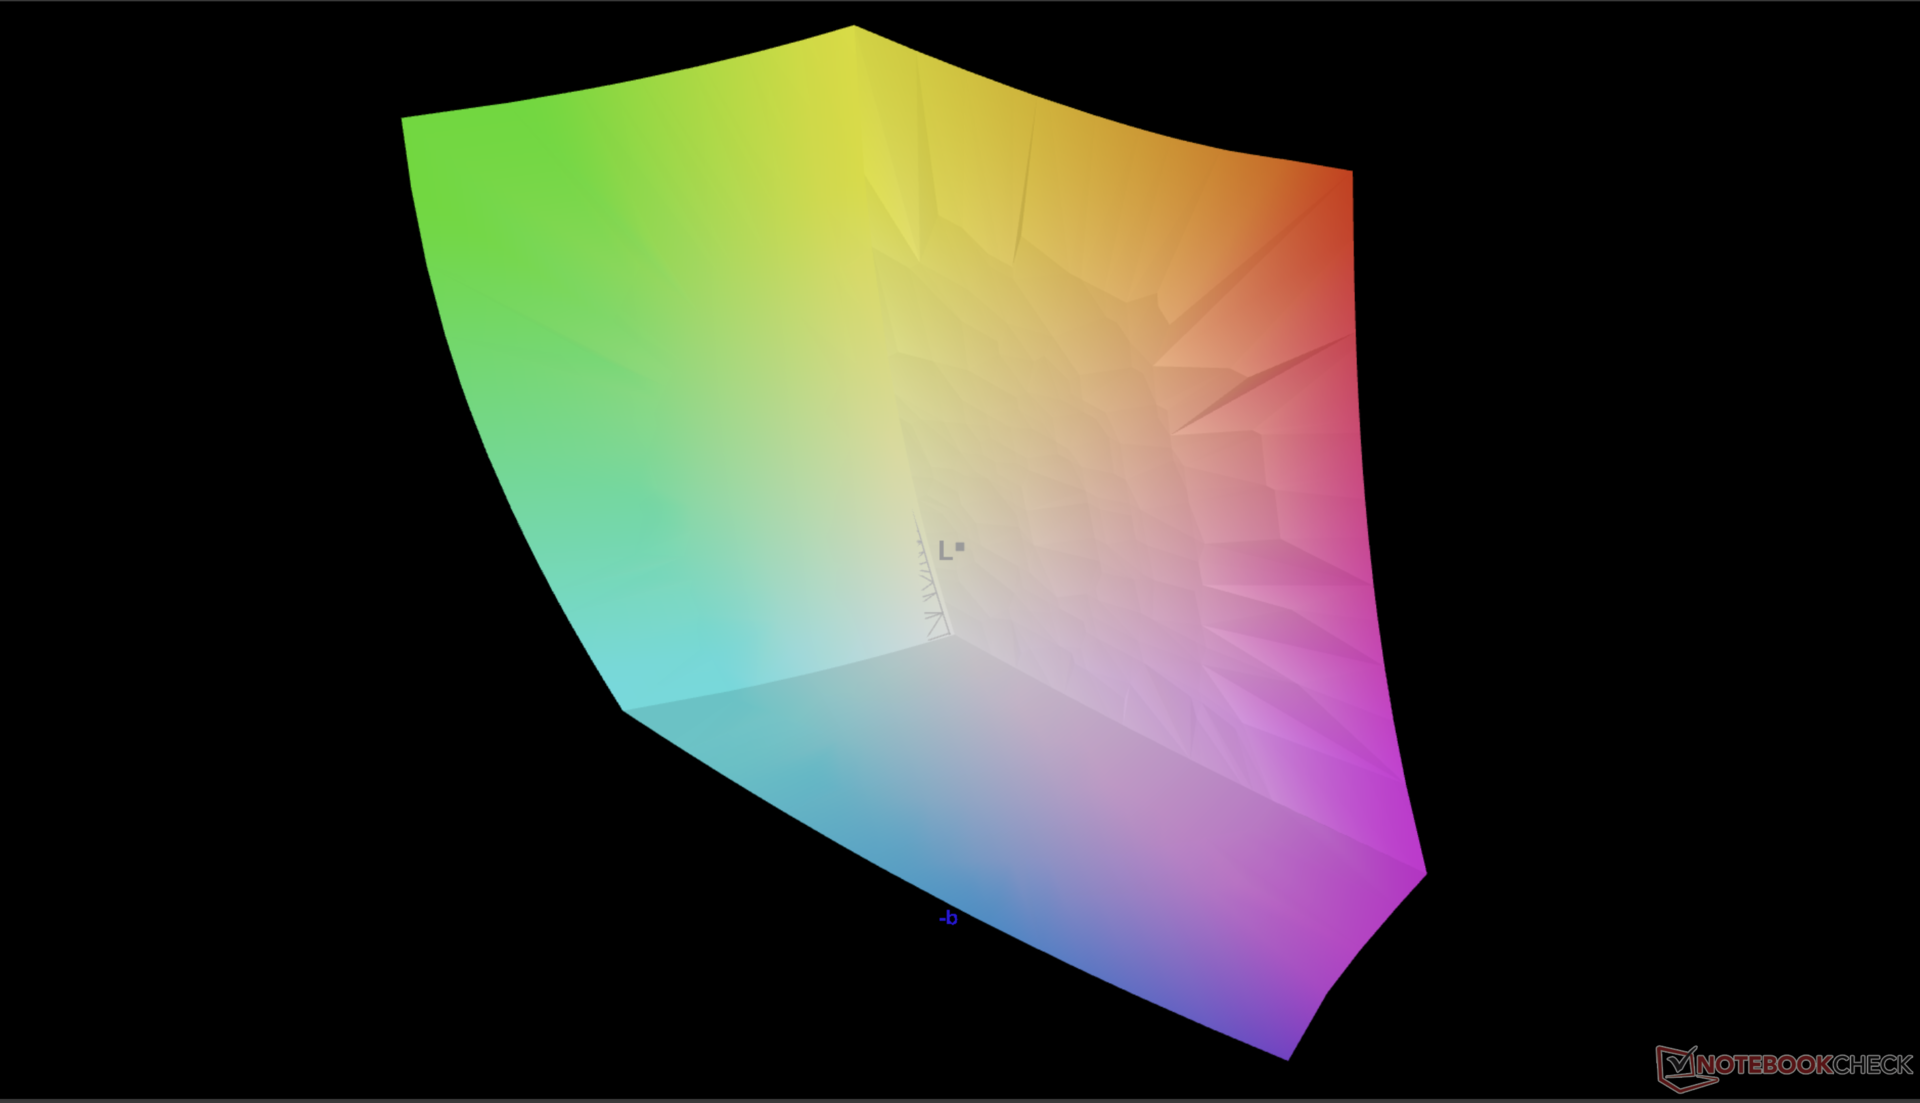
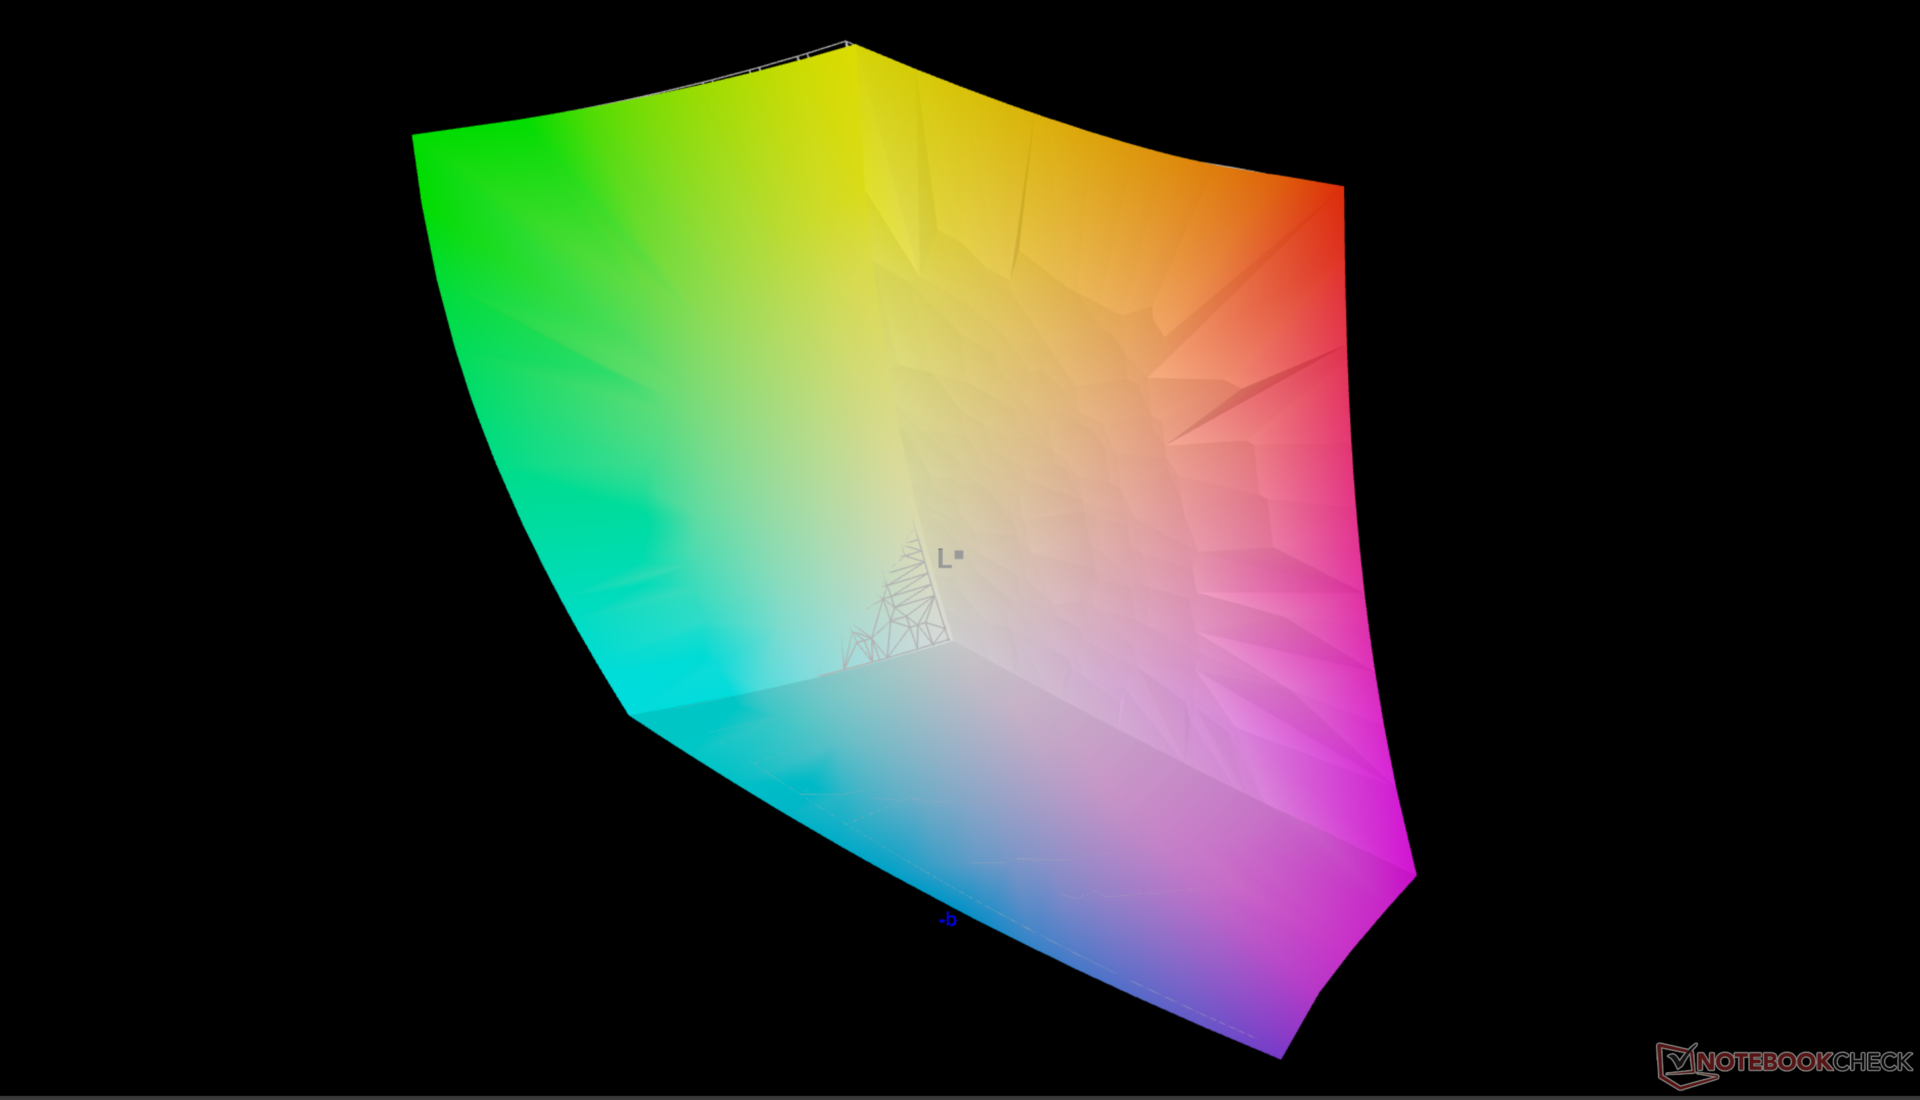
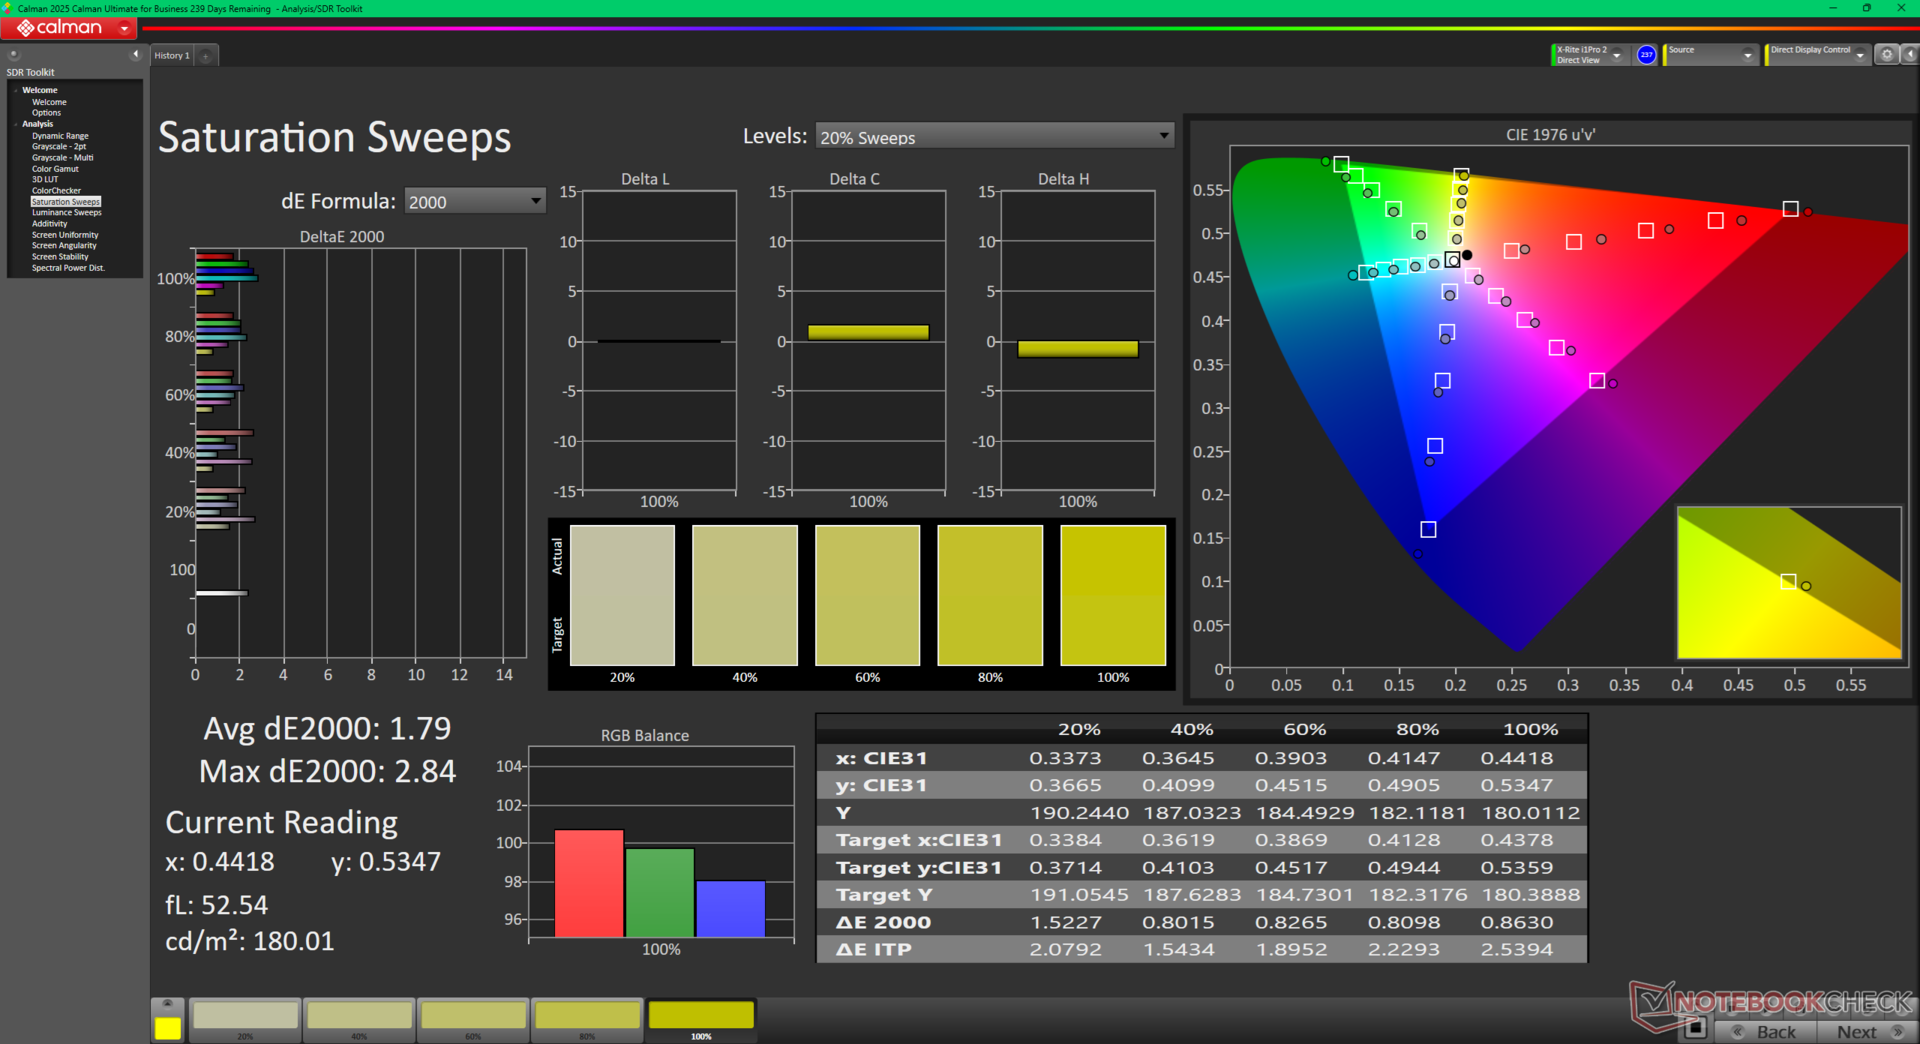
The display comes well-calibrated against the P3 standard with average grayscale and color deltaE values of just 1.1 and 3.39, respectively.
Display Response Times
| ↔ Response Time Black to White | ||
|---|---|---|
| 2.7 ms ... rise ↗ and fall ↘ combined | ↗ 1.6 ms rise | 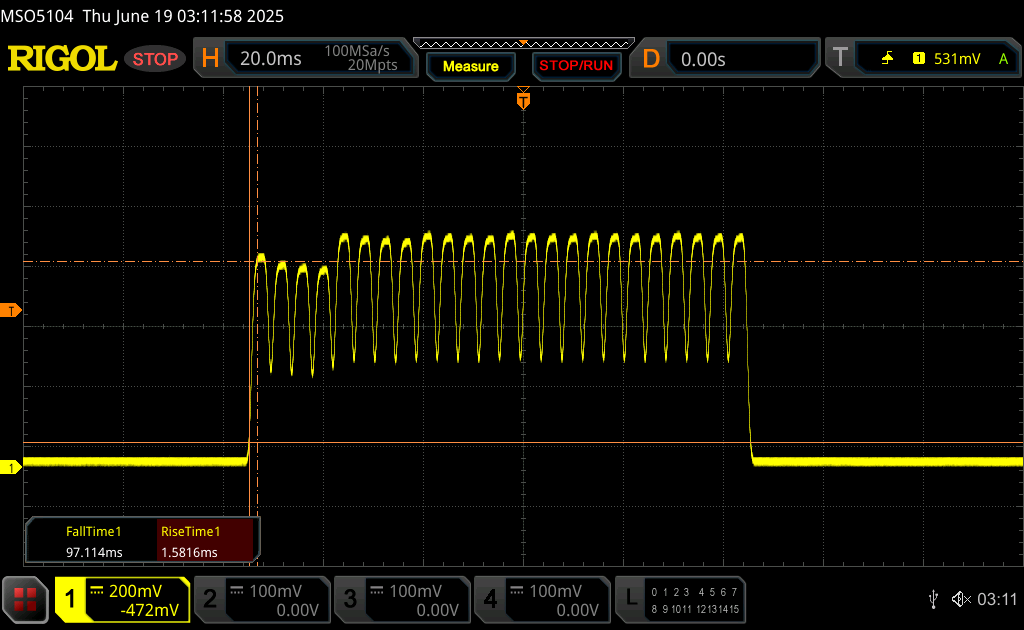 |
| ↘ 1.1 ms fall | ||
| The screen shows very fast response rates in our tests and should be very well suited for fast-paced gaming. In comparison, all tested devices range from 0.1 (minimum) to 240 (maximum) ms. » 14 % of all devices are better. This means that the measured response time is better than the average of all tested devices (19.9 ms). | ||
| ↔ Response Time 50% Grey to 80% Grey | ||
| 1.4 ms ... rise ↗ and fall ↘ combined | ↗ 0.7 ms rise | 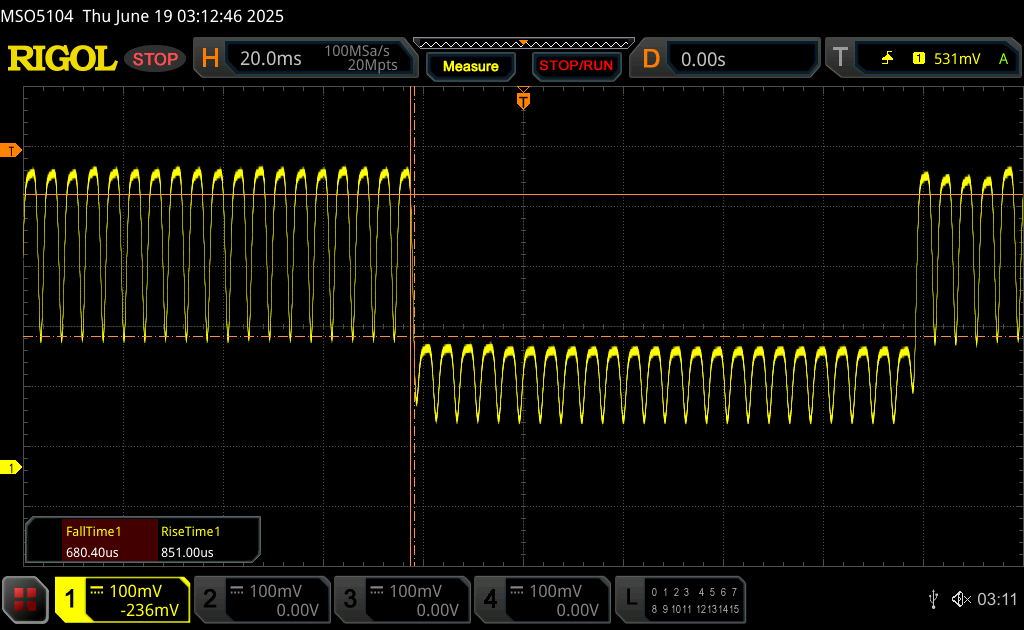 |
| ↘ 0.7 ms fall | ||
| The screen shows very fast response rates in our tests and should be very well suited for fast-paced gaming. In comparison, all tested devices range from 0.165 (minimum) to 636 (maximum) ms. » 6 % of all devices are better. This means that the measured response time is better than the average of all tested devices (31.1 ms). | ||
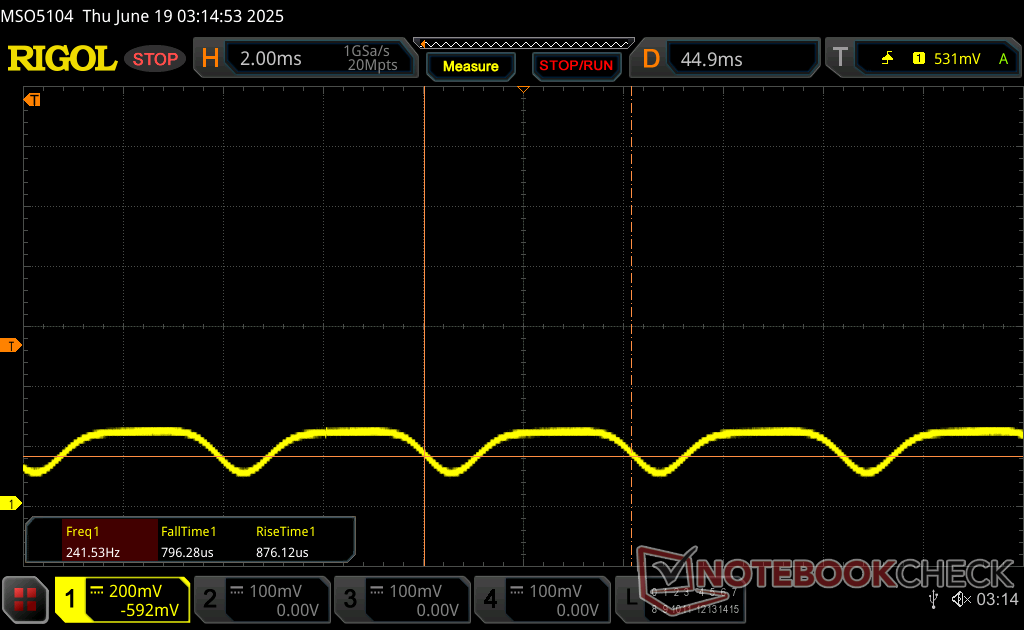
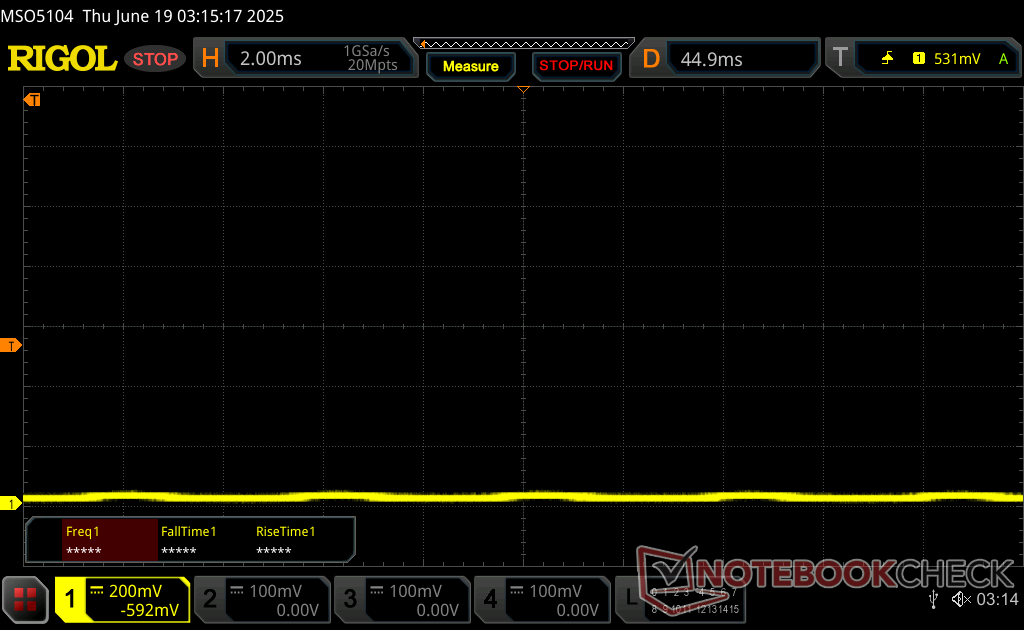
Screen Flickering / PWM (Pulse-Width Modulation)
| Screen flickering / PWM detected | 241.1 Hz Amplitude: 32 % | ≤ 100 % brightness setting | 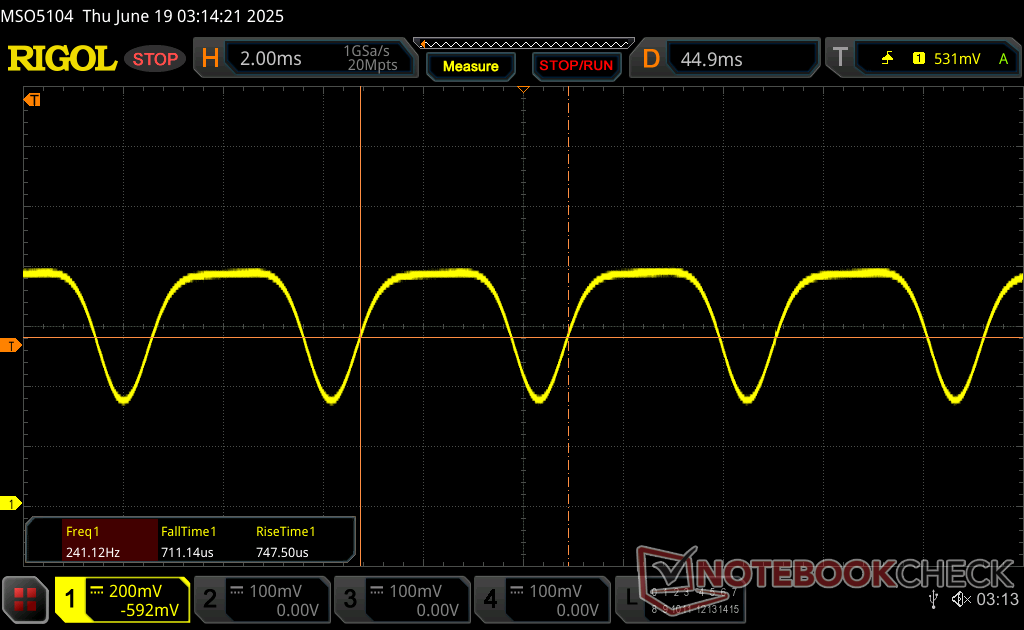 |
The display backlight flickers at 241.1 Hz (worst case, e.g., utilizing PWM) Flickering detected at a brightness setting of 100 % and below. There should be no flickering or PWM above this brightness setting. The frequency of 241.1 Hz is relatively low, so sensitive users will likely notice flickering and experience eyestrain at the stated brightness setting and below. In comparison: 52 % of all tested devices do not use PWM to dim the display. If PWM was detected, an average of 7794 (minimum: 5 - maximum: 343500) Hz was measured. | |||


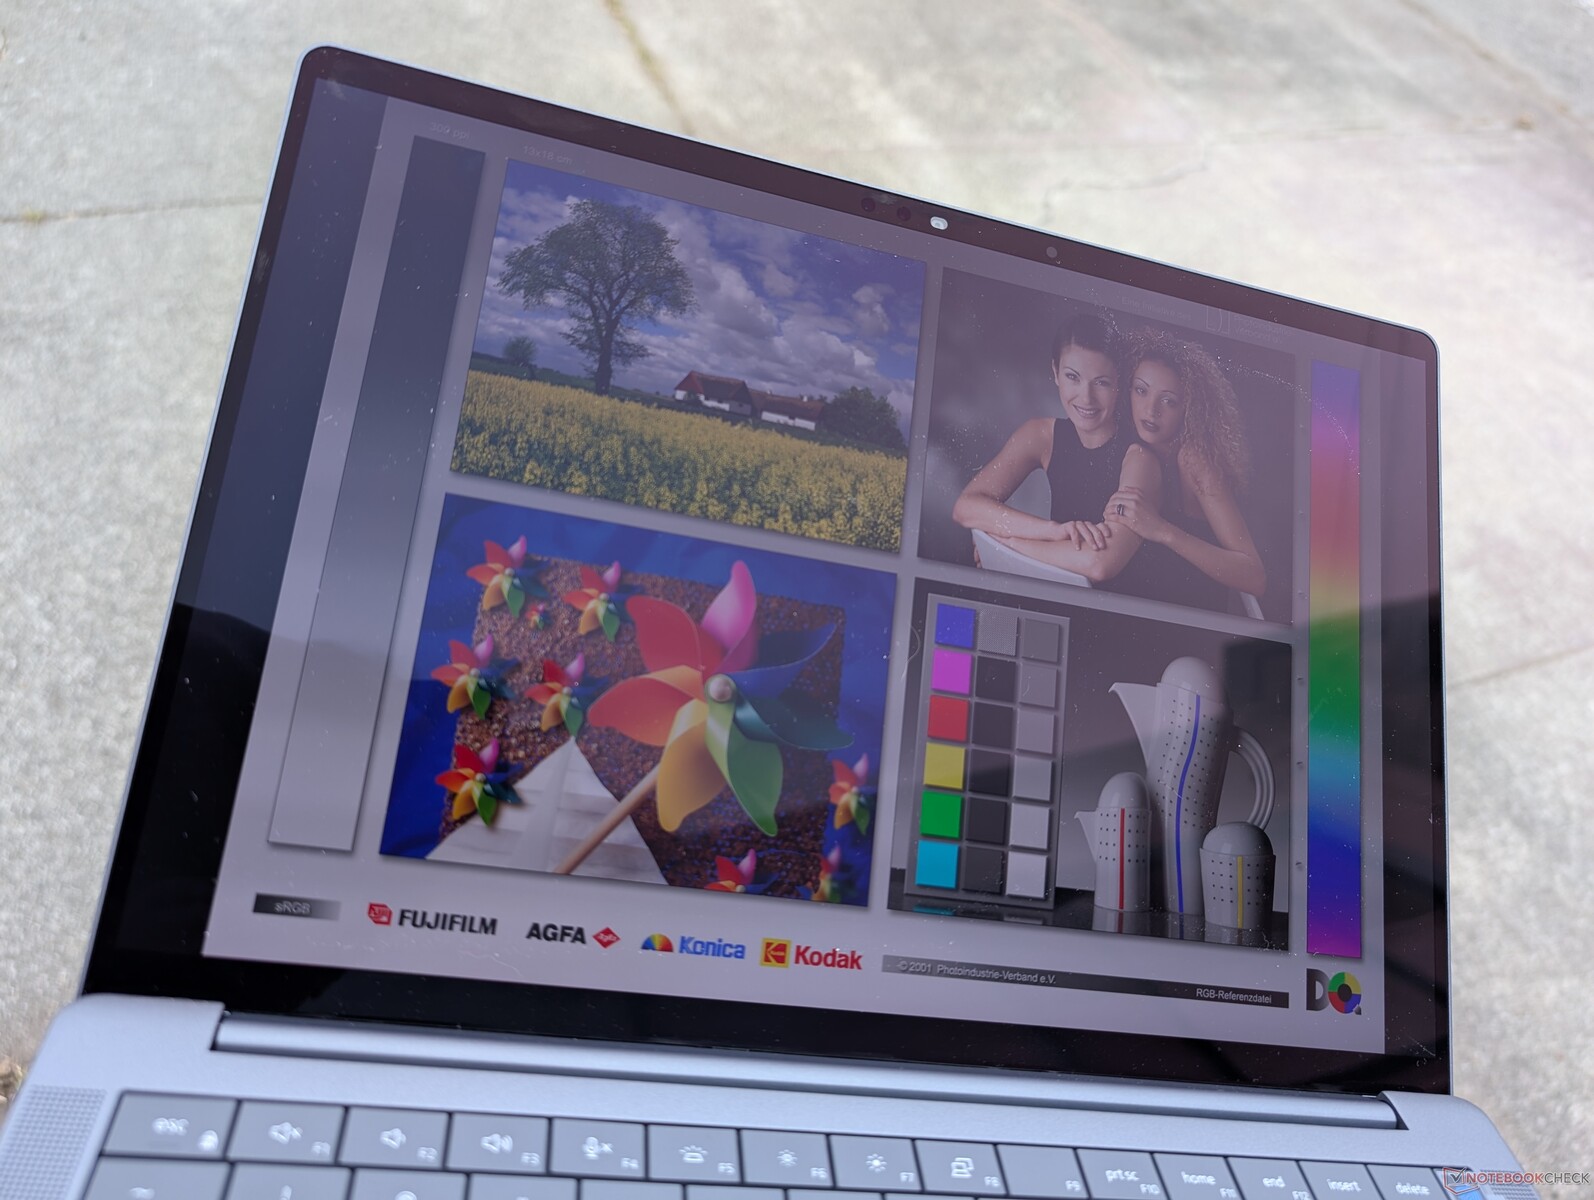
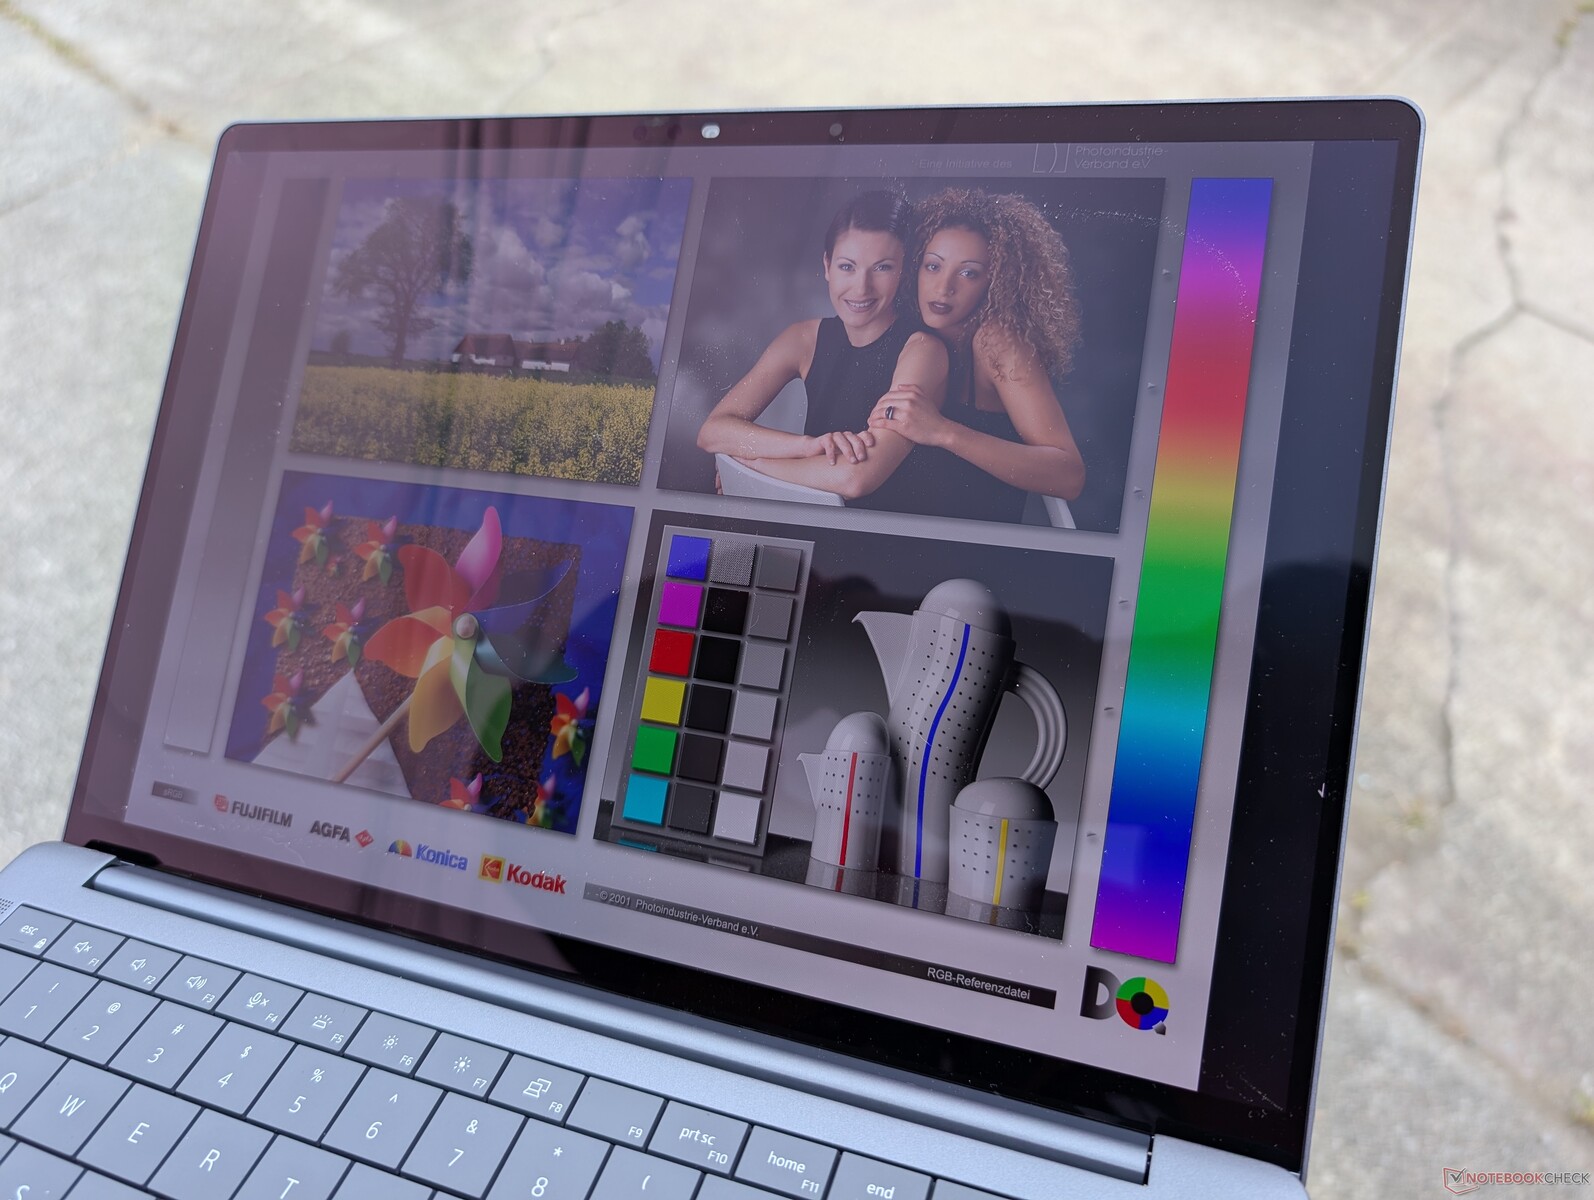
The OLED touchscreen may be sharp and vibrant, but it's still not bright enough for comfortable viewing outdoors. Colors become washed out and glare is evitable.


Performance — Efficiency Is The Name Of The Game


Testing Conditions
We set Dell Optimizer to Performance mode prior to running the benchmarks below. The Optimizer power profiles can automatically sync with the regular Windows power profiles which is not always the case on laptops from Lenovo or HP.
Processor
The Core Ultra 7 268V is only slighter faster than the Raptor Lake Core i5-1345U or Core i7-1355U on last year's Latitude 14 series when it comes to traditional CPU tasks. This is very much intentional as Lunar Lake-V focuses on NPU, GPU, RAM, and overall efficiency gains rather than raw processor performance. Nonetheless, the Core Ultra 7 268V exhibits less throttling when stressed for more consistent performance over time as shown by our CineBench R15 xT loop test results below.
Cinebench R15 Multi Loop
Cinebench R23: Multi Core | Single Core
Cinebench R20: CPU (Multi Core) | CPU (Single Core)
Cinebench R15: CPU Multi 64Bit | CPU Single 64Bit
Blender: v2.79 BMW27 CPU
7-Zip 18.03: 7z b 4 | 7z b 4 -mmt1
Geekbench 6.7: Multi-Core | Single-Core
Geekbench 5.5: Multi-Core | Single-Core
HWBOT x265 Benchmark v2.2: 4k Preset
LibreOffice : 20 Documents To PDF
R Benchmark 2.5: Overall mean
* ... smaller is better
AIDA64: FP32 Ray-Trace | FPU Julia | CPU SHA3 | CPU Queen | FPU SinJulia | FPU Mandel | CPU AES | CPU ZLib | FP64 Ray-Trace | CPU PhotoWorxx
| Performance rating | |
| Dell XPS 14 2024 OLED | |
| Dell Pro 14 Premium | |
| Average Intel Core Ultra 7 268V | |
| Lenovo ThinkPad T14s Gen 6 Intel | |
| HP EliteBook Ultra G1i 14 | |
| Dell Latitude 7440 | |
| Asus ExpertBook B1 B1403CVA | |
| AIDA64 / FP32 Ray-Trace | |
| Dell Pro 14 Premium | |
| Average Intel Core Ultra 7 268V (10556 - 12759, n=5) | |
| Dell XPS 14 2024 OLED | |
| Lenovo ThinkPad T14s Gen 6 Intel | |
| HP EliteBook Ultra G1i 14 | |
| Dell Latitude 7440 | |
| Asus ExpertBook B1 B1403CVA | |
| AIDA64 / FPU Julia | |
| Dell XPS 14 2024 OLED | |
| Dell Pro 14 Premium | |
| Average Intel Core Ultra 7 268V (47659 - 62563, n=5) | |
| Lenovo ThinkPad T14s Gen 6 Intel | |
| HP EliteBook Ultra G1i 14 | |
| Dell Latitude 7440 | |
| Asus ExpertBook B1 B1403CVA | |
| AIDA64 / CPU SHA3 | |
| Dell XPS 14 2024 OLED | |
| Dell Pro 14 Premium | |
| Average Intel Core Ultra 7 268V (2117 - 2803, n=5) | |
| HP EliteBook Ultra G1i 14 | |
| Lenovo ThinkPad T14s Gen 6 Intel | |
| Dell Latitude 7440 | |
| Asus ExpertBook B1 B1403CVA | |
| AIDA64 / CPU Queen | |
| Dell XPS 14 2024 OLED | |
| Asus ExpertBook B1 B1403CVA | |
| Dell Latitude 7440 | |
| Dell Pro 14 Premium | |
| Average Intel Core Ultra 7 268V (49629 - 49759, n=5) | |
| HP EliteBook Ultra G1i 14 | |
| Lenovo ThinkPad T14s Gen 6 Intel | |
| AIDA64 / FPU SinJulia | |
| Dell XPS 14 2024 OLED | |
| Asus ExpertBook B1 B1403CVA | |
| Dell Latitude 7440 | |
| HP EliteBook Ultra G1i 14 | |
| Dell Pro 14 Premium | |
| Average Intel Core Ultra 7 268V (4351 - 4429, n=5) | |
| Lenovo ThinkPad T14s Gen 6 Intel | |
| AIDA64 / FPU Mandel | |
| Dell Pro 14 Premium | |
| Average Intel Core Ultra 7 268V (25929 - 33207, n=5) | |
| Dell XPS 14 2024 OLED | |
| Lenovo ThinkPad T14s Gen 6 Intel | |
| HP EliteBook Ultra G1i 14 | |
| Dell Latitude 7440 | |
| Asus ExpertBook B1 B1403CVA | |
| AIDA64 / CPU AES | |
| Dell XPS 14 2024 OLED | |
| Dell Latitude 7440 | |
| Dell Pro 14 Premium | |
| Average Intel Core Ultra 7 268V (33196 - 39140, n=5) | |
| HP EliteBook Ultra G1i 14 | |
| Lenovo ThinkPad T14s Gen 6 Intel | |
| Asus ExpertBook B1 B1403CVA | |
| AIDA64 / CPU ZLib | |
| Dell XPS 14 2024 OLED | |
| Dell Latitude 7440 | |
| Dell Pro 14 Premium | |
| Average Intel Core Ultra 7 268V (441 - 633, n=5) | |
| Lenovo ThinkPad T14s Gen 6 Intel | |
| HP EliteBook Ultra G1i 14 | |
| Asus ExpertBook B1 B1403CVA | |
| AIDA64 / FP64 Ray-Trace | |
| Dell Pro 14 Premium | |
| Average Intel Core Ultra 7 268V (5938 - 6960, n=5) | |
| Lenovo ThinkPad T14s Gen 6 Intel | |
| Dell XPS 14 2024 OLED | |
| HP EliteBook Ultra G1i 14 | |
| Dell Latitude 7440 | |
| Asus ExpertBook B1 B1403CVA | |
| AIDA64 / CPU PhotoWorxx | |
| Dell Pro 14 Premium | |
| Average Intel Core Ultra 7 268V (46733 - 55083, n=5) | |
| Lenovo ThinkPad T14s Gen 6 Intel | |
| HP EliteBook Ultra G1i 14 | |
| Dell XPS 14 2024 OLED | |
| Dell Latitude 7440 | |
| Asus ExpertBook B1 B1403CVA | |
System Performance
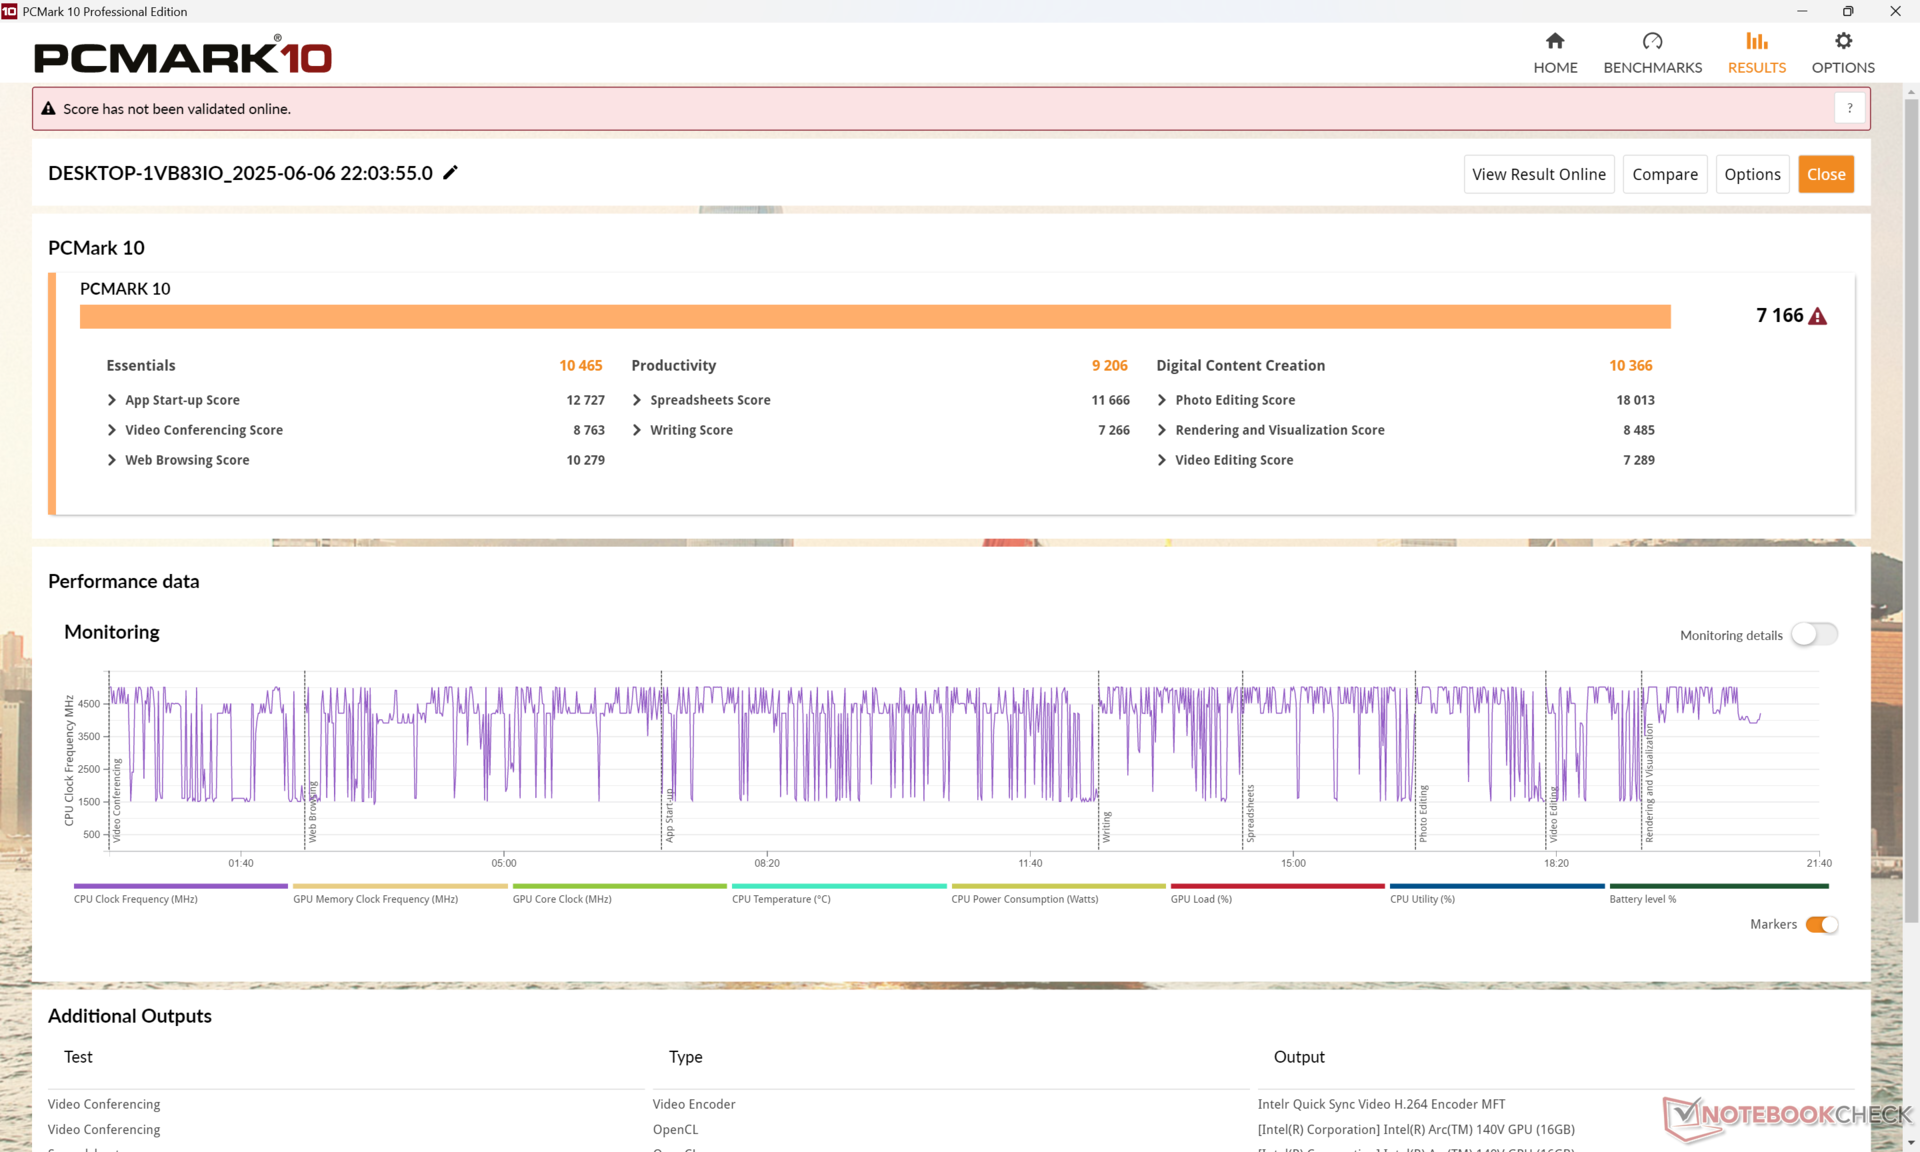
PCMark results over last year's Latitude 7440 or 9440 2-in-1 are most improved in the Digital Content Creation subtest due to the significantly faster integrated GPU of Lunar Lake. Otherwise, traditional office tasks aren't much faster on the Dell Pro 14 Premium as exemplified by the relatively minor boost in raw processor performance mentioned above.
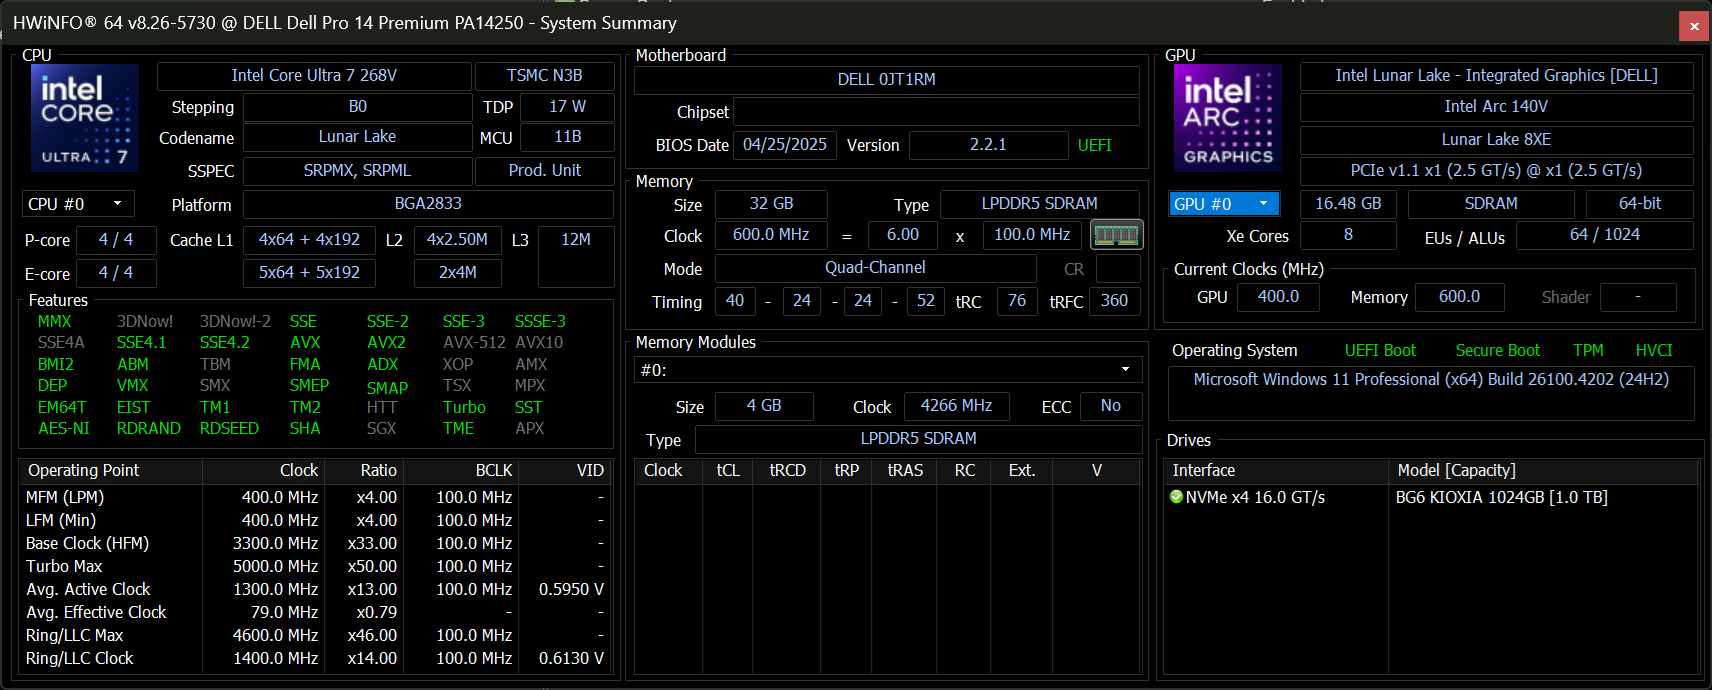
RAM performance is almost twice as fast due to the unique on-die RAM solution of Lunar Lake over the older Raptor Lake architecture.
PCMark 10: Score | Essentials | Productivity | Digital Content Creation
CrossMark: Overall | Productivity | Creativity | Responsiveness
WebXPRT 3: Overall
WebXPRT 4: Overall
Mozilla Kraken 1.1: Total
| Performance rating | |
| Dell Pro 14 Premium | |
| HP EliteBook Ultra G1i 14 | |
| Average Intel Core Ultra 7 268V, Intel Arc Graphics 140V | |
| Dell XPS 14 2024 OLED | |
| Lenovo ThinkPad T14s Gen 6 Intel | |
| Asus ExpertBook B1 B1403CVA | |
| Dell Latitude 7440 -4! | |
| PCMark 10 / Score | |
| Dell Pro 14 Premium | |
| HP EliteBook Ultra G1i 14 | |
| Average Intel Core Ultra 7 268V, Intel Arc Graphics 140V (6729 - 7236, n=5) | |
| Lenovo ThinkPad T14s Gen 6 Intel | |
| Dell XPS 14 2024 OLED | |
| Dell Latitude 7440 | |
| Asus ExpertBook B1 B1403CVA | |
| PCMark 10 / Essentials | |
| Dell Latitude 7440 | |
| HP EliteBook Ultra G1i 14 | |
| Dell Pro 14 Premium | |
| Asus ExpertBook B1 B1403CVA | |
| Average Intel Core Ultra 7 268V, Intel Arc Graphics 140V (10007 - 10701, n=5) | |
| Dell XPS 14 2024 OLED | |
| Lenovo ThinkPad T14s Gen 6 Intel | |
| PCMark 10 / Productivity | |
| HP EliteBook Ultra G1i 14 | |
| Dell Pro 14 Premium | |
| Average Intel Core Ultra 7 268V, Intel Arc Graphics 140V (8766 - 9217, n=5) | |
| Dell XPS 14 2024 OLED | |
| Lenovo ThinkPad T14s Gen 6 Intel | |
| Dell Latitude 7440 | |
| Asus ExpertBook B1 B1403CVA | |
| PCMark 10 / Digital Content Creation | |
| Dell Pro 14 Premium | |
| Average Intel Core Ultra 7 268V, Intel Arc Graphics 140V (9425 - 10429, n=5) | |
| HP EliteBook Ultra G1i 14 | |
| Lenovo ThinkPad T14s Gen 6 Intel | |
| Dell XPS 14 2024 OLED | |
| Asus ExpertBook B1 B1403CVA | |
| Dell Latitude 7440 | |
| CrossMark / Overall | |
| Dell Pro 14 Premium | |
| HP EliteBook Ultra G1i 14 | |
| Average Intel Core Ultra 7 268V, Intel Arc Graphics 140V (1643 - 1763, n=5) | |
| Dell XPS 14 2024 OLED | |
| Lenovo ThinkPad T14s Gen 6 Intel | |
| Asus ExpertBook B1 B1403CVA | |
| CrossMark / Productivity | |
| Dell Pro 14 Premium | |
| HP EliteBook Ultra G1i 14 | |
| Average Intel Core Ultra 7 268V, Intel Arc Graphics 140V (1577 - 1696, n=5) | |
| Dell XPS 14 2024 OLED | |
| Lenovo ThinkPad T14s Gen 6 Intel | |
| Asus ExpertBook B1 B1403CVA | |
| CrossMark / Creativity | |
| Dell Pro 14 Premium | |
| HP EliteBook Ultra G1i 14 | |
| Average Intel Core Ultra 7 268V, Intel Arc Graphics 140V (1866 - 2021, n=5) | |
| Dell XPS 14 2024 OLED | |
| Lenovo ThinkPad T14s Gen 6 Intel | |
| Asus ExpertBook B1 B1403CVA | |
| CrossMark / Responsiveness | |
| Dell XPS 14 2024 OLED | |
| Asus ExpertBook B1 B1403CVA | |
| HP EliteBook Ultra G1i 14 | |
| Dell Pro 14 Premium | |
| Average Intel Core Ultra 7 268V, Intel Arc Graphics 140V (1239 - 1313, n=5) | |
| Lenovo ThinkPad T14s Gen 6 Intel | |
| WebXPRT 3 / Overall | |
| Dell Pro 14 Premium | |
| Average Intel Core Ultra 7 268V, Intel Arc Graphics 140V (266 - 317, n=5) | |
| HP EliteBook Ultra G1i 14 | |
| Lenovo ThinkPad T14s Gen 6 Intel | |
| Dell XPS 14 2024 OLED | |
| Dell Latitude 7440 | |
| Asus ExpertBook B1 B1403CVA | |
| WebXPRT 4 / Overall | |
| Dell Pro 14 Premium | |
| HP EliteBook Ultra G1i 14 | |
| Average Intel Core Ultra 7 268V, Intel Arc Graphics 140V (245 - 292, n=5) | |
| Lenovo ThinkPad T14s Gen 6 Intel | |
| Dell XPS 14 2024 OLED | |
| Asus ExpertBook B1 B1403CVA | |
| Dell Latitude 7440 | |
| Mozilla Kraken 1.1 / Total | |
| Asus ExpertBook B1 B1403CVA | |
| Dell Latitude 7440 | |
| Dell XPS 14 2024 OLED | |
| Lenovo ThinkPad T14s Gen 6 Intel | |
| HP EliteBook Ultra G1i 14 | |
| Average Intel Core Ultra 7 268V, Intel Arc Graphics 140V (460 - 476, n=5) | |
| Dell Pro 14 Premium | |
* ... smaller is better
| PCMark 10 Score | 7166 points | |
Help | ||
| AIDA64 / Memory Copy | |
| HP EliteBook Ultra G1i 14 | |
| Dell Pro 14 Premium | |
| Average Intel Core Ultra 7 268V (100445 - 108317, n=5) | |
| Lenovo ThinkPad T14s Gen 6 Intel | |
| Dell XPS 14 2024 OLED | |
| Asus ExpertBook B1 B1403CVA | |
| Dell Latitude 7440 | |
| AIDA64 / Memory Read | |
| HP EliteBook Ultra G1i 14 | |
| Dell Pro 14 Premium | |
| Average Intel Core Ultra 7 268V (82511 - 88341, n=5) | |
| Dell XPS 14 2024 OLED | |
| Lenovo ThinkPad T14s Gen 6 Intel | |
| Asus ExpertBook B1 B1403CVA | |
| Dell Latitude 7440 | |
| AIDA64 / Memory Write | |
| Dell Pro 14 Premium | |
| HP EliteBook Ultra G1i 14 | |
| Average Intel Core Ultra 7 268V (104206 - 117888, n=5) | |
| Lenovo ThinkPad T14s Gen 6 Intel | |
| Dell XPS 14 2024 OLED | |
| Dell Latitude 7440 | |
| Asus ExpertBook B1 B1403CVA | |
| AIDA64 / Memory Latency | |
| Dell XPS 14 2024 OLED | |
| Dell Latitude 7440 | |
| Dell Pro 14 Premium | |
| Average Intel Core Ultra 7 268V (94.4 - 101.5, n=5) | |
| Asus ExpertBook B1 B1403CVA | |
| Lenovo ThinkPad T14s Gen 6 Intel | |
| HP EliteBook Ultra G1i 14 | |
* ... smaller is better
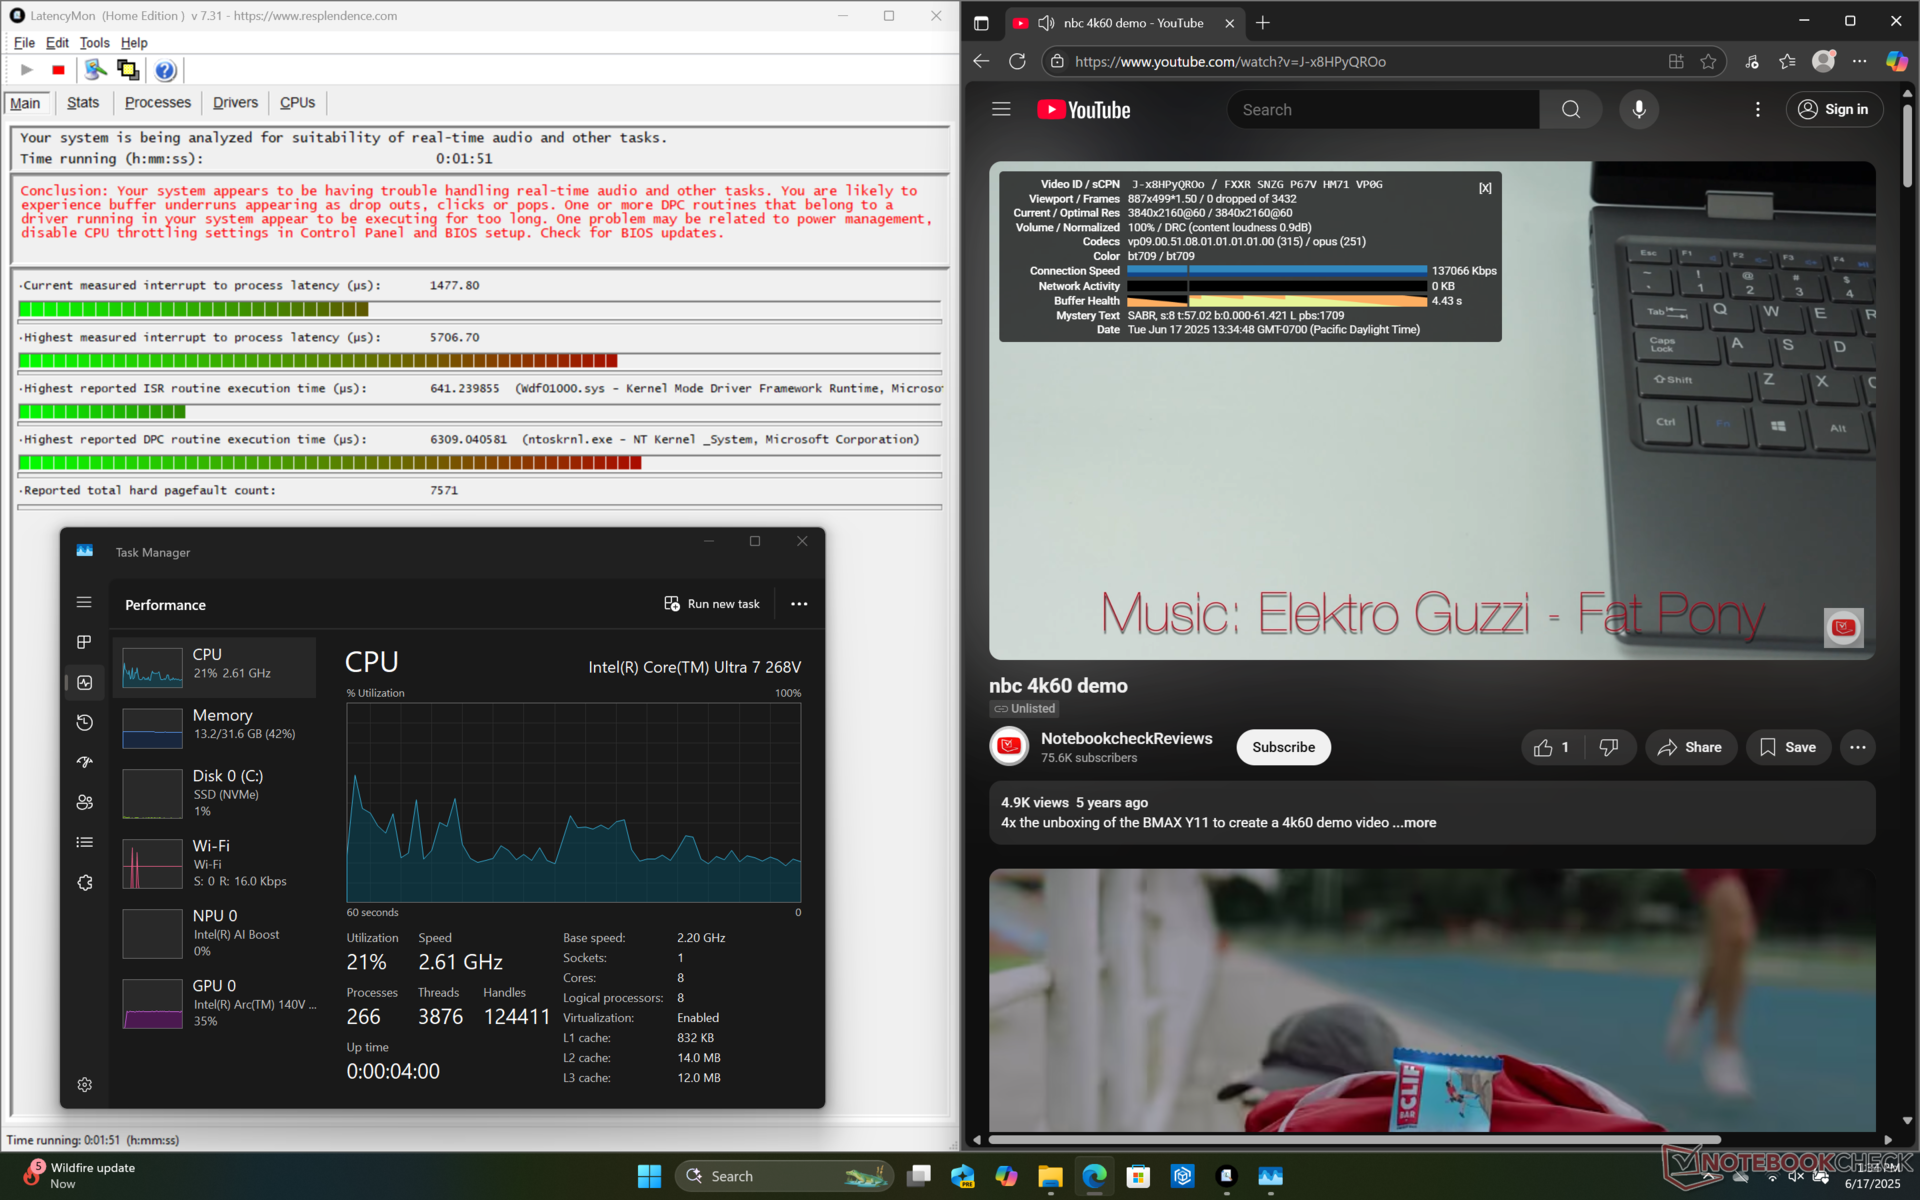
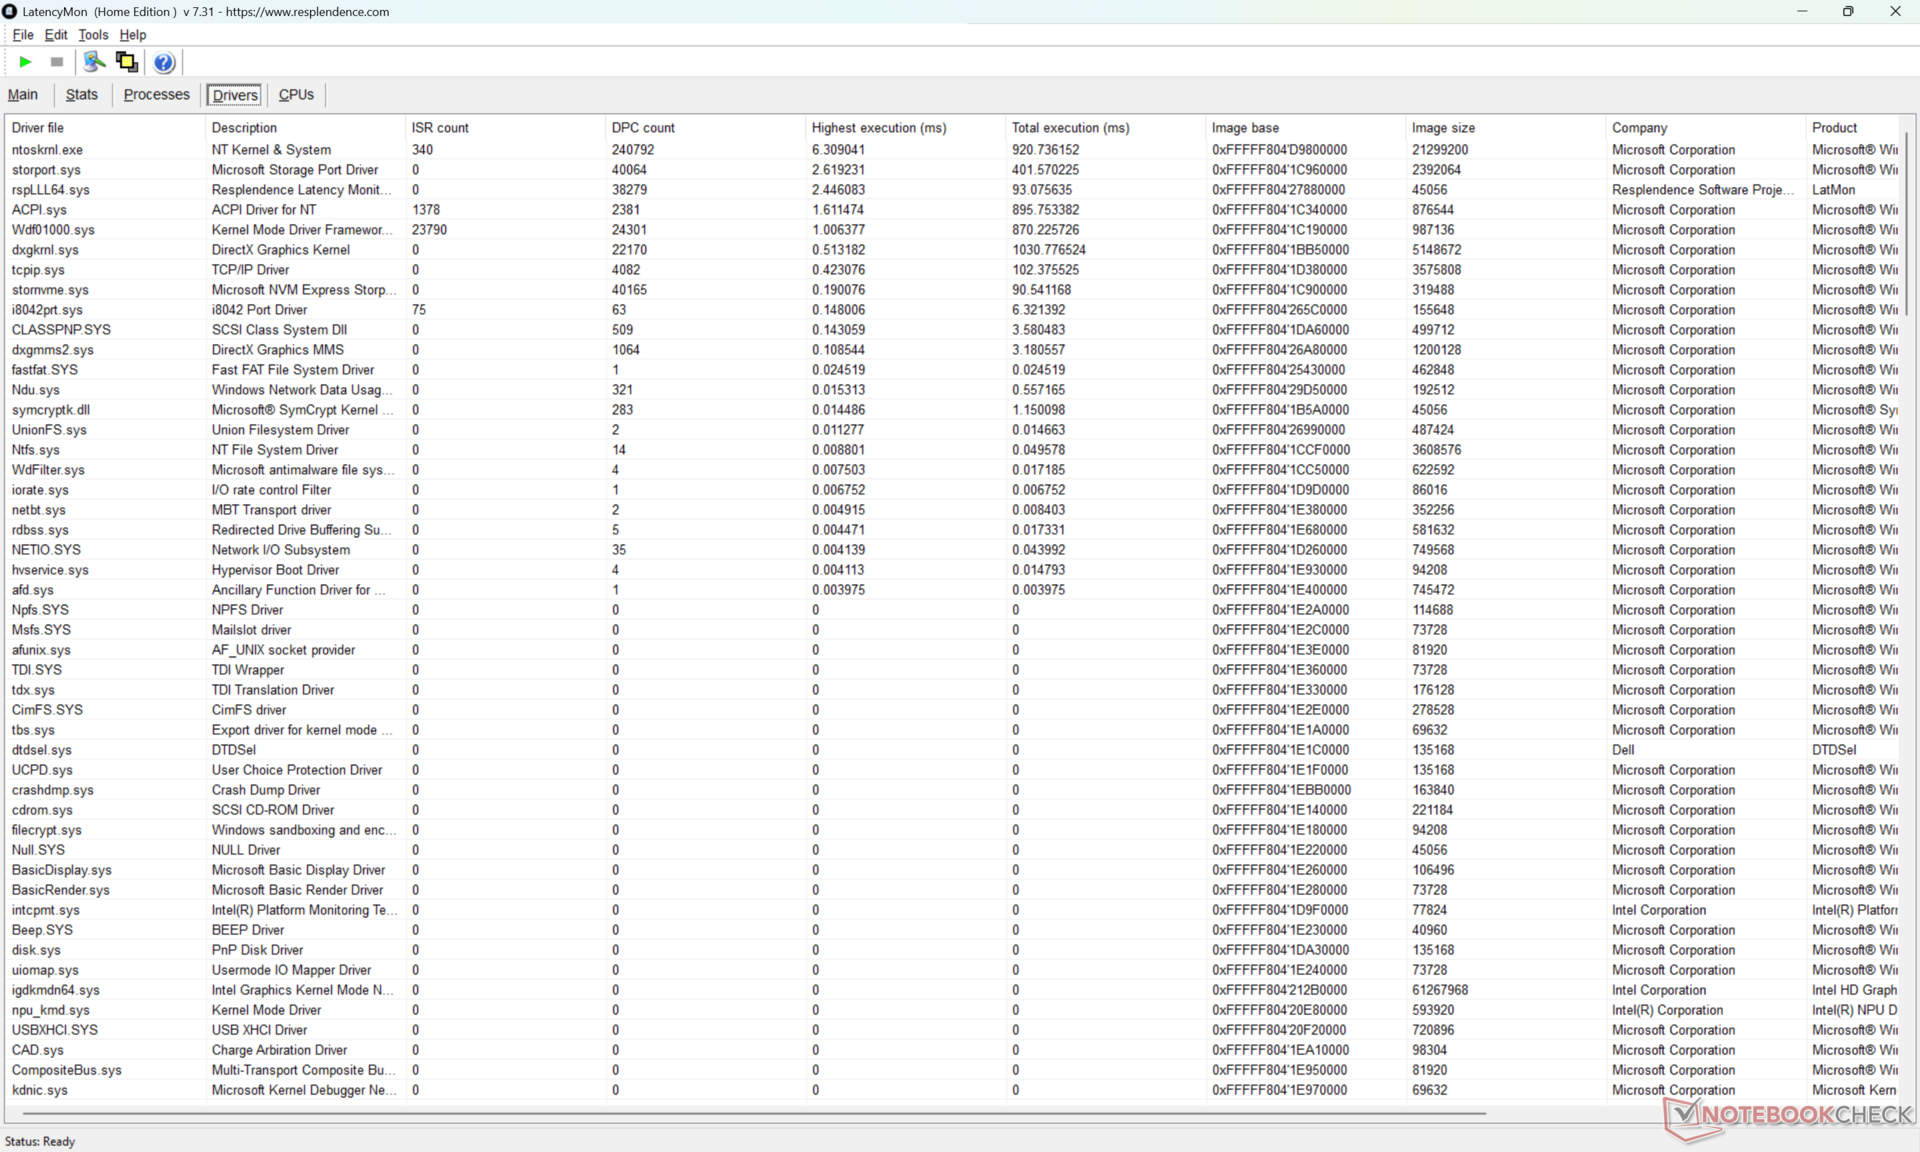
DPC Latency
LatencyMon shows DPC issues when opening multiple browser tabs of our homepage but with otherwise no dropped frames record when streaming 4K60 video content.
| DPC Latencies / LatencyMon - interrupt to process latency (max), Web, Youtube, Prime95 | |
| Dell Pro 14 Premium | |
| Dell XPS 14 2024 OLED | |
| HP EliteBook Ultra G1i 14 | |
| Dell Latitude 7440 | |
| Asus ExpertBook B1 B1403CVA | |
| Lenovo ThinkPad T14s Gen 6 Intel | |
* ... smaller is better
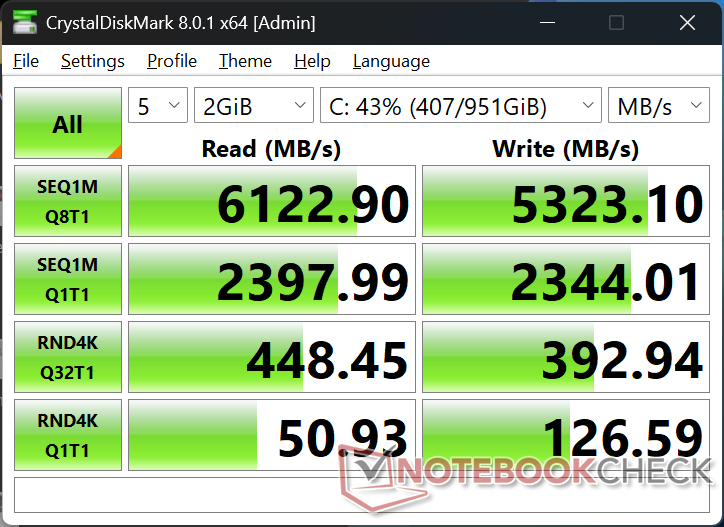
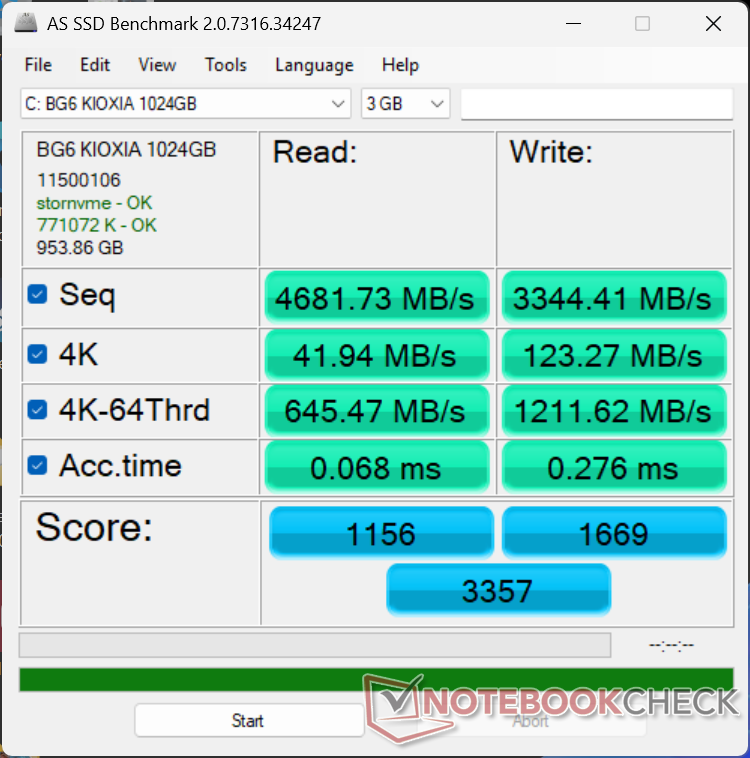
Storage Devices
The Kioxia BG6 in the system performs both faster and more consistently than the Samsung drives in last year's Latitude 14 models as shown by the graph below. Maximum transfer rates are stable at around 6000 MB/s compared to <3500 MB/s on the Latitude 7440 or 9440 2-in-1.

| Drive Performance rating - Percent | |
| Asus ExpertBook B1 B1403CVA | |
| Lenovo ThinkPad T14s Gen 6 Intel | |
| Dell XPS 14 2024 OLED | |
| HP EliteBook Ultra G1i 14 | |
| Dell Latitude 7440 | |
| Dell Pro 14 Premium | |
* ... smaller is better
Disk Throttling: DiskSpd Read Loop, Queue Depth 8
GPU Performance
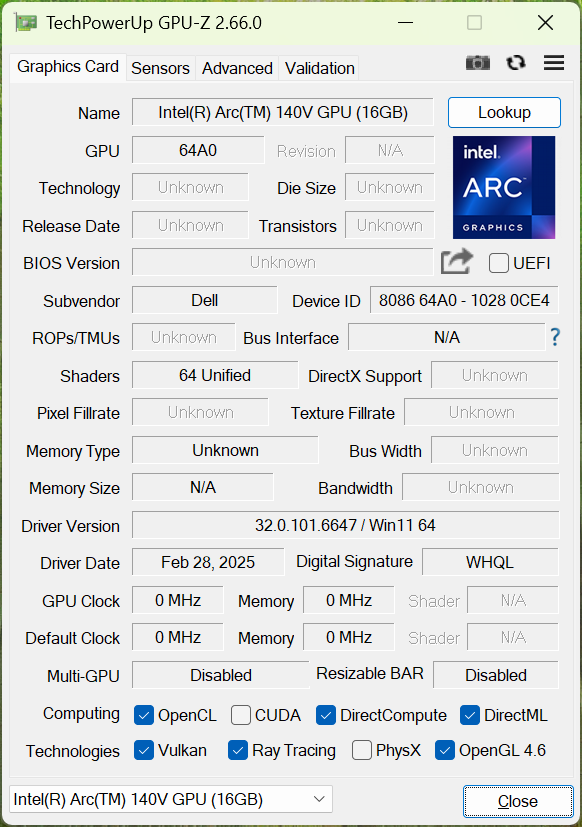
The integrated Arc 140V is faster than one might expect especially for a business subnotebook. The newer GPU is a significant improvement over the Iris Xe series on last year's Latitude 7440 or 9440 2-in-1 by over 2x in many cases. Demanding titles like Cyberpunk 2077 are playable at 1080p and 30 FPS on medium settings whereas such games would be unplayable on older Latitude subnotebooks no matter the setting.
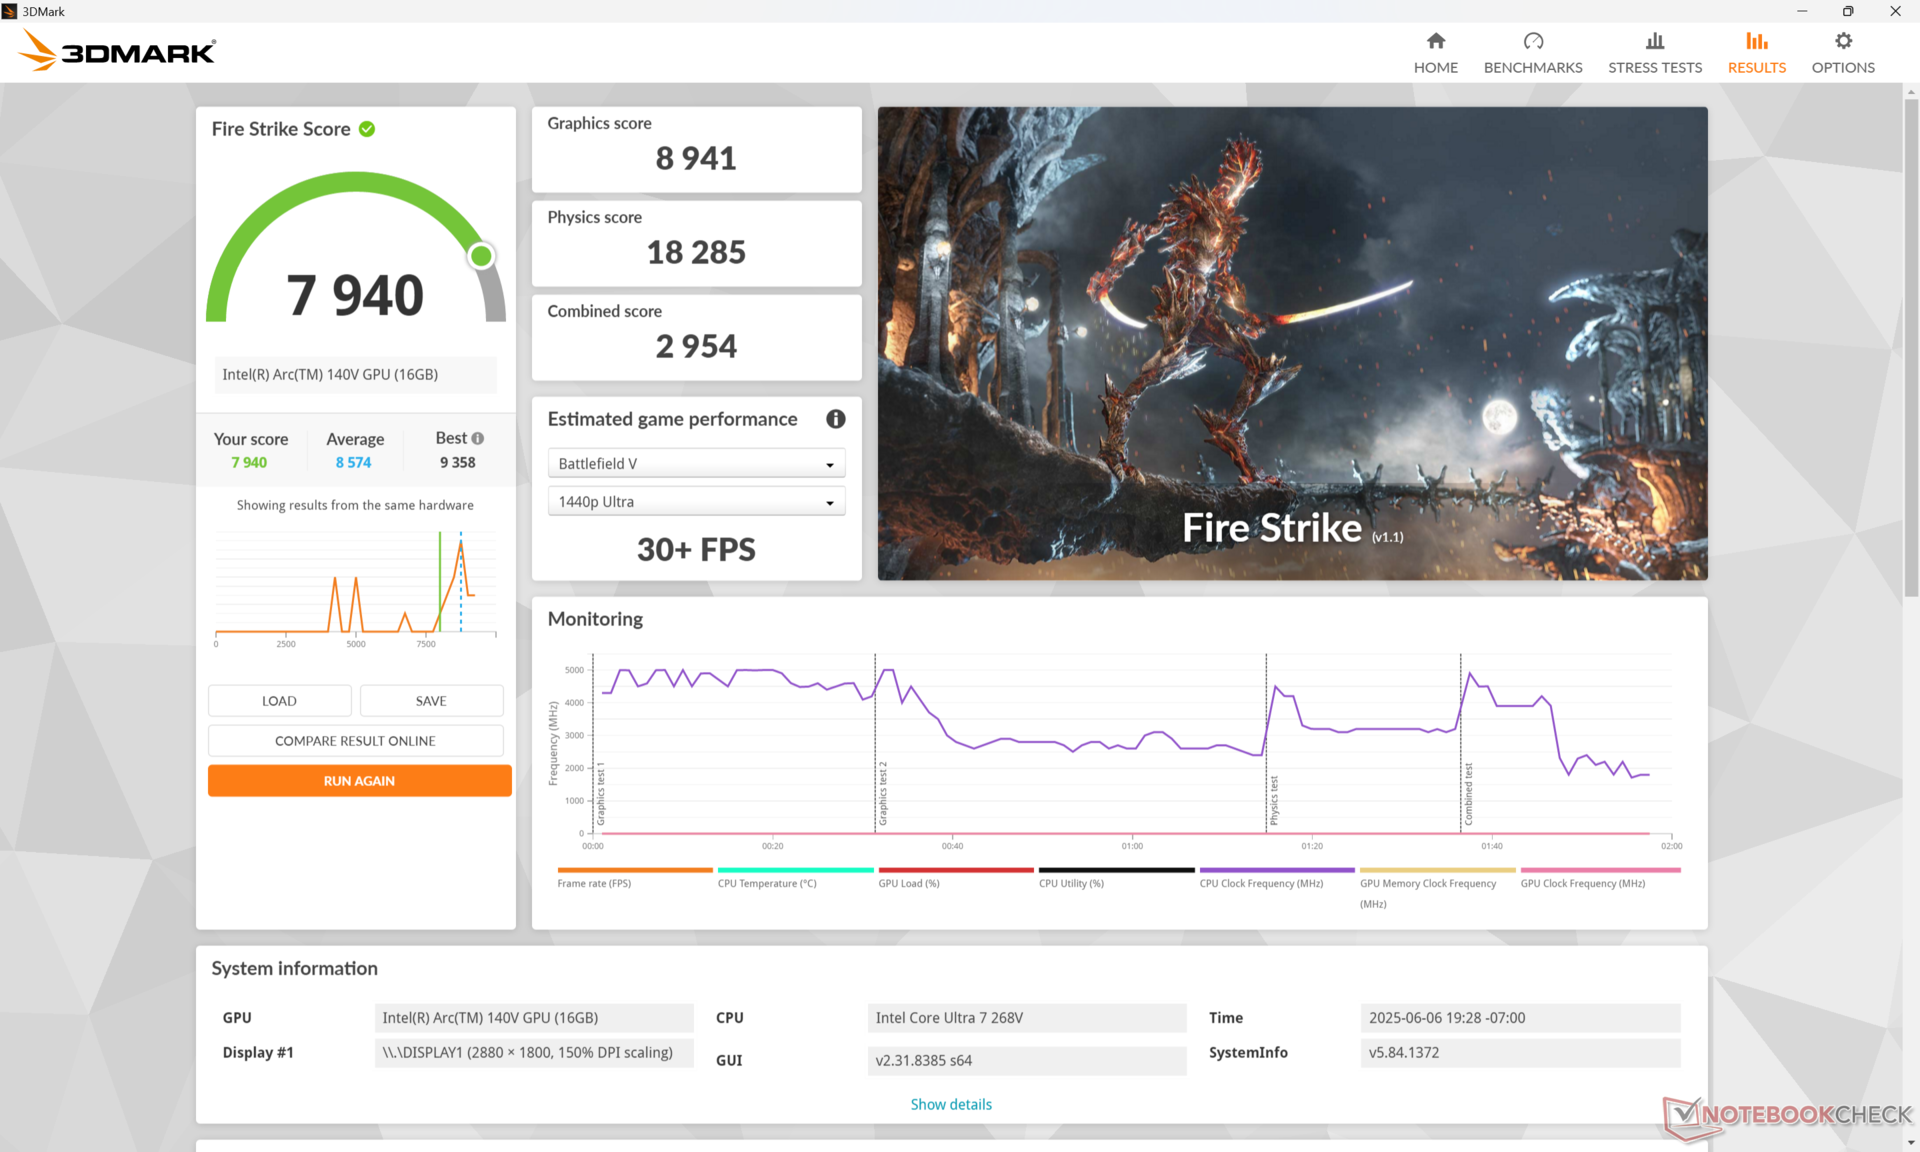
| Power Profile | Graphics Score | Physics Score | Combined Score |
| Performance Mode | 8941 | 18285 | 2954 |
| Balanced Mode | 8402 (-6%) | 16811 (-8%) | 2313 (-22%) |
| Battery Power | 8685 (-3%) | 16092 (-12%) | 2399 (-18%) |
Running the system on Balanced or battery mode instead of Performance mode would reduce performance by a few percentage points as shown by our Fire Strike results table above.
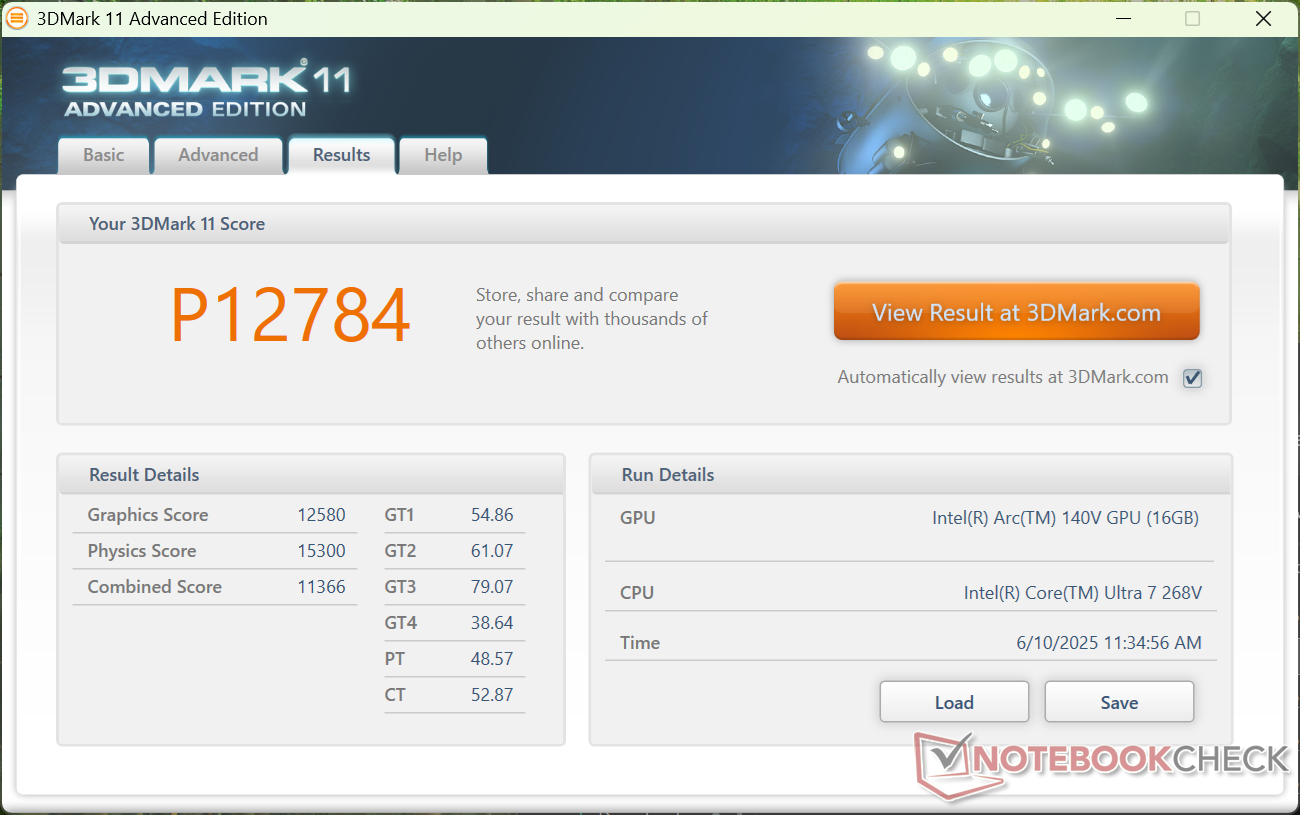

| 3DMark 11 Performance | 12784 points | |
| 3DMark Cloud Gate Standard Score | 30158 points | |
| 3DMark Fire Strike Score | 7940 points | |
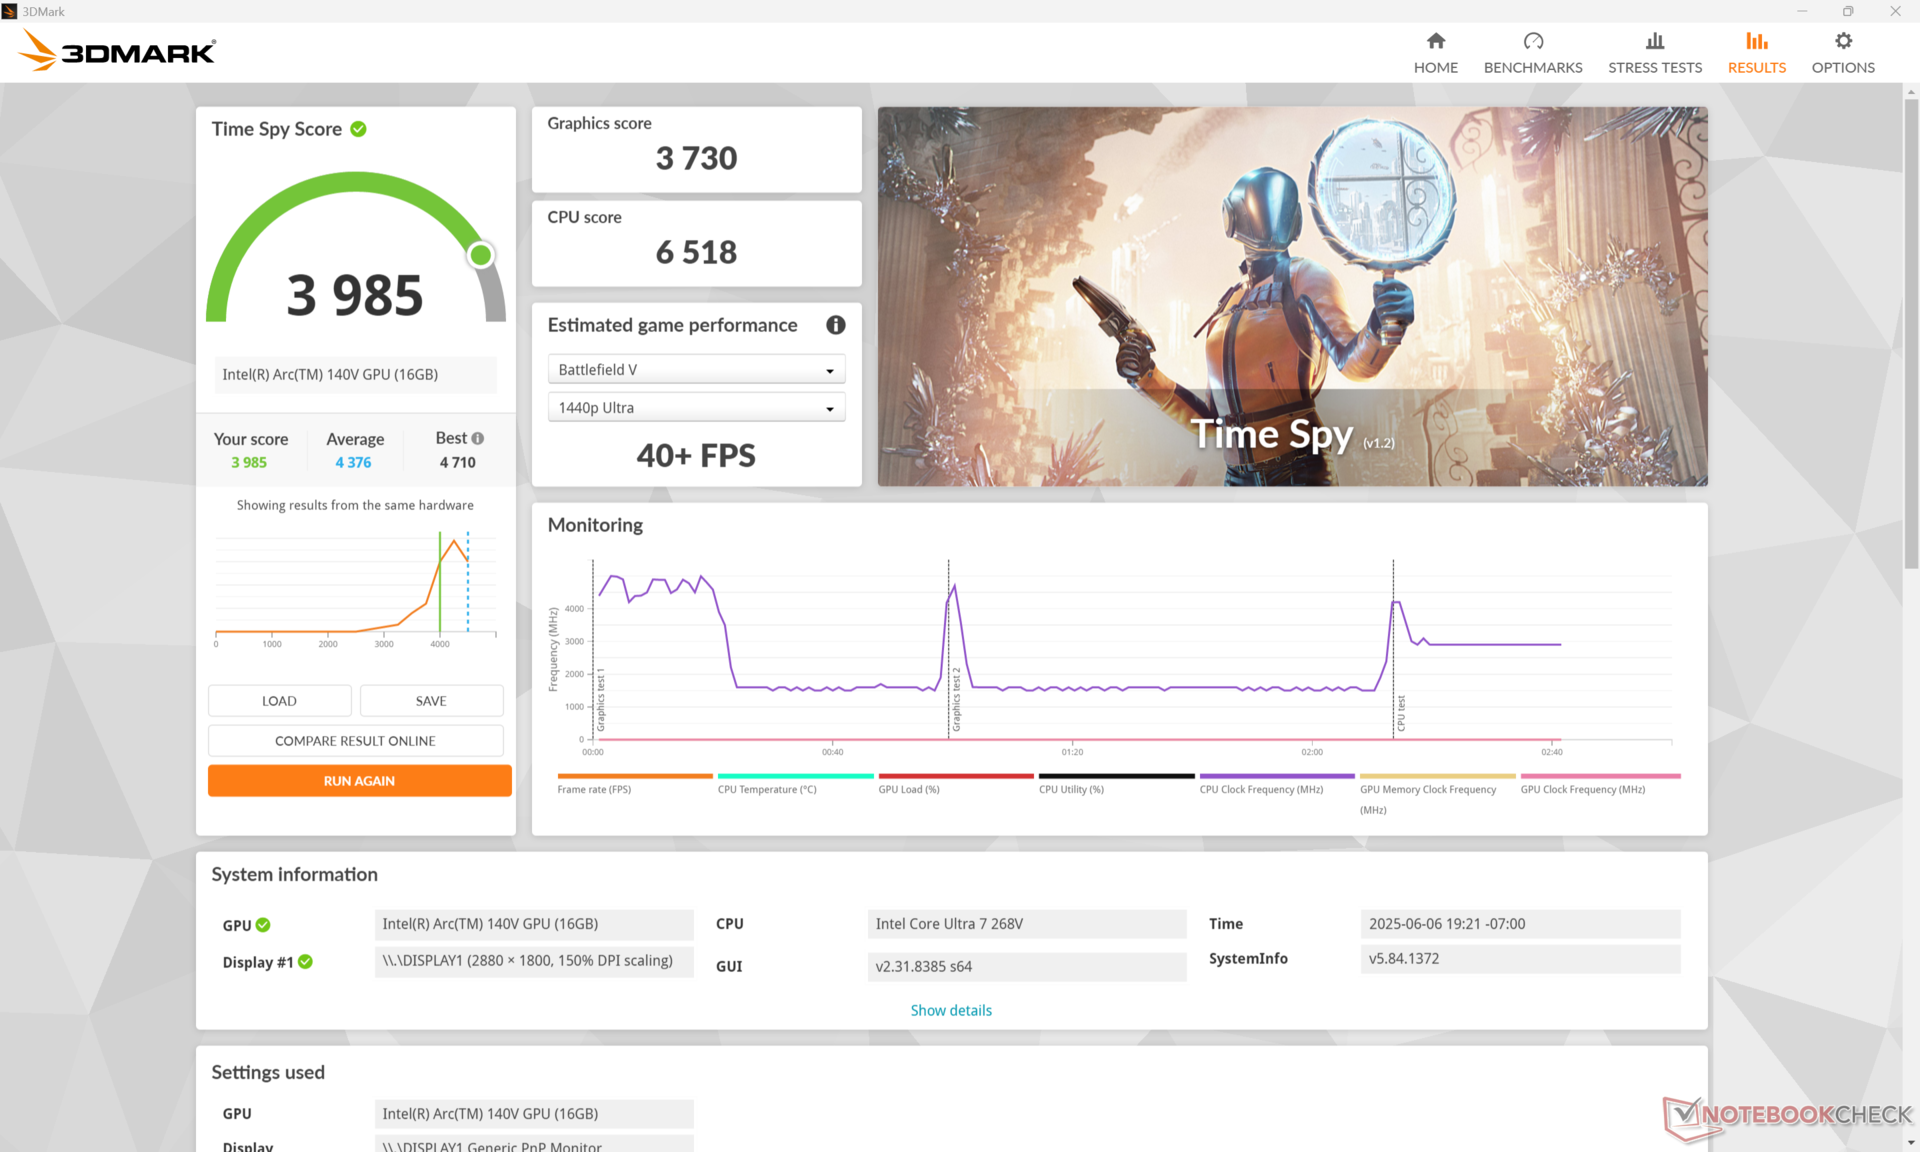
| 3DMark Time Spy Score | 3985 points | |
Help | ||
* ... smaller is better
Cyberpunk 2077 ultra FPS Chart
| low | med. | high | ultra | |
|---|---|---|---|---|
| Dota 2 Reborn (2015) | 104.1 | 89.5 | 75 | 87.4 |
| Final Fantasy XV Benchmark (2018) | 88.5 | 49.5 | 36.5 | |
| X-Plane 11.11 (2018) | 46.2 | 39.6 | 34.9 | |
| Strange Brigade (2018) | 194.3 | 80.2 | 67.4 | 57.6 |
| Baldur's Gate 3 (2023) | 43.6 | 36.8 | 32.2 | 31.6 |
| Cyberpunk 2077 (2023) | 47.8 | 38.5 | 33.4 | 29 |
| F1 24 (2024) | 82.4 | 75.7 | 59.9 | 19.1 |
Emissions
System Noise
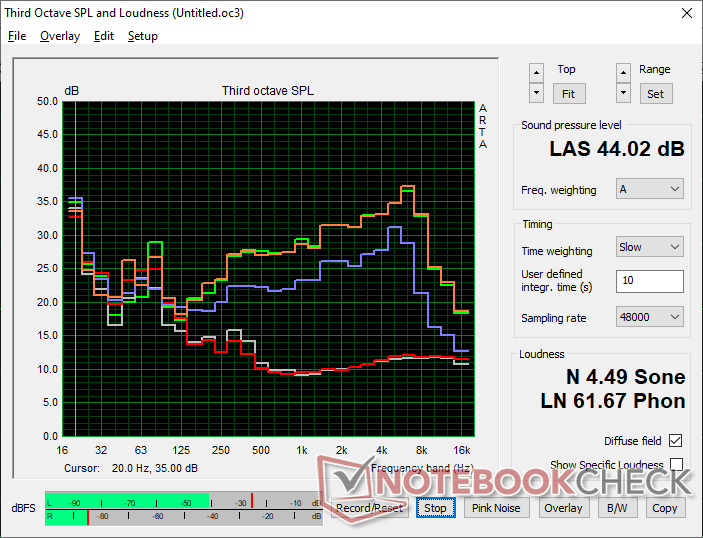
Fan noise profile and behavior are similar to what we observed on the Latitude 9440 2-in-1 which is perhaps unsurprising given that they share many similar physical features. The Dell Pro 14 Premium is essentially silent during day-to-day office loads like web browsing or word processing with minimal pulsing. Should the fans pick up in speed, they would drop back down relatively quickly when the extra processing power is no longer required.
The fan noise ceiling of 44 dB(A) is close to what we recorded on the Latitude 9440 2-in-1 to be louder than many other business subnotebooks. The pitch is relatively sharp as well and thus more noticeable than we would like.
Noise level
| Idle |
| 23.1 / 23.1 / 23.1 dB(A) |
| Load |
| 38.2 / 44.2 dB(A) |
 | ||
30 dB silent 40 dB(A) audible 50 dB(A) loud |
||
min: | ||
| Dell Pro 14 Premium Arc 140V, Core Ultra 7 268V, Kioxia BG6 KBG6AZNV1T02 | Dell Latitude 7440 Iris Xe G7 80EUs, i5-1345U, Samsung MZ9L4512HBLU-00BMV | Dell XPS 14 2024 OLED GeForce RTX 4050 Laptop GPU, Ultra 7 155H, Samsung PM9A1 MZVL21T0HCLR | Lenovo ThinkPad T14s Gen 6 Intel Arc 130V, Core Ultra 5 228V, SK hynix PCB01 HFS001TFM9X179N GL | HP EliteBook Ultra G1i 14 Arc 140V, Core Ultra 7 258V, Kioxia XG8 KXG80ZNV1T02 | Asus ExpertBook B1 B1403CVA UHD Graphics Xe G4 48EUs, i5-13420H, Western Digital PC SN5000S SDEQNSJ-512G-1002 | |
|---|---|---|---|---|---|---|
| Noise | 8% | -7% | 3% | 10% | 6% | |
| off / environment * (dB) | 23.1 | 22.8 1% | 24.3 -5% | 24.2 -5% | 23.9 -3% | 23.6 -2% |
| Idle Minimum * (dB) | 23.1 | 22.8 1% | 24.3 -5% | 24.2 -5% | 23.9 -3% | 23.6 -2% |
| Idle Average * (dB) | 23.1 | 22.8 1% | 26.5 -15% | 24.2 -5% | 23.9 -3% | 23.6 -2% |
| Idle Maximum * (dB) | 23.1 | 22.8 1% | 28.5 -23% | 24.2 -5% | 23.9 -3% | 23.7 -3% |
| Load Average * (dB) | 38.2 | 26.3 31% | 37 3% | 30.2 21% | 28.4 26% | 28.7 25% |
| Cyberpunk 2077 ultra * (dB) | 44.2 | 39.3 11% | 31.5 29% | 34.3 22% | ||
| Load Maximum * (dB) | 44.2 | 38.3 13% | 43.3 2% | 39.6 10% | 31.5 29% | 41.4 6% |
| Witcher 3 ultra * (dB) | 30 | 39.1 |
* ... smaller is better
Temperature
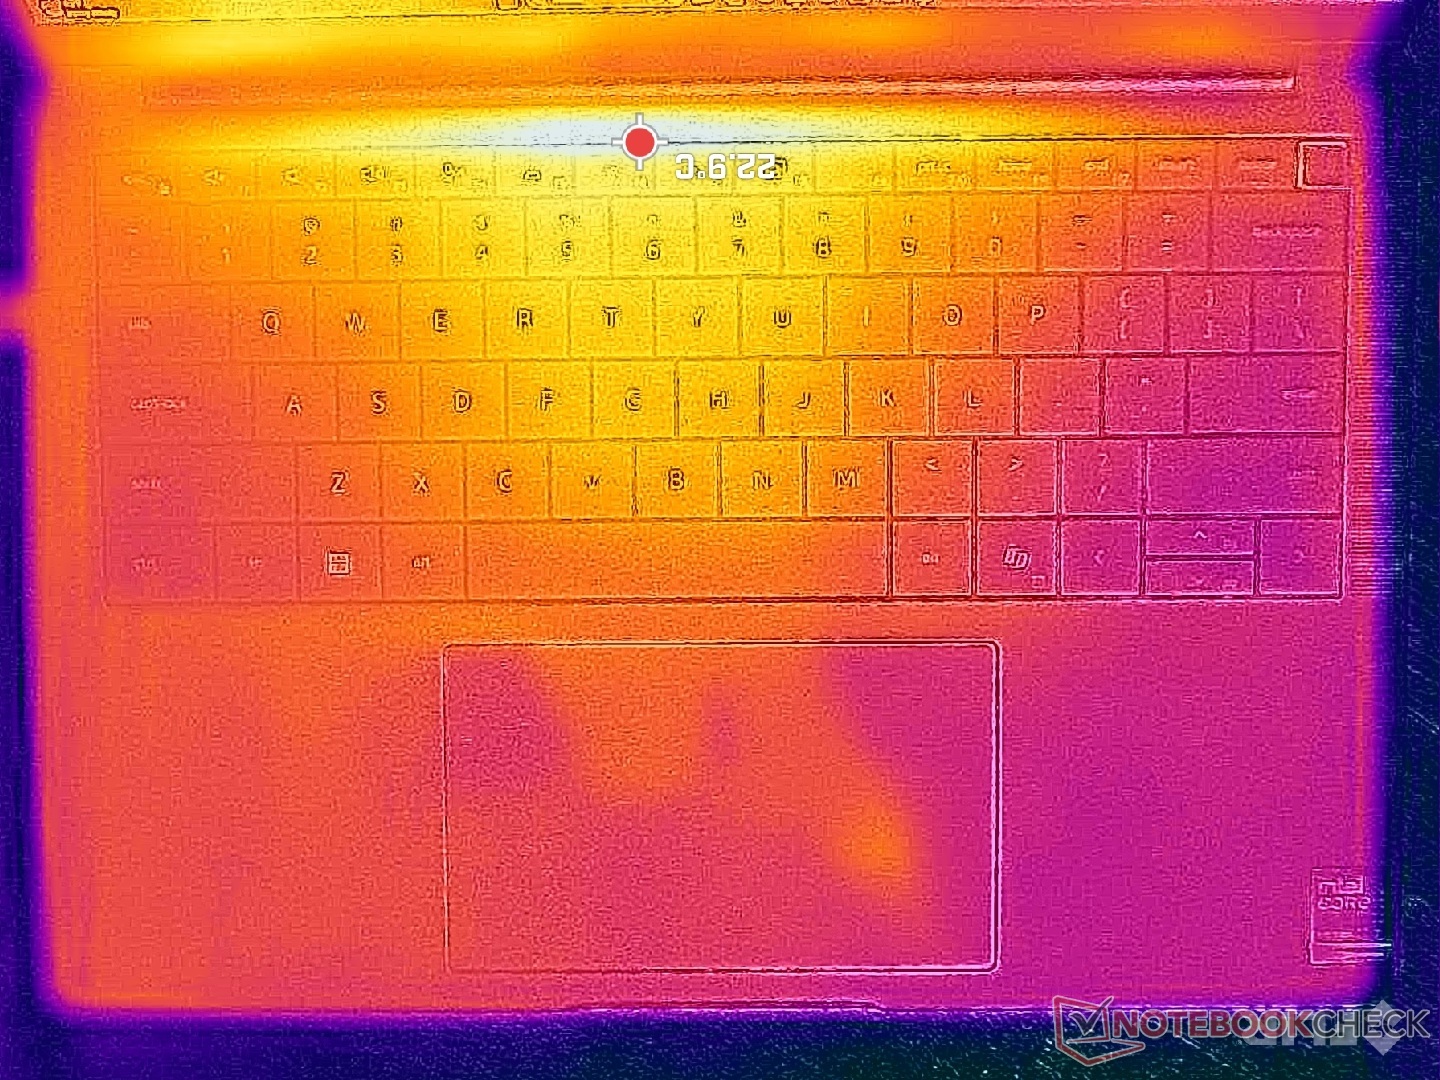
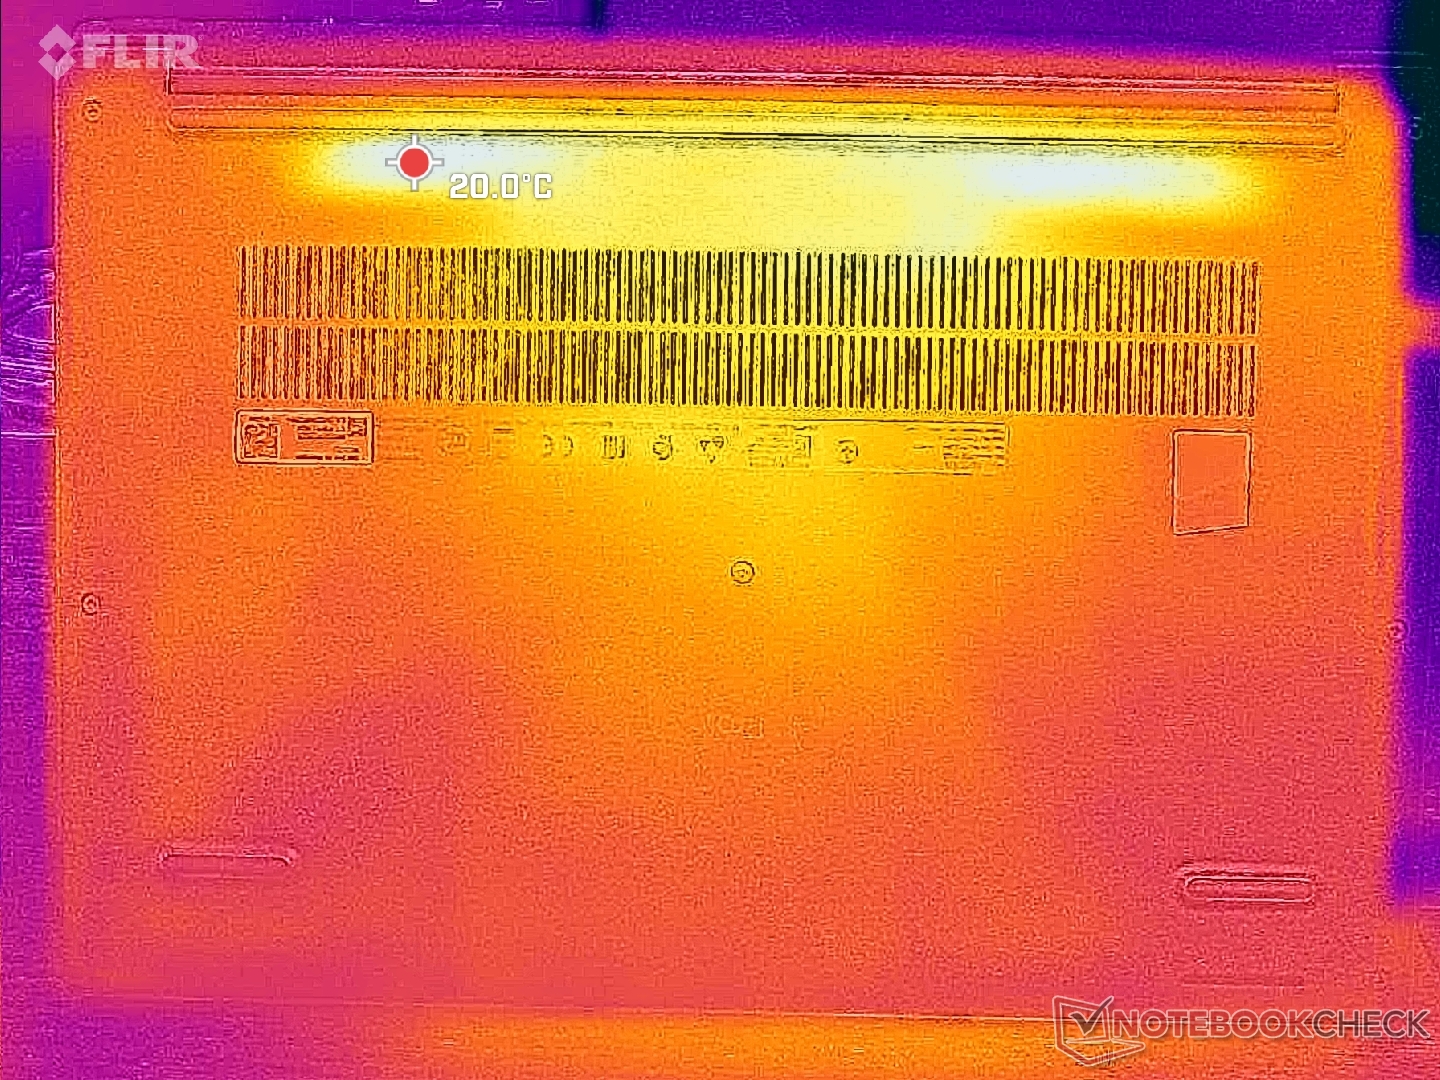
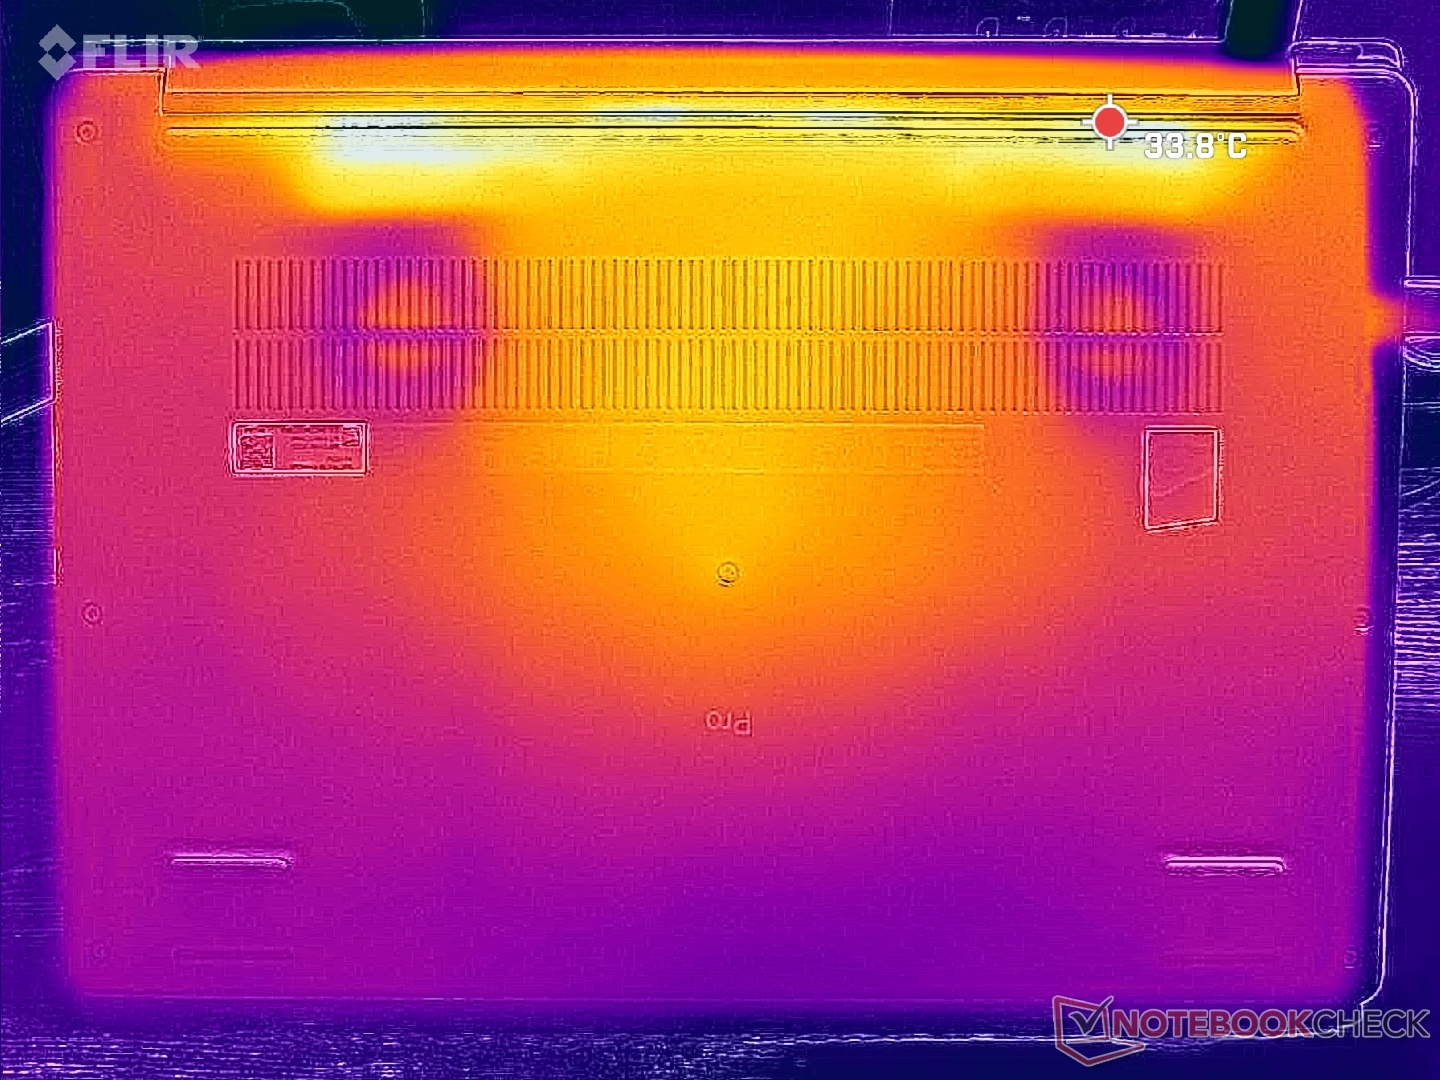
Surface temperatures are much cooler than what we recorded on both the Latitude 9440 2-in-1 and Latitude 7440. Hot spots on the keyboard surface and bottom panel reach just 33 C and 28 C, respectively, compared to 40 C on the aforementioned Latitude models. The improvements can be largely attributed to the more efficient Lunar Lake CPU.
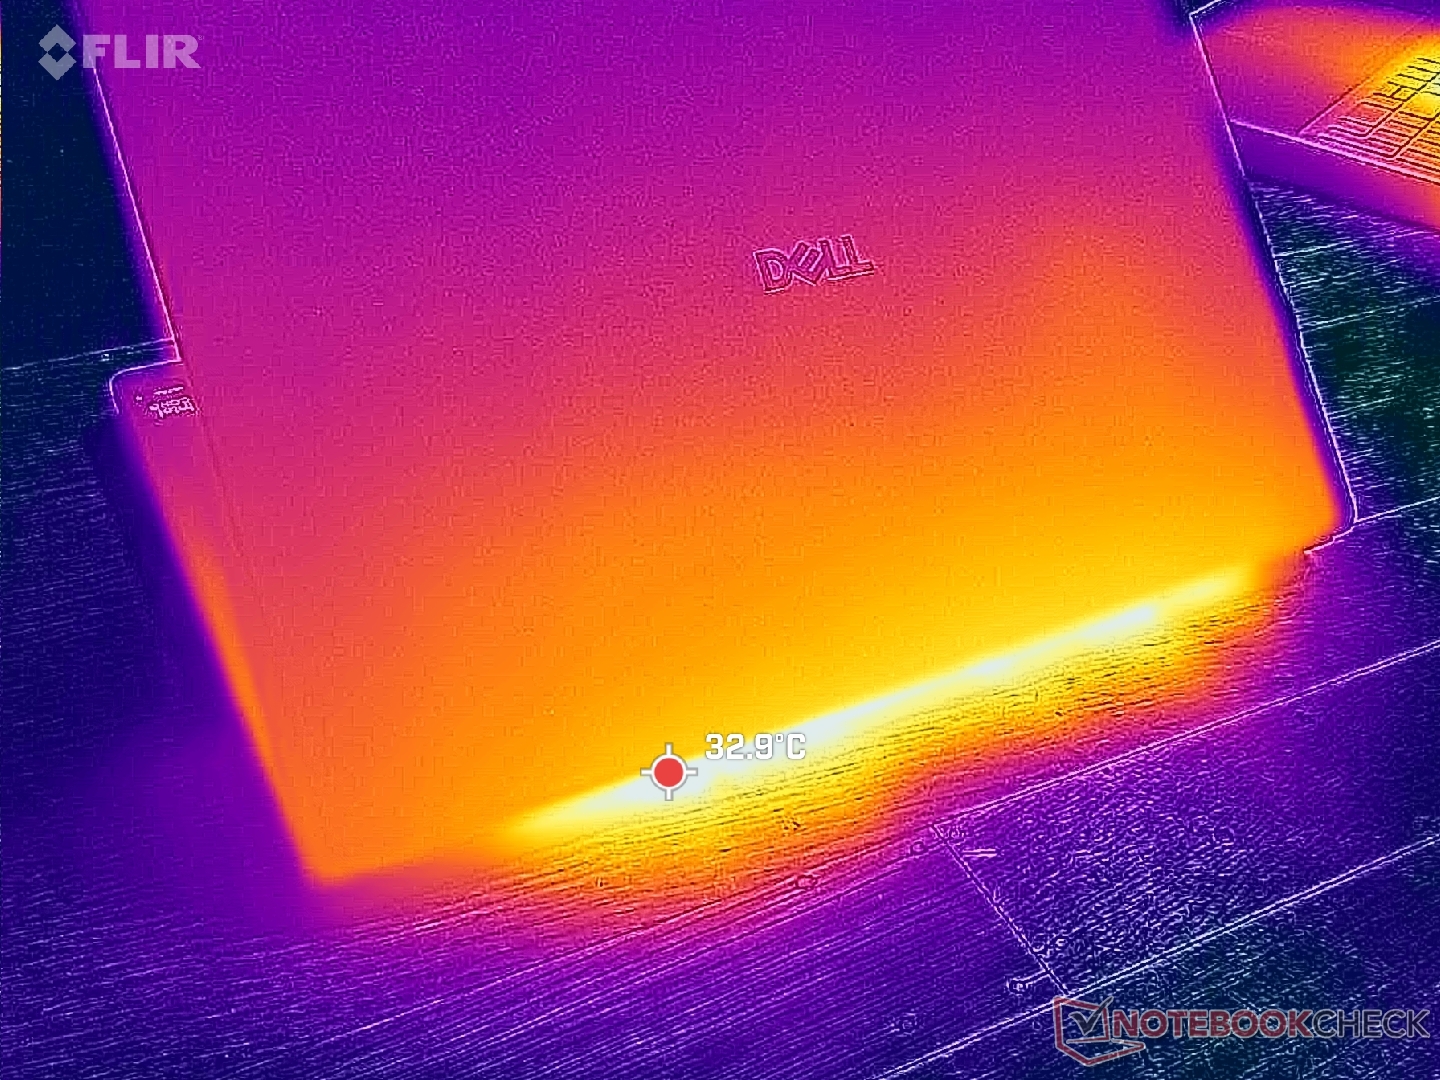

(+) The maximum temperature on the upper side is 33 °C / 91 F, compared to the average of 34.3 °C / 94 F, ranging from 21.2 to 62.5 °C for the class Office.
(+) The bottom heats up to a maximum of 28 °C / 82 F, compared to the average of 36.8 °C / 98 F
(+) In idle usage, the average temperature for the upper side is 26 °C / 79 F, compared to the device average of 29.5 °C / 85 F.
(+) The palmrests and touchpad are cooler than skin temperature with a maximum of 25.4 °C / 77.7 F and are therefore cool to the touch.
(+) The average temperature of the palmrest area of similar devices was 27.5 °C / 81.5 F (+2.1 °C / 3.8 F).

| Dell Pro 14 Premium Intel Core Ultra 7 268V, Intel Arc Graphics 140V | Dell Latitude 7440 Intel Core i5-1345U, Intel Iris Xe Graphics G7 80EUs | Dell XPS 14 2024 OLED Intel Core Ultra 7 155H, NVIDIA GeForce RTX 4050 Laptop GPU | Lenovo ThinkPad T14s Gen 6 Intel Intel Core Ultra 5 228V, Intel Arc Graphics 130V | HP EliteBook Ultra G1i 14 Intel Core Ultra 7 258V, Intel Arc Graphics 140V | Asus ExpertBook B1 B1403CVA Intel Core i5-13420H, Intel UHD Graphics Xe G4 48EUs | |
|---|---|---|---|---|---|---|
| Heat | -16% | -17% | -18% | -10% | -19% | |
| Maximum Upper Side * (°C) | 33 | 39 -18% | 40.5 -23% | 42.6 -29% | 37.9 -15% | 41.2 -25% |
| Maximum Bottom * (°C) | 28 | 40.6 -45% | 42.6 -52% | 41.6 -49% | 44.3 -58% | 44.4 -59% |
| Idle Upper Side * (°C) | 28 | 28 -0% | 26.9 4% | 27.1 3% | 23.3 17% | 26.7 5% |
| Idle Bottom * (°C) | 28.8 | 28.8 -0% | 27.8 3% | 27.6 4% | 23.6 18% | 28 3% |
* ... smaller is better
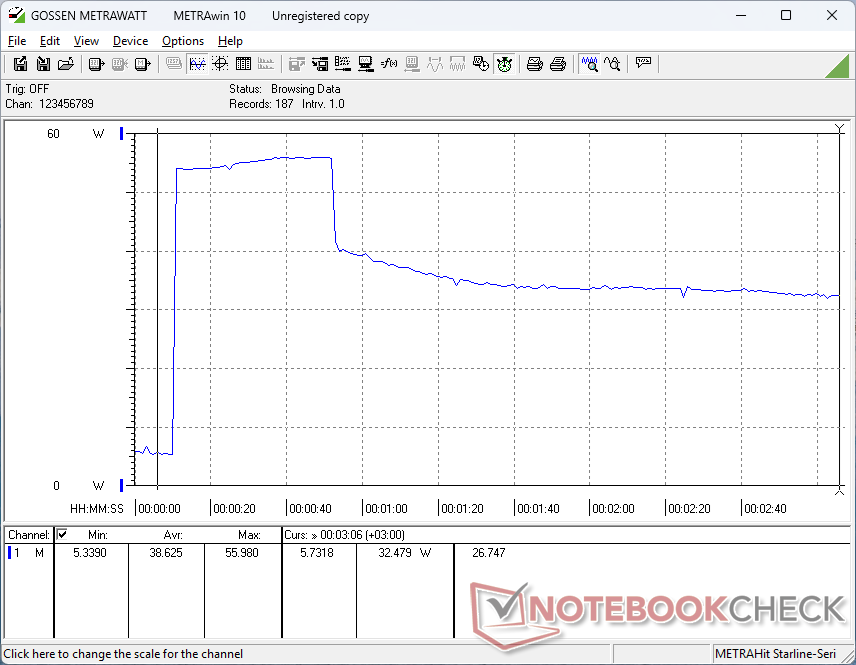
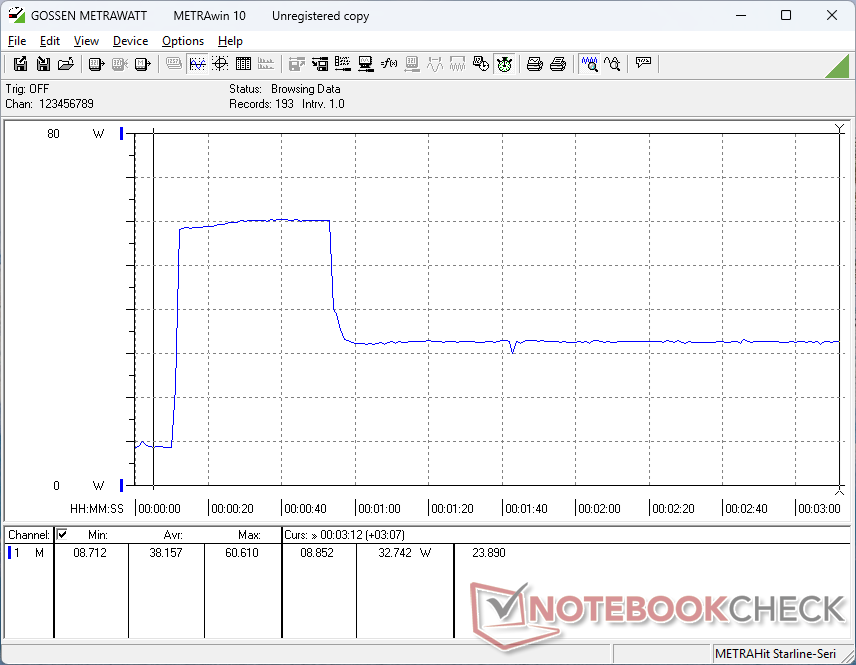
Stress Test
The CPU would boost to 3.3 GHz and 38 W when initiating Prime95 stress until reaching a core temperature of 96 C about 40 seconds later. Thereafter, performance would drop slightly to 3 GHz and 31 W in order to maintain a cooler temperature in the lower 80 C range. Maximum Turbo Boost is thus limited as to be expected from ULV laptops.
Core temperature when gaming remains just below 60 C compared to over 80 C on the Latitude 9440 2-in-1. Needless to say, the Dell Pro 14 Premium is significantly more efficient when running GPU-heavy loads.
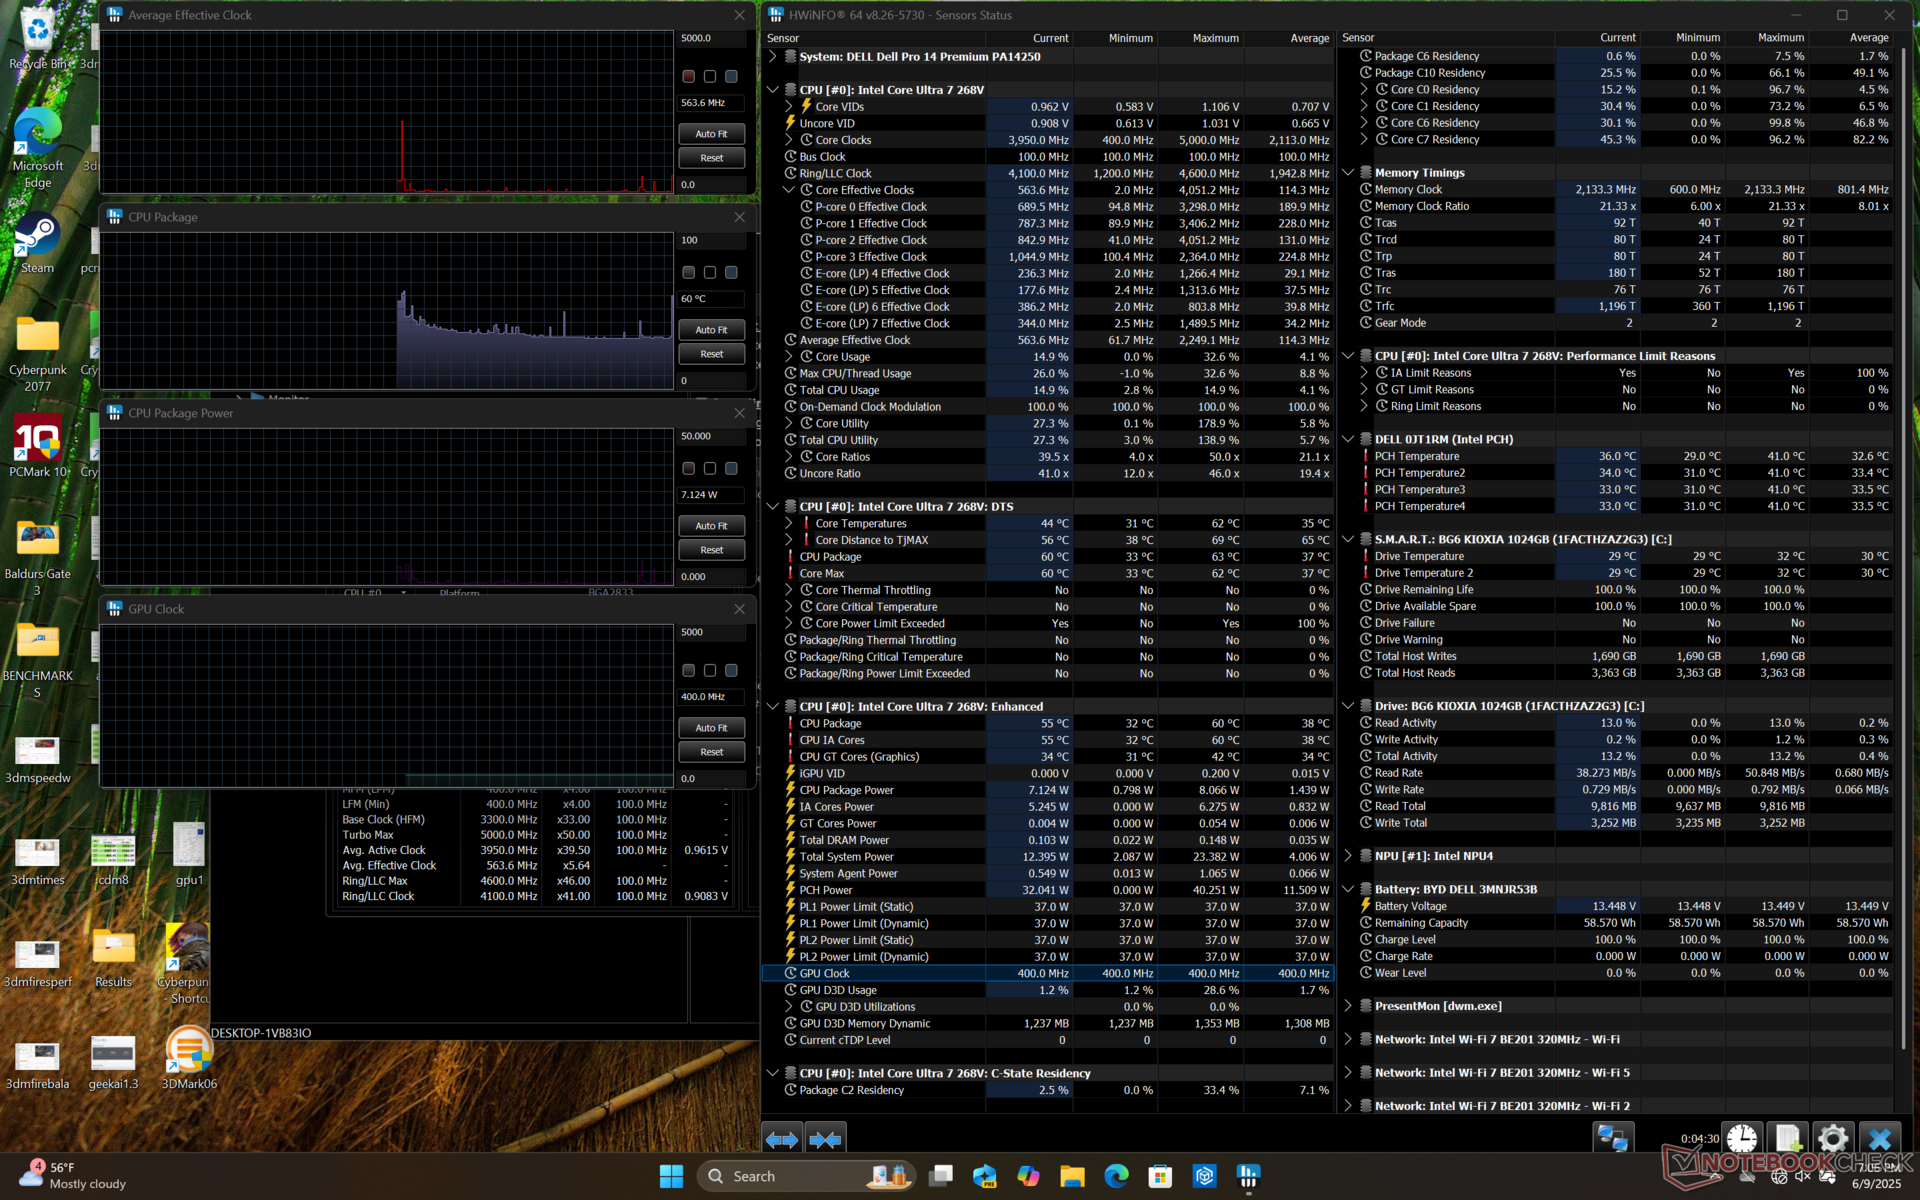
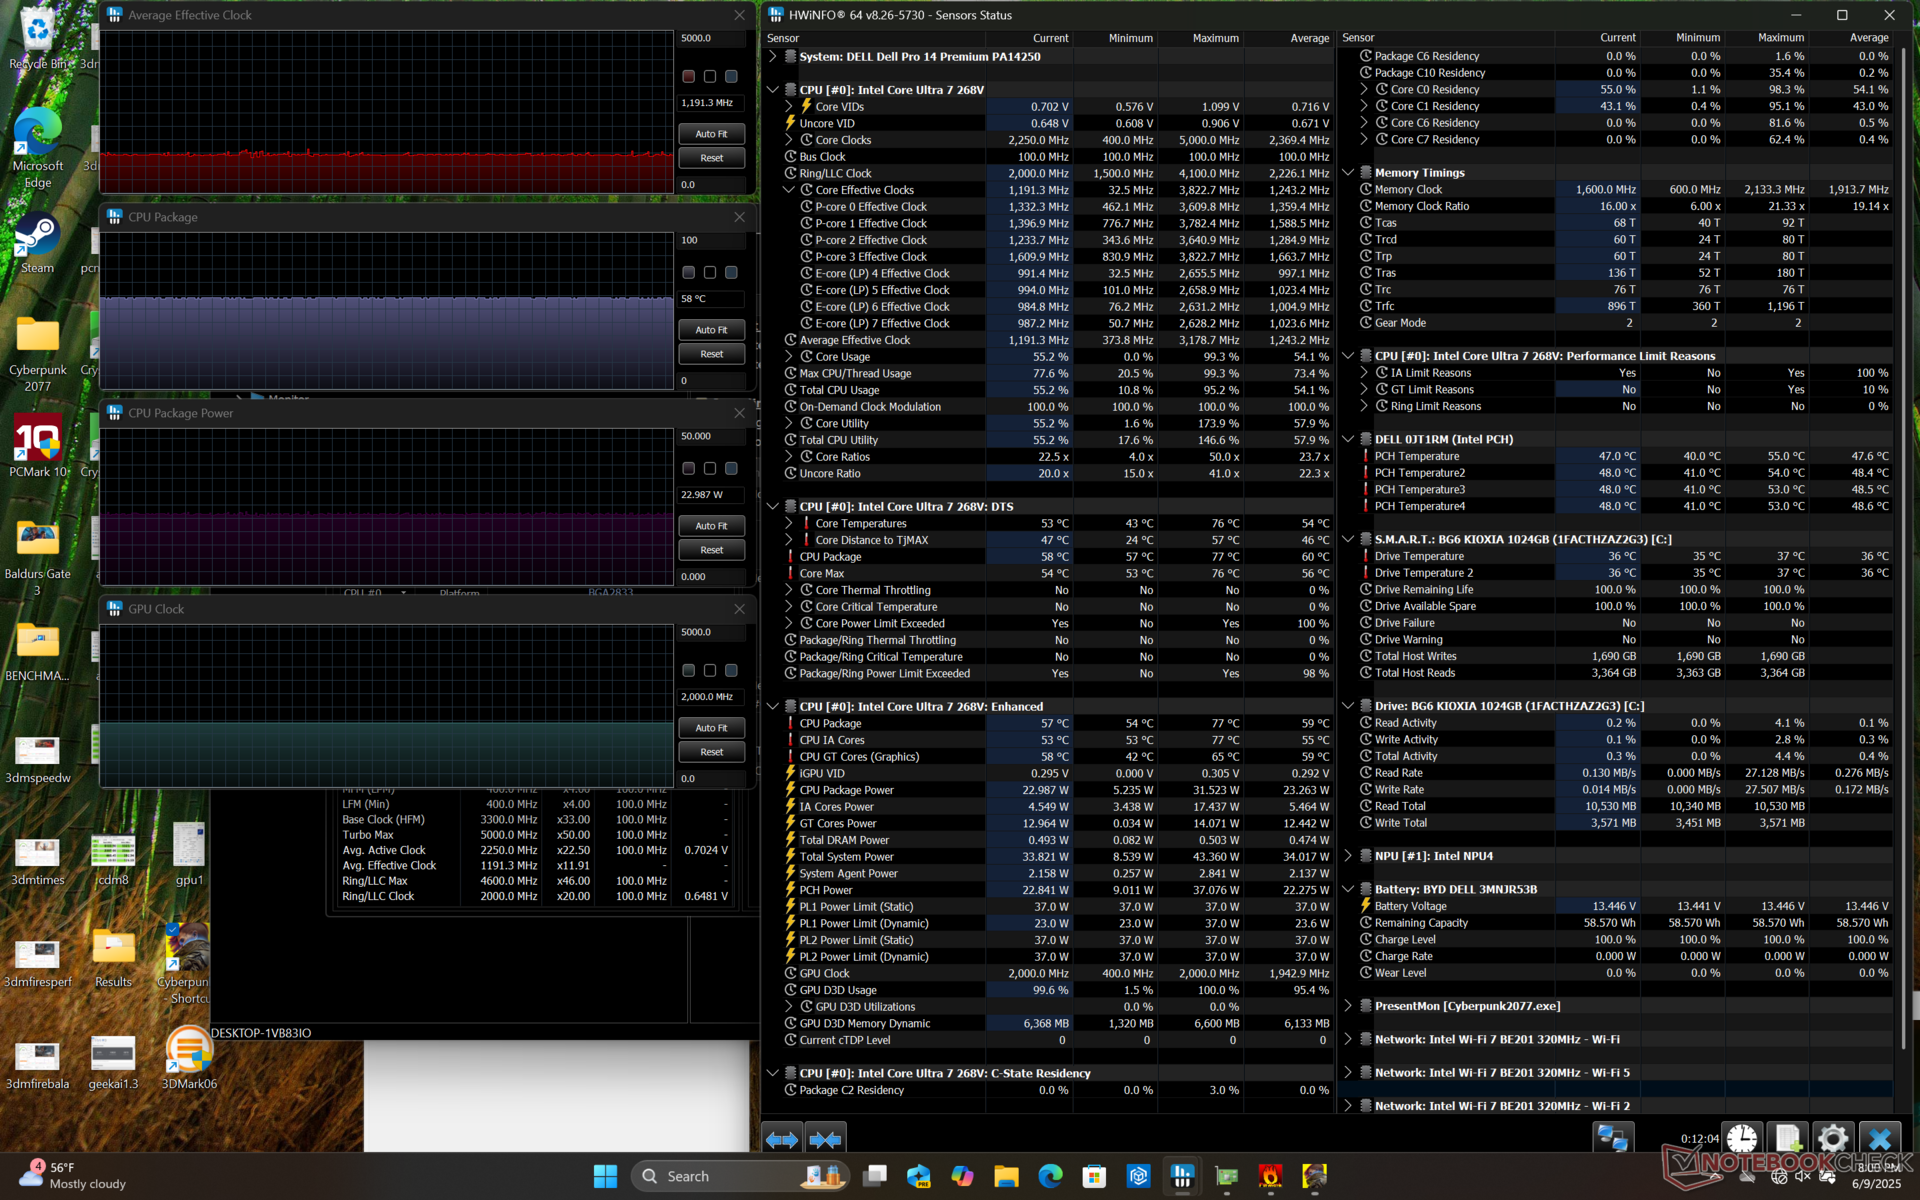
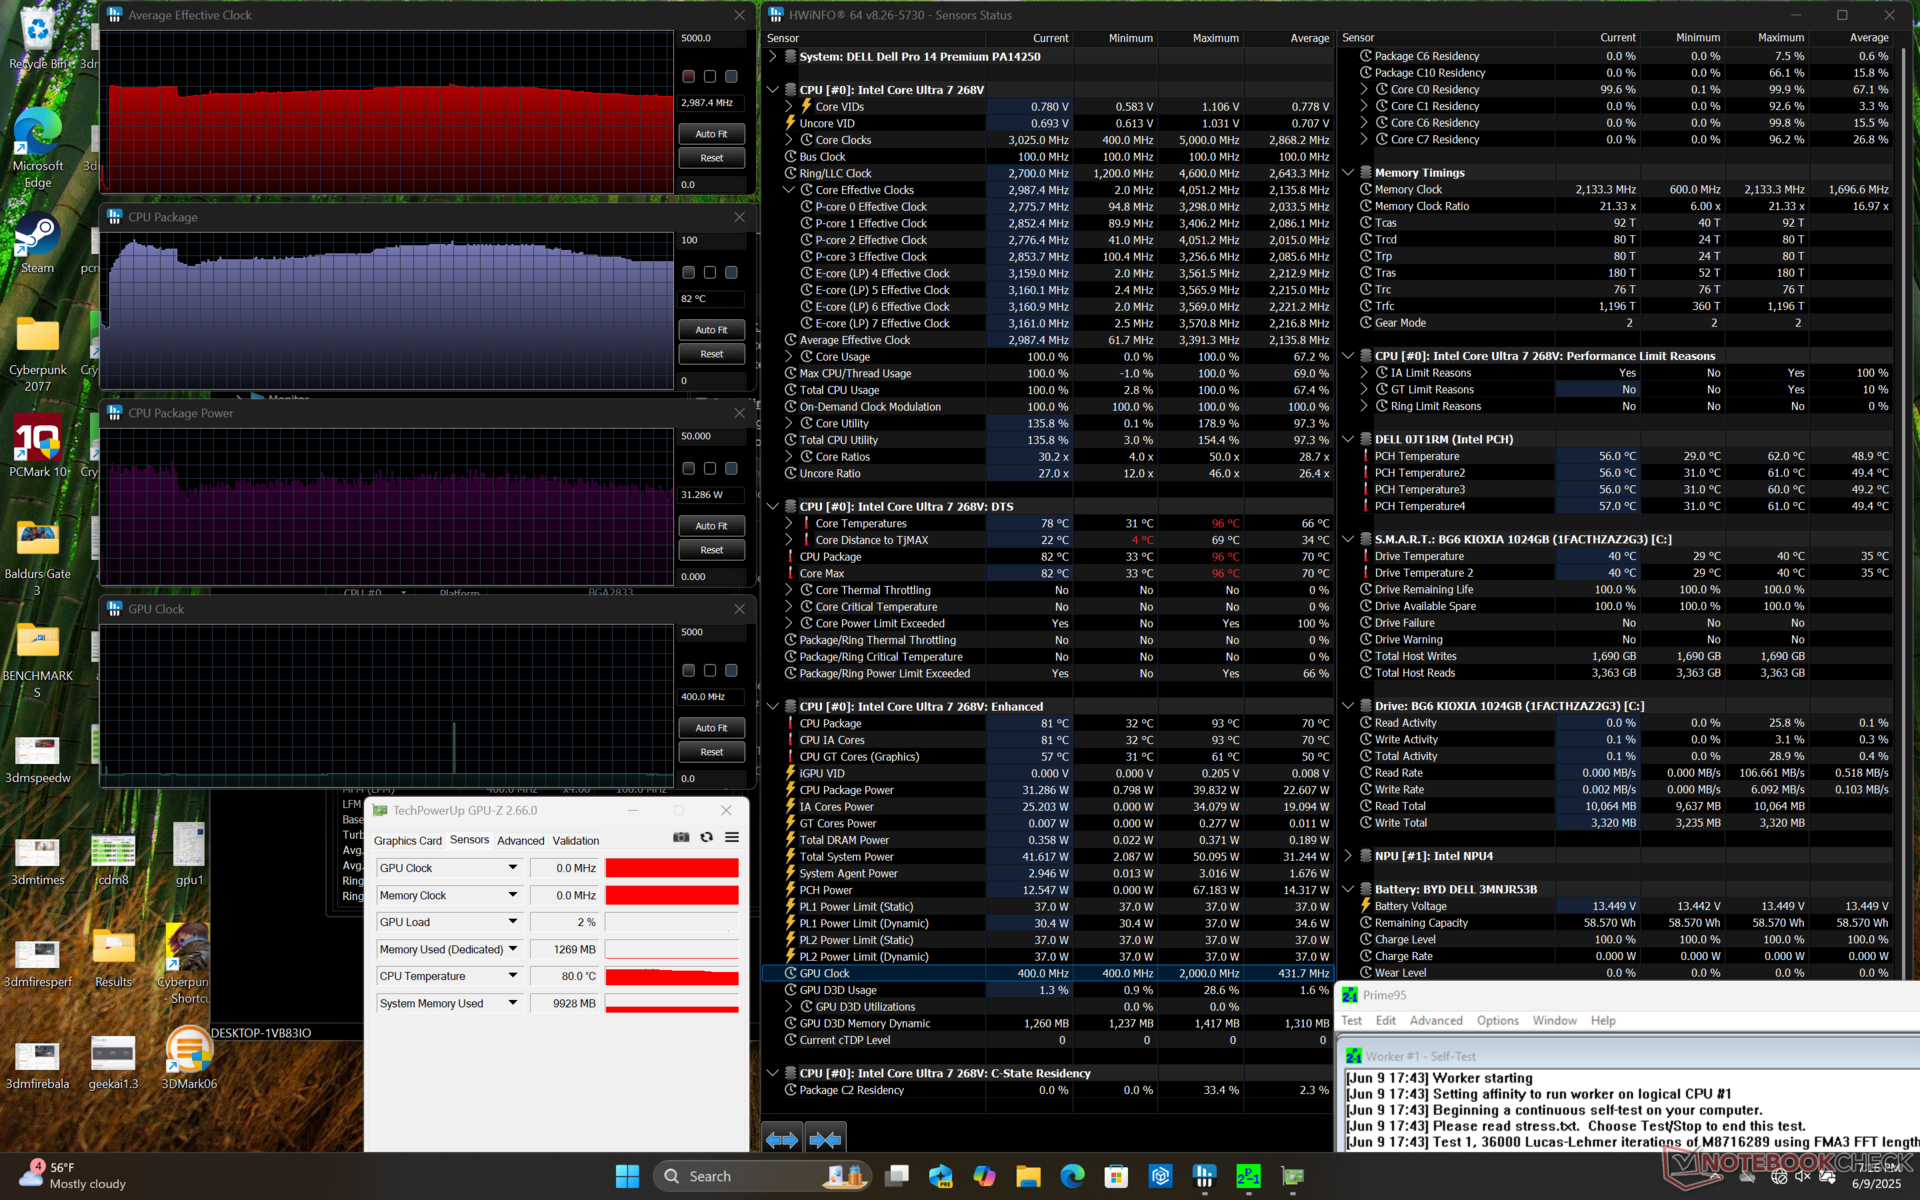
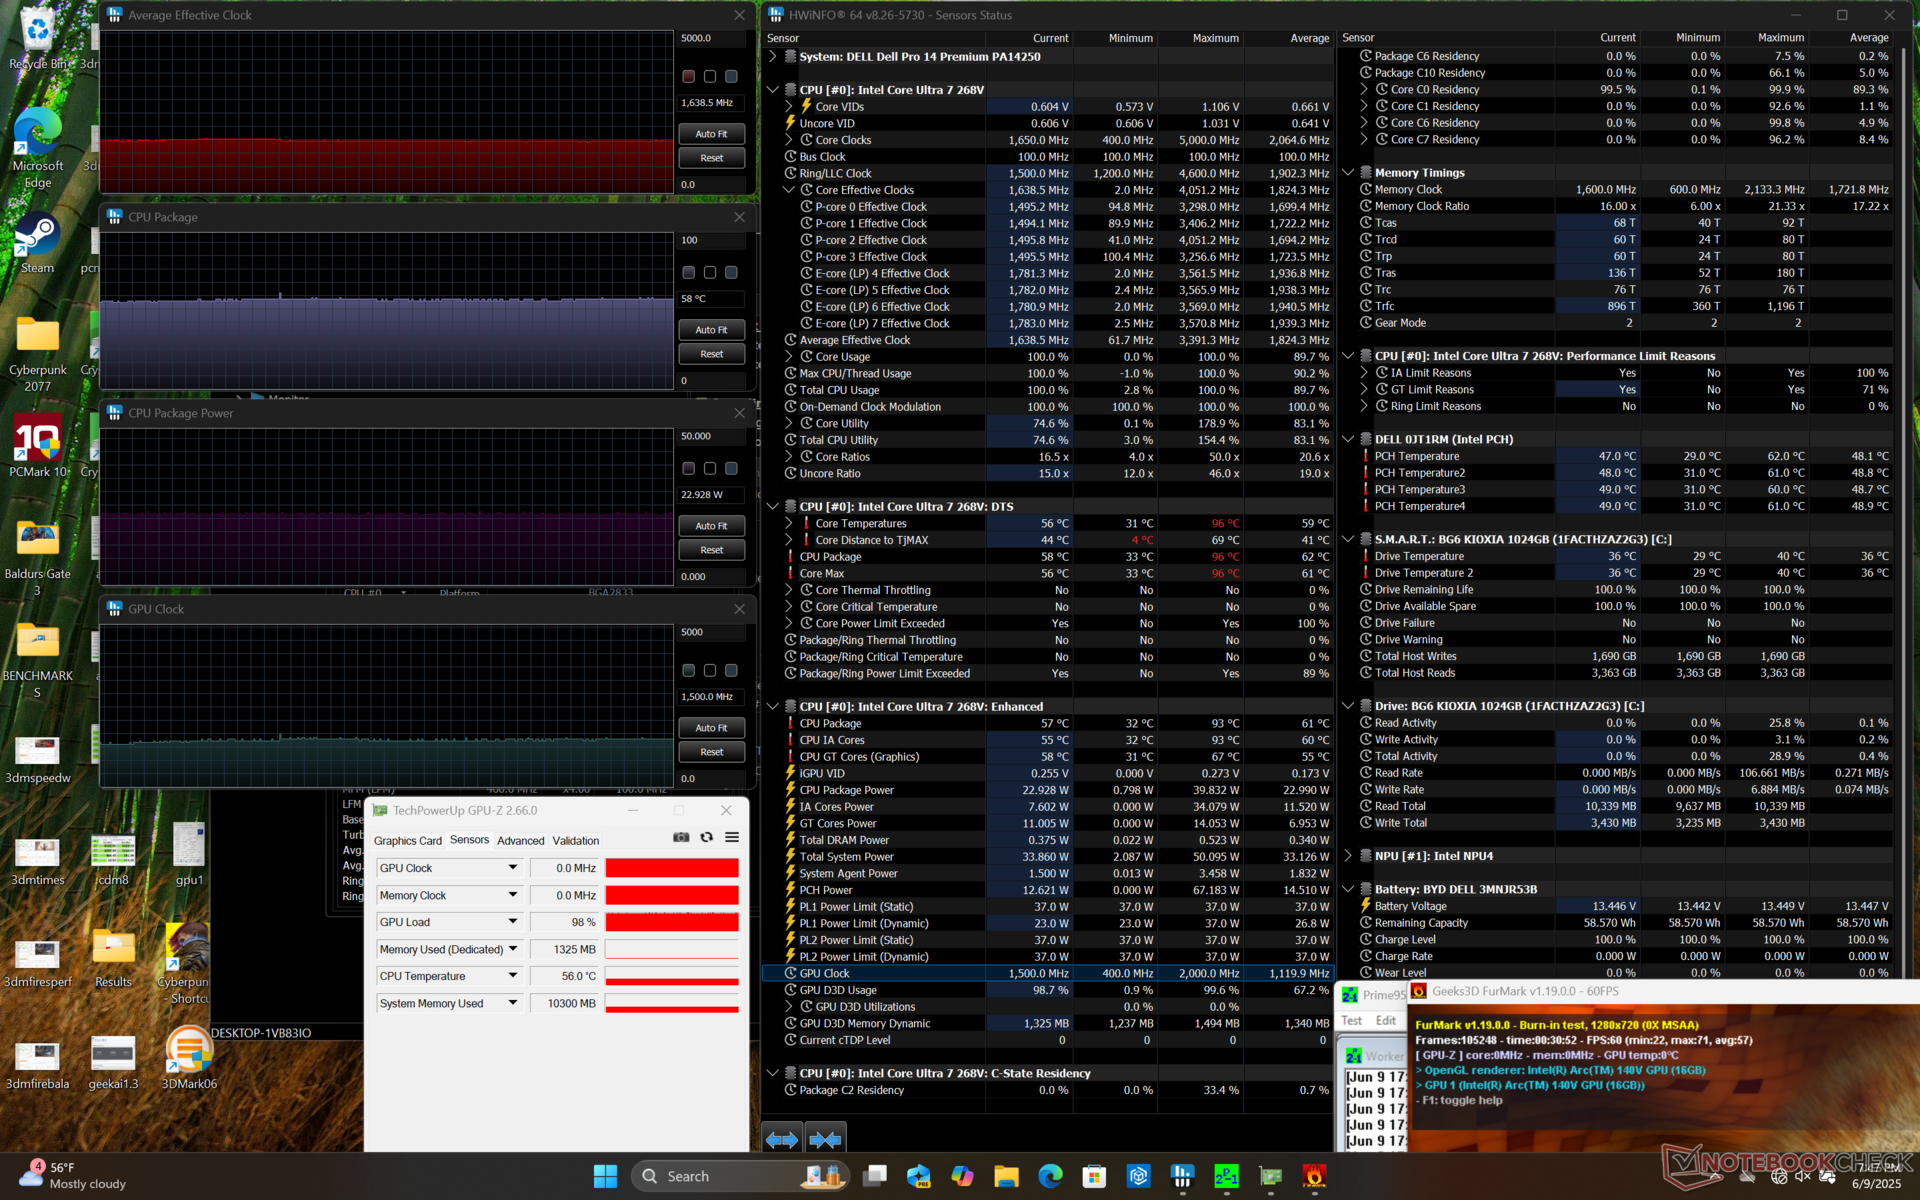
| Average CPU Clock (GHz) | GPU Clock (MHz) | Average CPU Temperature (°C) | |
| System Idle | -- | -- | 32 |
| Prime95 Stress | 3.0 | -- | 82 |
| Prime95 + FurMark Stress | 1.6 | 1500 | 58 |
| Cyberpunk 2077 Stress | 1.2 | 2000 | 58 |
Speakers
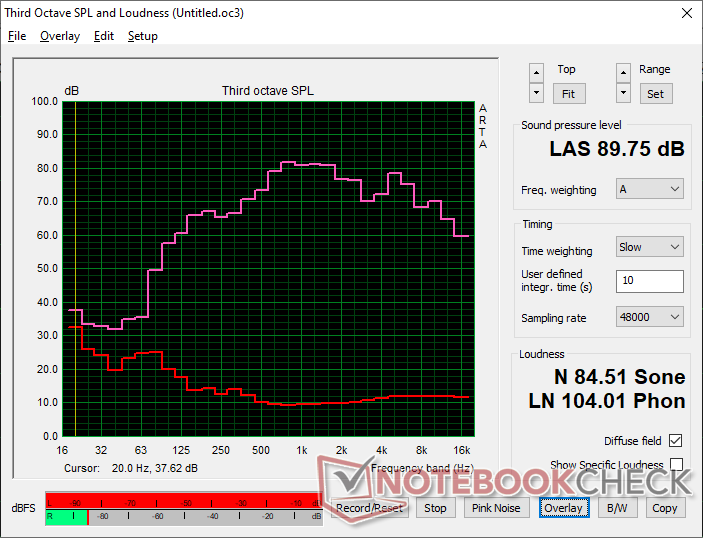
Dell Pro 14 Premium audio analysis
(+) | speakers can play relatively loud (89.8 dB)
Bass 100 - 315 Hz
(±) | reduced bass - on average 8.2% lower than median
(+) | bass is linear (5.7% delta to prev. frequency)
Mids 400 - 2000 Hz
(±) | higher mids - on average 6.3% higher than median
(+) | mids are linear (4.3% delta to prev. frequency)
Highs 2 - 16 kHz
(+) | balanced highs - only 3.1% away from median
(+) | highs are linear (6.4% delta to prev. frequency)
Overall 100 - 16.000 Hz
(+) | overall sound is linear (11.3% difference to median)
Compared to same class
» 2% of all tested devices in this class were better, 2% similar, 96% worse
» The best had a delta of 7%, average was 21%, worst was 53%
Compared to all devices tested
» 7% of all tested devices were better, 2% similar, 91% worse
» The best had a delta of 4%, average was 24%, worst was 134%
Apple MacBook Pro 16 2021 M1 Pro audio analysis
(+) | speakers can play relatively loud (84.7 dB)
Bass 100 - 315 Hz
(+) | good bass - only 3.8% away from median
(+) | bass is linear (5.2% delta to prev. frequency)
Mids 400 - 2000 Hz
(+) | balanced mids - only 1.3% away from median
(+) | mids are linear (2.1% delta to prev. frequency)
Highs 2 - 16 kHz
(+) | balanced highs - only 1.9% away from median
(+) | highs are linear (2.7% delta to prev. frequency)
Overall 100 - 16.000 Hz
(+) | overall sound is linear (4.6% difference to median)
Compared to same class
» 0% of all tested devices in this class were better, 0% similar, 100% worse
» The best had a delta of 5%, average was 17%, worst was 45%
Compared to all devices tested
» 0% of all tested devices were better, 0% similar, 100% worse
» The best had a delta of 4%, average was 24%, worst was 134%
Energy Management
Power Consumption
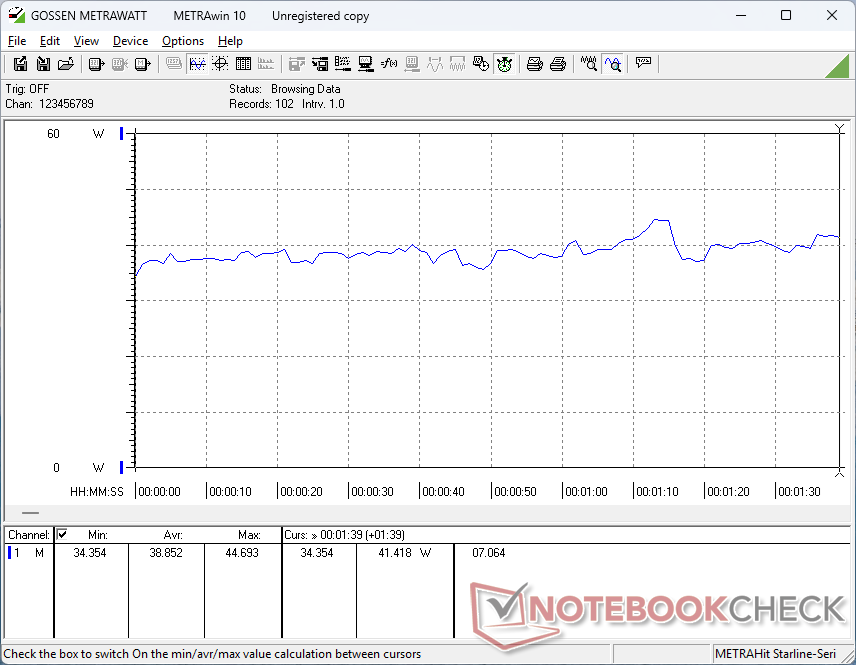
The system is about 15 percent more efficient than the Latitude 7440 when running CPU-heavy loads while simultaneously offering up to 15 percent faster performance in the process for improved performance-per-watt. The advantages are significantly greater for AI-accelerated tasks or GPU-heavy workloads for which Lunar Lake excels at when compared to Raptor Lake.
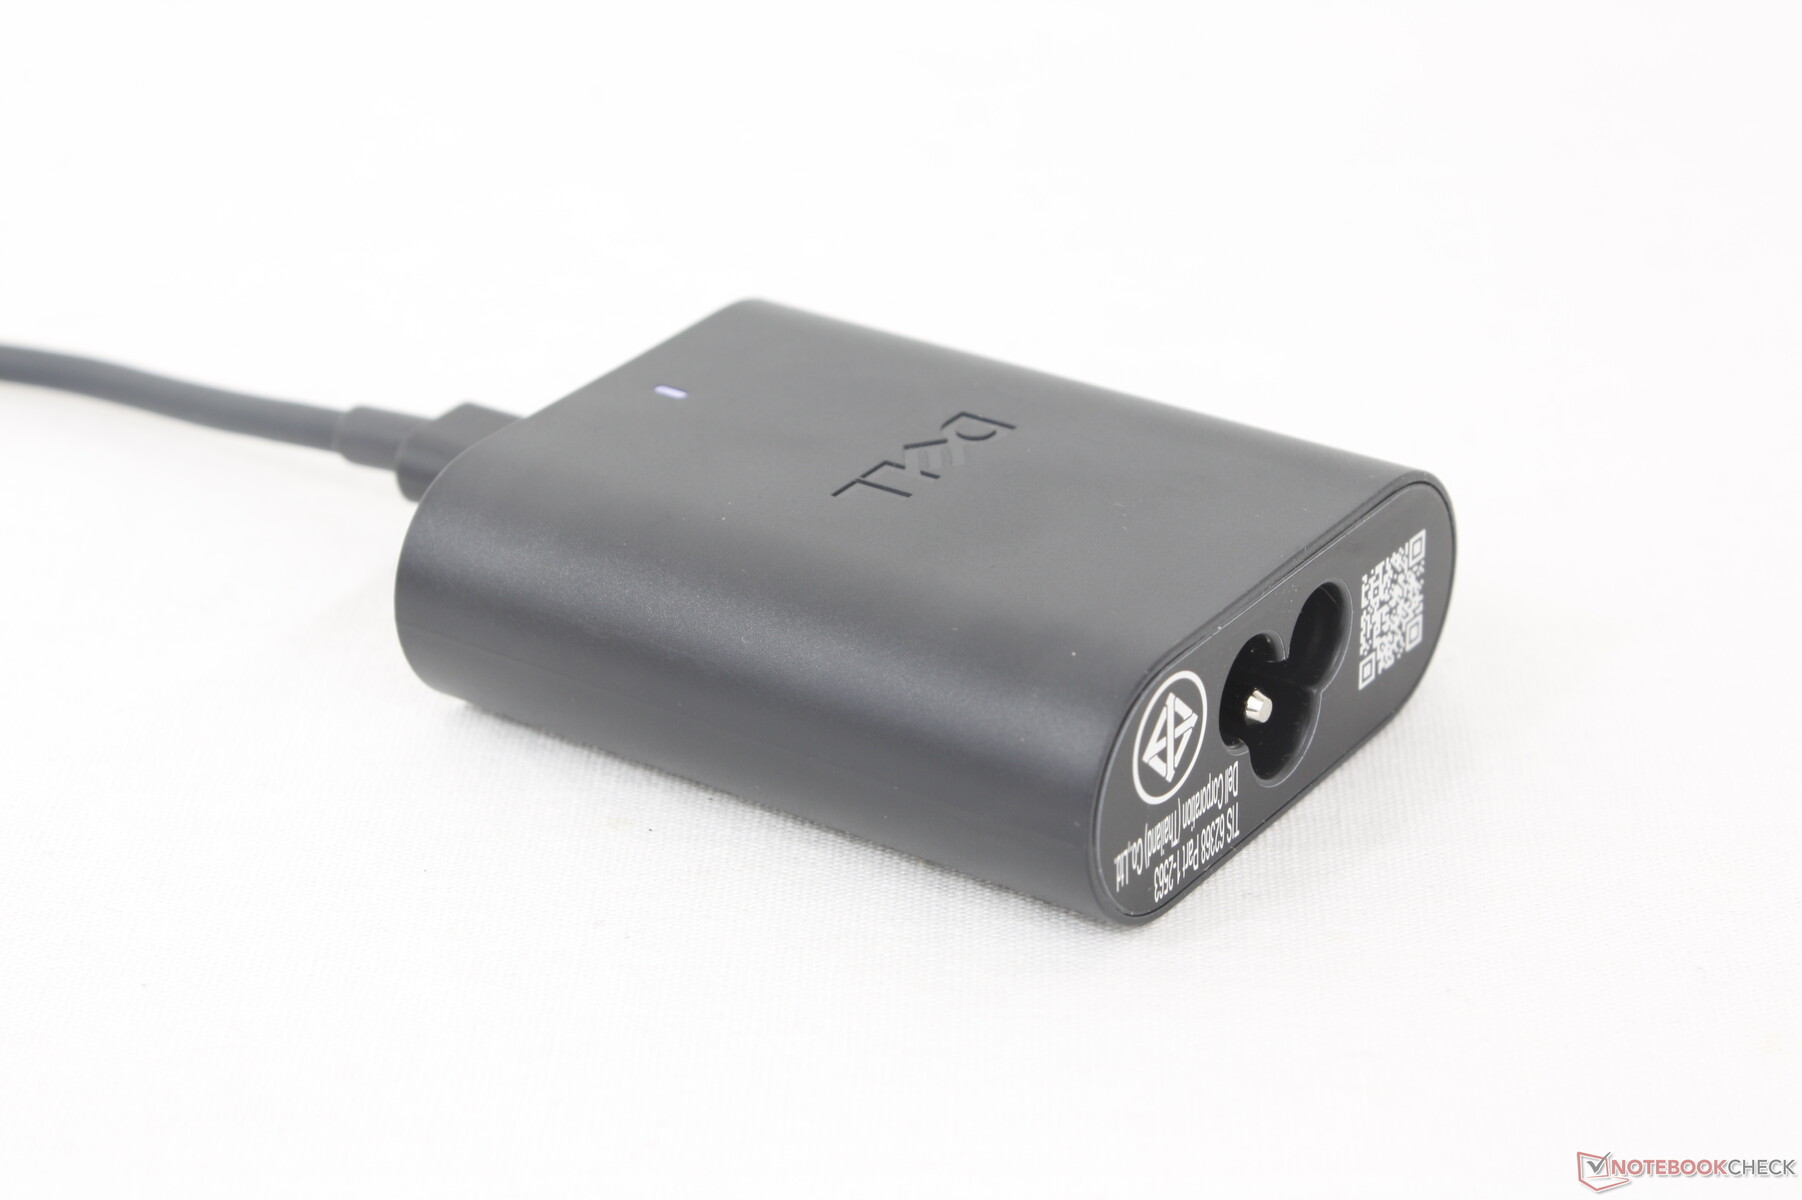
We're able to record a maximum draw of 61 W from the tiny (~6.5 x 5.5 x 2.2 cm) 60 W USB-C AC adapter when the CPU is at 100 percent utilization.

| Off / Standby | |
| Idle | |
| Load |
|
Key:
min: | |
| Dell Pro 14 Premium Core Ultra 7 268V, Arc 140V, Kioxia BG6 KBG6AZNV1T02, OLED, 2880x1800, 14" | Dell Latitude 7440 i5-1345U, Iris Xe G7 80EUs, Samsung MZ9L4512HBLU-00BMV, IPS, 2560x1600, 14" | Dell XPS 14 2024 OLED Ultra 7 155H, GeForce RTX 4050 Laptop GPU, Samsung PM9A1 MZVL21T0HCLR, OLED, 3200x2000, 14.5" | Lenovo ThinkPad T14s Gen 6 Intel Core Ultra 5 228V, Arc 130V, SK hynix PCB01 HFS001TFM9X179N GL, IPS LED, 1920x1200, 14" | HP EliteBook Ultra G1i 14 Core Ultra 7 258V, Arc 140V, Kioxia XG8 KXG80ZNV1T02, OLED, 2880x1800, 14" | Asus ExpertBook B1 B1403CVA i5-13420H, UHD Graphics Xe G4 48EUs, Western Digital PC SN5000S SDEQNSJ-512G-1002, IPS, 1920x1080, 14" | |
|---|---|---|---|---|---|---|
| Power Consumption | -22% | -93% | 9% | 2% | -23% | |
| Idle Minimum * (Watt) | 3.5 | 4.5 -29% | 8.1 -131% | 3 14% | 3.7 -6% | 3.7 -6% |
| Idle Average * (Watt) | 4.3 | 6.5 -51% | 9.9 -130% | 4.7 -9% | 5.4 -26% | 8.3 -93% |
| Idle Maximum * (Watt) | 7.9 | 7.3 8% | 10.4 -32% | 5.4 32% | 5.7 28% | 8.6 -9% |
| Load Average * (Watt) | 38.9 | 52.5 -35% | 75.6 -94% | 31.8 18% | 39.4 -1% | 52.5 -35% |
| Cyberpunk 2077 ultra external monitor * (Watt) | 38.7 | 37.1 4% | 32.4 16% | 41.1 -6% | ||
| Cyberpunk 2077 ultra * (Watt) | 39 | 38.7 1% | 35.3 9% | 42.8 -10% | ||
| Load Maximum * (Watt) | 60.7 | 63 -4% | 107.1 -76% | 58.9 3% | 62.9 -4% | 63.2 -4% |
| Witcher 3 ultra * (Watt) | 46.2 | 65.6 |
* ... smaller is better
Power Consumption Cyberpunk / Stress Test
Power Consumption external Monitor
Battery Life
Runtimes have improved over the last generation Latitude 14 series even though battery capacity hasn't changed by very much. We're able to record just over 15 hours of real-world WLAN browsing before automatic shutdown to be at least two hours longer than on the Latitude 7440 under similar conditions. Battery life is expected to be even longer if configuring with the base IPS panel instead of our OLED one.
Charging from empty to full takes just over 90 minutes.
| Dell Pro 14 Premium Core Ultra 7 268V, Arc 140V, 60 Wh | Dell Latitude 7440 i5-1345U, Iris Xe G7 80EUs, 57 Wh | Dell XPS 14 2024 OLED Ultra 7 155H, GeForce RTX 4050 Laptop GPU, 69.5 Wh | Lenovo ThinkPad T14s Gen 6 Intel Core Ultra 5 228V, Arc 130V, 58 Wh | HP EliteBook Ultra G1i 14 Core Ultra 7 258V, Arc 140V, 64 Wh | Asus ExpertBook B1 B1403CVA i5-13420H, UHD Graphics Xe G4 48EUs, 50 Wh | |
|---|---|---|---|---|---|---|
| Battery runtime | -14% | -49% | 43% | -21% | -54% | |
| WiFi v1.3 (h) | 15.2 | 13 -14% | 7.8 -49% | 21.8 43% | 12 -21% | 7 -54% |
| Reader / Idle (h) | 23.8 | |||||
| Load (h) | 2.7 | 1.3 | 1.8 | |||
| H.264 (h) | 10.6 |
Notebookcheck Rating
Dell Pro 14 Premium
- 06/19/2025 v8
Allen Ngo
 Total Sustainability Score:
 Potential Competitors in Comparison
Image | Model / Review | Price | Weight | Height | Display |
|---|---|---|---|---|---|
1. 86.4%  | Dell Pro 14 Premium Intel Core Ultra 7 268V ⎘ Intel Arc Graphics 140V ⎘ 32 GB Memory, 1024 GB SSD | List Price: 2500 USD | 1.3 kg | 17.95 mm | 14.00" 2880x1800 243 PPI OLED |
2. 90.3% v7 (old)  | Dell Latitude 7440 Intel Core i5-1345U ⎘ Intel Iris Xe Graphics G7 80EUs ⎘ 16 GB Memory, 512 GB SSD | Amazon: 1. $769.00 Dell Latitude 7440 14" Lapto... 2. $465.00 Dell Latitude 7440 Business ... 3. $599.99 Dell Latitude 7440 14" Lapto... List Price: 1900 USD | 1.2 kg | 17.95 mm | 14.00" 2560x1600 216 PPI IPS |
3. 86.3% v7 (old)  | Dell XPS 14 2024 OLED Intel Core Ultra 7 155H ⎘ NVIDIA GeForce RTX 4050 Laptop GPU ⎘ 32 GB Memory, 1024 GB SSD | Amazon: List Price: 2949€ | 1.8 kg | 19 mm | 14.50" 3200x2000 260 PPI OLED |
4. 88.6%  | Lenovo ThinkPad T14s Gen 6 Intel Intel Core Ultra 5 228V ⎘ Intel Arc Graphics 130V ⎘ 32 GB Memory, 1024 GB SSD | Amazon: List Price: 2070 Euo | 1.3 kg | 19 mm | 14.00" 1920x1200 162 PPI IPS LED |
5. 89.6% 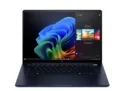 | HP EliteBook Ultra G1i 14 Intel Core Ultra 7 258V ⎘ Intel Arc Graphics 140V ⎘ 32 GB Memory, 1024 GB SSD | Amazon: List Price: 2349€ | 1.2 kg | 12.1 mm | 14.00" 2880x1800 243 PPI OLED |
6. 80.9%  | Asus ExpertBook B1 B1403CVA Intel Core i5-13420H ⎘ Intel UHD Graphics Xe G4 48EUs ⎘ 16 GB Memory, 512 GB SSD | Amazon: 1. $699.00 ASUS ExpertBook B1 14" FHD L... 2. $36.99 B31N1915 C31N1915 Laptop Bat... 3. $1,299.00 ASUS ExpertBook B1 B1500 B15... List Price: 700€ | 1.5 kg | 19.7 mm | 14.00" 1920x1080 157 PPI IPS |
