
Dell Pro 13 Premium review: The almost perfect business laptop
The "Promium" laptop.
We're seizing the opportunity to review the 13-inch business laptop in Dell's product line. Aimed at demanding business users and designed to appeal to entrepreneurs with its modern ports, the Dell Pro 13 Premium has a sturdy yet lightweight magnesium chassis, AI and also enjoys very long battery runtimes. Update: SSD re-tested resulting in better performance values.Christian Hintze, 👁 Christian Hintze (translated by Andrew Dickson) Published 🇩🇪 🇫🇷 ...
Verdict - An almost complete business laptop
The Dell Pro 13 Premium is a great business laptop with virtually no weaknesses but plenty of positive features that earn this mobile laptop our award. Corporate employees and other potential buyers get a compact, small, lightweight, economical, extremely long-running (24 hours!) and powerful laptop with a high-quality magnesium chassis, a high-resolution 8 MP webcam, and modern interfaces such as dual Thunderbolt 4 and Wi-Fi 7. Furthermore, the laptop remains consistently cool in virtually every situation.
However, that comes at a cost, with the laptop priced at no less than $1,900 to $2,500! Keeping that in mind, the lame M.2 2230 SSD is almost outrageous, but in everyday situations, you'd hardly notice the difference. The only areas where improvements are required are the name and the upgradeability.
Pros
Cons
Price and availability
Our review model comes with an FHD+ display and costs around $2,100 on Dell's online store.
- Dell Pro 13 Premium PA13250 13.3" Touchscreen Copilot+ PC Notebook - QHD+ - Intel Core Ultra 7 268V - vPro Technology - Evo Platform - 32 GB - 512 GB SSD - English (US) Keyboard - Magnetite
- Dell Pro 13 Premium PA13250 13.3" Copilot+ PC Notebook - Full HD Plus - Intel Core Ultra 7 266V - vPro Technology - 16 GB - 512 GB SSD - English (US) Keyboard - Magnetite
- PA13250 Dell Pro 13 Premium CORE Ultra 7
Possible alternatives compared
Image | Model / Review | Price | Weight | Height | Display |
|---|---|---|---|---|---|
1. 90%  | Dell Pro 13 Premium PA13250 Intel Core Ultra 7 268V ⎘ Intel Arc Graphics 140V ⎘ 32 GB Memory, 1024 GB SSD | Amazon: List Price: 2700 Euro | 1.1 kg | 17.2 mm | 13.30" 1920x1200 170 PPI IPS |
2. 85%  | MSI Prestige 13 AI Plus Evo A2VMG Intel Core Ultra 7 258V ⎘ Intel Arc Graphics 140V ⎘ 32 GB Memory | Amazon: 1. $1,149.49 msi Prestige 13 AI Evo Lapto... 2. $31.99 CPU Cooling Fan Replacement ... 3. $1,349.00 HIDevolution [2024] MSI Pres... List Price: 1400 USD | 970 g | 16.9 mm | 13.30" 2880x1800 255 PPI OLED |
3. 85.1%  | Lenovo ThinkPad X13 2-in-1 Gen 5 Intel Core Ultra 7 165U ⎘ Intel Graphics 4-Core iGPU (Meteor / Arrow Lake) ⎘ 32 GB Memory, 1000 GB SSD | Amazon: List Price: 2107.23 Euro | 1.3 kg | 16.4 mm | 13.30" 1920x1200 170 PPI IPS |
4. 84%  | Framework Laptop 13.5 Core Ultra 7 155H Intel Core Ultra 7 155H ⎘ Intel Arc 8-Core iGPU ⎘ 32 GB Memory | Amazon: 1. $815.00 MSI Modern 13 inch Ultrabook... List Price: 1500 USD | 1.4 kg | 15.85 mm | 13.50" 2880x1920 256 PPI IPS |
5. 85.3%  | Dell XPS 13 9350 Intel Core Ultra 7 256V ⎘ Intel Arc Graphics 140V ⎘ 16 GB Memory, 512 GB SSD | Amazon: List Price: 1400 USD | 1.2 kg | 15.3 mm | 13.40" 1920x1200 169 PPI IPS |
6. 80.7%  | Microsoft Surface Pro Copilot+ Qualcomm Snapdragon X Plus X1P-64-100 ⎘ Qualcomm SD X Adreno X1-85 3.8 TFLOPS ⎘ 16 GB Memory, 256 GB SSD | Amazon: List Price: 1199€ | 872 g | 9.3 mm | 13.00" 2880x1920 266 PPI IPS |
Table of Contents
- Verdict - An almost complete business laptop
- Specifications
- Case & features - This Dell comes with an 8 MP webcam
- Input devices - The 13 Premium has a conference call touchpad
- Display - A high contrast office panel with additional options
- Performance - A powerful Arc 140V
- Emissions & energy - The Dell Pro is economical
- Notebookcheck overall rating
Dell has recently changed its naming scheme. With the Pro series, Dell is targeting the typical business user, essentially replacing the previous Latitude series. Premium stands for the best materials and features, and our current 13-inch model comes with modern ports, extensive security, plenty of AI, a sturdy magnesium chassis, and, despite this, tips the scales at just over 1 kg. So, is this the premium laptop for business users?
May 5, 2025 update: The manufacturer alerted us to unusually low SSD scores. We repeated the measurements and, in some cases, achieved significantly better results (see the Performance - Storage devices section). The overall rating increased from 89.9 to a full 90 percent.
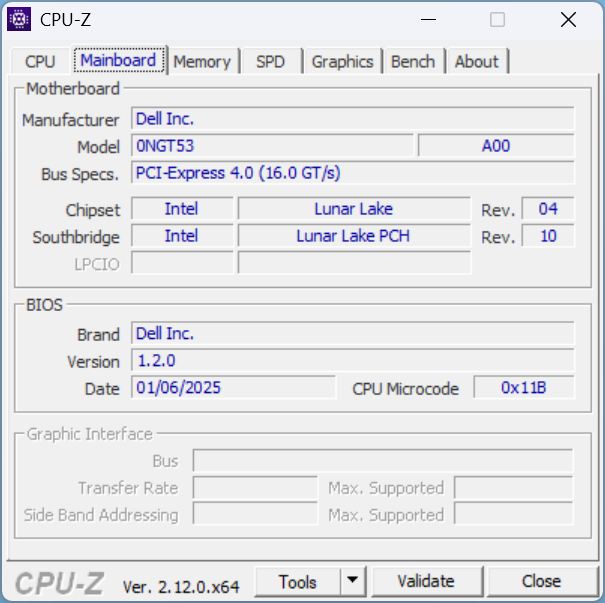
Specifications
Case & features - This Dell comes with an 8 MP webcam
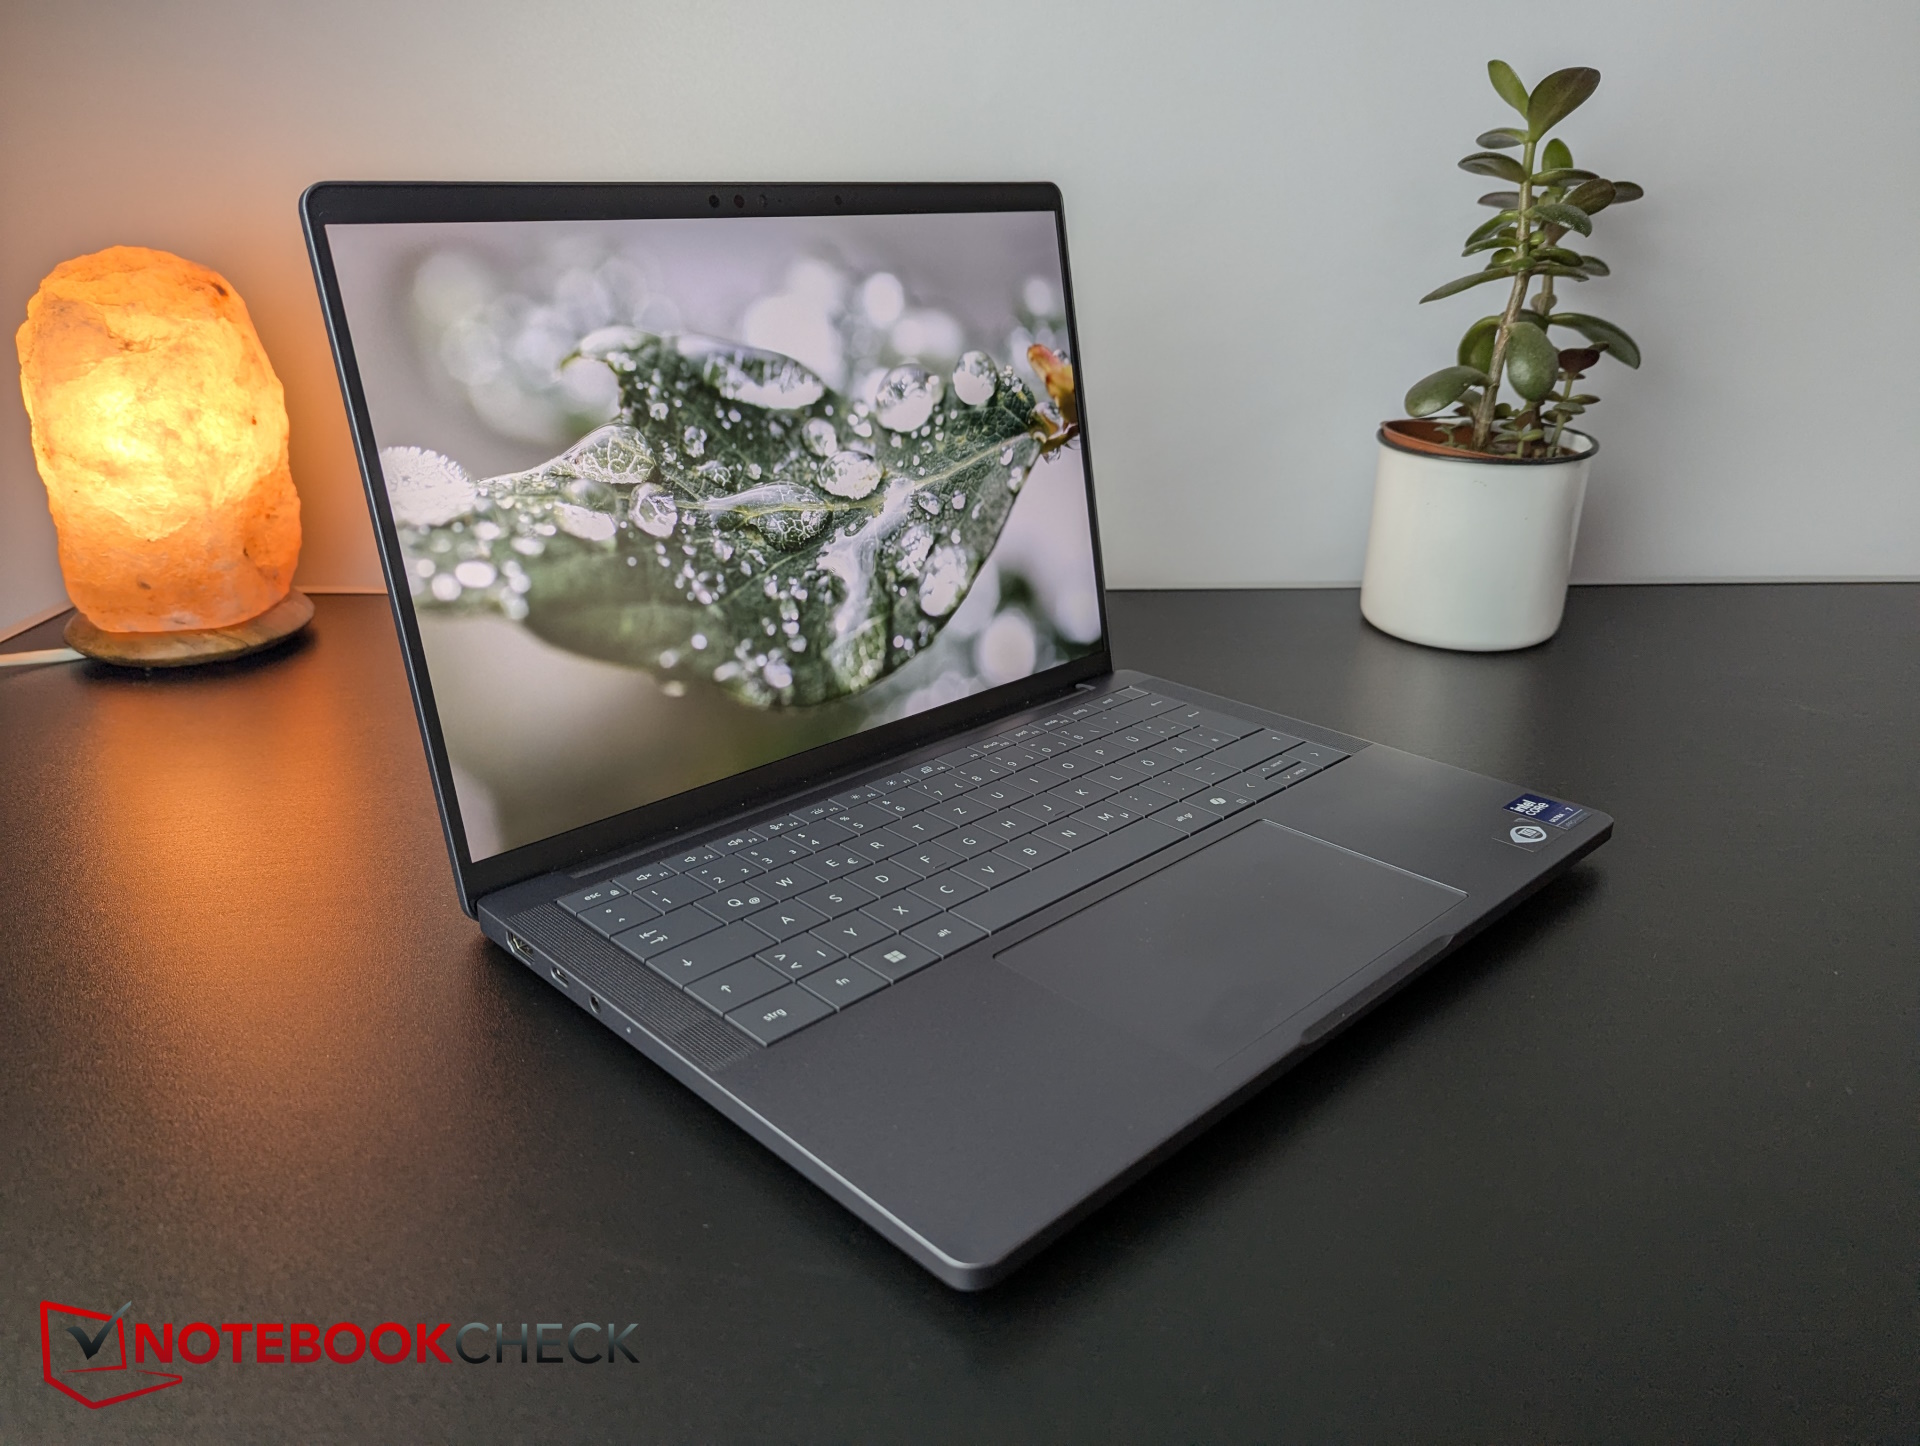
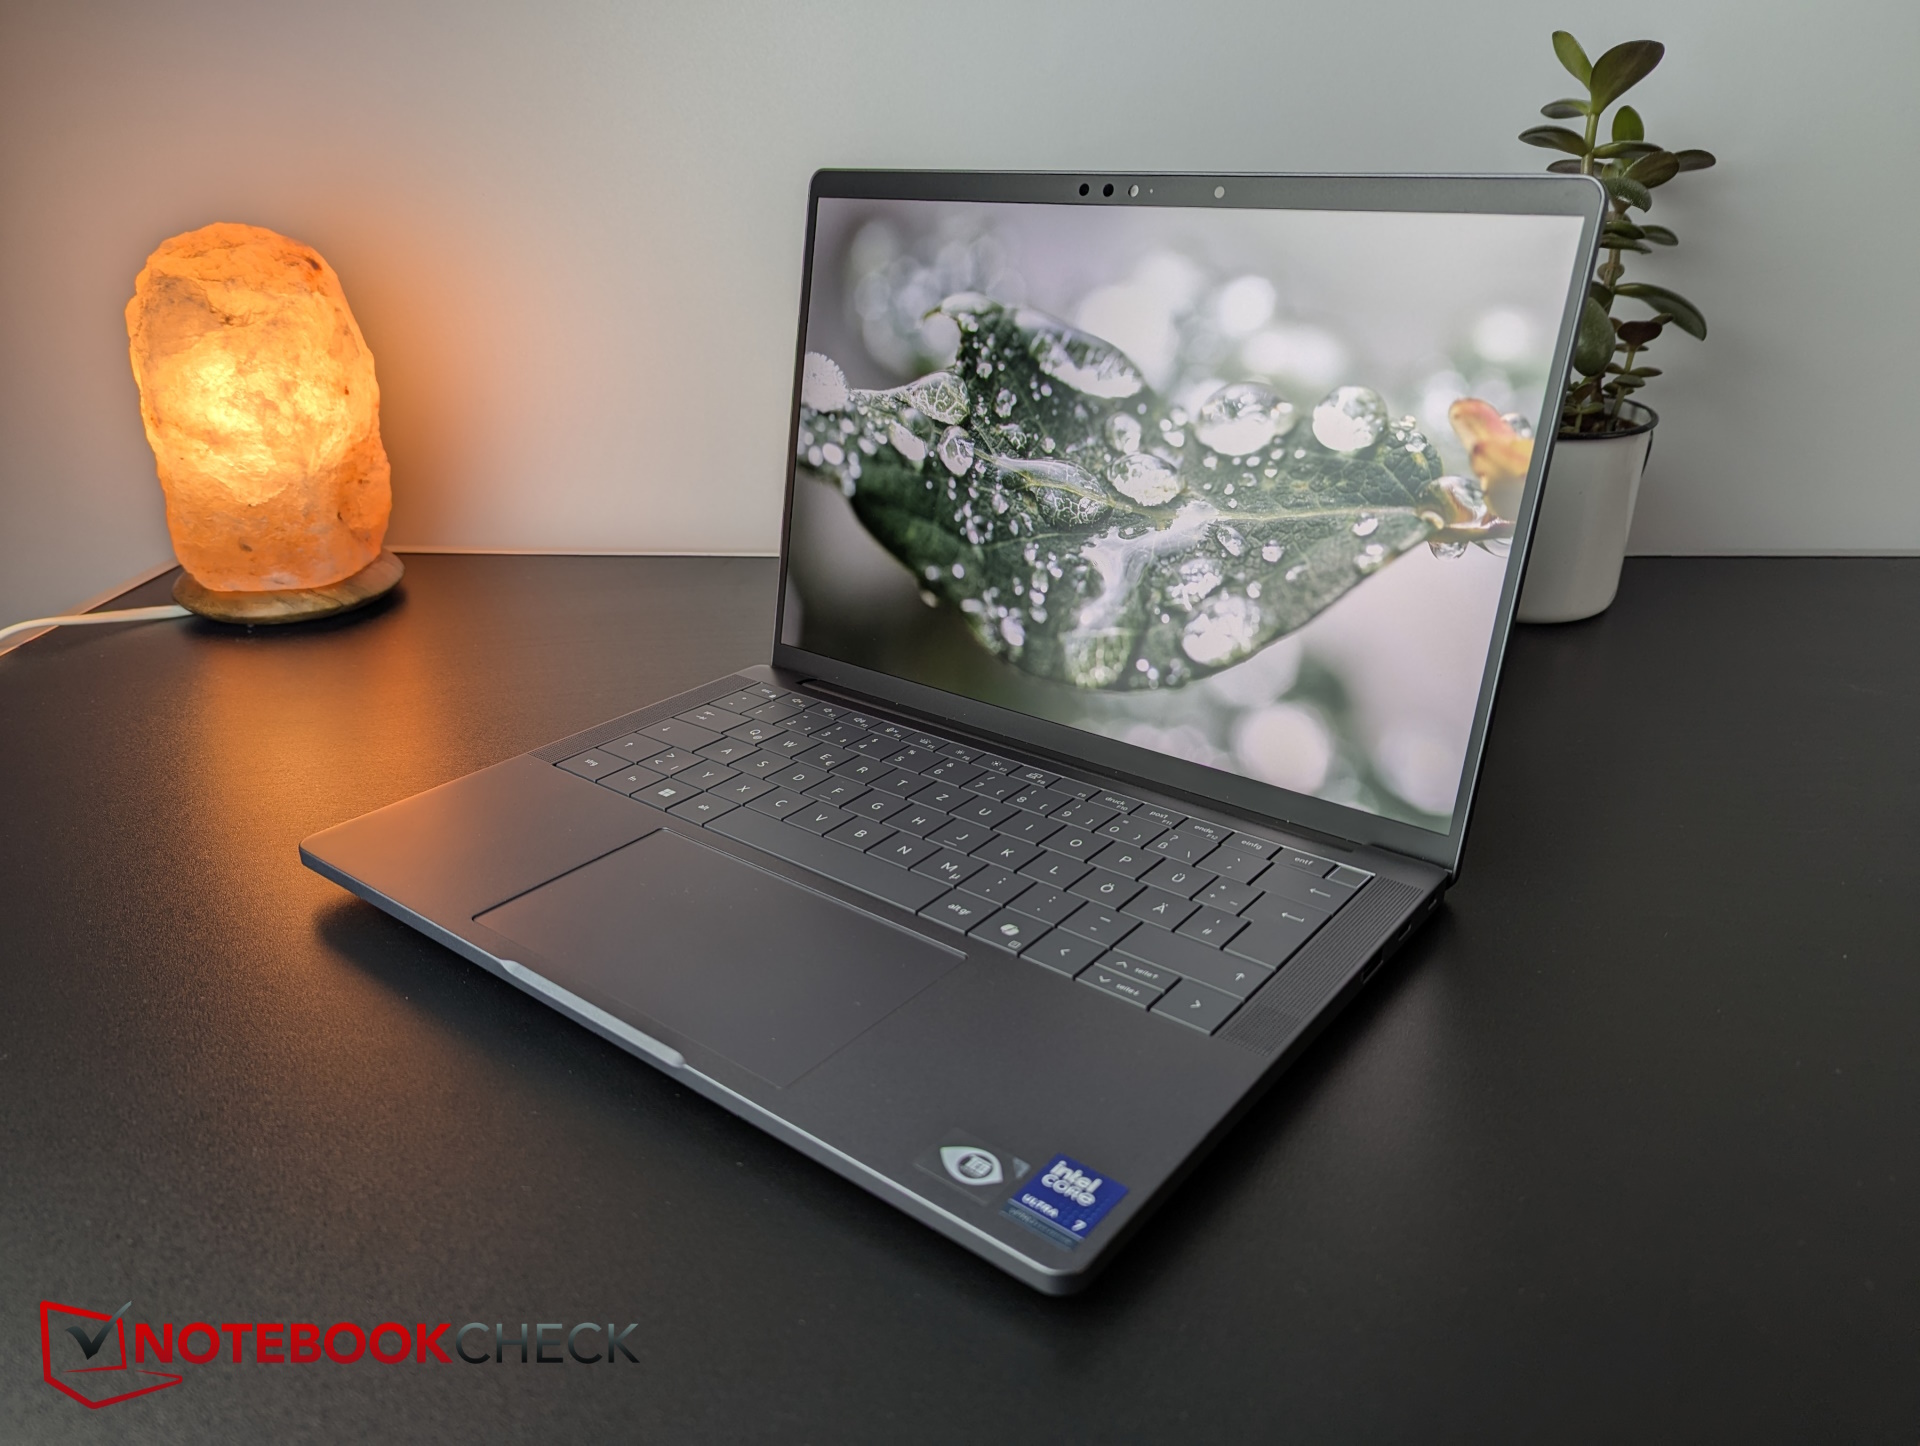
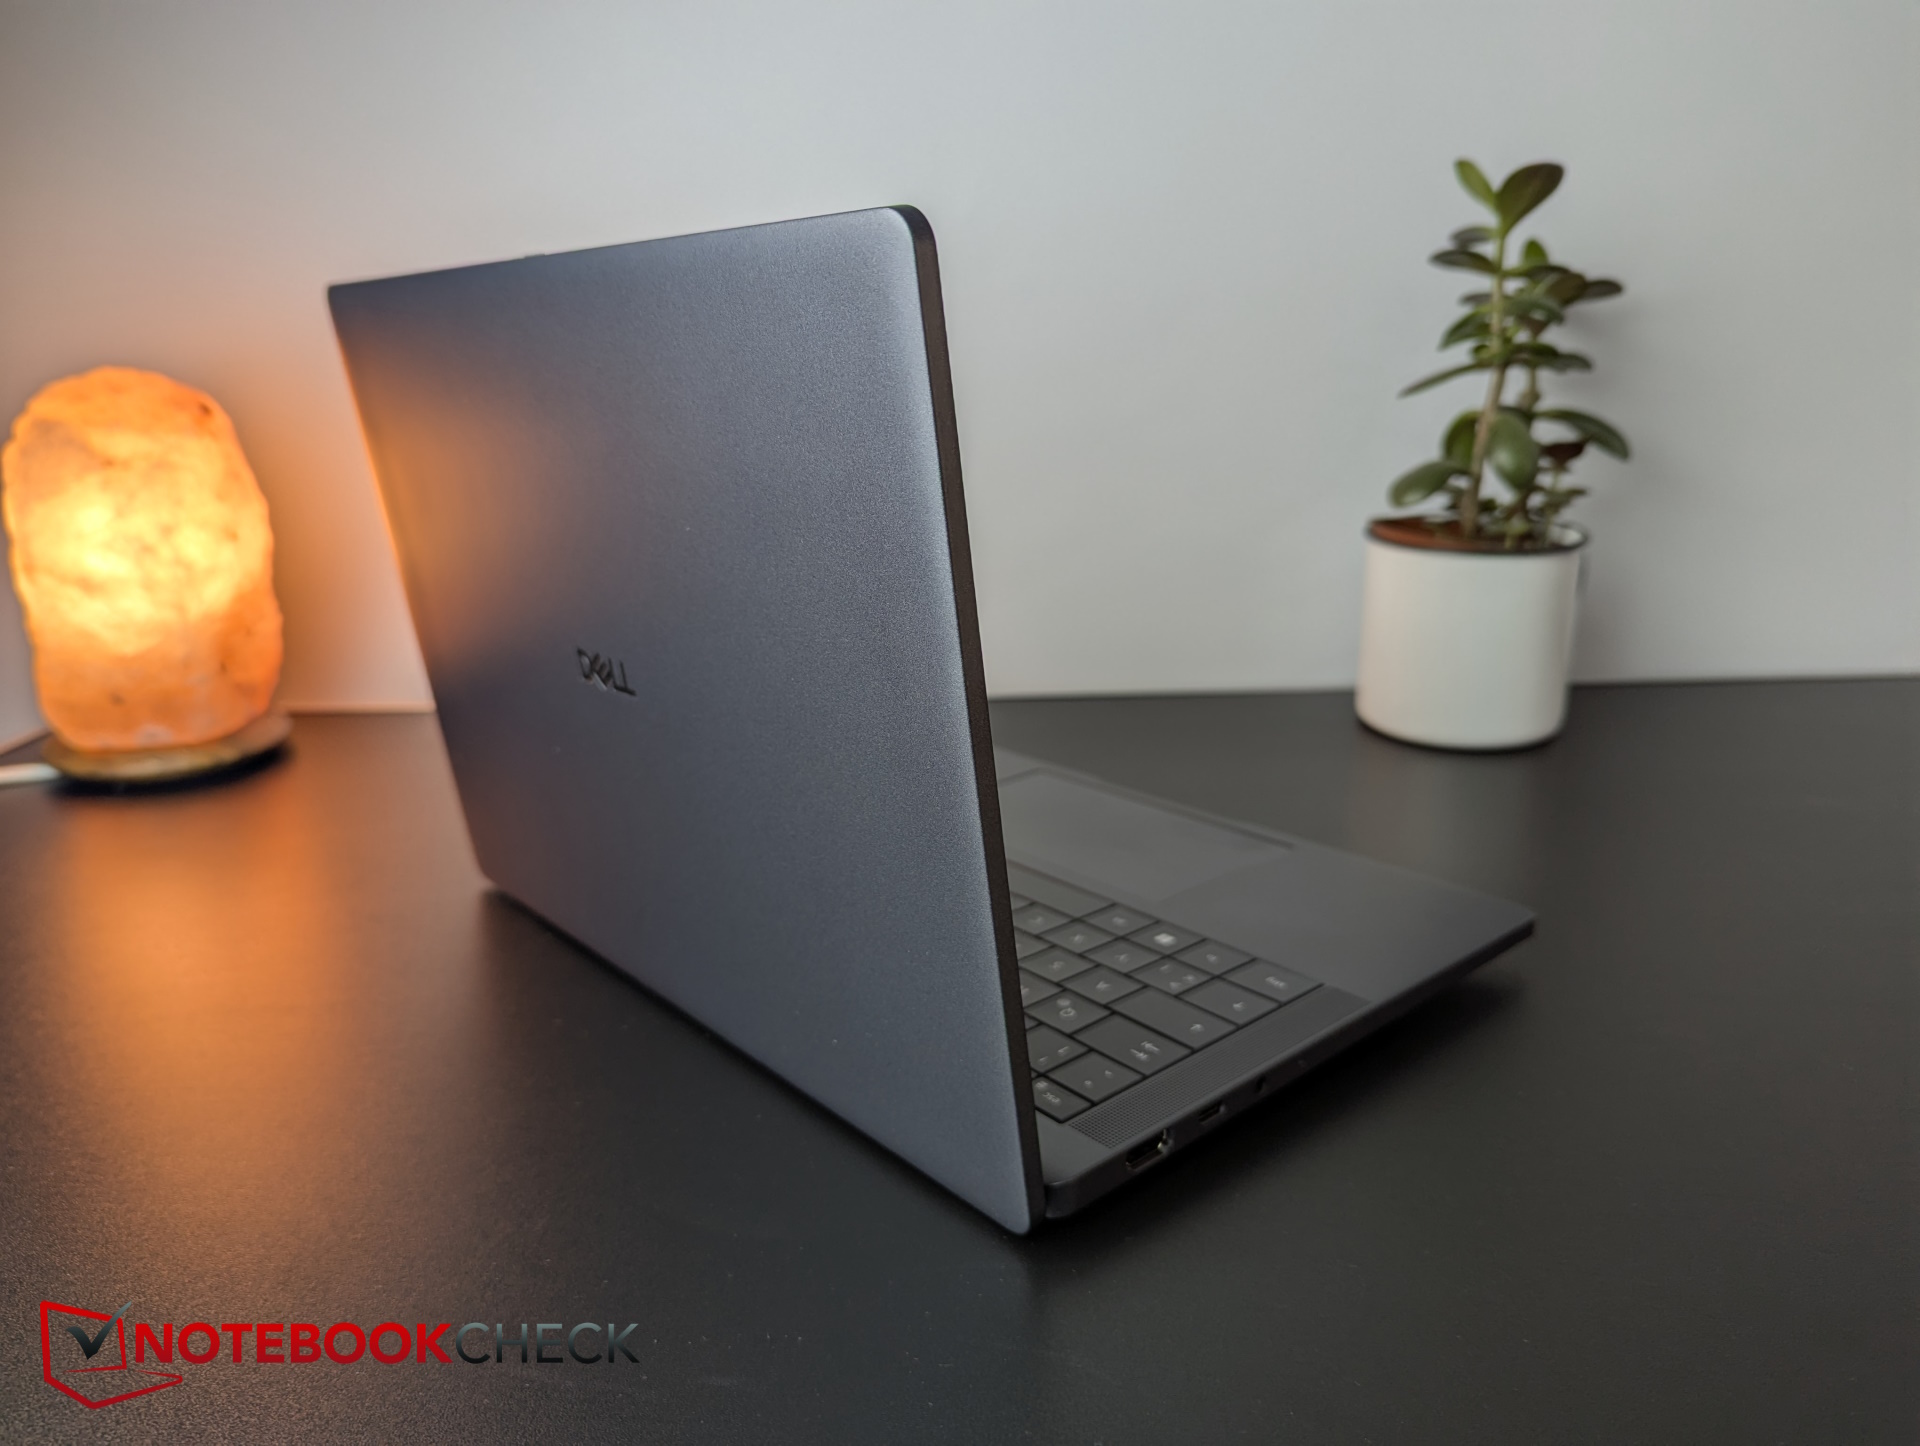
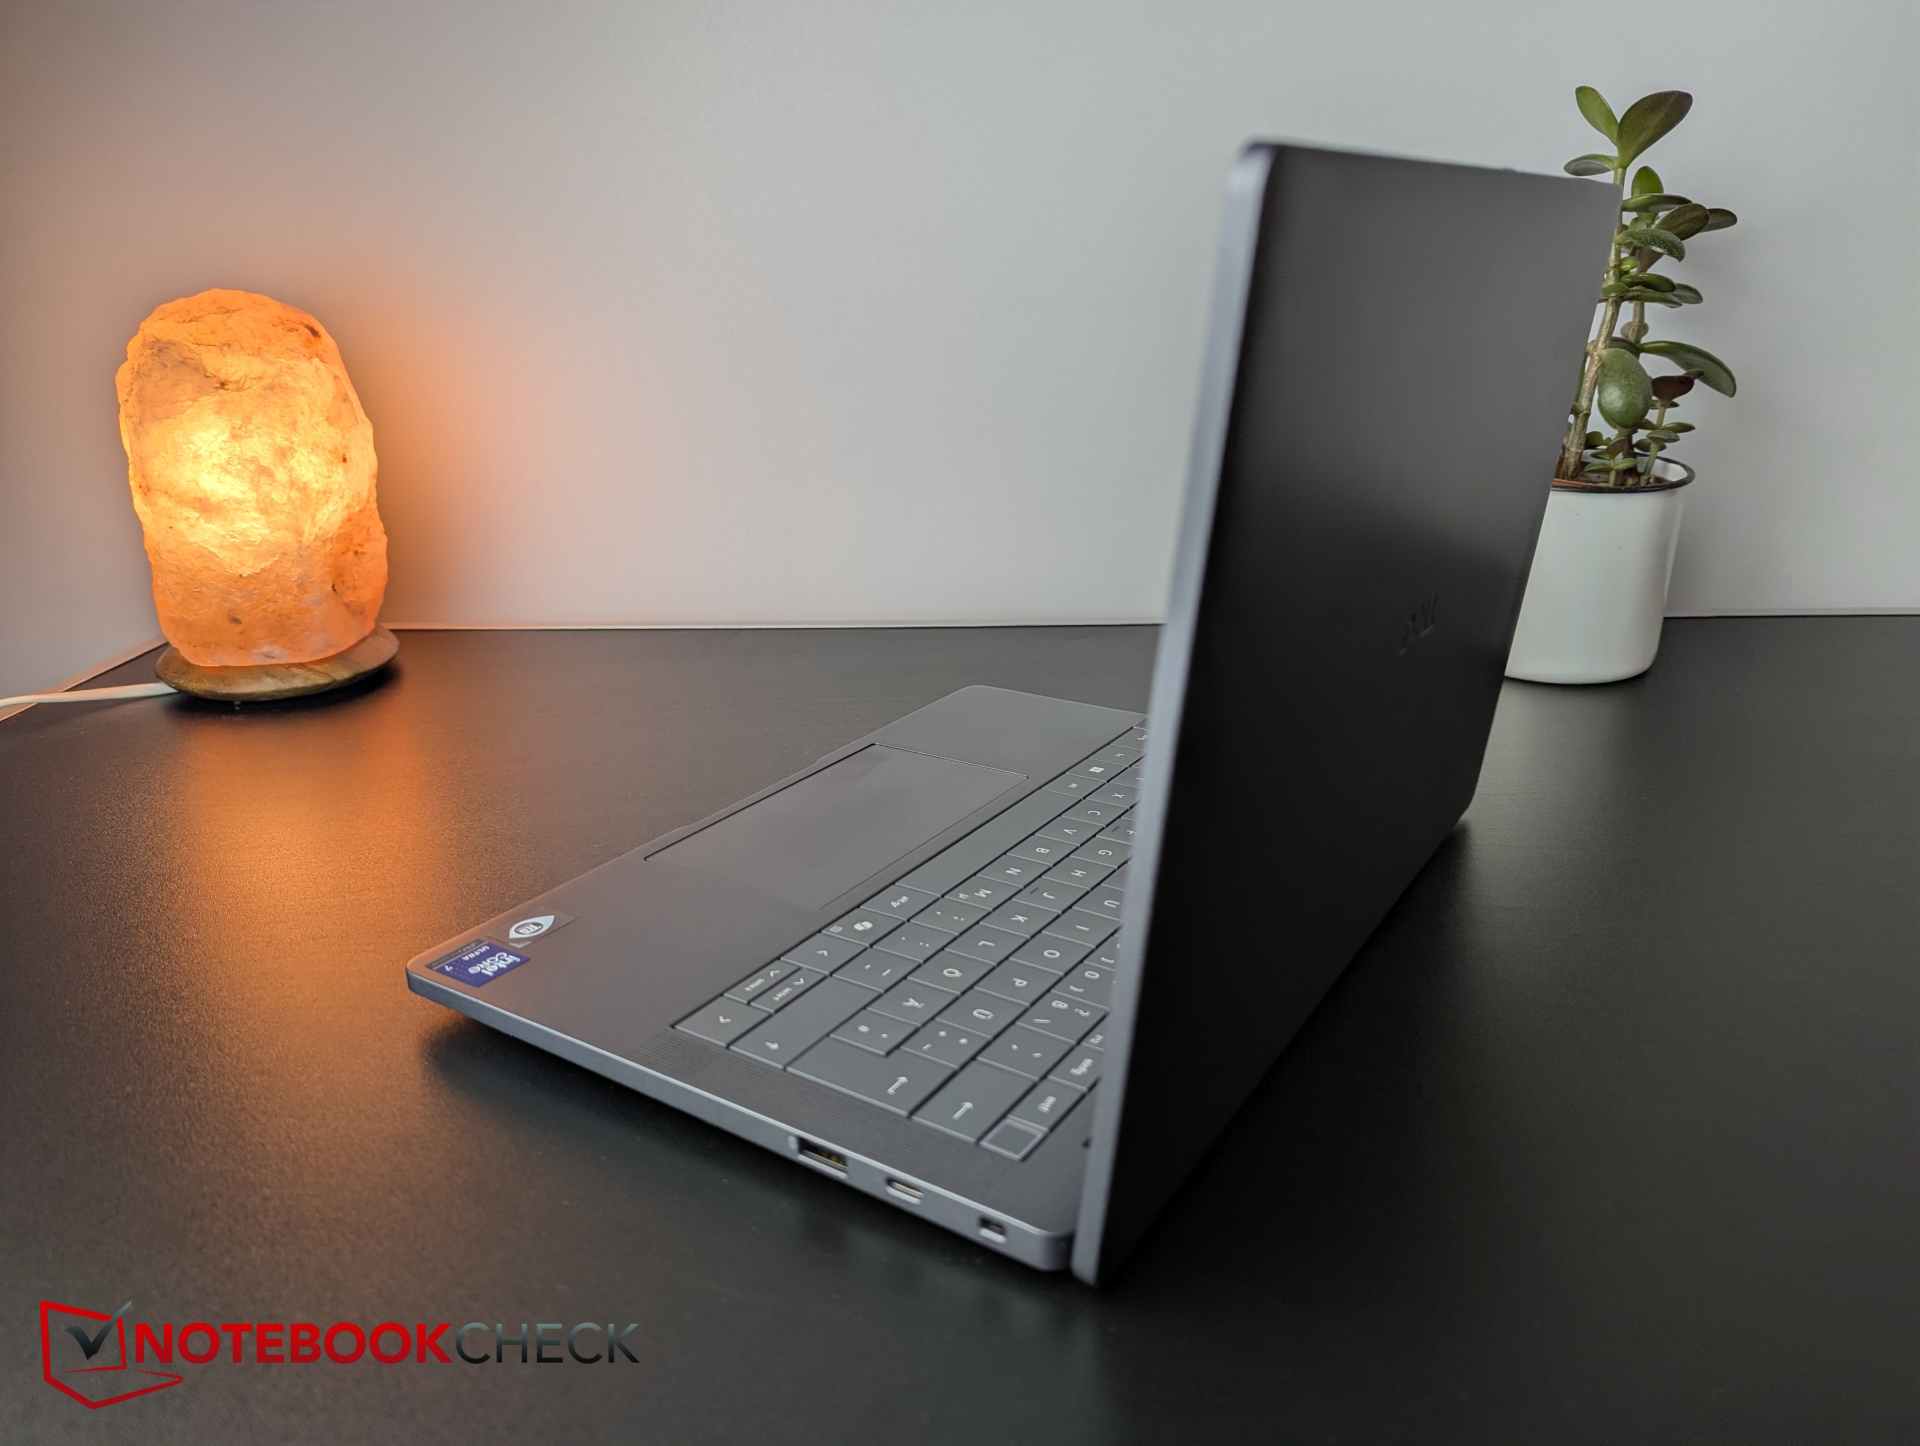
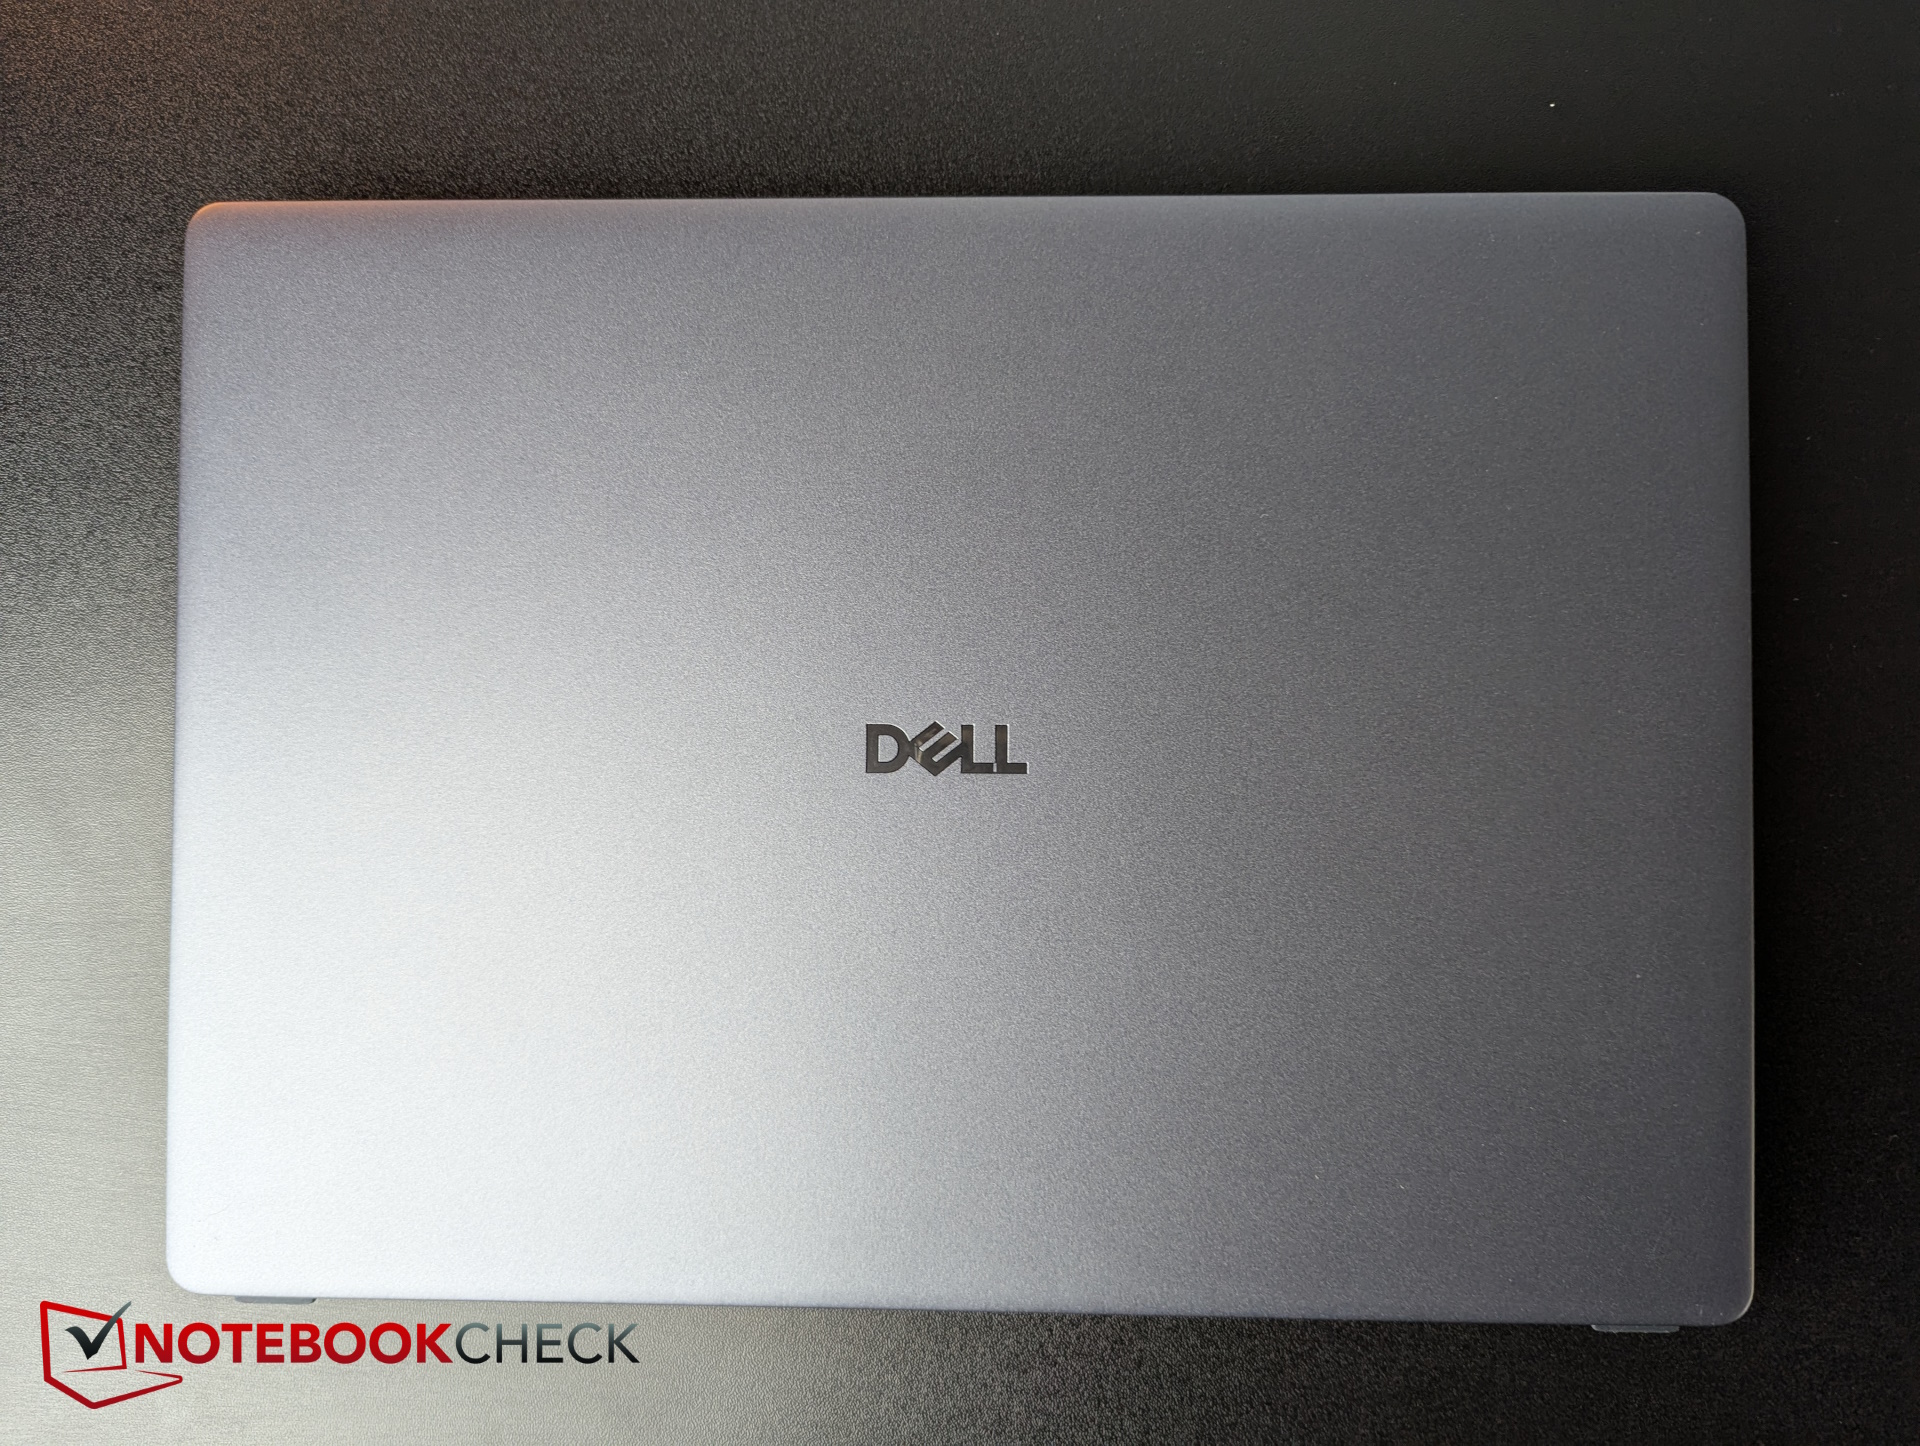
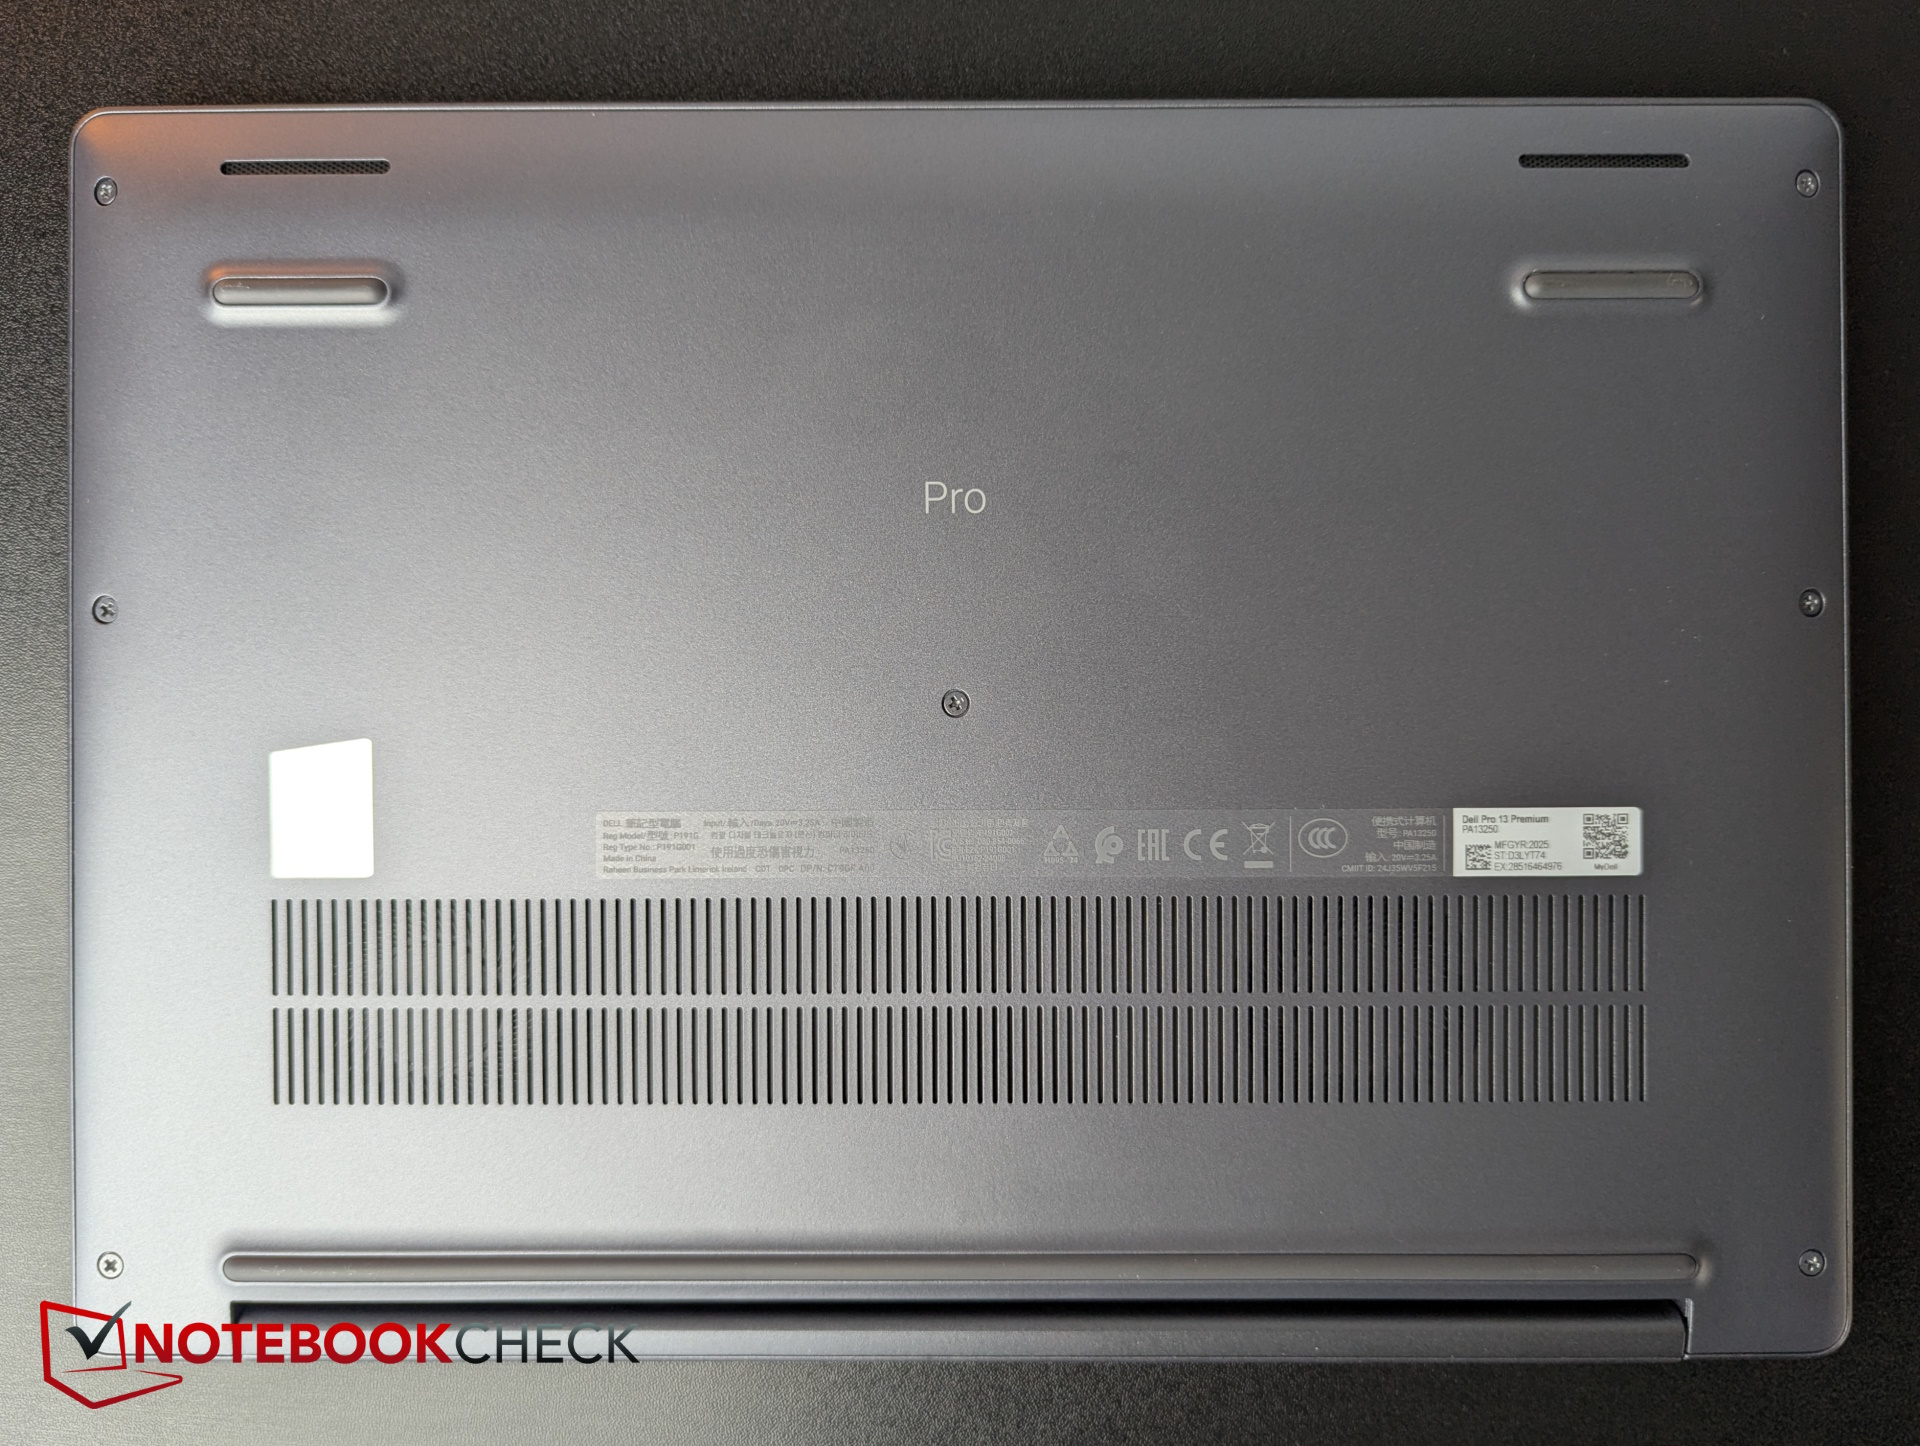
The dark gray case is made of 90 percent recycled magnesium. This makes the base unit and the 180-degree lid very stable, and we didn't detect any creaking noises when twisting the device. The design appears extremely compact and simple yet elegant.
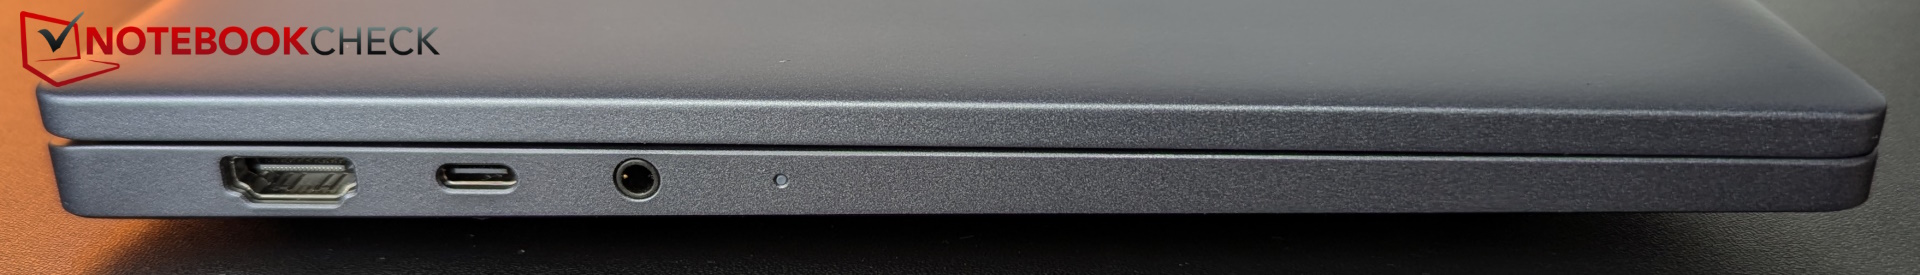
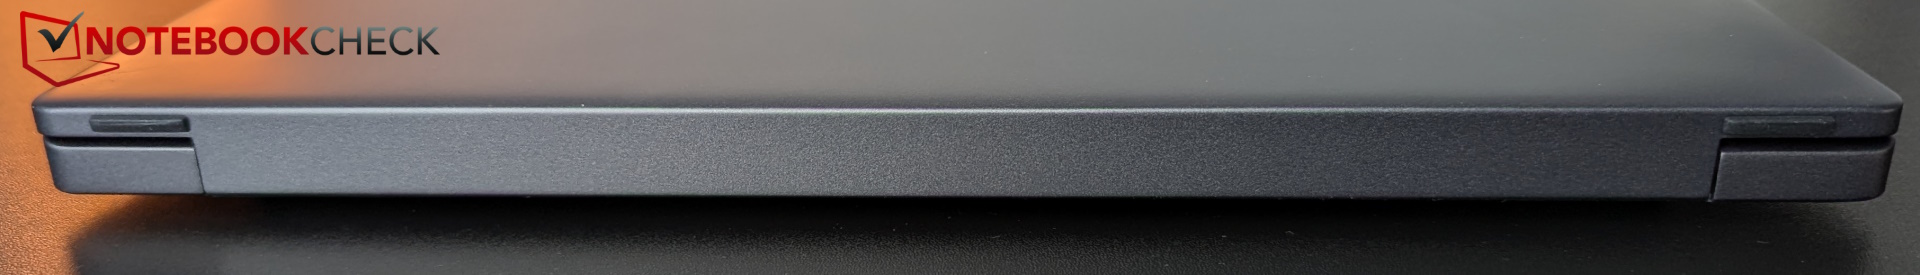
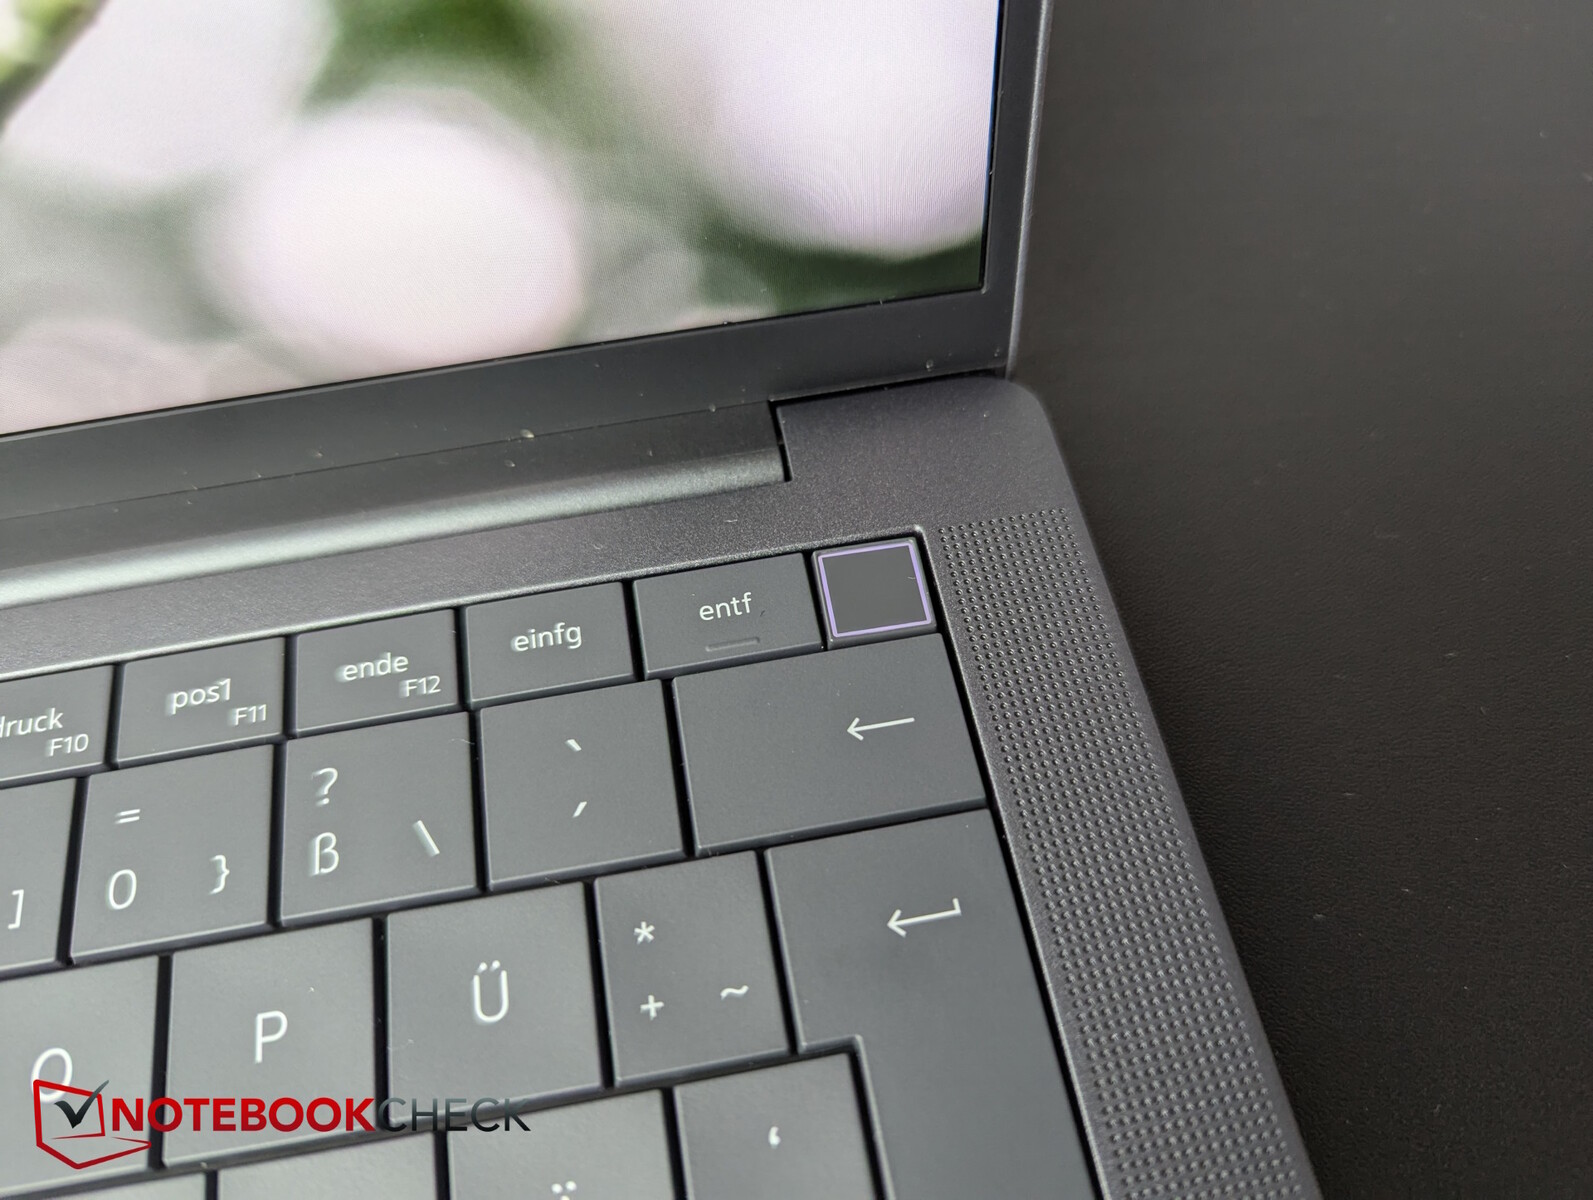
The Pro 13 Premium features two Thunderbolt 4 ports, one on each side, and a full-size HDMI port. A fingerprint sensor is integrated into the power button. There's no card reader or dedicated LAN port. Dell does, however, offer Wi-Fi 7. A SIM card slot is optional.
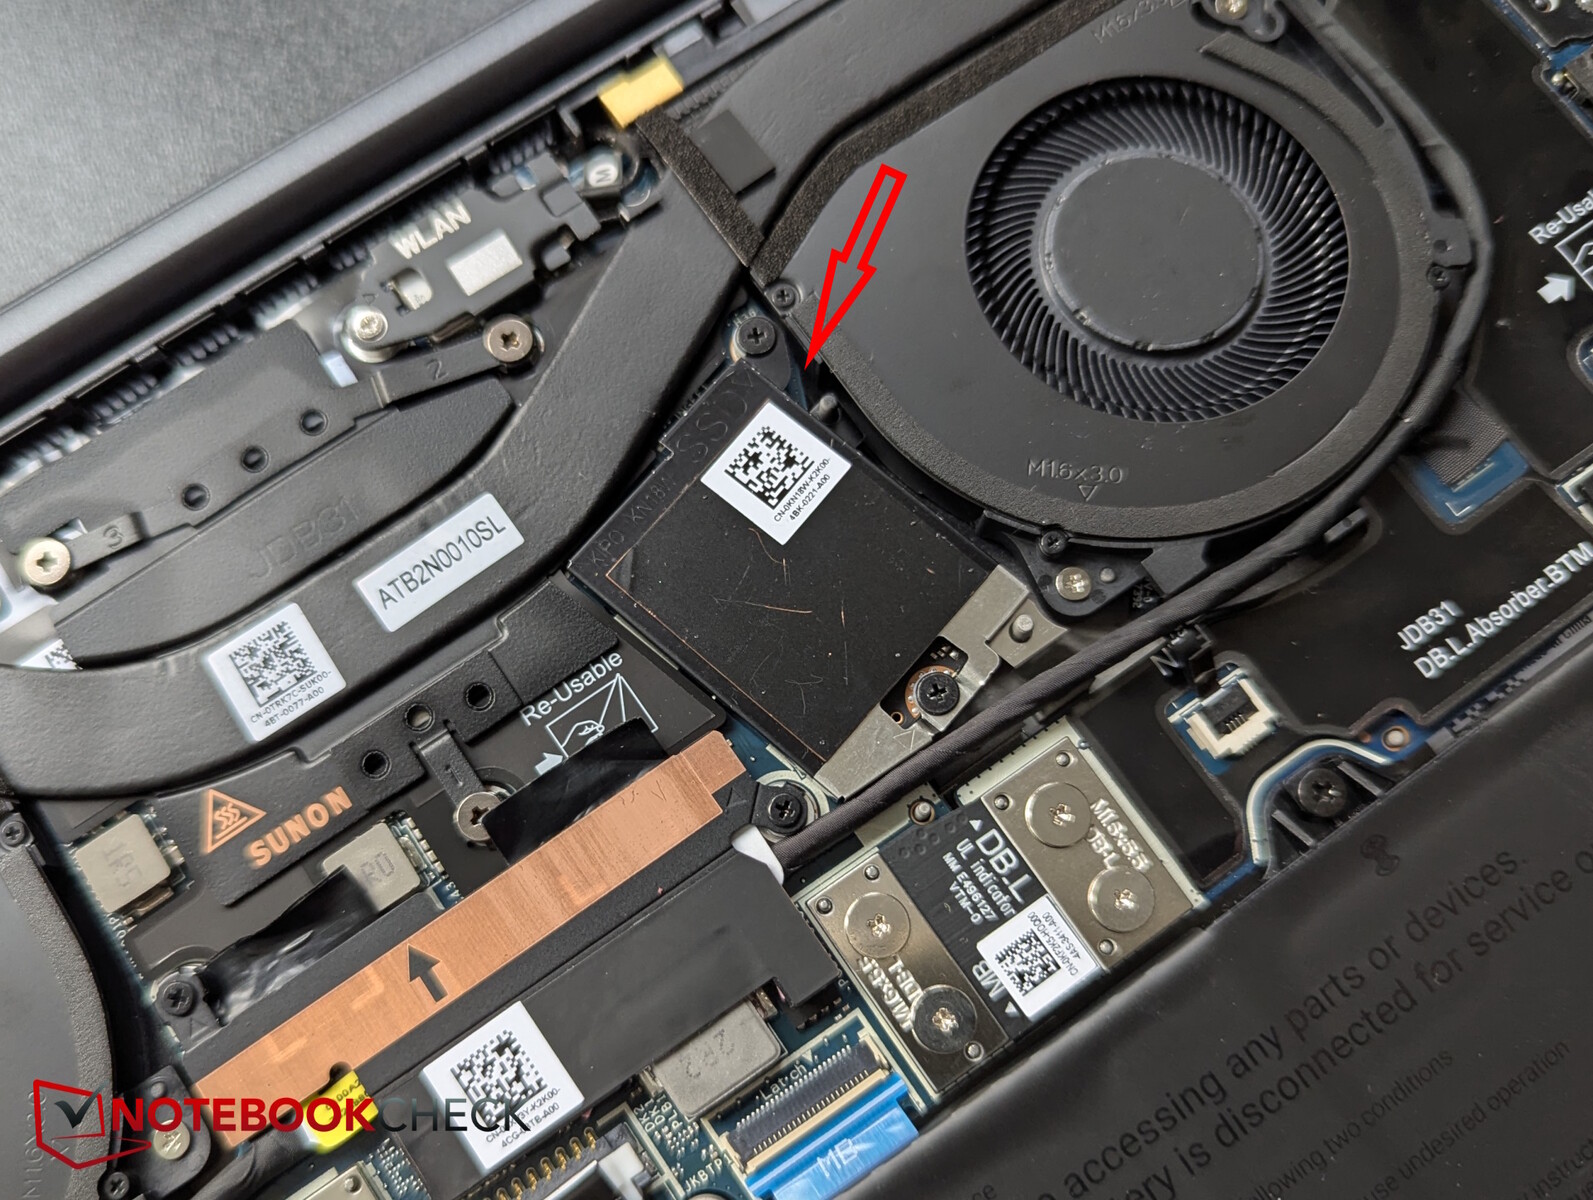
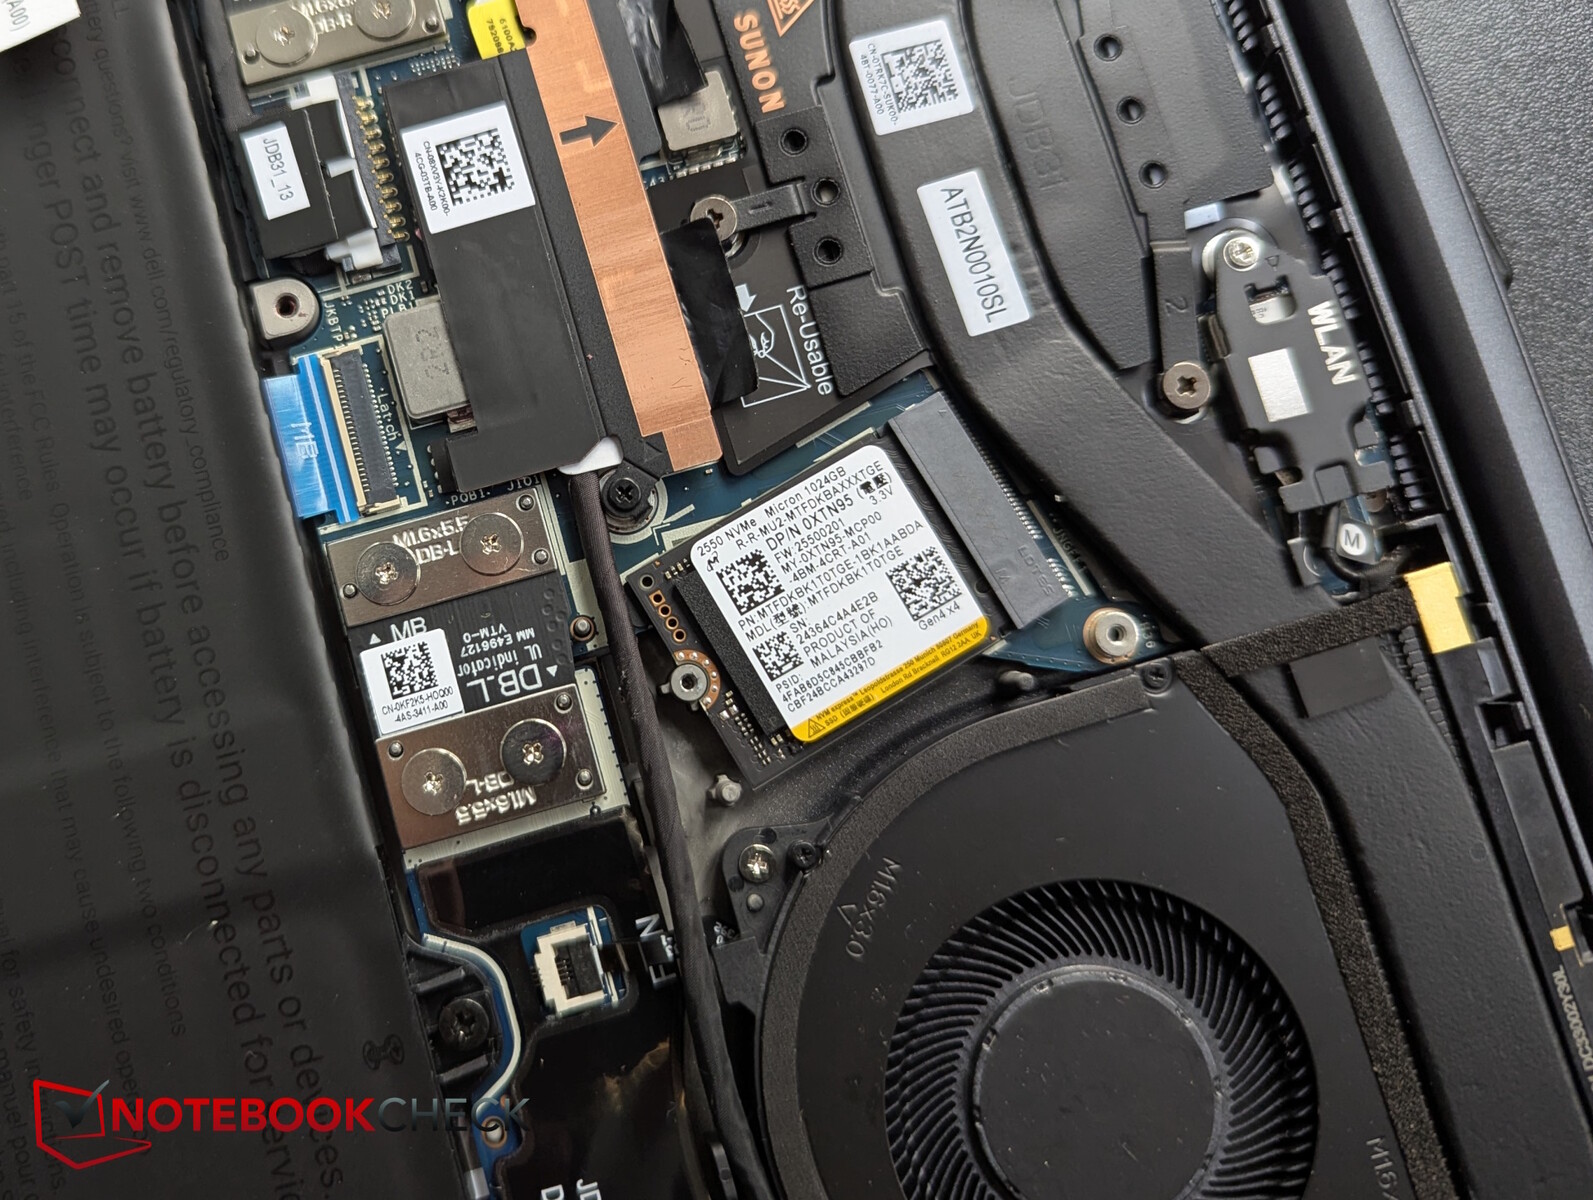
The business laptop is relatively easy to open with the Phillips screws remaining in the base plate. However, the RAM and Wi-Fi module are permanently installed inside, and the SSD is only the small M.2 2230 format and lacks a second slot.
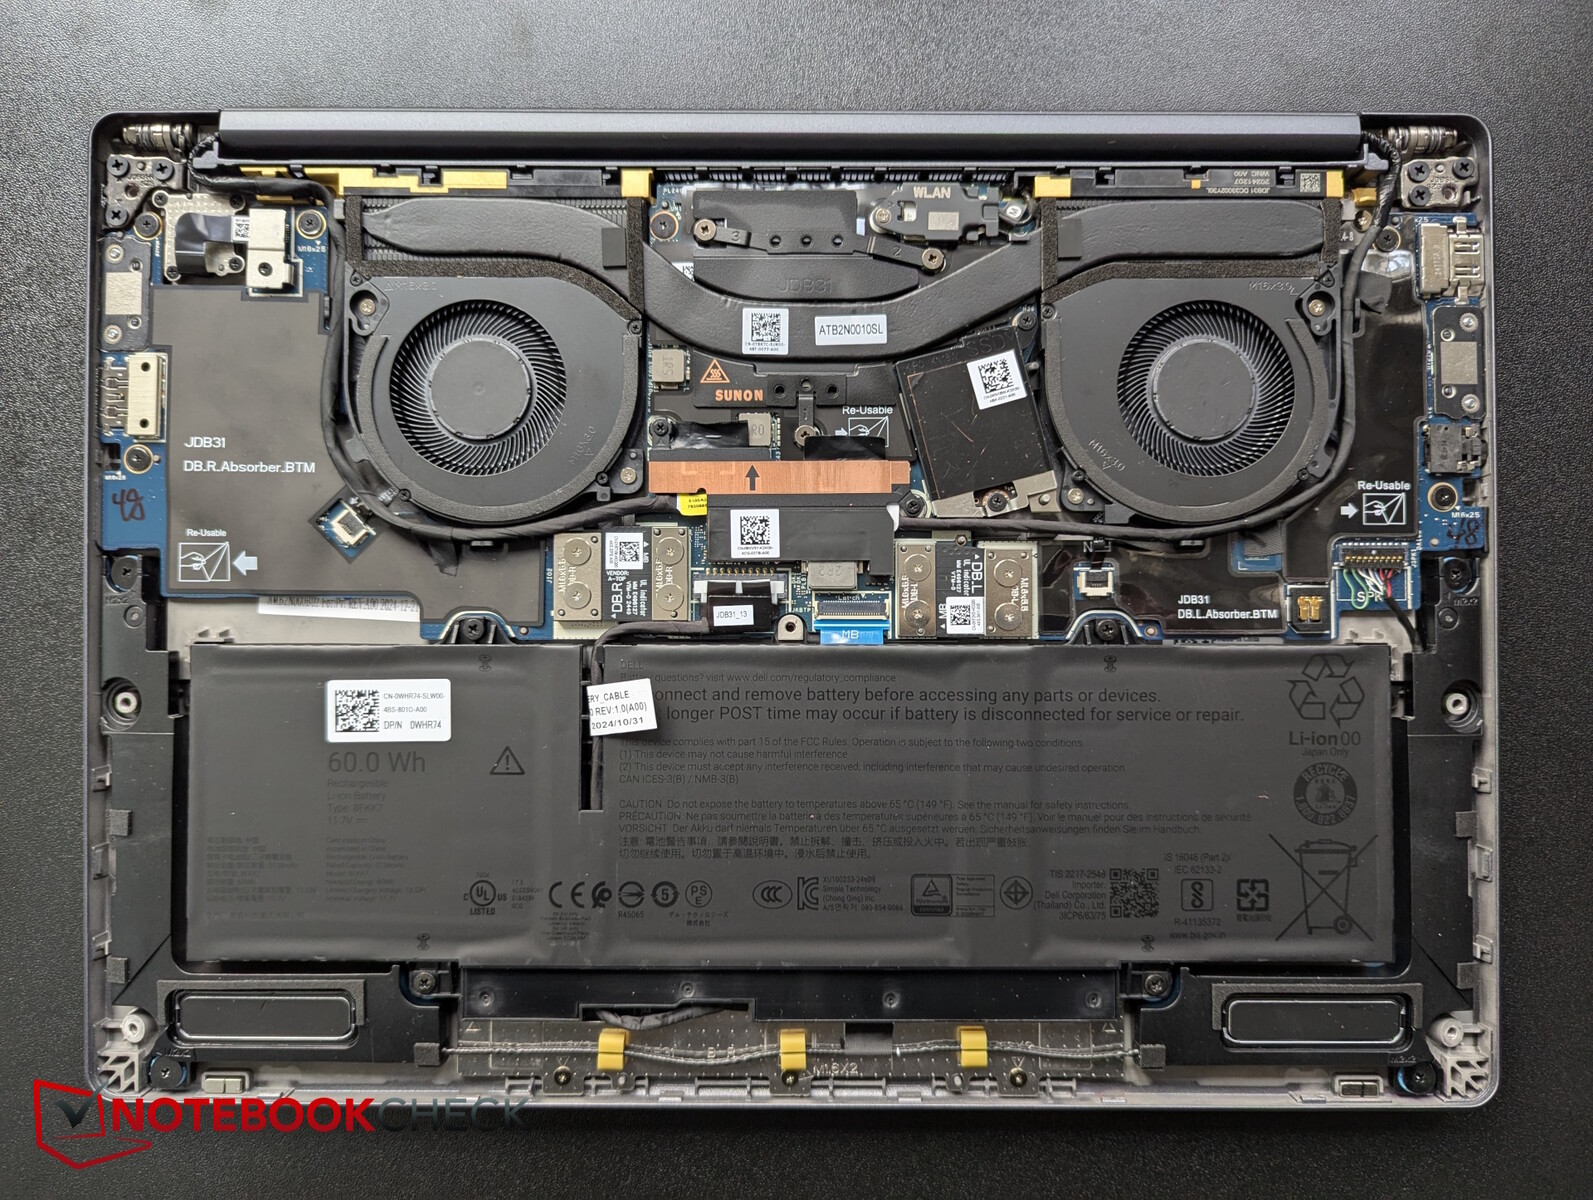
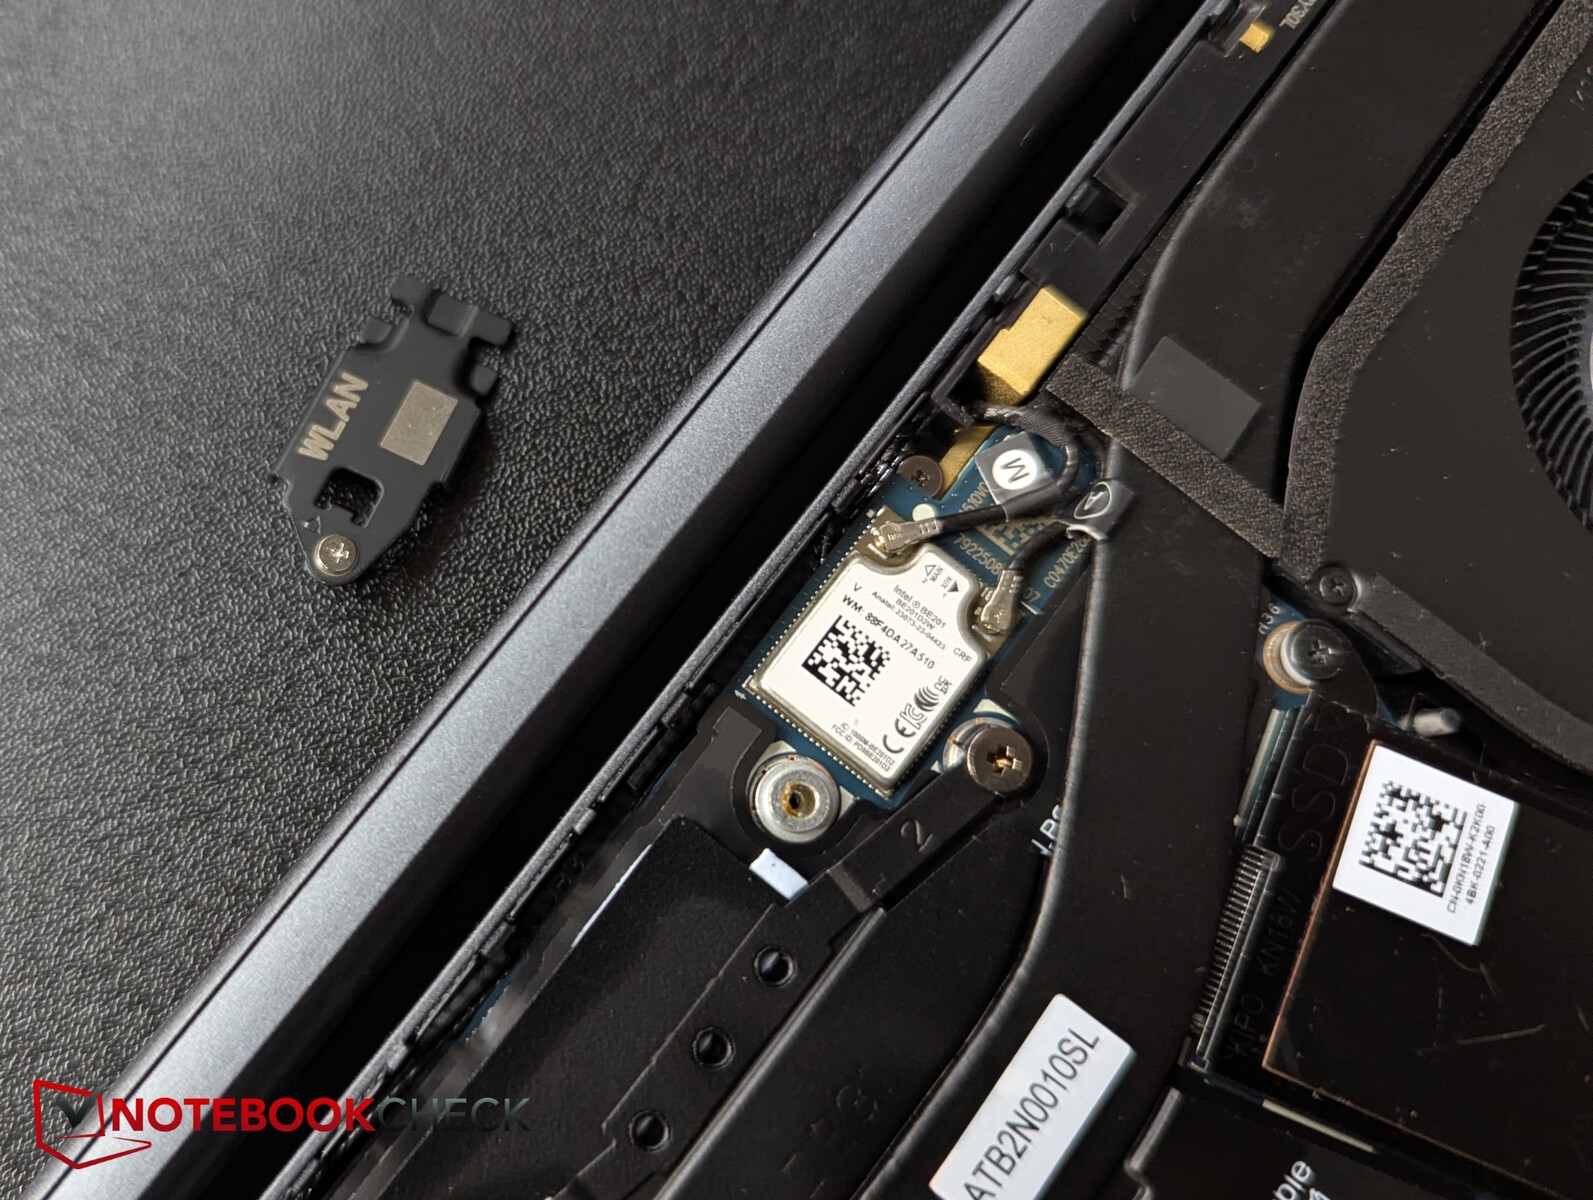
At 8 MP, the IR webcam has an unusually high resolution. This lends the test images good sharpness, but color deviations are medium to high, especially in the green range. The WiFi 7 module delivers consistently high transfer speeds.


Sustainability
According to Asus, the Pro 13 Premium is ENERGY STAR certified, EPEAT Gold registered, and has a Climate+ seal. It also meets the latest TCO Generation 9 certification for power consumption and repairability.
Materials used include PCR plastic, recycled magnesium, bio-based plastic, and recycled cobalt, and the packaging is made from 100% recycled or renewable materials, which are primarily cardboard.
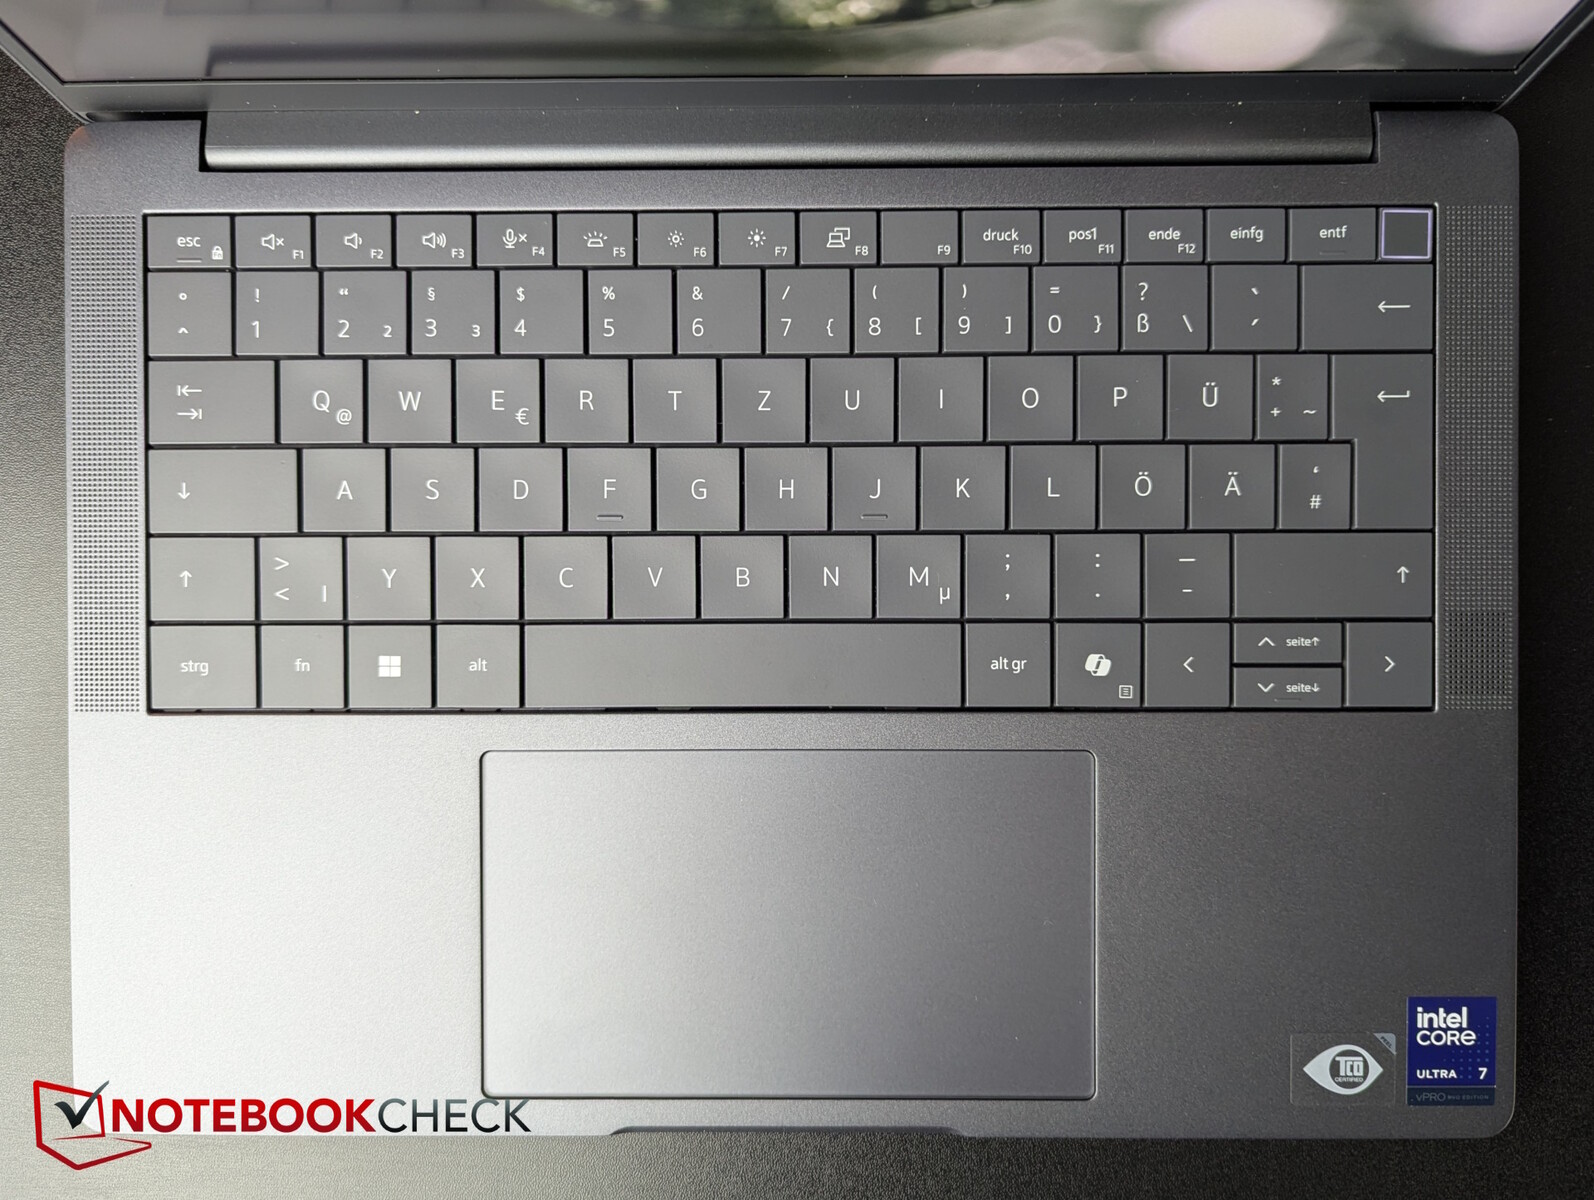
Input devices - The 13 Premium has a conference call touchpad
The Dell offers a very uncluttered and compact layout with large keys (approx. 1.7 cm), no gaps between them, and the vertical arrow keys are halved in height. The power button integrated into the keyboard at the top right-hand side also houses a fingerprint sensor.
The keys possess shallow to medium travel but tangible feedback. This allows the user to type quickly, and the keystroke noise is more than moderate. The power consumption of the two-stage backlight is said to have been reduced by up to 75 percent thanks to mini LEDs.
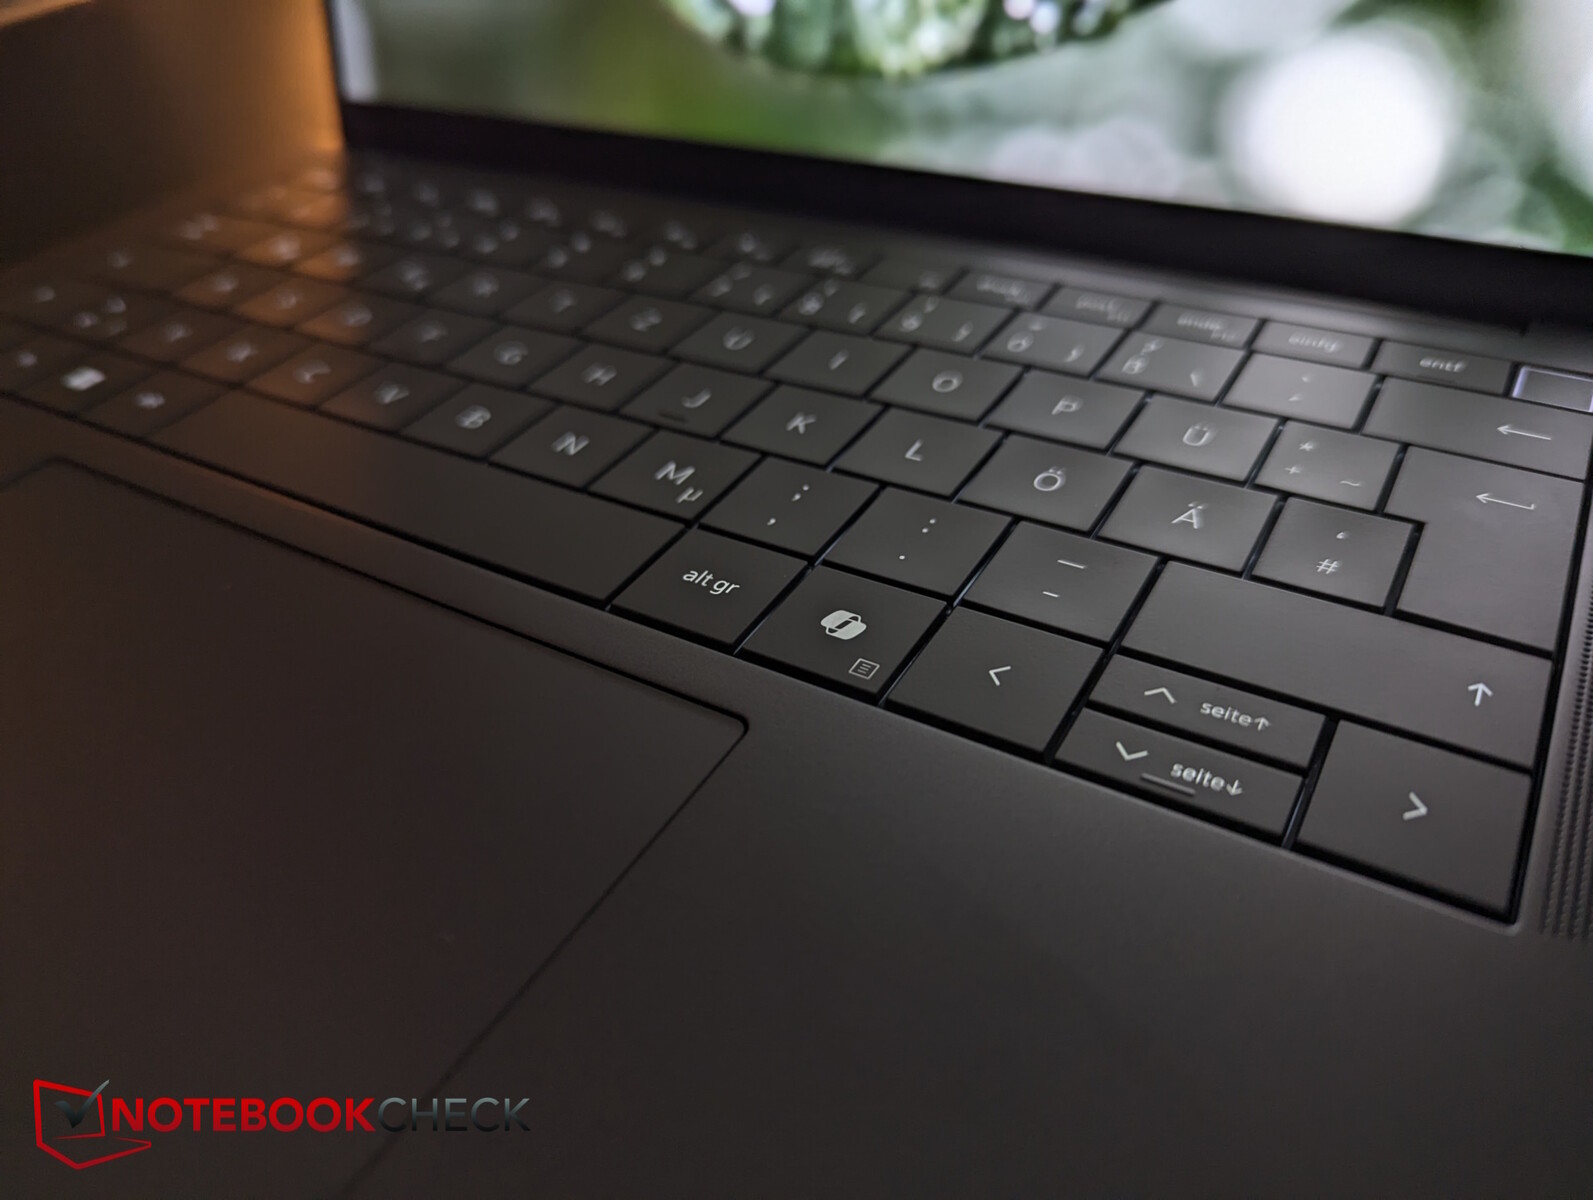
The touchpad measures approximately 12.5 x 7.1 cm, and its standout feature is the inclusion of special keys for video chat in the top row (camera on/off, screen share, chat, microphone on/off). The touch symbols are only visible during Zoom or Microsoft Teams calls. The surface is very smooth, but if you've just washed your hands or have slightly damp fingers for some other reason, it will stutter considerably. The integrated mouse buttons' quiet clicks provide pleasant feedback and are triggered reliably.

Display - A high contrast office panel with additional options
There are several display options, but what we're looking at here is a matte, 16:10 aspect ratio, 1,920 x 1,200 display with an official brightness of 400 nits and no touch input. There's also a 300-nit version, as well as the top option, which has a resolution of 2,560 x 1,600 pixels, 500 nits, and touch functionality. Dell emphasizes that all its displays are particularly energy-efficient.
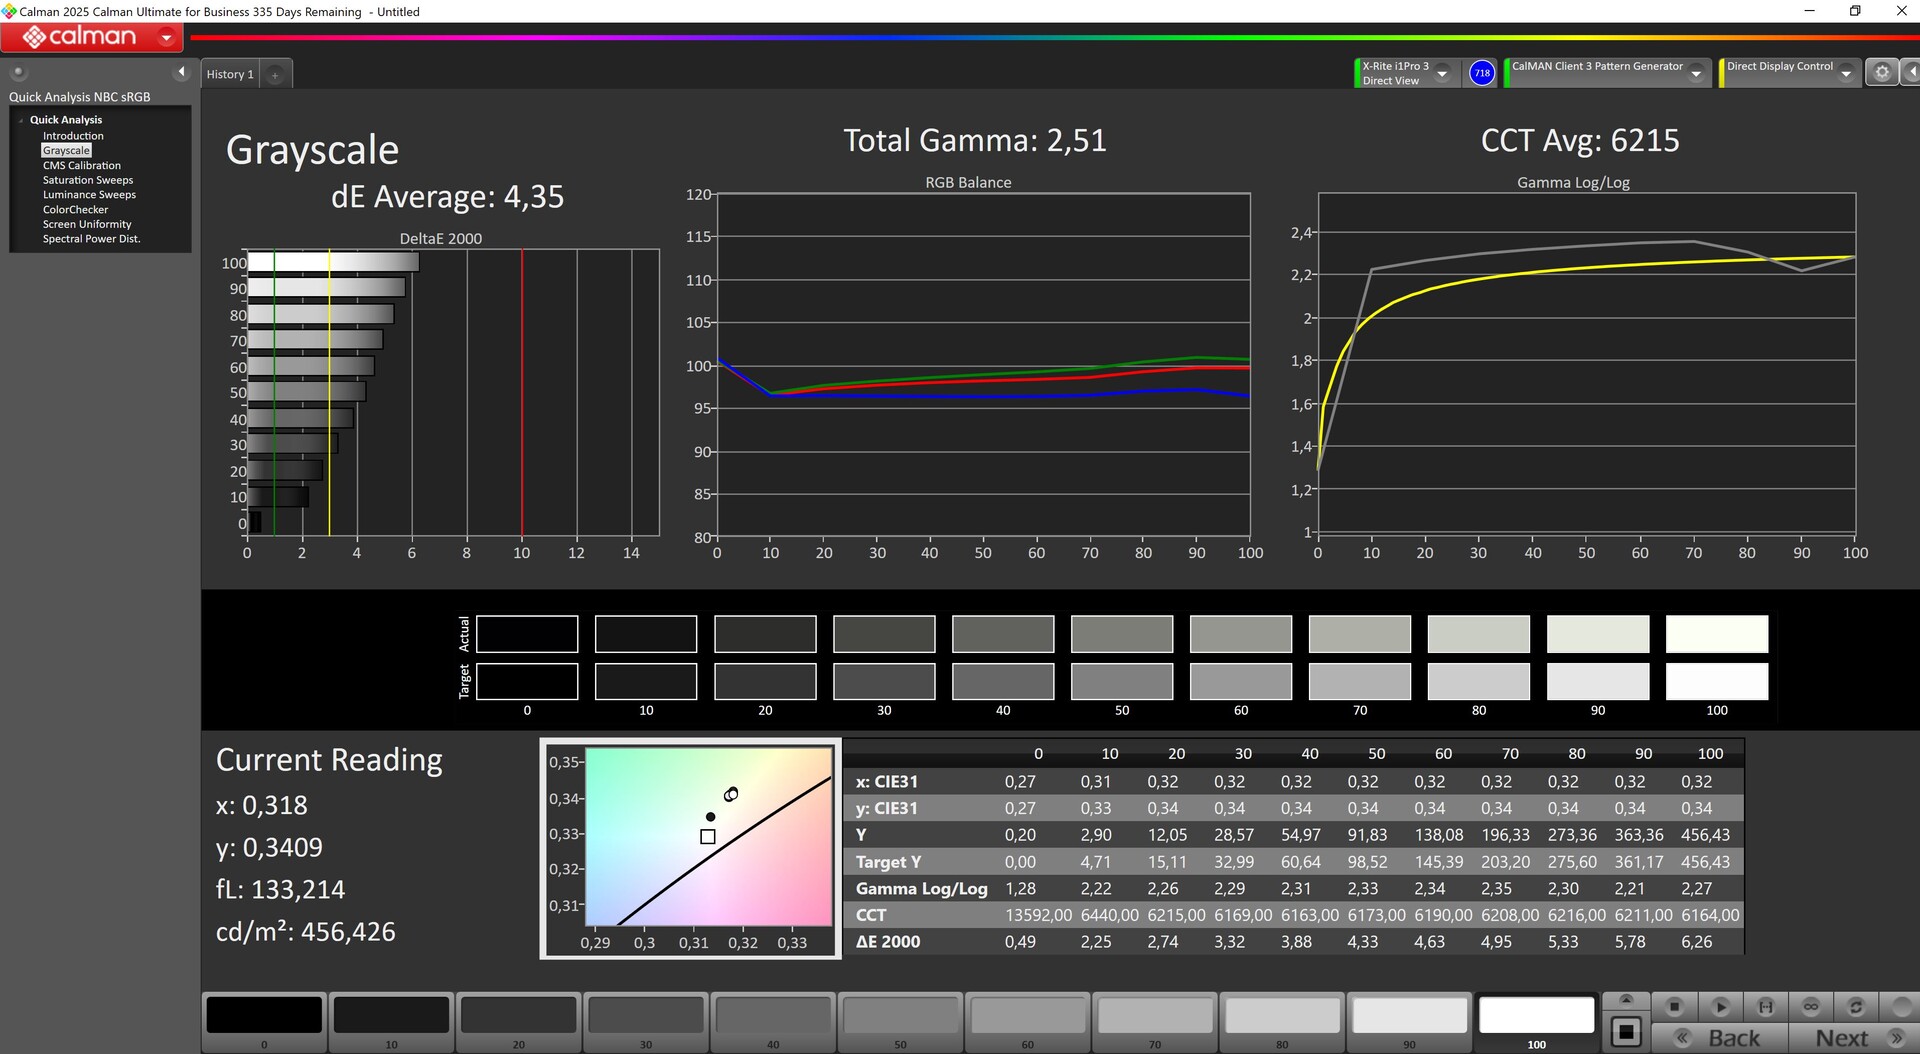
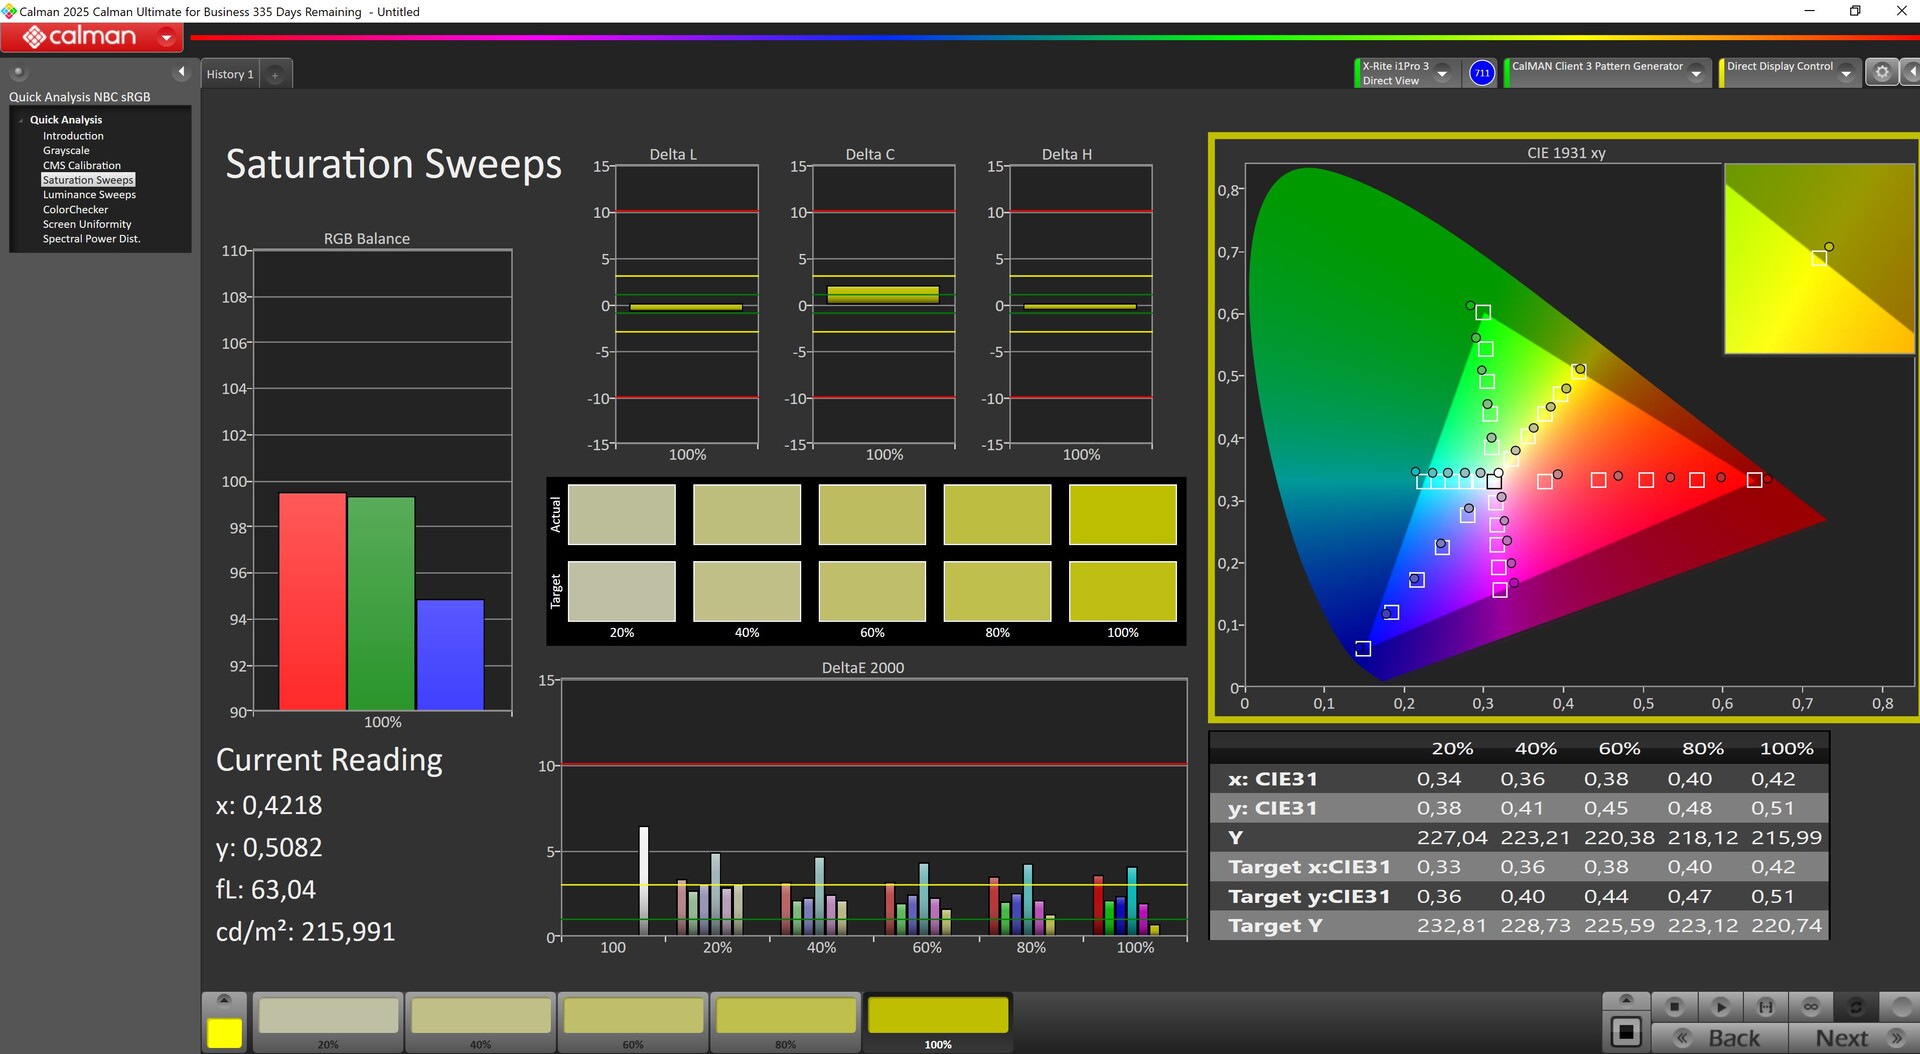
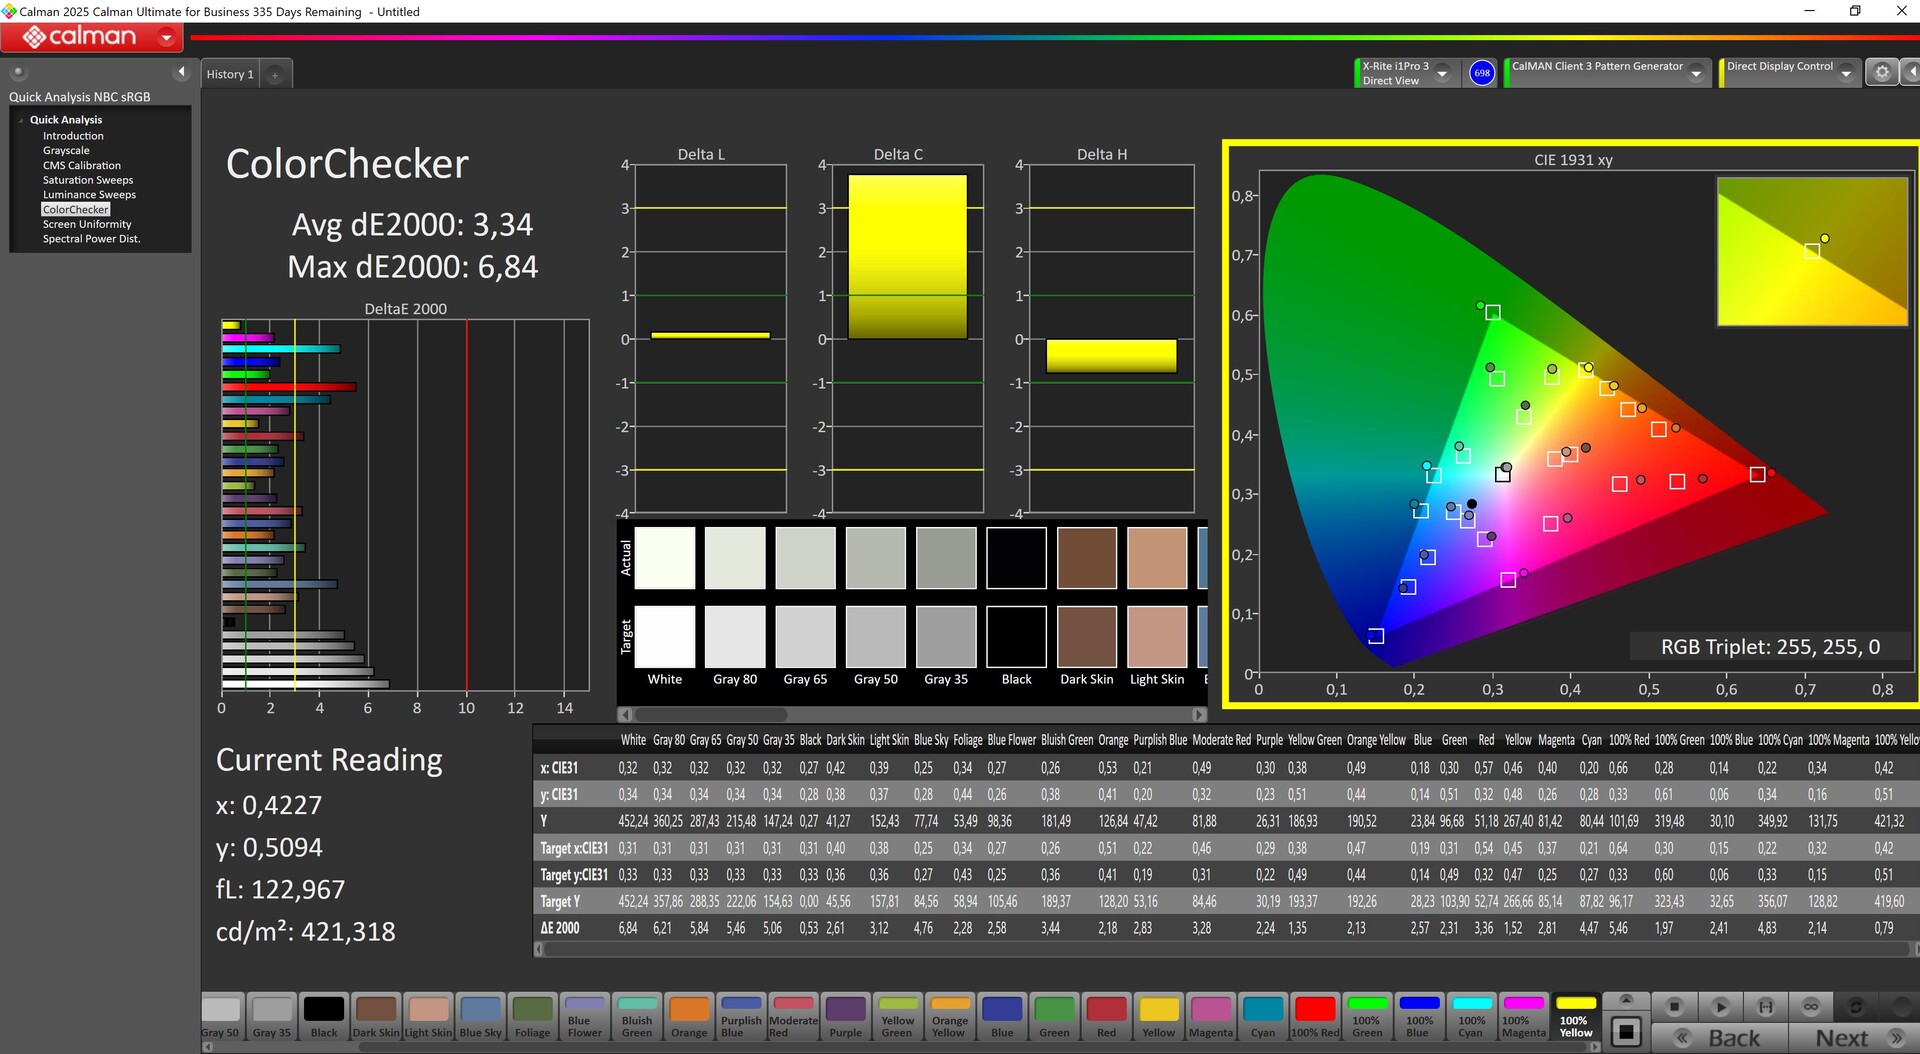
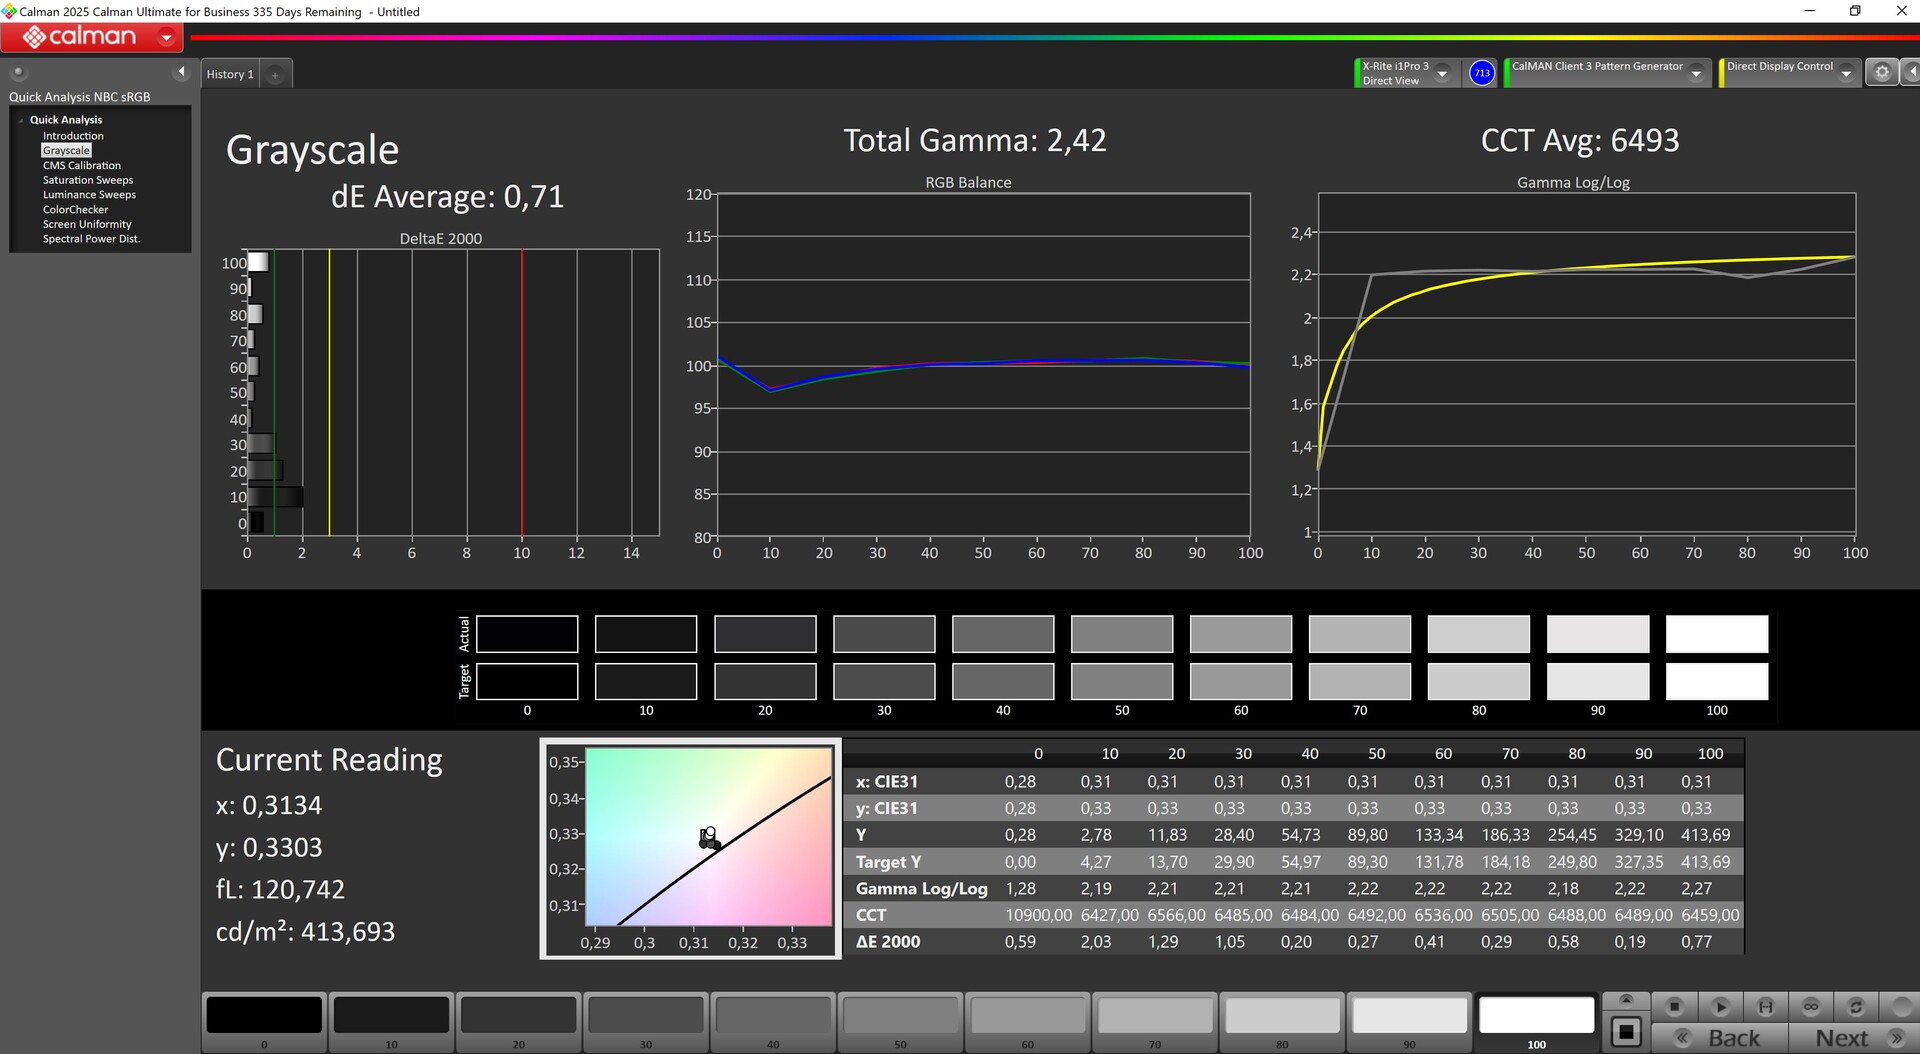
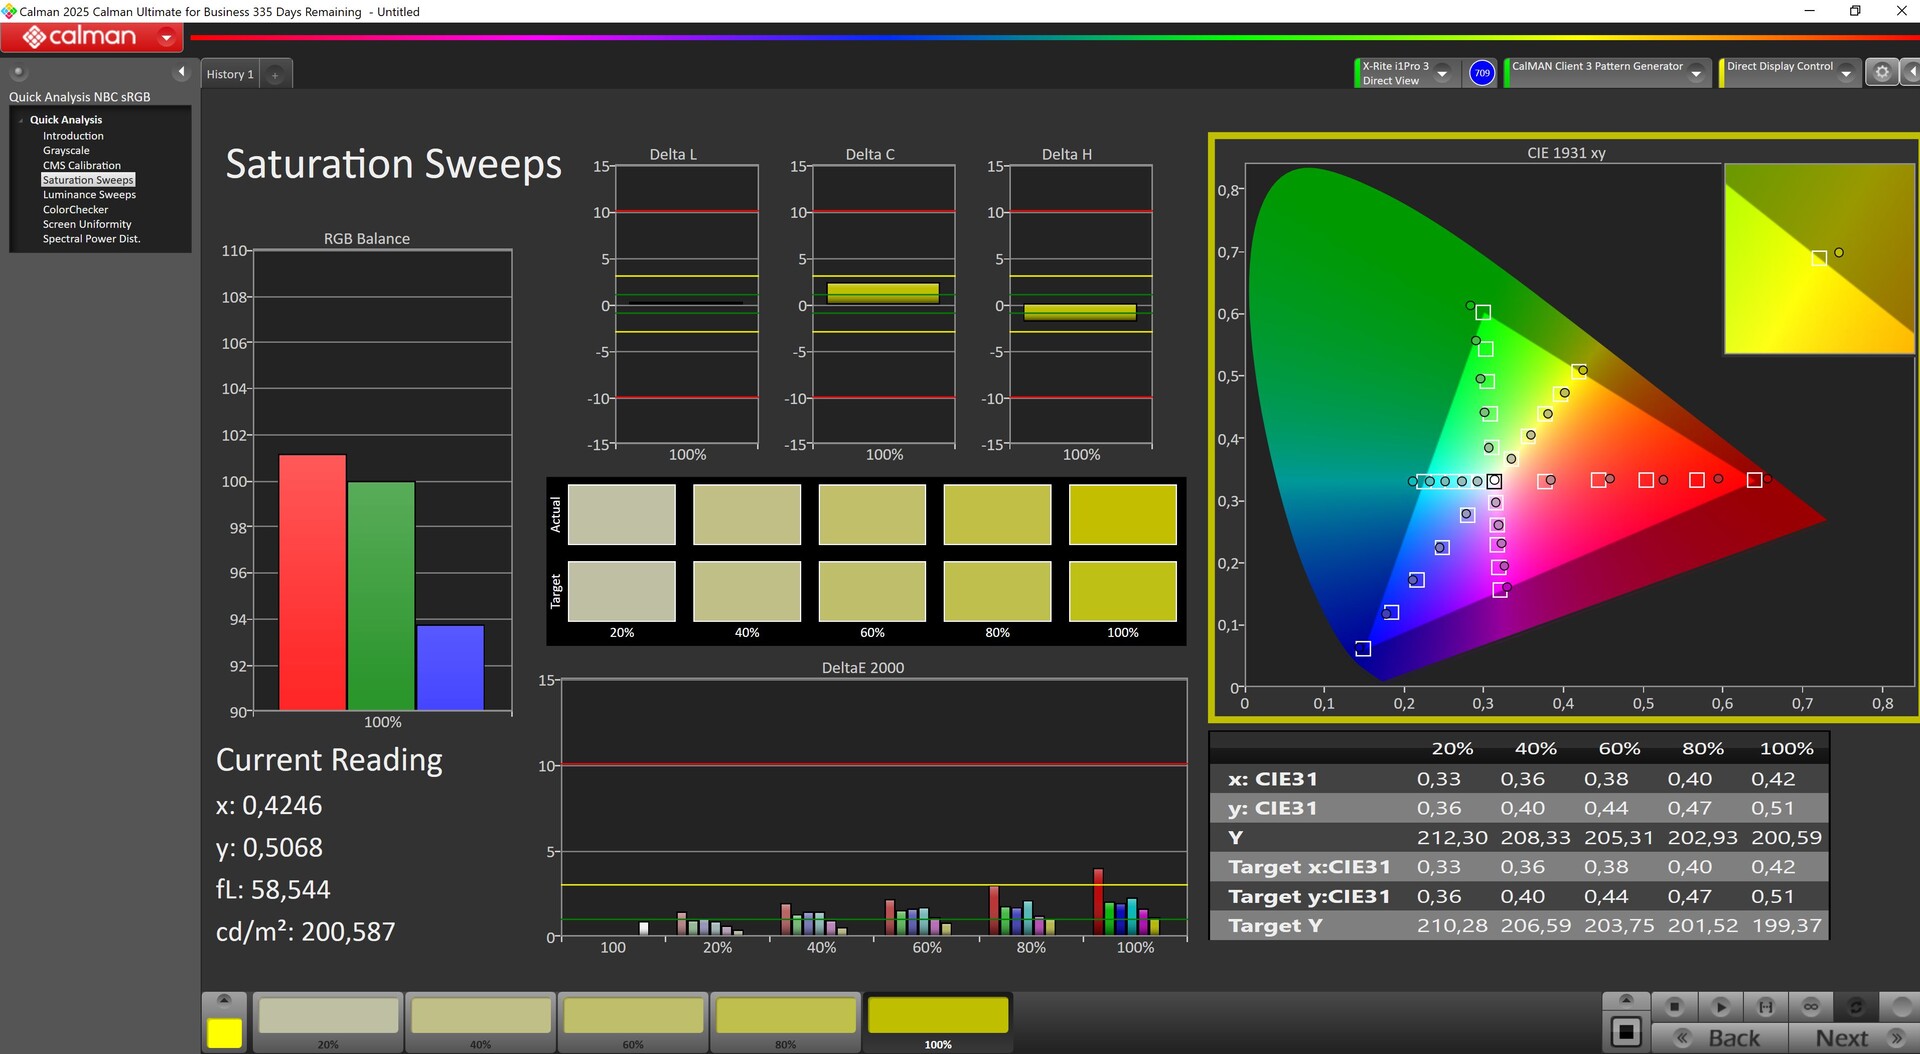
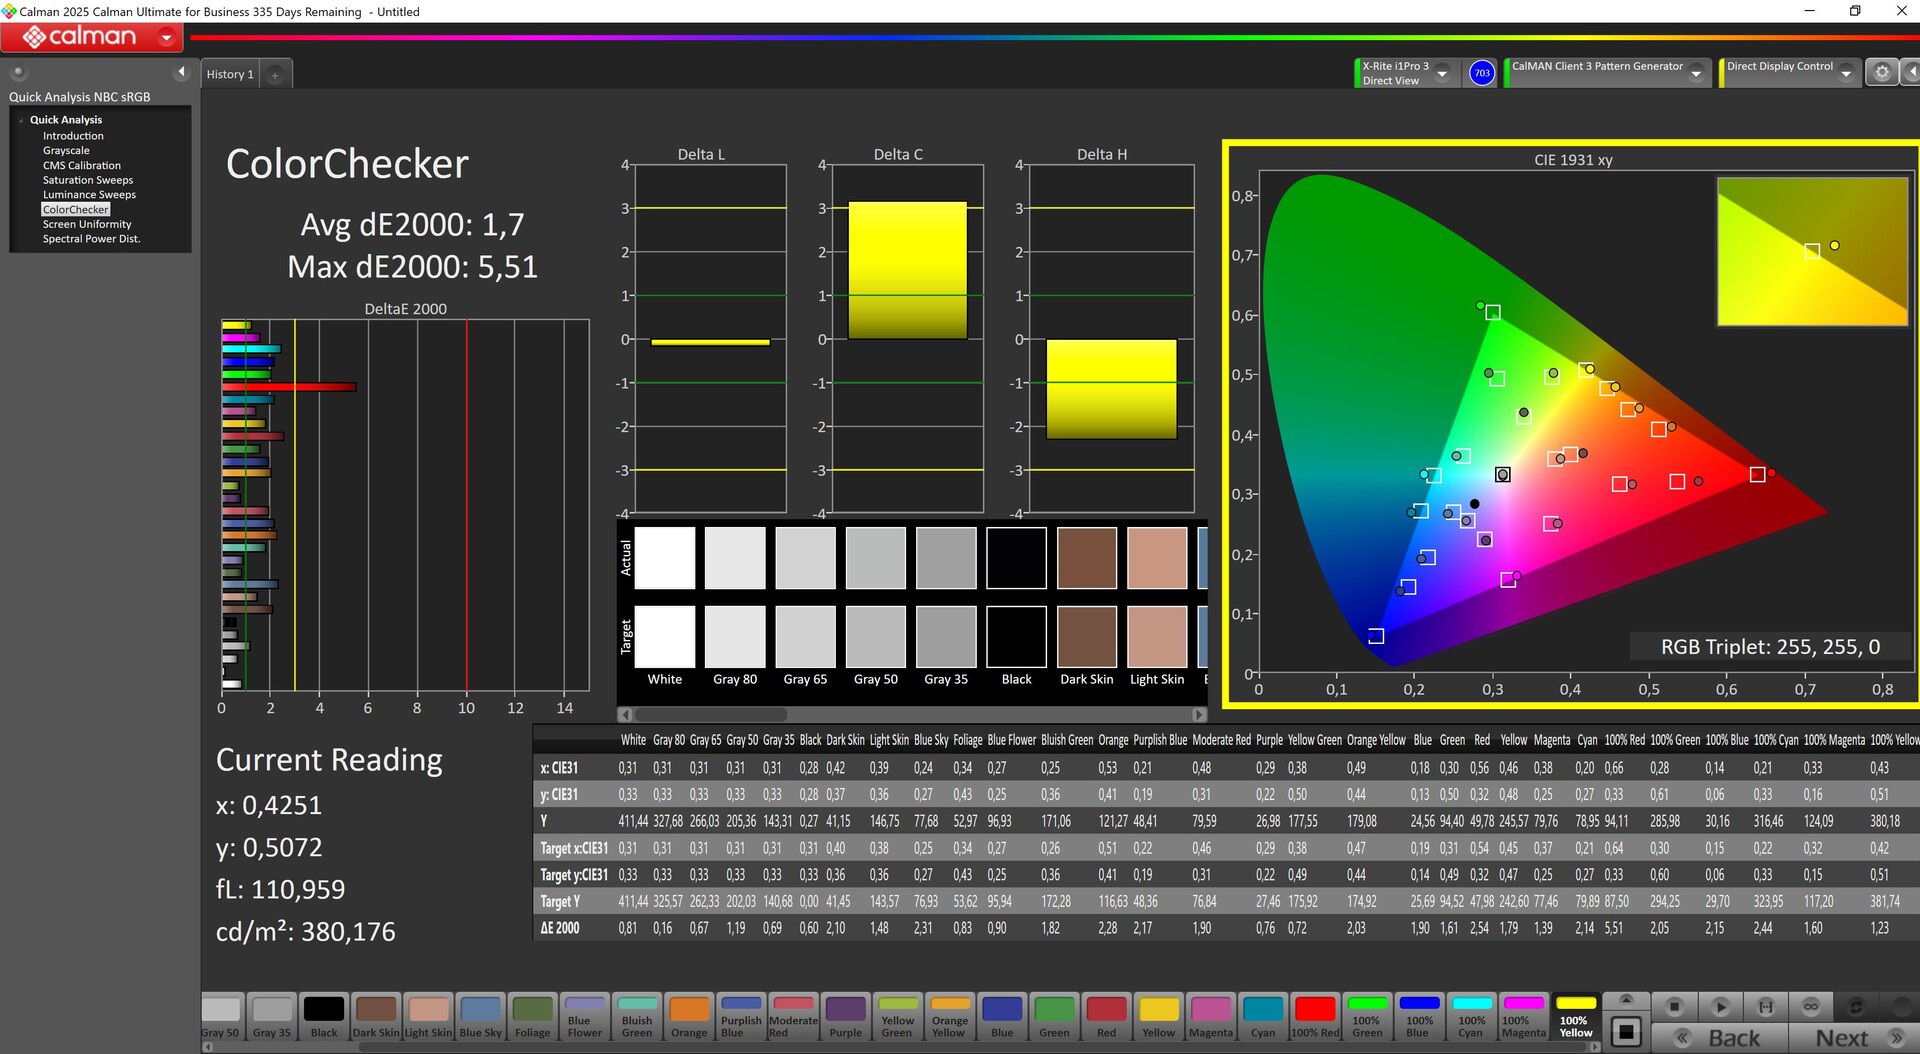
We measured a well-illuminated average brightness of 460 nits. The contrast is also more than decent, thanks to the relatively low black level. AdobeRGB and Display P3 are covered to around 75 percent, and sRGB almost completely.
The response times, however, are quite slow, and the panel only supports 60 Hz.
| |||||||||||||||||||||||||
Brightness Distribution: 89 %
Center on Battery: 456 cd/m²
Contrast: 1983:1 (Black: 0.23 cd/m²)
ΔE ColorChecker Calman: 3.3 | ∀{0.5-29.43 Ø4.71}
calibrated: 1.7
ΔE Greyscale Calman: 4.35 | ∀{0.09-98 Ø4.96}
75.9% AdobeRGB 1998 (Argyll 3D)
99.1% sRGB (Argyll 3D)
74.3% Display P3 (Argyll 3D)
Gamma: 2.51
CCT: 6215 K
| Dell Pro 13 Premium PA13250 B133UAN (AUOBEB0), IPS, 1920x1200, 13.3", 60 Hz | MSI Prestige 13 AI Plus Evo A2VMG ATNA33AA07-0, OLED, 2880x1800, 13.3", 60 Hz | Lenovo ThinkPad X13 2-in-1 Gen 5 Lenovo B133UAN01.2, IPS, 1920x1200, 13.3", 60 Hz | Framework Laptop 13.5 Core Ultra 7 155H BOE NE135A1M-NY1, IPS, 2880x1920, 13.5", 120 Hz | Dell XPS 13 9350 LG Philips 134WU2, IPS, 1920x1200, 13.4", 120 Hz | Microsoft Surface Pro Copilot+ LP129WT342166, IPS, 2880x1920, 13", 120 Hz | |
|---|---|---|---|---|---|---|
| Display | 20% | -4% | -2% | -6% | 6% | |
| Display P3 Coverage (%) | 74.3 | 99.9 34% | 71.1 -4% | 72.8 -2% | 67.3 -9% | 83.4 12% |
| sRGB Coverage (%) | 99.1 | 100 1% | 97.1 -2% | 98.6 -1% | 99 0% | 99.7 1% |
| AdobeRGB 1998 Coverage (%) | 75.9 | 95.8 26% | 71.7 -6% | 72.9 -4% | 68.6 -10% | 79.4 5% |
| Response Times | 94% | -9% | 16% | 16% | 29% | |
| Response Time Grey 50% / Grey 80% * (ms) | 52.8 ? | 1.94 ? 96% | 50.2 ? 5% | 41.9 ? 21% | 37.3 ? 29% | 39.6 ? 25% |
| Response Time Black / White * (ms) | 26.4 ? | 2.02 ? 92% | 32.6 ? -23% | 23.7 ? 10% | 25.9 ? 2% | 18 ? 32% |
| PWM Frequency (Hz) | 60 ? | |||||
| PWM Amplitude * (%) | 21.9 | |||||
| Screen | 17% | -9% | -11% | 31% | 4% | |
| Brightness middle (cd/m²) | 456 | 382.4 -16% | 334 -27% | 498.5 9% | 462.8 1% | 585 28% |
| Brightness (cd/m²) | 460 | 383 -17% | 308 -33% | 464 1% | 435 -5% | 574 25% |
| Brightness Distribution (%) | 89 | 99 11% | 86 -3% | 86 -3% | 87 -2% | 89 0% |
| Black Level * (cd/m²) | 0.23 | 0.37 -61% | 0.36 -57% | 0.19 17% | 0.56 -143% | |
| Contrast (:1) | 1983 | 903 -54% | 1385 -30% | 2436 23% | 1045 -47% | |
| Colorchecker dE 2000 * | 3.3 | 3.84 -16% | 2.36 28% | 4.27 -29% | 1.92 42% | 1.3 61% |
| Colorchecker dE 2000 max. * | 6.47 | 6.66 -3% | 4.93 24% | 7.08 -9% | 3.45 47% | 3 54% |
| Colorchecker dE 2000 calibrated * | 1.7 | 0.41 76% | 1.25 26% | 1.26 26% | 0.48 72% | |
| Greyscale dE 2000 * | 4.35 | 0.7 84% | 3.38 22% | 4.7 -8% | 0.6 86% | 2 54% |
| Gamma | 2.51 88% | 2.23 99% | 2.38 92% | 2.09 105% | 2.19 100% | 2.18 101% |
| CCT | 6215 105% | 6475 100% | 6352 102% | 7417 88% | 6539 99% | 6914 94% |
| Total Average (Program / Settings) | 44% /
31% | -7% /
-8% | 1% /
-5% | 14% /
21% | 13% /
8% |
* ... smaller is better
Out of the box, the panel is not particularly well calibrated, and although our manual calibration managed to improve the DeltaE values regarding both the grayscale and ColorChecker, there was still an outlier in the red area.
Display Response Times
| ↔ Response Time Black to White | ||
|---|---|---|
| 26.4 ms ... rise ↗ and fall ↘ combined | ↗ 12.2 ms rise | 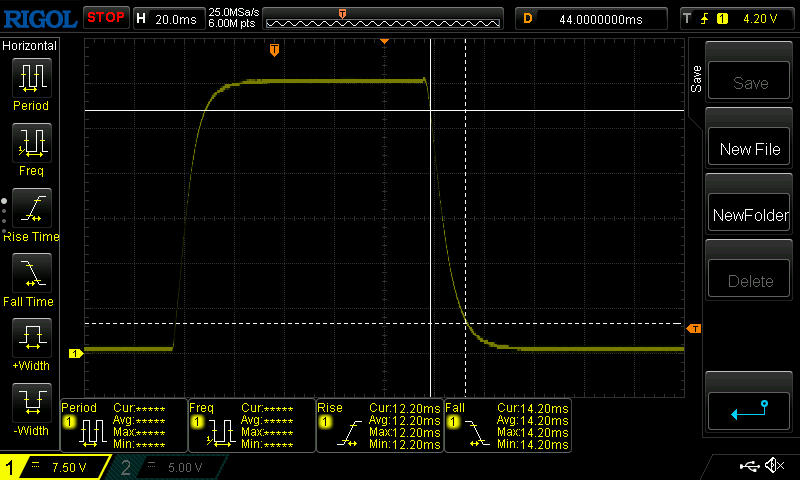 |
| ↘ 14.2 ms fall | ||
| The screen shows relatively slow response rates in our tests and may be too slow for gamers. In comparison, all tested devices range from 0.1 (minimum) to 240 (maximum) ms. » 66 % of all devices are better. This means that the measured response time is worse than the average of all tested devices (19.8 ms). | ||
| ↔ Response Time 50% Grey to 80% Grey | ||
| 52.8 ms ... rise ↗ and fall ↘ combined | ↗ 23.4 ms rise | 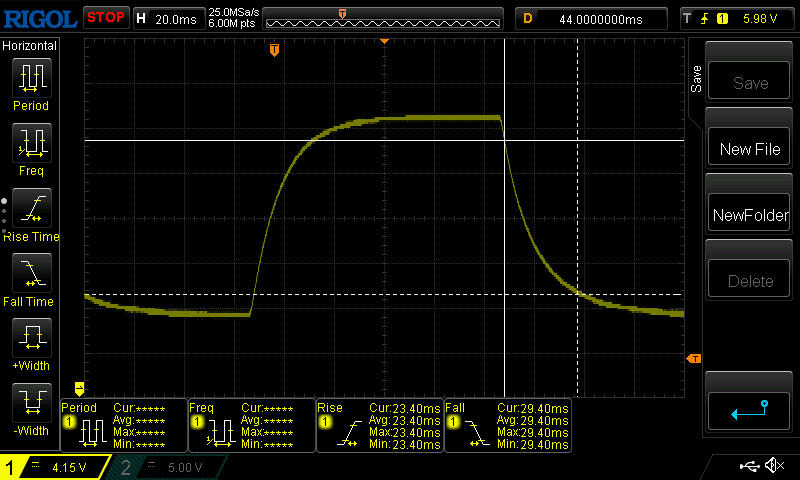 |
| ↘ 29.4 ms fall | ||
| The screen shows slow response rates in our tests and will be unsatisfactory for gamers. In comparison, all tested devices range from 0.165 (minimum) to 636 (maximum) ms. » 89 % of all devices are better. This means that the measured response time is worse than the average of all tested devices (31 ms). | ||
Screen Flickering / PWM (Pulse-Width Modulation)
| Screen flickering / PWM not detected |  | ||
In comparison: 52 % of all tested devices do not use PWM to dim the display. If PWM was detected, an average of 7754 (minimum: 5 - maximum: 343500) Hz was measured. | |||
Outdoors, the good brightness and contrast, matte surface as well as good viewing angle stability help to ensure largely problem-free operation.


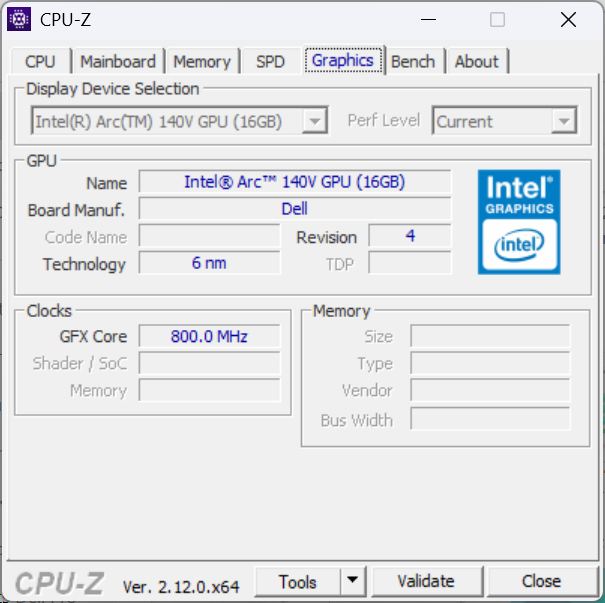
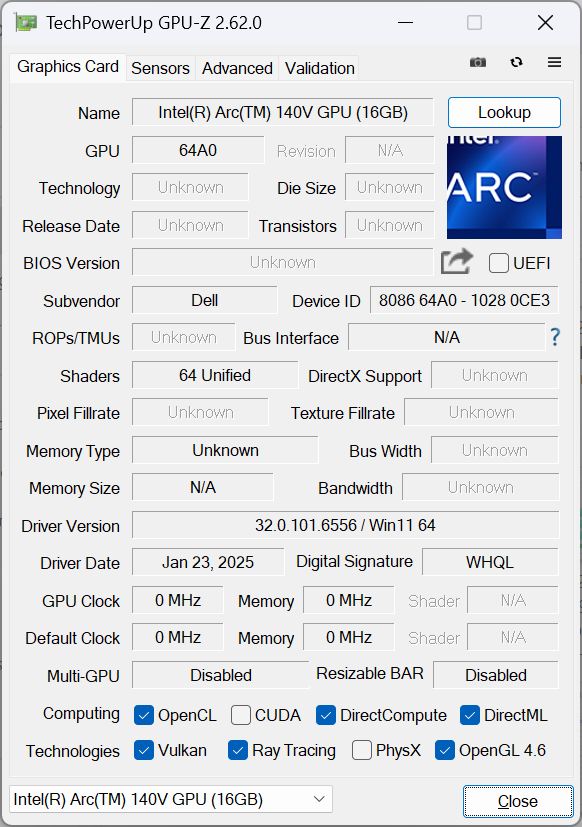
Performance - A powerful Arc 140V
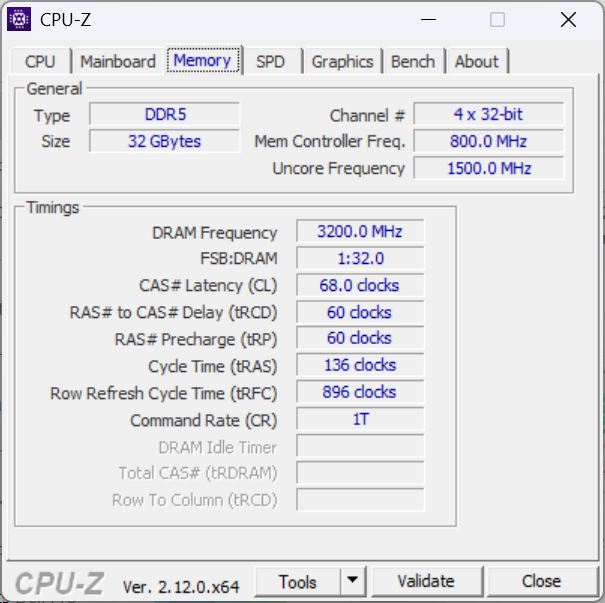
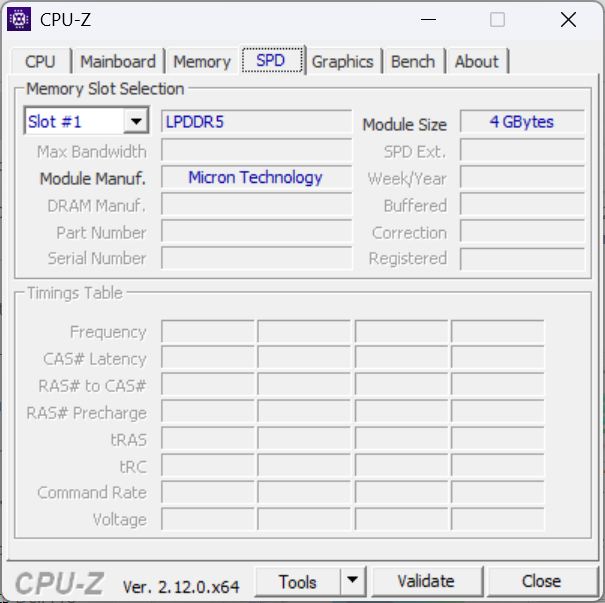
The beating heart is the new Intel Core Ultra 7 268V processor which also comes with 32 GB of built-in RAM. Alternatively, there is a version with a weaker Core Ultra 5 236V and 16 GB of RAM. Storage is also available in various configurations (256 GB, 512 GB, 1 TB). The Dell Pro 13 Premium is clearly aimed at mobile business users.
Test conditions
Dell Optimizer serves as the control center, offering fan settings that affect performance and a few other options. For our benchmarks, we left it with the preselected "Optimized" mode.


Processor
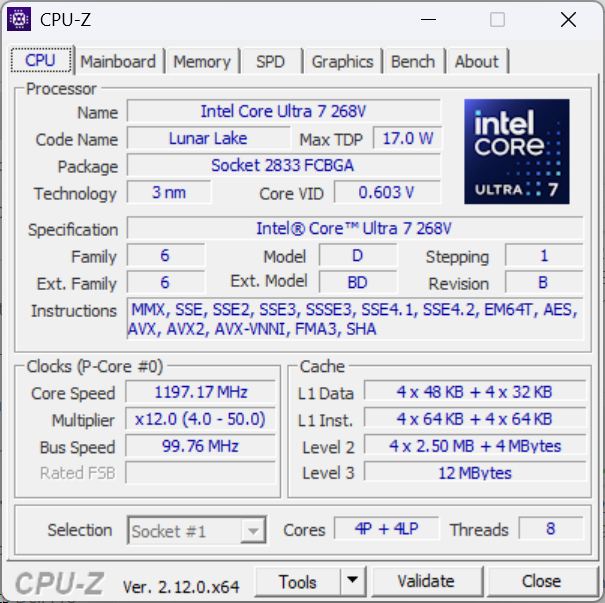
The Intel Core Ultra 7 268V is one of the higher-end models in the energy-efficient Lunar Lake family. Its four E and four P cores clock from 2.2 GHz to 5.0 GHz and also feature a 48 TOPS NPU.
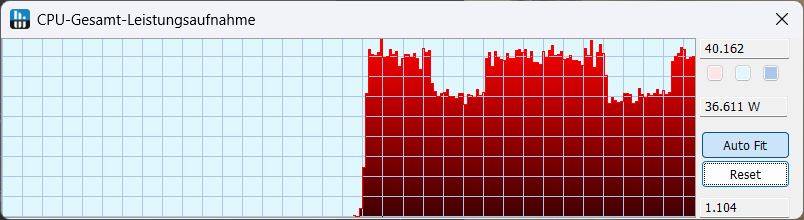
Its single-core performance was particularly impressive in every test we ran. In multi-core benchmarks, the CPU in the Dell Pro 13 is somewhat disappointing, often lagging slightly behind the competition, some with nominally weaker processors. In battery mode, about 16 percent of performance is lost.
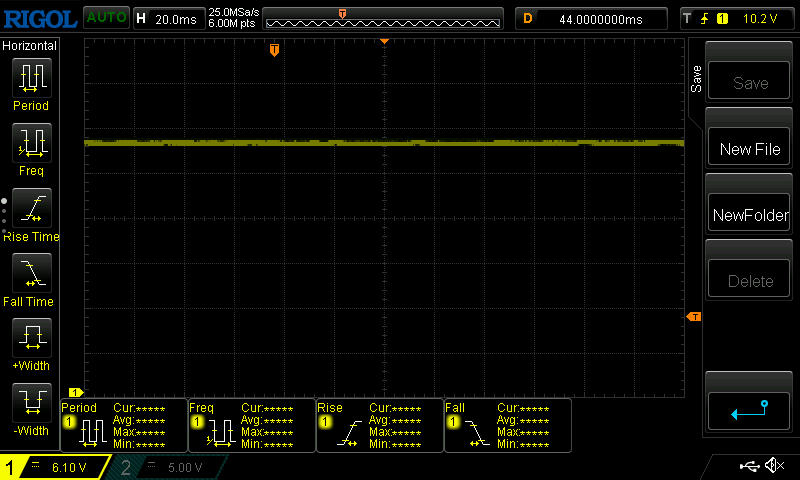
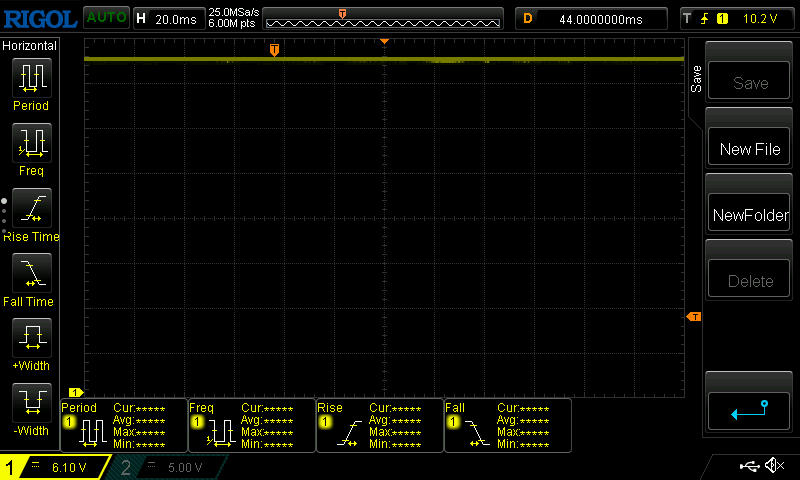
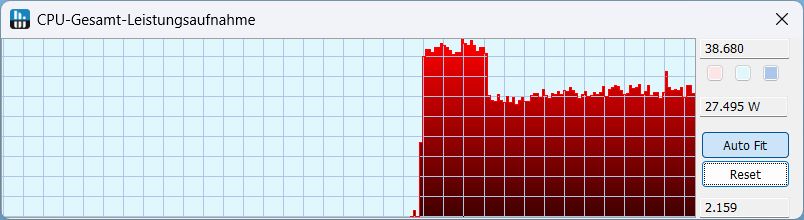
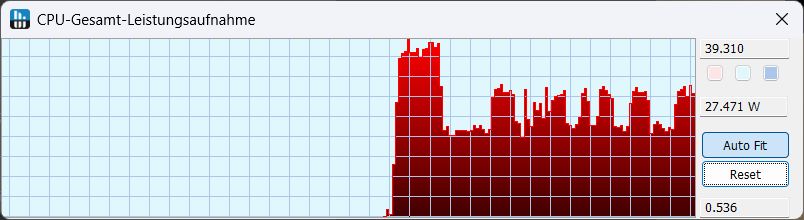
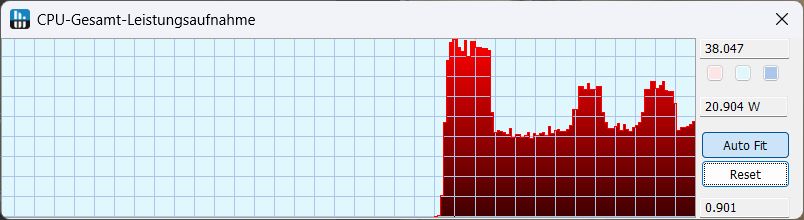
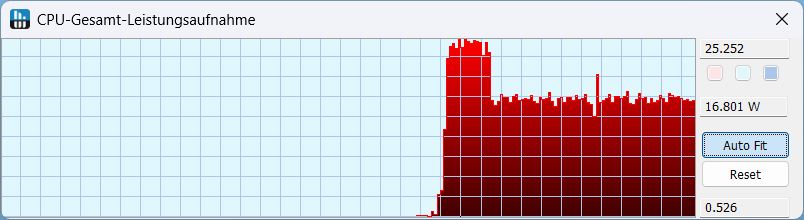
In the Cinebench R15 loop, performance dropped by about 28 percent (!) within the first three runs and remained constant thereafter. In the standard Optimized mode, power consumption was initially around 38 W and then dropped to 27 W. The images on the right show the power consumption behavior in Cinebench R23, depending on the fan mode.
Cinebench R15 Multi Continuous Test
Cinebench R23: Multi Core | Single Core
Cinebench R20: CPU (Multi Core) | CPU (Single Core)
Cinebench R15: CPU Multi 64Bit | CPU Single 64Bit
Blender: v2.79 BMW27 CPU
7-Zip 18.03: 7z b 4 | 7z b 4 -mmt1
Geekbench 6.7: Multi-Core | Single-Core
Geekbench 5.5: Multi-Core | Single-Core
HWBOT x265 Benchmark v2.2: 4k Preset
LibreOffice : 20 Documents To PDF
R Benchmark 2.5: Overall mean
| CPU Performance rating | |
| Framework Laptop 13.5 Core Ultra 7 155H | |
| Average of class Subnotebook | |
| Average Intel Core Ultra 7 268V | |
| MSI Prestige 13 AI Plus Evo A2VMG | |
| Dell XPS 13 9350 | |
| Dell Pro 13 Premium PA13250 | |
| Lenovo ThinkPad X13 2-in-1 Gen 5 | |
| Microsoft Surface Pro Copilot+ -2! | |
| Cinebench R23 / Multi Core | |
| Framework Laptop 13.5 Core Ultra 7 155H | |
| Average of class Subnotebook (1555 - 21812, n=59, last 2 years) | |
| MSI Prestige 13 AI Plus Evo A2VMG | |
| Average Intel Core Ultra 7 268V (9835 - 10913, n=5) | |
| Dell XPS 13 9350 | |
| Dell Pro 13 Premium PA13250 | |
| Microsoft Surface Pro Copilot+ | |
| Lenovo ThinkPad X13 2-in-1 Gen 5 | |
| Cinebench R23 / Single Core | |
| Dell Pro 13 Premium PA13250 | |
| Average Intel Core Ultra 7 268V (1903 - 1985, n=5) | |
| Dell XPS 13 9350 | |
| MSI Prestige 13 AI Plus Evo A2VMG | |
| Framework Laptop 13.5 Core Ultra 7 155H | |
| Average of class Subnotebook (358 - 2213, n=60, last 2 years) | |
| Lenovo ThinkPad X13 2-in-1 Gen 5 | |
| Microsoft Surface Pro Copilot+ | |
| Cinebench R20 / CPU (Multi Core) | |
| Framework Laptop 13.5 Core Ultra 7 155H | |
| Average of class Subnotebook (579 - 8541, n=56, last 2 years) | |
| MSI Prestige 13 AI Plus Evo A2VMG | |
| Average Intel Core Ultra 7 268V (3811 - 4255, n=5) | |
| Dell XPS 13 9350 | |
| Dell Pro 13 Premium PA13250 | |
| Lenovo ThinkPad X13 2-in-1 Gen 5 | |
| Microsoft Surface Pro Copilot+ | |
| Cinebench R20 / CPU (Single Core) | |
| Dell Pro 13 Premium PA13250 | |
| Average Intel Core Ultra 7 268V (733 - 764, n=5) | |
| Dell XPS 13 9350 | |
| MSI Prestige 13 AI Plus Evo A2VMG | |
| Framework Laptop 13.5 Core Ultra 7 155H | |
| Average of class Subnotebook (128 - 832, n=56, last 2 years) | |
| Lenovo ThinkPad X13 2-in-1 Gen 5 | |
| Microsoft Surface Pro Copilot+ | |
| Cinebench R15 / CPU Multi 64Bit | |
| Framework Laptop 13.5 Core Ultra 7 155H | |
| Average of class Subnotebook (327 - 3345, n=56, last 2 years) | |
| Microsoft Surface Pro Copilot+ | |
| MSI Prestige 13 AI Plus Evo A2VMG | |
| Average Intel Core Ultra 7 268V (1574 - 1651, n=5) | |
| Dell Pro 13 Premium PA13250 | |
| Dell XPS 13 9350 | |
| Lenovo ThinkPad X13 2-in-1 Gen 5 | |
| Cinebench R15 / CPU Single 64Bit | |
| Dell Pro 13 Premium PA13250 | |
| Average Intel Core Ultra 7 268V (287 - 302, n=5) | |
| Dell XPS 13 9350 | |
| MSI Prestige 13 AI Plus Evo A2VMG | |
| Average of class Subnotebook (72.4 - 322, n=56, last 2 years) | |
| Framework Laptop 13.5 Core Ultra 7 155H | |
| Lenovo ThinkPad X13 2-in-1 Gen 5 | |
| Microsoft Surface Pro Copilot+ | |
| Blender / v2.79 BMW27 CPU | |
| Dell Pro 13 Premium PA13250 | |
| Microsoft Surface Pro Copilot+ | |
| Lenovo ThinkPad X13 2-in-1 Gen 5 | |
| Average of class Subnotebook (159 - 2271, n=57, last 2 years) | |
| Average Intel Core Ultra 7 268V (311 - 410, n=5) | |
| Dell XPS 13 9350 | |
| MSI Prestige 13 AI Plus Evo A2VMG | |
| Framework Laptop 13.5 Core Ultra 7 155H | |
| 7-Zip 18.03 / 7z b 4 | |
| Framework Laptop 13.5 Core Ultra 7 155H | |
| Average of class Subnotebook (11668 - 77867, n=56, last 2 years) | |
| Microsoft Surface Pro Copilot+ | |
| Dell XPS 13 9350 | |
| MSI Prestige 13 AI Plus Evo A2VMG | |
| Average Intel Core Ultra 7 268V (32797 - 36654, n=5) | |
| Dell Pro 13 Premium PA13250 | |
| Lenovo ThinkPad X13 2-in-1 Gen 5 | |
| 7-Zip 18.03 / 7z b 4 -mmt1 | |
| Dell Pro 13 Premium PA13250 | |
| Average Intel Core Ultra 7 268V (5688 - 6021, n=5) | |
| Dell XPS 13 9350 | |
| Average of class Subnotebook (2643 - 6699, n=58, last 2 years) | |
| MSI Prestige 13 AI Plus Evo A2VMG | |
| Framework Laptop 13.5 Core Ultra 7 155H | |
| Microsoft Surface Pro Copilot+ | |
| Lenovo ThinkPad X13 2-in-1 Gen 5 | |
| Geekbench 6.7 / Multi-Core | |
| Microsoft Surface Pro Copilot+ | |
| Average of class Subnotebook (2244 - 20325, n=62, last 2 years) | |
| Framework Laptop 13.5 Core Ultra 7 155H | |
| Average Intel Core Ultra 7 268V (10589 - 11388, n=6) | |
| MSI Prestige 13 AI Plus Evo A2VMG | |
| Dell XPS 13 9350 | |
| Dell Pro 13 Premium PA13250 | |
| Lenovo ThinkPad X13 2-in-1 Gen 5 | |
| Geekbench 6.7 / Single-Core | |
| Dell Pro 13 Premium PA13250 | |
| Average Intel Core Ultra 7 268V (2583 - 2871, n=6) | |
| Average of class Subnotebook (960 - 4195, n=61, last 2 years) | |
| Dell XPS 13 9350 | |
| MSI Prestige 13 AI Plus Evo A2VMG | |
| Microsoft Surface Pro Copilot+ | |
| Framework Laptop 13.5 Core Ultra 7 155H | |
| Lenovo ThinkPad X13 2-in-1 Gen 5 | |
| Lenovo ThinkPad X13 2-in-1 Gen 5 | |
| Geekbench 5.5 / Multi-Core | |
| Framework Laptop 13.5 Core Ultra 7 155H | |
| Average of class Subnotebook (2557 - 17218, n=48, last 2 years) | |
| Average Intel Core Ultra 7 268V (9491 - 9855, n=6) | |
| MSI Prestige 13 AI Plus Evo A2VMG | |
| Dell Pro 13 Premium PA13250 | |
| Dell XPS 13 9350 | |
| Lenovo ThinkPad X13 2-in-1 Gen 5 | |
| Geekbench 5.5 / Single-Core | |
| Average Intel Core Ultra 7 268V (2008 - 2097, n=6) | |
| Dell XPS 13 9350 | |
| Dell Pro 13 Premium PA13250 | |
| MSI Prestige 13 AI Plus Evo A2VMG | |
| Average of class Subnotebook (726 - 2224, n=48, last 2 years) | |
| Framework Laptop 13.5 Core Ultra 7 155H | |
| Lenovo ThinkPad X13 2-in-1 Gen 5 | |
| HWBOT x265 Benchmark v2.2 / 4k Preset | |
| MSI Prestige 13 AI Plus Evo A2VMG | |
| Framework Laptop 13.5 Core Ultra 7 155H | |
| Average of class Subnotebook (0.97 - 25.1, n=56, last 2 years) | |
| Dell XPS 13 9350 | |
| Average Intel Core Ultra 7 268V (10.4 - 13.9, n=5) | |
| Dell Pro 13 Premium PA13250 | |
| Lenovo ThinkPad X13 2-in-1 Gen 5 | |
| Microsoft Surface Pro Copilot+ | |
| LibreOffice / 20 Documents To PDF | |
| Dell Pro 13 Premium PA13250 | |
| Microsoft Surface Pro Copilot+ | |
| Average of class Subnotebook (39.9 - 220, n=55, last 2 years) | |
| Lenovo ThinkPad X13 2-in-1 Gen 5 | |
| Dell XPS 13 9350 | |
| MSI Prestige 13 AI Plus Evo A2VMG | |
| Average Intel Core Ultra 7 268V (44.9 - 60.8, n=5) | |
| Framework Laptop 13.5 Core Ultra 7 155H | |
| R Benchmark 2.5 / Overall mean | |
| Microsoft Surface Pro Copilot+ | |
| Lenovo ThinkPad X13 2-in-1 Gen 5 | |
| Average of class Subnotebook (0.4024 - 1.456, n=57, last 2 years) | |
| Framework Laptop 13.5 Core Ultra 7 155H | |
| MSI Prestige 13 AI Plus Evo A2VMG | |
| Dell XPS 13 9350 | |
| Average Intel Core Ultra 7 268V (0.4344 - 0.4565, n=5) | |
| Dell Pro 13 Premium PA13250 | |
* ... smaller is better
AIDA64: FP32 Ray-Trace | FPU Julia | CPU SHA3 | CPU Queen | FPU SinJulia | FPU Mandel | CPU AES | CPU ZLib | FP64 Ray-Trace | CPU PhotoWorxx
| Performance rating | |
| Framework Laptop 13.5 Core Ultra 7 155H | |
| Average of class Subnotebook | |
| MSI Prestige 13 AI Plus Evo A2VMG | |
| Dell XPS 13 9350 | |
| Average Intel Core Ultra 7 268V | |
| Dell Pro 13 Premium PA13250 | |
| Lenovo ThinkPad X13 2-in-1 Gen 5 | |
| Microsoft Surface Pro Copilot+ | |
| AIDA64 / FP32 Ray-Trace | |
| Average of class Subnotebook (1135 - 32888, n=57, last 2 years) | |
| MSI Prestige 13 AI Plus Evo A2VMG | |
| Dell XPS 13 9350 | |
| Average Intel Core Ultra 7 268V (10556 - 12759, n=5) | |
| Framework Laptop 13.5 Core Ultra 7 155H | |
| Dell Pro 13 Premium PA13250 | |
| Microsoft Surface Pro Copilot+ | |
| Lenovo ThinkPad X13 2-in-1 Gen 5 | |
| AIDA64 / FPU Julia | |
| MSI Prestige 13 AI Plus Evo A2VMG | |
| Average of class Subnotebook (5218 - 123315, n=57, last 2 years) | |
| Dell XPS 13 9350 | |
| Framework Laptop 13.5 Core Ultra 7 155H | |
| Average Intel Core Ultra 7 268V (47659 - 62563, n=5) | |
| Dell Pro 13 Premium PA13250 | |
| Lenovo ThinkPad X13 2-in-1 Gen 5 | |
| Microsoft Surface Pro Copilot+ | |
| AIDA64 / CPU SHA3 | |
| Average of class Subnotebook (444 - 5287, n=57, last 2 years) | |
| MSI Prestige 13 AI Plus Evo A2VMG | |
| Framework Laptop 13.5 Core Ultra 7 155H | |
| Dell XPS 13 9350 | |
| Average Intel Core Ultra 7 268V (2117 - 2803, n=5) | |
| Dell Pro 13 Premium PA13250 | |
| Lenovo ThinkPad X13 2-in-1 Gen 5 | |
| Microsoft Surface Pro Copilot+ | |
| AIDA64 / CPU Queen | |
| Framework Laptop 13.5 Core Ultra 7 155H | |
| Microsoft Surface Pro Copilot+ | |
| Average of class Subnotebook (10579 - 95002, n=48, last 2 years) | |
| MSI Prestige 13 AI Plus Evo A2VMG | |
| Dell Pro 13 Premium PA13250 | |
| Average Intel Core Ultra 7 268V (49629 - 49759, n=5) | |
| Dell XPS 13 9350 | |
| Lenovo ThinkPad X13 2-in-1 Gen 5 | |
| AIDA64 / FPU SinJulia | |
| Framework Laptop 13.5 Core Ultra 7 155H | |
| Average of class Subnotebook (744 - 18418, n=57, last 2 years) | |
| Lenovo ThinkPad X13 2-in-1 Gen 5 | |
| Dell XPS 13 9350 | |
| MSI Prestige 13 AI Plus Evo A2VMG | |
| Average Intel Core Ultra 7 268V (4351 - 4429, n=5) | |
| Dell Pro 13 Premium PA13250 | |
| Microsoft Surface Pro Copilot+ | |
| AIDA64 / FPU Mandel | |
| MSI Prestige 13 AI Plus Evo A2VMG | |
| Average of class Subnotebook (3341 - 65433, n=57, last 2 years) | |
| Dell XPS 13 9350 | |
| Average Intel Core Ultra 7 268V (25929 - 33207, n=5) | |
| Framework Laptop 13.5 Core Ultra 7 155H | |
| Dell Pro 13 Premium PA13250 | |
| Lenovo ThinkPad X13 2-in-1 Gen 5 | |
| Microsoft Surface Pro Copilot+ | |
| AIDA64 / CPU AES | |
| Framework Laptop 13.5 Core Ultra 7 155H | |
| Microsoft Surface Pro Copilot+ | |
| Average of class Subnotebook (638 - 96917, n=57, last 2 years) | |
| Dell XPS 13 9350 | |
| MSI Prestige 13 AI Plus Evo A2VMG | |
| Average Intel Core Ultra 7 268V (33196 - 39140, n=5) | |
| Lenovo ThinkPad X13 2-in-1 Gen 5 | |
| Dell Pro 13 Premium PA13250 | |
| AIDA64 / CPU ZLib | |
| Framework Laptop 13.5 Core Ultra 7 155H | |
| Average of class Subnotebook (164.9 - 1379, n=57, last 2 years) | |
| Microsoft Surface Pro Copilot+ | |
| MSI Prestige 13 AI Plus Evo A2VMG | |
| Average Intel Core Ultra 7 268V (441 - 633, n=5) | |
| Dell XPS 13 9350 | |
| Lenovo ThinkPad X13 2-in-1 Gen 5 | |
| Dell Pro 13 Premium PA13250 | |
| AIDA64 / FP64 Ray-Trace | |
| Average of class Subnotebook (610 - 17495, n=57, last 2 years) | |
| MSI Prestige 13 AI Plus Evo A2VMG | |
| Average Intel Core Ultra 7 268V (5938 - 6960, n=5) | |
| Dell XPS 13 9350 | |
| Framework Laptop 13.5 Core Ultra 7 155H | |
| Dell Pro 13 Premium PA13250 | |
| Lenovo ThinkPad X13 2-in-1 Gen 5 | |
| Microsoft Surface Pro Copilot+ | |
| AIDA64 / CPU PhotoWorxx | |
| MSI Prestige 13 AI Plus Evo A2VMG | |
| Average Intel Core Ultra 7 268V (46733 - 55083, n=5) | |
| Dell XPS 13 9350 | |
| Average of class Subnotebook (6569 - 85600, n=57, last 2 years) | |
| Dell Pro 13 Premium PA13250 | |
| Framework Laptop 13.5 Core Ultra 7 155H | |
| Lenovo ThinkPad X13 2-in-1 Gen 5 | |
| Microsoft Surface Pro Copilot+ | |
System performance
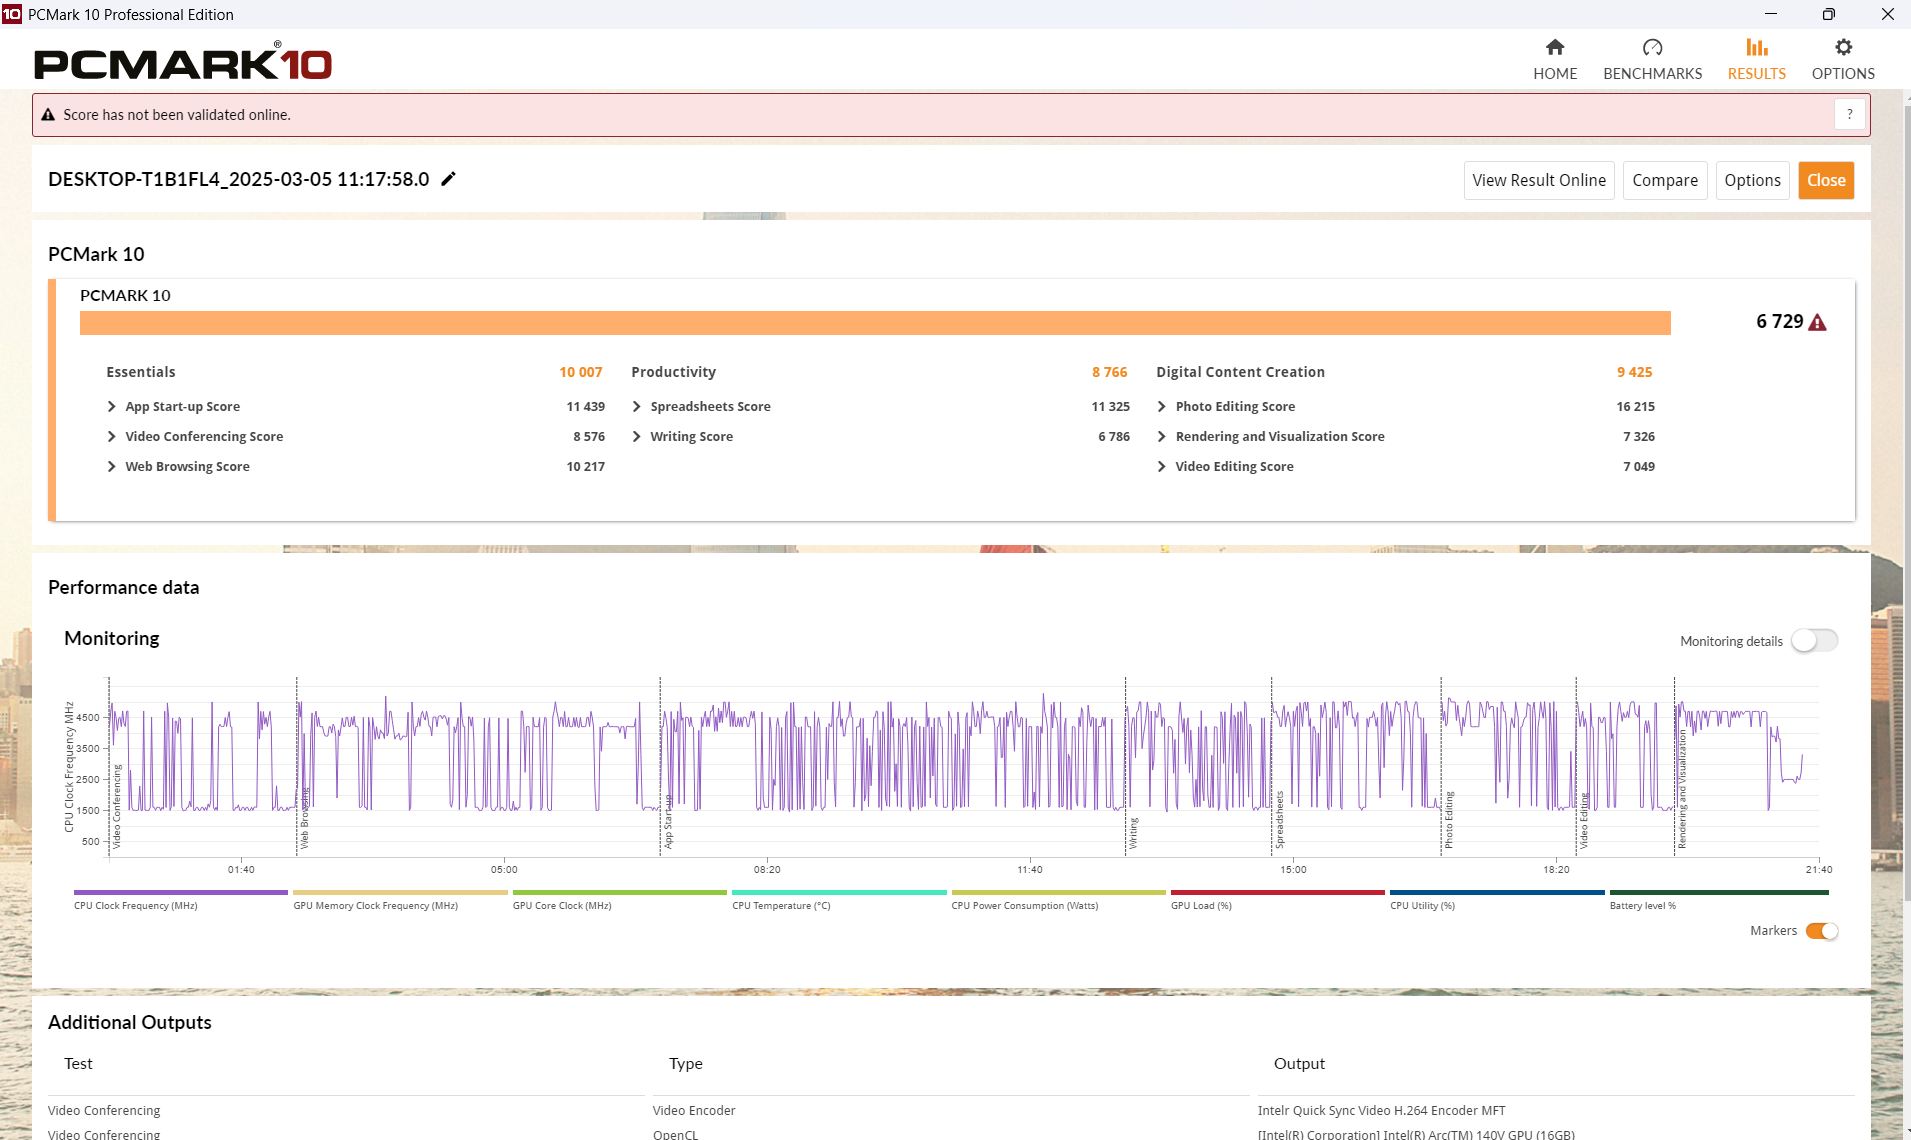
In PCMark 10 and CrossMark, the comparison devices are close to one another, but both in this area and the web tests, our Dell Pro ranks more in the middle than gunning for the top spot.
CrossMark: Overall | Productivity | Creativity | Responsiveness
WebXPRT 3: Overall
WebXPRT 4: Overall
Mozilla Kraken 1.1: Total
| PCMark 10 / Score | |
| Average of class Subnotebook (4920 - 9939, n=45, last 2 years) | |
| Average Intel Core Ultra 7 268V, Intel Arc Graphics 140V (6729 - 7236, n=5) | |
| Dell XPS 13 9350 | |
| Framework Laptop 13.5 Core Ultra 7 155H | |
| MSI Prestige 13 AI Plus Evo A2VMG | |
| Dell Pro 13 Premium PA13250 | |
| Lenovo ThinkPad X13 2-in-1 Gen 5 | |
| PCMark 10 / Essentials | |
| Lenovo ThinkPad X13 2-in-1 Gen 5 | |
| Framework Laptop 13.5 Core Ultra 7 155H | |
| Average of class Subnotebook (8552 - 11646, n=45, last 2 years) | |
| Average Intel Core Ultra 7 268V, Intel Arc Graphics 140V (10007 - 10701, n=5) | |
| MSI Prestige 13 AI Plus Evo A2VMG | |
| Dell Pro 13 Premium PA13250 | |
| Dell XPS 13 9350 | |
| PCMark 10 / Productivity | |
| Average of class Subnotebook (5435 - 16606, n=45, last 2 years) | |
| Dell XPS 13 9350 | |
| Average Intel Core Ultra 7 268V, Intel Arc Graphics 140V (8766 - 9217, n=5) | |
| Dell Pro 13 Premium PA13250 | |
| Framework Laptop 13.5 Core Ultra 7 155H | |
| MSI Prestige 13 AI Plus Evo A2VMG | |
| Lenovo ThinkPad X13 2-in-1 Gen 5 | |
| PCMark 10 / Digital Content Creation | |
| Average Intel Core Ultra 7 268V, Intel Arc Graphics 140V (9425 - 10429, n=5) | |
| MSI Prestige 13 AI Plus Evo A2VMG | |
| Dell XPS 13 9350 | |
| Average of class Subnotebook (5722 - 13779, n=45, last 2 years) | |
| Framework Laptop 13.5 Core Ultra 7 155H | |
| Dell Pro 13 Premium PA13250 | |
| Lenovo ThinkPad X13 2-in-1 Gen 5 | |
| CrossMark / Overall | |
| Dell XPS 13 9350 | |
| MSI Prestige 13 AI Plus Evo A2VMG | |
| Average Intel Core Ultra 7 268V, Intel Arc Graphics 140V (1643 - 1763, n=5) | |
| Framework Laptop 13.5 Core Ultra 7 155H | |
| Average of class Subnotebook (365 - 2356, n=59, last 2 years) | |
| Dell Pro 13 Premium PA13250 | |
| Lenovo ThinkPad X13 2-in-1 Gen 5 | |
| Microsoft Surface Pro Copilot+ | |
| CrossMark / Productivity | |
| Dell XPS 13 9350 | |
| Average Intel Core Ultra 7 268V, Intel Arc Graphics 140V (1577 - 1696, n=5) | |
| MSI Prestige 13 AI Plus Evo A2VMG | |
| Framework Laptop 13.5 Core Ultra 7 155H | |
| Average of class Subnotebook (364 - 2277, n=59, last 2 years) | |
| Dell Pro 13 Premium PA13250 | |
| Lenovo ThinkPad X13 2-in-1 Gen 5 | |
| Microsoft Surface Pro Copilot+ | |
| CrossMark / Creativity | |
| MSI Prestige 13 AI Plus Evo A2VMG | |
| Dell XPS 13 9350 | |
| Average Intel Core Ultra 7 268V, Intel Arc Graphics 140V (1866 - 2021, n=5) | |
| Framework Laptop 13.5 Core Ultra 7 155H | |
| Average of class Subnotebook (372 - 2743, n=59, last 2 years) | |
| Dell Pro 13 Premium PA13250 | |
| Lenovo ThinkPad X13 2-in-1 Gen 5 | |
| Microsoft Surface Pro Copilot+ | |
| CrossMark / Responsiveness | |
| Lenovo ThinkPad X13 2-in-1 Gen 5 | |
| Average of class Subnotebook (312 - 1854, n=59, last 2 years) | |
| Framework Laptop 13.5 Core Ultra 7 155H | |
| Dell XPS 13 9350 | |
| MSI Prestige 13 AI Plus Evo A2VMG | |
| Average Intel Core Ultra 7 268V, Intel Arc Graphics 140V (1239 - 1313, n=5) | |
| Dell Pro 13 Premium PA13250 | |
| Microsoft Surface Pro Copilot+ | |
| WebXPRT 3 / Overall | |
| Microsoft Surface Pro Copilot+ | |
| Average of class Subnotebook (156 - 530, n=55, last 2 years) | |
| Dell XPS 13 9350 | |
| MSI Prestige 13 AI Plus Evo A2VMG | |
| Average Intel Core Ultra 7 268V, Intel Arc Graphics 140V (266 - 317, n=5) | |
| Framework Laptop 13.5 Core Ultra 7 155H | |
| Dell Pro 13 Premium PA13250 | |
| Lenovo ThinkPad X13 2-in-1 Gen 5 | |
| WebXPRT 4 / Overall | |
| MSI Prestige 13 AI Plus Evo A2VMG | |
| Dell XPS 13 9350 | |
| Average Intel Core Ultra 7 268V, Intel Arc Graphics 140V (245 - 292, n=5) | |
| Average of class Subnotebook (132 - 378, n=60, last 2 years) | |
| Microsoft Surface Pro Copilot+ | |
| Framework Laptop 13.5 Core Ultra 7 155H | |
| Dell Pro 13 Premium PA13250 | |
| Lenovo ThinkPad X13 2-in-1 Gen 5 | |
| Mozilla Kraken 1.1 / Total | |
| Lenovo ThinkPad X13 2-in-1 Gen 5 | |
| Framework Laptop 13.5 Core Ultra 7 155H | |
| Dell Pro 13 Premium PA13250 | |
| Average of class Subnotebook (234 - 1104, n=60, last 2 years) | |
| MSI Prestige 13 AI Plus Evo A2VMG | |
| Dell XPS 13 9350 | |
| Average Intel Core Ultra 7 268V, Intel Arc Graphics 140V (460 - 476, n=5) | |
| Microsoft Surface Pro Copilot+ | |
* ... smaller is better
| PCMark 10 Score | 6729 points | |
Help | ||
| AIDA64 / Memory Copy | |
| MSI Prestige 13 AI Plus Evo A2VMG | |
| Average Intel Core Ultra 7 268V (100445 - 108317, n=5) | |
| Dell XPS 13 9350 | |
| Dell Pro 13 Premium PA13250 | |
| Average of class Subnotebook (14554 - 131023, n=57, last 2 years) | |
| Framework Laptop 13.5 Core Ultra 7 155H | |
| Lenovo ThinkPad X13 2-in-1 Gen 5 | |
| Microsoft Surface Pro Copilot+ | |
| AIDA64 / Memory Read | |
| Microsoft Surface Pro Copilot+ | |
| Dell XPS 13 9350 | |
| MSI Prestige 13 AI Plus Evo A2VMG | |
| Average Intel Core Ultra 7 268V (82511 - 88341, n=5) | |
| Average of class Subnotebook (15948 - 127174, n=57, last 2 years) | |
| Dell Pro 13 Premium PA13250 | |
| Framework Laptop 13.5 Core Ultra 7 155H | |
| Lenovo ThinkPad X13 2-in-1 Gen 5 | |
| AIDA64 / Memory Write | |
| MSI Prestige 13 AI Plus Evo A2VMG | |
| Dell Pro 13 Premium PA13250 | |
| Average Intel Core Ultra 7 268V (104206 - 117888, n=5) | |
| Dell XPS 13 9350 | |
| Average of class Subnotebook (15709 - 135141, n=57, last 2 years) | |
| Framework Laptop 13.5 Core Ultra 7 155H | |
| Lenovo ThinkPad X13 2-in-1 Gen 5 | |
| Microsoft Surface Pro Copilot+ | |
| AIDA64 / Memory Latency | |
| Lenovo ThinkPad X13 2-in-1 Gen 5 | |
| Framework Laptop 13.5 Core Ultra 7 155H | |
| Dell Pro 13 Premium PA13250 | |
| MSI Prestige 13 AI Plus Evo A2VMG | |
| Dell XPS 13 9350 | |
| Average Intel Core Ultra 7 268V (94.4 - 101.5, n=5) | |
| Average of class Subnotebook (6.1 - 159.9, n=55, last 2 years) | |
| Microsoft Surface Pro Copilot+ | |
* ... smaller is better
DPC latencies
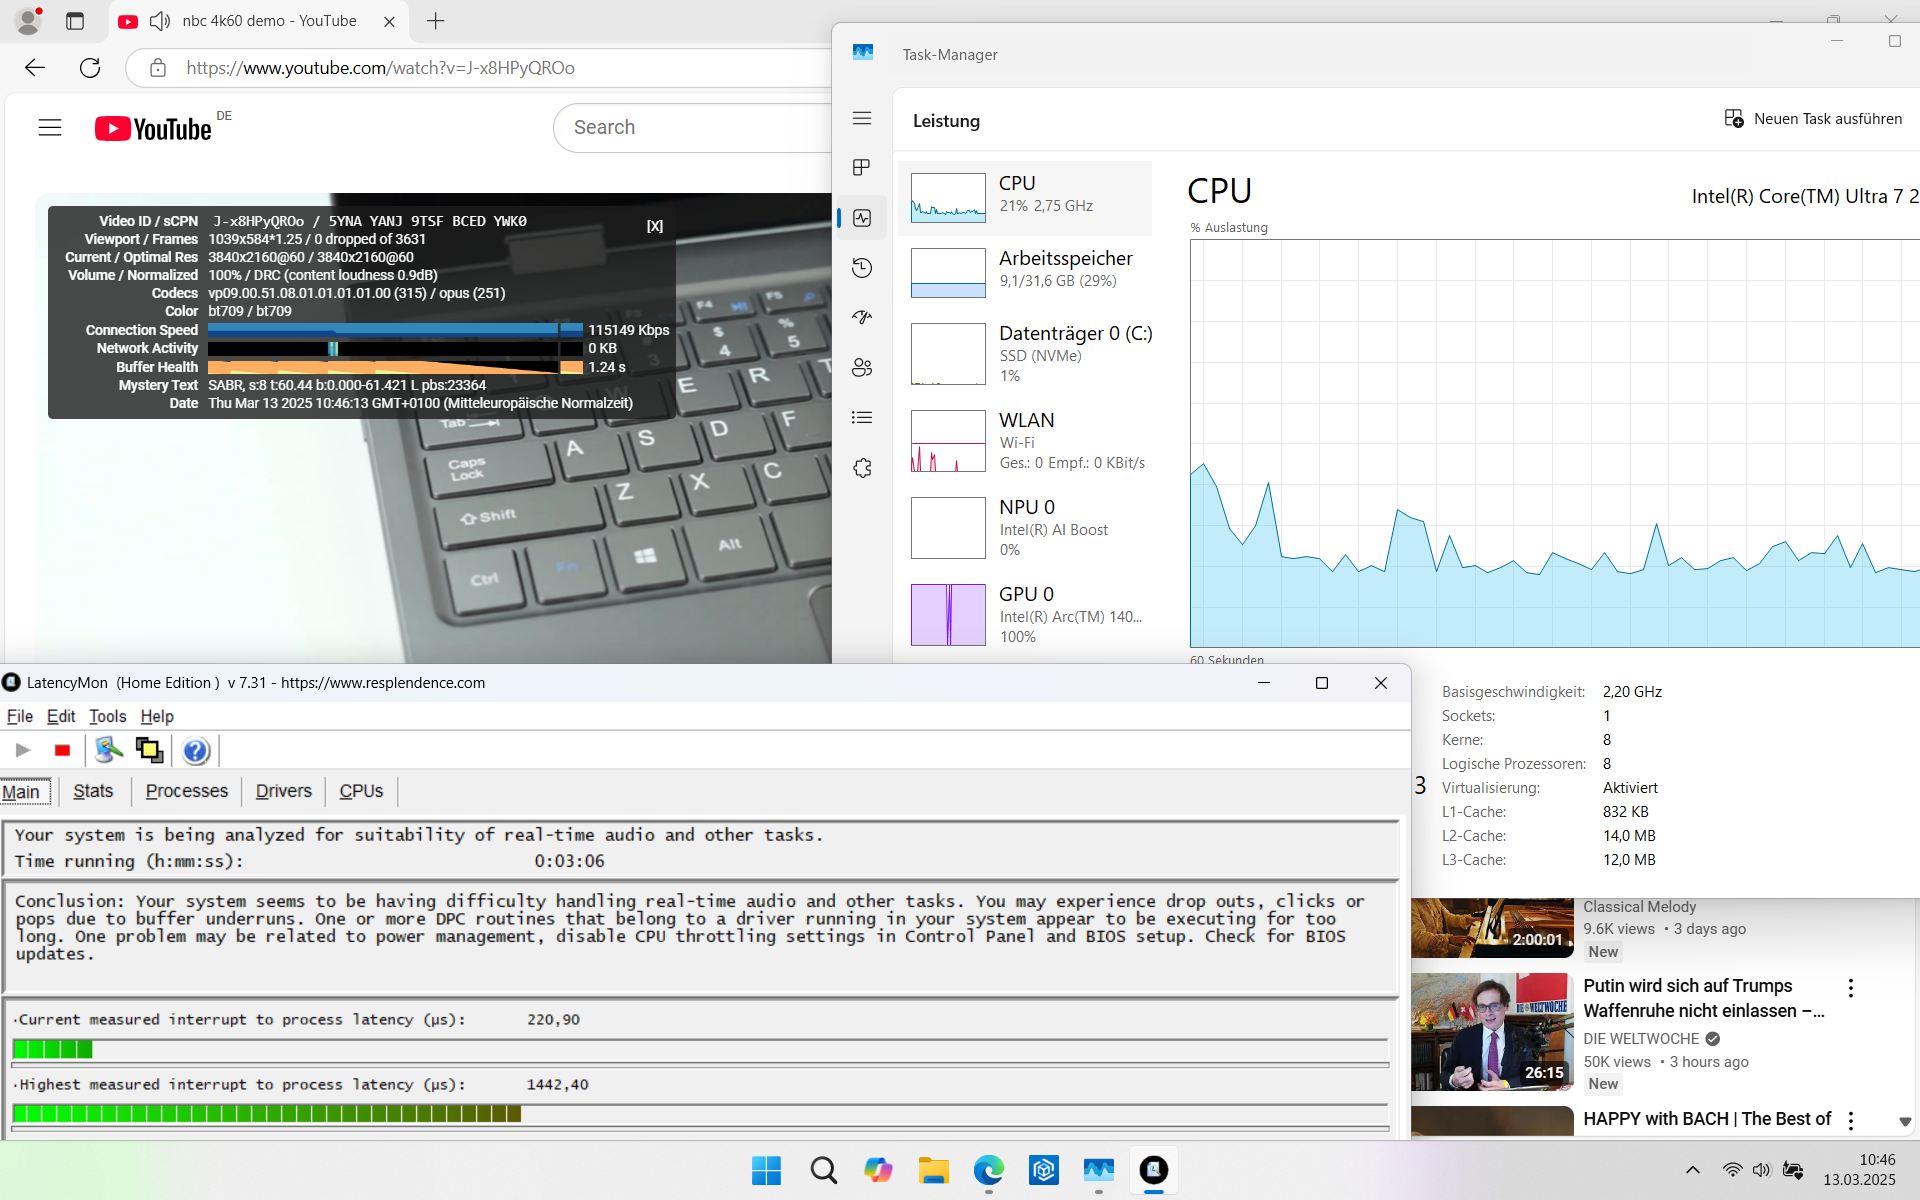
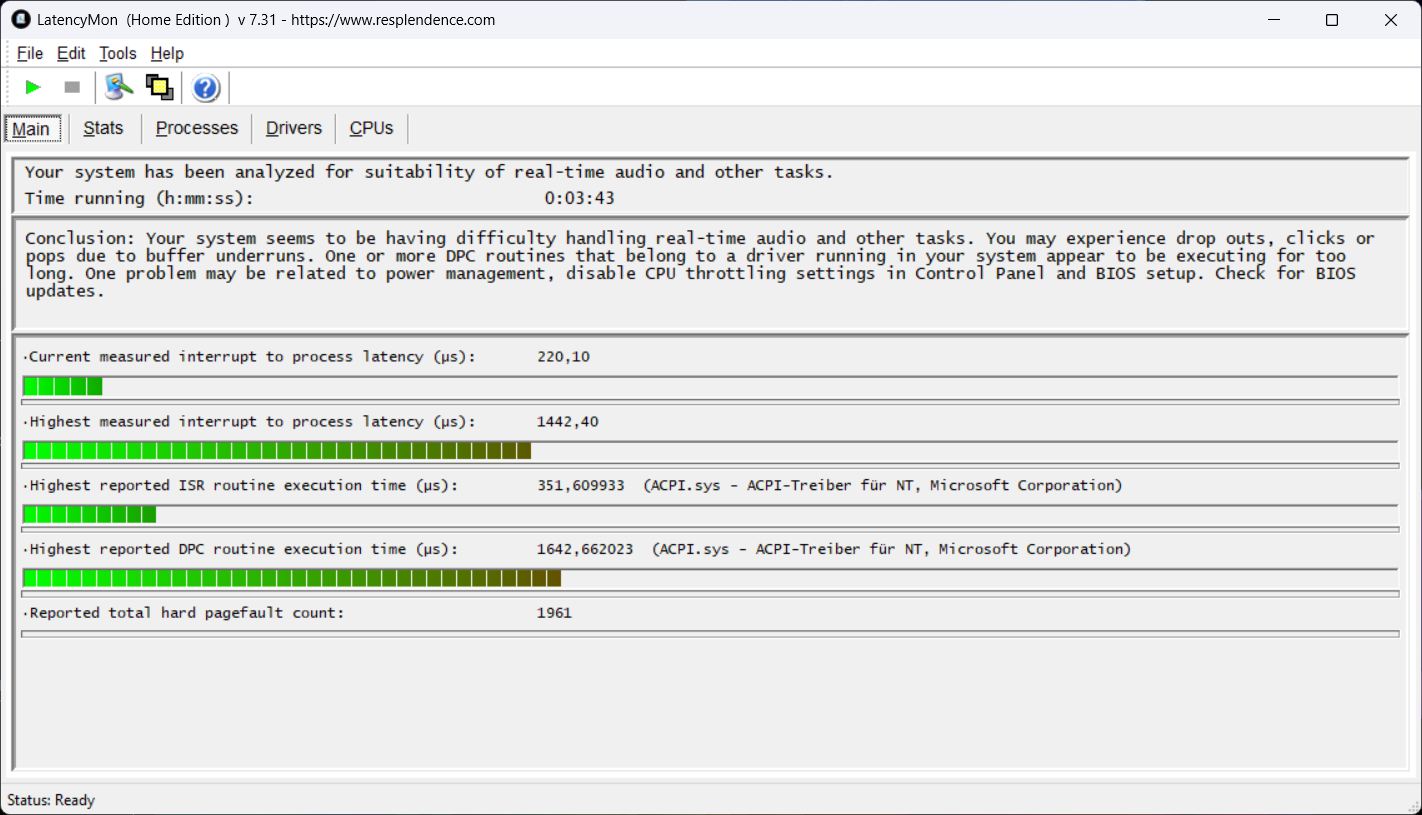
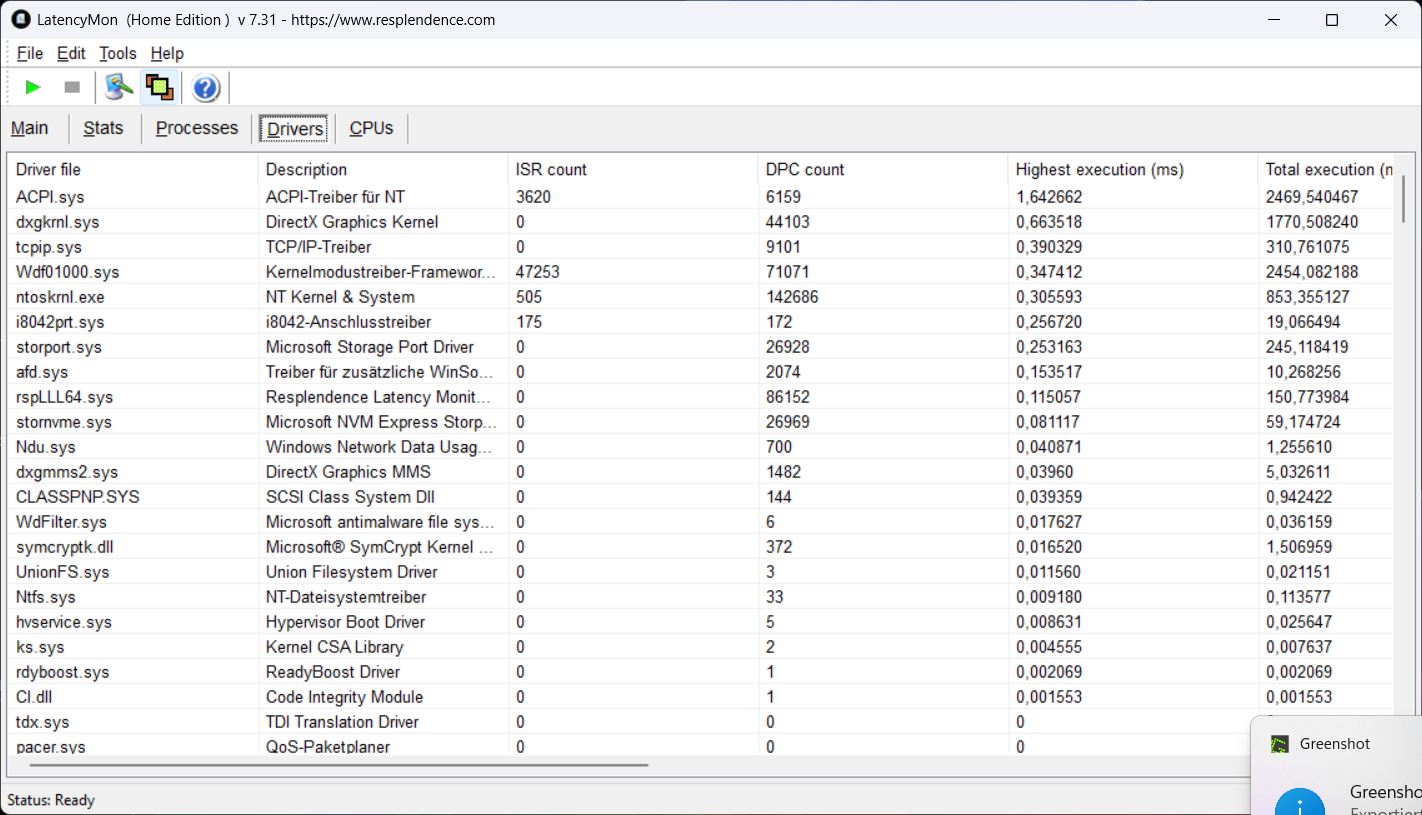
The first serious latency issues reared their head when opening multiple browser tabs. The latency increased when playing our 4K/60fps YouTube video, which fortunately still ran without dropping any frames. The final value is a bit too high for us.
| DPC Latencies / LatencyMon - interrupt to process latency (max), Web, Youtube, Prime95 | |
| Dell Pro 13 Premium PA13250 | |
| Lenovo ThinkPad X13 2-in-1 Gen 5 | |
| MSI Prestige 13 AI Plus Evo A2VMG | |
| Framework Laptop 13.5 Core Ultra 7 155H | |
* ... smaller is better
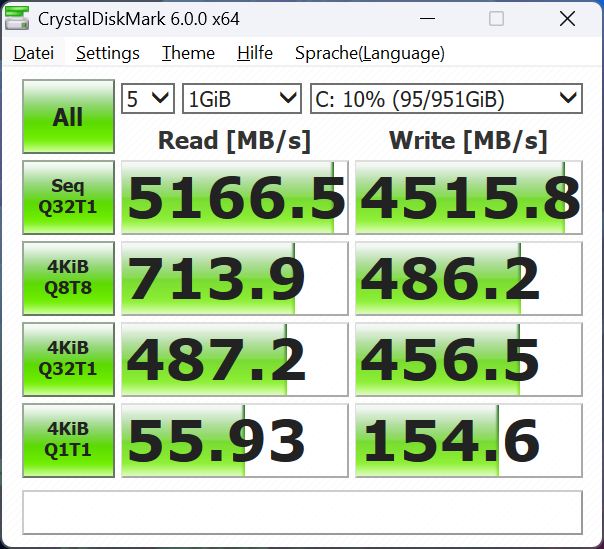
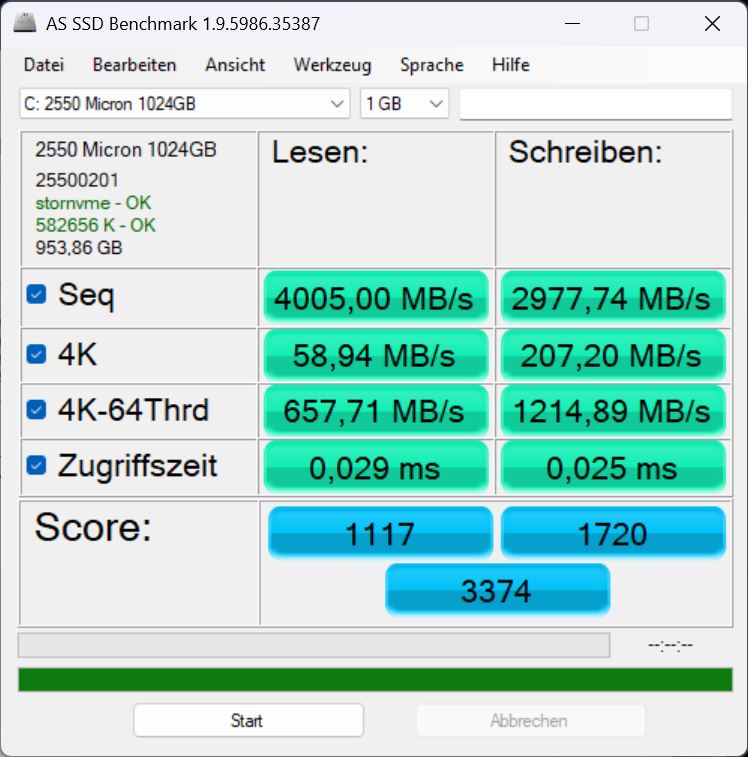
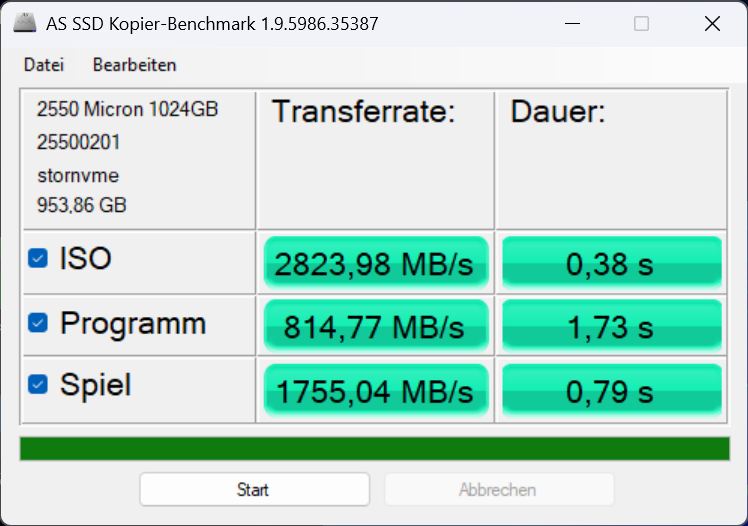
Storage devices
May 5, 2025 update: The storage device is a 1 TB Micron 2550; depending on the configuration, 512 GB models are also available. Our initial measurements of the drive were disappointing; background processes were apparently interfering with the process. Our new measurements reveal good speed values.

* ... smaller is better
Continuous Performance Read: DiskSpd Read Loop, Queue Depth 8
Graphics card
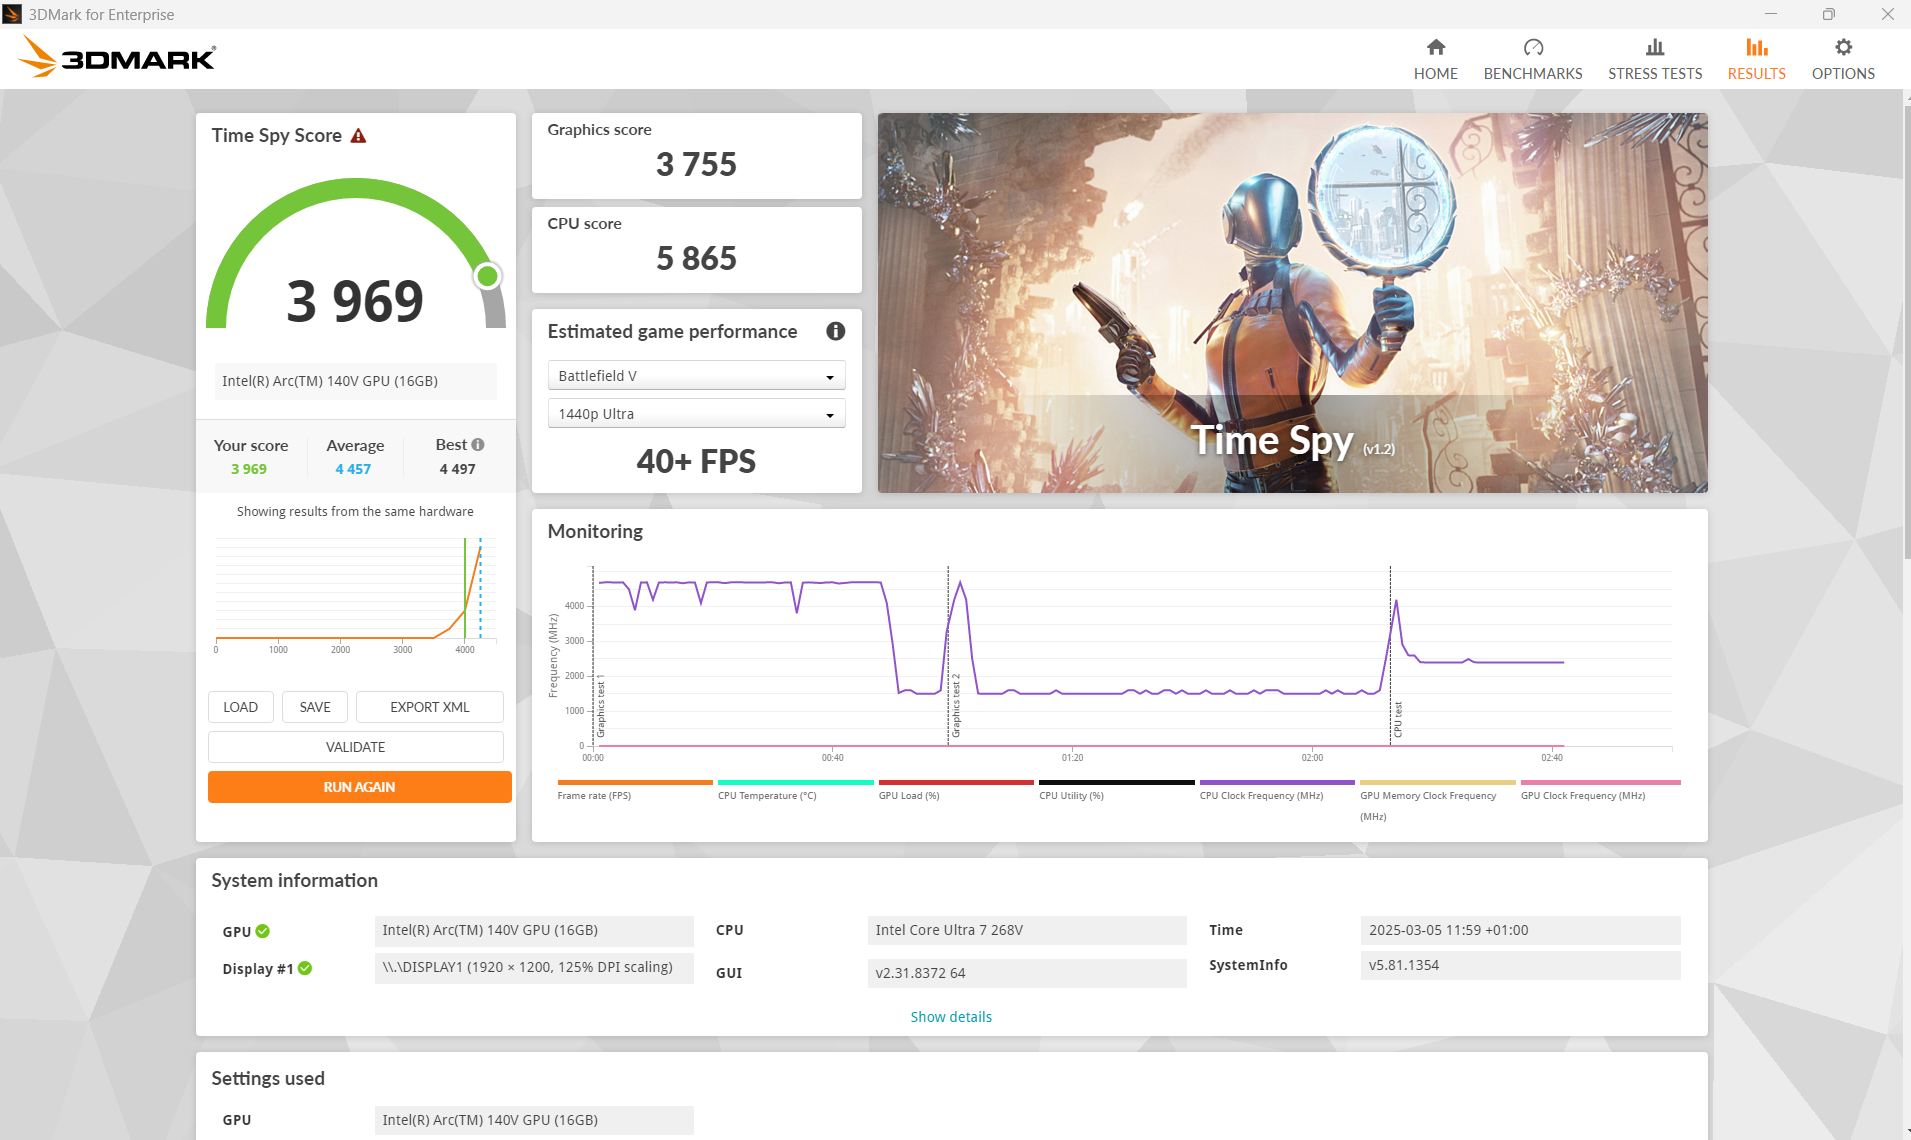
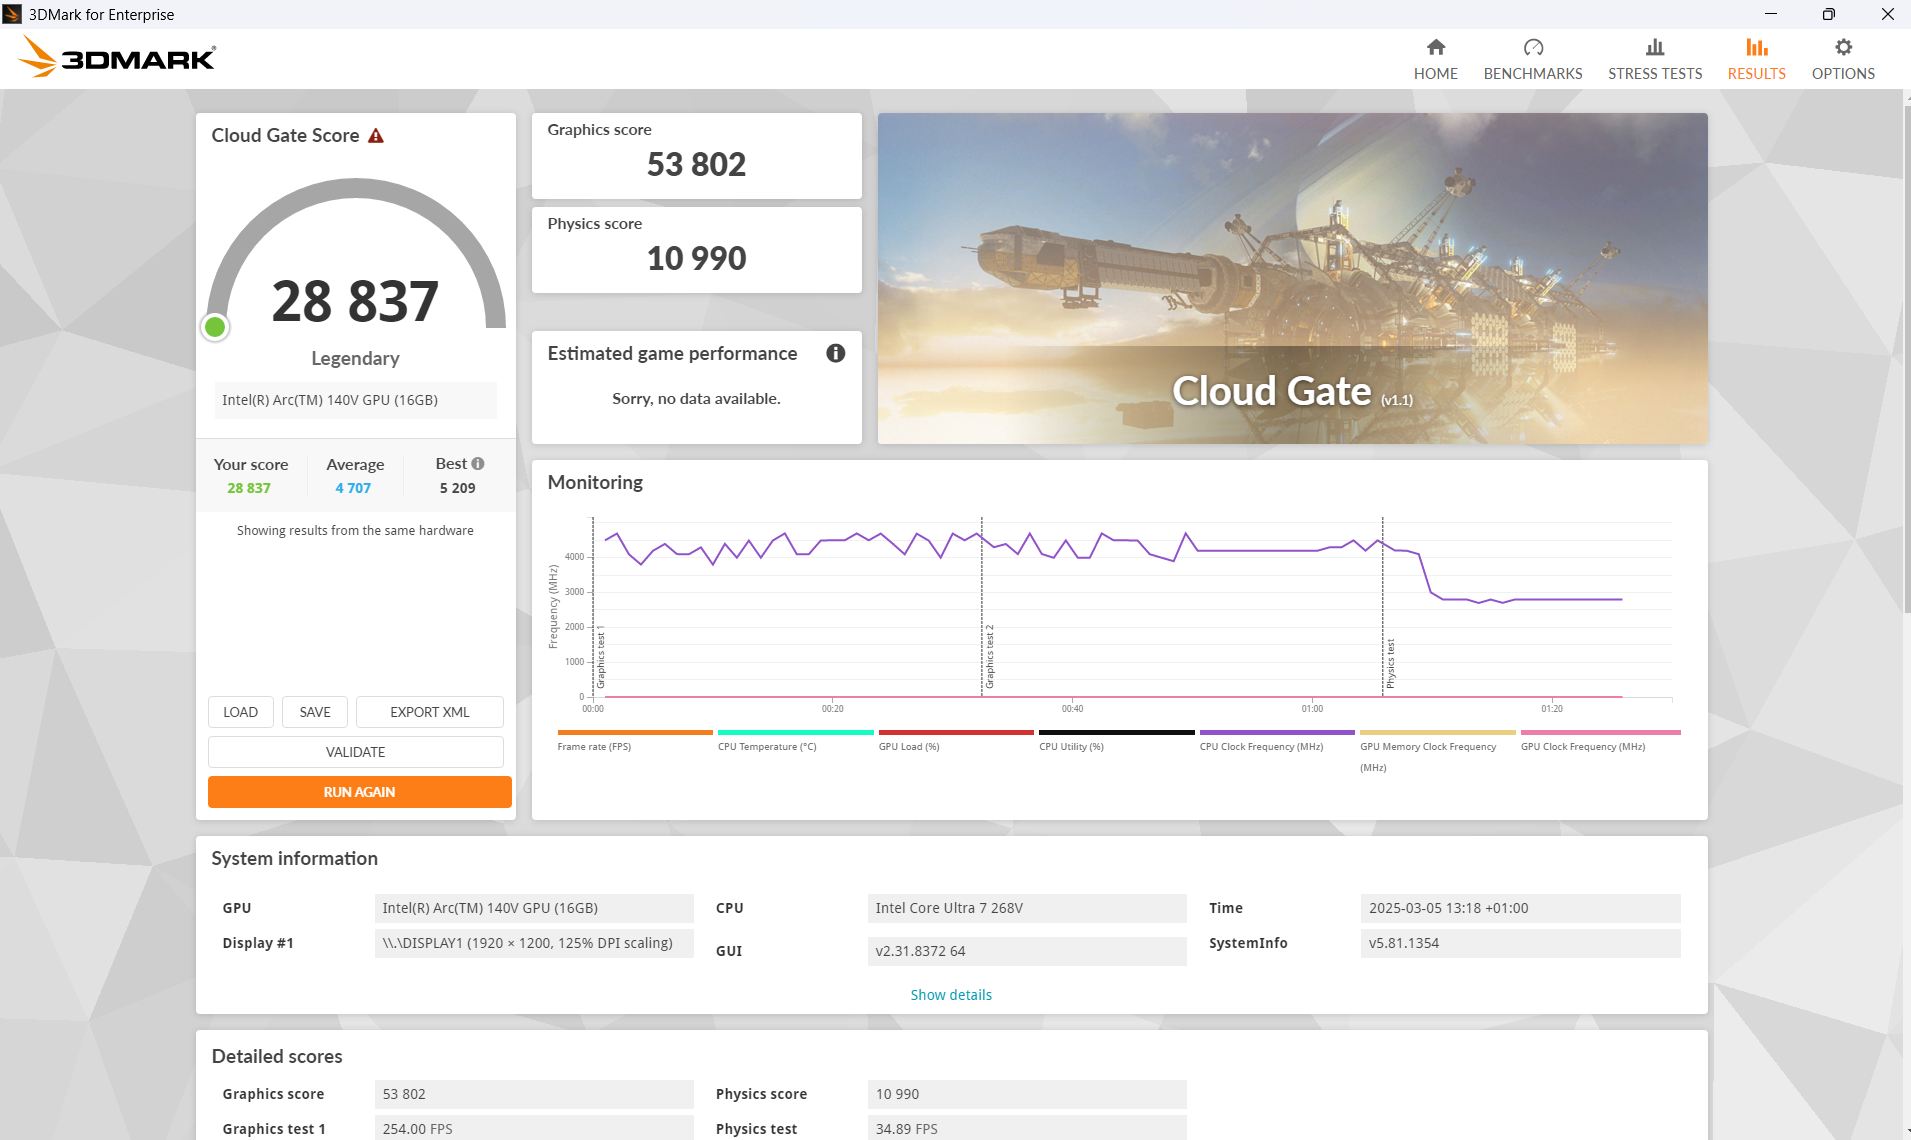
The Intel Arc Graphics 140V iGPU It's a relatively fast integrated graphics card. In the synthetic 3DMark benchmarks, it performed at or slightly above our expectations. We didn't notice any performance degradation in a looped Fire Strike running on battery power.
It also performed impressively when gaming, with almost every game running at Full HD and medium details above 30fps, and in some cases, it was even sufficient for high details. The 30-minute frame rate in Cyberpunk 2077 looked very consistent.
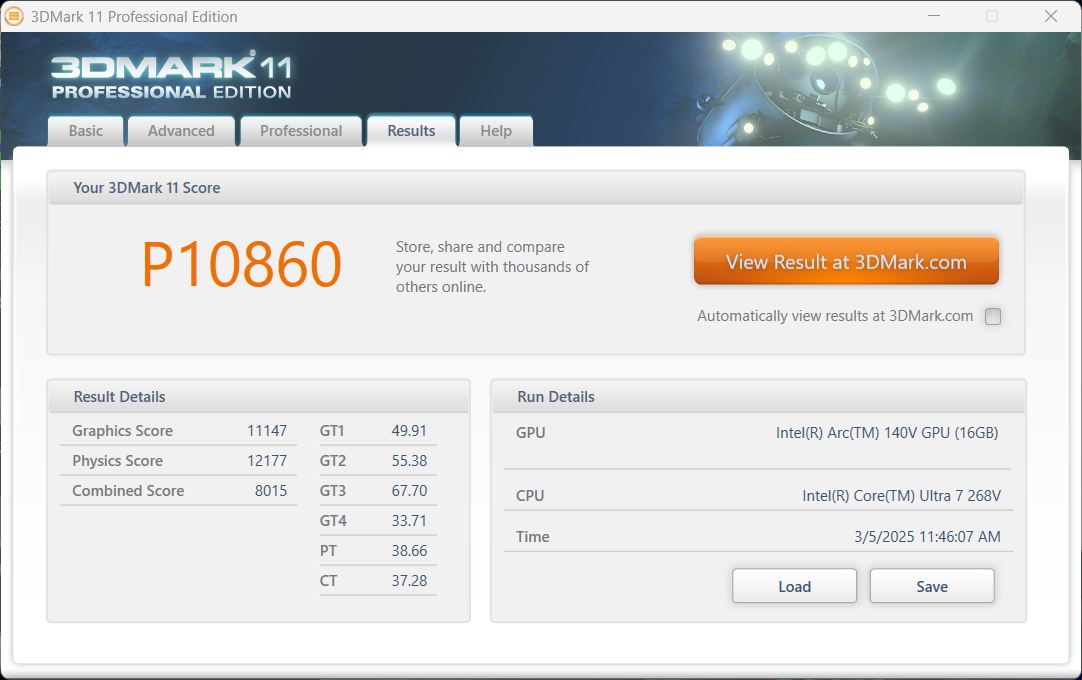
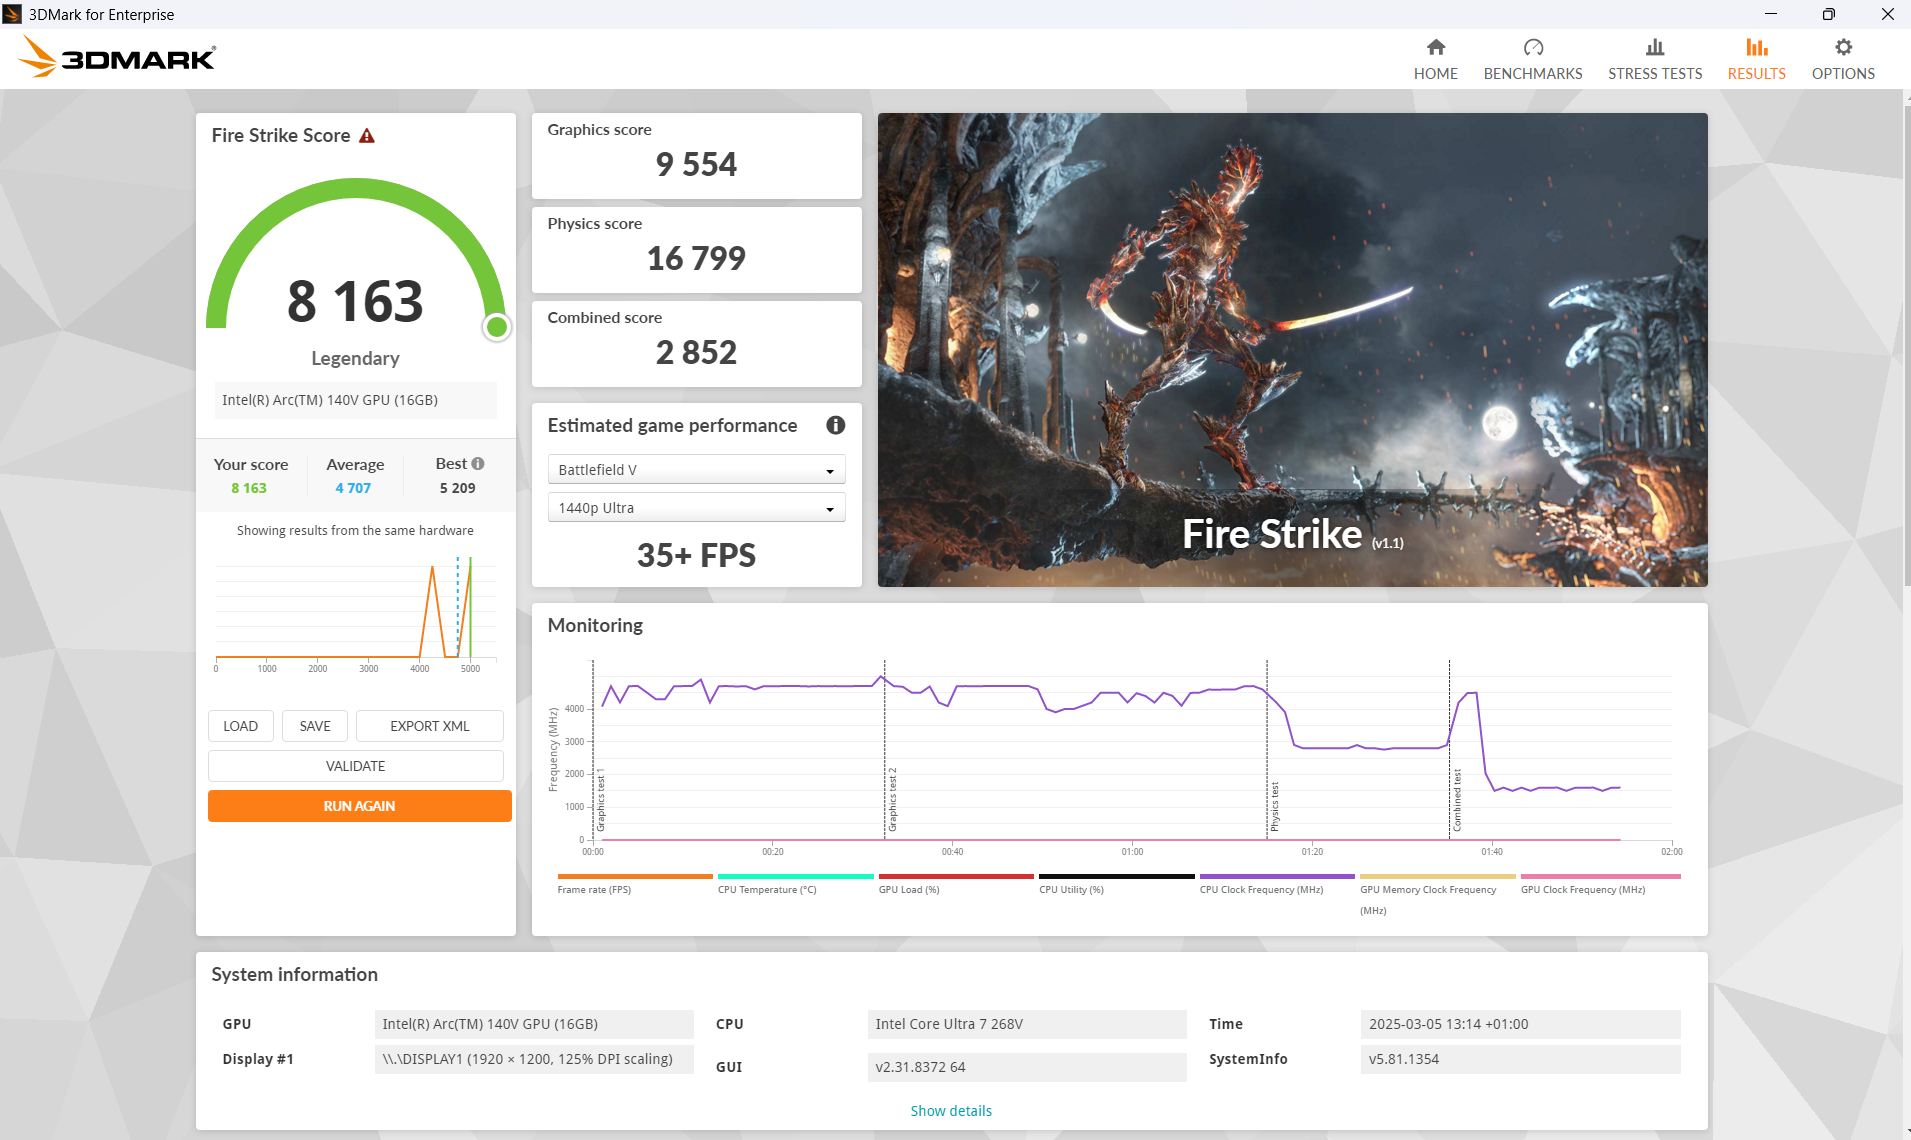
| 3DMark 11 Performance | 10860 points | |
| 3DMark Cloud Gate Standard Score | 28837 points | |
| 3DMark Fire Strike Score | 8163 points | |
| 3DMark Time Spy Score | 3969 points | |
Help | ||
* ... smaller is better
Cyberpunk 2077 ultra FPS diagram
| low | med. | high | ultra | |
|---|---|---|---|---|
| GTA V (2015) | 153.4 | 140 | 26.3 | |
| Dota 2 Reborn (2015) | 107.5 | 101.7 | 87.8 | 71.2 |
| Final Fantasy XV Benchmark (2018) | 74.9 | 42.3 | 29.1 | |
| X-Plane 11.11 (2018) | 48.1 | 36.7 | 32.7 | |
| Strange Brigade (2018) | 223 | 83.3 | 69.5 | 57.8 |
| Baldur's Gate 3 (2023) | 45.5 | 35.7 | 31.3 | 30.8 |
| Cyberpunk 2077 (2023) | 43.5 | 35.4 | 28.6 | 28.1 |
Emissions & energy - The Dell Pro is economical
Noise emissions
The fans are usually quiet when running idle. While gaming under maximum load, we measured a maximum of 42 dB, but in reality, it was lower (even in stress tests) and often only hit 36 or 37 dB.
Noise level
| Idle |
| 23 / 23 / 23 dB(A) |
| Load |
| 37 / 42.74 dB(A) |
 | ||
30 dB silent 40 dB(A) audible 50 dB(A) loud |
||
min: | ||
| Dell Pro 13 Premium PA13250 Arc 140V, Core Ultra 7 268V, Micron 2550 1TB | MSI Prestige 13 AI Plus Evo A2VMG Arc 140V, Core Ultra 7 258V | Lenovo ThinkPad X13 2-in-1 Gen 5 Graphics 4-Core iGPU (Arrow Lake), Ultra 7 165U, Lenovo UMIS RPETJ1T24MHP2QDQ | Framework Laptop 13.5 Core Ultra 7 155H Arc 8-Core, Ultra 7 155H | Dell XPS 13 9350 Arc 140V, Core Ultra 7 256V, Micron 2550 512GB | Microsoft Surface Pro Copilot+ Adreno X1-85 3.8 TFLOPS, SD X Plus X1P-64-100, Samsung PM9B1 256GB MZ9L4256HCJQ | |
|---|---|---|---|---|---|---|
| Noise | -8% | 4% | -7% | 3% | 2% | |
| off / environment * (dB) | 23 | 24.1 -5% | 23 -0% | 24 -4% | 24.1 -5% | 23.8 -3% |
| Idle Minimum * (dB) | 23 | 24.8 -8% | 23 -0% | 24.1 -5% | 24.4 -6% | 23.8 -3% |
| Idle Average * (dB) | 23 | 24.8 -8% | 23 -0% | 25.1 -9% | 24.4 -6% | 23.8 -3% |
| Idle Maximum * (dB) | 23 | 26.7 -16% | 23 -0% | 27 -17% | 24.4 -6% | 23.8 -3% |
| Load Average * (dB) | 37 | 36.8 1% | 34.44 7% | 38.4 -4% | 26.2 29% | 23.8 36% |
| Cyberpunk 2077 ultra * (dB) | 42.74 | 44.5 -4% | 38.28 10% | 43.7 -2% | 34.2 20% | 44.7 -5% |
| Load Maximum * (dB) | 42.74 | 50.8 -19% | 39.04 9% | 45.8 -7% | 45.2 -6% | 44.7 -5% |
* ... smaller is better
Temperature
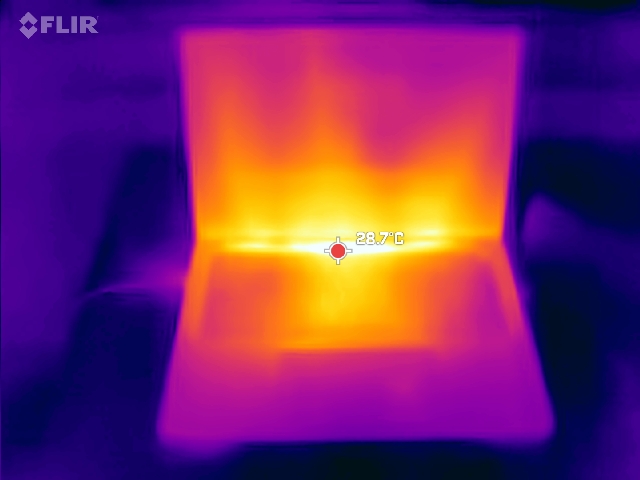
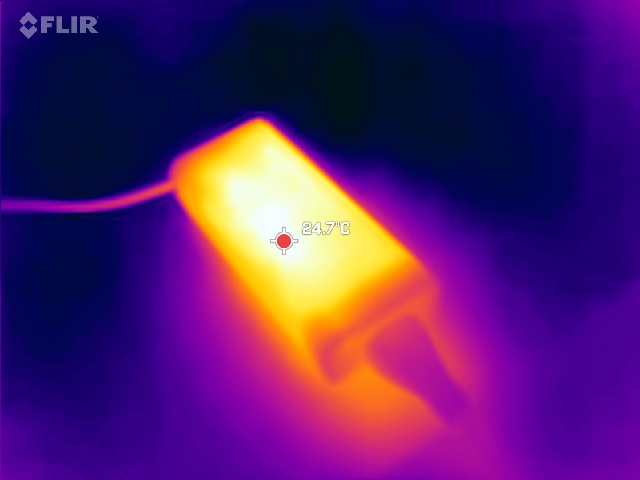
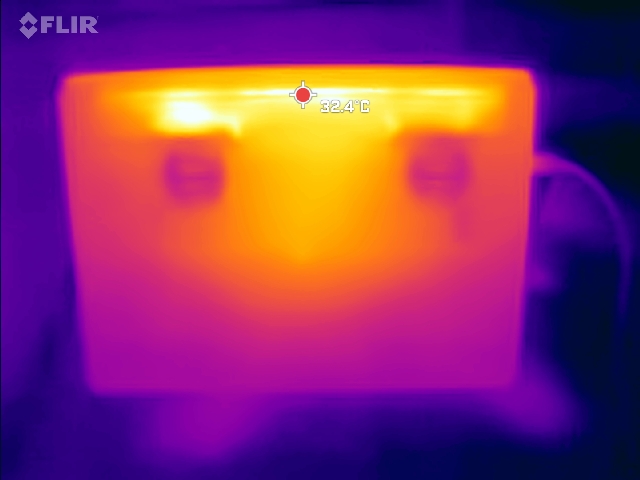
Unlike many office and business competitors of this size, the Dell Pro 13 Premium uses two fans instead of just one, and this is something that has a positive impact on surface temperatures. Gaming gets warmer than in our stress test, but even here, we measured hot spots of just 37°C. Both sides of the laptop are cooled equally instead of just the one side seen by some competitors.
(+) The maximum temperature on the upper side is 31 °C / 88 F, compared to the average of 35.9 °C / 97 F, ranging from 21.4 to 59 °C for the class Subnotebook.
(+) The bottom heats up to a maximum of 31 °C / 88 F, compared to the average of 39.2 °C / 103 F
(+) In idle usage, the average temperature for the upper side is 22.3 °C / 72 F, compared to the device average of 30.8 °C / 87 F.
(+) 3: The average temperature for the upper side is 28.8 °C / 84 F, compared to the average of 30.8 °C / 87 F for the class Subnotebook.
(+) The palmrests and touchpad are cooler than skin temperature with a maximum of 26 °C / 78.8 F and are therefore cool to the touch.
(+) The average temperature of the palmrest area of similar devices was 28.2 °C / 82.8 F (+2.2 °C / 4 F).
| Dell Pro 13 Premium PA13250 Intel Core Ultra 7 268V, Intel Arc Graphics 140V | MSI Prestige 13 AI Plus Evo A2VMG Intel Core Ultra 7 258V, Intel Arc Graphics 140V | Lenovo ThinkPad X13 2-in-1 Gen 5 Intel Core Ultra 7 165U, Intel Graphics 4-Core iGPU (Meteor / Arrow Lake) | Framework Laptop 13.5 Core Ultra 7 155H Intel Core Ultra 7 155H, Intel Arc 8-Core iGPU | Dell XPS 13 9350 Intel Core Ultra 7 256V, Intel Arc Graphics 140V | Microsoft Surface Pro Copilot+ Qualcomm Snapdragon X Plus X1P-64-100, Qualcomm SD X Adreno X1-85 3.8 TFLOPS | |
|---|---|---|---|---|---|---|
| Heat | -23% | -52% | -29% | -12% | -25% | |
| Maximum Upper Side * (°C) | 31 | 43.4 -40% | 60 -94% | 42.8 -38% | 34.8 -12% | 43.9 -42% |
| Maximum Bottom * (°C) | 31 | 42.4 -37% | 57 -84% | 45.2 -46% | 37.4 -21% | 44.9 -45% |
| Idle Upper Side * (°C) | 24 | 25.4 -6% | 27 -13% | 27.2 -13% | 25.4 -6% | 26.2 -9% |
| Idle Bottom * (°C) | 24 | 25.6 -7% | 28 -17% | 28.6 -19% | 26.2 -9% | 24.6 -3% |
* ... smaller is better
Speakers
For such a small laptop, the speakers even manage to outperform some much larger models. The midrange is balanced, but they still lack bass. An audio jack input is available for connecting to external devices.
Dell Pro 13 Premium PA13250 audio analysis
(+) | speakers can play relatively loud (87.49 dB)
Bass 100 - 315 Hz
(-) | nearly no bass - on average 15.9% lower than median
(±) | linearity of bass is average (8.3% delta to prev. frequency)
Mids 400 - 2000 Hz
(+) | balanced mids - only 2.9% away from median
(+) | mids are linear (4.7% delta to prev. frequency)
Highs 2 - 16 kHz
(±) | reduced highs - on average 5.2% lower than median
(±) | linearity of highs is average (7.1% delta to prev. frequency)
Overall 100 - 16.000 Hz
(+) | overall sound is linear (12.2% difference to median)
Compared to same class
» 15% of all tested devices in this class were better, 5% similar, 80% worse
» The best had a delta of 5%, average was 18%, worst was 53%
Compared to all devices tested
» 10% of all tested devices were better, 2% similar, 88% worse
» The best had a delta of 4%, average was 23%, worst was 134%
MSI Prestige 13 AI Plus Evo A2VMG audio analysis
(+) | speakers can play relatively loud (84.5 dB)
Bass 100 - 315 Hz
(-) | nearly no bass - on average 19.4% lower than median
(±) | linearity of bass is average (9.6% delta to prev. frequency)
Mids 400 - 2000 Hz
(±) | higher mids - on average 6.4% higher than median
(+) | mids are linear (5.1% delta to prev. frequency)
Highs 2 - 16 kHz
(±) | higher highs - on average 6.1% higher than median
(+) | highs are linear (4.6% delta to prev. frequency)
Overall 100 - 16.000 Hz
(±) | linearity of overall sound is average (18.2% difference to median)
Compared to same class
» 52% of all tested devices in this class were better, 7% similar, 40% worse
» The best had a delta of 5%, average was 18%, worst was 53%
Compared to all devices tested
» 39% of all tested devices were better, 8% similar, 53% worse
» The best had a delta of 4%, average was 23%, worst was 134%
Power consumption
Thanks to the Lunar Lake SoC, the Dell Pro 13 is very economical. It only consumes 2 to 4.75 W when idling, and we measured just 38 W when running Cyberpunk 2077. Only the Dell XPS 13 9350, with its slightly weaker Lunar Lake CPU, is more economical, and every other competitor consumes more
| Off / Standby | |
| Idle | |
| Load |
|
Key:
min: | |
| Dell Pro 13 Premium PA13250 Core Ultra 7 268V, Arc 140V | MSI Prestige 13 AI Plus Evo A2VMG Core Ultra 7 258V, Arc 140V | Lenovo ThinkPad X13 2-in-1 Gen 5 Ultra 7 165U, Graphics 4-Core iGPU (Arrow Lake) | Framework Laptop 13.5 Core Ultra 7 155H Ultra 7 155H, Arc 8-Core | Dell XPS 13 9350 Core Ultra 7 256V, Arc 140V | Microsoft Surface Pro Copilot+ SD X Plus X1P-64-100, Adreno X1-85 3.8 TFLOPS | Average of class Subnotebook | |
|---|---|---|---|---|---|---|---|
| Power Consumption | -39% | -19% | -26% | 7% | -23% | -45% | |
| Idle Minimum * (Watt) | 2 | 3.5 -75% | 3.2 -60% | 2.5 -25% | 1.3 35% | 1.9 5% | 3.73 ? -87% |
| Idle Average * (Watt) | 4.3 | 5.9 -37% | 6.1 -42% | 5.2 -21% | 2.5 42% | 9.2 -114% | 6.51 ? -51% |
| Idle Maximum * (Watt) | 4.75 | 10 -111% | 6.7 -41% | 5.8 -22% | 4.1 14% | 9.5 -100% | 7.88 ? -66% |
| Load Average * (Watt) | 40 | 38.7 3% | 44.2 -11% | 47.5 -19% | 40.1 -0% | 29.6 26% | 42.3 ? -6% |
| Cyberpunk 2077 ultra * (Watt) | 36.4 | 46.3 -27% | 25.2 31% | 54.5 -50% | 46.1 -27% | 39.5 -9% | |
| Cyberpunk 2077 ultra external monitor * (Watt) | 38 | 45.6 -20% | 38.5 -1% | 52.4 -38% | 43.1 -13% | 37.4 2% | |
| Load Maximum * (Watt) | 57 | 61.5 -8% | 62.5 -10% | 61.5 -8% | 57.3 -1% | 40.7 29% | 64.8 ? -14% |
* ... smaller is better
Power consumption Cyberpunk / stress test
Power consumption with an external monitor
Battery life
Thanks to the low power consumption, the battery life is excellent. We recorded almost 24 hours in the Wi-Fi and video tests, which is a fantastic result! The 60W battery is rather mid-range in terms of its capacity. The XPS 13 only loses marginally due to its slightly smaller battery (55 Wh).
| Dell Pro 13 Premium PA13250 Core Ultra 7 268V, Arc 140V, 60 Wh | MSI Prestige 13 AI Plus Evo A2VMG Core Ultra 7 258V, Arc 140V, 75 Wh | Lenovo ThinkPad X13 2-in-1 Gen 5 Ultra 7 165U, Graphics 4-Core iGPU (Arrow Lake), 54.7 Wh | Framework Laptop 13.5 Core Ultra 7 155H Ultra 7 155H, Arc 8-Core, 61 Wh | Dell XPS 13 9350 Core Ultra 7 256V, Arc 140V, 55 Wh | Microsoft Surface Pro Copilot+ SD X Plus X1P-64-100, Adreno X1-85 3.8 TFLOPS, 47 Wh | Average of class Subnotebook | |
|---|---|---|---|---|---|---|---|
| Battery runtime | -44% | -49% | -51% | -14% | -47% | -36% | |
| H.264 (h) | 23.8 | 12.2 -49% | 14 -41% | 15.3 ? -36% | |||
| WiFi v1.3 (h) | 24 | 13.4 -44% | 12.3 -49% | 10.5 -56% | 20.6 -14% | 11 -54% | 14 ? -42% |
| Load (h) | 2.8 | 1.4 -50% | 1.5 -46% | 2.4 -14% | 1.5 -46% | 1.998 ? -29% | |
| Reader / Idle (h) | 38.3 | 56.8 | 28.6 ? |
Notebookcheck overall rating
The Dell Pro 13 Premium is almost everything you'd expect from a mobile business laptop: It's quite small, light, economical, has great battery life, and still delivers high-level performance. Aside from the high price, there are virtually no real complaints to be had.
Dell Pro 13 Premium PA13250
- 05/05/2025 v8
Christian Hintze
 Total Sustainability Score:
 Transparency
The selection of devices to be reviewed is made by our editorial team. The test sample was provided to the author as a loan by the manufacturer or retailer for the purpose of this review. The lender had no influence on this review, nor did the manufacturer receive a copy of this review before publication. There was no obligation to publish this review. As an independent media company, Notebookcheck is not subjected to the authority of manufacturers, retailers or publishers.
This is how Notebookcheck is testing
Every year, Notebookcheck independently reviews hundreds of laptops and smartphones using standardized procedures to ensure that all results are comparable. We have continuously developed our test methods for around 20 years and set industry standards in the process. In our test labs, high-quality measuring equipment is utilized by experienced technicians and editors. These tests involve a multi-stage validation process. Our complex rating system is based on hundreds of well-founded measurements and benchmarks, which maintains objectivity. Further information on our test methods can be found here.

