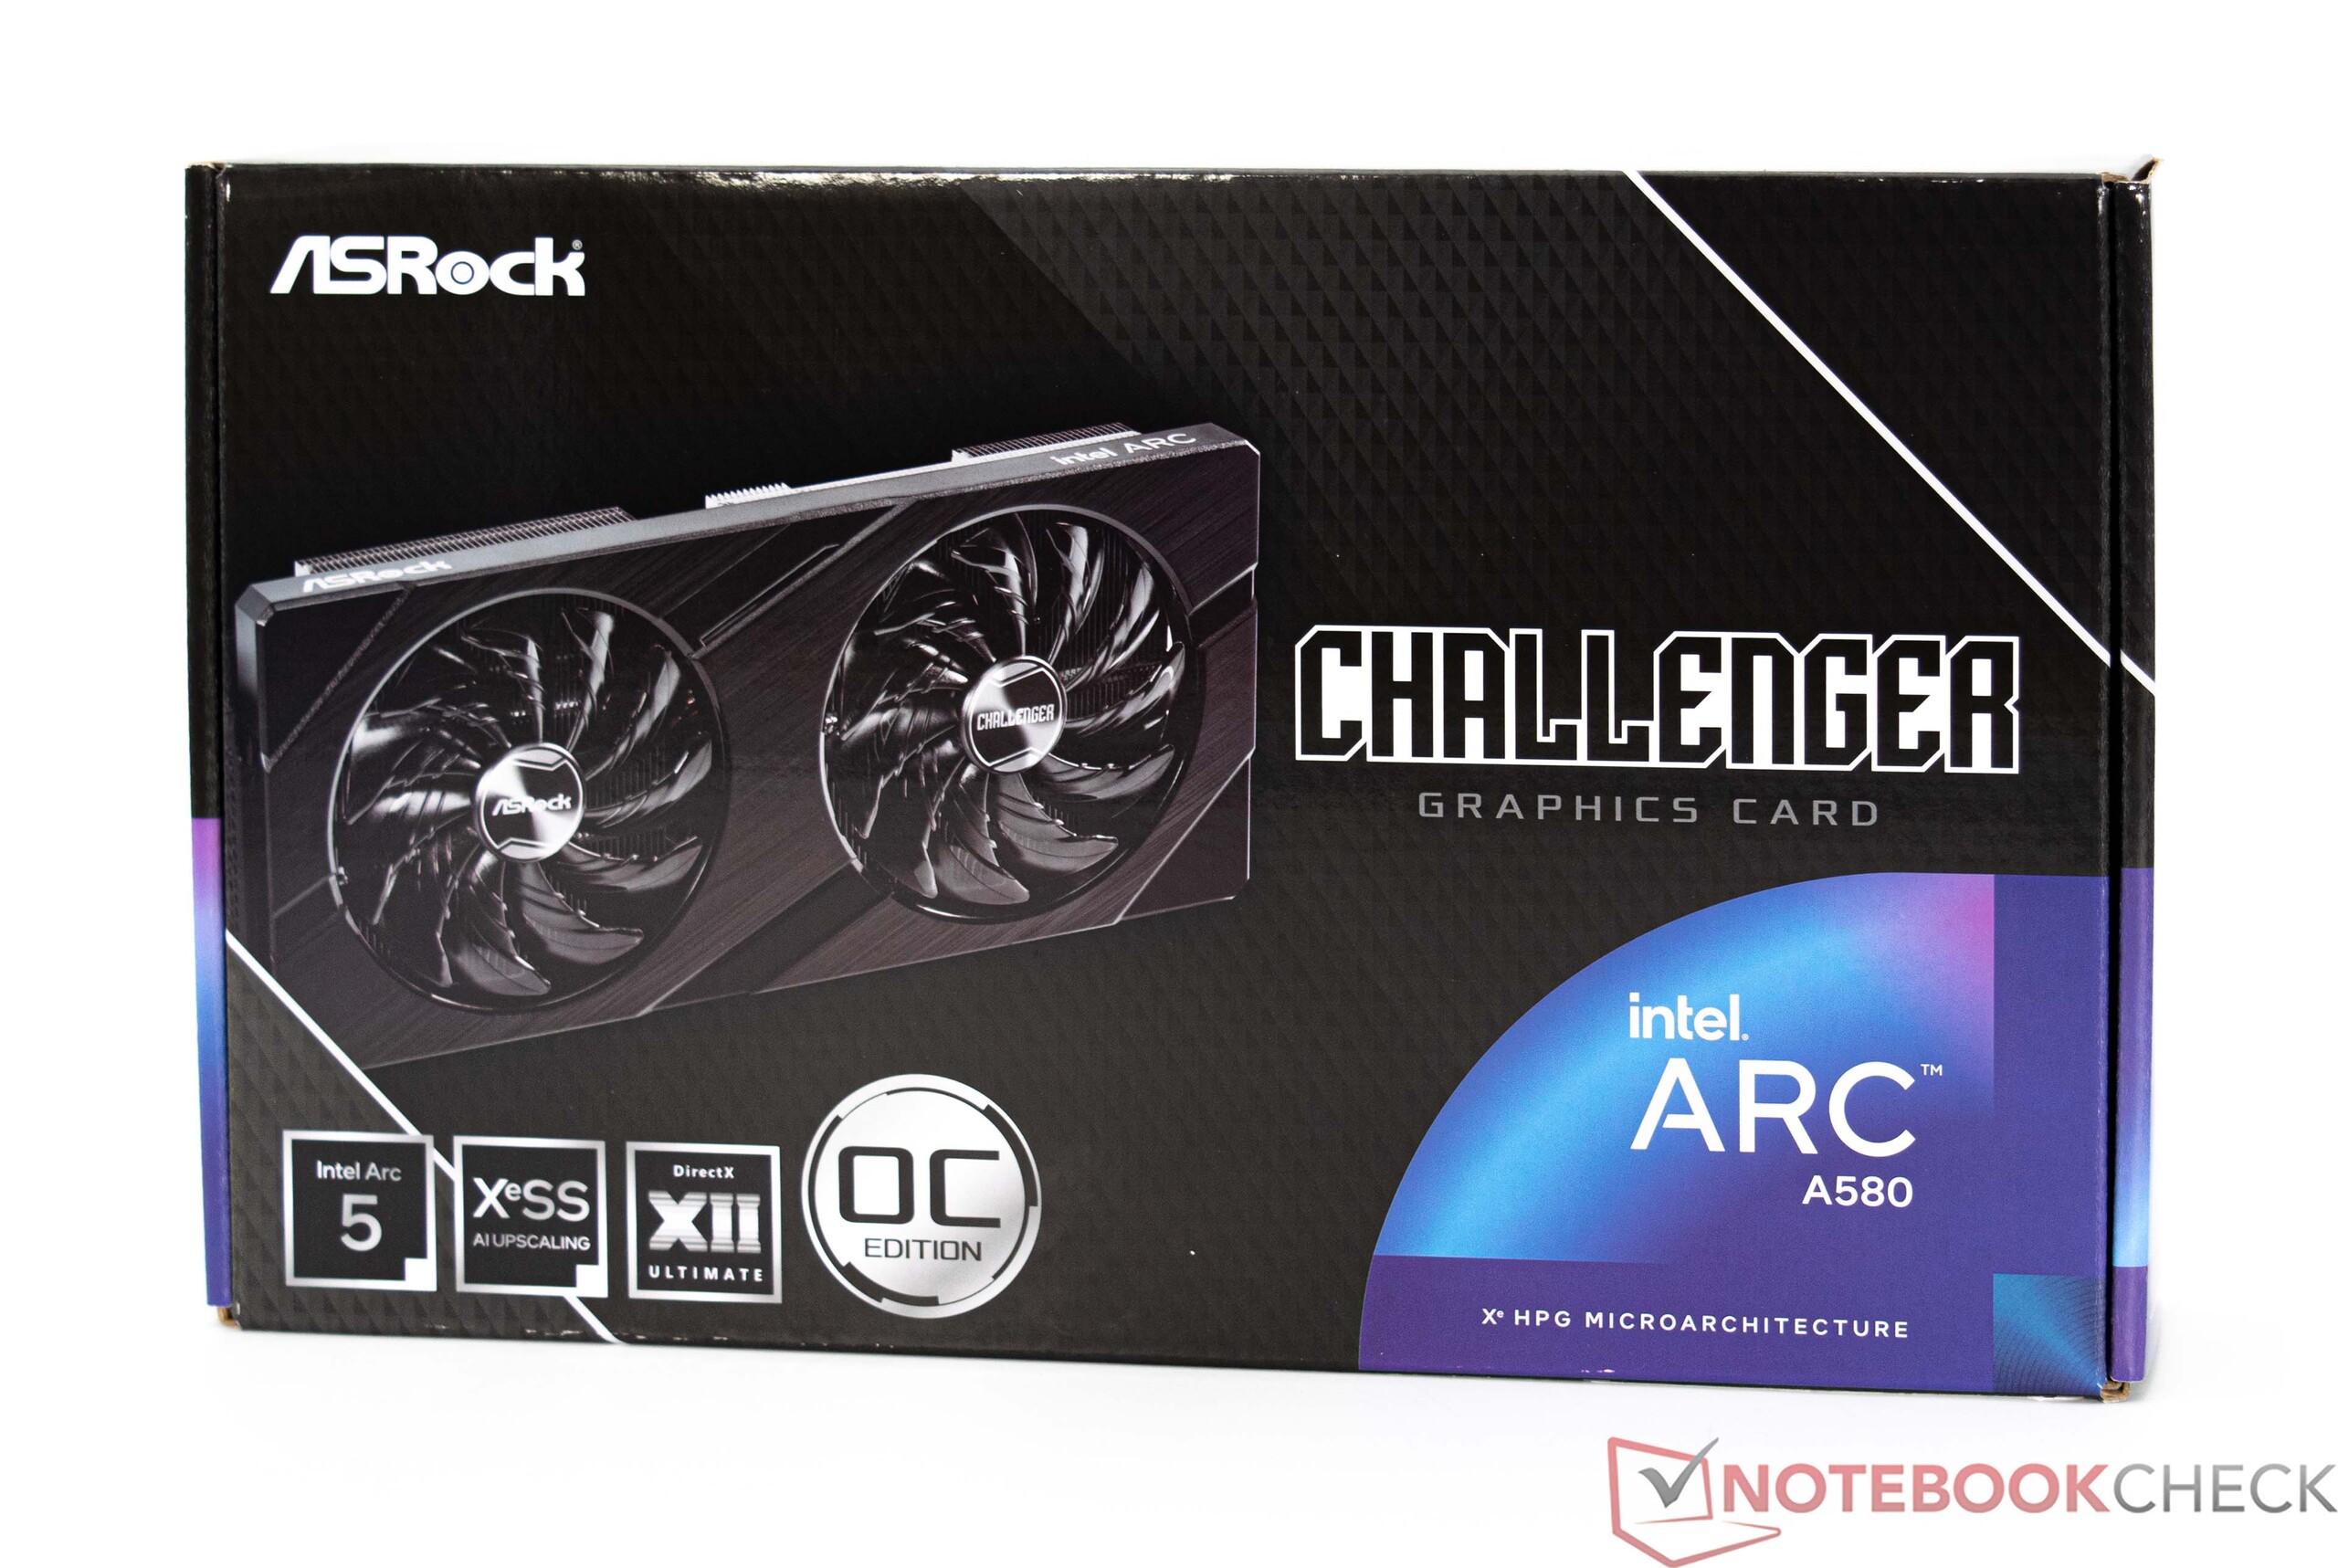
ASRock Arc A580 Challenger OC desktop graphics card review - Intel's budget GPU for 1,080p gaming for under US$200

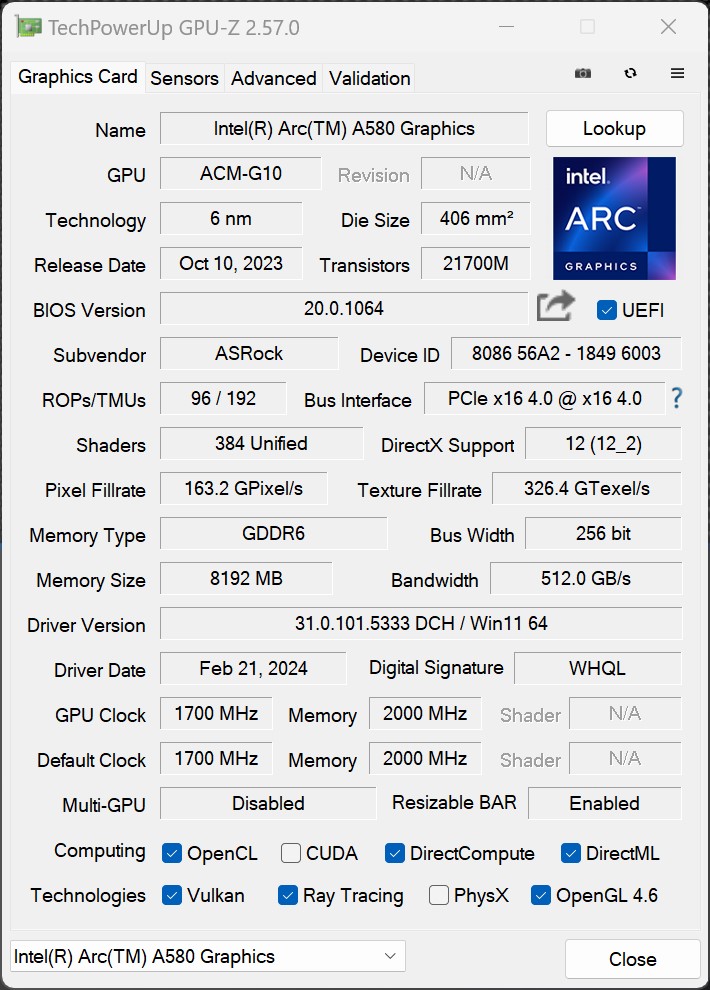
In October last year, Intel presented a relatively affordable graphics card based on current GPU architecture, namely the Intel Arc A580. Different to the Intel Arc A750 and the Intel Arc A770, all Arc-A580 models are sold exclusively by board partners. As a result, we will be using a model from ASRock for this review. The ASRock Arc A580 Challenger OC is powered by the same graphics chip that's used in both of the faster models. The Intel Arc A580's performance is slightly stunted by its fewer shader units. Even so, the presumably weak graphics card delivers surprisingly good performance—this much we can reveal already.
The component features 8 GB GDDR6 VRAM which is connected via a 256-bit interface. No cuts have been made here, as both the Intel Arc A750 and the Intel Arc A770 offer the same memory interface. The latter can also be had as a 16-GB version which we previously reviewed.
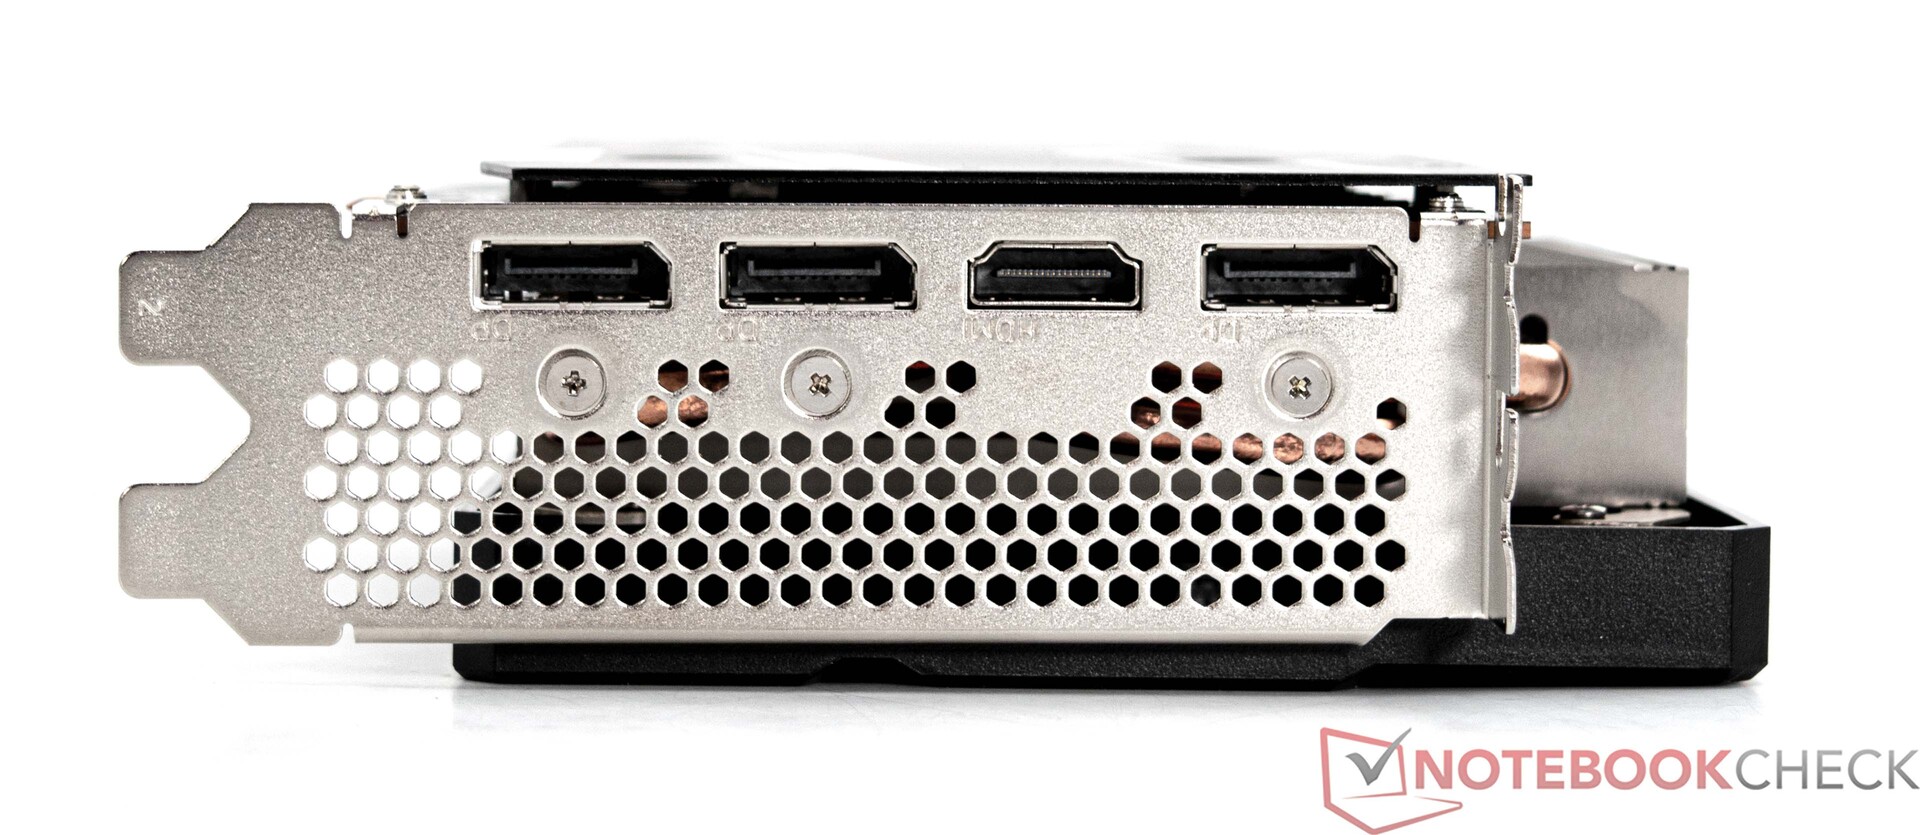
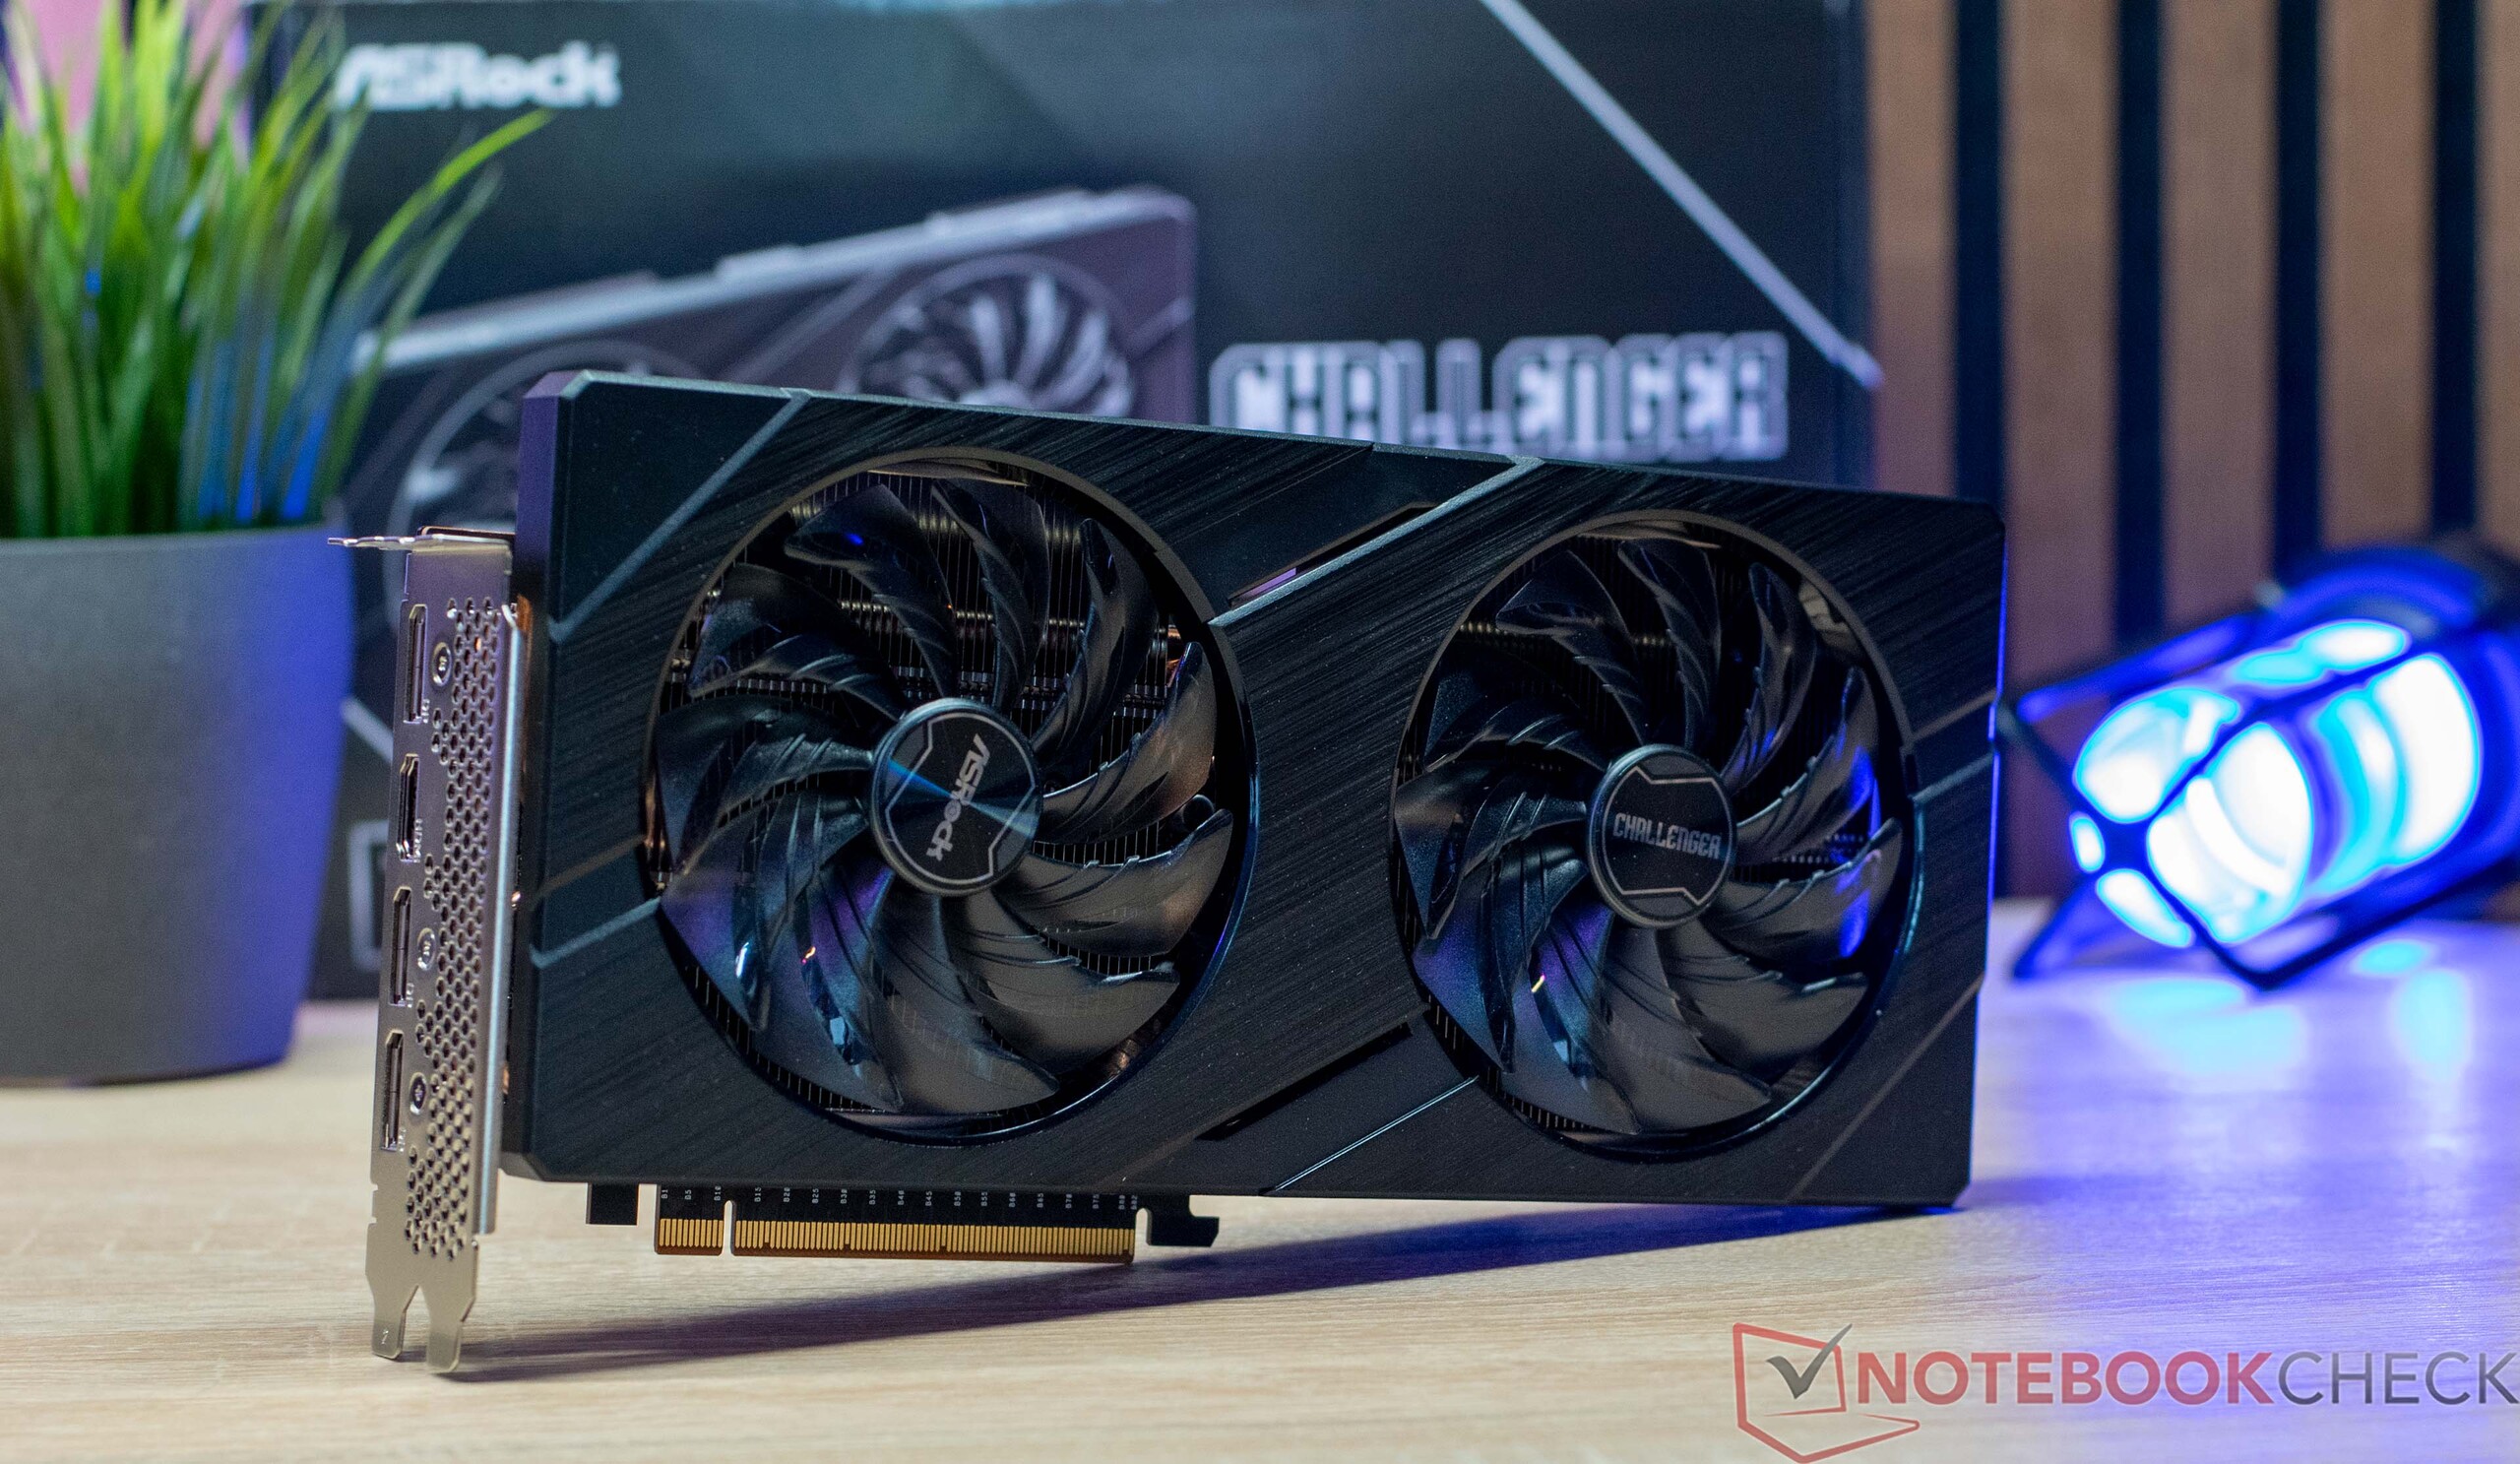
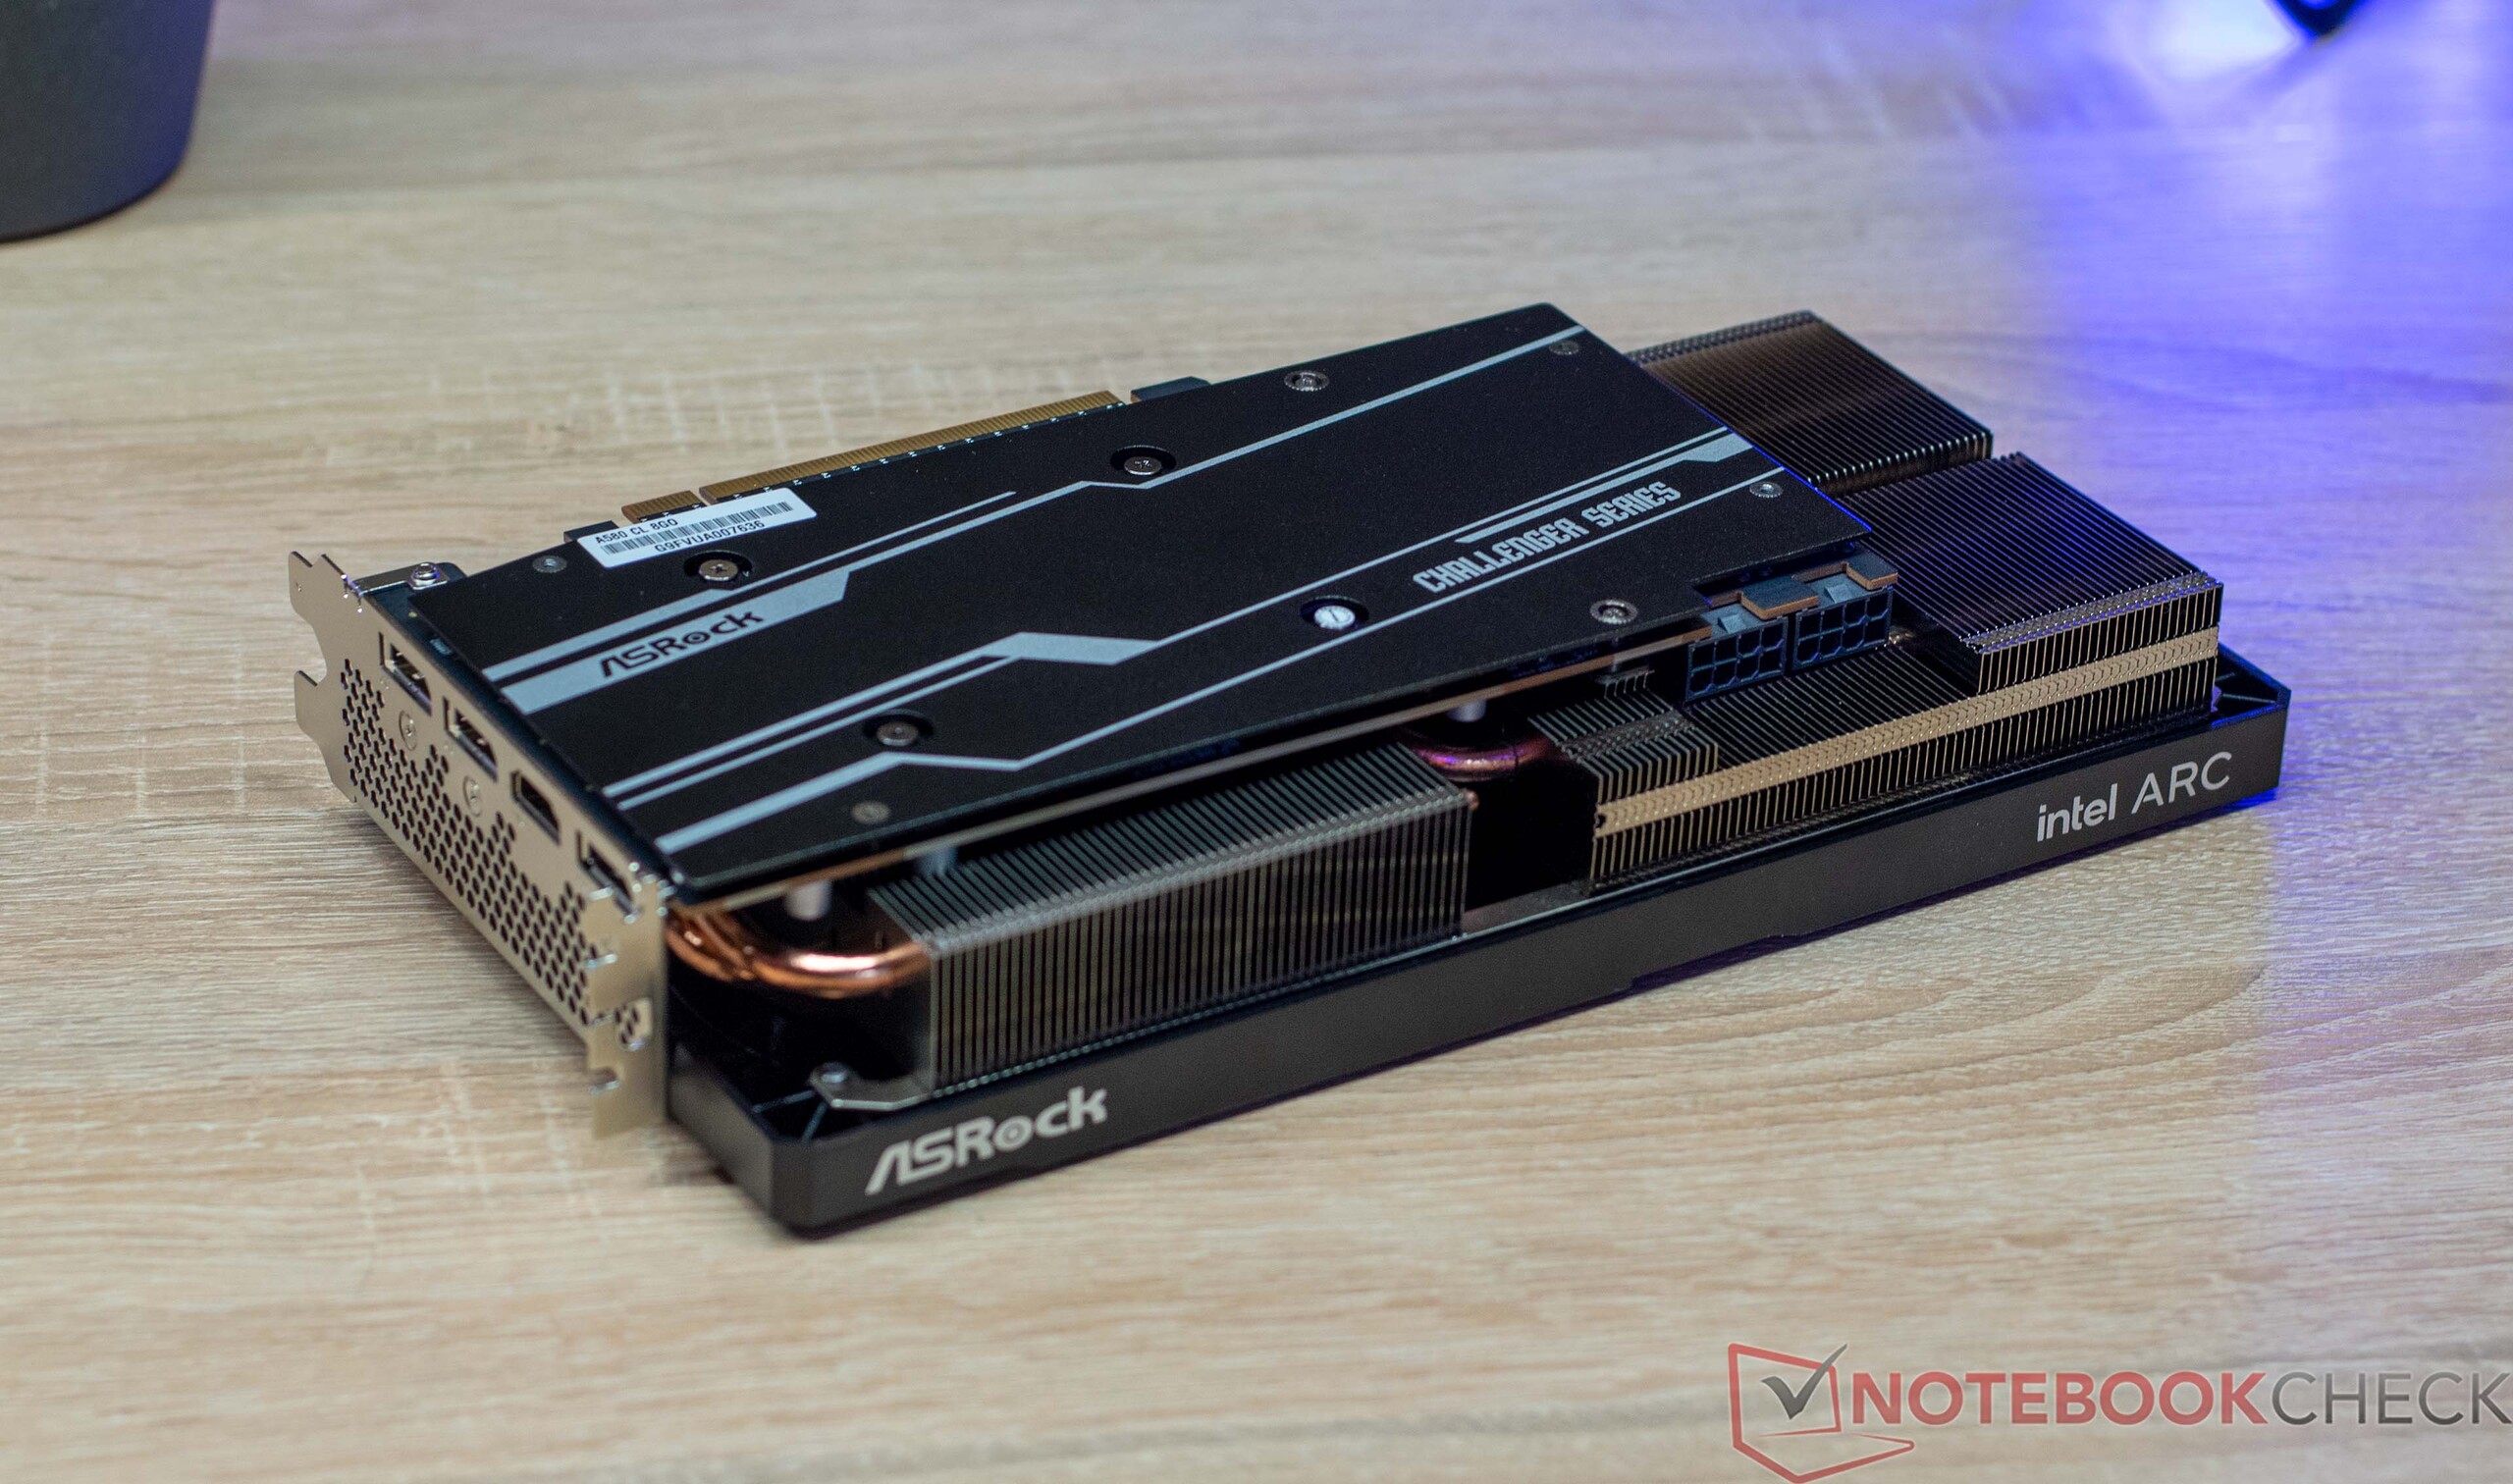
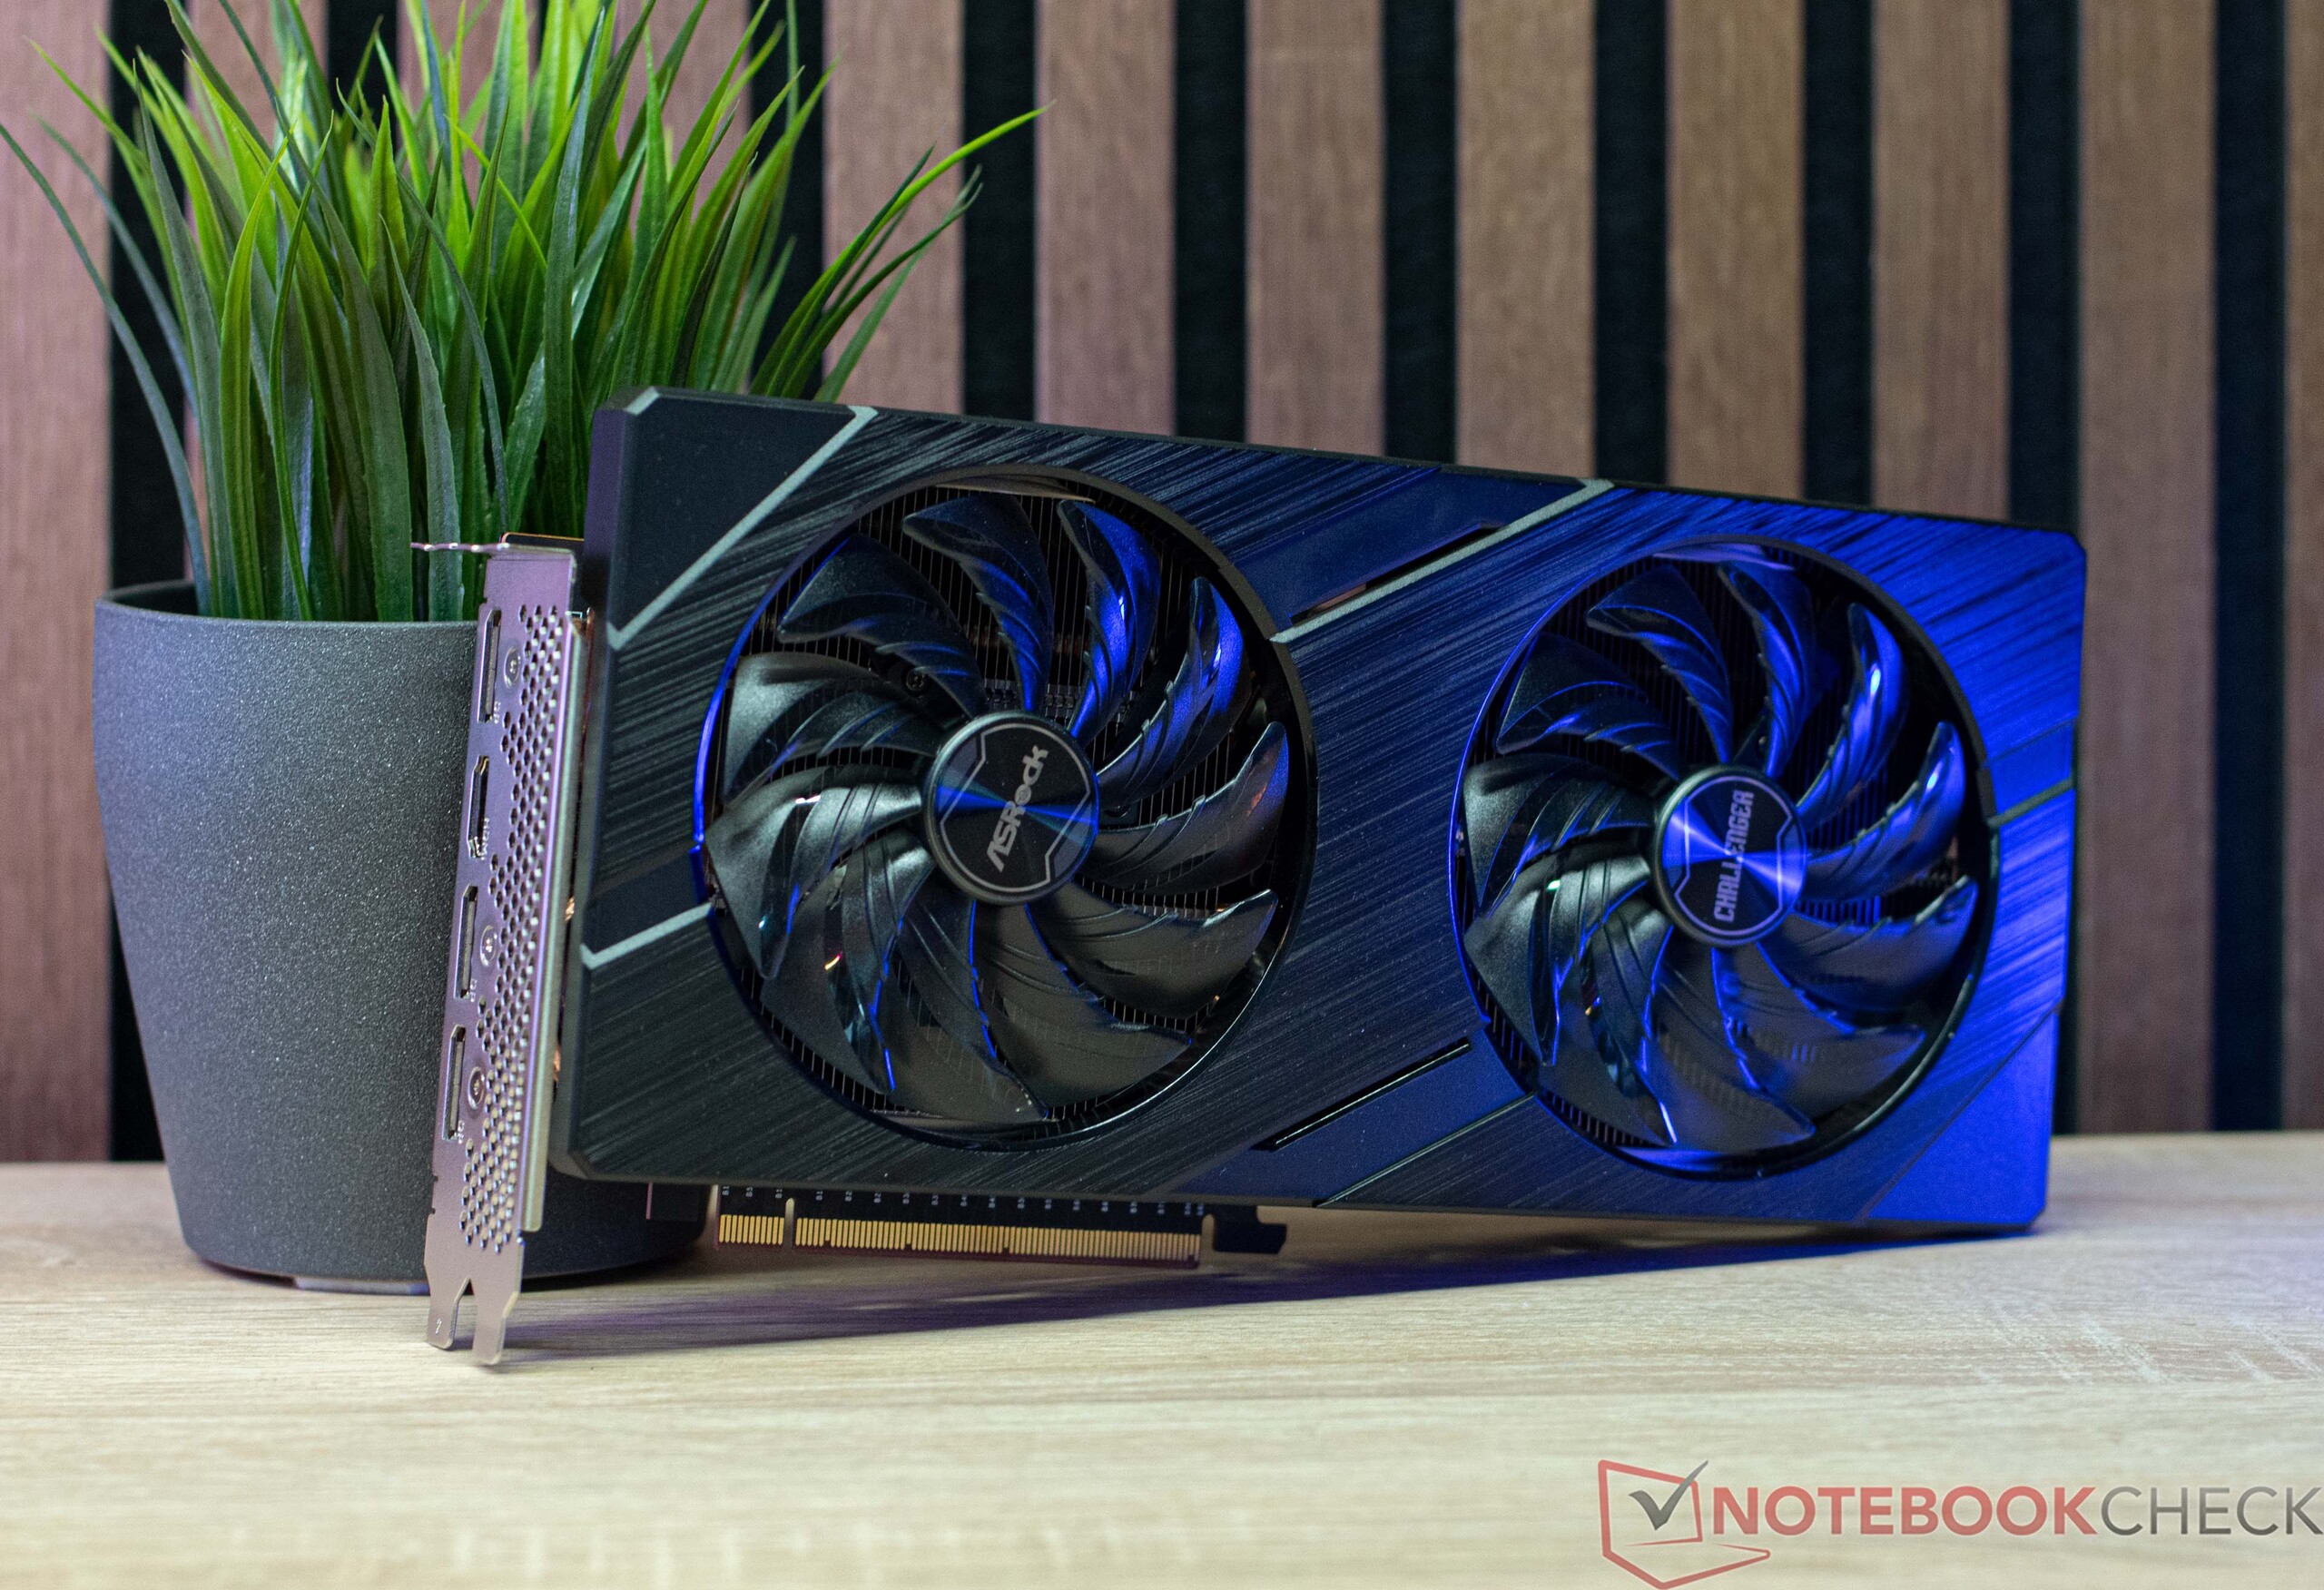
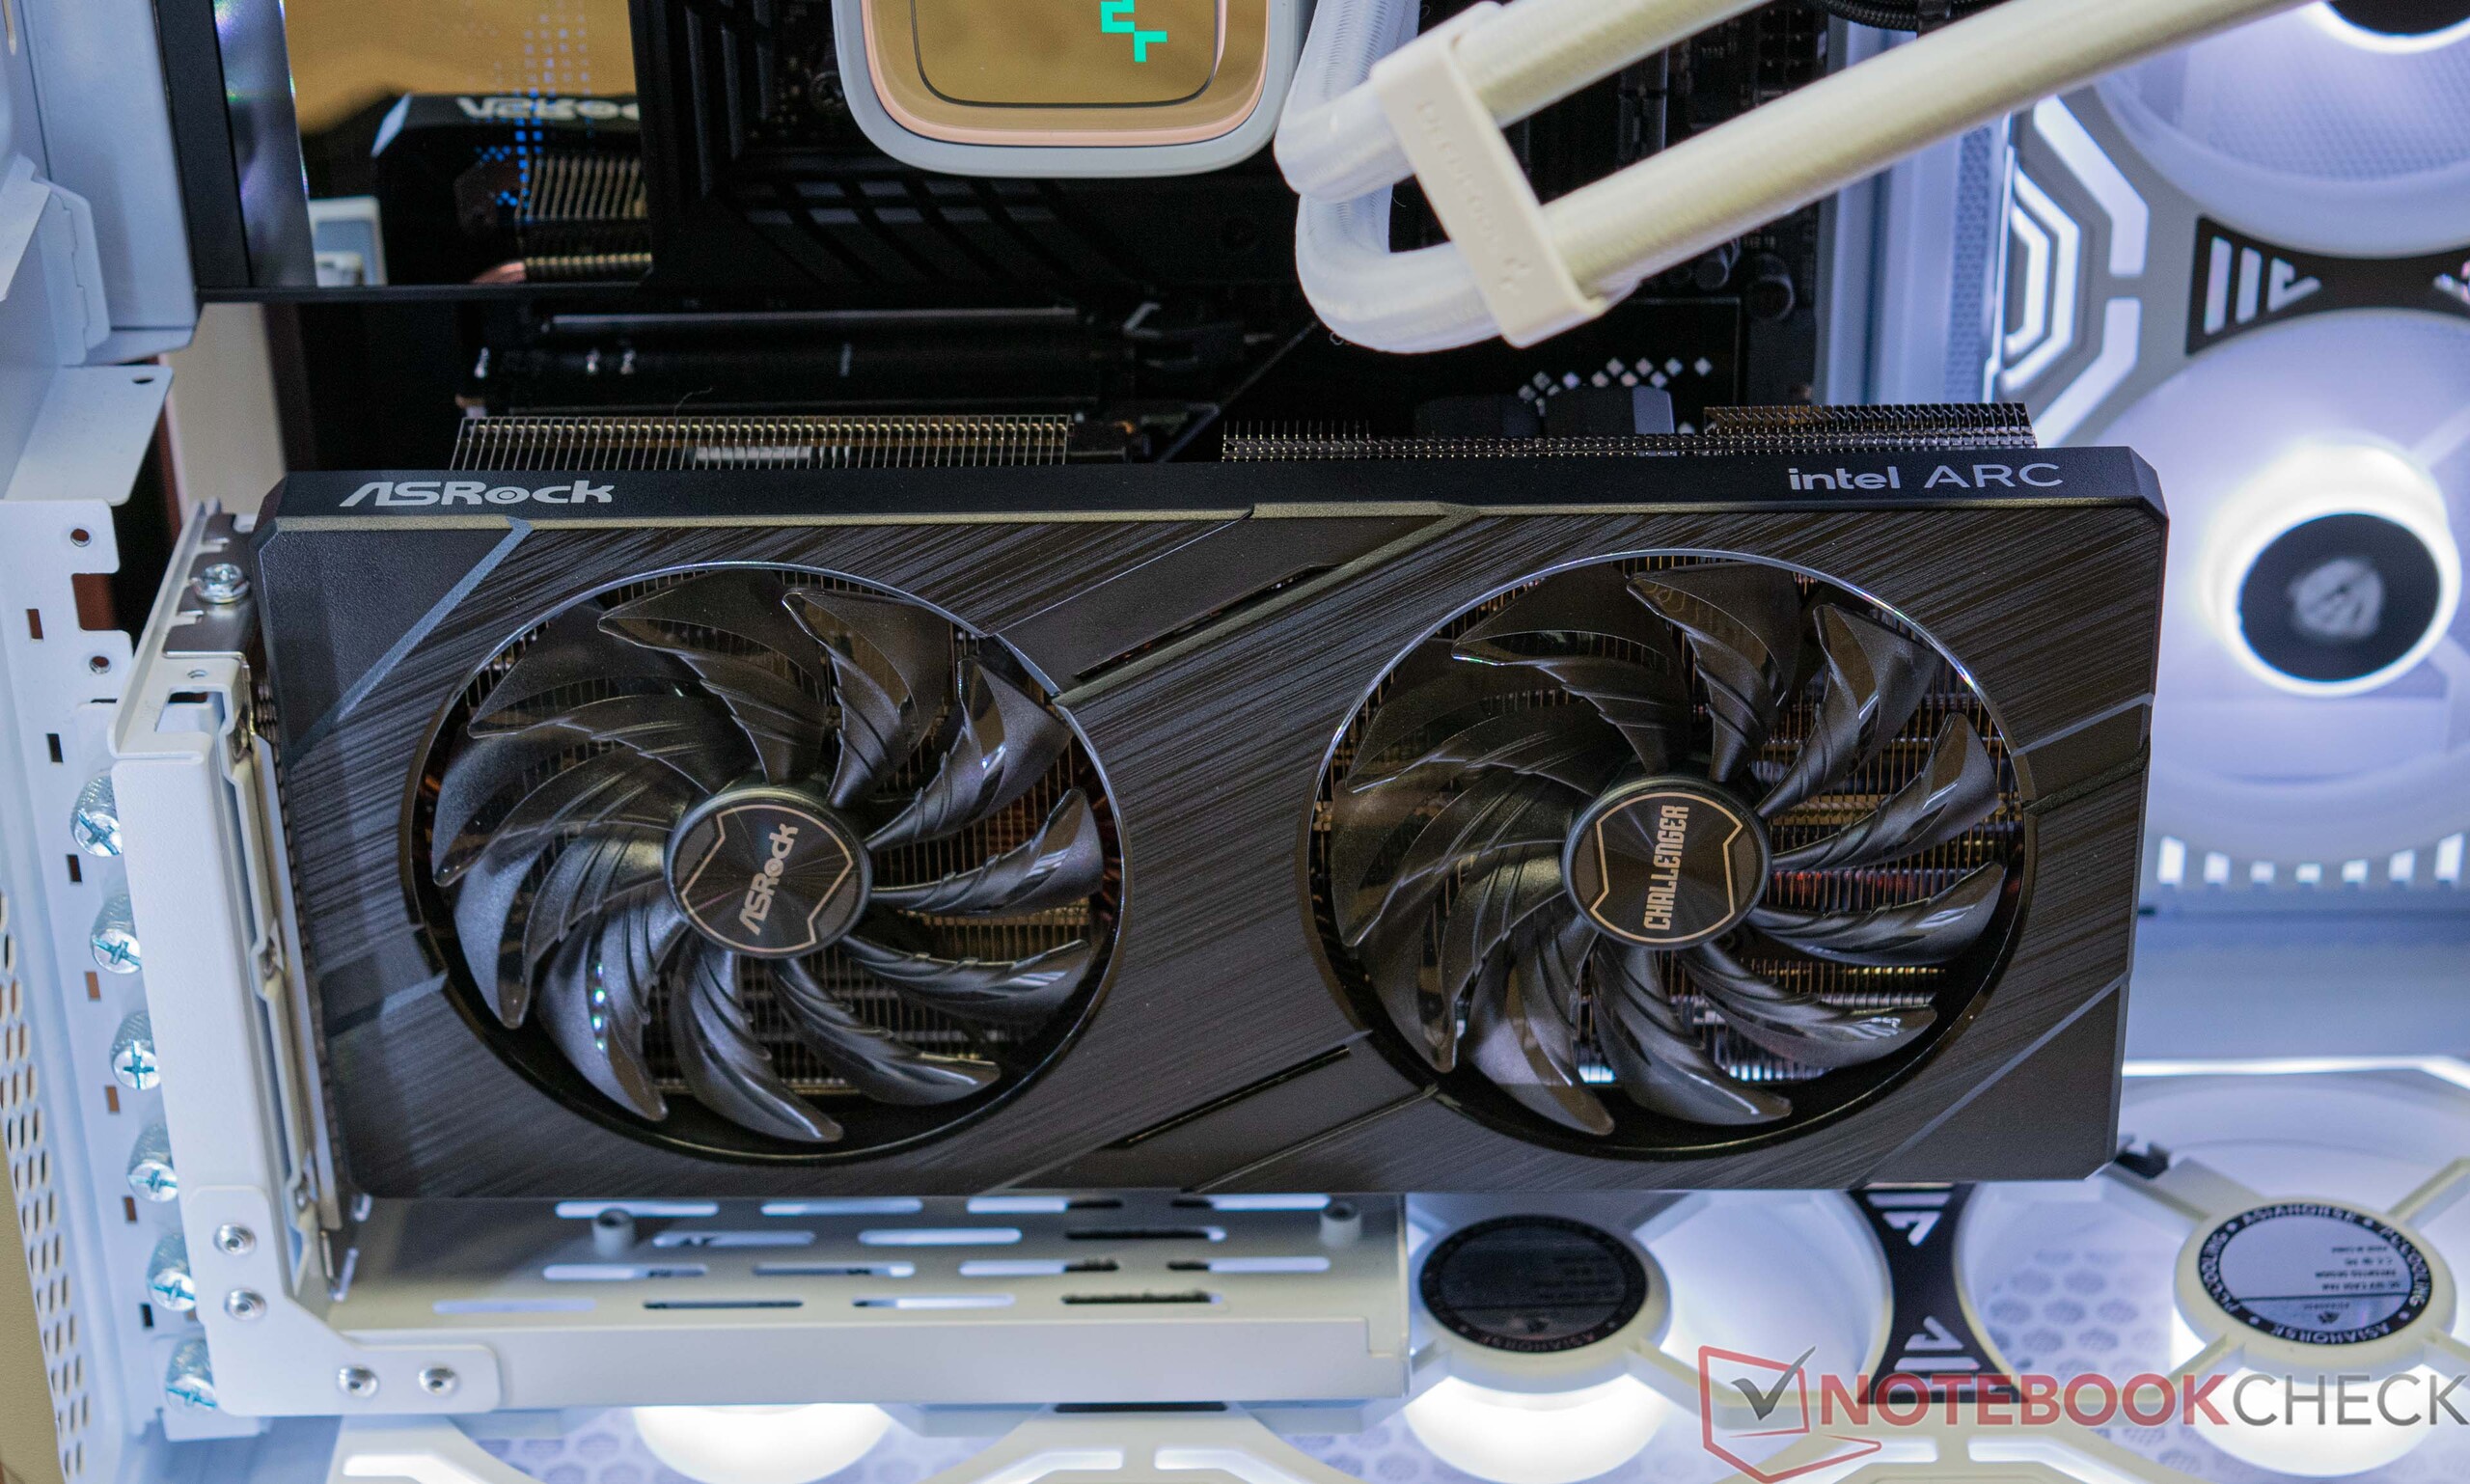
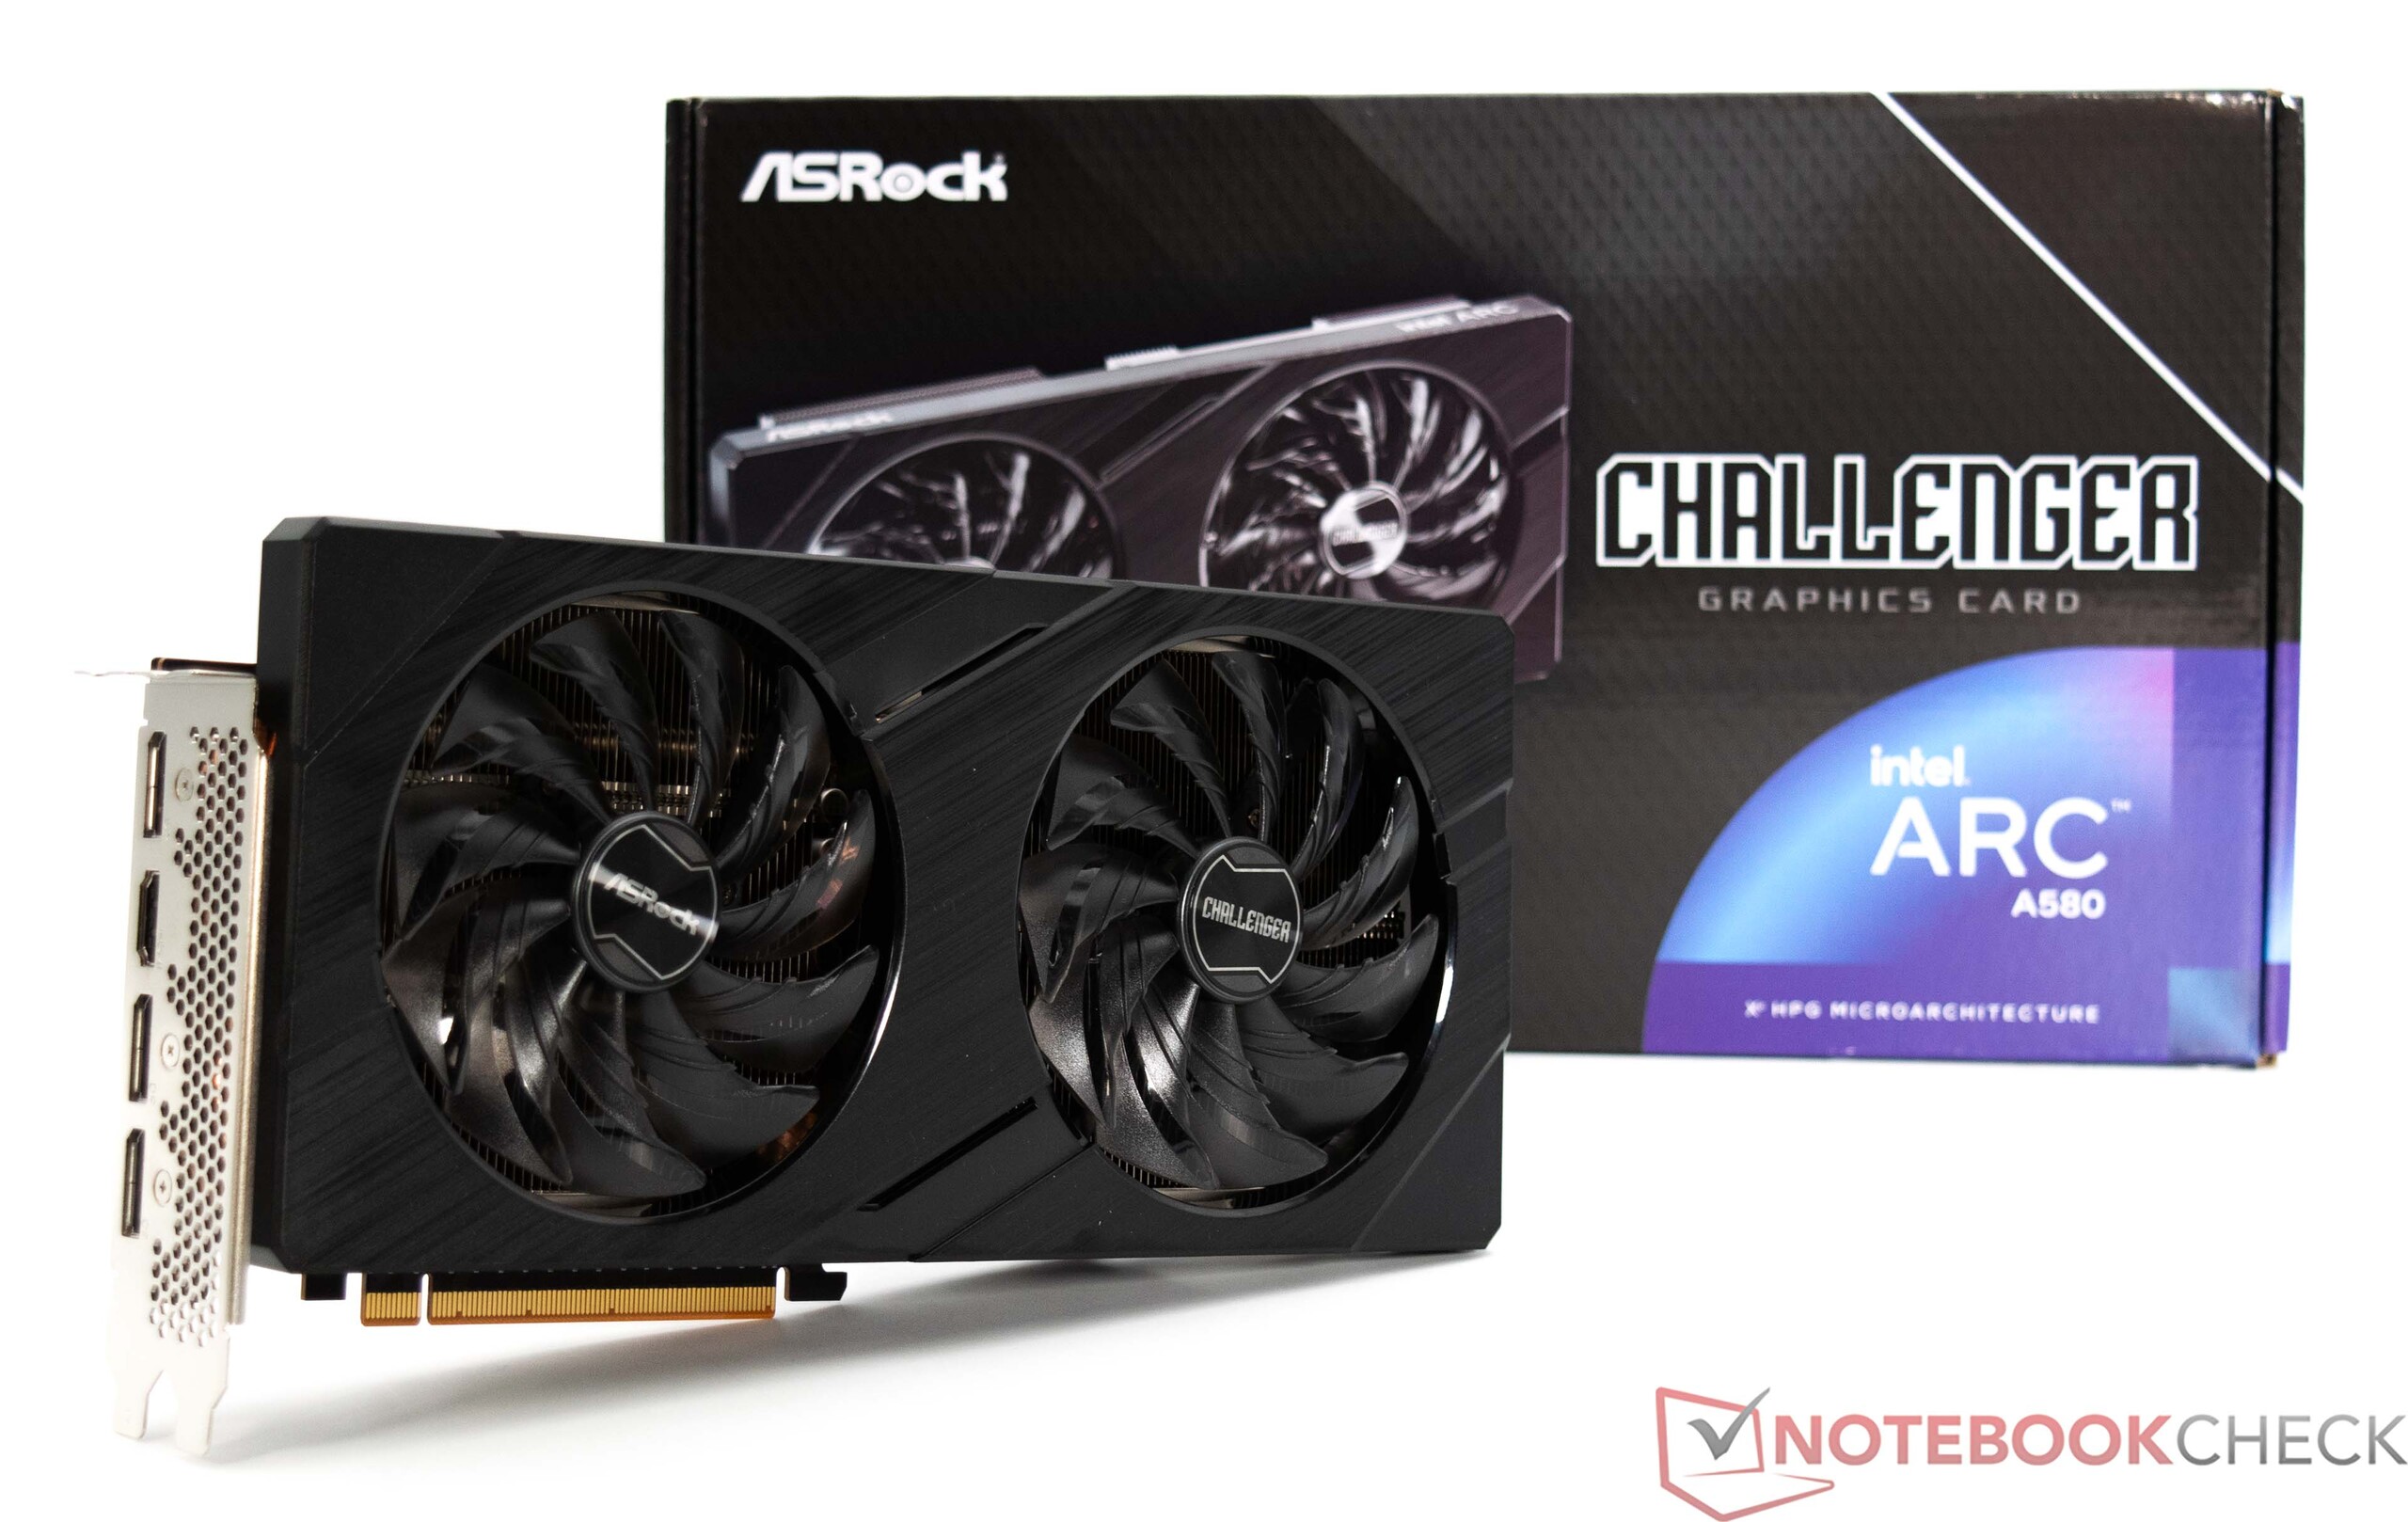
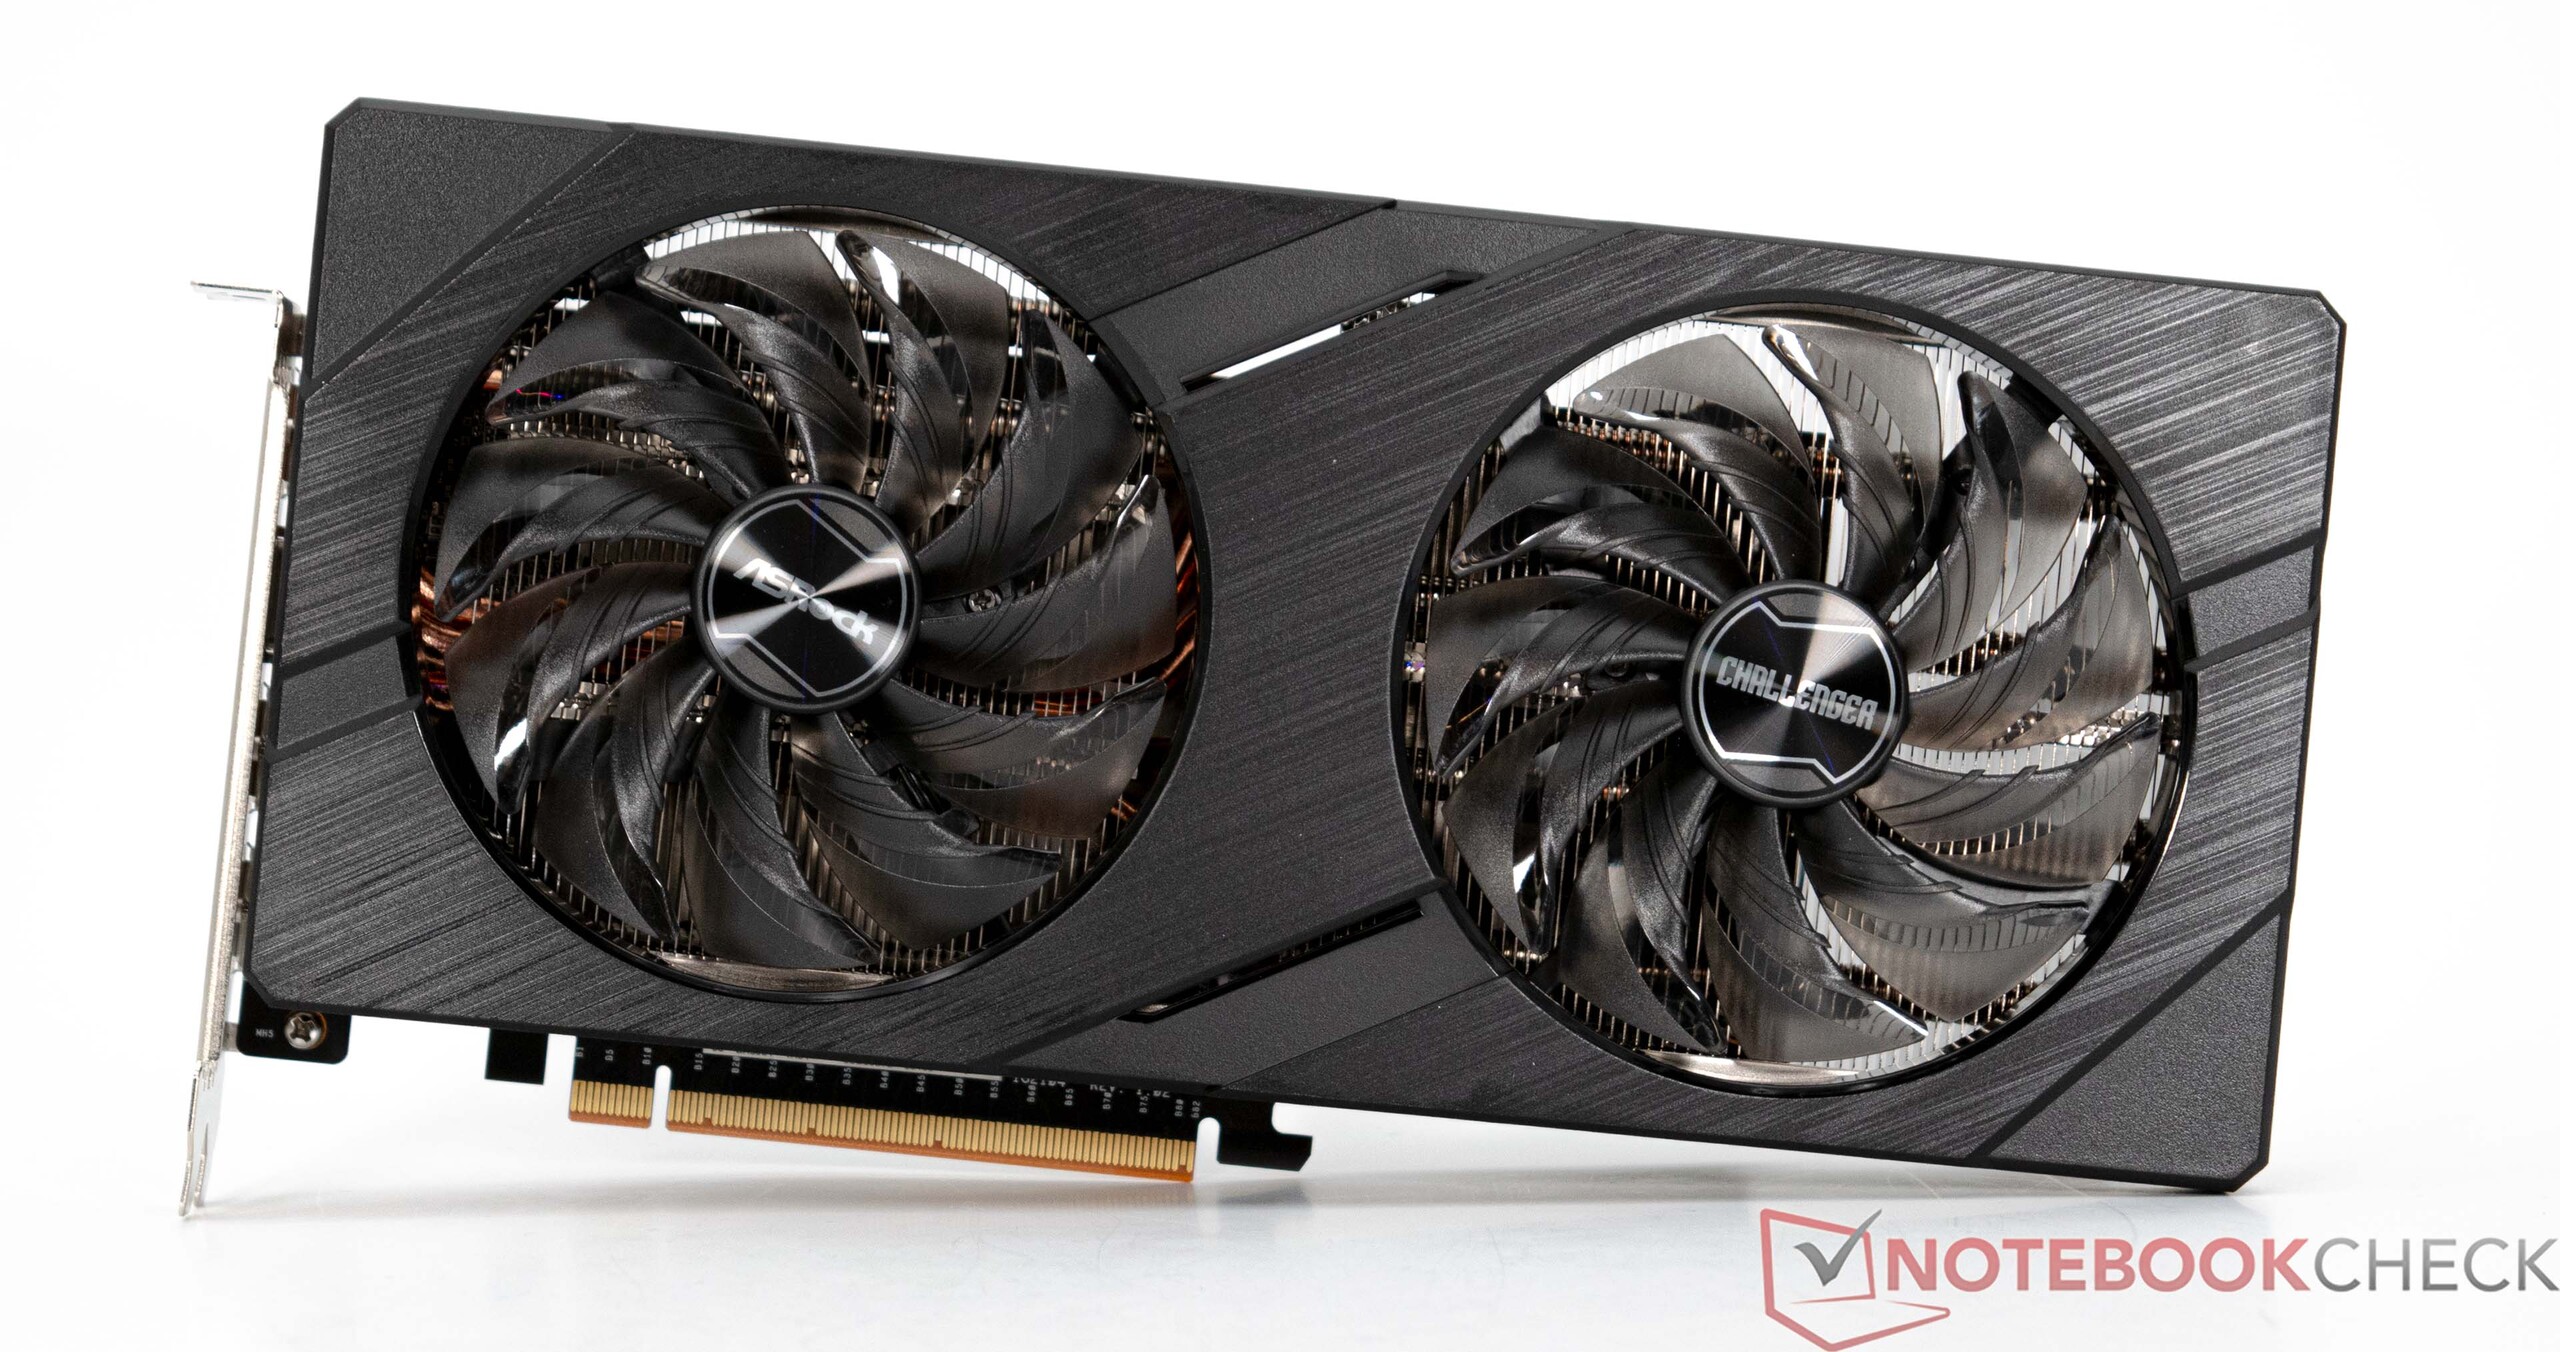
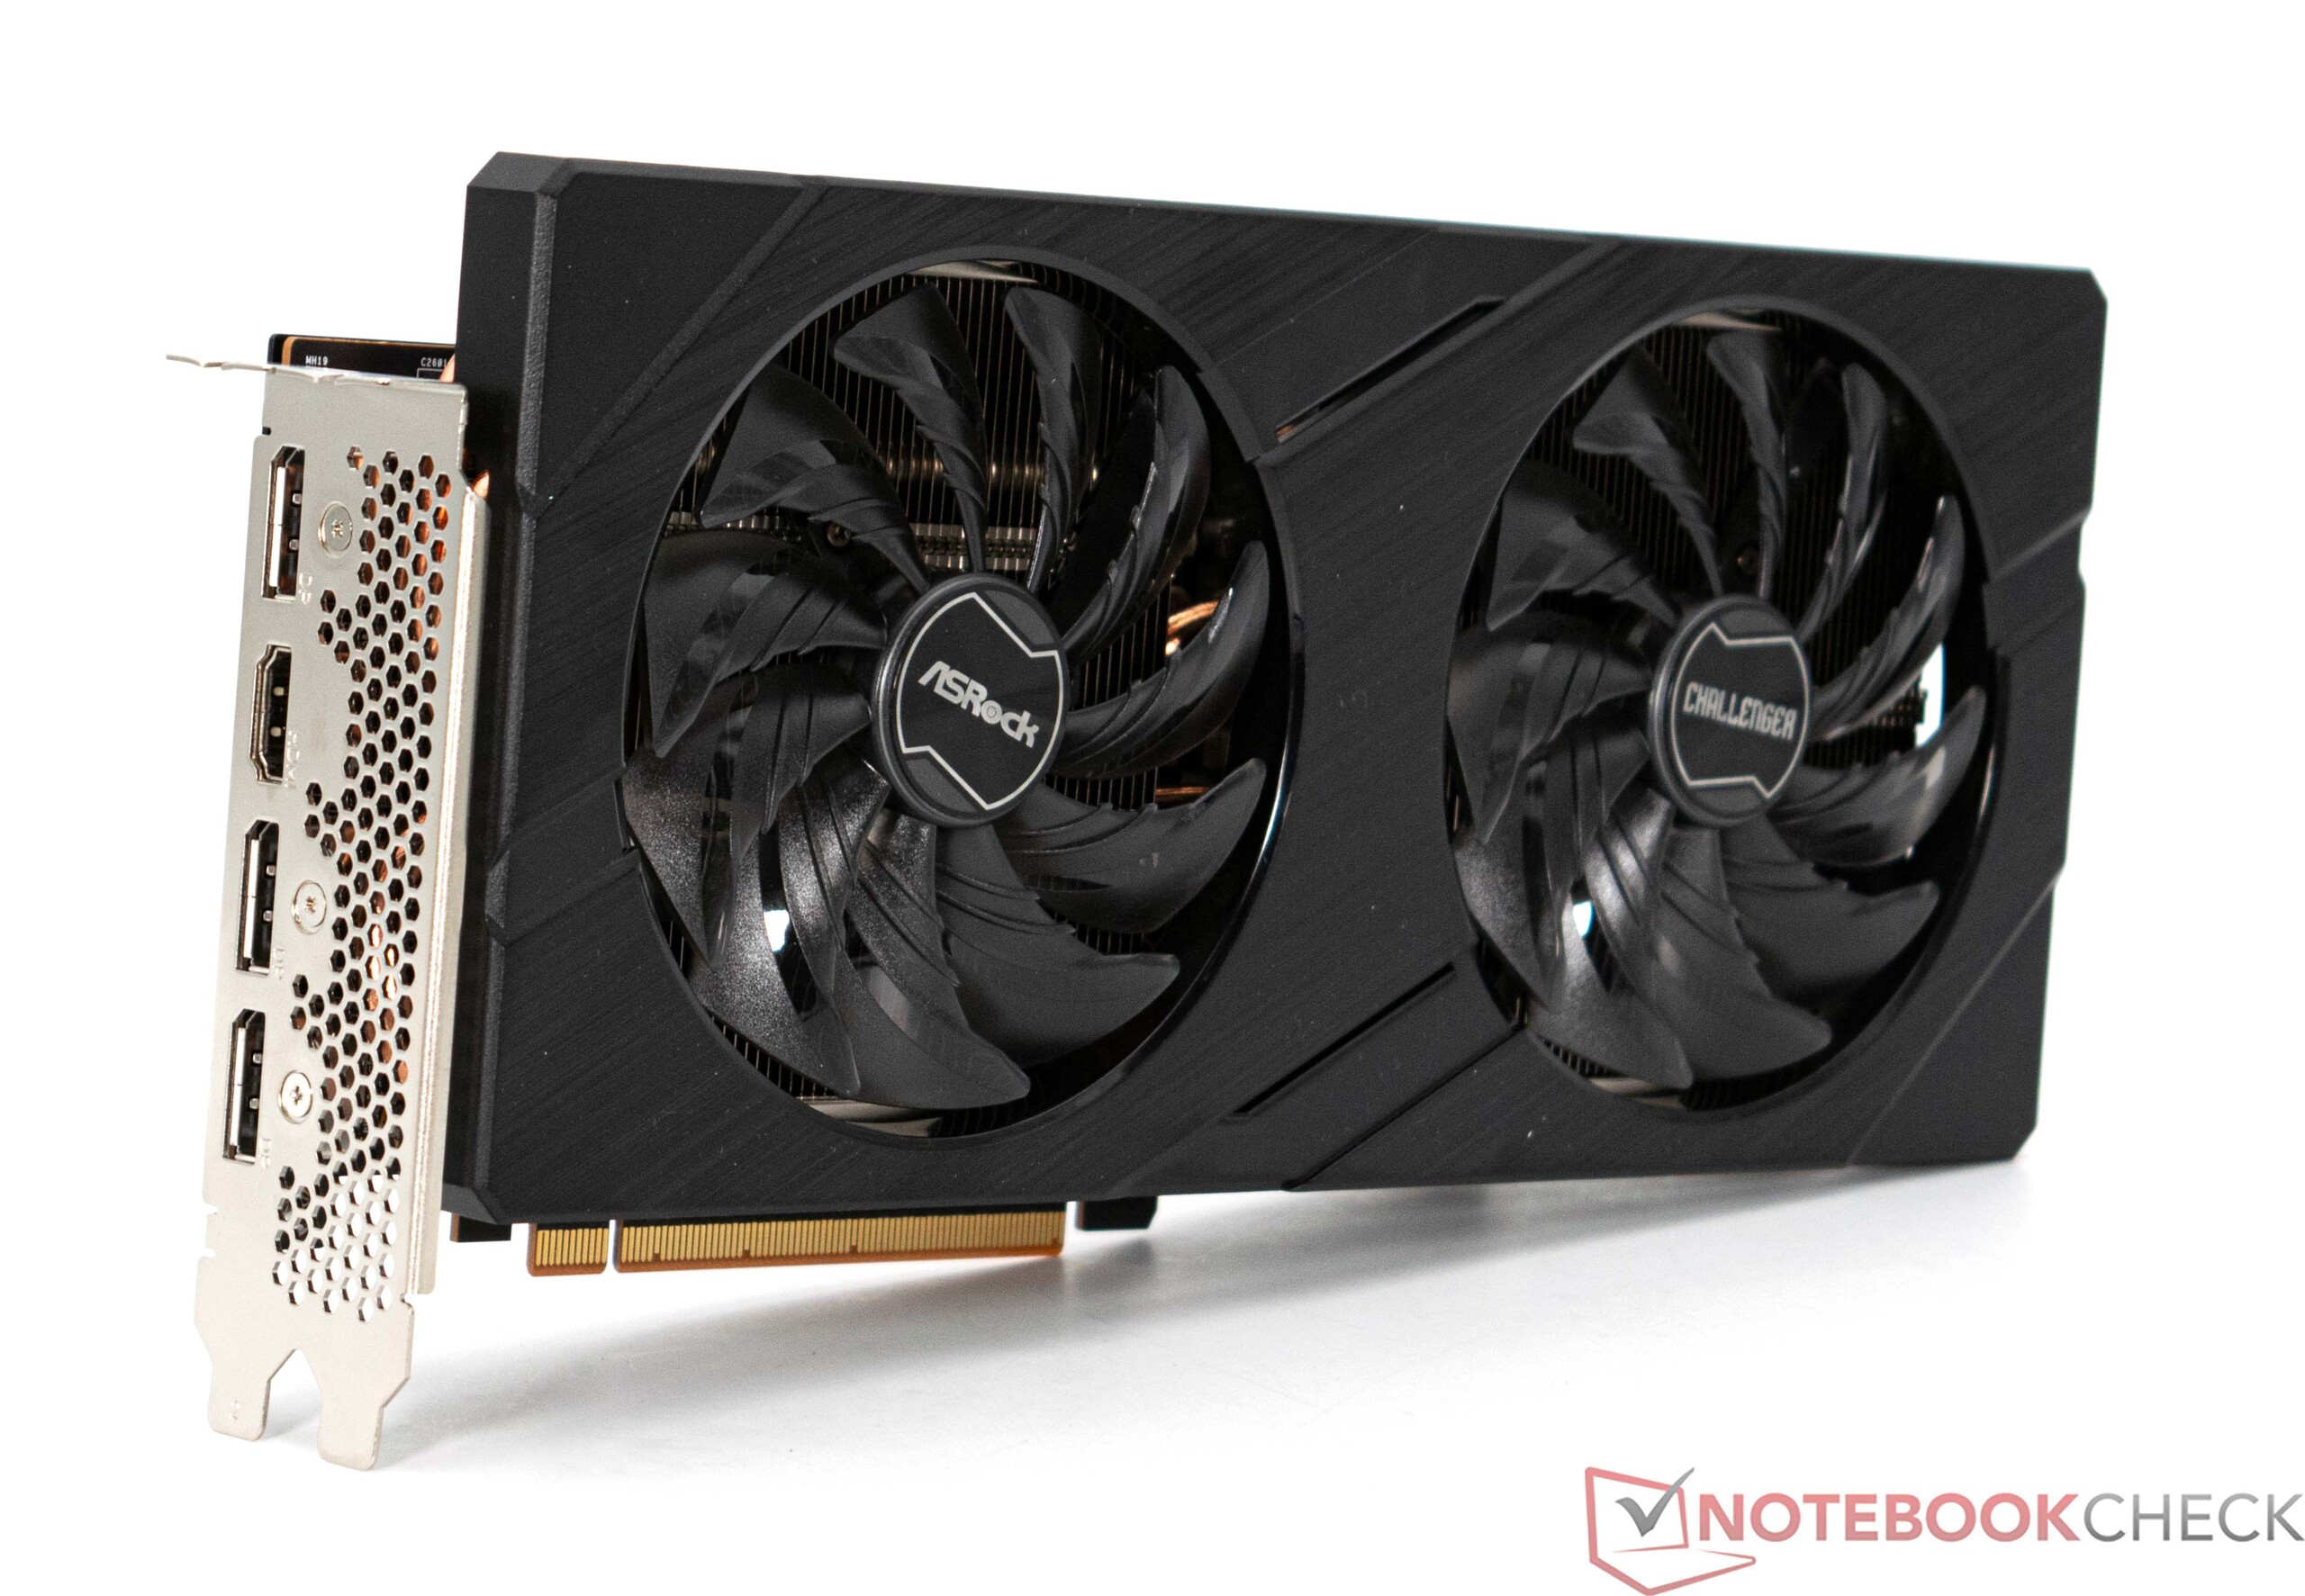
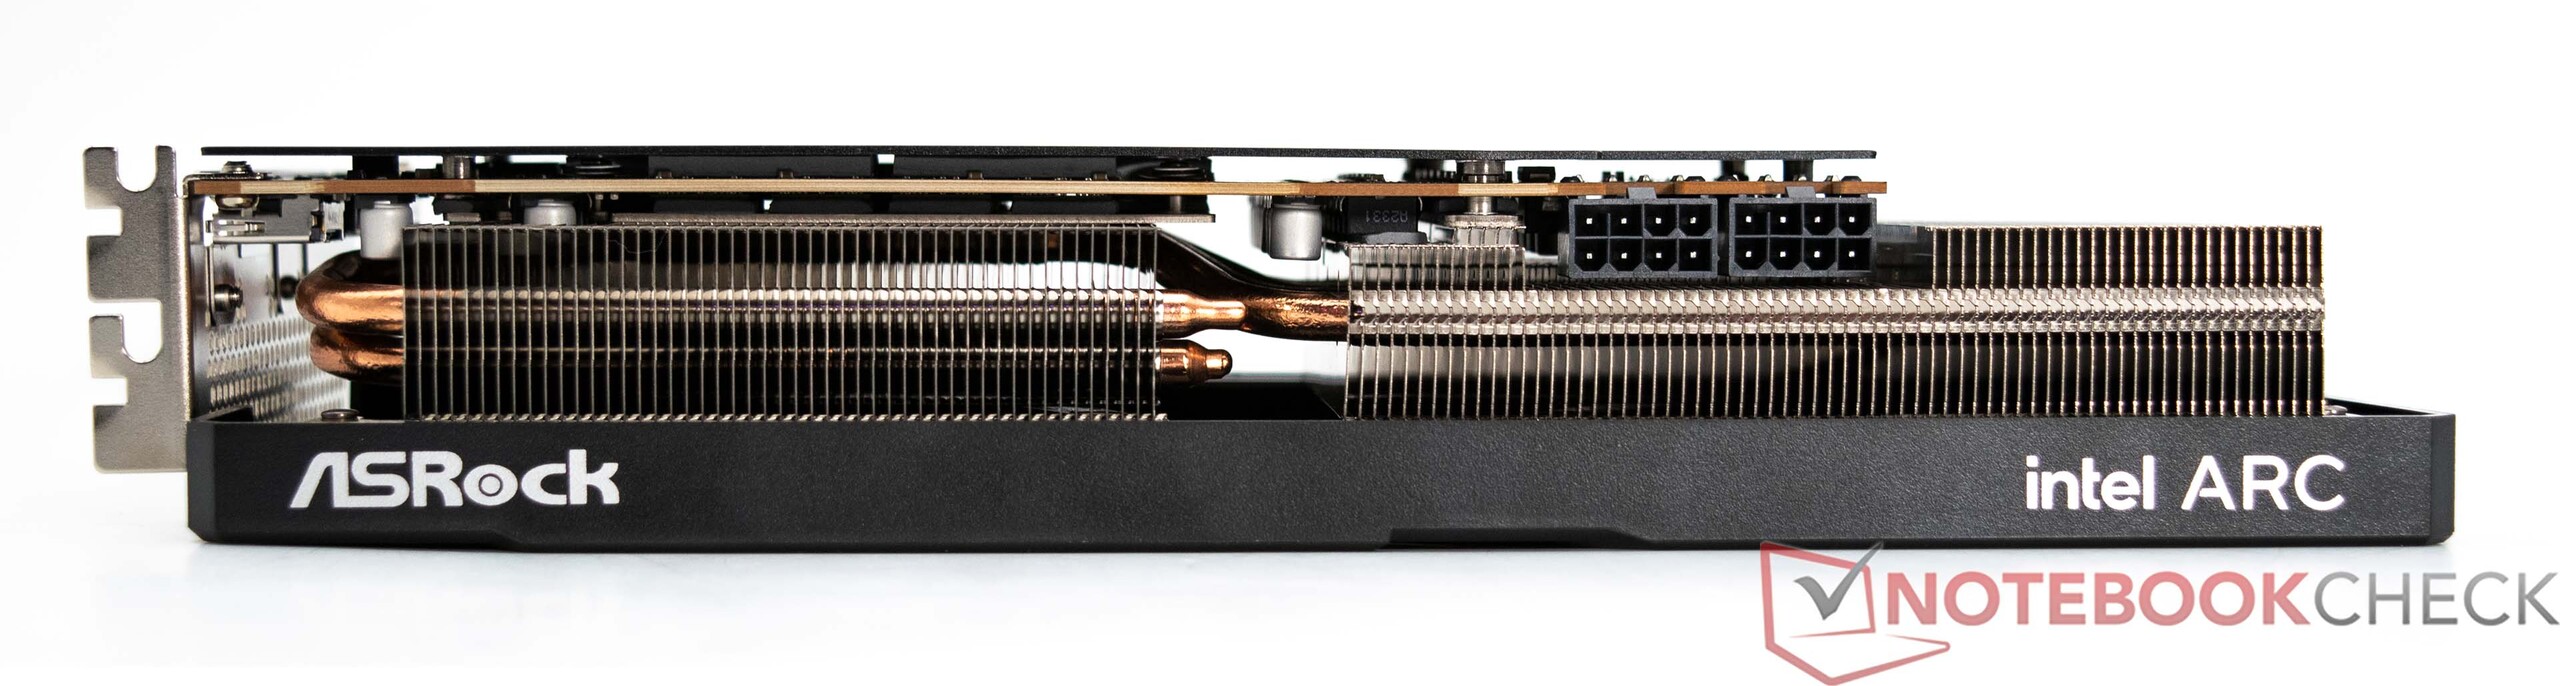
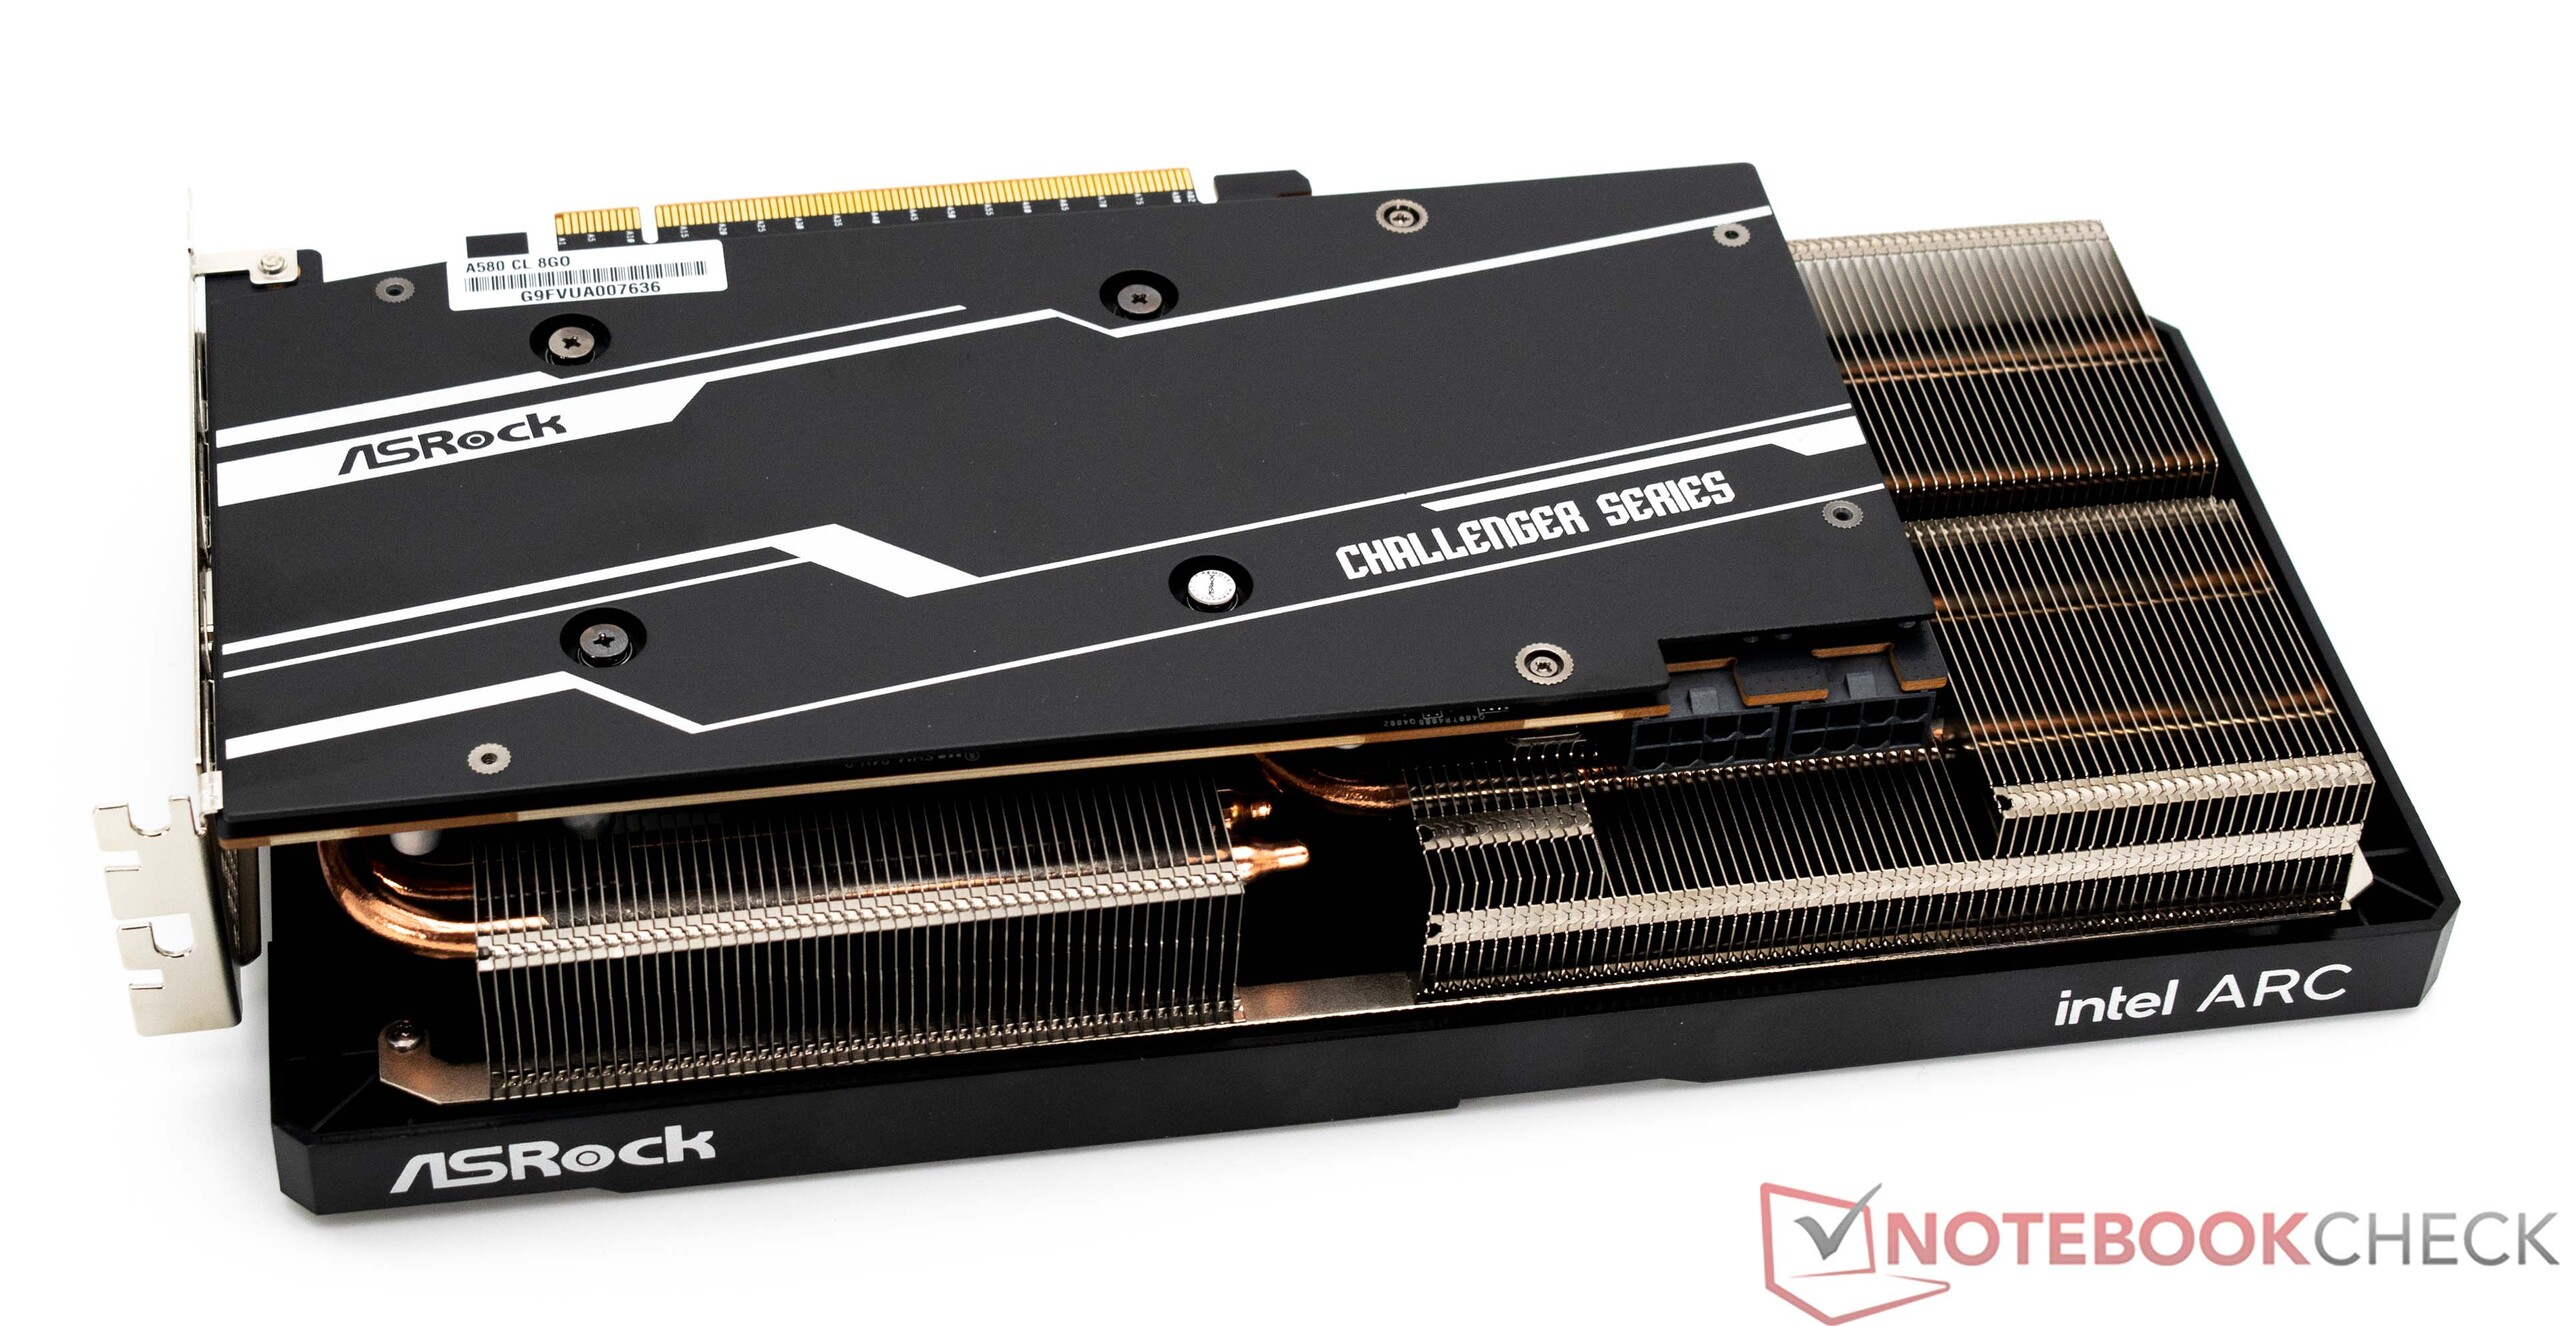
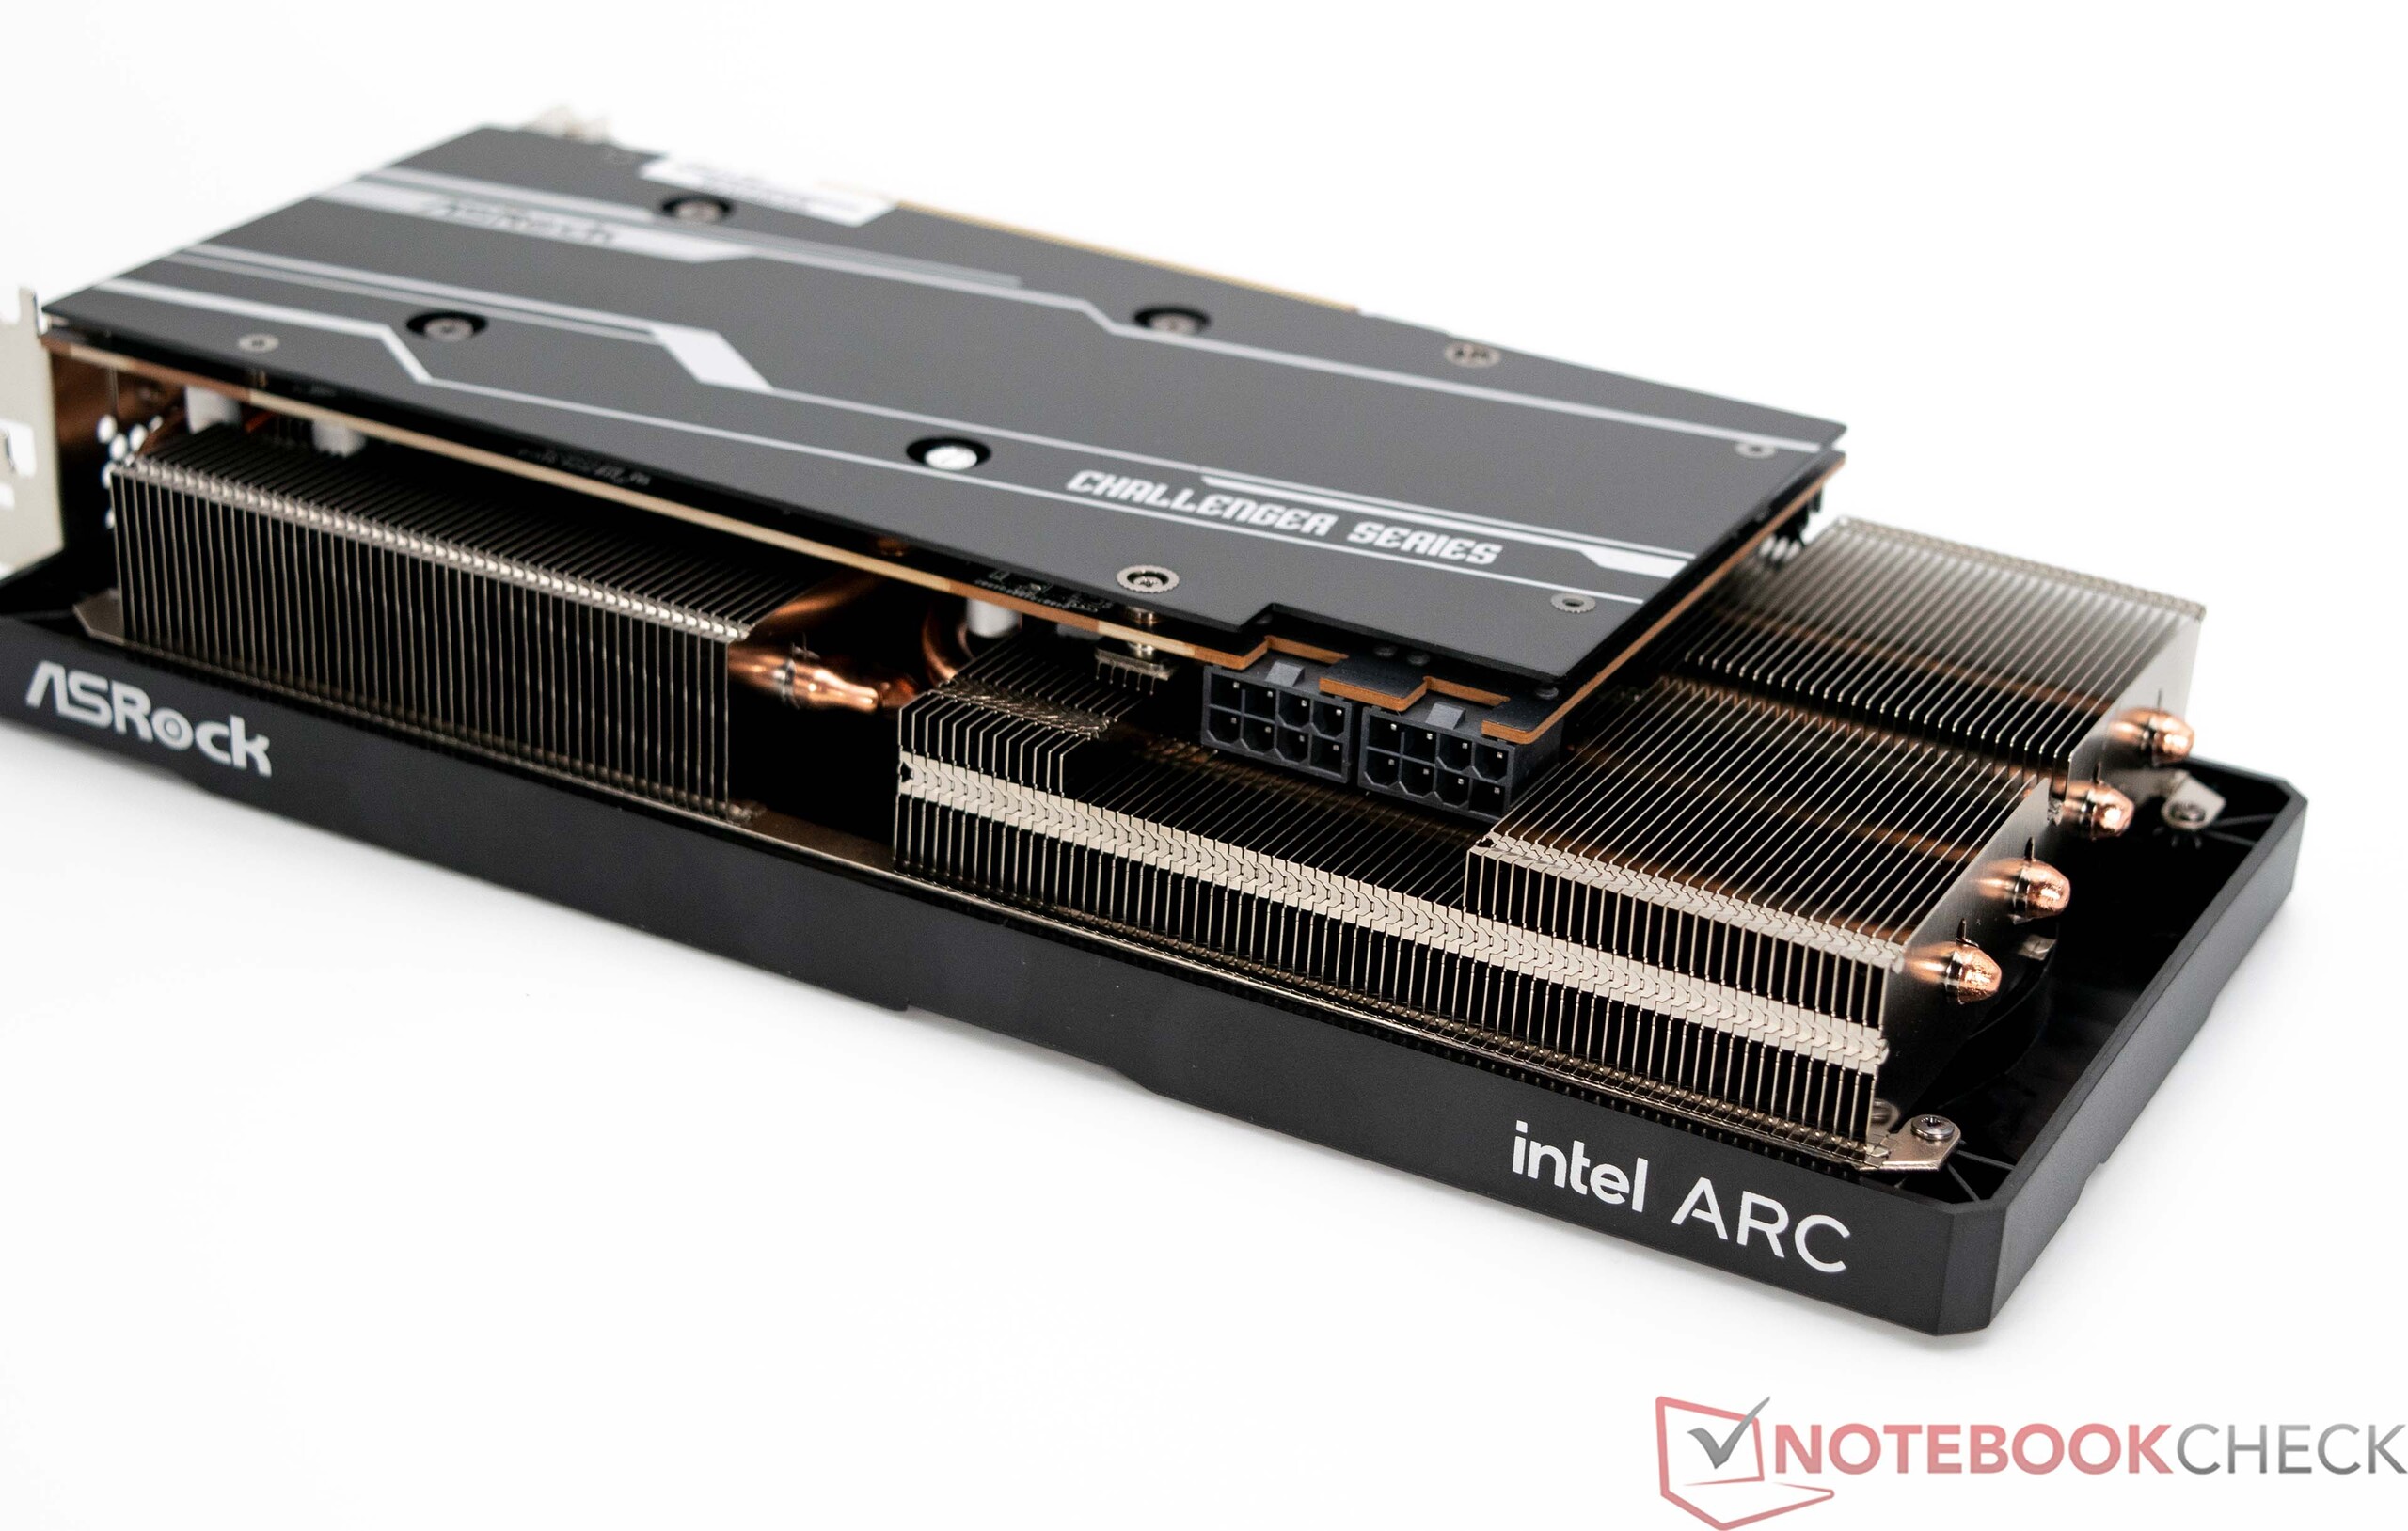
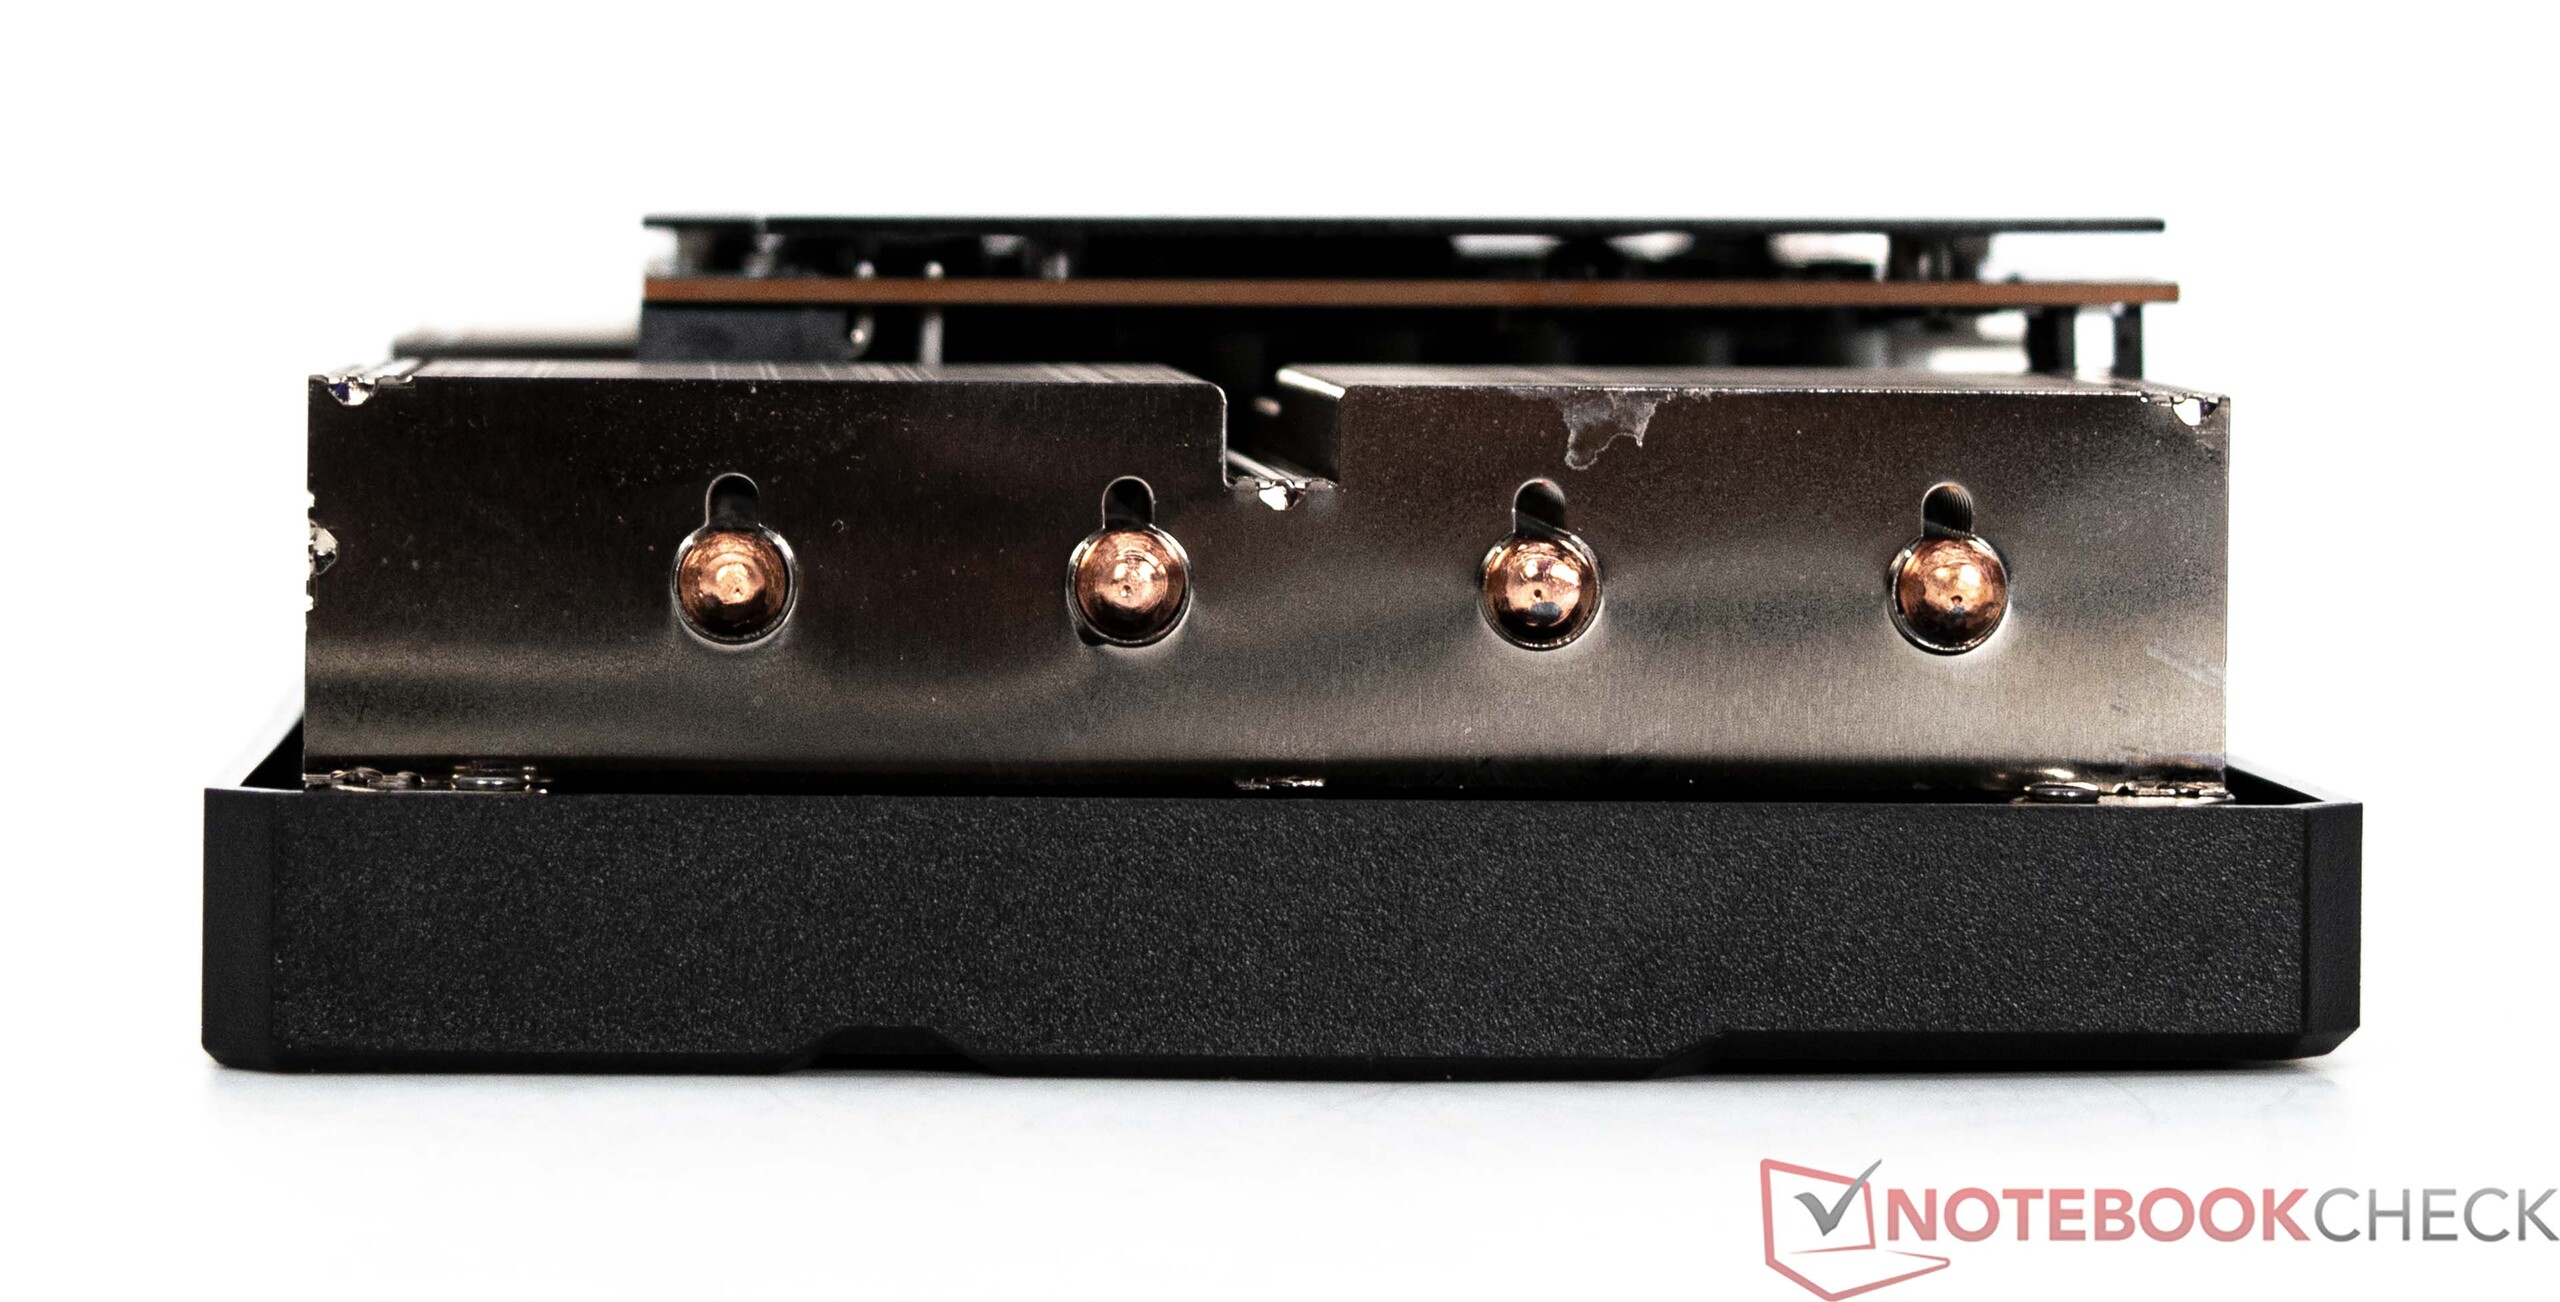
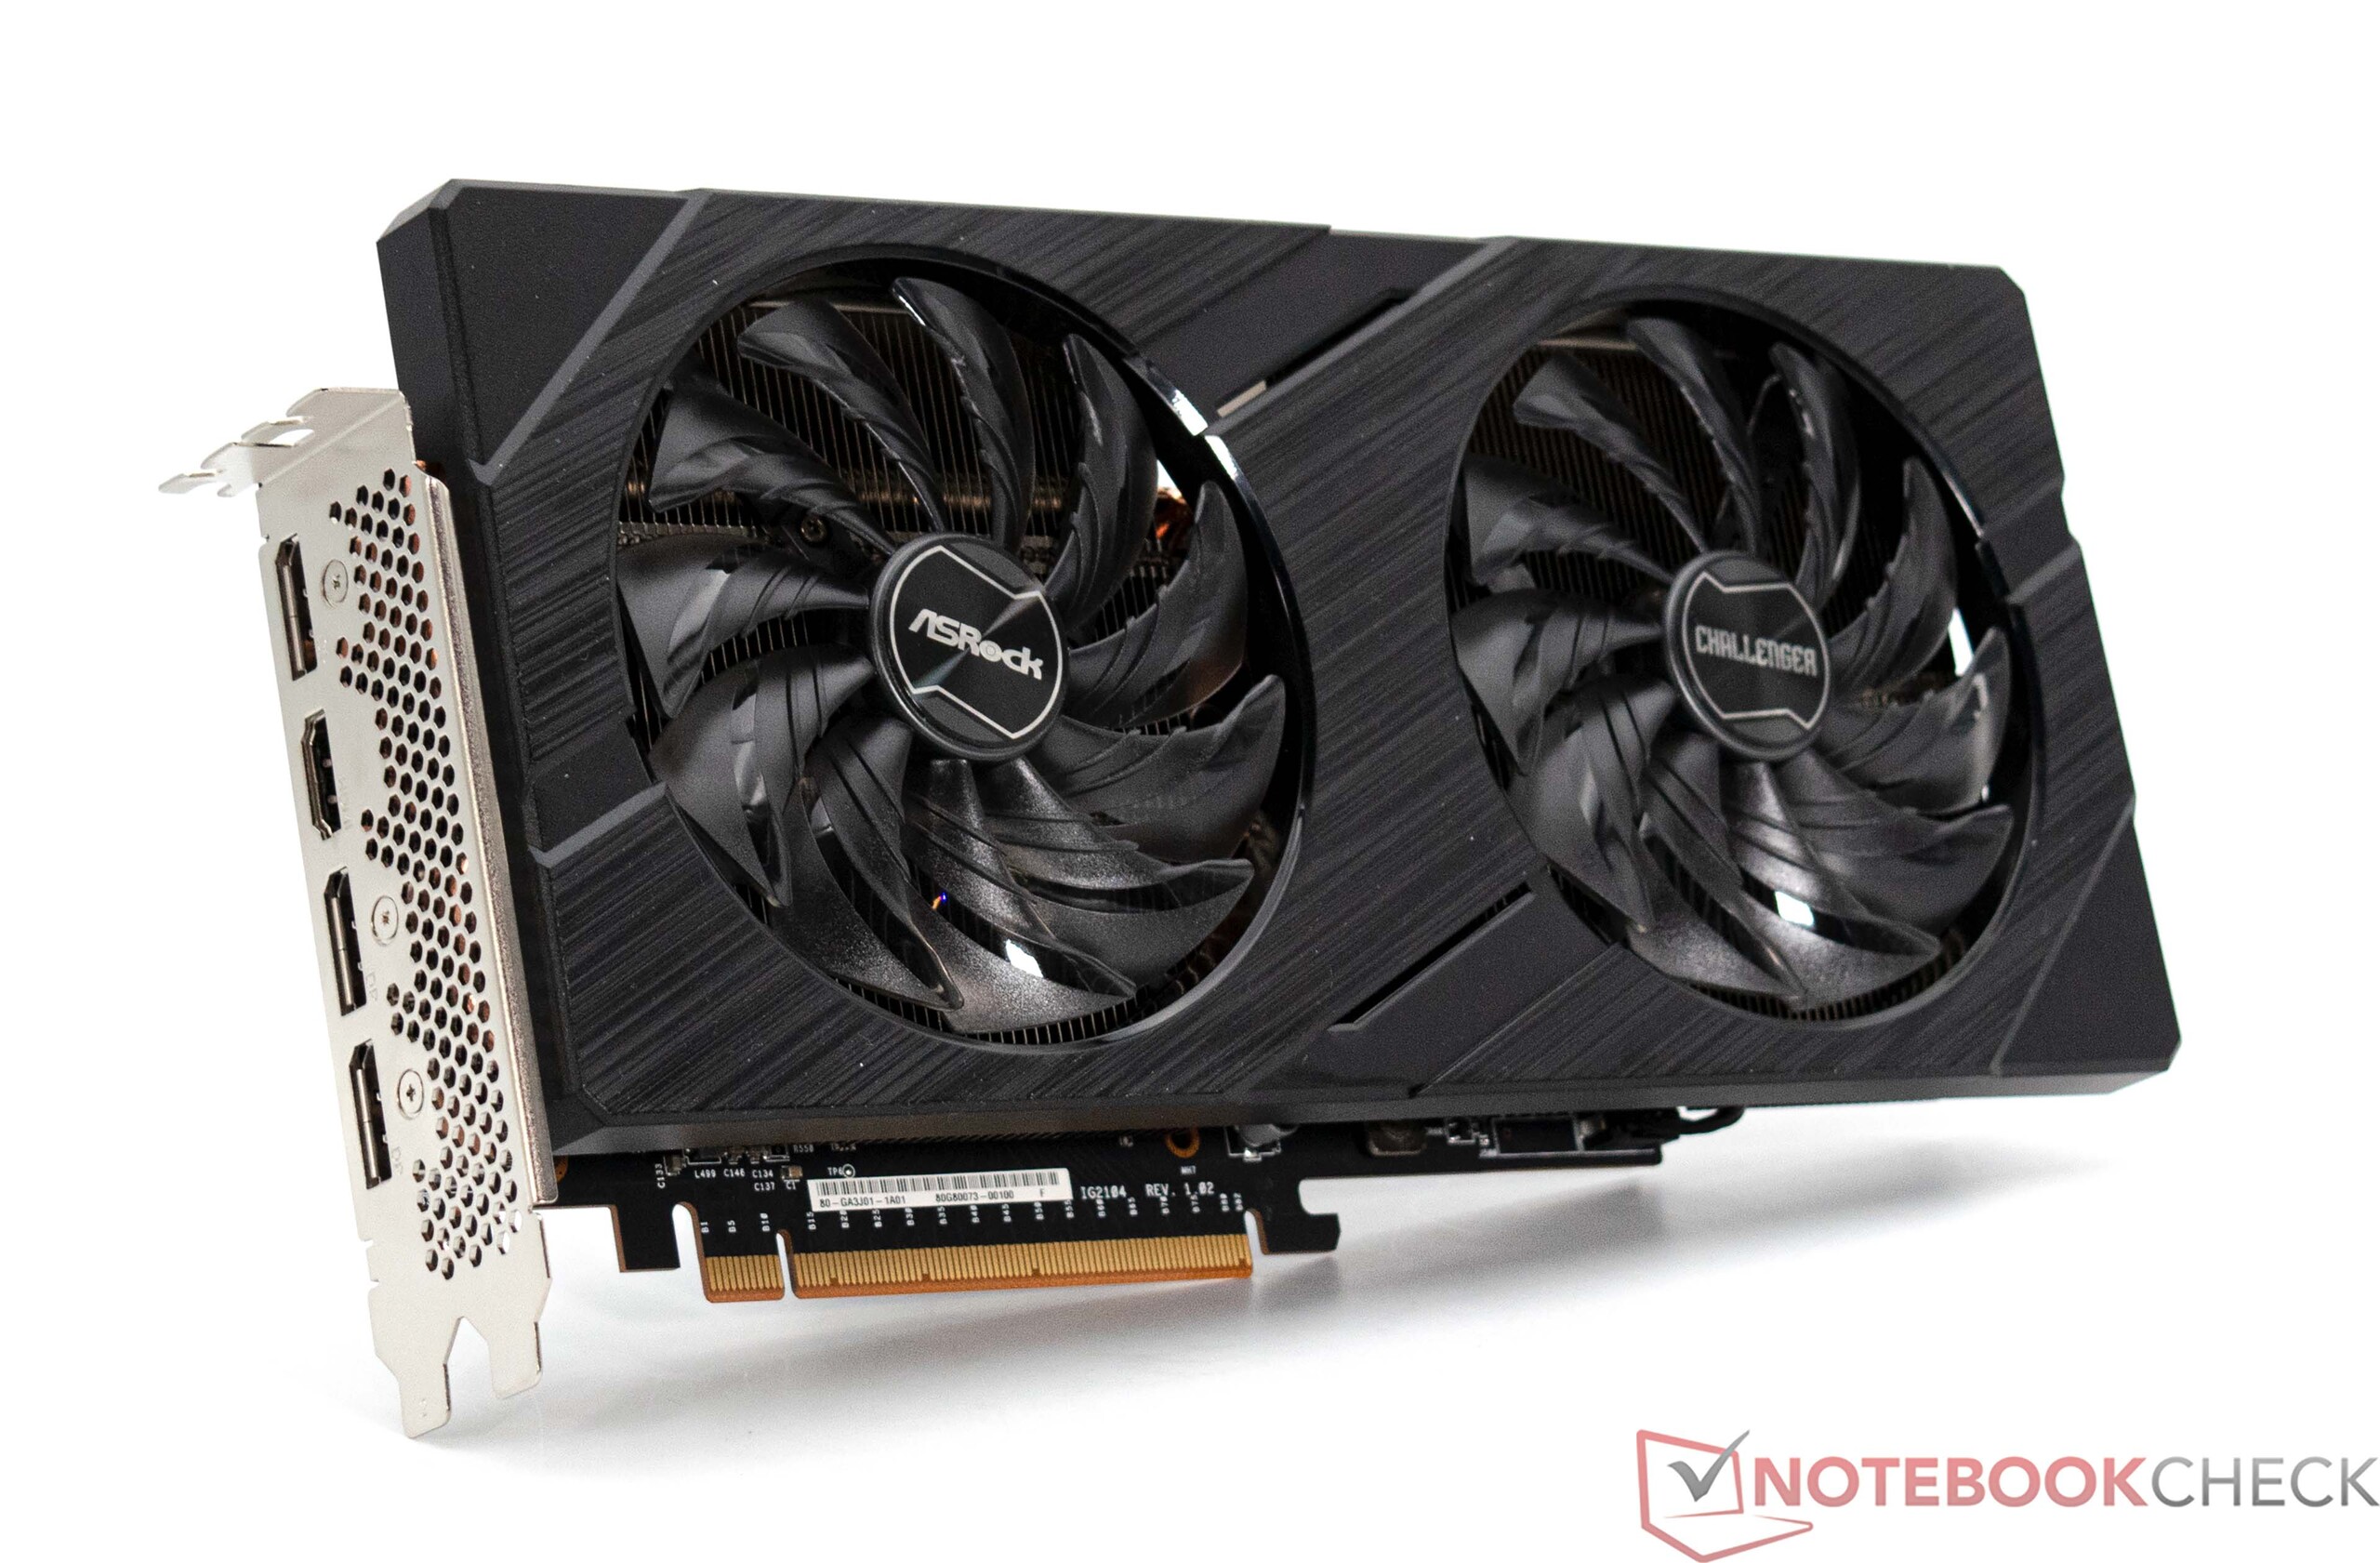
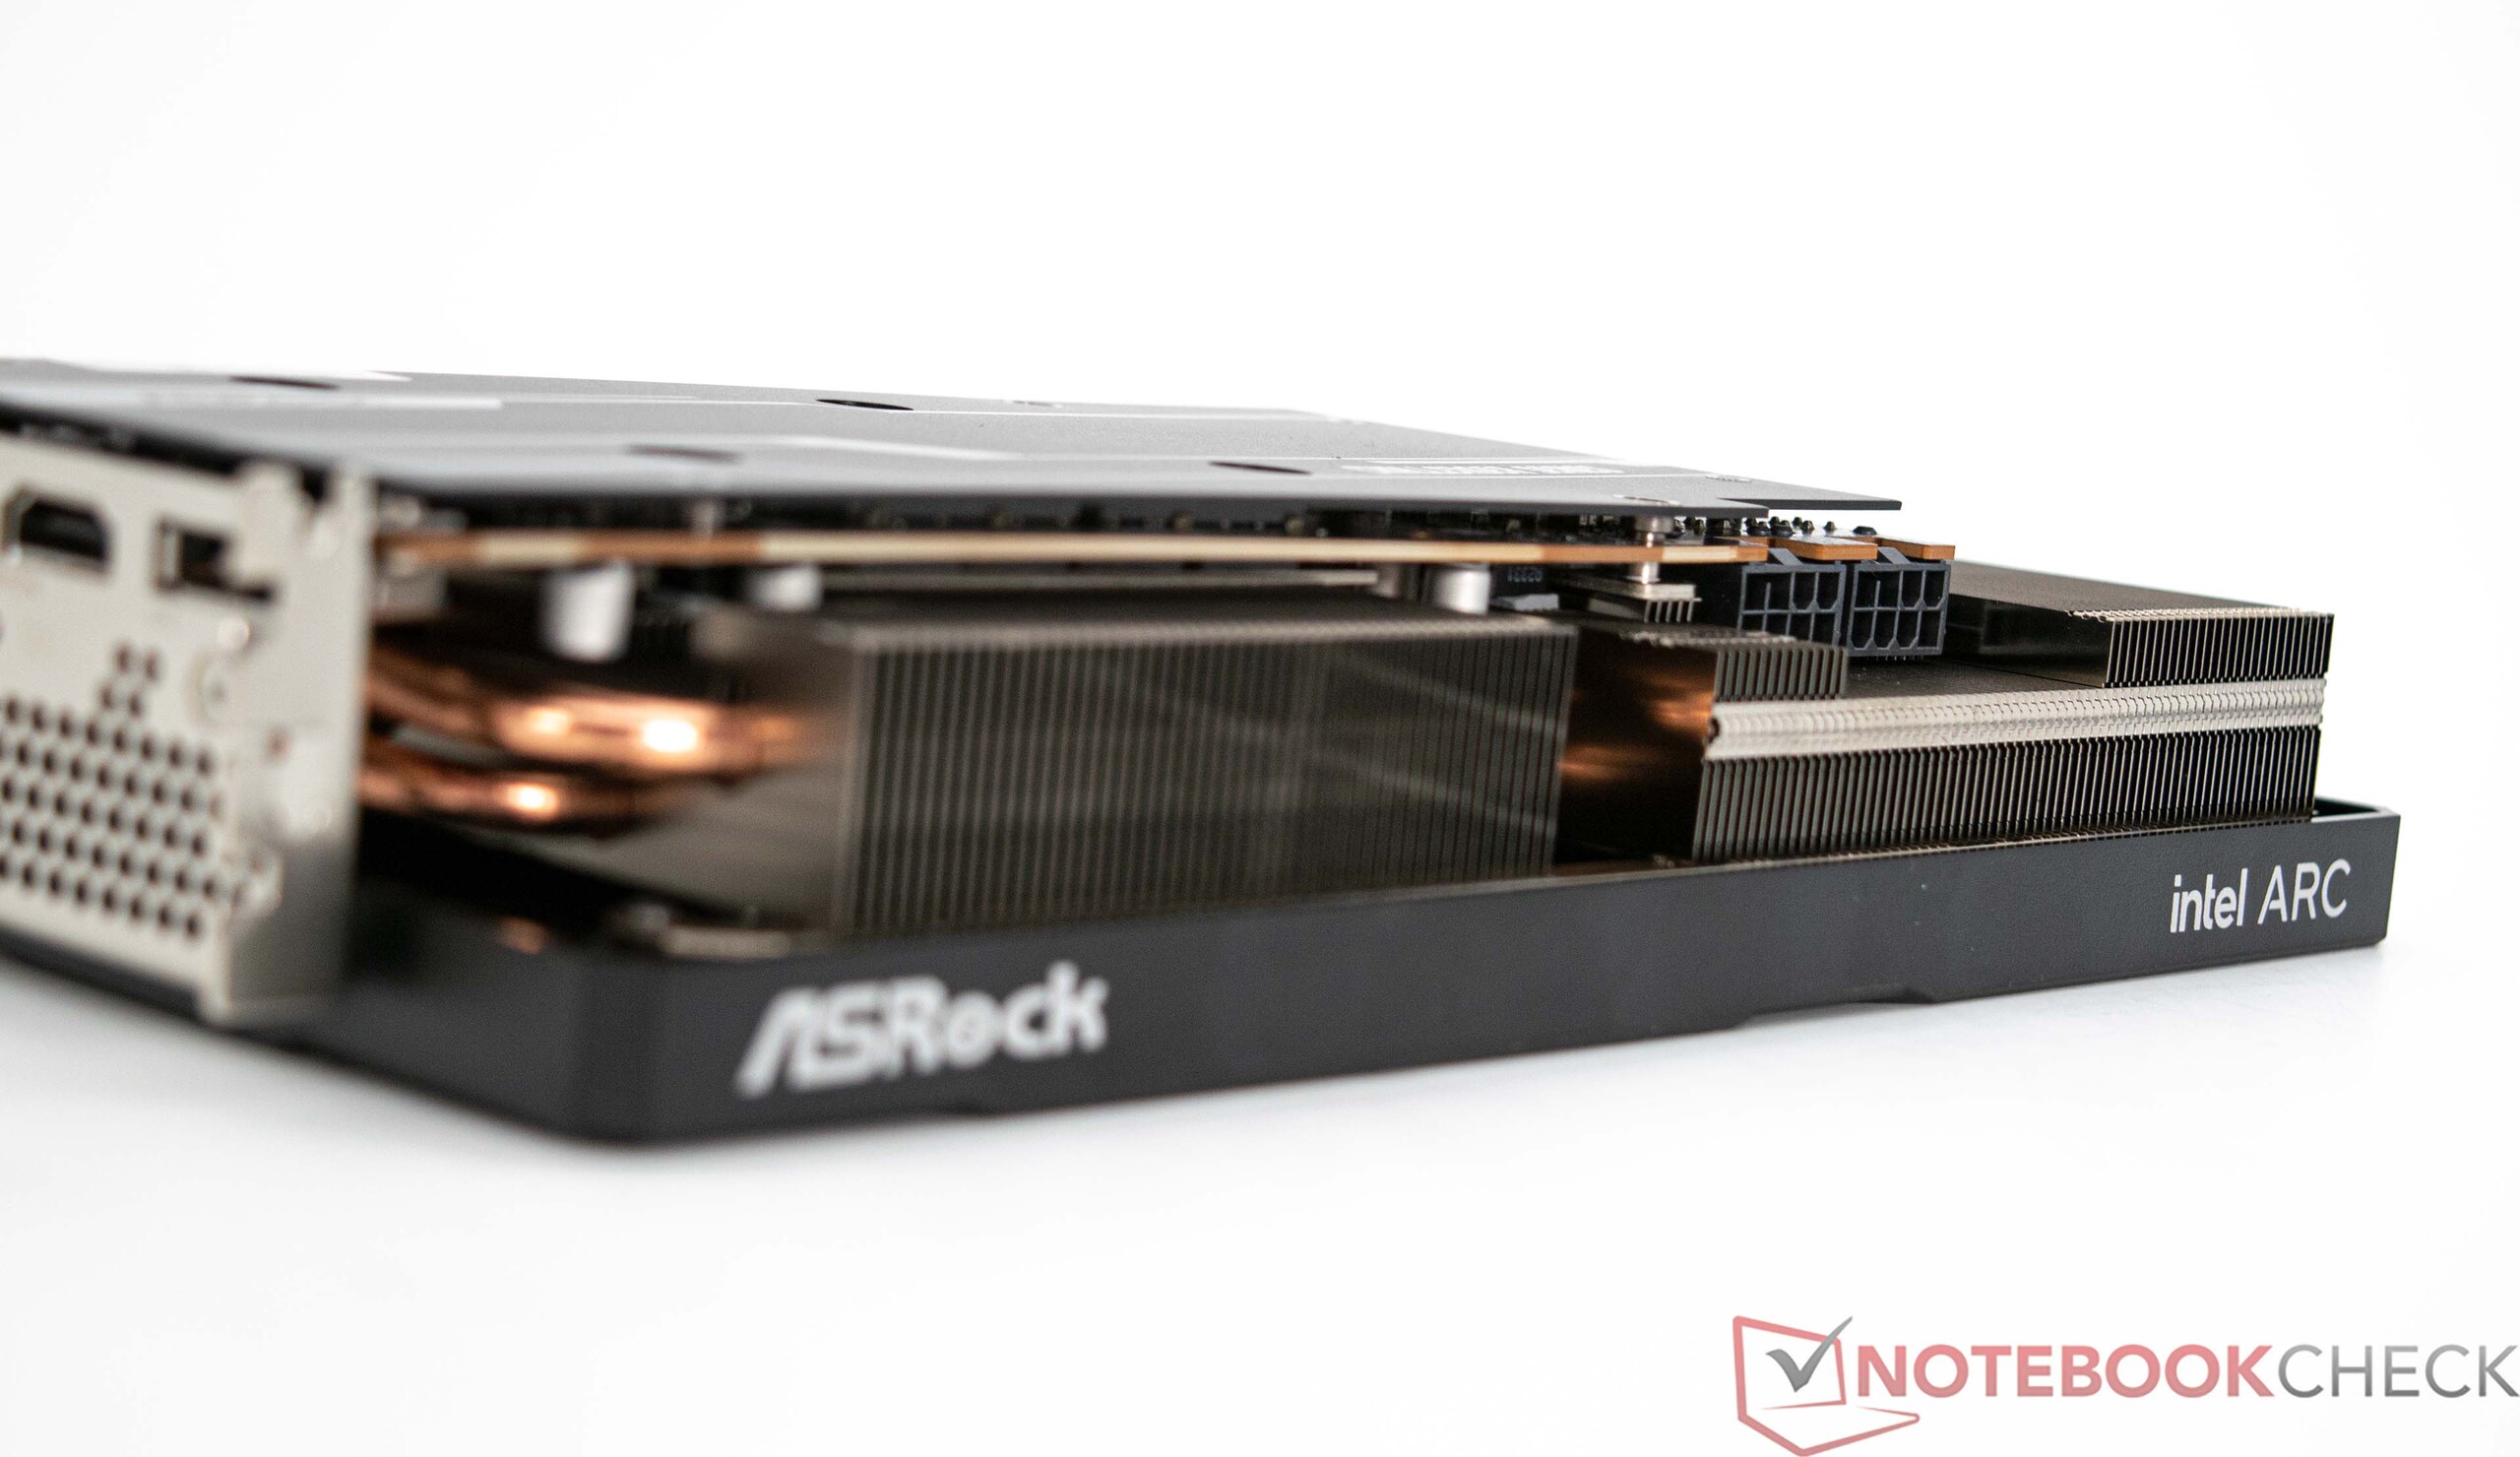
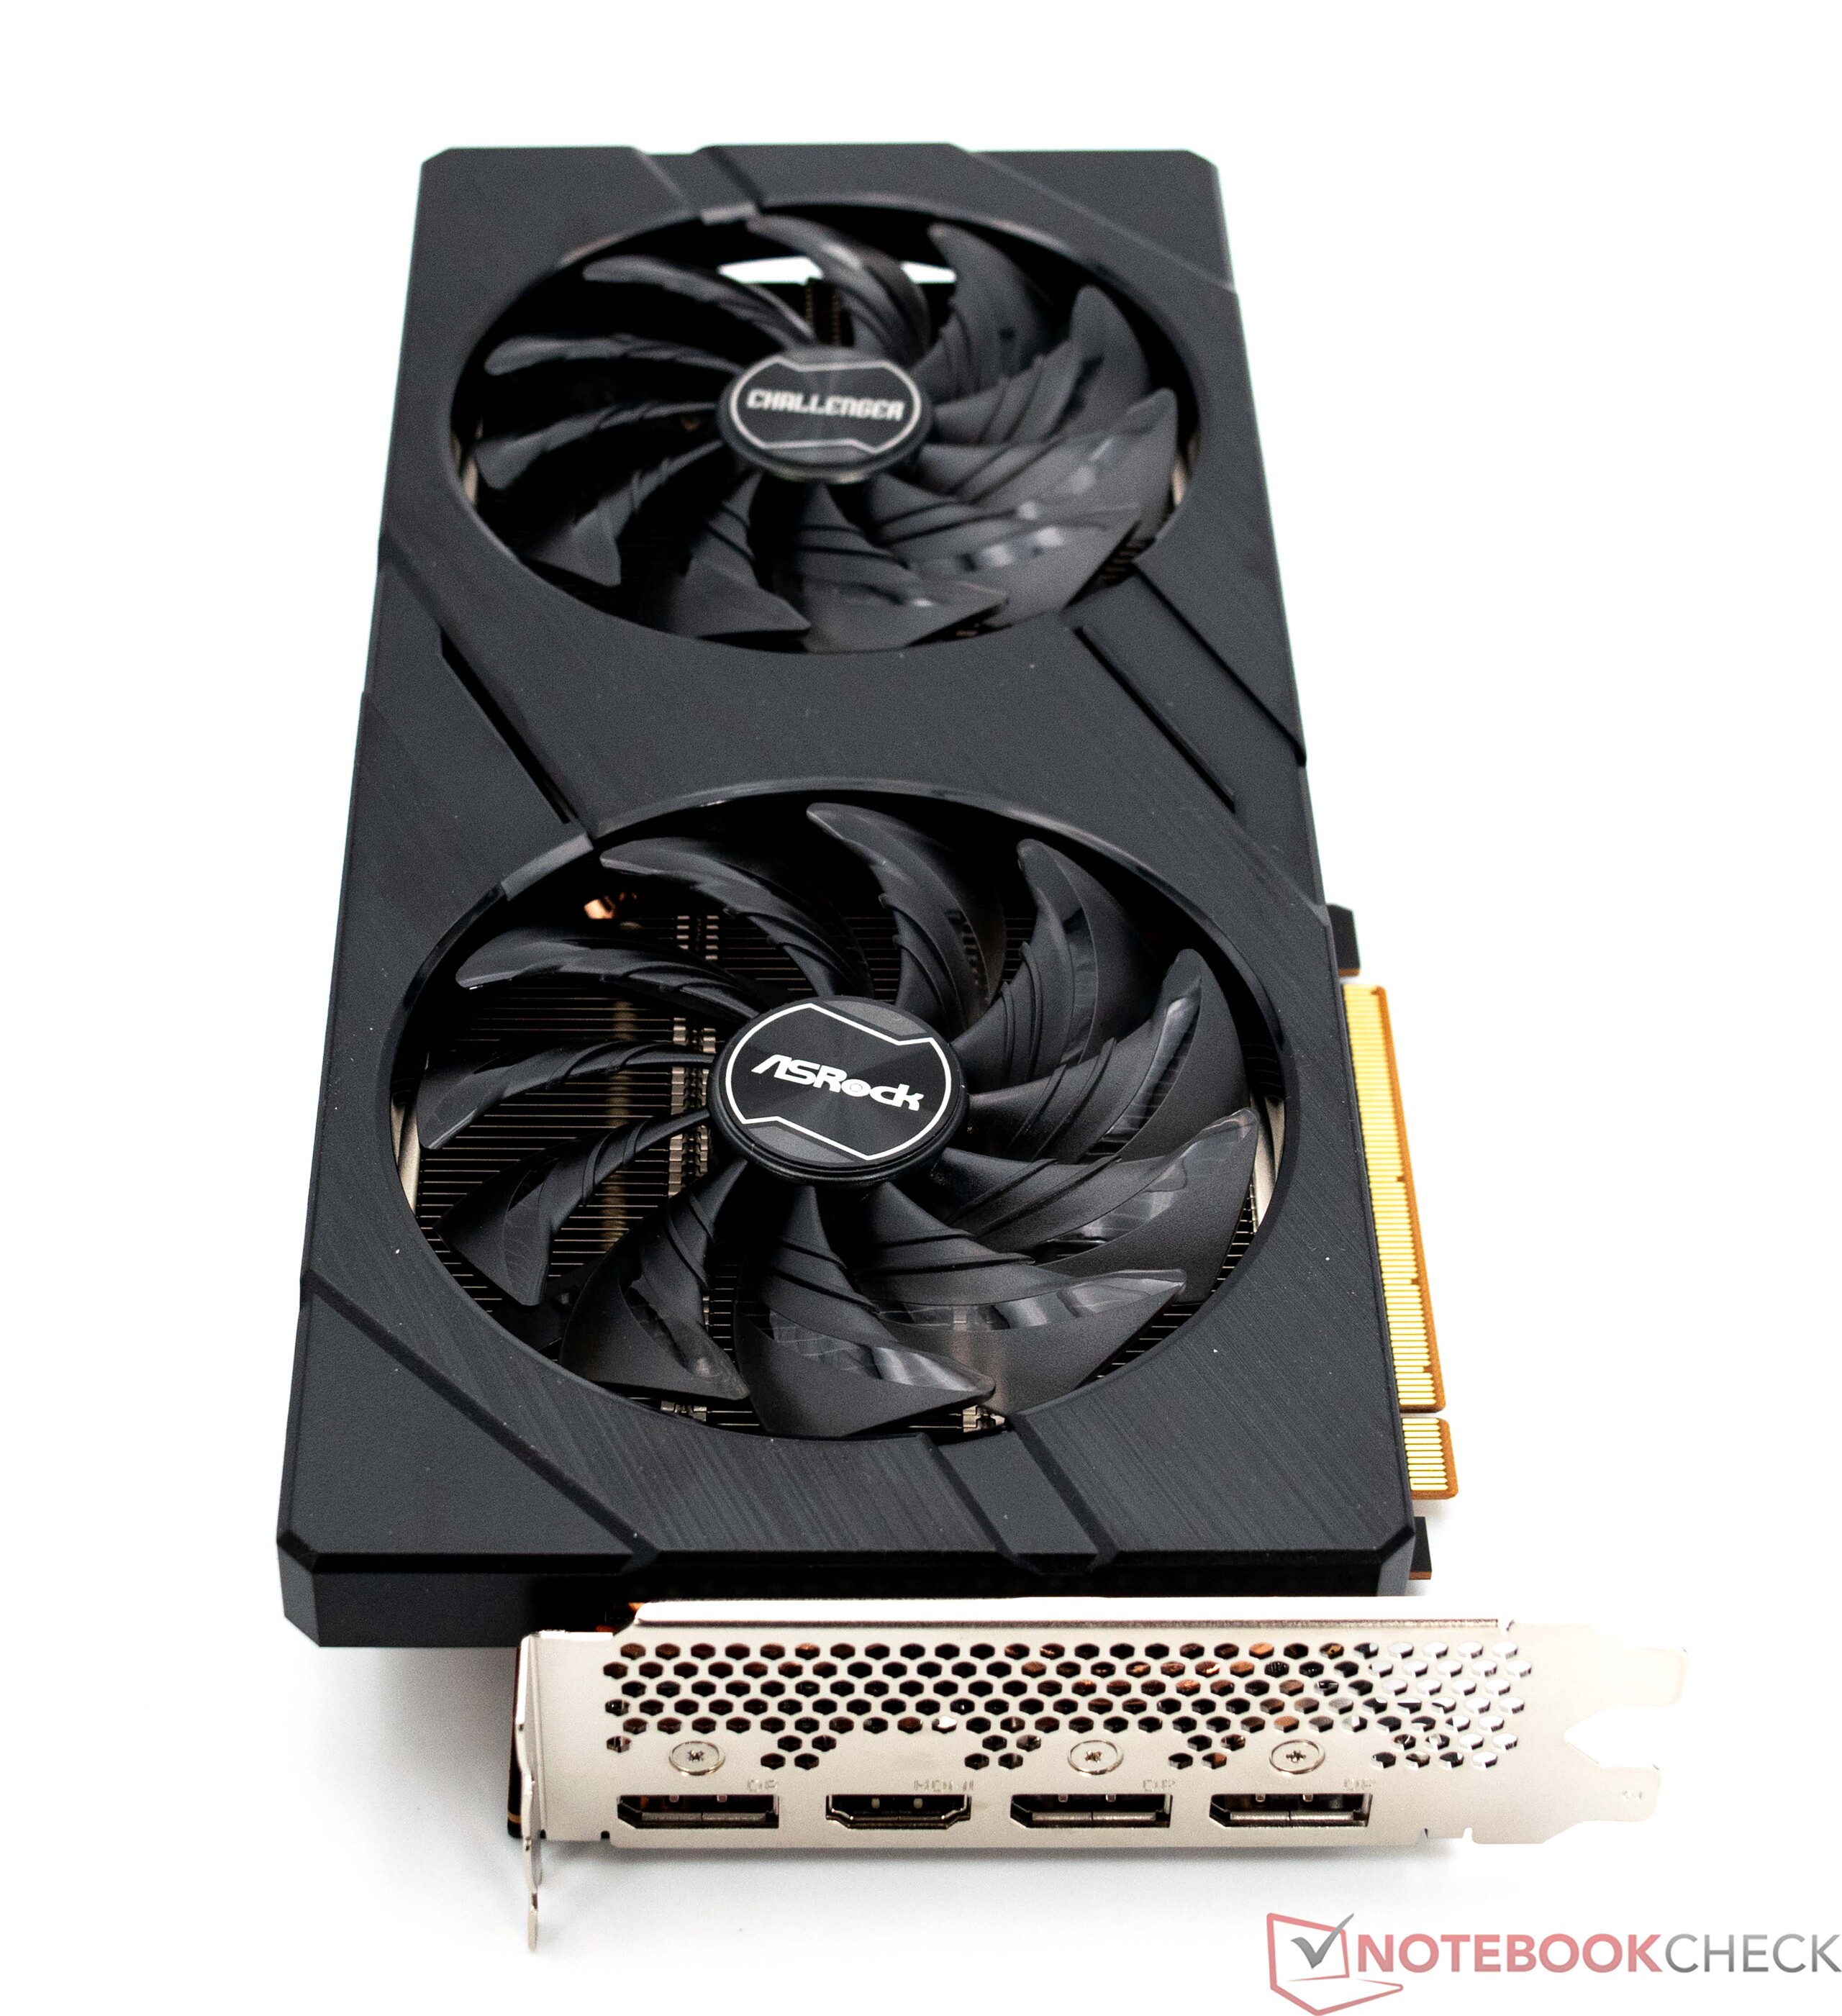
Visually, the ASRock Arc A580 Challenger OC isn't the most eye-catching graphics card and it doesn't feature any RGB elements. Still, its installed cooling unit feels relatively mighty nonetheless—two 100-millimeter fans are supposed to keep the component cool under load. For the 175-watt model, this promises quiet use. Aside from its PCIe 4.0 x16 slot, power is additionally supplied via two 6 + 2 Pin PCIe power sockets. Externally, the ASRock Arc A580 Challenger OC offers an HDMI-2.0 port and three DisplayPort-2.0 connections. Compared to Nvidia, our test sample uses a newer standard, although AMD takes things a step further, with its RX-7000 models featuring DisplayPort 2.1.
Infos about our test system
The ASRock Arc A580 Challenger OC in detail
Tech specs in comparison
| Specifications | Intel Arc A770 | Intel Arc A750 | Intel Arc A580 | Intel Arc A380 | Radeon RX 7700 XT | Radeon RX 7600 | RTX 4060 Ti | RTX 4060 |
| GPU | DG2-512 | DG2-512 | DG2-512 | DG2-128 | Navi 32 XL | Navi 33 XL | AD106 | AD107 |
| Manufacturing process | 6 nm | 6 nm | 6 nm | 6 nm | 5/6 nm | 6 nm | TSMC 4N | TSMC 4N |
| Shading units | 4,096 | 3,584 | 3,072 | 1,024 | 3,456 | 2,048 | 4,352 | 3,072 |
| Texture mapping units | 256 | 224 | 192 | 64 | 216 | 128 | 136 | 96 |
| Ray accelerators | 32 | 28 | 24 | 8 | 54 | 32 | 34 | 24 |
| Base clock | 2,100 MHz | 2,050 MHz | 1,700 MHz | 2,000 MHz | 1,700 MHz | 1,720 MHz | 2,310 MHz | 1,830 MHz |
| Game clock | - | - | - | - | 2,171 MHz | - | - | 1,815 MHz |
| Boost clock | 2,400 MHz | 2,400 MHz | 2,000 MHz | 2,050 MHz | 2,544 MHz | 2,535 MHz | 2,460 MHz | 2,105 MHz |
| Cache | 16 MB | 16 MB | 8 MB | 4 MB | 48 MB | 32 MB | 32 MB | 24 MB |
| Memory bus width | 256-bit | 256-bit | 256-bit | 96-bit | 256-bit | 128-bit | 128-bit | 128-bit |
| Memory bandwidth | 560 GB/s | 512 GB/s | 512 GB/s | 186 GB/s | 432 GB/s | 288 GB/s | 288 GB/s | 272 GB/s |
| Memory size | 16 GB GDDR6 | 8 GB GDDR6 | 8 GB GDDR6 | 6 GB GDDR6 | 12 GB | 8 GB GDDR6 | 8 GB GDDR6 | 8 GB GDDR6 |
| TBP | 225 watts | 225 watts | 175 watts | 75 watts | 245 watts | 165 watts | 160 watts | 115 watts |
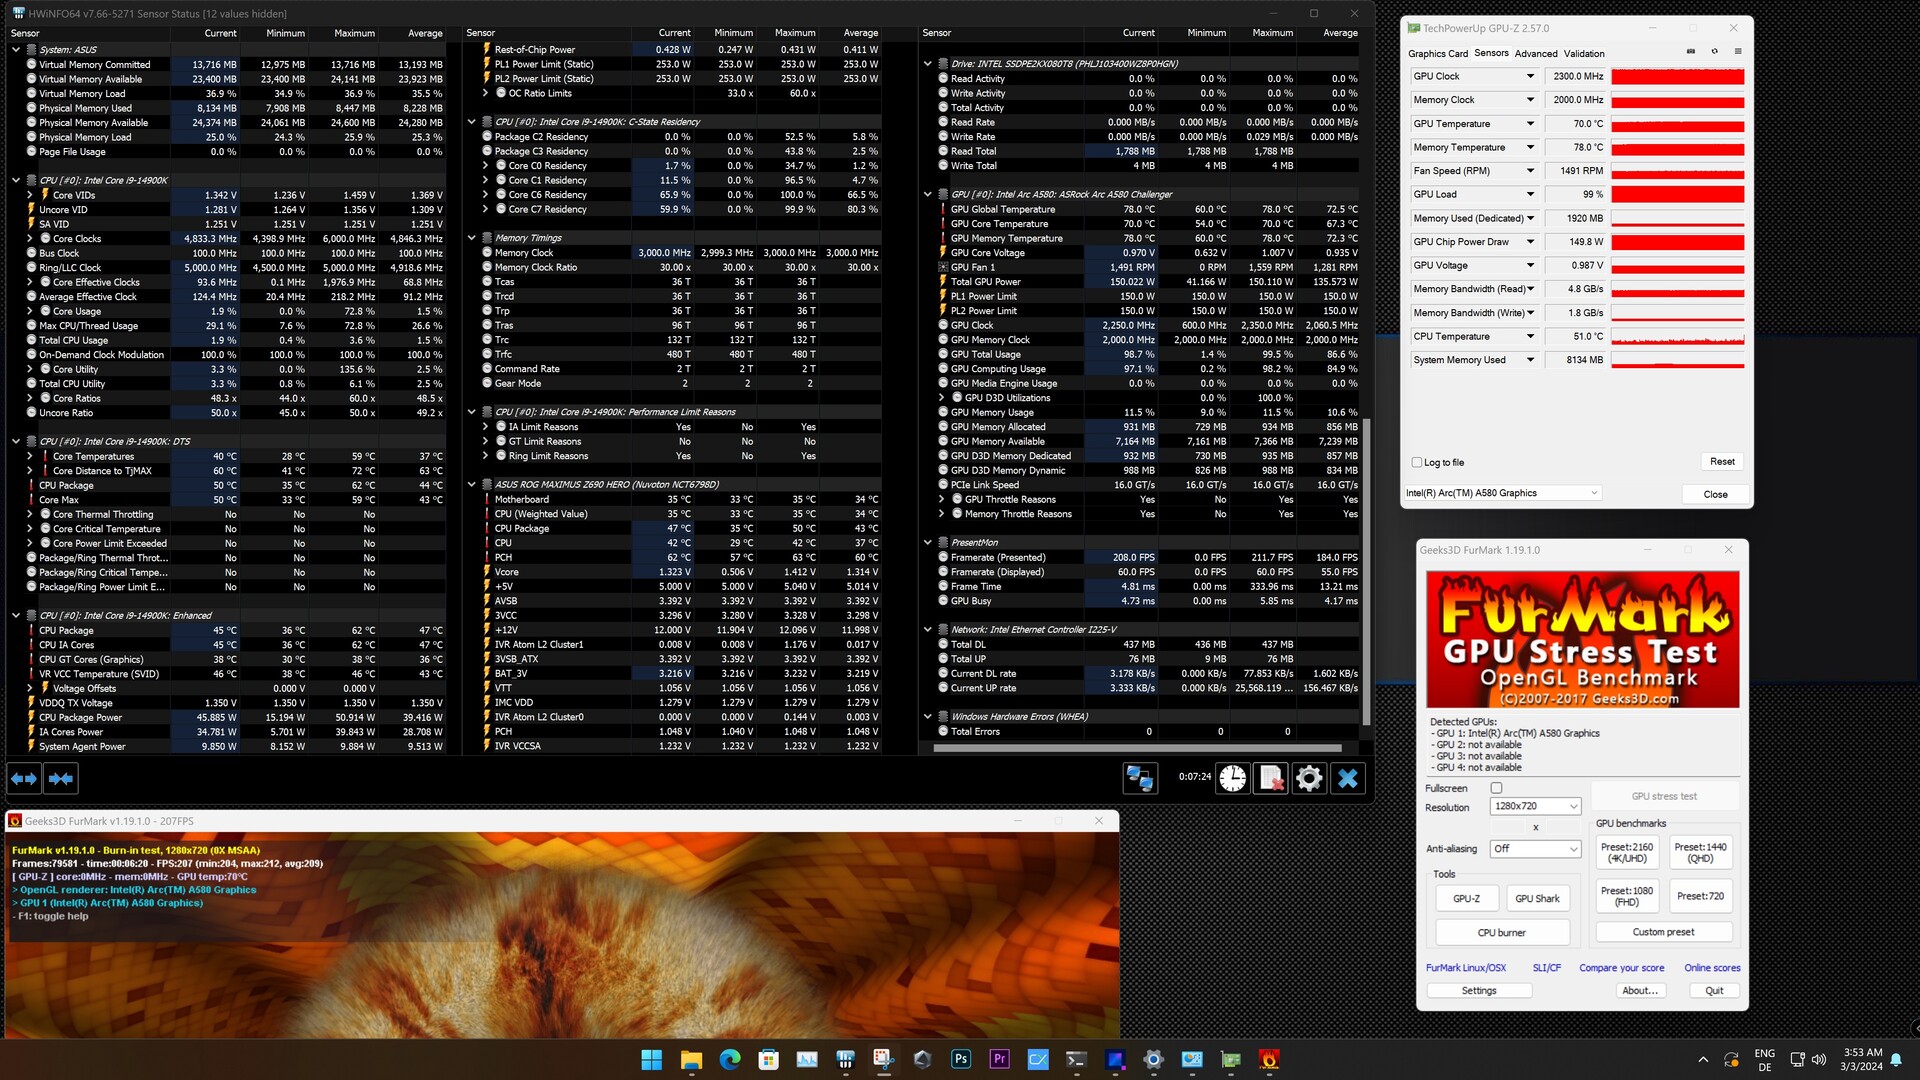
The ASRock Arc A580 Challenger OC's clock rates
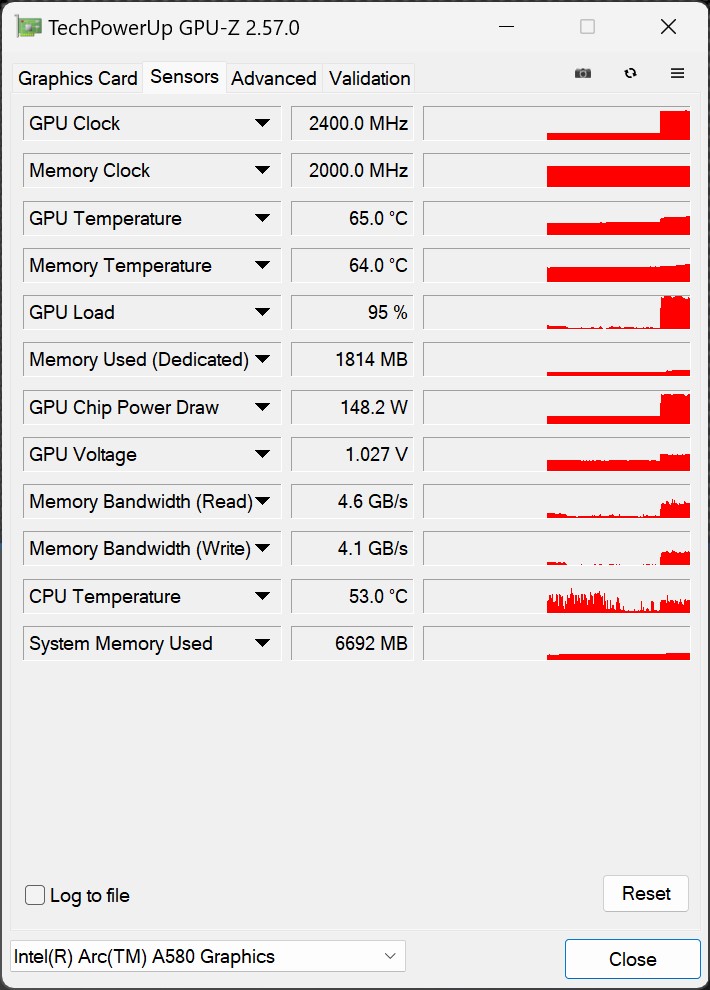
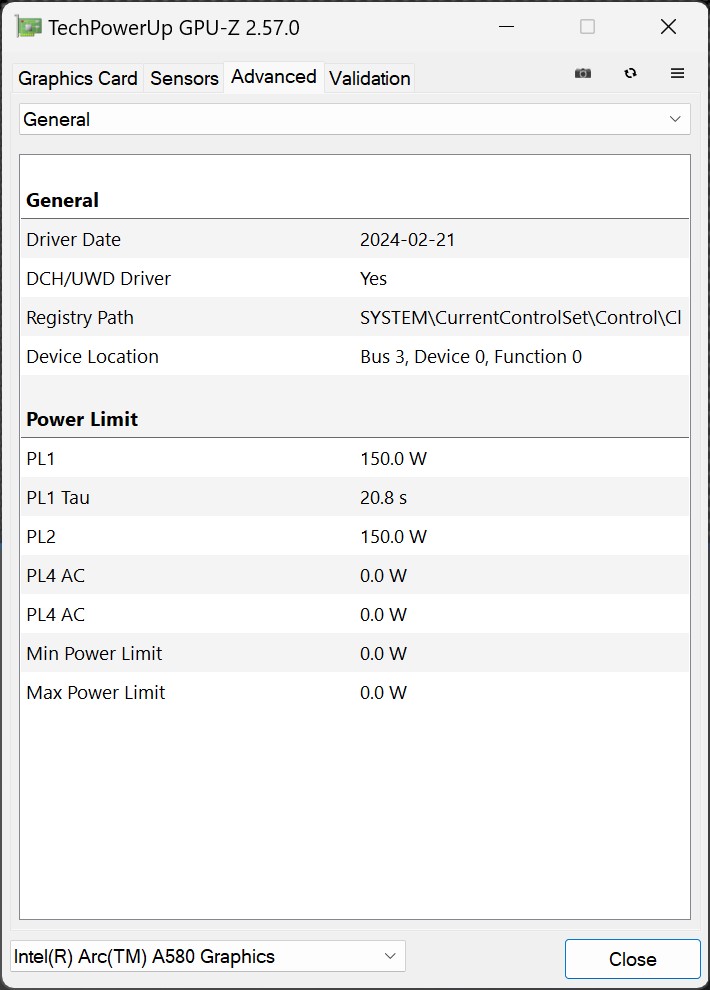
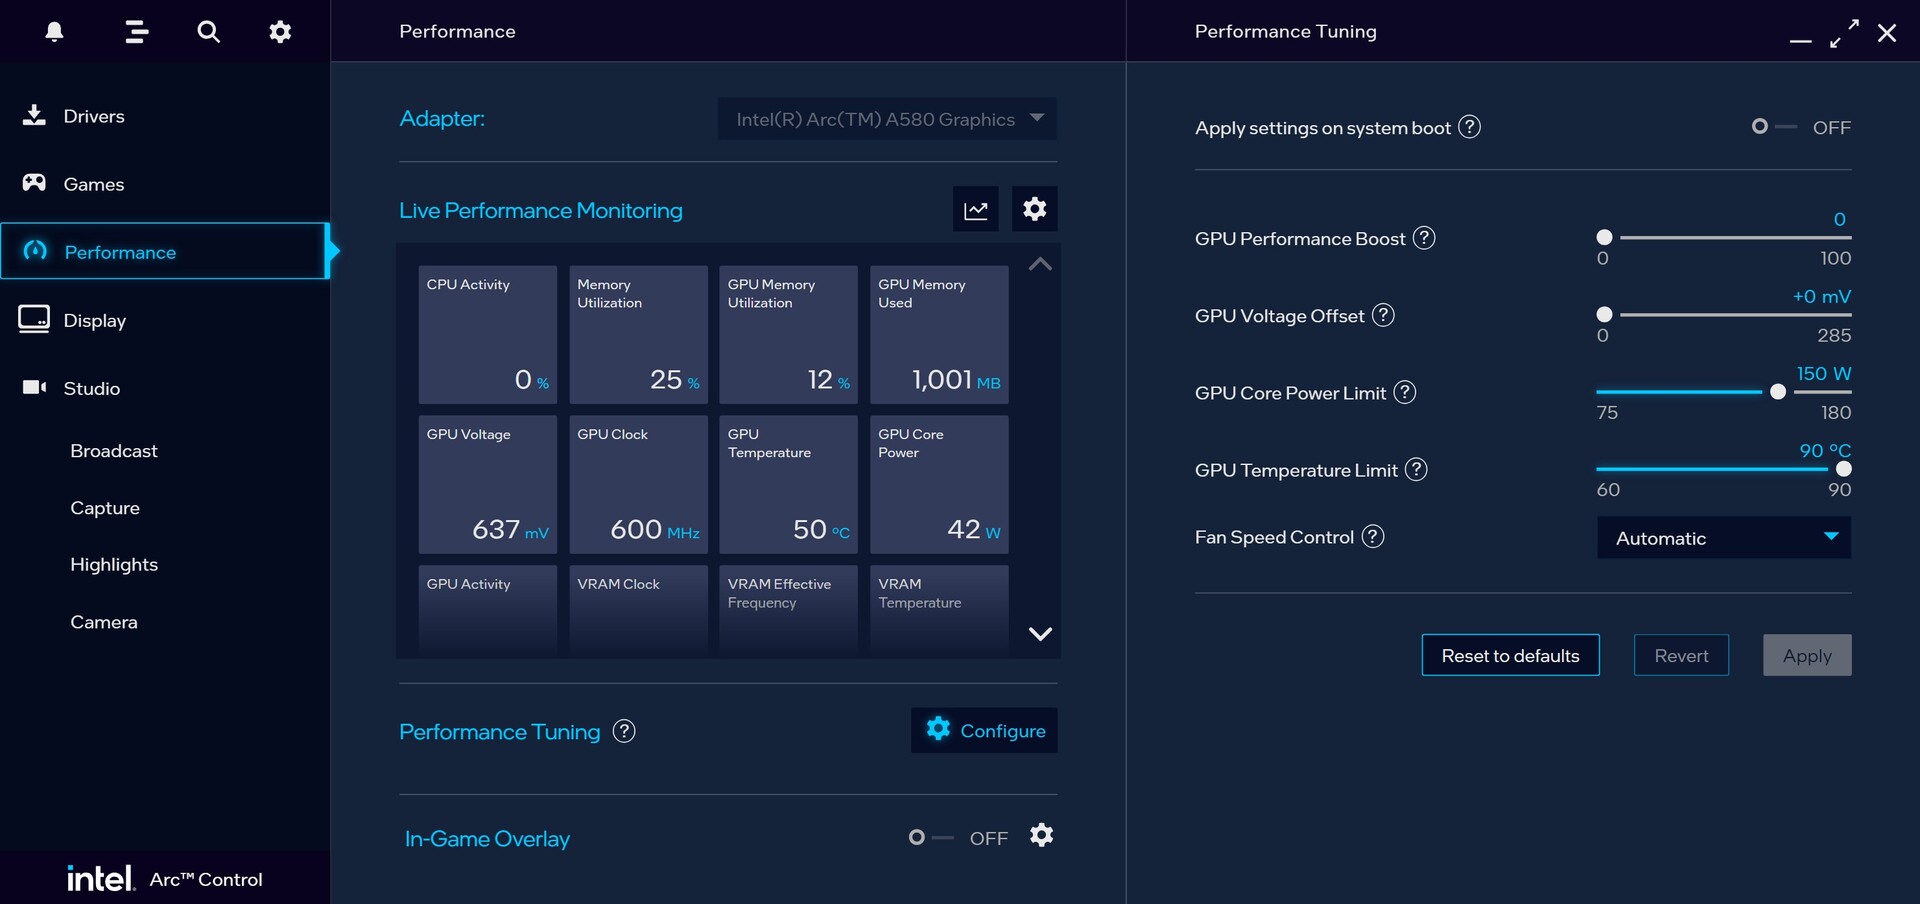
The ASRock Arc A580 Challenger OC's clock rates are considerably higher than those published by Intel as a reference for the Arc A580. The abbreviation OC reveals to us that ASRock has overclocked an Arc A580 graphics card. Under load, we noted that our test sample achieved a maximum GPU clock rate of 2,400 MHz. Furthermore, ASRock has only allowed this model to consume 150 watts. At the same time, you can manually raise this to 180 watts within its driver. However, we didn't change its power target for any of the following benchmarks and tests.
Synthetic benchmarks
The synthetic benchmarks show us the ASRock Arc A580 Challenger OC's rough performance classification. Due to the technical framework conditions, our test sample managed to place itself behind the Acer Predator BiFrost Arc A750 OC by a small margin. Based on the same GPU chip, but with slightly fewer shader units, the gap is relatively small. Nevertheless, it should be noted that Intel isn't able to keep up with the current models from Nvidia and AMD with its current graphics cards. Both an Nvidia GeForce RTX 4060 and an AMD Radeon RX 7600 were significantly faster in some cases—but they also cost a lot more money. In terms of performance, the ASRock Arc A580 Challenger OC can only compete with older graphics cards such as an Nvidia GeForce RTX 2060 Super or an AMD Radeon RX 6600.
| Performance rating - Percent | |
| KFA2 GeForce RTX 4070 Ti EX Gamer | |
| AMD Radeon RX 7900 GRE | |
| AMD Radeon RX 7800 XT | |
| KFA2 GeForce RTX 4070 EX Gamer | |
| Sapphire Pulse Radeon RX 7700 XT | |
| Sapphire Pulse Radeon RX 6750 XT | |
| AMD Radeon RX 6700 XT | |
| KFA2 GeForce RTX 4060 Ti EX, 16GB GDDR6 | |
| Acer Predator BiFrost Arc A770 OC, 16GB GDDR6 | |
| XFX Speedster QICK 308 Radeon RX 7600 Black Edition | |
| Sapphire Nitro+ Radeon RX 6650 XT | |
| Nvidia GeForce RTX 2070 Super | |
| KFA2 GeForce RTX 4060 1-Click-OC 2X | |
| Acer Predator BiFrost Arc A750 OC | |
| ASRock Arc A580 Challenger OC | |
| Nvidia GeForce RTX 2060 Super | |
| Sapphire Pulse Radeon RX 6600 | |
| Affinity Photo 2 - Combined (Single / Multi GPU) | |
| KFA2 GeForce RTX 4070 EX Gamer | |
| KFA2 GeForce RTX 4070 Ti EX Gamer | |
| AMD Radeon RX 7800 XT | |
| Nvidia GeForce RTX 2070 Super | |
| AMD Radeon RX 7900 GRE | |
| Nvidia GeForce RTX 2060 Super | |
| Sapphire Pulse Radeon RX 7700 XT | |
| Sapphire Pulse Radeon RX 6750 XT | |
| KFA2 GeForce RTX 4060 1-Click-OC 2X | |
| KFA2 GeForce RTX 4060 Ti EX, 16GB GDDR6 | |
| XFX Speedster QICK 308 Radeon RX 7600 Black Edition | |
| ASRock Arc A580 Challenger OC | |
| Acer Predator BiFrost Arc A770 OC, 16GB GDDR6 | |
| Acer Predator BiFrost Arc A750 OC | |
| Sapphire Nitro+ Radeon RX 6650 XT | |
| AMD Radeon RX 6700 XT | |
| Sapphire Pulse Radeon RX 6600 | |
| 3DMark 05 Standard | 72998 points | |
| 3DMark 06 Standard Score | 64759 points | |
| 3DMark Vantage P Result | 95677 points | |
| 3DMark 11 Performance | 31518 points | |
| 3DMark Ice Storm Standard Score | 236713 points | |
| 3DMark Cloud Gate Standard Score | 67326 points | |
| 3DMark Fire Strike Score | 25411 points | |
| 3DMark Fire Strike Extreme Score | 12530 points | |
| 3DMark Time Spy Score | 11729 points | |
| 3DMark Steel Nomad Score | 2235 points | |
| 3DMark Steel Nomad Light Score | 9171 points | |
| 3DMark Steel Nomad Light Unlimited Score | 9199 points | |
Help | ||
Professional applications
Both AMD and Nvidia offer specialized graphics cards for professional use. Intel doesn't serve this market, although AMD and Nvidia graphics cards from the consumer sector can also be used for this purpose. In comparison, we noted that the ASRock Arc A580 Challenger OC offered the lowest performance. A similar picture already emerged with the two faster Intel Arc graphics cards. Within the professional sector, you should therefore avoid using Intel Arc graphics cards at present.
| ASRock Arc A580 Challenger OC i9-14900K | Intel Arc A750 R9 7950X | Intel Arc A770 R9 7950X | NVIDIA GeForce RTX 2060 Super (Desktop) R9 7950X | NVIDIA GeForce RTX 2070 Super (Desktop) R9 7950X | NVIDIA GeForce RTX 3060 Ti R9 7950X | NVIDIA GeForce RTX 4060 R9 7950X | NVIDIA GeForce RTX 4060 Ti 16G R9 7950X | NVIDIA GeForce RTX 4070 R9 7950X | NVIDIA GeForce RTX 4070 Ti R9 7950X | AMD Radeon RX 7600 R9 7950X | AMD Radeon RX 7700 XT R9 7950X | AMD Radeon RX 7800 XT R9 7950X | AMD Radeon RX 7900 GRE R9 7950X | AMD Radeon RX 6600 R9 7950X | AMD Radeon RX 6650 XT R9 7950X | AMD Radeon RX 6700 XT R9 7950X | AMD Radeon RX 6750 XT R9 7950X | Average of class | |
|---|---|---|---|---|---|---|---|---|---|---|---|---|---|---|---|---|---|---|---|
| SPECviewperf 12 | 4% | 10% | 70% | 90% | 112% | 115% | 178% | 267% | 393% | 243% | 344% | 410% | 437% | 273% | 341% | 383% | 324% | 103% | |
| 1900x1060 3ds Max (3dsmax-05) (fps) | 154 | 166 8% | 179 16% | 220 43% | 247 60% | 297 93% | 251 63% | 290 88% | 382 148% | 436 183% | 279 81% | 373 142% | 427 177% | 444 188% | 258 68% | 310 101% | 363 136% | 377 145% | 206 ? 34% |
| 1900x1060 Catia (catia-04) (fps) | 162 | 166 2% | 174 7% | 84.5 -48% | 114 -30% | 114 -30% | 113 -30% | 128 -21% | 161 -1% | 192 19% | 273 69% | 351 117% | 386 138% | 448 177% | 256 58% | 314 94% | 339 109% | 360 122% | 113.6 ? -30% |
| 1900x1060 Creo (creo-01) (fps) | 45.5 | 45.7 0% | 45.3 0% | 58.8 29% | 65.7 44% | 65.2 43% | 60.6 33% | 73.4 61% | 89.1 96% | 99.4 118% | 115 153% | 123 170% | 148 225% | 155 241% | 133 192% | 142 212% | 152 234% | 154 238% | 66.6 ? 46% |
| 1900x1060 Energy (energy-01) (fps) | 2.02 | 2.25 11% | 2.44 21% | 11.6 474% | 12.4 514% | 14.4 613% | 15.9 687% | 22.6 1019% | 31.7 1469% | 48 2276% | 25.5 1162% | 33.4 1553% | 38.4 1801% | 40.3 1895% | 31.3 1450% | 37.6 1761% | 40.6 1910% | 30.1 1390% | 16.9 ? 737% |
| 1900x1060 Maya (maya-04) (fps) | 165 | 177 7% | 183 11% | 200 21% | 225 36% | 251 52% | 233 41% | 257 56% | 284 72% | 287 74% | 236 43% | 283 72% | 304 84% | 323 96% | 218 32% | 246 49% | 268 62% | 277 68% | 117.7 ? -29% |
| 1900x1060 Medical (medical-01) (fps) | 40.9 | 42.4 4% | 46.7 14% | 49.5 21% | 55.9 37% | 65.6 60% | 82.4 101% | 110 169% | 132 223% | 157 284% | 128 213% | 177 333% | 200 389% | 226 453% | 102 149% | 137 235% | 150 267% | 144 252% | 59.2 ? 45% |
| 1900x1060 Showcase (showcase-01) (fps) | 108 | 110 2% | 119 10% | 121 12% | 135 25% | 150 39% | 109 1% | 132 22% | 190 76% | 244 126% | 127 18% | 179 66% | 235 118% | 222 106% | 125 16% | 151 40% | 176 63% | 186 72% | 103.7 ? -4% |
| 1900x1060 Solidworks (sw-03) (fps) | 72.3 | 72.6 0% | 73.4 2% | 79.7 10% | 95.1 32% | 93.5 29% | 91.2 26% | 95.1 32% | 109 51% | 118 63% | 221 206% | 288 298% | 322 345% | 319 341% | 232 221% | 242 235% | 275 280% | 290 301% | 89.4 ? 24% |
| SPECviewperf 13 | 6% | 12% | 25% | 45% | 56% | 50% | 81% | 128% | 176% | 150% | 239% | 293% | 315% | 96% | 133% | 175% | 202% | 51% | |
| 3ds Max (3dsmax-06) (fps) | 151 | 163 8% | 179 19% | 218 44% | 247 64% | 297 97% | 252 67% | 289 91% | 381 152% | 433 187% | 280 85% | 371 146% | 434 187% | 439 191% | 258 71% | 310 105% | 360 138% | 379 151% | 196.9 ? 30% |
| Catia (catia-05) (fps) | 240 | 249 4% | 260 8% | 119 -50% | 163 -32% | 167 -30% | 163 -32% | 189 -21% | 241 0% | 290 21% | 410 71% | 529 120% | 588 145% | 661 175% | 387 61% | 482 101% | 528 120% | 565 135% | 211 ? -12% |
| Creo (creo-02) (fps) | 87.5 | 88.6 1% | 90 3% | 203 132% | 240 174% | 243 178% | 230 163% | 301 244% | 375 329% | 455 420% | 294 236% | 387 342% | 442 405% | 470 437% | 279 219% | 317 262% | 353 303% | 389 345% | 216 ? 147% |
| Energy (energy-02) (fps) | 15.7 | 19.3 23% | 22.5 43% | 21.9 39% | 23.8 52% | 26.1 66% | 34.6 120% | 45.3 189% | 54.2 245% | 72.8 364% | 82.9 428% | 115 632% | 139 785% | 150 855% | 44 180% | 59.8 281% | 74.3 373% | 80.6 413% | 39.7 ? 153% |
| Maya (maya-05) (fps) | 285 | 301 6% | 319 12% | 291 2% | 344 21% | 372 31% | 343 20% | 403 41% | 510 79% | 591 107% | 333 17% | 487 71% | 548 92% | 580 104% | 348 22% | 403 41% | 462 62% | 482 69% | 278 ? -2% |
| Medical (medical-02) (fps) | 74.9 | 82.8 11% | 80.8 8% | 54.2 -28% | 63.7 -15% | 74.3 -1% | 76.5 2% | 85.1 14% | 112 50% | 132 76% | 226 202% | 300 301% | 332 343% | 372 397% | 88.8 19% | 105 40% | 148 98% | 202 170% | 88.4 ? 18% |
| Showcase (showcase-02) (fps) | 109 | 110 1% | 119 9% | 122 12% | 135 24% | 150 38% | 108 -1% | 133 22% | 191 75% | 244 124% | 127 17% | 179 64% | 234 115% | 221 103% | 125 15% | 151 39% | 176 61% | 186 71% | 126.2 ? 16% |
| Solidworks (sw-04) (fps) | 79.5 | 76.8 -3% | 77.5 -3% | 119 50% | 136 71% | 135 70% | 127 60% | 135 70% | 157 97% | 168 111% | 195 145% | 265 233% | 294 270% | 287 261% | 220 177% | 231 191% | 272 242% | 286 260% | 124.1 ? 56% |
| SPECviewperf 2020 | 24% | 21% | 12% | 19% | 47% | 35% | 66% | 115% | 161% | 115% | 202% | 283% | 298% | 42% | 77% | 116% | 143% | 76% | |
| 3840x2160 Medical (medical-03) (fps) | 14.5 | 20 38% | 22.3 54% | 10.3 -29% | 12 -17% | 11.9 -18% | 13.7 -6% | 16.5 14% | 22.2 53% | 26.9 86% | 36.1 149% | 56.2 288% | 63.7 339% | 76.1 425% | 20.9 44% | 27.3 88% | 30.1 108% | 39.9 175% | 24 ? 66% |
| 3840x2160 Maya (maya-06) (fps) | 166 | 180 8% | 195 17% | 162 -2% | 185 11% | 235 42% | 196 18% | 237 43% | 305 84% | 372 124% | 178 7% | 261 57% | 346 108% | 161 -3% | 192 16% | 258 55% | 279 68% | 221 ? 33% | |
| 3840x2160 Energy (energy-03) (fps) | 17.6 | 35 99% | 25 42% | 22.9 30% | 17.8 1% | 31.2 77% | 33.2 89% | 44.9 155% | 57.6 227% | 75.7 330% | 67 281% | 95 440% | 111 531% | 133 656% | 29.5 68% | 44.2 151% | 52.2 197% | 56.3 220% | 50 ? 184% |
| 3840x2160 Creo (creo-03) (fps) | 51.7 | 51.9 0% | 52.9 2% | 77.2 49% | 85.8 66% | 91.2 76% | 85.9 66% | 95.9 85% | 112 117% | 121 134% | 106 105% | 130 151% | 151 192% | 159 208% | 93.4 81% | 105 103% | 123 138% | 130 151% | 78.3 ? 51% |
| 3840x2160 CATIA (catia-06) (fps) | 36.7 | 38.9 6% | 38.9 6% | 30.5 -17% | 36.7 0% | 40.5 10% | 34 -7% | 38.5 5% | 51.6 41% | 61.2 67% | 68 85% | 88.8 142% | 101 175% | 107 192% | 60.8 66% | 70.1 91% | 77.2 110% | 83.8 128% | 48.9 ? 33% |
| 3840x2160 3ds Max (3dsmax-07) (fps) | 45.2 | 40.7 -10% | 47.4 5% | 63.1 40% | 69.7 54% | 87 92% | 67.4 49% | 88.8 96% | 122 170% | 147 225% | 72.9 61% | 106 135% | 125 177% | 134 196% | 42.4 -6% | 51.5 14% | 85.4 89% | 96.8 114% | 85 ? 88% |
| Total Average (Program / Settings) | 11% /
10% | 14% /
14% | 36% /
38% | 51% /
54% | 72% /
74% | 67% /
70% | 108% /
112% | 170% /
175% | 243% /
251% | 169% /
174% | 262% /
267% | 329% /
335% | 350% /
355% | 137% /
145% | 184% /
193% | 225% /
234% | 223% /
230% | 77% /
77% |
Gaming performance
In addition to the synthetic tests, the actual gaming tests are much more important for classifying components' performance. However, the ASRock Arc A580 Challenger OC also ranked in a similar way here. Sometimes it did slightly better (although this was often only enough to beat the Sapphire Pulse Radeon RX 6600) and sometimes it did slightly worse. However, its gap to the supposedly faster Acer Predator BiFrost Arc A750 OC wasn't that big—it only came a few percentage points behind.
In general, the ASRock Arc A580 Challenger OC is suitable for 1,080p gaming. You will, however, have to forgo the maximum level of detail when playing most games. At the same time, our test sample did mostly achieve playable frame rates using the "High" preset. On the other hand, there were quite a few games which we tested that the ASRock Arc A580 Challenger OC struggled with. The story games Alan Wake 2 and Avatar Frontiers of Pandora require quite a bit of graphics performance, which brought our affordable test card to its limits quickly. On average, it didn't even manage 50fps. However, this may well change with the help of future driver improvements.
If you would currently like to use an Intel graphics card for gaming, then you'll have to live with some compromises. Even so, we had surprisingly few problems during our test. Within the entry-level range below US$200, the ASRock Arc A580 Challenger OC is definitely worth thinking about and it is clearly currently the best graphics card within this segment.
| F1 2021 | |
| 1920x1080 Ultra High Preset + Raytracing AA:T AF:16x | |
| KFA2 GeForce RTX 4070 Ti EX Gamer (874931) | |
| KFA2 GeForce RTX 4070 EX Gamer (874931) | |
| AMD Radeon RX 7900 GRE (874931) | |
| AMD Radeon RX 7800 XT (874931) | |
| KFA2 GeForce RTX 4060 Ti EX, 16GB GDDR6 (874931) | |
| Sapphire Pulse Radeon RX 7700 XT (874931) | |
| Sapphire Pulse Radeon RX 6750 XT (874931) | |
| AMD Radeon RX 6700 XT (874931) | |
| XFX Speedster QICK 308 Radeon RX 7600 Black Edition (874931) | |
| Acer Predator BiFrost Arc A770 OC, 16GB GDDR6 (874931) | |
| Nvidia GeForce RTX 2070 Super (874931) | |
| Sapphire Nitro+ Radeon RX 6650 XT (874931) | |
| Acer Predator BiFrost Arc A750 OC (874931) | |
| ASRock Arc A580 Challenger OC (874931) | |
| Nvidia GeForce RTX 2060 Super (874931) | |
| Sapphire Pulse Radeon RX 6600 (874931) | |
| 2560x1440 Ultra High Preset + Raytracing AA:T AF:16x | |
| KFA2 GeForce RTX 4070 Ti EX Gamer (874931) | |
| KFA2 GeForce RTX 4070 EX Gamer (874931) | |
| AMD Radeon RX 7900 GRE (874931) | |
| AMD Radeon RX 7800 XT (874931) | |
| Sapphire Pulse Radeon RX 7700 XT (874931) | |
| KFA2 GeForce RTX 4060 Ti EX, 16GB GDDR6 (874931) | |
| Sapphire Pulse Radeon RX 6750 XT (874931) | |
| AMD Radeon RX 6700 XT (874931) | |
| Acer Predator BiFrost Arc A770 OC, 16GB GDDR6 (874931) | |
| XFX Speedster QICK 308 Radeon RX 7600 Black Edition (874931) | |
| Nvidia GeForce RTX 2070 Super (874931) | |
| Acer Predator BiFrost Arc A750 OC (874931) | |
| Sapphire Nitro+ Radeon RX 6650 XT (874931) | |
| ASRock Arc A580 Challenger OC (874931) | |
| Nvidia GeForce RTX 2060 Super (874931) | |
| Sapphire Pulse Radeon RX 6600 (874931) | |
| F1 23 | |
| 1920x1080 Ultra High Preset AA:T AF:16x | |
| KFA2 GeForce RTX 4070 EX Gamer | |
| AMD Radeon RX 7900 GRE (1016022) | |
| AMD Radeon RX 7800 XT (1022189) | |
| KFA2 GeForce RTX 4060 Ti EX, 16GB GDDR6 (1022189) | |
| Sapphire Pulse Radeon RX 7700 XT (1026791) | |
| Acer Predator BiFrost Arc A770 OC, 16GB GDDR6 (1026791) | |
| KFA2 GeForce RTX 4060 1-Click-OC 2X (1008687) | |
| Sapphire Pulse Radeon RX 6750 XT (1016022) | |
| Acer Predator BiFrost Arc A750 OC (1042581) | |
| Nvidia GeForce RTX 2070 Super (1021115) | |
| AMD Radeon RX 6700 XT (1016022) | |
| XFX Speedster QICK 308 Radeon RX 7600 Black Edition (1016022) | |
| ASRock Arc A580 Challenger OC (1082038) | |
| Nvidia GeForce RTX 2060 Super (1021115) | |
| Sapphire Nitro+ Radeon RX 6650 XT (1016022) | |
| Sapphire Pulse Radeon RX 6600 (1016022) | |
| 2560x1440 Ultra High Preset AA:T AF:16x | |
| KFA2 GeForce RTX 4070 EX Gamer | |
| AMD Radeon RX 7900 GRE (1016022) | |
| AMD Radeon RX 7800 XT (1022189) | |
| KFA2 GeForce RTX 4060 Ti EX, 16GB GDDR6 (1022189) | |
| Sapphire Pulse Radeon RX 7700 XT (1026791) | |
| Acer Predator BiFrost Arc A770 OC, 16GB GDDR6 (1026791) | |
| KFA2 GeForce RTX 4060 1-Click-OC 2X (1008687) | |
| Sapphire Pulse Radeon RX 6750 XT (1016022) | |
| Acer Predator BiFrost Arc A750 OC (1042581) | |
| Nvidia GeForce RTX 2070 Super (1021115) | |
| AMD Radeon RX 6700 XT (1016022) | |
| XFX Speedster QICK 308 Radeon RX 7600 Black Edition (1016022) | |
| ASRock Arc A580 Challenger OC (1082038) | |
| Nvidia GeForce RTX 2060 Super (1021115) | |
| Sapphire Nitro+ Radeon RX 6650 XT (1016022) | |
| Sapphire Pulse Radeon RX 6600 (1016022) | |
The ASRock Arc A580 Challenger OC's P1 values
Ray-tracing performance
In terms of ray-tracing performance, the ASRock Arc A580 Challenger OC relies on 24 RT cores. In our test, our test sample managed to assert itself somewhat more clearly against AMD and it even partially achieved a performance level comparable to the AMD Radeon RX 7600. Compared to Nvidia, however, Intel has to admit defeat. With activated ray tracing, its average frame rates sink considerably. If you want to game without compromise, then you might want to look around for a more powerful graphics card.
Intel's XeSS gives you the option to increase frame rates through AI upscaling. Lots of games offer this feature these days and AMD's FSR technology is made available to Intel GPUs, too.
| Metro Exodus - 1920x1080 Ultra Quality DXR AF:16x | |
| KFA2 GeForce RTX 4070 Ti EX Gamer | |
| MSI Radeon RX 6950 XT Gaming X Trio | |
| KFA2 GeForce RTX 4070 EX Gamer | |
| AMD Radeon RX 7900 GRE | |
| AMD Radeon RX 7800 XT | |
| KFA2 GeForce RTX 3070 Ti SG | |
| Sapphire Pulse Radeon RX 7700 XT | |
| ASUS Dual GeForce RTX 4060 Ti OC | |
| Nvidia GeForce RTX 3060 Ti FE | |
| Acer Predator BiFrost Arc A770 OC, 16GB GDDR6 | |
| Sapphire Pulse Radeon RX 6750 XT | |
| KFA2 GeForce RTX 4060 1-Click-OC 2X | |
| Acer Predator BiFrost Arc A750 OC | |
| XFX Speedster QICK 308 Radeon RX 7600 Black Edition | |
| Nvidia GeForce RTX 2070 Super | |
| ASRock Arc A580 Challenger OC | |
| Nvidia GeForce RTX 2060 Super | |
| Sapphire Pulse Radeon RX 6600 | |
| Spider-Man Miles Morales - 1920x0180 Very High Preset + Ray-Tracing AA:T | |
| KFA2 GeForce RTX 4070 Ti EX Gamer | |
| KFA2 GeForce RTX 4070 EX Gamer | |
| AMD Radeon RX 7800 XT | |
| MSI Radeon RX 6950 XT Gaming X Trio | |
| KFA2 GeForce RTX 3070 Ti SG | |
| AMD Radeon RX 7900 GRE | |
| ASUS Dual GeForce RTX 4060 Ti OC | |
| Sapphire Pulse Radeon RX 7700 XT | |
| AMD Radeon RX 6800 | |
| Nvidia GeForce RTX 3060 Ti FE | |
| Acer Predator BiFrost Arc A770 OC, 16GB GDDR6 | |
| KFA2 GeForce RTX 4060 1-Click-OC 2X | |
| Sapphire Pulse Radeon RX 6750 XT | |
| Nvidia GeForce RTX 2070 Super | |
| ASRock Arc A580 Challenger OC | |
| XFX Speedster QICK 308 Radeon RX 7600 Black Edition | |
| Acer Predator BiFrost Arc A750 OC | |
| Nvidia GeForce RTX 2060 Super | |
| Sapphire Nitro+ Radeon RX 6650 XT | |
| Sapphire Pulse Radeon RX 6600 | |
| Far Cry 6 - 1920x1080 Ultra Graphics Quality + HD Textures + DXR AA:T | |
| KFA2 GeForce RTX 4070 Ti EX Gamer | |
| AMD Radeon RX 7900 GRE | |
| MSI Radeon RX 6950 XT Gaming X Trio | |
| KFA2 GeForce RTX 4070 EX Gamer | |
| AMD Radeon RX 7800 XT | |
| AMD Radeon RX 6800 | |
| Sapphire Pulse Radeon RX 7700 XT | |
| Sapphire Pulse Radeon RX 6750 XT | |
| Acer Predator BiFrost Arc A770 OC, 16GB GDDR6 | |
| Acer Predator BiFrost Arc A750 OC | |
| ASRock Arc A580 Challenger OC | |
| XFX Speedster QICK 308 Radeon RX 7600 Black Edition | |
| KFA2 GeForce RTX 3070 Ti SG | |
| Nvidia GeForce RTX 2070 Super | |
| Nvidia GeForce RTX 2060 Super | |
| KFA2 GeForce RTX 4060 1-Click-OC 2X | |
| Cyberpunk 2077 1.6 - 1920x1080 Ray Tracing Ultra Preset (DLSS off) | |
| KFA2 GeForce RTX 4070 Ti EX Gamer | |
| KFA2 GeForce RTX 4070 EX Gamer | |
| AMD Radeon RX 7900 GRE (1.6) | |
| ASUS Dual GeForce RTX 4060 Ti OC (1.6) | |
| MSI Radeon RX 6950 XT Gaming X Trio (1.61) | |
| KFA2 GeForce RTX 3070 Ti SG (1.61) | |
| AMD Radeon RX 7800 XT (1.6) | |
| Nvidia GeForce RTX 3060 Ti FE (1.5) | |
| Sapphire Pulse Radeon RX 7700 XT (1.6) | |
| Sapphire Pulse Radeon RX 7700 XT (1.6) | |
| Sapphire Pulse Radeon RX 7700 XT (1.6) | |
| KFA2 GeForce RTX 4060 1-Click-OC 2X (1.6) | |
| AMD Radeon RX 6800 (1.61) | |
| Nvidia GeForce RTX 2070 Super (1.6) | |
| Acer Predator BiFrost Arc A770 OC, 16GB GDDR6 (1.6) | |
| Sapphire Pulse Radeon RX 6750 XT | |
| Acer Predator BiFrost Arc A750 OC (1.6) | |
| Nvidia GeForce RTX 2060 Super (1.6) | |
| ASRock Arc A580 Challenger OC (1.6) | |
| XFX Speedster QICK 308 Radeon RX 7600 Black Edition (1.6) | |
| Sapphire Nitro+ Radeon RX 6650 XT (1.5) | |
| The Callisto Protocol - 1920x1080 Ultra Preset (without FSR Upscaling) + Full Ray-Tracing | |
| AMD Radeon RX 7800 XT | |
| AMD Radeon RX 7900 GRE | |
| KFA2 GeForce RTX 4070 Ti EX Gamer | |
| Sapphire Pulse Radeon RX 7700 XT | |
| ASUS Dual GeForce RTX 4060 Ti OC | |
| MSI Radeon RX 6950 XT Gaming X Trio | |
| Nvidia GeForce RTX 3060 Ti FE | |
| KFA2 GeForce RTX 4070 EX Gamer | |
| AMD Radeon RX 6800 | |
| XFX Speedster QICK 308 Radeon RX 7600 Black Edition | |
| KFA2 GeForce RTX 3070 Ti SG | |
| Acer Predator BiFrost Arc A770 OC, 16GB GDDR6 | |
| Acer Predator BiFrost Arc A750 OC | |
| ASRock Arc A580 Challenger OC | |
| Sapphire Nitro+ Radeon RX 6650 XT | |
| Nvidia GeForce RTX 2070 Super | |
| Sapphire Pulse Radeon RX 6600 | |
| Nvidia GeForce RTX 2060 Super | |
| Sapphire Pulse Radeon RX 6750 XT | |
| PNY GeForce GTX 1660 | |
| KFA2 GeForce GTX 1660 Super | |
| Guardians of the Galaxy - 1920x1080 Ultra Preset + Ultra Ray-Tracing | |
| KFA2 GeForce RTX 4070 Ti EX Gamer | |
| KFA2 GeForce RTX 4070 EX Gamer | |
| AMD Radeon RX 7900 GRE | |
| MSI Radeon RX 6950 XT Gaming X Trio | |
| ASUS Dual GeForce RTX 4060 Ti OC | |
| AMD Radeon RX 7800 XT | |
| Nvidia GeForce RTX 3060 Ti FE | |
| KFA2 GeForce RTX 4060 1-Click-OC 2X | |
| Sapphire Pulse Radeon RX 7700 XT | |
| Nvidia GeForce RTX 2070 Super | |
| Sapphire Pulse Radeon RX 6750 XT | |
| Acer Predator BiFrost Arc A770 OC, 16GB GDDR6 | |
| Nvidia GeForce RTX 2060 Super | |
| Acer Predator BiFrost Arc A750 OC | |
| XFX Speedster QICK 308 Radeon RX 7600 Black Edition | |
| ASRock Arc A580 Challenger OC | |
| Sapphire Nitro+ Radeon RX 6650 XT | |
| Returnal - 1920x1080 Epic Preset + Epic Ray-Tracing | |
| KFA2 GeForce RTX 4070 Ti EX Gamer | |
| KFA2 GeForce RTX 4070 EX Gamer | |
| AMD Radeon RX 7900 GRE | |
| AMD Radeon RX 7800 XT | |
| ASUS Dual GeForce RTX 4060 Ti OC | |
| Sapphire Pulse Radeon RX 7700 XT | |
| Nvidia GeForce RTX 3060 Ti FE | |
| AMD Radeon RX 6800 | |
| KFA2 GeForce RTX 4060 1-Click-OC 2X | |
| Nvidia GeForce RTX 2070 Super | |
| Sapphire Pulse Radeon RX 6750 XT | |
| Nvidia GeForce RTX 2060 Super | |
| XFX Speedster QICK 308 Radeon RX 7600 Black Edition | |
| Acer Predator BiFrost Arc A770 OC, 16GB GDDR6 | |
| Acer Predator BiFrost Arc A750 OC | |
| Sapphire Nitro+ Radeon RX 6650 XT | |
| ASRock Arc A580 Challenger OC | |
| F1 23 - 1920x1080 Ultra High Preset AA:T AF:16x | |
| KFA2 GeForce RTX 4070 EX Gamer | |
| AMD Radeon RX 7900 GRE (1016022) | |
| MSI Radeon RX 6950 XT Gaming X Trio (1016022) | |
| AMD Radeon RX 7800 XT (1022189) | |
| KFA2 GeForce GTX 1660 Super (1016022) | |
| ASUS Dual GeForce RTX 4060 Ti OC (1012607) | |
| PNY GeForce GTX 1660 (1016022) | |
| Sapphire Pulse Radeon RX 7700 XT (1026791) | |
| Nvidia GeForce RTX 3060 Ti FE (1021115) | |
| AMD Radeon RX 6800 (1016022) | |
| Acer Predator BiFrost Arc A770 OC, 16GB GDDR6 (1026791) | |
| KFA2 GeForce RTX 4060 1-Click-OC 2X (1008687) | |
| Sapphire Pulse Radeon RX 6750 XT (1016022) | |
| Acer Predator BiFrost Arc A750 OC (1042581) | |
| Nvidia GeForce RTX 2070 Super (1021115) | |
| XFX Speedster QICK 308 Radeon RX 7600 Black Edition (1016022) | |
| ASRock Arc A580 Challenger OC (1082038) | |
| Nvidia GeForce RTX 2060 Super (1021115) | |
| Sapphire Nitro+ Radeon RX 6650 XT (1016022) | |
| Sapphire Pulse Radeon RX 6600 (1016022) | |
| Star Wars Jedi Survivor - 1920x1080 Epic Preset + Ray Tracing | |
| KFA2 GeForce RTX 4070 Ti EX Gamer | |
| MSI Radeon RX 6950 XT Gaming X Trio | |
| AMD Radeon RX 7900 GRE | |
| KFA2 GeForce RTX 4070 EX Gamer | |
| AMD Radeon RX 7800 XT | |
| Sapphire Pulse Radeon RX 7700 XT | |
| AMD Radeon RX 6800 | |
| Nvidia GeForce RTX 3060 Ti FE | |
| ASUS Dual GeForce RTX 4060 Ti OC | |
| Sapphire Pulse Radeon RX 6750 XT | |
| KFA2 GeForce RTX 4060 1-Click-OC 2X | |
| Nvidia GeForce RTX 2070 Super | |
| Acer Predator BiFrost Arc A770 OC, 16GB GDDR6 | |
| XFX Speedster QICK 308 Radeon RX 7600 Black Edition | |
| Sapphire Nitro+ Radeon RX 6650 XT | |
| Acer Predator BiFrost Arc A750 OC | |
| Nvidia GeForce RTX 2060 Super | |
| ASRock Arc A580 Challenger OC | |
| Sapphire Pulse Radeon RX 6600 | |
| Hogwarts Legacy - 1920x1080 Ultra Preset + Full Ray Tracing AA:High T | |
| KFA2 GeForce RTX 4070 EX Gamer | |
| KFA2 GeForce RTX 4070 Ti EX Gamer | |
| MSI Radeon RX 6950 XT Gaming X Trio | |
| AMD Radeon RX 7900 GRE | |
| ASUS Dual GeForce RTX 4060 Ti OC | |
| Nvidia GeForce RTX 3060 Ti FE | |
| Sapphire Pulse Radeon RX 7700 XT | |
| AMD Radeon RX 6800 | |
| KFA2 GeForce RTX 4060 1-Click-OC 2X | |
| Nvidia GeForce RTX 2070 Super | |
| Acer Predator BiFrost Arc A770 OC, 16GB GDDR6 | |
| Sapphire Pulse Radeon RX 6750 XT | |
| Nvidia GeForce RTX 2060 Super | |
| ASRock Arc A580 Challenger OC | |
| Sapphire Nitro+ Radeon RX 6650 XT | |
| Acer Predator BiFrost Arc A750 OC | |
| XFX Speedster QICK 308 Radeon RX 7600 Black Edition | |
| Ghostwire Tokyo - 1920x1080 Highest Settings + Maximum Ray Tracing | |
| KFA2 GeForce RTX 4070 Ti EX Gamer | |
| KFA2 GeForce RTX 4070 EX Gamer | |
| AMD Radeon RX 7900 GRE | |
| MSI Radeon RX 6950 XT Gaming X Trio | |
| AMD Radeon RX 7800 XT | |
| ASUS Dual GeForce RTX 4060 Ti OC | |
| Sapphire Pulse Radeon RX 7700 XT | |
| Nvidia GeForce RTX 3060 Ti FE | |
| KFA2 GeForce RTX 4060 1-Click-OC 2X | |
| Acer Predator BiFrost Arc A770 OC, 16GB GDDR6 | |
| Sapphire Pulse Radeon RX 6750 XT | |
| Acer Predator BiFrost Arc A750 OC | |
| Nvidia GeForce RTX 2070 Super | |
| XFX Speedster QICK 308 Radeon RX 7600 Black Edition | |
| ASRock Arc A580 Challenger OC | |
| Sapphire Nitro+ Radeon RX 6650 XT | |
| Nvidia GeForce RTX 2060 Super | |
| Sapphire Pulse Radeon RX 6600 | |
Overview of the tested games using the ASRock Arc A580 Challenger OC
| low | med. | high | ultra | QHD FSR | QHD | 4K FSR | 4K | |
|---|---|---|---|---|---|---|---|---|
| Prince of Persia The Lost Crown (2024) | 358 | 358 | 358 | 292 | 152.4 | |||
| Palworld (2024) | 111.9 | 94.8 | 73.5 | 67.9 | 48.5 | 26.7 | ||
| Enshrouded (2024) | 62.7 | 54.9 | 47.8 | 41 | 32.9 | 27.5 | 20.4 | |
| Helldivers 2 (2024) | 96.5 | 77.2 | 72.7 | 71.6 | 53.7 | 29 | ||
| Skull & Bones (2024) | 68 | 64 | 54 | 45 | 38 | 33 | 26 | |
| Last Epoch (2024) | 188.3 | 167.3 | 144.1 | 125.1 | 83.9 | 42.2 | ||
| Alone in the Dark (2024) | 171.1 | 145.8 | 127.6 | 72.5 | 43.8 | |||
| Dragon's Dogma 2 (2024) | 47.1 | 43.2 | 34.4 | 21.8 | ||||
| Horizon Forbidden West (2024) | 72.9 | 67.1 | 48.4 | 46.2 | 38.8 | 24.2 | 23.3 | |
| Ghost of Tsushima (2024) | 83.9 | 71.9 | 64.8 | 53.3 | 41.5 | 33.5 | 20.8 | |
| Senua's Saga Hellblade 2 (2024) | 41.2 | 35.7 | 28.1 | 30.2 | 18 | 17 | 10.5 | |
| F1 24 (2024) | 241 | 208 | 153.2 | 49.6 | 50.3 | 32 | 25.7 | 14.6 |
Emissions - Efficiency is not its strength
Noise emissions
The ASRock Arc A580 Challenger OC features two 100-millimeter fans which generally run quietly. Thanks to a fan-stop mode, the coolers don't spin in 2D use, meaning the graphics card runs completely silently. One thing to mention about our noise emission measurements is that they were carried out using an open setup. Under average load, we documented 34.3 dB(A). During the stress test, our test sample reached 36.9 dB(A) and these values were topped slightly when gaming. At the same time, we noticed that the graphics card emits some coil whining under load. This was slightly more noticeable when gaming than it was during the stress test, which is why there were deviations in its maximum noise emissions. During our gaming tests, which we always carry out with the case closed, the coil whining wasn't as pronounced.
Noise level
| Idle |
| 25.7 / 25.8 / 25.8 dB(A) |
| Load |
| 34.3 / 36.9 dB(A) |
 | ||
30 dB silent 40 dB(A) audible 50 dB(A) loud |
||
min: | ||
| ASRock Arc A580 Challenger OC | Acer Predator BiFrost Arc A750 OC | Acer Predator BiFrost Arc A770 OC, 16GB GDDR6 | AMD Radeon RX 7800 XT | KFA2 GeForce RTX 4070 Ti EX Gamer | KFA2 GeForce RTX 4070 EX Gamer | KFA2 GeForce RTX 4060 1-Click-OC 2X | ASUS Dual GeForce RTX 4060 Ti OC | XFX Speedster QICK 308 Radeon RX 7600 Black Edition | Sapphire Pulse Radeon RX 7700 XT | |
|---|---|---|---|---|---|---|---|---|---|---|
| Noise | -14% | -28% | -5% | -12% | -13% | -4% | -5% | -1% | -5% | |
| off / environment * (dB) | 25.3 | 25.4 -0% | 25.4 -0% | 24.7 2% | 30 -19% | 30 -19% | 25.8 -2% | 25.4 -0% | 25.4 -0% | 25 1% |
| Idle Minimum * (dB) | 25.7 | 29 -13% | 39 -52% | 26.8 -4% | 30.1 -17% | 30.2 -18% | 25.9 -1% | 26.7 -4% | 26.3 -2% | 27.4 -7% |
| Idle Average * (dB) | 25.8 | 29.2 -13% | 39 -51% | 27.2 -5% | 30.1 -17% | 30.2 -17% | 25.9 -0% | 26.7 -3% | 26.3 -2% | 27.5 -7% |
| Idle Maximum * (dB) | 25.8 | 29.3 -14% | 39 -51% | 27.3 -6% | 30.1 -17% | 30.2 -17% | 25.9 -0% | 26.7 -3% | 26.3 -2% | 28 -9% |
| Load Average * (dB) | 34.3 | 35.1 -2% | 39 -14% | 30.7 10% | 30.2 12% | 31.8 7% | 30.3 12% | 29.3 15% | 29.6 14% | 32.6 5% |
| Witcher 3 ultra * (dB) | 37.1 | 44.2 -19% | 41.5 -12% | 42.6 -15% | 40.2 -8% | 45.2 -22% | 42.5 -15% | 39.6 -7% | 42.1 -13% | |
| Load Maximum * (dB) | 36.9 | 49.7 -35% | 42.1 -14% | 43 -17% | 44.7 -21% | 41.1 -11% | 43.5 -18% | 46 -25% | 39.4 -7% | 37.6 -2% |
* ... smaller is better
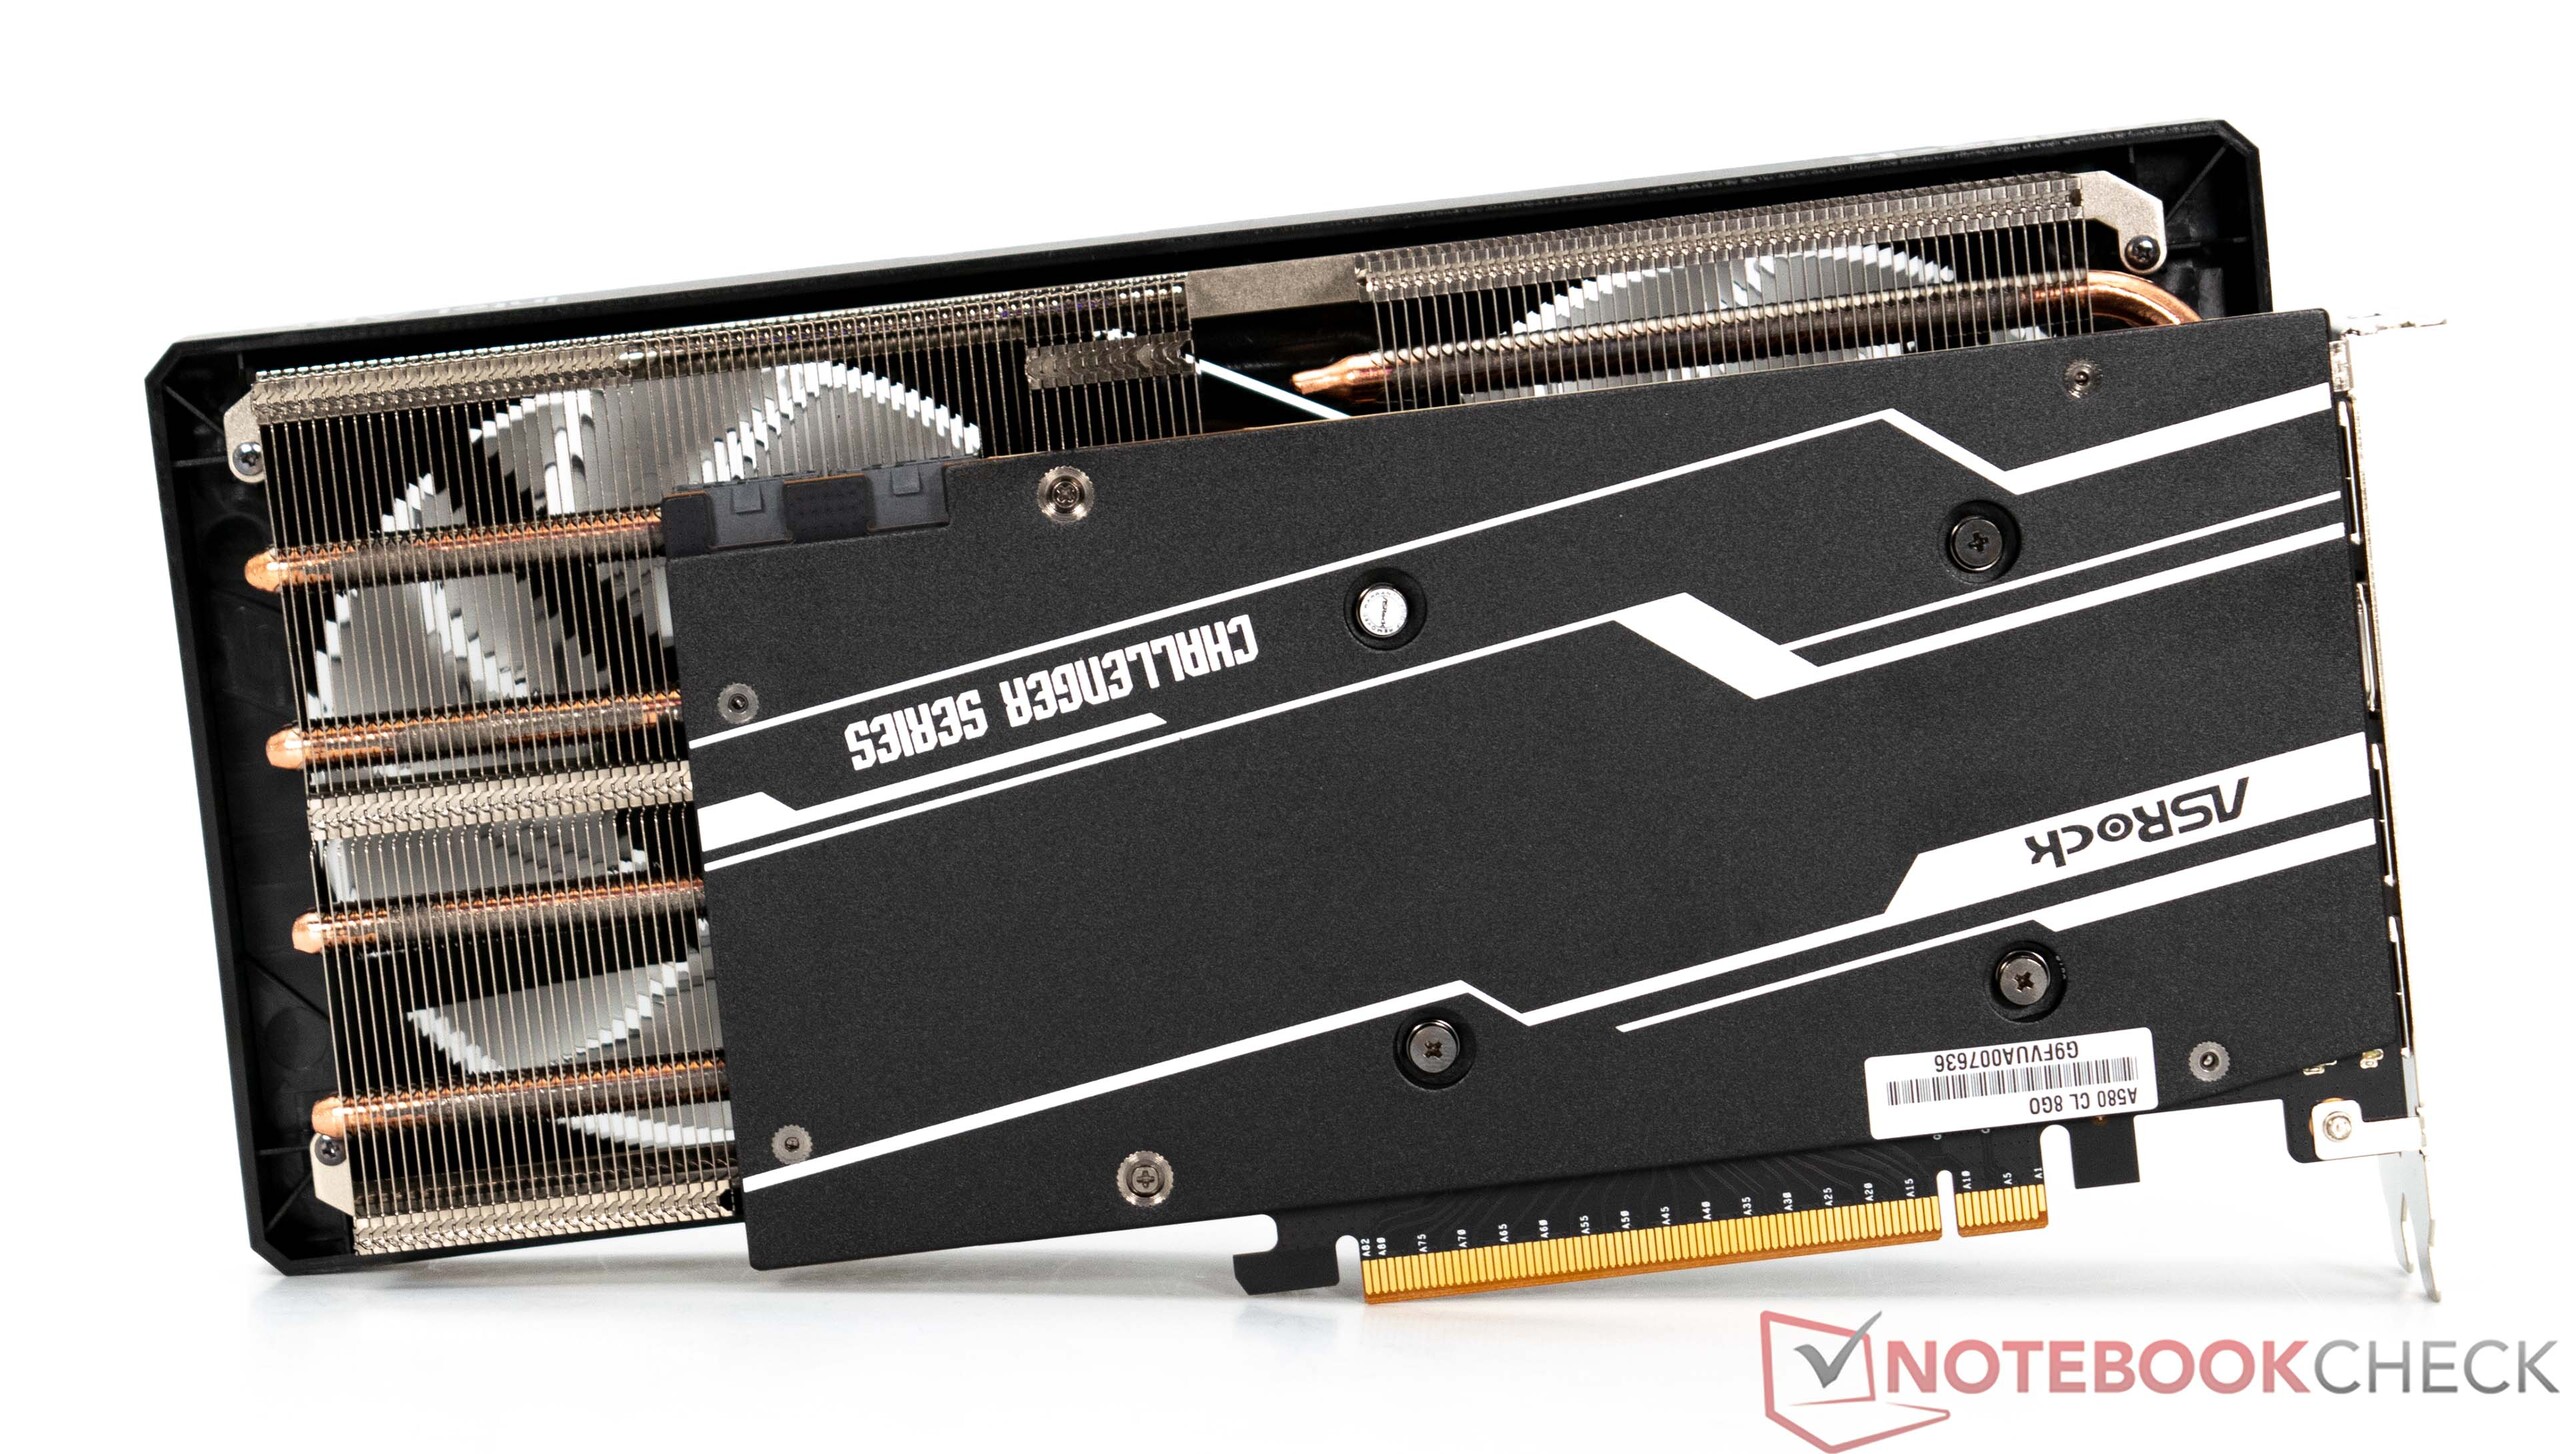
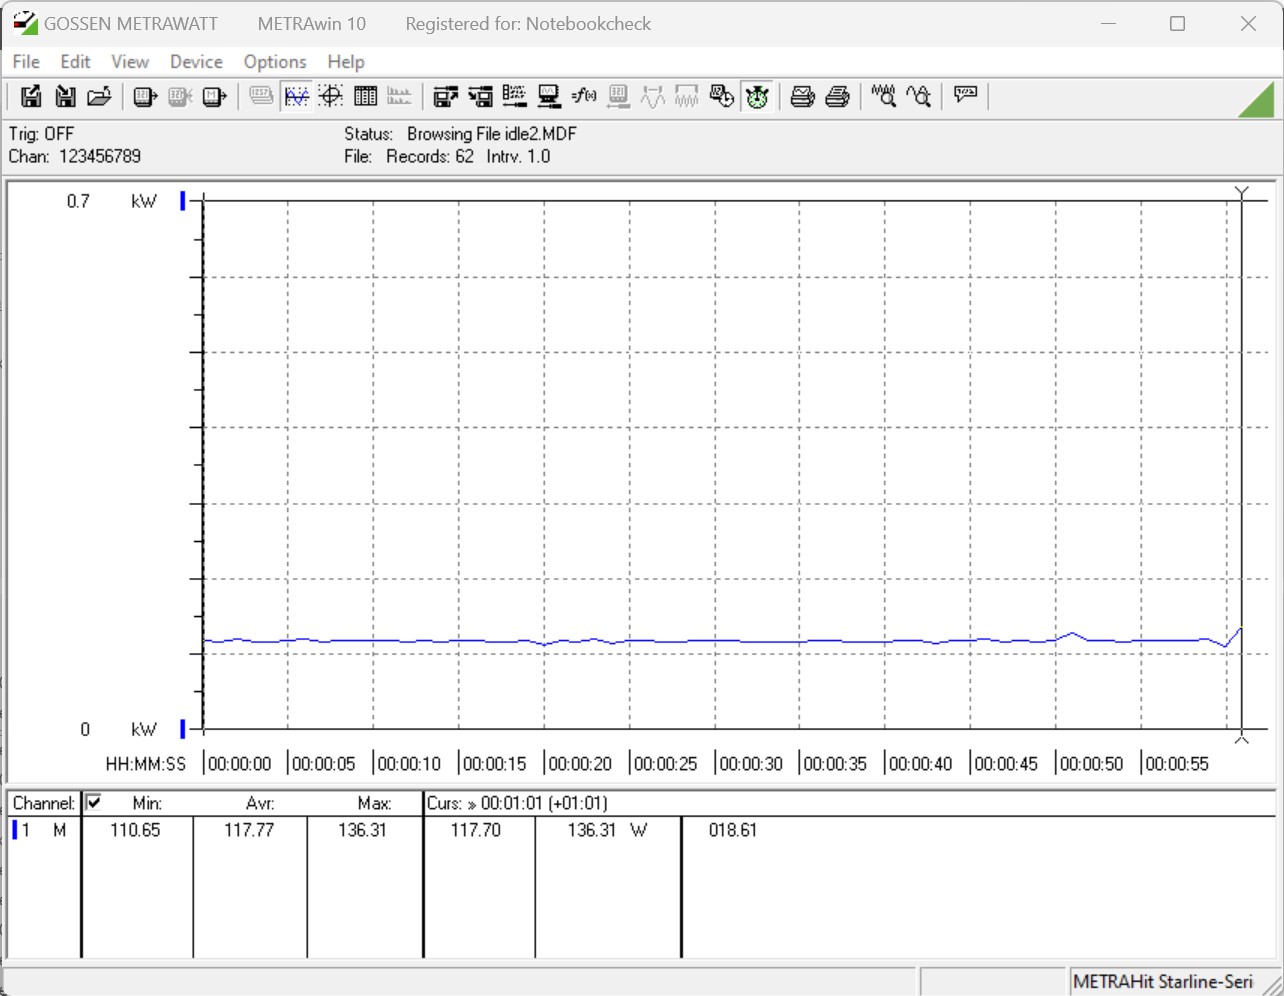
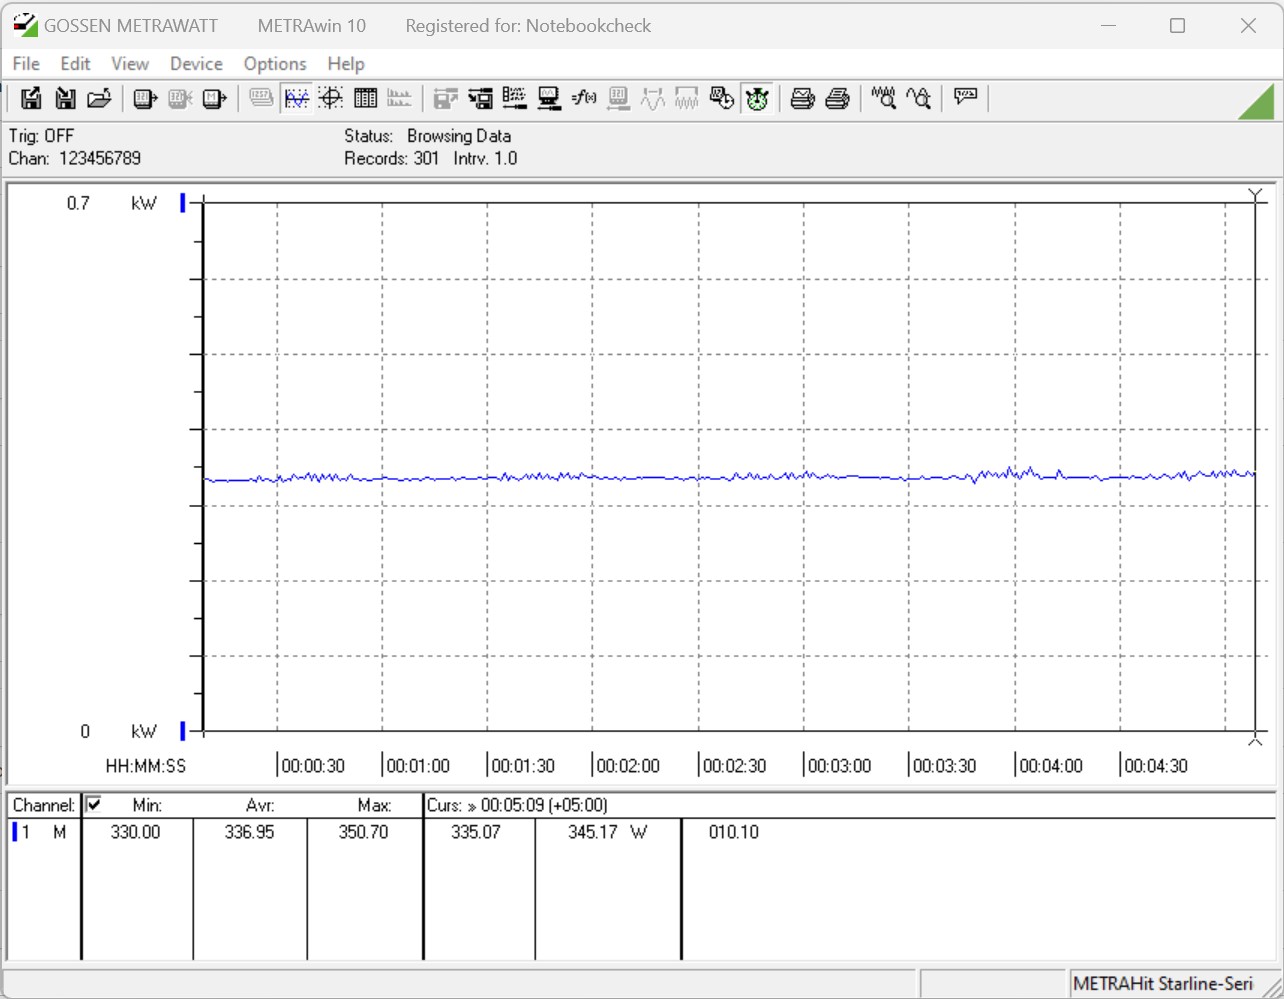
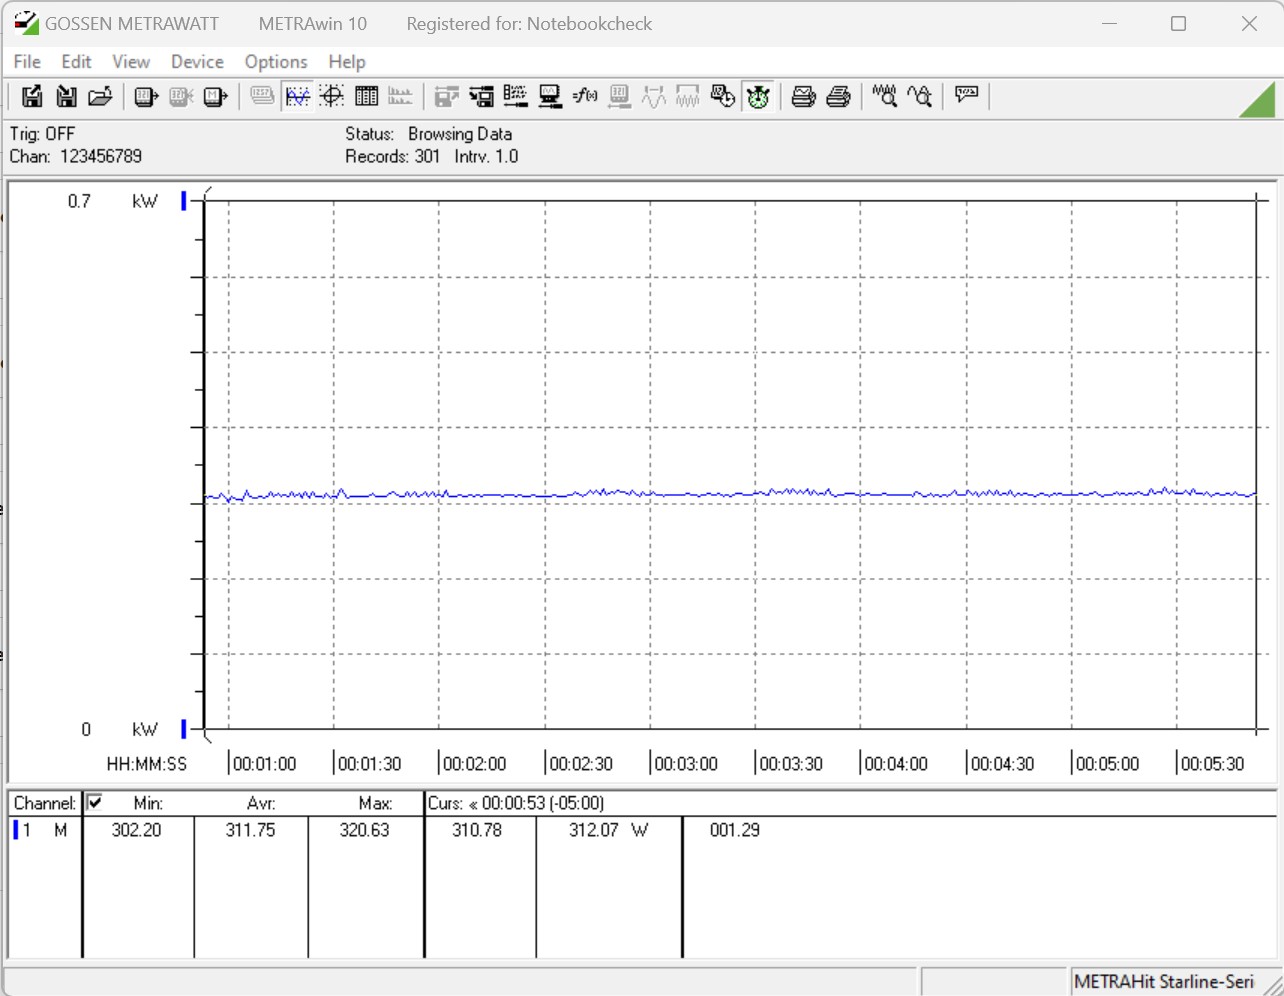
Temperatures and power requirement
We put the graphics card through its paces during our stress test in order to assess the cooling unit's performance. On the whole, ASRock has installed a solid cooling unit which keeps the ASRock Arc A580 Challenger OC's temperatures well under control. We noted that the GPU chip and VRAM reached a maximum of 78 °C during the stress test. This means that the graphics card remains relatively cool at all times and is spared a reduction in performance due to thermal issues.
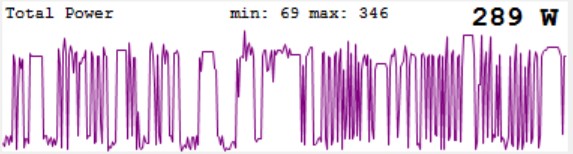
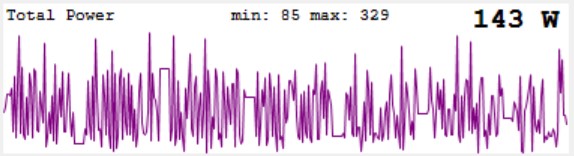
The Intel Arc A750 and Intel Arc A770 already revealed to us that the Intel Arc graphics cards are not among the most efficient models. Due to it using the same architecture, the ASRock Arc A580 Challenger OC also has to contend with this problem. The stress test loaded our test system's power supply with an average of 340 watts and a good 310 watts during gaming. Compared to current high-end models, these values look excellent, but in relation to the performance it achieved, the ASRock Arc A580 Challenger OC only managed to come in second to last place. ASRock recommends a 650-watt power supply for our test sample, which probably sounds a little oversized. After all, the graphics card's power limit in standard operation is only 175 watts. However, when looking at its short-term load peaks, it quickly becomes clear why ASRock makes this recommendation. In the stress test, we measured up to 350 watts, which is solely due to the graphics card.
| Power Consumption / The Witcher 3 ultra (external Monitor) | |
| AMD Radeon RX 7900 XTX (Idle: 86.5 W) | |
| NVIDIA GeForce RTX 3090 Founders Edition | |
| Palit GeForce RTX 4090 GameRock OC | |
| KFA2 GeForce RTX 4080 SG (Idle: 86.4 W) | |
| AMD Radeon RX 7900 XT (Idle: 84.6 W) | |
| KFA2 GeForce RTX 3070 Ti SG (Idle: 88.9 W) | |
| AMD Radeon RX 7900 GRE | |
| KFA2 GeForce RTX 4070 Ti EX Gamer | |
| AMD Radeon RX 7800 XT | |
| Sapphire Pulse Radeon RX 6750 XT | |
| KFA2 GeForce RTX 4070 EX Gamer | |
| XFX Speedster QICK 308 Radeon RX 7600 Black Edition | |
| Sapphire Nitro+ Radeon RX 6650 XT | |
| Acer Predator BiFrost Arc A750 OC | |
| ASRock Arc A580 Challenger OC | |
| KFA2 GeForce RTX 4060 Ti EX | |
| Acer Predator BiFrost Arc A770 OC, 16GB GDDR6 | |
| KFA2 GeForce RTX 4060 1-Click-OC 2X | |
| Power Consumption / FurMark 1.19 GPU Stress Test (external Monitor) | |
| Palit GeForce RTX 4090 GameRock OC | |
| AMD Radeon RX 7900 XTX (Idle: 86.5 W) | |
| NVIDIA GeForce RTX 3090 Founders Edition | |
| AMD Radeon RX 7900 XT (Idle: 84.6 W) | |
| KFA2 GeForce RTX 3070 Ti SG (Idle: 88.9 W) | |
| KFA2 GeForce RTX 4080 SG (Idle: 86.4 W) | |
| Acer Predator BiFrost Arc A750 OC | |
| KFA2 GeForce RTX 4070 Ti EX Gamer | |
| AMD Radeon RX 7900 GRE | |
| Sapphire Pulse Radeon RX 6750 XT | |
| AMD Radeon RX 7800 XT | |
| Acer Predator BiFrost Arc A770 OC, 16GB GDDR6 | |
| ASRock Arc A580 Challenger OC | |
| XFX Speedster QICK 308 Radeon RX 7600 Black Edition | |
| Sapphire Nitro+ Radeon RX 6650 XT | |
| KFA2 GeForce RTX 4070 EX Gamer | |
| KFA2 GeForce RTX 4060 Ti EX | |
| KFA2 GeForce RTX 4060 1-Click-OC 2X | |
| Power Consumption / Witcher 3 ultra Efficiency (external Monitor) | |
| Palit GeForce RTX 4090 GameRock OC | |
| KFA2 GeForce RTX 4080 SG | |
| AMD Radeon RX 7900 XT | |
| AMD Radeon RX 7900 XTX | |
| KFA2 GeForce RTX 4070 Ti EX Gamer | |
| AMD Radeon RX 7900 GRE | |
| KFA2 GeForce RTX 4070 EX Gamer | |
| KFA2 GeForce RTX 4060 Ti EX | |
| AMD Radeon RX 7800 XT | |
| KFA2 GeForce RTX 4060 1-Click-OC 2X | |
| Sapphire Pulse Radeon RX 6750 XT | |
| NVIDIA GeForce RTX 3090 Founders Edition | |
| XFX Speedster QICK 308 Radeon RX 7600 Black Edition | |
| KFA2 GeForce RTX 3070 Ti SG | |
| Sapphire Nitro+ Radeon RX 6650 XT | |
| Acer Predator BiFrost Arc A770 OC, 16GB GDDR6 | |
| ASRock Arc A580 Challenger OC | |
| Acer Predator BiFrost Arc A750 OC | |
* ... smaller is better
Power consumption with external monitor
Pros
Cons
Verdict - An affordable 1,080p-gaming graphics card

If you want to take the plunge and give Intel a chance as a GPU manufacturer, then the ASRock Arc A580 Challenger OC graphics card will currently give you decent performance for comparatively little money. You won't likely find many other graphics cards offering this performance for below US$200. Even though Intel has been on this market for over a year with its Alchemist-generation components, its performance has been continuously improved with the help of numerous driver optimizations.
The ASRock Arc A580 Challenger OC is currently an affordable alternative to AMD and Nvidia as a full-HD gaming graphics card for PC systems.
At its core, the ASRock Arc A580 Challenger OC relies on the same graphics card that both of the faster models also use. This means that the A580 offshoot also has the same technical features. At the same time, its performance is slightly limited compared to an Intel Arc A750 as a result of its comparatively lower number of shader units. The more affordable model does, however, have a relatively large amount of RAM—8 GB to be precise—which is additionally connected via a wide memory interface. Resulting from this is good performance that allowed most of the games we tested to run at 1,080p with high details. Compared to AMD, Intel also boasts good ray-tracing performance. However, Nvidia reigns supreme in this field and offers a lot more performance. The same can also be said for its feature set, as Nvidia's DLSS simply seems more mature. Intel and AMD offer similar technologies when it comes to this, namely XeSS and FSR.
Price and availability
The ASRock Arc A580 Challenger OC can be purchased from many online retailers and will currently set you back around US$165.
Transparency
The selection of devices to be reviewed is made by our editorial team. The test sample was freely purchased by the author at his/her own expense. The lender had no influence on this review, nor did the manufacturer receive a copy of this review before publication. There was no obligation to publish this review. As an independent media company, Notebookcheck is not subjected to the authority of manufacturers, retailers or publishers.
This is how Notebookcheck is testing
Every year, Notebookcheck independently reviews hundreds of laptops and smartphones using standardized procedures to ensure that all results are comparable. We have continuously developed our test methods for around 20 years and set industry standards in the process. In our test labs, high-quality measuring equipment is utilized by experienced technicians and editors. These tests involve a multi-stage validation process. Our complex rating system is based on hundreds of well-founded measurements and benchmarks, which maintains objectivity. Further information on our test methods can be found here.

