Verdict — Fast, But Could Be Faster
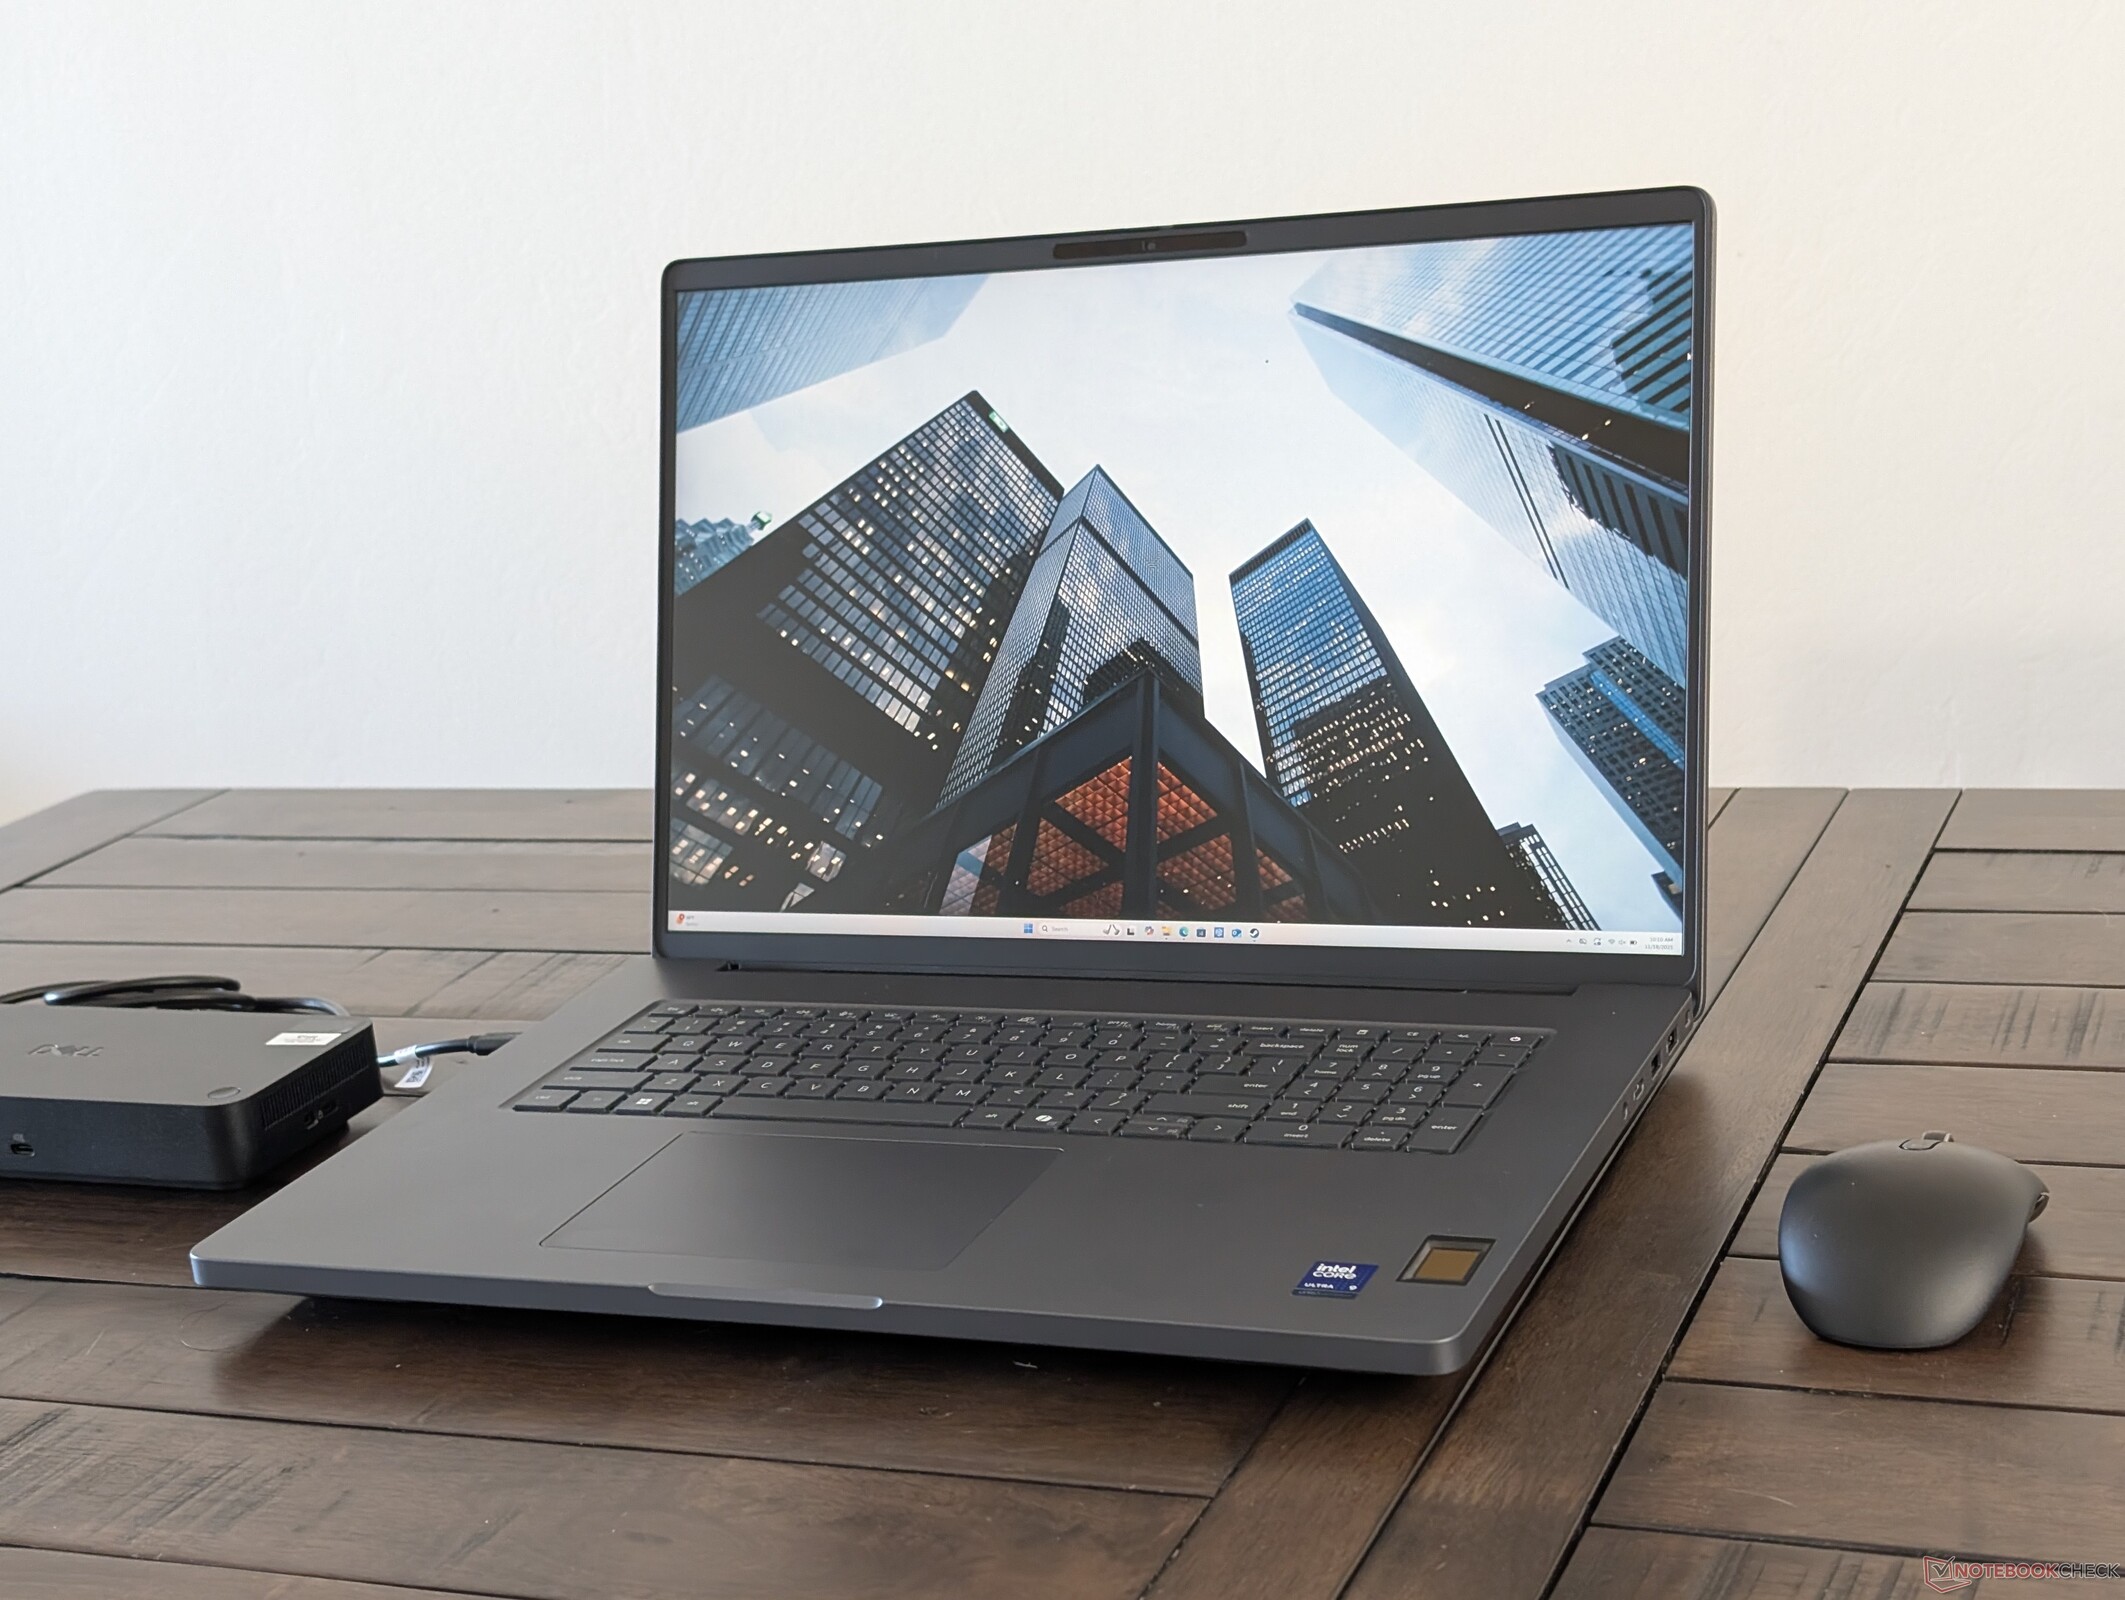
The Dell Pro Max 18 Plus is an impressive and well-built piece of hardware reflective of its four-digit starting prices. Its unique components like CAMM2, DGFF, and modular USB-C ports for increased repairability help to distinguish the model from the competition. This isn't a gaming-laptop-turned-workstation, but a laptop optimized from the ground up specifically for professional workloads. Performance-wise, the Dell is easily one of the fastest mobile workstations with its Arrow Lake-HX CPU, 175 W Nvidia Pro RTX 5000 Blackwell GPU, and spacious 128 to 256 GB of RAM that AI applications can utilize. The entire system is powered by a universal 280 USB-C AC adapter which is another noteworthy feature we've yet to see from major competitors.
As amazing as the build quality and hardware are, performance could still be a little better. The CPU runs too warm at around 100 C when stressed which impacts Turbo Boost performance. Features like the cooling solution, keyboard, and port options remain essentially the same as on the smaller Dell Pro Max 16 Plus despite their size differences. The lack of display options in particular may disappoint users especially since the 16-inch model comes with at least three panels to choose from including 4K OLED.
Other drawbacks include the lack of per-key RGB lighting or dedicated mouse buttons both of which are available on the HP ZBook Fury G1i 18, but these are relatively minor dings on an otherwise solid DTR workstation.
Pros
Cons
Price and Availability
The Dell Pro Max 18 Plus is now shipping directly from the manufacturer starting at $3790 for the base configuration up to over $6000.
- $1,799.95Dell Pro 16 Plus PB16250 (Replaces Latitude 5550) AI Business Notebook 16" FHD+ Intel Ultra 7-265U, 32GB DDR5 RAM, 512GB SSD PCIe, Wi-Fi 6E, BT, Backlit Keyboard, HD Webcam, RJ-45, Win 11 Pro - Silver
- $54.99165W USB-C Gan Laptop Charger Compatible with Dell Pro Max 16 18 Plus MB16250 MB18250, Pro Max 16 Premium MA16250, Precision 5680 5690 Laptop Type C AC Adapter Power Cord
- $109.99GKLSPL 165W/280W USB-C Charger for Dell Pro Max 16 18 Plus MB16250 MB18250
The Dell Pro Max 18 Plus succeeds the older generation Precision series of mobile workstations. While it's one of the fastest and largest models in Dell's lineup, it's built on the same platform as the smaller 16-inch Dell Pro Max 16 Plus and so the two models share many physical features. Most of our comments about the Dell Pro Max 16 Plus subsequently apply here for the 18-inch model.
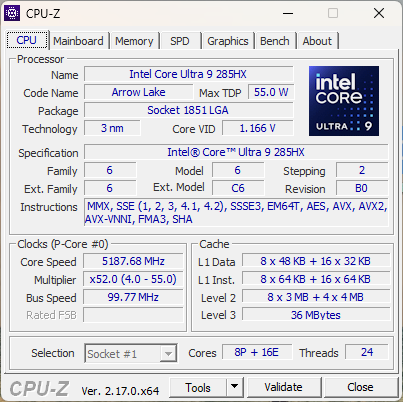
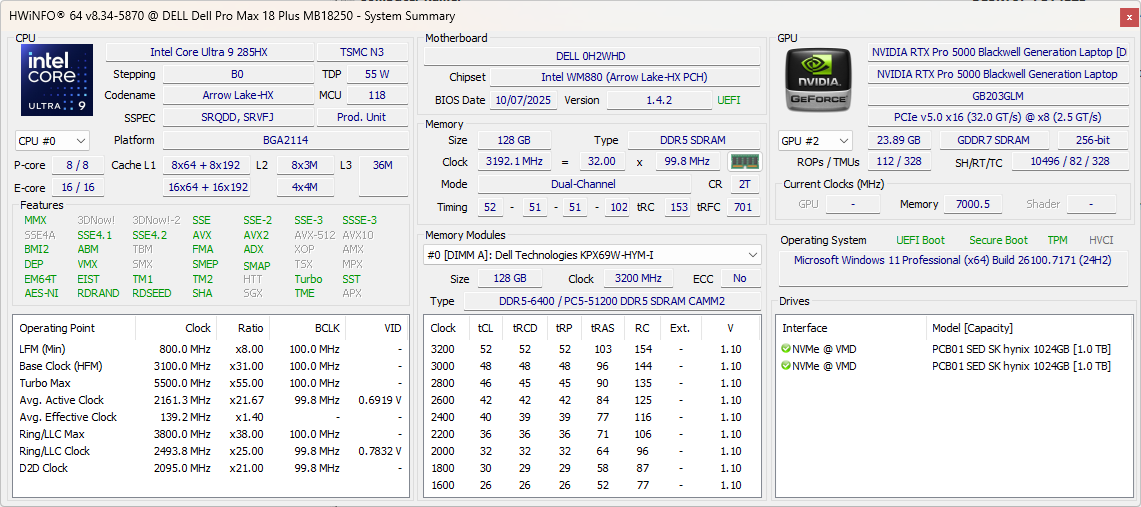
Our test unit is a higher-end configuration with the Arrow Lake-HX Core Ultra 9 285HX vPro CPU, 175 W Nvidia RTX Pro 5000 Blackwell GPU, and two PCIe5 SSDs in RAID 0 for well over $6000. All options otherwise ship with the same QHD+ 1600p non-touch display.
Alternatives are far and few between since 18-inch DTR workstations are uncommon. The HP ZBook Fury G1i 18 is a major competitor.
More Dell reviews:
Specifications
Case — MIL-STD Approved
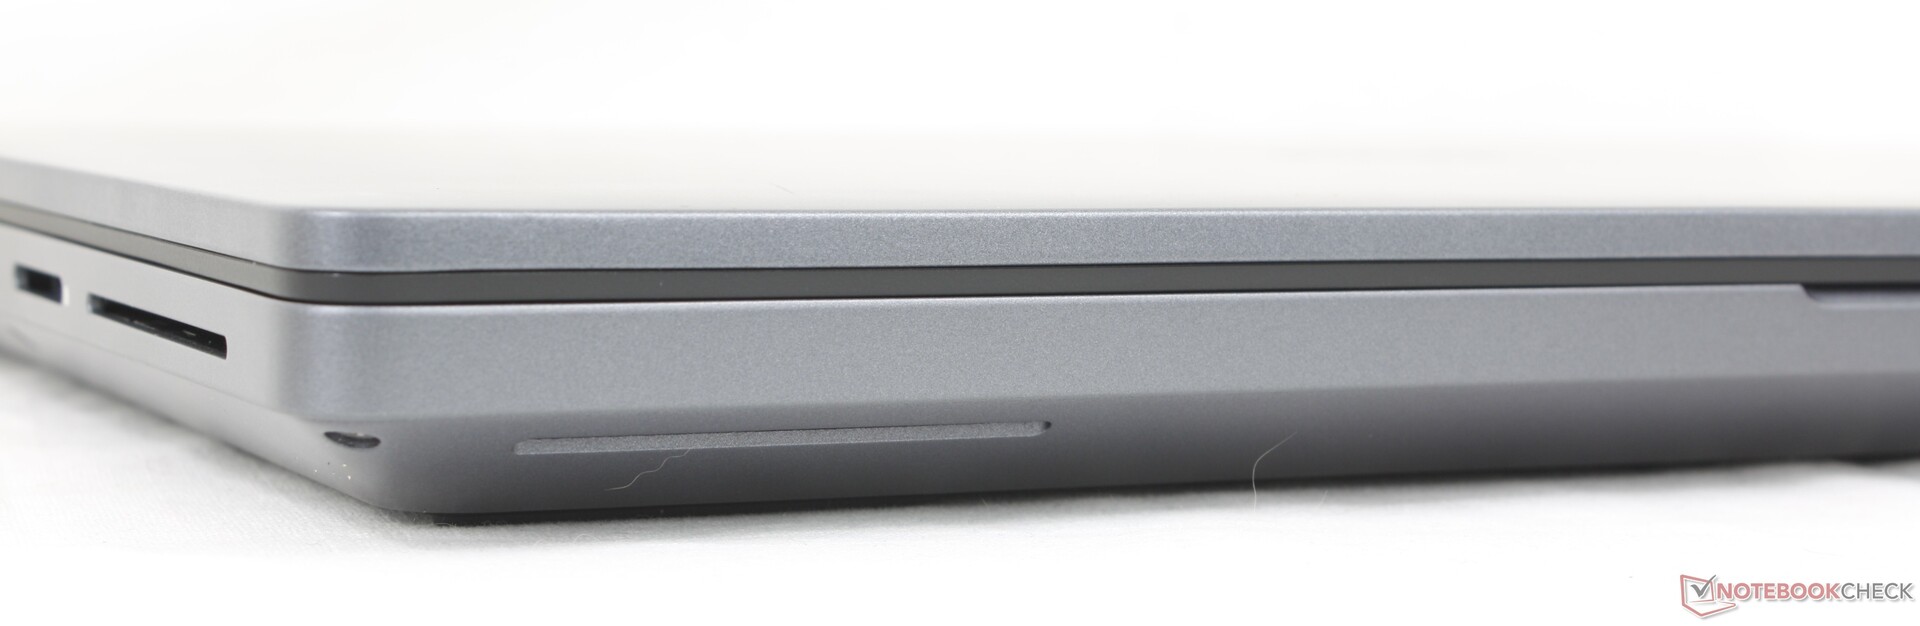
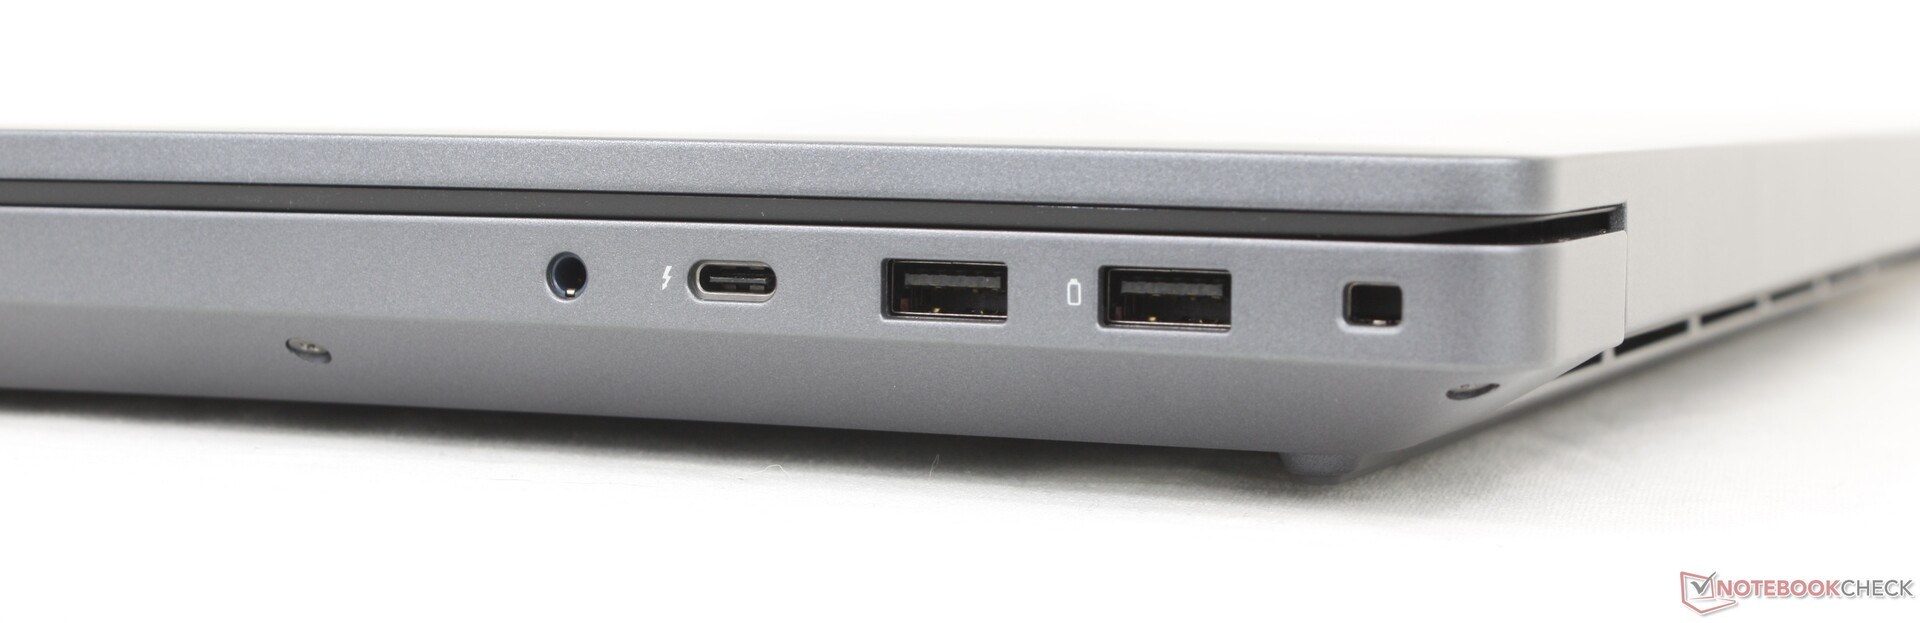
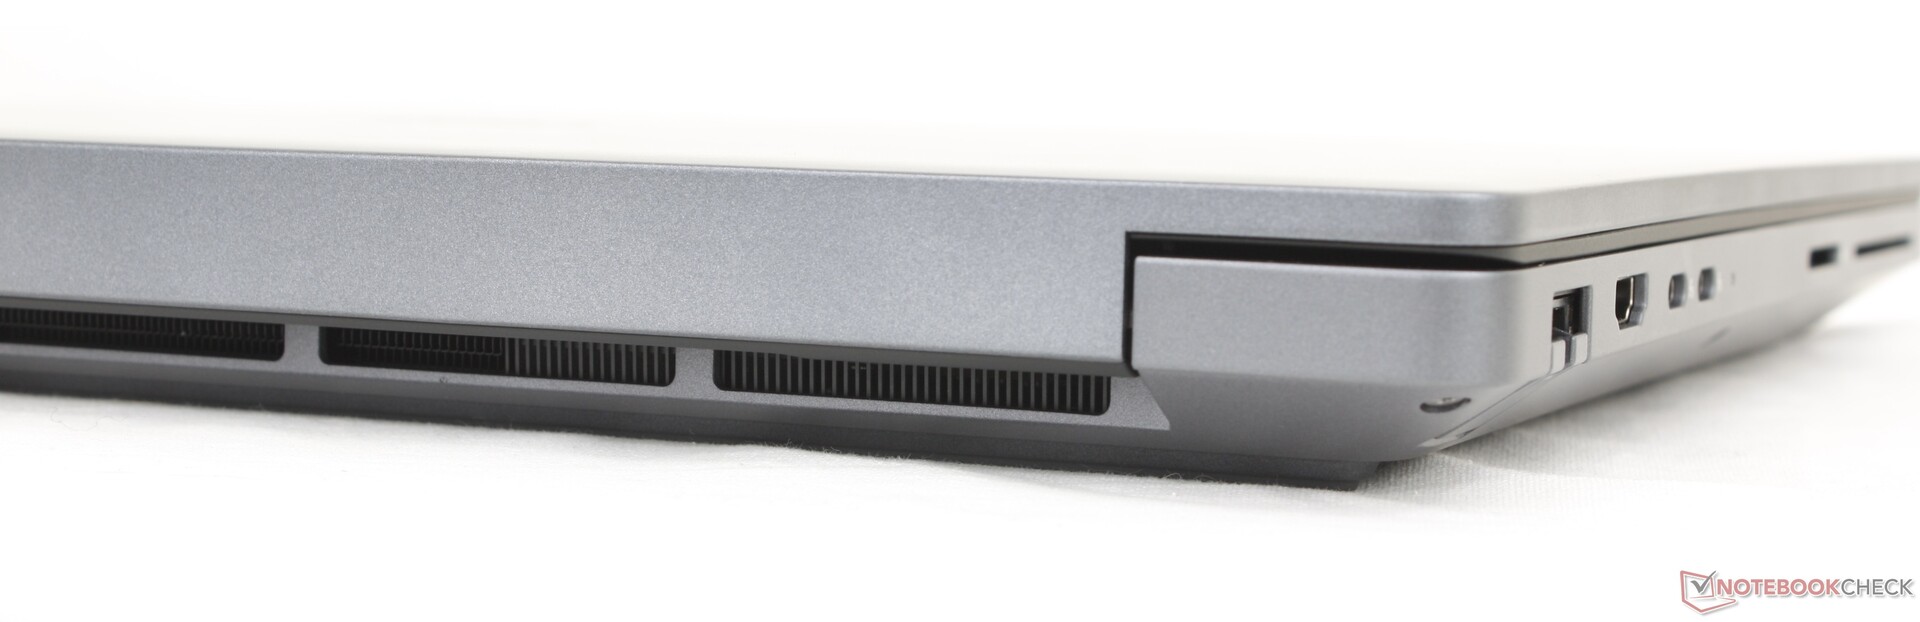
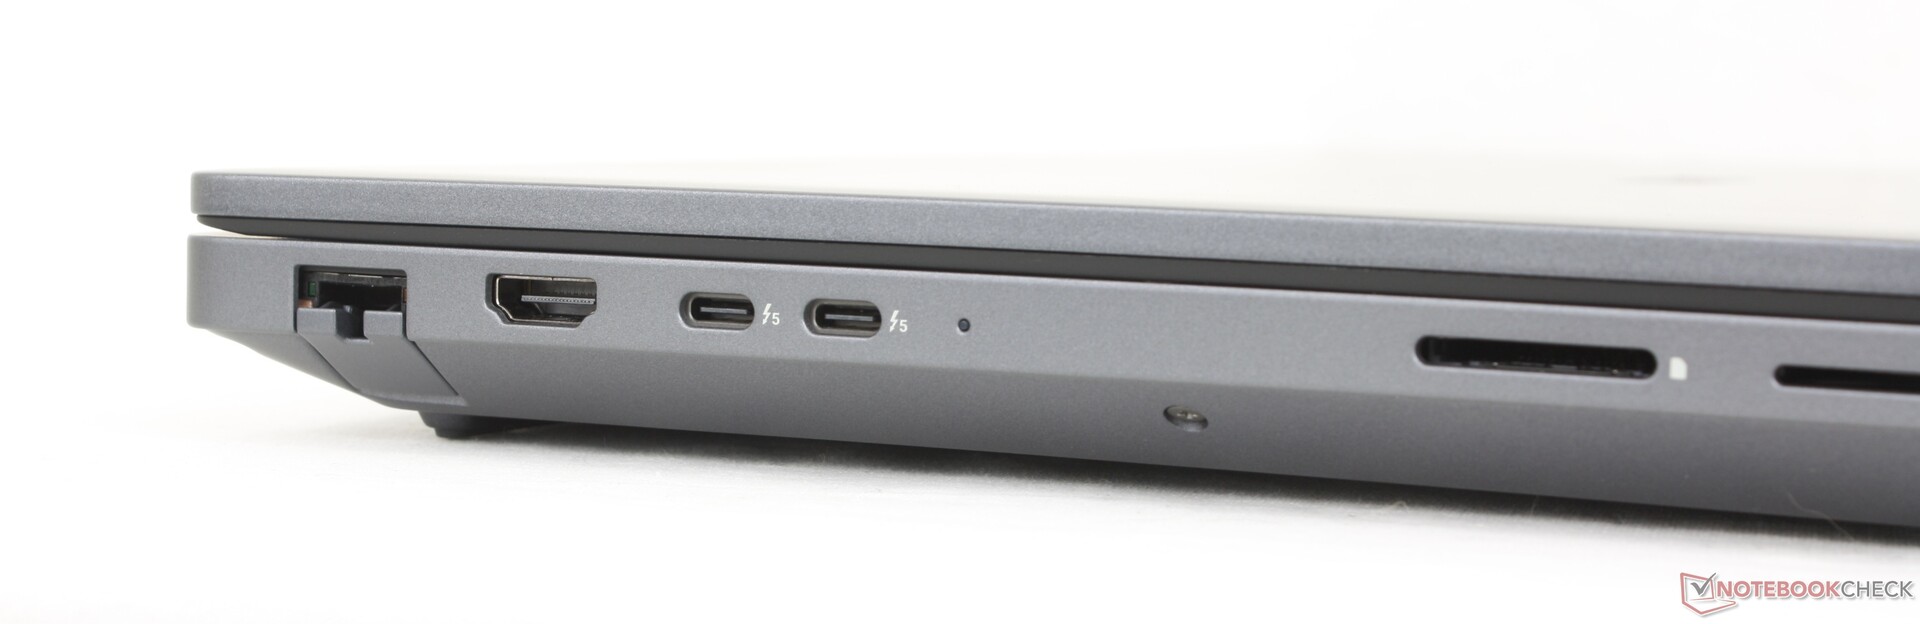
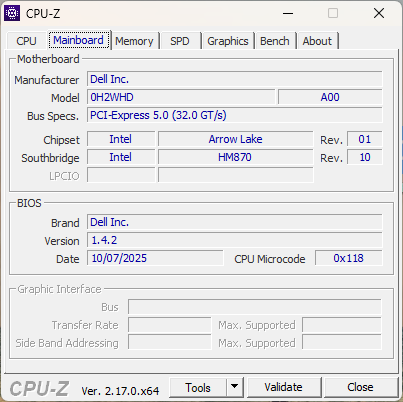
The chassis is essentially an enlarged version of the 16-inch Dell Pro Max 16 Plus for an almost 30 percent increase in weight. Most physical features like the keyboard, clickpad, and even ports remain identical with only minor differences in the motherboard.

Connectivity
SD Card Reader
| SD Card Reader | |
| average JPG Copy Test (av. of 3 runs) | |
| HP ZBook X G1i 16 (Toshiba Exceria Pro SDXC 64 GB UHS-II) | |
| Dell Pro Max 18 Plus MB18250 (Toshiba Exceria Pro SDXC 64 GB UHS-II) | |
| Schenker Key 18 Pro M25 RTX 5090 (Angelbird AV Pro V60) | |
| Dell Pro Max 16 Plus (Toshiba Exceria Pro SDXC 64 GB UHS-II) | |
| maximum AS SSD Seq Read Test (1GB) | |
| HP ZBook X G1i 16 (Toshiba Exceria Pro SDXC 64 GB UHS-II) | |
| Dell Pro Max 18 Plus MB18250 (Toshiba Exceria Pro SDXC 64 GB UHS-II) | |
| Dell Pro Max 16 Plus (Toshiba Exceria Pro SDXC 64 GB UHS-II) | |
| Schenker Key 18 Pro M25 RTX 5090 (Angelbird AV Pro V60) | |
Communication
Webcam
The 8 MP IR webcam is an optional upgrade over the base 2 MP webcam.


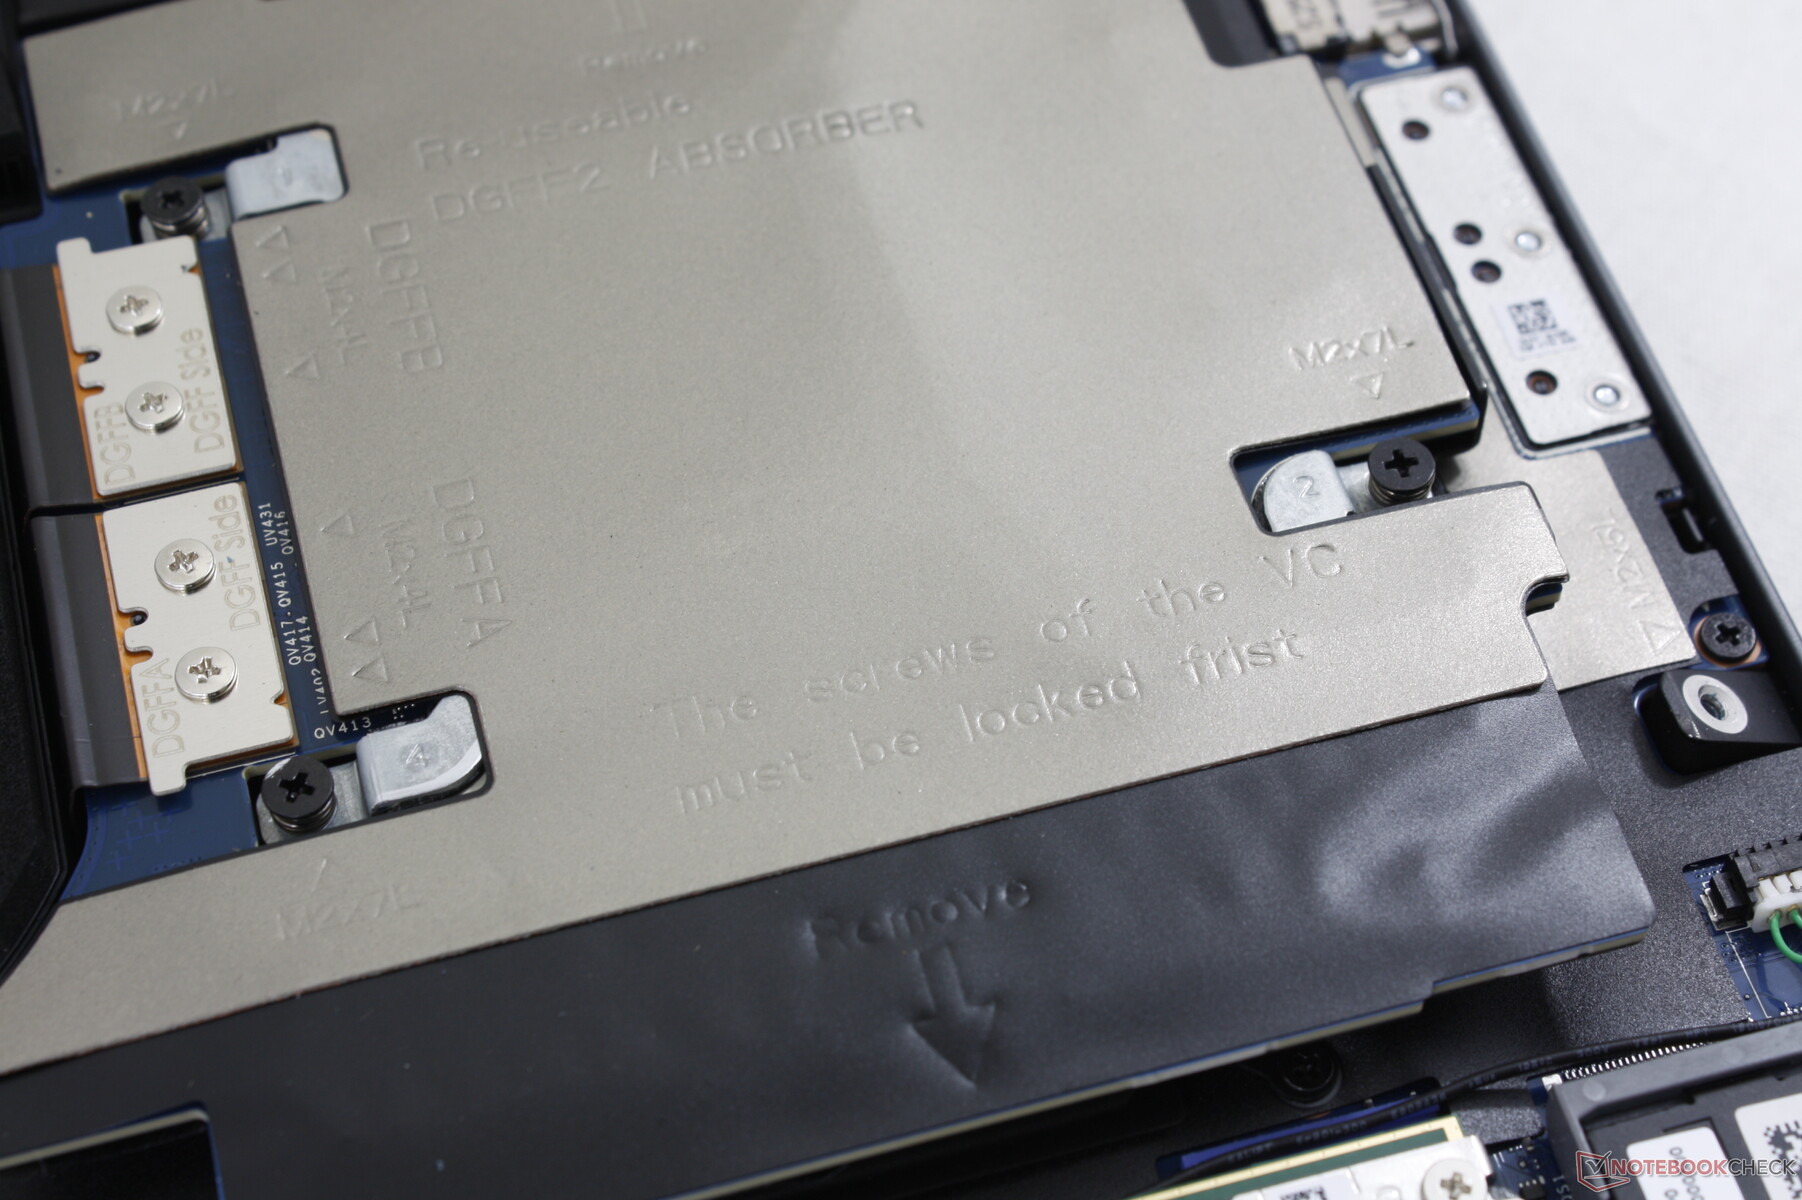
Maintenance
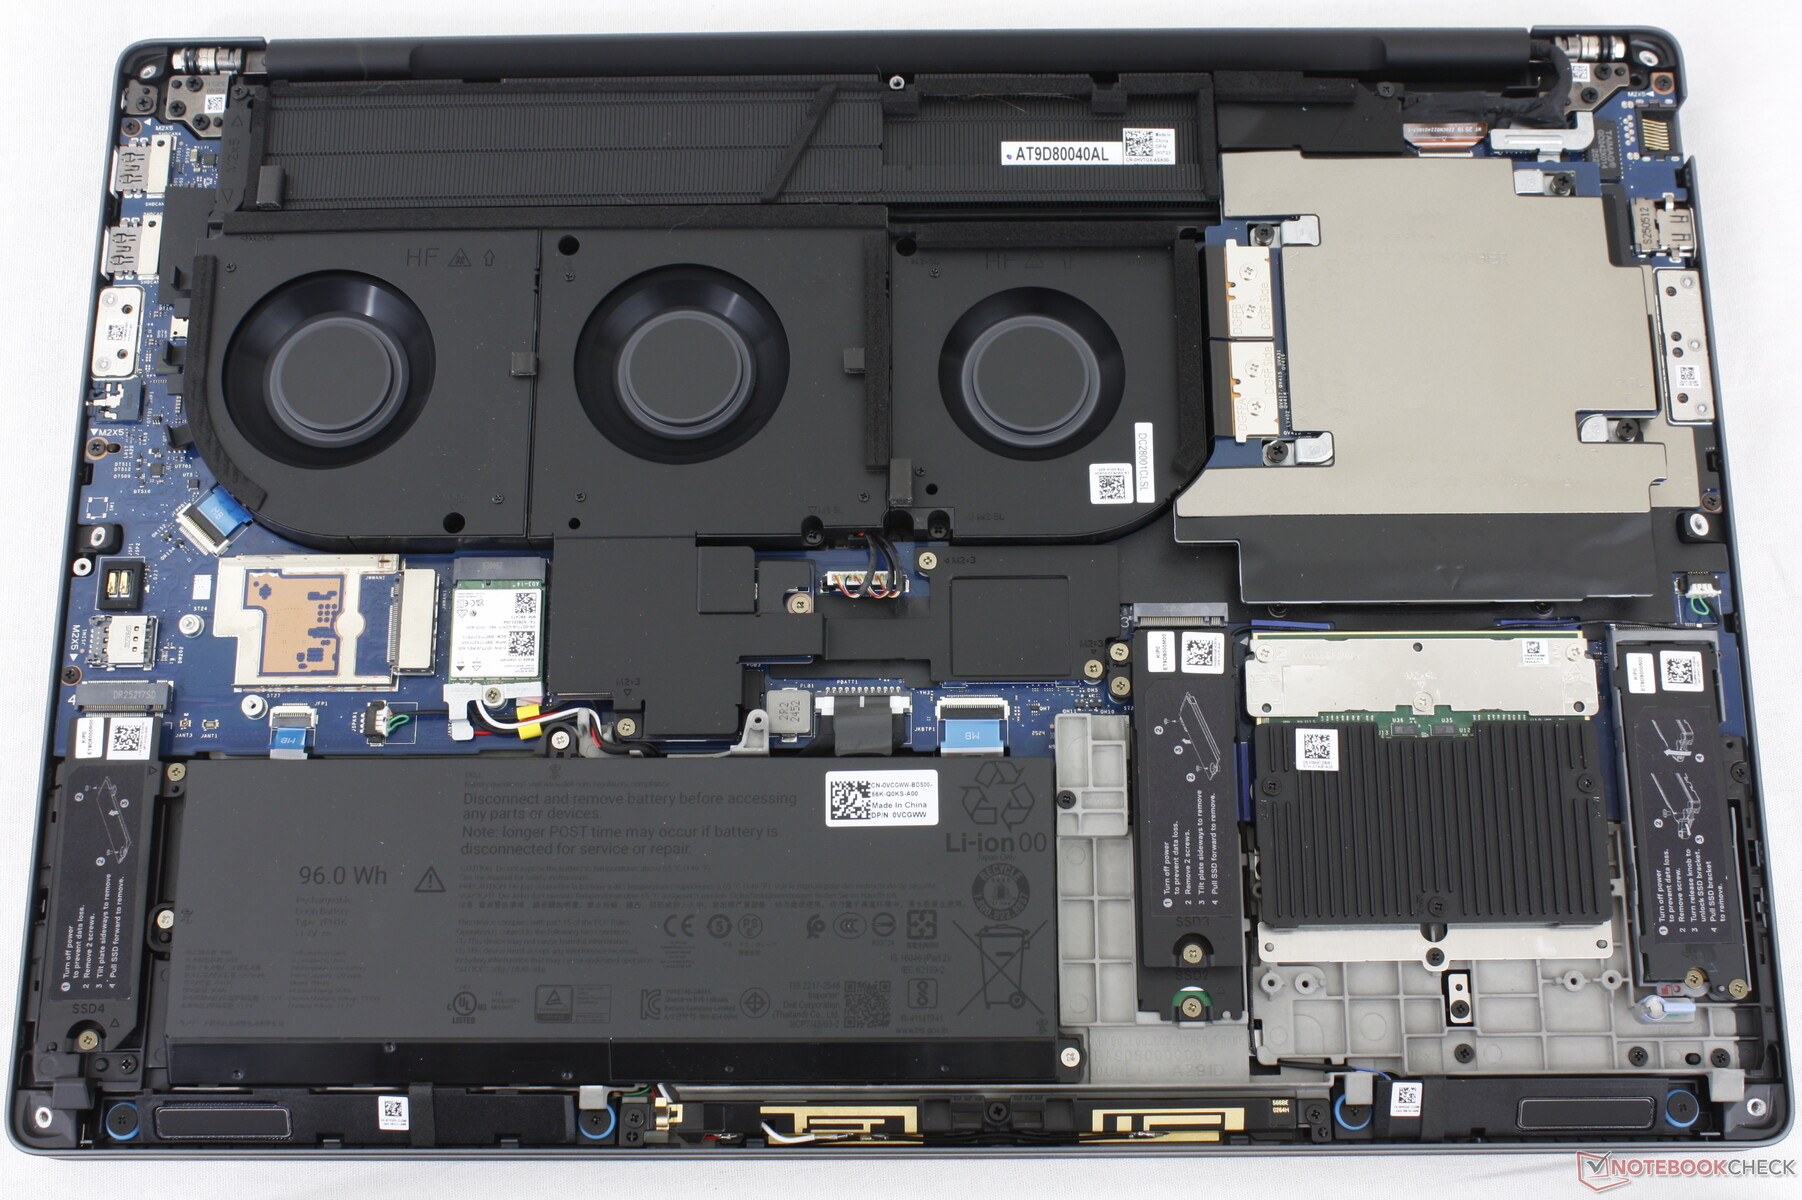
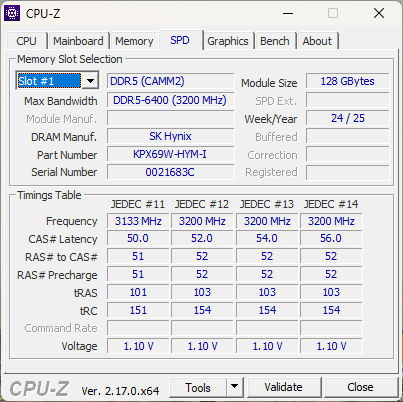
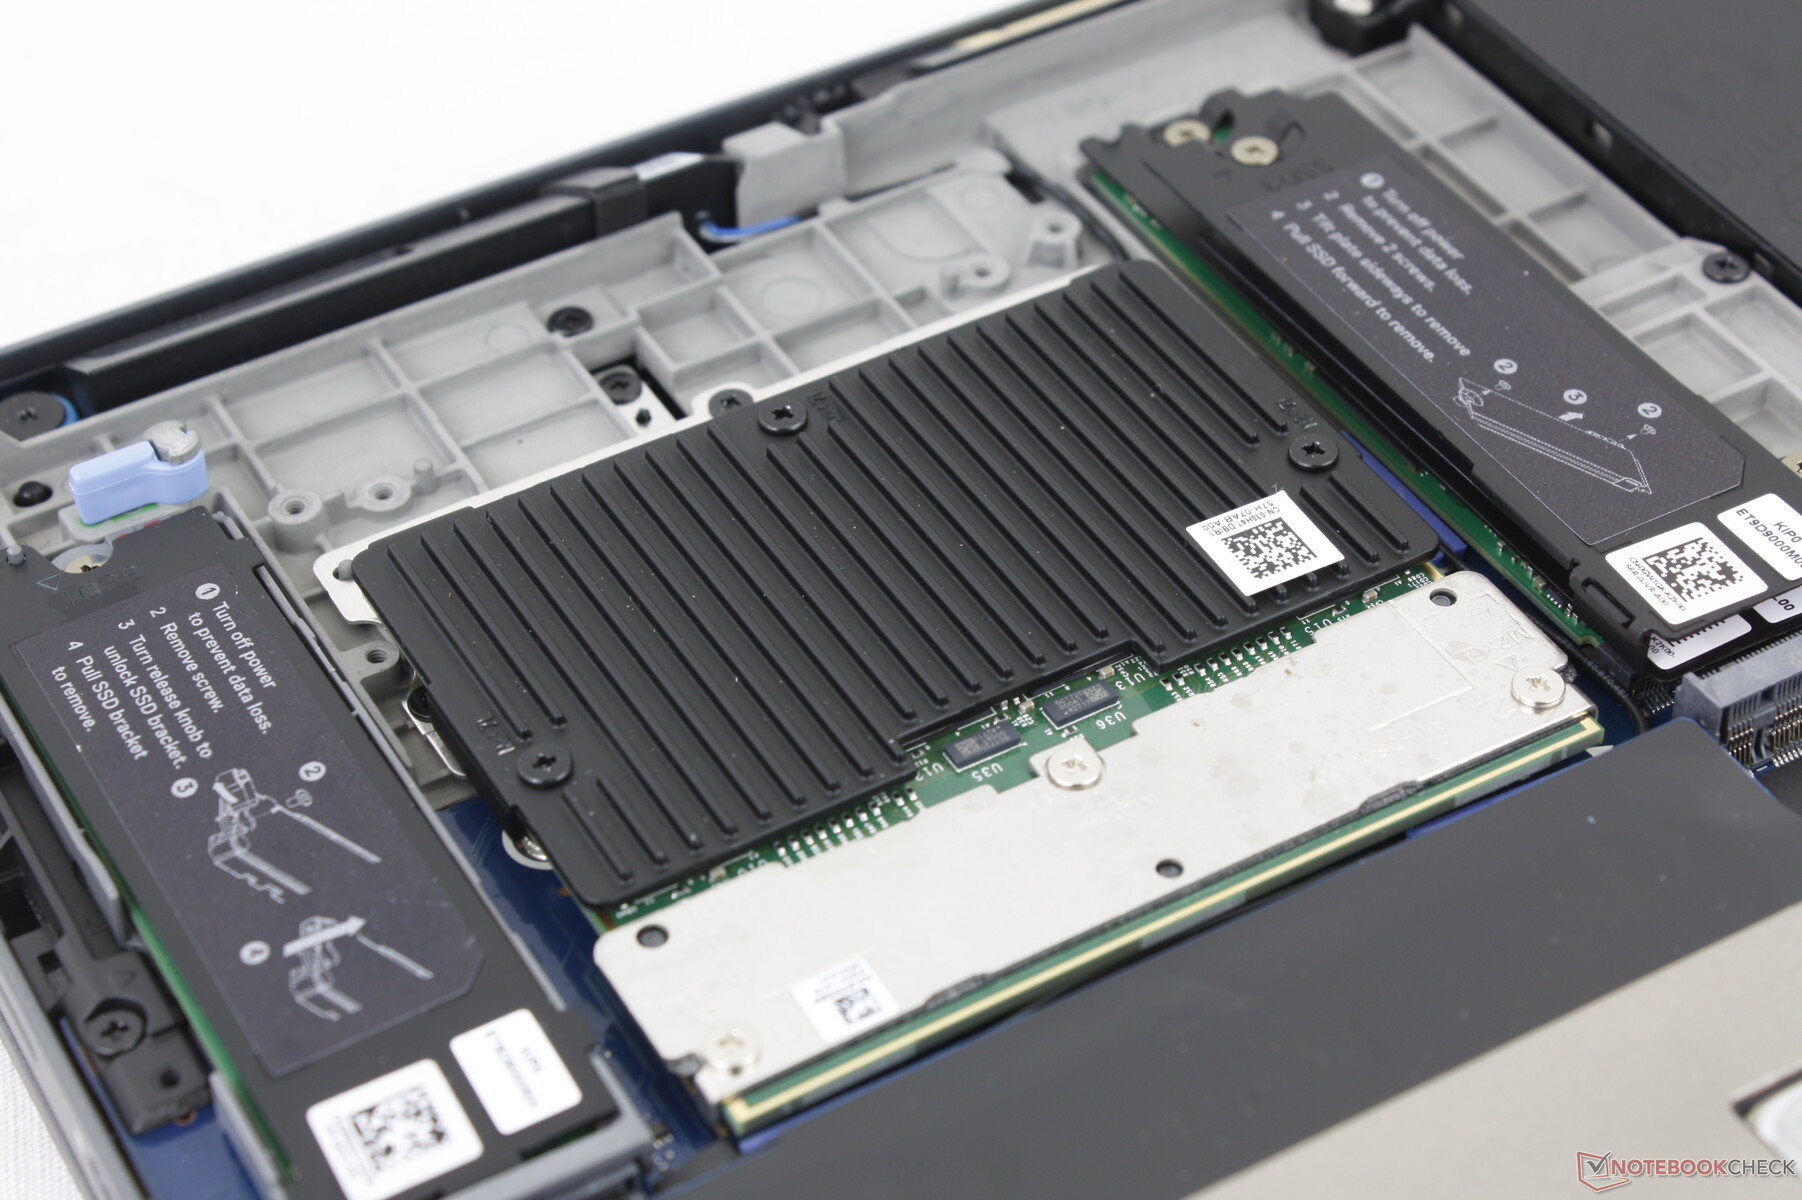
Removing the bottom panel reveals two M.2 2280 PCIe5 x4 SSD slots, the CAMM2 RAM slot, removable WLAN module, DGFF GPU, and WAN slot. A CAMM2 to SODIMM adapter is available should users prefer the older standard.
Sustainability
Approximately 90 percent of recycled magnesium was used for the top and bottom covers, 30 to 50 percent recycled plastics for the palm rests and bottom bumpers, and 50 percent recycled cobalt for the battery. The packaging is all paper and recyclable.
Accessories And Warranty
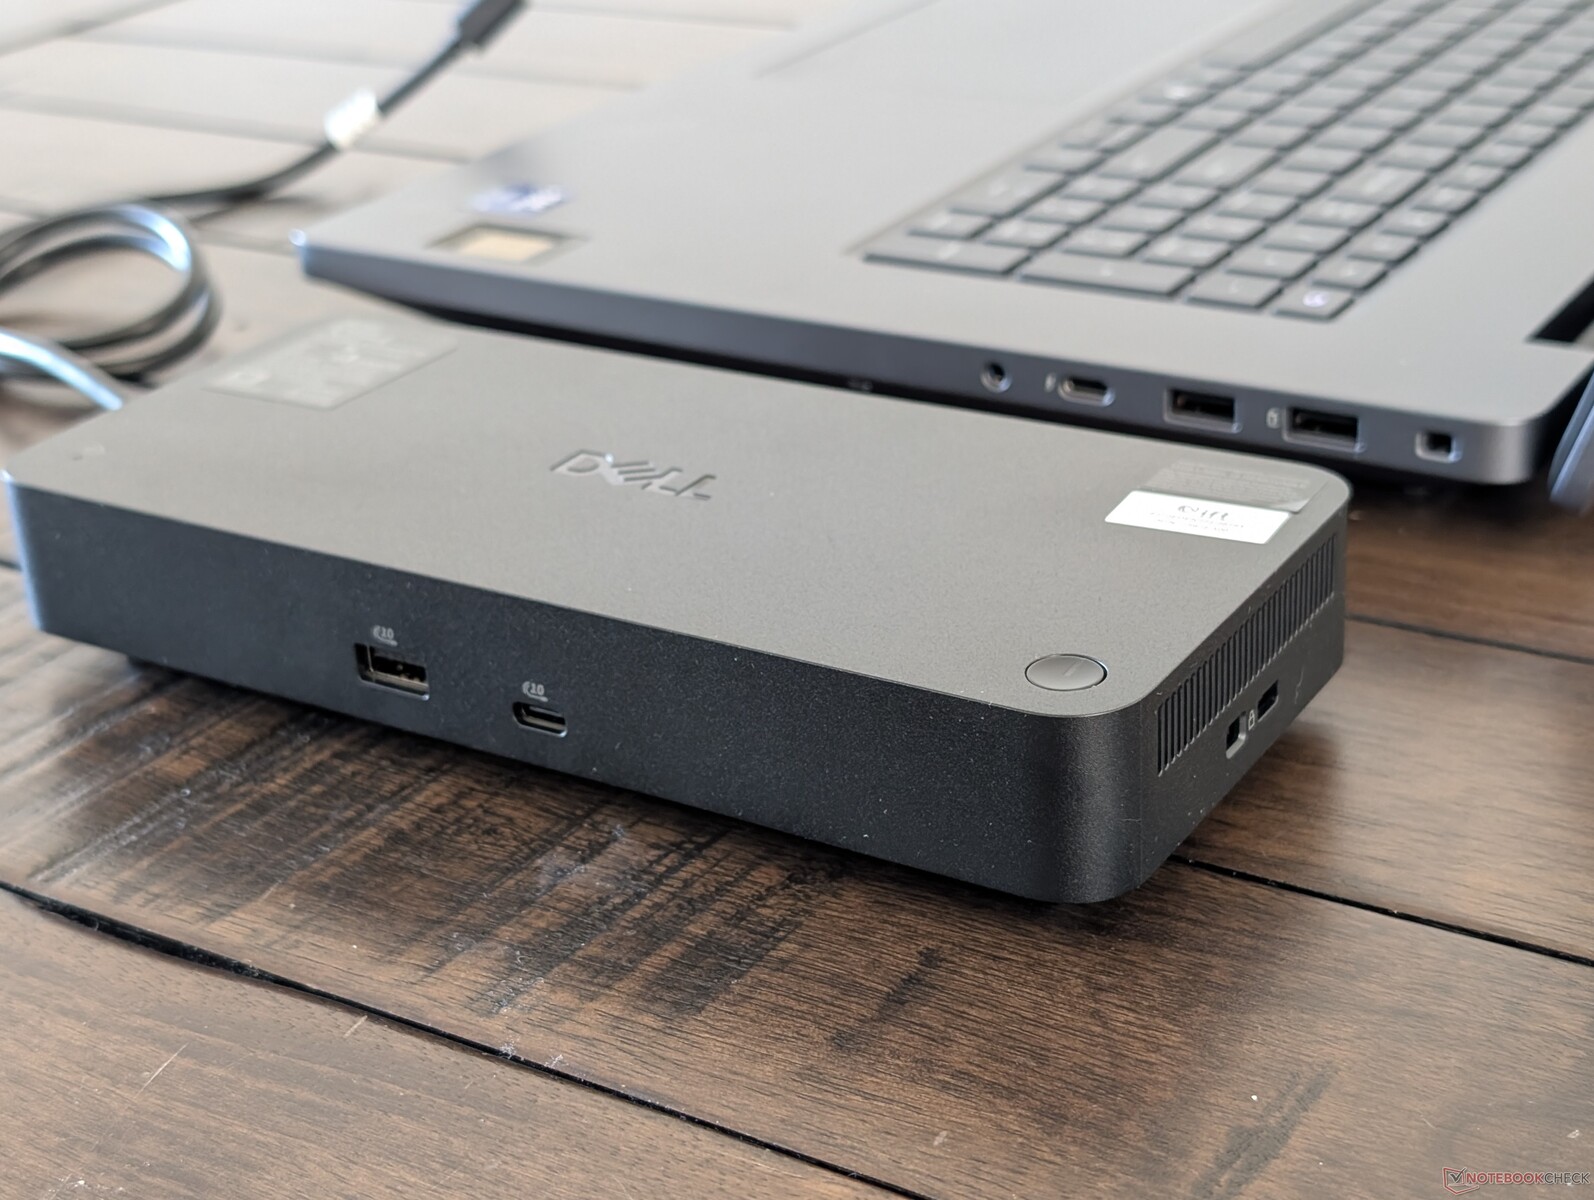
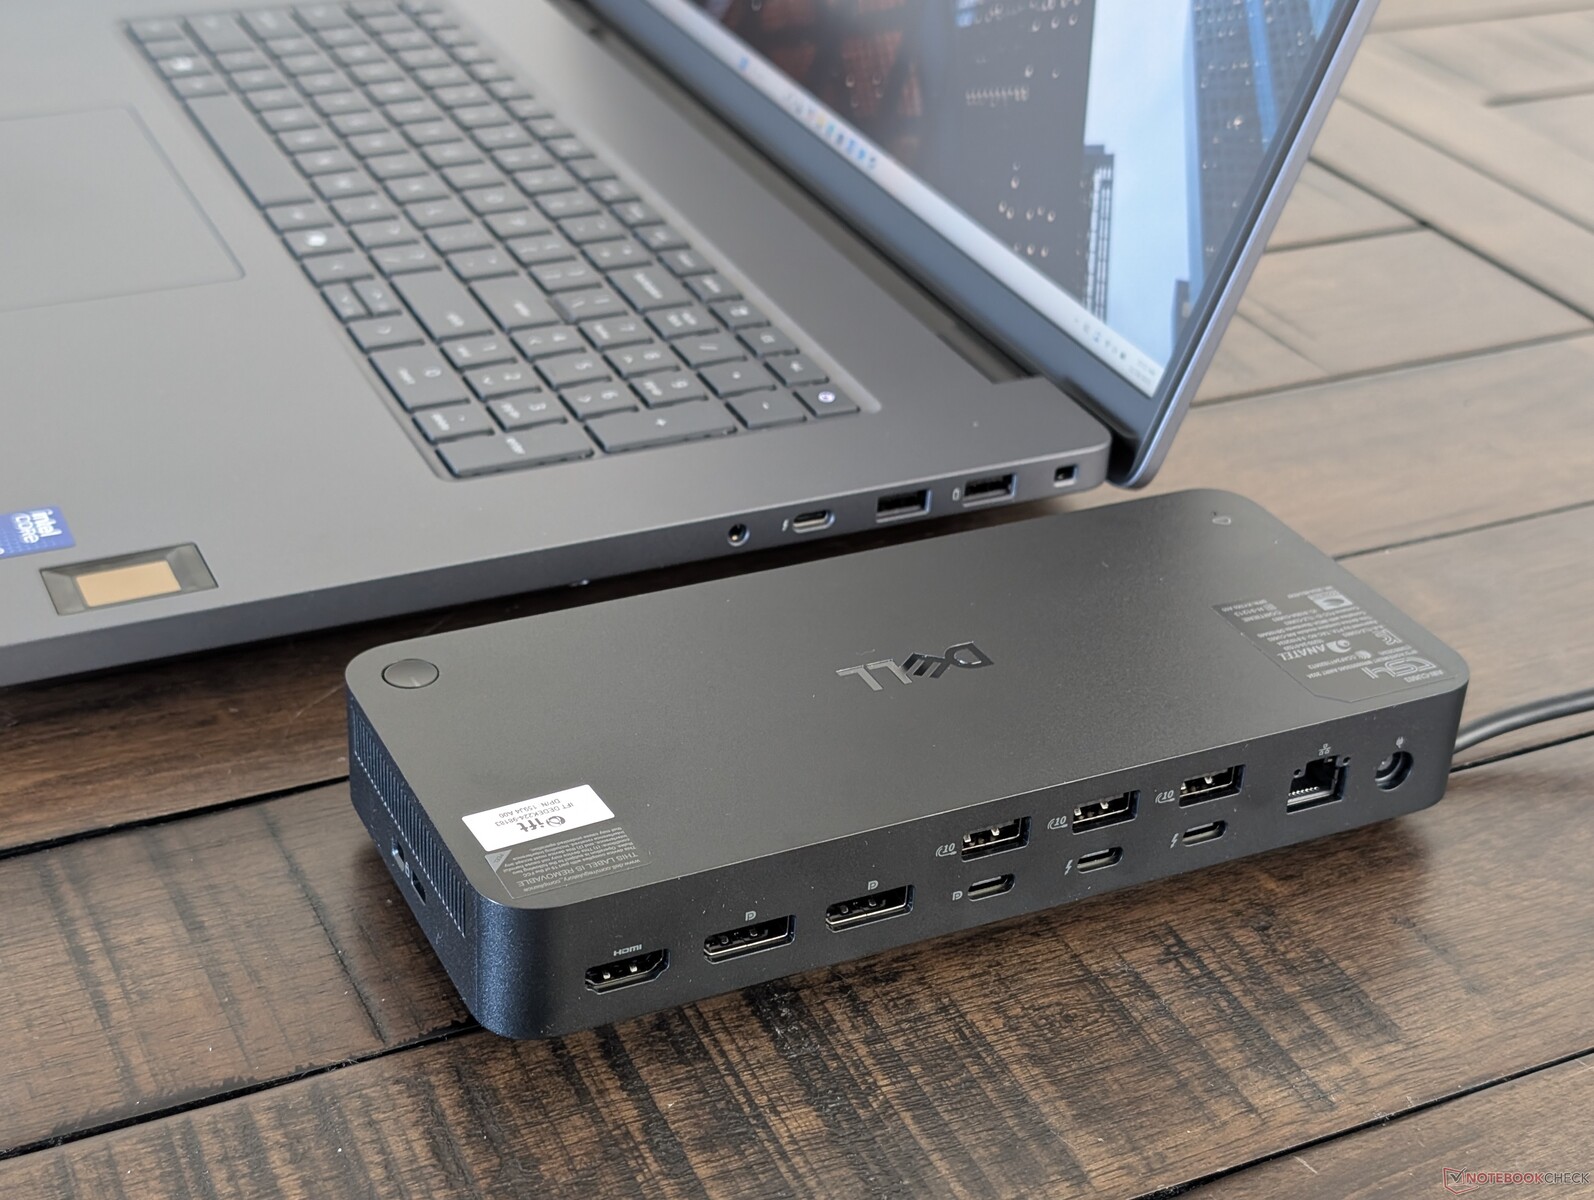
Optional extras include the Dell Pro Thunderbolt 5 Smart Dock as shown below. The docking station is a one-cable solution providing both power pass-through (up to 300 W) and additional ports for the laptop. It comes with its own AC adapter, however, which is just as big as the docking station itself.
A three-year limited manufacturer warranty comes standard for the laptop and the optional docking station.
Input Devices
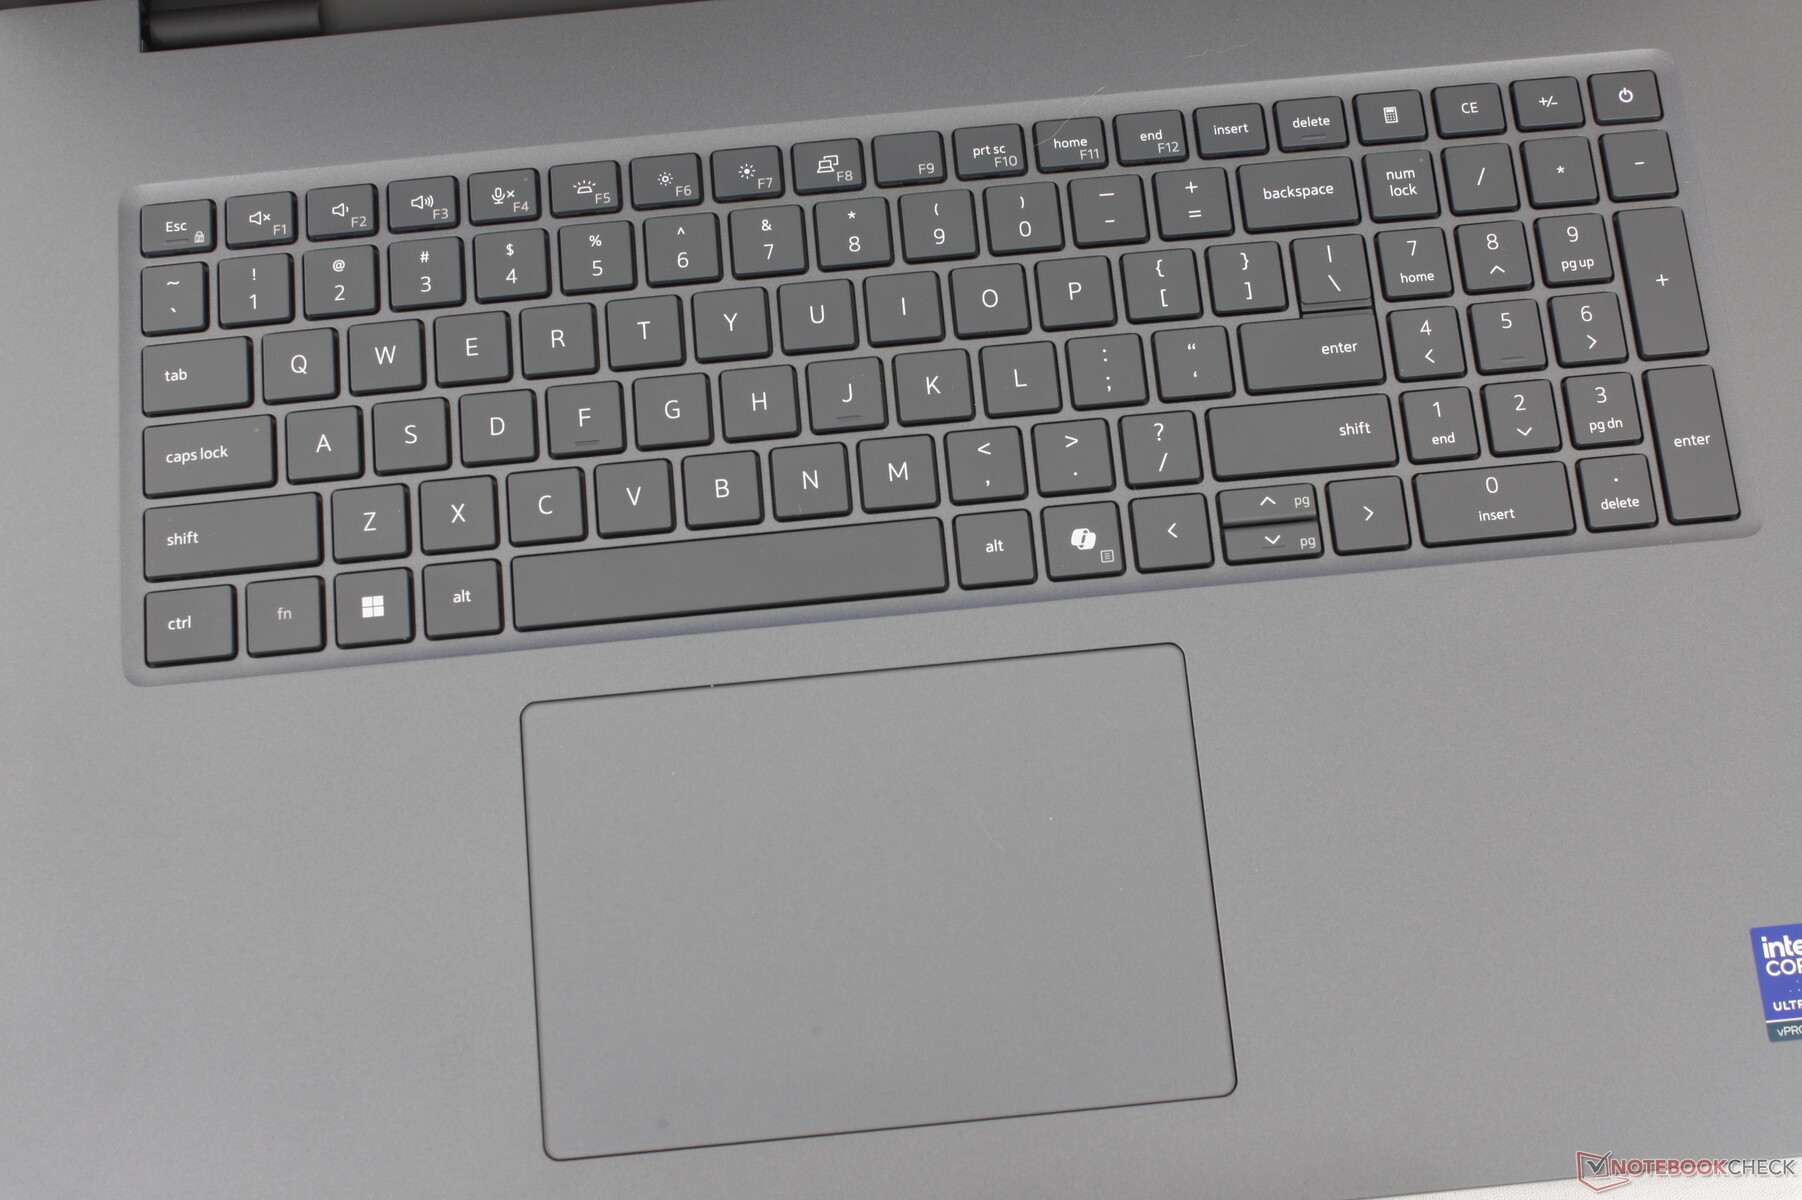
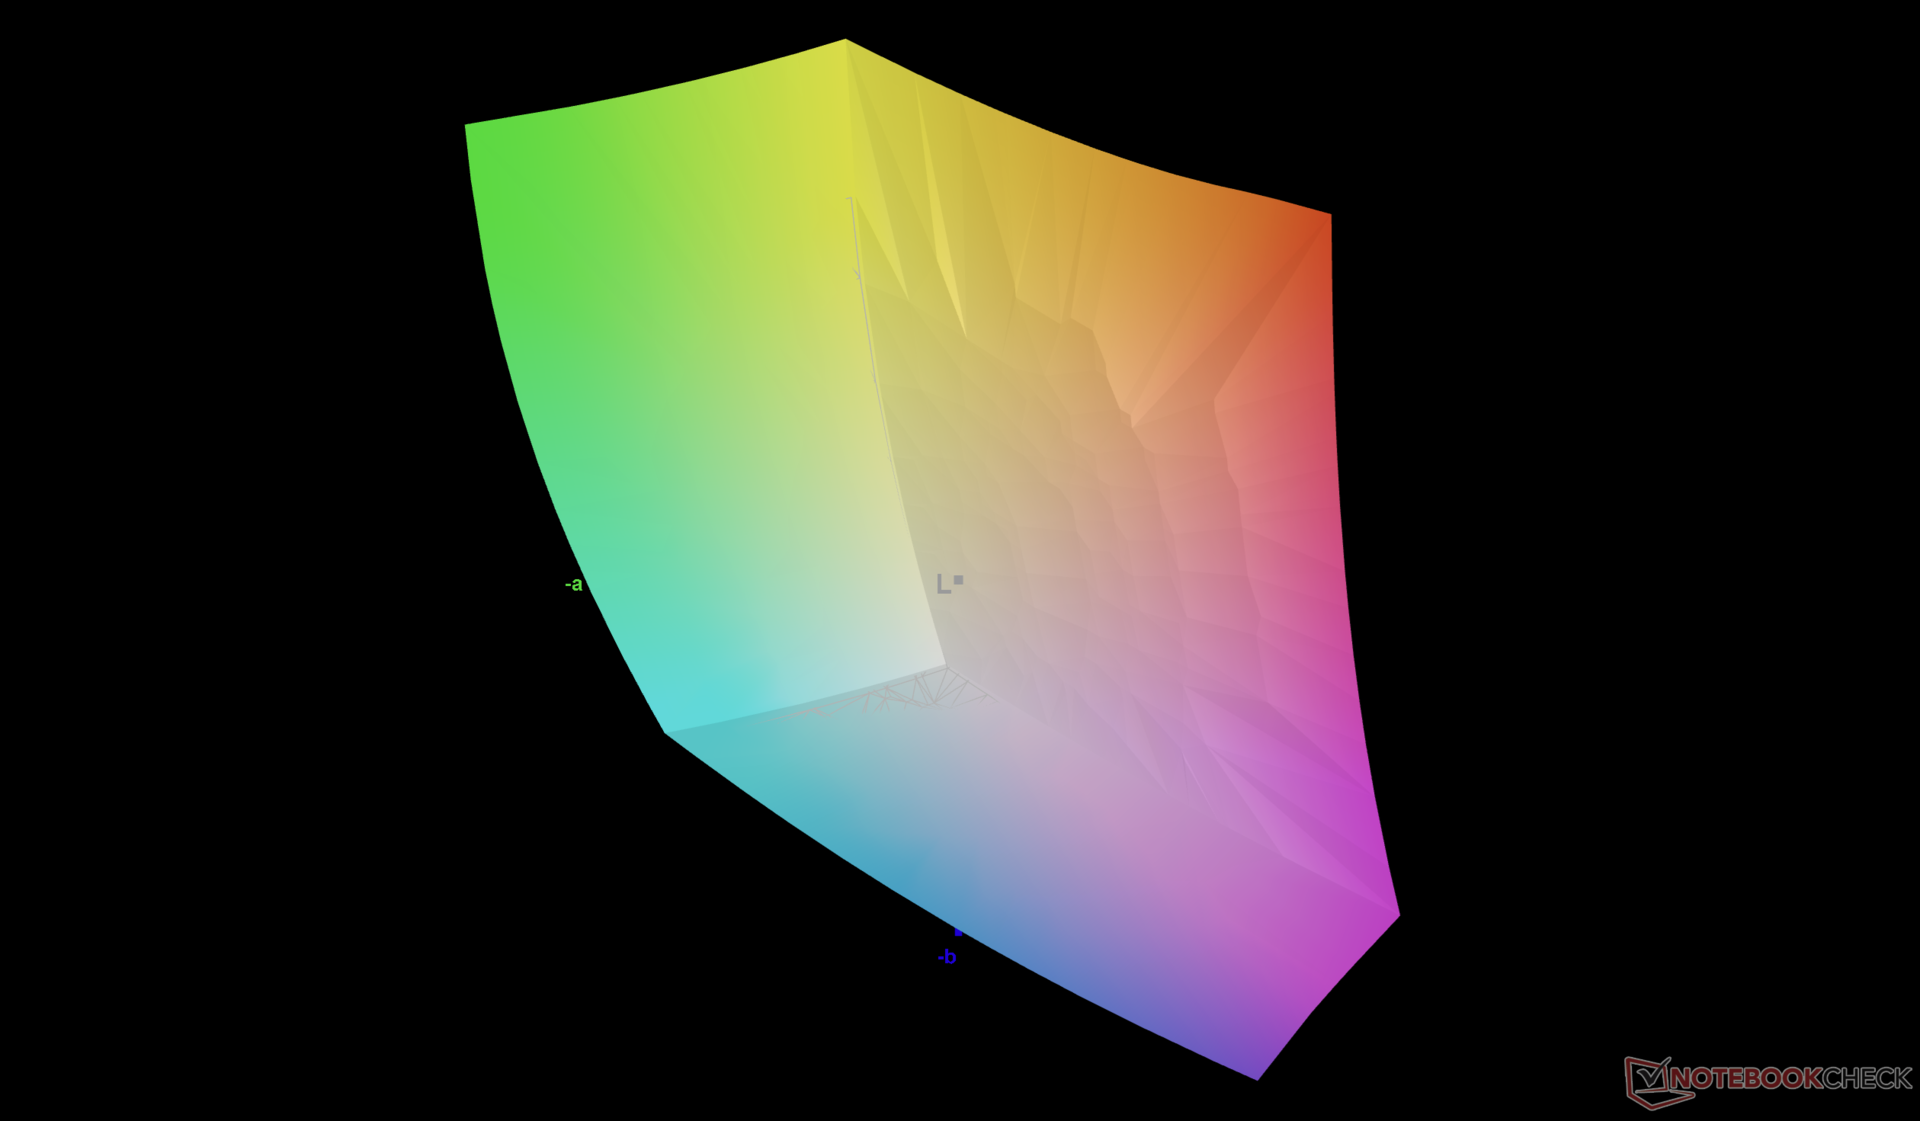
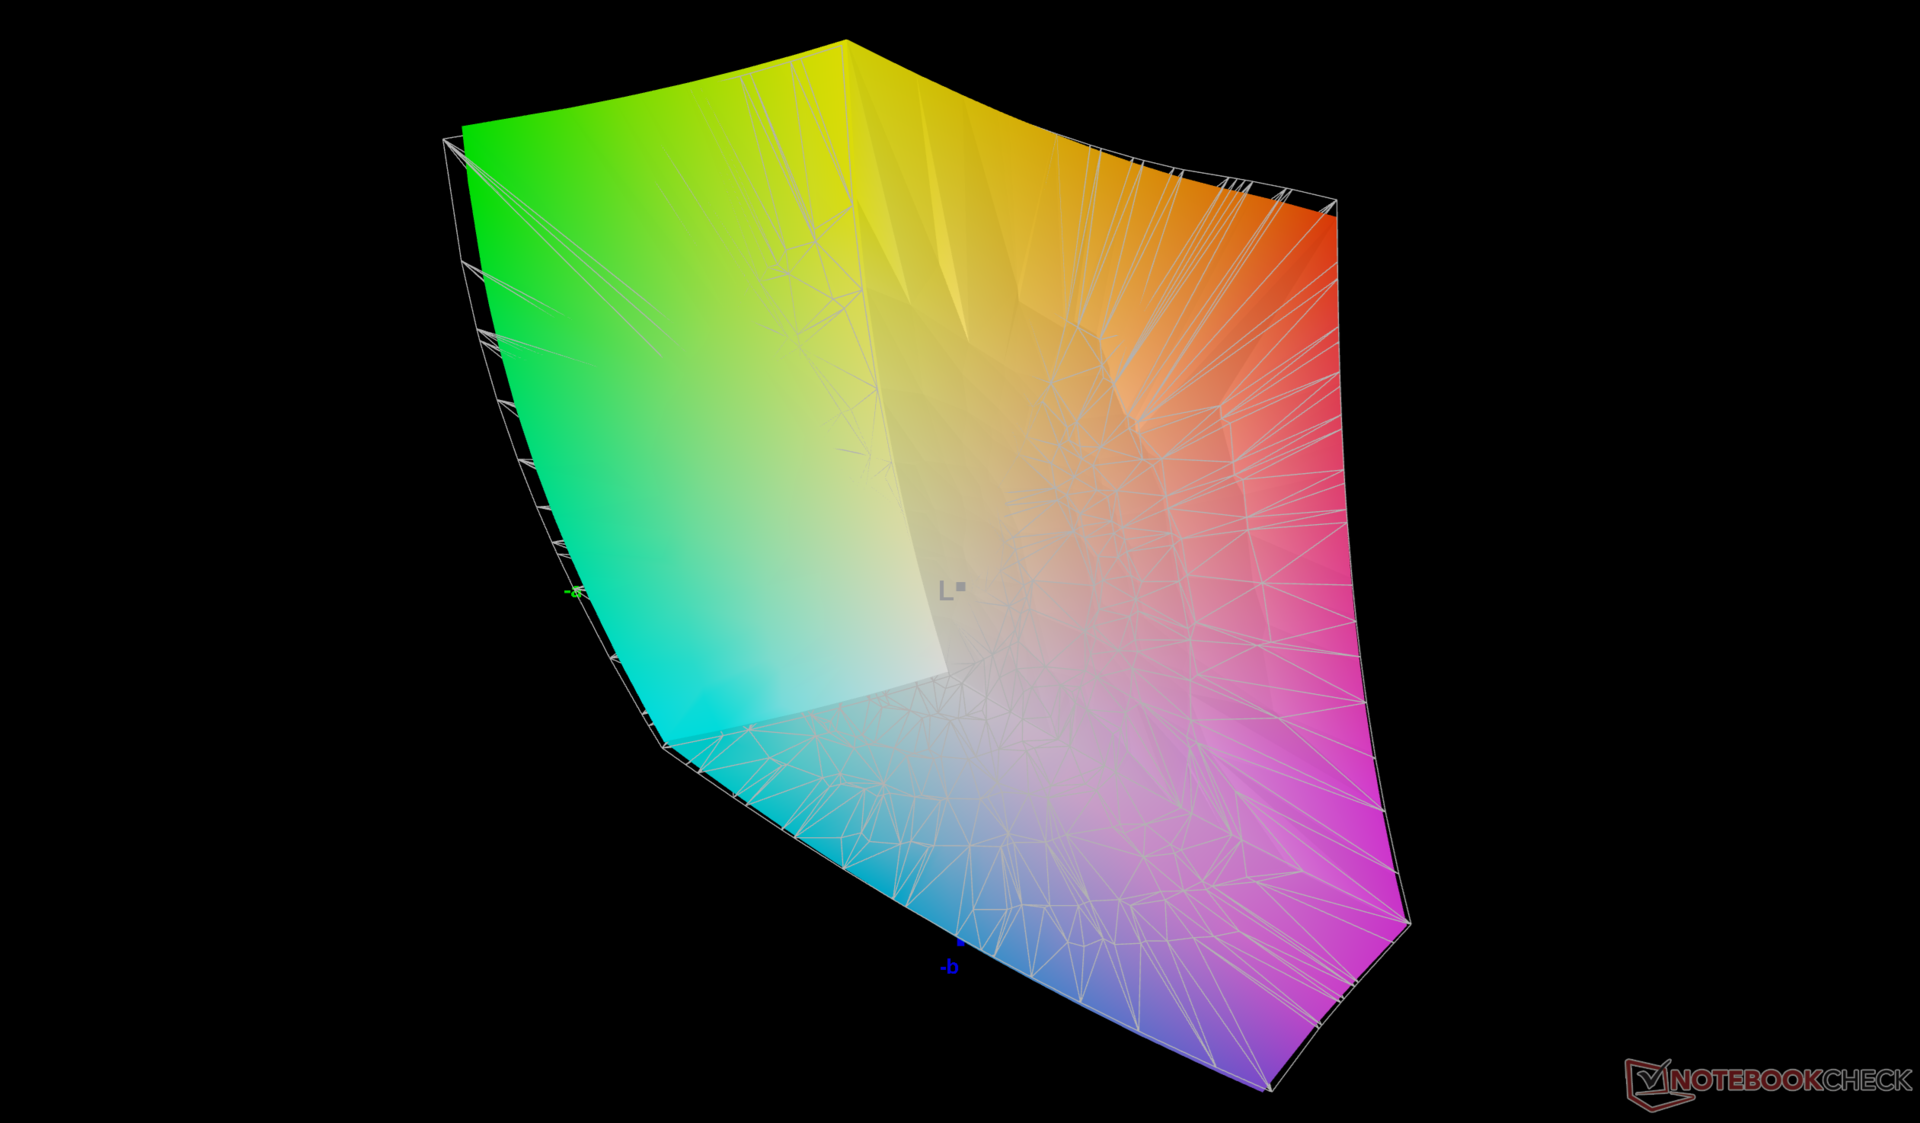
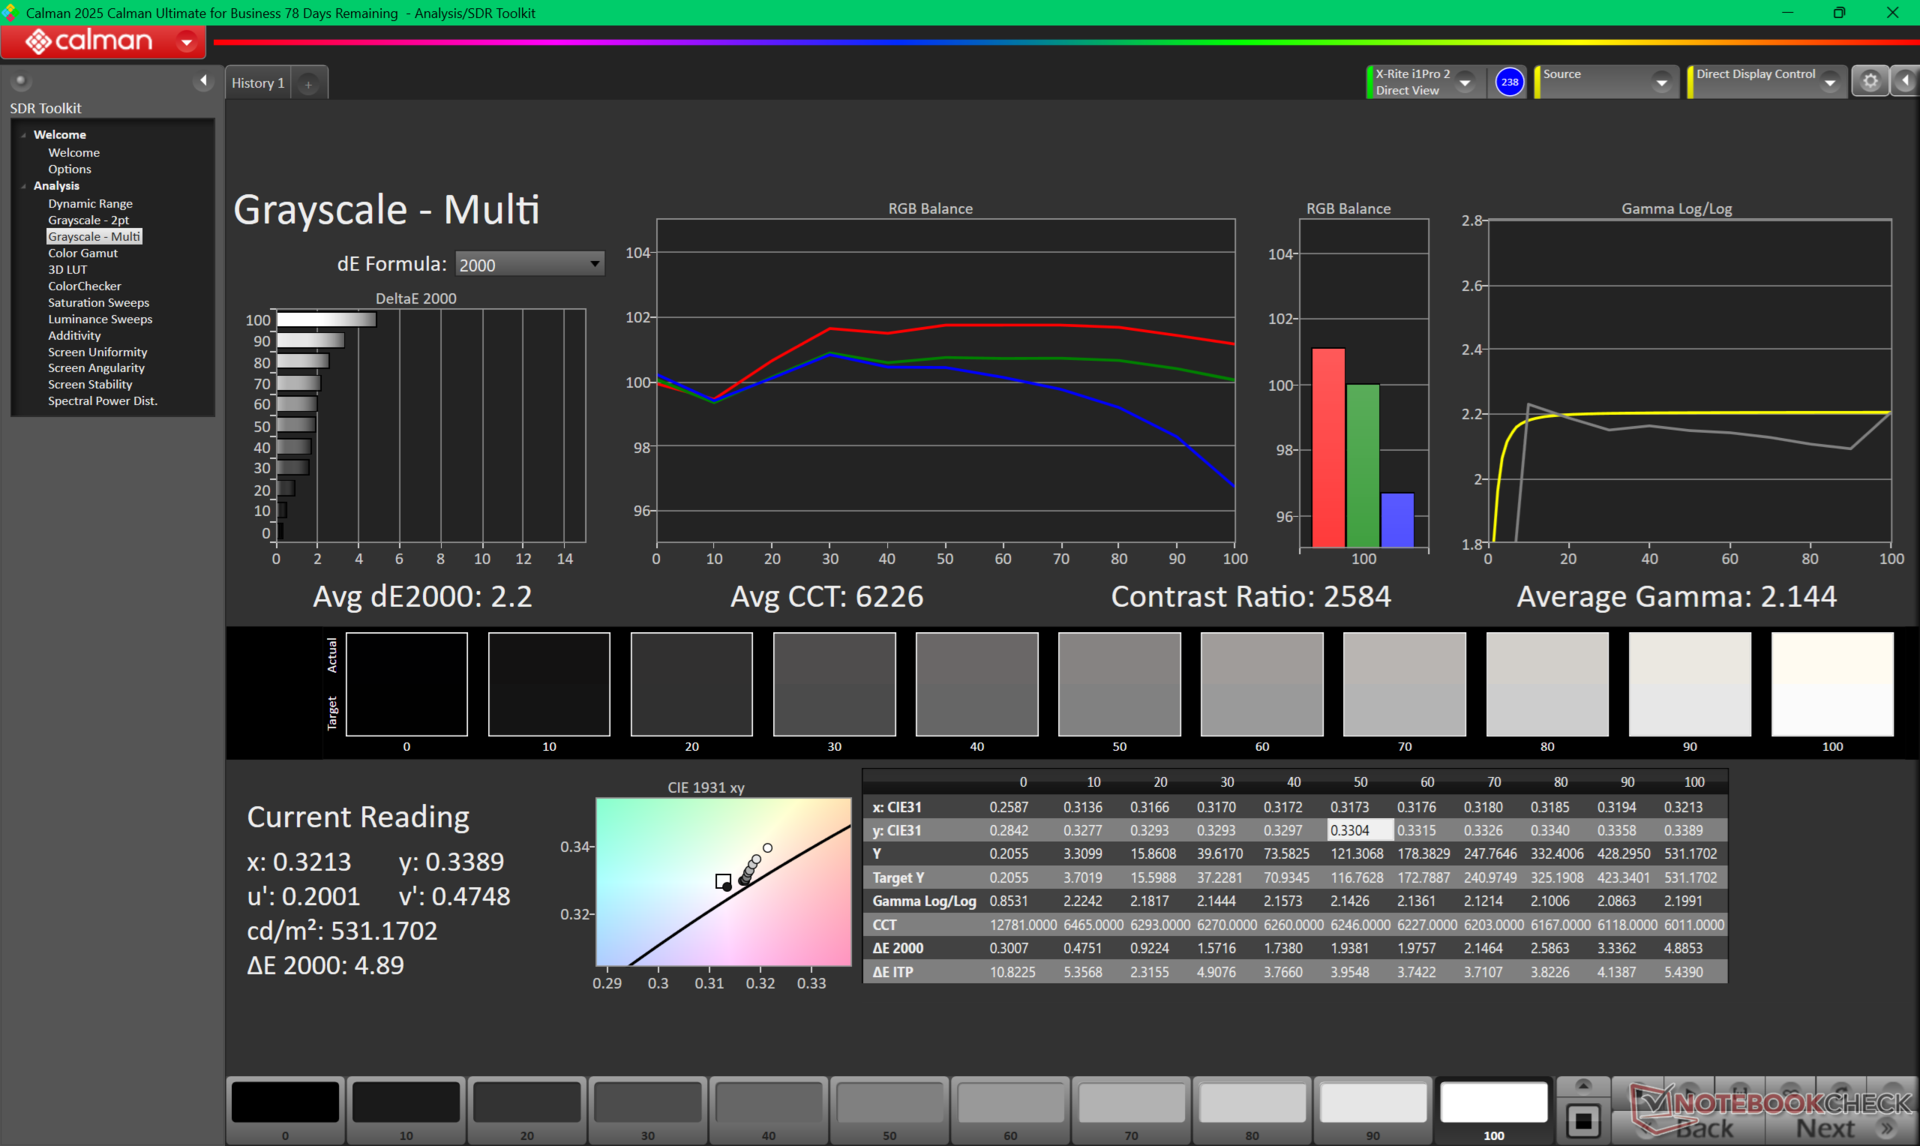
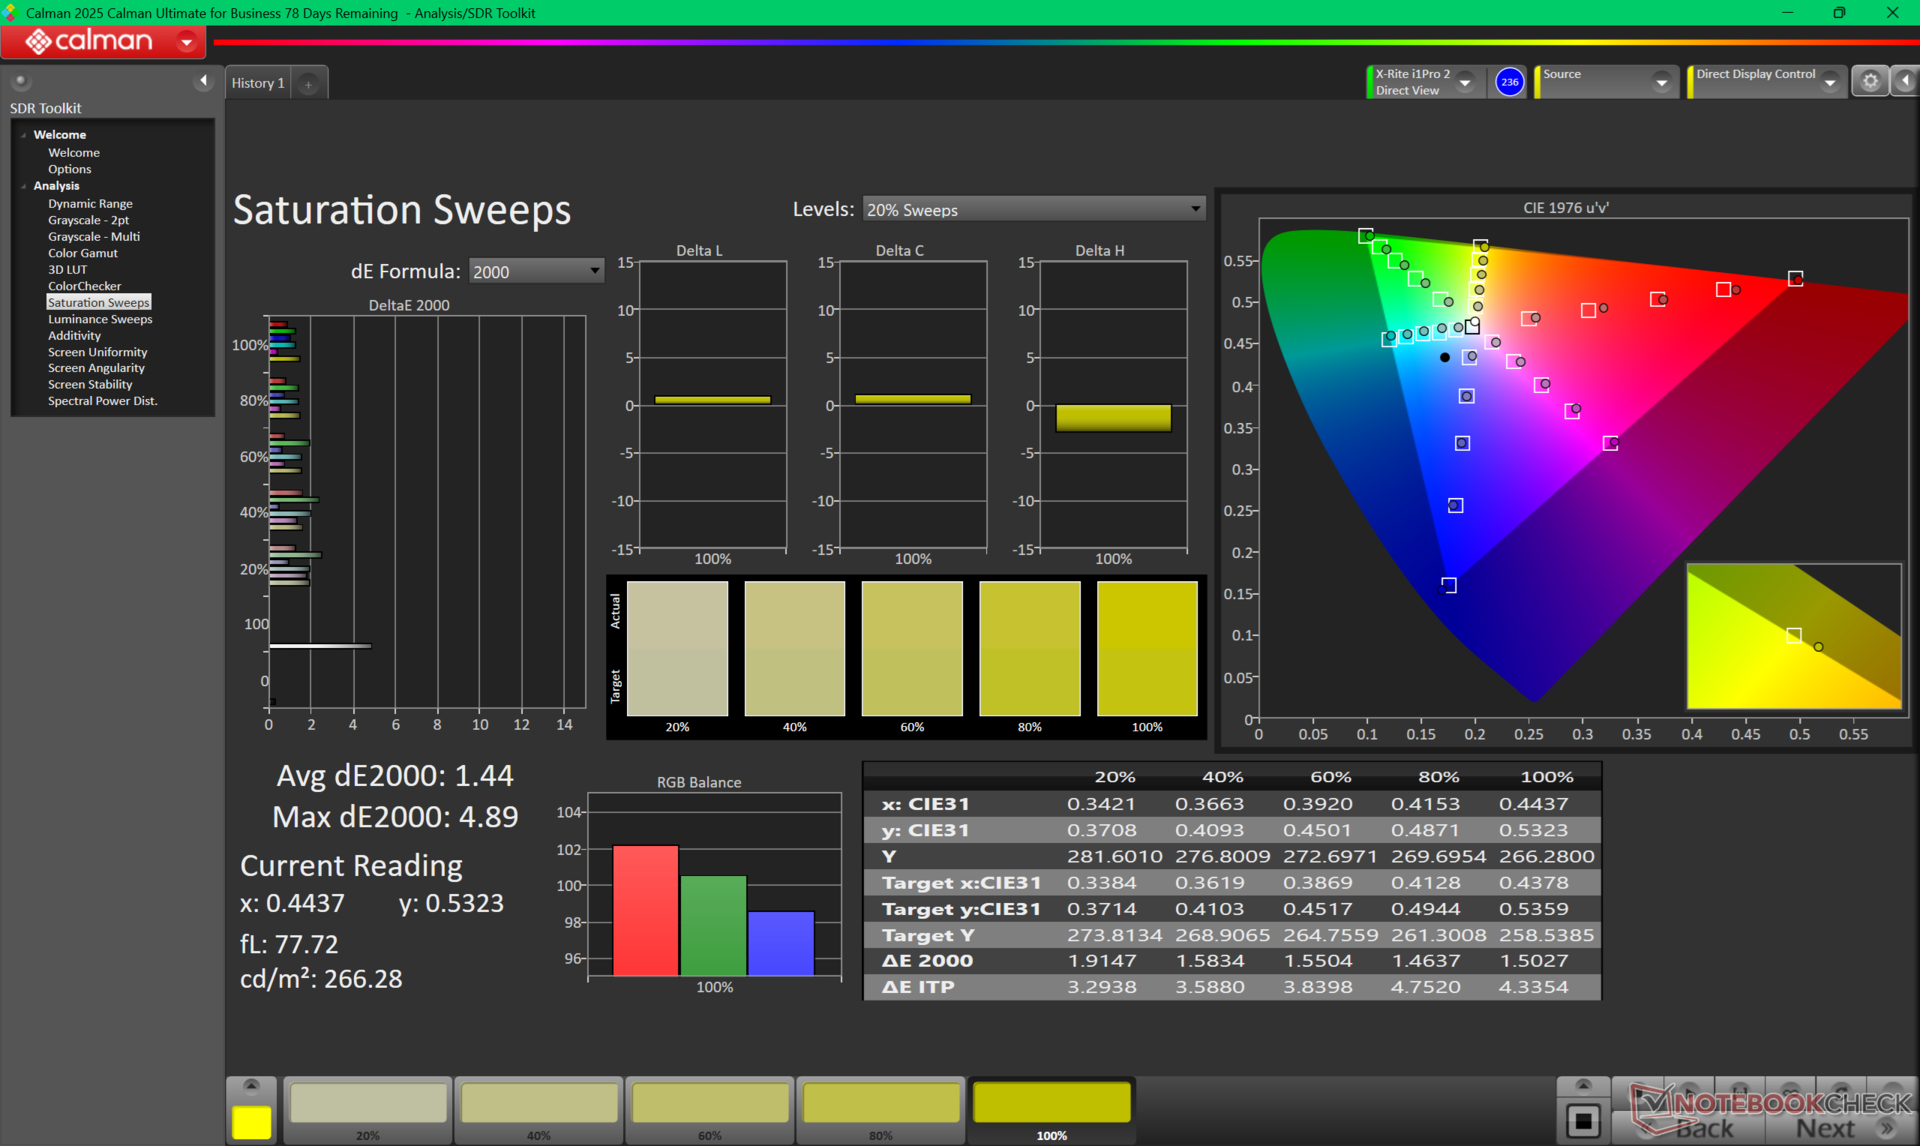
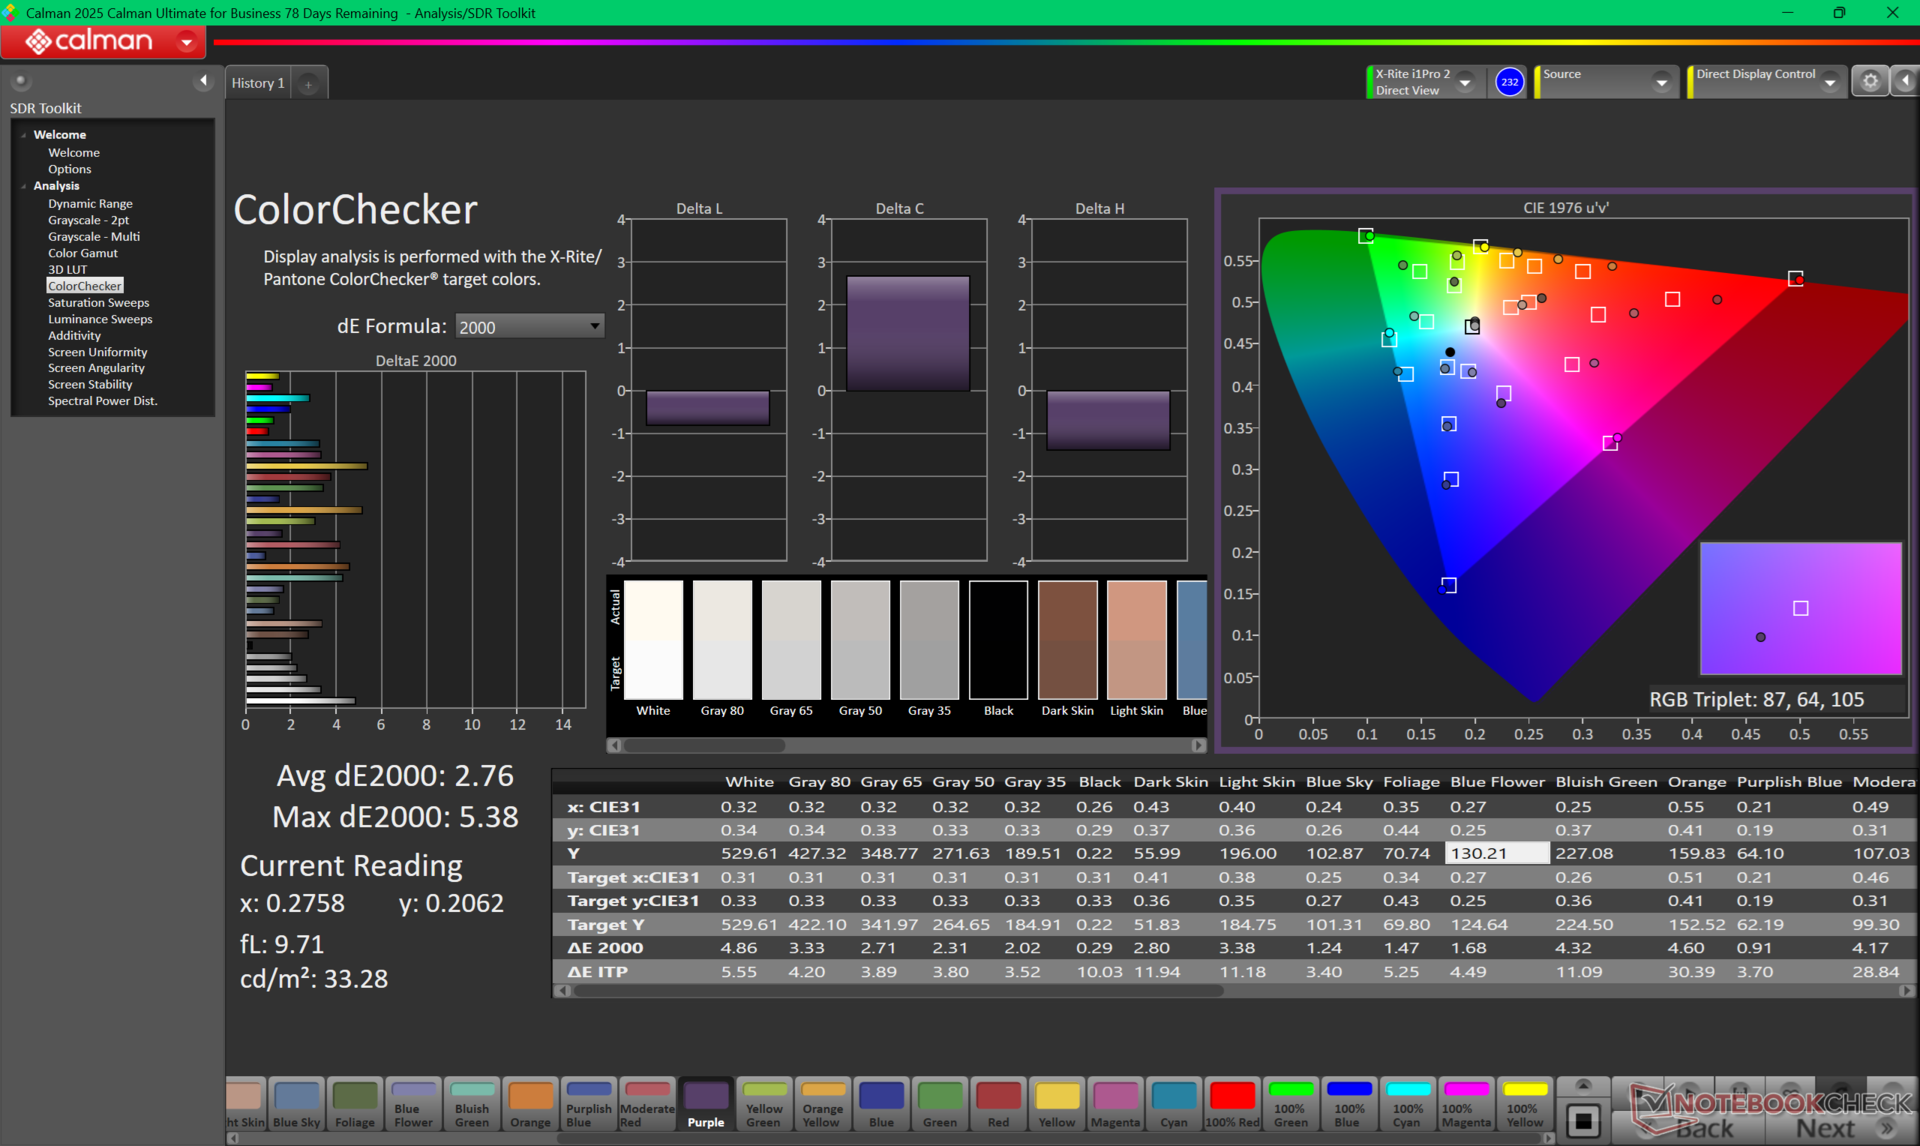
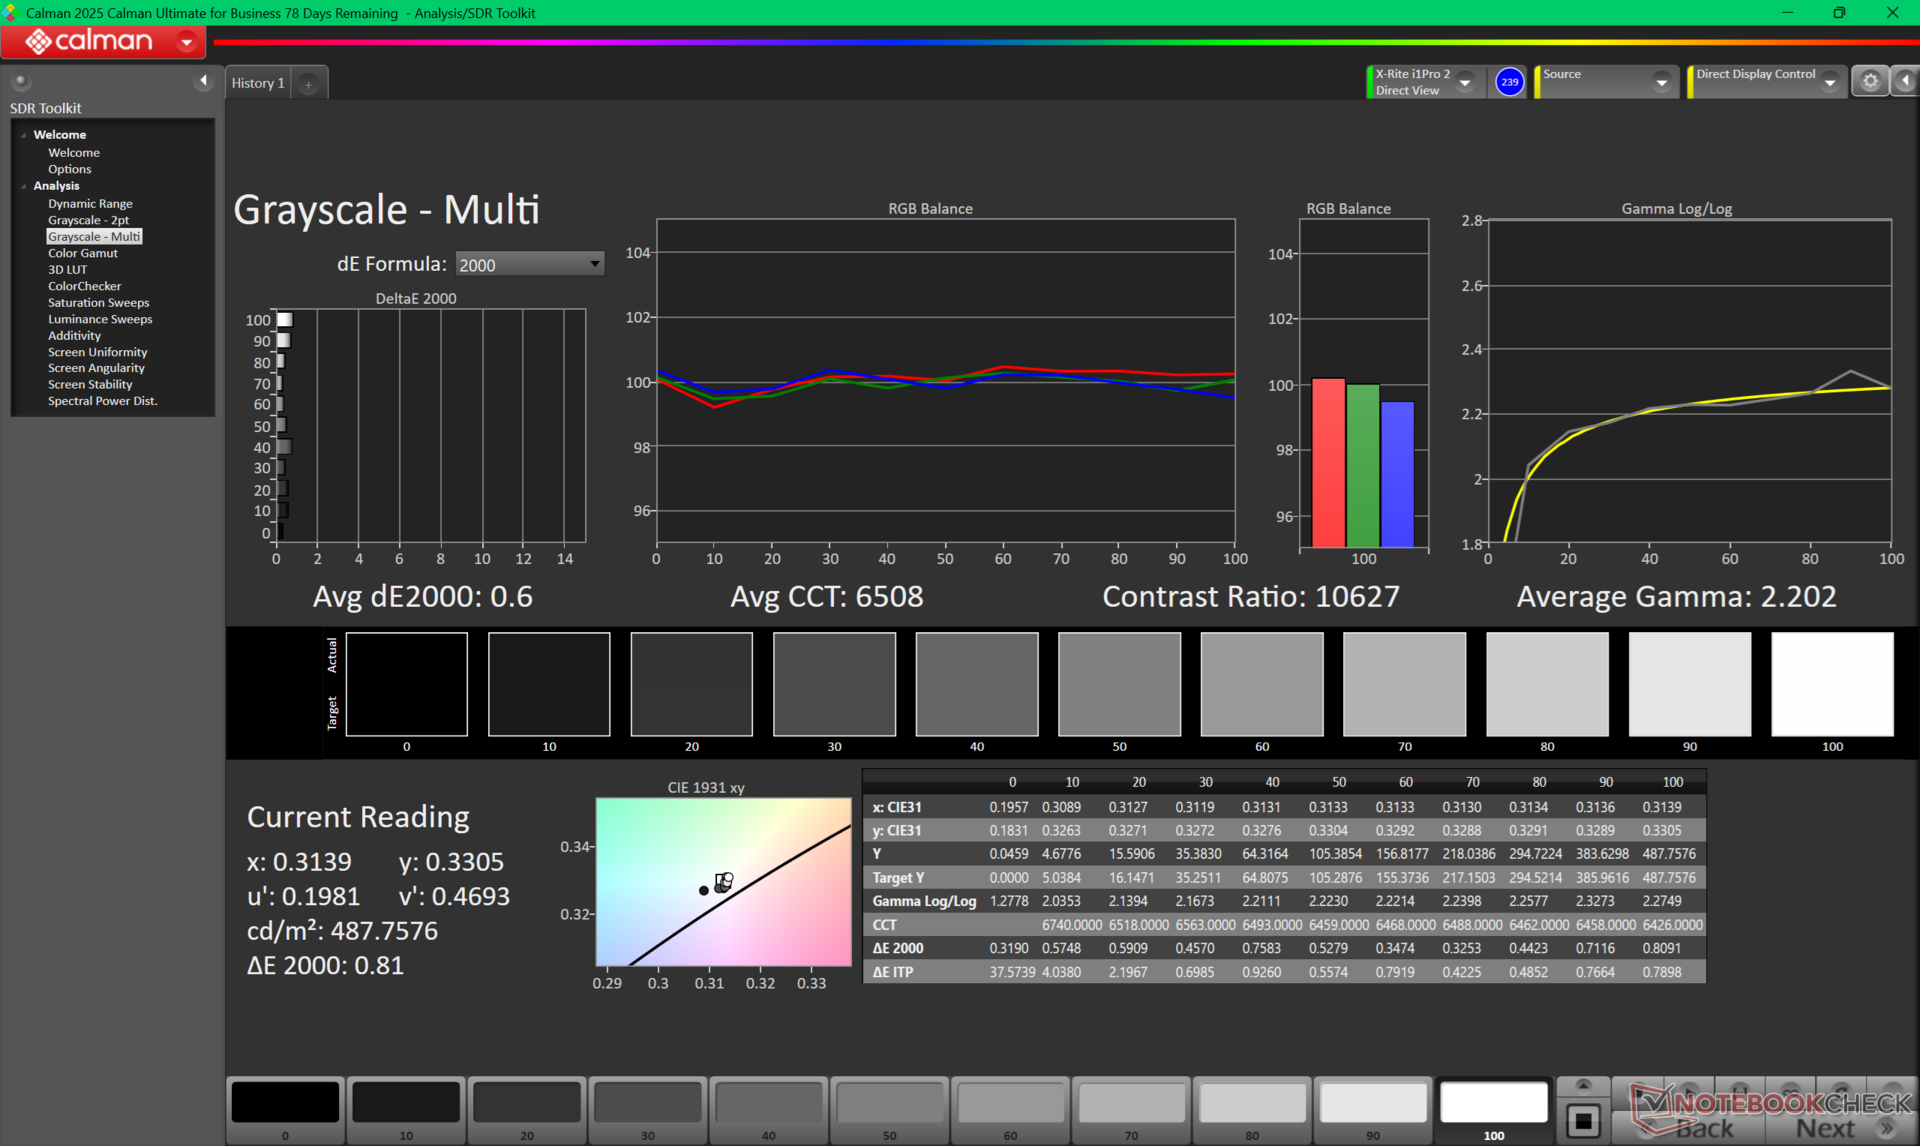
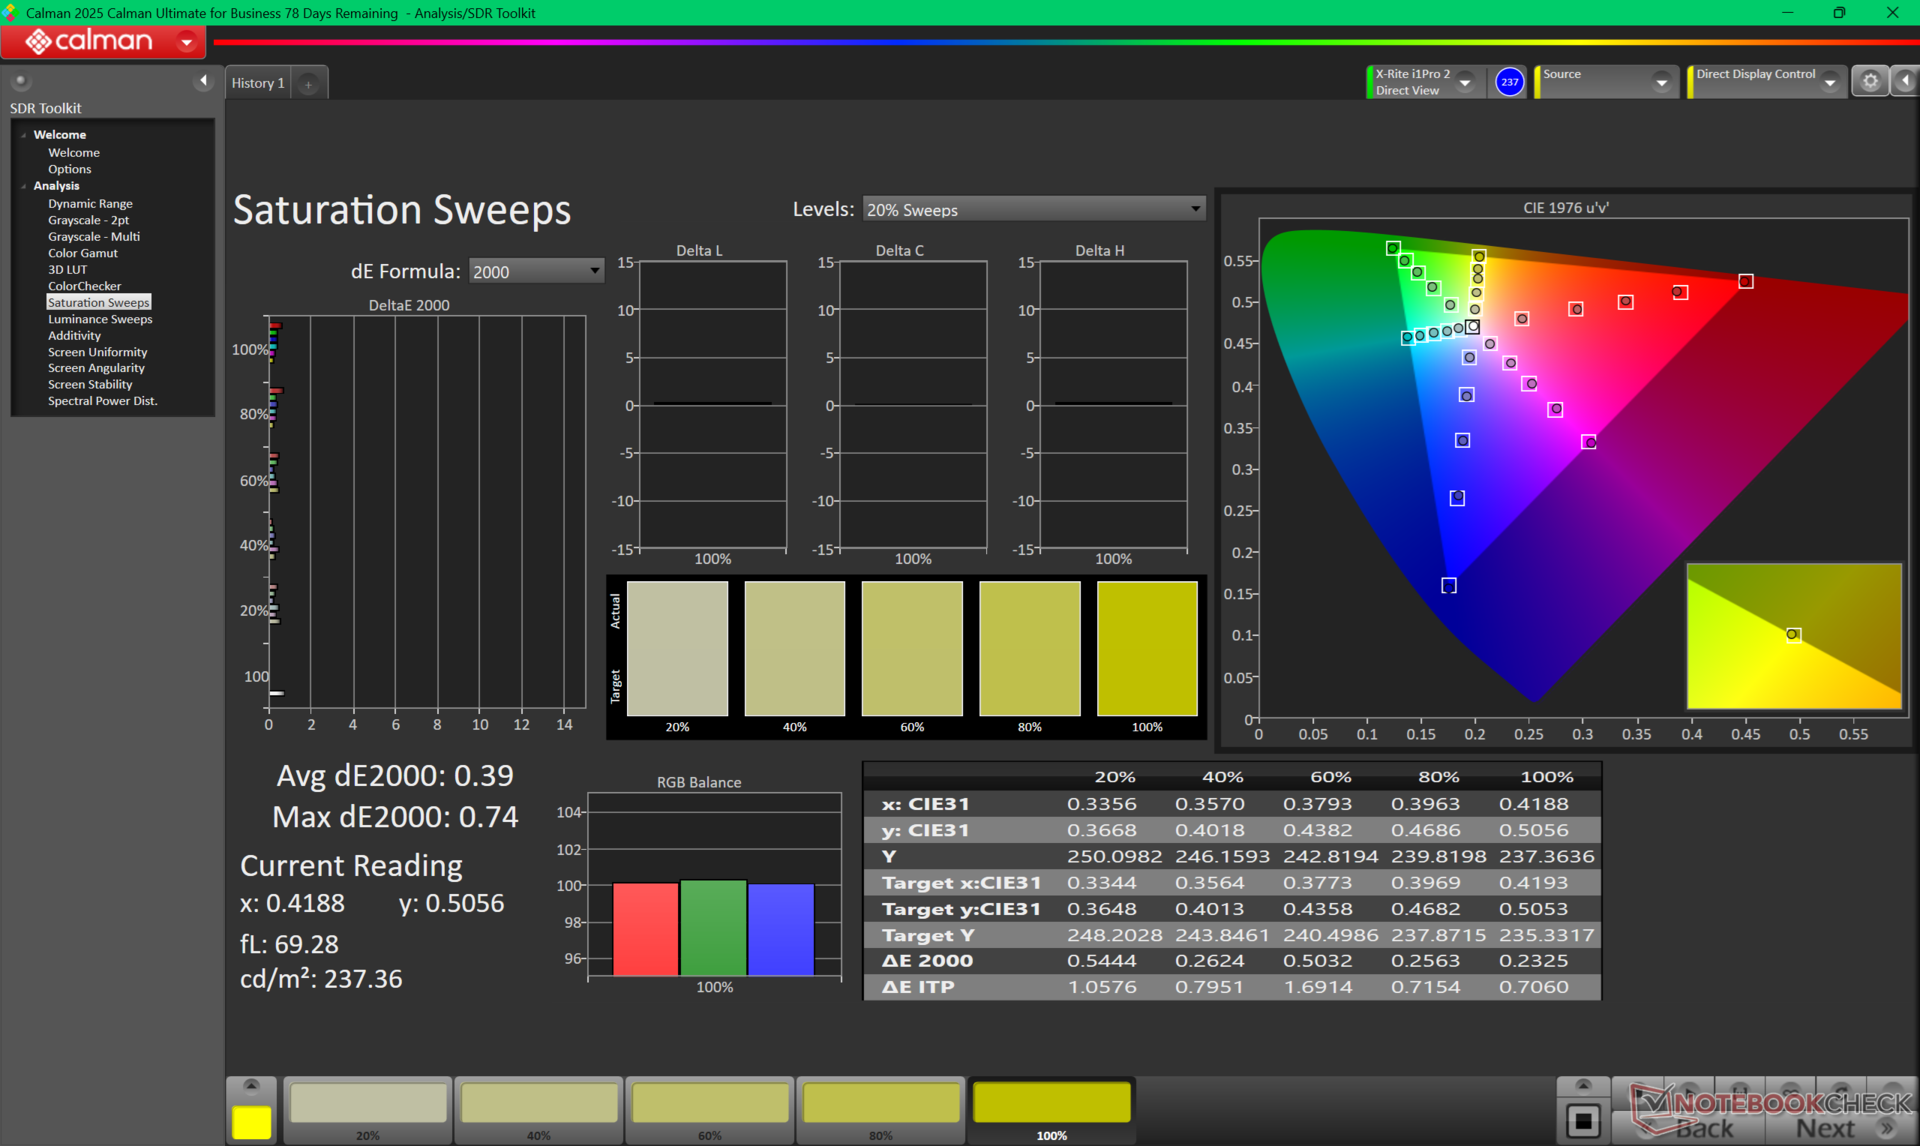
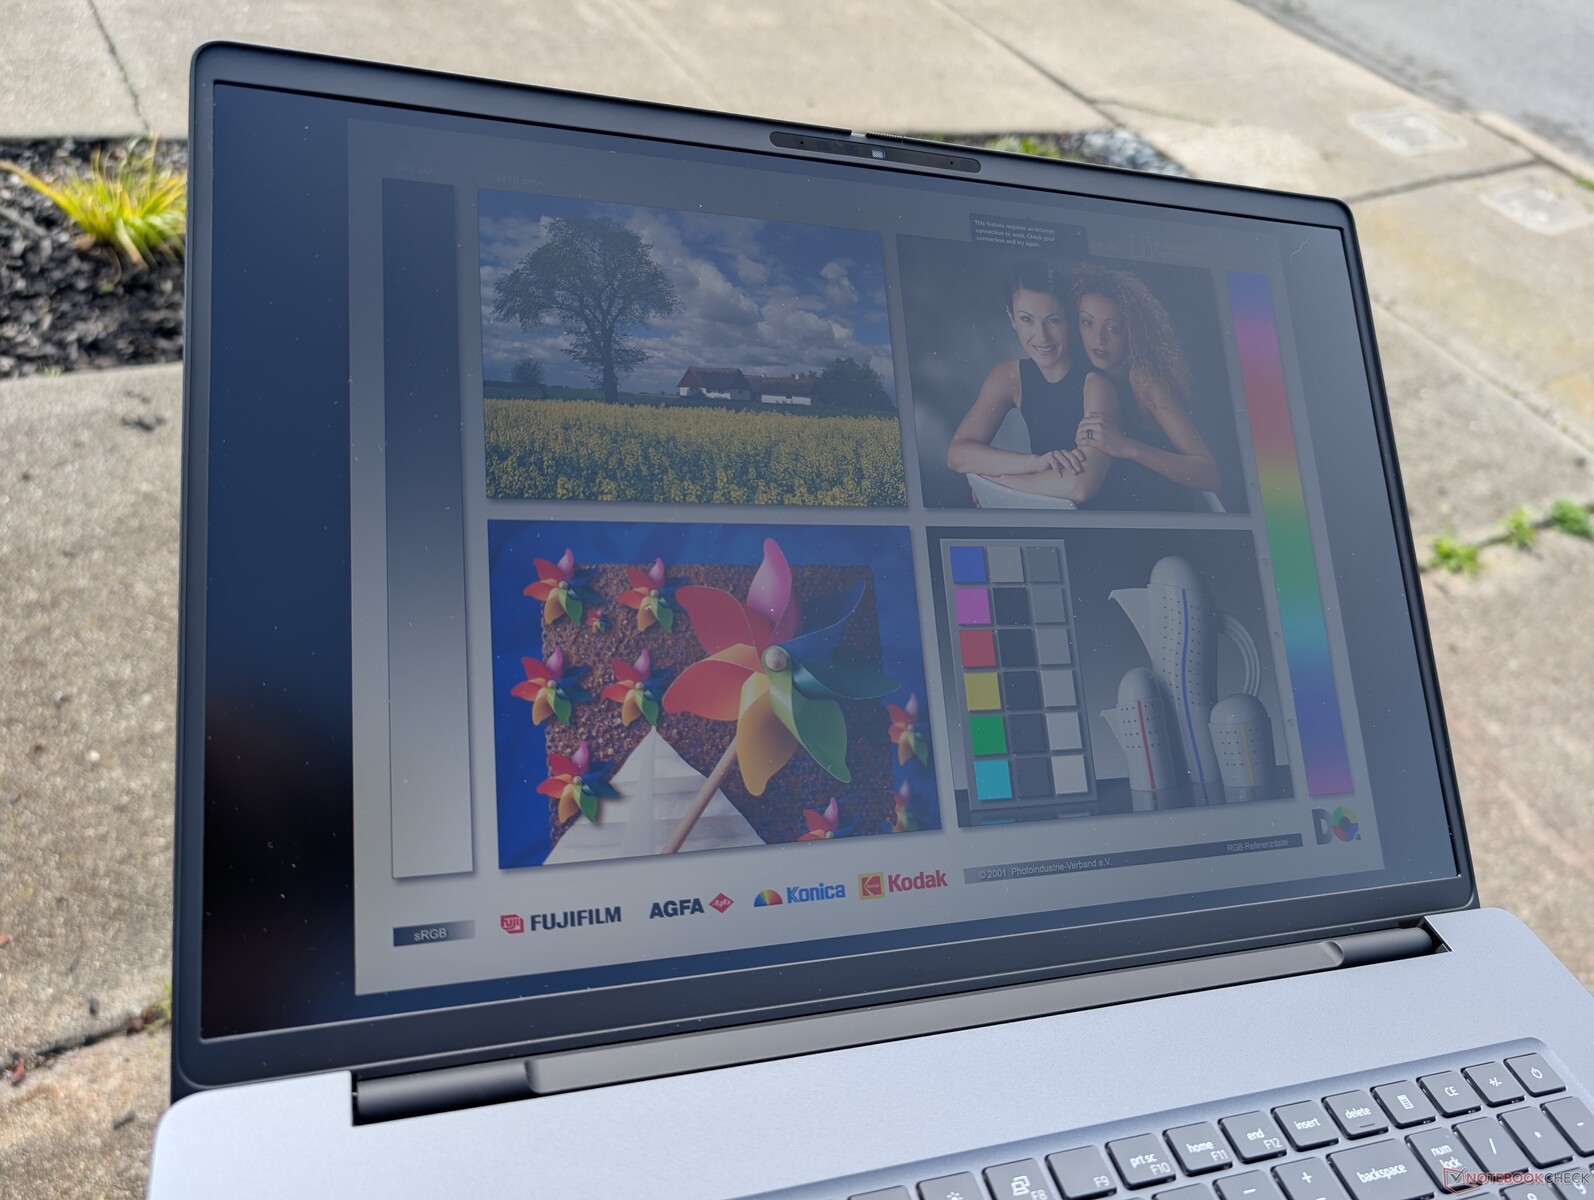
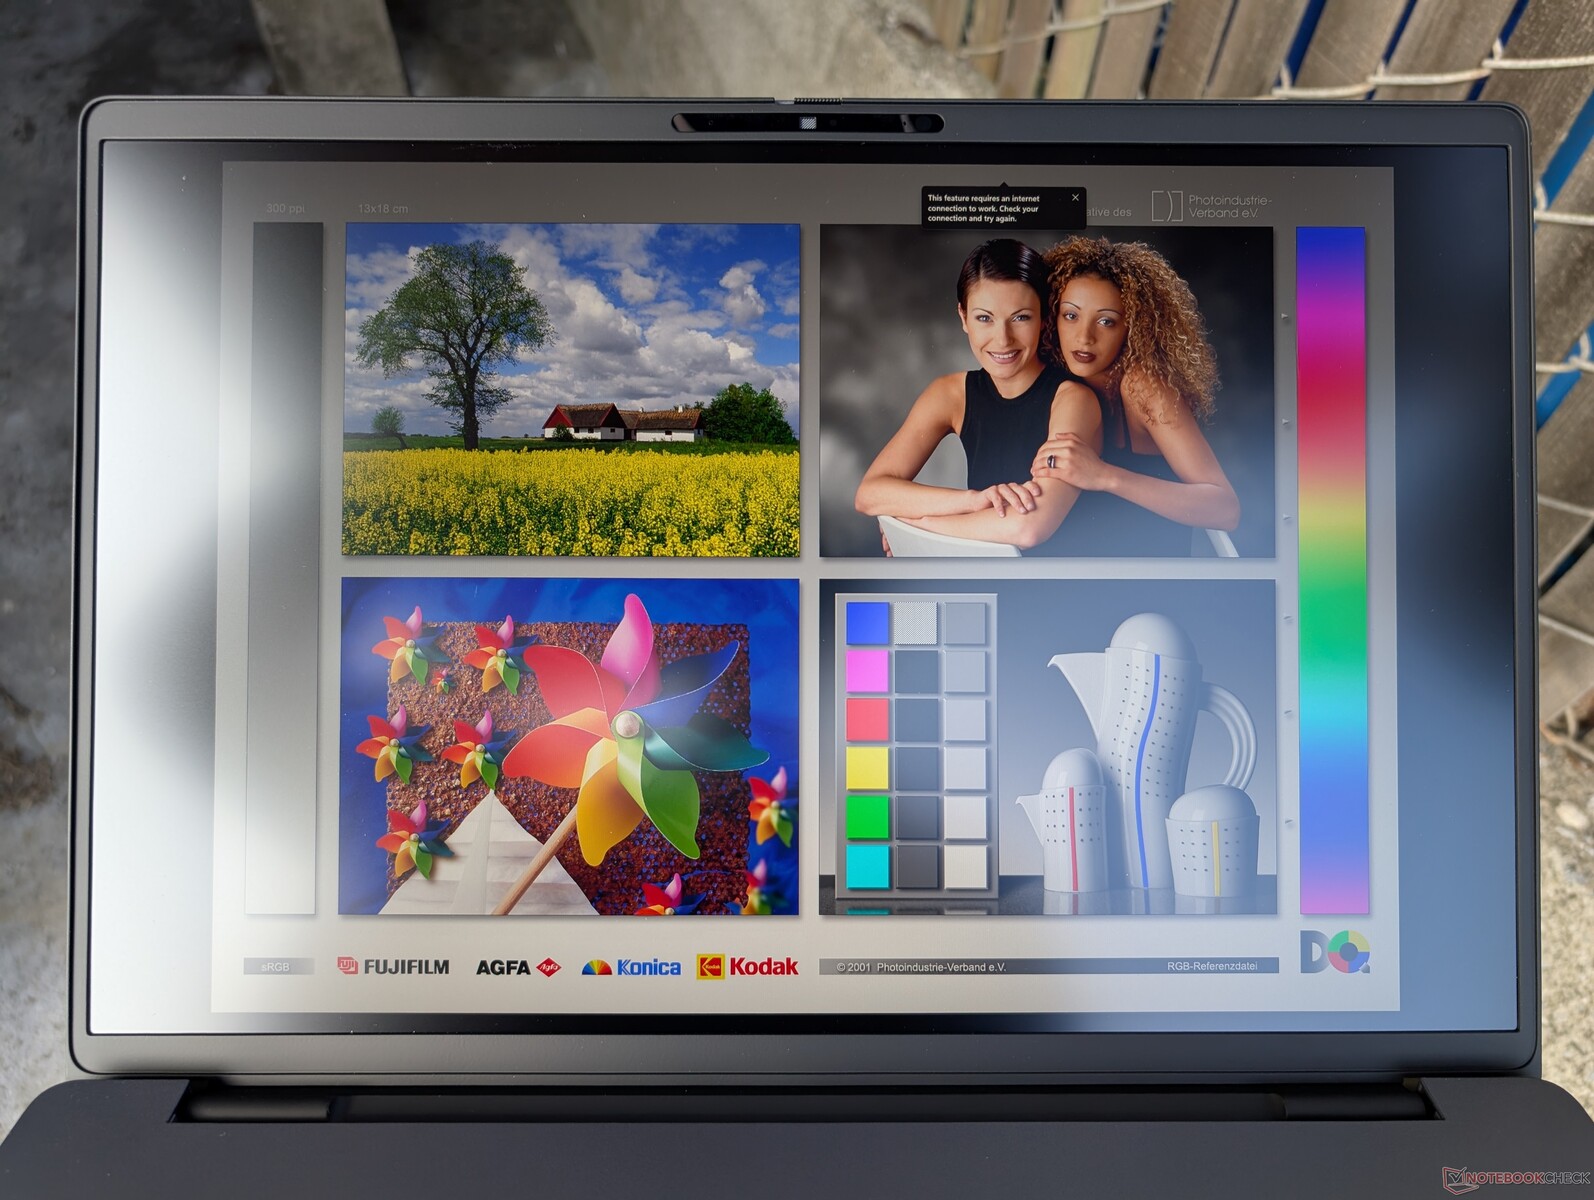
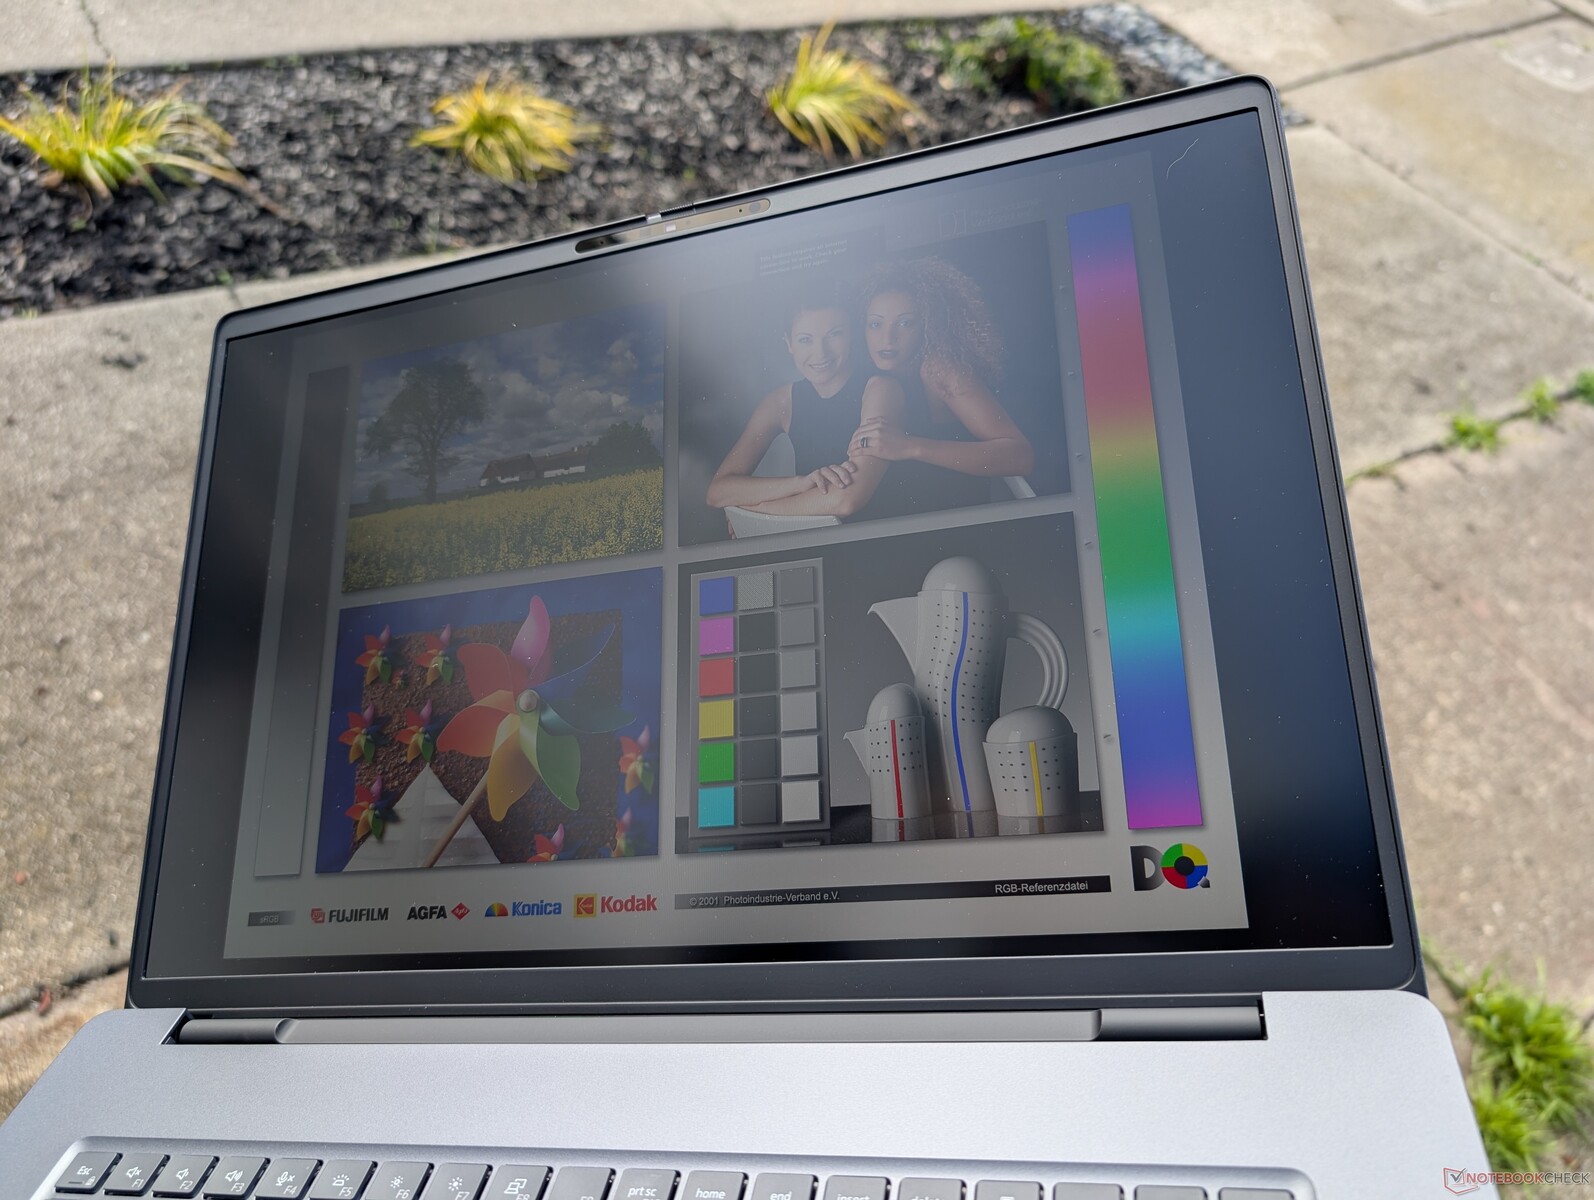
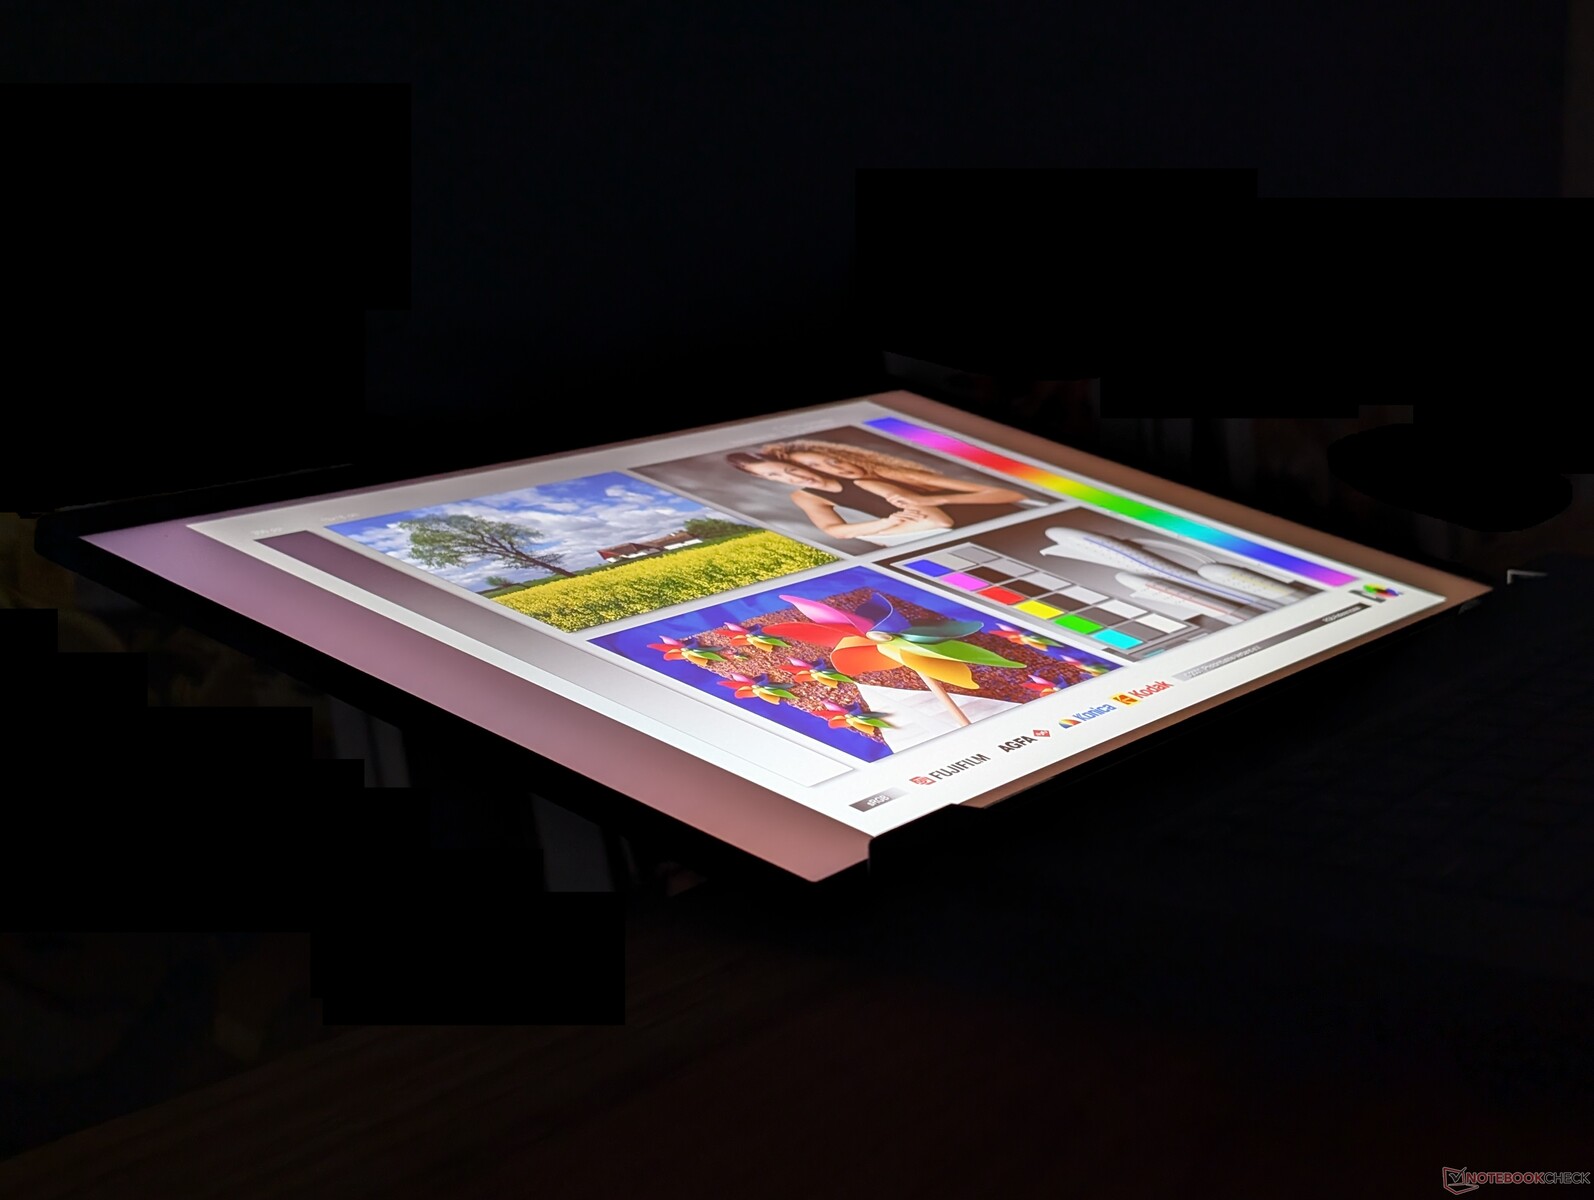
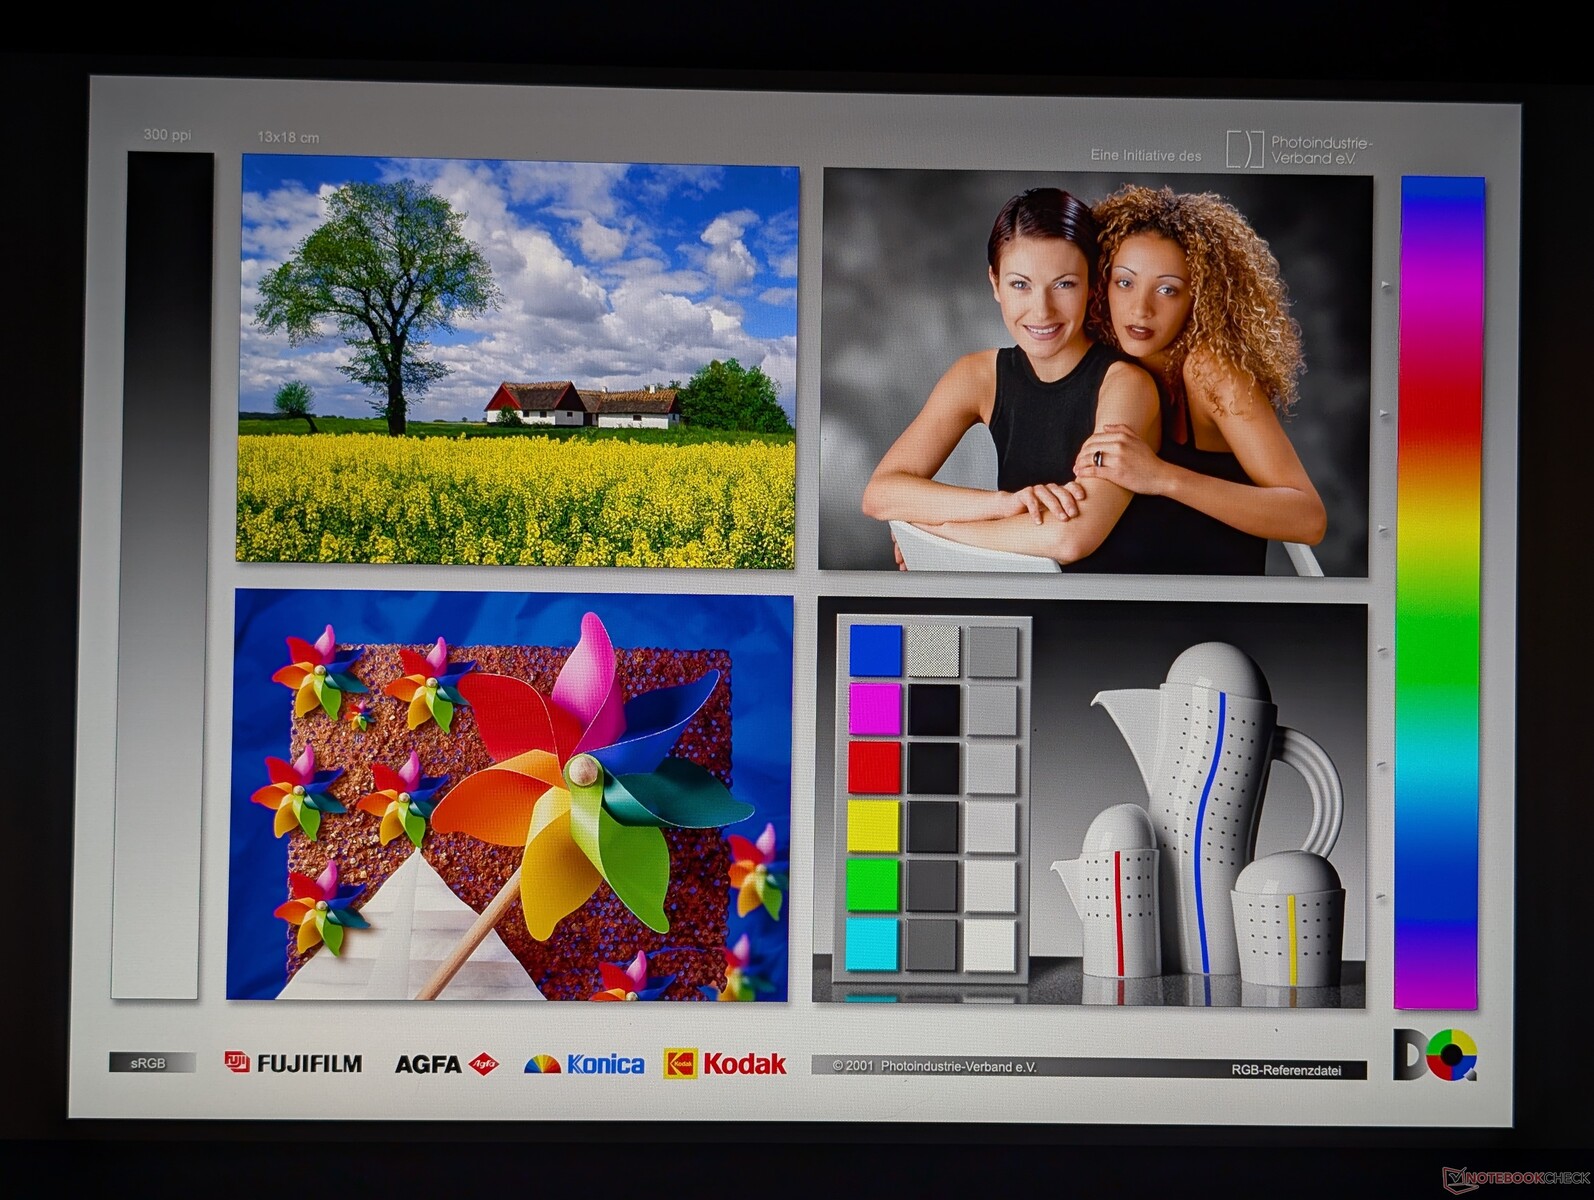
Display — P3 Colors And 120 Hz With IPS
Dell offers only a single panel option across all configurations at the moment whereas other 18-inch laptops like the Schenker Key 18 Pro may offer higher resolution 4K options. The display here is otherwise excellent and one of the best IPS displays we've seen on any 18-inch laptop in terms of color coverage, contrast ratio, and brightness. Nonetheless, features like HDR support and response times can't hold a candle to current OLED offerings.


| |||||||||||||||||||||||||
Brightness Distribution: 91 %
Center on Battery: 528.8 cd/m²
Contrast: 2404:1 (Black: 0.22 cd/m²)
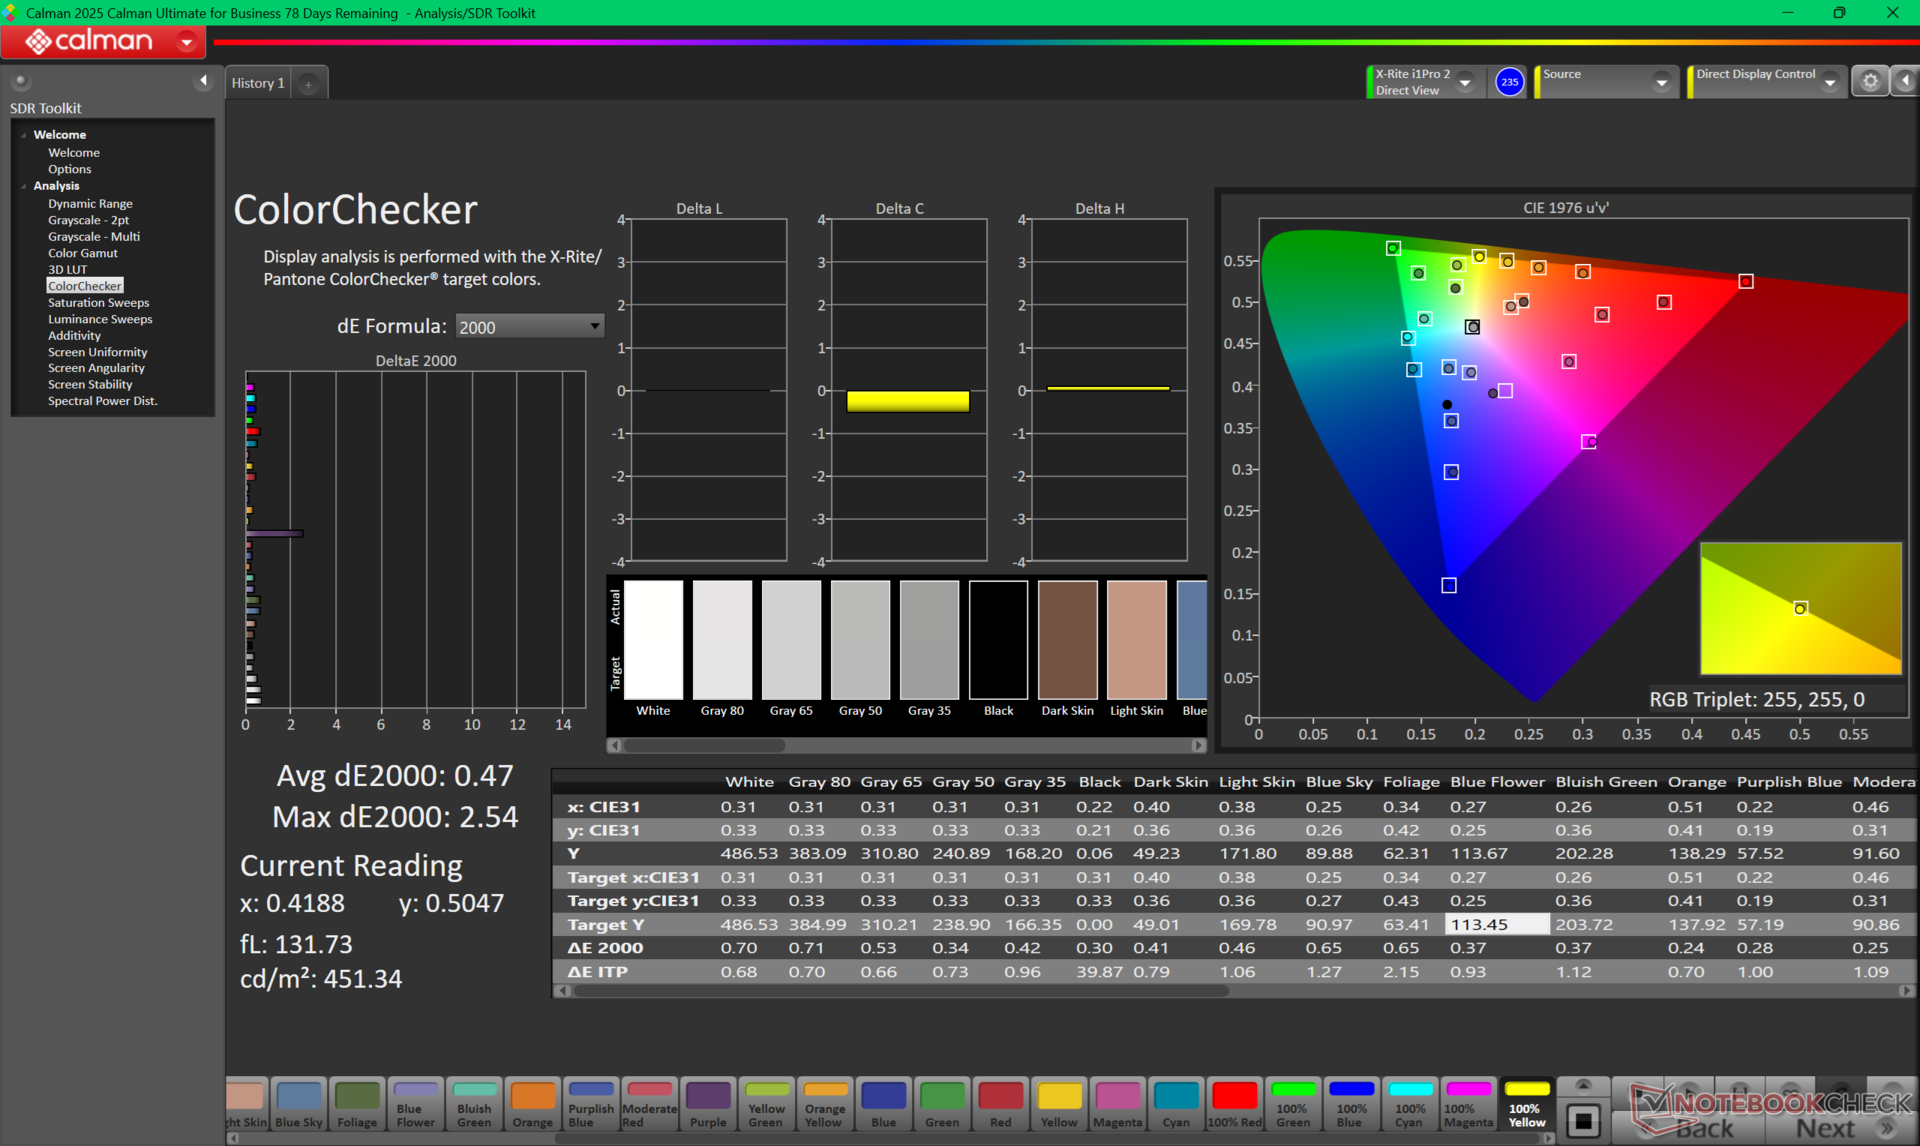
ΔE ColorChecker Calman: 2.76 | ∀{0.5-29.43 Ø4.72}
calibrated: 0.47
ΔE Greyscale Calman: 2.2 | ∀{0.09-98 Ø4.97}
85.9% AdobeRGB 1998 (Argyll 3D)
99.9% sRGB (Argyll 3D)
97.7% Display P3 (Argyll 3D)
Gamma: 2.14
CCT: 2584 K
| Dell Pro Max 18 Plus MB18250 BOE NE18NZ7, IPS, 2560x1600, 18", 120 Hz | Schenker Key 18 Pro M25 RTX 5090 LQ180D1JW01, IPS, 3840x2400, 18", 200 Hz | HP ZBook X G1i 16 LG Philips LGD07B3, IPS, 2560x1600, 16", 120 Hz | HP ZBook Studio 16 G11 AUO87A8, IPS, 3840x2400, 16", 120 Hz | Lenovo ThinkPad P16s Gen 4 21RX000YGE N160JCA-GT1, IPS LED, 1920x1200, 16", 60 Hz | Dell Pro Max 16 Plus Samsung 160HC01, OLED, 3840x2400, 16", 120 Hz | |
|---|---|---|---|---|---|---|
| Display | -2% | 5% | 0% | -19% | 1% | |
| Display P3 Coverage (%) | 97.7 | 90.5 -7% | 97.2 -1% | 97.7 0% | 65.8 -33% | 97.3 0% |
| sRGB Coverage (%) | 99.9 | 100 0% | 100 0% | 99.9 0% | 96.8 -3% | 100 0% |
| AdobeRGB 1998 Coverage (%) | 85.9 | 87.4 2% | 99.9 16% | 85.7 0% | 67.8 -21% | 88.8 3% |
| Response Times | 86% | -2% | 64% | 25% | 98% | |
| Response Time Grey 50% / Grey 80% * (ms) | 39.9 ? | 5.2 ? 87% | 45.5 ? -14% | 14.2 ? 64% | 29.4 ? 26% | 0.63 ? 98% |
| Response Time Black / White * (ms) | 29.4 ? | 4.3 ? 85% | 26.1 ? 11% | 10.6 ? 64% | 22.4 ? 24% | 0.89 ? 97% |
| PWM Frequency (Hz) | 26536 ? | 479.9 ? | ||||
| PWM Amplitude * (%) | 47 | 28 | ||||
| Screen | -34% | -46% | -33% | -36% | 4% | |
| Brightness middle (cd/m²) | 528.8 | 529 0% | 461.8 -13% | 404.3 -24% | 540 2% | 530.9 0% |
| Brightness (cd/m²) | 515 | 513 0% | 427 -17% | 405 -21% | 516 0% | 540 5% |
| Brightness Distribution (%) | 91 | 95 4% | 88 -3% | 92 1% | 93 2% | 95 4% |
| Black Level * (cd/m²) | 0.22 | 0.31 -41% | 0.46 -109% | 0.28 -27% | 0.37 -68% | |
| Contrast (:1) | 2404 | 1706 -29% | 1004 -58% | 1444 -40% | 1459 -39% | |
| Colorchecker dE 2000 * | 2.76 | 2.7 2% | 4.08 -48% | 2.63 5% | 3.4 -23% | 2.42 12% |
| Colorchecker dE 2000 max. * | 5.38 | 7.8 -45% | 8.1 -51% | 4.48 17% | 5.6 -4% | 5.76 -7% |
| Colorchecker dE 2000 calibrated * | 0.47 | 0.8 -70% | 0.75 -60% | 1.46 -211% | 0.9 -91% | 0.7 -49% |
| Greyscale dE 2000 * | 2.2 | 4.9 -123% | 3.5 -59% | 2.1 5% | 4.5 -105% | 0.8 64% |
| Gamma | 2.14 103% | 2.23 99% | 2.15 102% | 2.3 96% | 2.51 88% | 2.23 99% |
| CCT | 2584 252% | 6997 93% | 6715 97% | 6810 95% | 6294 103% | 6488 100% |
| Total Average (Program / Settings) | 17% /
-10% | -14% /
-29% | 10% /
-12% | -10% /
-24% | 34% /
19% |
* ... smaller is better
Display Response Times
| ↔ Response Time Black to White | ||
|---|---|---|
| 29.4 ms ... rise ↗ and fall ↘ combined | ↗ 13.9 ms rise | 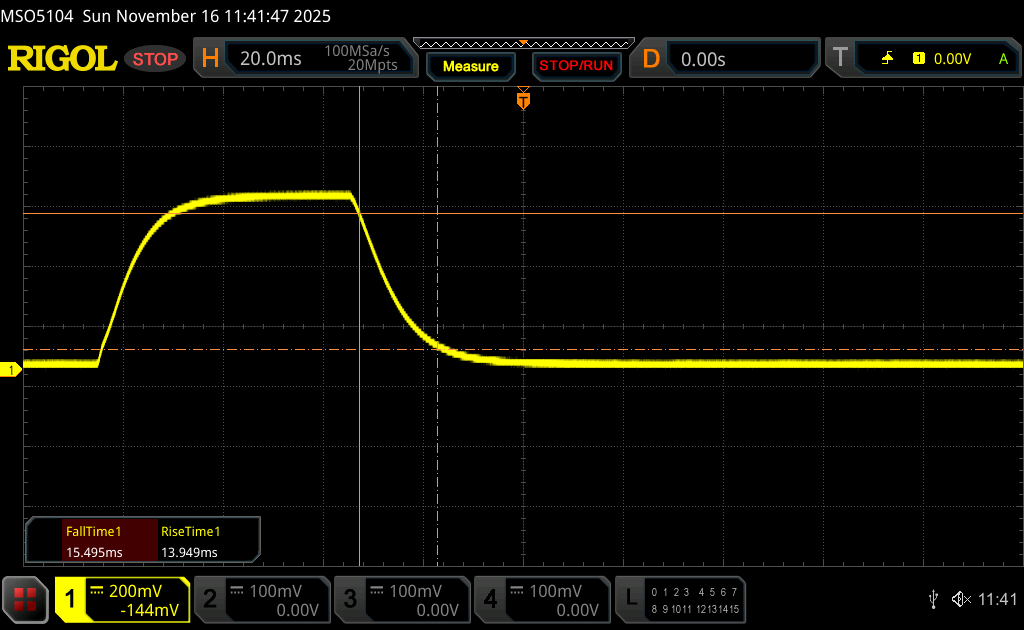 |
| ↘ 15.5 ms fall | ||
| The screen shows relatively slow response rates in our tests and may be too slow for gamers. In comparison, all tested devices range from 0.1 (minimum) to 240 (maximum) ms. » 79 % of all devices are better. This means that the measured response time is worse than the average of all tested devices (19.8 ms). | ||
| ↔ Response Time 50% Grey to 80% Grey | ||
| 39.9 ms ... rise ↗ and fall ↘ combined | ↗ 17.7 ms rise | 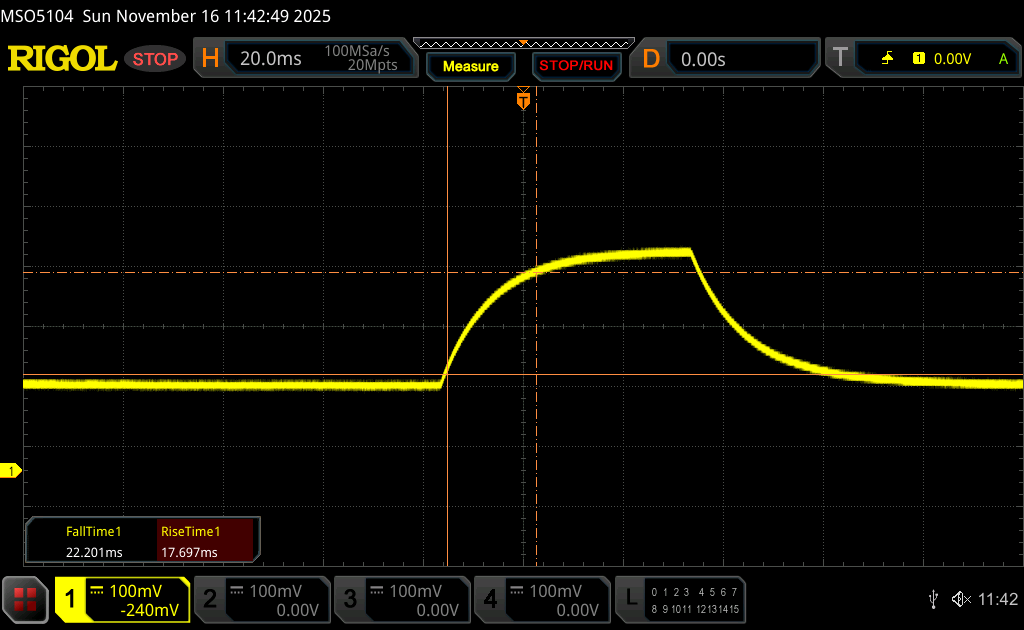 |
| ↘ 22.2 ms fall | ||
| The screen shows slow response rates in our tests and will be unsatisfactory for gamers. In comparison, all tested devices range from 0.165 (minimum) to 636 (maximum) ms. » 61 % of all devices are better. This means that the measured response time is worse than the average of all tested devices (31 ms). | ||
Screen Flickering / PWM (Pulse-Width Modulation)
| Screen flickering / PWM not detected | 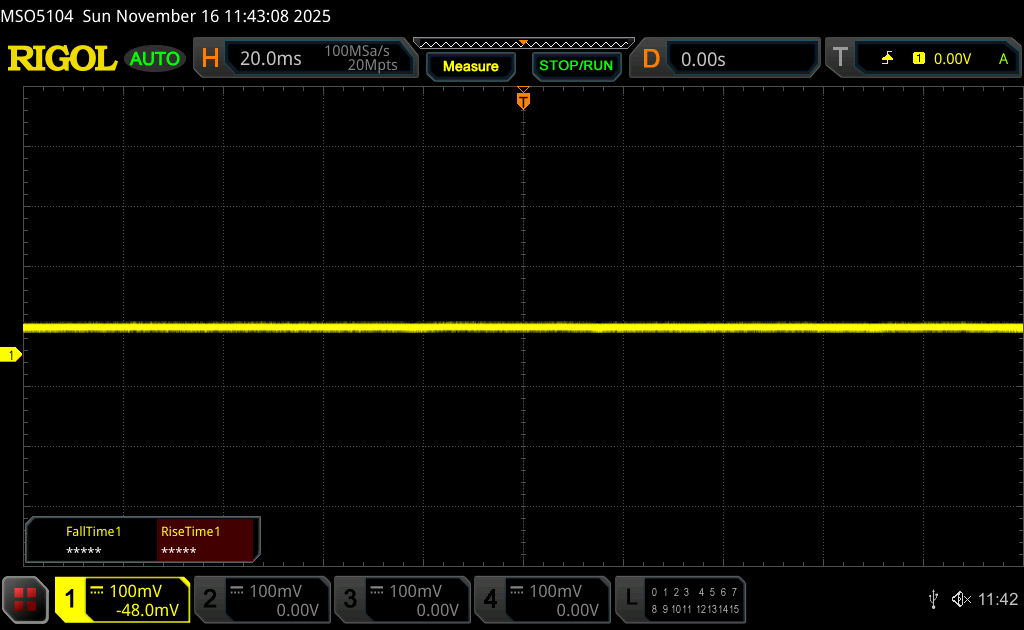 | ||
In comparison: 52 % of all tested devices do not use PWM to dim the display. If PWM was detected, an average of 7778 (minimum: 5 - maximum: 343500) Hz was measured. | |||

Performance
Testing Conditions
We set Dell Optimizer and Nvidia Control Panel to Performance mode and discrete graphics mode, respectively, prior to running the benchmarks below. Advanced Optimus is supported to switch between iGPU and dGPU modes without rebooting.
Processor
CPU performance is excellent but imperfect. When running CineBench R15 xT in a loop, for example, our Core Ultra 9 285HX initial score would dip by about 15 percent over time as shown by the graph below due to limited Turbo Boost sustainability.
Cinebench R15 Multi Loop
Cinebench R23: Multi Core | Single Core
Cinebench R20: CPU (Multi Core) | CPU (Single Core)
Cinebench R15: CPU Multi 64Bit | CPU Single 64Bit
Blender: v2.79 BMW27 CPU
7-Zip 18.03: 7z b 4 | 7z b 4 -mmt1
Geekbench 6.7: Multi-Core | Single-Core
Geekbench 5.5: Multi-Core | Single-Core
HWBOT x265 Benchmark v2.2: 4k Preset
LibreOffice : 20 Documents To PDF
R Benchmark 2.5: Overall mean
| Cinebench R20 / CPU (Multi Core) | |
| Dell Pro Max 18 Plus MB18250 | |
| Average Intel Core Ultra 9 285HX (13152 - 15751, n=6) | |
| Schenker Key 18 Pro M25 RTX 5090 | |
| Dell Pro Max 16 Plus | |
| Lenovo ThinkPad P16 Gen 2 | |
| HP ZBook Fury 16 G10 | |
| HP ZBook X G1i 16 | |
| Lenovo ThinkPad P16s Gen 4 21RX000YGE | |
| HP ZBook Studio 16 G11 | |
| Dell Precision 7000 7670 Performance | |
| Cinebench R20 / CPU (Single Core) | |
| Schenker Key 18 Pro M25 RTX 5090 | |
| Average Intel Core Ultra 9 285HX (799 - 884, n=6) | |
| Dell Pro Max 18 Plus MB18250 | |
| HP ZBook Fury 16 G10 | |
| Dell Pro Max 16 Plus | |
| Lenovo ThinkPad P16s Gen 4 21RX000YGE | |
| Lenovo ThinkPad P16 Gen 2 | |
| HP ZBook X G1i 16 | |
| Dell Precision 7000 7670 Performance | |
| HP ZBook Studio 16 G11 | |
| Cinebench R15 / CPU Multi 64Bit | |
| Dell Pro Max 18 Plus MB18250 | |
| Average Intel Core Ultra 9 285HX (5427 - 6232, n=6) | |
| Schenker Key 18 Pro M25 RTX 5090 | |
| Dell Pro Max 16 Plus | |
| Lenovo ThinkPad P16 Gen 2 | |
| HP ZBook Fury 16 G10 | |
| HP ZBook X G1i 16 | |
| Lenovo ThinkPad P16s Gen 4 21RX000YGE | |
| HP ZBook Studio 16 G11 | |
| Dell Precision 7000 7670 Performance | |
| Cinebench R15 / CPU Single 64Bit | |
| Schenker Key 18 Pro M25 RTX 5090 | |
| Average Intel Core Ultra 9 285HX (307 - 340, n=6) | |
| Dell Pro Max 18 Plus MB18250 | |
| Lenovo ThinkPad P16s Gen 4 21RX000YGE | |
| Dell Pro Max 16 Plus | |
| HP ZBook X G1i 16 | |
| HP ZBook Fury 16 G10 | |
| Lenovo ThinkPad P16 Gen 2 | |
| Dell Precision 7000 7670 Performance | |
| HP ZBook Studio 16 G11 | |
| Geekbench 6.7 / Multi-Core | |
| Dell Pro Max 18 Plus MB18250 | |
| Dell Pro Max 16 Plus | |
| Average Intel Core Ultra 9 285HX (18212 - 22104, n=6) | |
| HP ZBook X G1i 16 | |
| Schenker Key 18 Pro M25 RTX 5090 | |
| Lenovo ThinkPad P16 Gen 2 | |
| HP ZBook Fury 16 G10 | |
| Lenovo ThinkPad P16s Gen 4 21RX000YGE | |
| HP ZBook Studio 16 G11 | |
| Geekbench 6.7 / Single-Core | |
| Dell Pro Max 18 Plus MB18250 | |
| Average Intel Core Ultra 9 285HX (2907 - 3088, n=6) | |
| HP ZBook Fury 16 G10 | |
| Lenovo ThinkPad P16s Gen 4 21RX000YGE | |
| HP ZBook X G1i 16 | |
| Dell Pro Max 16 Plus | |
| Lenovo ThinkPad P16 Gen 2 | |
| Schenker Key 18 Pro M25 RTX 5090 | |
| HP ZBook Studio 16 G11 | |
| HWBOT x265 Benchmark v2.2 / 4k Preset | |
| Dell Pro Max 18 Plus MB18250 | |
| Average Intel Core Ultra 9 285HX (35.3 - 44.3, n=6) | |
| Schenker Key 18 Pro M25 RTX 5090 | |
| Dell Pro Max 16 Plus | |
| HP ZBook Fury 16 G10 | |
| HP ZBook X G1i 16 | |
| Lenovo ThinkPad P16 Gen 2 | |
| Lenovo ThinkPad P16s Gen 4 21RX000YGE | |
| HP ZBook Studio 16 G11 | |
| Dell Precision 7000 7670 Performance | |
| LibreOffice / 20 Documents To PDF | |
| Lenovo ThinkPad P16s Gen 4 21RX000YGE | |
| Lenovo ThinkPad P16 Gen 2 | |
| HP ZBook Studio 16 G11 | |
| Dell Precision 7000 7670 Performance | |
| HP ZBook Fury 16 G10 | |
| Average Intel Core Ultra 9 285HX (38 - 49.1, n=6) | |
| Dell Pro Max 16 Plus | |
| HP ZBook X G1i 16 | |
| Dell Pro Max 18 Plus MB18250 | |
| Schenker Key 18 Pro M25 RTX 5090 | |
| R Benchmark 2.5 / Overall mean | |
| Lenovo ThinkPad P16s Gen 4 21RX000YGE | |
| HP ZBook Studio 16 G11 | |
| Dell Precision 7000 7670 Performance | |
| Schenker Key 18 Pro M25 RTX 5090 | |
| Dell Pro Max 16 Plus | |
| HP ZBook X G1i 16 | |
| Average Intel Core Ultra 9 285HX (0.4012 - 0.4444, n=6) | |
| Dell Pro Max 18 Plus MB18250 | |
| Lenovo ThinkPad P16 Gen 2 | |
| HP ZBook Fury 16 G10 | |
* ... smaller is better
AIDA64: FP32 Ray-Trace | FPU Julia | CPU SHA3 | CPU Queen | FPU SinJulia | FPU Mandel | CPU AES | CPU ZLib | FP64 Ray-Trace | CPU PhotoWorxx
| Performance rating | |
| Dell Pro Max 18 Plus MB18250 | |
| Schenker Key 18 Pro M25 RTX 5090 | |
| Average Intel Core Ultra 9 285HX | |
| Dell Pro Max 16 Plus | |
| Lenovo ThinkPad P16s Gen 4 21RX000YGE | |
| HP ZBook Studio 16 G11 | |
| AIDA64 / FP32 Ray-Trace | |
| Schenker Key 18 Pro M25 RTX 5090 | |
| Dell Pro Max 18 Plus MB18250 | |
| Average Intel Core Ultra 9 285HX (29076 - 42341, n=6) | |
| Dell Pro Max 16 Plus | |
| Lenovo ThinkPad P16s Gen 4 21RX000YGE | |
| HP ZBook Studio 16 G11 | |
| AIDA64 / FPU Julia | |
| Schenker Key 18 Pro M25 RTX 5090 | |
| Average Intel Core Ultra 9 285HX (161276 - 210885, n=6) | |
| Dell Pro Max 18 Plus MB18250 | |
| Dell Pro Max 16 Plus | |
| Lenovo ThinkPad P16s Gen 4 21RX000YGE | |
| HP ZBook Studio 16 G11 | |
| AIDA64 / CPU SHA3 | |
| Schenker Key 18 Pro M25 RTX 5090 | |
| Dell Pro Max 18 Plus MB18250 | |
| Average Intel Core Ultra 9 285HX (7757 - 9815, n=6) | |
| Dell Pro Max 16 Plus | |
| Lenovo ThinkPad P16s Gen 4 21RX000YGE | |
| HP ZBook Studio 16 G11 | |
| AIDA64 / CPU Queen | |
| Average Intel Core Ultra 9 285HX (134345 - 141681, n=6) | |
| Dell Pro Max 18 Plus MB18250 | |
| Dell Pro Max 16 Plus | |
| Schenker Key 18 Pro M25 RTX 5090 | |
| Lenovo ThinkPad P16s Gen 4 21RX000YGE | |
| HP ZBook Studio 16 G11 | |
| AIDA64 / FPU SinJulia | |
| Lenovo ThinkPad P16s Gen 4 21RX000YGE | |
| Schenker Key 18 Pro M25 RTX 5090 | |
| Dell Pro Max 18 Plus MB18250 | |
| Average Intel Core Ultra 9 285HX (12559 - 14431, n=6) | |
| Dell Pro Max 16 Plus | |
| HP ZBook Studio 16 G11 | |
| AIDA64 / FPU Mandel | |
| Schenker Key 18 Pro M25 RTX 5090 | |
| Average Intel Core Ultra 9 285HX (84053 - 108922, n=6) | |
| Dell Pro Max 18 Plus MB18250 | |
| Dell Pro Max 16 Plus | |
| Lenovo ThinkPad P16s Gen 4 21RX000YGE | |
| HP ZBook Studio 16 G11 | |
| AIDA64 / CPU AES | |
| Schenker Key 18 Pro M25 RTX 5090 | |
| Dell Pro Max 18 Plus MB18250 | |
| Average Intel Core Ultra 9 285HX (119553 - 134195, n=6) | |
| Dell Pro Max 16 Plus | |
| Lenovo ThinkPad P16s Gen 4 21RX000YGE | |
| HP ZBook Studio 16 G11 | |
| AIDA64 / CPU ZLib | |
| Dell Pro Max 18 Plus MB18250 | |
| Schenker Key 18 Pro M25 RTX 5090 | |
| Average Intel Core Ultra 9 285HX (1886 - 2267, n=6) | |
| Dell Pro Max 16 Plus | |
| Lenovo ThinkPad P16s Gen 4 21RX000YGE | |
| HP ZBook Studio 16 G11 | |
| AIDA64 / FP64 Ray-Trace | |
| Schenker Key 18 Pro M25 RTX 5090 | |
| Average Intel Core Ultra 9 285HX (15059 - 22312, n=6) | |
| Dell Pro Max 18 Plus MB18250 | |
| Dell Pro Max 16 Plus | |
| Lenovo ThinkPad P16s Gen 4 21RX000YGE | |
| HP ZBook Studio 16 G11 | |
| AIDA64 / CPU PhotoWorxx | |
| Dell Pro Max 16 Plus | |
| Dell Pro Max 18 Plus MB18250 | |
| HP ZBook Studio 16 G11 | |
| Average Intel Core Ultra 9 285HX (39232 - 62611, n=6) | |
| Lenovo ThinkPad P16s Gen 4 21RX000YGE | |
| Schenker Key 18 Pro M25 RTX 5090 | |
Stress Test
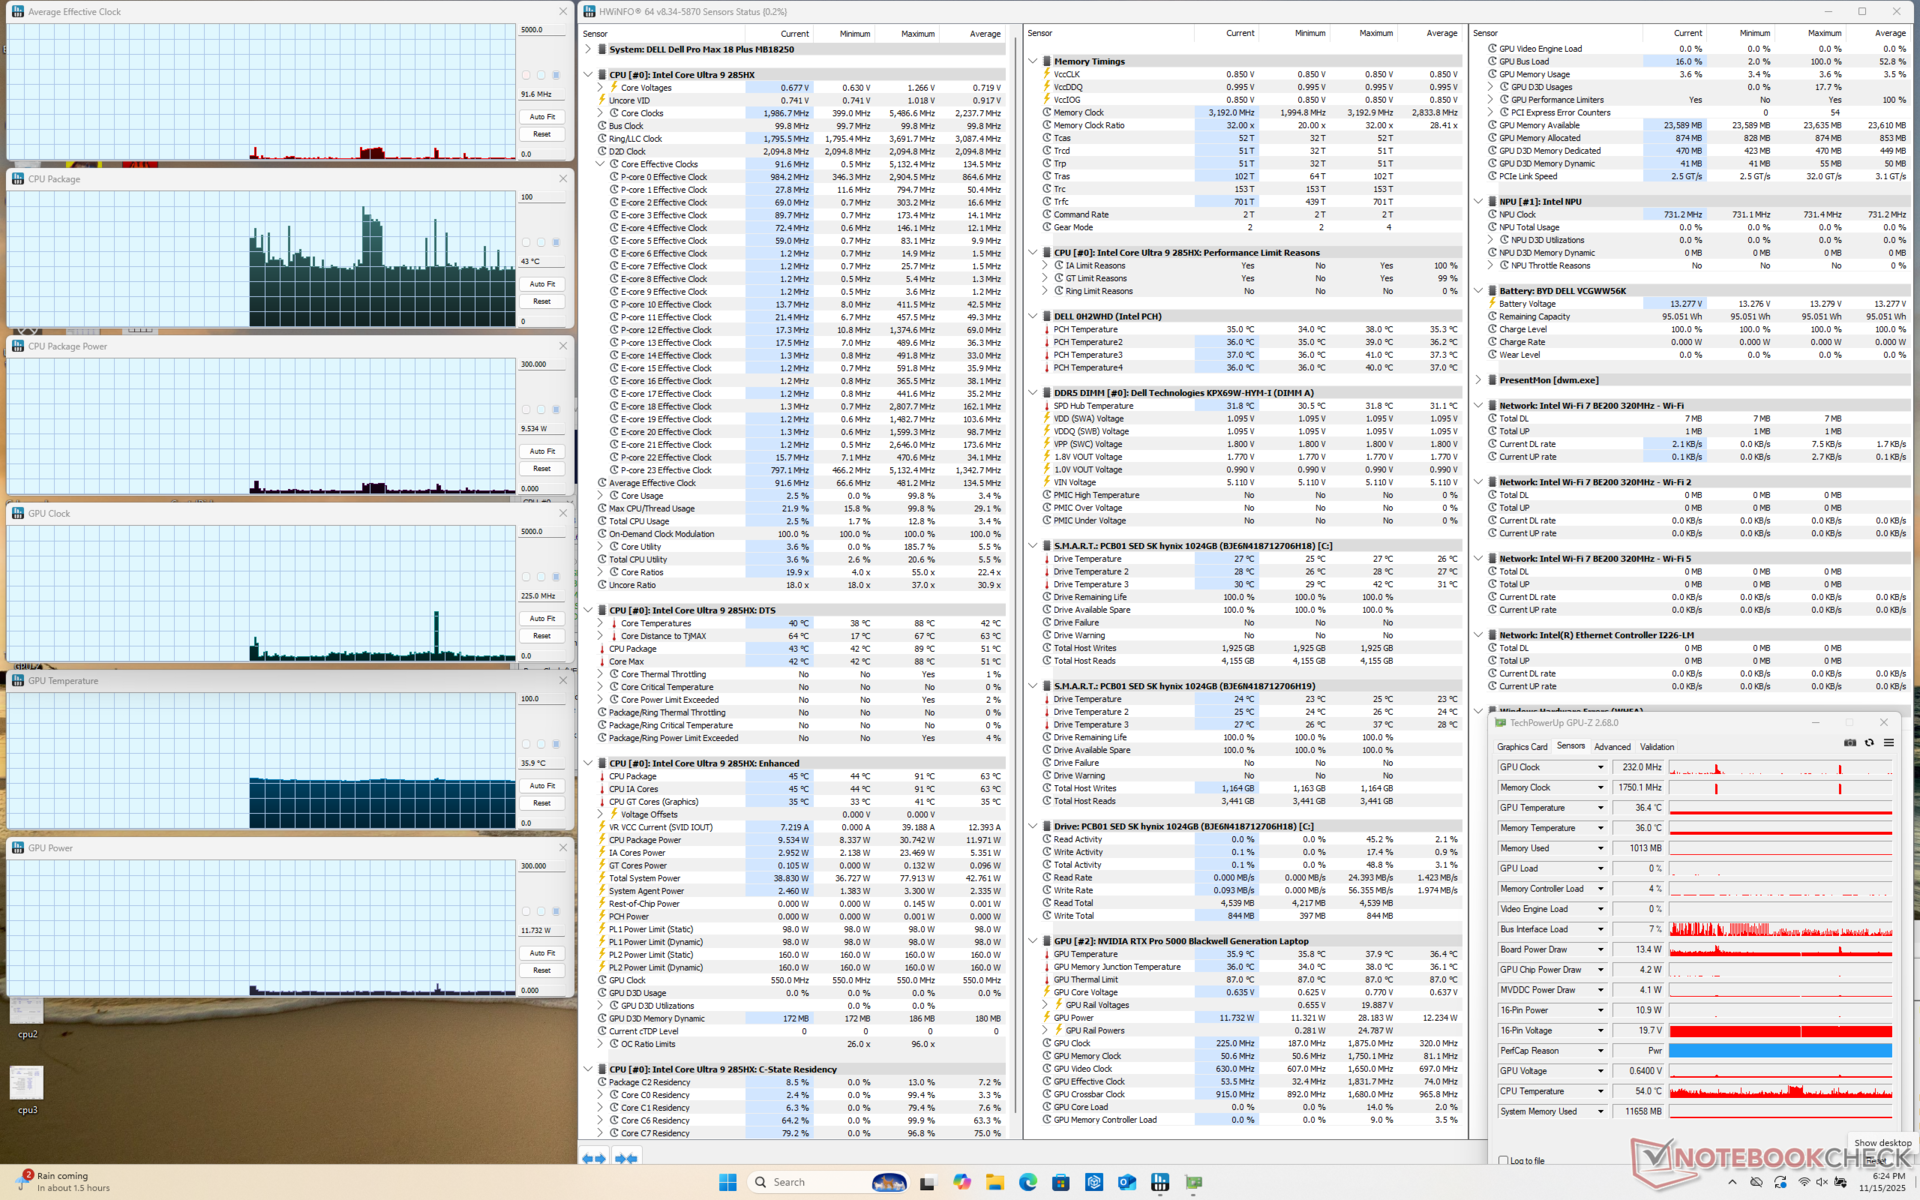
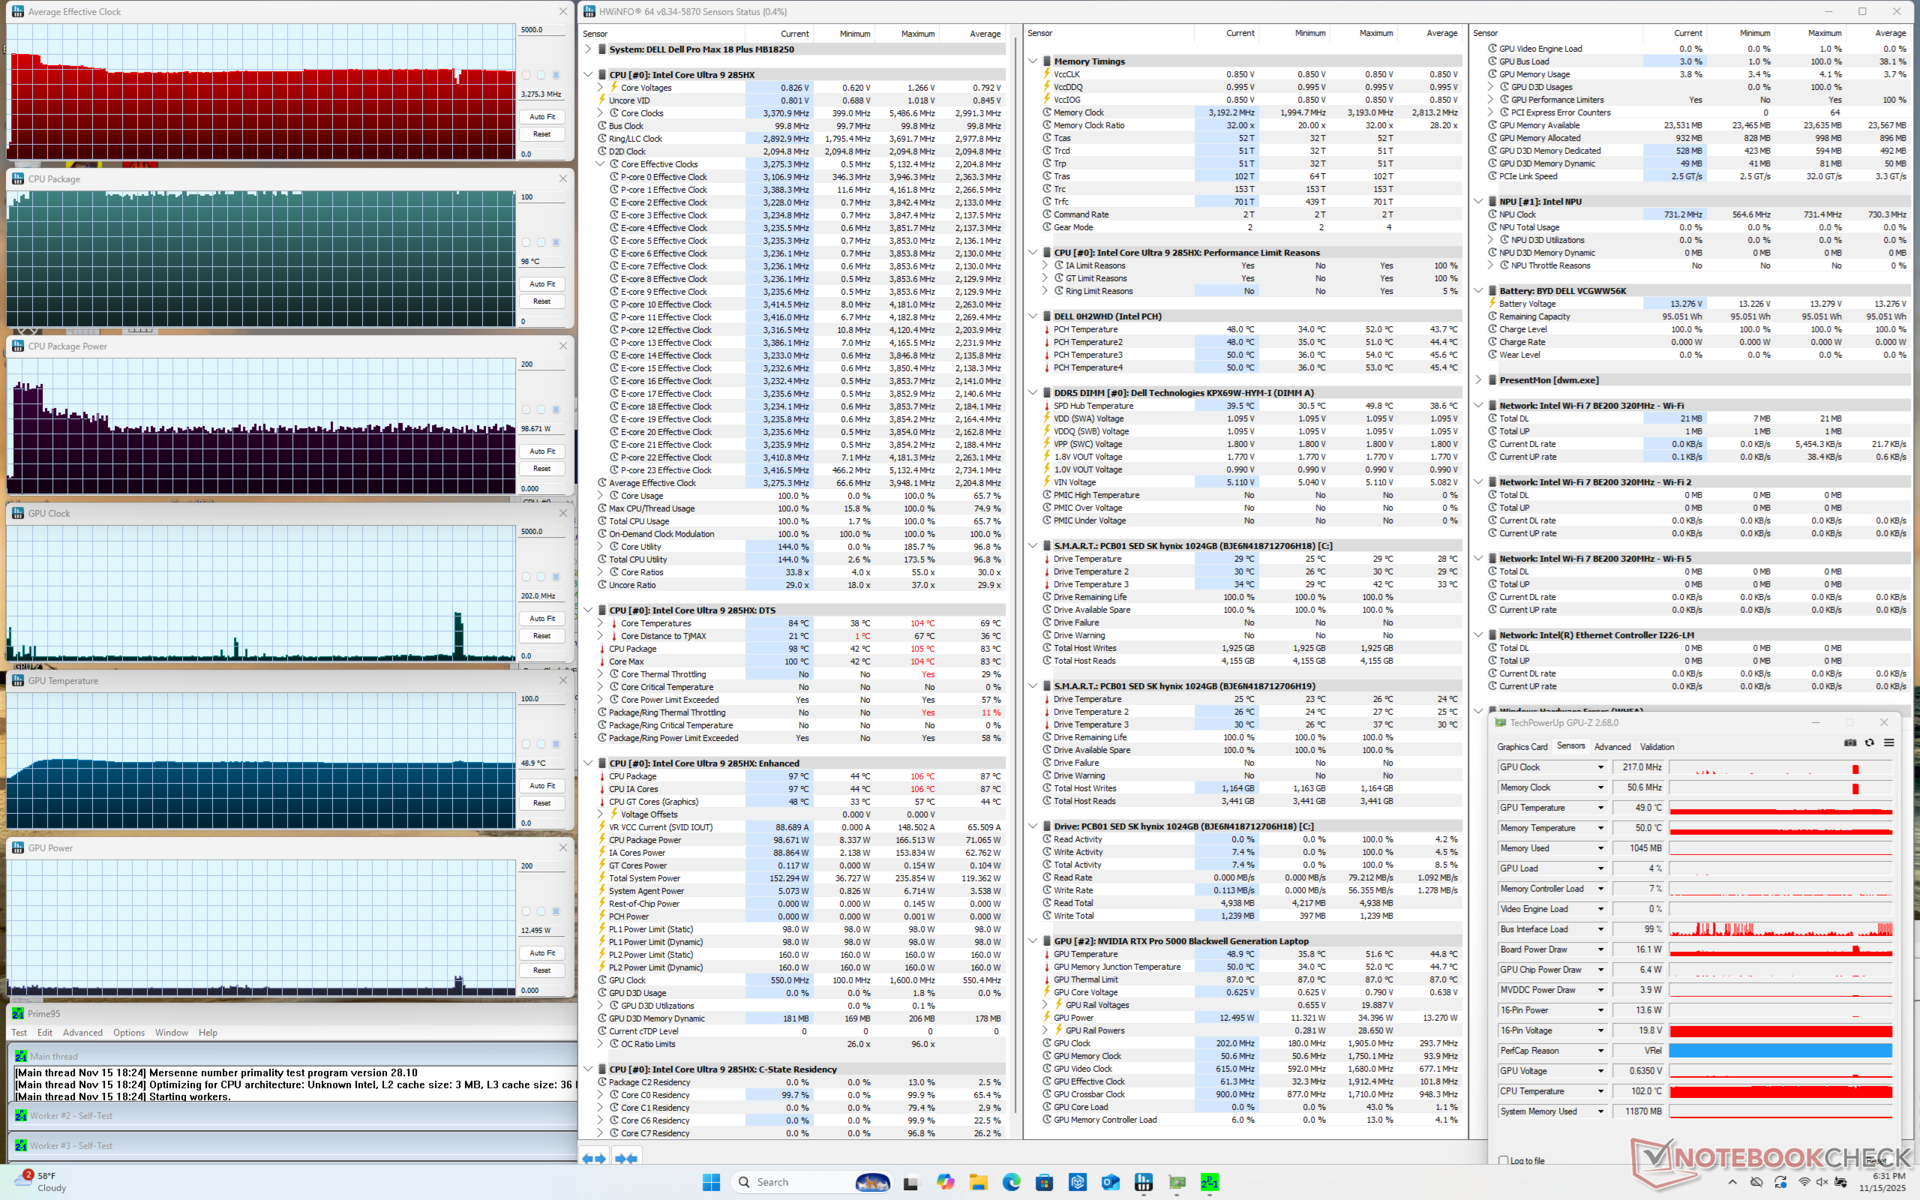
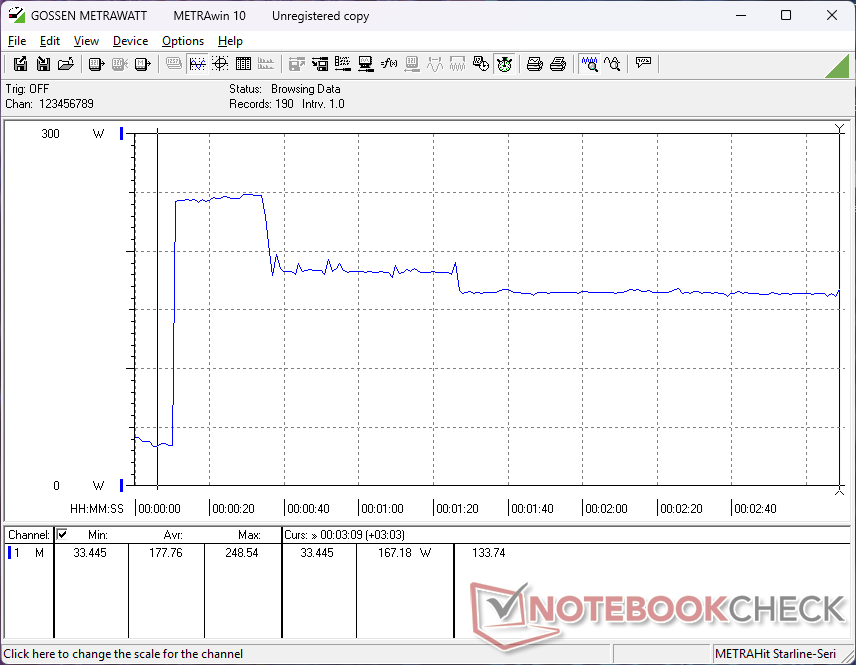
When running Prime95 stress, the CPU would boost to 4 GHz, 160 W, and just over 100 C (!) before falling and stabilizing at 3.2 GHz, 99 W, and 98 C. The short-lived Turbo Boost complements our CineBench R15 xT loop observations mentioned above.
CPU temperatures would remain very warm at ~100 C when running other demanding loads like games compared to just 77 C on the older Dell Precision 7670 Performance.
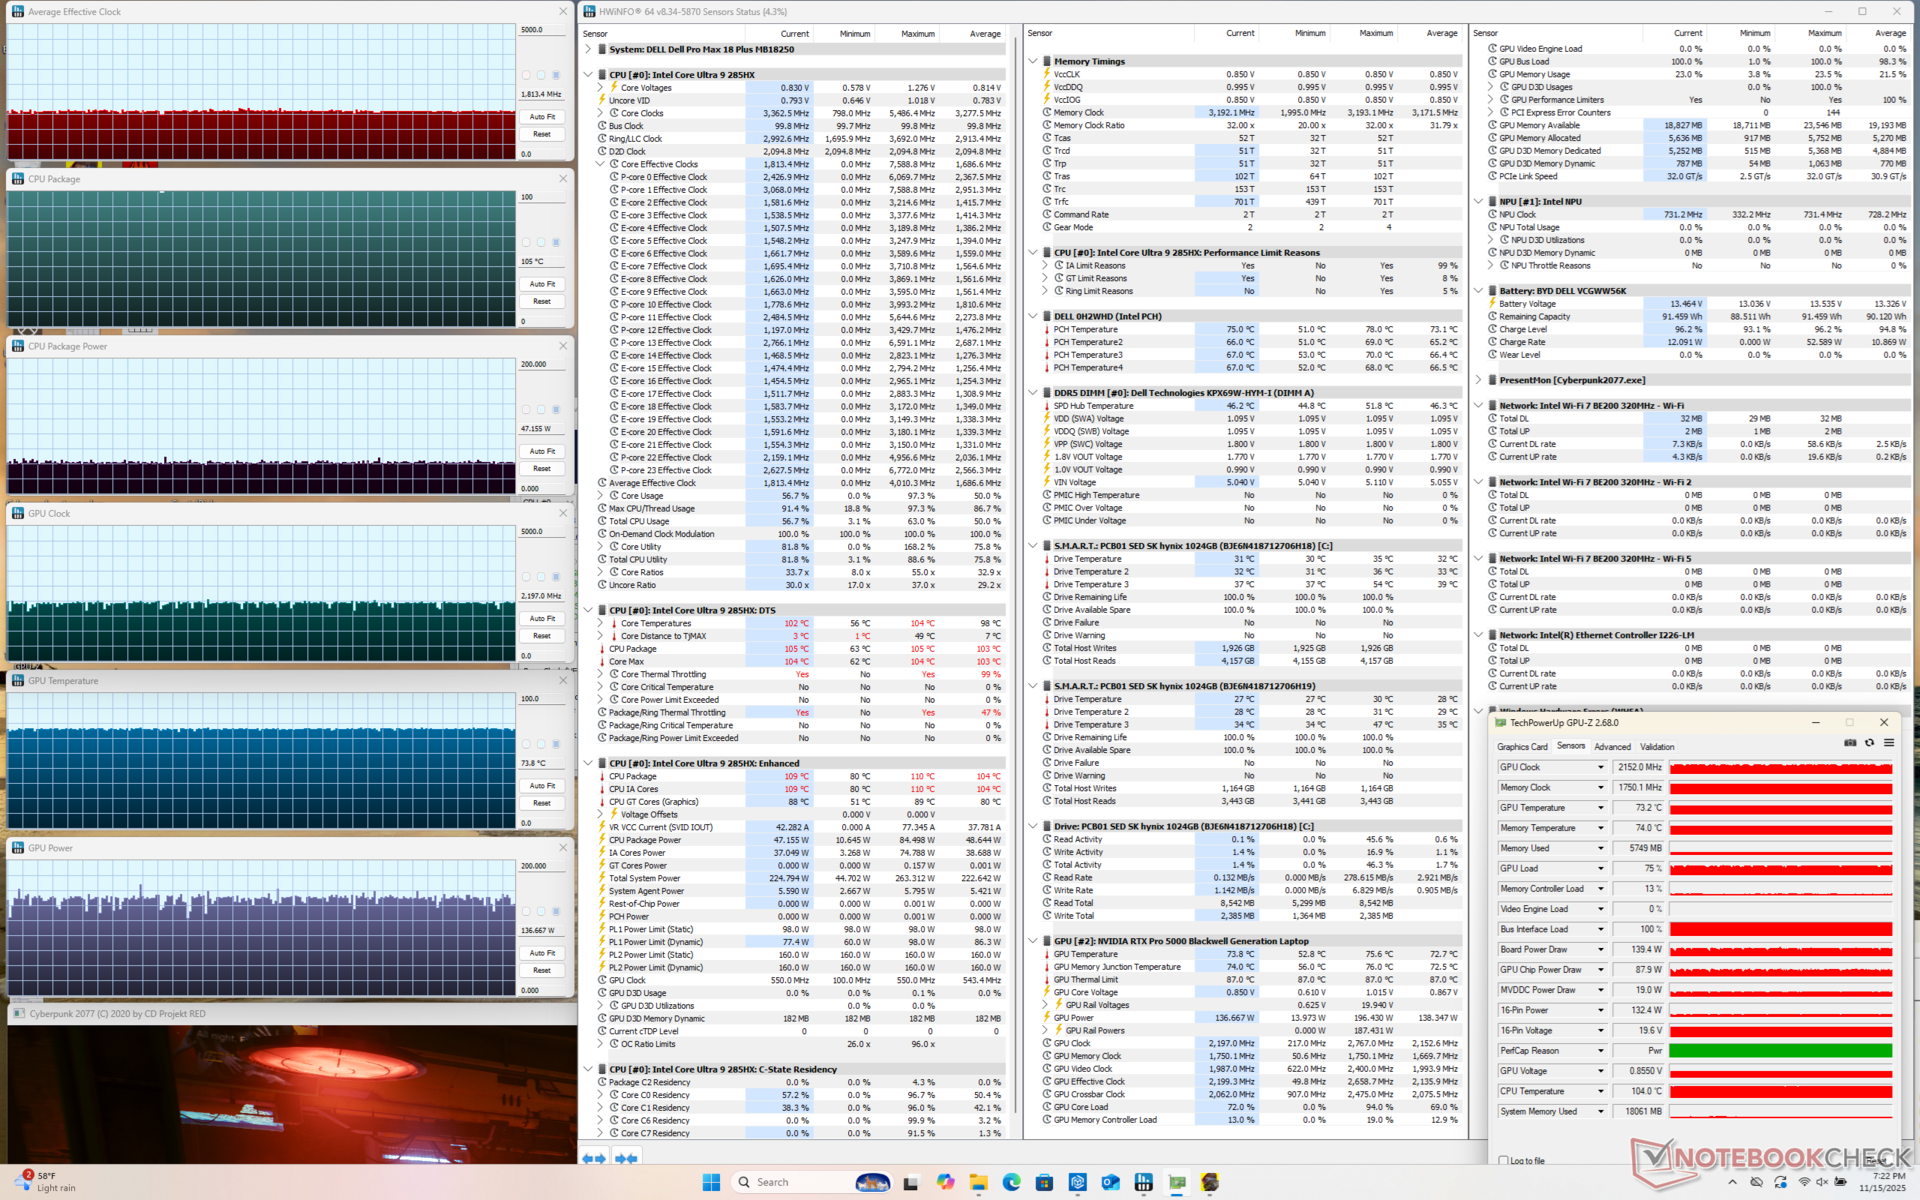
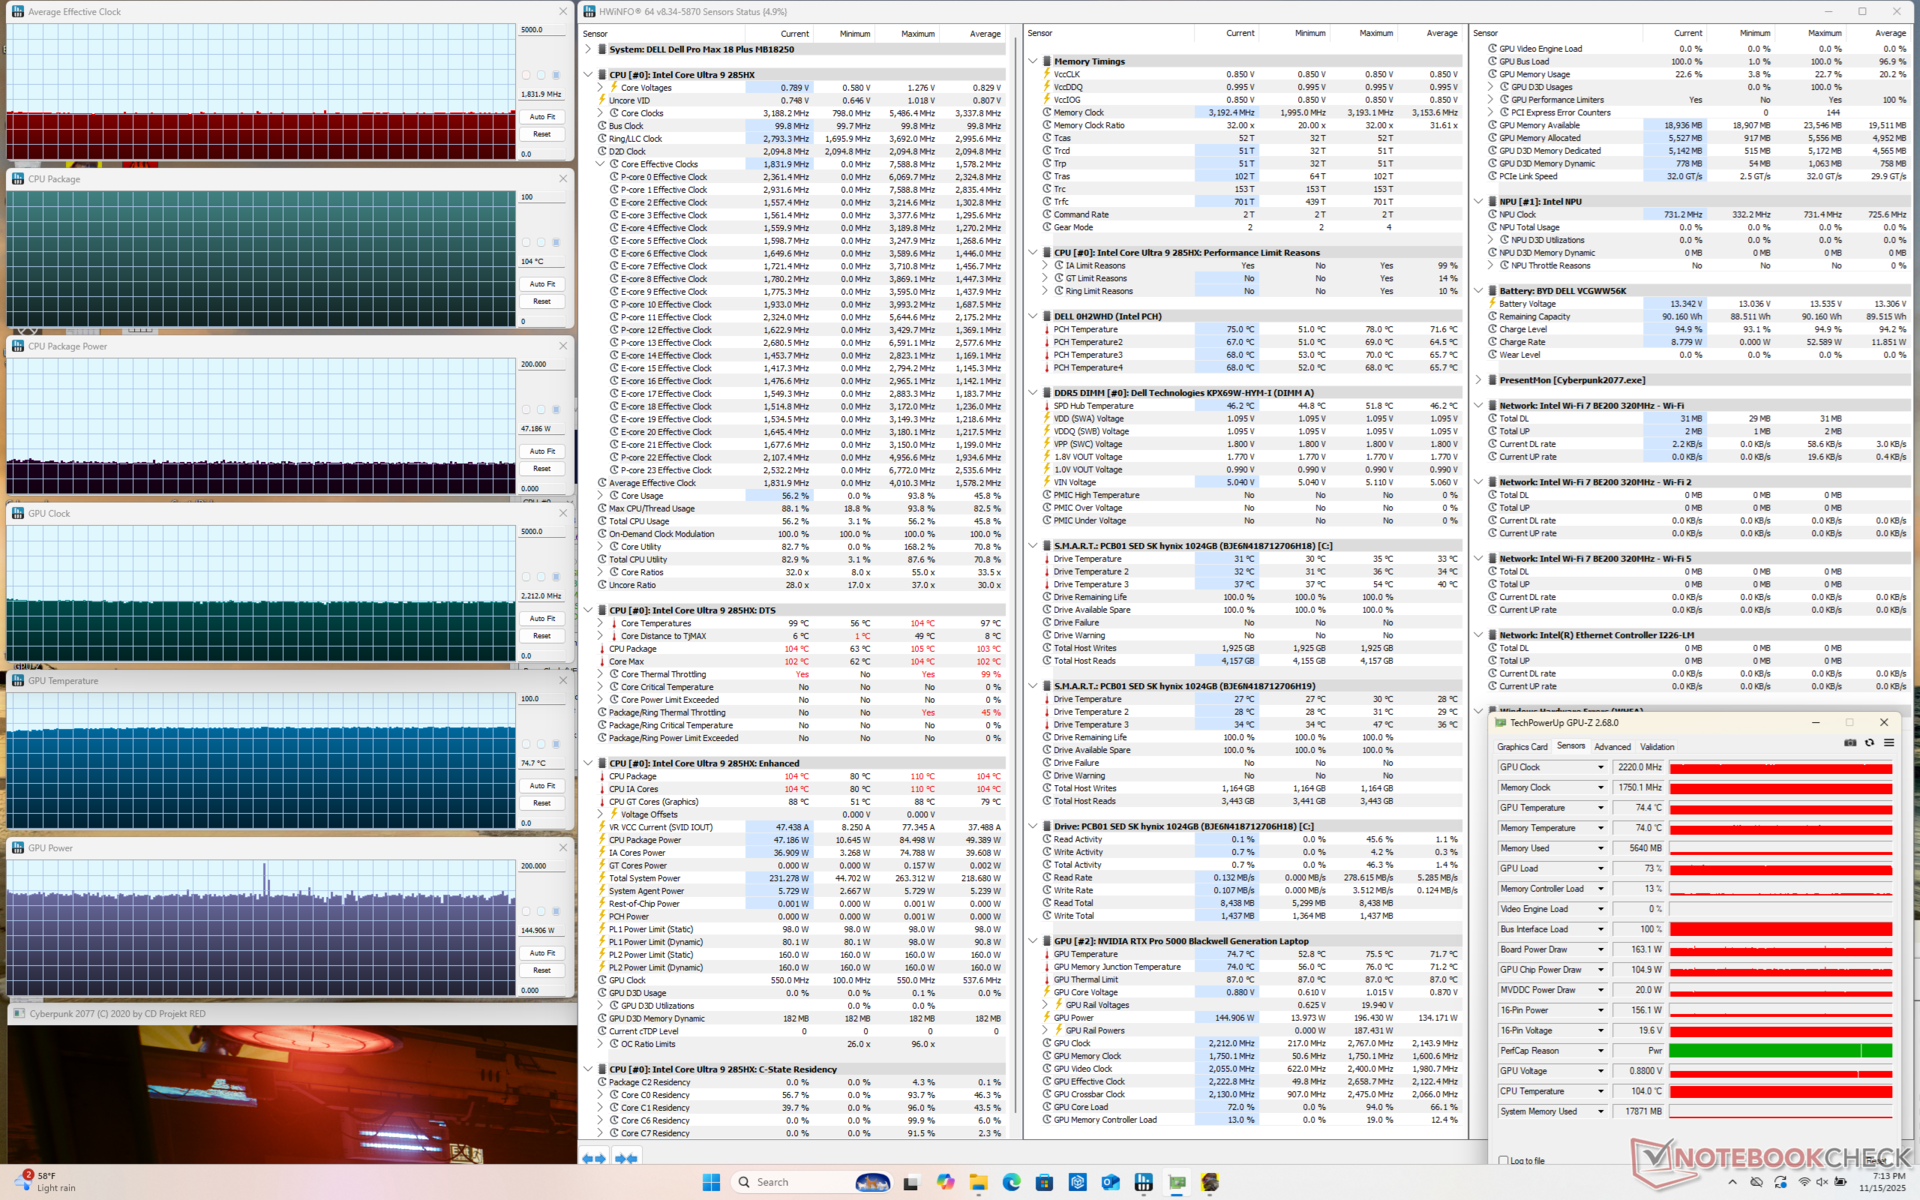
Note that GPU board power draw and clock rates would drop slightly when running on Balanced mode instead of Performance mode as shown by the screenshots below.
| Average CPU Clock (GHz) | GPU Clock (MHz) | Average CPU Temperature (°C) | Average GPU Temperature (°C) | |
| System Idle | -- | 225 | 43 | 36 |
| Prime95 Stress | 3.3 | -- | 99 | 49 |
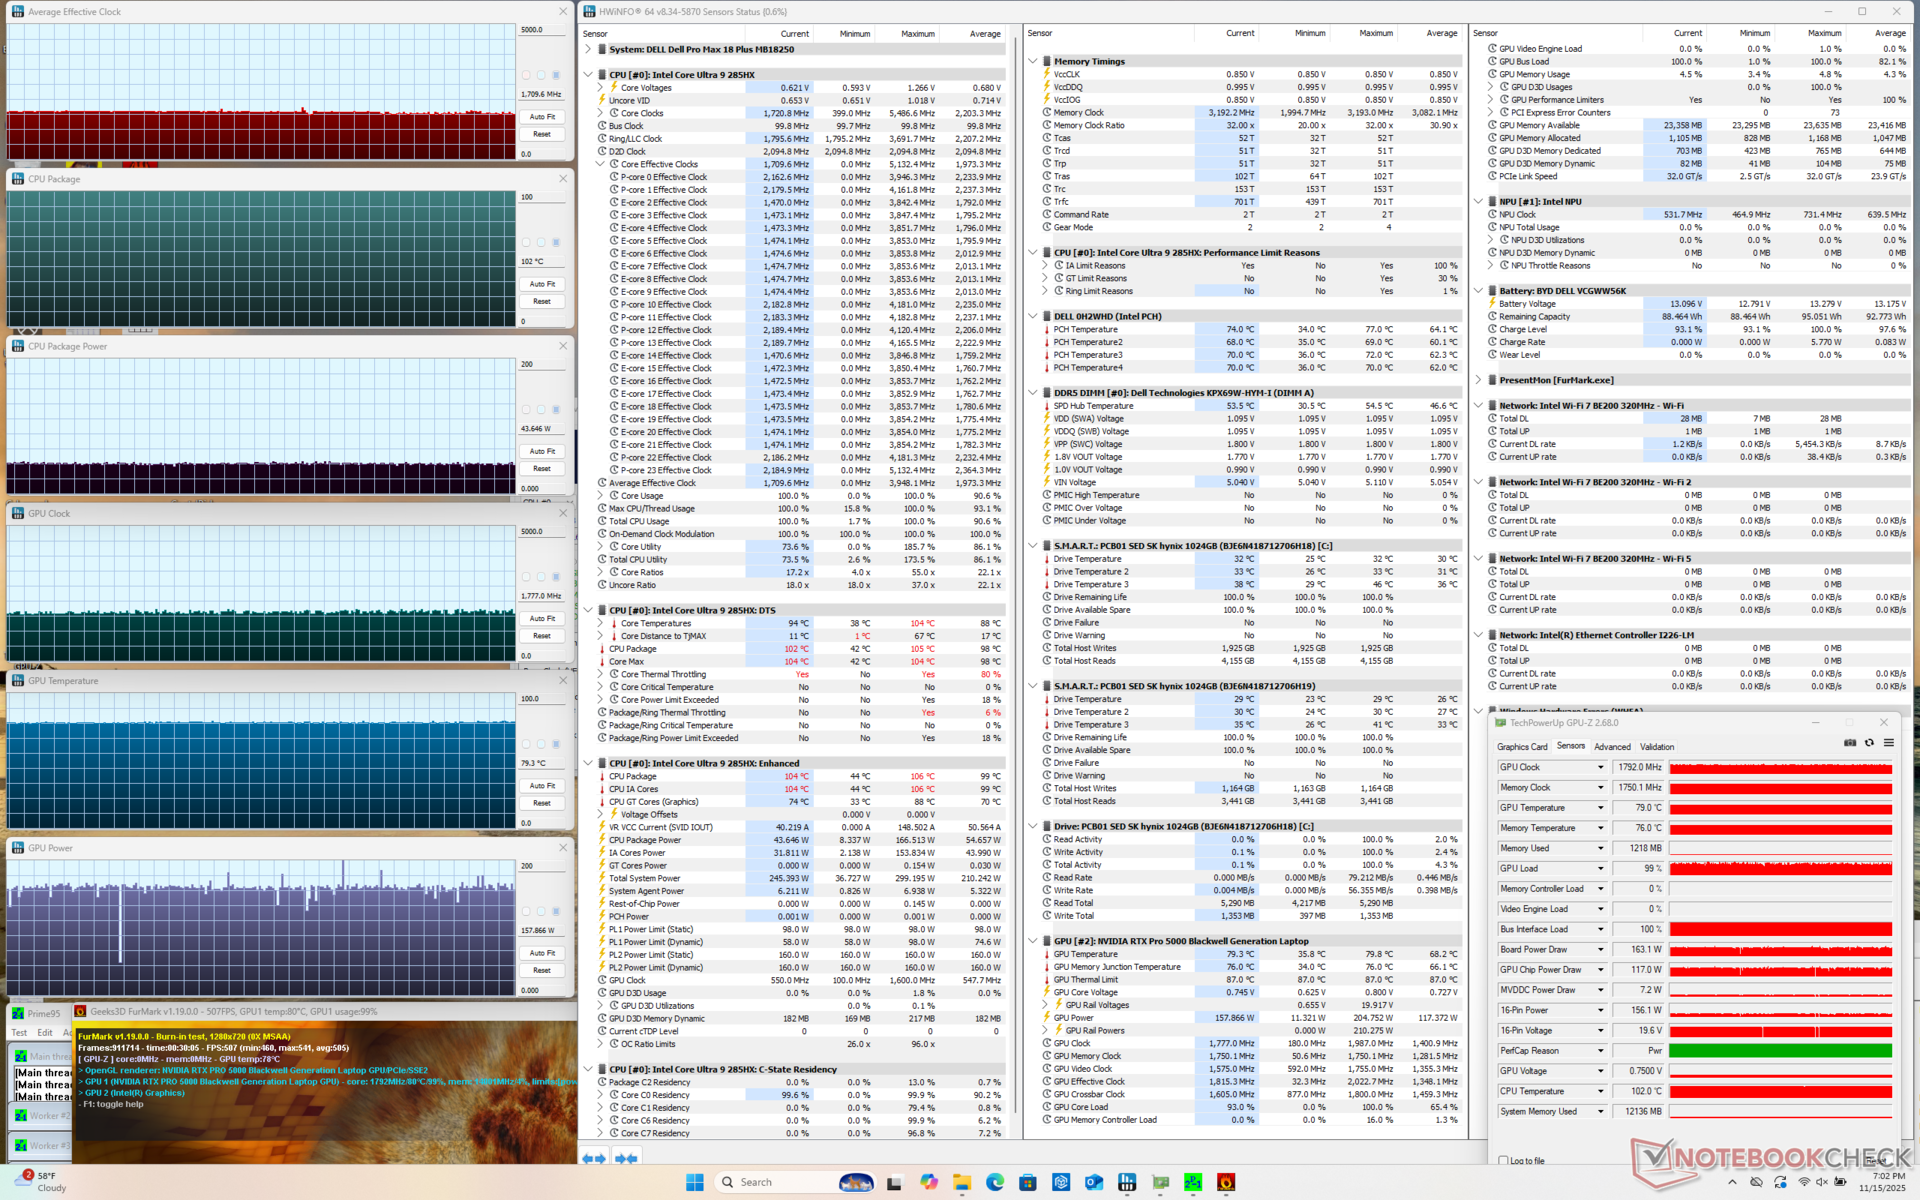
| Prime95 + FurMark Stress | 1.7 | 1777 | 102 | 79 |
| Cyberpunk 2077 Stress (Balanced mode) | 1.8 | 2197 | 105 | 74 |
| Cyberpunk 2077 Stress (Performance mode) | 1.8 | 2212 | 104 | 75 |
System Performance
PCMark 10 would fail to complete no matter the GPU settings and so its scores are not listed below.
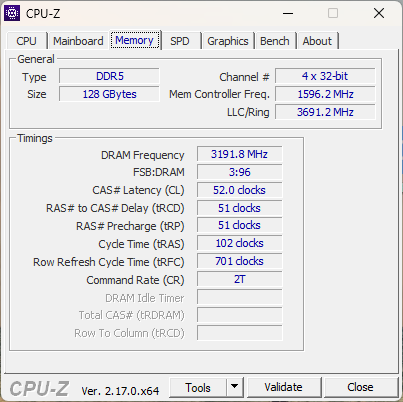
AIDA64 memory scores are very high especially for a laptop with 128 GB of RAM due to the CAMM2 form factor. The new standard was designed to overcome many of the limitations of the aging SODIMM connector.
CrossMark: Overall | Productivity | Creativity | Responsiveness
WebXPRT 3: Overall
WebXPRT 4: Overall
Mozilla Kraken 1.1: Total
| Performance rating | |
| Dell Pro Max 18 Plus MB18250 | |
| Average Intel Core Ultra 9 285HX, NVIDIA RTX PRO 5000 Blackwell Generation Laptop | |
| Dell Pro Max 16 Plus | |
| Schenker Key 18 Pro M25 RTX 5090 | |
| HP ZBook X G1i 16 | |
| HP ZBook Studio 16 G11 | |
| Lenovo ThinkPad P16s Gen 4 21RX000YGE | |
| CrossMark / Overall | |
| Dell Pro Max 18 Plus MB18250 | |
| Dell Pro Max 16 Plus | |
| Average Intel Core Ultra 9 285HX, NVIDIA RTX PRO 5000 Blackwell Generation Laptop (2142 - 2267, n=3) | |
| Schenker Key 18 Pro M25 RTX 5090 | |
| HP ZBook X G1i 16 | |
| HP ZBook Studio 16 G11 | |
| Lenovo ThinkPad P16s Gen 4 21RX000YGE | |
| CrossMark / Productivity | |
| Average Intel Core Ultra 9 285HX, NVIDIA RTX PRO 5000 Blackwell Generation Laptop (2016 - 2028, n=3) | |
| Dell Pro Max 16 Plus | |
| Dell Pro Max 18 Plus MB18250 | |
| Schenker Key 18 Pro M25 RTX 5090 | |
| HP ZBook X G1i 16 | |
| HP ZBook Studio 16 G11 | |
| Lenovo ThinkPad P16s Gen 4 21RX000YGE | |
| CrossMark / Creativity | |
| Dell Pro Max 18 Plus MB18250 | |
| Dell Pro Max 16 Plus | |
| Average Intel Core Ultra 9 285HX, NVIDIA RTX PRO 5000 Blackwell Generation Laptop (2395 - 2725, n=3) | |
| HP ZBook X G1i 16 | |
| Schenker Key 18 Pro M25 RTX 5090 | |
| HP ZBook Studio 16 G11 | |
| Lenovo ThinkPad P16s Gen 4 21RX000YGE | |
| CrossMark / Responsiveness | |
| Schenker Key 18 Pro M25 RTX 5090 | |
| Dell Pro Max 18 Plus MB18250 | |
| Average Intel Core Ultra 9 285HX, NVIDIA RTX PRO 5000 Blackwell Generation Laptop (1806 - 1858, n=3) | |
| Dell Pro Max 16 Plus | |
| HP ZBook X G1i 16 | |
| HP ZBook Studio 16 G11 | |
| Lenovo ThinkPad P16s Gen 4 21RX000YGE | |
| WebXPRT 3 / Overall | |
| Dell Pro Max 18 Plus MB18250 | |
| Average Intel Core Ultra 9 285HX, NVIDIA RTX PRO 5000 Blackwell Generation Laptop (327 - 360, n=3) | |
| Schenker Key 18 Pro M25 RTX 5090 | |
| Dell Pro Max 16 Plus | |
| HP ZBook X G1i 16 | |
| Lenovo ThinkPad P16s Gen 4 21RX000YGE | |
| HP ZBook Studio 16 G11 | |
| WebXPRT 4 / Overall | |
| Schenker Key 18 Pro M25 RTX 5090 | |
| Average Intel Core Ultra 9 285HX, NVIDIA RTX PRO 5000 Blackwell Generation Laptop (306 - 323, n=3) | |
| Dell Pro Max 16 Plus | |
| Dell Pro Max 18 Plus MB18250 | |
| HP ZBook X G1i 16 | |
| HP ZBook Studio 16 G11 | |
| Lenovo ThinkPad P16s Gen 4 21RX000YGE | |
| Mozilla Kraken 1.1 / Total | |
| HP ZBook Studio 16 G11 | |
| Lenovo ThinkPad P16s Gen 4 21RX000YGE | |
| HP ZBook X G1i 16 | |
| Dell Pro Max 18 Plus MB18250 | |
| Dell Pro Max 16 Plus | |
| Average Intel Core Ultra 9 285HX, NVIDIA RTX PRO 5000 Blackwell Generation Laptop (411 - 439, n=3) | |
| Schenker Key 18 Pro M25 RTX 5090 | |
* ... smaller is better
| AIDA64 / Memory Copy | |
| Dell Pro Max 16 Plus | |
| Dell Pro Max 18 Plus MB18250 | |
| Average Intel Core Ultra 9 285HX (63431 - 93933, n=6) | |
| HP ZBook Studio 16 G11 | |
| Lenovo ThinkPad P16s Gen 4 21RX000YGE | |
| Schenker Key 18 Pro M25 RTX 5090 | |
| AIDA64 / Memory Read | |
| Dell Pro Max 16 Plus | |
| Dell Pro Max 18 Plus MB18250 | |
| Lenovo ThinkPad P16s Gen 4 21RX000YGE | |
| Average Intel Core Ultra 9 285HX (67084 - 97565, n=6) | |
| HP ZBook Studio 16 G11 | |
| Schenker Key 18 Pro M25 RTX 5090 | |
| AIDA64 / Memory Write | |
| Dell Pro Max 18 Plus MB18250 | |
| Dell Pro Max 16 Plus | |
| Lenovo ThinkPad P16s Gen 4 21RX000YGE | |
| Average Intel Core Ultra 9 285HX (64112 - 89691, n=6) | |
| HP ZBook Studio 16 G11 | |
| Schenker Key 18 Pro M25 RTX 5090 | |
| AIDA64 / Memory Latency | |
| Schenker Key 18 Pro M25 RTX 5090 | |
| Average Intel Core Ultra 9 285HX (104.8 - 151.7, n=6) | |
| HP ZBook Studio 16 G11 | |
| Dell Pro Max 16 Plus | |
| Dell Pro Max 18 Plus MB18250 | |
| Lenovo ThinkPad P16s Gen 4 21RX000YGE | |
* ... smaller is better
DPC Latency
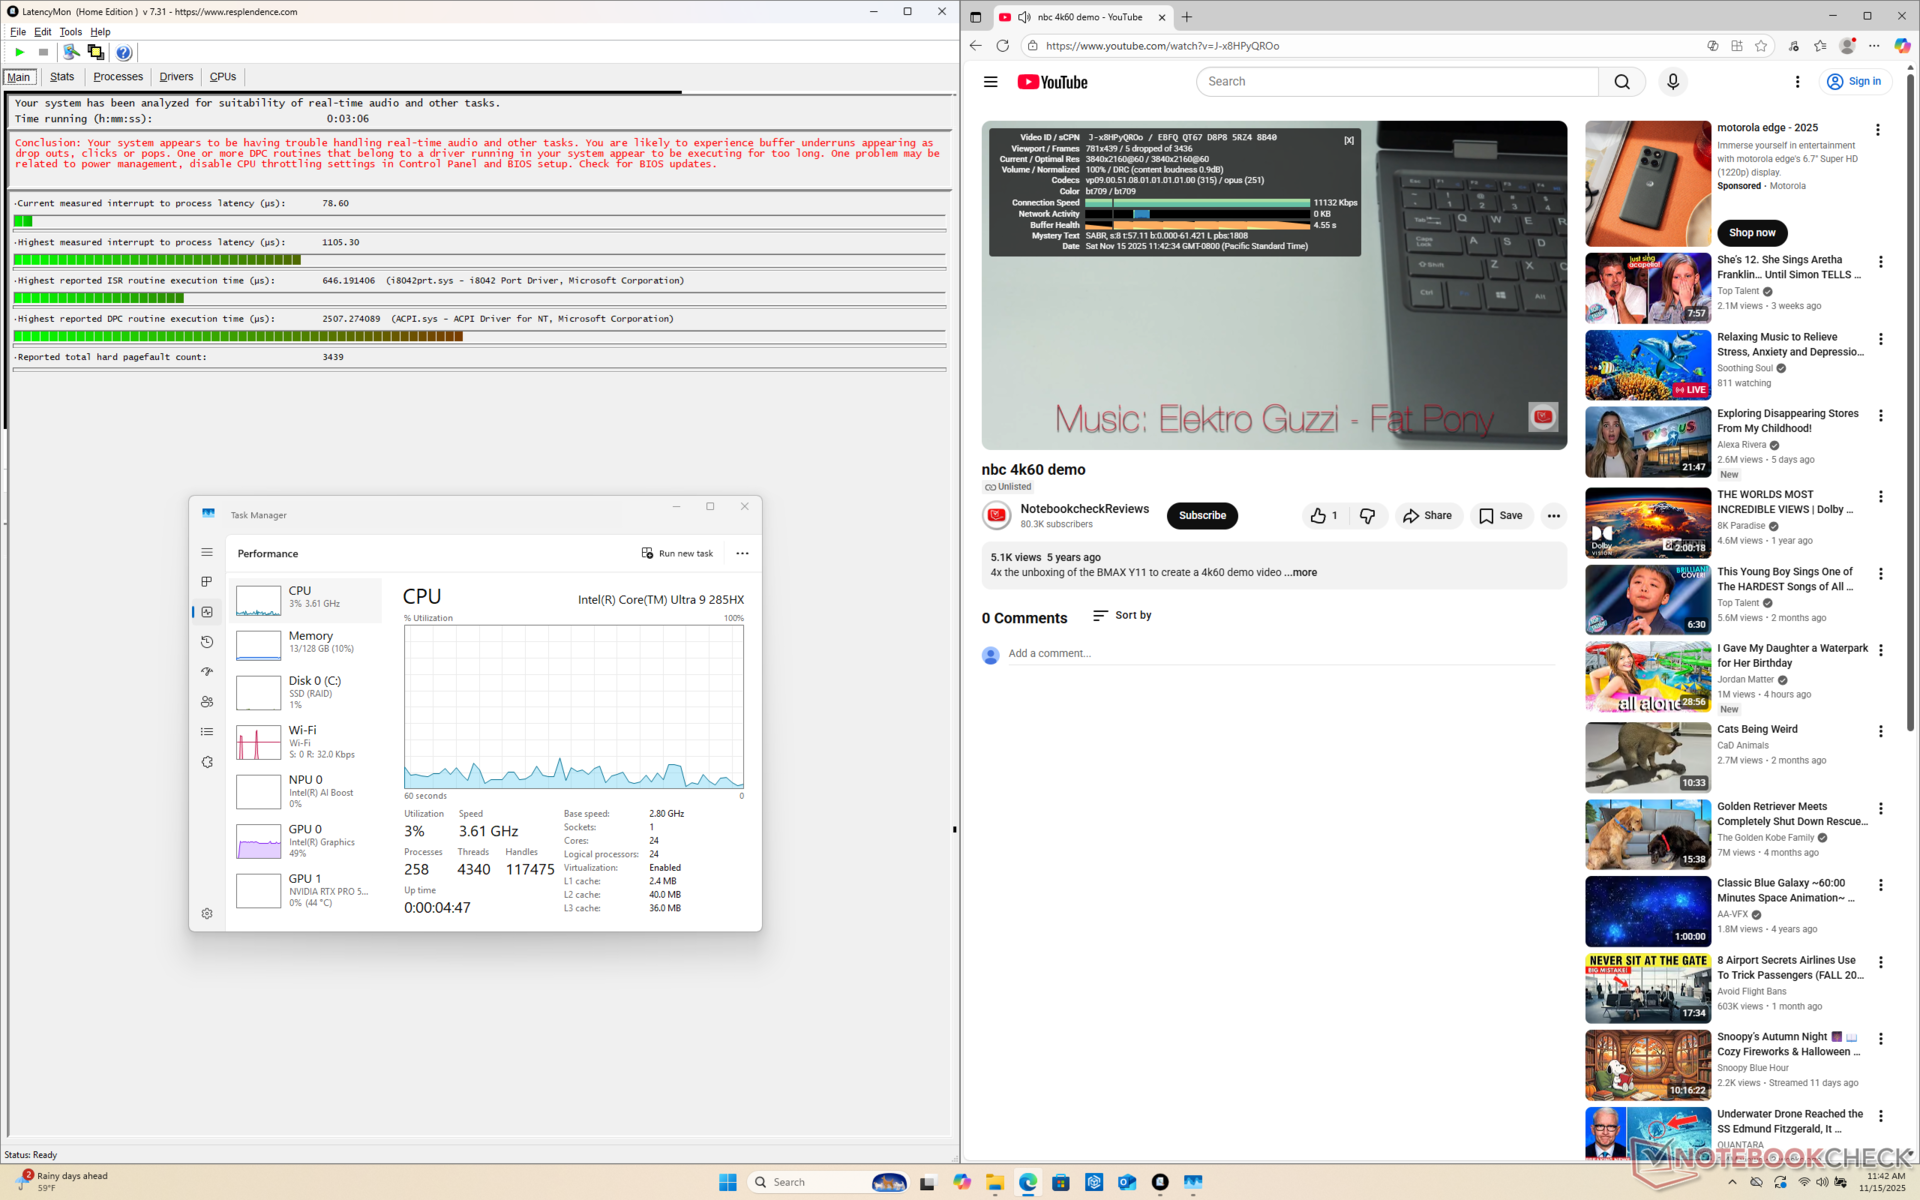
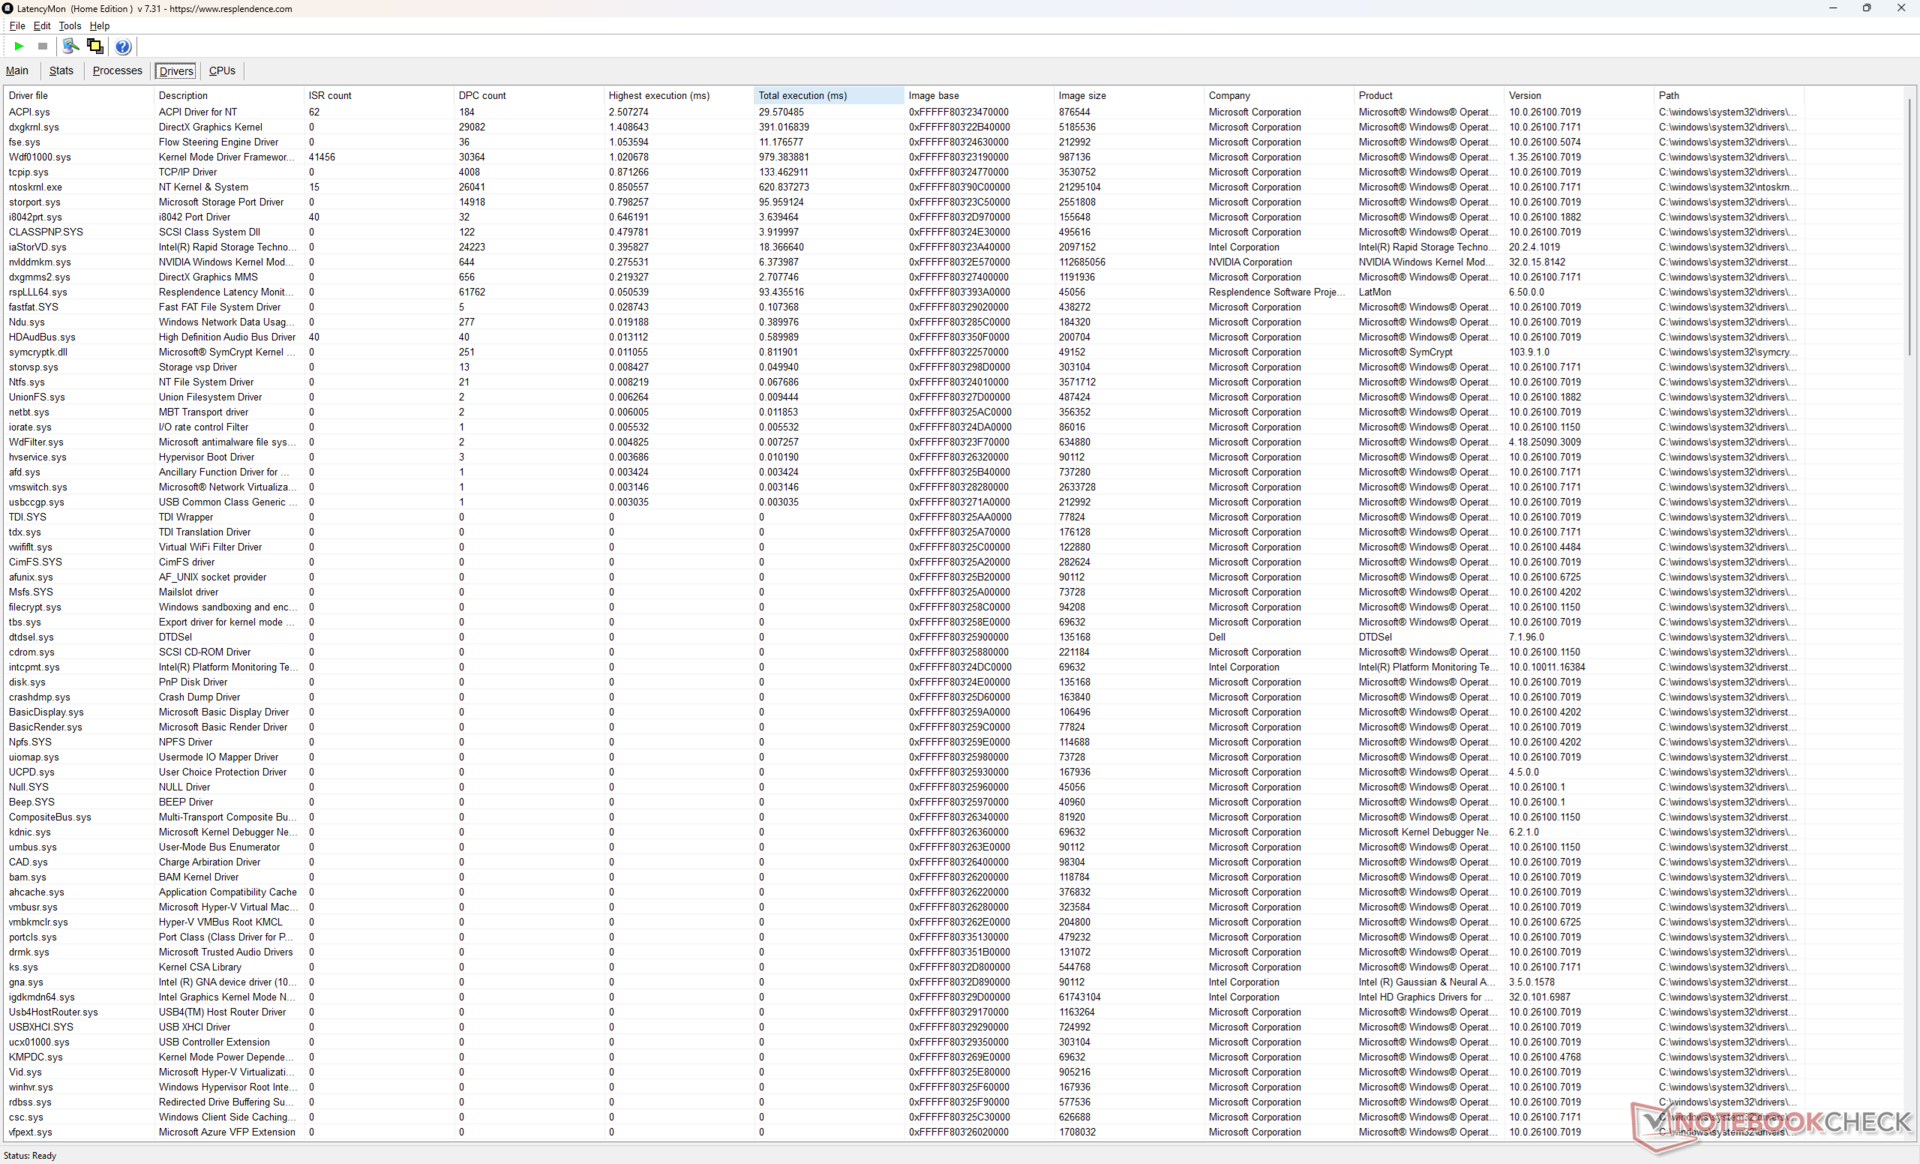
| DPC Latencies / LatencyMon - interrupt to process latency (max), Web, Youtube, Prime95 | |
| Schenker Key 18 Pro M25 RTX 5090 | |
| Dell Pro Max 16 Plus | |
| HP ZBook Studio 16 G11 | |
| Dell Pro Max 18 Plus MB18250 | |
| Lenovo ThinkPad P16s Gen 4 21RX000YGE | |
| HP ZBook X G1i 16 | |
* ... smaller is better
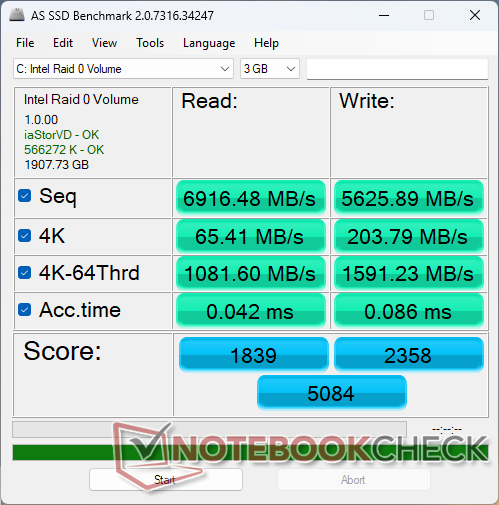
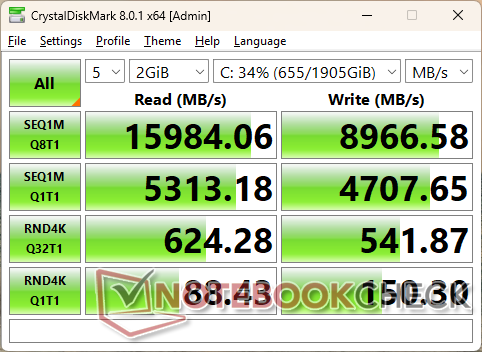
Storage Devices
Our test unit runs on two SK hynix PCB01 PCIe5 SSDs in RAID 0 configuration. A single drive can reach transfer rates of ~16000 MB/s albeit only for a few minutes at a time according to our DiskSpd loop test results below.

| Drive Performance rating - Percent | |
| Schenker Key 18 Pro M25 RTX 5090 | |
| HP ZBook X G1i 16 | |
| Dell Pro Max 16 Plus | |
| Dell Pro Max 18 Plus MB18250 | |
| Lenovo ThinkPad P16s Gen 4 21RX000YGE | |
| HP ZBook Studio 16 G11 | |
* ... smaller is better
Disk Throttling: DiskSpd Read Loop, Queue Depth 8
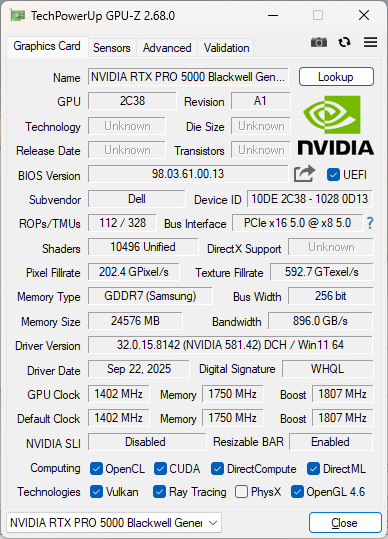
GPU Performance
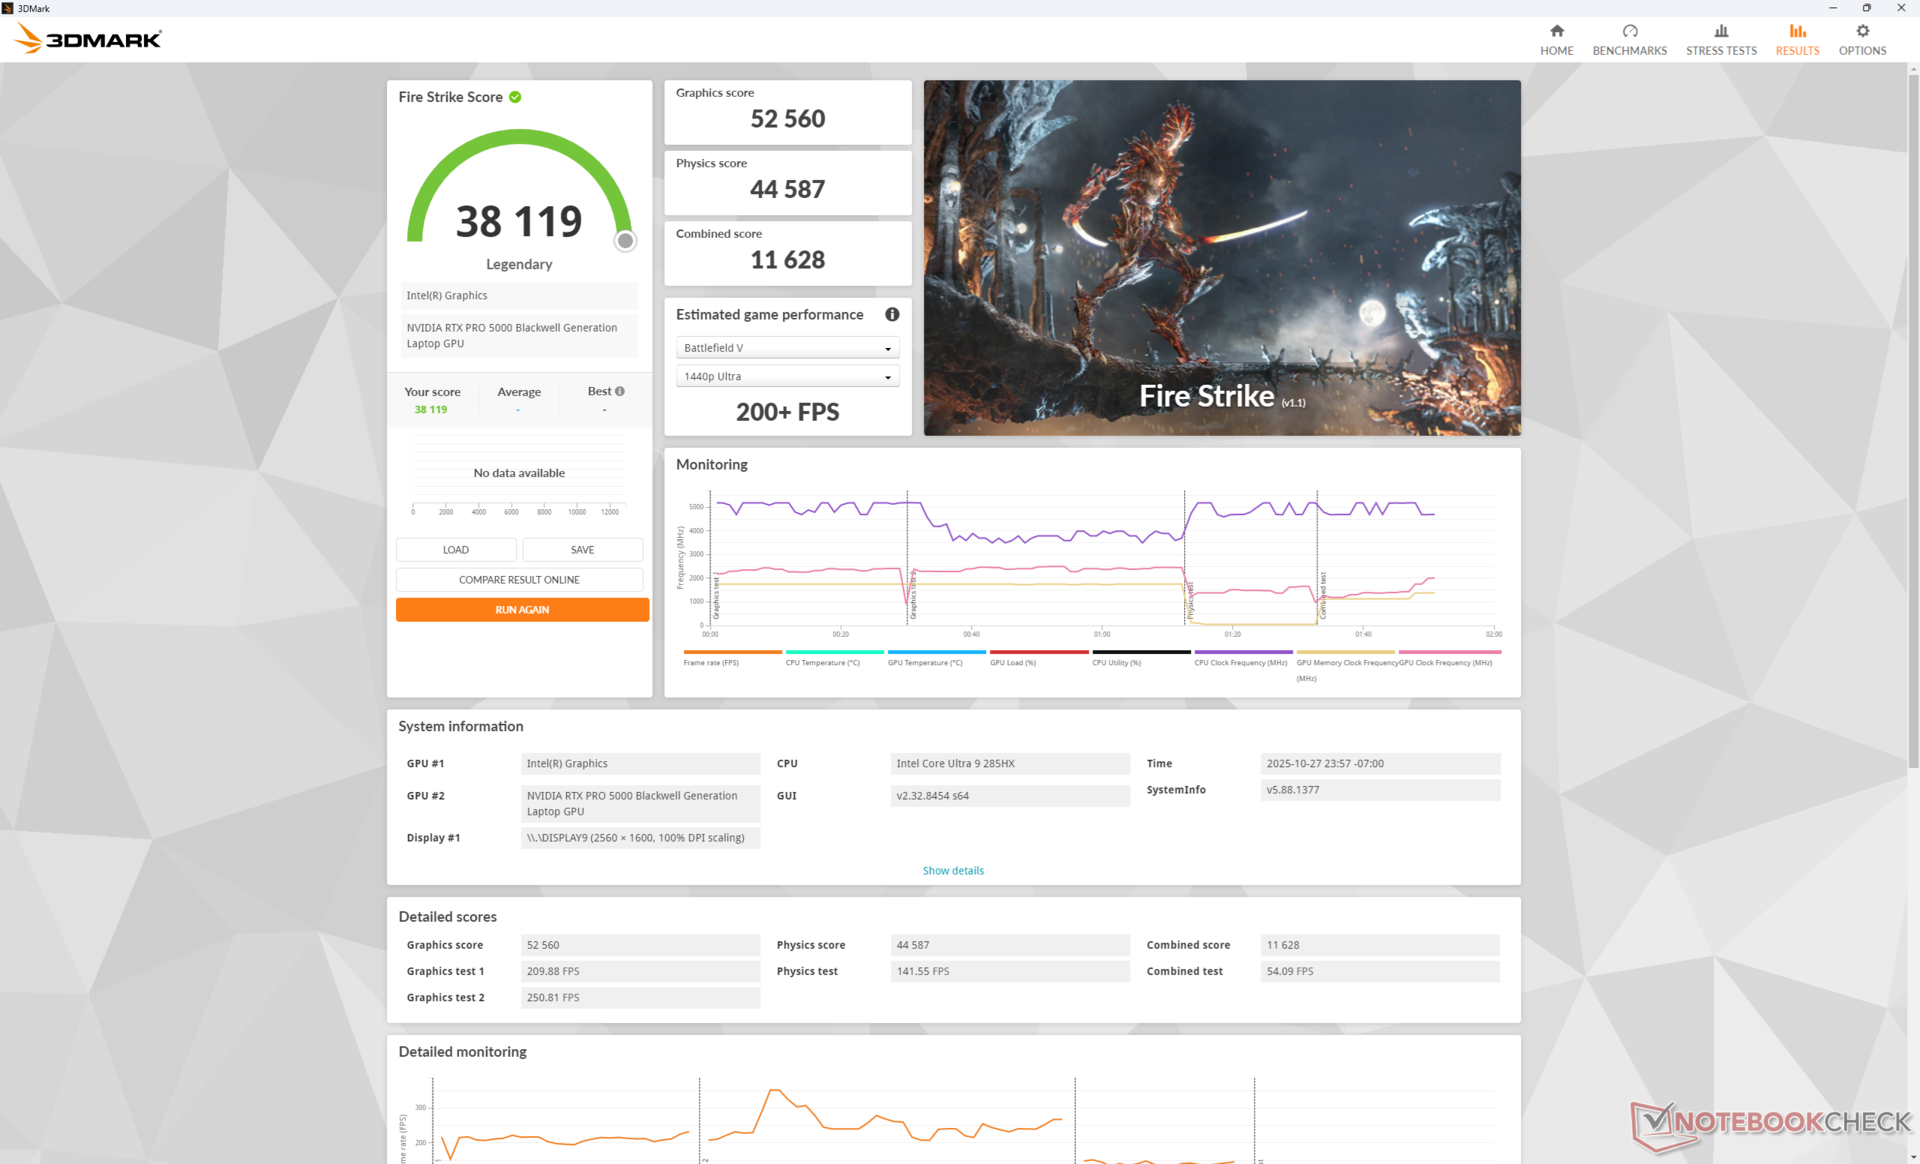
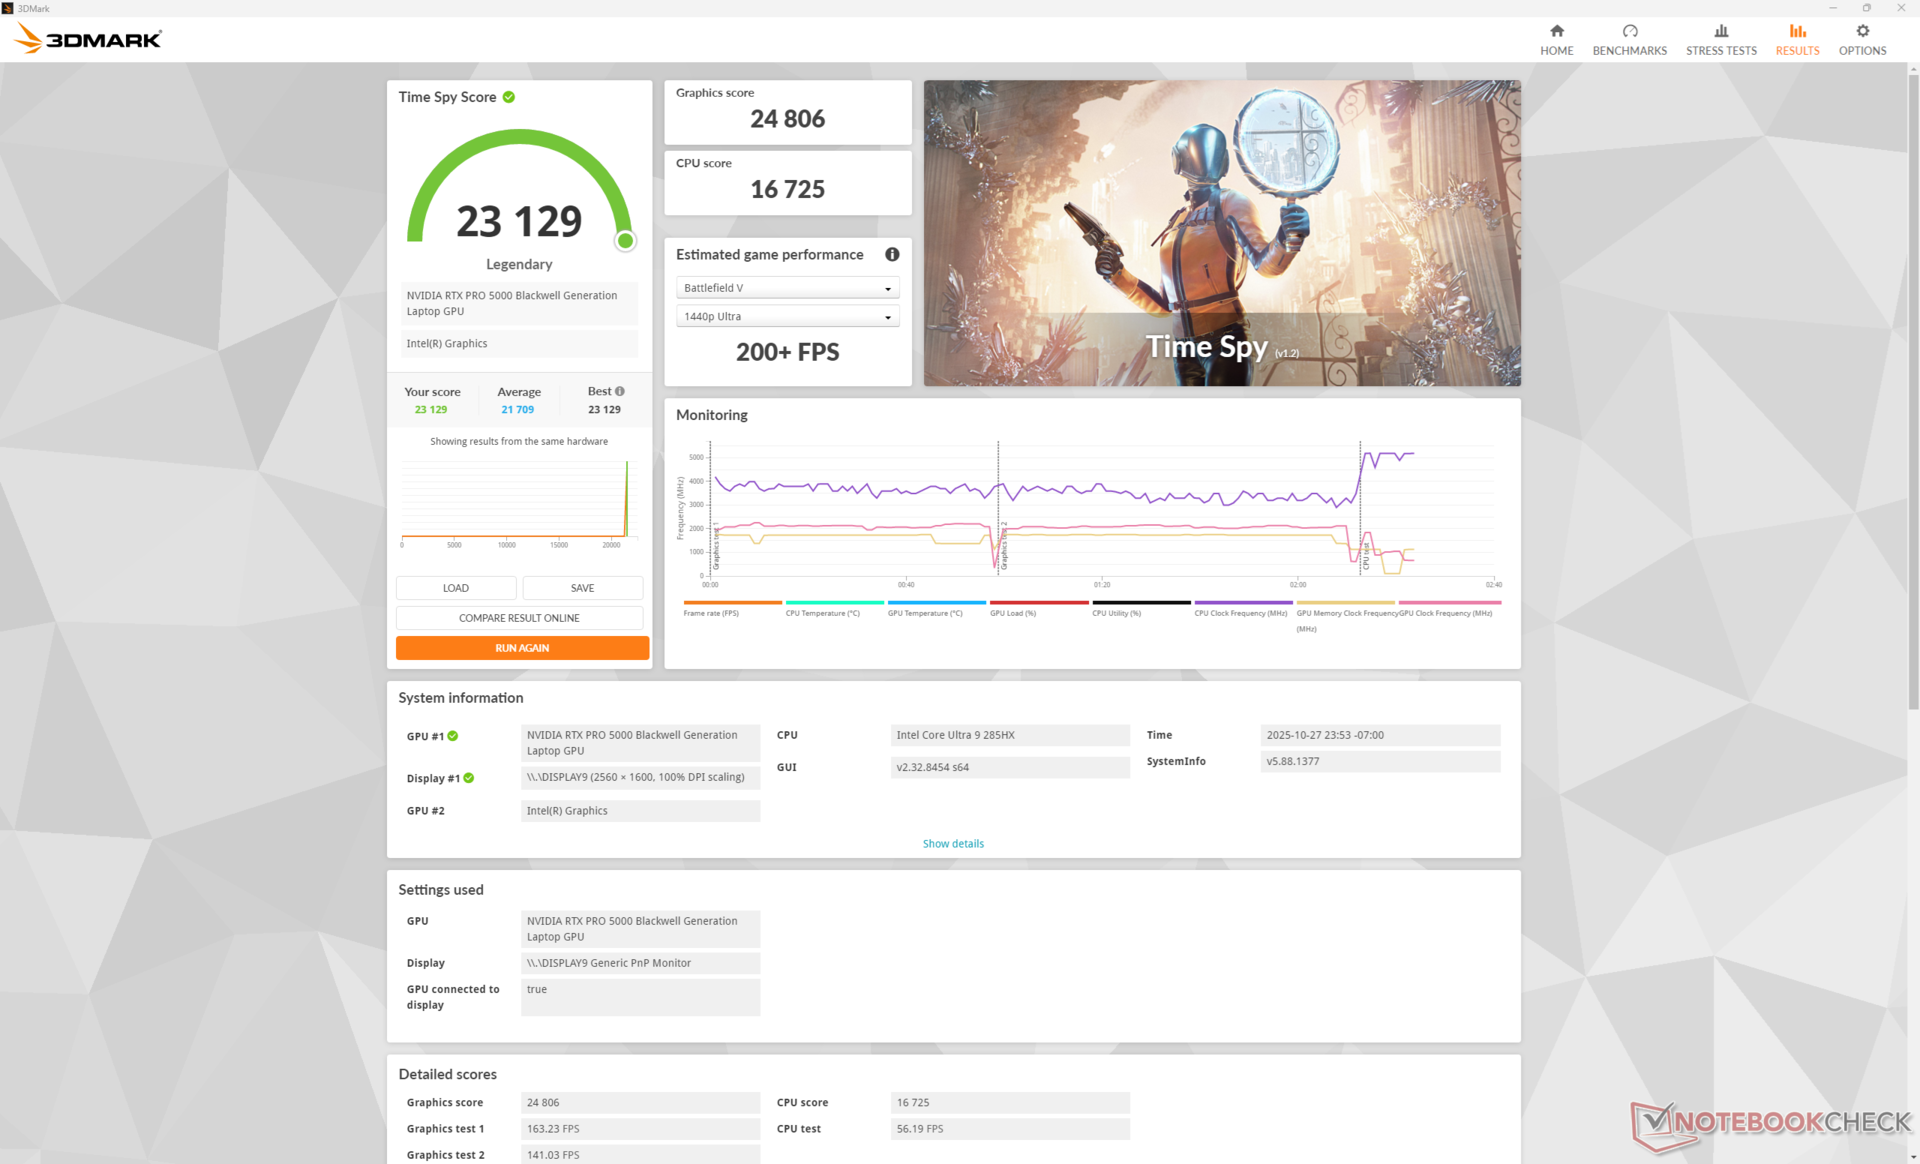
Graphics performance is ever-so-slightly faster by just a few percentage points than on the Dell Pro Max 16 Plus equipped with the same GPU. GPU board power draw averages about 163 W on Performance mode which is close to the 175 W maximum.
| Power Profile | Graphics Score | Physics Score | Combined Score |
| Performance Mode | 52560 | 44587 | 11628 |
| Balanced Mode | 47593 (-10%) | 47039 (+6%) | 11029 (-5%) |
| Battery Power | 22941 (-56%) | 32131 (-28%) | 6944 (-40%) |
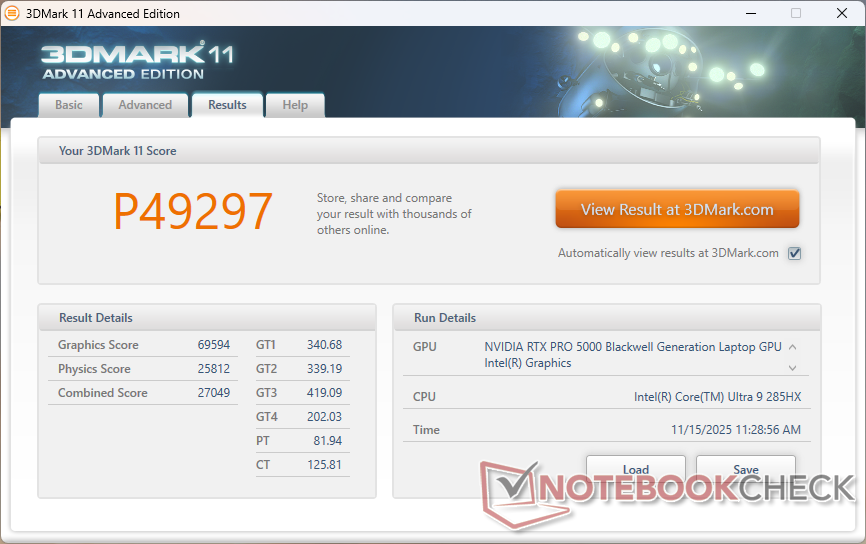
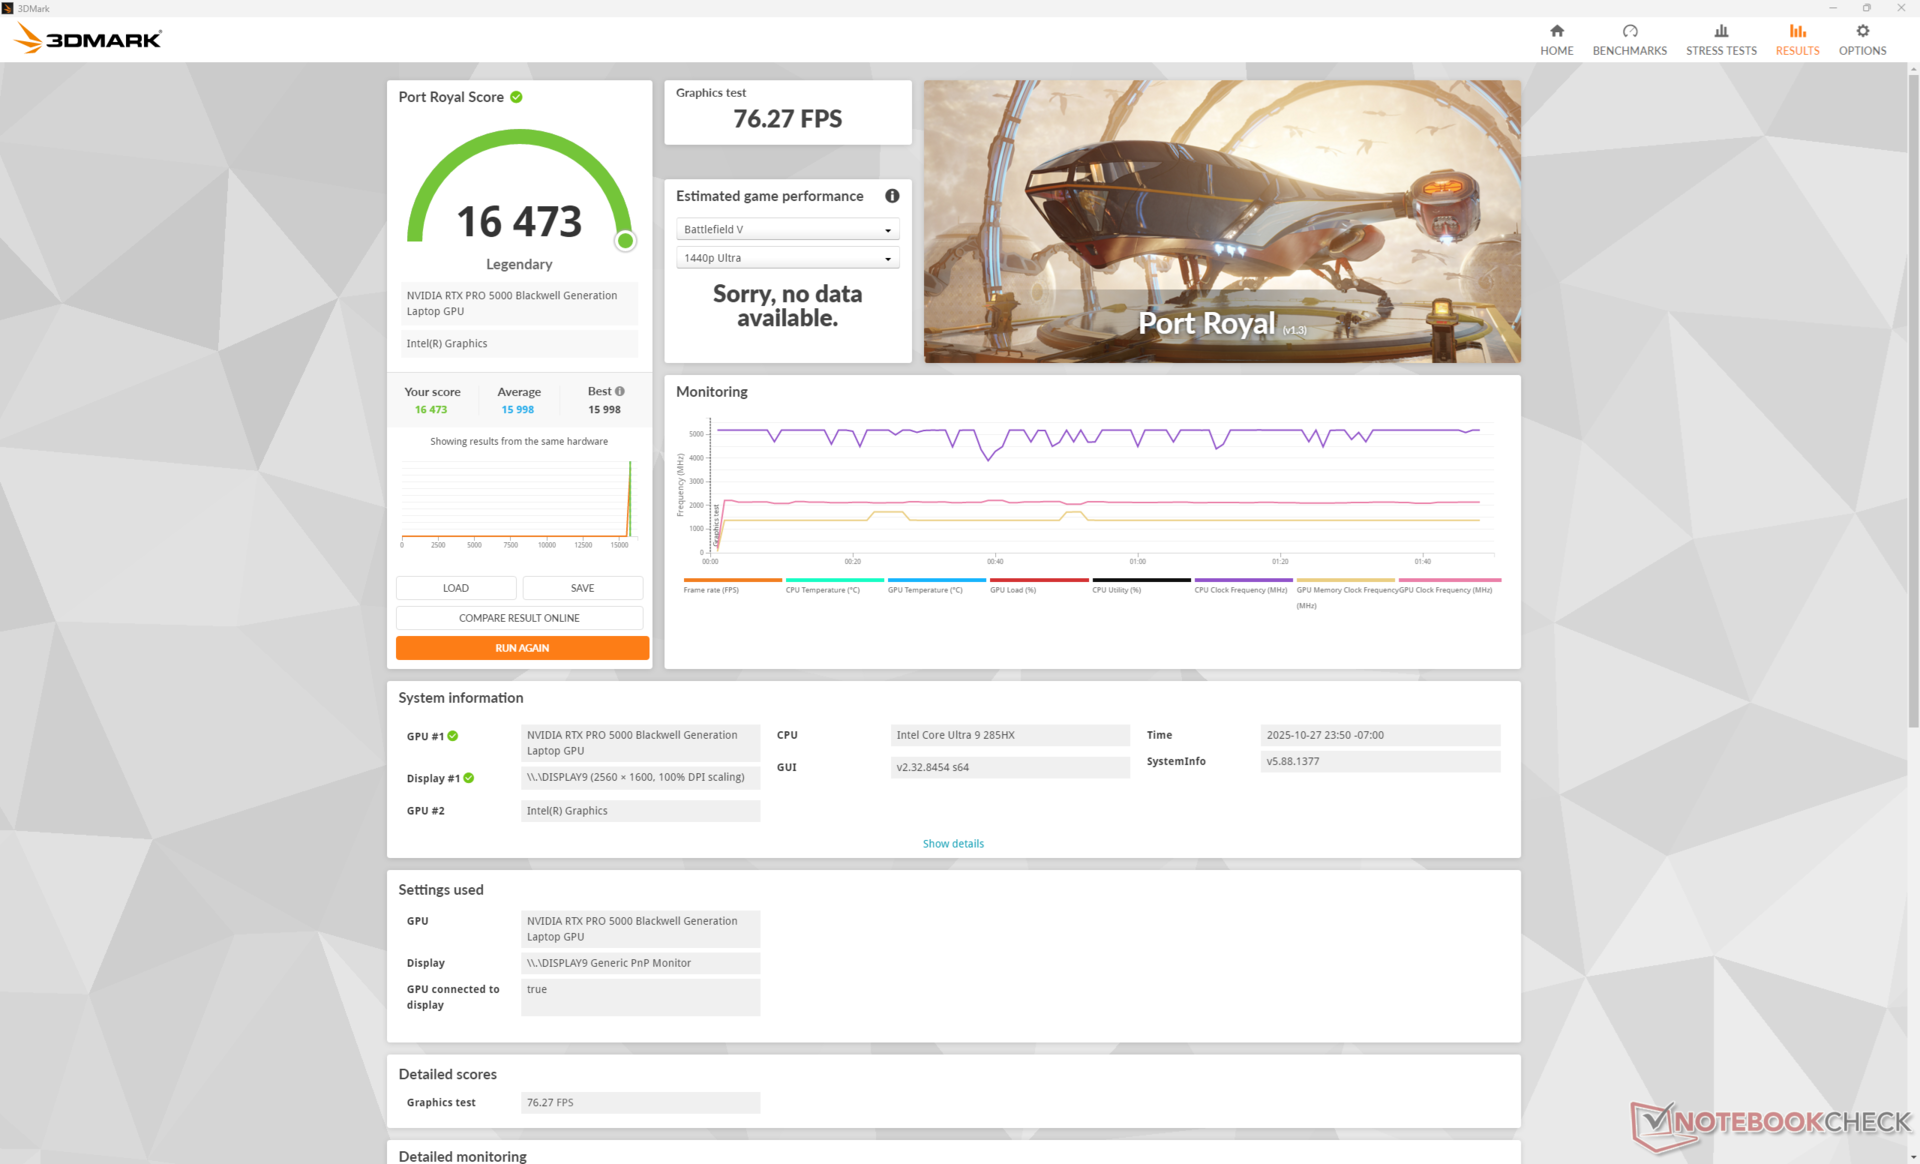
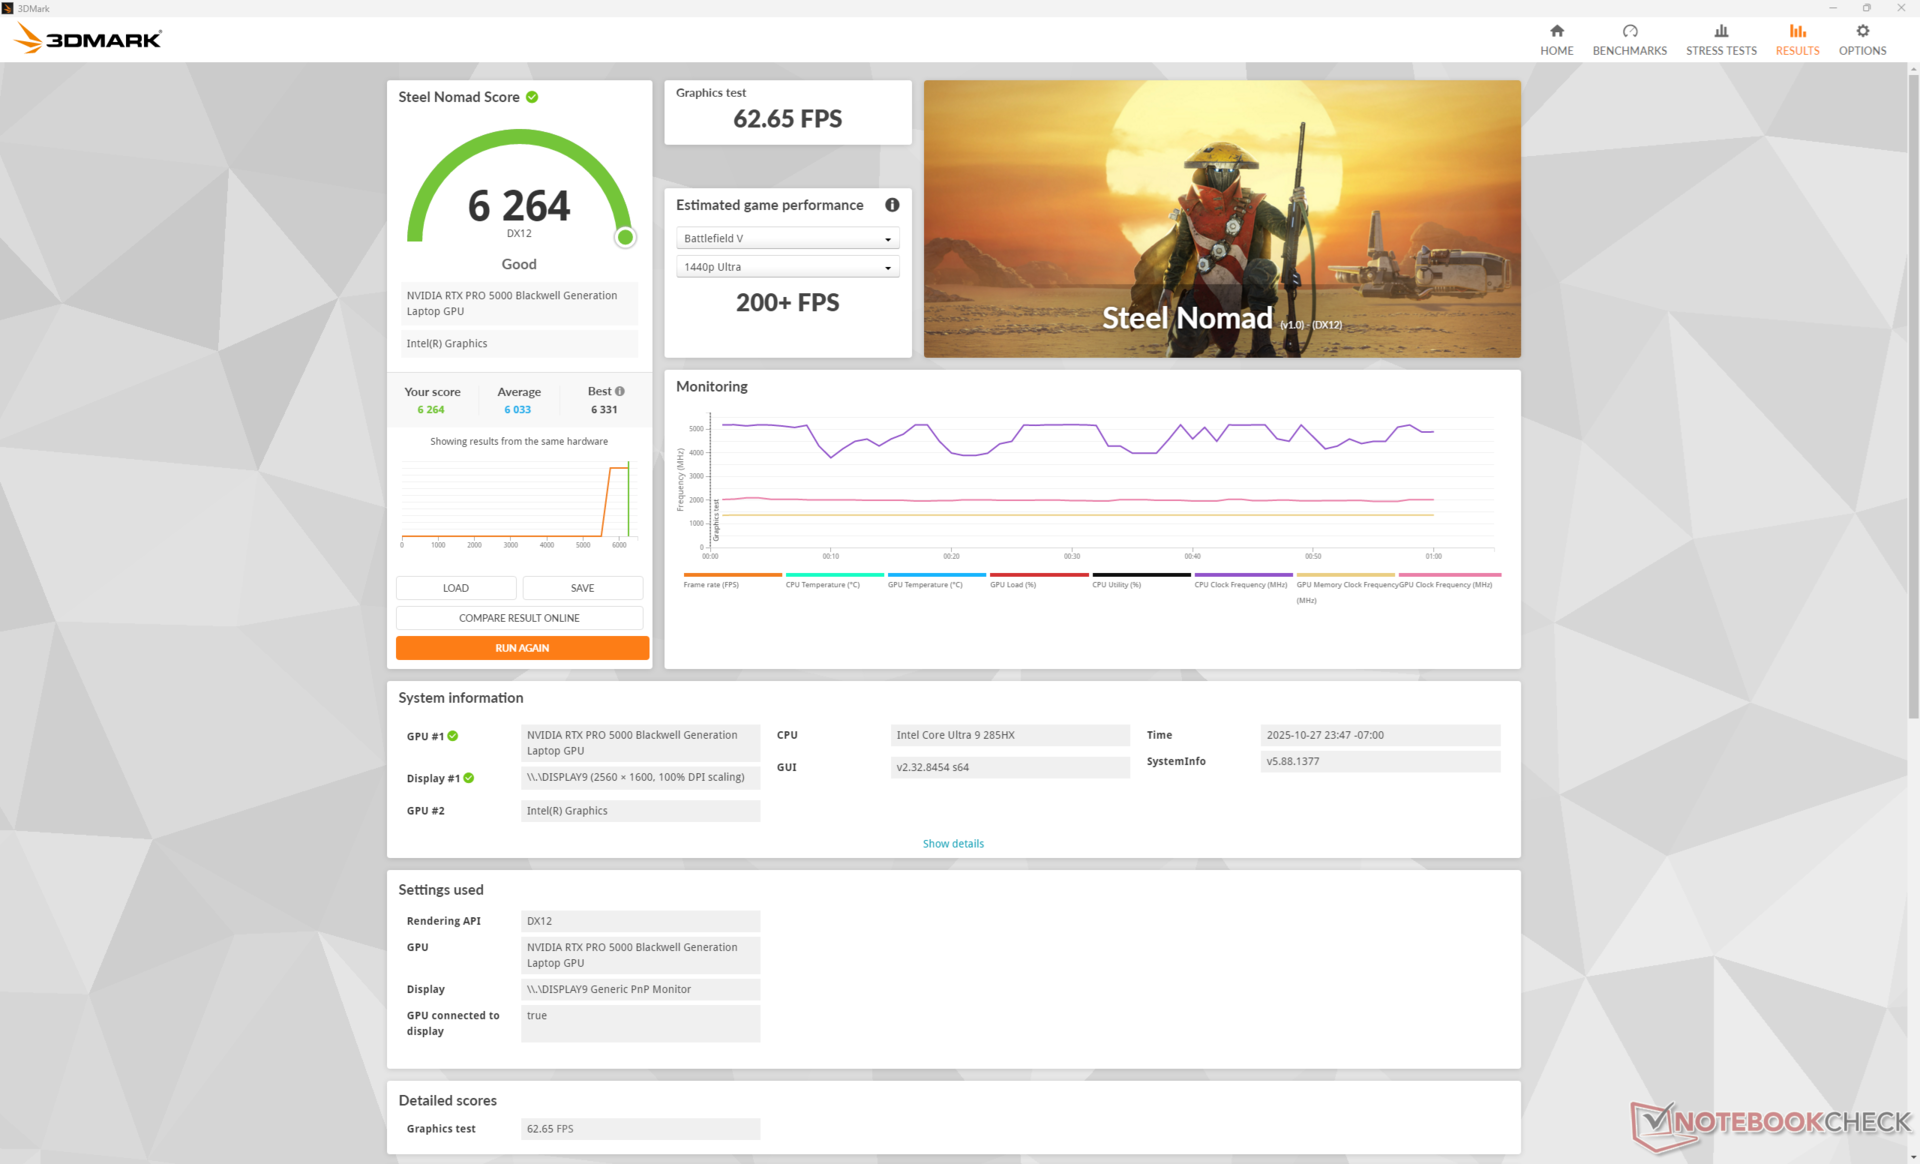
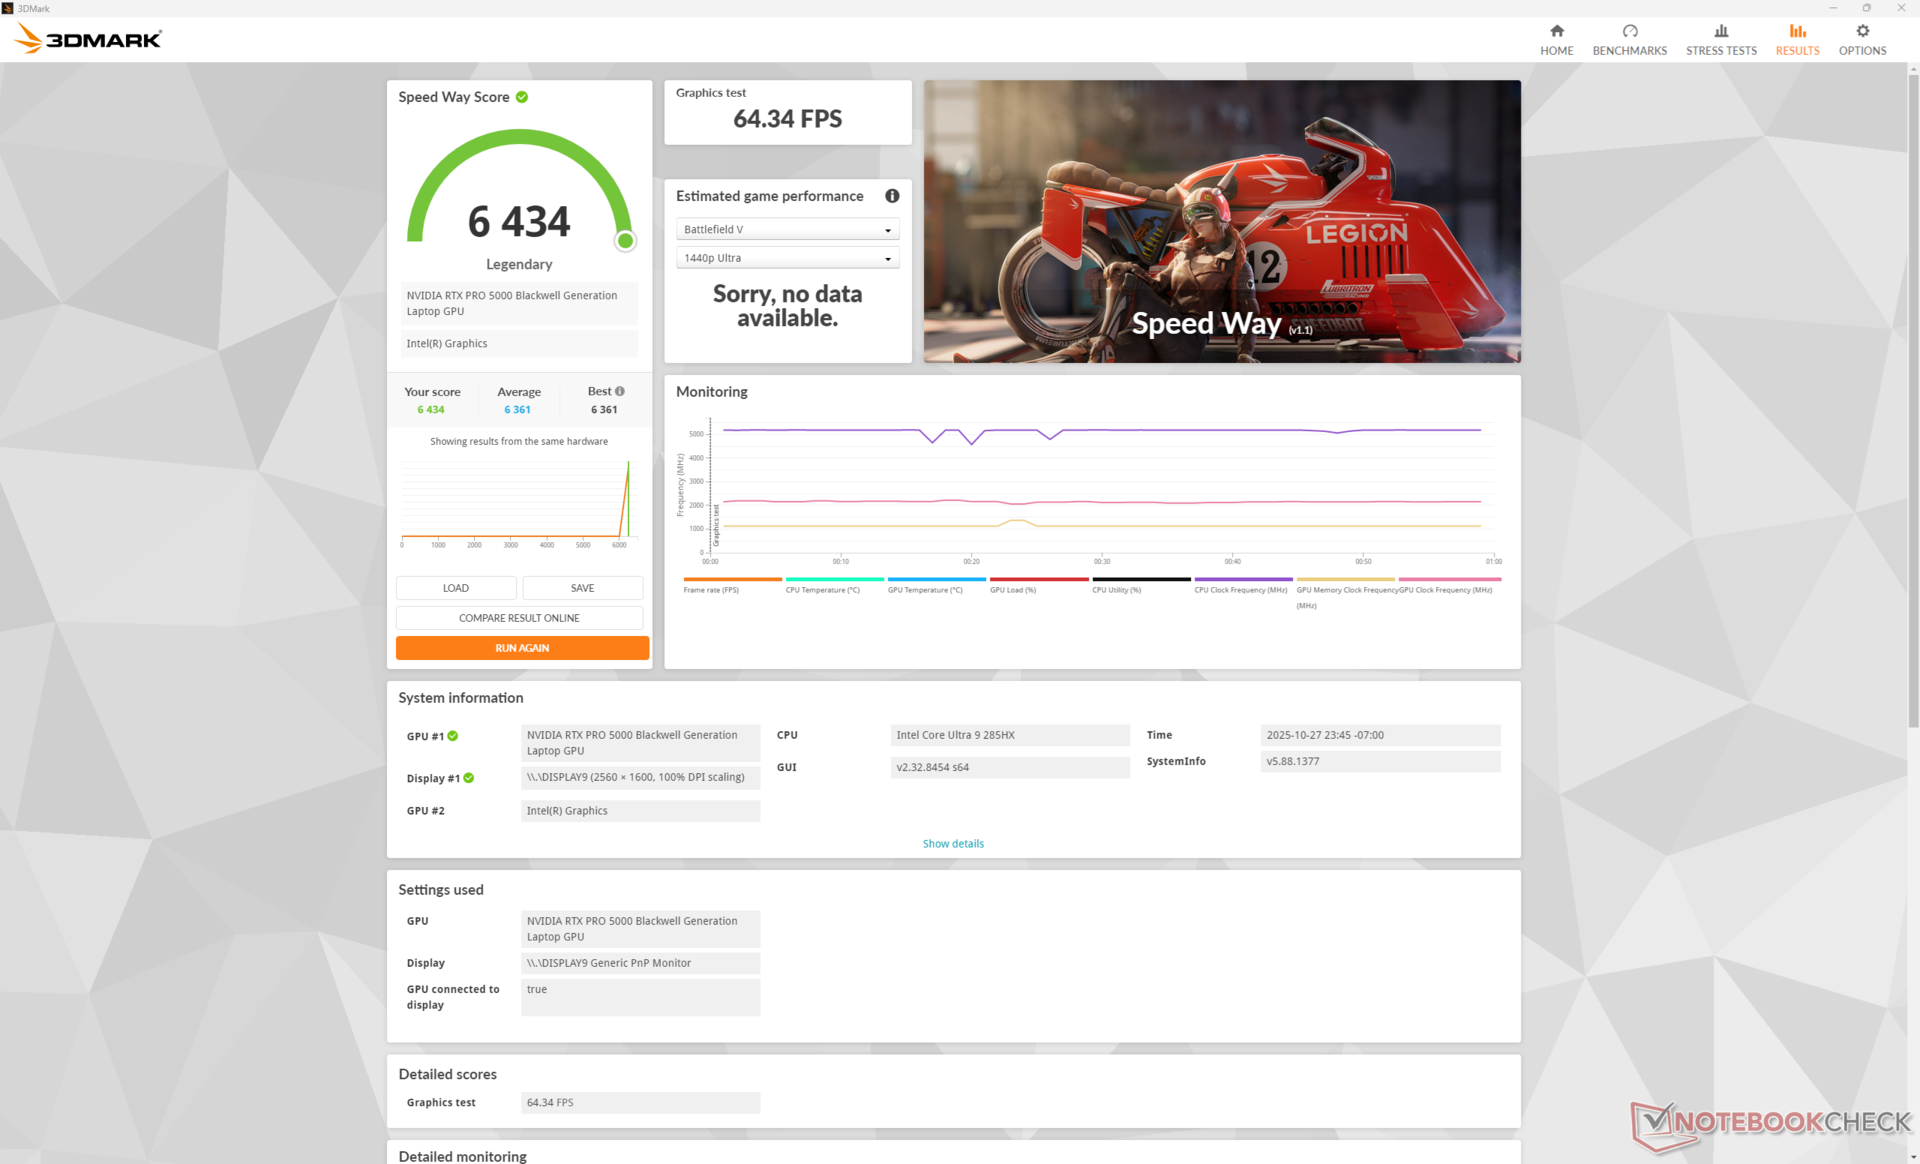
| 3DMark 11 Performance | 49297 points | |
| 3DMark Cloud Gate Standard Score | 67936 points | |
| 3DMark Fire Strike Score | 38119 points | |
| 3DMark Time Spy Score | 23129 points | |
| 3DMark Steel Nomad Score | 6264 points | |
Help | ||
* ... smaller is better
| Performance rating - Percent | |
| Dell Pro Max 18 Plus MB18250 | |
| Schenker Key 18 Pro M25 RTX 5090 | |
| Dell Pro Max 16 Plus | |
| HP ZBook X G1i 16 | |
| HP ZBook Studio 16 G11 | |
| Lenovo ThinkPad P16s Gen 4 21RX000YGE -1! | |
| Cyberpunk 2077 - 1920x1080 Ultra Preset (FSR off) | |
| Dell Pro Max 18 Plus MB18250 | |
| Schenker Key 18 Pro M25 RTX 5090 | |
| Dell Pro Max 16 Plus | |
| HP ZBook X G1i 16 | |
| HP ZBook Studio 16 G11 | |
| Lenovo ThinkPad P16s Gen 4 21RX000YGE | |
| Baldur's Gate 3 - 1920x1080 Ultra Preset AA:T | |
| Dell Pro Max 18 Plus MB18250 | |
| Dell Pro Max 16 Plus | |
| Schenker Key 18 Pro M25 RTX 5090 | |
| HP ZBook Studio 16 G11 | |
| HP ZBook X G1i 16 | |
| Lenovo ThinkPad P16s Gen 4 21RX000YGE | |
| GTA V - 1920x1080 Highest AA:4xMSAA + FX AF:16x | |
| Dell Pro Max 18 Plus MB18250 | |
| Schenker Key 18 Pro M25 RTX 5090 | |
| Dell Pro Max 16 Plus | |
| HP ZBook X G1i 16 | |
| HP ZBook Studio 16 G11 | |
| Lenovo ThinkPad P16s Gen 4 21RX000YGE | |
| Final Fantasy XV Benchmark - 1920x1080 High Quality | |
| Dell Pro Max 18 Plus MB18250 | |
| Dell Pro Max 16 Plus | |
| Schenker Key 18 Pro M25 RTX 5090 | |
| HP ZBook X G1i 16 | |
| HP ZBook Studio 16 G11 | |
| Lenovo ThinkPad P16s Gen 4 21RX000YGE | |
| Strange Brigade - 1920x1080 ultra AA:ultra AF:16 | |
| Dell Pro Max 18 Plus MB18250 | |
| Schenker Key 18 Pro M25 RTX 5090 | |
| Dell Pro Max 16 Plus | |
| HP ZBook Studio 16 G11 | |
| HP ZBook X G1i 16 | |
| Dota 2 Reborn - 1920x1080 ultra (3/3) best looking | |
| Dell Pro Max 16 Plus | |
| Dell Pro Max 18 Plus MB18250 | |
| Schenker Key 18 Pro M25 RTX 5090 | |
| HP ZBook Studio 16 G11 | |
| HP ZBook X G1i 16 | |
| Lenovo ThinkPad P16s Gen 4 21RX000YGE | |
| X-Plane 11.11 - 1920x1080 high (fps_test=3) | |
| Dell Pro Max 18 Plus MB18250 | |
| Dell Pro Max 16 Plus | |
| Schenker Key 18 Pro M25 RTX 5090 | |
| HP ZBook Studio 16 G11 | |
| HP ZBook X G1i 16 | |
| Lenovo ThinkPad P16s Gen 4 21RX000YGE | |
| Dota 2 Reborn - 3840x2160 ultra (3/3) best looking | |
| HP ZBook Fury 16 G10 | |
| Schenker Key 18 Pro M25 RTX 5090 | |
| Dell Pro Max 18 Plus MB18250 | |
| Average NVIDIA RTX PRO 5000 Blackwell Generation Laptop (143.9 - 149.4, n=3) | |
| Dell Pro Max 16 Plus | |
| Dell Precision 7000 7670 Performance | |
Cyberpunk 2077 ultra FPS Chart
| low | med. | high | ultra | QHD DLSS | QHD | 4K DLSS | 4K FSR | 4K | |
|---|---|---|---|---|---|---|---|---|---|
| GTA V (2015) | 186.7 | 185.8 | 178.3 | 156.1 | 152.6 | ||||
| Dota 2 Reborn (2015) | 219 | 179.8 | 182 | 163.9 | 149.4 | ||||
| Final Fantasy XV Benchmark (2018) | 233 | 232 | 197.6 | 156.9 | 101.5 | ||||
| X-Plane 11.11 (2018) | 154.4 | 133.2 | 104.2 | 94.4 | |||||
| Strange Brigade (2018) | 548 | 442 | 426 | 418 | 351 | 188.7 | |||
| Baldur's Gate 3 (2023) | 253 | 238 | 212 | 205 | 198.2 | 150.3 | 126.3 | 85.9 | |
| Cyberpunk 2077 (2023) | 176 | 174.3 | 161.4 | 152.4 | 130.3 | 116.7 | |||
| F1 24 (2024) | 338 | 322 | 322 | 147.7 | 148.6 | 101.8 | 85.7 | 83.6 | 50.2 |
Emissions
System Noise
The three internal fans are almost always active and so the system is never truly silent in most cases. Even so, they are almost inaudible in a typical office during most low to low-medium workloads and they don't become noticeable until much higher loads are introduced. We're able to reach almost 54 dB(A) when running games or similar loads on Balanced mode or Performance mode.
Perhaps uncoincidentally, fan behavior and measurements are very similar to what we recorded on the Dell Pro Max 16 Plus.
Noise level
| Idle |
| 27.1 / 27.1 / 27.1 dB(A) |
| Load |
| 38 / 53.8 dB(A) |
 | ||
30 dB silent 40 dB(A) audible 50 dB(A) loud |
||
min: | ||
| Dell Pro Max 18 Plus MB18250 Ultra 9 285HX, RTX PRO 5000 Blackwell Generation Laptop | Schenker Key 18 Pro M25 RTX 5090 Ultra 9 275HX, GeForce RTX 5090 Laptop | HP ZBook X G1i 16 Ultra 7 265H, RTX PRO 2000 Blackwell Generation Laptop | HP ZBook Studio 16 G11 Ultra 9 185H, RTX 3000 Ada Generation Laptop | Lenovo ThinkPad P16s Gen 4 21RX000YGE Ryzen AI 9 HX PRO 370, Radeon 890M | Dell Pro Max 16 Plus Ultra 9 285HX, RTX PRO 5000 Blackwell Generation Laptop | |
|---|---|---|---|---|---|---|
| Noise | -3% | 9% | 6% | -0% | -6% | |
| off / environment * (dB) | 23.1 | 23.9 -3% | 23.7 -3% | 23.8 -3% | 25.9 -12% | 23.2 -0% |
| Idle Minimum * (dB) | 27.1 | 25.2 7% | 23.7 13% | 23.8 12% | 25.9 4% | 26.7 1% |
| Idle Average * (dB) | 27.1 | 25.2 7% | 23.7 13% | 26.4 3% | 25.9 4% | 30.5 -13% |
| Idle Maximum * (dB) | 27.1 | 25.2 7% | 23.7 13% | 26.4 3% | 28.5 -5% | 34 -25% |
| Load Average * (dB) | 38 | 47.8 -26% | 32.7 14% | 33.7 11% | 42.9 -13% | 39.8 -5% |
| Cyberpunk 2077 ultra * (dB) | 53.8 | 54.4 -1% | 50.9 5% | 46.1 14% | 48.7 9% | 54.3 -1% |
| Load Maximum * (dB) | 53.8 | 58.6 -9% | 48 11% | 53.2 1% | 48.5 10% | 54.3 -1% |
* ... smaller is better
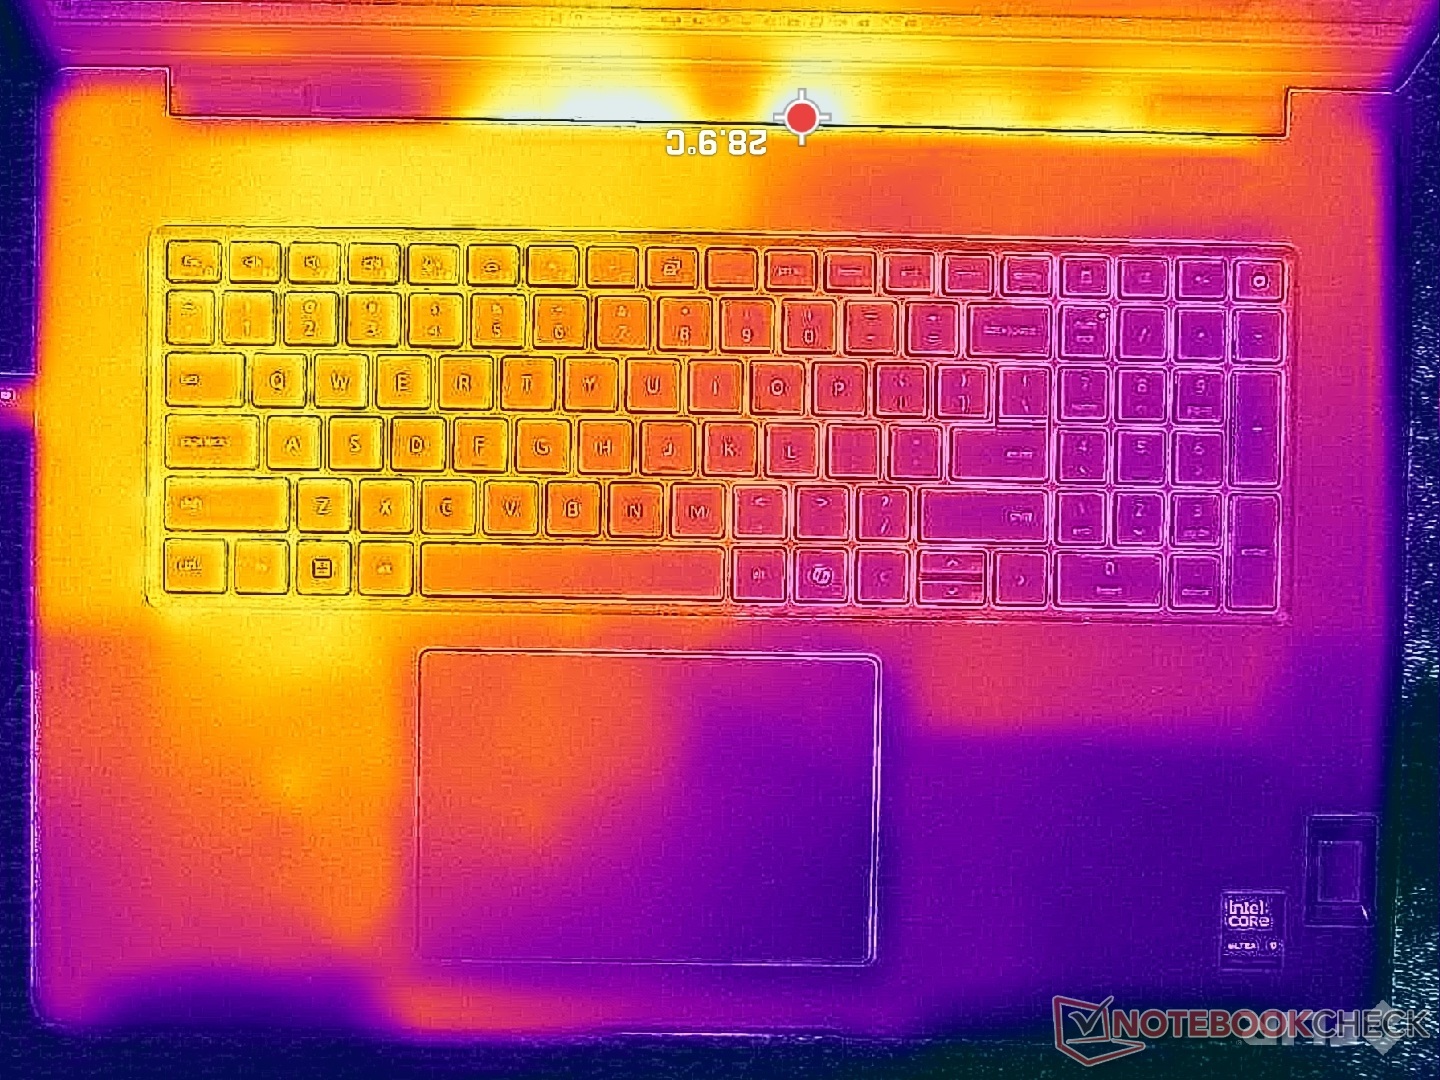
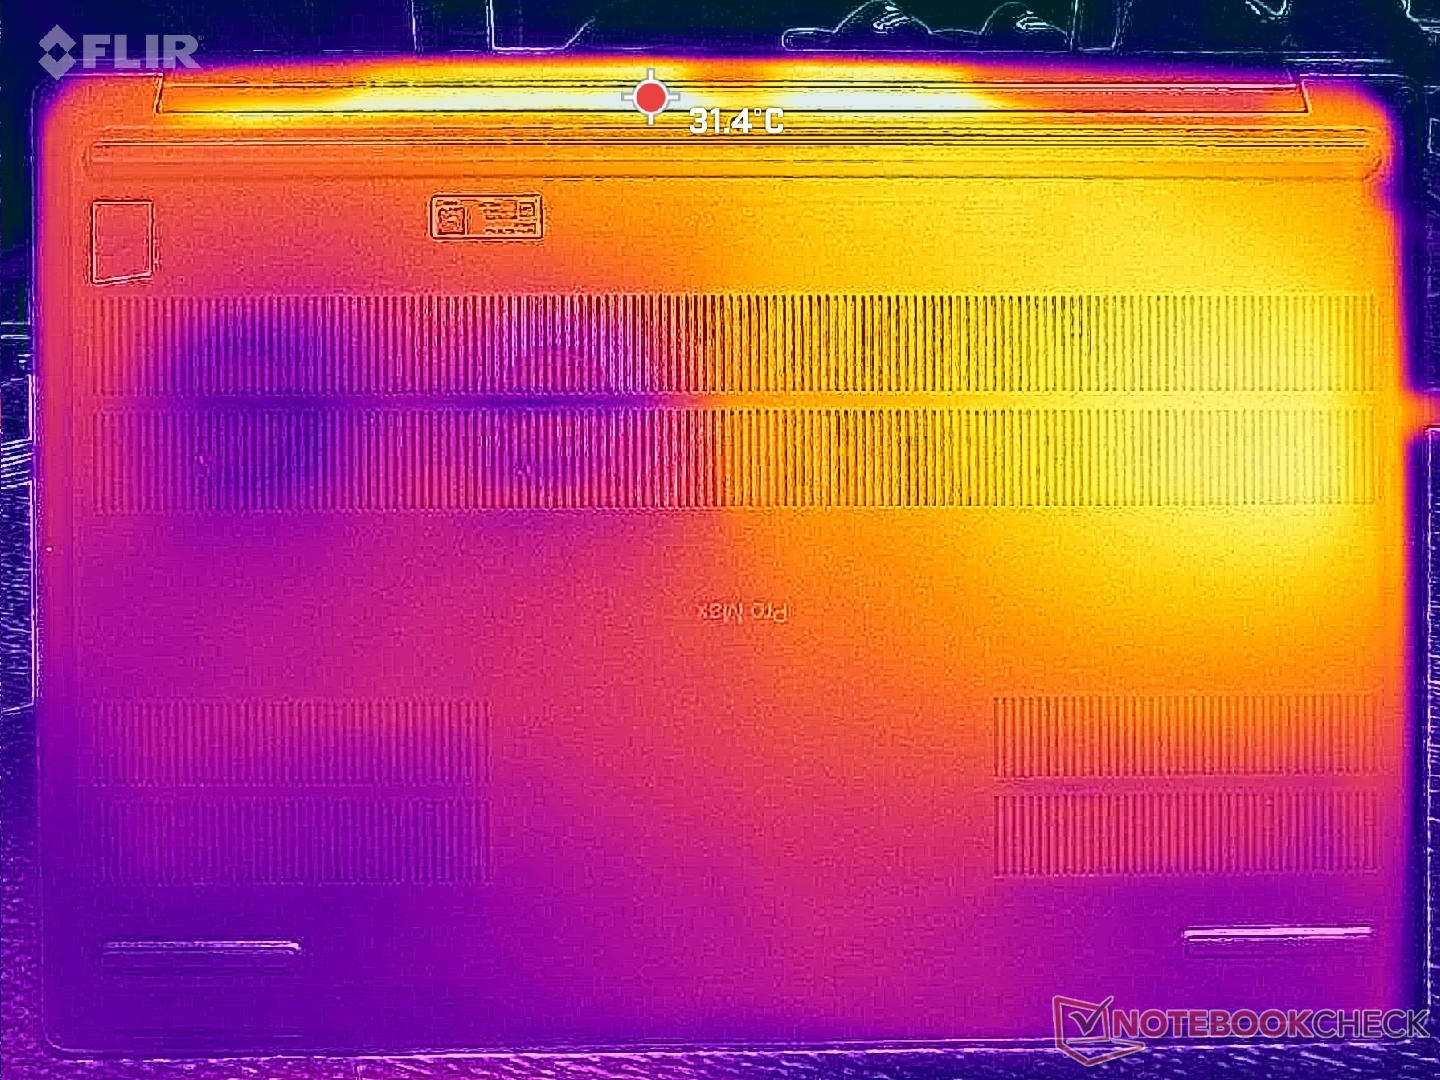
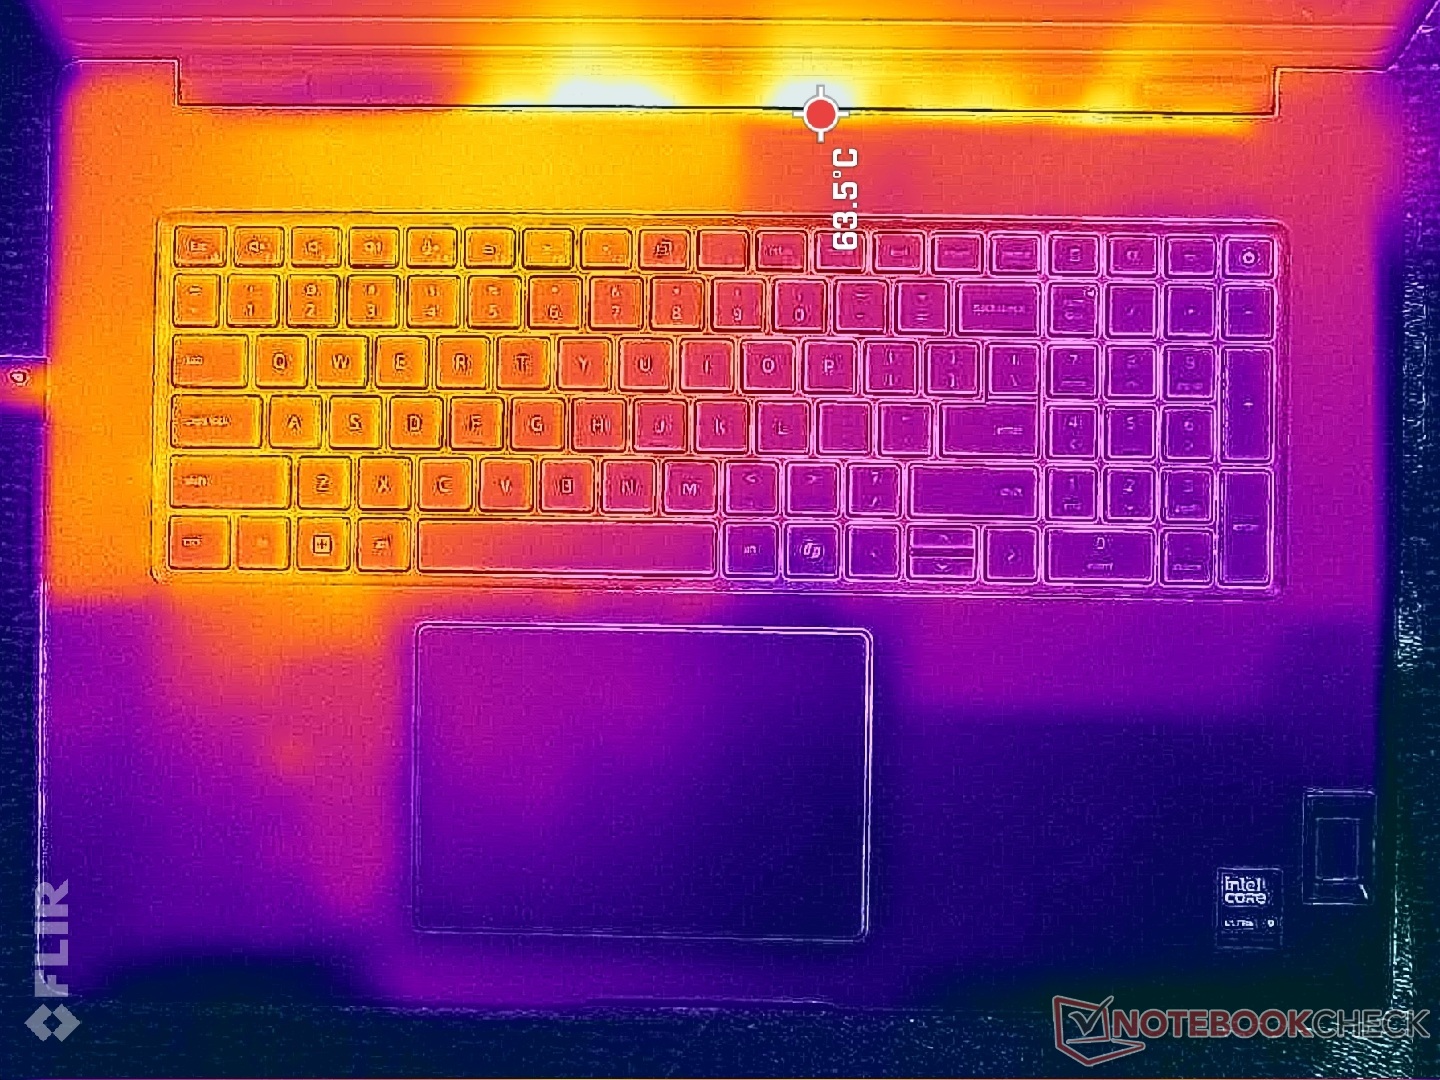
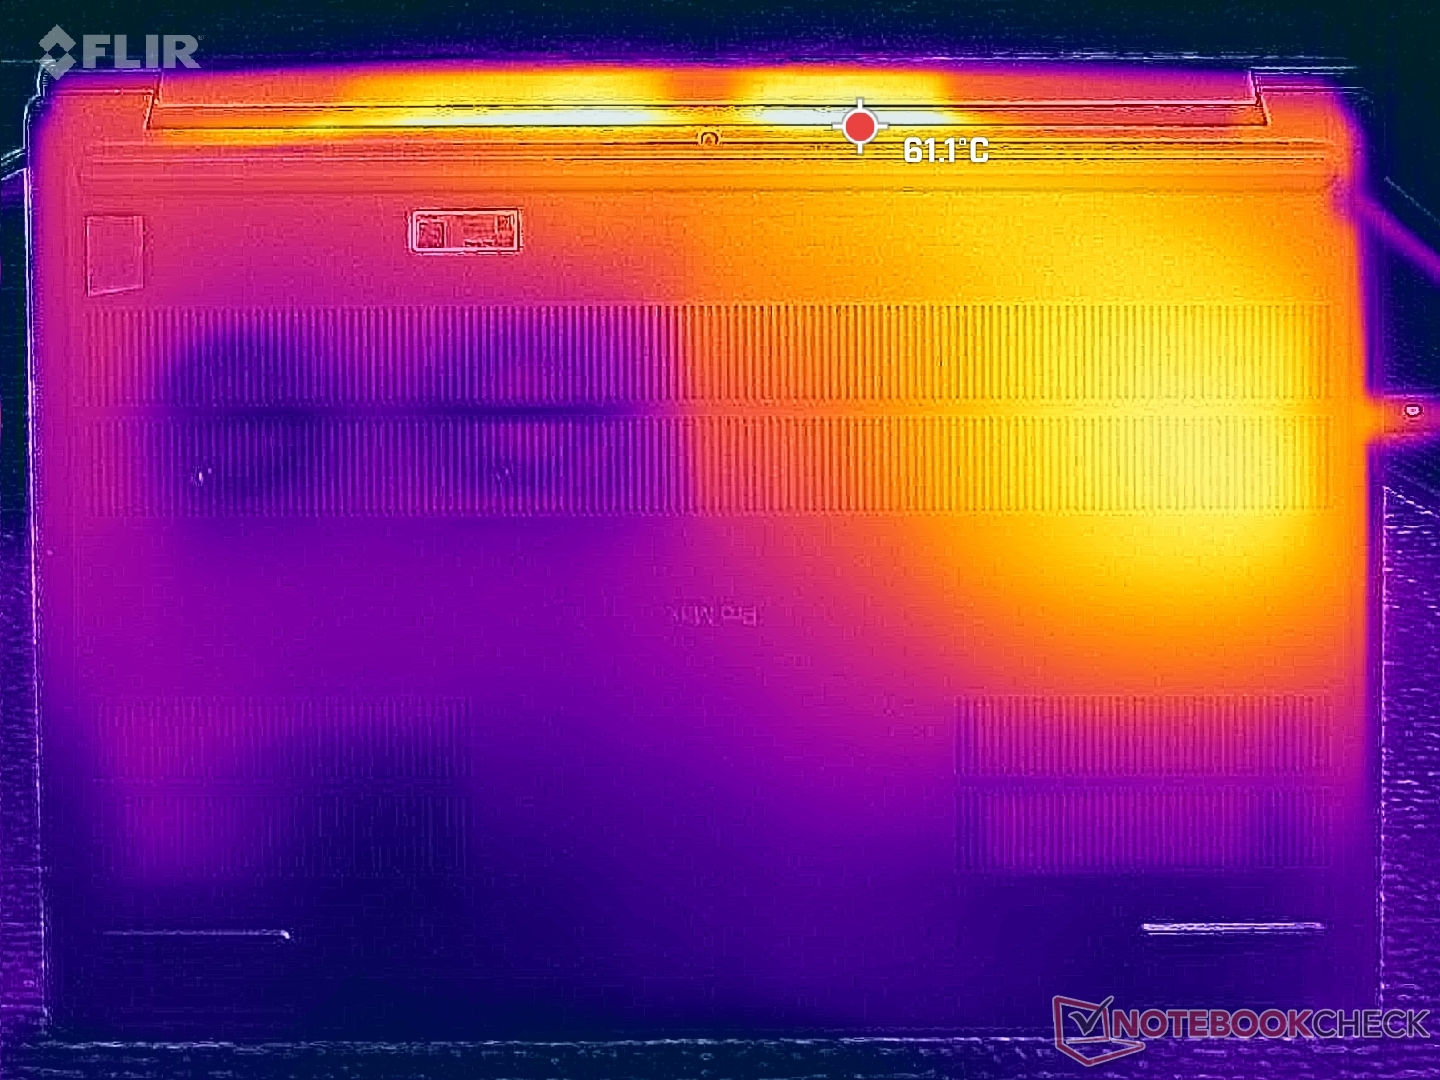
Temperature
Surface temperatures are warmer on the left half of the system than the right where hot spots can reach 43 C to 47 C when under load.
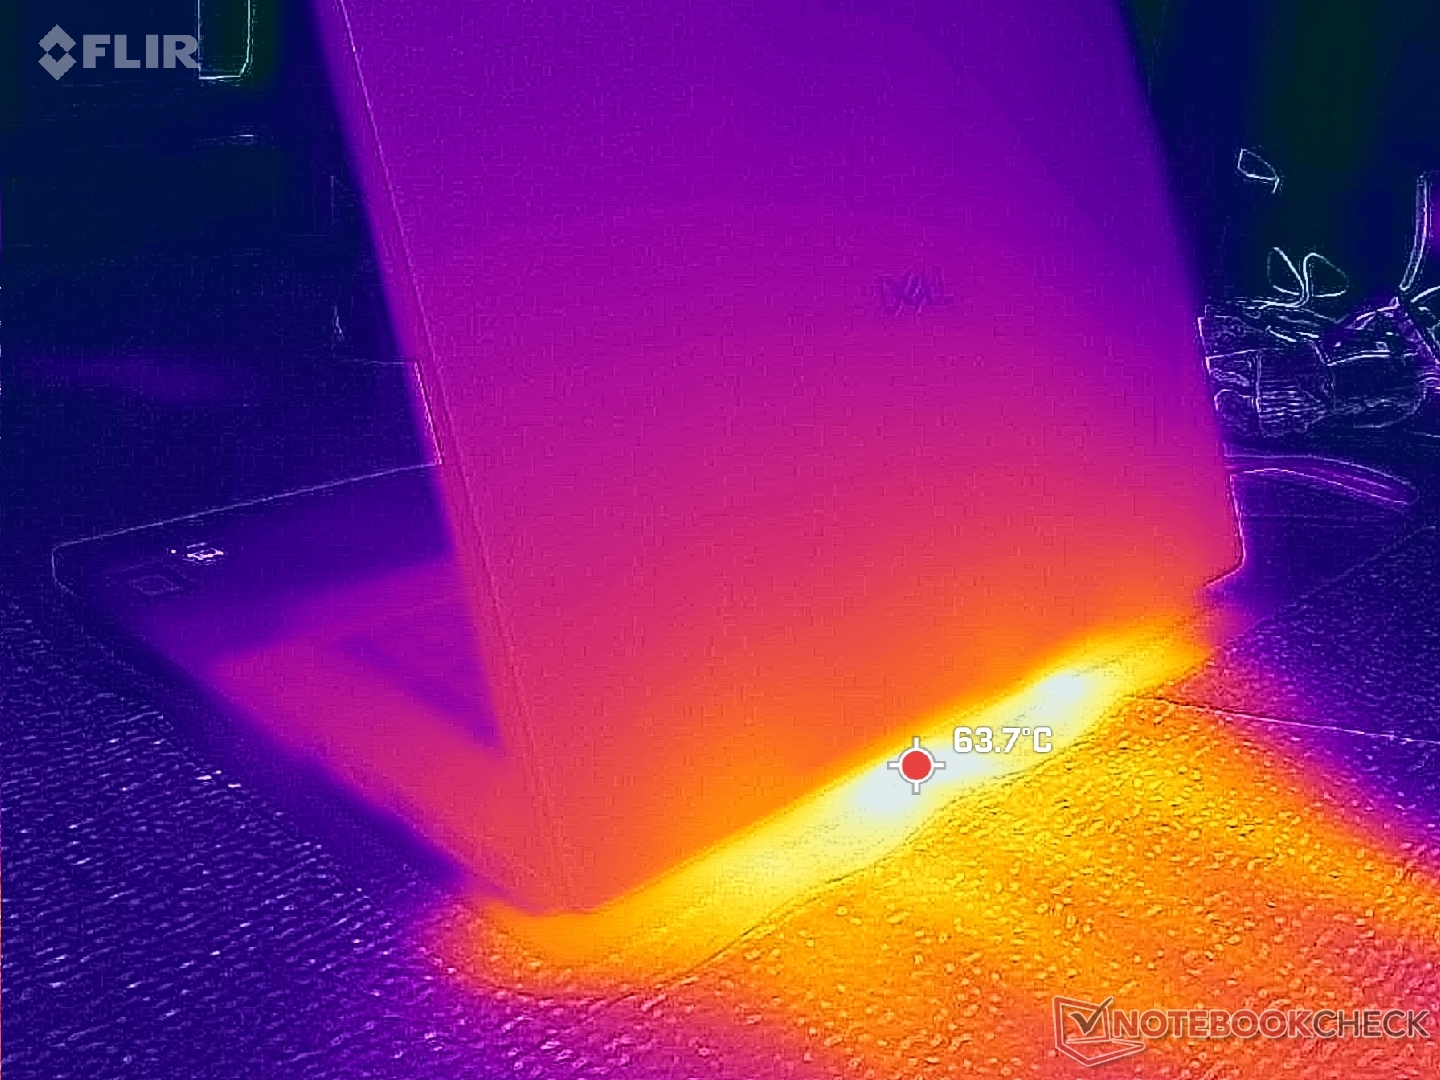

(±) The maximum temperature on the upper side is 44.8 °C / 113 F, compared to the average of 38.2 °C / 101 F, ranging from 22.2 to 69.8 °C for the class Workstation.
(-) The bottom heats up to a maximum of 47 °C / 117 F, compared to the average of 41.1 °C / 106 F
(+) In idle usage, the average temperature for the upper side is 29.3 °C / 85 F, compared to the device average of 32 °C / 90 F.
(+) The palmrests and touchpad are reaching skin temperature as a maximum (32.8 °C / 91 F) and are therefore not hot.
(-) The average temperature of the palmrest area of similar devices was 27.8 °C / 82 F (-5 °C / -9 F).
| Dell Pro Max 18 Plus MB18250 Ultra 9 285HX, RTX PRO 5000 Blackwell Generation Laptop | Schenker Key 18 Pro M25 RTX 5090 Ultra 9 275HX, GeForce RTX 5090 Laptop | HP ZBook X G1i 16 Ultra 7 265H, RTX PRO 2000 Blackwell Generation Laptop | HP ZBook Studio 16 G11 Ultra 9 185H, RTX 3000 Ada Generation Laptop | Lenovo ThinkPad P16s Gen 4 21RX000YGE Ryzen AI 9 HX PRO 370, Radeon 890M | Dell Pro Max 16 Plus Ultra 9 285HX, RTX PRO 5000 Blackwell Generation Laptop | |
|---|---|---|---|---|---|---|
| Heat | -1% | 10% | 1% | -16% | 1% | |
| Maximum Upper Side * (°C) | 44.8 | 47.5 -6% | 36 20% | 36.6 18% | 50.6 -13% | 40.4 10% |
| Maximum Bottom * (°C) | 47 | 52.8 -12% | 39.4 16% | 47.8 -2% | 54.3 -16% | 45.6 3% |
| Idle Upper Side * (°C) | 31.8 | 28.5 10% | 30.4 4% | 31.4 1% | 35.3 -11% | 32.8 -3% |
| Idle Bottom * (°C) | 31.4 | 30.1 4% | 31.8 -1% | 35.6 -13% | 38.5 -23% | 33 -5% |
* ... smaller is better
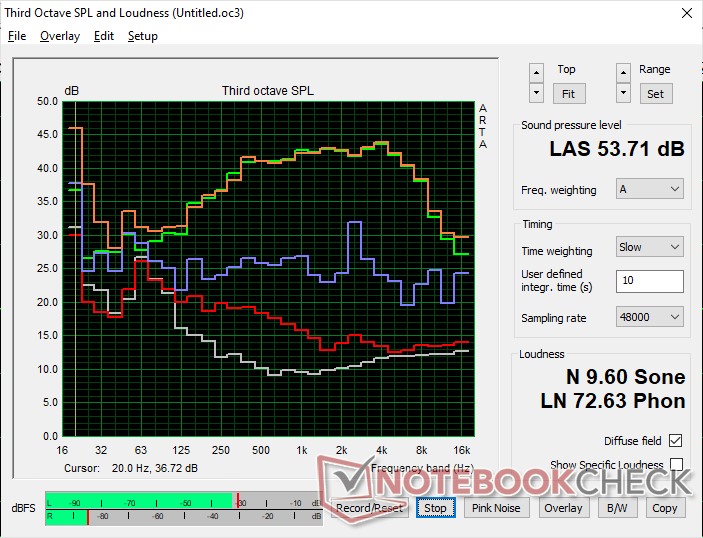
Speakers
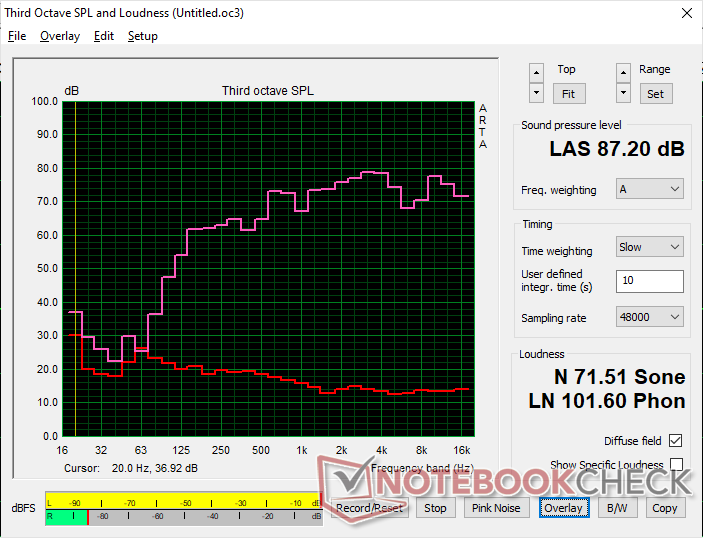
Dell Pro Max 18 Plus MB18250 audio analysis
(+) | speakers can play relatively loud (87.2 dB)
Bass 100 - 315 Hz
(±) | reduced bass - on average 12.8% lower than median
(±) | linearity of bass is average (8.4% delta to prev. frequency)
Mids 400 - 2000 Hz
(+) | balanced mids - only 4% away from median
(+) | mids are linear (6.6% delta to prev. frequency)
Highs 2 - 16 kHz
(+) | balanced highs - only 4.7% away from median
(+) | highs are linear (5.9% delta to prev. frequency)
Overall 100 - 16.000 Hz
(+) | overall sound is linear (11.4% difference to median)
Compared to same class
» 13% of all tested devices in this class were better, 4% similar, 83% worse
» The best had a delta of 7%, average was 17%, worst was 35%
Compared to all devices tested
» 7% of all tested devices were better, 2% similar, 91% worse
» The best had a delta of 4%, average was 24%, worst was 134%
Apple MacBook Pro 16 2021 M1 Pro audio analysis
(+) | speakers can play relatively loud (84.7 dB)
Bass 100 - 315 Hz
(+) | good bass - only 3.8% away from median
(+) | bass is linear (5.2% delta to prev. frequency)
Mids 400 - 2000 Hz
(+) | balanced mids - only 1.3% away from median
(+) | mids are linear (2.1% delta to prev. frequency)
Highs 2 - 16 kHz
(+) | balanced highs - only 1.9% away from median
(+) | highs are linear (2.7% delta to prev. frequency)
Overall 100 - 16.000 Hz
(+) | overall sound is linear (4.6% difference to median)
Compared to same class
» 0% of all tested devices in this class were better, 0% similar, 100% worse
» The best had a delta of 5%, average was 17%, worst was 45%
Compared to all devices tested
» 0% of all tested devices were better, 0% similar, 100% worse
» The best had a delta of 4%, average was 24%, worst was 134%
Energy Management
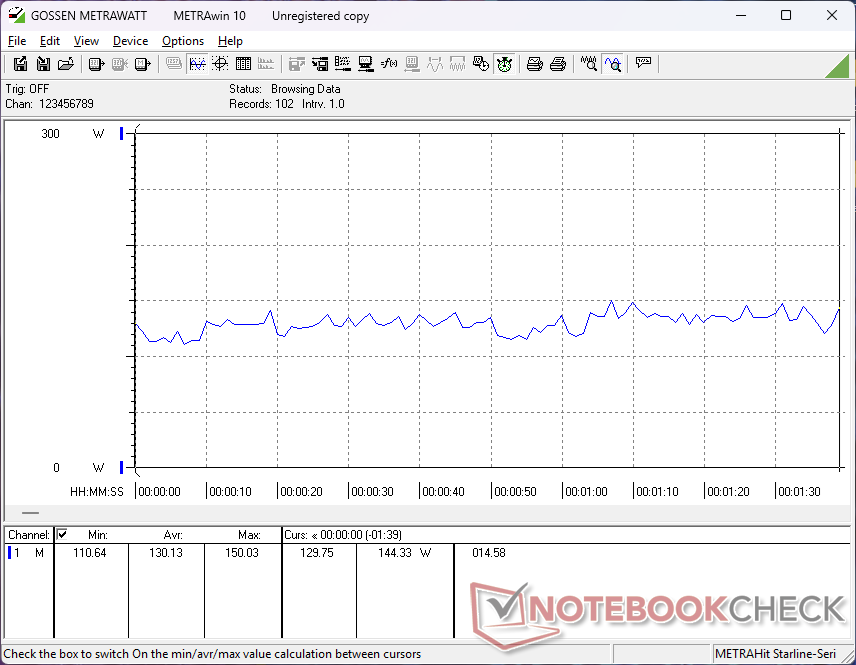
Power Consumption
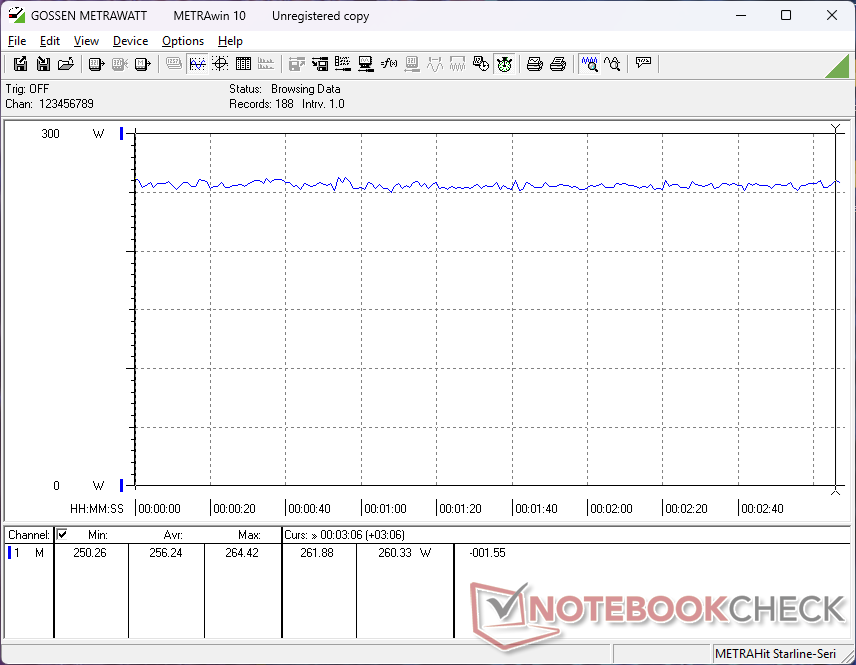
Idling can draw as little as 6 W up to 32 W if on the maximum brightness setting with the discrete GPU active. This minimum is lower than most other 18-inch laptops which explains the relatively long battery life in the next section.
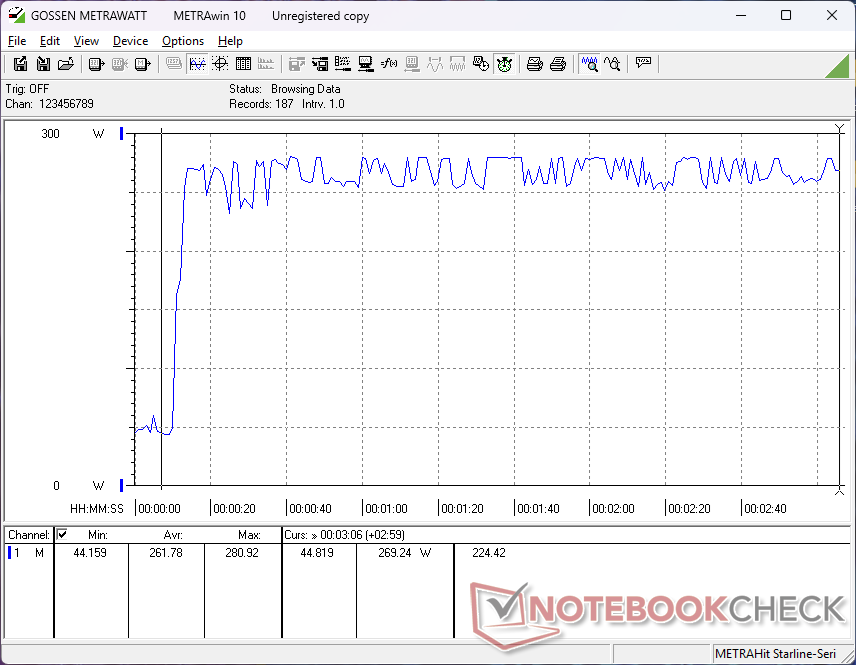
Running demanding loads like Cyberpunk 2077 demands almost 260 W from the 280 W (~16.2 x 7.8 x 2.3 cm) USB-C AC adapter. Expect charging rates to be very slow if running demanding loads simultaneously. In comparison, the HP ZBook Fury G1i 18 ships with a bulkier 330 W AC adapter for potentially higher performance maximums and faster charge rates.
| Off / Standby | |
| Idle | |
| Load |
|
Key:
min: | |
| Dell Pro Max 18 Plus MB18250 Ultra 9 285HX, RTX PRO 5000 Blackwell Generation Laptop, , IPS, 2560x1600, 18" | Schenker Key 18 Pro M25 RTX 5090 Ultra 9 275HX, GeForce RTX 5090 Laptop, Samsung 9100 Pro 4 TB, IPS, 3840x2400, 18" | HP ZBook X G1i 16 Ultra 7 265H, RTX PRO 2000 Blackwell Generation Laptop, Samsung PM9A1 MZVL22T0HBLB, IPS, 2560x1600, 16" | HP ZBook Studio 16 G11 Ultra 9 185H, RTX 3000 Ada Generation Laptop, Kioxia XG8 KXG80ZNV1T02, IPS, 3840x2400, 16" | Lenovo ThinkPad P16 Gen 2 i7-14700HX, RTX 4000 Ada Generation Laptop, SK hynix PC801 HFS001TEJ9X162N, IPS, 2560x1600, 16" | Dell Pro Max 16 Plus Ultra 9 285HX, RTX PRO 5000 Blackwell Generation Laptop, SK hynix PCB01 HFS001TFM9X186N, OLED, 3840x2400, 16" | |
|---|---|---|---|---|---|---|
| Power Consumption | -38% | 49% | 4% | 7% | -97% | |
| Idle Minimum * (Watt) | 6.1 | 14 -130% | 4.1 33% | 14 -130% | 7.9 -30% | 35.1 -475% |
| Idle Average * (Watt) | 15.2 | 21.9 -44% | 9 41% | 22.4 -47% | 13.1 14% | 39.2 -158% |
| Idle Maximum * (Watt) | 32.4 | 22.3 31% | 9.4 71% | 25.7 21% | 24.2 25% | 56 -73% |
| Load Average * (Watt) | 130.1 | 149.5 -15% | 86.7 33% | 90.2 31% | 127.4 2% | 130.2 -0% |
| Cyberpunk 2077 ultra external monitor * (Watt) | 252 | 336 -33% | 102 60% | 120.3 52% | 219 13% | 213 15% |
| Cyberpunk 2077 ultra * (Watt) | 256 | 333 -30% | 106.1 59% | 125.4 51% | 225 12% | 229 11% |
| Load Maximum * (Watt) | 280.9 | 415.4 -48% | 152.9 46% | 142 49% | 248.5 12% | 285.2 -2% |
* ... smaller is better
Power Consumption Cyberpunk / Stress Test
Power Consumption external Monitor
Battery Life
Runtimes are surprisingly long when web browsing on integrated graphics mode and the balanced power profile. We're able to squeeze over 9 hours of real-world use which is hours longer than what we recorded on the Lenovo ThinkPad P16 or HP ZBook Studio 16 G11.
| Dell Pro Max 18 Plus MB18250 Ultra 9 285HX, RTX PRO 5000 Blackwell Generation Laptop, 96 Wh | Schenker Key 18 Pro M25 RTX 5090 Ultra 9 275HX, GeForce RTX 5090 Laptop, 98 Wh | HP ZBook X G1i 16 Ultra 7 265H, RTX PRO 2000 Blackwell Generation Laptop, 83 Wh | HP ZBook Studio 16 G11 Ultra 9 185H, RTX 3000 Ada Generation Laptop, 86 Wh | Lenovo ThinkPad P16 Gen 2 i7-14700HX, RTX 4000 Ada Generation Laptop, 94 Wh | Dell Pro Max 16 Plus Ultra 9 285HX, RTX PRO 5000 Blackwell Generation Laptop, 96 Wh | |
|---|---|---|---|---|---|---|
| Battery runtime | ||||||
| WiFi v1.3 (h) | 9.3 | 5.8 -38% | 12.5 34% | 4.8 -48% | 2.5 -73% | 3.6 -61% |
Notebookcheck Rating
Dell's biggest mobile workstation yet is also one if its best and fastest, but it curiously has fewer display options than on the smaller 16-inch counterpart.
Dell Pro Max 18 Plus MB18250
- 11/19/2025 v8
Allen Ngo
 Total Sustainability Score:
 Potential Competitors in Comparison
Image | Model / Review | Price | Weight | Height | Display |
|---|---|---|---|---|---|
1. 88.9%  | Dell Pro Max 18 Plus MB18250 Intel Core Ultra 9 285HX ⎘ NVIDIA RTX PRO 5000 Blackwell Generation Laptop ⎘ 128 GB Memory | Amazon: List Price: 6000 USD | 3.6 kg | 30.2 mm | 18.00" 2560x1600 168 PPI IPS |
2. 84.6%  | Schenker Key 18 Pro M25 RTX 5090 Intel Core Ultra 9 275HX ⎘ NVIDIA GeForce RTX 5090 Laptop ⎘ 256 GB Memory, 4096 GB SSD | Amazon: List Price: 6400€ | 4.1 kg | 29.5 mm | 18.00" 3840x2400 252 PPI IPS |
3. 87.4%  | HP ZBook X G1i 16 Intel Core Ultra 7 265H ⎘ NVIDIA RTX PRO 2000 Blackwell Generation Laptop ⎘ 64 GB Memory, 2048 GB SSD | Amazon: List Price: 2700 USD | 2.2 kg | 23 mm | 16.00" 2560x1600 189 PPI IPS |
4. 84.2%  | HP ZBook Studio 16 G11 Intel Core Ultra 9 185H ⎘ NVIDIA RTX 3000 Ada Generation Laptop ⎘ 64 GB Memory, 1024 GB SSD | Amazon: List Price: 4300 USD | 1.8 kg | 19 mm | 16.00" 3840x2400 283 PPI IPS |
5. 82%  | Lenovo ThinkPad P16s Gen 4 21RX000YGE AMD Ryzen AI 9 HX PRO 370 ⎘ AMD Radeon 890M ⎘ 64 GB Memory, 1024 GB SSD | Amazon: List Price: 2440 Euro | 2 kg | 23 mm | 16.00" 1920x1200 142 PPI IPS LED |
6. 88.4%  | Dell Pro Max 16 Plus Intel Core Ultra 9 285HX ⎘ NVIDIA RTX PRO 5000 Blackwell Generation Laptop ⎘ 128 GB Memory, SSD | Amazon: List Price: 5000 USD | 2.8 kg | 30.9 mm | 16.00" 3840x2400 283 PPI OLED |
Transparency
The selection of devices to be reviewed is made by our editorial team. The test sample was provided to the author as a loan by the manufacturer or retailer for the purpose of this review. The lender had no influence on this review, nor did the manufacturer receive a copy of this review before publication. There was no obligation to publish this review. As an independent media company, Notebookcheck is not subjected to the authority of manufacturers, retailers or publishers.
This is how Notebookcheck is testing
Every year, Notebookcheck independently reviews hundreds of laptops and smartphones using standardized procedures to ensure that all results are comparable. We have continuously developed our test methods for around 20 years and set industry standards in the process. In our test labs, high-quality measuring equipment is utilized by experienced technicians and editors. These tests involve a multi-stage validation process. Our complex rating system is based on hundreds of well-founded measurements and benchmarks, which maintains objectivity. Further information on our test methods can be found here.
