Schenker XMG Apex 15 (Clevo N950TP6) Laptop Review

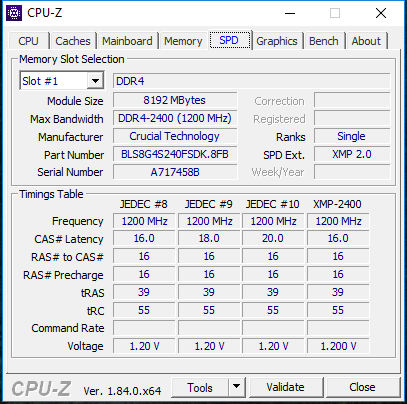
Based on the new N950TP6 barebone by Clevo the XMG Apex 15 is a 15-inch gaming notebook powered by an Nvidia GeForce GTX 1060, a brand-new Intel Coffee Lake desktop CPU with six cores, and a choice of various different displays at a base price of roughly 1,200 Euros (~$1,438). Our review unit's weight was just shy of 2.8 kg, and it came with a price tag of 1,659 Euros (~$1,989). It was equipped with an Intel Core i7-8700, 16 GB of RAM, a conventional 60 Hz FHD display without G-Sync, a 256 GB SSD, a 1 TB HDD, and the operating system most commonly found on gaming notebooks: Windows 10 Home. In addition to the blazingly fast hexa-core CPU the notebook’s connectivity deserves praise as well. Among others, it features 2x USB 3.1 Gen 2 and 2x DisplayPort.
CPU, RAM, display, storage, Wi-Fi card, and operating system are all configurable. For more details, check out Schenker’s online store. We will discuss all three available displays in more detail below.
When choosing our comparison units we have taken size and price into consideration. A comparison with other GeForce GTX 1060 GPUs as well as the i7-8700’s performance vis-à-vis its more commonly used Kaby Lake generation Core i7-7700HQ counterpart were the deciding factors. Accordingly, we chose the following three candidates:
Case
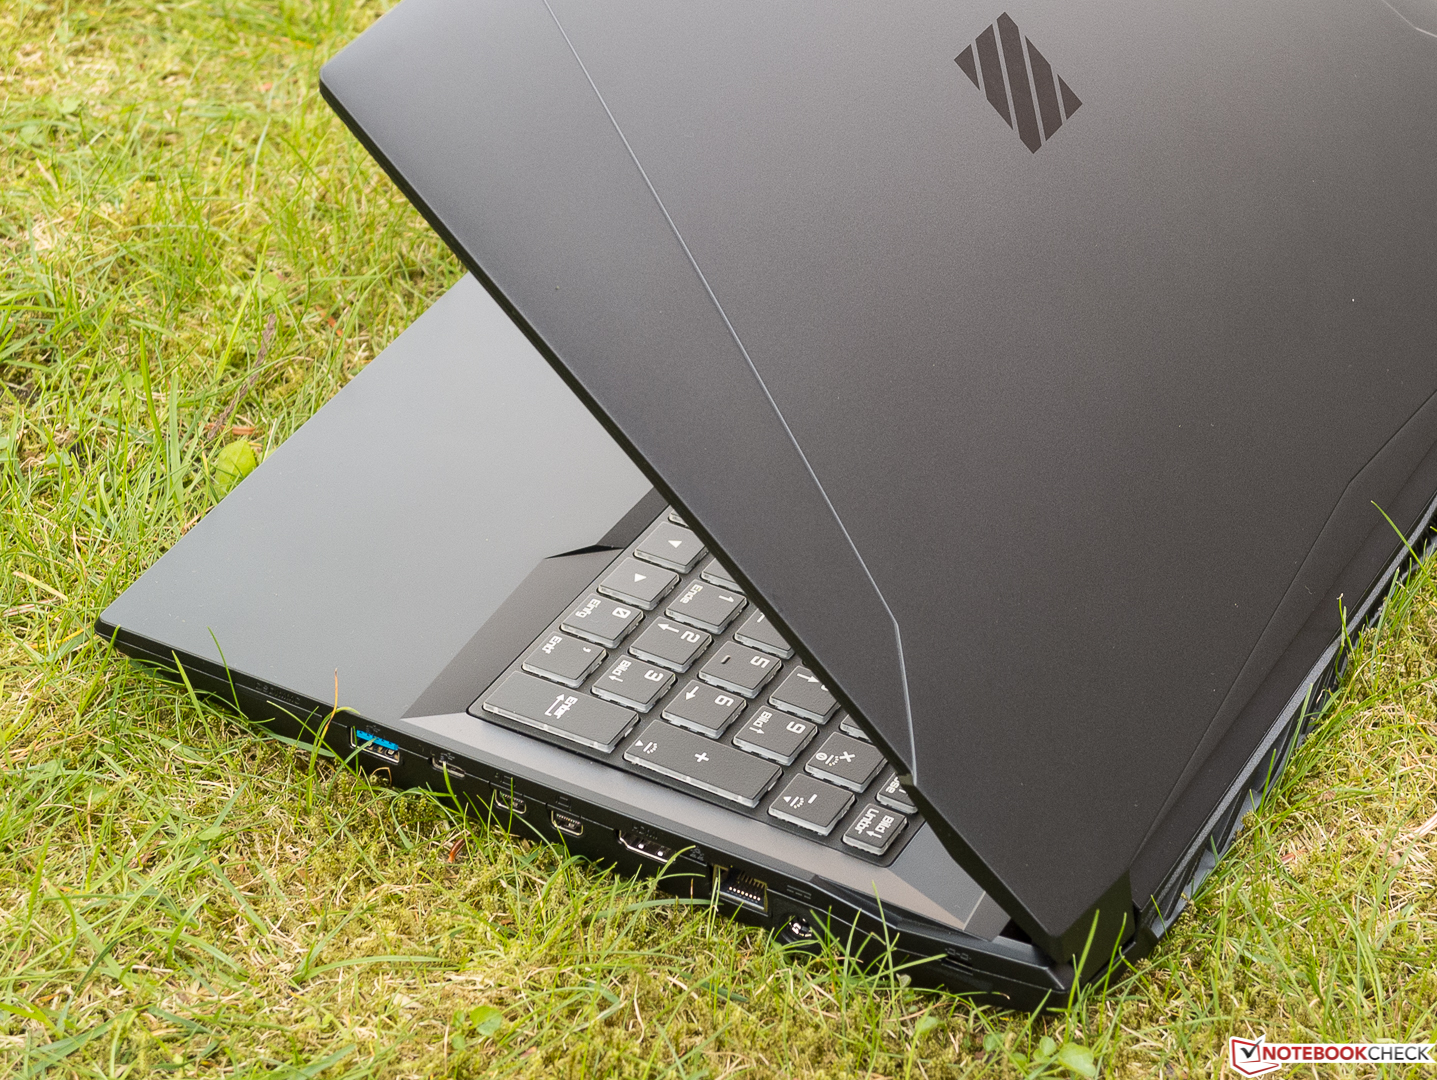
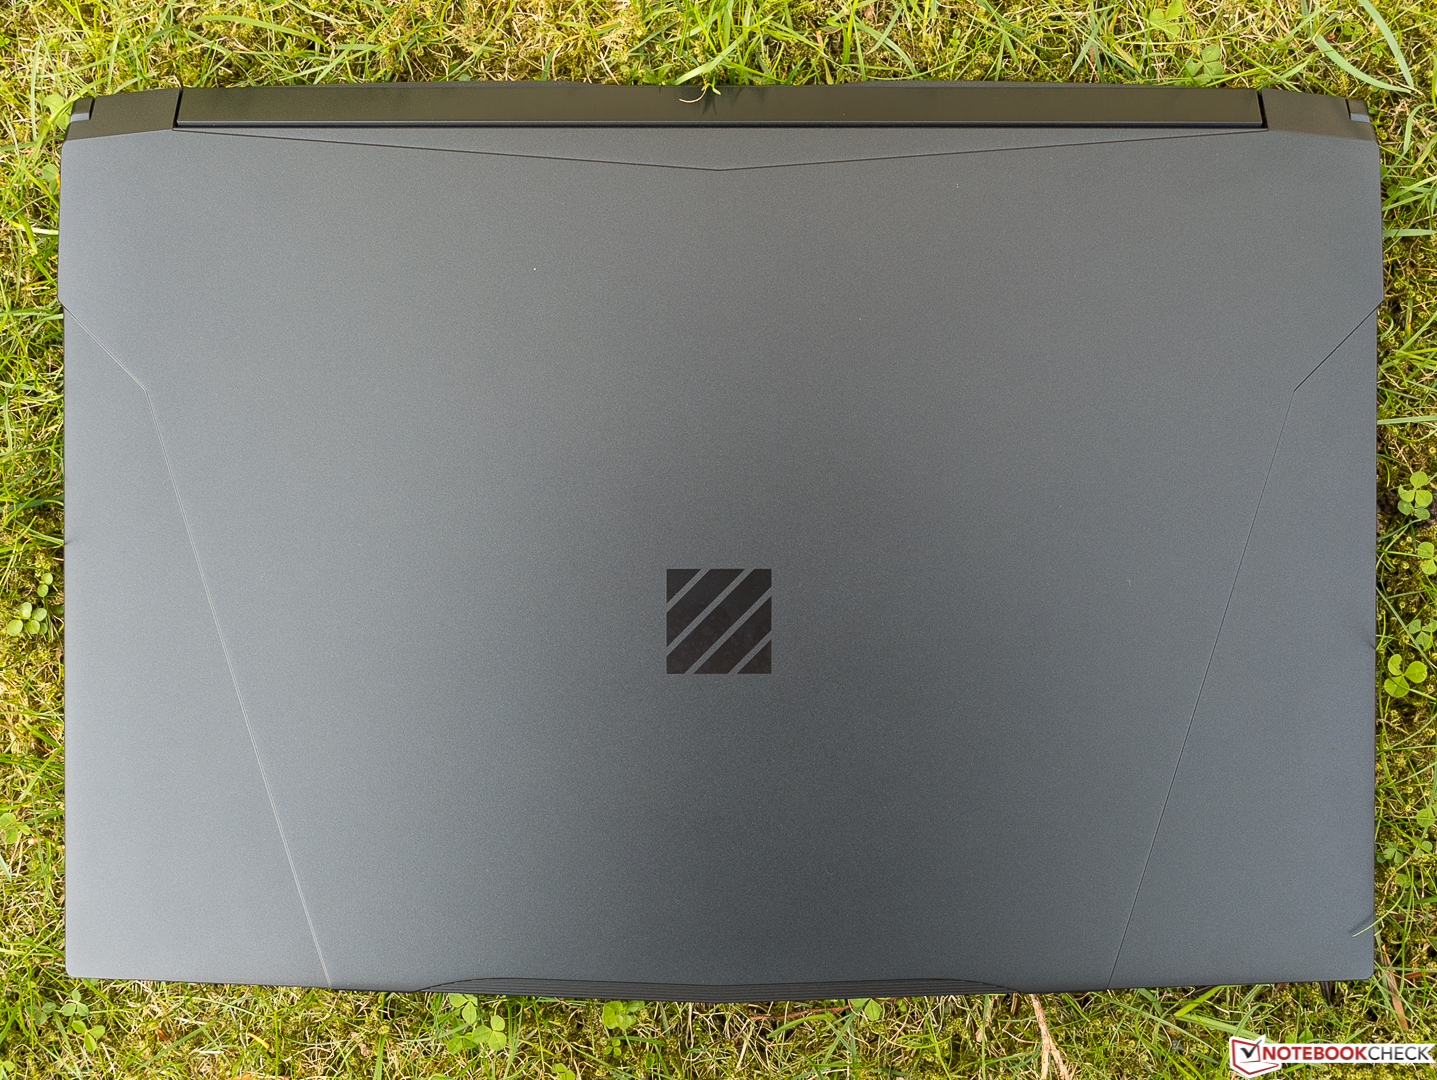
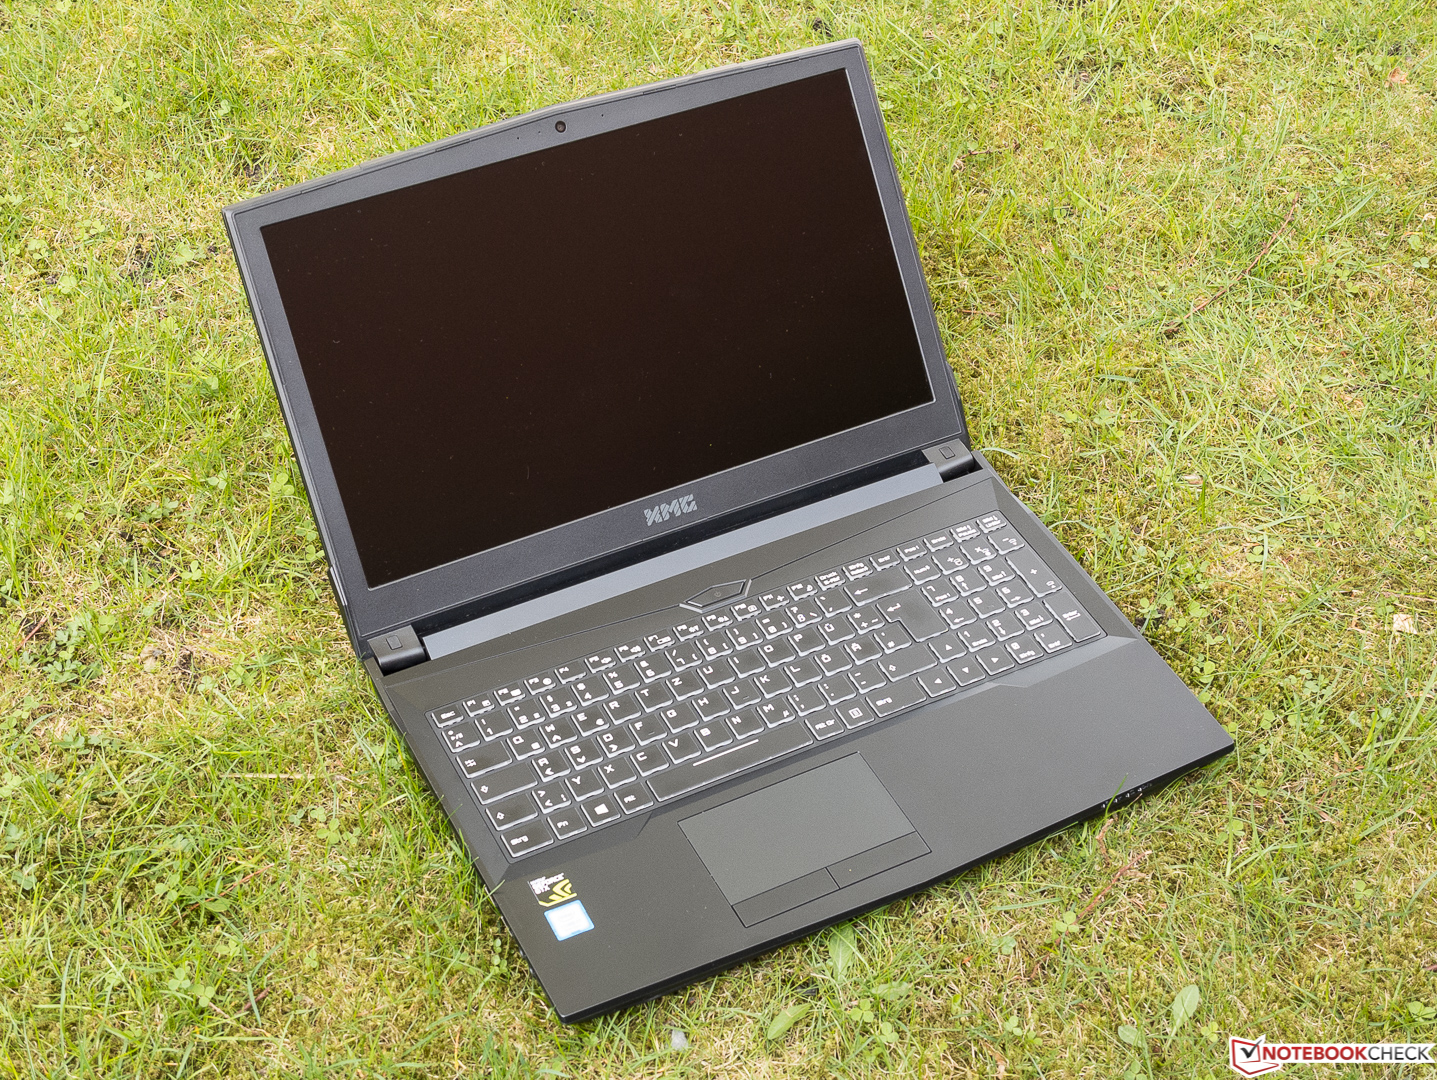
Matching the taste of the predominantly male customer base means the case, made entirely of plastic, is clad in black from head to toe. The bottom cover and display bezels are slightly rippled and thus fairly slip-proof. The base’s top cover and display lid feature a smooth and silky finish instead which, fortunately, was not particularly susceptible to fingerprints. The design can best be described as futuristic and square-edged, with distinct accentuations such as the eye-catching power button or the ragged and broken-up surface texture. All things considered the Apex 15 looks like a regular mid-range gaming notebook.
We were able to warp the seemingly solid base with some force, which caused an unobtrusive yet hard to define sound. By and large, the base was solid and decent.
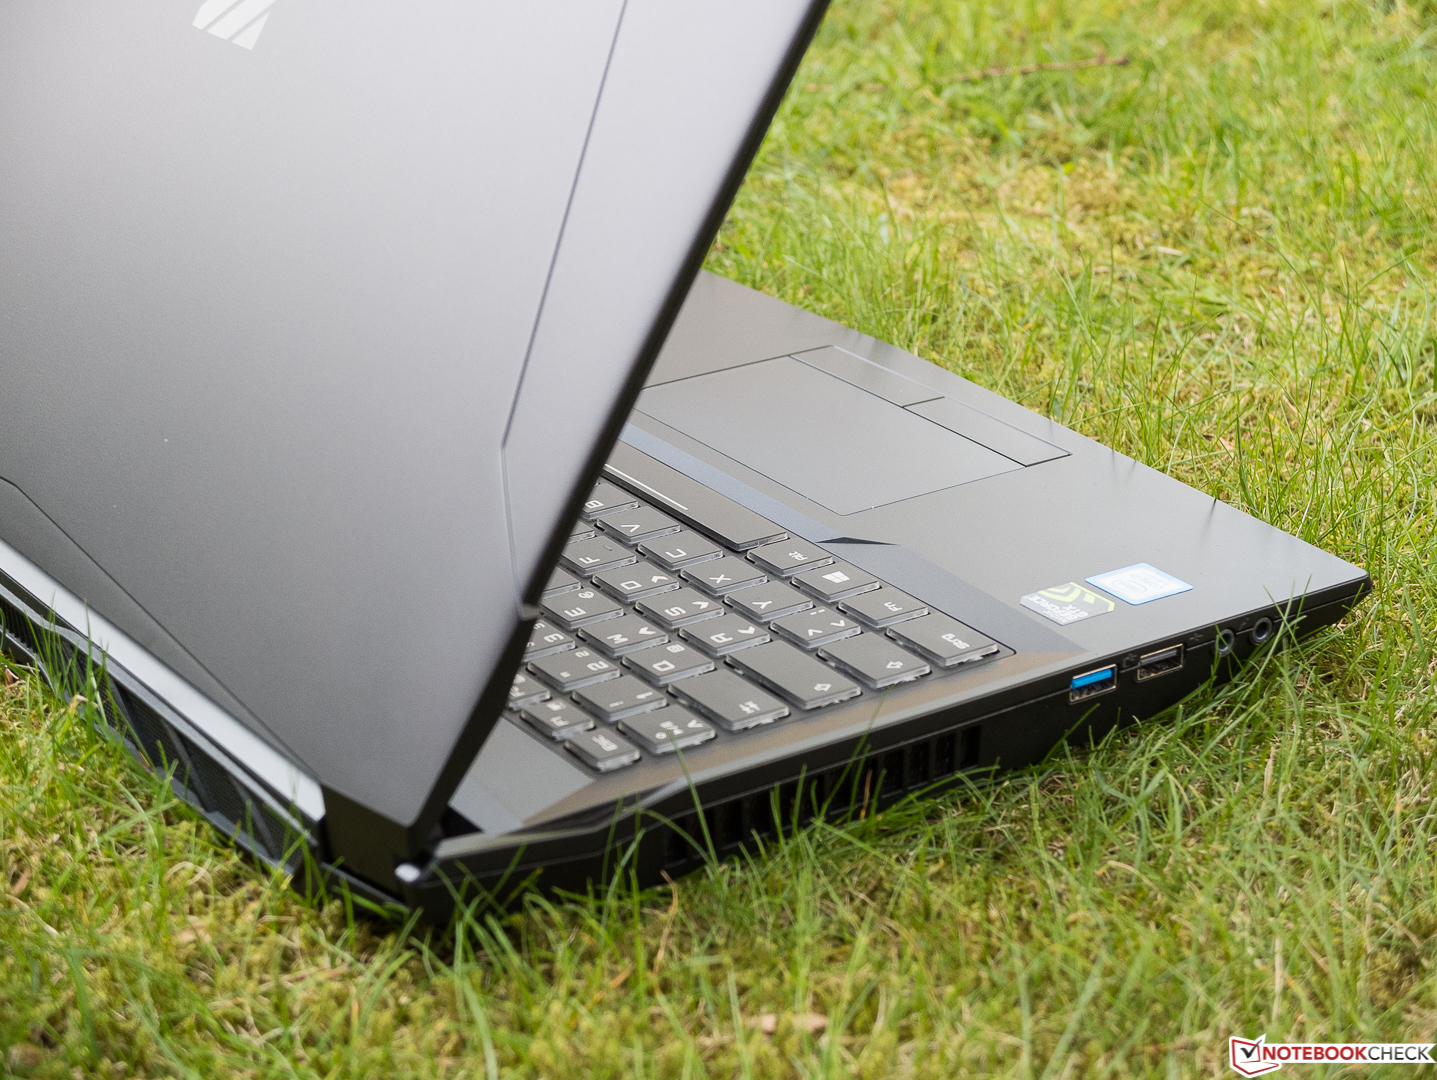
We were unfortunately surprised at the poorly designed display lid. It bends very easily in the middle and creaks quite heavily while doing so. With enough pressure applied to the back the display panel pressed against the top of the base, and gaps became very visible and noticeable. The display also distorted quite heavily. In addition, the quality of the display installation was rather poor and the panel bulges outwards slightly resulting in uneven gaps around the display bezel. Even in a sub-$400 notebook we would have criticized such a poor build quality, and in return we have to rate the case accordingly. In our personal opinion this is more of a design flaw rather than a singular quality issue, and it is most likely going to be present on every single device. But to end this chapter on a more positive note: The display can be opened one-handed.


The device with the largest footprint in our comparison group was HP’s Omen. In return, it was around 3 mm thinner than the Schenker XMG Core 15 and at 2.6 kg just as heavy. The MSI GE63VR Raider was just as large as the Core 15 but around 200 g lighter. The Apex was the thickest and at 2.8 kg also the heaviest contender.
Connectivity
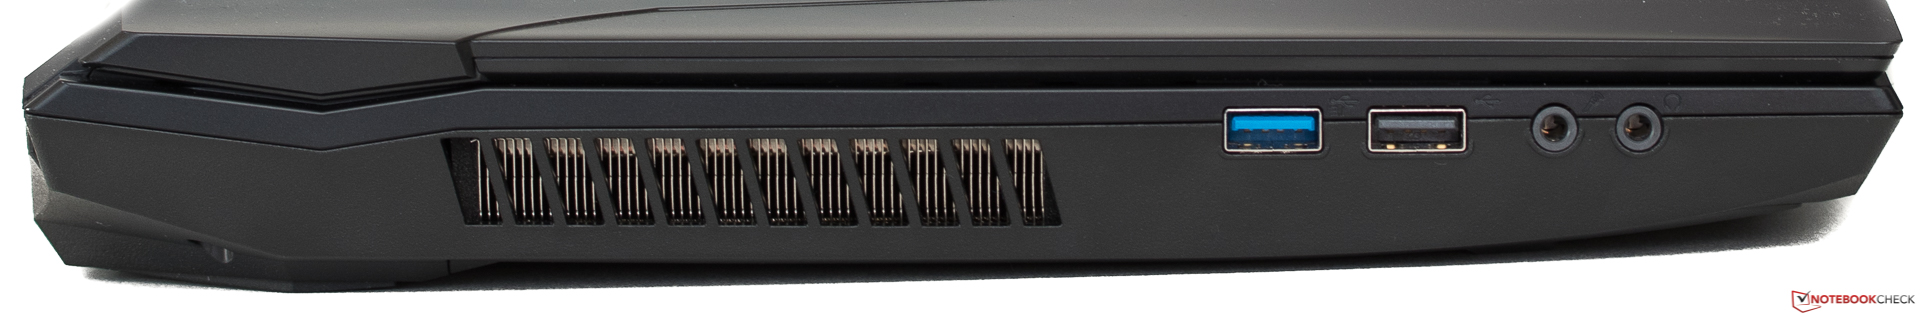
We were positively surprised by the device’s connectivity. One of the three USB Type-A ports was slower than the other two, which supported USB 3.1 Gen 1 and Gen 2, respectively. The USB Type-C port also supported the latter. Up to three external displays can be powered at the same time, two of which support 60 Hz at 4K thanks to HDMI 2.0 and DP 1.4. The latter also supports G-Sync-compatible displays; the second DP 1.2 port supports Optimus in return.

SD Card Reader
The only truly fast card reader in our test group can be found inside the MSI notebook. It also happened to be the only one connected via PCIe instead of the much slower USB 3.0 interface. When benchmarked with our 64 GB Toshiba Exceria Pro SDXC UHS-II reference card all other card readers performed below average.
| SD Card Reader | |
| average JPG Copy Test (av. of 3 runs) | |
| MSI GE63VR 7RF Raider (Toshiba Exceria Pro SDXC 64 GB UHS-II) | |
| Average of class Gaming (20.9 - 210, n=54, last 2 years) | |
| Schenker XMG Apex 15 (Toshiba Exceria Pro SDXC 64 GB UHS-II) | |
| Schenker XMG Core 15 (Toshiba Exceria Pro SDXC 64 GB UHS-II) | |
| HP Omen 15t-ce000 (Toshiba Exceria Pro SDXC 64 GB UHS-II) | |
| maximum AS SSD Seq Read Test (1GB) | |
| MSI GE63VR 7RF Raider (Toshiba Exceria Pro SDXC 64 GB UHS-II) | |
| Average of class Gaming (25.5 - 261, n=51, last 2 years) | |
| Schenker XMG Apex 15 (Toshiba Exceria Pro SDXC 64 GB UHS-II) | |
| HP Omen 15t-ce000 (Toshiba Exceria Pro SDXC 64 GB UHS-II) | |
| Schenker XMG Core 15 (Toshiba Exceria Pro SDXC 64 GB UHS-II) | |
Communication
Intel’s Dual Band Wireless-AC 8265 may not be the latest Wi-Fi chip available, but it is well proven and tested. It supports data rates of up to 867 Mbps (MIMO 2x2) and Bluetooth 4.2. Taking the usual 200 Mbps overhead into consideration the XMG Apex came close to the theoretical maximum performance when benchmarked against our Linksys EA8500 reference router at a distance of 1 m. However, that was also true for all of its competitors except for the HP Omen, which had the worst RX performance but trumped its rivals in TX in return.
| Networking | |
| iperf3 transmit AX12 | |
| HP Omen 15t-ce000 | |
| MSI GE63VR 7RF Raider | |
| Schenker XMG Apex 15 | |
| Schenker XMG Core 15 | |
| iperf3 receive AX12 | |
| MSI GE63VR 7RF Raider | |
| Schenker XMG Apex 15 | |
| Schenker XMG Core 15 | |
| HP Omen 15t-ce000 | |
Accessories
In addition to the mandatory power supply the box also contained a driver DVD, a Windows 10 Home DVD, a few spare screws, and the usual quick-start guide and safety instructions. There are no model-specific accessories for the XMG Apex 15.
Maintenance
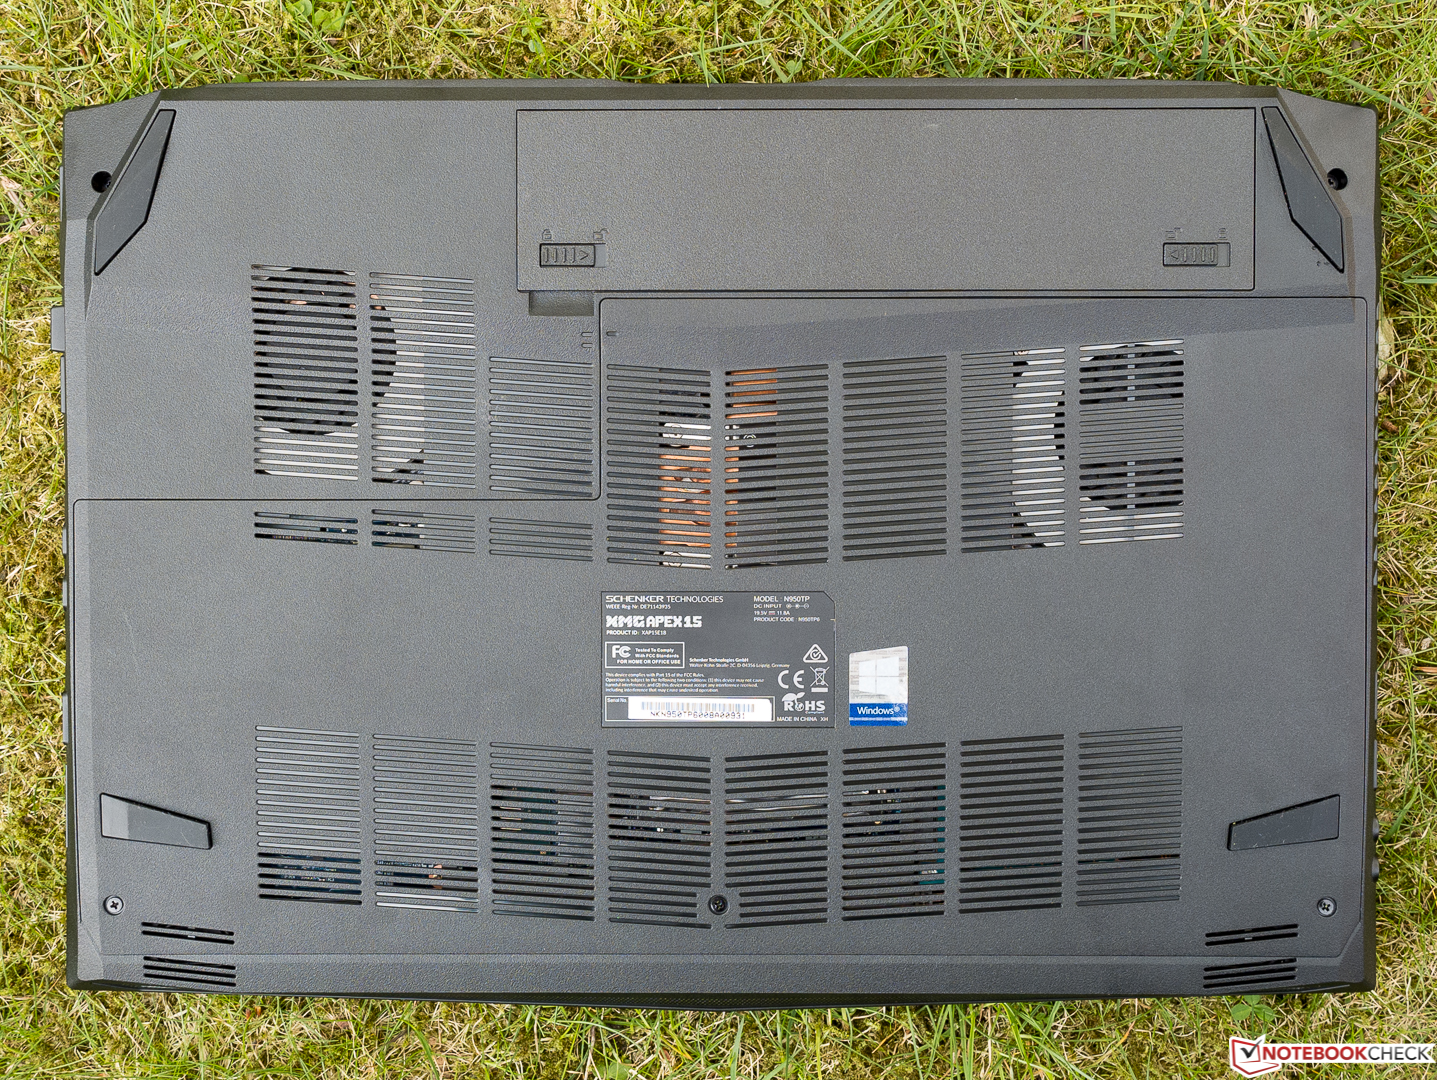
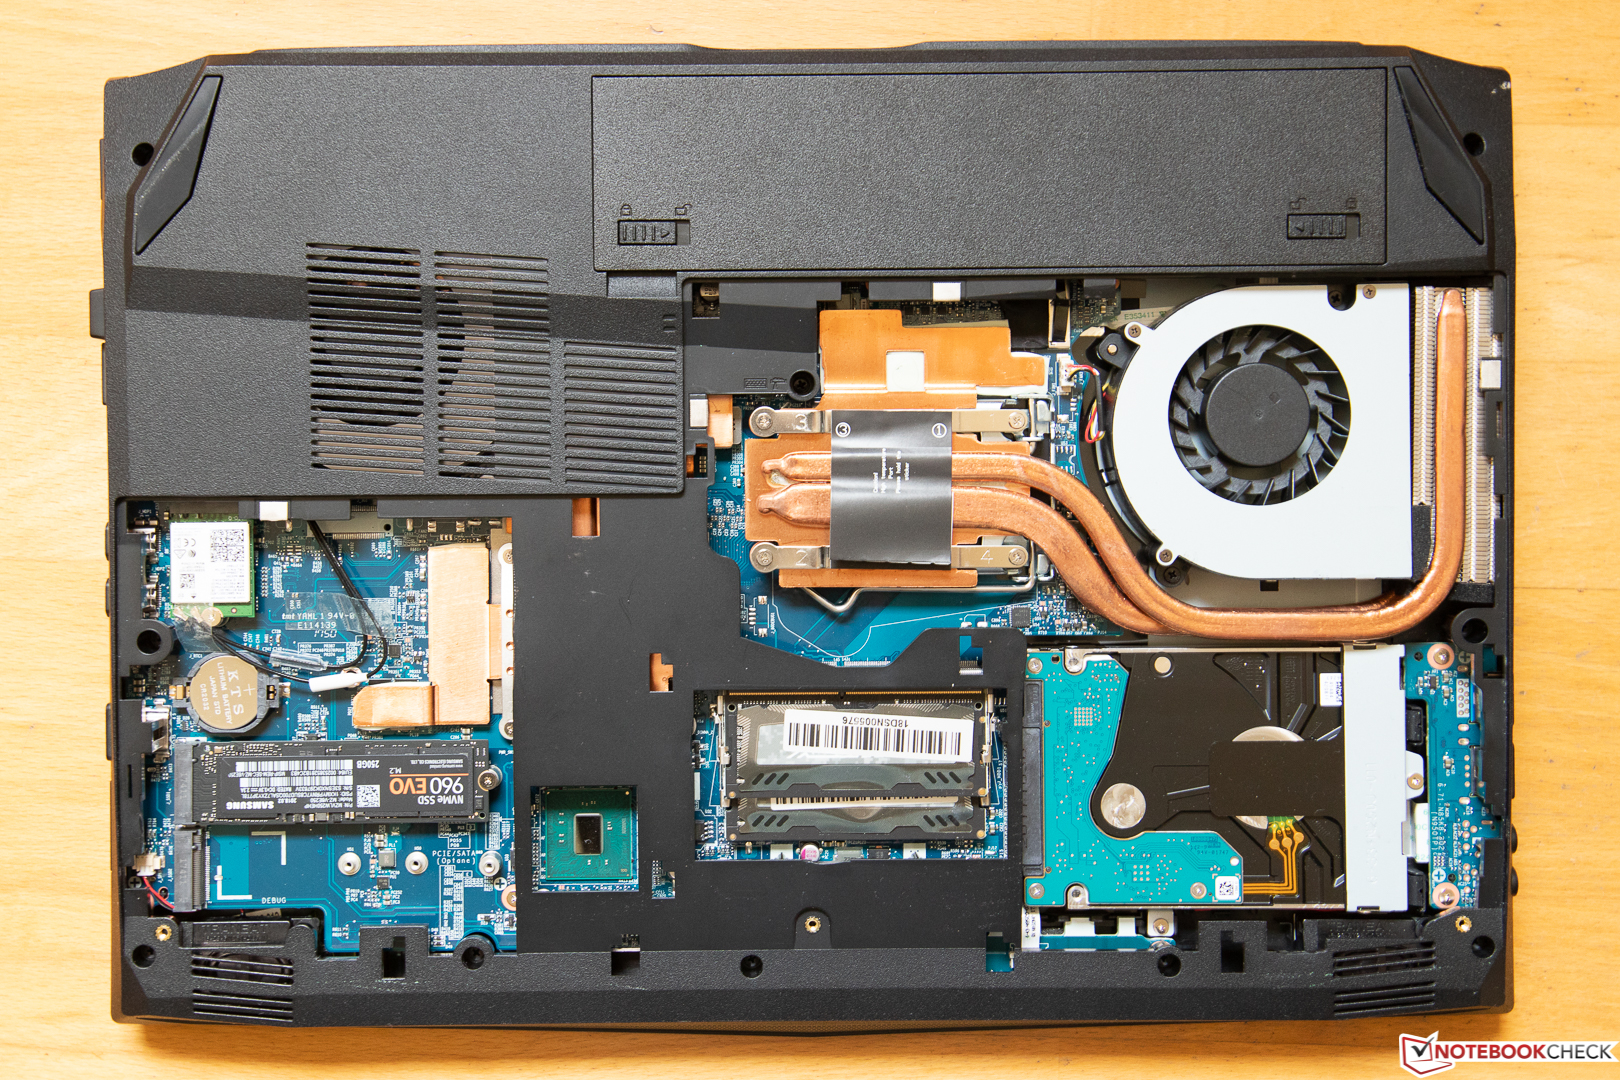
No more than three Phillips screws have to be undone in order to remove the bottom cover. Once the screws are removed, the bottom cover must be slid forward slightly in order to pop open, and maintenance is thus not only tolerated by Schenker but also very easy to perform. As can be seen in the photo below one gets access to the CPU fan, the M.2 slots for SSDs (one free), the two RAM slots (both used), the 2.5-inch hard disk drive, and the Wi-Fi module. The battery is user-replaceable and can be removed without prior disassembly.
Warranty
By default, Schenker sells its notebooks with a 24-month limited pickup & return warranty. Extensions are available here.
Input Devices
Keyboard
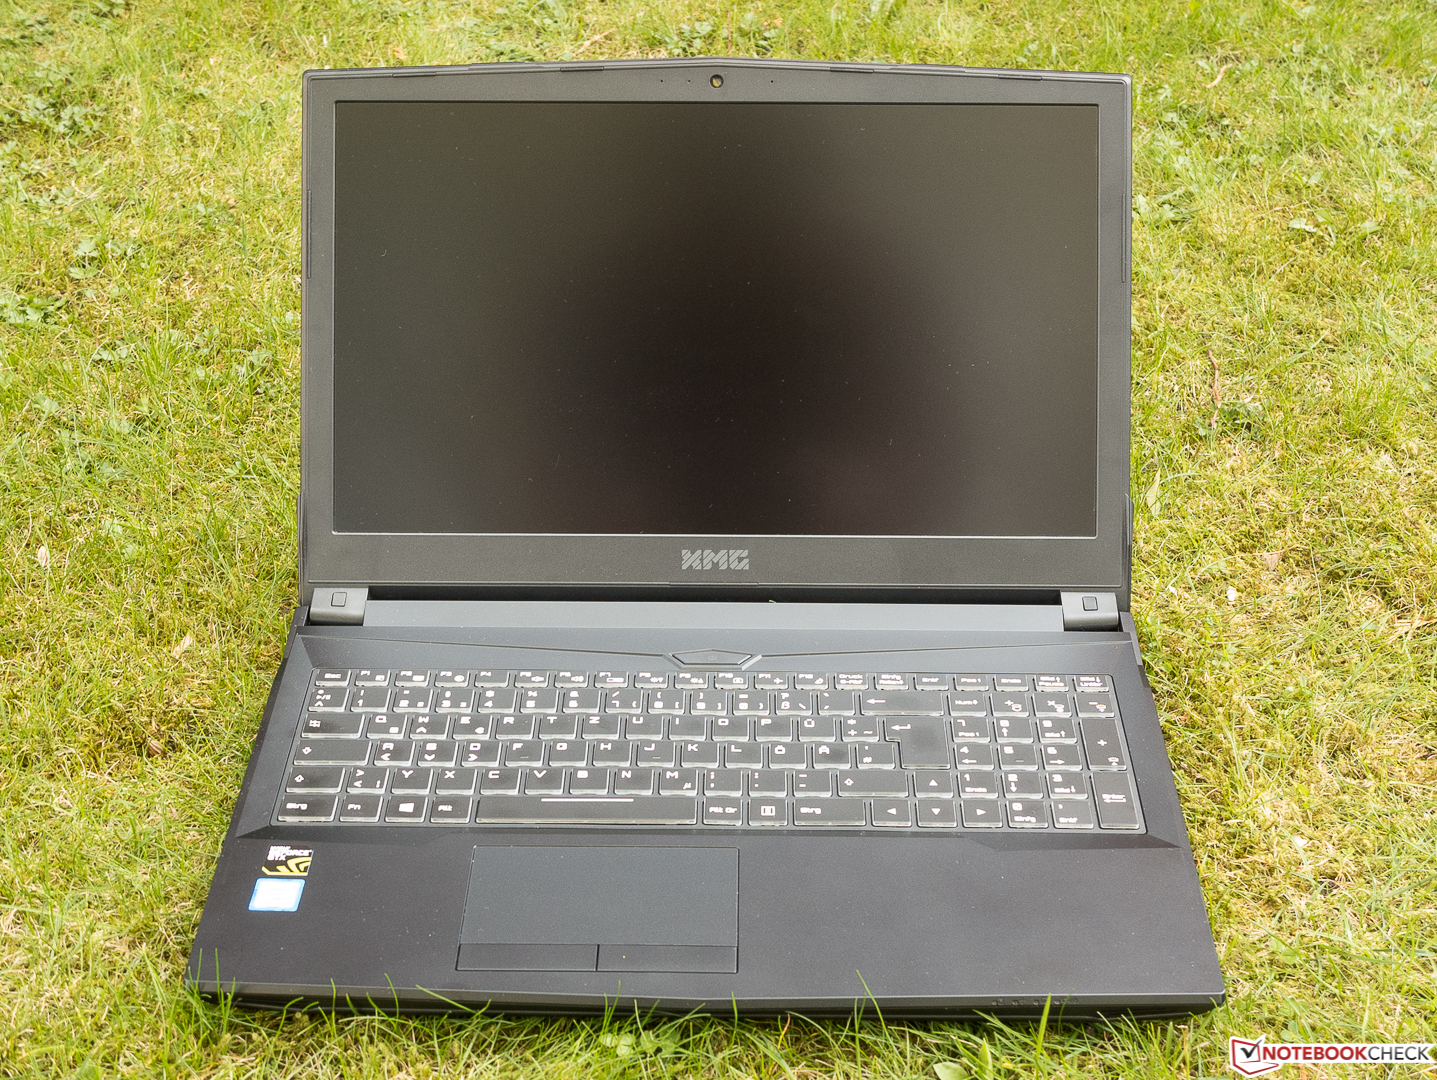
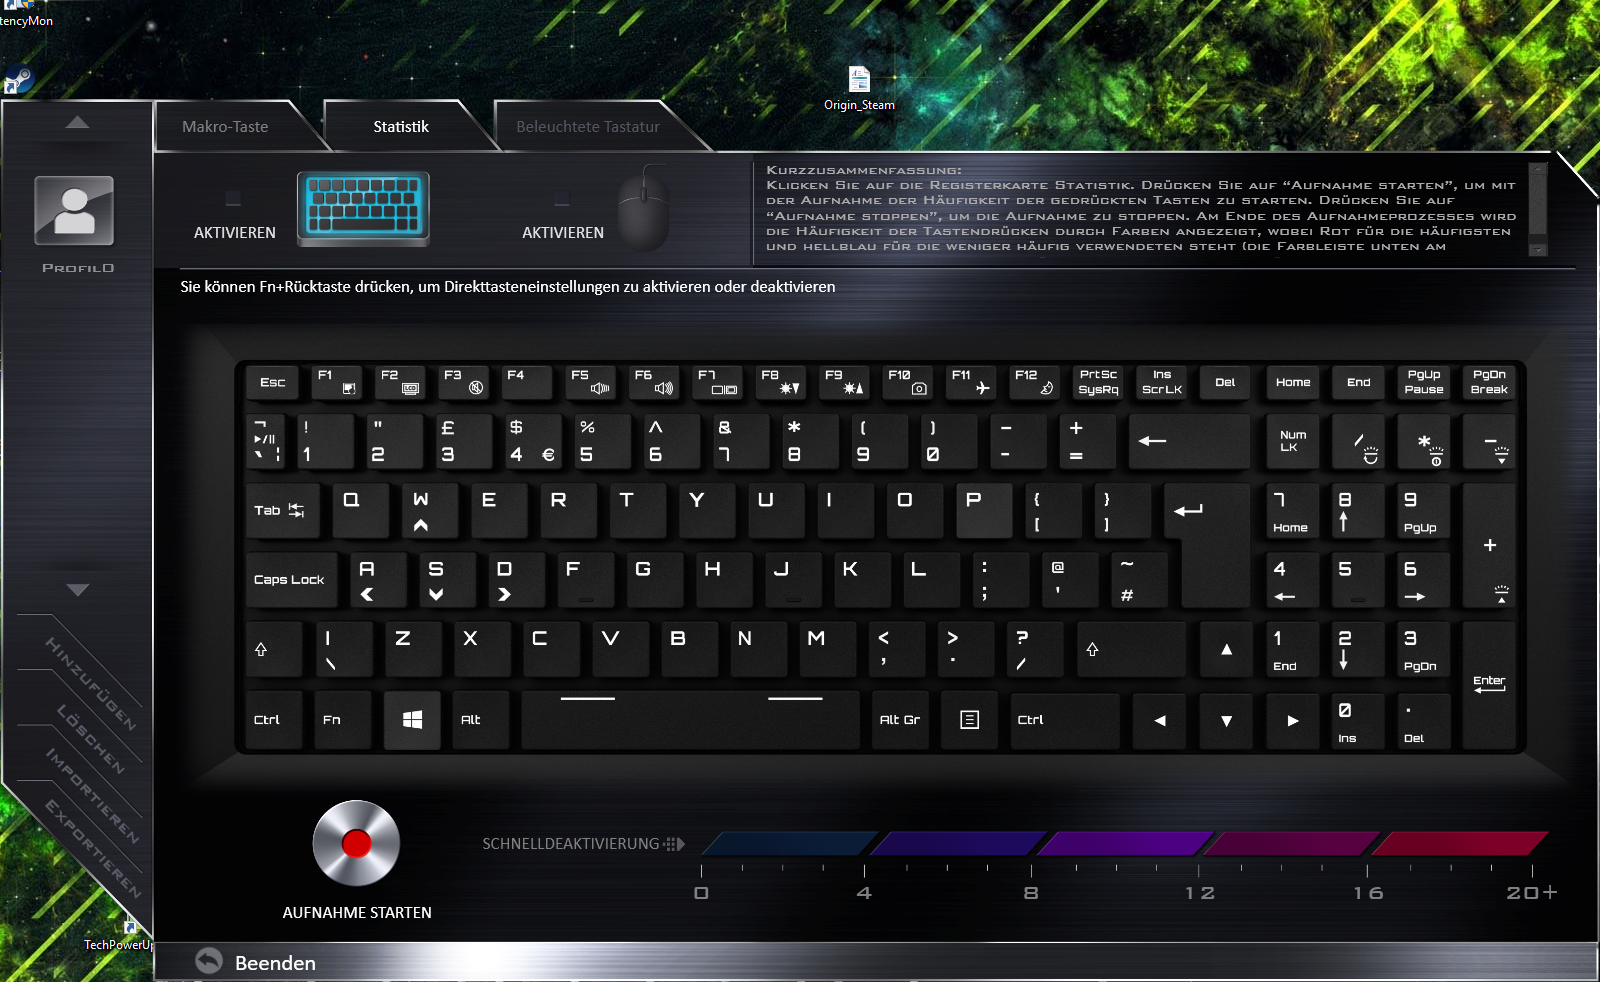
The so-called RGB Gaming Keyboard features three separate configurable RGB zones as well as a remapping of individual keys with macros using the Flexikey software that we were already familiar with from other Schenker notebooks. The four-stage backlight was even and bright. Not much force is required to bend the keyboard around the middle, although this did not happen during regular typing sessions. Despite the fact that the larger keys were somewhat louder than the smaller ones the overall soundscape was unobtrusive unless one really went berserk on the keycaps.
While the numpad is regular sized the keyboard's main area is around 1 cm narrower than a regular desktop-sized keyboard. The keyboard layout is pretty standard save for one exception: Due to the placement of the right arrow key the numpad’s 0 key had to be cut in half vertically. The flat, rubberized, and ergonomically labeled keycaps seemed somewhat small in comparison but at least their spacing is adequate. As is the case with most gaming notebooks, key travel is fairly generous with a decent accentuation point and a noticeably suspended keystroke. By and large, typing on this keyboard felt deep and full yet also pleasantly soft at the same time.
Touchpad
With moist fingers, the not particularly large conventional touchpad’s smoothness decreased dramatically. It also stopped responding to initial inputs around the bottom edge but worked very well otherwise. Cursor movement was very accurate and fast movements were no problem at all, as was drag & drop via double tap. Both dedicated mouse buttons seemed a bit rickety and shallow but offered a subjectively well-balanced and somewhat firm resistance and a pleasant acoustic feedback in return. Gestures with up to four fingers can be configured with the usual tools included in Windows 10.


Display
In addition to the 60 Hz FHD IPS display our review unit was equipped with Schenker also sells the XMG Apex 15 with a 144 Hz FHD IPS display and a 120 Hz TN display with a response time of just 3 ms. Given its 15.6-inch diameter, pixel density is a somewhat meager 141 ppi which, however, only looks grainy and pixelated from an unhealthy short distance.
Given that gaming notebooks are rarely ever used outdoors high brightness is not of particular importance to most users. Accordingly, every single one of the notebooks in our test group, save for the HP Omen, end up below the 300 nits threshold. Coincidentally, the Omen is also the only contender with a UHD (3840x2160) display. Brightness distribution was slightly above average (91%) and when looking at a not particularly luscious black image in a dark room we noticed some light bleeding in the left and right corners that changed and got worse once we started moving or applied pressure to the wobbly display lid. That being said, when left untouched the bright areas on the display were only visible with dark content on the screen.
| |||||||||||||||||||||||||
Brightness Distribution: 91 %
Center on Battery: 269 cd/m²
Contrast: 1170:1 (Black: 0.23 cd/m²)
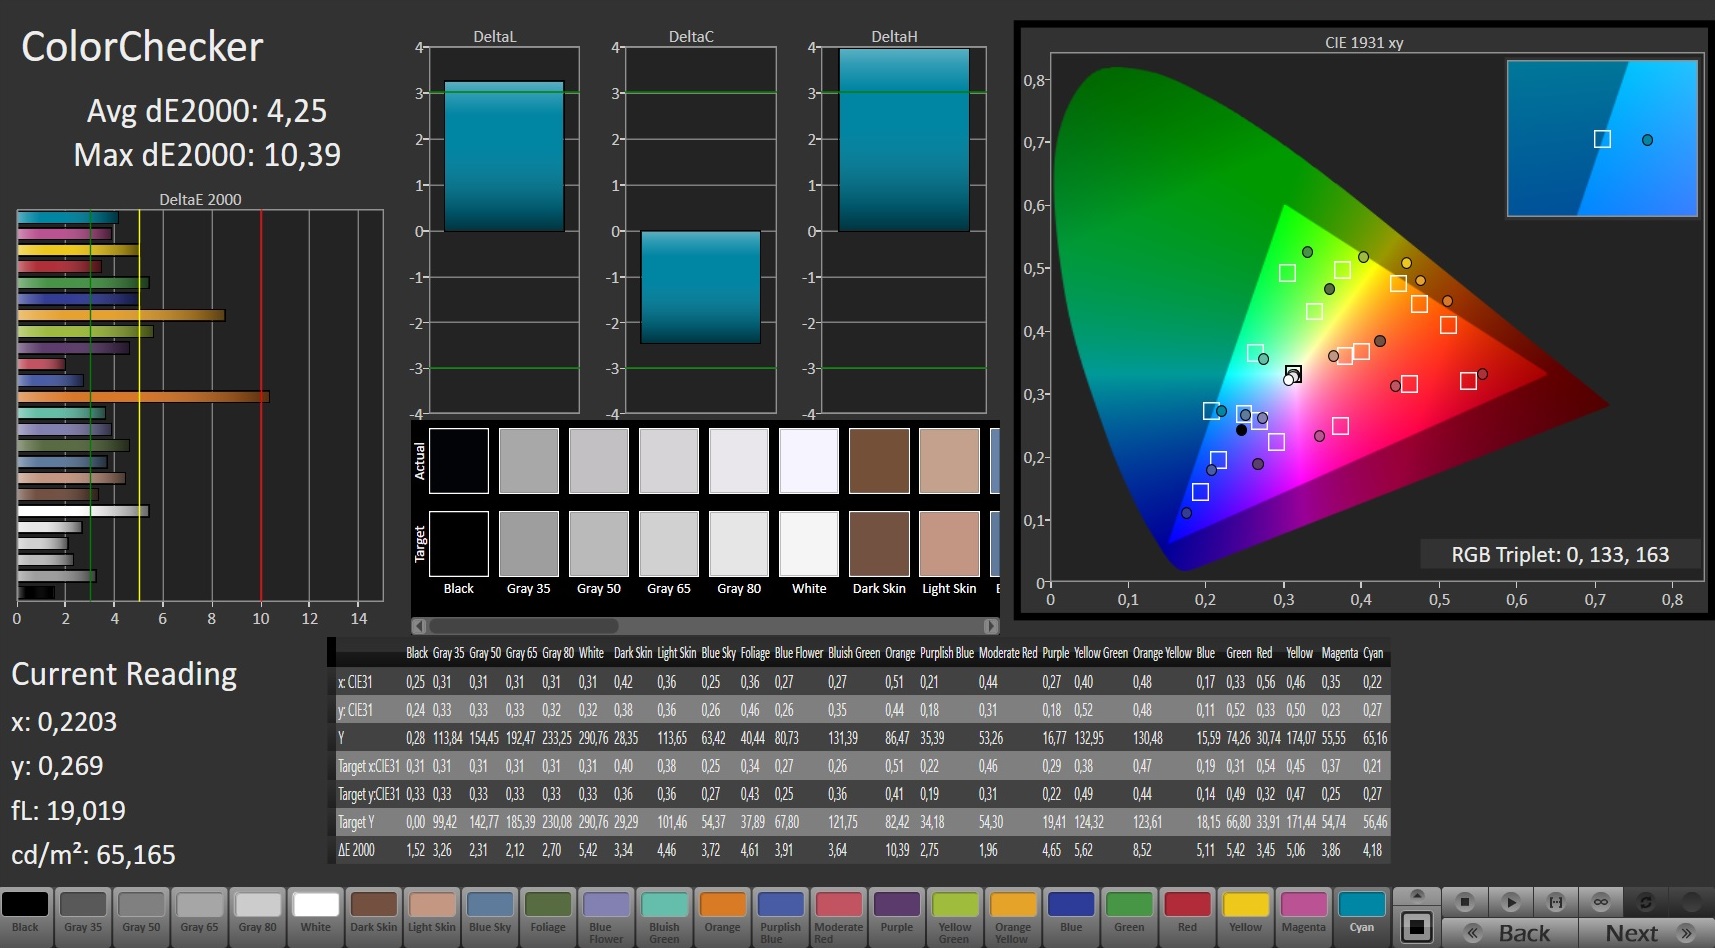
ΔE ColorChecker Calman: 4.25 | ∀{0.5-29.43 Ø4.71}
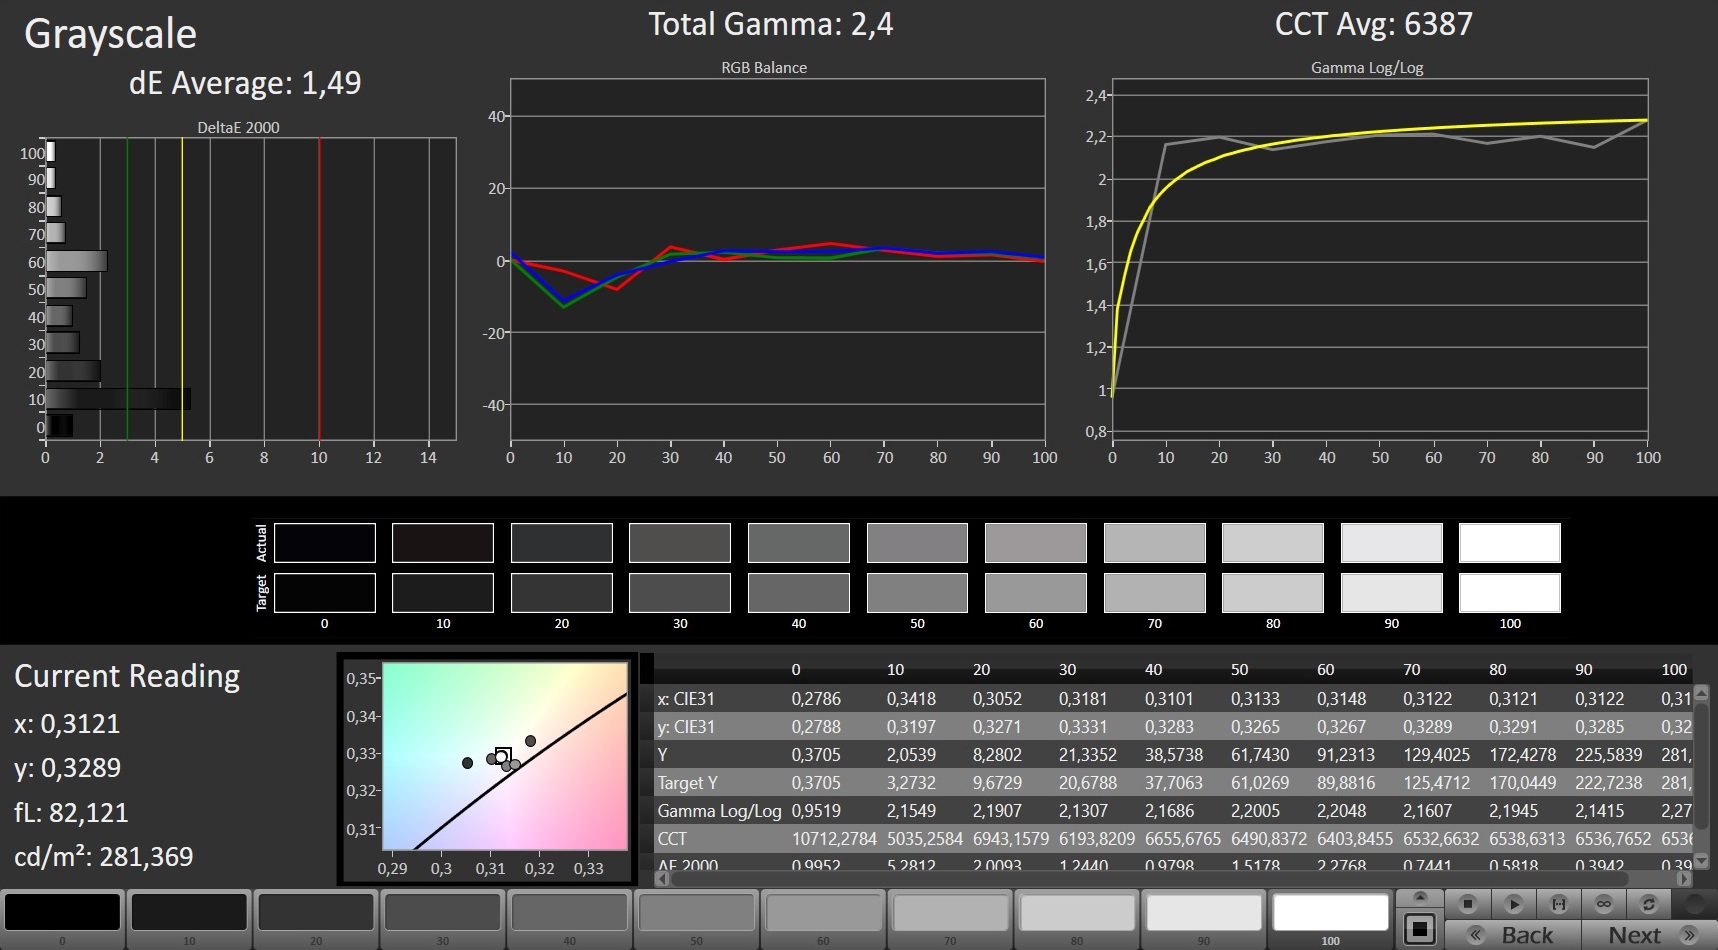
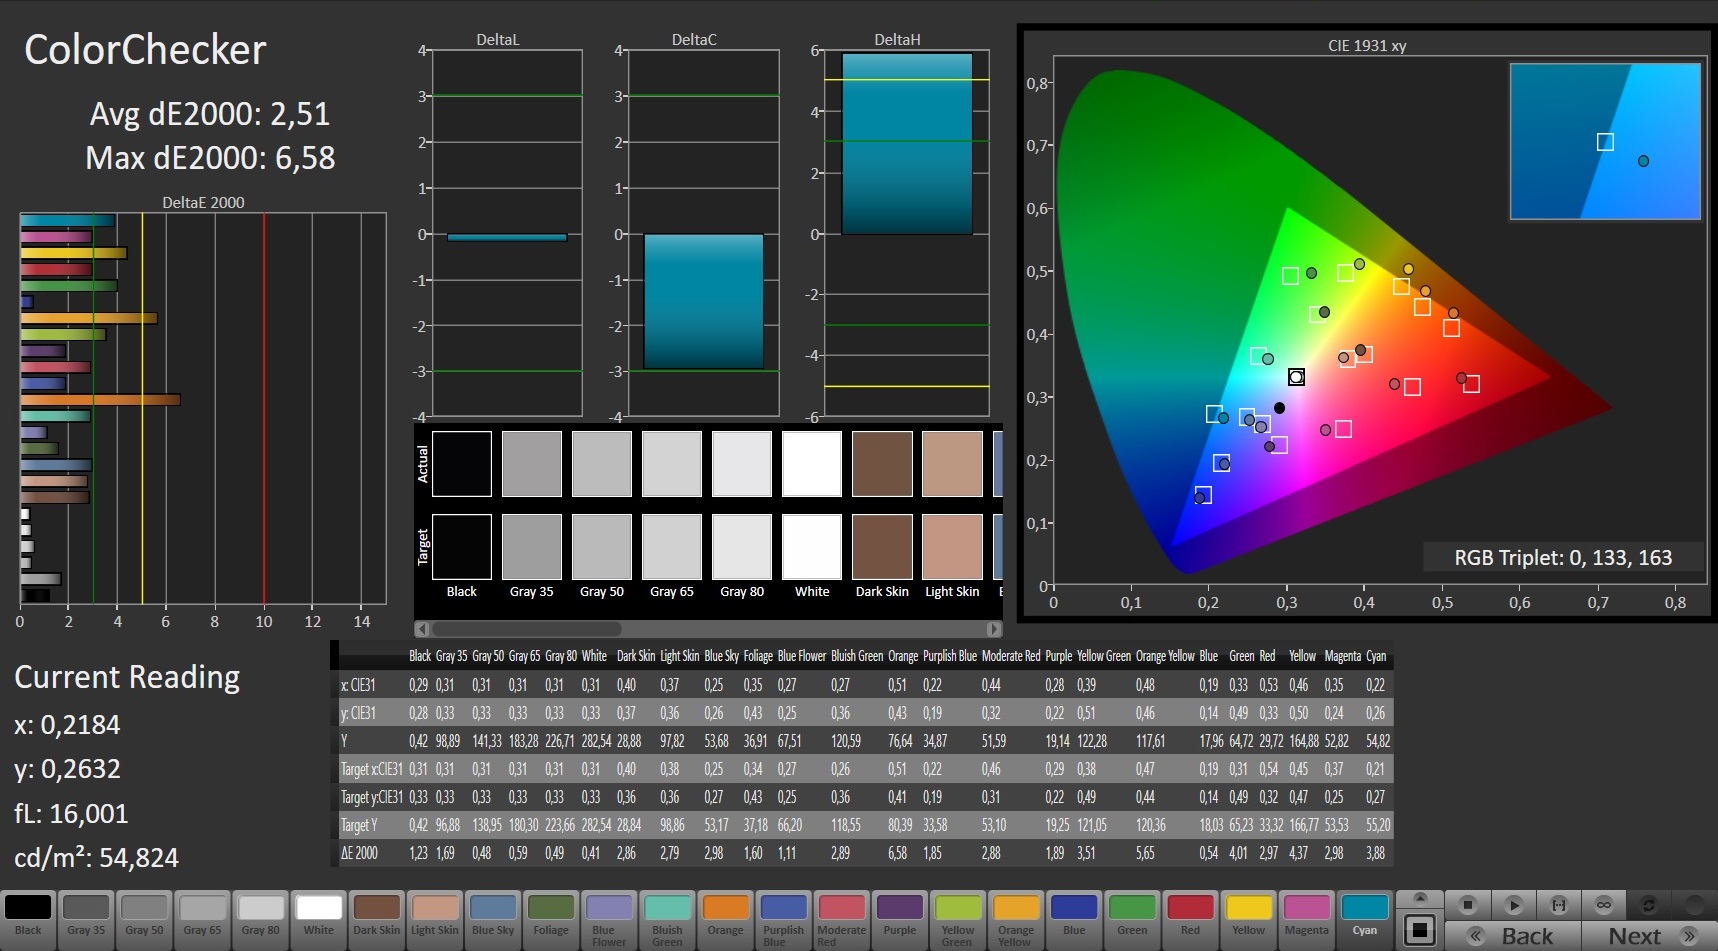
calibrated: 2.51
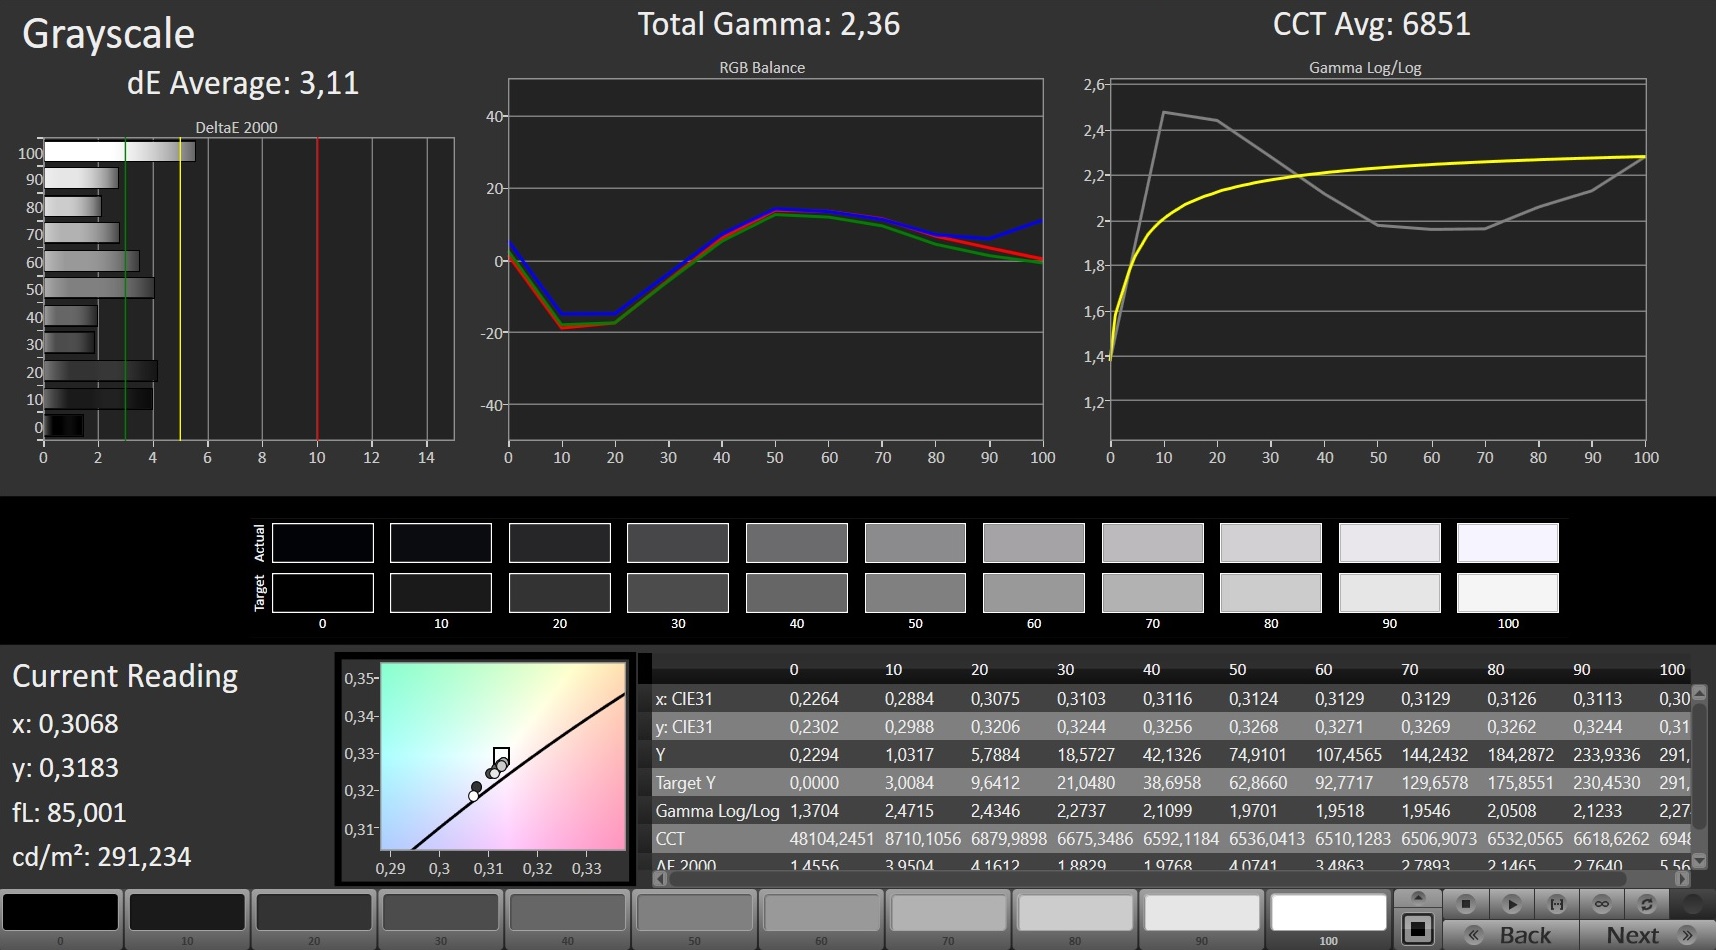
ΔE Greyscale Calman: 3.11 | ∀{0.09-98 Ø4.96}
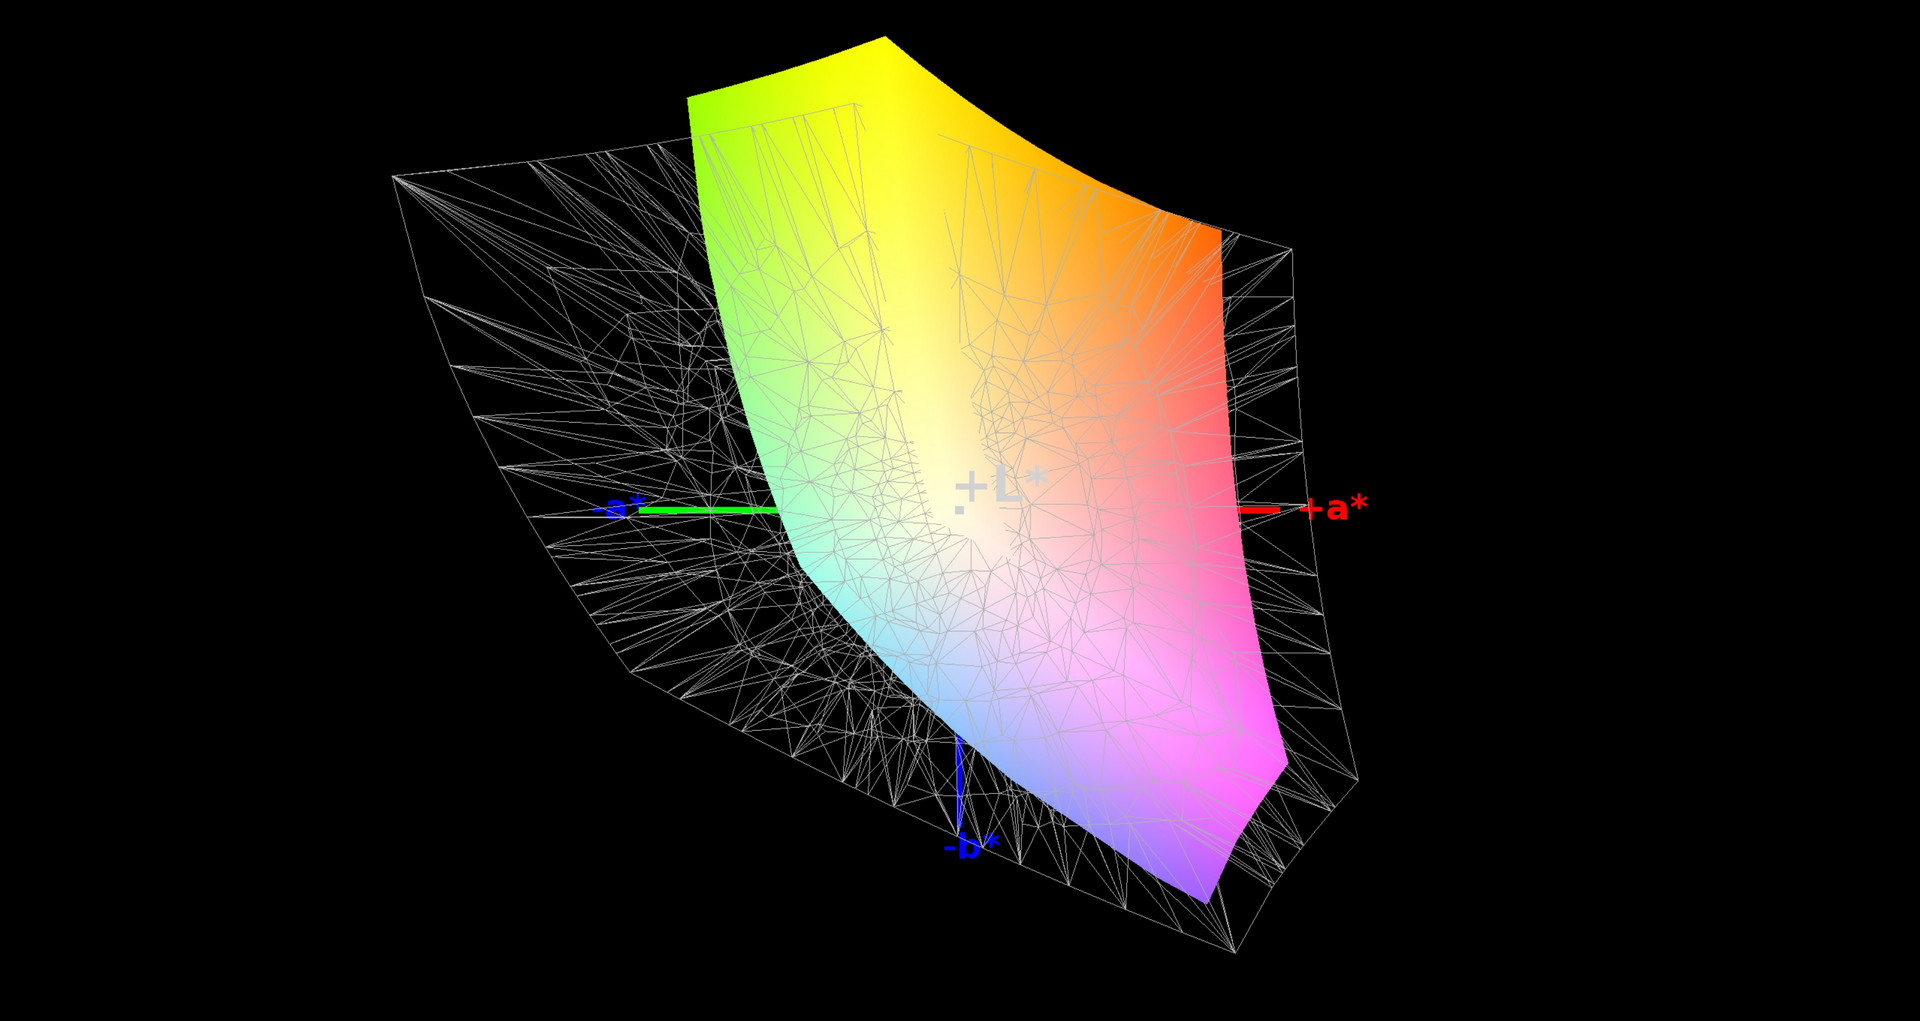
83% sRGB (Argyll 1.6.3 3D)
54% AdobeRGB 1998 (Argyll 1.6.3 3D)
60.4% AdobeRGB 1998 (Argyll 3D)
82.7% sRGB (Argyll 3D)
62% Display P3 (Argyll 3D)
Gamma: 2.36
CCT: 6851 K
| Schenker XMG Apex 15 LG Philips LP156WF6 (LGD046F), IPS, 1920x1080 | MSI GE63VR 7RF Raider Chi Mei N156HHE-GA1 (CMN15F4), TN LED, 1920x1080 | HP Omen 15t-ce000 AU Optronics AUO23EB, IPS, 3840x2160 | Schenker XMG Core 15 LG Philips LP156WF6 (LGD046F), IPS, 1920x1080 | |
|---|---|---|---|---|
| Display | 37% | 10% | 1% | |
| Display P3 Coverage (%) | 62 | 91.3 47% | 66.1 7% | 64.3 4% |
| sRGB Coverage (%) | 82.7 | 100 21% | 91.8 11% | 83 0% |
| AdobeRGB 1998 Coverage (%) | 60.4 | 86.7 44% | 66.9 11% | 60.6 0% |
| Response Times | 77% | 17% | 5% | |
| Response Time Grey 50% / Grey 80% * (ms) | 42.4 ? | 9.6 ? 77% | 37.6 ? 11% | 40.8 ? 4% |
| Response Time Black / White * (ms) | 32 ? | 7.2 ? 77% | 24.8 ? 22% | 30.4 ? 5% |
| PWM Frequency (Hz) | 20490 ? | 26000 ? | 20490 ? | |
| Screen | 12% | -5% | -11% | |
| Brightness middle (cd/m²) | 269 | 285 6% | 358.5 33% | 297 10% |
| Brightness (cd/m²) | 274 | 273 0% | 350 28% | 276 1% |
| Brightness Distribution (%) | 91 | 84 -8% | 95 4% | 87 -4% |
| Black Level * (cd/m²) | 0.23 | 0.23 -0% | 0.39 -70% | 0.3 -30% |
| Contrast (:1) | 1170 | 1239 6% | 919 -21% | 990 -15% |
| Colorchecker dE 2000 * | 4.25 | 3.52 17% | 4.6 -8% | 5.25 -24% |
| Colorchecker dE 2000 max. * | 10.39 | 5.18 50% | 8.5 18% | 10.3 1% |
| Colorchecker dE 2000 calibrated * | 2.51 | |||
| Greyscale dE 2000 * | 3.11 | 3.41 -10% | 5.2 -67% | 4.64 -49% |
| Gamma | 2.36 93% | 2.05 107% | 2.28 96% | 2.39 92% |
| CCT | 6851 95% | 7077 92% | 6410 101% | 6600 98% |
| Color Space (Percent of AdobeRGB 1998) (%) | 54 | 77 43% | 66.9 24% | 54 0% |
| Color Space (Percent of sRGB) (%) | 83 | 100 20% | 91.8 11% | 83 0% |
| Total Average (Program / Settings) | 42% /
26% | 7% /
1% | -2% /
-6% |
* ... smaller is better
All gaming notebooks in our test group except for - you guessed it: the HP Omen - featured a striking low black level. Accordingly, with just 919:1 the Omen featured the lowest yet still acceptable contrast ratio in our test group despite its superior display brightness.
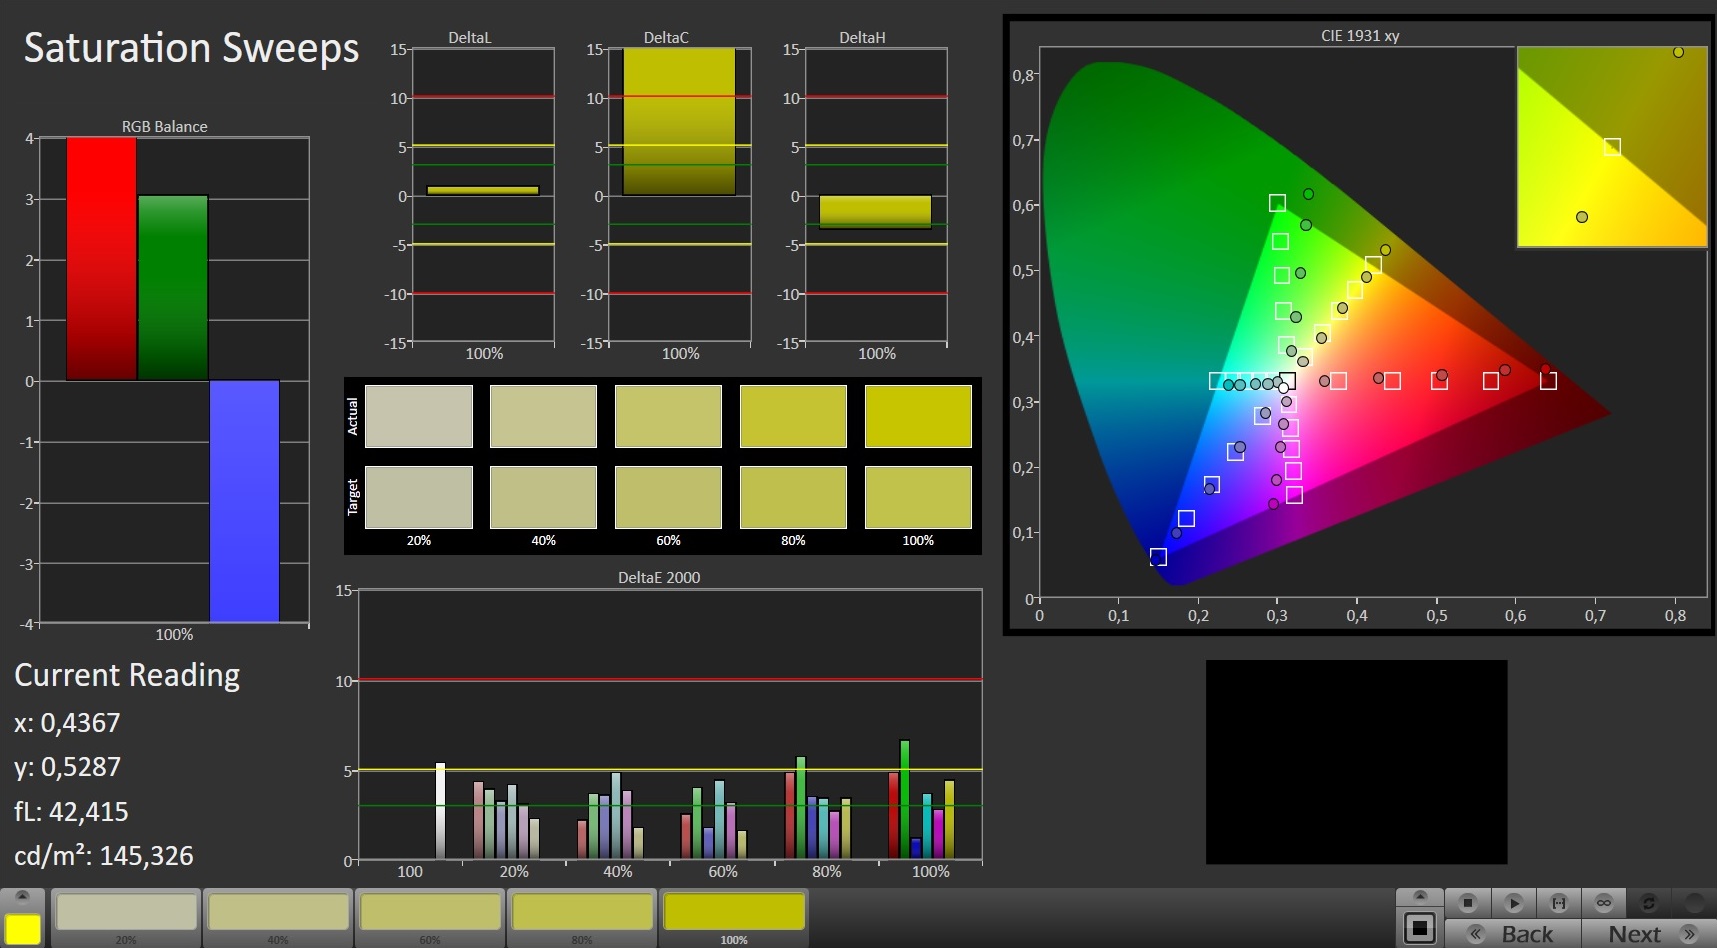
Even without calibration our review unit’s color representation and accuracy were very close to the defined norm and lacked any color tints whatsoever. DeltaE deviations of less than 3 are usually not visible to the naked eye. While the Schenker XMG Core 15’s DeltaE deviations were the highest among the competitors they were still acceptable by and large. Through calibration we were able to lower DeltaE values to 1.49 and 2.51 for grayscale and colors, respectively. However, yellow and orange colors remained somewhat oversaturated.
So far it looks like the new Schenker gaming notebook could be usable for non-professional photo-editing tasks. Unfortunately, all photo-editing ambitions are brought to naught by the display’s low sRGB color-space coverage of just 83%. Among its competitors the only contender that would fit this bill is the MSI GE63VR Raider with its high-contrast display. Gamers will most likely find the display response times slightly too high and won’t even notice the very high PWM frequency.


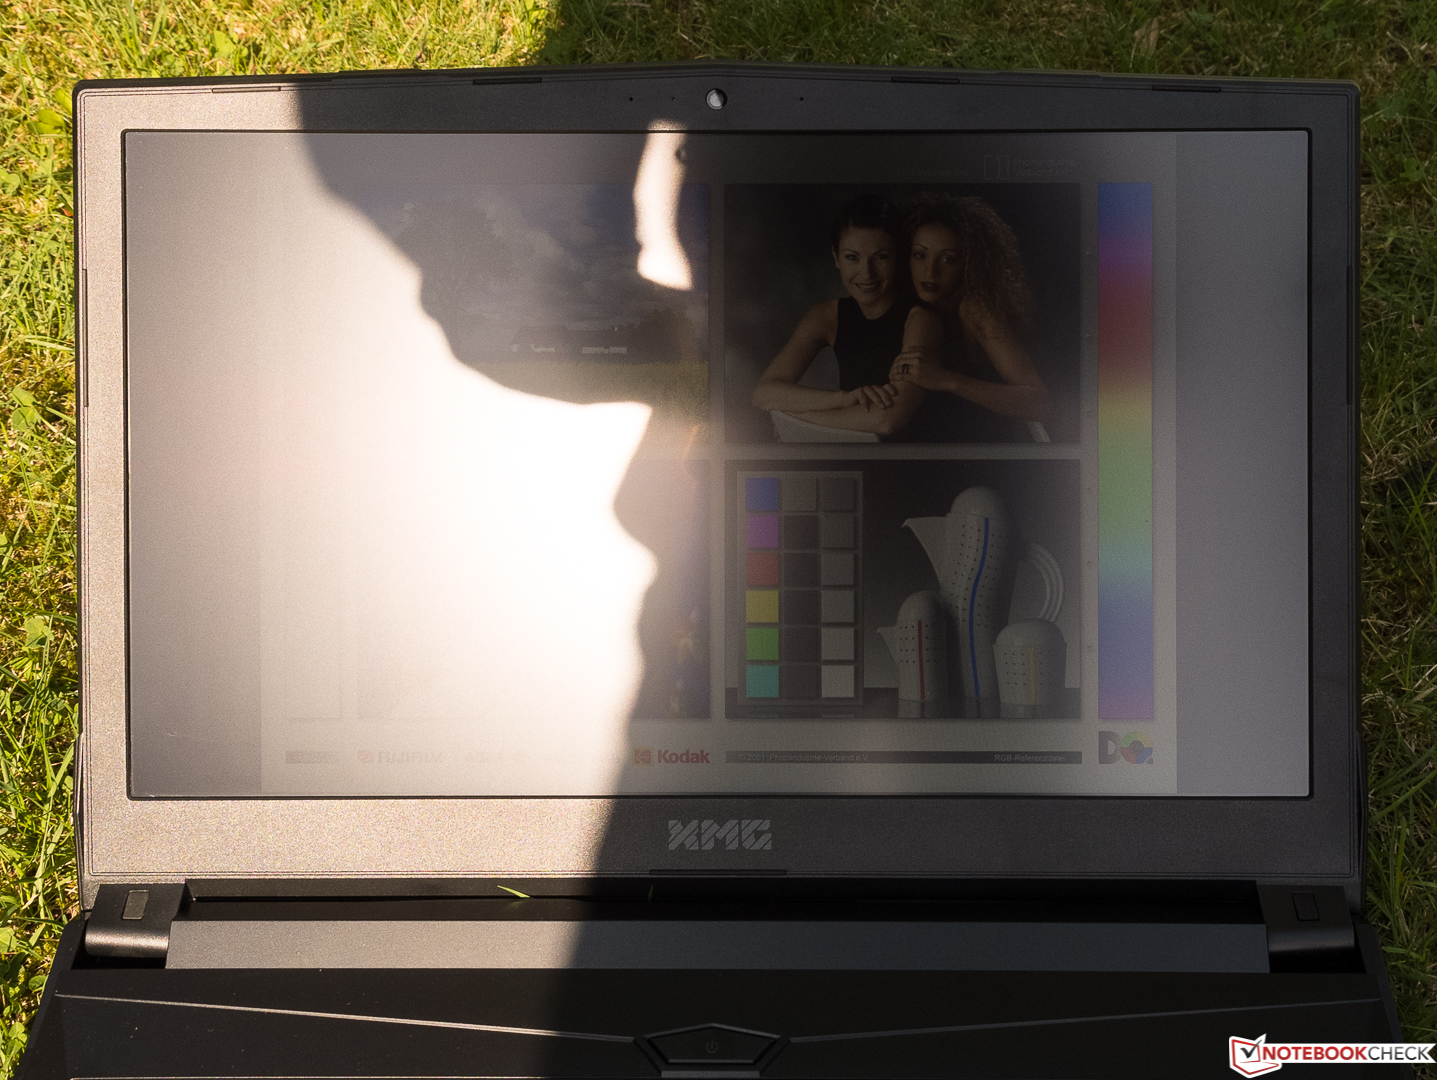
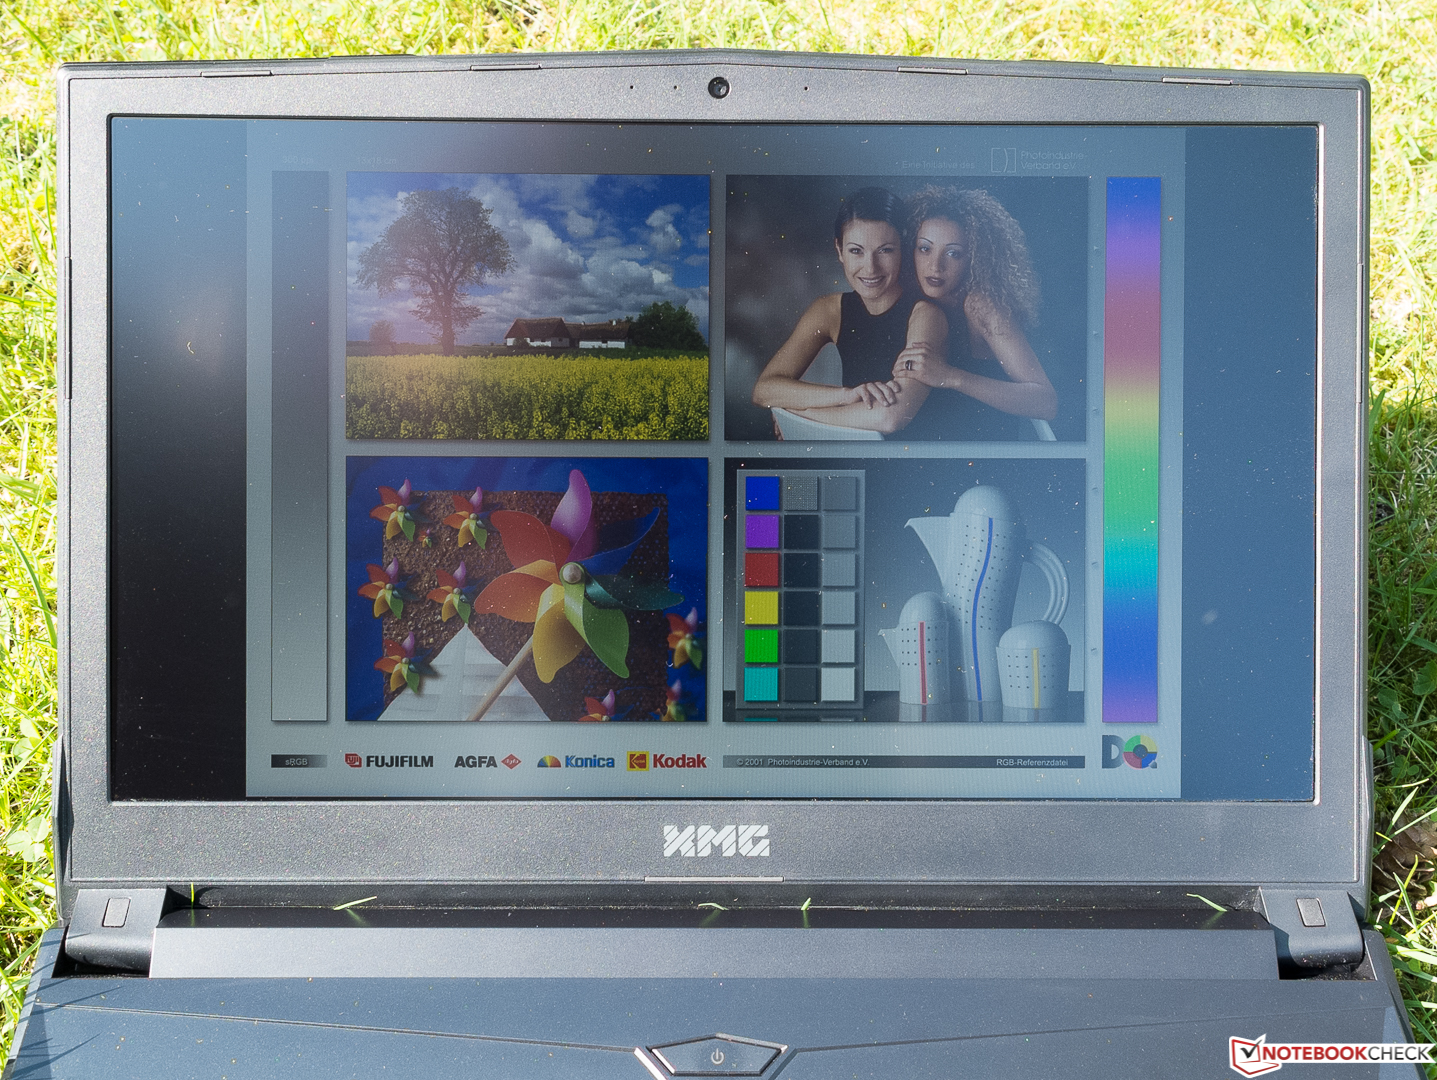
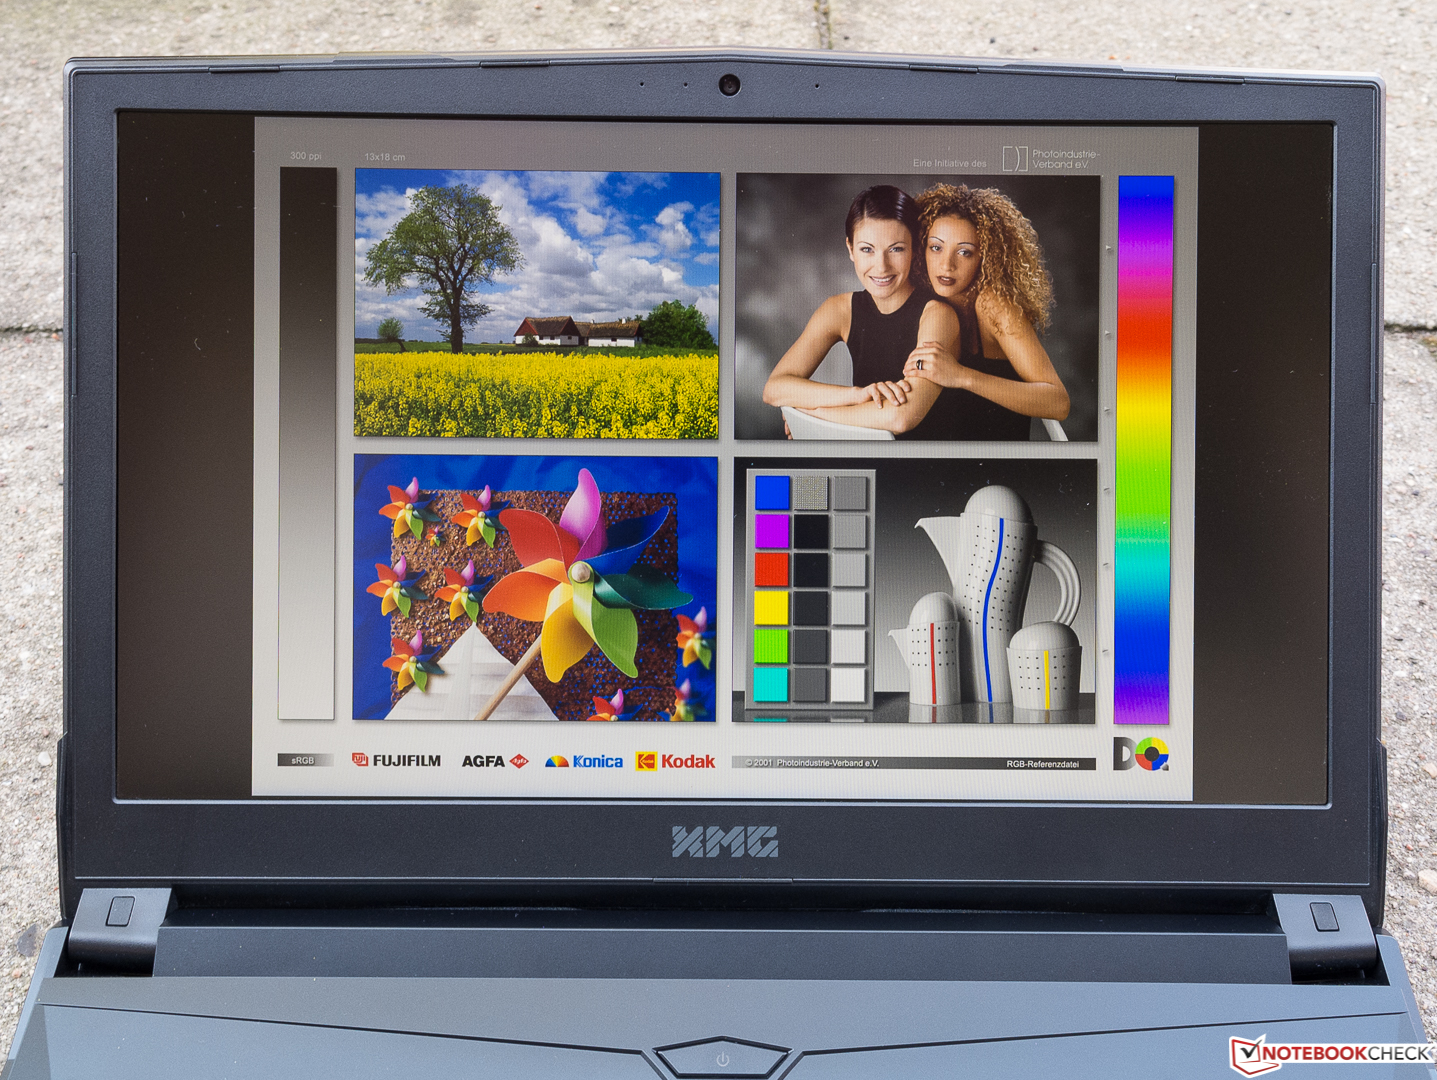
The Apex 15 does not stand a chance against direct sunlight (leftmost photo) - the shadow on the right side of the display is the photographer. The photo in the middle was taken with the sun coming in from the side, and the one on the right was taken with a wall behind us. Thus, with some diligence the Schenker XMG Apex 15 is usable outdoors even on a sunny day.
Display Response Times
| ↔ Response Time Black to White | ||
|---|---|---|
| 32 ms ... rise ↗ and fall ↘ combined | ↗ 18 ms rise | 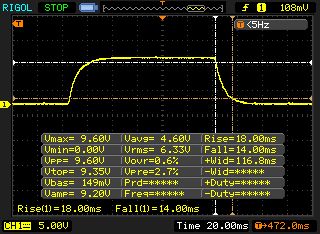 |
| ↘ 14 ms fall | ||
| The screen shows slow response rates in our tests and will be unsatisfactory for gamers. In comparison, all tested devices range from 0.1 (minimum) to 240 (maximum) ms. » 86 % of all devices are better. This means that the measured response time is worse than the average of all tested devices (19.8 ms). | ||
| ↔ Response Time 50% Grey to 80% Grey | ||
| 42.4 ms ... rise ↗ and fall ↘ combined | ↗ 20.4 ms rise | 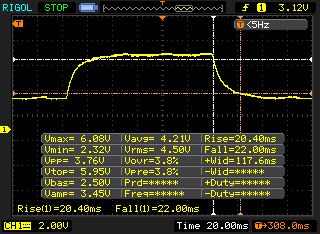 |
| ↘ 22 ms fall | ||
| The screen shows slow response rates in our tests and will be unsatisfactory for gamers. In comparison, all tested devices range from 0.165 (minimum) to 636 (maximum) ms. » 70 % of all devices are better. This means that the measured response time is worse than the average of all tested devices (31 ms). | ||
Screen Flickering / PWM (Pulse-Width Modulation)
| Screen flickering / PWM detected | 20490 Hz | ≤ 99 % brightness setting | 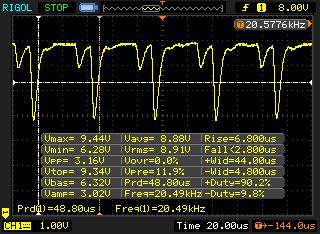 |
The display backlight flickers at 20490 Hz (worst case, e.g., utilizing PWM) Flickering detected at a brightness setting of 99 % and below. There should be no flickering or PWM above this brightness setting. The frequency of 20490 Hz is quite high, so most users sensitive to PWM should not notice any flickering. In comparison: 52 % of all tested devices do not use PWM to dim the display. If PWM was detected, an average of 7754 (minimum: 5 - maximum: 343500) Hz was measured. | |||
The panel was made by LG Philips and offers superb viewing angles. Only at very acute angles did we notice slight and definitely below average decreases in brightness and contrast ratio. We did not notice any color distortions whatsoever.

Performance
The Schenker XMG Apex 15 is a high-performance laptop with a hexa-core CPU and support for Hyper-Threading that no current game will be able to bring to its knees. Thanks to 12 threads, plenty of RAM, and a fast SSD, the Apex is made for highly parallelized workloads such as Adobe’s Premiere video-editing software. That being said, Premiere would have definitely profited from more RAM. Accordingly, the device scored a very impressive 98.5% in our system performance category. The only area with room for improvement was 3D performance. After all, faster GPUs are available.
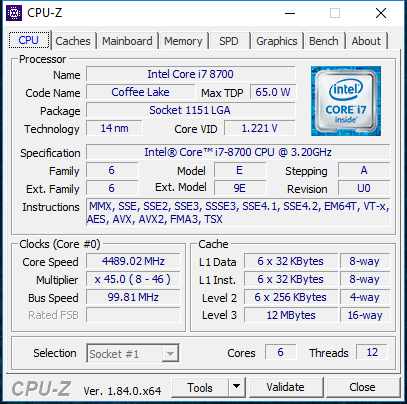


Processor
Intel’s brand-new Coffee Lake CPUs are based on an improved 14 nm manufacturing process, and the core count has been increased from four to six in the i5 and i7-series CPUs. As before, Hyper-Threading is only available with the i7 chips, which now feature a total of 12 threads. The Schenker notebook is powered by Intel’s i7-8700 (6x 3.2-4.6 GHz, Hyper-Threading, 65 W TDP), and we have decided to pitch it against the extremely popular Kaby Lake quad-core i7-7700HQ (4x 2.8-3.8 GHz, Hyper-Threading, 45 W TDP). In Cinebench R15’s single-thread test, the older CPU was up to 23% faster thanks to its higher boost speeds. However, the i7-8700 practically wiped the floor with its Kaby Lake competitor in the multithread test and was up to 68% faster thanks to its extra cores and its higher TDP.
Unfortunately, real-world experience requires us to curb our enthusiasm somewhat. While it’s true that highly parallelized workloads such as rendering videos are going to benefit immensely from a hexa-core CPU this is not the case for all current and expected games in the near future. Thus, if you already own a gaming notebook based on Intel’s Skylake or Kaby Lake quad-core processors and an Nvidia GeForce GTX 1060 then the Apex 15’s higher CPU performance is most likely not going to be noticeable when running games.
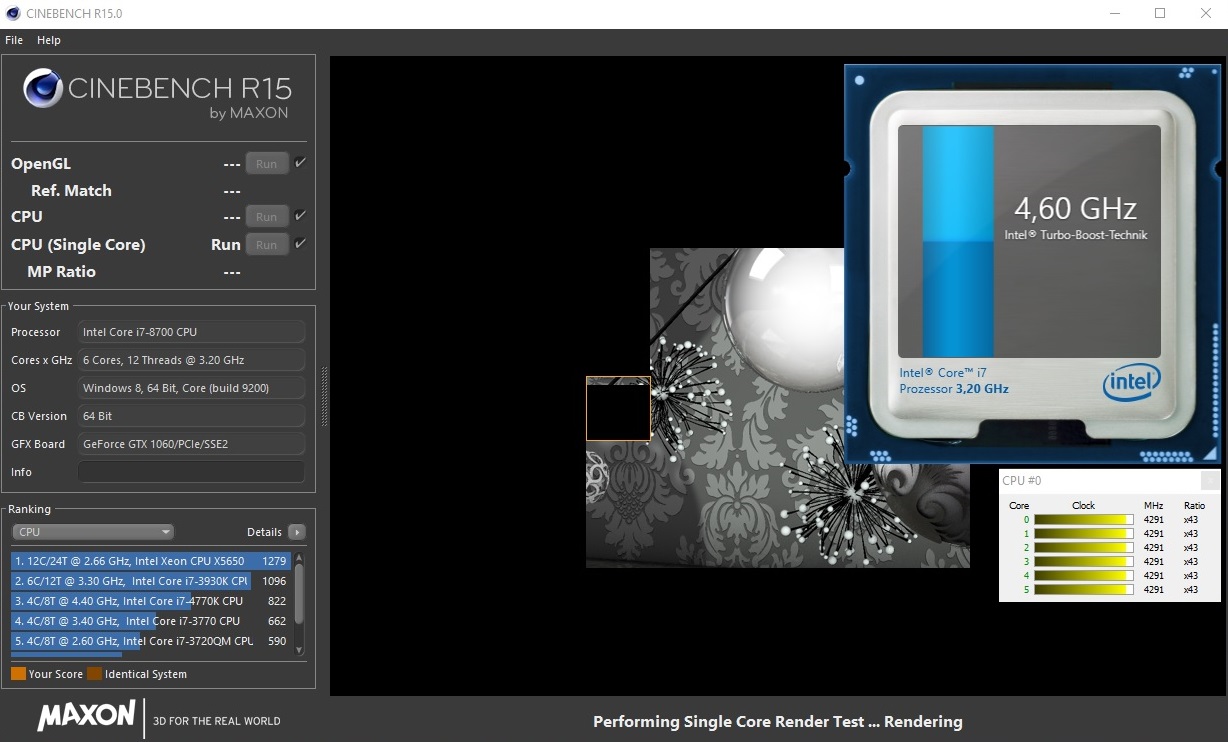
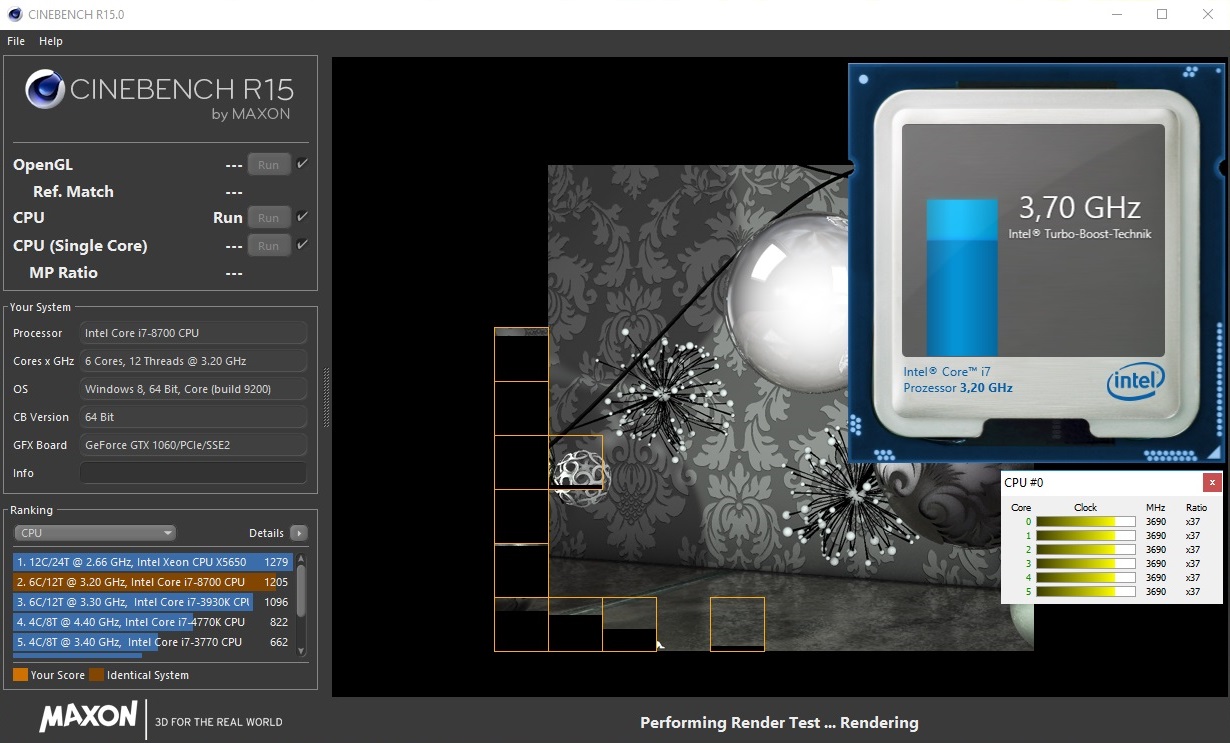
As with every notebook we put the Apex through our Cinebench R15 sustained load loop test. The first iteration yielded an impressive 1,215 points, which subsequently dropped to a low of 1,080 points constituting a 3% decrease. The Coffee Lake CPU is thus capable of utilizing its turbo boost potential in realistic high-load scenarios over a prolonged period of time. On battery, the multithread score dropped to just 571 points.
System Performance
PCMark 8 is an older benchmark tool, and unfortunately it has not aged particularly well. With current systems benchmark scores are always somewhat identical regardless of components, and thus unusable for actual performance comparisons. More often than not the scores are all within margin of error. The current review unit most likely achieved its high scores thanks to its fast hexa-core CPU and its high-performance SSD while the HP Omen is in last place most likely due to its comparatively slow GeForce GTX 1060 Max-Q. Subjectively speaking, the Schenker XMG Apex 15 booted up very quickly, ran very smoothly, and it delighted us with its fast application launch times. Considering the device’s components we expected no less.
| PCMark 8 Home Score Accelerated v2 | 4697 points | |
| PCMark 8 Work Score Accelerated v2 | 5653 points | |
| PCMark 10 Score | 5732 points | |
Help | ||
Storage Devices
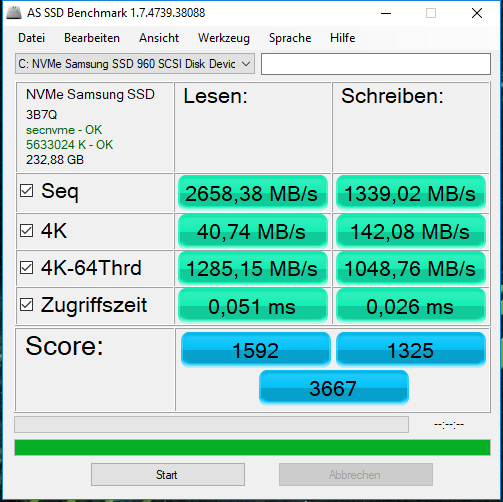
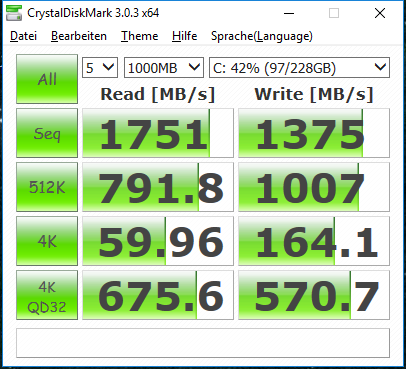
Even though the AS SSD results differed dramatically from the CrystalDiskMark 3.0 results we have decided to use the former for our evaluation. Sequential read speeds, which among others are relevant when launching large games, were very fast. In fact they were so high that the built-in 256 GB Samsung SSD turned out to be one of the fastest singular SSDs in our database. When considering operating system boot and application launch times the most important factor is 4K random read, and at 41 MB/s the Samsung SSD did very well in this category.
Some competitors featured NVMe SSDs as well, but the above average performance of this Samsung 960 Evo SSD was superior nonetheless. It even aced the less important write tests. The additional 5,400 rpm 1 TB HDD behaved inconspicuously by and large.

| Schenker XMG Apex 15 Samsung SSD 960 Evo 250GB m.2 NVMe | MSI GE63VR 7RF Raider Toshiba HG6 THNSNJ256G8NY | HP Omen 15t-ce000 Samsung PM961 NVMe MZVLW128HEGR | Schenker XMG Core 15 Samsung SSD 960 Evo 250GB m.2 NVMe | Average Samsung SSD 960 Evo 250GB m.2 NVMe | |
|---|---|---|---|---|---|
| CrystalDiskMark 3.0 | -59% | -40% | -12% | -4% | |
| Read Seq (MB/s) | 1751 | 507 -71% | 1411 -19% | 1338 -24% | 1642 ? -6% |
| Write Seq (MB/s) | 1375 | 441.4 -68% | 749 -46% | 1188 -14% | 1408 ? 2% |
| Read 512 (MB/s) | 792 | 411.9 -48% | 503 -36% | 780 -2% | 880 ? 11% |
| Write 512 (MB/s) | 1007 | 409.9 -59% | 174 -83% | 1006 0% | 1065 ? 6% |
| Read 4k (MB/s) | 60 | 21.77 -64% | 46.09 -23% | 58.3 -3% | 54.2 ? -10% |
| Write 4k (MB/s) | 164.1 | 88.9 -46% | 130.7 -20% | 134 -18% | 141.9 ? -14% |
| Read 4k QD32 (MB/s) | 676 | 368.8 -45% | 518 -23% | 577 -15% | 617 ? -9% |
| Write 4k QD32 (MB/s) | 571 | 190.3 -67% | 173.9 -70% | 481.9 -16% | 511 ? -11% |

GPU Performance
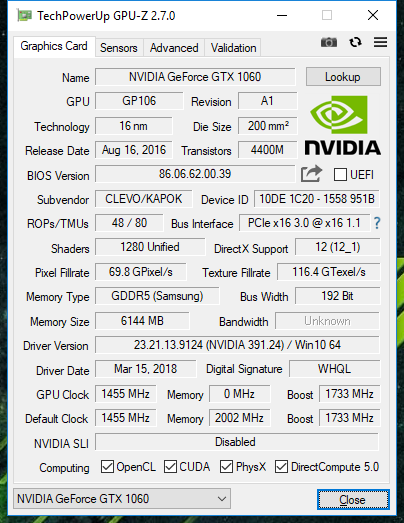
Nvidia’s GeForce GTX 1060 is an old friend back from 2016, and it can still be found in many a gaming notebook today. The Pascal core with 6 GB of GDDR5 VRAM is after all still the fastest GPU available after the GTX 1080, GTX 1070, and their respective Max-Q variants. Its base clock speed of 1,455 MHz and turbo boost of up to 1,733 MHz are accompanied by VRAM running effectively at 8,000 MHz connected by a 192-bit wide bus. More on the GeForce GTX 1060 can be found here.
How does the GTX 1060 fare against its competitors? In 3DMark 2013’s Fire Strike it achieved the second-highest GTX 1060 result of all time, and it could still be found in the top 25% in the older 3DMark 11 benchmark. These results are impressive and most likely due to the slightly higher (turbo boost) frequency.
| 3DMark 11 Performance | 14618 points | |
| 3DMark Cloud Gate Standard Score | 36010 points | |
| 3DMark Fire Strike Score | 10794 points | |
Help | ||
Gaming Performance
The GTX 1060 is capable of running most current games smoothly in FHD and on maximum details. Higher resolutions usually require a faster GTX 1070, like the one in the MSI GE63VR Raider. In our tests, the Schenker XMG was slightly faster than its 1060 (Max-Q) competitors, and overall it was up to 15% faster than the average GTX 1060 GPU.
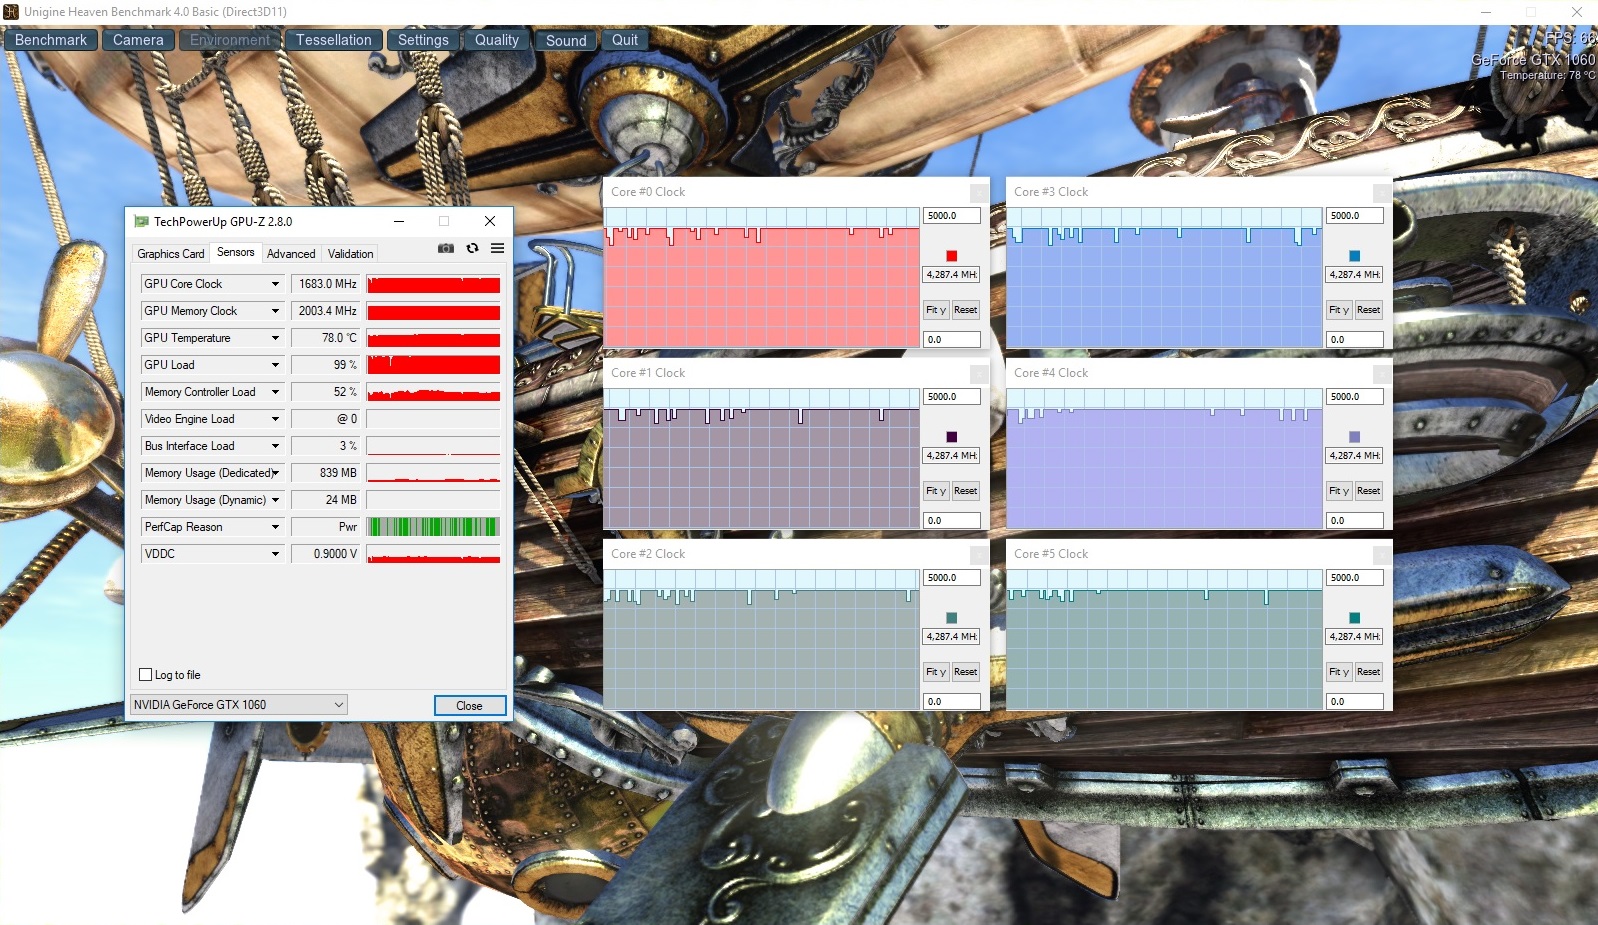
In our real-world gaming benchmark (The Witcher 3) the Apex started out at 39 to 41 fps and subsequently dropped to 37-39 fps. The GPU ran at 1,680 MHz and reached a maximum temperature of 89 °C. All things considered, we can attest the Apex 15’s GeForce GTX 1060 a consistent above-average performance.
| The Witcher 3 | |
| 1920x1080 Ultra Graphics & Postprocessing (HBAO+) | |
| Average of class Gaming (104.7 - 240, n=7, last 2 years) | |
| MSI GE63VR 7RF Raider | |
| Schenker XMG Apex 15 | |
| Average NVIDIA GeForce GTX 1060 Mobile (24 - 42.3, n=60) | |
| Schenker XMG Core 15 | |
| HP Omen 15t-ce000 | |
| 1920x1080 High Graphics & Postprocessing (Nvidia HairWorks Off) | |
| Average of class Gaming (341 - 404, n=2, last 2 years) | |
| Schenker XMG Apex 15 | |
| Schenker XMG Core 15 | |
| HP Omen 15t-ce000 | |
| Average NVIDIA GeForce GTX 1060 Mobile (52.6 - 80.6, n=49) | |
| Rise of the Tomb Raider | |
| 1920x1080 Very High Preset AA:FX AF:16x | |
| MSI GE63VR 7RF Raider | |
| Schenker XMG Apex 15 | |
| Average NVIDIA GeForce GTX 1060 Mobile (51 - 68.8, n=37) | |
| Schenker XMG Core 15 | |
| HP Omen 15t-ce000 | |
| 1920x1080 High Preset AA:FX AF:4x | |
| MSI GE63VR 7RF Raider | |
| Schenker XMG Apex 15 | |
| Average NVIDIA GeForce GTX 1060 Mobile (65.3 - 82, n=24) | |
| Schenker XMG Core 15 | |
| HP Omen 15t-ce000 | |
| The Division | |
| 1920x1080 Ultra Preset AF:16x | |
| Schenker XMG Apex 15 | |
| Average NVIDIA GeForce GTX 1060 Mobile (37.8 - 57.4, n=7) | |
| 1920x1080 High Preset AF:8x | |
| Schenker XMG Apex 15 | |
| Average NVIDIA GeForce GTX 1060 Mobile (46.9 - 73.3, n=6) | |
| For Honor | |
| 1920x1080 Extreme Preset AA:T AF:16x | |
| MSI GE63VR 7RF Raider | |
| Schenker XMG Apex 15 | |
| Average NVIDIA GeForce GTX 1060 Mobile (42.4 - 78.9, n=8) | |
| 1920x1080 High Preset AA:T AF:8x | |
| MSI GE63VR 7RF Raider | |
| Schenker XMG Apex 15 | |
| Average NVIDIA GeForce GTX 1060 Mobile (56.3 - 103.2, n=7) | |
| Ghost Recon Wildlands | |
| 1920x1080 Ultra Preset AA:T AF:16x | |
| MSI GE63VR 7RF Raider | |
| Schenker XMG Apex 15 | |
| Average NVIDIA GeForce GTX 1060 Mobile (34.5 - 38.7, n=6) | |
| 1920x1080 High Preset AA:T AF:4x | |
| MSI GE63VR 7RF Raider | |
| Schenker XMG Apex 15 | |
| Average NVIDIA GeForce GTX 1060 Mobile (60.1 - 67.8, n=6) | |
| Assassin´s Creed Origins | |
| 1920x1080 Ultra High Preset | |
| Schenker XMG Apex 15 | |
| Average NVIDIA GeForce GTX 1060 Mobile (42 - 56, n=5) | |
| 1920x1080 High Preset | |
| Schenker XMG Apex 15 | |
| Average NVIDIA GeForce GTX 1060 Mobile (49 - 66, n=5) | |
| Final Fantasy XV Benchmark | |
| 1920x1080 High Quality | |
| Average of class Gaming (41 - 215, n=95, last 2 years) | |
| Schenker XMG Apex 15 | |
| Average NVIDIA GeForce GTX 1060 Mobile (37.2 - 47.3, n=5) | |
| 1920x1080 Standard Quality | |
| Average of class Gaming (85.7 - 236, n=82, last 2 years) | |
| Schenker XMG Apex 15 | |
| Average NVIDIA GeForce GTX 1060 Mobile (58.6 - 62.4, n=2) | |
| Far Cry 5 | |
| 1920x1080 Ultra Preset AA:T | |
| Average of class Gaming (70 - 151, n=6, last 2 years) | |
| Schenker XMG Apex 15 | |
| Average NVIDIA GeForce GTX 1060 Mobile (59 - 65, n=5) | |
| 1920x1080 High Preset AA:T | |
| Average of class Gaming (82 - 163, n=6, last 2 years) | |
| Schenker XMG Apex 15 | |
| Average NVIDIA GeForce GTX 1060 Mobile (62 - 69, n=5) | |
| low | med. | high | ultra | |
|---|---|---|---|---|
| The Witcher 3 (2015) | 77.6 | 41.9 | ||
| Rainbow Six Siege (2015) | 118 | |||
| Rise of the Tomb Raider (2016) | 76.1 | 67.9 | ||
| The Division (2016) | 72.8 | 56.7 | ||
| For Honor (2017) | 108.3 | 103.2 | 78.9 | |
| Ghost Recon Wildlands (2017) | 67.8 | 38.7 | ||
| Assassin´s Creed Origins (2017) | 74 | 66 | 56 | |
| Final Fantasy XV Benchmark (2018) | 62.4 | 47.3 | ||
| Far Cry 5 (2018) | 75 | 69 | 64 |
Emissions
System Noise
While performing our tests, we chose the preselected entertainment mode in the Control Center. In addition, the Apex 15 also features three extra presets: quiet, energy efficient, and performance. That being said, we failed to notice a difference between the performance and the entertainment modes.
When idle the fan was off most of the time, and we were only able to hear the hard drive's humming noise. However, even the slightest load, such as for example rebooting the system or launching an application, would rev up the fans immediately. Running the browser benchmark Kraken 1.1 resulted in a continuous increase of fan speed to medium levels starting after around eight seconds. At this level, the fan was already very noticeable at a distance of roughly 3 m and accompanied by a somewhat annoying whistling noise.
This whistling noise was also present with higher fan speeds caused by running our Prime95 + FurMark stress test. Under maximum load the fan noise was very present and forceful, albeit not particularly annoying despite the aforementioned whistling noise. For short periods of time it was bearable even without headphones, which is okay for a modern GTX 1060 gaming notebook.
Noise level
| Idle |
| 32 / 33 / 38 dB(A) |
| HDD |
| 33 dB(A) |
| Load |
| 47 / 52 dB(A) |
 | ||
30 dB silent 40 dB(A) audible 50 dB(A) loud |
||
min: | ||
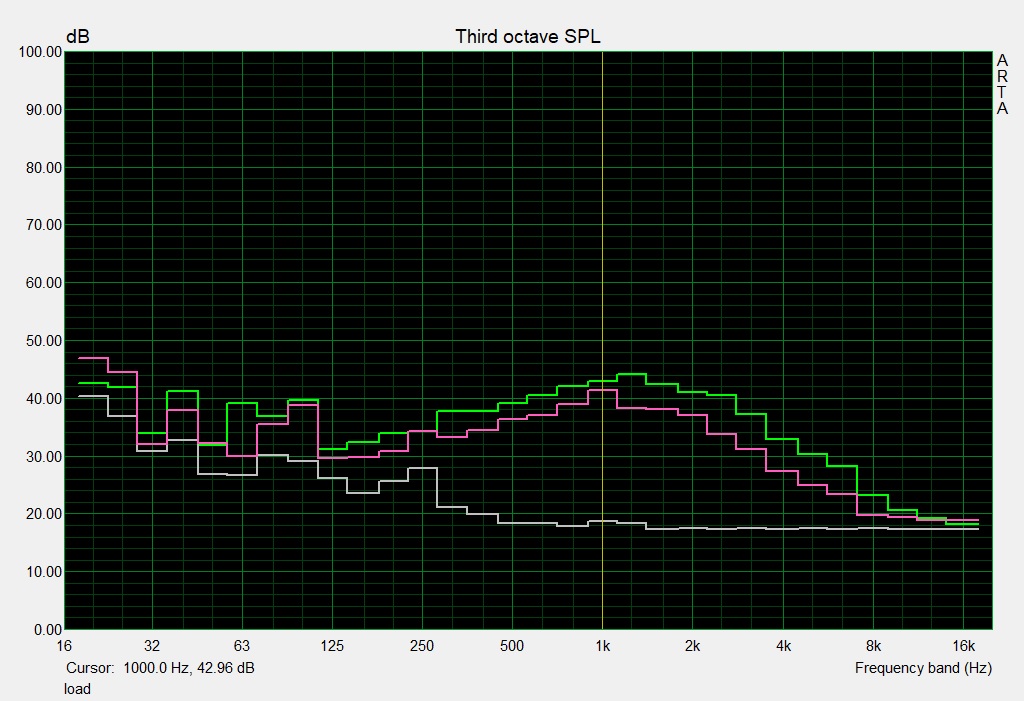
Temperature
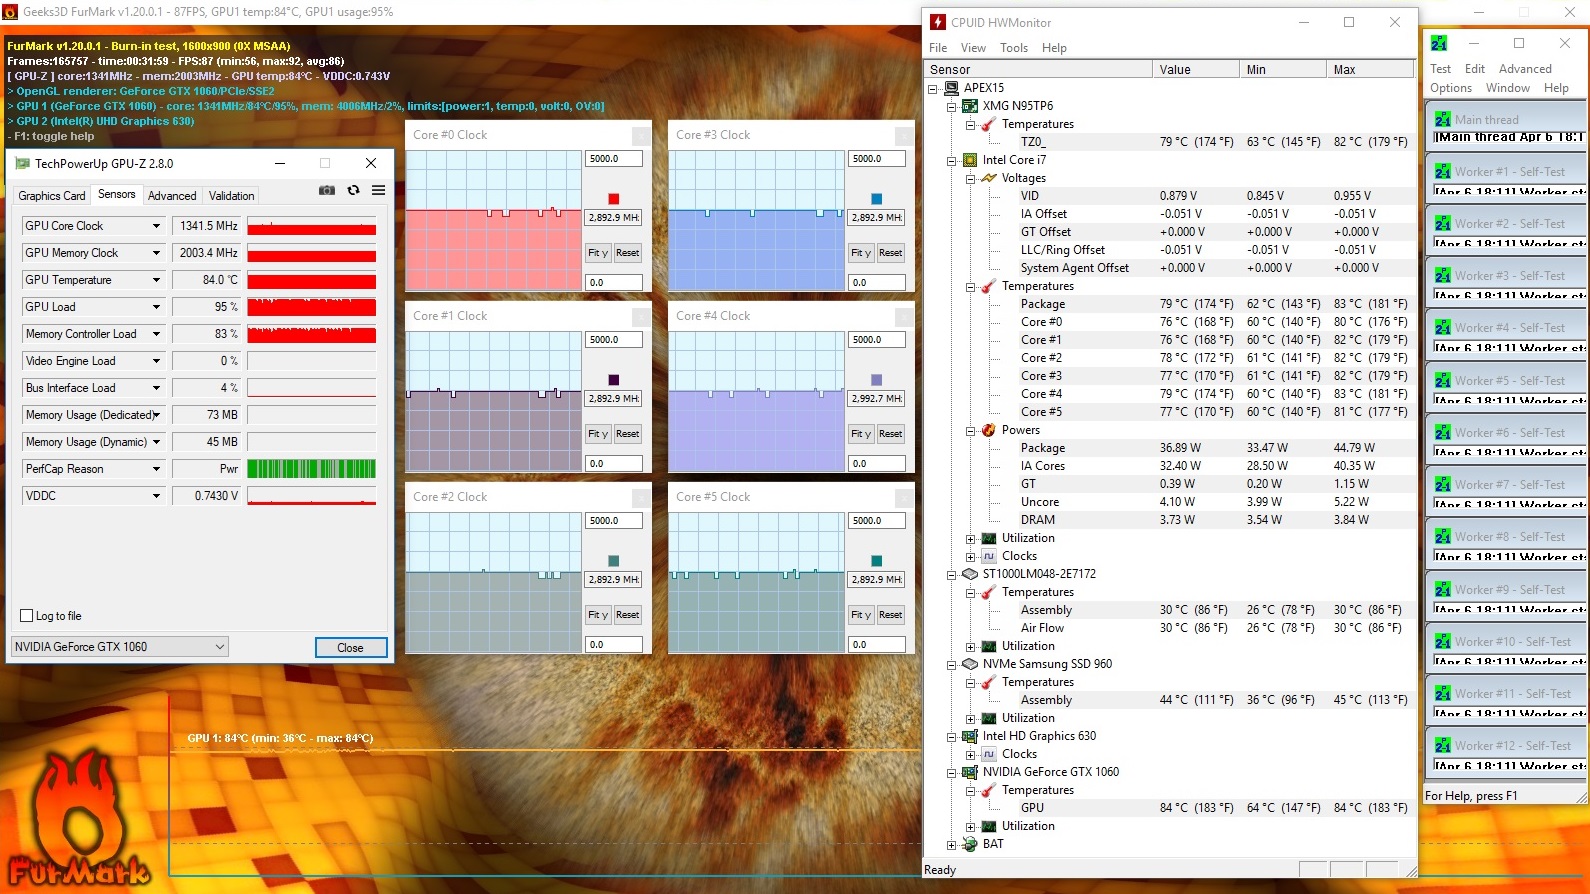
If you happen to be one of the few people who is actually seriously considering playing games on a 2.8 kg heavy gaming laptop resting on your lap then you need to brace yourself for temperatures of up to 49 °C at the bottom. However, gaming notebooks are usually placed on tables, so the palm rest’s temperatures are much more important. In this particular case, they reach up to 43 °C. The temperatures were inconspicuous in low load scenarios and when the device was idle.
While running our Prime95 + FurMark stress test the CPU ran at 2.9-3 GHz while the GPU settled at around 1,340 MHz. Thus, this not particularly realistic load scenario led to moderate throttling. Maximum temperatures were determined to be 83 and 84 °C for the CPU and GPU, respectively.
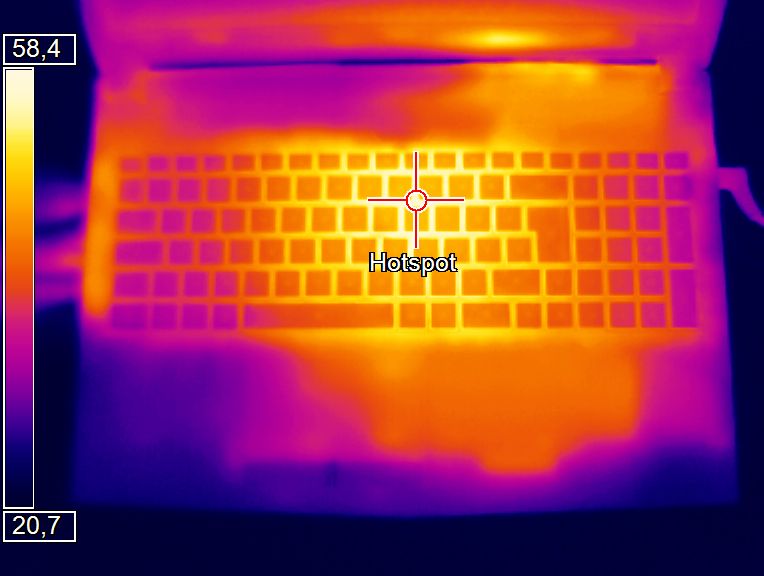
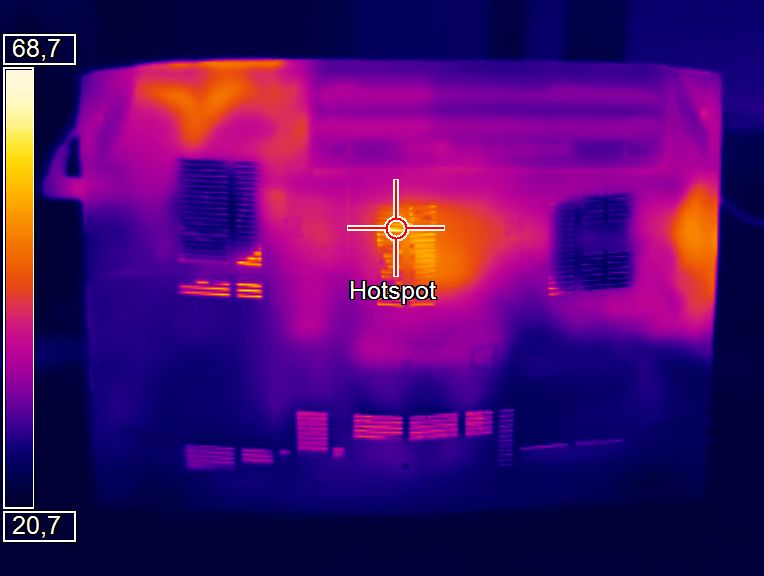
(-) The maximum temperature on the upper side is 50 °C / 122 F, compared to the average of 40.4 °C / 105 F, ranging from 21.2 to 68.8 °C for the class Gaming.
(-) The bottom heats up to a maximum of 49 °C / 120 F, compared to the average of 43.2 °C / 110 F
(+) In idle usage, the average temperature for the upper side is 25.6 °C / 78 F, compared to the device average of 33.9 °C / 93 F.
(-) Playing The Witcher 3, the average temperature for the upper side is 42.7 °C / 109 F, compared to the device average of 33.9 °C / 93 F.
(-) The palmrests and touchpad can get very hot to the touch with a maximum of 43 °C / 109.4 F.
(-) The average temperature of the palmrest area of similar devices was 28.8 °C / 83.8 F (-14.2 °C / -25.6 F).
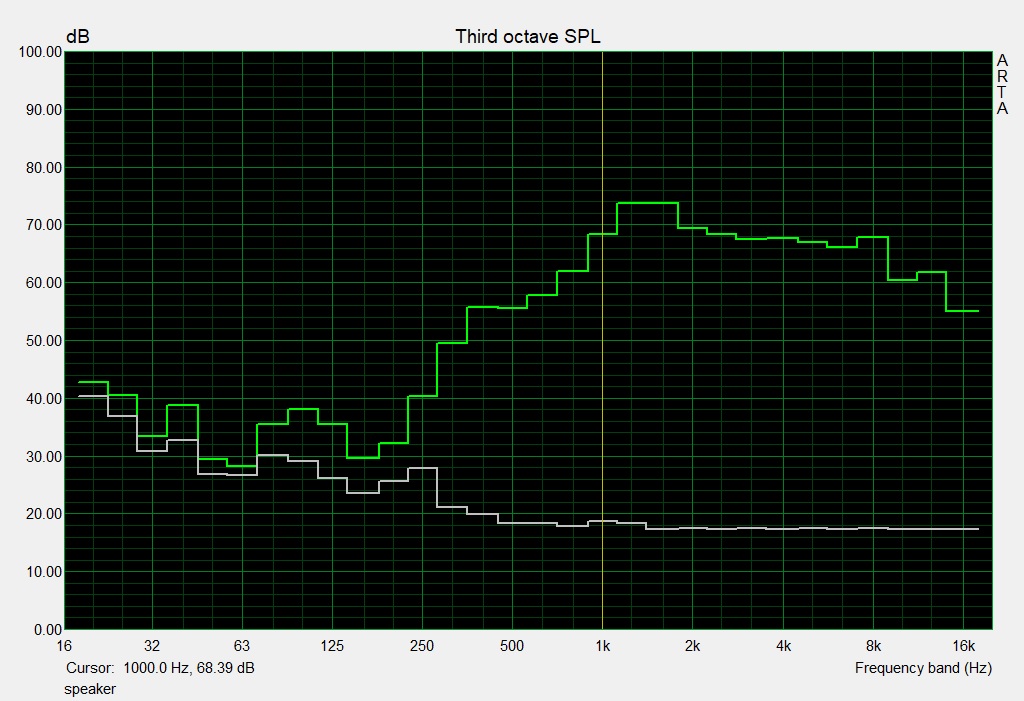
Speaker
The front-facing 2.0 speakers sounded somewhat balanced and natural; however, they were also noticeably muffled. Dynamic range and auditory spaciousness were practically non-existent and several high-pitched instruments (think Metal music for example) tended to blend and mash. In addition, they caused volume fluctuations due to overburdened speakers that were forced to down-regulate their levels.
On the plus side, the speakers did not distort and neither was their soundscape particularly shrill. By and large they were still pretty poor and inadequate considering the notebook’s price. In fact, the sound performance would have even been too poor for a cheap multimedia notebook.
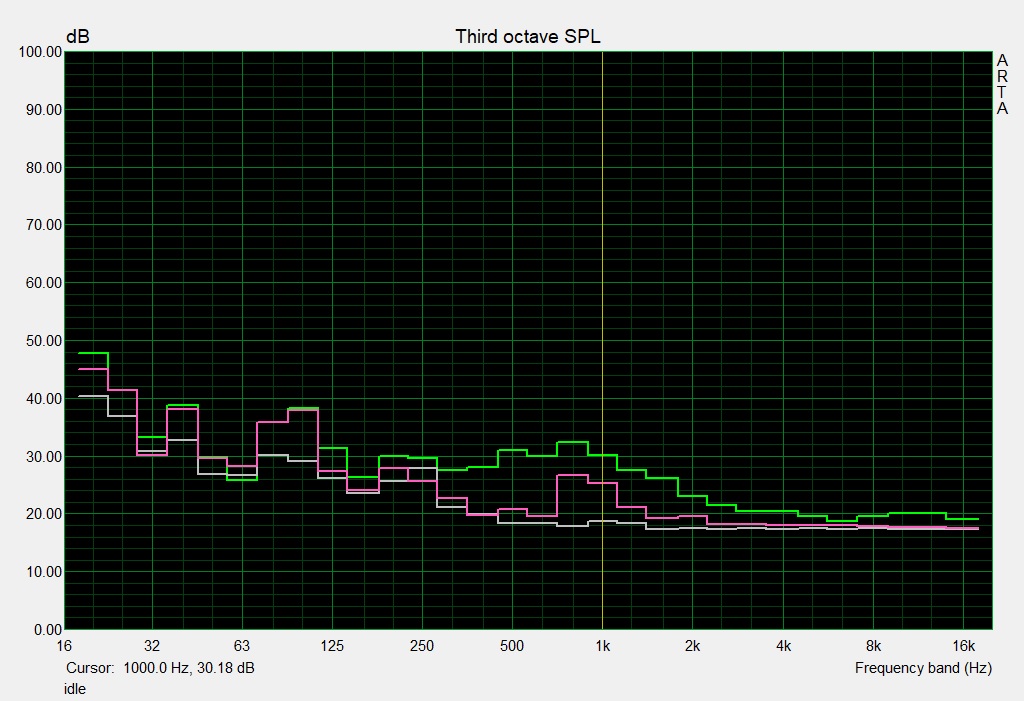
Schenker XMG Apex 15 audio analysis
(±) | speaker loudness is average but good (81 dB)
Bass 100 - 315 Hz
(-) | nearly no bass - on average 24.2% lower than median
(±) | linearity of bass is average (11.7% delta to prev. frequency)
Mids 400 - 2000 Hz
(±) | higher mids - on average 6.8% higher than median
(±) | linearity of mids is average (8.3% delta to prev. frequency)
Highs 2 - 16 kHz
(±) | higher highs - on average 5.1% higher than median
(+) | highs are linear (4.1% delta to prev. frequency)
Overall 100 - 16.000 Hz
(±) | linearity of overall sound is average (25.3% difference to median)
Compared to same class
» 90% of all tested devices in this class were better, 2% similar, 7% worse
» The best had a delta of 6%, average was 18%, worst was 132%
Compared to all devices tested
» 78% of all tested devices were better, 5% similar, 18% worse
» The best had a delta of 4%, average was 23%, worst was 134%
MSI GE63VR 7RF Raider audio analysis
(+) | speakers can play relatively loud (93 dB)
Bass 100 - 315 Hz
(±) | reduced bass - on average 6.6% lower than median
(±) | linearity of bass is average (8.2% delta to prev. frequency)
Mids 400 - 2000 Hz
(+) | balanced mids - only 4.1% away from median
(+) | mids are linear (4.7% delta to prev. frequency)
Highs 2 - 16 kHz
(+) | balanced highs - only 2.6% away from median
(+) | highs are linear (4.6% delta to prev. frequency)
Overall 100 - 16.000 Hz
(+) | overall sound is linear (9.9% difference to median)
Compared to same class
» 5% of all tested devices in this class were better, 2% similar, 94% worse
» The best had a delta of 6%, average was 18%, worst was 132%
Compared to all devices tested
» 4% of all tested devices were better, 1% similar, 95% worse
» The best had a delta of 4%, average was 23%, worst was 134%
HP Omen 15t-ce000 audio analysis
(-) | not very loud speakers (65.4 dB)
Bass 100 - 315 Hz
(±) | reduced bass - on average 13.8% lower than median
(-) | bass is not linear (15.7% delta to prev. frequency)
Mids 400 - 2000 Hz
(+) | balanced mids - only 3.3% away from median
(±) | linearity of mids is average (10.4% delta to prev. frequency)
Highs 2 - 16 kHz
(+) | balanced highs - only 3.8% away from median
(±) | linearity of highs is average (7.2% delta to prev. frequency)
Overall 100 - 16.000 Hz
(±) | linearity of overall sound is average (21.7% difference to median)
Compared to same class
» 78% of all tested devices in this class were better, 5% similar, 17% worse
» The best had a delta of 6%, average was 18%, worst was 132%
Compared to all devices tested
» 62% of all tested devices were better, 7% similar, 31% worse
» The best had a delta of 4%, average was 23%, worst was 134%
Schenker XMG Core 15 audio analysis
(±) | speaker loudness is average but good (75 dB)
Bass 100 - 315 Hz
(±) | reduced bass - on average 8% lower than median
(±) | linearity of bass is average (11.7% delta to prev. frequency)
Mids 400 - 2000 Hz
(±) | higher mids - on average 10.1% higher than median
(±) | linearity of mids is average (13.2% delta to prev. frequency)
Highs 2 - 16 kHz
(+) | balanced highs - only 1.9% away from median
(±) | linearity of highs is average (7.5% delta to prev. frequency)
Overall 100 - 16.000 Hz
(±) | linearity of overall sound is average (23.6% difference to median)
Compared to same class
» 86% of all tested devices in this class were better, 4% similar, 10% worse
» The best had a delta of 6%, average was 18%, worst was 132%
Compared to all devices tested
» 71% of all tested devices were better, 6% similar, 23% worse
» The best had a delta of 4%, average was 23%, worst was 134%
Energy Management
Power Consumption
Our three idle tests paint a very clear picture: The new Apex was not just the most energy-efficient notebook in our test group but also consumed much less power than the average GTX 1060 laptop. The XMG Core 15 had the highest idle power consumption of our test group, even higher than the GTX 1070-powered MSI or the UHD display-equipped HP. In return, our review unit had the highest power consumption under medium load, most likely due to the 65 W hexa-core CPU.
The power consumption while running The Witcher 3 is also worth taking a closer look at. The MSI had the highest power consumption due to its GTX 1070 GPU, followed by our review unit due to its 65 W CPU. Thanks to its GTX 1060 Max-Q GPU the HP Omen had the lowest gaming power consumption. The Schenker’s 230 W power supply is amply dimensioned.
| Off / Standby | |
| Idle | |
| Load |
|
Key:
min: | |
| Schenker XMG Apex 15 i7-8700, GeForce GTX 1060 Mobile | MSI GE63VR 7RF Raider i7-7700HQ, GeForce GTX 1070 Mobile | HP Omen 15t-ce000 i7-7700HQ, GeForce GTX 1060 Max-Q | Schenker XMG Core 15 i7-7700HQ, GeForce GTX 1060 Mobile | Average of class Gaming | |
|---|---|---|---|---|---|
| Power Consumption | -38% | -38% | -57% | -61% | |
| Idle Minimum * (Watt) | 7 | 11 -57% | 15.4 -120% | 18 -157% | 13 ? -86% |
| Idle Average * (Watt) | 10 | 16 -60% | 22.4 -124% | 22 -120% | 19 ? -90% |
| Idle Maximum * (Watt) | 14 | 21 -50% | 22.4 -60% | 26 -86% | 24.6 ? -76% |
| Load Average * (Watt) | 114 | 92 19% | 78.1 31% | 93 18% | 110.7 ? 3% |
| Witcher 3 ultra * (Watt) | 131 | 185 -41% | 97.5 26% | 119 9% | |
| Load Maximum * (Watt) | 164 | 224 -37% | 133.52 19% | 175 -7% | 259 ? -58% |
* ... smaller is better
Battery Life
Battery life is most likely found towards the bottom of any list of a gaming notebook’s priorities and characteristics. To our surprise the Apex 15’s 62 Wh battery offered very decent battery life in all of our test scenarios and outperformed every single one of its competitors, including the HP and Schenker XMG Core 15 with their 70 and 82 Wh batteries, respectively. Taking a step back and looking at the big picture of all gaming notebooks the Apex 15 performed significantly above average. The actual delta depends on test scenario and was anywhere between 27% (H.264) and 79% (Idle). The Apex lasted for 5.5 hours in our real-world Wi-Fi test - for office notebooks, we usually expect a runtime of around 10 hours. Thus, the Apex 15’s low power consumption and long battery life were definitely positive aspects.
| Schenker XMG Apex 15 i7-8700, GeForce GTX 1060 Mobile, 62 Wh | MSI GE63VR 7RF Raider i7-7700HQ, GeForce GTX 1070 Mobile, 51 Wh | HP Omen 15t-ce000 i7-7700HQ, GeForce GTX 1060 Max-Q, 70 Wh | Schenker XMG Core 15 i7-7700HQ, GeForce GTX 1060 Mobile, 82 Wh | Average of class Gaming | |
|---|---|---|---|---|---|
| Battery runtime | -48% | -36% | -29% | 15% | |
| Reader / Idle (h) | 9.6 | 5.4 -44% | 5 -48% | 5 -48% | 8.27 ? -14% |
| H.264 (h) | 5.1 | 3.9 -24% | 8.32 ? 63% | ||
| WiFi v1.3 (h) | 5.6 | 3.4 -39% | 3.5 -37% | 4.7 -16% | 7.11 ? 27% |
| Load (h) | 1.8 | 0.7 -61% | 1.4 -22% | 1.3 -28% | 1.502 ? -17% |
Verdict
Pros
Cons
Granted, the Schenker XMG Apex 15’s Core i7-8700 CPU is too much when looking exclusively at gaming requirements. However, this does not necessarily have to be a bad thing given that the usual drawbacks, such as higher power consumption and a more pronounced system noise, were suspiciously lacking in this case.
All things considered, the Apex 15 is a fun notebook. If only it wasn’t for the poor display lid design.
At a price of roughly 1,700 Euros (~$2,037) you get a solid gaming notebook without extras such as G-Sync or Thunderbolt 3. If you don’t expect to go beyond FHD in the near future then the GTX 1060 will last for quite a few more years, especially considering that the Apex 15 features one of the fastest GTX 1060 implementations currently available.
Its connectivity sets the notebook apart from many of its competitors, and its maintenance options are almost ideal. True, the display lacks dedicated gaming features that we grew accustomed to. Nevertheless, it does a fairly good job. The fast CPU is accompanied by a very quick SSD, and the notebook’s low power consumption results in long battery life. Most drawbacks circle around the display or, more specifically, the display lid design. While we simply cannot understand what choices led to this poor design the device still deserves our full endorsement. If you need even more 3D power then the GTX 1070-powered MSI notebook might be worth taking a closer look at. Beware this notebook’s TN panel, though.
Schenker XMG Apex 15
- 04/28/2018 v6 (old)
Sven Kloevekorn
Price comparison

