Verdict
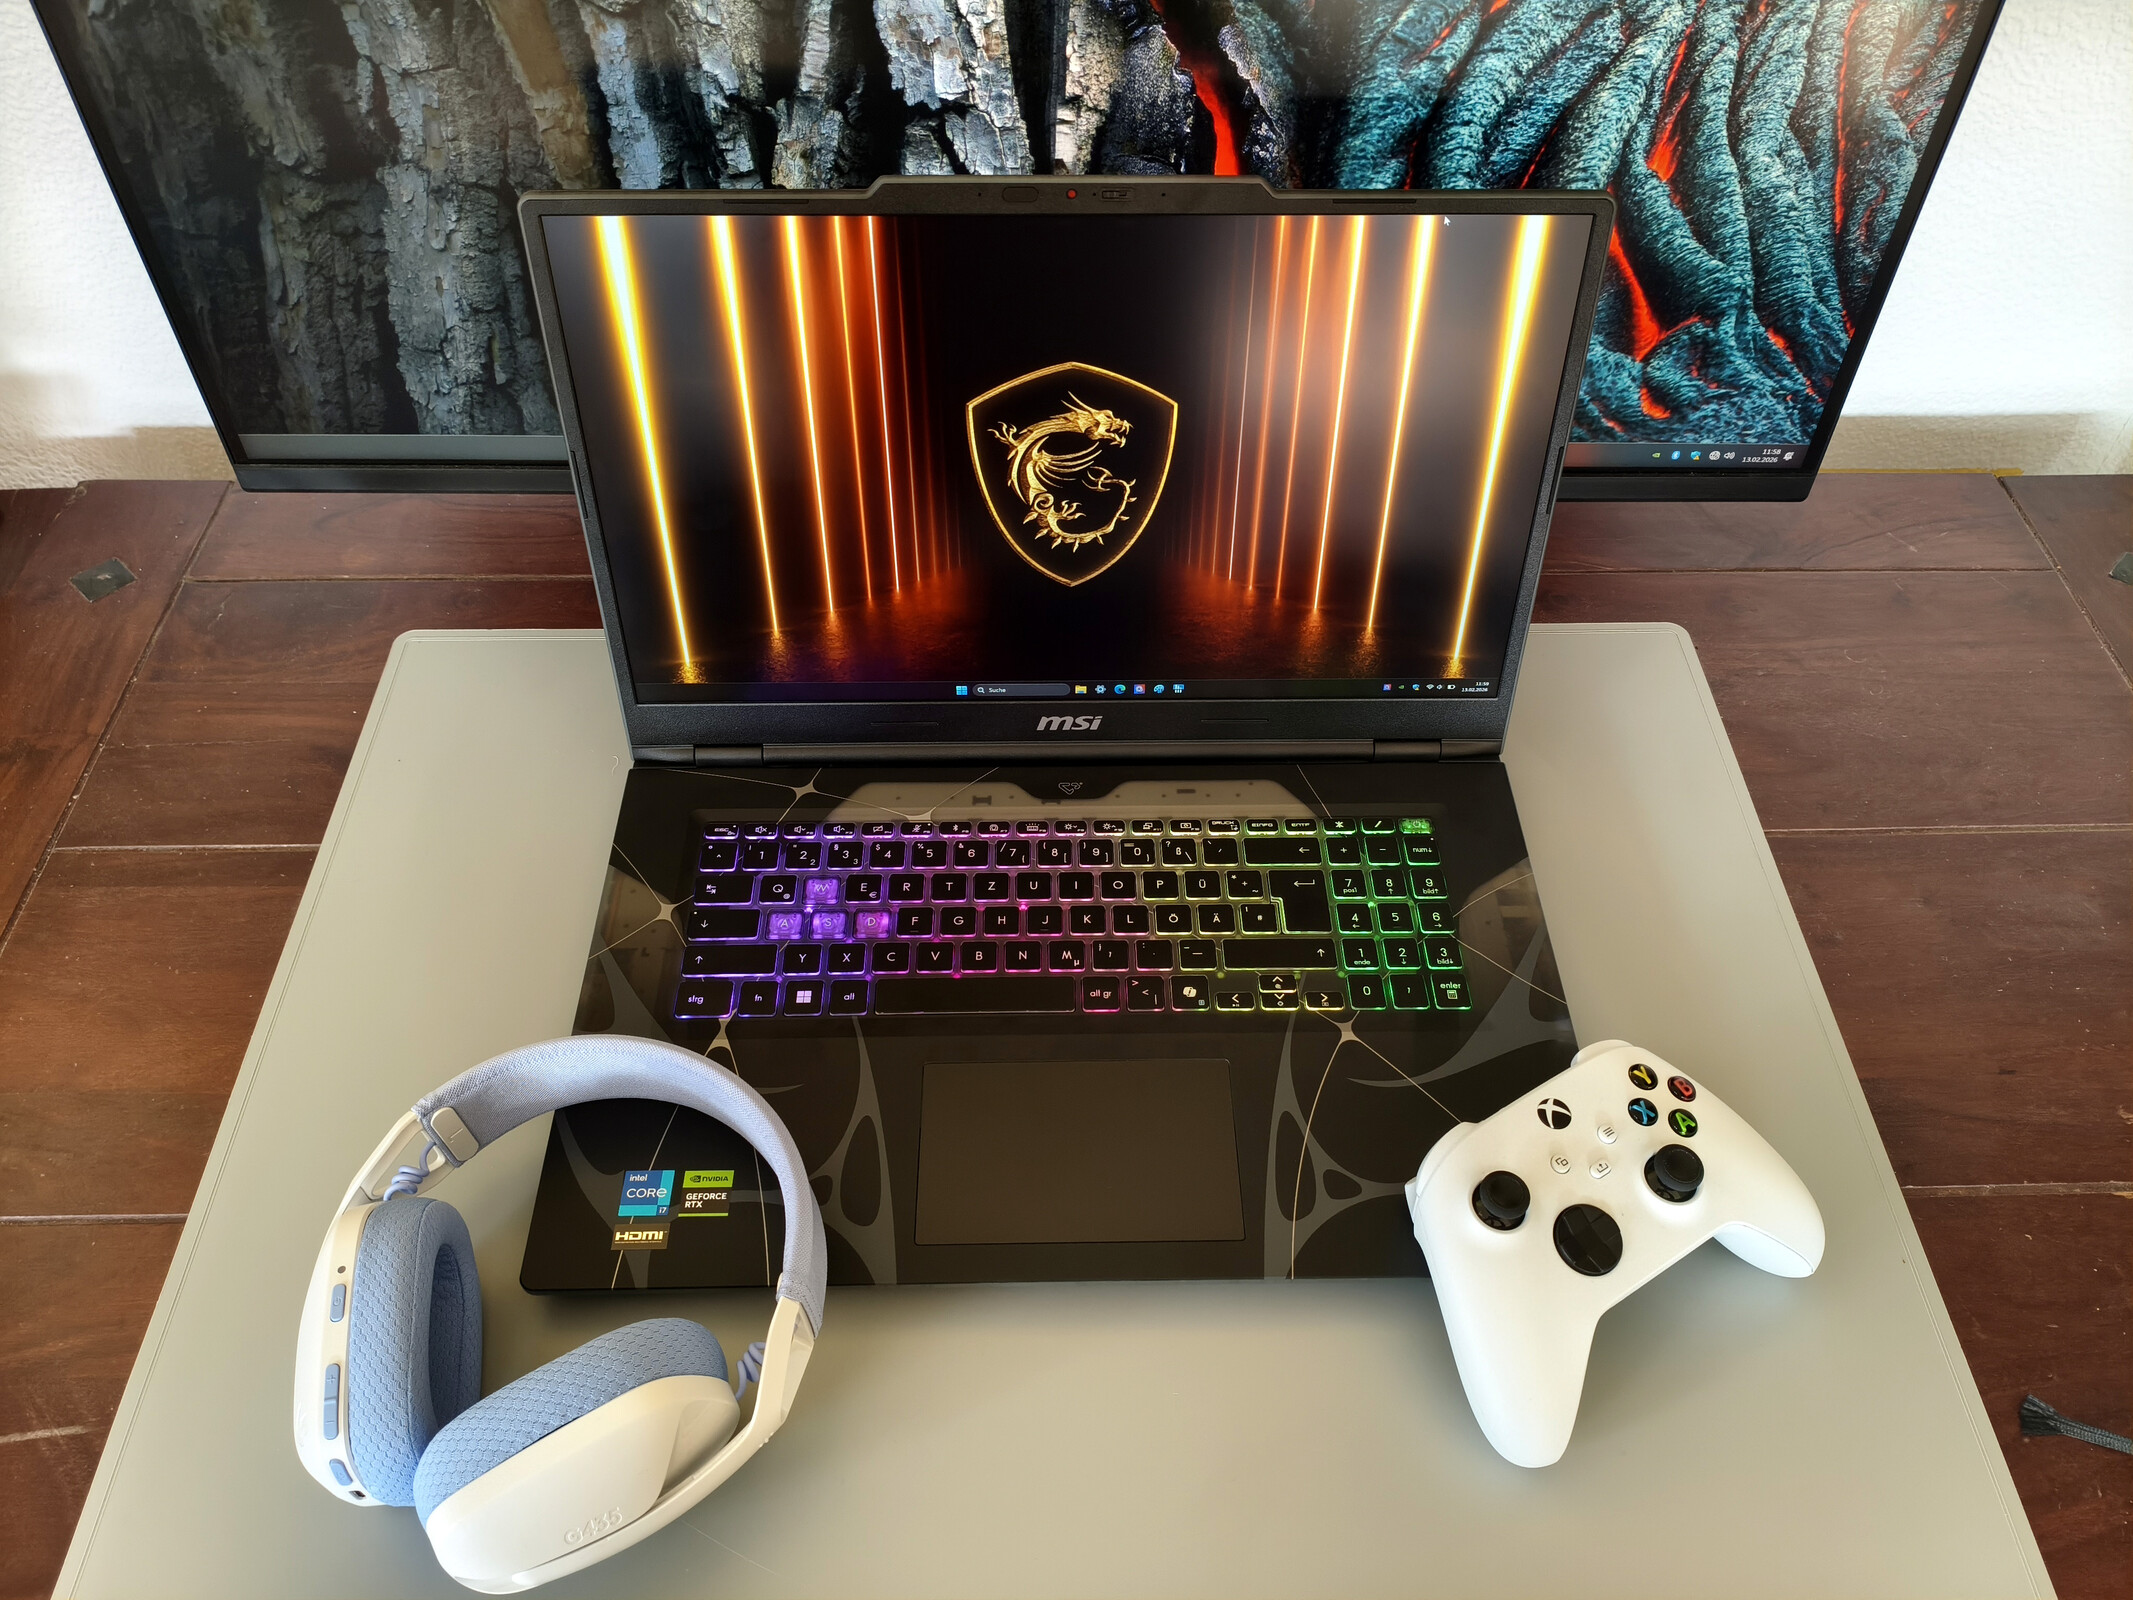
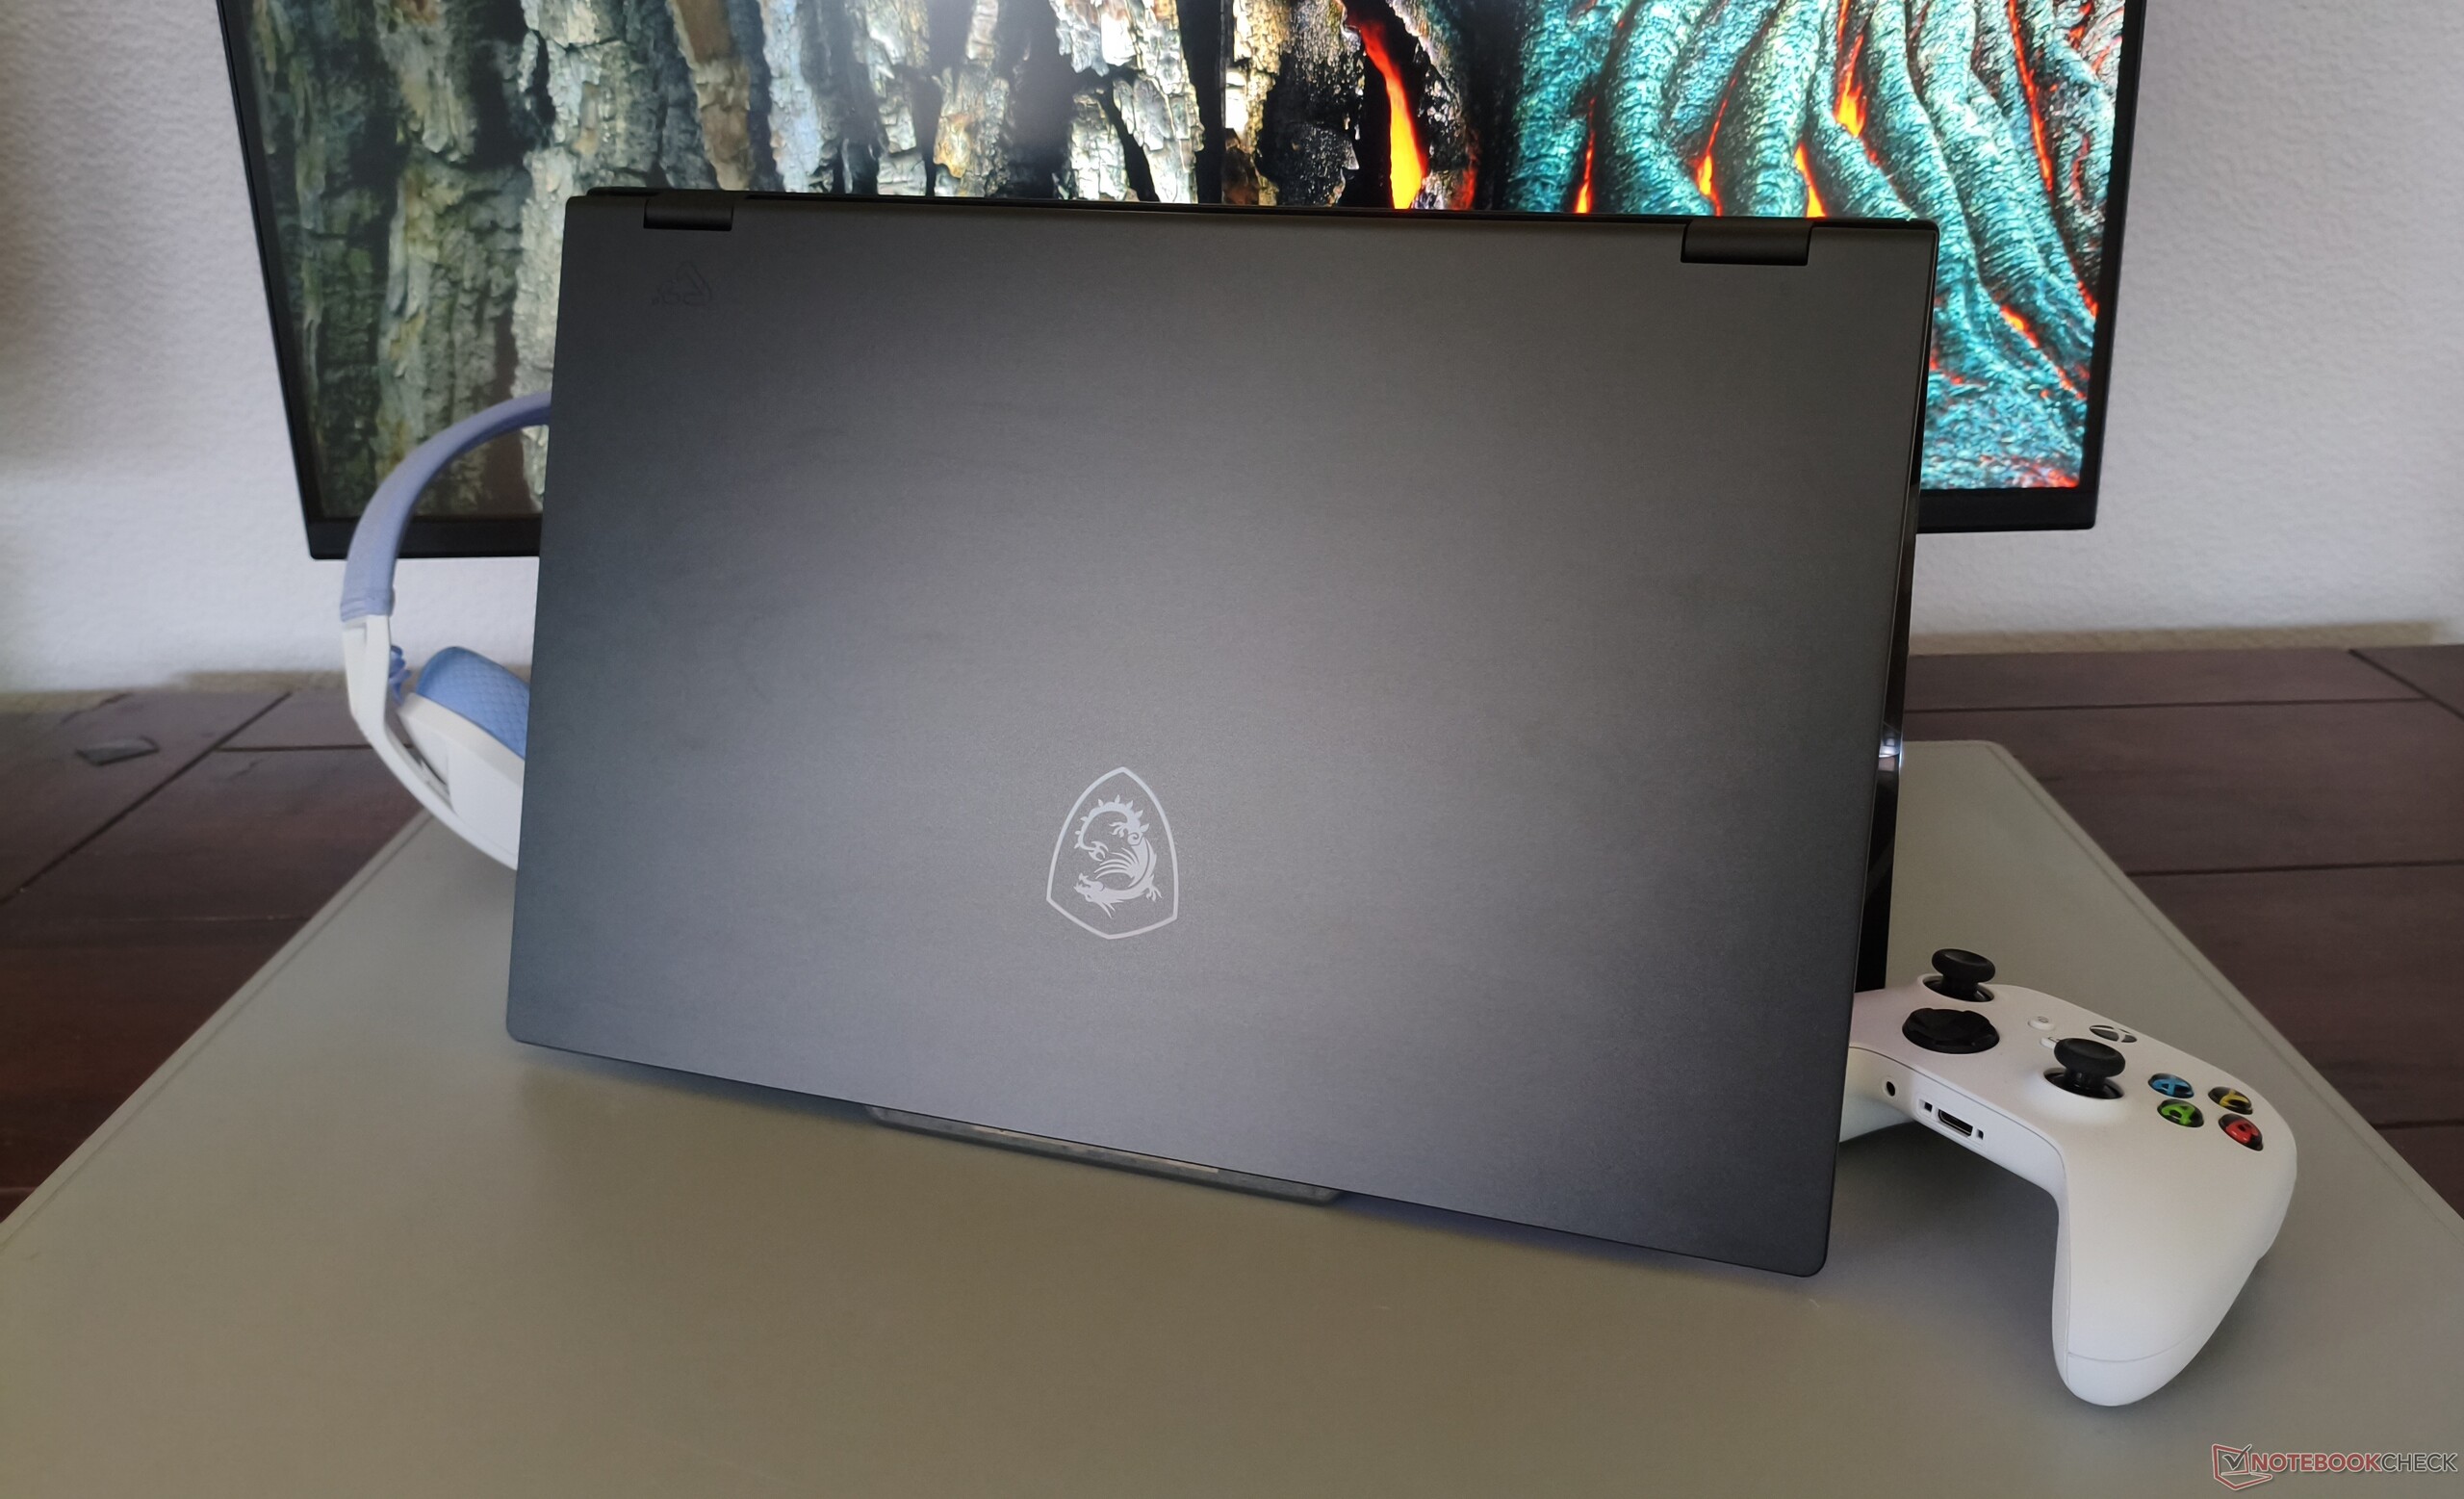
The Cyborg 17 cuts an impressive figure at first glance. The textured top cover with its translucent elements looks appealing and distinctive, and a metal lid is far from guaranteed in the sub-€1,500 price range. Performance, however, leaves a mixed impression. While this test configuration is among the more affordable RTX 5060 laptops, the low 55-watt TGP often causes the 17-inch system to fall behind the competition, and in some cases even behind notebooks equipped with the RTX 5050.
The display reveals further compromises. The Full HD panel is not especially bright and offers only limited colour coverage. There is also room for improvement in terms of connectivity (no card reader) and battery capacity (only 55 Wh). On the other hand, the input devices are reasonably good aside from the unconventional keyboard layout. The ability to upgrade both memory and storage earns additional points, although having only a single M.2 slot is somewhat modest for a 17-inch device.
Competing models in the sub-€1,500 RTX 5000 segment include the Acer Nitro V 16 AI, the Alienware 16 Aurora, the HP Omen 16 and the Gigabyte Gaming A16. One of the stronger RTX 5060 implementations, the more expensive Lenovo Legion 7 16, also serves as a reference point in our comparison charts.
Pros
Cons
Price and availability
The tested MSI Cyborg 17 B13WFKG with a Core i7-13620H and GeForce RTX 5050 Laptop GPU is available from various online retailers (for example, Galaxus) starting at around €1,200, although pricing and availability can vary depending on region and configuration.
- $1,230.99msi Cyborg 17 17.3" FHD 144Hz Gaming Laptop: Intel Core 7-240H, NVIDIA Geforce RTX 5060, 16GB DDR5, 1TB NVMe SSD, Type C, Wi-Fi 6E, Win 11 Home: Translucent Black B2RWFKG-074US
- $939.99msi Cyborg 17 17.3" FHD IPS-Level, 144Hz Gaming Laptop, Intel Core 5-210H Processor, 16GB RAM, 512GB SSD, NVIDIA RTX 5060 Graphics (8GB GDDR7), Wi-Fi 6E, BT 5.3 CYBORG17B2039 (Renewed)
- $1,599.00msi Cyborg 17 B2RWFKG Gaming Laptop 2025 17.3” FHD 1920x1080 Display IPS 144 hz Intel Core 7 240H NVIDIA GeForce RTX 5060 8GB GDDR7 16GB DDR5 1TB SSD Four-Zone RGB Backlit KB Wi-Fi 6E Windows 11 Home
Specifications
Case
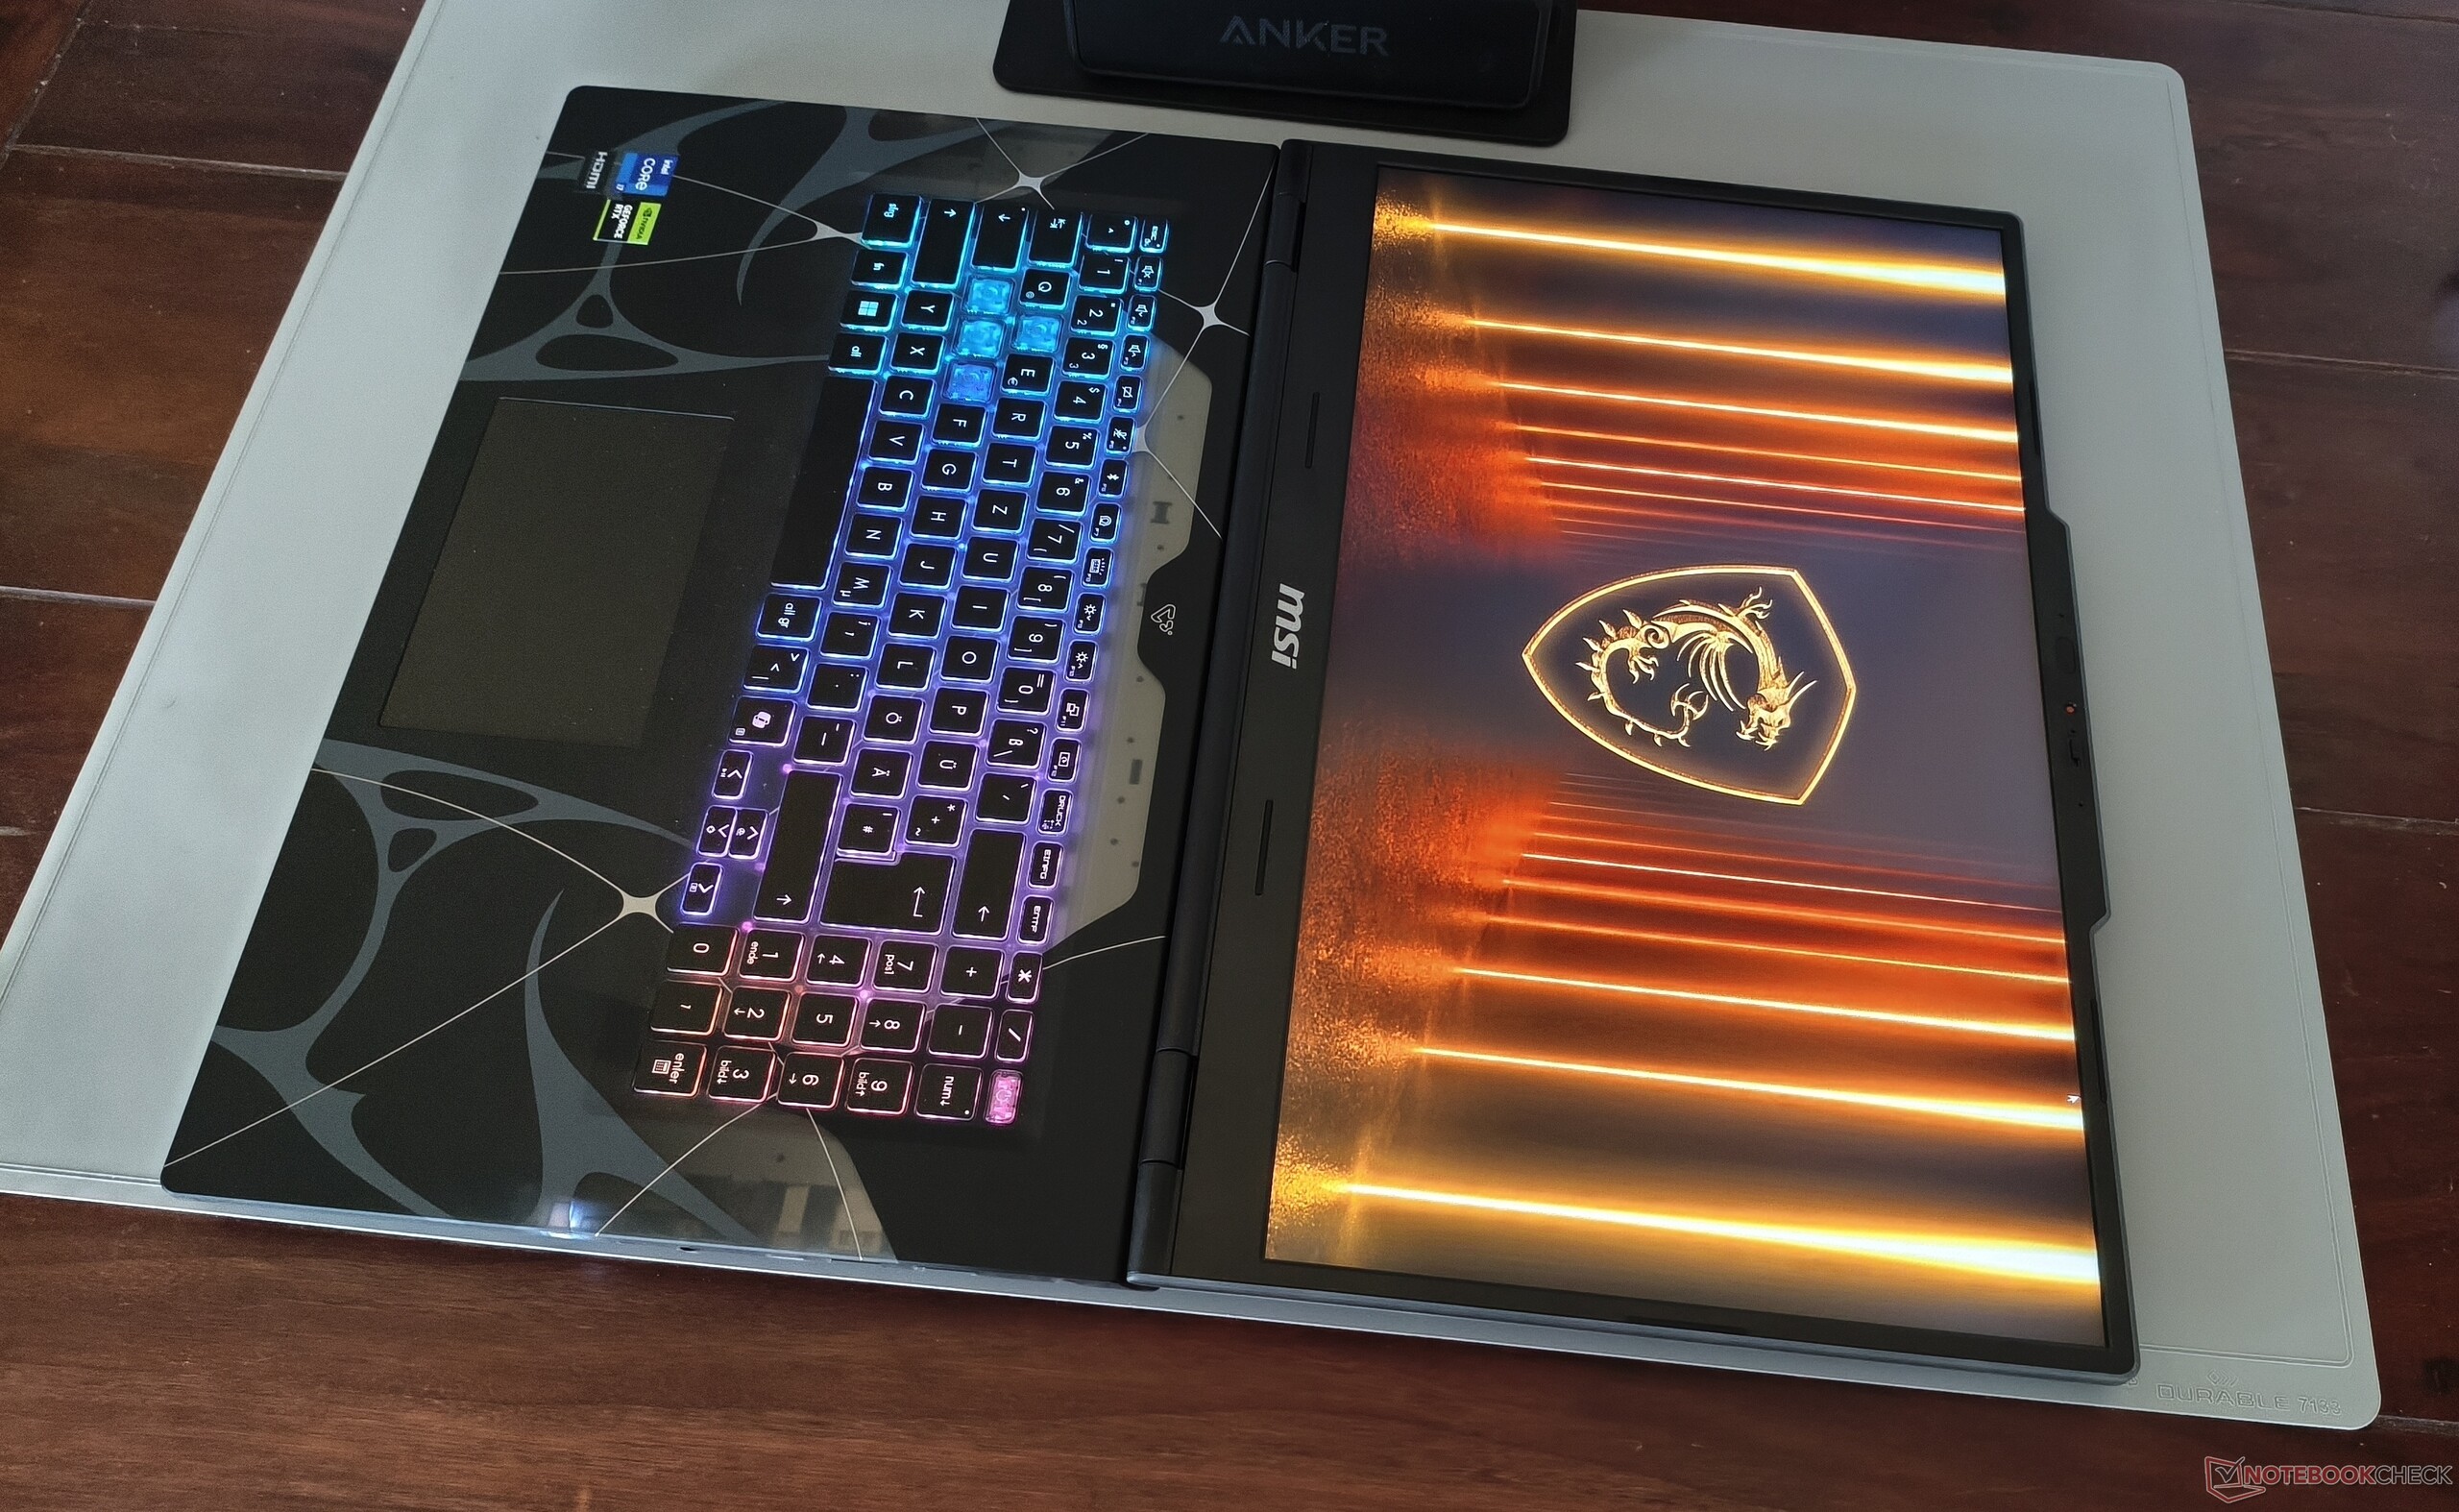
As mentioned at the outset, the case has several strengths. In addition to the design and choice of materials, both build quality and stability are largely convincing. A 180-degree hinge is also not something you see every day. At around 2.6 kg, the Cyborg 17 is in a similar weight range to the Alienware 16 Aurora, and a height of 2.2 cm is perfectly acceptable for a 17-inch device.
Connectivity
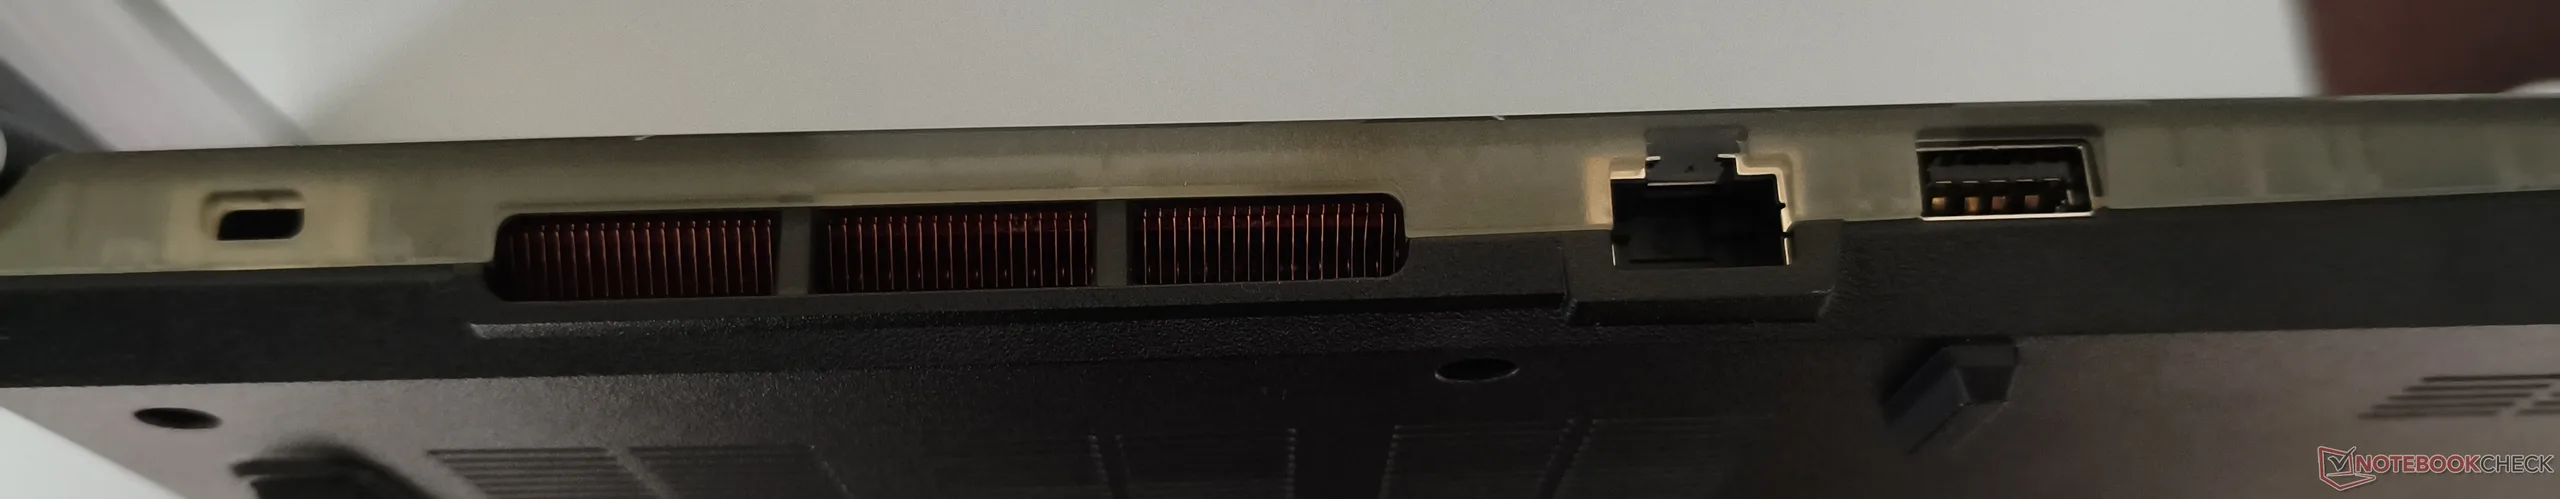
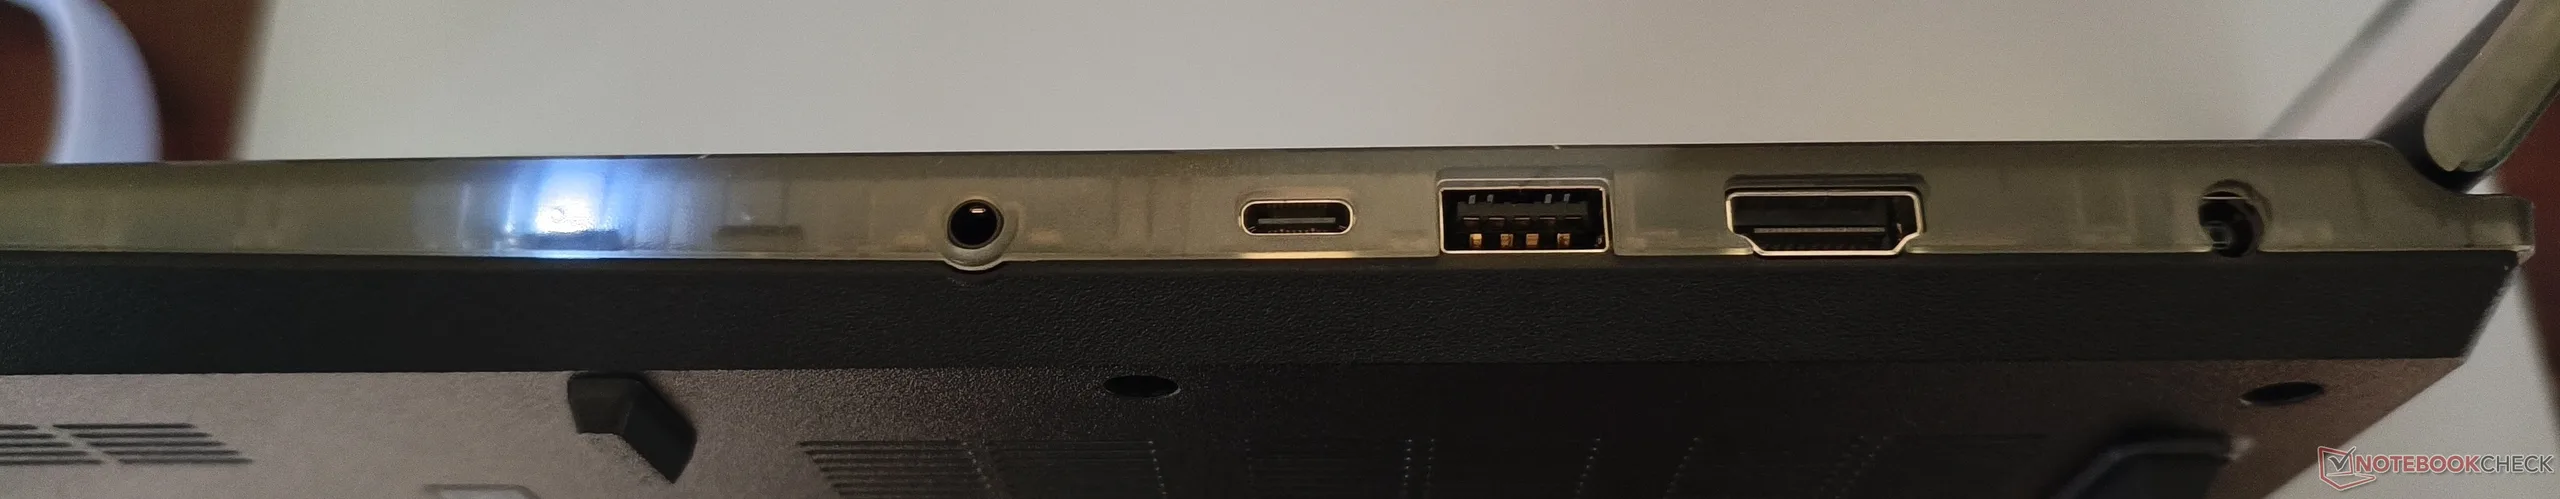
The selection of ports is not particularly generous. Three USB ports feel rather limited, especially since MSI has omitted USB 4 and Thunderbolt support. On the plus side, the available USB-C port supports Power Delivery and DisplayPort. External displays can also be connected directly via HDMI. The package is rounded off by an audio jack, an RJ45 port and a Kensington lock.
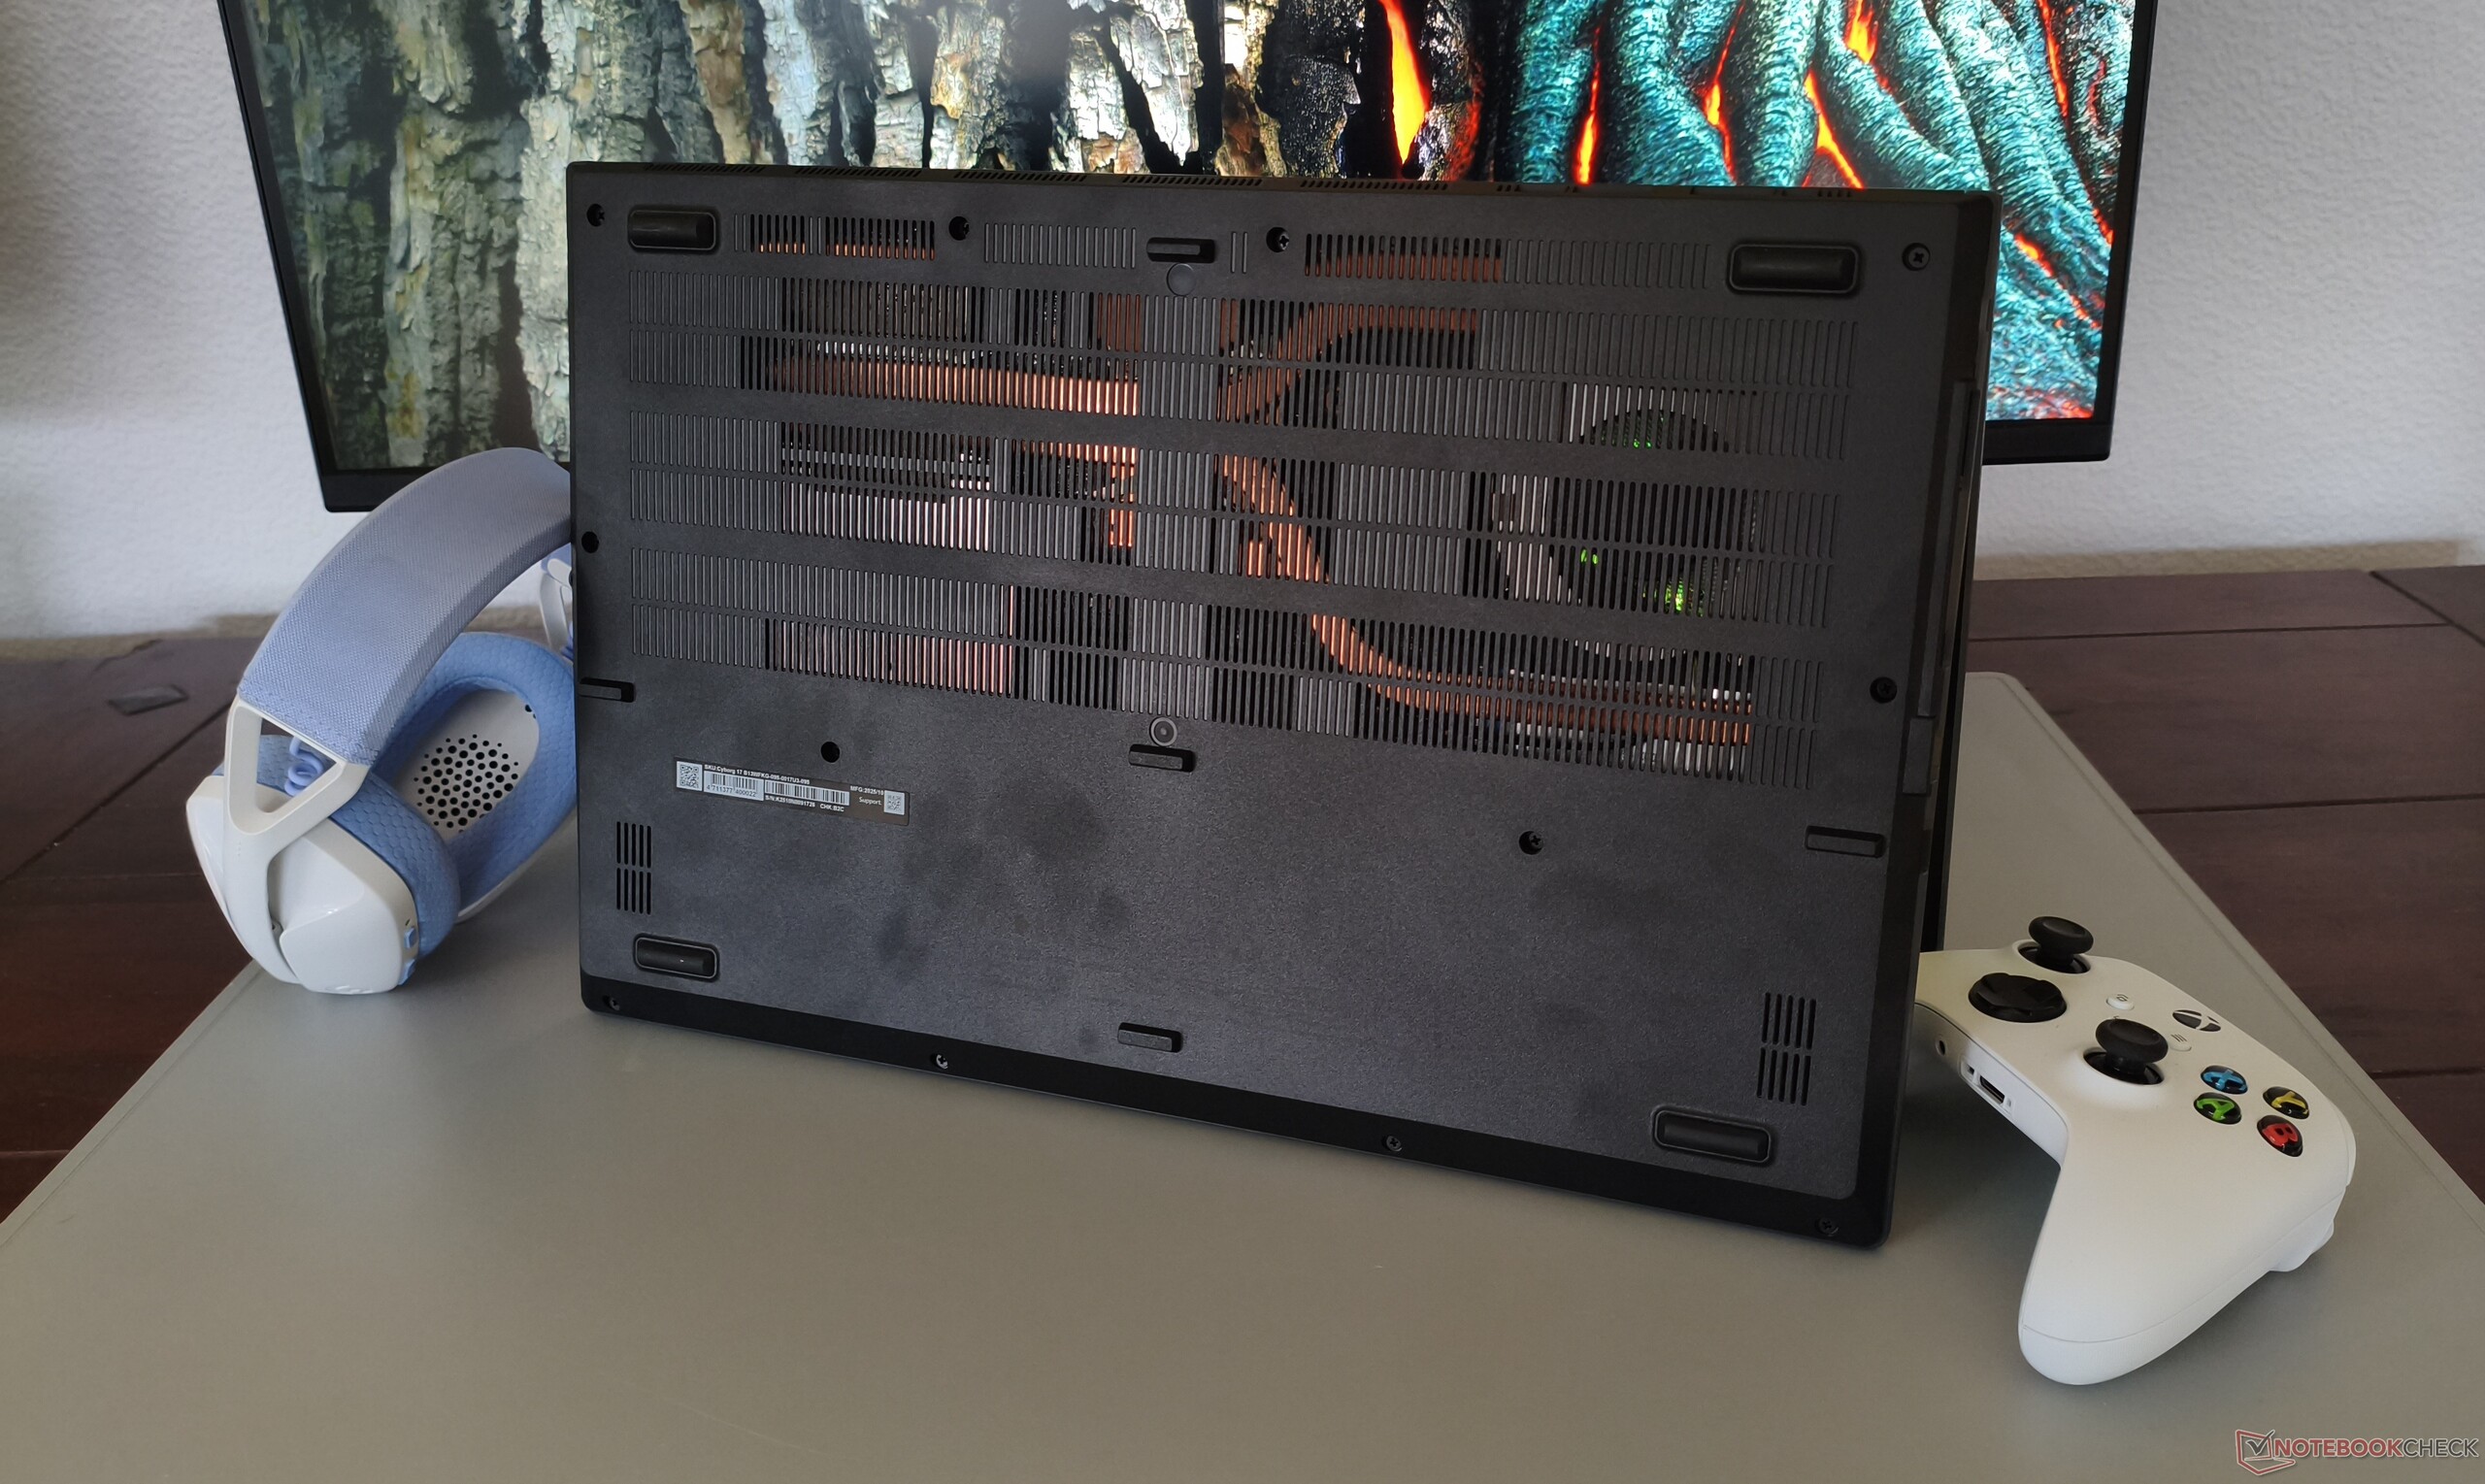
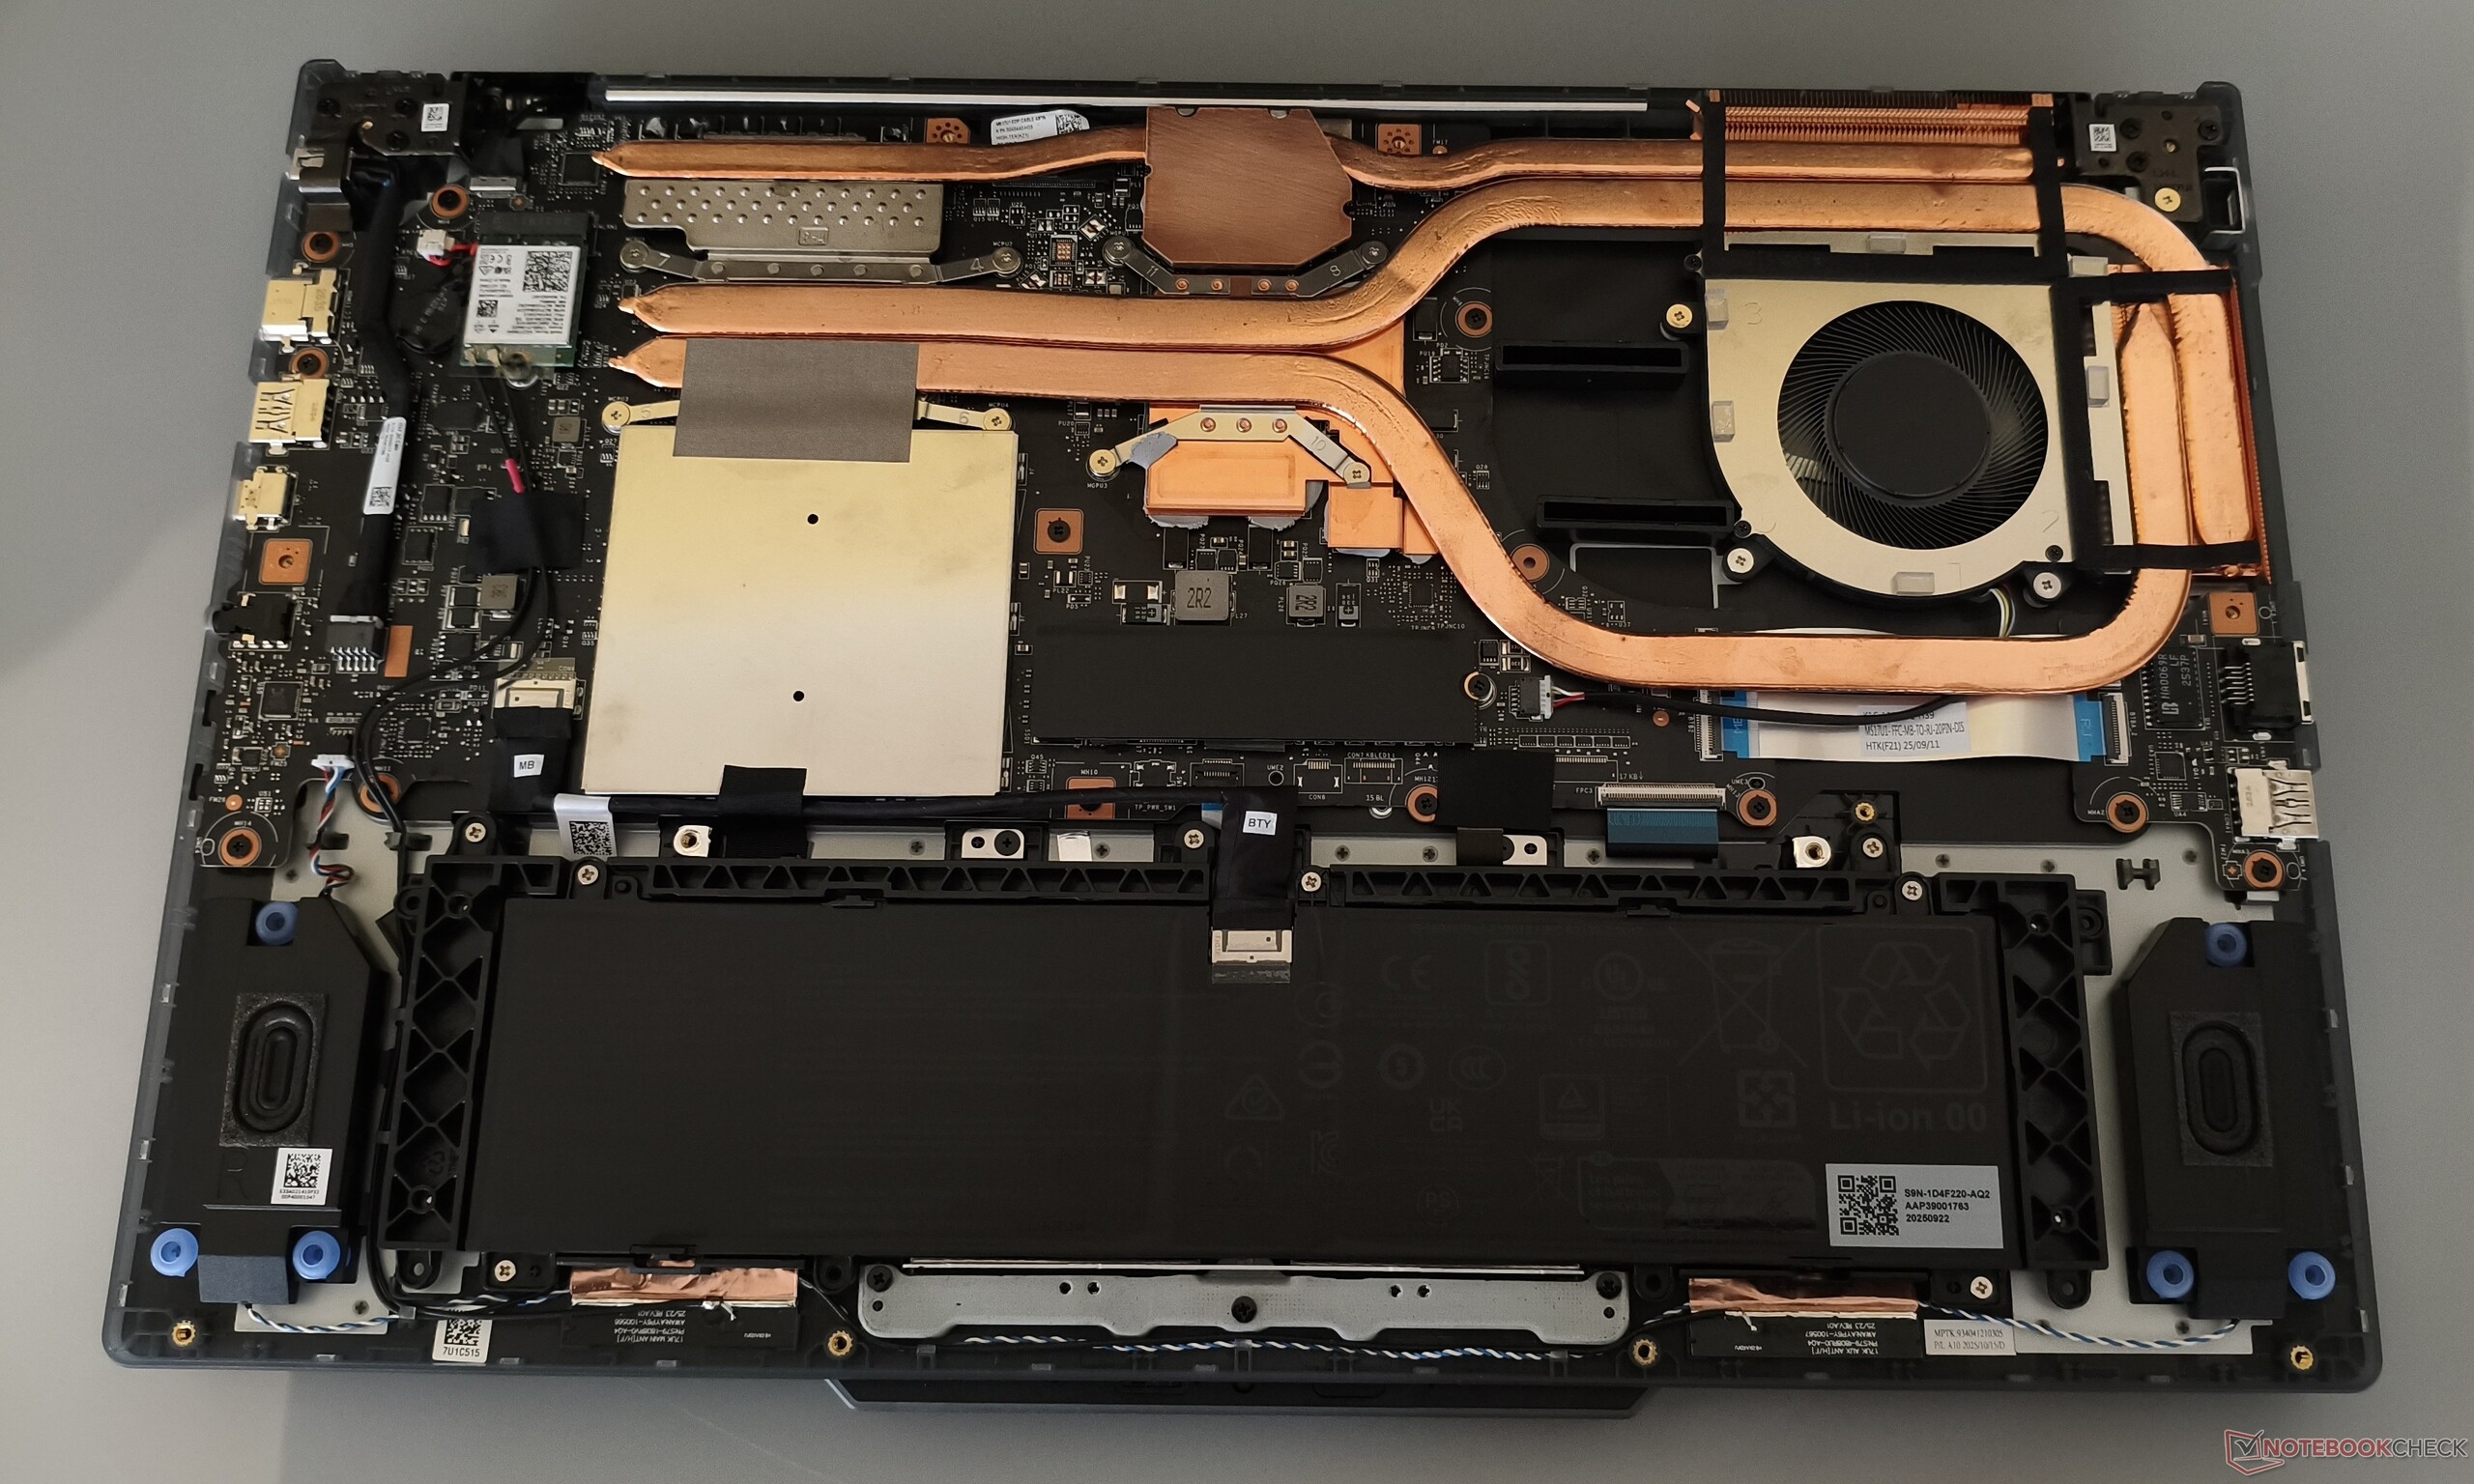
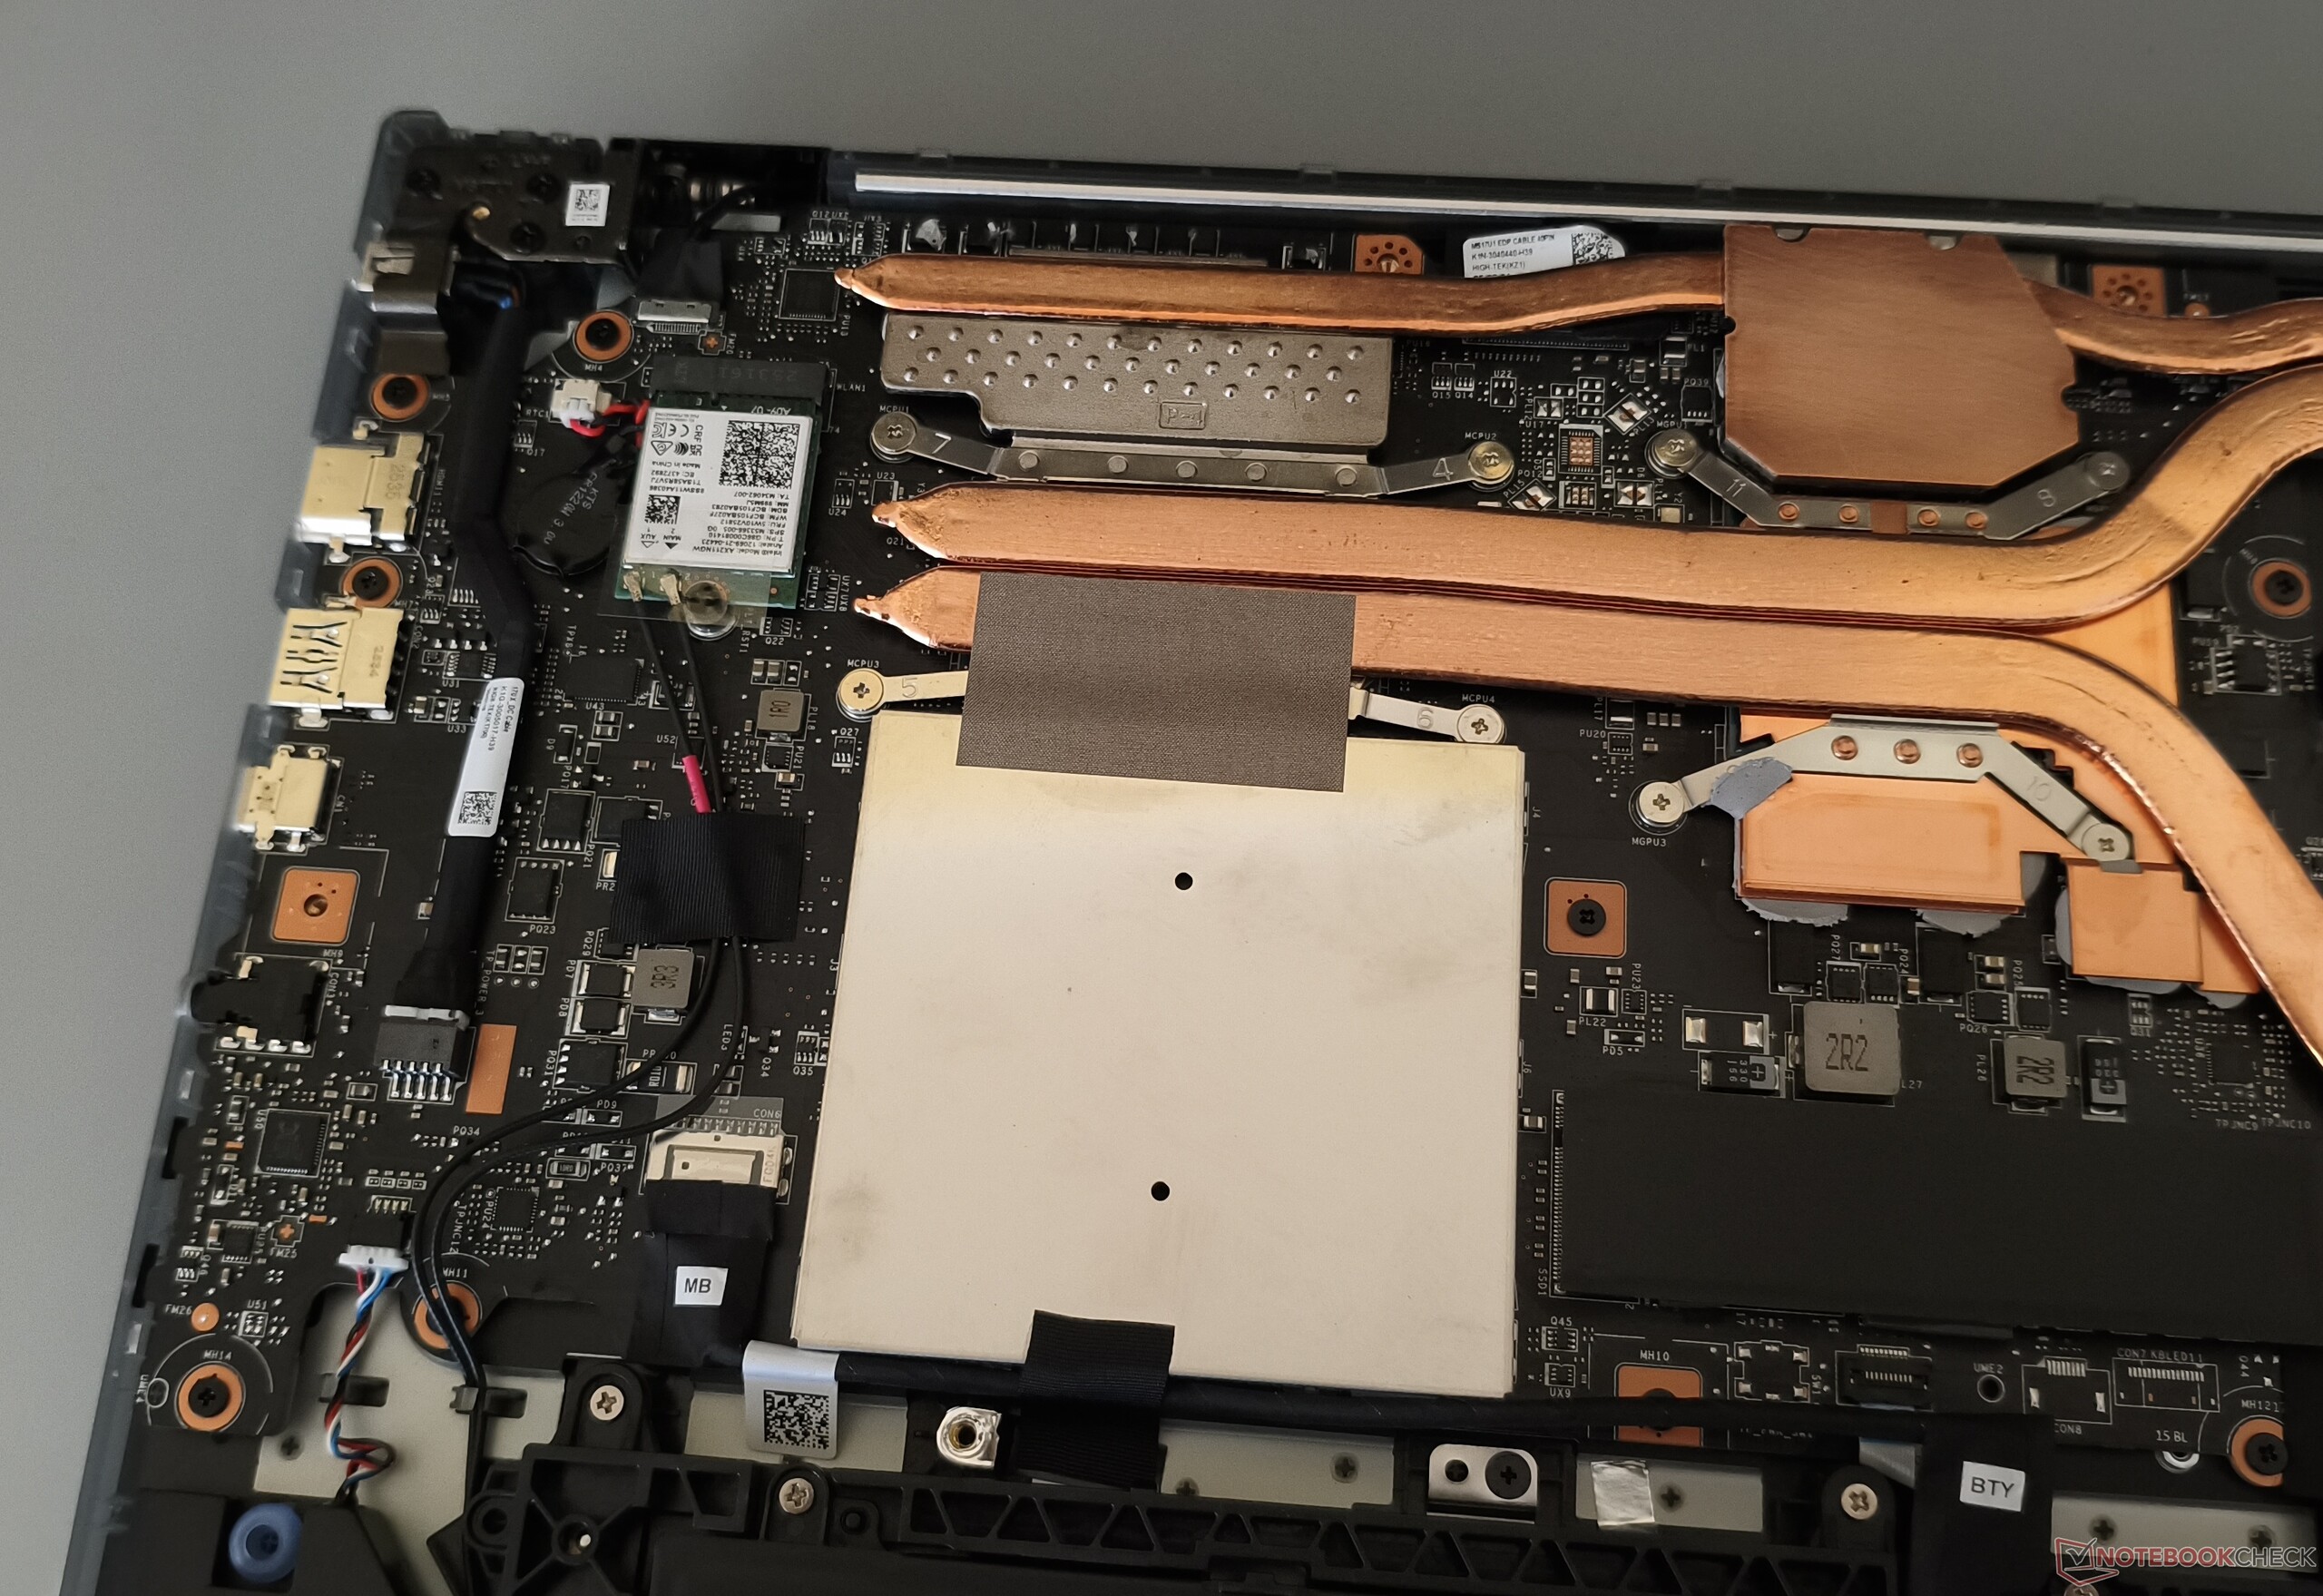
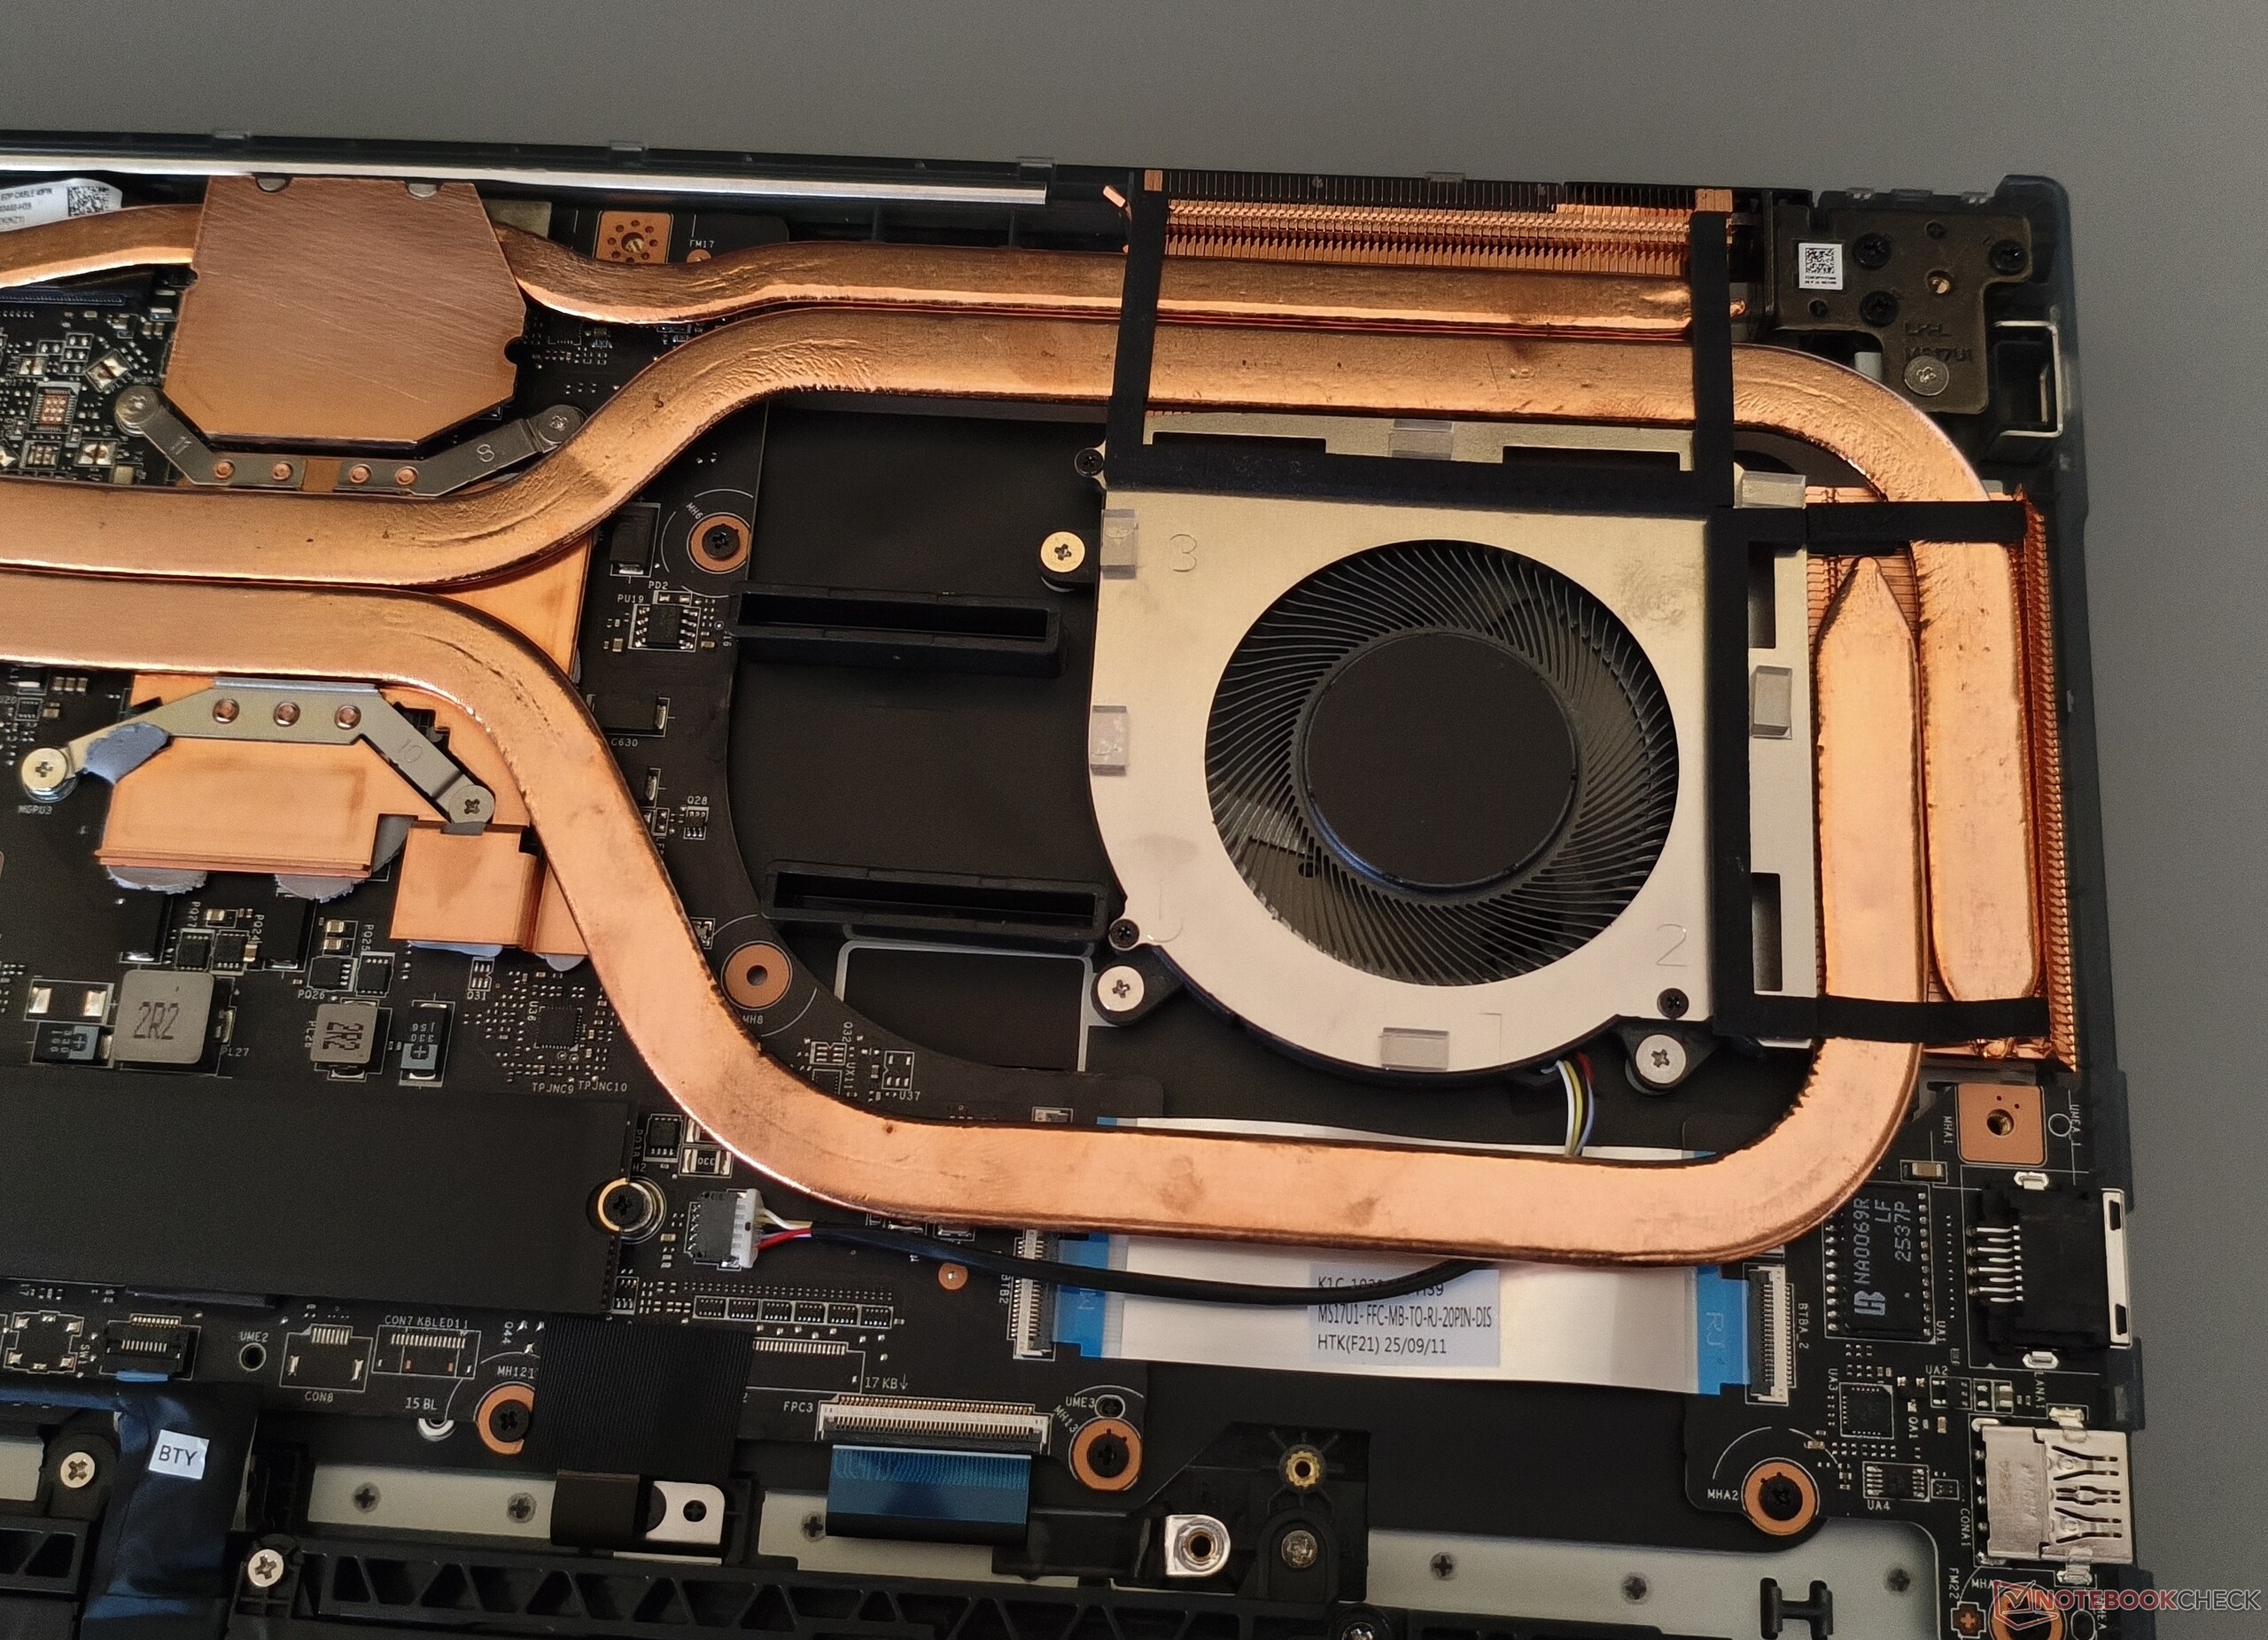
The integrated Wi-Fi 6E module from Intel (AX211) delivers solid performance when transmitting and very good performance when receiving. The webcam quality, however, is quite poor in terms of sharpness and colour accuracy. Opening the case requires removing twelve Phillips screws. Unlike some competitors, MSI relies on a single-fan cooling solution.
Communication
Webcam


Maintenance
Input devices
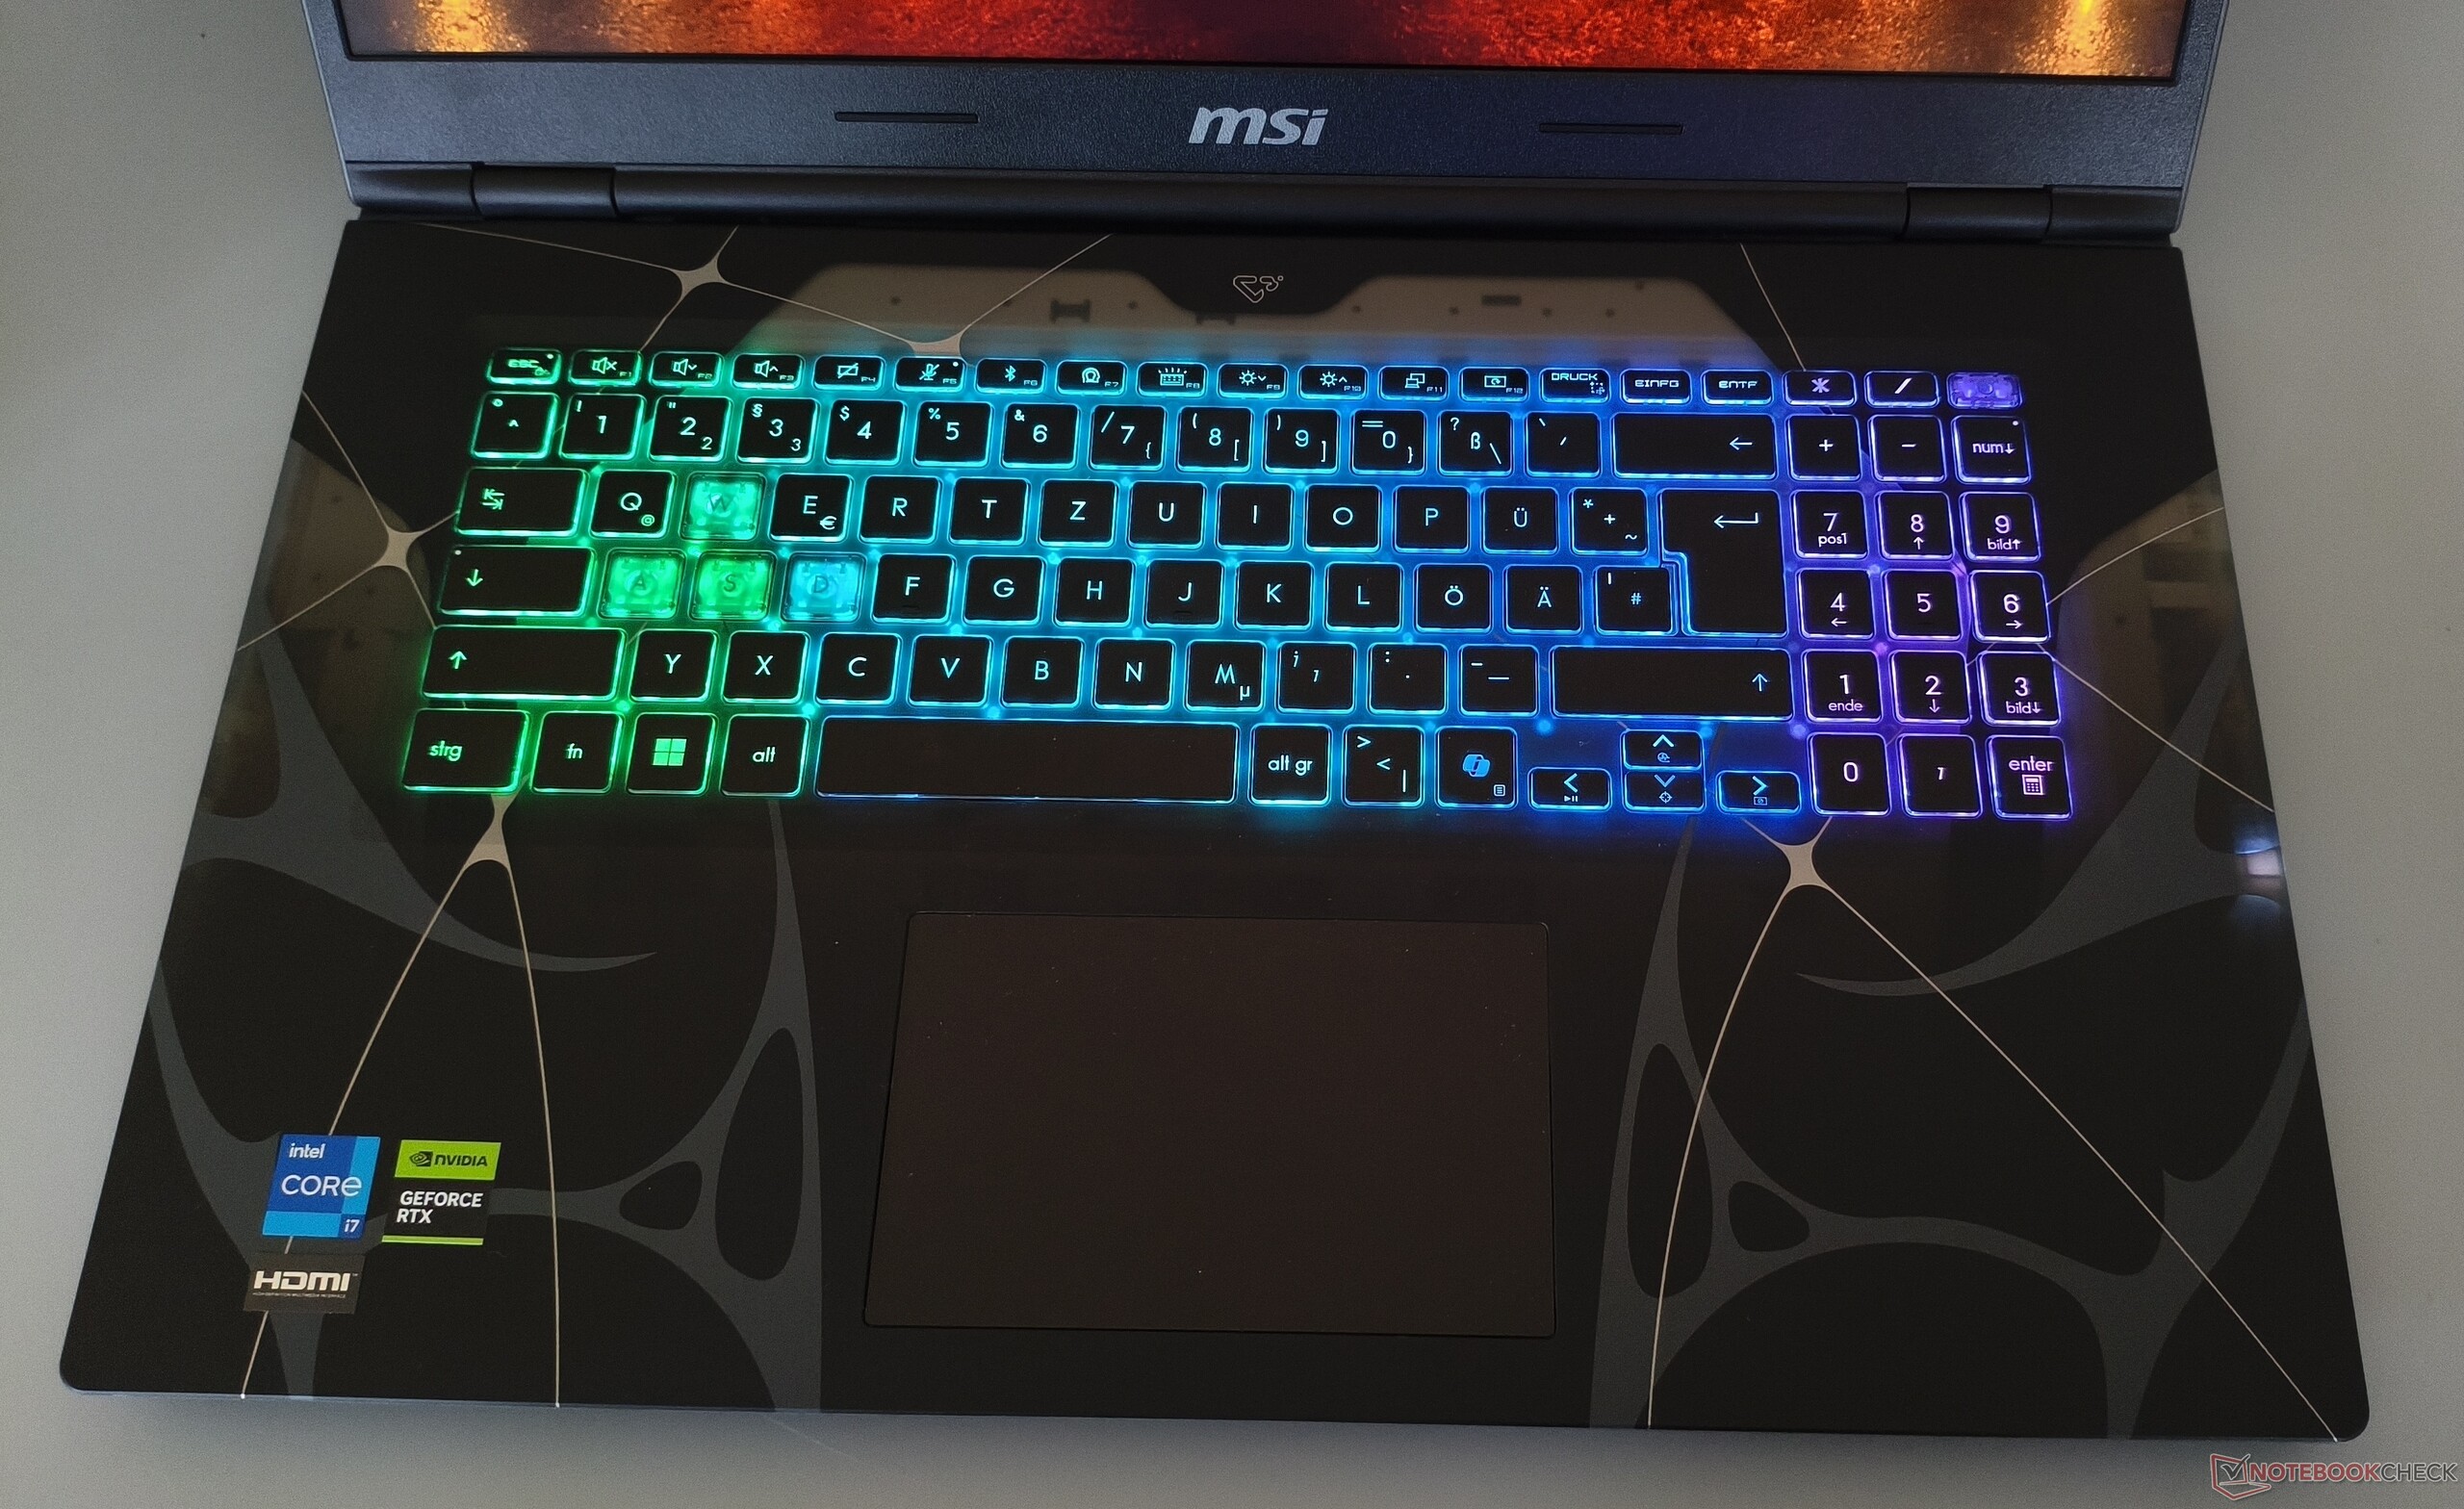
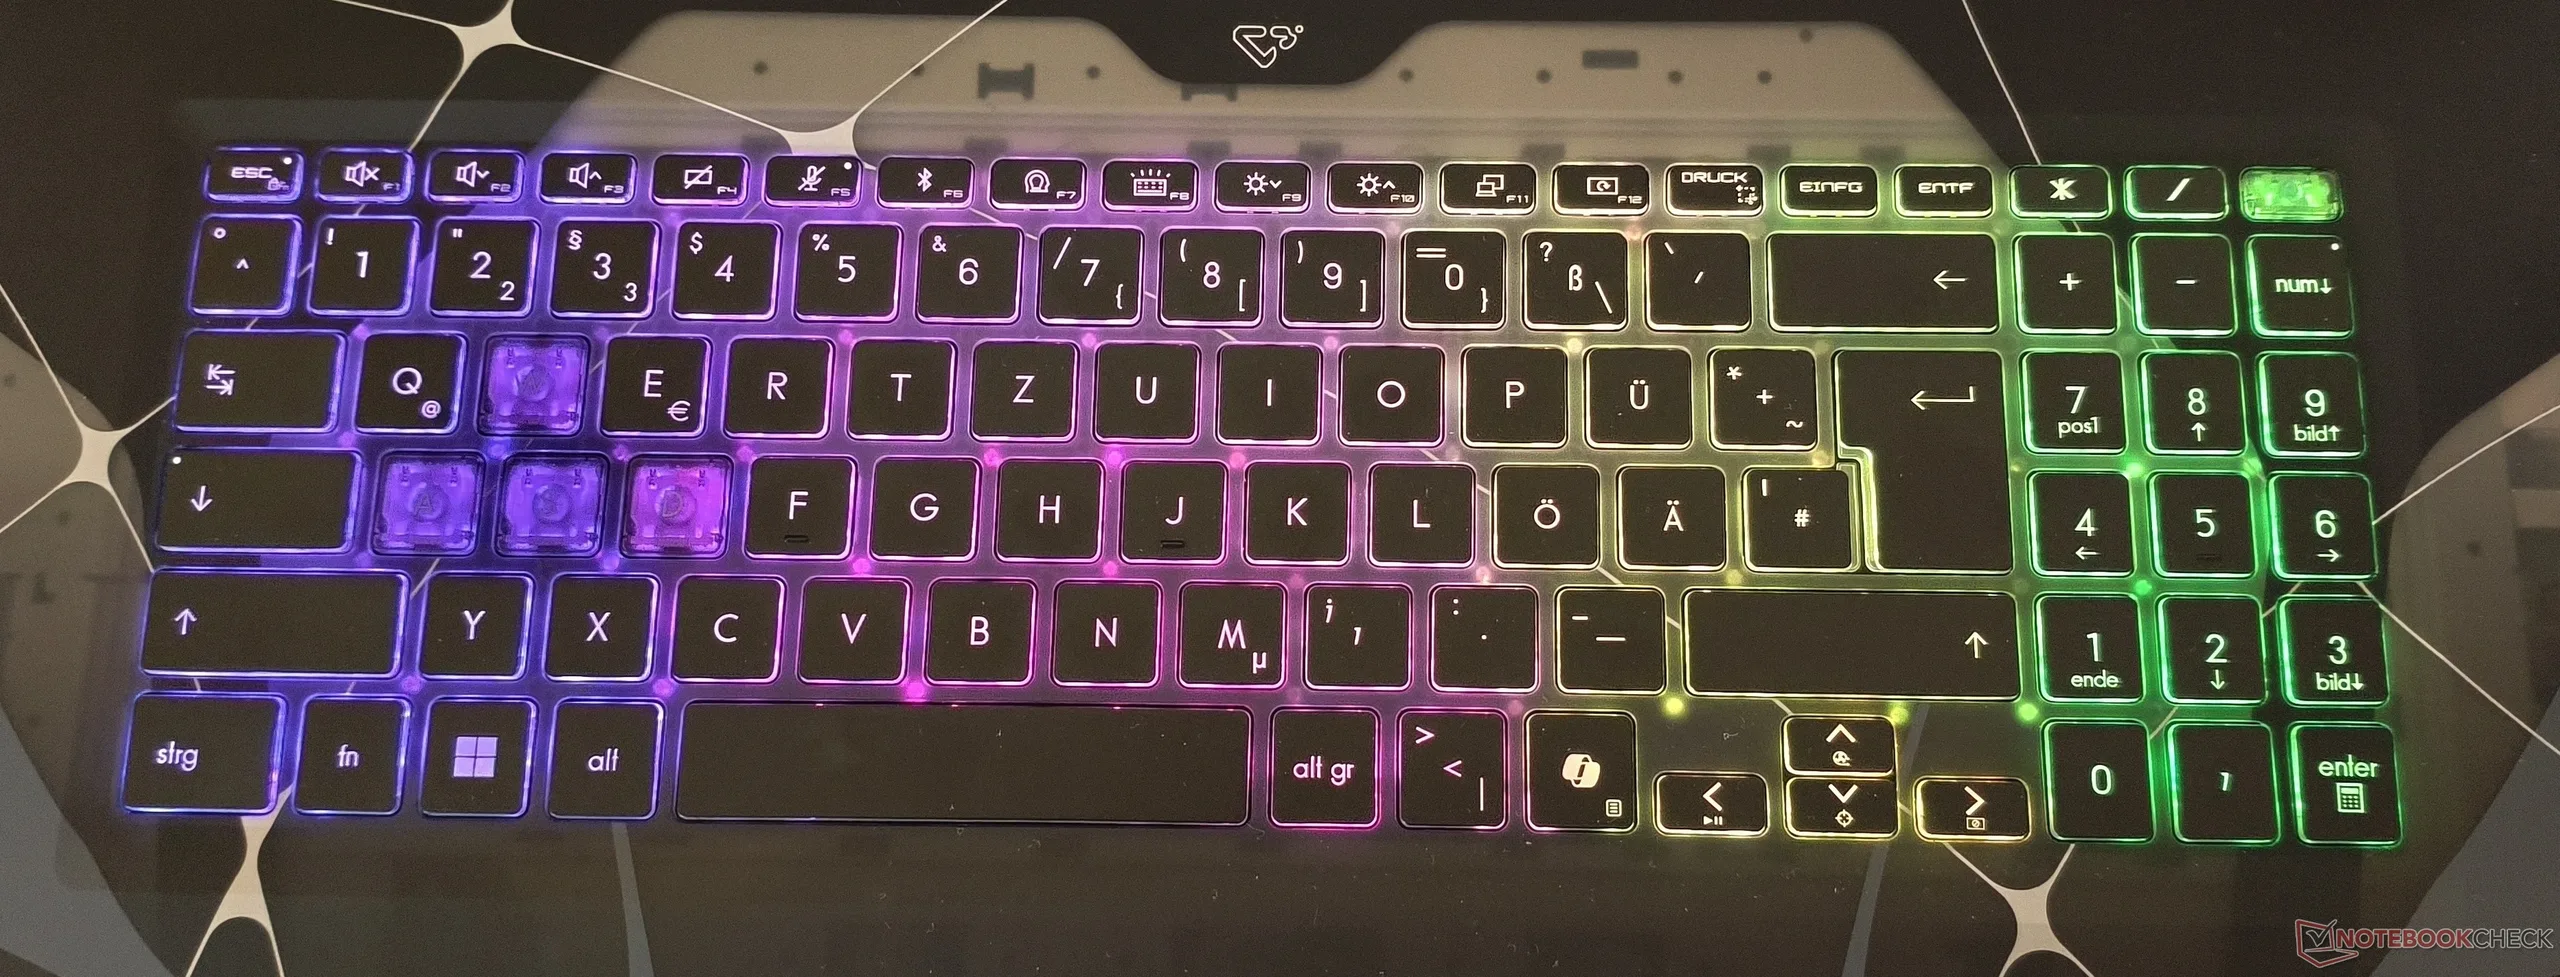
Anyone unfamiliar with MSI keyboards will initially struggle with the layout. This starts with the number pad, which is three columns wide rather than four despite there being enough space. The tiny arrow keys and the partly non-standard key arrangement also do not make the user experience any easier. Typing feel, however, is solid. The strong RGB lighting, which can be adjusted in several steps, was a particular highlight.
The touchpad, measuring roughly 12 x 7.5 cm, is suitably sized for a 17-inch device and offers good gliding characteristics. MSI could improve stability, though, as the click mechanism tends to rattle and the left side in particular would benefit from a firmer construction.
Display
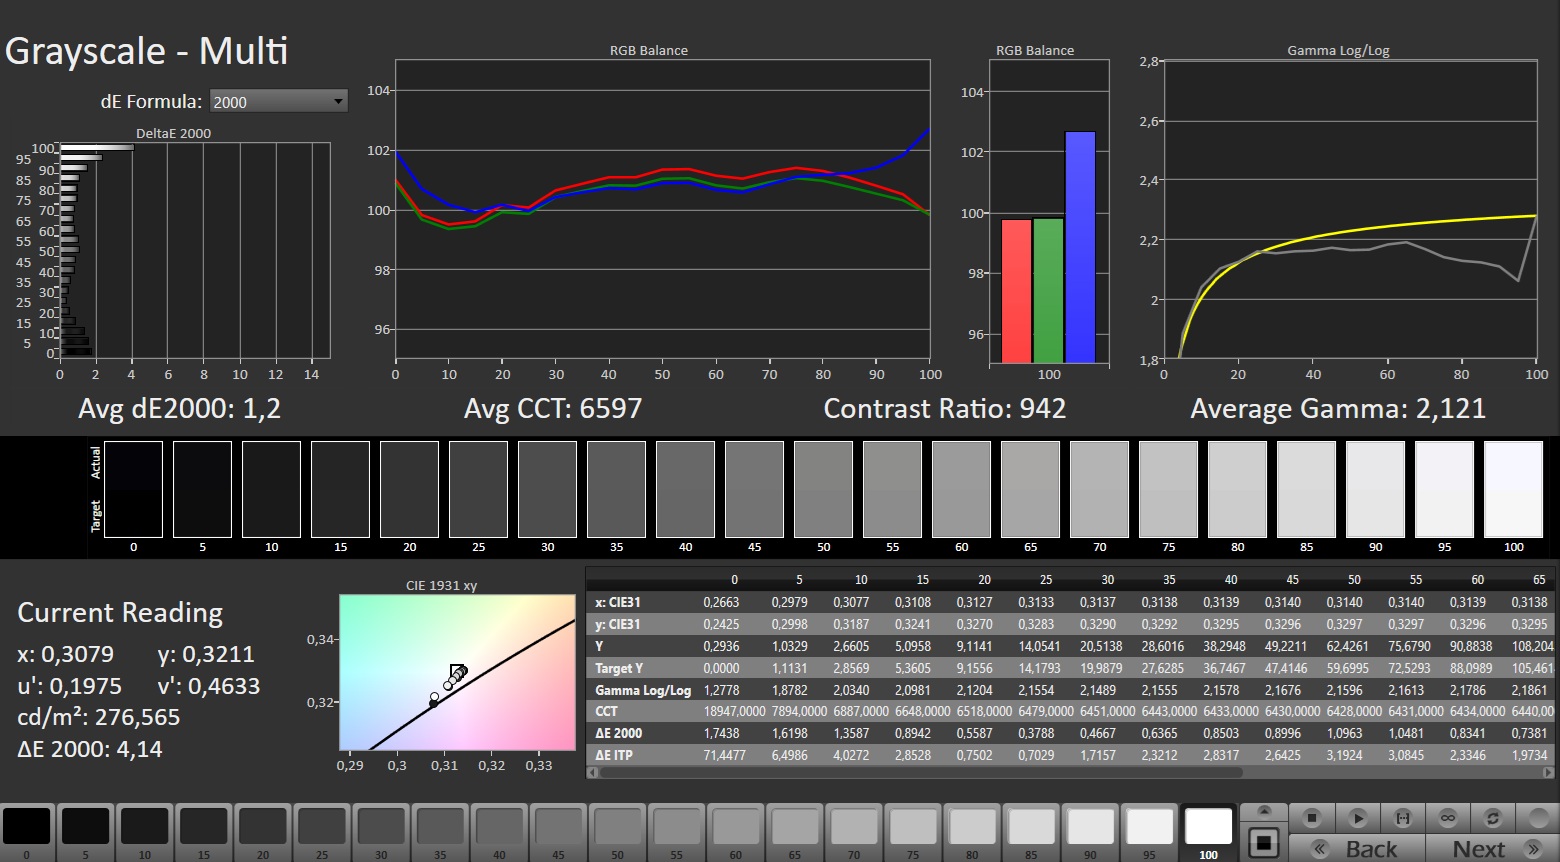
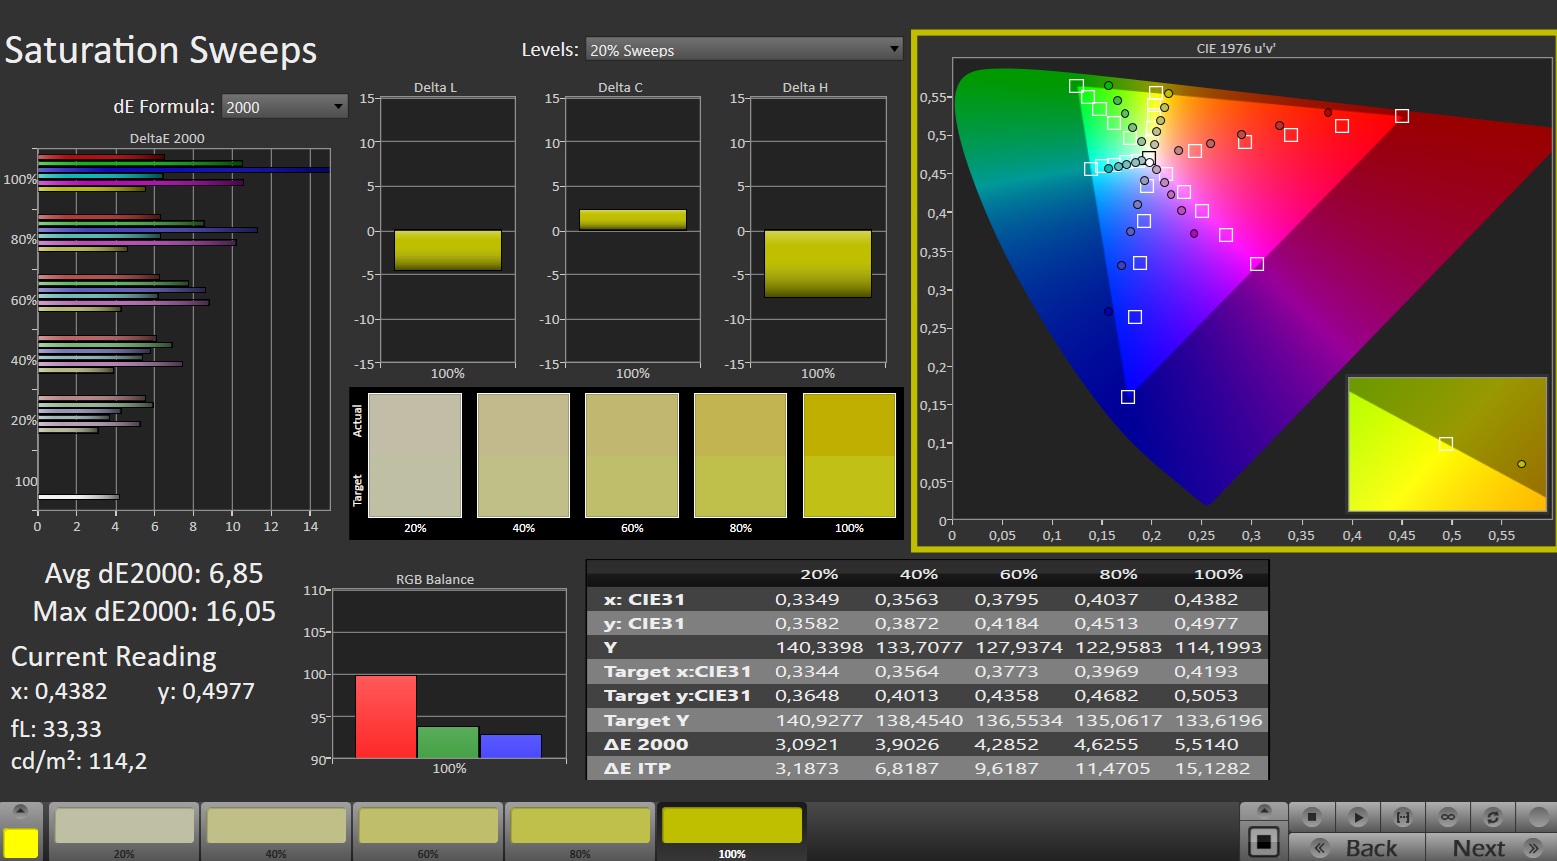
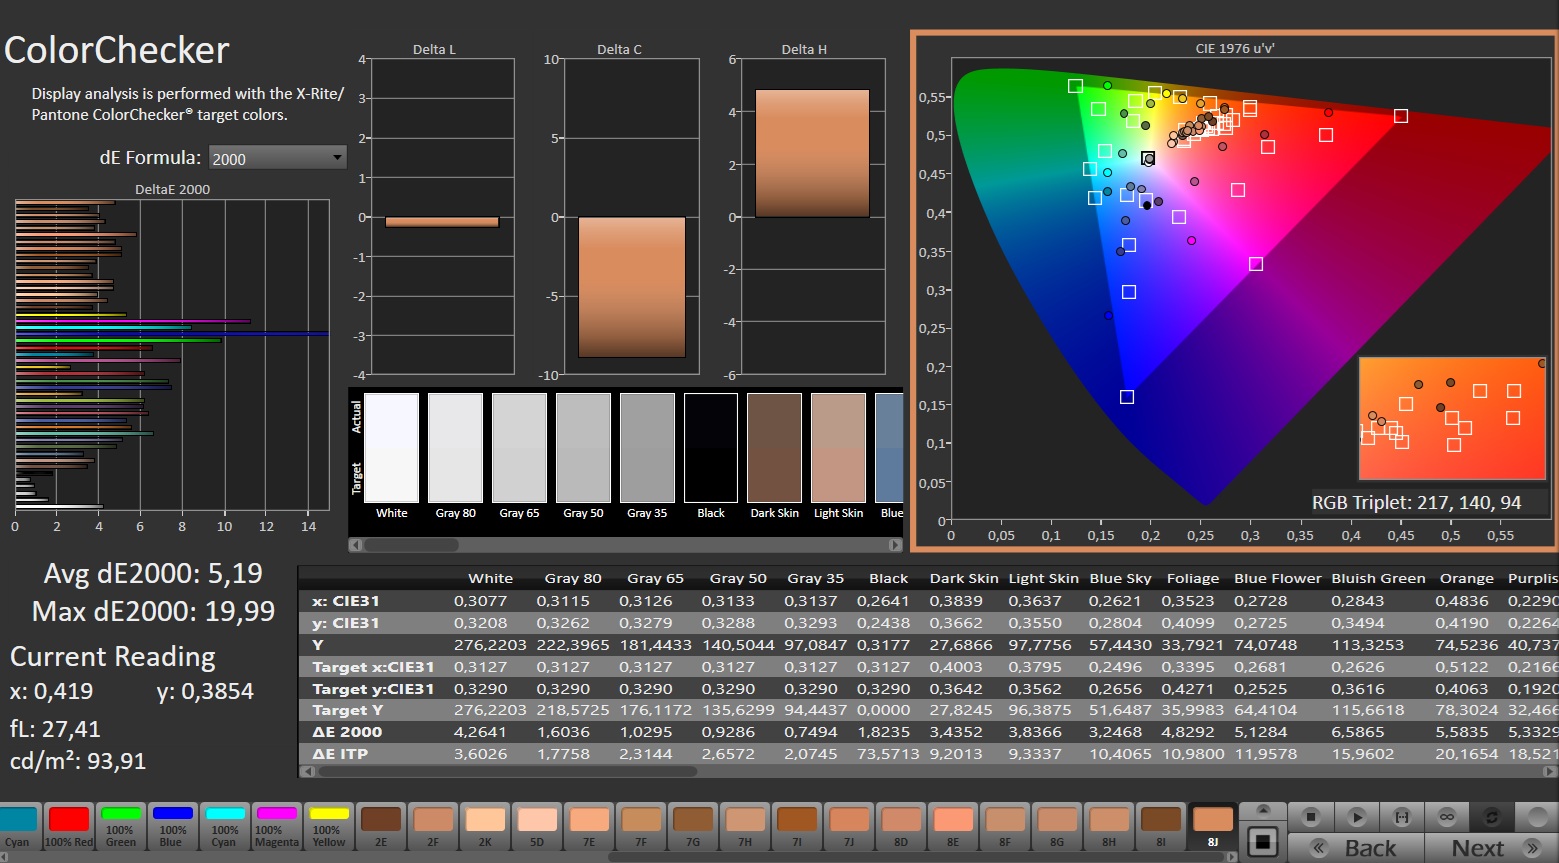
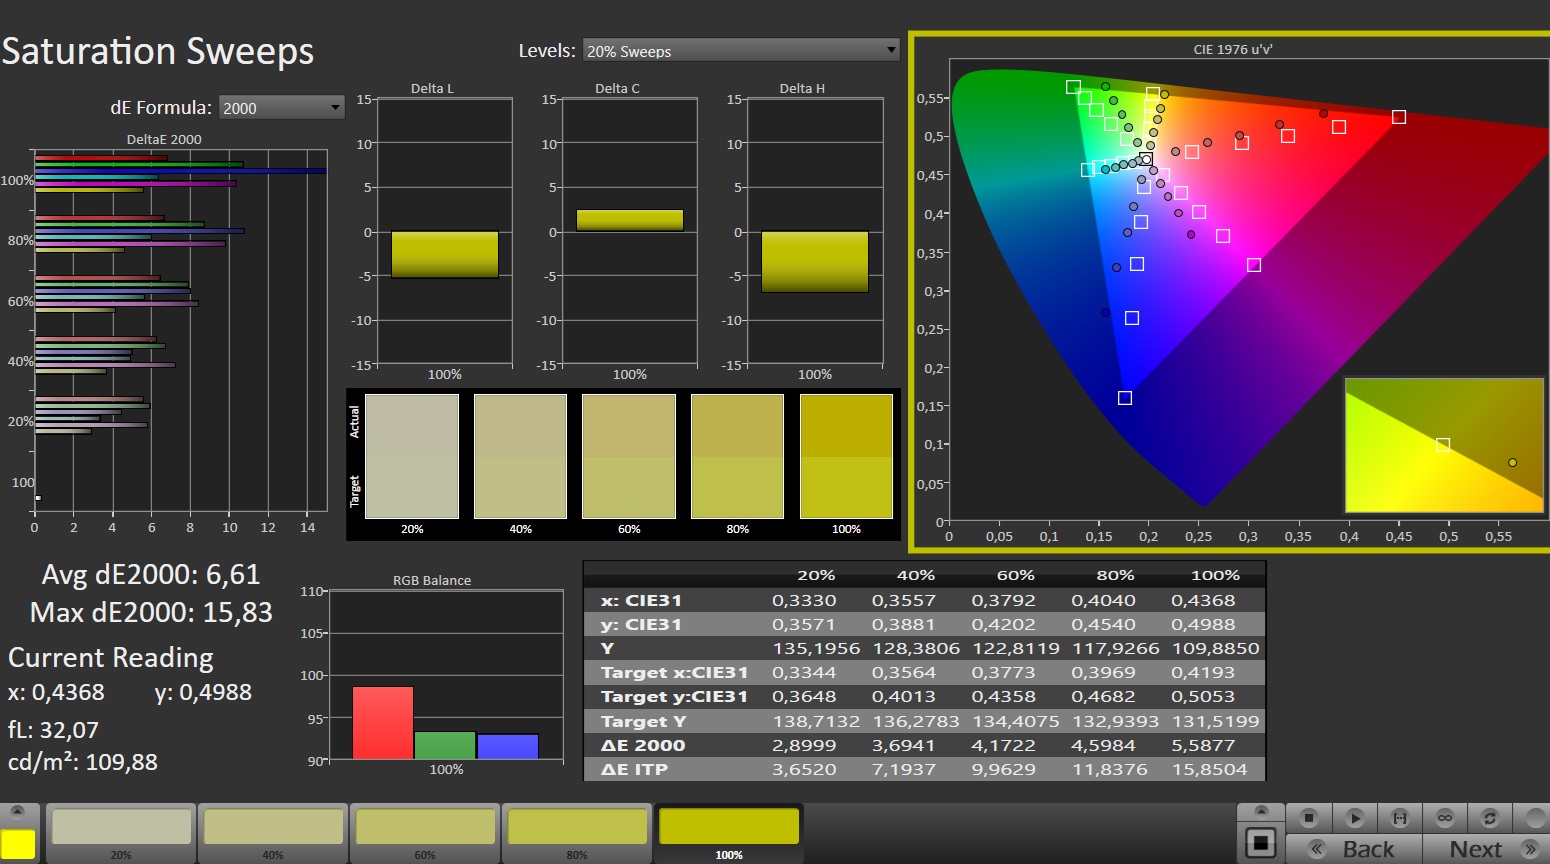
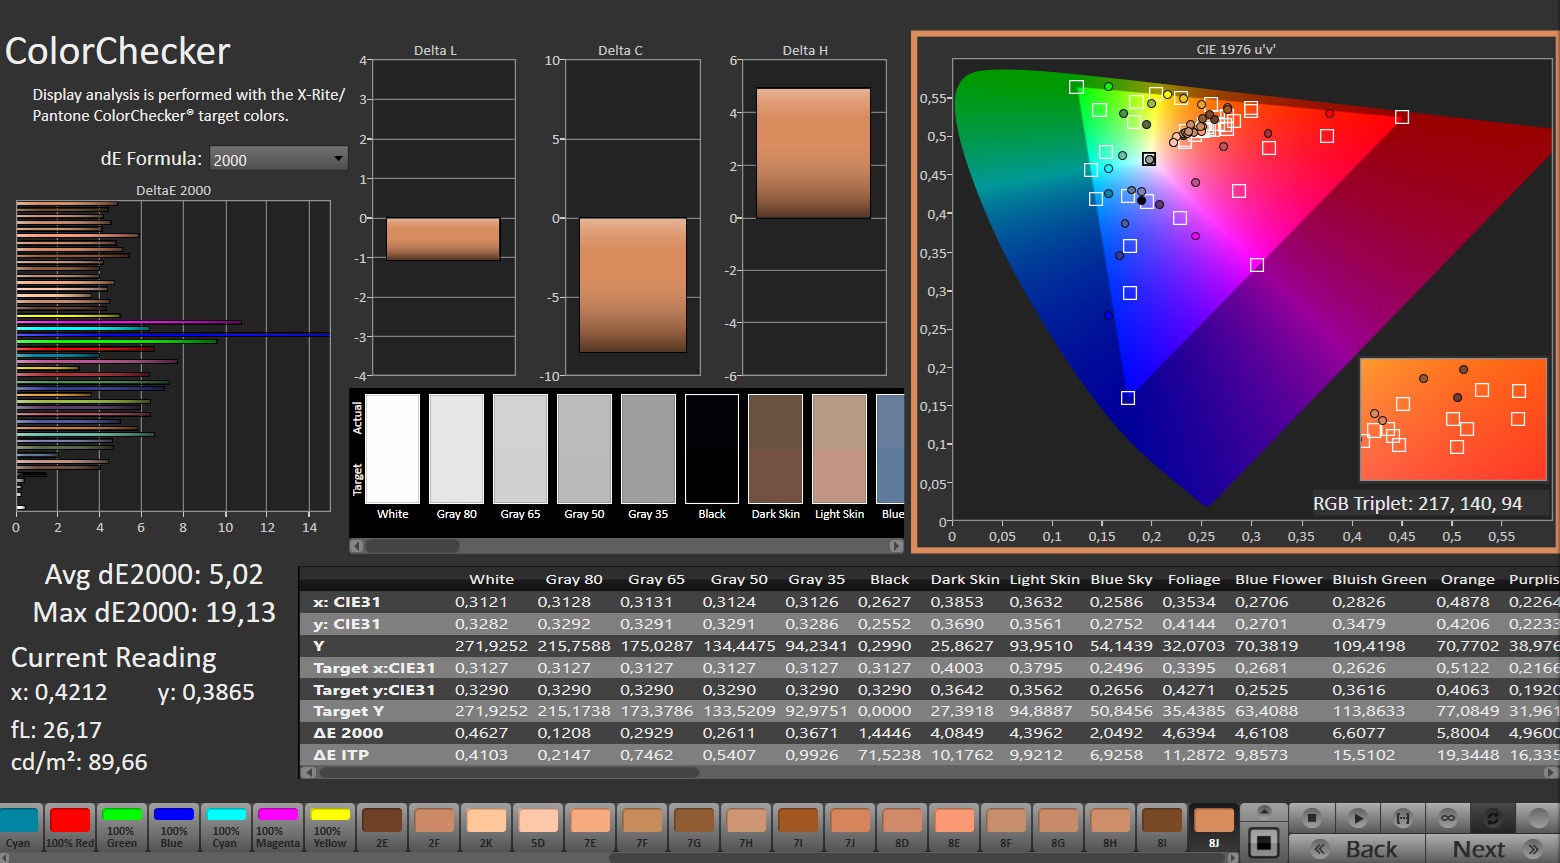
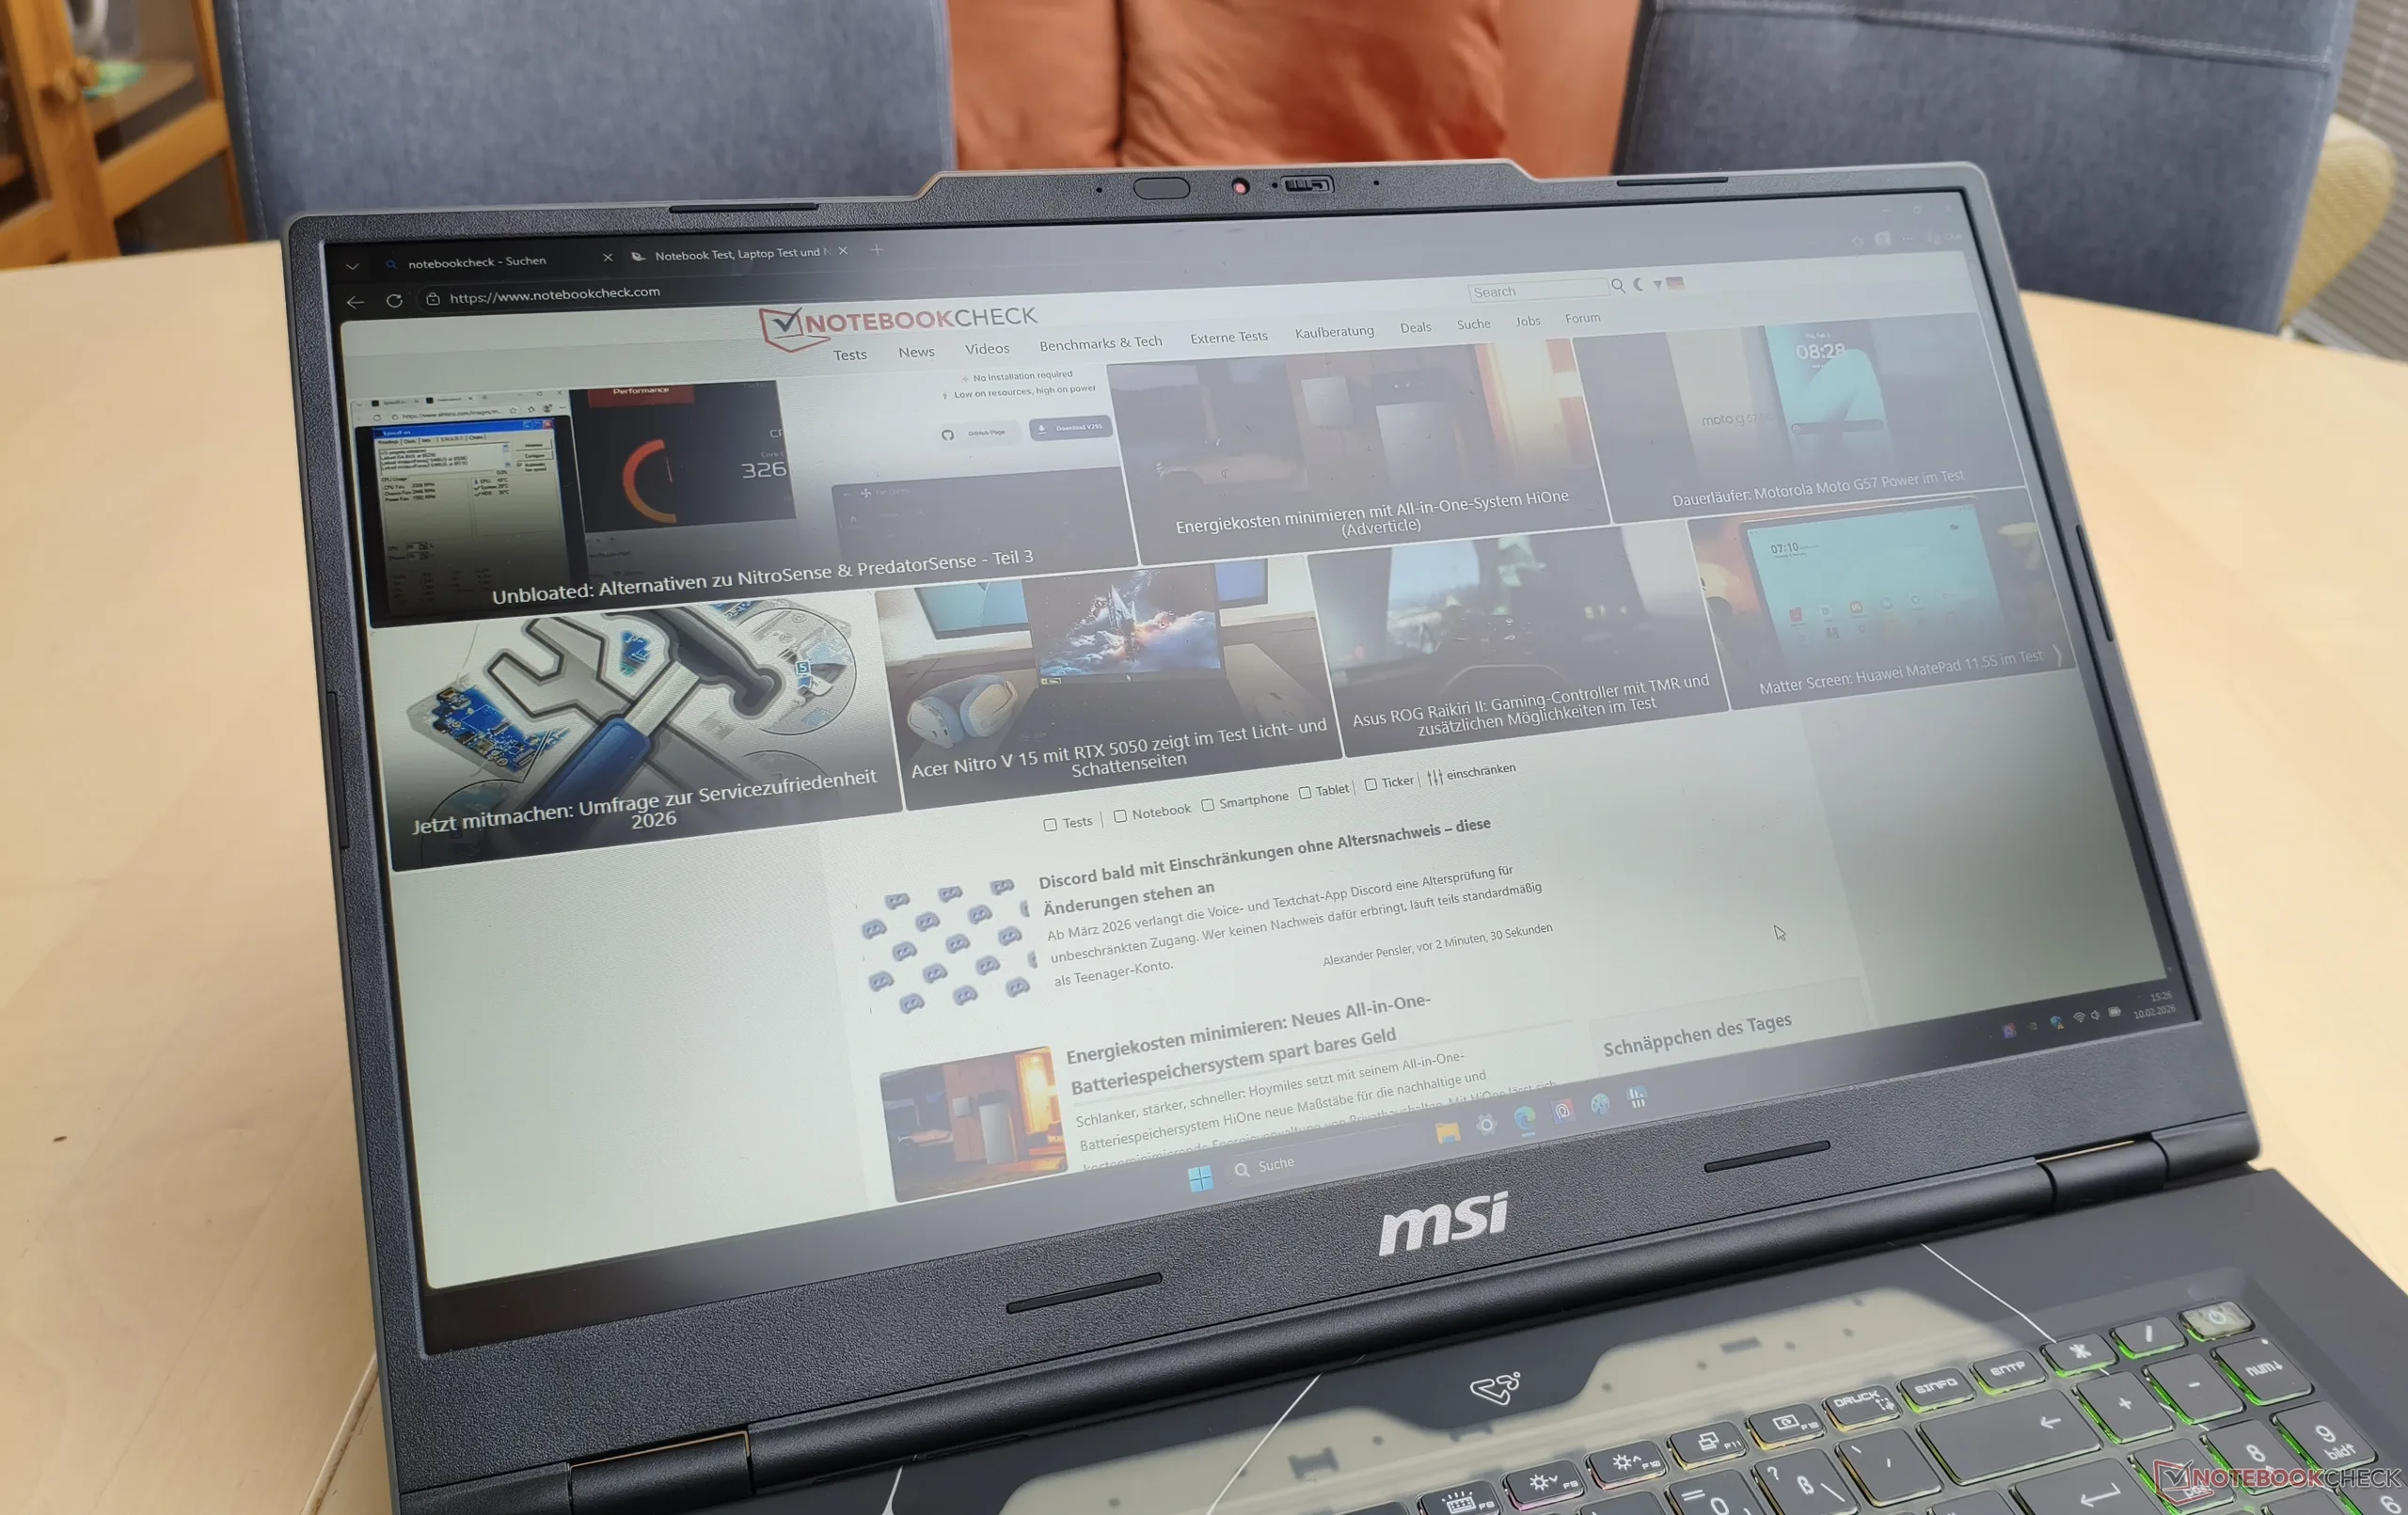
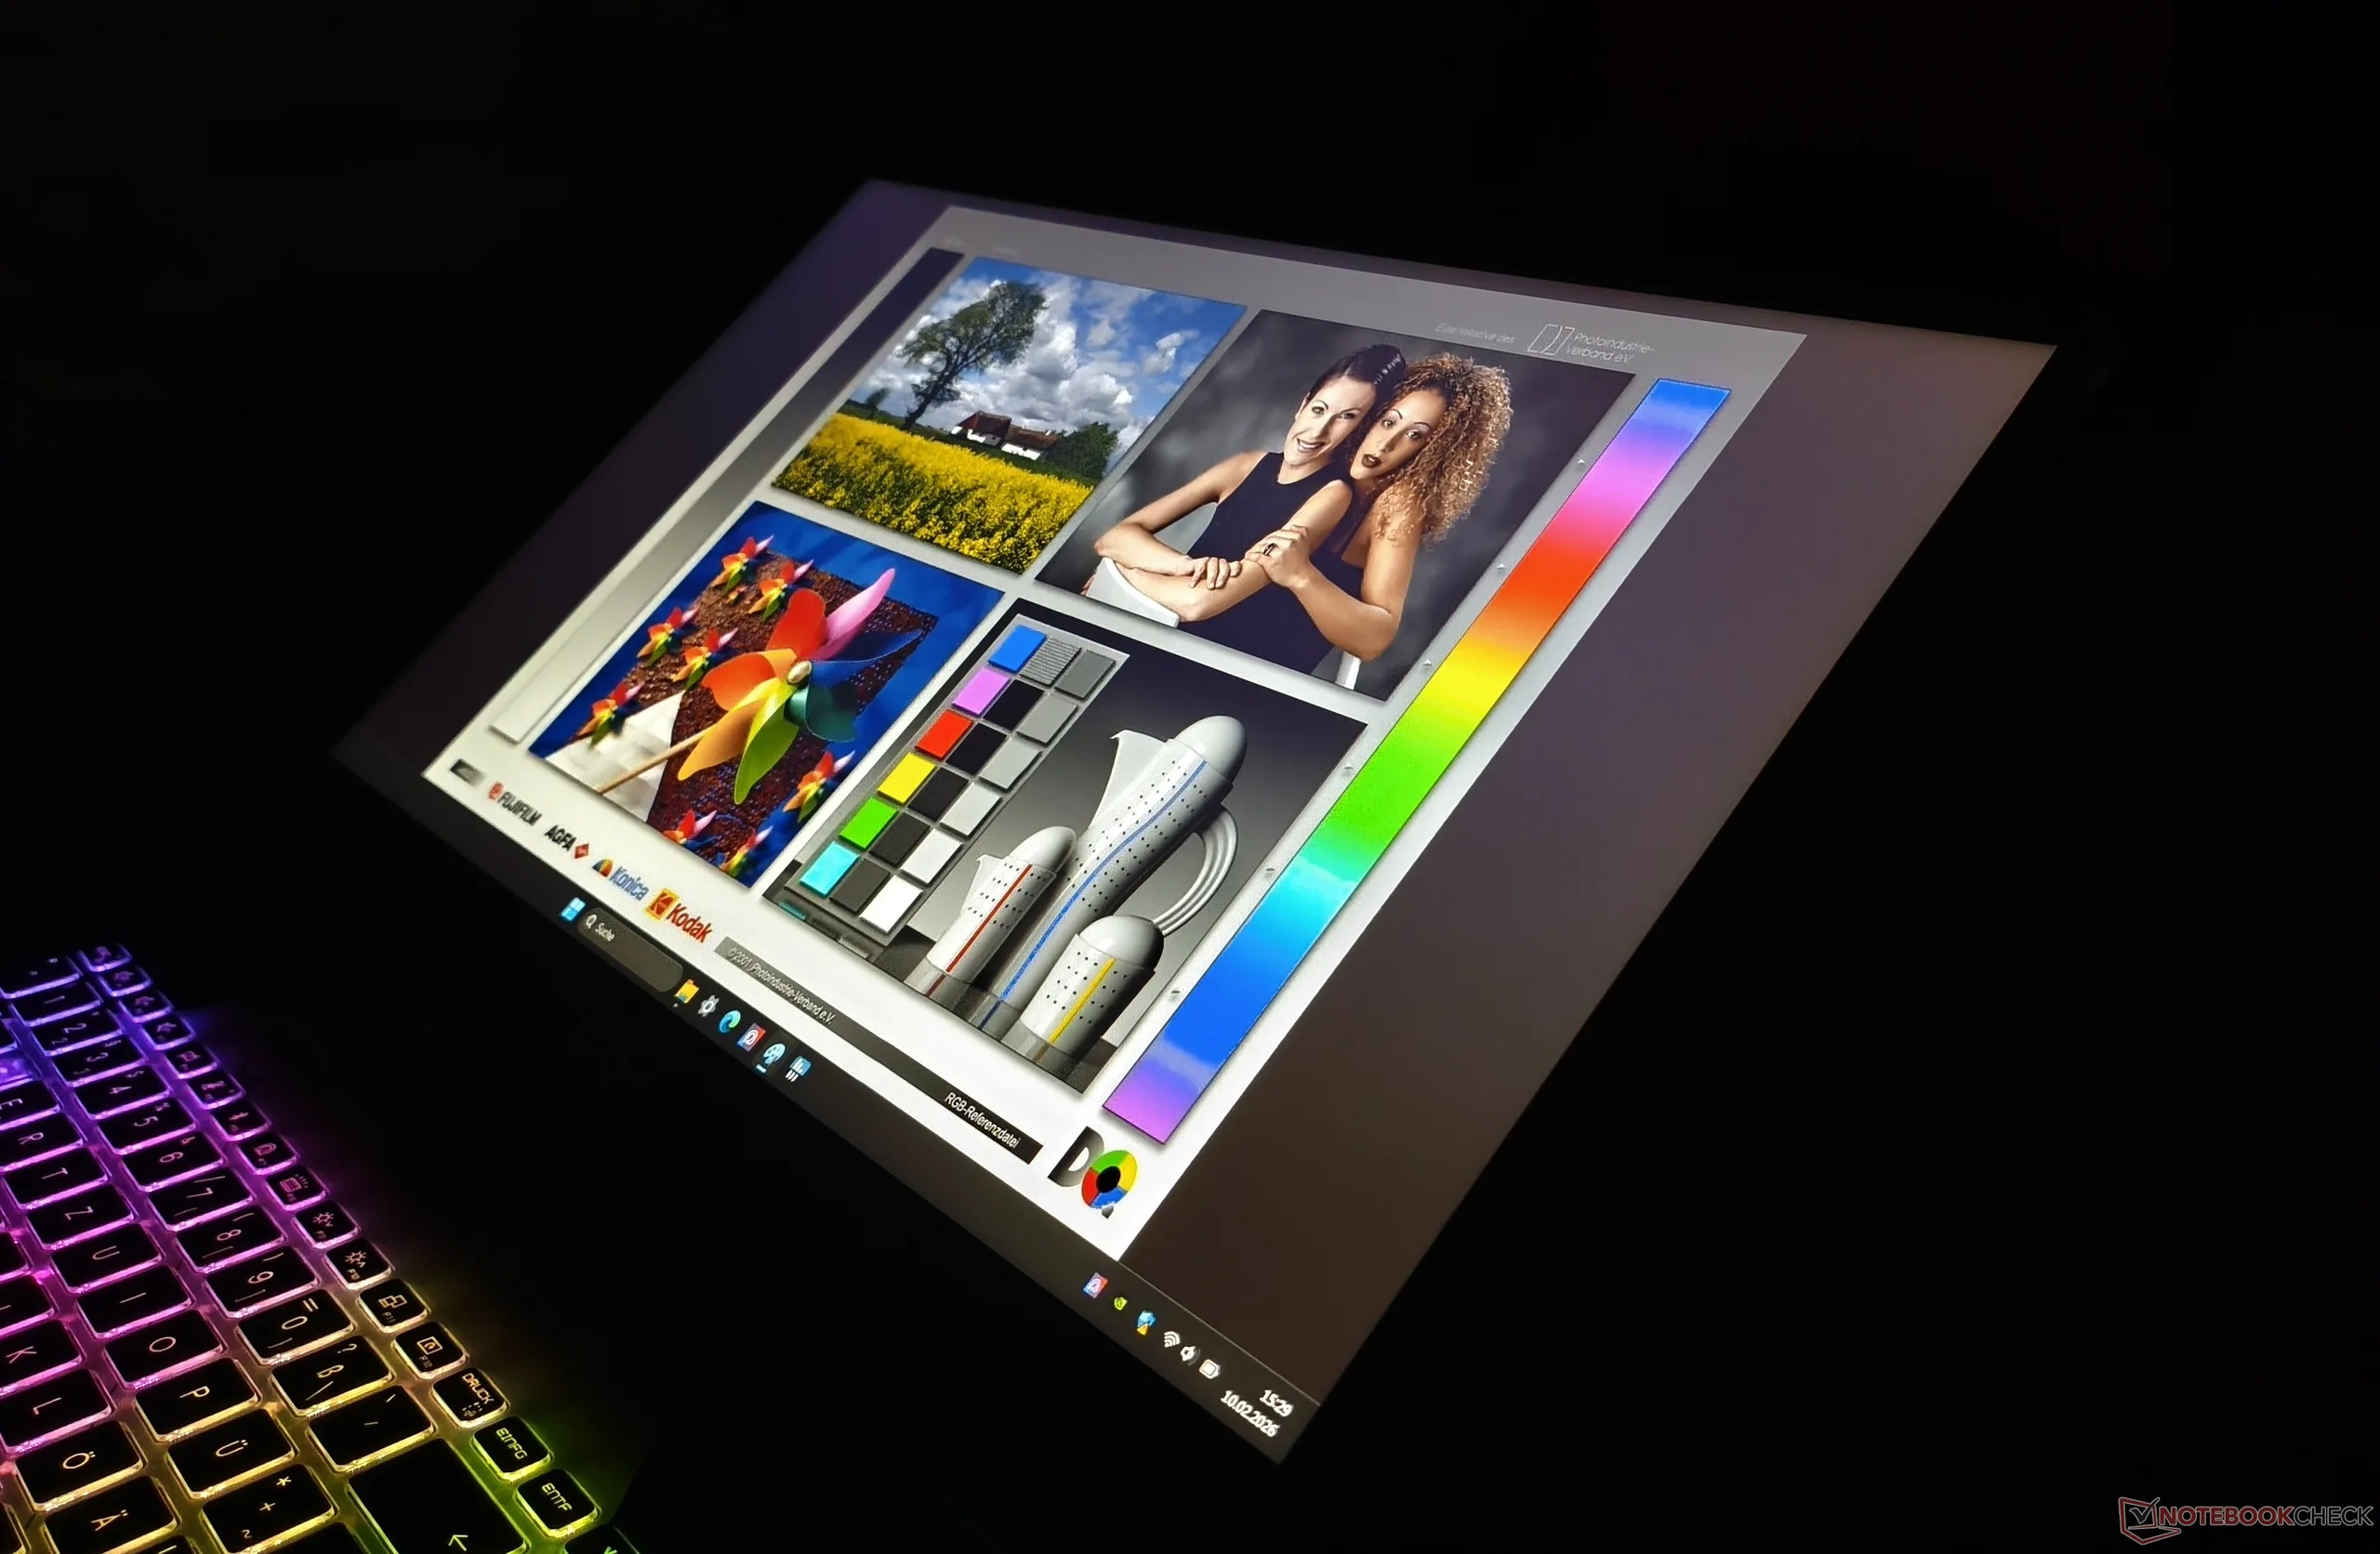
One of the Cyborg 17’s biggest weaknesses is its modest display. While the black level (just under 0.3 cd/m²) and contrast ratio (almost 1,000:1) leave little room for criticism, the average brightness of 250 cd/m² is suitable only for indoor use. Colour coverage also lags behind some competitors. At around 50 percent sRGB, the image appears rather washed out. Viewing angles and response times, meanwhile, are in line with typical IPS performance.
| |||||||||||||||||||||||||
Brightness Distribution: 85 %
Center on Battery: 274 cd/m²
Contrast: 945:1 (Black: 0.29 cd/m²)
ΔE ColorChecker Calman: 5.19 | ∀{0.5-29.43 Ø4.73}
calibrated: 5.02
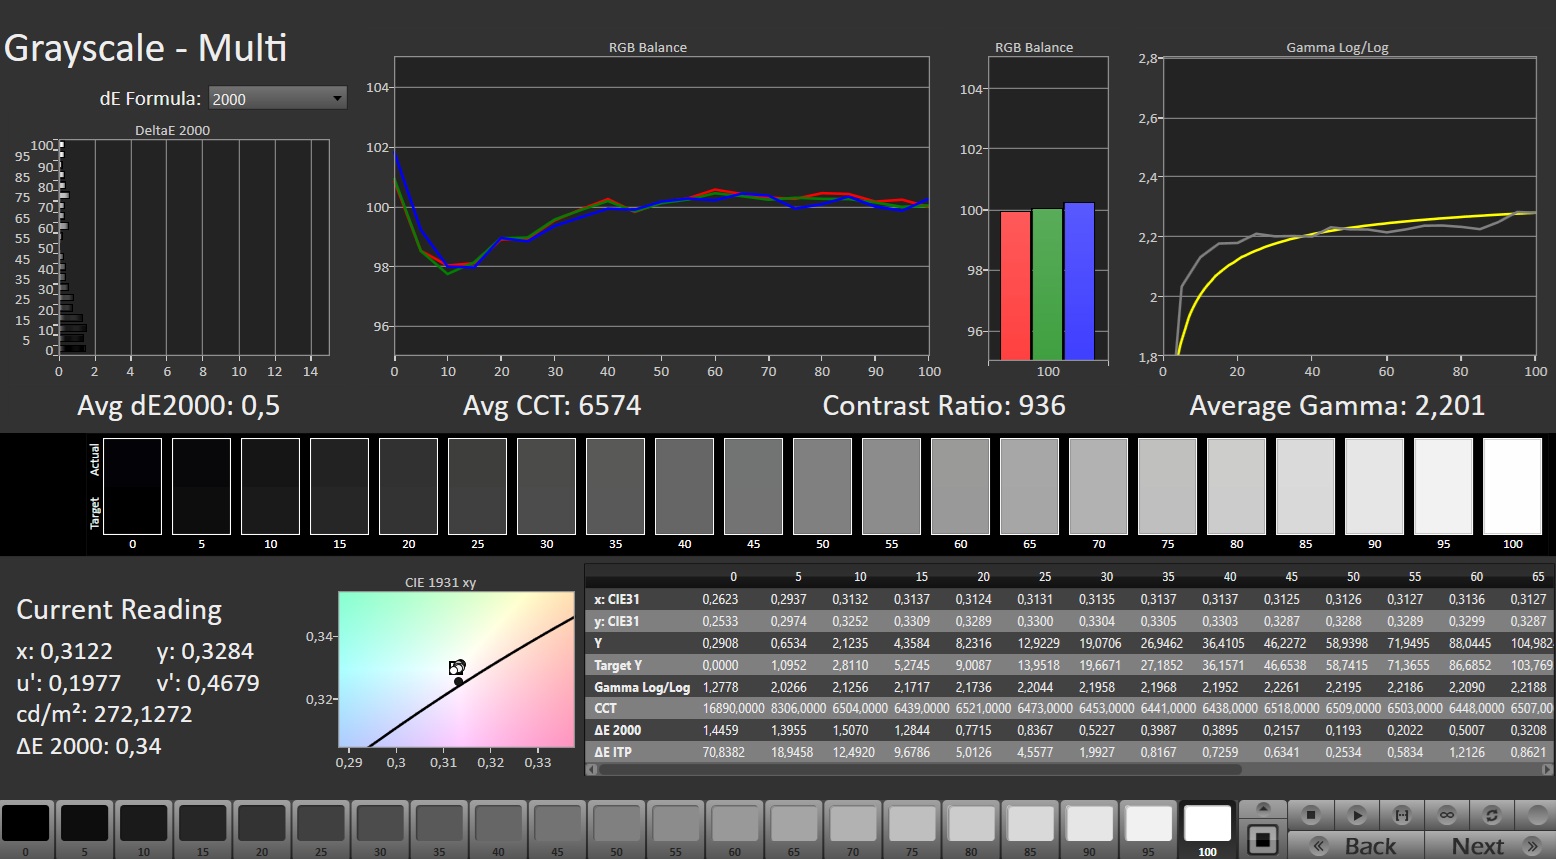
ΔE Greyscale Calman: 1.2 | ∀{0.09-98 Ø4.98}
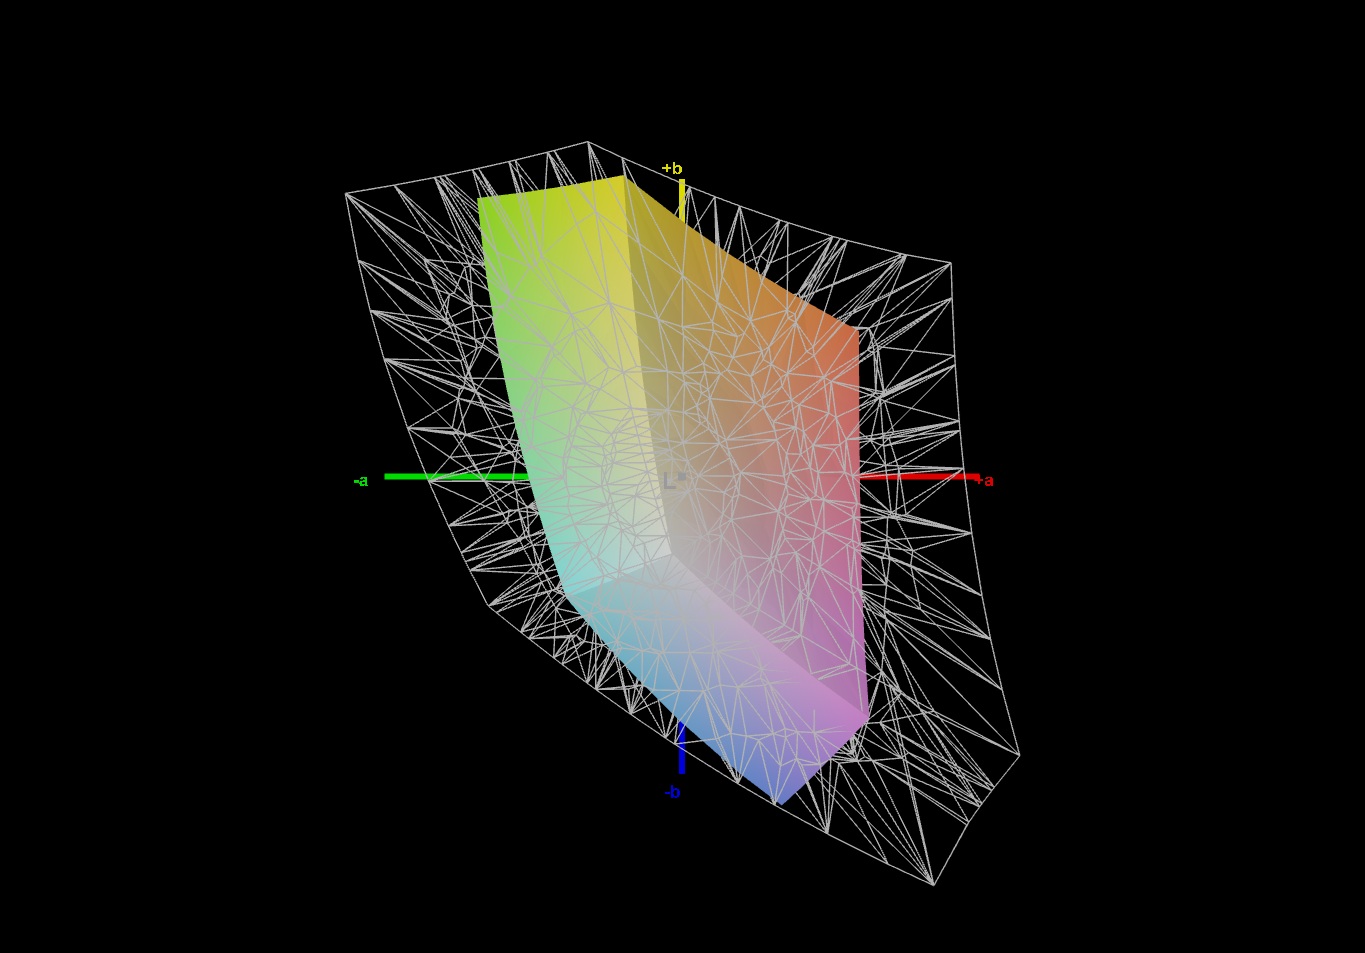
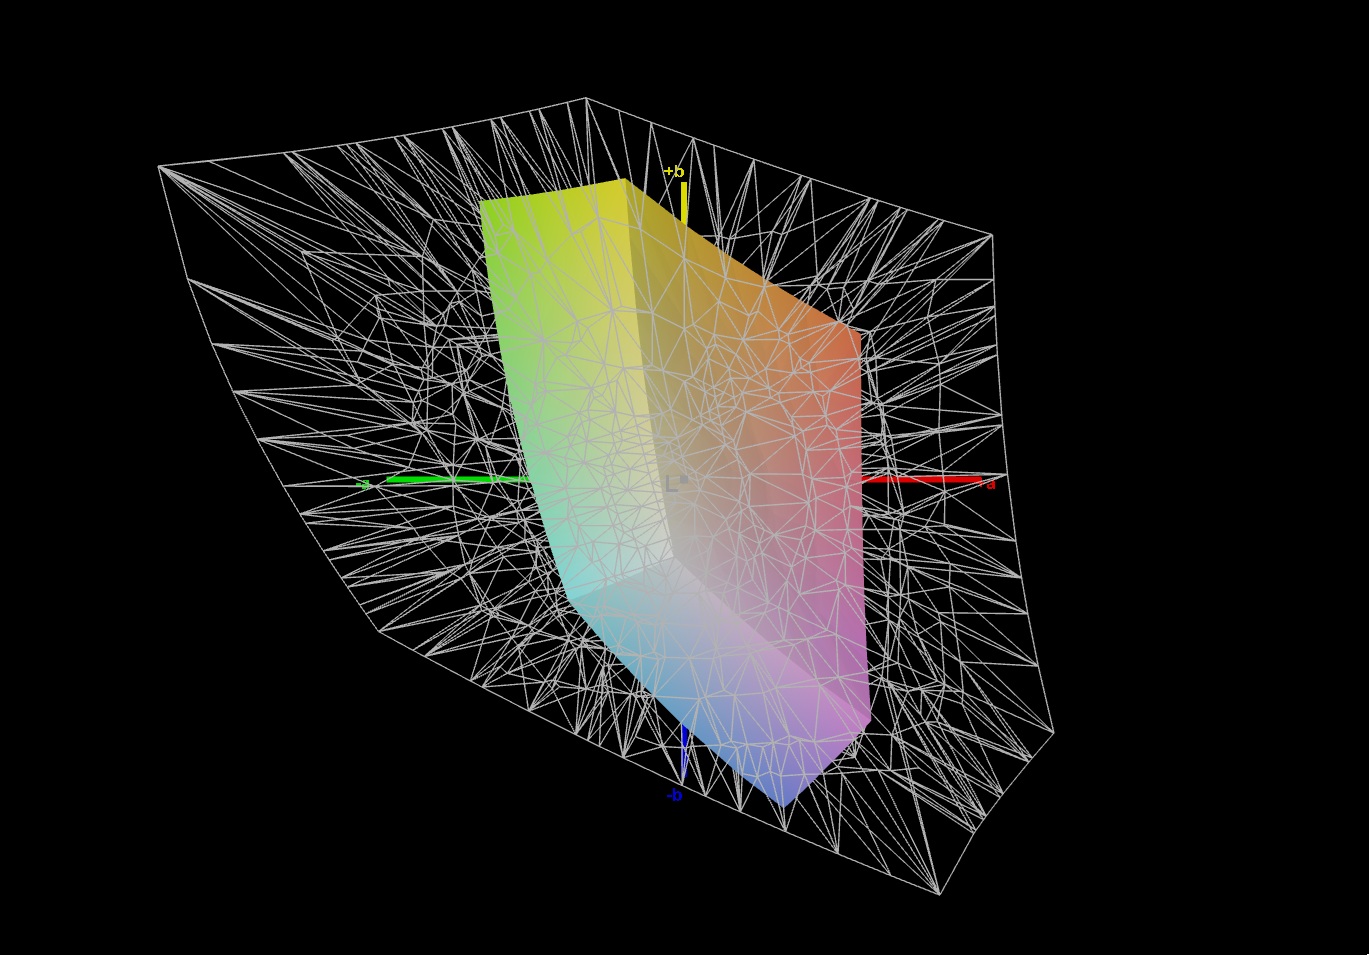
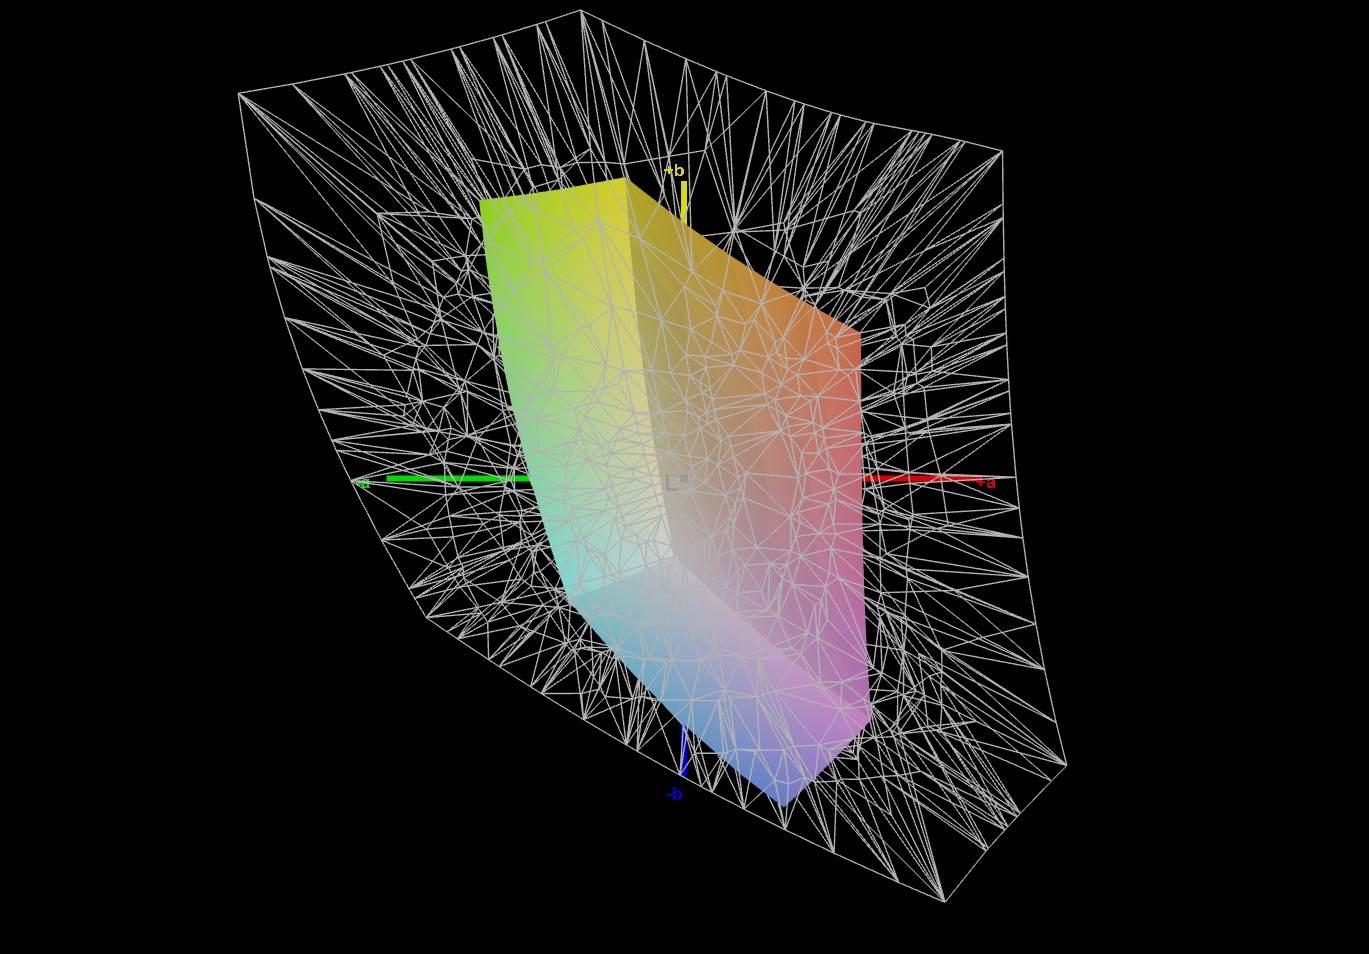
34.8% AdobeRGB 1998 (Argyll 3D)
50.7% sRGB (Argyll 3D)
33.7% Display P3 (Argyll 3D)
Gamma: 2.121
CCT: 6597 K
| MSI Cyborg 17 B13WFKG BOEhydis NV173FHM-NX4, IPS, 1920x1080, 17.3", 144 Hz | Acer Nitro V 16 AI ANV16-42-R860 B160UAN08.3 (AUO2CB8), IPS, 1920x1200, 16", 180 Hz | Alienware 16 Aurora BOE NE16N41, IPS, 2560x1600, 16", 120 Hz | HP Omen 16-ap0091ng AUODBB2, IPS, 1920x1200, 16", 144 Hz | Lenovo Legion 7 16IAX10 Samsung ATNA60HS01-0, OLED, 2560x1600, 16", 165 Hz | Gigabyte Gaming A16 GA6H NE160QDM-NYJ (BOE0C80), IPS, 2560x1600, 16", 165 Hz | |
|---|---|---|---|---|---|---|
| Display | 16% | 105% | 15% | 154% | 103% | |
| Display P3 Coverage (%) | 33.7 | 39.2 16% | 70.8 110% | 40 19% | 99.6 196% | 69.4 106% |
| sRGB Coverage (%) | 50.7 | 58.2 15% | 99.9 97% | 58.1 15% | 100 97% | 99.5 96% |
| AdobeRGB 1998 Coverage (%) | 34.8 | 40.5 16% | 72.1 107% | 38.7 11% | 93.5 169% | 71.6 106% |
| Response Times | 50% | -106% | -25% | 96% | 46% | |
| Response Time Grey 50% / Grey 80% * (ms) | 21.9 ? | 11.6 ? 47% | 49.5 ? -126% | 27.6 ? -26% | 0.6 ? 97% | 14.3 ? 35% |
| Response Time Black / White * (ms) | 15.8 ? | 7.4 ? 53% | 29.3 ? -85% | 19.4 ? -23% | 0.8 ? 95% | 7 ? 56% |
| PWM Frequency (Hz) | 1317 ? | |||||
| PWM Amplitude * (%) | 23 | |||||
| Screen | -29% | 6% | 7% | 57% | -16% | |
| Brightness middle (cd/m²) | 274 | 384 40% | 345.3 26% | 328 20% | 477.6 74% | 432 58% |
| Brightness (cd/m²) | 252 | 372 48% | 324 29% | 313 24% | 483 92% | 425 69% |
| Brightness Distribution (%) | 85 | 92 8% | 88 4% | 91 7% | 95 12% | 91 7% |
| Black Level * (cd/m²) | 0.29 | 0.36 -24% | 0.23 21% | 0.26 10% | 0.37 -28% | |
| Contrast (:1) | 945 | 1067 13% | 1501 59% | 1262 34% | 1168 24% | |
| Colorchecker dE 2000 * | 5.19 | 5.82 -12% | 3.22 38% | 4.73 9% | 3.11 40% | 4.76 8% |
| Colorchecker dE 2000 max. * | 19.99 | 20.34 -2% | 5.68 72% | 17.47 13% | 5.99 70% | 8.59 57% |
| Colorchecker dE 2000 calibrated * | 5.02 | 3.95 21% | 0.93 81% | 4.22 16% | 0.79 84% | 1.18 76% |
| Greyscale dE 2000 * | 1.2 | 5.4 -350% | 4.5 -275% | 2.05 -71% | 0.9 25% | 6.2 -417% |
| Gamma | 2.121 104% | 2.174 101% | 2.1 105% | 2.63 84% | 2.18 101% | 2.079 106% |
| CCT | 6597 99% | 6067 107% | 7041 92% | 6718 97% | 6405 101% | 6690 97% |
| Total Average (Program / Settings) | 12% /
-8% | 2% /
11% | -1% /
4% | 102% /
88% | 44% /
18% |
* ... smaller is better
Display Response Times
| ↔ Response Time Black to White | ||
|---|---|---|
| 15.8 ms ... rise ↗ and fall ↘ combined | ↗ 8 ms rise | 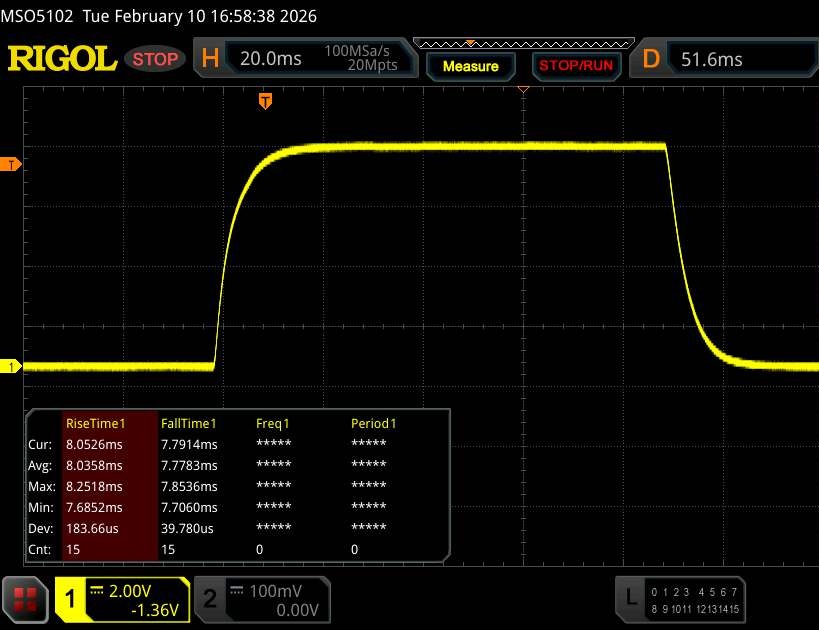 |
| ↘ 7.8 ms fall | ||
| The screen shows good response rates in our tests, but may be too slow for competitive gamers. In comparison, all tested devices range from 0.1 (minimum) to 240 (maximum) ms. » 37 % of all devices are better. This means that the measured response time is better than the average of all tested devices (19.9 ms). | ||
| ↔ Response Time 50% Grey to 80% Grey | ||
| 21.9 ms ... rise ↗ and fall ↘ combined | ↗ 10.4 ms rise | 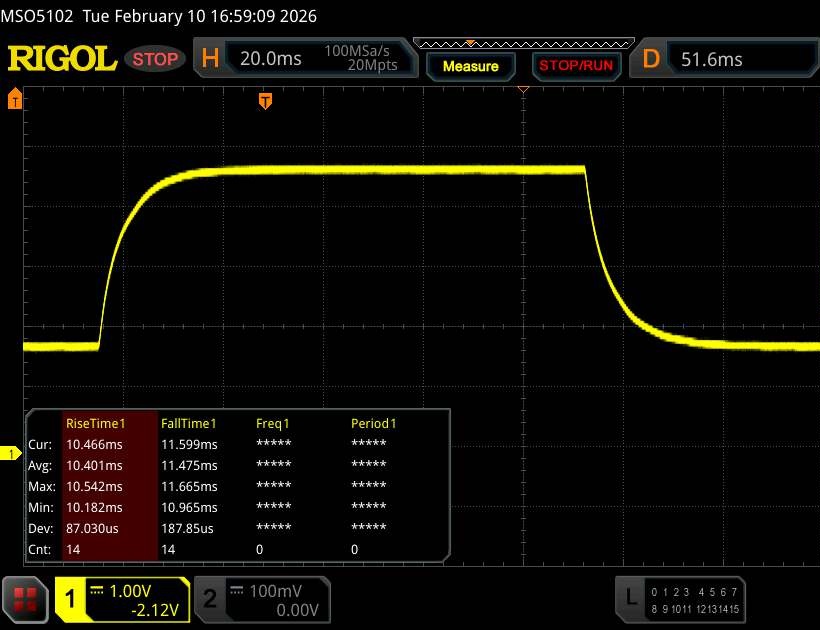 |
| ↘ 11.5 ms fall | ||
| The screen shows good response rates in our tests, but may be too slow for competitive gamers. In comparison, all tested devices range from 0.165 (minimum) to 636 (maximum) ms. » 33 % of all devices are better. This means that the measured response time is better than the average of all tested devices (31.2 ms). | ||
Screen Flickering / PWM (Pulse-Width Modulation)
| Screen flickering / PWM not detected |  | ||
In comparison: 52 % of all tested devices do not use PWM to dim the display. If PWM was detected, an average of 7857 (minimum: 5 - maximum: 343500) Hz was measured. | |||
Performance
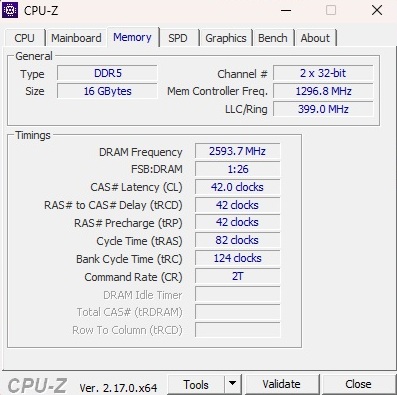
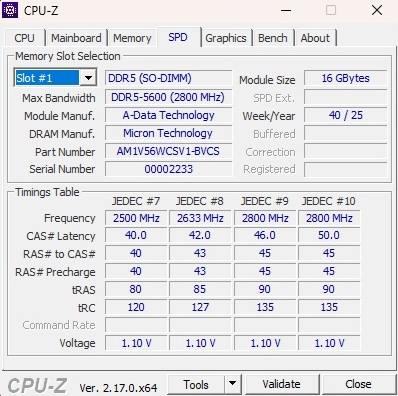
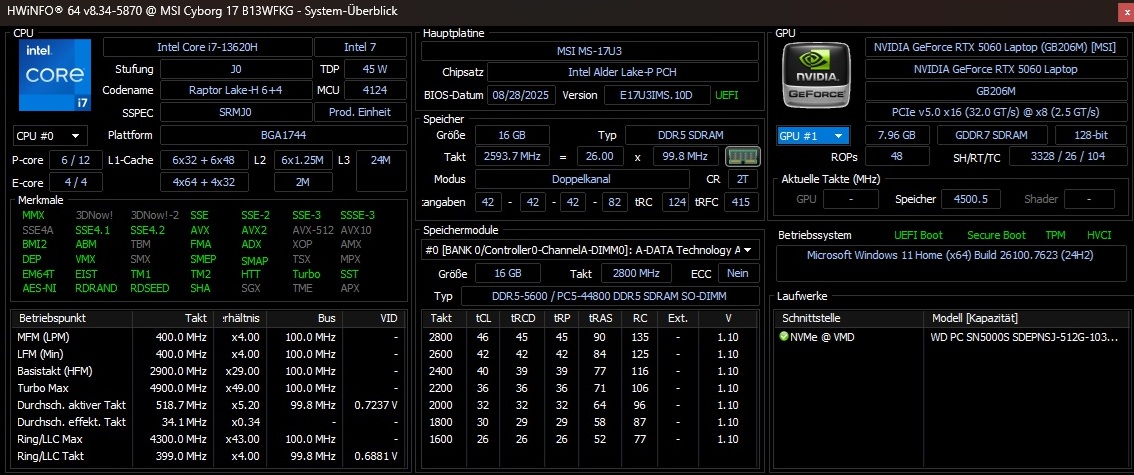
The Cyborg 17’s performance places it in the lower mid-range segment. With 16 GB of DDR5 RAM, the system is still sufficiently equipped for gaming in 2026. However, the 512 GB SSD can quickly become a limiting factor, as many modern titles easily exceed 100 GB in size.
Test conditions
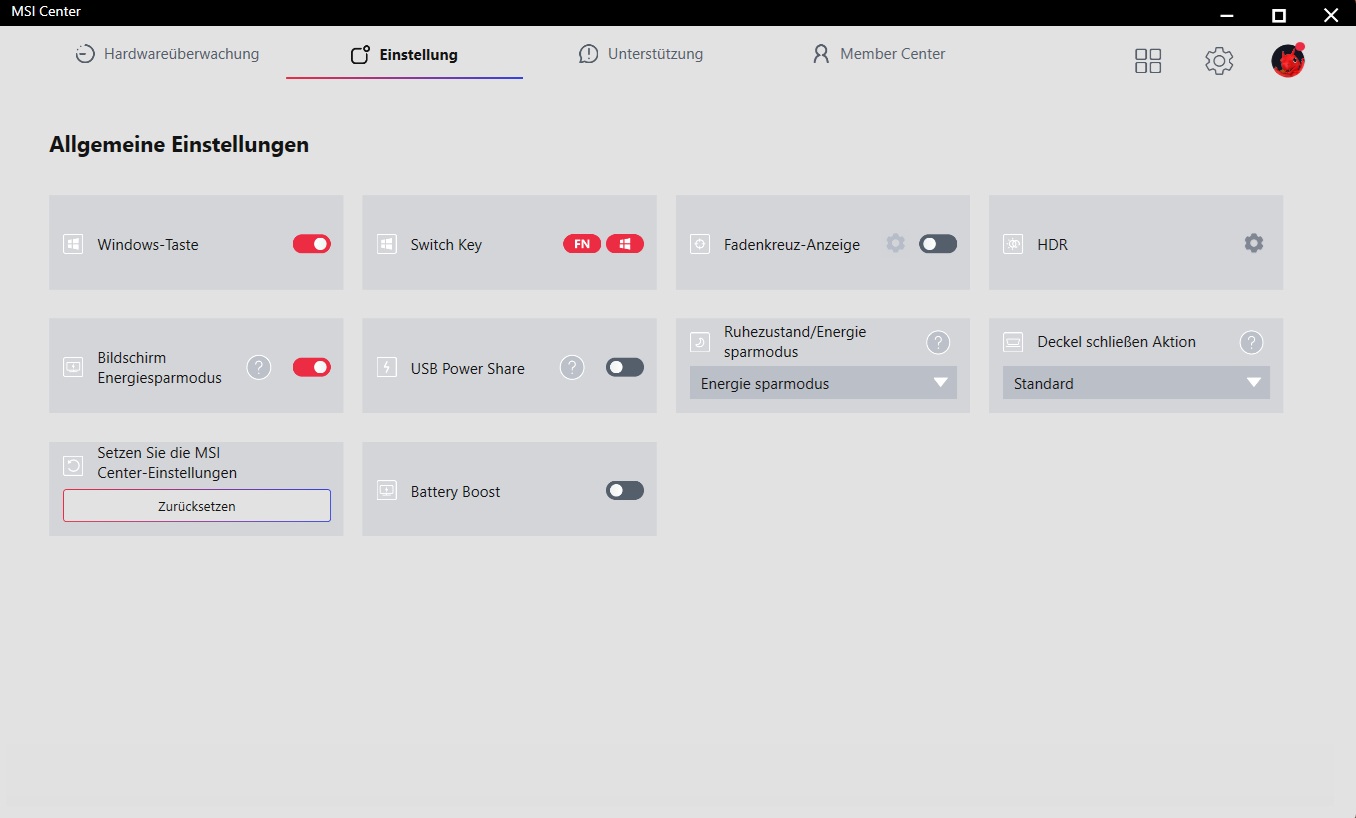
All of our measurements were carried out in the AI “Smart Auto” mode, which, in terms of CPU performance, is comparable to the “Extreme Performance” profile. From the “Balanced” mode onwards, GPU performance is essentially identical (see table).
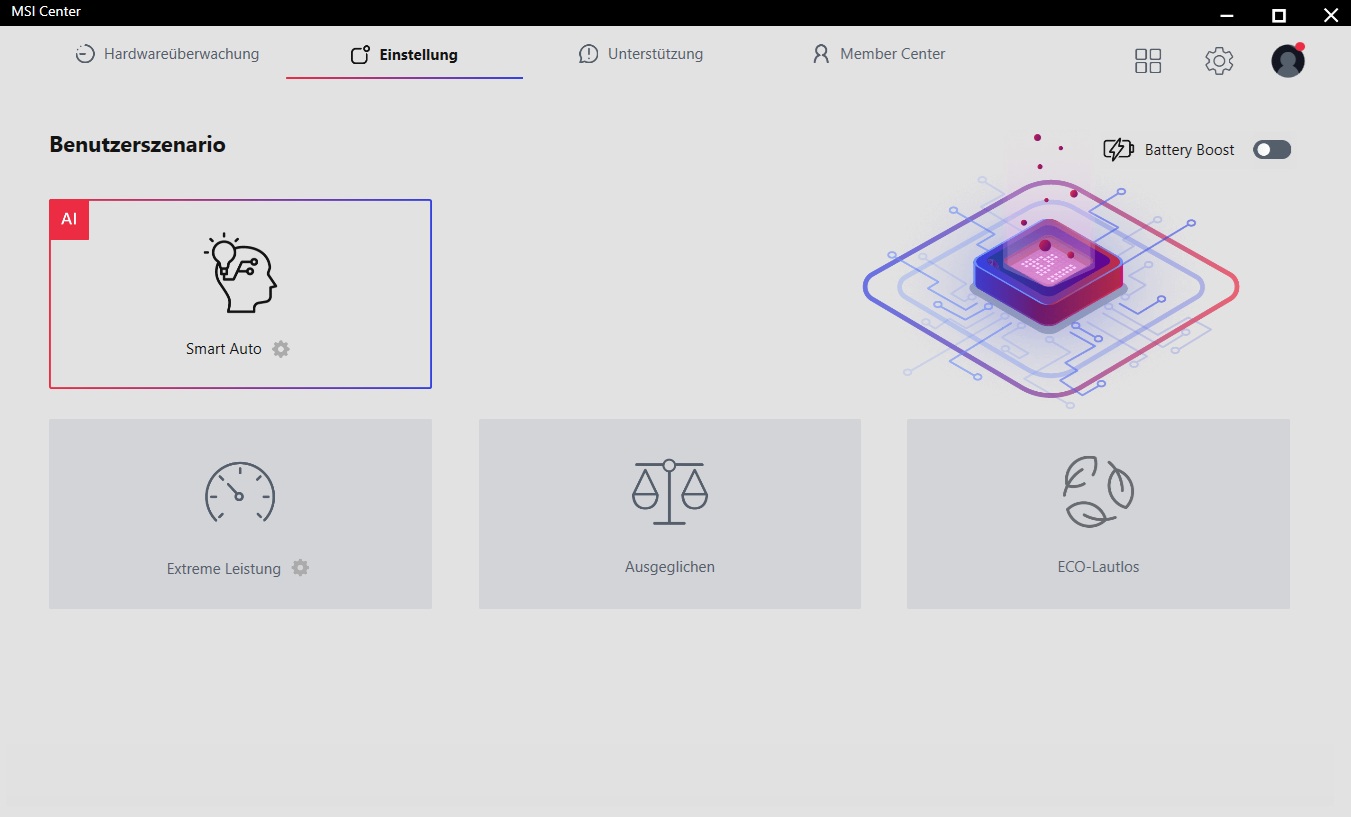
| Mode | Smart Auto | Extreme performance | Balanced | ECO Silent |
| Cyberpunk 2077 Noise | 48 dB(A) | 49 dB(A) | 48 dB(A) | 35 dB(A) |
| Cyberpunk 2077 frame rate (FHD/Ultra) | 68.1 fps | 69.1 fps | 68 fps | 30 fps |
| GPU Power Draw | ~55 W | ~55 W | ~55 W | ~25 W |
| CPU PL1 | 45 W | 45 W | 35 W | 15 W |
| CPU PL2 | 45 W | 45 W | 35 W | 15 W |
| Cinebench R15 Multi Score | 1798 Points | 1802 Points | 1582 Points | 765 Points |
Processor
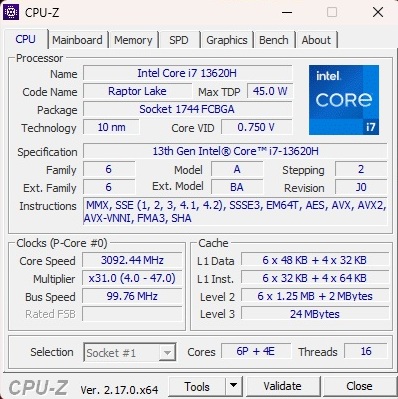
The Core i7-13620H is no longer a particularly new processor from Intel’s Raptor Lake generation. It offers six performance cores and four efficiency cores, supporting a total of up to sixteen threads. In the CPU benchmarks, the 10 nm model is unable to fully realise its potential and ends up around sixteen percent below the previously established average for this CPU. On the plus side, results in the Cinebench loop remained largely consistent. Even so, the processors in competing devices are faster overall.
Cinebench R15 multi-core endurance test
* ... smaller is better
AIDA64: FP32 Ray-Trace | FPU Julia | CPU SHA3 | CPU Queen | FPU SinJulia | FPU Mandel | CPU AES | CPU ZLib | FP64 Ray-Trace | CPU PhotoWorxx
| Performance rating | |
| HP Omen 16-ap0091ng | |
| Lenovo Legion 7 16IAX10 | |
| Average of class Gaming | |
| Acer Nitro V 16 AI ANV16-42-R860 | |
| Alienware 16 Aurora | |
| Average Intel Core i7-13620H | |
| Gigabyte Gaming A16 GA6H | |
| MSI Cyborg 17 B13WFKG | |
| AIDA64 / FP32 Ray-Trace | |
| HP Omen 16-ap0091ng (v6.92.6600) | |
| Average of class Gaming (10227 - 85542, n=113, last 2 years) | |
| Lenovo Legion 7 16IAX10 (v6.92.6600) | |
| Acer Nitro V 16 AI ANV16-42-R860 (v6.92.6600) | |
| Alienware 16 Aurora (v6.92.6600) | |
| Gigabyte Gaming A16 GA6H (v6.92.6600) | |
| Average Intel Core i7-13620H (10779 - 13601, n=7) | |
| MSI Cyborg 17 B13WFKG (v6.92.6600) | |
| AIDA64 / FPU Julia | |
| HP Omen 16-ap0091ng (v6.92.6600) | |
| Lenovo Legion 7 16IAX10 (v6.92.6600) | |
| Average of class Gaming (51376 - 238426, n=113, last 2 years) | |
| Acer Nitro V 16 AI ANV16-42-R860 (v6.92.6600) | |
| Alienware 16 Aurora (v6.92.6600) | |
| Gigabyte Gaming A16 GA6H (v6.92.6600) | |
| Average Intel Core i7-13620H (54287 - 67187, n=7) | |
| MSI Cyborg 17 B13WFKG (v6.92.6600) | |
| AIDA64 / CPU SHA3 | |
| HP Omen 16-ap0091ng (v6.92.6600) | |
| Lenovo Legion 7 16IAX10 (v6.92.6600) | |
| Average of class Gaming (2180 - 9817, n=113, last 2 years) | |
| Acer Nitro V 16 AI ANV16-42-R860 (v6.92.6600) | |
| Alienware 16 Aurora (v6.92.6600) | |
| Gigabyte Gaming A16 GA6H (v6.92.6600) | |
| Average Intel Core i7-13620H (2327 - 2773, n=7) | |
| MSI Cyborg 17 B13WFKG (v6.92.6600) | |
| AIDA64 / CPU Queen | |
| HP Omen 16-ap0091ng (v6.92.6600) | |
| Lenovo Legion 7 16IAX10 (v6.92.6600) | |
| Average of class Gaming (49785 - 173351, n=107, last 2 years) | |
| Acer Nitro V 16 AI ANV16-42-R860 (v6.92.6600) | |
| Alienware 16 Aurora (v6.92.6600) | |
| Gigabyte Gaming A16 GA6H (v6.92.6600) | |
| Average Intel Core i7-13620H (66885 - 78867, n=7) | |
| MSI Cyborg 17 B13WFKG (v6.92.6600) | |
| AIDA64 / FPU SinJulia | |
| HP Omen 16-ap0091ng (v6.92.6600) | |
| Average of class Gaming (4424 - 33636, n=113, last 2 years) | |
| Lenovo Legion 7 16IAX10 (v6.92.6600) | |
| Acer Nitro V 16 AI ANV16-42-R860 (v6.92.6600) | |
| Alienware 16 Aurora (v6.92.6600) | |
| Gigabyte Gaming A16 GA6H (v6.92.6600) | |
| Average Intel Core i7-13620H (6737 - 8421, n=7) | |
| MSI Cyborg 17 B13WFKG (v6.92.6600) | |
| AIDA64 / FPU Mandel | |
| HP Omen 16-ap0091ng (v6.92.6600) | |
| Lenovo Legion 7 16IAX10 (v6.92.6600) | |
| Average of class Gaming (25115 - 128721, n=113, last 2 years) | |
| Acer Nitro V 16 AI ANV16-42-R860 (v6.92.6600) | |
| Alienware 16 Aurora (v6.92.6600) | |
| Gigabyte Gaming A16 GA6H (v6.92.6600) | |
| Average Intel Core i7-13620H (27242 - 32787, n=7) | |
| MSI Cyborg 17 B13WFKG (v6.92.6600) | |
| AIDA64 / CPU AES | |
| HP Omen 16-ap0091ng (v6.92.6600) | |
| Lenovo Legion 7 16IAX10 (v6.92.6600) | |
| Average of class Gaming (39258 - 247074, n=113, last 2 years) | |
| Acer Nitro V 16 AI ANV16-42-R860 (v6.92.6600) | |
| Alienware 16 Aurora (v6.92.6600) | |
| Average Intel Core i7-13620H (48646 - 85895, n=7) | |
| Gigabyte Gaming A16 GA6H (v6.92.6600) | |
| MSI Cyborg 17 B13WFKG (v6.92.6600) | |
| AIDA64 / CPU ZLib | |
| Lenovo Legion 7 16IAX10 (v6.92.6600) | |
| HP Omen 16-ap0091ng (v6.92.6600) | |
| Average of class Gaming (574 - 2531, n=113, last 2 years) | |
| Alienware 16 Aurora (v6.92.6600) | |
| Acer Nitro V 16 AI ANV16-42-R860 (v6.92.6600) | |
| Gigabyte Gaming A16 GA6H (v6.92.6600) | |
| Average Intel Core i7-13620H (688 - 835, n=7) | |
| MSI Cyborg 17 B13WFKG (v6.92.6600) | |
| AIDA64 / FP64 Ray-Trace | |
| HP Omen 16-ap0091ng (v6.92.6600) | |
| Average of class Gaming (5509 - 45446, n=113, last 2 years) | |
| Lenovo Legion 7 16IAX10 (v6.92.6600) | |
| Acer Nitro V 16 AI ANV16-42-R860 (v6.92.6600) | |
| Alienware 16 Aurora (v6.92.6600) | |
| Gigabyte Gaming A16 GA6H (v6.92.6600) | |
| Average Intel Core i7-13620H (5919 - 7364, n=7) | |
| MSI Cyborg 17 B13WFKG (v6.92.6600) | |
| AIDA64 / CPU PhotoWorxx | |
| Lenovo Legion 7 16IAX10 (v6.92.6600) | |
| Average of class Gaming (12271 - 84167, n=113, last 2 years) | |
| Alienware 16 Aurora (v6.92.6600) | |
| Acer Nitro V 16 AI ANV16-42-R860 (v6.92.6600) | |
| Average Intel Core i7-13620H (19421 - 34544, n=7) | |
| MSI Cyborg 17 B13WFKG (v6.92.6600) | |
| Gigabyte Gaming A16 GA6H (v6.92.6600) | |
| HP Omen 16-ap0091ng (v6.92.6600) | |
System performance
In terms of overall system performance, the Cyborg 17 manages at least to avoid finishing last, placing just ahead of the Acer Nitro V 16 in our comparison field.
PCMark 10: Score | Essentials | Productivity | Digital Content Creation
CrossMark: Overall | Productivity | Creativity | Responsiveness
WebXPRT 3: Overall
WebXPRT 4: Overall
Mozilla Kraken 1.1: Total
| Performance rating | |
| Lenovo Legion 7 16IAX10 | |
| Average of class Gaming | |
| HP Omen 16-ap0091ng | |
| Alienware 16 Aurora -4! | |
| Gigabyte Gaming A16 GA6H | |
| MSI Cyborg 17 B13WFKG | |
| Average Intel Core i7-13620H, NVIDIA GeForce RTX 5060 Laptop | |
| Acer Nitro V 16 AI ANV16-42-R860 | |
| PCMark 10 / Score | |
| Average of class Gaming (5828 - 11574, n=98, last 2 years) | |
| HP Omen 16-ap0091ng | |
| MSI Cyborg 17 B13WFKG | |
| Average Intel Core i7-13620H, NVIDIA GeForce RTX 5060 Laptop (n=1) | |
| Lenovo Legion 7 16IAX10 | |
| Acer Nitro V 16 AI ANV16-42-R860 | |
| Gigabyte Gaming A16 GA6H | |
| PCMark 10 / Essentials | |
| Lenovo Legion 7 16IAX10 | |
| HP Omen 16-ap0091ng | |
| Average of class Gaming (8810 - 12600, n=102, last 2 years) | |
| Gigabyte Gaming A16 GA6H | |
| Acer Nitro V 16 AI ANV16-42-R860 | |
| MSI Cyborg 17 B13WFKG | |
| Average Intel Core i7-13620H, NVIDIA GeForce RTX 5060 Laptop (n=1) | |
| PCMark 10 / Productivity | |
| MSI Cyborg 17 B13WFKG | |
| Average Intel Core i7-13620H, NVIDIA GeForce RTX 5060 Laptop (n=1) | |
| Average of class Gaming (6845 - 18766, n=100, last 2 years) | |
| Lenovo Legion 7 16IAX10 | |
| HP Omen 16-ap0091ng | |
| Acer Nitro V 16 AI ANV16-42-R860 | |
| Gigabyte Gaming A16 GA6H | |
| PCMark 10 / Digital Content Creation | |
| Average of class Gaming (7602 - 19351, n=100, last 2 years) | |
| HP Omen 16-ap0091ng | |
| Gigabyte Gaming A16 GA6H | |
| MSI Cyborg 17 B13WFKG | |
| Average Intel Core i7-13620H, NVIDIA GeForce RTX 5060 Laptop (n=1) | |
| Lenovo Legion 7 16IAX10 | |
| Acer Nitro V 16 AI ANV16-42-R860 | |
| CrossMark / Overall | |
| Lenovo Legion 7 16IAX10 | |
| Alienware 16 Aurora | |
| Average of class Gaming (1366 - 2409, n=100, last 2 years) | |
| HP Omen 16-ap0091ng | |
| Gigabyte Gaming A16 GA6H | |
| Acer Nitro V 16 AI ANV16-42-R860 | |
| MSI Cyborg 17 B13WFKG | |
| Average Intel Core i7-13620H, NVIDIA GeForce RTX 5060 Laptop (n=1) | |
| CrossMark / Productivity | |
| Lenovo Legion 7 16IAX10 | |
| Alienware 16 Aurora | |
| Average of class Gaming (1386 - 2254, n=100, last 2 years) | |
| HP Omen 16-ap0091ng | |
| Gigabyte Gaming A16 GA6H | |
| Acer Nitro V 16 AI ANV16-42-R860 | |
| MSI Cyborg 17 B13WFKG | |
| Average Intel Core i7-13620H, NVIDIA GeForce RTX 5060 Laptop (n=1) | |
| CrossMark / Creativity | |
| Lenovo Legion 7 16IAX10 | |
| Average of class Gaming (1343 - 2729, n=100, last 2 years) | |
| Alienware 16 Aurora | |
| HP Omen 16-ap0091ng | |
| Gigabyte Gaming A16 GA6H | |
| Acer Nitro V 16 AI ANV16-42-R860 | |
| MSI Cyborg 17 B13WFKG | |
| Average Intel Core i7-13620H, NVIDIA GeForce RTX 5060 Laptop (n=1) | |
| CrossMark / Responsiveness | |
| Alienware 16 Aurora | |
| Gigabyte Gaming A16 GA6H | |
| Lenovo Legion 7 16IAX10 | |
| Average of class Gaming (1226 - 2334, n=100, last 2 years) | |
| HP Omen 16-ap0091ng | |
| Acer Nitro V 16 AI ANV16-42-R860 | |
| MSI Cyborg 17 B13WFKG | |
| Average Intel Core i7-13620H, NVIDIA GeForce RTX 5060 Laptop (n=1) | |
| WebXPRT 3 / Overall | |
| Lenovo Legion 7 16IAX10 | |
| HP Omen 16-ap0091ng | |
| Average of class Gaming (237 - 532, n=103, last 2 years) | |
| Alienware 16 Aurora | |
| Acer Nitro V 16 AI ANV16-42-R860 | |
| Gigabyte Gaming A16 GA6H | |
| MSI Cyborg 17 B13WFKG | |
| Average Intel Core i7-13620H, NVIDIA GeForce RTX 5060 Laptop (n=1) | |
| WebXPRT 4 / Overall | |
| Lenovo Legion 7 16IAX10 | |
| Average of class Gaming (176.4 - 354, n=103, last 2 years) | |
| Alienware 16 Aurora | |
| Gigabyte Gaming A16 GA6H | |
| HP Omen 16-ap0091ng | |
| Acer Nitro V 16 AI ANV16-42-R860 | |
| MSI Cyborg 17 B13WFKG | |
| Average Intel Core i7-13620H, NVIDIA GeForce RTX 5060 Laptop (n=1) | |
| Mozilla Kraken 1.1 / Total | |
| Acer Nitro V 16 AI ANV16-42-R860 | |
| MSI Cyborg 17 B13WFKG | |
| Average Intel Core i7-13620H, NVIDIA GeForce RTX 5060 Laptop (n=1) | |
| Alienware 16 Aurora | |
| Gigabyte Gaming A16 GA6H | |
| HP Omen 16-ap0091ng | |
| Average of class Gaming (391 - 594, n=108, last 2 years) | |
| Lenovo Legion 7 16IAX10 | |
* ... smaller is better
| PCMark 10 Score | 7664 points | |
Help | ||
| AIDA64 / Memory Copy | |
| Lenovo Legion 7 16IAX10 | |
| Average of class Gaming (21750 - 119676, n=113, last 2 years) | |
| Alienware 16 Aurora | |
| Acer Nitro V 16 AI ANV16-42-R860 | |
| Average Intel Core i7-13620H (31629 - 53927, n=7) | |
| MSI Cyborg 17 B13WFKG | |
| Gigabyte Gaming A16 GA6H | |
| HP Omen 16-ap0091ng | |
| AIDA64 / Memory Read | |
| Lenovo Legion 7 16IAX10 | |
| Average of class Gaming (22956 - 112454, n=113, last 2 years) | |
| Alienware 16 Aurora | |
| Acer Nitro V 16 AI ANV16-42-R860 | |
| Average Intel Core i7-13620H (35115 - 61853, n=7) | |
| MSI Cyborg 17 B13WFKG | |
| HP Omen 16-ap0091ng | |
| Gigabyte Gaming A16 GA6H | |
| AIDA64 / Memory Write | |
| Acer Nitro V 16 AI ANV16-42-R860 | |
| Lenovo Legion 7 16IAX10 | |
| Average of class Gaming (22297 - 133486, n=113, last 2 years) | |
| Alienware 16 Aurora | |
| Average Intel Core i7-13620H (30611 - 54111, n=7) | |
| MSI Cyborg 17 B13WFKG | |
| HP Omen 16-ap0091ng | |
| Gigabyte Gaming A16 GA6H | |
| AIDA64 / Memory Latency | |
| Lenovo Legion 7 16IAX10 | |
| Alienware 16 Aurora | |
| Average of class Gaming (75.3 - 259, n=113, last 2 years) | |
| Gigabyte Gaming A16 GA6H | |
| MSI Cyborg 17 B13WFKG | |
| Average Intel Core i7-13620H (75.9 - 108.2, n=7) | |
| Acer Nitro V 16 AI ANV16-42-R860 | |
| HP Omen 16-ap0091ng | |
* ... smaller is better
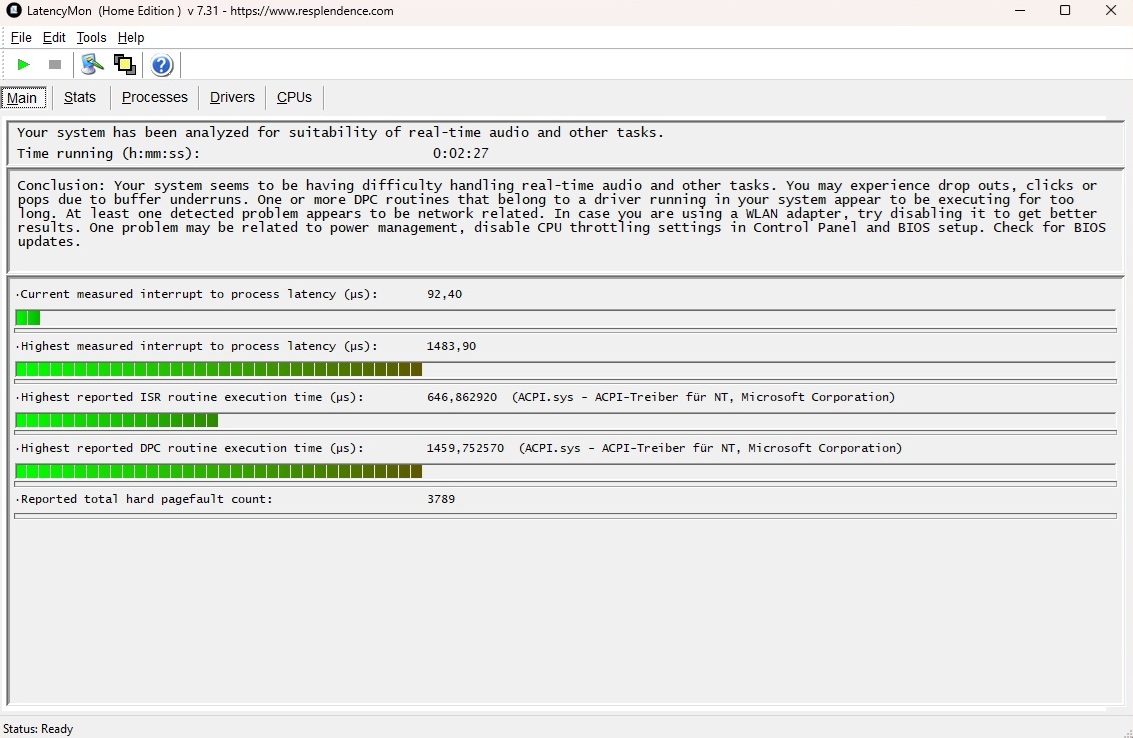
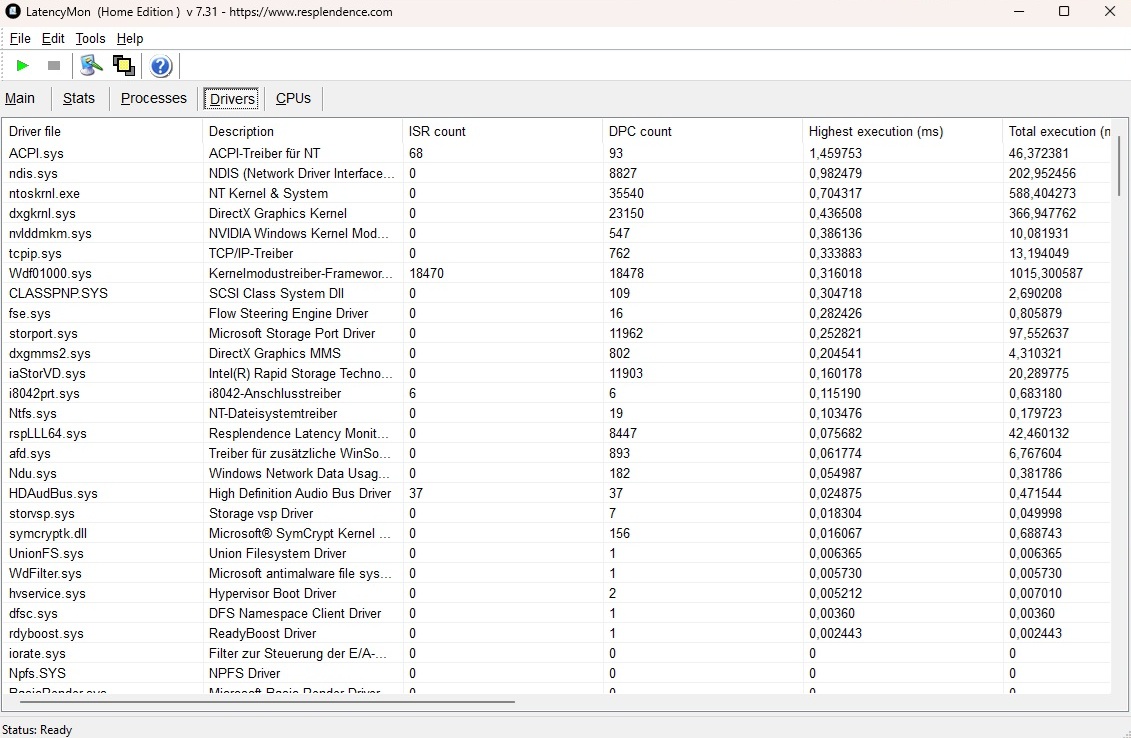
DPC latencies
Latency results fall in the mid-range and are neither particularly good nor especially poor.
| DPC Latencies / LatencyMon - interrupt to process latency (max), Web, Youtube, Prime95 | |
| Gigabyte Gaming A16 GA6H | |
| Acer Nitro V 16 AI ANV16-42-R860 | |
| MSI Cyborg 17 B13WFKG | |
| HP Omen 16-ap0091ng | |
| Lenovo Legion 7 16IAX10 | |
* ... smaller is better
Storage
MSI equips the system with an NVMe SSD from Western Digital that performs adequately, but does not offer anything exceptional.

* ... smaller is better
Sustained read performance: DiskSpd read loop (queue depth 8)
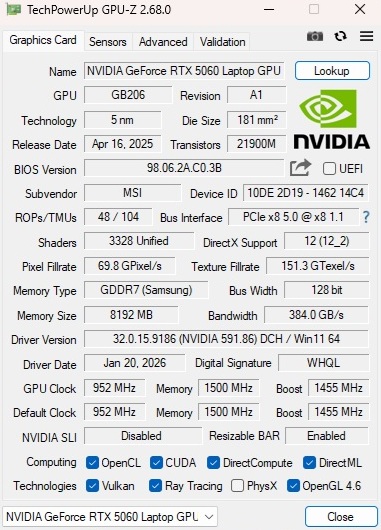
GPU performance
As with the CPU, the GPU is unable to reach its full potential. A maximum TGP of 55 watts including Dynamic Boost is quite limited, especially considering that the RTX 5060 can operate at up to 115 watts. As a result, the Cyborg 17 faces an uphill battle in the graphics tests. Even the RTX 5050 in the Nitro V 16 AI performs better here. Overall, the gap to the previously recorded RTX 5060 average is almost twenty percent.
| 3DMark 11 Performance | 26544 points | |
| 3DMark Cloud Gate Standard Score | 52784 points | |
| 3DMark Fire Strike Score | 21242 points | |
| 3DMark Time Spy Score | 9228 points | |
Help | ||
* ... smaller is better
Gaming performance
The same ranking trend continues in the gaming tests. Since MSI has opted for a resolution of 1,920 x 1,080 pixels, most games run smoothly at high settings. Things only become tight with extremely demanding or poorly optimised titles such as Borderlands 4. We tested upscaling using Outer Worlds 2 as an example. While a combination of Full HD and maximum settings produced only 31 fps, enabling DLSS Quality resulted in a usable 45 fps. With four times frame generation, the frame rate even jumped to 141 fps, although the controls then felt somewhat odd.
| low | med. | high | ultra | |
|---|---|---|---|---|
| GTA V (2015) | 178.4 | 160.3 | 103.5 | |
| Dota 2 Reborn (2015) | 136.3 | 118.7 | 115 | |
| X-Plane 11.11 (2018) | 79.8 | 68.2 | ||
| Baldur's Gate 3 (2023) | 96.2 | 81.1 | 78.1 | |
| Cyberpunk 2077 (2023) | 92.4 | 79.9 | 68.1 | |
| Kingdom Come Deliverance 2 (2025) | 77.6 | 64.9 | 46.1 | |
| Monster Hunter Wilds (2025) | 53.8 | 49.7 | 36.5 | |
| The Elder Scrolls IV Oblivion Remastered (2025) | 48.2 | 43.7 | 22.8 | |
| Doom: The Dark Ages (2025) | 52.6 | 48.6 | 47.1 | |
| Borderlands 4 (2025) | 41.2 | 34.1 | 20.5 | |
| The Outer Worlds 2 (2025) | 71.5 | 58.3 | 31.1 | |
| ARC Raiders (2025) | 102 | 79.9 | 55 | |
| Anno 117: Pax Romana (2025) | 69 | 50 | 25.1 |
| The Outer Worlds 2 | |
| 1920x1080 High Preset AA:T | |
| Average of class Gaming (51.1 - 94.5, n=11, last 2 years) | |
| Average NVIDIA GeForce RTX 5060 Laptop (58.3 - 72.7, n=4) | |
| Acer Nitro V 16 AI ANV16-42-R860 | |
| MSI Cyborg 17 B13WFKG | |
| 1920x1080 Very High Preset AA:T | |
| Average of class Gaming (26.4 - 58.4, n=11, last 2 years) | |
| Average NVIDIA GeForce RTX 5060 Laptop (31.1 - 40.9, n=4) | |
| Acer Nitro V 16 AI ANV16-42-R860 | |
| MSI Cyborg 17 B13WFKG | |
| Borderlands 4 | |
| 1920x1080 High Preset AA:FX | |
| Average of class Gaming (28.7 - 76.6, n=13, last 2 years) | |
| MSI Cyborg 17 B13WFKG | |
| Average NVIDIA GeForce RTX 5060 Laptop (28.7 - 39.3, n=4) | |
| Acer Nitro V 16 AI ANV16-42-R860 | |
| 1920x1080 Badass Preset AA:FX | |
| Average of class Gaming (16 - 54, n=13, last 2 years) | |
| Average NVIDIA GeForce RTX 5060 Laptop (16.3 - 24.8, n=4) | |
| MSI Cyborg 17 B13WFKG | |
| Acer Nitro V 16 AI ANV16-42-R860 | |
| The Elder Scrolls IV Oblivion Remastered | |
| 1920x1080 High Preset AA:T | |
| Average of class Gaming (39.9 - 111.8, n=16, last 2 years) | |
| Average NVIDIA GeForce RTX 5060 Laptop (43.7 - 54.9, n=3) | |
| Gigabyte Gaming A16 GA6H | |
| MSI Cyborg 17 B13WFKG | |
| 1920x1080 Ultra Preset AA:T | |
| Average of class Gaming (19.8 - 61.9, n=17, last 2 years) | |
| Gigabyte Gaming A16 GA6H | |
| Average NVIDIA GeForce RTX 5060 Laptop (22.8 - 29.2, n=3) | |
| MSI Cyborg 17 B13WFKG | |
| Kingdom Come Deliverance 2 | |
| 1920x1080 High Preset | |
| Average of class Gaming (58.2 - 165.7, n=15, last 2 years) | |
| Gigabyte Gaming A16 GA6H | |
| Average NVIDIA GeForce RTX 5060 Laptop (64.9 - 86, n=3) | |
| MSI Cyborg 17 B13WFKG | |
| 1920x1080 Ultra Preset | |
| Average of class Gaming (41.4 - 130.3, n=16, last 2 years) | |
| Gigabyte Gaming A16 GA6H | |
| Average NVIDIA GeForce RTX 5060 Laptop (46.1 - 61.1, n=3) | |
| MSI Cyborg 17 B13WFKG | |
| Monster Hunter Wilds | |
| 1920x1080 high, no upscaling | |
| Average NVIDIA GeForce RTX 5060 Laptop (49.7 - 58.8, n=2) | |
| MSI Cyborg 17 B13WFKG | |
| Average of class Gaming (41.4 - 63.2, n=4, last 2 years) | |
| 1920x1080 ultra, RT: high, no upscaling | |
| Average of class Gaming (16.6 - 95.3, n=27, last 2 years) | |
| MSI Cyborg 17 B13WFKG | |
| Alienware 16 Aurora | |
| Average NVIDIA GeForce RTX 5060 Laptop (16.6 - 36.5, n=4) | |
| Lenovo Legion 7 16IAX10 | |
Cyberpunk 2077 Ultra FPS chart
Emissions
Noise emissions
Despite its lower power limits, the Cyborg 17 reaches similar noise levels to its competitors under load. At 44 to 50 dB(A), using a headset is advisable. In idle operation, however, the fan sometimes switches off completely.
Noise level
| Idle |
| 25 / 27 / 34 dB(A) |
| Load |
| 44 / 50 dB(A) |
 | ||
30 dB silent 40 dB(A) audible 50 dB(A) loud |
||
min: | ||
| MSI Cyborg 17 B13WFKG i7-13620H, GeForce RTX 5060 Laptop | Acer Nitro V 16 AI ANV16-42-R860 R5 240, GeForce RTX 5050 Laptop | Alienware 16 Aurora Core 7 240H, GeForce RTX 5060 Laptop | HP Omen 16-ap0091ng R9 8940HX, GeForce RTX 5060 Laptop | Lenovo Legion 7 16IAX10 Ultra 7 255HX, GeForce RTX 5060 Laptop | Gigabyte Gaming A16 GA6H i7-13620H, GeForce RTX 5070 Laptop | |
|---|---|---|---|---|---|---|
| Noise | 1% | 3% | 4% | 3% | -2% | |
| off / environment * (dB) | 25 | 25 -0% | 22.9 8% | 23 8% | 23.9 4% | 24 4% |
| Idle Minimum * (dB) | 25 | 25 -0% | 24 4% | 23 8% | 24 4% | 25 -0% |
| Idle Average * (dB) | 27 | 30 -11% | 25.6 5% | 23 15% | 26 4% | 26 4% |
| Idle Maximum * (dB) | 34 | 33 3% | 25.6 25% | 27.64 19% | 29.4 14% | 27 21% |
| Load Average * (dB) | 44 | 38 14% | 46.8 -6% | 49.5 -13% | 35.4 20% | 54 -23% |
| Cyberpunk 2077 ultra * (dB) | 48 | 49 -2% | 49.9 -4% | 49.5 -3% | 54.6 -14% | 54 -13% |
| Load Maximum * (dB) | 50 | 50 -0% | 55.6 -11% | 52.73 -5% | 54.7 -9% | 55 -10% |
* ... smaller is better
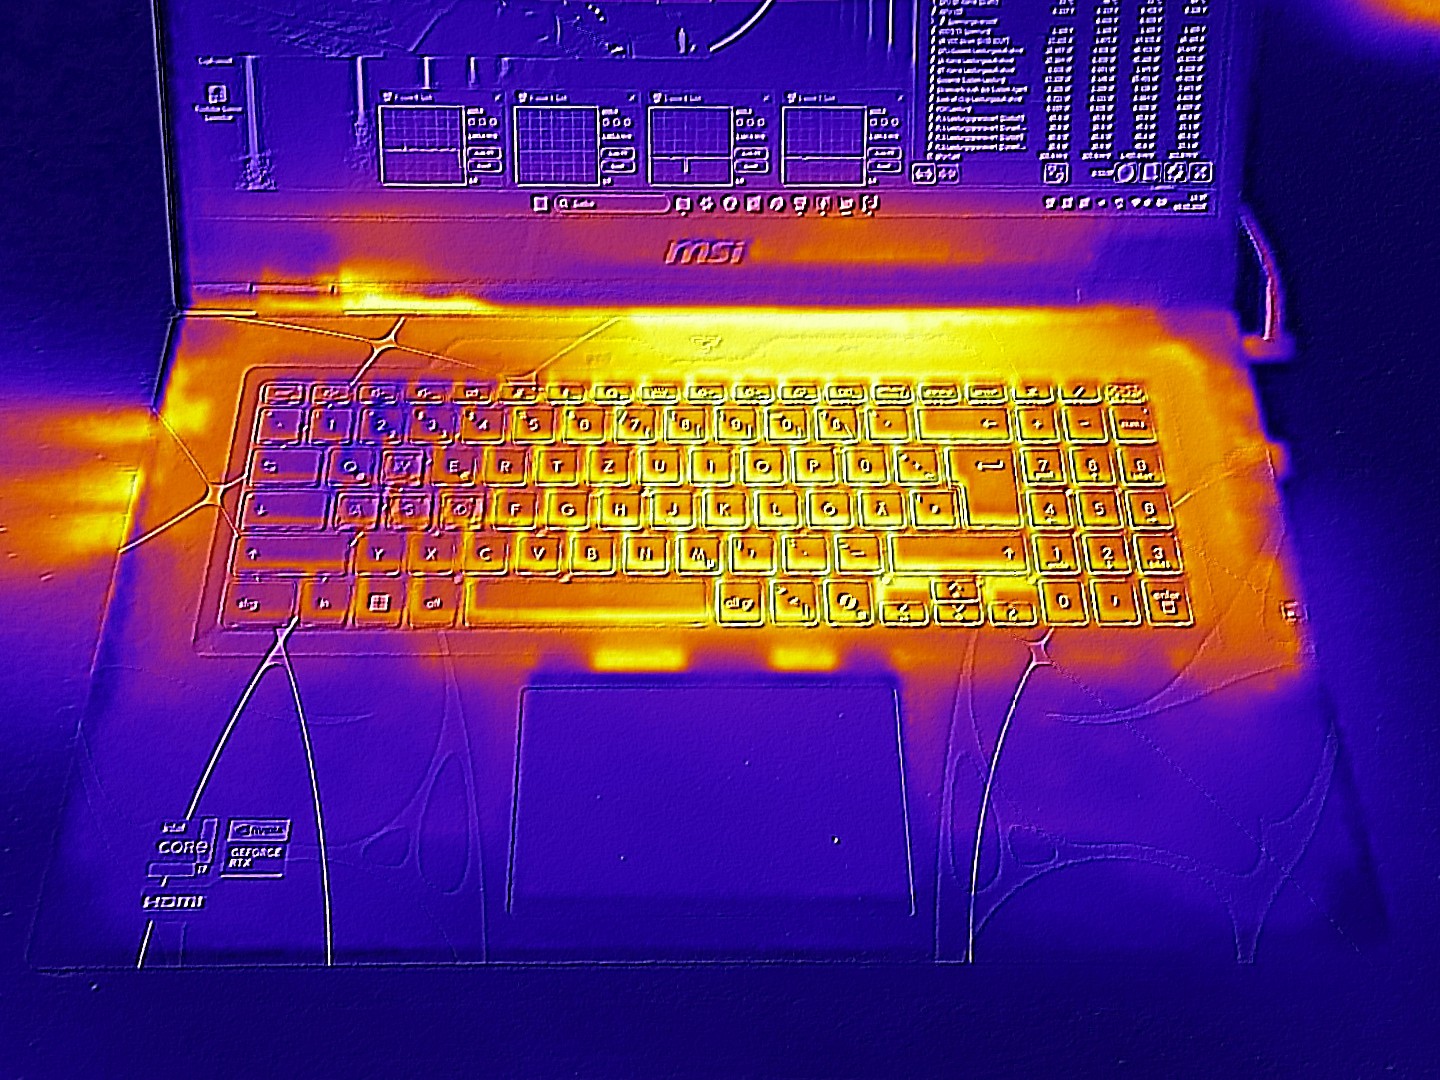
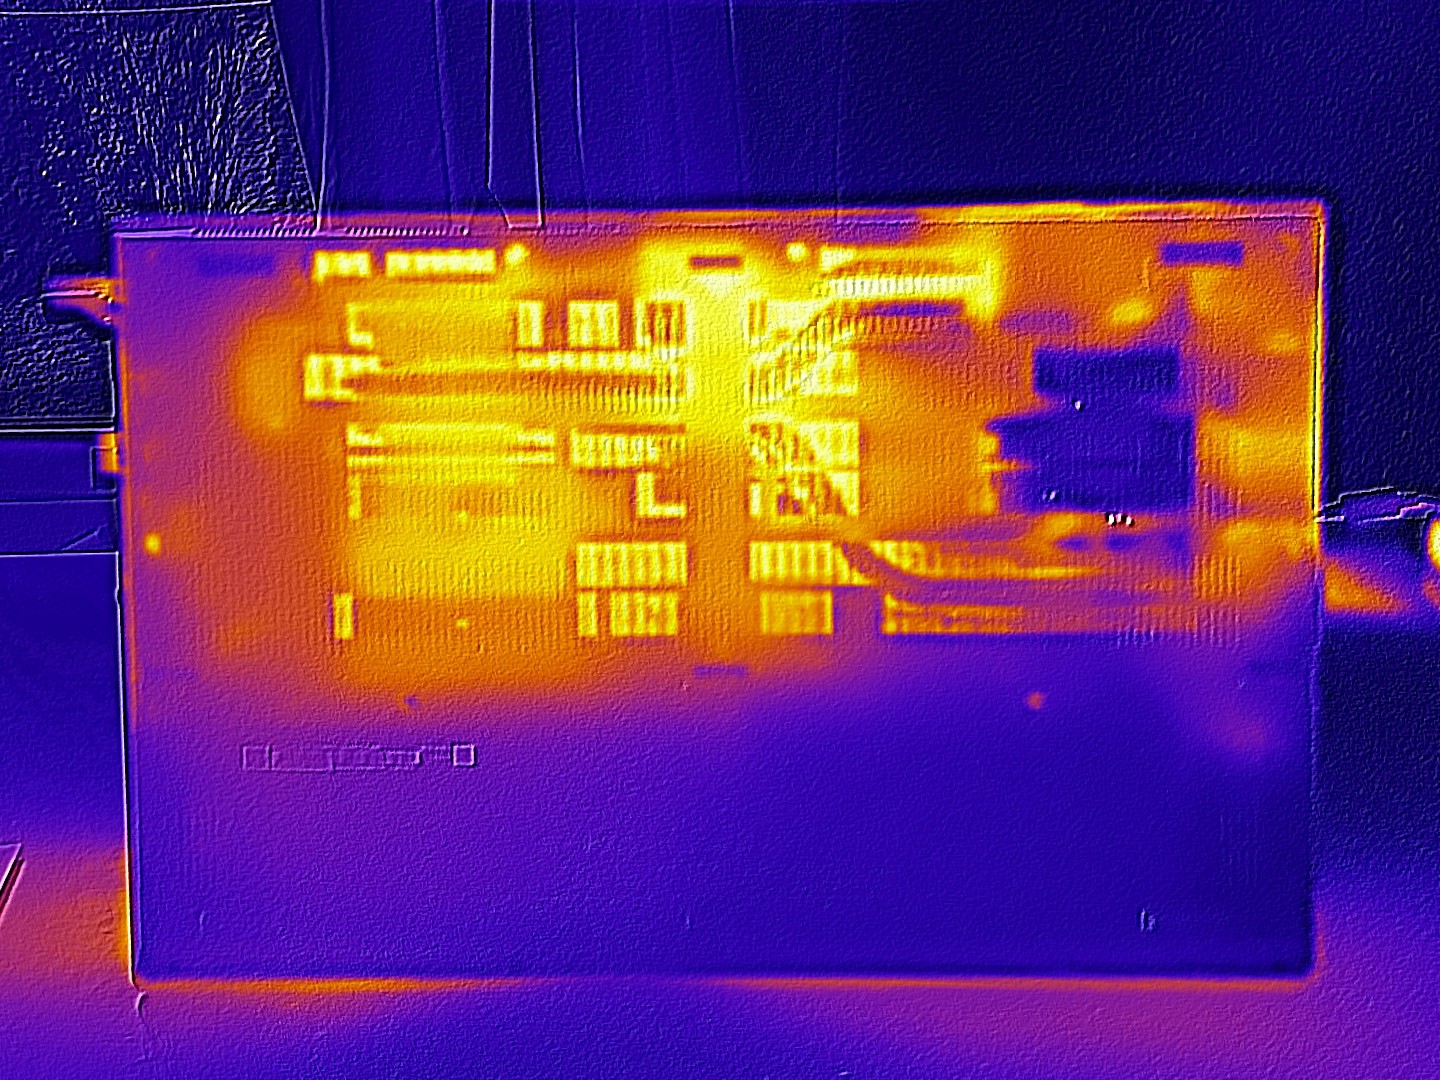
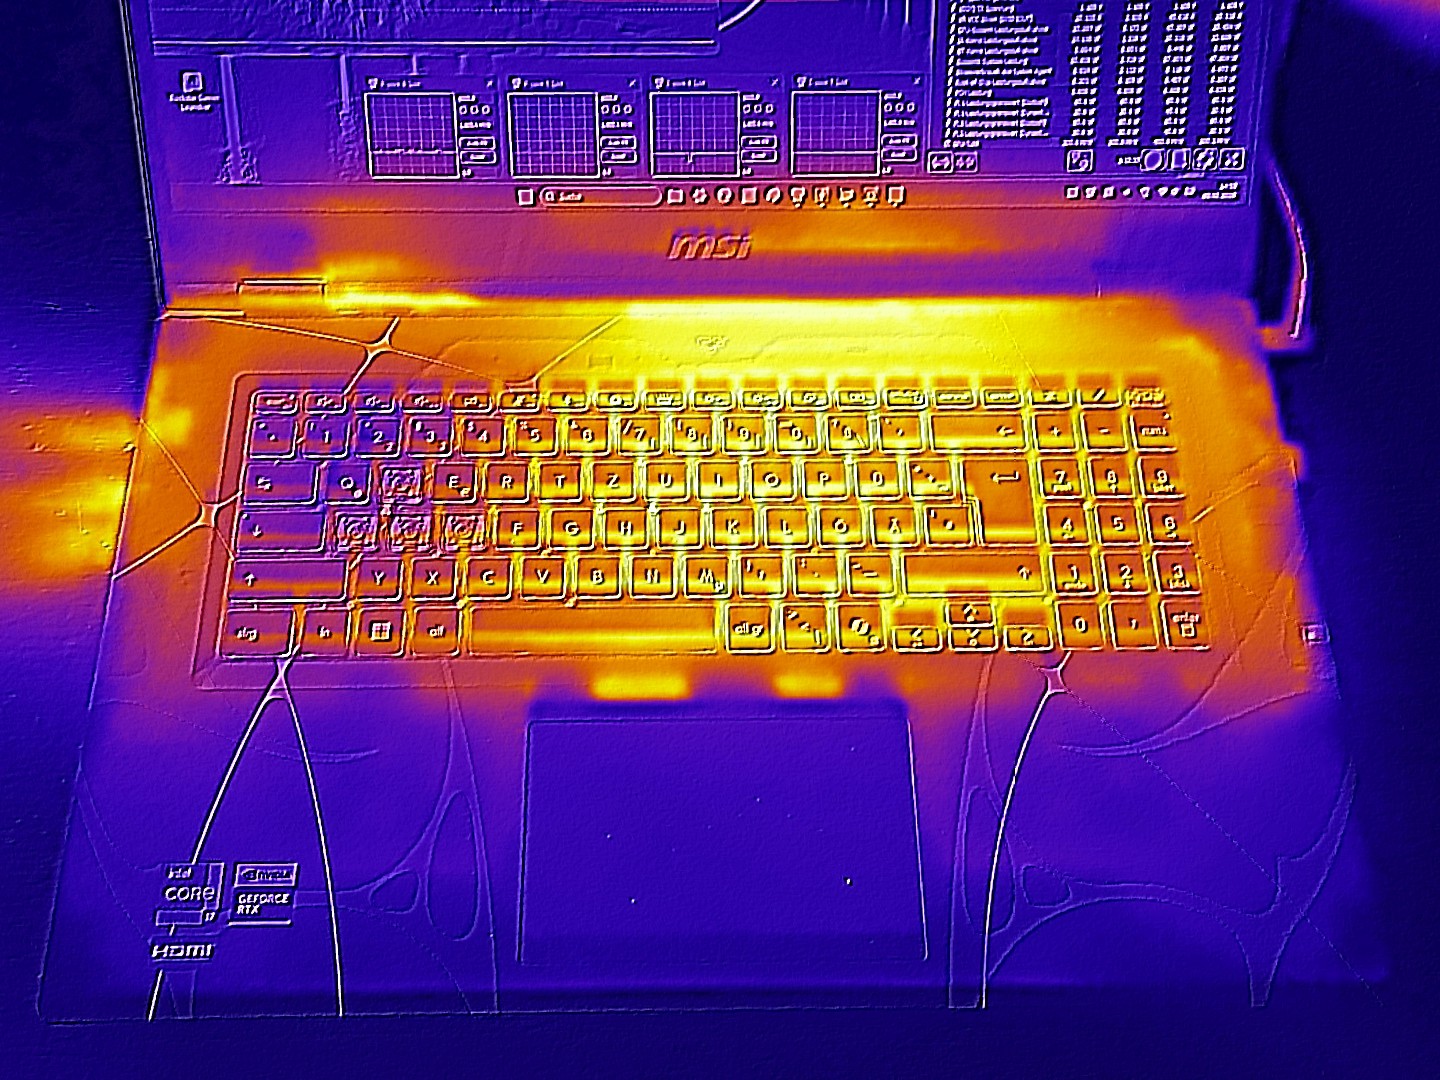
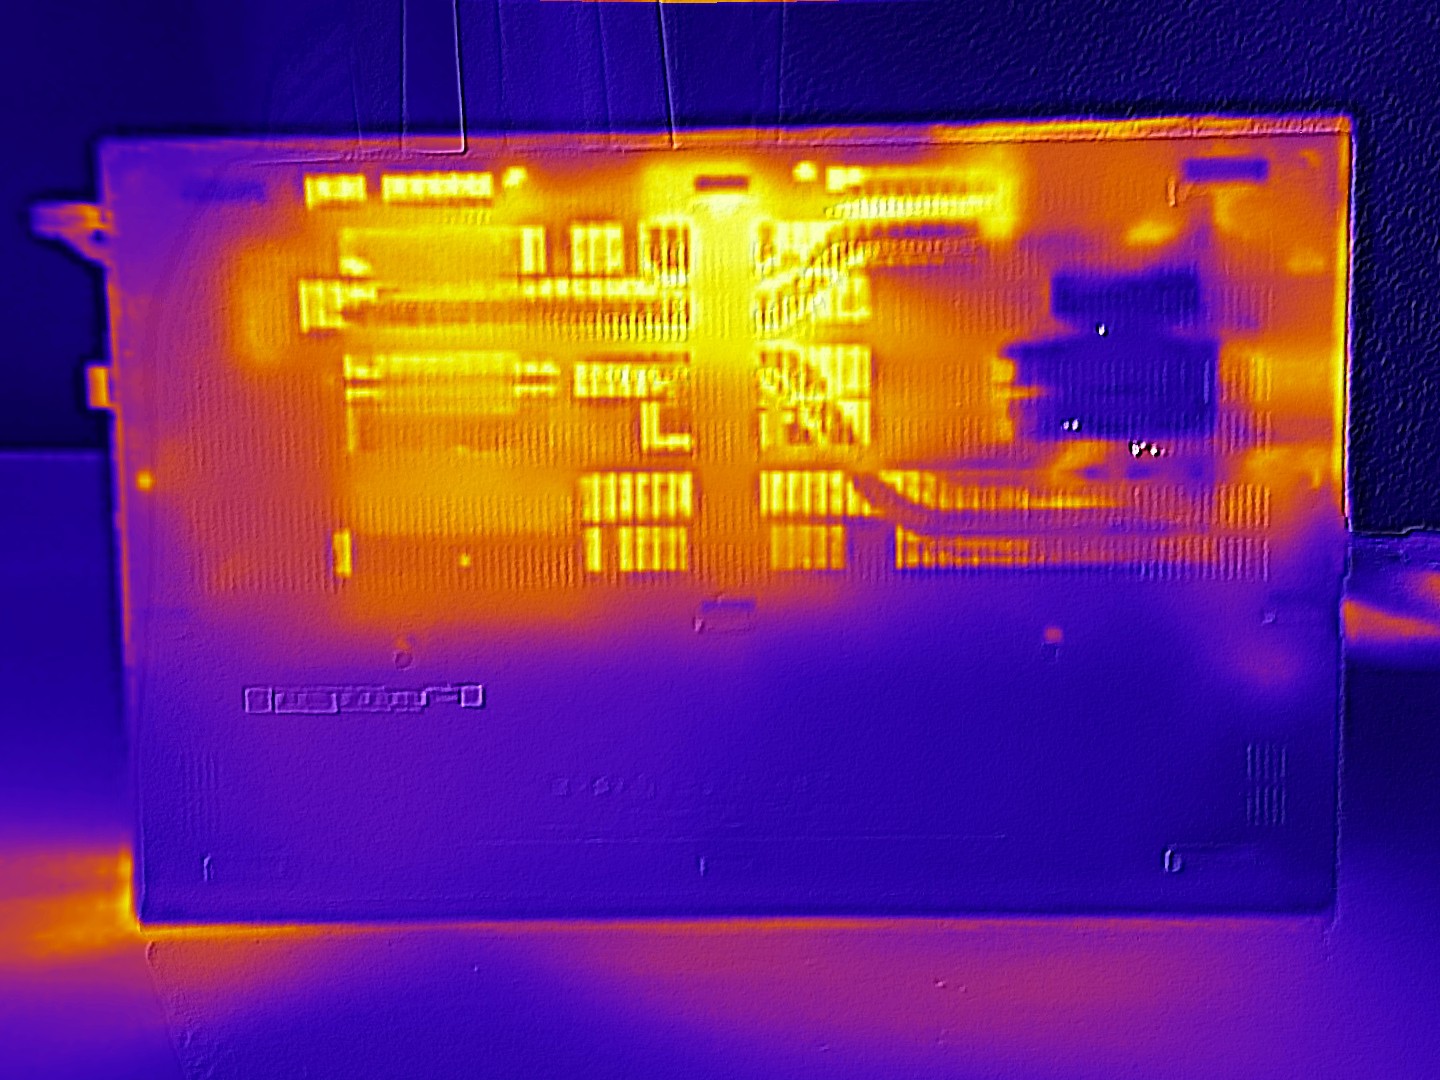
Temperature
Temperatures also do not fully reflect the performance on offer, although a maximum of 49 °C on the top side or underside of the case is far from critical.
(-) The maximum temperature on the upper side is 49 °C / 120 F, compared to the average of 40.4 °C / 105 F, ranging from 21.2 to 68.8 °C for the class Gaming.
(-) The bottom heats up to a maximum of 49 °C / 120 F, compared to the average of 43.2 °C / 110 F
(±) In idle usage, the average temperature for the upper side is 32.3 °C / 90 F, compared to the device average of 33.9 °C / 93 F.
(-) 3: The average temperature for the upper side is 40.1 °C / 104 F, compared to the average of 33.9 °C / 93 F for the class Gaming.
(+) The palmrests and touchpad are reaching skin temperature as a maximum (32 °C / 89.6 F) and are therefore not hot.
(-) The average temperature of the palmrest area of similar devices was 28.8 °C / 83.8 F (-3.2 °C / -5.8 F).
| MSI Cyborg 17 B13WFKG i7-13620H, GeForce RTX 5060 Laptop | Acer Nitro V 16 AI ANV16-42-R860 R5 240, GeForce RTX 5050 Laptop | HP Omen 16-ap0091ng R9 8940HX, GeForce RTX 5060 Laptop | Lenovo Legion 7 16IAX10 Ultra 7 255HX, GeForce RTX 5060 Laptop | Gigabyte Gaming A16 GA6H i7-13620H, GeForce RTX 5070 Laptop | |
|---|---|---|---|---|---|
| Heat | 5% | 22% | 7% | 4% | |
| Maximum Upper Side * (°C) | 49 | 45 8% | 36 27% | 47 4% | 50 -2% |
| Maximum Bottom * (°C) | 49 | 59 -20% | 37 24% | 44 10% | 49 -0% |
| Idle Upper Side * (°C) | 37 | 29 22% | 30 19% | 35.6 4% | 35 5% |
| Idle Bottom * (°C) | 39 | 36 8% | 32 18% | 35.2 10% | 34 13% |
* ... smaller is better
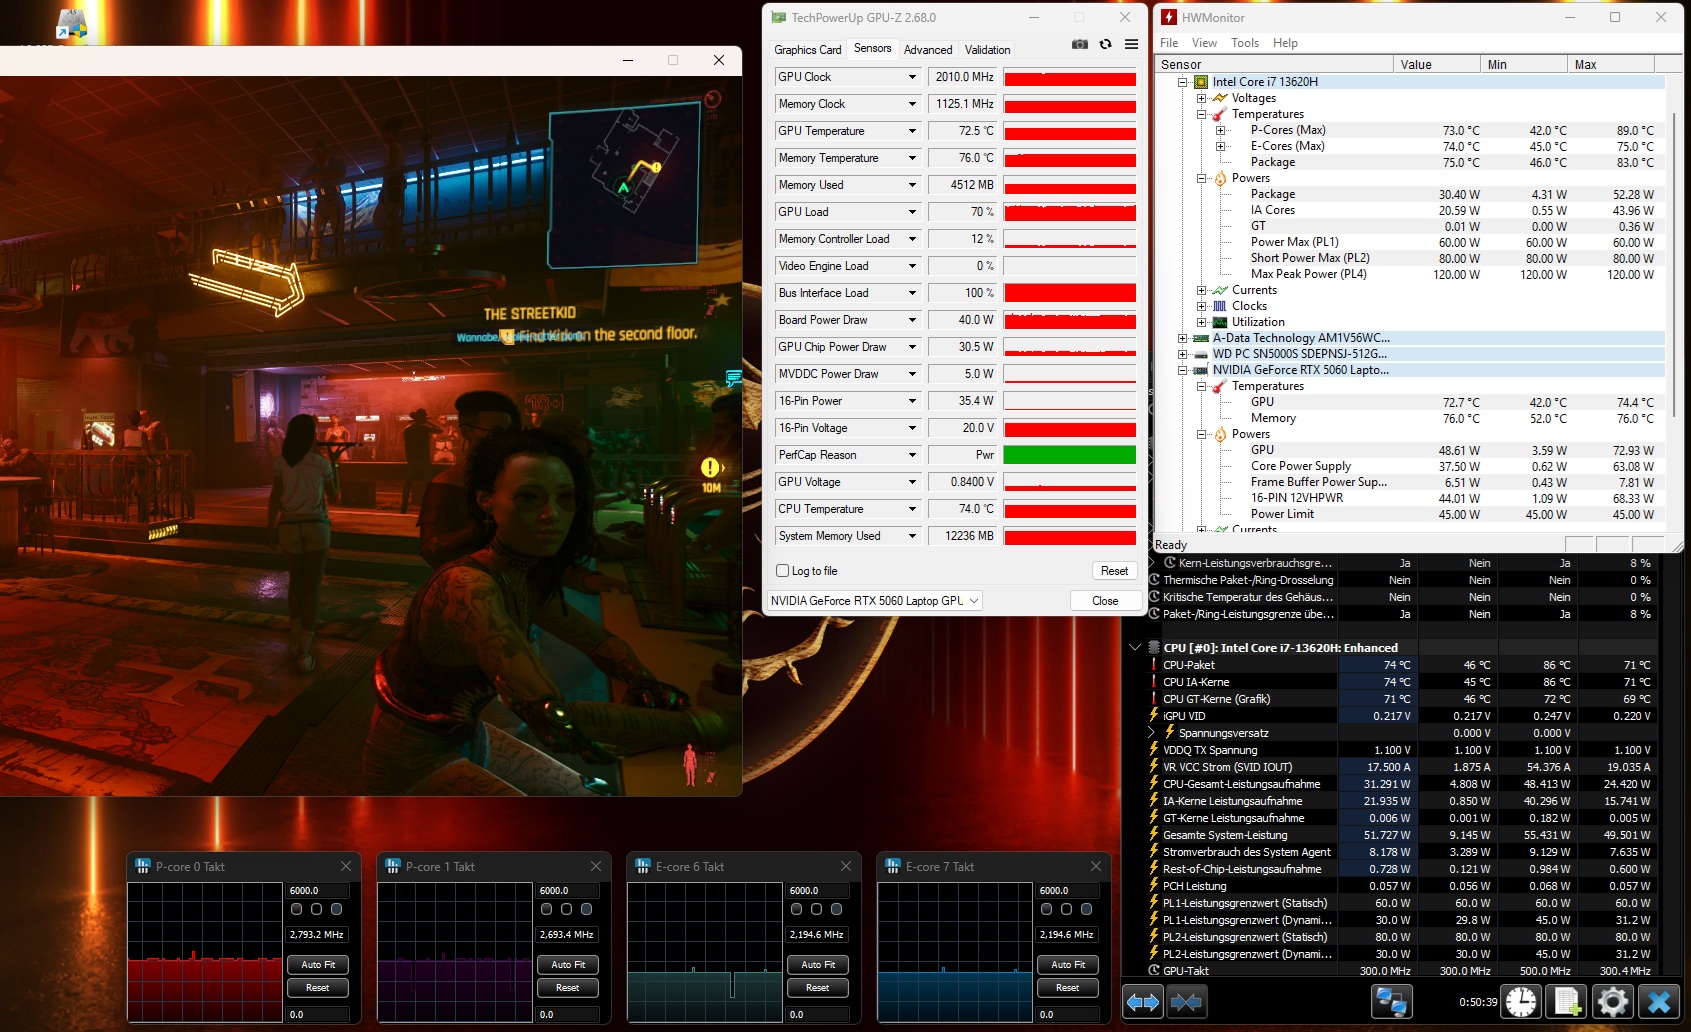
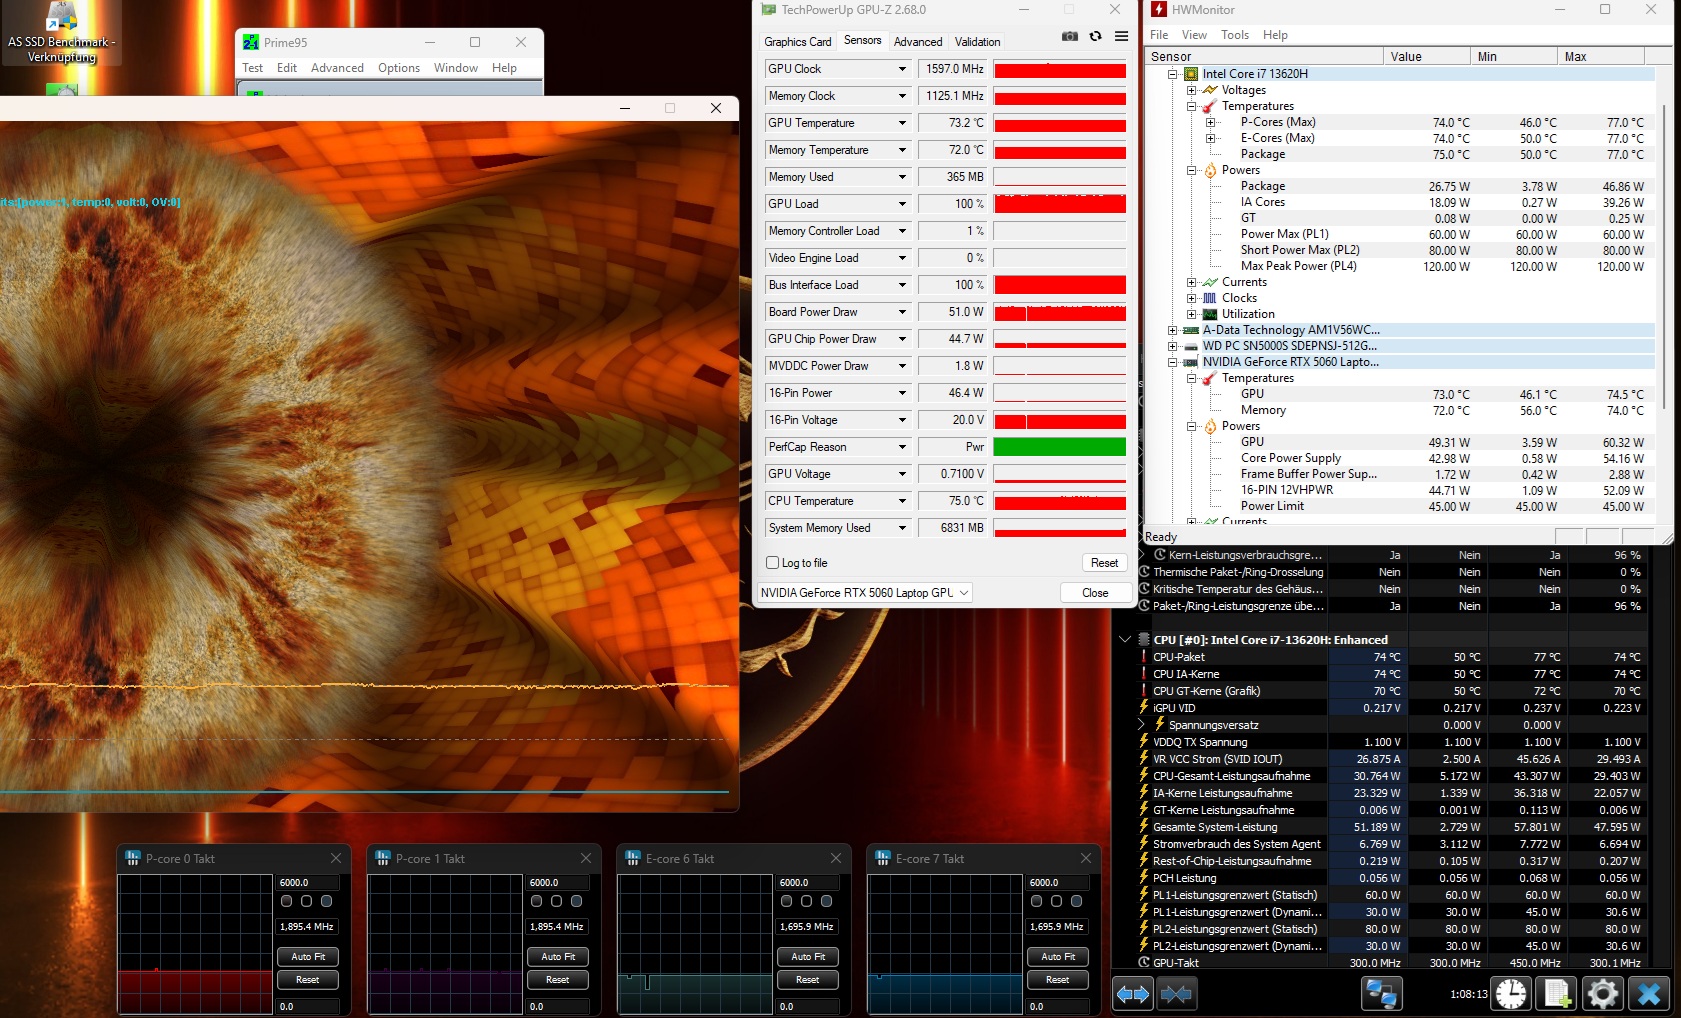
Stress test
In the stress test using the tools FurMark and Prime95, both the CPU and GPU settled at just above 70 °C, which is a moderate result.
Speakers
The 2.0 speaker system delivers a more than solid sound quality aside from its limited bass, and even surpasses the HP Omen 16 in this respect.
MSI Cyborg 17 B13WFKG audio analysis
(+) | speakers can play relatively loud (86 dB)
Bass 100 - 315 Hz
(-) | nearly no bass - on average 23% lower than median
(±) | linearity of bass is average (14% delta to prev. frequency)
Mids 400 - 2000 Hz
(+) | balanced mids - only 2.5% away from median
(+) | mids are linear (4.3% delta to prev. frequency)
Highs 2 - 16 kHz
(±) | higher highs - on average 5.1% higher than median
(+) | highs are linear (4% delta to prev. frequency)
Overall 100 - 16.000 Hz
(±) | linearity of overall sound is average (15.2% difference to median)
Compared to same class
» 33% of all tested devices in this class were better, 6% similar, 61% worse
» The best had a delta of 6%, average was 18%, worst was 132%
Compared to all devices tested
» 21% of all tested devices were better, 4% similar, 74% worse
» The best had a delta of 4%, average was 24%, worst was 134%
HP Omen 16-ap0091ng audio analysis
(±) | speaker loudness is average but good (79.91 dB)
Bass 100 - 315 Hz
(-) | nearly no bass - on average 18% lower than median
(±) | linearity of bass is average (11.1% delta to prev. frequency)
Mids 400 - 2000 Hz
(±) | higher mids - on average 6.9% higher than median
(±) | linearity of mids is average (7.5% delta to prev. frequency)
Highs 2 - 16 kHz
(+) | balanced highs - only 2.1% away from median
(±) | linearity of highs is average (7.5% delta to prev. frequency)
Overall 100 - 16.000 Hz
(±) | linearity of overall sound is average (17.8% difference to median)
Compared to same class
» 53% of all tested devices in this class were better, 10% similar, 37% worse
» The best had a delta of 6%, average was 18%, worst was 132%
Compared to all devices tested
» 36% of all tested devices were better, 8% similar, 56% worse
» The best had a delta of 4%, average was 24%, worst was 134%
Energy management
Power consumption
While idle power consumption could be lower, the Cyborg 17 uses less energy than its competitors under load at around 90 to 115 watts.
| Off / Standby | |
| Idle | |
| Load |
|
Key:
min: | |
| MSI Cyborg 17 B13WFKG i7-13620H, GeForce RTX 5060 Laptop | Acer Nitro V 16 AI ANV16-42-R860 R5 240, GeForce RTX 5050 Laptop | Alienware 16 Aurora Core 7 240H, GeForce RTX 5060 Laptop | HP Omen 16-ap0091ng R9 8940HX, GeForce RTX 5060 Laptop | Lenovo Legion 7 16IAX10 Ultra 7 255HX, GeForce RTX 5060 Laptop | Gigabyte Gaming A16 GA6H i7-13620H, GeForce RTX 5070 Laptop | Average of class Gaming | |
|---|---|---|---|---|---|---|---|
| Power Consumption | 16% | -11% | -32% | -55% | -15% | -59% | |
| Idle Minimum * (Watt) | 7.9 | 4.2 47% | 4.4 44% | 7.8 1% | 9.4 -19% | 9 -14% | 13.4 ? -70% |
| Idle Average * (Watt) | 12.7 | 6.8 46% | 18 -42% | 8.8 31% | 10.6 17% | 11 13% | 19 ? -50% |
| Idle Maximum * (Watt) | 18.1 | 9.8 46% | 18.2 -1% | 21.5 -19% | 36.4 -101% | 23 -27% | 24.5 ? -35% |
| Load Average * (Watt) | 90 | 62 31% | 87.1 3% | 119 -32% | 107.7 -20% | 91 -1% | 108.3 ? -20% |
| Cyberpunk 2077 ultra external monitor * (Watt) | 108.4 | 129.6 -20% | 120.6 -11% | 164.5 -52% | 187.5 -73% | 130 -20% | |
| Cyberpunk 2077 ultra * (Watt) | 109.7 | 130.3 -19% | 123 -12% | 192 -75% | 188 -71% | 132.5 -21% | |
| Load Maximum * (Watt) | 115 | 135 -17% | 183 -59% | 208 -81% | 247 -115% | 155 -35% | 254 ? -121% |
* ... smaller is better
energy consumption Cyberpunk / Stress test
Power consumption in stress test with external monitor
Battery life
The combination of suboptimal idle consumption and a modest battery capacity results in somewhat disappointing runtimes. At just under four hours in our Wi-Fi test (with brightness reduced to 150 cd/m²), the Cyborg 17 records the weakest result in the comparison field. This is not surprising, as competing devices offer between 70 and 96 Wh.
| MSI Cyborg 17 B13WFKG i7-13620H, GeForce RTX 5060 Laptop, 55.2 Wh | Acer Nitro V 16 AI ANV16-42-R860 R5 240, GeForce RTX 5050 Laptop, 76 Wh | Alienware 16 Aurora Core 7 240H, GeForce RTX 5060 Laptop, 96 Wh | HP Omen 16-ap0091ng R9 8940HX, GeForce RTX 5060 Laptop, 70 Wh | Lenovo Legion 7 16IAX10 Ultra 7 255HX, GeForce RTX 5060 Laptop, 84 Wh | Gigabyte Gaming A16 GA6H i7-13620H, GeForce RTX 5070 Laptop, 76 Wh | Average of class Gaming | |
|---|---|---|---|---|---|---|---|
| Battery runtime | 195% | 97% | 32% | 24% | 103% | 82% | |
| WiFi v1.3 (h) | 3.8 | 11.2 195% | 7.5 97% | 5 32% | 4.7 24% | 7.7 103% | 6.91 ? 82% |
| H.264 (h) | 5.1 | 8.16 ? | |||||
| Load (h) | 1.3 | 1.527 ? |
Notebookcheck overall rating
MSI has cut costs in so many areas with the Cyborg 17 that we can recommend this 17-inch gaming laptop only with reservations, even from a budget perspective.
MSI Cyborg 17 B13WFKG
- 02/13/2026 v8
Florian Glaser
 Total Sustainability Score:
 Possible alternatives at a glance
Image | Model / Review | Price | Weight | Height | Display |
|---|---|---|---|---|---|
1. 76.3%  | MSI Cyborg 17 B13WFKG Intel Core i7-13620H ⎘ NVIDIA GeForce RTX 5060 Laptop ⎘ 16 GB Memory, 512 GB SSD | Amazon: List Price: 1200 EUR | 2.6 kg | 22.2 mm | 17.30" 1920x1080 127 PPI IPS |
2. 77.5%  | Acer Nitro V 16 AI ANV16-42-R860 AMD Ryzen 5 240 ⎘ NVIDIA GeForce RTX 5050 Laptop ⎘ 16 GB Memory, 1024 GB SSD | Amazon: 1. $125.98 Replacement LCD for Acer Nit... 2. $849.00 acer Nitro V 16 AI WUXGA (19... 3. $899.99 acer Nitro V 16 AI Gaming La... List Price: 1100 EUR | 2.4 kg | 24.5 mm | 16.00" 1920x1200 142 PPI IPS |
3. 76.2%  | Alienware 16 Aurora Intel Core 7 240H ⎘ NVIDIA GeForce RTX 5060 Laptop ⎘ 32 GB Memory | Amazon: List Price: 1100 USD | 2.6 kg | 15.2 mm | 16.00" 2560x1600 189 PPI IPS |
4. 82.5%  | HP Omen 16-ap0091ng AMD Ryzen 9 8940HX ⎘ NVIDIA GeForce RTX 5060 Laptop ⎘ 16 GB Memory, 1000 GB SSD | Amazon: List Price: 1500 Euro | 2.4 kg | 23.7 mm | 16.00" 1920x1200 162 PPI IPS |
5. 86.6% 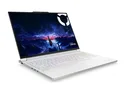 | Lenovo Legion 7 16IAX10 Intel Core Ultra 7 255HX ⎘ NVIDIA GeForce RTX 5060 Laptop ⎘ 32 GB Memory, 1024 GB SSD | Amazon: List Price: 1650 USD | 2 kg | 17.9 mm | 16.00" 2560x1600 189 PPI OLED |
6. 80.1%  | Gigabyte Gaming A16 GA6H Intel Core i7-13620H ⎘ NVIDIA GeForce RTX 5070 Laptop ⎘ 16 GB Memory, 1024 GB SSD | Amazon: 1. $1,303.96 GIGABYTE - Gaming A16 Gaming... 2. $971.14 GIGABYTE - Gaming A16 Gaming... 3. $1,349.99 GIGABYTE - Gaming A16 Gaming... List Price: 1700 EUR | 2.3 kg | 23 mm | 16.00" 2560x1600 189 PPI IPS |
Transparency
The selection of devices to be reviewed is made by our editorial team. The test sample was provided to the author as a loan by the manufacturer or retailer for the purpose of this review. The lender had no influence on this review, nor did the manufacturer receive a copy of this review before publication. There was no obligation to publish this review. As an independent media company, Notebookcheck is not subjected to the authority of manufacturers, retailers or publishers.
This is how Notebookcheck is testing
Every year, Notebookcheck independently reviews hundreds of laptops and smartphones using standardized procedures to ensure that all results are comparable. We have continuously developed our test methods for around 20 years and set industry standards in the process. In our test labs, high-quality measuring equipment is utilized by experienced technicians and editors. These tests involve a multi-stage validation process. Our complex rating system is based on hundreds of well-founded measurements and benchmarks, which maintains objectivity. Further information on our test methods can be found here.

