Schenker XMG Pro 17 with RTX 3080 (Clevo PC70HS) review: A throttled ultra-slim gaming laptop and workstation in one
The last time we tested the 17-inch version of the XMG Pro was in the beginning of 2020, and a lot has happened since then. As we saw in the 15-inch version in March of last year, Schenker has completely reworked the design, turning a case that used to be thick into a particularly slim system with high-performance hardware that is targeted for gamers as well as creative professionals. We now ask whether this ultra-slim design can offer sufficient power for gamers and professionals at the same time.
The predecessor with its RTX 2060 and Intel Core i7-9750H is hardly suited for comparison anymore. For the benchmarks, we therefore use other competitors such as the Alienware x17 R1, the Medion Erazer Beast X25, and the significantly more expensive Asus ROG Zephyrus S17 and MSI GS76 Stealth 11UH, as well as the 15-inch XMG Pro 15 sibling model for comparison.
Possible Competitors for Comparison
Rating | Date | Model | Weight | Height | Size | Resolution | Price |
|---|---|---|---|---|---|---|---|
| 84.7 % v7 (old) | 01 / 2022 | Schenker XMG Pro 17 (Late 2021, RTX 3080) i7-11800H, GeForce RTX 3080 Laptop GPU | 2.4 kg | 19.9 mm | 17.30" | 3840x2160 | |
| 84.6 % v7 (old) | 01 / 2022 | Schenker XMG Pro 15 (Late 2021) i7-11800H, GeForce RTX 3080 Laptop GPU | 2 kg | 19.8 mm | 15.60" | 3840x2160 | |
| 89 % v7 (old) | 09 / 2021 | Alienware x17 RTX 3080 P48E i7-11800H, GeForce RTX 3080 Laptop GPU | 3.2 kg | 21.4 mm | 17.30" | 3840x2160 | |
| 85 % v7 (old) | 07 / 2021 | Medion Erazer Beast X25 R9 5900HX, GeForce RTX 3080 Laptop GPU | 2.3 kg | 23 mm | 17.30" | 1920x1080 | |
| 86.2 % v7 (old) | 09 / 2021 | MSI GS76 Stealth 11UH i9-11900H, GeForce RTX 3080 Laptop GPU | 2.4 kg | 20 mm | 17.30" | 3840x2160 | |
| 90.1 % v7 (old) | 07 / 2021 | Asus ROG Zephyrus S17 GX703HSD i9-11900H, GeForce RTX 3080 Laptop GPU | 2.8 kg | 19.9 mm | 17.30" | 2560x1440 |
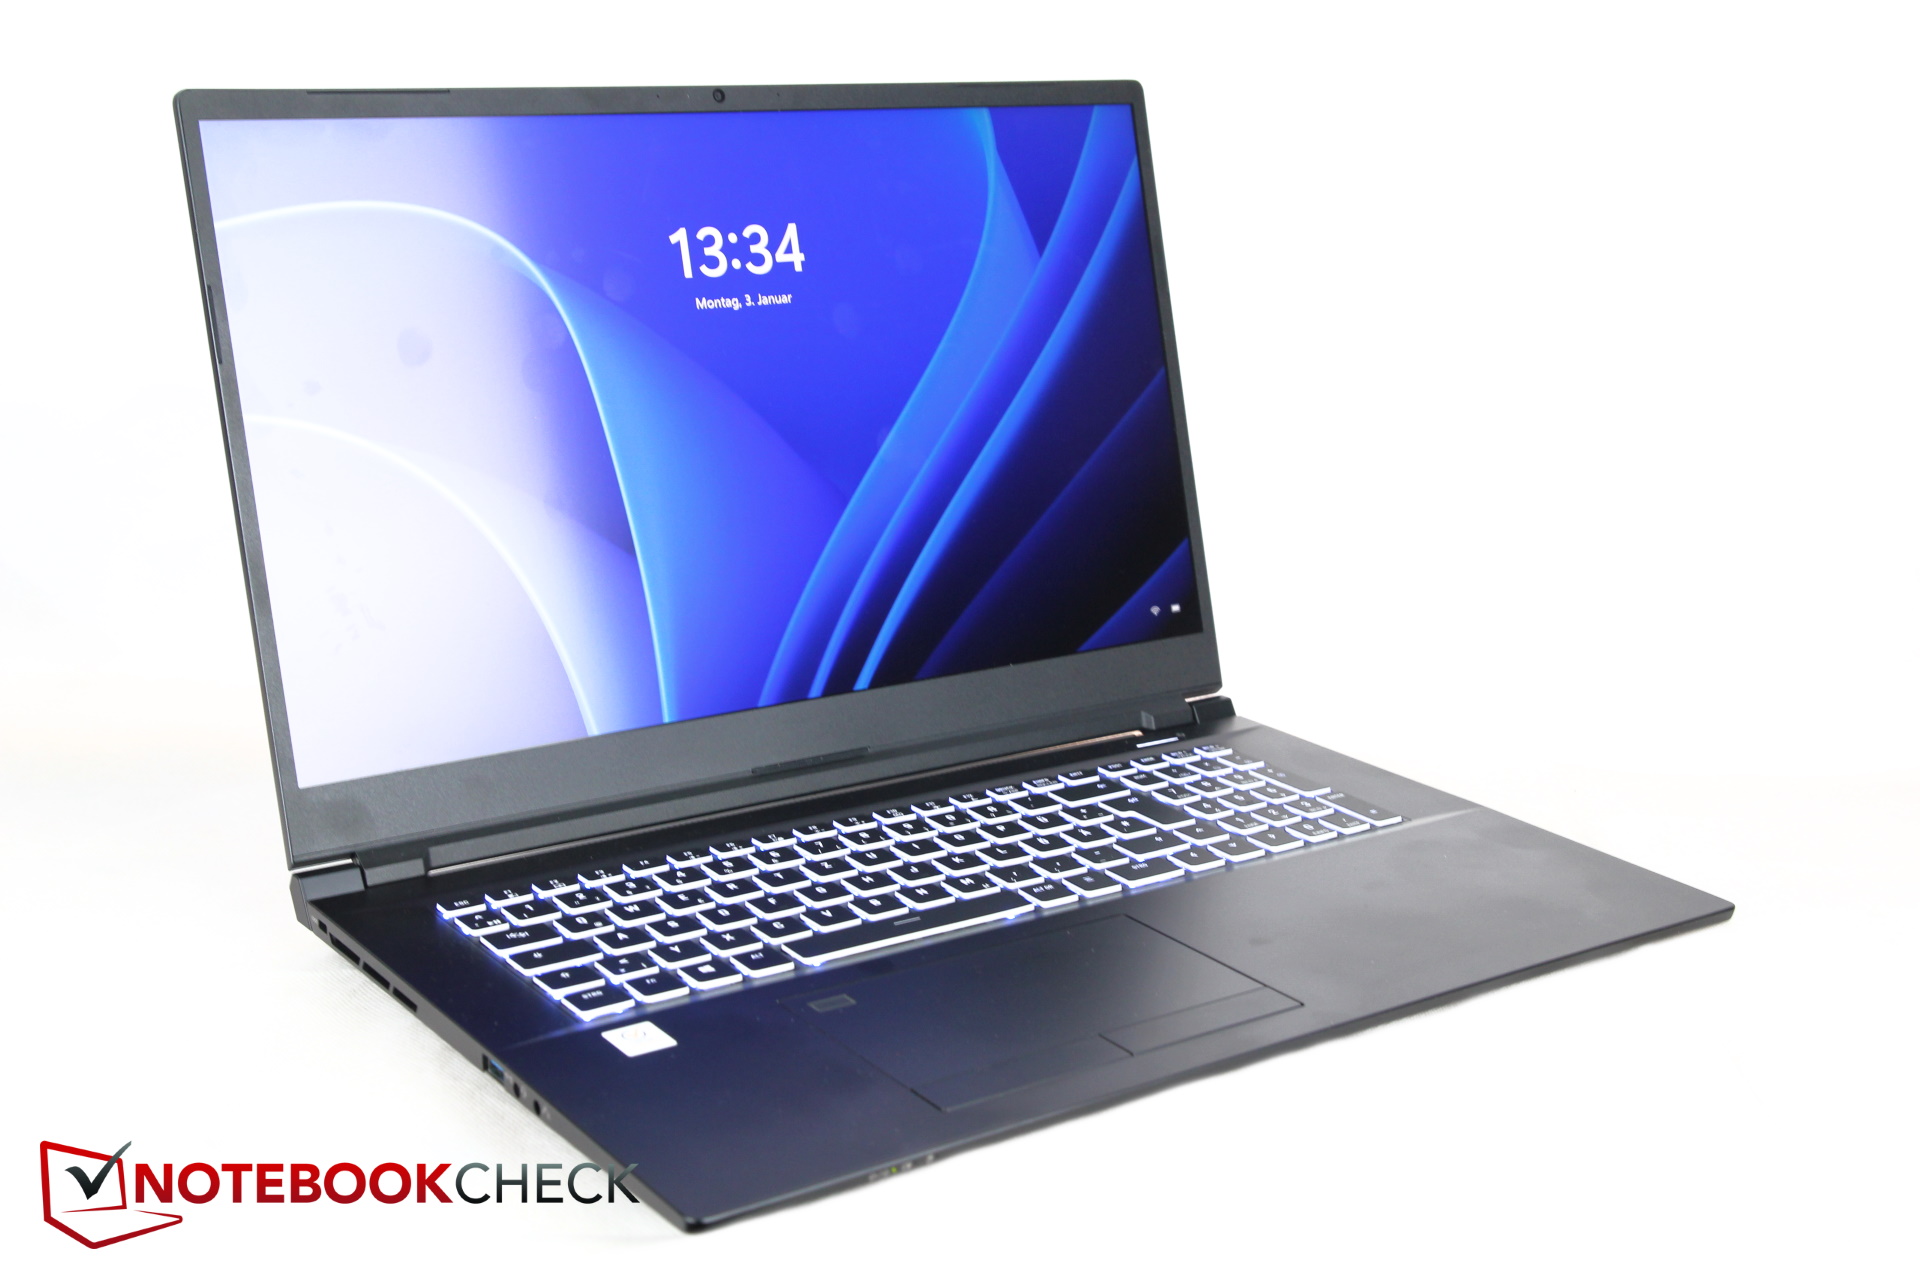
Case - Ultra-slim metal case with a plastic keyboard
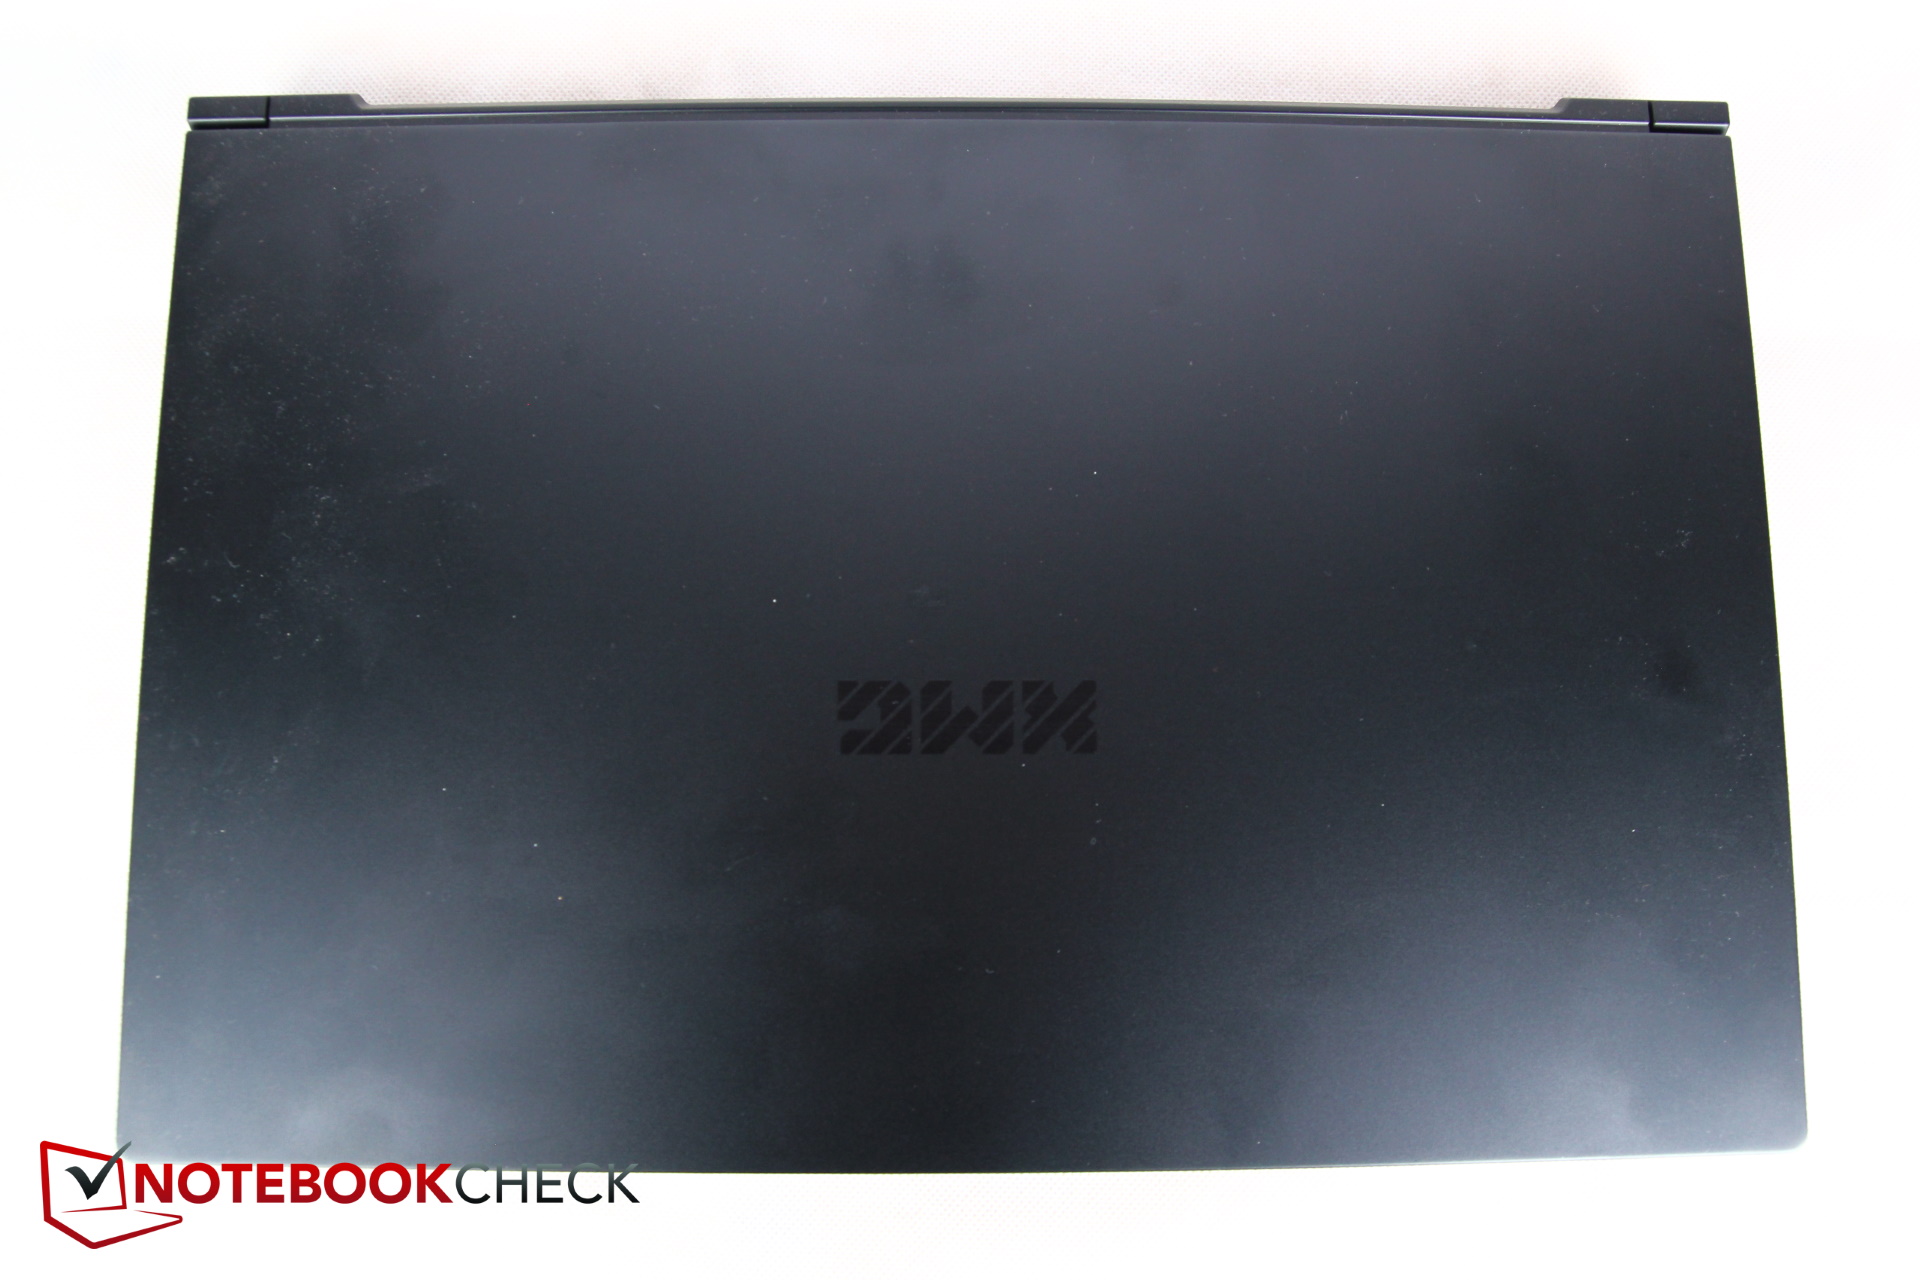
The slim, black case is now almost completely made of metal, except for the display bezels and the keyboard that is set into the base. For a gaming laptop, the design is kept very modest, reflecting more its parallel ambitions of being a professional workstation.
The basis is not completely resistant to warping but still fairly robust, even though it still produces various creaking noises when we try to bend it, particularly on the right side.
Although the display lid can also be bent slightly, it appears comfortably robust due to the metal frame. The hinges could have been tighter, particularly with small opening angles.
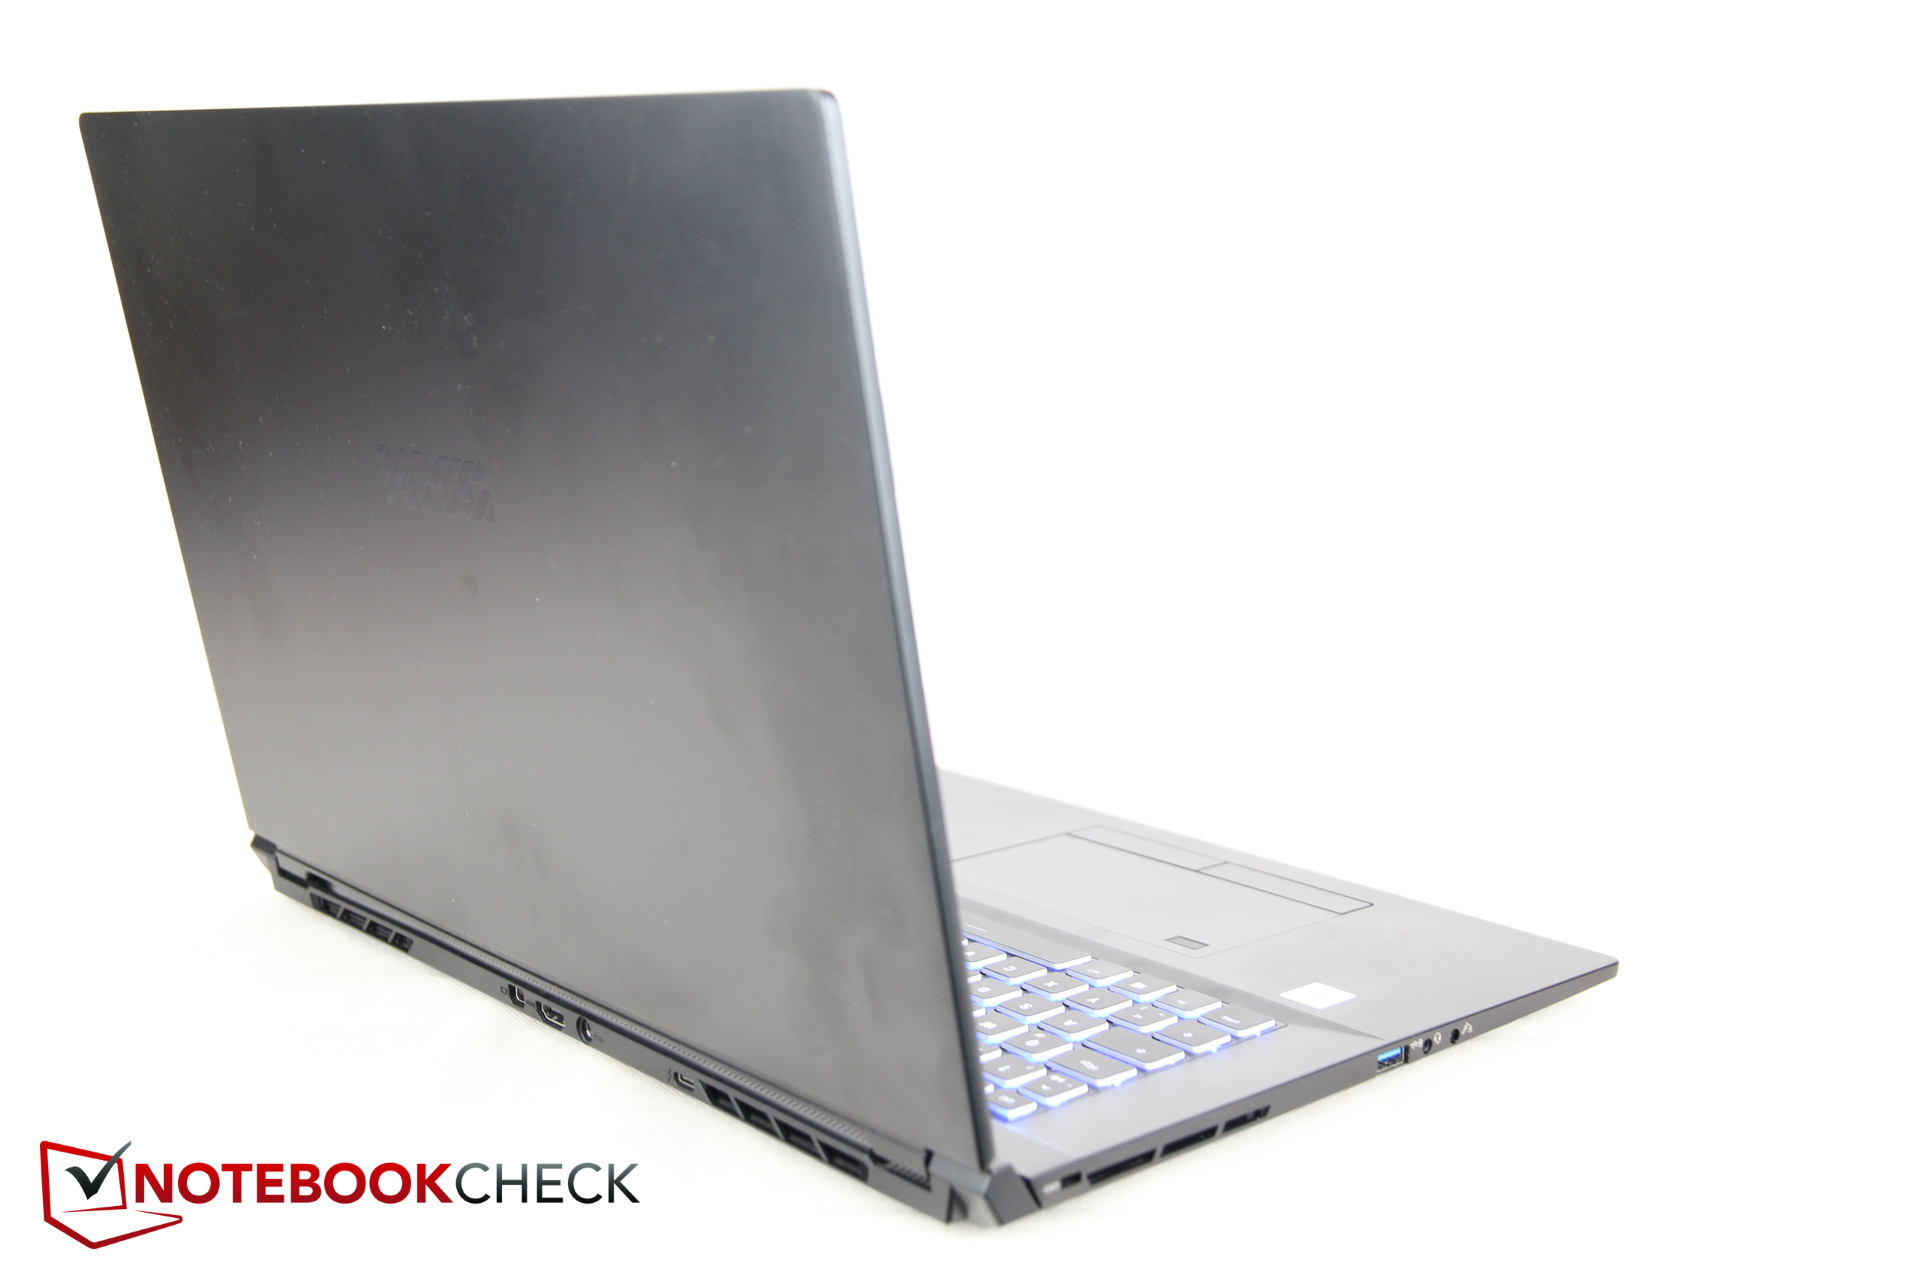
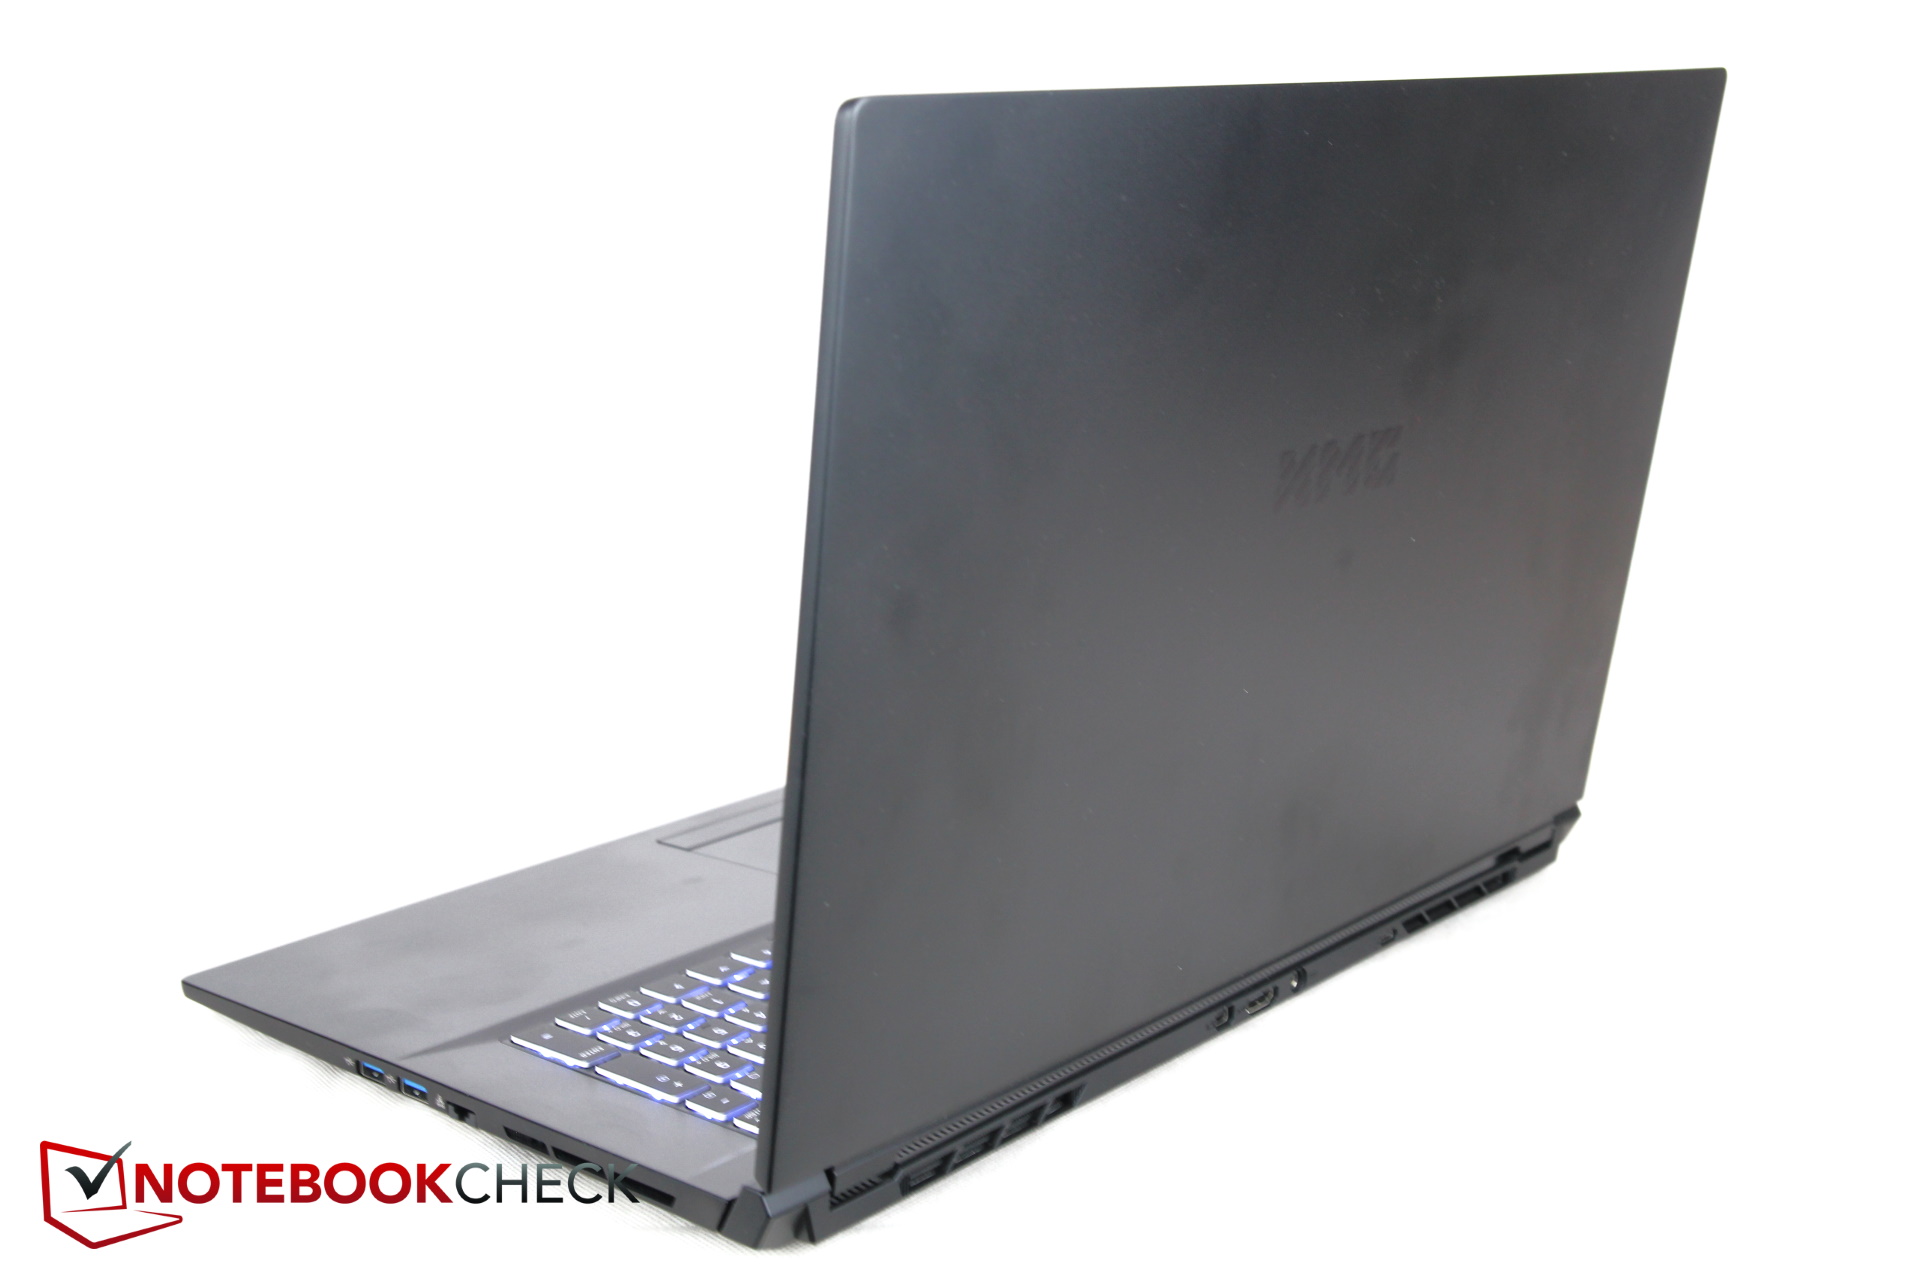
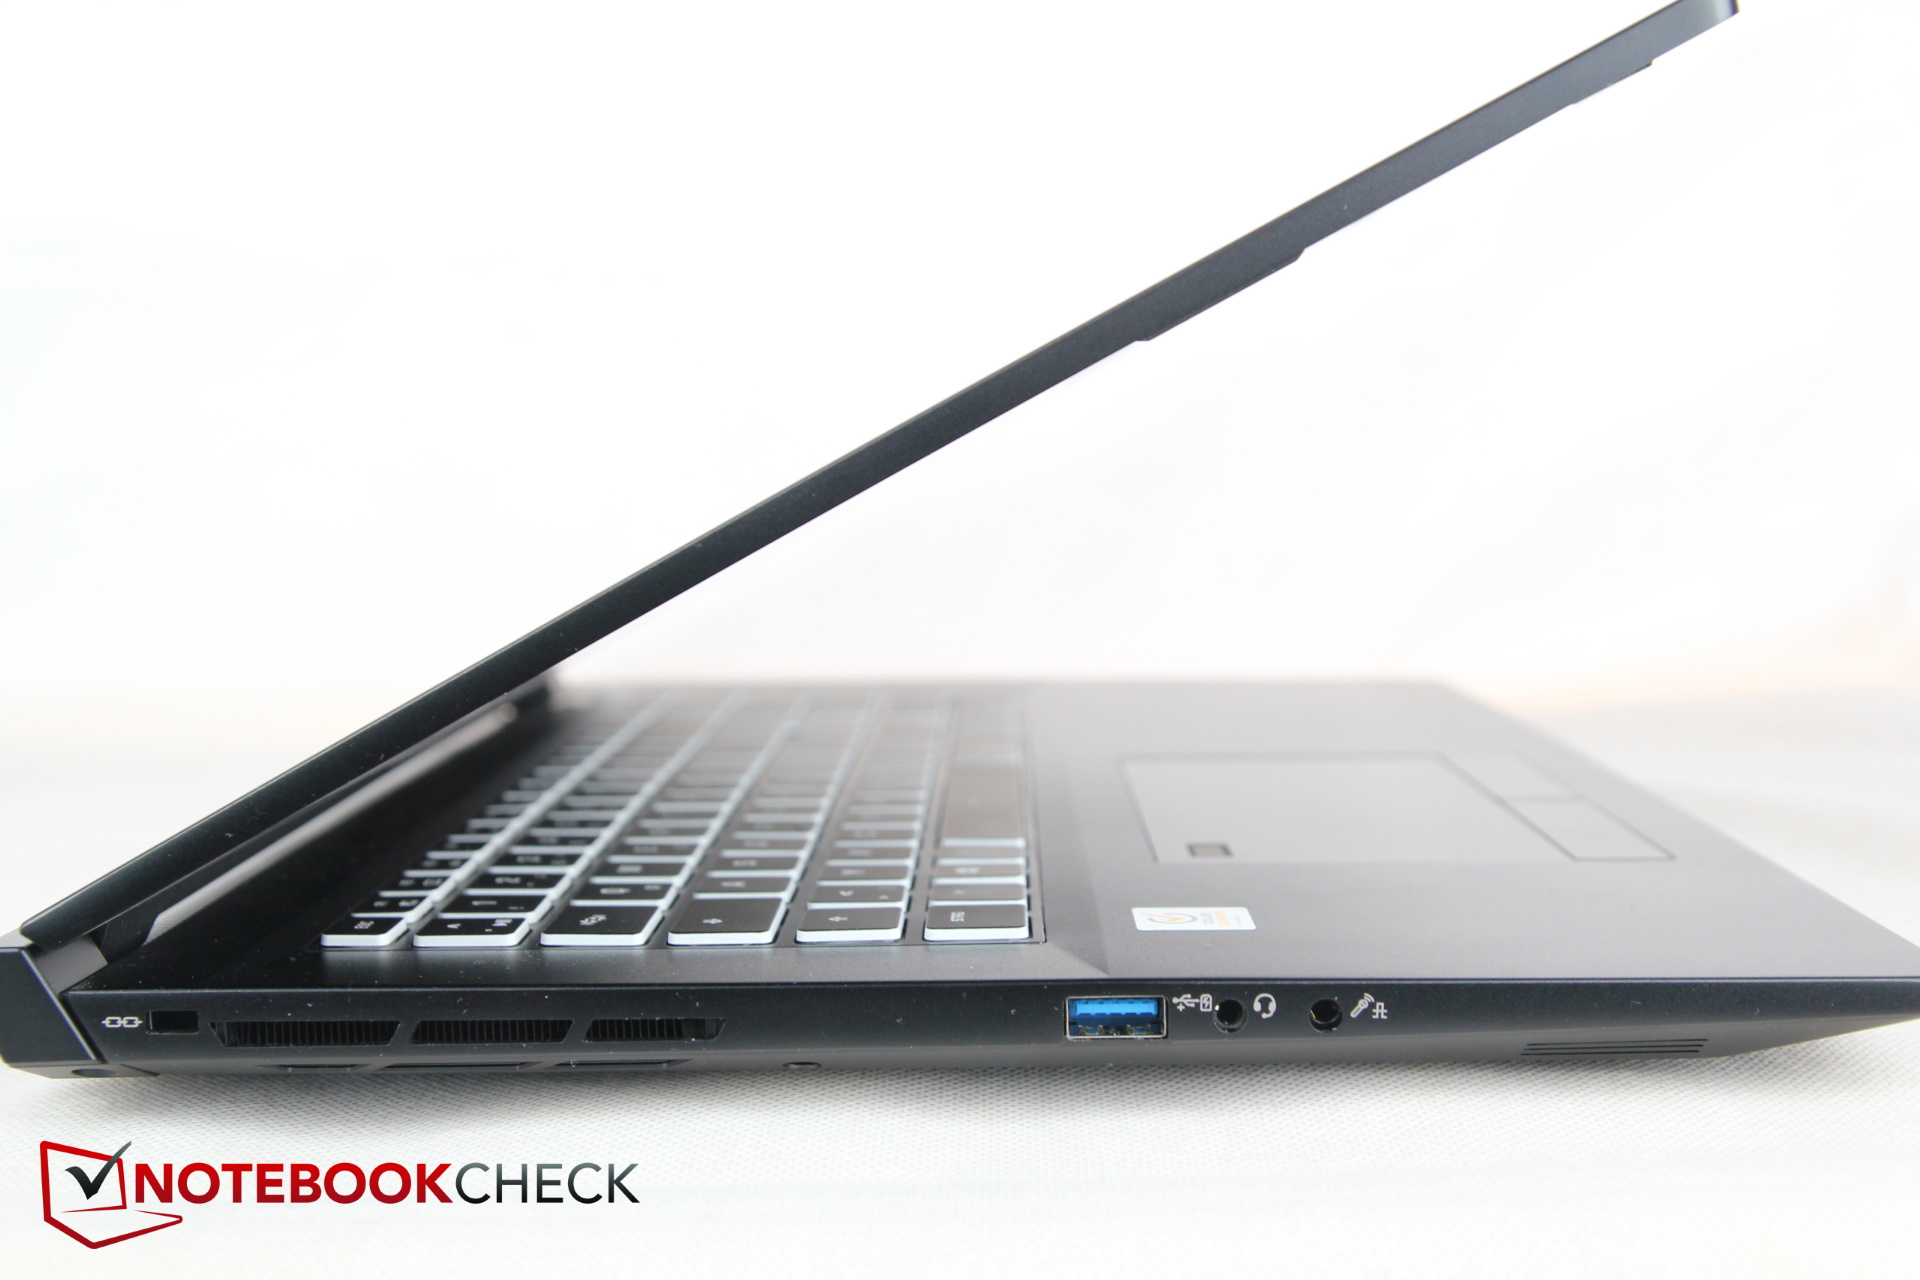
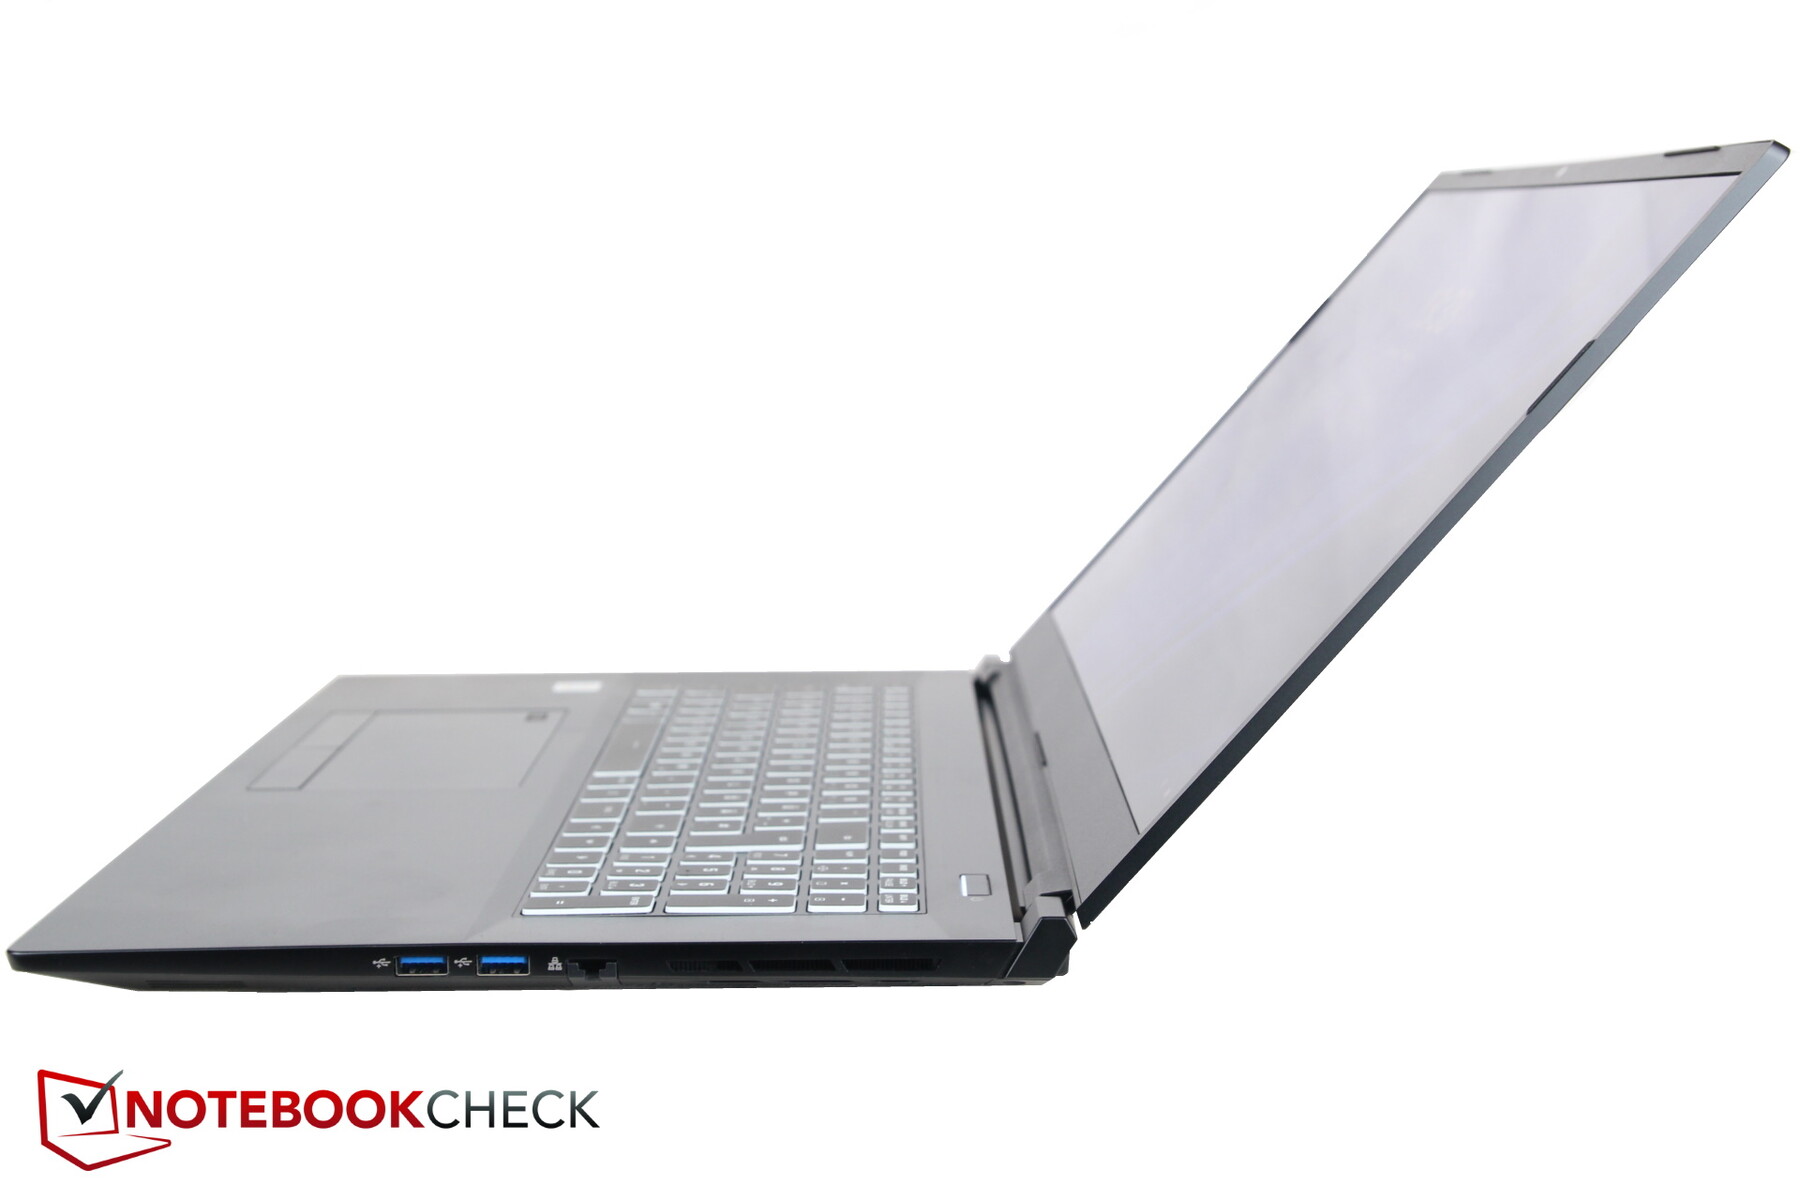
Schenker offers various 17-inch laptops, but the new XMG Pro 17 can easily beat the Key, Apex, Core, Ultra, Focus, Neo, and the predecessor in terms of a slim design. It is a full centimeter (~0.4 in) slimmer, making it the slimmest 17-inch Schenker overall!
The MSI and the Asus ROG are similarly slim but cost considerably more. The Alienware and the Medion cannot quite keep up here, even if at least the Alienware is anything but thick.
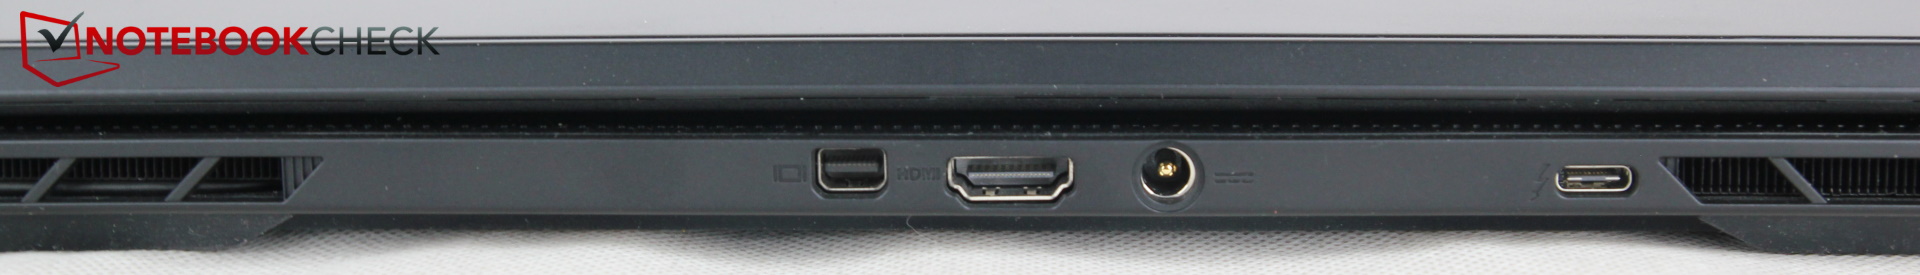
Equipment - 3 external monitors
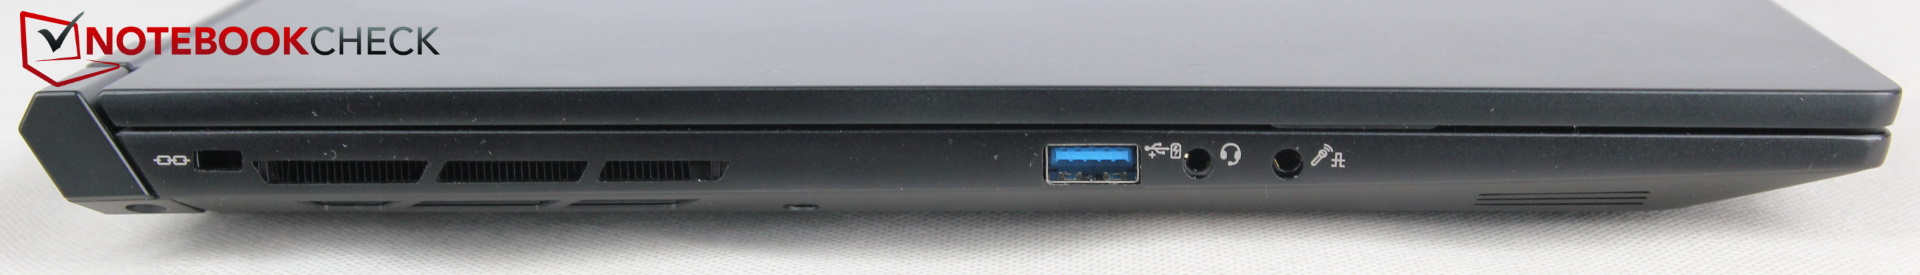
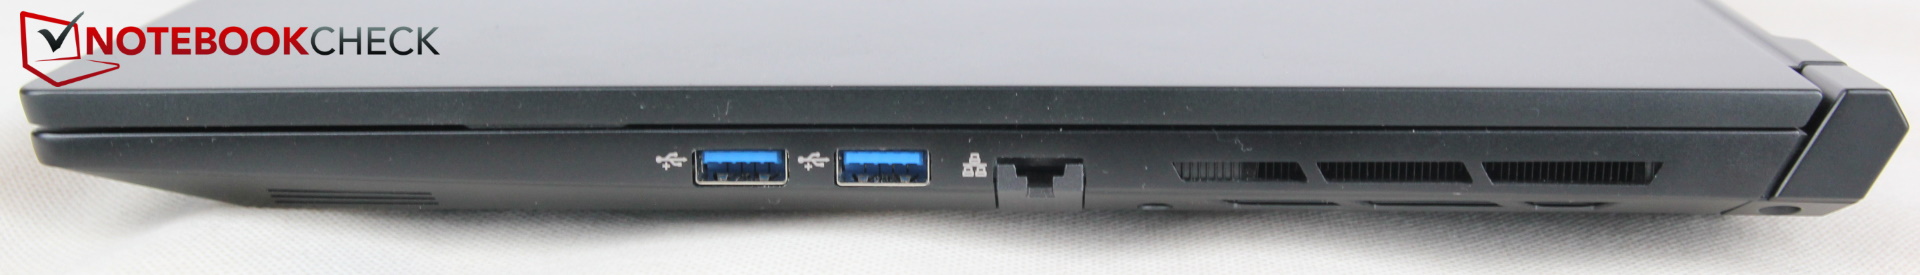
With Thunderbolt 4 (USB-C without a charging function), MiniDisplayport, and HDMI, you can connect three external monitors to the Pro 17. All the display ports are G-Sync compatible. The separate ports for microphone and headphones are also positive.
On the other hand, professional users will probably miss an SD card reader, and the positioning of the connections also gives some small reason for complaint. Even though the ports are distributed over the back, left, and right sides, unfortunately they are placed very close together. In this regard, all the manufacturers should take a look at the affordable MSI GP66 Leopard as a good example.
Communication
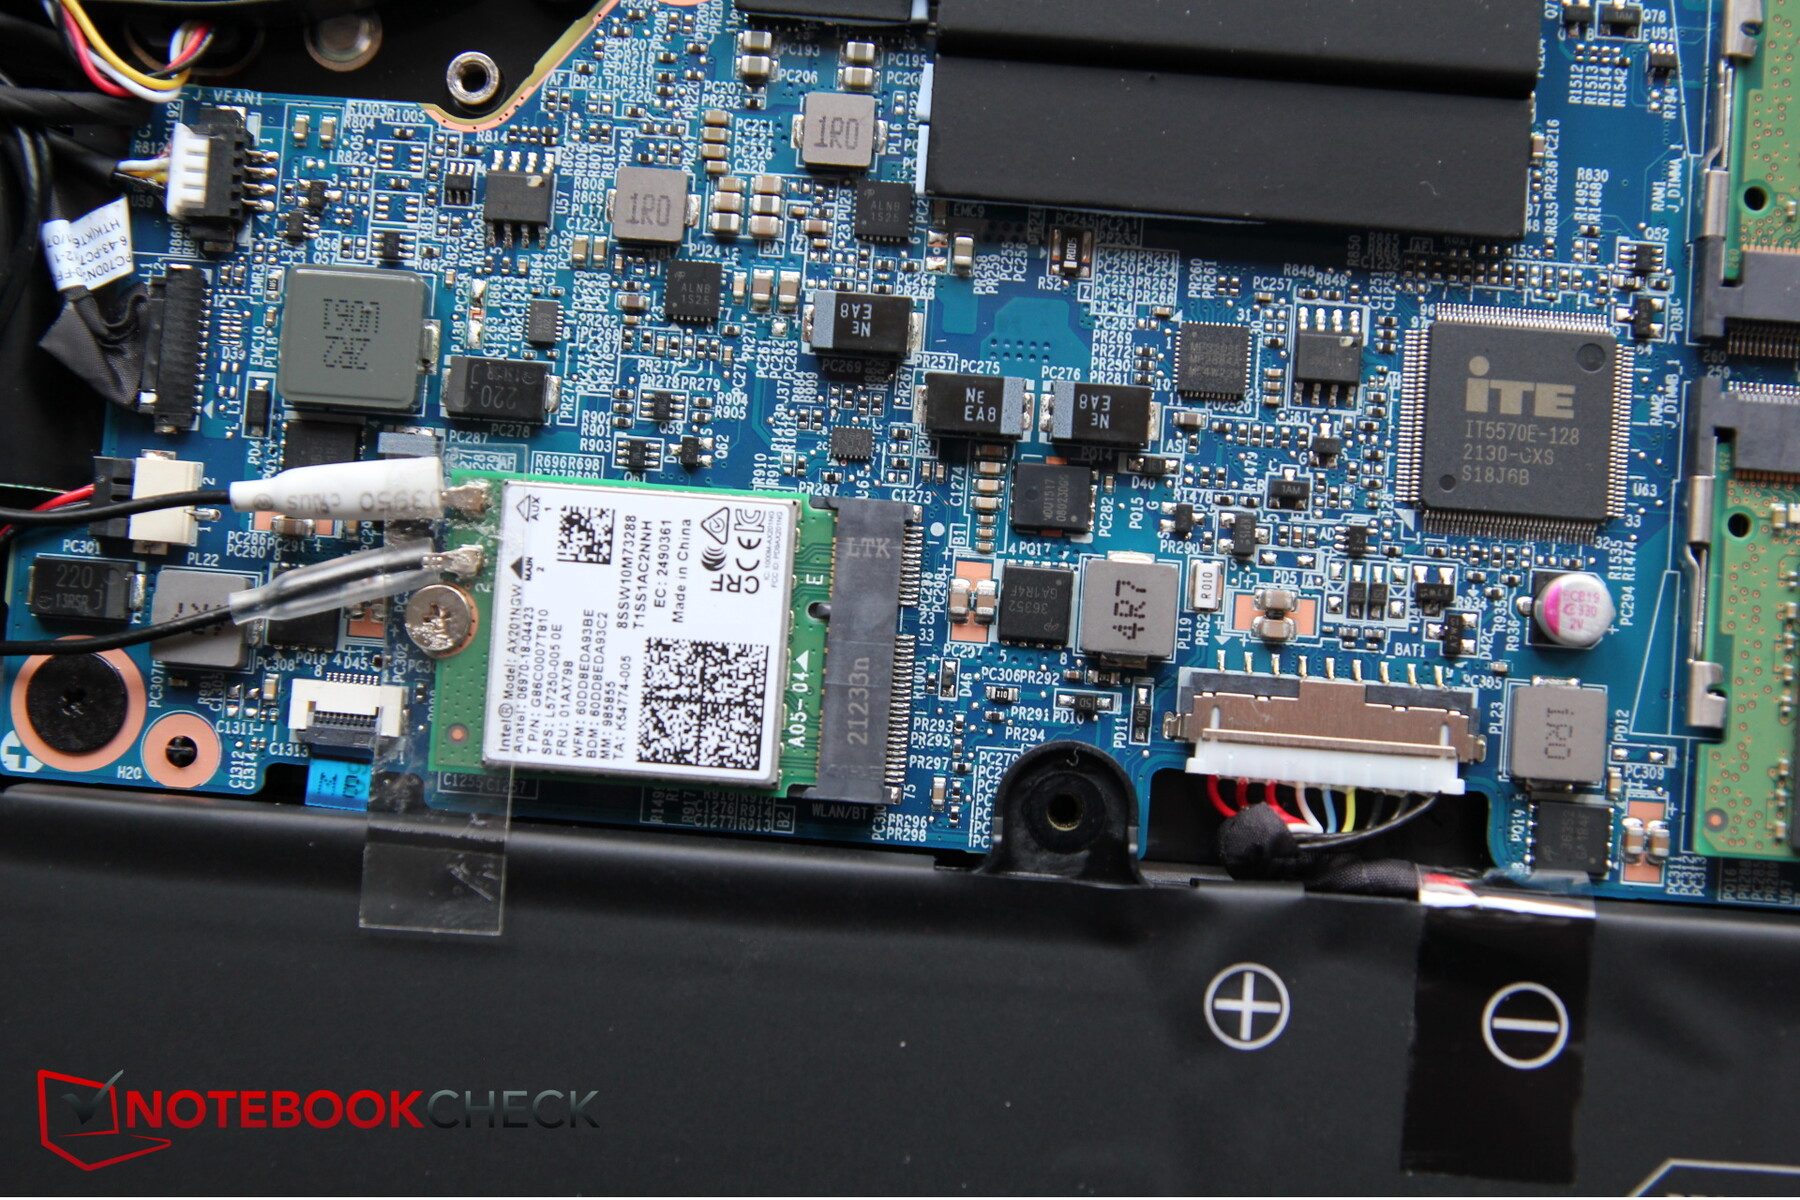
While the Intel AX201 WiFi module used here achieves Gigabit speeds, it still performs slightly below its full capabilities, particularly when receiving data.
Webcam
Despite the target group being creative professionals, there is a standard 720p webcam that struggles with even larger color deviations than the competitors, which are already not very good.


")
")
 GeForce RTX 3080 Laptop GPU, i7-11800H, Samsung SSD 980 Pro 1TB MZ-V8P1T0BW")
 GeForce RTX 3080 Laptop GPU, i7-11800H, Samsung SSD 980 Pro 1TB MZ-V8P1T0BW")
Security
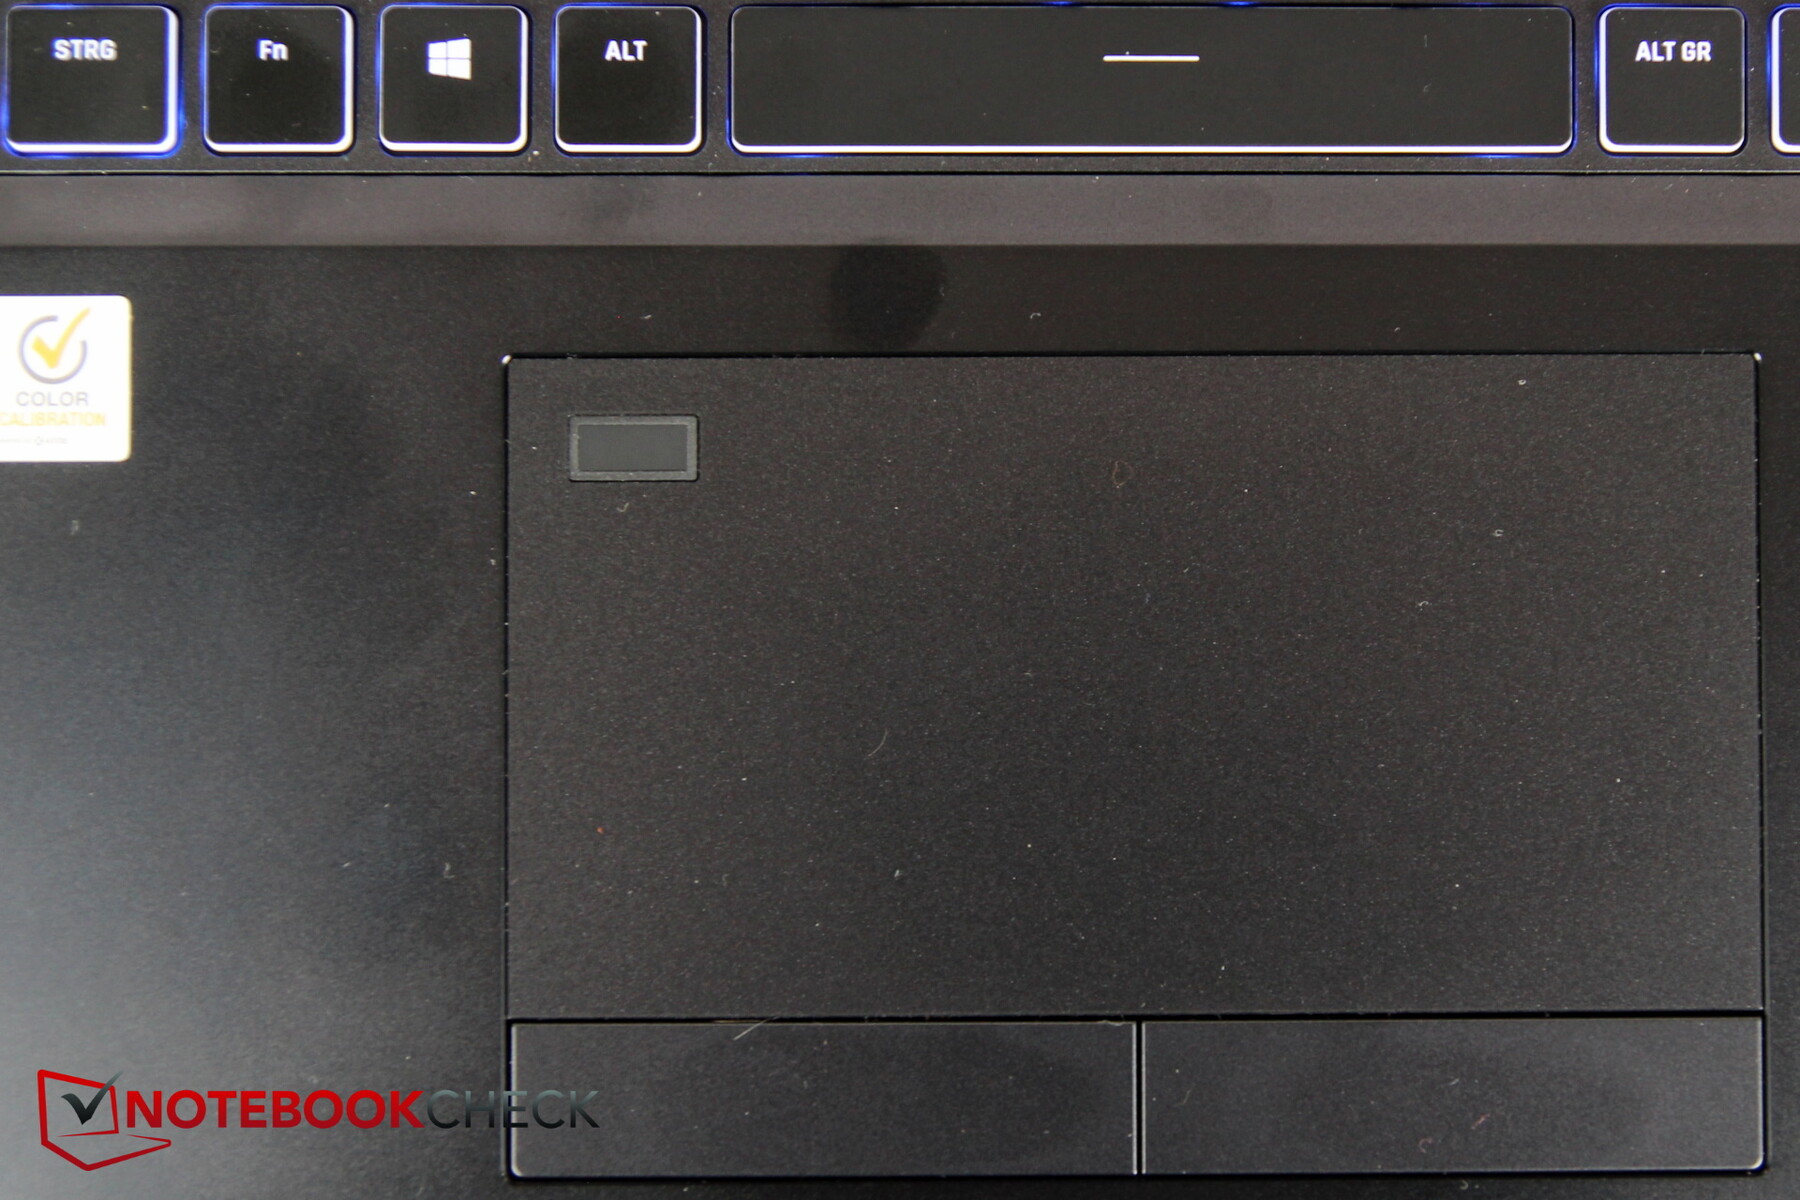
There is a Kensington Lock slot and also TPM 2.0. In addition, the Pro 17 offers a fingerprint sensor, which is integrated into the top left corner of the touchpad.
The sensor operates in combination with Windows Hello and succeeds in unlocking the laptop very quickly.
Accessories
In addition to the usual paperwork, as typical for Schenker the box includes a USB stick with drivers and alternatively also a driver CD, as well as a black cleaning cloth. Other manufacturers only include less or no accessories at all.
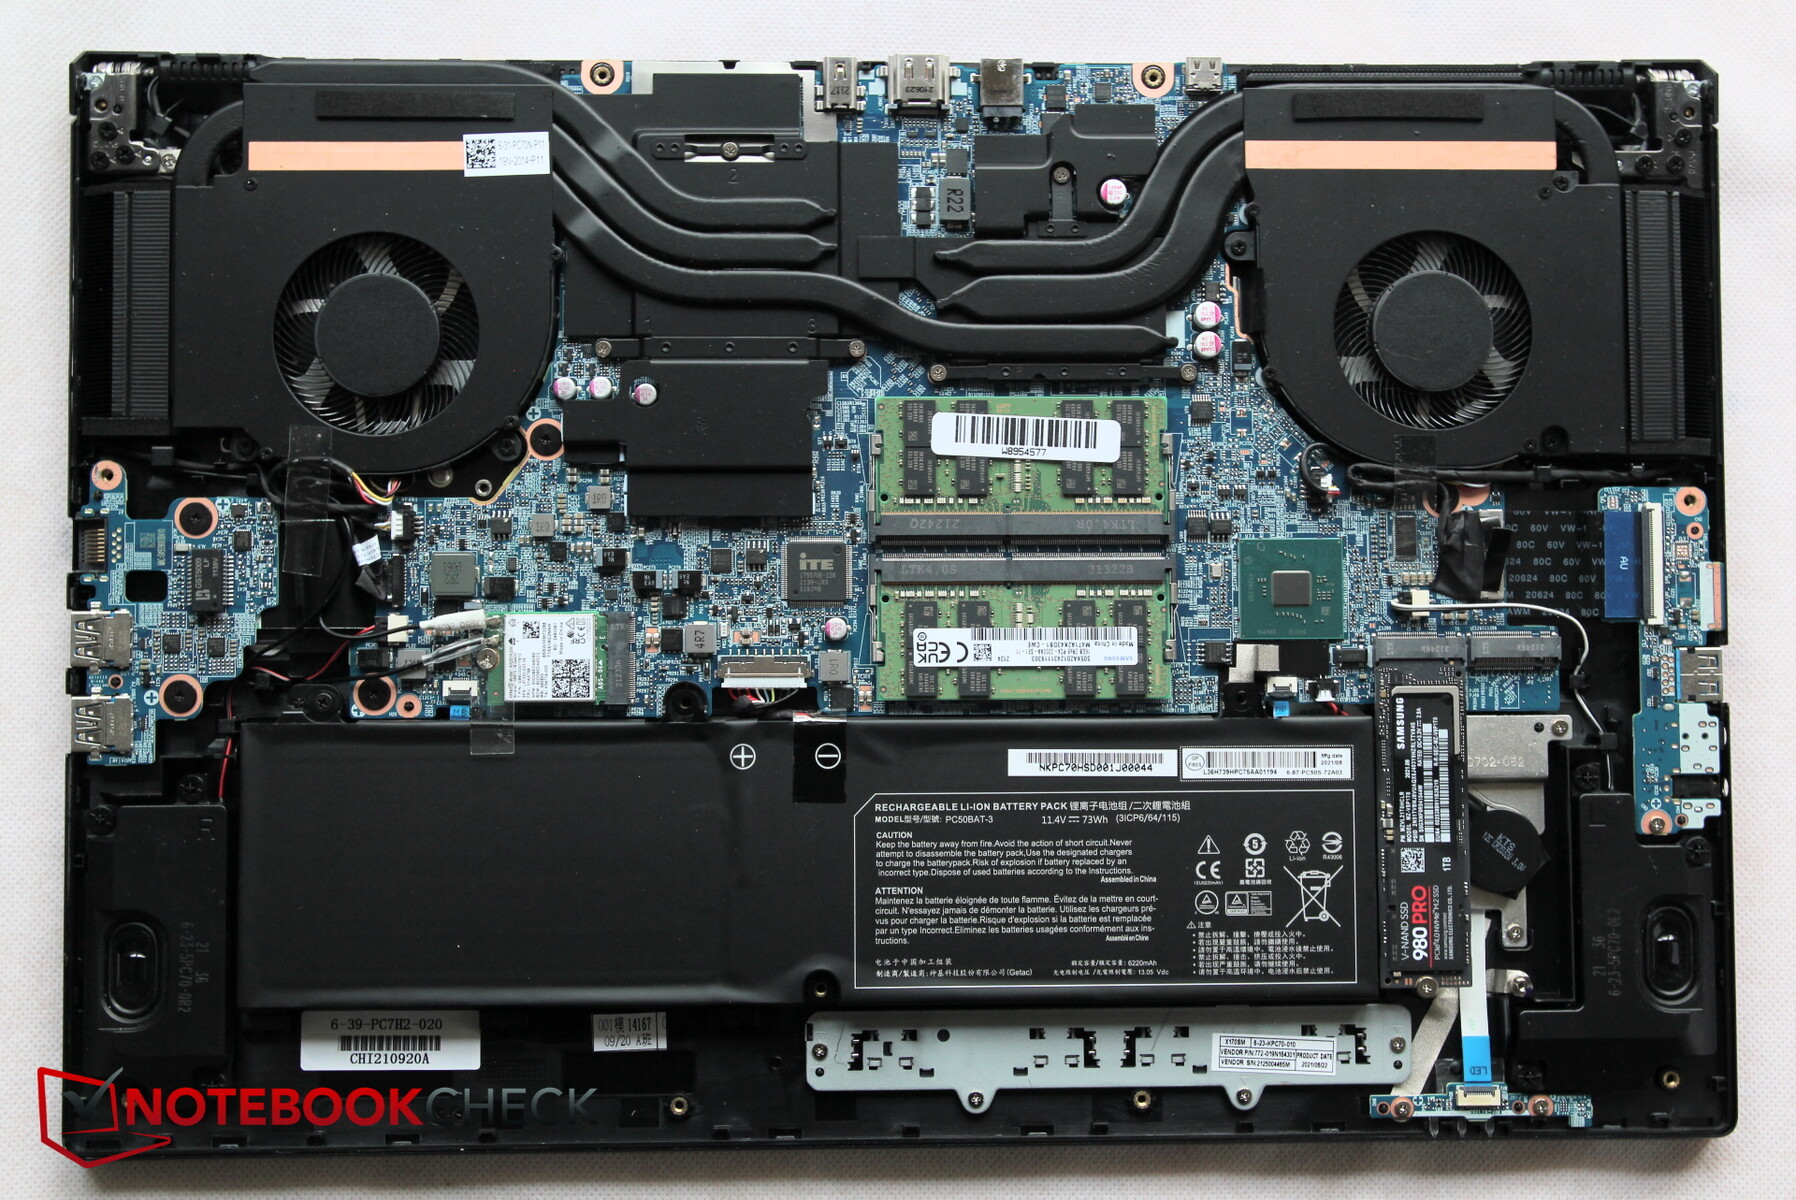
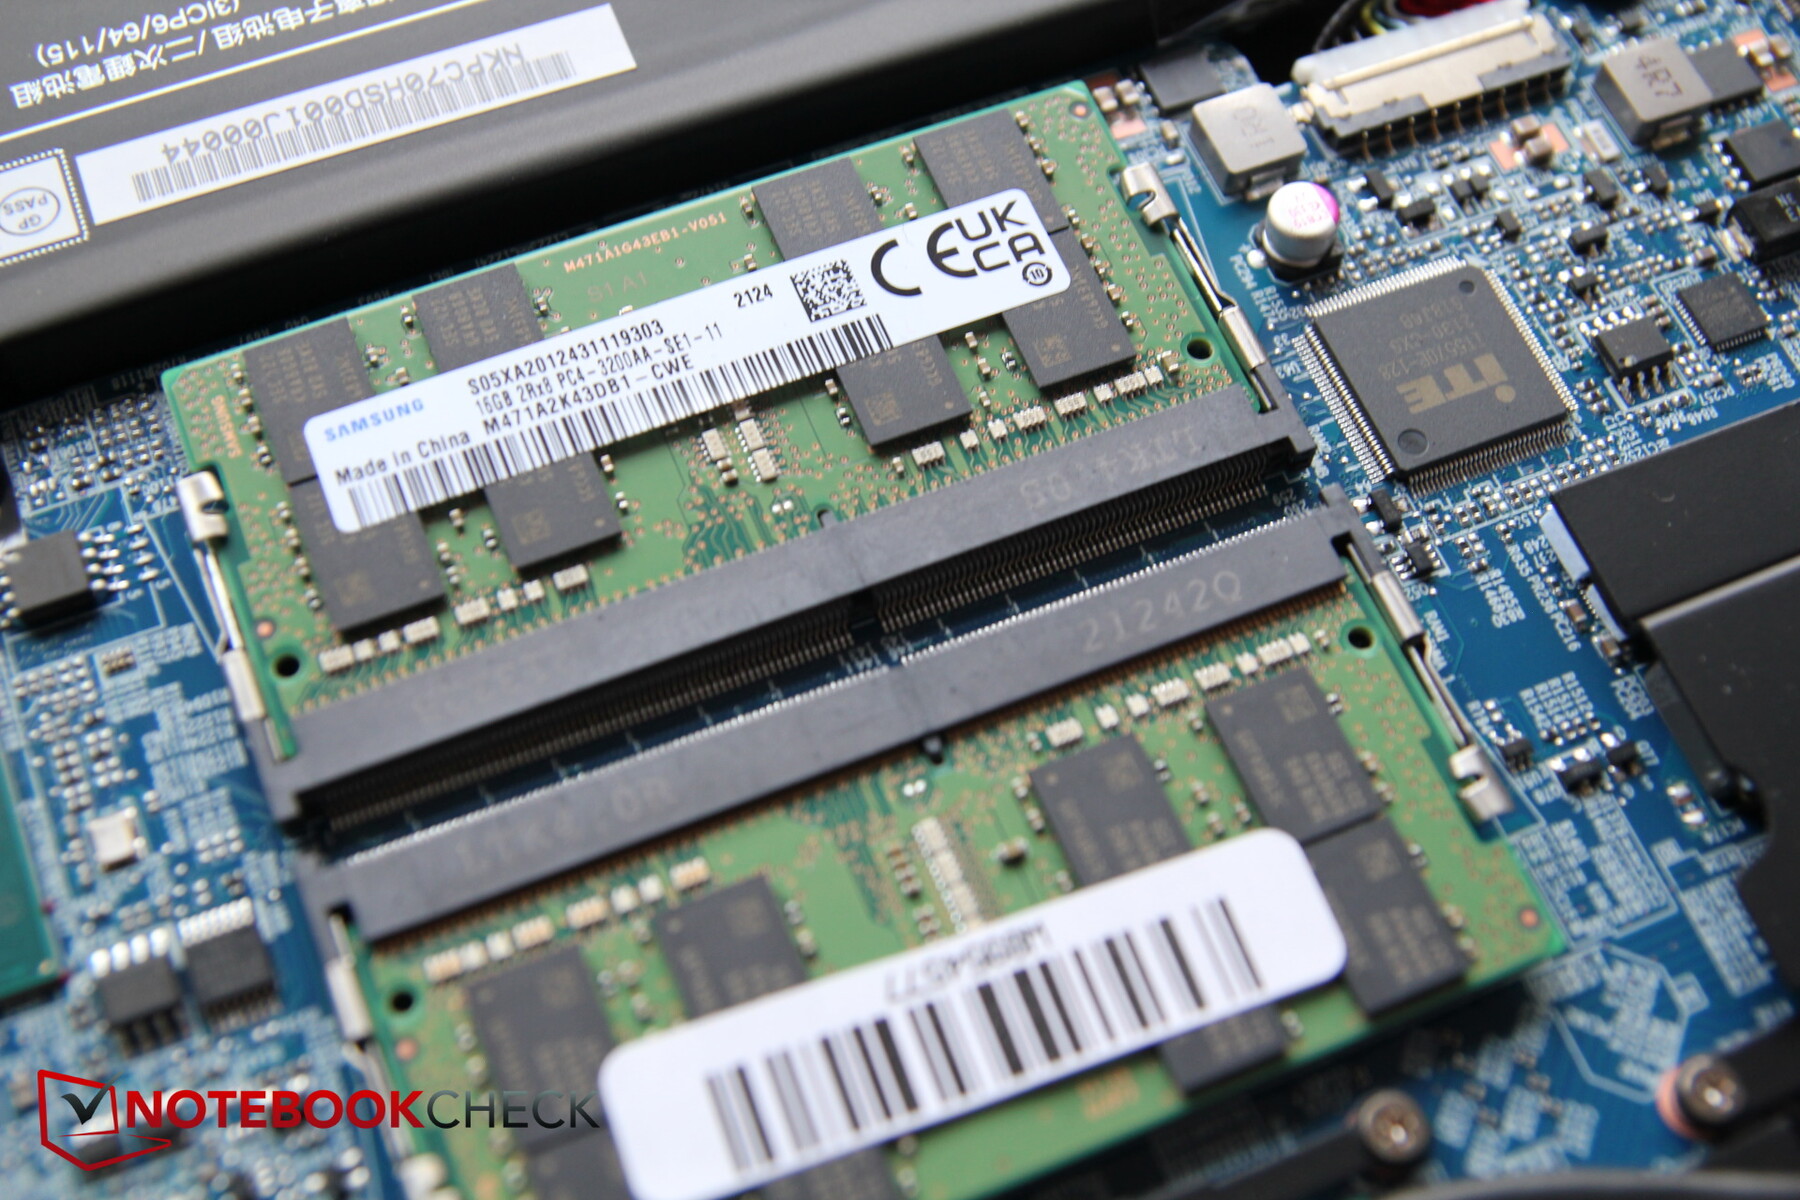
Maintenance
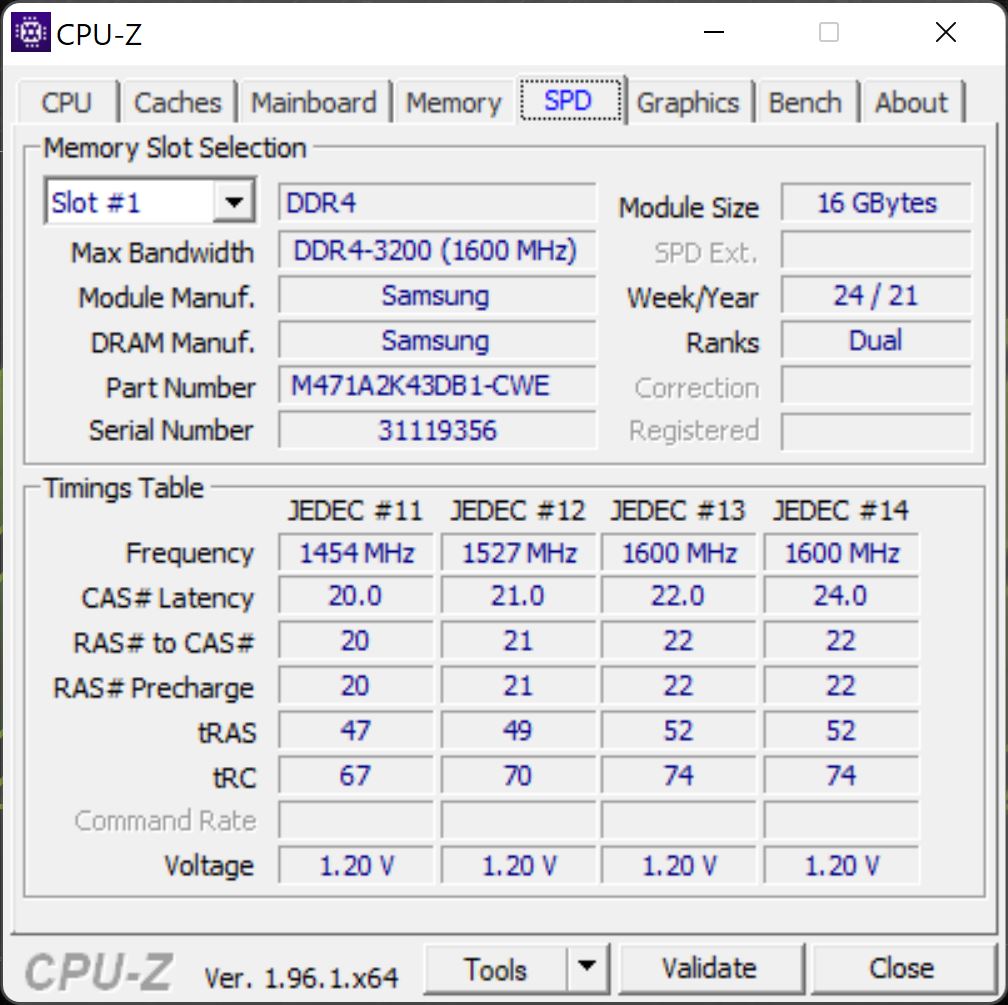
The bottom of the case is secured with 12 Philips screws. After removing them, it is not too hard to pry open the bottom plate although it is made of solid metal. Once you get access to the insides, you can replace the two RAM modules, the WLAN module, and the SSD and also clean the two fans. There is space for a second SSD, and the battery is also accessible.
Warranty
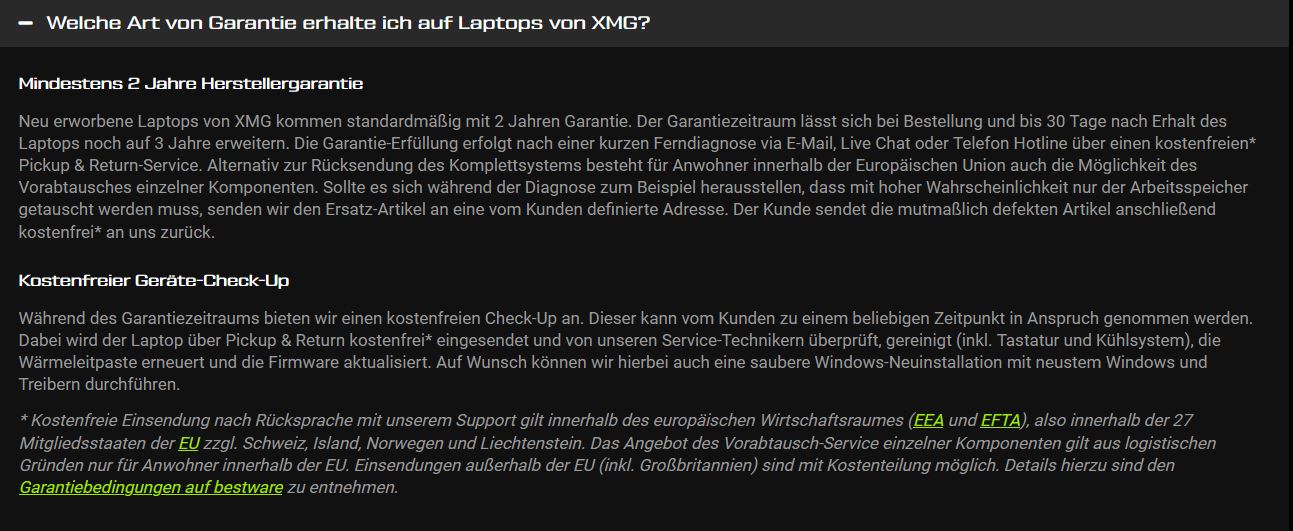
XMG offers a two-year manufacturer warranty. When ordering the laptop, you can also expand this to three years at an extra cost. In contrast to many other manufacturers, the warranty service also includes a free inspection. After you send in the laptop for free, it is cleaned, the heat paste is renewed, and the firmware is updated to the newest version. If you like, Windows can also be reinstalled with all the current updates.
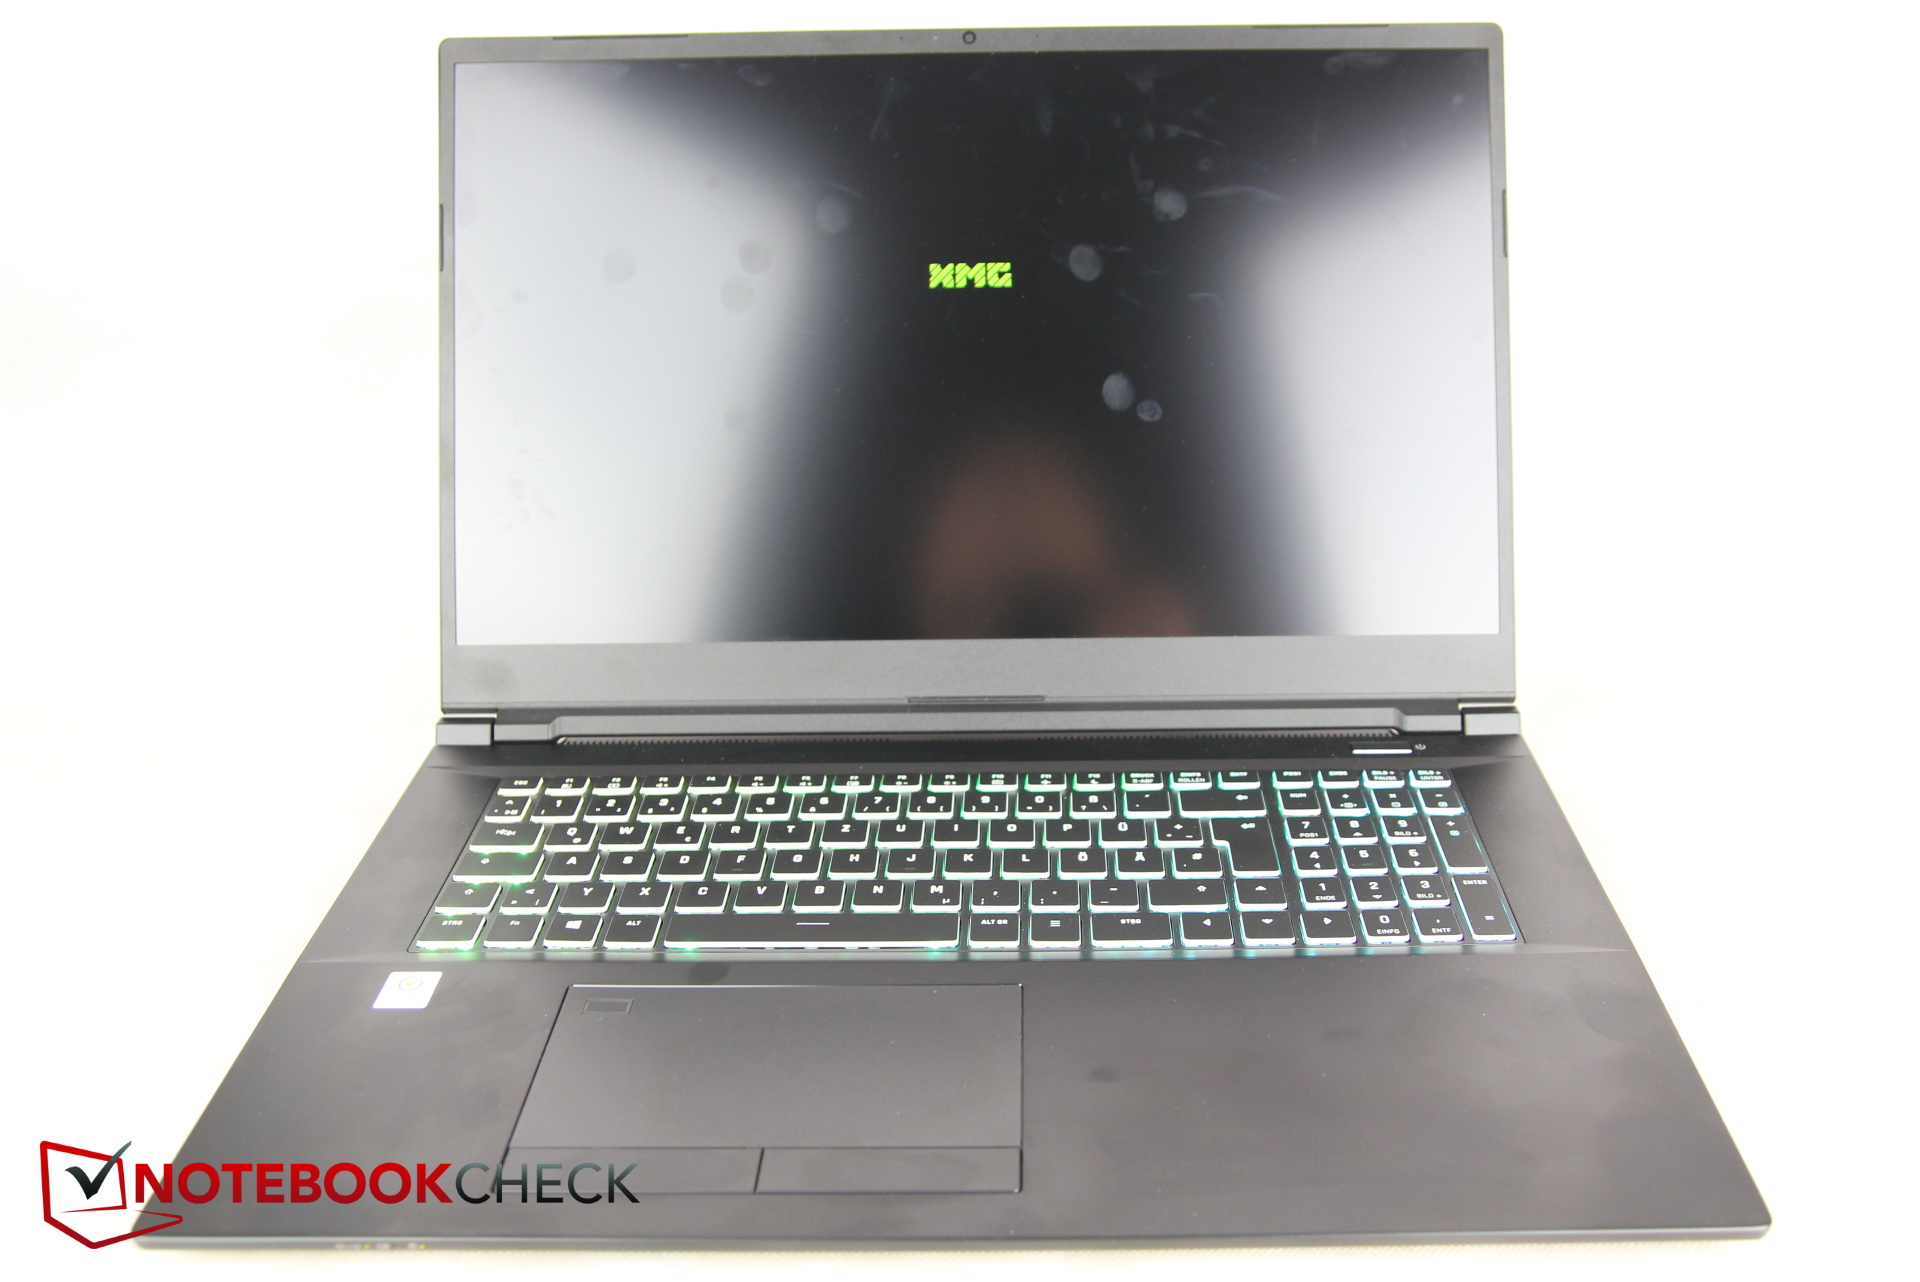
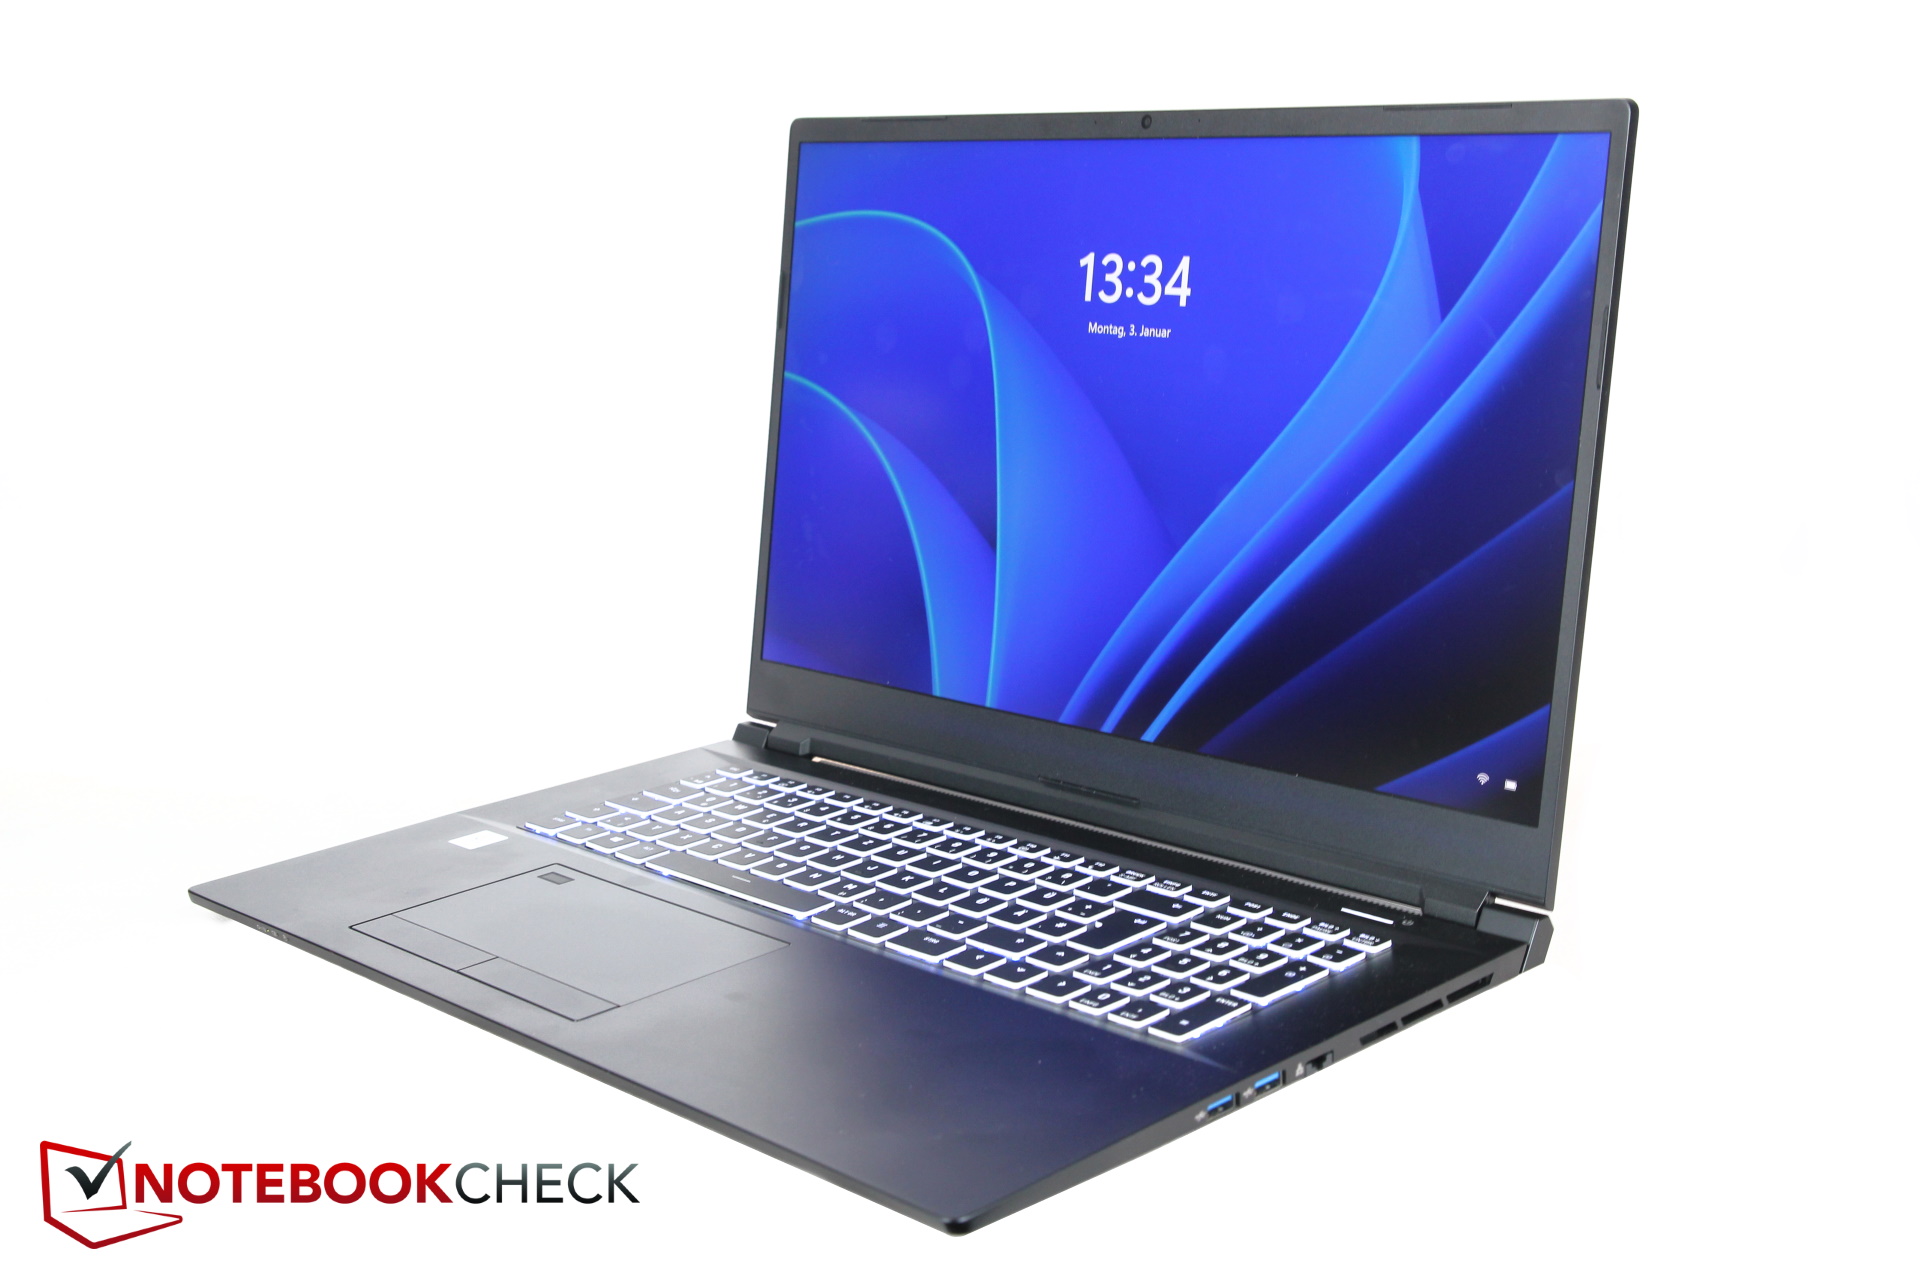
Input Devices - Small keys on a keyboard that bends too much
Keyboard
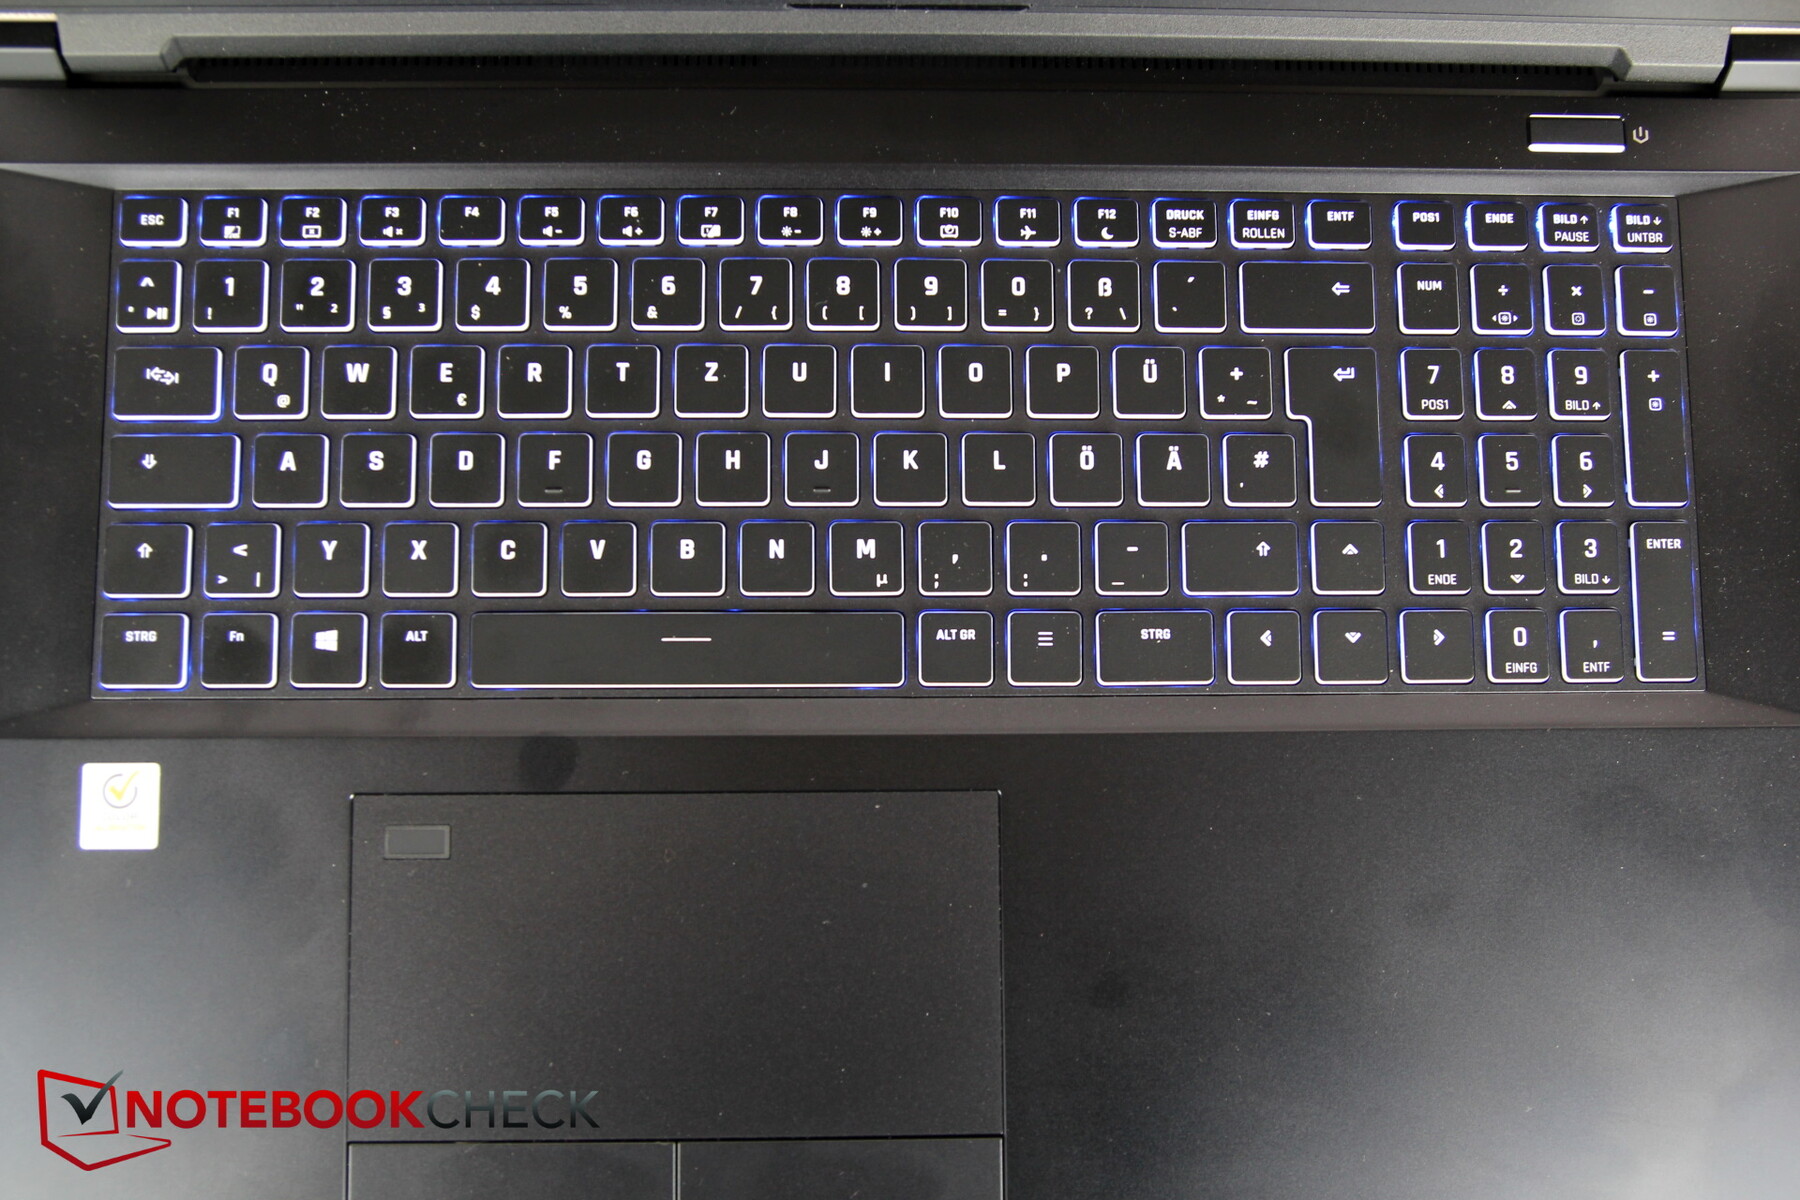
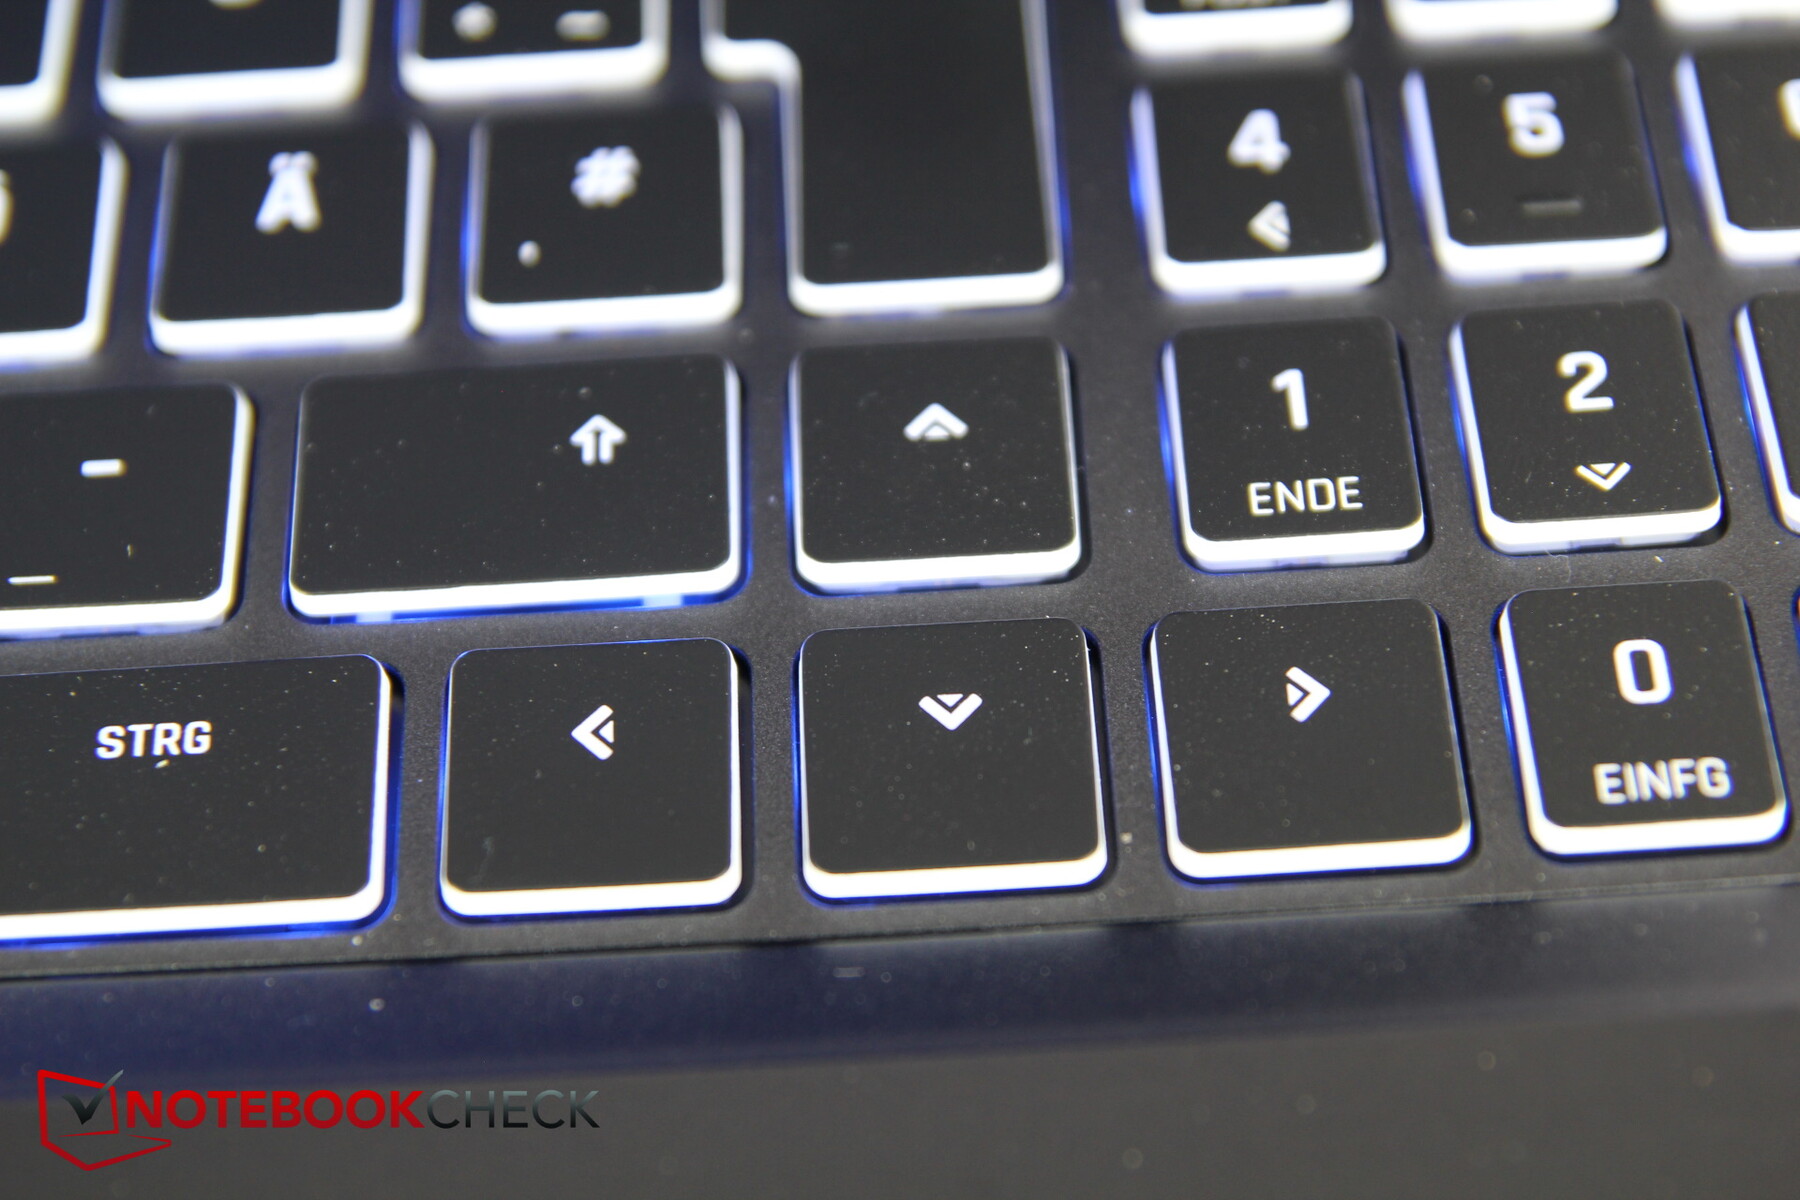
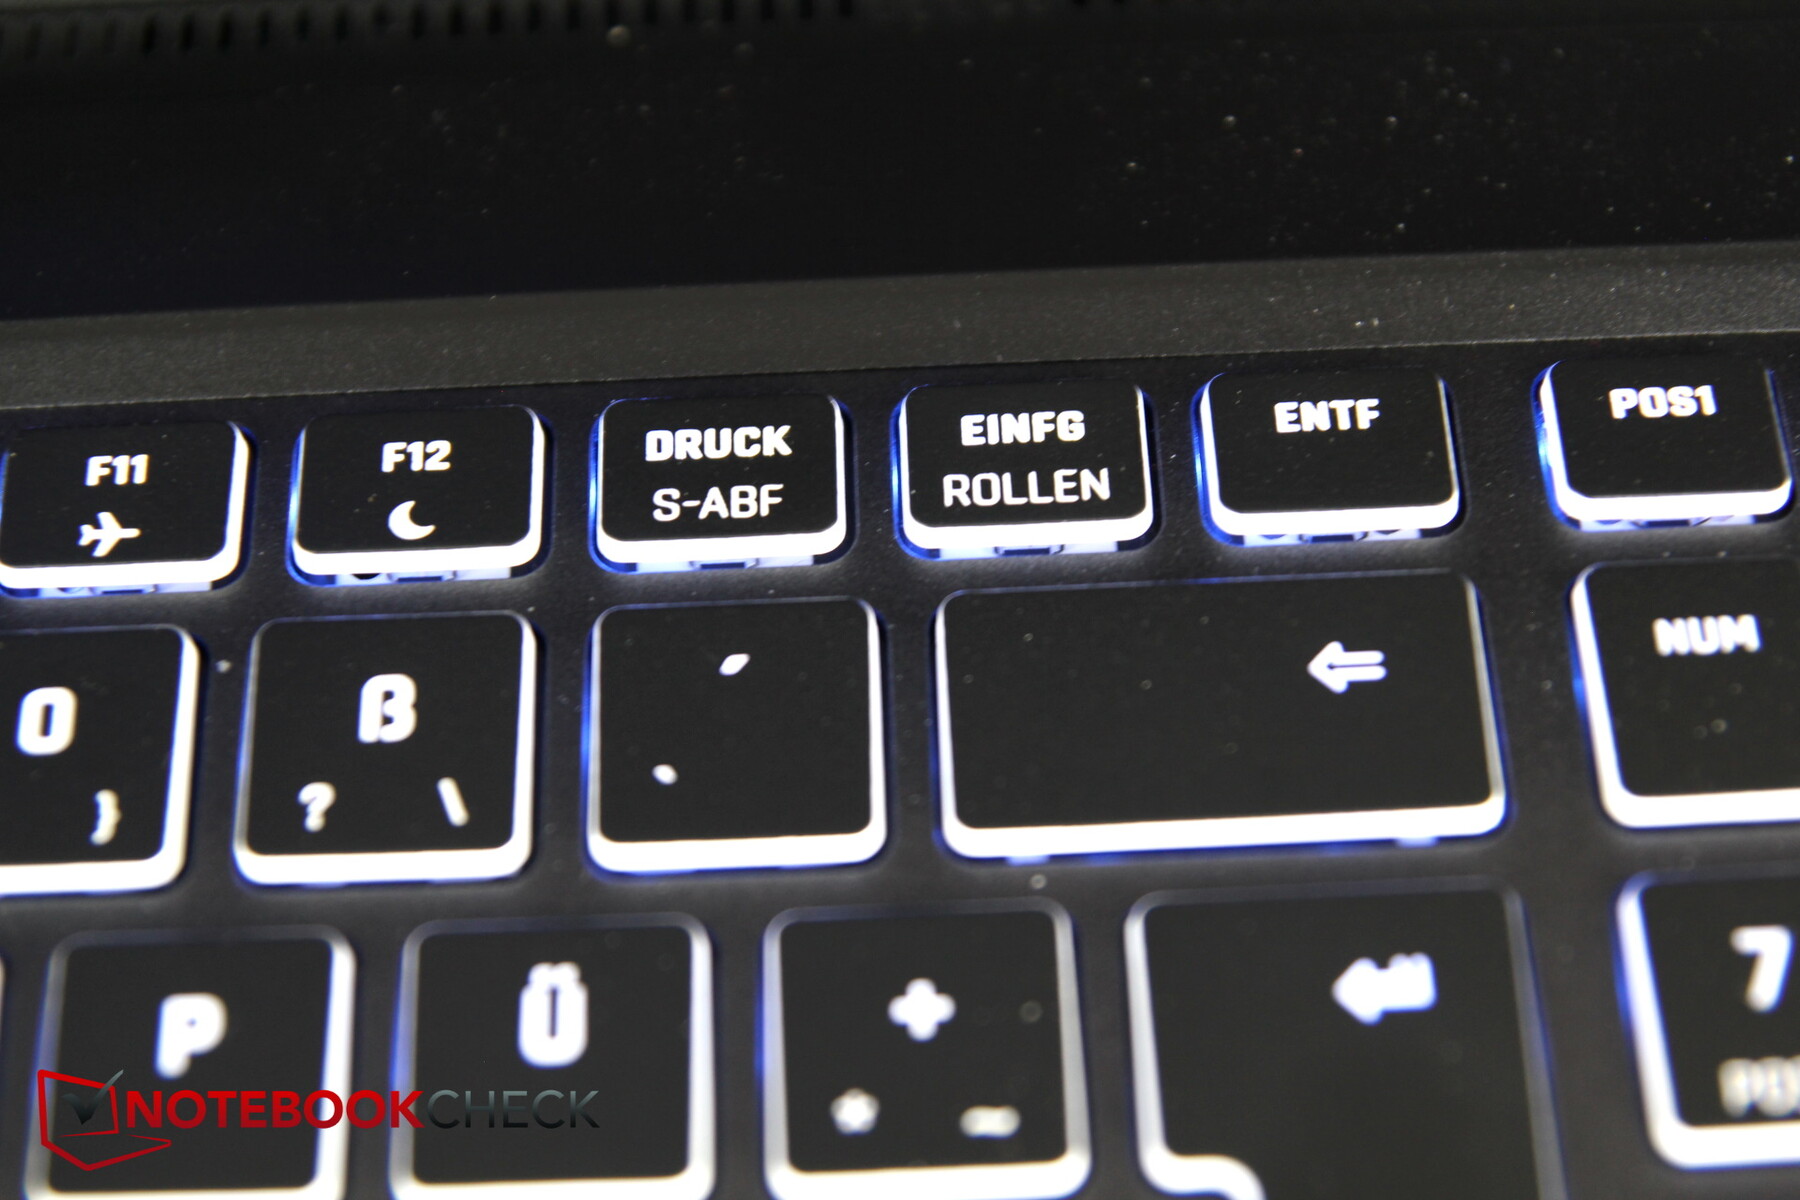
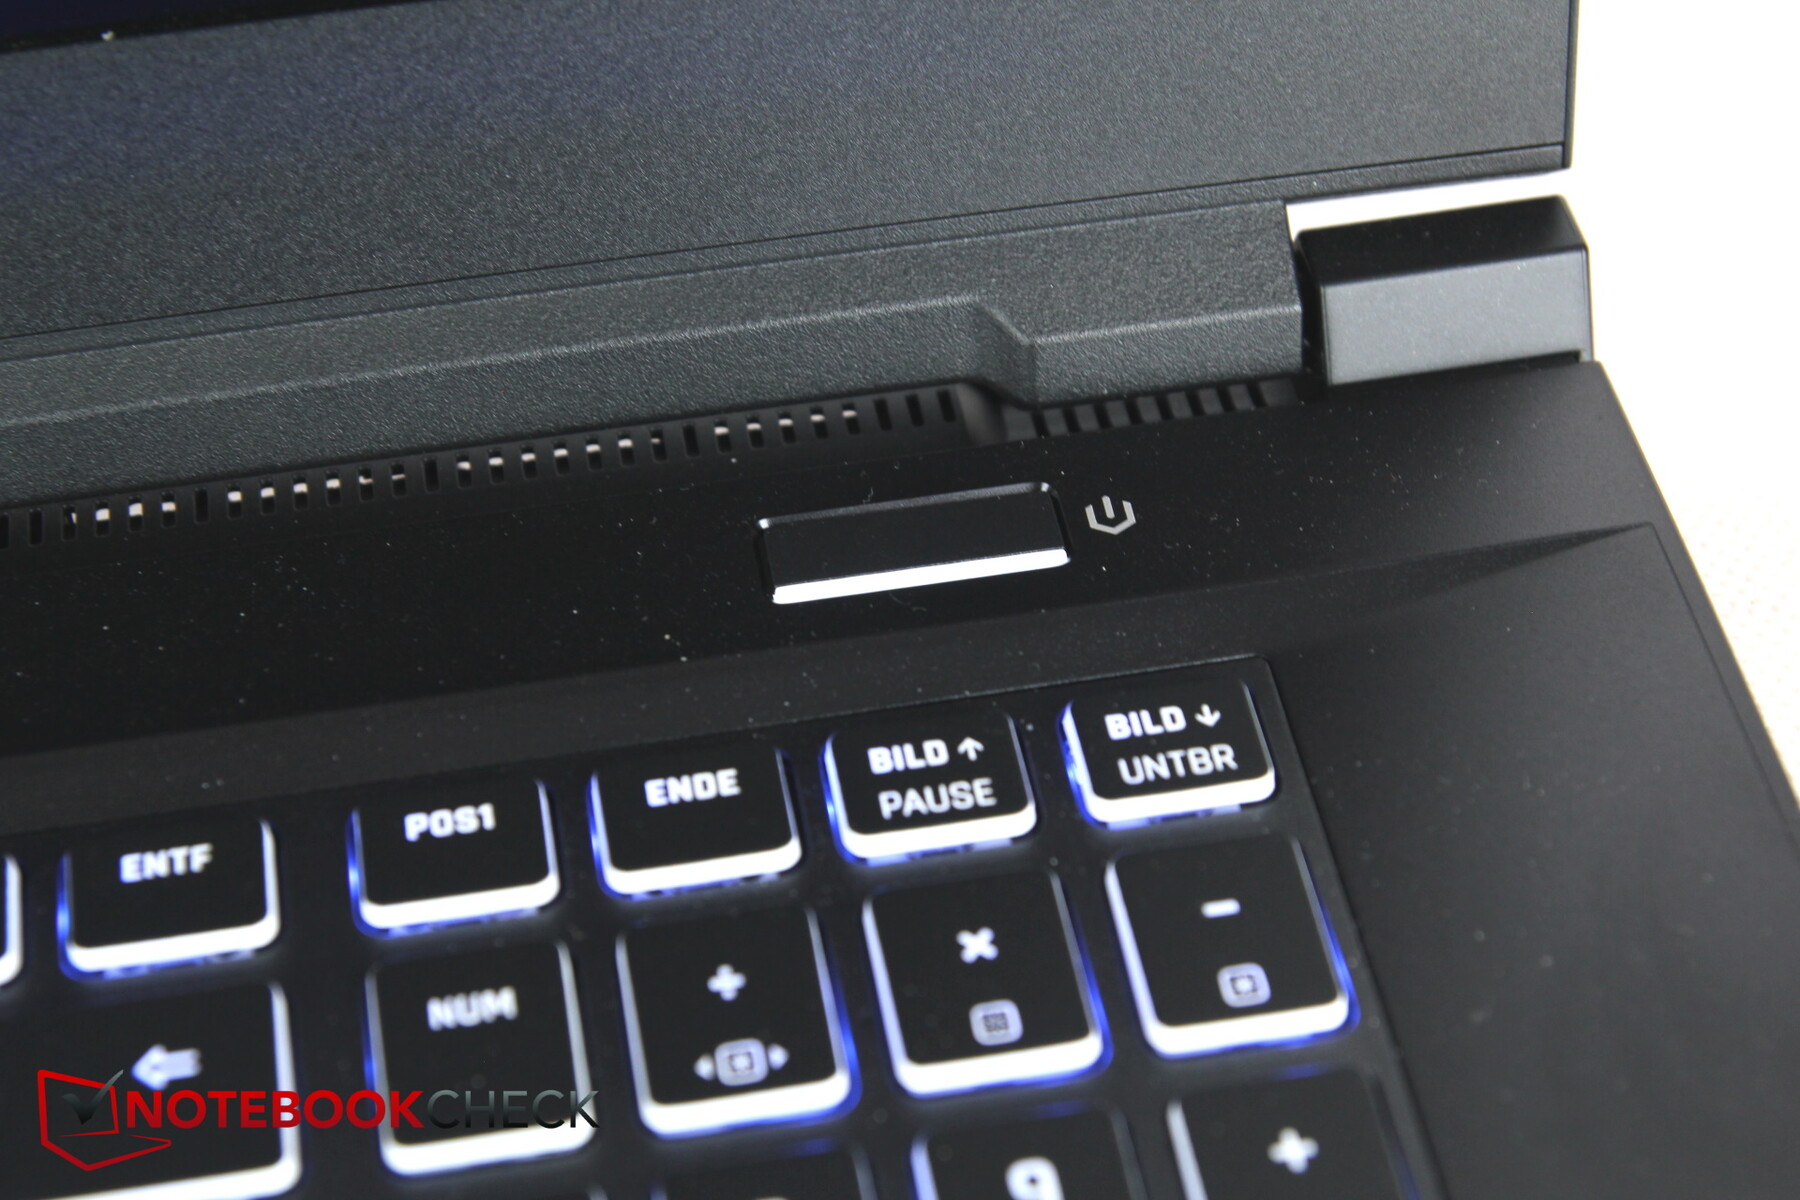
The keys look fairly small, particularly for a 17-inch laptop. But the layout looks very clean, and there is a number block. Unfortunately, there is no gap between the regular keyboard and the number block, so that the regular-sized arrow keys are not placed separately but positioned between the two keyboard halves.
It is not apparent at first glance, but the keyboard, which is set into the metal base, is only made from thin plastic. This means that the thin plate below the keys bends down a lot, moving in visible waves while typing. This is a bit much for us and becomes annoying.
The stroke height turns out mediocre, but the feedback is clear and typing is fairly comfortable. Only the small size of the keys is slightly annoying. The typing noise is very moderate.
The keyboard offers a separate RGB illumination for each key, allowing you to illuminate the WASD keys in a different color, for example, to make them stand out more from the other keys. The settings for this are contained in the Control Center.
Touchpad
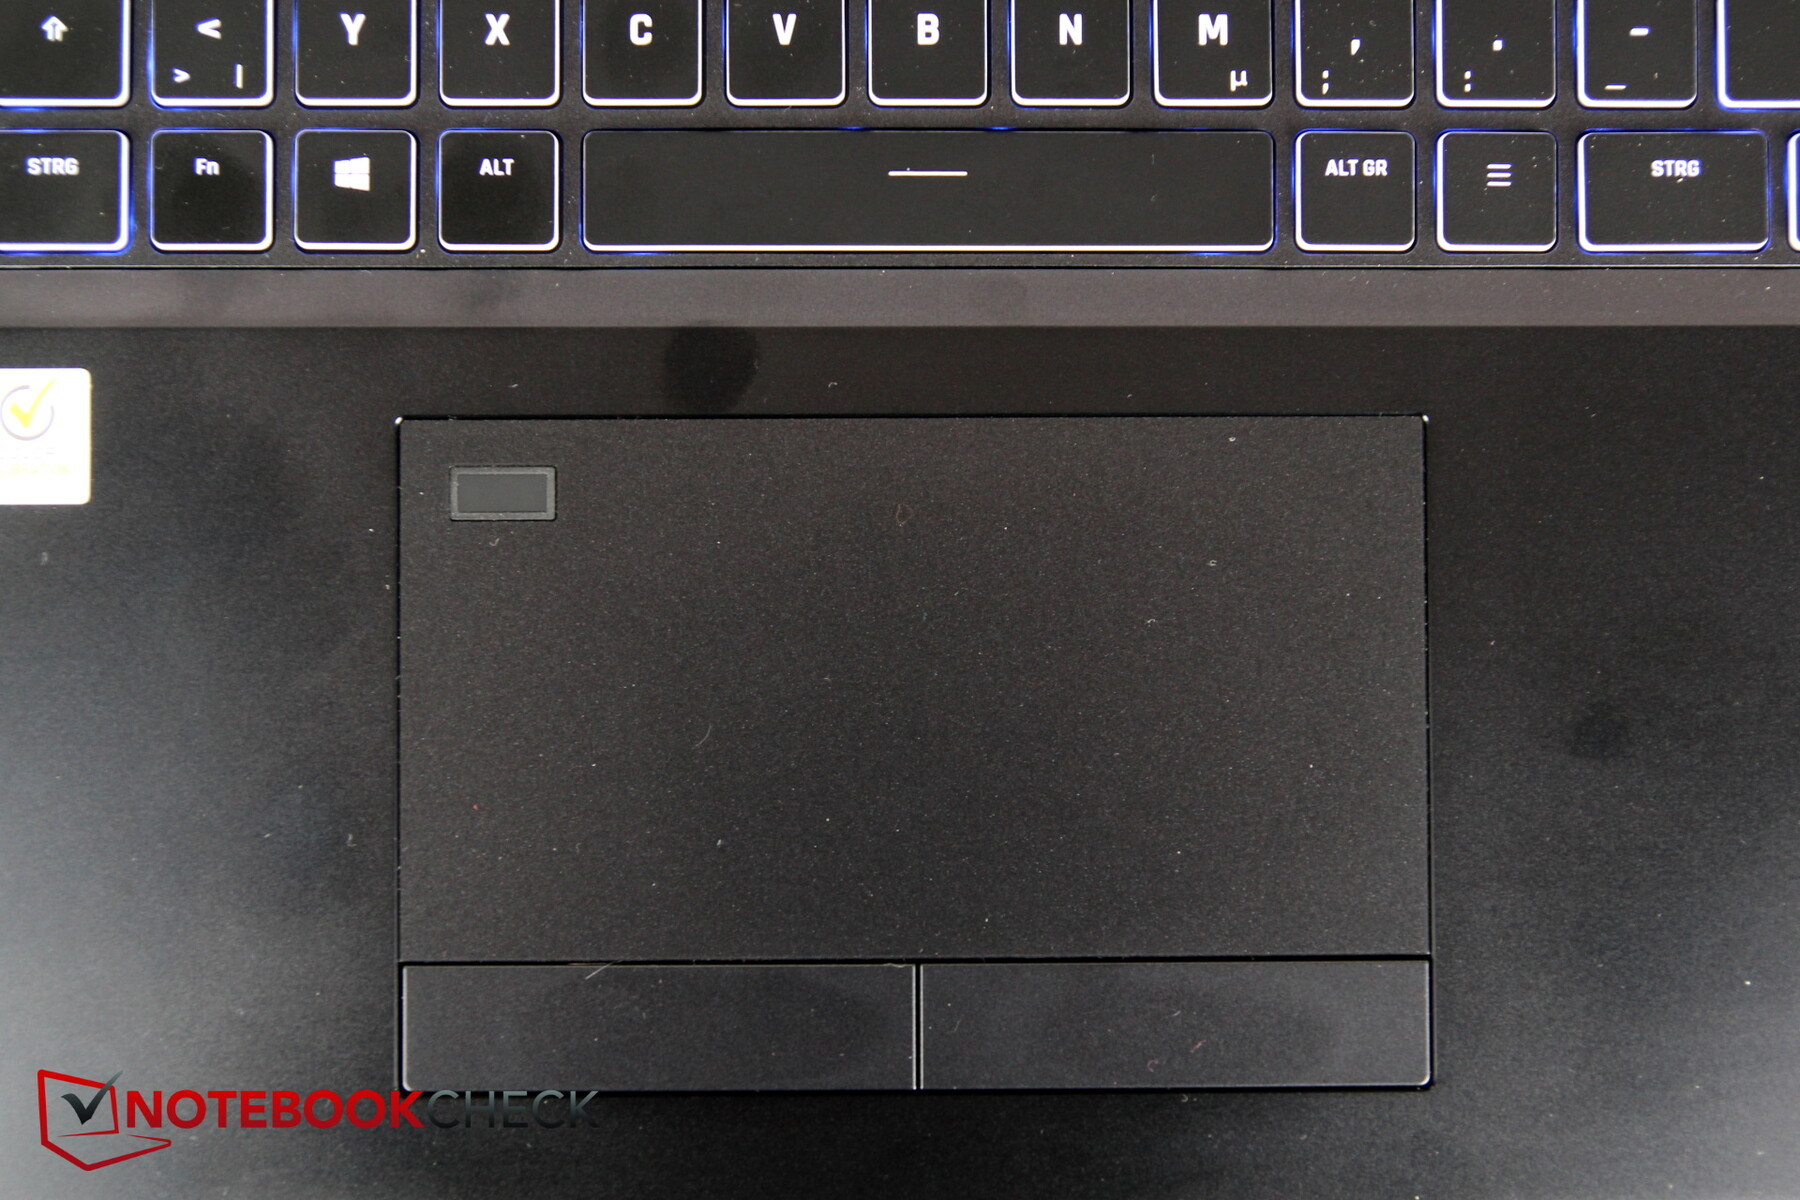
The touchpad is fairly large (~13 x 6.8 cm, ~5.1 x 2.7 in) with dedicated mouse keys below. The fingerprint sensor is integrated in the left, top corner. Finger movements above and to the left of that are not registered.
The surface allows easy sliding of the fingers, and there are hardly any stutters even in slow movements.
The extra mouse keys below are wide and make a good impression at first glance. The volume of the mouse clicks is also at a moderate level. However, when listening closely, the keys produce some slight squeaking noise.
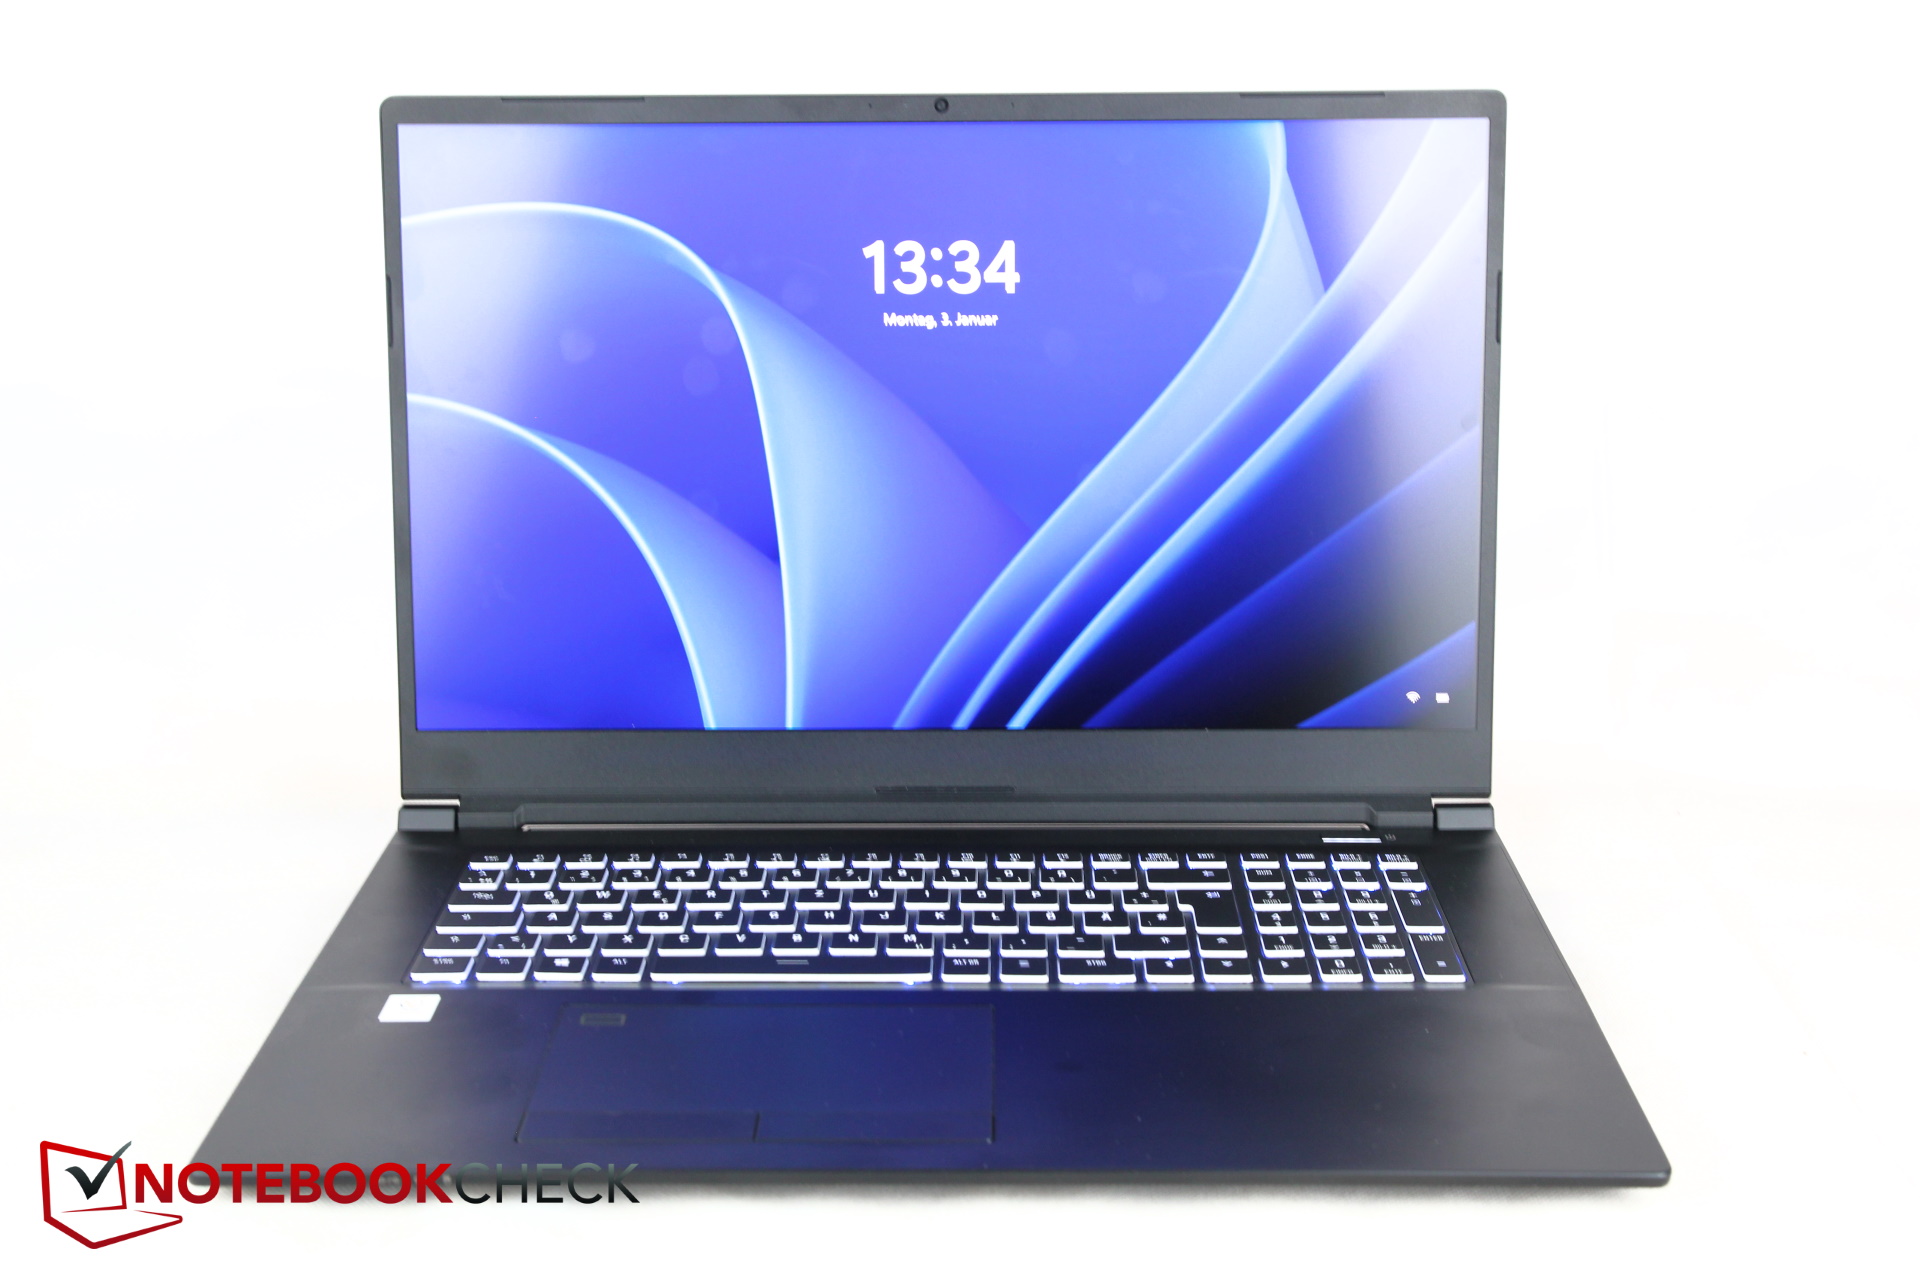
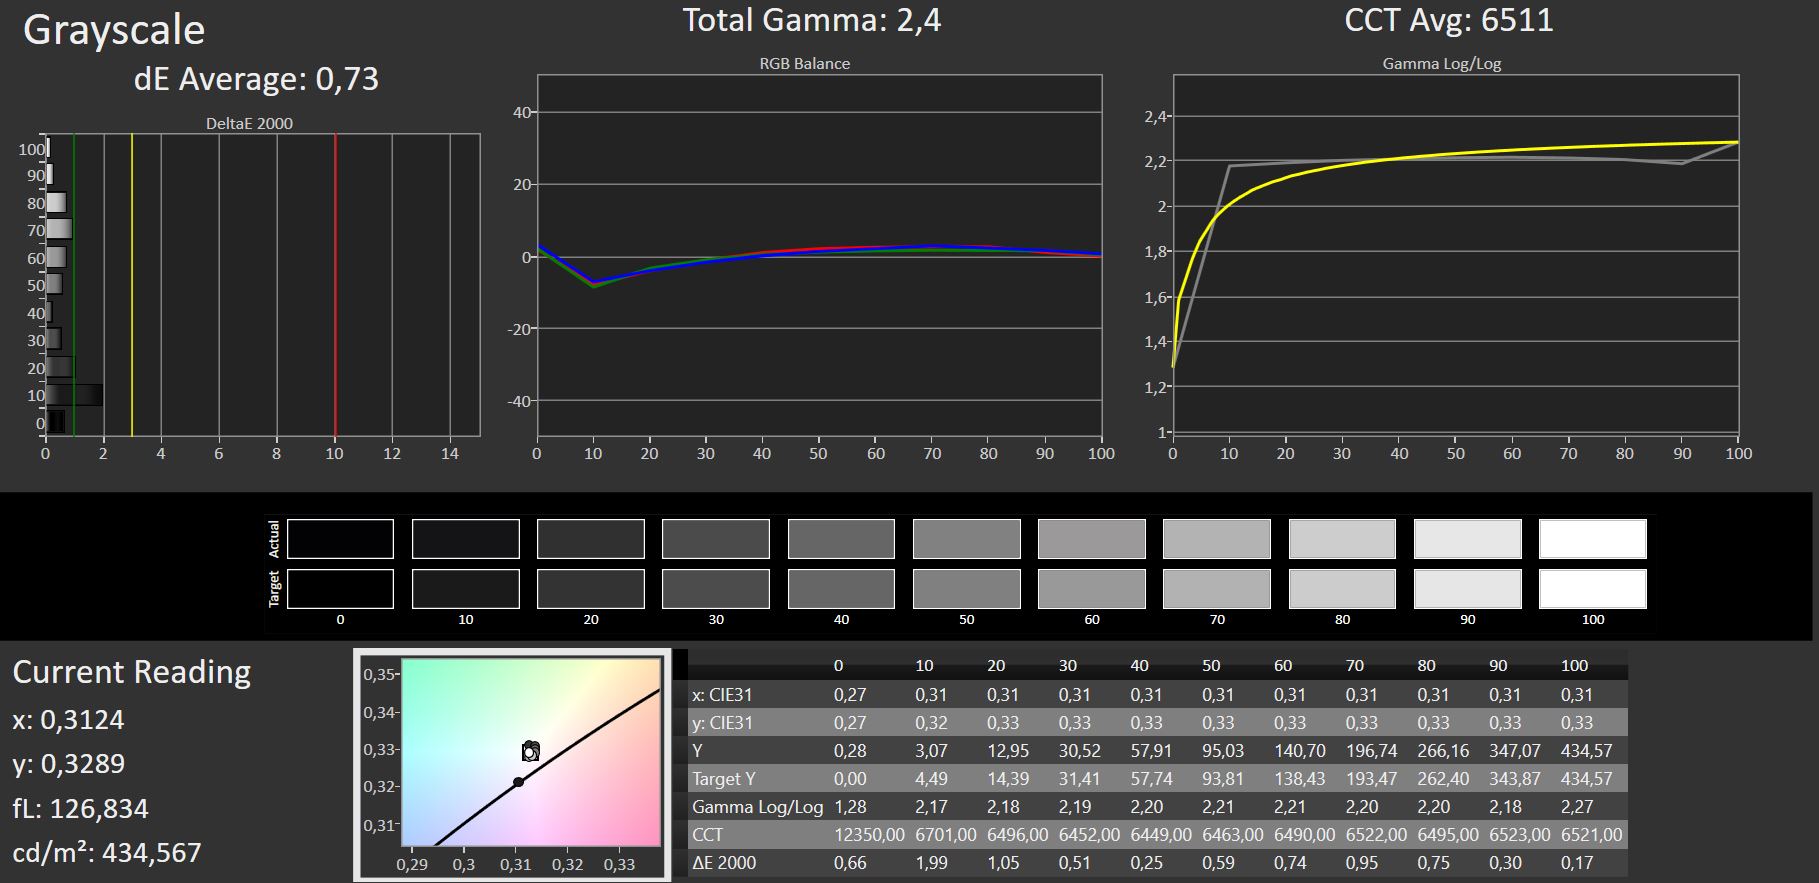
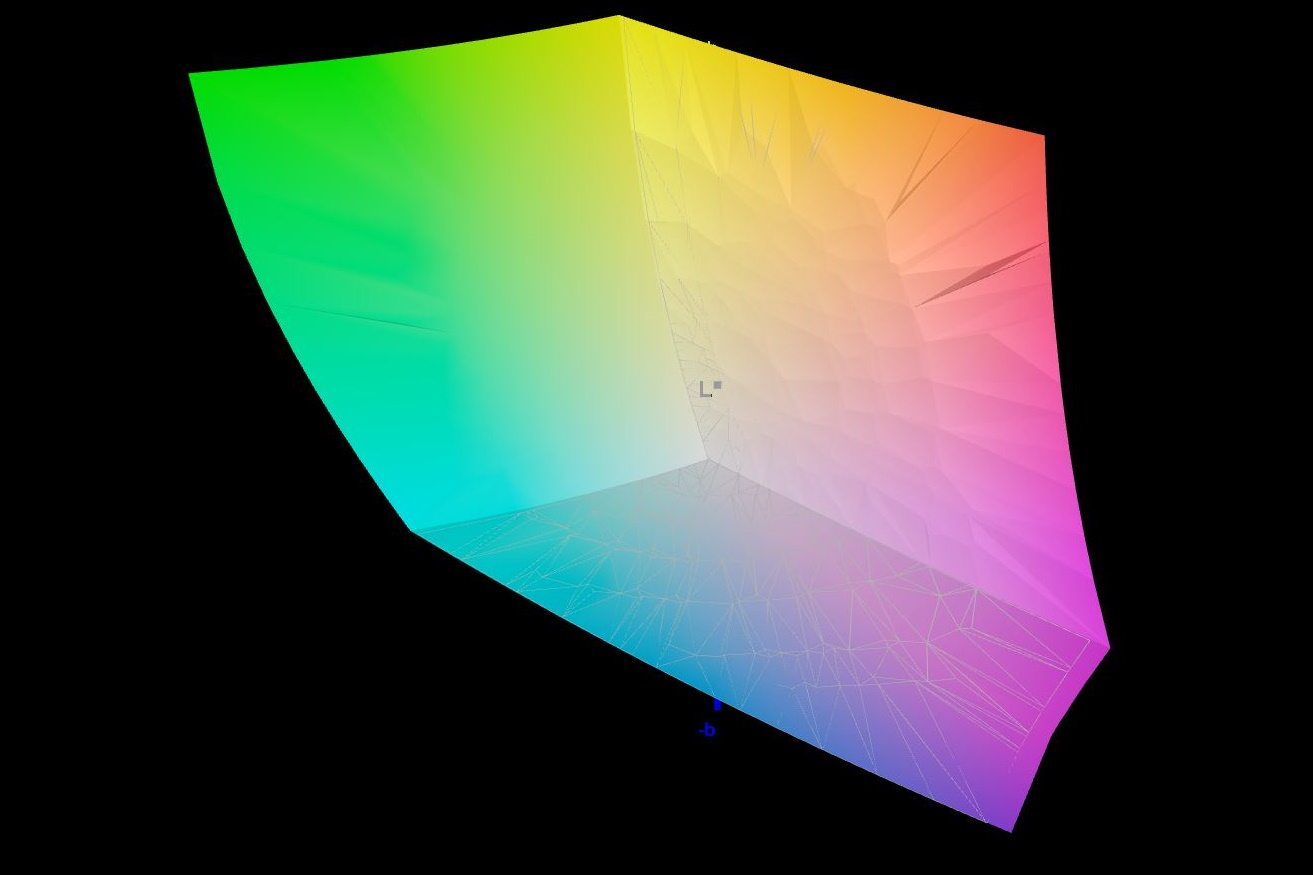
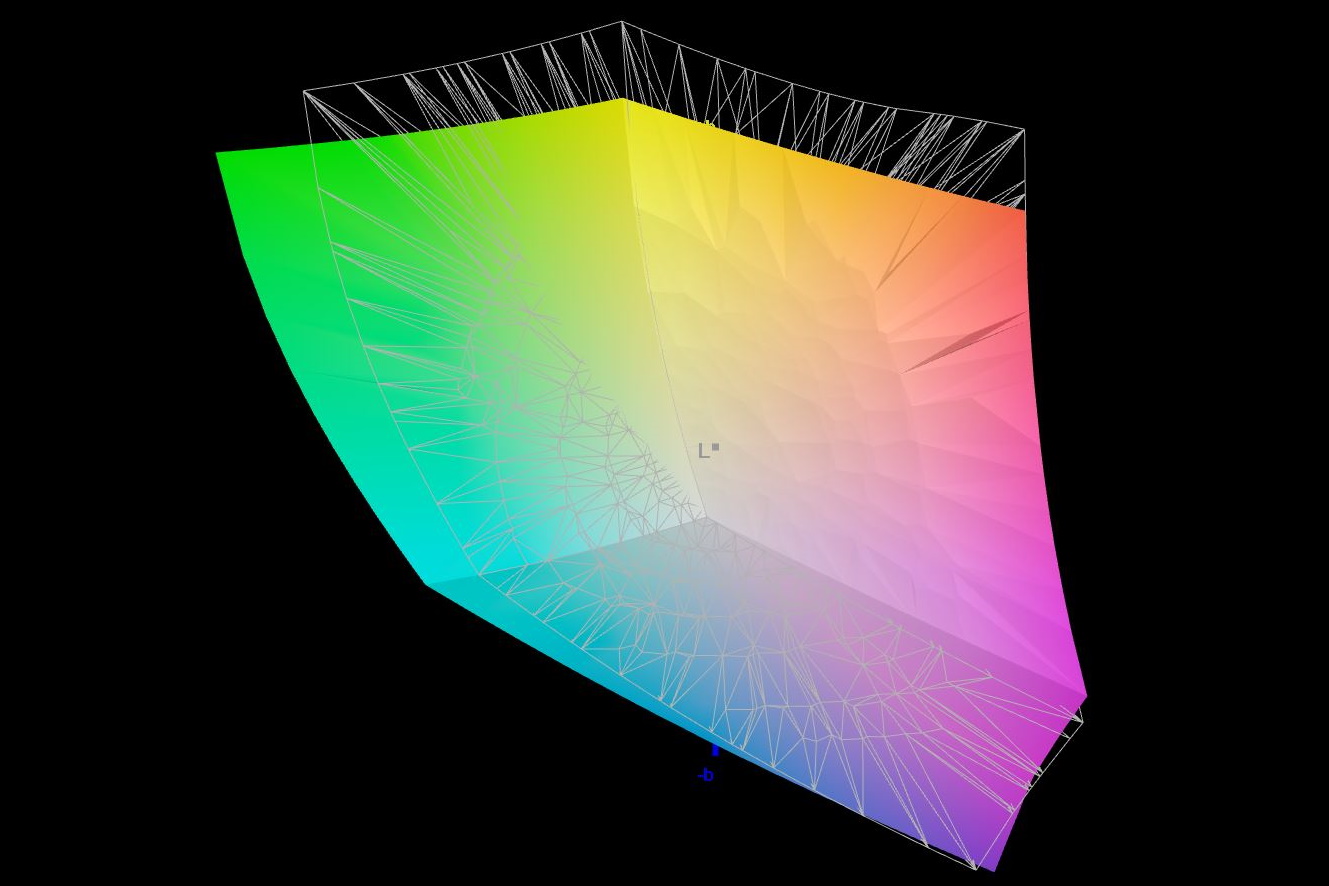
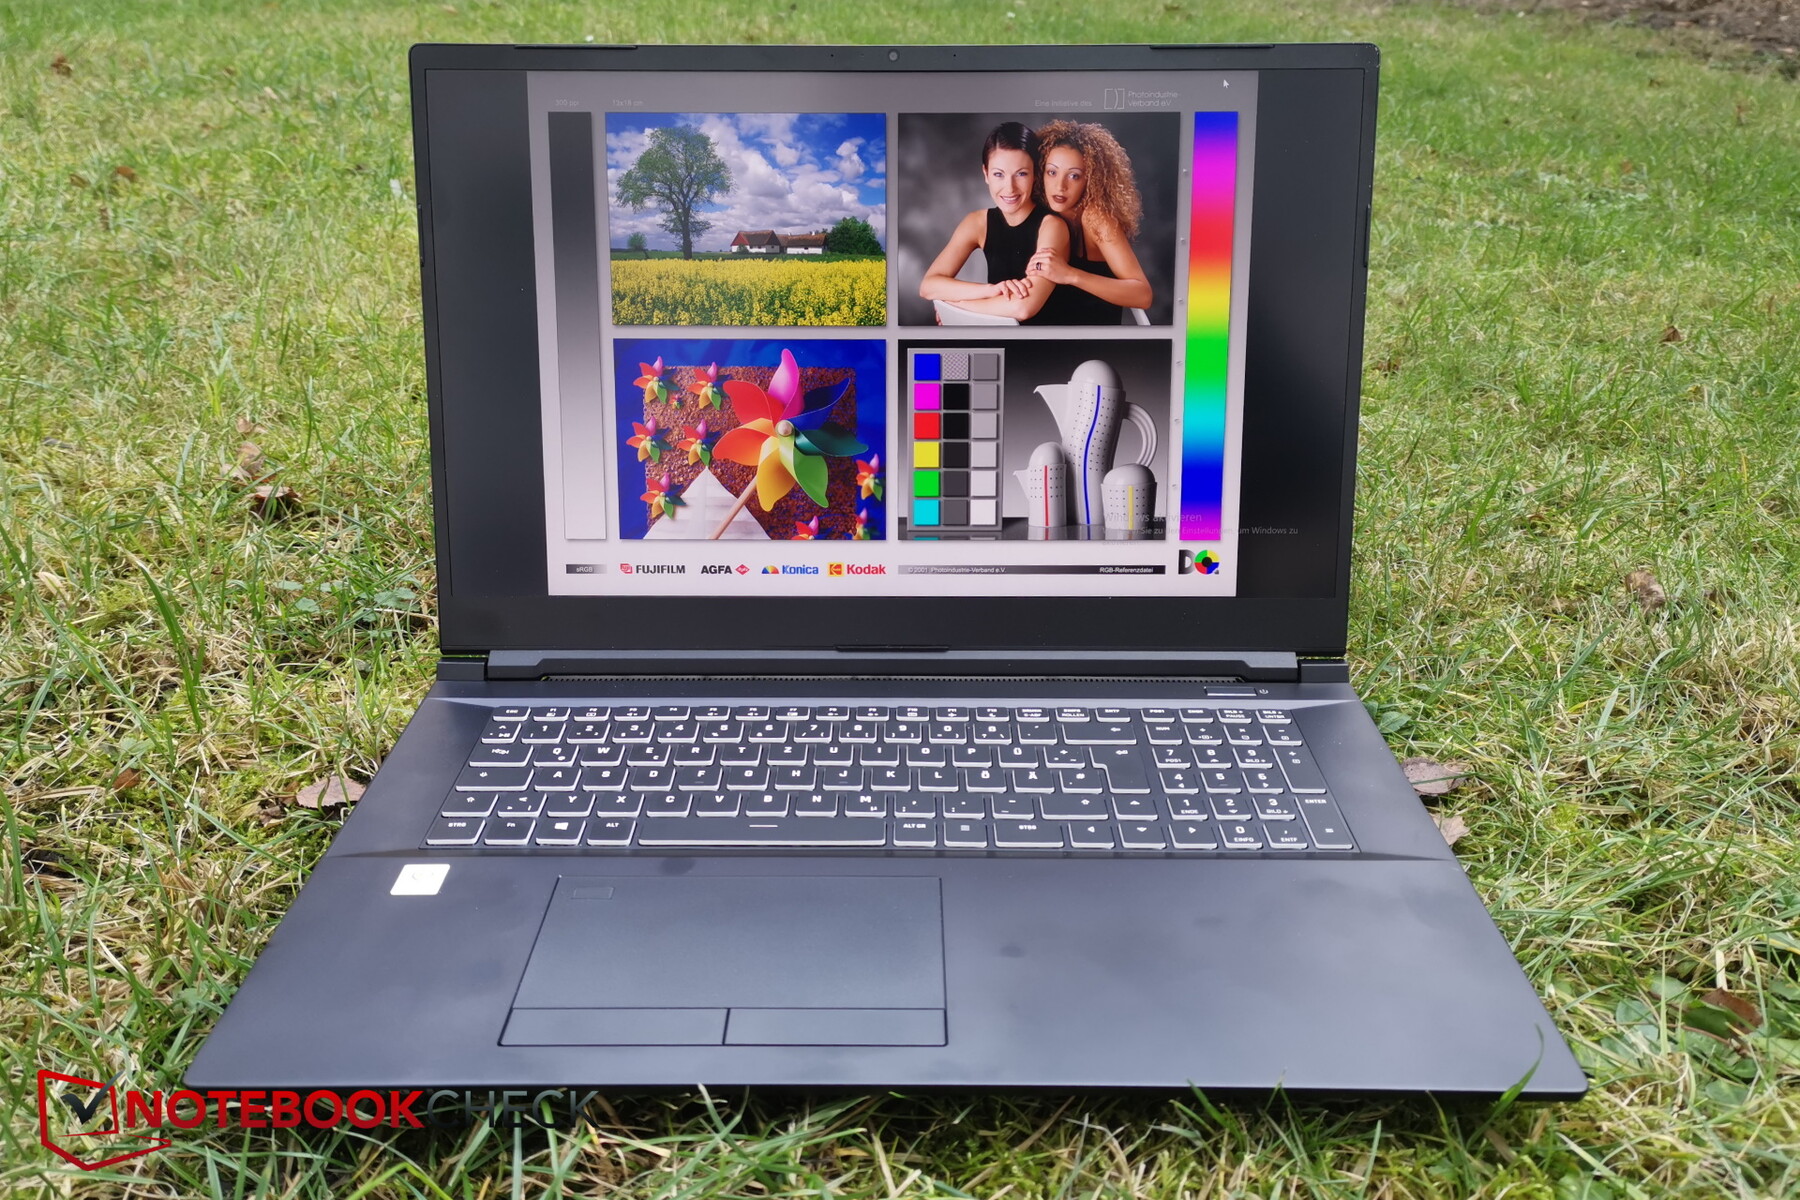
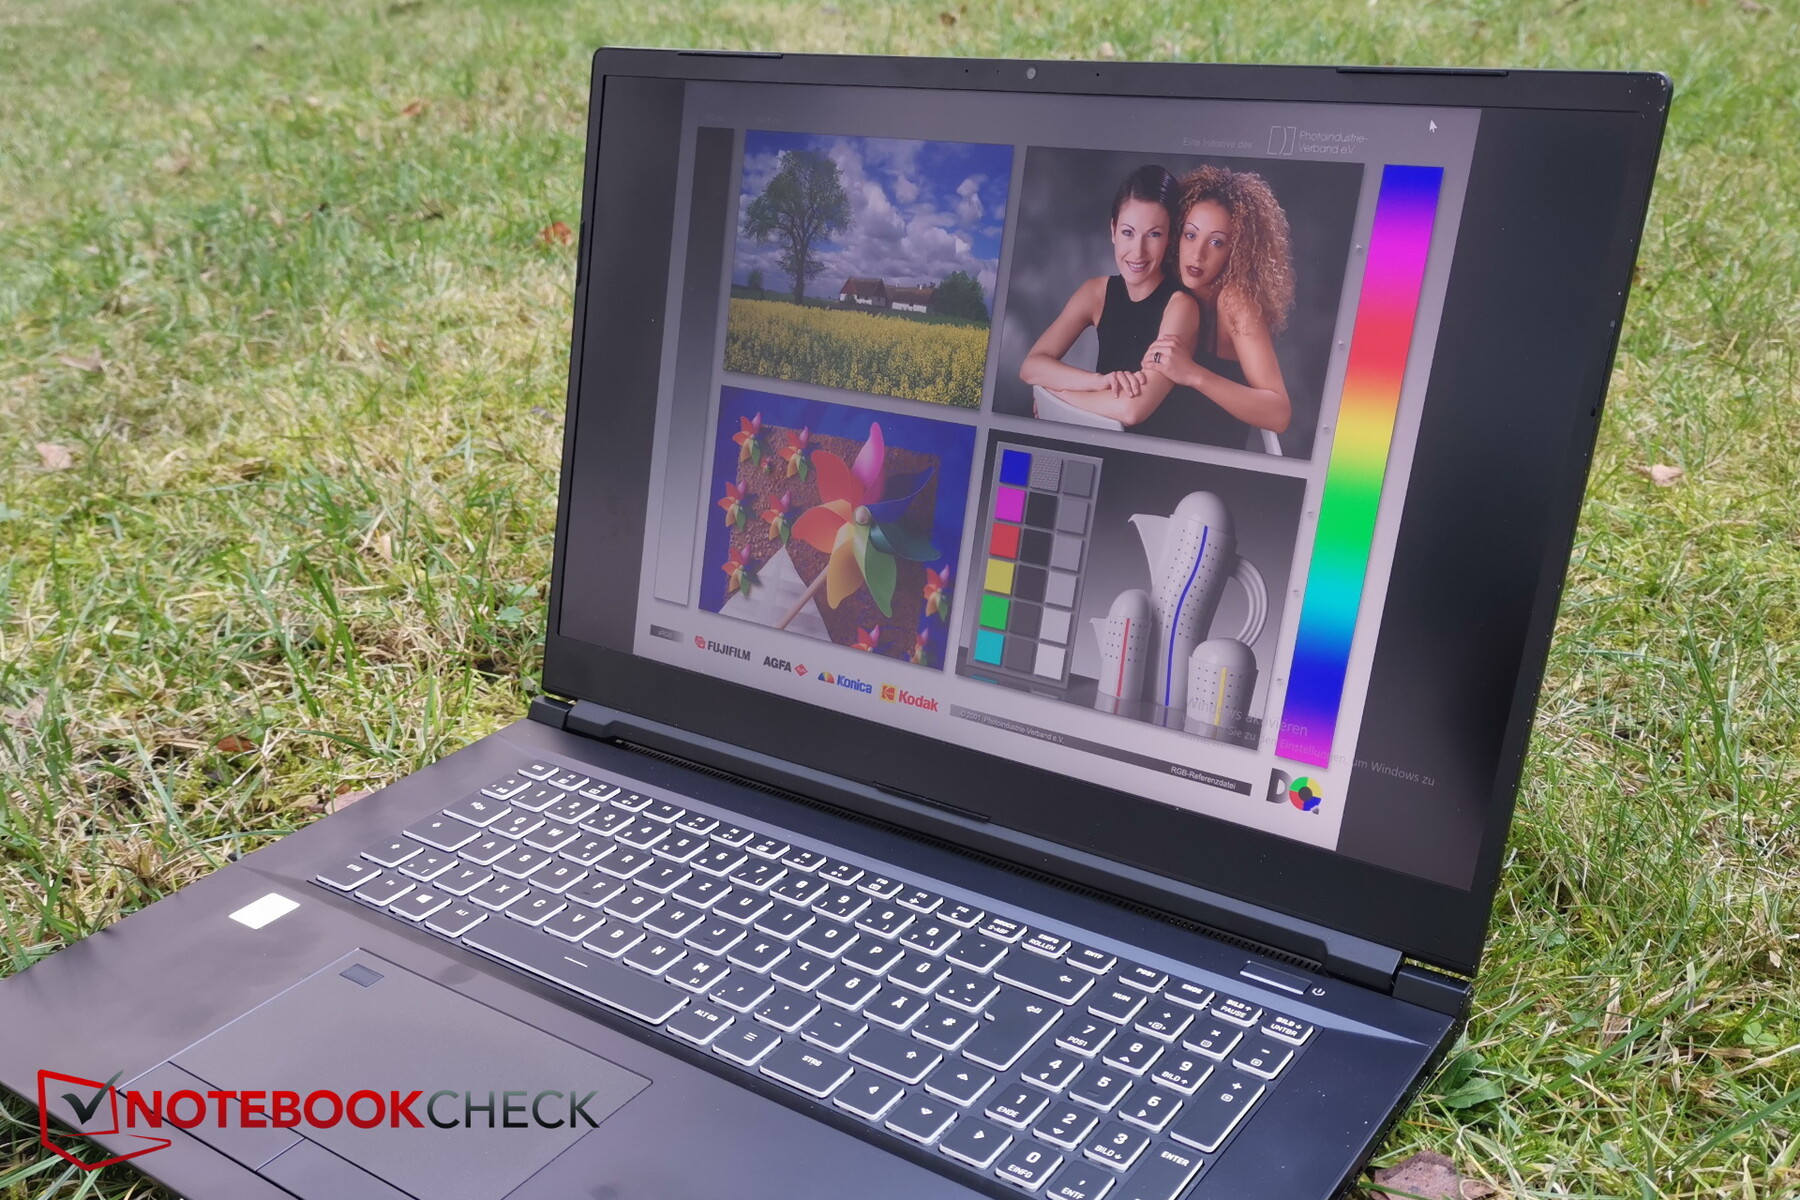
Display - 4K with a high color space coverage
The matte 4K IPS display is the same that is used in the Schenker XMG Ultra 17 from last year. Unfortunately, you have to make do without a higher refresh rate due to the 4K resolution. Alternatively, the laptop is also available with a Full-HD display and fast 300 Hz.
In addition, the panel is very bright, and the brightness distribution is still decent. The black value and contrast are also at a good level, with the latter being even slightly higher than that of the competitors.
What is less good is the very lame response time. In combination with the lower refresh rate, this also shows that the XMG Pro 17 with the 4K display is targeted more towards creative professionals, while gamers might rather choose the Full-HD model, depending on their preference.
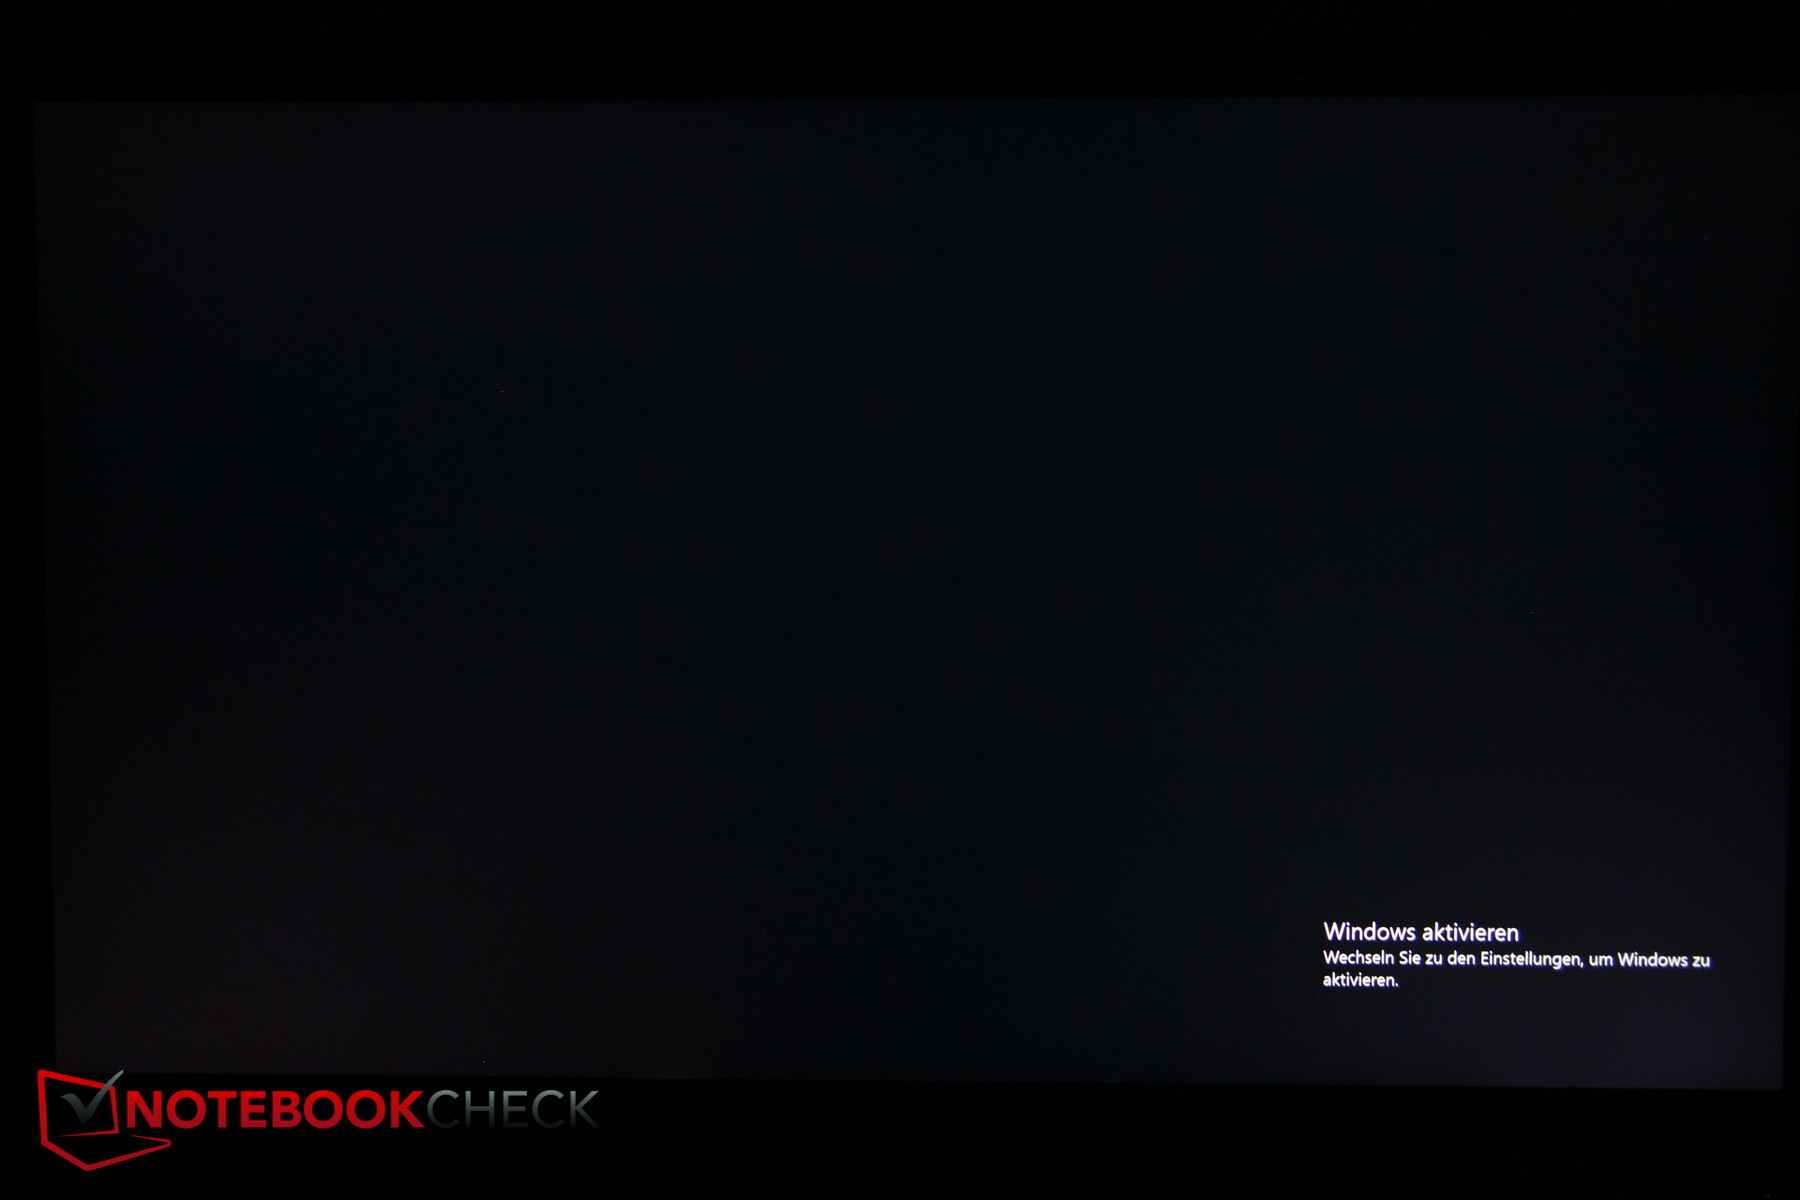
We did not detect any PWM. Even looking very closely in the dark, we can only see some minimal screen bleeding at the bottom edge (but it is not visible in the screenshot), so this is not problematic.
| |||||||||||||||||||||||||
Brightness Distribution: 84 %
Center on Battery: 471 cd/m²
Contrast: 1397:1 (Black: 0.34 cd/m²)
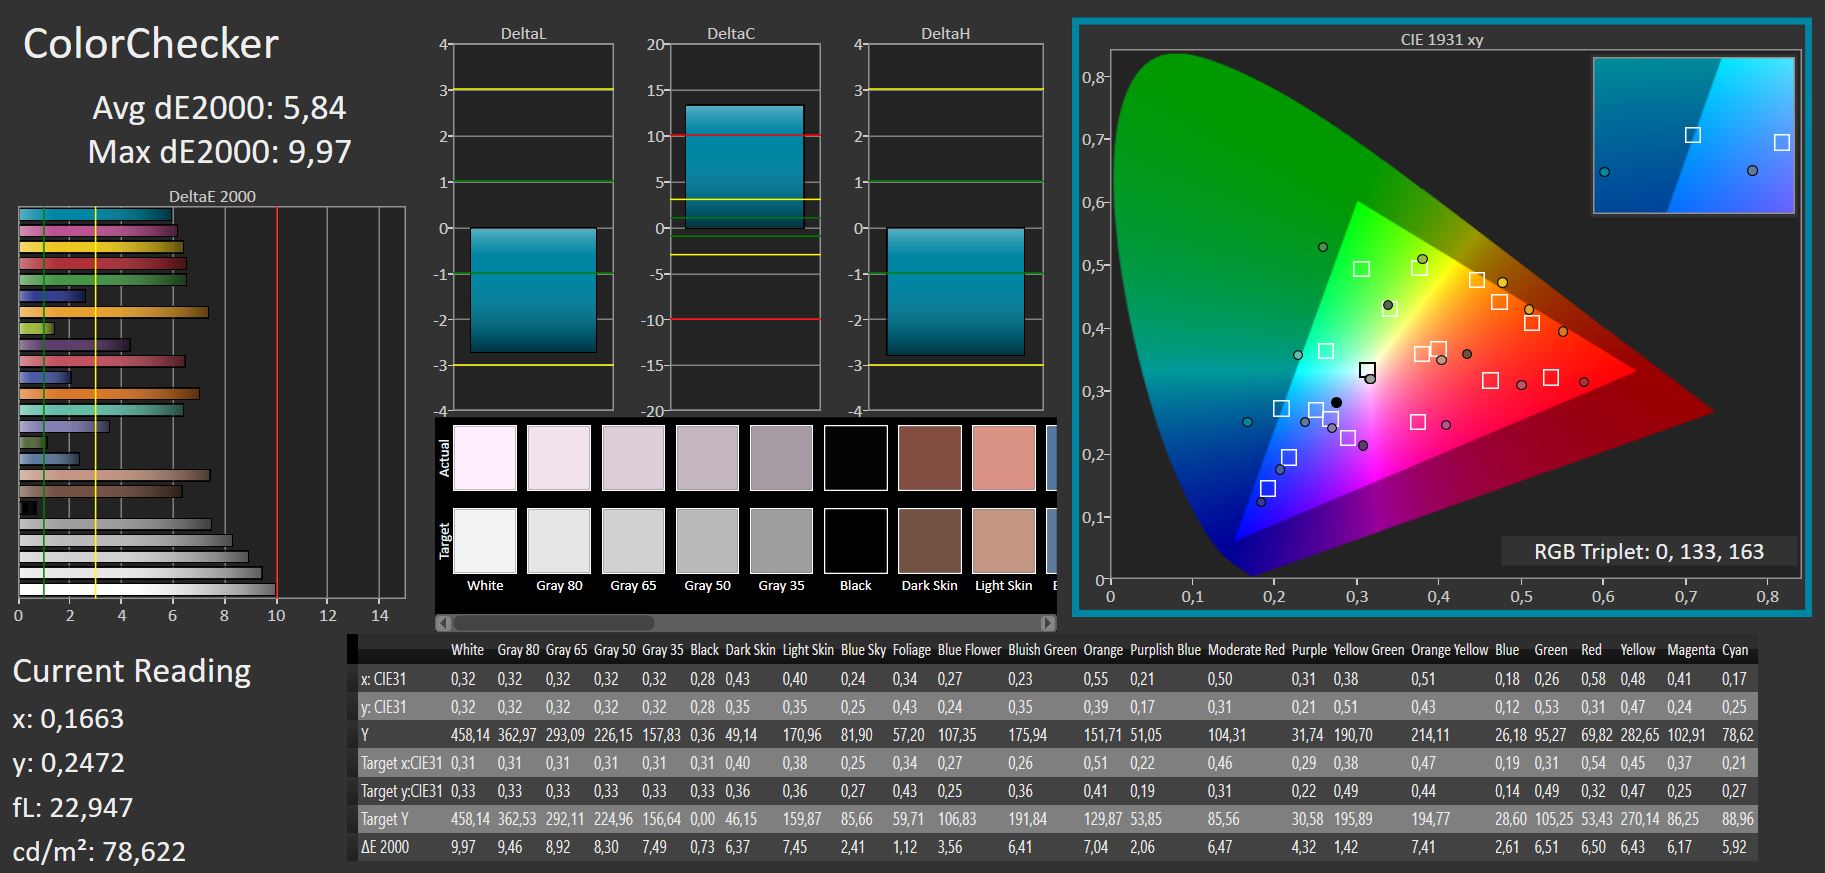
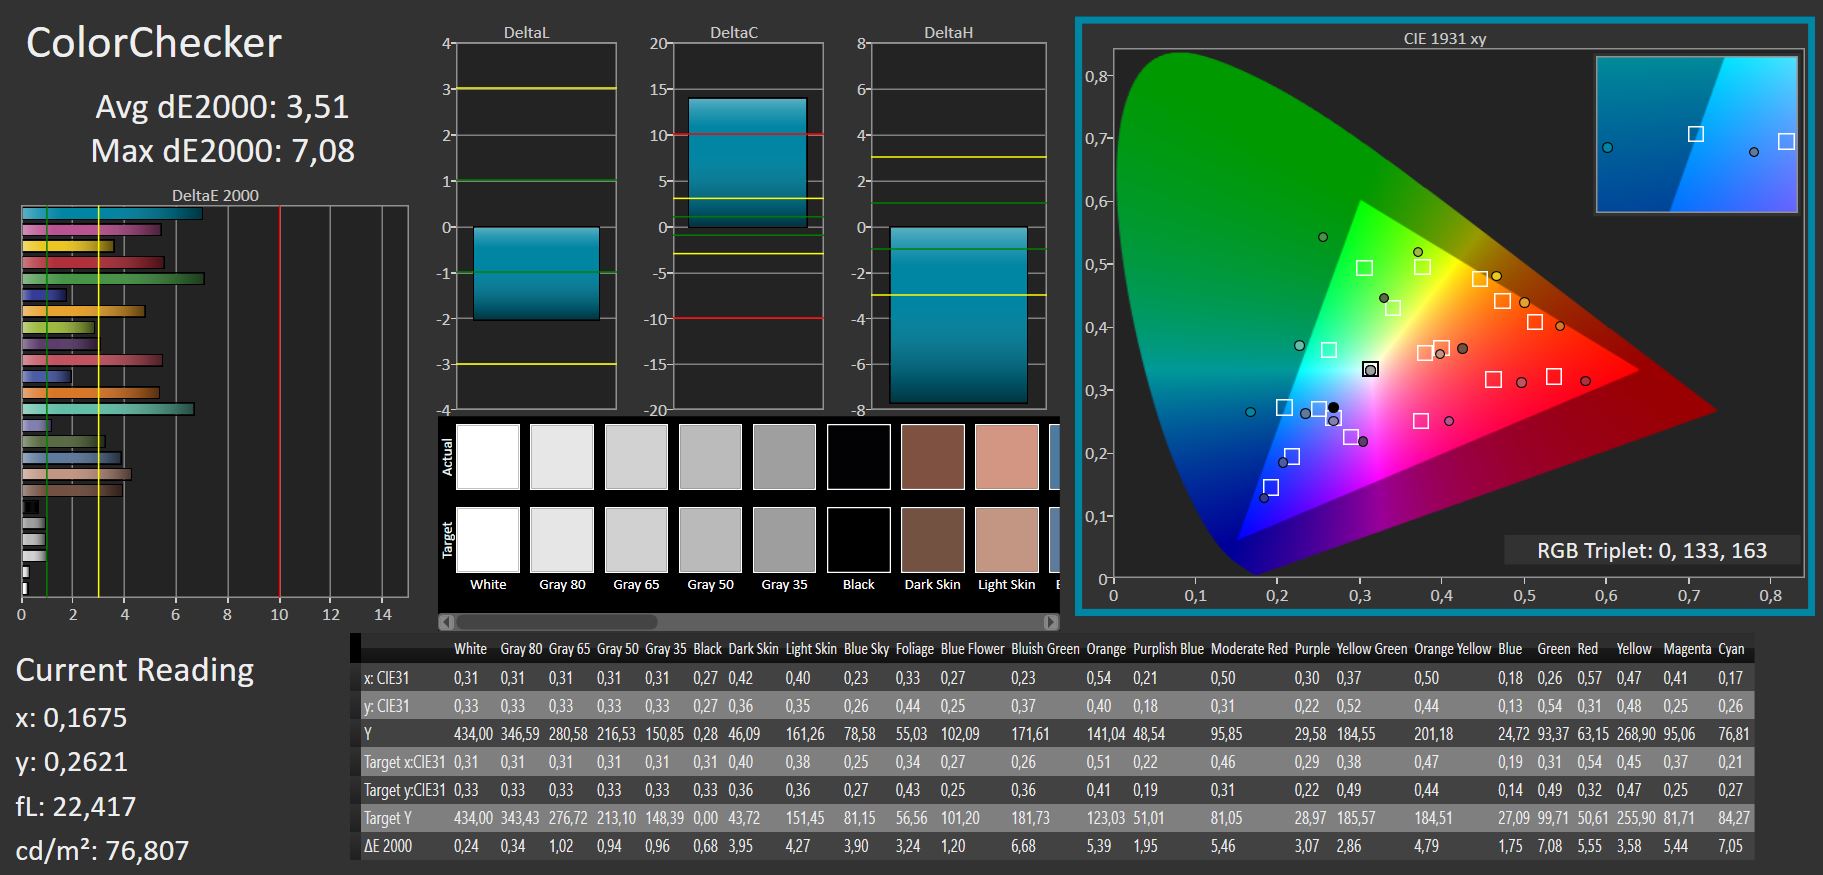
ΔE ColorChecker Calman: 5.84 | ∀{0.5-29.43 Ø4.73}
calibrated: 3.51
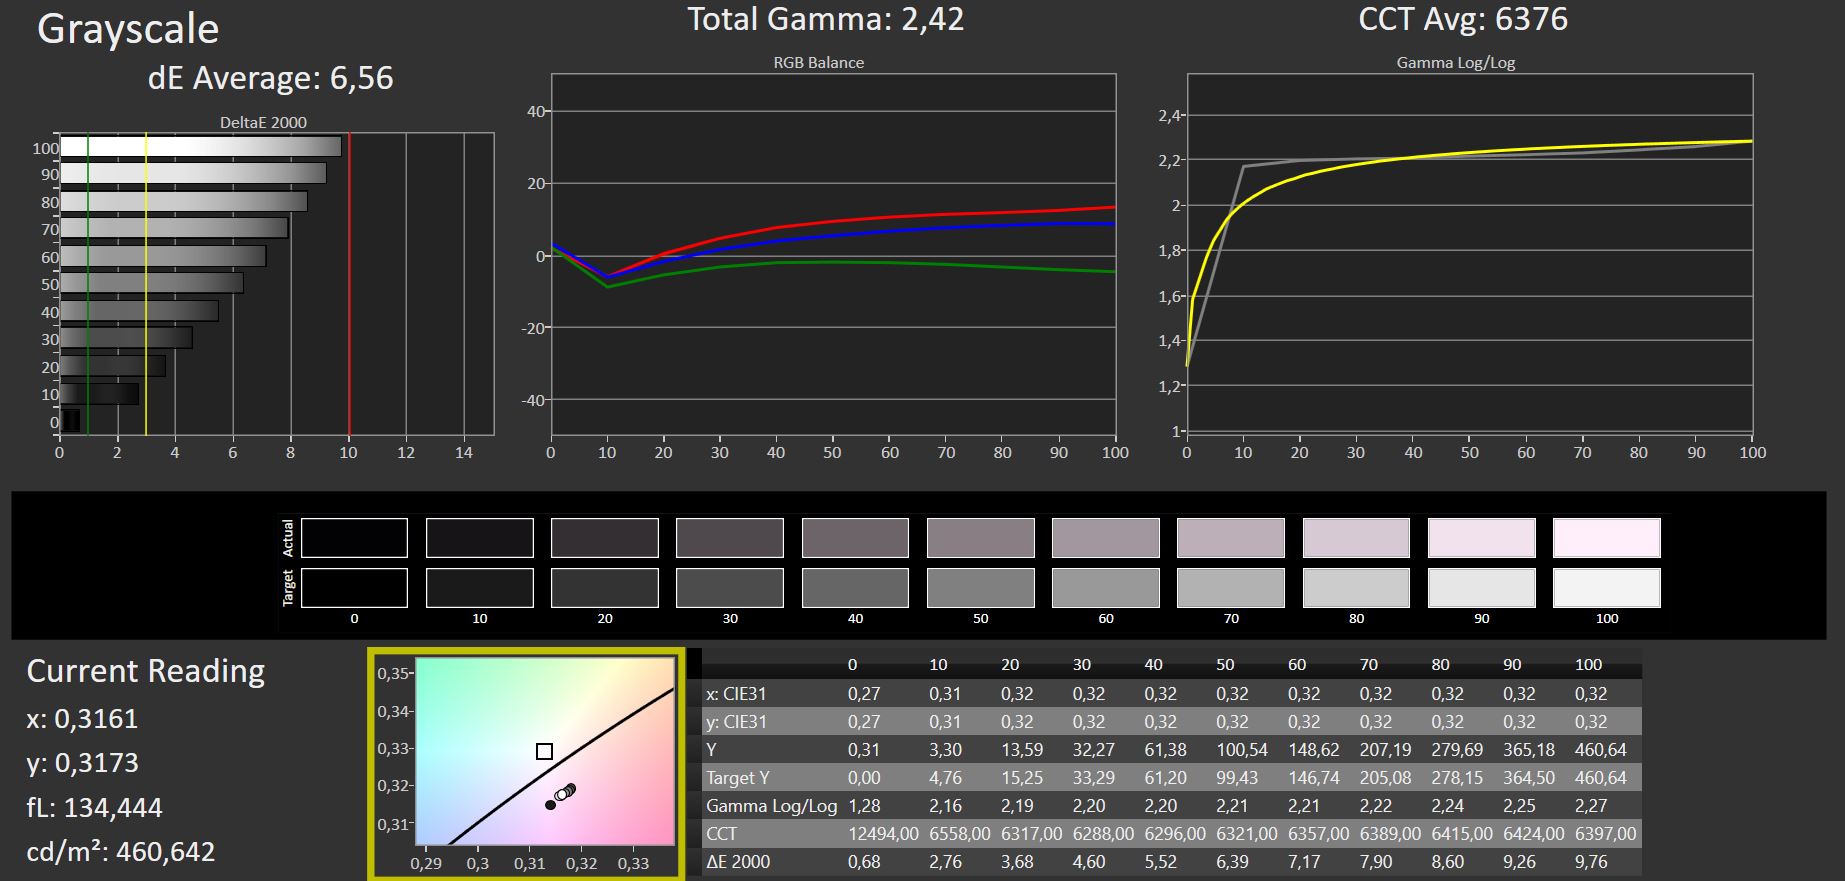
ΔE Greyscale Calman: 6.56 | ∀{0.09-98 Ø4.97}
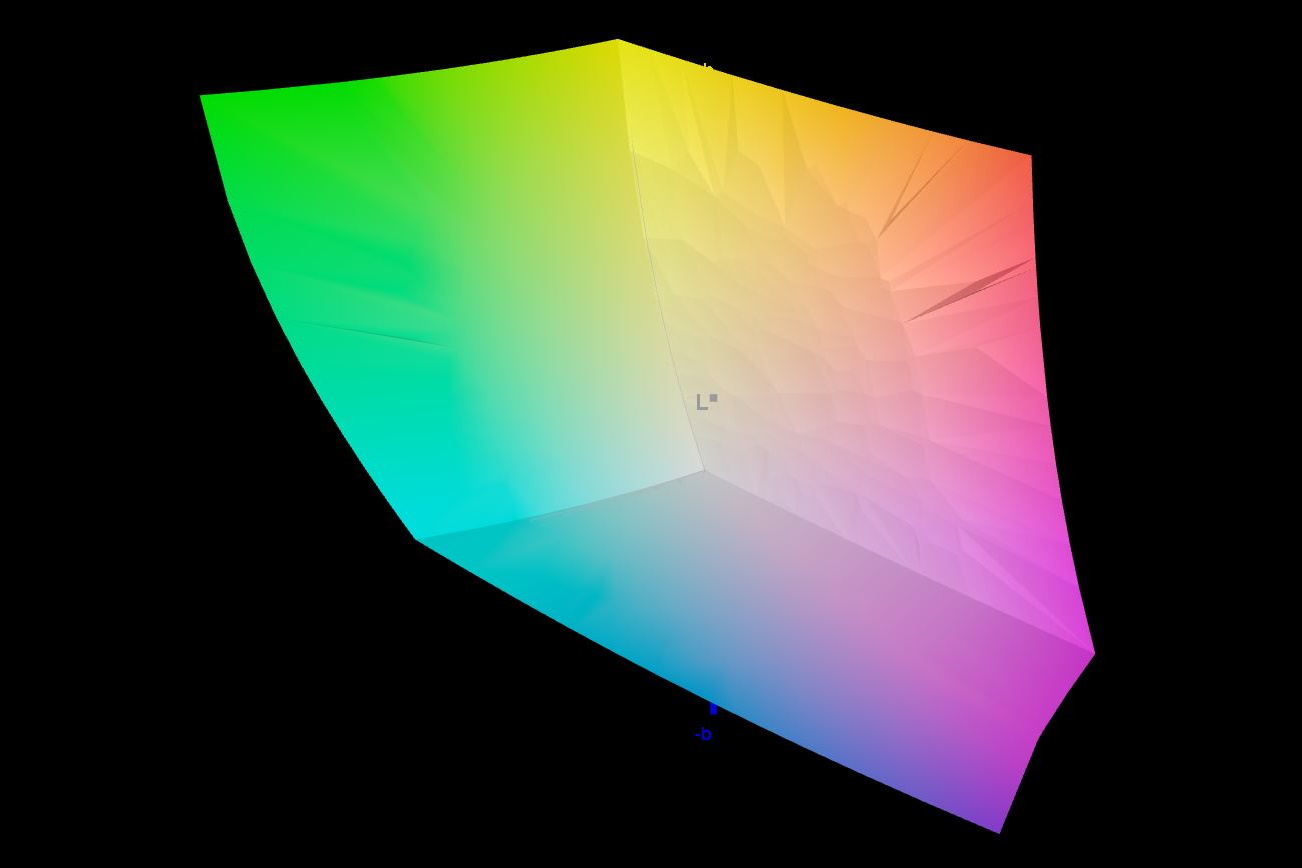
100% AdobeRGB 1998 (Argyll 3D)
100% sRGB (Argyll 3D)
87.1% Display P3 (Argyll 3D)
Gamma: 2.42
CCT: 6376 K
| Schenker XMG Pro 17 (Late 2021, RTX 3080) AUO B173ZAN3.0 (AUO309B), IPS, 3840x2160, 17.3" | Schenker XMG Pro 15 (Late 2021) Samsung ATNA56WR14-0, OLED, 3840x2160, 15.6" | Alienware x17 RTX 3080 P48E AU Optronics B173ZAN, IPS, 3840x2160, 17.3" | Medion Erazer Beast X25 BOE NE173FHM-NZ1 (BOE0884), IPS, 1920x1080, 17.3" | MSI GS76 Stealth 11UH AUO B173ZAN06.1 (AUODE95), IPS, 3840x2160, 17.3" | Asus ROG Zephyrus S17 GX703HSD BOE099D (BOE CQ NE173QHM-NY3), IPS, 2560x1440, 17.3" | |
|---|---|---|---|---|---|---|
| Display | -7% | 0% | -16% | -23% | -3% | |
| Display P3 Coverage (%) | 87.1 | 81.2 -7% | 88.3 1% | 70.4 -19% | 63 -28% | 94.2 8% |
| sRGB Coverage (%) | 100 | 97.7 -2% | 100 0% | 99.8 0% | 94.8 -5% | 98.7 -1% |
| AdobeRGB 1998 Coverage (%) | 100 | 89.1 -11% | 100 0% | 71.6 -28% | 65 -35% | 84.4 -16% |
| Response Times | 94% | 69% | 82% | 81% | 83% | |
| Response Time Grey 50% / Grey 80% * (ms) | 46.8 ? | 3.2 ? 93% | 14.4 ? 69% | 9.2 ? 80% | 8.8 ? 81% | 4.8 90% |
| Response Time Black / White * (ms) | 32.6 ? | 1.6 ? 95% | 10.4 ? 68% | 5.6 ? 83% | 6.4 ? 80% | 8 75% |
| PWM Frequency (Hz) | 60 ? | |||||
| Screen | 212% | 13% | 17% | 22% | 11% | |
| Brightness middle (cd/m²) | 475 | 443 -7% | 438.7 -8% | 329 -31% | 474 0% | 322 -32% |
| Brightness (cd/m²) | 451 | 434 -4% | 435 -4% | 315 -30% | 454 1% | 288 -36% |
| Brightness Distribution (%) | 84 | 94 12% | 91 8% | 88 5% | 88 5% | 72 -14% |
| Black Level * (cd/m²) | 0.34 | 0.02 94% | 0.48 -41% | 0.33 3% | 0.46 -35% | 0.3 12% |
| Contrast (:1) | 1397 | 22150 1486% | 914 -35% | 997 -29% | 1030 -26% | 1073 -23% |
| Colorchecker dE 2000 * | 5.84 | 3.73 36% | 4.34 26% | 2.03 65% | 1.5 74% | 3.05 48% |
| Colorchecker dE 2000 max. * | 9.97 | 8.12 19% | 7.3 27% | 5.5 45% | 5.59 44% | 5.23 48% |
| Colorchecker dE 2000 calibrated * | 3.51 | 0.72 79% | 0.82 77% | 0.86 75% | 1.92 45% | |
| Greyscale dE 2000 * | 6.56 | 2.5 62% | 2.4 63% | 3.5 47% | 2.8 57% | 3.11 53% |
| Gamma | 2.42 91% | 2.001 110% | 2.09 105% | 2.223 99% | 2.158 102% | 2.13 103% |
| CCT | 6376 102% | 6522 100% | 6413 101% | 6526 100% | 6597 99% | 6553 99% |
| Color Space (Percent of AdobeRGB 1998) (%) | 84 | |||||
| Color Space (Percent of sRGB) (%) | 99 | |||||
| Total Average (Program / Settings) | 100% /
144% | 27% /
18% | 28% /
19% | 27% /
21% | 30% /
18% |
* ... smaller is better
Schenker advertises the display as color calibrated by X-Rite, but the color deviations still leave room for improvement. Warm, red tones are dominating, at least at full brightness. A manual calibration decreases the Delta-E value further, and you can download the corresponding ICC profile file from the link further above.
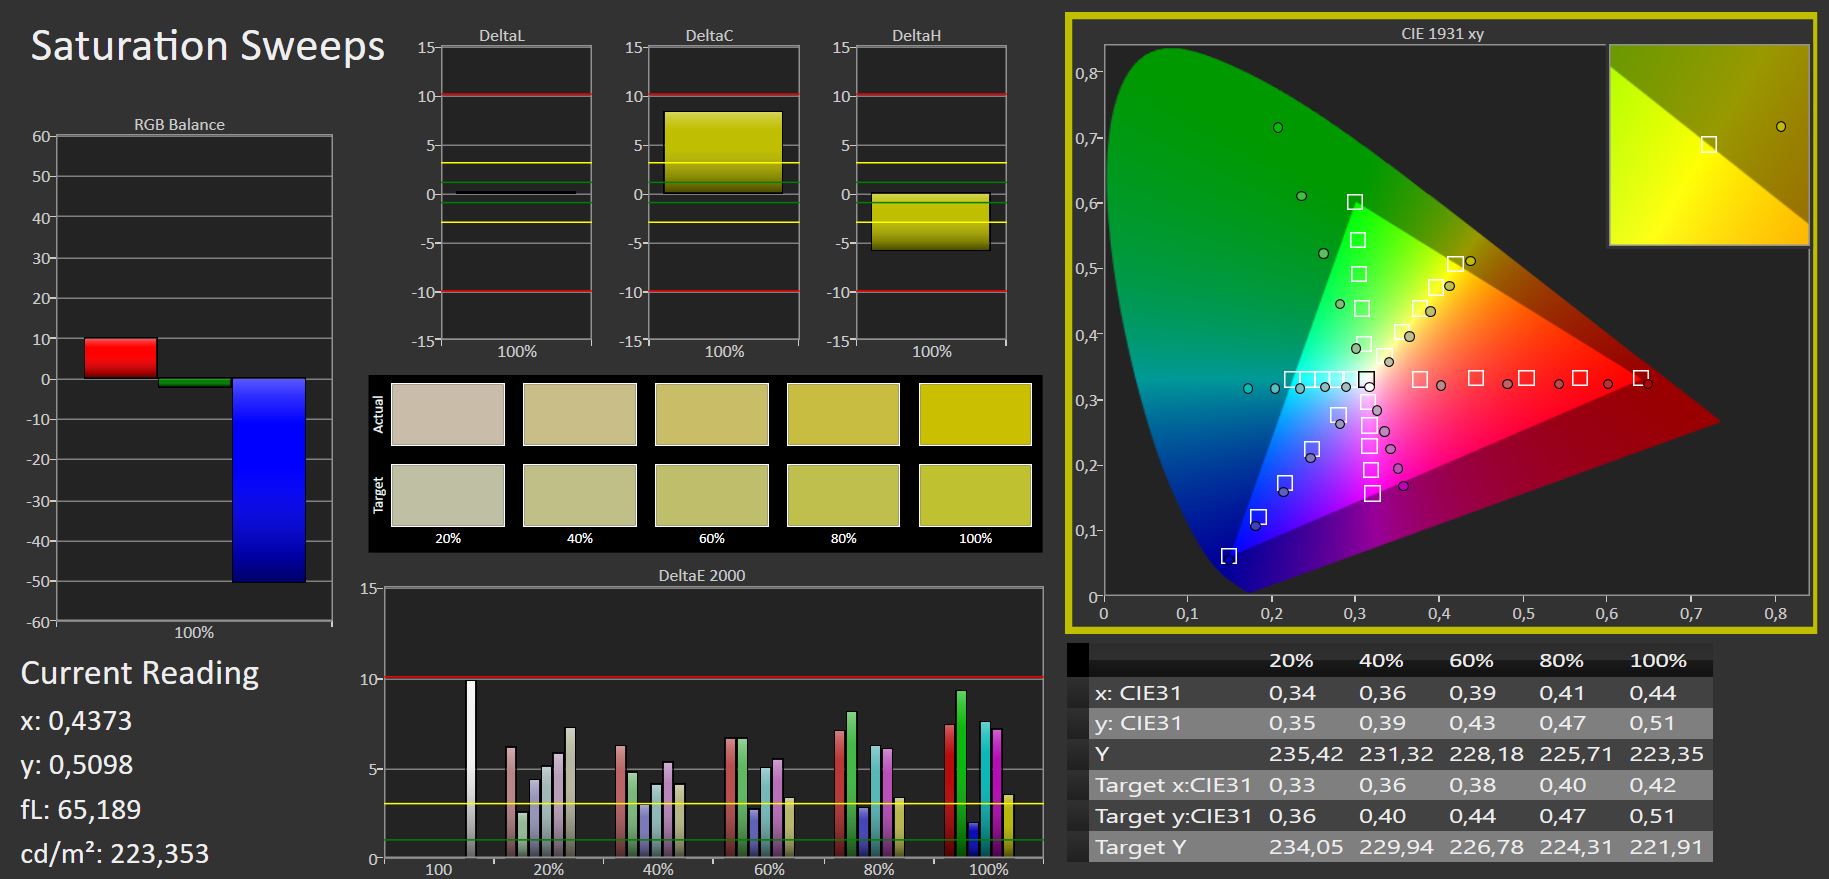
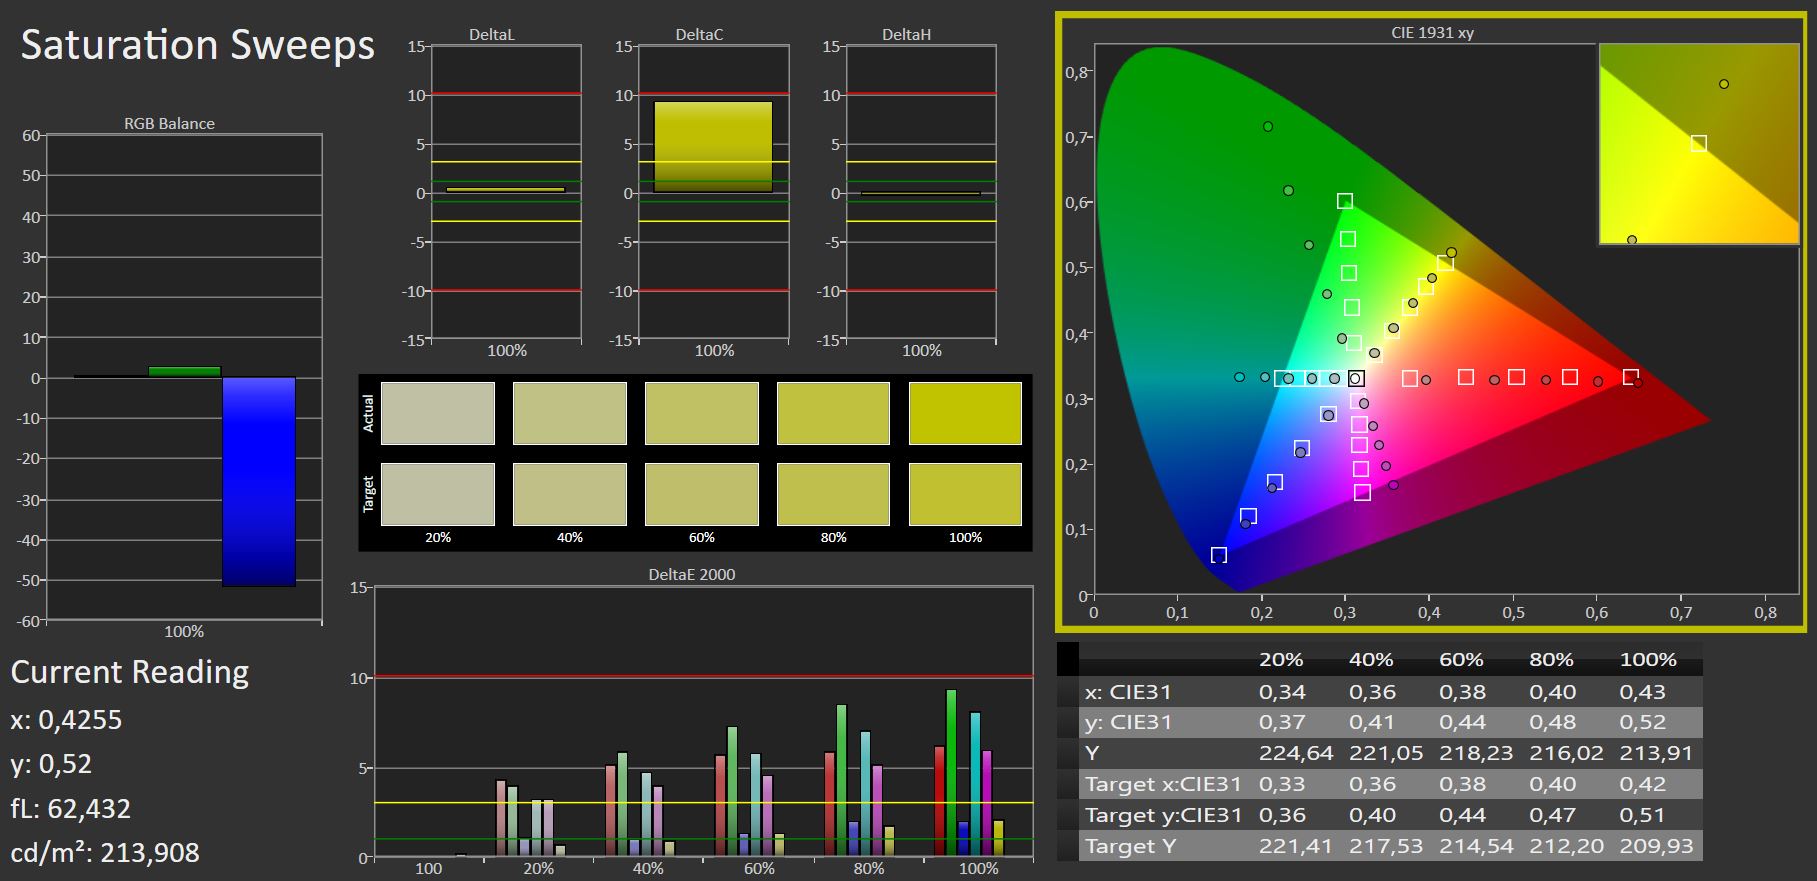
The display is very well suited for image processing and video editing, since various color spaces are covered well. While sRGB and AdobeRGB are covered completely, DCI-P3 is still covered to 87%.
The 4K panel of the Alienware and the 2K panel of the Asus Zephyrus are similarly good, and the Medion Erazer Beast and the MSI GS76 Stealth turn out worse here, but this is also a matter of the price.
Display Response Times
| ↔ Response Time Black to White | ||
|---|---|---|
| 32.6 ms ... rise ↗ and fall ↘ combined | ↗ 16.6 ms rise | 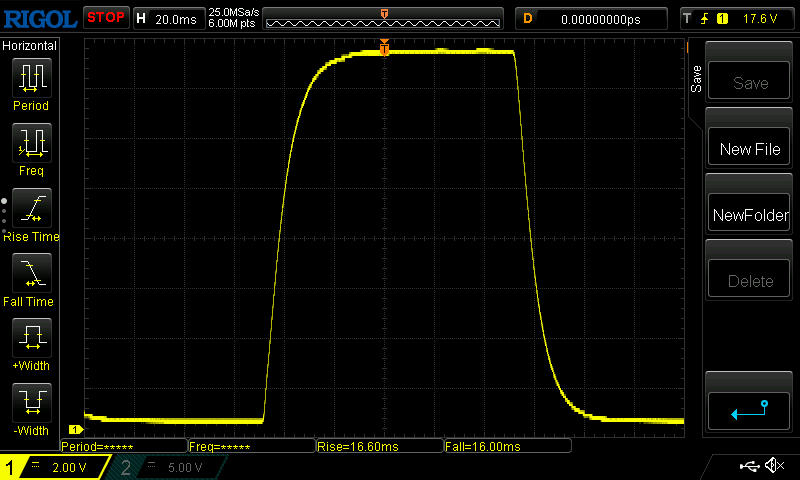 |
| ↘ 16 ms fall | ||
| The screen shows slow response rates in our tests and will be unsatisfactory for gamers. In comparison, all tested devices range from 0.1 (minimum) to 240 (maximum) ms. » 88 % of all devices are better. This means that the measured response time is worse than the average of all tested devices (19.9 ms). | ||
| ↔ Response Time 50% Grey to 80% Grey | ||
| 46.8 ms ... rise ↗ and fall ↘ combined | ↗ 23.4 ms rise | 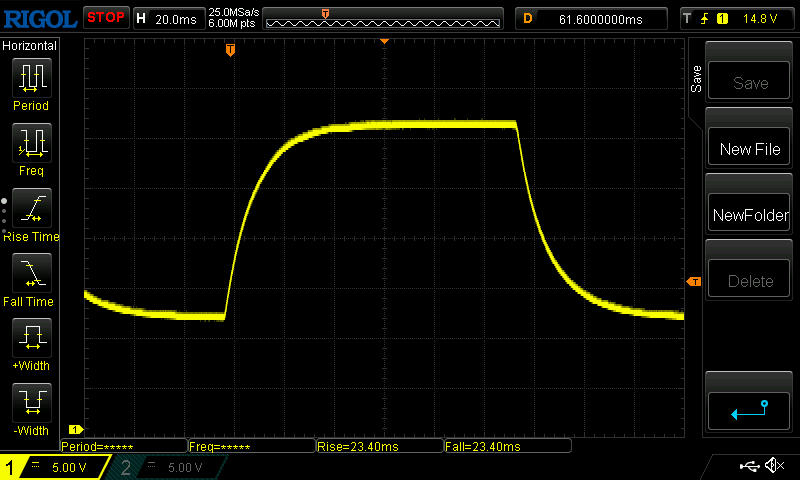 |
| ↘ 23.4 ms fall | ||
| The screen shows slow response rates in our tests and will be unsatisfactory for gamers. In comparison, all tested devices range from 0.165 (minimum) to 636 (maximum) ms. » 80 % of all devices are better. This means that the measured response time is worse than the average of all tested devices (31.1 ms). | ||
Screen Flickering / PWM (Pulse-Width Modulation)
| Screen flickering / PWM not detected |  | ||
In comparison: 52 % of all tested devices do not use PWM to dim the display. If PWM was detected, an average of 7810 (minimum: 5 - maximum: 343500) Hz was measured. | |||
Outdoors, the matte surface, the high brightness of more than 400 Nits, the good viewing angles, and the fairly high contrast will benefit, allowing you to read the display contents in most situations without being impacted much.
The viewing angle stability is decent, even though the brightness decreases noticeably from extreme viewing angles. There are IPS panels with even more stable viewing angles.

Performance - Throttled for the slim case
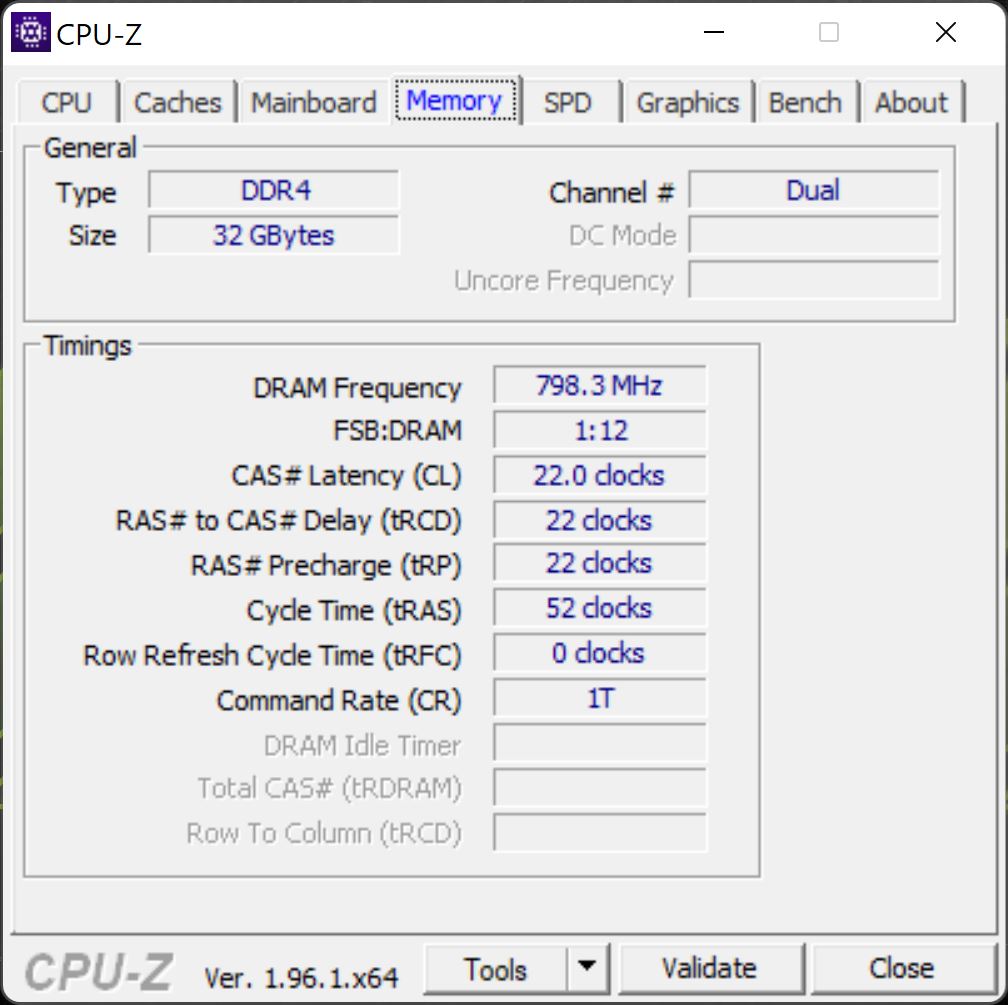
Schenker advertises the XMG Pro 17 targeting gamers as well as professional users. The Intel Core i7-11800H and particularly the NVIDIA GeForce RTX 3080 laptop GPU, and also the ample 32 GB of RAM support this cause. On the other hand, the 4K display with only 60 Hz but very good color space coverage shows that the laptop aims slightly more towards the needs of creative users rather than gamers. Also, you wouldn't really expect the highest gaming performance from an ultra-slim design either. For example, the TGP of the graphics card is limited to relatively weak 105 watts.
Test Conditions
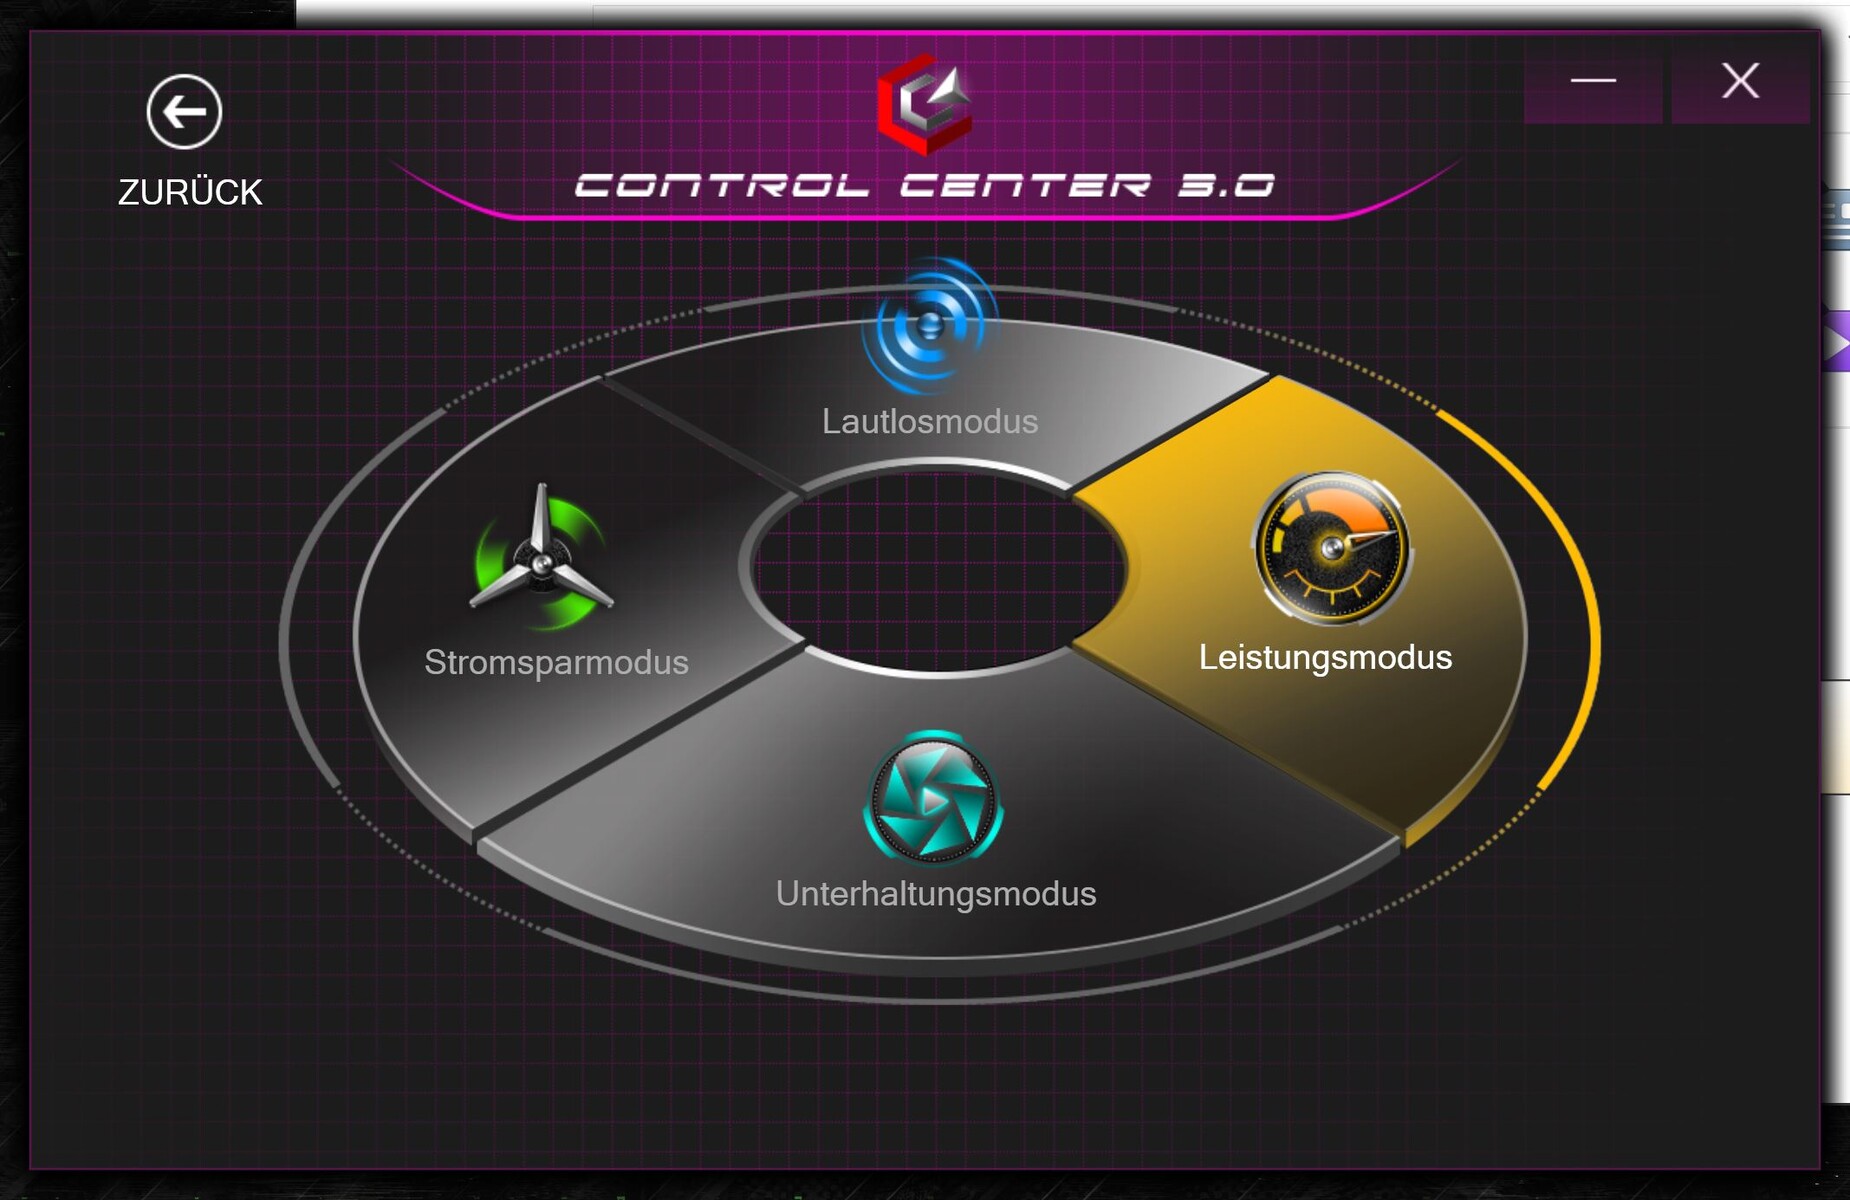
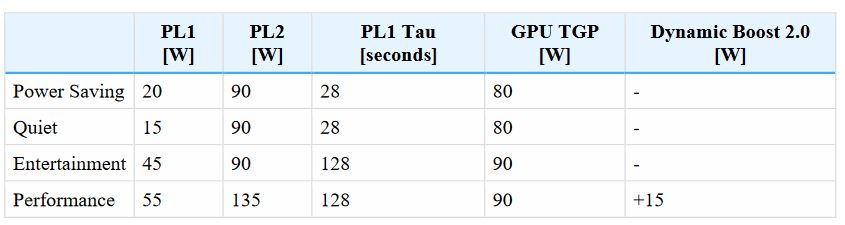
Schenker is fairly transparent about the performance values of its various performance profiles. The manufacturer officially recommends the "Entertainment" mode as the best compromise between noise volume and performance. However, since we measure all the gaming laptops in the best performance mode (without overclocking), we change to the "Performance" mode in the Control Center. Only here, the GPU is also allowed to use the Dynamic Boost, and the TDPs of the CPU are also slightly higher. The image below shows the performance values of all the modes as listed by Schenker.
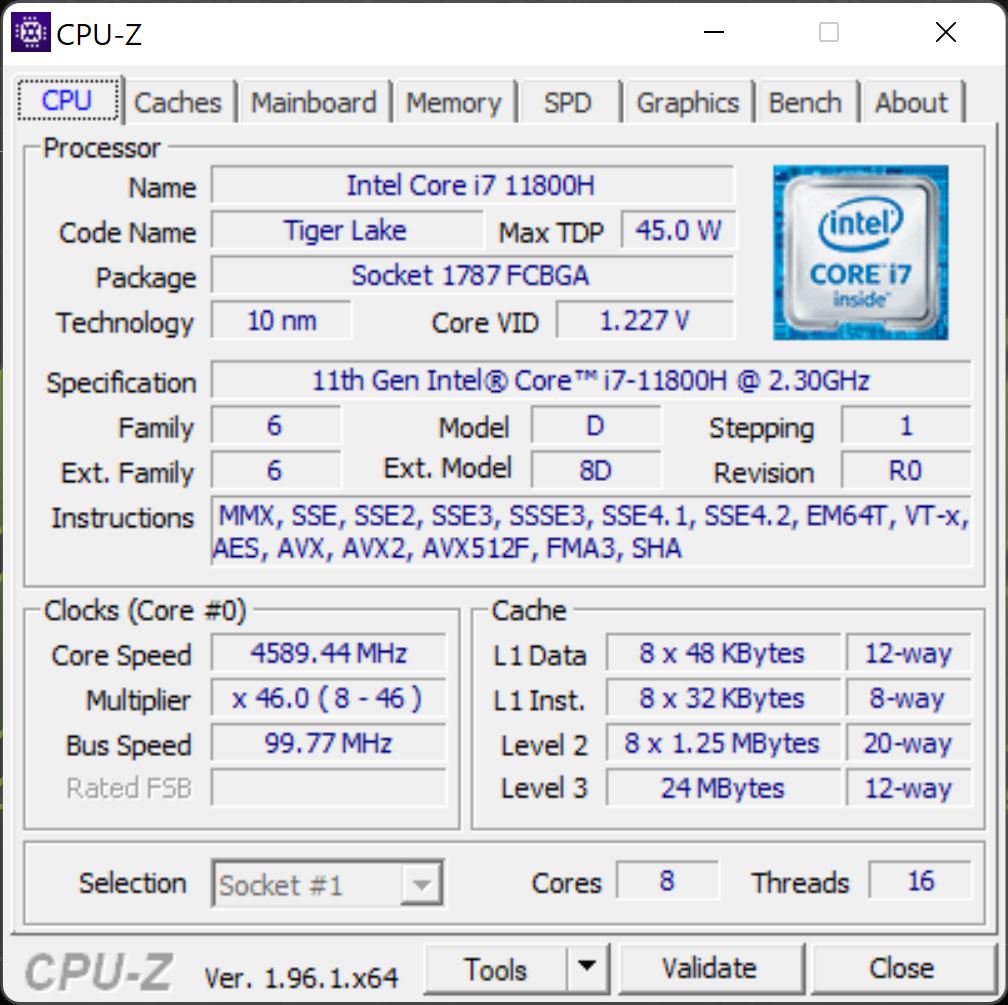
Processor
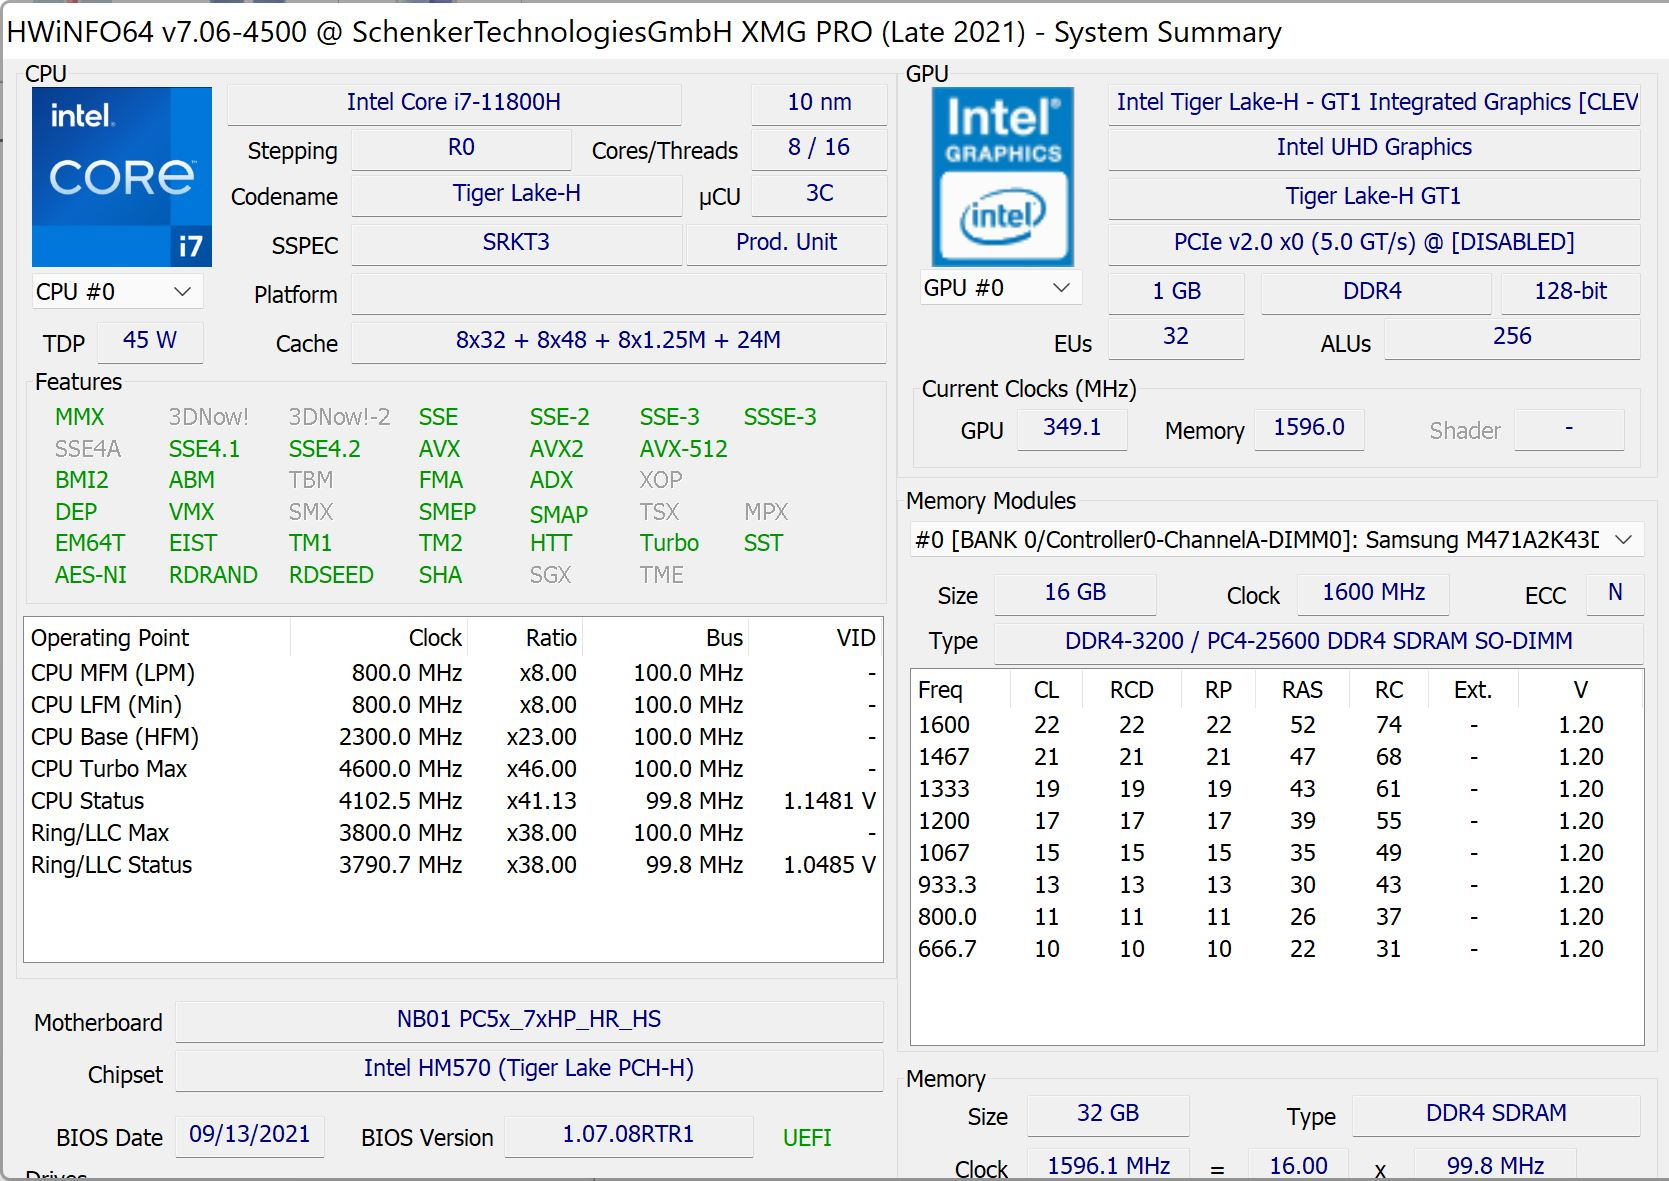
The Intel Core i7-11800H offers an ample eight cores that have a clock speed between 2.3 and 4.6 GHz.
In the Cinebench loop, the values drop by about 7% within the first four or five loops, but they remain stable after that.
Even though they use the same CPU, the XMG Pro is unable to keep up with the powerful, unthrottled Alienware X17 in the multi-core test, and the rest of the competitors are slightly ahead of it. However, these small differences are not relevant in everyday operation, and only the Alienware is significantly faster by 10 to 15%.
In the single-core tests, the differences between the laptops are significantly smaller.
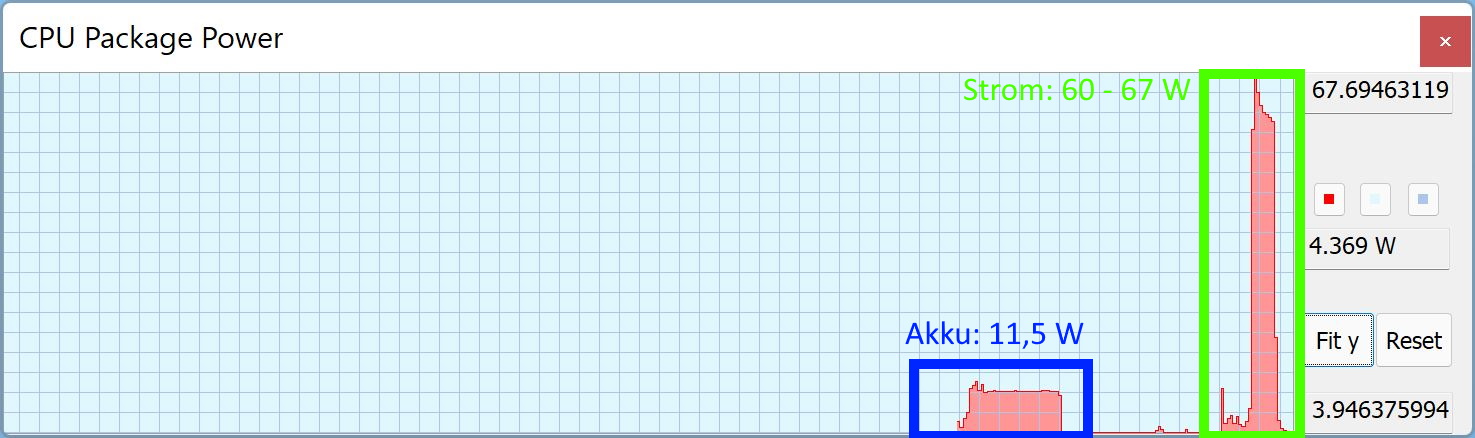
In battery mode, the CPU performance is considerably lower. After an initial value of 13 watts, the TDP decreases to only 11.5 watts. Correspondingly, the score drops from 1,865 - 2,009 to only 534 points, which is a decrease of at least 71%!
Cinebench R15 Multi Constant Load Test
Cinebench R23: Multi Core | Single Core
Cinebench R20: CPU (Multi Core) | CPU (Single Core)
Cinebench R15: CPU Multi 64Bit | CPU Single 64Bit
Blender: v2.79 BMW27 CPU
7-Zip 18.03: 7z b 4 | 7z b 4 -mmt1
Geekbench 5.5: Multi-Core | Single-Core
HWBOT x265 Benchmark v2.2: 4k Preset
LibreOffice : 20 Documents To PDF
R Benchmark 2.5: Overall mean
| CPU Performance rating | |
| Average of class Gaming | |
| Asus ROG Zephyrus S17 GX703HSD | |
| MSI GS76 Stealth 11UH | |
| Medion Erazer Beast X25 | |
| Schenker XMG Pro 15 (Late 2021) | |
| Alienware x17 RTX 3080 P48E -2! | |
| Schenker XMG Pro 17 (Late 2021, RTX 3080) | |
| Average Intel Core i7-11800H | |
| Cinebench R23 / Multi Core | |
| Average of class Gaming (10488 - 40970, n=112, last 2 years) | |
| Alienware x17 RTX 3080 P48E | |
| MSI GS76 Stealth 11UH | |
| Schenker XMG Pro 15 (Late 2021) | |
| Asus ROG Zephyrus S17 GX703HSD | |
| Medion Erazer Beast X25 | |
| Schenker XMG Pro 17 (Late 2021, RTX 3080) | |
| Average Intel Core i7-11800H (6508 - 14088, n=48) | |
| Cinebench R23 / Single Core | |
| Average of class Gaming (1166 - 2356, n=112, last 2 years) | |
| Asus ROG Zephyrus S17 GX703HSD | |
| MSI GS76 Stealth 11UH | |
| Schenker XMG Pro 17 (Late 2021, RTX 3080) | |
| Schenker XMG Pro 15 (Late 2021) | |
| Alienware x17 RTX 3080 P48E | |
| Average Intel Core i7-11800H (1386 - 1522, n=45) | |
| Medion Erazer Beast X25 | |
| Cinebench R20 / CPU (Multi Core) | |
| Average of class Gaming (4029 - 16108, n=111, last 2 years) | |
| Alienware x17 RTX 3080 P48E | |
| Asus ROG Zephyrus S17 GX703HSD | |
| MSI GS76 Stealth 11UH | |
| Medion Erazer Beast X25 | |
| Schenker XMG Pro 15 (Late 2021) | |
| Schenker XMG Pro 17 (Late 2021, RTX 3080) | |
| Average Intel Core i7-11800H (2498 - 5408, n=50) | |
| Cinebench R20 / CPU (Single Core) | |
| Average of class Gaming (442 - 895, n=111, last 2 years) | |
| MSI GS76 Stealth 11UH | |
| Asus ROG Zephyrus S17 GX703HSD | |
| Schenker XMG Pro 17 (Late 2021, RTX 3080) | |
| Schenker XMG Pro 15 (Late 2021) | |
| Alienware x17 RTX 3080 P48E | |
| Medion Erazer Beast X25 | |
| Average Intel Core i7-11800H (520 - 586, n=47) | |
| Cinebench R15 / CPU Multi 64Bit | |
| Average of class Gaming (1578 - 6271, n=112, last 2 years) | |
| Asus ROG Zephyrus S17 GX703HSD | |
| Alienware x17 RTX 3080 P48E | |
| MSI GS76 Stealth 11UH | |
| Schenker XMG Pro 15 (Late 2021) | |
| Medion Erazer Beast X25 | |
| Schenker XMG Pro 17 (Late 2021, RTX 3080) | |
| Average Intel Core i7-11800H (1342 - 2173, n=50) | |
| Cinebench R15 / CPU Single 64Bit | |
| Average of class Gaming (188.8 - 343, n=111, last 2 years) | |
| Asus ROG Zephyrus S17 GX703HSD | |
| Medion Erazer Beast X25 | |
| MSI GS76 Stealth 11UH | |
| Schenker XMG Pro 17 (Late 2021, RTX 3080) | |
| Alienware x17 RTX 3080 P48E | |
| Schenker XMG Pro 15 (Late 2021) | |
| Average Intel Core i7-11800H (201 - 231, n=46) | |
| Blender / v2.79 BMW27 CPU | |
| Average Intel Core i7-11800H (217 - 454, n=46) | |
| Schenker XMG Pro 17 (Late 2021, RTX 3080) | |
| Medion Erazer Beast X25 | |
| MSI GS76 Stealth 11UH | |
| Schenker XMG Pro 15 (Late 2021) | |
| Asus ROG Zephyrus S17 GX703HSD | |
| Alienware x17 RTX 3080 P48E | |
| Average of class Gaming (80 - 330, n=109, last 2 years) | |
| 7-Zip 18.03 / 7z b 4 | |
| Average of class Gaming (33491 - 148086, n=110, last 2 years) | |
| Medion Erazer Beast X25 | |
| Asus ROG Zephyrus S17 GX703HSD | |
| Schenker XMG Pro 15 (Late 2021) | |
| Alienware x17 RTX 3080 P48E | |
| MSI GS76 Stealth 11UH | |
| Schenker XMG Pro 17 (Late 2021, RTX 3080) | |
| Average Intel Core i7-11800H (33718 - 56758, n=46) | |
| 7-Zip 18.03 / 7z b 4 -mmt1 | |
| Average of class Gaming (4199 - 7436, n=110, last 2 years) | |
| Asus ROG Zephyrus S17 GX703HSD | |
| Medion Erazer Beast X25 | |
| MSI GS76 Stealth 11UH | |
| Schenker XMG Pro 17 (Late 2021, RTX 3080) | |
| Schenker XMG Pro 15 (Late 2021) | |
| Average Intel Core i7-11800H (5138 - 5732, n=46) | |
| Alienware x17 RTX 3080 P48E | |
| Geekbench 5.5 / Multi-Core | |
| Average of class Gaming (6460 - 27010, n=110, last 2 years) | |
| MSI GS76 Stealth 11UH | |
| Asus ROG Zephyrus S17 GX703HSD | |
| Schenker XMG Pro 15 (Late 2021) | |
| Schenker XMG Pro 17 (Late 2021, RTX 3080) | |
| Medion Erazer Beast X25 | |
| Average Intel Core i7-11800H (4655 - 9851, n=40) | |
| Geekbench 5.5 / Single-Core | |
| Average of class Gaming (986 - 2474, n=110, last 2 years) | |
| Asus ROG Zephyrus S17 GX703HSD | |
| MSI GS76 Stealth 11UH | |
| Schenker XMG Pro 17 (Late 2021, RTX 3080) | |
| Schenker XMG Pro 15 (Late 2021) | |
| Average Intel Core i7-11800H (1429 - 1625, n=40) | |
| Medion Erazer Beast X25 | |
| HWBOT x265 Benchmark v2.2 / 4k Preset | |
| Average of class Gaming (11.5 - 44.3, n=110, last 2 years) | |
| Alienware x17 RTX 3080 P48E | |
| Asus ROG Zephyrus S17 GX703HSD | |
| Medion Erazer Beast X25 | |
| Schenker XMG Pro 15 (Late 2021) | |
| MSI GS76 Stealth 11UH | |
| Schenker XMG Pro 17 (Late 2021, RTX 3080) | |
| Average Intel Core i7-11800H (7.38 - 17.4, n=46) | |
| LibreOffice / 20 Documents To PDF | |
| Medion Erazer Beast X25 | |
| MSI GS76 Stealth 11UH | |
| Average of class Gaming (19 - 88.8, n=110, last 2 years) | |
| Schenker XMG Pro 15 (Late 2021) | |
| Schenker XMG Pro 17 (Late 2021, RTX 3080) | |
| Alienware x17 RTX 3080 P48E | |
| Average Intel Core i7-11800H (38.6 - 59.9, n=45) | |
| Asus ROG Zephyrus S17 GX703HSD | |
| R Benchmark 2.5 / Overall mean | |
| Average Intel Core i7-11800H (0.548 - 0.615, n=46) | |
| Alienware x17 RTX 3080 P48E | |
| Schenker XMG Pro 17 (Late 2021, RTX 3080) | |
| Schenker XMG Pro 15 (Late 2021) | |
| MSI GS76 Stealth 11UH | |
| Asus ROG Zephyrus S17 GX703HSD | |
| Medion Erazer Beast X25 | |
| Average of class Gaming (0.3439 - 0.759, n=111, last 2 years) | |
* ... smaller is better
AIDA64: FP32 Ray-Trace | FPU Julia | CPU SHA3 | CPU Queen | FPU SinJulia | FPU Mandel | CPU AES | CPU ZLib | FP64 Ray-Trace | CPU PhotoWorxx
| Performance rating | |
| Average of class Gaming | |
| Schenker XMG Pro 17 (Late 2021, RTX 3080) | |
| Average Intel Core i7-11800H | |
| AIDA64 / FP32 Ray-Trace | |
| Average of class Gaming (10227 - 85542, n=109, last 2 years) | |
| Schenker XMG Pro 17 (Late 2021, RTX 3080) | |
| Average Intel Core i7-11800H (8772 - 15961, n=20) | |
| AIDA64 / FPU Julia | |
| Average of class Gaming (51376 - 238426, n=109, last 2 years) | |
| Schenker XMG Pro 17 (Late 2021, RTX 3080) | |
| Average Intel Core i7-11800H (39404 - 65636, n=20) | |
| AIDA64 / CPU SHA3 | |
| Average of class Gaming (2180 - 9817, n=109, last 2 years) | |
| Schenker XMG Pro 17 (Late 2021, RTX 3080) | |
| Average Intel Core i7-11800H (2599 - 4439, n=20) | |
| AIDA64 / CPU Queen | |
| Average of class Gaming (49785 - 173351, n=101, last 2 years) | |
| Schenker XMG Pro 17 (Late 2021, RTX 3080) | |
| Average Intel Core i7-11800H (85233 - 91941, n=20) | |
| AIDA64 / FPU SinJulia | |
| Average of class Gaming (4424 - 33636, n=109, last 2 years) | |
| Schenker XMG Pro 17 (Late 2021, RTX 3080) | |
| Average Intel Core i7-11800H (6420 - 9792, n=20) | |
| AIDA64 / FPU Mandel | |
| Average of class Gaming (25115 - 128721, n=109, last 2 years) | |
| Schenker XMG Pro 17 (Late 2021, RTX 3080) | |
| Average Intel Core i7-11800H (23365 - 39464, n=20) | |
| AIDA64 / CPU AES | |
| Schenker XMG Pro 17 (Late 2021, RTX 3080) | |
| Average Intel Core i7-11800H (74617 - 149388, n=20) | |
| Average of class Gaming (39258 - 247074, n=109, last 2 years) | |
| AIDA64 / CPU ZLib | |
| Average of class Gaming (574 - 2531, n=109, last 2 years) | |
| Schenker XMG Pro 17 (Late 2021, RTX 3080) | |
| Average Intel Core i7-11800H (461 - 830, n=43) | |
| AIDA64 / FP64 Ray-Trace | |
| Average of class Gaming (5509 - 45446, n=109, last 2 years) | |
| Schenker XMG Pro 17 (Late 2021, RTX 3080) | |
| Average Intel Core i7-11800H (4545 - 8717, n=21) | |
| AIDA64 / CPU PhotoWorxx | |
| Average of class Gaming (12271 - 89891, n=109, last 2 years) | |
| Schenker XMG Pro 17 (Late 2021, RTX 3080) | |
| Average Intel Core i7-11800H (11898 - 26757, n=21) | |
System Performance
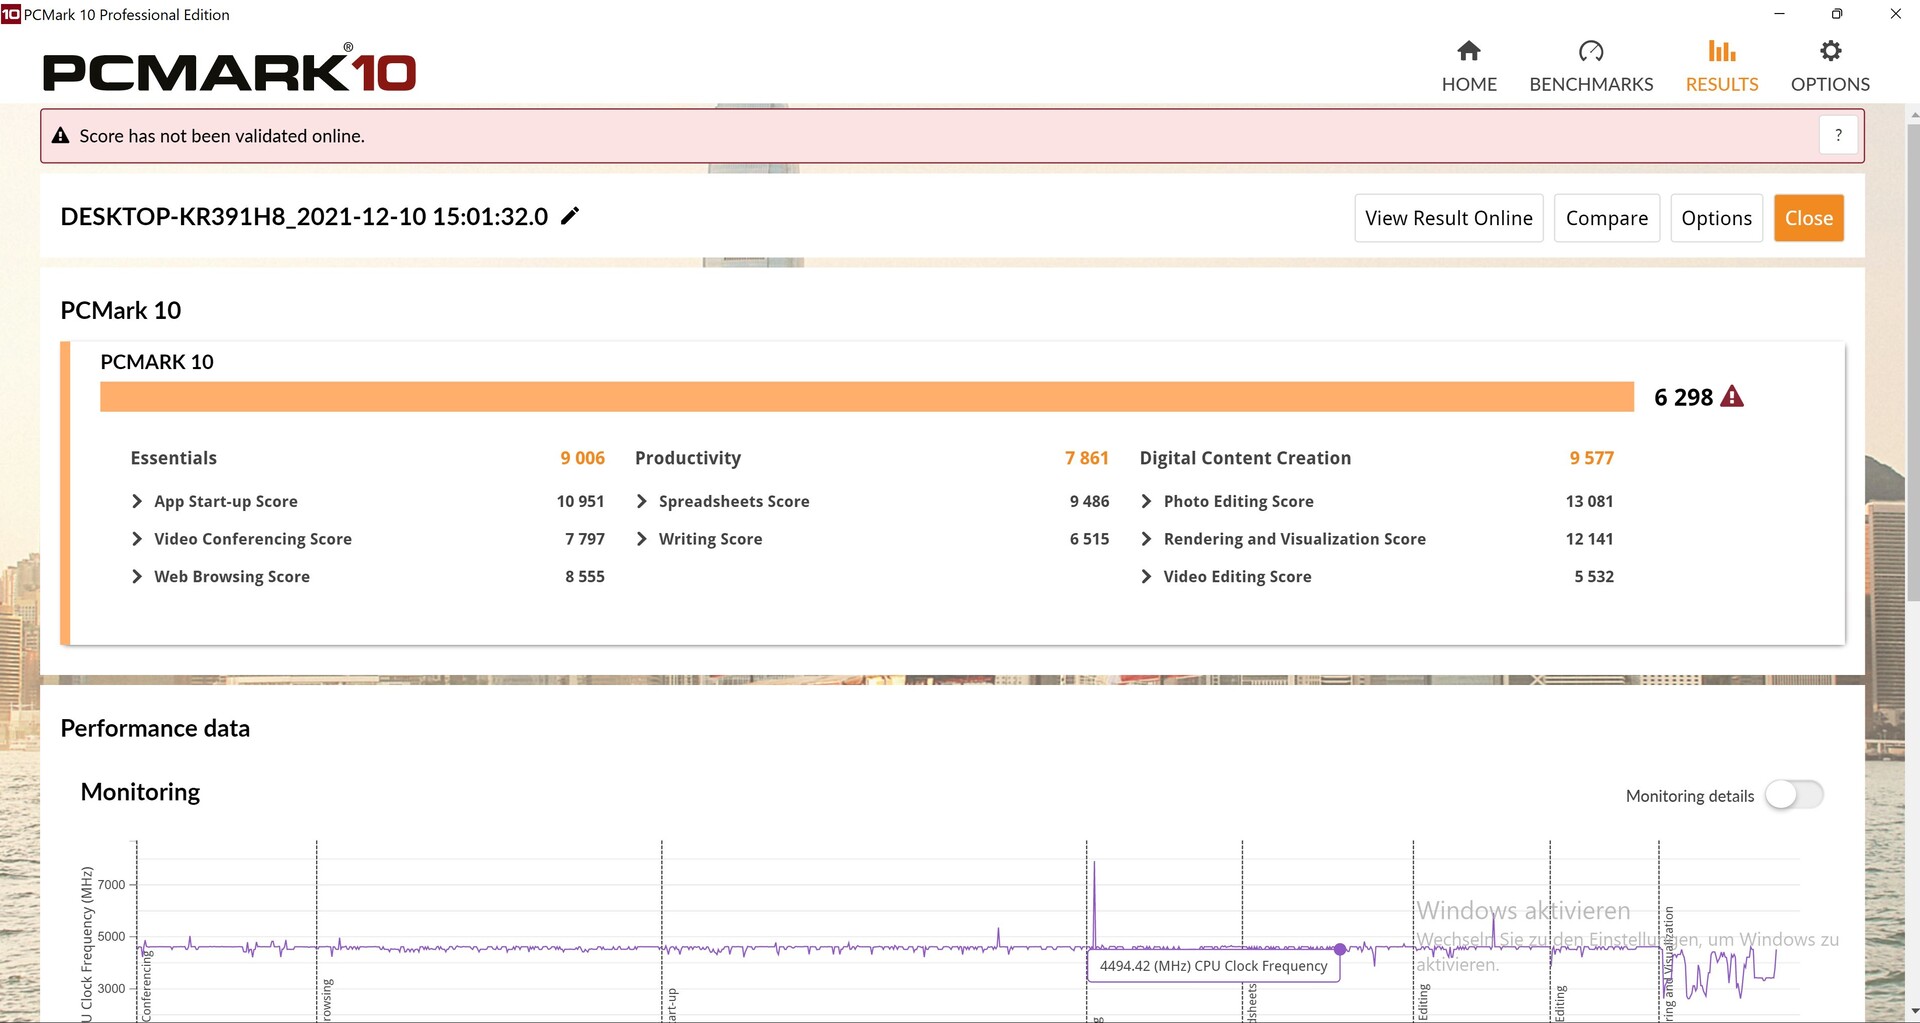
In PCMark 10, the XMG Pro doesn't necessarily deliver the most powerful performance, to say it mildly. Usually, the competitors in the test remain fairly close together, but our test unit always remains behind the competitors by about 8% (MSI) to 18% (Alienware). While in this performance class, this won't really be that noticeable in everyday operation since everything runs smoothly, for performance enthusiasts, the PCMark scores of the slim laptop are a disappointment.
| PCMark 10 / Score | |
| Average of class Gaming (5828 - 11574, n=95, last 2 years) | |
| Alienware x17 RTX 3080 P48E | |
| Asus ROG Zephyrus S17 GX703HSD | |
| Average Intel Core i7-11800H, NVIDIA GeForce RTX 3080 Laptop GPU (6673 - 7470, n=11) | |
| Schenker XMG Pro 17 (Late 2021, RTX 3080) | |
| Medion Erazer Beast X25 | |
| MSI GS76 Stealth 11UH | |
| Schenker XMG Pro 15 (Late 2021) | |
| PCMark 10 / Essentials | |
| Average of class Gaming (8810 - 12600, n=99, last 2 years) | |
| Asus ROG Zephyrus S17 GX703HSD | |
| Average Intel Core i7-11800H, NVIDIA GeForce RTX 3080 Laptop GPU (9862 - 11064, n=11) | |
| Alienware x17 RTX 3080 P48E | |
| Schenker XMG Pro 17 (Late 2021, RTX 3080) | |
| Medion Erazer Beast X25 | |
| Schenker XMG Pro 15 (Late 2021) | |
| MSI GS76 Stealth 11UH | |
| PCMark 10 / Productivity | |
| Average of class Gaming (6845 - 18766, n=97, last 2 years) | |
| Alienware x17 RTX 3080 P48E | |
| Medion Erazer Beast X25 | |
| Asus ROG Zephyrus S17 GX703HSD | |
| Schenker XMG Pro 17 (Late 2021, RTX 3080) | |
| Average Intel Core i7-11800H, NVIDIA GeForce RTX 3080 Laptop GPU (8278 - 9803, n=11) | |
| MSI GS76 Stealth 11UH | |
| Schenker XMG Pro 15 (Late 2021) | |
| PCMark 10 / Digital Content Creation | |
| Average of class Gaming (7602 - 19657, n=97, last 2 years) | |
| Alienware x17 RTX 3080 P48E | |
| Asus ROG Zephyrus S17 GX703HSD | |
| Average Intel Core i7-11800H, NVIDIA GeForce RTX 3080 Laptop GPU (9881 - 11323, n=11) | |
| Schenker XMG Pro 17 (Late 2021, RTX 3080) | |
| MSI GS76 Stealth 11UH | |
| Schenker XMG Pro 15 (Late 2021) | |
| Medion Erazer Beast X25 | |
| PCMark 10 Score | 6996 points | |
Help | ||
| AIDA64 / Memory Copy | |
| Average of class Gaming (21750 - 129946, n=109, last 2 years) | |
| Schenker XMG Pro 15 (Late 2021) | |
| Schenker XMG Pro 17 (Late 2021, RTX 3080) | |
| Medion Erazer Beast X25 | |
| Average Intel Core i7-11800H (24508 - 48144, n=21) | |
| AIDA64 / Memory Read | |
| Average of class Gaming (22956 - 118858, n=109, last 2 years) | |
| Schenker XMG Pro 15 (Late 2021) | |
| Schenker XMG Pro 17 (Late 2021, RTX 3080) | |
| Average Intel Core i7-11800H (25882 - 50365, n=20) | |
| Medion Erazer Beast X25 | |
| AIDA64 / Memory Write | |
| Average of class Gaming (22297 - 135096, n=109, last 2 years) | |
| Medion Erazer Beast X25 | |
| Schenker XMG Pro 15 (Late 2021) | |
| Schenker XMG Pro 17 (Late 2021, RTX 3080) | |
| Average Intel Core i7-11800H (22240 - 46214, n=20) | |
| AIDA64 / Memory Latency | |
| Average of class Gaming (75.3 - 259, n=109, last 2 years) | |
| Schenker XMG Pro 15 (Late 2021) | |
| Schenker XMG Pro 17 (Late 2021, RTX 3080) | |
| Medion Erazer Beast X25 | |
| Average Intel Core i7-11800H (71.9 - 104.1, n=44) | |
| Asus ROG Zephyrus S17 GX703HSD | |
| Alienware x17 RTX 3080 P48E | |
* ... smaller is better
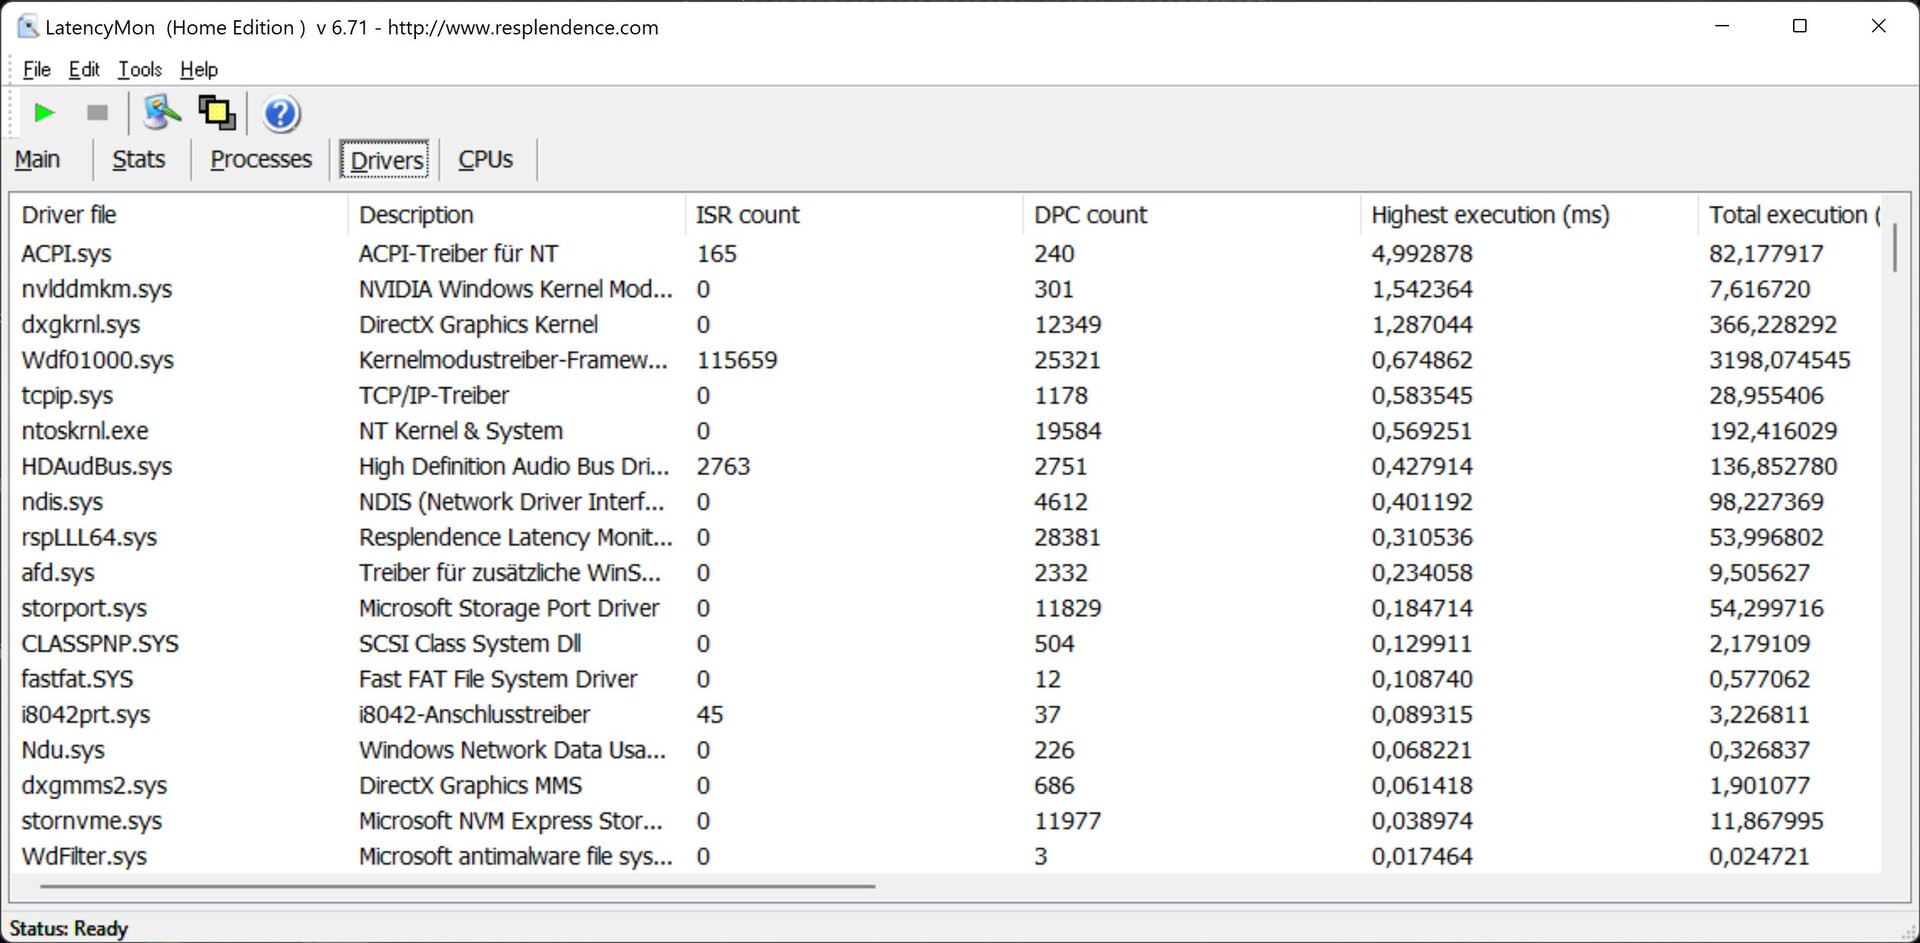
DPC Latencies
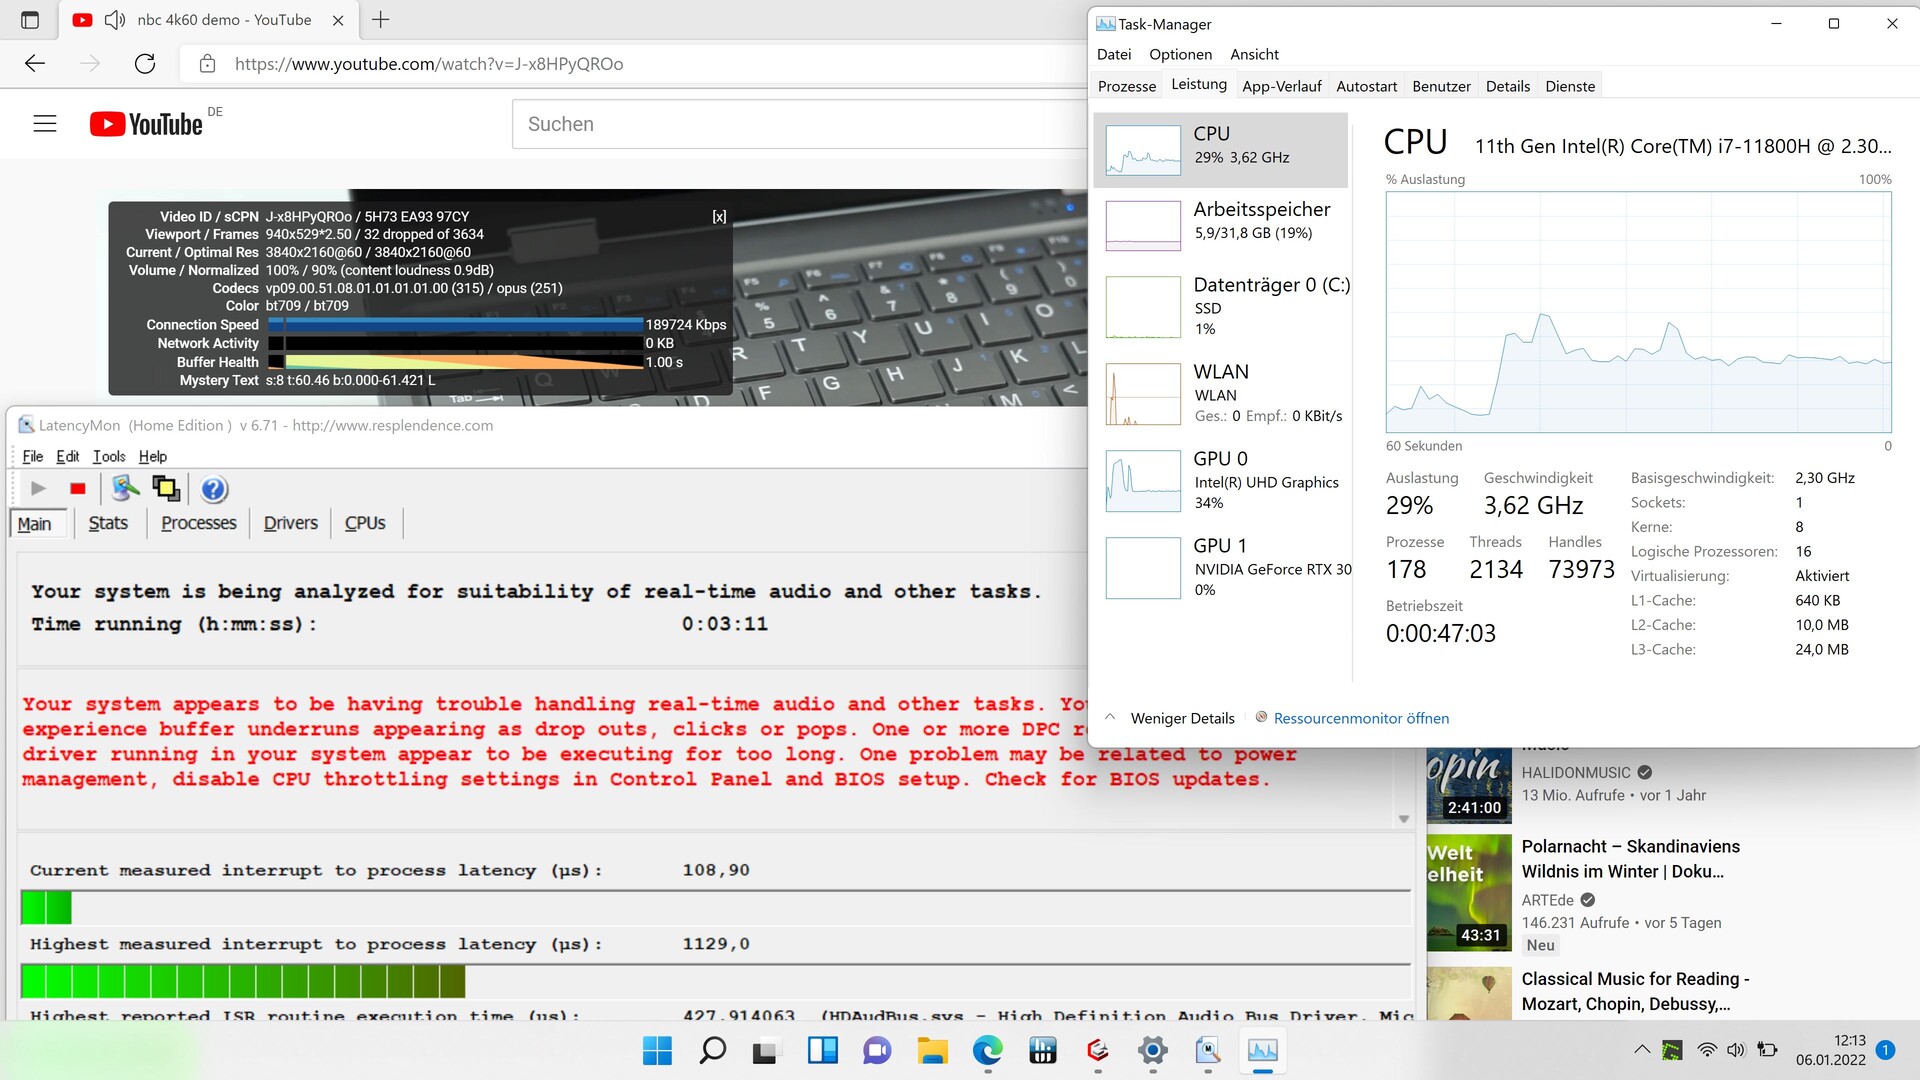
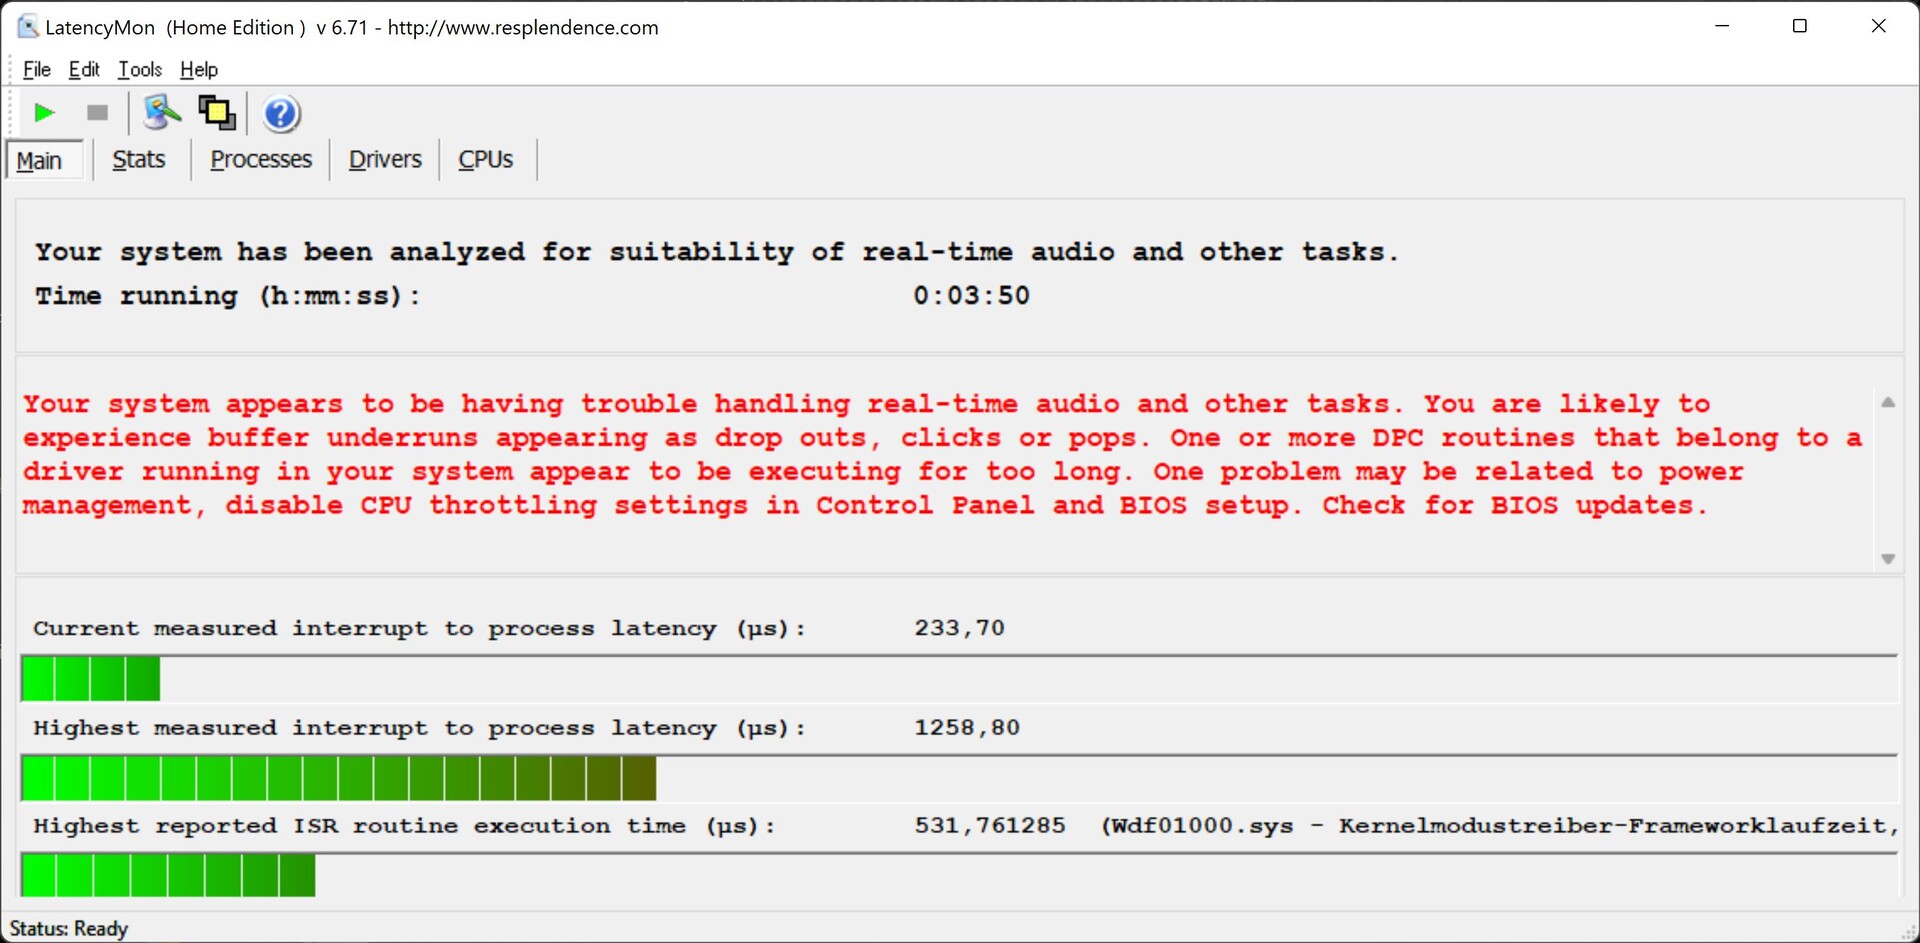
When just opening the web browser (Edge), the LatencyMon software already encounters some latency problems. These increase when playing our 4K, 60-fps YouTube test video (32 dropped frames) or briefly starting the Prime95 test.
The fault appears to lie mainly in the ACPI driver for NT, but there is also an Nvidia driver that creates some problems for the system.
However, in our comparison the size of the latency value is more in the middle of the field, and the comparison laptops are also not free of problems. It is only that their latencies start later and definitely not when just starting the browser.
| DPC Latencies / LatencyMon - interrupt to process latency (max), Web, Youtube, Prime95 | |
| Alienware x17 RTX 3080 P48E | |
| Asus ROG Zephyrus S17 GX703HSD | |
| Schenker XMG Pro 17 (Late 2021, RTX 3080) | |
| Schenker XMG Pro 15 (Late 2021) | |
| Medion Erazer Beast X25 | |
| MSI GS76 Stealth 11UH | |
* ... smaller is better
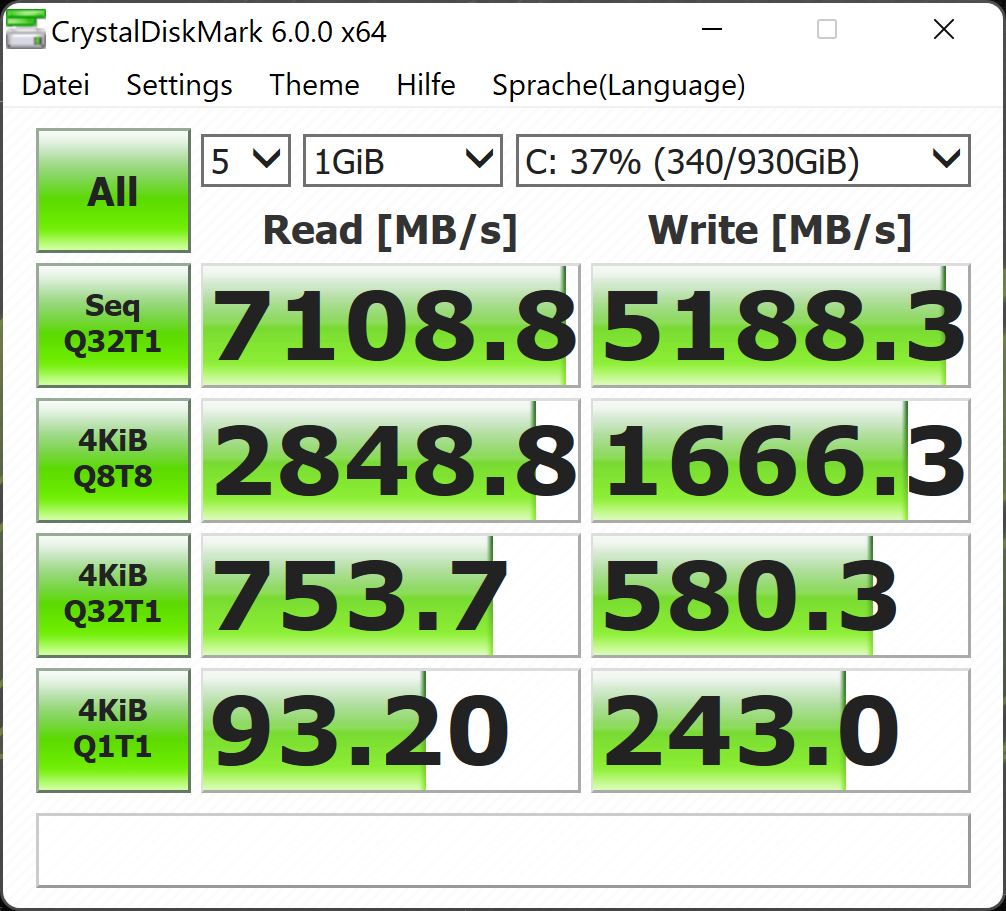
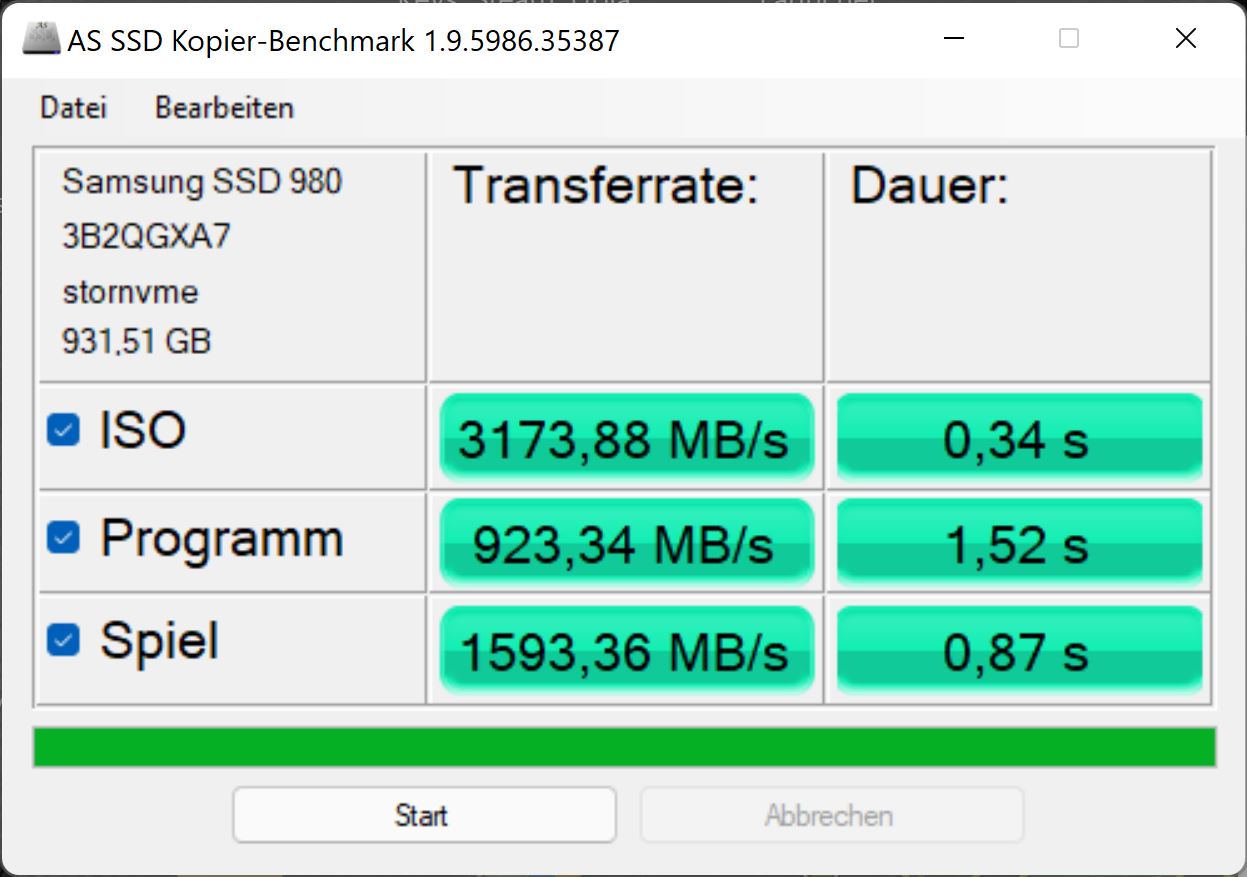
Storage Solution
Schenker uses the proven and fast Samsung SSD 980 Pro with 1 TB of storage space. Its performance is at the top end, and only the PM9A1 (MSI, Asus Zephyrus) from the same manufacturer is slightly faster in some areas.
During the constant read test, the very high performance drops slightly over time, but it should still be higher than that of some competitors.


* ... smaller is better
Constant Performance Reading: DiskSpd Read Loop, Queue Depth 8
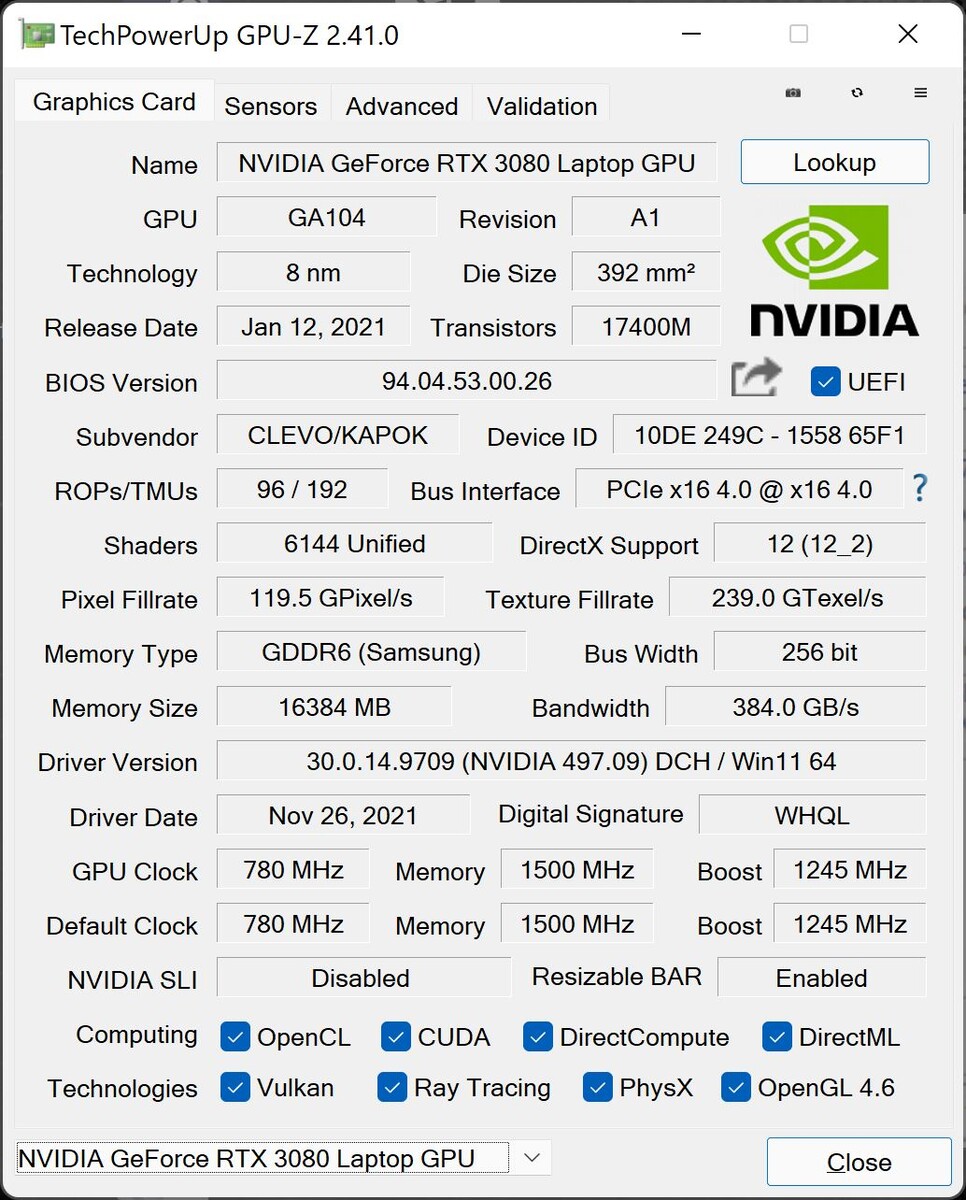
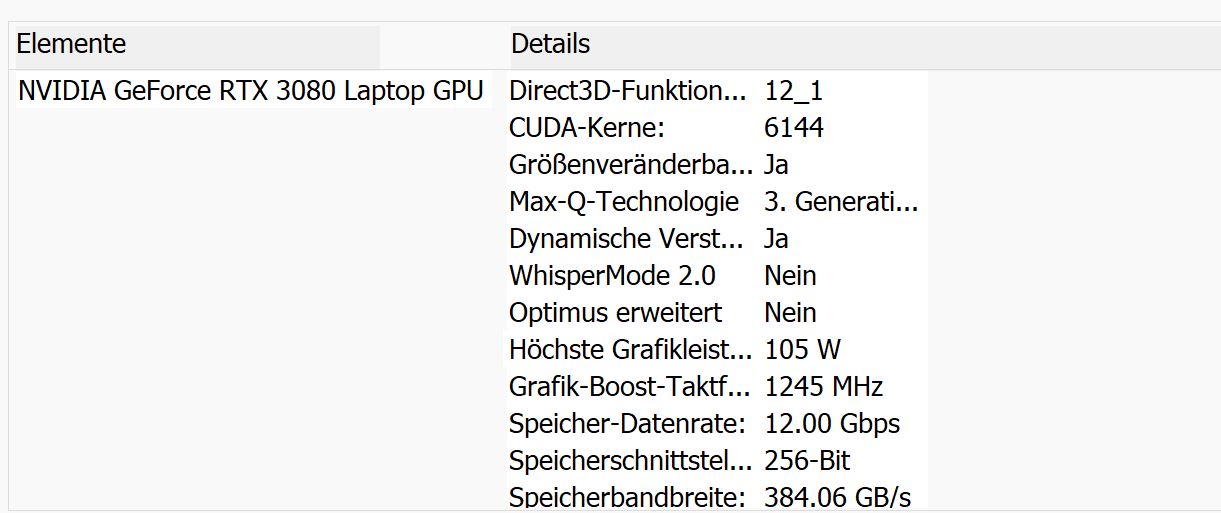
Graphics Card
The 16-GB version of the NVIDIA GeForce RTX 3080 Laptop GPU is used, but it is only allowed to consume 90 watts plus 15 watts Dynamic Boost, resulting in a total maximum of 105 watts. In contrast, the Zephyrus S17 reaches up to 140 watts and the Alienware X17 R1 even 165 watts. This shows that the Schenker has to make some compromises due to the slim case, aiming more for efficiency rather than maximum performance.
While the configuration of our test unit does not offer advanced Optimus, you can choose in the BIOS for the USB-C port via MUX, whether it should be connected via iGPU or dGPU.
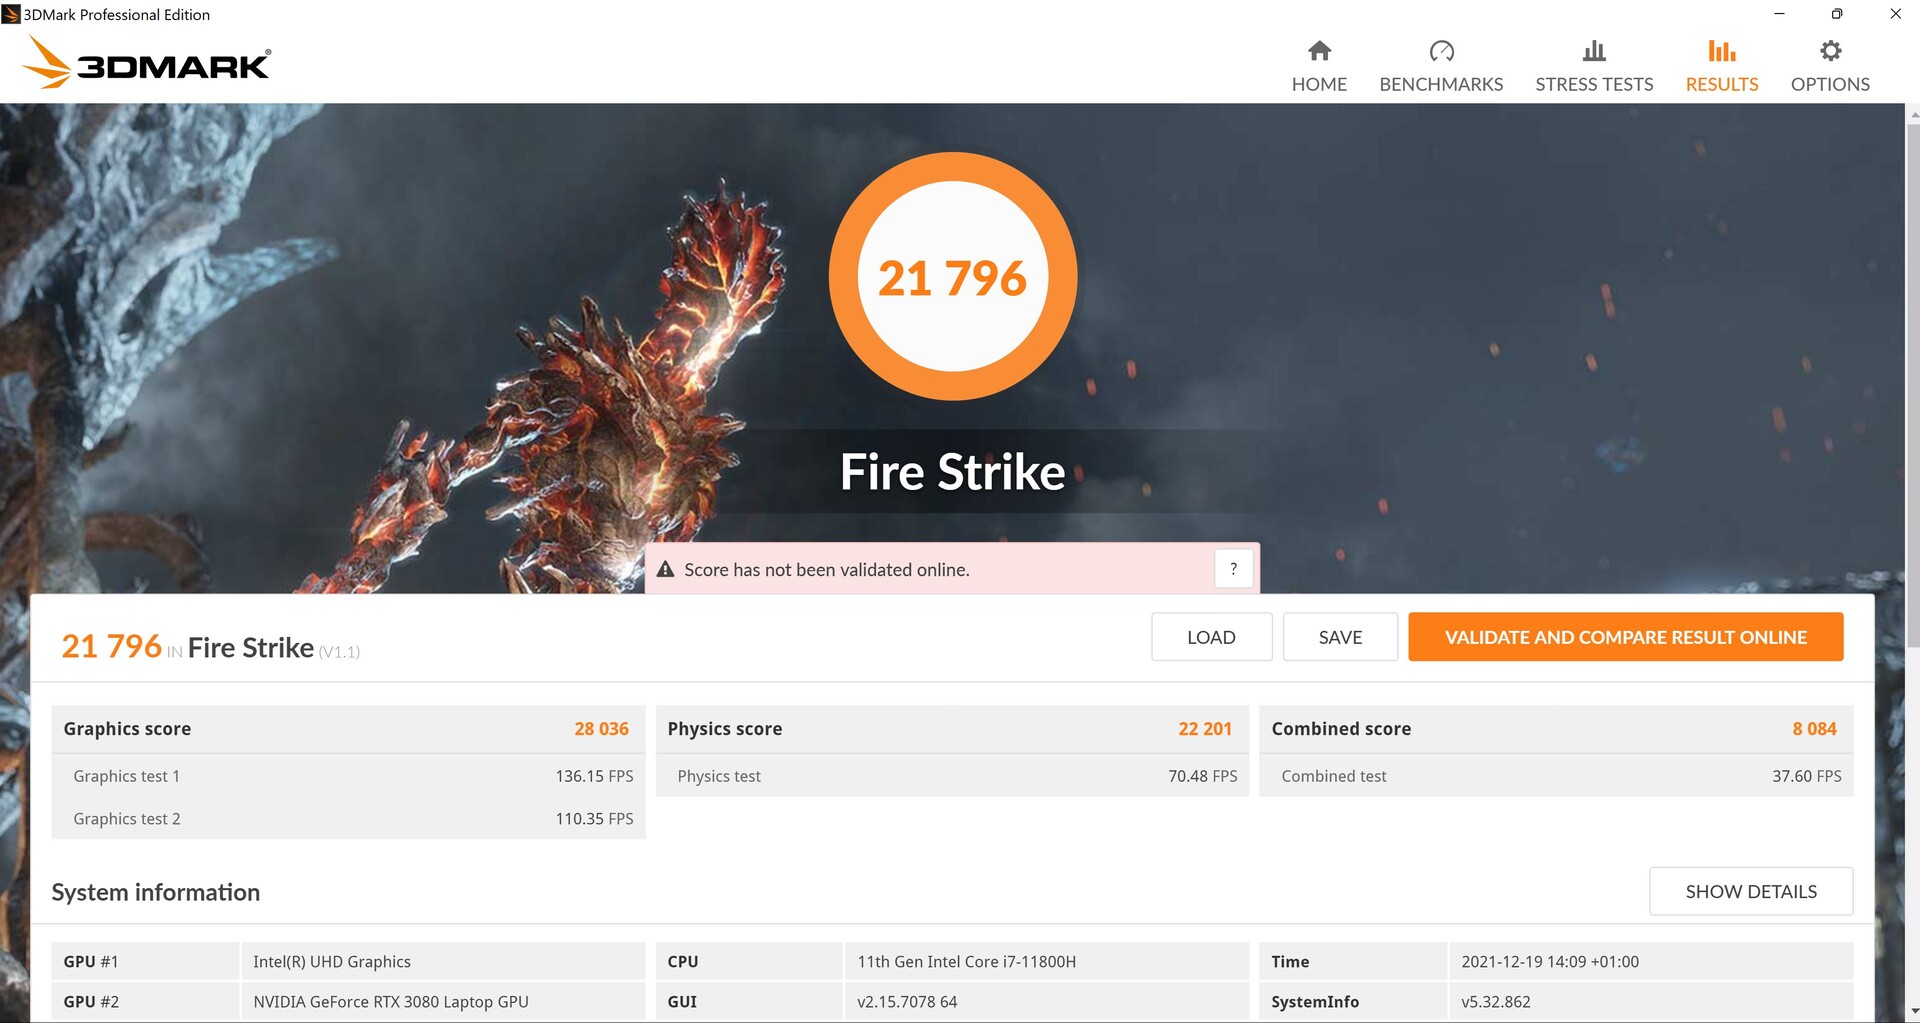
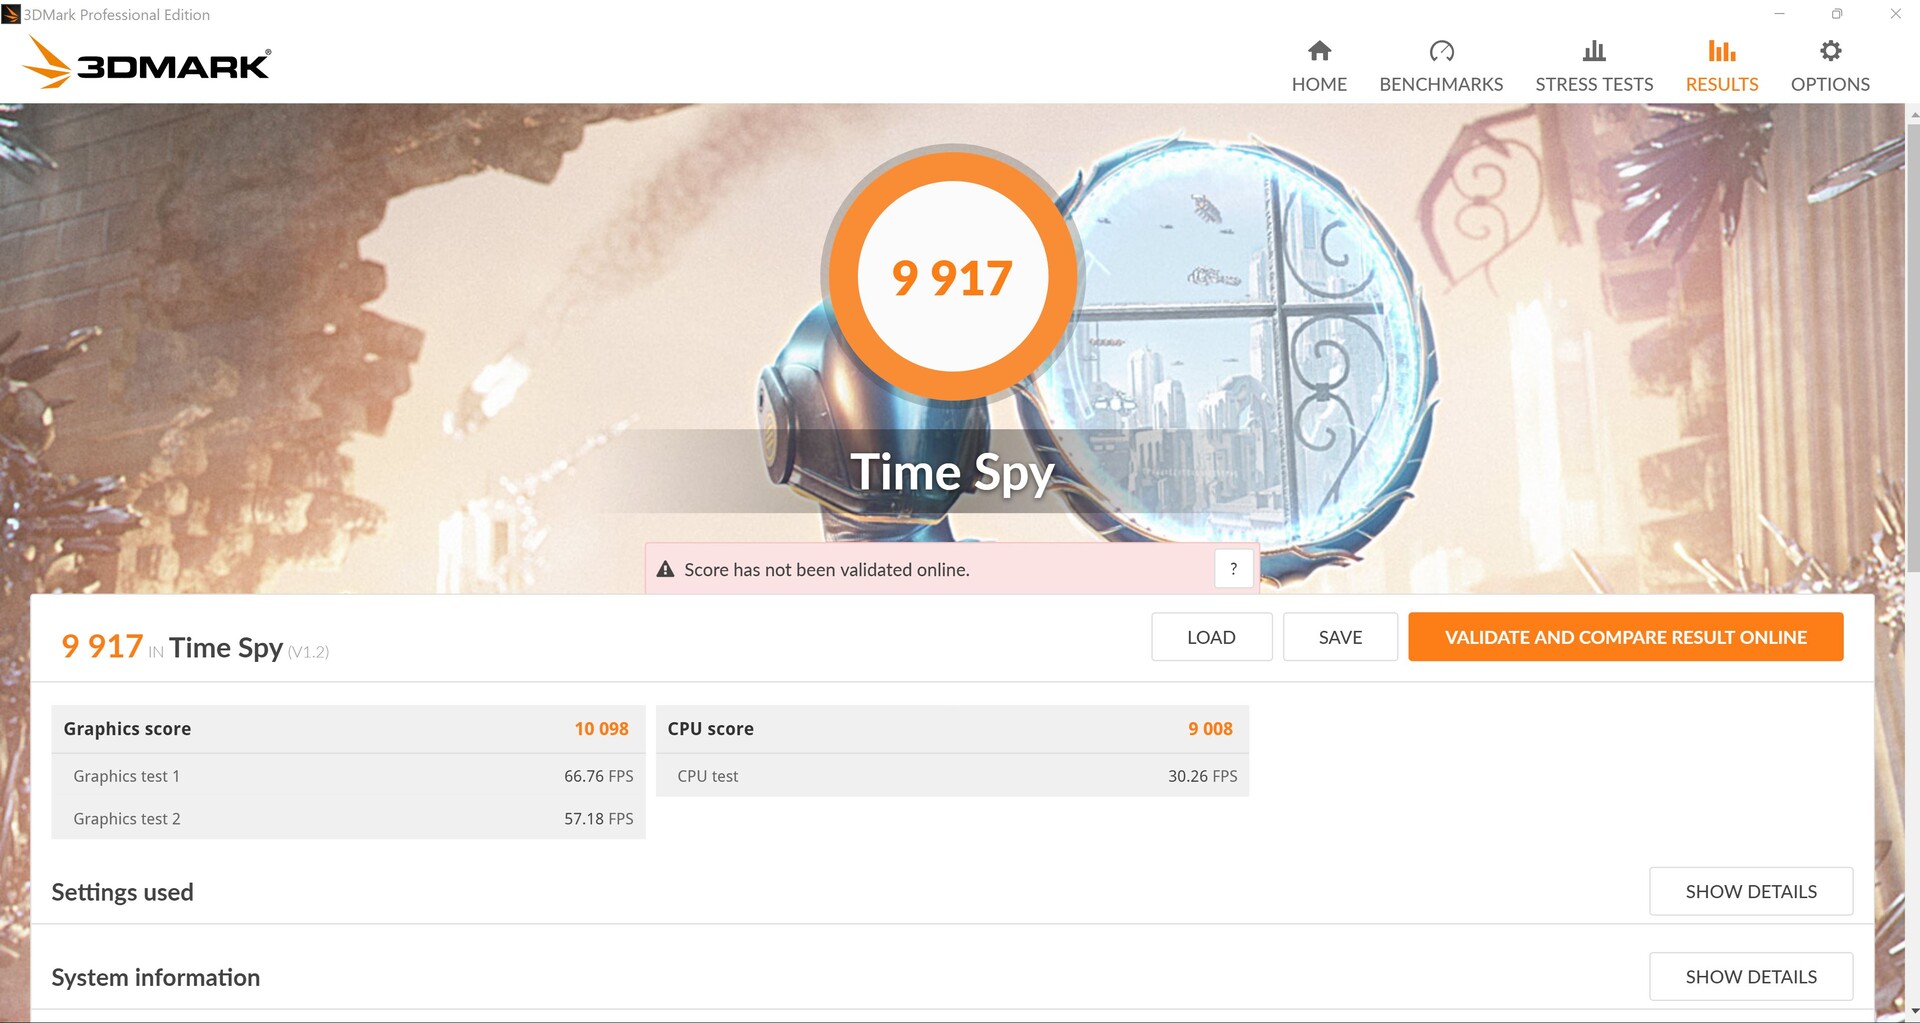
In the 3DMark tests, the XMG Pro correspondingly performs slightly below the average, but it still fares better than the MSI or even the Medion laptop in some areas. The Asus ROG Zephyrus and the Alienware are clearly faster.
In battery mode, most of the 3D performance is lost. Instead of running at 90 - 107 fps, "The Witcher 3 Ultra" only runs at 8 - 10 fps, which leaves it unplayable. So away from the outlet, you can only play casual or ancient games.
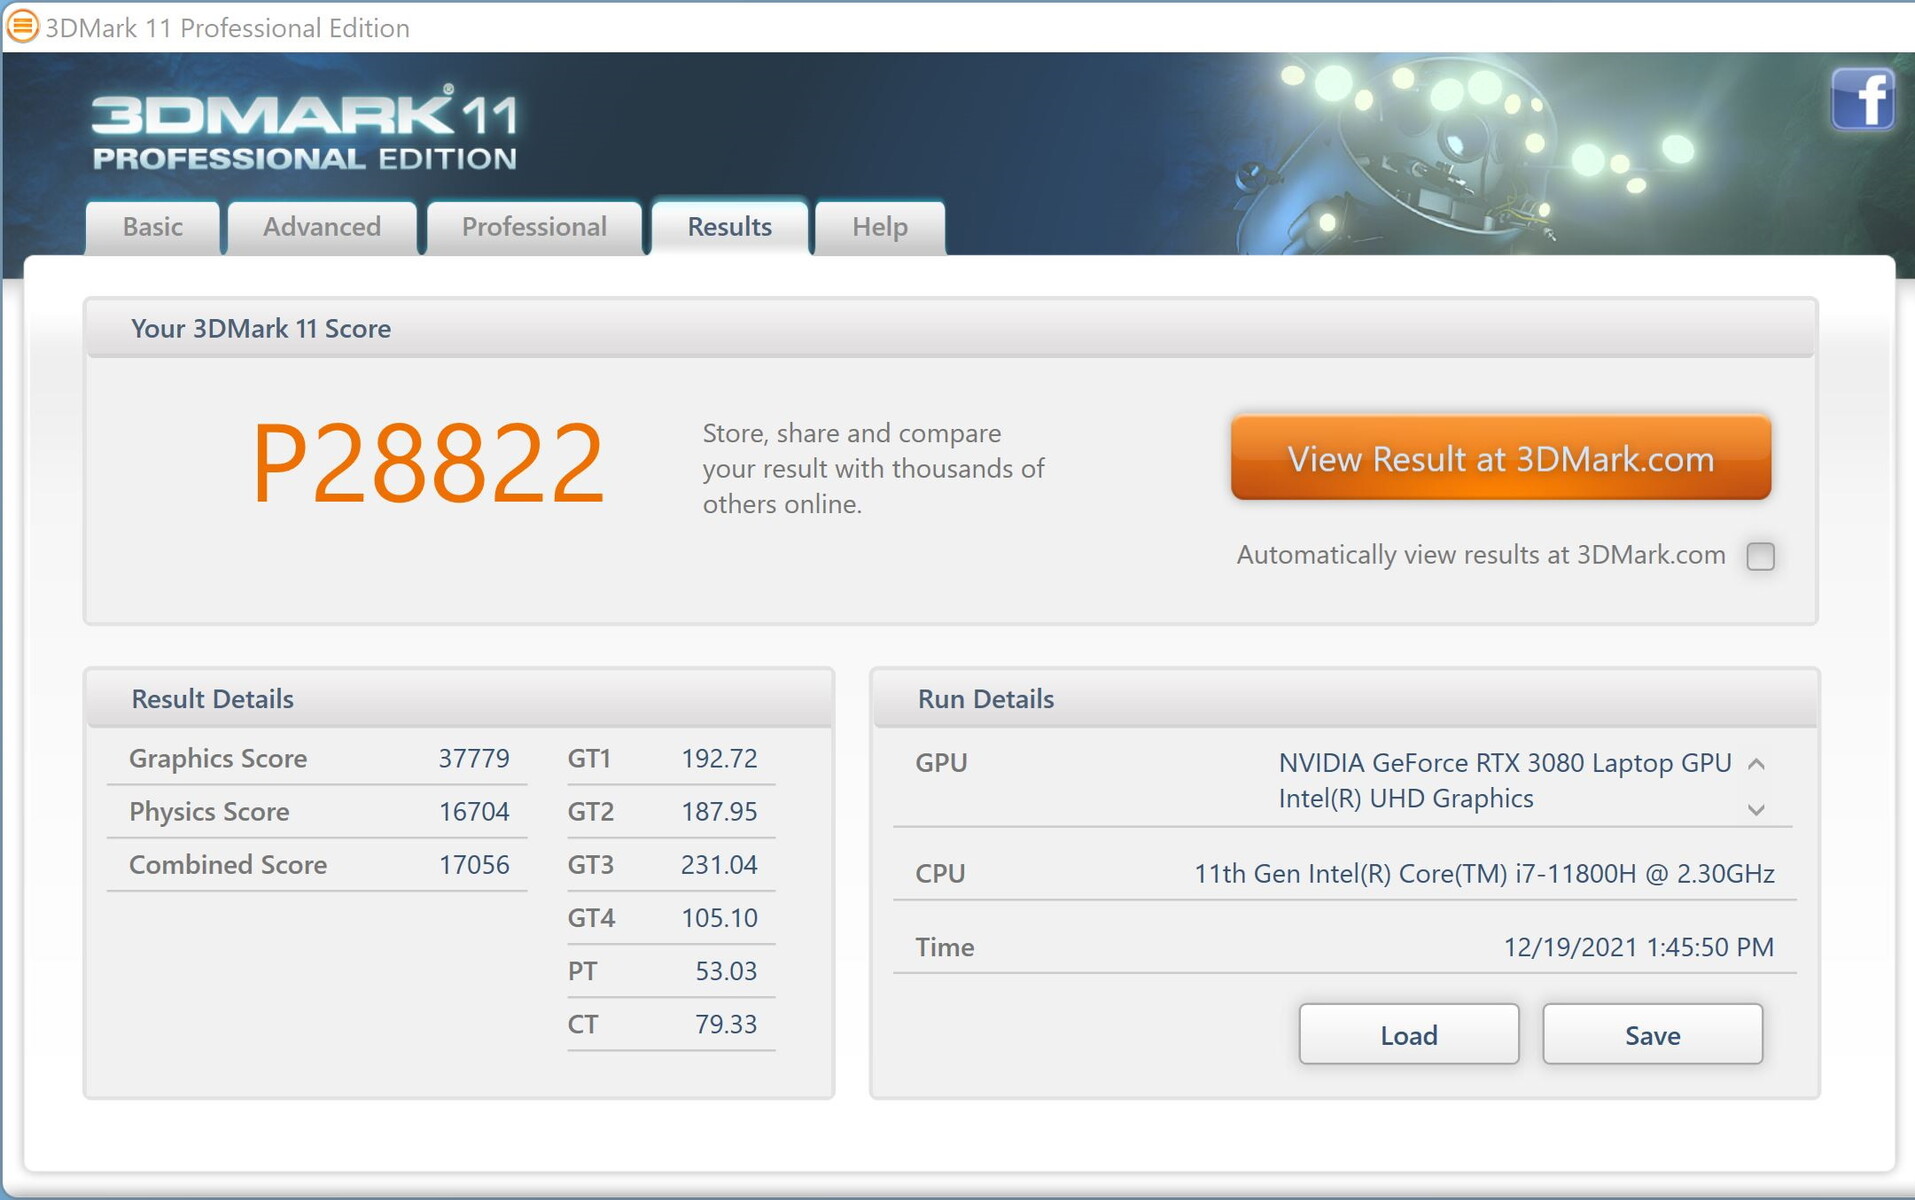

| 3DMark 11 Performance | 28822 points | |
| 3DMark Cloud Gate Standard Score | 36099 points | |
| 3DMark Fire Strike Score | 21796 points | |
| 3DMark Time Spy Score | 9917 points | |
Help | ||
Gaming Performance
The XMG Pro is able to play all the games smoothly in Full HD, but the throttled RTX 3080 can work up some sweat with very modern games in the native 4K resolution. For example, "New World" in 4K and maximum details only runs at 37 fps in the beginning sequences, and during some complicated fighting there might already be some stutters. In "Far Cry 5," it will at least reach a good 56 fps with the same settings.
As expected, depending on the game, the performance will be slightly lower than that of an average RTX 3080, but in some games, the TGP disadvantage is almost unnoticeable. Correspondingly, the card will place in the middle again, with a similar order as in the 3DMark tests.
| New World | |
| 1920x1080 High Video Quality | |
| Average NVIDIA GeForce RTX 3080 Laptop GPU (75.1 - 96.7, n=4) | |
| Schenker XMG Pro 17 (Late 2021, RTX 3080) | |
| 1920x1080 Very High Video Quality | |
| Average NVIDIA GeForce RTX 3080 Laptop GPU (71.5 - 90.4, n=4) | |
| Schenker XMG Pro 17 (Late 2021, RTX 3080) | |
| 2560x1440 Very High Video Quality | |
| Average NVIDIA GeForce RTX 3080 Laptop GPU (63.3 - 67.2, n=2) | |
| Schenker XMG Pro 17 (Late 2021, RTX 3080) | |
| 3840x2160 Very High Video Quality | |
| Average NVIDIA GeForce RTX 3080 Laptop GPU (37.1 - 42.9, n=2) | |
| Schenker XMG Pro 17 (Late 2021, RTX 3080) | |
Within one hour, the framerate in "The Witcher 3" only drops minimally in the beginning from about 109 to 100 fps.
The Witcher 3 FPS Chart
| low | med. | high | ultra | QHD | 4K | |
|---|---|---|---|---|---|---|
| The Witcher 3 (2015) | 151 | 262 | 189 | 109 | 60 | |
| Dota 2 Reborn (2015) | 178 | 151 | 134 | 136 | 119 | |
| Final Fantasy XV Benchmark (2018) | 187 | 123 | 94.2 | 73.1 | 43.6 | |
| X-Plane 11.11 (2018) | 125 | 110 | 88.8 | 67.9 | ||
| Far Cry 5 (2018) | 170 | 135 | 128 | 120 | 101 | 56 |
| Strange Brigade (2018) | 472 | 254 | 204 | 182 | ||
| New World (2021) | 97.4 | 80.8 | 75.1 | 71.5 | 63.3 | 37.1 |
Emissions - Fairly loud and hot
Noise Emissions
The slim form factor takes its toll here, with the noise load turning out a bit higher than that of most competitors and only the Medion beast being similarly loud. Under maximum load, the XMG is even the loudest in our test field, despite its limited RTX TGP. Even during idle operation, the fans are turned on most of the time. The "Silent" mode only does justice to its name in the lowest performance settings, even during idle operation.
Under average load (first benchmark in 3DMark 06), the fans can already become quite loud, and in "The Witcher 3," the noise level is even higher than 51 dB. We did not notice any electronic noises.
Noise level
| Idle |
| 24 / 31.26 / 38.64 dB(A) |
| Load |
| 48.11 / 56.74 dB(A) |
 | ||
30 dB silent 40 dB(A) audible 50 dB(A) loud |
||
min: | ||
| Schenker XMG Pro 17 (Late 2021, RTX 3080) GeForce RTX 3080 Laptop GPU, i7-11800H, Samsung SSD 980 Pro 1TB MZ-V8P1T0BW | Schenker XMG Pro 15 (Late 2021) GeForce RTX 3080 Laptop GPU, i7-11800H, Samsung SSD 980 Pro 1TB MZ-V8P1T0BW | Alienware x17 RTX 3080 P48E GeForce RTX 3080 Laptop GPU, i7-11800H, 2x WDC PC SN730 SDBPNTY-1T00 (RAID 0) | Medion Erazer Beast X25 GeForce RTX 3080 Laptop GPU, R9 5900HX, Samsung PM9A1 MZVL22T0HBLB | MSI GS76 Stealth 11UH GeForce RTX 3080 Laptop GPU, i9-11900H, Samsung PM9A1 MZVL22T0HBLB | Asus ROG Zephyrus S17 GX703HSD GeForce RTX 3080 Laptop GPU, i9-11900H, Samsung PM9A1 MZVL22T0HBLB | |
|---|---|---|---|---|---|---|
| Noise | -11% | 11% | -4% | 5% | 16% | |
| off / environment * (dB) | 24 | 24 -0% | 24.9 -4% | 25 -4% | 24 -0% | 23 4% |
| Idle Minimum * (dB) | 24 | 31 -29% | 24.9 -4% | 26 -8% | 24 -0% | 23 4% |
| Idle Average * (dB) | 31.26 | 37 -18% | 24.9 20% | 30 4% | 25 20% | 23 26% |
| Idle Maximum * (dB) | 38.64 | 41 -6% | 29.6 23% | 43 -11% | 42 -9% | 23 40% |
| Load Average * (dB) | 48.11 | 56 -16% | 31.1 35% | 54 -12% | 46 4% | 41 15% |
| Witcher 3 ultra * (dB) | 51.5 | 53 -3% | 49.7 3% | 52 -1% | 48 7% | 45 13% |
| Load Maximum * (dB) | 56.74 | 58 -2% | 54.8 3% | 55 3% | 48 15% | 52 8% |
* ... smaller is better
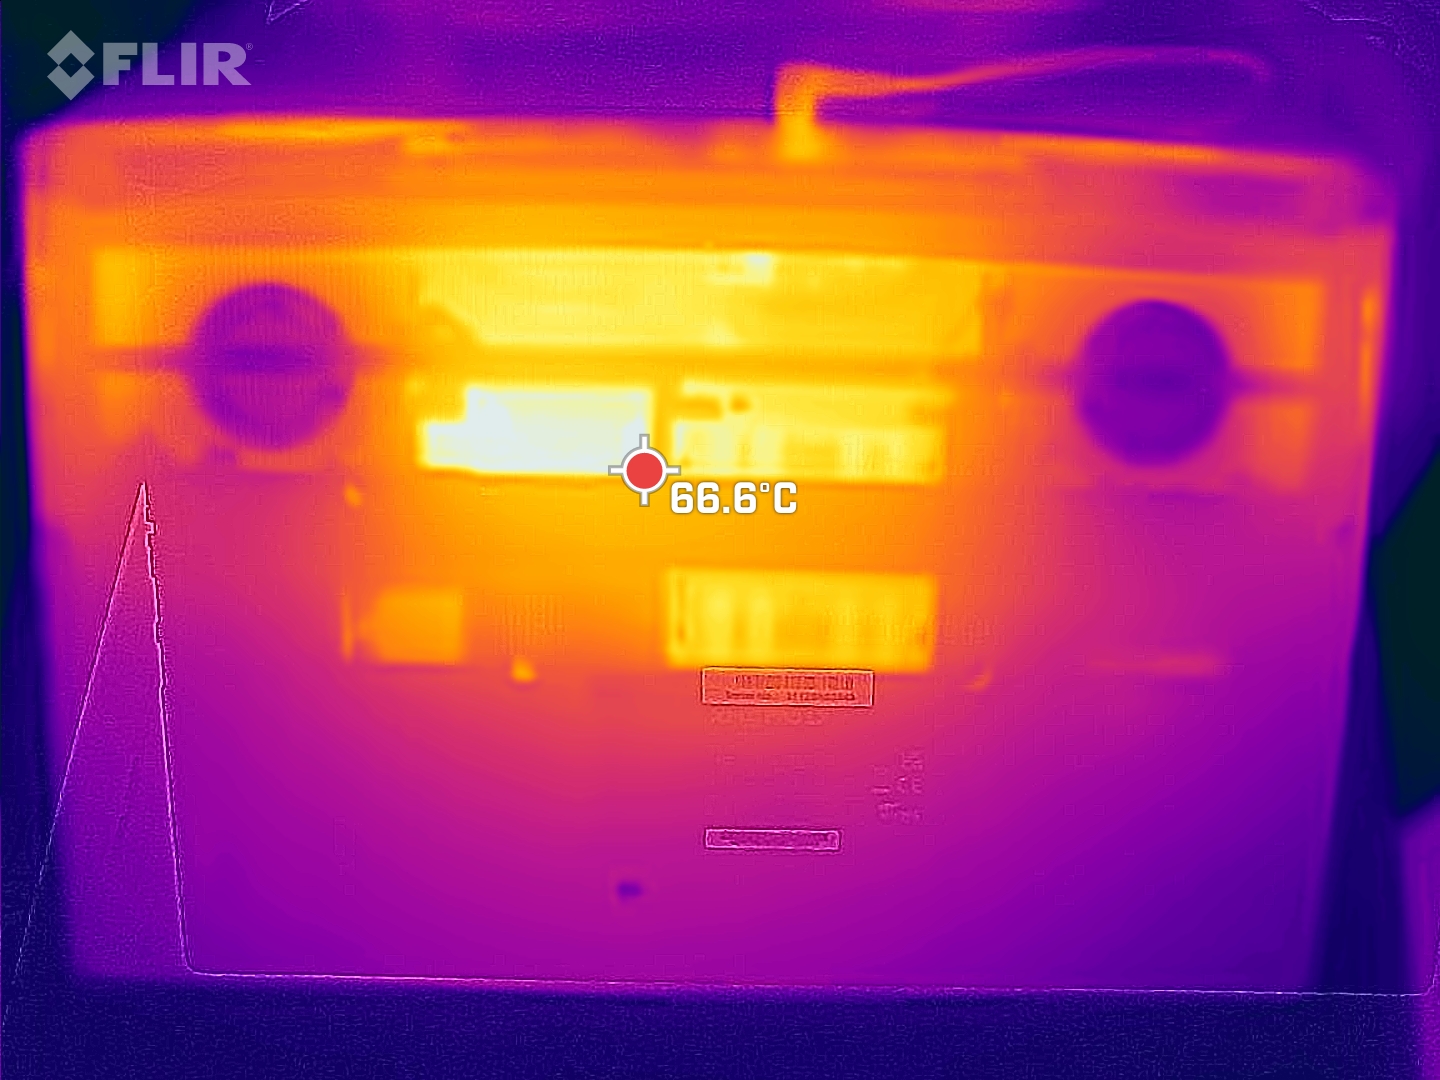
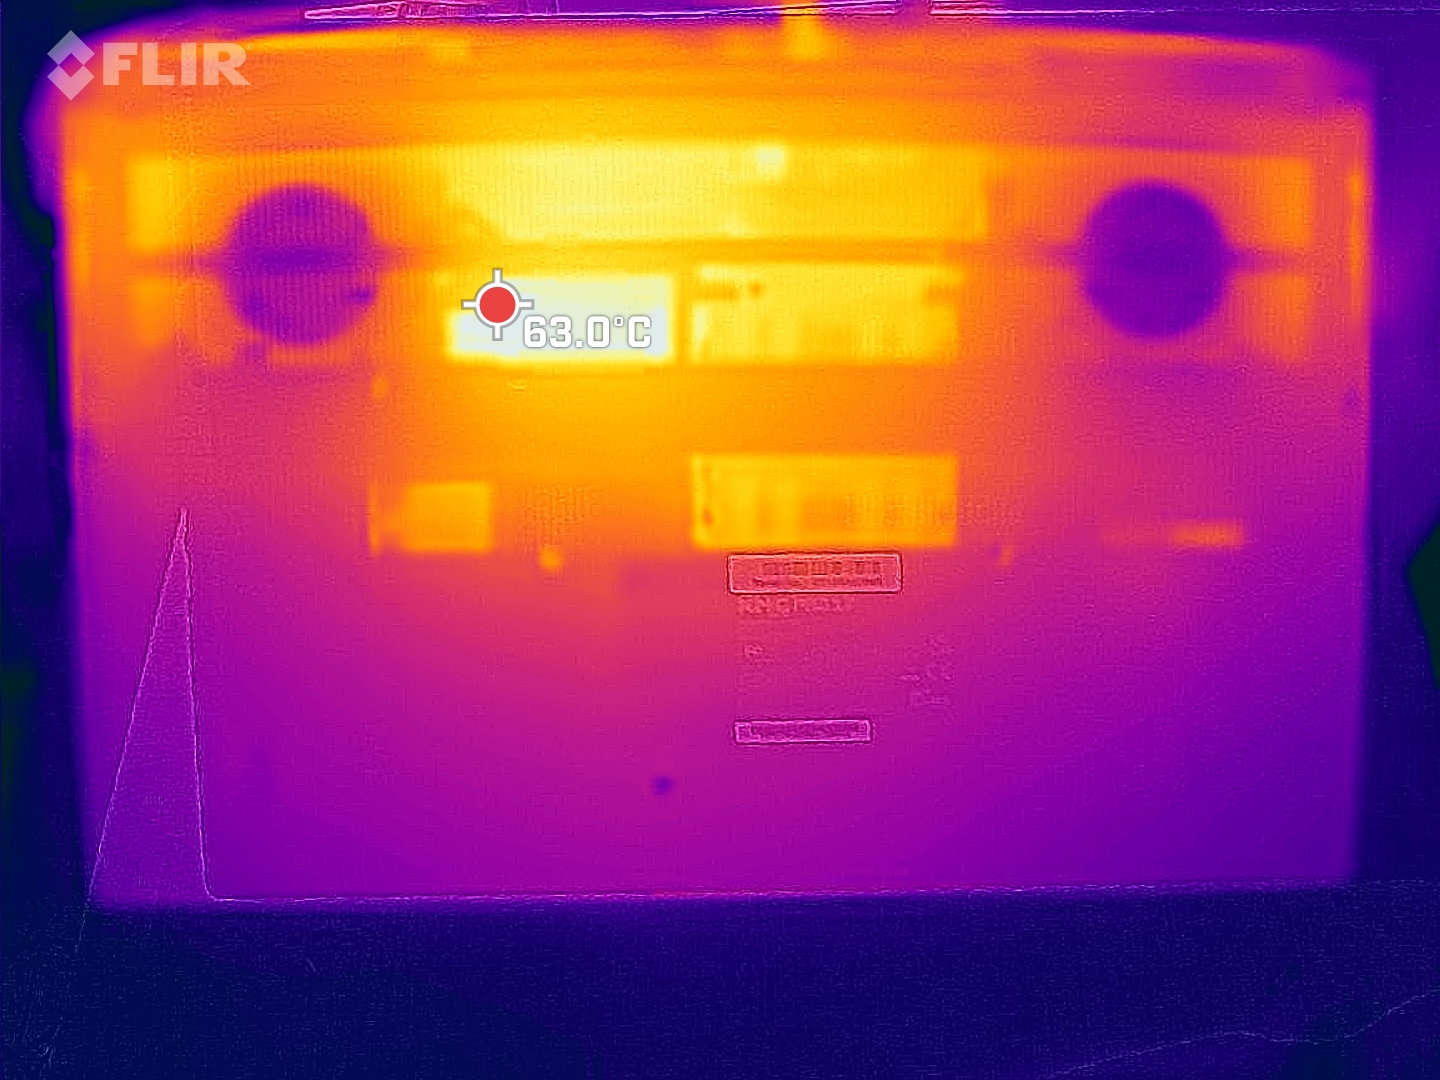
Temperature
Despite the fans being a bit louder and the reduced performance, the cooling system has a hard time to keep the surface temperatures within moderate limits. While at a maximum of 53 °C (127 °F), the top reaches similar temperatures as the competitors, we measure up to 68 °C (154 °F) at the bottom, which is definitely too high for our tastes. The 15-inch model also gets significantly hotter at the bottom than on top. During the stress test the latest, you should take the XMG Pro 17 off your lap.
Even during the stress test, the palm rests remain relatively cool, and the whole left side including the WASD keys is less impacted by the heat development. At least, the 17-inch laptop stays relatively cool during idle operation.
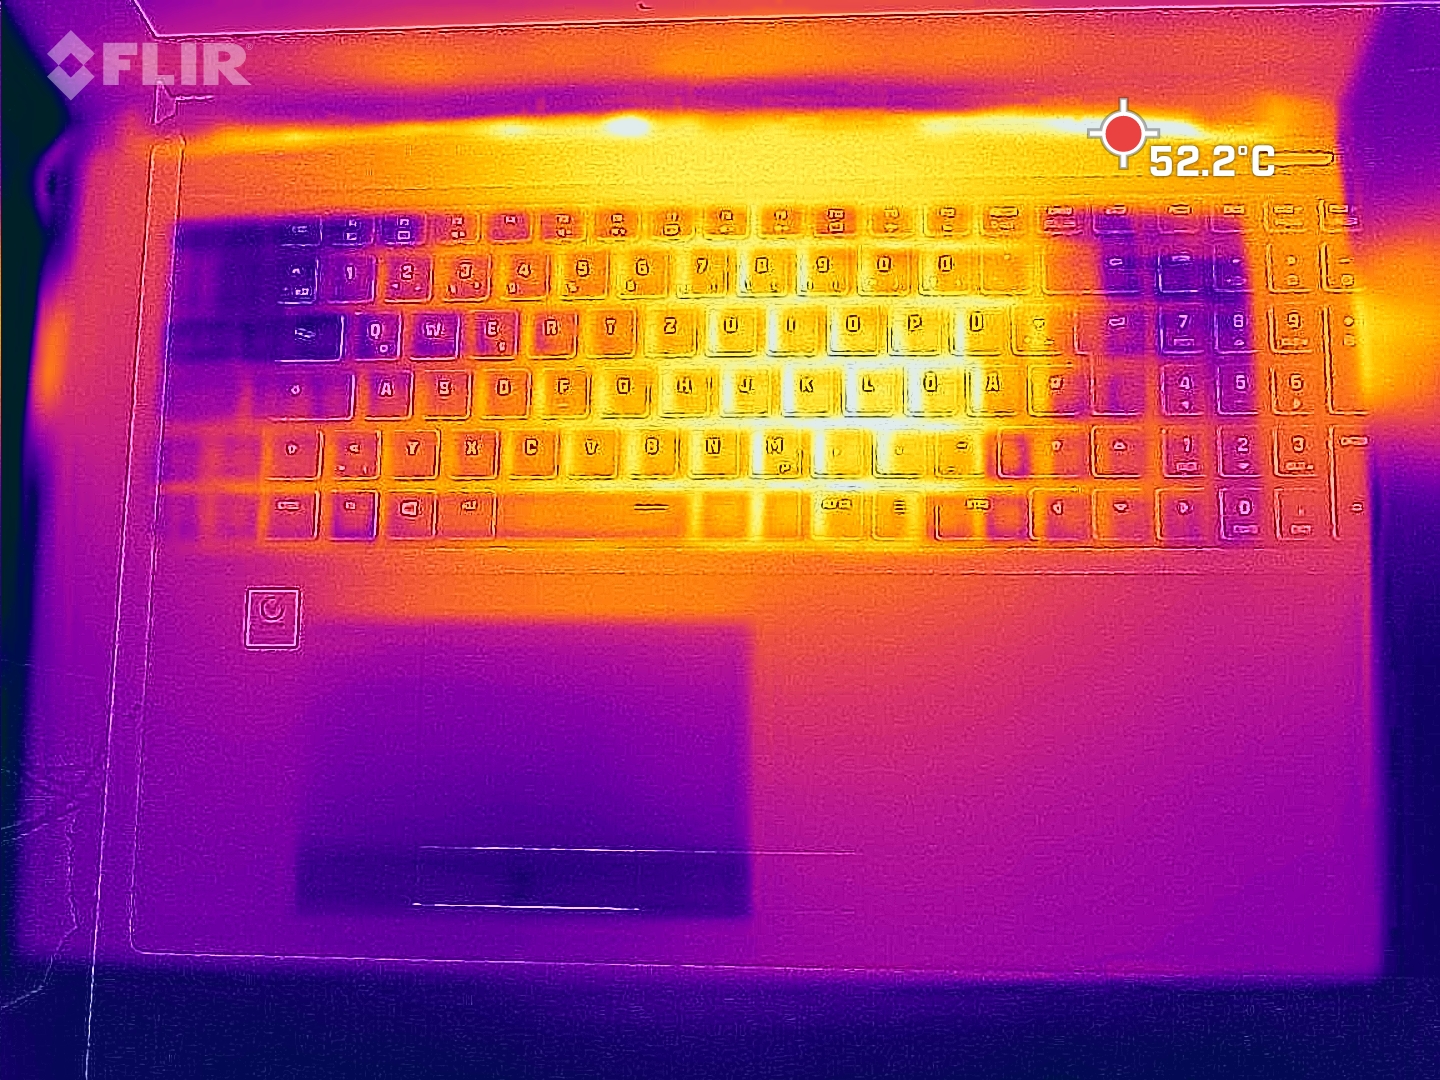
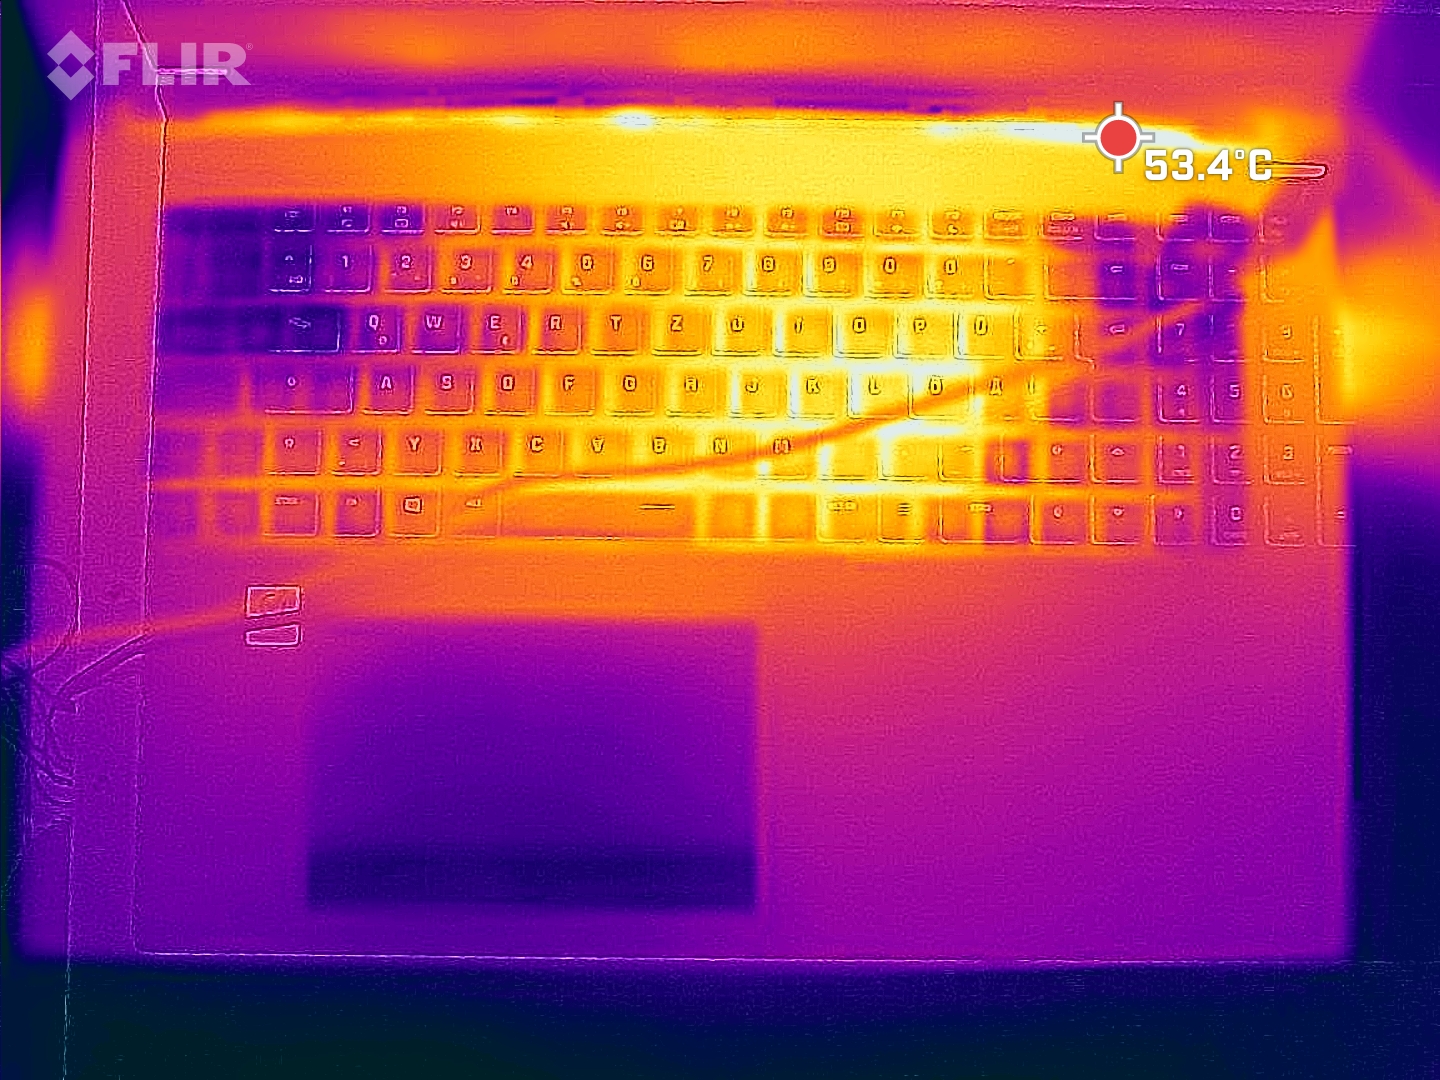
(-) The maximum temperature on the upper side is 53 °C / 127 F, compared to the average of 40.4 °C / 105 F, ranging from 21.2 to 68.8 °C for the class Gaming.
(-) The bottom heats up to a maximum of 68 °C / 154 F, compared to the average of 43.2 °C / 110 F
(+) In idle usage, the average temperature for the upper side is 24.2 °C / 76 F, compared to the device average of 33.9 °C / 93 F.
(-) Playing The Witcher 3, the average temperature for the upper side is 44.9 °C / 113 F, compared to the device average of 33.9 °C / 93 F.
(±) The palmrests and touchpad can get very hot to the touch with a maximum of 37 °C / 98.6 F.
(-) The average temperature of the palmrest area of similar devices was 28.8 °C / 83.8 F (-8.2 °C / -14.8 F).
| Schenker XMG Pro 17 (Late 2021, RTX 3080) Intel Core i7-11800H, NVIDIA GeForce RTX 3080 Laptop GPU | Schenker XMG Pro 15 (Late 2021) Intel Core i7-11800H, NVIDIA GeForce RTX 3080 Laptop GPU | Alienware x17 RTX 3080 P48E Intel Core i7-11800H, NVIDIA GeForce RTX 3080 Laptop GPU | Medion Erazer Beast X25 AMD Ryzen 9 5900HX, NVIDIA GeForce RTX 3080 Laptop GPU | MSI GS76 Stealth 11UH Intel Core i9-11900H, NVIDIA GeForce RTX 3080 Laptop GPU | Asus ROG Zephyrus S17 GX703HSD Intel Core i9-11900H, NVIDIA GeForce RTX 3080 Laptop GPU | |
|---|---|---|---|---|---|---|
| Heat | -1% | -8% | -9% | 3% | -11% | |
| Maximum Upper Side * (°C) | 53 | 44 17% | 58.4 -10% | 54 -2% | 49 8% | 59 -11% |
| Maximum Bottom * (°C) | 68 | 60 12% | 49 28% | 57 16% | 57 16% | 53 22% |
| Idle Upper Side * (°C) | 27 | 30 -11% | 33.6 -24% | 34 -26% | 28 -4% | 35 -30% |
| Idle Bottom * (°C) | 28 | 34 -21% | 34.6 -24% | 35 -25% | 30 -7% | 35 -25% |
* ... smaller is better
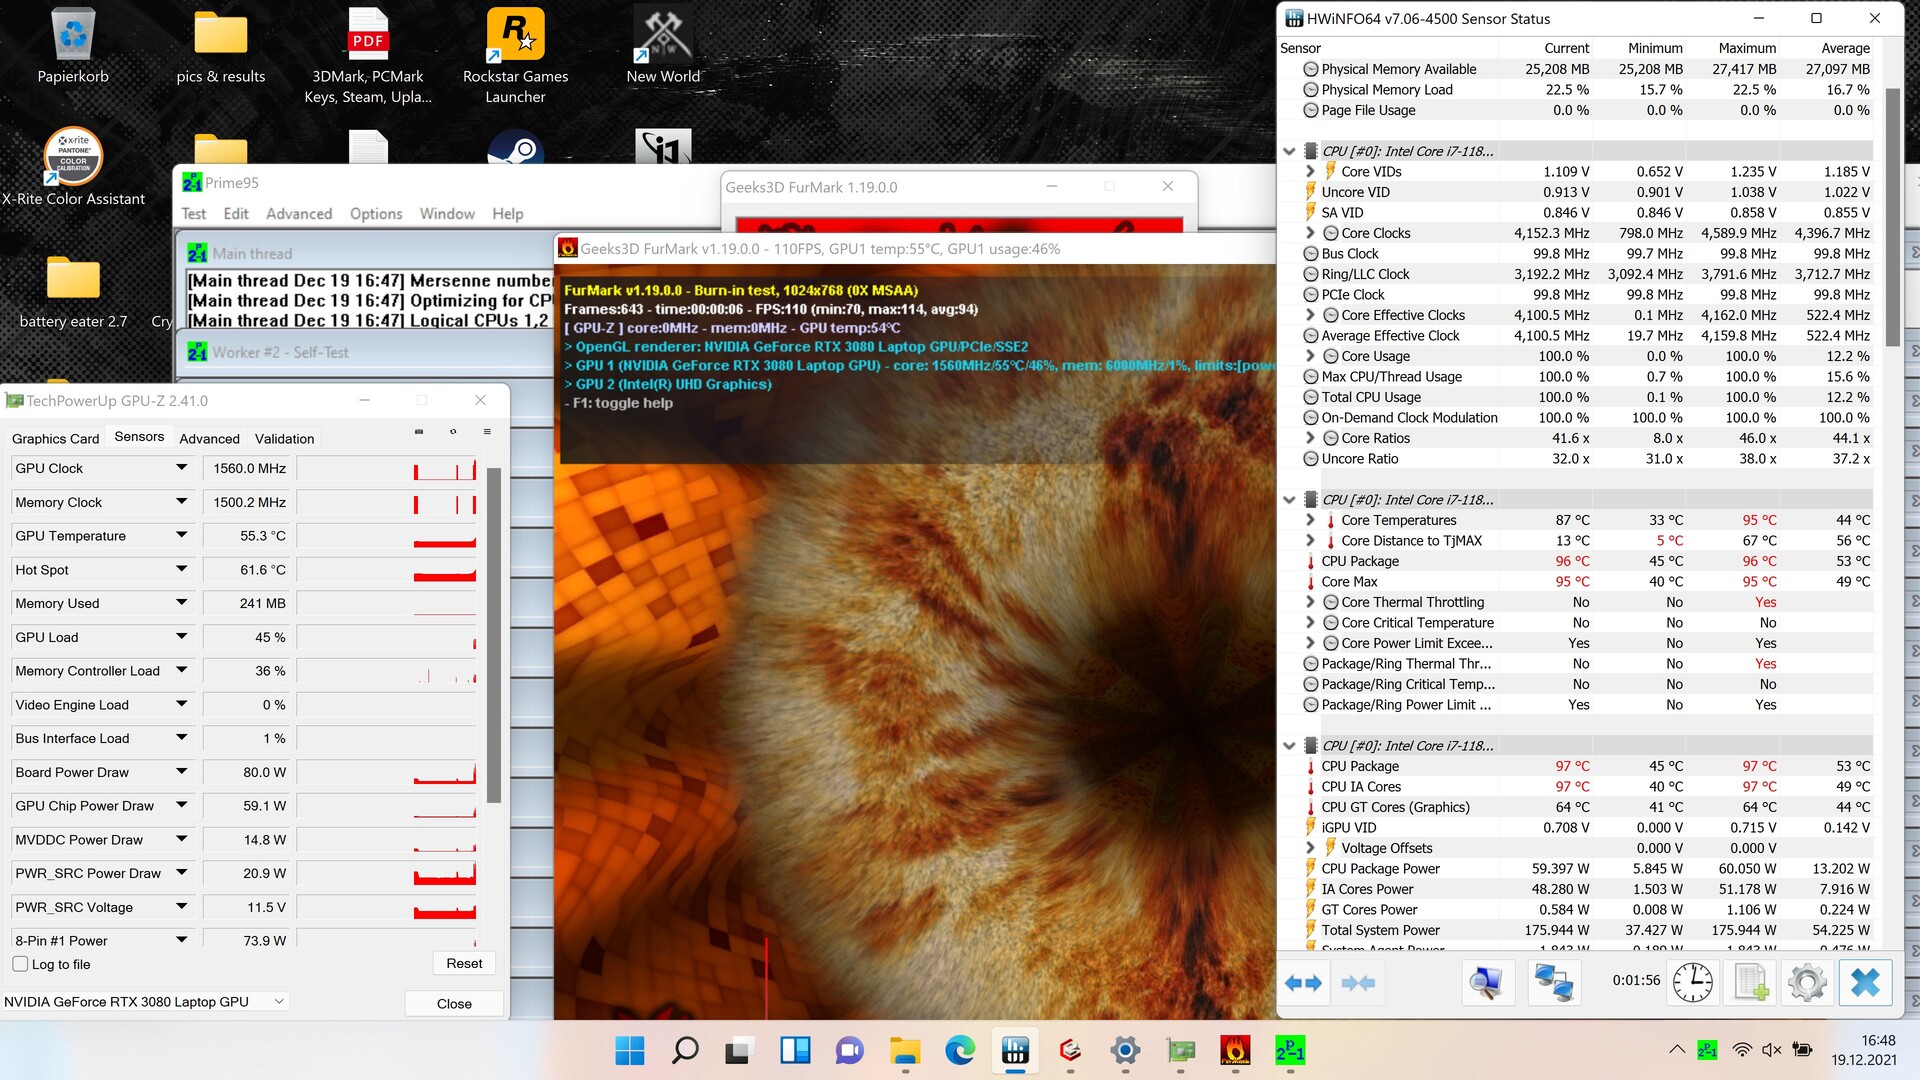
Stress Test
The cores start the stress test at about 4.2 GHz. Already after a few seconds, however, the CPU reaches temperatures of more than 90 °C (194 °F) and the thermal throttling kicks in. During the whole course of the test, the clock speed then continues to drop. After about 30 minutes it is only 3 GHz, after an hour, only 2.8 GHz, and a few minutes later, only 2.7 GHz. While this happens, the CPU temperatures are often very high and continue to reach 90 °C (194 °F), with the throttling targeting a temperature of about 85 °C (185 °F).
The GPU starts at a clock speed of about 1.5 GHz. Depending on the thermal load, the speed drops to 1.2 GHz at times, before recovering again to above 1.3 GHz. The temperature here also reaches a fairly high 85 °C (185 °F), and temporarily even higher.
After the stress test, the system recovers fairly quickly. A 3DMark 11 test immediately afterwards resulted in a score that was about 3 - 4% lower than usual.
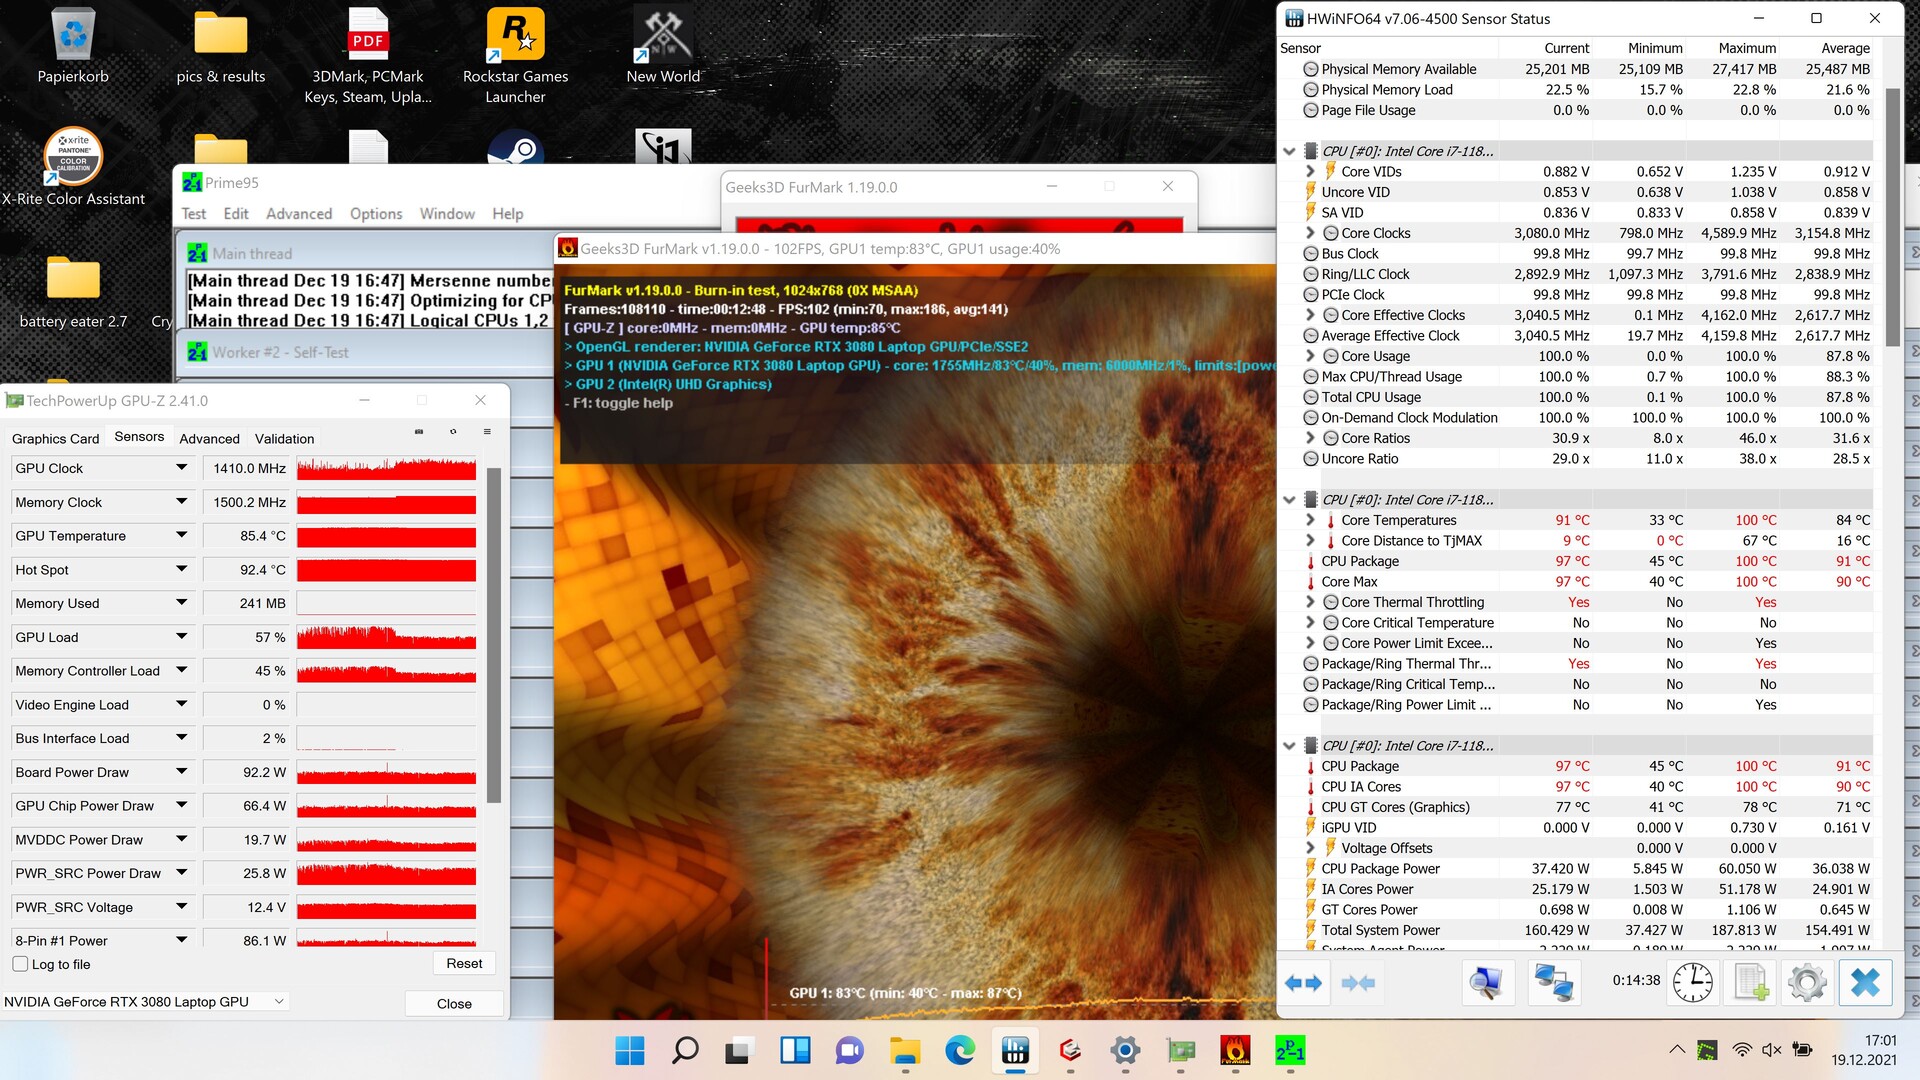
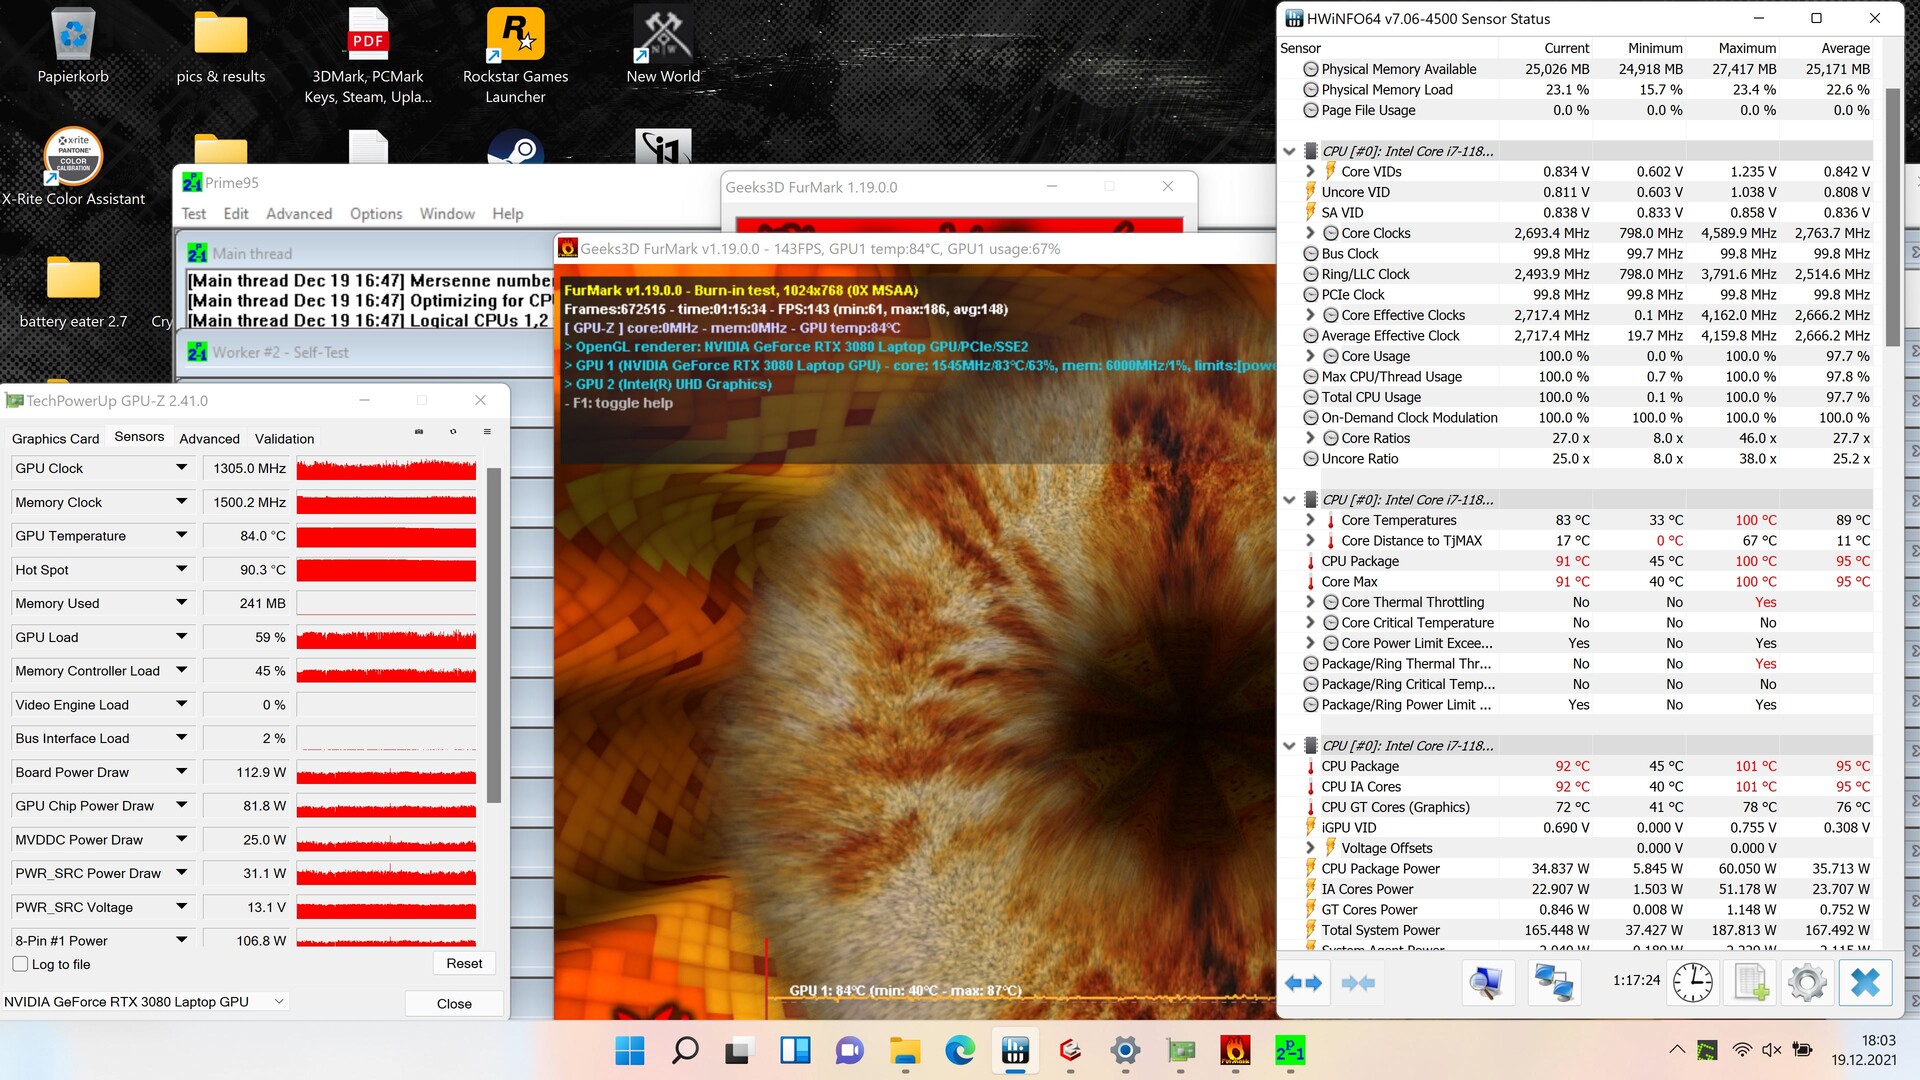
| CPU Clock (GHz) | GPU Clock (MHz) | Average CPU Temperature (°C) | Average GPU Temperature (°C) | |
| System Idle | 3.6 | 350 (iGPU) | 35 | 35 |
| Prime95 + FurMark Stress | 2.6 | 1,230 - 1,375 | 88 | 85 |
Speakers
The speakers produce a fairly good maximum volume and balanced and linear high frequencies. While the mids are slightly under-represented, the bass is hardly there at all, despite the 17-inch form factor.
You can connect external audio devices using the headset or the line in port.
Schenker XMG Pro 17 (Late 2021, RTX 3080) audio analysis
(+) | speakers can play relatively loud (87.4 dB)
Bass 100 - 315 Hz
(-) | nearly no bass - on average 24% lower than median
(±) | linearity of bass is average (8.7% delta to prev. frequency)
Mids 400 - 2000 Hz
(±) | higher mids - on average 10.1% higher than median
(±) | linearity of mids is average (7.2% delta to prev. frequency)
Highs 2 - 16 kHz
(+) | balanced highs - only 2% away from median
(+) | highs are linear (2.6% delta to prev. frequency)
Overall 100 - 16.000 Hz
(±) | linearity of overall sound is average (18.8% difference to median)
Compared to same class
» 62% of all tested devices in this class were better, 8% similar, 30% worse
» The best had a delta of 6%, average was 18%, worst was 132%
Compared to all devices tested
» 43% of all tested devices were better, 8% similar, 49% worse
» The best had a delta of 4%, average was 24%, worst was 134%
Apple MacBook 12 (Early 2016) 1.1 GHz audio analysis
(+) | speakers can play relatively loud (83.6 dB)
Bass 100 - 315 Hz
(±) | reduced bass - on average 11.3% lower than median
(±) | linearity of bass is average (14.2% delta to prev. frequency)
Mids 400 - 2000 Hz
(+) | balanced mids - only 2.4% away from median
(+) | mids are linear (5.5% delta to prev. frequency)
Highs 2 - 16 kHz
(+) | balanced highs - only 2% away from median
(+) | highs are linear (4.5% delta to prev. frequency)
Overall 100 - 16.000 Hz
(+) | overall sound is linear (10.2% difference to median)
Compared to same class
» 7% of all tested devices in this class were better, 2% similar, 91% worse
» The best had a delta of 5%, average was 18%, worst was 53%
Compared to all devices tested
» 5% of all tested devices were better, 1% similar, 94% worse
» The best had a delta of 4%, average was 24%, worst was 134%
Power Management - Efficient, but with a weak power supply
Power Consumption
During idle operation, the XMG Pro 17 presents itself as relatively efficient. While gaming, our test unit also consumes slightly less power than the Alienware or the Asus ROG, but those offer a noticeably higher performance. Overall, the consumption levels correspond to the performance.
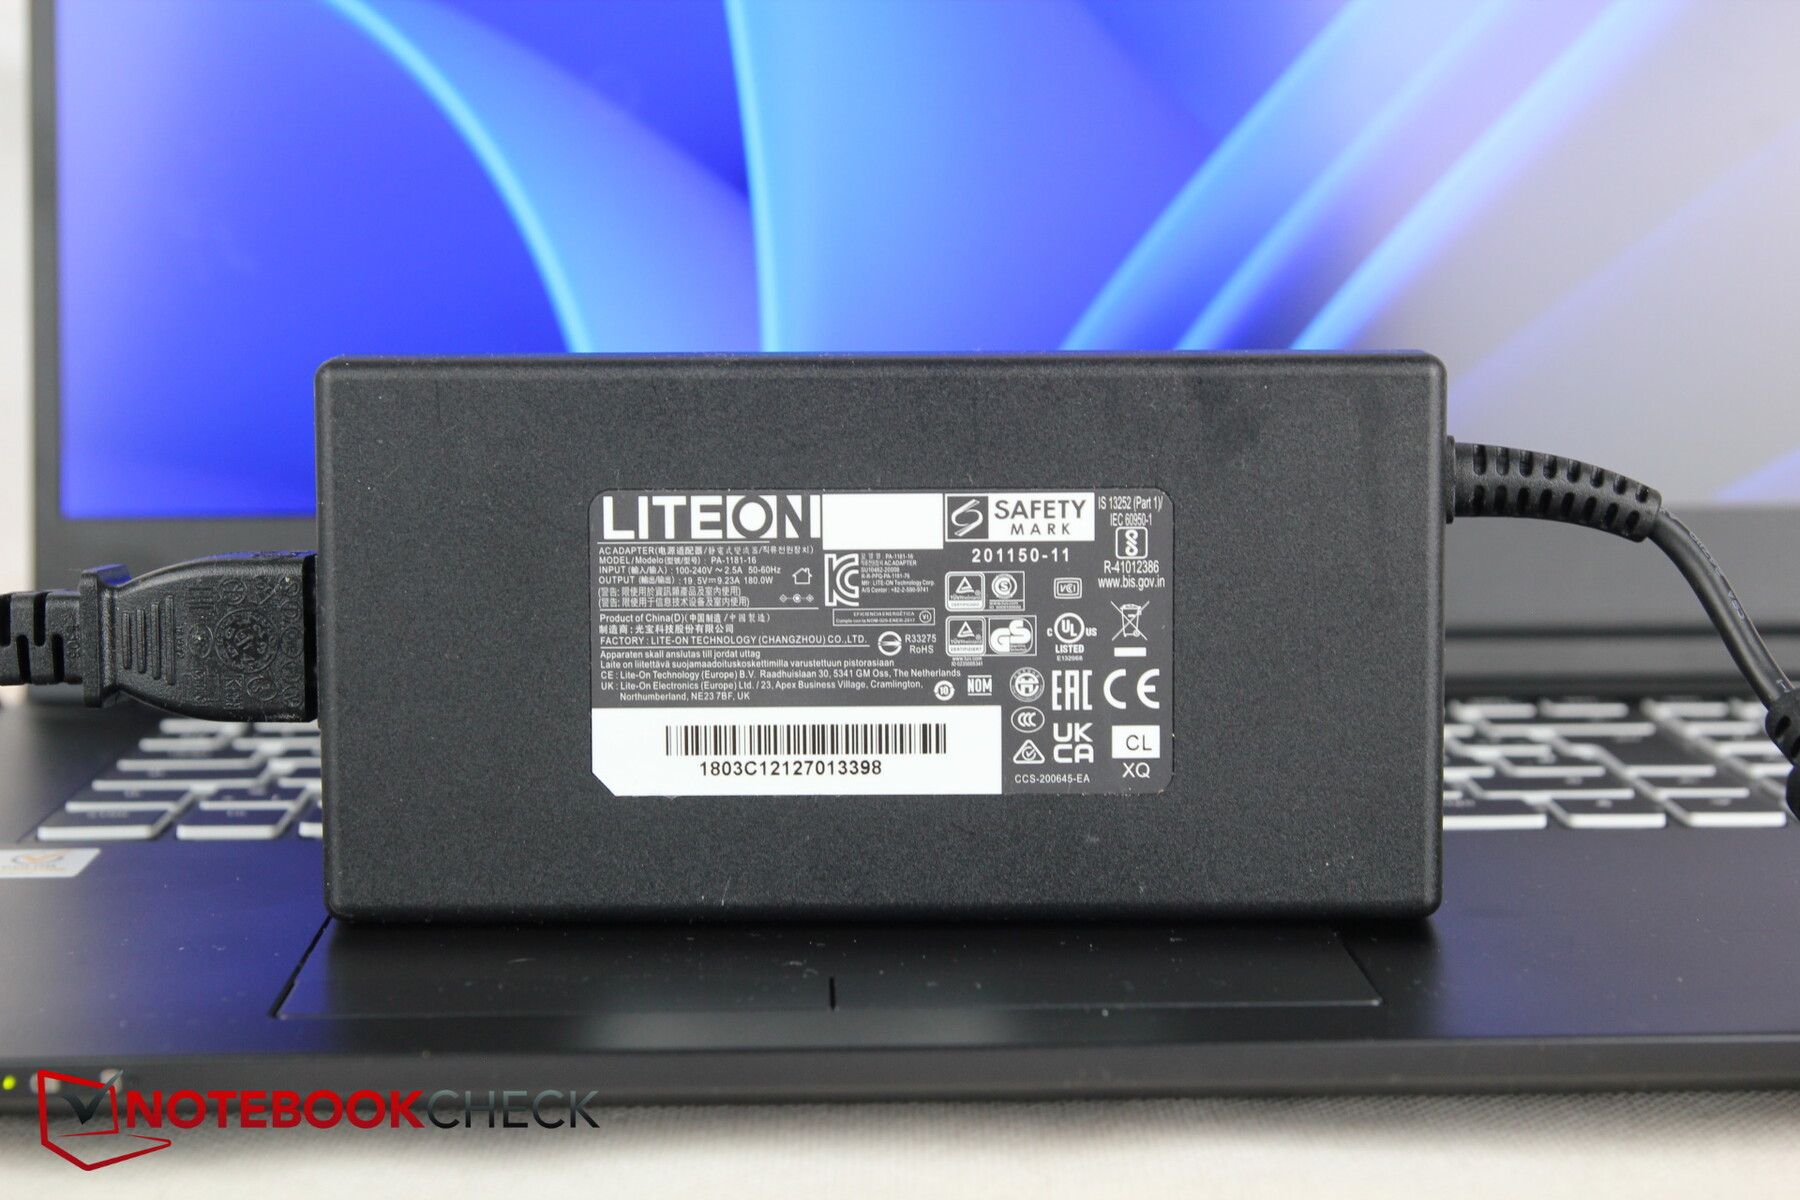
We measure a top consumption of 227 watts max. However, the included LiteOn power supply is only rated at 180 watts. Even at times with other than maximum consumption, this can become a problem. For example, it constantly used around 200 watts during the stress test. In such extreme scenarios, the power supply is unable to charge the laptop reliably.
| Idle | |
| Load |
|
Key:
min: | |
| Schenker XMG Pro 17 (Late 2021, RTX 3080) i7-11800H, GeForce RTX 3080 Laptop GPU, Samsung SSD 980 Pro 1TB MZ-V8P1T0BW, IPS, 3840x2160, 17.3" | Schenker XMG Pro 15 (Late 2021) i7-11800H, GeForce RTX 3080 Laptop GPU, Samsung SSD 980 Pro 1TB MZ-V8P1T0BW, OLED, 3840x2160, 15.6" | Alienware x17 RTX 3080 P48E i7-11800H, GeForce RTX 3080 Laptop GPU, 2x WDC PC SN730 SDBPNTY-1T00 (RAID 0), IPS, 3840x2160, 17.3" | Medion Erazer Beast X25 R9 5900HX, GeForce RTX 3080 Laptop GPU, Samsung PM9A1 MZVL22T0HBLB, IPS, 1920x1080, 17.3" | MSI GS76 Stealth 11UH i9-11900H, GeForce RTX 3080 Laptop GPU, Samsung PM9A1 MZVL22T0HBLB, IPS, 3840x2160, 17.3" | Asus ROG Zephyrus S17 GX703HSD i9-11900H, GeForce RTX 3080 Laptop GPU, Samsung PM9A1 MZVL22T0HBLB, IPS, 2560x1440, 17.3" | Average NVIDIA GeForce RTX 3080 Laptop GPU | Average of class Gaming | |
|---|---|---|---|---|---|---|---|---|
| Power Consumption | -9% | -21% | -24% | 1% | -21% | -18% | 1% | |
| Idle Minimum * (Watt) | 13.6 | 20 -47% | 10.2 25% | 22 -62% | 14 -3% | 21.7 -60% | 19.8 ? -46% | 13.4 ? 1% |
| Idle Average * (Watt) | 19.4 | 22 -13% | 21.2 -9% | 26 -34% | 19 2% | 27 -39% | 24.3 ? -25% | 19.1 ? 2% |
| Idle Maximum * (Watt) | 27.7 | 26 6% | 48.4 -75% | 34 -23% | 31 -12% | 33 -19% | 33.3 ? -20% | 24.7 ? 11% |
| Load Average * (Watt) | 110 | 103 6% | 118.7 -8% | 120 -9% | 97 12% | 108 2% | 108.1 ? 2% | 108.4 ? 1% |
| Witcher 3 ultra * (Watt) | 170 | 186 -9% | 249 -46% | 189 -11% | 156 8% | 195 -15% | ||
| Load Maximum * (Watt) | 227 | 218 4% | 262 -15% | 231 -2% | 231 -2% | 210 7% | 230 ? -1% | 254 ? -12% |
* ... smaller is better
Power Consumption The Witcher 3 / Stress Test
Power Consumption With External Monitor
Battery Life
Like in the 15-inch model, Schenker uses a 73-Wh battery here as well. The competitors offer 87 (Alienware) up to almost 100 Wh (MSI), but this doesn't necessarily result in a better battery life for the comparison models. Only the Asus ROG Zephyrus lasts clearly longer with its 90-Wh battery, and the remaining competitors do even worse in parts, including the MSI.
You can plan for a movie evening of about 5 hours at reduced brightness, and while surfing, the XMG lasts about 40 minutes longer.
| Schenker XMG Pro 17 (Late 2021, RTX 3080) i7-11800H, GeForce RTX 3080 Laptop GPU, 73 Wh | Schenker XMG Pro 15 (Late 2021) i7-11800H, GeForce RTX 3080 Laptop GPU, 73 Wh | Alienware x17 RTX 3080 P48E i7-11800H, GeForce RTX 3080 Laptop GPU, 87 Wh | Medion Erazer Beast X25 R9 5900HX, GeForce RTX 3080 Laptop GPU, 91 Wh | MSI GS76 Stealth 11UH i9-11900H, GeForce RTX 3080 Laptop GPU, 99.9 Wh | Asus ROG Zephyrus S17 GX703HSD i9-11900H, GeForce RTX 3080 Laptop GPU, 90 Wh | Average of class Gaming | |
|---|---|---|---|---|---|---|---|
| Battery runtime | -4% | -26% | -2% | -8% | 40% | 21% | |
| H.264 (h) | 5.2 | 6.5 25% | 7.2 38% | 8.26 ? 59% | |||
| WiFi v1.3 (h) | 5.7 | 5.2 -9% | 5.9 4% | 6.8 19% | 6.4 12% | 7.5 32% | 6.94 ? 22% |
| Load (h) | 1.8 | 1.3 -28% | 0.8 -56% | 1.4 -22% | 1.3 -28% | 2.7 50% | 1.47 ? -18% |
| Reader / Idle (h) | 10.6 | 7 | 9.9 | 9.9 | 8.71 ? | ||
| Witcher 3 ultra (h) | 1 |
Pros
Cons
Verdict - More a workstation than a gaming laptop
Even though the XMG Pro 17 wants to attract gamers as well as creative professionals at the same time, it is unlikely to attract the performance enthusiasts among the gamers, since there are too many performance compromises due to the ultra-slim design. However, the Schenker model might still be interesting to some gamers. At least, the slim laptop with an RTX 3080 is more mobile than most competitors, and in addition to the size and weight, the battery life is also right. The bright 4K display with its large color space coverage is also a great plus for professionals, making it also suitable for video editing or image processing.
With its powerful hardware, the disadvantages of a slim case are clear. The laptop gets quite hot at the bottom, it isn't really quiet, and the performance is also lower than that of many competitors. In addition, the wobbly keyboard base is a bit annoying, and Schenker should also rethink its power supply, which is really too weak.
In addition to its 4K display, the large advantage of the XMG Pro 17 lies in its ultra-slim case and relatively low weight. Those gamers and professionals who prefer mobility over maximal performance should give this model a chance.
The alternative laptops also don't do everything right, perhaps with the exception of the Asus ROG Zephyrus, which is similarly slim, but also 400 g (~14 oz.) heavier. But that laptop impresses us in almost all areas, and you only have to pay attention to any annoying noises in some units when purchasing it. Unfortunately, the Asus is also a bit more expensive, although the XMG Pro isn't a bargain either. Those who want to save money should take a look at the MSI GP66 Leopard for less than 2000 Euros (~$2286).
Price and Availability
The XMG Pro 17 costs 2249€ in the Schenker shop with a Full HD display and 278€ more with a 4K display. The Clevo PC70HS, which shares a similar build, starts from $2560 at the Clevo shop.
Schenker XMG Pro 17 (Late 2021, RTX 3080)
- 01/13/2022 v7 (old)
Christian Hintze
Price comparison

