Aorus Master 18 gaming laptop review: The RTX 5090 takes its toll
Is the 18-inch device worth its premium price?
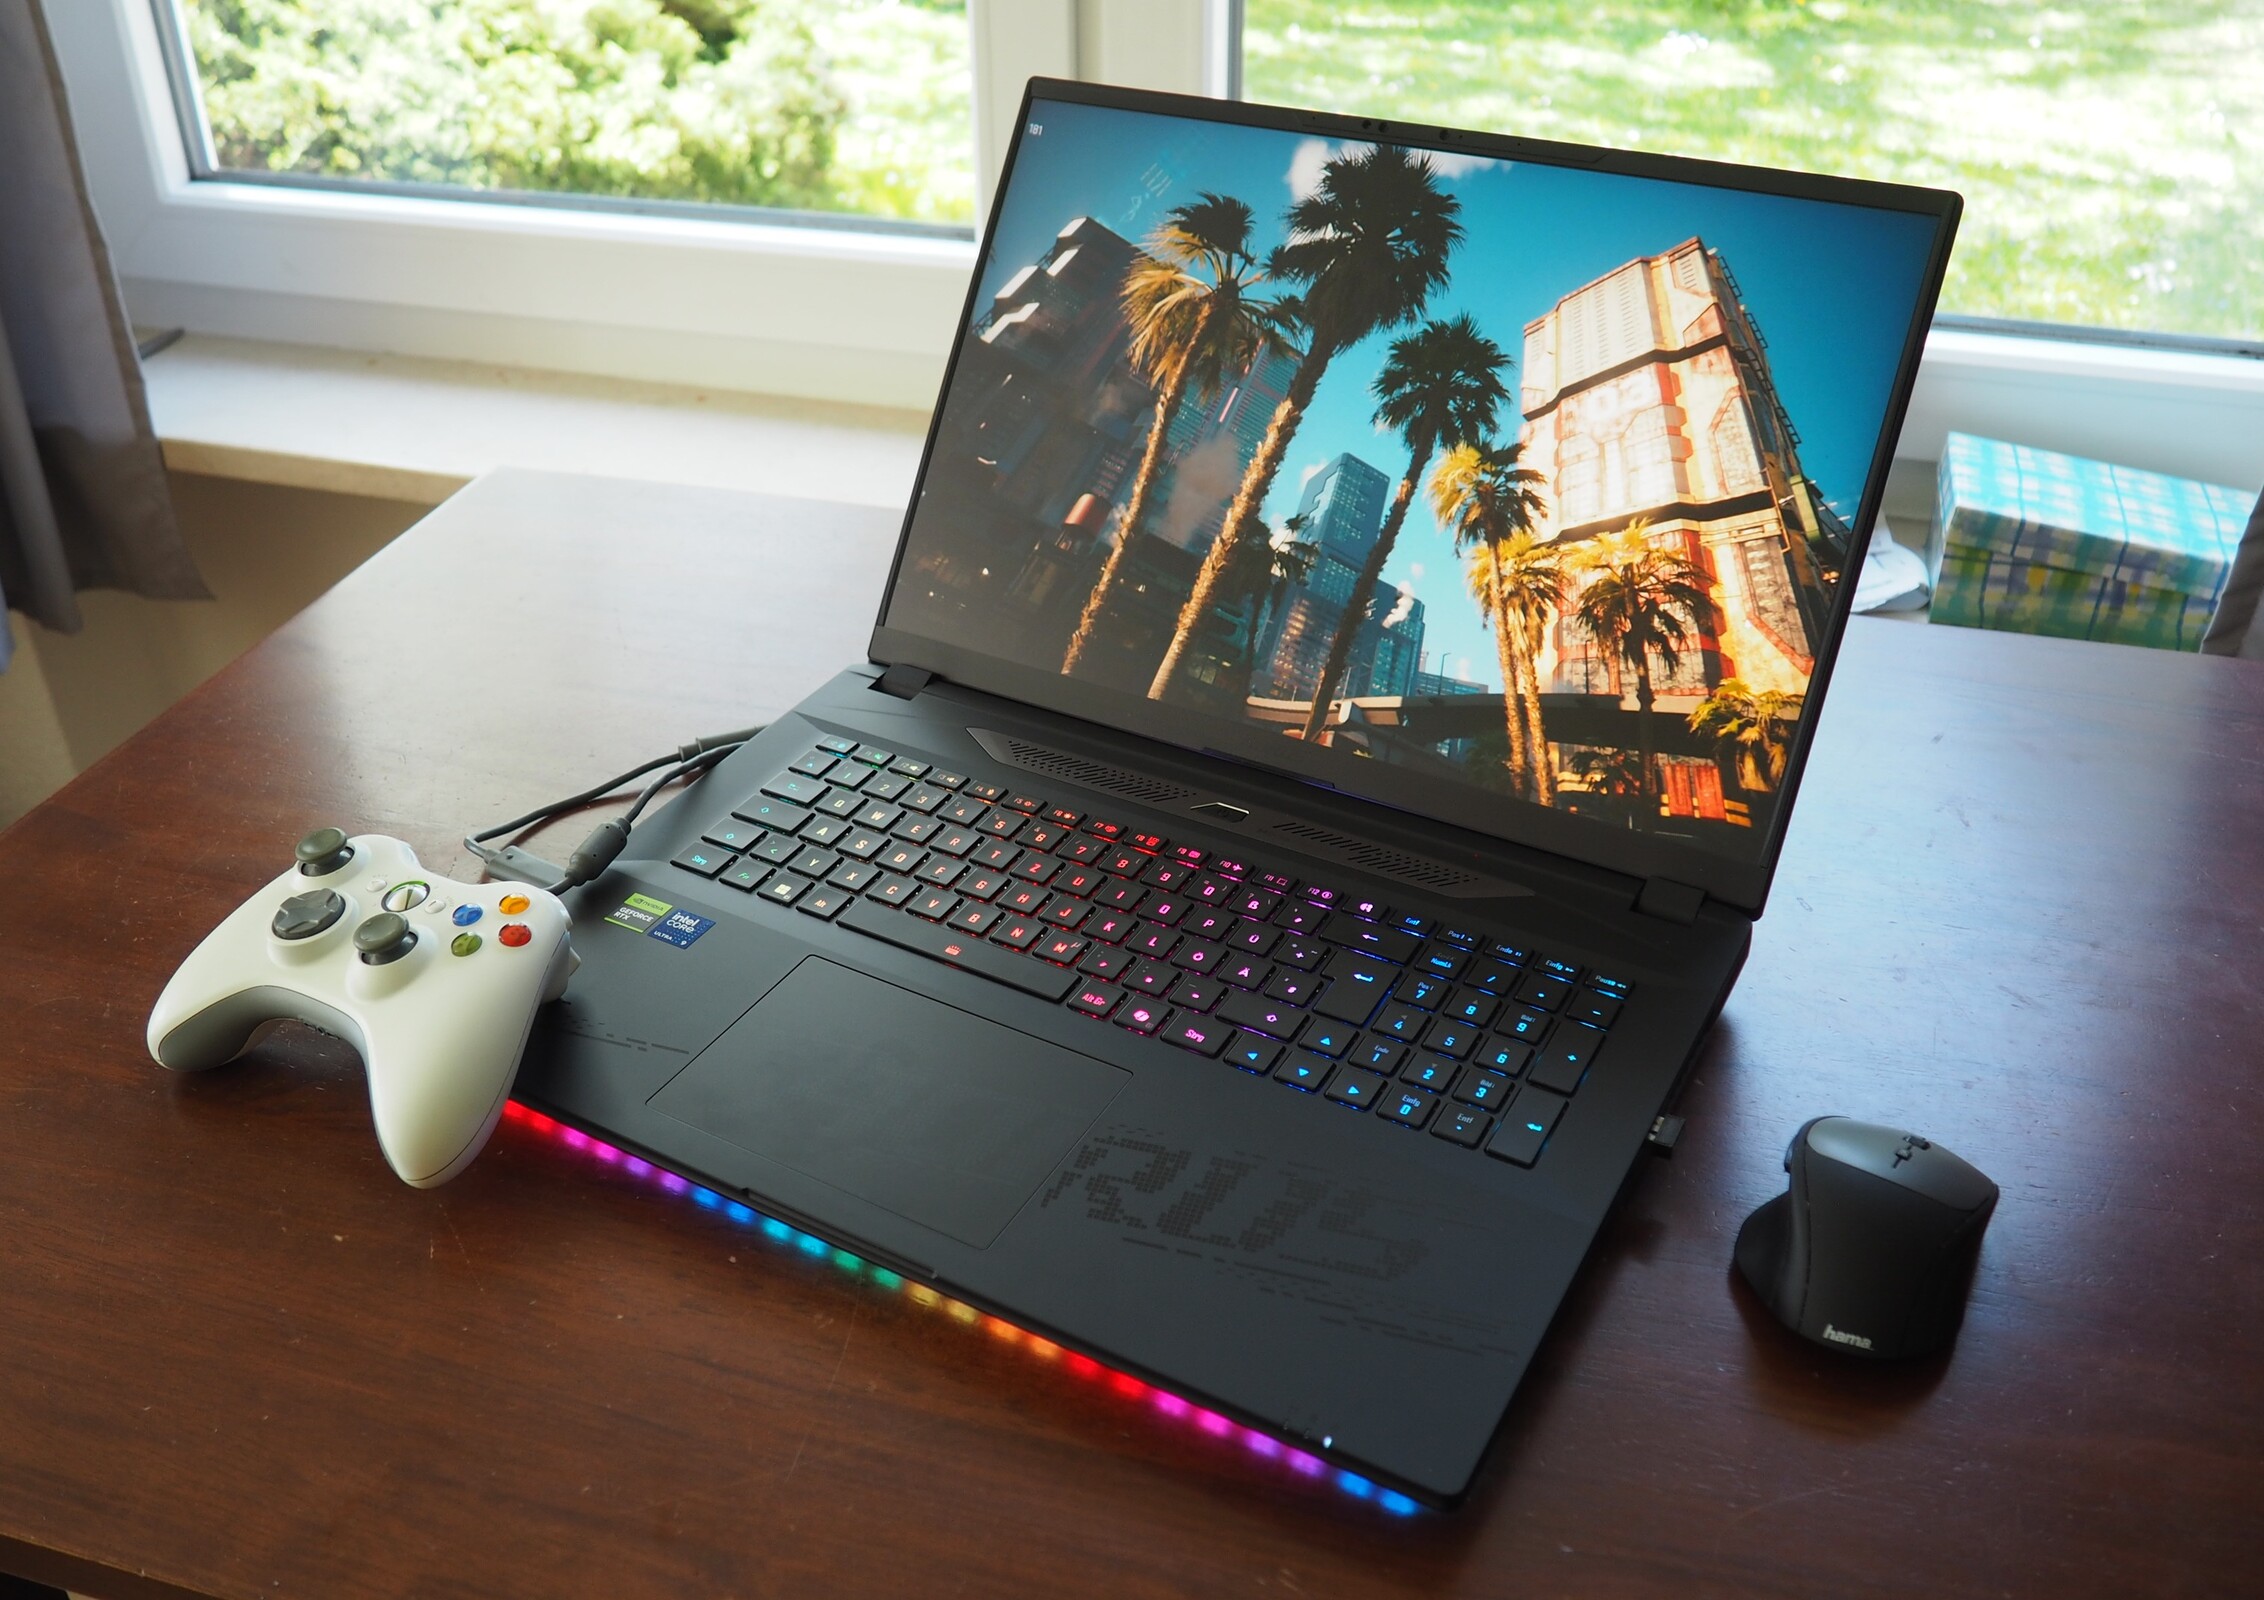
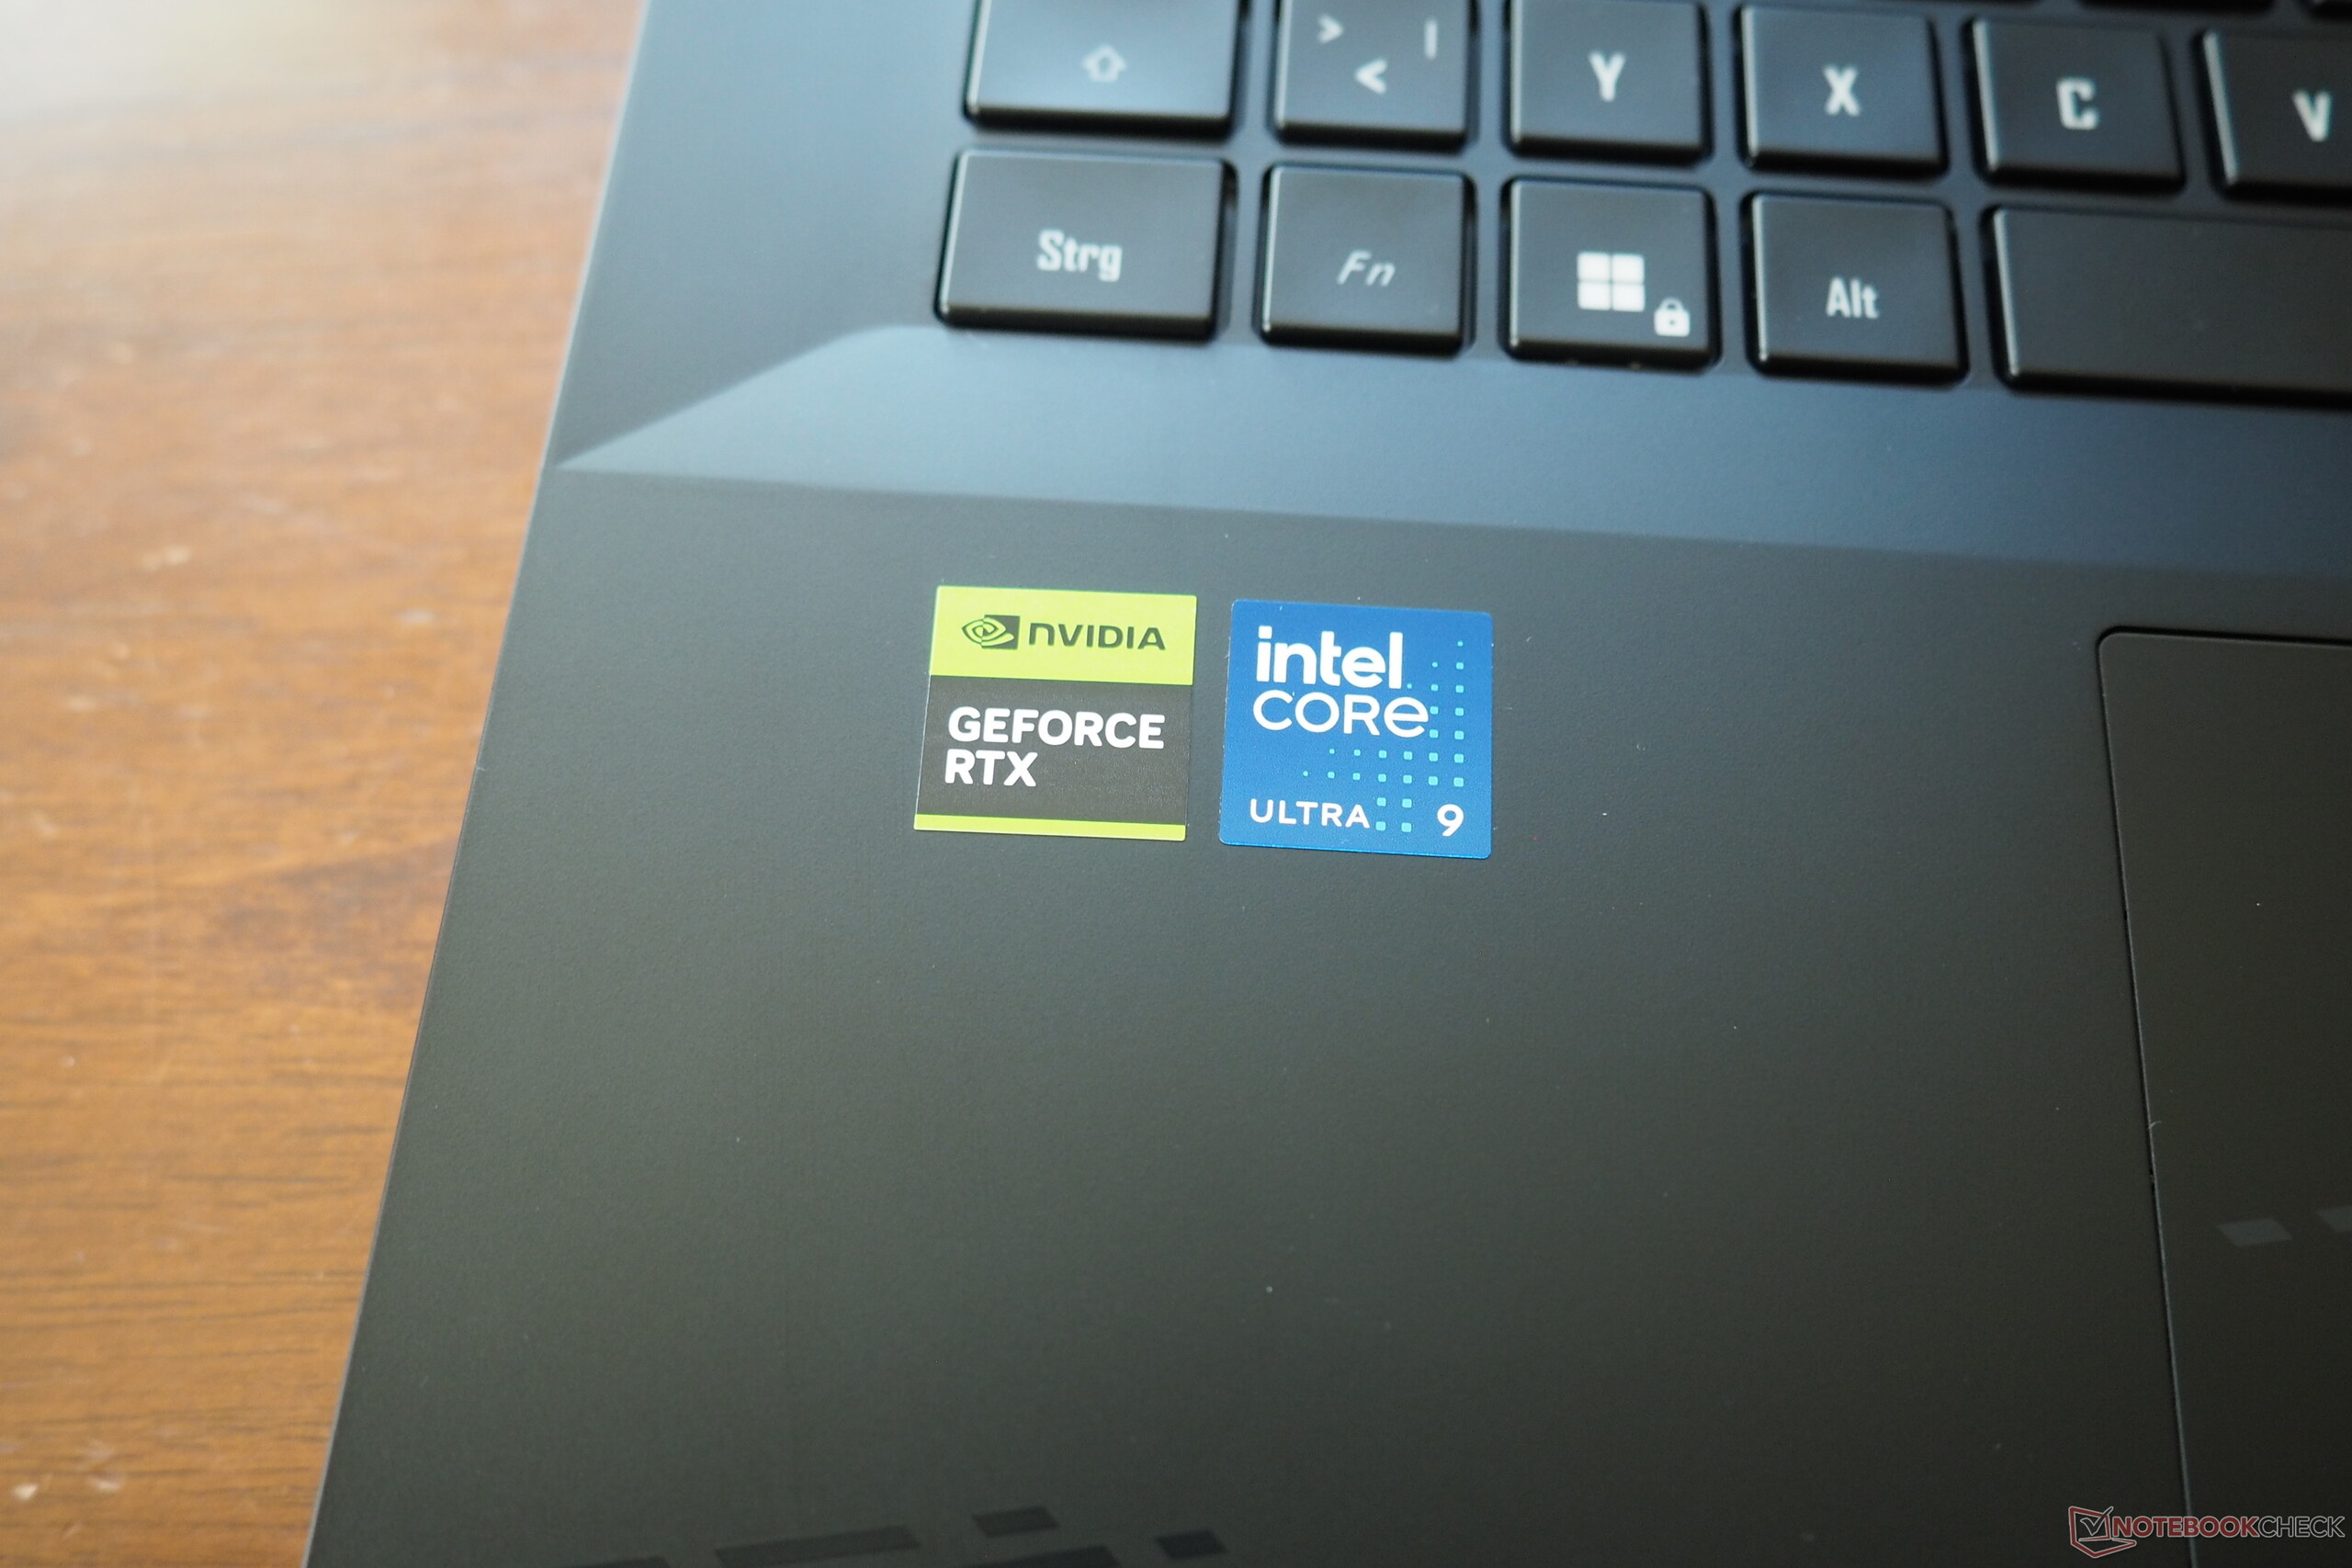
Gigabyte has gone all out with its Aorus Master 18: A large mini LED display, a 24-core processor from the Arrow Lake generation, a GeForce RTX 5090 and a generous RAM and SSD configuration should all appeal to passionate gamers.Florian Glaser, 👁 Florian Glaser (translated by Daisy Dickson) Published 🇩🇪 🇫🇷 ...
Verdict - The RTX 5090 can flex its muscles in the Master 18
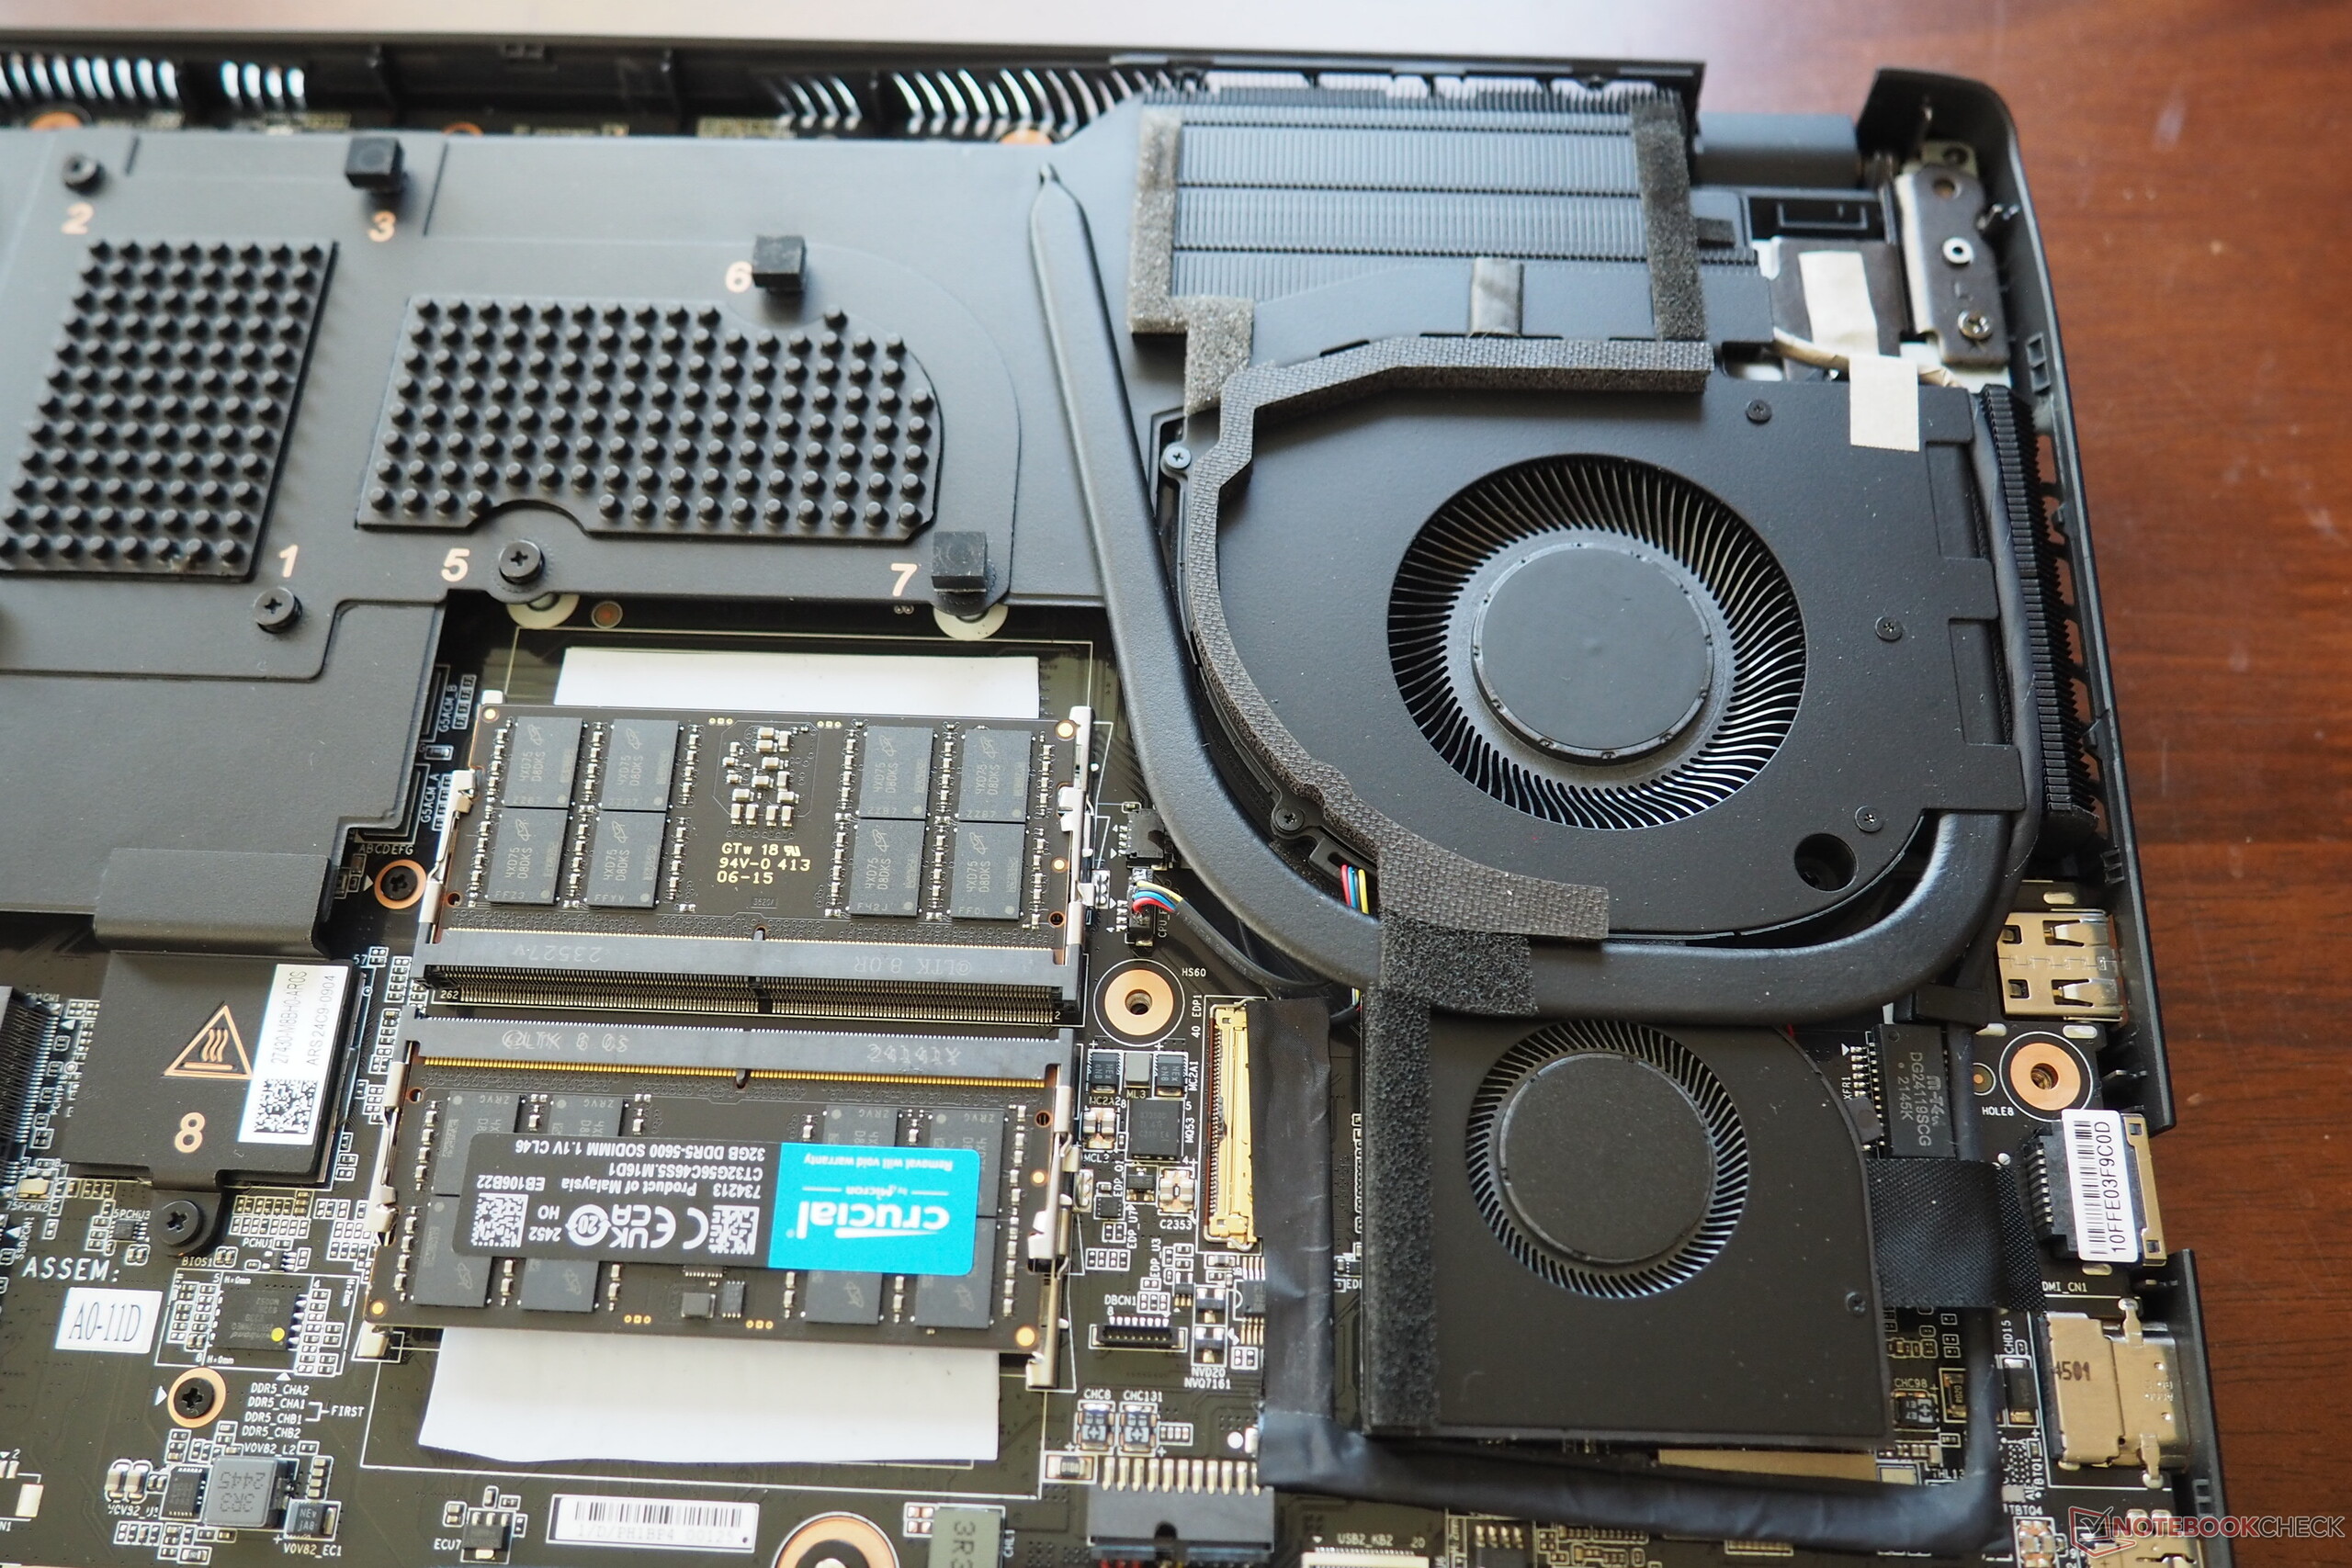
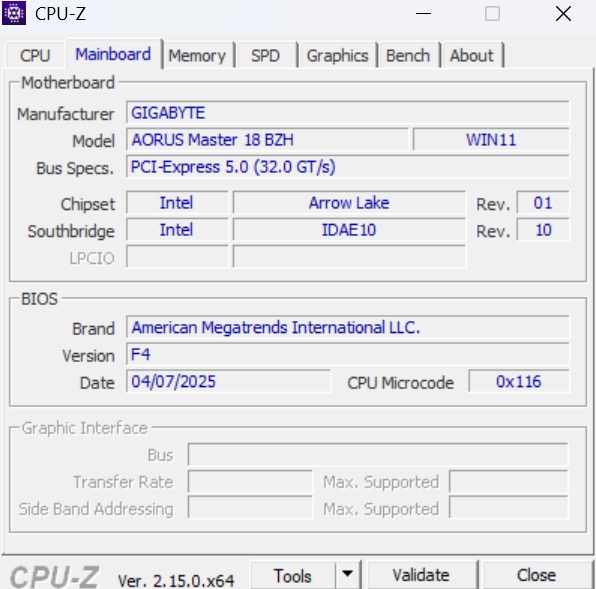
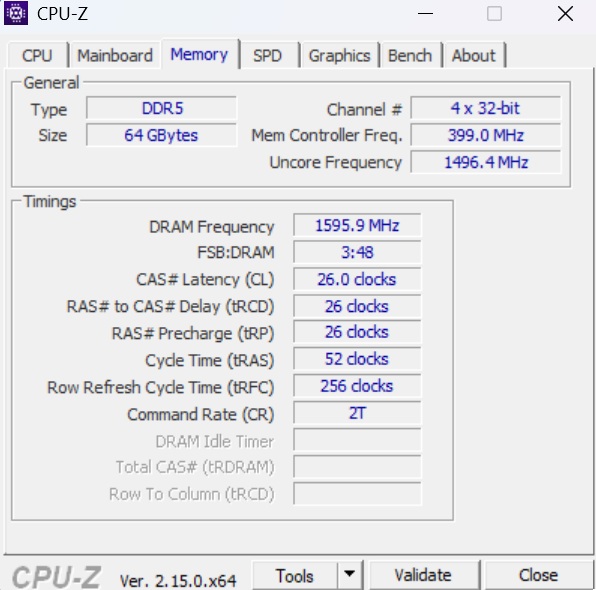
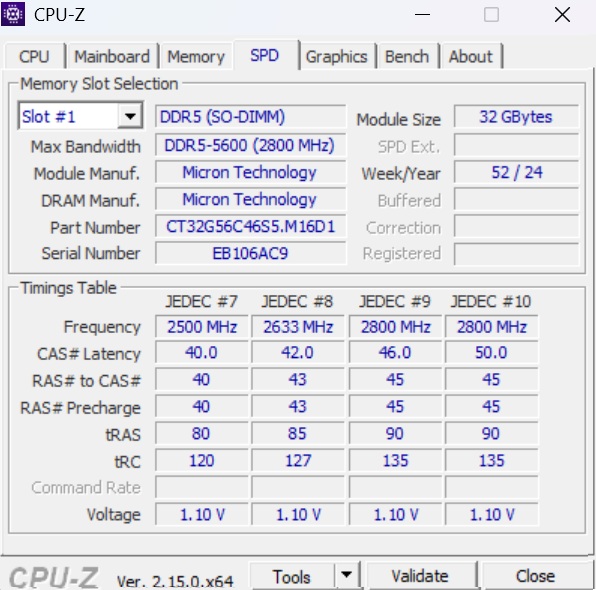
The Aorus Master 18 presents itself as a superlative high-end laptop: Its four case fans alone speak for themselves. No wonder, as the Core Ultra 9 275HX and the GeForce RTX 5090 want or need to be cooled accordingly—but the 18-inch device does get quite loud under load. Four SO-DIMM banks and three M.2 slots (our test device has 2x 32 GB DDR5-5600 RAM and two 2 TB SSDs) aren't bad even for a desktop replacement and attempt to at least halfway justify its exorbitant price of over $5,000.
Its case and input devices appear good to very good, and its connectivity options are particularly plentiful and modern thanks to Thunderbolt 5. Its 16:10-format mini LED panel with a resolution of 2,560 x 1,600 pixels, a 240 Hz refresh rate and Pantone validation cuts a fine figure for the most part, even in SDR mode. The manufacturer could make some improvements, not least when it comes to its idle consumption, tuning of the system profiles and continuous SSD performance. If you don't have a problem with its high price as well as its noise development in 3D mode, then the Aorus Master 18 is an extremely powerful companion for games and other 3D applications.
Please note: You can find our video test of the RTX 5080 version of the Master 18 at the end of the article.
Pros
Cons
Specifications
Case
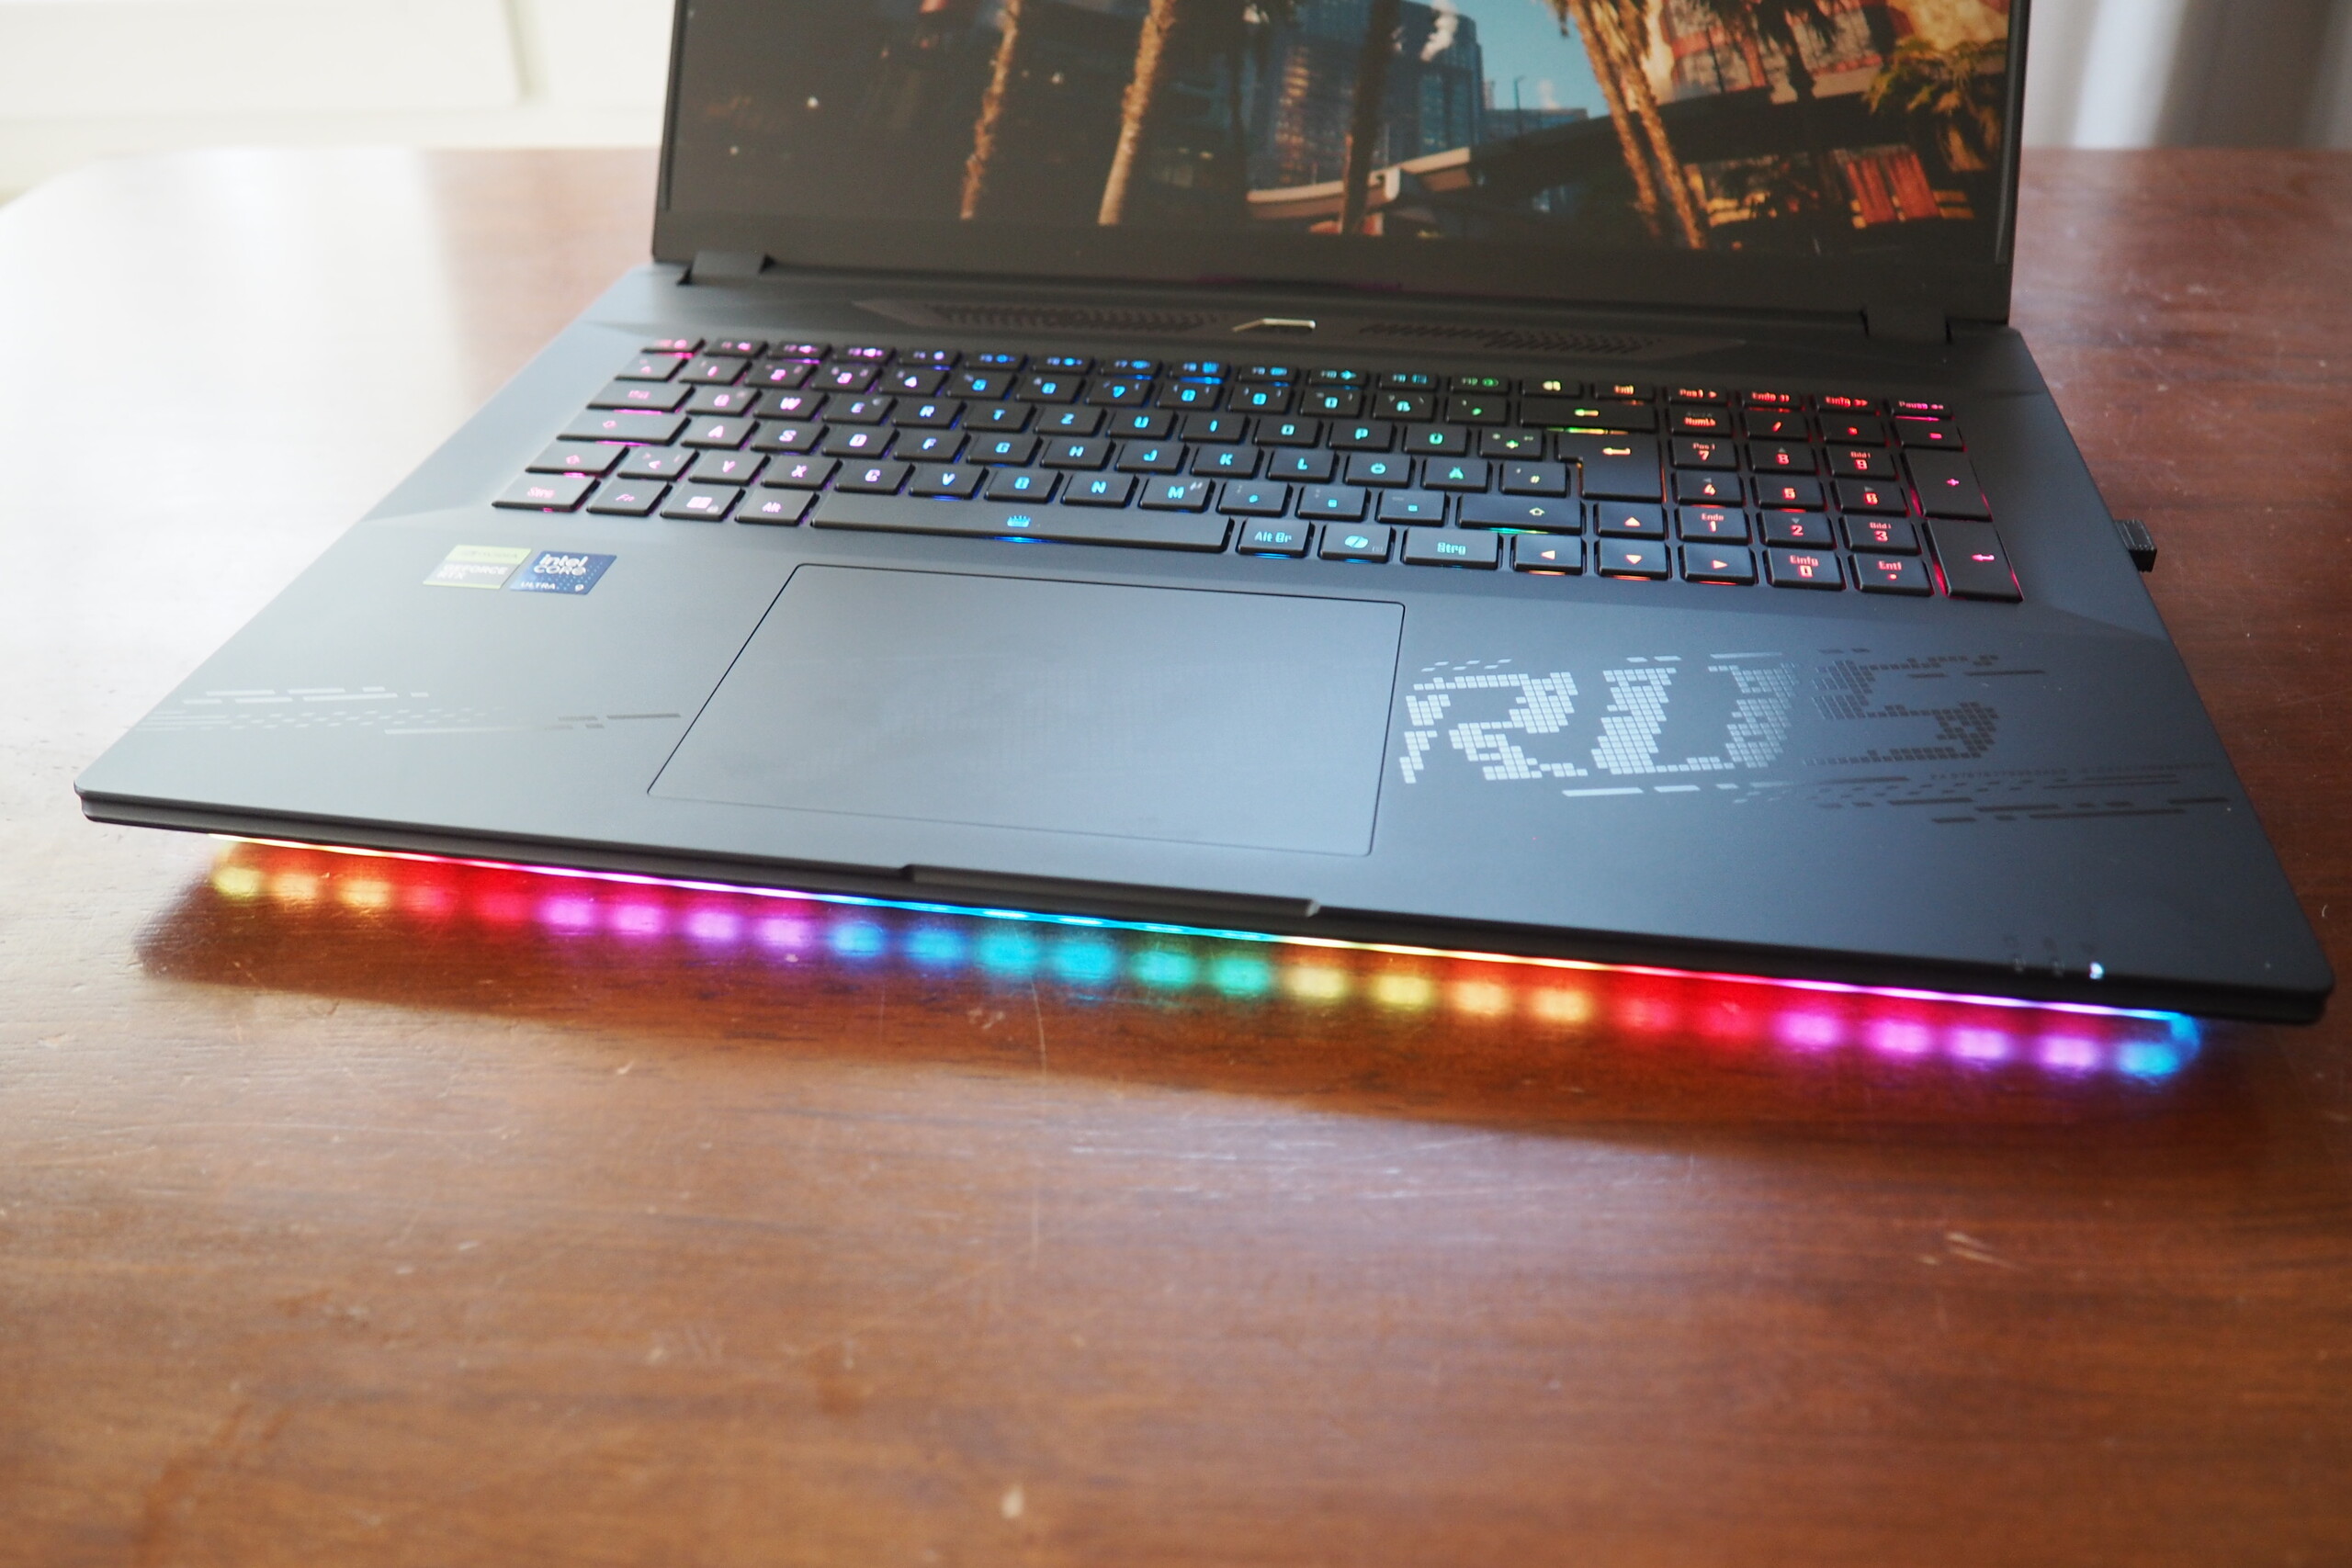
Gigabyte has limited itself to plastic for the 18-inch laptop's sturdy case, which isn't necessarily immediately noticeable. Its build quality is good but not perfect (the A-cover, for example, could be built a little better). Fans of extravagant lighting can look forward to a bright LED strip on the front and an RGB keyboard. The display's maximum opening angle isn't quite as generous: Just under 120° is pretty meagre. On the other hand, the tight hinges hold the lid adequately in position.

With a weight of 3.4 kilograms, the Master 18 is comparable to the 18-inch competitor device from Asus. The Strix Scar 18 that we recently tested, which also contains an RTX 5090, comes in at around 3.3 kilograms. Its dimensions are also similar.
Connectivity
Ports
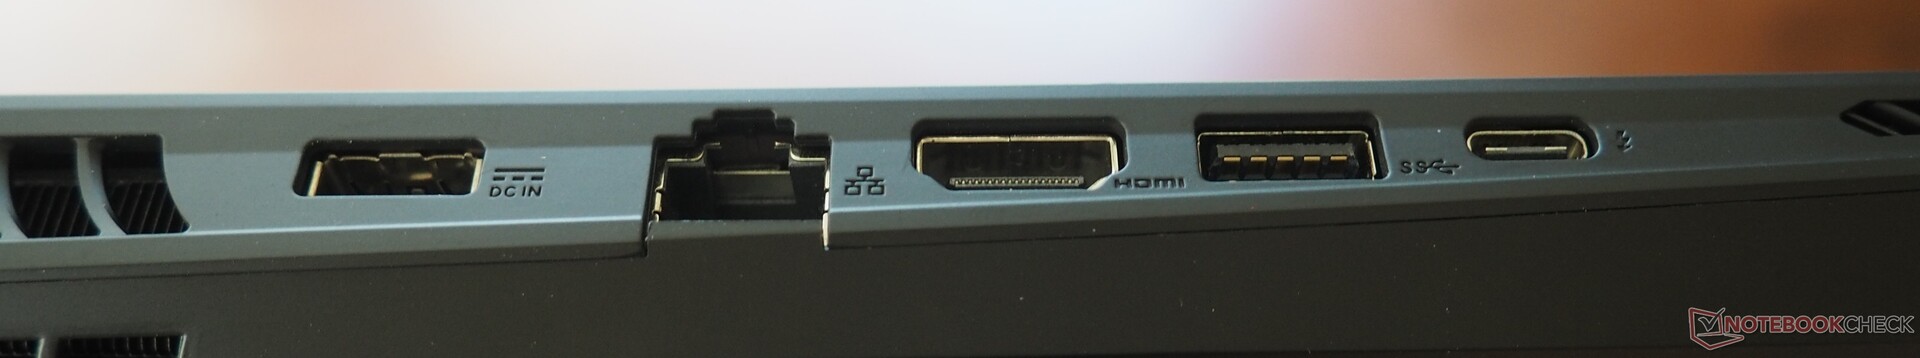
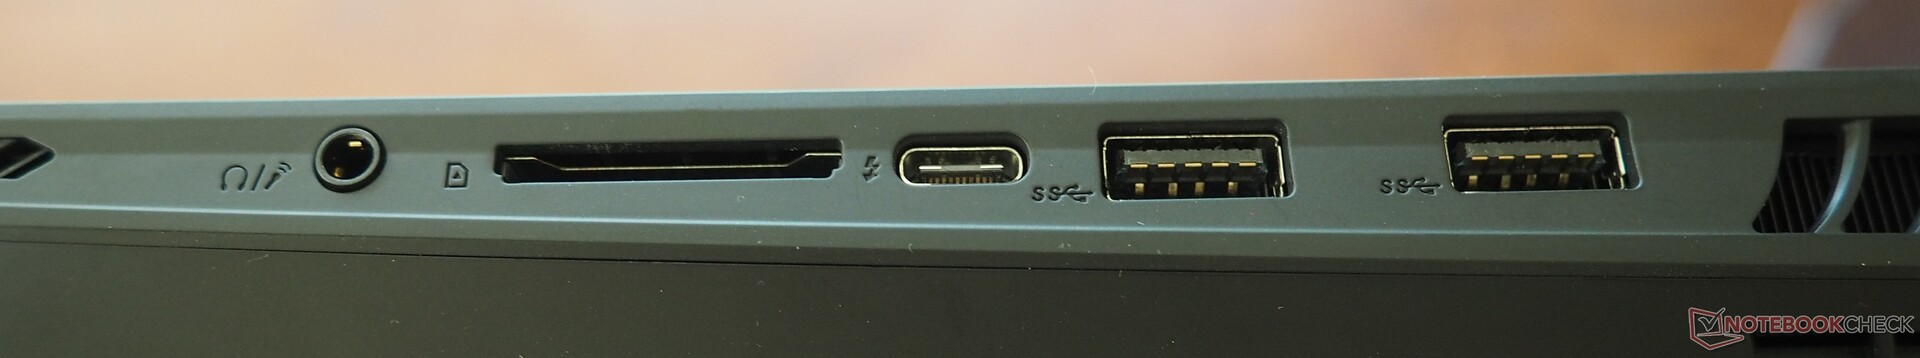
With regard to its connections, the Gigabyte laptop really comes up trumps. Two Thunderbolt ports (one v4 and one v5) with DisplayPort and Power Delivery functionality leave nothing else to be desired. There are also three classic USB-A ports that work according to the 3.2 Gen2 standard. The package is rounded off by an audio jack, an HDMI 2.1 output and a fully-fledged SD card reader. A 2.5 GBit LAN port handles wired networking.
SD card reader
The installed card reader is of the faster variety and managed around 200 MB/s when reading our reference card sequentially—a respectable result.
| SD Card Reader | |
| average JPG Copy Test (av. of 3 runs) | |
| Alienware m18 R2 (Toshiba Exceria Pro SDXC 64 GB UHS-II) | |
| Aorus Master 18 AM8H (AV PRO microSD 128 GB V60) | |
| Asus ROG Zephyrus G16 GU605CX (Angelbird AV Pro V60) | |
| Razer Blade 16 2025 RTX 5090 (Angelbird AV Pro V60) | |
| Average of class Gaming (20.9 - 210, n=54, last 2 years) | |
| MSI Titan 18 HX A14VIG (Toshiba Exceria Pro SDXC 64 GB UHS-II) | |
| maximum AS SSD Seq Read Test (1GB) | |
| Alienware m18 R2 (Toshiba Exceria Pro SDXC 64 GB UHS-II) | |
| Asus ROG Zephyrus G16 GU605CX (Angelbird AV Pro V60) | |
| Aorus Master 18 AM8H (AV PRO microSD 128 GB V60) | |
| Razer Blade 16 2025 RTX 5090 (Angelbird AV Pro V60) | |
| Average of class Gaming (25.5 - 261, n=51, last 2 years) | |
| MSI Titan 18 HX A14VIG (Toshiba Exceria Pro SDXC 64 GB UHS-II) | |
Communication
A Wi-Fi 7 chip from Intel (model BE200) is responsible for wireless connections and achieved good to very good results during our range test.
Webcam
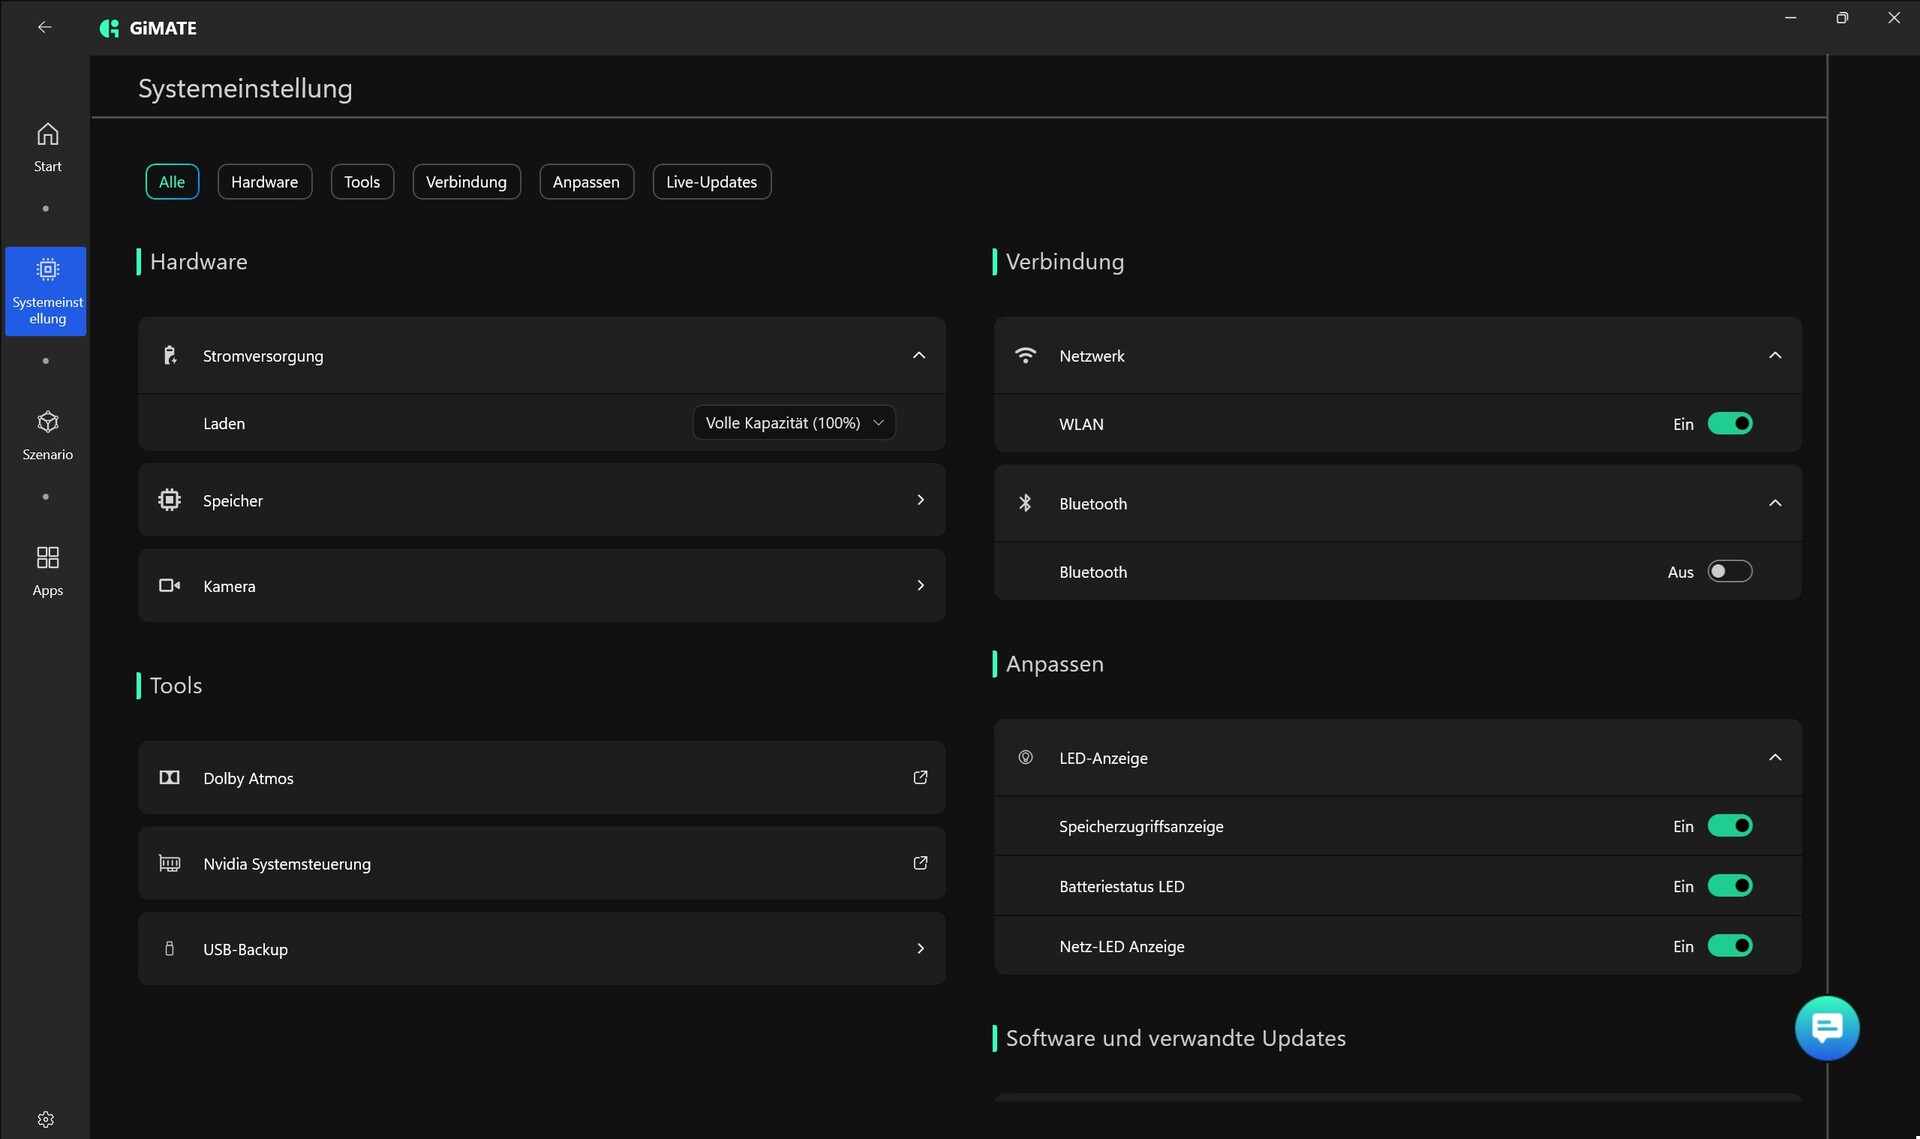
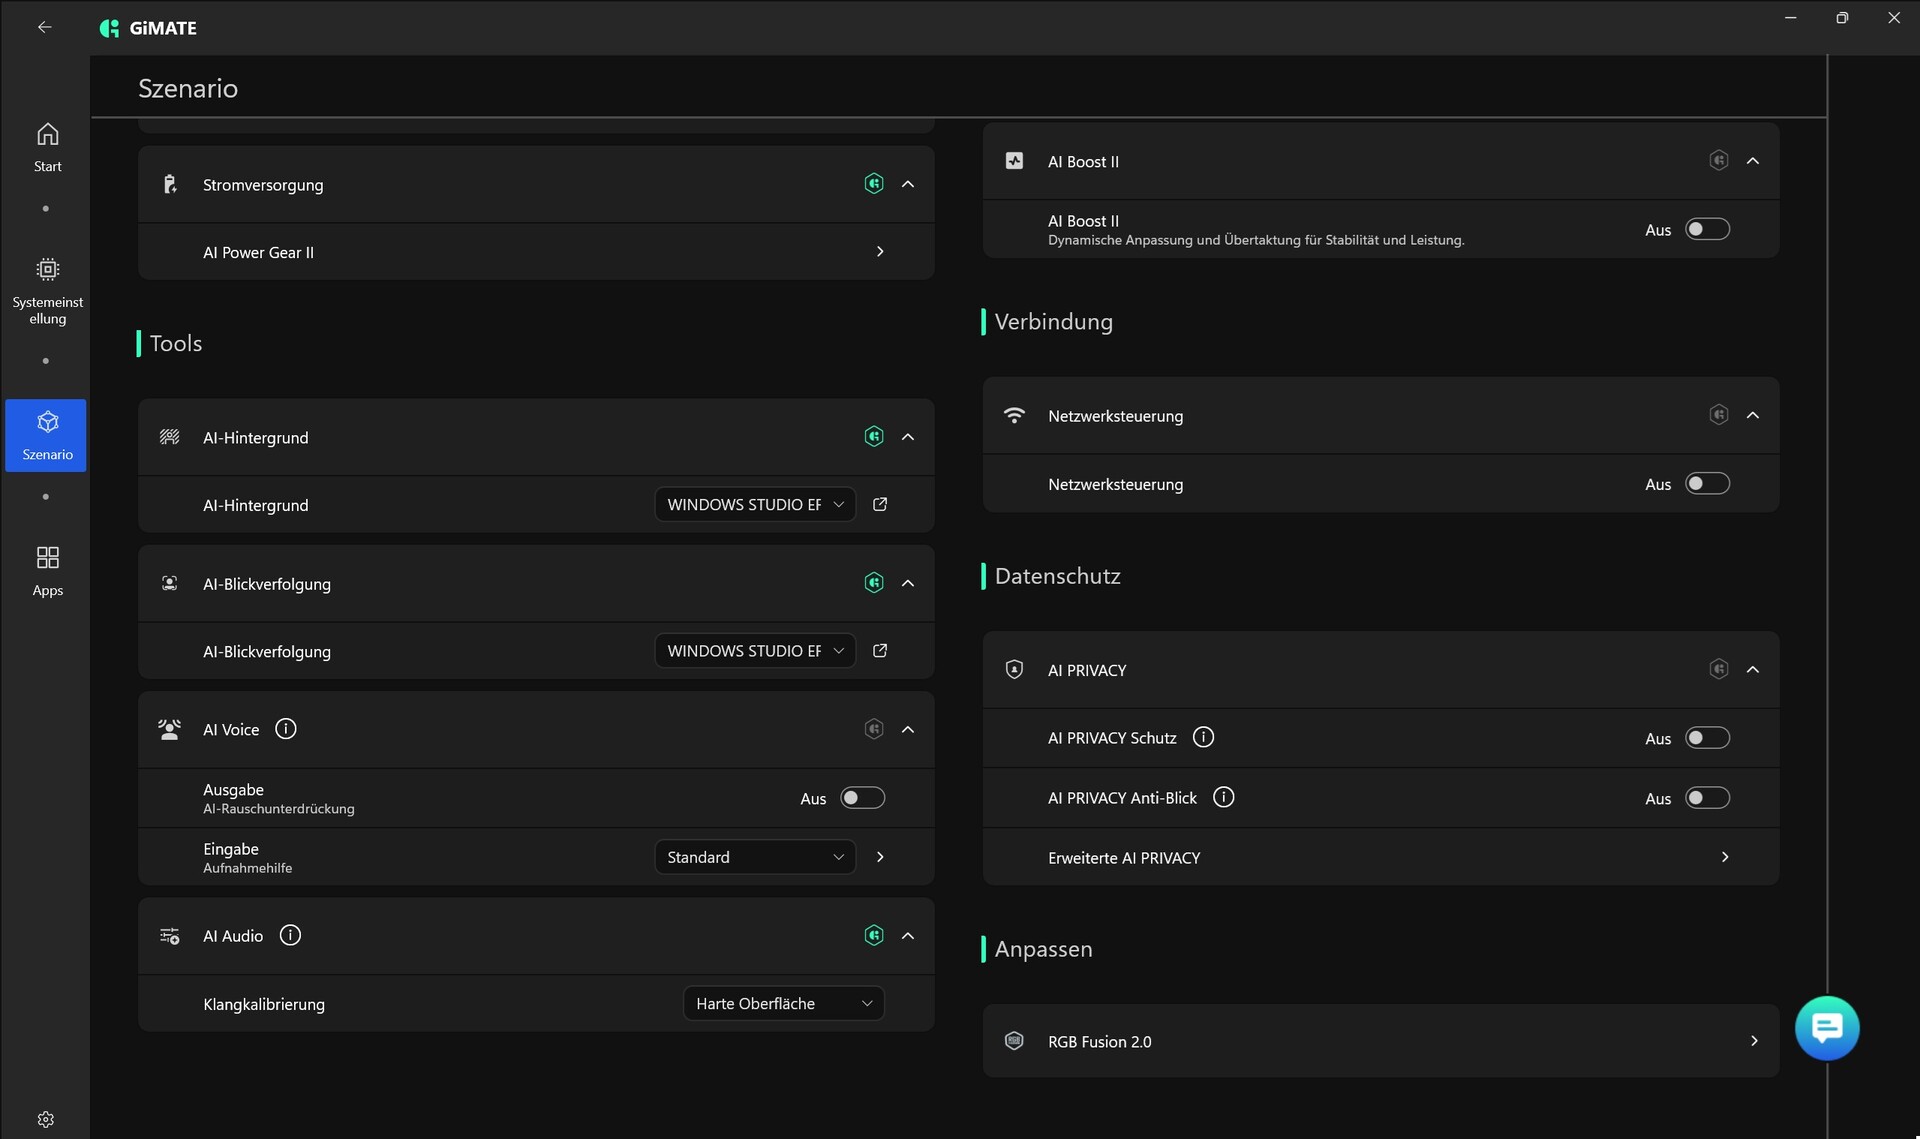
The device's 2 MP webcam produces solid images without being terribly impressive. There is still room for improvement in terms of its image sharpness and color accuracy. Gigabyte has spared itself a privacy cover. In return, the manufacturer's software offers various privacy features (see screenshots below).


Accessories
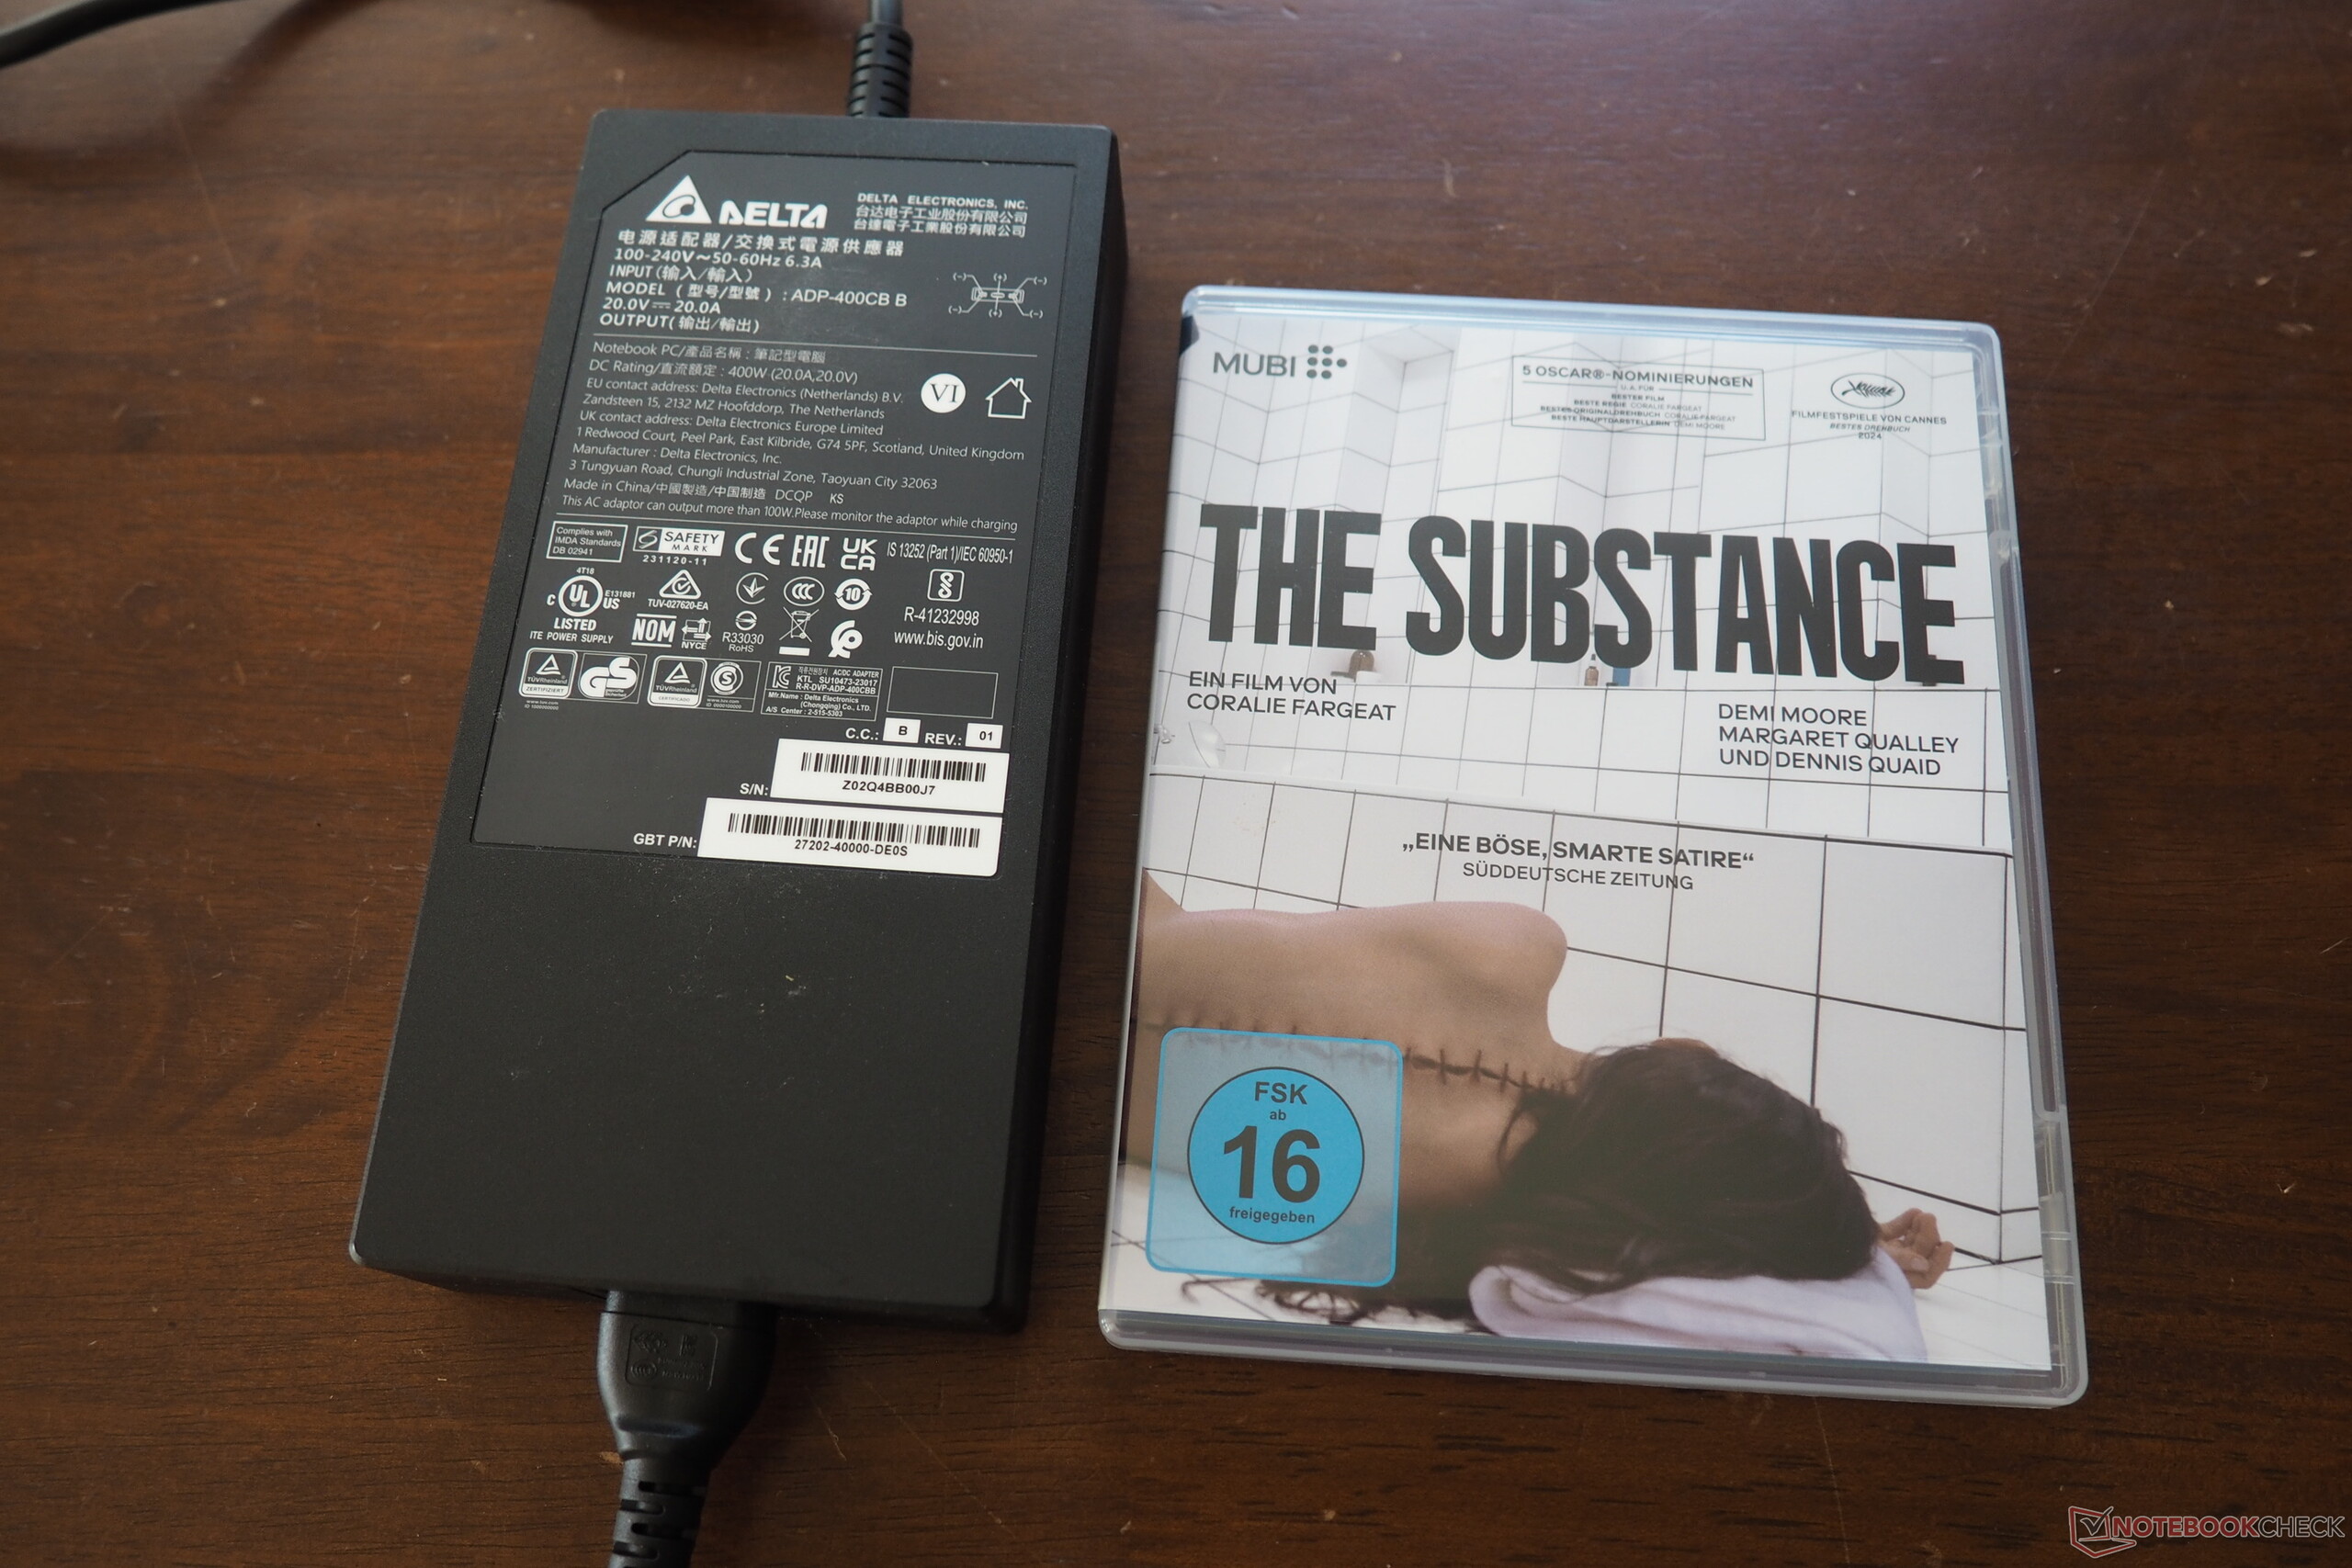
The laptop comes with a bulky 400-watt power supply unit weighing more than 1 kilogram.
Maintenance
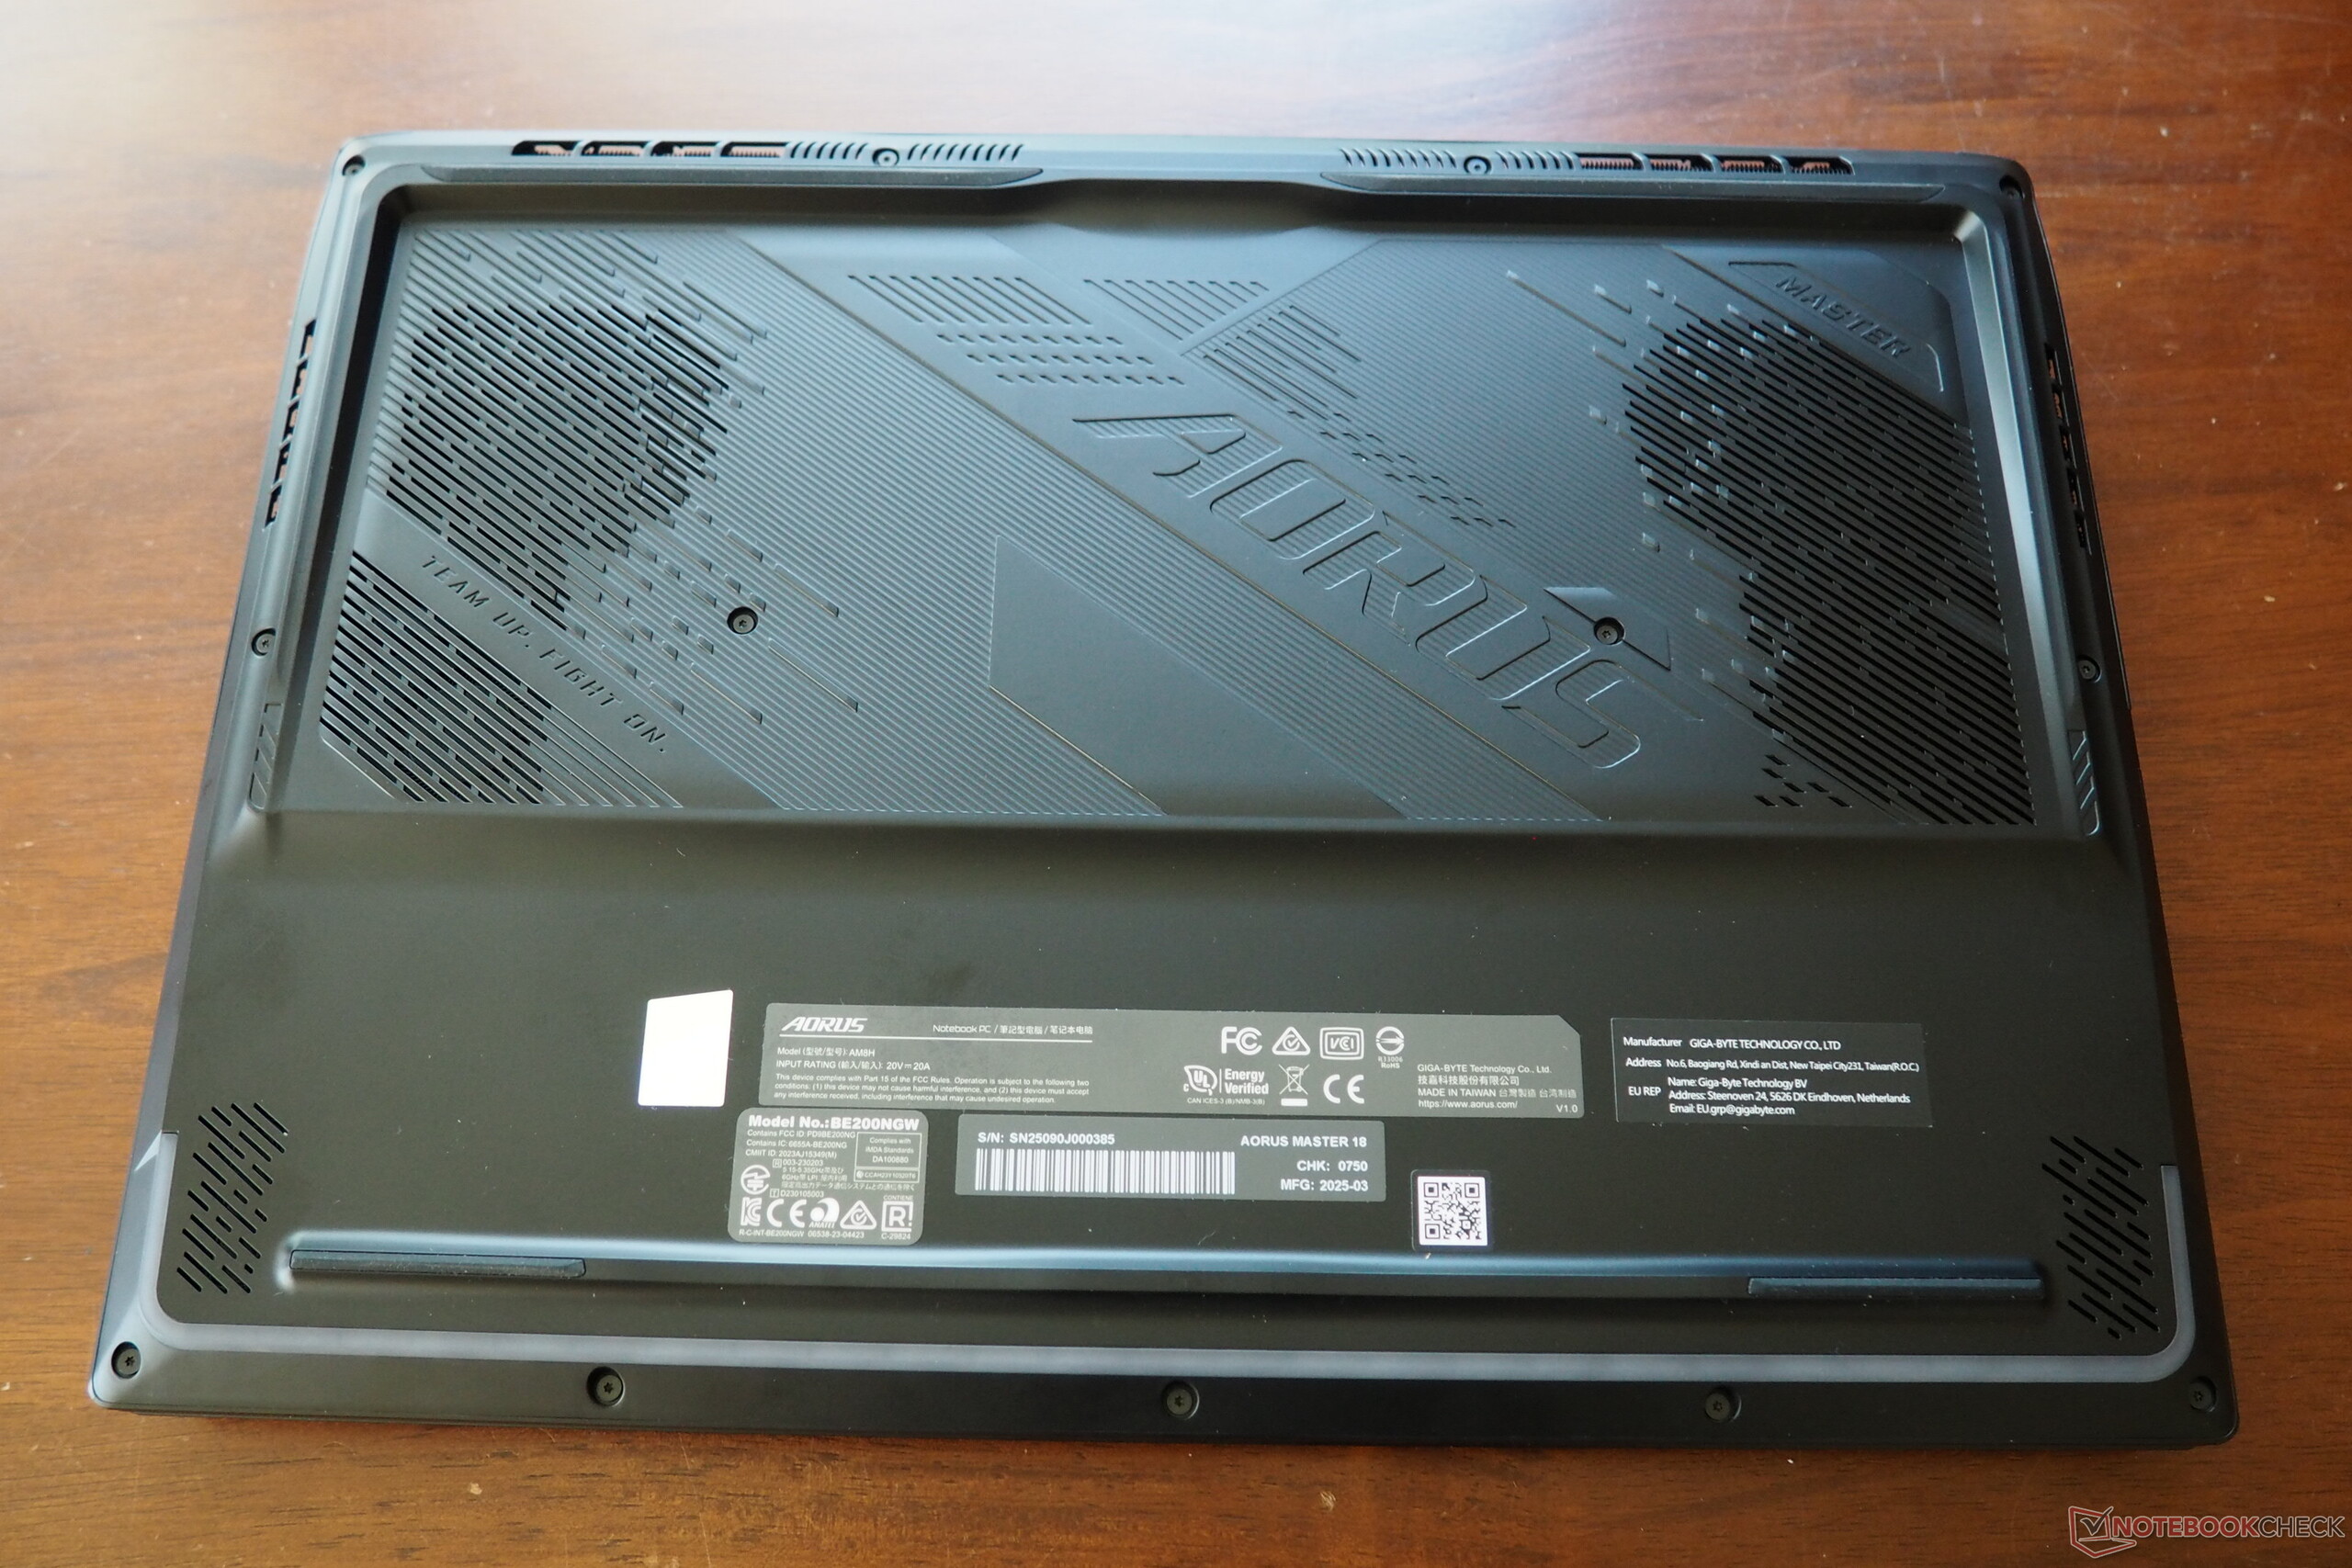
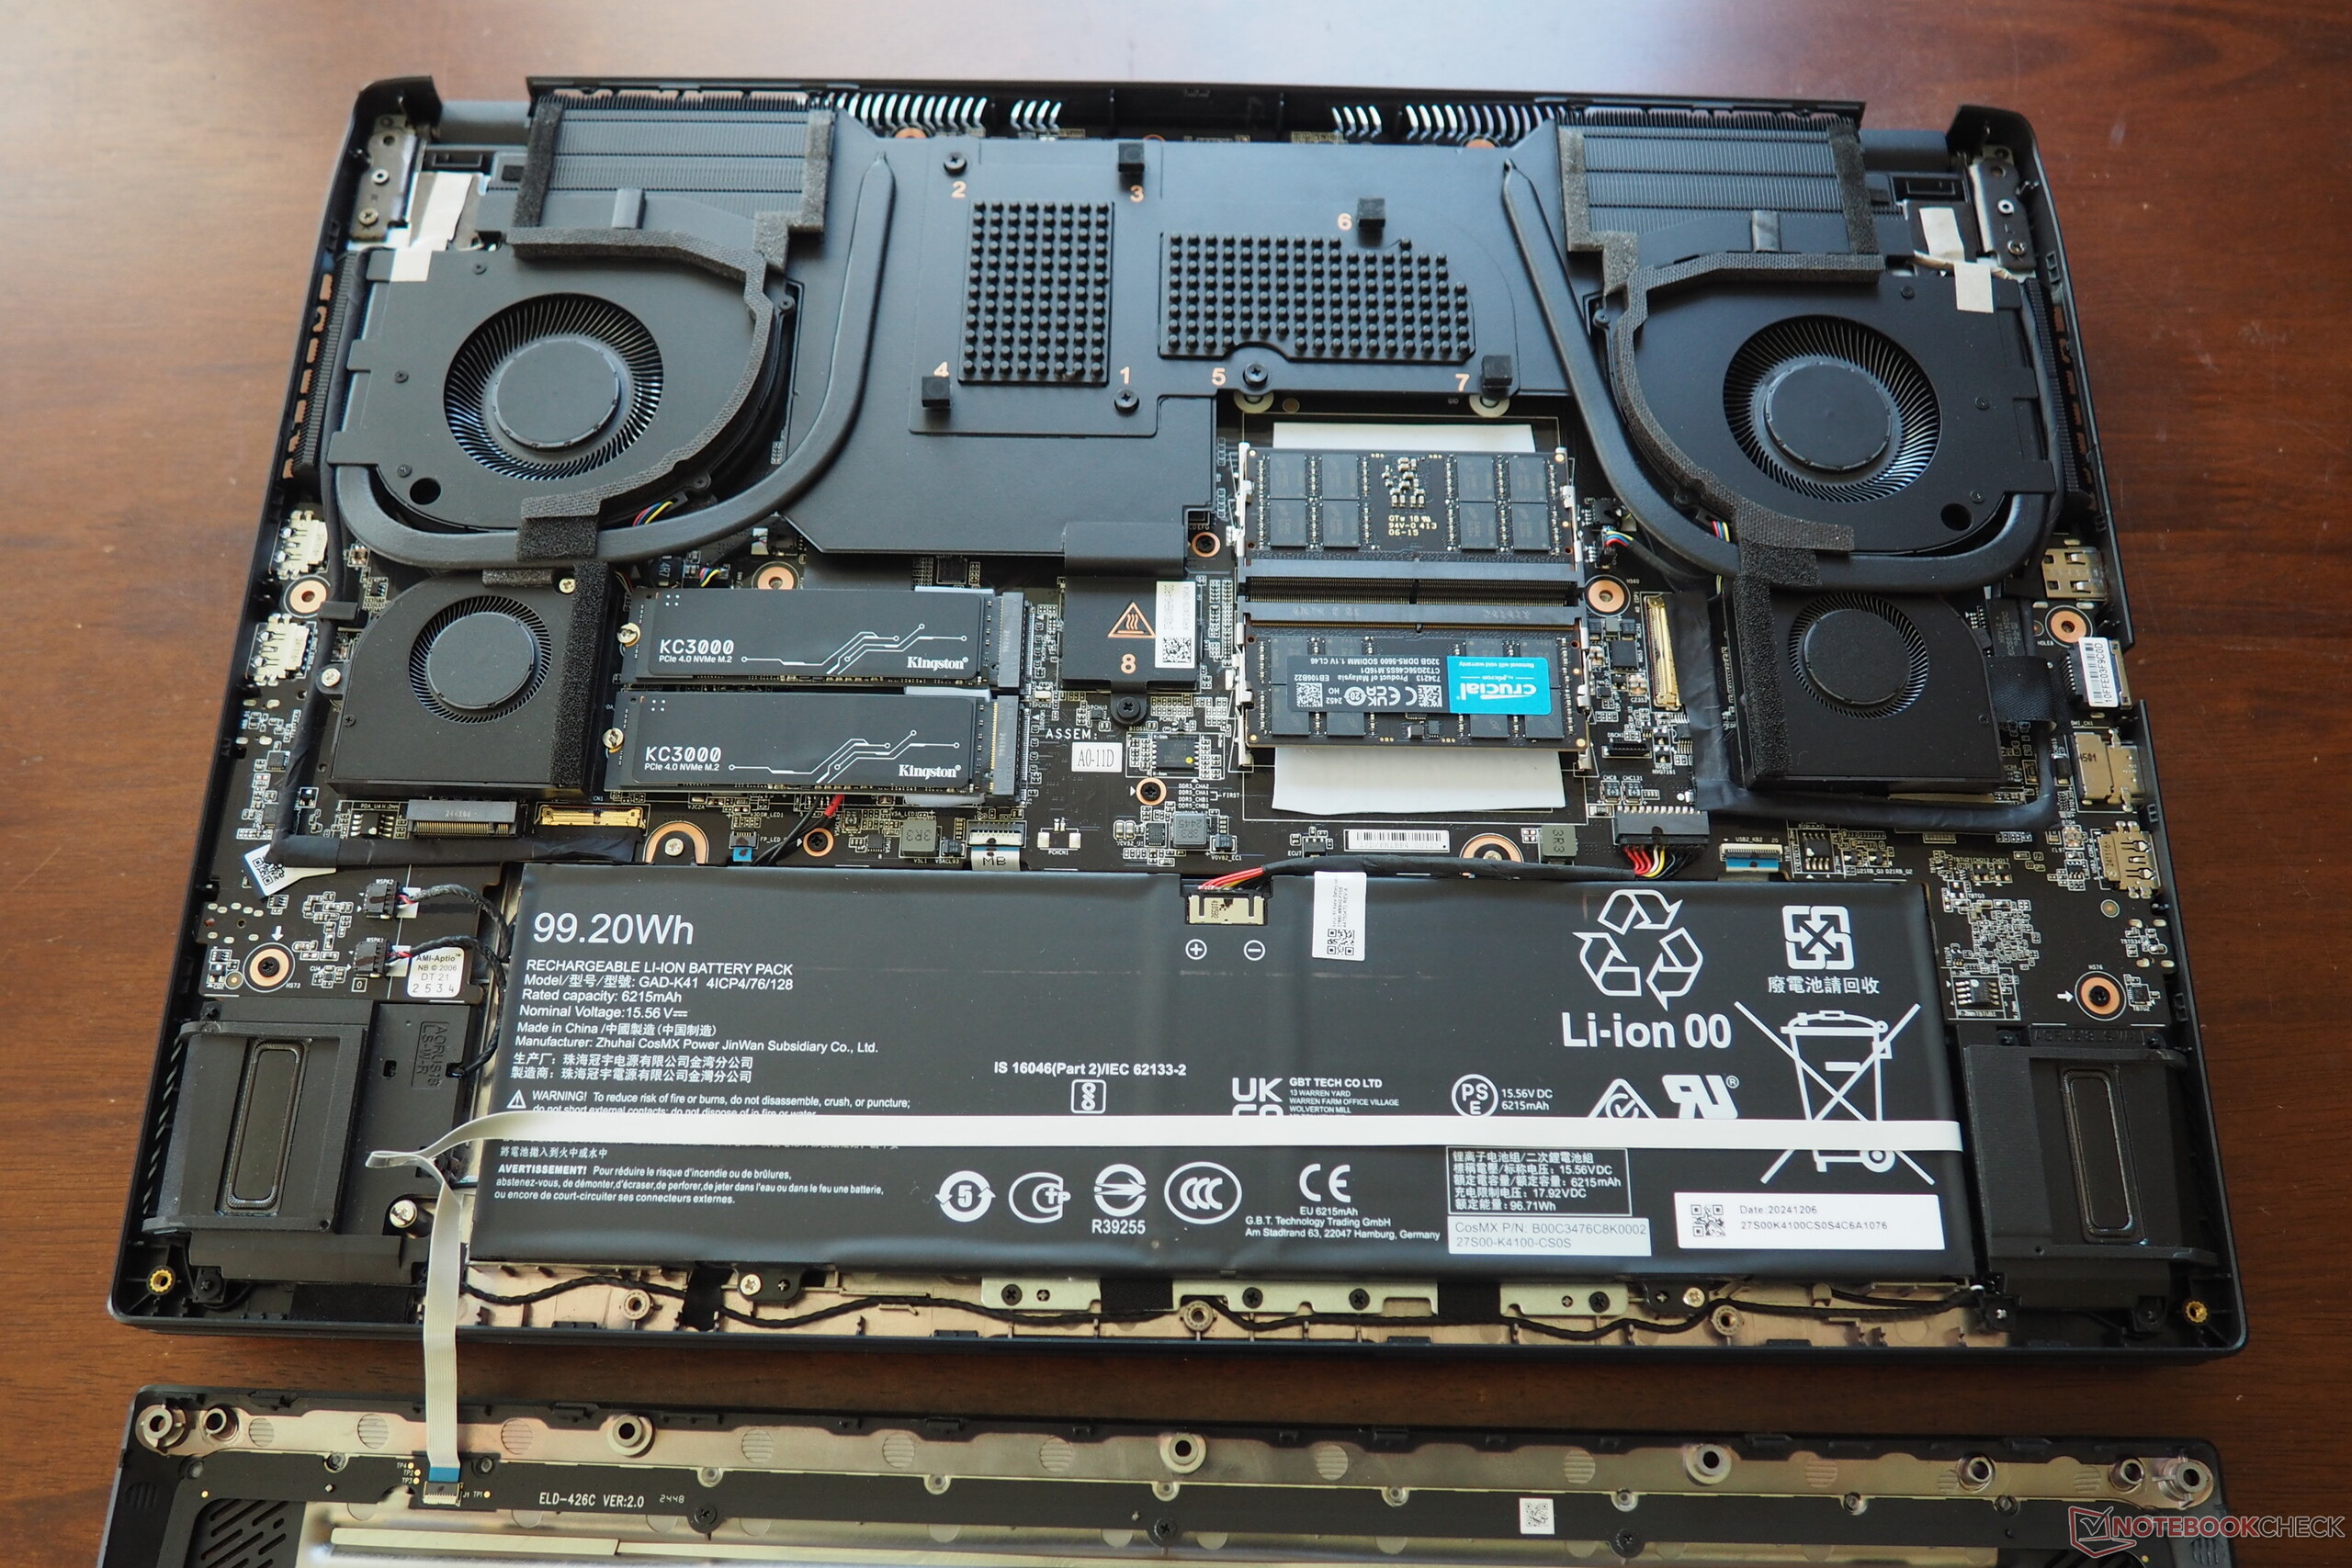
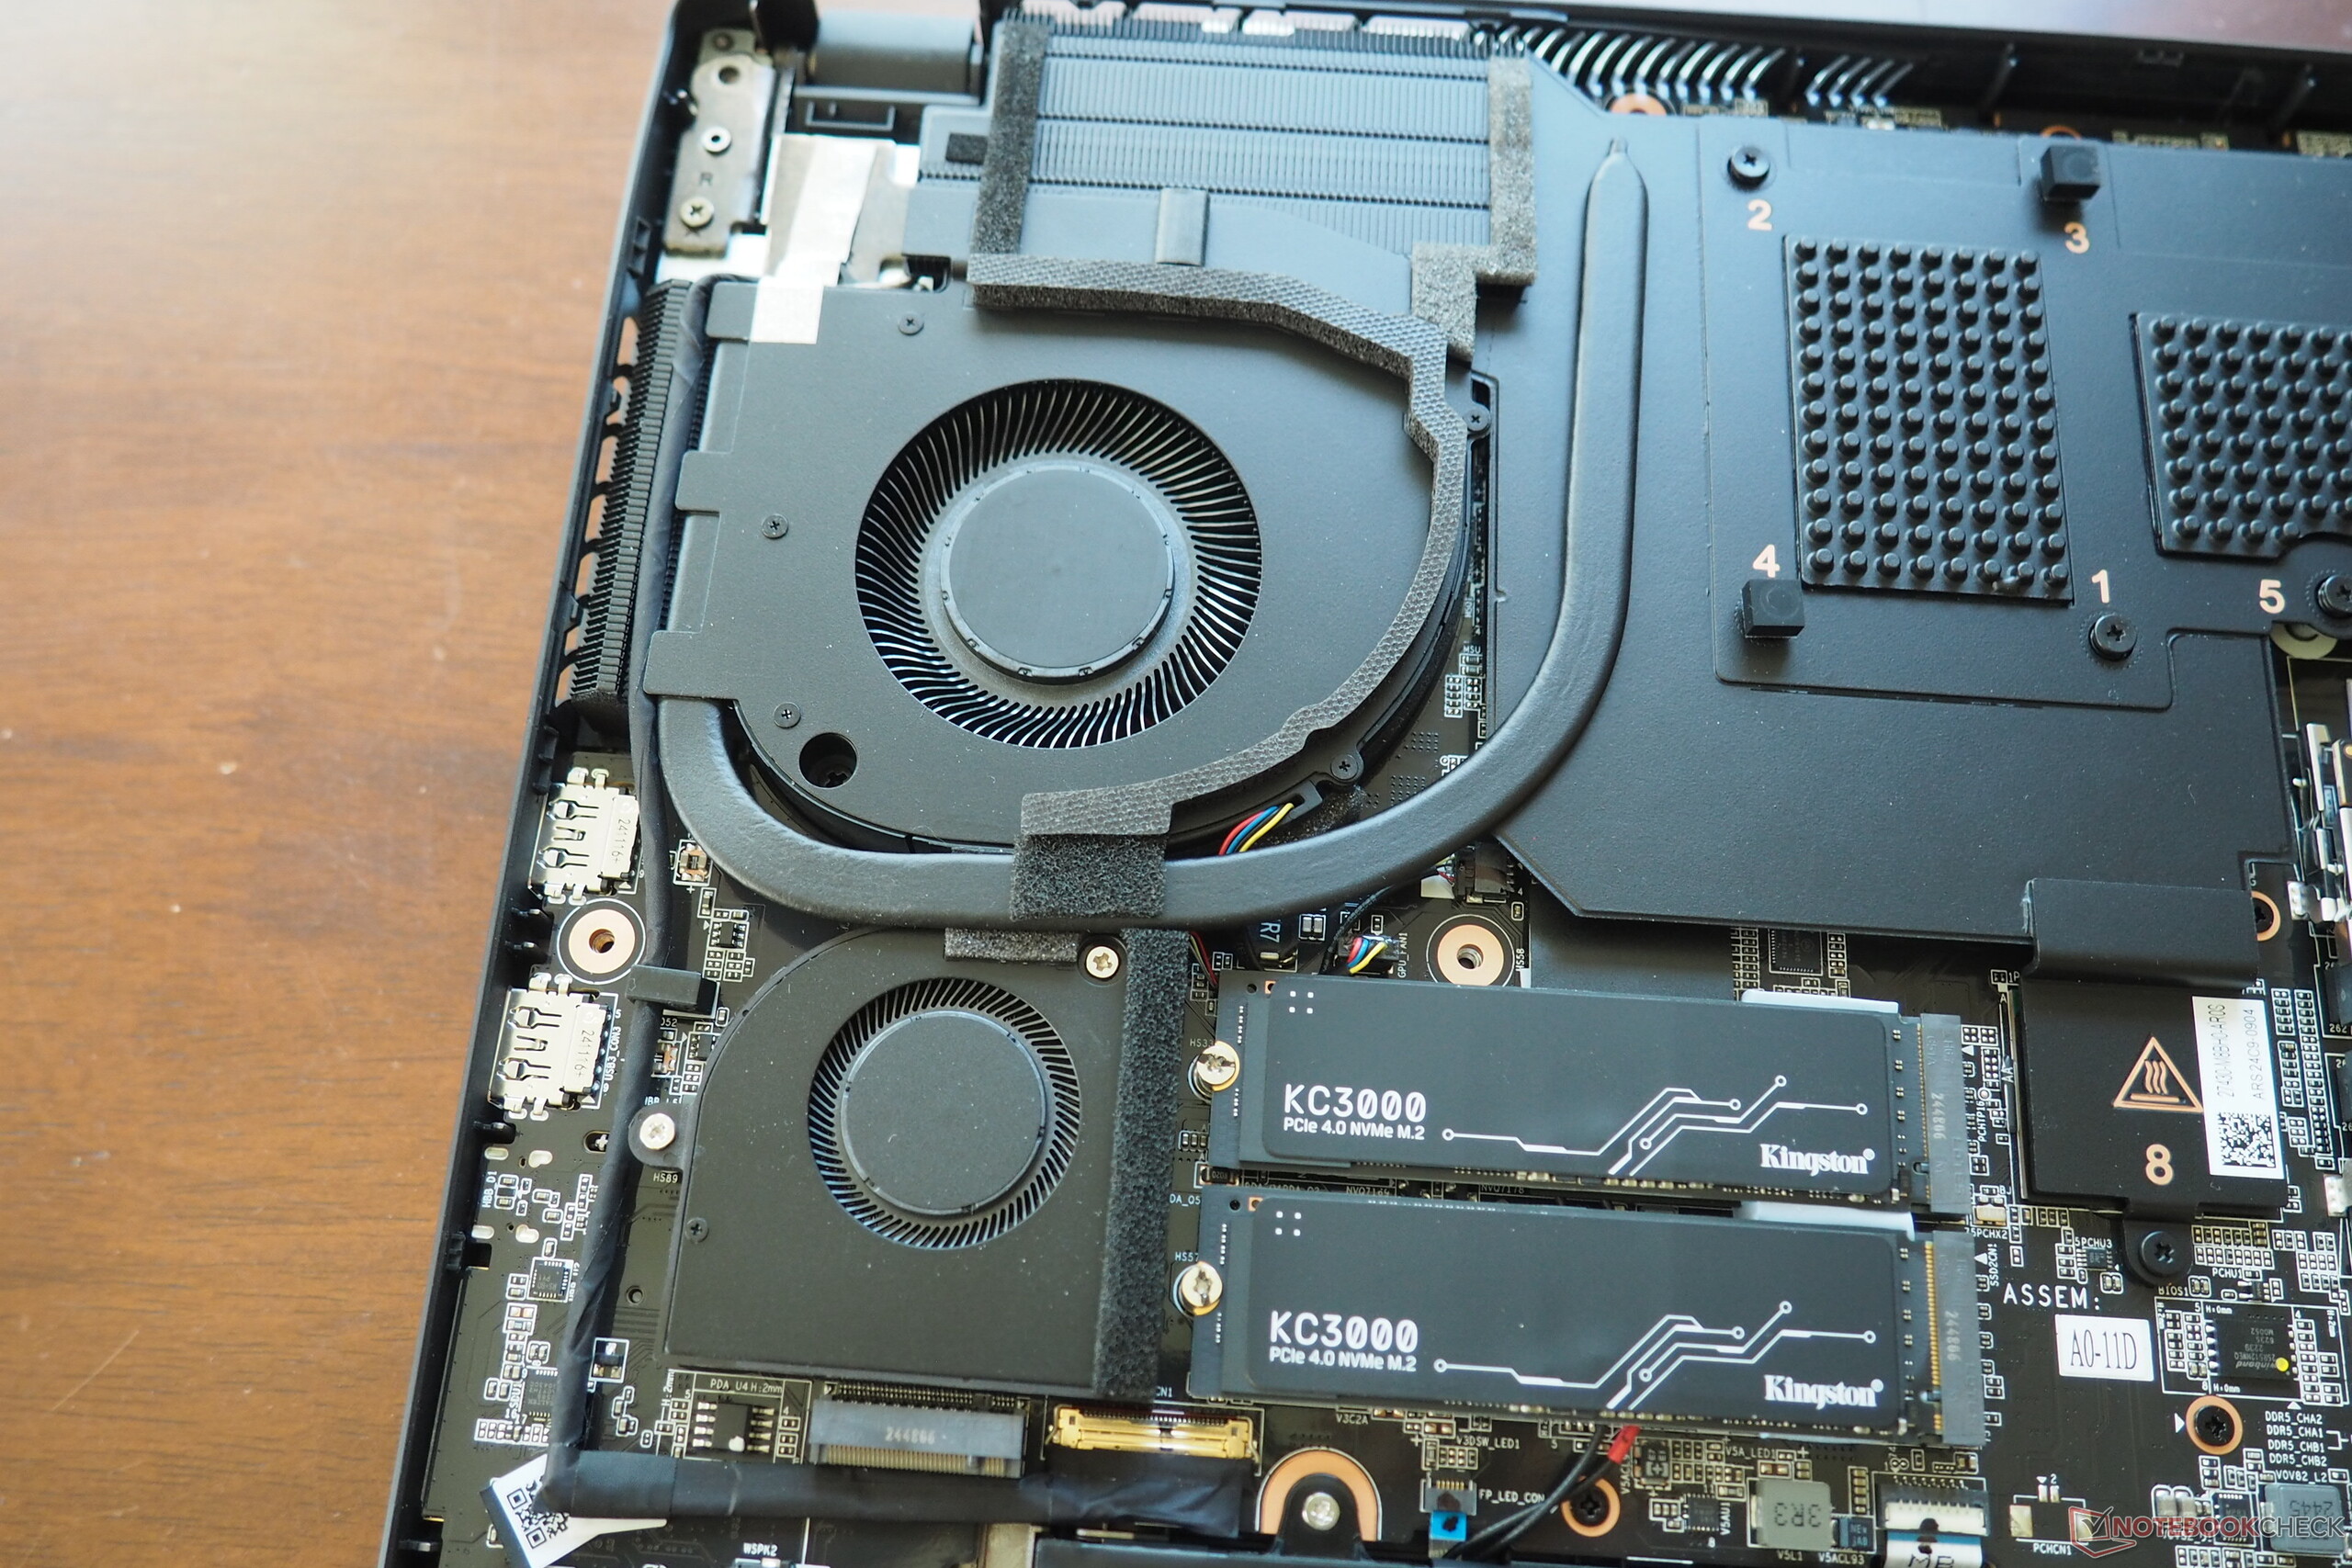
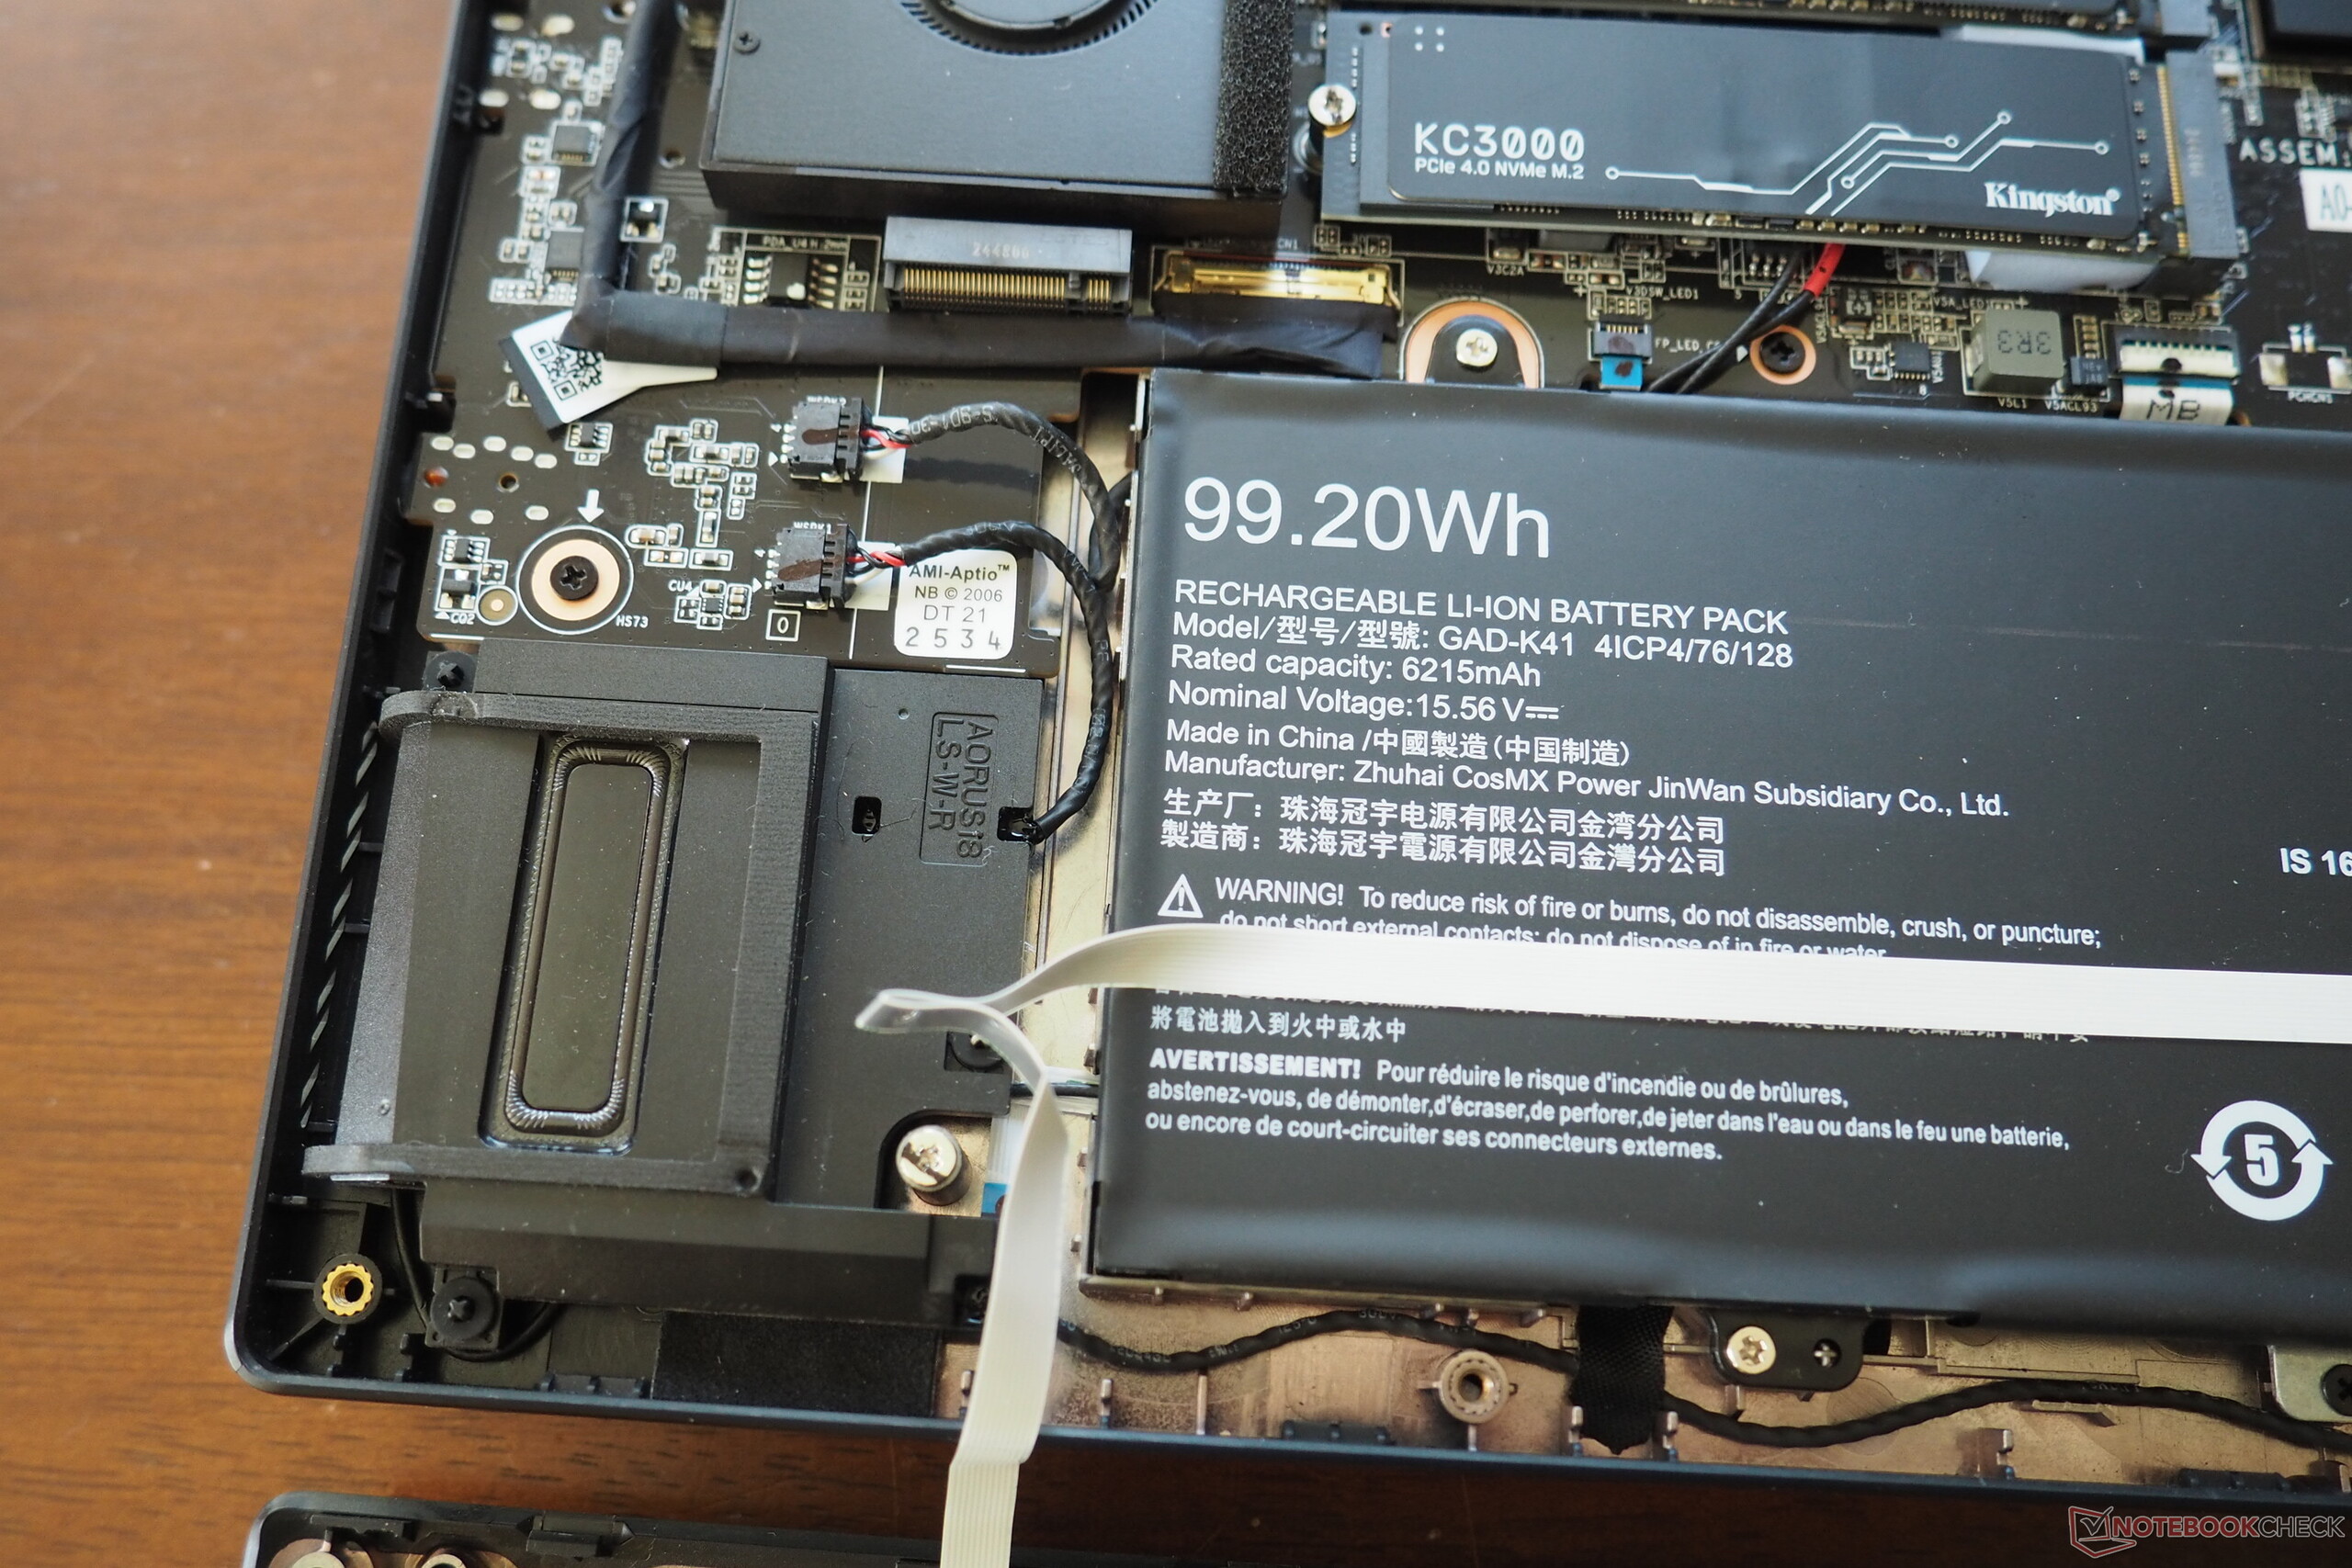
You can loosen the base plate after removing 13 Torx screws (caution: the case base has wires for the lighting on the front). Upgrade options are made possible by an empty M.2 slot and two free RAM banks. A positive: The laptop's cooling system uses vapor-chamber technology.
Sustainability
Some of its packaging uses polypropylene—the manufacturer could do better in this respect.
Warranty
The device is covered by a standard 12-month warranty in the United States.
Input devices
Keyboard
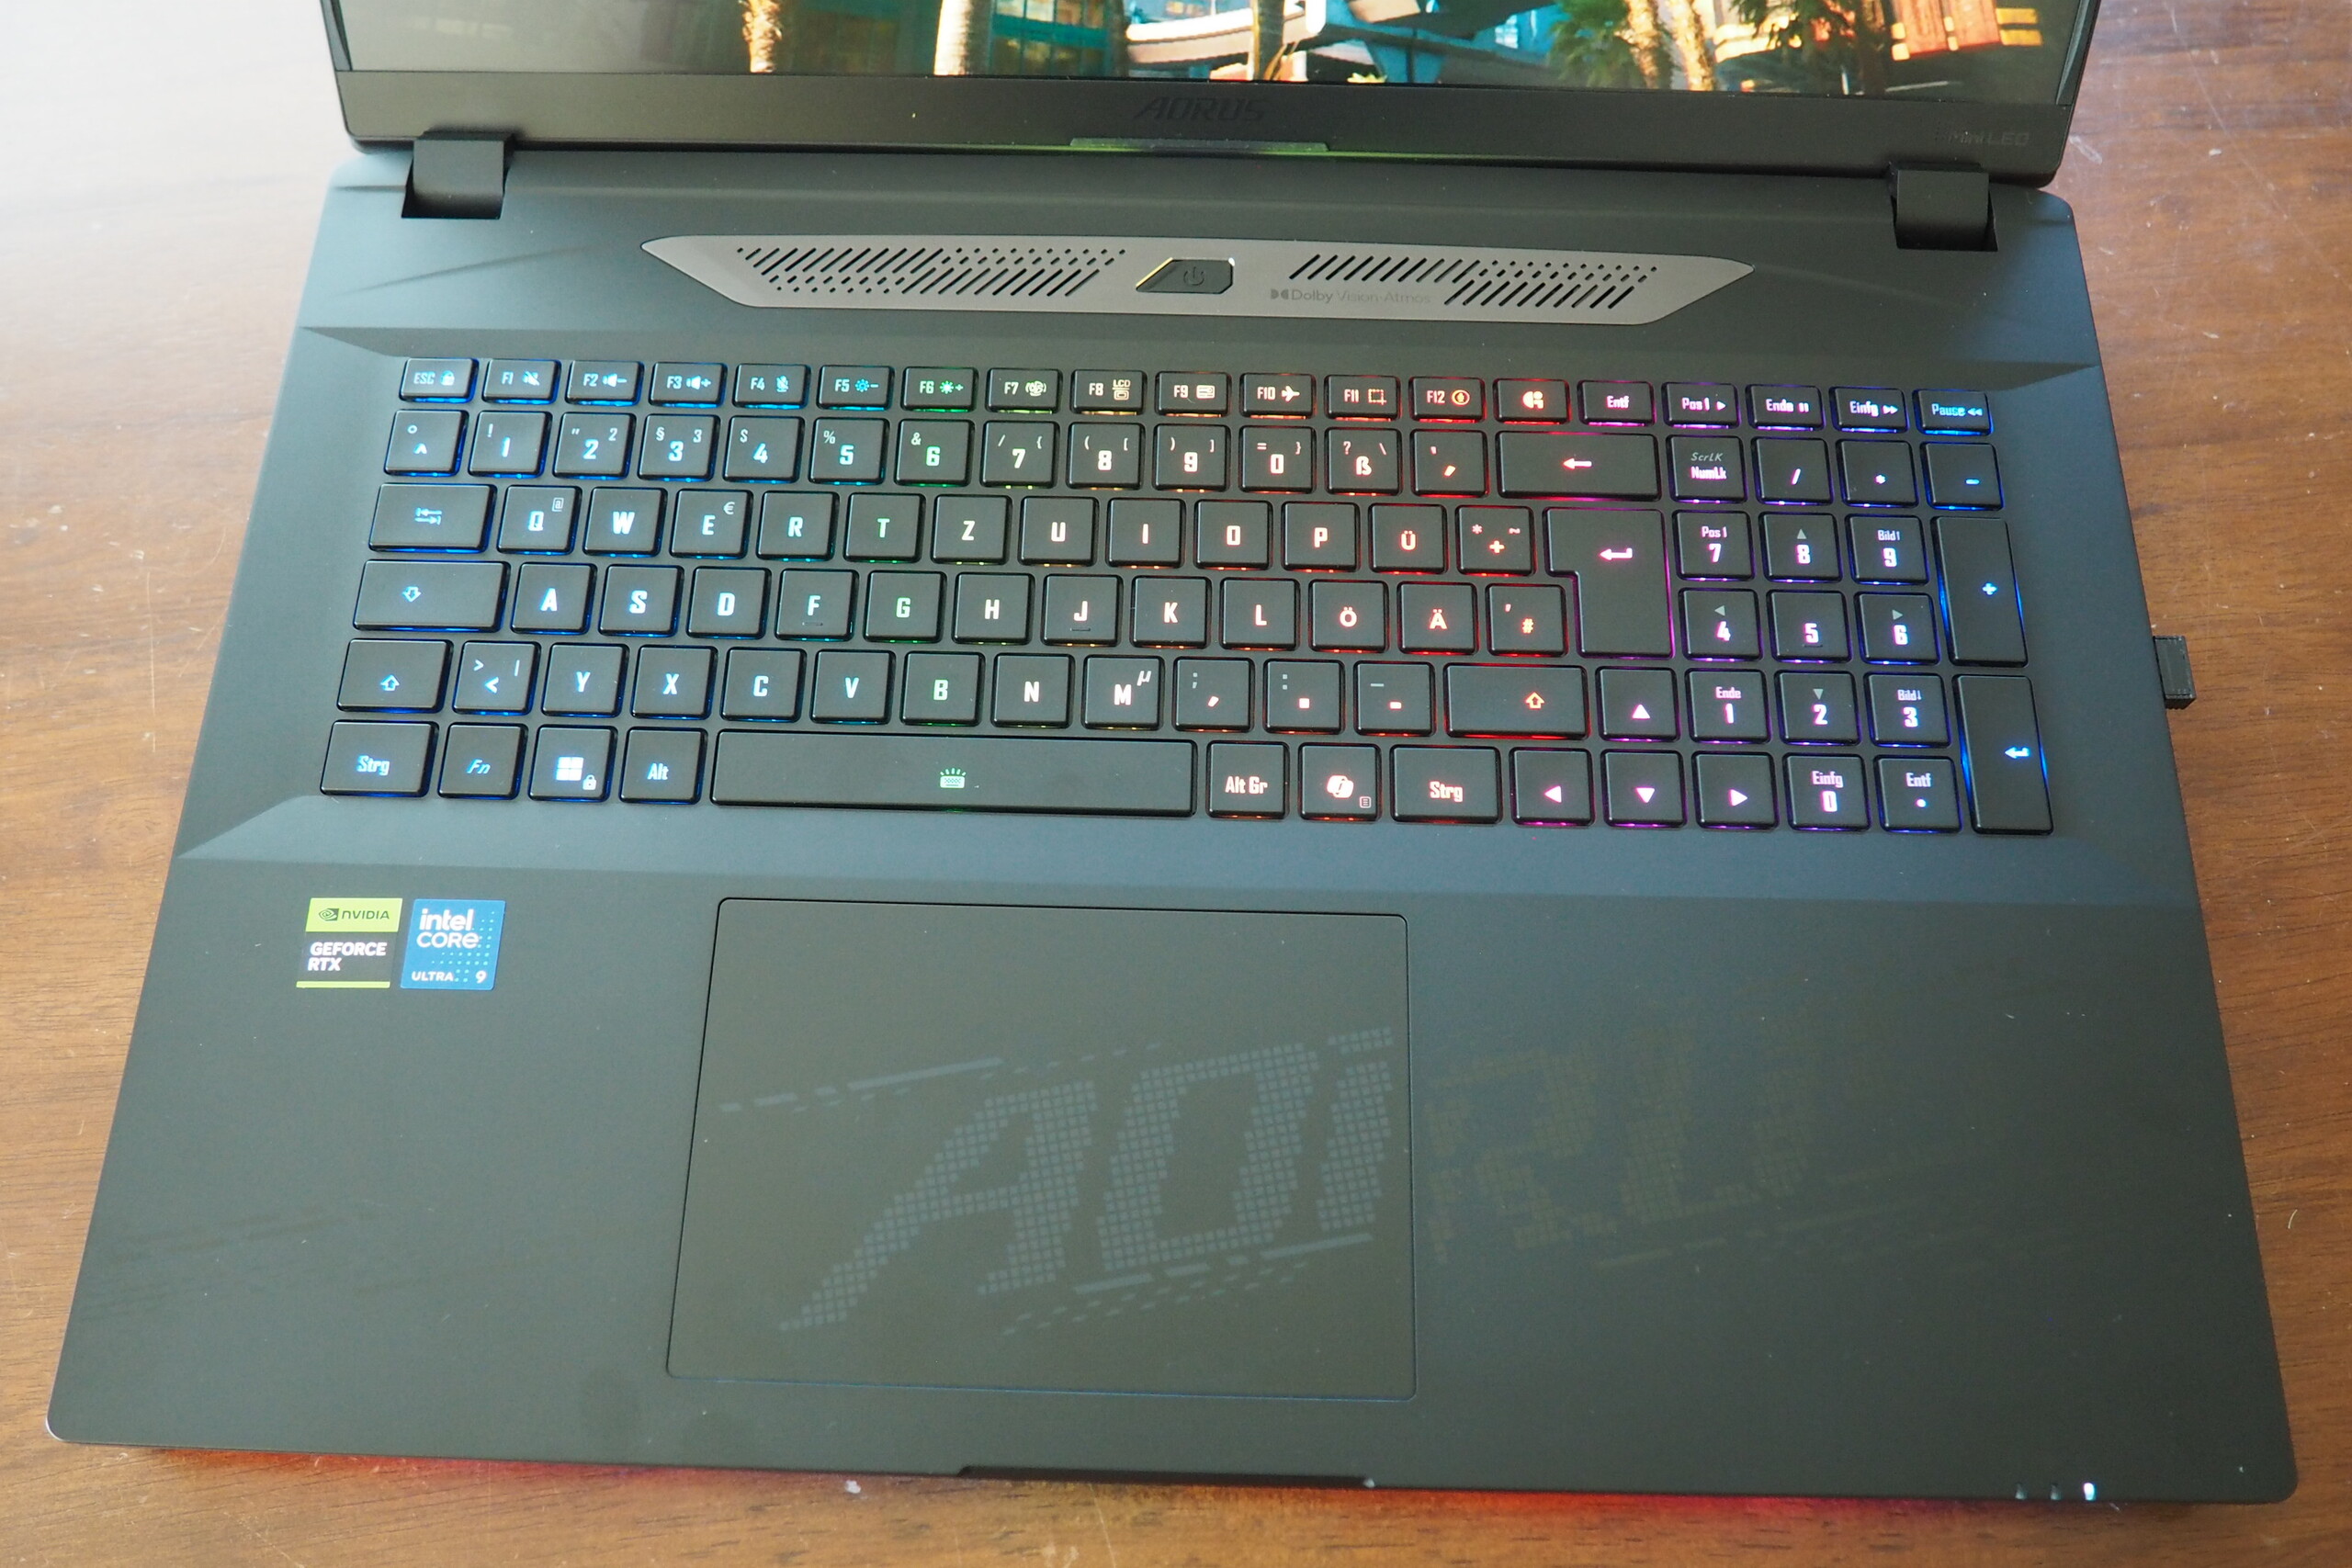
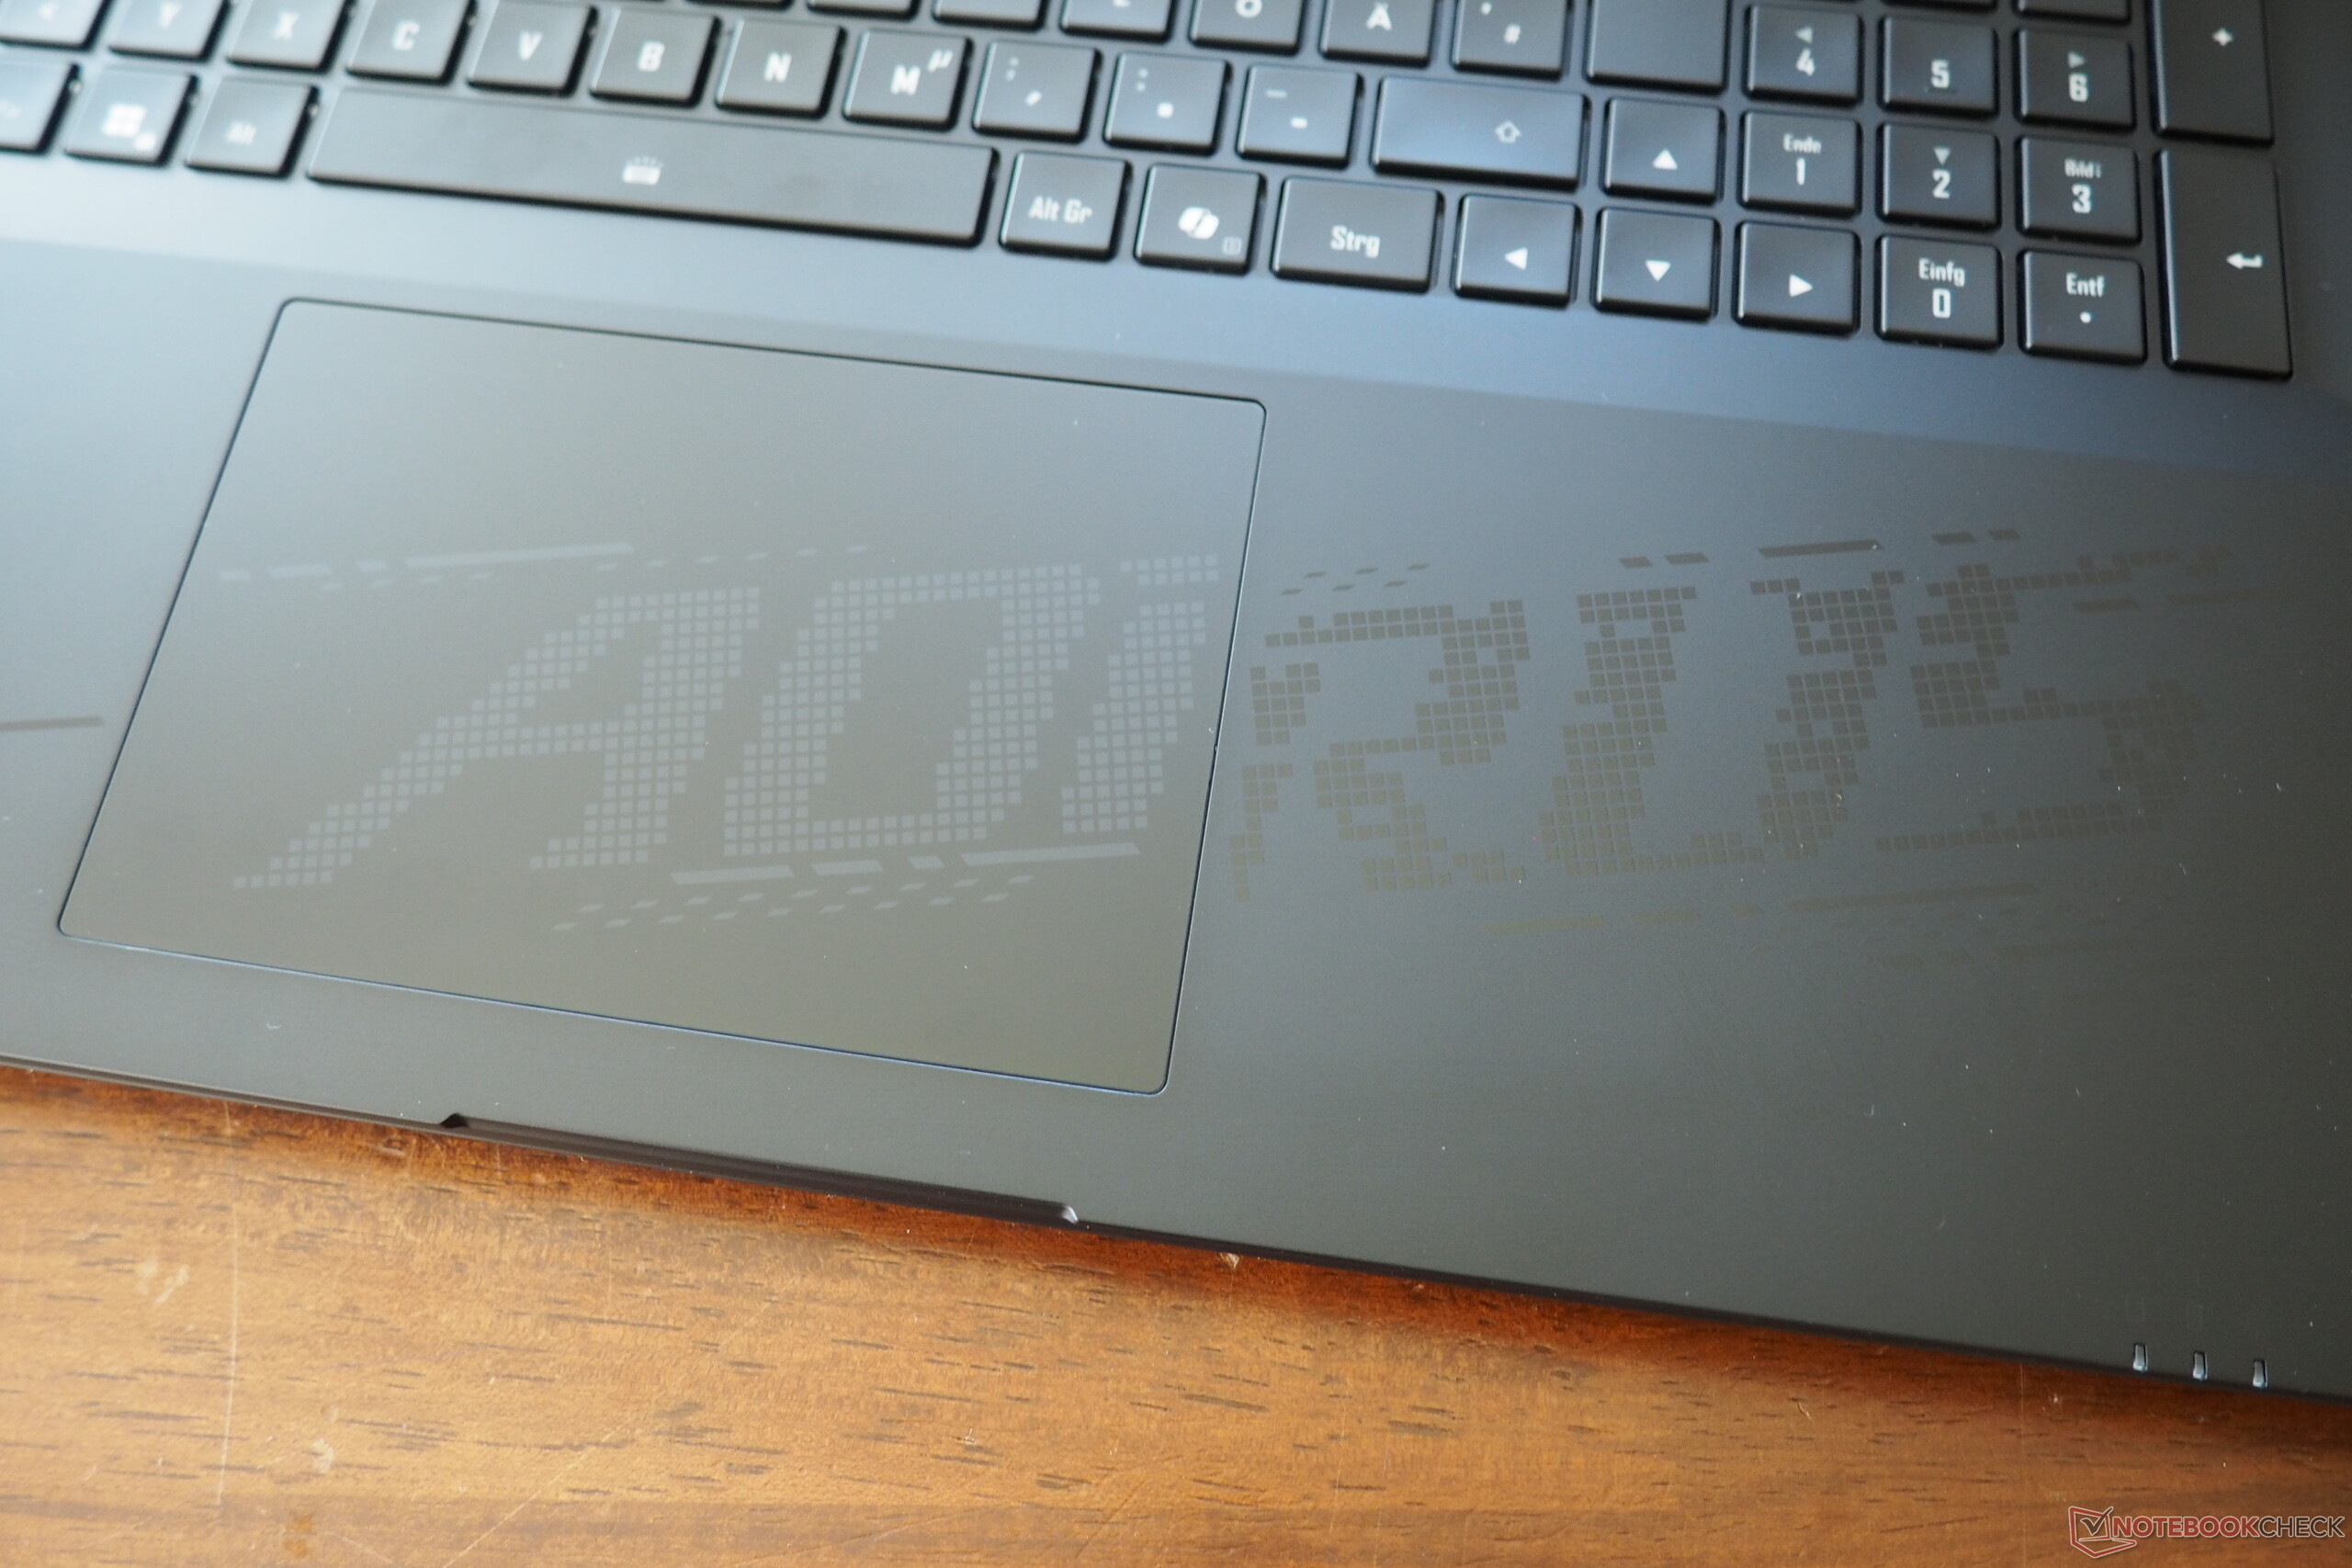
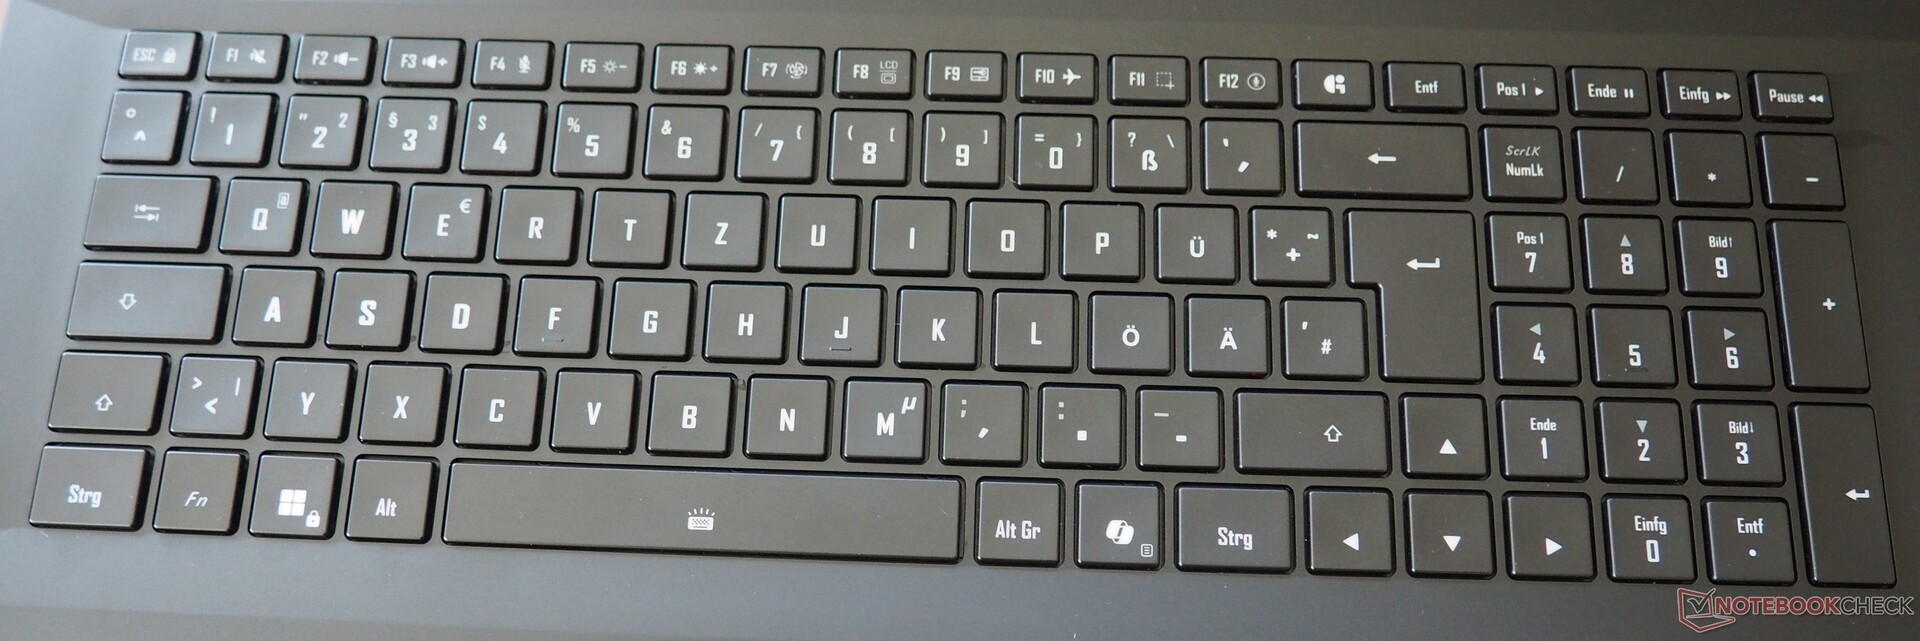
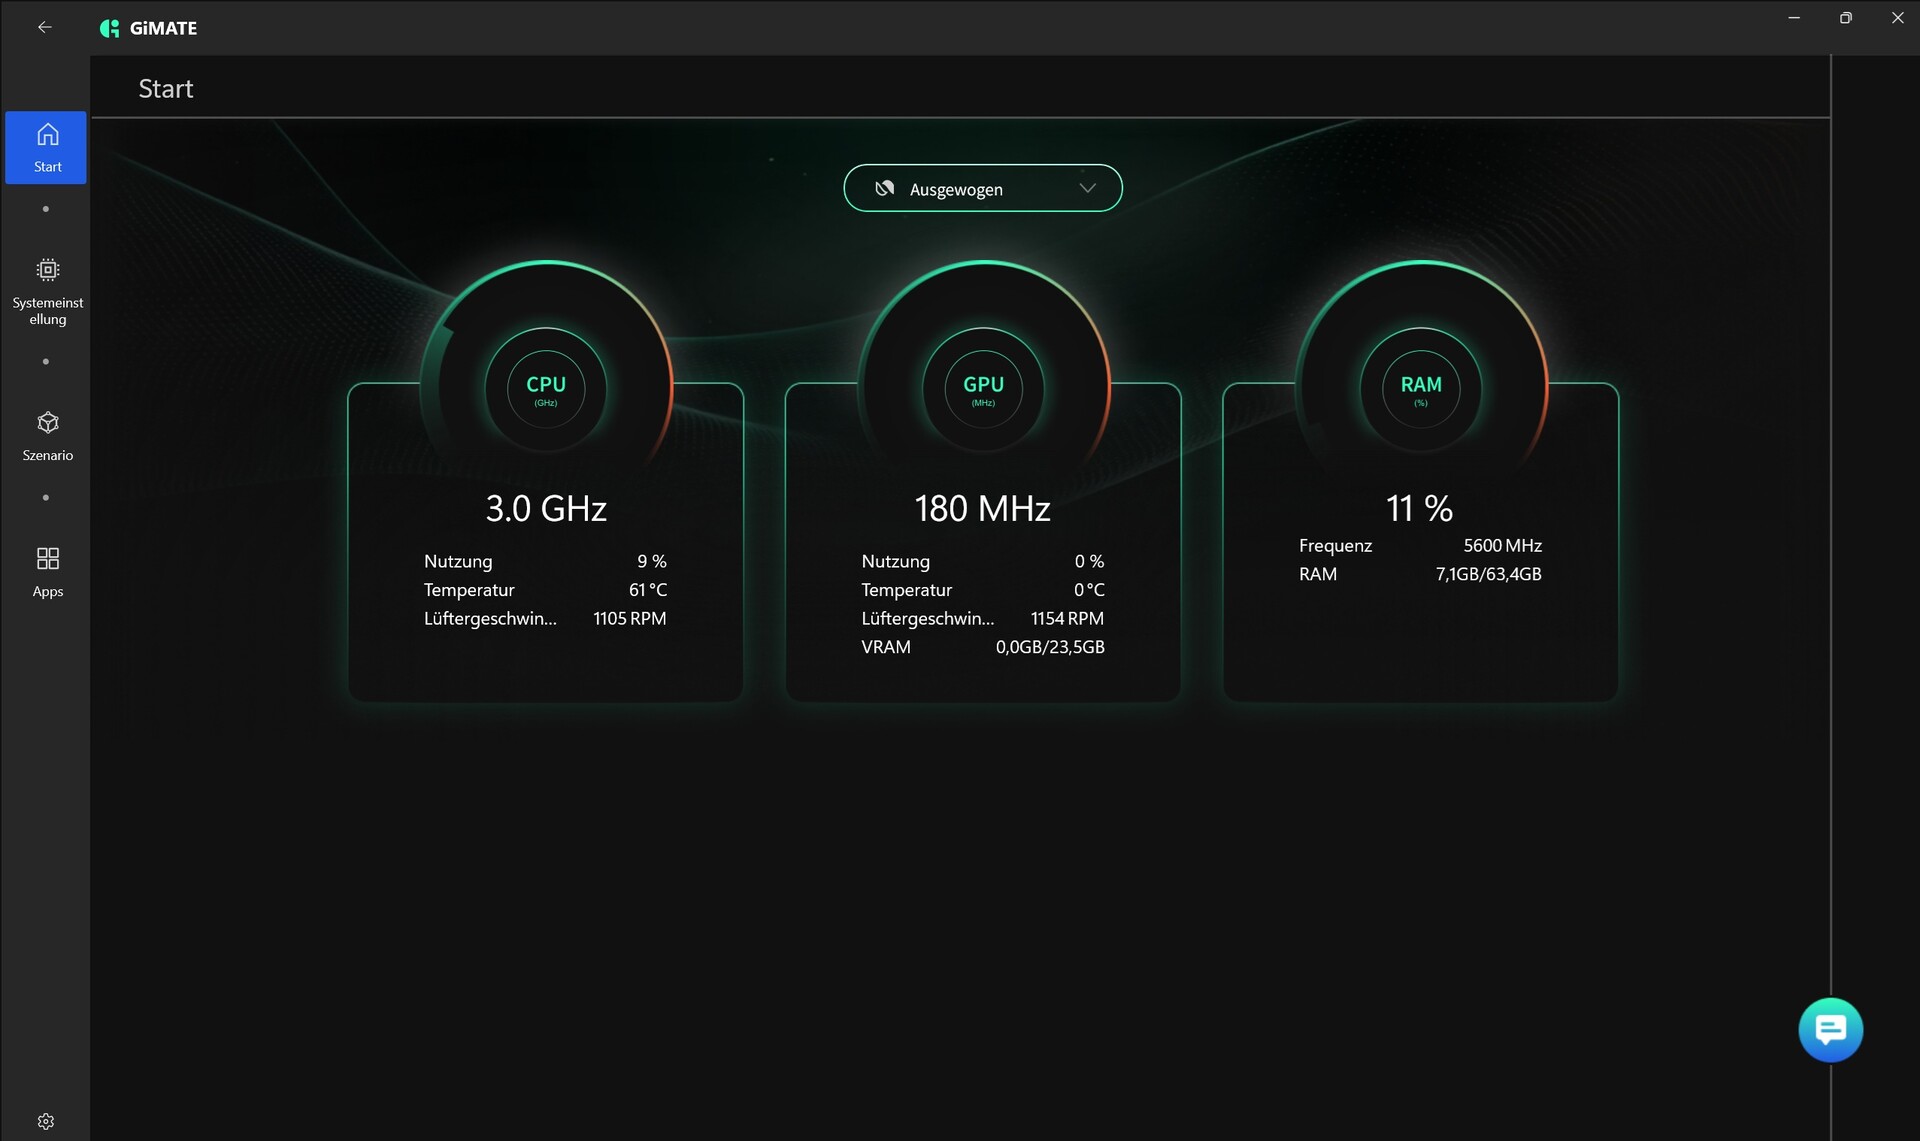
Gigabyte has installed a chiclet keyboard with a number pad, which feels nice to type on. While we liked its normal-sized directional arrows, the key layout in the top right corner (e.g. distance between Del & Ins) takes some getting used to. Pressing the special Gi key opens a dialog with the manufacturer's own GiMATE AI. You'll have to decide for yourself whether such functions make sense. Meanwhile, the installed lighting can be adjusted in three intensity levels.
Touchpad
With a size of 13.4 x 9 centimeters, the touchpad is more than big enough for an 18-inch device. As expected, its smooth surface ensures good gliding qualities. Its gesture support also works just fine. The click areas along the lower edge seem a little rickety (both acoustically and haptically), but trigger reliably.
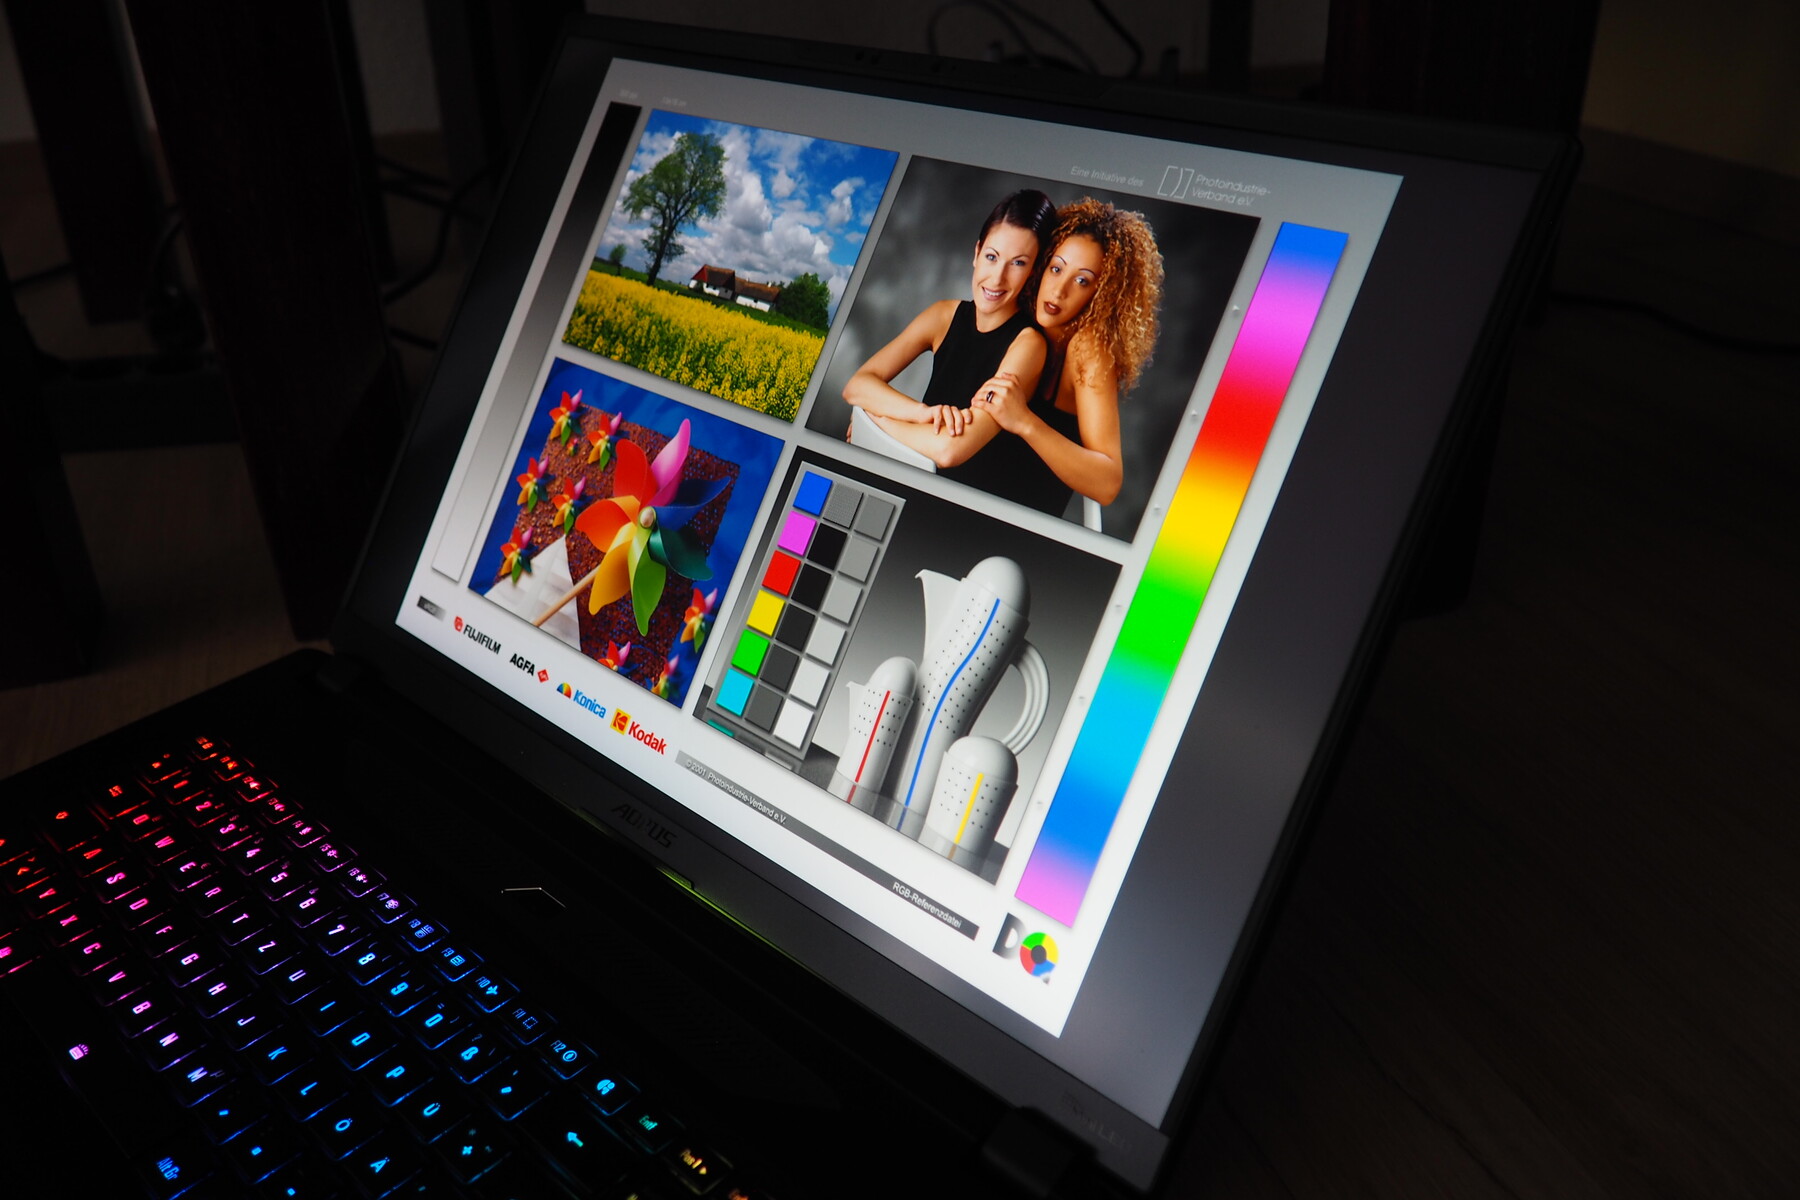
Display
Like its 18-inch counterpart from Asus, the Master 18 has a mini LED panel that features a passable, albeit not outstanding, pixel density of 2,560 x 1,600 pixels.
| |||||||||||||||||||||||||
Brightness Distribution: 90 %
Center on Battery: 428 cd/m²
Contrast: 3369:1 (Black: 0.13 cd/m²)
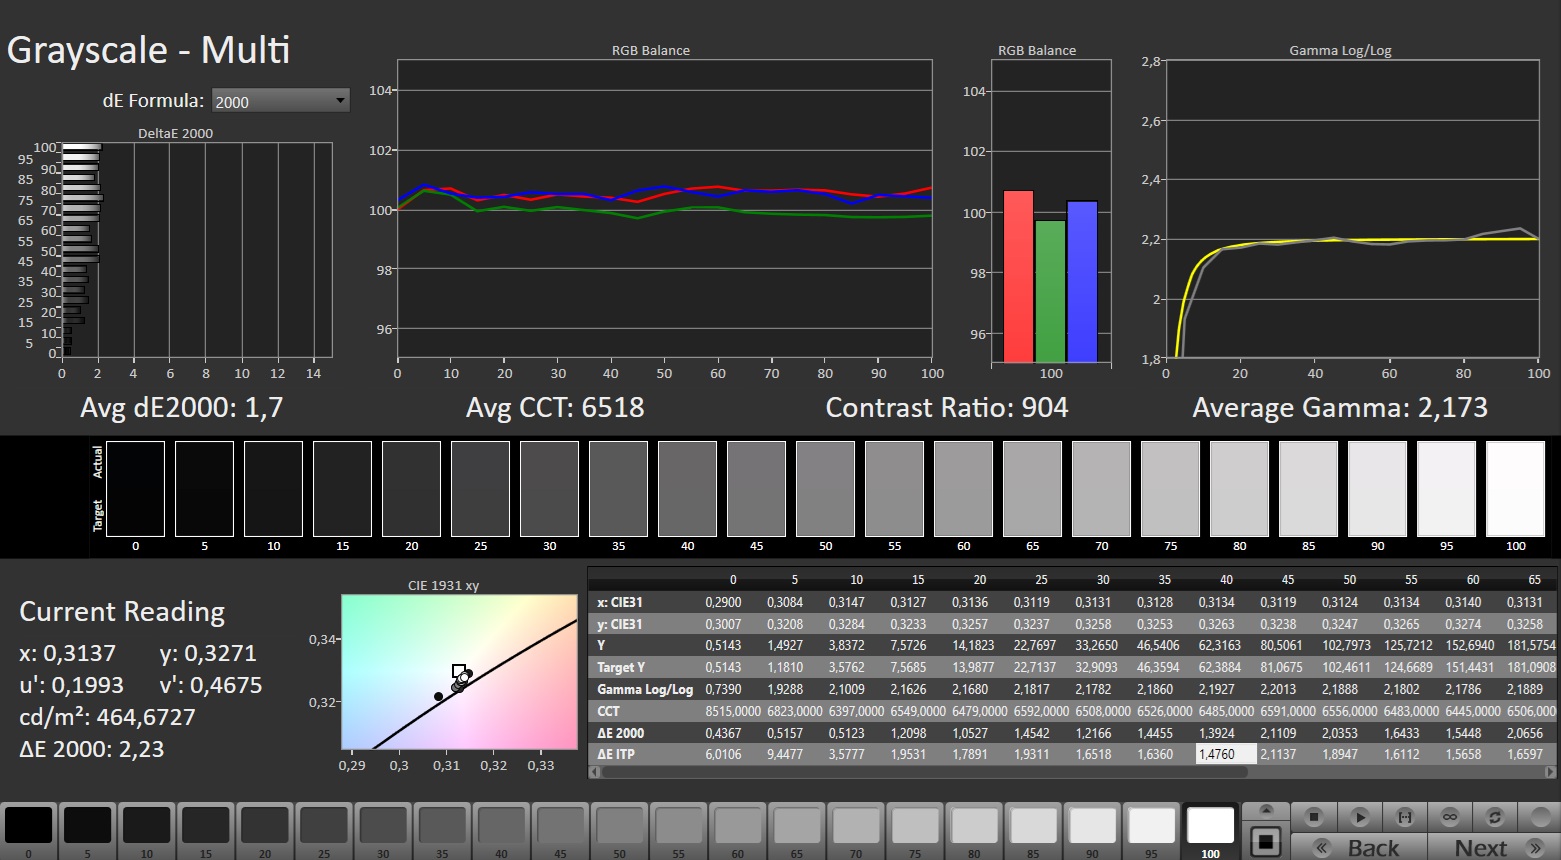
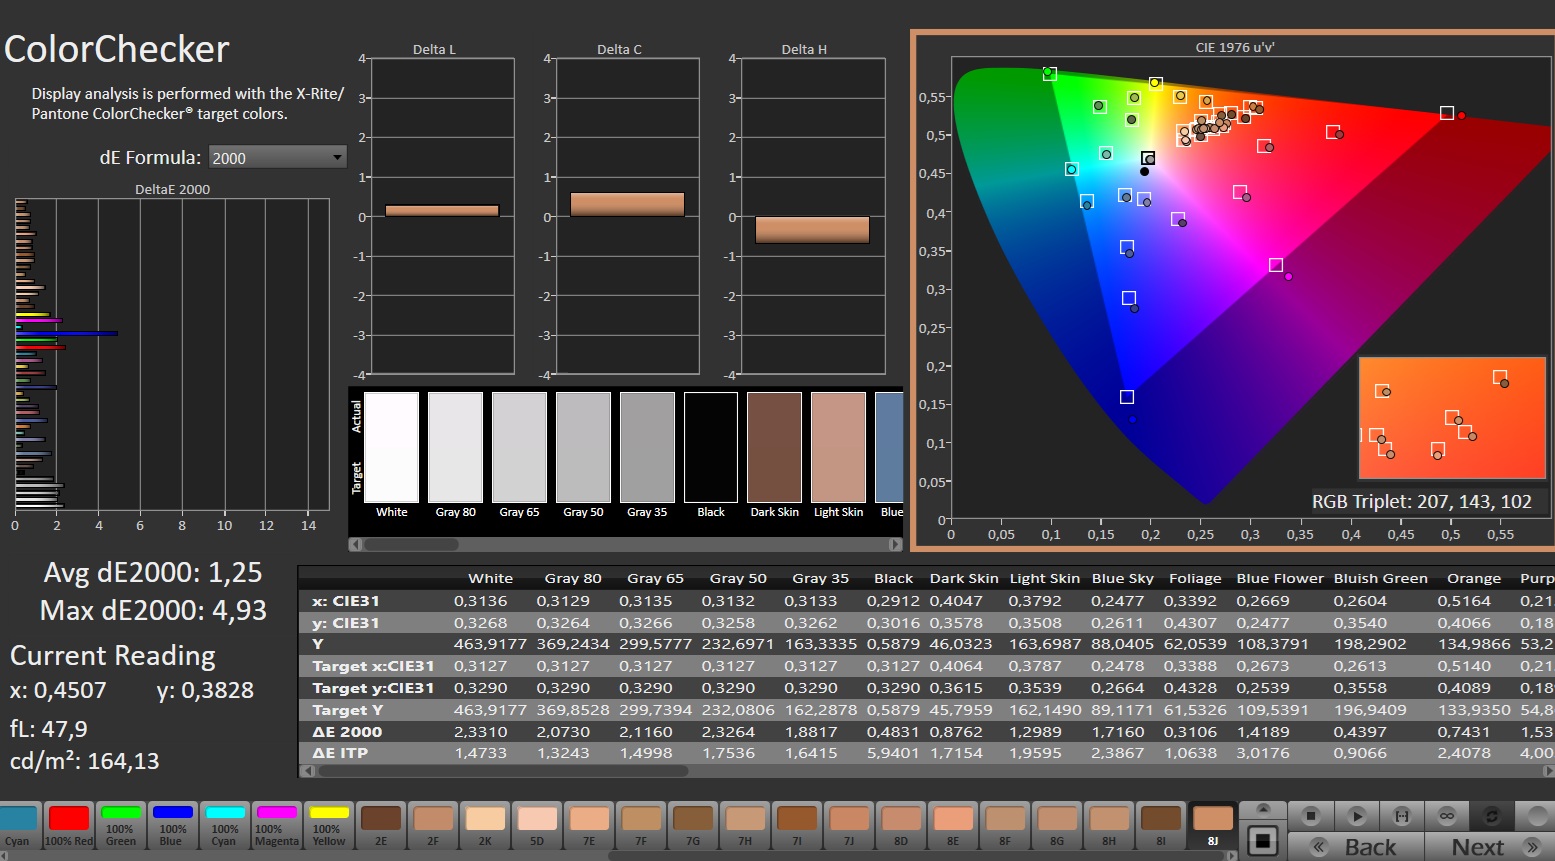
ΔE ColorChecker Calman: 1.25 | ∀{0.5-29.43 Ø4.73}
ΔE Greyscale Calman: 1.7 | ∀{0.09-98 Ø4.97}
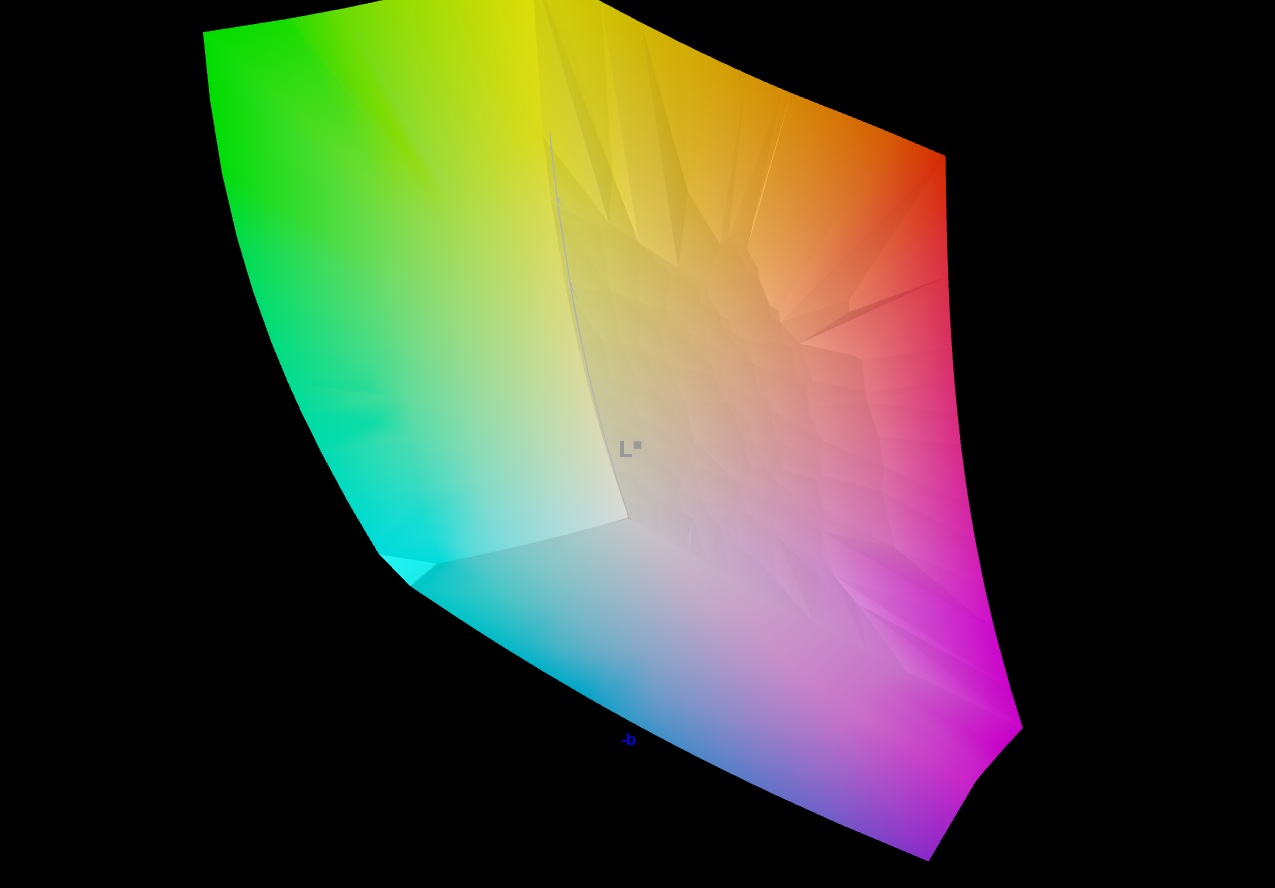
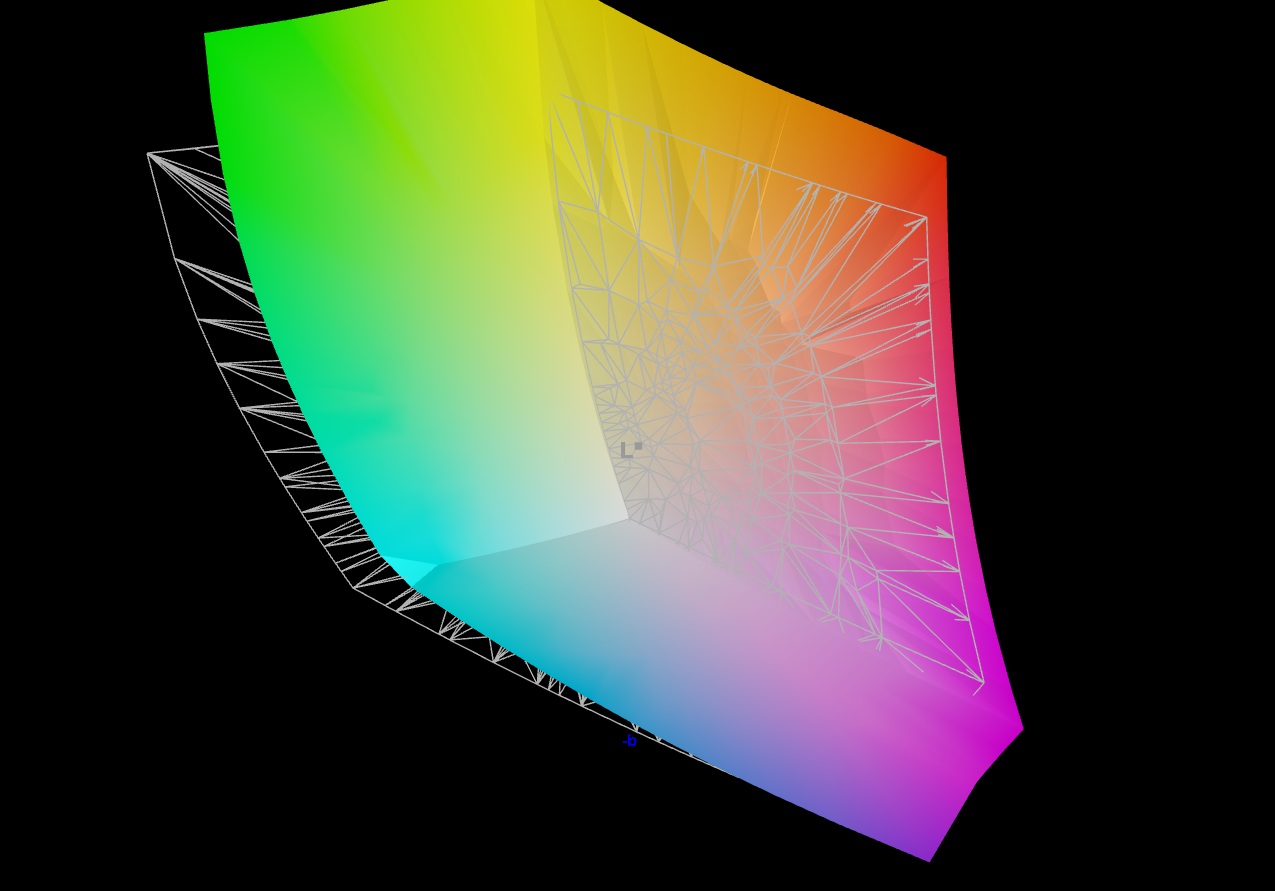
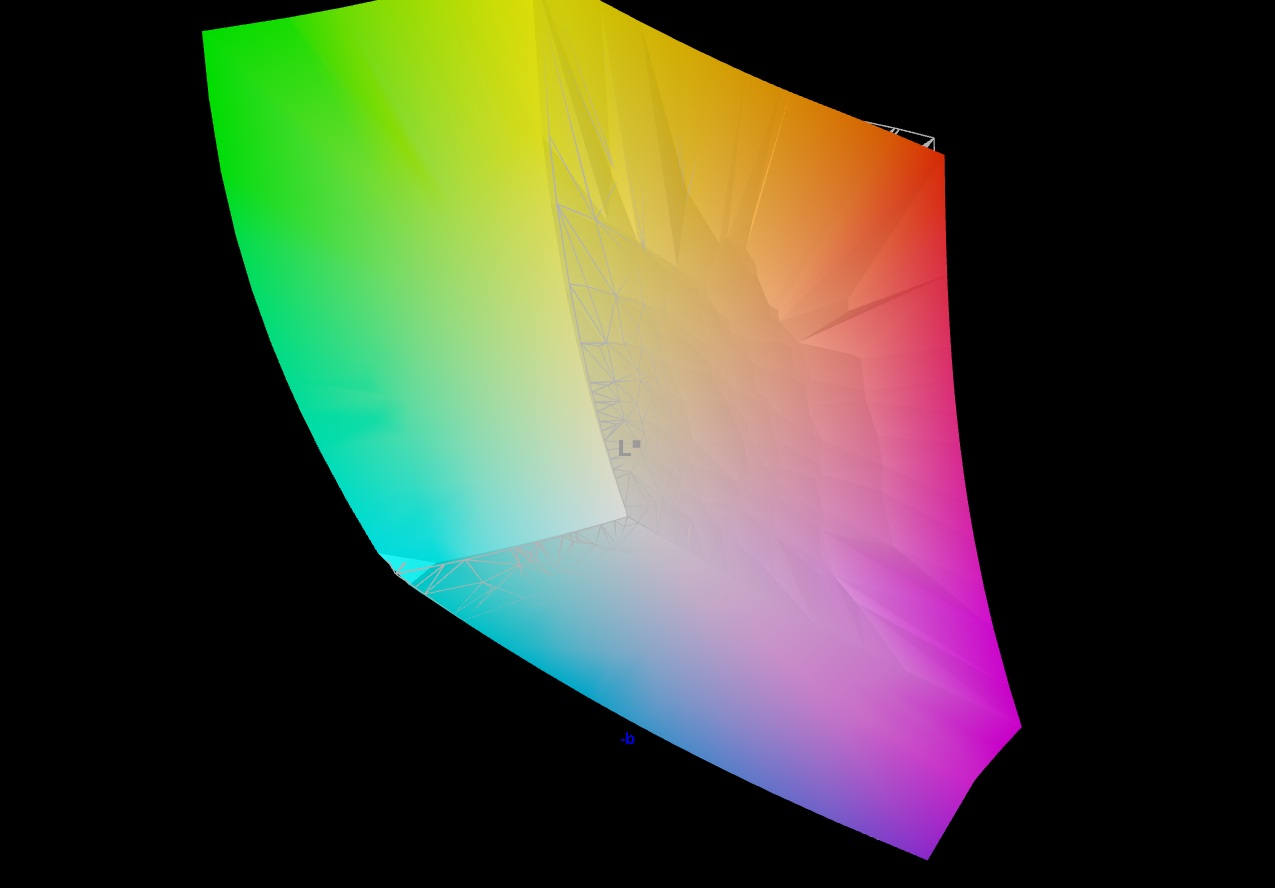
87.7% AdobeRGB 1998 (Argyll 3D)
100% sRGB (Argyll 3D)
99.9% Display P3 (Argyll 3D)
Gamma: 2.173
CCT: 6518 K
| Aorus Master 18 AM8H NE180QDM-NM1 (BOE0C58), Mini-LED, 2560x1600, 18", 240 Hz | Asus Strix Scar 18 G835LX N180QDM-NM2, Mini-LED, 2560x1600, 18", 240 Hz | Asus ROG Zephyrus G16 GU605CX ATNA60DL01-0, OLED, 2560x1600, 16", 240 Hz | Razer Blade 16 2025 RTX 5090 ATNA60DL04-0, OLED, 2560x1600, 16", 240 Hz | Alienware m18 R2 BOE NE18NZ1, IPS, 2560x1600, 18", 165 Hz | MSI Titan 18 HX A14VIG AU Optronics B180ZAN01.0, Mini-LED, 3840x2400, 18", 120 Hz | |
|---|---|---|---|---|---|---|
| Display | -1% | 3% | -2% | -0% | -1% | |
| Display P3 Coverage (%) | 99.9 | 99 -1% | 99.9 0% | 96.1 -4% | 97.8 -2% | 98.1 -2% |
| sRGB Coverage (%) | 100 | 100 0% | 100 0% | 99.9 0% | 99.5 0% | 99.8 0% |
| AdobeRGB 1998 Coverage (%) | 87.7 | 87.2 -1% | 96.9 10% | 85 -3% | 88.9 1% | 86.2 -2% |
| Response Times | 9% | 98% | 84% | 20% | -431% | |
| Response Time Grey 50% / Grey 80% * (ms) | 16.4 ? | 7.4 ? 55% | 0.22 99% | 0.2 ? 99% | 5.3 ? 68% | 8.6 ? 48% |
| Response Time Black / White * (ms) | 8.1 ? | 10.4 ? -28% | 0.25 97% | 0.25 ? 97% | 10.4 ? -28% | 81.8 ? -910% |
| PWM Frequency (Hz) | 1398 ? | 20610 ? | 960 | 960 ? | 2592 ? | |
| PWM Amplitude * (%) | 100 | 100 -0% | 44 56% | |||
| Screen | 44% | -6% | 3% | -62% | -51% | |
| Brightness middle (cd/m²) | 438 | 764 74% | 416 -5% | 391 -11% | 271.8 -38% | 467.5 7% |
| Brightness (cd/m²) | 451 | 747 66% | 418 -7% | 393 -13% | 275 -39% | 459 2% |
| Brightness Distribution (%) | 90 | 93 3% | 96 7% | 98 9% | 78 -13% | 90 0% |
| Black Level * (cd/m²) | 0.13 | 0.1 23% | 0.27 -108% | |||
| Contrast (:1) | 3369 | 7640 127% | 1007 -70% | |||
| Colorchecker dE 2000 * | 1.25 | 1.2 4% | 1.6 -28% | 1.2 4% | 2.48 -98% | 3.77 -202% |
| Colorchecker dE 2000 max. * | 4.93 | 2.8 43% | 2.1 57% | 3.2 35% | 5.59 -13% | 6.12 -24% |
| Greyscale dE 2000 * | 1.7 | 1.5 12% | 2.7 -59% | 1.8 -6% | 3.7 -118% | 3.2 -88% |
| Gamma | 2.173 101% | 2.17 101% | 2.16 102% | 2.2 100% | 2.2 100% | 2.43 91% |
| CCT | 6518 100% | 6556 99% | 6331 103% | 6493 100% | 6355 102% | 6478 100% |
| Colorchecker dE 2000 calibrated * | 0.56 | 2.94 | ||||
| Total Average (Program / Settings) | 17% /
27% | 32% /
16% | 28% /
22% | -14% /
-35% | -161% /
-106% |
* ... smaller is better
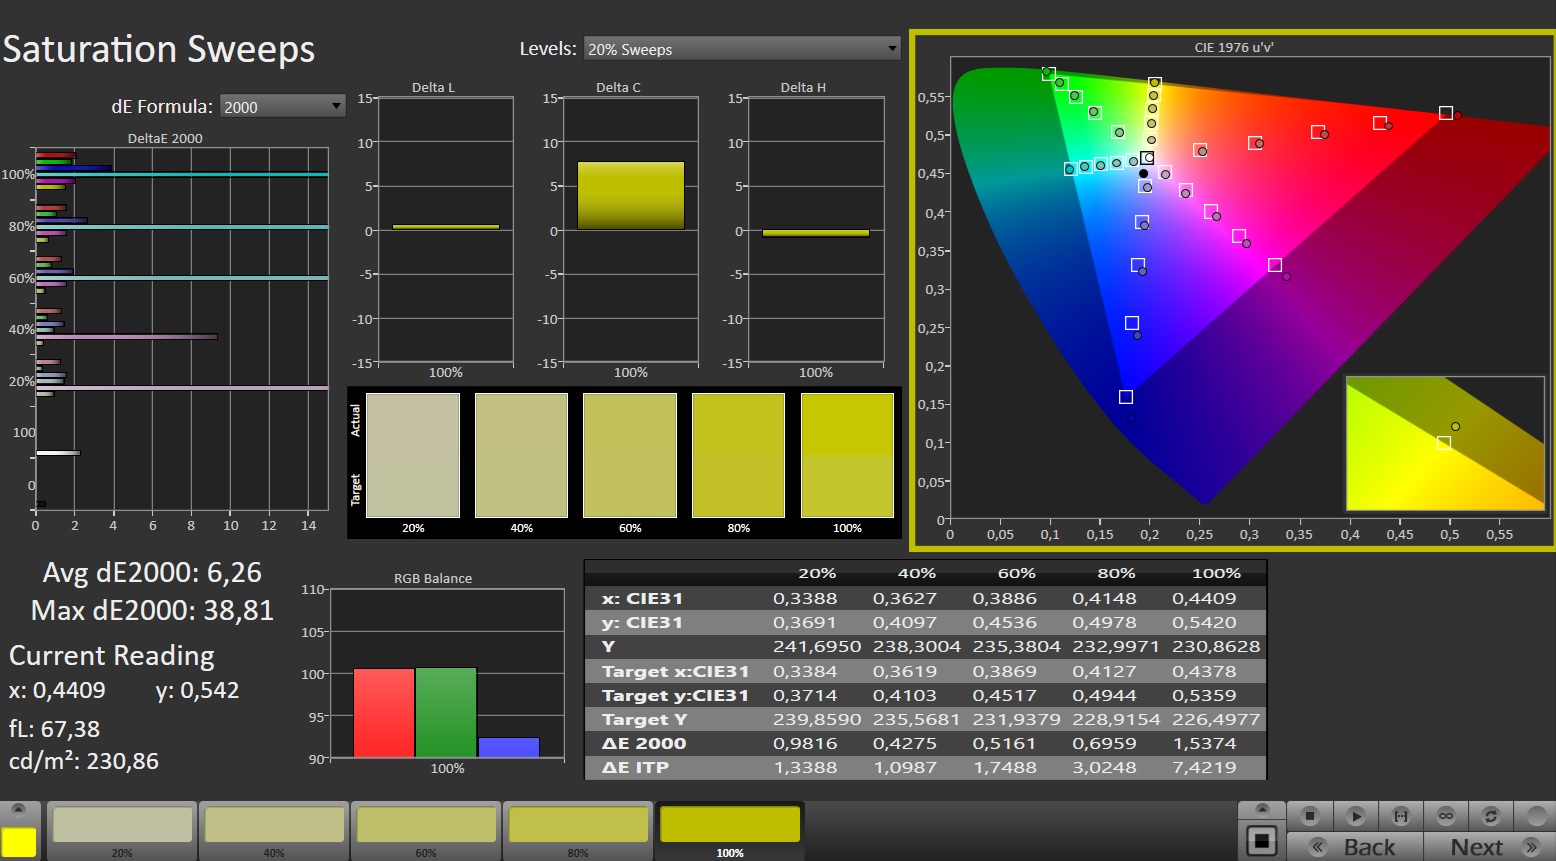
One of the strengths of the laptop's 240 Hz screen is its rich color space coverage. In addition to sRGB, it also covers DCI-P3 in its entirety (and 88% of AdobeRGB). As we tested its brightness in SDR mode, the luminosity we measured was significantly lower than the values specified by the manufacturer. An average of 451 cd/m² can't come close to the level of the Strix Scar 18, but is still enough for most indoor rooms and the occasional outdoor use. As our video test showed, its brightness came close to Gigabyte's advertised values with HDR activated.
Its black levels and contrast generally don't need to be criticized, as long as you ignore the OLED competition. The same applies to its response times.
A specific point of criticism would be its picture flickering, which occurs across every brightness level—but this may only be an issue for extremely sensitive people due to its high frequency.

Display Response Times
| ↔ Response Time Black to White | ||
|---|---|---|
| 8.1 ms ... rise ↗ and fall ↘ combined | ↗ 8.1 ms rise | 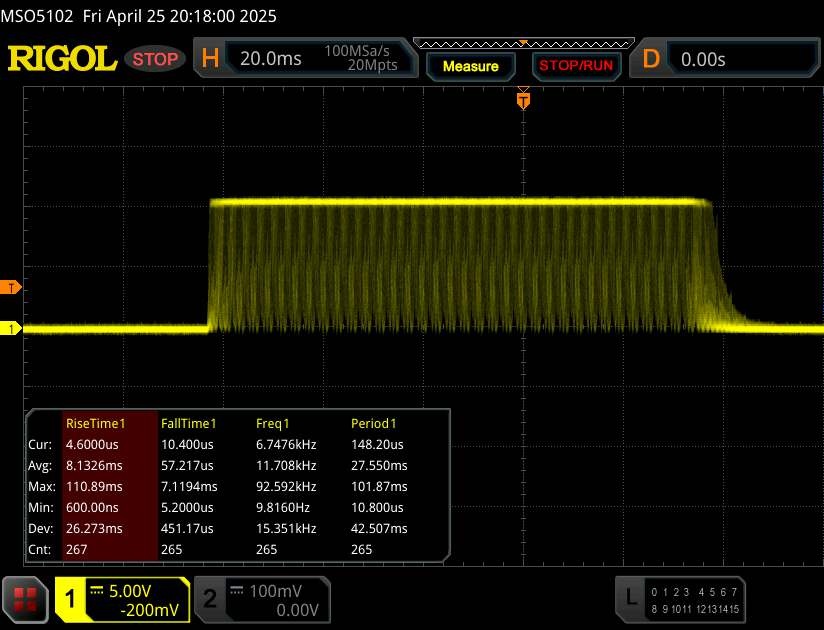 |
| ↘ ms fall | ||
| The screen shows fast response rates in our tests and should be suited for gaming. In comparison, all tested devices range from 0.1 (minimum) to 240 (maximum) ms. » 23 % of all devices are better. This means that the measured response time is better than the average of all tested devices (19.9 ms). | ||
| ↔ Response Time 50% Grey to 80% Grey | ||
| 16.4 ms ... rise ↗ and fall ↘ combined | ↗ 16.4 ms rise | 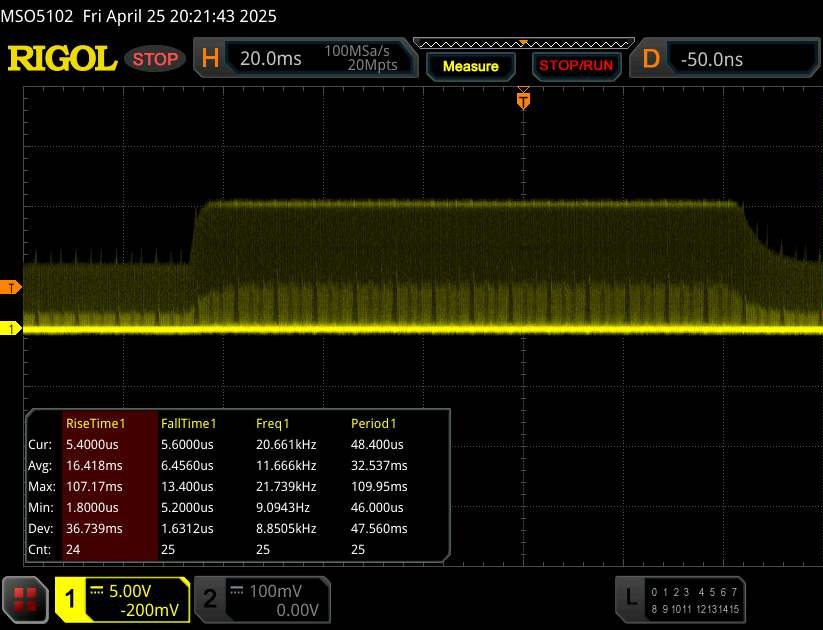 |
| ↘ ms fall | ||
| The screen shows good response rates in our tests, but may be too slow for competitive gamers. In comparison, all tested devices range from 0.165 (minimum) to 636 (maximum) ms. » 30 % of all devices are better. This means that the measured response time is better than the average of all tested devices (31.1 ms). | ||
Screen Flickering / PWM (Pulse-Width Modulation)
| Screen flickering / PWM detected | 1398 Hz Amplitude: 100 % | ≤ 100 % brightness setting | 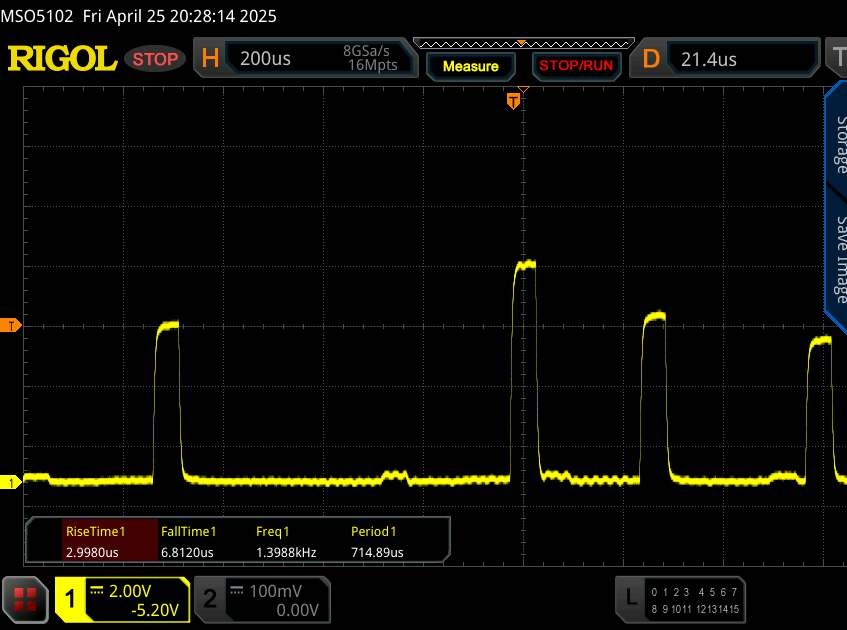 |
The display backlight flickers at 1398 Hz (worst case, e.g., utilizing PWM) Flickering detected at a brightness setting of 100 % and below. There should be no flickering or PWM above this brightness setting. The frequency of 1398 Hz is quite high, so most users sensitive to PWM should not notice any flickering. In comparison: 52 % of all tested devices do not use PWM to dim the display. If PWM was detected, an average of 7794 (minimum: 5 - maximum: 343500) Hz was measured. | |||
Performance
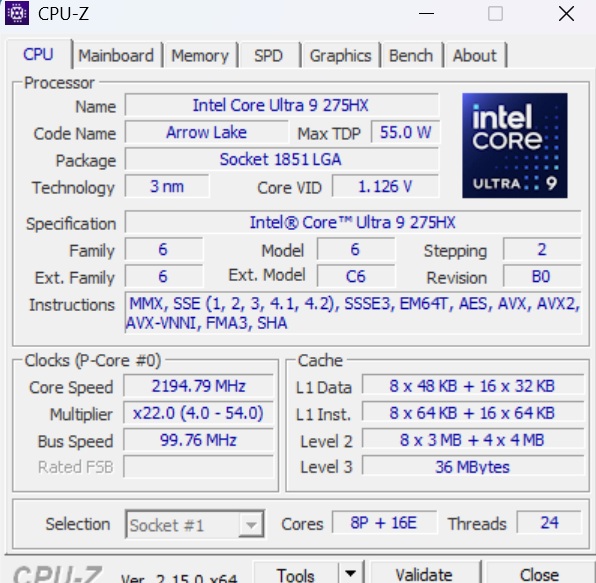
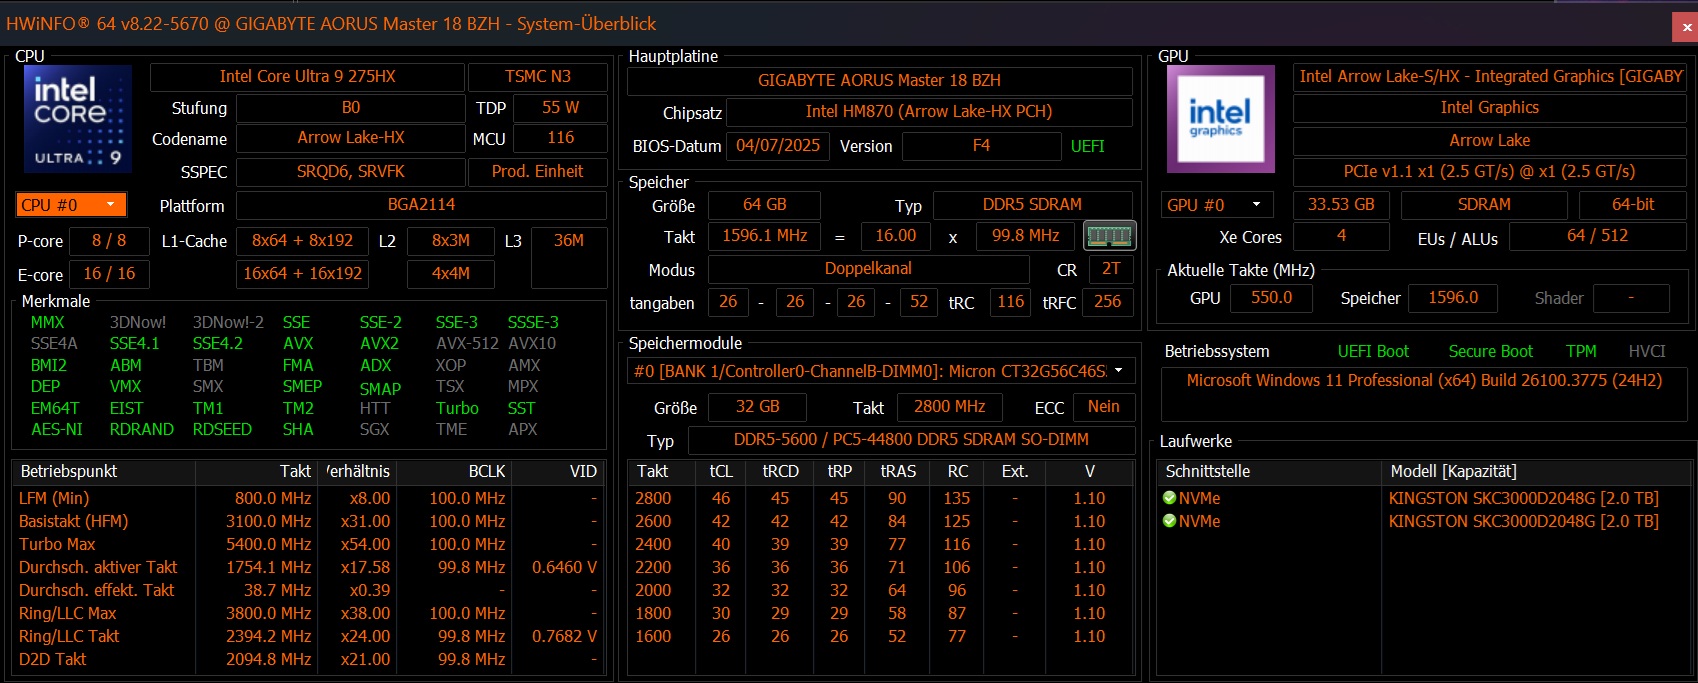
Our test configuration of the Master 18 is in the absolute high-end range. 24 CPU cores, 24 GB VRAM, 64 GB RAM and 4-TB SSD capacity should provide enough reserves for the coming years.
Testing conditions
There are various operating modes to select from in the GiMATE software. Since the 18-inch device gets very loud using the gaming and creative profiles, we limited our measurements to the balanced mode, which generates a comparable 3D performance to other RTX 5090 laptops in maximum mode.
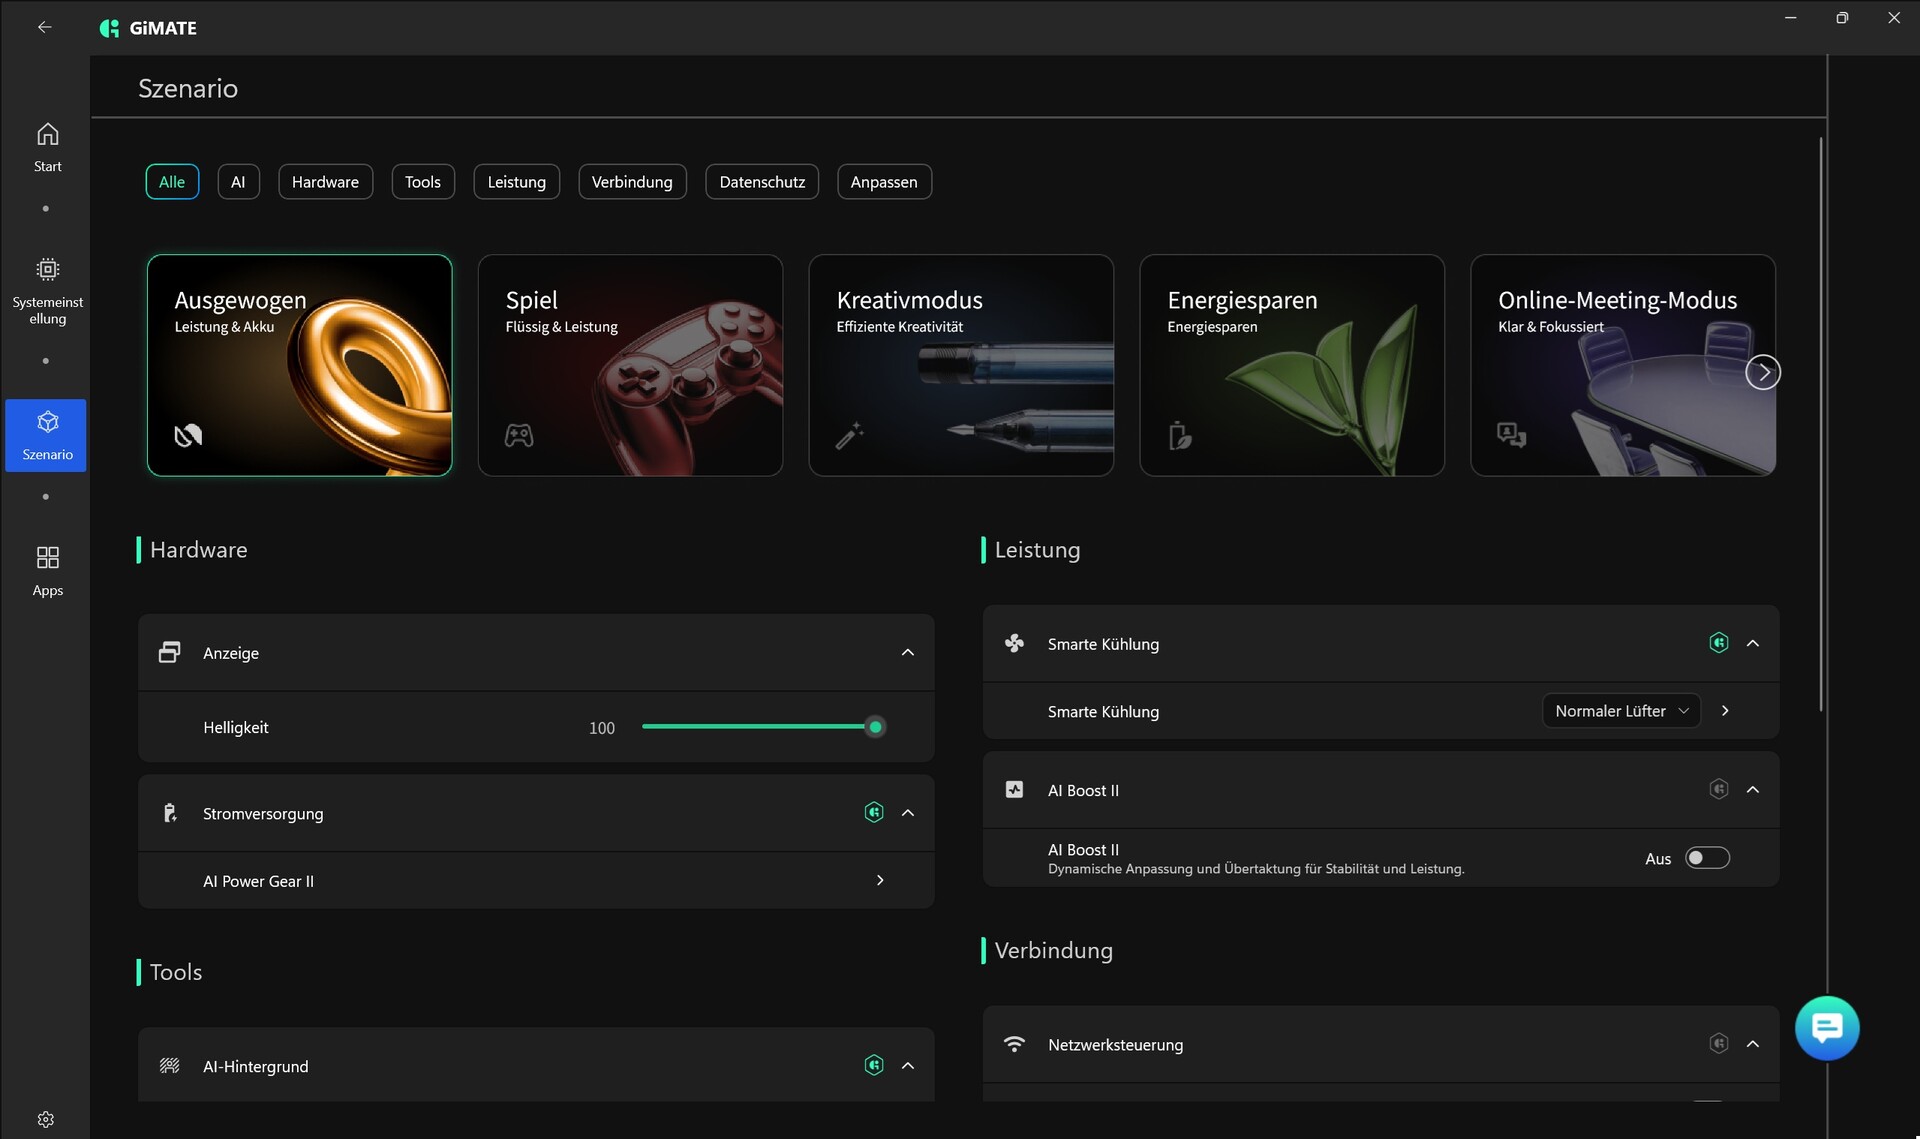
| GiMATE Mode | Balanced | Gaming | Creative | Energy-saving |
| Cyberpunk 2077 Noise | 52 dB(A) | 60 dB(A) | 60 dB(A) | 49 dB(A) |
| Cyberpunk 2077 Performance (FHD/Ultra) | 152.5fps | 159.1fps | 158.6fps | 121.2fps |
| Cinebench R15 Multi Score | 5096 points | 5443 points | 5479 points | 4834 points |
| CPU PL1 | 90 watts | 125 watts | 125 watts | 65 watts |
| CPU PL2 | 120 watts | 150 watts | 150 watts | 100 watts |
Processor
The Core Ultra 9 275HX from the Arrow Lake series is equipped with 8 performance cores and 16 efficiency cores, and can access 90 watts (PL1) and 120 watts (PL2) using the balanced profile. If you consider all CPU benchmarks together, its performance is similar to the old Core i9-14900HX. Very good: In our Cinebench loop, its results remained very stable, which speaks in favor of its cooling system.
Cinebench R15 Multi continuous test
* ... smaller is better
AIDA64: FP32 Ray-Trace | FPU Julia | CPU SHA3 | CPU Queen | FPU SinJulia | FPU Mandel | CPU AES | CPU ZLib | FP64 Ray-Trace | CPU PhotoWorxx
| Performance rating | |
| Asus Strix Scar 18 G835LX | |
| Average Intel Core Ultra 9 275HX | |
| Aorus Master 18 AM8H | |
| MSI Titan 18 HX A14VIG | |
| Alienware m18 R2 | |
| Razer Blade 16 2025 RTX 5090 | |
| Average of class Gaming | |
| Asus ROG Zephyrus G16 GU605CX | |
| AIDA64 / FP32 Ray-Trace | |
| Asus Strix Scar 18 G835LX | |
| Razer Blade 16 2025 RTX 5090 | |
| Average Intel Core Ultra 9 275HX (28039 - 39895, n=30) | |
| Aorus Master 18 AM8H | |
| Average of class Gaming (10227 - 85542, n=109, last 2 years) | |
| MSI Titan 18 HX A14VIG | |
| Alienware m18 R2 | |
| Asus ROG Zephyrus G16 GU605CX | |
| AIDA64 / FPU Julia | |
| Asus Strix Scar 18 G835LX | |
| Average Intel Core Ultra 9 275HX (140254 - 200744, n=30) | |
| Aorus Master 18 AM8H | |
| MSI Titan 18 HX A14VIG | |
| Alienware m18 R2 | |
| Razer Blade 16 2025 RTX 5090 | |
| Average of class Gaming (51376 - 238426, n=109, last 2 years) | |
| Asus ROG Zephyrus G16 GU605CX | |
| AIDA64 / CPU SHA3 | |
| Asus Strix Scar 18 G835LX | |
| Average Intel Core Ultra 9 275HX (6710 - 9817, n=30) | |
| Aorus Master 18 AM8H | |
| MSI Titan 18 HX A14VIG | |
| Alienware m18 R2 | |
| Average of class Gaming (2180 - 9817, n=109, last 2 years) | |
| Razer Blade 16 2025 RTX 5090 | |
| Asus ROG Zephyrus G16 GU605CX | |
| AIDA64 / CPU Queen | |
| MSI Titan 18 HX A14VIG | |
| Asus Strix Scar 18 G835LX | |
| Alienware m18 R2 | |
| Average Intel Core Ultra 9 275HX (113887 - 140937, n=30) | |
| Aorus Master 18 AM8H | |
| Average of class Gaming (49785 - 173351, n=100, last 2 years) | |
| Razer Blade 16 2025 RTX 5090 | |
| Asus ROG Zephyrus G16 GU605CX | |
| AIDA64 / FPU SinJulia | |
| Razer Blade 16 2025 RTX 5090 | |
| MSI Titan 18 HX A14VIG | |
| Alienware m18 R2 | |
| Average of class Gaming (4424 - 33636, n=109, last 2 years) | |
| Asus Strix Scar 18 G835LX | |
| Average Intel Core Ultra 9 275HX (11172 - 14425, n=30) | |
| Aorus Master 18 AM8H | |
| Asus ROG Zephyrus G16 GU605CX | |
| AIDA64 / FPU Mandel | |
| Asus Strix Scar 18 G835LX | |
| Average Intel Core Ultra 9 275HX (72596 - 104508, n=30) | |
| Aorus Master 18 AM8H | |
| Razer Blade 16 2025 RTX 5090 | |
| Alienware m18 R2 | |
| MSI Titan 18 HX A14VIG | |
| Average of class Gaming (25115 - 128721, n=109, last 2 years) | |
| Asus ROG Zephyrus G16 GU605CX | |
| AIDA64 / CPU AES | |
| MSI Titan 18 HX A14VIG | |
| Asus Strix Scar 18 G835LX | |
| Alienware m18 R2 | |
| Average Intel Core Ultra 9 275HX (105608 - 247074, n=30) | |
| Aorus Master 18 AM8H | |
| Average of class Gaming (39258 - 247074, n=109, last 2 years) | |
| Razer Blade 16 2025 RTX 5090 | |
| Asus ROG Zephyrus G16 GU605CX | |
| AIDA64 / CPU ZLib | |
| Asus Strix Scar 18 G835LX | |
| MSI Titan 18 HX A14VIG | |
| Alienware m18 R2 | |
| Average Intel Core Ultra 9 275HX (1582 - 2263, n=30) | |
| Aorus Master 18 AM8H | |
| Average of class Gaming (574 - 2531, n=109, last 2 years) | |
| Razer Blade 16 2025 RTX 5090 | |
| Asus ROG Zephyrus G16 GU605CX | |
| AIDA64 / FP64 Ray-Trace | |
| Asus Strix Scar 18 G835LX | |
| Razer Blade 16 2025 RTX 5090 | |
| Average Intel Core Ultra 9 275HX (14847 - 21854, n=30) | |
| Aorus Master 18 AM8H | |
| Average of class Gaming (5509 - 45446, n=109, last 2 years) | |
| Alienware m18 R2 | |
| MSI Titan 18 HX A14VIG | |
| Asus ROG Zephyrus G16 GU605CX | |
| AIDA64 / CPU PhotoWorxx | |
| Asus ROG Zephyrus G16 GU605CX | |
| Asus Strix Scar 18 G835LX | |
| Razer Blade 16 2025 RTX 5090 | |
| Average Intel Core Ultra 9 275HX (37482 - 62916, n=30) | |
| Alienware m18 R2 | |
| Aorus Master 18 AM8H | |
| Average of class Gaming (12271 - 89891, n=109, last 2 years) | |
| MSI Titan 18 HX A14VIG | |
System performance
The laptop's system performance doesn't yet appear to be fully developed. It's a known problem, for example, that opening programs on laptops with graphics switching leads to short freezes. However, these freezes are above average in length and frequency on the Master 18, which may be due to its graphics driver, as the 18-inch device sometimes struggled with black screens when playing games during our test. The latter seems to occur more frequently with Nvidia's Blackwell generation.
CrossMark: Overall | Productivity | Creativity | Responsiveness
WebXPRT 3: Overall
WebXPRT 4: Overall
Mozilla Kraken 1.1: Total
| PCMark 10 / Score | |
| Alienware m18 R2 | |
| MSI Titan 18 HX A14VIG | |
| Asus ROG Zephyrus G16 GU605CX | |
| Asus Strix Scar 18 G835LX | |
| Aorus Master 18 AM8H | |
| Average Intel Core Ultra 9 275HX, NVIDIA GeForce RTX 5090 Laptop (7474 - 9497, n=11) | |
| Average of class Gaming (5828 - 11574, n=95, last 2 years) | |
| Razer Blade 16 2025 RTX 5090 | |
| PCMark 10 / Essentials | |
| MSI Titan 18 HX A14VIG | |
| Alienware m18 R2 | |
| Aorus Master 18 AM8H | |
| Asus Strix Scar 18 G835LX | |
| Average Intel Core Ultra 9 275HX, NVIDIA GeForce RTX 5090 Laptop (9994 - 11369, n=12) | |
| Asus ROG Zephyrus G16 GU605CX | |
| Average of class Gaming (8810 - 12600, n=99, last 2 years) | |
| Razer Blade 16 2025 RTX 5090 | |
| PCMark 10 / Productivity | |
| Alienware m18 R2 | |
| Asus ROG Zephyrus G16 GU605CX | |
| Average of class Gaming (6845 - 18766, n=97, last 2 years) | |
| Razer Blade 16 2025 RTX 5090 | |
| MSI Titan 18 HX A14VIG | |
| Average Intel Core Ultra 9 275HX, NVIDIA GeForce RTX 5090 Laptop (9122 - 10925, n=11) | |
| Asus Strix Scar 18 G835LX | |
| Aorus Master 18 AM8H | |
| PCMark 10 / Digital Content Creation | |
| Asus Strix Scar 18 G835LX | |
| Aorus Master 18 AM8H | |
| MSI Titan 18 HX A14VIG | |
| Average Intel Core Ultra 9 275HX, NVIDIA GeForce RTX 5090 Laptop (9952 - 19234, n=11) | |
| Alienware m18 R2 | |
| Asus ROG Zephyrus G16 GU605CX | |
| Average of class Gaming (7602 - 19657, n=97, last 2 years) | |
| Razer Blade 16 2025 RTX 5090 | |
| CrossMark / Overall | |
| Aorus Master 18 AM8H | |
| Asus Strix Scar 18 G835LX | |
| Average Intel Core Ultra 9 275HX, NVIDIA GeForce RTX 5090 Laptop (1995 - 2339, n=12) | |
| Alienware m18 R2 | |
| Asus ROG Zephyrus G16 GU605CX | |
| Average of class Gaming (1366 - 2409, n=97, last 2 years) | |
| MSI Titan 18 HX A14VIG | |
| CrossMark / Productivity | |
| Aorus Master 18 AM8H | |
| Average Intel Core Ultra 9 275HX, NVIDIA GeForce RTX 5090 Laptop (1847 - 2211, n=12) | |
| Asus Strix Scar 18 G835LX | |
| Asus ROG Zephyrus G16 GU605CX | |
| Alienware m18 R2 | |
| Average of class Gaming (1386 - 2254, n=97, last 2 years) | |
| MSI Titan 18 HX A14VIG | |
| CrossMark / Creativity | |
| Asus Strix Scar 18 G835LX | |
| Average Intel Core Ultra 9 275HX, NVIDIA GeForce RTX 5090 Laptop (2170 - 2642, n=12) | |
| Aorus Master 18 AM8H | |
| Asus ROG Zephyrus G16 GU605CX | |
| Alienware m18 R2 | |
| Average of class Gaming (1343 - 2729, n=97, last 2 years) | |
| MSI Titan 18 HX A14VIG | |
| CrossMark / Responsiveness | |
| Aorus Master 18 AM8H | |
| Average Intel Core Ultra 9 275HX, NVIDIA GeForce RTX 5090 Laptop (1673 - 2217, n=12) | |
| Asus Strix Scar 18 G835LX | |
| Alienware m18 R2 | |
| Average of class Gaming (1226 - 2334, n=97, last 2 years) | |
| Asus ROG Zephyrus G16 GU605CX | |
| MSI Titan 18 HX A14VIG | |
| WebXPRT 3 / Overall | |
| Average Intel Core Ultra 9 275HX, NVIDIA GeForce RTX 5090 Laptop (315 - 372, n=12) | |
| Asus Strix Scar 18 G835LX | |
| Asus ROG Zephyrus G16 GU605CX | |
| MSI Titan 18 HX A14VIG | |
| Alienware m18 R2 | |
| Razer Blade 16 2025 RTX 5090 | |
| Average of class Gaming (242 - 532, n=100, last 2 years) | |
| Aorus Master 18 AM8H | |
| WebXPRT 4 / Overall | |
| Asus Strix Scar 18 G835LX | |
| Average Intel Core Ultra 9 275HX, NVIDIA GeForce RTX 5090 Laptop (301 - 341, n=11) | |
| Aorus Master 18 AM8H | |
| Asus ROG Zephyrus G16 GU605CX | |
| Alienware m18 R2 | |
| MSI Titan 18 HX A14VIG | |
| Average of class Gaming (176.4 - 354, n=100, last 2 years) | |
| Razer Blade 16 2025 RTX 5090 | |
| Mozilla Kraken 1.1 / Total | |
| Average of class Gaming (391 - 590, n=105, last 2 years) | |
| MSI Titan 18 HX A14VIG | |
| Asus ROG Zephyrus G16 GU605CX | |
| Alienware m18 R2 | |
| Razer Blade 16 2025 RTX 5090 | |
| Aorus Master 18 AM8H | |
| Average Intel Core Ultra 9 275HX, NVIDIA GeForce RTX 5090 Laptop (402 - 424, n=12) | |
| Asus Strix Scar 18 G835LX | |
* ... smaller is better
| PCMark 10 Score | 8608 points | |
Help | ||
| AIDA64 / Memory Copy | |
| Asus ROG Zephyrus G16 GU605CX | |
| Razer Blade 16 2025 RTX 5090 | |
| Asus Strix Scar 18 G835LX | |
| Average Intel Core Ultra 9 275HX (56003 - 94460, n=30) | |
| Alienware m18 R2 | |
| Aorus Master 18 AM8H | |
| Average of class Gaming (21750 - 129946, n=109, last 2 years) | |
| MSI Titan 18 HX A14VIG | |
| AIDA64 / Memory Read | |
| Razer Blade 16 2025 RTX 5090 | |
| Asus Strix Scar 18 G835LX | |
| Alienware m18 R2 | |
| Average Intel Core Ultra 9 275HX (55795 - 97151, n=30) | |
| Asus ROG Zephyrus G16 GU605CX | |
| Aorus Master 18 AM8H | |
| Average of class Gaming (22956 - 118858, n=109, last 2 years) | |
| MSI Titan 18 HX A14VIG | |
| AIDA64 / Memory Write | |
| Razer Blade 16 2025 RTX 5090 | |
| Asus Strix Scar 18 G835LX | |
| Average Intel Core Ultra 9 275HX (55663 - 116129, n=30) | |
| Alienware m18 R2 | |
| Average of class Gaming (22297 - 135096, n=109, last 2 years) | |
| Asus ROG Zephyrus G16 GU605CX | |
| Aorus Master 18 AM8H | |
| MSI Titan 18 HX A14VIG | |
| AIDA64 / Memory Latency | |
| Asus ROG Zephyrus G16 GU605CX | |
| Aorus Master 18 AM8H | |
| Average Intel Core Ultra 9 275HX (105.8 - 161.6, n=30) | |
| Asus Strix Scar 18 G835LX | |
| Average of class Gaming (75.3 - 259, n=109, last 2 years) | |
| MSI Titan 18 HX A14VIG | |
| Razer Blade 16 2025 RTX 5090 | |
| Alienware m18 R2 | |
* ... smaller is better
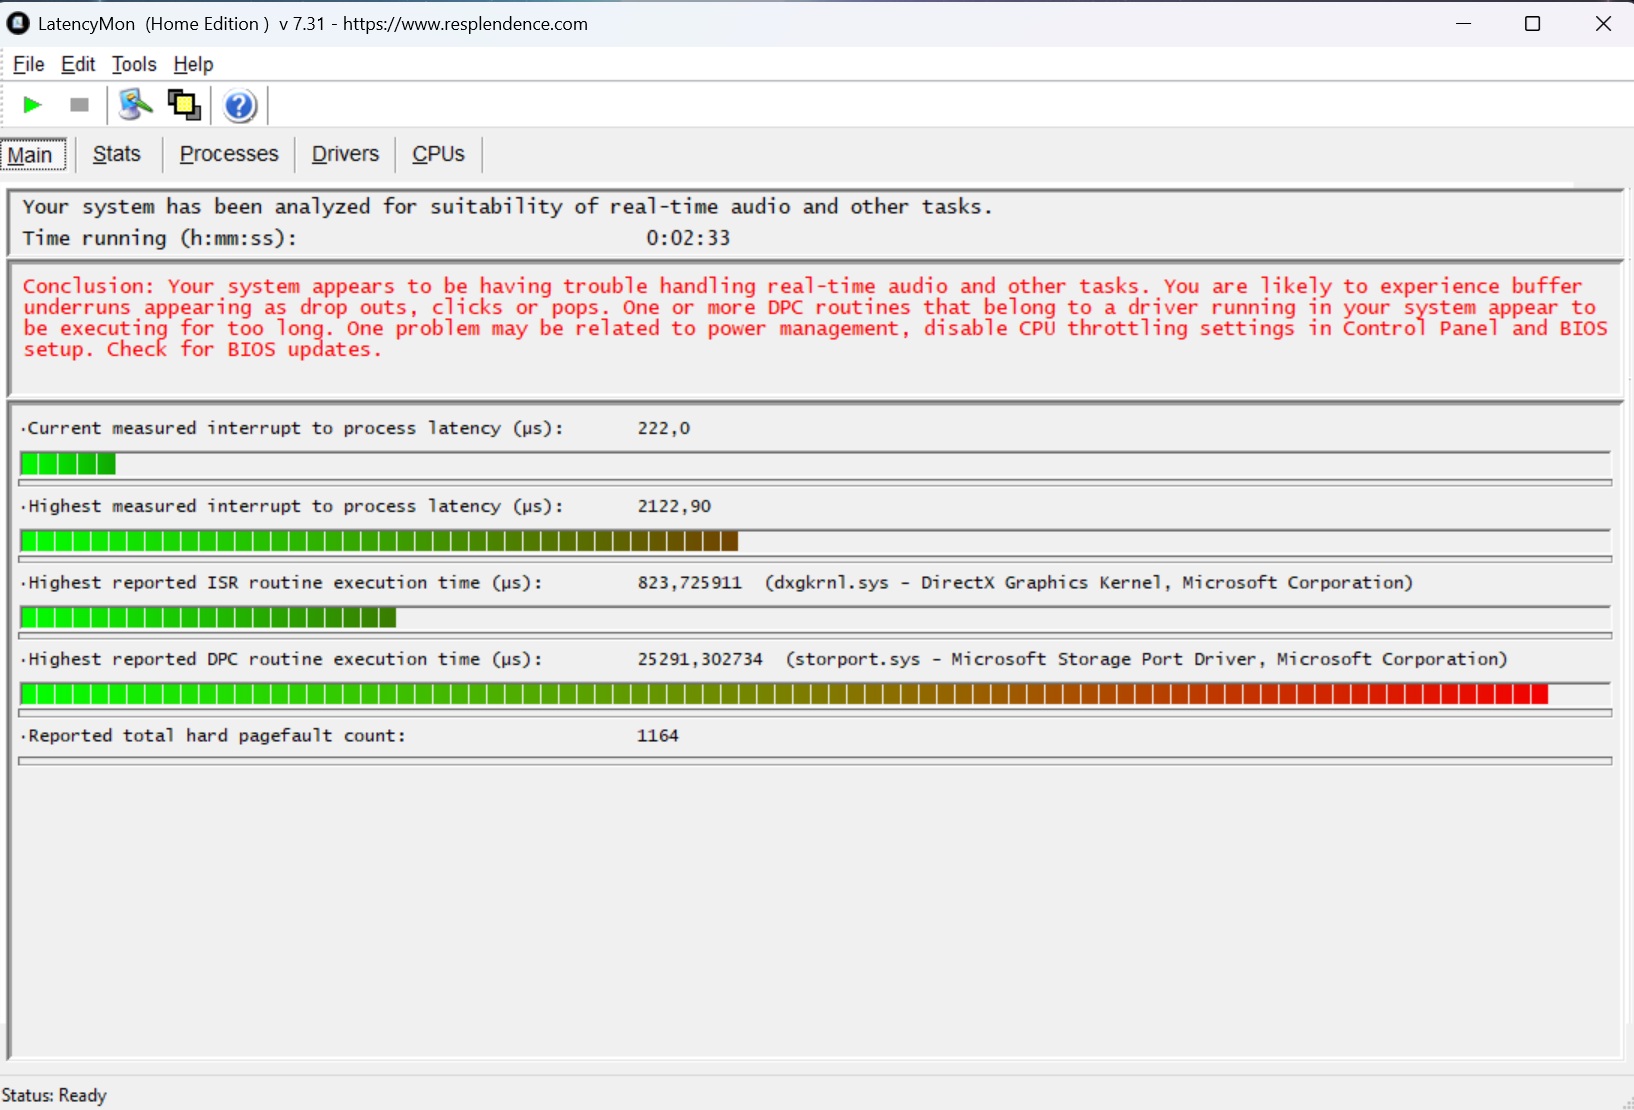
DPC latencies
As with lots of laptops, its latency values are also a cause for complaint, although only few users are likely to be affected by this issue.
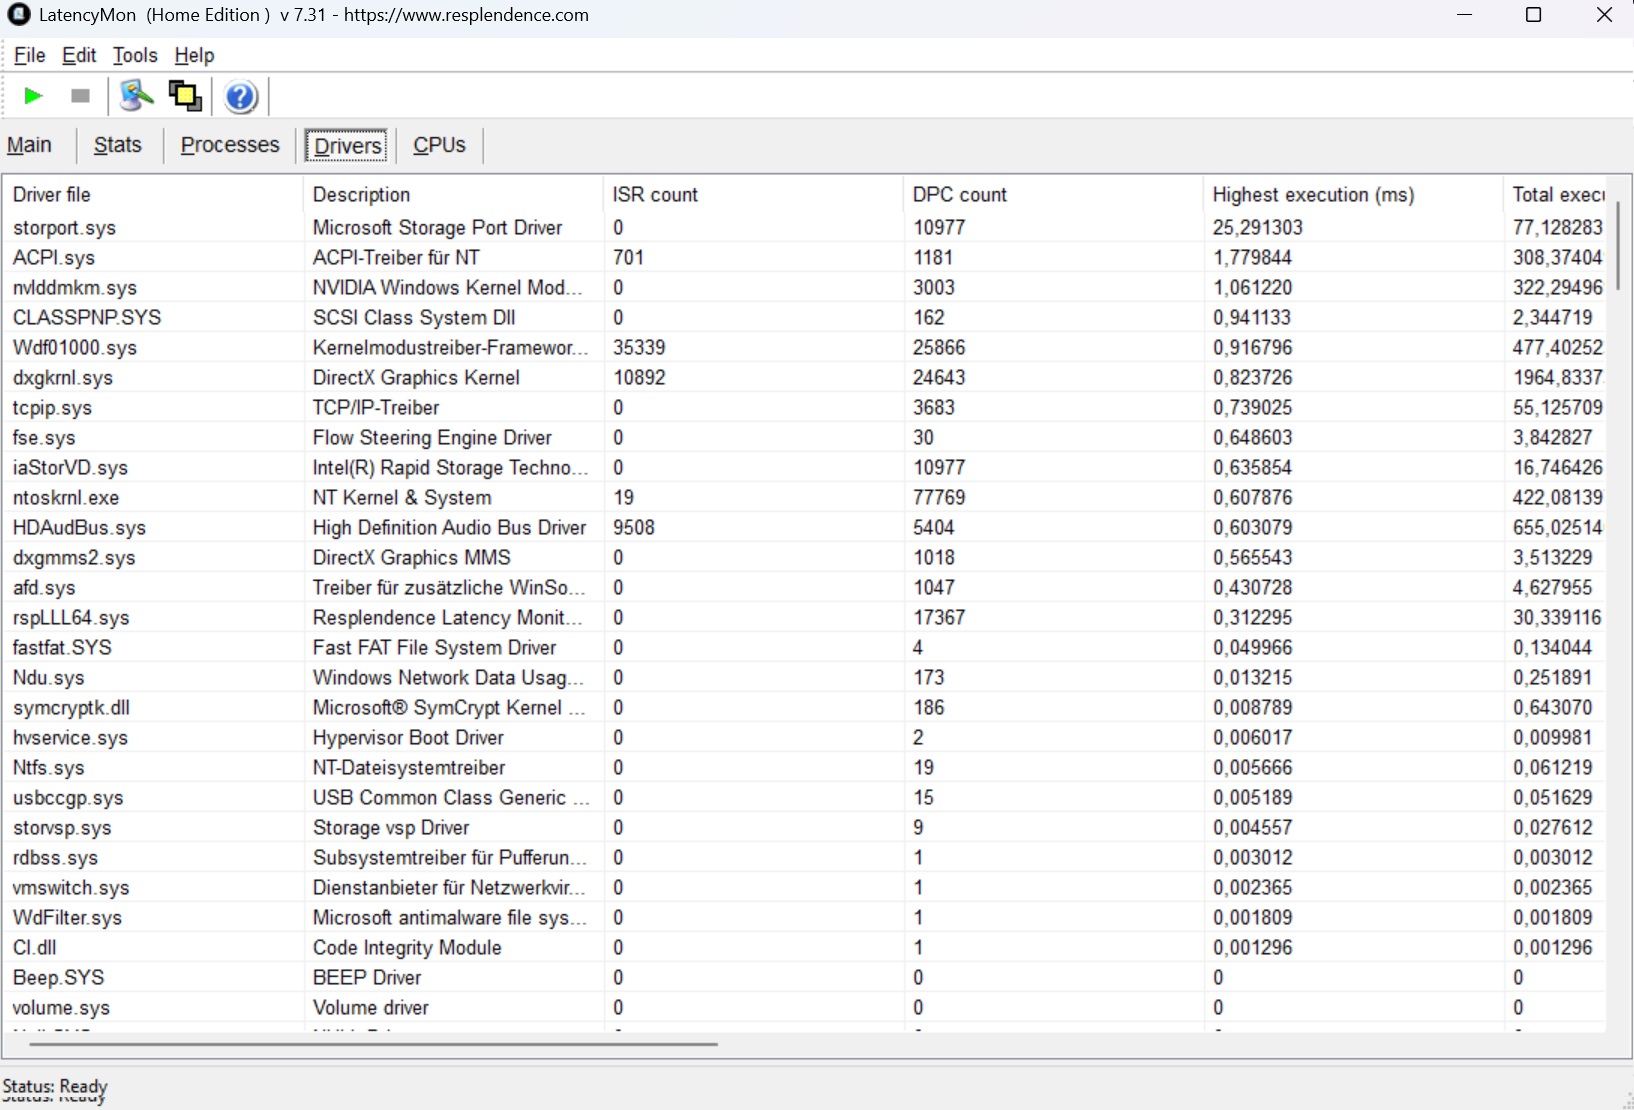
| DPC Latencies / LatencyMon - interrupt to process latency (max), Web, Youtube, Prime95 | |
| Asus ROG Zephyrus G16 GU605CX | |
| Alienware m18 R2 | |
| MSI Titan 18 HX A14VIG | |
| Aorus Master 18 AM8H | |
| Asus Strix Scar 18 G835LX | |
| Razer Blade 16 2025 RTX 5090 | |
* ... smaller is better
Storage device
Our test configuration is equipped with two SSDs from Kingston, each with a capacity of 2 TB. The M.2 duo actually achieved very high speeds during our test, but throttling occurred at some point in our DiskSpd loop. Better SSD cooling would probably help in this case.

* ... smaller is better
Reading continuous performance: DiskSpd Read Loop, Queue Depth 8
Graphics card
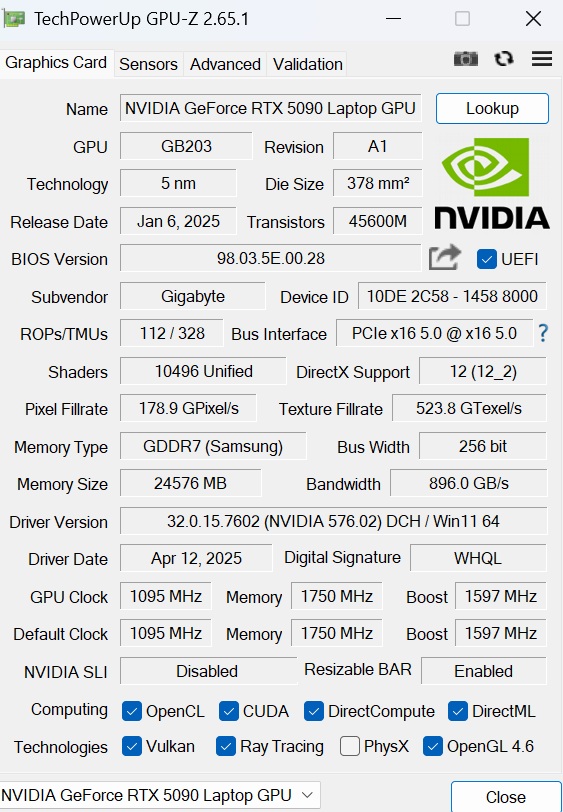
Despite not using the maximum operating mode, the Master 18 was the fastest RTX 5090 laptop we've tested so far in the synthetic graphics tests, although the difference or gap was fairly small. However, this also revealed that the old generation in the form of the RTX 4090 hardly fell behind—at least when it came to the MSI Titan 18 and the Alienware m18 R2. Normally, the GeForce RTX 5090 boasts 10,496 shader units, 24 GB DDR7 VRAM and a TGP of up to 175 watts (including Dynamic Boost). Nvidia likes to use Multi Frame Generation as one of its biggest selling points.
| 3DMark 11 Performance | 50464 points | |
| 3DMark Ice Storm Standard Score | 278456 points | |
| 3DMark Cloud Gate Standard Score | 72337 points | |
| 3DMark Fire Strike Score | 36895 points | |
| 3DMark Time Spy Score | 22138 points | |
Help | ||
* ... smaller is better
Gaming performance
The 18-inch device performed similarly well in our gaming parcours and came neck-and-neck with the Strix Scar 18. Even demanding games such as Star Wars Outlaws could be run in QHD at almost 60fps or more—at full settings, mind you. The values including upscaling can be found in the overview table below. The RTX 5090 would technically usually have enough reserves for 4K, although DLSS or (Multi) Frame Generation could or should be used in an emergency.
| low | med. | high | ultra | QHD DLSS | QHD | |
|---|---|---|---|---|---|---|
| GTA V (2015) | 186.7 | 182.5 | 166.1 | 164.3 | ||
| Dota 2 Reborn (2015) | 225 | 195.2 | 187.5 | 170.3 | ||
| Final Fantasy XV Benchmark (2018) | 226 | 201 | 160.7 | |||
| X-Plane 11.11 (2018) | 153.2 | 136.1 | 110 | |||
| Strange Brigade (2018) | 475 | 450 | 418 | 308 | ||
| Baldur's Gate 3 (2023) | 224 | 198.5 | 196.2 | 139.6 | ||
| Cyberpunk 2077 (2023) | 181.6 | 166.8 | 152.5 | 104.8 | ||
| Counter-Strike 2 (2023) | 390 | 327 | 275 | 224 | ||
| Prince of Persia The Lost Crown (2024) | 358 | 358 | 357 | 357 | ||
| Helldivers 2 (2024) | 157.7 | 157.3 | 153.8 | 140.1 | ||
| Dragon's Dogma 2 (2024) | 99.3 | 93.4 | ||||
| Horizon Forbidden West (2024) | 160.3 | 121.6 | 120.3 | 116.6 | 95 | |
| Ghost of Tsushima (2024) | 119.6 | 115.1 | 104.2 | 105.2 | 84.9 | |
| Senua's Saga Hellblade 2 (2024) | 96.8 | 76.6 | 81.9 | 56.2 | ||
| F1 24 (2024) | 335 | 305 | 139 | 141 | 95 | |
| Star Wars Outlaws (2024) | 91.1 | 82.9 | 71.6 | 70.9 | 54 | |
| Space Marine 2 (2024) | 104.1 | 103.1 | 100.8 | 100.8 | 98.6 | |
| Until Dawn (2024) | 110.6 | 96.9 | 87.5 | 79.7 | 65.6 | |
| Stalker 2 (2024) | 100 | 88.1 | 76.3 | 124.9 | 59.8 | |
| Kingdom Come Deliverance 2 (2025) | 184.3 | 151.7 | 108 | 98.7 | 82.6 | |
| Civilization 7 (2025) | 206 | 203 | 171.3 |
| Stalker 2 | |
| 2560x1440 Epic Preset | |
| Average NVIDIA GeForce RTX 5090 Laptop (59.8 - 110.7, n=3) | |
| Aorus Master 18 AM8H | |
| Average of class Gaming (29 - 110.7, n=13, last 2 years) | |
| 2560x1440 Epic Preset + Quality DLSS + FG | |
| Average NVIDIA GeForce RTX 5090 Laptop (124.9 - 134.6, n=2) | |
| Aorus Master 18 AM8H | |
| Average of class Gaming (58.3 - 134.6, n=12, last 2 years) | |
| Horizon Forbidden West | |
| 2560x1440 Very High Preset AA:T | |
| Average NVIDIA GeForce RTX 5090 Laptop (95 - 100.9, n=2) | |
| Aorus Master 18 AM8H | |
| Average of class Gaming (39.6 - 100.9, n=10, last 2 years) | |
| 2560x1440 Very High Preset + DLSS Quality | |
| Aorus Master 18 AM8H | |
| Average NVIDIA GeForce RTX 5090 Laptop (n=1) | |
| Average of class Gaming (58.4 - 116.6, n=8, last 2 years) | |
| Ghost of Tsushima | |
| 2560x1440 Very High Preset AA:T | |
| Average NVIDIA GeForce RTX 5090 Laptop (84.9 - 100.3, n=2) | |
| Aorus Master 18 AM8H | |
| Average of class Gaming (22.7 - 100.3, n=13, last 2 years) | |
| 2560x1440 Very High Preset + Quality DLSS | |
| Aorus Master 18 AM8H | |
| Average NVIDIA GeForce RTX 5090 Laptop (n=1) | |
| Average of class Gaming (55.2 - 105.2, n=10, last 2 years) | |
| Senua's Saga Hellblade 2 | |
| 2560x1440 High Preset | |
| Average NVIDIA GeForce RTX 5090 Laptop (56.2 - 63.1, n=2) | |
| Aorus Master 18 AM8H | |
| Average of class Gaming (24.2 - 63.1, n=11, last 2 years) | |
| 2560x1440 High Preset + Quality DLSS | |
| Aorus Master 18 AM8H | |
| Average NVIDIA GeForce RTX 5090 Laptop (n=1) | |
| Average of class Gaming (39.6 - 81.9, n=9, last 2 years) | |
| Star Wars Outlaws | |
| 2560x1440 cinem. ultra | |
| Aorus Master 18 AM8H | |
| Average NVIDIA GeForce RTX 5090 Laptop (43.7 - 61, n=4) | |
| Average of class Gaming (23.2 - 61, n=13, last 2 years) | |
| 2560x1440 cinem. ultra DLSS | |
| Aorus Master 18 AM8H | |
| Average NVIDIA GeForce RTX 5090 Laptop (66.5 - 70.9, n=3) | |
| Average of class Gaming (32.6 - 70.9, n=12, last 2 years) | |
| Until Dawn | |
| 2560x1440 Ultra Preset | |
| Average NVIDIA GeForce RTX 5090 Laptop (65.6 - 76.6, n=3) | |
| Aorus Master 18 AM8H | |
| Average of class Gaming (30.4 - 76.6, n=11, last 2 years) | |
| 2560x1440 Ultra Preset + Quality DLSS + Ray Tracing | |
| Average NVIDIA GeForce RTX 5090 Laptop (79.7 - 86.3, n=2) | |
| Aorus Master 18 AM8H | |
| Average of class Gaming (39.5 - 86.3, n=10, last 2 years) | |
| Kingdom Come Deliverance 2 | |
| 2560x1440 Ultra Preset | |
| Average NVIDIA GeForce RTX 5090 Laptop (82.6 - 97.2, n=3) | |
| Aorus Master 18 AM8H | |
| Average of class Gaming (36.8 - 97.2, n=13, last 2 years) | |
| 2560x1440 Ultra Preset + Quality DLSS | |
| Average NVIDIA GeForce RTX 5090 Laptop (98.7 - 115.5, n=3) | |
| Aorus Master 18 AM8H | |
| Average of class Gaming (50.3 - 115.5, n=13, last 2 years) | |
| Space Marine 2 | |
| 2560x1440 Ultra Preset AA:T | |
| Average NVIDIA GeForce RTX 5090 Laptop (97.2 - 107.4, n=3) | |
| Aorus Master 18 AM8H | |
| Average of class Gaming (48.2 - 107.4, n=11, last 2 years) | |
| 2560x1440 Ultra Preset + Quality DLSS | |
| Aorus Master 18 AM8H | |
| Average NVIDIA GeForce RTX 5090 Laptop (97.5 - 100.8, n=2) | |
| Average of class Gaming (58.5 - 100.8, n=10, last 2 years) | |
Moreover, our Cyberpunk test showed that both its CPU and GPU performance stay nice and consistent. Apart from the sporadic black screens as mentioned above, its subjective gaming experience is excellent, with the picture always feeling super smooth thanks to the laptop's high raw performance.
Cyberpunk 2077 ultra FPS diagram
Emissions
Noise emissions
During our test, the Master 18 already reached the noise levels of the Scar 18 in turbo mode when we ran it using the balanced profile. 50 to 53 dB(A) under load are clearly audible, so you might want to reach for a headset. In idle mode, the situation is much more relaxed or pleasant, as the fans are usually either off or run at a fairly discreet level (the 18-inch device only sometimes whirs unpleasantly).
Noise level
| Idle |
| 26 / 29 / 34 dB(A) |
| Load |
| 50 / 53 dB(A) |
 | ||
30 dB silent 40 dB(A) audible 50 dB(A) loud |
||
min: | ||
| Aorus Master 18 AM8H Ultra 9 275HX, GeForce RTX 5090 Laptop | Asus Strix Scar 18 G835LX Ultra 9 275HX, GeForce RTX 5090 Laptop | Asus ROG Zephyrus G16 GU605CX Ultra 9 285H, GeForce RTX 5090 Laptop | Razer Blade 16 2025 RTX 5090 Ryzen AI 9 HX 370, GeForce RTX 5090 Laptop | Alienware m18 R2 i9-14900HX, GeForce RTX 4090 Laptop GPU | MSI Titan 18 HX A14VIG i9-14900HX, GeForce RTX 4090 Laptop GPU | |
|---|---|---|---|---|---|---|
| Noise | 2% | 5% | 4% | 10% | 10% | |
| off / environment * (dB) | 25 | 23.3 7% | 23.8 5% | 24.1 4% | 23.6 6% | 22.8 9% |
| Idle Minimum * (dB) | 26 | 29.8 -15% | 23.8 8% | 24.1 7% | 23.8 8% | 23.8 8% |
| Idle Average * (dB) | 29 | 29.8 -3% | 27.2 6% | 30.6 -6% | 26.1 10% | 23.8 18% |
| Idle Maximum * (dB) | 34 | 29.8 12% | 31.3 8% | 30.6 10% | 31.5 7% | 28 18% |
| Load Average * (dB) | 50 | 42.9 14% | 47.6 5% | 45.5 9% | 31.5 37% | 38 24% |
| Cyberpunk 2077 ultra * (dB) | 52 | 53.7 -3% | 51.3 1% | 48.2 7% | ||
| Load Maximum * (dB) | 53 | 53.7 -1% | 53.3 -1% | 53.4 -1% | 56.6 -7% | 62.8 -18% |
| Witcher 3 ultra * (dB) | 52.1 | 57.3 |
* ... smaller is better
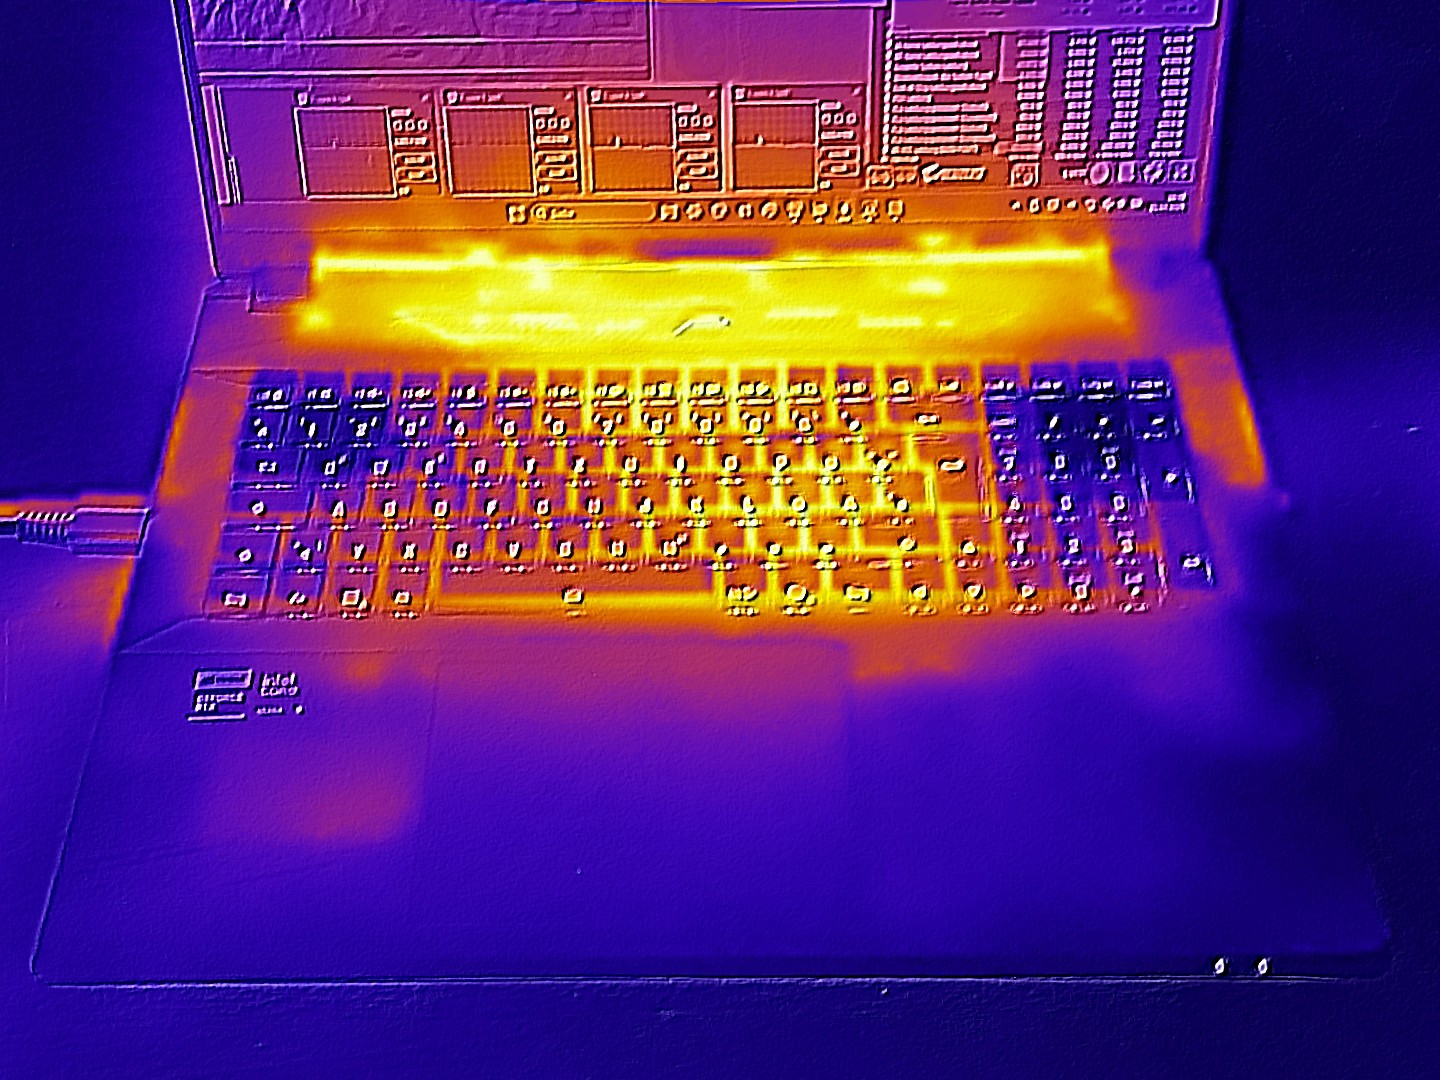
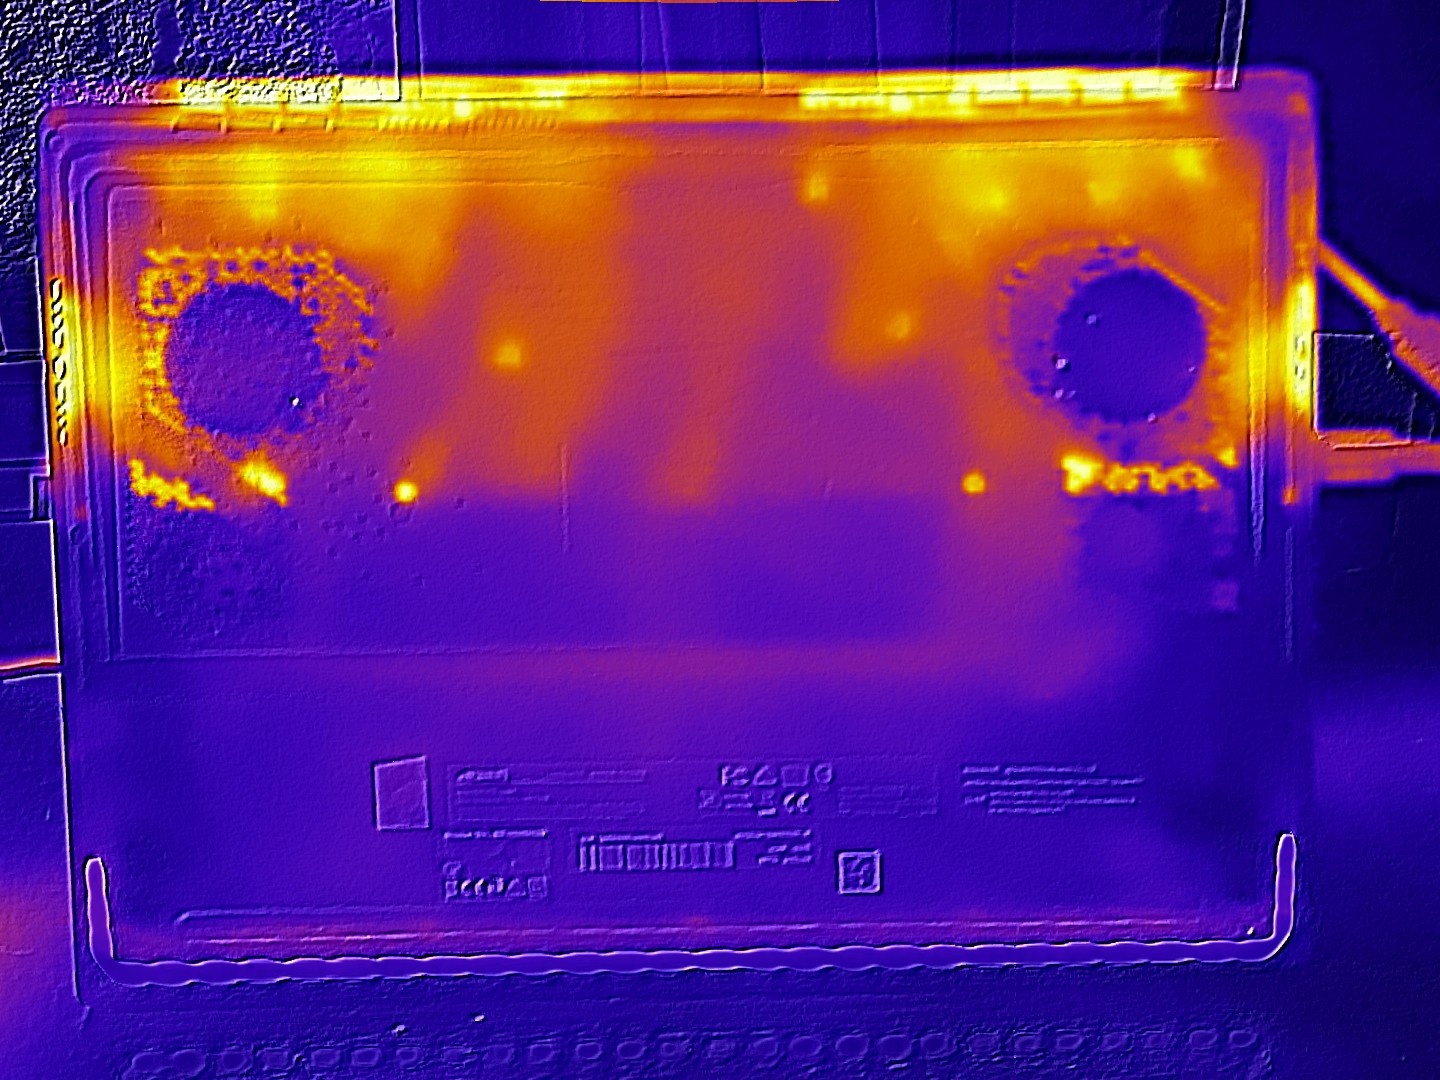
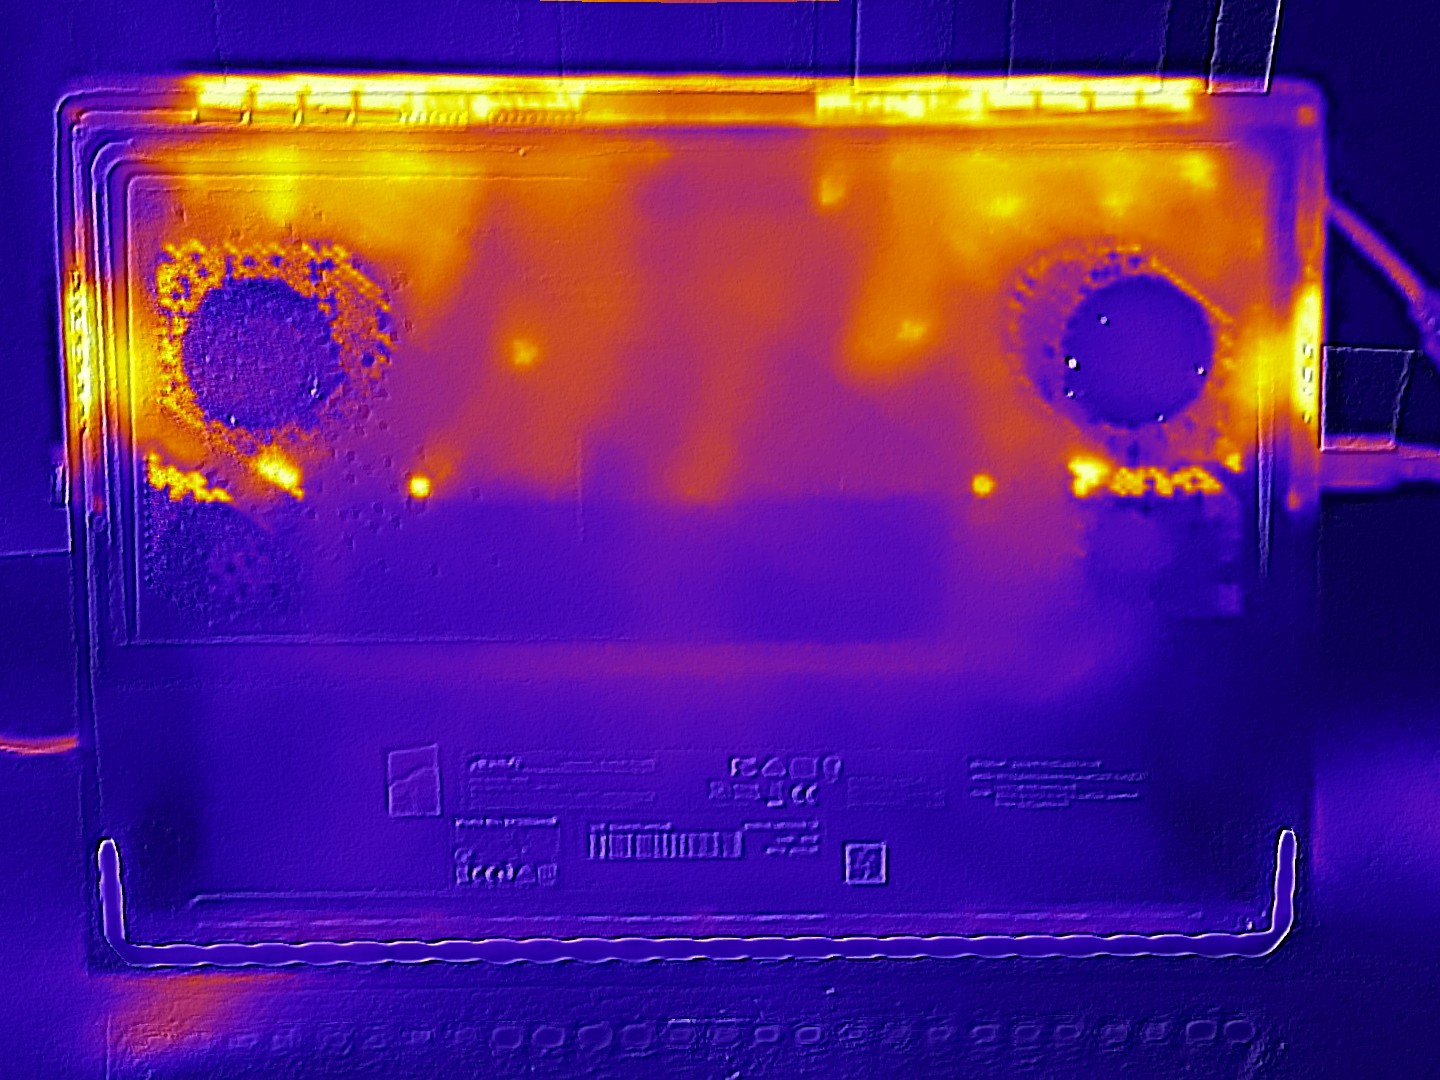
Temperature
The laptop's case mainly heats up in the rear third. We were able to elicit up to 50 °C (top) and up to 46 °C (bottom) from its surfaces in 3D mode. On the other hand, we thankfully noted that the wrist-rest never gets warmer than 34 °C. Its performance in idle mode turned out to be a little weak, as the entire case quickly cracked the 30 °C mark during our test.
(-) The maximum temperature on the upper side is 50 °C / 122 F, compared to the average of 40.4 °C / 105 F, ranging from 21.2 to 68.8 °C for the class Gaming.
(-) The bottom heats up to a maximum of 46 °C / 115 F, compared to the average of 43.2 °C / 110 F
(±) In idle usage, the average temperature for the upper side is 33.9 °C / 93 F, compared to the device average of 33.9 °C / 93 F.
(-) 3: The average temperature for the upper side is 40.6 °C / 105 F, compared to the average of 33.9 °C / 93 F for the class Gaming.
(+) The palmrests and touchpad are reaching skin temperature as a maximum (34 °C / 93.2 F) and are therefore not hot.
(-) The average temperature of the palmrest area of similar devices was 28.8 °C / 83.8 F (-5.2 °C / -9.4 F).
| Aorus Master 18 AM8H Ultra 9 275HX, GeForce RTX 5090 Laptop | Asus Strix Scar 18 G835LX Ultra 9 275HX, GeForce RTX 5090 Laptop | Asus ROG Zephyrus G16 GU605CX Ultra 9 285H, GeForce RTX 5090 Laptop | Razer Blade 16 2025 RTX 5090 Ryzen AI 9 HX 370, GeForce RTX 5090 Laptop | Alienware m18 R2 i9-14900HX, GeForce RTX 4090 Laptop GPU | MSI Titan 18 HX A14VIG i9-14900HX, GeForce RTX 4090 Laptop GPU | |
|---|---|---|---|---|---|---|
| Heat | 12% | 18% | 5% | -0% | 11% | |
| Maximum Upper Side * (°C) | 50 | 45.6 9% | 44 12% | 48.3 3% | 41.2 18% | 37.8 24% |
| Maximum Bottom * (°C) | 46 | 46 -0% | 44.1 4% | 53.3 -16% | 34.6 25% | 37.6 18% |
| Idle Upper Side * (°C) | 36 | 28.9 20% | 26.1 27% | 28.3 21% | 42.8 -19% | 34.8 3% |
| Idle Bottom * (°C) | 35 | 29.2 17% | 25.5 27% | 30.3 13% | 43.6 -25% | 36 -3% |
* ... smaller is better
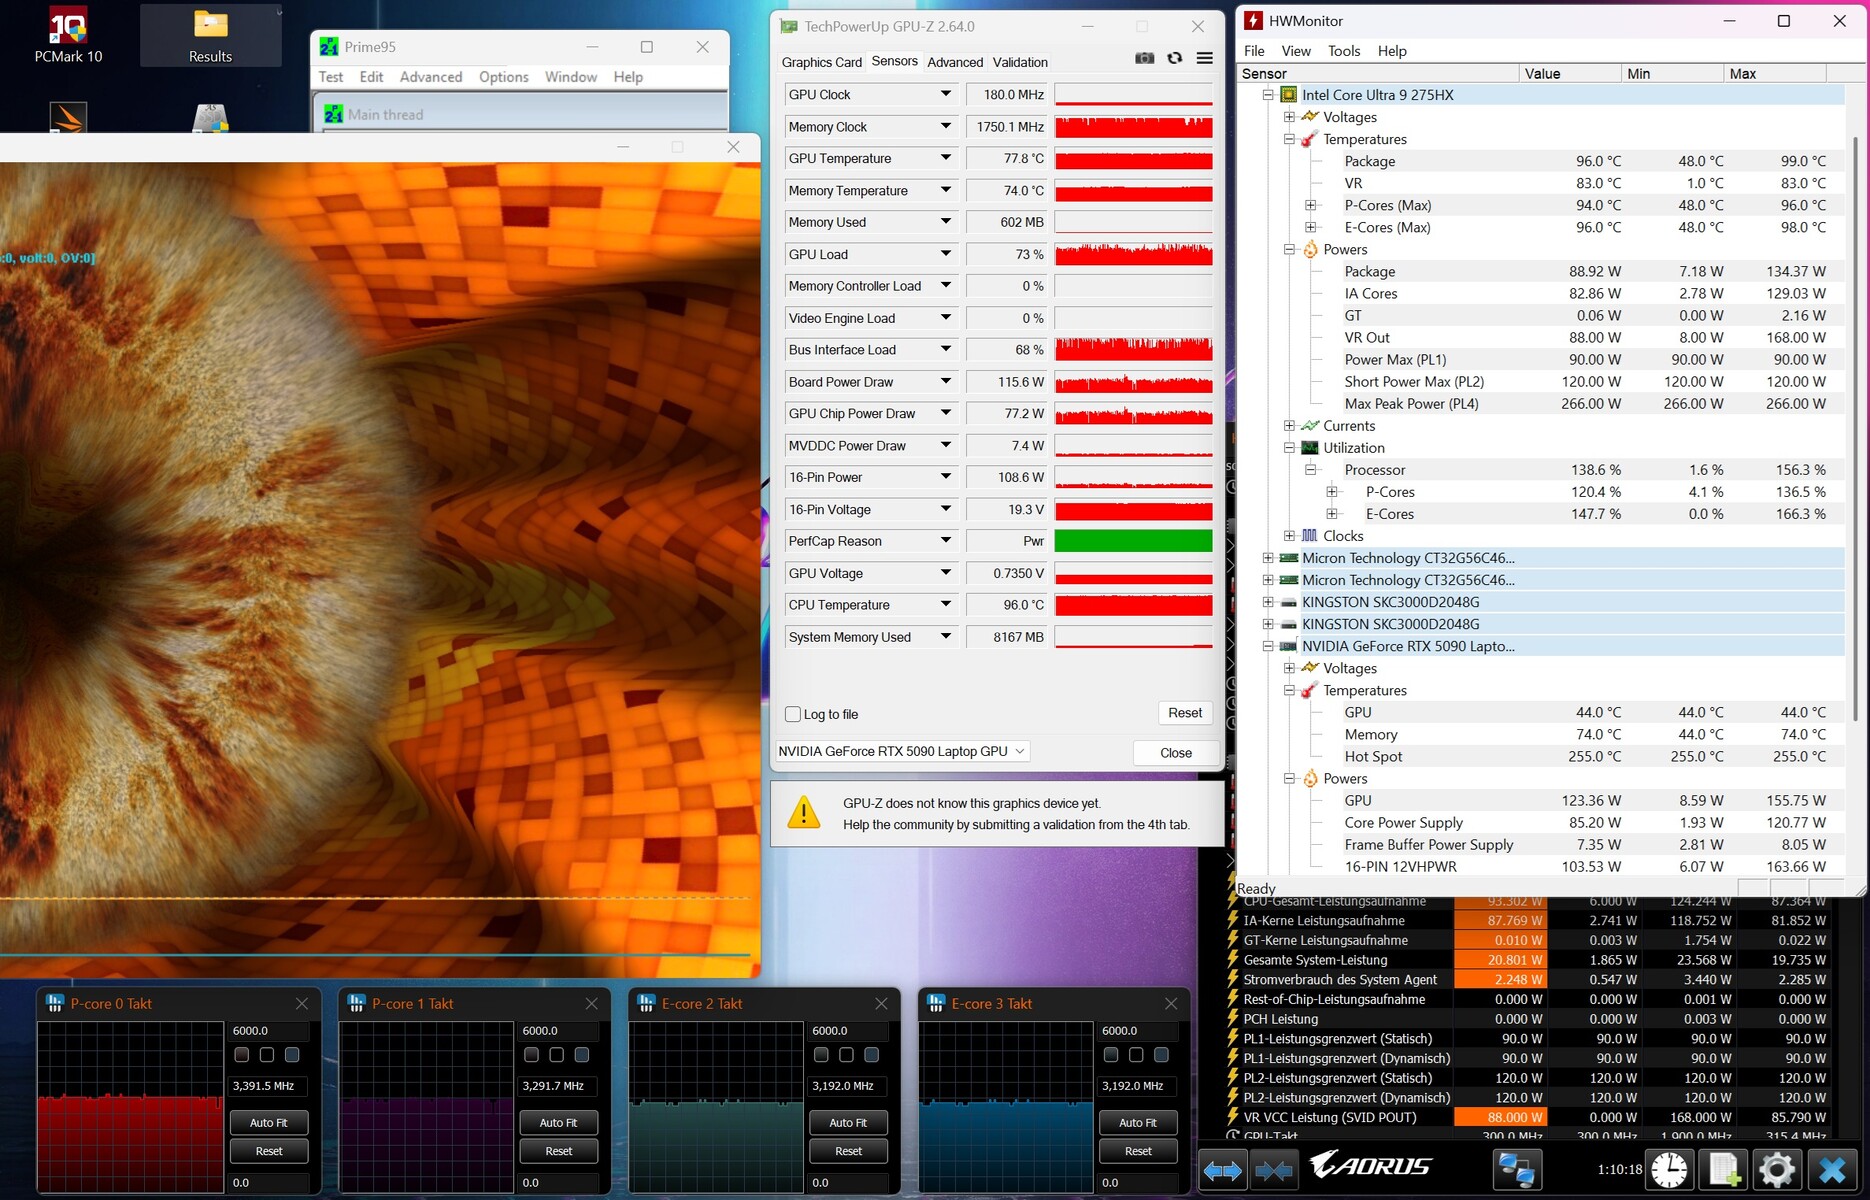
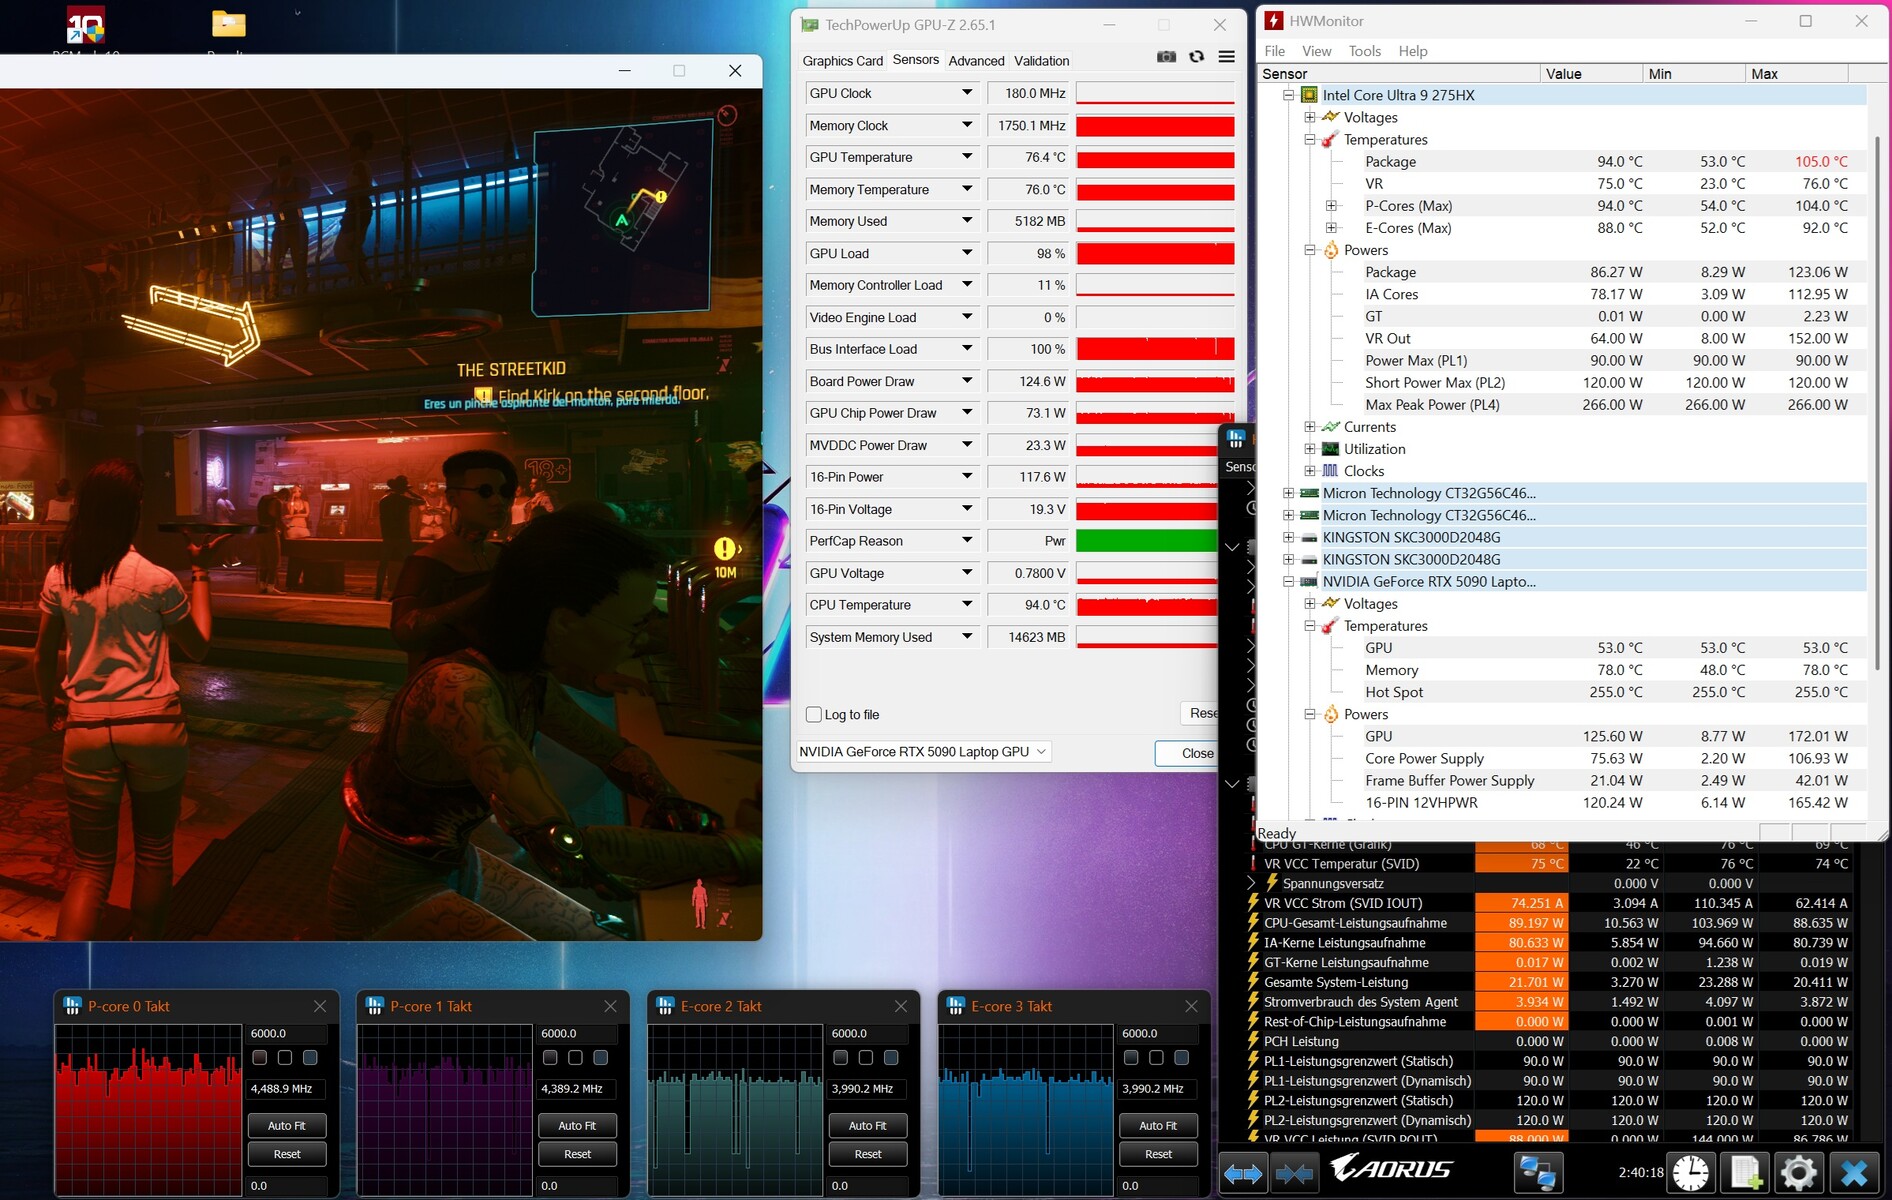
Stress test
During the stress test using the Furmark and Prime95 tools, the GeForce RTX 5090 heated up to an average of 78 °C according to our measurement software, whereas the Core Ultra 9 275HX leveled off at a borderline 96 °C. The results when running Cyberpunk 2077 were similar.

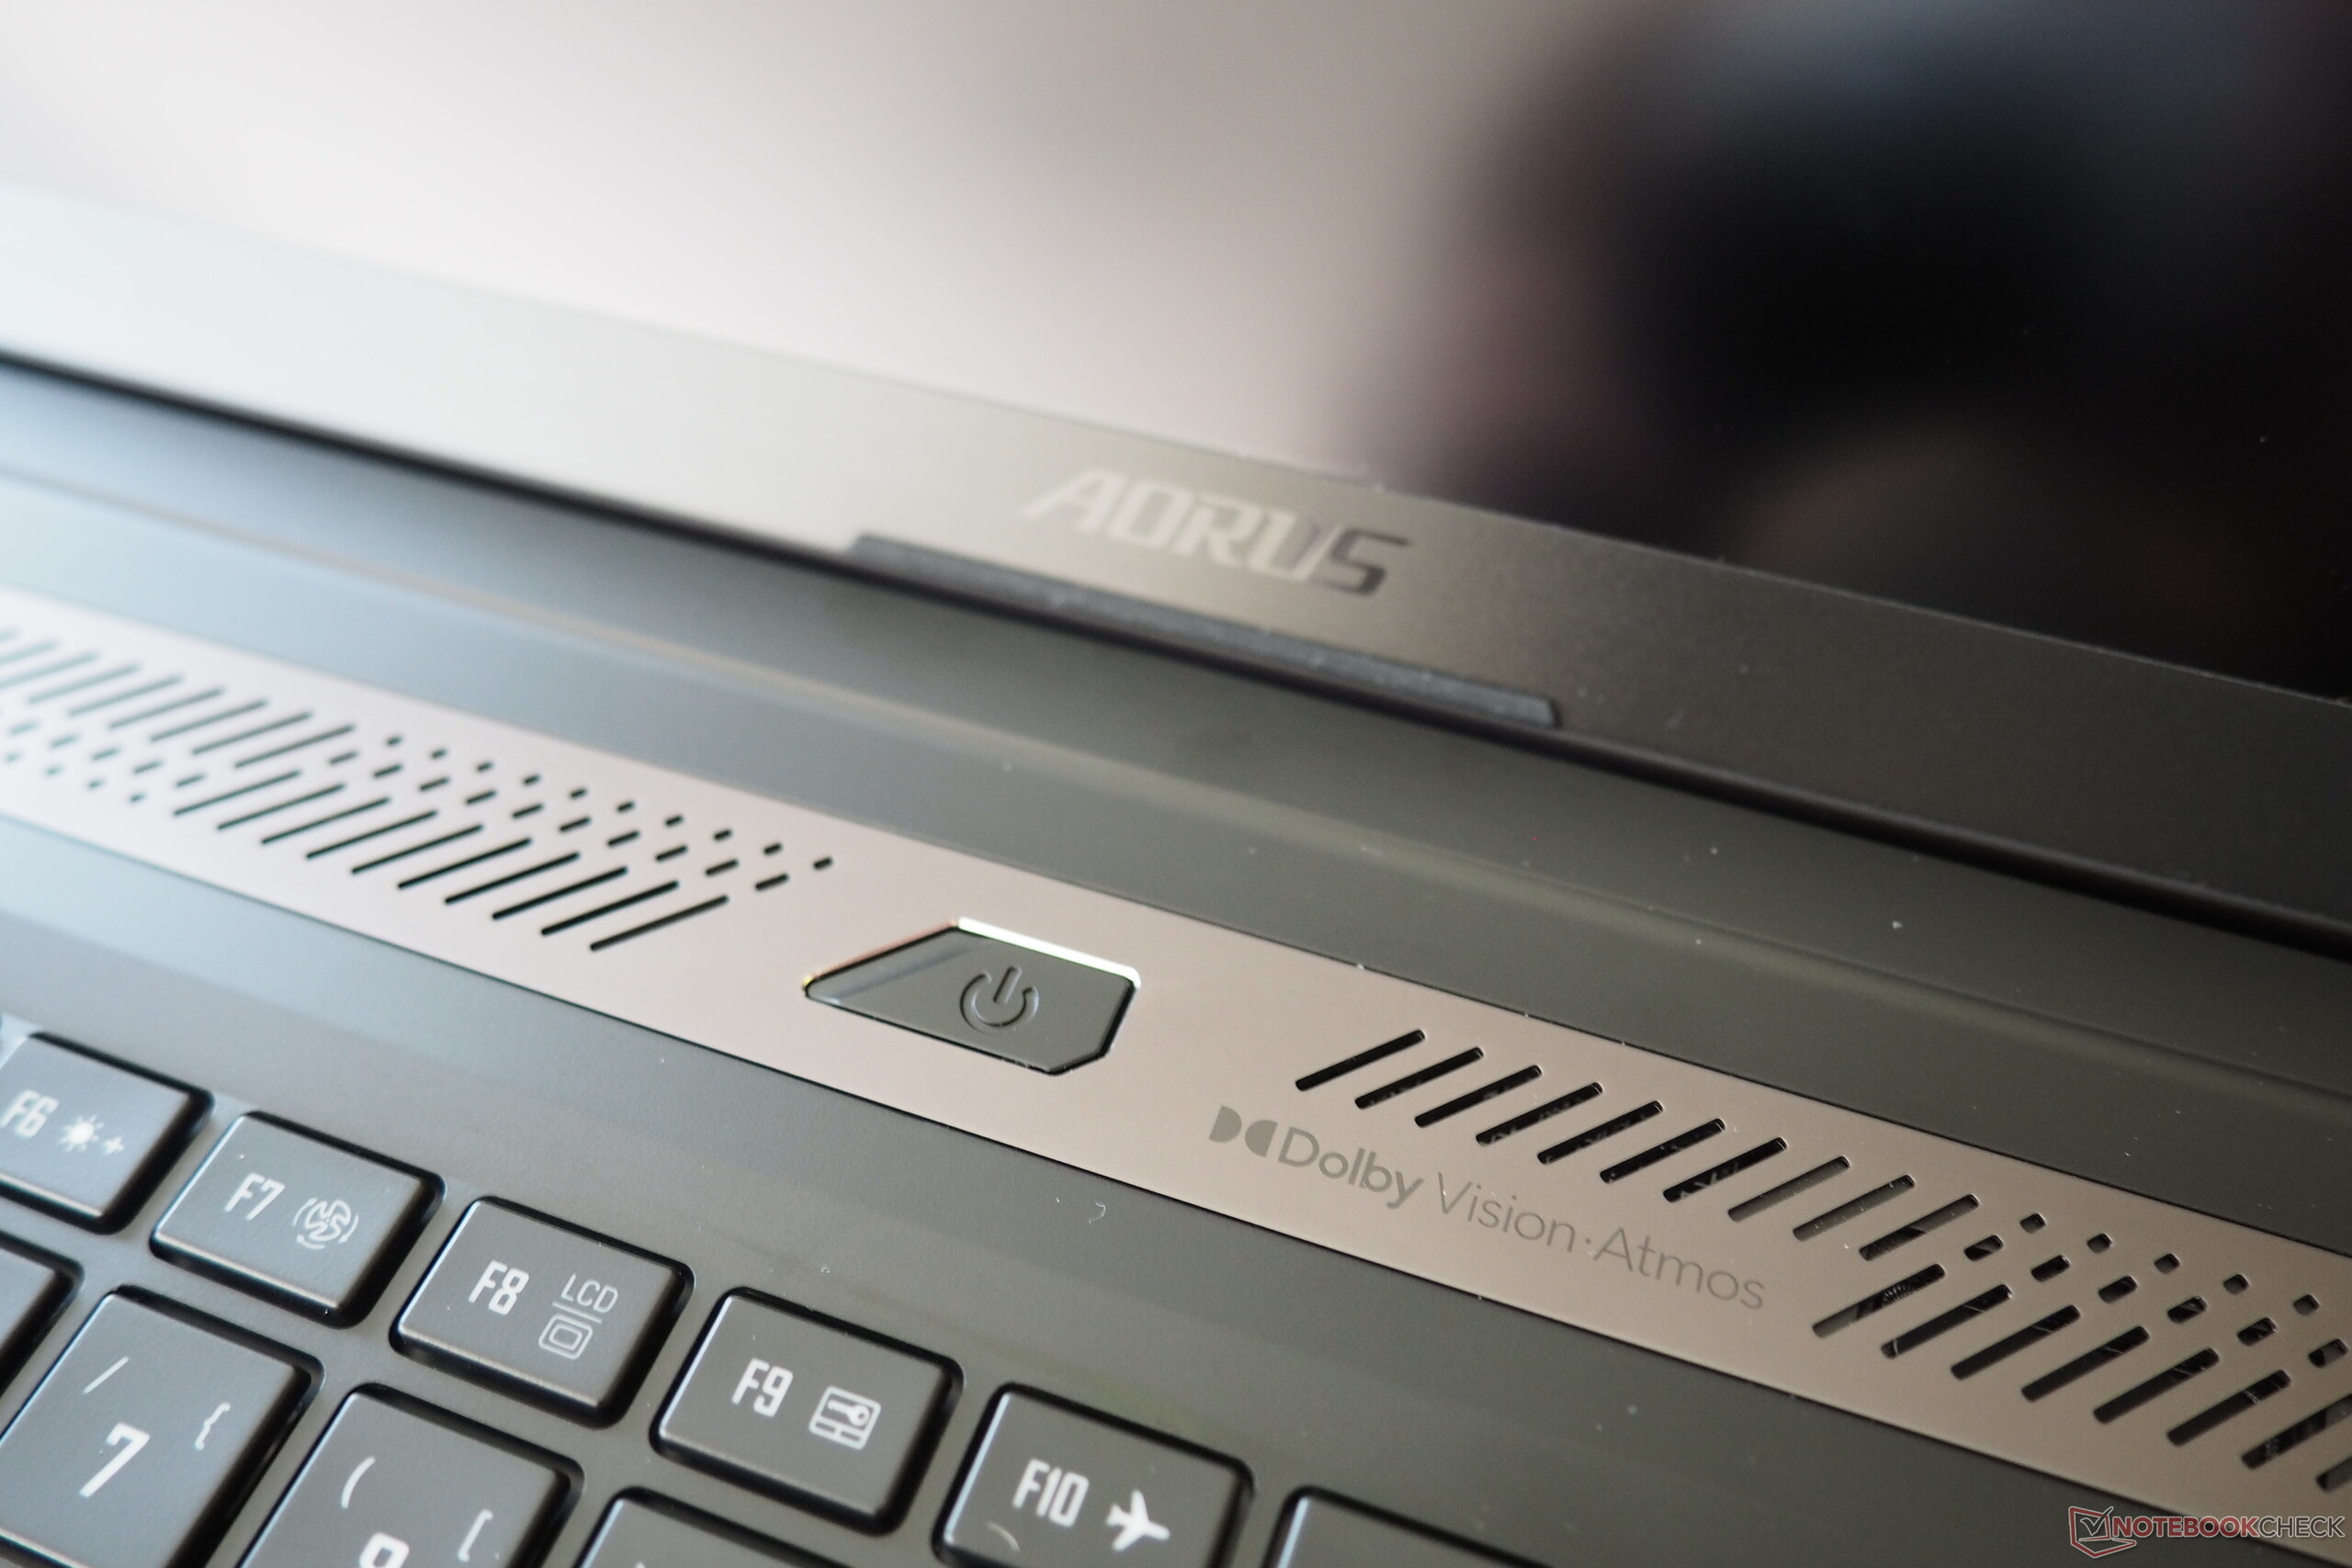
Speakers
Apart from its mediocre maximum volume (77 dB), the Master 18's sound system offers a good sound that can easily compete with the Strix Scar 18.
Aorus Master 18 AM8H audio analysis
(±) | speaker loudness is average but good (77 dB)
Bass 100 - 315 Hz
(±) | reduced bass - on average 8.7% lower than median
(±) | linearity of bass is average (10.3% delta to prev. frequency)
Mids 400 - 2000 Hz
(+) | balanced mids - only 3% away from median
(+) | mids are linear (4.3% delta to prev. frequency)
Highs 2 - 16 kHz
(+) | balanced highs - only 2.8% away from median
(+) | highs are linear (5.4% delta to prev. frequency)
Overall 100 - 16.000 Hz
(+) | overall sound is linear (11.9% difference to median)
Compared to same class
» 12% of all tested devices in this class were better, 4% similar, 84% worse
» The best had a delta of 6%, average was 18%, worst was 132%
Compared to all devices tested
» 9% of all tested devices were better, 2% similar, 89% worse
» The best had a delta of 4%, average was 24%, worst was 134%
Asus Strix Scar 18 G835LX audio analysis
(+) | speakers can play relatively loud (86.3 dB)
Bass 100 - 315 Hz
(±) | reduced bass - on average 7.5% lower than median
(±) | linearity of bass is average (7.7% delta to prev. frequency)
Mids 400 - 2000 Hz
(±) | higher mids - on average 9.9% higher than median
(+) | mids are linear (6.9% delta to prev. frequency)
Highs 2 - 16 kHz
(+) | balanced highs - only 2.2% away from median
(+) | highs are linear (4.1% delta to prev. frequency)
Overall 100 - 16.000 Hz
(+) | overall sound is linear (13.7% difference to median)
Compared to same class
» 21% of all tested devices in this class were better, 7% similar, 72% worse
» The best had a delta of 6%, average was 18%, worst was 132%
Compared to all devices tested
» 15% of all tested devices were better, 4% similar, 81% worse
» The best had a delta of 4%, average was 24%, worst was 134%
Energy management
Power consumption
The Master 18 already consumes a decent amount of energy when idling—the Scar 18 sends its regards: On paper, 29 to 48 watts are no guarantee for long battery runtimes. Under load, its demand climbs up to 340 watts, the Asus laptop consumes more in this case due to its processor's more generous PL1/PL2 values.
| Off / Standby | |
| Idle | |
| Load |
|
Key:
min: | |
| Aorus Master 18 AM8H Ultra 9 275HX, GeForce RTX 5090 Laptop | Asus Strix Scar 18 G835LX Ultra 9 275HX, GeForce RTX 5090 Laptop | Asus ROG Zephyrus G16 GU605CX Ultra 9 285H, GeForce RTX 5090 Laptop | Razer Blade 16 2025 RTX 5090 Ryzen AI 9 HX 370, GeForce RTX 5090 Laptop | Alienware m18 R2 i9-14900HX, GeForce RTX 4090 Laptop GPU | MSI Titan 18 HX A14VIG i9-14900HX, GeForce RTX 4090 Laptop GPU | Average of class Gaming | |
|---|---|---|---|---|---|---|---|
| Power Consumption | 1% | 48% | 44% | 13% | 9% | 39% | |
| Idle Minimum * (Watt) | 29 | 11.4 61% | 9.4 68% | 10.9 62% | 10.6 63% | 13.2 54% | 13.2 ? 54% |
| Idle Average * (Watt) | 33 | 39.2 -19% | 13.6 59% | 13.5 59% | 20.9 37% | 25.4 23% | 18.9 ? 43% |
| Idle Maximum * (Watt) | 48 | 40.2 16% | 15.8 67% | 13.7 71% | 40 17% | 53.5 -11% | 24.3 ? 49% |
| Load Average * (Watt) | 141 | 161.2 -14% | 115.4 18% | 120.2 15% | 201.1 -43% | 151.4 -7% | 108 ? 23% |
| Cyberpunk 2077 ultra * (Watt) | 283 | 303 -7% | 164.5 42% | 178.2 37% | |||
| Cyberpunk 2077 ultra external monitor * (Watt) | 283 | 295 -4% | 160.4 43% | 177.6 37% | |||
| Load Maximum * (Watt) | 340 | 430.9 -27% | 216.7 36% | 246.1 28% | 378.9 -11% | 395.2 -16% | 254 ? 25% |
| Witcher 3 ultra * (Watt) | 358 | 336 |
* ... smaller is better
Power consumption Cyberpunk / stress test
Power consumption with external monitor
Runtimes
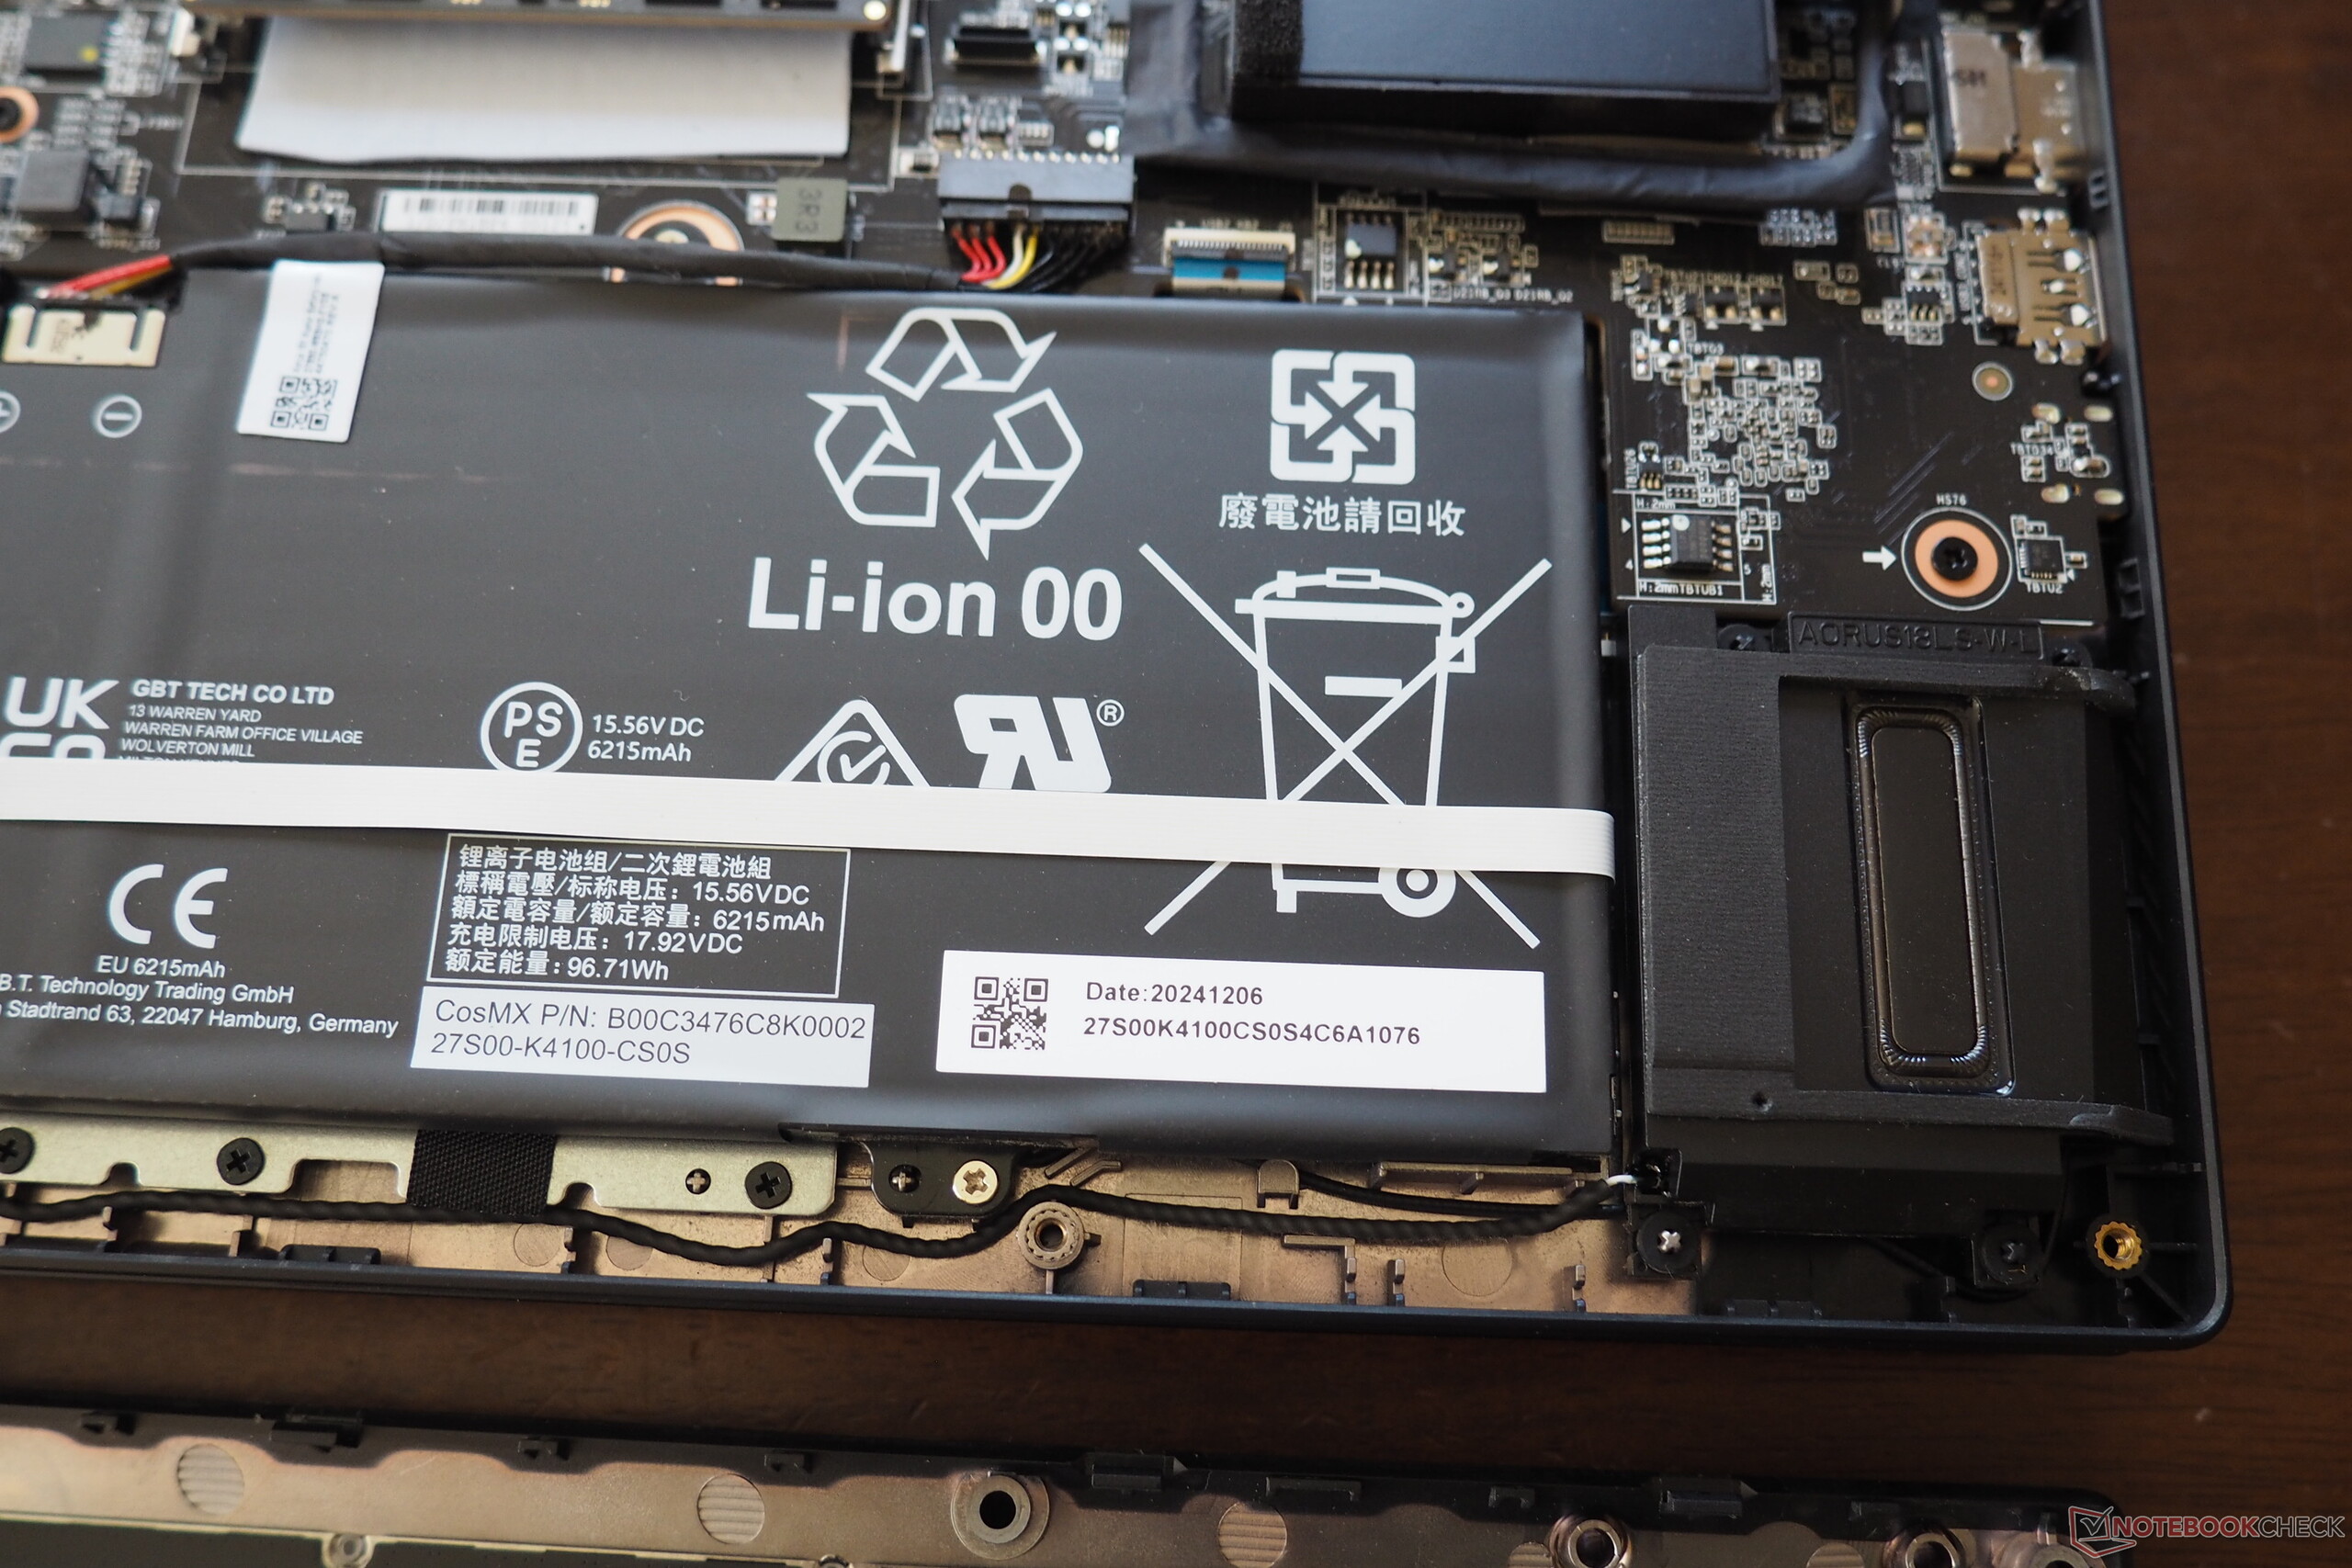
Gigabyte has given its 18-inch laptop a respectable battery capacity of 99 Wh, which is higher than the Scar 18's 90 Wh. During our Wi-Fi test with the brightness reduced to 150 cd/m², the Master 18 lasted around 5 hours. By comparison, the Asus laptop managed just under 5.5 hours, which is slightly more despite its lower capacity. By the way, when using balanced mode, the dGPU is automatically deactivated as soon as the device is disconnected from the power supply.
| Aorus Master 18 AM8H Ultra 9 275HX, GeForce RTX 5090 Laptop, 99 Wh | Asus Strix Scar 18 G835LX Ultra 9 275HX, GeForce RTX 5090 Laptop, 90 Wh | Asus ROG Zephyrus G16 GU605CX Ultra 9 285H, GeForce RTX 5090 Laptop, 90 Wh | Razer Blade 16 2025 RTX 5090 Ryzen AI 9 HX 370, GeForce RTX 5090 Laptop, 90 Wh | Alienware m18 R2 i9-14900HX, GeForce RTX 4090 Laptop GPU, 97 Wh | MSI Titan 18 HX A14VIG i9-14900HX, GeForce RTX 4090 Laptop GPU, 99.9 Wh | Average of class Gaming | |
|---|---|---|---|---|---|---|---|
| Battery runtime | -13% | 84% | 61% | -2% | -16% | 23% | |
| Reader / Idle (h) | 5.8 | 5.9 2% | 8.71 ? 50% | ||||
| WiFi v1.3 (h) | 4.9 | 5.5 12% | 9 84% | 7.9 61% | 4.8 -2% | 4.2 -14% | 7.02 ? 43% |
| Load (h) | 1.9 | 1.2 -37% | 1.2 -37% | 1.47 ? -23% | |||
| H.264 (h) | 5.8 | 9.9 | 8.26 ? | ||||
| Cyberpunk 2077 ultra 150cd (h) | 0.7 | 1.2 |
Notebookcheck total rating
The Aorus Master 18 is an extremely expensive but very powerful 18-inch desktop replacement.
Aorus Master 18 AM8H
- 04/29/2025 v8
Florian Glaser
 Total Sustainability Score:
 Video test of the RTX 5080 version
Possible alternatives compared
Image | Model / Review | Price | Weight | Height | Display |
|---|---|---|---|---|---|
1. 86.8%  | Aorus Master 18 AM8H Intel Core Ultra 9 275HX ⎘ NVIDIA GeForce RTX 5090 Laptop ⎘ 64 GB Memory, 2048 GB SSD | Amazon: List Price: 5000 EUR | 3.4 kg | 31 mm | 18.00" 2560x1600 168 PPI Mini-LED |
2. 88%  | Asus Strix Scar 18 G835LX Intel Core Ultra 9 275HX ⎘ NVIDIA GeForce RTX 5090 Laptop ⎘ 64 GB Memory, 2048 GB SSD | Amazon: List Price: 5799€ | 3.3 kg | 32 mm | 18.00" 2560x1600 168 PPI Mini-LED |
3. 90%  | Asus ROG Zephyrus G16 GU605CX Intel Core Ultra 9 285H ⎘ NVIDIA GeForce RTX 5090 Laptop ⎘ 64 GB Memory, 2048 GB SSD | Amazon: List Price: 4799€ | 1.9 kg | 17.4 mm | 16.00" 2560x1600 189 PPI OLED |
4. 87% 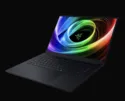 | Razer Blade 16 2025 RTX 5090 AMD Ryzen AI 9 HX 370 ⎘ NVIDIA GeForce RTX 5090 Laptop ⎘ 32 GB Memory, 2048 GB SSD | Amazon: List Price: 4399€ | 2.1 kg | 17.4 mm | 16.00" 2560x1600 189 PPI OLED |
5. 89.5% v7 (old)  | Alienware m18 R2 Intel Core i9-14900HX ⎘ NVIDIA GeForce RTX 4090 Laptop GPU ⎘ 32 GB Memory, 2048 GB SSD | Amazon: 1. $2,408.13 Alienware 18 Area-51 Gaming ... 2. $3,899.99 Dell Alienware 18 Area-51 Ga... 3. $3,066.75 Alienware 18 Area-51 Gaming ... List Price: 3300 USD | 4 kg | 26.7 mm | 18.00" 2560x1600 168 PPI IPS |
6. 88.8% v7 (old) 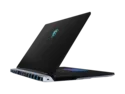 | MSI Titan 18 HX A14VIG Intel Core i9-14900HX ⎘ NVIDIA GeForce RTX 4090 Laptop GPU ⎘ 128 GB Memory, 4096 GB SSD | Amazon: 1. msi Titan 18 HX AI 18" 120Hz... 2. $2,149.00 msi Crosshair 18 HX AI Gamin... 3. $3,713.10 msi Stealth 18 HX AI 18” 1... List Price: 5000 USD | 3.6 kg | 32.1 mm | 18.00" 3840x2400 252 PPI Mini-LED |
Transparency
The selection of devices to be reviewed is made by our editorial team. The test sample was provided to the author as a loan by the manufacturer or retailer for the purpose of this review. The lender had no influence on this review, nor did the manufacturer receive a copy of this review before publication. There was no obligation to publish this review. As an independent media company, Notebookcheck is not subjected to the authority of manufacturers, retailers or publishers.
This is how Notebookcheck is testing
Every year, Notebookcheck independently reviews hundreds of laptops and smartphones using standardized procedures to ensure that all results are comparable. We have continuously developed our test methods for around 20 years and set industry standards in the process. In our test labs, high-quality measuring equipment is utilized by experienced technicians and editors. These tests involve a multi-stage validation process. Our complex rating system is based on hundreds of well-founded measurements and benchmarks, which maintains objectivity. Further information on our test methods can be found here.

