

Razer Blade 16 2025 review - Gaming laptop now with GeForce RTX 5090 Laptop and an even slimmer case
Back to the roots - Will this work?
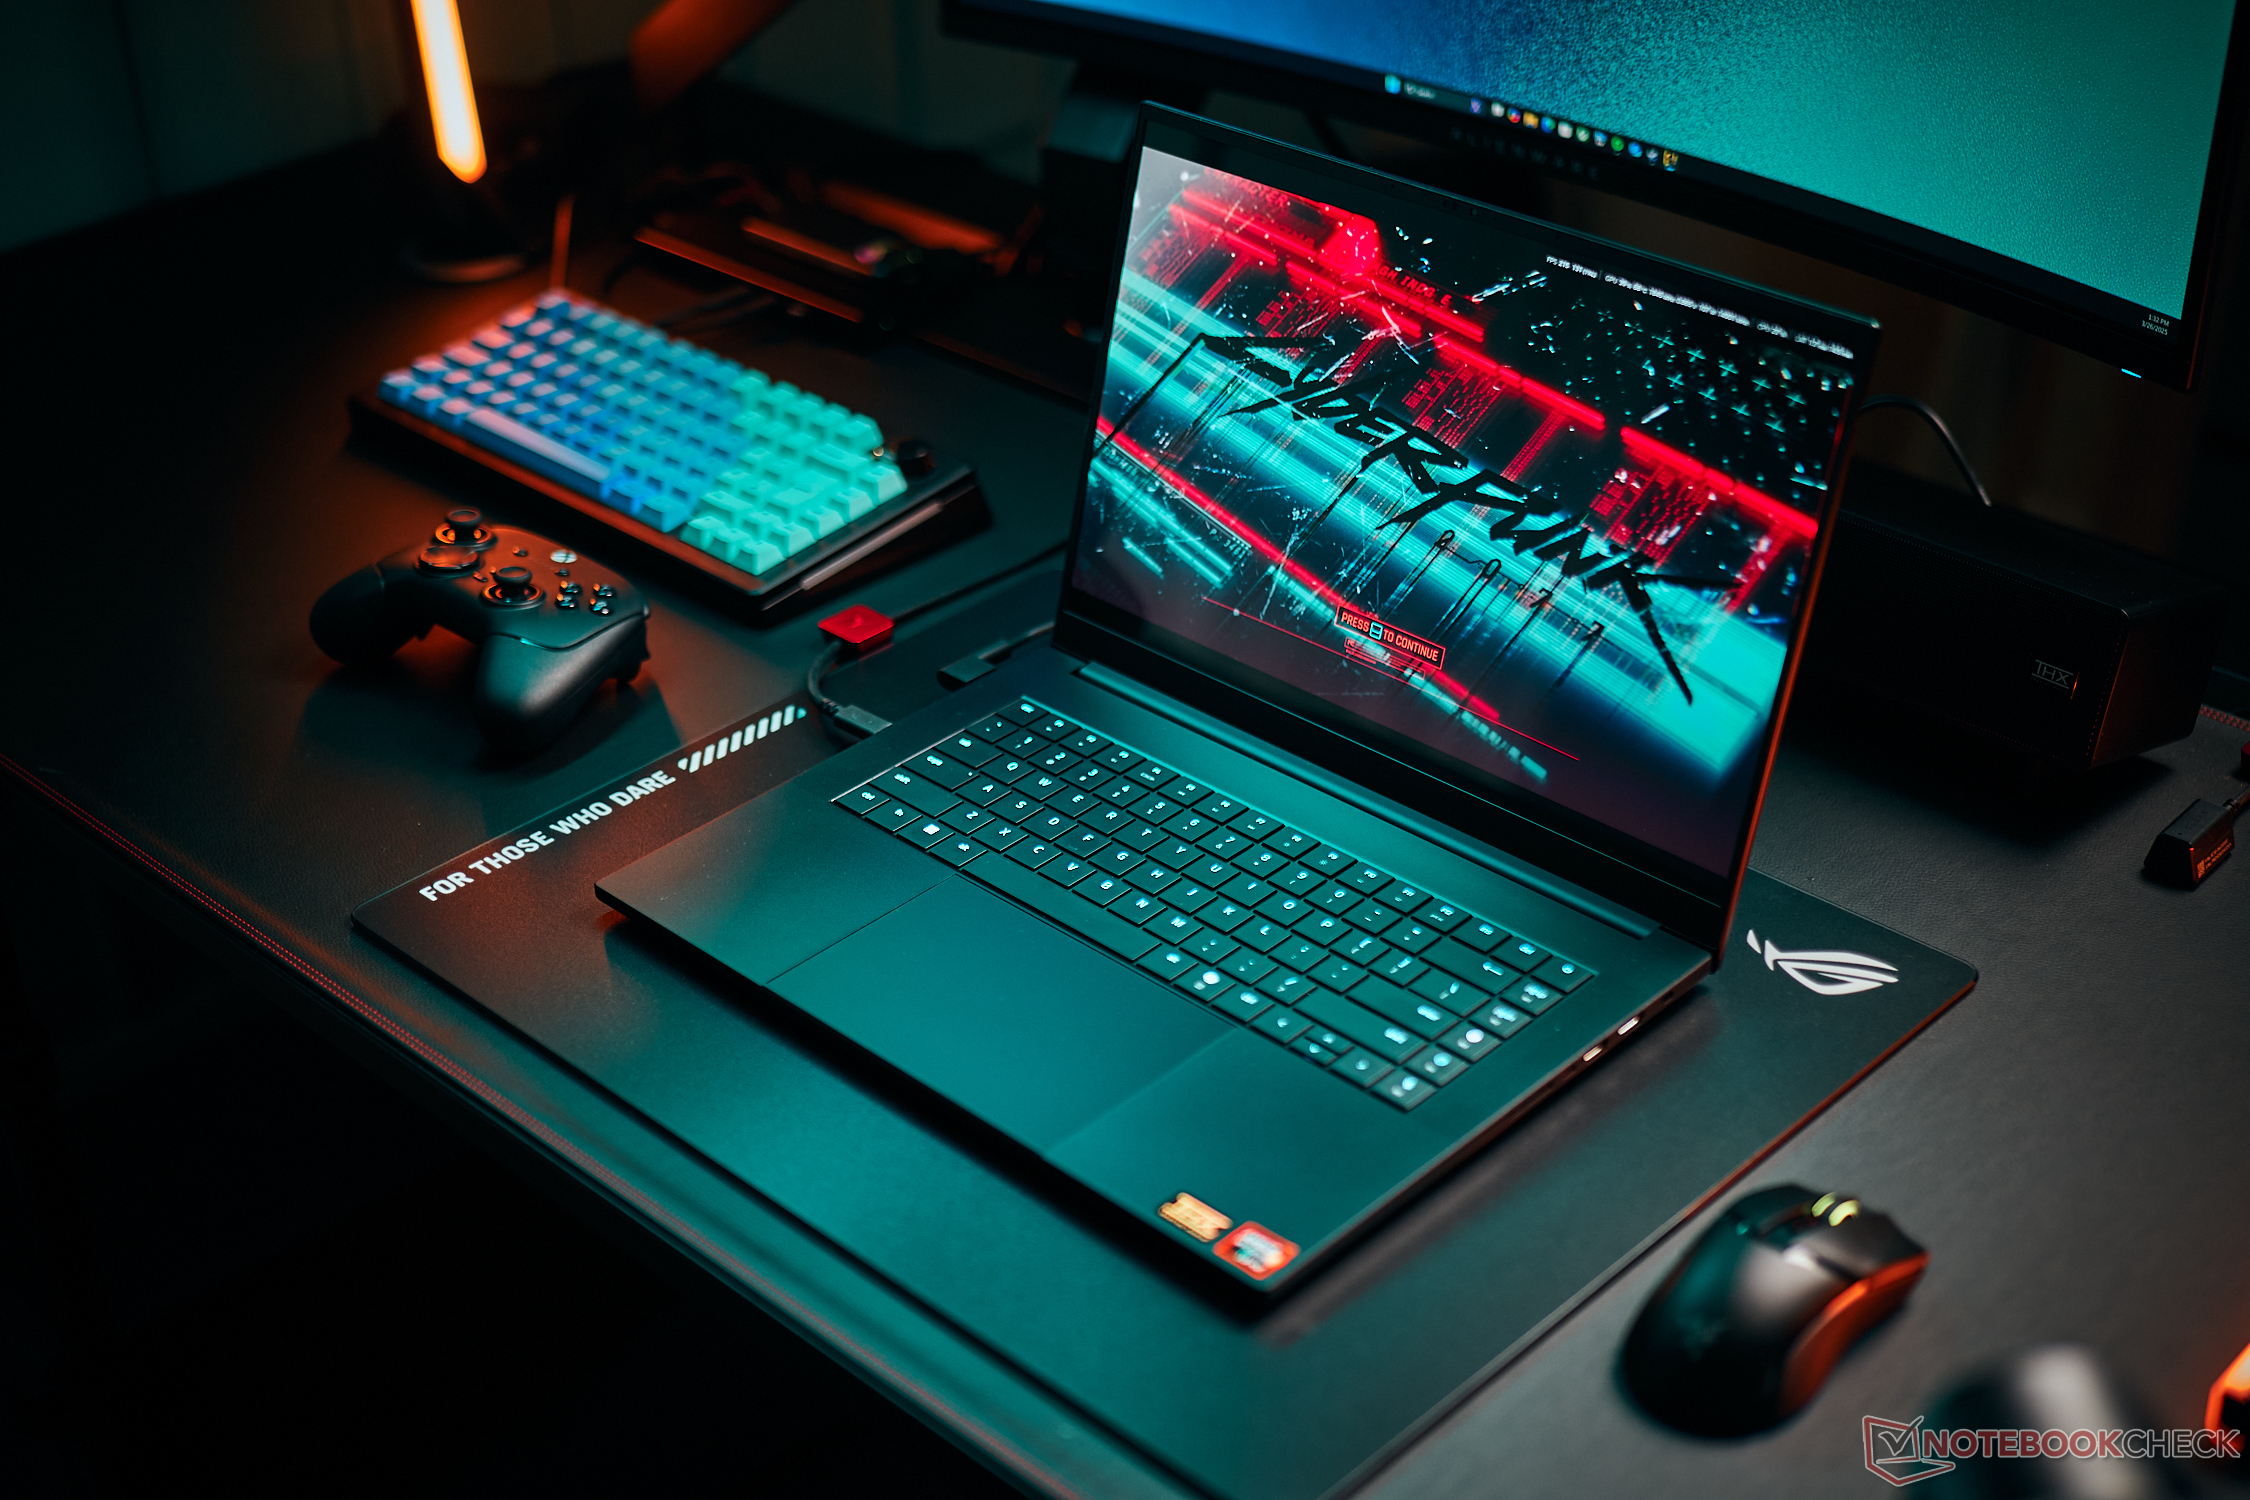
The Razer Blade 16 2025 is the first laptop equipped with the brand-new Nvidia GeForce RTX 5090 Laptop, which runs the 240-Hz OLED panel. At the same time, the Blade 16 has again become significantly slimmer, which also means that it now uses a slower AMD Ryzen processor.Andreas Osthoff, 👁 Andreas Osthoff (translated by Mark Riege) Published 🇩🇪 🇫🇷 ...
Verdict - Despite its slim case, the Razer Blade 16 impresses with its performance
What makes the Razer Blade 2025 interesting is of course not only the brand-new GeForce RTX 5090 Laptop but also its significantly slimmer case. With a maximum TGP of 160 watts, the Razer still manages to include a very fast version of the new RTX 5090 Laptop.
Another compromise is the weaker processor. Although the AMD Ryzen AI 9 HX 370 is by no means slow, there is still a difference to the faster HX CPUs, which becomes particularly noticeable in the 1080p resolution. But you can still use the 5090 Laptop without any problems for gaming in the native QHD resolution, and particularly in the maximum settings including raytracing, the 5090 Laptop will show its strengths. Thanks to Multi Frame Generation, the performance can additionally be improved significantly further, making almost 200 FPS in Cyberpunk possible (QHD + RT Overdrive). However, if you already have a gaming laptop with the RTX 4090 Laptop, an upgrade is really only worthwhile if you can make use of the additional 8 GB of VRAM. On the other hand, the upgrade definitely makes sense for current users of the RTX 3000 GPUs.
With its thickness of barely 17 mm (~0.67 in) and weight of around 2 kg (~4.4 lb), the Blade 16 2025 is very mobile, and the quality of the case continues to be very high. But unfortunately, the surfaces remain extremely susceptible to dirt. In terms of the maintenance options, we see a step backwards, since the Ryzen processor is combined with soldered RAM. While the keyboard was improved, it continues to be weaker than that of the ROG Zephyrus G16.
The large vapor-chamber cooling does a decent job in terms of the noise volume, but the case temperatures have increased. The OLED display with 240 Hz is excellently suited for gaming, and the included color profiles (both P3 and sRGB) are superbly calibrated. Only the HDR capabilities of the OLED panel leave something to be desired. Overall, the new Razer Blade 2025 is a good and particularly mobile gaming laptop that also offers a lot of performance for creative users.
Pros
Cons
Price and Availability
The new Razer Blade 16 can be ordered from Razer, with RTX 5090 options starting from $4500 with shipping starting on April 30.
- $6,698.00Razer Blade 18 Gaming Laptop: NVIDIA GeForce RTX 4090 - Intel Core i9 14900HX 14th Gen CPU - 18” UHD+ 4K 200Hz Display - 32GB RAM - 2TB SSD - Thunderbolt 5 - Chroma RGB - Snap Tap - Mercury
Table of Contents
- Verdict - Despite its slim case, the Razer Blade 16 impresses with its performance
- Specifications
- Case - The Blade 16 is now significantly slimmer
- Equipment - USB 4 and Wi-Fi 7
- Input Devices - Blade 16 now with a 1.5 mm key stroke
- Display - OLED with 240 Hz and G-Sync
- Performance - Ryzen AI and GeForce RTX 5090 Laptop
- Emissions - Massive vapor chamber
- Power Management - Improved battery life
- Notebookcheck Overall Valuation
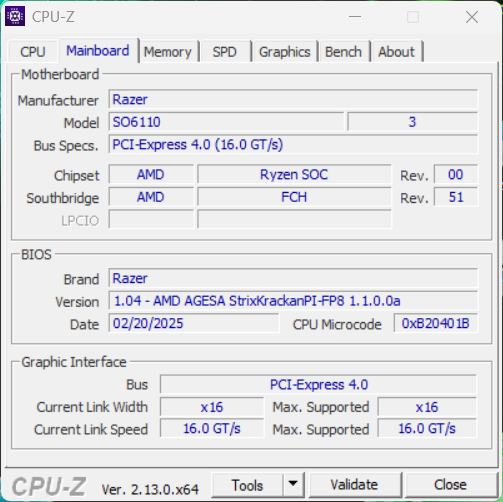
While the Razer Blade 16 was one of the fastest gaming laptops on the market in previous years, Razer is now returning more to its roots with a significantly slimmer 2025 model. We test the model with the Ryzen AI 9 HX 370, 32 GB of RAM, 2-TB SSD storage, and the Nvidia GeForce RTX 5090 Laptop available at an MSRP of 4,399 Euros (~$4,500 in the US). In comparison to the launch price of the old Blade 16 with comparable equipment, the price has dropped by 450 Euros (~$485) with this.
Specifications
Case - The Blade 16 is now significantly slimmer
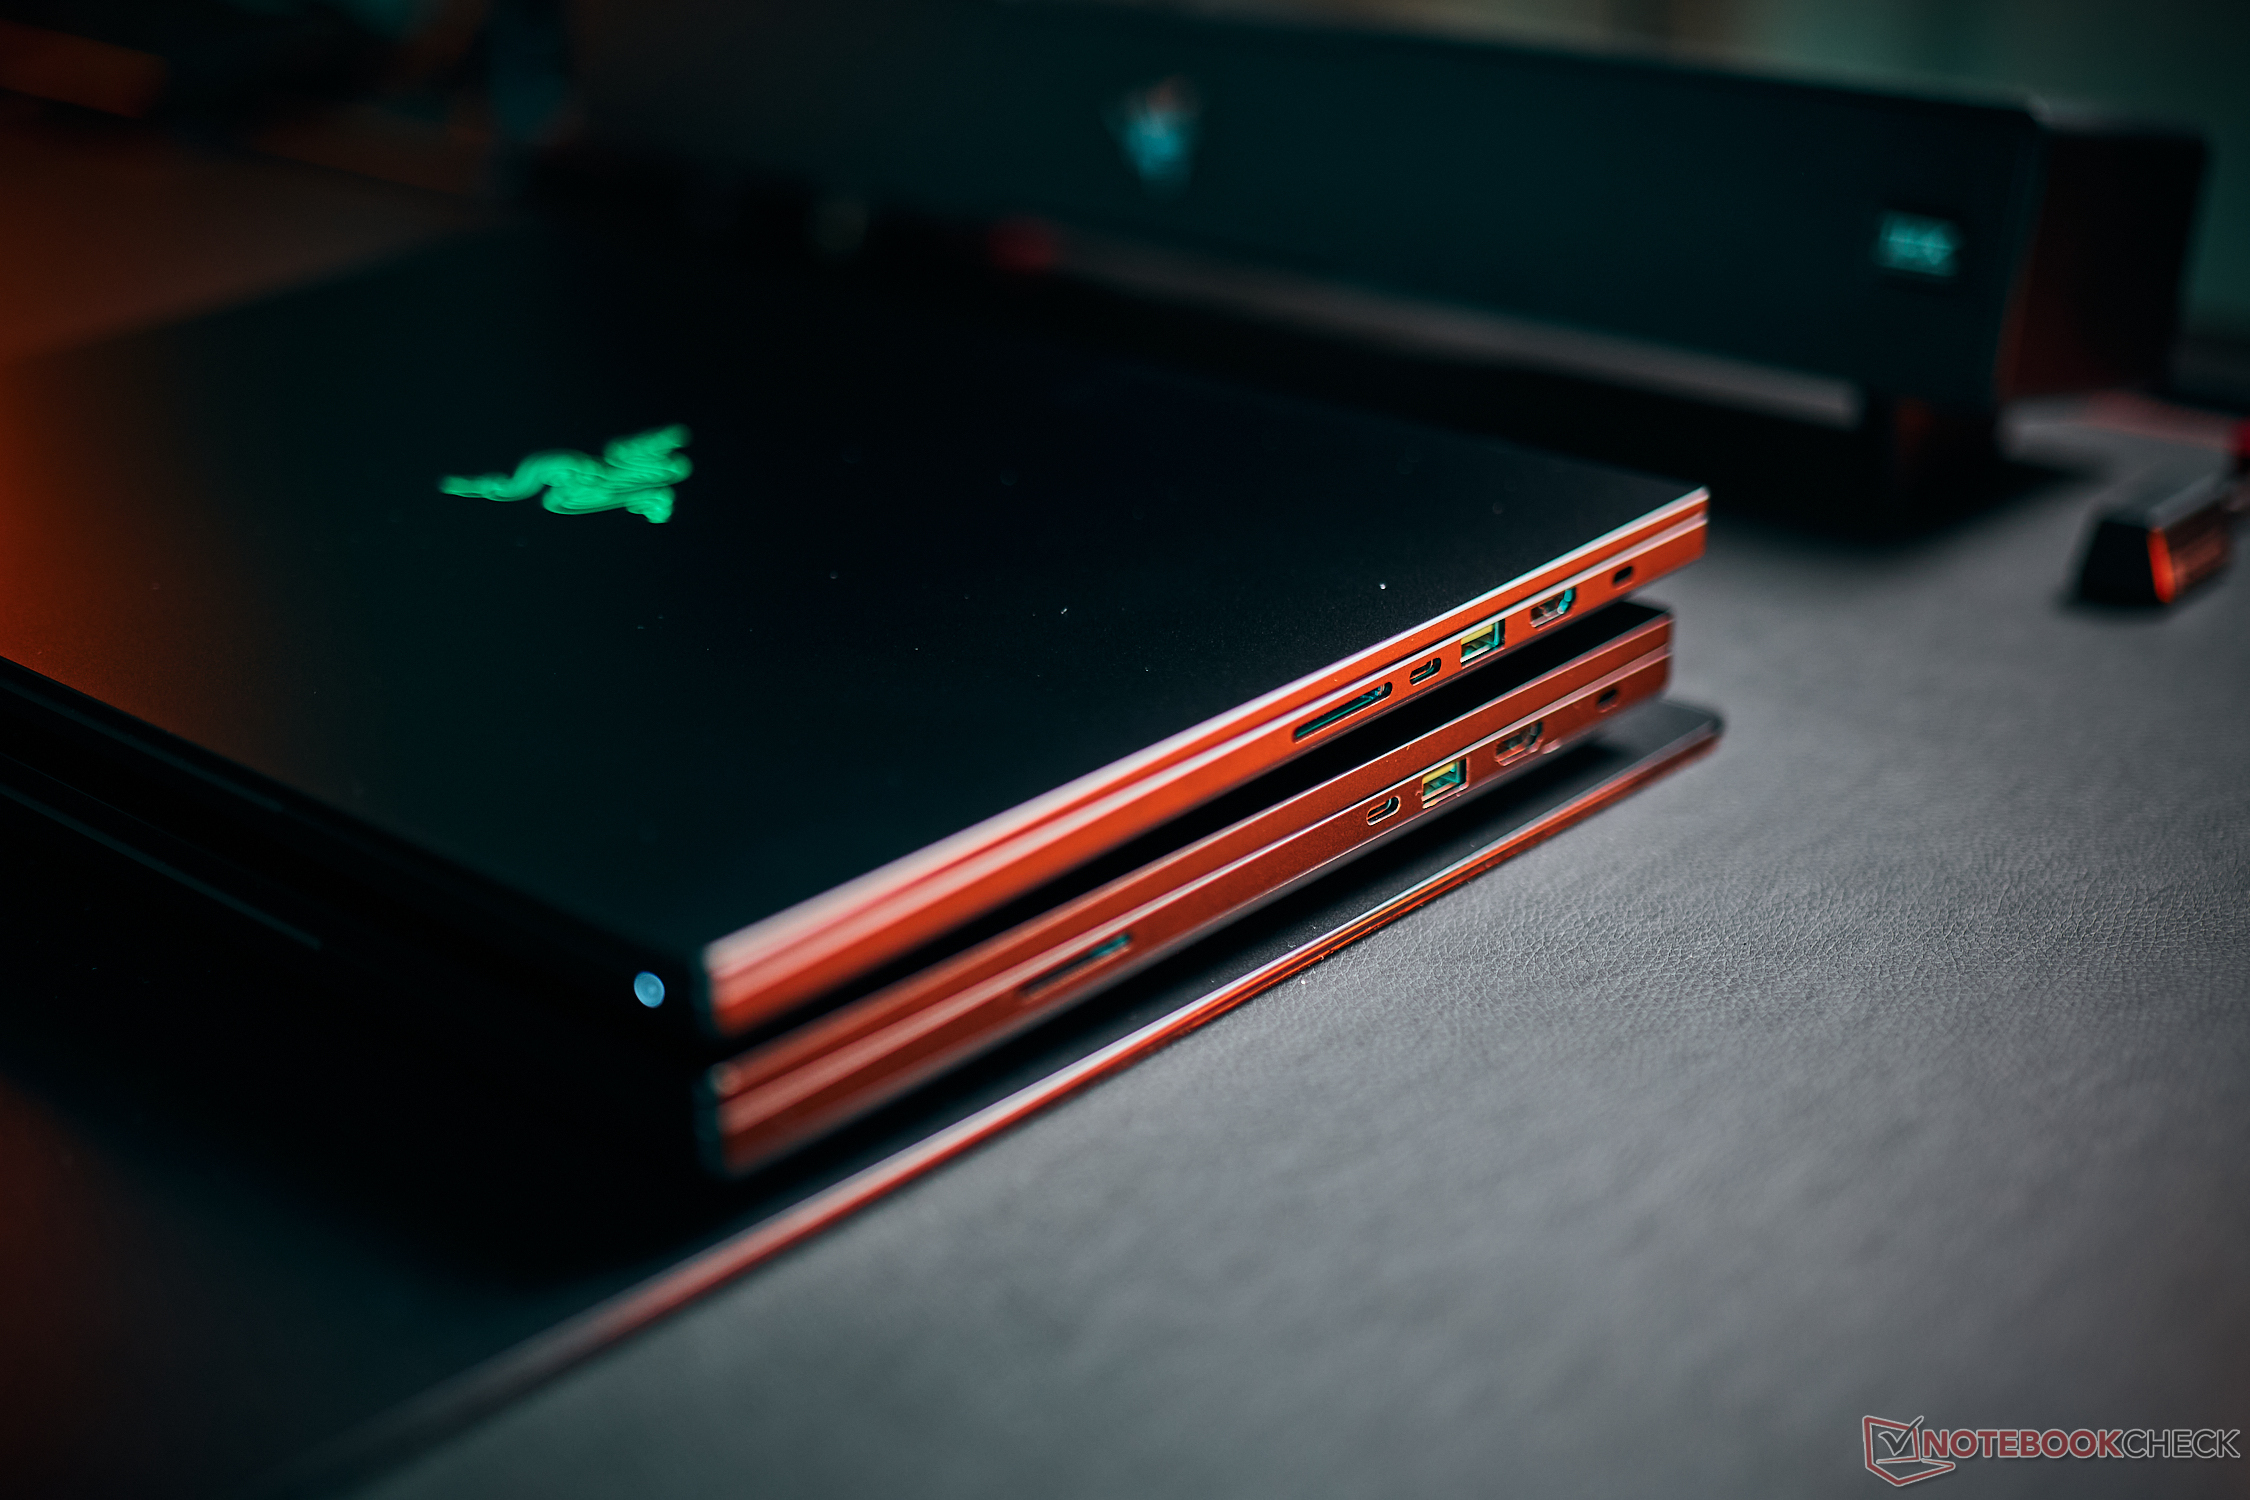
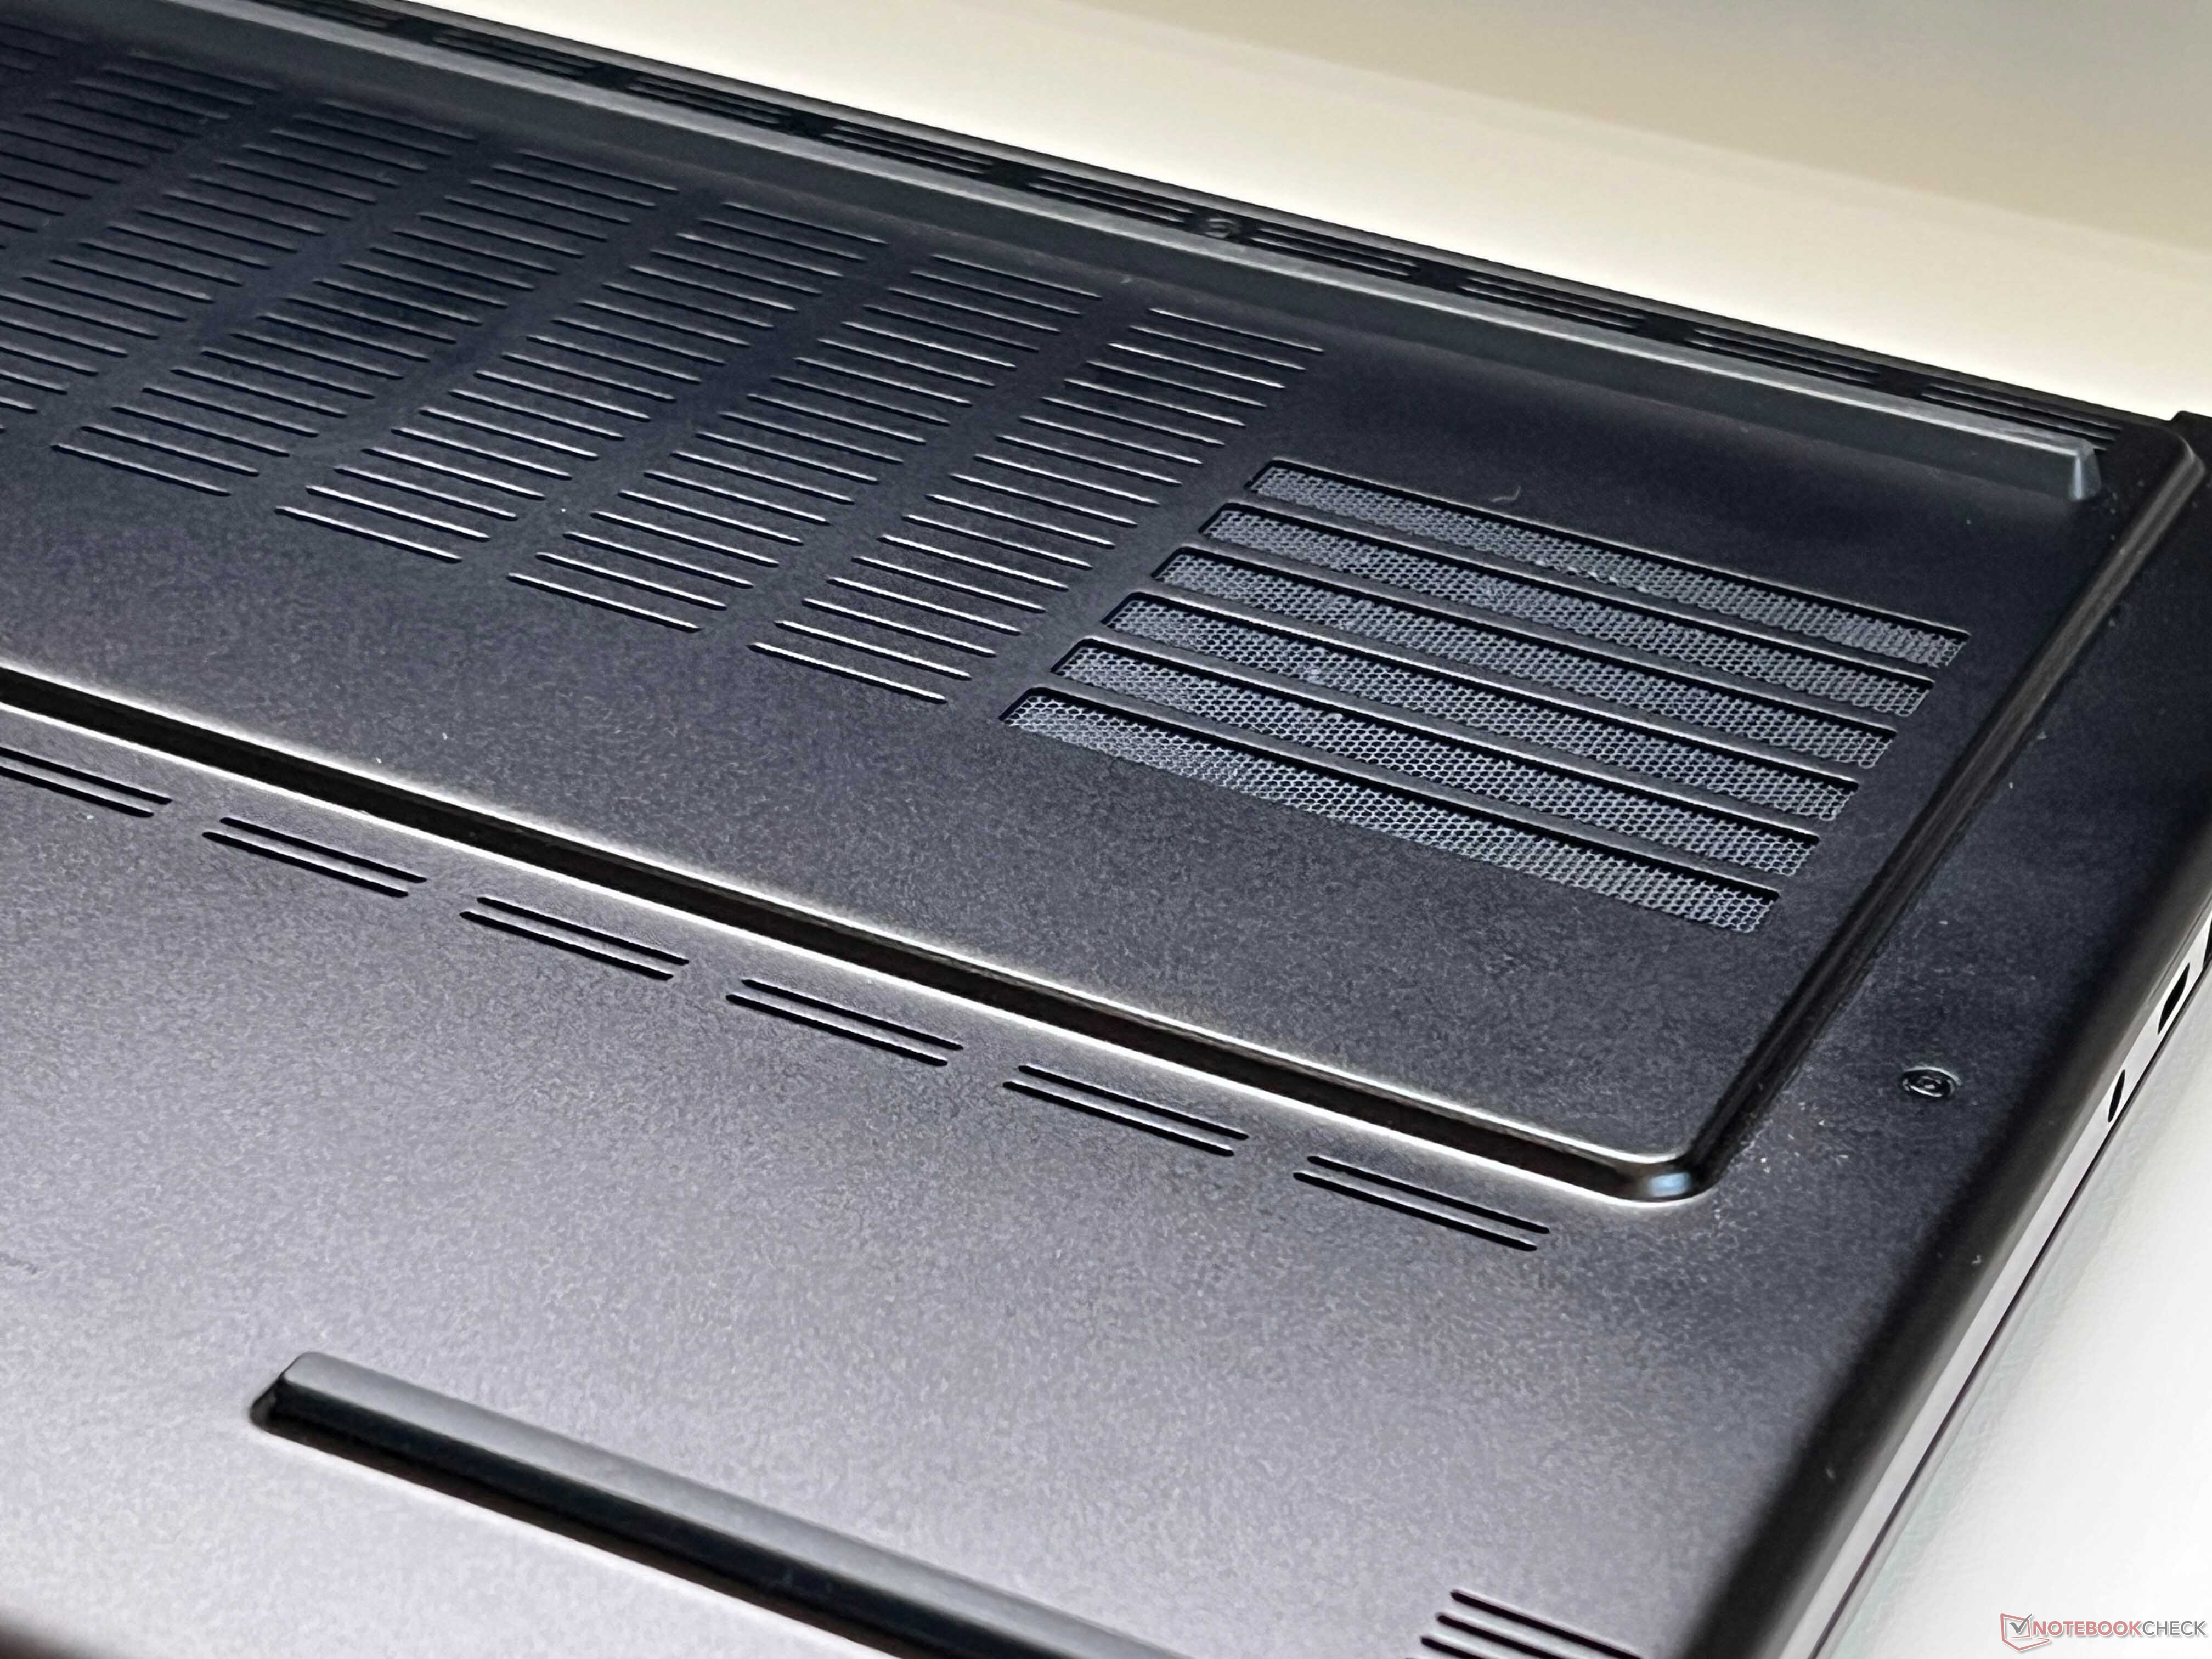
The new Razer Blade 16 has become more than 30% slimmer (14.9 - 17.4 mm, 0.587 - 0.685 in), but the basic design hasn't changed. There continues to be a black aluminum case (unibody design) with a high stability. The base unit cannot be warped, and the keyboard can only be pressed down minimally in the central area by trying hard. Even though the lid is very thin, it is still very robust, and the hinges are adjusted very well. The lid is held securely at all angles (135 degrees max.), and there is only some minimal wobbling after it was moved. In this regard, the Blade 16 has a clear advantage compared to the Asus ROG Zephyrus G16. The workmanship is excellent, and it offers the impression of a very high quality.
Razor continues to make do without extensive design elements with illumination. In addition to the keyboard, only the Razer logo on the lid is illuminated (which can be deactivated). Users of the Blade 16 have to be prepared to clean their laptop regularly, since its black surfaces are real fingerprint magnets. But they are easy to clean most of the time.
An area at the bottom is elevated to give slightly more space for the cooling. But this isn't really noticeable in everyday operation, and the height difference by far isn't as pronounced as that of the ThinkPad X9 15, for example.
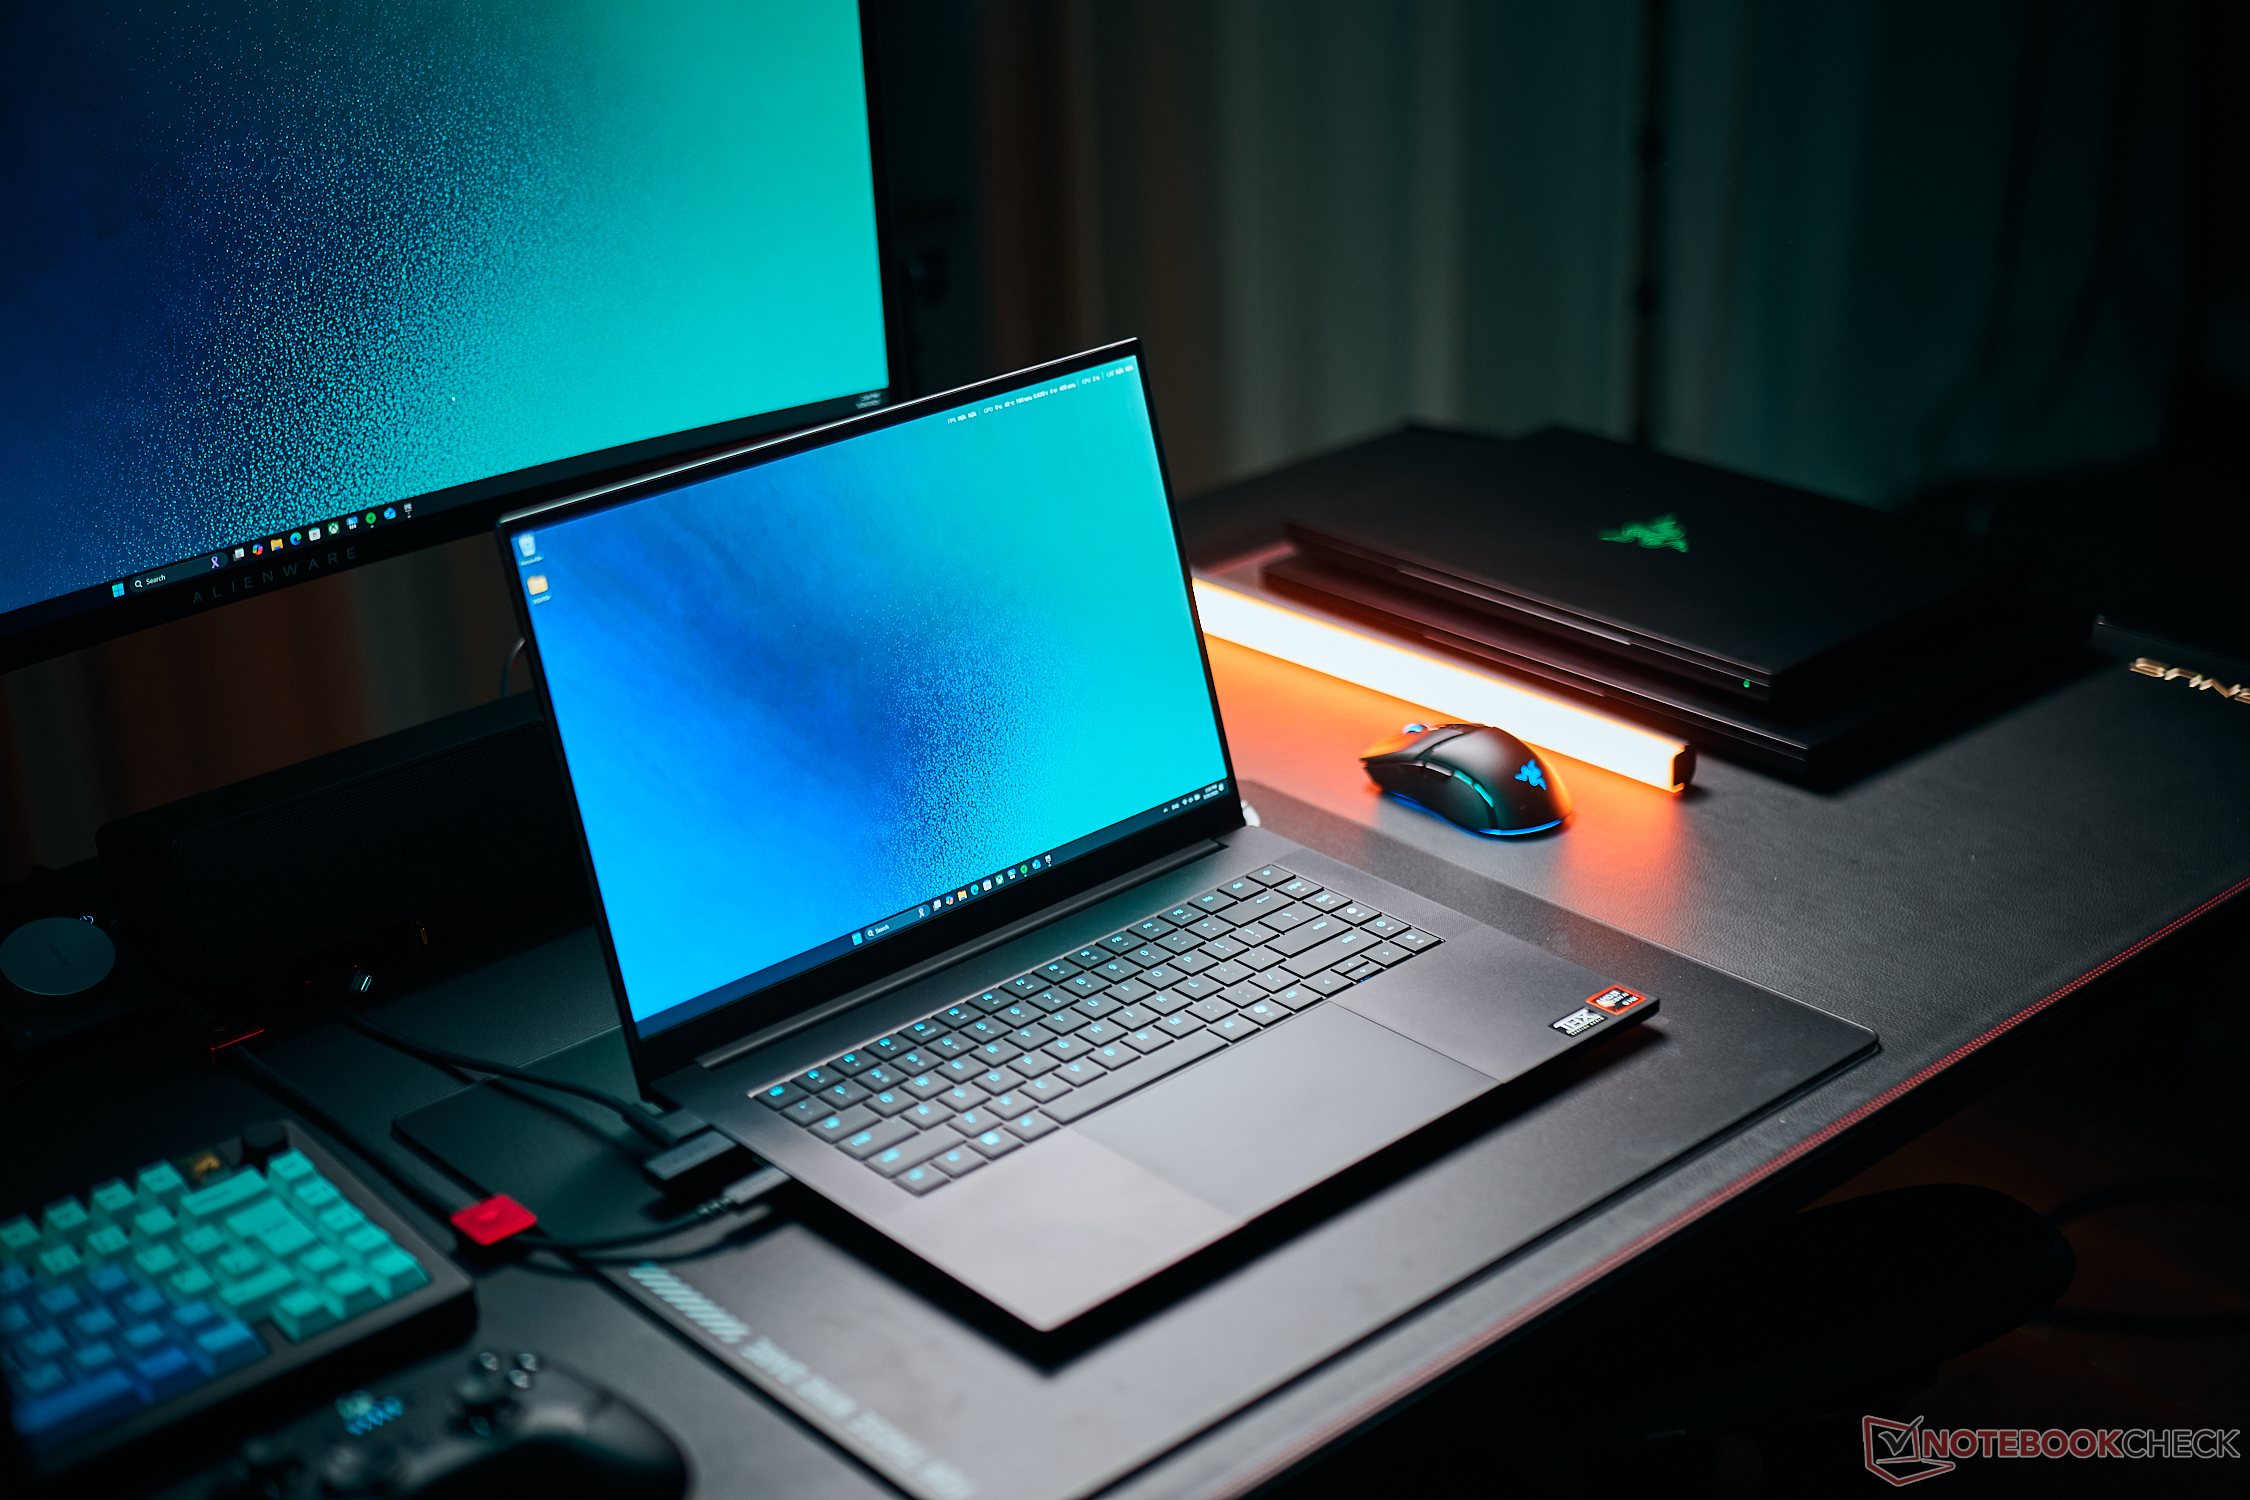


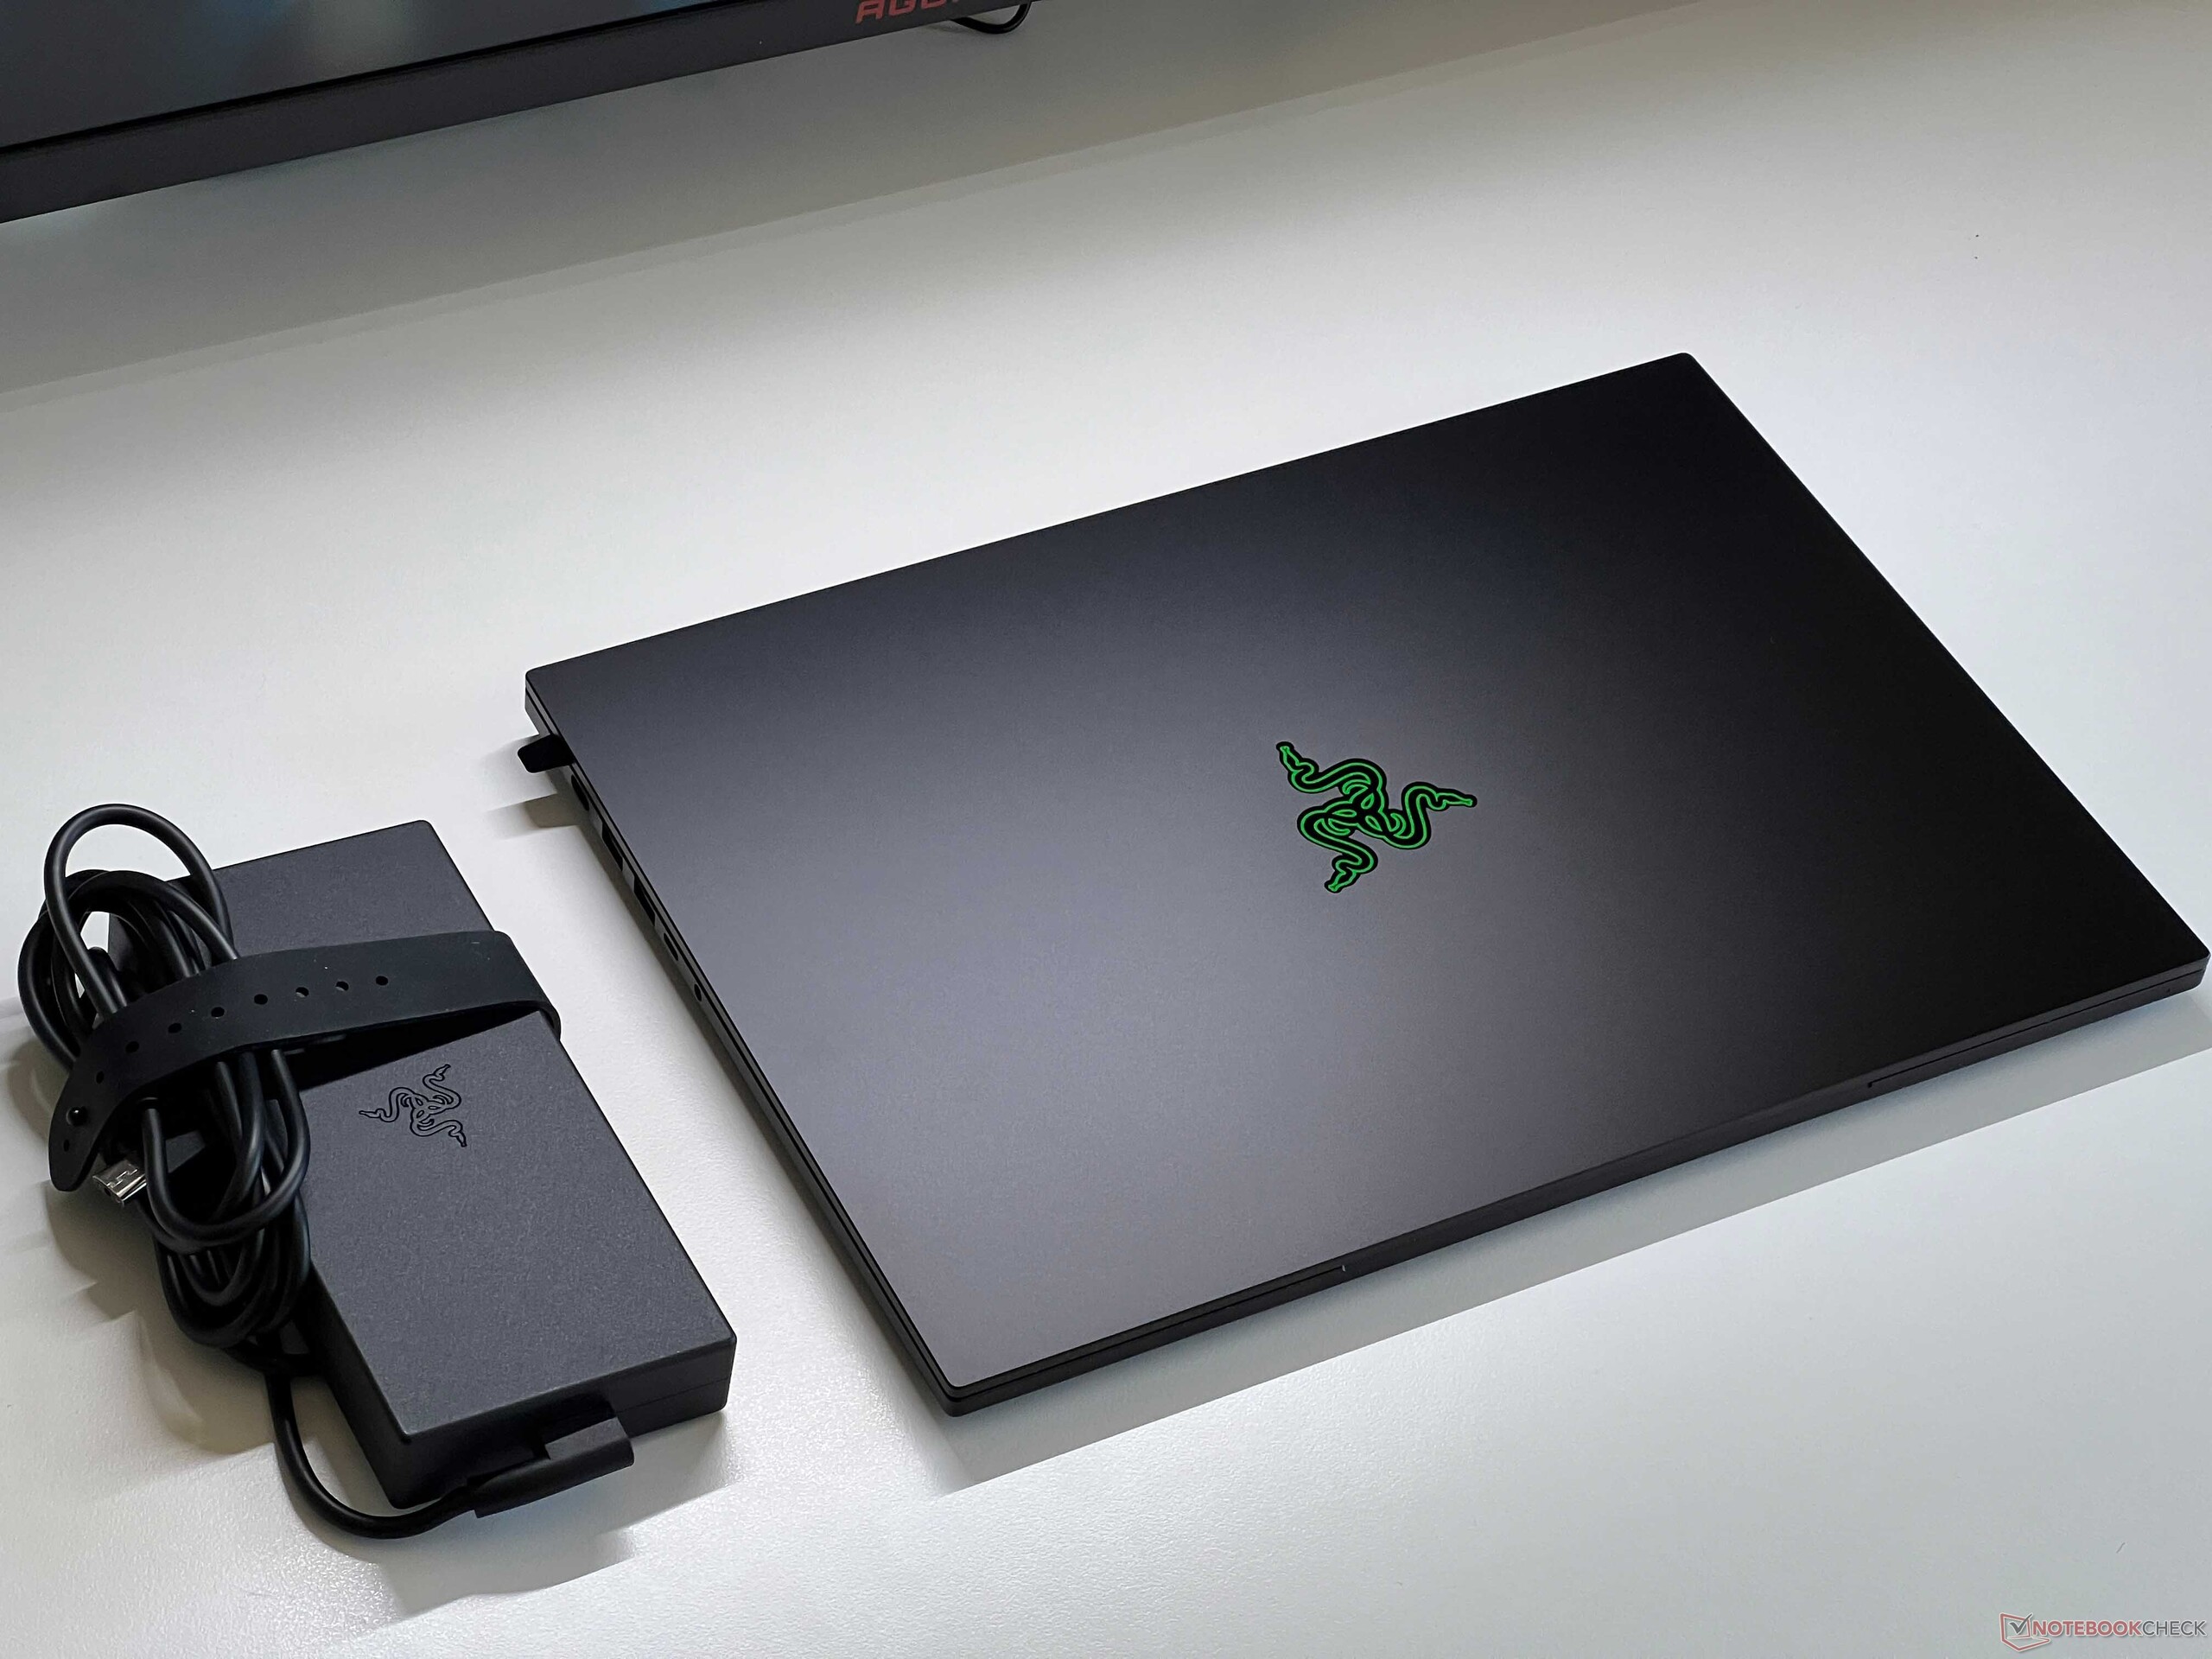
In the size comparison, the Blade 16, the ROG Zephyrus G16 and also the MacBook Pro 16 are practically identical, while the other gaming laptops show significantly more bulk. The weight of 2.1 kg (~4.6 lb) is also comparable to that of the MacBook, but the Zephyrus G16 is almost 200 grams (~7 oz) lighter. The 280-Watt charger brings 795 grams (~28 oz) to the scale.
Equipment - USB 4 and Wi-Fi 7
The Blade 16 continues to offer all the important connections. However, it foregoes Thunderbolt 4, and you only get an Ethernet port via USB-C adapter. The two USB-C 4.0 ports are connected via the iGPU, so when you add an external monitor, the GeForce GPU doesn't always have to run (HDMI is connected via the dGPU). The Blade 16 is a Copilot+ laptop.

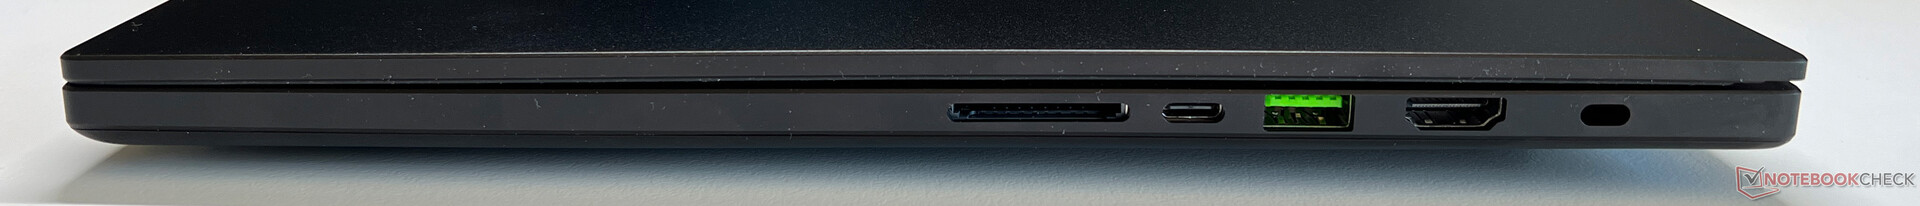
SD Card Reader
The card reader is placed on the right side. I reaches transfer rates of up to 193 MB/s and ~133 MB/s when copying image files in combination with our reference card (Angelbird AV Pro V60). An inserted card will stick out from the case by about 1 cm (~0.4 in).
| SD Card Reader | |
| average JPG Copy Test (av. of 3 runs) | |
| Razer Blade 16 2024, RTX 4090 | |
| Alienware x16 R2 P120F (AV PRO microSD 128 GB V60) | |
| Apple MacBook Pro 16 2024 M4 Pro (Angelbird AV Pro V60) | |
| Razer Blade 16 2025 RTX 5090 (Angelbird AV Pro V60) | |
| Average of class Gaming (20 - 207, n=73, last 2 years) | |
| Asus ROG Zephyrus G16 GU605MY | |
| SCHENKER XMG Neo 16 (Early 24) (AV PRO microSD 128 GB V60) | |
| Lenovo Legion 9 16IRX9, RTX 4090 | |
| maximum AS SSD Seq Read Test (1GB) | |
| Alienware x16 R2 P120F (AV PRO microSD 128 GB V60) | |
| Apple MacBook Pro 16 2024 M4 Pro (Angelbird AV Pro V60) | |
| Razer Blade 16 2025 RTX 5090 (Angelbird AV Pro V60) | |
| Razer Blade 16 2024, RTX 4090 | |
| Average of class Gaming (25.8 - 261, n=72, last 2 years) | |
| Asus ROG Zephyrus G16 GU605MY | |
| Lenovo Legion 9 16IRX9, RTX 4090 | |
| SCHENKER XMG Neo 16 (Early 24) (AV PRO microSD 128 GB V60) | |
Communication
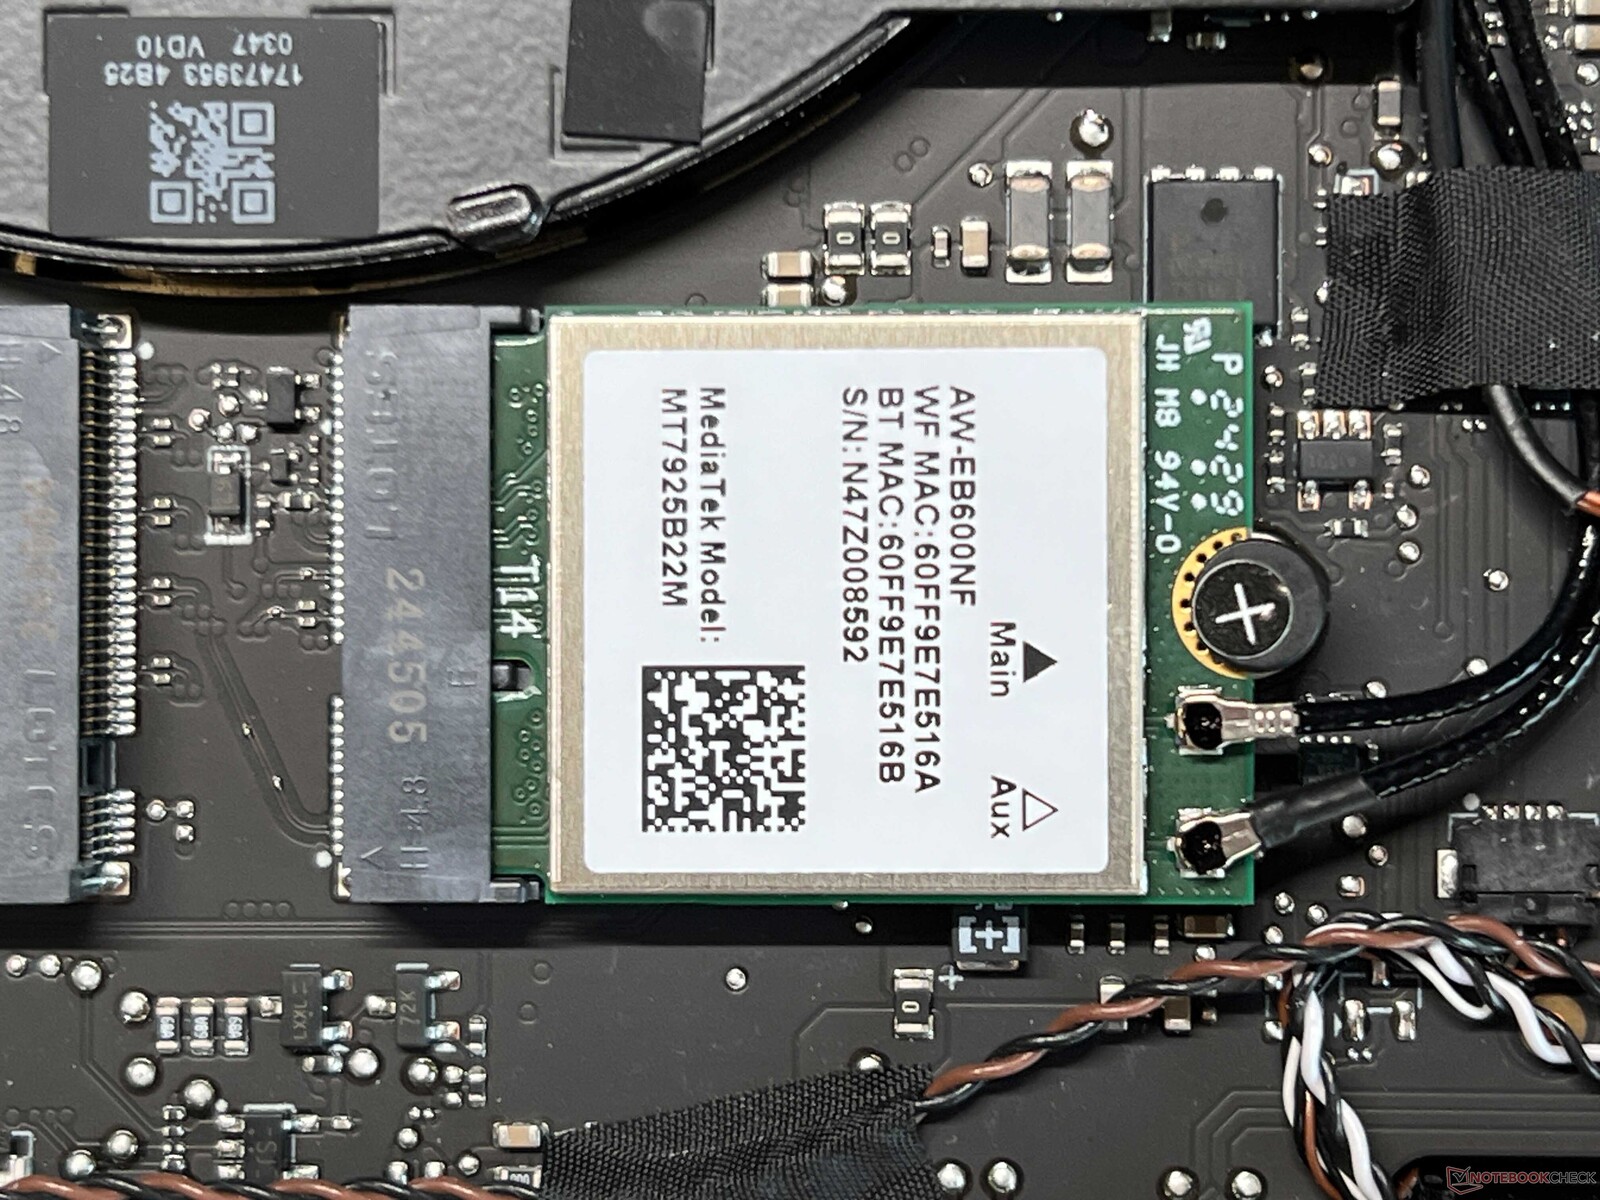
The AMD Blade 16 is equipped with a WLAN module from MediaTek (MT7925). In addition to the current Wi-Fi-7 standard, it also supports Bluetooth 5.4. In combination with our reference router from Asus, the transfer rates are very good and stable. We encountered no problems at all with the signal quality during our tests.
| Networking | |
| Razer Blade 16 2025 RTX 5090 | |
| iperf3 transmit AXE11000 | |
| iperf3 receive AXE11000 | |
| SCHENKER XMG Neo 16 (Early 24) | |
| iperf3 transmit AXE11000 | |
| iperf3 receive AXE11000 | |
| Alienware x16 R2 P120F | |
| iperf3 transmit AXE11000 | |
| iperf3 receive AXE11000 | |
| iperf3 transmit AXE11000 6GHz | |
| iperf3 receive AXE11000 6GHz | |
| Lenovo Legion 9 16IRX9, RTX 4090 | |
| iperf3 transmit AXE11000 | |
| iperf3 receive AXE11000 | |
| iperf3 transmit AXE11000 6GHz | |
| iperf3 receive AXE11000 6GHz | |
| Asus ROG Zephyrus G16 GU605MY | |
| iperf3 transmit AXE11000 | |
| iperf3 receive AXE11000 | |
| Razer Blade 16 2024, RTX 4090 | |
| iperf3 transmit AXE11000 | |
| iperf3 receive AXE11000 | |
| iperf3 transmit AXE11000 6GHz | |
| iperf3 receive AXE11000 6GHz | |
| Apple MacBook Pro 16 2024 M4 Pro | |
| iperf3 transmit AXE11000 | |
| iperf3 receive AXE11000 | |
Webcam
The 1080p webcam supports the studio effects of Windows, but it doesn't offer a mechanical lens cover. While the image quality isn't particularly good, the webcam does its job. In addition, there is also an IR module for face recognition via Windows Hello.


Maintenance
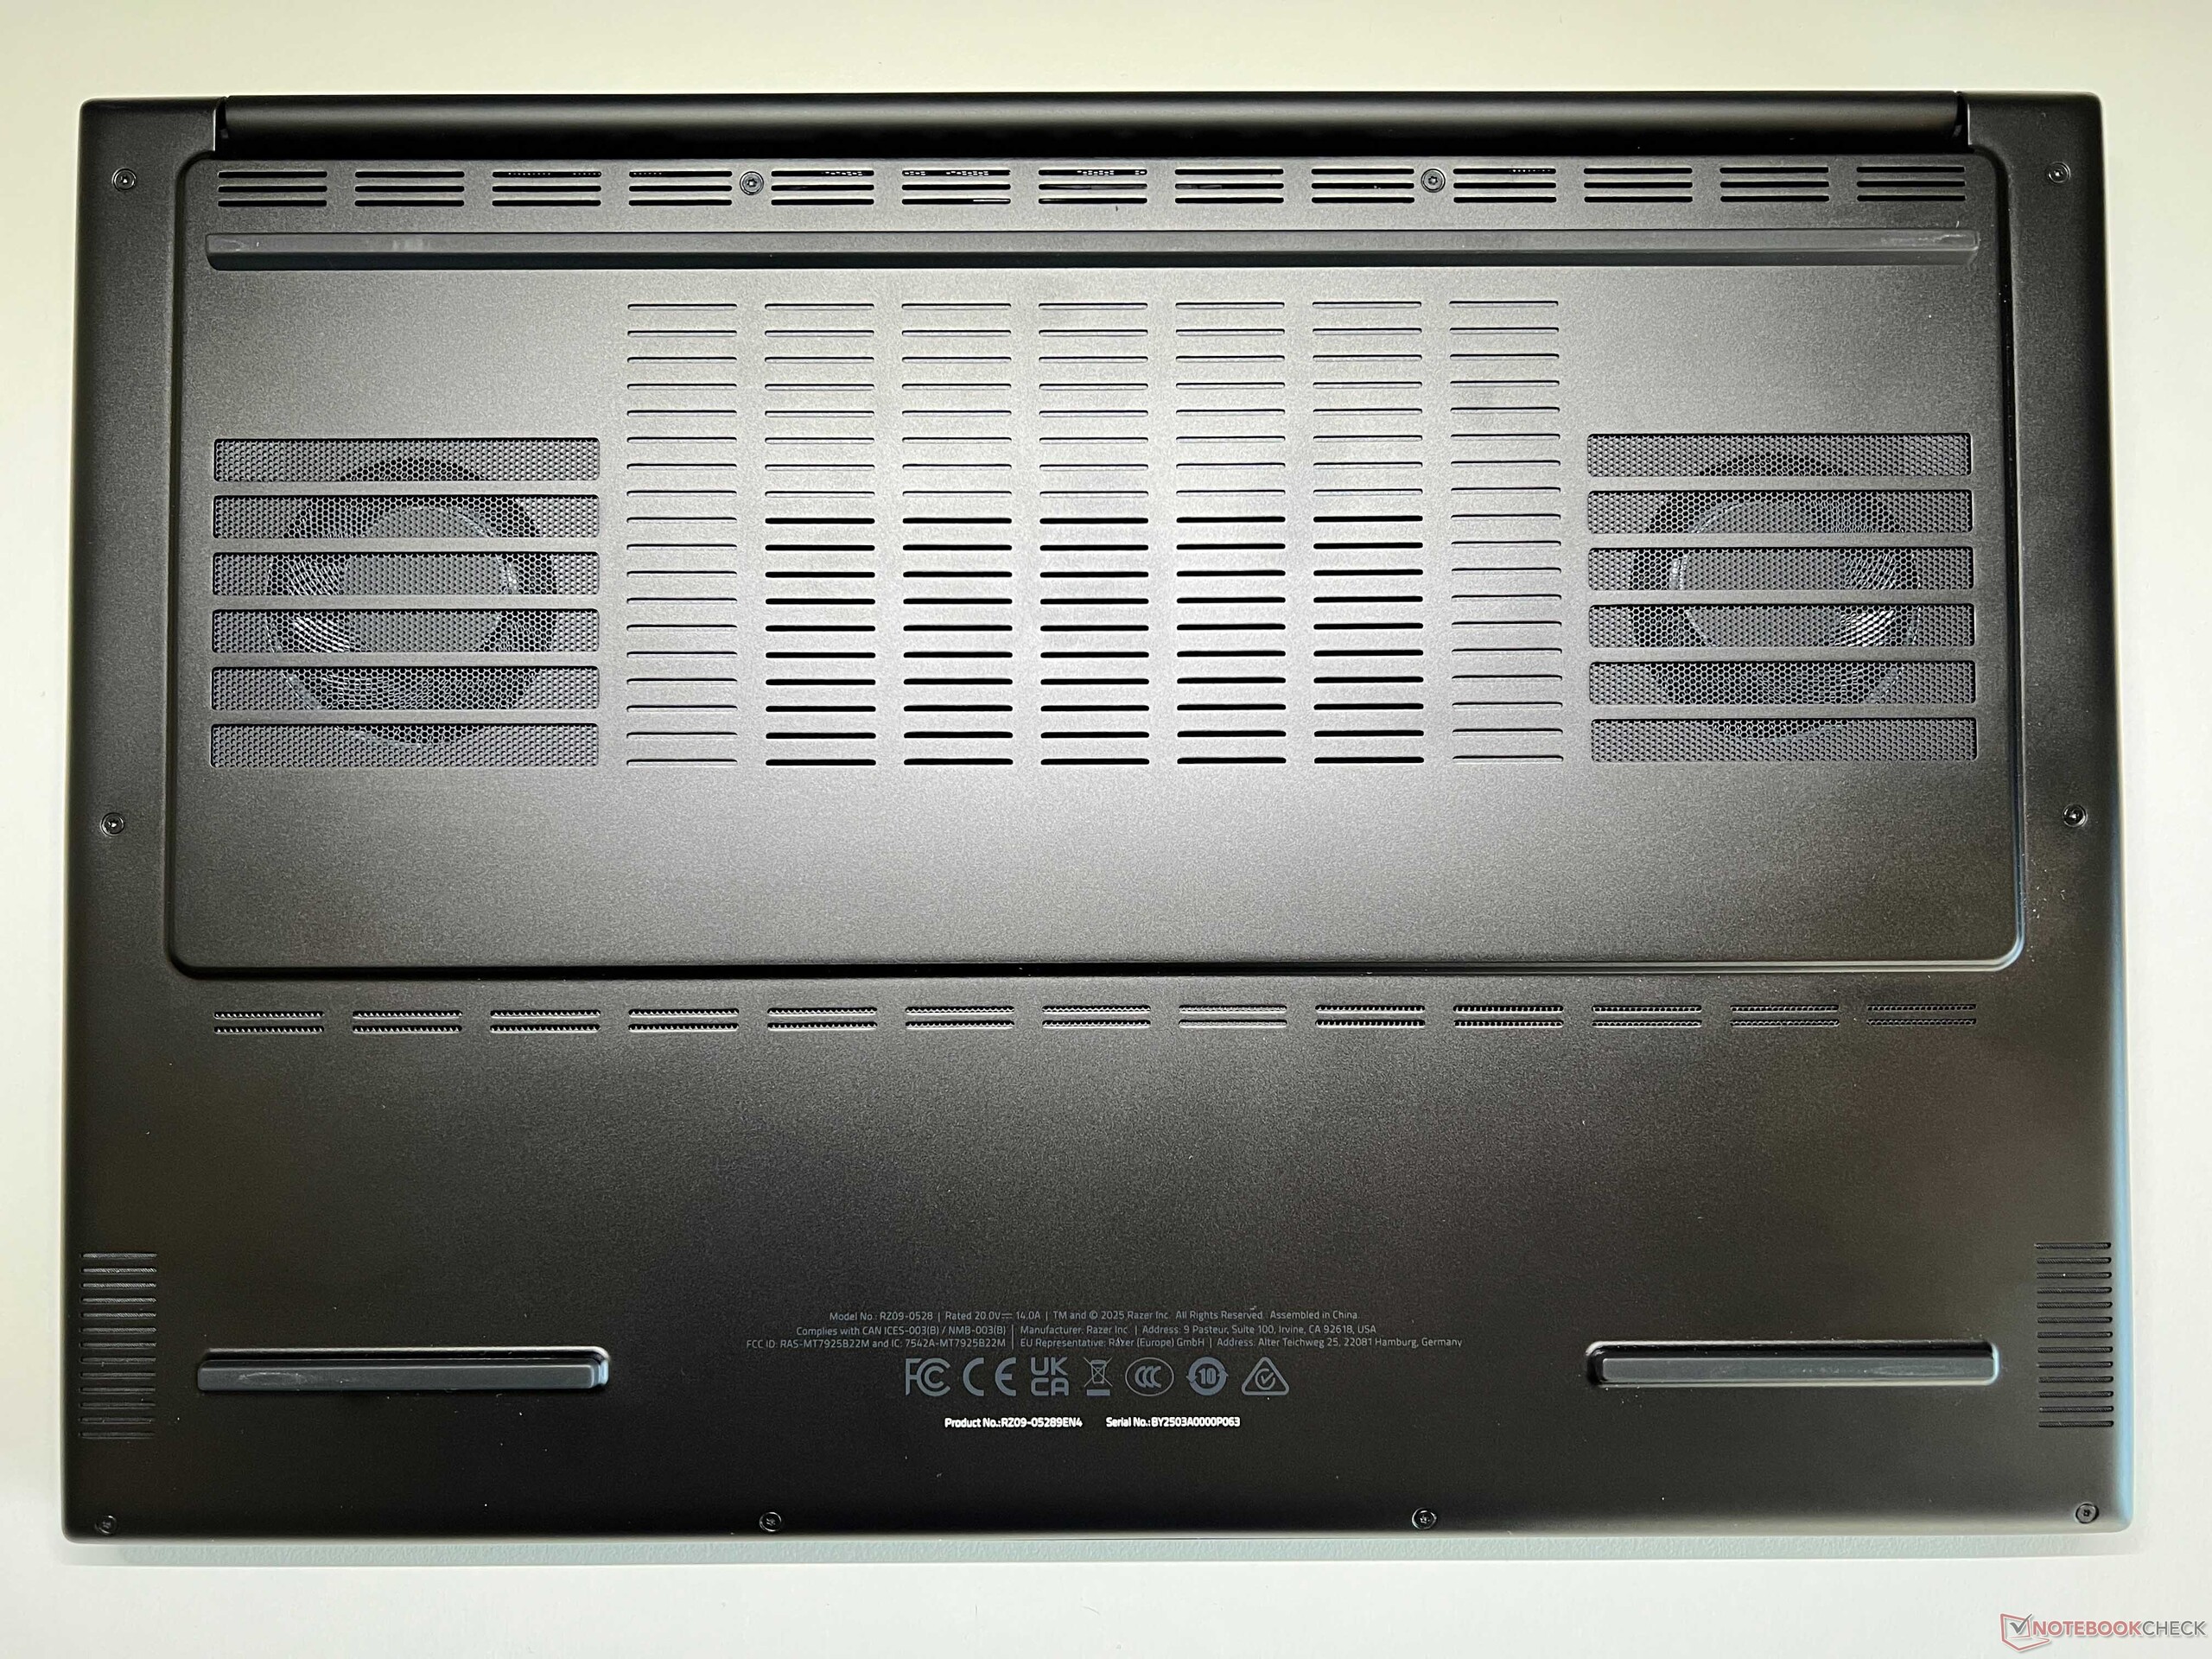
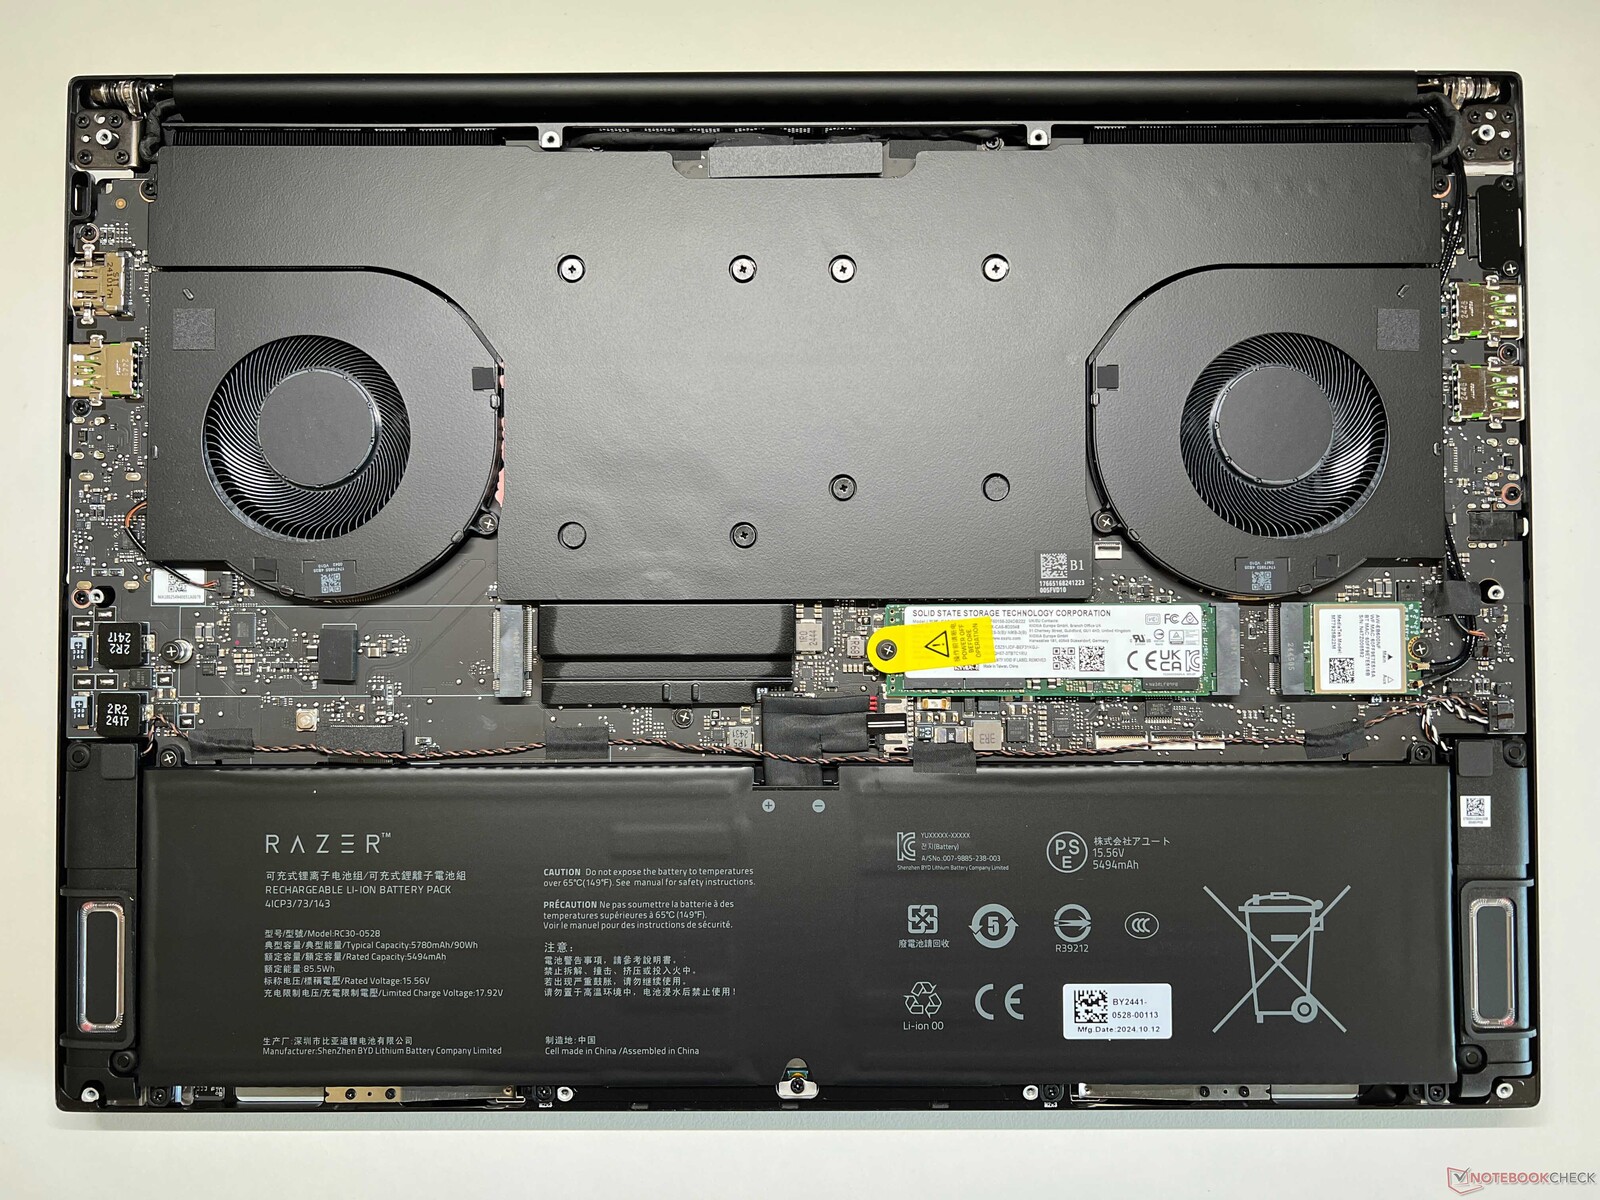
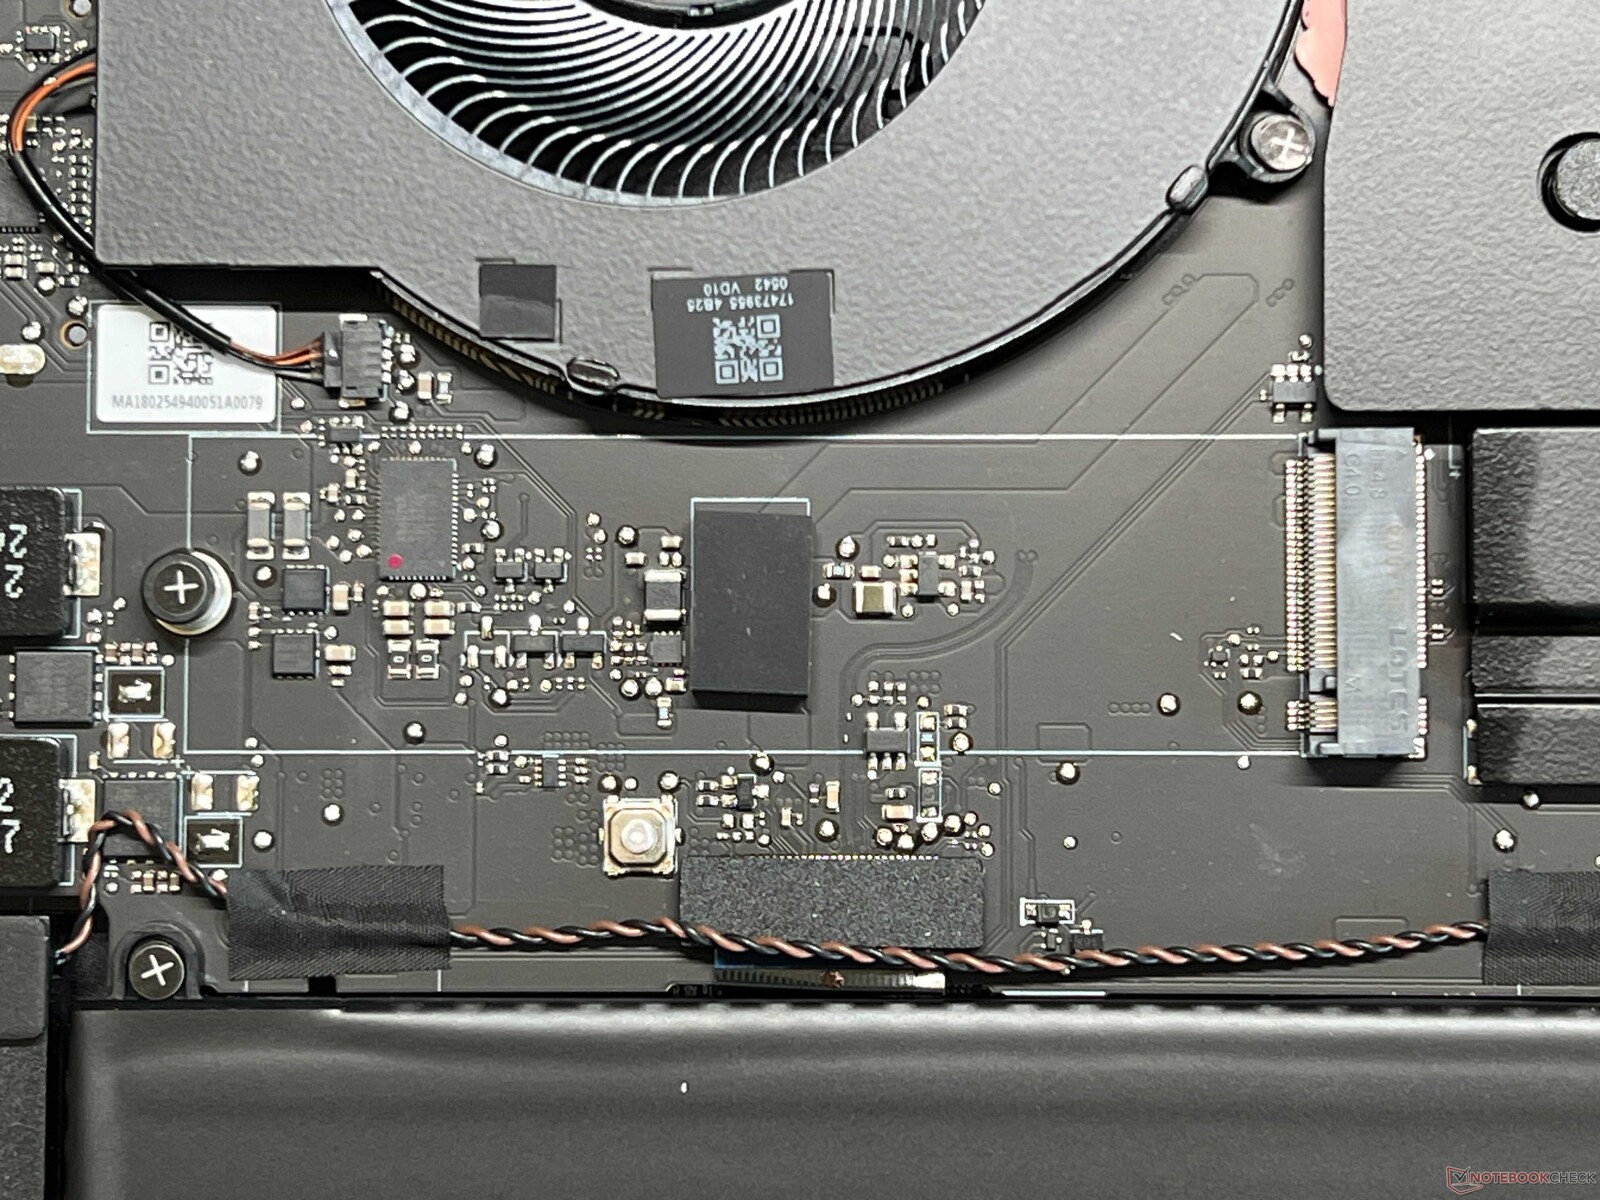
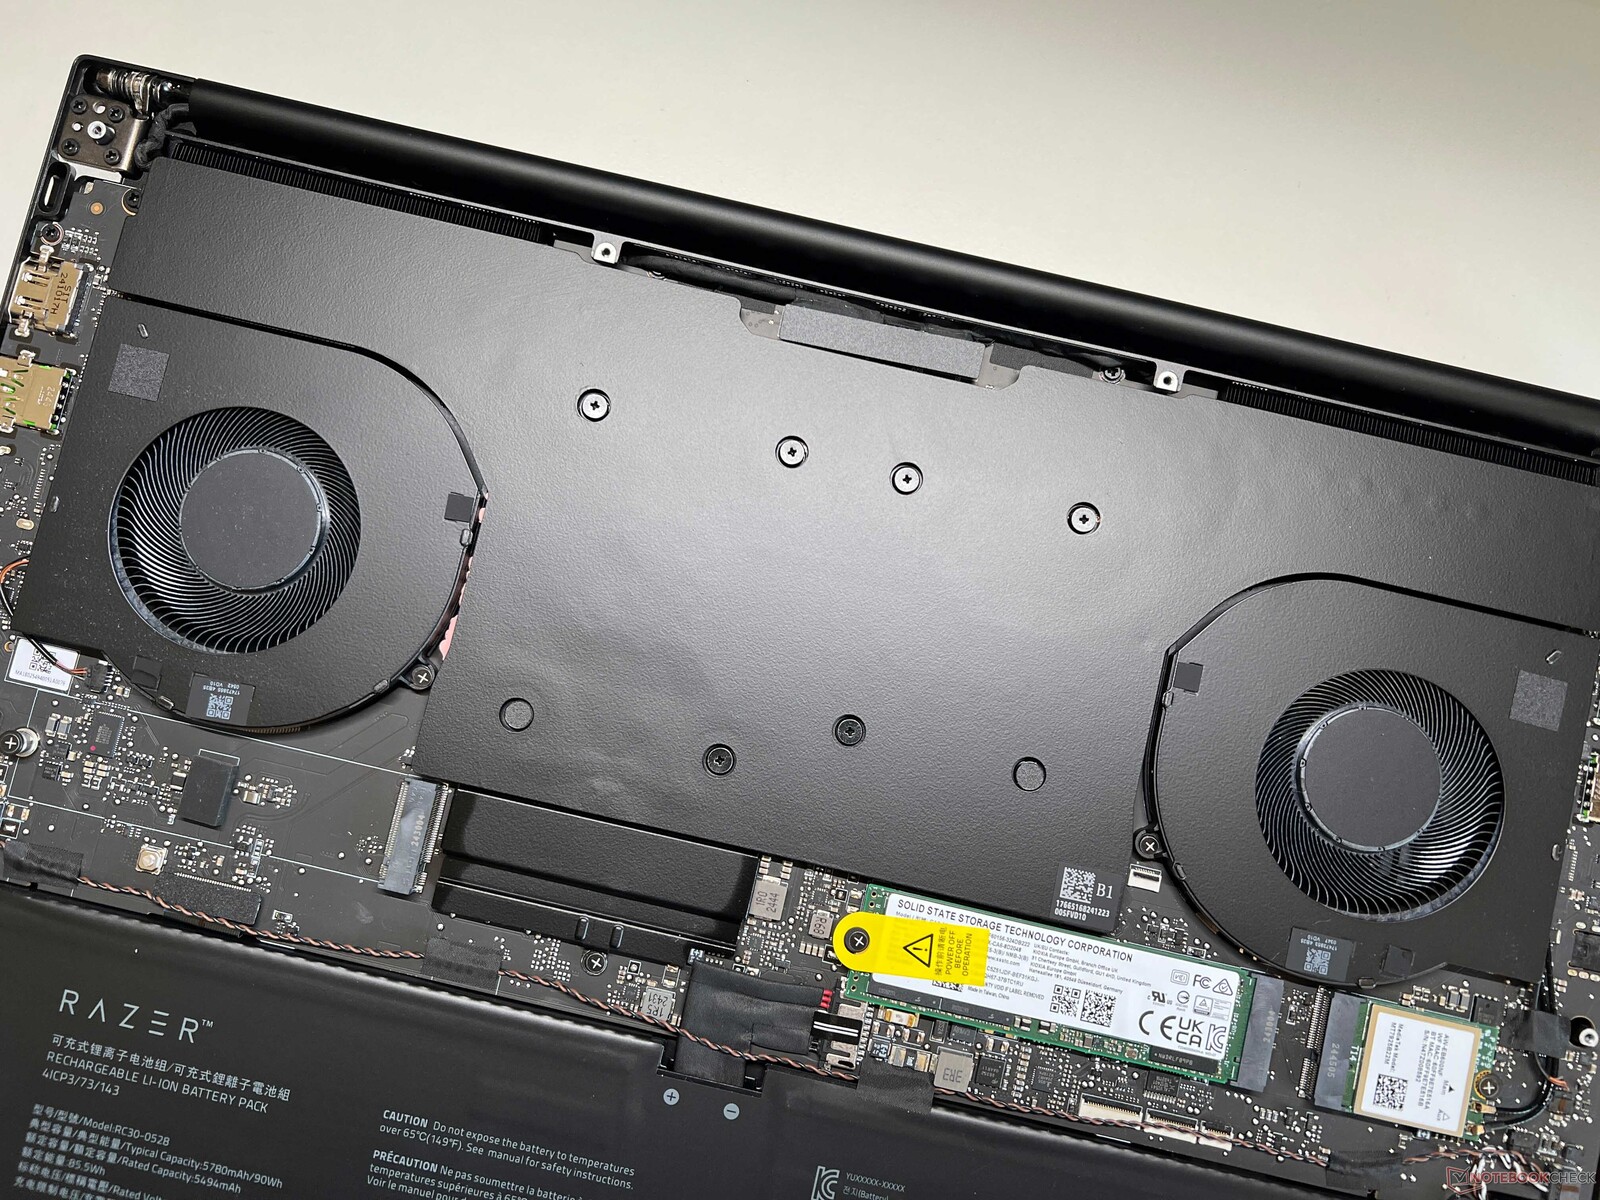
The bottom case cover is secured by only a few screws and can be removed without any problems. Inside, there are some large differences compared to the old model, and the cooling with its massive vapor chamber and the battery (screwed in) now dominate. There are also two slots for M.2-2280 SSDs, and if needed, the WLAN module can be replaced. The RAM is soldered, though.

Sustainability
Razer doesn't offer any information on the sustainability or environmental certifications for the Blade 16.
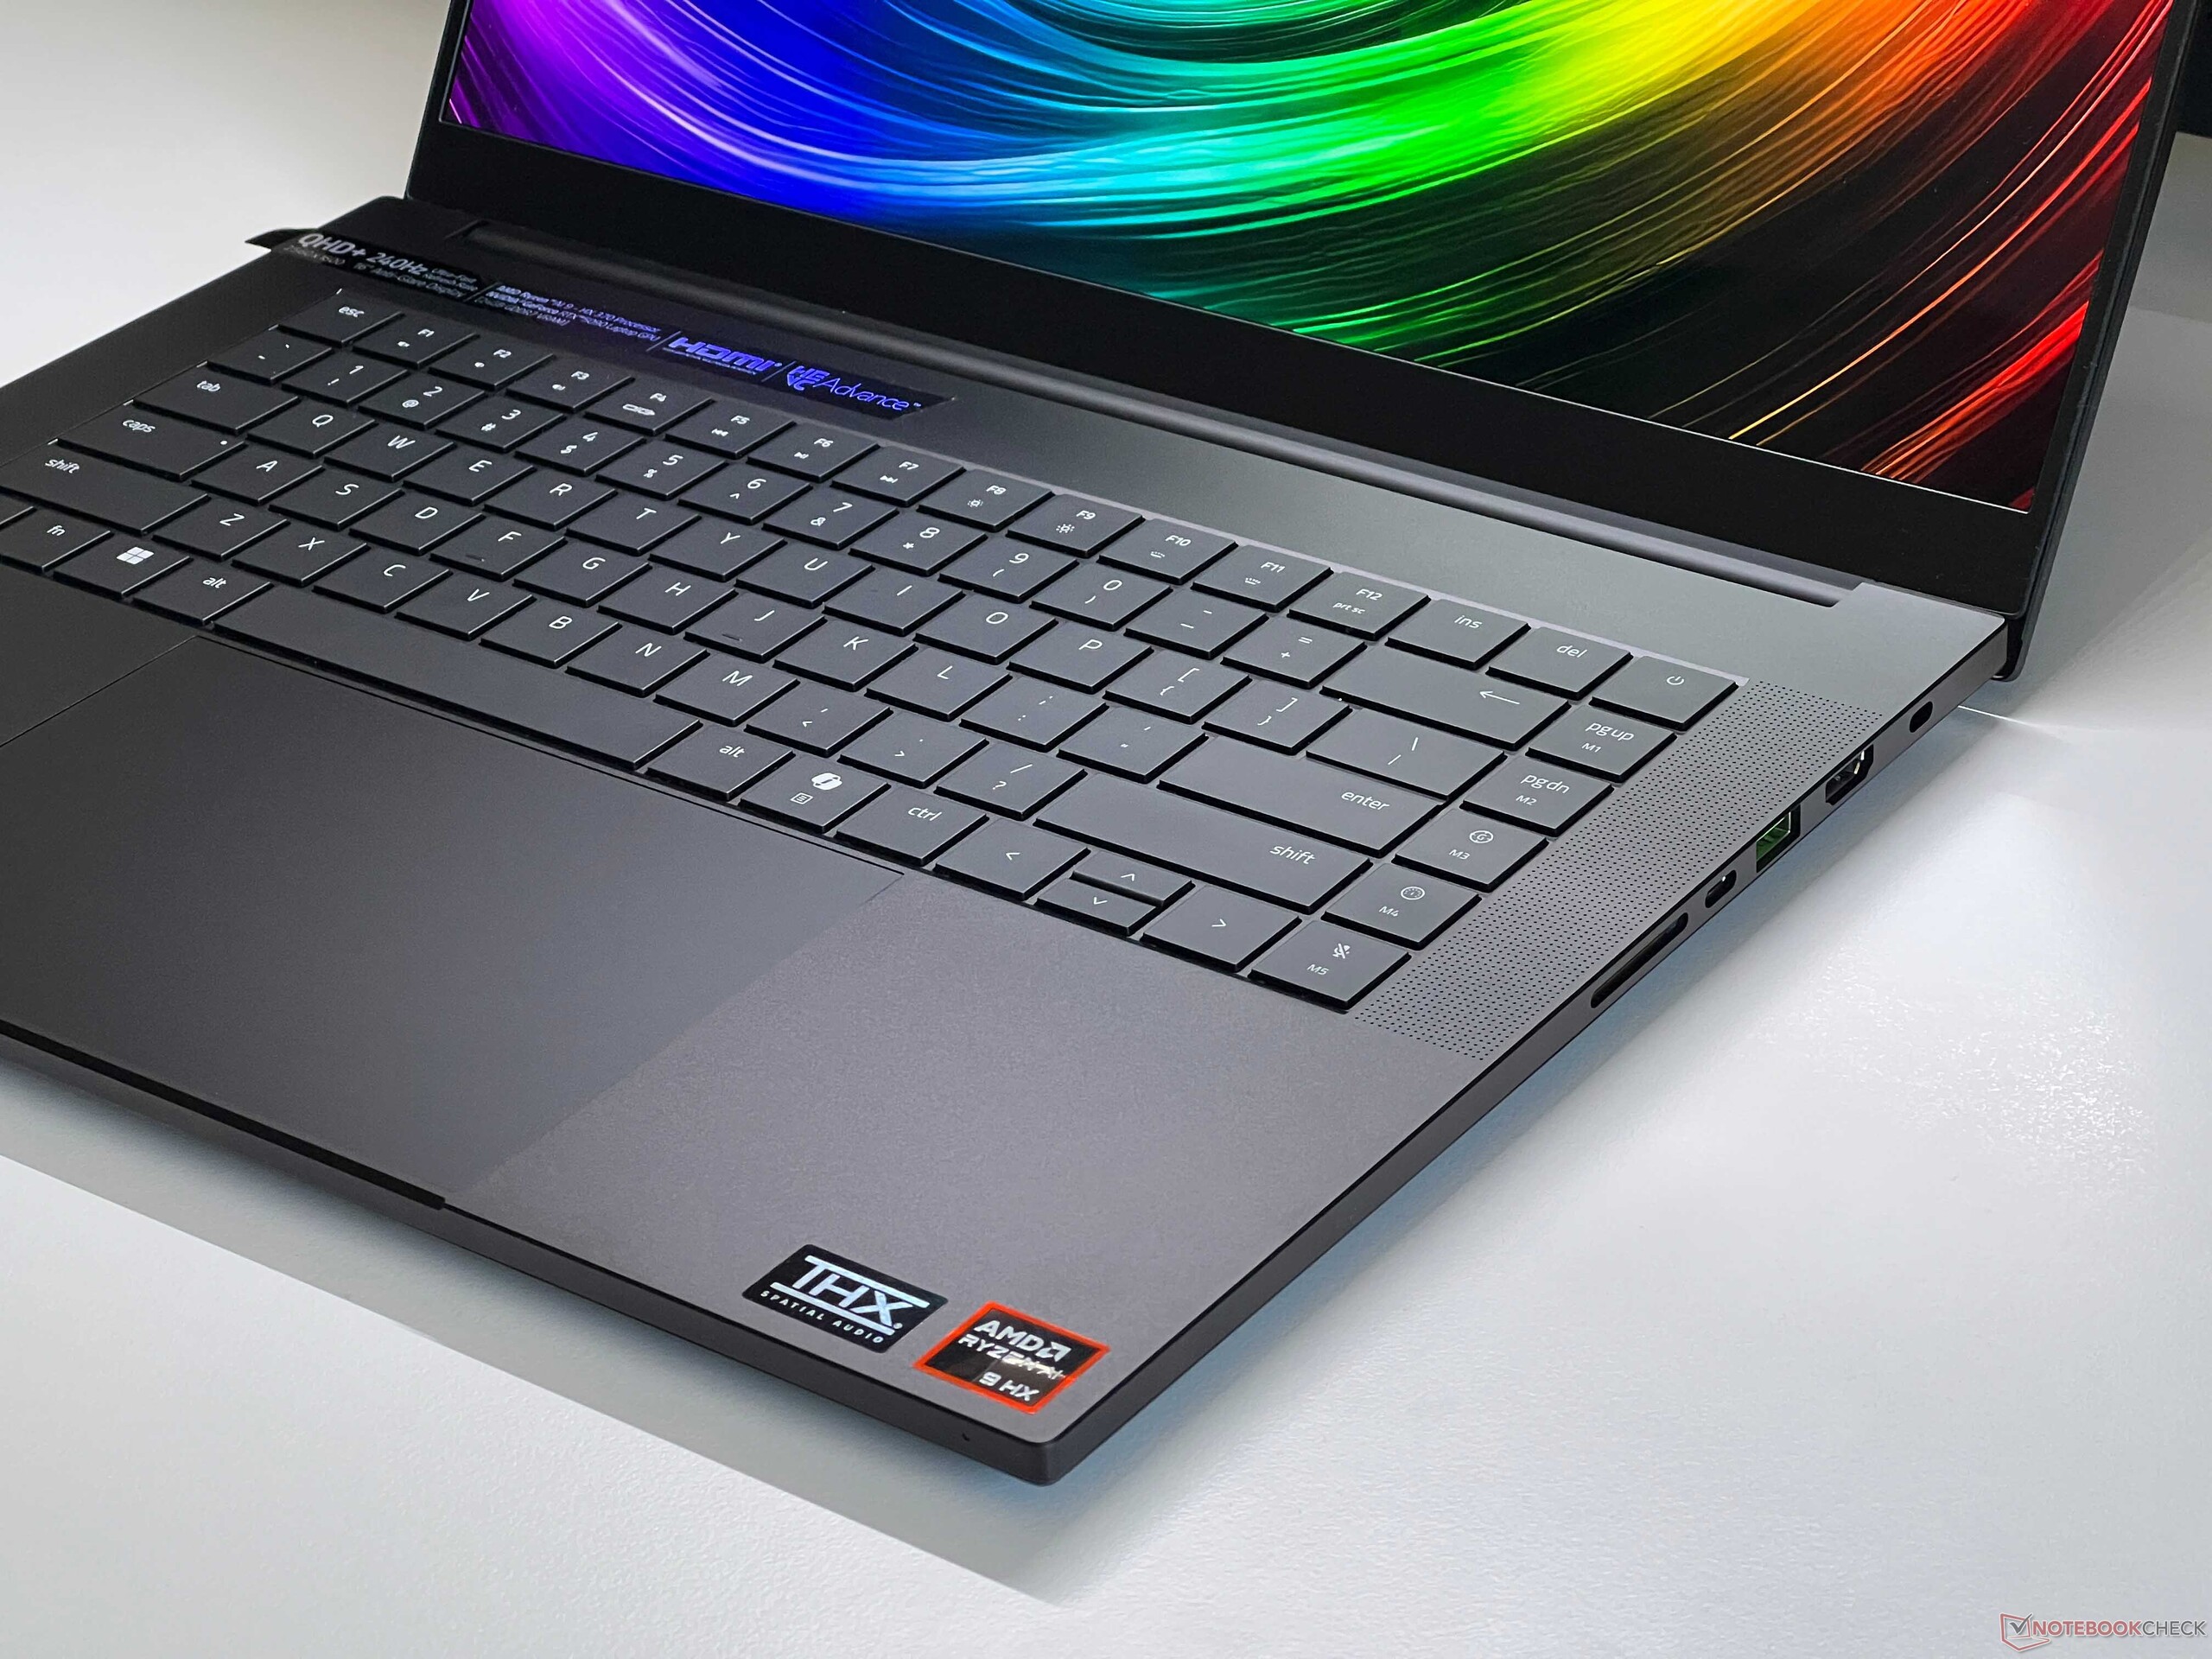
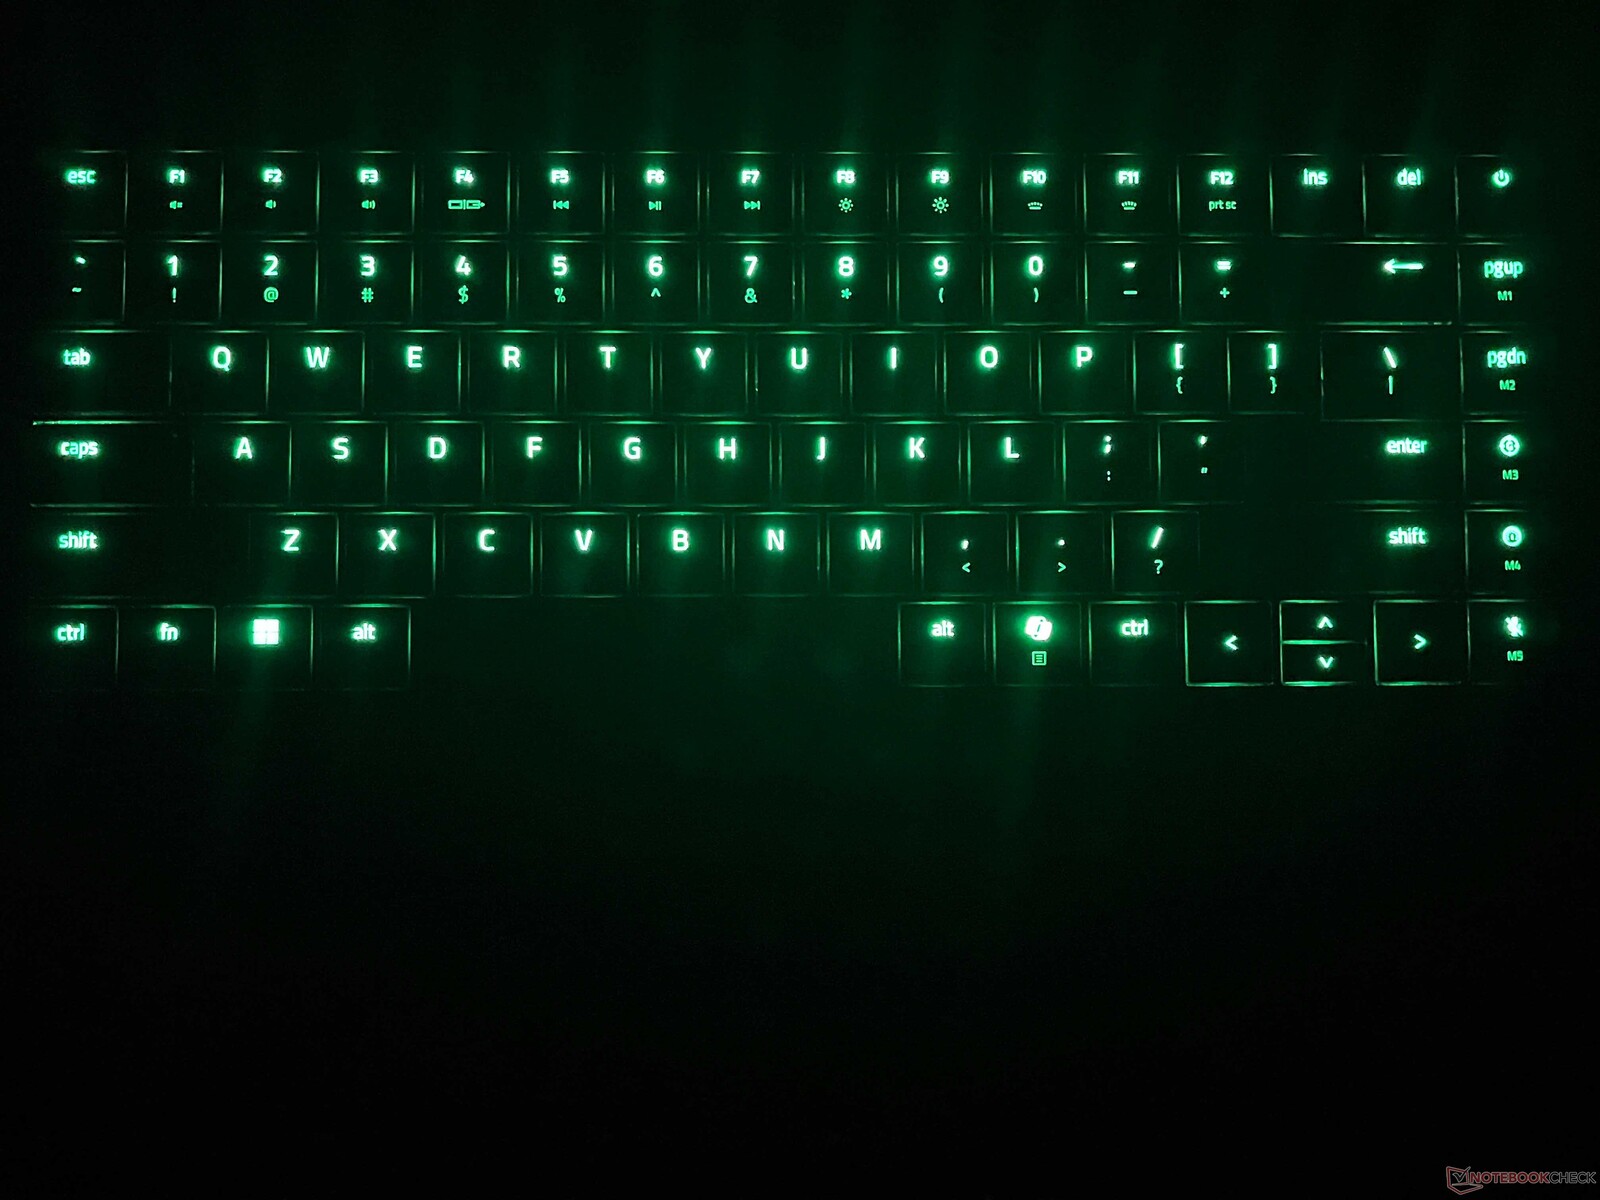
Input Devices - Blade 16 now with a 1.5 mm key stroke
The keyboard of the old Blade 16 was a point of contention for many users. Although the pressure point was crisp, the keystroke was very shallow at only 1 mm (~0.04 in). In the new Blade 16, Razer has now increased the keystroke to 1.5 mm (~0.06 in), which definitely improves the typing experience. However, we still have to say that the typing comfort is only average compared to that of other gaming laptops. The slim ROG Zephyrus G16 with its 1.7 mm (~0.07) keystroke offers a significantly more comfortable keyboard, for example. As is customary, you can change the illumination for each key individually, and with the Chroma software, Razer provides an extensive software package that allows gamers to adjust the illumination according to any specific situation.

Measuring 15 x 9.7 cm (~5.9 x 3.8 in), the ClickPad is very large, and its glass surface offers excellent sliding characteristics. The bottom area of the pad can be physically clicked and responds with an even, full, and discrete (and therefore high-quality) clicking noise.
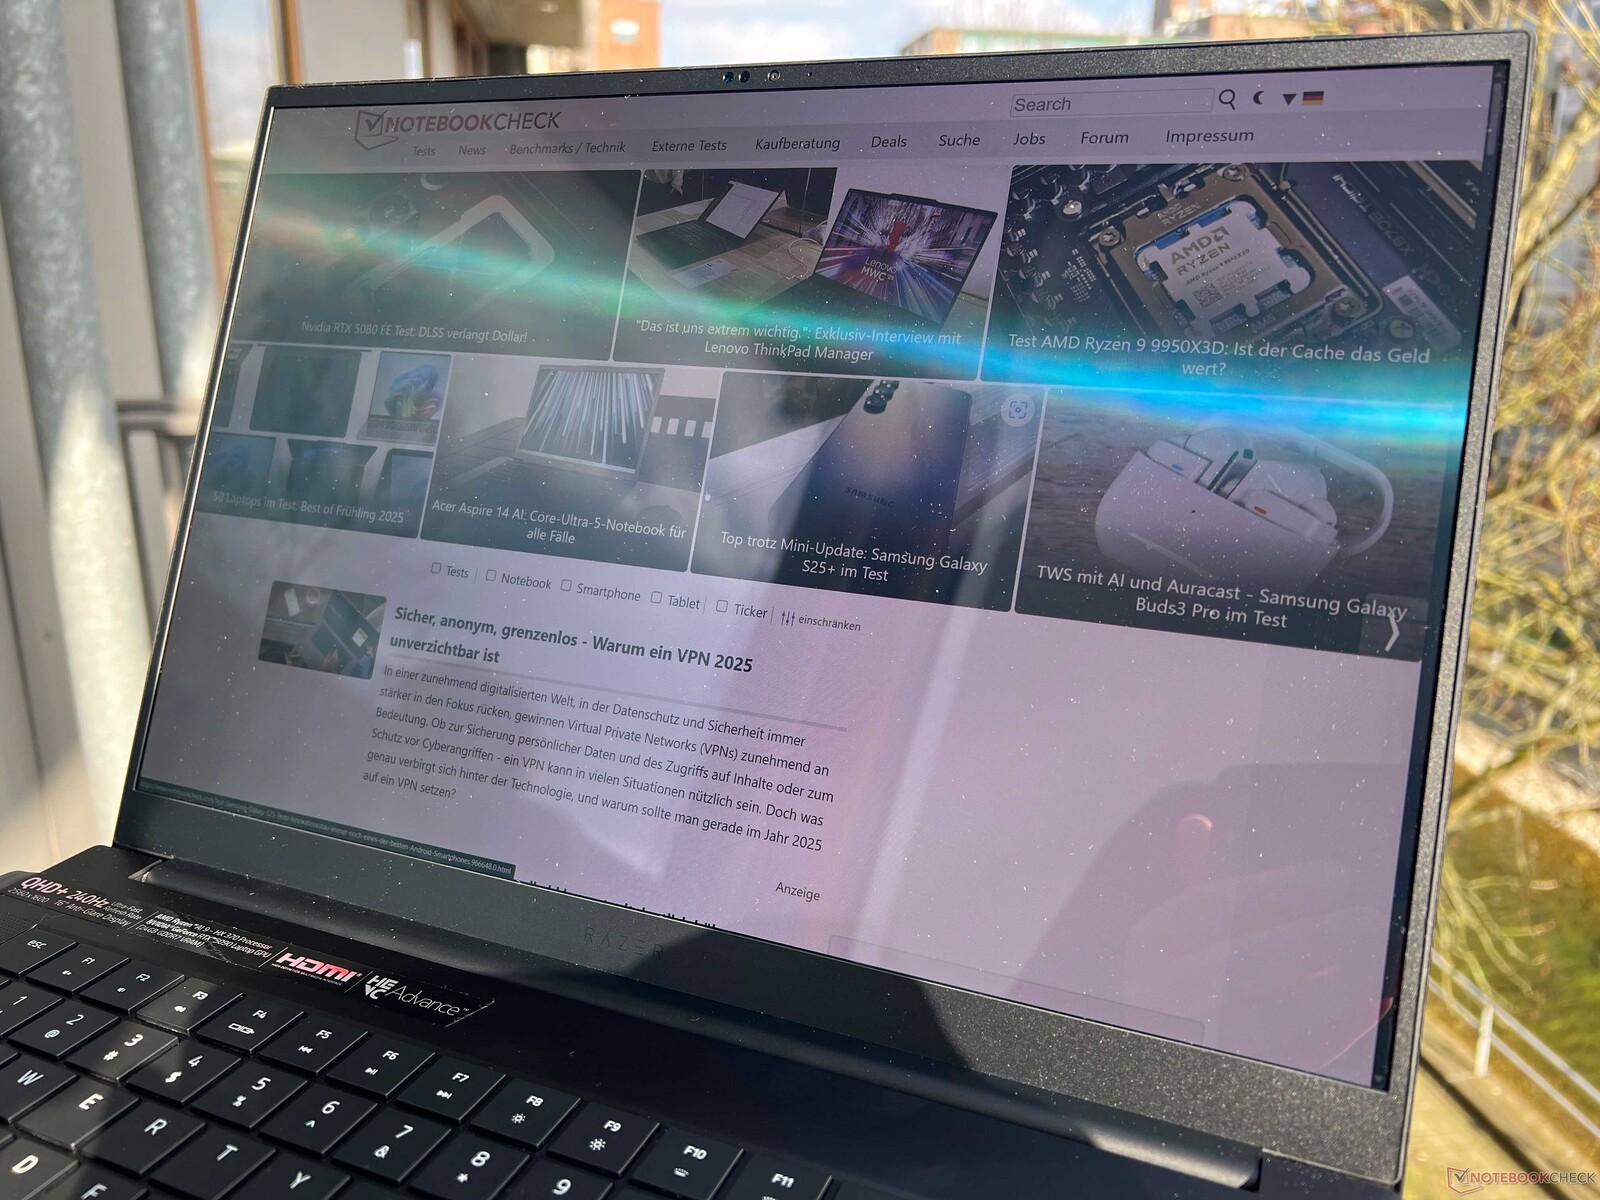
Display - OLED with 240 Hz and G-Sync
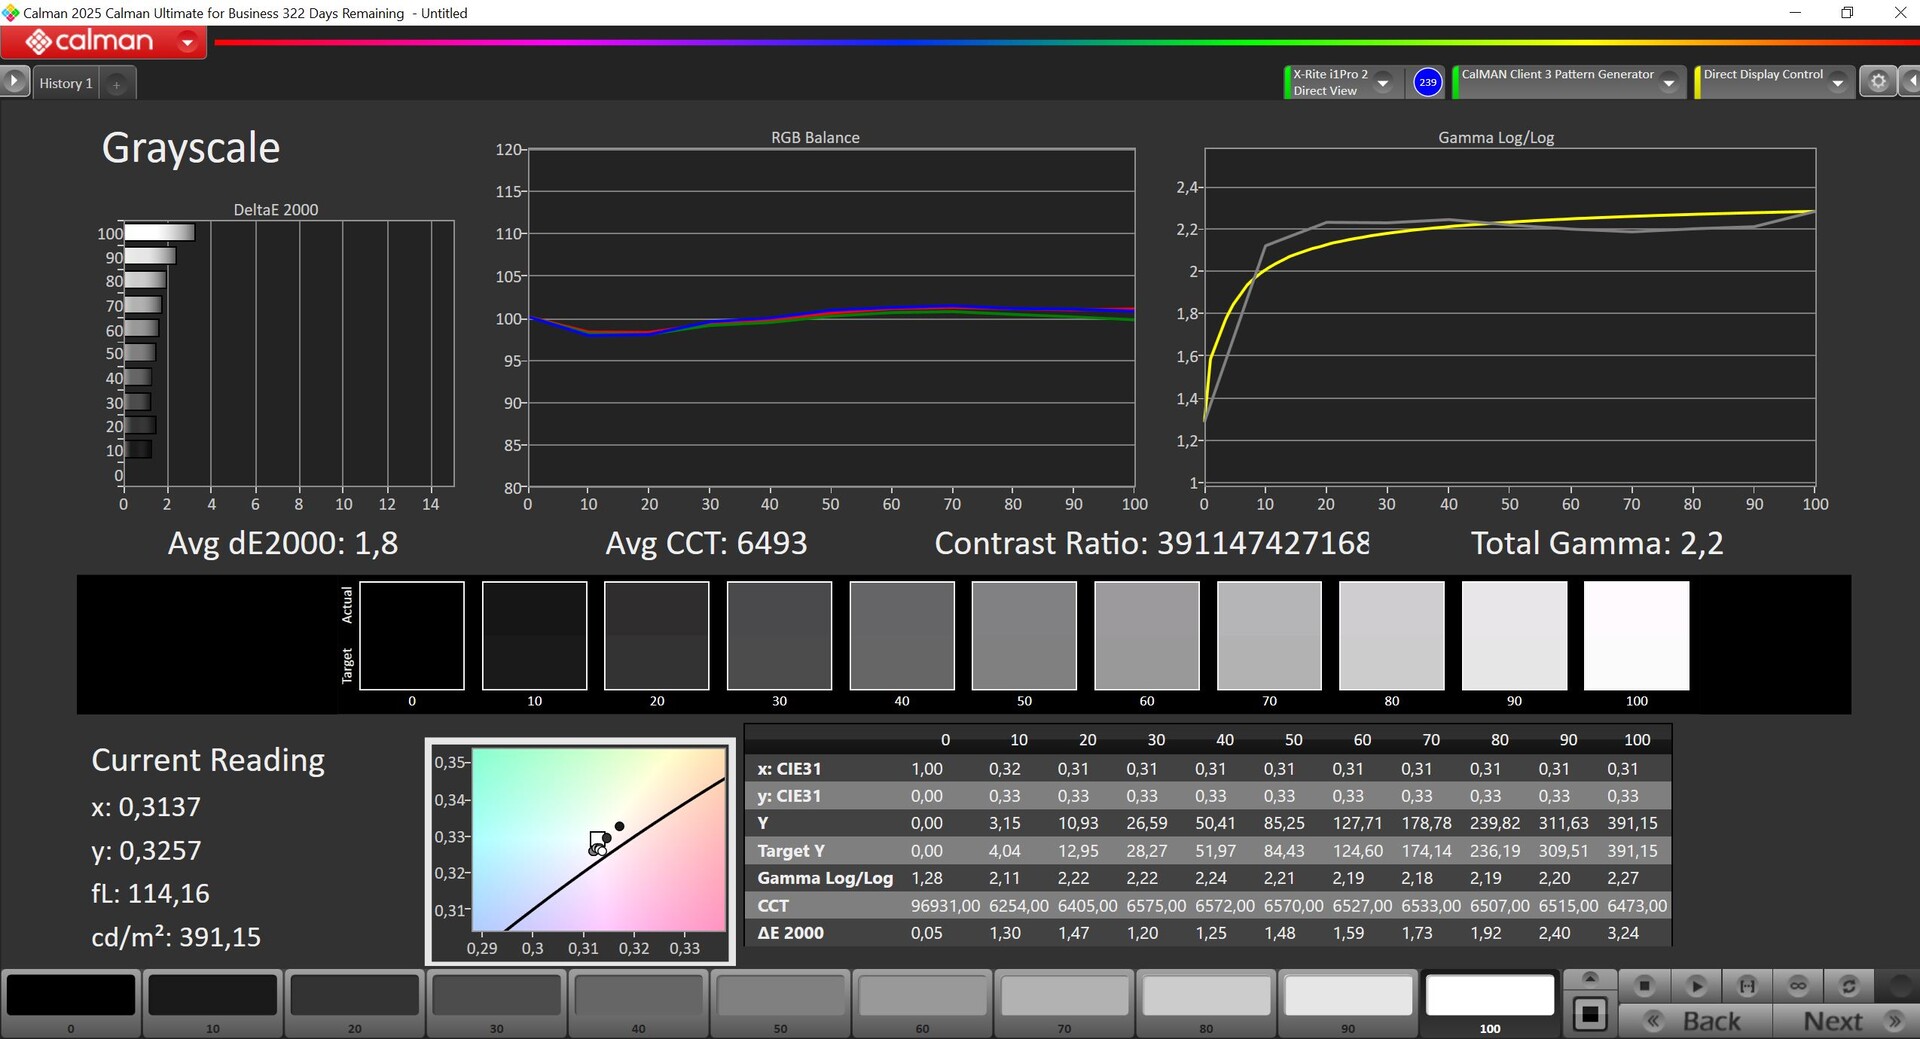
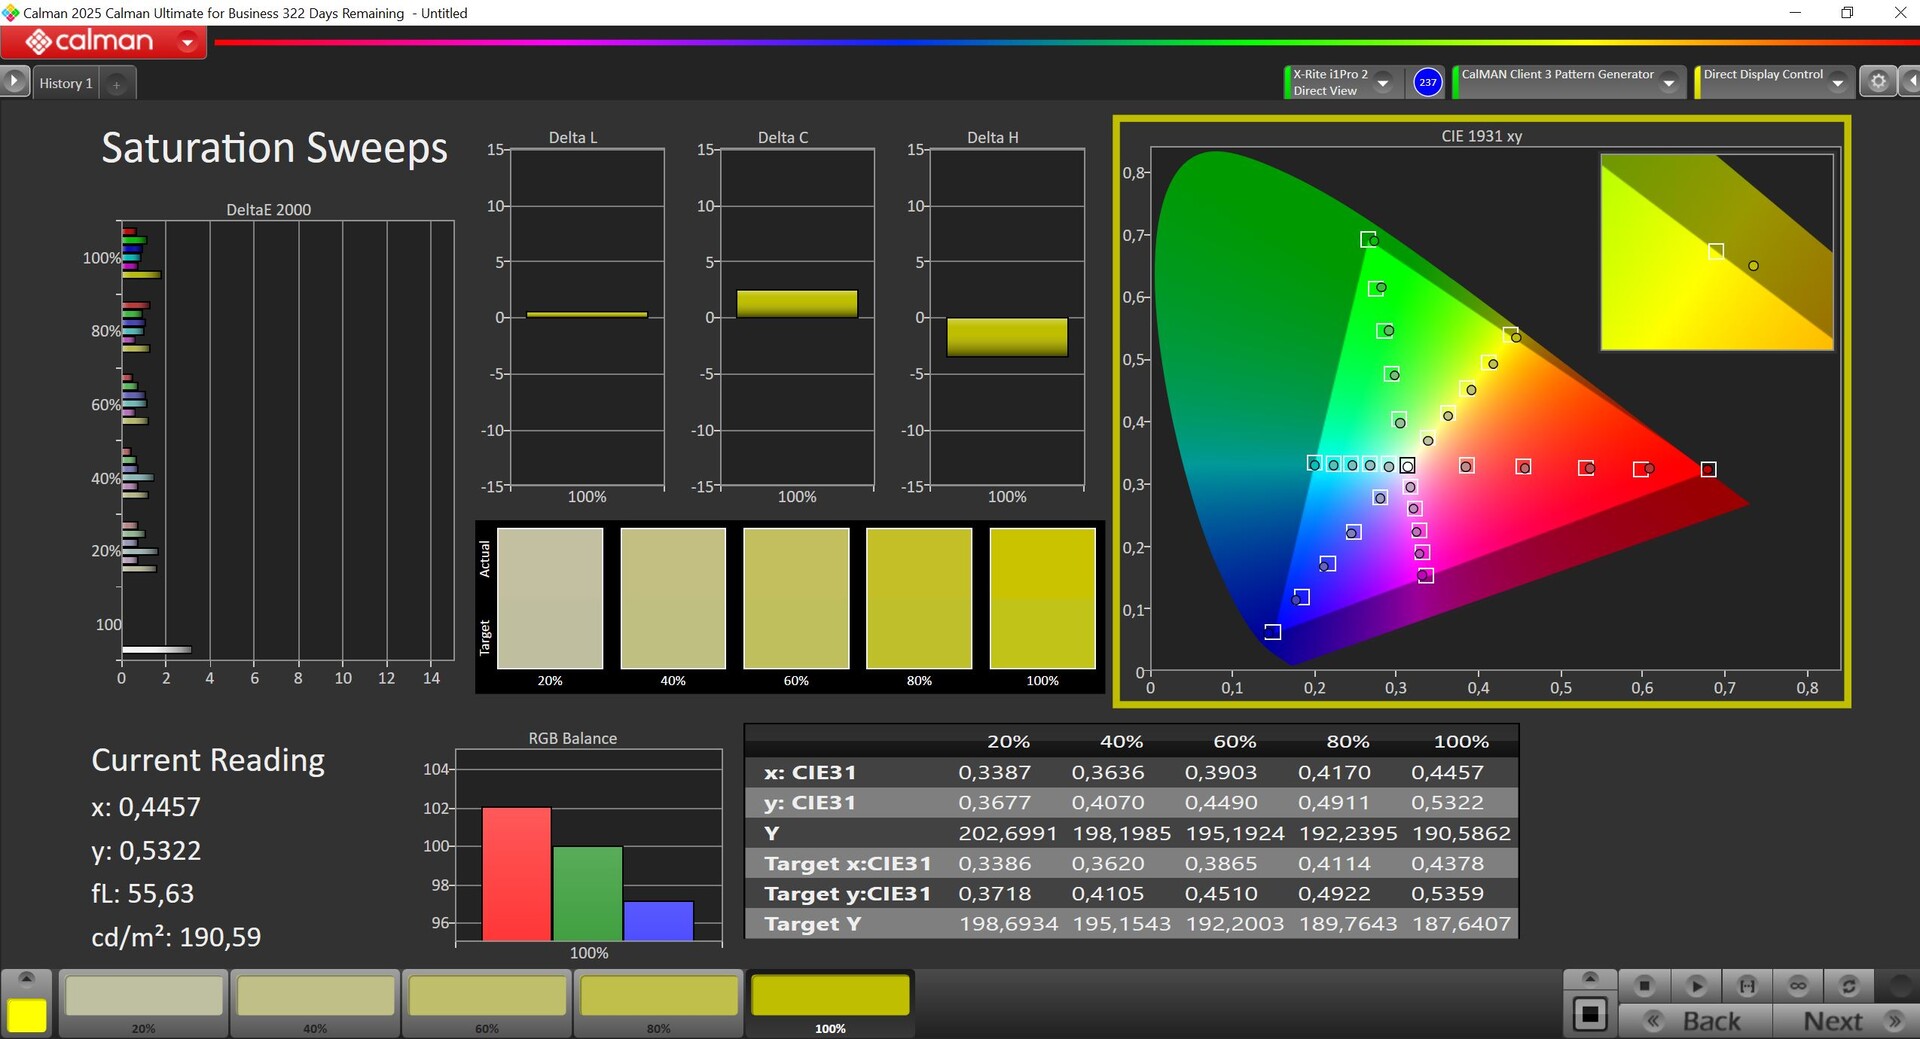
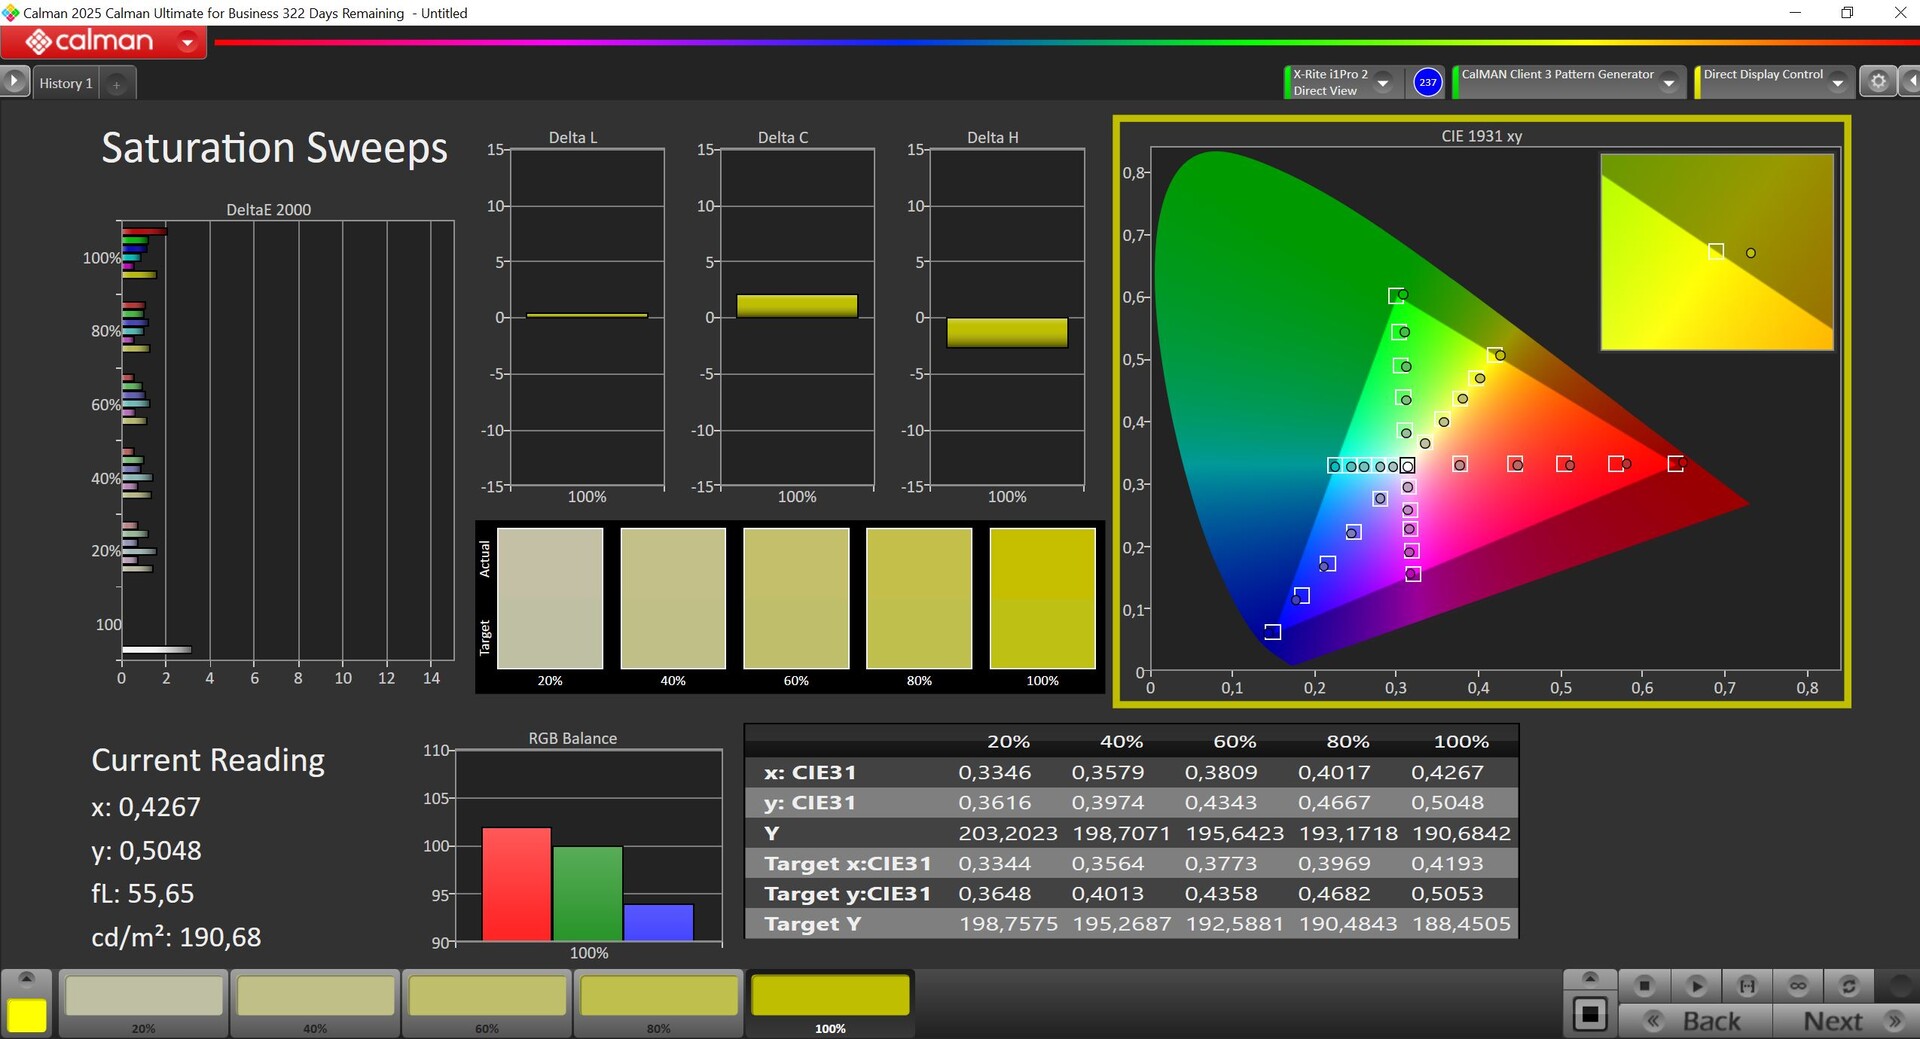
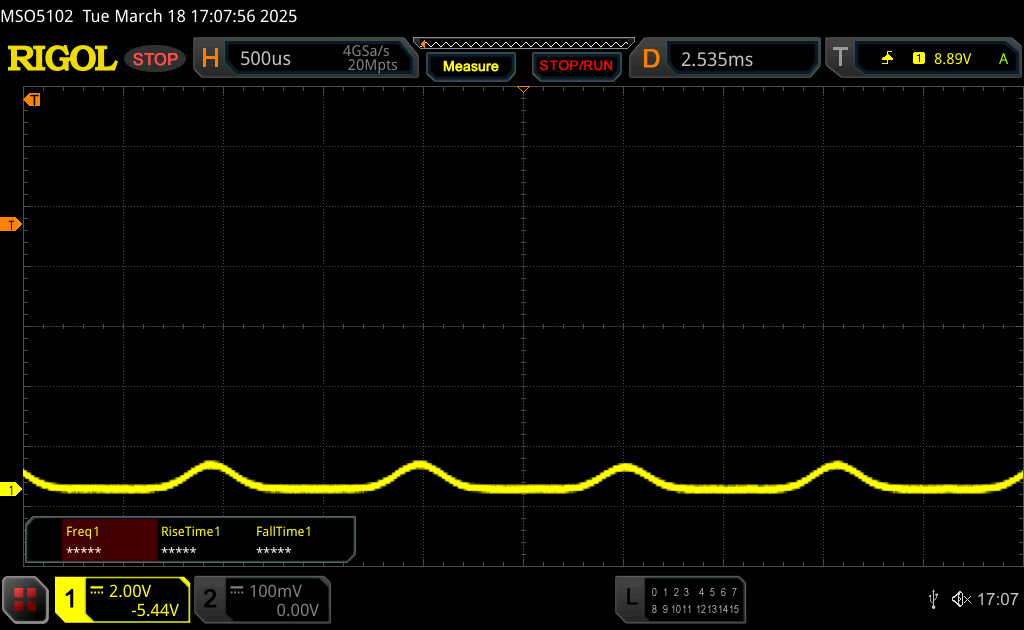
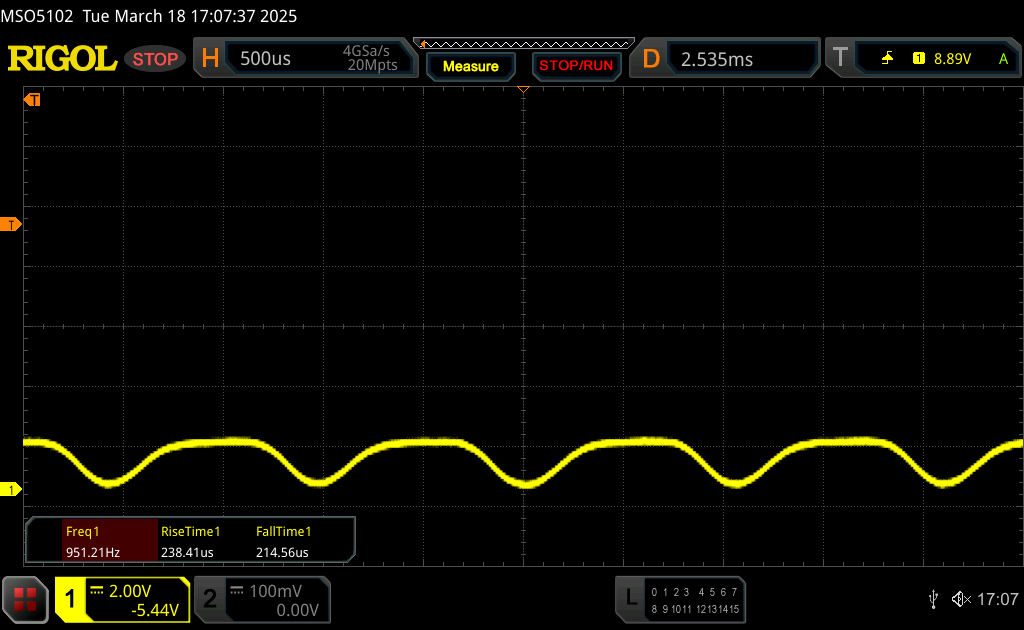
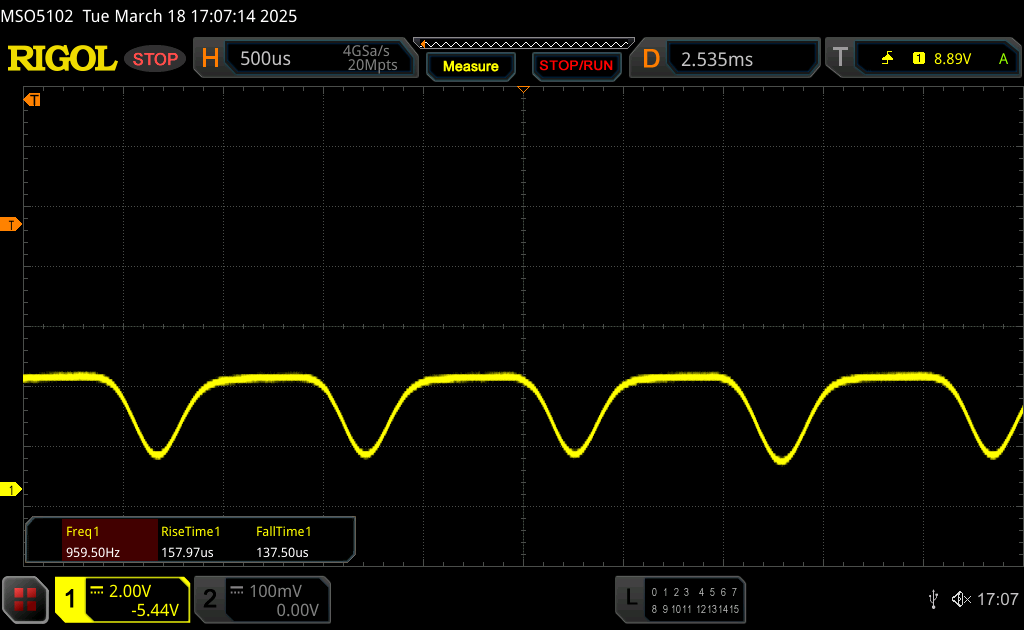
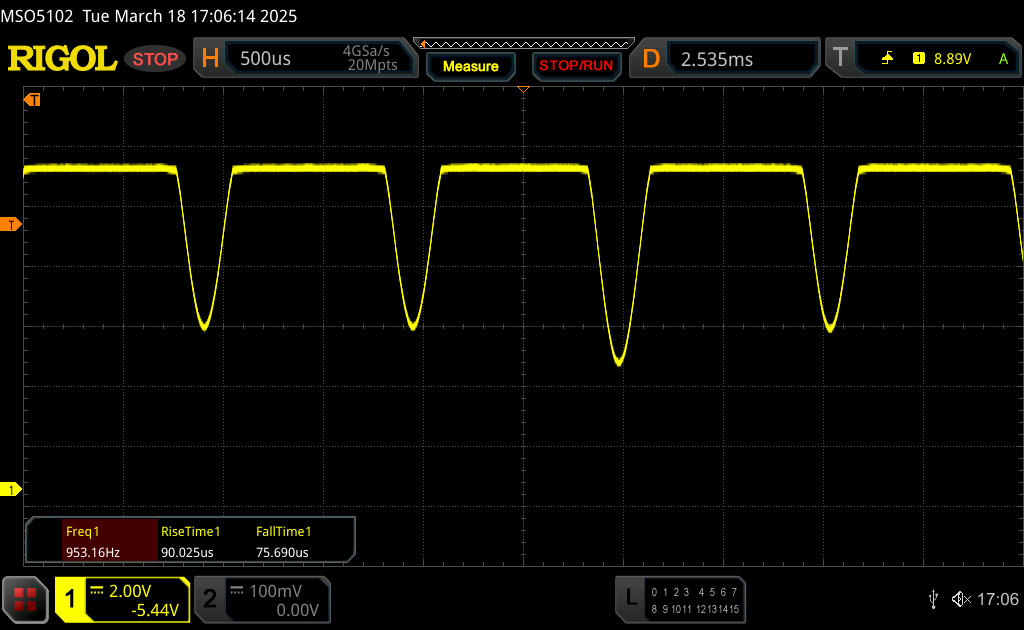
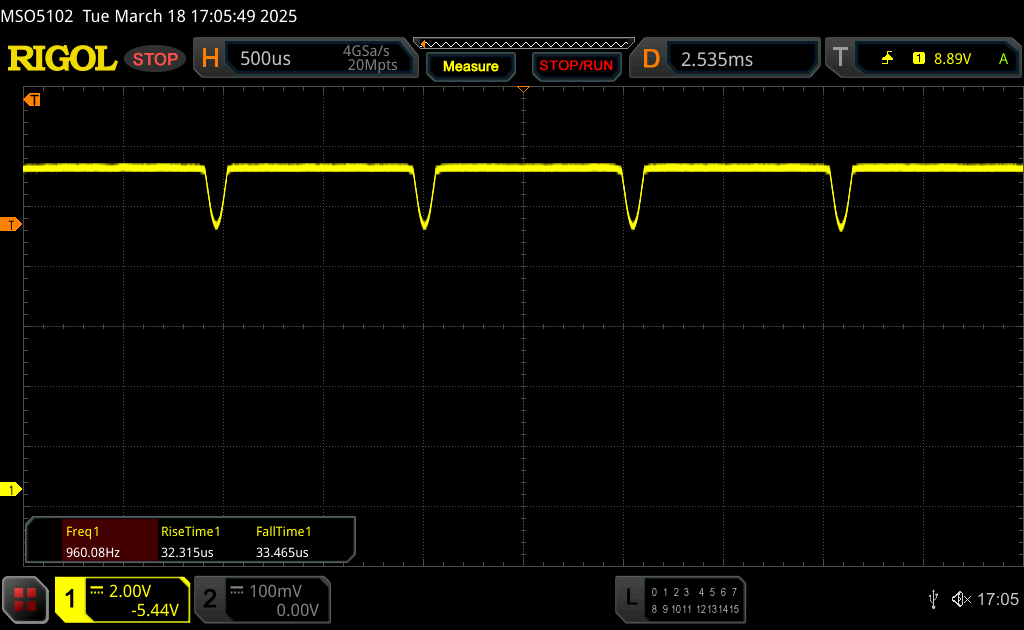
This year, the 240-Hz OLED from Samsung has a minimally different Panel ID, but the image quality is practically identical, continuing to be at a very high level. Colors are vibrant, black is saturated, and the response times are extremely fast. The display is therefore very well suited for gaming. PWM flickering is present at all brightness levels, but its frequency is very high at 960 Hz, so it shouldn't create any problems even for sensitive users.
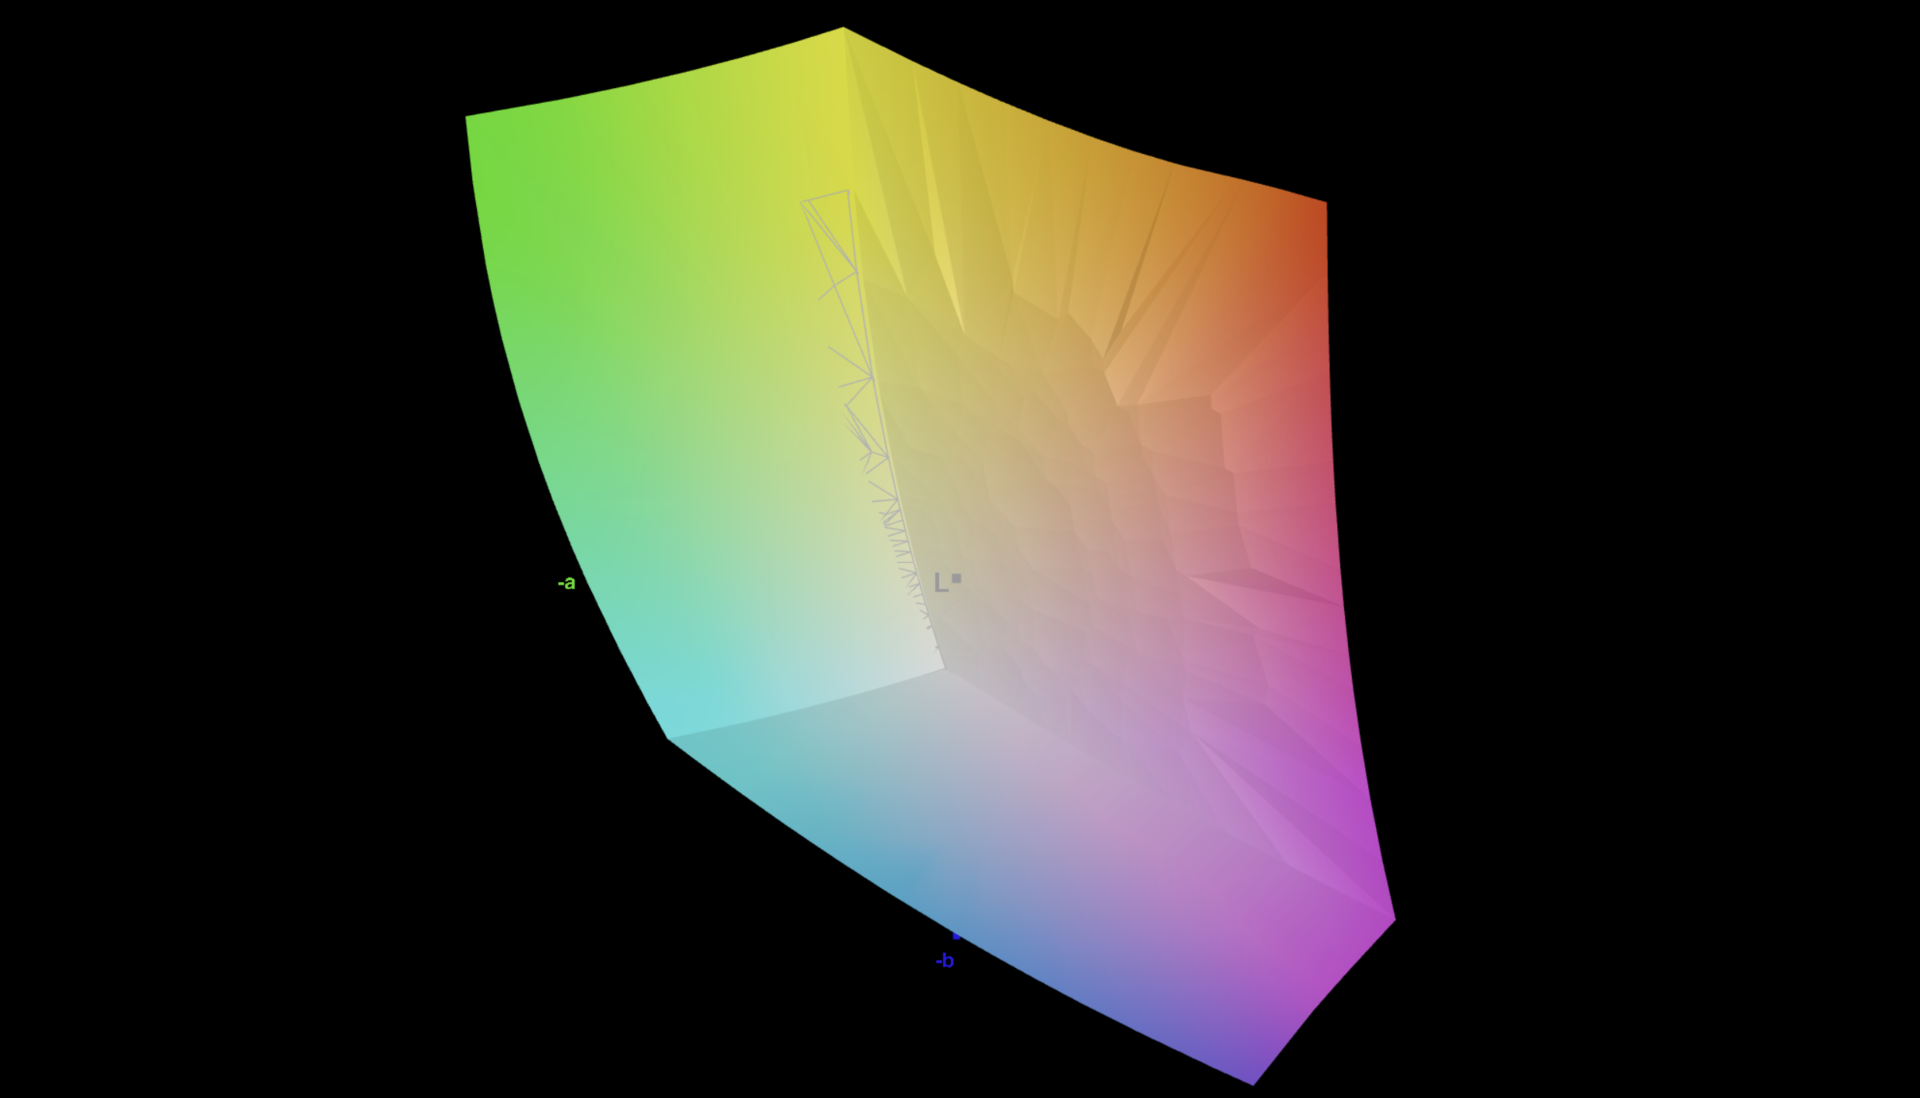
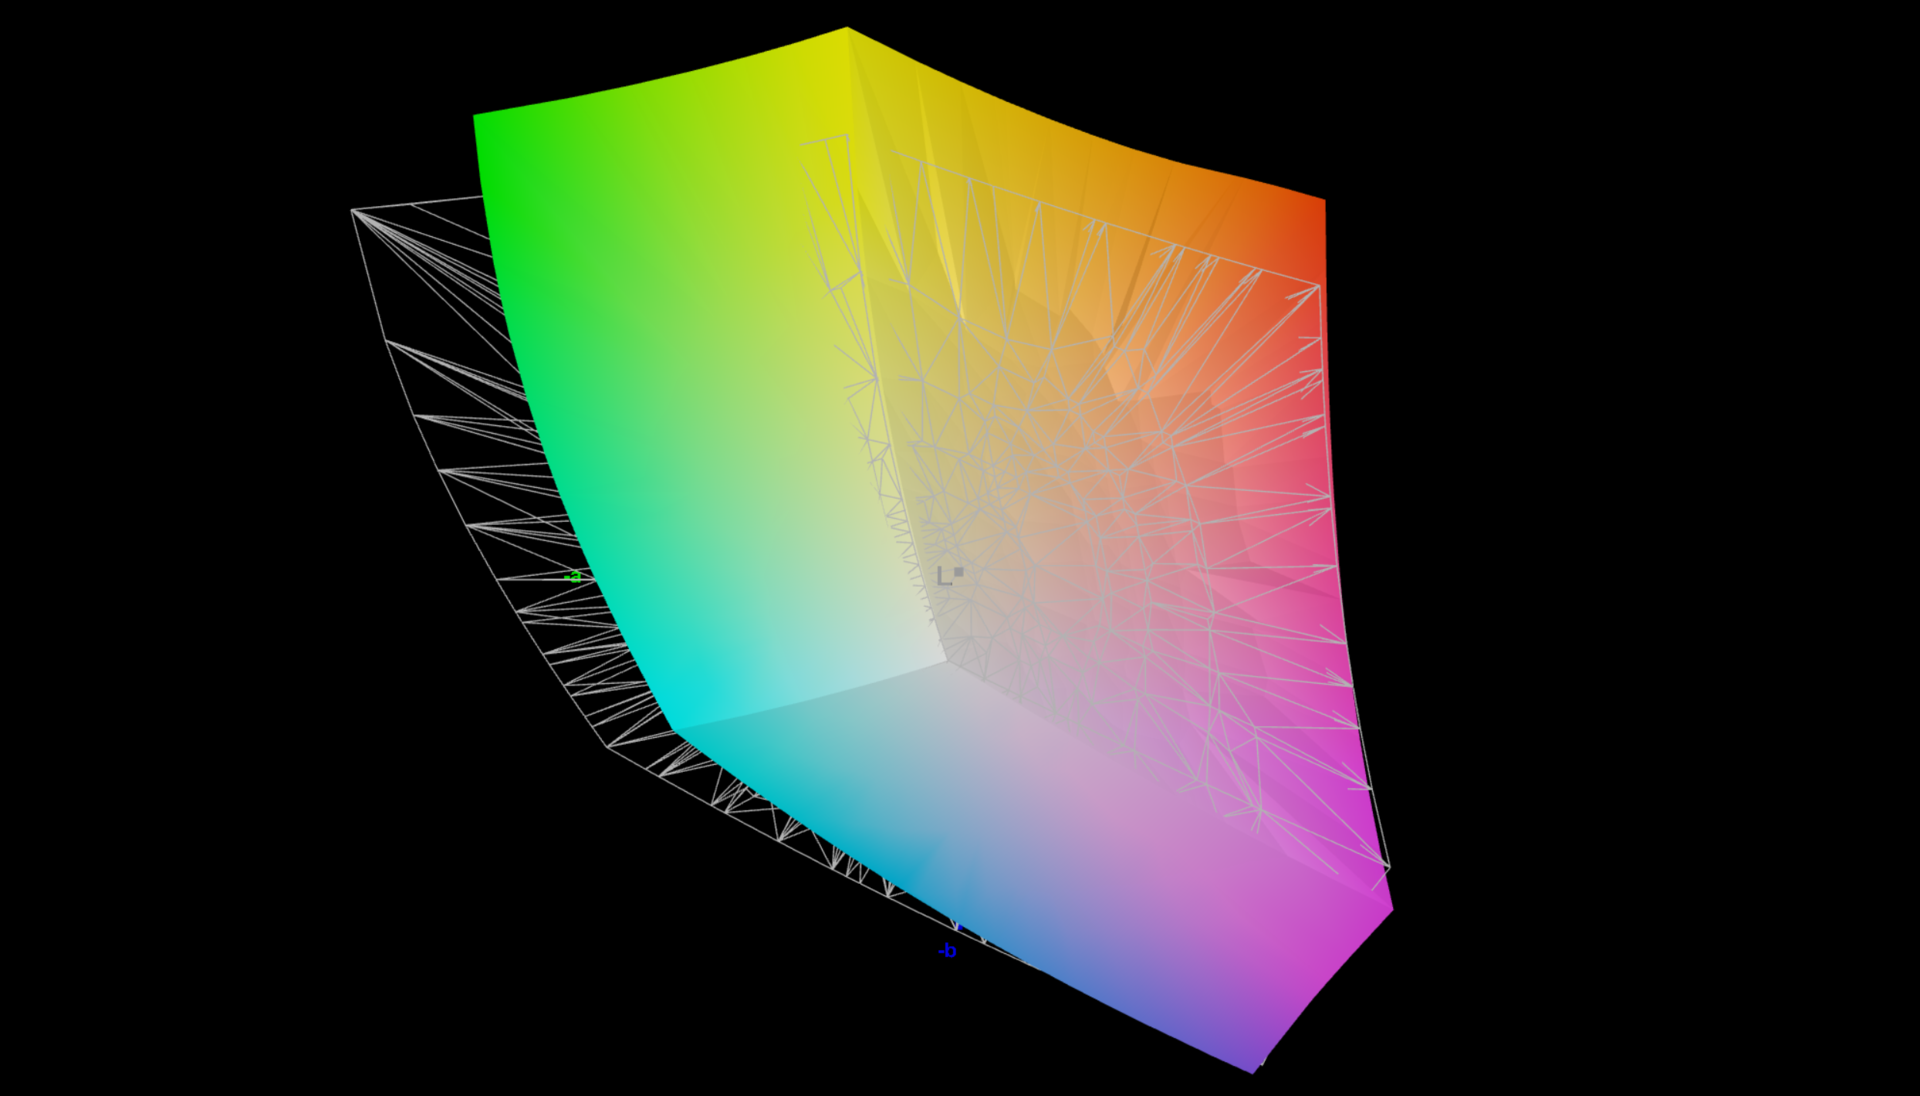
This year, the brightness turns out slightly lower at around 390 cd/m², with the competitors often offering better values. In addition, the maximum HDR brightness is also very low at 431 cd/m². On the other hand, very accurate color profiles for the P3 and sRGB color spaces are already available in the state of delivery (analysis using the professional CalMAN software), and we were unable to improve the display even further.
| |||||||||||||||||||||||||
Brightness Distribution: 98 %
Center on Battery: 391 cd/m²
Contrast: ∞:1 (Black: 0 cd/m²)
ΔE ColorChecker Calman: 1.2 | ∀{0.5-29.43 Ø4.83}
ΔE Greyscale Calman: 1.8 | ∀{0.09-98 Ø5.1}
85% AdobeRGB 1998 (Argyll 3D)
99.9% sRGB (Argyll 3D)
96.1% Display P3 (Argyll 3D)
Gamma: 2.2
CCT: 6493 K
| Razer Blade 16 2025 RTX 5090 ATNA60DL04-0, OLED, 2560x1600, 16", 240 Hz | SCHENKER XMG Neo 16 (Early 24) BOE NE160QDM-NZA, IPS, 2560x1600, 16", 240 Hz | Alienware x16 R2 P120F BOE B160QAN, IPS, 2560x1600, 16", 240 Hz | Lenovo Legion 9 16IRX9, RTX 4090 CSOT T3 MNG007ZA2-2, MiniLED, 3200x2000, 16", 165 Hz | Asus ROG Zephyrus G16 GU605MY ATNA60DL01-0, OLED, 2560x1600, 16", 240 Hz | Razer Blade 16 2024, RTX 4090 Samsung SDC41AB (ATNA60DL03-0), OLED, 2560x1600, 16", 240 Hz | Apple MacBook Pro 16 2024 M4 Pro Mini-LED, 3456x2234, 16.2", 120 Hz | |
|---|---|---|---|---|---|---|---|
| Display | -15% | 2% | 0% | 6% | 5% | 3% | |
| Display P3 Coverage | 96.1 | 70.2 -27% | 98.3 2% | 95.3 -1% | 99.9 4% | 99.1 3% | 99.7 4% |
| sRGB Coverage | 99.9 | 98 -2% | 100 0% | 99.9 0% | 100 0% | 99.9 0% | 100 0% |
| AdobeRGB 1998 Coverage | 85 | 70.6 -17% | 88.8 4% | 86.6 2% | 96.9 14% | 95.6 12% | 88.8 4% |
| Response Times | -3720% | -2435% | -3339% | -8% | -40% | -12628% | |
| Response Time Grey 50% / Grey 80% * | 0.2 ? | 11.2 ? -5500% | 3.9 ? -1850% | 12.6 ? -6200% | 0.22 ? -10% | 0.24 ? -20% | 43 ? -21400% |
| Response Time Black / White * | 0.25 ? | 5.1 ? -1940% | 7.8 ? -3020% | 10 ? -3900% | 0.25 ? -0% | 0.4 ? -60% | 41.2 ? -16380% |
| PWM Frequency | 960 ? | 5430 | 960 ? | 960 | 14880 | ||
| PWM Amplitude * | 44 | 8 82% | 50 -14% | 90 -105% | |||
| Screen | -56% | -46% | -25% | -7% | 6% | 47% | |
| Brightness middle | 391 | 530 36% | 348.4 -11% | 631 61% | 416 6% | 418 7% | 632 62% |
| Brightness | 393 | 497 26% | 340 -13% | 664 69% | 418 6% | 420 7% | 616 57% |
| Brightness Distribution | 98 | 85 -13% | 90 -8% | 91 -7% | 96 -2% | 98 0% | 95 -3% |
| Black Level * | 0.53 | 0.33 | 0.03 | 0.02 | |||
| Colorchecker dE 2000 * | 1.2 | 3.21 -168% | 2.68 -123% | 2.68 -123% | 1.6 -33% | 1.07 11% | 0.6 50% |
| Colorchecker dE 2000 max. * | 3.2 | 5.8 -81% | 4.14 -29% | 6.41 -100% | 2.1 34% | 4.04 -26% | 1.2 62% |
| Greyscale dE 2000 * | 1.8 | 4.2 -133% | 3.4 -89% | 2.71 -51% | 2.7 -50% | 1.12 38% | 0.8 56% |
| Gamma | 2.2 100% | 2.226 99% | 2.41 91% | 2.27 97% | 2.16 102% | 2.29 96% | 2.21 100% |
| CCT | 6493 100% | 6448 101% | 6083 107% | 6135 106% | 6331 103% | 6417 101% | 6450 101% |
| Contrast | 1000 | 1056 | 21033 | 20900 | |||
| Colorchecker dE 2000 calibrated * | 1.44 | 0.42 | 2.68 | 1.07 | |||
| Total Average (Program / Settings) | -1264% /
-711% | -826% /
-467% | -1121% /
-847% | -3% /
-4% | -10% /
-3% | -4193% /
-3133% |
* ... smaller is better


Display Response Times
| ↔ Response Time Black to White | ||
|---|---|---|
| 0.25 ms ... rise ↗ and fall ↘ combined | ↗ 0.13 ms rise | 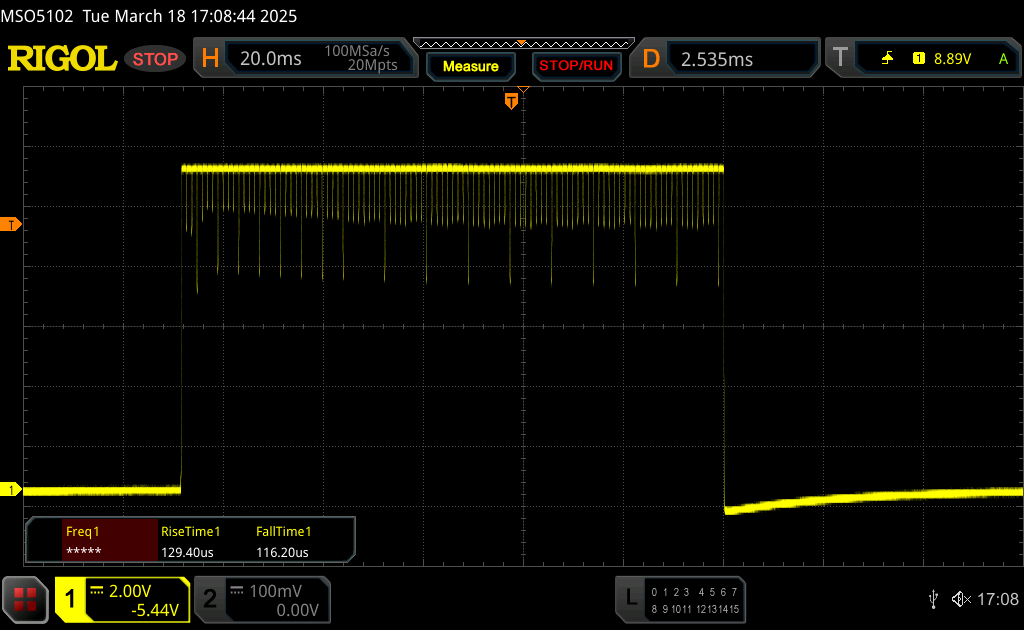 |
| ↘ 0.12 ms fall | ||
| The screen shows very fast response rates in our tests and should be very well suited for fast-paced gaming. In comparison, all tested devices range from 0.1 (minimum) to 240 (maximum) ms. » 0 % of all devices are better. This means that the measured response time is better than the average of all tested devices (20.5 ms). | ||
| ↔ Response Time 50% Grey to 80% Grey | ||
| 0.2 ms ... rise ↗ and fall ↘ combined | ↗ 0.1 ms rise | 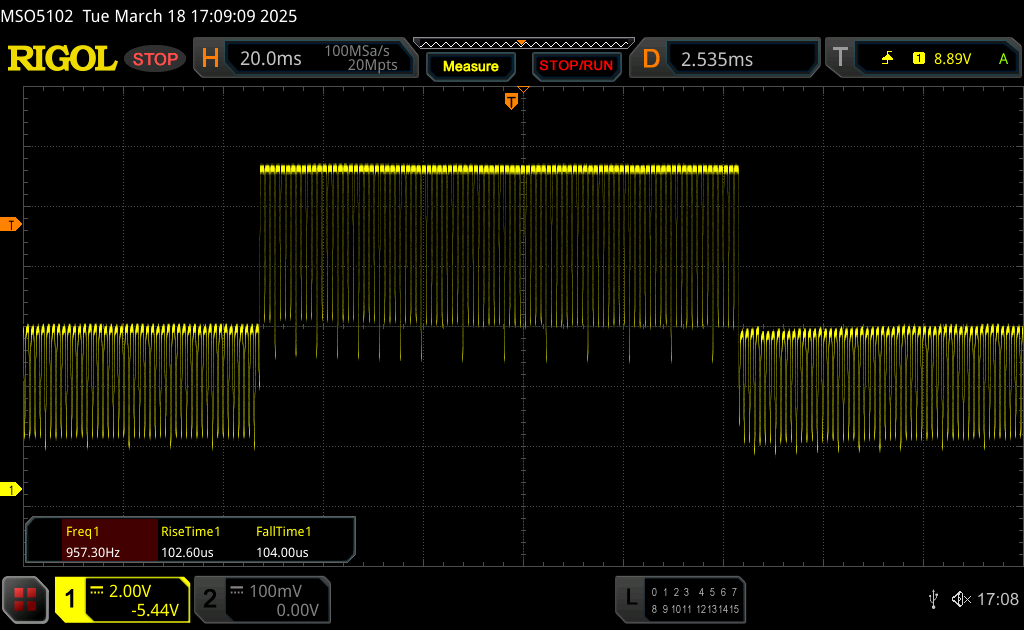 |
| ↘ 0.1 ms fall | ||
| The screen shows very fast response rates in our tests and should be very well suited for fast-paced gaming. In comparison, all tested devices range from 0.165 (minimum) to 636 (maximum) ms. » 0 % of all devices are better. This means that the measured response time is better than the average of all tested devices (32.1 ms). | ||
Screen Flickering / PWM (Pulse-Width Modulation)
| Screen flickering / PWM detected | 960 Hz Amplitude: 44 % | ≤ 100 % brightness setting | 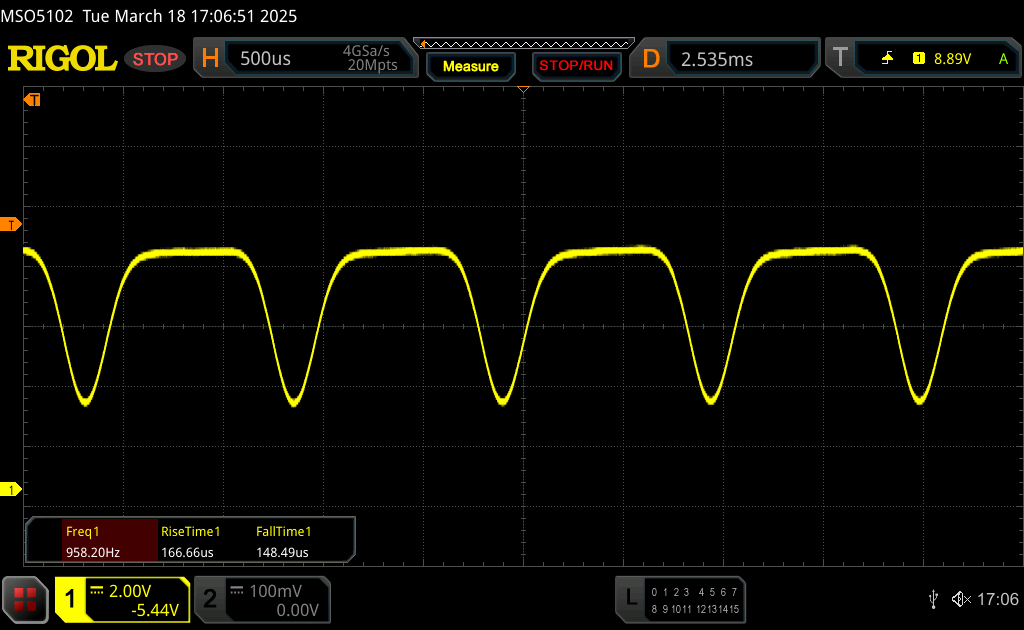 |
The display backlight flickers at 960 Hz (worst case, e.g., utilizing PWM) Flickering detected at a brightness setting of 100 % and below. There should be no flickering or PWM above this brightness setting. The frequency of 960 Hz is quite high, so most users sensitive to PWM should not notice any flickering. In comparison: 53 % of all tested devices do not use PWM to dim the display. If PWM was detected, an average of 8327 (minimum: 5 - maximum: 343500) Hz was measured. | |||


Performance - Ryzen AI and GeForce RTX 5090 Laptop
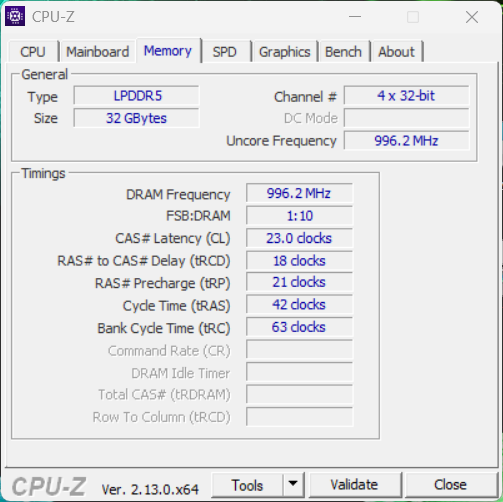
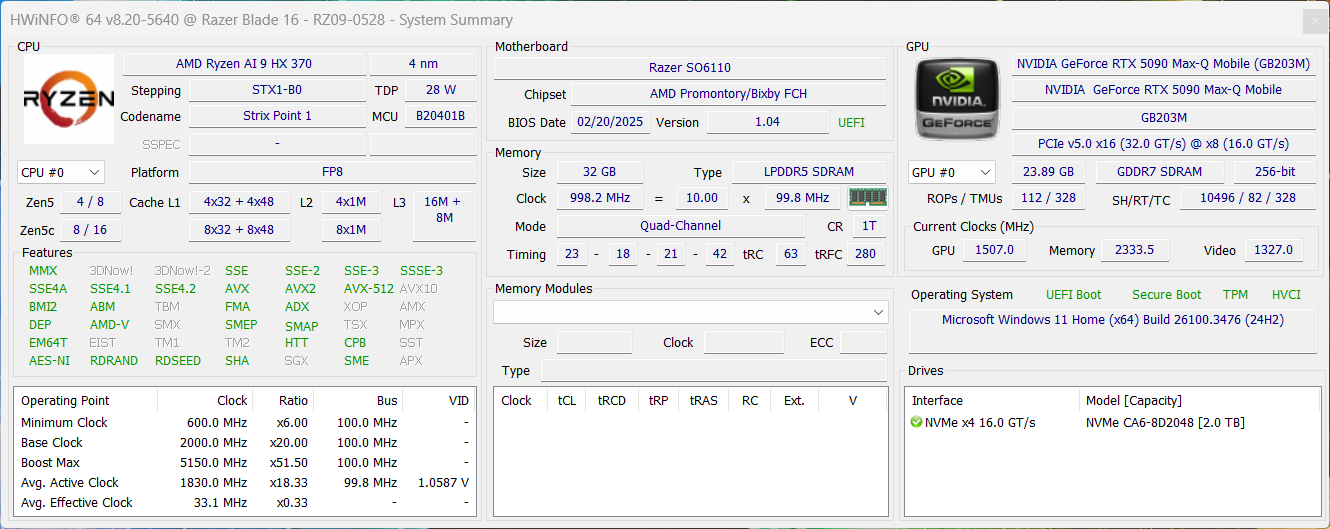
To allow for the fast GPU in the slimmer case, Razer has changed from the Intel HX CPUs to the Ryzen AI mobile processors from AMD. You can choose between either the Ryzen AI 9 HX 370 or the Ryzen AI 9 365 with up to 64 GB of soldered memory (LPDDR5x-8000).
Test Conditions
Razer offers various power profiles that we list in the table below. To get the maximum performance, we used the Performance mode in our benchmarks and measurements. In contrast to last year's model, we were unable to increase the performance further using the Custom mode.
| Mode | CPU TDP | CB R23 Multi | GPU TGP | Time Spy Graphics | Cyberpunk 2077 QHD Ultra | Cyberpunk 2077 fan volume | max. fan volume |
|---|---|---|---|---|---|---|---|
| Silent | 35 Watt | 18,105 points | 110 Watt | 17,919 points | 84.5 FPS | 43 dB(A) | 45.7 dB(A) |
| Balanced | 55/46 Watt | 20,651 points | 125 Watt | 19,487 points | 87.3 FPS | 48.2 dB(A) | 50.8 dB(A) |
| Performance | 78/75 Watt | 23,804 points | 160 Watt | 22,082 points | 98.6 FPS | 48.2 dB(A) | 53.4 dB(A) |
| Battery | 52/40 Watt | 19,112 points | 65 Watt | 10,464 points | 34.8 FPS | 40 dB(A) | 40 dB(A) |
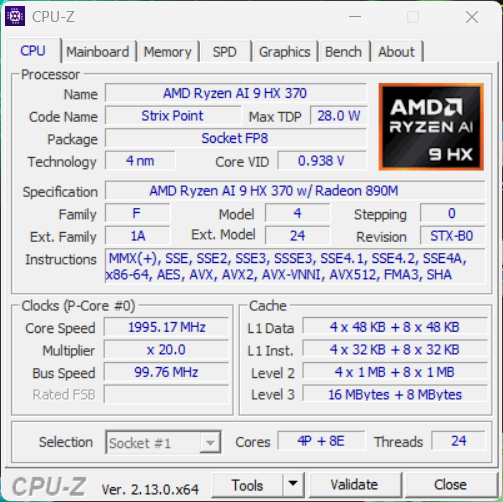
Processor - AMD Ryzen AI 9 HX 370
The Ryzen AI 9 HX 370 offers 12 CPU cores and can consume a maximum of 78 watts. Basically, the multi-core performance is good and also better than that of the 2024 Zephyrus G16 with the Core Ultra 7 155H. But it remains behind that of the Core i9-14900HX in the old Blade 16 and the other comparison devices, where the HX processor is of course allowed to consume considerably more power. Under constant load, the performance remains stable, but in battery operation, the multi-core performance drops by about 20%.
Cinebench R15 Multi Constant Load Test
Cinebench 2024: CPU Multi Core | CPU Single Core
Cinebench R23: Multi Core | Single Core
Cinebench R20: CPU (Multi Core) | CPU (Single Core)
Cinebench R15: CPU Multi 64Bit | CPU Single 64Bit
Blender: v2.79 BMW27 CPU
7-Zip 18.03: 7z b 4 | 7z b 4 -mmt1
Geekbench 6.4: Multi-Core | Single-Core
Geekbench 5.5: Multi-Core | Single-Core
HWBOT x265 Benchmark v2.2: 4k Preset
LibreOffice : 20 Documents To PDF
R Benchmark 2.5: Overall mean
| CPU Performance Rating | |
| Apple MacBook Pro 16 M4 Max -8! | |
| SCHENKER XMG Neo 16 (Early 24) | |
| Razer Blade 16 2024, RTX 4090 -2! | |
| Lenovo Legion 9 16IRX9, RTX 4090 -2! | |
| Razer Blade 16 2025 RTX 5090 | |
| Average of class Gaming | |
| Asus ROG Zephyrus G16 GA605WV | |
| Average AMD Ryzen AI 9 HX 370 | |
| Lenovo Yoga Pro 9 16IMH9 -2! | |
| Asus ROG Zephyrus G16 GU605MY -2! | |
| Alienware x16 R2 P120F -2! | |
| Cinebench 2024 / CPU Multi Core | |
| Apple MacBook Pro 16 M4 Max | |
| Apple MacBook Pro 16 M4 Max | |
| SCHENKER XMG Neo 16 (Early 24) | |
| Average of class Gaming (331 - 2298, n=84, last 2 years) | |
| Razer Blade 16 2025 RTX 5090 | |
| Asus ROG Zephyrus G16 GA605WV | |
| Average AMD Ryzen AI 9 HX 370 (621 - 1284, n=27) | |
| Cinebench 2024 / CPU Single Core | |
| Apple MacBook Pro 16 M4 Max | |
| SCHENKER XMG Neo 16 (Early 24) | |
| Average of class Gaming (68.2 - 138.2, n=85, last 2 years) | |
| Razer Blade 16 2025 RTX 5090 | |
| Average AMD Ryzen AI 9 HX 370 (113.6 - 121, n=17) | |
| Asus ROG Zephyrus G16 GA605WV | |
| Cinebench R23 / Multi Core | |
| SCHENKER XMG Neo 16 (Early 24) | |
| Lenovo Legion 9 16IRX9, RTX 4090 | |
| Razer Blade 16 2024, RTX 4090 | |
| Apple MacBook Pro 16 M4 Max | |
| Average of class Gaming (5668 - 40970, n=144, last 2 years) | |
| Razer Blade 16 2025 RTX 5090 | |
| Asus ROG Zephyrus G16 GA605WV | |
| Average AMD Ryzen AI 9 HX 370 (10435 - 23902, n=26) | |
| Lenovo Yoga Pro 9 16IMH9 | |
| Asus ROG Zephyrus G16 GU605MY | |
| Alienware x16 R2 P120F | |
| Cinebench R23 / Single Core | |
| SCHENKER XMG Neo 16 (Early 24) | |
| Apple MacBook Pro 16 M4 Max | |
| Razer Blade 16 2024, RTX 4090 | |
| Razer Blade 16 2025 RTX 5090 | |
| Average AMD Ryzen AI 9 HX 370 (1921 - 2049, n=19) | |
| Asus ROG Zephyrus G16 GA605WV | |
| Average of class Gaming (1136 - 2267, n=144, last 2 years) | |
| Lenovo Yoga Pro 9 16IMH9 | |
| Asus ROG Zephyrus G16 GU605MY | |
| Lenovo Legion 9 16IRX9, RTX 4090 | |
| Alienware x16 R2 P120F | |
| Cinebench R20 / CPU (Multi Core) | |
| SCHENKER XMG Neo 16 (Early 24) | |
| Lenovo Legion 9 16IRX9, RTX 4090 | |
| Razer Blade 16 2024, RTX 4090 | |
| Average of class Gaming (2179 - 16108, n=144, last 2 years) | |
| Razer Blade 16 2025 RTX 5090 | |
| Asus ROG Zephyrus G16 GA605WV | |
| Average AMD Ryzen AI 9 HX 370 (6449 - 9280, n=18) | |
| Lenovo Yoga Pro 9 16IMH9 | |
| Asus ROG Zephyrus G16 GU605MY | |
| Alienware x16 R2 P120F | |
| Apple MacBook Pro 16 M4 Max | |
| Cinebench R20 / CPU (Single Core) | |
| SCHENKER XMG Neo 16 (Early 24) | |
| Razer Blade 16 2024, RTX 4090 | |
| Razer Blade 16 2025 RTX 5090 | |
| Average AMD Ryzen AI 9 HX 370 (753 - 804, n=18) | |
| Asus ROG Zephyrus G16 GA605WV | |
| Average of class Gaming (439 - 870, n=144, last 2 years) | |
| Lenovo Yoga Pro 9 16IMH9 | |
| Asus ROG Zephyrus G16 GU605MY | |
| Lenovo Legion 9 16IRX9, RTX 4090 | |
| Alienware x16 R2 P120F | |
| Apple MacBook Pro 16 M4 Max | |
| Cinebench R15 / CPU Multi 64Bit | |
| SCHENKER XMG Neo 16 (Early 24) | |
| Lenovo Legion 9 16IRX9, RTX 4090 | |
| Razer Blade 16 2024, RTX 4090 | |
| Average of class Gaming (1537 - 6271, n=144, last 2 years) | |
| Apple MacBook Pro 16 M4 Max | |
| Razer Blade 16 2025 RTX 5090 | |
| Asus ROG Zephyrus G16 GA605WV | |
| Average AMD Ryzen AI 9 HX 370 (2498 - 3551, n=18) | |
| Asus ROG Zephyrus G16 GU605MY | |
| Lenovo Yoga Pro 9 16IMH9 | |
| Alienware x16 R2 P120F | |
| Cinebench R15 / CPU Single 64Bit | |
| Razer Blade 16 2024, RTX 4090 | |
| SCHENKER XMG Neo 16 (Early 24) | |
| Razer Blade 16 2025 RTX 5090 | |
| Apple MacBook Pro 16 M4 Max | |
| Asus ROG Zephyrus G16 GA605WV | |
| Average AMD Ryzen AI 9 HX 370 (192.1 - 315, n=18) | |
| Average of class Gaming (191.9 - 343, n=143, last 2 years) | |
| Lenovo Yoga Pro 9 16IMH9 | |
| Asus ROG Zephyrus G16 GU605MY | |
| Lenovo Legion 9 16IRX9, RTX 4090 | |
| Alienware x16 R2 P120F | |
| Blender / v2.79 BMW27 CPU | |
| Alienware x16 R2 P120F | |
| Asus ROG Zephyrus G16 GU605MY | |
| Lenovo Yoga Pro 9 16IMH9 | |
| Average of class Gaming (80 - 517, n=141, last 2 years) | |
| Average AMD Ryzen AI 9 HX 370 (139 - 192, n=19) | |
| Asus ROG Zephyrus G16 GA605WV | |
| Razer Blade 16 2025 RTX 5090 | |
| Razer Blade 16 2024, RTX 4090 | |
| Lenovo Legion 9 16IRX9, RTX 4090 | |
| SCHENKER XMG Neo 16 (Early 24) | |
| 7-Zip 18.03 / 7z b 4 | |
| SCHENKER XMG Neo 16 (Early 24) | |
| Lenovo Legion 9 16IRX9, RTX 4090 | |
| Razer Blade 16 2024, RTX 4090 | |
| Average of class Gaming (23795 - 148086, n=142, last 2 years) | |
| Razer Blade 16 2025 RTX 5090 | |
| Asus ROG Zephyrus G16 GA605WV | |
| Average AMD Ryzen AI 9 HX 370 (66154 - 83714, n=18) | |
| Lenovo Yoga Pro 9 16IMH9 | |
| Asus ROG Zephyrus G16 GU605MY | |
| Alienware x16 R2 P120F | |
| 7-Zip 18.03 / 7z b 4 -mmt1 | |
| SCHENKER XMG Neo 16 (Early 24) | |
| Razer Blade 16 2024, RTX 4090 | |
| Average of class Gaming (4199 - 7573, n=142, last 2 years) | |
| Razer Blade 16 2025 RTX 5090 | |
| Average AMD Ryzen AI 9 HX 370 (5859 - 6497, n=18) | |
| Asus ROG Zephyrus G16 GA605WV | |
| Lenovo Yoga Pro 9 16IMH9 | |
| Asus ROG Zephyrus G16 GU605MY | |
| Lenovo Legion 9 16IRX9, RTX 4090 | |
| Alienware x16 R2 P120F | |
| Geekbench 6.4 / Multi-Core | |
| Apple MacBook Pro 16 M4 Max | |
| SCHENKER XMG Neo 16 (Early 24) | |
| Razer Blade 16 2024, RTX 4090 | |
| Lenovo Legion 9 16IRX9, RTX 4090 | |
| Razer Blade 16 2025 RTX 5090 | |
| Average of class Gaming (5340 - 22104, n=139, last 2 years) | |
| Asus ROG Zephyrus G16 GA605WV | |
| Asus ROG Zephyrus G16 GU605MY | |
| Average AMD Ryzen AI 9 HX 370 (11973 - 15994, n=20) | |
| Lenovo Yoga Pro 9 16IMH9 | |
| Alienware x16 R2 P120F | |
| Geekbench 6.4 / Single-Core | |
| Apple MacBook Pro 16 M4 Max | |
| SCHENKER XMG Neo 16 (Early 24) | |
| Razer Blade 16 2024, RTX 4090 | |
| Razer Blade 16 2025 RTX 5090 | |
| Average AMD Ryzen AI 9 HX 370 (2780 - 2965, n=20) | |
| Asus ROG Zephyrus G16 GA605WV | |
| Average of class Gaming (1490 - 3219, n=139, last 2 years) | |
| Lenovo Yoga Pro 9 16IMH9 | |
| Asus ROG Zephyrus G16 GU605MY | |
| Lenovo Legion 9 16IRX9, RTX 4090 | |
| Alienware x16 R2 P120F | |
| Geekbench 5.5 / Multi-Core | |
| SCHENKER XMG Neo 16 (Early 24) | |
| Lenovo Legion 9 16IRX9, RTX 4090 | |
| Razer Blade 16 2024, RTX 4090 | |
| Average of class Gaming (4557 - 27010, n=141, last 2 years) | |
| Razer Blade 16 2025 RTX 5090 | |
| Asus ROG Zephyrus G16 GA605WV | |
| Asus ROG Zephyrus G16 GU605MY | |
| Average AMD Ryzen AI 9 HX 370 (11394 - 15759, n=19) | |
| Lenovo Yoga Pro 9 16IMH9 | |
| Alienware x16 R2 P120F | |
| Geekbench 5.5 / Single-Core | |
| SCHENKER XMG Neo 16 (Early 24) | |
| Razer Blade 16 2025 RTX 5090 | |
| Razer Blade 16 2024, RTX 4090 | |
| Asus ROG Zephyrus G16 GA605WV | |
| Average AMD Ryzen AI 9 HX 370 (1957 - 2160, n=19) | |
| Average of class Gaming (986 - 2423, n=141, last 2 years) | |
| Lenovo Yoga Pro 9 16IMH9 | |
| Asus ROG Zephyrus G16 GU605MY | |
| Lenovo Legion 9 16IRX9, RTX 4090 | |
| Alienware x16 R2 P120F | |
| HWBOT x265 Benchmark v2.2 / 4k Preset | |
| SCHENKER XMG Neo 16 (Early 24) | |
| Lenovo Legion 9 16IRX9, RTX 4090 | |
| Razer Blade 16 2024, RTX 4090 | |
| Razer Blade 16 2025 RTX 5090 | |
| Asus ROG Zephyrus G16 GA605WV | |
| Average of class Gaming (7.7 - 44.3, n=142, last 2 years) | |
| Average AMD Ryzen AI 9 HX 370 (20.3 - 28.7, n=18) | |
| Lenovo Yoga Pro 9 16IMH9 | |
| Asus ROG Zephyrus G16 GU605MY | |
| Alienware x16 R2 P120F | |
| LibreOffice / 20 Documents To PDF | |
| Asus ROG Zephyrus G16 GA605WV | |
| Average AMD Ryzen AI 9 HX 370 (46.8 - 66.6, n=18) | |
| Lenovo Legion 9 16IRX9, RTX 4090 | |
| Razer Blade 16 2024, RTX 4090 | |
| Average of class Gaming (19 - 96.6, n=140, last 2 years) | |
| Razer Blade 16 2025 RTX 5090 | |
| Alienware x16 R2 P120F | |
| Asus ROG Zephyrus G16 GU605MY | |
| Lenovo Yoga Pro 9 16IMH9 | |
| SCHENKER XMG Neo 16 (Early 24) | |
| R Benchmark 2.5 / Overall mean | |
| Alienware x16 R2 P120F | |
| Lenovo Legion 9 16IRX9, RTX 4090 | |
| Lenovo Yoga Pro 9 16IMH9 | |
| Asus ROG Zephyrus G16 GU605MY | |
| Average of class Gaming (0.3551 - 0.759, n=143, last 2 years) | |
| Average AMD Ryzen AI 9 HX 370 (0.3892 - 0.529, n=18) | |
| Asus ROG Zephyrus G16 GA605WV | |
| Razer Blade 16 2025 RTX 5090 | |
| Razer Blade 16 2024, RTX 4090 | |
| SCHENKER XMG Neo 16 (Early 24) | |
* ... smaller is better
AIDA64: FP32 Ray-Trace | FPU Julia | CPU SHA3 | CPU Queen | FPU SinJulia | FPU Mandel | CPU AES | CPU ZLib | FP64 Ray-Trace | CPU PhotoWorxx
| Performance Rating | |
| SCHENKER XMG Neo 16 (Early 24) | |
| Lenovo Legion 9 16IRX9, RTX 4090 | |
| Razer Blade 16 2025 RTX 5090 | |
| Razer Blade 16 2024, RTX 4090 | |
| Average AMD Ryzen AI 9 HX 370 | |
| Average of class Gaming | |
| Alienware x16 R2 P120F | |
| Asus ROG Zephyrus G16 GU605MY | |
| AIDA64 / FP32 Ray-Trace | |
| Razer Blade 16 2025 RTX 5090 | |
| Average AMD Ryzen AI 9 HX 370 (24673 - 37804, n=17) | |
| SCHENKER XMG Neo 16 (Early 24) | |
| Lenovo Legion 9 16IRX9, RTX 4090 | |
| Average of class Gaming (7192 - 85542, n=141, last 2 years) | |
| Razer Blade 16 2024, RTX 4090 | |
| Alienware x16 R2 P120F | |
| Asus ROG Zephyrus G16 GU605MY | |
| AIDA64 / FPU Julia | |
| SCHENKER XMG Neo 16 (Early 24) | |
| Razer Blade 16 2025 RTX 5090 | |
| Lenovo Legion 9 16IRX9, RTX 4090 | |
| Average AMD Ryzen AI 9 HX 370 (95655 - 147937, n=18) | |
| Razer Blade 16 2024, RTX 4090 | |
| Average of class Gaming (35040 - 252486, n=141, last 2 years) | |
| Alienware x16 R2 P120F | |
| Asus ROG Zephyrus G16 GU605MY | |
| AIDA64 / CPU SHA3 | |
| SCHENKER XMG Neo 16 (Early 24) | |
| Lenovo Legion 9 16IRX9, RTX 4090 | |
| Razer Blade 16 2024, RTX 4090 | |
| Razer Blade 16 2025 RTX 5090 | |
| Average of class Gaming (1728 - 10389, n=141, last 2 years) | |
| Average AMD Ryzen AI 9 HX 370 (4421 - 5926, n=18) | |
| Alienware x16 R2 P120F | |
| Asus ROG Zephyrus G16 GU605MY | |
| AIDA64 / CPU Queen | |
| SCHENKER XMG Neo 16 (Early 24) | |
| Razer Blade 16 2024, RTX 4090 | |
| Lenovo Legion 9 16IRX9, RTX 4090 | |
| Average of class Gaming (50699 - 200651, n=141, last 2 years) | |
| Alienware x16 R2 P120F | |
| Asus ROG Zephyrus G16 GU605MY | |
| Razer Blade 16 2025 RTX 5090 | |
| Average AMD Ryzen AI 9 HX 370 (41744 - 99088, n=18) | |
| AIDA64 / FPU SinJulia | |
| Razer Blade 16 2025 RTX 5090 | |
| Average AMD Ryzen AI 9 HX 370 (16445 - 19115, n=18) | |
| SCHENKER XMG Neo 16 (Early 24) | |
| Lenovo Legion 9 16IRX9, RTX 4090 | |
| Razer Blade 16 2024, RTX 4090 | |
| Average of class Gaming (5020 - 33636, n=141, last 2 years) | |
| Alienware x16 R2 P120F | |
| Asus ROG Zephyrus G16 GU605MY | |
| AIDA64 / FPU Mandel | |
| SCHENKER XMG Neo 16 (Early 24) | |
| Razer Blade 16 2025 RTX 5090 | |
| Average AMD Ryzen AI 9 HX 370 (50357 - 93798, n=17) | |
| Lenovo Legion 9 16IRX9, RTX 4090 | |
| Razer Blade 16 2024, RTX 4090 | |
| Average of class Gaming (17585 - 134044, n=141, last 2 years) | |
| Alienware x16 R2 P120F | |
| Asus ROG Zephyrus G16 GU605MY | |
| AIDA64 / CPU AES | |
| SCHENKER XMG Neo 16 (Early 24) | |
| Lenovo Legion 9 16IRX9, RTX 4090 | |
| Razer Blade 16 2024, RTX 4090 | |
| Average of class Gaming (19065 - 328679, n=141, last 2 years) | |
| Alienware x16 R2 P120F | |
| Asus ROG Zephyrus G16 GU605MY | |
| Average AMD Ryzen AI 9 HX 370 (67015 - 118806, n=18) | |
| Razer Blade 16 2025 RTX 5090 | |
| AIDA64 / CPU ZLib | |
| SCHENKER XMG Neo 16 (Early 24) | |
| Lenovo Legion 9 16IRX9, RTX 4090 | |
| Razer Blade 16 2024, RTX 4090 | |
| Razer Blade 16 2025 RTX 5090 | |
| Average of class Gaming (373 - 2531, n=141, last 2 years) | |
| Average AMD Ryzen AI 9 HX 370 (1077 - 1530, n=18) | |
| Alienware x16 R2 P120F | |
| Asus ROG Zephyrus G16 GU605MY | |
| AIDA64 / FP64 Ray-Trace | |
| Razer Blade 16 2025 RTX 5090 | |
| Average AMD Ryzen AI 9 HX 370 (13665 - 20648, n=18) | |
| SCHENKER XMG Neo 16 (Early 24) | |
| Lenovo Legion 9 16IRX9, RTX 4090 | |
| Average of class Gaming (3856 - 45446, n=141, last 2 years) | |
| Razer Blade 16 2024, RTX 4090 | |
| Alienware x16 R2 P120F | |
| Asus ROG Zephyrus G16 GU605MY | |
| AIDA64 / CPU PhotoWorxx | |
| Lenovo Legion 9 16IRX9, RTX 4090 | |
| Alienware x16 R2 P120F | |
| Asus ROG Zephyrus G16 GU605MY | |
| Razer Blade 16 2025 RTX 5090 | |
| Razer Blade 16 2024, RTX 4090 | |
| SCHENKER XMG Neo 16 (Early 24) | |
| Average AMD Ryzen AI 9 HX 370 (36752 - 51727, n=18) | |
| Average of class Gaming (10805 - 62916, n=141, last 2 years) | |
System Performance
As expected, the new Blade 16 is an extremely fast laptop that also performs very well in the synthetic benchmarks. We did not run into any problems during our testing. Only the Advanced Optimus graphics switching led to some slight delays, for example when starting a game.
CrossMark: Overall | Productivity | Creativity | Responsiveness
WebXPRT 3: Overall
WebXPRT 4: Overall
Mozilla Kraken 1.1: Total
| PCMark 10 / Score | |
| SCHENKER XMG Neo 16 (Early 24) | |
| Razer Blade 16 2024, RTX 4090 | |
| Razer Blade 16 2025 RTX 5090 | |
| Average AMD Ryzen AI 9 HX 370, Nvidia GeForce RTX 5090 Laptop (n=1) | |
| Lenovo Legion 9 16IRX9, RTX 4090 | |
| Average of class Gaming (5776 - 9852, n=128, last 2 years) | |
| Asus ROG Zephyrus G16 GU605MY | |
| Alienware x16 R2 P120F | |
| PCMark 10 / Essentials | |
| SCHENKER XMG Neo 16 (Early 24) | |
| Lenovo Legion 9 16IRX9, RTX 4090 | |
| Razer Blade 16 2024, RTX 4090 | |
| Asus ROG Zephyrus G16 GU605MY | |
| Average of class Gaming (9057 - 12600, n=128, last 2 years) | |
| Razer Blade 16 2025 RTX 5090 | |
| Average AMD Ryzen AI 9 HX 370, Nvidia GeForce RTX 5090 Laptop (n=1) | |
| Alienware x16 R2 P120F | |
| PCMark 10 / Productivity | |
| SCHENKER XMG Neo 16 (Early 24) | |
| Razer Blade 16 2024, RTX 4090 | |
| Razer Blade 16 2025 RTX 5090 | |
| Average AMD Ryzen AI 9 HX 370, Nvidia GeForce RTX 5090 Laptop (n=1) | |
| Lenovo Legion 9 16IRX9, RTX 4090 | |
| Asus ROG Zephyrus G16 GU605MY | |
| Average of class Gaming (6662 - 14612, n=128, last 2 years) | |
| Alienware x16 R2 P120F | |
| PCMark 10 / Digital Content Creation | |
| SCHENKER XMG Neo 16 (Early 24) | |
| Razer Blade 16 2025 RTX 5090 | |
| Average AMD Ryzen AI 9 HX 370, Nvidia GeForce RTX 5090 Laptop (n=1) | |
| Lenovo Legion 9 16IRX9, RTX 4090 | |
| Average of class Gaming (7440 - 19351, n=128, last 2 years) | |
| Razer Blade 16 2024, RTX 4090 | |
| Alienware x16 R2 P120F | |
| Asus ROG Zephyrus G16 GU605MY | |
| CrossMark / Productivity | |
| SCHENKER XMG Neo 16 (Early 24) | |
| Apple MacBook Pro 16 M4 Max | |
| Razer Blade 16 2024, RTX 4090 | |
| Average of class Gaming (1299 - 2211, n=110, last 2 years) | |
| Lenovo Legion 9 16IRX9, RTX 4090 | |
| Asus ROG Zephyrus G16 GU605MY | |
| Alienware x16 R2 P120F | |
| CrossMark / Responsiveness | |
| SCHENKER XMG Neo 16 (Early 24) | |
| Razer Blade 16 2024, RTX 4090 | |
| Lenovo Legion 9 16IRX9, RTX 4090 | |
| Average of class Gaming (1030 - 2330, n=110, last 2 years) | |
| Alienware x16 R2 P120F | |
| Apple MacBook Pro 16 M4 Max | |
| Asus ROG Zephyrus G16 GU605MY | |
| WebXPRT 3 / Overall | |
| Apple MacBook Pro 16 M4 Max | |
| SCHENKER XMG Neo 16 (Early 24) | |
| Razer Blade 16 2024, RTX 4090 | |
| Razer Blade 16 2025 RTX 5090 | |
| Average AMD Ryzen AI 9 HX 370, Nvidia GeForce RTX 5090 Laptop (n=1) | |
| Average of class Gaming (237 - 532, n=122, last 2 years) | |
| Asus ROG Zephyrus G16 GU605MY | |
| Lenovo Legion 9 16IRX9, RTX 4090 | |
| Alienware x16 R2 P120F | |
| WebXPRT 4 / Overall | |
| Apple MacBook Pro 16 M4 Max | |
| SCHENKER XMG Neo 16 (Early 24) | |
| Average of class Gaming (176.4 - 341, n=109, last 2 years) | |
| Asus ROG Zephyrus G16 GU605MY | |
| Razer Blade 16 2025 RTX 5090 | |
| Average AMD Ryzen AI 9 HX 370, Nvidia GeForce RTX 5090 Laptop (n=1) | |
| Lenovo Legion 9 16IRX9, RTX 4090 | |
| Alienware x16 R2 P120F | |
| Mozilla Kraken 1.1 / Total | |
| Alienware x16 R2 P120F | |
| Lenovo Legion 9 16IRX9, RTX 4090 | |
| Asus ROG Zephyrus G16 GU605MY | |
| Average of class Gaming (397 - 674, n=132, last 2 years) | |
| Razer Blade 16 2024, RTX 4090 | |
| Razer Blade 16 2025 RTX 5090 | |
| Average AMD Ryzen AI 9 HX 370, Nvidia GeForce RTX 5090 Laptop (n=1) | |
| SCHENKER XMG Neo 16 (Early 24) | |
| Apple MacBook Pro 16 M4 Max | |
* ... smaller is better
| PCMark 10 Score | 8254 points | |
Help | ||
| AIDA64 / Memory Copy | |
| Asus ROG Zephyrus G16 GU605MY | |
| Razer Blade 16 2025 RTX 5090 | |
| Alienware x16 R2 P120F | |
| Average AMD Ryzen AI 9 HX 370 (72702 - 93640, n=18) | |
| Lenovo Legion 9 16IRX9, RTX 4090 | |
| SCHENKER XMG Neo 16 (Early 24) | |
| Razer Blade 16 2024, RTX 4090 | |
| Average of class Gaming (21750 - 97515, n=141, last 2 years) | |
| AIDA64 / Memory Read | |
| Razer Blade 16 2025 RTX 5090 | |
| Average AMD Ryzen AI 9 HX 370 (84635 - 102937, n=18) | |
| SCHENKER XMG Neo 16 (Early 24) | |
| Razer Blade 16 2024, RTX 4090 | |
| Asus ROG Zephyrus G16 GU605MY | |
| Alienware x16 R2 P120F | |
| Lenovo Legion 9 16IRX9, RTX 4090 | |
| Average of class Gaming (22956 - 104349, n=141, last 2 years) | |
| AIDA64 / Memory Write | |
| Razer Blade 16 2025 RTX 5090 | |
| Average AMD Ryzen AI 9 HX 370 (83907 - 108954, n=18) | |
| Lenovo Legion 9 16IRX9, RTX 4090 | |
| SCHENKER XMG Neo 16 (Early 24) | |
| Asus ROG Zephyrus G16 GU605MY | |
| Razer Blade 16 2024, RTX 4090 | |
| Alienware x16 R2 P120F | |
| Average of class Gaming (22297 - 133486, n=141, last 2 years) | |
| AIDA64 / Memory Latency | |
| Alienware x16 R2 P120F | |
| Asus ROG Zephyrus G16 GU605MY | |
| Average AMD Ryzen AI 9 HX 370 (87.2 - 119.4, n=18) | |
| Razer Blade 16 2025 RTX 5090 | |
| Average of class Gaming (59.5 - 259, n=141, last 2 years) | |
| Lenovo Legion 9 16IRX9, RTX 4090 | |
| Razer Blade 16 2024, RTX 4090 | |
| SCHENKER XMG Neo 16 (Early 24) | |
* ... smaller is better
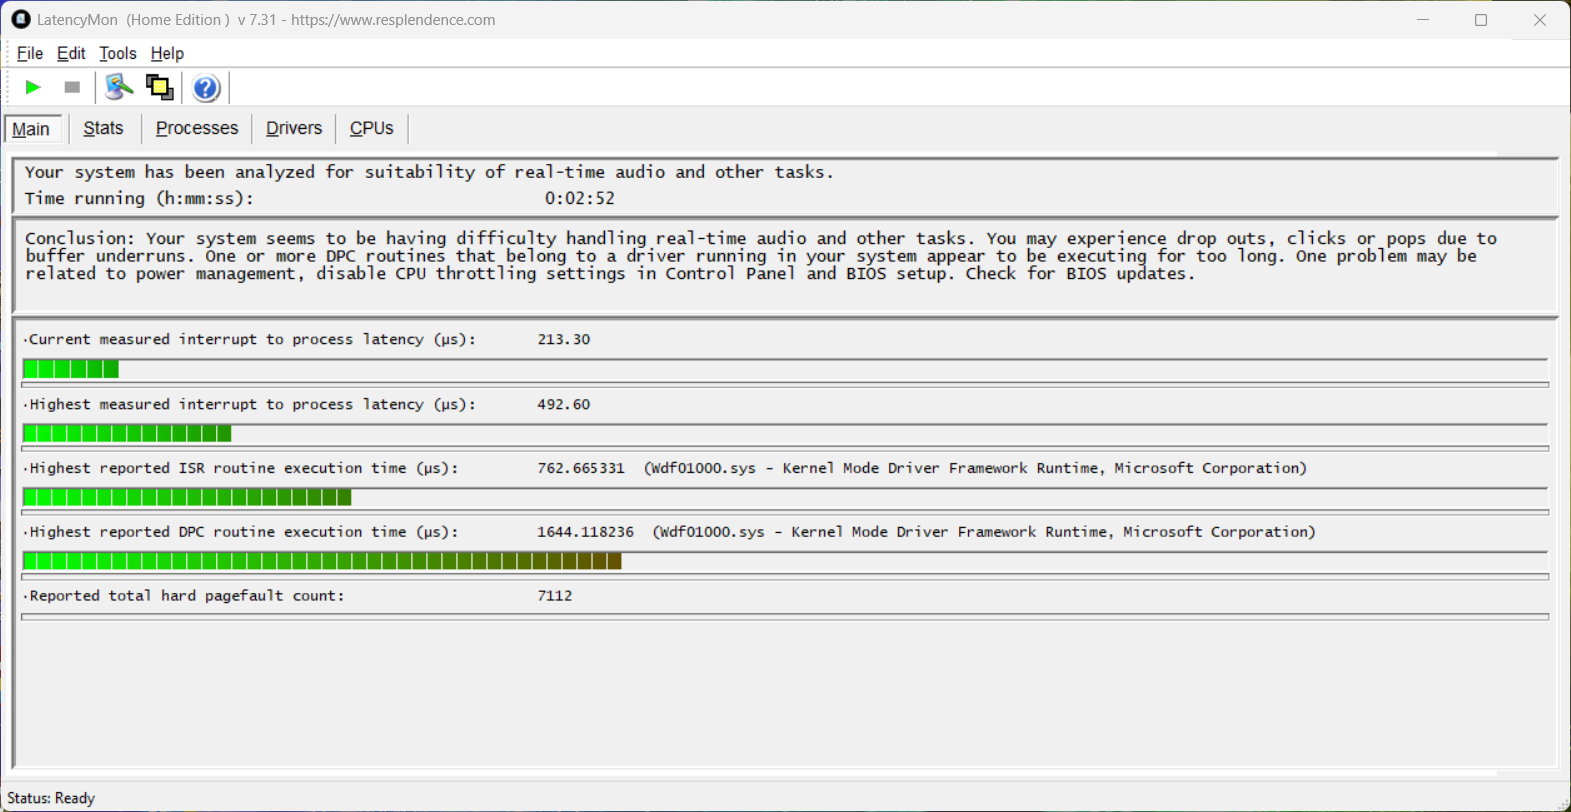
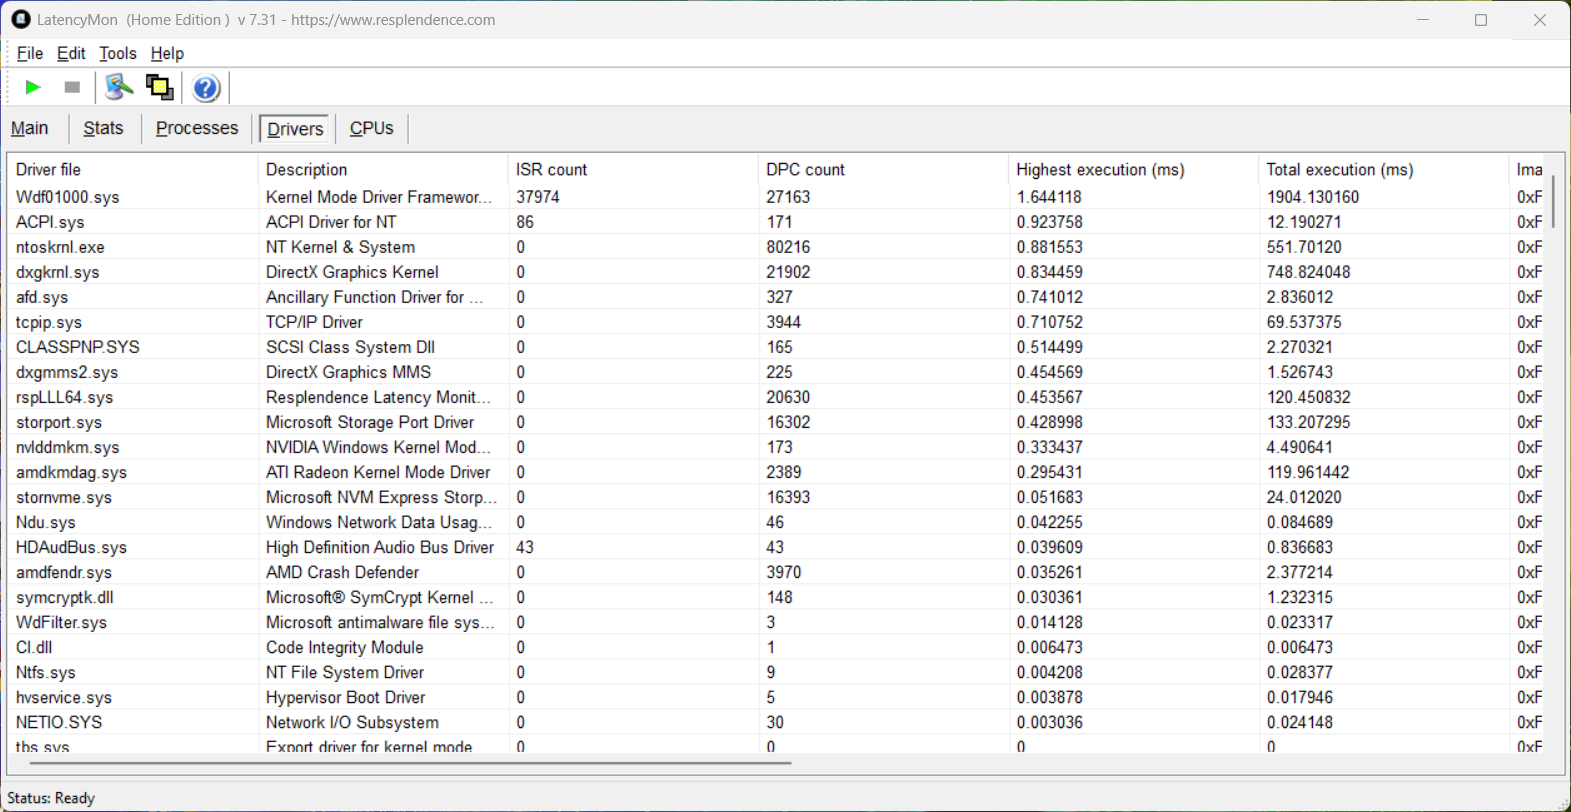
DPC Latencies
In our standardized latency test (surfing the Internet, 4K YouTube video, CPU load), the Razer laptop with the current BIOS version doesn't show any limitations. Even though one driver gives some indications, the important "interrupt-to-process-latency" value is low.
| DPC Latencies / LatencyMon - interrupt to process latency (max), Web, Youtube, Prime95 | |
| Alienware x16 R2 P120F | |
| Asus ROG Zephyrus G16 GU605MY | |
| SCHENKER XMG Neo 16 (Early 24) | |
| Lenovo Legion 9 16IRX9, RTX 4090 | |
| Razer Blade 16 2024, RTX 4090 | |
| Razer Blade 16 2025 RTX 5090 | |
* ... smaller is better
Storage Solution
Our test unit uses the 2-TB version of the well-known SSSTC CA6, which reaches very good transfer rates and maintains its constantly fast speed even under longer load.

* ... smaller is better
Disk Throttling: DiskSpd Read Loop, Queue Depth 8
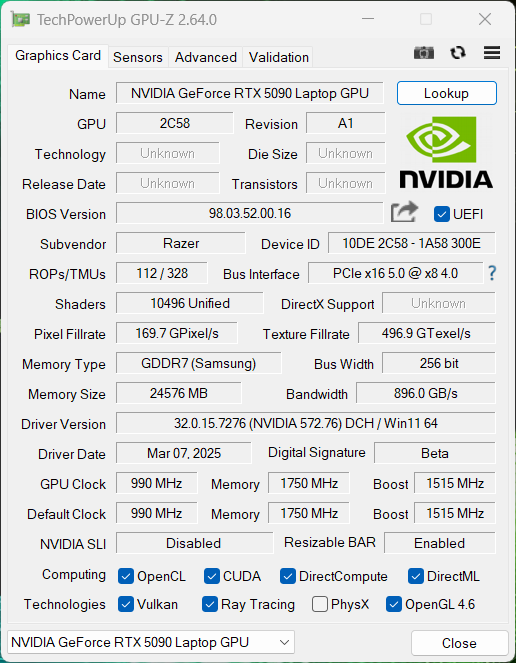
Graphics Card
Our test unit of the Blade 16 2025 is equipped with the new Nvidia GeForce RTX 5090 Laptop with 24 GB of VRAM (GDDR7). The graphics switching occurs via Advanced Optimus and the maximum TGP is 160 watts (135 + max. 25 watts Dynamic Boost). You can find additional technical details including efficiency comparisons in our GPU analysis.
The synthetic benchmarks show a slightly mixed picture: The old Blade 16 is surpassed in all the tests, with the RTX 5090 Laptop being ahead between 7 and 20% depending on the test, while the RTX 4090 Laptop in the XMG Neo 16 at times performs at the same level. In the creator benchmarks (PugetBench), the 5090 Laptop doesn't really have any advantage compared to the old RTX 4090 Laptop, but the additional 8 GB of VRAM represent a clear advantage when cutting videos. In the Procyon AI test, the 5090 Laptop is ahead by about 15-17%. The GPU performance remains stable under constant load.
| GFXBench | |
| 3840x2160 4K Aztec Ruins High Tier Offscreen | |
| Average Nvidia GeForce RTX 5090 Laptop (243 - 267, n=2) | |
| Razer Blade 16 2025 RTX 5090 | |
| Apple MacBook Pro 16 M4 Max | |
| Average of class Gaming (47.1 - 243, n=7, last 2 years) | |
| Razer Blade 17 Early 2022 | |
| 2560x1440 Aztec Ruins High Tier Offscreen | |
| Apple MacBook Pro 16 M4 Max | |
| Average Nvidia GeForce RTX 5090 Laptop (466 - 557, n=2) | |
| Razer Blade 16 2025 RTX 5090 | |
| Average of class Gaming (109 - 518, n=7, last 2 years) | |
| Razer Blade 17 Early 2022 | |
| 3DMark 06 Standard Score | 64778 points | |
| 3DMark Vantage P Result | 111238 points | |
| 3DMark 11 Performance | 45291 points | |
| 3DMark Fire Strike Score | 37321 points | |
| 3DMark Time Spy Score | 18898 points | |
| 3DMark Steel Nomad Score | 5652 points | |
| 3DMark Steel Nomad Light Score | 22897 points | |
| 3DMark Steel Nomad Light Unlimited Score | 25160 points | |
Help | ||
| Blender / v3.3 Classroom OPTIX/RTX | |
| Average of class Gaming (9 - 95, n=136, last 2 years) | |
| Alienware x16 R2 P120F | |
| Asus ROG Zephyrus G16 GU605MY | |
| Lenovo Legion 9 16IRX9, RTX 4090 | |
| SCHENKER XMG Neo 16 (Early 24) | |
| Razer Blade 16 2025 RTX 5090 | |
| Razer Blade 16 2024, RTX 4090 | |
| Average Nvidia GeForce RTX 5090 Laptop (9 - 18, n=14) | |
| Blender / v3.3 Classroom CUDA | |
| Average of class Gaming (15 - 110, n=136, last 2 years) | |
| Alienware x16 R2 P120F | |
| Asus ROG Zephyrus G16 GU605MY | |
| Razer Blade 16 2025 RTX 5090 | |
| Average Nvidia GeForce RTX 5090 Laptop (15 - 37, n=12) | |
| Razer Blade 16 2024, RTX 4090 | |
| Lenovo Legion 9 16IRX9, RTX 4090 | |
| SCHENKER XMG Neo 16 (Early 24) | |
| Blender / v3.3 Classroom CPU | |
| Asus ROG Zephyrus G16 GU605MY | |
| Alienware x16 R2 P120F | |
| Average of class Gaming (122 - 962, n=142, last 2 years) | |
| Razer Blade 16 2025 RTX 5090 | |
| Razer Blade 16 2024, RTX 4090 | |
| Lenovo Legion 9 16IRX9, RTX 4090 | |
| SCHENKER XMG Neo 16 (Early 24) | |
| Apple MacBook Pro 16 M4 Max | |
| Average Nvidia GeForce RTX 5090 Laptop (123 - 259, n=14) | |
| Blender / v3.3 Classroom METAL | |
| Apple MacBook Pro 16 M4 Max | |
| Blender / v4.3 Barbershop OPTIX | |
| Average Nvidia GeForce RTX 5090 Laptop (46 - 286, n=6) | |
| Average of class Gaming (46 - 171, n=12, last 2 years) | |
| Razer Blade 16 2025 RTX 5090 | |
* ... smaller is better
| DaVinci Resolve PugetBench | |
| Standard Score 1.1 | |
| Razer Blade 16 2025 RTX 5090 | |
| Extended Score 1.1 | |
| Apple MacBook Pro 16 M4 Max | |
| Razer Blade 16 2025 RTX 5090 | |
| Razer Blade 16 2024, RTX 4090 | |
| Asus ROG Zephyrus G16 GA605WI | |
| Lenovo Yoga Pro 9 16IMH9 | |
| Photoshop PugetBench - Overall Score 1.01 | |
| Apple MacBook Pro 16 M4 Max | |
| Asus ROG Strix Scar 17 G733PYV-LL053X | |
| Razer Blade 16 2025 RTX 5090 | |
| Razer Blade 16 2024, RTX 4090 | |
| Premiere Pro PugetBench - Overall Score 1.1 | |
| Razer Blade 16 2025 RTX 5090 | |
| Apple MacBook Pro 16 M4 Max | |
| Asus ROG Strix Scar 17 G733PYV-LL053X | |
| Razer Blade 16 2024, RTX 4090 | |
| UL Procyon for Windows / | |
| Lenovo Yoga Pro 9 16IMH9 | |
| Asus ROG Zephyrus G16 GA605WI | |
| Alienware m18 R2 | |
| Razer Blade 16 2025 RTX 5090 | |
| UL Procyon for Windows / | |
| Razer Blade 16 2025 RTX 5090 | |
| Alienware m18 R2 | |
| Asus ROG Zephyrus G16 GA605WI | |
| Lenovo Yoga Pro 9 16IMH9 | |
* ... smaller is better
Gaming Performance
We now take a look at the gaming performance, where we distinguish between the native tests and benchmarks with upscaling. In this, the new Multi Frame Generation of the GeForce RTX 5000-series is particularly interesting. In the native tests, you can clearly see that the weaker AMD processor limits the performance in 1080p, which is also the reason why the new Blade 16 does worse than expected here. Starting from the QHD resolution, the behavior changes, and in the 4K resolution the 5090 Laptop has a clear advantage, which even increases as soon as you activate raytracing.
| Cyberpunk 2077 2.2 Phantom Liberty - 1920x1080 Ultra Preset (FSR off) | |
| SCHENKER XMG Neo 16 (Early 24) | |
| Lenovo Legion 9 16IRX9, RTX 4090 | |
| Razer Blade 16 2025 RTX 5090 | |
| Average of class Gaming (6.76 - 166.5, n=123, last 2 years) | |
| Alienware x16 R2 P120F | |
| Razer Blade 16 2024, RTX 4090 | |
| Asus ROG Zephyrus G16 GU605MY | |
| Razer Blade 17 Early 2022 | |
| Apple MacBook Pro 16 M4 Max | |
| GTA V - 1920x1080 Highest Settings possible AA:4xMSAA + FX AF:16x | |
| SCHENKER XMG Neo 16 (Early 24) | |
| Razer Blade 16 2024, RTX 4090 | |
| Lenovo Legion 9 16IRX9, RTX 4090 | |
| Razer Blade 16 2025 RTX 5090 | |
| Average of class Gaming (12.1 - 186.9, n=124, last 2 years) | |
| Asus ROG Zephyrus G16 GU605MY | |
| Razer Blade 17 Early 2022 | |
| GTA V - 2560x1440 Highest Settings possible AA:4xMSAA + FX AF:16x | |
| SCHENKER XMG Neo 16 (Early 24) | |
| Average Nvidia GeForce RTX 5090 Laptop (96.9 - 183.9, n=11) | |
| Lenovo Legion 9 16IRX9, RTX 4090 | |
| Razer Blade 16 2024, RTX 4090 | |
| Razer Blade 16 2025 RTX 5090 | |
| Average of class Gaming (36.9 - 183.9, n=89, last 2 years) | |
| Asus ROG Zephyrus G16 GU605MY | |
| Razer Blade 17 Early 2022 | |
| Assassin's Creed Shadows - 2560x1440 Ultra High | |
| Average Nvidia GeForce RTX 5090 Laptop (37 - 64, n=13) | |
| Razer Blade 16 2024, RTX 4090 | |
| Razer Blade 16 2025 RTX 5090 | |
| Average of class Gaming (25 - 64, n=30, last 2 years) | |
| Monster Hunter Wilds - 2560x1440 ultra, RT: high, no upscaling | |
| Average Nvidia GeForce RTX 5090 Laptop (54 - 80.5, n=10) | |
| Average of class Gaming (54 - 80.5, n=17, last 2 years) | |
| Razer Blade 16 2025 RTX 5090 | |
| Razer Blade 16 2024, RTX 4090 | |
| Black Myth: Wukong - 2560x1440 cinematic TSR 100 | |
| Average Nvidia GeForce RTX 5090 Laptop (44 - 50, n=4) | |
| Razer Blade 16 2025 RTX 5090 | |
| Average of class Gaming (19 - 50, n=13, last 2 years) | |
| Razer Blade 16 2024, RTX 4090 | |
| Asus ROG Zephyrus G16 GU605MY | |
| Indiana Jones and the Great Circle - 2560x1440 Very Ultra Preset | |
| Average Nvidia GeForce RTX 5090 Laptop (66.1 - 115.9, n=14) | |
| Razer Blade 16 2025 RTX 5090 | |
| Razer Blade 16 2024, RTX 4090 | |
| Average of class Gaming (9.43 - 115.9, n=26, last 2 years) | |
| Cyberpunk 2077 2.2 Phantom Liberty - 3840x2160 Ultra Preset (FSR off) | |
| Average Nvidia GeForce RTX 5090 Laptop (39.6 - 55, n=12) | |
| Razer Blade 16 2025 RTX 5090 | |
| Razer Blade 16 2024, RTX 4090 | |
| Average of class Gaming (13.8 - 55, n=39, last 2 years) | |
| Asus ROG Zephyrus G16 GU605MY | |
| Alienware x16 R2 P120F | |
| Razer Blade 17 Early 2022 | |
| GTA V - 3840x2160 Highest Settings possible AA:4xMSAA + FX AF:16x | |
| Average Nvidia GeForce RTX 5090 Laptop (84.4 - 116.7, n=6) | |
| Razer Blade 16 2025 RTX 5090 | |
| Razer Blade 16 2024, RTX 4090 | |
| Lenovo Legion 9 16IRX9, RTX 4090 | |
| Average of class Gaming (33.6 - 116.7, n=26, last 2 years) | |
| Asus ROG Zephyrus G16 GU605MY | |
| Razer Blade 17 Early 2022 | |
| Final Fantasy XV Benchmark - 3840x2160 High Quality | |
| Average Nvidia GeForce RTX 5090 Laptop (96.8 - 109.4, n=9) | |
| Razer Blade 16 2025 RTX 5090 | |
| Average of class Gaming (32.6 - 109.4, n=39, last 2 years) | |
| Alienware x16 R2 P120F | |
| Asus ROG Zephyrus G16 GU605MY | |
| Razer Blade 17 Early 2022 | |
| Assassin's Creed Shadows - 3840x2160 Ultra High | |
| Average Nvidia GeForce RTX 5090 Laptop (35 - 46, n=10) | |
| Average of class Gaming (18 - 46, n=17, last 2 years) | |
| Razer Blade 16 2025 RTX 5090 | |
| Razer Blade 16 2024, RTX 4090 | |
| Monster Hunter Wilds - 3840x2160 ultra, RT: high, no upscaling | |
| Average Nvidia GeForce RTX 5090 Laptop (33.4 - 50.8, n=10) | |
| Razer Blade 16 2025 RTX 5090 | |
| Average of class Gaming (33.4 - 50.8, n=17, last 2 years) | |
| Razer Blade 16 2024, RTX 4090 | |
| Alan Wake 2 - 3840x2160 High Preset | |
| Average Nvidia GeForce RTX 5090 Laptop (33.4 - 49.6, n=11) | |
| Razer Blade 16 2025 RTX 5090 | |
| Razer Blade 16 2024, RTX 4090 | |
| Average of class Gaming (12.3 - 49.6, n=22, last 2 years) | |
| F1 24 - 3840x2160 Ultra High Preset AA:T AF:16x | |
| Average Nvidia GeForce RTX 5090 Laptop (48.8 - 54.2, n=10) | |
| Razer Blade 16 2025 RTX 5090 | |
| Average of class Gaming (15.5 - 52.3, n=17, last 2 years) | |
| Asus ROG Zephyrus G16 GU605MY | |
| Black Myth: Wukong - 3840x2160 cinematic TSR 100 | |
| Average Nvidia GeForce RTX 5090 Laptop (27 - 33, n=4) | |
| Razer Blade 16 2025 RTX 5090 | |
| Average of class Gaming (12.6 - 33, n=12, last 2 years) | |
| Razer Blade 16 2024, RTX 4090 | |
| Indiana Jones and the Great Circle - 3840x2160 Very Ultra Preset | |
| Average Nvidia GeForce RTX 5090 Laptop (48.2 - 73, n=11) | |
| Razer Blade 16 2025 RTX 5090 | |
| Average of class Gaming (43.1 - 73, n=17, last 2 years) | |
| Razer Blade 16 2024, RTX 4090 | |
Cyberpunk 2077 Ultra FPS Chart
The main feature of the new GeForce 50xx generation is Multi Frame Generation. In our test with Cyberpunk 2077, we see massive performance jumps, particularly in MFG(x4). But you have to be careful, since the impression can change while gaming and also depends a bit on the native performance. In the WQHD resolution, for example, MFG(x4) worked very well, but in 4K resolution on an external monitor, the image looked slightly blurry with fast movements.
| Resolution | Preset | Native | DLSS (Auto) | DLSS (Auto) + FG (x2) | DLSS (Auto) + FG (x4) |
|---|---|---|---|---|---|
| QHD | Ultra | 98.6 FPS | 104.3 FPS | 189.9 FPS | 321.2 FPS |
| QHD | RT Overdrive | 26.8 FPS | 58.4 FPS | 99.1 FPS | 185.1 FPS |
| 4K | Ultra | 50.7 FPS | 84.5 FPS | 130.9 FPS | 219.9 FPS |
| 4K | RT Overdrive | 12.6 FPS | 43.2 FPS | 69.2 FPS | 121.5 FPS |
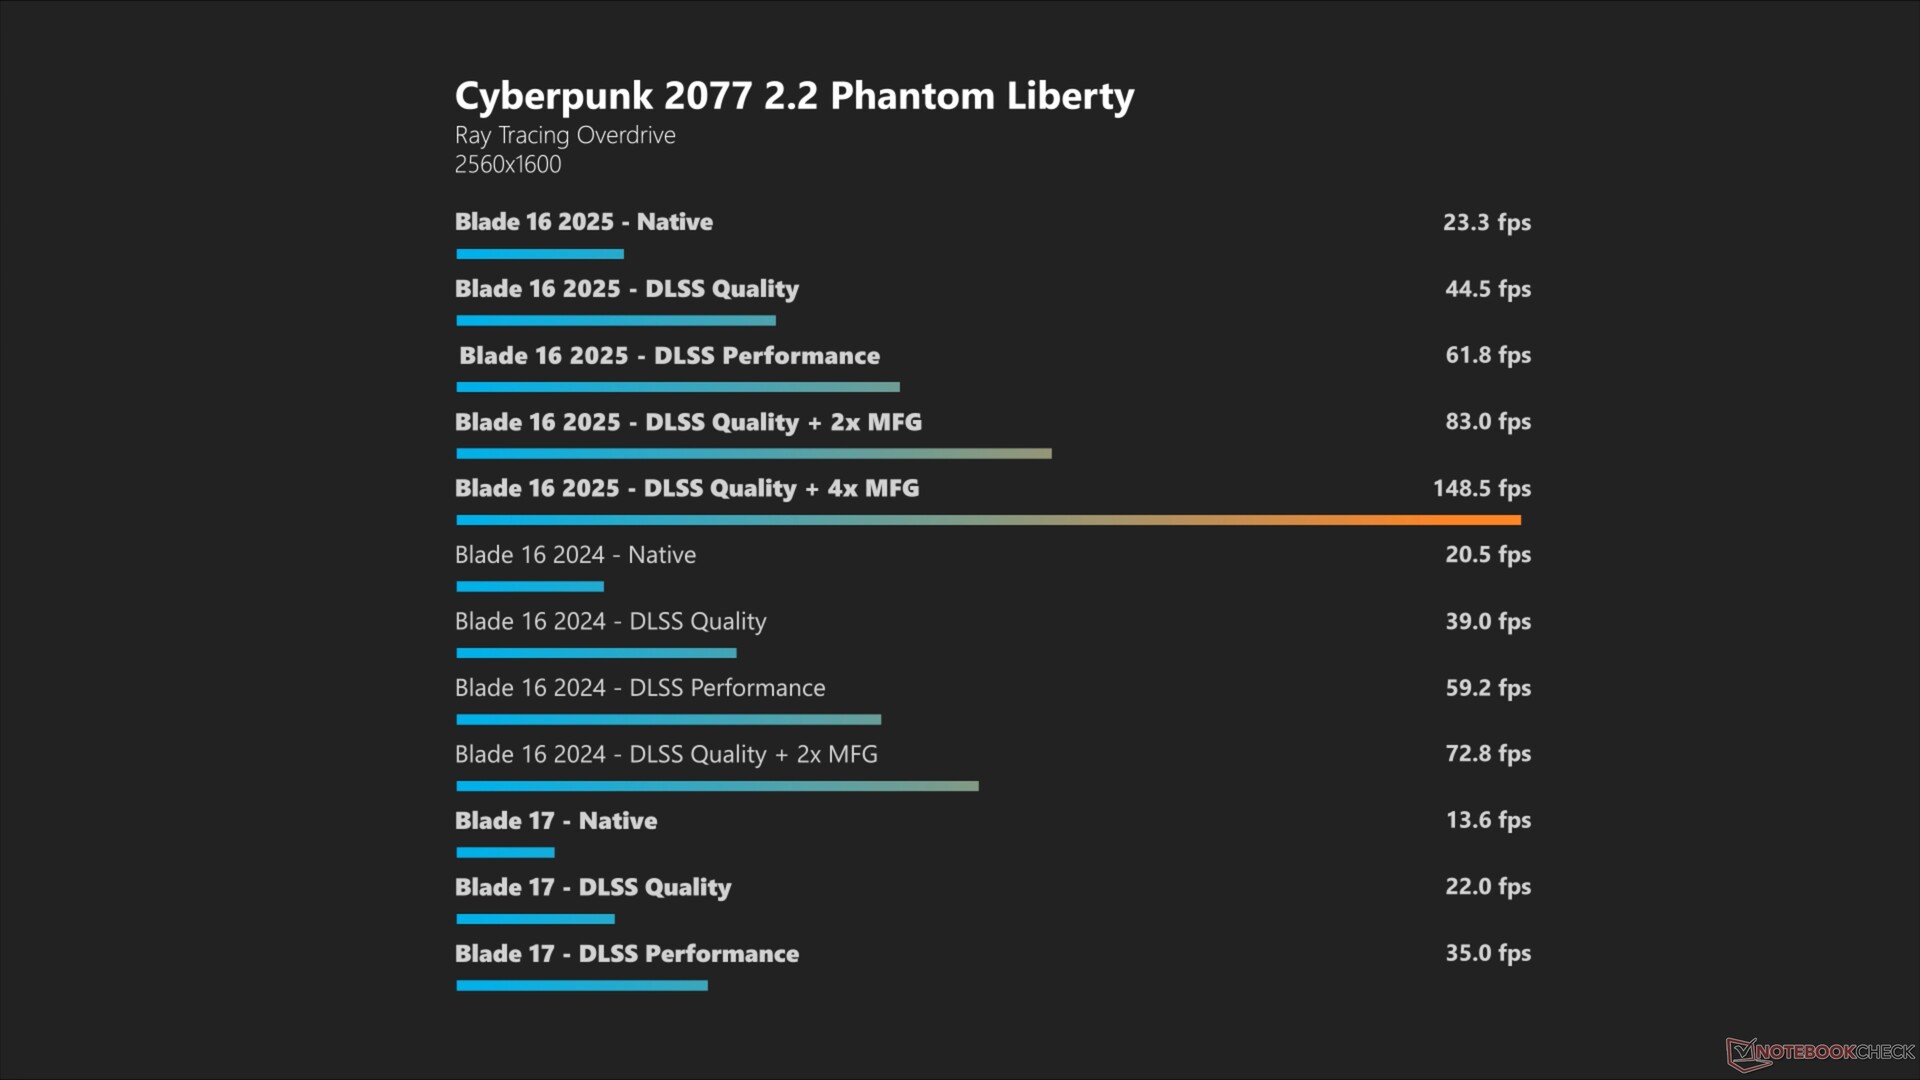
Using the two games Cyberpunk 2077 and Alan Wake 2, we also compared the gaming performances of the RTX 5090 Laptop, RTX 4090 Laptop (Blade 16 2024), and RTX 3080 Ti Laptop (Blade 17) with each other when all the available upscaling technologies are combined with the maximum settings. Here you can see very clearly that the new 5090 Laptop has a clear advantage compared to the RTX 4090 Laptop thanks to MFG(x4). But in the other settings, the advantage isn't clear enough to justify a new purchase. On the other hand, the advantage compared to the RTX 3080 Ti Laptop is enormous.

| low | med. | high | ultra | QHD DLSS | QHD | 4K DLSS | 4K | |
|---|---|---|---|---|---|---|---|---|
| GTA V (2015) | 121.6 | 121.4 | 150.7 | |||||
| The Witcher 3 (2015) | 192 | 151 | 129 | |||||
| Dota 2 Reborn (2015) | 173.9 | 152.7 | 143.3 | 137.1 | 133 | |||
| Final Fantasy XV Benchmark (2018) | 174.7 | 167.8 | 147.4 | 139.5 | 96.8 | |||
| X-Plane 11.11 (2018) | 109.4 | 103.6 | 85.2 | 71.3 | ||||
| Strange Brigade (2018) | 404 | 341 | 322 | 319 | 303 | 174.6 | ||
| Baldur's Gate 3 (2023) | 180 | 175 | 163.5 | 162 | 138.8 | 124.2 | 79.1 | |
| Cyberpunk 2077 2.2 Phantom Liberty (2023) | 125.8 | 115.4 | 117.8 | 105.3 | 104.6 | 98.6 | 72.2 | 50.7 |
| Alan Wake 2 (2023) | 95.2 | 76.7 | 43 | |||||
| F1 24 (2024) | 236 | 236 | 236 | 133 | 130.7 | 94.9 | 80.5 | 48.8 |
| Black Myth: Wukong (2024) | 57 | 64 | 44 | 46 | 27 | |||
| Indiana Jones and the Great Circle (2024) | 119.6 | 113.9 | 97.3 | 62.3 | ||||
| Monster Hunter Wilds (2025) | 68.06 | 68.57 | 65.61 | 57.59 | 44.07 | |||
| Assassin's Creed Shadows (2025) | 64 | 62 | 50 | 47 | 35 |
Emissions - Massive vapor chamber
Noise Emissions
Razer uses two fans and a massive vapor chamber for cooling. Already with very simple tasks, the fans almost always run, producing a slight whir at ~30 dB(A). While gaming, this can get fairly loud at 48 dB(A) and up to 53 dB(A) during the stress test. But to be fair, we also have to mention that the ROG Zephyrus G16 from 2024 gets even louder despite its lower performance while gaming. Our test unit doesn't produce any other electronic noises.
Noise Level
| Idle |
| 24.1 / 30.6 / 30.6 dB(A) |
| Load |
| 45.5 / 53.4 dB(A) |
 | ||
30 dB silent 40 dB(A) audible 50 dB(A) loud |
||
min: | ||
| Razer Blade 16 2025 RTX 5090 GeForce RTX 5090 Laptop, Ryzen AI 9 HX 370, SSSTC CA6-8D2048 | Apple MacBook Pro 16 M4 Max M4 Max 40-Core GPU, M4 Max (16 cores), Apple SSD AP1024Z | SCHENKER XMG Neo 16 (Early 24) NVIDIA GeForce RTX 4090 Laptop GPU, i9-14900HX, Samsung 990 Pro 1 TB | Alienware x16 R2 P120F NVIDIA GeForce RTX 4080 Laptop GPU, Ultra 9 185H, WDC PC SN810 1TB | Lenovo Legion 9 16IRX9, RTX 4090 NVIDIA GeForce RTX 4090 Laptop GPU, i9-14900HX, Micron 3400 2TB MTFDKBA2T0TFH | Asus ROG Zephyrus G16 GU605MY NVIDIA GeForce RTX 4090 Laptop GPU, Ultra 9 185H, Samsung PM9A1a MZVL22T0HDLB | Razer Blade 16 2024, RTX 4090 NVIDIA GeForce RTX 4090 Laptop GPU, i9-14900HX, Samsung PM9A1 MZVL22T0HBLB | |
|---|---|---|---|---|---|---|---|
| Noise | 12% | -6% | 9% | 12% | -2% | 9% | |
| off / environment * | 24.1 | 24.1 -0% | 26 -8% | 23.4 3% | 23 5% | 24.6 -2% | 23 5% |
| Idle Minimum * | 24.1 | 24.1 -0% | 28 -16% | 23.8 1% | 23 5% | 24.6 -2% | 23 5% |
| Idle Average * | 30.6 | 24.1 21% | 29 5% | 28.5 7% | 23 25% | 27.8 9% | 23 25% |
| Idle Maximum * | 30.6 | 24.1 21% | 31 -1% | 28.5 7% | 23 25% | 31.9 -4% | 27.66 10% |
| Load Average * | 45.5 | 42.2 7% | 51 -12% | 28.8 37% | 39 14% | 49.2 -8% | 43.76 4% |
| Cyberpunk 2077 ultra * | 48.2 | 42.2 12% | 52.3 -9% | ||||
| Load Maximum * | 53.4 | 42.2 21% | 56 -5% | 54.2 -1% | 55.56 -4% | 52.3 2% | 50.37 6% |
| Witcher 3 ultra * | 54 | 49.5 | 55.32 | 46.81 |
* ... smaller is better
Temperatures
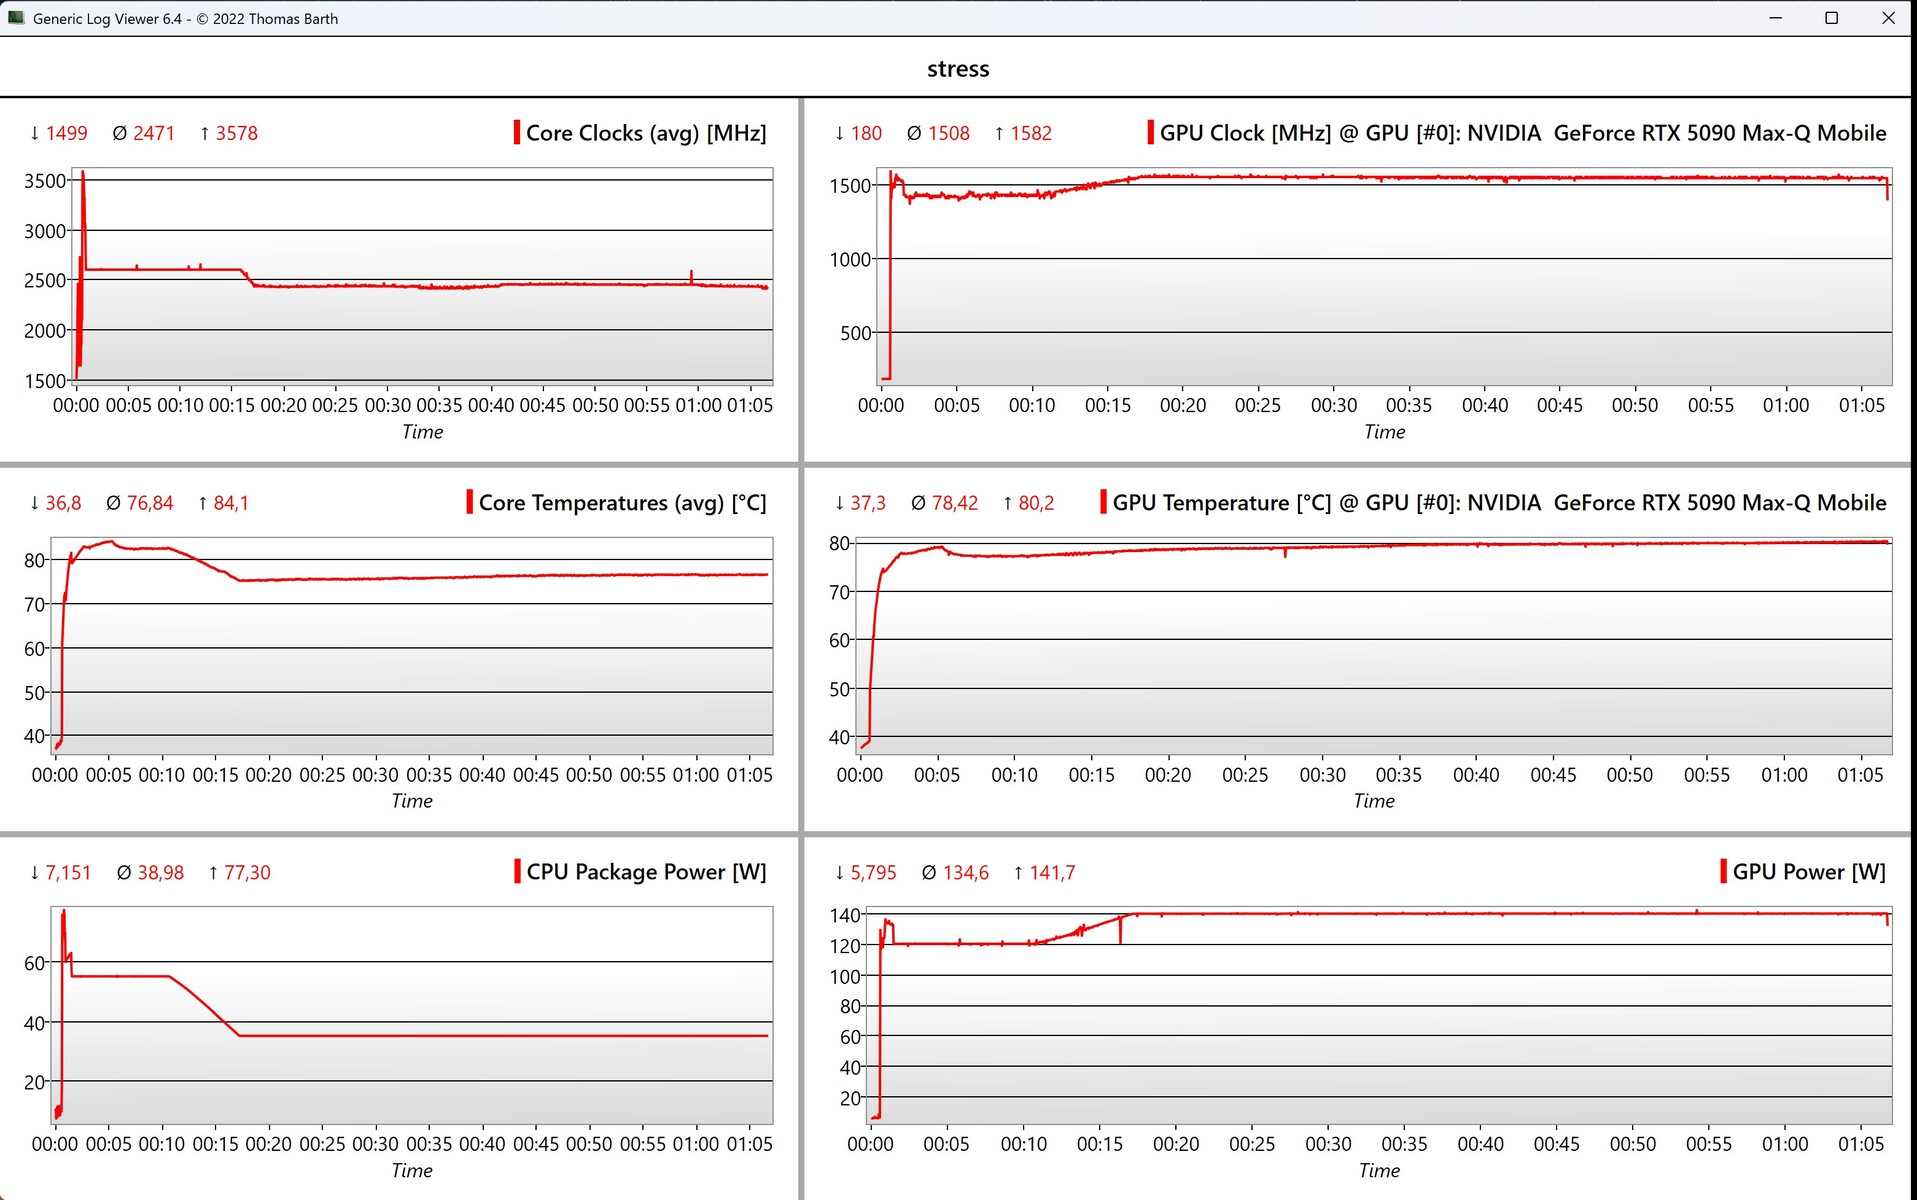
During idle operation, the aluminum case remains very cool, but we measure more than 50 °C (122 °F) at the bottom under load. So you should not place the device on your lap and ensure good ventilation in those conditions. Parts of the keyboard also warm up significantly, even though the WASD area, which is important for gamers, remains comfortably cool. During the stress test, the ratio between CPU and GPU shifts a bit after a while, but the GPU is still clearly preferred overall. At the maximum, the Blade 16 is able to constantly cool almost 180 watts.
(-) The maximum temperature on the upper side is 48.3 °C / 119 F, compared to the average of 40.5 °C / 105 F, ranging from 21.2 to 68.8 °C for the class Gaming.
(-) The bottom heats up to a maximum of 53.3 °C / 128 F, compared to the average of 43.3 °C / 110 F
(+) In idle usage, the average temperature for the upper side is 27 °C / 81 F, compared to the device average of 33.9 °C / 93 F.
(±) 3: The average temperature for the upper side is 37.1 °C / 99 F, compared to the average of 33.9 °C / 93 F for the class Gaming.
(±) The palmrests and touchpad can get very hot to the touch with a maximum of 36.4 °C / 97.5 F.
(-) The average temperature of the palmrest area of similar devices was 28.9 °C / 84 F (-7.5 °C / -13.5 F).


| Razer Blade 16 2025 RTX 5090 AMD Ryzen AI 9 HX 370, Nvidia GeForce RTX 5090 Laptop | Apple MacBook Pro 16 M4 Max Apple M4 Max (16 cores), Apple M4 Max 40-Core GPU | SCHENKER XMG Neo 16 (Early 24) Intel Core i9-14900HX, NVIDIA GeForce RTX 4090 Laptop GPU | Alienware x16 R2 P120F Intel Core Ultra 9 185H, NVIDIA GeForce RTX 4080 Laptop GPU | Lenovo Legion 9 16IRX9, RTX 4090 Intel Core i9-14900HX, NVIDIA GeForce RTX 4090 Laptop GPU | Asus ROG Zephyrus G16 GU605MY Intel Core Ultra 9 185H, NVIDIA GeForce RTX 4090 Laptop GPU | Razer Blade 16 2024, RTX 4090 Intel Core i9-14900HX, NVIDIA GeForce RTX 4090 Laptop GPU | |
|---|---|---|---|---|---|---|---|
| Heat | 18% | 4% | -12% | -20% | 9% | 6% | |
| Maximum Upper Side * | 48.3 | 42.8 11% | 47 3% | 51 -6% | 56 -16% | 45.9 5% | 45 7% |
| Maximum Bottom * | 53.3 | 42.3 21% | 56 -5% | 50.8 5% | 53 1% | 47.5 11% | 45 16% |
| Idle Upper Side * | 28.3 | 23.6 17% | 27 5% | 36.6 -29% | 38 -34% | 26.1 8% | 29 -2% |
| Idle Bottom * | 30.3 | 23.5 22% | 27 11% | 35.2 -16% | 39 -29% | 26.6 12% | 30 1% |
* ... smaller is better
Speakers
The quality of the speakers has suffered a bit under the sliming regimen, with the ROG Zephyrus G16 showing that it is also possible to do better here.
Razer Blade 16 2025 RTX 5090 audio analysis
(+) | speakers can play relatively loud (82.1 dB)
Bass 100 - 315 Hz
(±) | reduced bass - on average 11.8% lower than median
(±) | linearity of bass is average (8.5% delta to prev. frequency)
Mids 400 - 2000 Hz
(±) | higher mids - on average 5.2% higher than median
(+) | mids are linear (5% delta to prev. frequency)
Highs 2 - 16 kHz
(+) | balanced highs - only 4.5% away from median
(+) | highs are linear (4.6% delta to prev. frequency)
Overall 100 - 16.000 Hz
(+) | overall sound is linear (14.3% difference to median)
Compared to same class
» 26% of all tested devices in this class were better, 7% similar, 67% worse
» The best had a delta of 6%, average was 18%, worst was 132%
Compared to all devices tested
» 16% of all tested devices were better, 4% similar, 80% worse
» The best had a delta of 4%, average was 24%, worst was 134%
SCHENKER XMG Neo 16 (Early 24) audio analysis
(+) | speakers can play relatively loud (86 dB)
Bass 100 - 315 Hz
(-) | nearly no bass - on average 16.3% lower than median
(±) | linearity of bass is average (8.6% delta to prev. frequency)
Mids 400 - 2000 Hz
(+) | balanced mids - only 3% away from median
(+) | mids are linear (3.6% delta to prev. frequency)
Highs 2 - 16 kHz
(+) | balanced highs - only 2.5% away from median
(+) | highs are linear (4.9% delta to prev. frequency)
Overall 100 - 16.000 Hz
(+) | overall sound is linear (12.4% difference to median)
Compared to same class
» 14% of all tested devices in this class were better, 3% similar, 82% worse
» The best had a delta of 6%, average was 18%, worst was 132%
Compared to all devices tested
» 10% of all tested devices were better, 2% similar, 88% worse
» The best had a delta of 4%, average was 24%, worst was 134%
Alienware x16 R2 P120F audio analysis
(+) | speakers can play relatively loud (89.9 dB)
Bass 100 - 315 Hz
(±) | reduced bass - on average 7.4% lower than median
(±) | linearity of bass is average (7.6% delta to prev. frequency)
Mids 400 - 2000 Hz
(+) | balanced mids - only 2.6% away from median
(+) | mids are linear (3.6% delta to prev. frequency)
Highs 2 - 16 kHz
(+) | balanced highs - only 3.4% away from median
(+) | highs are linear (2.8% delta to prev. frequency)
Overall 100 - 16.000 Hz
(+) | overall sound is linear (8.2% difference to median)
Compared to same class
» 1% of all tested devices in this class were better, 1% similar, 98% worse
» The best had a delta of 6%, average was 18%, worst was 132%
Compared to all devices tested
» 1% of all tested devices were better, 1% similar, 98% worse
» The best had a delta of 4%, average was 24%, worst was 134%
Lenovo Legion 9 16IRX9, RTX 4090 audio analysis
(±) | speaker loudness is average but good (78.96 dB)
Bass 100 - 315 Hz
(±) | reduced bass - on average 13.2% lower than median
(±) | linearity of bass is average (8.9% delta to prev. frequency)
Mids 400 - 2000 Hz
(+) | balanced mids - only 3.2% away from median
(+) | mids are linear (3.4% delta to prev. frequency)
Highs 2 - 16 kHz
(+) | balanced highs - only 1.8% away from median
(+) | highs are linear (4% delta to prev. frequency)
Overall 100 - 16.000 Hz
(+) | overall sound is linear (11.3% difference to median)
Compared to same class
» 8% of all tested devices in this class were better, 3% similar, 88% worse
» The best had a delta of 6%, average was 18%, worst was 132%
Compared to all devices tested
» 6% of all tested devices were better, 2% similar, 92% worse
» The best had a delta of 4%, average was 24%, worst was 134%
Asus ROG Zephyrus G16 GU605MY audio analysis
(+) | speakers can play relatively loud (83 dB)
Bass 100 - 315 Hz
(+) | good bass - only 3.3% away from median
(±) | linearity of bass is average (7.6% delta to prev. frequency)
Mids 400 - 2000 Hz
(+) | balanced mids - only 3.4% away from median
(+) | mids are linear (3.1% delta to prev. frequency)
Highs 2 - 16 kHz
(+) | balanced highs - only 1.7% away from median
(+) | highs are linear (4.6% delta to prev. frequency)
Overall 100 - 16.000 Hz
(+) | overall sound is linear (6.5% difference to median)
Compared to same class
» 0% of all tested devices in this class were better, 0% similar, 100% worse
» The best had a delta of 6%, average was 18%, worst was 132%
Compared to all devices tested
» 0% of all tested devices were better, 0% similar, 99% worse
» The best had a delta of 4%, average was 24%, worst was 134%
Razer Blade 16 2024, RTX 4090 audio analysis
(±) | speaker loudness is average but good (81.16 dB)
Bass 100 - 315 Hz
(±) | reduced bass - on average 8.2% lower than median
(±) | linearity of bass is average (7.4% delta to prev. frequency)
Mids 400 - 2000 Hz
(+) | balanced mids - only 3.3% away from median
(+) | mids are linear (5.9% delta to prev. frequency)
Highs 2 - 16 kHz
(+) | balanced highs - only 1.6% away from median
(+) | highs are linear (3.1% delta to prev. frequency)
Overall 100 - 16.000 Hz
(+) | overall sound is linear (9.2% difference to median)
Compared to same class
» 3% of all tested devices in this class were better, 2% similar, 96% worse
» The best had a delta of 6%, average was 18%, worst was 132%
Compared to all devices tested
» 3% of all tested devices were better, 1% similar, 97% worse
» The best had a delta of 4%, average was 24%, worst was 134%
Apple MacBook Pro 16 2024 M4 Pro audio analysis
(+) | speakers can play relatively loud (84.6 dB)
Bass 100 - 315 Hz
(±) | reduced bass - on average 5.1% lower than median
(+) | bass is linear (5.6% delta to prev. frequency)
Mids 400 - 2000 Hz
(+) | balanced mids - only 1.4% away from median
(+) | mids are linear (2.4% delta to prev. frequency)
Highs 2 - 16 kHz
(+) | balanced highs - only 1.7% away from median
(+) | highs are linear (3% delta to prev. frequency)
Overall 100 - 16.000 Hz
(+) | overall sound is linear (4.8% difference to median)
Compared to same class
» 0% of all tested devices in this class were better, 1% similar, 99% worse
» The best had a delta of 5%, average was 18%, worst was 45%
Compared to all devices tested
» 0% of all tested devices were better, 0% similar, 100% worse
» The best had a delta of 4%, average was 24%, worst was 134%
Power Management - Improved battery life
Power Consumption
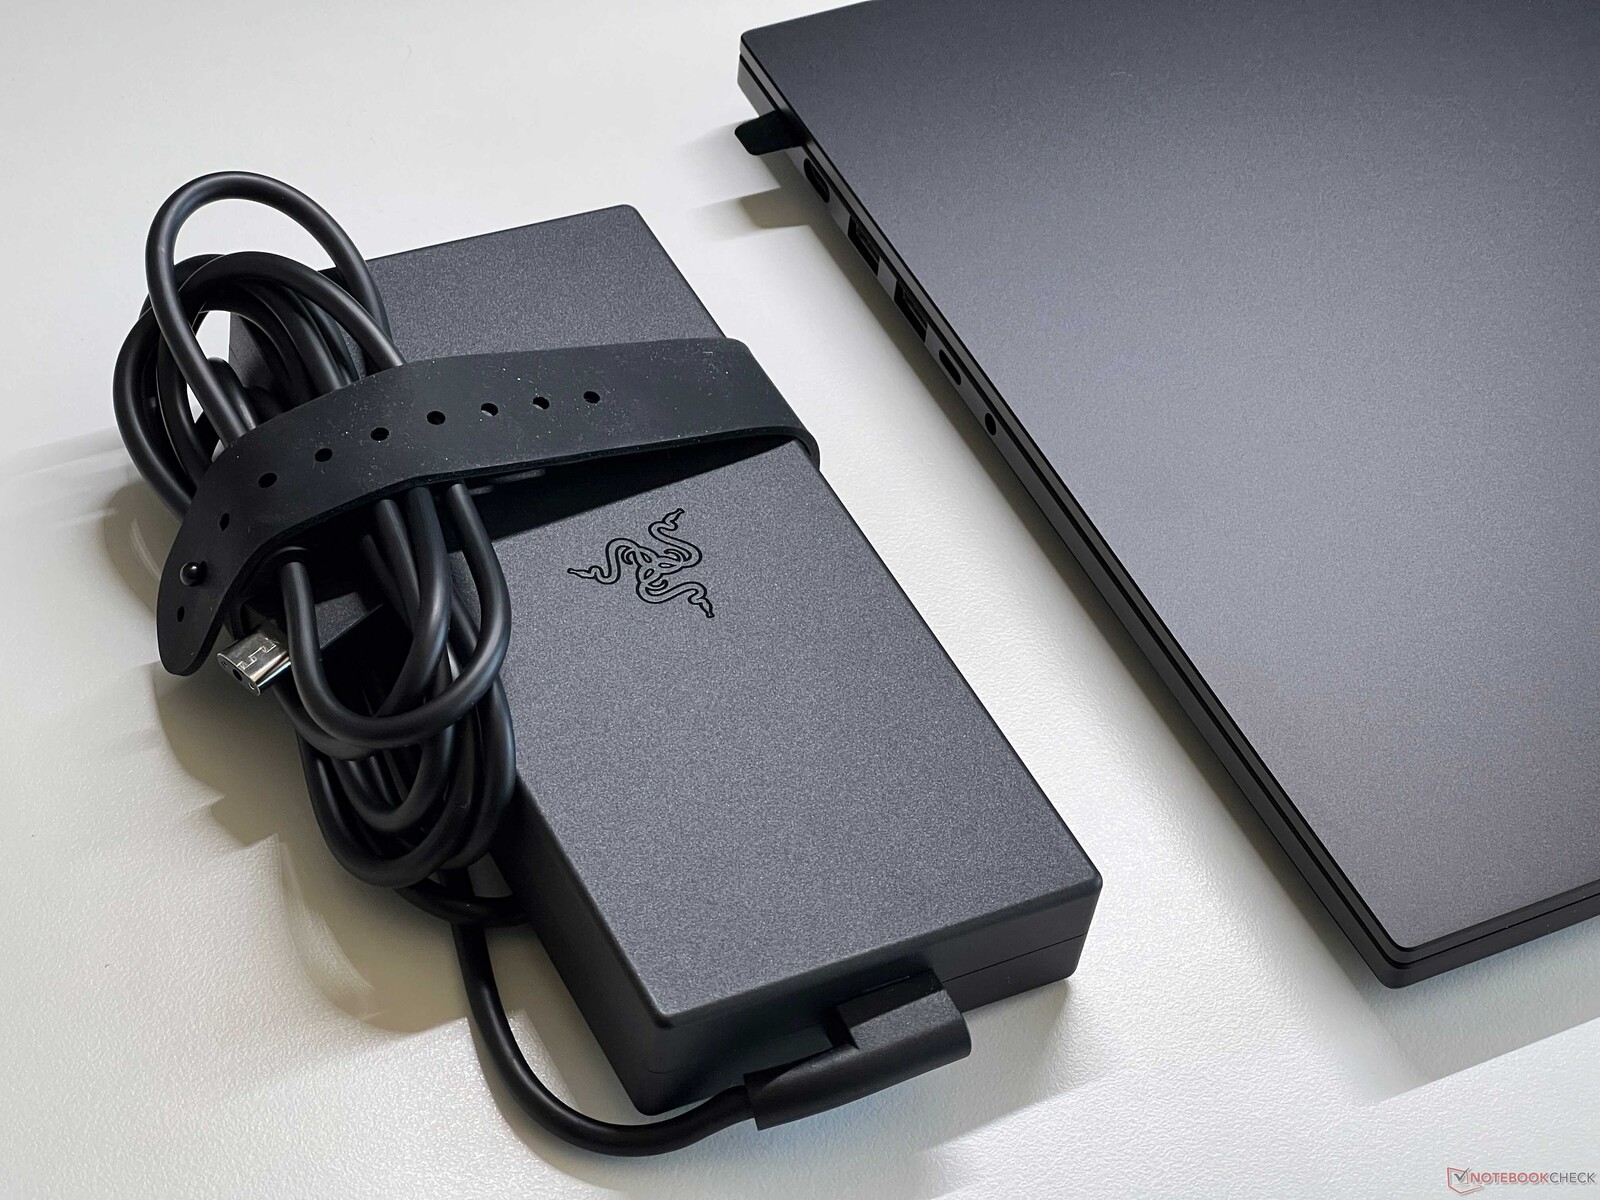
In our measurements of the power consumption, the slower processor and lower TGP of the GPU of course become noticeable. The Blade 16 2025 is more efficient in all scenarios. It also includes only a 280-Watt charger (compared to 330 watts before), but this is completely sufficient. Wir measure a maximum of almost 250 watts at the beginning of the stress test, which drops to 220 watts after about 45 seconds.
| Off / Standby | |
| Idle | |
| Load |
|
Key:
min: | |
| Razer Blade 16 2025 RTX 5090 Ryzen AI 9 HX 370, GeForce RTX 5090 Laptop, SSSTC CA6-8D2048, OLED, 2560x1600, 16" | Apple MacBook Pro 16 M4 Max M4 Max (16 cores), M4 Max 40-Core GPU, Apple SSD AP1024Z, Mini-LED, 3456x2234, 16.2" | SCHENKER XMG Neo 16 (Early 24) i9-14900HX, NVIDIA GeForce RTX 4090 Laptop GPU, Samsung 990 Pro 1 TB, IPS, 2560x1600, 16" | Alienware x16 R2 P120F Ultra 9 185H, NVIDIA GeForce RTX 4080 Laptop GPU, WDC PC SN810 1TB, IPS, 2560x1600, 16" | Lenovo Legion 9 16IRX9, RTX 4090 i9-14900HX, NVIDIA GeForce RTX 4090 Laptop GPU, Micron 3400 2TB MTFDKBA2T0TFH, MiniLED, 3200x2000, 16" | Asus ROG Zephyrus G16 GU605MY Ultra 9 185H, NVIDIA GeForce RTX 4090 Laptop GPU, Samsung PM9A1a MZVL22T0HDLB, OLED, 2560x1600, 16" | Razer Blade 16 2024, RTX 4090 i9-14900HX, NVIDIA GeForce RTX 4090 Laptop GPU, Samsung PM9A1 MZVL22T0HBLB, OLED, 2560x1600, 16" | Average Nvidia GeForce RTX 5090 Laptop | Average of class Gaming | |
|---|---|---|---|---|---|---|---|---|---|
| Power Consumption | 20% | -27% | -30% | -69% | 15% | -34% | -68% | -35% | |
| Idle Minimum * | 10.9 | 4.7 57% | 6 45% | 9.9 9% | 20.5 -88% | 7.8 28% | 16.9 -55% | 17.8 ? -63% | 14.2 ? -30% |
| Idle Average * | 13.5 | 15.5 -15% | 16 -19% | 14.5 -7% | 27.7 -105% | 10.9 19% | 17.8 -32% | 26.4 ? -96% | 20.2 ? -50% |
| Idle Maximum * | 13.7 | 15.6 -14% | 28 -104% | 33.5 -145% | 32.1 -134% | 11.6 15% | 19.6 -43% | 31.2 ? -128% | 27.2 ? -99% |
| Load Average * | 120.2 | 125 -4% | 130 -8% | 97.5 19% | 105 13% | 98.7 18% | 128 -6% | 136.9 ? -14% | 107.7 ? 10% |
| Cyberpunk 2077 ultra * | 178.2 | 116.2 35% | 157.3 12% | ||||||
| Cyberpunk 2077 ultra external monitor * | 177.6 | 107.2 40% | 165.5 7% | ||||||
| Load Maximum * | 246.1 | 143.7 42% | 361 -47% | 315.2 -28% | 323 -31% | 232 6% | 328 -33% | 346 ? -41% | 260 ? -6% |
| Witcher 3 ultra * | 302 | 230 | 246 | 243 |
* ... smaller is better
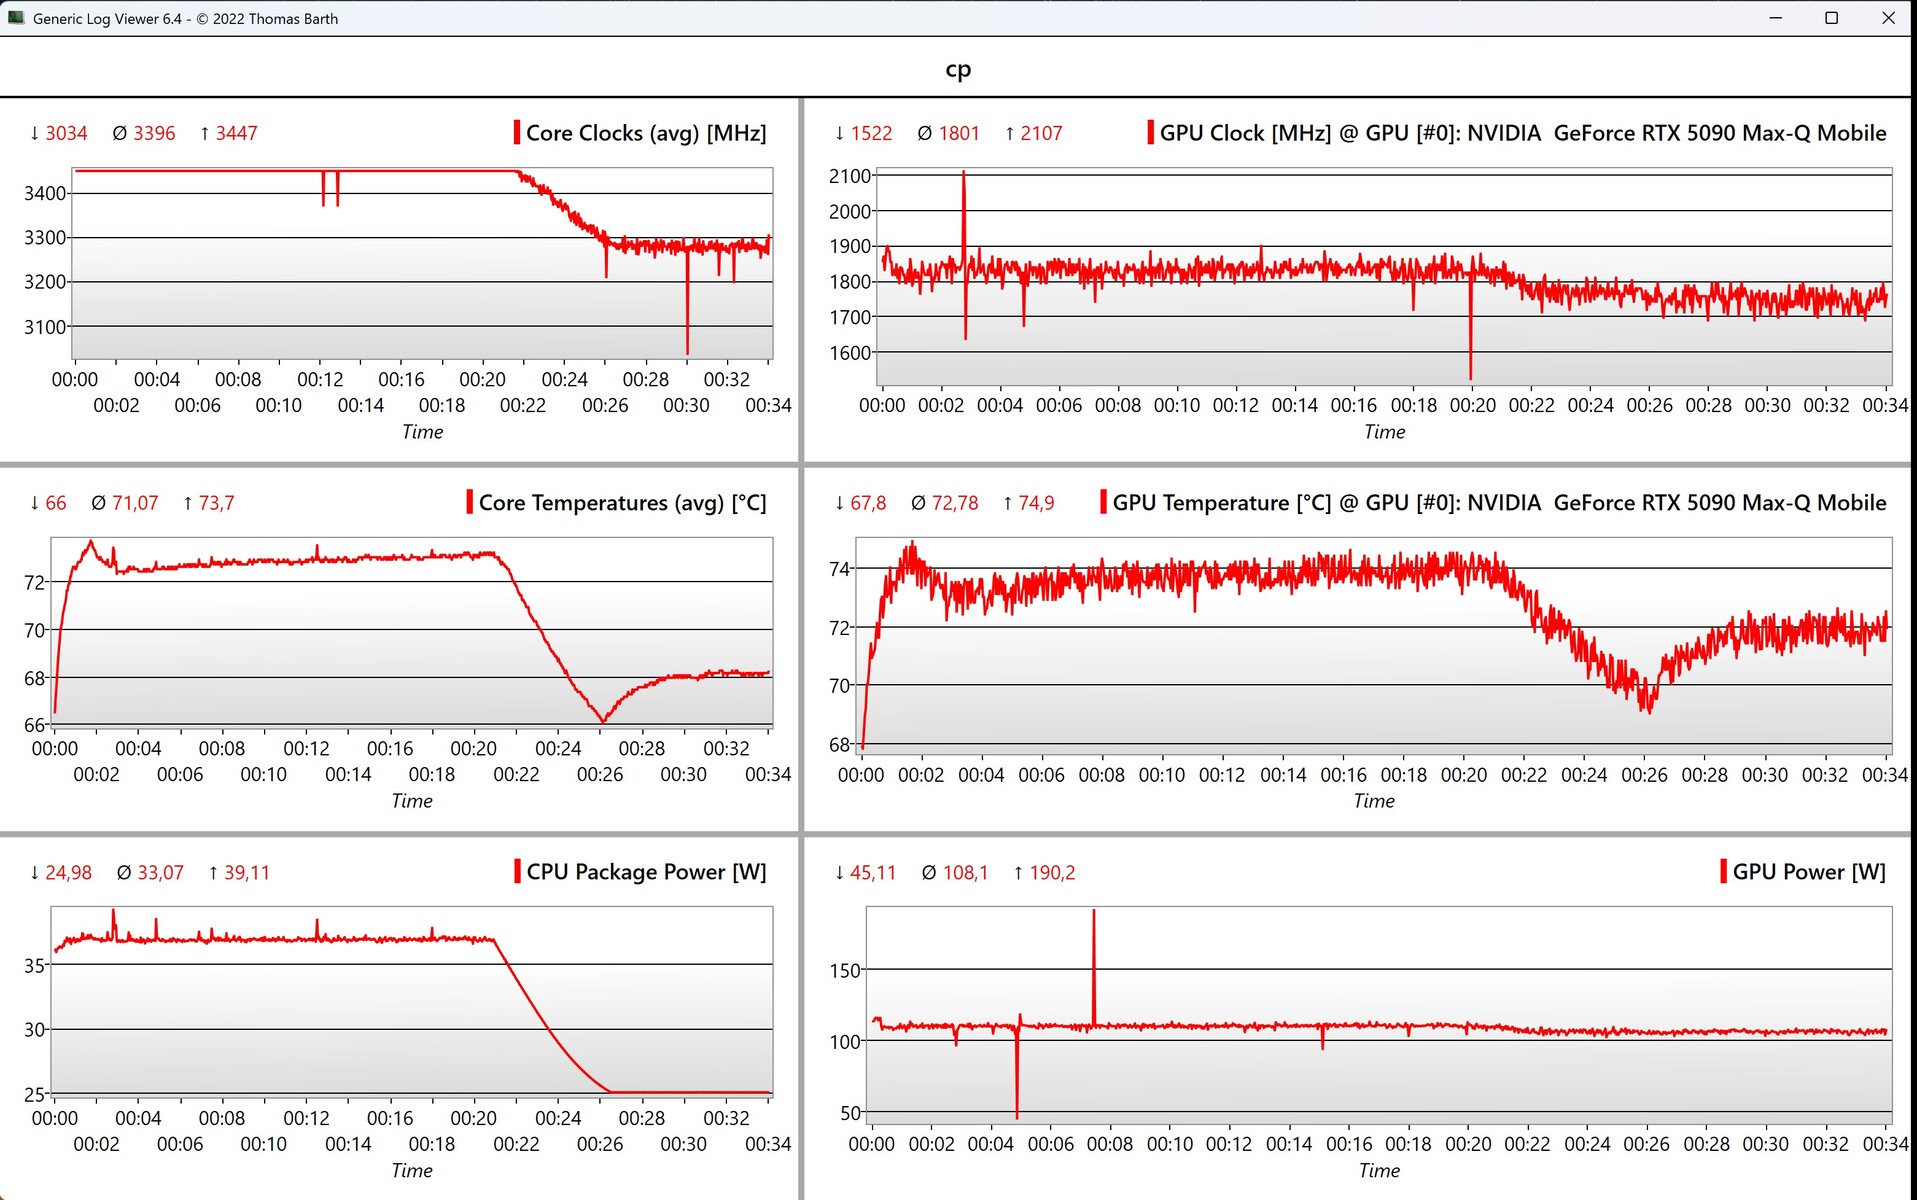
Power Consumption Cyberpunk / Stress Test
Power Consumption with External Monitor
Battery Life
The battery capacity is slightly lower than before with 90 Wh now. However, the battery life is still better than before and we measure almost 8 hours or 5.5 hours at full brightness. Gaming is also possible in battery operation, but it will then only last slightly longer than an hour. The battery life can be improved with the Battery Boost function from Nvidia, which limits the performance with the help of AI to around 30 FPS depending on the situation. But this didn't work very well, at least during Cyberpunk (~22-24 FPS).


| Razer Blade 16 2025 RTX 5090 Ryzen AI 9 HX 370, GeForce RTX 5090 Laptop, 90 Wh | Apple MacBook Pro 16 M4 Max M4 Max (16 cores), M4 Max 40-Core GPU, 99.6 Wh | SCHENKER XMG Neo 16 (Early 24) i9-14900HX, NVIDIA GeForce RTX 4090 Laptop GPU, 99.8 Wh | Alienware x16 R2 P120F Ultra 9 185H, NVIDIA GeForce RTX 4080 Laptop GPU, 90 Wh | Lenovo Legion 9 16IRX9, RTX 4090 i9-14900HX, NVIDIA GeForce RTX 4090 Laptop GPU, 99.99 Wh | Asus ROG Zephyrus G16 GU605MY Ultra 9 185H, NVIDIA GeForce RTX 4090 Laptop GPU, 90 Wh | Razer Blade 16 2024, RTX 4090 i9-14900HX, NVIDIA GeForce RTX 4090 Laptop GPU, 95.2 Wh | Average of class Gaming | |
|---|---|---|---|---|---|---|---|---|
| Battery Runtime | 124% | -28% | -59% | -45% | -18% | -27% | -21% | |
| H.264 | 592 | 1305 120% | 418 -29% | 294 -50% | 456 -23% | 457 ? -23% | ||
| WiFi v1.3 | 475 | 1078 127% | 350 -26% | 193 -59% | 290 -39% | 391 -18% | 329 -31% | 387 ? -19% |
| Cyberpunk 2077 ultra 150cd | 71 |
Notebookcheck Overall Valuation
Razer Blade 16 2025 RTX 5090
- 03/26/2025 v8
Andreas Osthoff
 Total Sustainability Score:
 Possible Alternatives in Comparison
Image | Model / Review | Price | Weight | Height | Display |
|---|---|---|---|---|---|
1. 87%  | Razer Blade 16 2025 RTX 5090 AMD Ryzen AI 9 HX 370 ⎘ Nvidia GeForce RTX 5090 Laptop ⎘ 32 GB Memory, 2048 GB SSD | Amazon: 1. $6,328.75 Razer Blade 16 Gaming Laptop... 2. $6,698.00 Razer Blade 18 Gaming Laptop... List Price: 4399€ | 2.1 kg | 17.4 mm | 16.00" 2560x1600 189 PPI OLED |
2. 91.7%  | Apple MacBook Pro 16 M4 Max Apple M4 Max (16 cores) ⎘ Apple M4 Max 40-Core GPU ⎘ 48 GB Memory, 1024 GB SSD | Amazon: 1. $3,561.34 Apple 2024 MacBook Pro Lapto... 2. $5,679.00 Apple 2024 MacBook Pro Lapto... 3. $2,884.00 Apple 2024 MacBook Pro Lapto... List Price: 4699€ | 2.1 kg | 16.8 mm | 16.20" 3456x2234 254 PPI Mini-LED |
3. 85.5%  | SCHENKER XMG Neo 16 (Early 24) Intel Core i9-14900HX ⎘ NVIDIA GeForce RTX 4090 Laptop GPU ⎘ 32 GB Memory, 1024 GB SSD | Amazon: 1. $145.00 16.0" WQXGA 2560(RGB)×1600 ... 2. $155.00 Replacement Screen 16.0" for... 3. $143.00 16.0" for Schenker XMG Neo 1... List Price: 3800 Euro | 2.5 kg | 26.6 mm | 16.00" 2560x1600 189 PPI IPS |
4. 88.4% v7 (old)  | Alienware x16 R2 P120F Intel Core Ultra 9 185H ⎘ NVIDIA GeForce RTX 4080 Laptop GPU ⎘ 32 GB Memory, 1024 GB SSD | Amazon: $2,799.00 List Price: 3200 USD | 2.7 kg | 18.57 mm | 16.00" 2560x1600 189 PPI IPS |
5. 83.9%  | Lenovo Legion 9 16IRX9, RTX 4090 Intel Core i9-14900HX ⎘ NVIDIA GeForce RTX 4090 Laptop GPU ⎘ 64 GB Memory, 2048 GB SSD | Amazon: $4,999.00 List Price: 4899 Euro | 2.5 kg | 22.7 mm | 16.00" 3200x2000 236 PPI MiniLED |
6. 86.1%  | Asus ROG Zephyrus G16 GU605MY Intel Core Ultra 9 185H ⎘ NVIDIA GeForce RTX 4090 Laptop GPU ⎘ 32 GB Memory, 2048 GB SSD | Amazon: List Price: 4300€ | 1.9 kg | 16.4 mm | 16.00" 2560x1600 189 PPI OLED |
7. 91.1% v7 (old)  | Razer Blade 16 2024, RTX 4090 Intel Core i9-14900HX ⎘ NVIDIA GeForce RTX 4090 Laptop GPU ⎘ 32 GB Memory, 2048 GB SSD | Amazon: $4,375.00 List Price: 4850 Euro | 2.5 kg | 22 mm | 16.00" 2560x1600 189 PPI OLED |
More articles related to this device
Razer Blade 16 2025 RTX 5090 (Blade 16 Series)Related Articles


Transparency
The selection of devices to be reviewed is made by our editorial team. The test sample was provided to the author as a loan by the manufacturer or retailer for the purpose of this review. The lender had no influence on this review, nor did the manufacturer receive a copy of this review before publication. There was no obligation to publish this review. We never accept compensation or payment in return for our reviews. As an independent media company, Notebookcheck is not subjected to the authority of manufacturers, retailers or publishers.
This is how Notebookcheck is testing
Every year, Notebookcheck independently reviews hundreds of laptops and smartphones using standardized procedures to ensure that all results are comparable. We have continuously developed our test methods for around 20 years and set industry standards in the process. In our test labs, high-quality measuring equipment is utilized by experienced technicians and editors. These tests involve a multi-stage validation process. Our complex rating system is based on hundreds of well-founded measurements and benchmarks, which maintains objectivity. Further information on our test methods can be found here.

