Verdict – excellent creator display
Our HP ZBook 8 G1i with RTX 500 positions itself performance-wise right between the ZBook 8 with integrated graphics and the ZBook Ultra with Radeon 8050S. Its performance is consistently strong, the build quality is high, and the display impresses with an almost unrivalled colour-space coverage.
The fact that the SSD cannot maintain its thermal performance and the latencies are currently quite high is suboptimal for a workstation. HP could also finally finish developing its HP app: Occasionally long startup times, incomplete translations, and questionable design choices are not ideal for the target audience.
Pros
Cons
Price and availability
Our test configuration is listed on HP's website as "Coming soon", with prices expected to range between €2,500 and €2,900. On HP's US website, the customisable HP ZBook 8 G1i 14-inch Mobile Workstation PC carries an MSRP of $2,942.00 USD. Final pricing and configuration details may vary depending on region and selected options.
Table of Contents
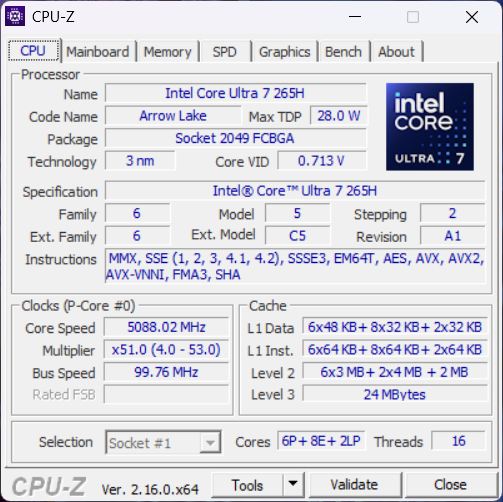
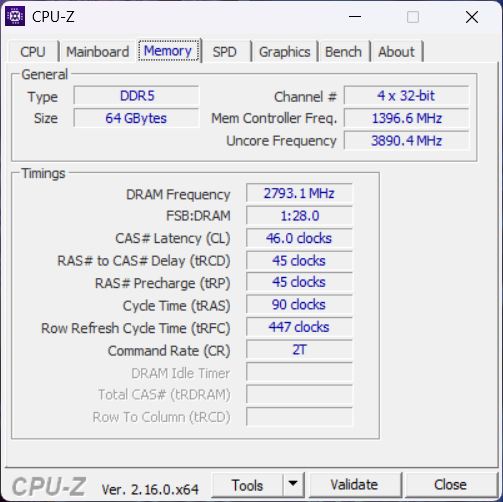
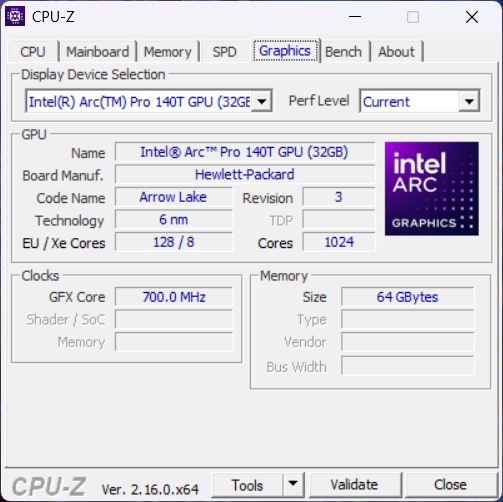
In a recent review, we examined the ZBook 8 with a Core Ultra 255H and integrated graphics. Since a professional workstation is expected to include a dedicated GPU, this review covers the version equipped with an Nvidia RTX 500, 64 GB of RAM, and a Core Ultra 7 265H.
Specifications
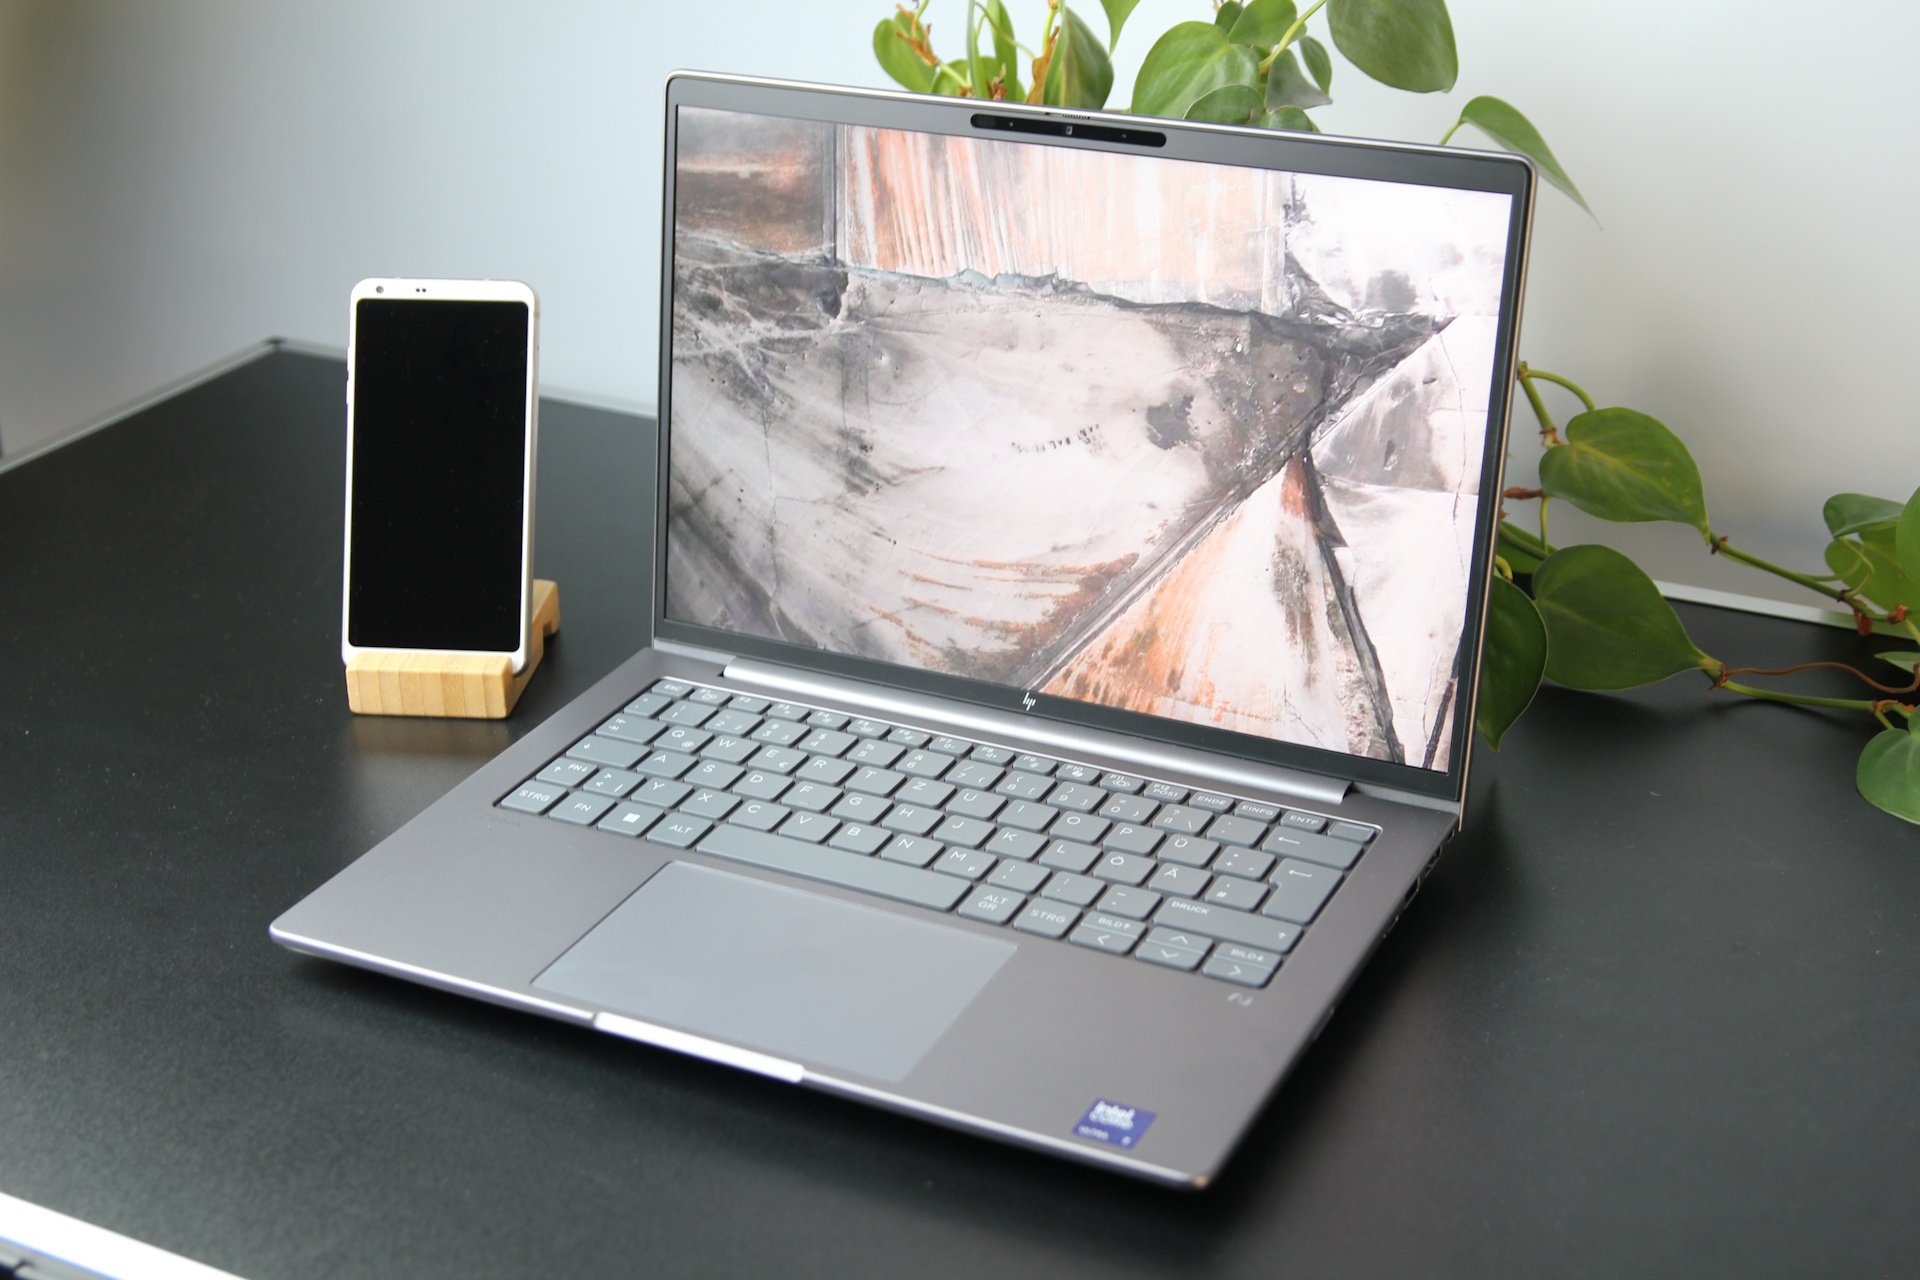
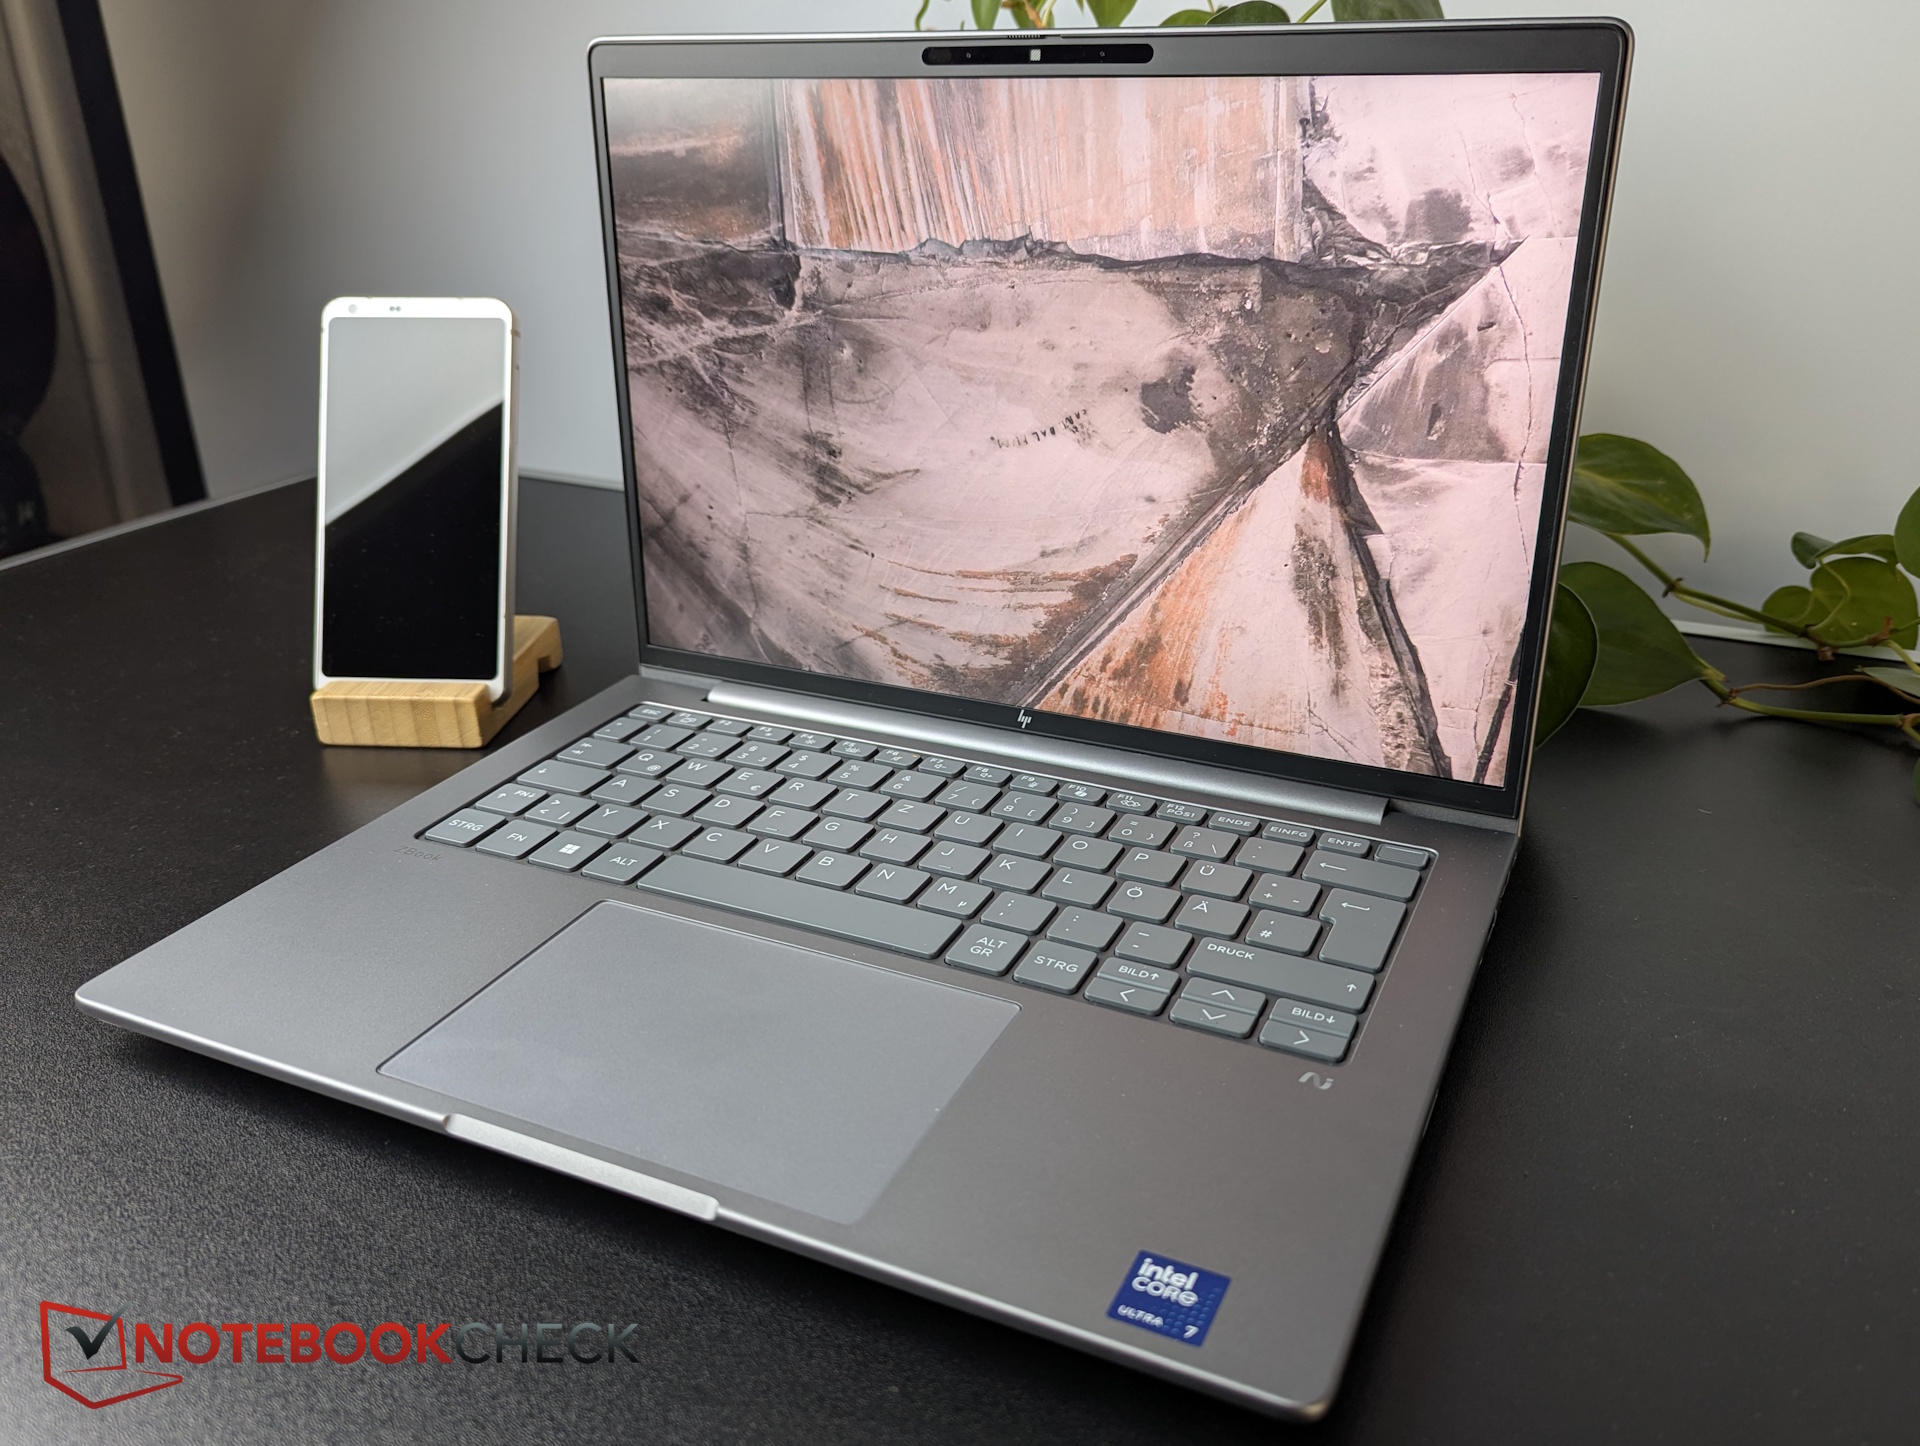
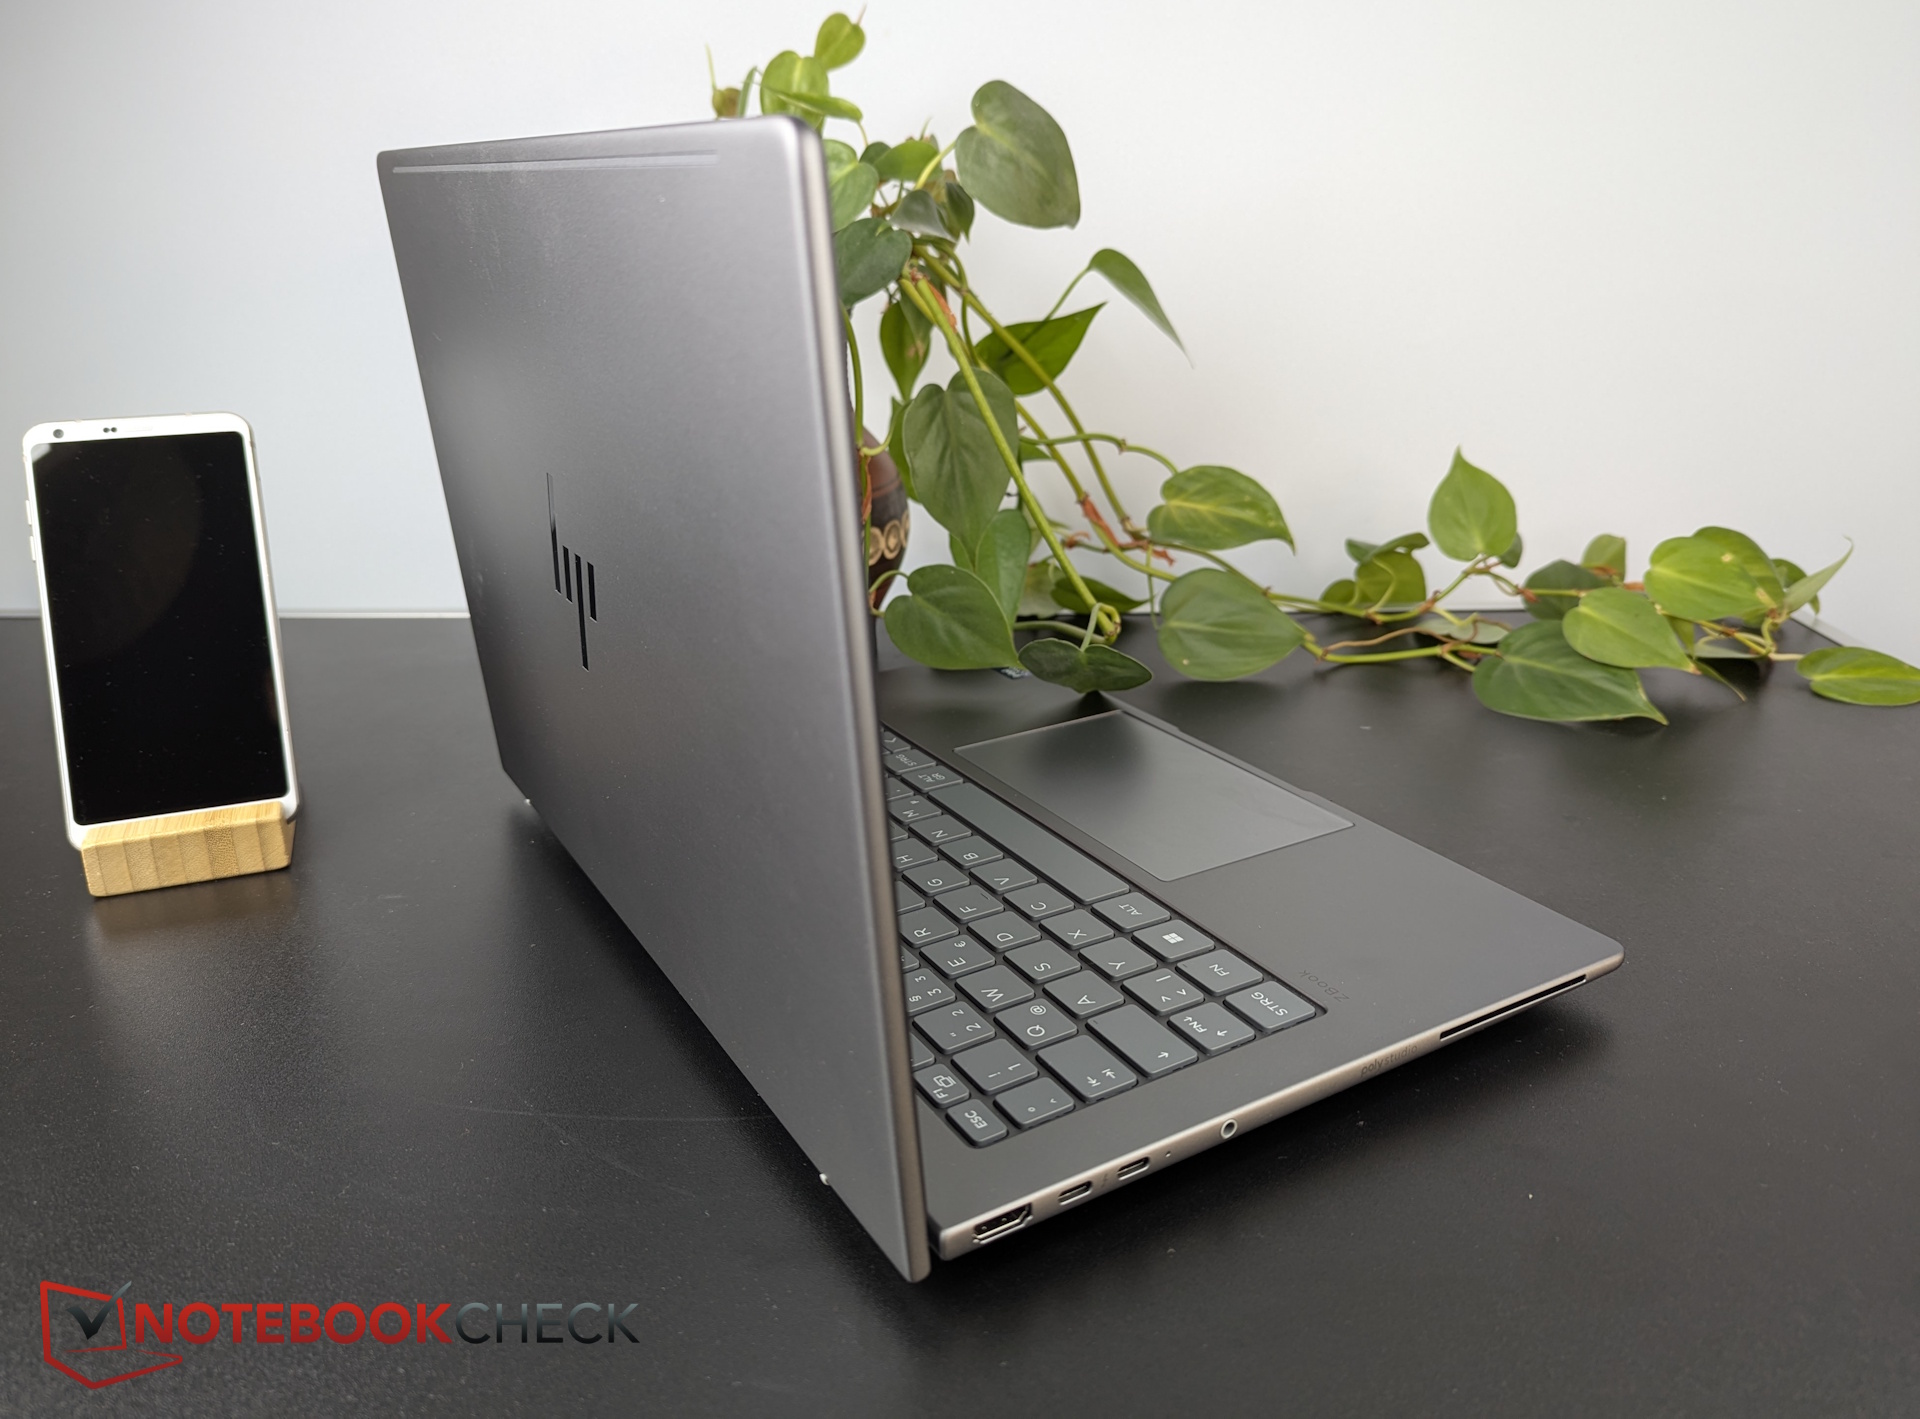
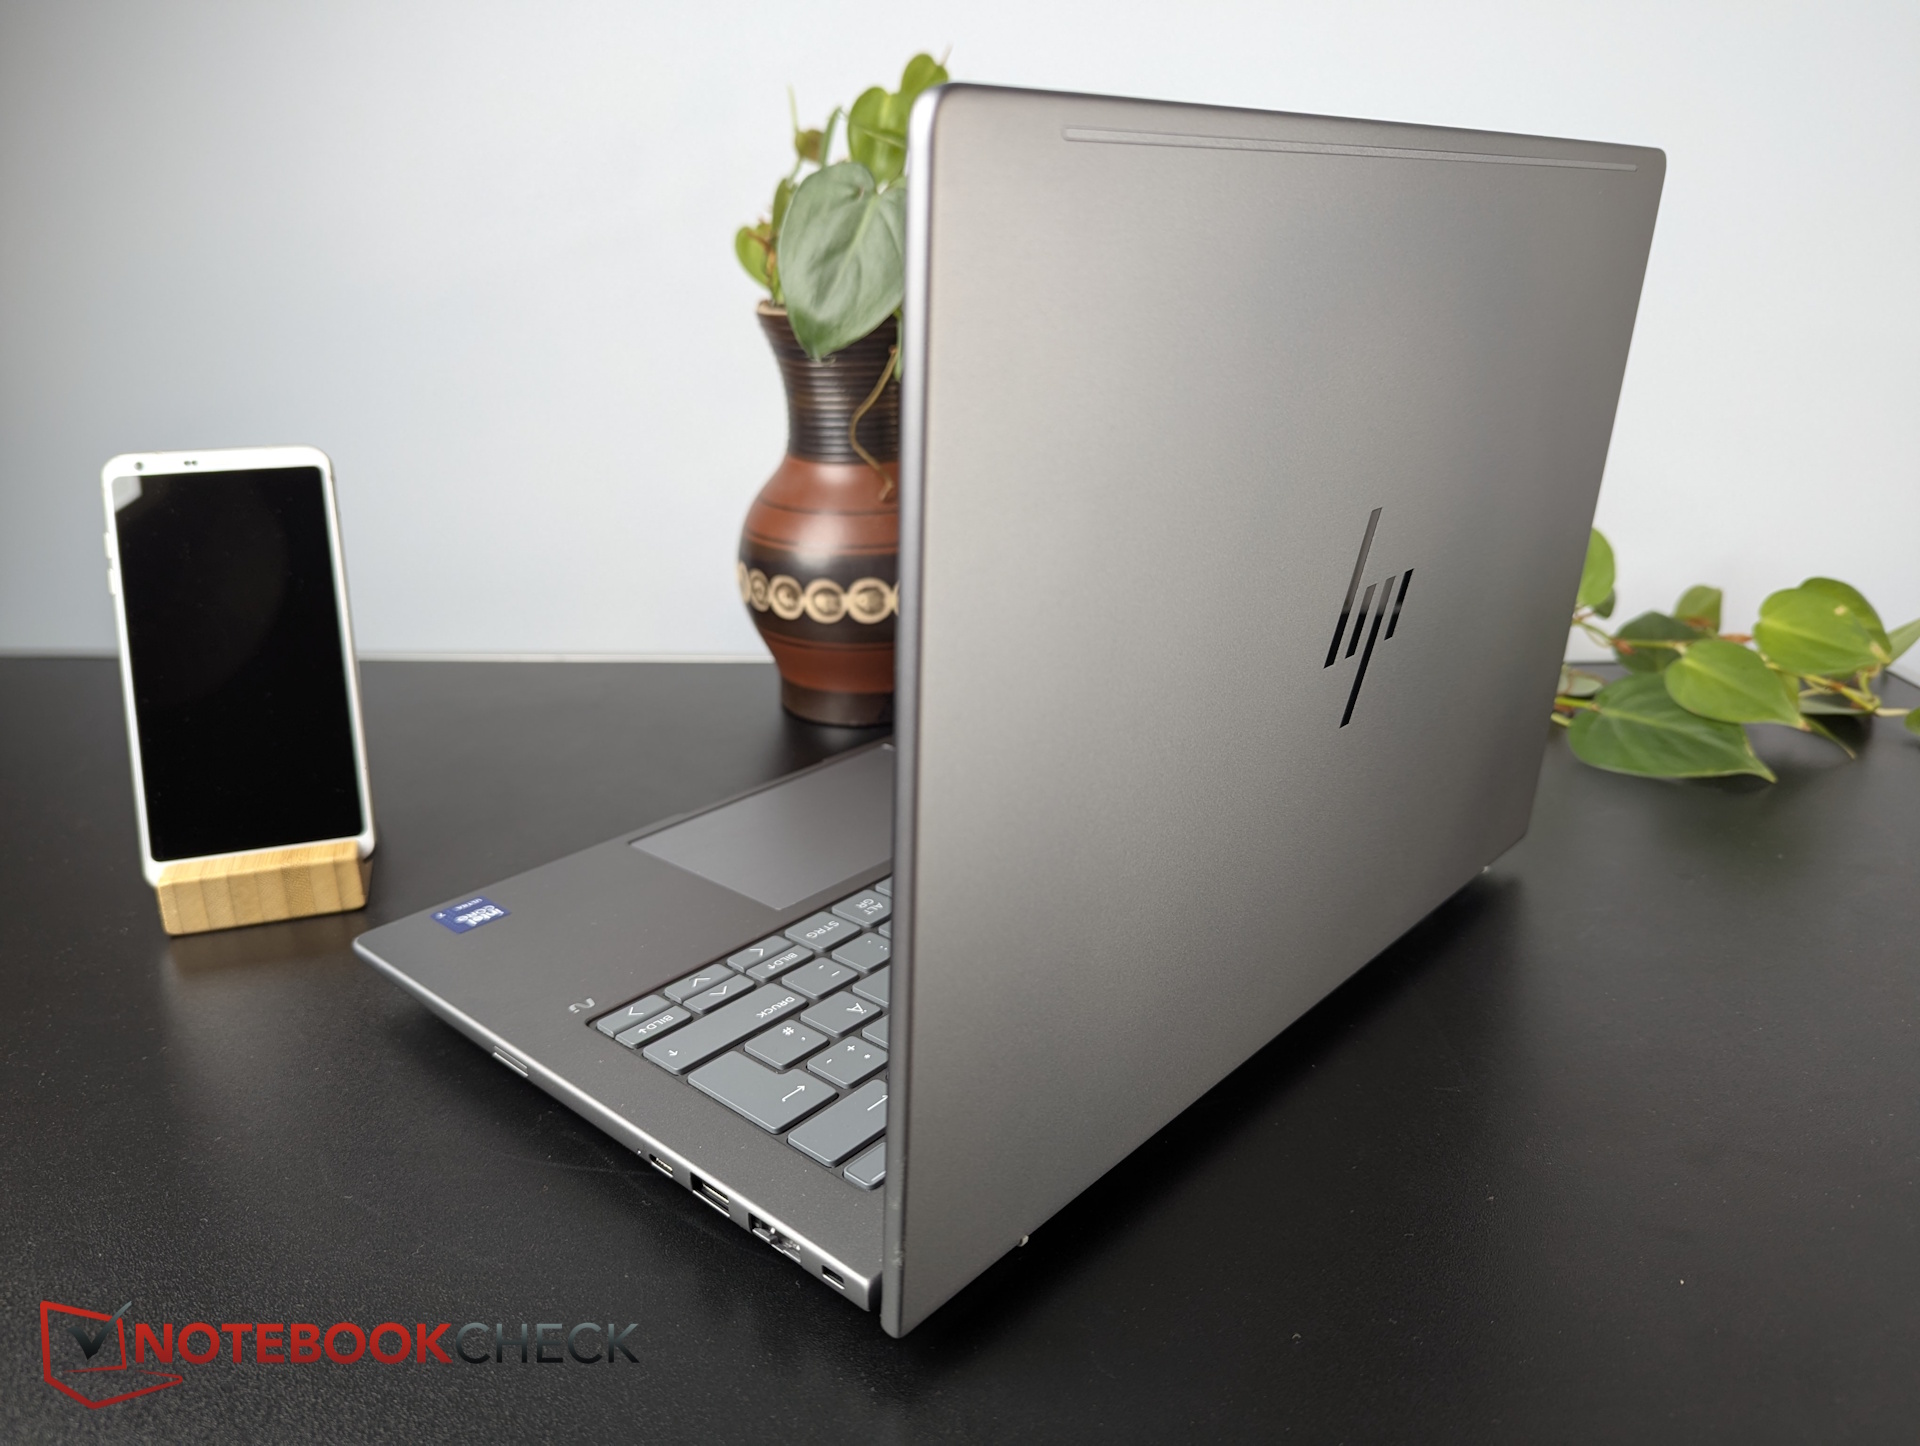
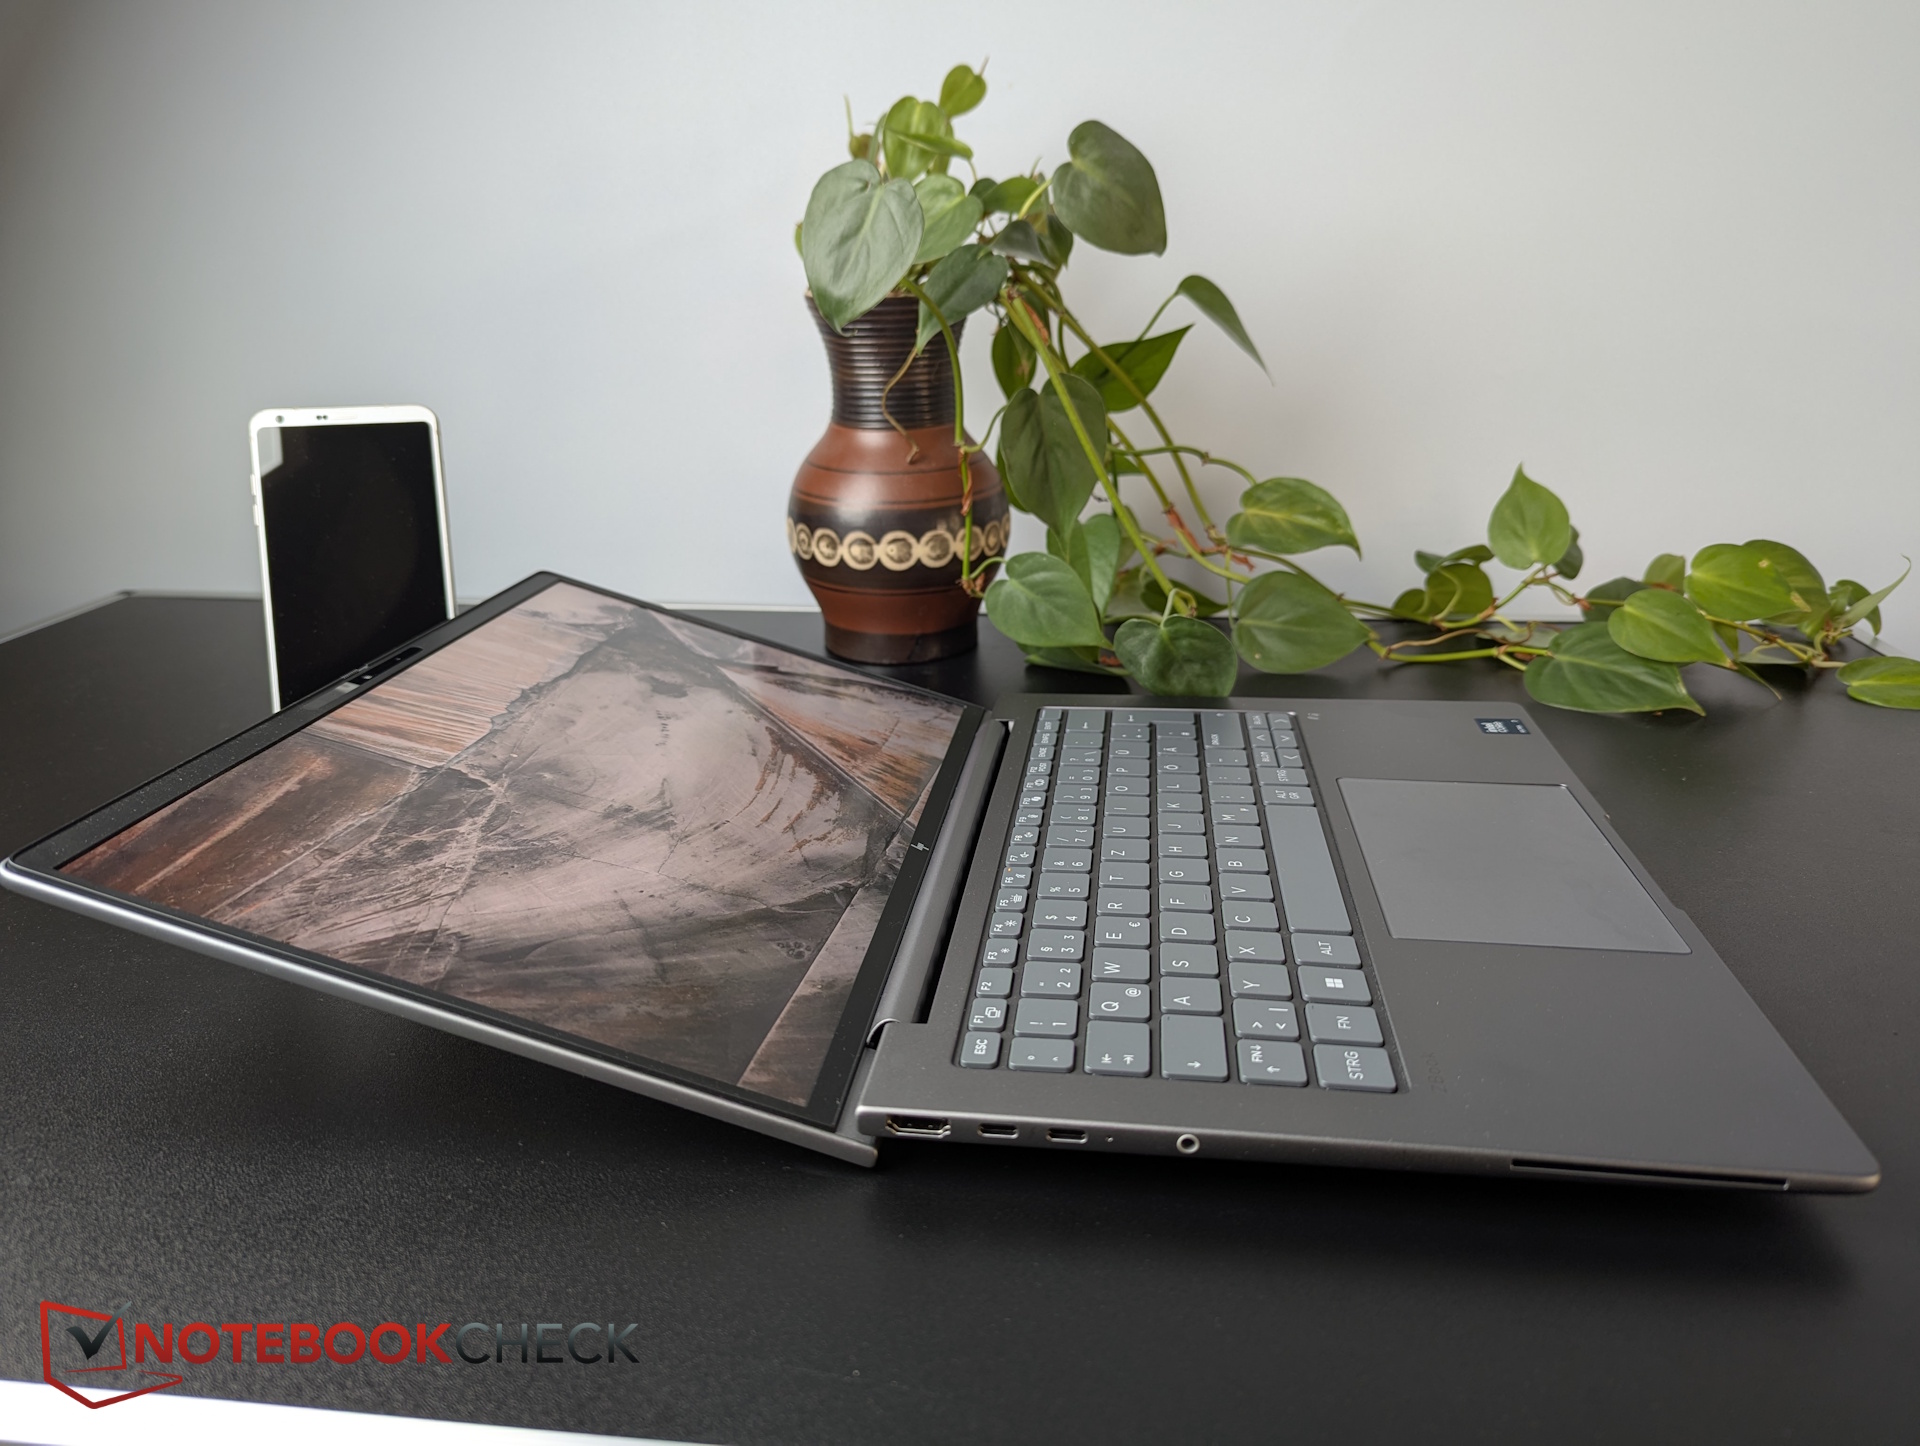
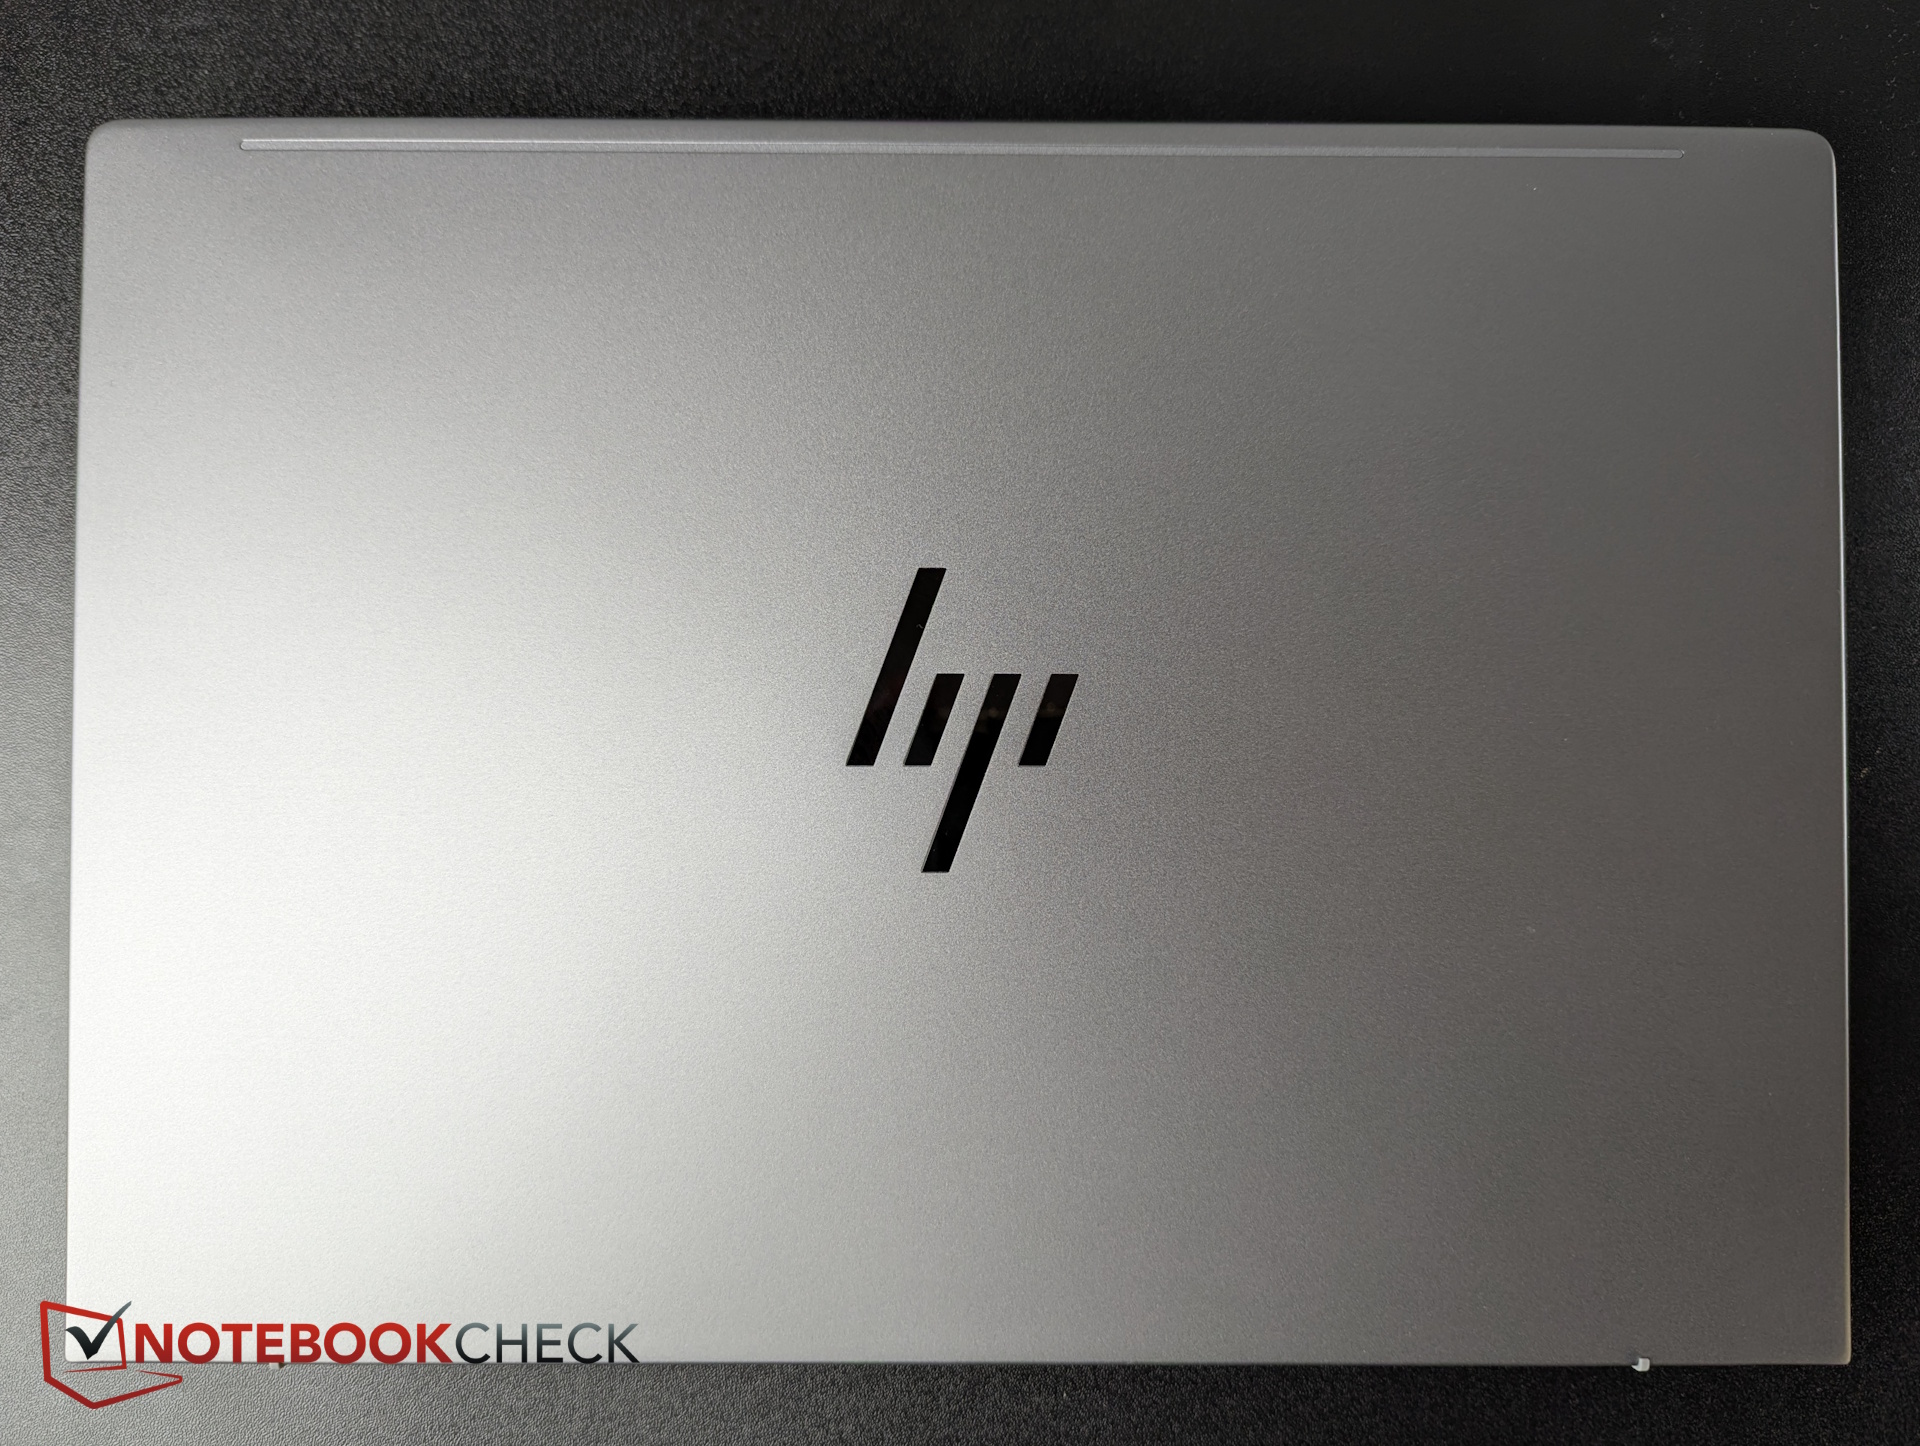
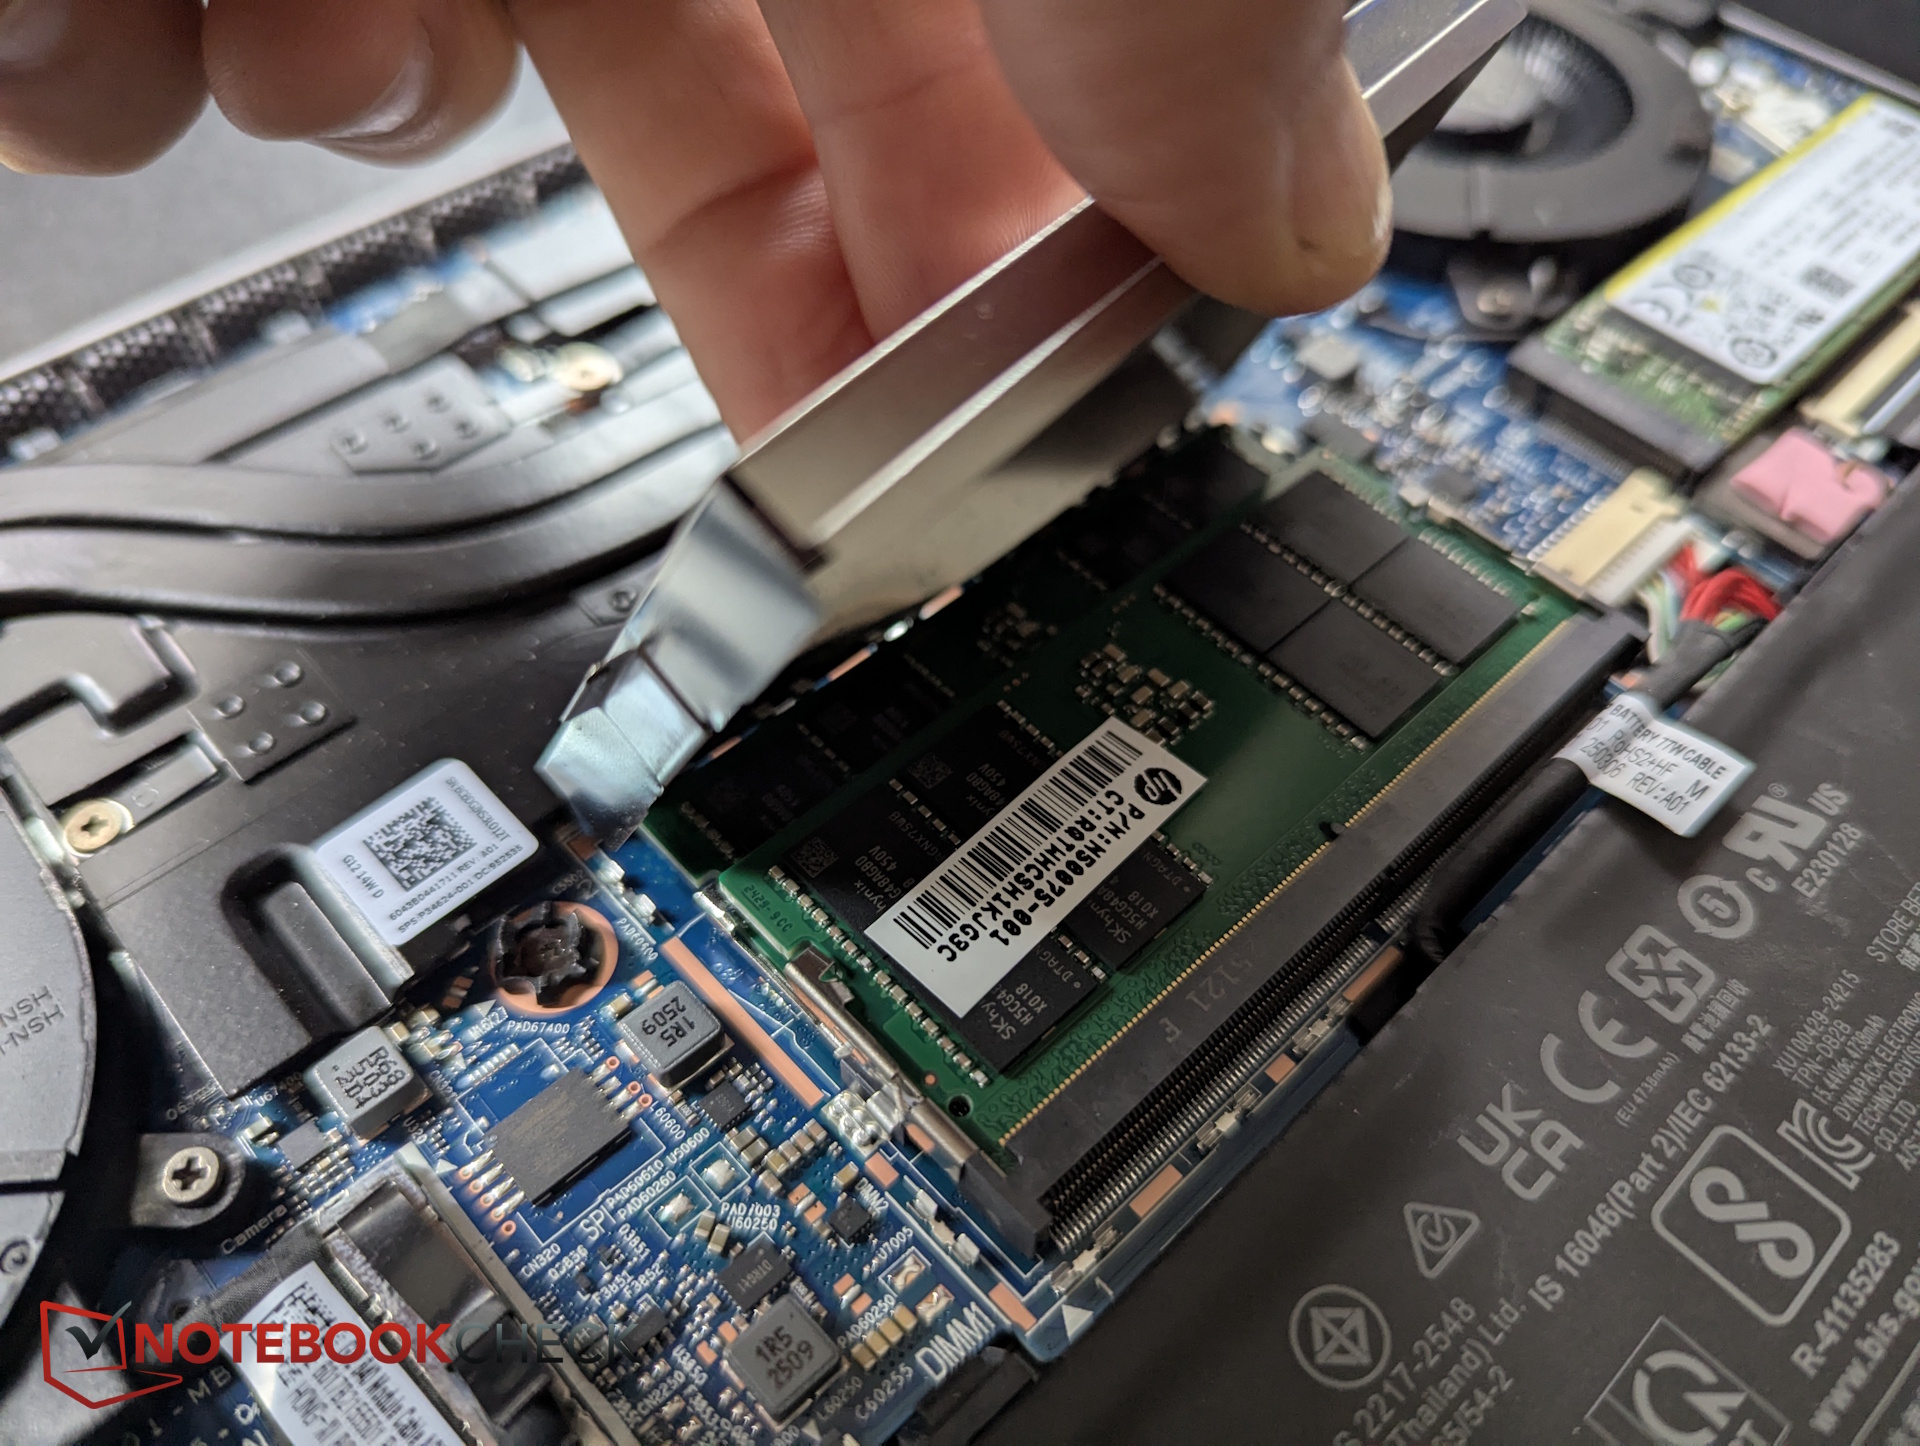
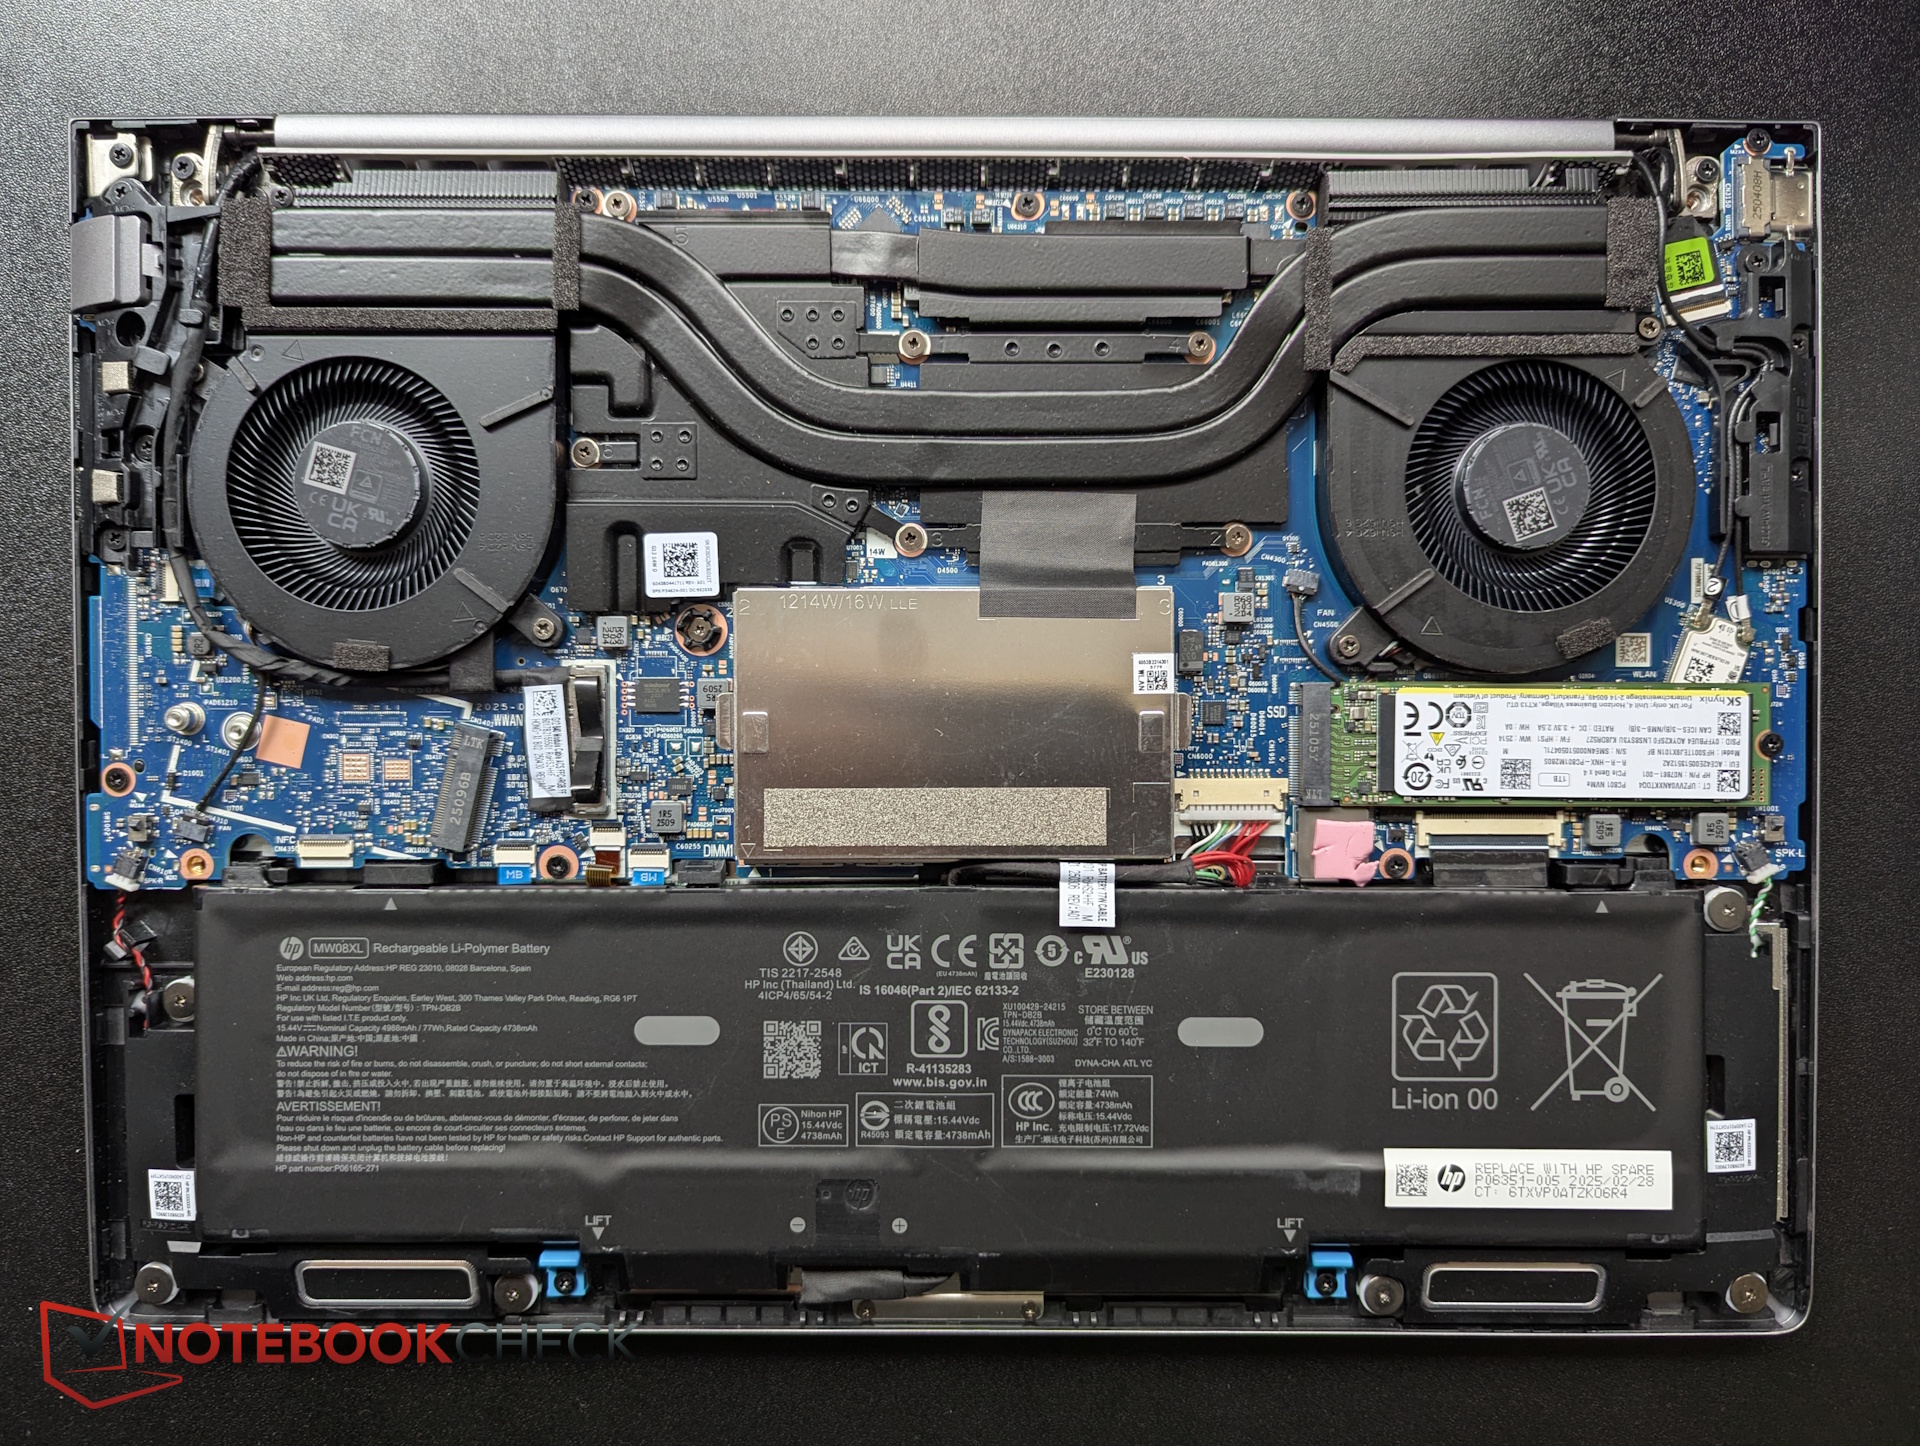
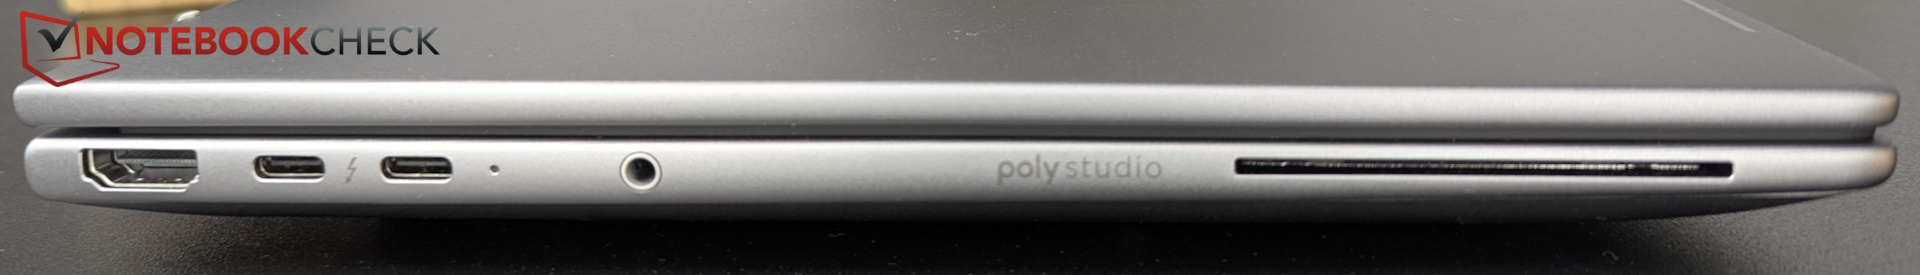
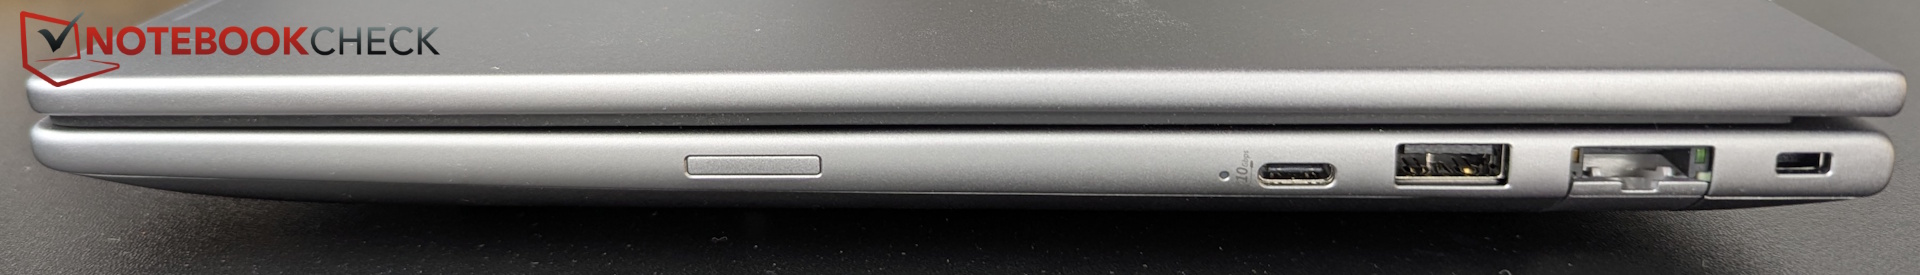
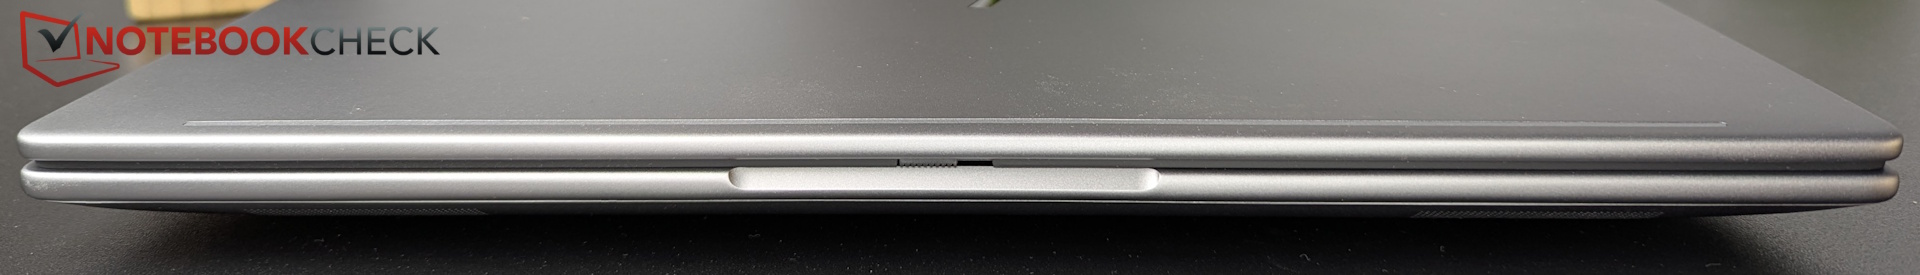
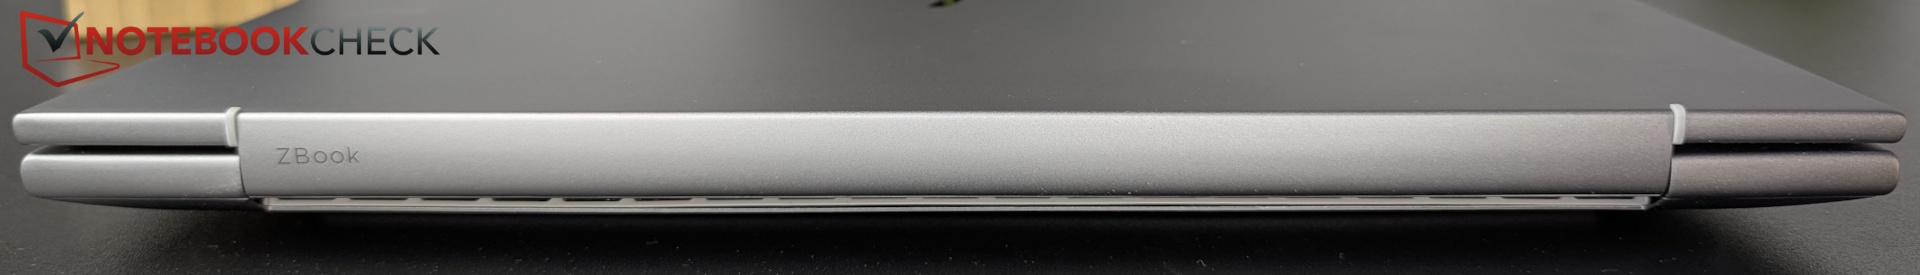
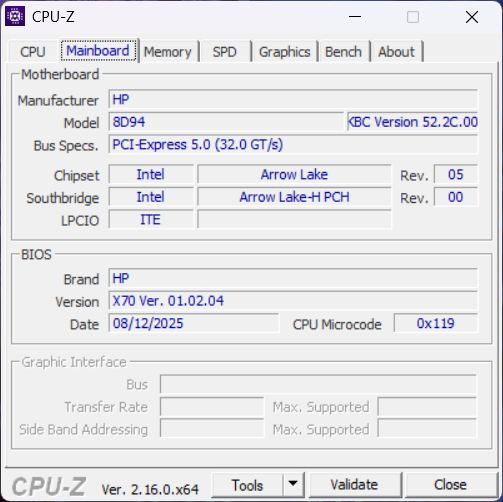
Case and connectivity – sturdy silver metal
The high-quality, silver-grey metal chassis feels solid, with hinges that show only a slight amount of play.
A particular highlight is the SmartCard reader, although an SD card reader is missing. A SIM card slot is available as an option.
Webcam


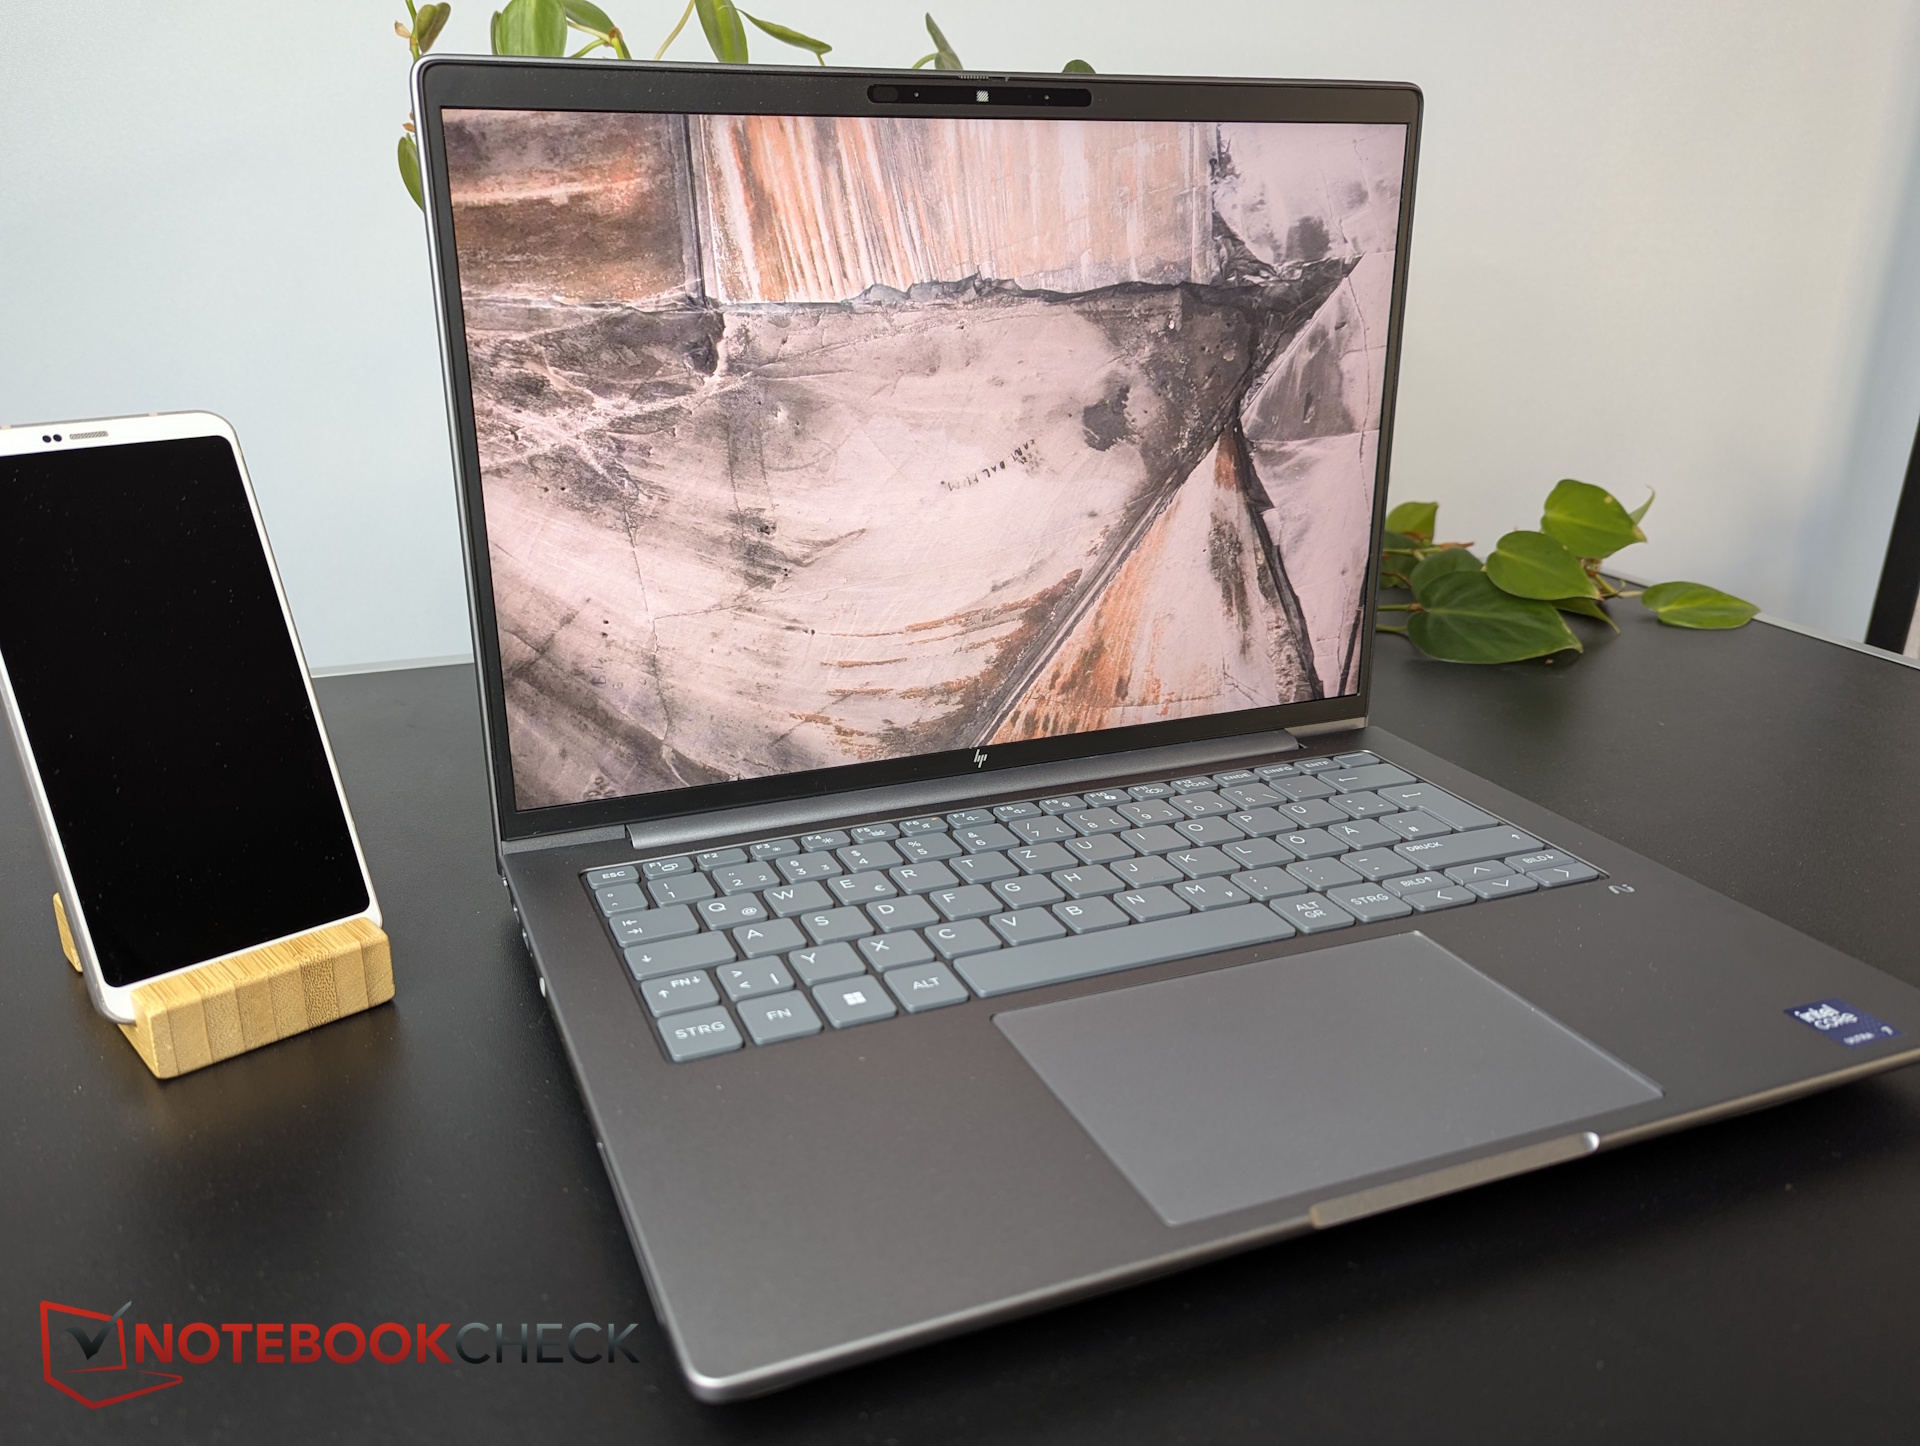
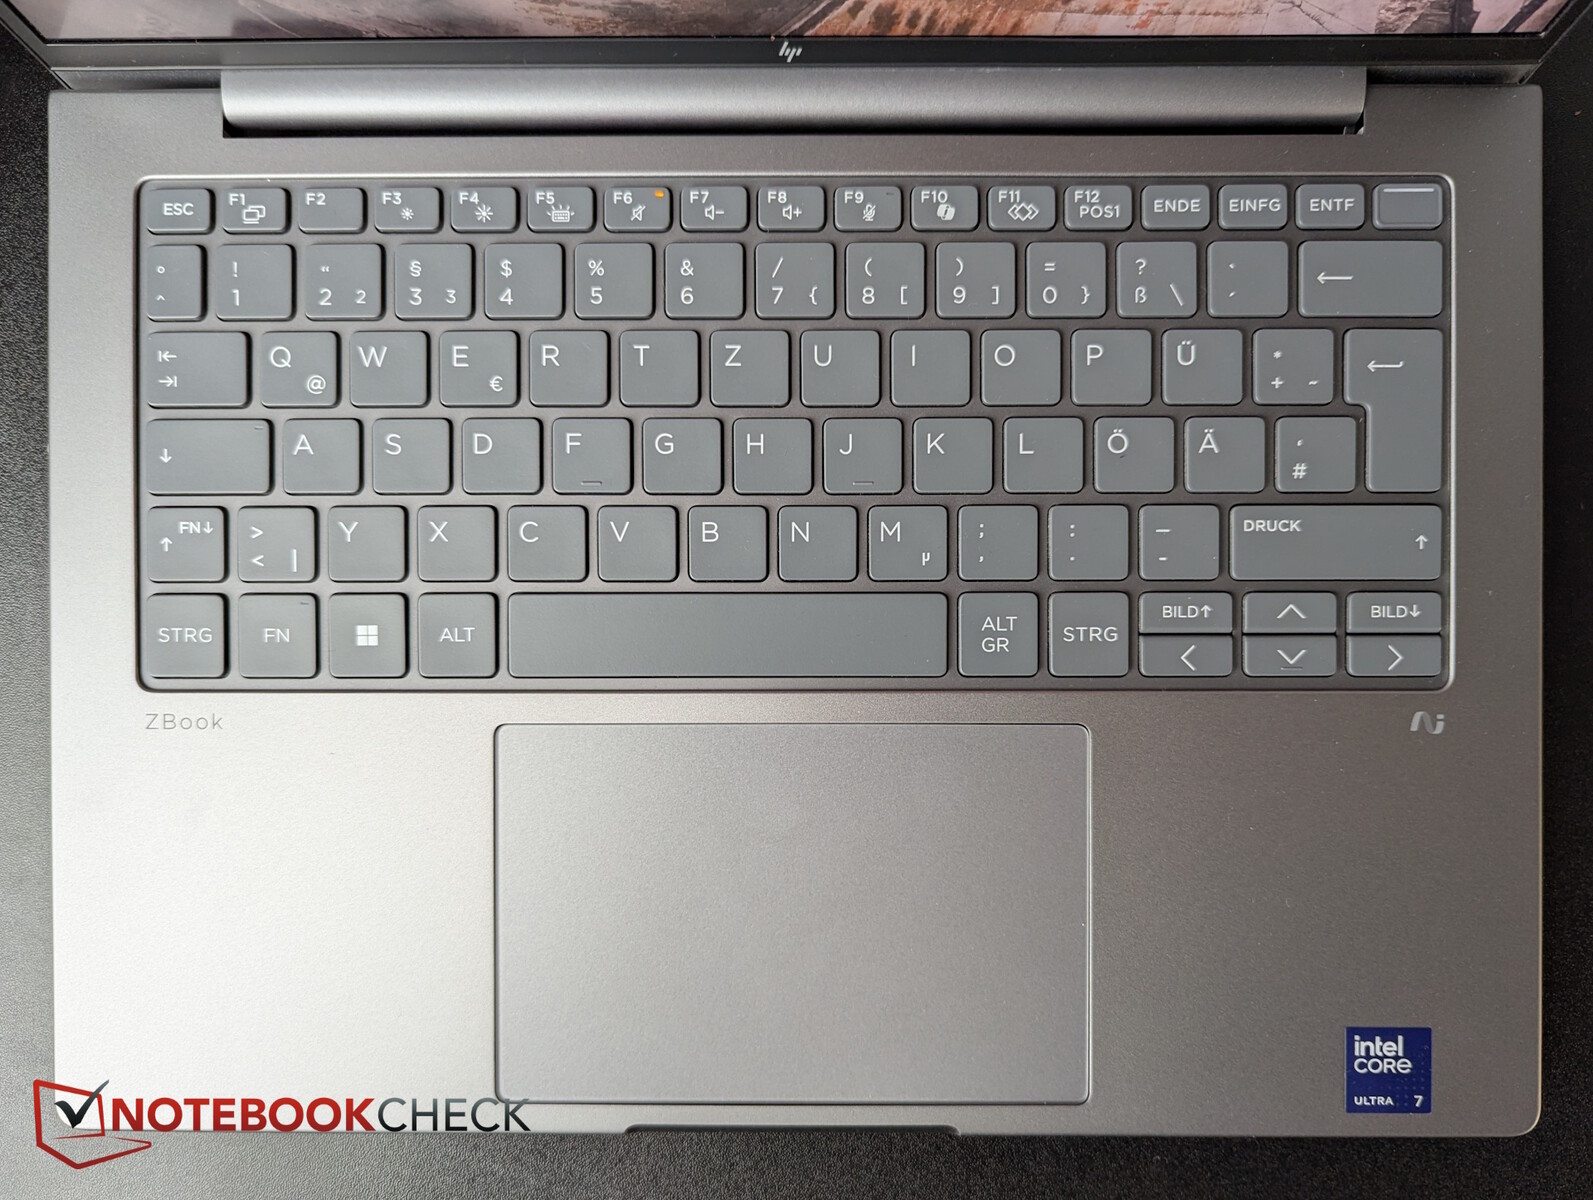
Input devices – HP ZBook with Quiet Keyboard
The grey keys of the HP Premium Quiet Keyboard are well-damped and very quiet. Despite the short to medium key travel, the feedback is excellent, although the arrow keys are half-height.
The touchpad measures approximately 12.5 × 8 cm, offers excellent gliding characteristics, precise input response, and reliable, quiet-clicking buttons with clear feedback.
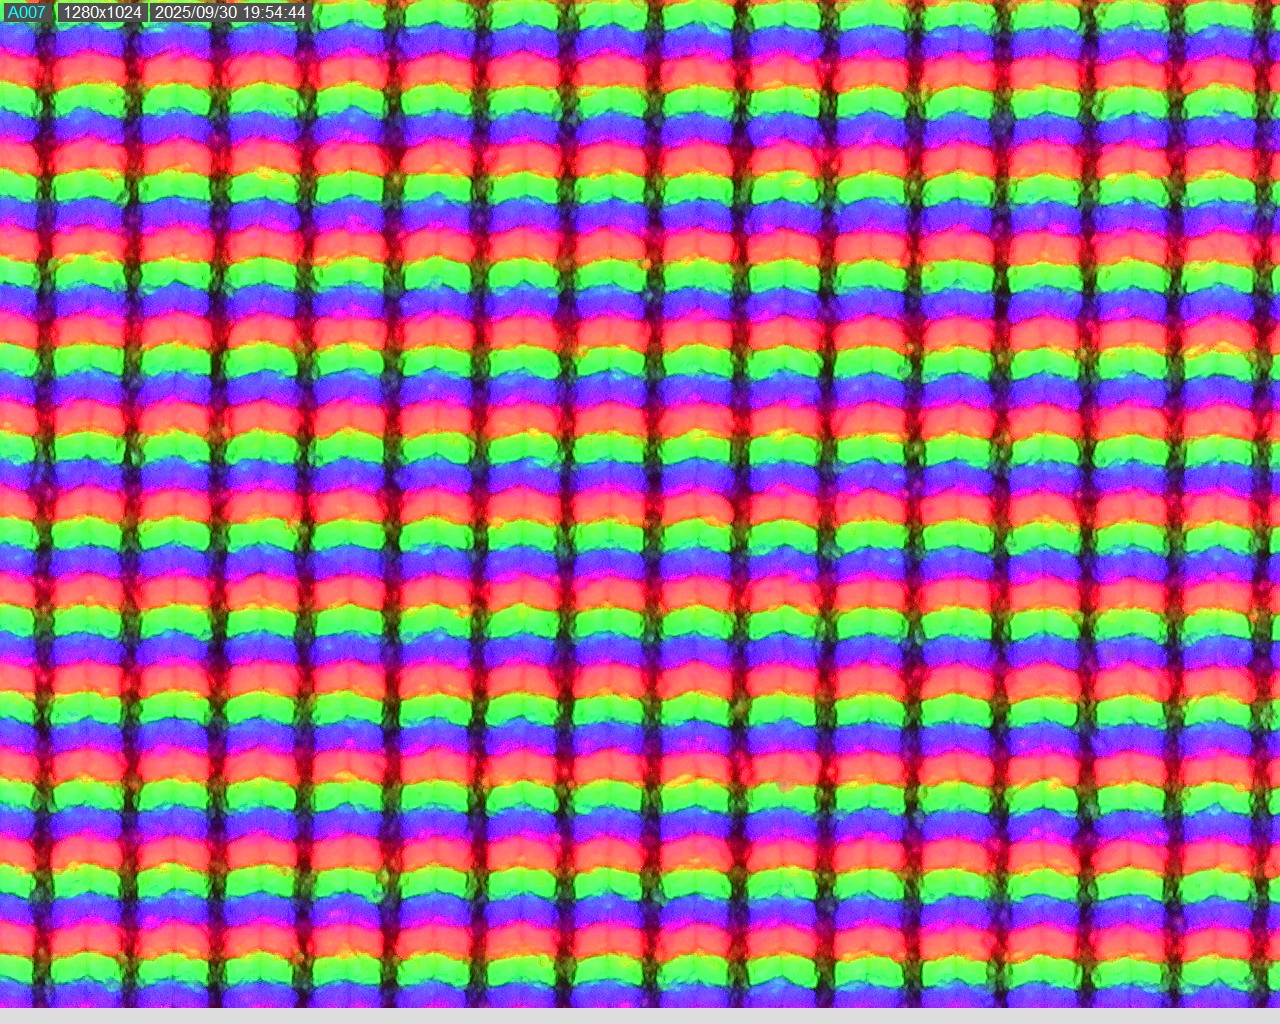
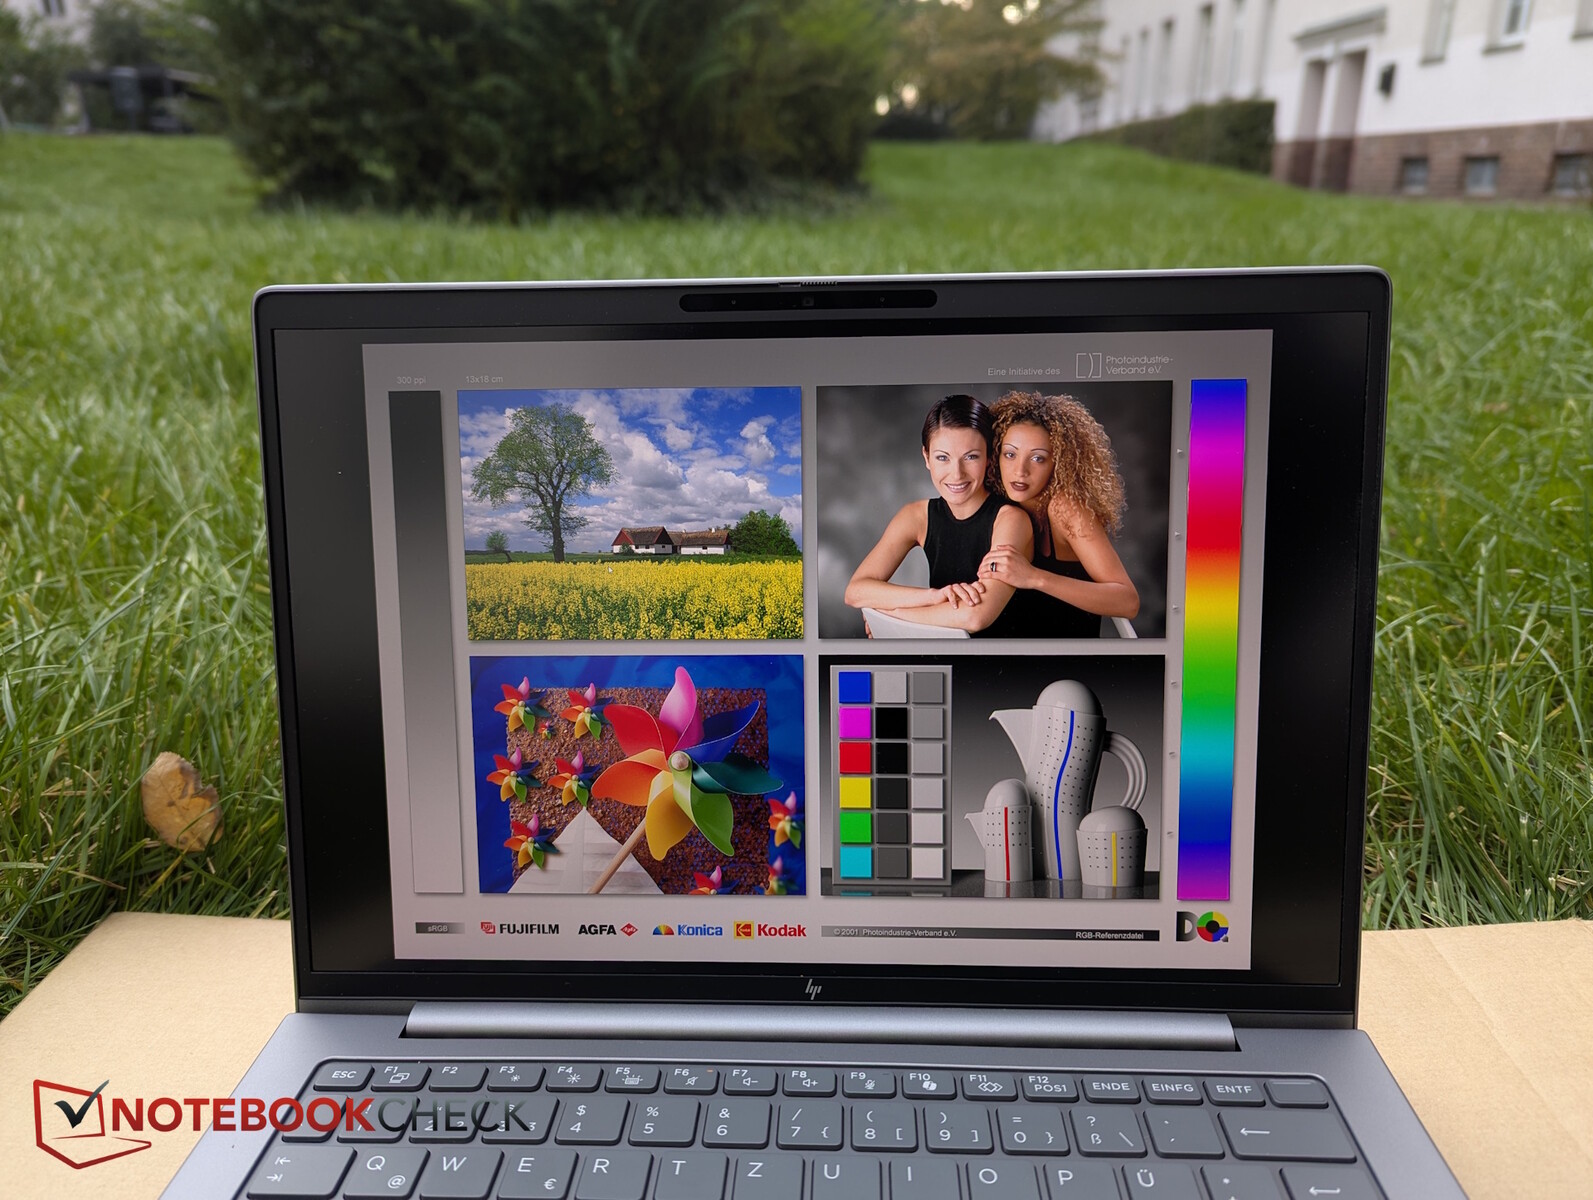
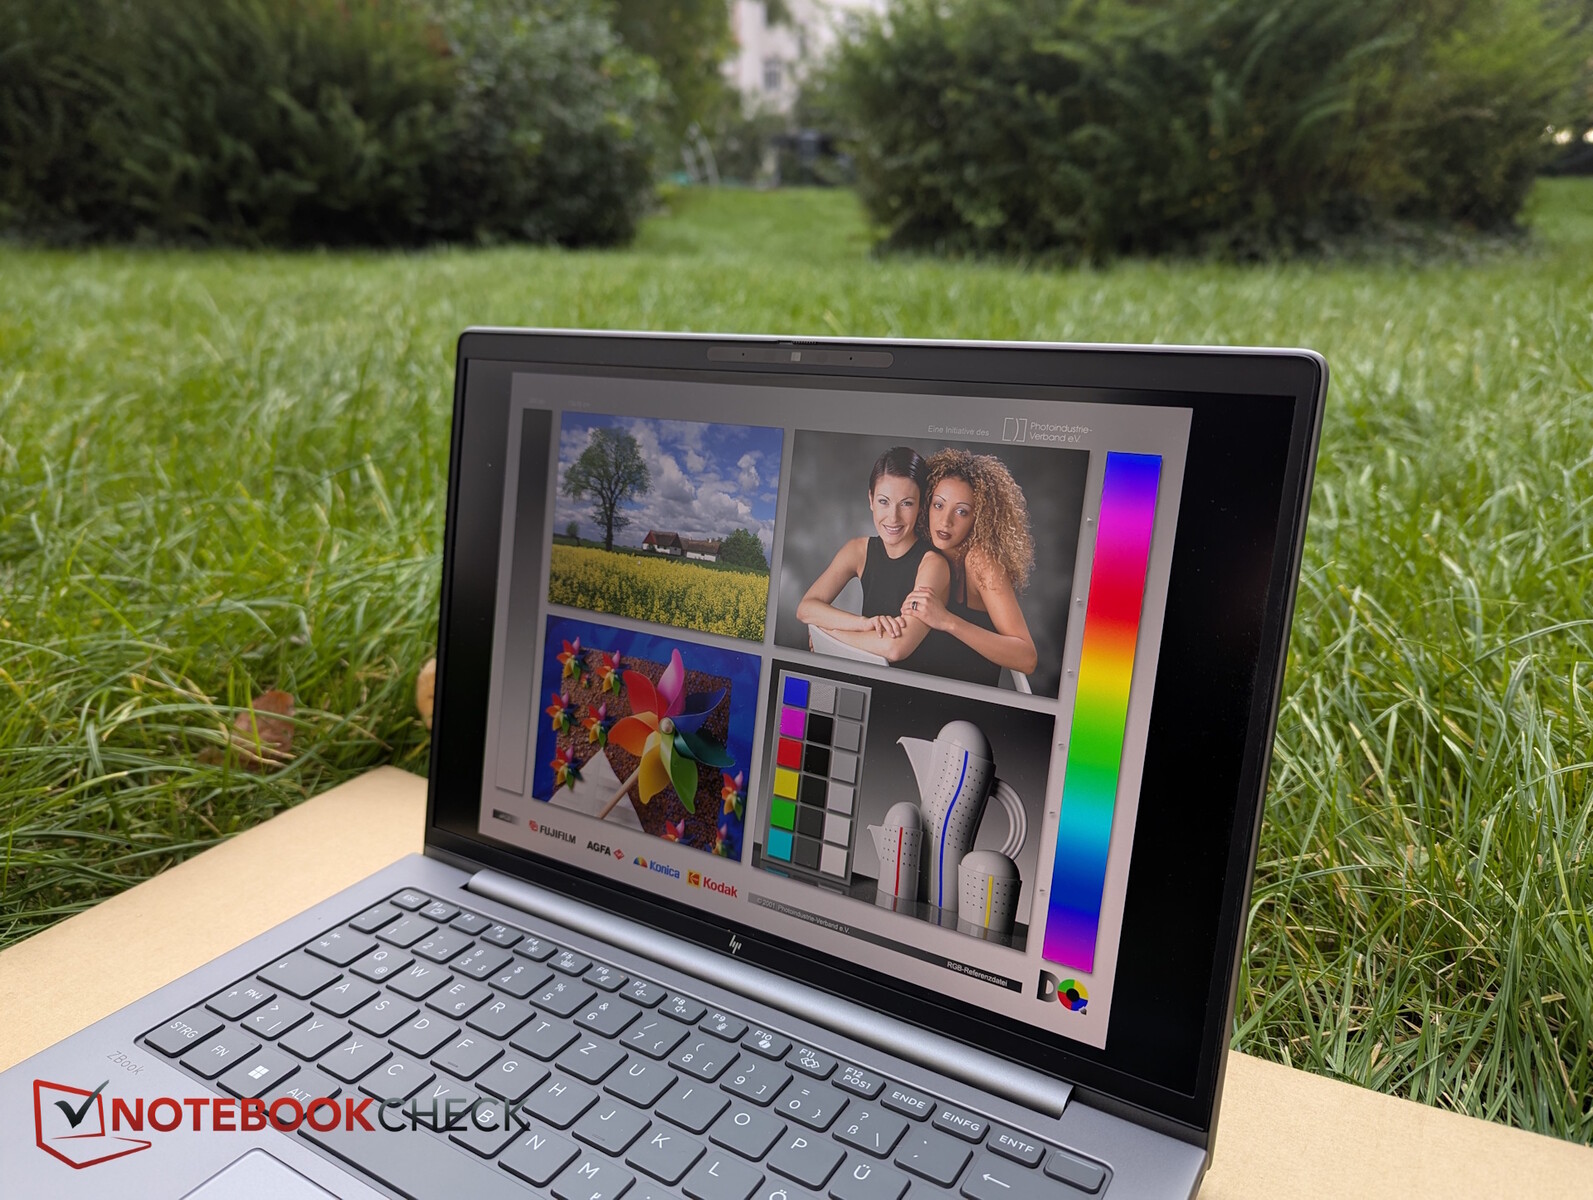
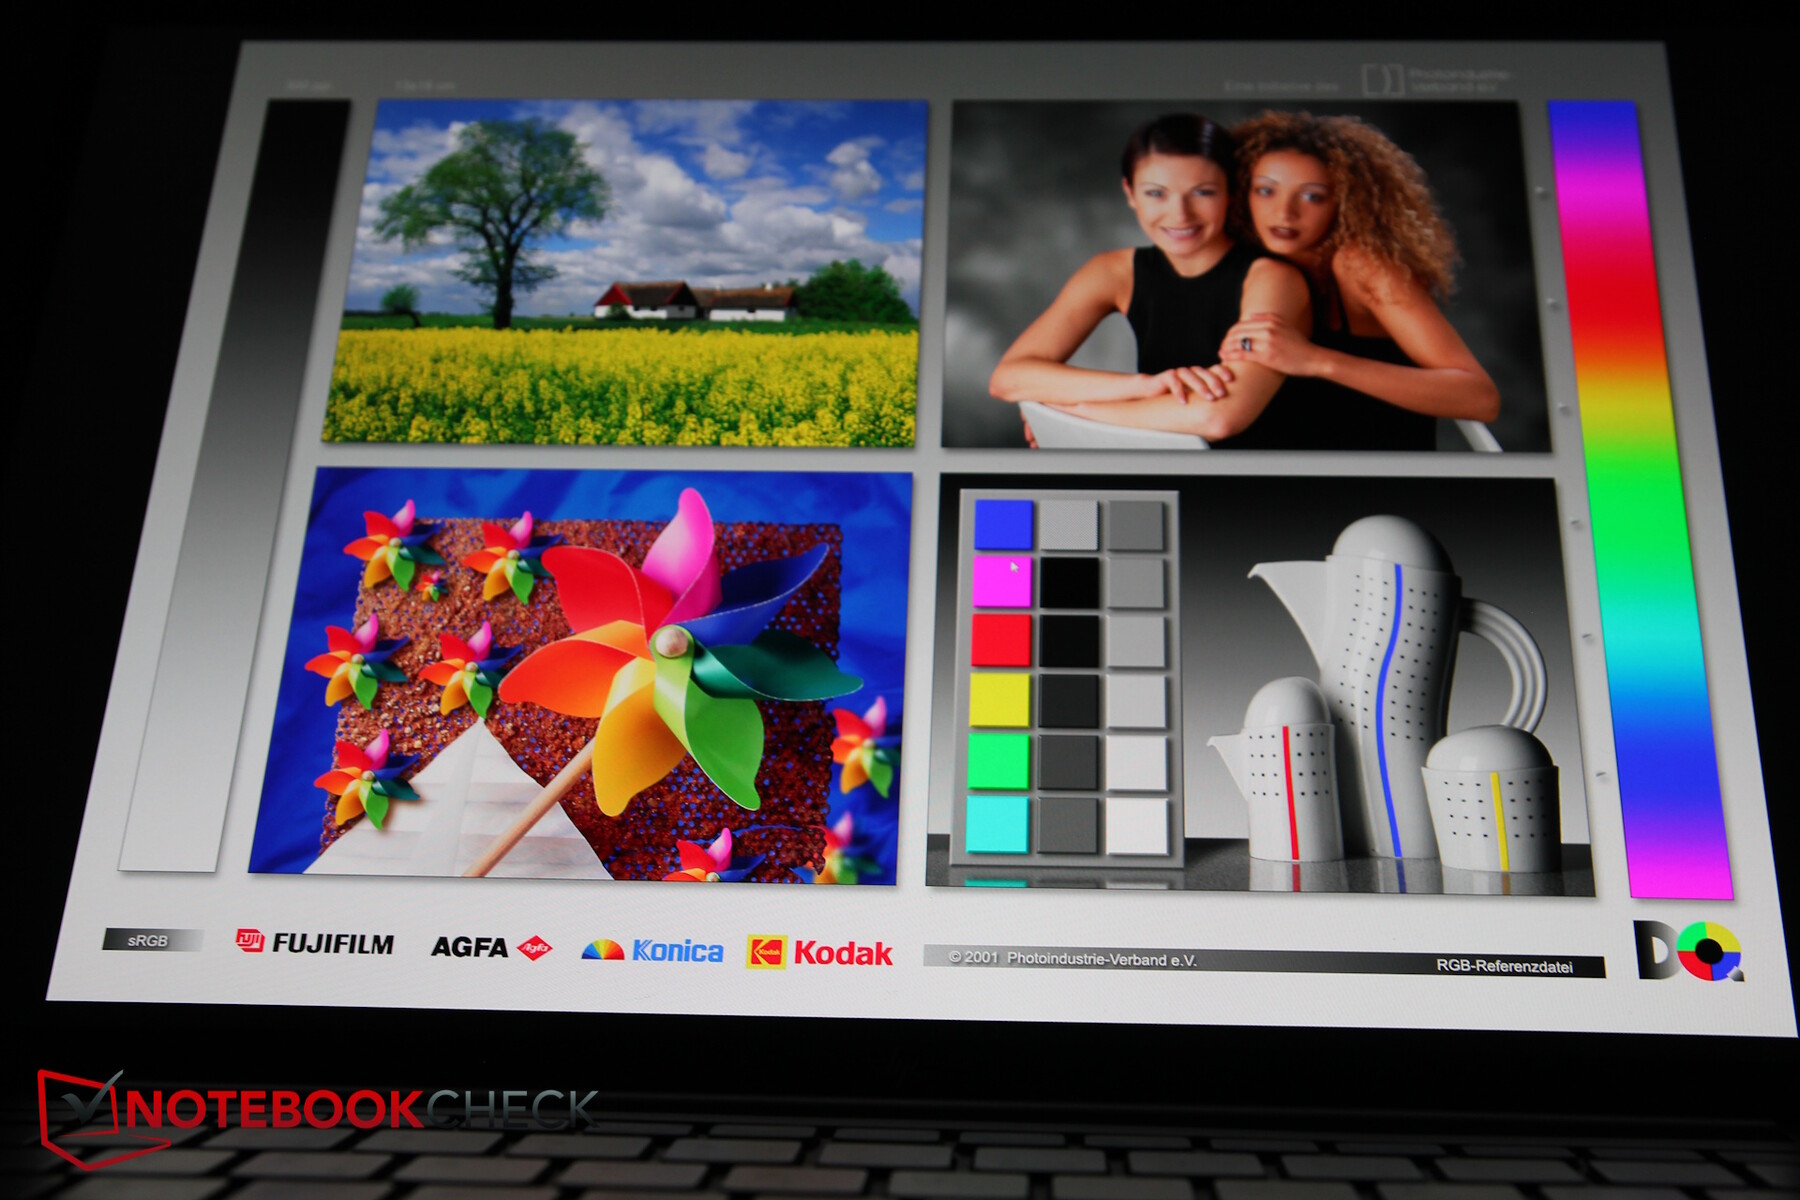
Display - ZBook 8 G1i 14 with 14 options
We counted no fewer than 14 display options, ranging from 1200p panels with or without touch (300 to 800 nits) to our 1600p version with 120 Hz, 500 nits, and no touch support.
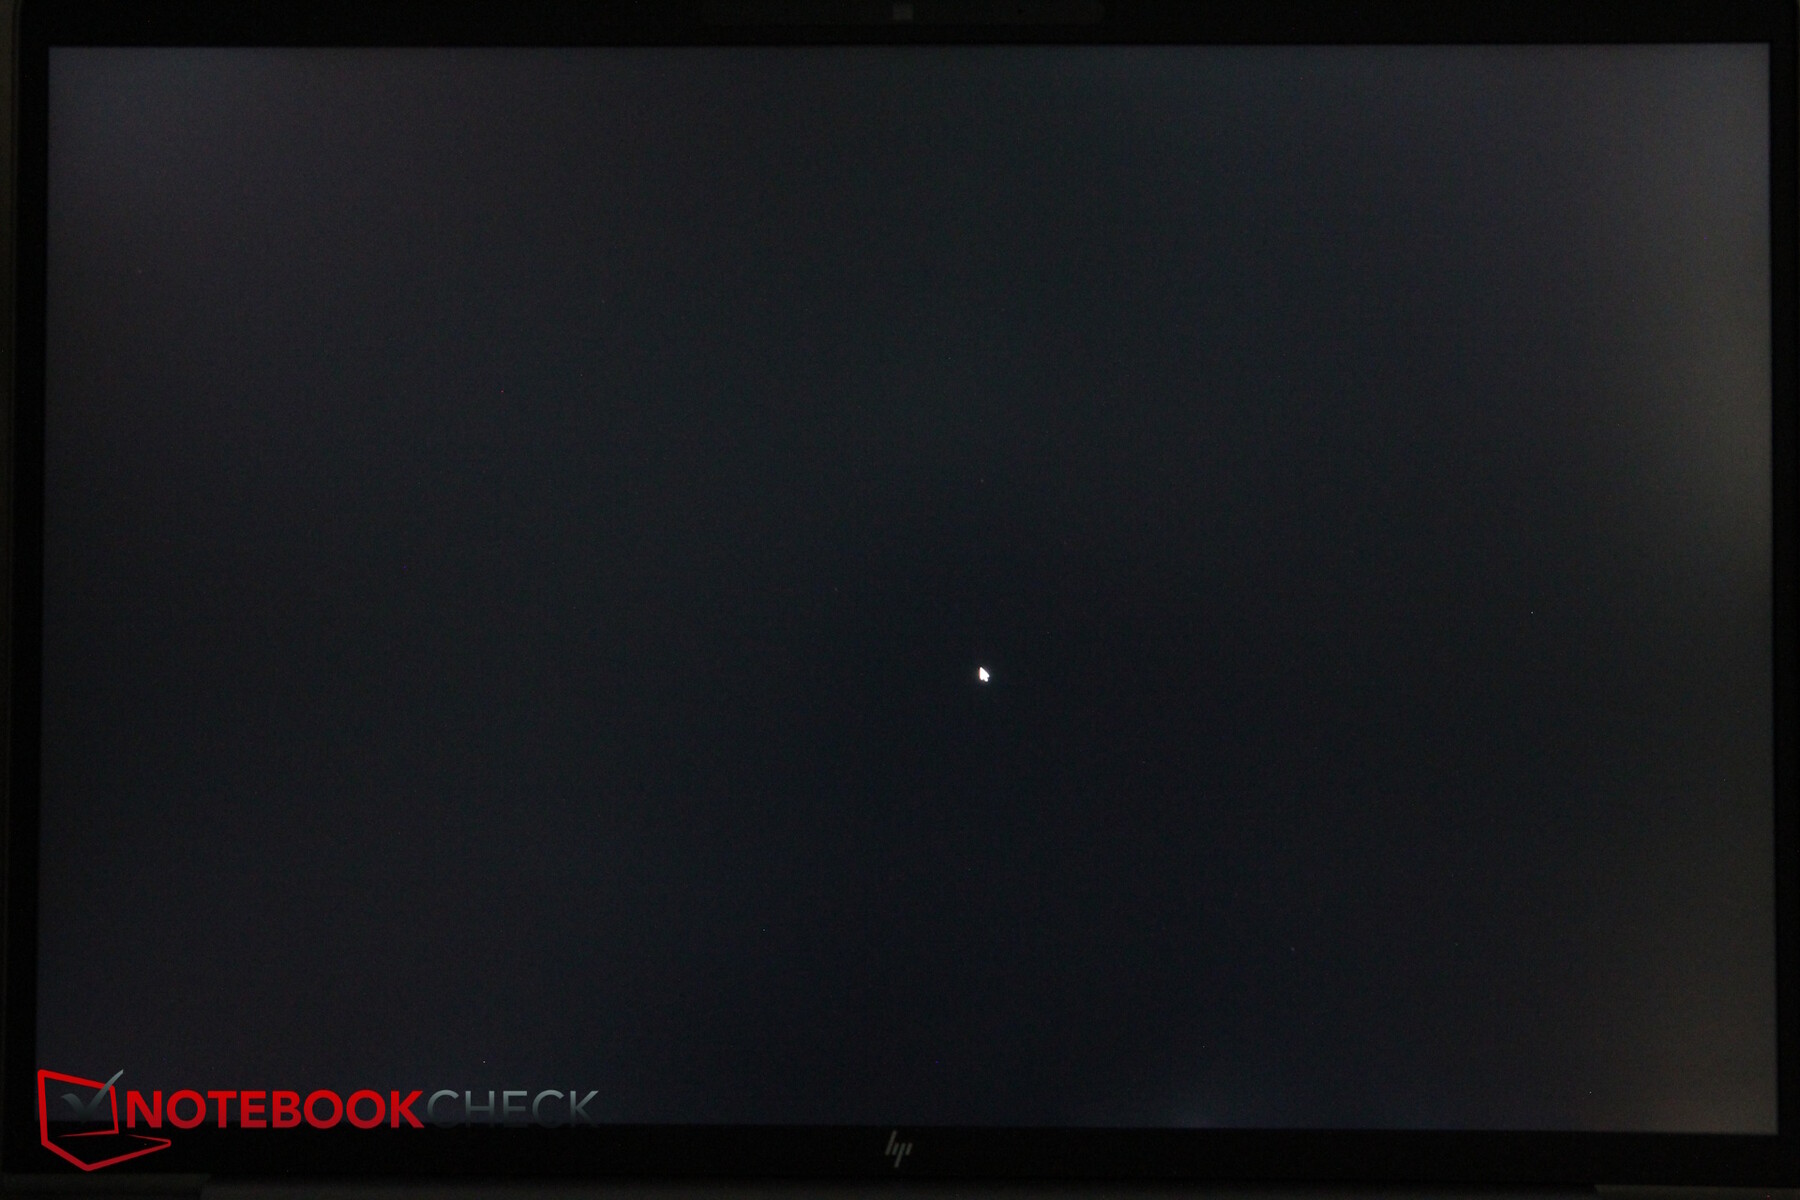
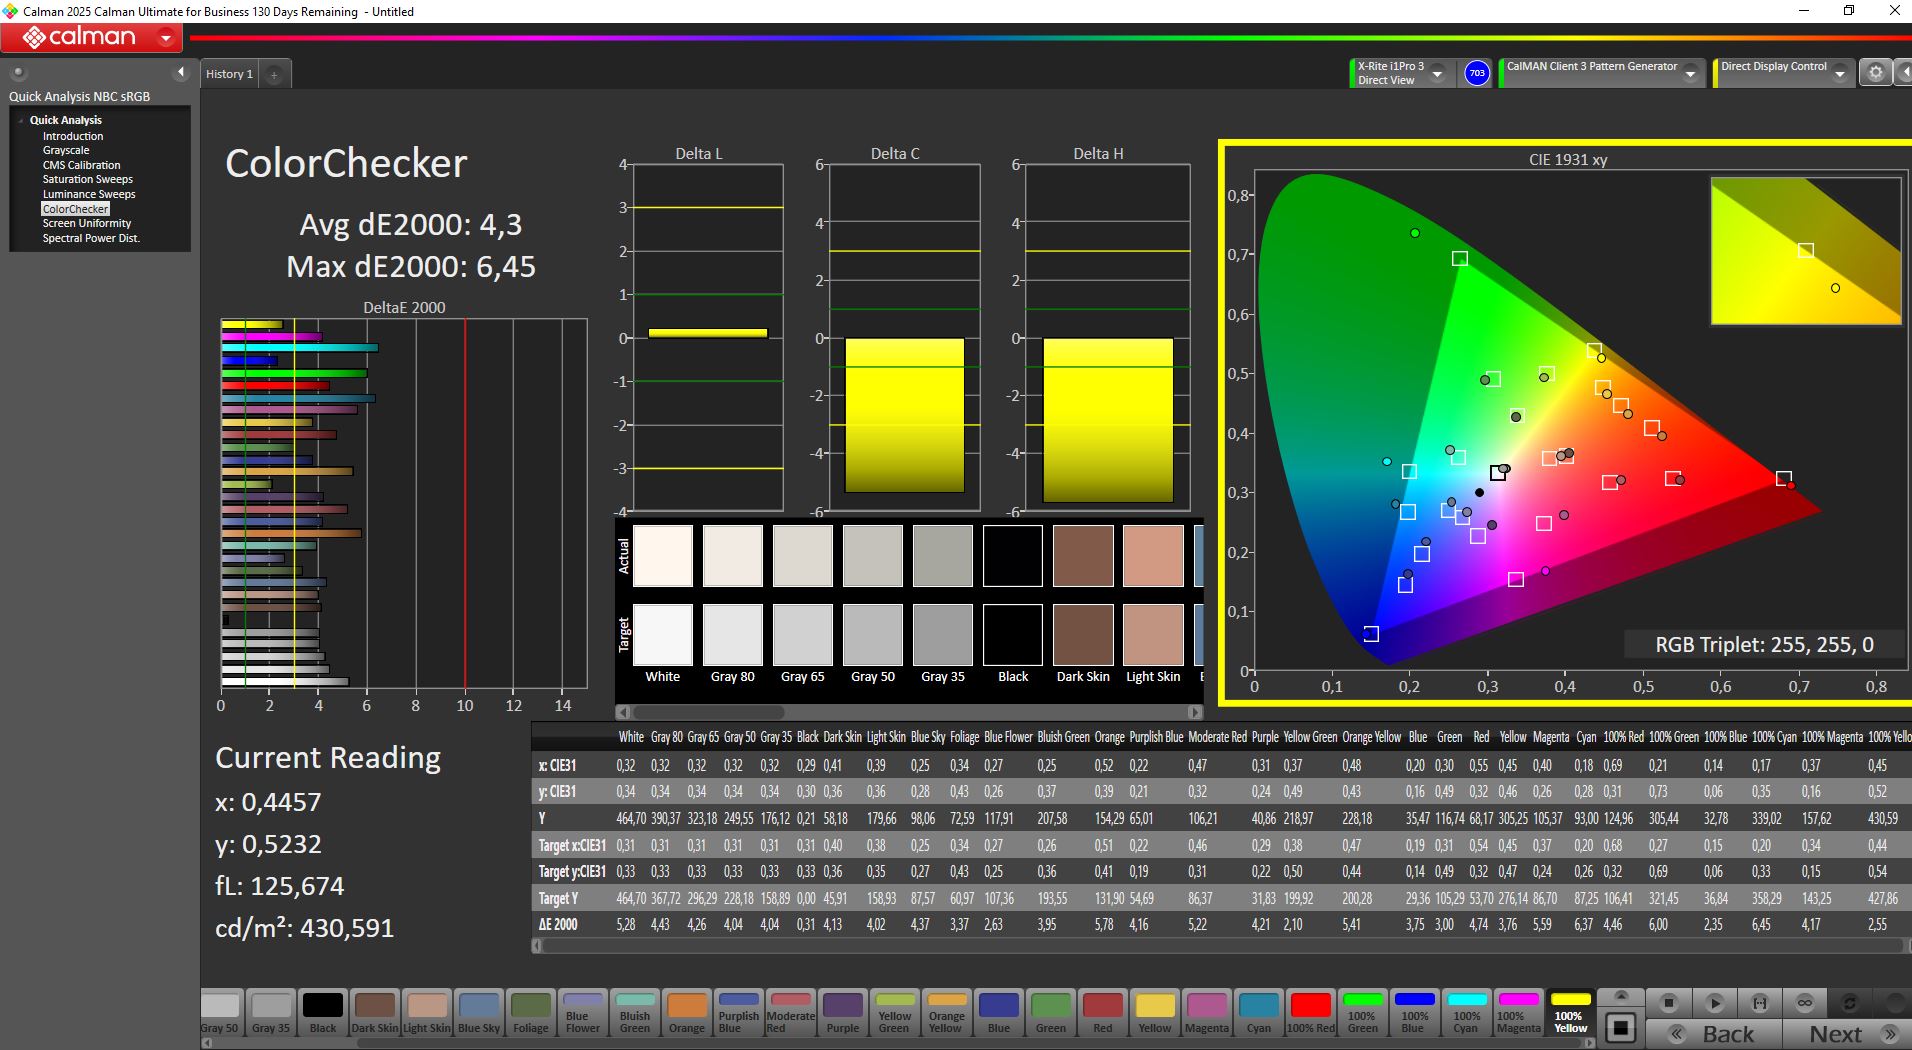
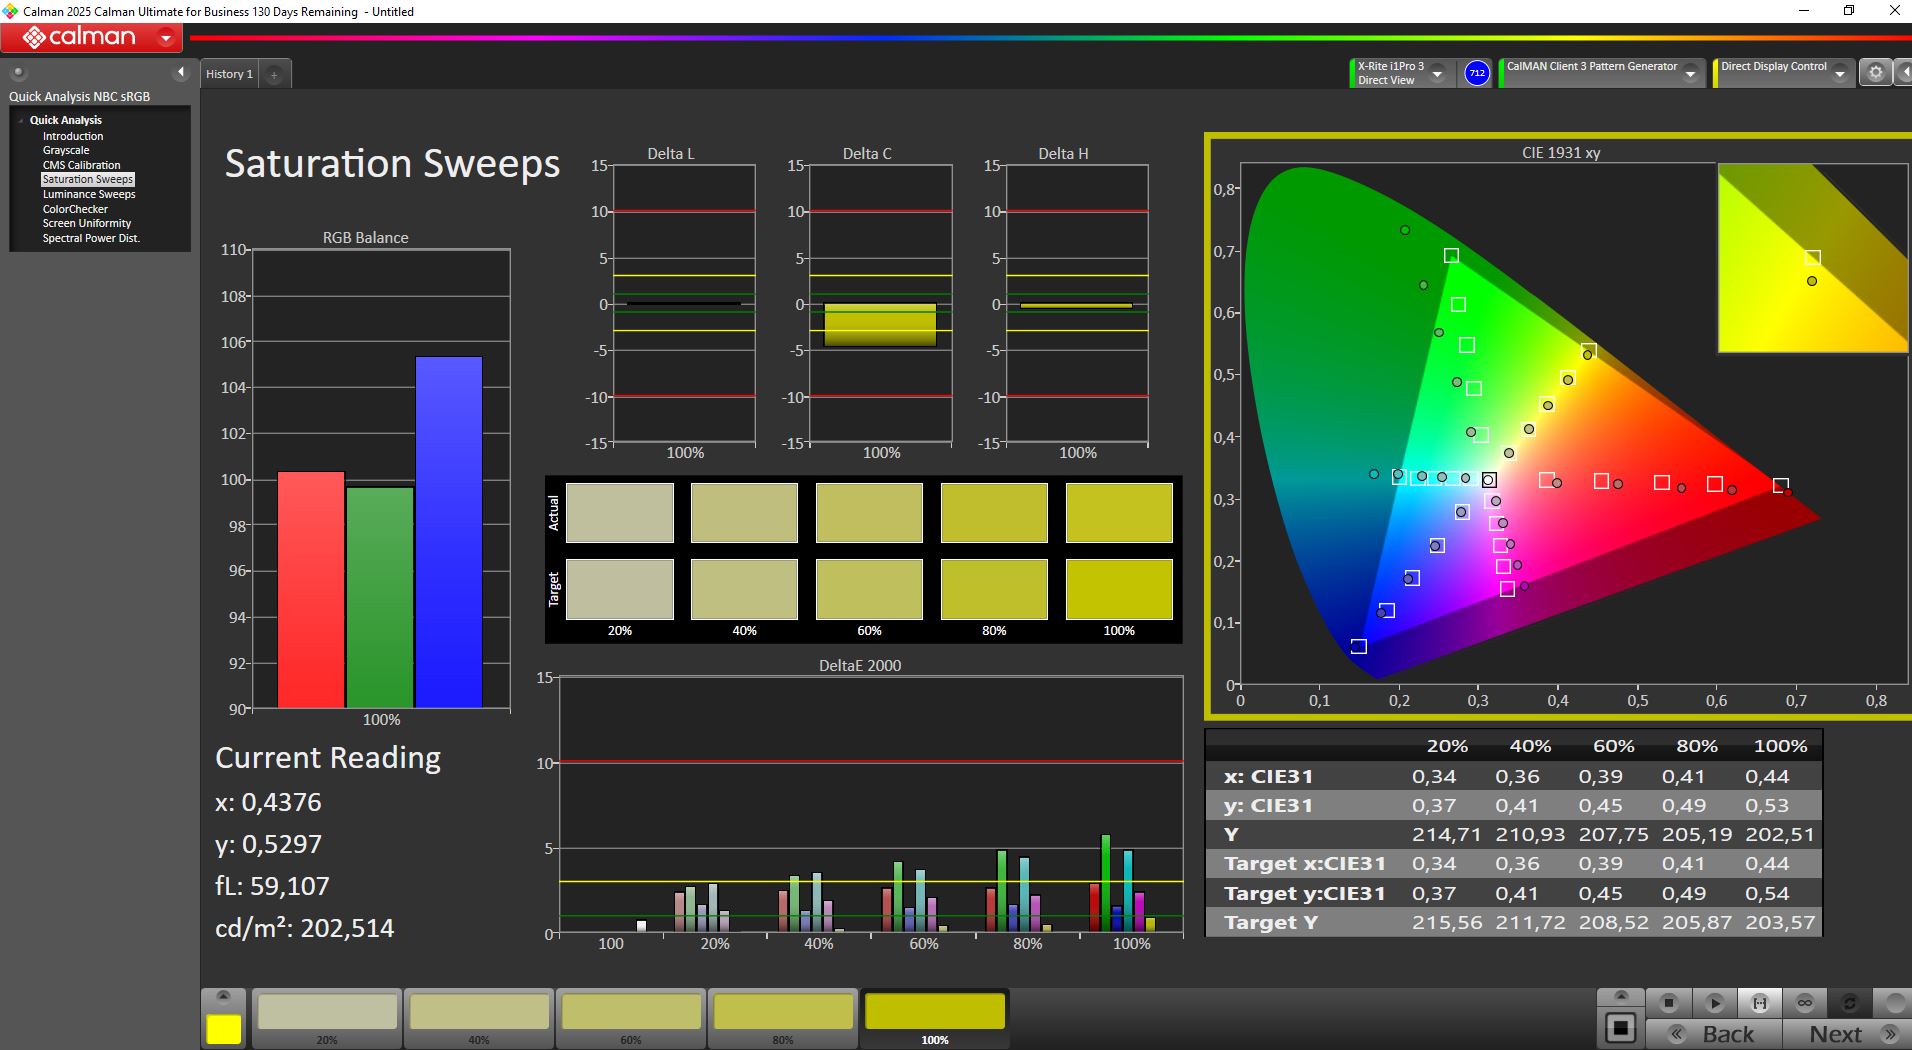
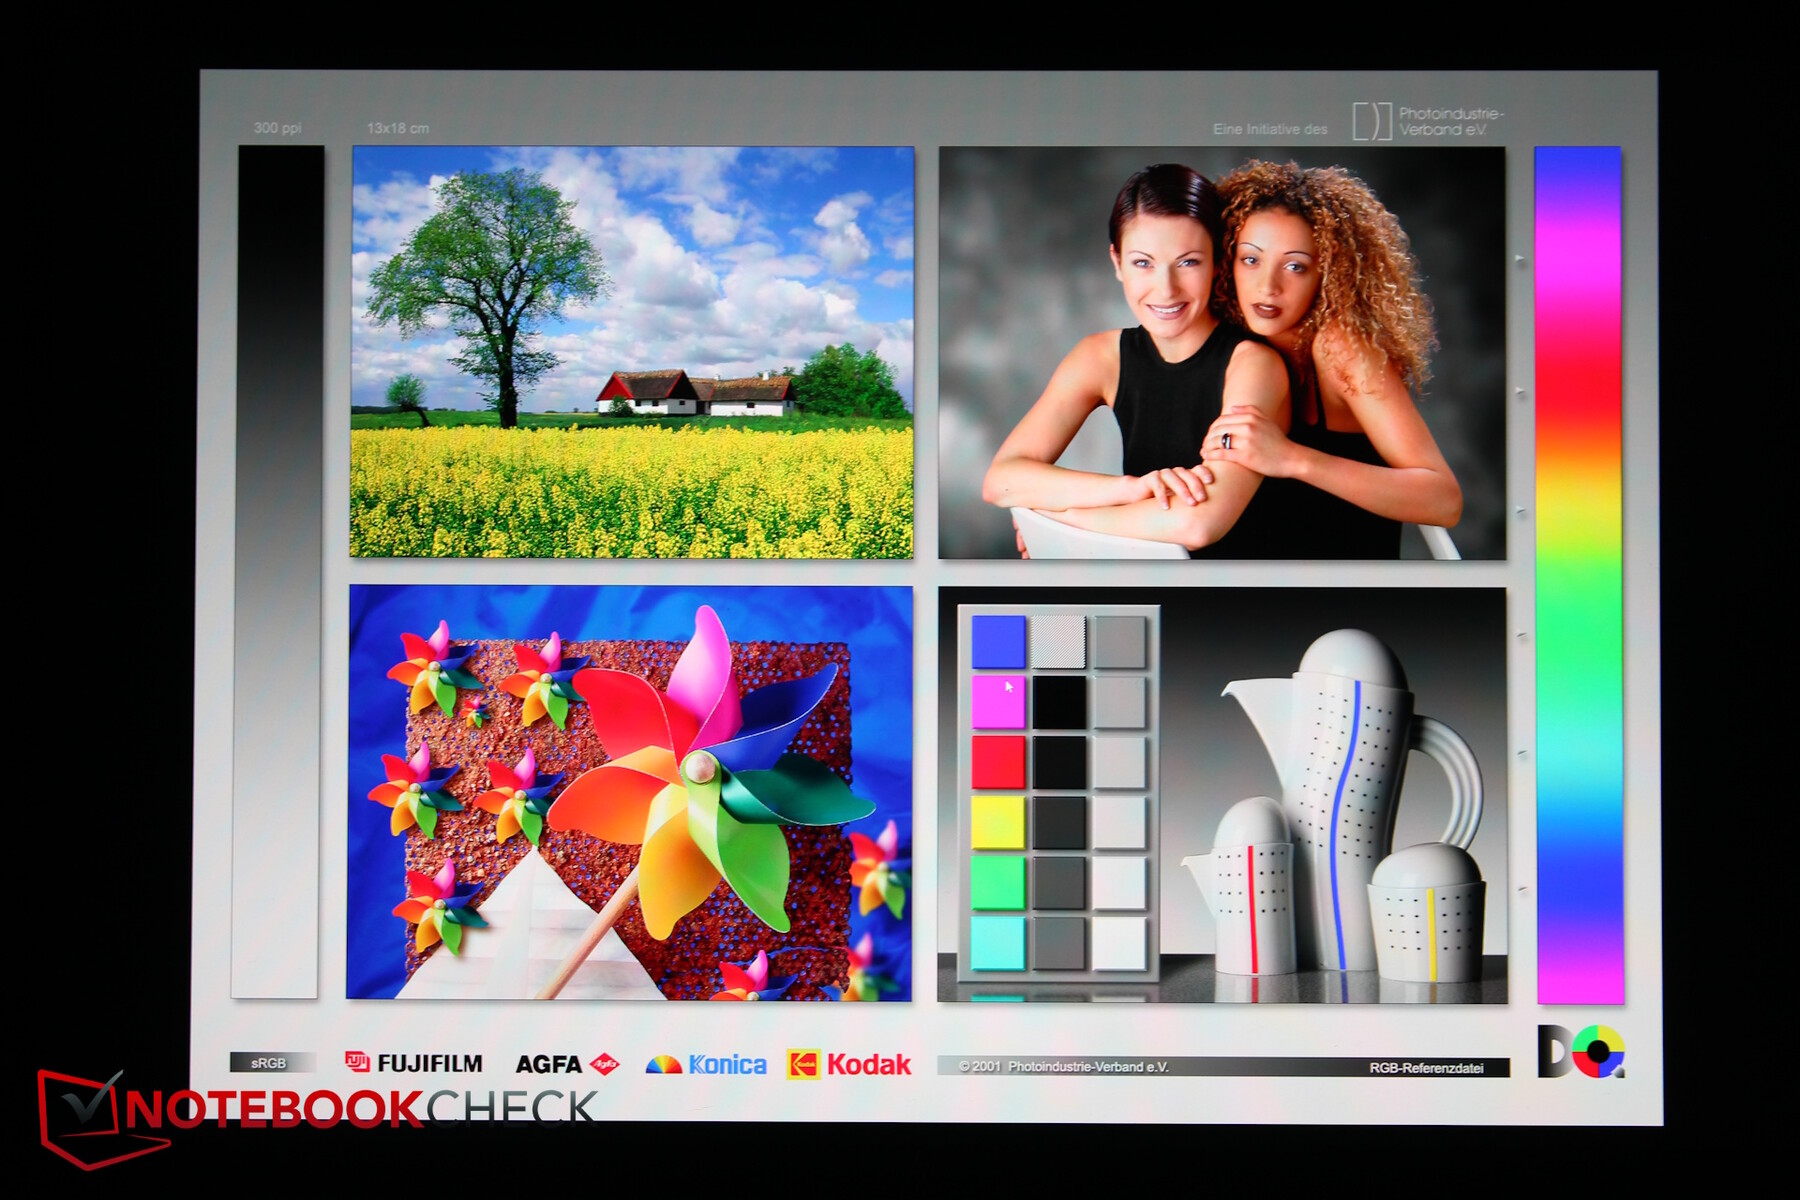
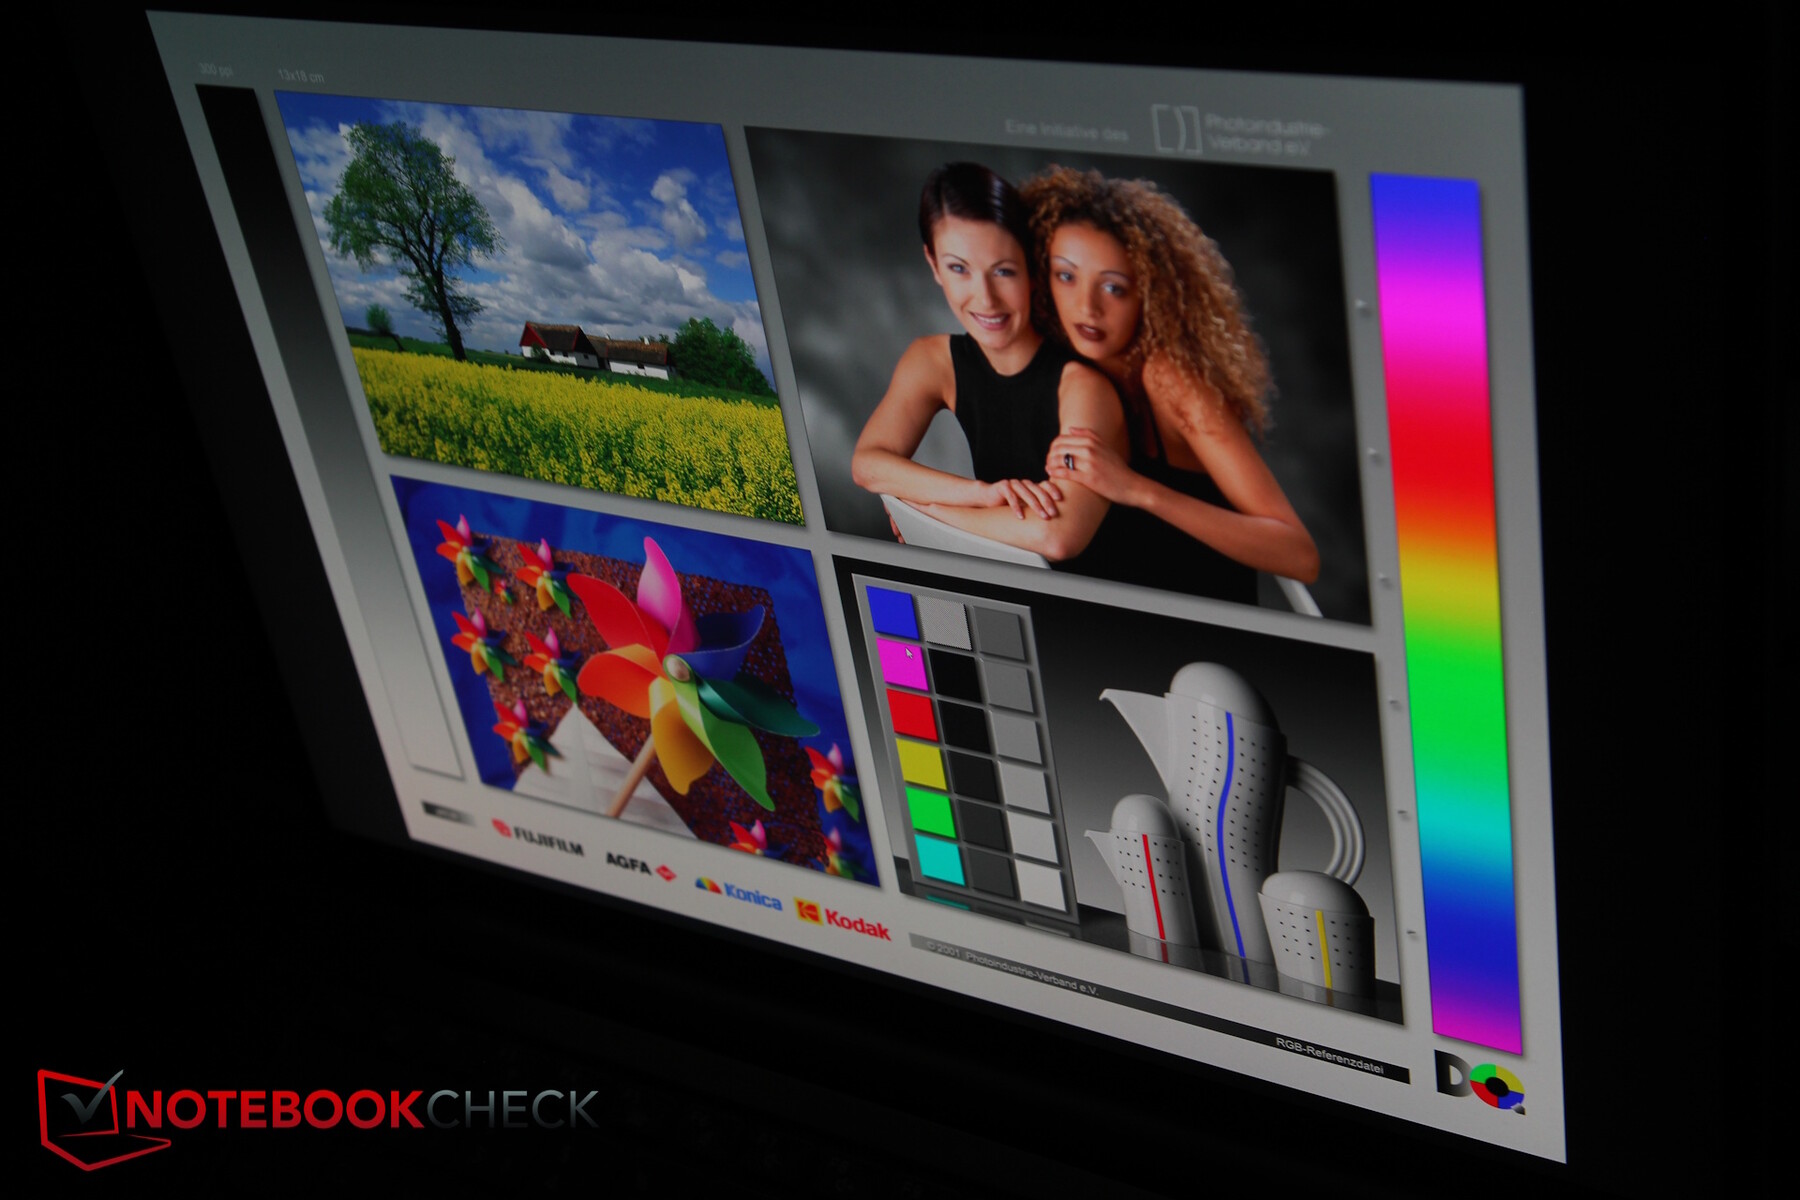
Our unit reached “only” 429 nits, but black level and contrast are impressive, and the panel almost fully covers the sRGB, DisplayP3, and AdobeRGB colour spaces.
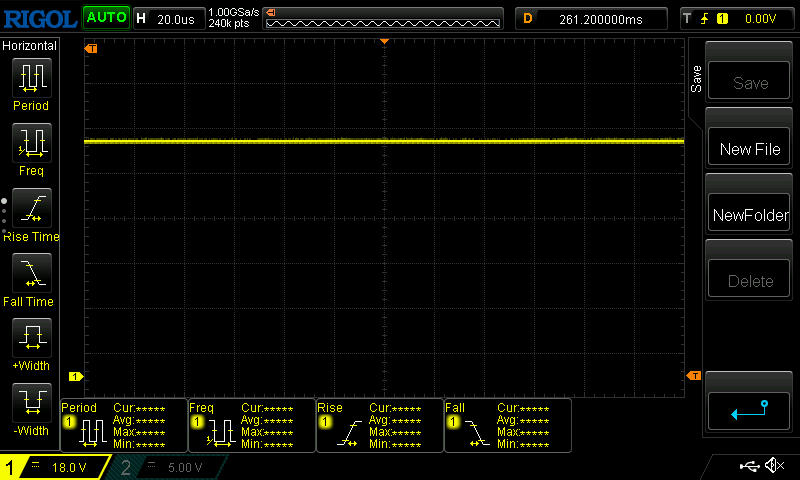
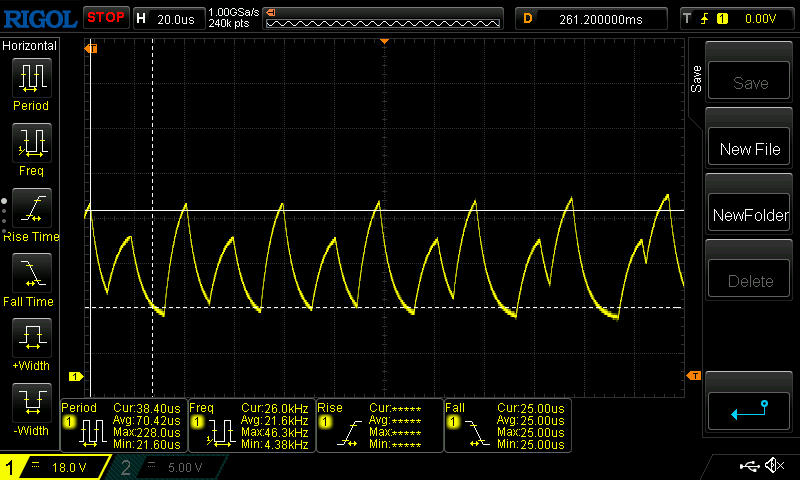
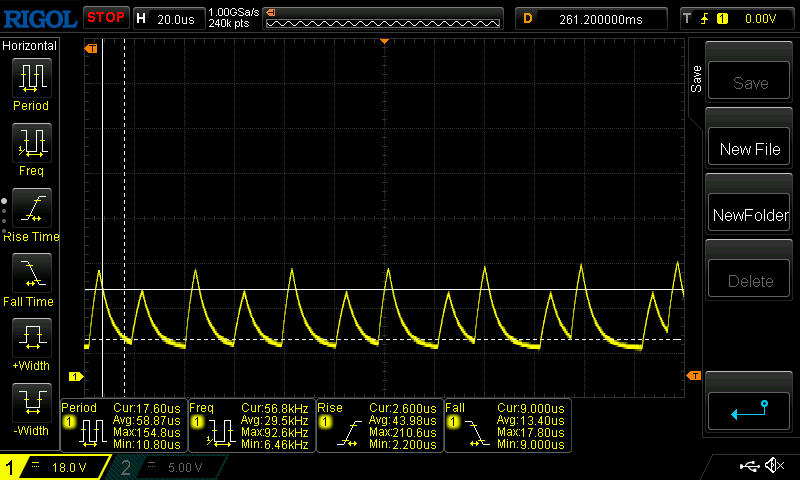
Below 75 percent brightness, PWM is used at a frequency of 25 kHz.
| |||||||||||||||||||||||||
Brightness Distribution: 87 %
Center on Battery: 464 cd/m²
Contrast: 2320:1 (Black: 0.2 cd/m²)
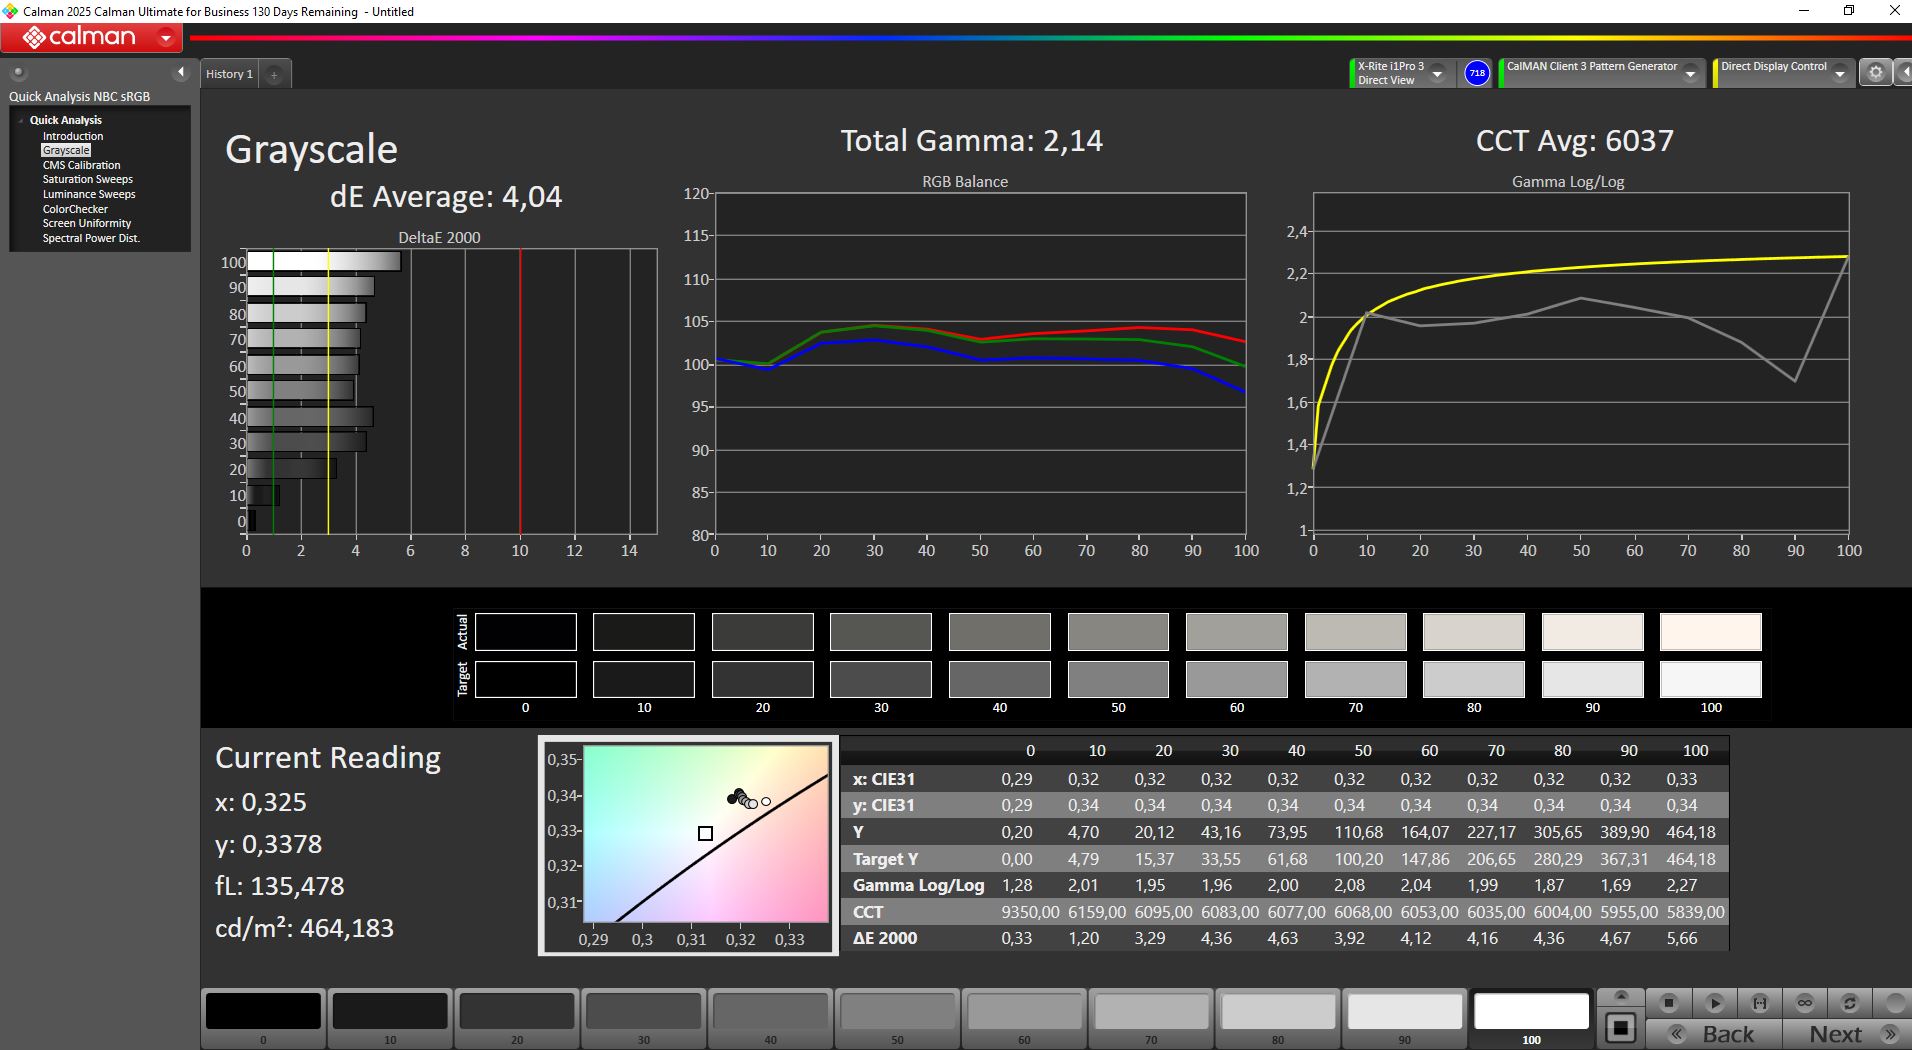
ΔE ColorChecker Calman: 4.3 | ∀{0.5-29.43 Ø4.72}
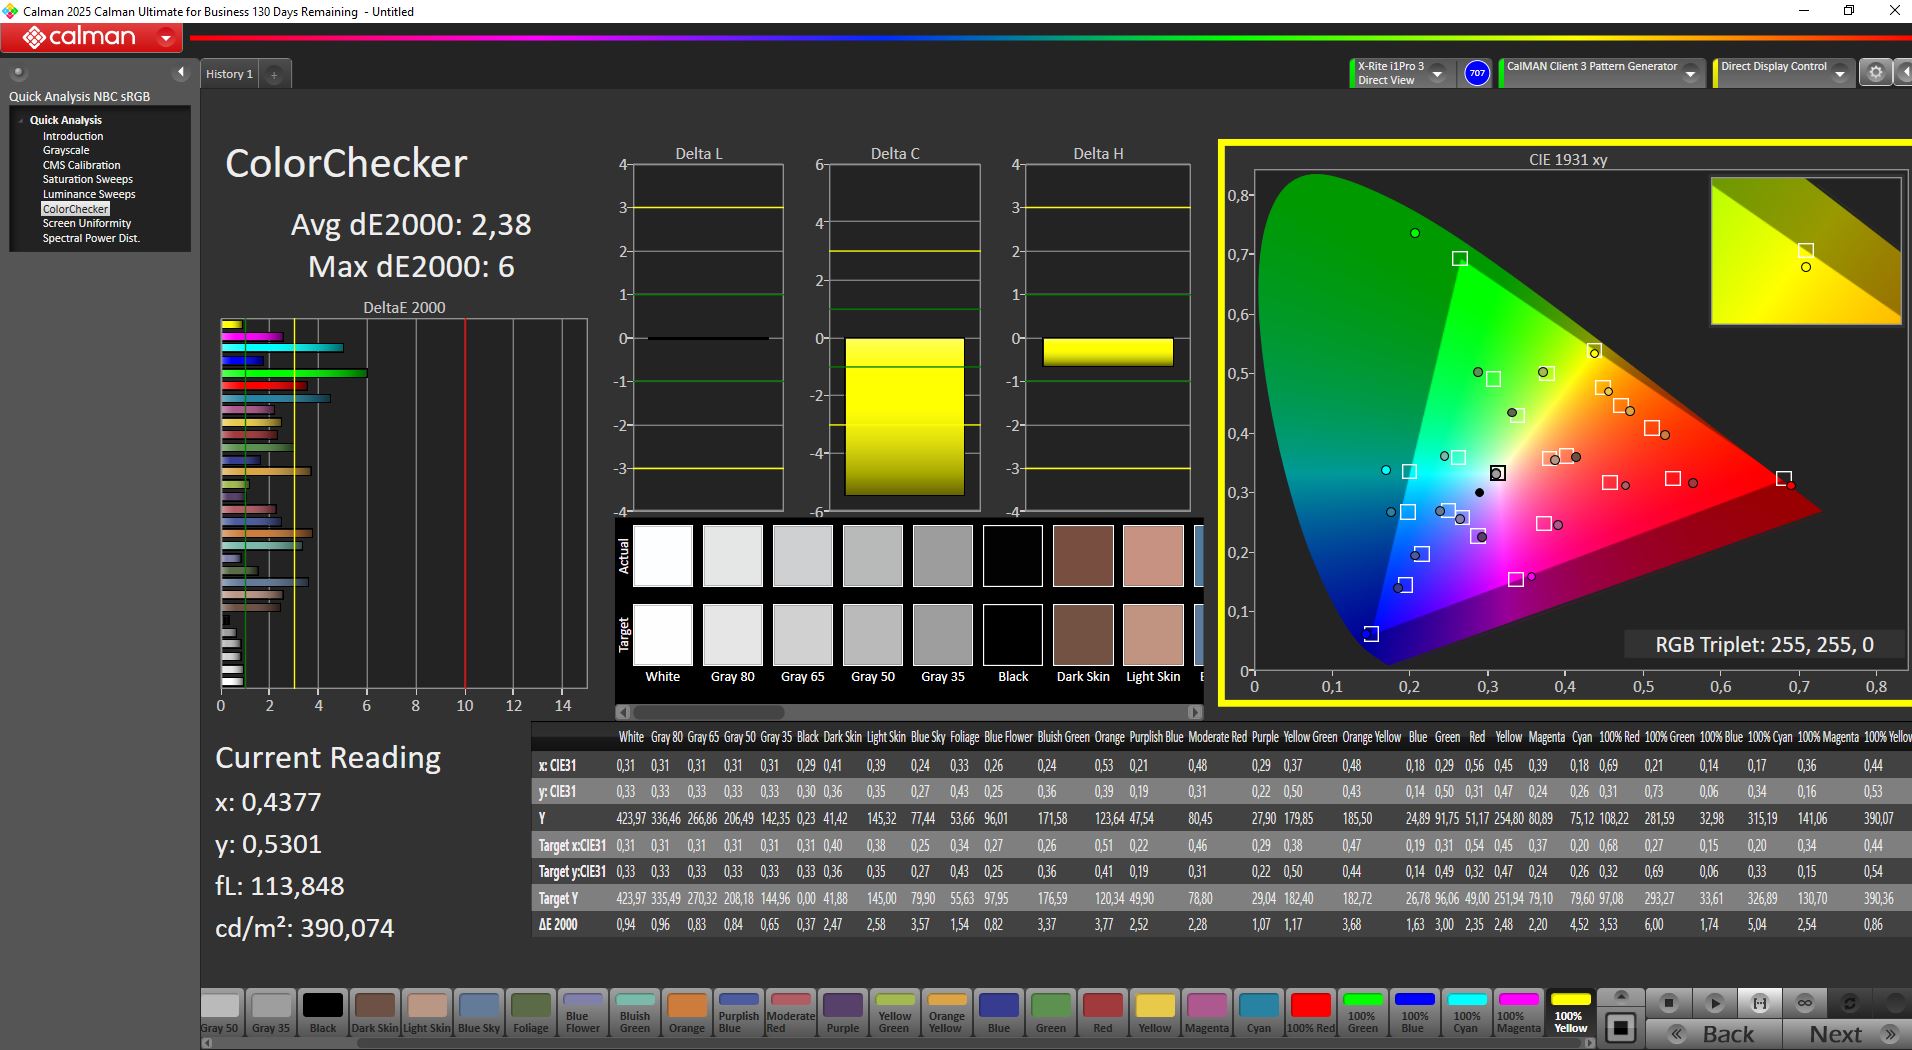
calibrated: 2.38
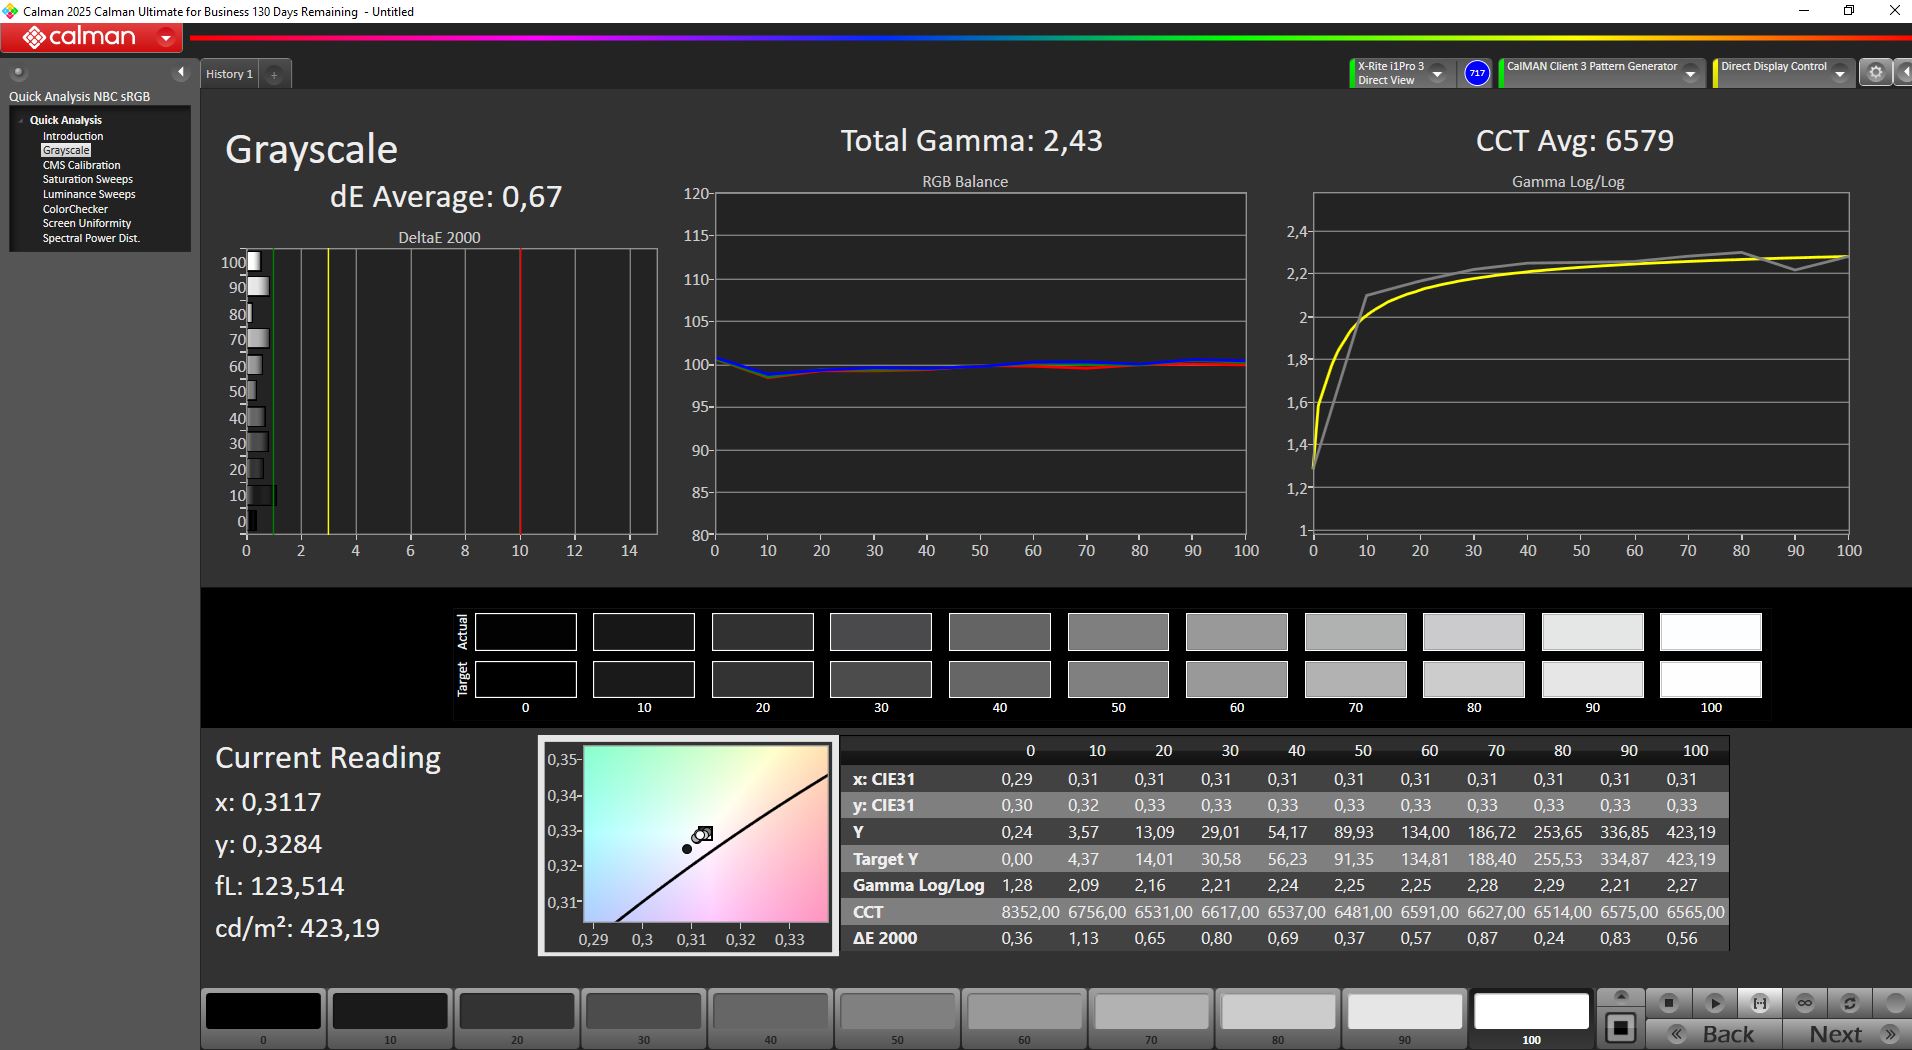
ΔE Greyscale Calman: 4.04 | ∀{0.09-98 Ø4.97}
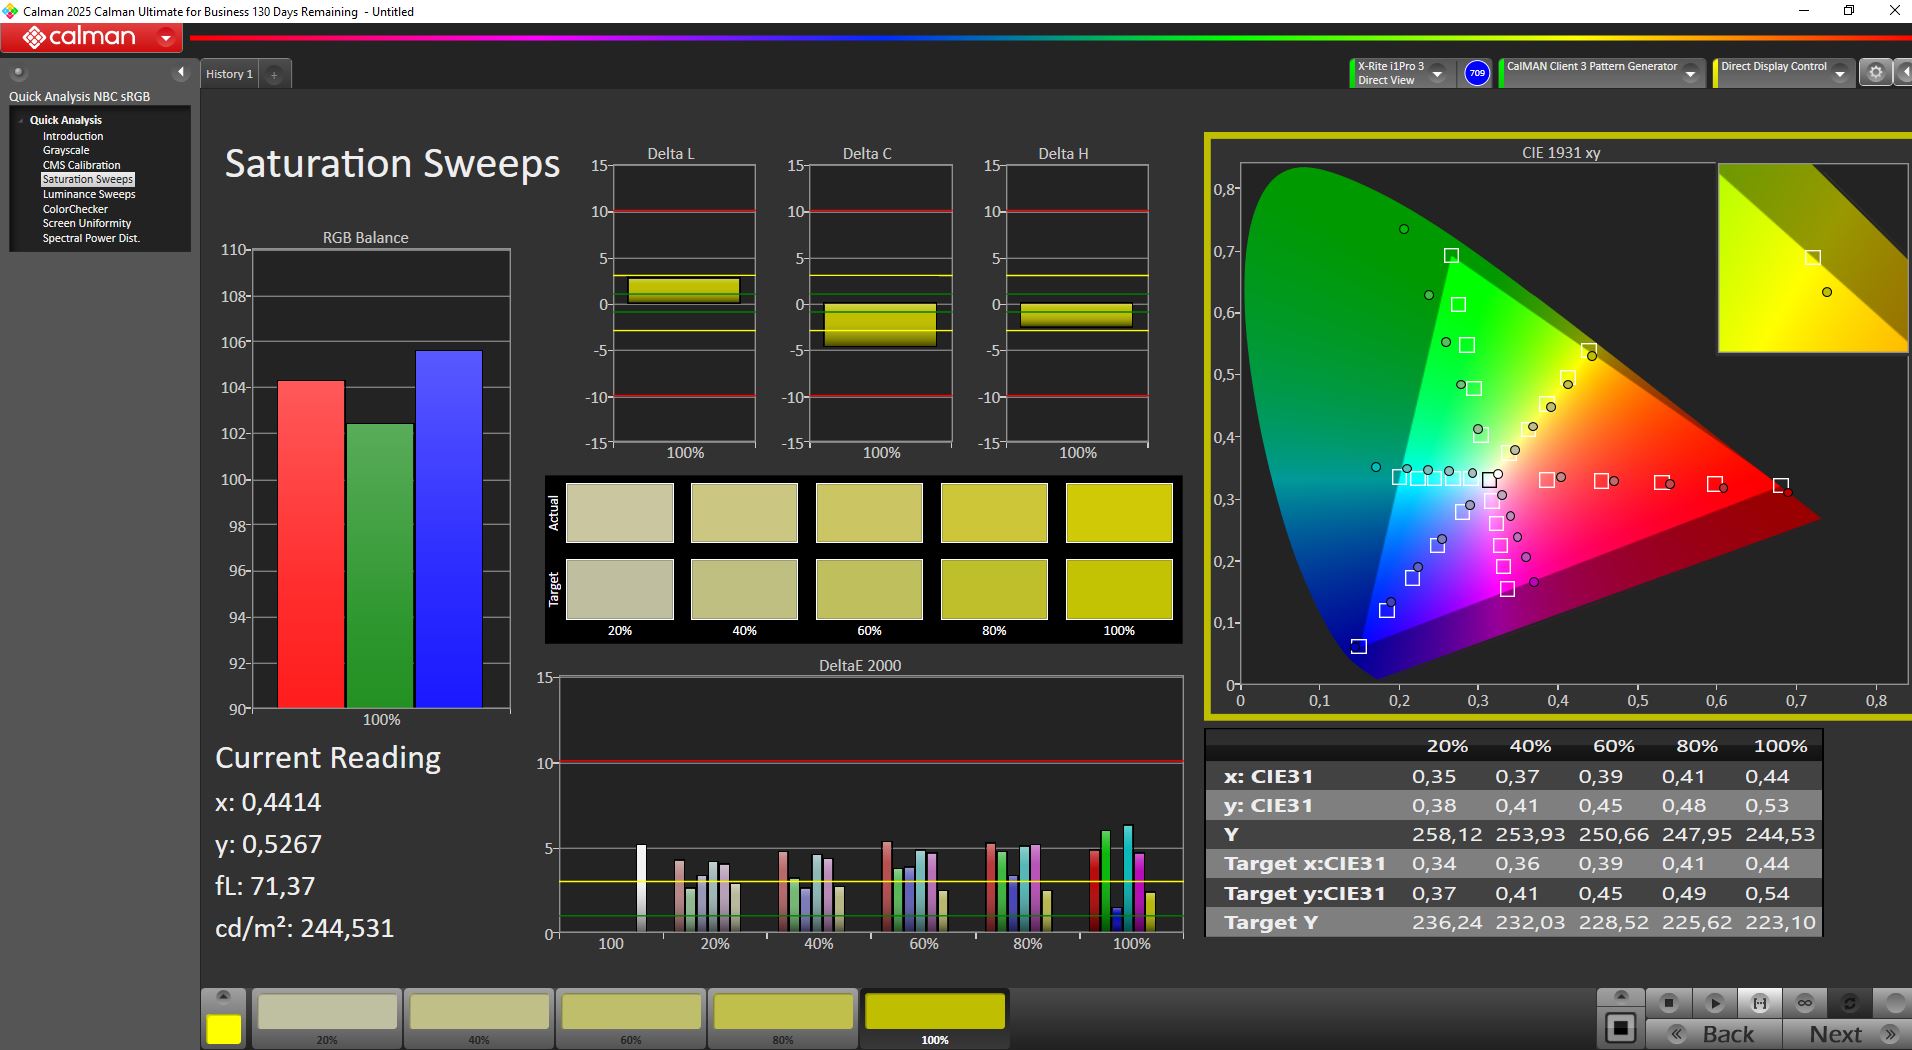
99.9% AdobeRGB 1998 (Argyll 3D)
99.9% sRGB (Argyll 3D)
96.5% Display P3 (Argyll 3D)
Gamma: 2.14
CCT: 6037 K
| HP ZBook 8 G1i 14, RTX 500 LG Philips LGD07B5, IPS, 2560x1600, 14", 120 Hz | HP ZBook 8 G1i 14 LGD07B5, IPS LED, 2560x1600, 14", 120 Hz | HP ZBook Ultra G1a A3ZQ0ET LGD07A1, IPS LED, 1920x1200, 14", 60 Hz | Lenovo ThinkPad P14s Gen 6 21RV0017GE NE140WUM-N6M, IPS LED, 1920x1200, 14", 60 Hz | Dell Precision 5000 5490 AU Optronics B140QAN, IPS, 2560x1600, 14", 60 Hz | HP ZBook Firefly 14 G11 AUO6DA8, IPS, 2560x1600, 14", 120 Hz | |
|---|---|---|---|---|---|---|
| Display | -0% | -23% | -21% | -12% | -4% | |
| Display P3 Coverage (%) | 96.5 | 95.8 -1% | 65.8 -32% | 67.1 -30% | 79.7 -17% | 98.9 2% |
| sRGB Coverage (%) | 99.9 | 99.9 0% | 97.4 -3% | 98.6 -1% | 100 0% | 99.9 0% |
| AdobeRGB 1998 Coverage (%) | 99.9 | 99.9 0% | 67.1 -33% | 69.2 -31% | 79.5 -20% | 86.6 -13% |
| Response Times | -4% | -26% | 12% | -45% | 65% | |
| Response Time Grey 50% / Grey 80% * (ms) | 39.6 ? | 30.3 ? 23% | 52 ? -31% | 31.1 ? 21% | 52.3 ? -32% | 12.3 ? 69% |
| Response Time Black / White * (ms) | 21.05 ? | 22.2 ? -5% | 25.3 ? -20% | 20.5 ? 3% | 33.3 ? -58% | 8.3 ? 61% |
| PWM Frequency (Hz) | 26000 | 24000 ? | ||||
| PWM Amplitude * (%) | 58.3 | 75 -29% | ||||
| Screen | -26% | -5% | 12% | 8% | 2% | |
| Brightness middle (cd/m²) | 464 | 441 -5% | 406 -12% | 558 20% | 485.1 5% | 554.1 19% |
| Brightness (cd/m²) | 429 | 417 -3% | 379 -12% | 545 27% | 471 10% | 540 26% |
| Brightness Distribution (%) | 87 | 92 6% | 89 2% | 91 5% | 90 3% | 93 7% |
| Black Level * (cd/m²) | 0.2 | 0.2 -0% | 0.28 -40% | 0.32 -60% | 0.38 -90% | 0.58 -190% |
| Contrast (:1) | 2320 | 2205 -5% | 1450 -37% | 1744 -25% | 1277 -45% | 955 -59% |
| Colorchecker dE 2000 * | 4.3 | 6.4 -49% | 3.3 23% | 2.7 37% | 2.15 50% | 2.54 41% |
| Colorchecker dE 2000 max. * | 6.45 | 11 -71% | 6.4 1% | 5.3 18% | 5.39 16% | 4.99 23% |
| Colorchecker dE 2000 calibrated * | 2.38 | 4.8 -102% | 1.1 54% | 0.7 71% | 0.67 72% | 0.56 76% |
| Greyscale dE 2000 * | 4.04 | 4.3 -6% | 5 -24% | 3.5 13% | 2 50% | 1 75% |
| Gamma | 2.14 103% | 1.92 115% | 2.33 94% | 2.1 105% | 2.3 96% | 2.3 96% |
| CCT | 6037 108% | 6017 108% | 6163 105% | 7191 90% | 6826 95% | 6556 99% |
| Total Average (Program / Settings) | -10% /
-16% | -18% /
-12% | 1% /
5% | -16% /
-4% | 21% /
10% |
* ... smaller is better
Manual calibration reduces grayscale and colour deviations.
Display Response Times
| ↔ Response Time Black to White | ||
|---|---|---|
| 21.05 ms ... rise ↗ and fall ↘ combined | ↗ 5.2 ms rise | 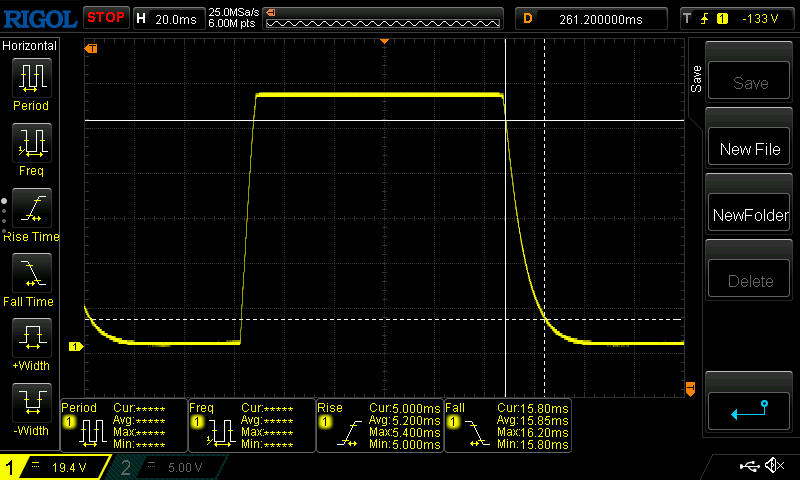 |
| ↘ 15.85 ms fall | ||
| The screen shows good response rates in our tests, but may be too slow for competitive gamers. In comparison, all tested devices range from 0.1 (minimum) to 240 (maximum) ms. » 47 % of all devices are better. This means that the measured response time is similar to the average of all tested devices (19.8 ms). | ||
| ↔ Response Time 50% Grey to 80% Grey | ||
| 39.6 ms ... rise ↗ and fall ↘ combined | ↗ 13.4 ms rise | 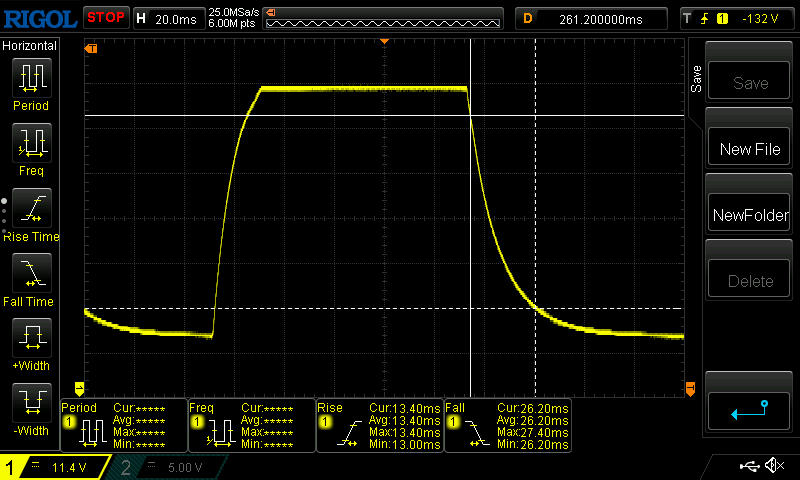 |
| ↘ 26.2 ms fall | ||
| The screen shows slow response rates in our tests and will be unsatisfactory for gamers. In comparison, all tested devices range from 0.165 (minimum) to 636 (maximum) ms. » 61 % of all devices are better. This means that the measured response time is worse than the average of all tested devices (31 ms). | ||
Screen Flickering / PWM (Pulse-Width Modulation)
| Screen flickering / PWM detected | 26000 Hz Amplitude: 58.3 % | 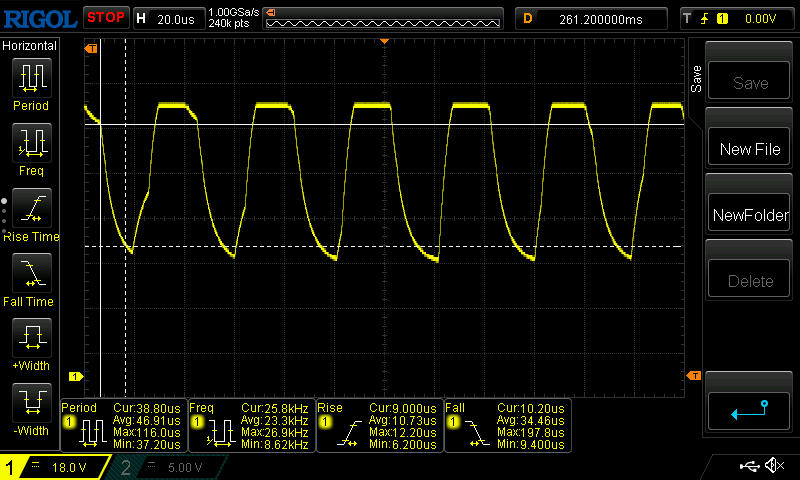 | |
The display backlight flickers at 26000 Hz (worst case, e.g., utilizing PWM) . The frequency of 26000 Hz is quite high, so most users sensitive to PWM should not notice any flickering. In comparison: 52 % of all tested devices do not use PWM to dim the display. If PWM was detected, an average of 7747 (minimum: 5 - maximum: 343500) Hz was measured. | |||


Performance – consistently high ZBook performance
As a workstation, the ZBook 8 G1i targets project managers, business professionals, designers, engineers, and content creators. Its strong hardware, including 64 GB of RAM, a Core Ultra 7 265H and an RTX 500, provides the necessary performance for demanding workloads.
Test conditions
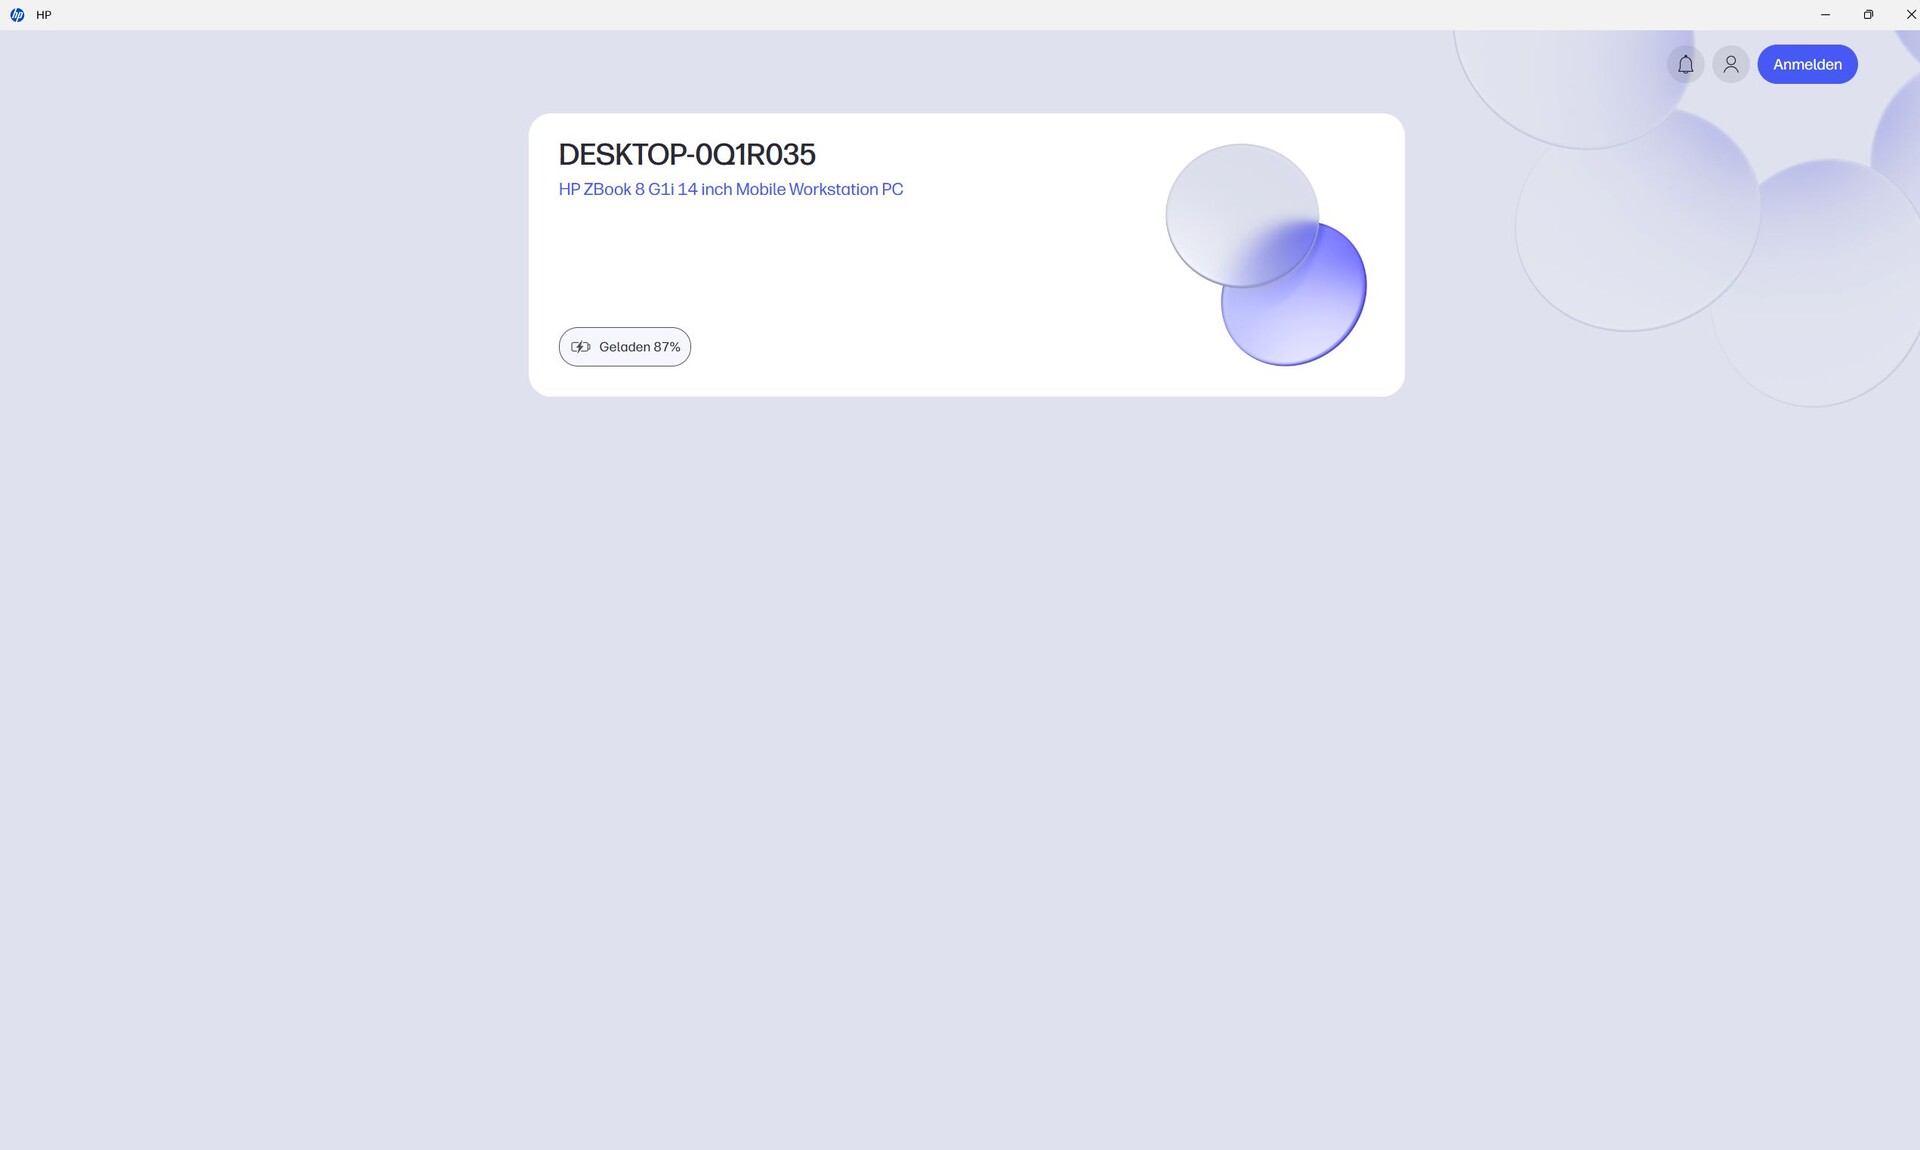
The "Support Assistant", "System Information", "PC Diagnostics Windows", and "HP Device Control" apps could easily have been integrated into a single application.
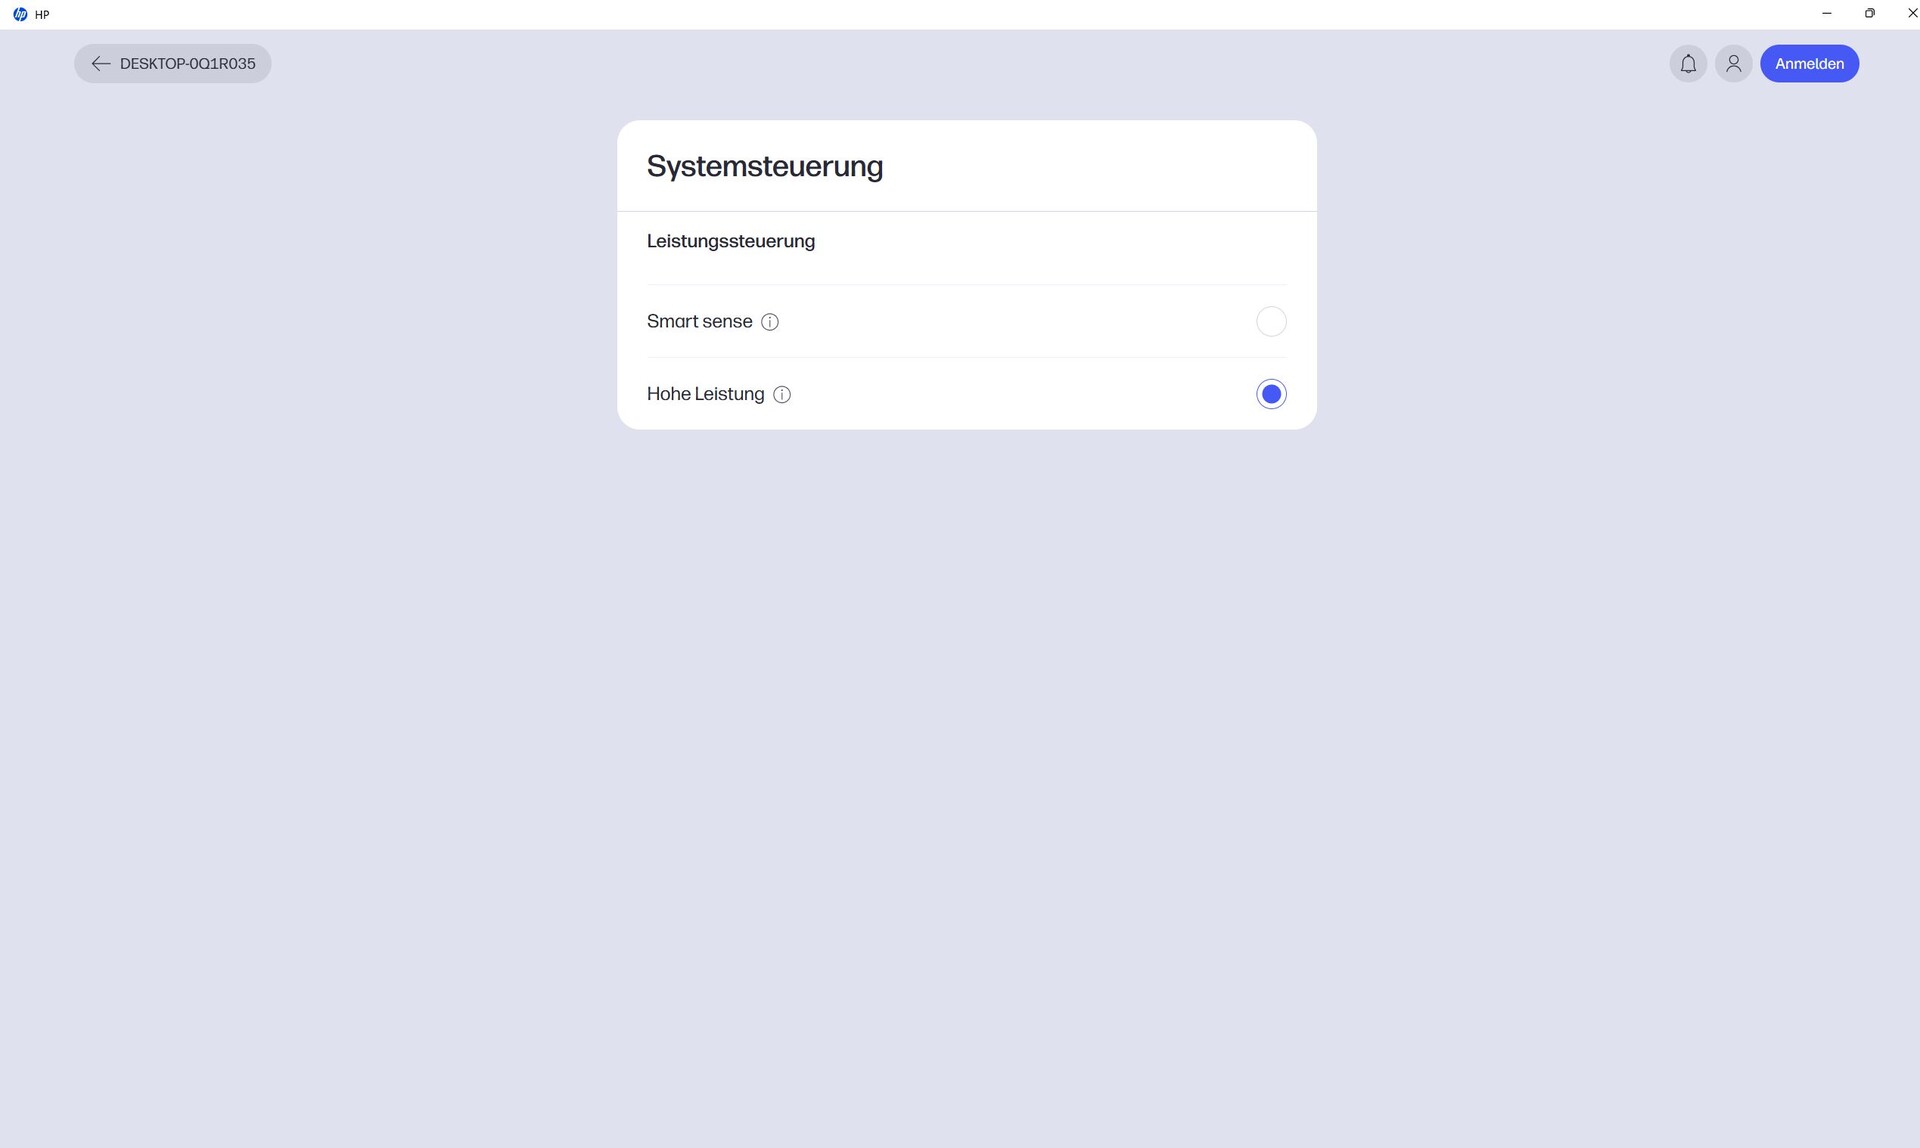
The "HP App" takes far too long to load (sometimes it does not finish at all), and parts of it are incorrectly or incompletely translated. Under "System control" we find two performance modes, of which we used "High performance" for our tests.
Due to a bug, the battery sometimes does not fully charge, even when the setting in "Battery Manager" is changed to "Minimise battery status management".

Processor
Our 16-core Core Ultra 7 265H shows relatively consistent performance in Cinebench R15, with only a slight drop after the fifth run.
Overall CPU results are very good, although the chip is not significantly faster than the Core Ultra 7 255H in our earlier test configuration. The ZBook Ultra G1a with the Ryzen AI Max PRO 390 still holds a clear lead.
In battery mode, CPU performance drops by around 13 percent.
Cinebench R15 Multi endurance test
Cinebench R23: Multi Core | Single Core
Cinebench R20: CPU (Multi Core) | CPU (Single Core)
Cinebench R15: CPU Multi 64Bit | CPU Single 64Bit
Blender: v2.79 BMW27 CPU
7-Zip 18.03: 7z b 4 | 7z b 4 -mmt1
Geekbench 6.7: Multi-Core | Single-Core
Geekbench 5.5: Multi-Core | Single-Core
HWBOT x265 Benchmark v2.2: 4k Preset
LibreOffice : 20 Documents To PDF
R Benchmark 2.5: Overall mean
| CPU Performance rating | |
| Average of class Workstation | |
| HP ZBook Ultra G1a A3ZQ0ET | |
| Average Intel Core Ultra 7 265H | |
| HP ZBook 8 G1i 14 | |
| HP ZBook 8 G1i 14, RTX 500 | |
| Lenovo ThinkPad P14s Gen 6 21RV0017GE | |
| Dell Precision 5000 5490 | |
| HP ZBook Firefly 14 G11 | |
| Cinebench R23 / Multi Core | |
| Average of class Workstation (14621 - 38520, n=23, last 2 years) | |
| HP ZBook Ultra G1a A3ZQ0ET | |
| Average Intel Core Ultra 7 265H (19421 - 21369, n=3) | |
| HP ZBook 8 G1i 14, RTX 500 | |
| HP ZBook 8 G1i 14 | |
| Lenovo ThinkPad P14s Gen 6 21RV0017GE | |
| Dell Precision 5000 5490 | |
| HP ZBook Firefly 14 G11 | |
| Cinebench R23 / Single Core | |
| HP ZBook 8 G1i 14, RTX 500 | |
| Average Intel Core Ultra 7 265H (2011 - 2081, n=3) | |
| HP ZBook 8 G1i 14 | |
| Average of class Workstation (1712 - 2228, n=23, last 2 years) | |
| HP ZBook Ultra G1a A3ZQ0ET | |
| Lenovo ThinkPad P14s Gen 6 21RV0017GE | |
| Dell Precision 5000 5490 | |
| HP ZBook Firefly 14 G11 | |
| Cinebench R20 / CPU (Multi Core) | |
| Average of class Workstation (5760 - 15043, n=23, last 2 years) | |
| HP ZBook Ultra G1a A3ZQ0ET | |
| Average Intel Core Ultra 7 265H (7532 - 8400, n=3) | |
| HP ZBook 8 G1i 14, RTX 500 | |
| HP ZBook 8 G1i 14 | |
| Lenovo ThinkPad P14s Gen 6 21RV0017GE | |
| Dell Precision 5000 5490 | |
| HP ZBook Firefly 14 G11 | |
| Cinebench R20 / CPU (Single Core) | |
| HP ZBook 8 G1i 14, RTX 500 | |
| Average Intel Core Ultra 7 265H (776 - 793, n=3) | |
| HP ZBook 8 G1i 14 | |
| Average of class Workstation (671 - 857, n=23, last 2 years) | |
| HP ZBook Ultra G1a A3ZQ0ET | |
| Lenovo ThinkPad P14s Gen 6 21RV0017GE | |
| Dell Precision 5000 5490 | |
| HP ZBook Firefly 14 G11 | |
| Cinebench R15 / CPU Multi 64Bit | |
| Average of class Workstation (2489 - 5810, n=23, last 2 years) | |
| HP ZBook Ultra G1a A3ZQ0ET | |
| Average Intel Core Ultra 7 265H (2851 - 3440, n=3) | |
| Lenovo ThinkPad P14s Gen 6 21RV0017GE | |
| HP ZBook 8 G1i 14, RTX 500 | |
| HP ZBook 8 G1i 14 | |
| Dell Precision 5000 5490 | |
| HP ZBook Firefly 14 G11 | |
| Cinebench R15 / CPU Single 64Bit | |
| HP ZBook 8 G1i 14, RTX 500 | |
| Average Intel Core Ultra 7 265H (305 - 312, n=3) | |
| HP ZBook 8 G1i 14 | |
| HP ZBook Ultra G1a A3ZQ0ET | |
| Average of class Workstation (191.4 - 328, n=23, last 2 years) | |
| HP ZBook Firefly 14 G11 | |
| Dell Precision 5000 5490 | |
| Lenovo ThinkPad P14s Gen 6 21RV0017GE | |
| Blender / v2.79 BMW27 CPU | |
| HP ZBook Firefly 14 G11 | |
| Dell Precision 5000 5490 | |
| HP ZBook 8 G1i 14 | |
| HP ZBook 8 G1i 14, RTX 500 | |
| Average Intel Core Ultra 7 265H (164 - 180, n=3) | |
| Lenovo ThinkPad P14s Gen 6 21RV0017GE | |
| Average of class Workstation (91 - 222, n=23, last 2 years) | |
| HP ZBook Ultra G1a A3ZQ0ET | |
| 7-Zip 18.03 / 7z b 4 | |
| HP ZBook Ultra G1a A3ZQ0ET | |
| Average of class Workstation (60489 - 116969, n=23, last 2 years) | |
| Lenovo ThinkPad P14s Gen 6 21RV0017GE | |
| Dell Precision 5000 5490 | |
| HP ZBook 8 G1i 14, RTX 500 | |
| Average Intel Core Ultra 7 265H (60489 - 68913, n=3) | |
| HP ZBook 8 G1i 14 | |
| HP ZBook Firefly 14 G11 | |
| 7-Zip 18.03 / 7z b 4 -mmt1 | |
| HP ZBook 8 G1i 14, RTX 500 | |
| Average of class Workstation (5126 - 6960, n=23, last 2 years) | |
| HP ZBook Ultra G1a A3ZQ0ET | |
| Average Intel Core Ultra 7 265H (5777 - 6304, n=3) | |
| Lenovo ThinkPad P14s Gen 6 21RV0017GE | |
| HP ZBook 8 G1i 14 | |
| Dell Precision 5000 5490 | |
| HP ZBook Firefly 14 G11 | |
| Geekbench 6.7 / Multi-Core | |
| Average of class Workstation (12721 - 20887, n=23, last 2 years) | |
| HP ZBook 8 G1i 14, RTX 500 | |
| HP ZBook 8 G1i 14 | |
| Average Intel Core Ultra 7 265H (14502 - 17144, n=4) | |
| HP ZBook Ultra G1a A3ZQ0ET | |
| Lenovo ThinkPad P14s Gen 6 21RV0017GE | |
| Dell Precision 5000 5490 | |
| HP ZBook Firefly 14 G11 | |
| Geekbench 6.7 / Single-Core | |
| HP ZBook 8 G1i 14, RTX 500 | |
| Average Intel Core Ultra 7 265H (2822 - 2911, n=4) | |
| HP ZBook 8 G1i 14 | |
| Lenovo ThinkPad P14s Gen 6 21RV0017GE | |
| Average of class Workstation (2389 - 3065, n=23, last 2 years) | |
| HP ZBook Ultra G1a A3ZQ0ET | |
| HP ZBook Firefly 14 G11 | |
| Dell Precision 5000 5490 | |
| Geekbench 5.5 / Multi-Core | |
| Average of class Workstation (11542 - 25554, n=23, last 2 years) | |
| HP ZBook Ultra G1a A3ZQ0ET | |
| Average Intel Core Ultra 7 265H (14714 - 16453, n=3) | |
| HP ZBook 8 G1i 14, RTX 500 | |
| HP ZBook 8 G1i 14 | |
| Lenovo ThinkPad P14s Gen 6 21RV0017GE | |
| Dell Precision 5000 5490 | |
| HP ZBook Firefly 14 G11 | |
| Geekbench 5.5 / Single-Core | |
| Lenovo ThinkPad P14s Gen 6 21RV0017GE | |
| HP ZBook 8 G1i 14, RTX 500 | |
| Average Intel Core Ultra 7 265H (2037 - 2110, n=3) | |
| HP ZBook 8 G1i 14 | |
| Average of class Workstation (1783 - 2183, n=23, last 2 years) | |
| HP ZBook Ultra G1a A3ZQ0ET | |
| HP ZBook Firefly 14 G11 | |
| Dell Precision 5000 5490 | |
| HWBOT x265 Benchmark v2.2 / 4k Preset | |
| HP ZBook Ultra G1a A3ZQ0ET | |
| Average of class Workstation (17.8 - 40.5, n=23, last 2 years) | |
| Average Intel Core Ultra 7 265H (22.9 - 25.3, n=3) | |
| Lenovo ThinkPad P14s Gen 6 21RV0017GE | |
| HP ZBook 8 G1i 14, RTX 500 | |
| HP ZBook 8 G1i 14 | |
| Dell Precision 5000 5490 | |
| HP ZBook Firefly 14 G11 | |
| LibreOffice / 20 Documents To PDF | |
| HP ZBook 8 G1i 14, RTX 500 | |
| Average Intel Core Ultra 7 265H (42.2 - 74.7, n=3) | |
| HP ZBook Ultra G1a A3ZQ0ET | |
| Lenovo ThinkPad P14s Gen 6 21RV0017GE | |
| HP ZBook Firefly 14 G11 | |
| Average of class Workstation (37.1 - 74.7, n=23, last 2 years) | |
| HP ZBook 8 G1i 14 | |
| Dell Precision 5000 5490 | |
| R Benchmark 2.5 / Overall mean | |
| Dell Precision 5000 5490 | |
| HP ZBook Firefly 14 G11 | |
| Average Intel Core Ultra 7 265H (0.4241 - 0.4696, n=3) | |
| HP ZBook 8 G1i 14 | |
| Average of class Workstation (0.3825 - 0.603, n=23, last 2 years) | |
| HP ZBook 8 G1i 14, RTX 500 | |
| Lenovo ThinkPad P14s Gen 6 21RV0017GE | |
| HP ZBook Ultra G1a A3ZQ0ET | |
* ... smaller is better
AIDA64: FP32 Ray-Trace | FPU Julia | CPU SHA3 | CPU Queen | FPU SinJulia | FPU Mandel | CPU AES | CPU ZLib | FP64 Ray-Trace | CPU PhotoWorxx
| Performance rating | |
| HP ZBook Ultra G1a A3ZQ0ET | |
| Average of class Workstation | |
| Lenovo ThinkPad P14s Gen 6 21RV0017GE | |
| HP ZBook 8 G1i 14 | |
| HP ZBook 8 G1i 14, RTX 500 | |
| Average Intel Core Ultra 7 265H | |
| Dell Precision 5000 5490 | |
| HP ZBook Firefly 14 G11 | |
| AIDA64 / FP32 Ray-Trace | |
| HP ZBook Ultra G1a A3ZQ0ET | |
| Lenovo ThinkPad P14s Gen 6 21RV0017GE | |
| Average of class Workstation (16730 - 61611, n=23, last 2 years) | |
| Average Intel Core Ultra 7 265H (20975 - 21681, n=2) | |
| HP ZBook 8 G1i 14 | |
| HP ZBook 8 G1i 14, RTX 500 | |
| Dell Precision 5000 5490 | |
| HP ZBook Firefly 14 G11 | |
| AIDA64 / FPU Julia | |
| HP ZBook Ultra G1a A3ZQ0ET | |
| Average of class Workstation (89597 - 186971, n=23, last 2 years) | |
| Lenovo ThinkPad P14s Gen 6 21RV0017GE | |
| Average Intel Core Ultra 7 265H (104879 - 104898, n=2) | |
| HP ZBook 8 G1i 14, RTX 500 | |
| HP ZBook 8 G1i 14 | |
| Dell Precision 5000 5490 | |
| HP ZBook Firefly 14 G11 | |
| AIDA64 / CPU SHA3 | |
| HP ZBook Ultra G1a A3ZQ0ET | |
| Average of class Workstation (4178 - 8975, n=23, last 2 years) | |
| Lenovo ThinkPad P14s Gen 6 21RV0017GE | |
| HP ZBook 8 G1i 14 | |
| HP ZBook 8 G1i 14, RTX 500 | |
| Average Intel Core Ultra 7 265H (4755 - 4798, n=2) | |
| Dell Precision 5000 5490 | |
| HP ZBook Firefly 14 G11 | |
| AIDA64 / CPU Queen | |
| Average of class Workstation (60778 - 144411, n=23, last 2 years) | |
| HP ZBook Ultra G1a A3ZQ0ET | |
| Dell Precision 5000 5490 | |
| Lenovo ThinkPad P14s Gen 6 21RV0017GE | |
| HP ZBook Firefly 14 G11 | |
| HP ZBook 8 G1i 14 | |
| Average Intel Core Ultra 7 265H (60778 - 68430, n=2) | |
| HP ZBook 8 G1i 14, RTX 500 | |
| AIDA64 / FPU SinJulia | |
| HP ZBook Ultra G1a A3ZQ0ET | |
| Lenovo ThinkPad P14s Gen 6 21RV0017GE | |
| Average of class Workstation (8165 - 29343, n=23, last 2 years) | |
| Dell Precision 5000 5490 | |
| HP ZBook 8 G1i 14, RTX 500 | |
| HP ZBook 8 G1i 14 | |
| Average Intel Core Ultra 7 265H (8165 - 8630, n=2) | |
| HP ZBook Firefly 14 G11 | |
| AIDA64 / FPU Mandel | |
| HP ZBook Ultra G1a A3ZQ0ET | |
| Average of class Workstation (44497 - 98153, n=23, last 2 years) | |
| Lenovo ThinkPad P14s Gen 6 21RV0017GE | |
| HP ZBook 8 G1i 14, RTX 500 | |
| Average Intel Core Ultra 7 265H (54684 - 55399, n=2) | |
| HP ZBook 8 G1i 14 | |
| Dell Precision 5000 5490 | |
| HP ZBook Firefly 14 G11 | |
| AIDA64 / CPU AES | |
| HP ZBook Ultra G1a A3ZQ0ET | |
| Average of class Workstation (73133 - 187841, n=23, last 2 years) | |
| Lenovo ThinkPad P14s Gen 6 21RV0017GE | |
| Dell Precision 5000 5490 | |
| HP ZBook 8 G1i 14 | |
| Average Intel Core Ultra 7 265H (73133 - 74345, n=2) | |
| HP ZBook 8 G1i 14, RTX 500 | |
| HP ZBook Firefly 14 G11 | |
| AIDA64 / CPU ZLib | |
| HP ZBook Ultra G1a A3ZQ0ET | |
| Average of class Workstation (929 - 2148, n=23, last 2 years) | |
| Lenovo ThinkPad P14s Gen 6 21RV0017GE | |
| Average Intel Core Ultra 7 265H (1129 - 1205, n=2) | |
| HP ZBook 8 G1i 14 | |
| HP ZBook 8 G1i 14, RTX 500 | |
| Dell Precision 5000 5490 | |
| HP ZBook Firefly 14 G11 | |
| AIDA64 / FP64 Ray-Trace | |
| HP ZBook Ultra G1a A3ZQ0ET | |
| Lenovo ThinkPad P14s Gen 6 21RV0017GE | |
| Average of class Workstation (8545 - 32891, n=23, last 2 years) | |
| HP ZBook 8 G1i 14, RTX 500 | |
| HP ZBook 8 G1i 14 | |
| Average Intel Core Ultra 7 265H (11313 - 11656, n=2) | |
| Dell Precision 5000 5490 | |
| HP ZBook Firefly 14 G11 | |
| AIDA64 / CPU PhotoWorxx | |
| HP ZBook Ultra G1a A3ZQ0ET | |
| HP ZBook 8 G1i 14, RTX 500 | |
| HP ZBook 8 G1i 14 | |
| Average Intel Core Ultra 7 265H (46752 - 56808, n=2) | |
| Dell Precision 5000 5490 | |
| Average of class Workstation (37151 - 93684, n=23, last 2 years) | |
| Lenovo ThinkPad P14s Gen 6 21RV0017GE | |
| HP ZBook Firefly 14 G11 | |
System performance
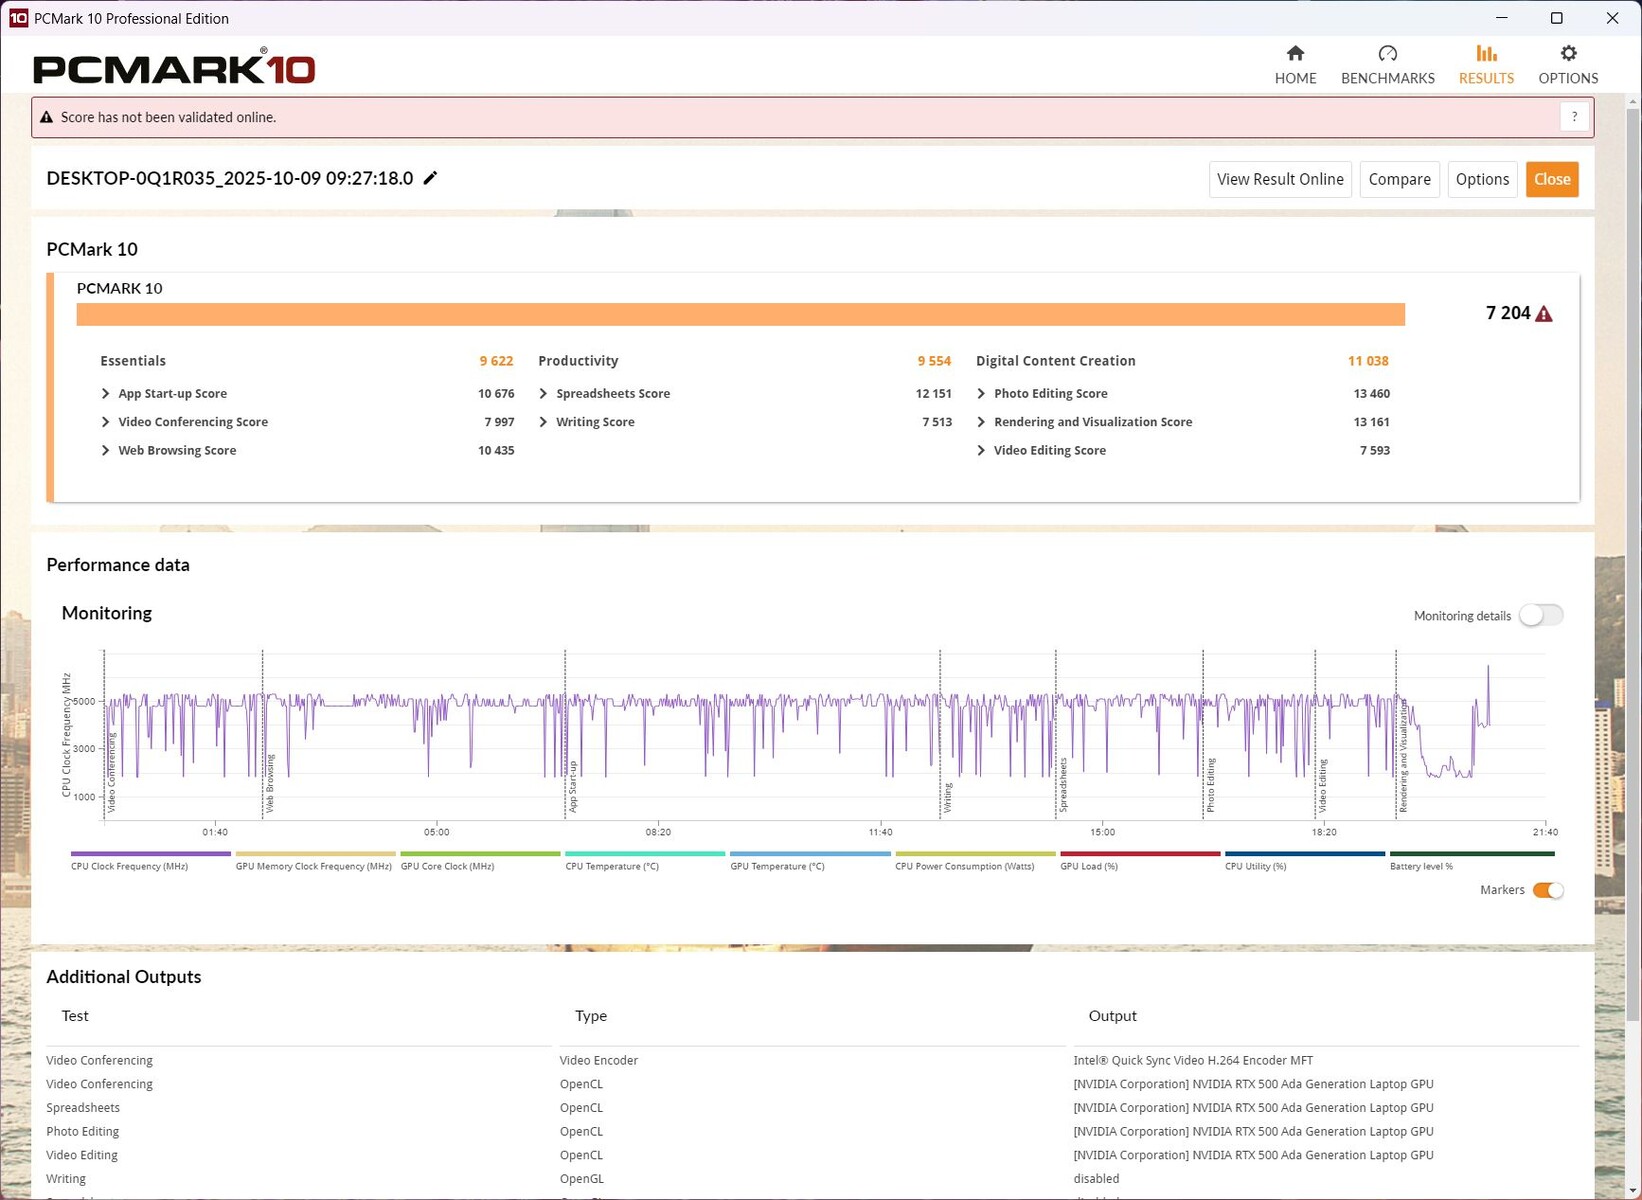
Overall performance values are as expected, with the excellent CrossMark results helping to lift the average.
PCMark 10: Score | Essentials | Productivity | Digital Content Creation
CrossMark: Overall | Productivity | Creativity | Responsiveness
WebXPRT 3: Overall
WebXPRT 4: Overall
Mozilla Kraken 1.1: Total
| Performance rating | |
| Average of class Workstation | |
| HP ZBook 8 G1i 14 | |
| HP ZBook 8 G1i 14, RTX 500 | |
| Average Intel Core Ultra 7 265H, NVIDIA RTX 500 Ada Generation Laptop | |
| Lenovo ThinkPad P14s Gen 6 21RV0017GE | |
| HP ZBook Ultra G1a A3ZQ0ET | |
| Dell Precision 5000 5490 | |
| HP ZBook Firefly 14 G11 | |
| PCMark 10 / Score | |
| Average of class Workstation (6563 - 10409, n=19, last 2 years) | |
| HP ZBook Ultra G1a A3ZQ0ET | |
| HP ZBook 8 G1i 14 | |
| Lenovo ThinkPad P14s Gen 6 21RV0017GE | |
| Dell Precision 5000 5490 | |
| HP ZBook 8 G1i 14, RTX 500 | |
| Average Intel Core Ultra 7 265H, NVIDIA RTX 500 Ada Generation Laptop (n=1) | |
| HP ZBook Firefly 14 G11 | |
| PCMark 10 / Essentials | |
| Dell Precision 5000 5490 | |
| HP ZBook 8 G1i 14 | |
| Lenovo ThinkPad P14s Gen 6 21RV0017GE | |
| HP ZBook Ultra G1a A3ZQ0ET | |
| Average of class Workstation (9622 - 11157, n=19, last 2 years) | |
| HP ZBook Firefly 14 G11 | |
| HP ZBook 8 G1i 14, RTX 500 | |
| Average Intel Core Ultra 7 265H, NVIDIA RTX 500 Ada Generation Laptop (n=1) | |
| PCMark 10 / Productivity | |
| Average of class Workstation (8789 - 20616, n=19, last 2 years) | |
| Lenovo ThinkPad P14s Gen 6 21RV0017GE | |
| HP ZBook 8 G1i 14 | |
| HP ZBook 8 G1i 14, RTX 500 | |
| Average Intel Core Ultra 7 265H, NVIDIA RTX 500 Ada Generation Laptop (n=1) | |
| HP ZBook Ultra G1a A3ZQ0ET | |
| HP ZBook Firefly 14 G11 | |
| Dell Precision 5000 5490 | |
| PCMark 10 / Digital Content Creation | |
| HP ZBook Ultra G1a A3ZQ0ET | |
| Average of class Workstation (8108 - 15631, n=19, last 2 years) | |
| HP ZBook 8 G1i 14 | |
| HP ZBook 8 G1i 14, RTX 500 | |
| Average Intel Core Ultra 7 265H, NVIDIA RTX 500 Ada Generation Laptop (n=1) | |
| Dell Precision 5000 5490 | |
| Lenovo ThinkPad P14s Gen 6 21RV0017GE | |
| HP ZBook Firefly 14 G11 | |
| CrossMark / Overall | |
| Average of class Workstation (1307 - 2267, n=22, last 2 years) | |
| HP ZBook 8 G1i 14, RTX 500 | |
| Average Intel Core Ultra 7 265H, NVIDIA RTX 500 Ada Generation Laptop (n=1) | |
| HP ZBook 8 G1i 14 | |
| Lenovo ThinkPad P14s Gen 6 21RV0017GE | |
| HP ZBook Ultra G1a A3ZQ0ET | |
| Dell Precision 5000 5490 | |
| HP ZBook Firefly 14 G11 | |
| CrossMark / Productivity | |
| Average of class Workstation (1130 - 2122, n=22, last 2 years) | |
| HP ZBook 8 G1i 14, RTX 500 | |
| Average Intel Core Ultra 7 265H, NVIDIA RTX 500 Ada Generation Laptop (n=1) | |
| HP ZBook 8 G1i 14 | |
| Lenovo ThinkPad P14s Gen 6 21RV0017GE | |
| Dell Precision 5000 5490 | |
| HP ZBook Firefly 14 G11 | |
| HP ZBook Ultra G1a A3ZQ0ET | |
| CrossMark / Creativity | |
| HP ZBook Ultra G1a A3ZQ0ET | |
| HP ZBook 8 G1i 14, RTX 500 | |
| Average Intel Core Ultra 7 265H, NVIDIA RTX 500 Ada Generation Laptop (n=1) | |
| Average of class Workstation (1657 - 2725, n=22, last 2 years) | |
| HP ZBook 8 G1i 14 | |
| Lenovo ThinkPad P14s Gen 6 21RV0017GE | |
| Dell Precision 5000 5490 | |
| HP ZBook Firefly 14 G11 | |
| CrossMark / Responsiveness | |
| Average of class Workstation (993 - 2096, n=22, last 2 years) | |
| Lenovo ThinkPad P14s Gen 6 21RV0017GE | |
| Dell Precision 5000 5490 | |
| HP ZBook 8 G1i 14 | |
| HP ZBook 8 G1i 14, RTX 500 | |
| Average Intel Core Ultra 7 265H, NVIDIA RTX 500 Ada Generation Laptop (n=1) | |
| HP ZBook Firefly 14 G11 | |
| HP ZBook Ultra G1a A3ZQ0ET | |
| WebXPRT 3 / Overall | |
| Lenovo ThinkPad P14s Gen 6 21RV0017GE | |
| HP ZBook 8 G1i 14, RTX 500 | |
| Average Intel Core Ultra 7 265H, NVIDIA RTX 500 Ada Generation Laptop (n=1) | |
| HP ZBook 8 G1i 14 | |
| Average of class Workstation (260 - 360, n=23, last 2 years) | |
| HP ZBook Firefly 14 G11 | |
| Dell Precision 5000 5490 | |
| HP ZBook Ultra G1a A3ZQ0ET | |
| WebXPRT 4 / Overall | |
| HP ZBook 8 G1i 14 | |
| HP ZBook 8 G1i 14, RTX 500 | |
| Average Intel Core Ultra 7 265H, NVIDIA RTX 500 Ada Generation Laptop (n=1) | |
| HP ZBook Ultra G1a A3ZQ0ET | |
| Average of class Workstation (189.2 - 326, n=23, last 2 years) | |
| Lenovo ThinkPad P14s Gen 6 21RV0017GE | |
| Dell Precision 5000 5490 | |
| HP ZBook Firefly 14 G11 | |
| Mozilla Kraken 1.1 / Total | |
| Dell Precision 5000 5490 | |
| HP ZBook Firefly 14 G11 | |
| Average of class Workstation (411 - 538, n=23, last 2 years) | |
| HP ZBook 8 G1i 14, RTX 500 | |
| Average Intel Core Ultra 7 265H, NVIDIA RTX 500 Ada Generation Laptop (n=1) | |
| Lenovo ThinkPad P14s Gen 6 21RV0017GE | |
| HP ZBook 8 G1i 14 | |
| HP ZBook Ultra G1a A3ZQ0ET | |
* ... smaller is better
| PCMark 10 Score | 7204 points | |
Help | ||
| AIDA64 / Memory Copy | |
| HP ZBook Ultra G1a A3ZQ0ET | |
| Dell Precision 5000 5490 | |
| HP ZBook 8 G1i 14 | |
| HP ZBook 8 G1i 14, RTX 500 | |
| Average of class Workstation (56003 - 164795, n=23, last 2 years) | |
| Average Intel Core Ultra 7 265H (73609 - 82677, n=2) | |
| HP ZBook Firefly 14 G11 | |
| Lenovo ThinkPad P14s Gen 6 21RV0017GE | |
| AIDA64 / Memory Read | |
| HP ZBook Ultra G1a A3ZQ0ET | |
| HP ZBook 8 G1i 14 | |
| Dell Precision 5000 5490 | |
| Lenovo ThinkPad P14s Gen 6 21RV0017GE | |
| HP ZBook 8 G1i 14, RTX 500 | |
| Average of class Workstation (55795 - 121563, n=23, last 2 years) | |
| HP ZBook Firefly 14 G11 | |
| Average Intel Core Ultra 7 265H (68026 - 80201, n=2) | |
| AIDA64 / Memory Write | |
| HP ZBook Ultra G1a A3ZQ0ET | |
| Dell Precision 5000 5490 | |
| Average of class Workstation (55663 - 214520, n=23, last 2 years) | |
| Lenovo ThinkPad P14s Gen 6 21RV0017GE | |
| HP ZBook 8 G1i 14, RTX 500 | |
| HP ZBook 8 G1i 14 | |
| HP ZBook Firefly 14 G11 | |
| Average Intel Core Ultra 7 265H (57721 - 79370, n=2) | |
| AIDA64 / Memory Latency | |
| HP ZBook Ultra G1a A3ZQ0ET | |
| Dell Precision 5000 5490 | |
| Average Intel Core Ultra 7 265H (106.4 - 157, n=2) | |
| Average of class Workstation (84.5 - 165.2, n=23, last 2 years) | |
| HP ZBook Firefly 14 G11 | |
| HP ZBook 8 G1i 14 | |
| HP ZBook 8 G1i 14, RTX 500 | |
| Lenovo ThinkPad P14s Gen 6 21RV0017GE | |
* ... smaller is better
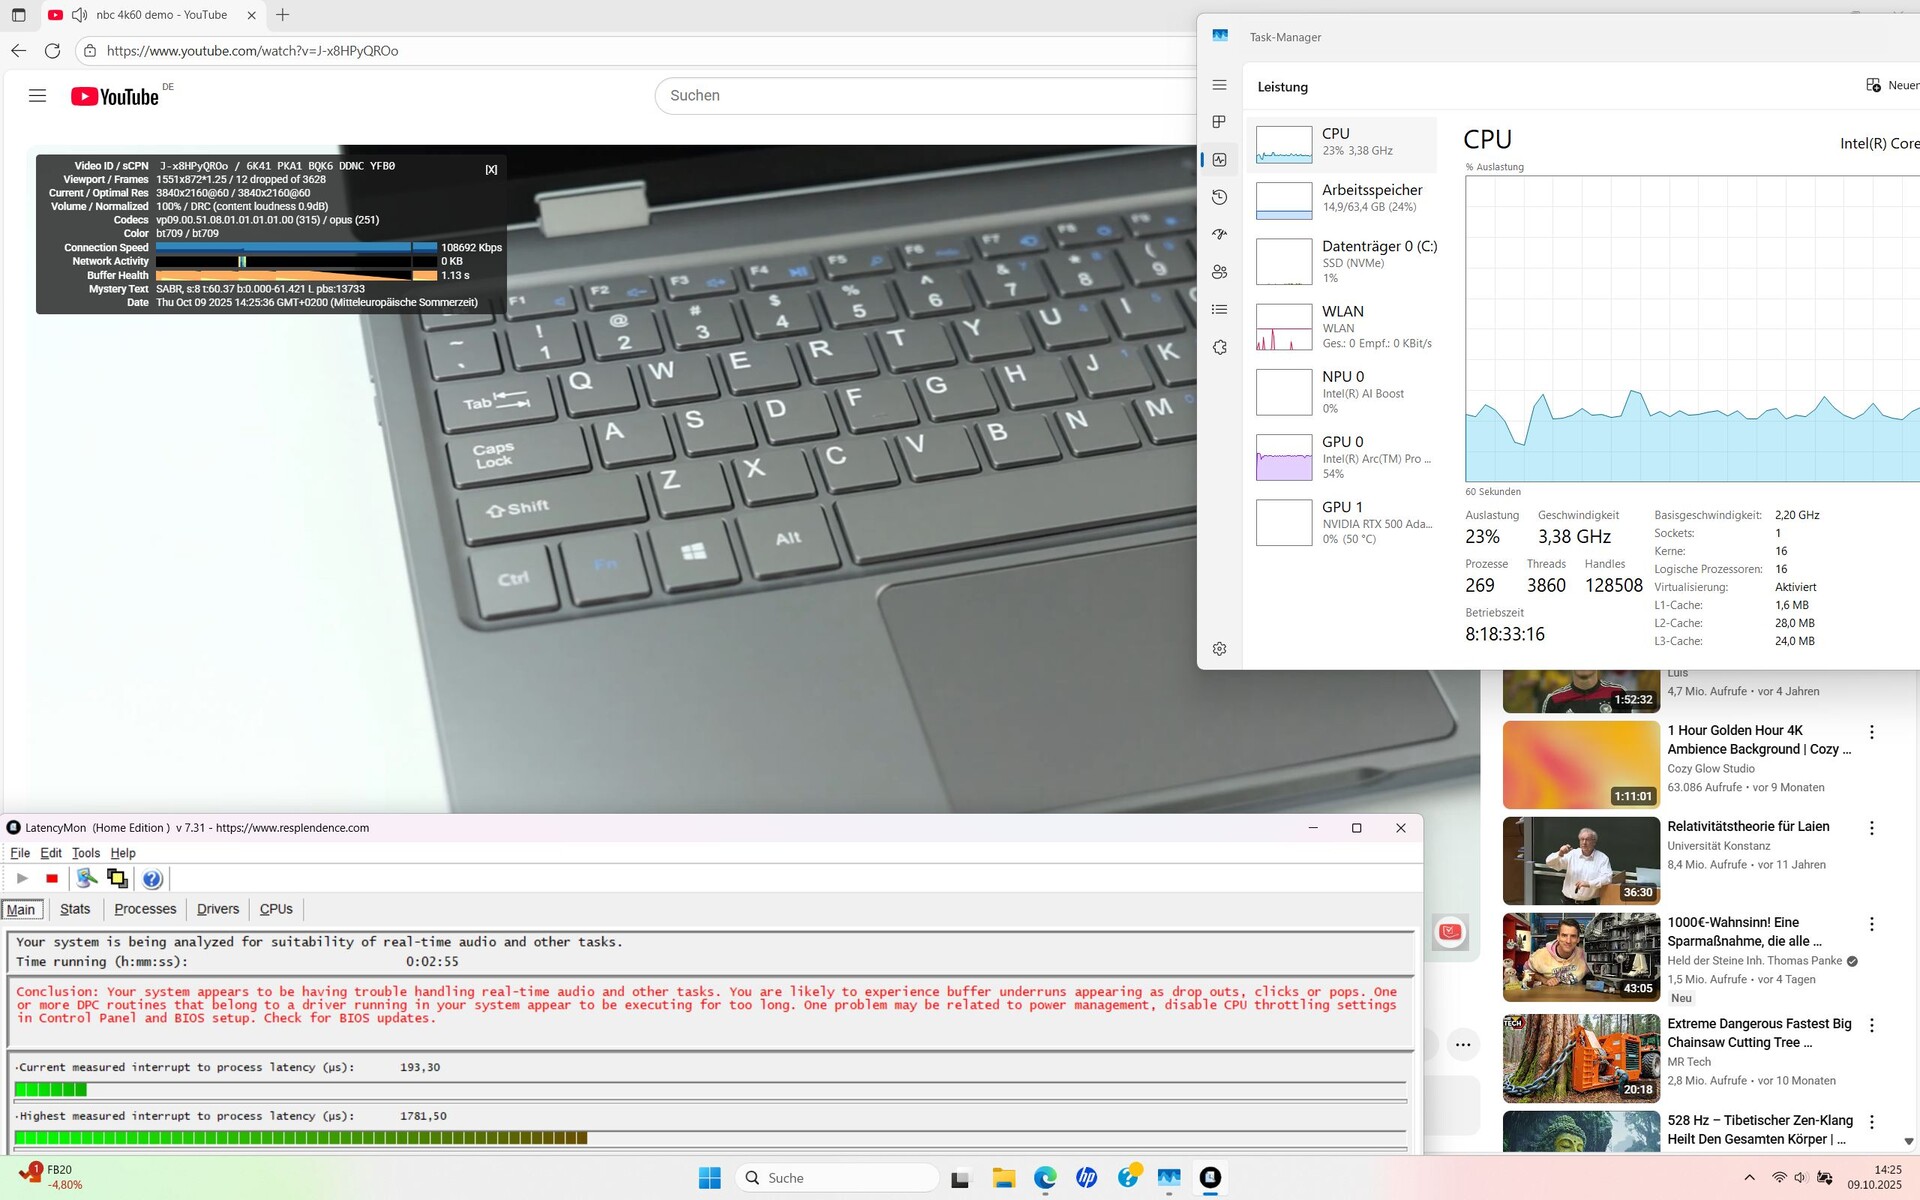
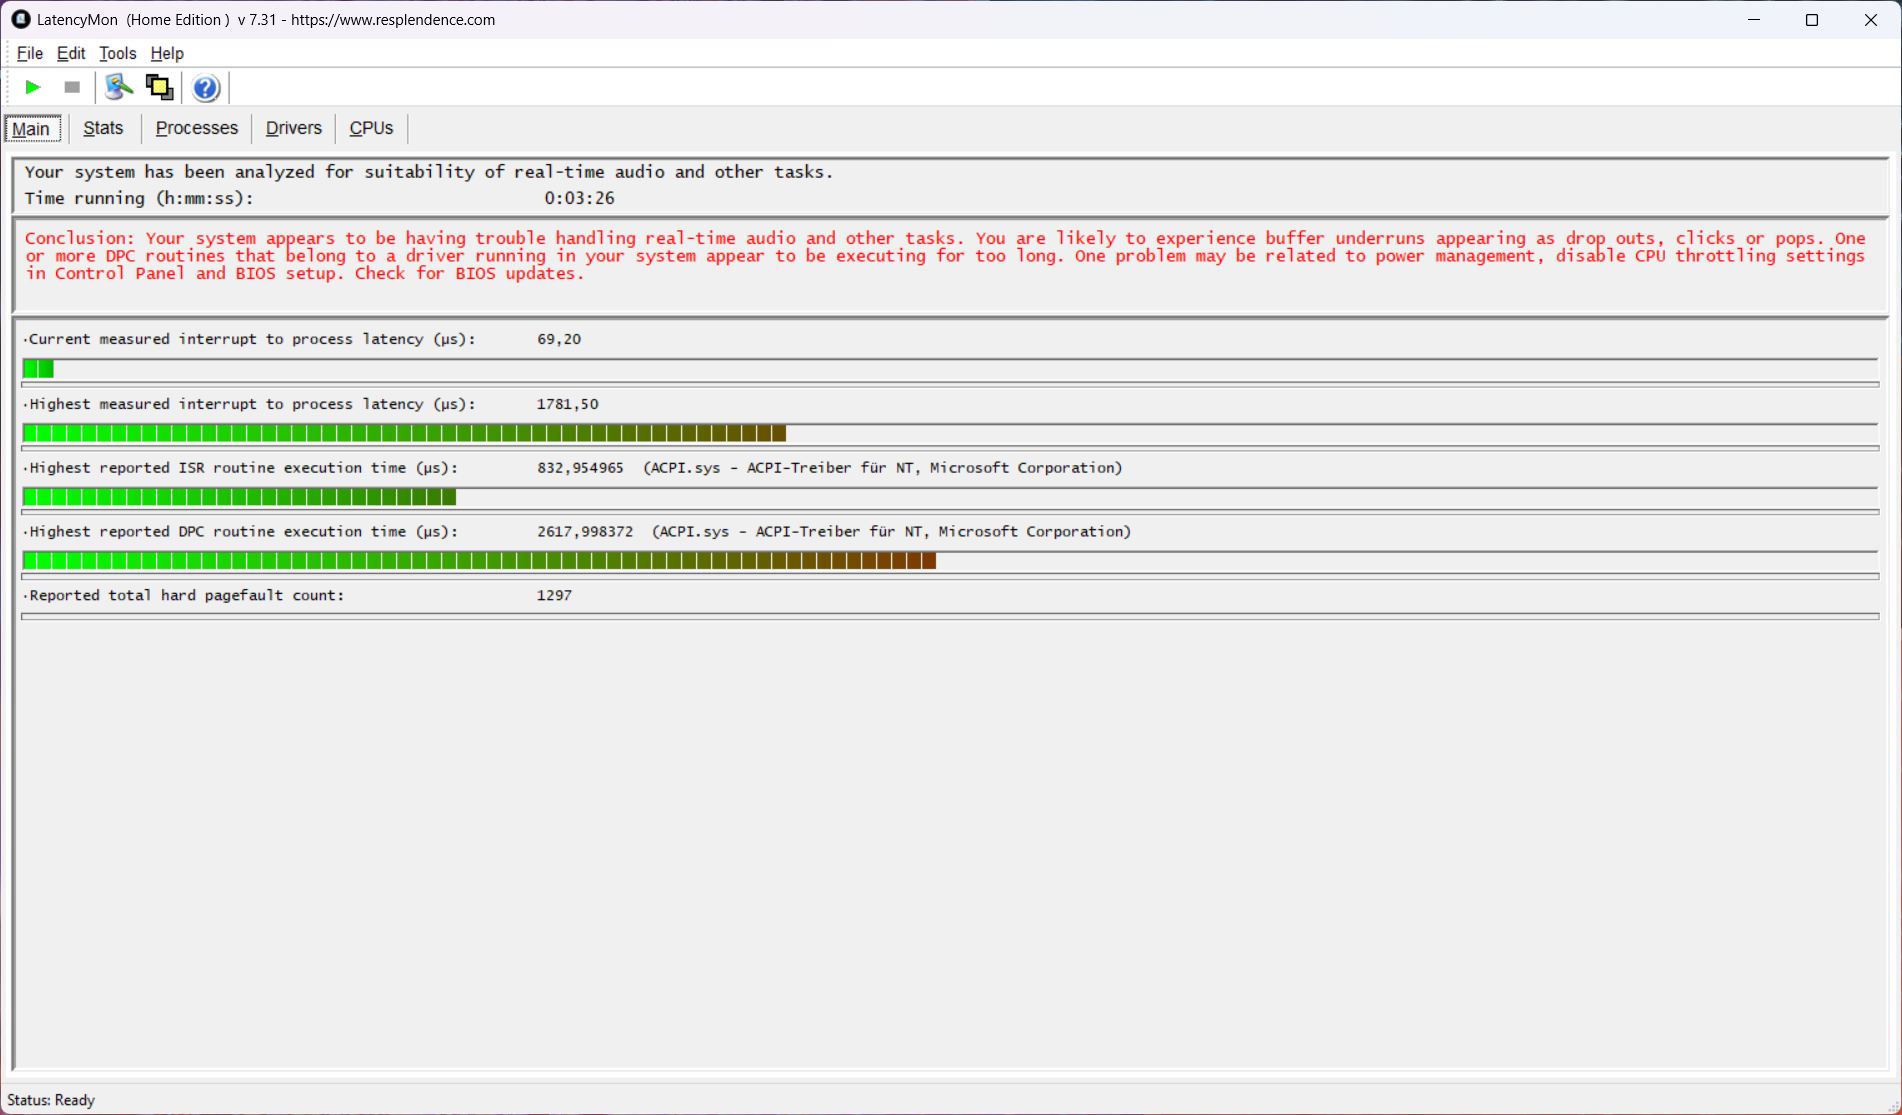
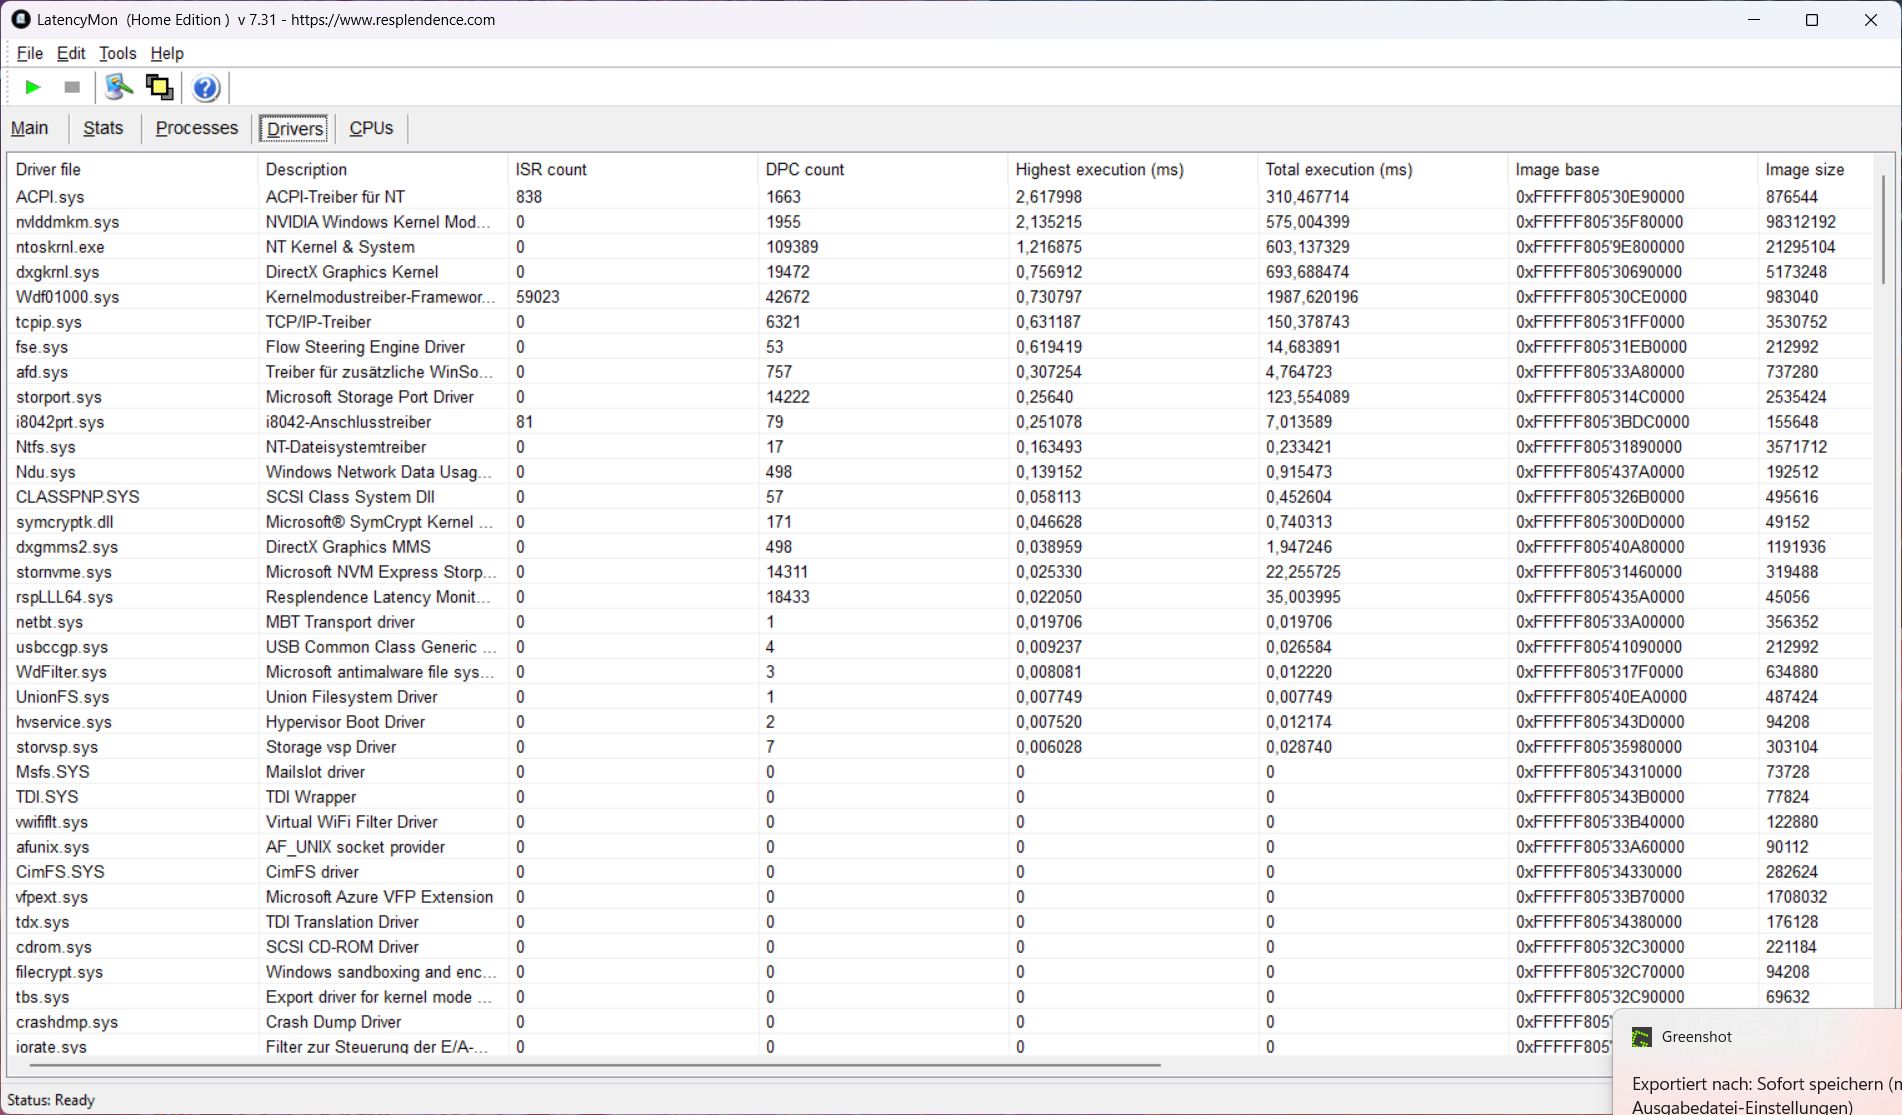
DPC latencies
Opening the browser causes initial latency spikes, which increase during playback of our YouTube test video. The video also shows 12 dropped frames. For a workstation, these results are sub-optimal, although several competitors perform similarly.
| DPC Latencies / LatencyMon - interrupt to process latency (max), Web, Youtube, Prime95 | |
| HP ZBook Firefly 14 G11 | |
| Dell Precision 5000 5490 | |
| HP ZBook 8 G1i 14, RTX 500 | |
| HP ZBook Ultra G1a A3ZQ0ET | |
| HP ZBook 8 G1i 14 | |
| Lenovo ThinkPad P14s Gen 6 21RV0017GE | |
* ... smaller is better
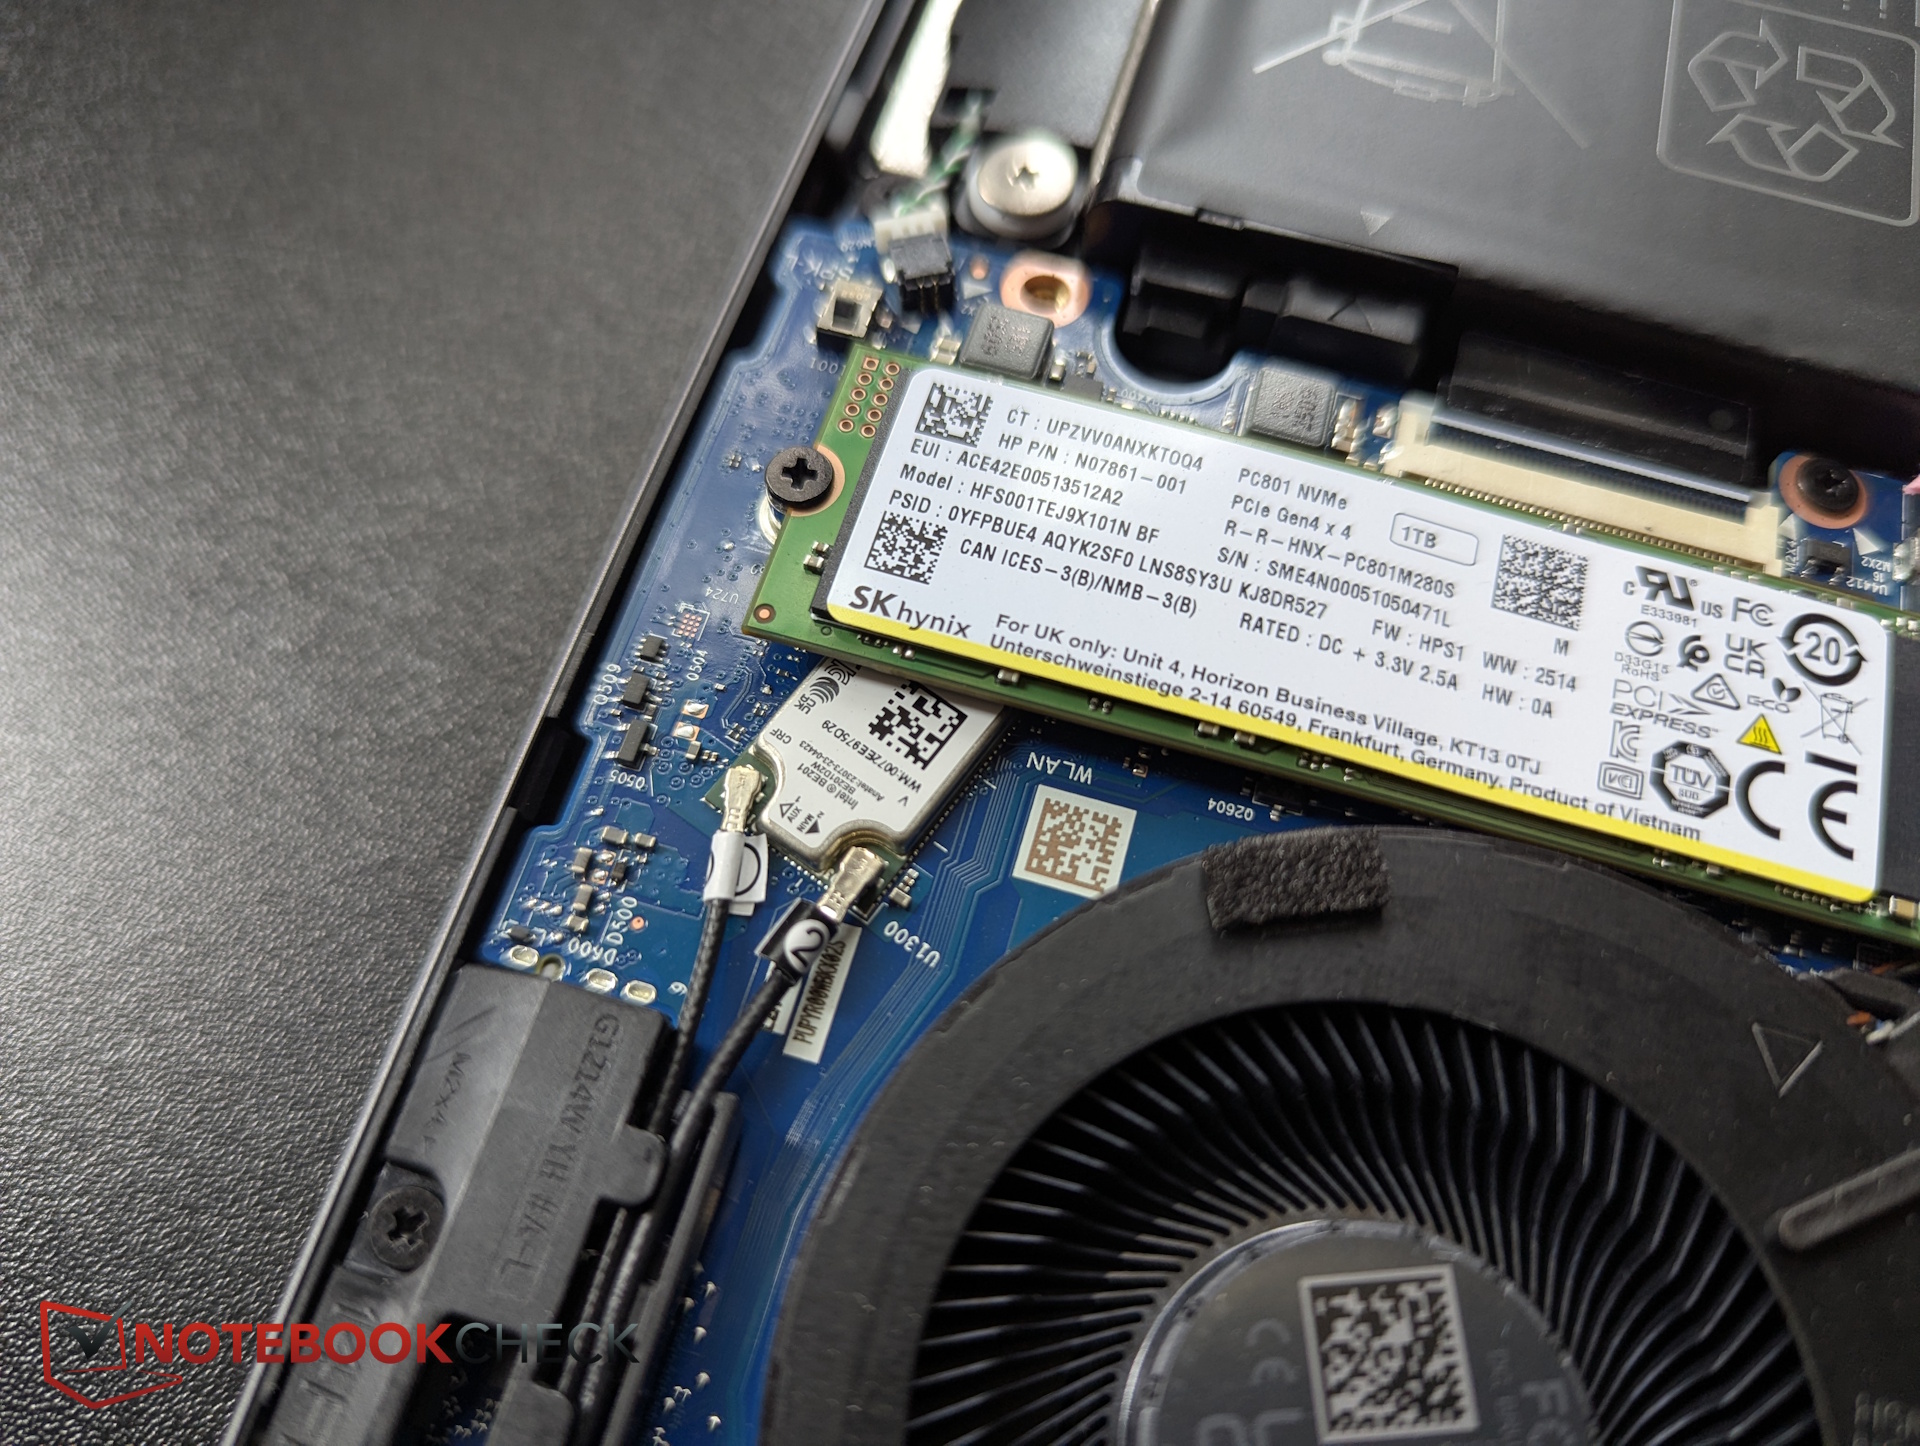
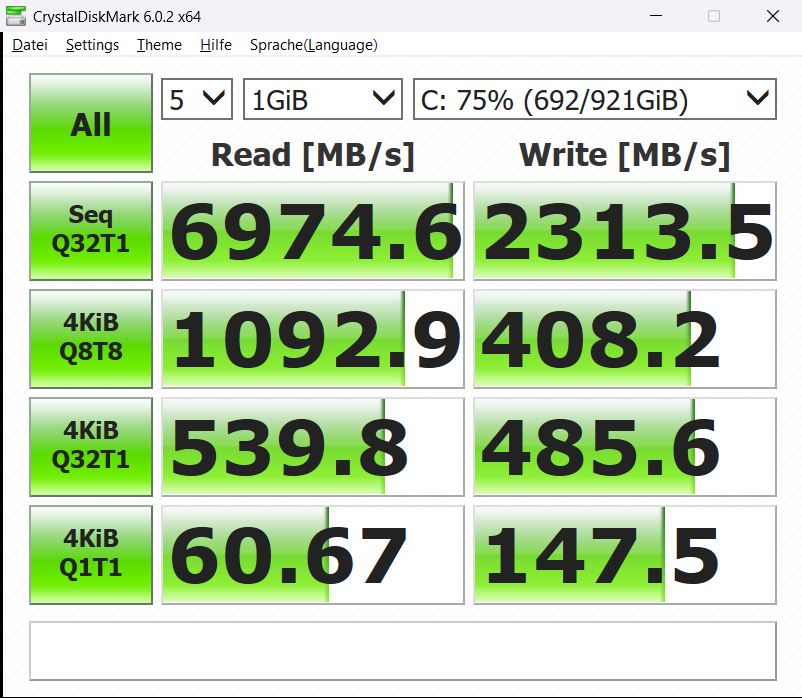
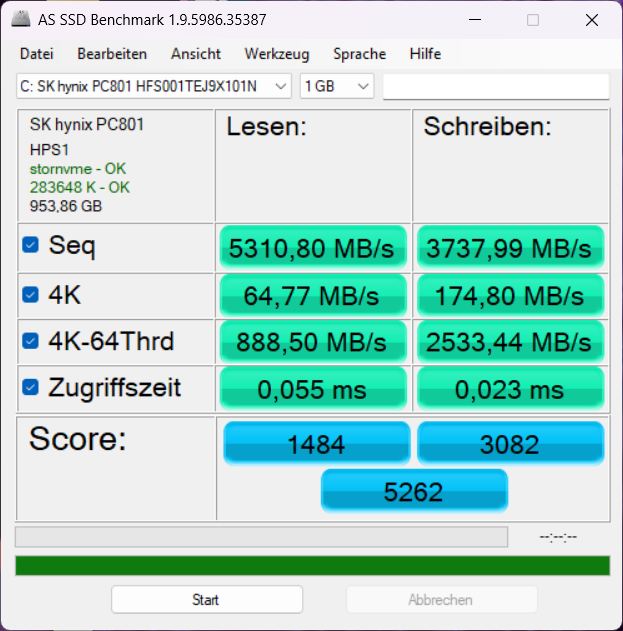
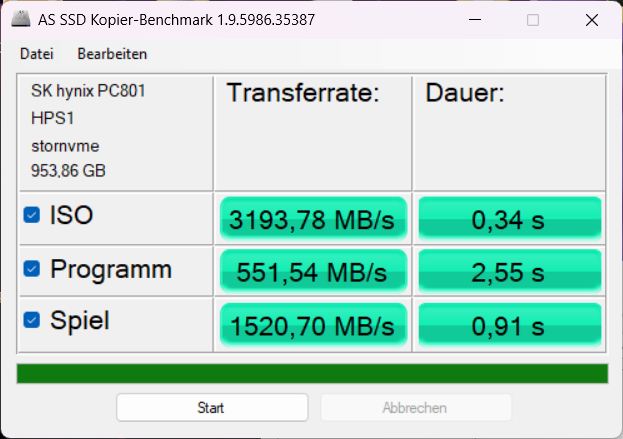
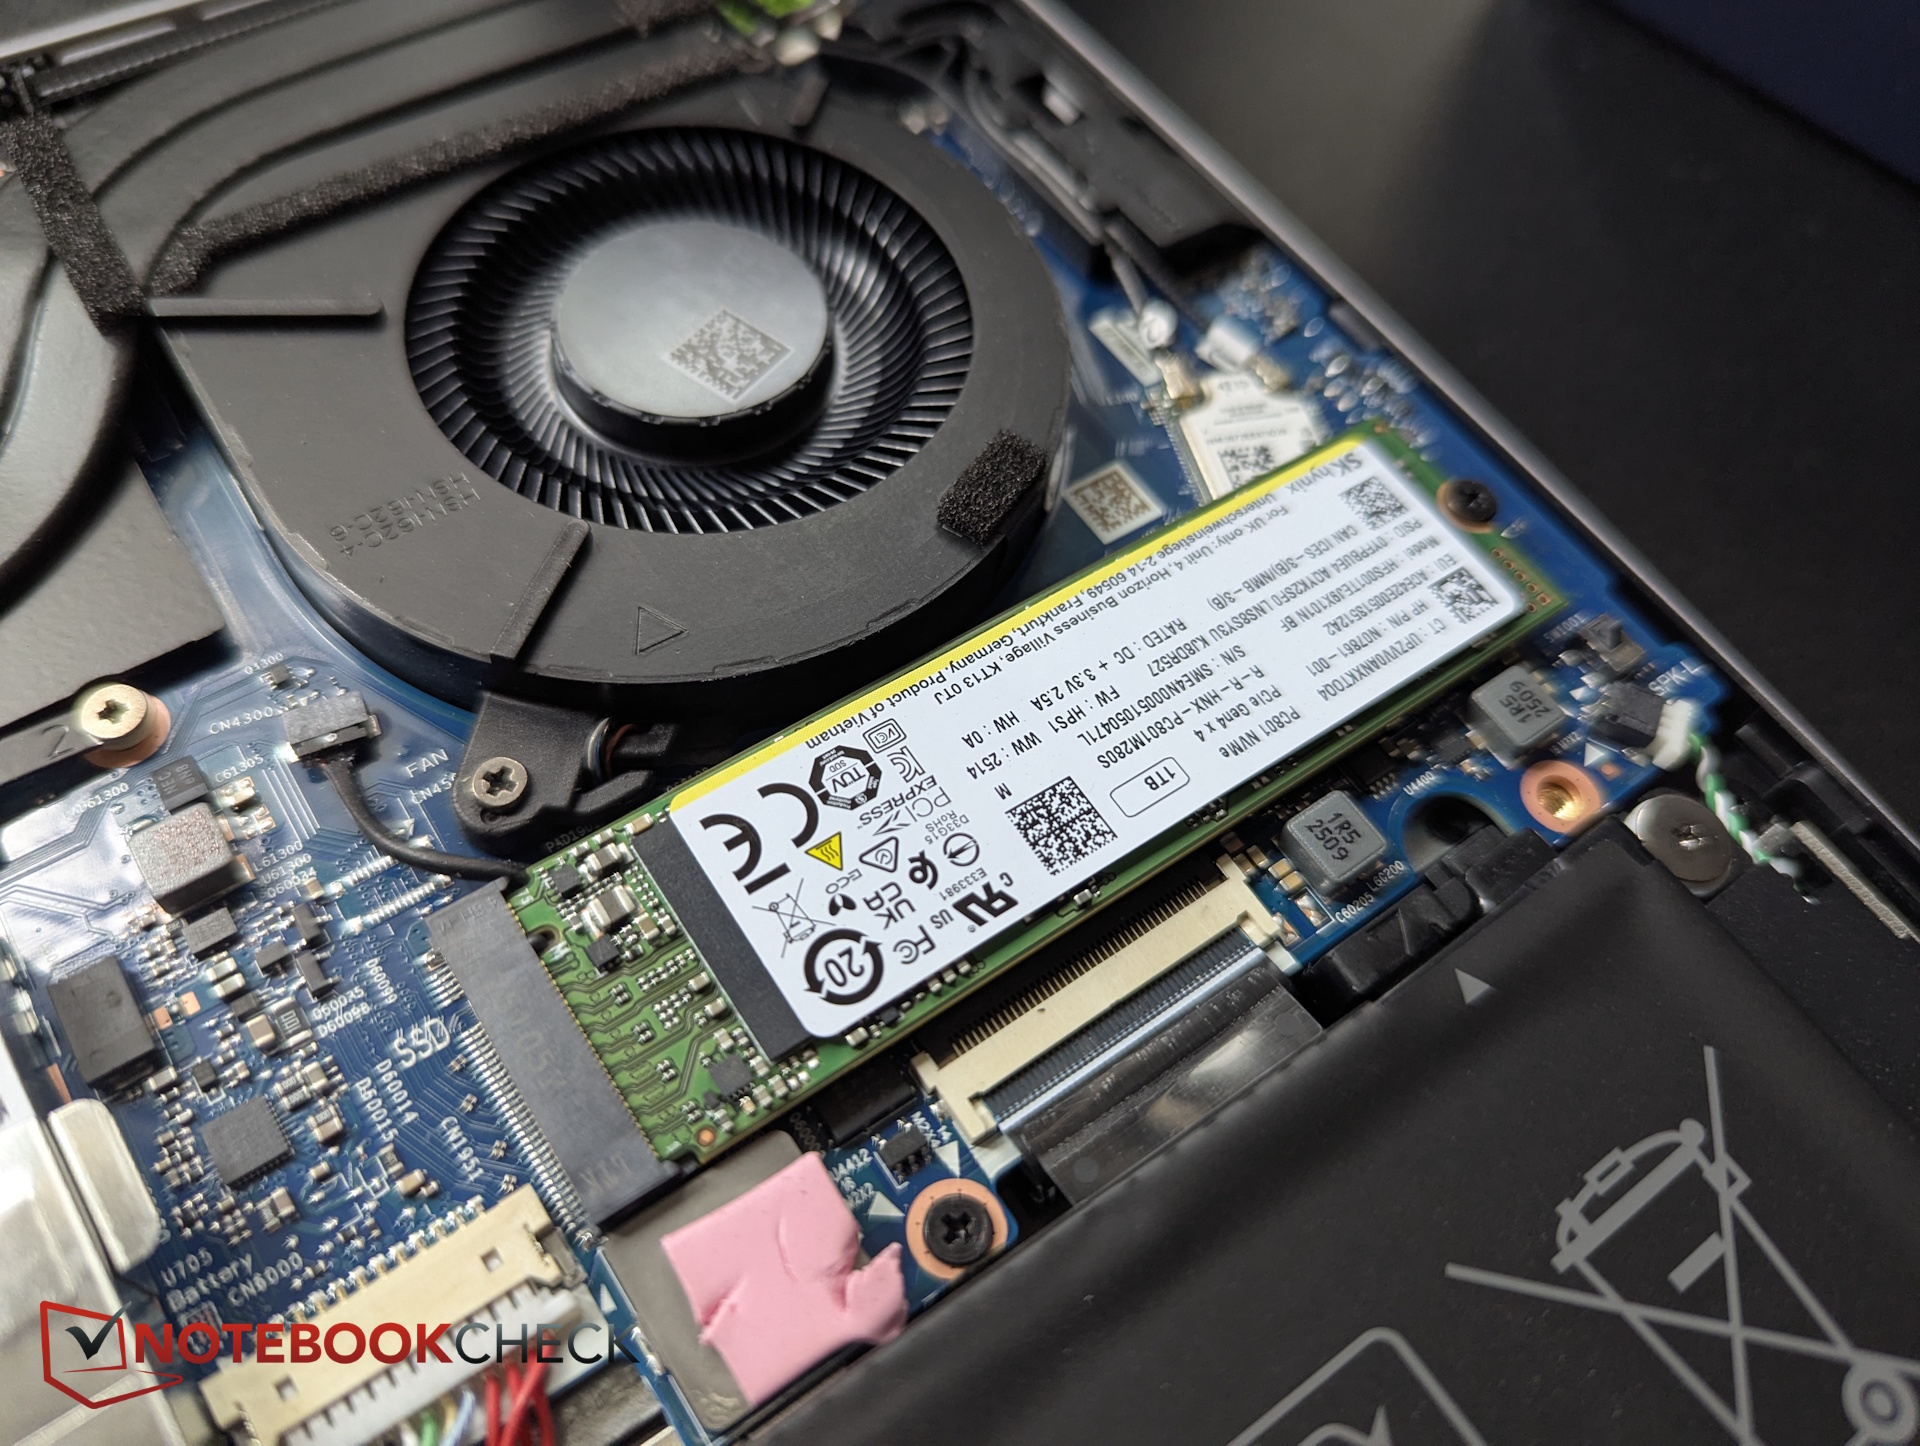
Storage
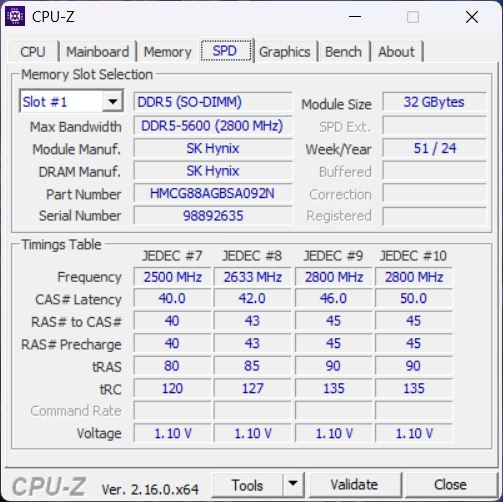
HP uses a 1-TB SK Hynix SSD with PCIe 4×4, which unfortunately throttles thermally over time.

* ... smaller is better
Read continuous performance: DiskSpd Read Loop, Queue Depth 8
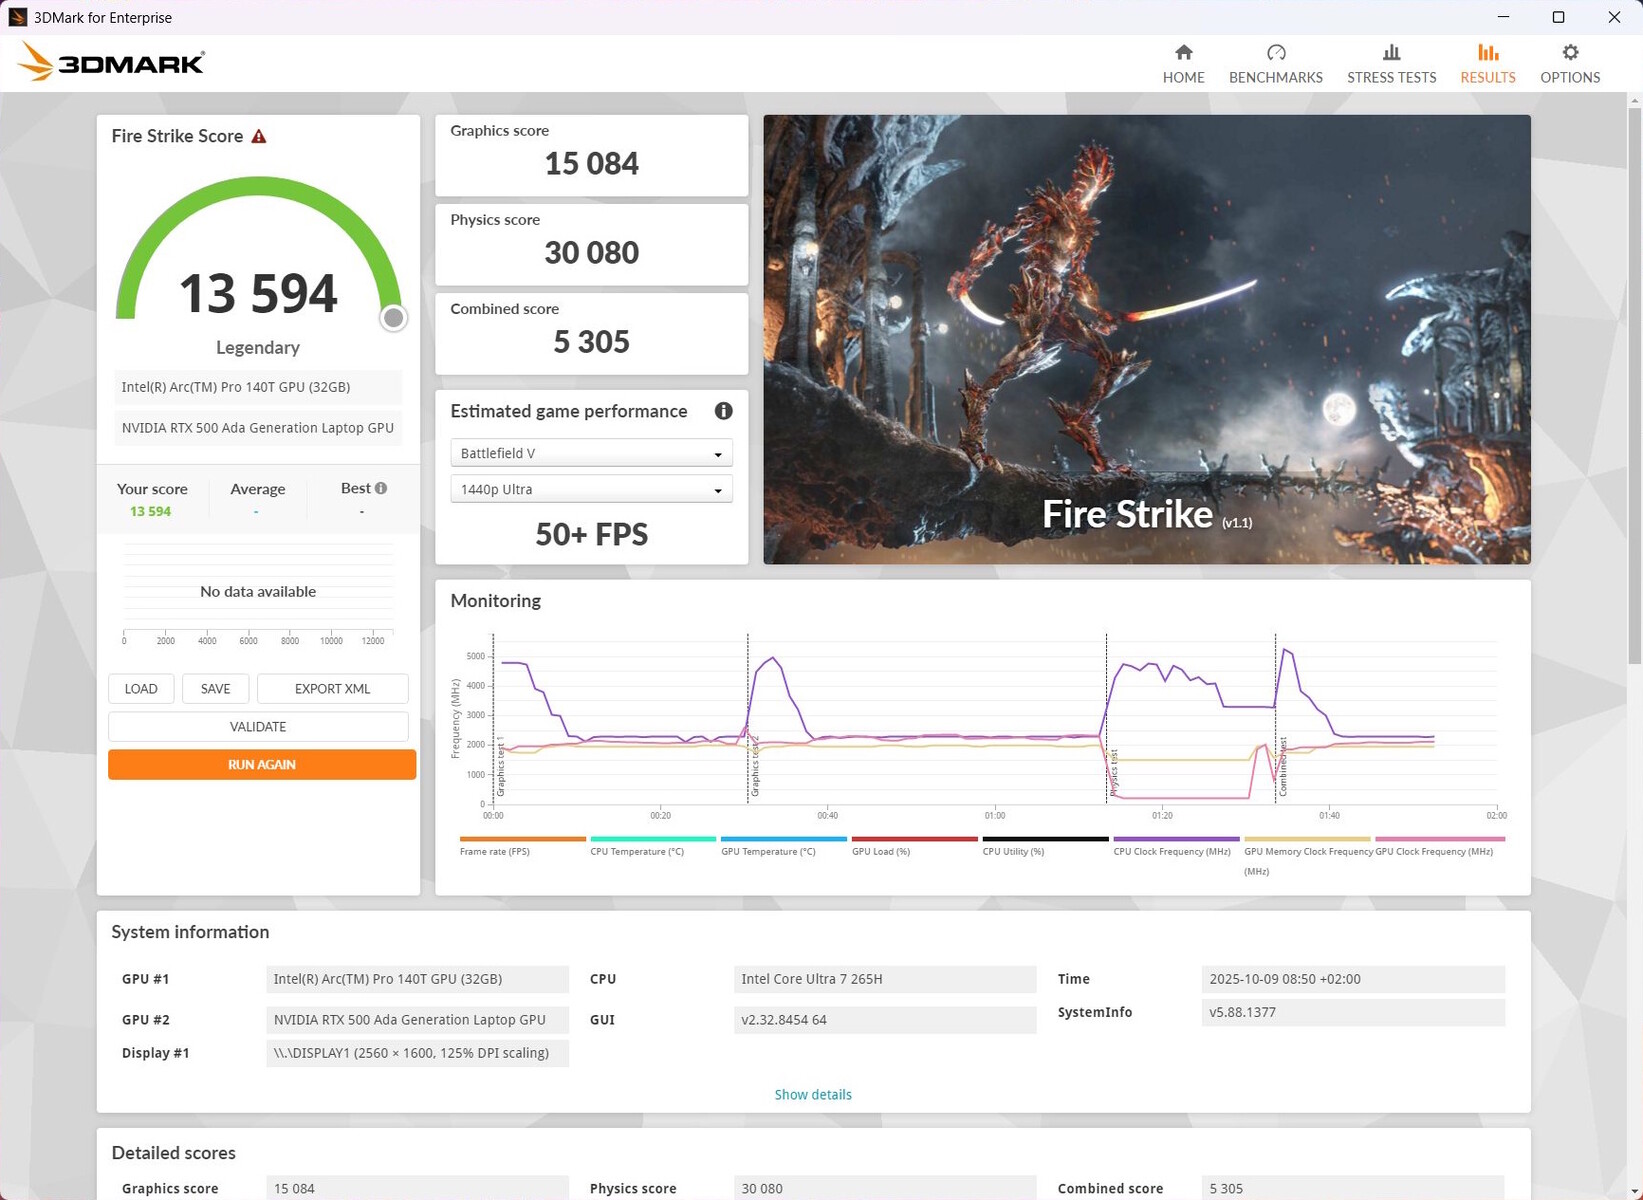
GPU performance
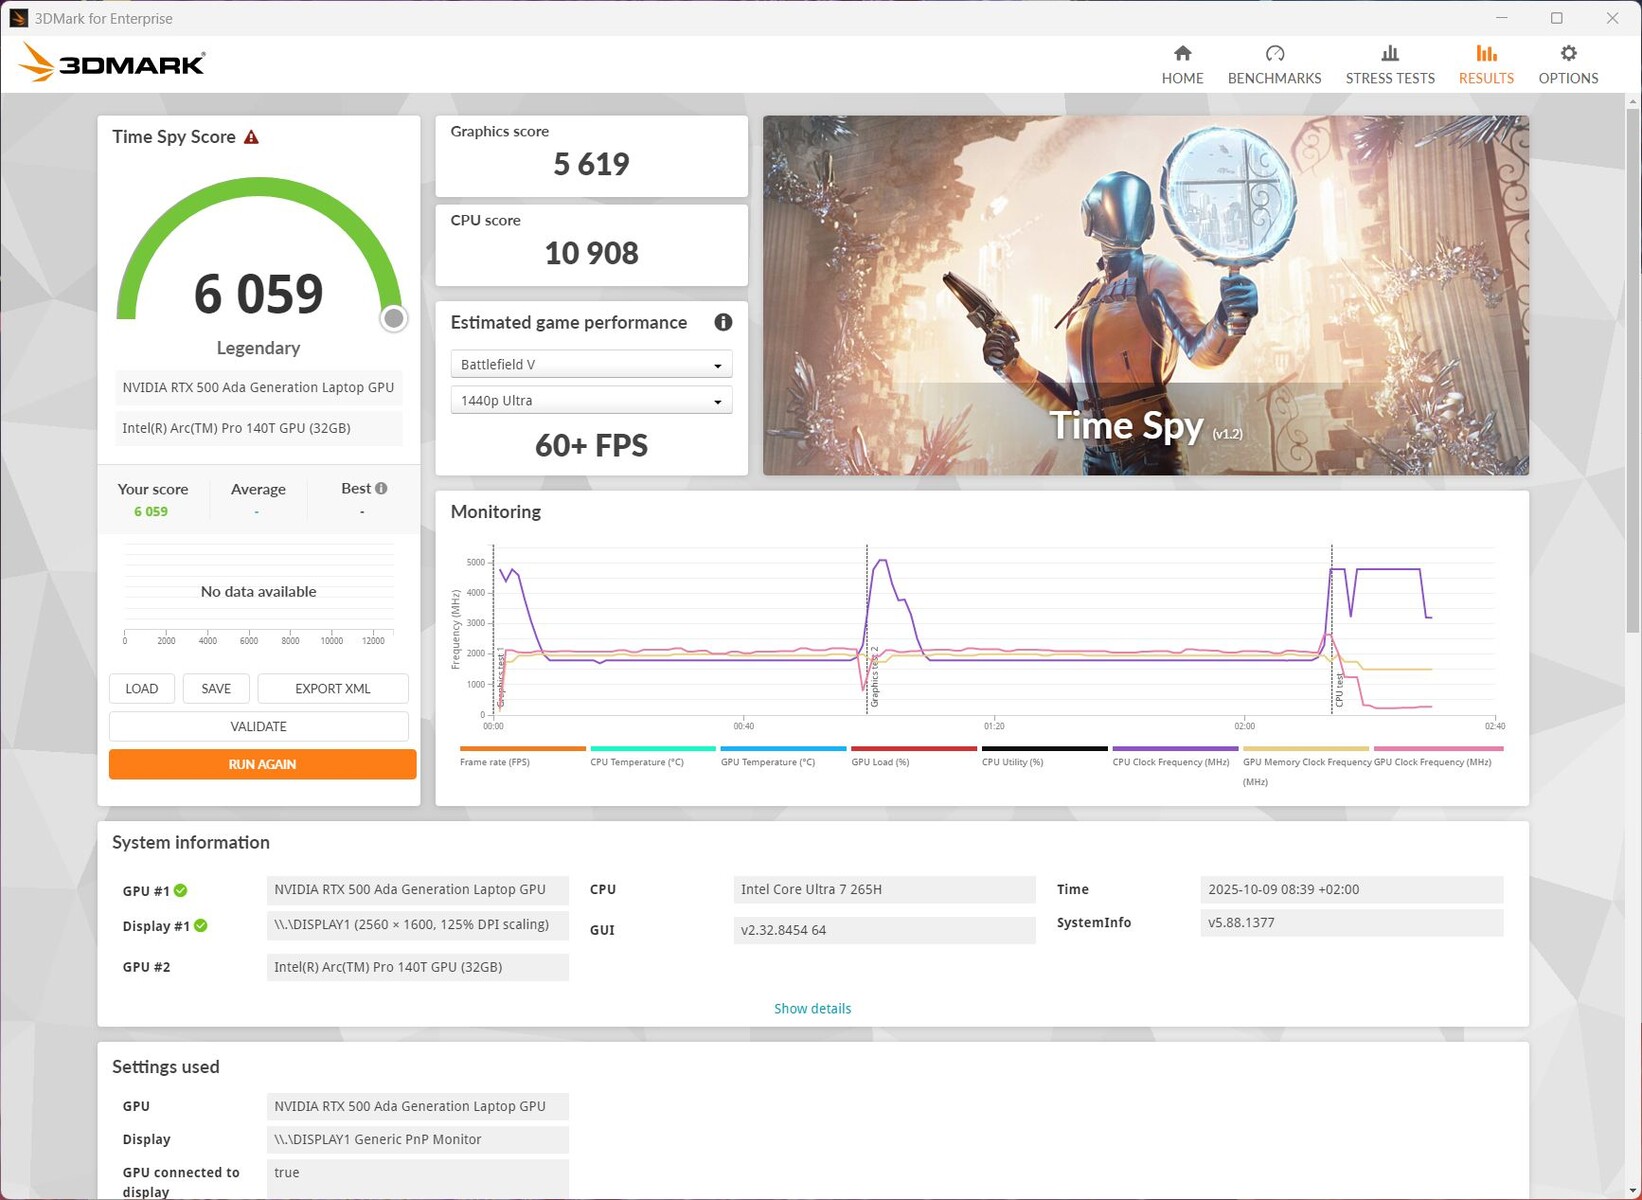
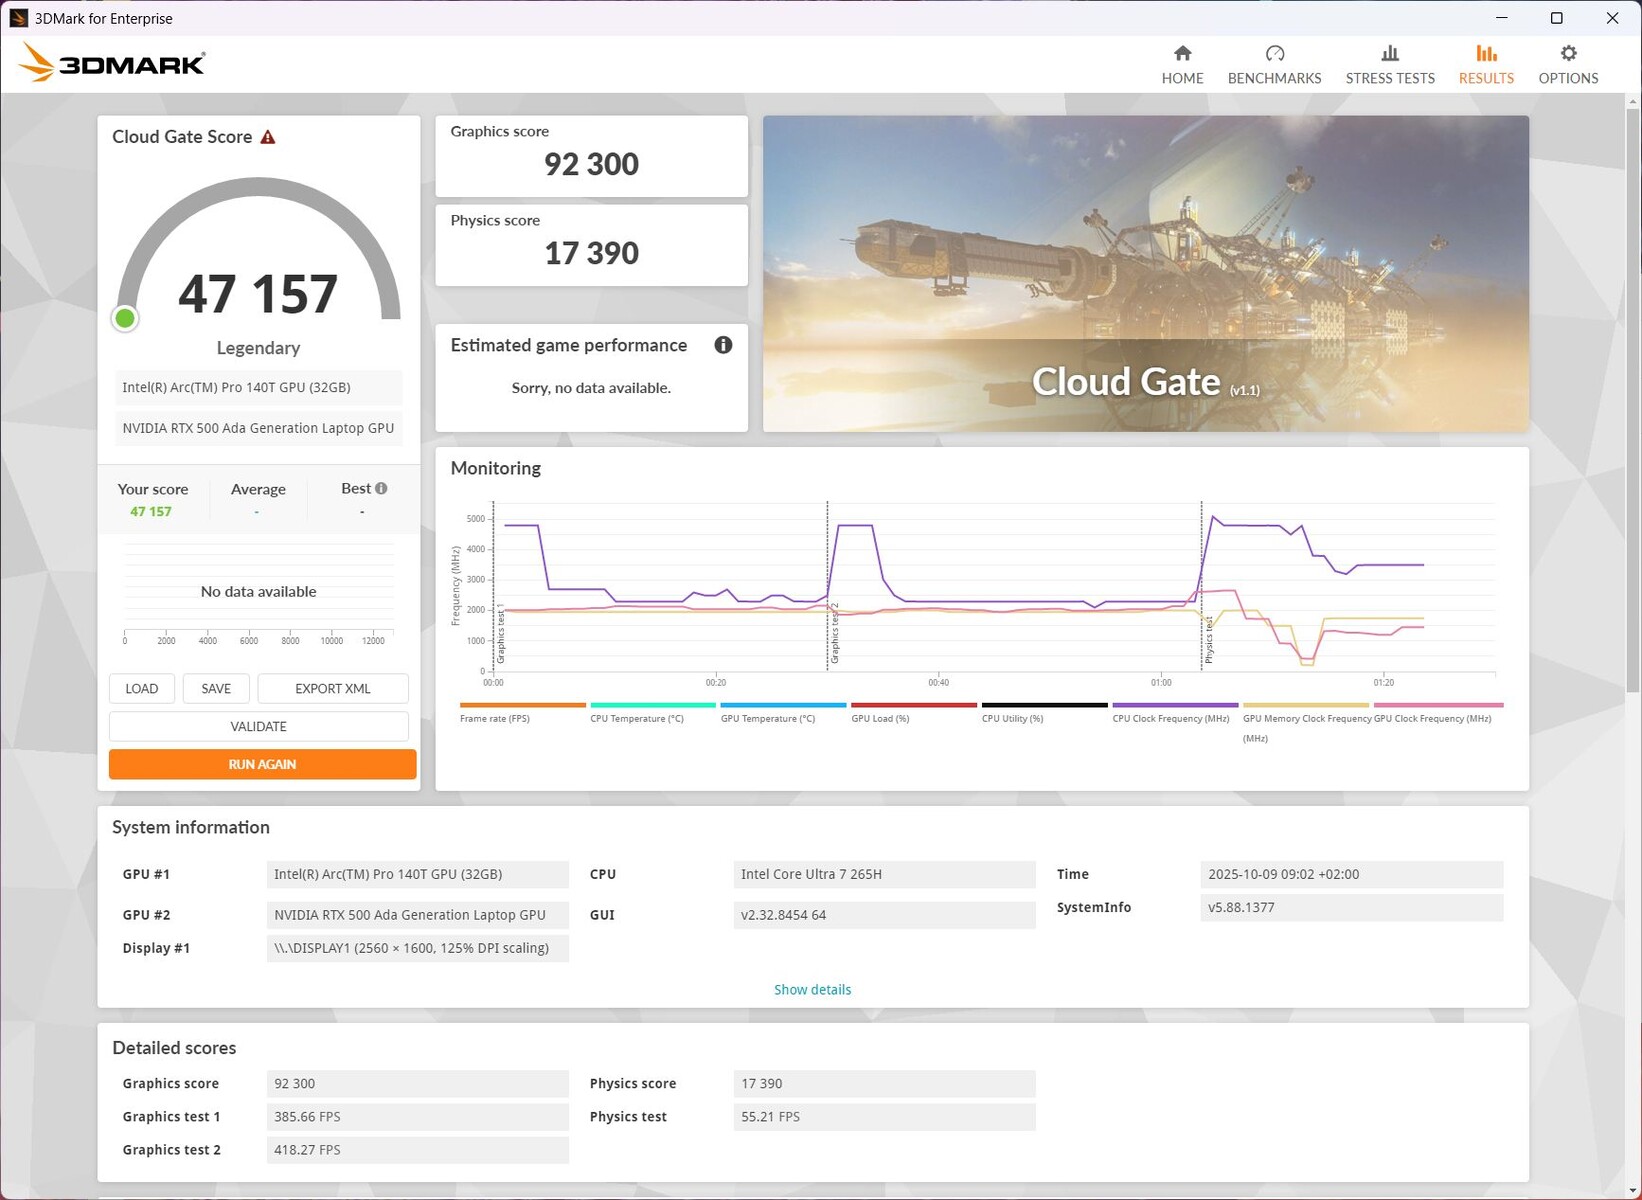
The Nvidia RTX 500, an entry-level professional GPU, performs slightly above average in the 3DMark tests but cannot come close to the impressive integrated Radeon 8050S in the ZBook Ultra. Lenovo's Yoga Pro 7 14 with the RTX 4050 is also faster.
Gaming is possible with the RTX 500, which is likely based on a cut-down RTX 4050 (roughly 20 to 25 percent faster), though only up to Full HD and at medium settings. Its 4 GB of video memory is no longer entirely up to date for modern games. With DLSS Quality enabled, the frame rate in Baldur's Gate 3 can be increased from around 53 to 75 fps (Full HD). In the long-term Cyberpunk 2077 test, performance remains very consistent.
When running on battery power, GPU performance drops by about 30 percent.
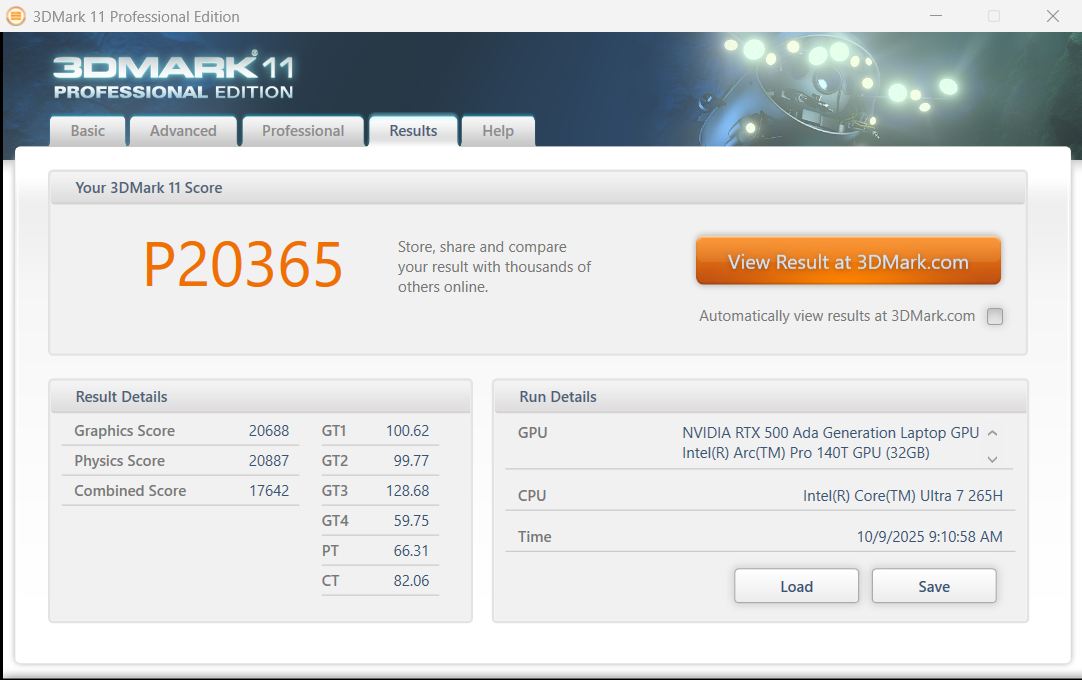
| 3DMark 11 Performance | 20365 points | |
| 3DMark Cloud Gate Standard Score | 47157 points | |
| 3DMark Fire Strike Score | 13594 points | |
| 3DMark Time Spy Score | 6059 points | |
Help | ||
* ... smaller is better
| GTA V - 1920x1080 Highest AA:4xMSAA + FX AF:16x | |
| Average of class Workstation (18.1 - 156.1, n=23, last 2 years) | |
| Lenovo Yoga Pro 7 14IMH9, RTX 4050 | |
| HP ZBook Ultra G1a A3ZQ0ET | |
| HP ZBook 8 G1i 14, RTX 500 | |
| Lenovo ThinkPad P14s Gen 6 21RV0017GE | |
| HP ZBook 8 G1i 14 | |
| Strange Brigade - 1920x1080 ultra AA:ultra AF:16 | |
| Average of class Workstation (93.2 - 418, n=17, last 2 years) | |
| HP ZBook Ultra G1a A3ZQ0ET | |
| Dell Precision 5000 5490 | |
| Lenovo Yoga Pro 7 14IMH9, RTX 4050 | |
| HP ZBook 8 G1i 14, RTX 500 | |
| HP ZBook Firefly 14 G11 | |
Cyberpunk 2077 ultra FPS chart
| low | med. | high | ultra | |
|---|---|---|---|---|
| GTA V (2015) | 183.8 | 178.9 | 139.1 | 69.7 |
| Dota 2 Reborn (2015) | 178 | 163.3 | 145.6 | 136 |
| Final Fantasy XV Benchmark (2018) | 148.5 | 77.8 | 57.1 | |
| X-Plane 11.11 (2018) | 98 | 79.4 | 67 | |
| Strange Brigade (2018) | 333 | 129.6 | 106.7 | 93.2 |
| Baldur's Gate 3 (2023) | 79.6 | 61.9 | 54.9 | 53.1 |
| Cyberpunk 2077 (2023) | 72.8 | 55.5 | 45.6 | 39.6 |
| F1 25 (2025) | 130 | 96.9 | 73.6 | 7.44 |
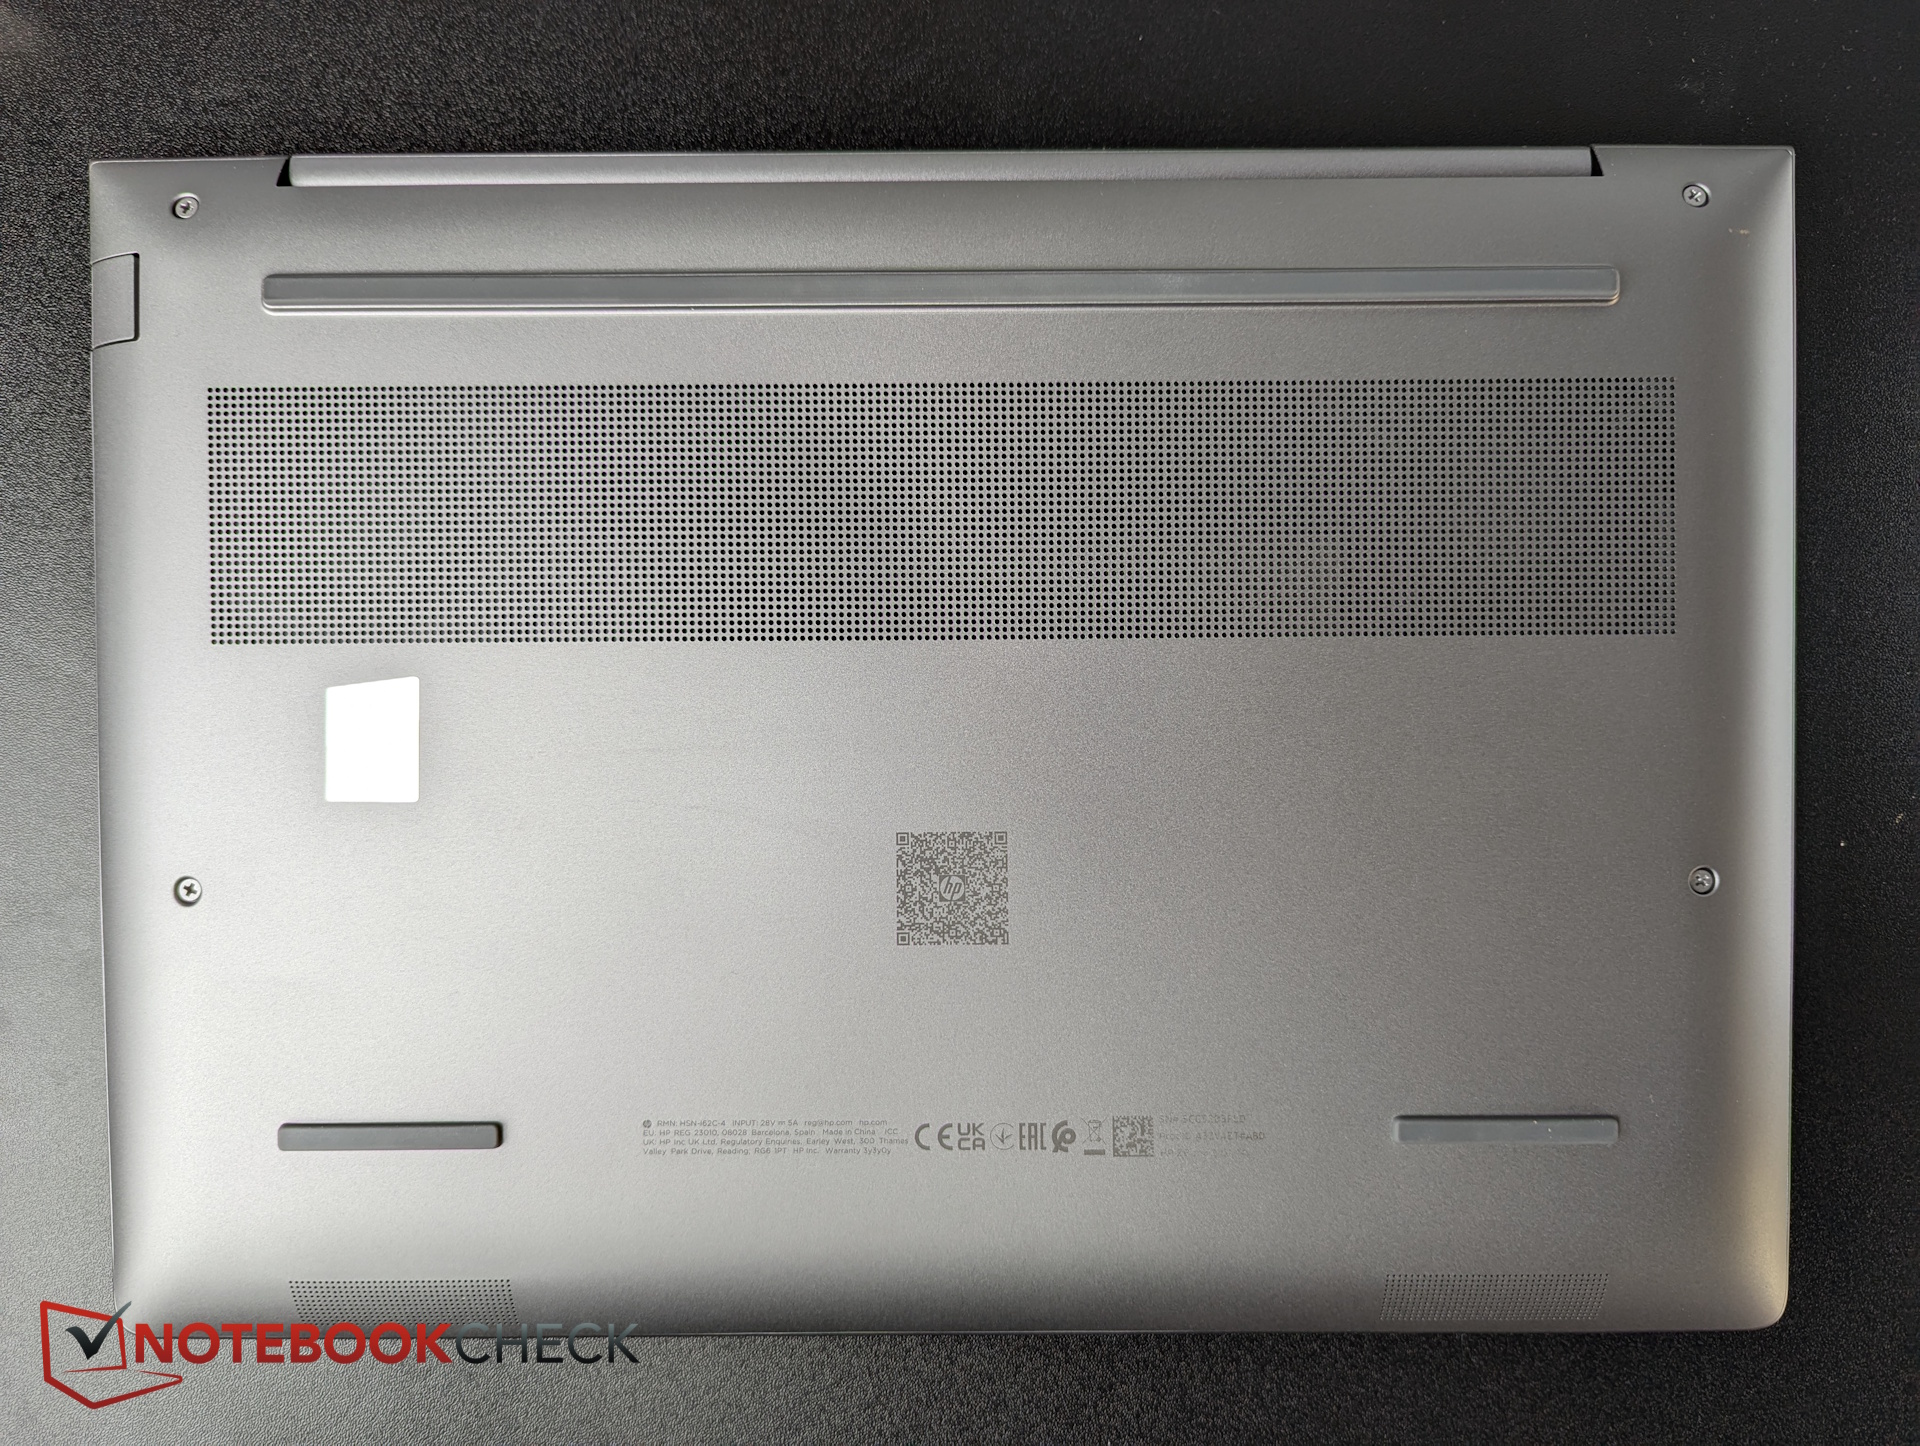
Emissions and energy - good speakers
Noise emissions
When idle, the fans are usually off. Under stress or during gaming, fan noise fluctuates between 44 and 46 dB. After a period of load, the fans quickly return to a quiet state. Unfortunately, maximum fan speed is already reached under medium load.
Noise level
| Idle |
| 23 / 23 / 23 dB(A) |
| Load |
| 46.26 / 46.26 dB(A) |
 | ||
30 dB silent 40 dB(A) audible 50 dB(A) loud |
||
min: | ||
| HP ZBook 8 G1i 14, RTX 500 RTX 500 Ada Generation Laptop, Ultra 7 265H, SK hynix PC801 HFS001TEJ9X101N | HP ZBook 8 G1i 14 Arc 140T, Ultra 7 255H, SK hynix PC801 HFS001TEJ9X101N | HP ZBook Ultra G1a A3ZQ0ET Radeon 8050S, Ryzen AI Max PRO 390, SK hynix PC801 HFS001TEJ9X101N | Lenovo ThinkPad P14s Gen 6 21RV0017GE Radeon 890M, Ryzen AI 9 HX PRO 370, SK hynix PC801 HFS001TEJ9X162N | Dell Precision 5000 5490 RTX 3000 Ada Generation Laptop, Ultra 9 185H, Kioxia XG8 KXG80ZNV1T02 | HP ZBook Firefly 14 G11 RTX A500 Laptop GPU, Ultra 7 165H, Kioxia XG8 KXG80ZNV512G | |
|---|---|---|---|---|---|---|
| Noise | -5% | -2% | -0% | -1% | -2% | |
| off / environment * (dB) | 23 | 24.9 -8% | 24.6 -7% | 24.5 -7% | 22.8 1% | 24.3 -6% |
| Idle Minimum * (dB) | 23 | 24.9 -8% | 24.6 -7% | 24.5 -7% | 23.8 -3% | 24.6 -7% |
| Idle Average * (dB) | 23 | 24.9 -8% | 24.6 -7% | 24.5 -7% | 23.8 -3% | 25.2 -10% |
| Idle Maximum * (dB) | 23 | 30.3 -32% | 24.6 -7% | 24.5 -7% | 24.7 -7% | 26.8 -17% |
| Load Average * (dB) | 46.26 | 44.1 5% | 40.7 12% | 36.5 21% | 38.9 16% | 38.9 16% |
| Cyberpunk 2077 ultra * (dB) | 46.23 | 40.4 13% | 45.4 2% | 44.7 3% | 41.8 10% | |
| Load Maximum * (dB) | 46.26 | 44.1 5% | 45.4 2% | 44.9 3% | 51.4 -11% | 45.8 1% |
| Witcher 3 ultra * (dB) | 49.9 |
* ... smaller is better
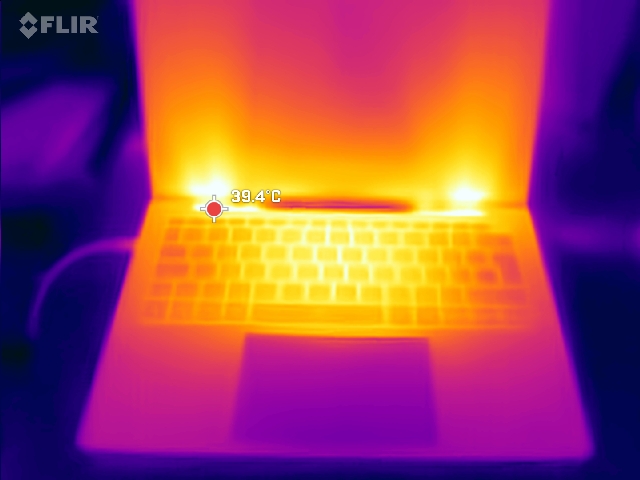
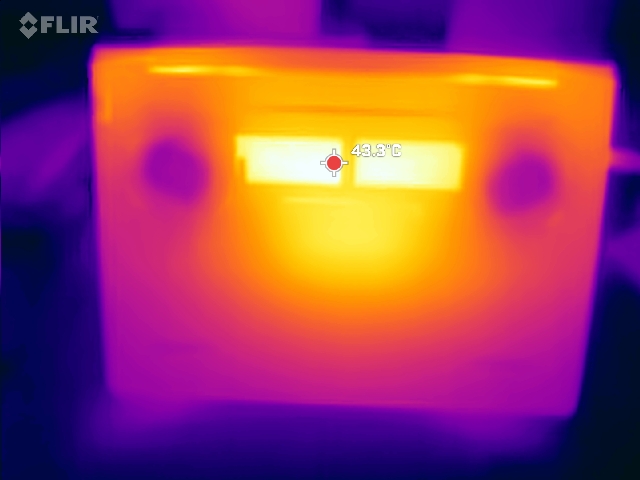
Temperature
In the stress test, the hot spot reaches 43 °C on the underside, near the centre towards the display. The central area of the keyboard also warms up, but both sides remain cooler and the palm rests stay comfortably cool.
(±) The maximum temperature on the upper side is 41 °C / 106 F, compared to the average of 38.2 °C / 101 F, ranging from 22.2 to 69.8 °C for the class Workstation.
(±) The bottom heats up to a maximum of 43 °C / 109 F, compared to the average of 41.1 °C / 106 F
(+) In idle usage, the average temperature for the upper side is 28.2 °C / 83 F, compared to the device average of 32 °C / 90 F.
(±) 3: The average temperature for the upper side is 34.3 °C / 94 F, compared to the average of 32 °C / 90 F for the class Workstation.
(+) The palmrests and touchpad are cooler than skin temperature with a maximum of 29 °C / 84.2 F and are therefore cool to the touch.
(±) The average temperature of the palmrest area of similar devices was 27.8 °C / 82 F (-1.2 °C / -2.2 F).
| HP ZBook 8 G1i 14, RTX 500 Intel Core Ultra 7 265H, NVIDIA RTX 500 Ada Generation Laptop | HP ZBook 8 G1i 14 Intel Core Ultra 7 255H, Intel Arc Graphics 140T | HP ZBook Ultra G1a A3ZQ0ET AMD Ryzen AI Max PRO 390, AMD Radeon 8050S | Lenovo ThinkPad P14s Gen 6 21RV0017GE AMD Ryzen AI 9 HX PRO 370, AMD Radeon 890M | Dell Precision 5000 5490 Intel Core Ultra 9 185H, NVIDIA RTX 3000 Ada Generation Laptop | HP ZBook Firefly 14 G11 Intel Core Ultra 7 165H, NVIDIA RTX A500 Laptop GPU | |
|---|---|---|---|---|---|---|
| Heat | 8% | 2% | -5% | 4% | 1% | |
| Maximum Upper Side * (°C) | 41 | 40.3 2% | 43 -5% | 50.5 -23% | 43.2 -5% | 42.8 -4% |
| Maximum Bottom * (°C) | 43 | 38.4 11% | 40.4 6% | 50.2 -17% | 38.4 11% | 44 -2% |
| Idle Upper Side * (°C) | 30 | 29.4 2% | 31.2 -4% | 29.1 3% | 31.6 -5% | 30.6 -2% |
| Idle Bottom * (°C) | 36 | 30.3 16% | 32.5 10% | 30.1 16% | 30.6 15% | 31.4 13% |
* ... smaller is better
| CPU Clock (MHz) | GPU Clock (MHz) | Average CPU Temperature (°C) | Average GPU Temperature (°C) | |
| Prime95 + FurMark Stress | 1,333 | 1,576 | 71 | 64 |
| Cyberpunk 2077 Stress | 673 | 1,576 | 66 | 64 |
Speakers
Balanced mids and highs, a powerful maximum volume, and even a moderately pronounced bass make for better-than-average laptop speakers.
HP ZBook 8 G1i 14, RTX 500 audio analysis
(+) | speakers can play relatively loud (87.55 dB)
Bass 100 - 315 Hz
(±) | reduced bass - on average 14.7% lower than median
(±) | linearity of bass is average (9.8% delta to prev. frequency)
Mids 400 - 2000 Hz
(+) | balanced mids - only 2.4% away from median
(+) | mids are linear (2.4% delta to prev. frequency)
Highs 2 - 16 kHz
(+) | balanced highs - only 3.2% away from median
(+) | highs are linear (4.7% delta to prev. frequency)
Overall 100 - 16.000 Hz
(+) | overall sound is linear (10.2% difference to median)
Compared to same class
» 6% of all tested devices in this class were better, 5% similar, 89% worse
» The best had a delta of 7%, average was 17%, worst was 35%
Compared to all devices tested
» 5% of all tested devices were better, 1% similar, 94% worse
» The best had a delta of 4%, average was 23%, worst was 134%
Dell Precision 5000 5490 audio analysis
(+) | speakers can play relatively loud (87.8 dB)
Bass 100 - 315 Hz
(±) | reduced bass - on average 10.9% lower than median
(±) | linearity of bass is average (7.2% delta to prev. frequency)
Mids 400 - 2000 Hz
(+) | balanced mids - only 1.7% away from median
(+) | mids are linear (3.5% delta to prev. frequency)
Highs 2 - 16 kHz
(+) | balanced highs - only 4.4% away from median
(+) | highs are linear (3.4% delta to prev. frequency)
Overall 100 - 16.000 Hz
(+) | overall sound is linear (9.2% difference to median)
Compared to same class
» 4% of all tested devices in this class were better, 2% similar, 94% worse
» The best had a delta of 7%, average was 17%, worst was 35%
Compared to all devices tested
» 3% of all tested devices were better, 1% similar, 96% worse
» The best had a delta of 4%, average was 23%, worst was 134%
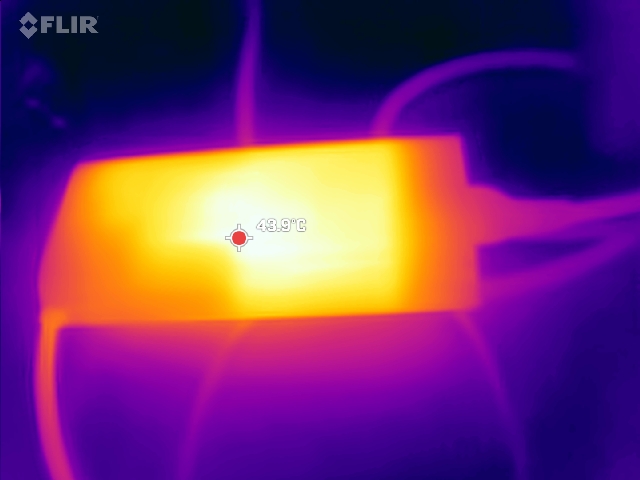
Power consumption
Idle power consumption is generally low. Under gaming load, it is reasonable, though at medium load the ZBook draws slightly more power than expected. With short peaks of up to 137 W, the 140 W USB-C power adapter handles the demand well, even with its long cables.
| Off / Standby | |
| Idle | |
| Load |
|
Key:
min: | |
| HP ZBook 8 G1i 14, RTX 500 Ultra 7 265H, RTX 500 Ada Generation Laptop, SK hynix PC801 HFS001TEJ9X101N, IPS, 2560x1600, 14" | HP ZBook 8 G1i 14 Ultra 7 255H, Arc 140T, SK hynix PC801 HFS001TEJ9X101N, IPS LED, 2560x1600, 14" | HP ZBook Ultra G1a A3ZQ0ET Ryzen AI Max PRO 390, Radeon 8050S, SK hynix PC801 HFS001TEJ9X101N, IPS LED, 1920x1200, 14" | Lenovo ThinkPad P14s Gen 6 21RV0017GE Ryzen AI 9 HX PRO 370, Radeon 890M, SK hynix PC801 HFS001TEJ9X162N, IPS LED, 1920x1200, 14" | Dell Precision 5000 5490 Ultra 9 185H, RTX 3000 Ada Generation Laptop, Kioxia XG8 KXG80ZNV1T02, IPS, 2560x1600, 14" | HP ZBook Firefly 14 G11 Ultra 7 165H, RTX A500 Laptop GPU, Kioxia XG8 KXG80ZNV512G, IPS, 2560x1600, 14" | Average NVIDIA RTX 500 Ada Generation Laptop | Average of class Workstation | |
|---|---|---|---|---|---|---|---|---|
| Power Consumption | 11% | -1% | 26% | -50% | -2% | -18% | -55% | |
| Idle Minimum * (Watt) | 5.5 | 4.7 15% | 4.5 18% | 4.7 15% | 11.1 -102% | 6.6 -20% | 6.5 ? -18% | 9.11 ? -66% |
| Idle Average * (Watt) | 8.4 | 8.2 2% | 7.5 11% | 7.7 8% | 14.8 -76% | 12.7 -51% | 11 ? -31% | 13.8 ? -64% |
| Idle Maximum * (Watt) | 8.7 | 10.8 -24% | 8.3 5% | 8 8% | 16.5 -90% | 13.3 -53% | 11.5 ? -32% | 17.9 ? -106% |
| Load Average * (Watt) | 87.9 | 64.1 27% | 80.7 8% | 53.3 39% | 70.1 20% | 67 24% | 94.1 ? -7% | 96 ? -9% |
| Cyberpunk 2077 ultra * (Watt) | 84 | 71.4 15% | 106.5 -27% | 58.3 31% | 63.4 25% | |||
| Cyberpunk 2077 ultra external monitor * (Watt) | 80.6 | 69.2 14% | 104.1 -29% | 58.6 27% | 58.1 28% | |||
| Load Maximum * (Watt) | 137 | 98 28% | 125.1 9% | 67.5 51% | 137.5 -0% | 94.9 31% | 137.2 ? -0% | 180.3 ? -32% |
| Witcher 3 ultra * (Watt) | 93.1 |
* ... smaller is better
energy consumption Cyberpunk / Stress test
energy consumption with external monitor
Battery life
The 72 Wh battery lasts for around 10 hours of web browsing or video playback.
| HP ZBook 8 G1i 14, RTX 500 Ultra 7 265H, RTX 500 Ada Generation Laptop, 72 Wh | HP ZBook 8 G1i 14 Ultra 7 255H, Arc 140T, 77 Wh | HP ZBook Ultra G1a A3ZQ0ET Ryzen AI Max PRO 390, Radeon 8050S, 74.5 Wh | Lenovo ThinkPad P14s Gen 6 21RV0017GE Ryzen AI 9 HX PRO 370, Radeon 890M, 57 Wh | Dell Precision 5000 5490 Ultra 9 185H, RTX 3000 Ada Generation Laptop, 72 Wh | HP ZBook Firefly 14 G11 Ultra 7 165H, RTX A500 Laptop GPU, 56 Wh | Average of class Workstation | |
|---|---|---|---|---|---|---|---|
| Battery runtime | -12% | -16% | -25% | 2% | -20% | -12% | |
| H.264 (h) | 10.1 | 10.1 ? 0% | |||||
| WiFi v1.3 (h) | 10.8 | 12 11% | 10.5 -3% | 9.3 -14% | 11 2% | 8.6 -20% | 8.55 ? -21% |
| Load (h) | 1.7 | 1.1 -35% | 1.2 -29% | 1.1 -35% | 1.441 ? -15% |
HP ZBook 8 G1i 14, RTX 500
- 10/16/2025 v8
Christian Hintze
 Total Sustainability Score:
 Alternatives at a glance
Image | Model / Review | Price | Weight | Height | Display |
|---|---|---|---|---|---|
1. 85.1%  | HP ZBook 8 G1i 14, RTX 500 Intel Core Ultra 7 265H ⎘ NVIDIA RTX 500 Ada Generation Laptop ⎘ 64 GB Memory, 1024 GB SSD | Amazon: | 1.7 kg | 18.9 mm | 14.00" 2560x1600 216 PPI IPS |
2. 82%  | HP ZBook 8 G1i 14 Intel Core Ultra 7 255H ⎘ Intel Arc Graphics 140T ⎘ 32 GB Memory, 1024 GB SSD | Amazon: List Price: 1860 Euro | 1.7 kg | 23 mm | 14.00" 2560x1600 216 PPI IPS LED |
3. 85.4%  | HP ZBook Ultra G1a A3ZQ0ET AMD Ryzen AI Max PRO 390 ⎘ AMD Radeon 8050S ⎘ 32 GB Memory, 1024 GB SSD | Amazon: List Price: 2545 Euro | 1.6 kg | 19 mm | 14.00" 1920x1200 162 PPI IPS LED |
4. 81.6%  | Lenovo ThinkPad P14s Gen 6 21RV0017GE AMD Ryzen AI 9 HX PRO 370 ⎘ AMD Radeon 890M ⎘ 64 GB Memory, 1024 GB SSD | Amazon: List Price: 2289 Euro | 1.4 kg | 22 mm | 14.00" 1920x1200 162 PPI IPS LED |
5. 89.3% v7 (old)  | Dell Precision 5000 5490 Intel Core Ultra 9 185H ⎘ NVIDIA RTX 3000 Ada Generation Laptop ⎘ 64 GB Memory, 1024 GB SSD | Amazon: List Price: 3800 USD | 1.6 kg | 18.95 mm | 14.00" 2560x1600 216 PPI IPS |
6. 80.3%  | HP ZBook Firefly 14 G11 Intel Core Ultra 7 165H ⎘ NVIDIA RTX A500 Laptop GPU ⎘ 32 GB Memory, 512 GB SSD | Amazon: List Price: 3500 USD | 1.5 kg | 19.2 mm | 14.00" 2560x1600 216 PPI IPS |

