Verdict — Falls A Bit Short Against Dell
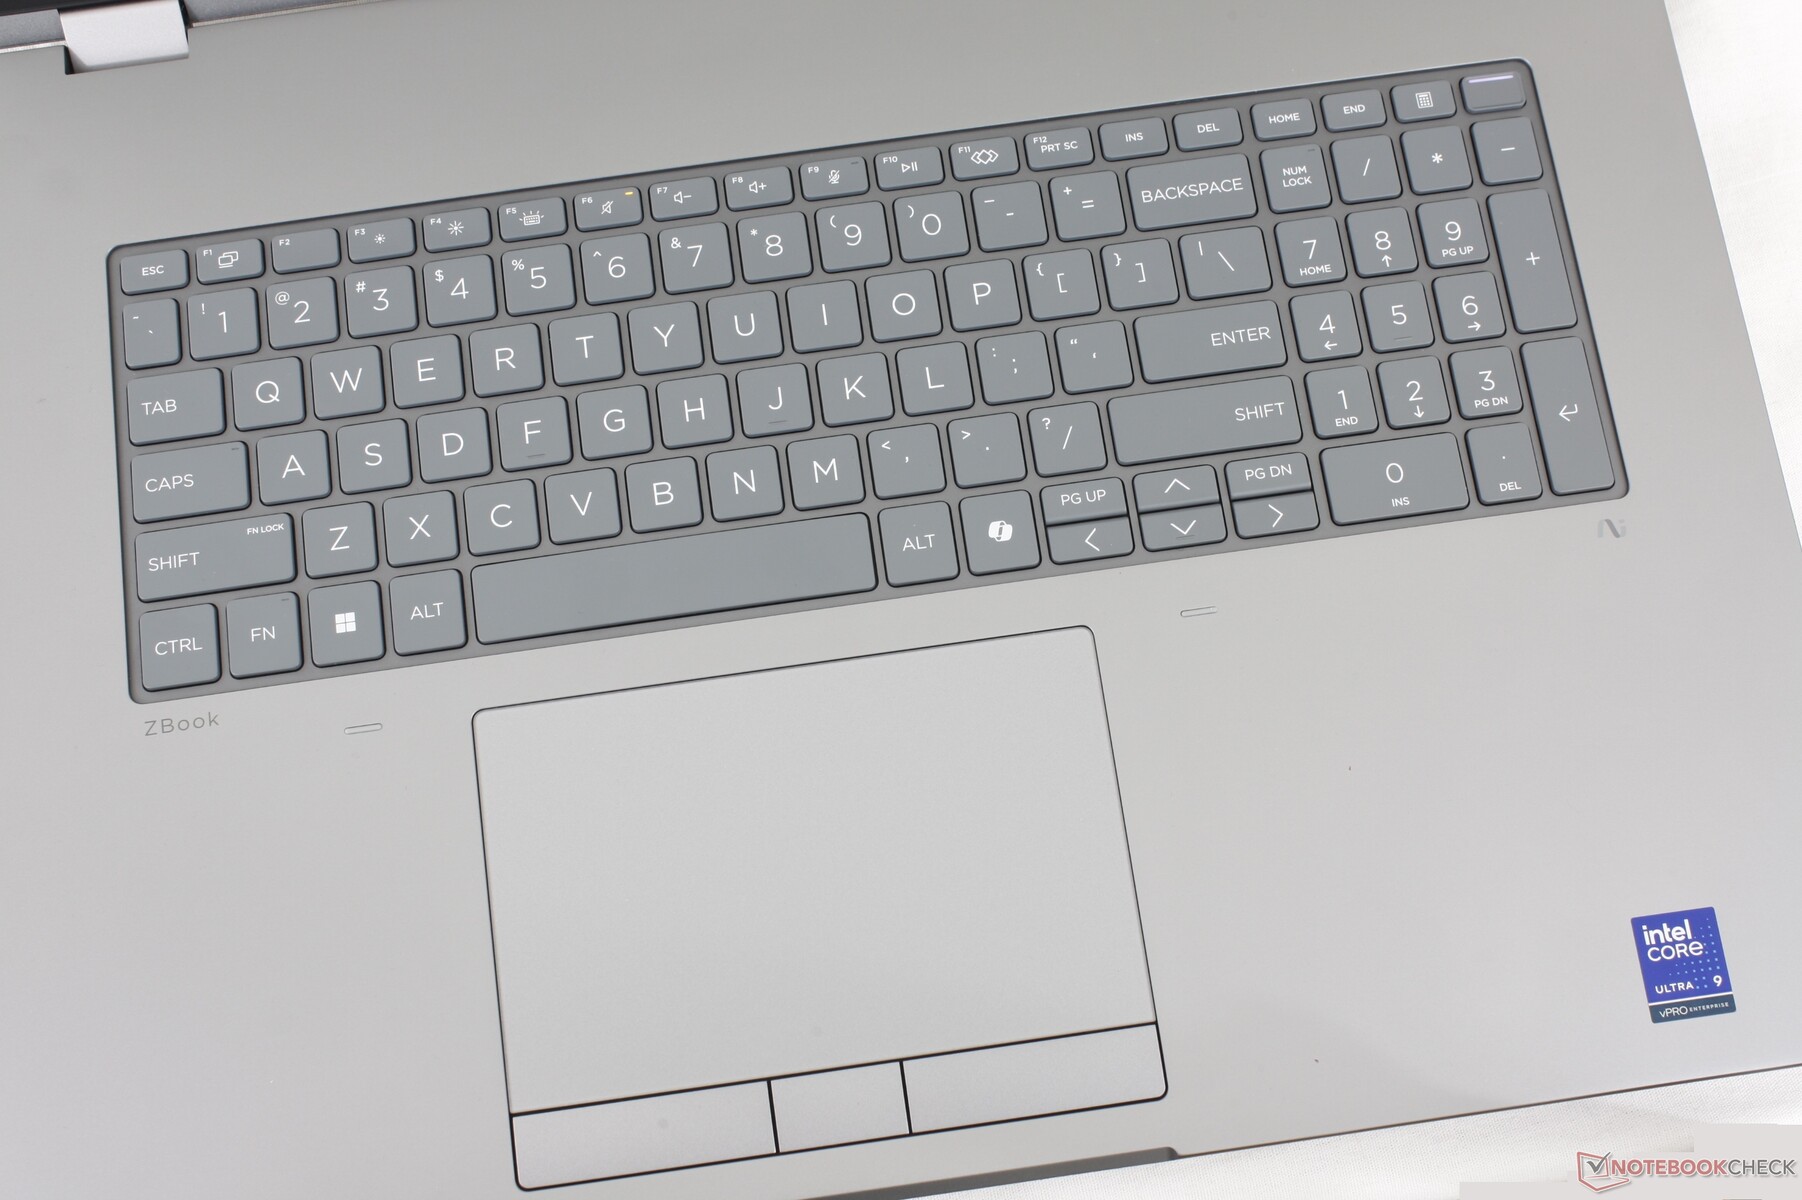
The HP ZBook Fury G1i 18 has some notable advantages over the Dell Pro Max 18 Plus. It runs cooler, is slightly thinner and lighter, includes per-key RGB lighting and actual mouse buttons, and it ships with a faster 165 Hz display with less noticeable ghosting. Meanwhile, the hardware is built just as tough if not arguably more versatile with its wider hinges and "tool-less" bottom panel for easier servicing.
Unfortunately, several drawbacks hold back the HP from being the ultimate 18-inch mobile workstation. Perhaps most notably, its CPU and GPU run slightly but consistently slower than on the Dell when both are configured with identical processors. The Dell Pro Max 18 Plus runs warmer while targeting a higher TGP of 175 W for more performance. Battery life and fan noise for the HP aren't necessarily longer or quieter, respectively, despite any performance differences between the two models. The Dell machine is also more optimized for AI workloads with its higher capacity CAMM2 RAM and removable DGFF that can be swapped with a discrete Qualcomm inference NPU. Performance hunters may therefore find more value out of the Dell machine.
Pros
Cons
Price and Availability
HP is now shipping the ZBook Fury G1i 18 starting at $5660 for the base configuration up to over $10000 if configured with the Core Ultra 9 285HX and Nvidia RTX Pro 5000 Blackwell.
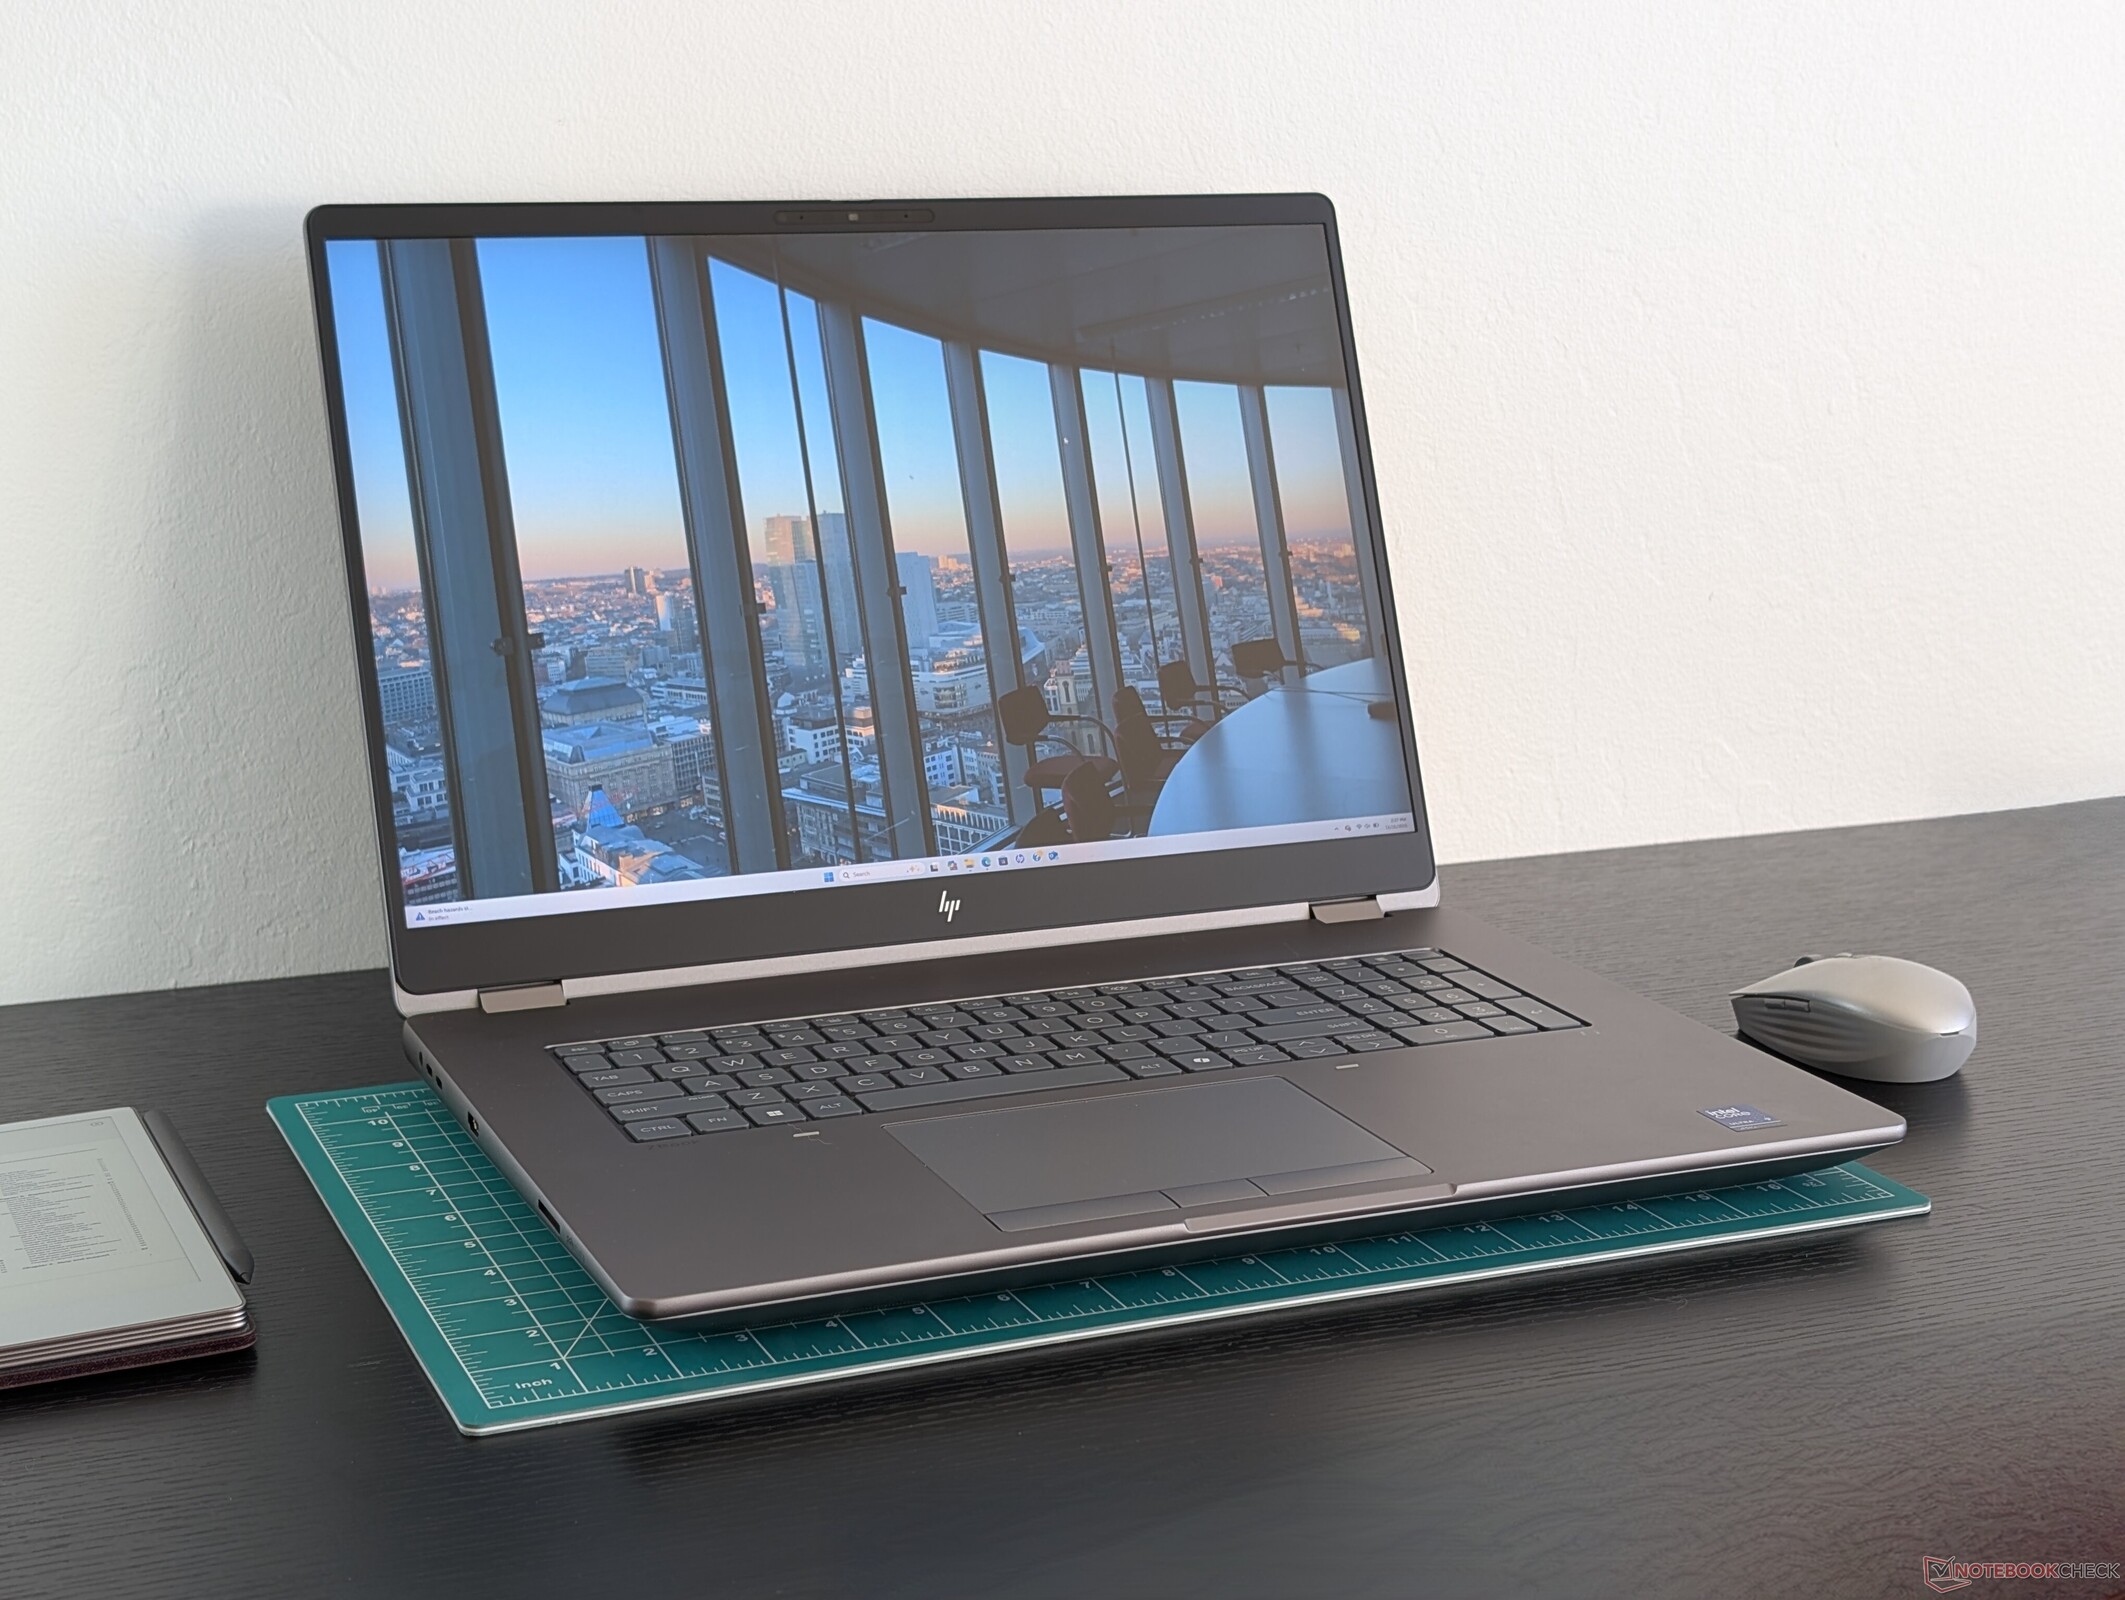
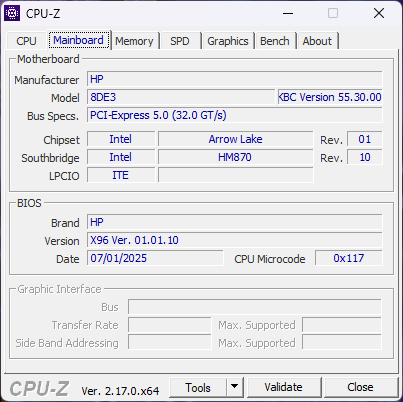
The ZBook Fury G1i 18 is the first 18-inch model in the Fury family of high-performance mobile workstations. It ships with the latest Intel Arrow Lake-HX CPUs and Nvidia Pro Blackwell GPUs to be one of the most powerful in the category.
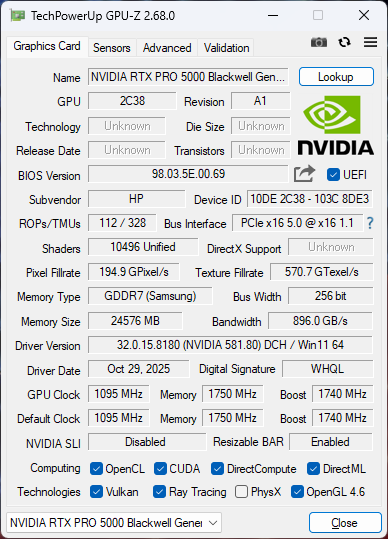
Our specific test unit has been configured to the brim with the Core Ultra 9 285HX CPU, 150 W Nvidia RTX Pro 5000 Blackwell GPU, and 64 GB of DDR5-5600 RAM for approximately $9000+ retail. All SKUs at the moment ship with the same 2560 x 1600p 165 Hz IPS display.
Competing 18-inch workstations are far and few between with the Dell Pro Max 18 Plus being the only direct competitor at the time of writing. Lenovo, for example, does not yet offer an 18-inch ThinkPad with professional Nvidia GPU options.
More HP reviews:
Specifications
Case
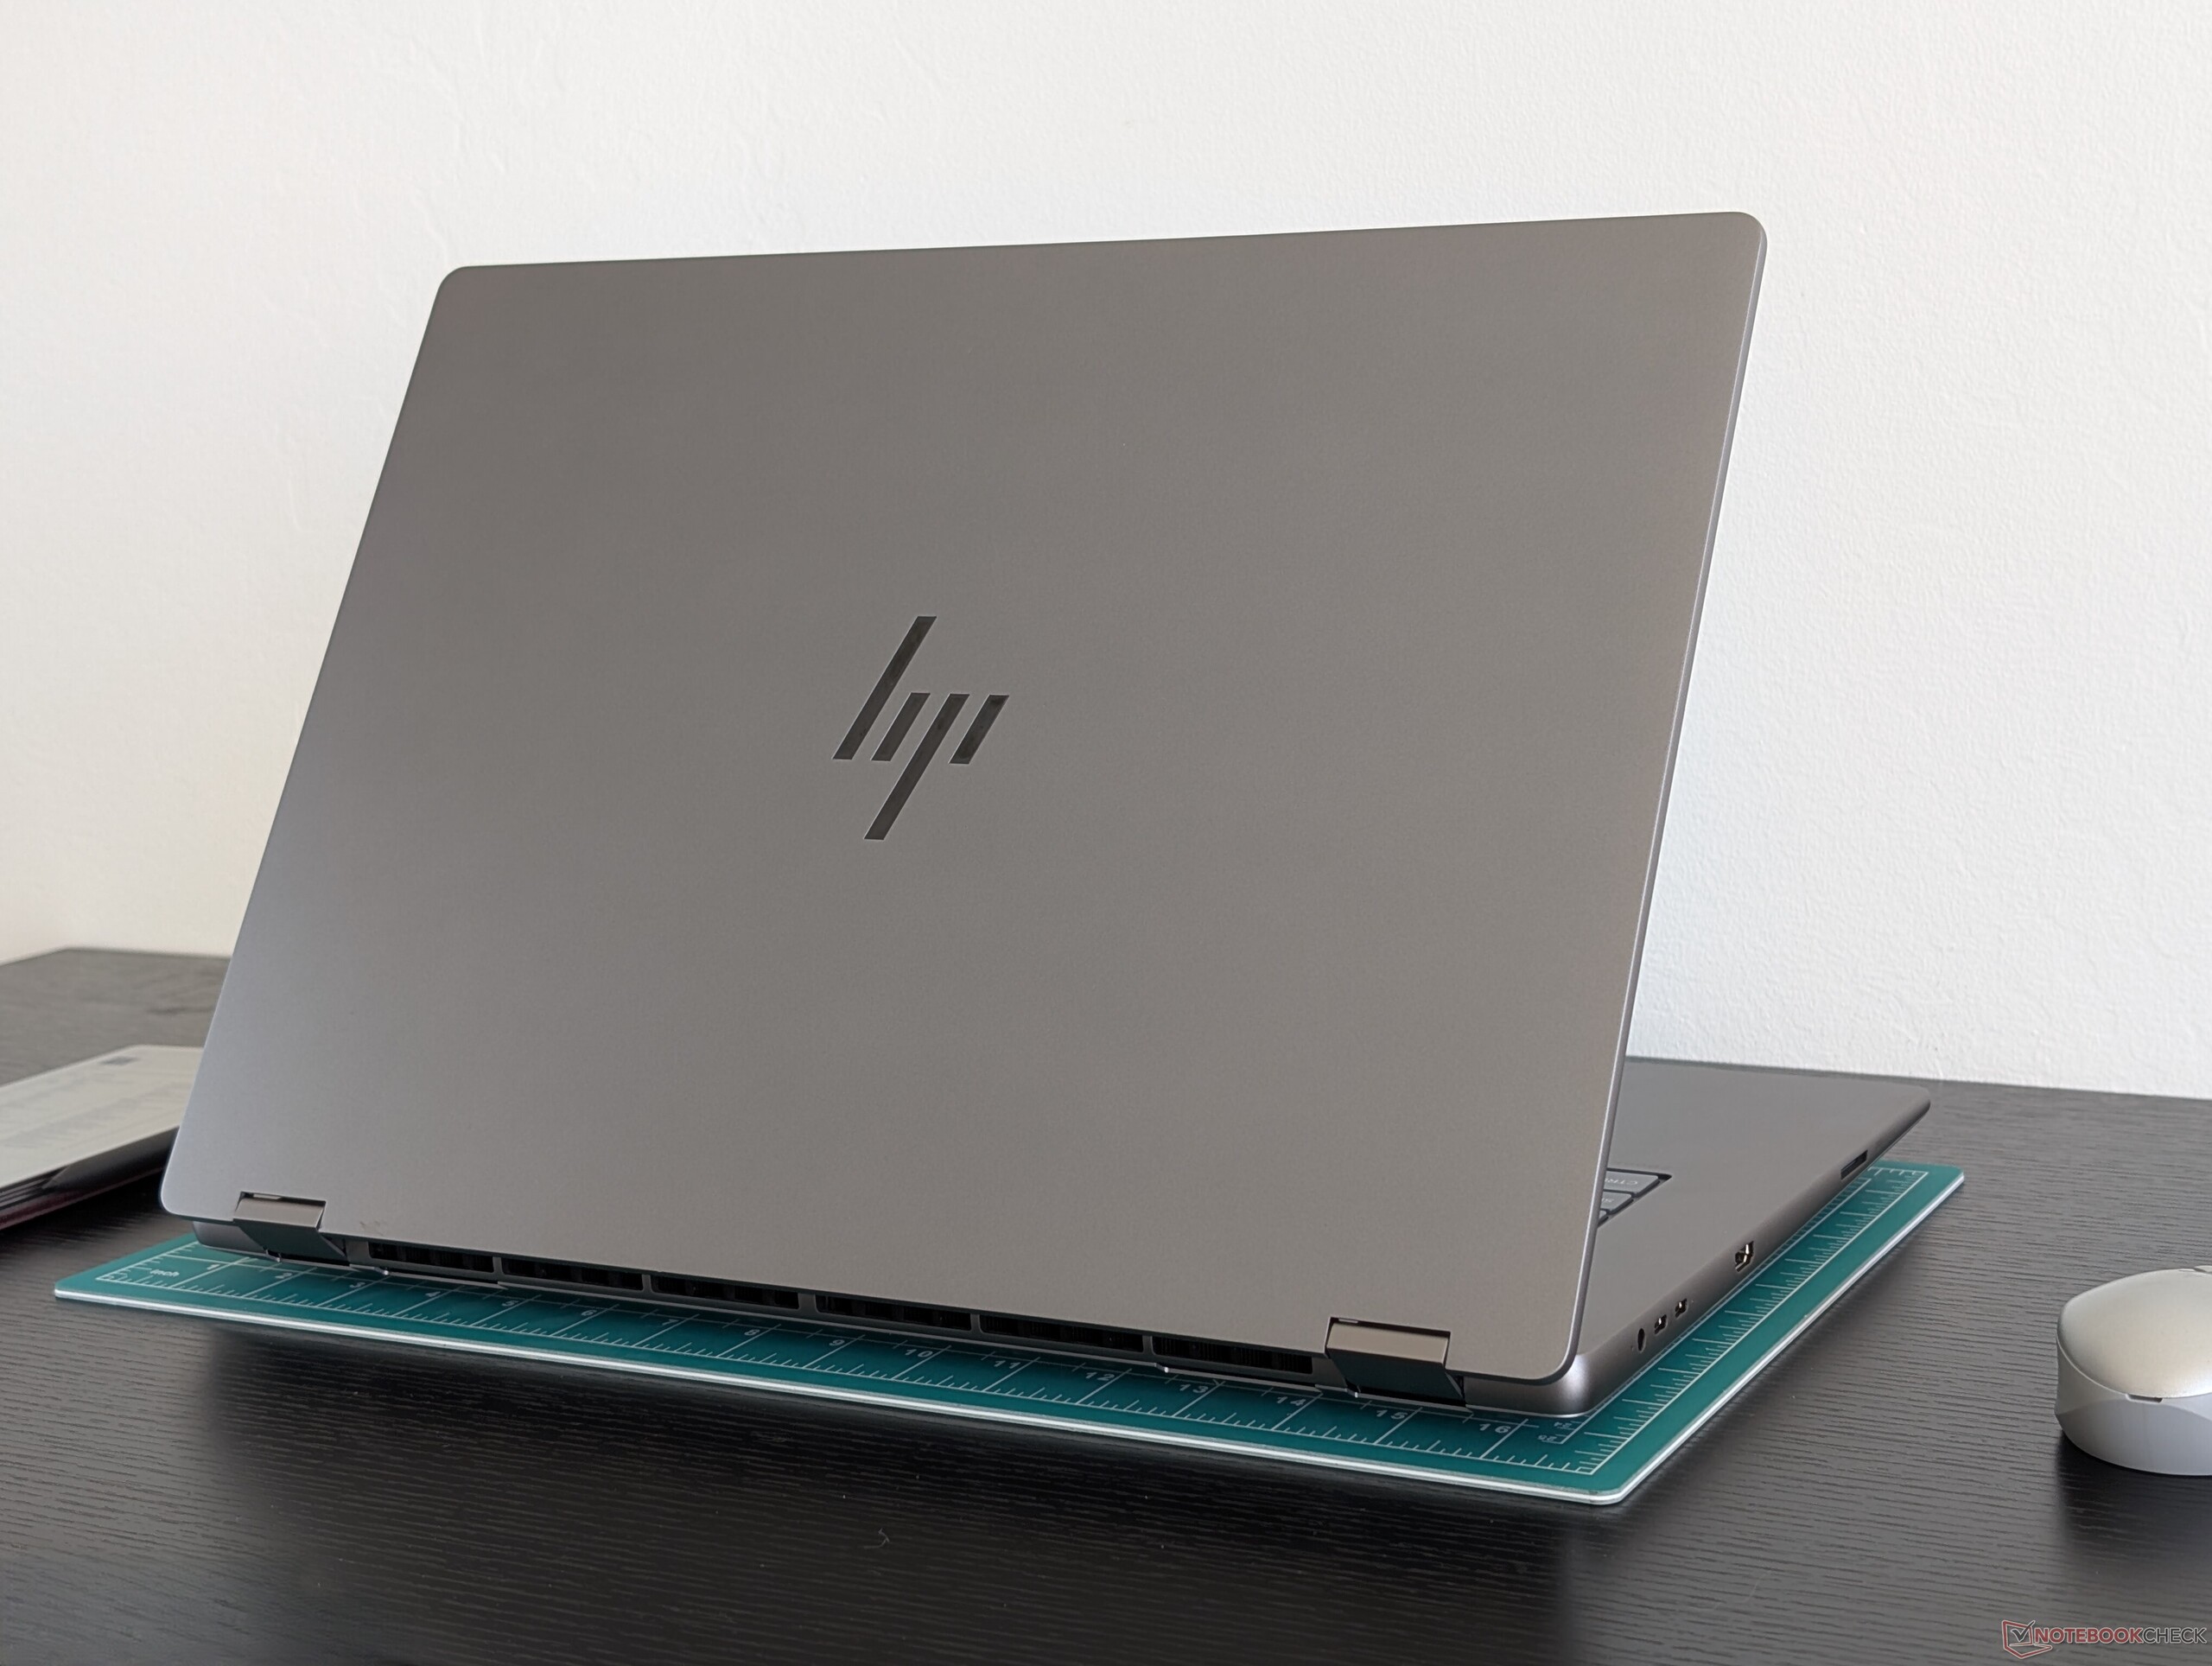
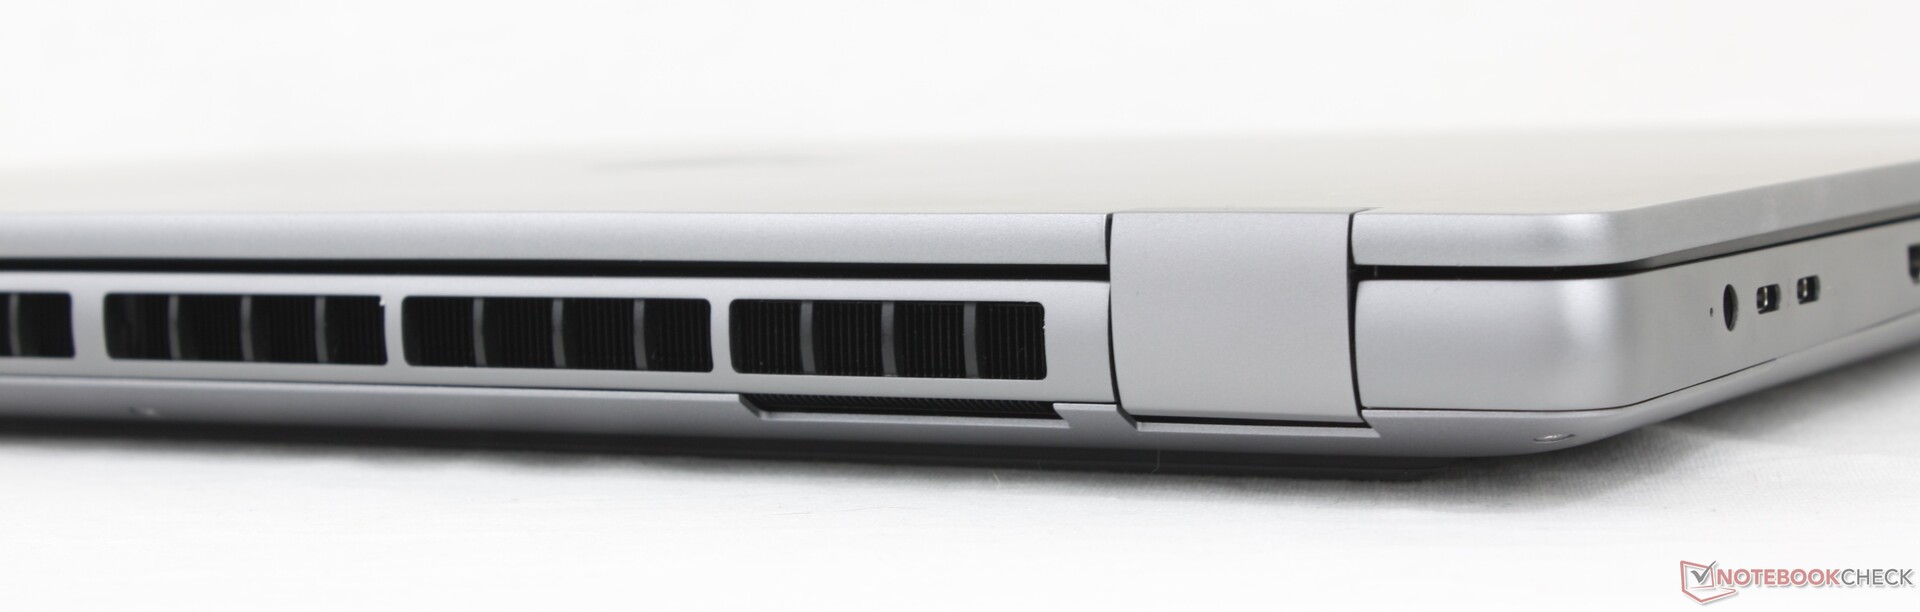
While the aluminum alloy chassis is not noticeably weaker or stronger than on the Dell Pro Max 18 Plus, it is slightly thinner and lighter than the Dell while being larger in length and width. One notable advantage for the HP, however, is that its display can open the full 180 degrees for a bit more versatility.
Connectivity
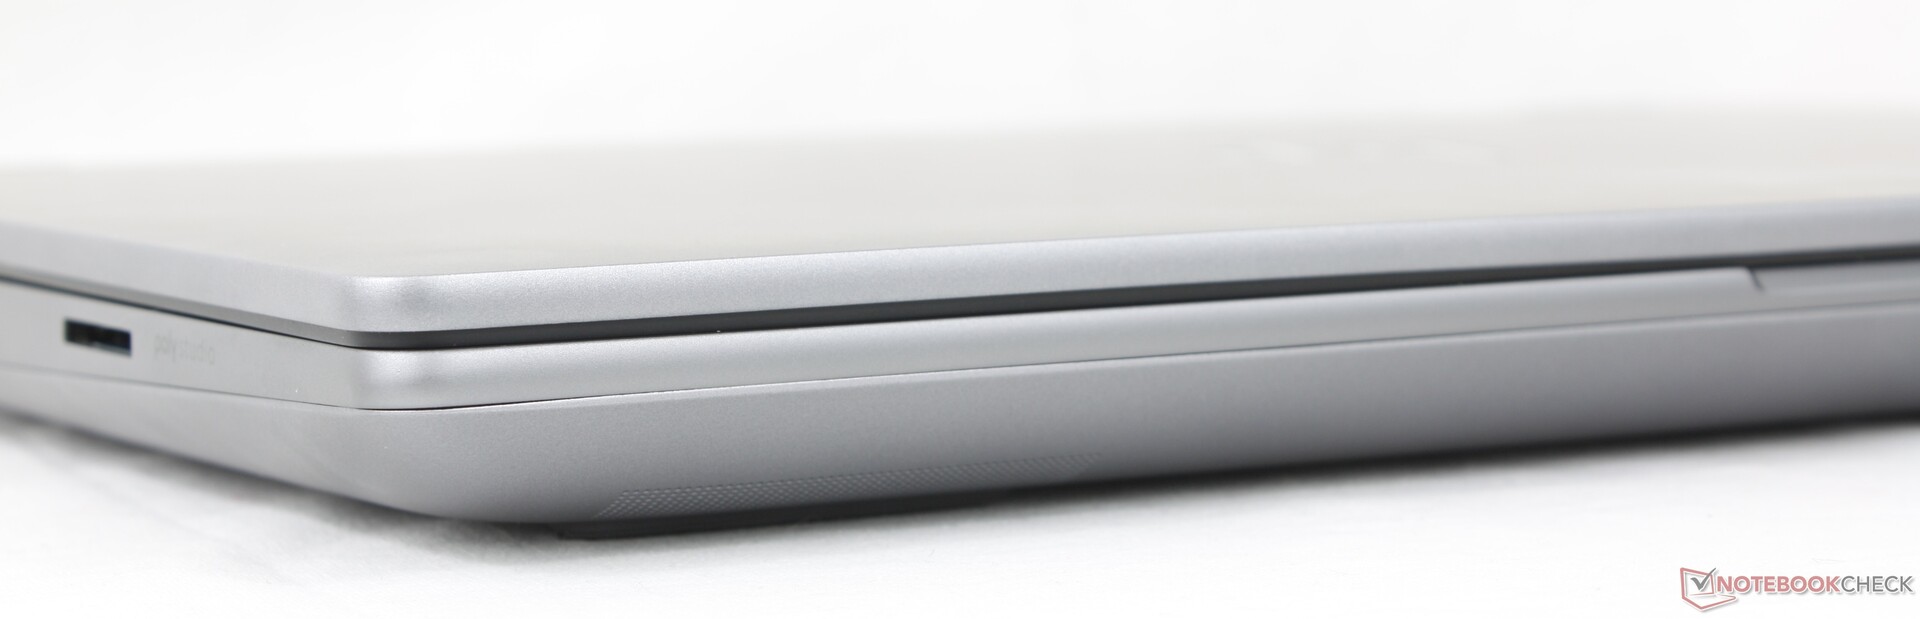
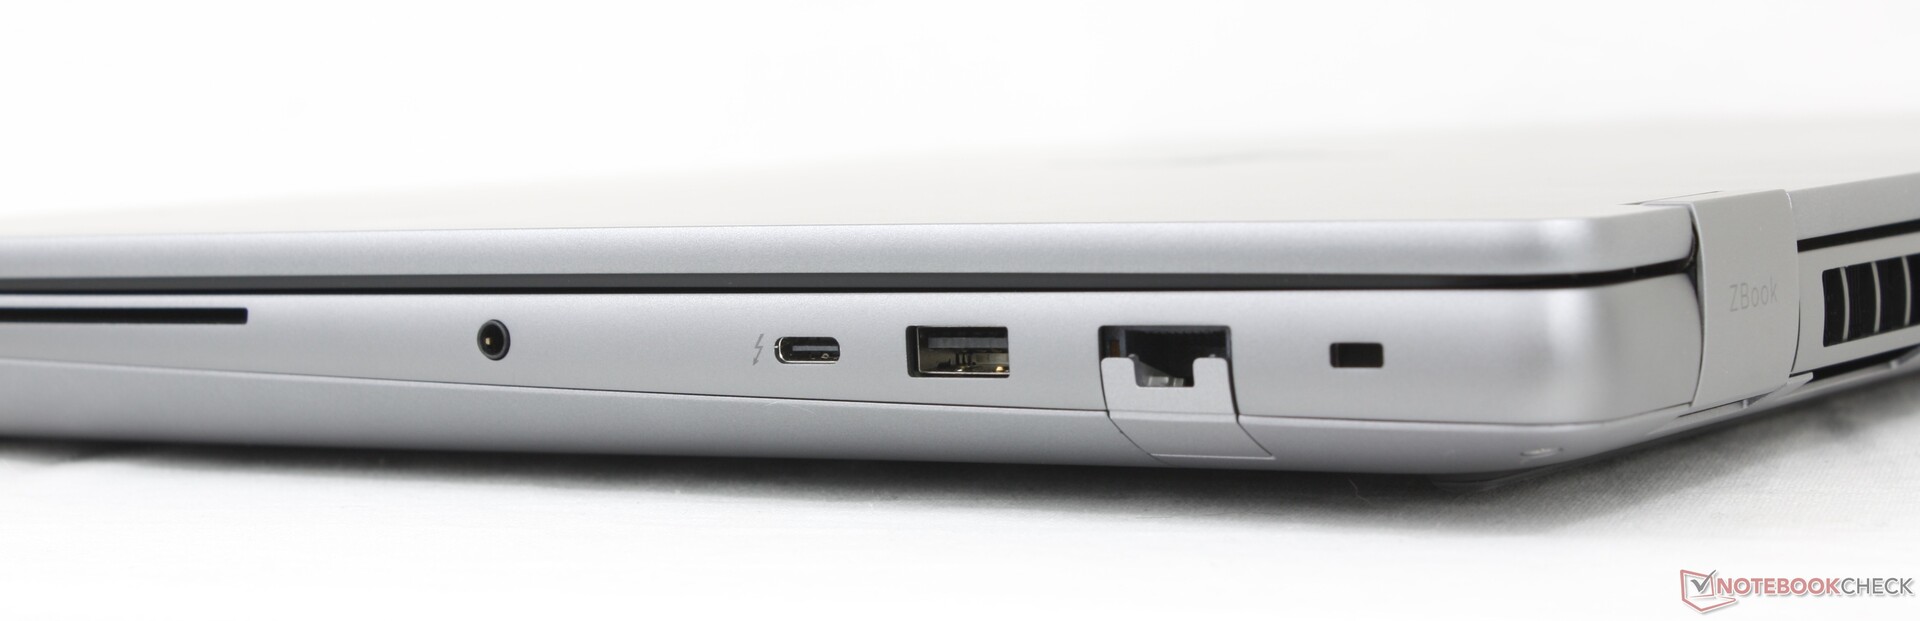
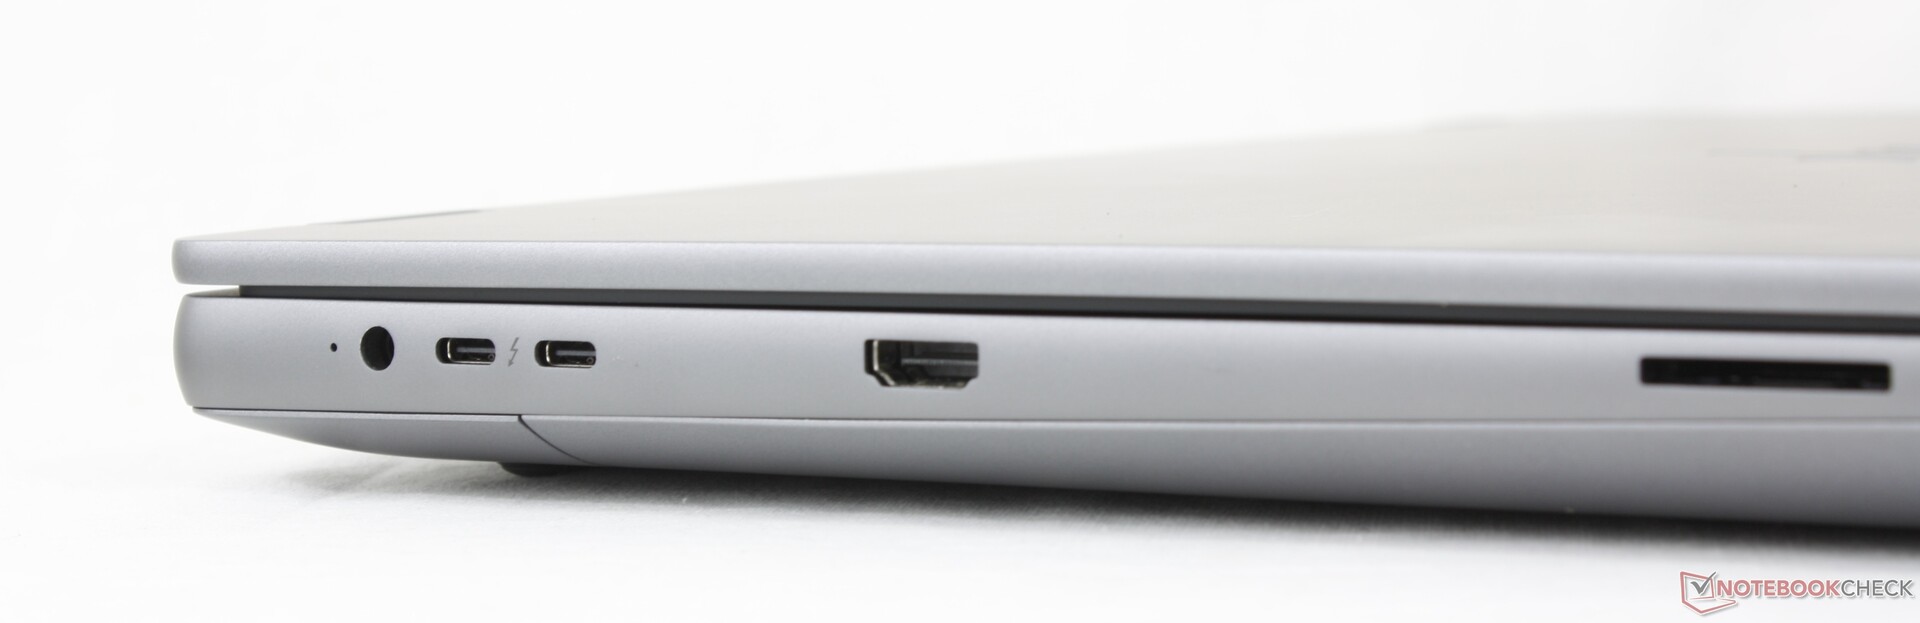
The model features all ports found on the Dell Pro Max 18 Plus albeit with one fewer USB-A port. Our main complaint is that the two USB-C ports along the left edge are too close to the AC adapter port. Connecting multiple cables can be cramped as a result.
SD Card Reader
| SD Card Reader | |
| average JPG Copy Test (av. of 3 runs) | |
| HP ZBook X G1i 16 (Toshiba Exceria Pro SDXC 64 GB UHS-II) | |
| Dell Pro Max 18 Plus MB18250 (Toshiba Exceria Pro SDXC 64 GB UHS-II) | |
| HP ZBook Fury G1i 18 (Toshiba Exceria Pro SDXC 64 GB UHS-II) | |
| Lenovo ThinkPad P16 Gen 2 (Toshiba Exceria Pro SDXC 64 GB UHS-II) | |
| Schenker Key 18 Pro M25 RTX 5090 (Angelbird AV Pro V60) | |
| maximum AS SSD Seq Read Test (1GB) | |
| HP ZBook X G1i 16 (Toshiba Exceria Pro SDXC 64 GB UHS-II) | |
| Dell Pro Max 18 Plus MB18250 (Toshiba Exceria Pro SDXC 64 GB UHS-II) | |
| HP ZBook Fury G1i 18 (Toshiba Exceria Pro SDXC 64 GB UHS-II) | |
| Schenker Key 18 Pro M25 RTX 5090 (Angelbird AV Pro V60) | |
| Lenovo ThinkPad P16 Gen 2 (Toshiba Exceria Pro SDXC 64 GB UHS-II) | |
Communication
Webcam
A 5 MP camera comes standard alongside IR and a physical shutter. The Poly Camera Pro software, which is also included on most other HP laptops, comes pre-installed on the ZBook Fury for additional video conferencing features.


Maintenance
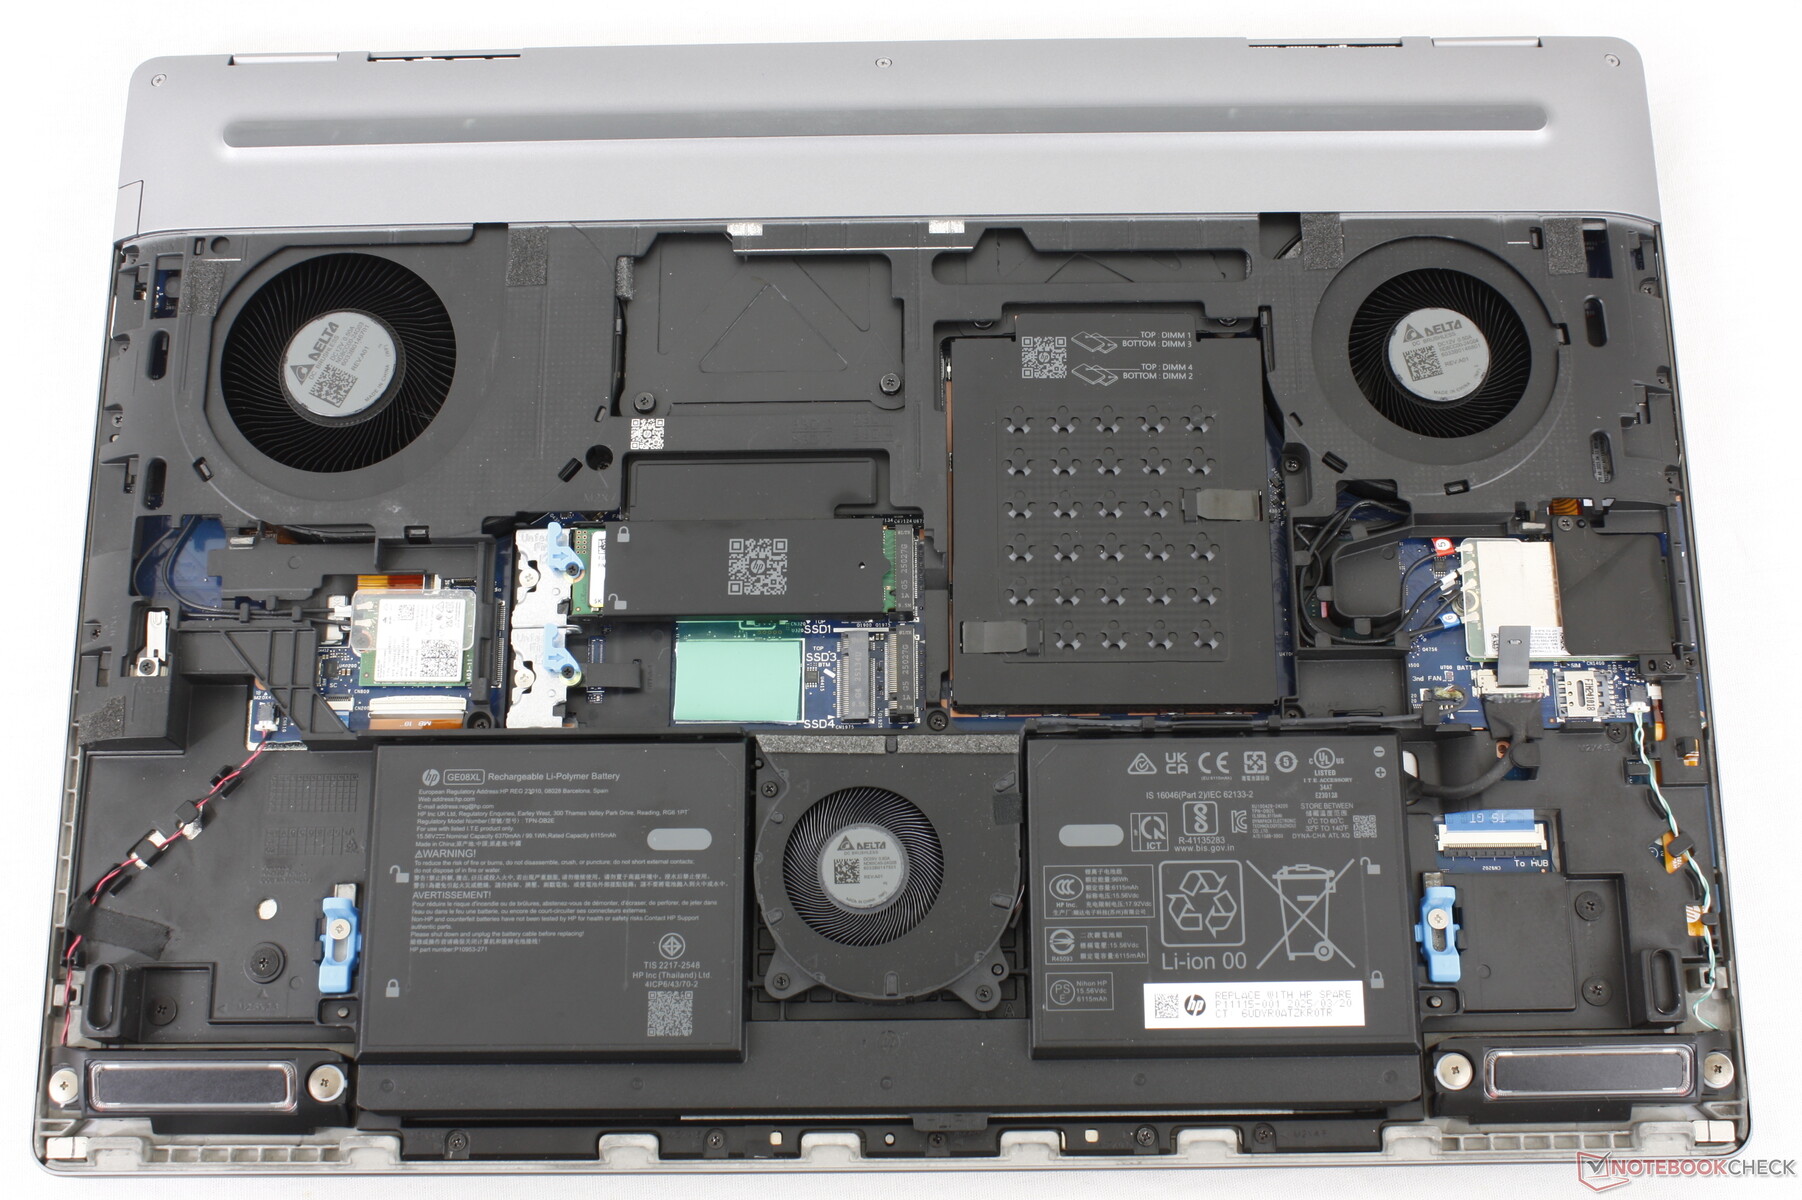
The bottom panel is "tool-less" and can be removed without any screwdrivers. Even so, most components are screwed onto the motherboard and so a screwdriver is still be required for servicing.
Sustainability
40 percent of the plastics around the chassis are sourced from post-consumer recycling while the packaging is mostly paper pulp with some plastic wrapping for the AC adapter.
Accessories And Warranty
There are no extras in the box other than the AC adapter and paperwork. Disappointingly, the system comes with just a one-year limited manufacturer warranty when ordering from the official HP website instead of the usual three years for high-end workstations.
Input Devices
Display — No 4K Or OLED For Now
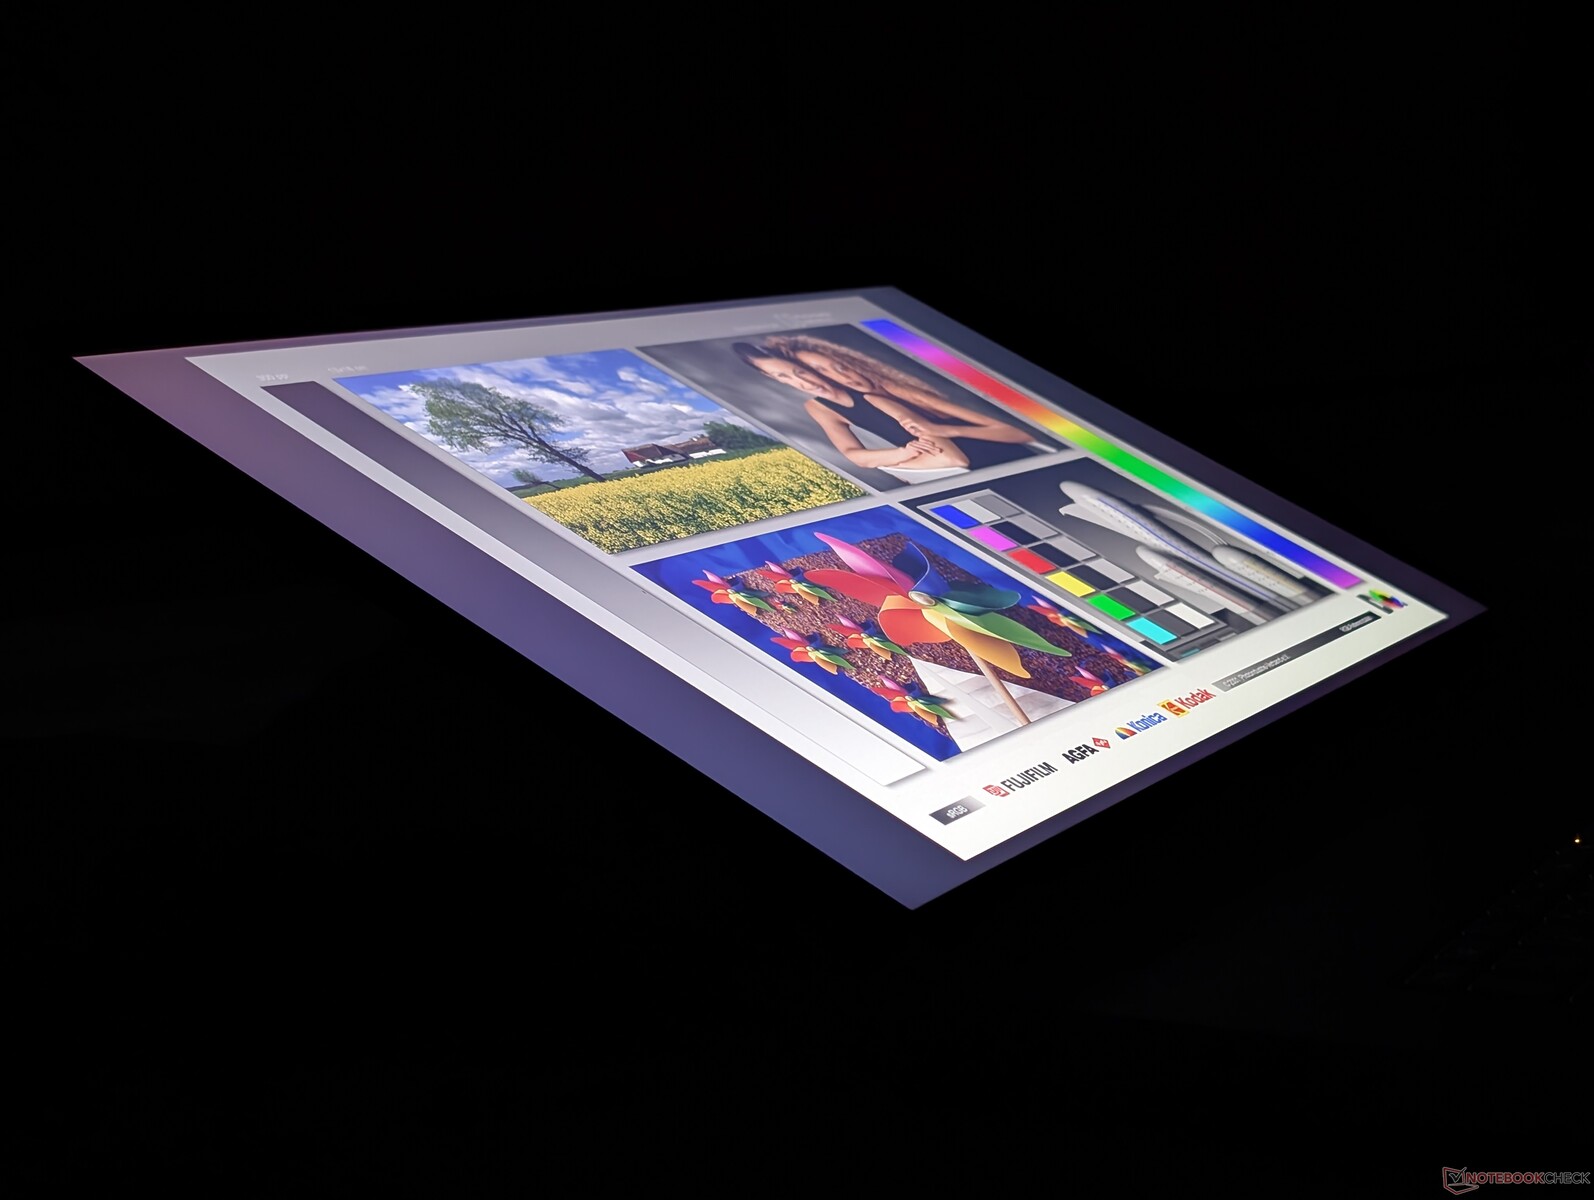
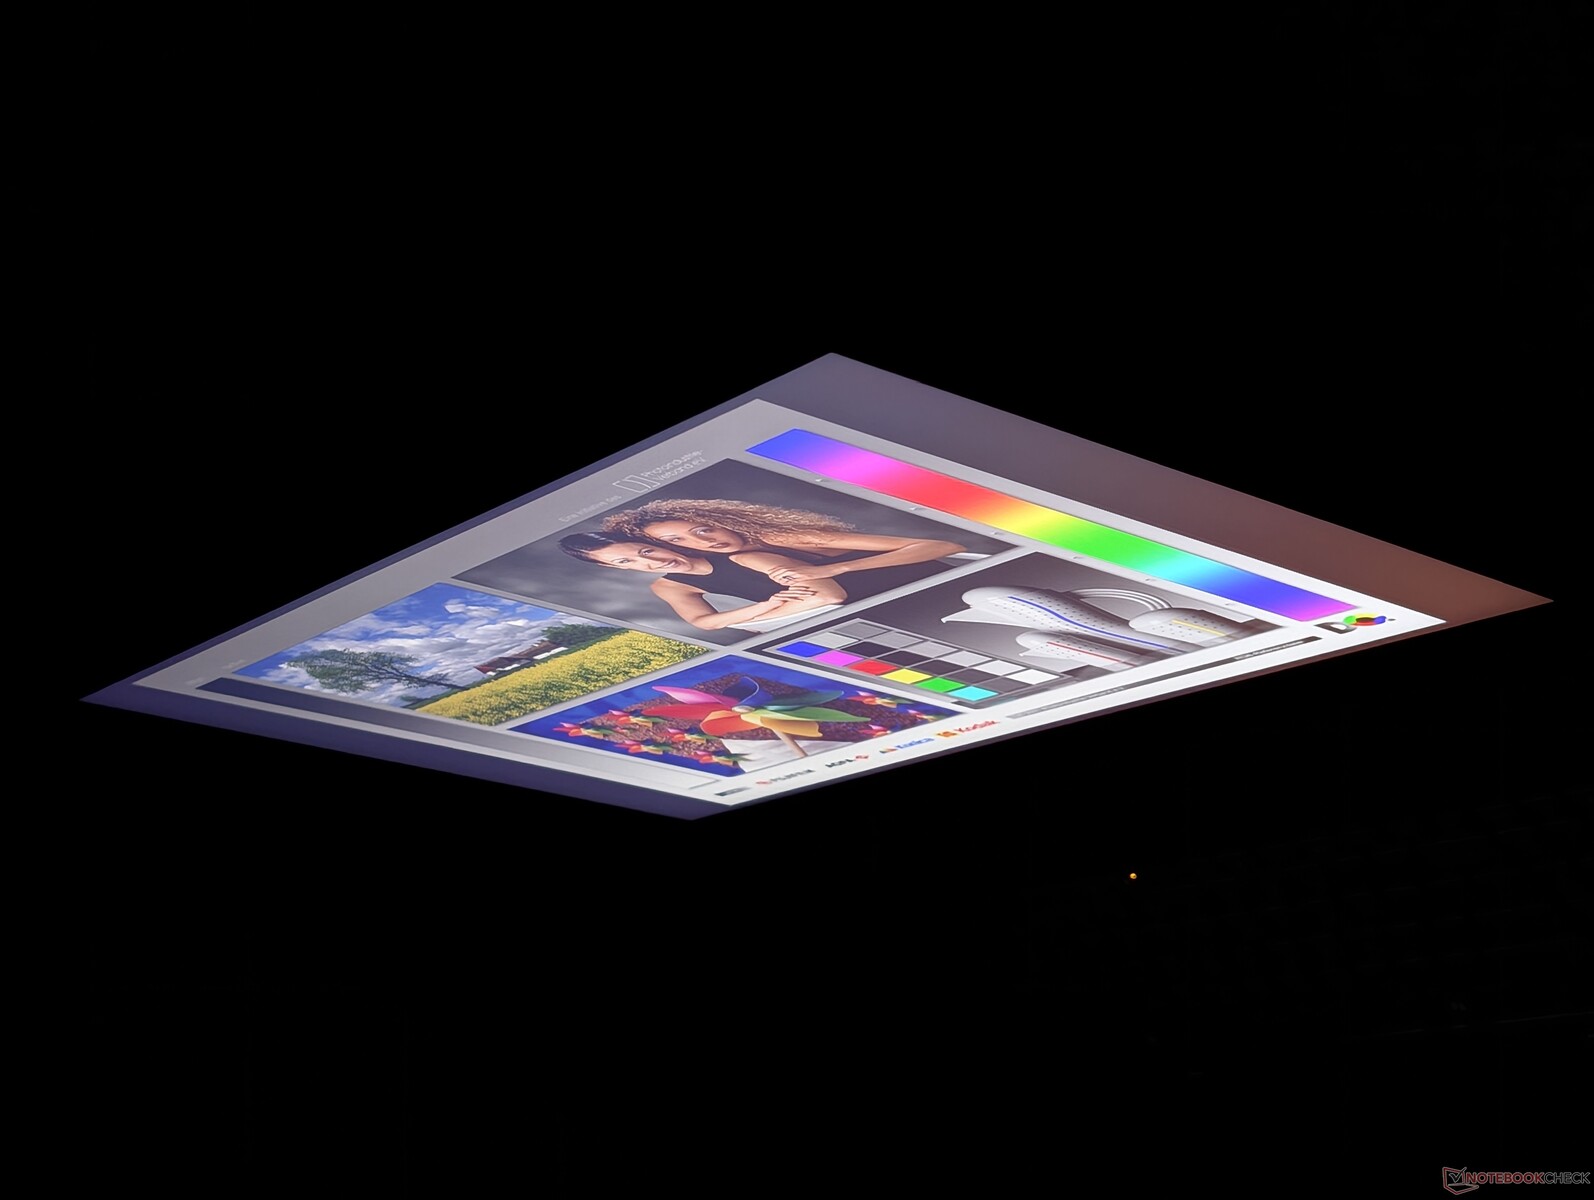
Like the Dell Pro Max 18 Plus, our the HP ZBook Fury G1i 18 is also limited to a single 2560 x 1600 IPS non-touch option. However, HP uses a different panel from AU Optronics instead of BOE which offers similar P3 colors and brightness levels but with faster black-white response times, faster native refresh rate, PSR2 support, and slightly lower contrast levels.
Our test unit suffers from moderate uneven backlight bleeding around the corners as shown by the picture below. While acceptable on cheaper laptops, the clouding is a bit disappointing to see on a premier workstation like the ZBook.


| |||||||||||||||||||||||||
Brightness Distribution: 92 %
Center on Battery: 517.5 cd/m²
Contrast: 1617:1 (Black: 0.32 cd/m²)
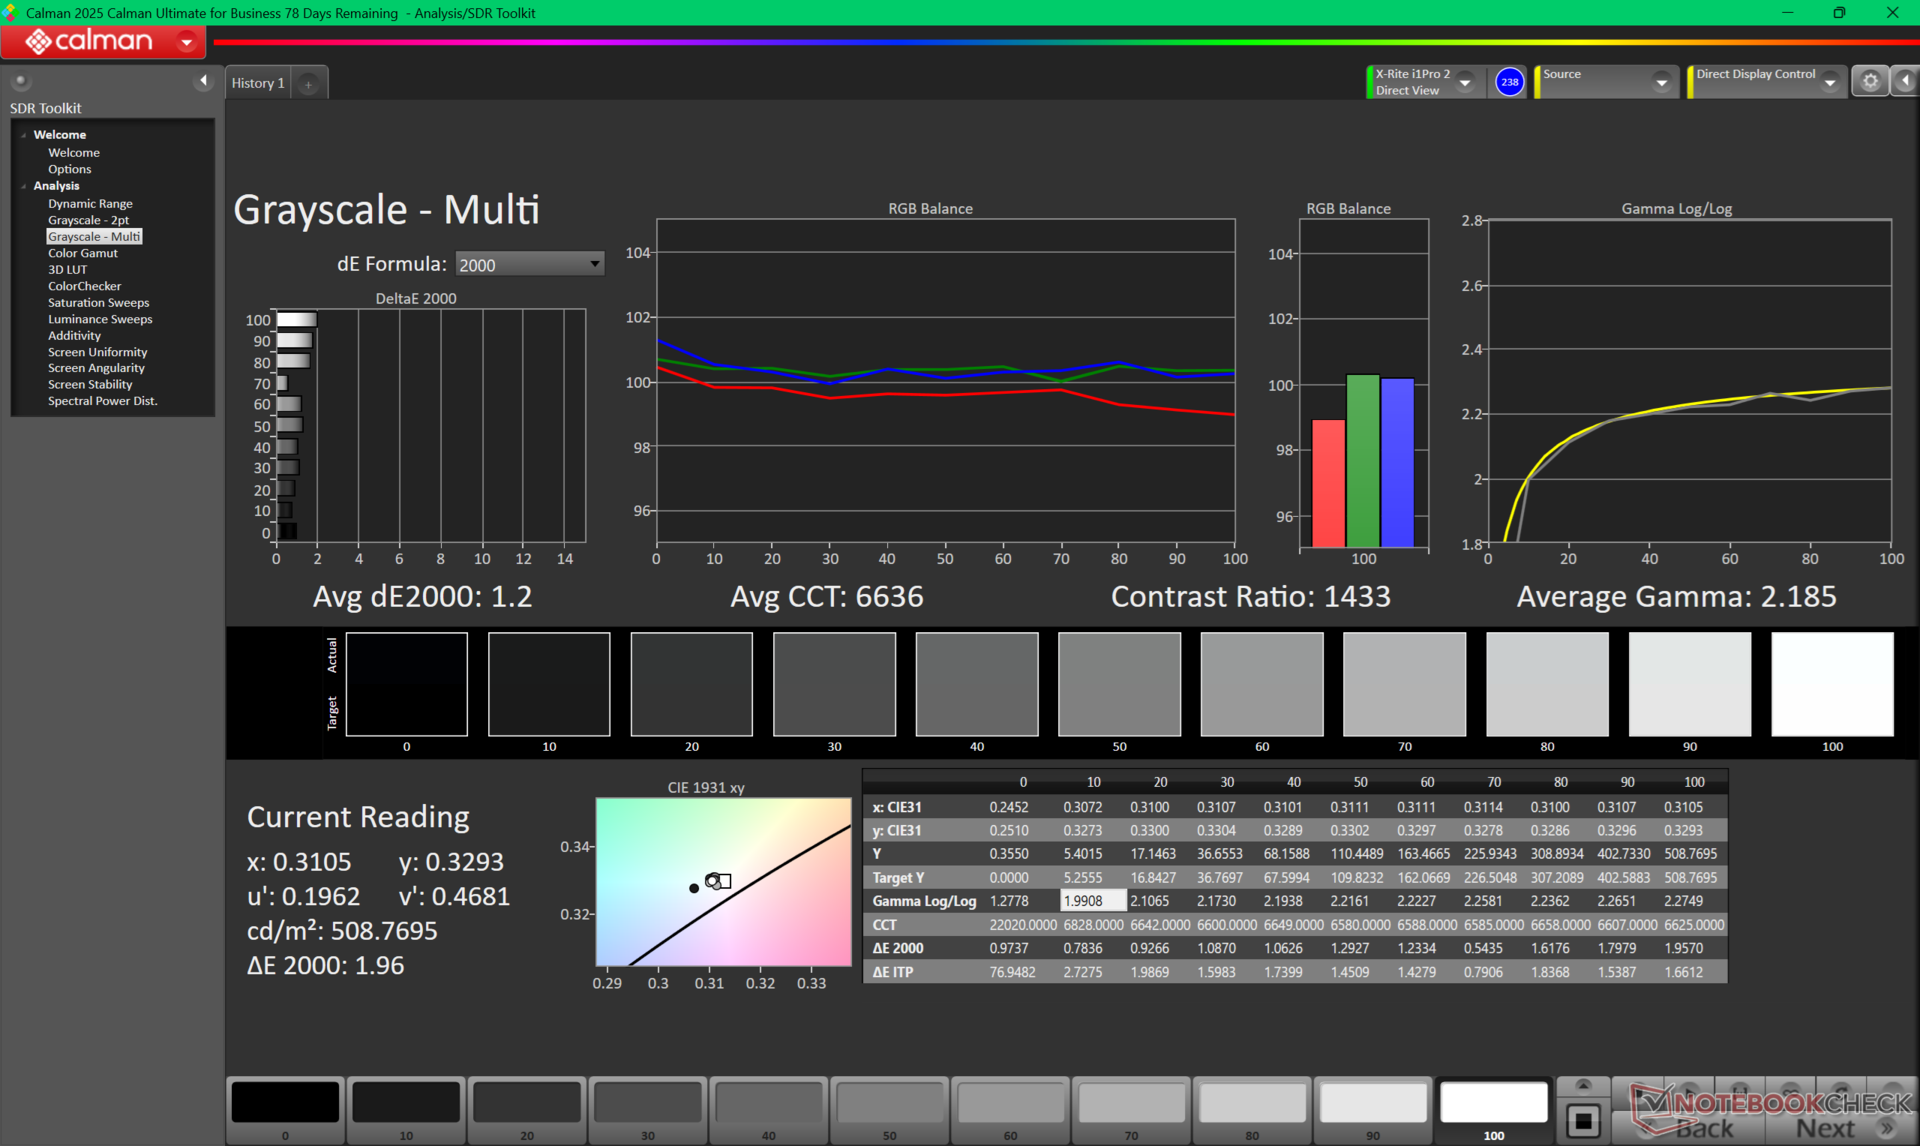
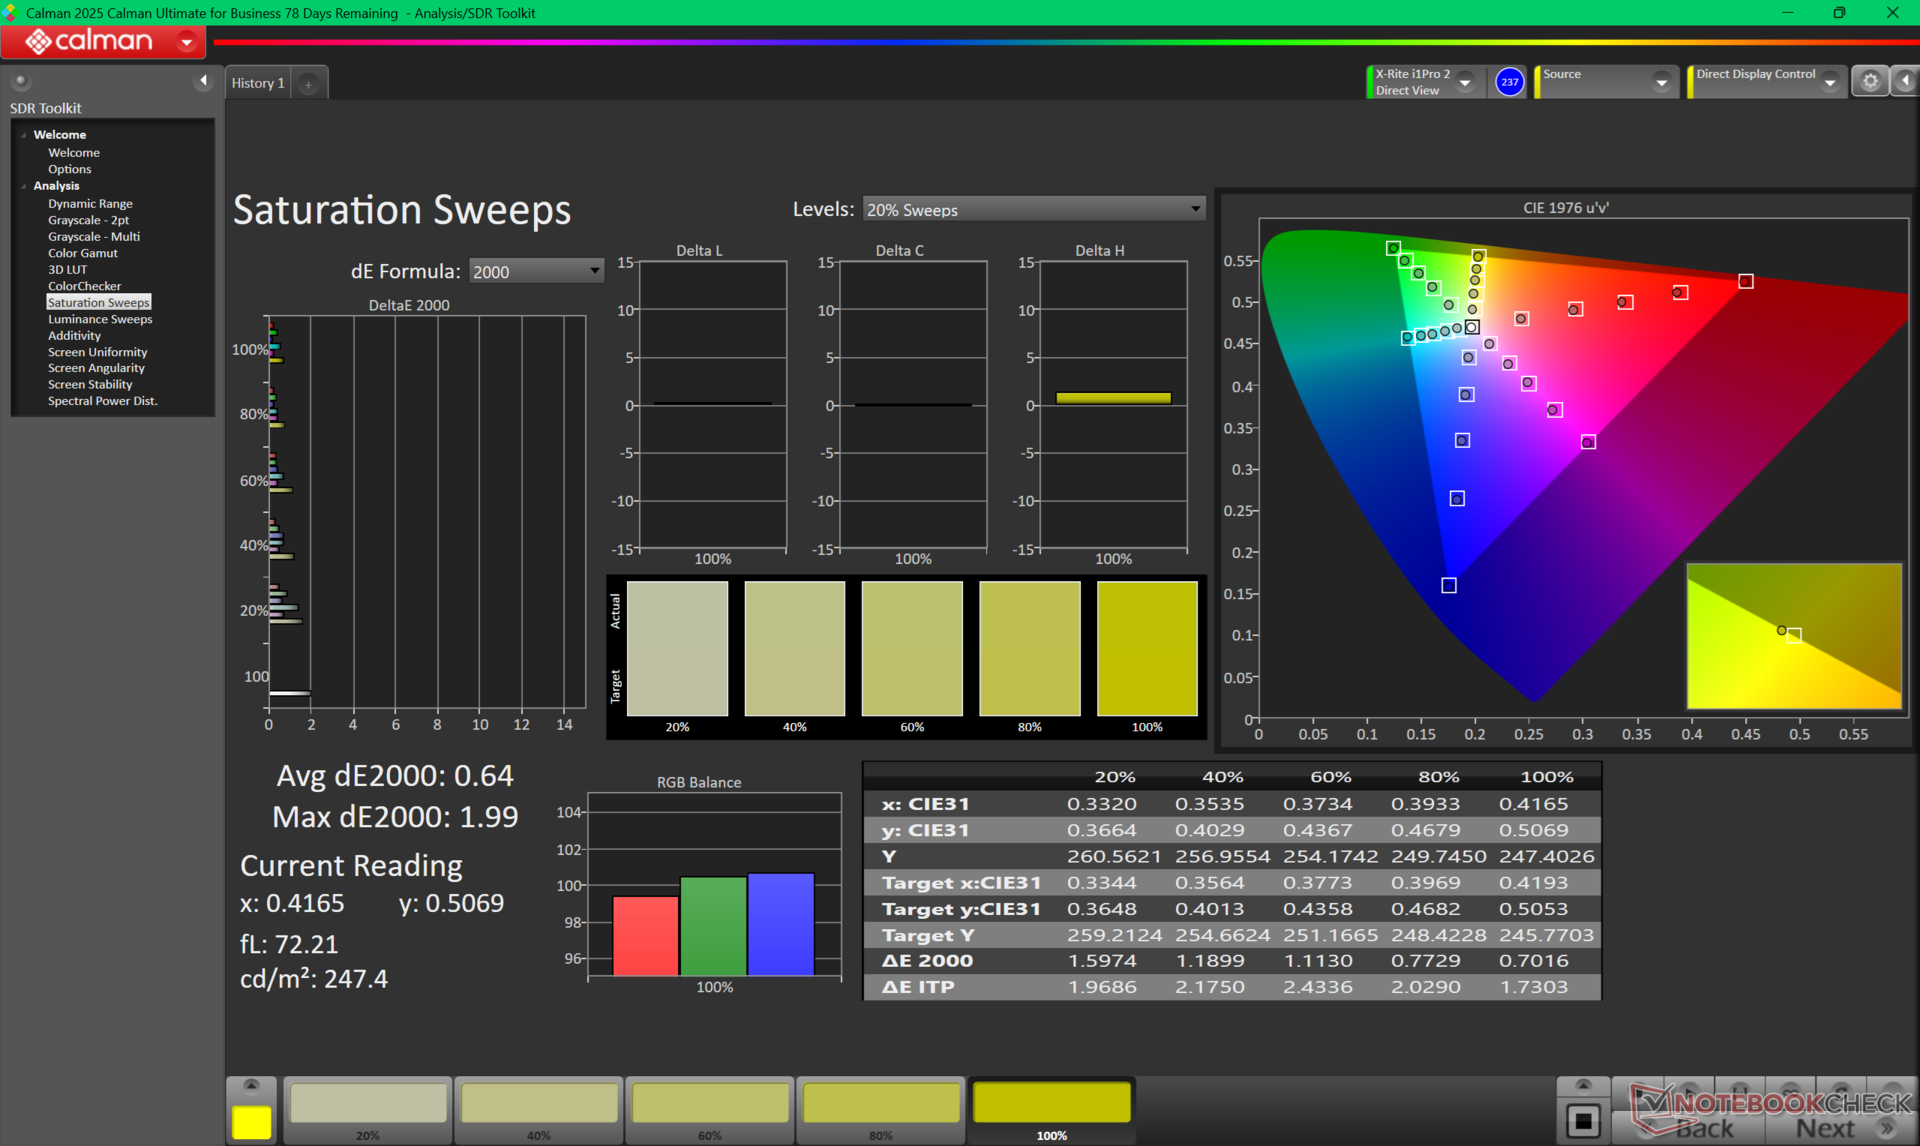
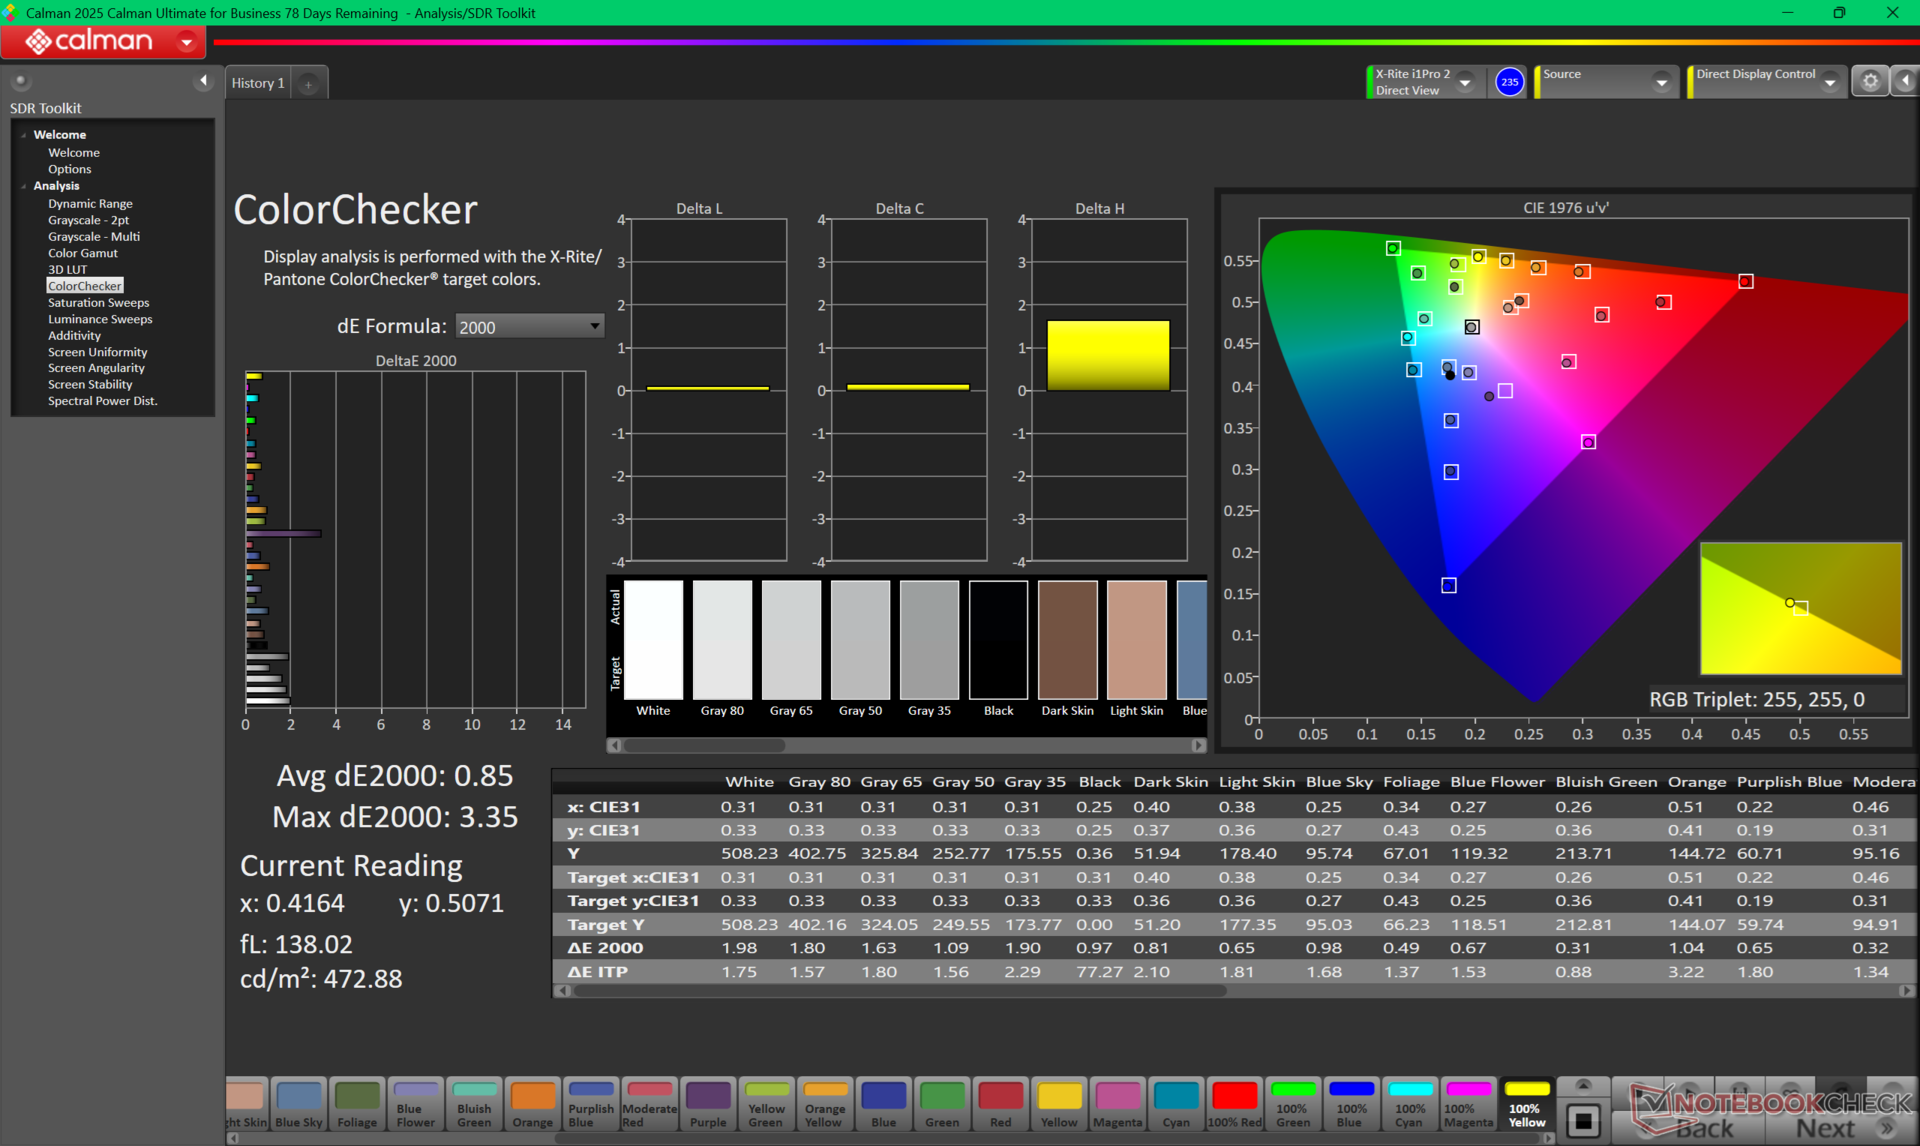
ΔE ColorChecker Calman: 3.62 | ∀{0.5-29.43 Ø4.72}
calibrated: 0.85
ΔE Greyscale Calman: 4.3 | ∀{0.09-98 Ø4.97}
87.7% AdobeRGB 1998 (Argyll 3D)
100% sRGB (Argyll 3D)
96.6% Display P3 (Argyll 3D)
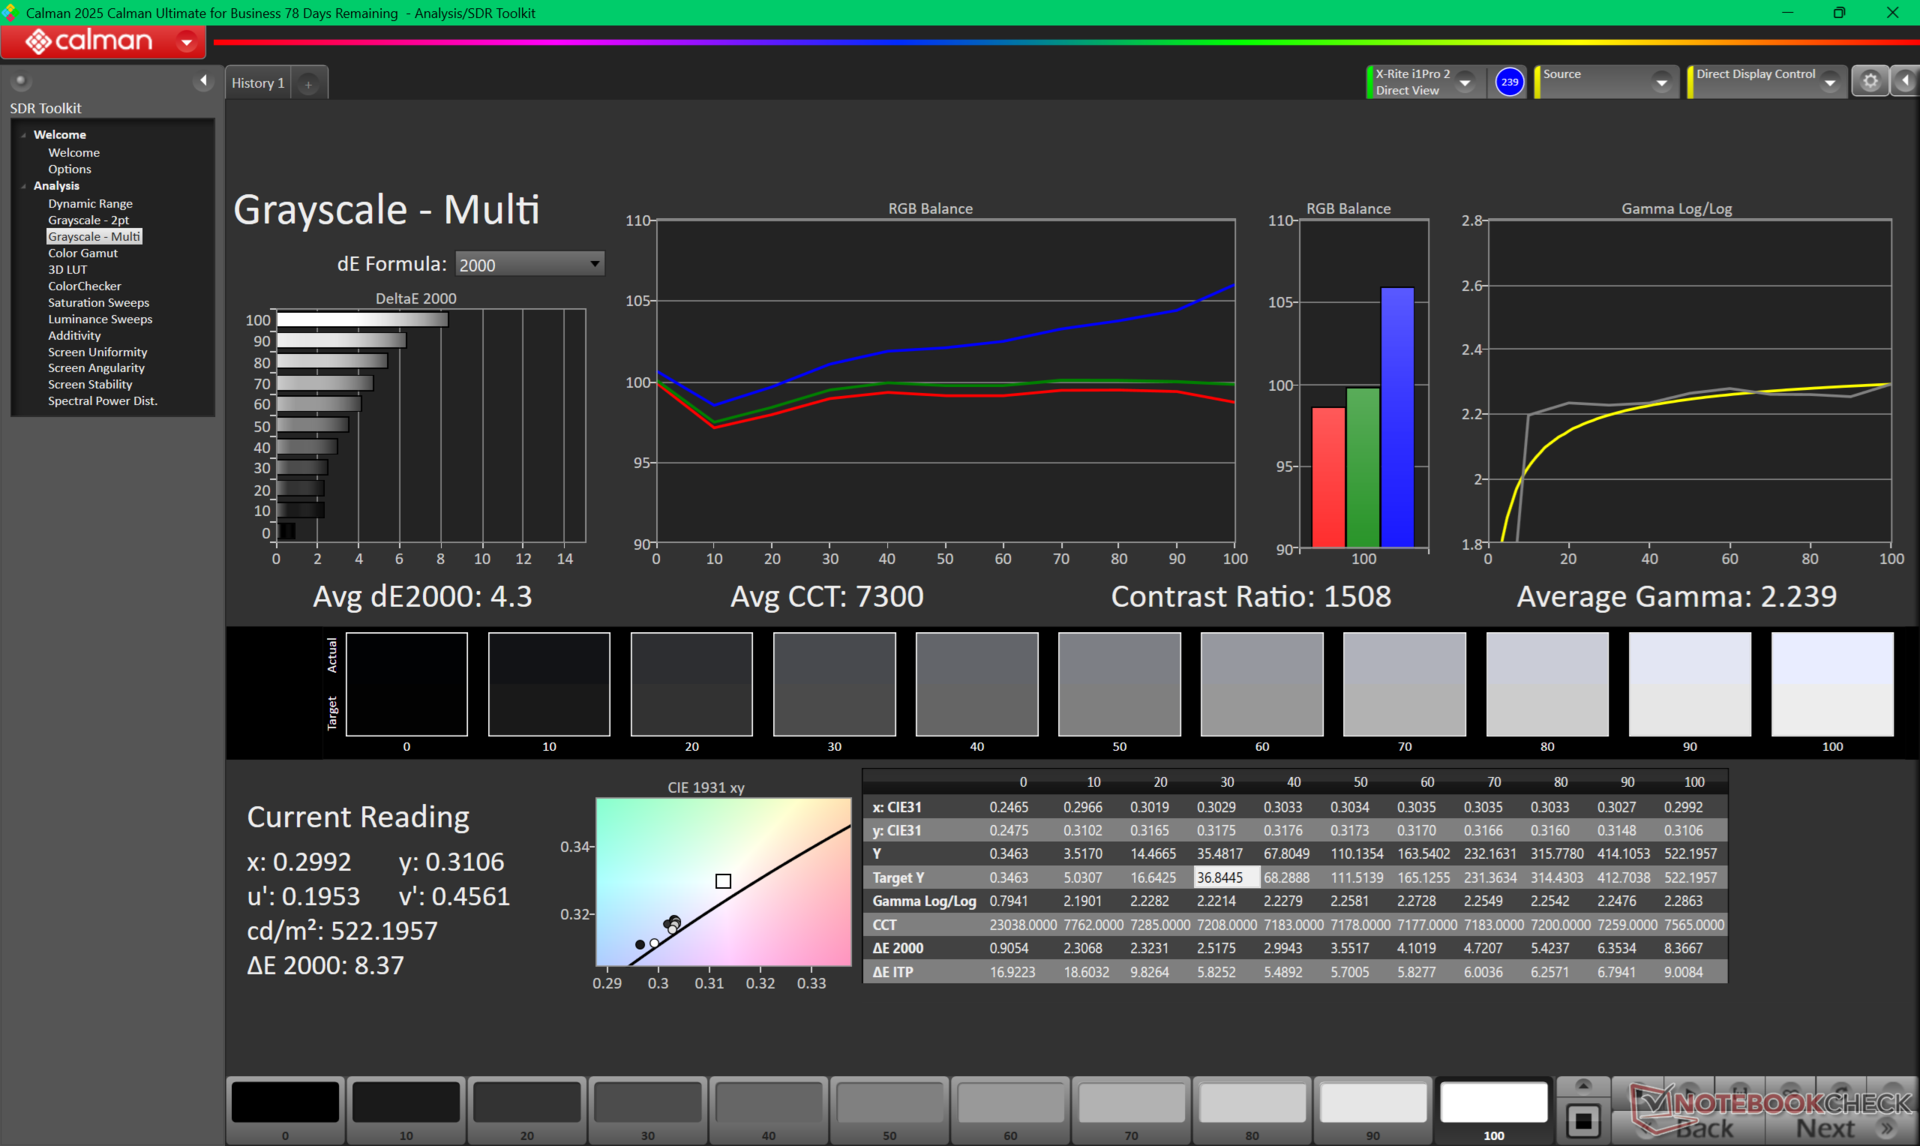
Gamma: 2.24
CCT: 7300 K
| HP ZBook Fury G1i 18 AUO12B6, IPS, 2560x1600, 18", 165 Hz | Dell Pro Max 18 Plus MB18250 BOE NE18NZ7, IPS, 2560x1600, 18", 120 Hz | Schenker Key 18 Pro M25 RTX 5090 LQ180D1JW01, IPS, 3840x2400, 18", 200 Hz | Lenovo ThinkPad P16 Gen 2 NE160QDM-NY1, IPS, 2560x1600, 16", 165 Hz | HP ZBook X G1i 16 LG Philips LGD07B3, IPS, 2560x1600, 16", 120 Hz | HP ZBook Studio 16 G11 AUO87A8, IPS, 3840x2400, 16", 120 Hz | |
|---|---|---|---|---|---|---|
| Display | -0% | -2% | -17% | 5% | -0% | |
| Display P3 Coverage (%) | 96.6 | 97.7 1% | 90.5 -6% | 68.4 -29% | 97.2 1% | 97.7 1% |
| sRGB Coverage (%) | 100 | 99.9 0% | 100 0% | 96.9 -3% | 100 0% | 99.9 0% |
| AdobeRGB 1998 Coverage (%) | 87.7 | 85.9 -2% | 87.4 0% | 70.6 -19% | 99.9 14% | 85.7 -2% |
| Response Times | -225% | 55% | -12% | -229% | -17% | |
| Response Time Grey 50% / Grey 80% * (ms) | 12.5 ? | 39.9 ? -219% | 5.2 ? 58% | 14.1 ? -13% | 45.5 ? -264% | 14.2 ? -14% |
| Response Time Black / White * (ms) | 8.9 ? | 29.4 ? -230% | 4.3 ? 52% | 9.9 ? -11% | 26.1 ? -193% | 10.6 ? -19% |
| PWM Frequency (Hz) | 26536 ? | |||||
| PWM Amplitude * (%) | 47 | |||||
| Screen | 27% | 5% | 19% | -10% | 2% | |
| Brightness middle (cd/m²) | 517.5 | 528.8 2% | 529 2% | 531.5 3% | 461.8 -11% | 404.3 -22% |
| Brightness (cd/m²) | 497 | 515 4% | 513 3% | 499 0% | 427 -14% | 405 -19% |
| Brightness Distribution (%) | 92 | 91 -1% | 95 3% | 89 -3% | 88 -4% | 92 0% |
| Black Level * (cd/m²) | 0.32 | 0.22 31% | 0.31 3% | 0.38 -19% | 0.46 -44% | 0.28 12% |
| Contrast (:1) | 1617 | 2404 49% | 1706 6% | 1399 -13% | 1004 -38% | 1444 -11% |
| Colorchecker dE 2000 * | 3.62 | 2.76 24% | 2.7 25% | 1.82 50% | 4.08 -13% | 2.63 27% |
| Colorchecker dE 2000 max. * | 8.75 | 5.38 39% | 7.8 11% | 4.1 53% | 8.1 7% | 4.48 49% |
| Colorchecker dE 2000 calibrated * | 0.85 | 0.47 45% | 0.8 6% | 0.63 26% | 0.75 12% | 1.46 -72% |
| Greyscale dE 2000 * | 4.3 | 2.2 49% | 4.9 -14% | 1.2 72% | 3.5 19% | 2.1 51% |
| Gamma | 2.24 98% | 2.14 103% | 2.23 99% | 2.15 102% | 2.15 102% | 2.3 96% |
| CCT | 7300 89% | 2584 252% | 6997 93% | 6484 100% | 6715 97% | 6810 95% |
| Total Average (Program / Settings) | -66% /
-15% | 19% /
11% | -3% /
7% | -78% /
-38% | -5% /
-1% |
* ... smaller is better
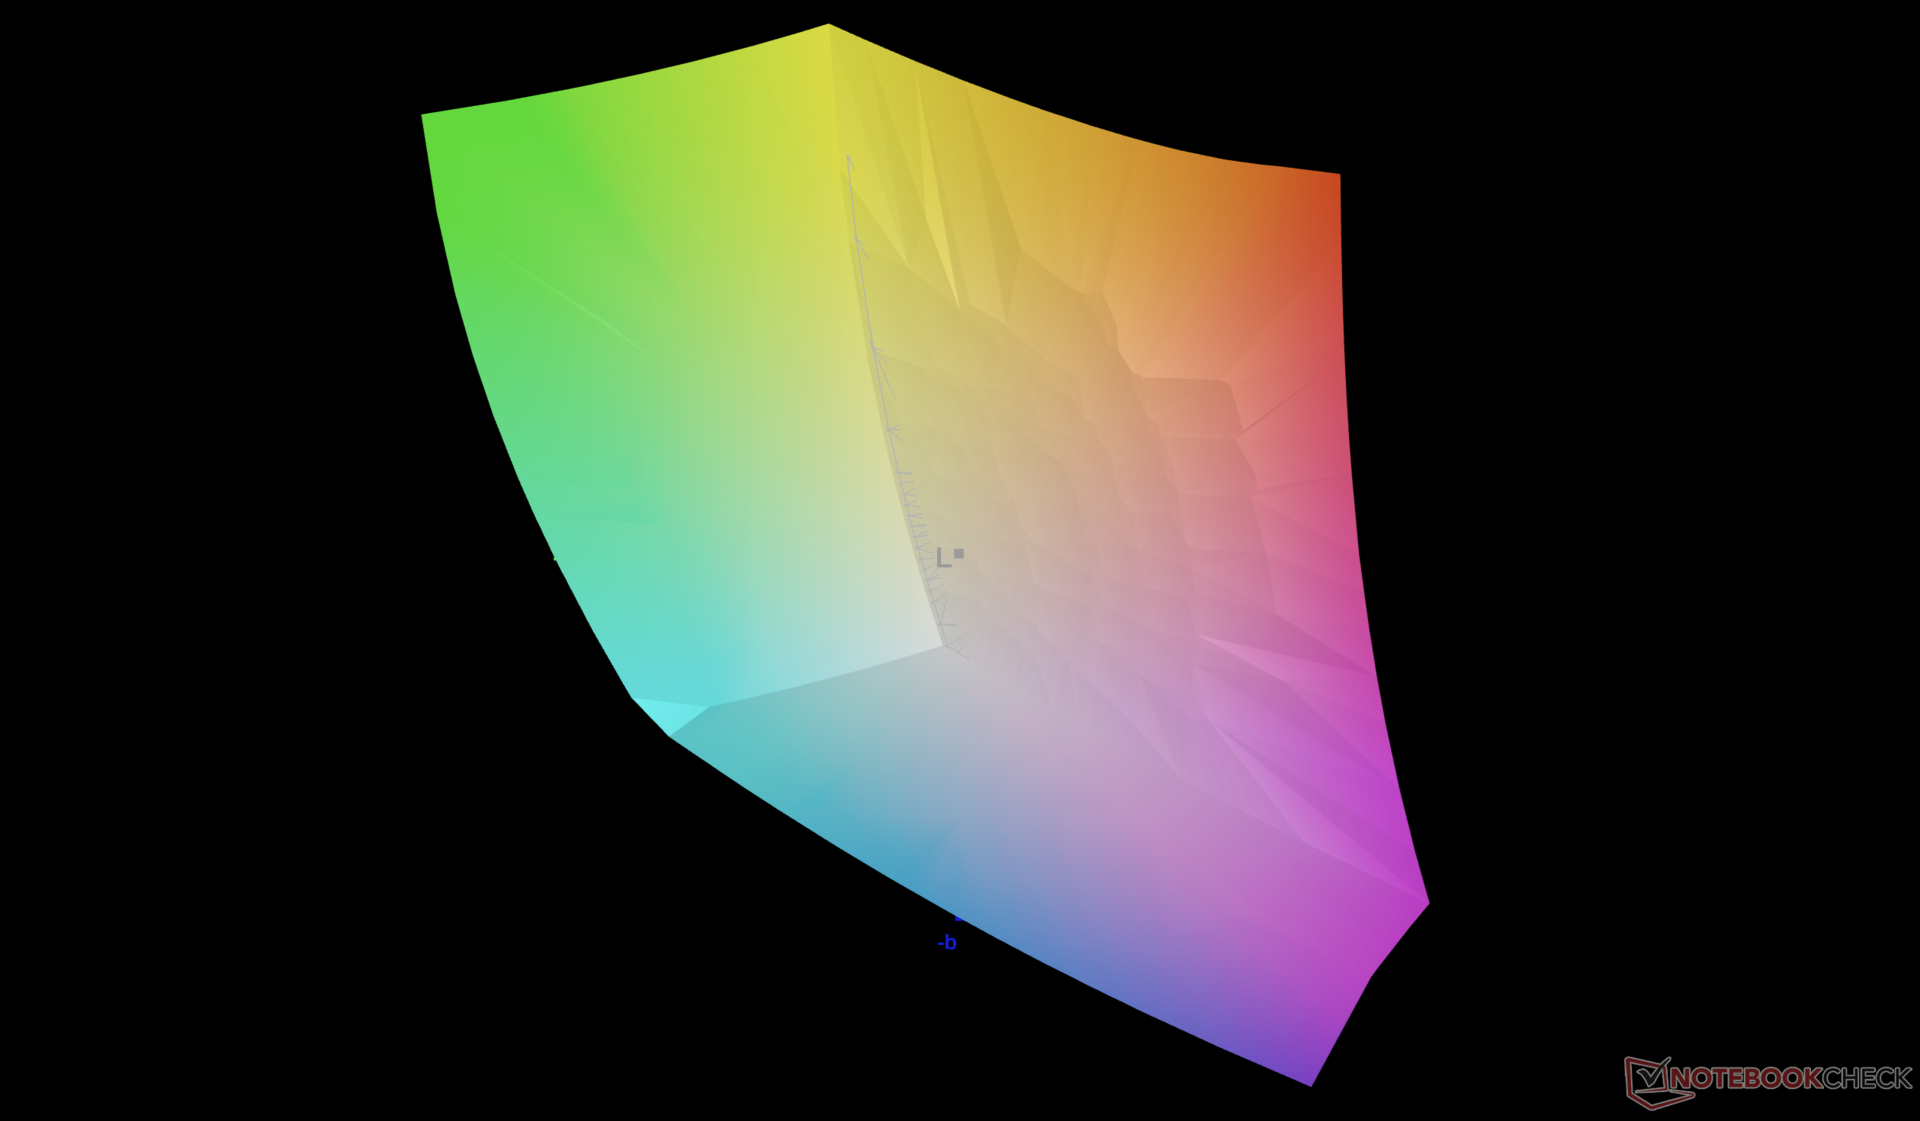

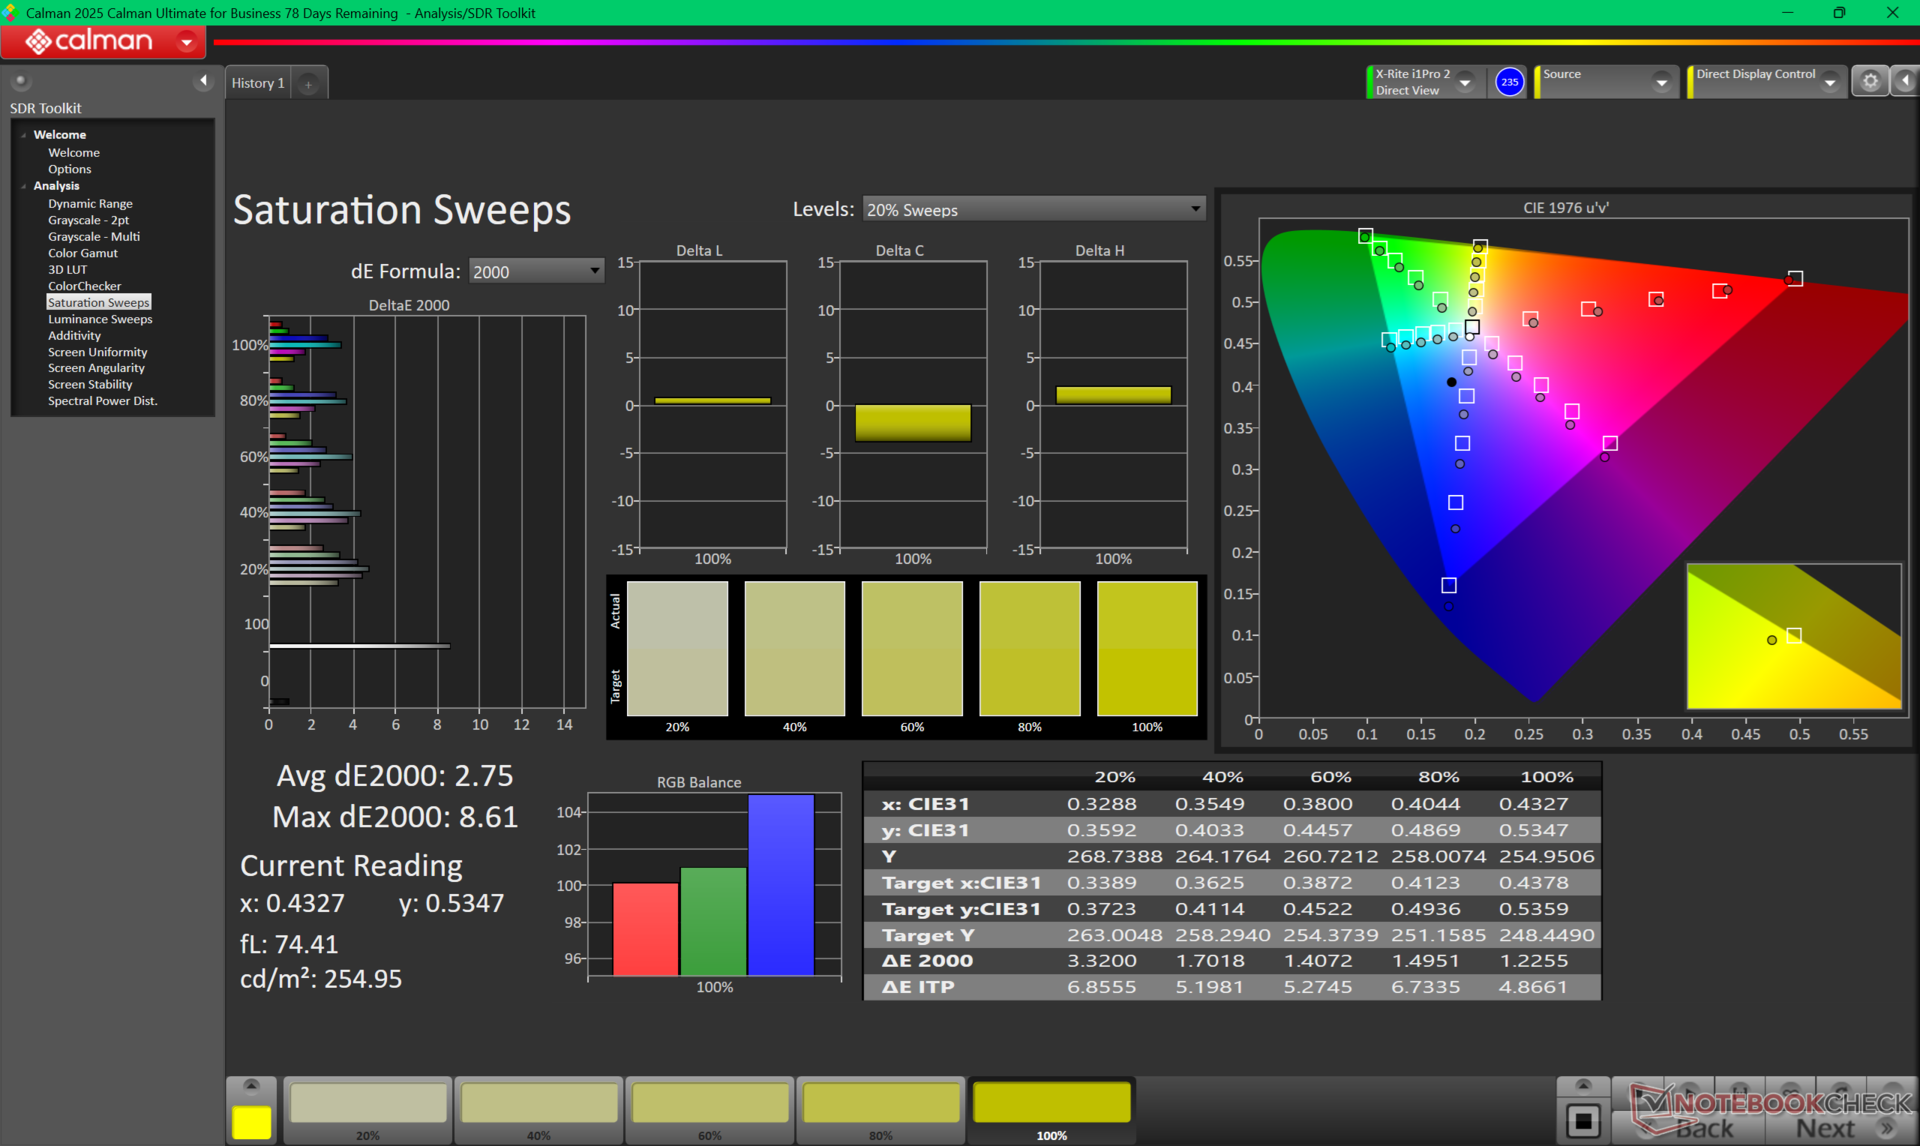
Color temperature is on the cool side out of the box at 7300 K. The display is otherwise decently calibrated against the P3 standard.

Display Response Times
| ↔ Response Time Black to White | ||
|---|---|---|
| 8.9 ms ... rise ↗ and fall ↘ combined | ↗ 4.5 ms rise | 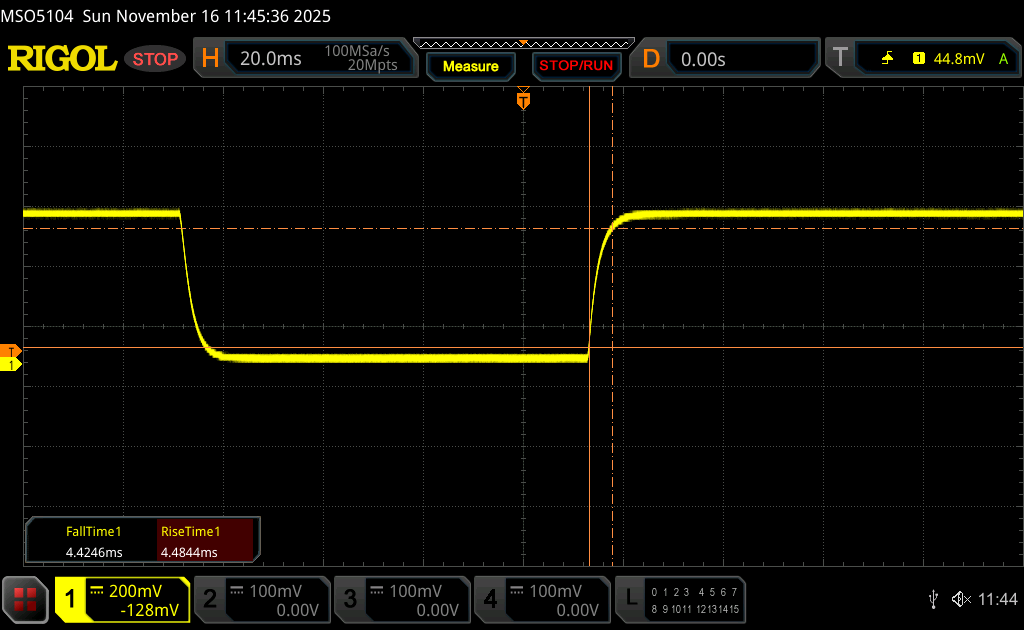 |
| ↘ 4.4 ms fall | ||
| The screen shows fast response rates in our tests and should be suited for gaming. In comparison, all tested devices range from 0.1 (minimum) to 240 (maximum) ms. » 25 % of all devices are better. This means that the measured response time is better than the average of all tested devices (19.8 ms). | ||
| ↔ Response Time 50% Grey to 80% Grey | ||
| 12.5 ms ... rise ↗ and fall ↘ combined | ↗ 6.1 ms rise | 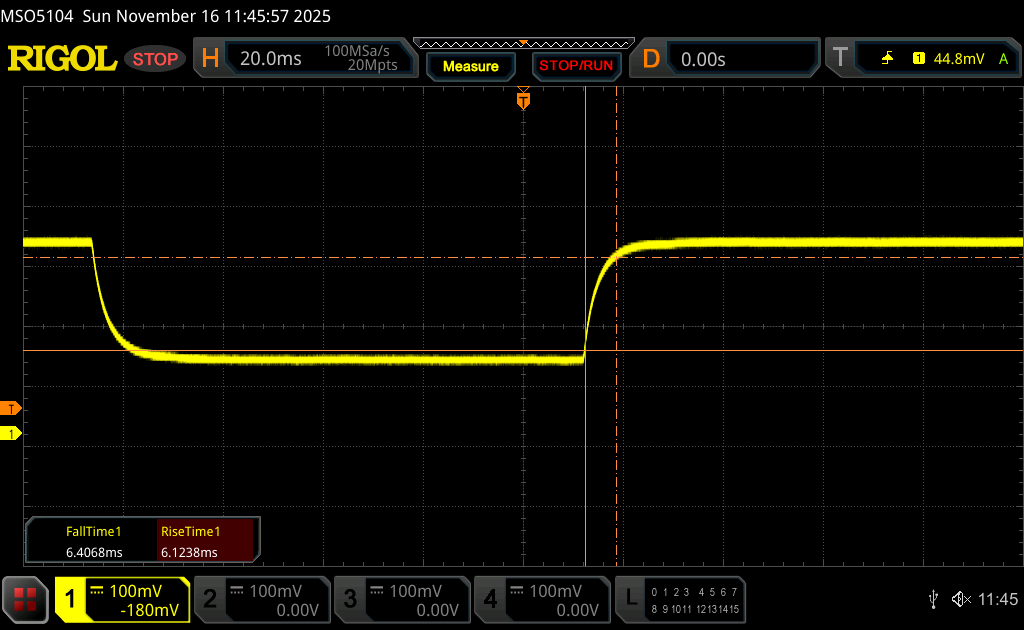 |
| ↘ 6.4 ms fall | ||
| The screen shows good response rates in our tests, but may be too slow for competitive gamers. In comparison, all tested devices range from 0.165 (minimum) to 636 (maximum) ms. » 26 % of all devices are better. This means that the measured response time is better than the average of all tested devices (31 ms). | ||
Screen Flickering / PWM (Pulse-Width Modulation)
| Screen flickering / PWM not detected |  | ||
In comparison: 52 % of all tested devices do not use PWM to dim the display. If PWM was detected, an average of 7753 (minimum: 5 - maximum: 343500) Hz was measured. | |||


Performance — Arrow Lake-HX And Nvidia Blackwell


Testing Conditions
We set Windows to Performance mode with the discrete GPU active before running the benchmarks below. Advanced Optimus is not supported unlike on the competing Dell Pro Max 18 Plus.
Processor
The Core Ultra 9 285HX in our HP runs consistently slower than the same CPU in the Dell Pro Max 18 Plus by just a few percentage points. Turbo Boost appears to be weaker on the HP as shown by our CineBench R15 xT loop results below, but both machines plateau at nearly the same clock rates once their Turbo Boost benefits settle down.
Configuring with the Core Ultra 7 255HX instead of the Core Ultra 9 285HX is expected to impact processor performance by just 5 percent based on our time with the Lenovo Legion Pro 5 16IAX10. Users may therefore want to consider the lower-end CPU option to save on costs.
Cinebench R15 Multi Loop
Cinebench R23: Multi Core | Single Core
Cinebench R20: CPU (Multi Core) | CPU (Single Core)
Cinebench R15: CPU Multi 64Bit | CPU Single 64Bit
Blender: v2.79 BMW27 CPU
7-Zip 18.03: 7z b 4 | 7z b 4 -mmt1
Geekbench 6.7: Multi-Core | Single-Core
Geekbench 5.5: Multi-Core | Single-Core
HWBOT x265 Benchmark v2.2: 4k Preset
LibreOffice : 20 Documents To PDF
R Benchmark 2.5: Overall mean
* ... smaller is better
AIDA64: FP32 Ray-Trace | FPU Julia | CPU SHA3 | CPU Queen | FPU SinJulia | FPU Mandel | CPU AES | CPU ZLib | FP64 Ray-Trace | CPU PhotoWorxx
| Performance rating | |
| Dell Pro Max 18 Plus MB18250 | |
| Schenker Key 18 Pro M25 RTX 5090 | |
| Average Intel Core Ultra 9 285HX | |
| HP ZBook Fury G1i 18 | |
| Lenovo ThinkPad P16 Gen 2 | |
| HP ZBook Studio 16 G11 | |
| AIDA64 / FP32 Ray-Trace | |
| Schenker Key 18 Pro M25 RTX 5090 | |
| Dell Pro Max 18 Plus MB18250 | |
| Average Intel Core Ultra 9 285HX (29076 - 42341, n=6) | |
| HP ZBook Fury G1i 18 | |
| Lenovo ThinkPad P16 Gen 2 | |
| HP ZBook Studio 16 G11 | |
| AIDA64 / FPU Julia | |
| Schenker Key 18 Pro M25 RTX 5090 | |
| Average Intel Core Ultra 9 285HX (161276 - 210885, n=6) | |
| Dell Pro Max 18 Plus MB18250 | |
| HP ZBook Fury G1i 18 | |
| Lenovo ThinkPad P16 Gen 2 | |
| HP ZBook Studio 16 G11 | |
| AIDA64 / CPU SHA3 | |
| Schenker Key 18 Pro M25 RTX 5090 | |
| Dell Pro Max 18 Plus MB18250 | |
| Average Intel Core Ultra 9 285HX (7757 - 9815, n=6) | |
| HP ZBook Fury G1i 18 | |
| Lenovo ThinkPad P16 Gen 2 | |
| HP ZBook Studio 16 G11 | |
| AIDA64 / CPU Queen | |
| Lenovo ThinkPad P16 Gen 2 | |
| Average Intel Core Ultra 9 285HX (134345 - 141681, n=6) | |
| Dell Pro Max 18 Plus MB18250 | |
| Schenker Key 18 Pro M25 RTX 5090 | |
| HP ZBook Fury G1i 18 | |
| HP ZBook Studio 16 G11 | |
| AIDA64 / FPU SinJulia | |
| Schenker Key 18 Pro M25 RTX 5090 | |
| Dell Pro Max 18 Plus MB18250 | |
| Lenovo ThinkPad P16 Gen 2 | |
| Average Intel Core Ultra 9 285HX (12559 - 14431, n=6) | |
| HP ZBook Fury G1i 18 | |
| HP ZBook Studio 16 G11 | |
| AIDA64 / FPU Mandel | |
| Schenker Key 18 Pro M25 RTX 5090 | |
| Average Intel Core Ultra 9 285HX (84053 - 108922, n=6) | |
| Dell Pro Max 18 Plus MB18250 | |
| HP ZBook Fury G1i 18 | |
| Lenovo ThinkPad P16 Gen 2 | |
| HP ZBook Studio 16 G11 | |
| AIDA64 / CPU AES | |
| Schenker Key 18 Pro M25 RTX 5090 | |
| Dell Pro Max 18 Plus MB18250 | |
| HP ZBook Fury G1i 18 | |
| Average Intel Core Ultra 9 285HX (119553 - 134195, n=6) | |
| Lenovo ThinkPad P16 Gen 2 | |
| HP ZBook Studio 16 G11 | |
| AIDA64 / CPU ZLib | |
| Dell Pro Max 18 Plus MB18250 | |
| Schenker Key 18 Pro M25 RTX 5090 | |
| Average Intel Core Ultra 9 285HX (1886 - 2267, n=6) | |
| HP ZBook Fury G1i 18 | |
| Lenovo ThinkPad P16 Gen 2 | |
| HP ZBook Studio 16 G11 | |
| AIDA64 / FP64 Ray-Trace | |
| Schenker Key 18 Pro M25 RTX 5090 | |
| Average Intel Core Ultra 9 285HX (15059 - 22312, n=6) | |
| Dell Pro Max 18 Plus MB18250 | |
| HP ZBook Fury G1i 18 | |
| Lenovo ThinkPad P16 Gen 2 | |
| HP ZBook Studio 16 G11 | |
| AIDA64 / CPU PhotoWorxx | |
| Dell Pro Max 18 Plus MB18250 | |
| HP ZBook Studio 16 G11 | |
| Average Intel Core Ultra 9 285HX (39232 - 62611, n=6) | |
| Lenovo ThinkPad P16 Gen 2 | |
| HP ZBook Fury G1i 18 | |
| Schenker Key 18 Pro M25 RTX 5090 | |
Stress Test
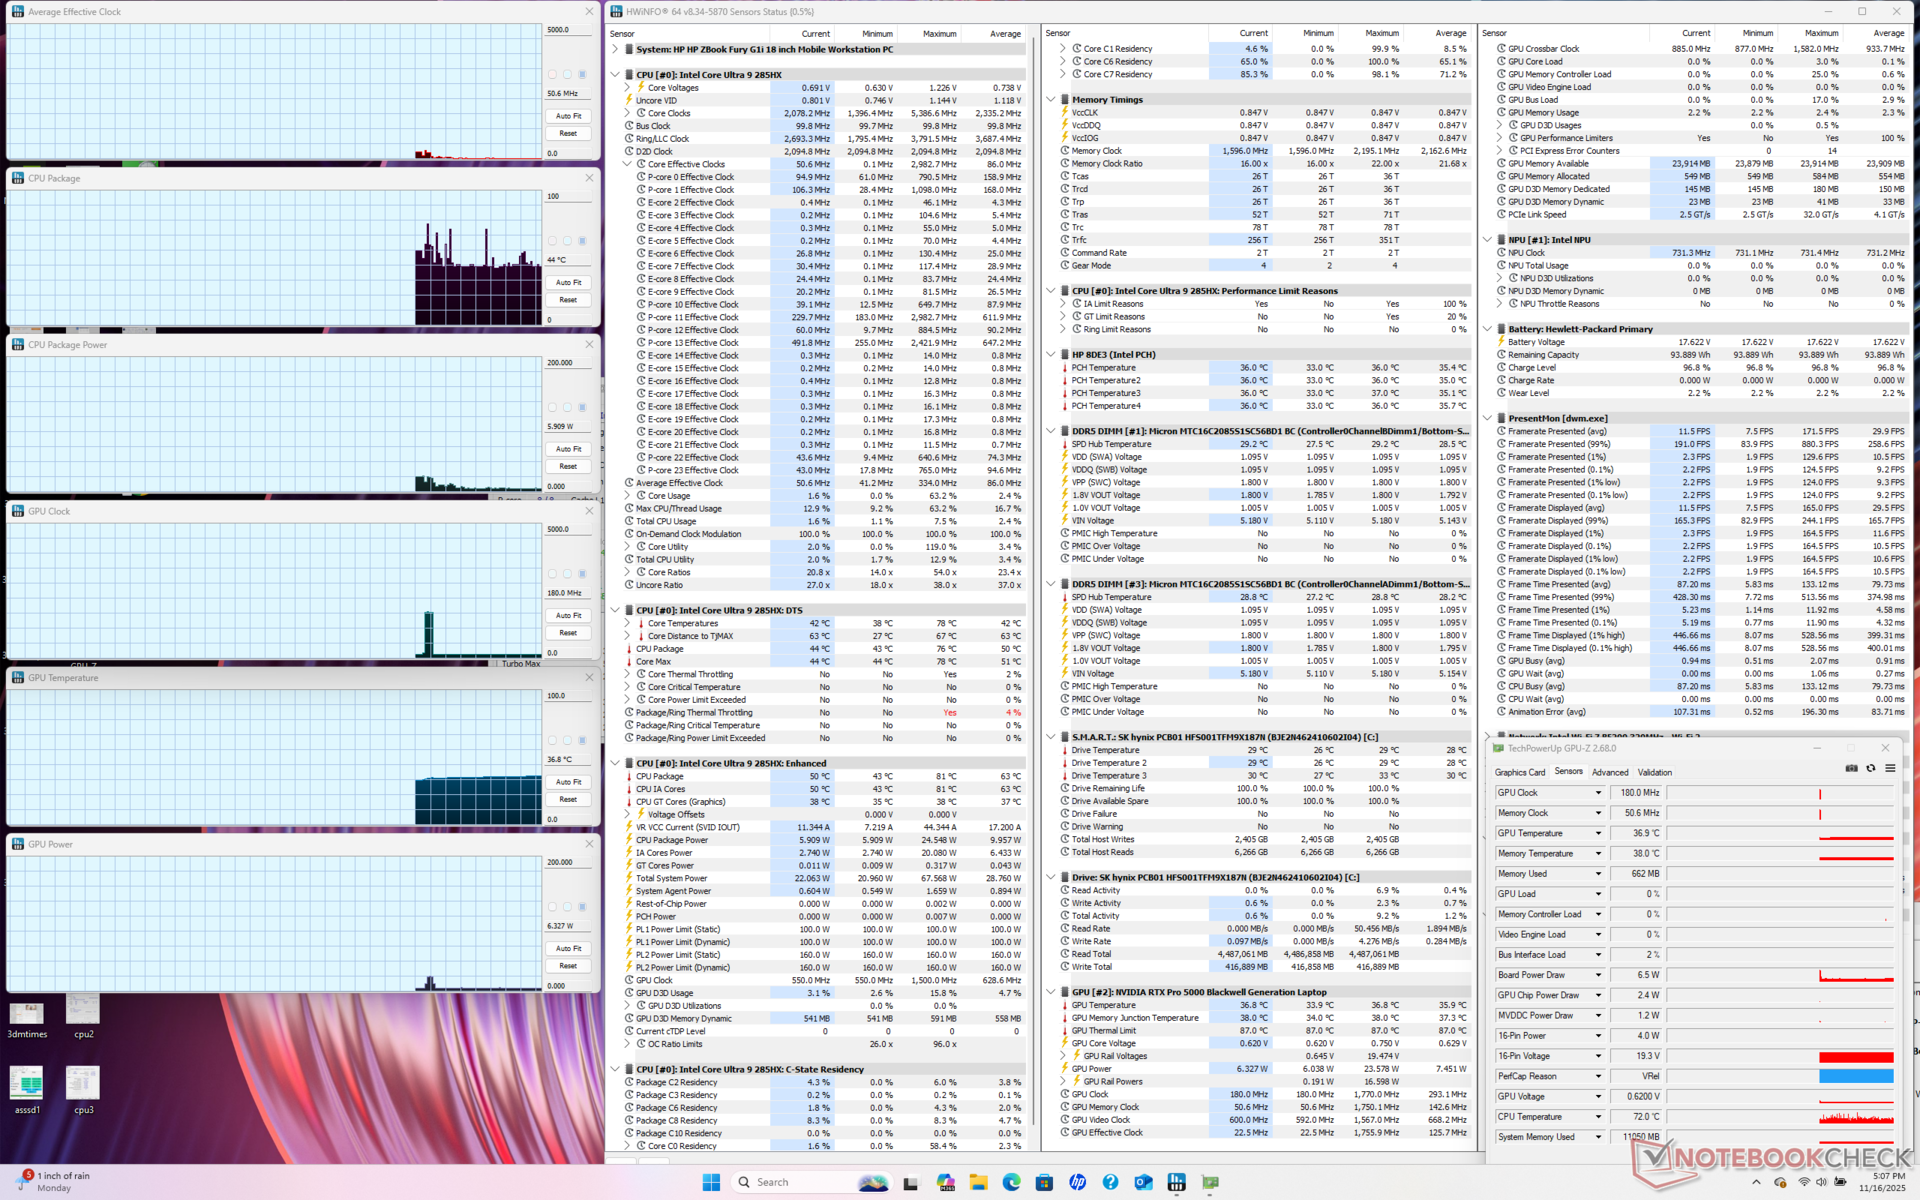
When running Prime95 to stress the CPU, average clock rates would boost to 3.9 GHz, 99 C, and 160 W for just a few seconds before dropping and stabilizing at 3.3 GHz, 91 C, and 89 W. This behavior is similar to what we observed on the Dell Pro Max 18 Plus albeit with slightly slower clock rates on average on the HP.
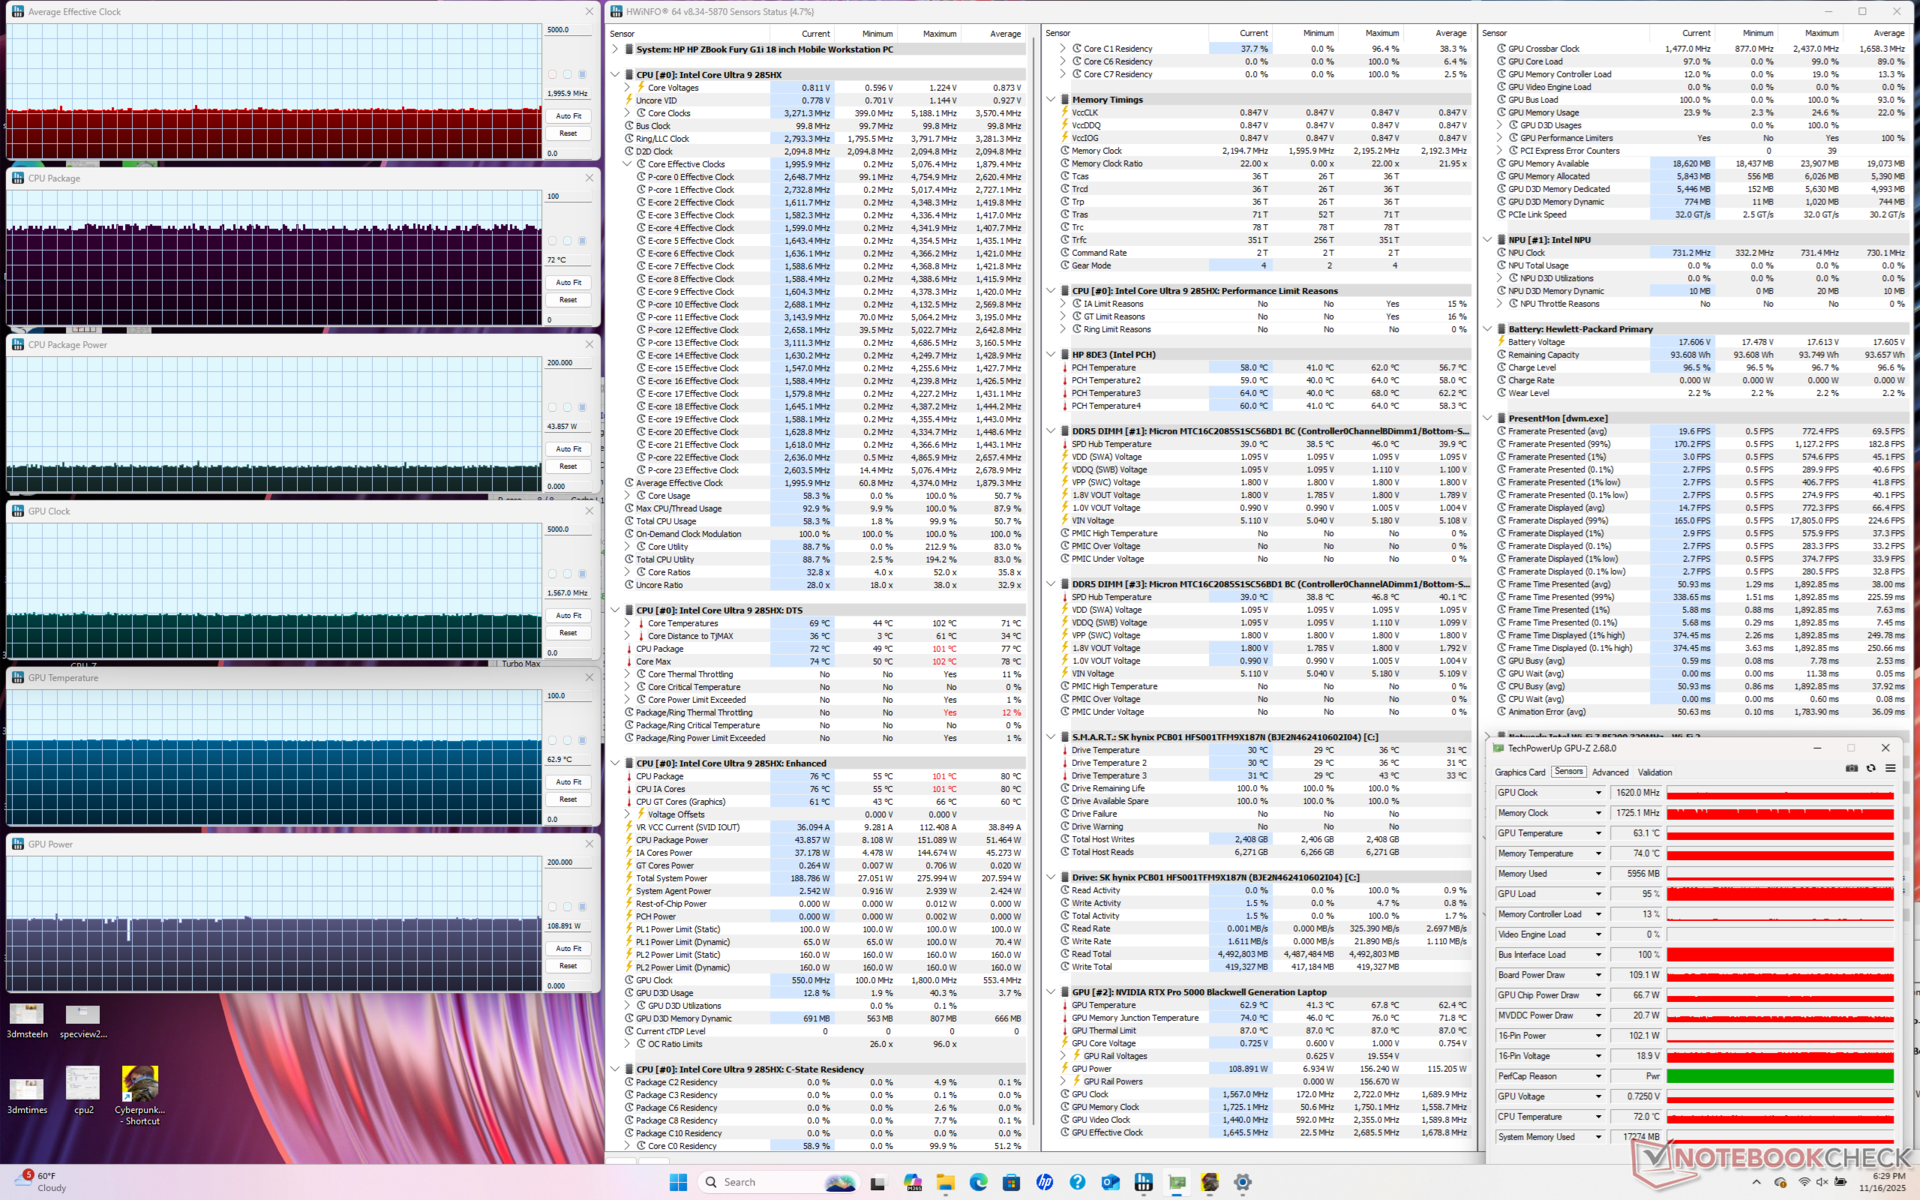
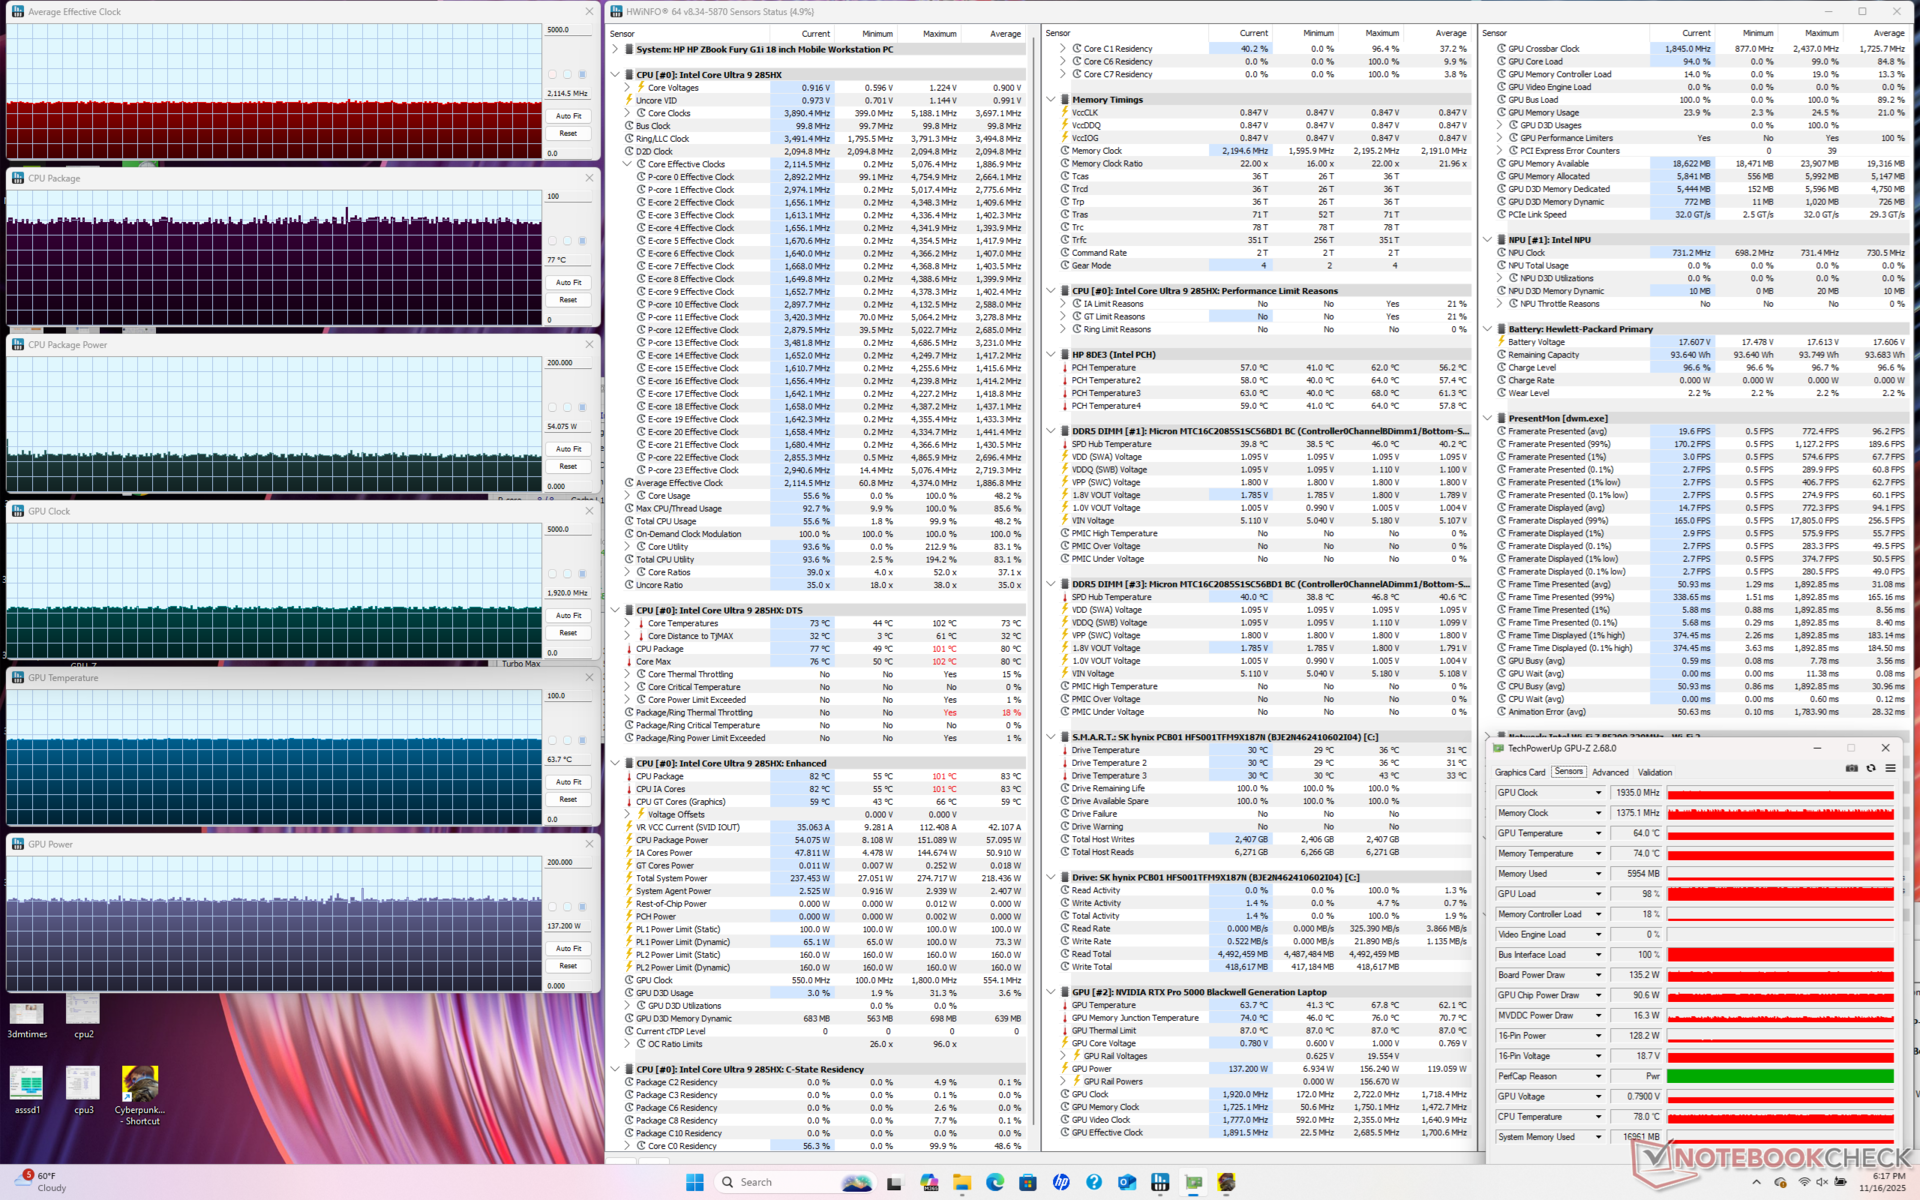
CPU and GPU temperatures when running Cyberpunk 2077 would stabilize at 77 C and 64 C, respectively, compared to 104 C and 75 C on the Dell Pro Max 18 Plus. However, performance is slightly slower on the HP with its GPU power draw averaging just 135 W compared to 163 W on the Dell when both systems are set to Performance mode.
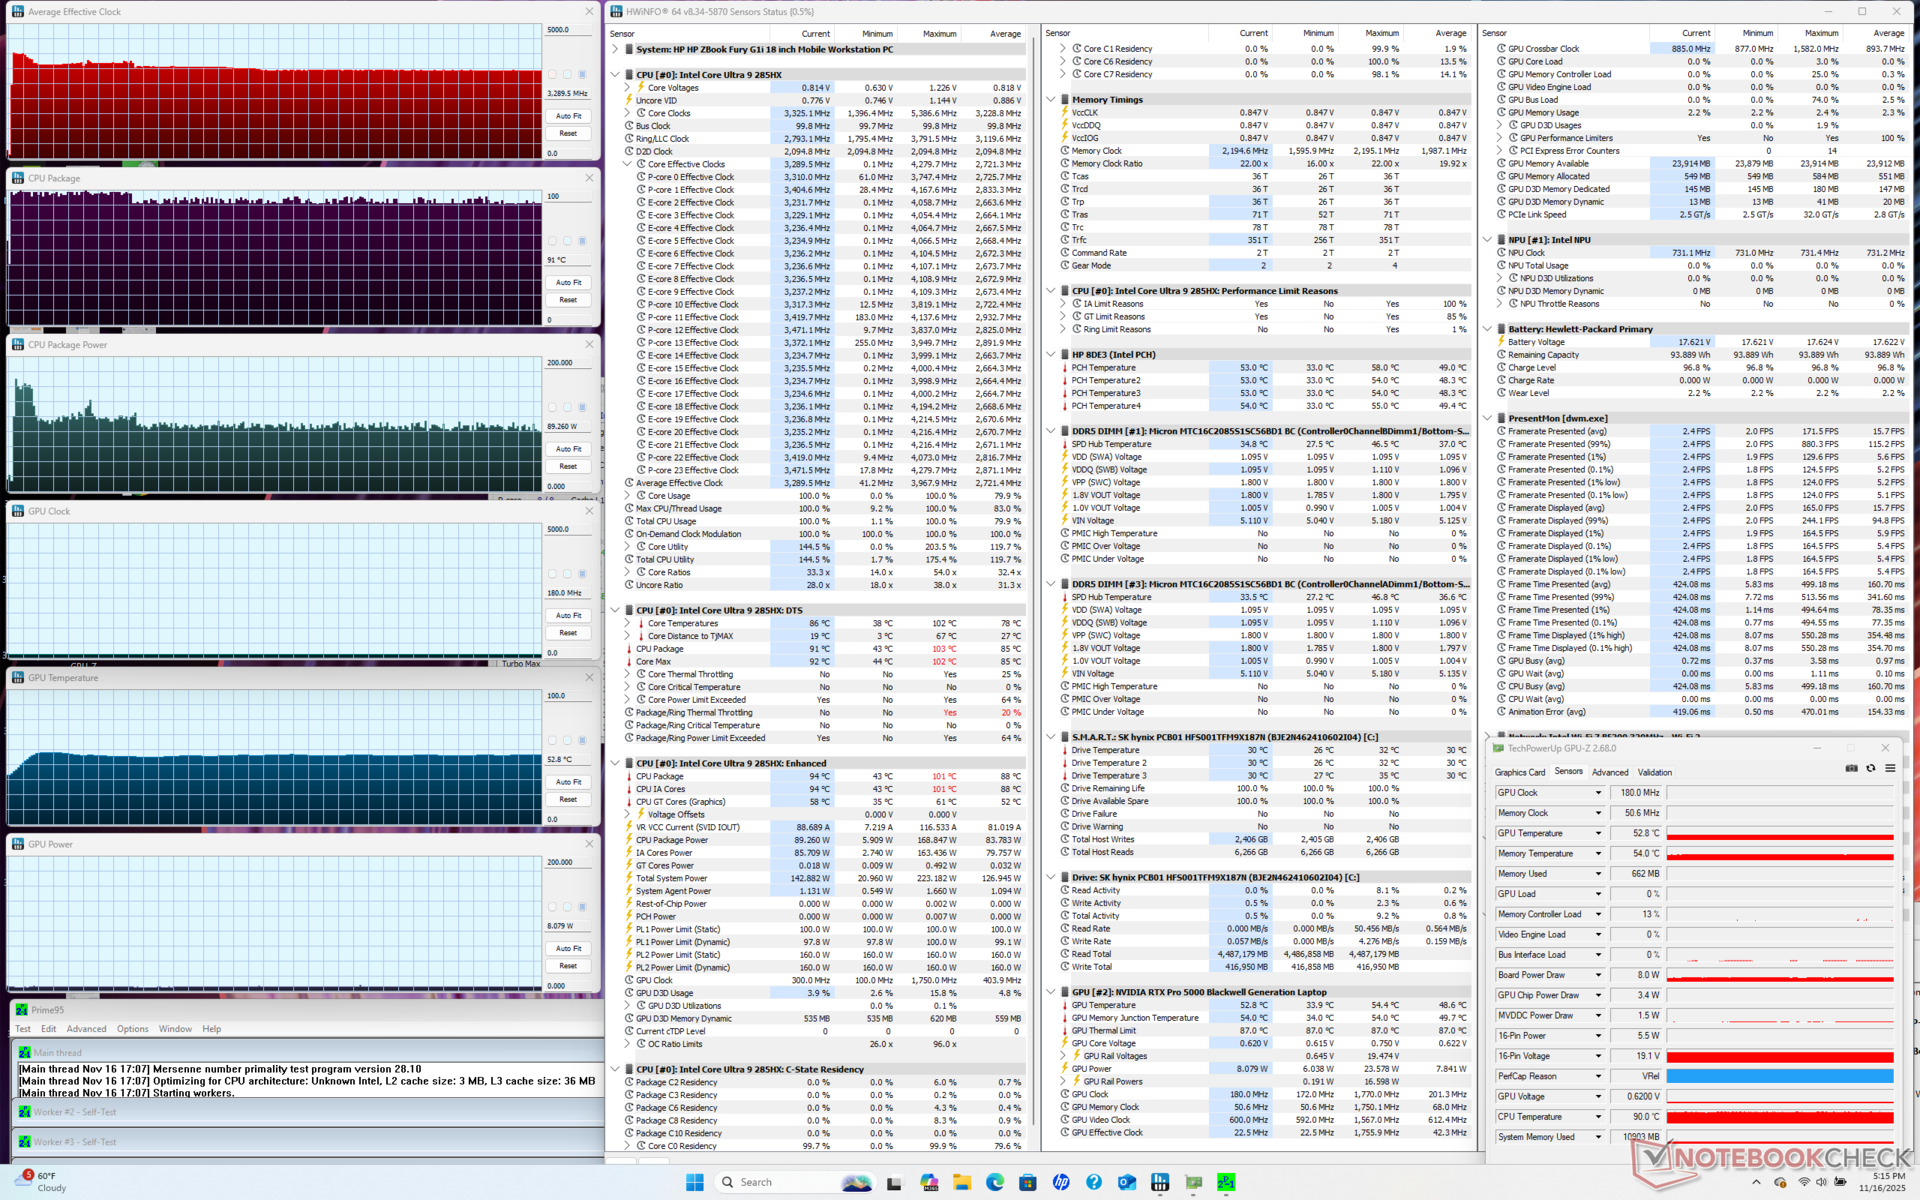

| Average CPU Clock (GHz) | GPU Clock (MHz) | Average CPU Temperature (°C) | Average GPU Temperature (°C) | |
| System Idle | -- | -- | 44 | 37 |
| Prime95 Stress | 3.3 | -- | 91 | 53 |
| Prime95 + FurMark Stress | 3.0 | 1882 | 86 | 65 |
| Cyberpunk 2077 Stress (Balanced Mode) | 2.0 | 1567 | 72 | 63 |
| Cyberpunk 2077 Stress (Performance Mode) | 2.1 | 1920 | 77 | 64 |
System Performance
PCMark 10 would fail to run to completion no matter the GPU settings and so its scores are not included below. Note that AIDA64 memory scores are notably slower than on the Dell Pro Max 18 Plus as RAM technology is one of the key differentiating factors between the two models.
CrossMark: Overall | Productivity | Creativity | Responsiveness
WebXPRT 3: Overall
WebXPRT 4: Overall
Mozilla Kraken 1.1: Total
Geekbench AI: Quantized GPU 1.7 | Half Precision GPU 1.7 | Single Precision GPU 1.7
| Performance rating | |
| Dell Pro Max 18 Plus MB18250 | |
| Average Intel Core Ultra 9 285HX, NVIDIA RTX PRO 5000 Blackwell Generation Laptop | |
| HP ZBook Fury G1i 18 | |
| Schenker Key 18 Pro M25 RTX 5090 | |
| Lenovo ThinkPad P16 Gen 2 -3! | |
| HP ZBook X G1i 16 | |
| HP ZBook Studio 16 G11 -3! | |
| CrossMark / Overall | |
| Dell Pro Max 18 Plus MB18250 | |
| Average Intel Core Ultra 9 285HX, NVIDIA RTX PRO 5000 Blackwell Generation Laptop (2142 - 2267, n=3) | |
| HP ZBook Fury G1i 18 | |
| Schenker Key 18 Pro M25 RTX 5090 | |
| Lenovo ThinkPad P16 Gen 2 | |
| HP ZBook X G1i 16 | |
| HP ZBook Studio 16 G11 | |
| CrossMark / Productivity | |
| HP ZBook Fury G1i 18 | |
| Average Intel Core Ultra 9 285HX, NVIDIA RTX PRO 5000 Blackwell Generation Laptop (2016 - 2028, n=3) | |
| Dell Pro Max 18 Plus MB18250 | |
| Schenker Key 18 Pro M25 RTX 5090 | |
| HP ZBook X G1i 16 | |
| Lenovo ThinkPad P16 Gen 2 | |
| HP ZBook Studio 16 G11 | |
| CrossMark / Creativity | |
| Dell Pro Max 18 Plus MB18250 | |
| Average Intel Core Ultra 9 285HX, NVIDIA RTX PRO 5000 Blackwell Generation Laptop (2395 - 2725, n=3) | |
| HP ZBook Fury G1i 18 | |
| Lenovo ThinkPad P16 Gen 2 | |
| HP ZBook X G1i 16 | |
| Schenker Key 18 Pro M25 RTX 5090 | |
| HP ZBook Studio 16 G11 | |
| CrossMark / Responsiveness | |
| Schenker Key 18 Pro M25 RTX 5090 | |
| Dell Pro Max 18 Plus MB18250 | |
| Average Intel Core Ultra 9 285HX, NVIDIA RTX PRO 5000 Blackwell Generation Laptop (1806 - 1858, n=3) | |
| HP ZBook Fury G1i 18 | |
| Lenovo ThinkPad P16 Gen 2 | |
| HP ZBook X G1i 16 | |
| HP ZBook Studio 16 G11 | |
| WebXPRT 3 / Overall | |
| HP ZBook Fury G1i 18 | |
| Dell Pro Max 18 Plus MB18250 | |
| Average Intel Core Ultra 9 285HX, NVIDIA RTX PRO 5000 Blackwell Generation Laptop (327 - 360, n=3) | |
| Schenker Key 18 Pro M25 RTX 5090 | |
| Lenovo ThinkPad P16 Gen 2 | |
| HP ZBook X G1i 16 | |
| HP ZBook Studio 16 G11 | |
| WebXPRT 4 / Overall | |
| HP ZBook Fury G1i 18 | |
| Schenker Key 18 Pro M25 RTX 5090 | |
| Average Intel Core Ultra 9 285HX, NVIDIA RTX PRO 5000 Blackwell Generation Laptop (306 - 323, n=3) | |
| Dell Pro Max 18 Plus MB18250 | |
| Lenovo ThinkPad P16 Gen 2 | |
| HP ZBook X G1i 16 | |
| HP ZBook Studio 16 G11 | |
| Mozilla Kraken 1.1 / Total | |
| HP ZBook Studio 16 G11 | |
| HP ZBook X G1i 16 | |
| Lenovo ThinkPad P16 Gen 2 | |
| Dell Pro Max 18 Plus MB18250 | |
| Average Intel Core Ultra 9 285HX, NVIDIA RTX PRO 5000 Blackwell Generation Laptop (411 - 439, n=3) | |
| Schenker Key 18 Pro M25 RTX 5090 | |
| HP ZBook Fury G1i 18 | |
| Geekbench AI / Quantized GPU 1.7 | |
| Dell Pro Max 18 Plus MB18250 | |
| Schenker Key 18 Pro M25 RTX 5090 | |
| Average Intel Core Ultra 9 285HX, NVIDIA RTX PRO 5000 Blackwell Generation Laptop (22519 - 24656, n=3) | |
| HP ZBook Fury G1i 18 | |
| HP ZBook X G1i 16 | |
| Geekbench AI / Half Precision GPU 1.7 | |
| Dell Pro Max 18 Plus MB18250 | |
| Average Intel Core Ultra 9 285HX, NVIDIA RTX PRO 5000 Blackwell Generation Laptop (51812 - 55275, n=3) | |
| Schenker Key 18 Pro M25 RTX 5090 | |
| HP ZBook Fury G1i 18 | |
| HP ZBook X G1i 16 | |
| Geekbench AI / Single Precision GPU 1.7 | |
| Dell Pro Max 18 Plus MB18250 | |
| Schenker Key 18 Pro M25 RTX 5090 | |
| Average Intel Core Ultra 9 285HX, NVIDIA RTX PRO 5000 Blackwell Generation Laptop (28665 - 32028, n=3) | |
| HP ZBook Fury G1i 18 | |
| HP ZBook X G1i 16 | |
* ... smaller is better
| AIDA64 / Memory Copy | |
| Dell Pro Max 18 Plus MB18250 | |
| Average Intel Core Ultra 9 285HX (63431 - 93933, n=6) | |
| HP ZBook Studio 16 G11 | |
| HP ZBook Fury G1i 18 | |
| Lenovo ThinkPad P16 Gen 2 | |
| Schenker Key 18 Pro M25 RTX 5090 | |
| AIDA64 / Memory Read | |
| Dell Pro Max 18 Plus MB18250 | |
| Average Intel Core Ultra 9 285HX (67084 - 97565, n=6) | |
| HP ZBook Studio 16 G11 | |
| Lenovo ThinkPad P16 Gen 2 | |
| HP ZBook Fury G1i 18 | |
| Schenker Key 18 Pro M25 RTX 5090 | |
| AIDA64 / Memory Write | |
| Dell Pro Max 18 Plus MB18250 | |
| Average Intel Core Ultra 9 285HX (64112 - 89691, n=6) | |
| HP ZBook Studio 16 G11 | |
| HP ZBook Fury G1i 18 | |
| Lenovo ThinkPad P16 Gen 2 | |
| Schenker Key 18 Pro M25 RTX 5090 | |
| AIDA64 / Memory Latency | |
| Schenker Key 18 Pro M25 RTX 5090 | |
| HP ZBook Fury G1i 18 | |
| Average Intel Core Ultra 9 285HX (104.8 - 151.7, n=6) | |
| HP ZBook Studio 16 G11 | |
| Dell Pro Max 18 Plus MB18250 | |
| Lenovo ThinkPad P16 Gen 2 | |
* ... smaller is better
DPC Latency
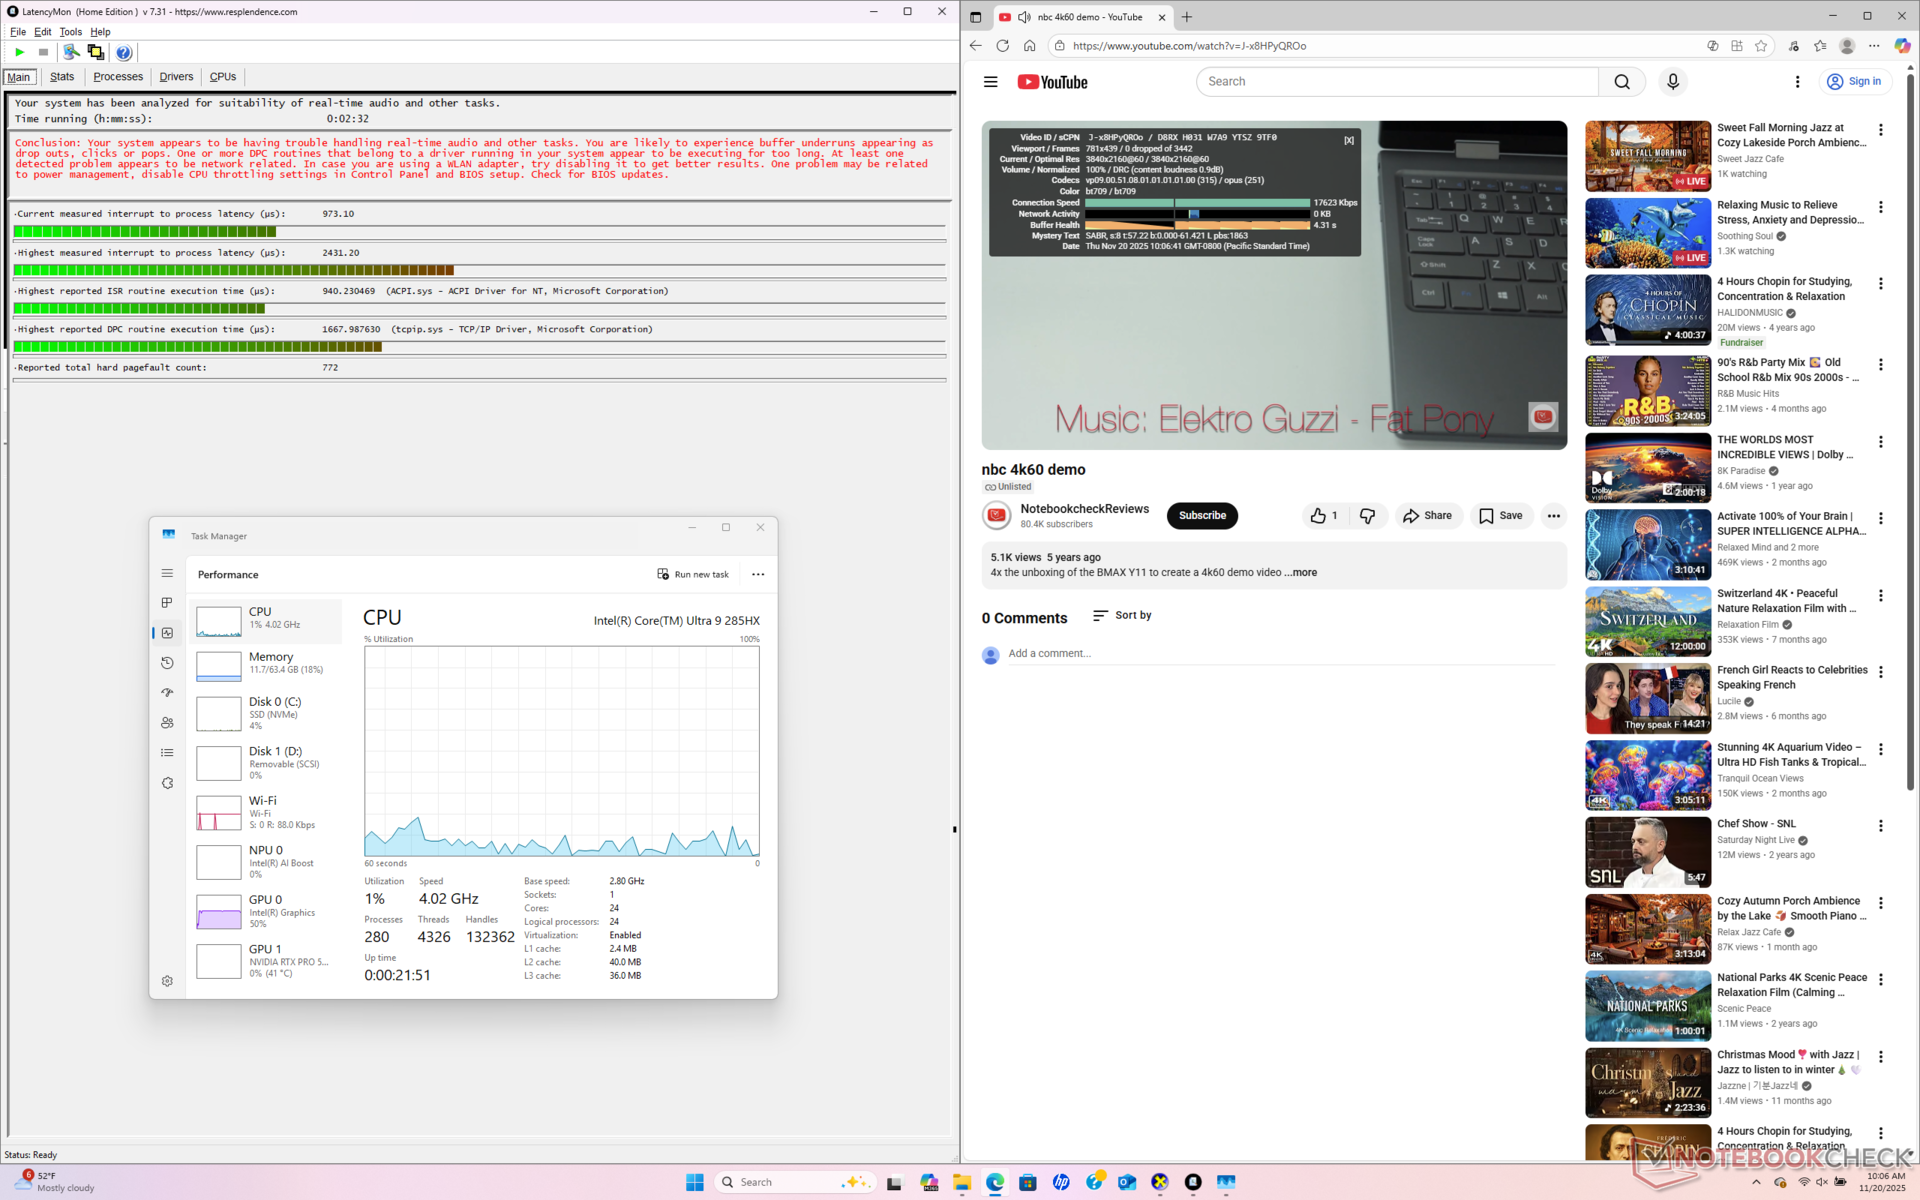

| DPC Latencies / LatencyMon - interrupt to process latency (max), Web, Youtube, Prime95 | |
| Schenker Key 18 Pro M25 RTX 5090 | |
| HP ZBook Fury G1i 18 | |
| HP ZBook Studio 16 G11 | |
| Dell Pro Max 18 Plus MB18250 | |
| Lenovo ThinkPad P16 Gen 2 | |
| HP ZBook X G1i 16 | |
* ... smaller is better
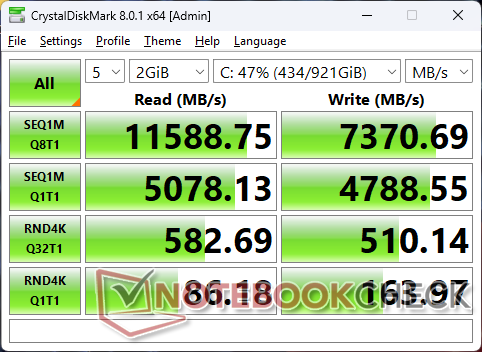
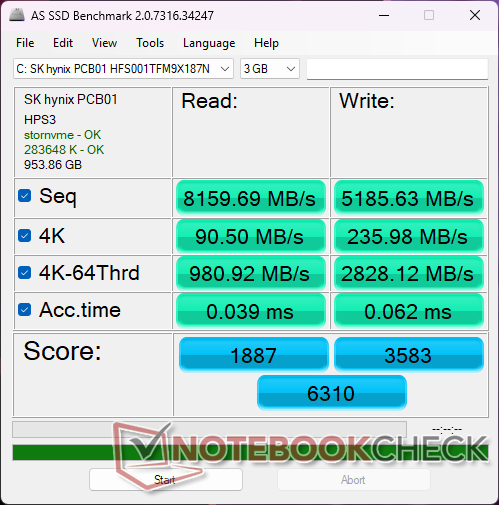
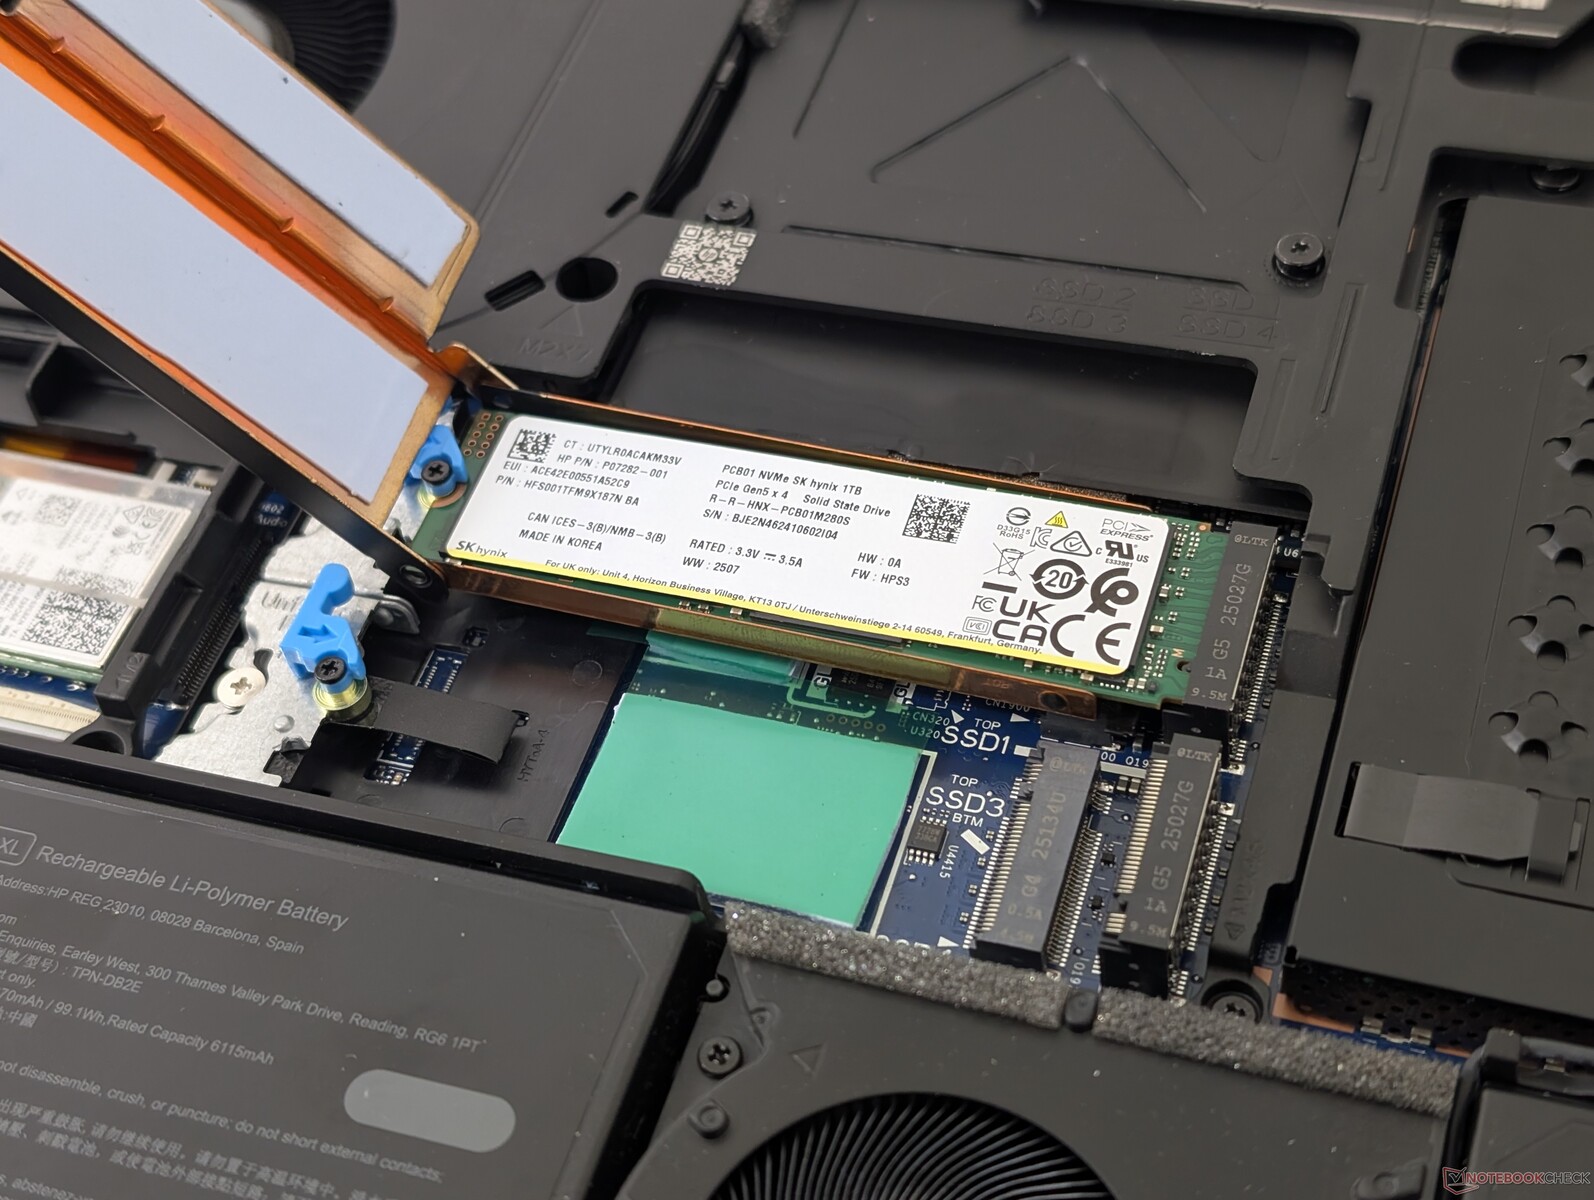
Storage Devices
Our unit ships with the SK Hynix PCB01 PCIe5 x4 NVMe SSD for steady transfer rates of around 12000 MB/s. The HP supports up to four individual M.2 2280 SSDs whereas the Dell Pro Max 18 Plus can support only up to two.

| Drive Performance rating - Percent | |
| Schenker Key 18 Pro M25 RTX 5090 | |
| HP ZBook Fury G1i 18 | |
| HP ZBook X G1i 16 | |
| Dell Pro Max 18 Plus MB18250 | |
| Lenovo ThinkPad P16 Gen 2 | |
| HP ZBook Studio 16 G11 | |
* ... smaller is better
Disk Throttling: DiskSpd Read Loop, Queue Depth 8
GPU Performance
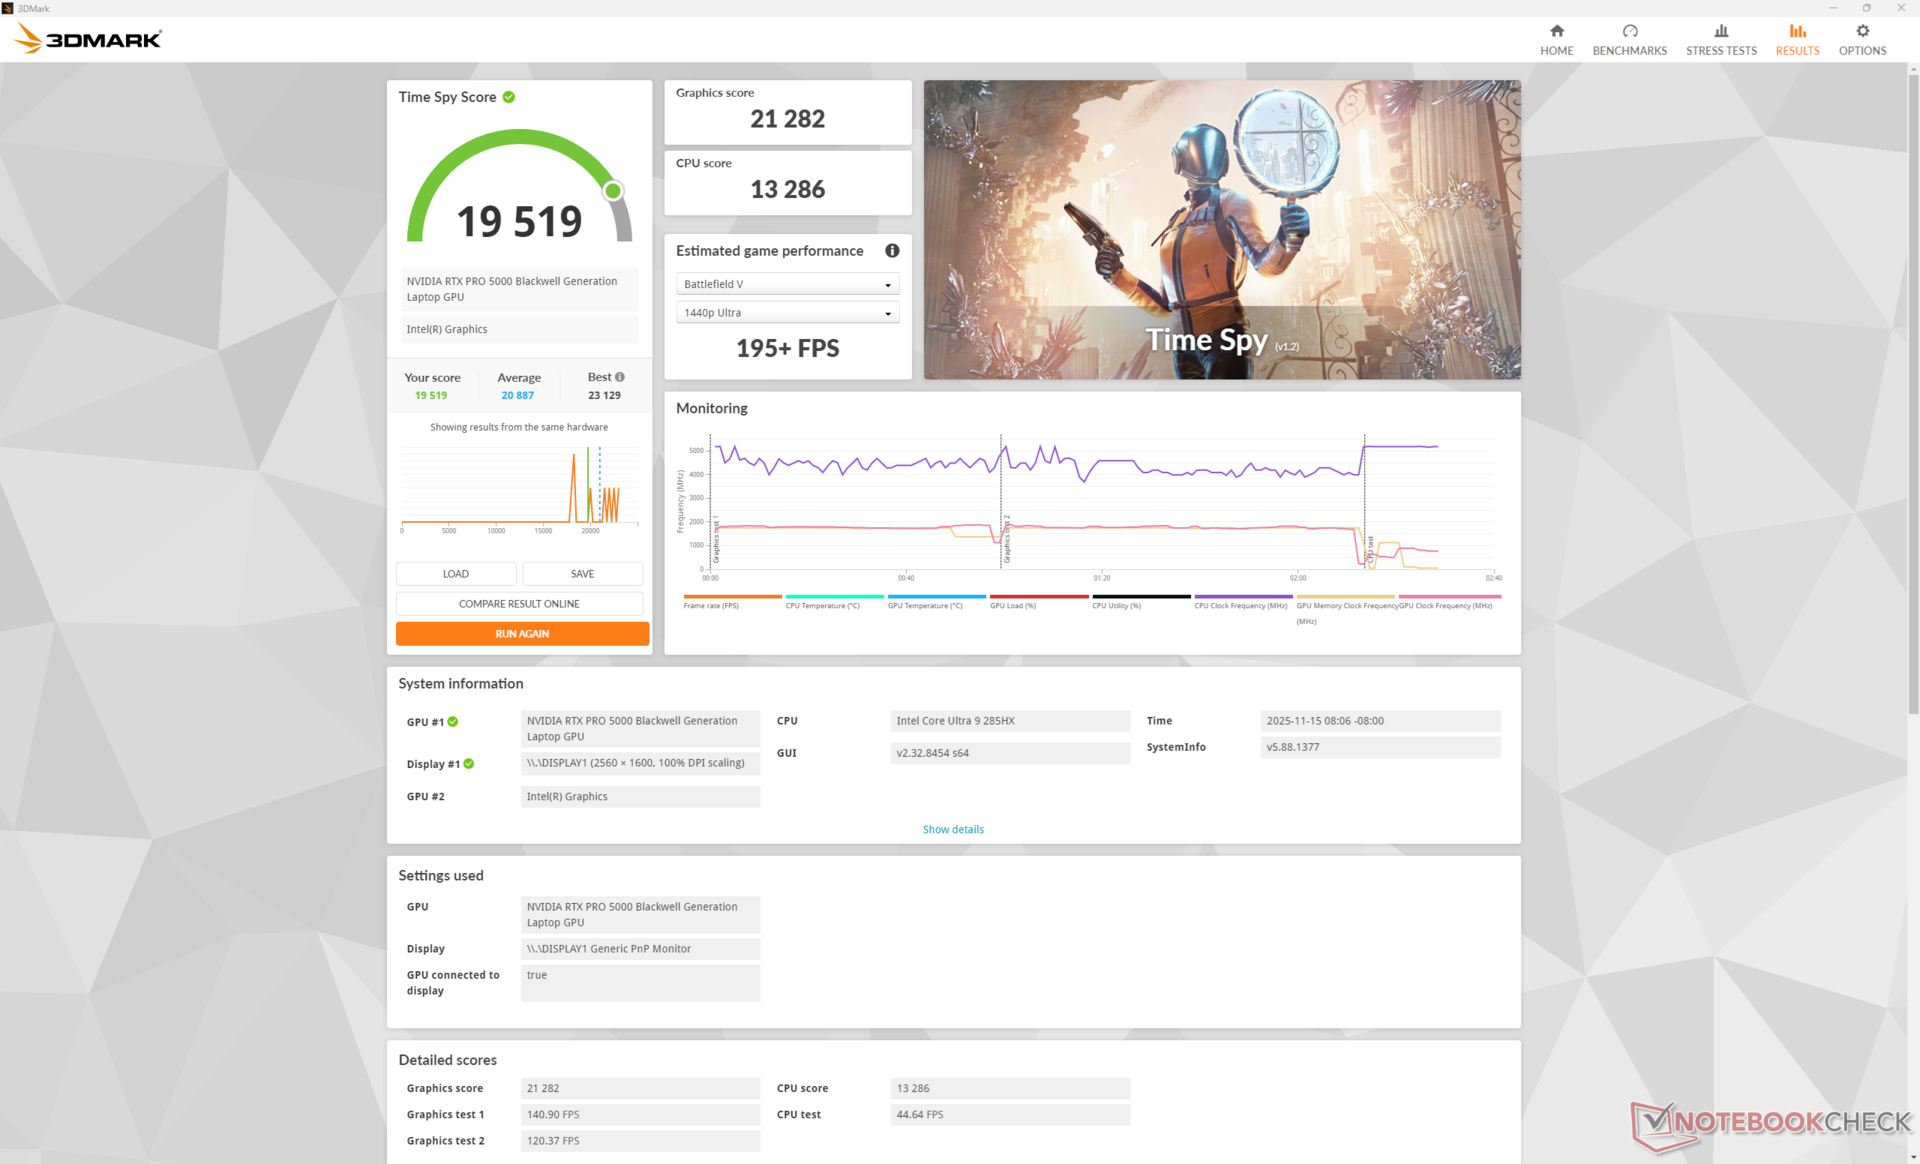
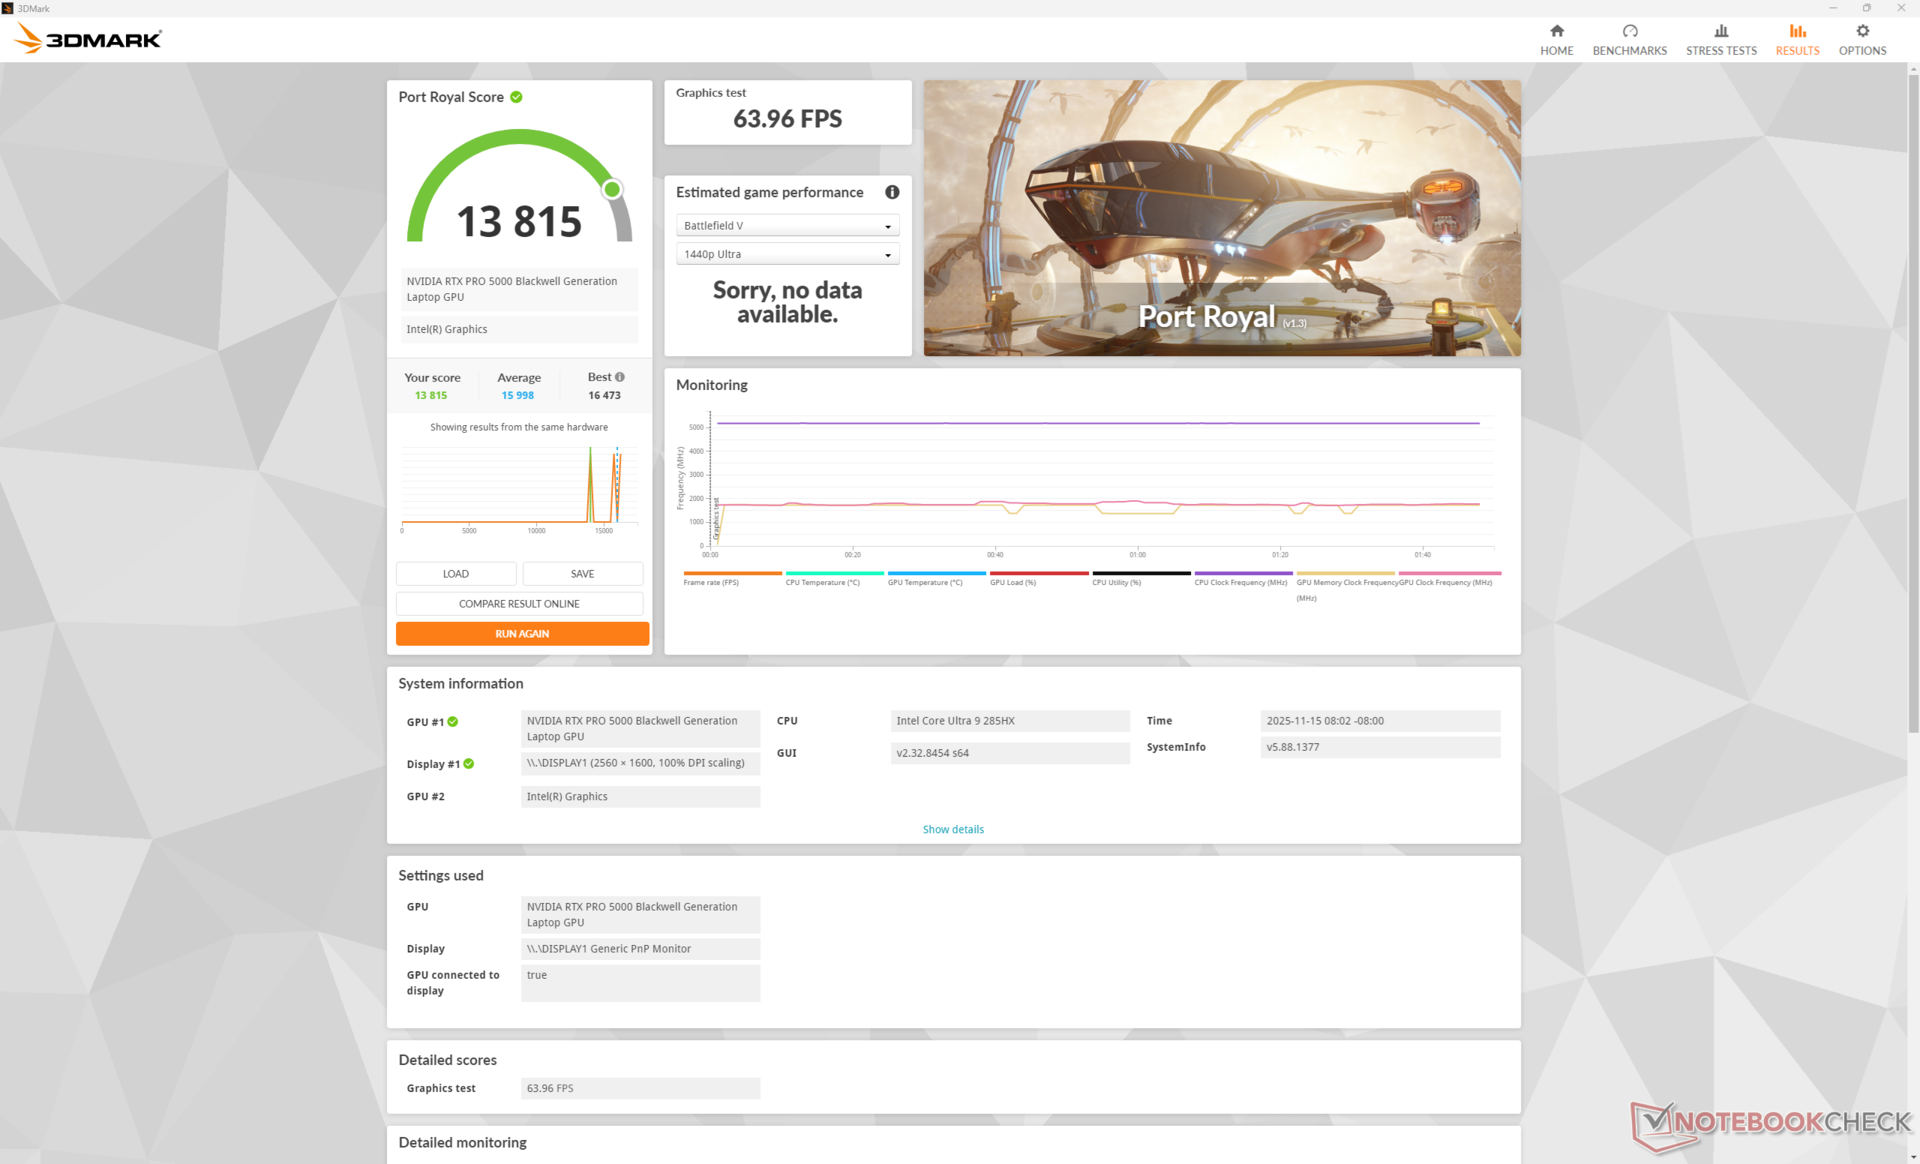
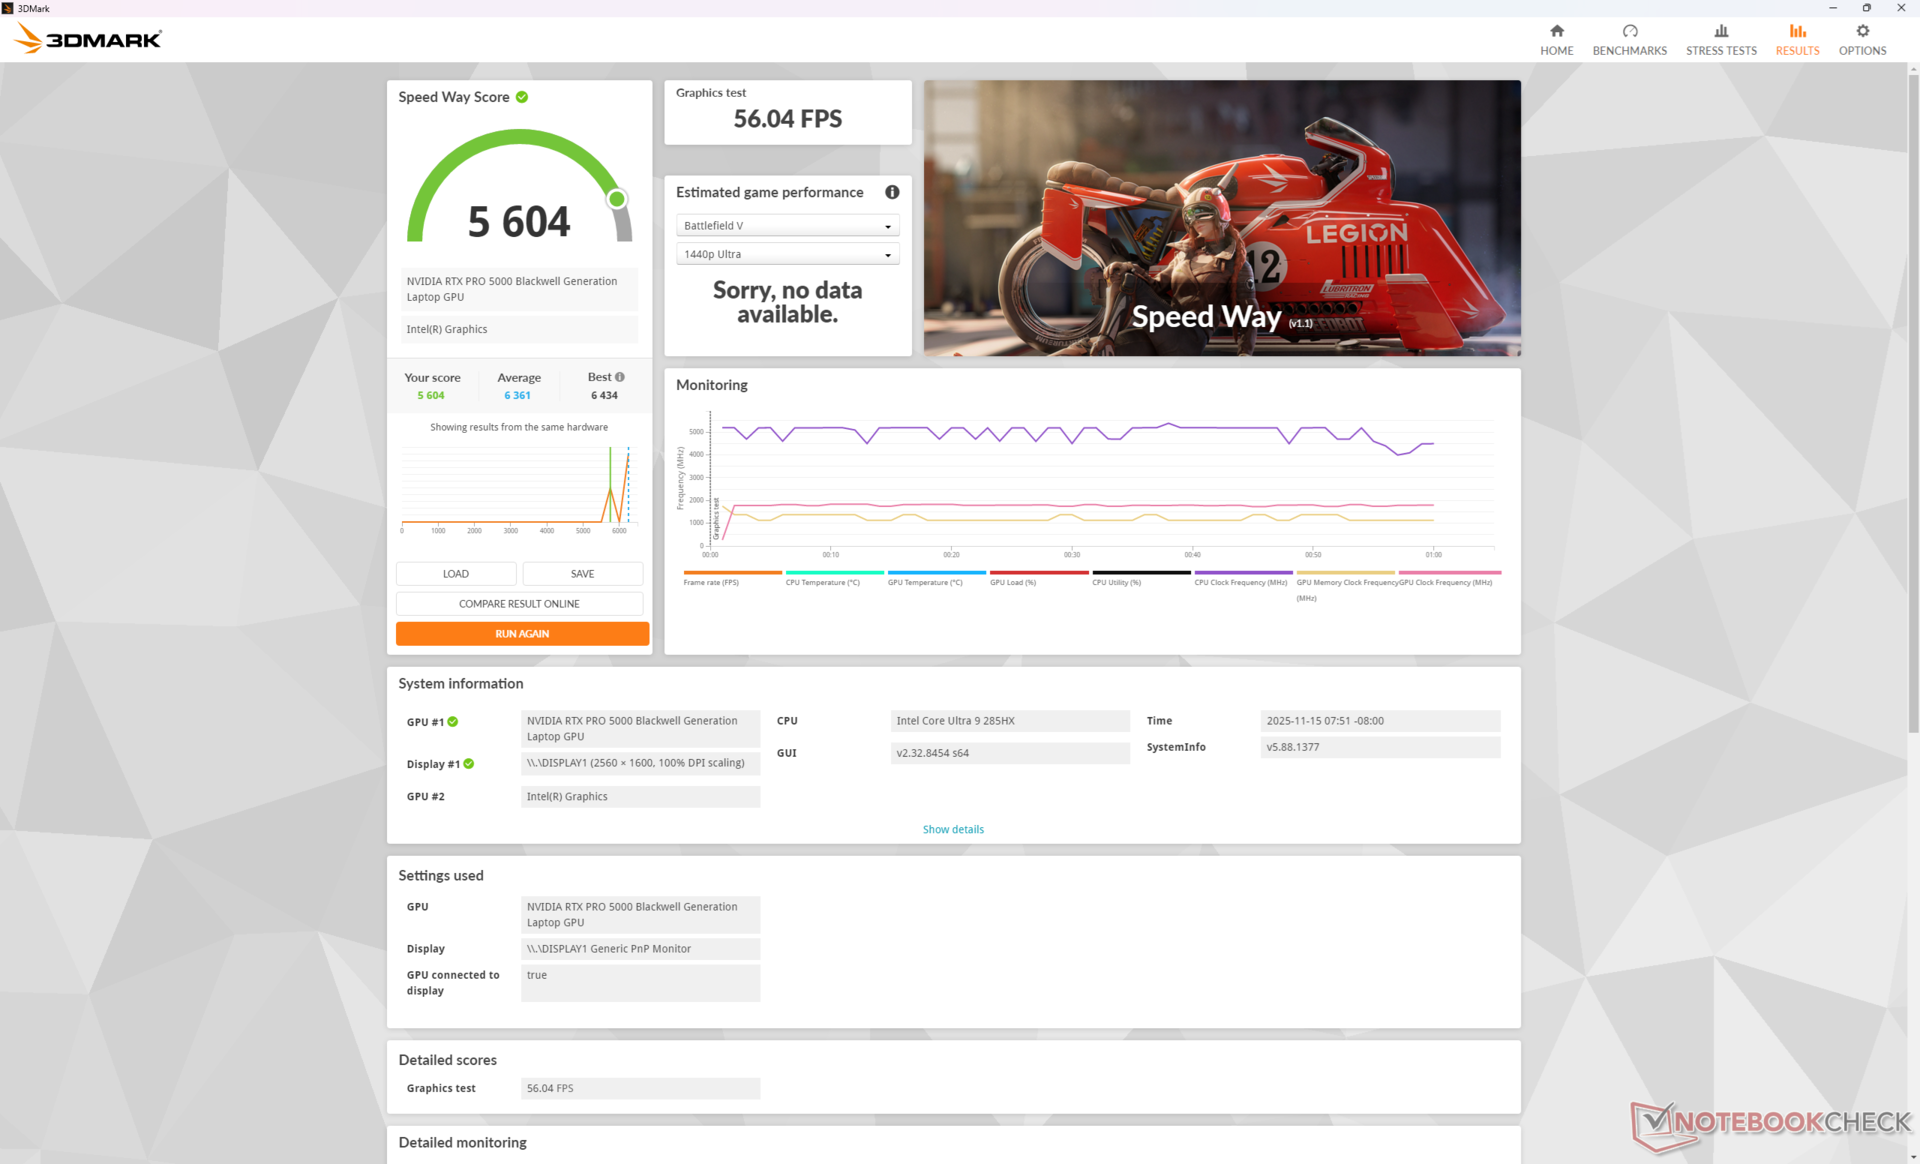
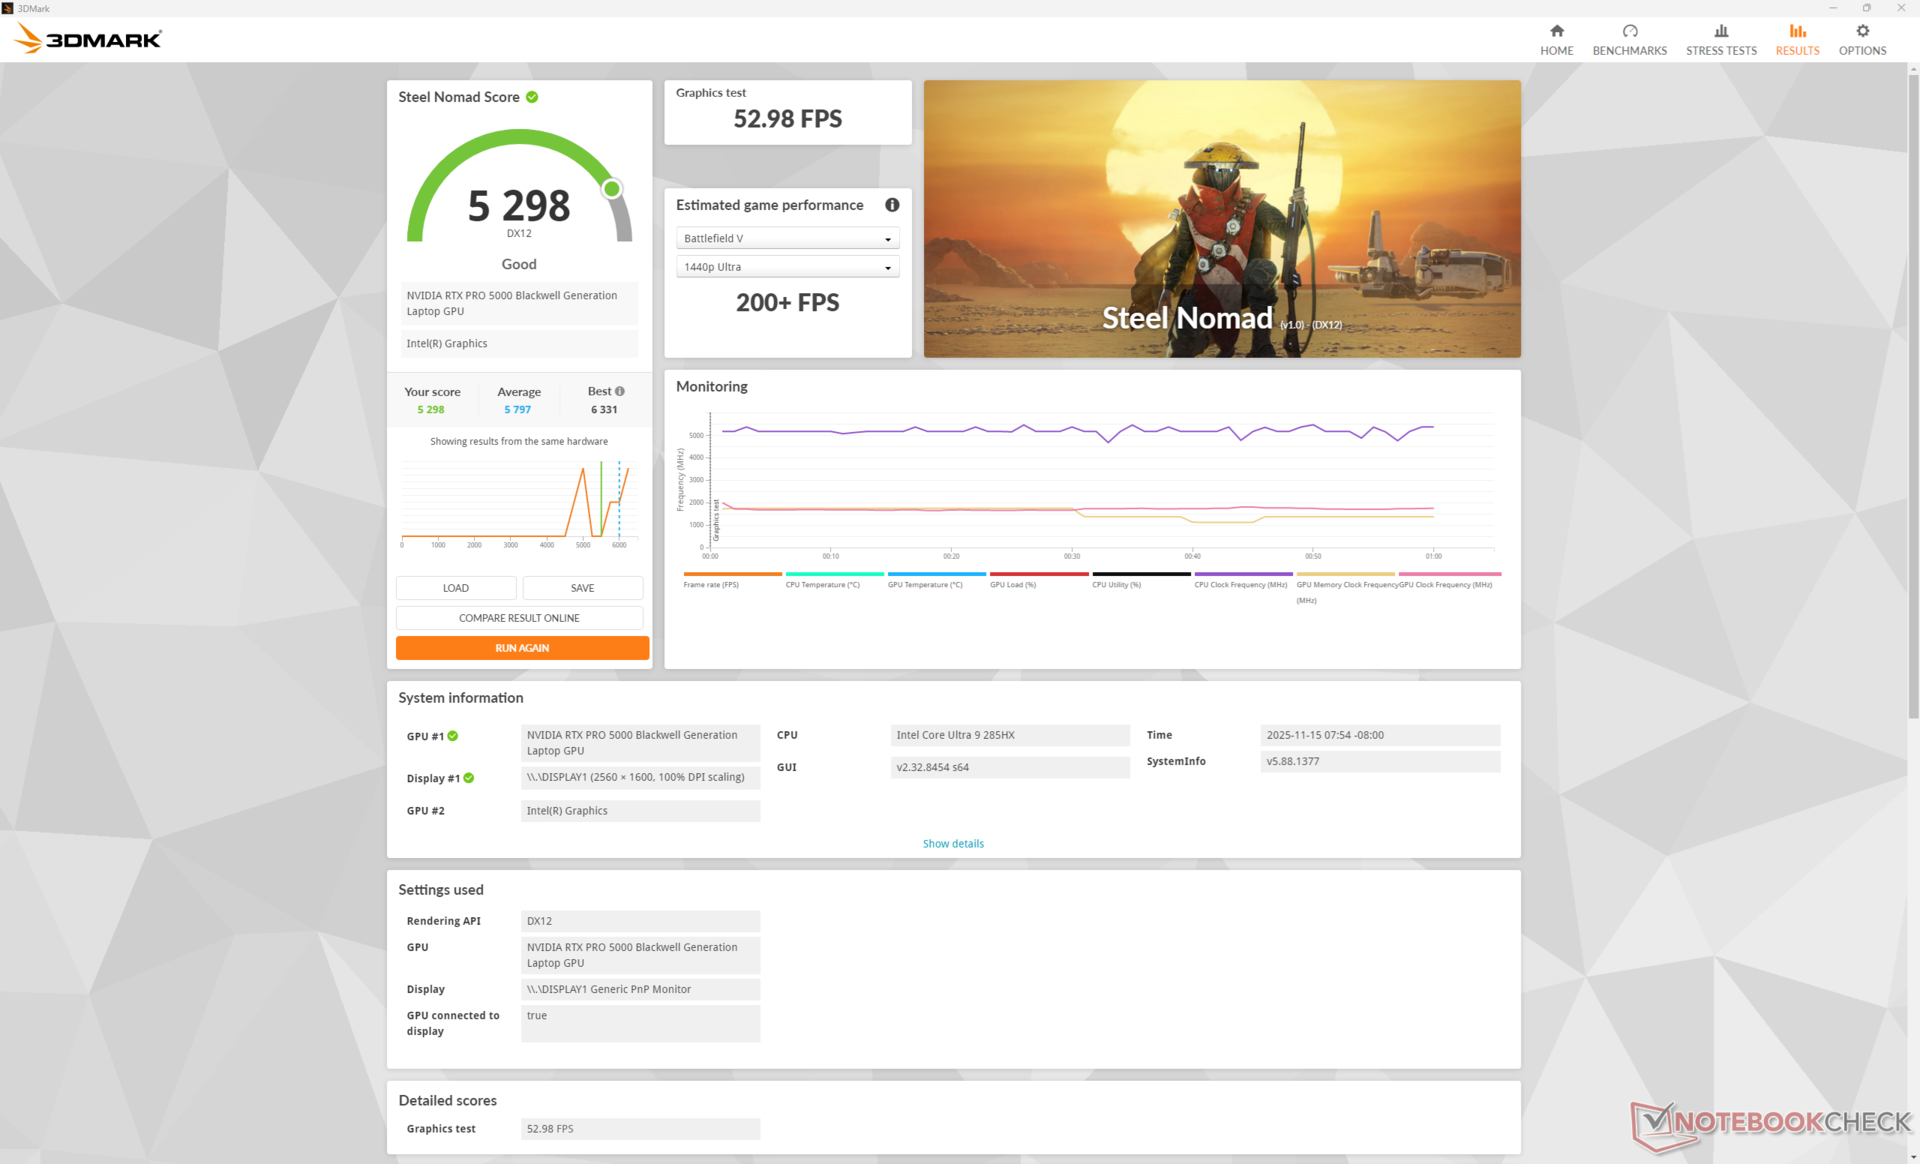
The Nvidia RTX Pro 5000 Blackwell in our HP runs consistently slower than the same GPU in the Dell Pro Max 18 Plus. This is largely because the GPU in the HP targets 150 W while the GPU in the dell targets 175 W for slightly faster performance. The performance benefits over last generation Ada options are nonetheless more significant.
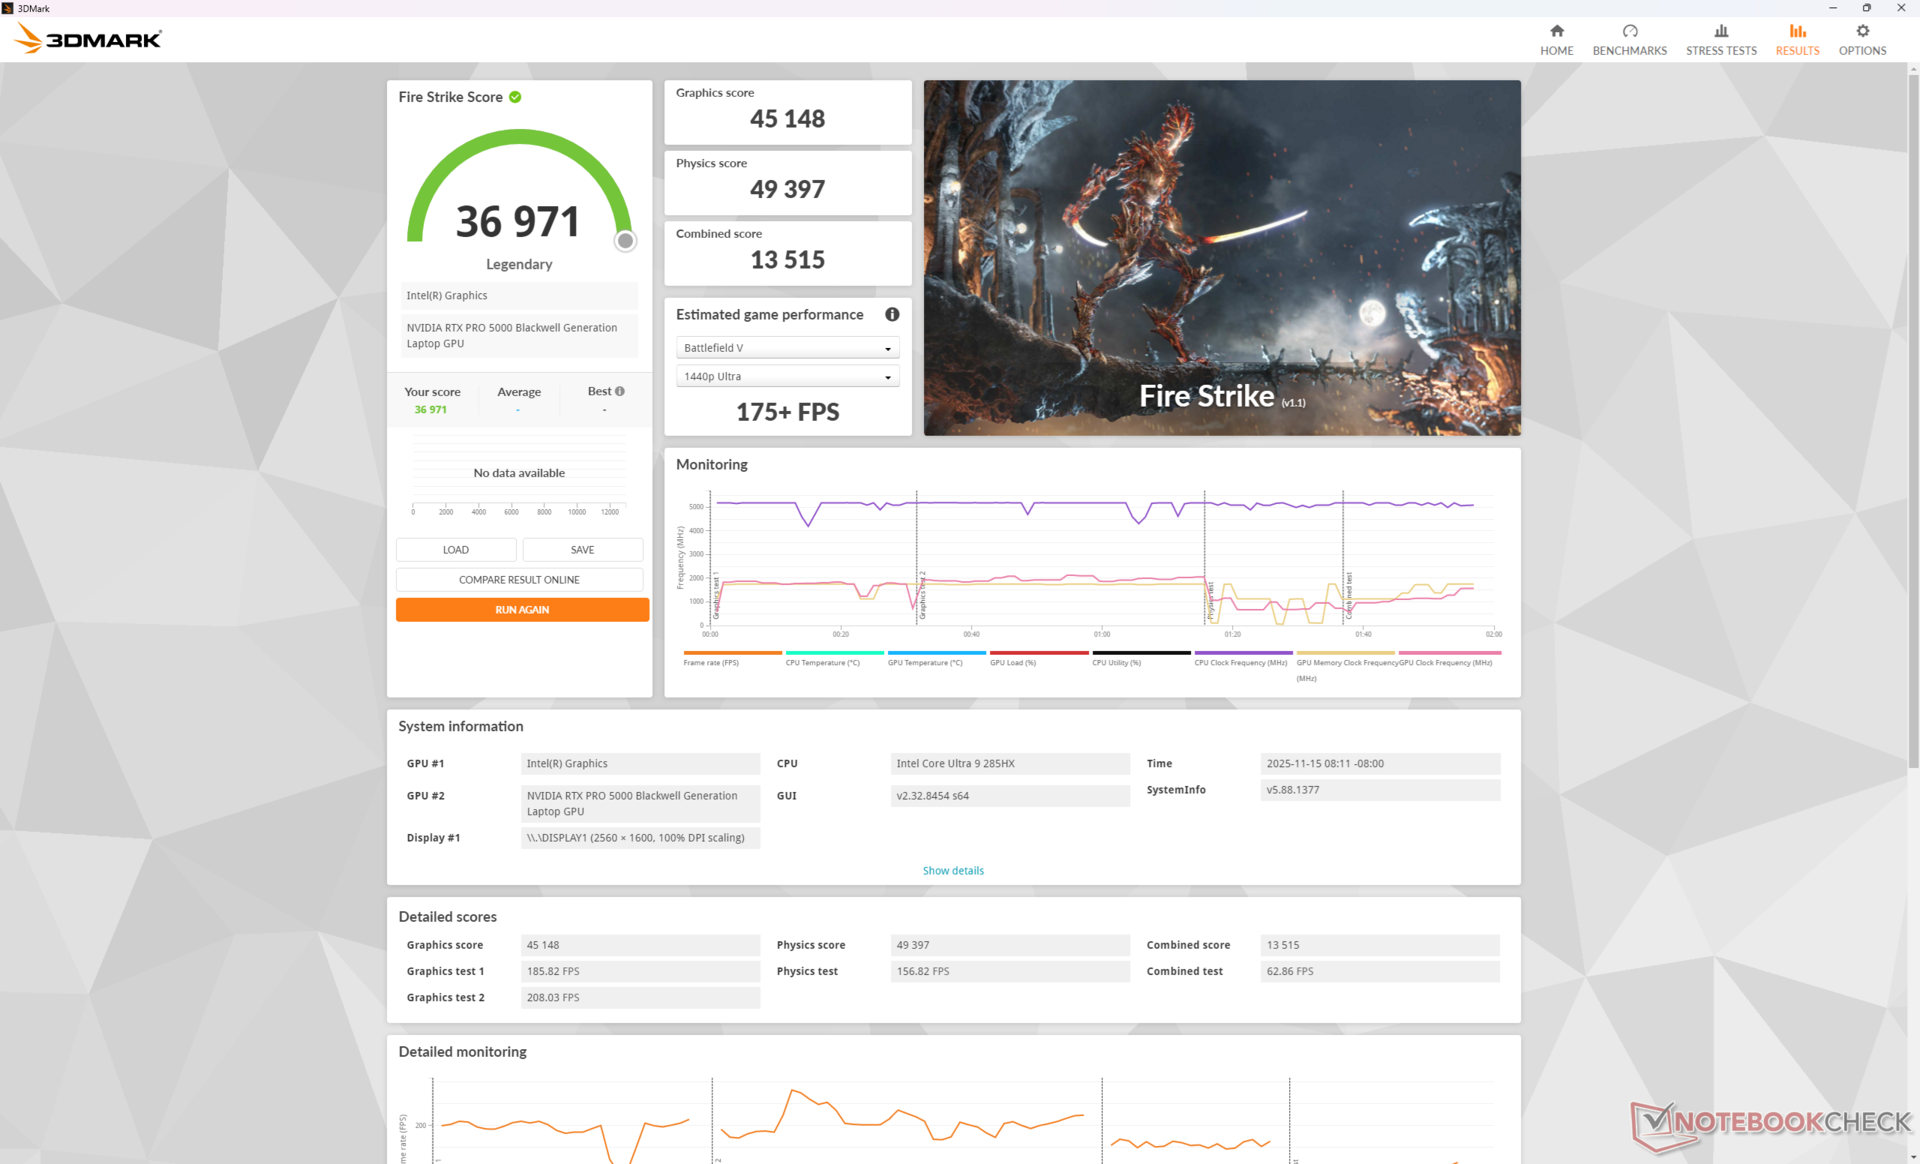
| Power Profile | Graphics Score | Physics Score | Combined Score |
| Performance Mode | 45148 | 49397 | 13515 |
| Balanced Mode | 43709 (-3%) | 48299 (-2%) | 11177 (-17%) |
| Battery Power | 28042 (-38%) | 21361 (-57%) | 7409 (-45%) |
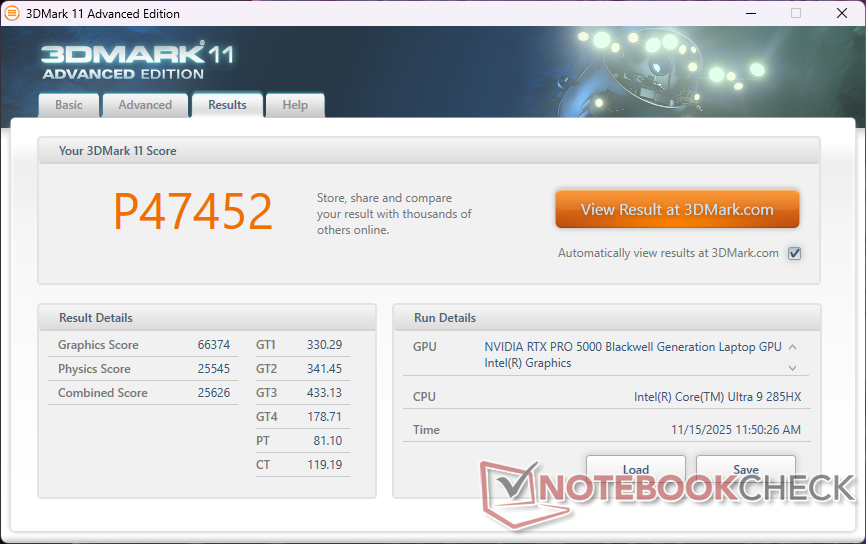
| 3DMark 11 Performance | 47452 points | |
| 3DMark Cloud Gate Standard Score | 51342 points | |
| 3DMark Fire Strike Score | 36971 points | |
| 3DMark Time Spy Score | 19519 points | |
| 3DMark Steel Nomad Score | 5298 points | |
Help | ||
* ... smaller is better
| Performance rating - Percent | |
| Dell Pro Max 18 Plus MB18250 | |
| Schenker Key 18 Pro M25 RTX 5090 | |
| HP ZBook Fury G1i 18 | |
| Lenovo ThinkPad P16 Gen 2 | |
| HP ZBook X G1i 16 | |
| HP ZBook Studio 16 G11 | |
| Cyberpunk 2077 - 1920x1080 Ultra Preset (FSR off) | |
| Dell Pro Max 18 Plus MB18250 | |
| Schenker Key 18 Pro M25 RTX 5090 | |
| HP ZBook Fury G1i 18 | |
| Lenovo ThinkPad P16 Gen 2 | |
| HP ZBook X G1i 16 | |
| HP ZBook Studio 16 G11 | |
| Baldur's Gate 3 - 1920x1080 Ultra Preset AA:T | |
| Dell Pro Max 18 Plus MB18250 | |
| Schenker Key 18 Pro M25 RTX 5090 | |
| HP ZBook Fury G1i 18 | |
| Lenovo ThinkPad P16 Gen 2 | |
| HP ZBook Studio 16 G11 | |
| HP ZBook X G1i 16 | |
| GTA V - 1920x1080 Highest AA:4xMSAA + FX AF:16x | |
| Dell Pro Max 18 Plus MB18250 | |
| Schenker Key 18 Pro M25 RTX 5090 | |
| HP ZBook Fury G1i 18 | |
| Lenovo ThinkPad P16 Gen 2 | |
| HP ZBook X G1i 16 | |
| HP ZBook Studio 16 G11 | |
| Final Fantasy XV Benchmark - 1920x1080 High Quality | |
| Dell Pro Max 18 Plus MB18250 | |
| HP ZBook Fury G1i 18 | |
| Schenker Key 18 Pro M25 RTX 5090 | |
| Lenovo ThinkPad P16 Gen 2 | |
| HP ZBook X G1i 16 | |
| HP ZBook Studio 16 G11 | |
| Strange Brigade - 1920x1080 ultra AA:ultra AF:16 | |
| Dell Pro Max 18 Plus MB18250 | |
| HP ZBook Fury G1i 18 | |
| Schenker Key 18 Pro M25 RTX 5090 | |
| Lenovo ThinkPad P16 Gen 2 | |
| HP ZBook Studio 16 G11 | |
| HP ZBook X G1i 16 | |
| Dota 2 Reborn - 1920x1080 ultra (3/3) best looking | |
| Lenovo ThinkPad P16 Gen 2 | |
| Dell Pro Max 18 Plus MB18250 | |
| HP ZBook Fury G1i 18 | |
| Schenker Key 18 Pro M25 RTX 5090 | |
| HP ZBook Studio 16 G11 | |
| HP ZBook X G1i 16 | |
| X-Plane 11.11 - 1920x1080 high (fps_test=3) | |
| Lenovo ThinkPad P16 Gen 2 | |
| Dell Pro Max 18 Plus MB18250 | |
| Schenker Key 18 Pro M25 RTX 5090 | |
| HP ZBook Fury G1i 18 | |
| HP ZBook Studio 16 G11 | |
| HP ZBook X G1i 16 | |
| F1 24 | |
| 3840x2160 Ultra High Preset AA:T AF:16x | |
| Dell Pro Max 18 Plus MB18250 | |
| Average NVIDIA RTX PRO 5000 Blackwell Generation Laptop (43.2 - 50.2, n=3) | |
| HP ZBook Fury G1i 18 | |
| Schenker Key 18 Pro M25 RTX 5090 | |
| 3840x2160 Ultra High Preset + Quality DLSS AF:16x | |
| Dell Pro Max 18 Plus MB18250 | |
| Average NVIDIA RTX PRO 5000 Blackwell Generation Laptop (71.8 - 85.7, n=3) | |
| HP ZBook Fury G1i 18 | |
| Schenker Key 18 Pro M25 RTX 5090 | |
| 2560x1440 Ultra High Preset + Quality DLSS AF:16x | |
| Dell Pro Max 18 Plus MB18250 | |
| Average NVIDIA RTX PRO 5000 Blackwell Generation Laptop (126.8 - 148.6, n=3) | |
| HP ZBook Fury G1i 18 | |
| Schenker Key 18 Pro M25 RTX 5090 | |
| HP ZBook X G1i 16 | |
| GTA V | |
| 3840x2160 High/On (Advanced Graphics Off) AA:FX AF:8x | |
| Average NVIDIA RTX PRO 5000 Blackwell Generation Laptop (165.3 - 170.3, n=2) | |
| HP ZBook Fury G1i 18 | |
| Lenovo Legion Pro 5 16IAX10, RTX 5070 | |
| 3840x2160 Highest AA:4xMSAA + FX AF:16x | |
| Schenker Key 18 Pro M25 RTX 5090 | |
| Average NVIDIA RTX PRO 5000 Blackwell Generation Laptop (101.6 - 105.5, n=2) | |
| HP ZBook Fury G1i 18 | |
| Lenovo Legion Pro 5 16IAX10, RTX 5070 | |
| Lenovo Legion Pro 5 16IAX10, RTX 5070 | |
| Final Fantasy XV Benchmark - 3840x2160 High Quality | |
| Schenker Key 18 Pro M25 RTX 5090 | |
| Dell Pro Max 18 Plus MB18250 | |
| Average NVIDIA RTX PRO 5000 Blackwell Generation Laptop (88.4 - 102.2, n=3) | |
| HP ZBook Fury G1i 18 | |
| Lenovo Legion Pro 5 16IAX10, RTX 5070 | |
| Lenovo ThinkPad P16 G1 RTX A5500 | |
Cyberpunk 2077 ultra FPS Chart
| low | med. | high | ultra | QHD DLSS | QHD | 4K DLSS | 4K | |
|---|---|---|---|---|---|---|---|---|
| GTA V (2015) | 186.5 | 181.3 | 175.3 | 133.6 | 130.5 | 165.3 | ||
| Dota 2 Reborn (2015) | 215 | 187.2 | 175 | 162 | 143.9 | |||
| Final Fantasy XV Benchmark (2018) | 232 | 222 | 183.8 | 145.7 | 88.4 | |||
| X-Plane 11.11 (2018) | 137.3 | 114.9 | 92 | 74.2 | ||||
| Strange Brigade (2018) | 619 | 493 | 440 | 396 | 303 | 165.7 | ||
| Baldur's Gate 3 (2023) | 245 | 208 | 182 | 177 | 179.4 | 129.5 | 114.3 | 74.1 |
| Cyberpunk 2077 (2023) | 171.8 | 173.3 | 157.7 | 143.7 | 109 | 98 | 46.1 | |
| F1 24 (2024) | 281 | 297 | 272 | 125.7 | 126.8 | 84.4 | 71.8 | 43.2 |
Emissions
System Noise
The internal fans are inaudible when idling or running undemanding tasks like browsers or Excel. However, they boost quite readily when higher loads are introduced. In fact, the system does not run any quieter than the Dell despite both models shipping with the same CPU and GPU.

Noise level
| Idle |
| 25.7 / 25.7 / 25.7 dB(A) |
| Load |
| 48.3 / 56.5 dB(A) |
 | ||
30 dB silent 40 dB(A) audible 50 dB(A) loud |
||
min: | ||
| HP ZBook Fury G1i 18 Ultra 9 285HX, RTX PRO 5000 Blackwell Generation Laptop | Dell Pro Max 18 Plus MB18250 Ultra 9 285HX, RTX PRO 5000 Blackwell Generation Laptop | Schenker Key 18 Pro M25 RTX 5090 Ultra 9 275HX, GeForce RTX 5090 Laptop | Lenovo ThinkPad P16 Gen 2 i7-14700HX, RTX 4000 Ada Generation Laptop | HP ZBook X G1i 16 Ultra 7 265H, RTX PRO 2000 Blackwell Generation Laptop | HP ZBook Studio 16 G11 Ultra 9 185H, RTX 3000 Ada Generation Laptop | |
|---|---|---|---|---|---|---|
| Noise | 4% | 2% | -1% | 13% | 9% | |
| off / environment * (dB) | 24.9 | 23.1 7% | 23.9 4% | 23.9 4% | 23.7 5% | 23.8 4% |
| Idle Minimum * (dB) | 25.7 | 27.1 -5% | 25.2 2% | 29.1 -13% | 23.7 8% | 23.8 7% |
| Idle Average * (dB) | 25.7 | 27.1 -5% | 25.2 2% | 29.1 -13% | 23.7 8% | 26.4 -3% |
| Idle Maximum * (dB) | 25.7 | 27.1 -5% | 25.2 2% | 29.1 -13% | 23.7 8% | 26.4 -3% |
| Load Average * (dB) | 48.3 | 38 21% | 47.8 1% | 41 15% | 32.7 32% | 33.7 30% |
| Cyberpunk 2077 ultra * (dB) | 58.2 | 53.8 8% | 54.4 7% | 52.8 9% | 50.9 13% | 46.1 21% |
| Load Maximum * (dB) | 56.5 | 53.8 5% | 58.6 -4% | 52.9 6% | 48 15% | 53.2 6% |
* ... smaller is better
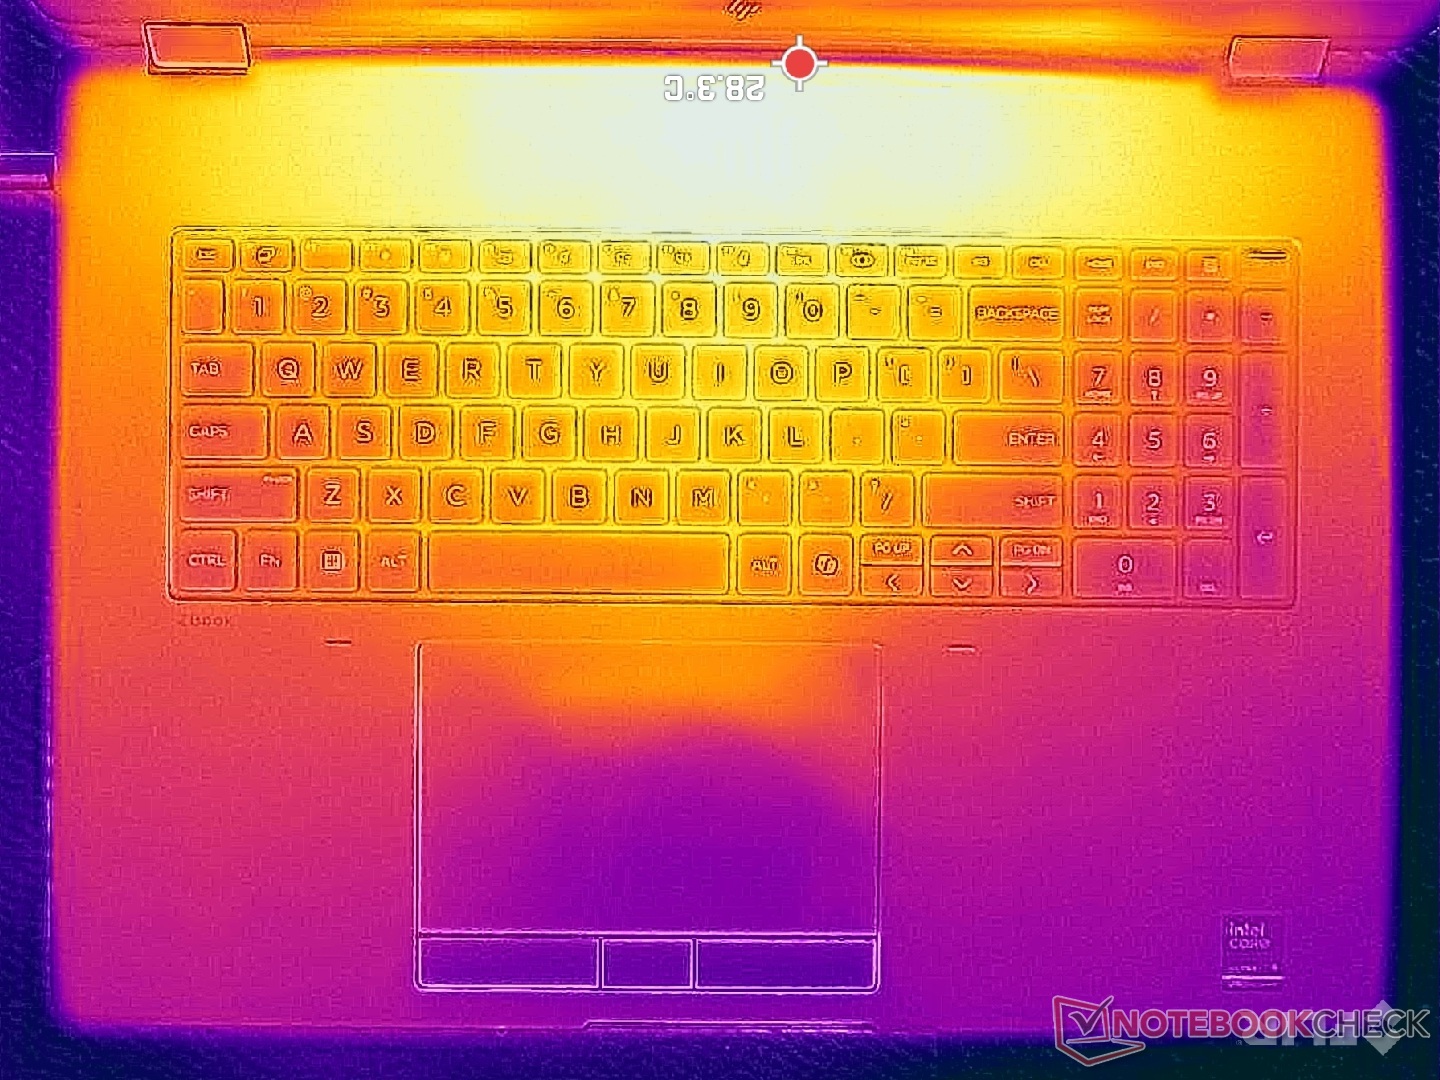
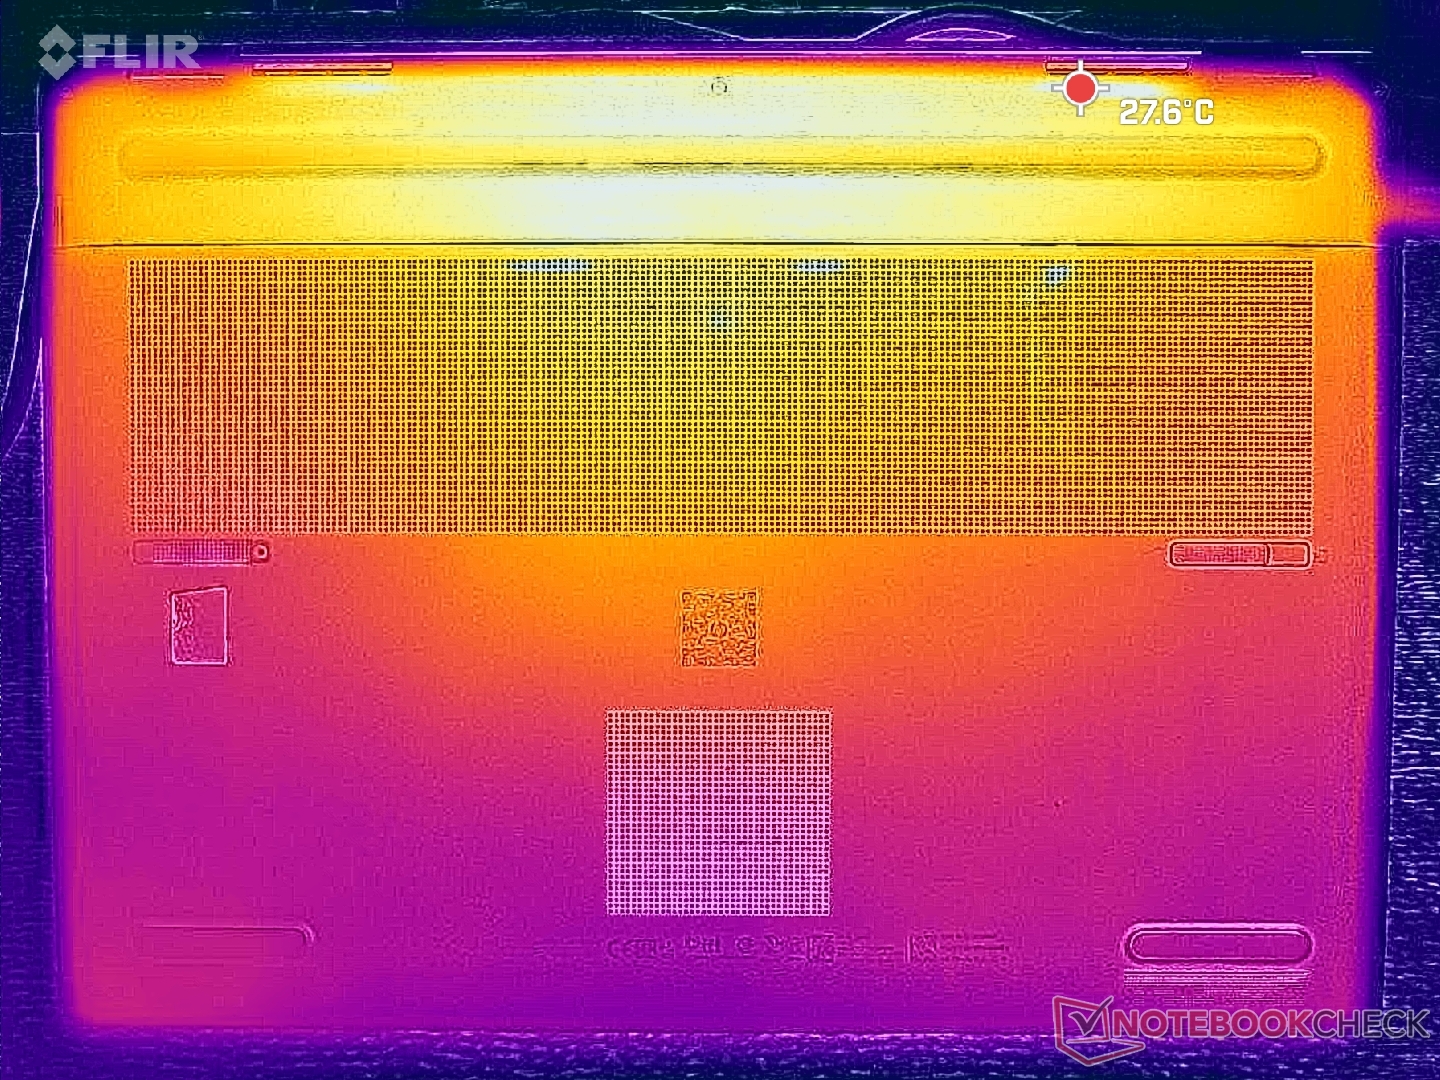
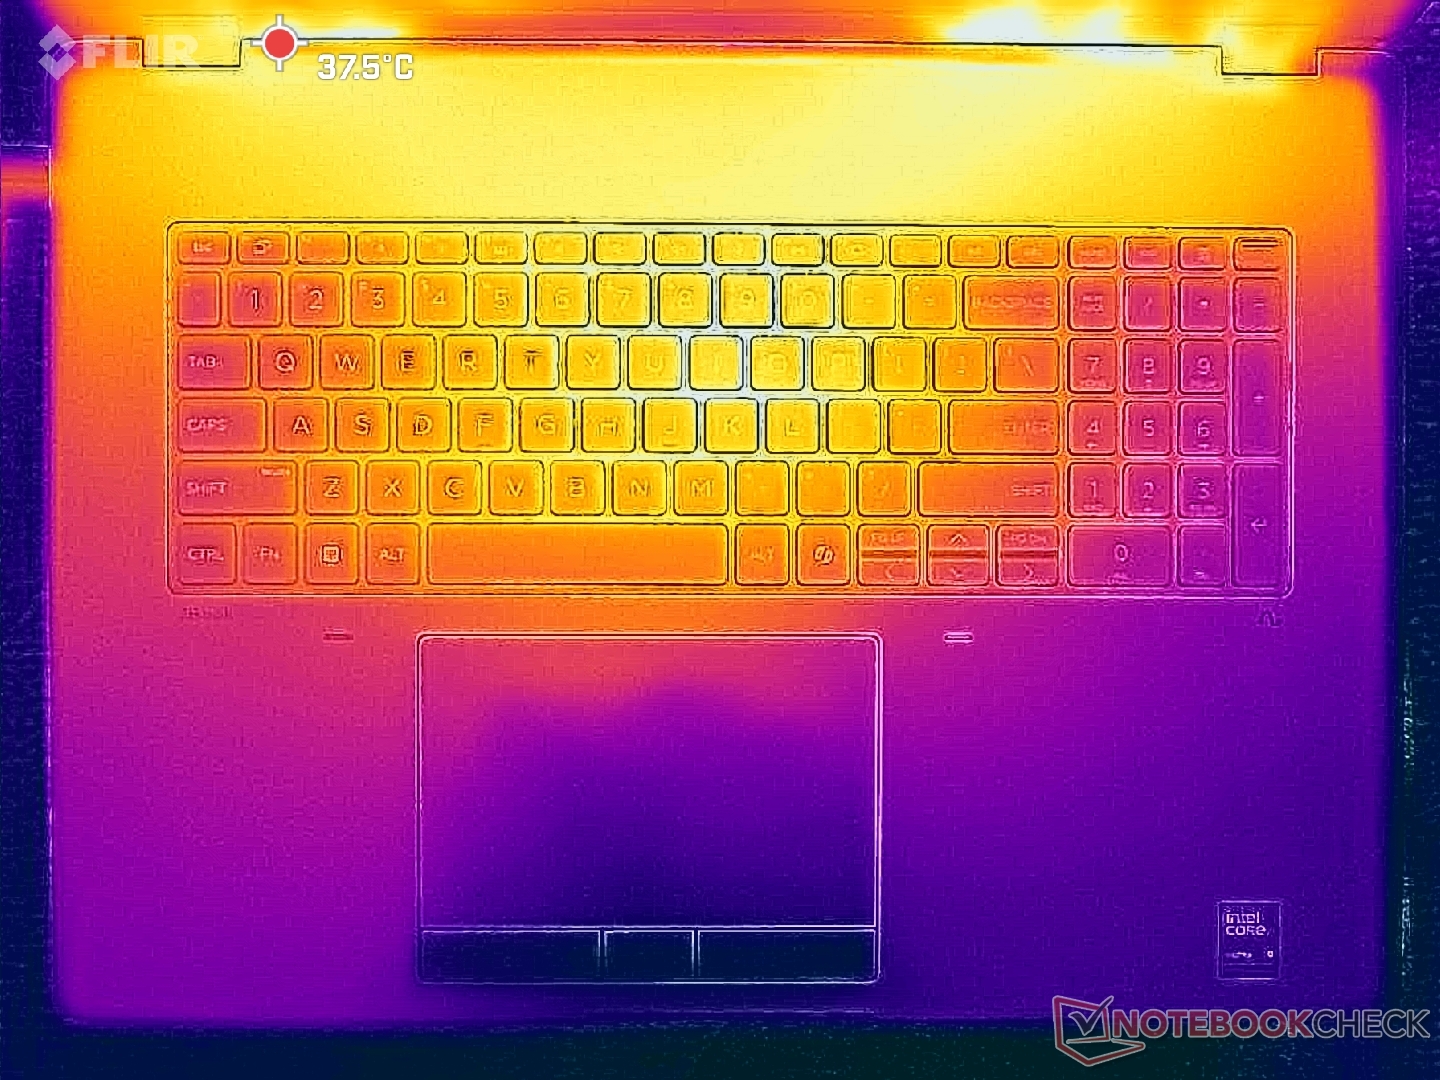
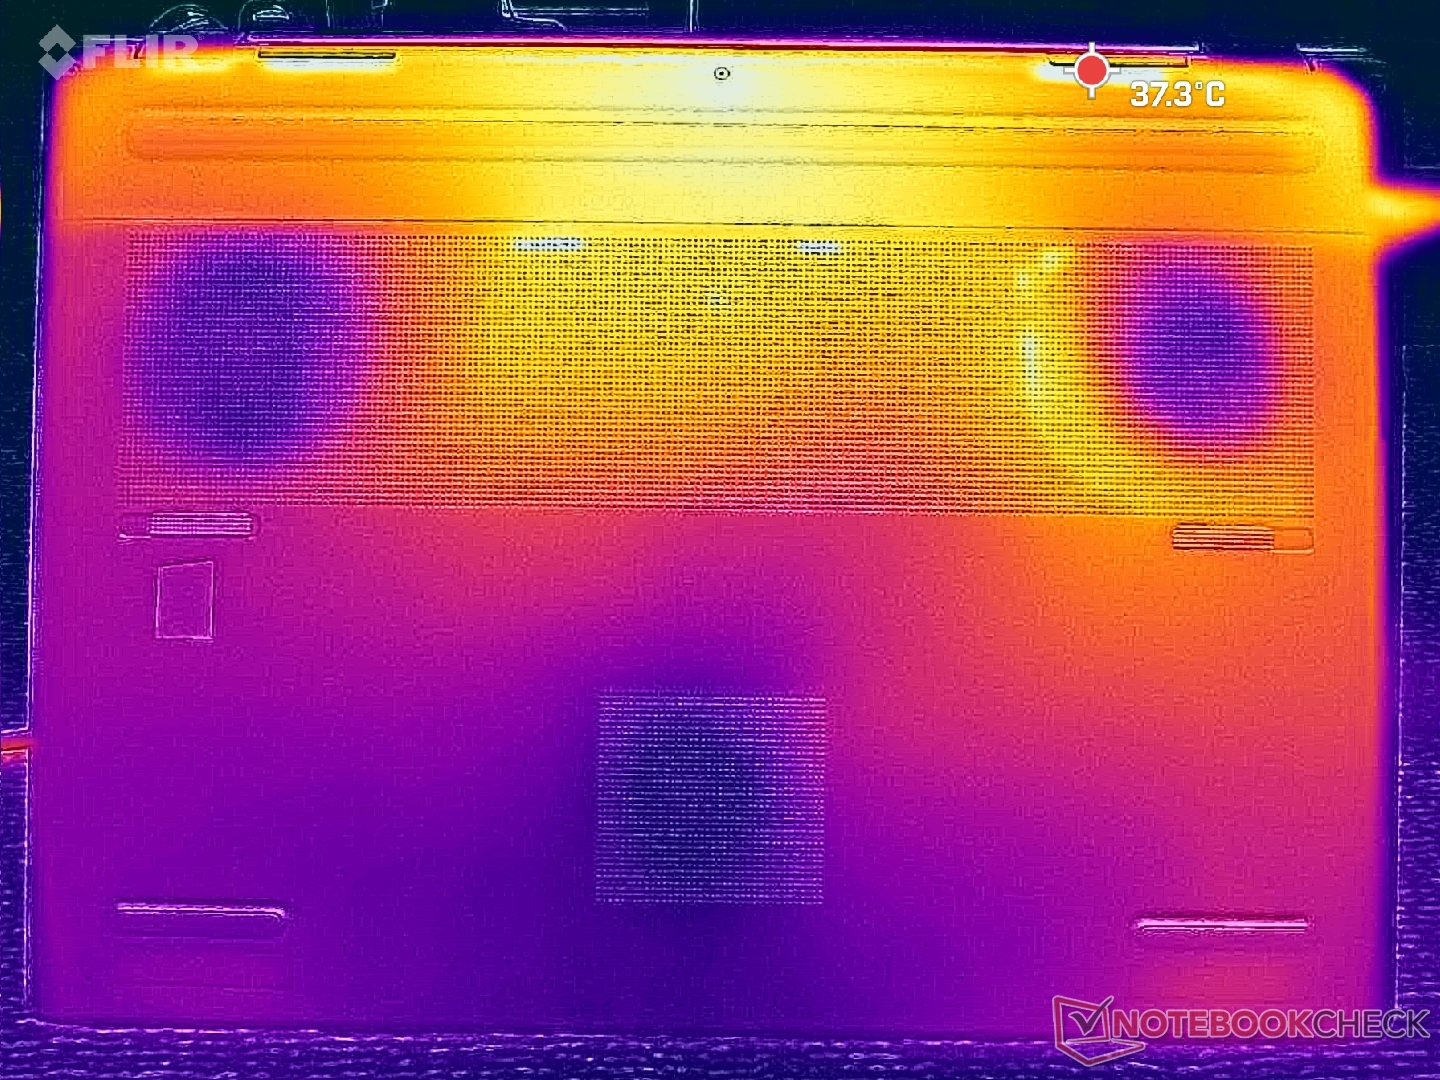
Temperature
Surface temperatures remain reasonably cool even when running demanding loads. Hot spots on the keyboard deck and bottom cover would reach up to 40 C and 36 C, respectively, compared to almost 50 C on the Schenker Key 18 Pro.
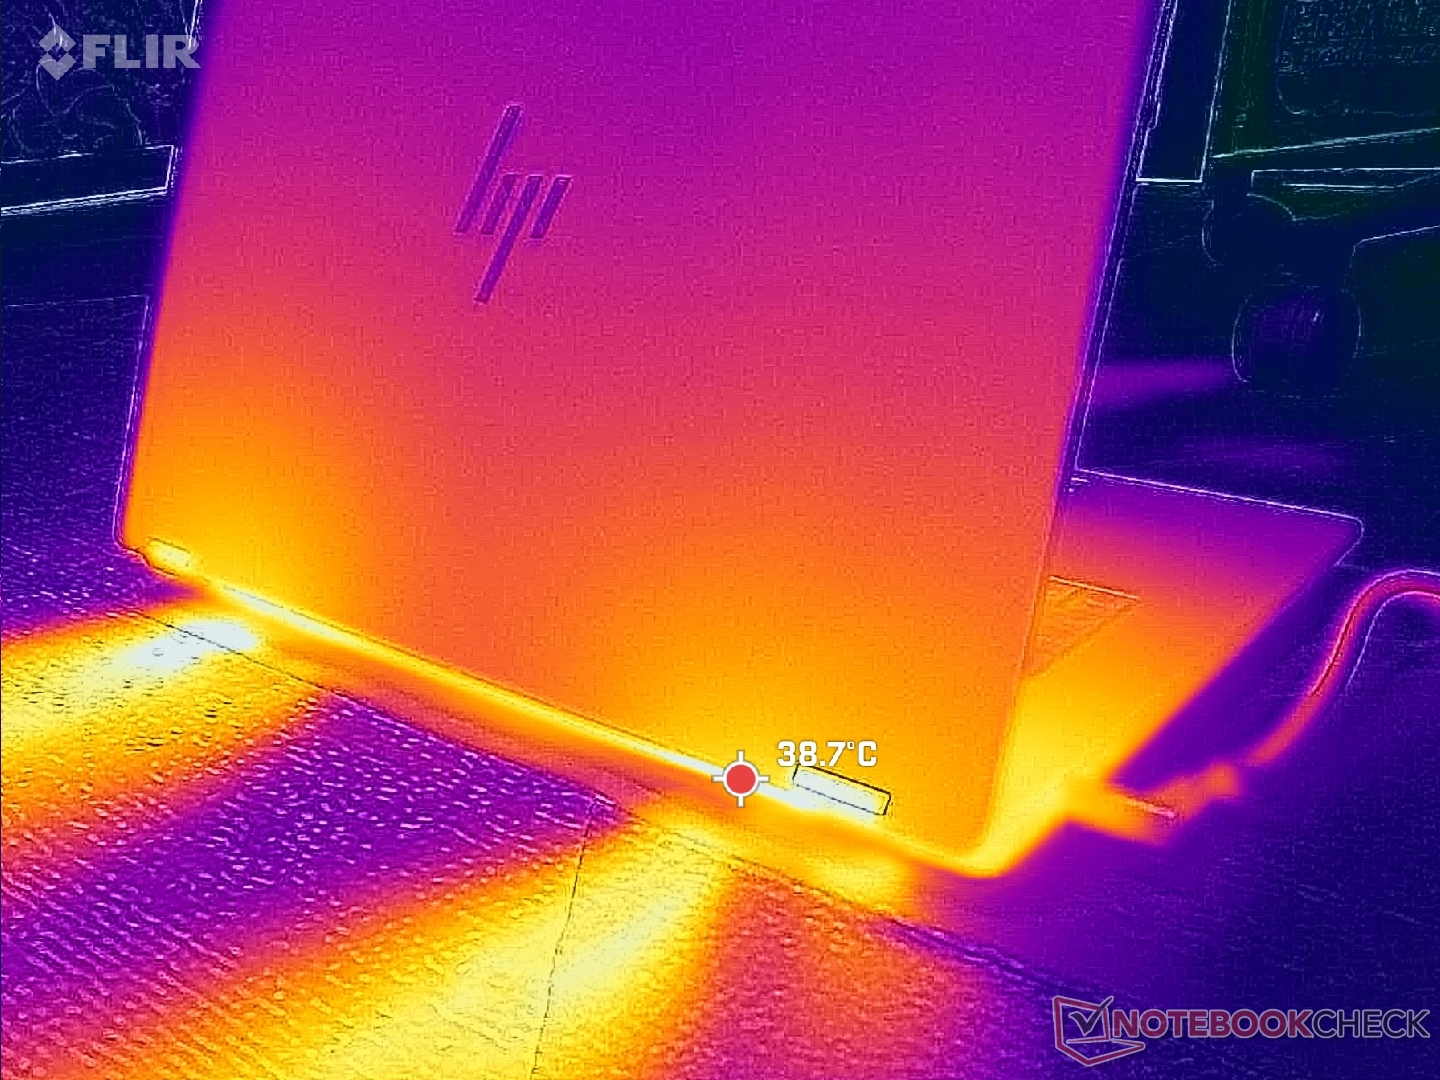
(+) The maximum temperature on the upper side is 39.6 °C / 103 F, compared to the average of 38.2 °C / 101 F, ranging from 22.2 to 69.8 °C for the class Workstation.
(+) The bottom heats up to a maximum of 35.4 °C / 96 F, compared to the average of 41.1 °C / 106 F
(+) In idle usage, the average temperature for the upper side is 28.4 °C / 83 F, compared to the device average of 32 °C / 90 F.
(+) The palmrests and touchpad are cooler than skin temperature with a maximum of 26 °C / 78.8 F and are therefore cool to the touch.
(±) The average temperature of the palmrest area of similar devices was 27.8 °C / 82 F (+1.8 °C / 3.2 F).
| HP ZBook Fury G1i 18 Ultra 9 285HX, RTX PRO 5000 Blackwell Generation Laptop | Dell Pro Max 18 Plus MB18250 Ultra 9 285HX, RTX PRO 5000 Blackwell Generation Laptop | Schenker Key 18 Pro M25 RTX 5090 Ultra 9 275HX, GeForce RTX 5090 Laptop | Lenovo ThinkPad P16 Gen 2 i7-14700HX, RTX 4000 Ada Generation Laptop | HP ZBook X G1i 16 Ultra 7 265H, RTX PRO 2000 Blackwell Generation Laptop | HP ZBook Studio 16 G11 Ultra 9 185H, RTX 3000 Ada Generation Laptop | |
|---|---|---|---|---|---|---|
| Heat | -12% | -14% | -6% | 0% | -10% | |
| Maximum Upper Side * (°C) | 39.6 | 44.8 -13% | 47.5 -20% | 46.6 -18% | 36 9% | 36.6 8% |
| Maximum Bottom * (°C) | 35.4 | 47 -33% | 52.8 -49% | 51 -44% | 39.4 -11% | 47.8 -35% |
| Idle Upper Side * (°C) | 31.6 | 31.8 -1% | 28.5 10% | 24.8 22% | 30.4 4% | 31.4 1% |
| Idle Bottom * (°C) | 31.2 | 31.4 -1% | 30.1 4% | 25.6 18% | 31.8 -2% | 35.6 -14% |
* ... smaller is better
Speakers
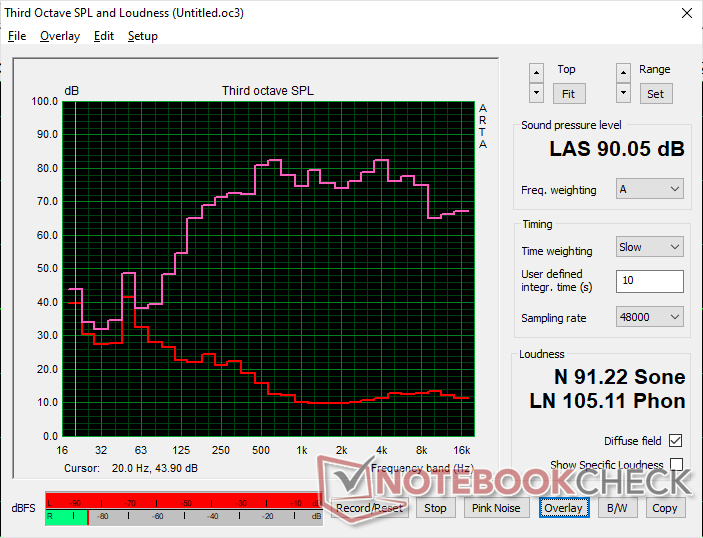
HP ZBook Fury G1i 18 audio analysis
(+) | speakers can play relatively loud (90.1 dB)
Bass 100 - 315 Hz
(±) | reduced bass - on average 11.4% lower than median
(±) | linearity of bass is average (8.9% delta to prev. frequency)
Mids 400 - 2000 Hz
(+) | balanced mids - only 3.2% away from median
(+) | mids are linear (5.6% delta to prev. frequency)
Highs 2 - 16 kHz
(+) | balanced highs - only 3.7% away from median
(+) | highs are linear (6.5% delta to prev. frequency)
Overall 100 - 16.000 Hz
(+) | overall sound is linear (10.8% difference to median)
Compared to same class
» 10% of all tested devices in this class were better, 4% similar, 86% worse
» The best had a delta of 7%, average was 17%, worst was 35%
Compared to all devices tested
» 6% of all tested devices were better, 2% similar, 92% worse
» The best had a delta of 4%, average was 23%, worst was 134%
Apple MacBook Pro 16 2021 M1 Pro audio analysis
(+) | speakers can play relatively loud (84.7 dB)
Bass 100 - 315 Hz
(+) | good bass - only 3.8% away from median
(+) | bass is linear (5.2% delta to prev. frequency)
Mids 400 - 2000 Hz
(+) | balanced mids - only 1.3% away from median
(+) | mids are linear (2.1% delta to prev. frequency)
Highs 2 - 16 kHz
(+) | balanced highs - only 1.9% away from median
(+) | highs are linear (2.7% delta to prev. frequency)
Overall 100 - 16.000 Hz
(+) | overall sound is linear (4.6% difference to median)
Compared to same class
» 0% of all tested devices in this class were better, 0% similar, 100% worse
» The best had a delta of 5%, average was 17%, worst was 45%
Compared to all devices tested
» 0% of all tested devices were better, 0% similar, 100% worse
» The best had a delta of 4%, average was 23%, worst was 134%
Energy Management
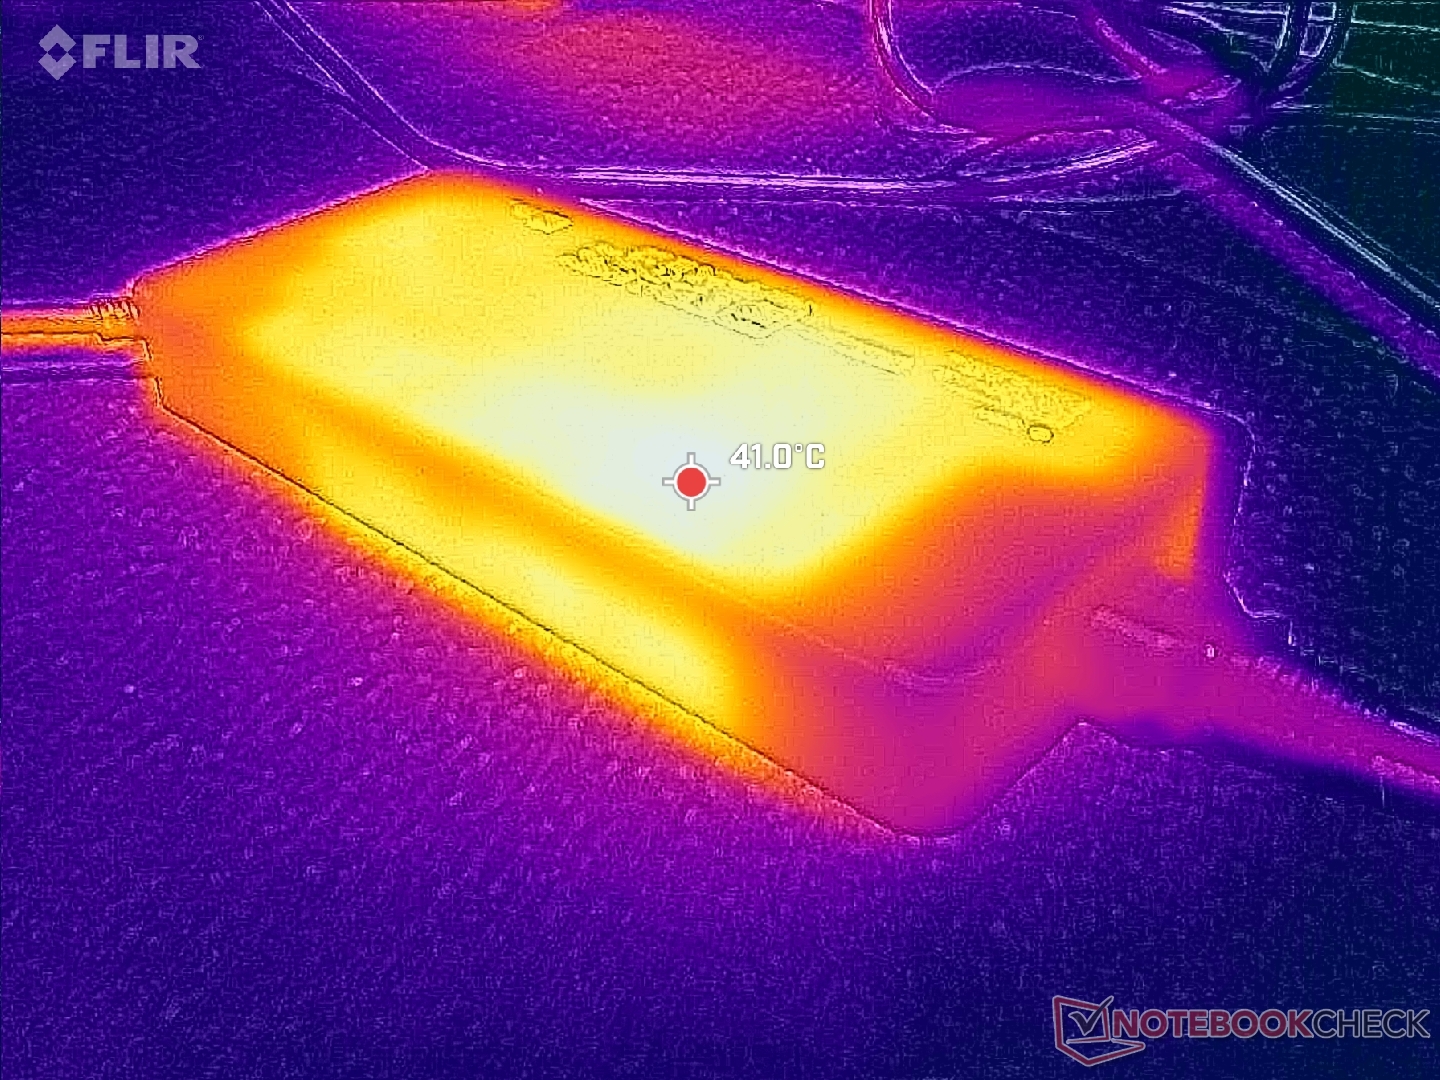
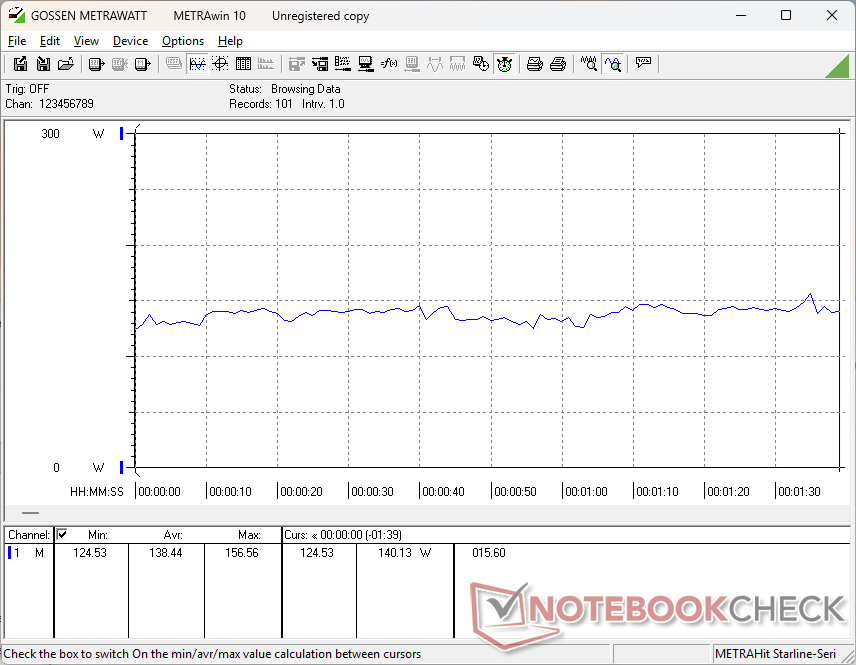
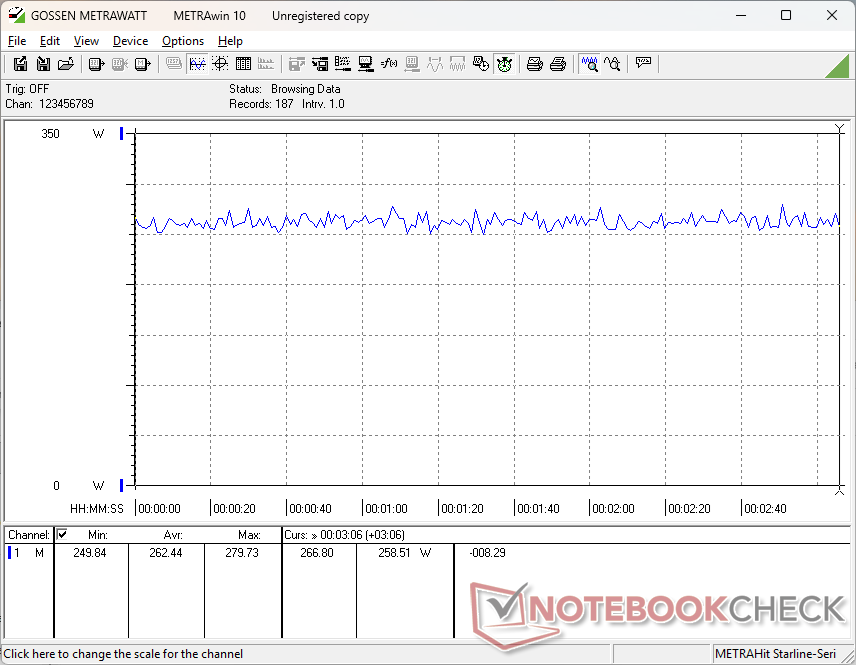
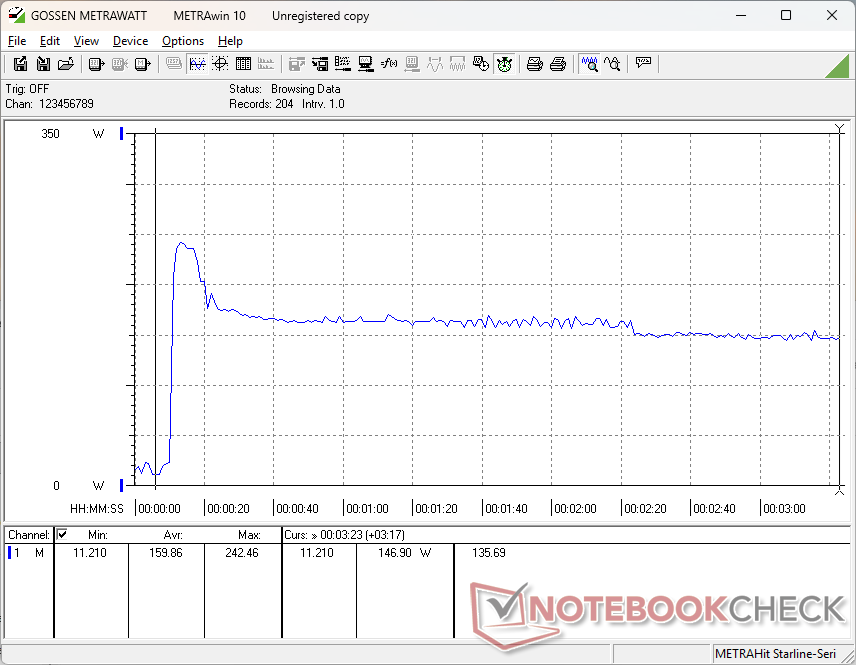
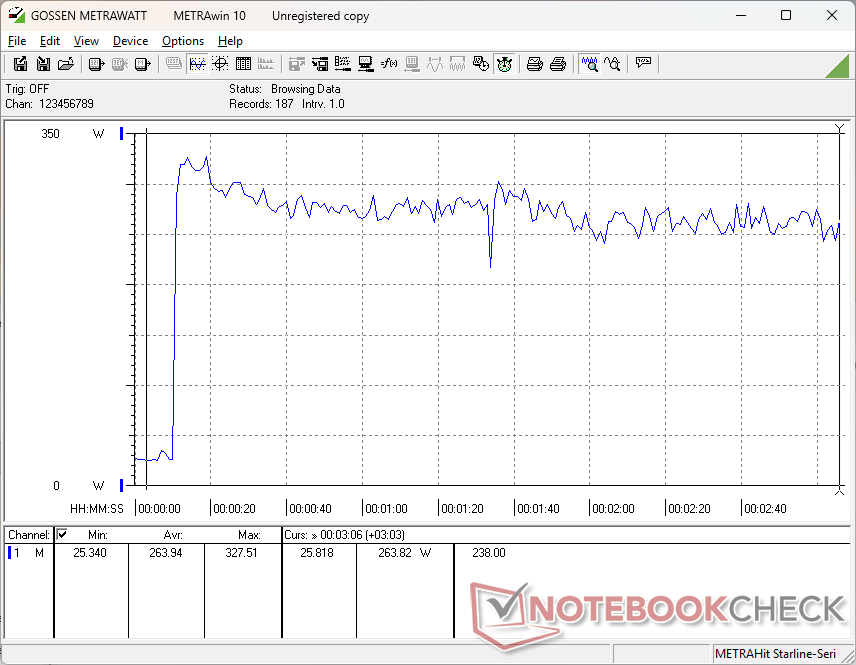
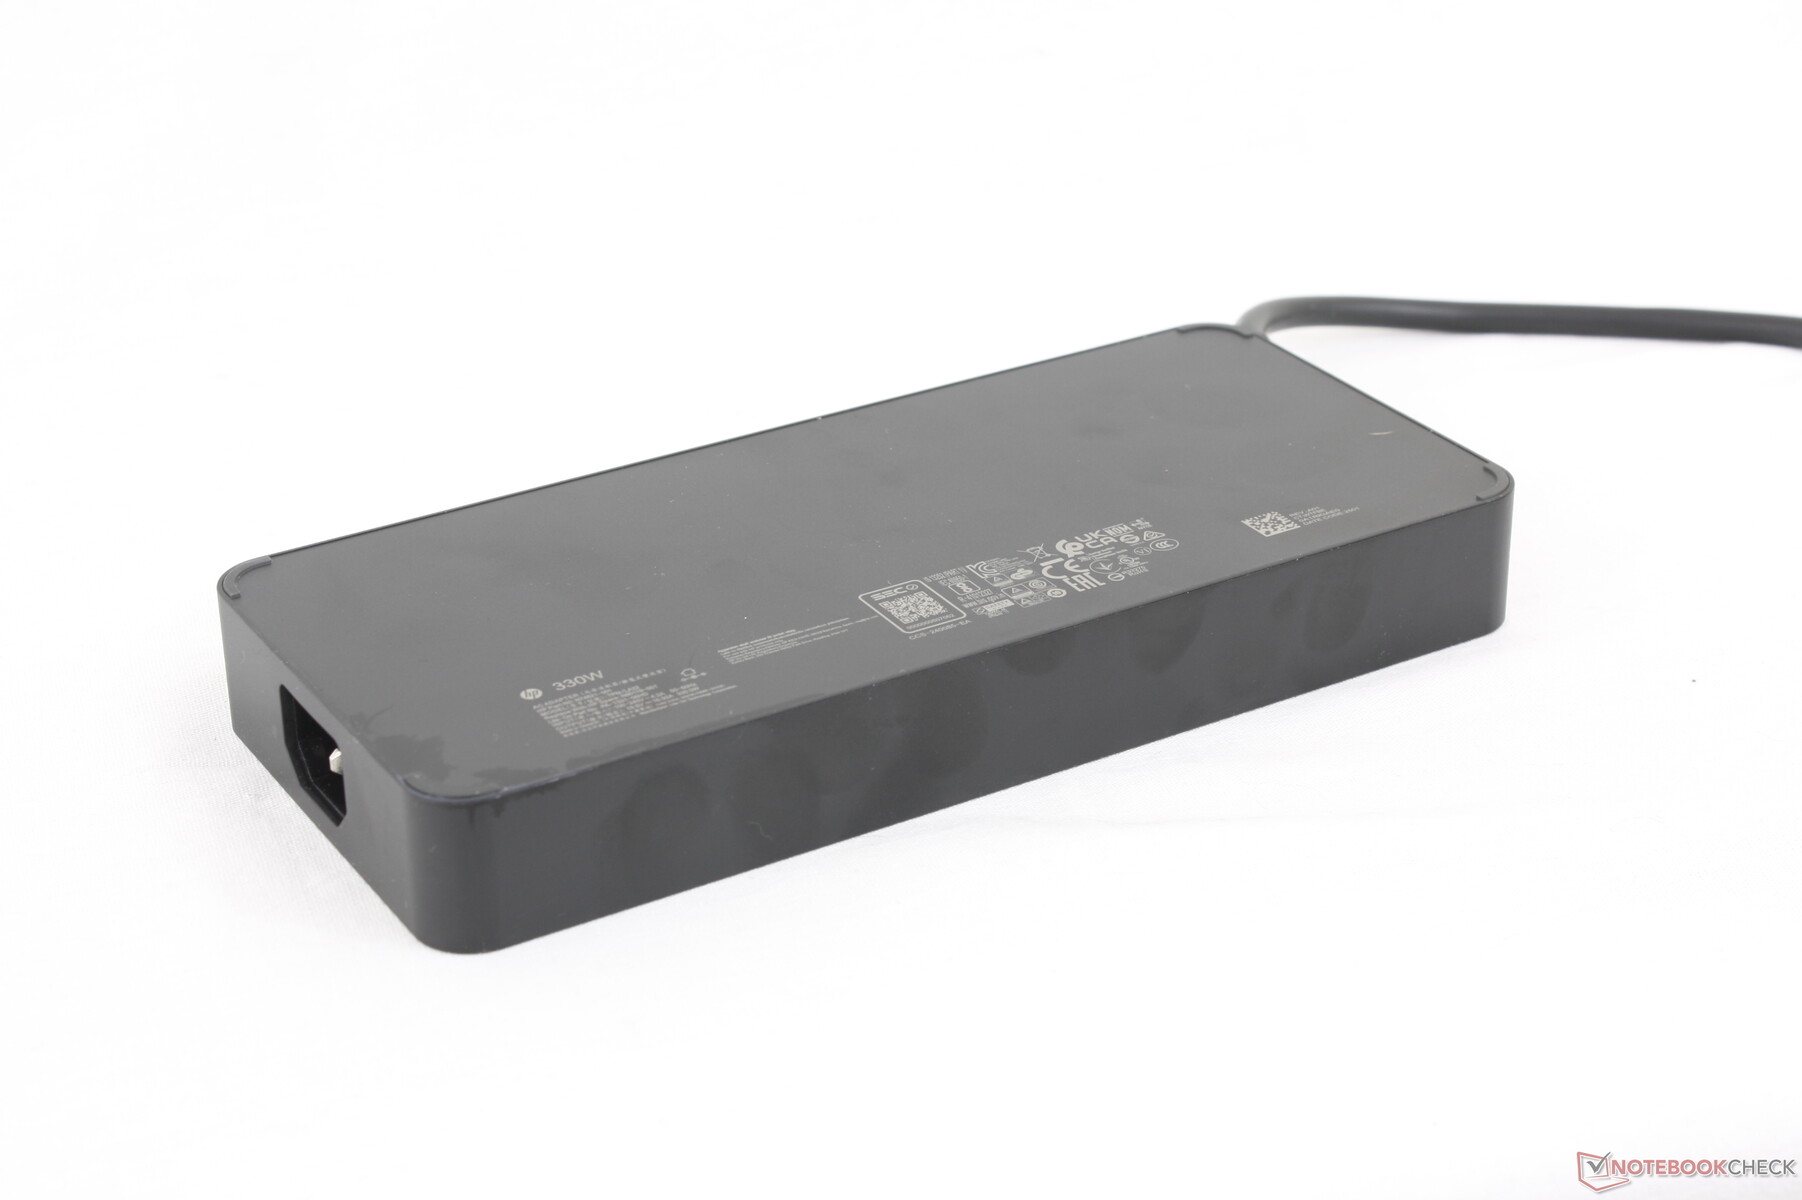
Power Consumption
The HP ships with a 330 W AC adapter whereas the Dell ships with a 280 W USB-C AC adapter. Maximum consumption is therefore higher on the HP where it can reach up to 328 W in our tests compared to 281 W on the Dell, but this high of a draw is short-lived due to thermal limitations or imposed ceilings. When running Prime95 and FurMark simultaneously, for example, consumption would peak at 328 W before quickly stabilizing at around 265 W similar to what we observed on the Dell. Thus, for performance purposes, the larger 330 W AC adapter matters little.
| Off / Standby | |
| Idle | |
| Load |
|
Key:
min: | |
| HP ZBook Fury G1i 18 Ultra 9 285HX, RTX PRO 5000 Blackwell Generation Laptop, , IPS, 2560x1600, 18" | Dell Pro Max 18 Plus MB18250 Ultra 9 285HX, RTX PRO 5000 Blackwell Generation Laptop, , IPS, 2560x1600, 18" | Schenker Key 18 Pro M25 RTX 5090 Ultra 9 275HX, GeForce RTX 5090 Laptop, Samsung 9100 Pro 4 TB, IPS, 3840x2400, 18" | Lenovo ThinkPad P16 Gen 2 i7-14700HX, RTX 4000 Ada Generation Laptop, SK hynix PC801 HFS001TEJ9X162N, IPS, 2560x1600, 16" | HP ZBook X G1i 16 Ultra 7 265H, RTX PRO 2000 Blackwell Generation Laptop, Samsung PM9A1 MZVL22T0HBLB, IPS, 2560x1600, 16" | HP ZBook Studio 16 G11 Ultra 9 185H, RTX 3000 Ada Generation Laptop, Kioxia XG8 KXG80ZNV1T02, IPS, 3840x2400, 16" | |
|---|---|---|---|---|---|---|
| Power Consumption | 11% | -11% | 21% | 58% | 28% | |
| Idle Minimum * (Watt) | 16.1 | 6.1 62% | 14 13% | 7.9 51% | 4.1 75% | 14 13% |
| Idle Average * (Watt) | 20.3 | 15.2 25% | 21.9 -8% | 13.1 35% | 9 56% | 22.4 -10% |
| Idle Maximum * (Watt) | 25 | 32.4 -30% | 22.3 11% | 24.2 3% | 9.4 62% | 25.7 -3% |
| Load Average * (Watt) | 138.5 | 130.1 6% | 149.5 -8% | 127.4 8% | 86.7 37% | 90.2 35% |
| Cyberpunk 2077 ultra external monitor * (Watt) | 255 | 252 1% | 336 -32% | 219 14% | 102 60% | 120.3 53% |
| Cyberpunk 2077 ultra * (Watt) | 262 | 256 2% | 333 -27% | 225 14% | 106.1 60% | 125.4 52% |
| Load Maximum * (Watt) | 327.5 | 280.9 14% | 415.4 -27% | 248.5 24% | 152.9 53% | 142 57% |
* ... smaller is better
Power Consumption Cyberpunk / Stress Test
Power Consumption external Monitor
Battery Life
WLAN runtime is still very good for the size albeit slightly shorter than on the Dell Pro Max 18 Plus. The display supports PSR2 or Panel Self Refresh 2 for power savings in lieu of Advanced Optimus.
| HP ZBook Fury G1i 18 Ultra 9 285HX, RTX PRO 5000 Blackwell Generation Laptop, 99 Wh | Dell Pro Max 18 Plus MB18250 Ultra 9 285HX, RTX PRO 5000 Blackwell Generation Laptop, 96 Wh | Schenker Key 18 Pro M25 RTX 5090 Ultra 9 275HX, GeForce RTX 5090 Laptop, 98 Wh | Lenovo ThinkPad P16 Gen 2 i7-14700HX, RTX 4000 Ada Generation Laptop, 94 Wh | HP ZBook X G1i 16 Ultra 7 265H, RTX PRO 2000 Blackwell Generation Laptop, 83 Wh | HP ZBook Studio 16 G11 Ultra 9 185H, RTX 3000 Ada Generation Laptop, 86 Wh | |
|---|---|---|---|---|---|---|
| Battery runtime | ||||||
| WiFi v1.3 (h) | 8 | 9.3 16% | 5.8 -27% | 2.5 -69% | 12.5 56% | 4.8 -40% |
Notebookcheck Rating
The HP ZBook Fury G1i 18 sounds excellent on paper, but the conservative CPU and GPU performances and overall lack of innovations make the Dell Pro Max 18 Plus an arguably more attractive option.
HP ZBook Fury G1i 18
- 11/22/2025 v8
Allen Ngo
 Total Sustainability Score:
 Potential Competitors in Comparison
Image | Model / Review | Price | Weight | Height | Display |
|---|---|---|---|---|---|
1. 89.5%  | HP ZBook Fury G1i 18 Intel Core Ultra 9 285HX ⎘ NVIDIA RTX PRO 5000 Blackwell Generation Laptop ⎘ 64 GB Memory | Amazon: List Price: 11000 USD | 3.4 kg | 27 mm | 18.00" 2560x1600 168 PPI IPS |
2. 88.9% 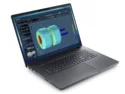 | Dell Pro Max 18 Plus MB18250 Intel Core Ultra 9 285HX ⎘ NVIDIA RTX PRO 5000 Blackwell Generation Laptop ⎘ 128 GB Memory | Amazon: List Price: 6000 USD | 3.6 kg | 30.2 mm | 18.00" 2560x1600 168 PPI IPS |
3. 84.6% 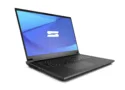 | Schenker Key 18 Pro M25 RTX 5090 Intel Core Ultra 9 275HX ⎘ NVIDIA GeForce RTX 5090 Laptop ⎘ 256 GB Memory, 4096 GB SSD | Amazon: List Price: 6400€ | 4.1 kg | 29.5 mm | 18.00" 3840x2400 252 PPI IPS |
4. 85.9%  | Lenovo ThinkPad P16 Gen 2 Intel Core i7-14700HX ⎘ NVIDIA RTX 4000 Ada Generation Laptop ⎘ 32 GB Memory, 1024 GB SSD | Amazon: List Price: 3500 USD | 3.1 kg | 30.23 mm | 16.00" 2560x1600 189 PPI IPS |
5. 87.4%  | HP ZBook X G1i 16 Intel Core Ultra 7 265H ⎘ NVIDIA RTX PRO 2000 Blackwell Generation Laptop ⎘ 64 GB Memory, 2048 GB SSD | Amazon: List Price: 2700 USD | 2.2 kg | 23 mm | 16.00" 2560x1600 189 PPI IPS |
6. 84.2%  | HP ZBook Studio 16 G11 Intel Core Ultra 9 185H ⎘ NVIDIA RTX 3000 Ada Generation Laptop ⎘ 64 GB Memory, 1024 GB SSD | Amazon: List Price: 4300 USD | 1.8 kg | 19 mm | 16.00" 3840x2400 283 PPI IPS |
Transparency
The selection of devices to be reviewed is made by our editorial team. The test sample was provided to the author as a loan by the manufacturer or retailer for the purpose of this review. The lender had no influence on this review, nor did the manufacturer receive a copy of this review before publication. There was no obligation to publish this review. As an independent media company, Notebookcheck is not subjected to the authority of manufacturers, retailers or publishers.
This is how Notebookcheck is testing
Every year, Notebookcheck independently reviews hundreds of laptops and smartphones using standardized procedures to ensure that all results are comparable. We have continuously developed our test methods for around 20 years and set industry standards in the process. In our test labs, high-quality measuring equipment is utilized by experienced technicians and editors. These tests involve a multi-stage validation process. Our complex rating system is based on hundreds of well-founded measurements and benchmarks, which maintains objectivity. Further information on our test methods can be found here.
