Verdict - Weak CPU performance, unremarkable gaming performance
It is annoying that the CPU performance of the Vector 17 drops sharply in the endurance test, especially since the Vector 16 performs consistently with a weaker CPU. The pure gaming performance is mediocre at best, but quite consistent. Unfortunately, the Vector 17 is quite loud.
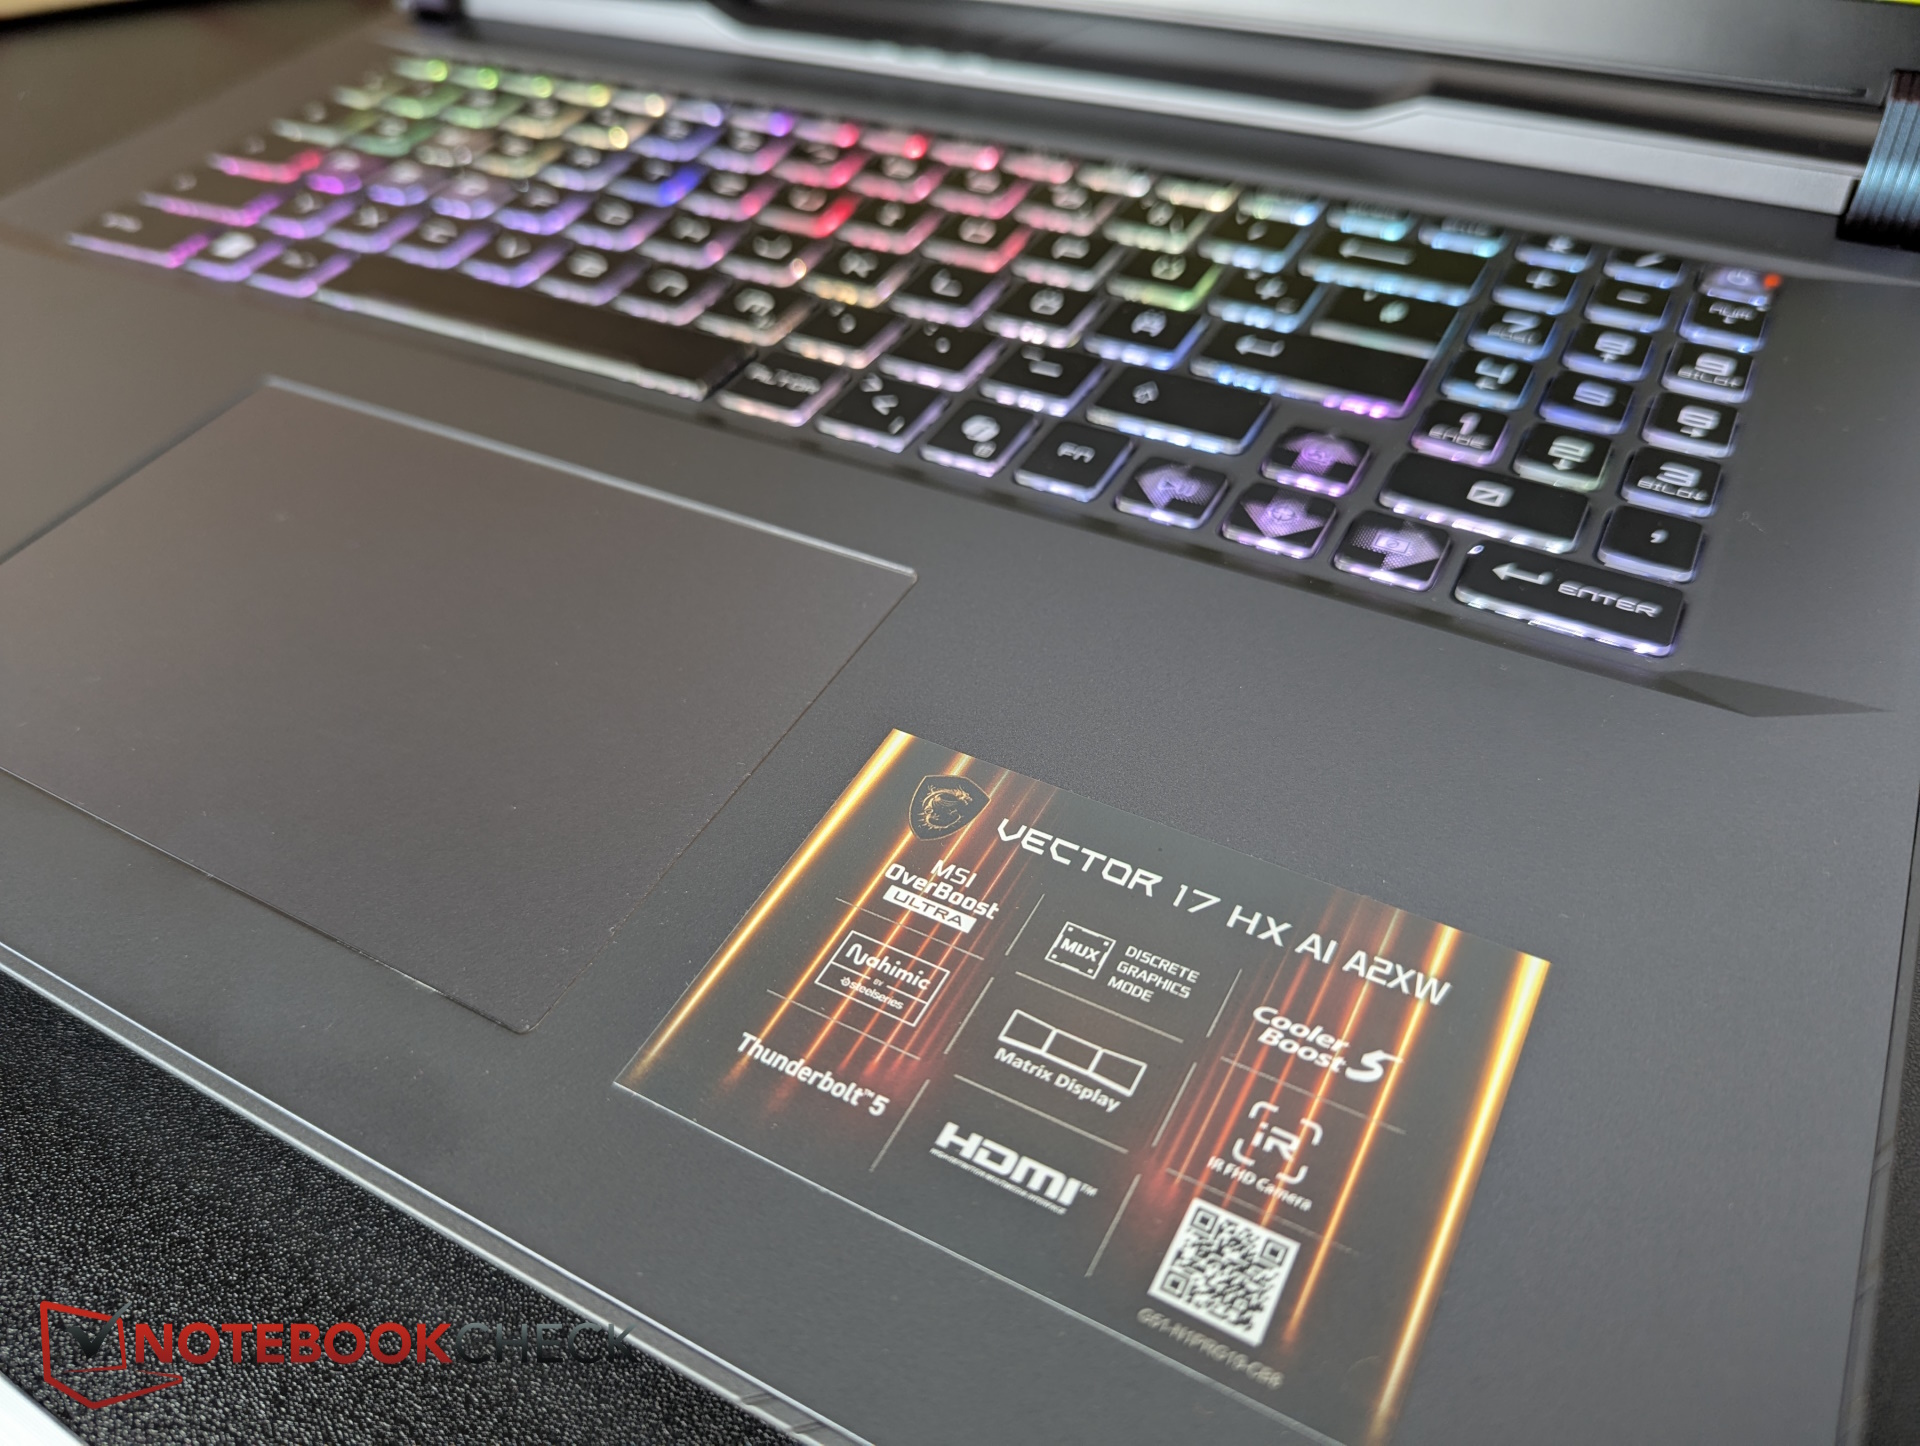
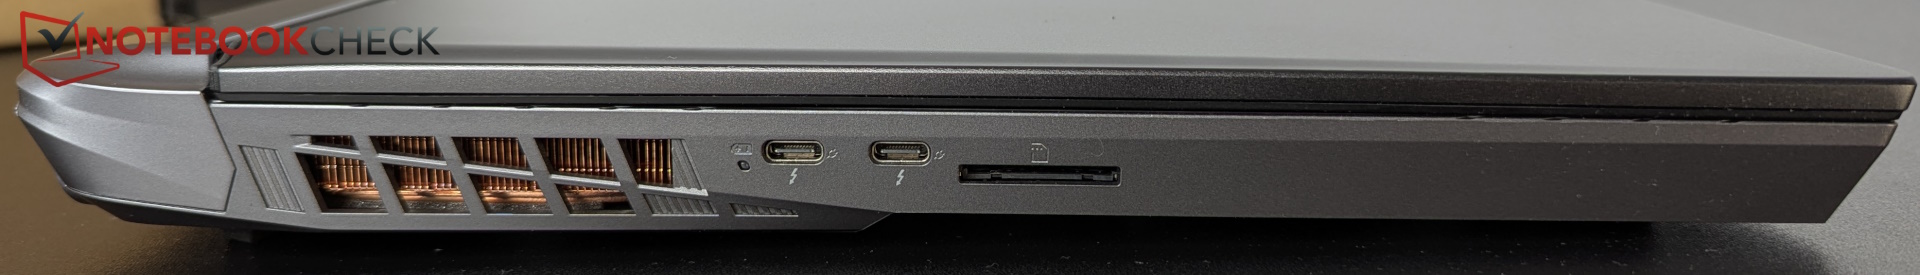
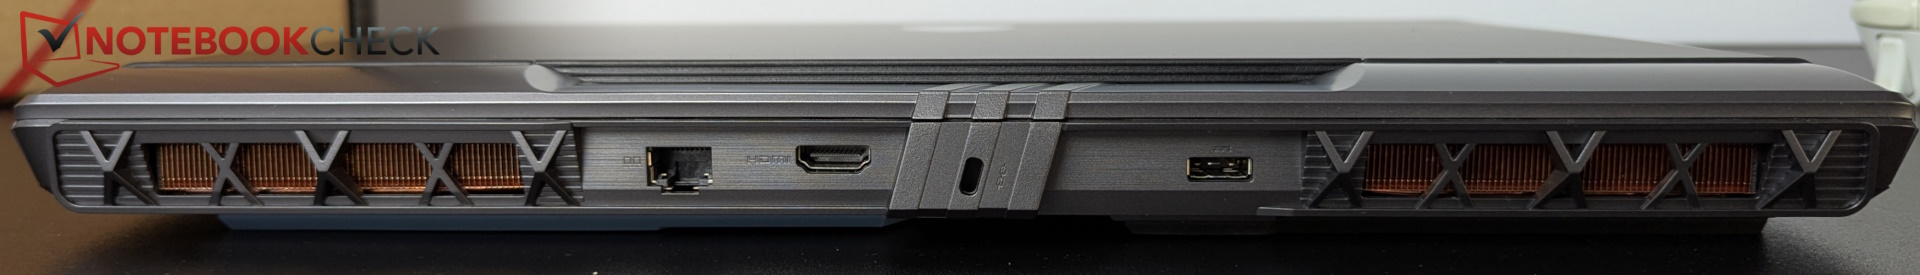
The display leaves an ambivalent impression: It scores with a decent luminosity and the P3 color space, but loses some sympathy due to the much too high black value. On the other hand, the equipment with dual Thunderbolt 5, full SD reader and Wi-Fi 7 leaves a positive impression.
It remains an average to good gaming laptop that, aside from its features, does not stand out from the crowd. For roughly the same price, you can also get the Legion Pro 7i Gen 10 with the same GPU, which impressed us much more in the test.
Pros
Cons
Price and availability
The Vector 17 with RTX 5080 normally costs 3,499 Euros (~$4066). It has just been reduced to 3,099 Euros (~$3602) on Amazon.
- $99.99400W 20V 20A AC Adapter for MSI Raider Titan 18 HX AI A2XWJG A2XWIG Vector A18 HX A9WIG A9WHG Laptop Charger A23-400P1A A400A001P ADP-400CB B Power Supply
- $1,649.99MSI Vector 16 HX AI A2XWHG-275US 16" Gaming Notebook - Full HD Plus - 144 Hz - Intel Core Ultra 7 255HX - 16 GB - 1 TB SSD - Cosmos Gray
- $59.99Rujcloud 4K Webcam for MSI Vector 17 HX AI A2XWIG,with Microphone& Privacy Cover & Plug&Play,Works Zoom/Teams/Skype/Google Meet
Table of Contents
- Verdict - Weak CPU performance, unremarkable gaming performance
- Specifications
- Case & features - As massive as an Alienware
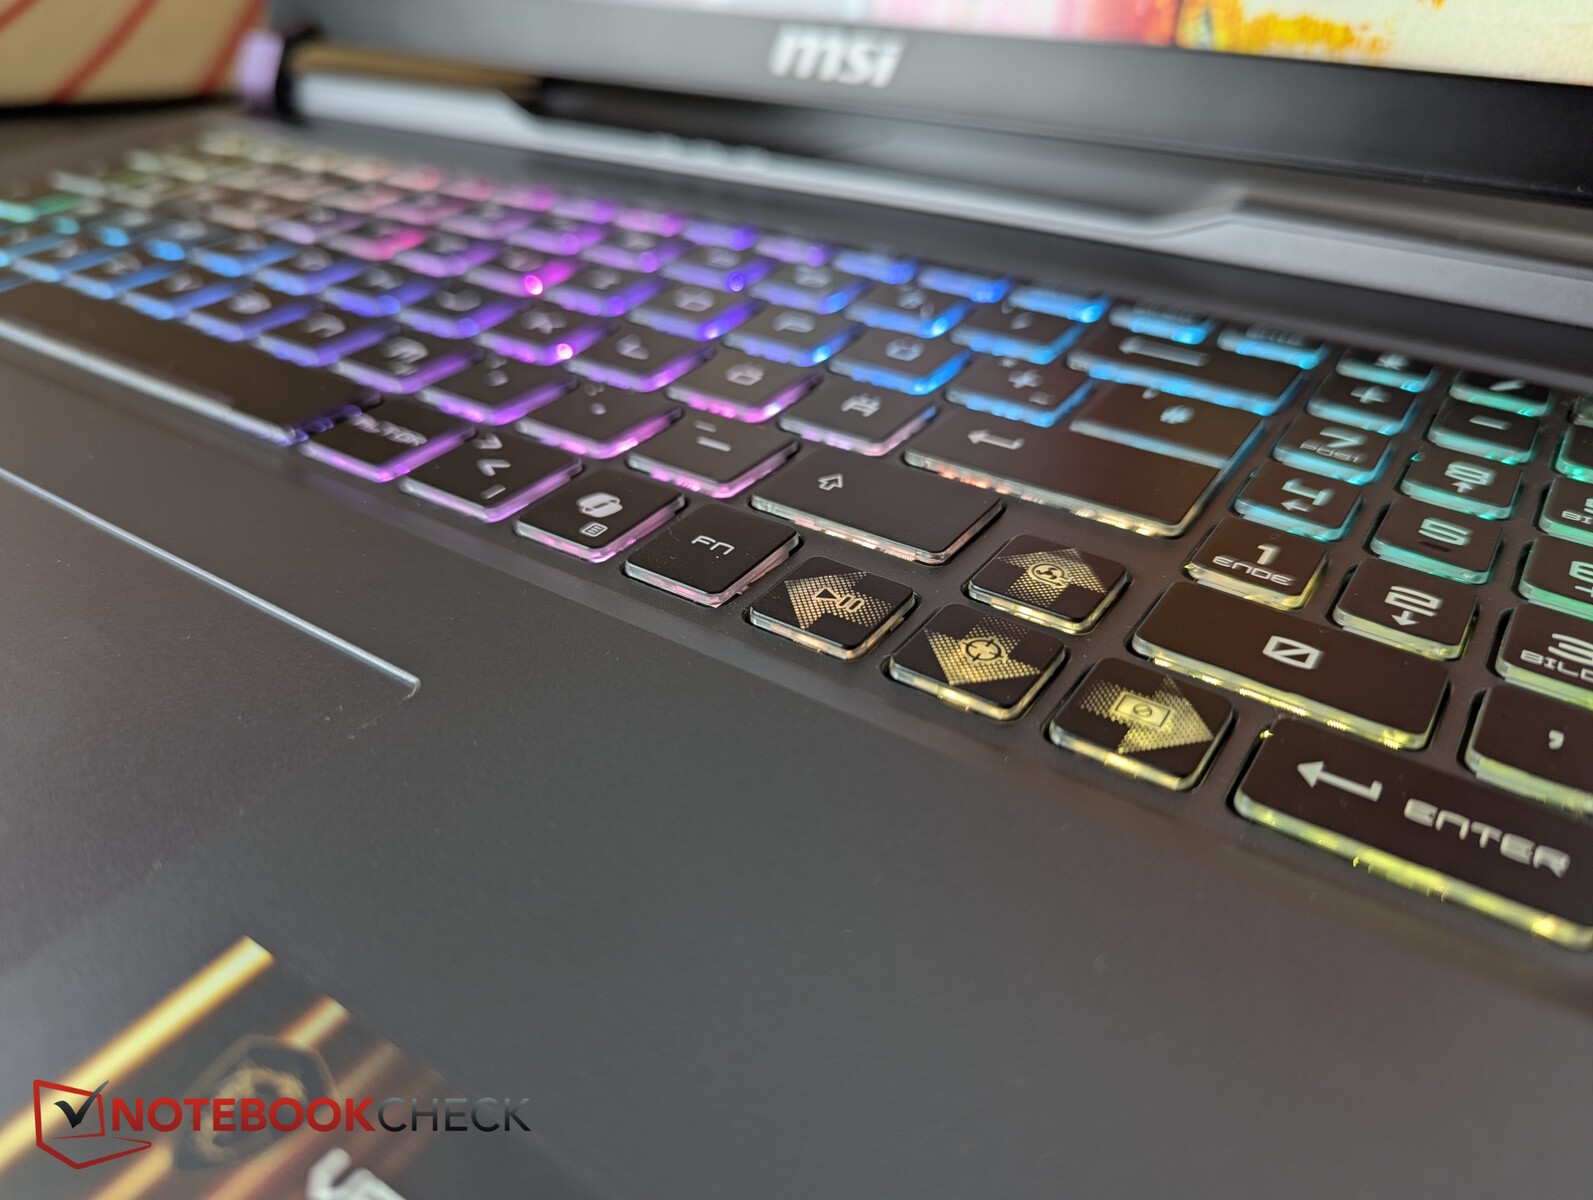
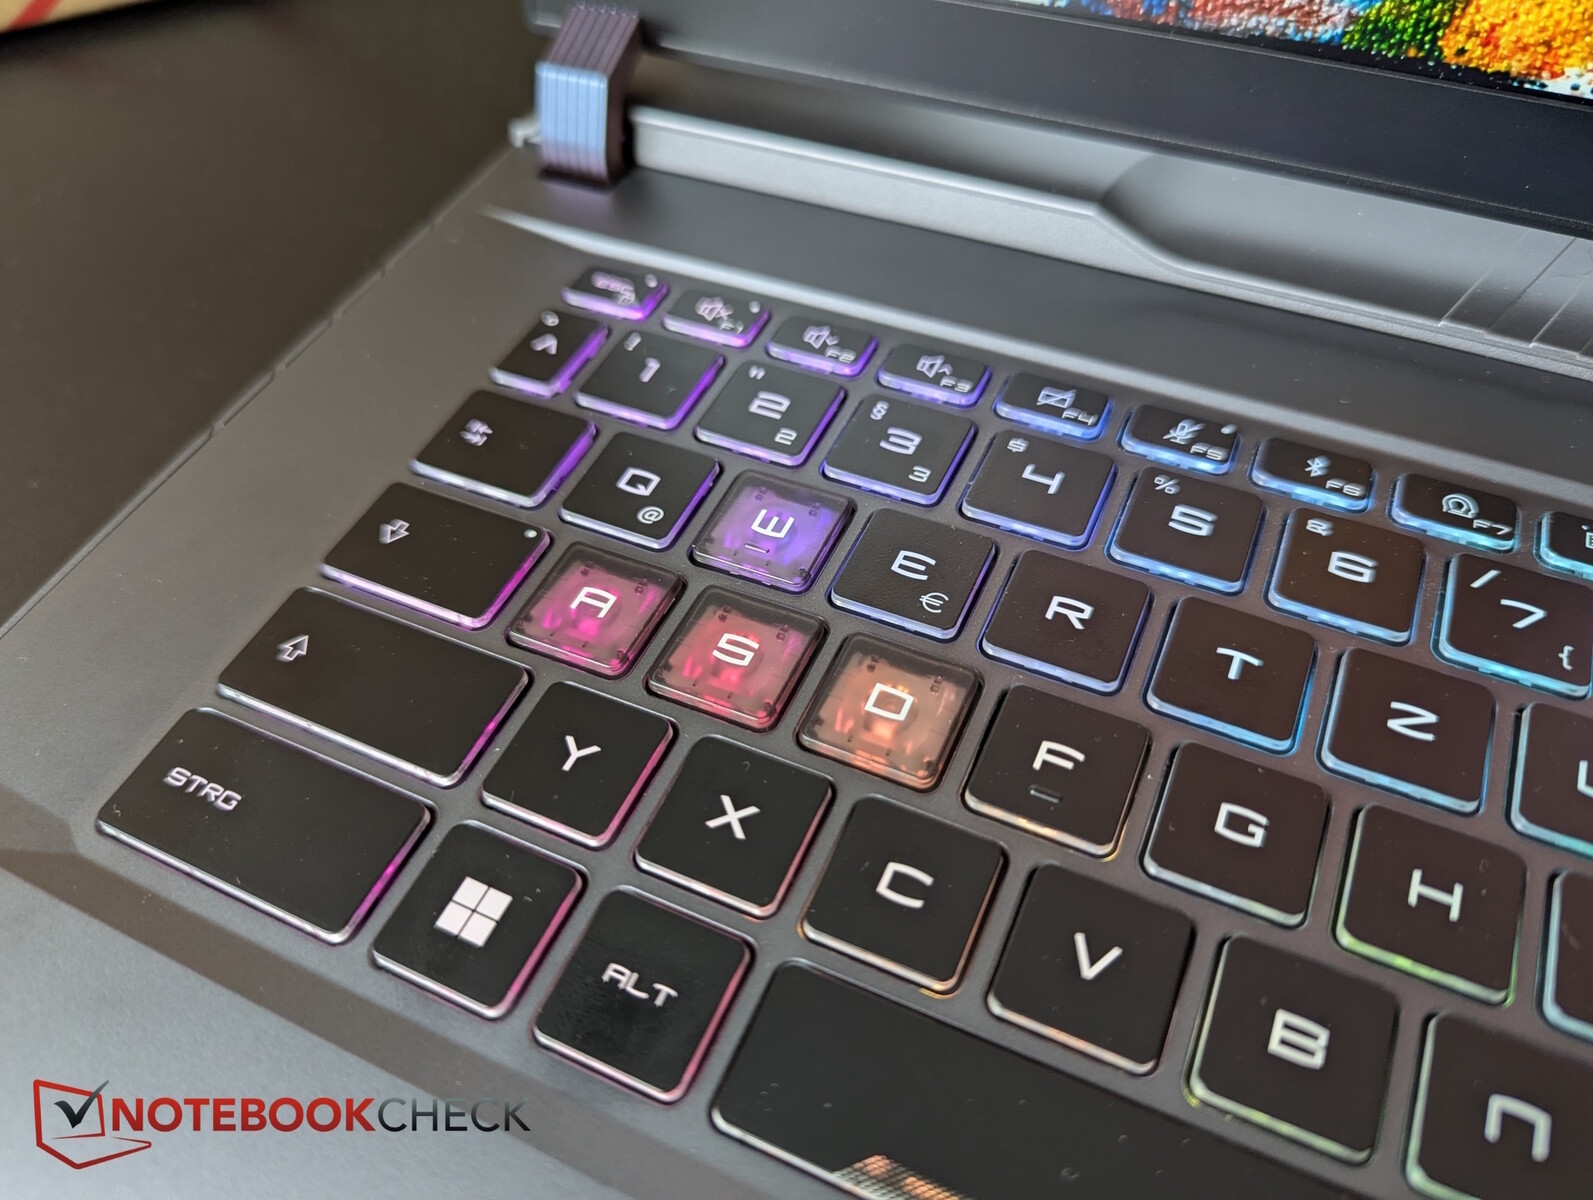
- Input devices - This MSI layout!
- Display - QHD+ IPS with 470 nits
- Performance - CPU collapse under continuous load
- Emissions & energy - Up to 60 dB(A) is quite loud in comparison
- Notebookcheck overall rating
- Comparison of possible alternatives
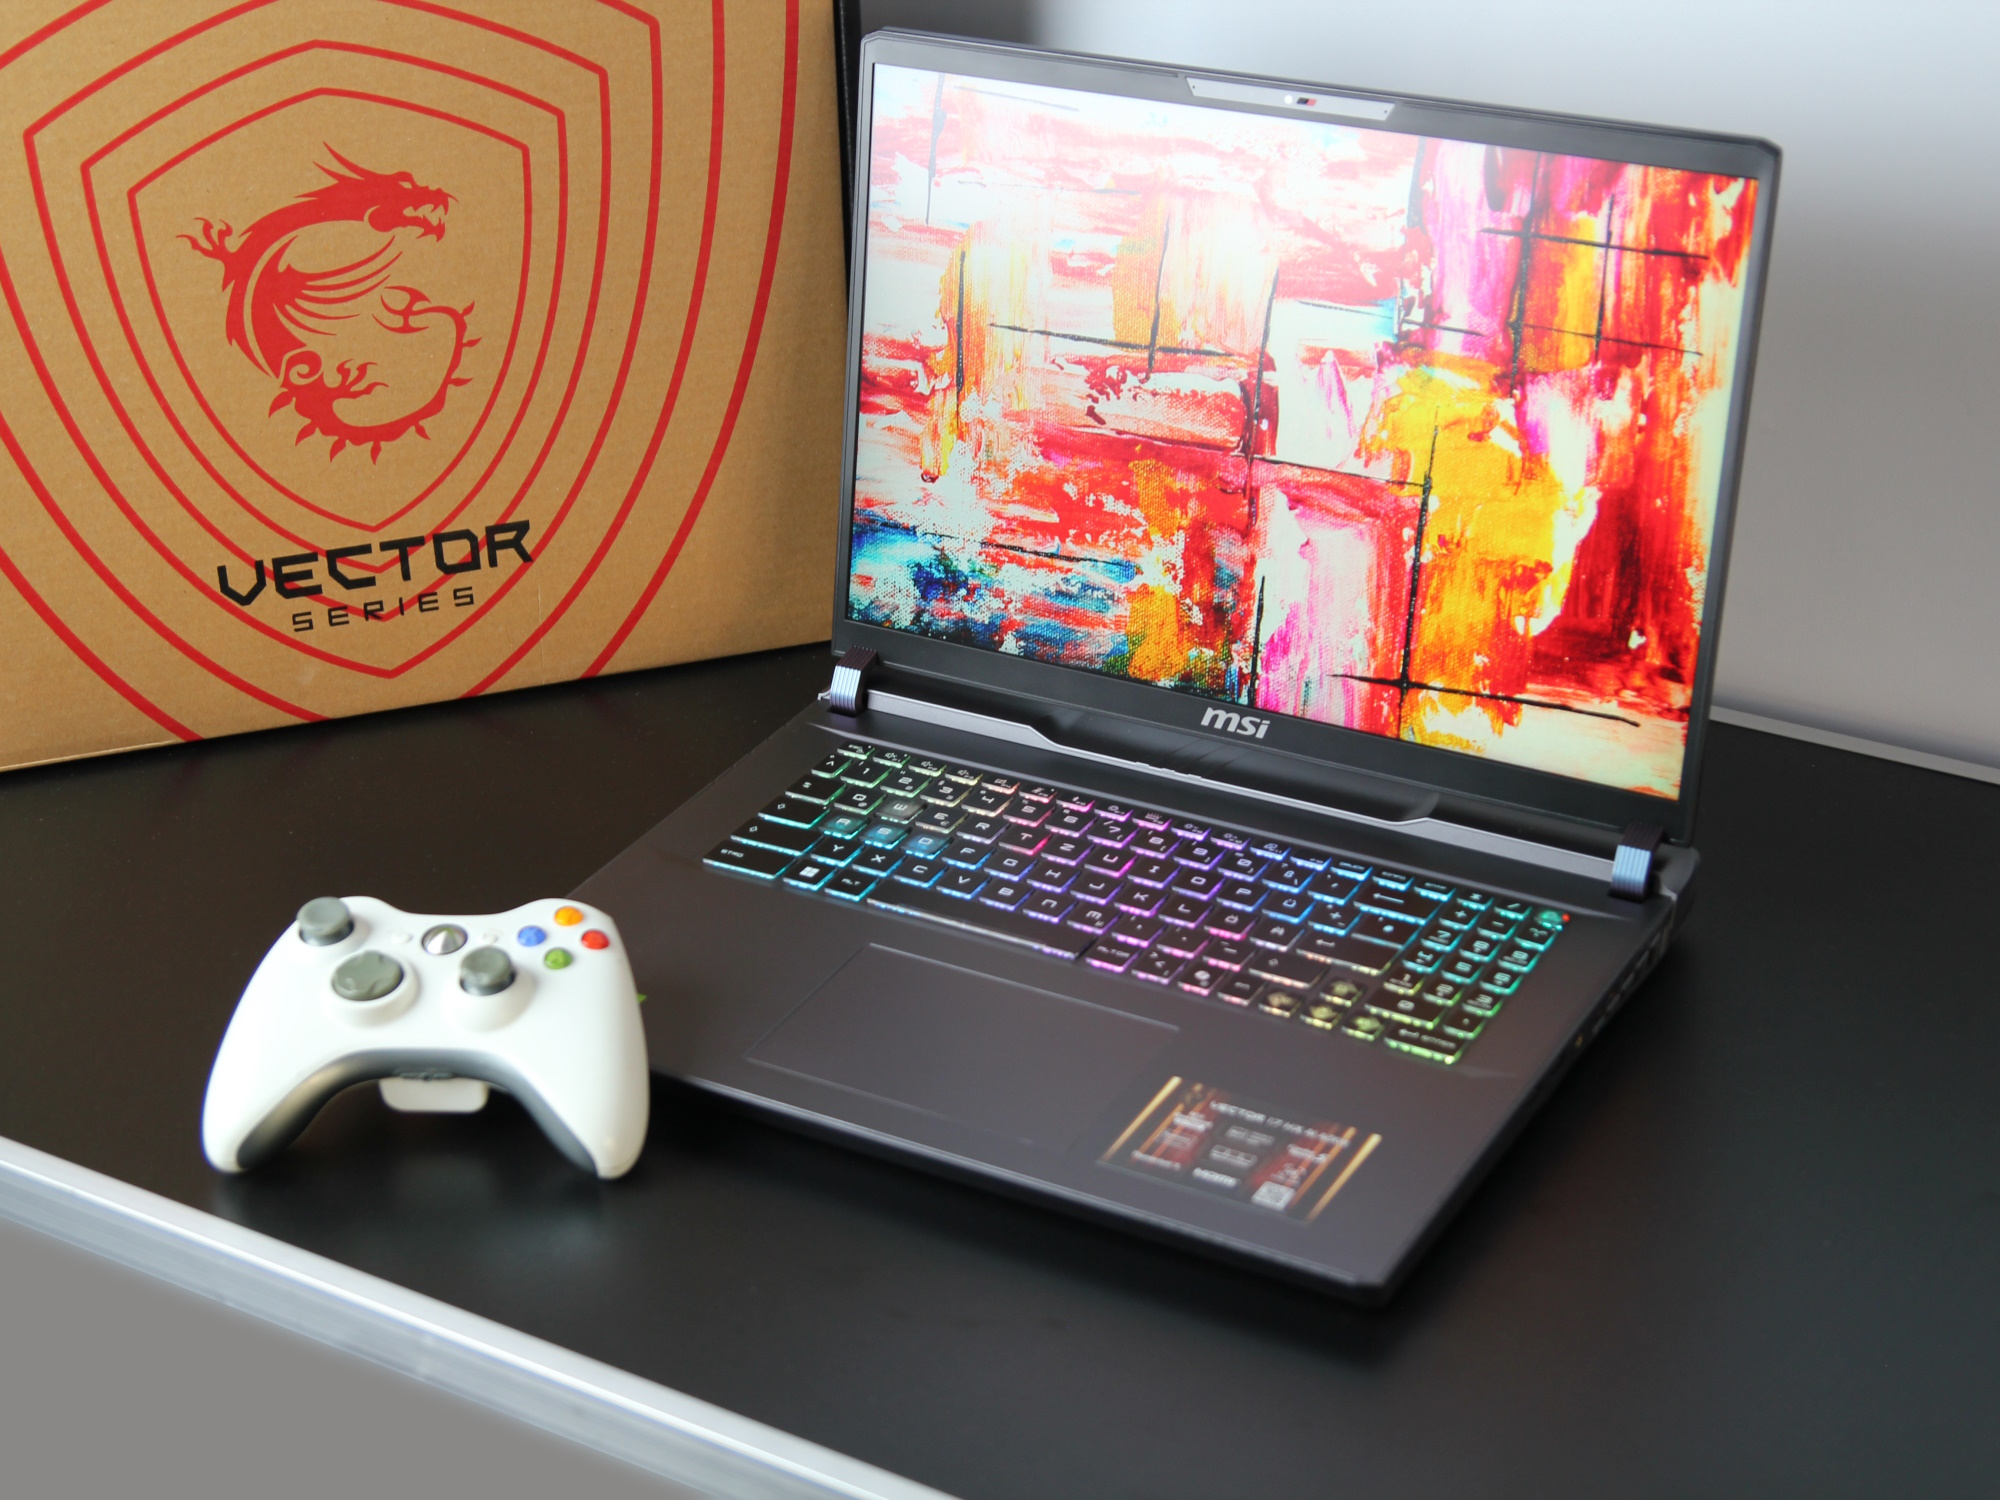
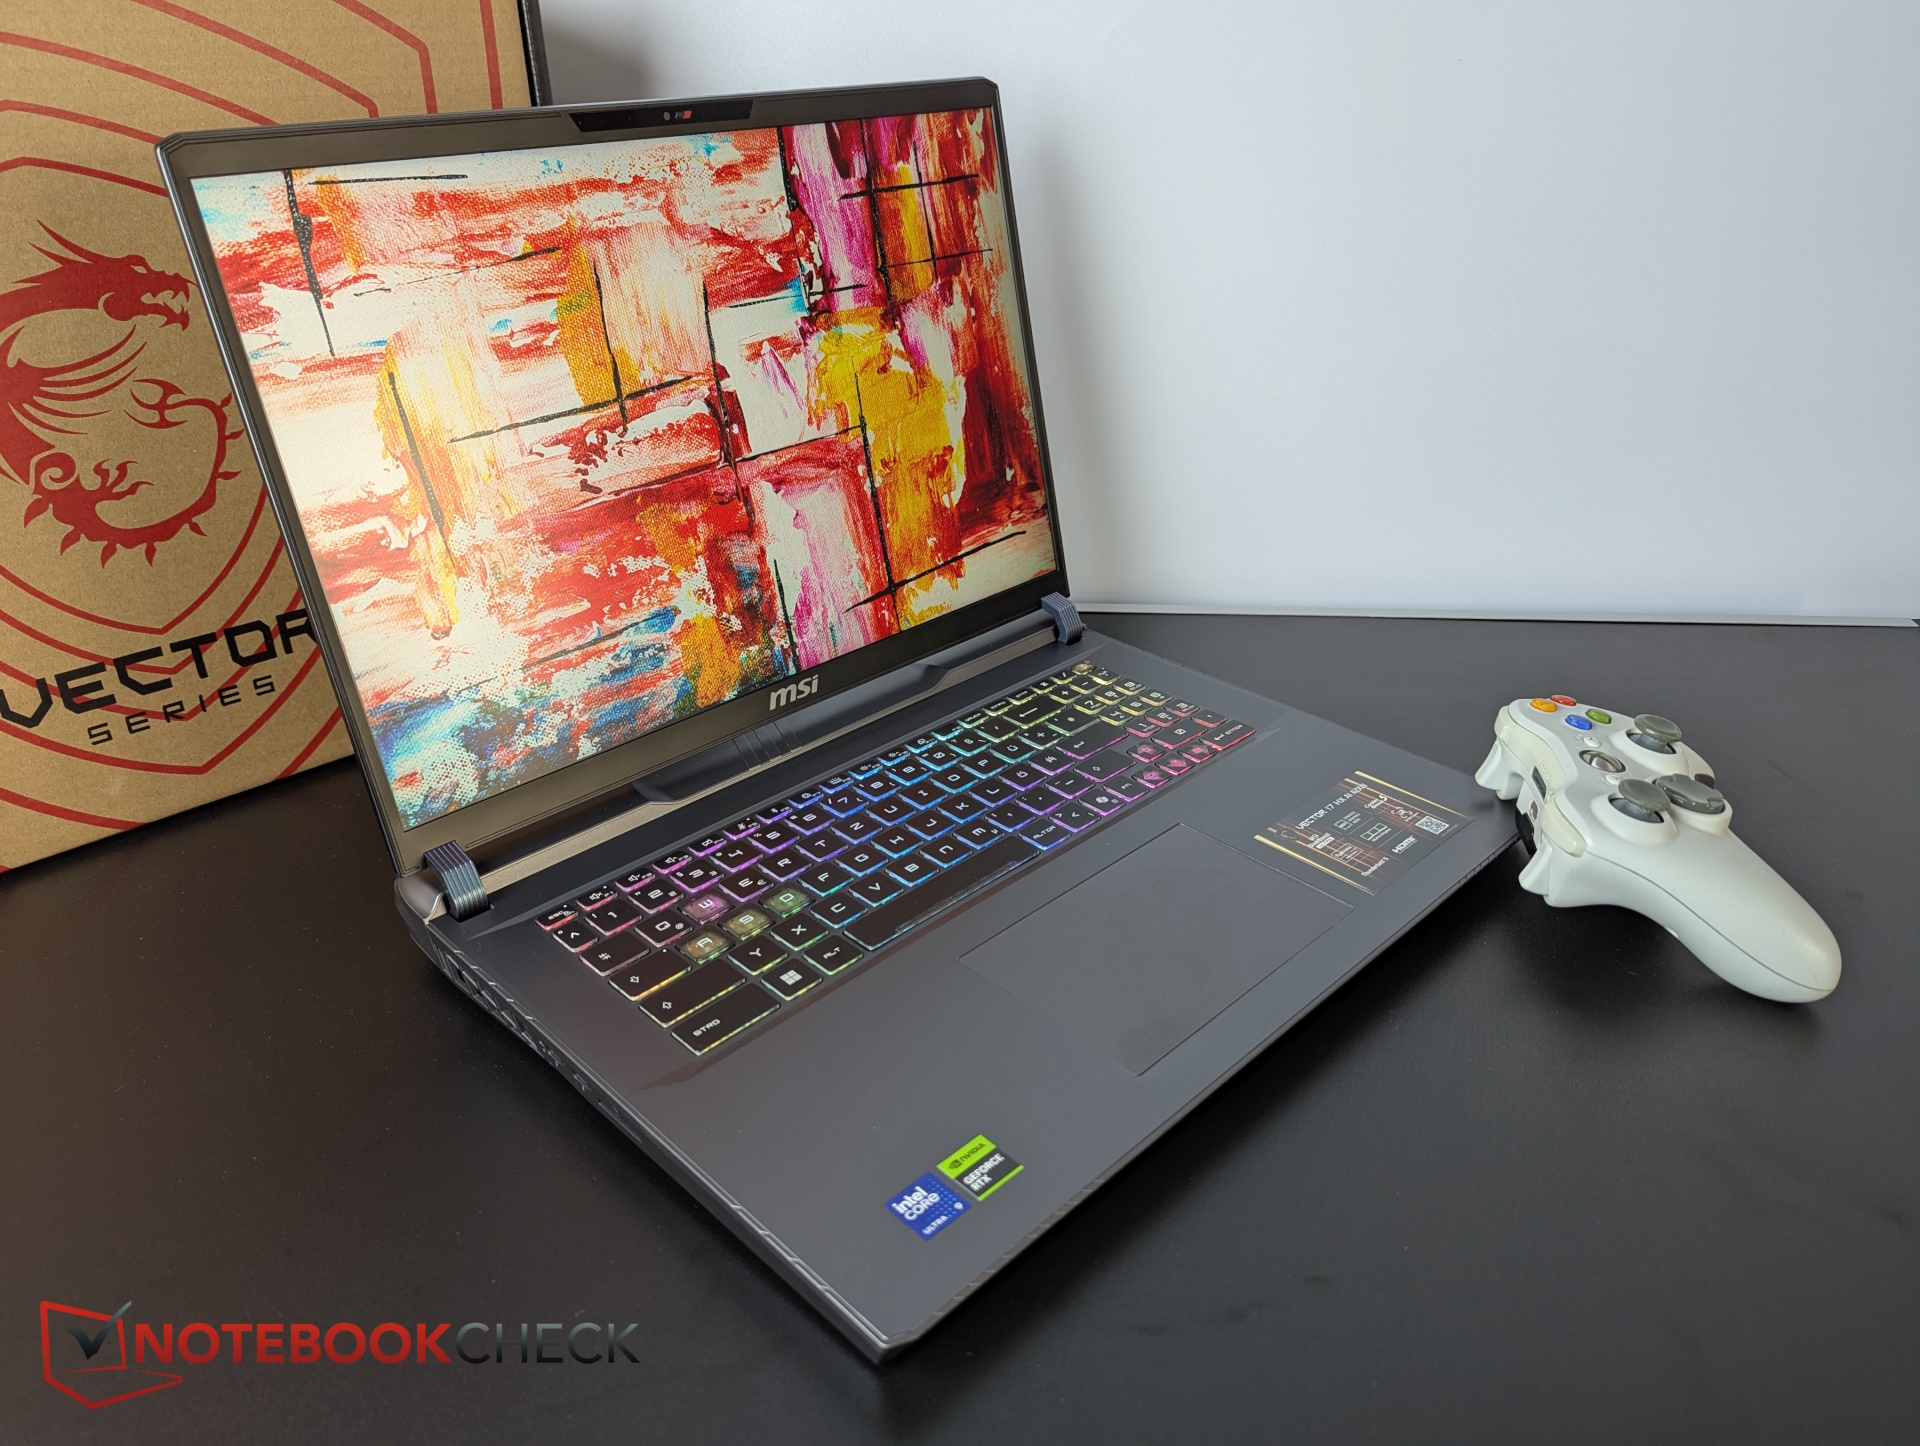
17-inch gamers with Blackwell graphics are extremely rare and so the gamer sits right between the many 16- and 18-inch devices. Our Vector 17 HX AI is available with RTX 5090, 5080 or 5070 Ti, we are testing the middle configuration.
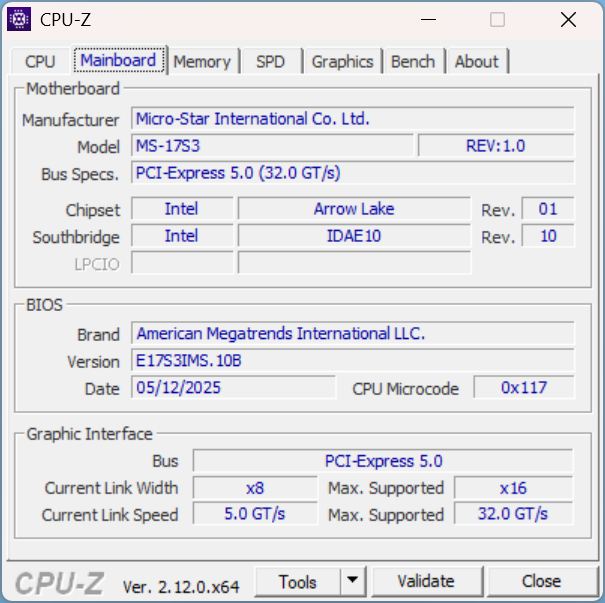
Specifications
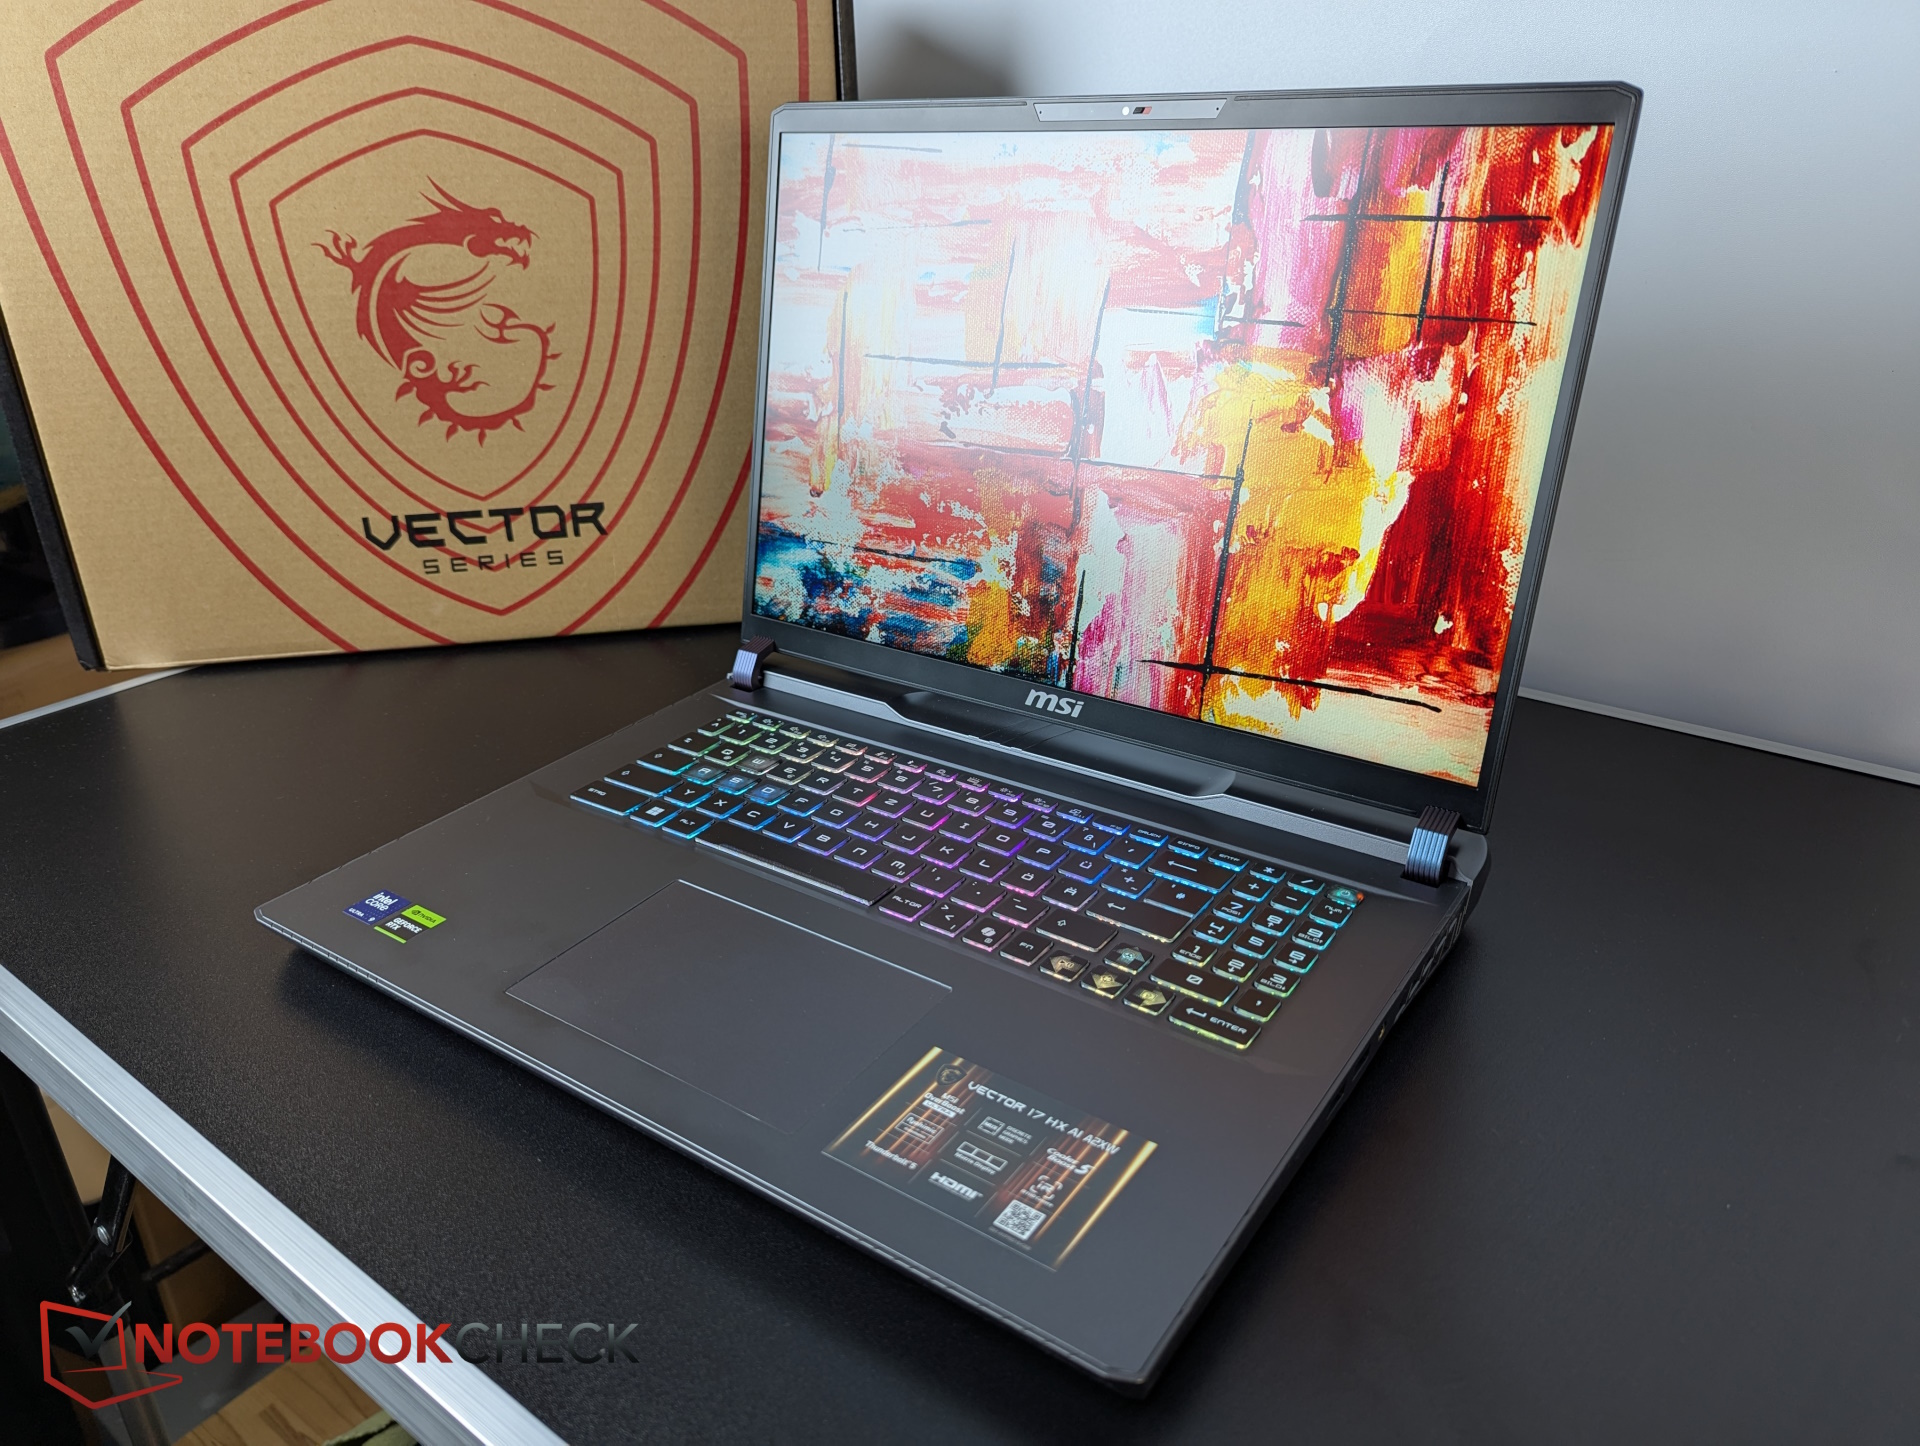
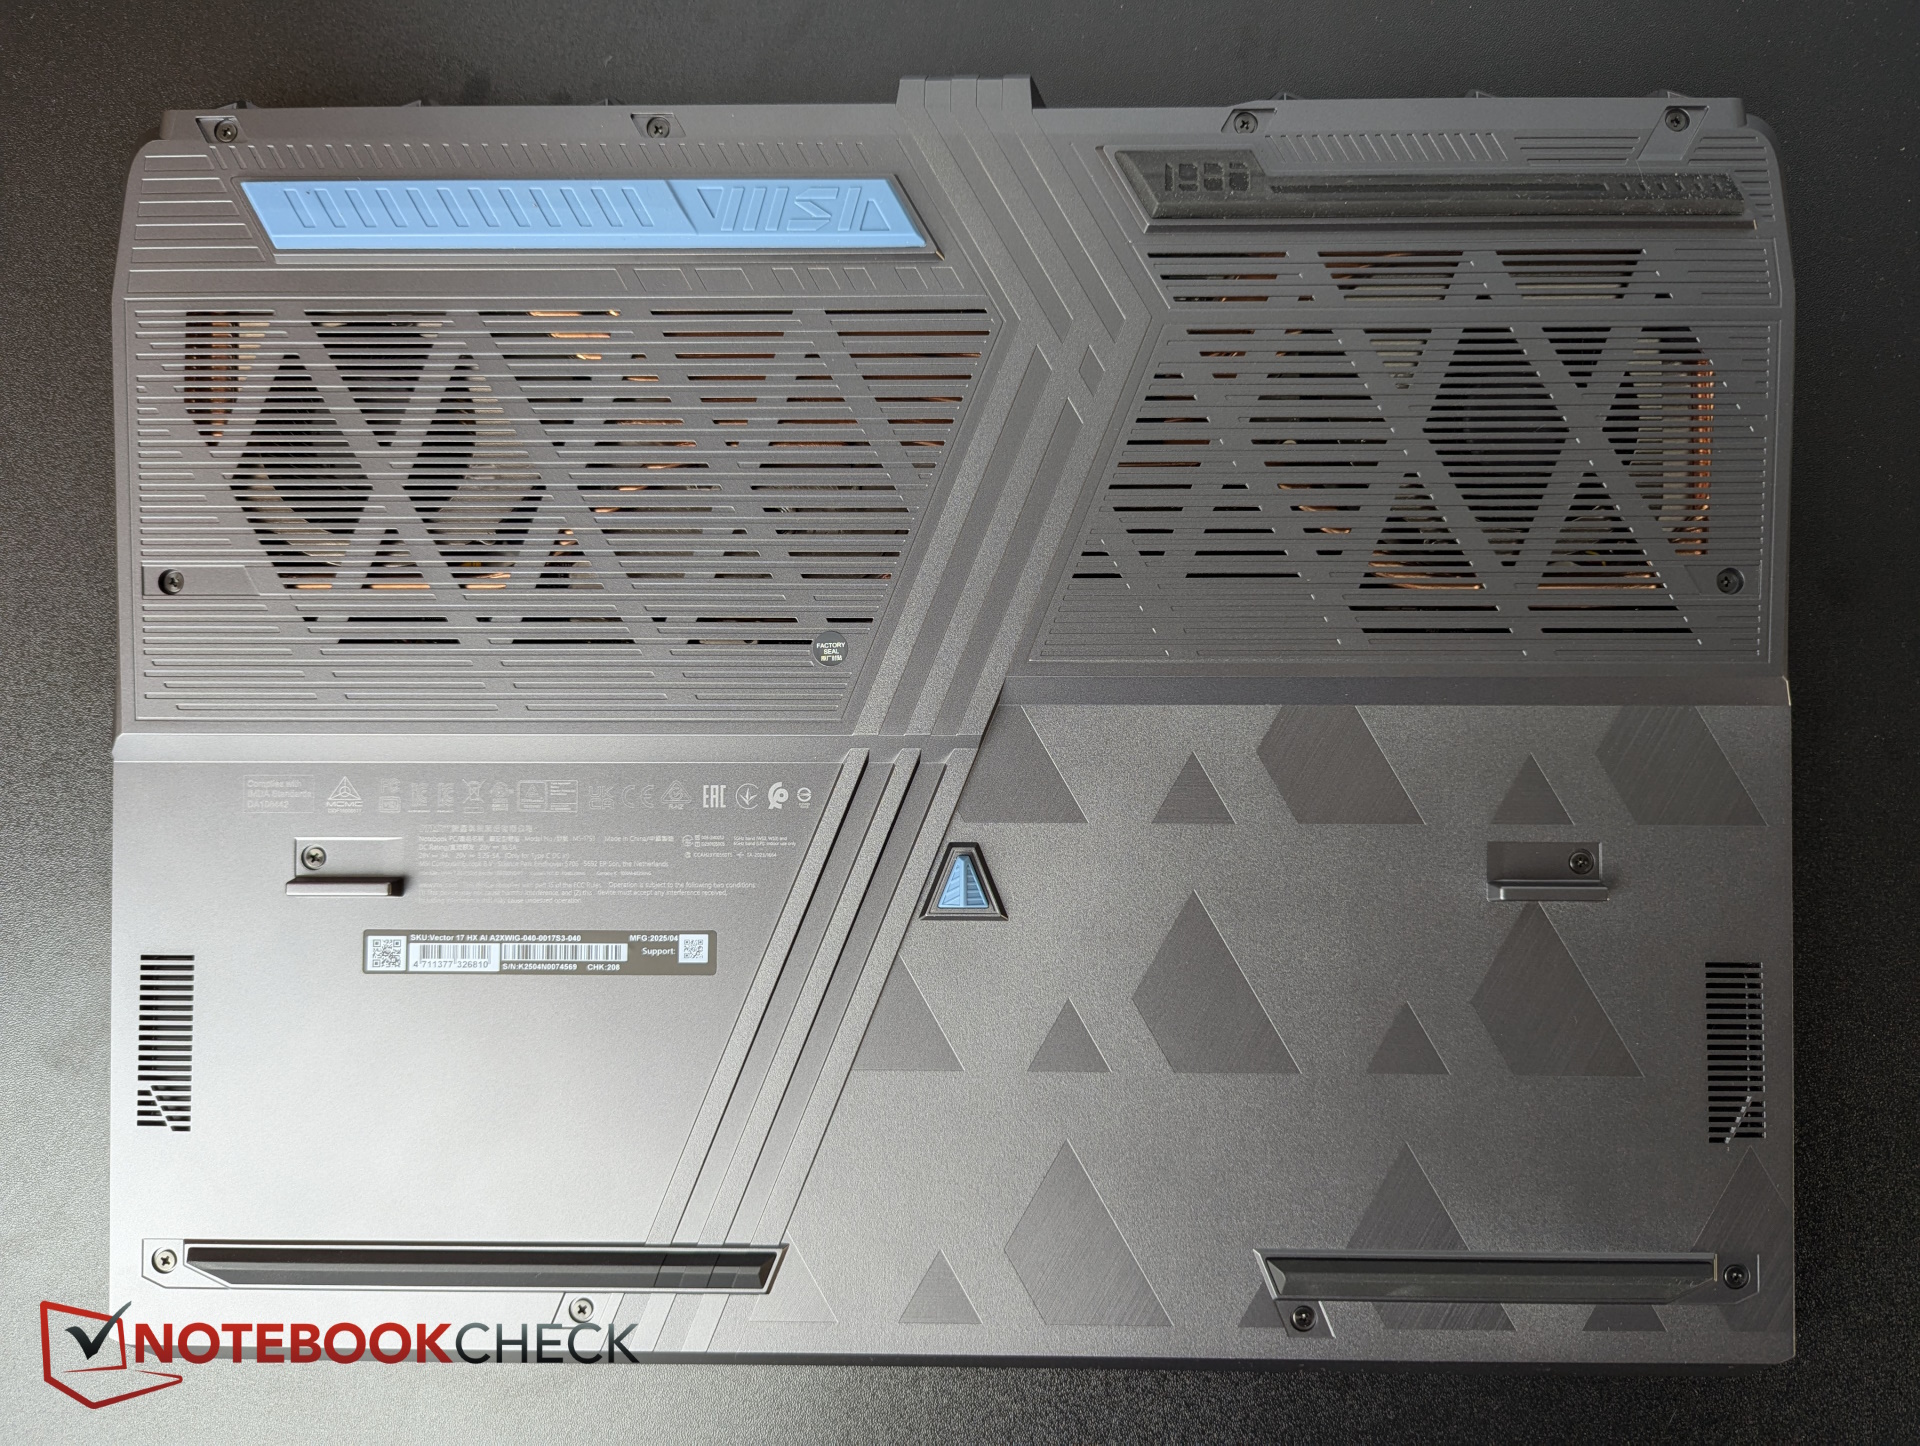
Case & features - As massive as an Alienware
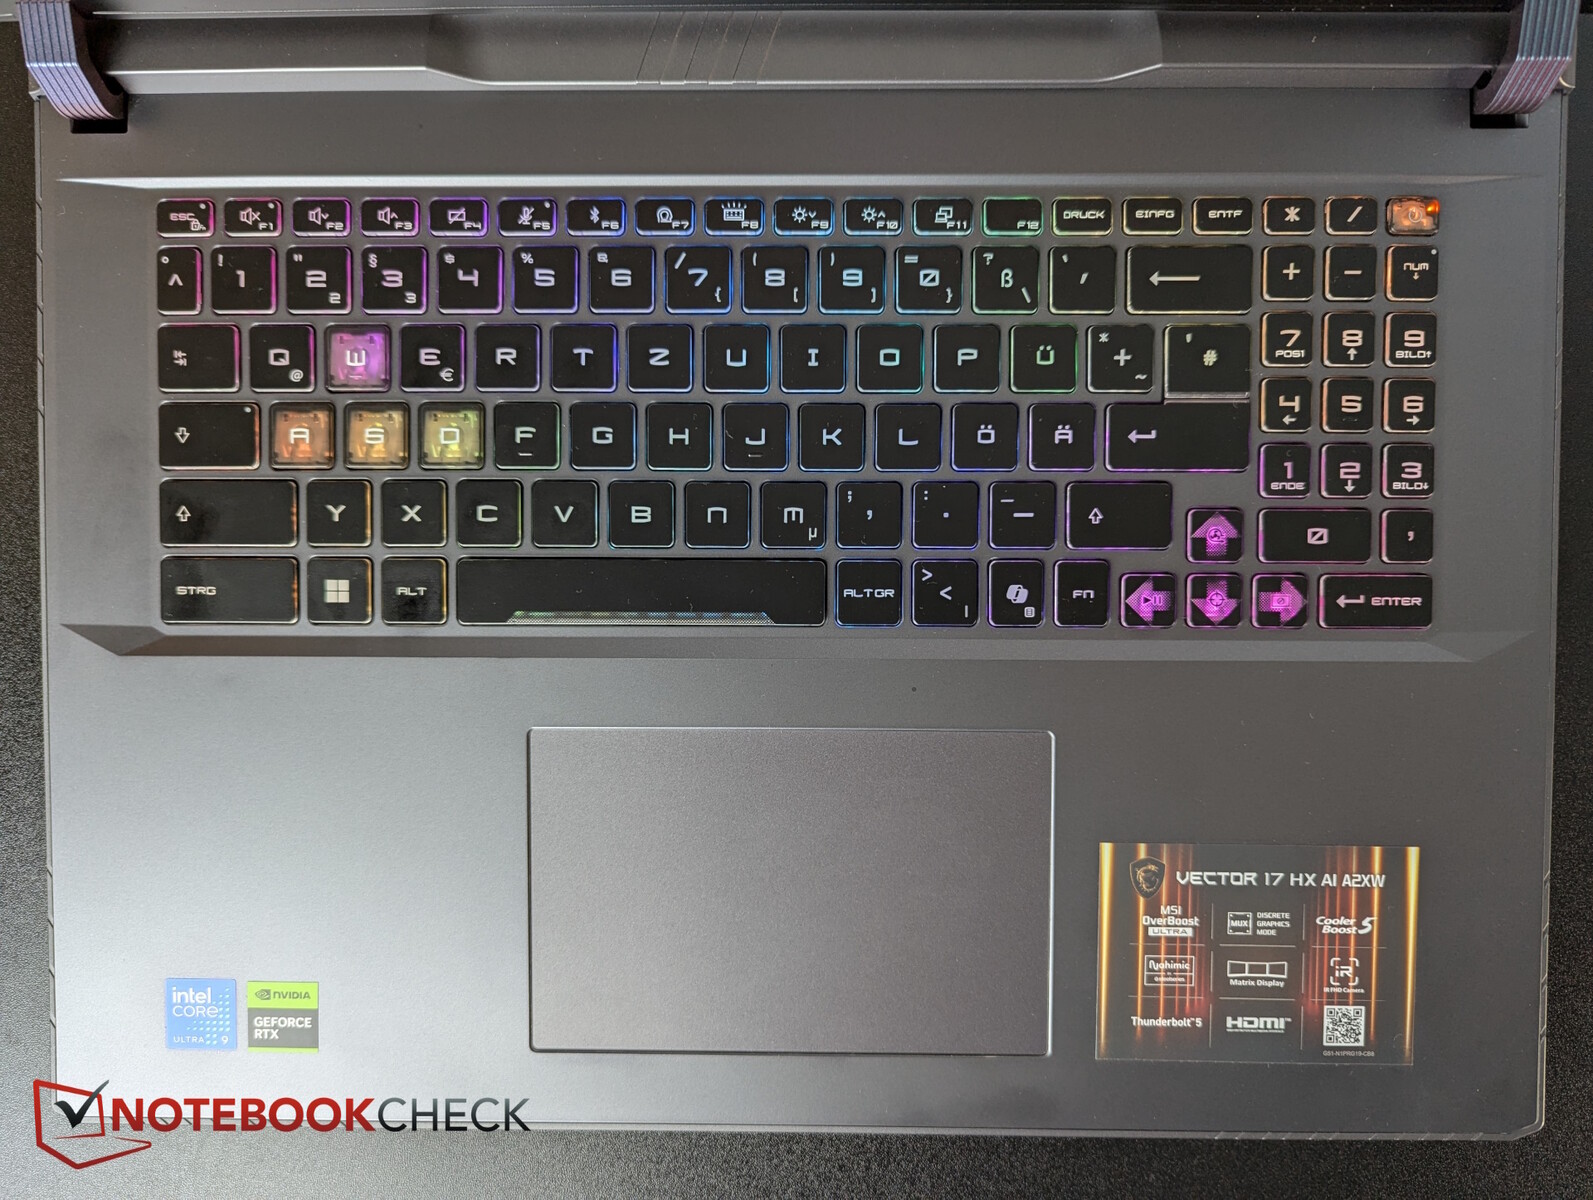
Since we already have the MSI Vector 16 HX AI with almost the same housing, we refer at this point to its Test and skip the sections on the case, maintenance and input devices.


| SD Card Reader | |
| average JPG Copy Test (av. of 3 runs) | |
| Alienware 16 Area-51 (Toshiba Exceria Pro SDXC 64 GB UHS-II) | |
| Average of class Gaming (20.9 - 210, n=54, last 2 years) | |
| Schenker XMG Neo 16 A25 5090 (Angelbird AV Pro V60) | |
| Aorus MASTER 16 AM6H | |
| MSI Vector 17 HX AI A2XWIG | |
| MSI Titan 18 HX AI A2XWJG (AV PRO microSD 128 GB V60) | |
| MSI Raider A18 HX A9WIG-080 | |
| maximum AS SSD Seq Read Test (1GB) | |
| Schenker XMG Neo 16 A25 5090 (Angelbird AV Pro V60) | |
| Alienware 16 Area-51 (Toshiba Exceria Pro SDXC 64 GB UHS-II) | |
| MSI Vector 17 HX AI A2XWIG | |
| Aorus MASTER 16 AM6H | |
| MSI Raider A18 HX A9WIG-080 | |
| Average of class Gaming (25.5 - 261, n=51, last 2 years) | |
| MSI Titan 18 HX AI A2XWJG (AV PRO microSD 128 GB V60) | |
Webcam
A Full HD webcam with manual shutter, good color fidelity and medium sharpness is installed.


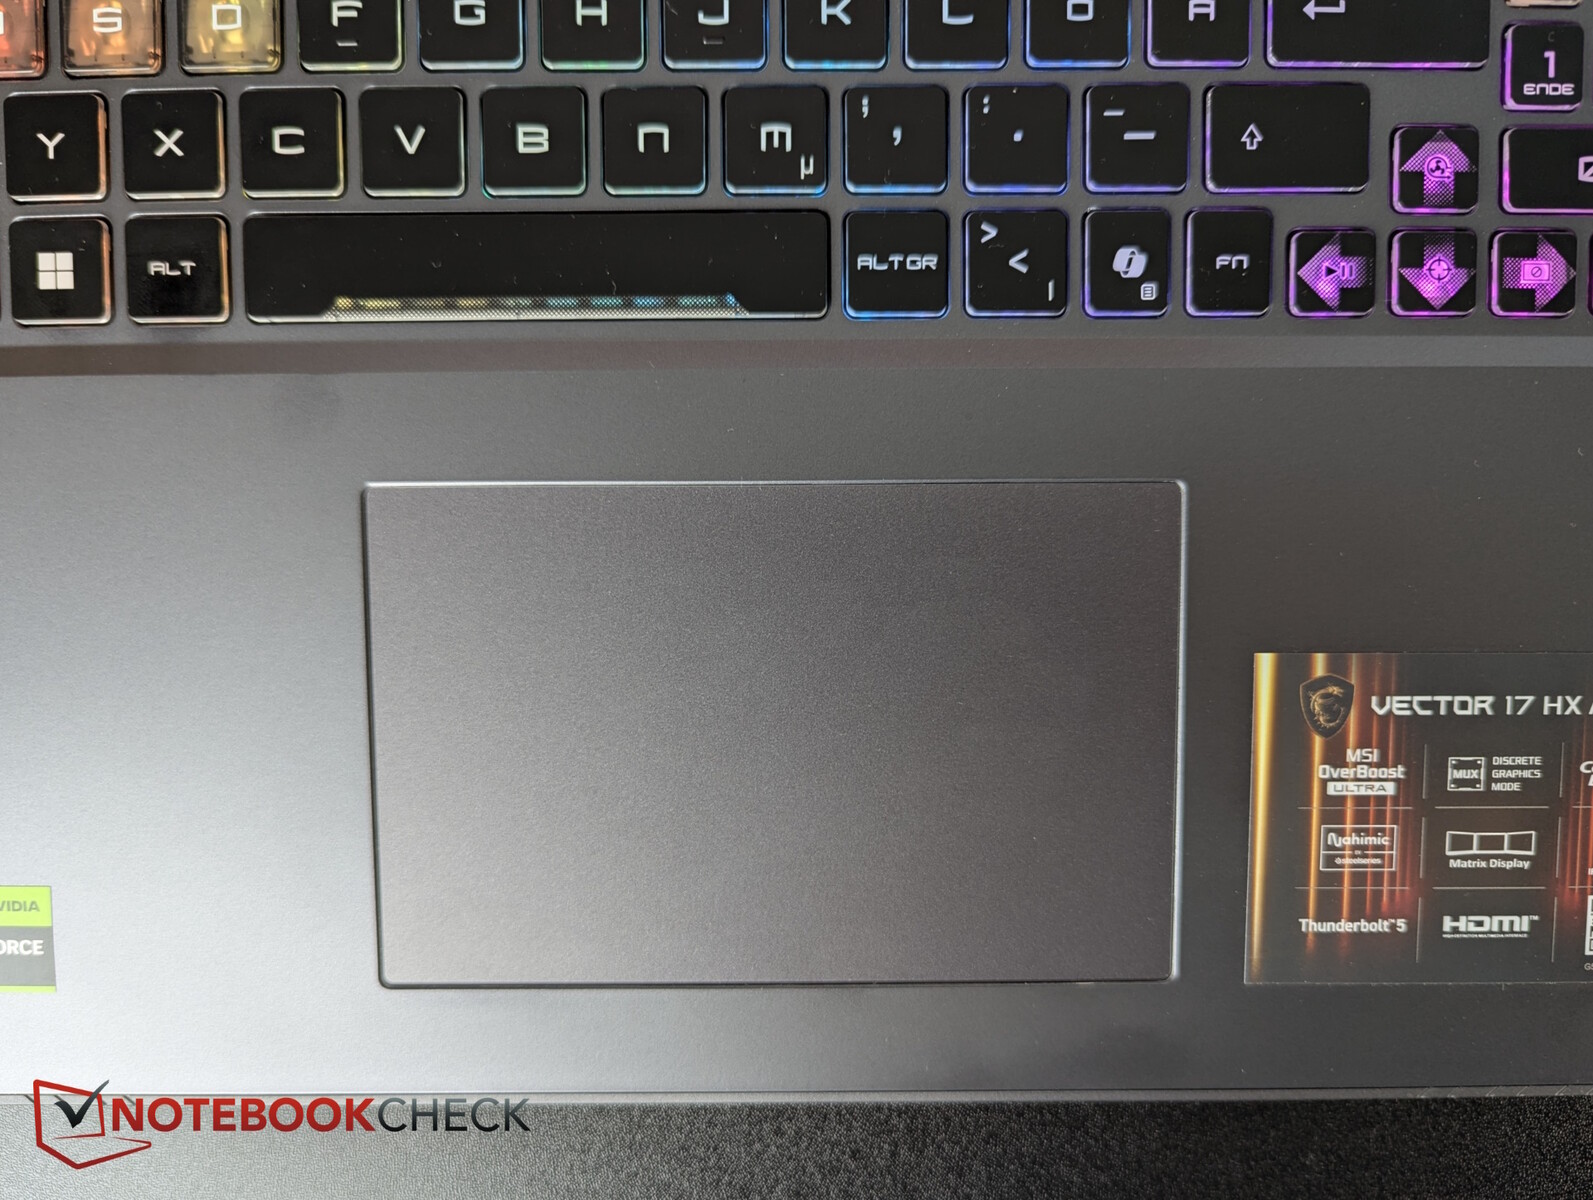
Input devices - This MSI layout!
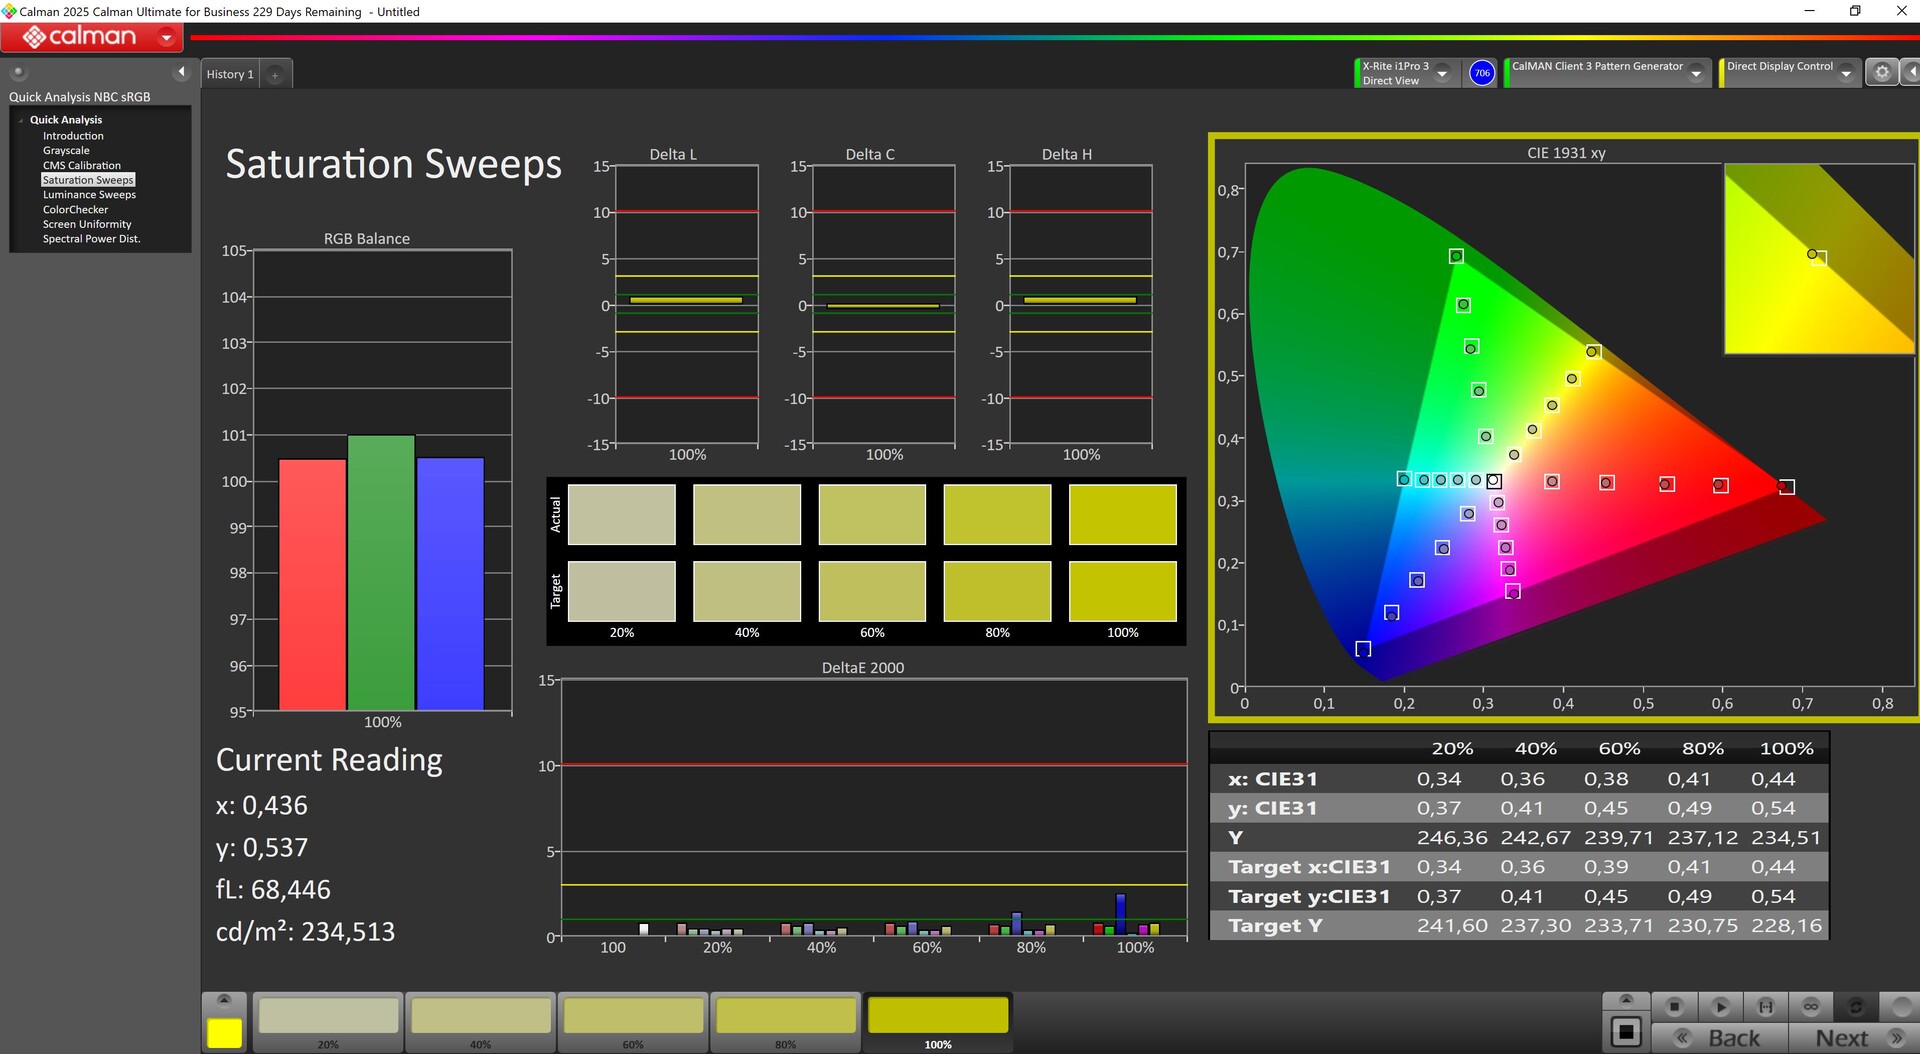
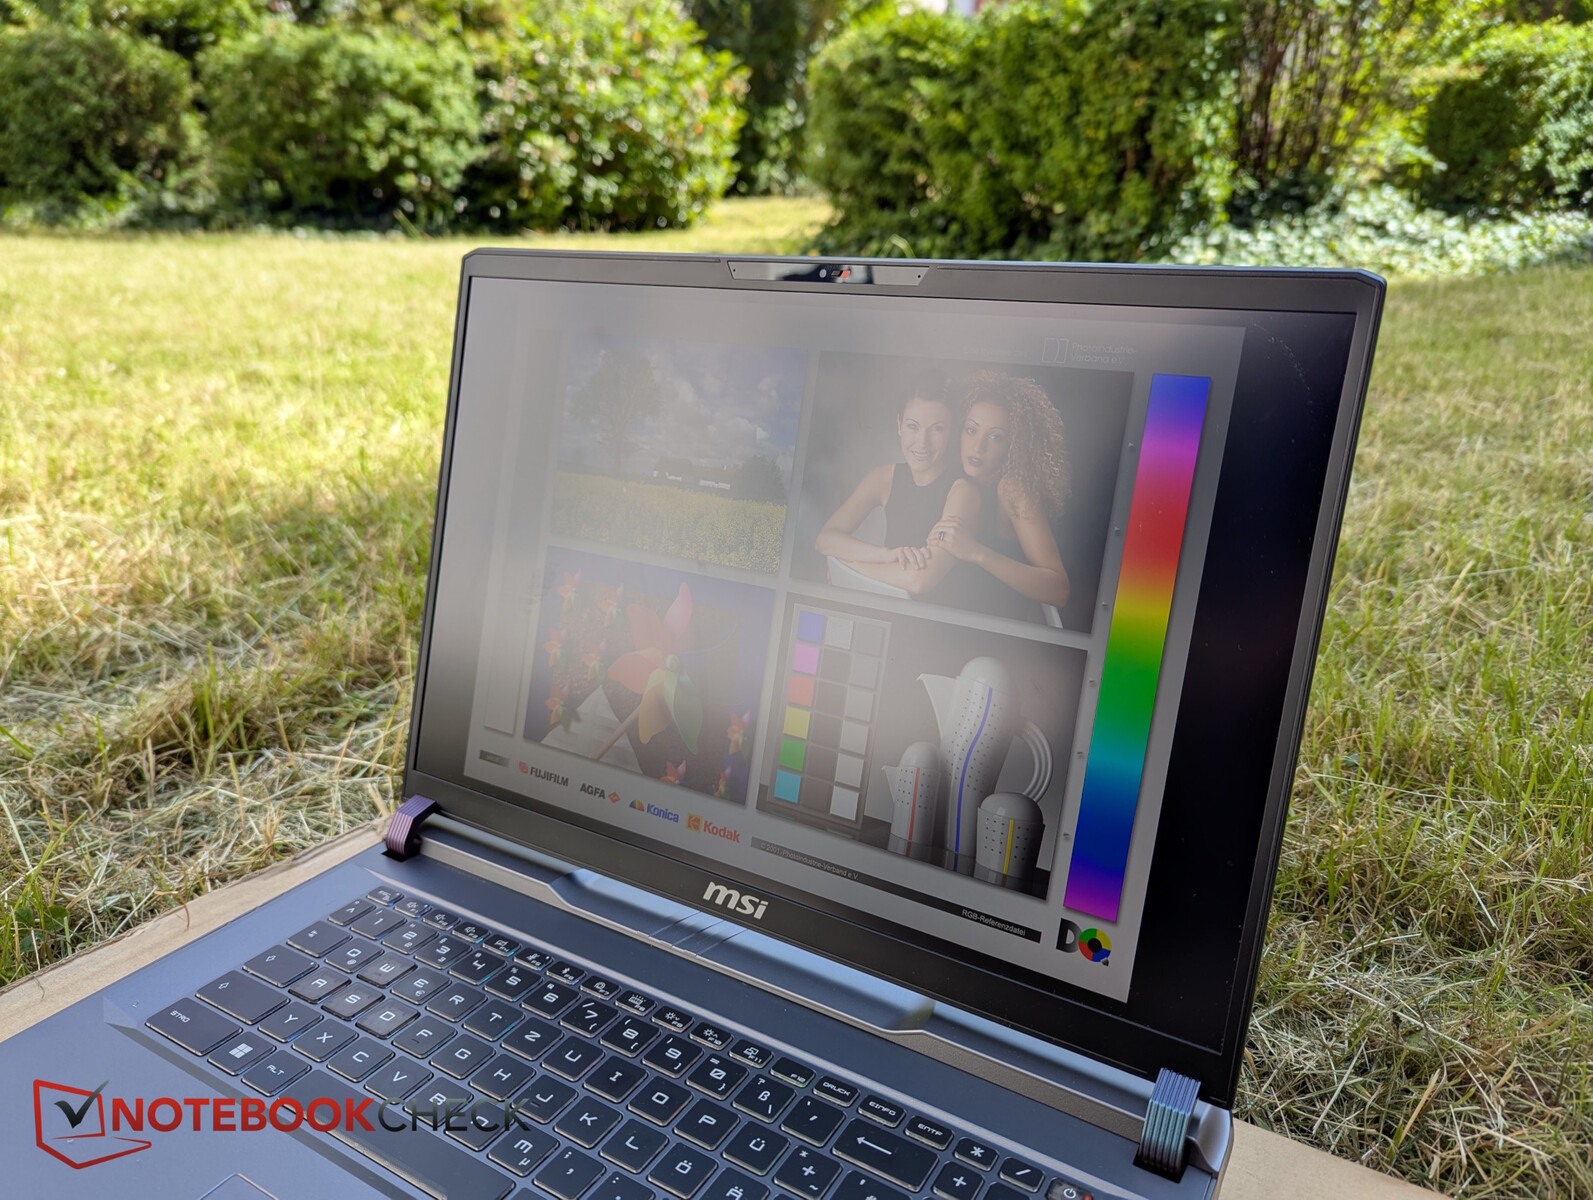
Display - QHD+ IPS with 470 nits
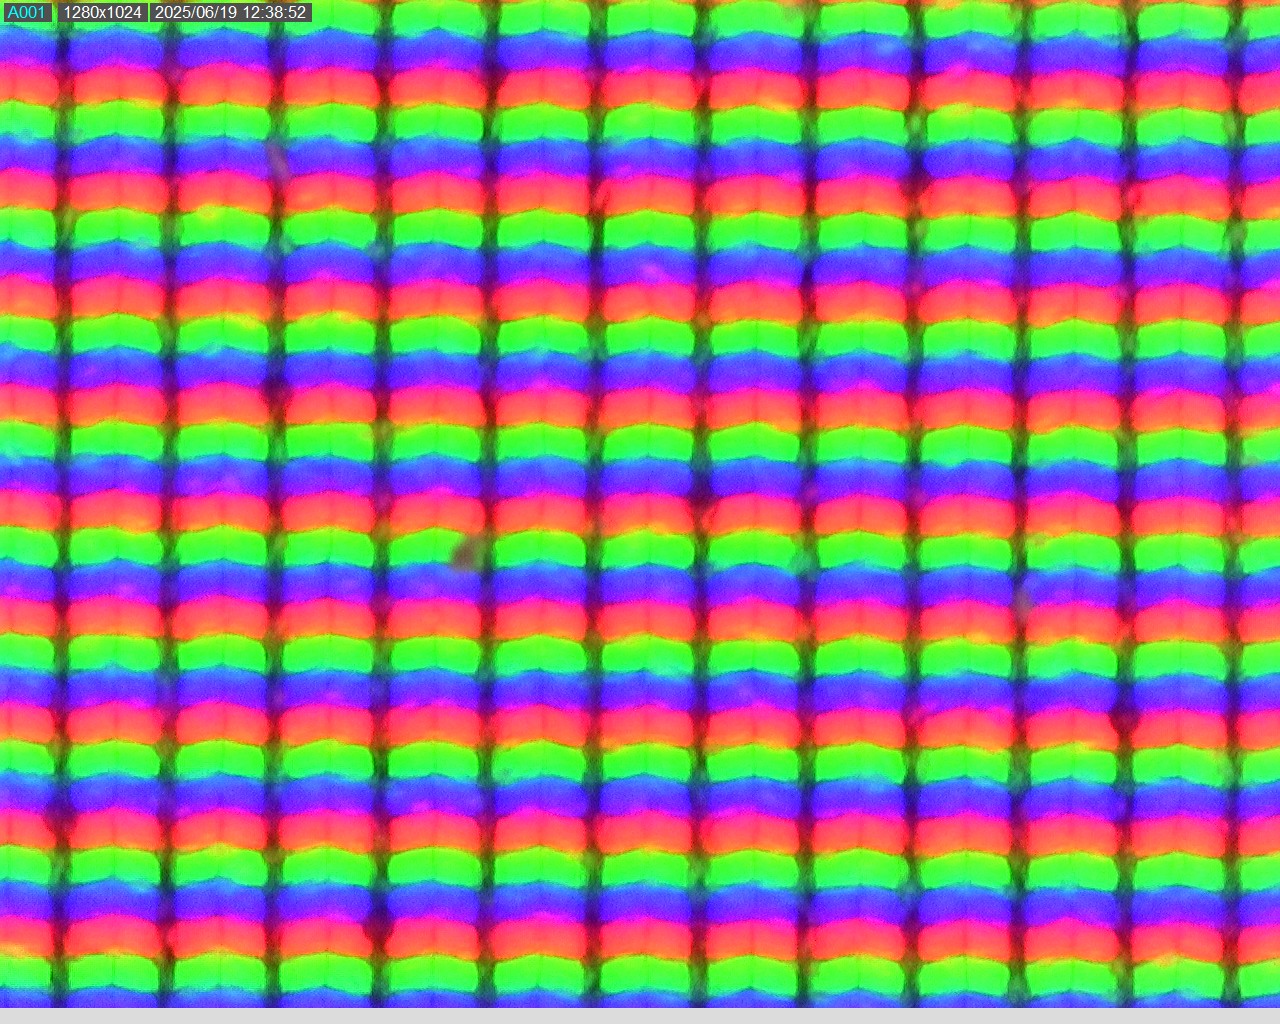
A matte, fast (approx. 4 ms) QHD+ IPS display (2,560 x 1,600 pixels) with 240 Hz is used. The average brightness is around 470 nits and the illumination is quite even. However, the black value is clearly too high, which costs contrast.
Note: MSI also offers a Full HD IPS display with 165 Hz as an alternative.

| |||||||||||||||||||||||||
Brightness Distribution: 91 %
Center on Battery: 486 cd/m²
Contrast: 659:1 (Black: 0.74 cd/m²)
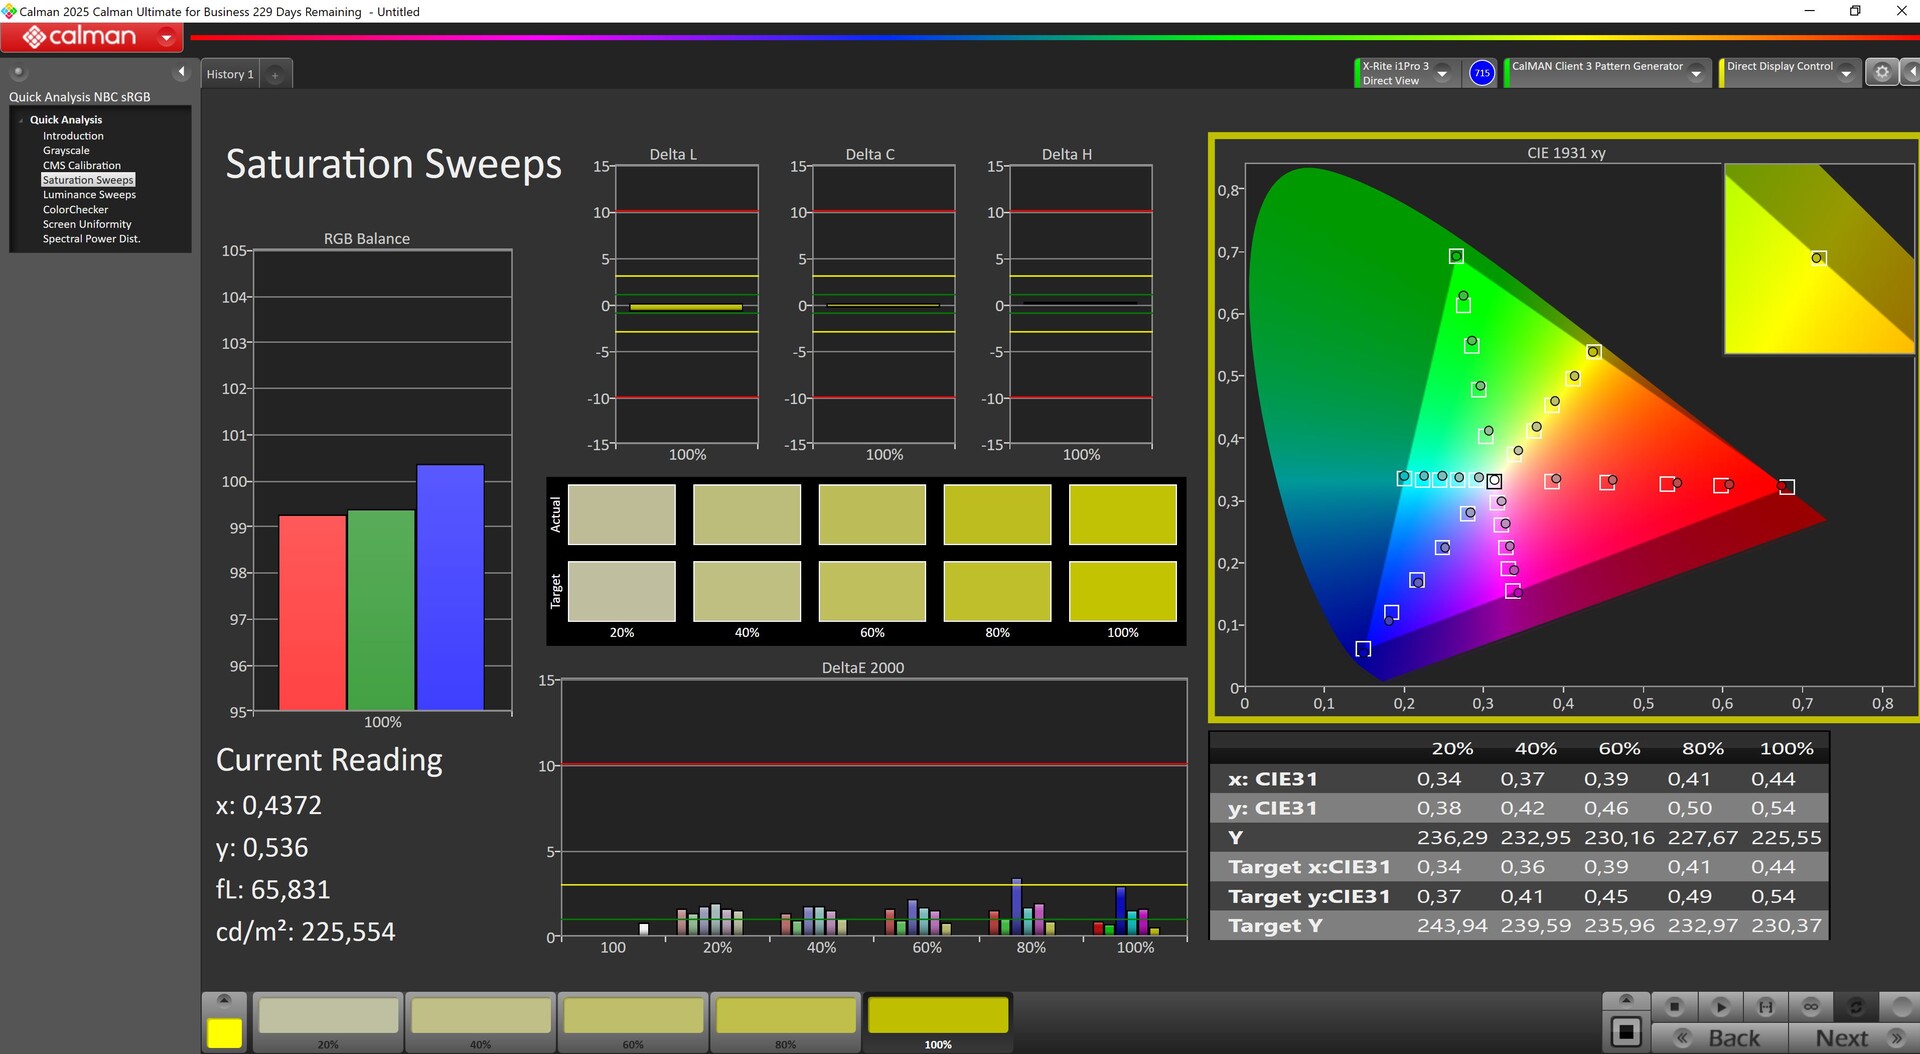
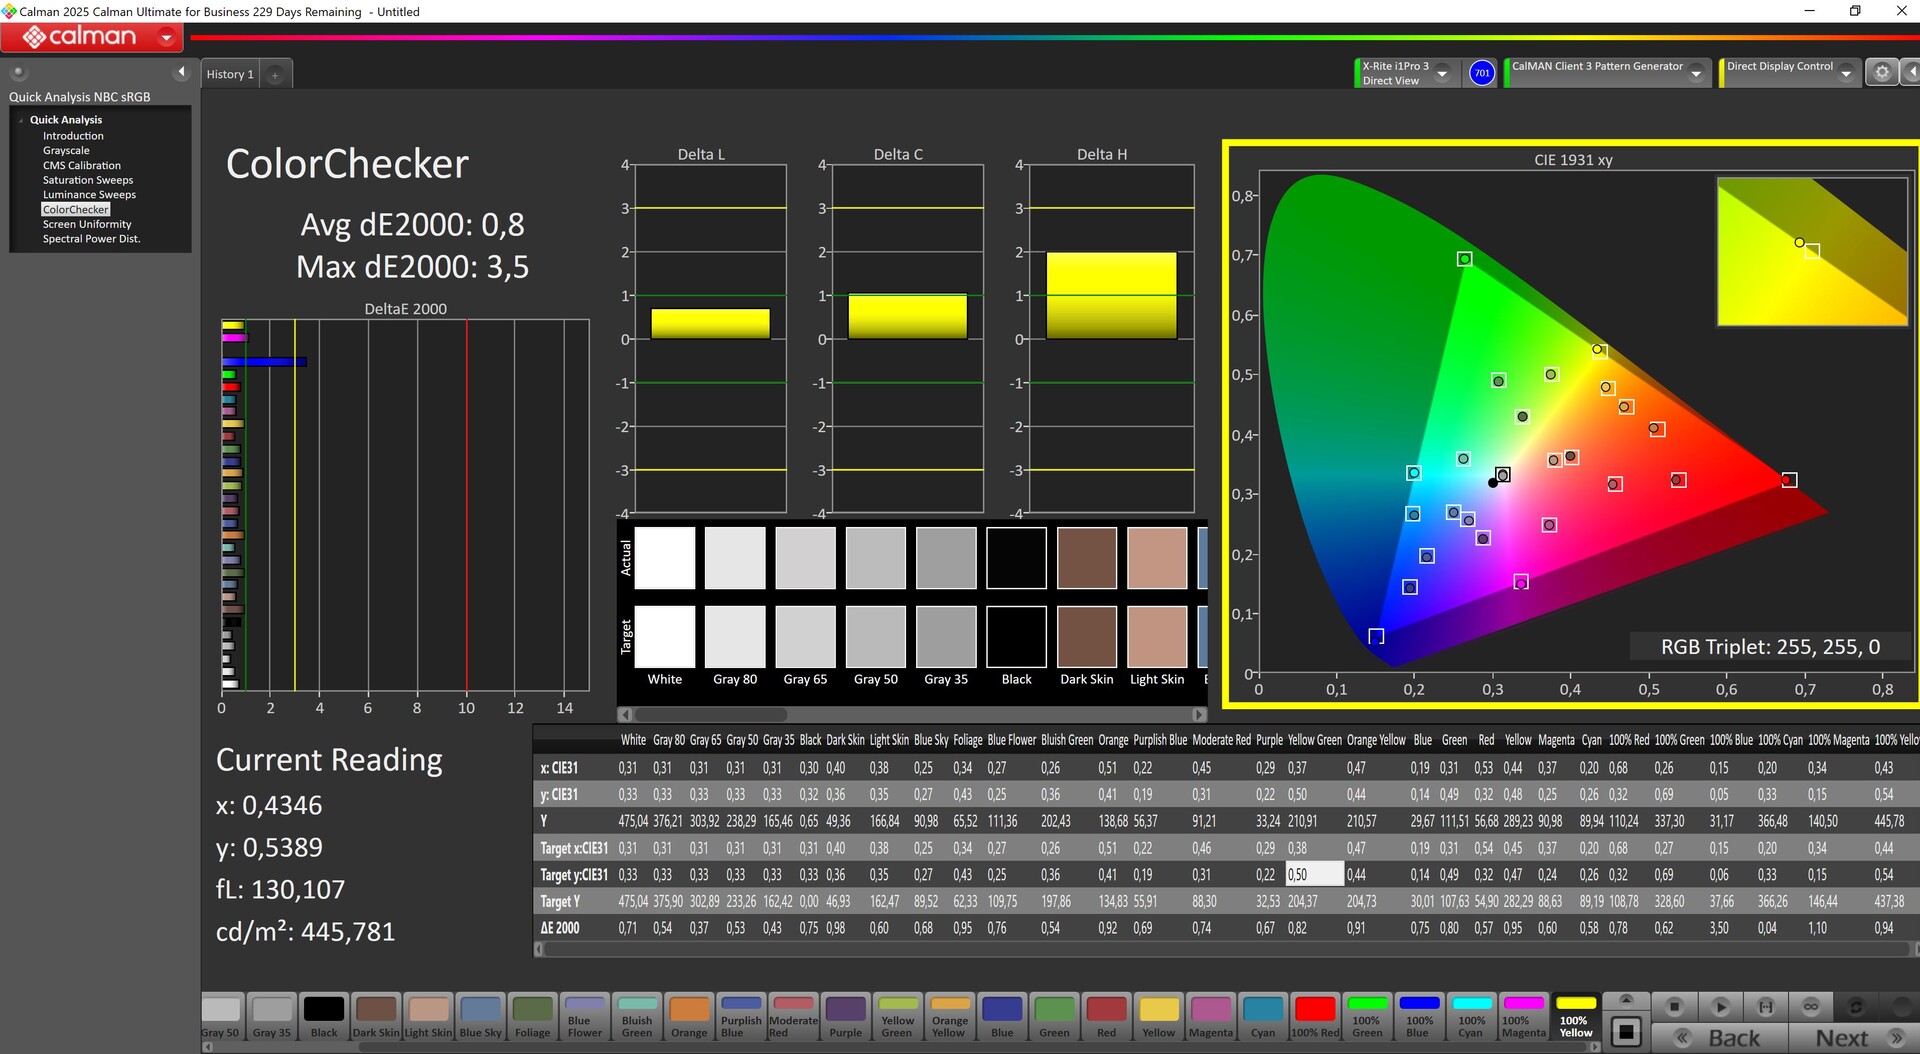
ΔE ColorChecker Calman: 1.67 | ∀{0.5-29.43 Ø4.72}
calibrated: 0.8
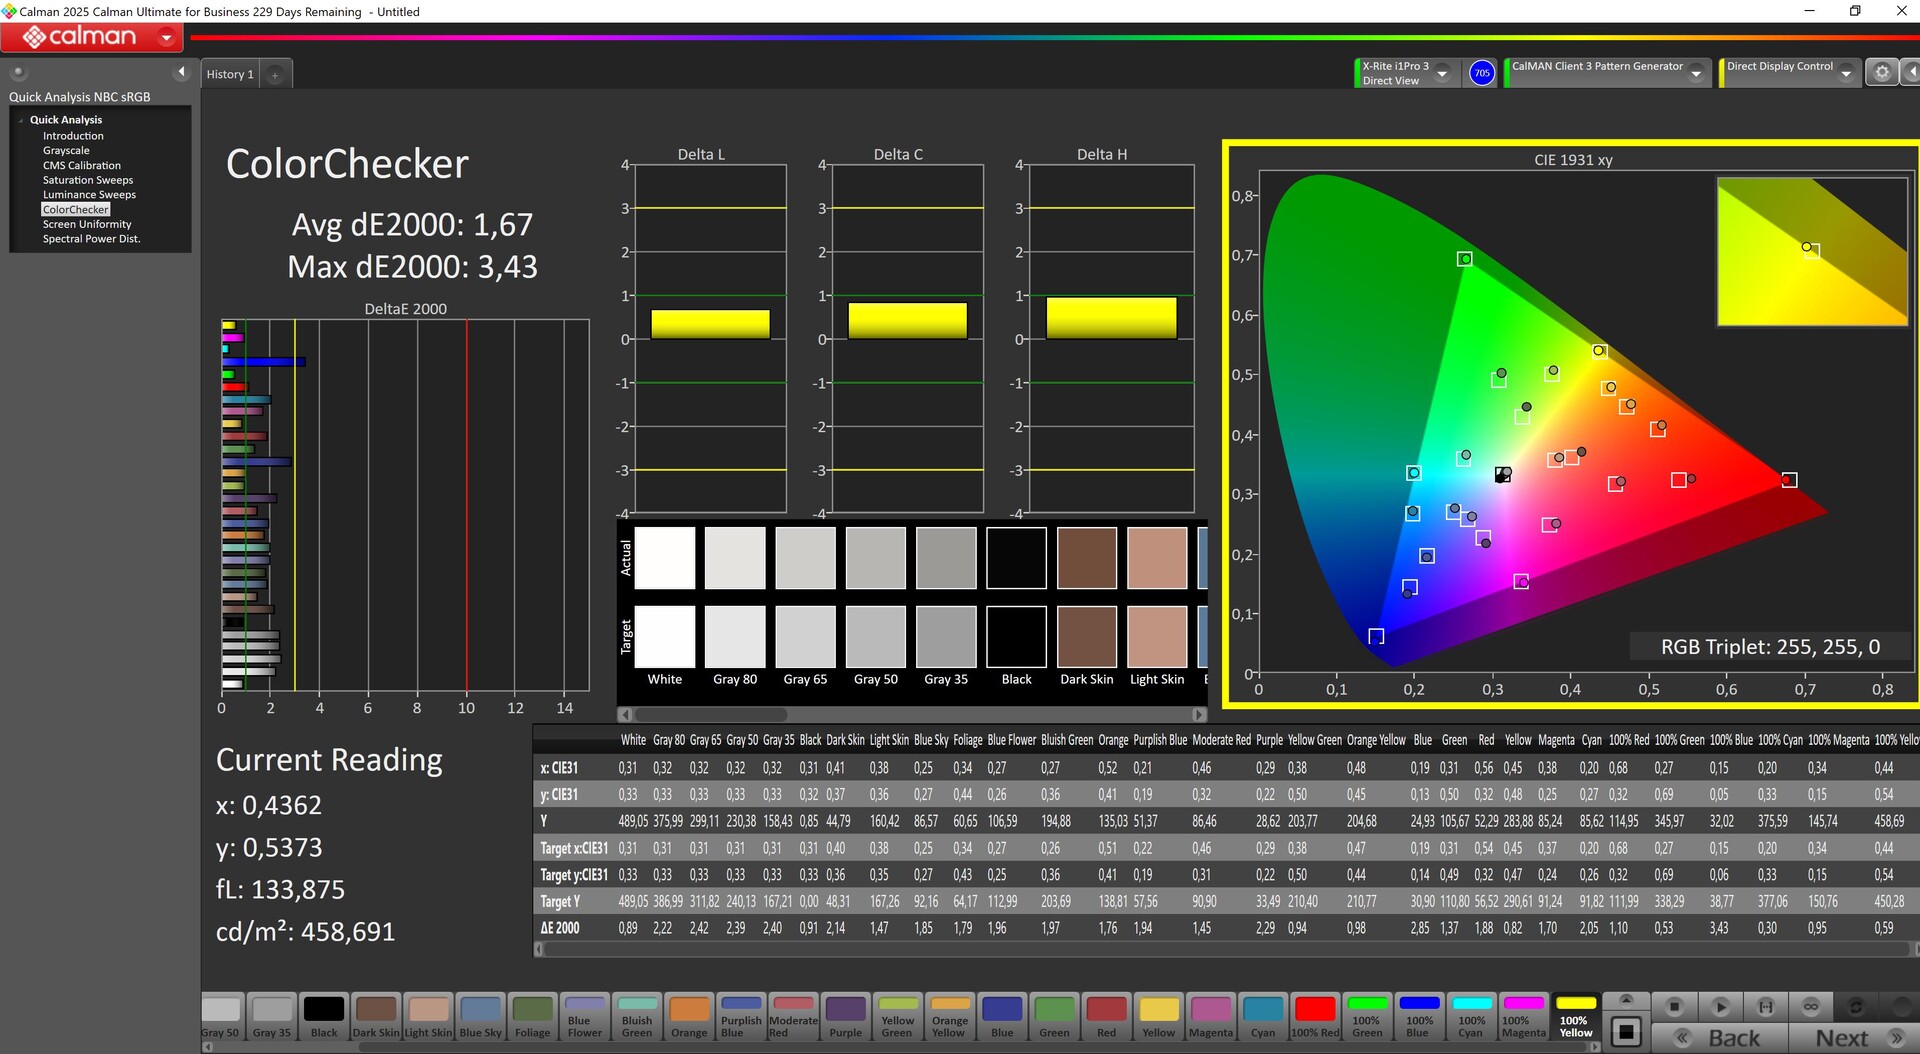
ΔE Greyscale Calman: 2.08 | ∀{0.09-98 Ø4.97}
87.4% AdobeRGB 1998 (Argyll 3D)
100% sRGB (Argyll 3D)
99.6% Display P3 (Argyll 3D)
Gamma: 2.55
CCT: 6240 K
| MSI Vector 17 HX AI A2XWIG B170QAN01.2 (AUO84A6), IPS, 2560x1600, 17", 240 Hz | Alienware 16 Area-51 AU Optronics B160QAN, IPS, 2560x1600, 16", 240 Hz | MSI Raider A18 HX A9WIG-080 B180ZAN01.0, MiniLED IPS, 3840x2400, 18", 120 Hz | Aorus MASTER 16 AM6H ATNA60DL03-0 (SDC41AB), OLED, 2560x1600, 16", 240 Hz | MSI Titan 18 HX AI A2XWJG AU Optronics B180ZAN01.0, Mini-LED, 3840x2160, 18", 120 Hz | Schenker XMG Neo 16 A25 5090 NE160QDM-NM9, Mini-LED, 2560x1600, 16", 300 Hz | |
|---|---|---|---|---|---|---|
| Display | -1% | 2% | 1% | 1% | 0% | |
| HDR Peak Brightness (cd/m²) | 1153 | |||||
| Display P3 Coverage (%) | 99.6 | 96 -4% | 99.9 0% | 95.3 -4% | 99.7 0% | 99.9 0% |
| sRGB Coverage (%) | 100 | 100 0% | 100 0% | 98.8 -1% | 99.9 0% | 100 0% |
| AdobeRGB 1998 Coverage (%) | 87.4 | 89.2 2% | 93.9 7% | 94.1 8% | 90.4 3% | 88.5 1% |
| Response Times | -42% | -377% | 92% | -179% | -277% | |
| Response Time Grey 50% / Grey 80% * (ms) | 3.6 ? | 4.8 ? -33% | 23 ? -539% | 0.24 ? 93% | 8.8 ? -144% | 17.4 ? -383% |
| Response Time Black / White * (ms) | 4.8 ? | 7.2 ? -50% | 15.1 ? -215% | 0.43 ? 91% | 15 ? -213% | 13 ? -171% |
| PWM Frequency (Hz) | 15203 | 960 | 15430 ? | 20253 | ||
| PWM Amplitude * (%) | 100 | 47 | 50 | 75 | ||
| Screen | -23% | 759% | 57% | -71% | -23% | |
| Brightness middle (cd/m²) | 488 | 554 14% | 510 5% | 435 -11% | 704 44% | 888 82% |
| Brightness (cd/m²) | 473 | 532 12% | 470 -1% | 437 -8% | 680 44% | 859 82% |
| Brightness Distribution (%) | 91 | 88 -3% | 85 -7% | 96 5% | 88 -3% | 94 3% |
| Black Level * (cd/m²) | 0.74 | 0.52 30% | 0.01 99% | 0.08 89% | ||
| Contrast (:1) | 659 | 1065 62% | 51000 7639% | 5438 725% | ||
| Colorchecker dE 2000 * | 1.67 | 2.81 -68% | 4.5 -169% | 2.42 -45% | 4.11 -146% | 3.3 -98% |
| Colorchecker dE 2000 max. * | 3.43 | 8.32 -143% | 7.3 -113% | 4.81 -40% | 6.43 -87% | 5.5 -60% |
| Colorchecker dE 2000 calibrated * | 0.8 | 0.65 19% | 5.7 -613% | 2.03 -154% | 2.5 -213% | 1.5 -88% |
| Greyscale dE 2000 * | 2.08 | 4.7 -126% | 2.3 -11% | 3.11 -50% | 4.9 -136% | 3.8 -83% |
| Gamma | 2.55 86% | 2.3 96% | 2.08 106% | 2.48 89% | 2.03 108% | 2.46 89% |
| CCT | 6240 104% | 6476 100% | 6648 98% | 6270 104% | 6331 103% | 6267 104% |
| Total Average (Program / Settings) | -22% /
-21% | 128% /
434% | 50% /
50% | -83% /
-71% | -100% /
-60% |
* ... smaller is better
We already measure well-calibrated values ex works. After our own calibration, we even reduce the deviations to below 1.

Display Response Times
| ↔ Response Time Black to White | ||
|---|---|---|
| 4.8 ms ... rise ↗ and fall ↘ combined | ↗ 1.8 ms rise | 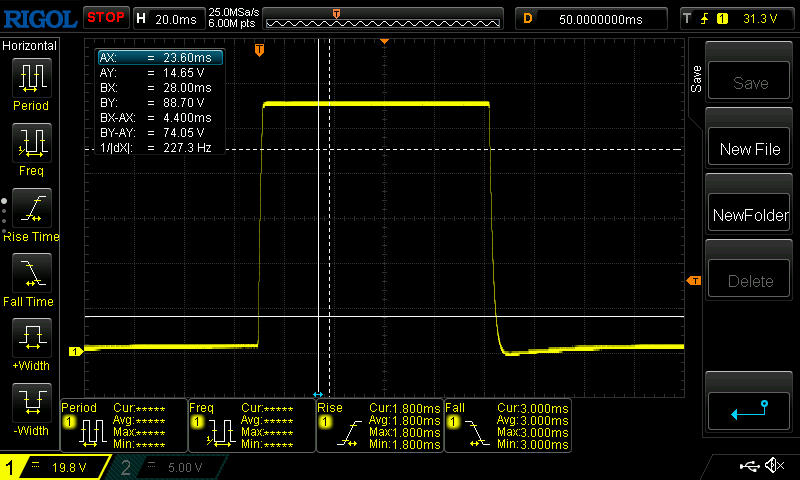 |
| ↘ 3 ms fall | ||
| The screen shows very fast response rates in our tests and should be very well suited for fast-paced gaming. In comparison, all tested devices range from 0.1 (minimum) to 240 (maximum) ms. » 17 % of all devices are better. This means that the measured response time is better than the average of all tested devices (19.8 ms). | ||
| ↔ Response Time 50% Grey to 80% Grey | ||
| 3.6 ms ... rise ↗ and fall ↘ combined | ↗ 1.8 ms rise | 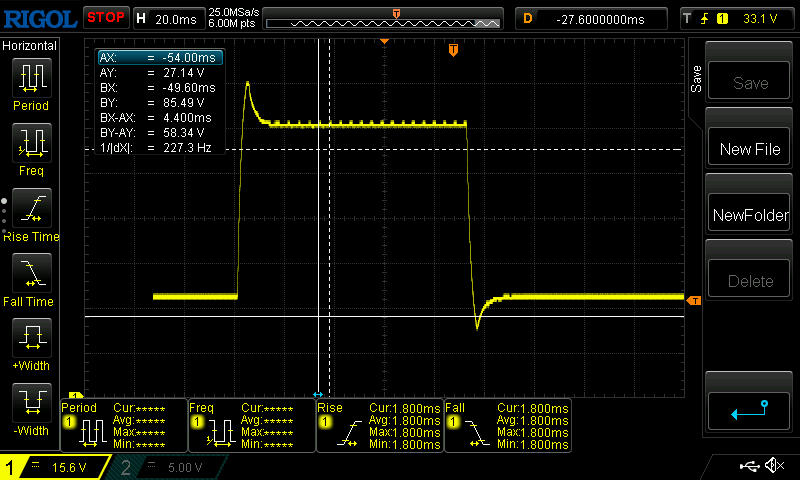 |
| ↘ 1.8 ms fall | ||
| The screen shows very fast response rates in our tests and should be very well suited for fast-paced gaming. In comparison, all tested devices range from 0.165 (minimum) to 636 (maximum) ms. » 14 % of all devices are better. This means that the measured response time is better than the average of all tested devices (31 ms). | ||
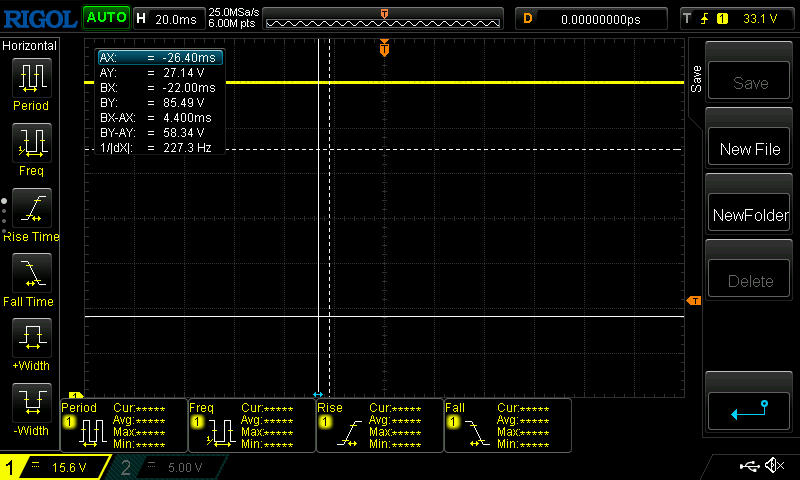
Screen Flickering / PWM (Pulse-Width Modulation)
| Screen flickering / PWM not detected |  | ||
In comparison: 52 % of all tested devices do not use PWM to dim the display. If PWM was detected, an average of 7747 (minimum: 5 - maximum: 343500) Hz was measured. | |||


Performance - CPU collapse under continuous load
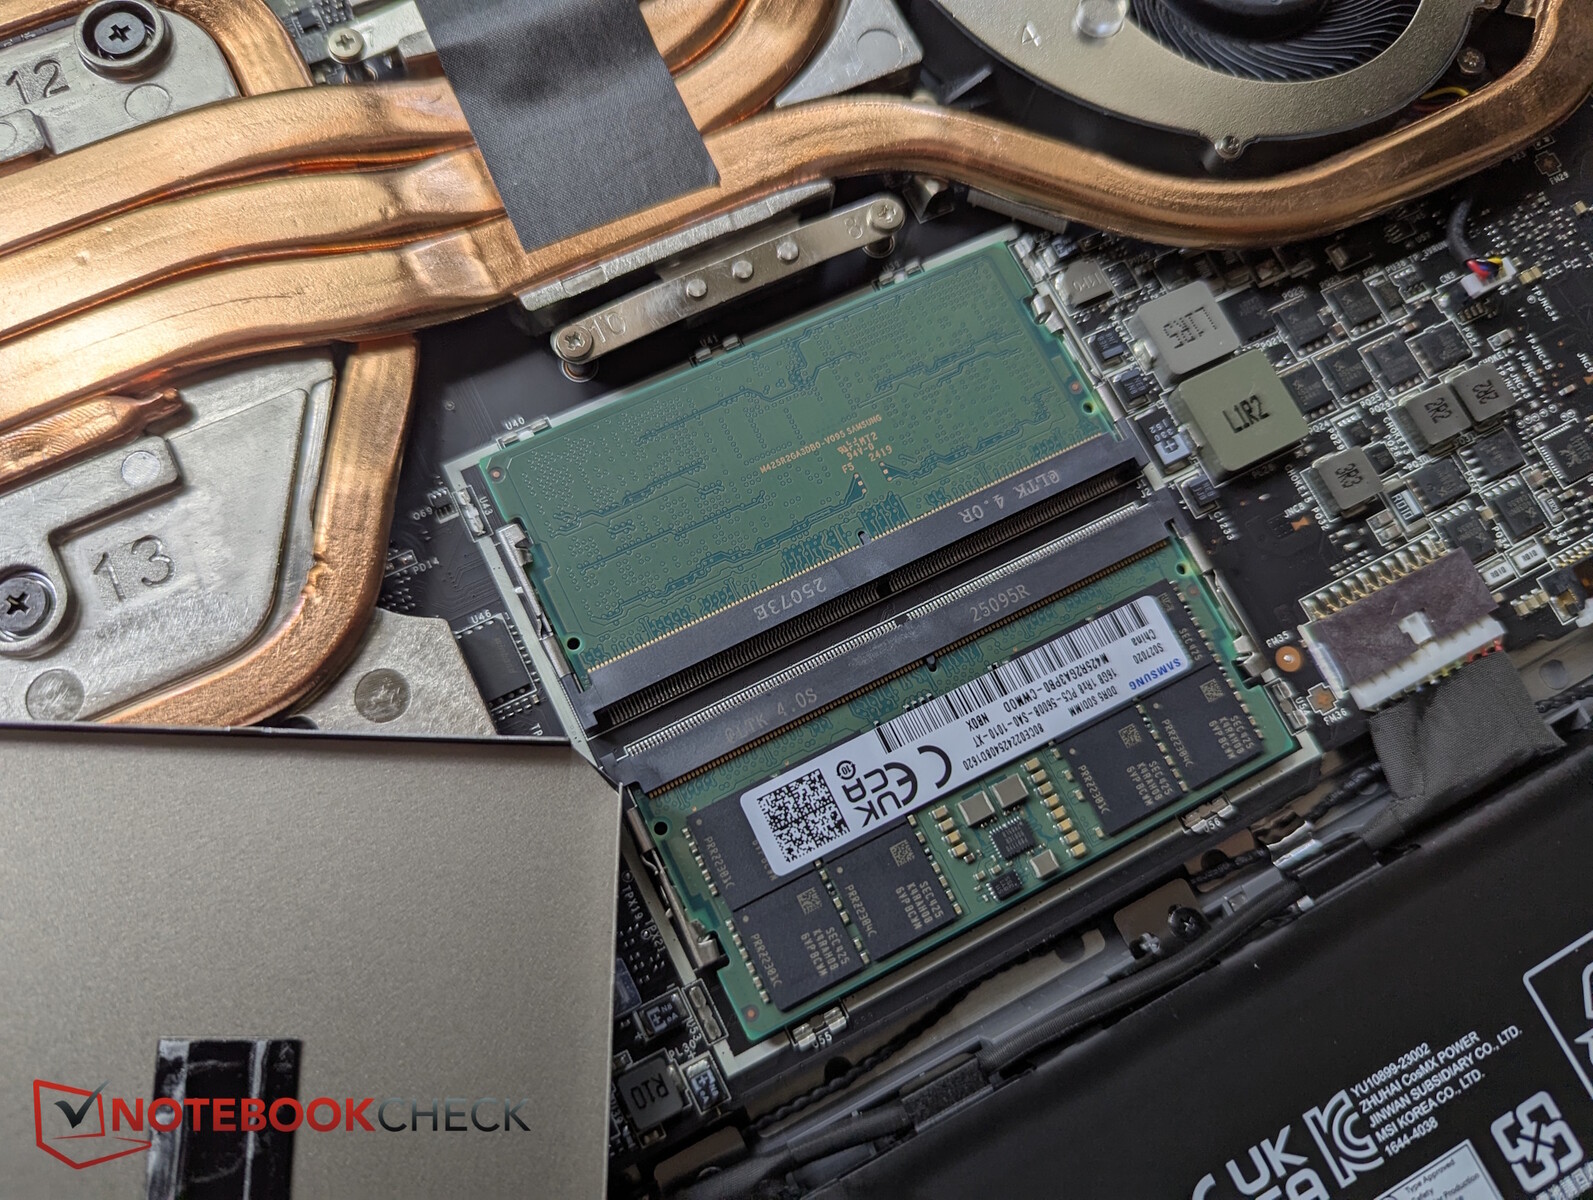
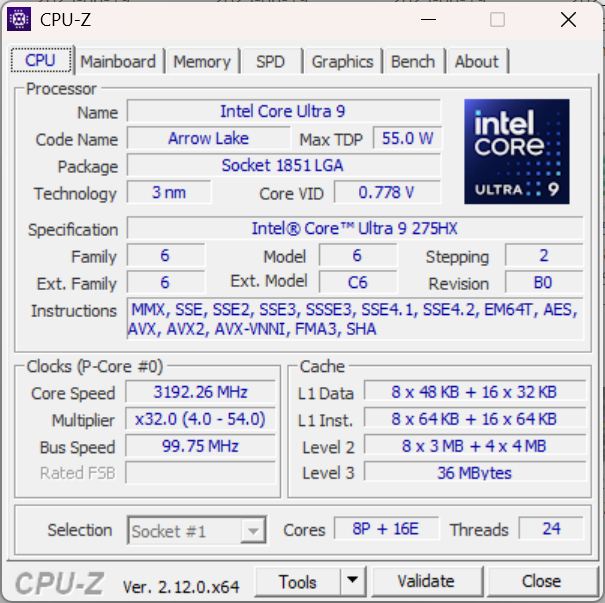
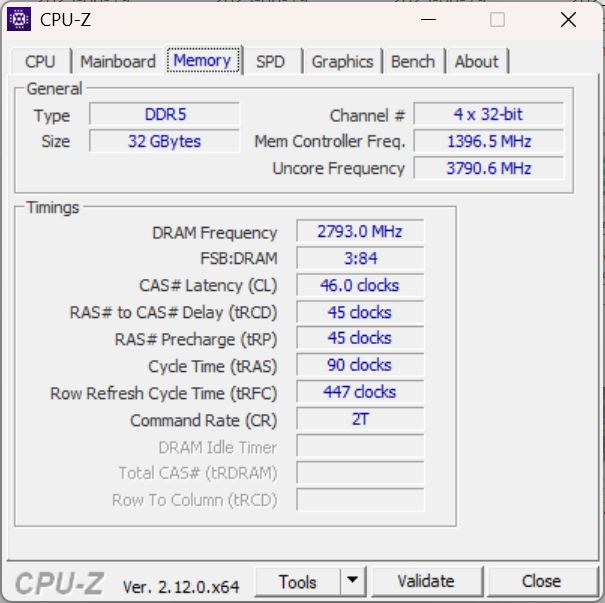
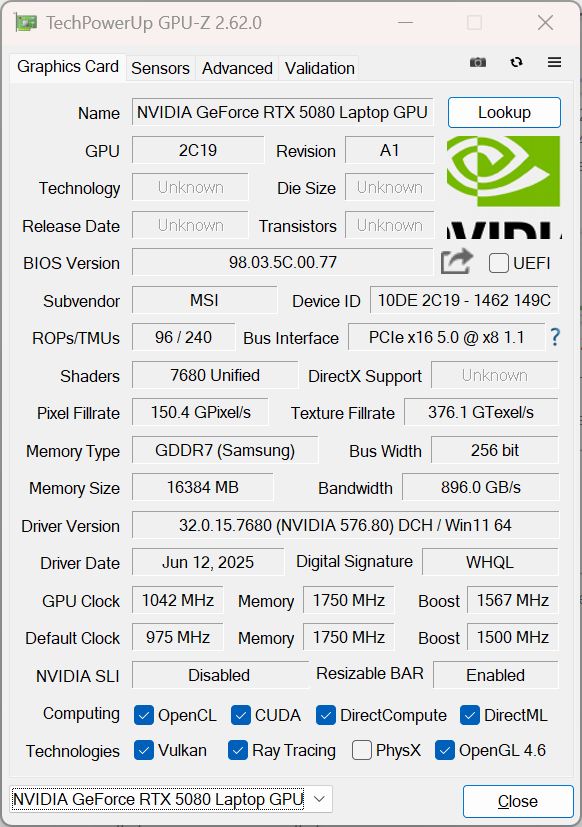
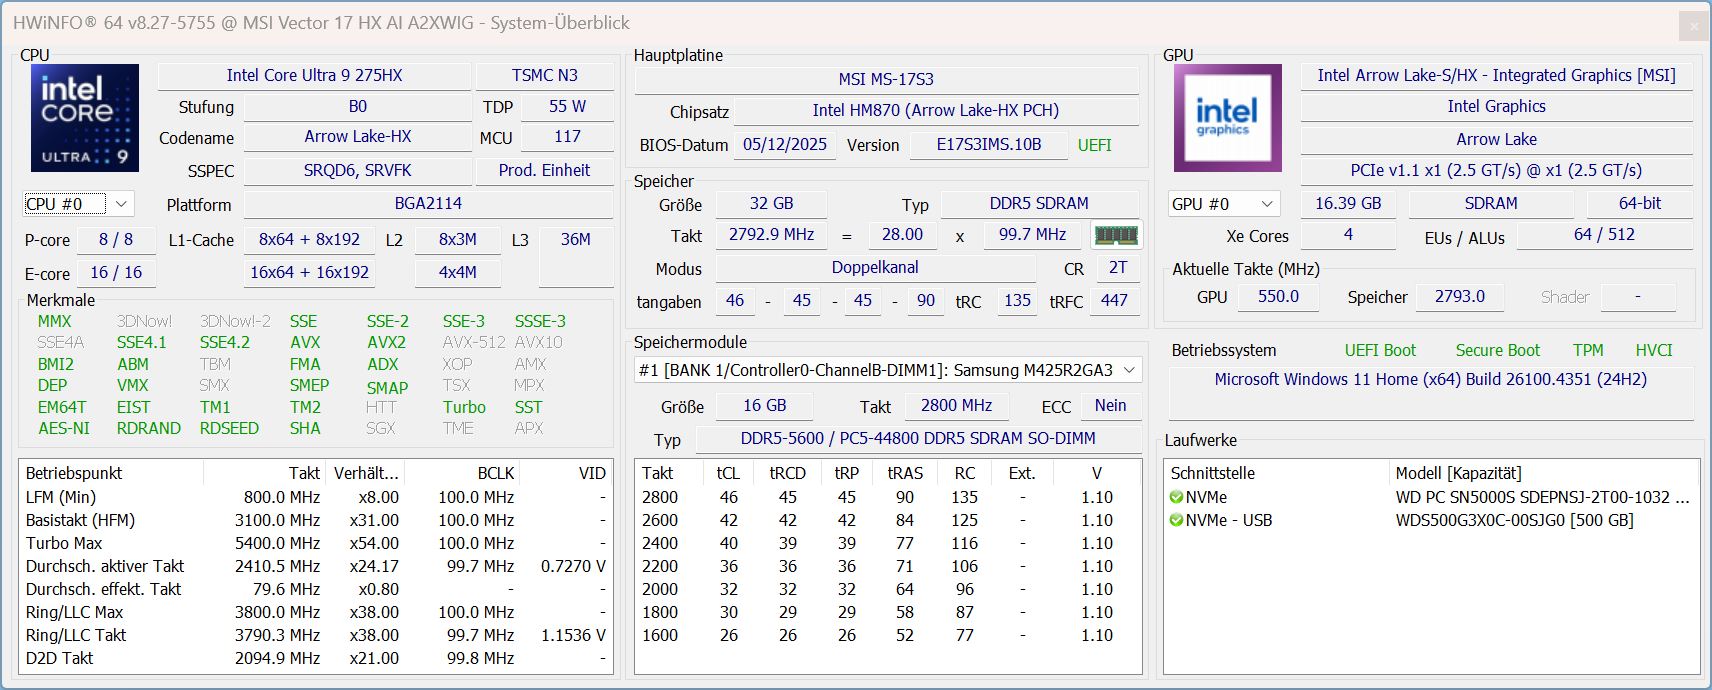
With Intel Core Ultra 9 275HX, RTX 5080 laptop, 2 TB SSD and 32 GB RAM, the Vector 17 HX is a high-end gamer and should be equipped for all current titles.

Test conditions
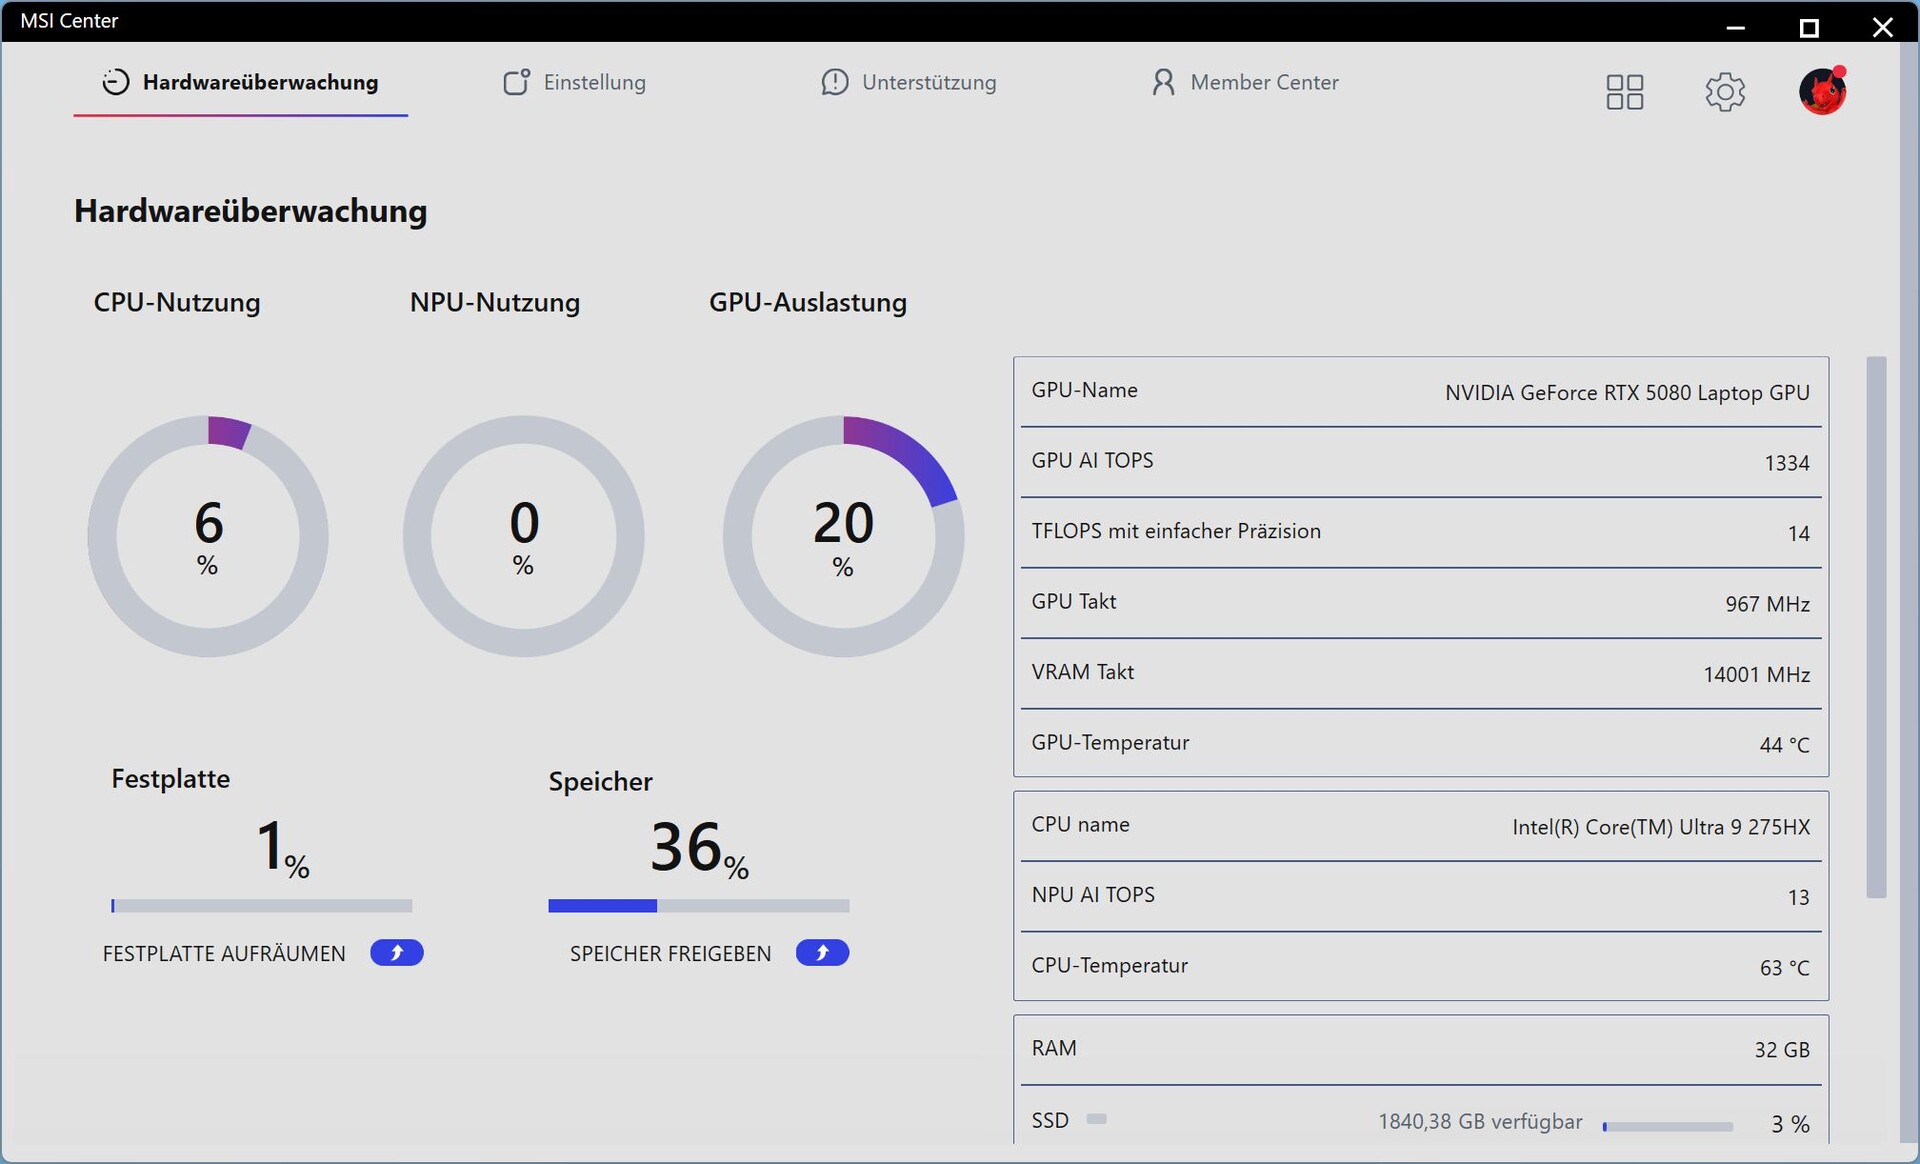
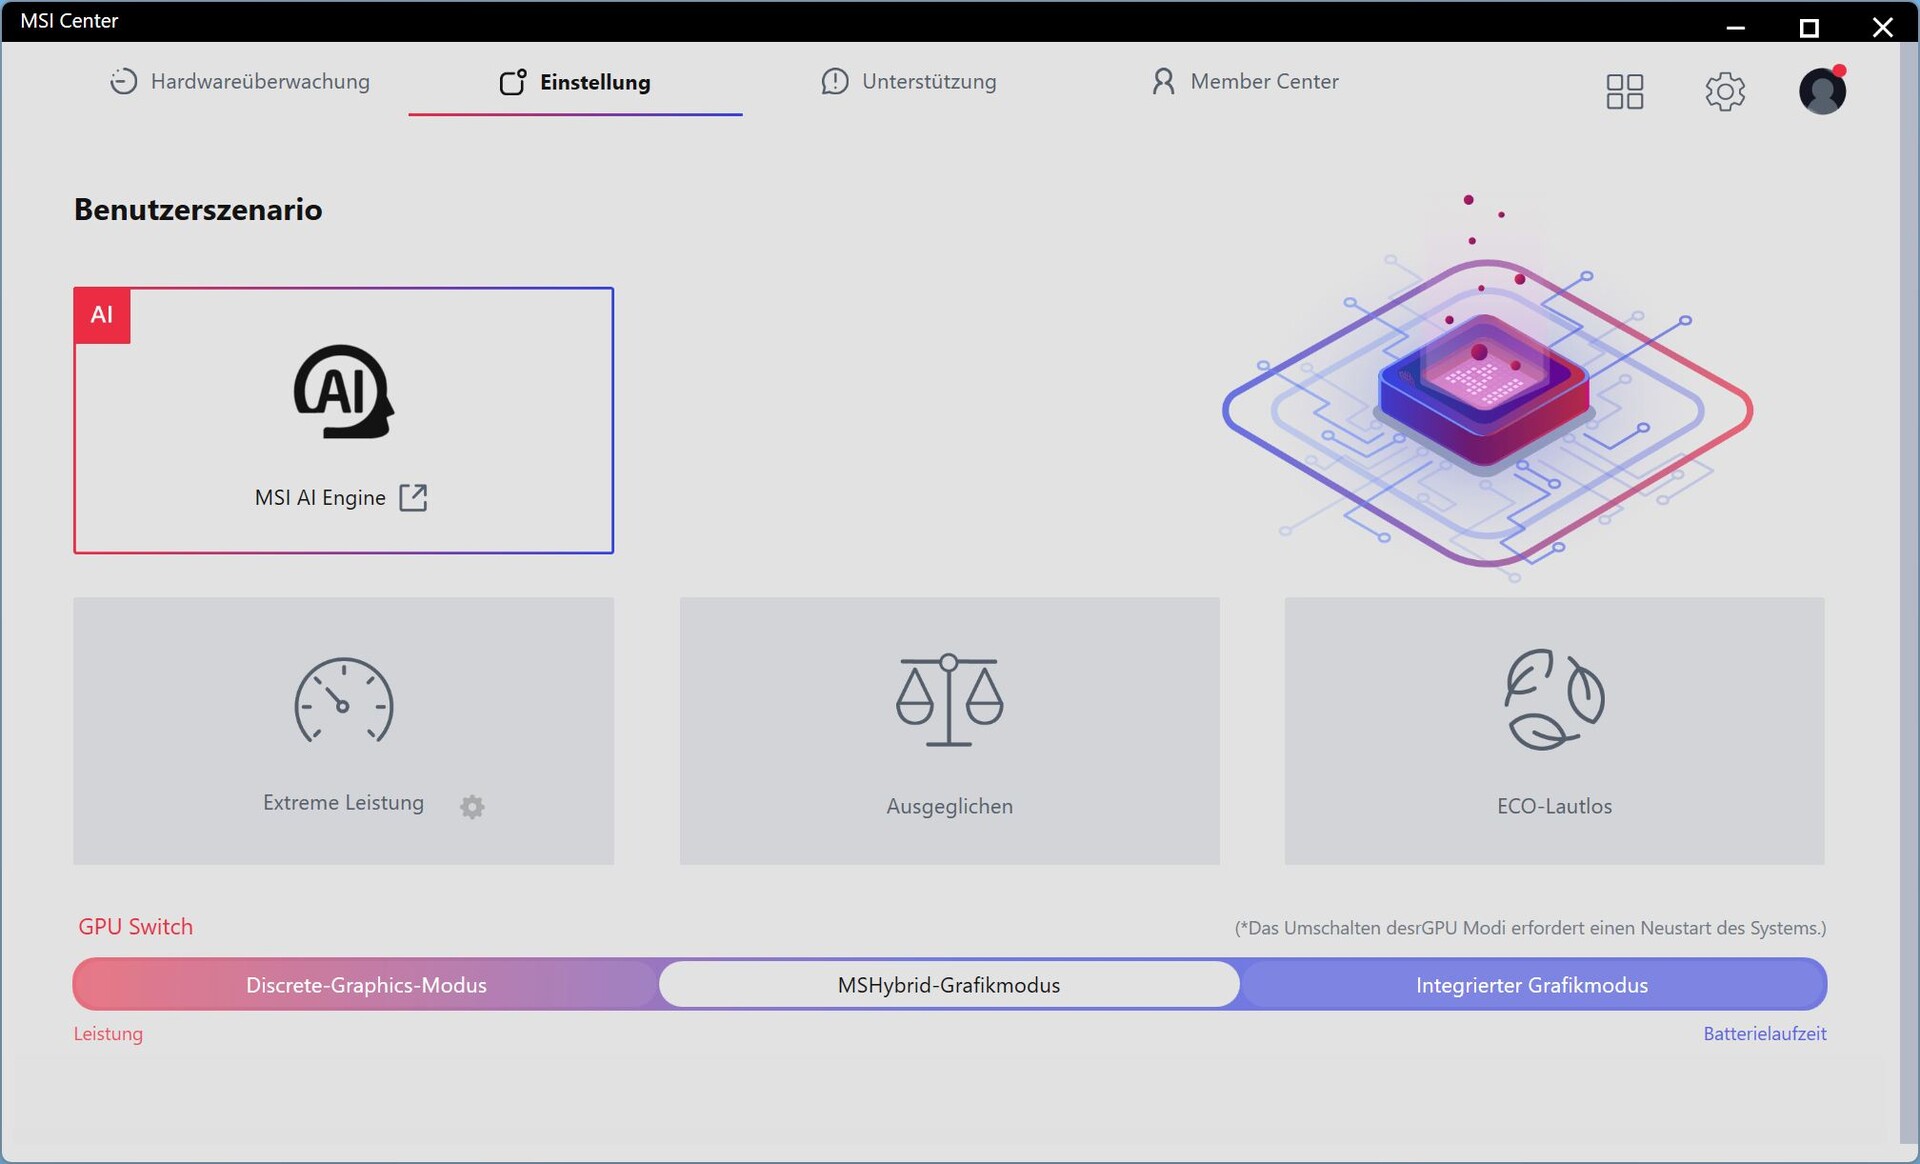
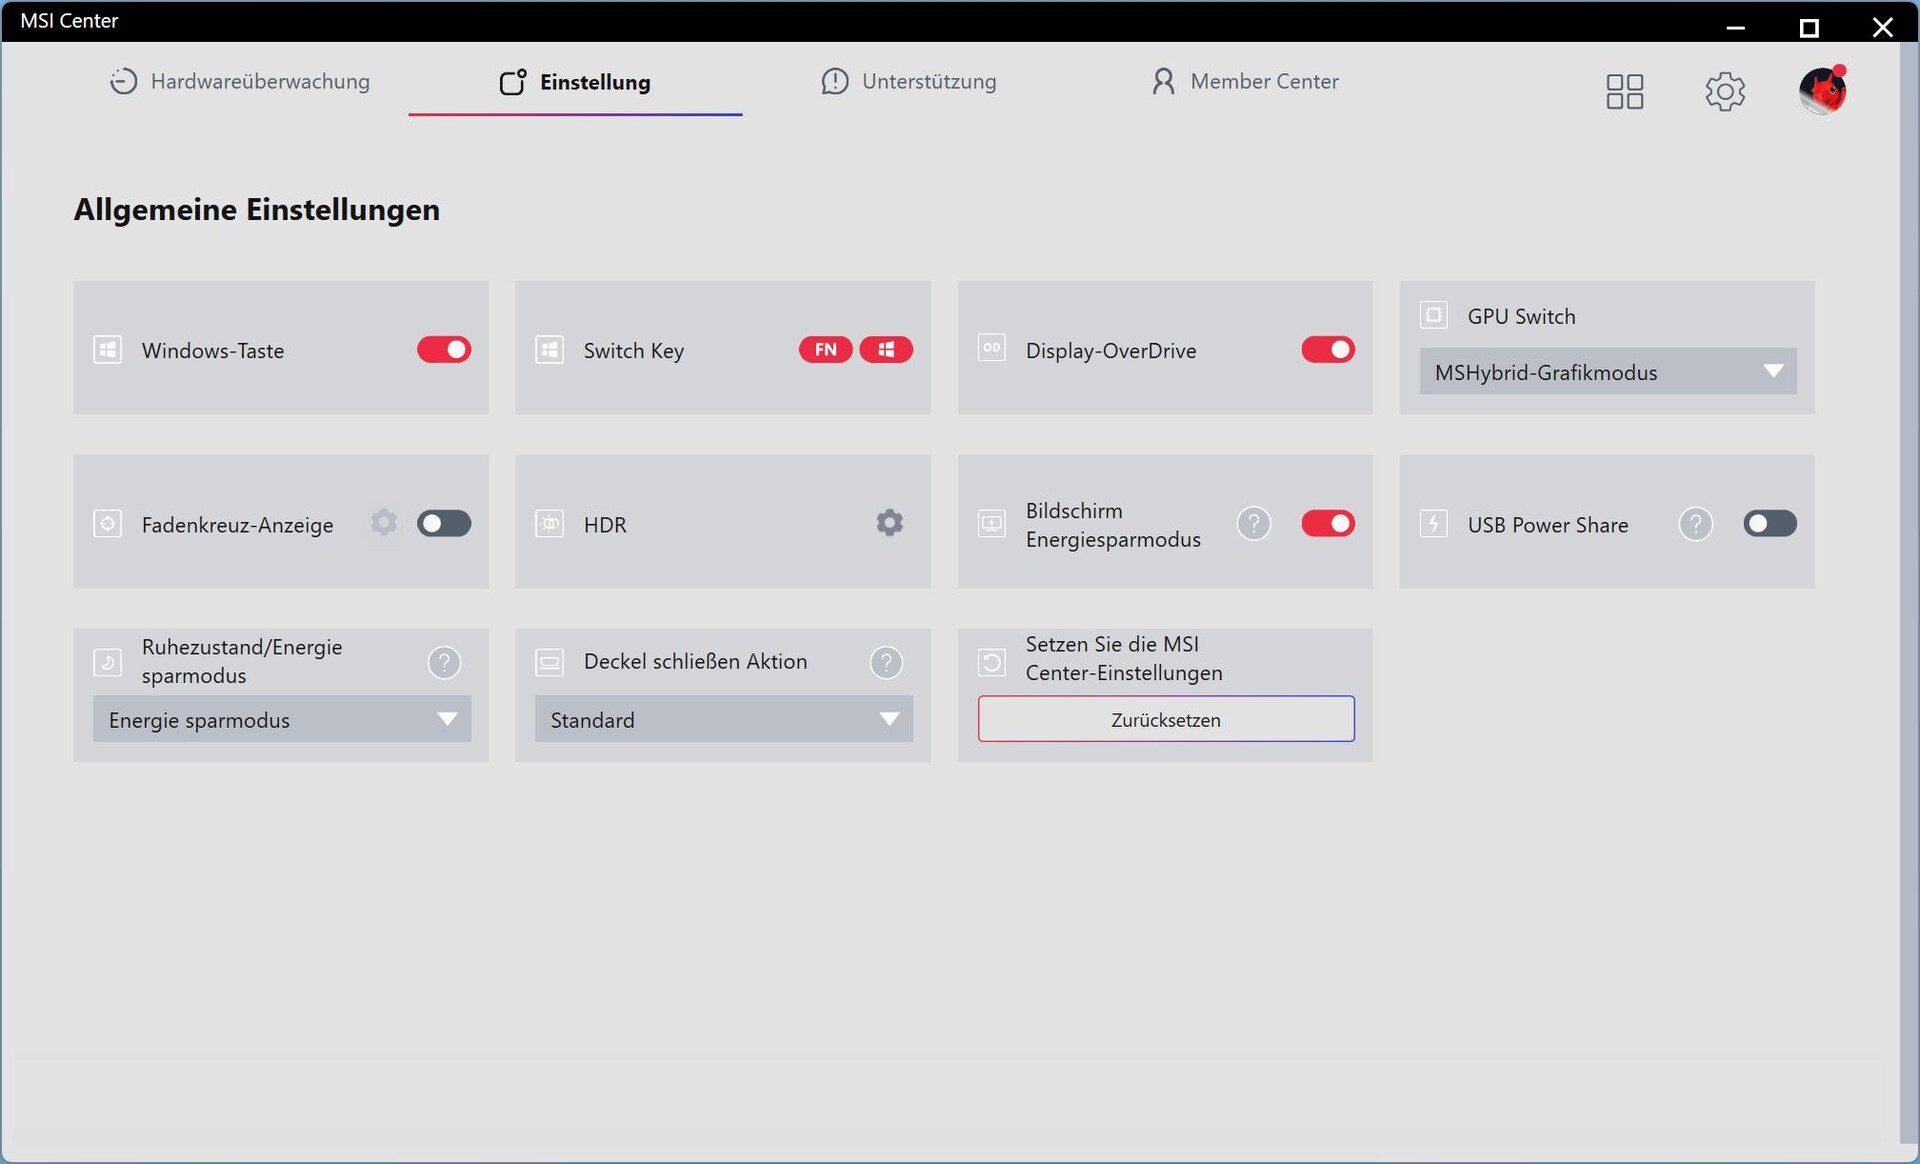
Of the four performance profiles, we select the AI engine; a MUX is also integrated in the MSI Center.
We originally had to contend with very high idle consumption of up to 60 W and excessive noise levels in the test. A BIOS and MSI Center update initially brought no improvement. The problem was only solved after the additional reinstallation of Windows. We had to carry out various measurements again.

| MSI Center Mode | MSI AI Engine | Extreme performance | Balanced | ECO Silent |
| Cyberpunk 2077 Noise in dB(A) | 60.35 | 60.35 | 47.4 | 36.21 |
| Power consumption Cyberpunk | 313 W | 313 W | 253 W | 134 W |
| GPU power consumption | 160 W | 160 W | 130 W | 80 W |
| Cyberpunk 2077 Performance (FHD/Ultra) | 134.6 fps | 134.5 fps | 123 fps | 78.4 fps |
| Cinebench R15 Multi Score | 5112 Points | 5430 Points | 4813 Points | 2019 Points |
| CPU PL1 | 110 watts | 150 watts | 65 watts | 20 watts |
| CPU PL2 | 150 watts | 150 watts | 110 watts | 25 watts |
Processor
The Core Ultra 9 275HX with 24 cores (8 P and 16 E cores, up to 5.4 GHz) is throttled under continuous load: it maintains a medium performance for 2 cycles, after which it drops more than 1,000 points. The long-term performance is therefore weaker than that of a Core Ultra 7 255HX. In Extreme Performance mode, however, the performance is stable.
Across all CPU tests, the Vector 17 HX is around 6 percent behind the average with the same CPU. Around 59 percent CPU performance is lost in battery mode.
Cinebench R15 Multi Endurance test
Cinebench R23: Multi Core | Single Core
Cinebench R20: CPU (Multi Core) | CPU (Single Core)
Cinebench R15: CPU Multi 64Bit | CPU Single 64Bit
Blender: v2.79 BMW27 CPU
7-Zip 18.03: 7z b 4 | 7z b 4 -mmt1
Geekbench 6.7: Multi-Core | Single-Core
Geekbench 5.5: Multi-Core | Single-Core
HWBOT x265 Benchmark v2.2: 4k Preset
LibreOffice : 20 Documents To PDF
R Benchmark 2.5: Overall mean
| CPU Performance rating | |
| Schenker XMG Neo 16 A25 5090 | |
| MSI Raider A18 HX A9WIG-080 | |
| MSI Titan 18 HX AI A2XWJG | |
| Aorus MASTER 16 AM6H | |
| Average Intel Core Ultra 9 275HX | |
| MSI Vector 17 HX AI A2XWIG | |
| Alienware 16 Area-51 | |
| Average of class Gaming | |
| Cinebench R23 / Multi Core | |
| MSI Titan 18 HX AI A2XWJG | |
| Schenker XMG Neo 16 A25 5090 | |
| MSI Raider A18 HX A9WIG-080 | |
| Aorus MASTER 16 AM6H | |
| Average Intel Core Ultra 9 275HX (30712 - 40970, n=31) | |
| MSI Vector 17 HX AI A2XWIG | |
| Alienware 16 Area-51 | |
| Average of class Gaming (10488 - 40970, n=106, last 2 years) | |
| Cinebench R23 / Single Core | |
| Aorus MASTER 16 AM6H | |
| Average Intel Core Ultra 9 275HX (2009 - 2267, n=31) | |
| MSI Titan 18 HX AI A2XWJG | |
| MSI Vector 17 HX AI A2XWIG | |
| Schenker XMG Neo 16 A25 5090 | |
| MSI Raider A18 HX A9WIG-080 | |
| Average of class Gaming (1166 - 2387, n=106, last 2 years) | |
| Alienware 16 Area-51 | |
| Cinebench R20 / CPU (Multi Core) | |
| MSI Titan 18 HX AI A2XWJG | |
| Schenker XMG Neo 16 A25 5090 | |
| MSI Raider A18 HX A9WIG-080 | |
| Aorus MASTER 16 AM6H | |
| Average Intel Core Ultra 9 275HX (12026 - 16108, n=30) | |
| Alienware 16 Area-51 | |
| MSI Vector 17 HX AI A2XWIG | |
| Average of class Gaming (4029 - 16108, n=105, last 2 years) | |
| Cinebench R20 / CPU (Single Core) | |
| Aorus MASTER 16 AM6H | |
| MSI Raider A18 HX A9WIG-080 | |
| Schenker XMG Neo 16 A25 5090 | |
| Average Intel Core Ultra 9 275HX (774 - 870, n=30) | |
| MSI Titan 18 HX AI A2XWJG | |
| MSI Vector 17 HX AI A2XWIG | |
| Average of class Gaming (442 - 904, n=105, last 2 years) | |
| Alienware 16 Area-51 | |
| Cinebench R15 / CPU Multi 64Bit | |
| MSI Titan 18 HX AI A2XWJG | |
| Schenker XMG Neo 16 A25 5090 | |
| MSI Raider A18 HX A9WIG-080 | |
| Aorus MASTER 16 AM6H | |
| Average Intel Core Ultra 9 275HX (4737 - 6271, n=30) | |
| MSI Vector 17 HX AI A2XWIG | |
| Alienware 16 Area-51 | |
| Average of class Gaming (1578 - 6271, n=104, last 2 years) | |
| Cinebench R15 / CPU Single 64Bit | |
| MSI Vector 17 HX AI A2XWIG | |
| MSI Vector 17 HX AI A2XWIG | |
| Schenker XMG Neo 16 A25 5090 | |
| Aorus MASTER 16 AM6H | |
| Average Intel Core Ultra 9 275HX (306 - 343, n=31) | |
| MSI Titan 18 HX AI A2XWJG | |
| MSI Raider A18 HX A9WIG-080 | |
| Alienware 16 Area-51 | |
| Average of class Gaming (188.8 - 344, n=105, last 2 years) | |
| Blender / v2.79 BMW27 CPU | |
| Average of class Gaming (80 - 330, n=103, last 2 years) | |
| MSI Vector 17 HX AI A2XWIG | |
| Alienware 16 Area-51 | |
| Average Intel Core Ultra 9 275HX (82 - 116, n=29) | |
| Aorus MASTER 16 AM6H | |
| MSI Titan 18 HX AI A2XWJG | |
| MSI Raider A18 HX A9WIG-080 | |
| Schenker XMG Neo 16 A25 5090 | |
| 7-Zip 18.03 / 7z b 4 | |
| Schenker XMG Neo 16 A25 5090 | |
| MSI Raider A18 HX A9WIG-080 | |
| MSI Titan 18 HX AI A2XWJG | |
| Average Intel Core Ultra 9 275HX (98236 - 124155, n=30) | |
| Aorus MASTER 16 AM6H | |
| Alienware 16 Area-51 | |
| MSI Vector 17 HX AI A2XWIG | |
| Average of class Gaming (33491 - 148086, n=104, last 2 years) | |
| 7-Zip 18.03 / 7z b 4 -mmt1 | |
| Schenker XMG Neo 16 A25 5090 | |
| MSI Raider A18 HX A9WIG-080 | |
| MSI Titan 18 HX AI A2XWJG | |
| Average Intel Core Ultra 9 275HX (6026 - 7149, n=30) | |
| Aorus MASTER 16 AM6H | |
| MSI Vector 17 HX AI A2XWIG | |
| Average of class Gaming (4199 - 7436, n=104, last 2 years) | |
| Alienware 16 Area-51 | |
| Geekbench 6.7 / Multi-Core | |
| MSI Titan 18 HX AI A2XWJG | |
| Schenker XMG Neo 16 A25 5090 | |
| MSI Raider A18 HX A9WIG-080 | |
| Average Intel Core Ultra 9 275HX (16033 - 21668, n=33) | |
| Aorus MASTER 16 AM6H | |
| MSI Vector 17 HX AI A2XWIG | |
| Alienware 16 Area-51 | |
| Average of class Gaming (6625 - 22104, n=105, last 2 years) | |
| Geekbench 6.7 / Single-Core | |
| Schenker XMG Neo 16 A25 5090 | |
| MSI Raider A18 HX A9WIG-080 | |
| MSI Vector 17 HX AI A2XWIG | |
| MSI Titan 18 HX AI A2XWJG | |
| Aorus MASTER 16 AM6H | |
| Average Intel Core Ultra 9 275HX (2843 - 3160, n=33) | |
| Alienware 16 Area-51 | |
| Average of class Gaming (1490 - 3259, n=105, last 2 years) | |
| Geekbench 5.5 / Multi-Core | |
| MSI Titan 18 HX AI A2XWJG | |
| Schenker XMG Neo 16 A25 5090 | |
| MSI Raider A18 HX A9WIG-080 | |
| Average Intel Core Ultra 9 275HX (19105 - 25855, n=31) | |
| Aorus MASTER 16 AM6H | |
| Alienware 16 Area-51 | |
| MSI Vector 17 HX AI A2XWIG | |
| Average of class Gaming (6460 - 27010, n=104, last 2 years) | |
| Geekbench 5.5 / Single-Core | |
| MSI Raider A18 HX A9WIG-080 | |
| Schenker XMG Neo 16 A25 5090 | |
| MSI Titan 18 HX AI A2XWJG | |
| MSI Vector 17 HX AI A2XWIG | |
| Aorus MASTER 16 AM6H | |
| Average Intel Core Ultra 9 275HX (2033 - 2292, n=31) | |
| Alienware 16 Area-51 | |
| Average of class Gaming (986 - 2474, n=104, last 2 years) | |
| HWBOT x265 Benchmark v2.2 / 4k Preset | |
| MSI Titan 18 HX AI A2XWJG | |
| MSI Raider A18 HX A9WIG-080 | |
| Schenker XMG Neo 16 A25 5090 | |
| Average Intel Core Ultra 9 275HX (30.7 - 43.8, n=30) | |
| Aorus MASTER 16 AM6H | |
| MSI Vector 17 HX AI A2XWIG | |
| Alienware 16 Area-51 | |
| Average of class Gaming (11.5 - 44.3, n=104, last 2 years) | |
| LibreOffice / 20 Documents To PDF | |
| Average of class Gaming (33.2 - 88.8, n=104, last 2 years) | |
| MSI Titan 18 HX AI A2XWJG | |
| Schenker XMG Neo 16 A25 5090 | |
| MSI Raider A18 HX A9WIG-080 | |
| Average Intel Core Ultra 9 275HX (33.2 - 62.1, n=30) | |
| Aorus MASTER 16 AM6H | |
| MSI Vector 17 HX AI A2XWIG | |
| Alienware 16 Area-51 | |
| R Benchmark 2.5 / Overall mean | |
| Aorus MASTER 16 AM6H | |
| Alienware 16 Area-51 | |
| Average of class Gaming (0.3439 - 0.759, n=105, last 2 years) | |
| Average Intel Core Ultra 9 275HX (0.3943 - 0.4568, n=30) | |
| MSI Vector 17 HX AI A2XWIG | |
| MSI Titan 18 HX AI A2XWJG | |
| MSI Raider A18 HX A9WIG-080 | |
| Schenker XMG Neo 16 A25 5090 | |
* ... smaller is better
AIDA64: FP32 Ray-Trace | FPU Julia | CPU SHA3 | CPU Queen | FPU SinJulia | FPU Mandel | CPU AES | CPU ZLib | FP64 Ray-Trace | CPU PhotoWorxx
| Performance rating | |
| Schenker XMG Neo 16 E25 RTX 5090 Laptop | |
| Medion Erazer Beast 16 X1 Ultimate | |
| Aorus MASTER 16 AM6H | |
| Lenovo Legion 5 Pro 16IAX10H | |
| Average Intel Core Ultra 9 275HX | |
| Alienware 16 Area-51 | |
| Average of class Gaming | |
| MSI Vector 17 HX AI A2XWIG | |
| MSI Vector 16 HX AI A2XWHG | |
| AIDA64 / FP32 Ray-Trace | |
| Schenker XMG Neo 16 E25 RTX 5090 Laptop | |
| Medion Erazer Beast 16 X1 Ultimate | |
| Aorus MASTER 16 AM6H | |
| Average Intel Core Ultra 9 275HX (28039 - 39895, n=30) | |
| Lenovo Legion 5 Pro 16IAX10H | |
| Alienware 16 Area-51 | |
| Average of class Gaming (10227 - 85542, n=103, last 2 years) | |
| MSI Vector 17 HX AI A2XWIG | |
| MSI Vector 16 HX AI A2XWHG | |
| AIDA64 / FPU Julia | |
| Schenker XMG Neo 16 E25 RTX 5090 Laptop | |
| Medion Erazer Beast 16 X1 Ultimate | |
| Aorus MASTER 16 AM6H | |
| Lenovo Legion 5 Pro 16IAX10H | |
| Average Intel Core Ultra 9 275HX (140254 - 200744, n=30) | |
| Alienware 16 Area-51 | |
| MSI Vector 17 HX AI A2XWIG | |
| MSI Vector 16 HX AI A2XWHG | |
| Average of class Gaming (51376 - 238426, n=103, last 2 years) | |
| AIDA64 / CPU SHA3 | |
| Schenker XMG Neo 16 E25 RTX 5090 Laptop | |
| Medion Erazer Beast 16 X1 Ultimate | |
| Aorus MASTER 16 AM6H | |
| Average Intel Core Ultra 9 275HX (6710 - 9817, n=30) | |
| Lenovo Legion 5 Pro 16IAX10H | |
| Alienware 16 Area-51 | |
| MSI Vector 17 HX AI A2XWIG | |
| MSI Vector 16 HX AI A2XWHG | |
| Average of class Gaming (2180 - 9817, n=103, last 2 years) | |
| AIDA64 / CPU Queen | |
| Schenker XMG Neo 16 E25 RTX 5090 Laptop | |
| Medion Erazer Beast 16 X1 Ultimate | |
| Lenovo Legion 5 Pro 16IAX10H | |
| Aorus MASTER 16 AM6H | |
| Average Intel Core Ultra 9 275HX (113887 - 140937, n=30) | |
| Alienware 16 Area-51 | |
| MSI Vector 17 HX AI A2XWIG | |
| Average of class Gaming (49785 - 173351, n=89, last 2 years) | |
| MSI Vector 16 HX AI A2XWHG | |
| AIDA64 / FPU SinJulia | |
| Average of class Gaming (4424 - 33636, n=103, last 2 years) | |
| Medion Erazer Beast 16 X1 Ultimate | |
| Schenker XMG Neo 16 E25 RTX 5090 Laptop | |
| Lenovo Legion 5 Pro 16IAX10H | |
| Alienware 16 Area-51 | |
| Aorus MASTER 16 AM6H | |
| Average Intel Core Ultra 9 275HX (11172 - 14425, n=30) | |
| MSI Vector 17 HX AI A2XWIG | |
| MSI Vector 16 HX AI A2XWHG | |
| AIDA64 / FPU Mandel | |
| Schenker XMG Neo 16 E25 RTX 5090 Laptop | |
| Aorus MASTER 16 AM6H | |
| Medion Erazer Beast 16 X1 Ultimate | |
| Average Intel Core Ultra 9 275HX (72596 - 104508, n=30) | |
| Lenovo Legion 5 Pro 16IAX10H | |
| Alienware 16 Area-51 | |
| MSI Vector 17 HX AI A2XWIG | |
| MSI Vector 16 HX AI A2XWHG | |
| Average of class Gaming (25115 - 128721, n=103, last 2 years) | |
| AIDA64 / CPU AES | |
| Schenker XMG Neo 16 E25 RTX 5090 Laptop | |
| Medion Erazer Beast 16 X1 Ultimate | |
| Lenovo Legion 5 Pro 16IAX10H | |
| Average Intel Core Ultra 9 275HX (105608 - 247074, n=30) | |
| Alienware 16 Area-51 | |
| Aorus MASTER 16 AM6H | |
| Average of class Gaming (39258 - 247074, n=103, last 2 years) | |
| MSI Vector 17 HX AI A2XWIG | |
| MSI Vector 16 HX AI A2XWHG | |
| AIDA64 / CPU ZLib | |
| Schenker XMG Neo 16 E25 RTX 5090 Laptop | |
| Medion Erazer Beast 16 X1 Ultimate | |
| Lenovo Legion 5 Pro 16IAX10H | |
| Aorus MASTER 16 AM6H | |
| Average Intel Core Ultra 9 275HX (1582 - 2263, n=30) | |
| Alienware 16 Area-51 | |
| MSI Vector 17 HX AI A2XWIG | |
| Average of class Gaming (574 - 2531, n=103, last 2 years) | |
| MSI Vector 16 HX AI A2XWHG | |
| AIDA64 / FP64 Ray-Trace | |
| Schenker XMG Neo 16 E25 RTX 5090 Laptop | |
| Medion Erazer Beast 16 X1 Ultimate | |
| Aorus MASTER 16 AM6H | |
| Average Intel Core Ultra 9 275HX (14847 - 21854, n=30) | |
| Lenovo Legion 5 Pro 16IAX10H | |
| Alienware 16 Area-51 | |
| Average of class Gaming (5509 - 45446, n=103, last 2 years) | |
| MSI Vector 16 HX AI A2XWHG | |
| MSI Vector 17 HX AI A2XWIG | |
| AIDA64 / CPU PhotoWorxx | |
| Schenker XMG Neo 16 E25 RTX 5090 Laptop | |
| Alienware 16 Area-51 | |
| Average Intel Core Ultra 9 275HX (37482 - 62916, n=30) | |
| Lenovo Legion 5 Pro 16IAX10H | |
| Medion Erazer Beast 16 X1 Ultimate | |
| MSI Vector 17 HX AI A2XWIG | |
| Aorus MASTER 16 AM6H | |
| Average of class Gaming (12271 - 89891, n=103, last 2 years) | |
| MSI Vector 16 HX AI A2XWHG | |
System performance
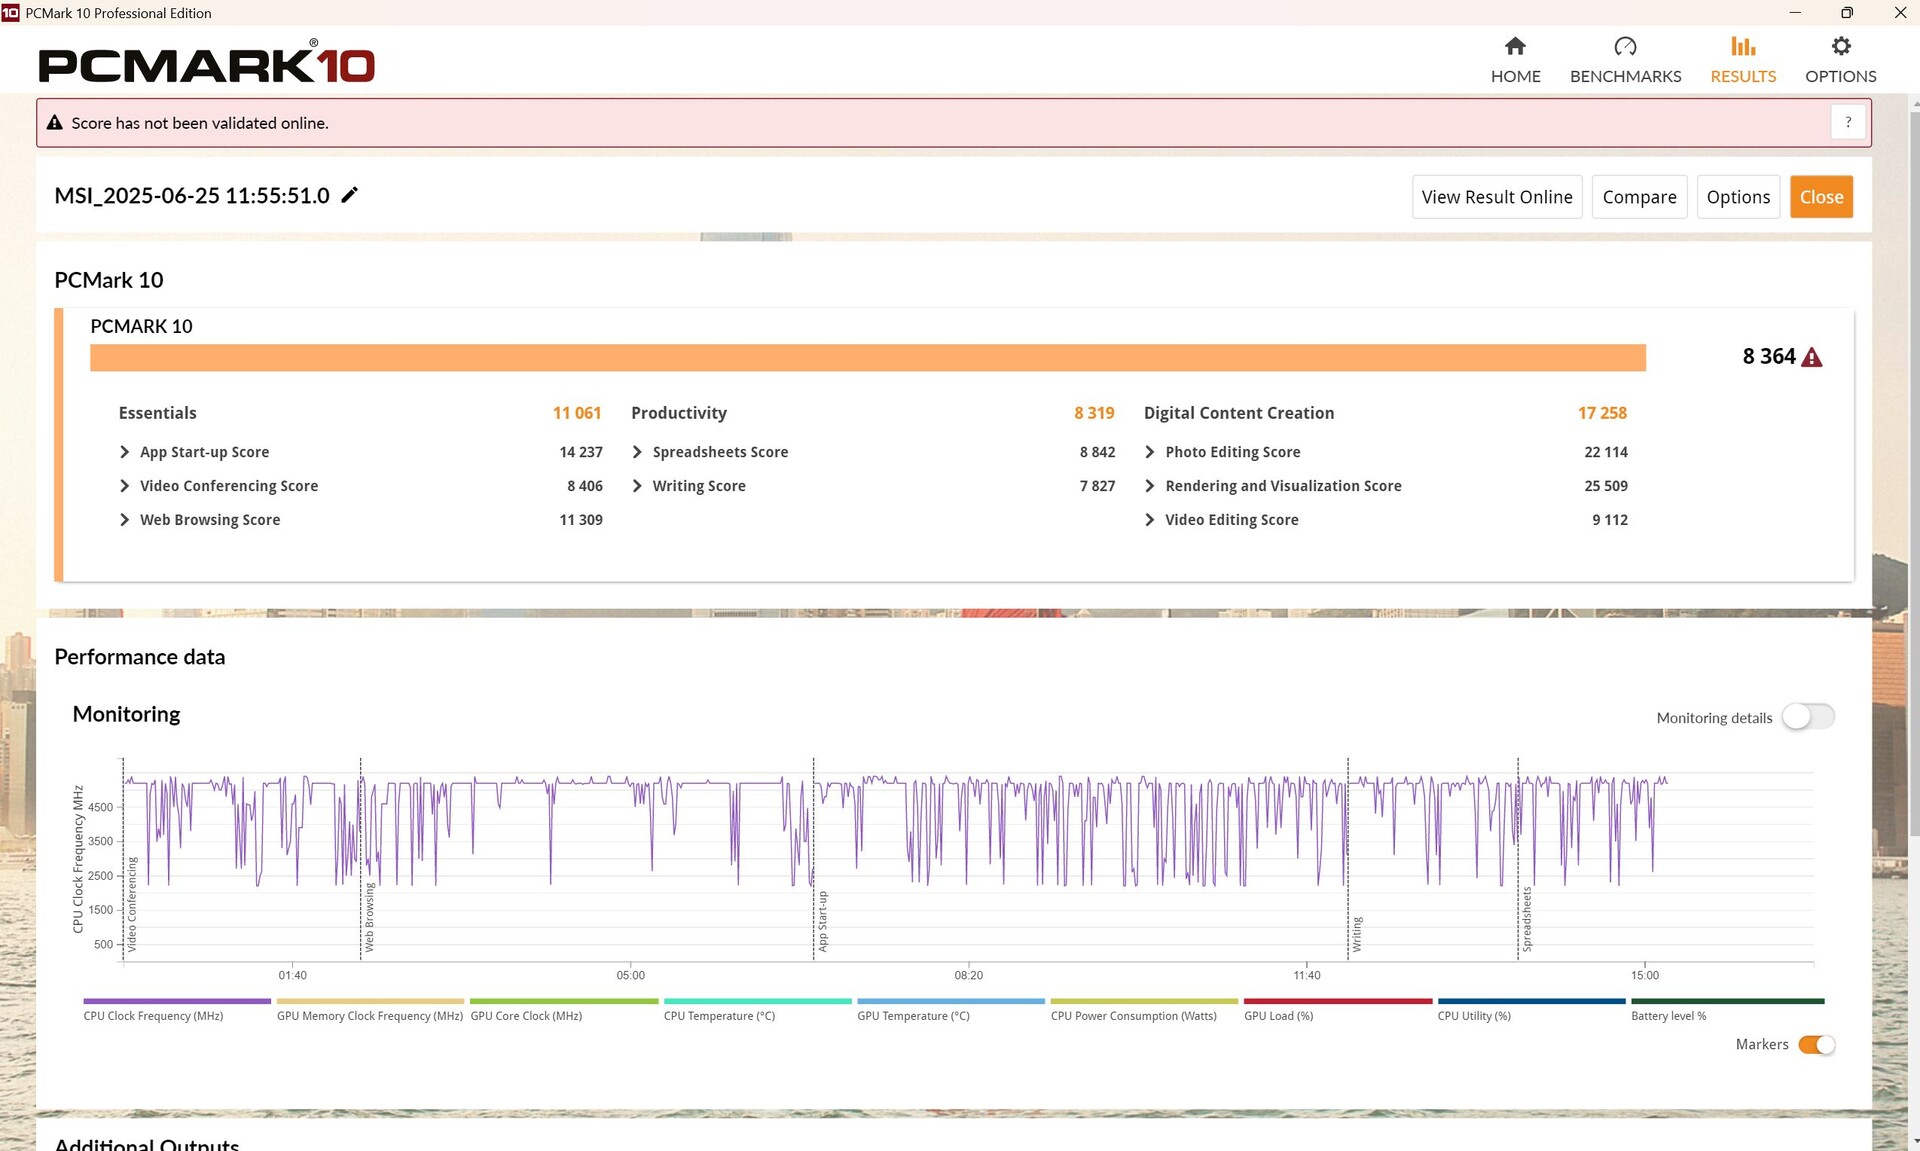
The Vector 17 performs slightly below average in PCMark 10, but slightly above average in CrossMark, so that we see an overall performance at the expected level.
PCMark 10: Score | Essentials | Productivity | Digital Content Creation
CrossMark: Overall | Productivity | Creativity | Responsiveness
WebXPRT 3: Overall
WebXPRT 4: Overall
Mozilla Kraken 1.1: Total
| Performance rating | |
| MSI Raider A18 HX A9WIG-080 | |
| Lenovo Legion 5 Pro 16IAX10H | |
| Alienware 16 Area-51 | |
| Average Intel Core Ultra 9 275HX, NVIDIA GeForce RTX 5080 Laptop | |
| Lenovo Legion Pro 7i 16 Gen 10 | |
| MSI Vector 17 HX AI A2XWIG | |
| Average of class Gaming | |
| Medion Erazer Beast 18 X1 MD62731 | |
| MSI Vector 16 HX AI A2XWHG | |
| PCMark 10 / Score | |
| Lenovo Legion Pro 7i 16 Gen 10 | |
| MSI Raider A18 HX A9WIG-080 | |
| Alienware 16 Area-51 | |
| Average Intel Core Ultra 9 275HX, NVIDIA GeForce RTX 5080 Laptop (7805 - 10409, n=9) | |
| Average of class Gaming (5828 - 11730, n=92, last 2 years) | |
| Medion Erazer Beast 18 X1 MD62731 | |
| MSI Vector 17 HX AI A2XWIG | |
| Lenovo Legion 5 Pro 16IAX10H | |
| MSI Vector 16 HX AI A2XWHG | |
| PCMark 10 / Essentials | |
| MSI Raider A18 HX A9WIG-080 | |
| Lenovo Legion Pro 7i 16 Gen 10 | |
| Alienware 16 Area-51 | |
| MSI Vector 17 HX AI A2XWIG | |
| Average Intel Core Ultra 9 275HX, NVIDIA GeForce RTX 5080 Laptop (10206 - 11472, n=9) | |
| Lenovo Legion 5 Pro 16IAX10H | |
| MSI Vector 16 HX AI A2XWHG | |
| Average of class Gaming (8810 - 11935, n=96, last 2 years) | |
| Medion Erazer Beast 18 X1 MD62731 | |
| PCMark 10 / Productivity | |
| Average of class Gaming (6845 - 21327, n=94, last 2 years) | |
| MSI Raider A18 HX A9WIG-080 | |
| Average Intel Core Ultra 9 275HX, NVIDIA GeForce RTX 5080 Laptop (8319 - 20616, n=9) | |
| Medion Erazer Beast 18 X1 MD62731 | |
| Lenovo Legion 5 Pro 16IAX10H | |
| Lenovo Legion Pro 7i 16 Gen 10 | |
| MSI Vector 16 HX AI A2XWHG | |
| Alienware 16 Area-51 | |
| MSI Vector 17 HX AI A2XWIG | |
| PCMark 10 / Digital Content Creation | |
| Lenovo Legion Pro 7i 16 Gen 10 | |
| Alienware 16 Area-51 | |
| MSI Vector 17 HX AI A2XWIG | |
| Average Intel Core Ultra 9 275HX, NVIDIA GeForce RTX 5080 Laptop (10505 - 19351, n=9) | |
| Medion Erazer Beast 18 X1 MD62731 | |
| Lenovo Legion 5 Pro 16IAX10H | |
| MSI Raider A18 HX A9WIG-080 | |
| Average of class Gaming (7602 - 19954, n=94, last 2 years) | |
| MSI Vector 16 HX AI A2XWHG | |
| CrossMark / Overall | |
| MSI Raider A18 HX A9WIG-080 | |
| MSI Vector 17 HX AI A2XWIG | |
| Lenovo Legion 5 Pro 16IAX10H | |
| Alienware 16 Area-51 | |
| Average Intel Core Ultra 9 275HX, NVIDIA GeForce RTX 5080 Laptop (1857 - 2244, n=9) | |
| Lenovo Legion Pro 7i 16 Gen 10 | |
| Average of class Gaming (1366 - 2409, n=93, last 2 years) | |
| MSI Vector 16 HX AI A2XWHG | |
| Medion Erazer Beast 18 X1 MD62731 | |
| CrossMark / Productivity | |
| MSI Vector 17 HX AI A2XWIG | |
| Lenovo Legion 5 Pro 16IAX10H | |
| Alienware 16 Area-51 | |
| MSI Raider A18 HX A9WIG-080 | |
| Average Intel Core Ultra 9 275HX, NVIDIA GeForce RTX 5080 Laptop (1764 - 2122, n=9) | |
| Lenovo Legion Pro 7i 16 Gen 10 | |
| Average of class Gaming (1386 - 2254, n=93, last 2 years) | |
| MSI Vector 16 HX AI A2XWHG | |
| Medion Erazer Beast 18 X1 MD62731 | |
| CrossMark / Creativity | |
| MSI Raider A18 HX A9WIG-080 | |
| Lenovo Legion 5 Pro 16IAX10H | |
| MSI Vector 17 HX AI A2XWIG | |
| Alienware 16 Area-51 | |
| Average Intel Core Ultra 9 275HX, NVIDIA GeForce RTX 5080 Laptop (2115 - 2498, n=9) | |
| Lenovo Legion Pro 7i 16 Gen 10 | |
| MSI Vector 16 HX AI A2XWHG | |
| Average of class Gaming (1343 - 2729, n=93, last 2 years) | |
| Medion Erazer Beast 18 X1 MD62731 | |
| CrossMark / Responsiveness | |
| Alienware 16 Area-51 | |
| MSI Vector 17 HX AI A2XWIG | |
| Lenovo Legion 5 Pro 16IAX10H | |
| Average Intel Core Ultra 9 275HX, NVIDIA GeForce RTX 5080 Laptop (1466 - 2096, n=9) | |
| MSI Raider A18 HX A9WIG-080 | |
| Average of class Gaming (1226 - 2334, n=93, last 2 years) | |
| Lenovo Legion Pro 7i 16 Gen 10 | |
| MSI Vector 16 HX AI A2XWHG | |
| Medion Erazer Beast 18 X1 MD62731 | |
| WebXPRT 3 / Overall | |
| Lenovo Legion 5 Pro 16IAX10H | |
| MSI Raider A18 HX A9WIG-080 | |
| Lenovo Legion Pro 7i 16 Gen 10 | |
| Alienware 16 Area-51 | |
| Average Intel Core Ultra 9 275HX, NVIDIA GeForce RTX 5080 Laptop (306 - 378, n=9) | |
| Medion Erazer Beast 18 X1 MD62731 | |
| MSI Vector 17 HX AI A2XWIG | |
| MSI Vector 16 HX AI A2XWHG | |
| Average of class Gaming (220 - 532, n=97, last 2 years) | |
| WebXPRT 4 / Overall | |
| MSI Vector 17 HX AI A2XWIG | |
| Lenovo Legion Pro 7i 16 Gen 10 | |
| MSI Raider A18 HX A9WIG-080 | |
| Alienware 16 Area-51 | |
| Lenovo Legion 5 Pro 16IAX10H | |
| Medion Erazer Beast 18 X1 MD62731 | |
| Average Intel Core Ultra 9 275HX, NVIDIA GeForce RTX 5080 Laptop (285 - 336, n=9) | |
| MSI Vector 16 HX AI A2XWHG | |
| Average of class Gaming (165 - 354, n=97, last 2 years) | |
| Mozilla Kraken 1.1 / Total | |
| Average of class Gaming (391 - 590, n=99, last 2 years) | |
| MSI Vector 16 HX AI A2XWHG | |
| MSI Vector 17 HX AI A2XWIG | |
| Medion Erazer Beast 18 X1 MD62731 | |
| Average Intel Core Ultra 9 275HX, NVIDIA GeForce RTX 5080 Laptop (405 - 432, n=9) | |
| Lenovo Legion 5 Pro 16IAX10H | |
| Alienware 16 Area-51 | |
| Lenovo Legion Pro 7i 16 Gen 10 | |
| MSI Raider A18 HX A9WIG-080 | |
* ... smaller is better
| PCMark 10 Score | 8364 points | |
Help | ||
| AIDA64 / Memory Copy | |
| Alienware 16 Area-51 | |
| Lenovo Legion Pro 7i 16 Gen 10 | |
| Average Intel Core Ultra 9 275HX (56003 - 94460, n=30) | |
| Lenovo Legion 5 Pro 16IAX10H | |
| MSI Vector 17 HX AI A2XWIG | |
| Medion Erazer Beast 18 X1 MD62731 | |
| Average of class Gaming (21750 - 129946, n=103, last 2 years) | |
| MSI Vector 16 HX AI A2XWHG | |
| MSI Raider A18 HX A9WIG-080 | |
| AIDA64 / Memory Read | |
| Lenovo Legion Pro 7i 16 Gen 10 | |
| Alienware 16 Area-51 | |
| Lenovo Legion 5 Pro 16IAX10H | |
| Medion Erazer Beast 18 X1 MD62731 | |
| MSI Vector 17 HX AI A2XWIG | |
| Average Intel Core Ultra 9 275HX (55795 - 97151, n=30) | |
| MSI Vector 16 HX AI A2XWHG | |
| Average of class Gaming (22956 - 118858, n=103, last 2 years) | |
| MSI Raider A18 HX A9WIG-080 | |
| AIDA64 / Memory Write | |
| Lenovo Legion Pro 7i 16 Gen 10 | |
| Alienware 16 Area-51 | |
| Average Intel Core Ultra 9 275HX (55663 - 116129, n=30) | |
| Lenovo Legion 5 Pro 16IAX10H | |
| Medion Erazer Beast 18 X1 MD62731 | |
| MSI Vector 17 HX AI A2XWIG | |
| Average of class Gaming (22297 - 135096, n=103, last 2 years) | |
| MSI Vector 16 HX AI A2XWHG | |
| MSI Raider A18 HX A9WIG-080 | |
| AIDA64 / Memory Latency | |
| Alienware 16 Area-51 | |
| Average Intel Core Ultra 9 275HX (105.8 - 161.6, n=30) | |
| MSI Vector 17 HX AI A2XWIG | |
| Lenovo Legion 5 Pro 16IAX10H | |
| Medion Erazer Beast 18 X1 MD62731 | |
| Lenovo Legion Pro 7i 16 Gen 10 | |
| Average of class Gaming (75.3 - 259, n=103, last 2 years) | |
| MSI Vector 16 HX AI A2XWHG | |
| MSI Raider A18 HX A9WIG-080 | |
* ... smaller is better
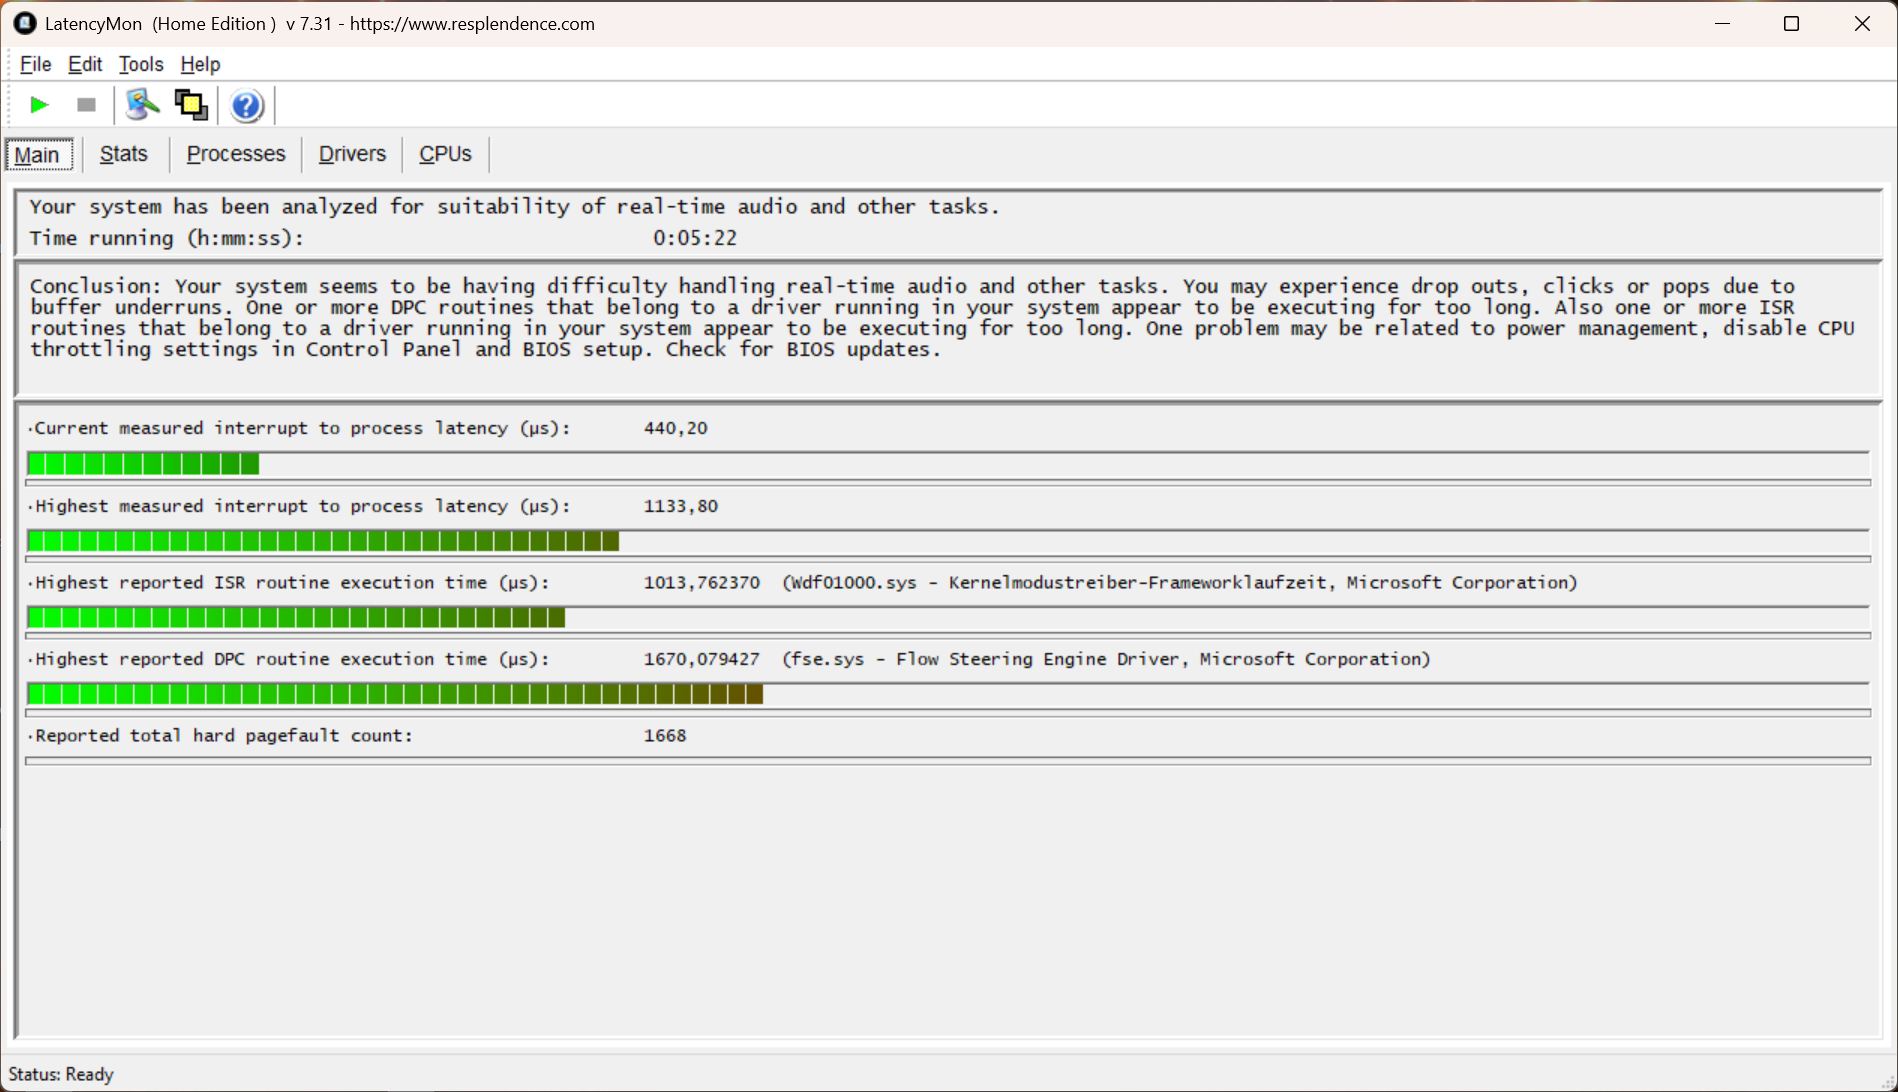
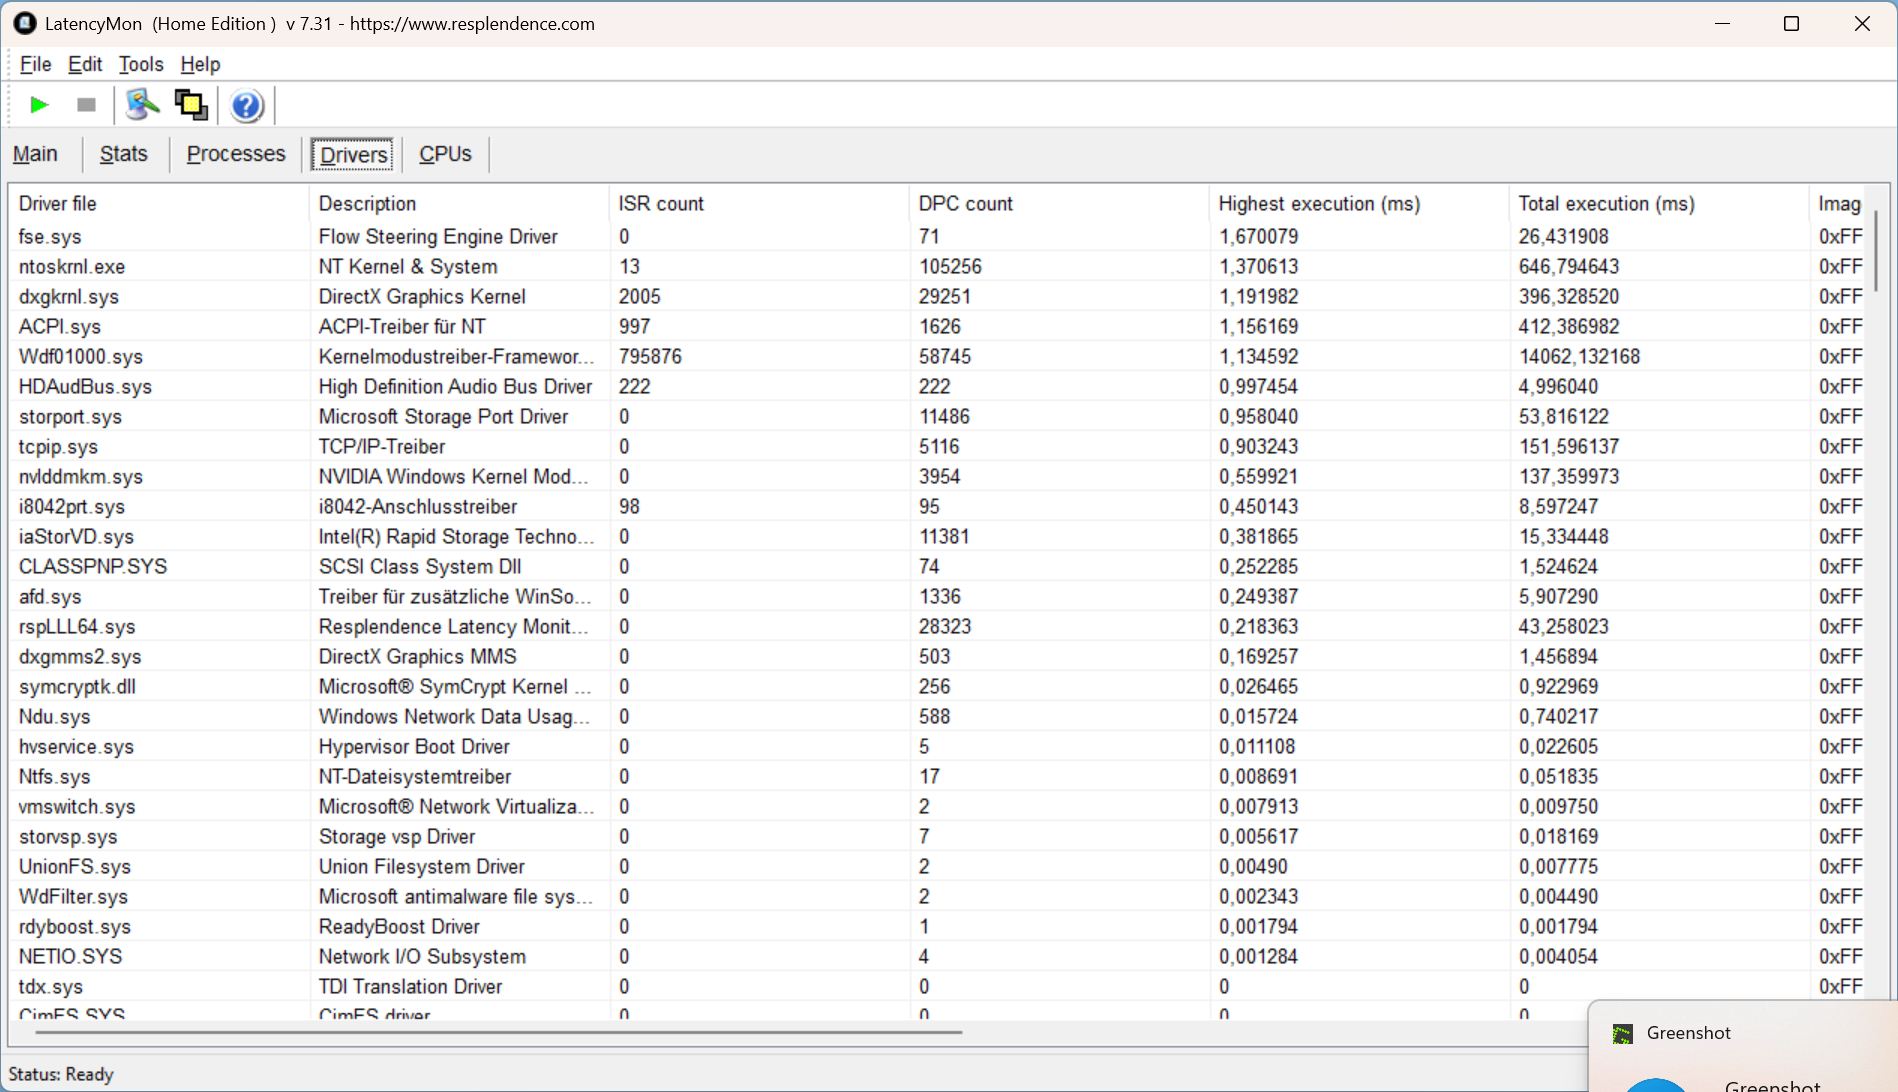
DPC latencies
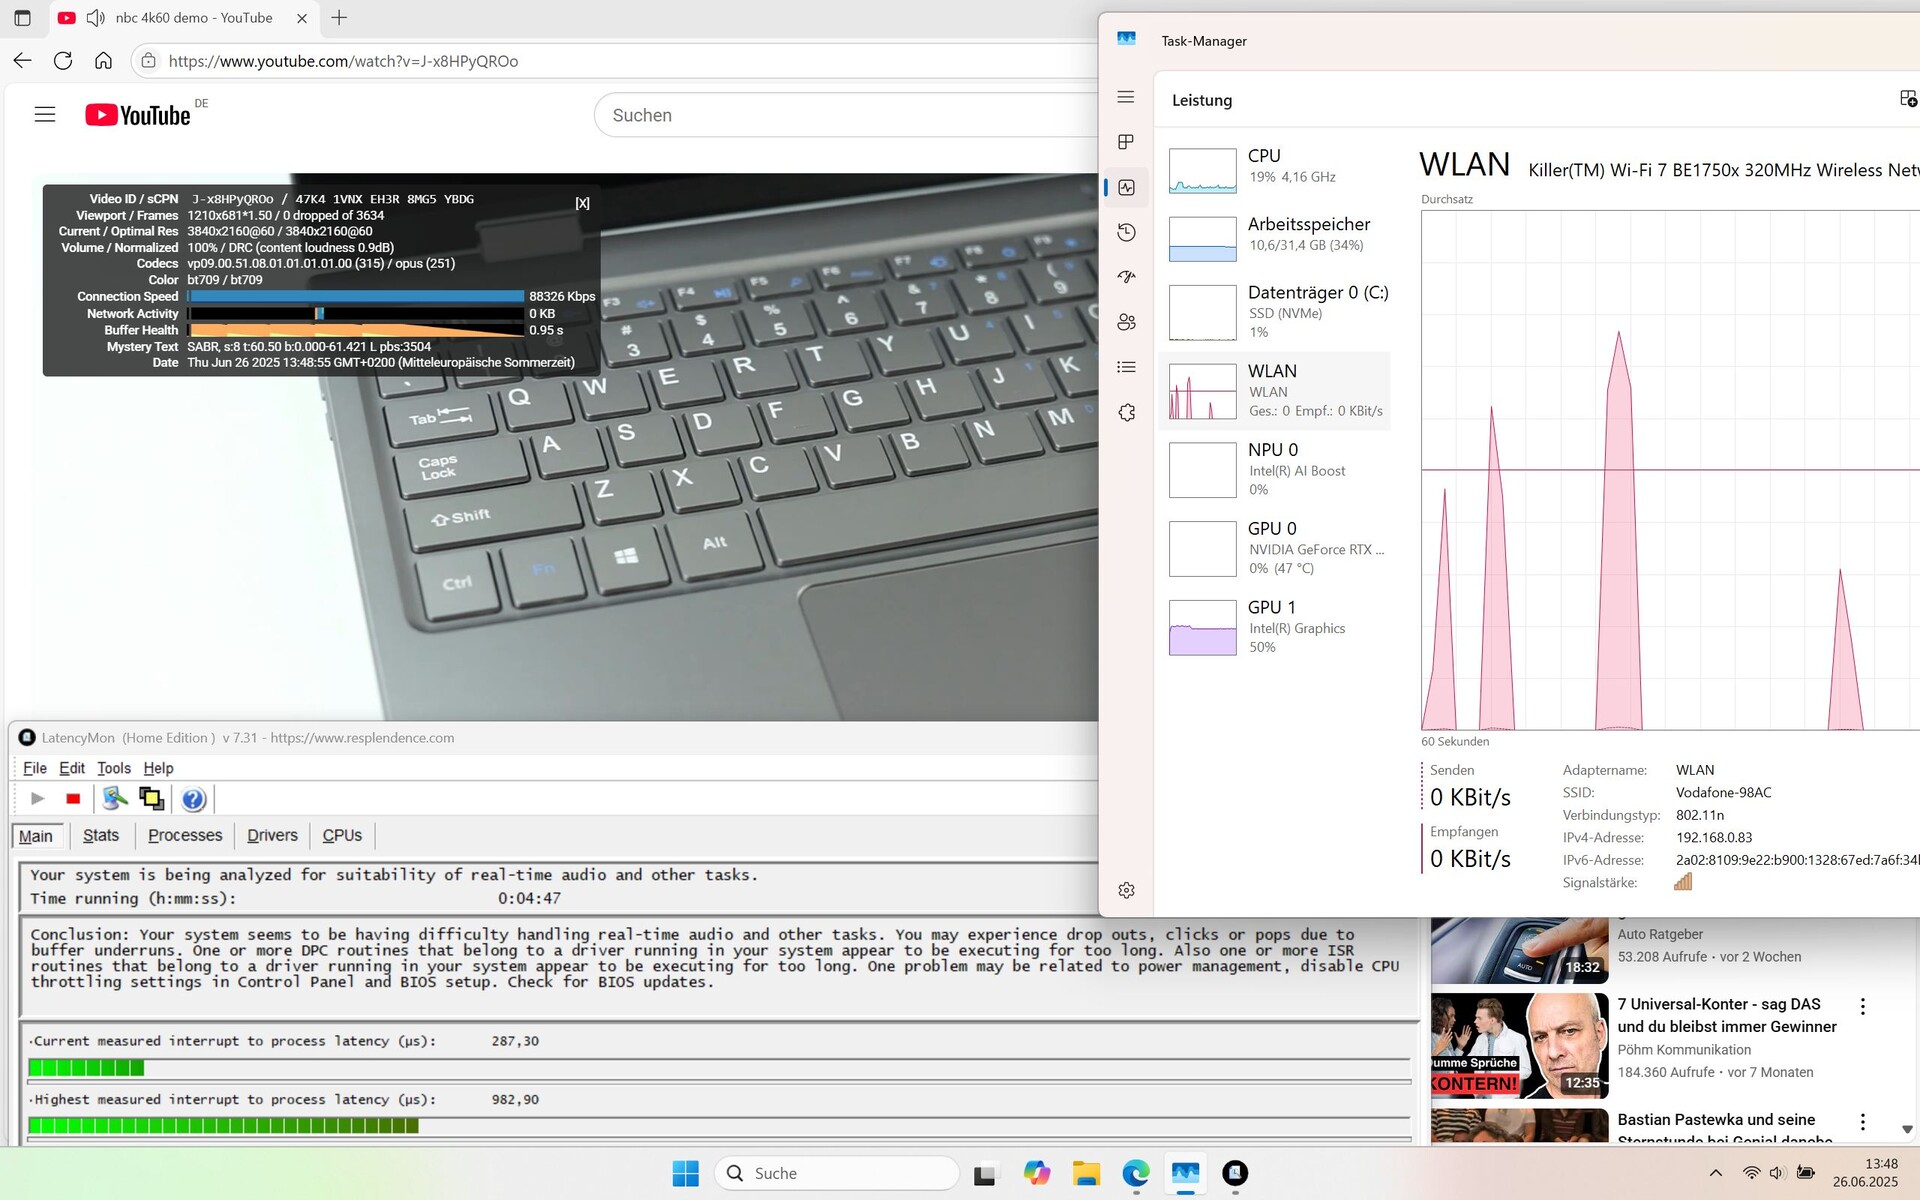
Latencies only occur when opening several browser tabs and is relatively low even afterward. Our 4K/60 fps video is played without any dropped frames.
| DPC Latencies / LatencyMon - interrupt to process latency (max), Web, Youtube, Prime95 | |
| Medion Erazer Beast 18 X1 MD62731 | |
| MSI Vector 16 HX AI A2XWHG | |
| Alienware 16 Area-51 | |
| MSI Vector 17 HX AI A2XWIG | |
| Lenovo Legion 5 Pro 16IAX10H | |
| MSI Raider A18 HX A9WIG-080 | |
| Lenovo Legion Pro 7i 16 Gen 10 | |
* ... smaller is better
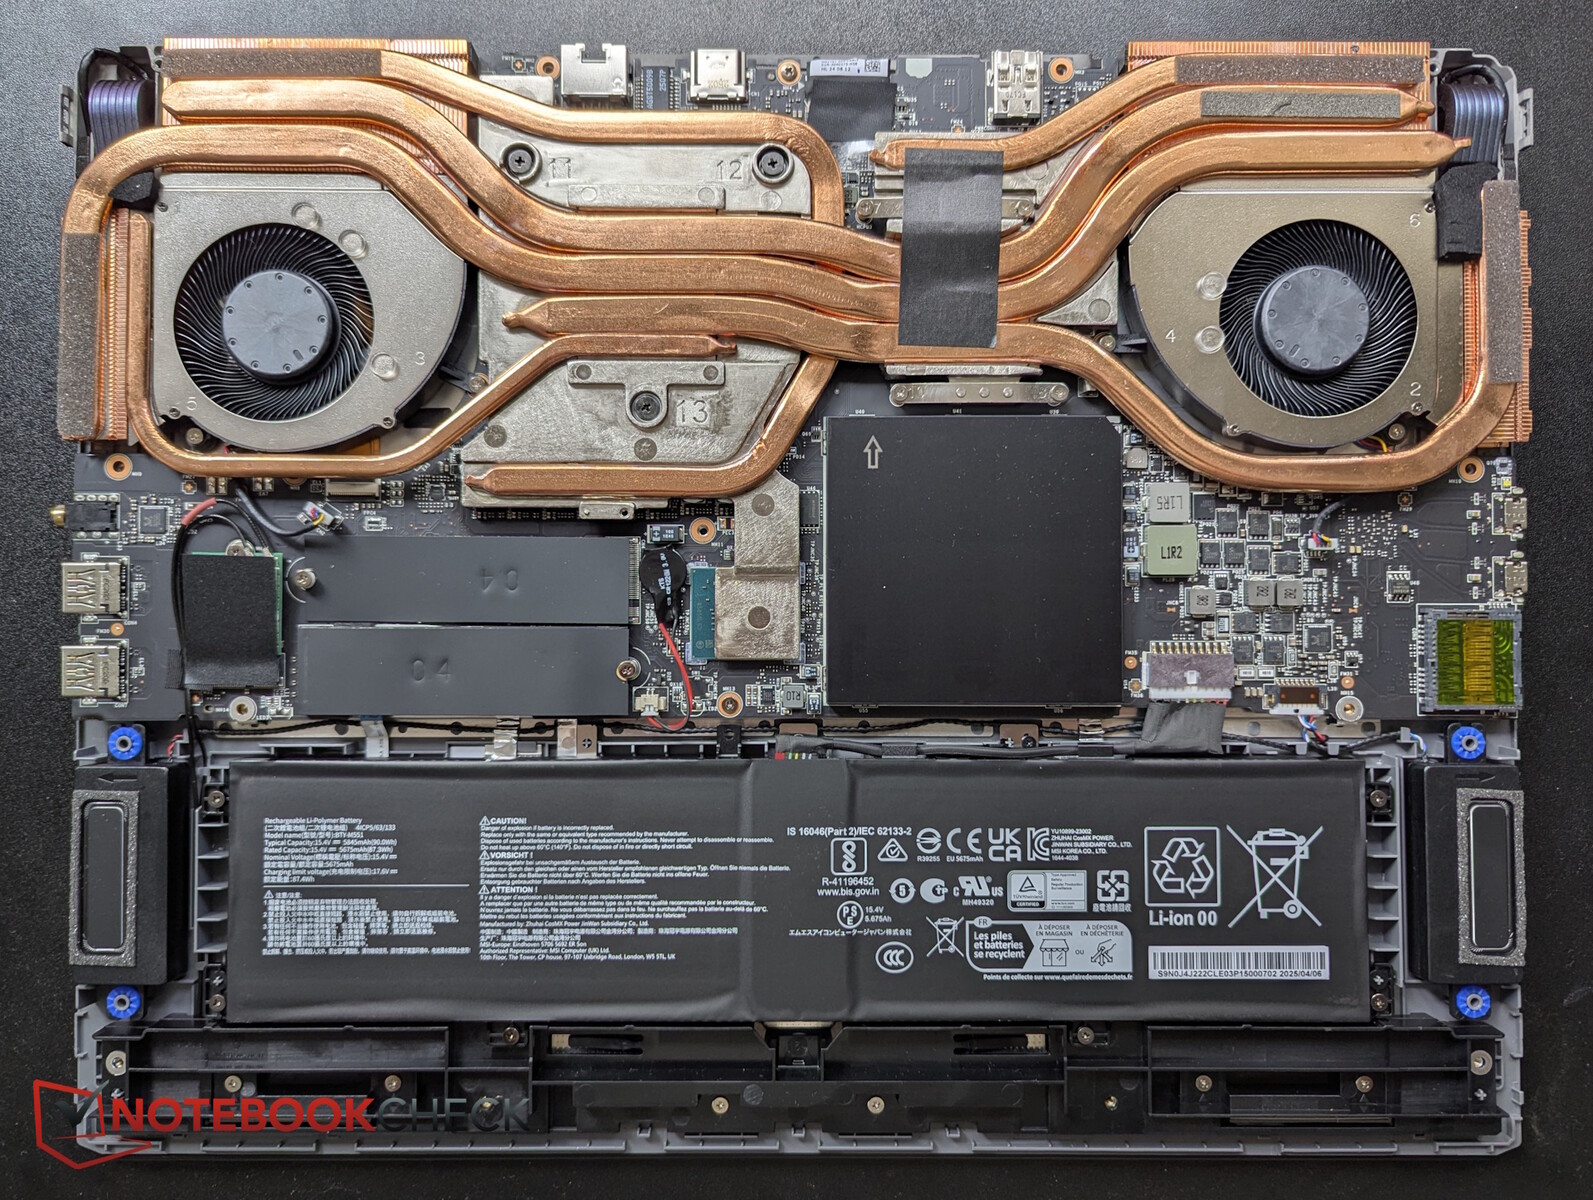
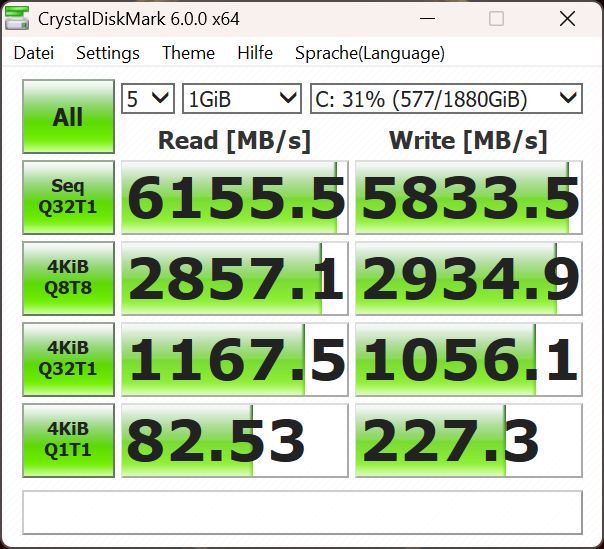
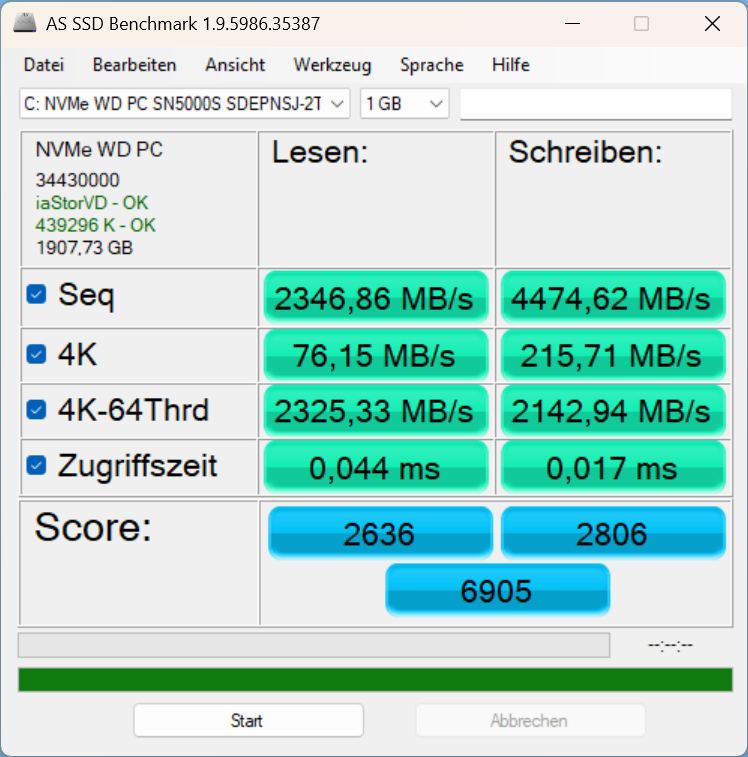
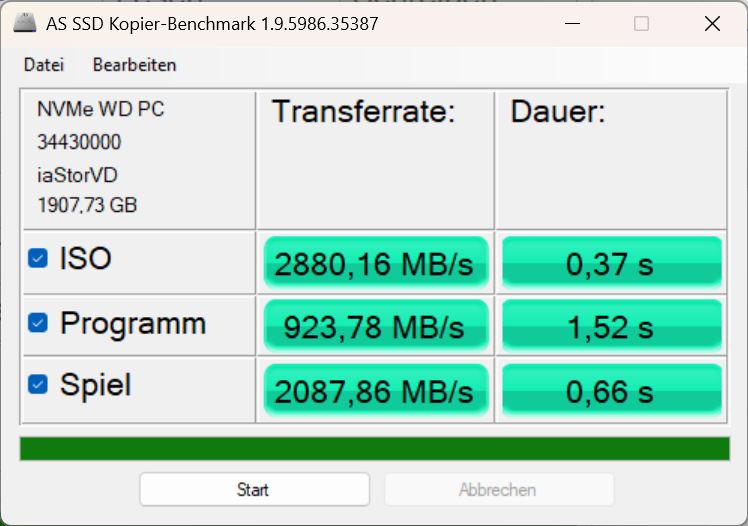
Mass storage
The Western Digital SSD with 2 TB achieves average to good values and is not throttled even under prolonged load.

* ... smaller is better
Continuous Reading: DiskSpd Read Loop, Queue Depth 8
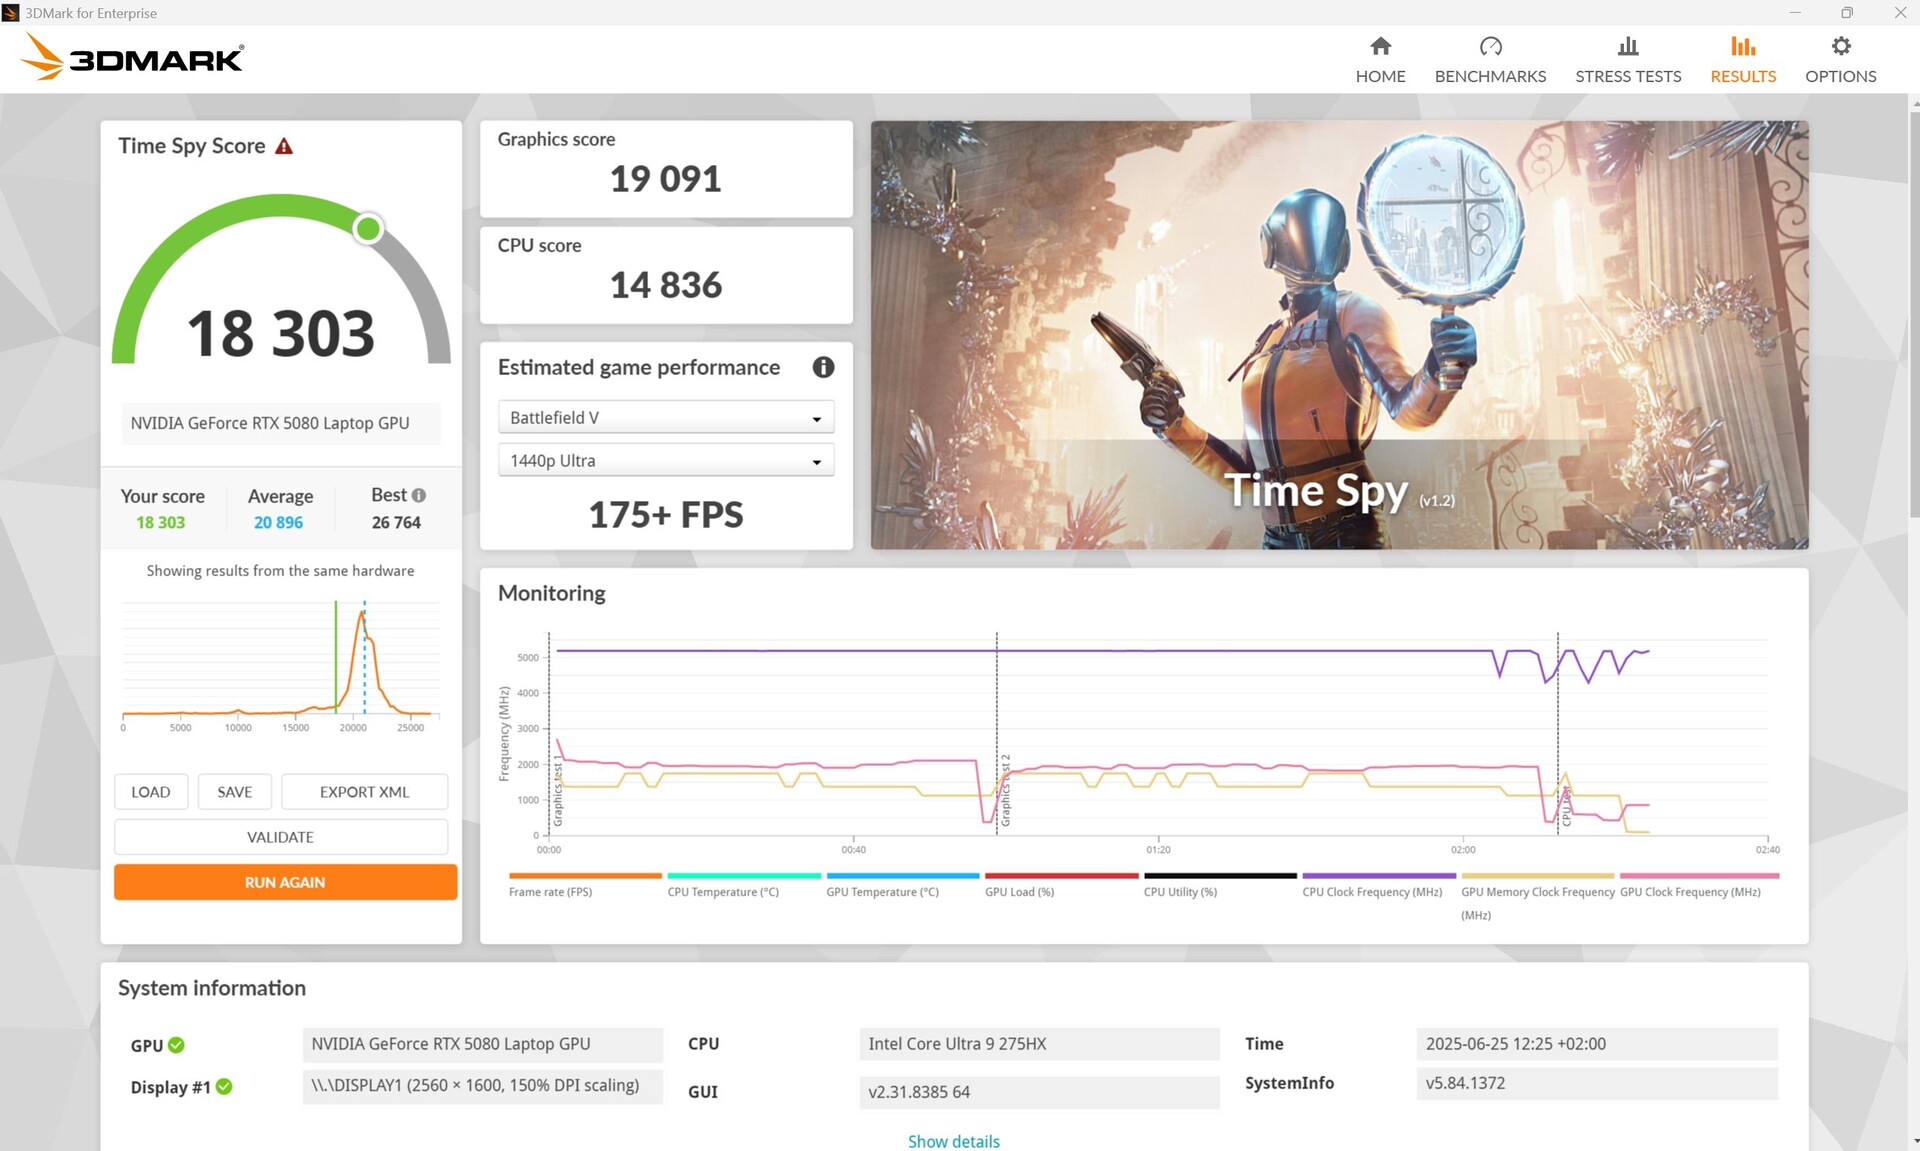
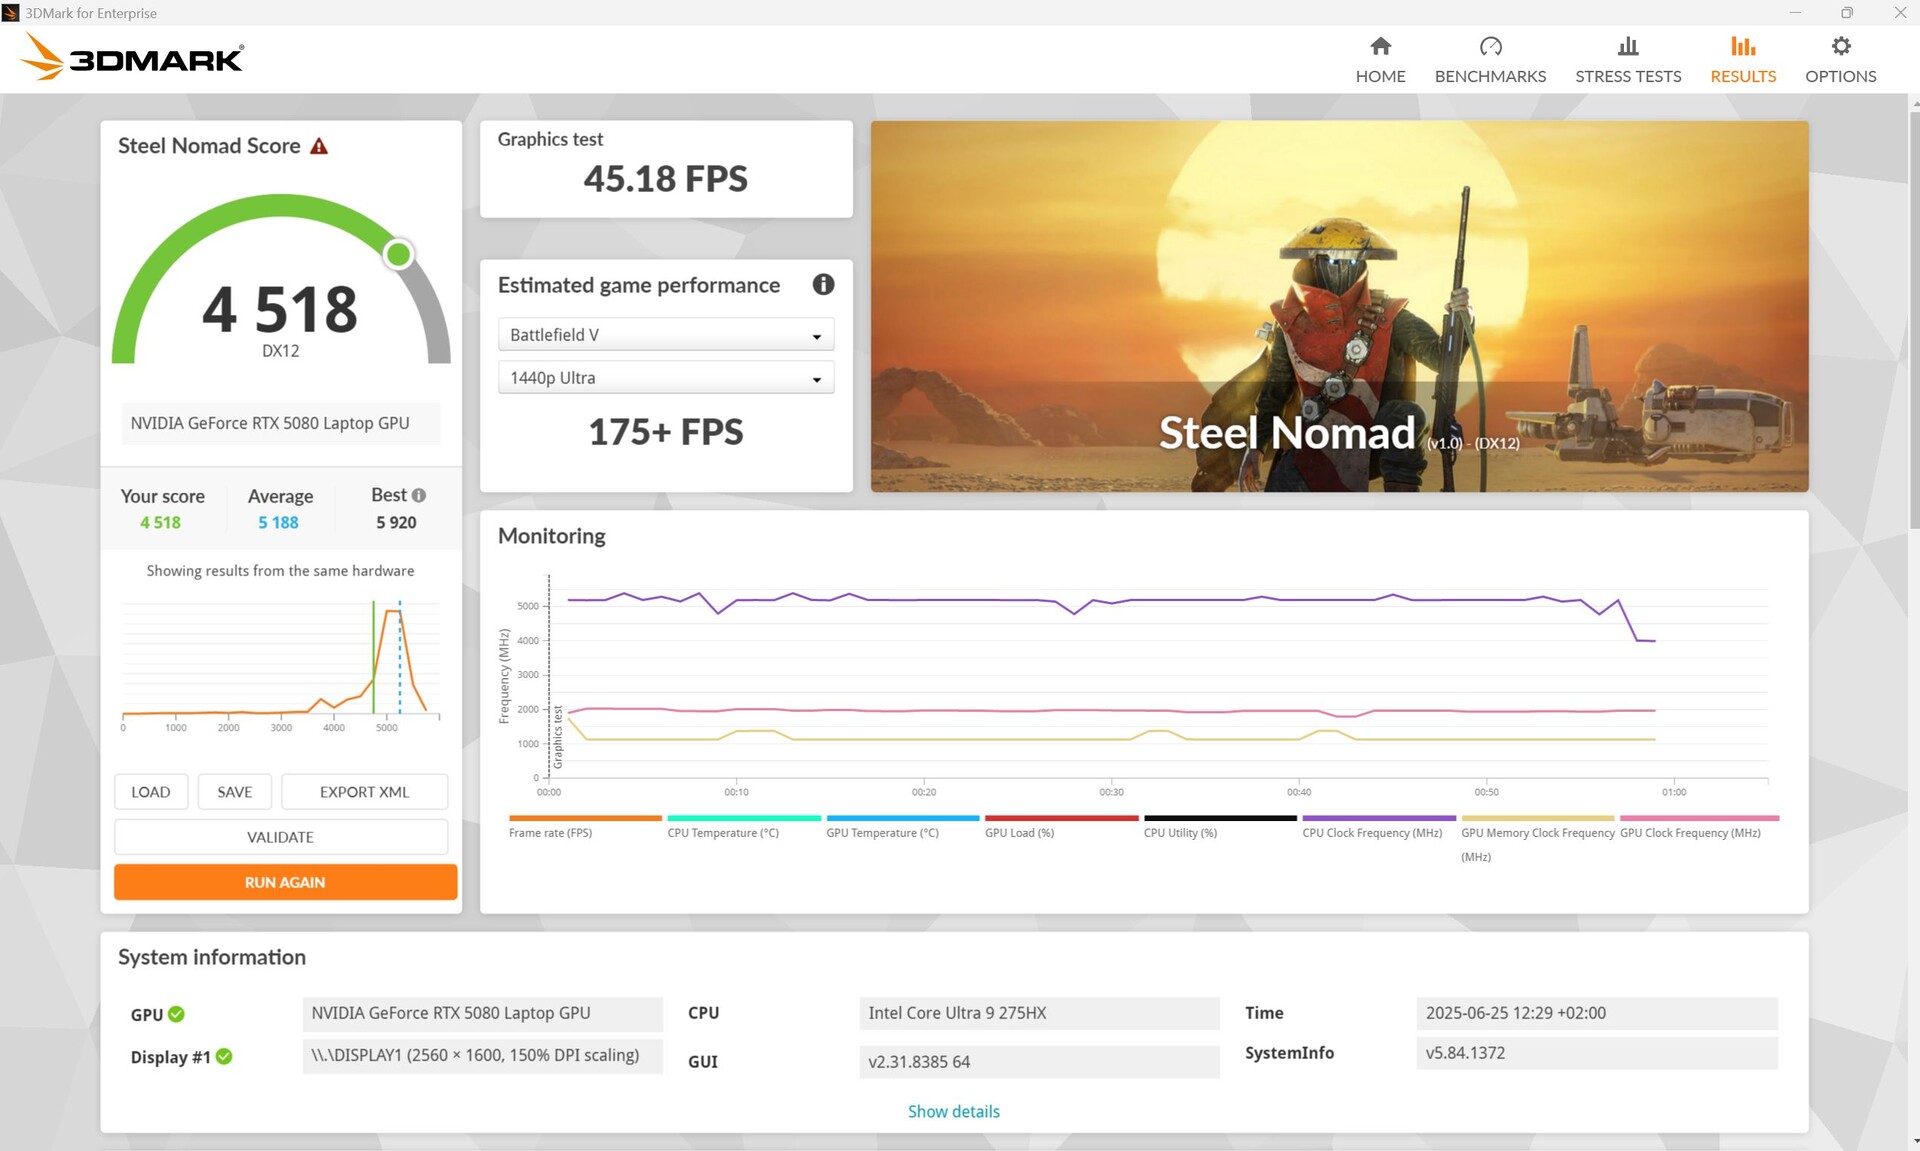
GPU performance
The RTX 5080 Laptop performs 4 percent below average in the 3DMarks. A Fire Strike test in battery mode reveals a 3D performance loss of 50 percent.
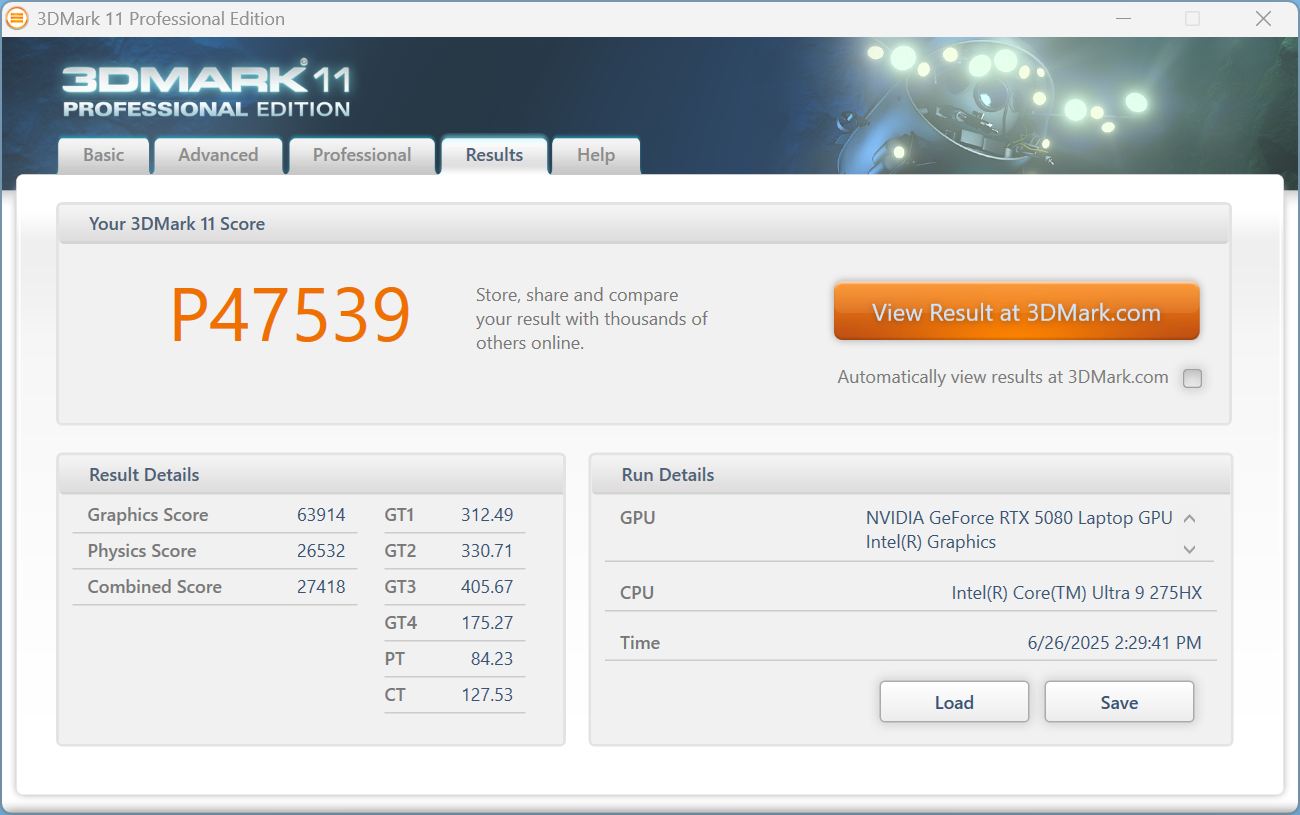


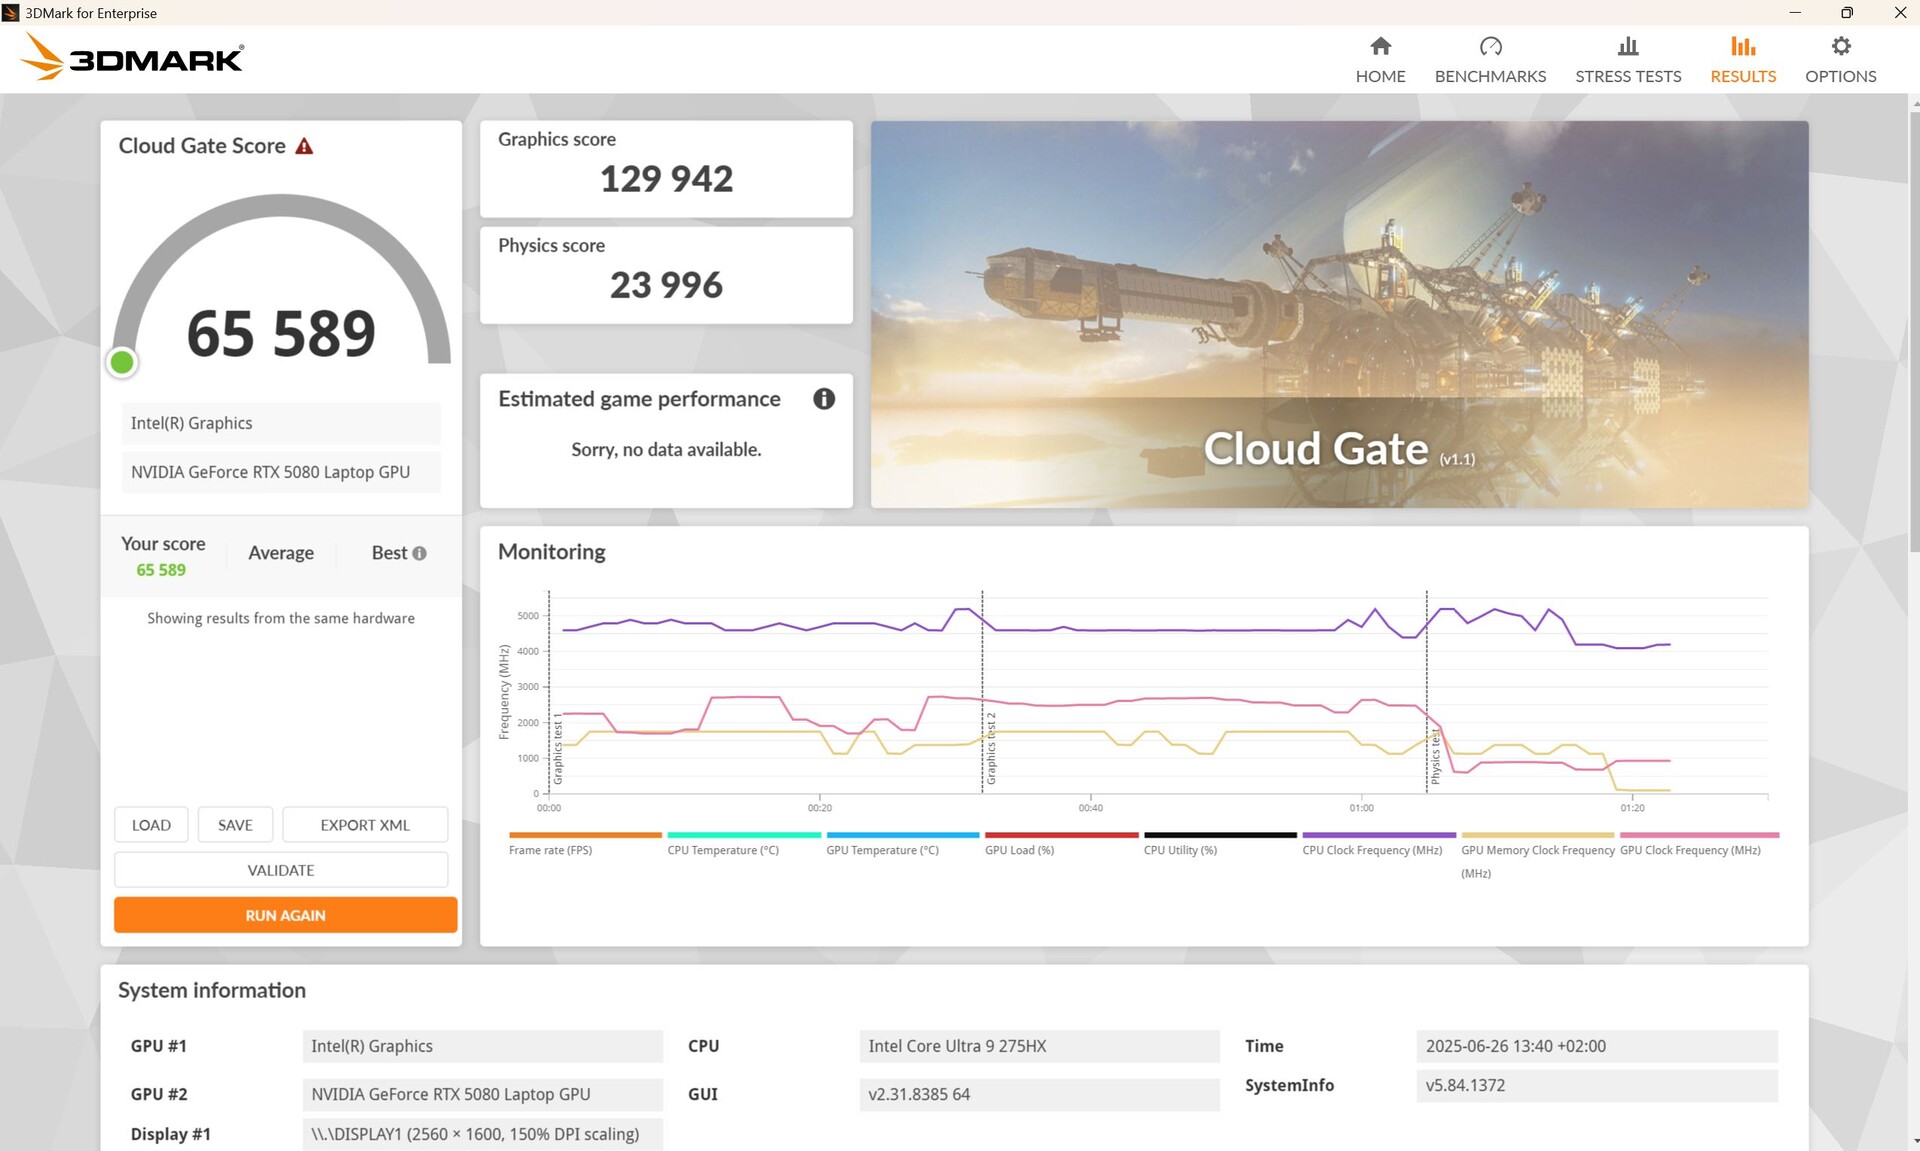
| 3DMark 11 Performance | 47539 points | |
| 3DMark Cloud Gate Standard Score | 65589 points | |
| 3DMark Fire Strike Score | 35915 points | |
| 3DMark Time Spy Score | 18303 points | |
| 3DMark Steel Nomad Score | 4518 points | |
Help | ||
* ... smaller is better
Gaming performance
In our games, the Vector 17 in Full HD is on par with a Medion Erazer Beast 18 X1 and thus slightly below the average of the RTX 5080 gamers. The continuous performance in Cyberpunk is very consistent.
It feels most at home in QHD, mainly thanks to DLSS. For example, Doom: The Dark Ages can be played in QHD with DLSS at roughly the same frame rate as in Full HD (85 - 88 fps). Combined with 4x frame generation, our Vector 17 even manages 214 fps, which comes close to the display's native refresh rate. We did not notice any increased latency, but the subjective experience can vary here.
| GTA V - 1920x1080 Highest AA:4xMSAA + FX AF:16x | |
| MSI Raider A18 HX A9WIG-080 | |
| MSI Vector 17 HX AI A2XWIG | |
| Lenovo Legion 5 Pro 16IAX10H | |
| MSI Vector 16 HX AI A2XWHG | |
| Medion Erazer Beast 18 X1 MD62731 | |
| Average of class Gaming (48.3 - 186.9, n=93, last 2 years) | |
| Strange Brigade - 1920x1080 ultra AA:ultra AF:16 | |
| Lenovo Legion Pro 7i 16 Gen 10 | |
| Alienware 16 Area-51 | |
| Medion Erazer Beast 18 X1 MD62731 | |
| MSI Vector 17 HX AI A2XWIG | |
| Lenovo Legion 5 Pro 16IAX10H | |
| Average of class Gaming (76.3 - 456, n=86, last 2 years) | |
Cyberpunk 2077 ultra FPS-Diagram
Cyberpunk 2077 GPU data

| low | med. | high | ultra | QHD DLSS | QHD | 4K DLSS | 4K | |
|---|---|---|---|---|---|---|---|---|
| GTA V (2015) | 186.5 | 184.1 | 181.5 | 158.7 | 151.7 | |||
| Dota 2 Reborn (2015) | 220 | 193.1 | 185.9 | 171.7 | 167.9 | |||
| Final Fantasy XV Benchmark (2018) | 231 | 207 | 183.7 | 111.2 | 68.6 | |||
| X-Plane 11.11 (2018) | 163.7 | 139.5 | 108.8 | 98.7 | ||||
| Strange Brigade (2018) | 549 | 429 | 393 | 356 | 265 | 144 | ||
| Baldur's Gate 3 (2023) | 203 | 160 | 141 | 166.3 | 167.3 | 118.3 | 83.2 | 55.7 |
| Cyberpunk 2077 (2023) | 171.8 | 136.6 | 103.9 | 90 | 39.1 | |||
| Doom: The Dark Ages (2025) | 88 | 85 | 64 |
Emissions & energy - Up to 60 dB(A) is quite loud in comparison
Noise emissions
The fans are often off when idling, but they do not switch off completely for a very long time after a load, not even in Eco mode. When gaming, they tend to run louder than the competition despite average 3D performance.
Noise level
| Idle |
| 24 / 30.82 / 31.31 dB(A) |
| Load |
| 31.12 / 59.24 dB(A) |
 | ||
30 dB silent 40 dB(A) audible 50 dB(A) loud |
||
min: | ||
| MSI Vector 17 HX AI A2XWIG GeForce RTX 5080 Laptop, Ultra 9 275HX, Western Digital PC SN5000S SDEPNSJ-2T00-1032 | Alienware 16 Area-51 GeForce RTX 5080 Laptop, Ultra 9 275HX, Samsung PM9C1a MZ9L81T0HDLB | MSI Vector 16 HX AI A2XWHG GeForce RTX 5070 Ti Laptop, Ultra 7 255HX, Micron 2400 MTFDKBA512QFM | Lenovo Legion Pro 7i 16 Gen 10 GeForce RTX 5080 Laptop, Ultra 9 275HX, SK Hynix HFS001TEJ9X115N | Lenovo Legion 5 Pro 16IAX10H GeForce RTX 5070 Ti Laptop, Ultra 9 275HX, Western Digital PC SN8000S SDEPNRK-1T00 | MSI Raider A18 HX A9WIG-080 GeForce RTX 5080 Laptop, R9 9955HX3D, Samsung PM9E1 MZVLC2T0HBLD | Medion Erazer Beast 18 X1 MD62731 GeForce RTX 5080 Laptop, Ultra 9 275HX, Phison E31 2 TB | |
|---|---|---|---|---|---|---|---|
| Noise | 6% | -12% | 12% | -7% | -4% | -17% | |
| off / environment * (dB) | 24 | 23.6 2% | 25 -4% | 22.9 5% | 24 -0% | 25.1 -5% | 25 -4% |
| Idle Minimum * (dB) | 24 | 25.4 -6% | 33 -38% | 22.9 5% | 24 -0% | 28.6 -19% | 25 -4% |
| Idle Average * (dB) | 30.82 | 27.8 10% | 34 -10% | 22.9 26% | 24 22% | 28.9 6% | 39 -27% |
| Idle Maximum * (dB) | 31.31 | 28.1 10% | 38 -21% | 26.3 16% | 30.9 1% | 29.2 7% | 42 -34% |
| Load Average * (dB) | 31.12 | 28.8 7% | 46 -48% | 27.8 11% | 55.9 -80% | 45.6 -47% | 52 -67% |
| Cyberpunk 2077 ultra * (dB) | 59.24 | 50.4 15% | 47 21% | 54.2 9% | 56.72 4% | 55.6 6% | 53 11% |
| Load Maximum * (dB) | 59.24 | 56.4 5% | 49 17% | 53.9 9% | 56.72 4% | 45.8 23% | 55 7% |
* ... smaller is better
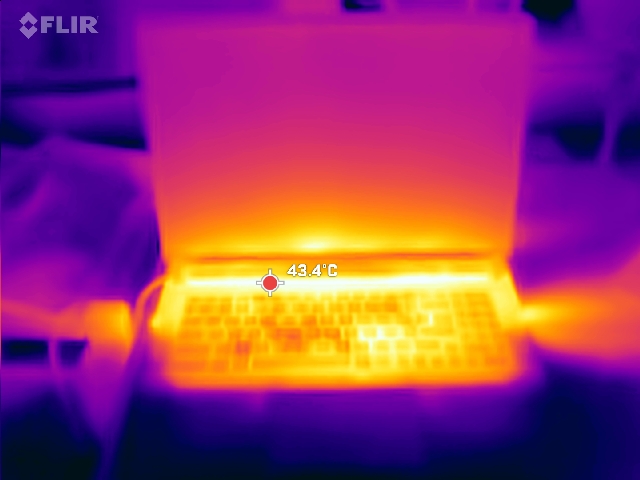
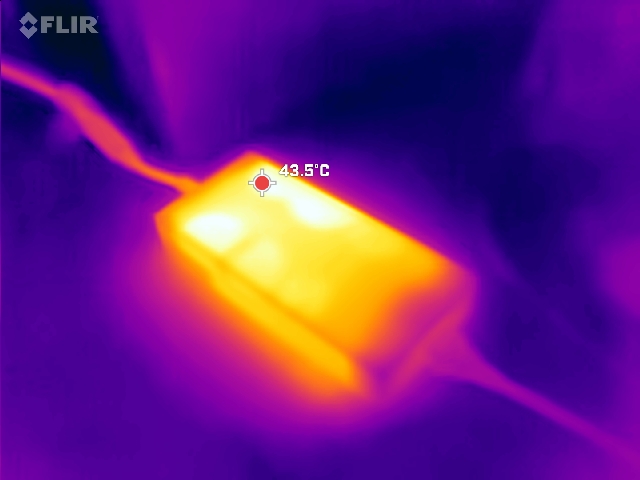
Temperature
Under stress, the surface temperatures reach up to 53 °C (127.4 °F), while gaming temperatures are a more moderate 47 °C(116.6 °F), with the WASD key area at 38 °C(100.4 °F).
(-) The maximum temperature on the upper side is 53 °C / 127 F, compared to the average of 40.4 °C / 105 F, ranging from 21.2 to 68.8 °C for the class Gaming.
(-) The bottom heats up to a maximum of 54 °C / 129 F, compared to the average of 43.2 °C / 110 F
(+) In idle usage, the average temperature for the upper side is 31.4 °C / 89 F, compared to the device average of 33.9 °C / 93 F.
(±) 3: The average temperature for the upper side is 36.4 °C / 98 F, compared to the average of 33.9 °C / 93 F for the class Gaming.
(+) The palmrests and touchpad are cooler than skin temperature with a maximum of 29 °C / 84.2 F and are therefore cool to the touch.
(±) The average temperature of the palmrest area of similar devices was 28.8 °C / 83.8 F (-0.2 °C / -0.4 F).

| MSI Vector 17 HX AI A2XWIG Intel Core Ultra 9 275HX, NVIDIA GeForce RTX 5080 Laptop | Alienware 16 Area-51 Intel Core Ultra 9 275HX, NVIDIA GeForce RTX 5080 Laptop | MSI Vector 16 HX AI A2XWHG Intel Core Ultra 7 255HX, NVIDIA GeForce RTX 5070 Ti Laptop | Lenovo Legion Pro 7i 16 Gen 10 Intel Core Ultra 9 275HX, NVIDIA GeForce RTX 5080 Laptop | Lenovo Legion 5 Pro 16IAX10H Intel Core Ultra 9 275HX, NVIDIA GeForce RTX 5070 Ti Laptop | MSI Raider A18 HX A9WIG-080 AMD Ryzen 9 9955HX3D, NVIDIA GeForce RTX 5080 Laptop | Medion Erazer Beast 18 X1 MD62731 Intel Core Ultra 9 275HX, NVIDIA GeForce RTX 5080 Laptop | |
|---|---|---|---|---|---|---|---|
| Heat | 12% | 9% | 16% | -1% | 6% | 13% | |
| Maximum Upper Side * (°C) | 53 | 43.8 17% | 53 -0% | 42.6 20% | 48 9% | 49.3 7% | 47 11% |
| Maximum Bottom * (°C) | 54 | 40 26% | 52 4% | 41.2 24% | 50 7% | 50.9 6% | 48 11% |
| Idle Upper Side * (°C) | 39 | 35.8 8% | 33 15% | 32.6 16% | 38 3% | 35.2 10% | 29 26% |
| Idle Bottom * (°C) | 34 | 35.2 -4% | 29 15% | 32.4 5% | 42 -24% | 33.5 1% | 33 3% |
* ... smaller is better
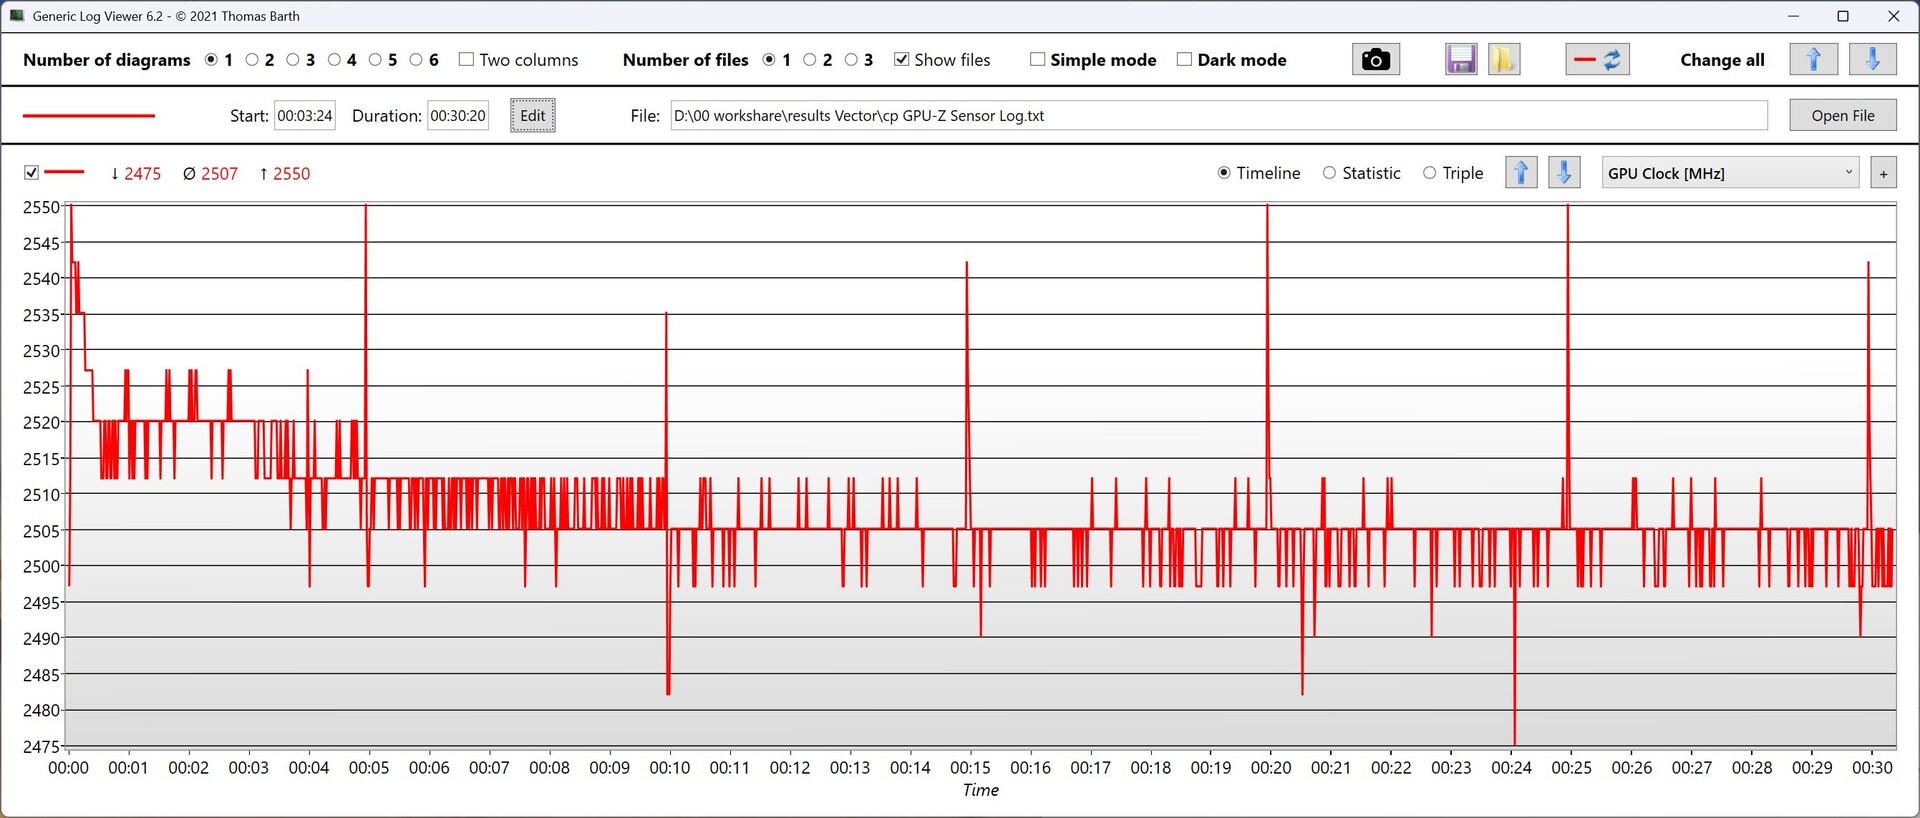
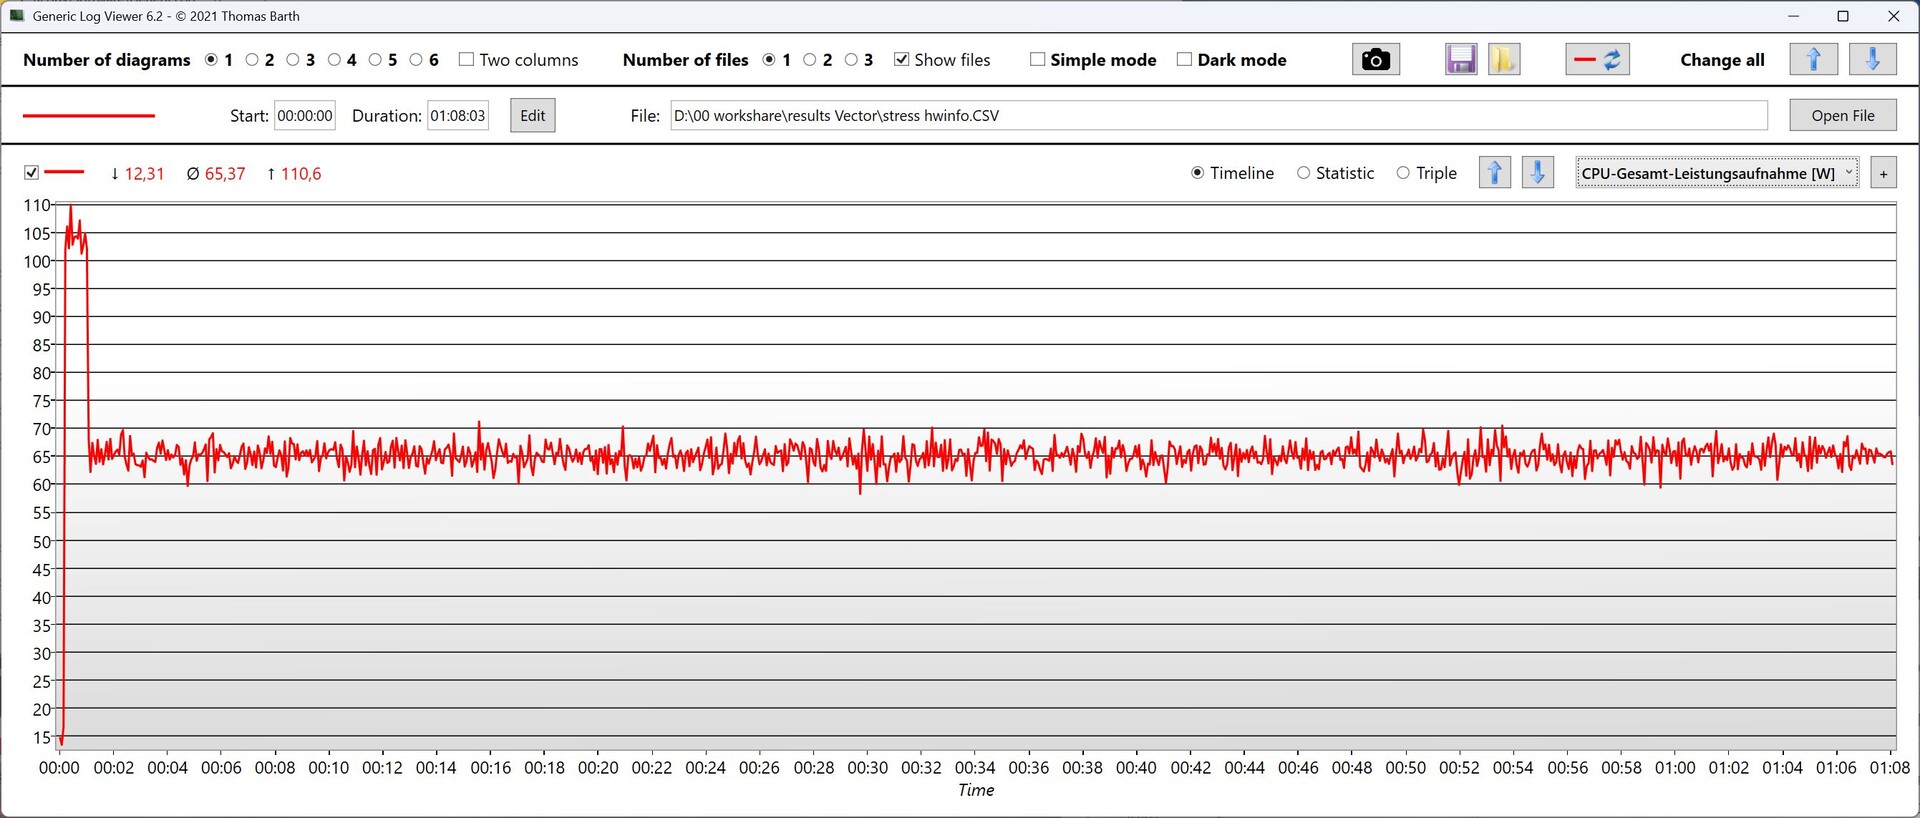
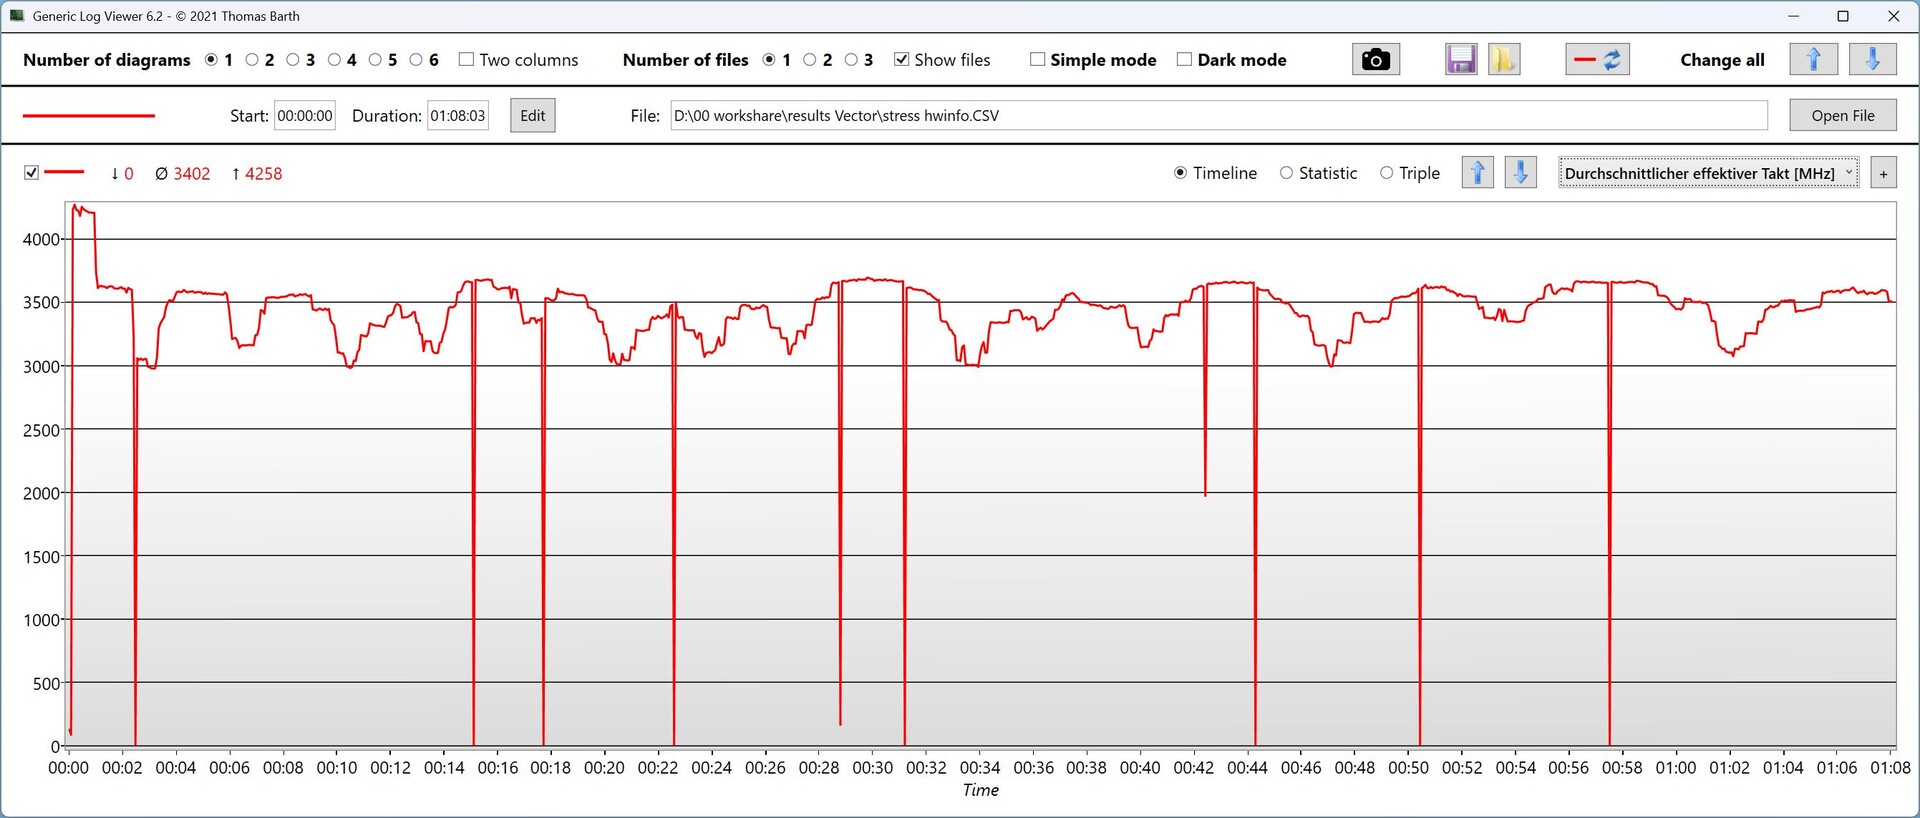
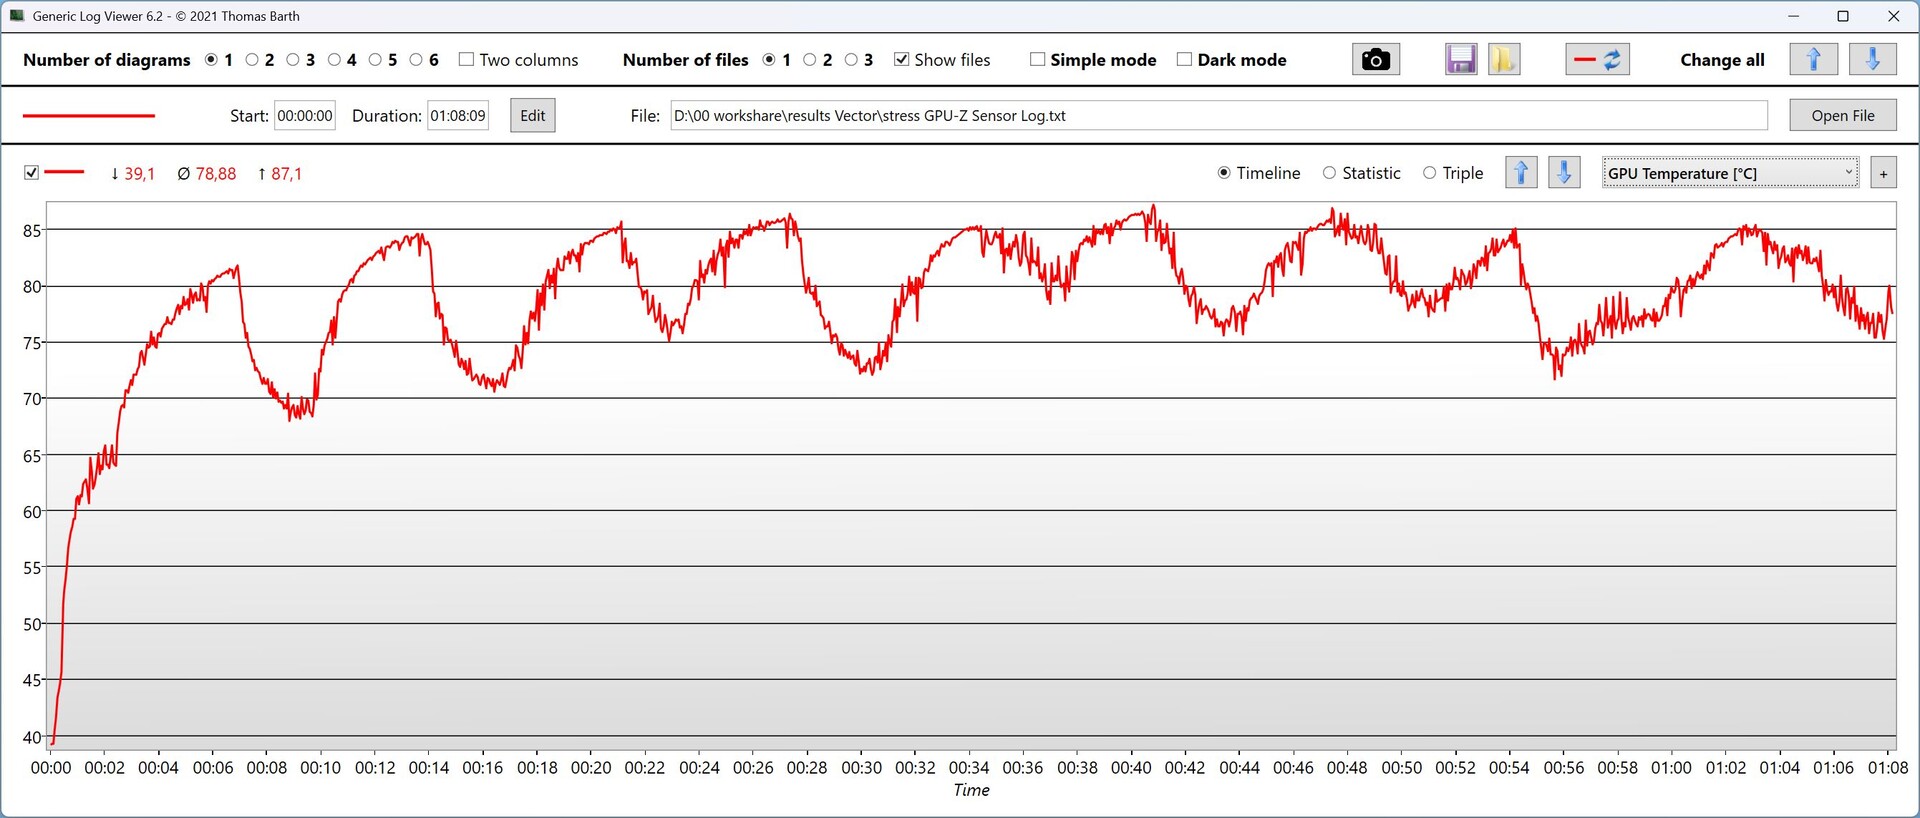
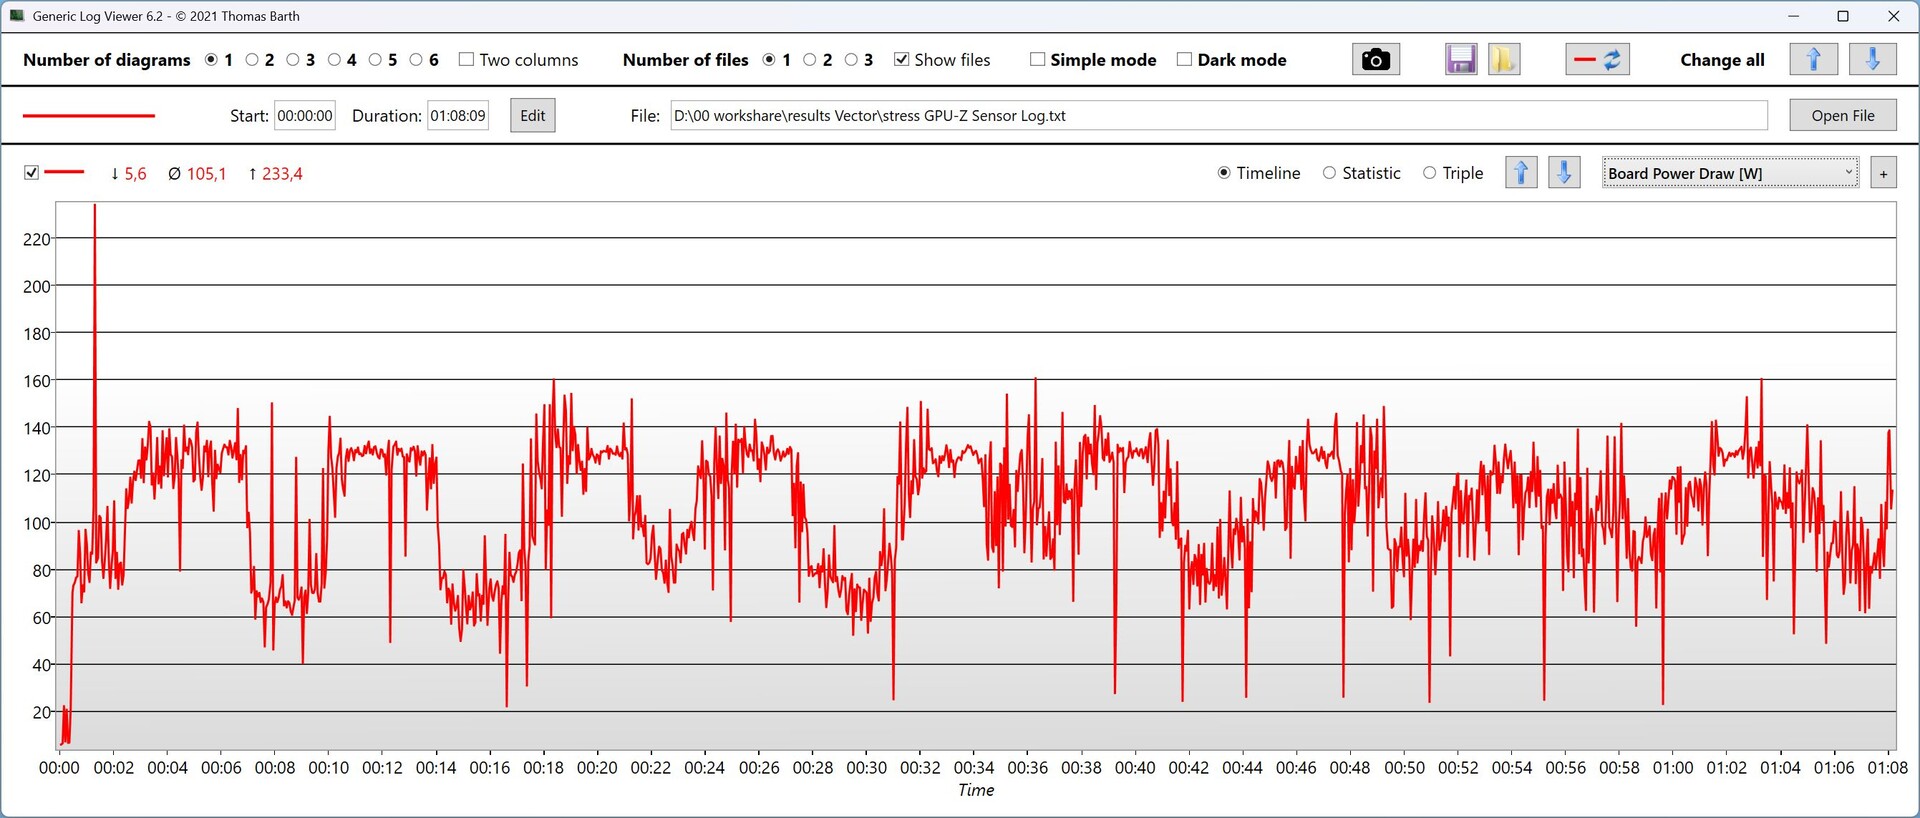
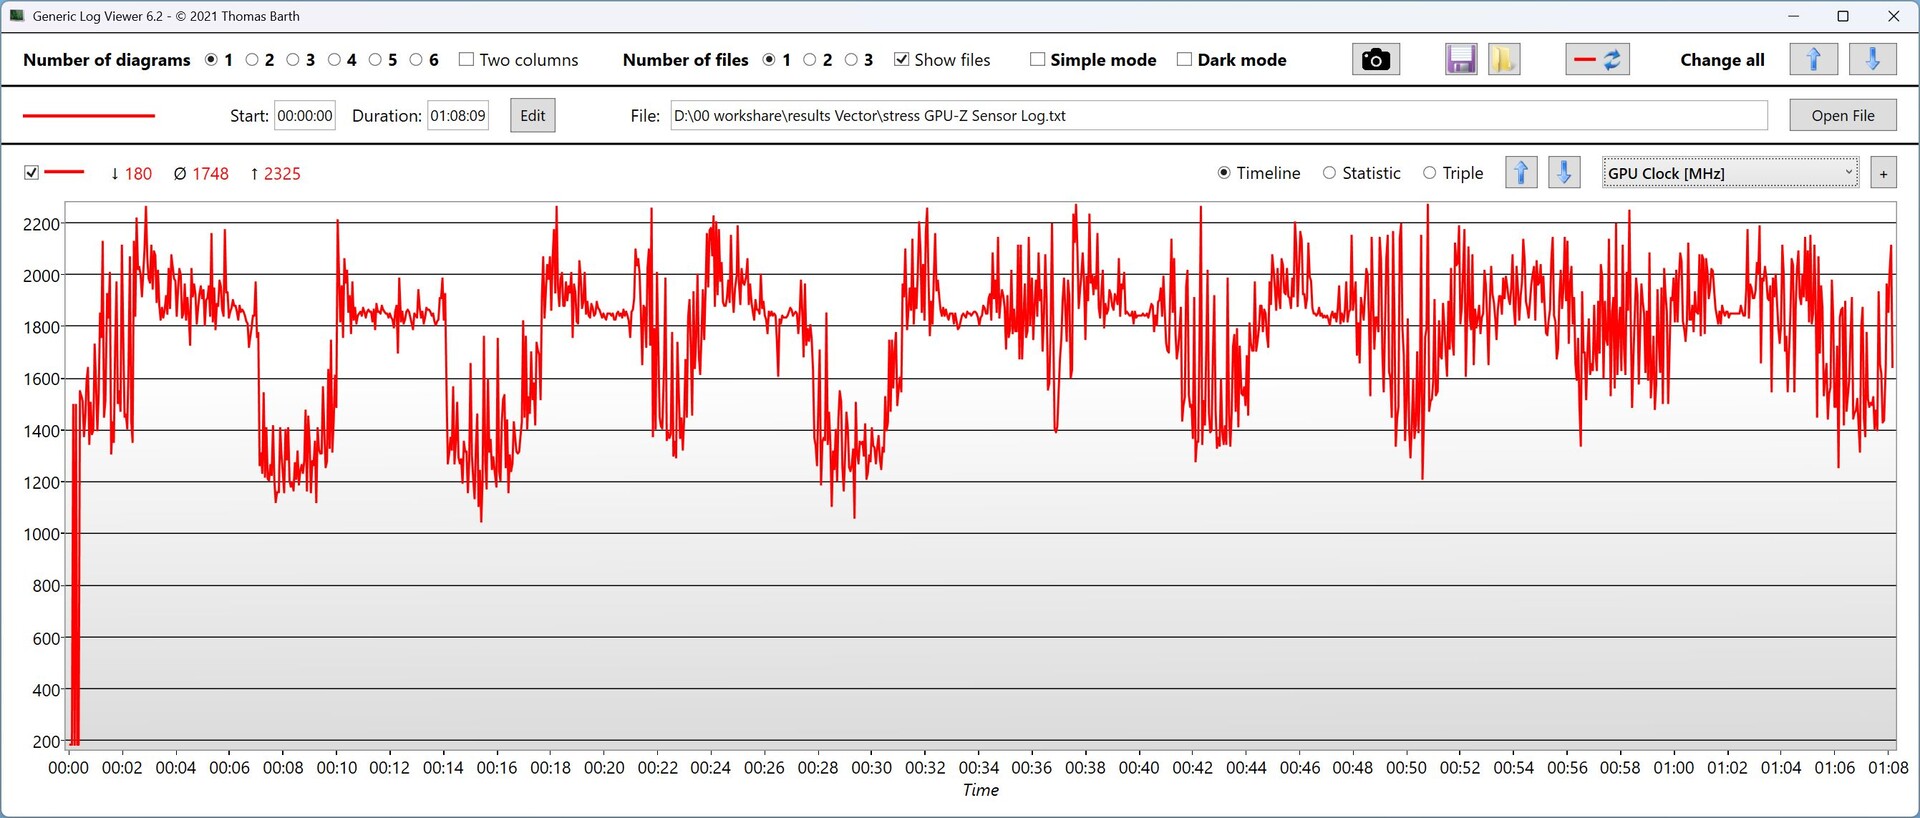
| CPU Clock (GHz) | GPU Clock (MHz) | Average CPU Temperature (°C) | Average GPU Temperature (°C) | |
| Prime95 Stress | 4.25 | 750 | 80 | 45 |
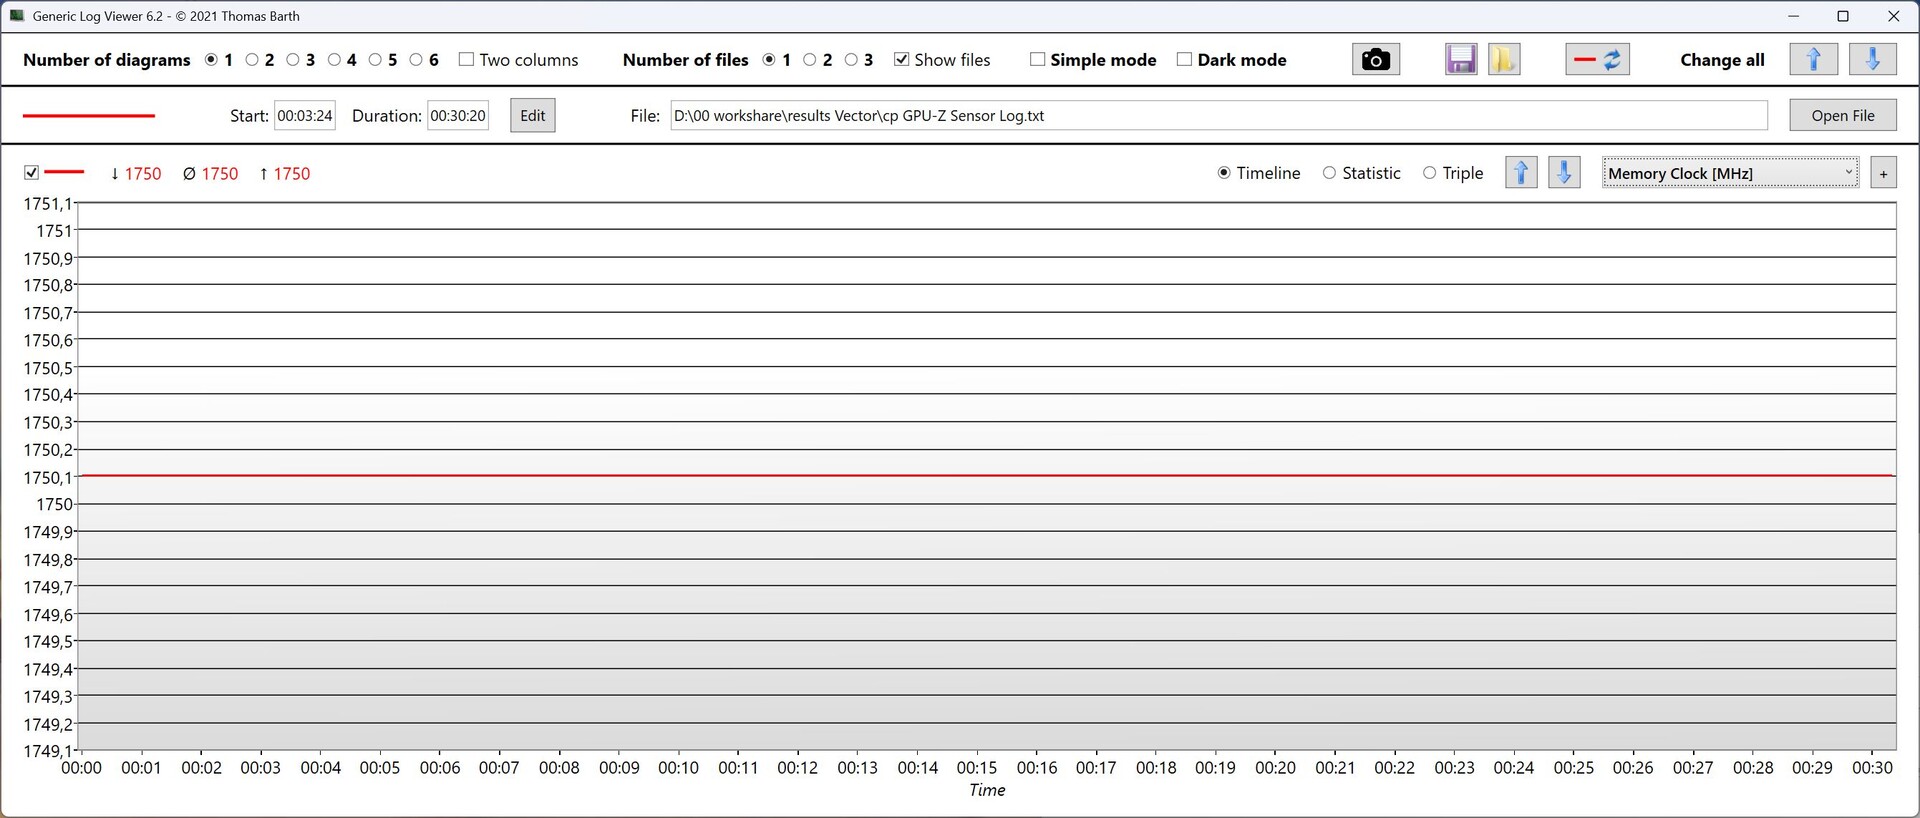
| Prime95 + FurMark Stress | 3.4 | 1,750 | 74 - 81 | 70 - 87 |
| Cyberpunk 2077 Stress | 1.9 | 2,500 | 81 - 89 | up to 80 |
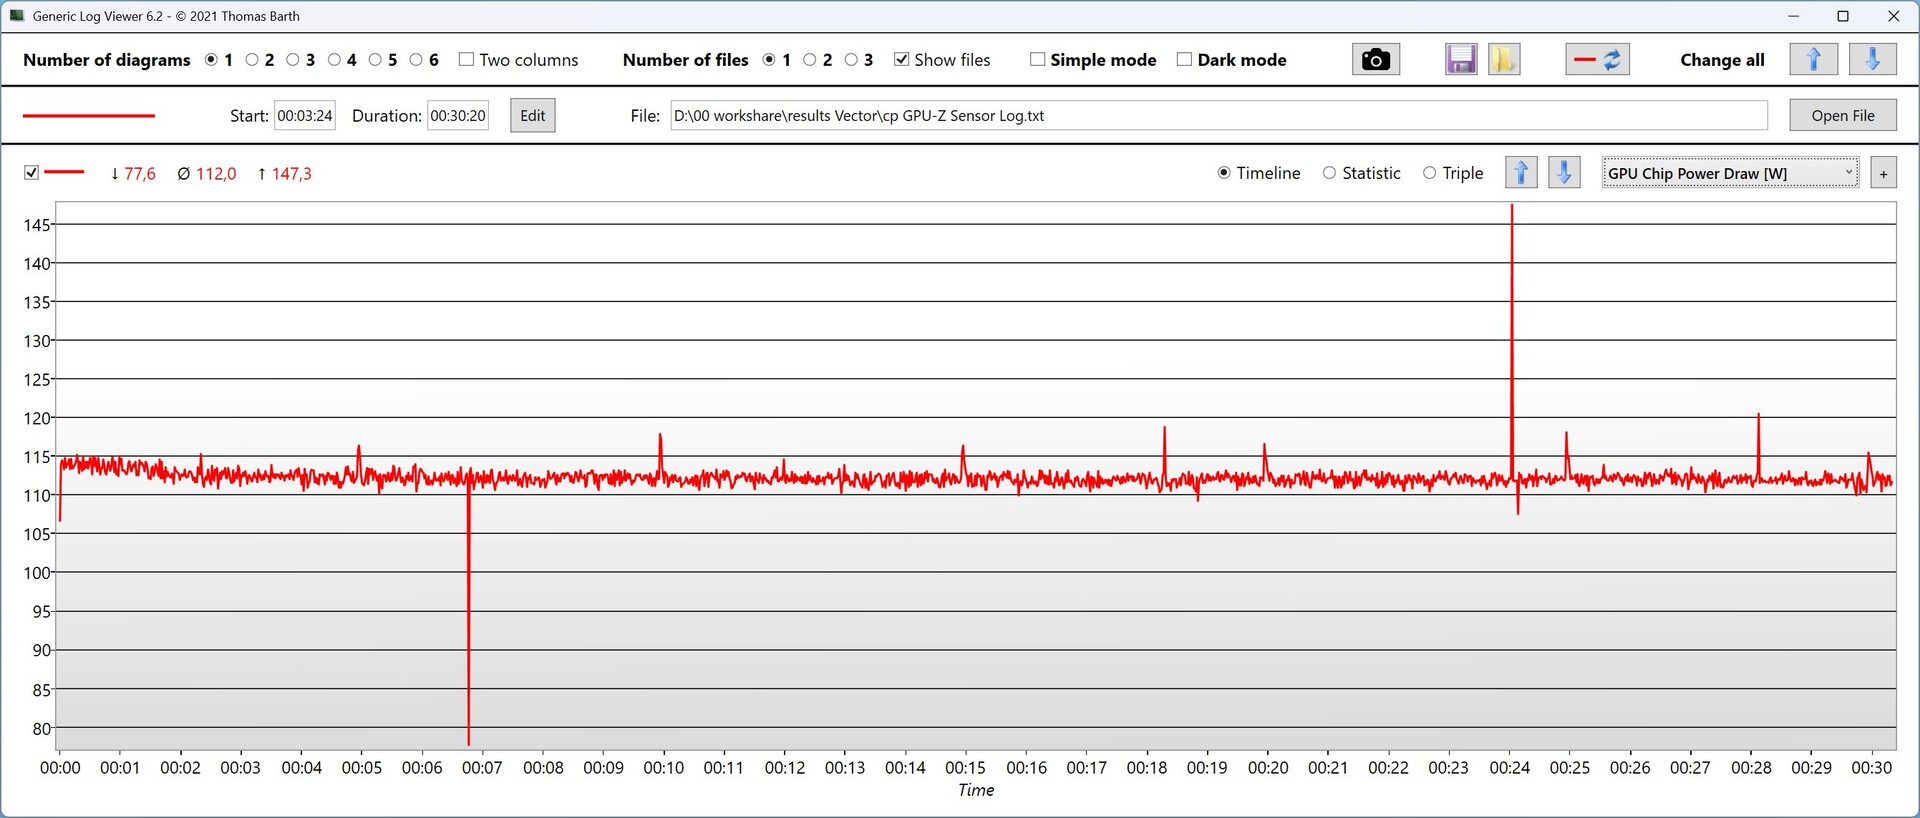
Stress test

Speaker
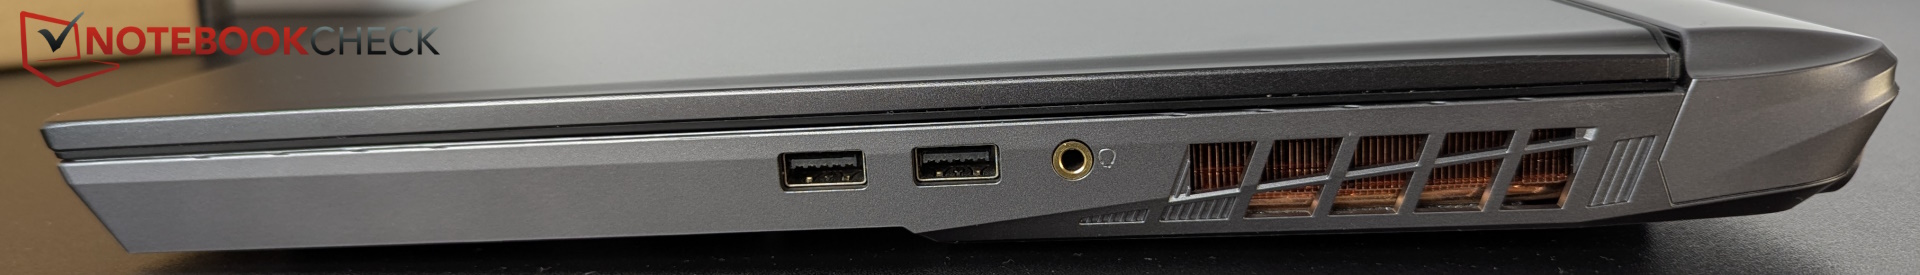
The speakers do an average job. A 3.5 mm jack port is available for headphones and the like.
MSI Vector 17 HX AI A2XWIG audio analysis
(±) | speaker loudness is average but good (80.39 dB)
Bass 100 - 315 Hz
(±) | reduced bass - on average 10.4% lower than median
(±) | linearity of bass is average (7.4% delta to prev. frequency)
Mids 400 - 2000 Hz
(±) | higher mids - on average 6.2% higher than median
(+) | mids are linear (4.7% delta to prev. frequency)
Highs 2 - 16 kHz
(+) | balanced highs - only 4.3% away from median
(±) | linearity of highs is average (8.7% delta to prev. frequency)
Overall 100 - 16.000 Hz
(±) | linearity of overall sound is average (15.6% difference to median)
Compared to same class
» 36% of all tested devices in this class were better, 6% similar, 58% worse
» The best had a delta of 6%, average was 18%, worst was 132%
Compared to all devices tested
» 23% of all tested devices were better, 5% similar, 72% worse
» The best had a delta of 4%, average was 23%, worst was 134%
Lenovo Legion 5 Pro 16IAX10H audio analysis
(±) | speaker loudness is average but good (78.2 dB)
Bass 100 - 315 Hz
(-) | nearly no bass - on average 21.1% lower than median
(±) | linearity of bass is average (8% delta to prev. frequency)
Mids 400 - 2000 Hz
(±) | higher mids - on average 6.3% higher than median
(+) | mids are linear (6.5% delta to prev. frequency)
Highs 2 - 16 kHz
(+) | balanced highs - only 1.6% away from median
(+) | highs are linear (4.9% delta to prev. frequency)
Overall 100 - 16.000 Hz
(±) | linearity of overall sound is average (18.3% difference to median)
Compared to same class
» 58% of all tested devices in this class were better, 9% similar, 33% worse
» The best had a delta of 6%, average was 18%, worst was 132%
Compared to all devices tested
» 40% of all tested devices were better, 8% similar, 52% worse
» The best had a delta of 4%, average was 23%, worst was 134%
Energy consumption
After the updates, the idle consumption is now okay. In gaming, it is still too high in view of the performance offered. If an external monitor is connected via HDMI, the dGPU is active and more power is consumed in idle mode.
| Off / Standby | |
| Idle | |
| Load |
|
Key:
min: | |
| MSI Vector 17 HX AI A2XWIG Ultra 9 275HX, GeForce RTX 5080 Laptop, Western Digital PC SN5000S SDEPNSJ-2T00-1032, IPS, 2560x1600, 17" | Alienware 16 Area-51 Ultra 9 275HX, GeForce RTX 5080 Laptop, Samsung PM9C1a MZ9L81T0HDLB, IPS, 2560x1600, 16" | MSI Vector 16 HX AI A2XWHG Ultra 7 255HX, GeForce RTX 5070 Ti Laptop, Micron 2400 MTFDKBA512QFM, IPS, 2560x1600, 16" | Lenovo Legion Pro 7i 16 Gen 10 Ultra 9 275HX, GeForce RTX 5080 Laptop, SK Hynix HFS001TEJ9X115N, OLED, 2560x1600, 16" | Lenovo Legion 5 Pro 16IAX10H Ultra 9 275HX, GeForce RTX 5070 Ti Laptop, Western Digital PC SN8000S SDEPNRK-1T00, OLED, 2560x1600, 16" | MSI Raider A18 HX A9WIG-080 R9 9955HX3D, GeForce RTX 5080 Laptop, Samsung PM9E1 MZVLC2T0HBLD, MiniLED IPS, 3840x2400, 18" | Medion Erazer Beast 18 X1 MD62731 Ultra 9 275HX, GeForce RTX 5080 Laptop, Phison E31 2 TB, IPS, 2560x1600, 18" | Average NVIDIA GeForce RTX 5080 Laptop | Average of class Gaming | |
|---|---|---|---|---|---|---|---|---|---|
| Power Consumption | -61% | -3% | -80% | -14% | -119% | 6% | -52% | -17% | |
| Idle Minimum * (Watt) | 10 | 27 -170% | 7.1 29% | 28.5 -185% | 14 -40% | 41.5 -315% | 7.9 21% | 19.1 ? -91% | 13 ? -30% |
| Idle Average * (Watt) | 15.4 | 33.5 -118% | 15.9 -3% | 38.8 -152% | 14.3 7% | 53.5 -247% | 11.5 25% | 25.3 ? -64% | 18.7 ? -21% |
| Idle Maximum * (Watt) | 18.7 | 41.4 -121% | 29.5 -58% | 45.6 -144% | 20.1 -7% | 53.8 -188% | 16.6 11% | 30.4 ? -63% | 24.3 ? -30% |
| Load Average * (Watt) | 89.7 | 124.7 -39% | 124 -38% | 132.2 -47% | 177 -97% | 168.5 -88% | 130 -45% | 128.5 ? -43% | 110.2 ? -23% |
| Cyberpunk 2077 ultra * (Watt) | 308 | 256 17% | 222 28% | 318 -3% | 255 17% | 298 3% | 253 18% | ||
| Cyberpunk 2077 ultra external monitor * (Watt) | 300 | 249 17% | 217 28% | 319 -6% | 255 15% | 295 2% | 245 18% | ||
| Load Maximum * (Watt) | 321 | 367.2 -14% | 336 -5% | 384 -20% | 294 8% | 323.7 -1% | 330 -3% | 314 ? 2% | 258 ? 20% |
* ... smaller is better
Energy consumption Cyberpunk / Stress test
Energy consumption with external Monitor
Battery life
With the 90 Wh battery, the Vector 17 achieves around 6.75 hours in our Wi-Fi test with the brightness lowered (Eco mode). This is a good value in comparison.
| MSI Vector 17 HX AI A2XWIG Ultra 9 275HX, GeForce RTX 5080 Laptop, 90 Wh | Alienware 16 Area-51 Ultra 9 275HX, GeForce RTX 5080 Laptop, 96 Wh | MSI Vector 16 HX AI A2XWHG Ultra 7 255HX, GeForce RTX 5070 Ti Laptop, 90 Wh | Lenovo Legion Pro 7i 16 Gen 10 Ultra 9 275HX, GeForce RTX 5080 Laptop, 99 Wh | Lenovo Legion 5 Pro 16IAX10H Ultra 9 275HX, GeForce RTX 5070 Ti Laptop, 80 Wh | MSI Raider A18 HX A9WIG-080 R9 9955HX3D, GeForce RTX 5080 Laptop, 99 Wh | Medion Erazer Beast 18 X1 MD62731 Ultra 9 275HX, GeForce RTX 5080 Laptop, 99 Wh | Average of class Gaming | |
|---|---|---|---|---|---|---|---|---|
| Battery runtime | -58% | 4% | -39% | -19% | -56% | 18% | -7% | |
| WiFi v1.3 (h) | 6.7 | 2.8 -58% | 7 4% | 5.4 -19% | 4.9 -27% | 2.1 -69% | 7.9 18% | 7.15 ? 7% |
| Load (h) | 1.9 | 0.8 -58% | 1.7 -11% | 1.1 -42% | 1.502 ? -21% | |||
| Reader / Idle (h) | 3.1 | 8.71 ? | ||||||
| H.264 (h) | 4.8 | 8.64 ? |
Notebookcheck overall rating
The MSI Vector 17 HX AI is an average gaming laptop that scores a few extra points thanks to dual Thunderbolt 5 and Wi-Fi 7.
MSI Vector 17 HX AI A2XWIG
- 07/16/2025 v8
Christian Hintze
 Total Sustainability Score:
 Comparison of possible alternatives
Image | Model / Review | Price | Weight | Height | Display |
|---|---|---|---|---|---|
1. 84.3%  | MSI Vector 17 HX AI A2XWIG Intel Core Ultra 9 275HX ⎘ NVIDIA GeForce RTX 5080 Laptop ⎘ 32 GB Memory, 2048 GB SSD | Amazon: List Price: 3499 Euro | 3 kg | 28.8 mm | 17.00" 2560x1600 178 PPI IPS |
2. 85.7%  | Alienware 16 Area-51 Intel Core Ultra 9 275HX ⎘ NVIDIA GeForce RTX 5080 Laptop ⎘ 32 GB Memory, 1024 GB SSD | Amazon: 1. $2,463.19 Alienware 16 Area-51 Gaming ... 2. $3,899.99 Alienware 16 Area-51 Gaming ... 3. $3,799.99 Alienware 16 Area-51 Gaming ... List Price: 3500 USD | 3.3 kg | 28.5 mm | 16.00" 2560x1600 189 PPI IPS |
3. 84%  | MSI Vector 16 HX AI A2XWHG Intel Core Ultra 7 255HX ⎘ NVIDIA GeForce RTX 5070 Ti Laptop ⎘ 16 GB Memory, 512 GB SSD | Amazon: List Price: 2000 EUR | 2.6 kg | 28.6 mm | 16.00" 2560x1600 189 PPI IPS |
4. 87.5%  | Lenovo Legion Pro 7i 16 Gen 10 Intel Core Ultra 9 275HX ⎘ NVIDIA GeForce RTX 5080 Laptop ⎘ 32 GB Memory, 1024 GB SSD | Amazon: List Price: 4200 USD | 2.6 kg | 26.65 mm | 16.00" 2560x1600 189 PPI OLED |
5. 84.5%  | Lenovo Legion 5 Pro 16IAX10H Intel Core Ultra 9 275HX ⎘ NVIDIA GeForce RTX 5070 Ti Laptop ⎘ 32 GB Memory, 1024 GB SSD | Amazon: 1. $2,999.00 Lenovo Legion Pro 5i Gen 10 ... 2. $99.97 Lenovo Slim 245W AC Adapter ... 3. $1,749.00 Lenovo Legion 5 16" WQXGA 24... List Price: 2500 Euro | 2.4 kg | 25.95 mm | 16.00" 2560x1600 189 PPI OLED |
6. 85.1%  | MSI Raider A18 HX A9WIG-080 AMD Ryzen 9 9955HX3D ⎘ NVIDIA GeForce RTX 5080 Laptop ⎘ 64 GB Memory, 2048 GB SSD | Amazon: List Price: 4350 Euro | 3.6 kg | 34 mm | 18.00" 3840x2400 252 PPI MiniLED IPS |
7. 82.5%  | Medion Erazer Beast 18 X1 MD62731 Intel Core Ultra 9 275HX ⎘ NVIDIA GeForce RTX 5080 Laptop ⎘ 32 GB Memory, SSD | Amazon: List Price: 3700 EUR | 3.6 kg | 30.4 mm | 18.00" 2560x1600 168 PPI IPS |
Transparency
The selection of devices to be reviewed is made by our editorial team. The test sample was provided to the author as a loan by the manufacturer or retailer for the purpose of this review. The lender had no influence on this review, nor did the manufacturer receive a copy of this review before publication. There was no obligation to publish this review. As an independent media company, Notebookcheck is not subjected to the authority of manufacturers, retailers or publishers.
This is how Notebookcheck is testing
Every year, Notebookcheck independently reviews hundreds of laptops and smartphones using standardized procedures to ensure that all results are comparable. We have continuously developed our test methods for around 20 years and set industry standards in the process. In our test labs, high-quality measuring equipment is utilized by experienced technicians and editors. These tests involve a multi-stage validation process. Our complex rating system is based on hundreds of well-founded measurements and benchmarks, which maintains objectivity. Further information on our test methods can be found here.

