Verdict - One of the fastest RTX 5090 notebooks
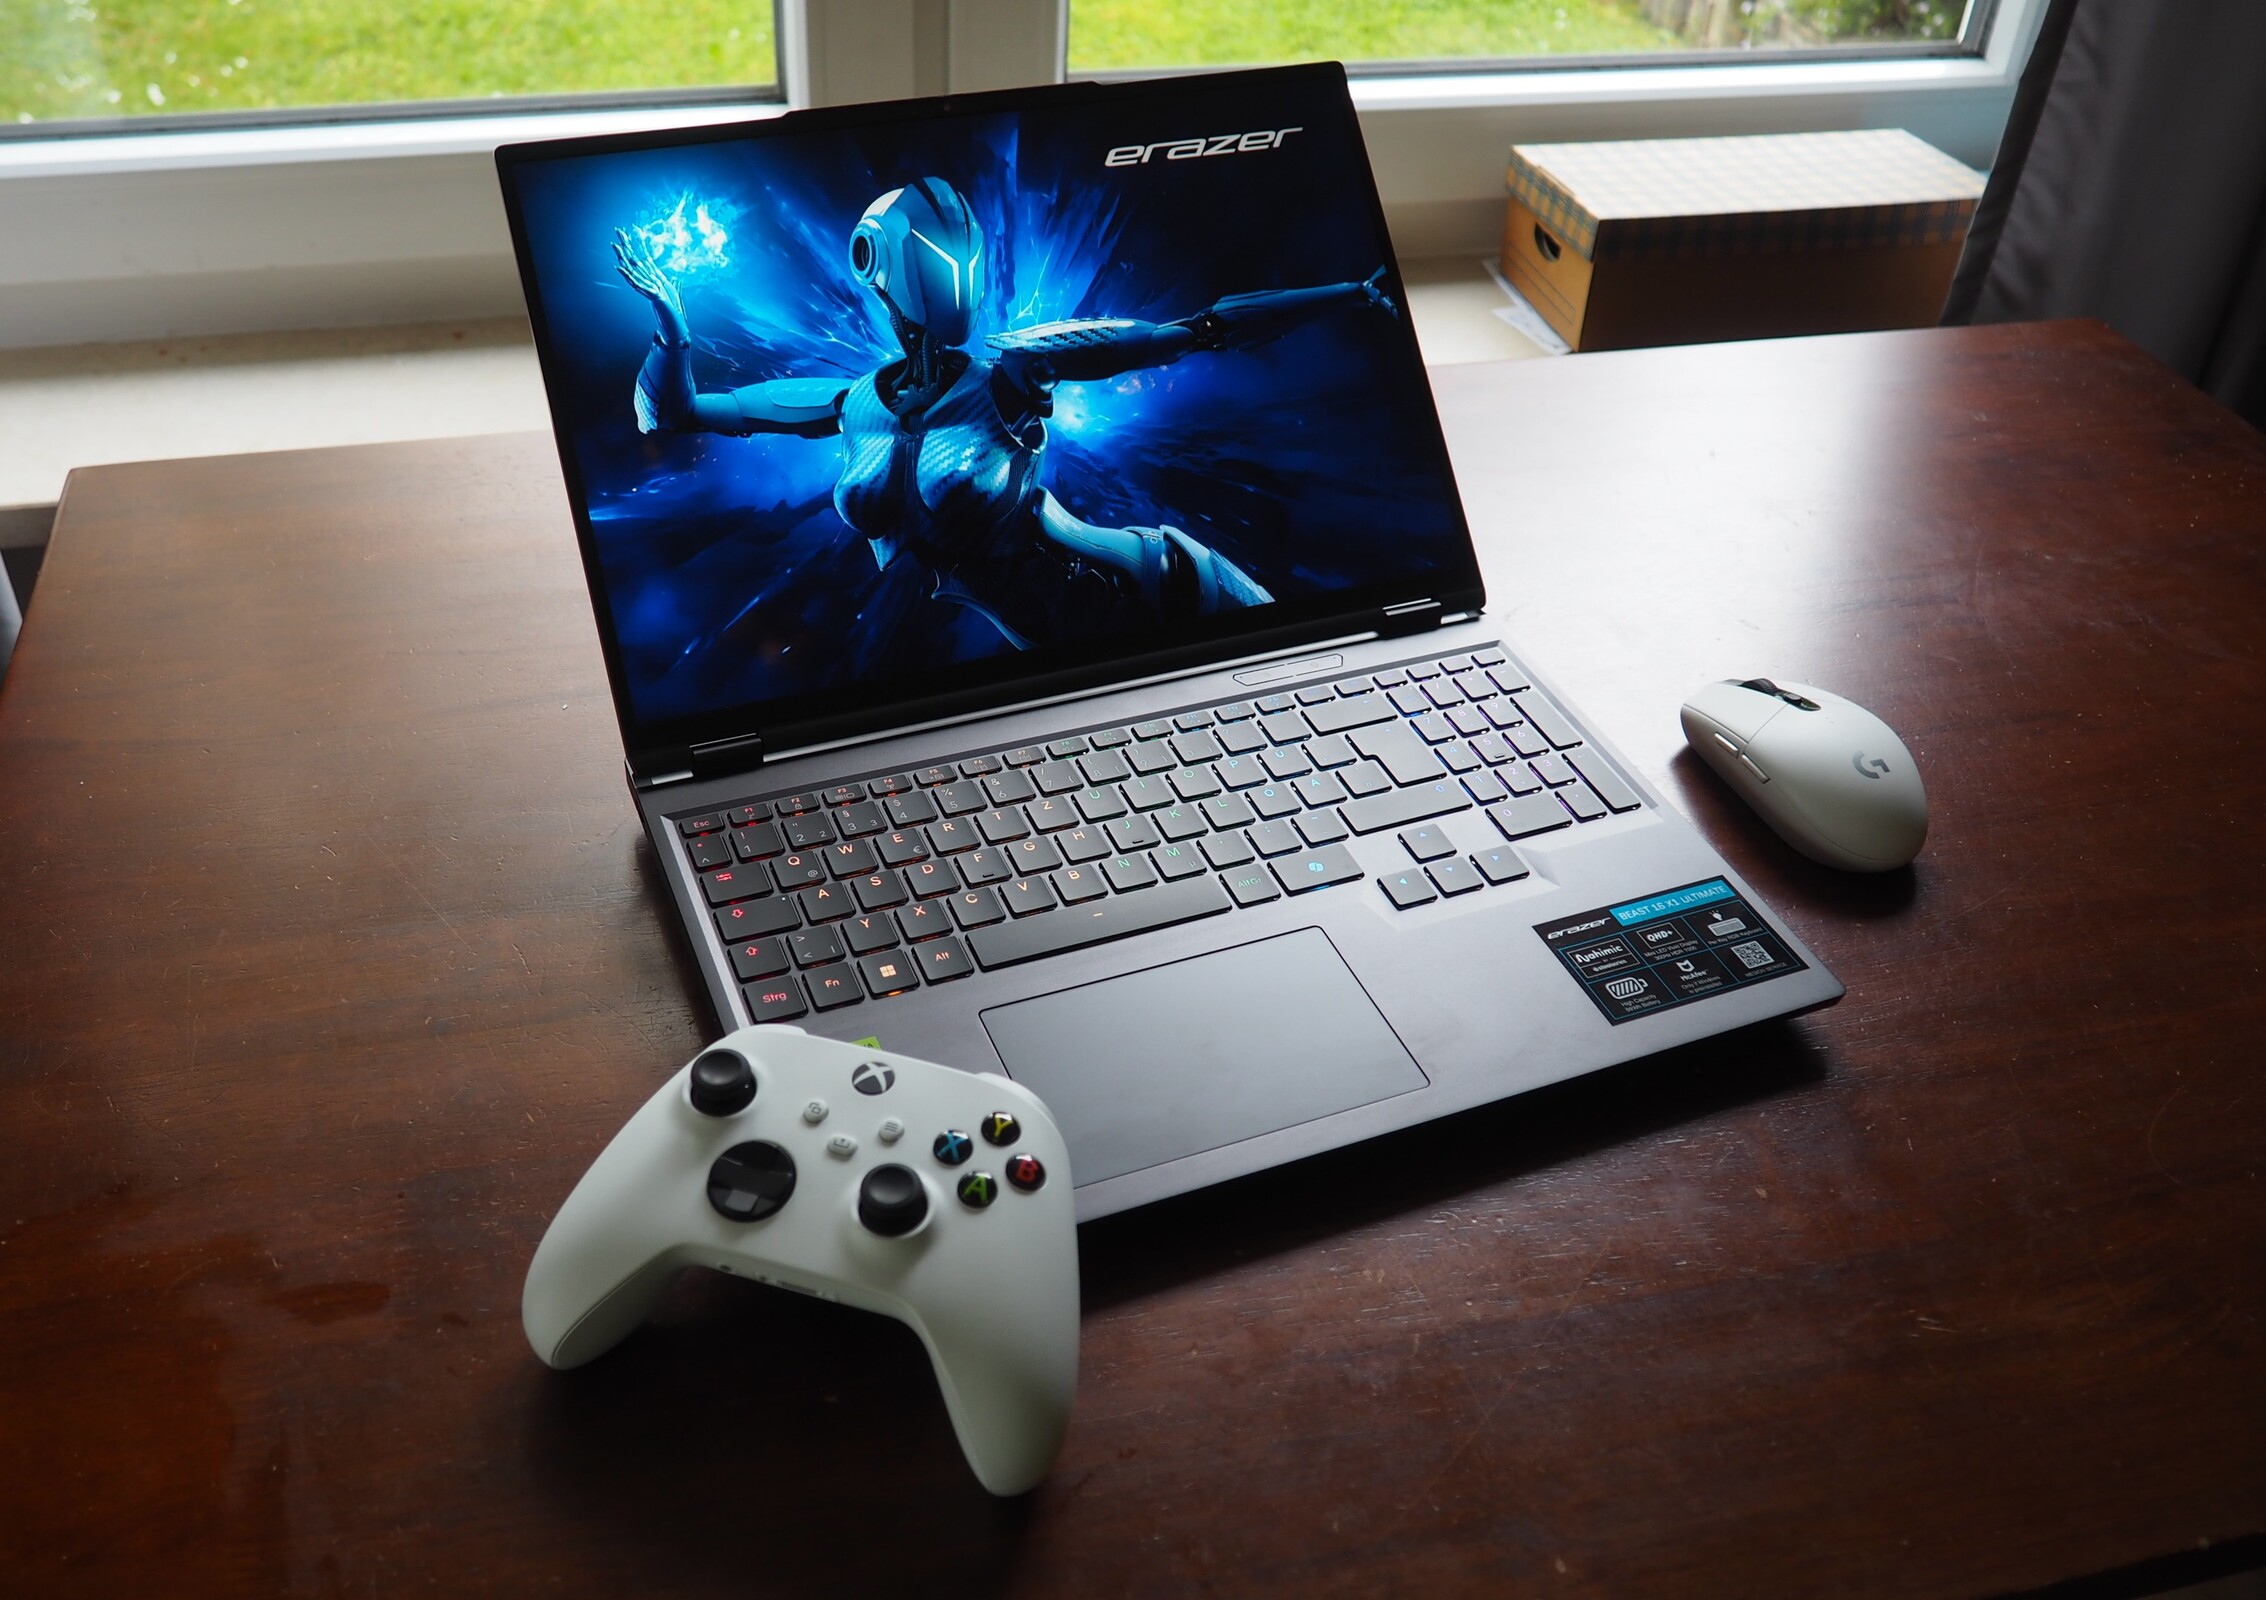
The Medion Erazer Beast 16 X1 is certainly no bargain: For the top version MD62732 with Core Ultra 9 275HX, GeForce RTX 5090, 32 GB RAM and 2 TB SSD, you have to put more than 4,000 Euros (~$4539) on the table at the time of testing. We will analyze whether the surcharge compared to RTX 5080 devices is worth it in the course of this article. All in all, the 16-inch laptop received a "very good" rating, which is due to its performance, display and casing. The mini LED panel in 16:10 format (2,560 x 1,600 pixels, 300 Hz) scores points not least with its high brightness, rich contrast and wide color gamut, which should please not only gamers but also professional users.
The chassis cuts a high-quality figure thanks to the metal insert and impresses with its good stability. The input devices and connections are not bad either. The Erazer Beast 16 X1 offers a Thunderbolt 4 port, among other things. There are few points of criticism, but what bothered us the most in the test was the hefty noise development under load. Unfortunately, this shortcoming affects almost all gaming laptops.
If you want to get even more out of the laptop, you can purchase the optional Erazer Cooling Kit V2 for around 250 Euros (~$284). We will be publishing a separate article with a few suitable measurements shortly.
Pros
Cons
Price and availability
The Erazer Beast 16 X1 Ultimate MD62732 is available for around 4,300 Euros (~$4879) on the Medion homepage (currently reduced to 4,090 Euros/~4641).
16-inch counterparts that also contain an RTX 5000 GPU are, for example, the HP Omen Max 16, the Asus ROG Strix Scar 16, the Lenovo Legion Pro 7i 16 and the Asus ROG Strix G16which all appear in the tables as comparison devices. However, the main competitor is the more or less identical XMG Neo 16 E25.
Specifications
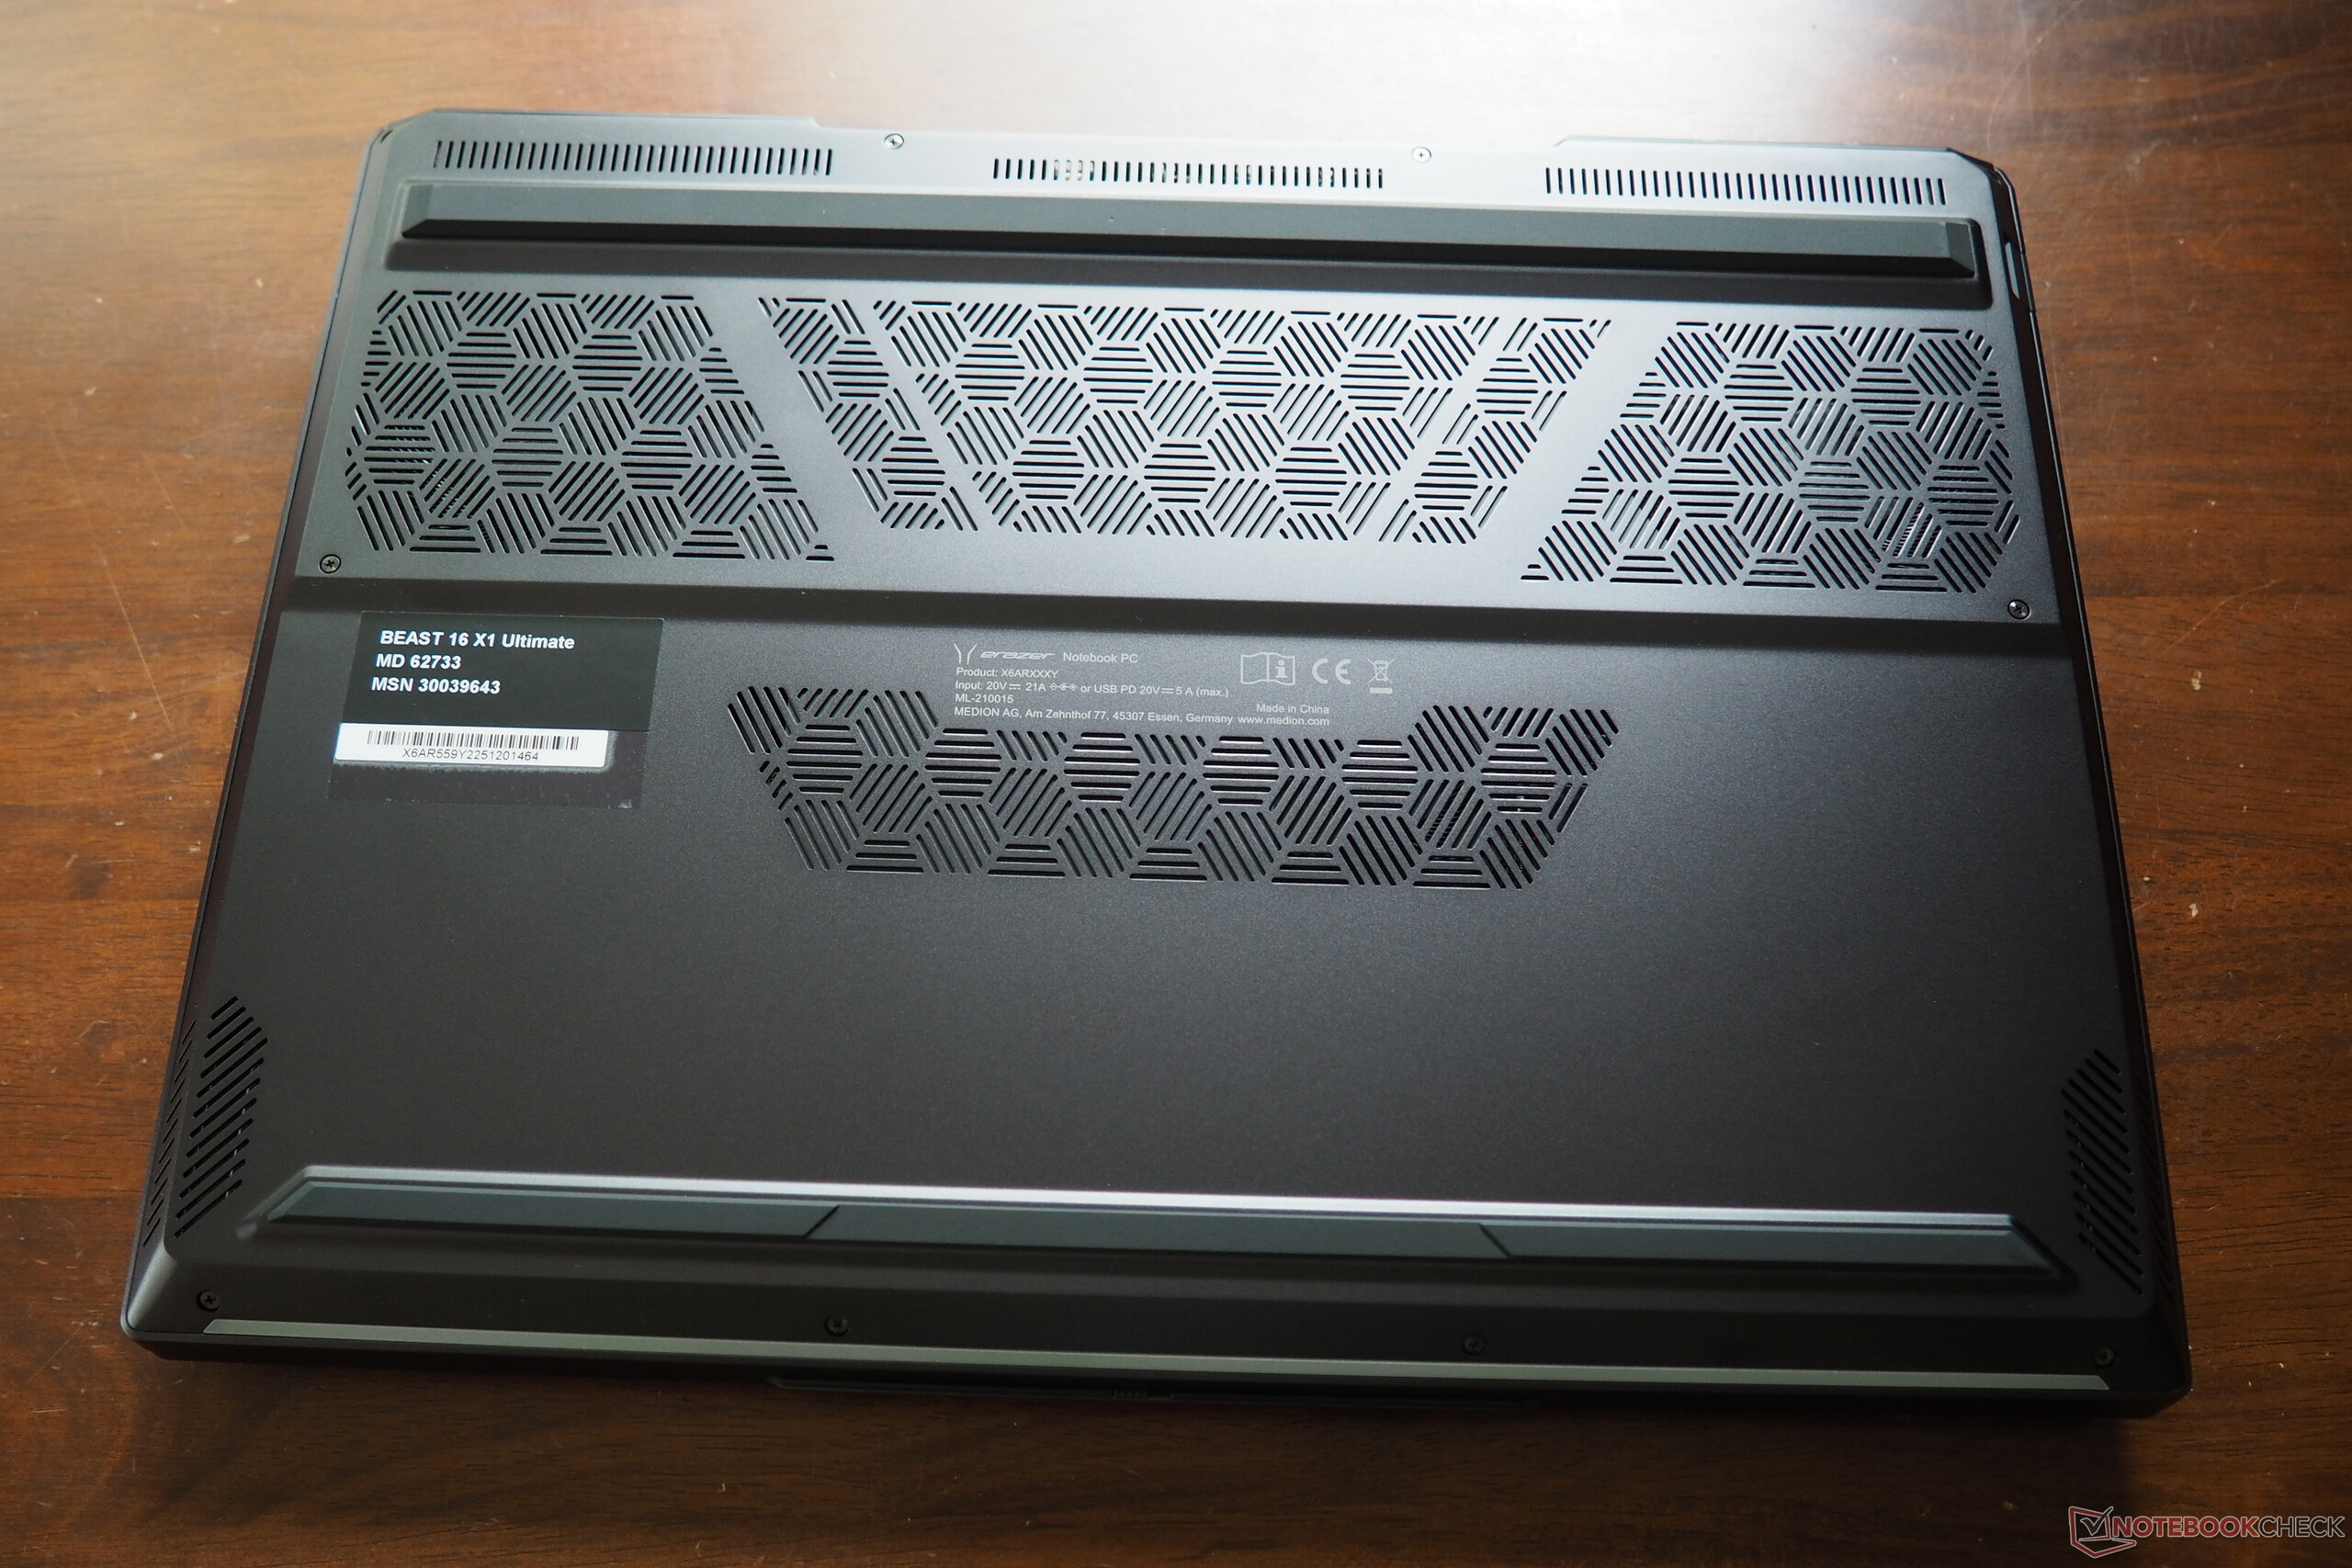
Case
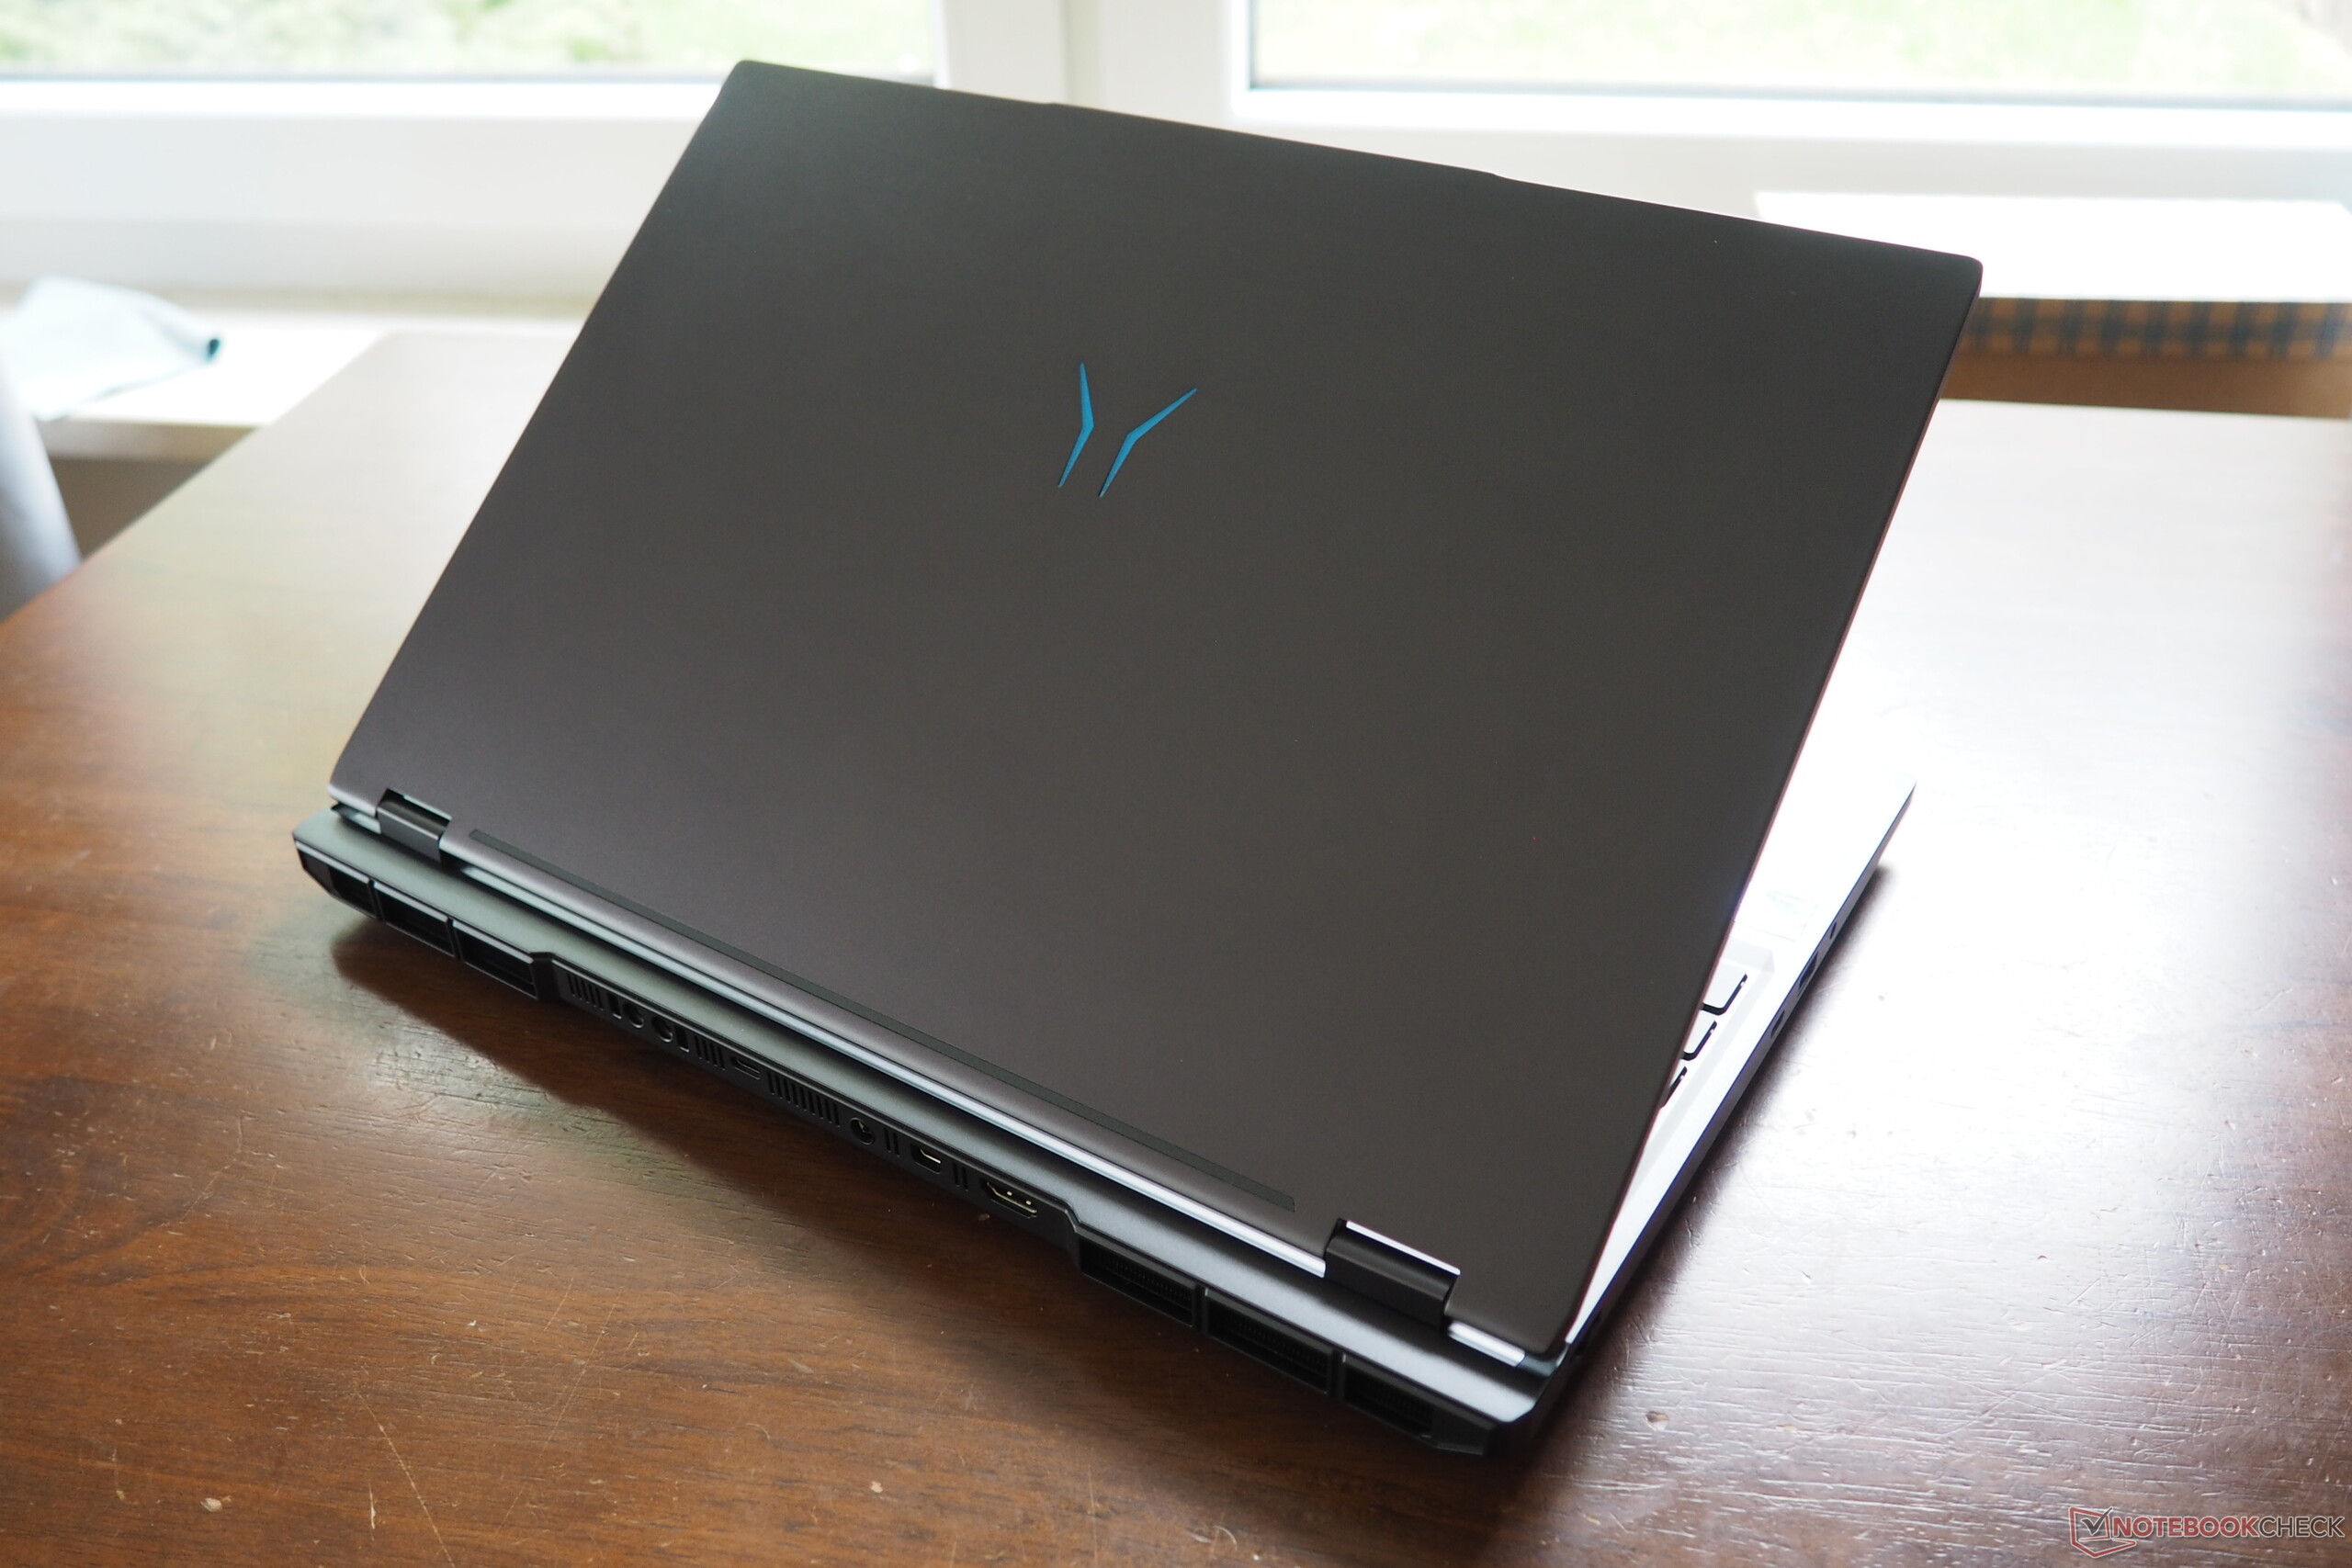
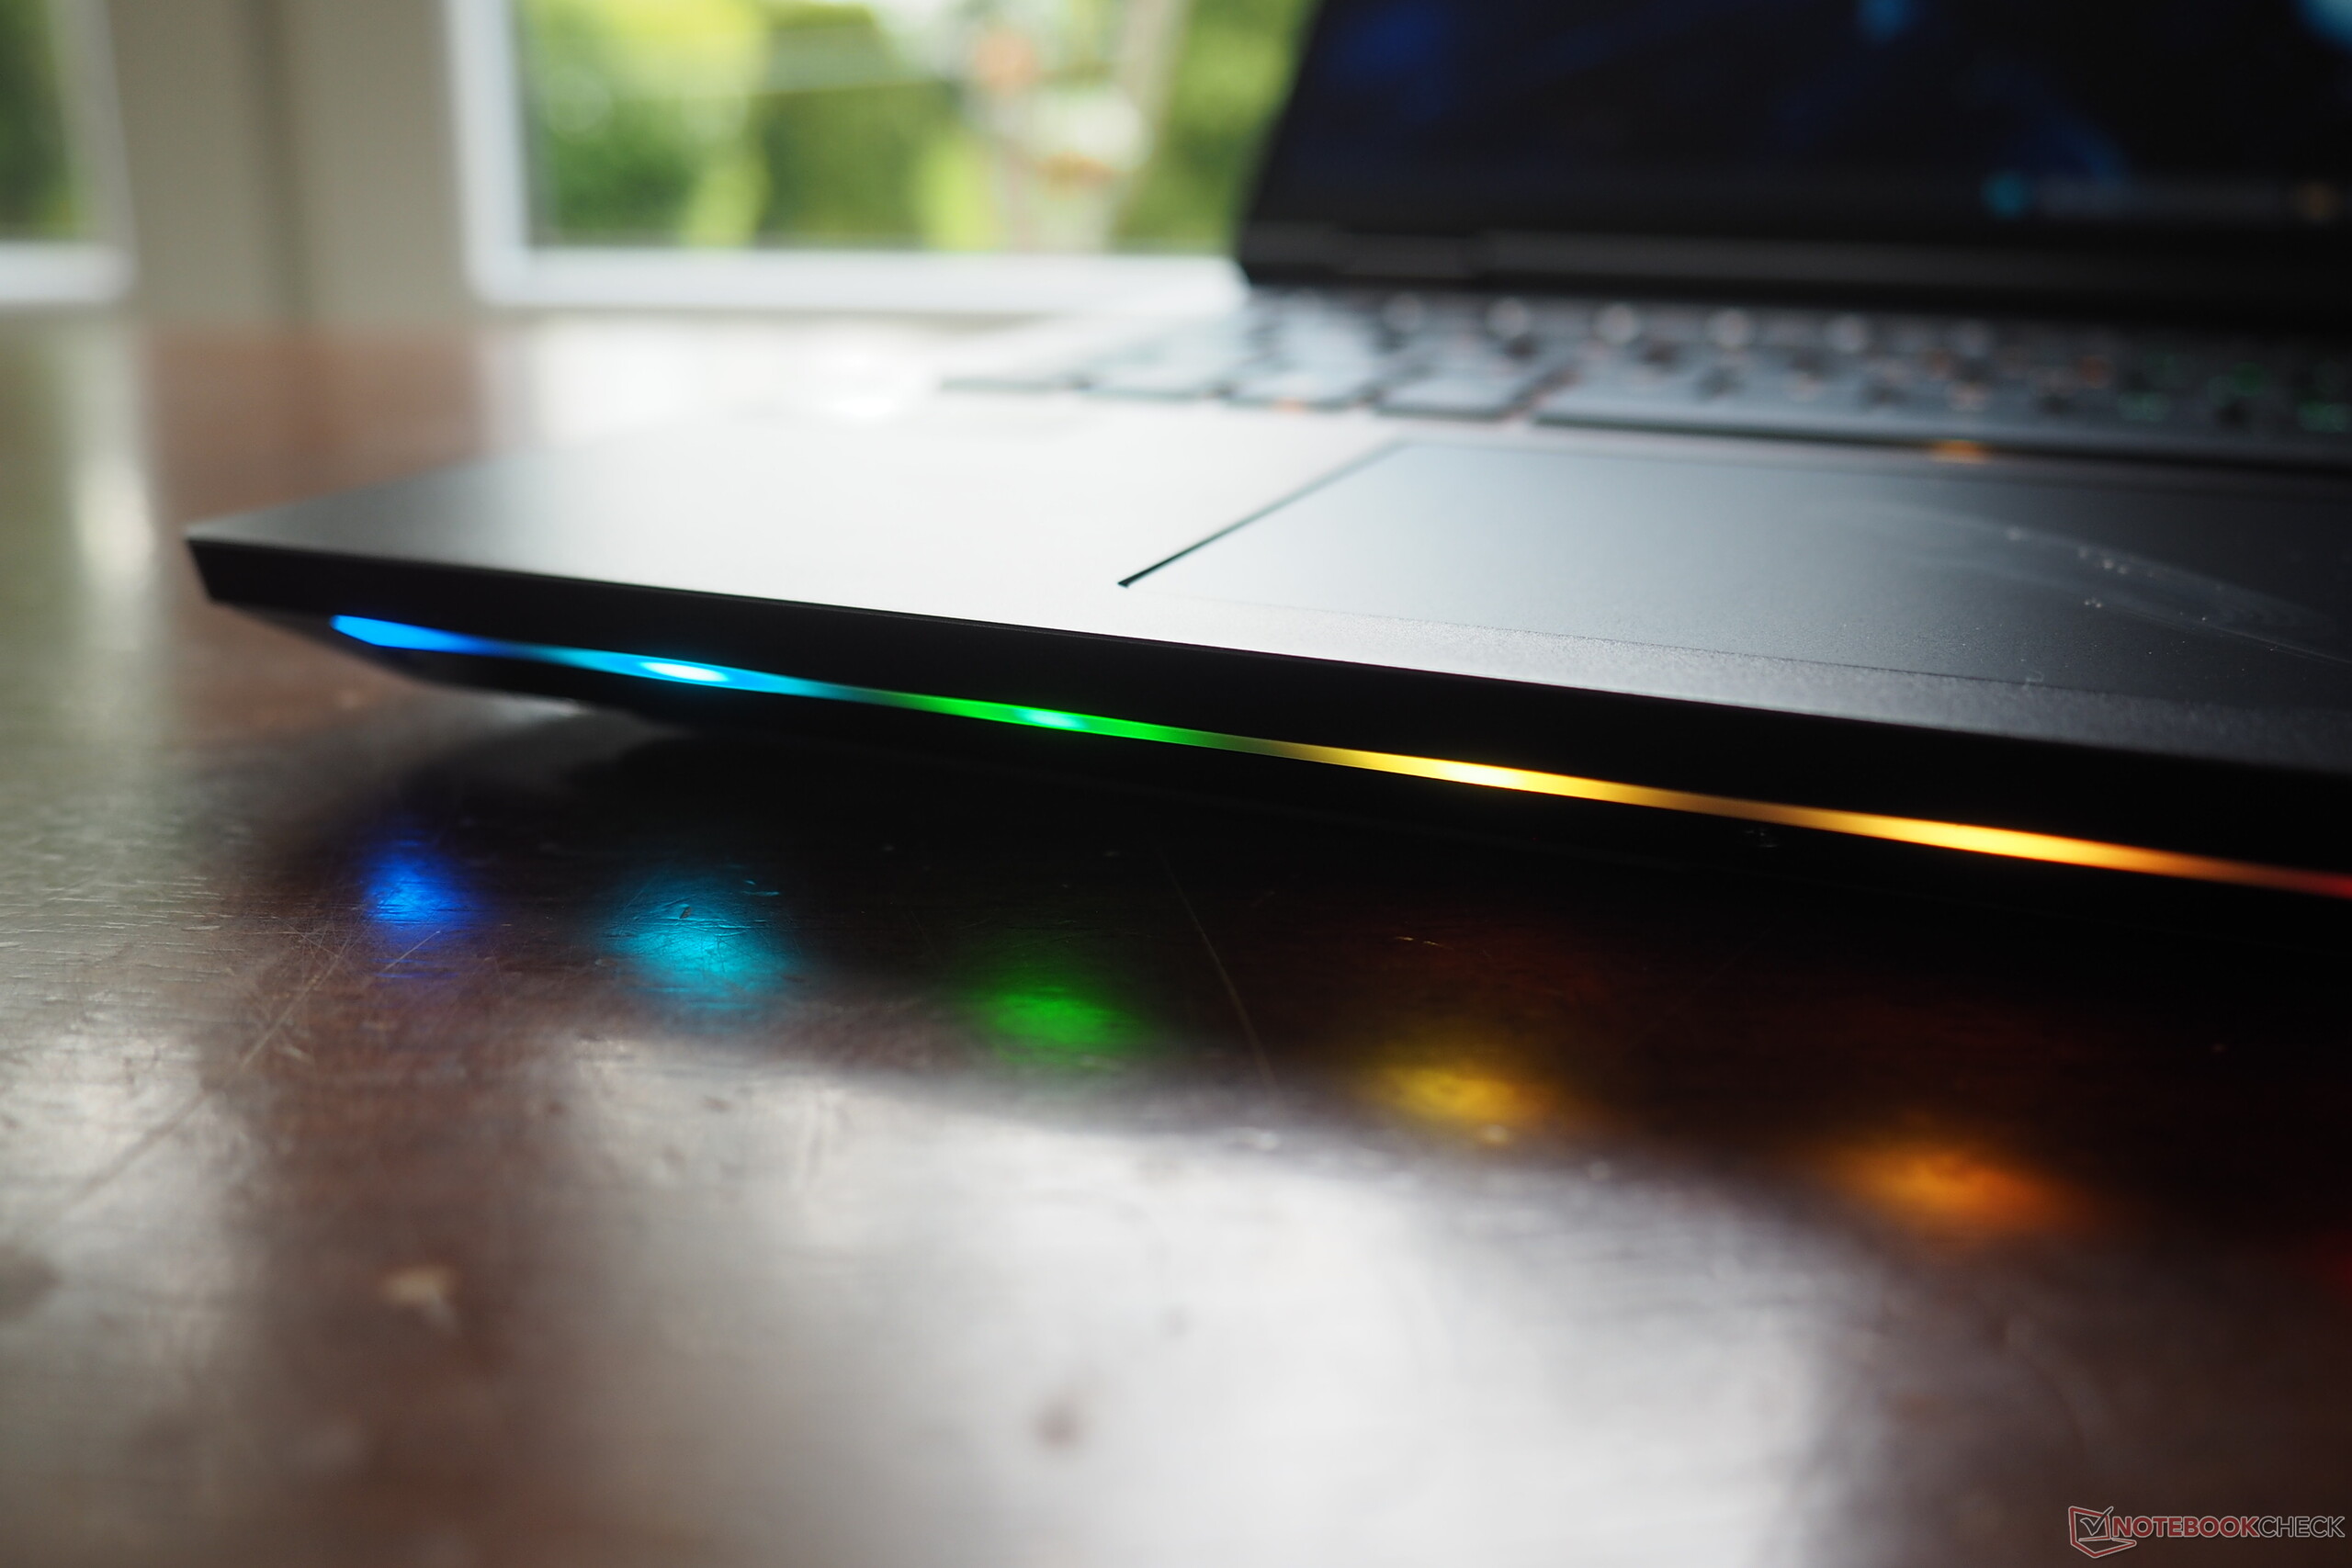
As mentioned at the beginning, the casing leaves a very good impression. Medion has opted for a chassis from Tonfang, which remains pleasantly stable even under heavy pressure and generally has a very elegant feel. The design with its shapes and edges offers a nice mix of elegance and playfulness, and lighting fans can look forward to a stylish LED strip on the front (see photos). At 2.8 kg (~6.2 lbs), the weight is neither low nor particularly high, comparable to the Strix Scar 16 and Omen Max 16. At 3 cm the height is not excessive. The generous opening angle of 180° deserves special respect - not every competitor can manage this.

Features
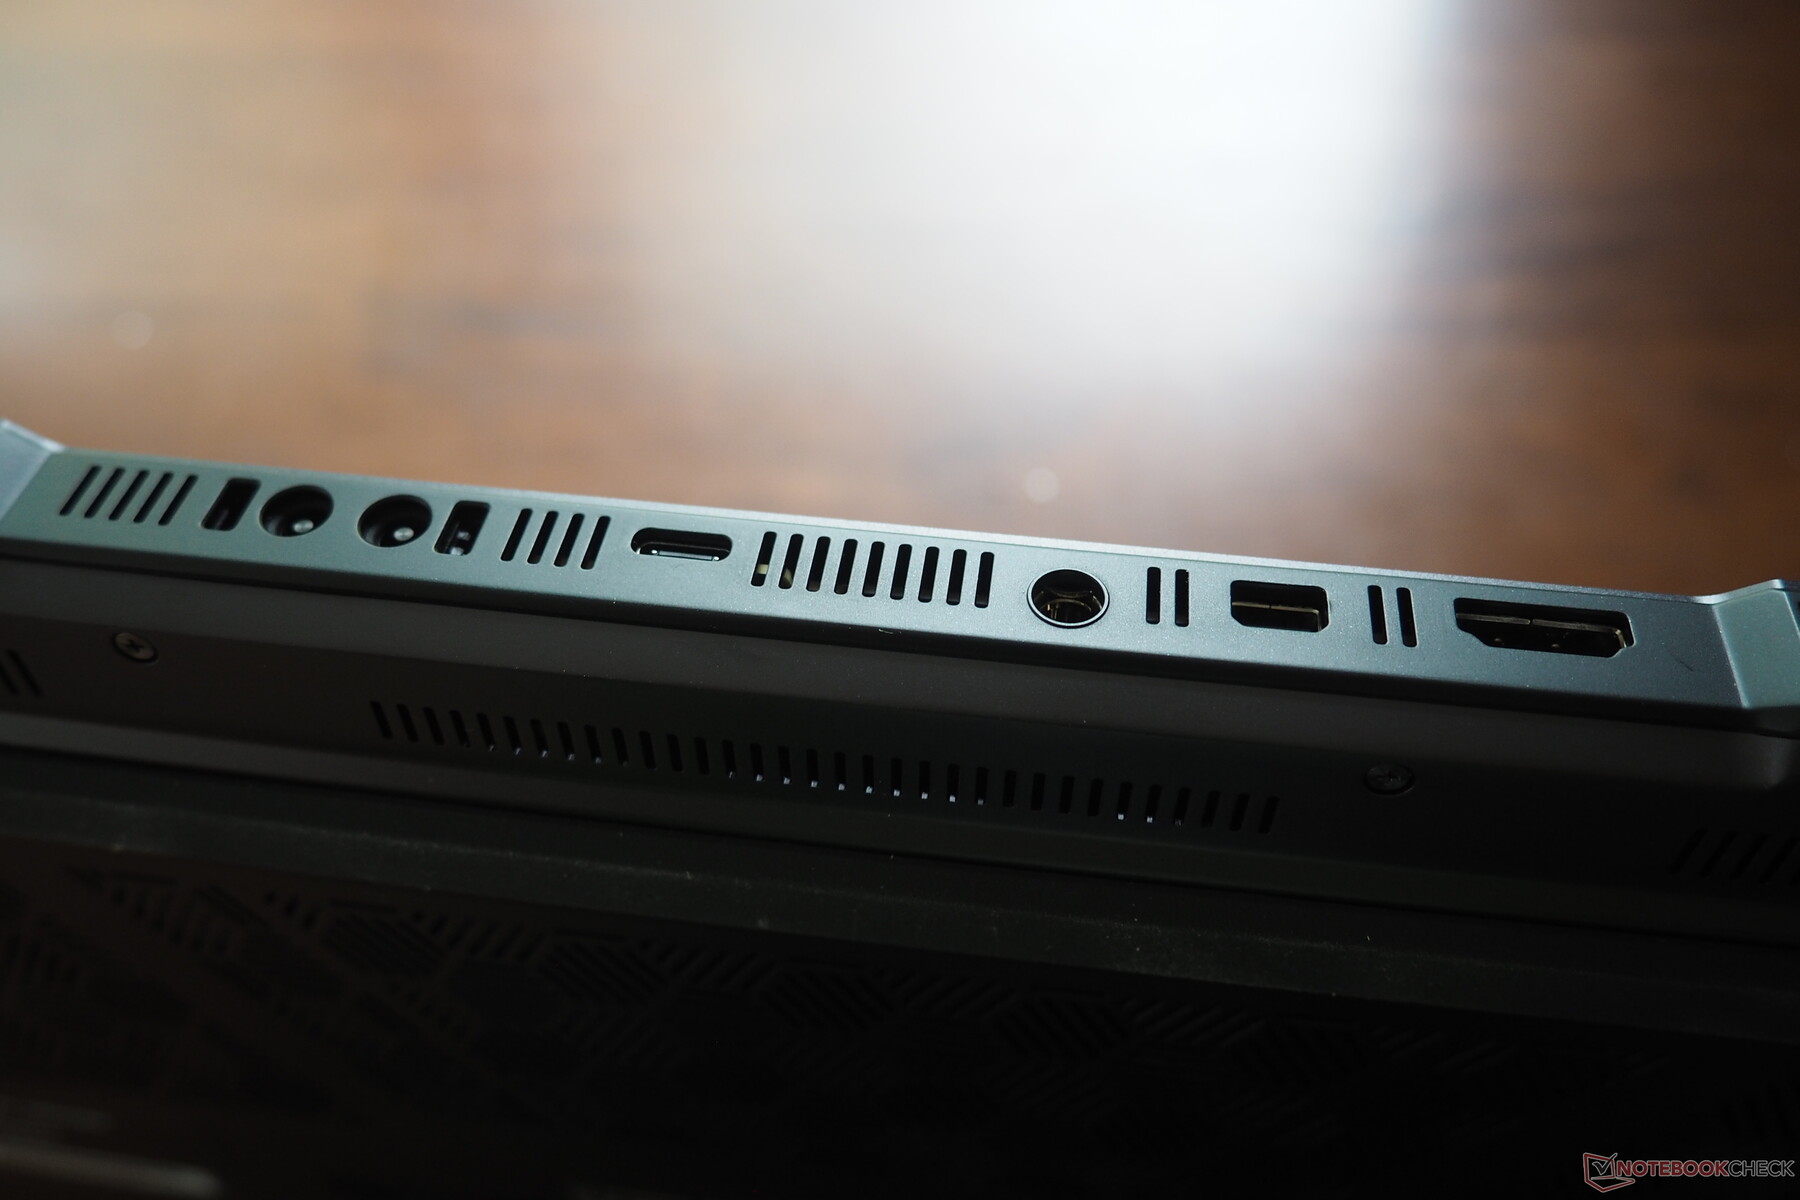
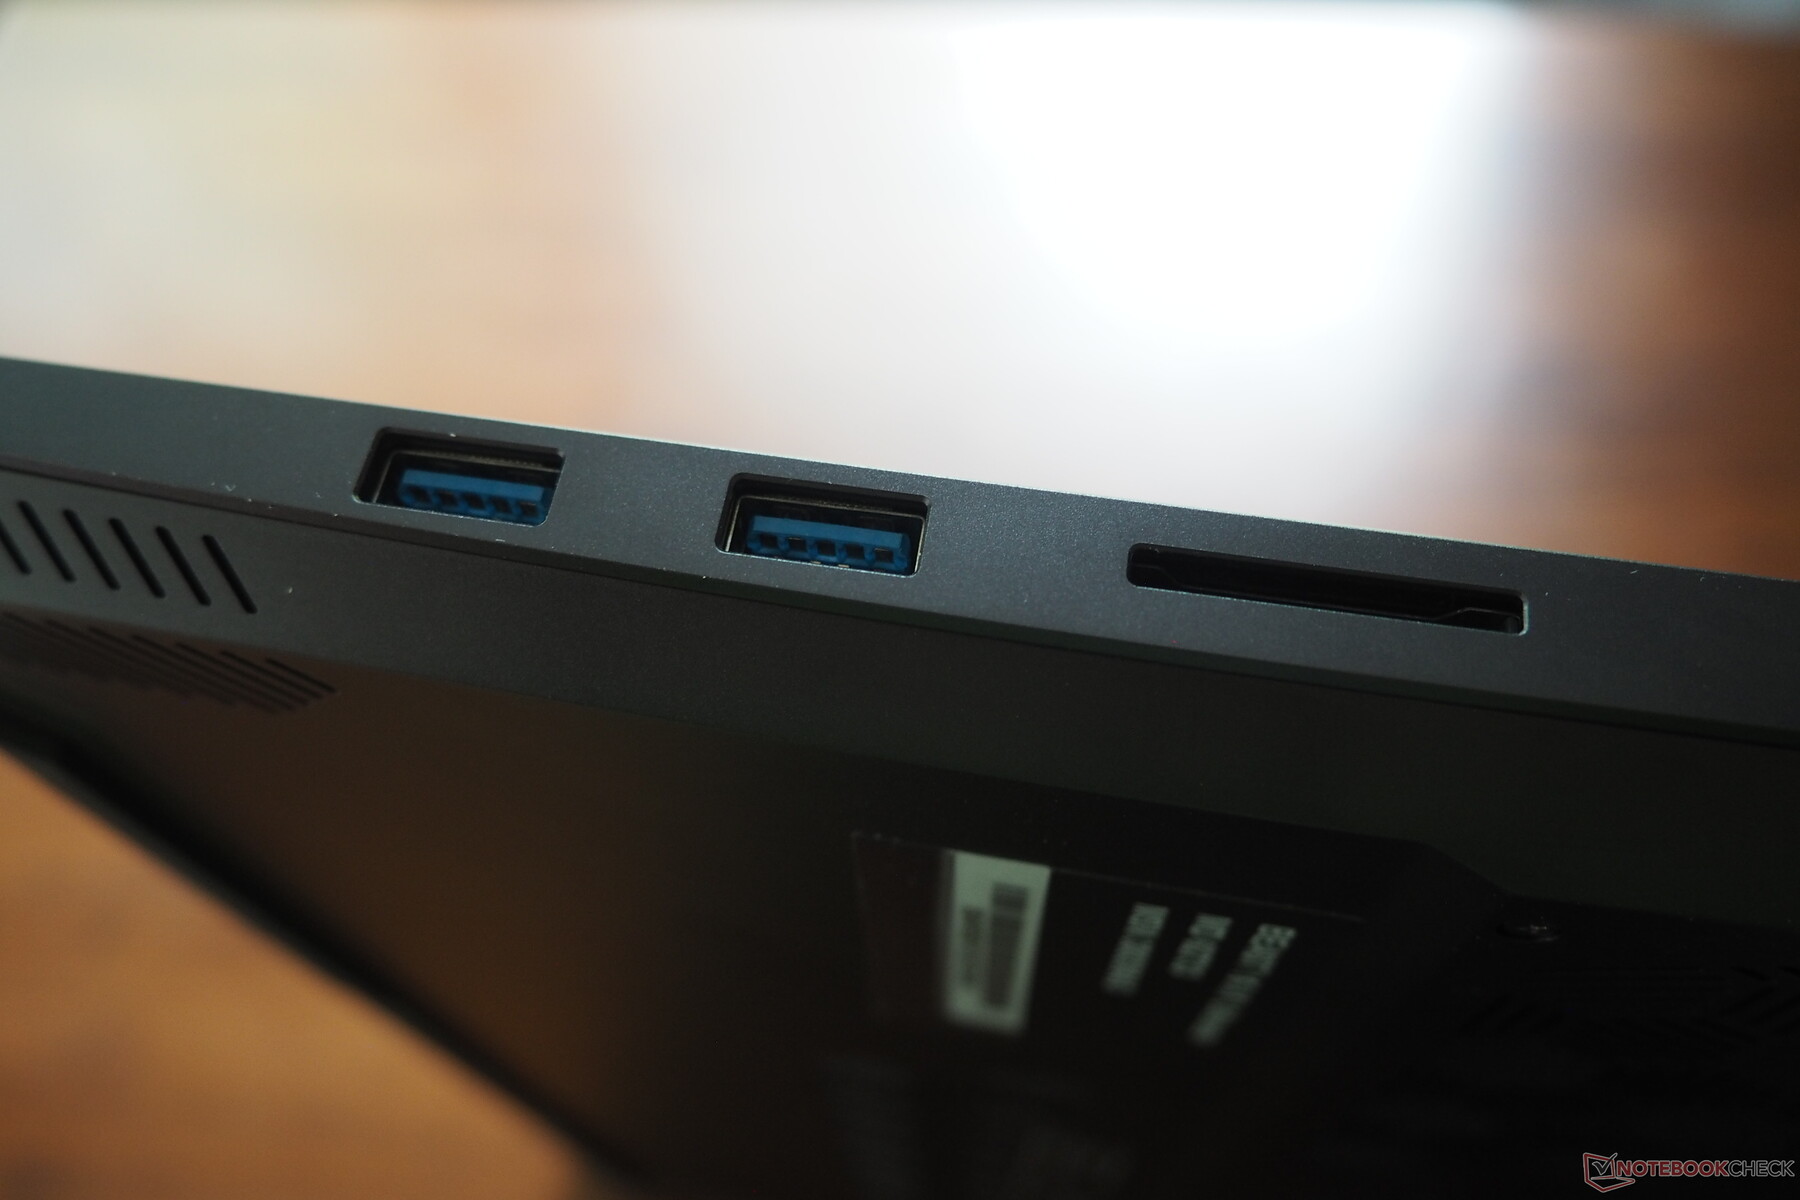
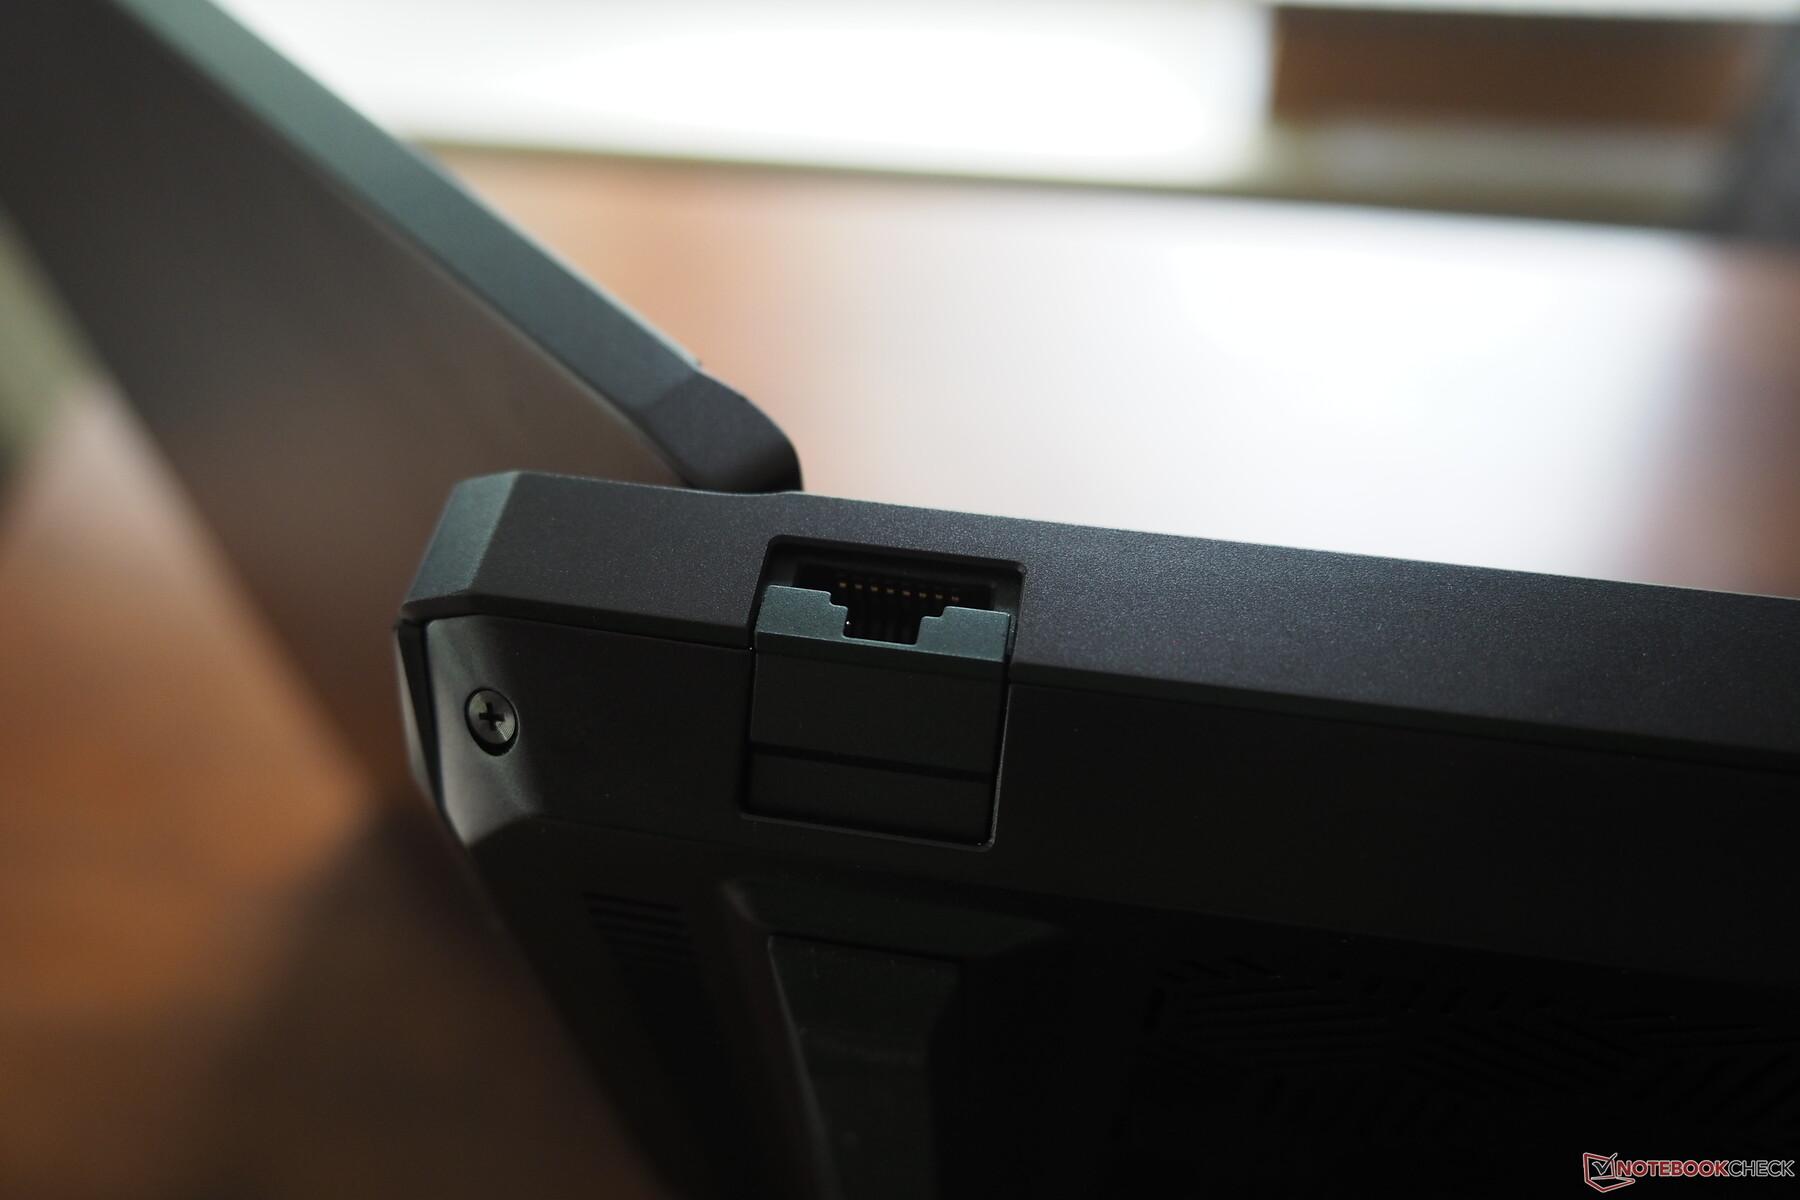
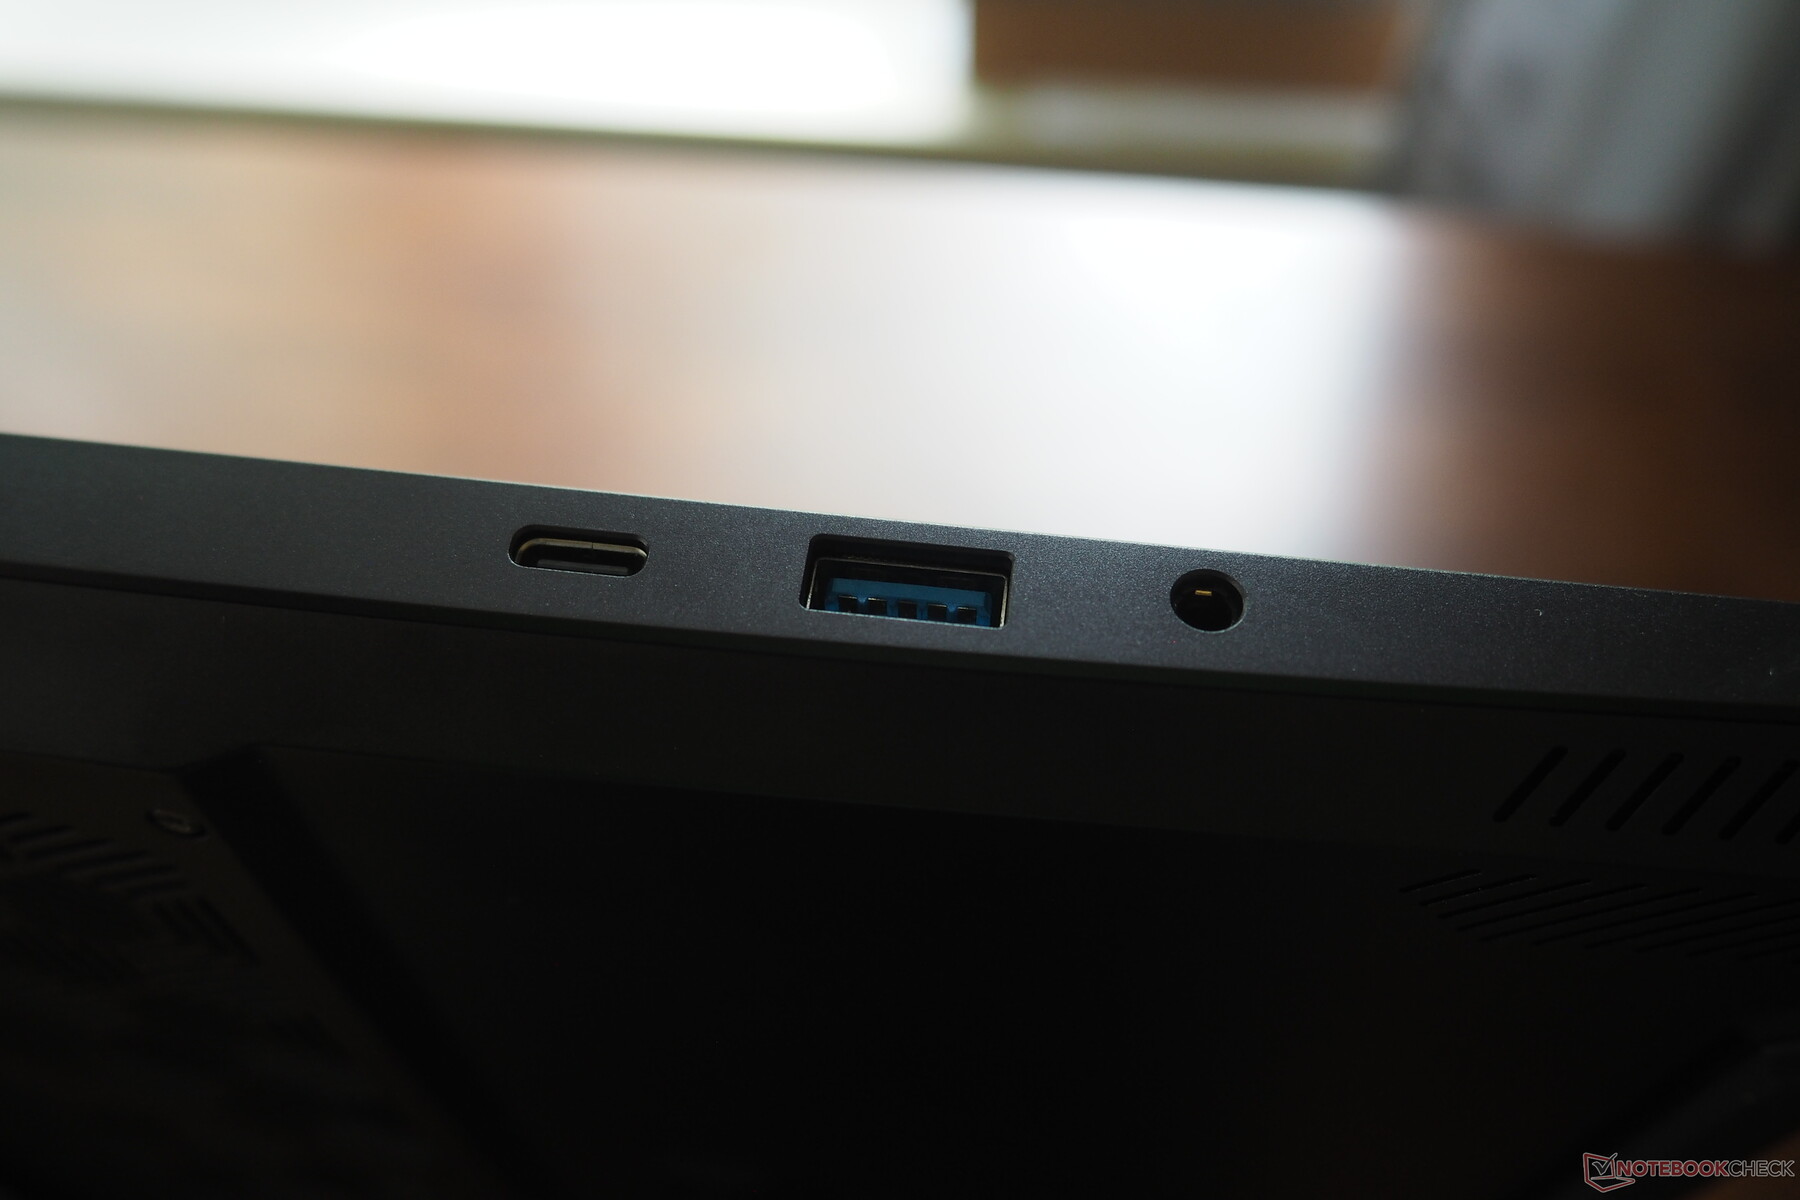
The Beast 16 X1 can boast all kinds of modern interfaces. 2.5 Gbit LAN is just as up-to-date as HDMI 2.1, (mini) DisplayPort 2.1a and Thunderbolt 4, as well as a USB-C 3.2 Gen2 port, two USB-A 3.2 Gen1 ports, an audio socket and a very fast card reader. The input for the external water cooling system is also located at the rear. There is also nothing to criticize about the performance of the wireless module; although the AX211 chip from Intel does not support Wi-Fi 7, it still achieves high to very high speeds.
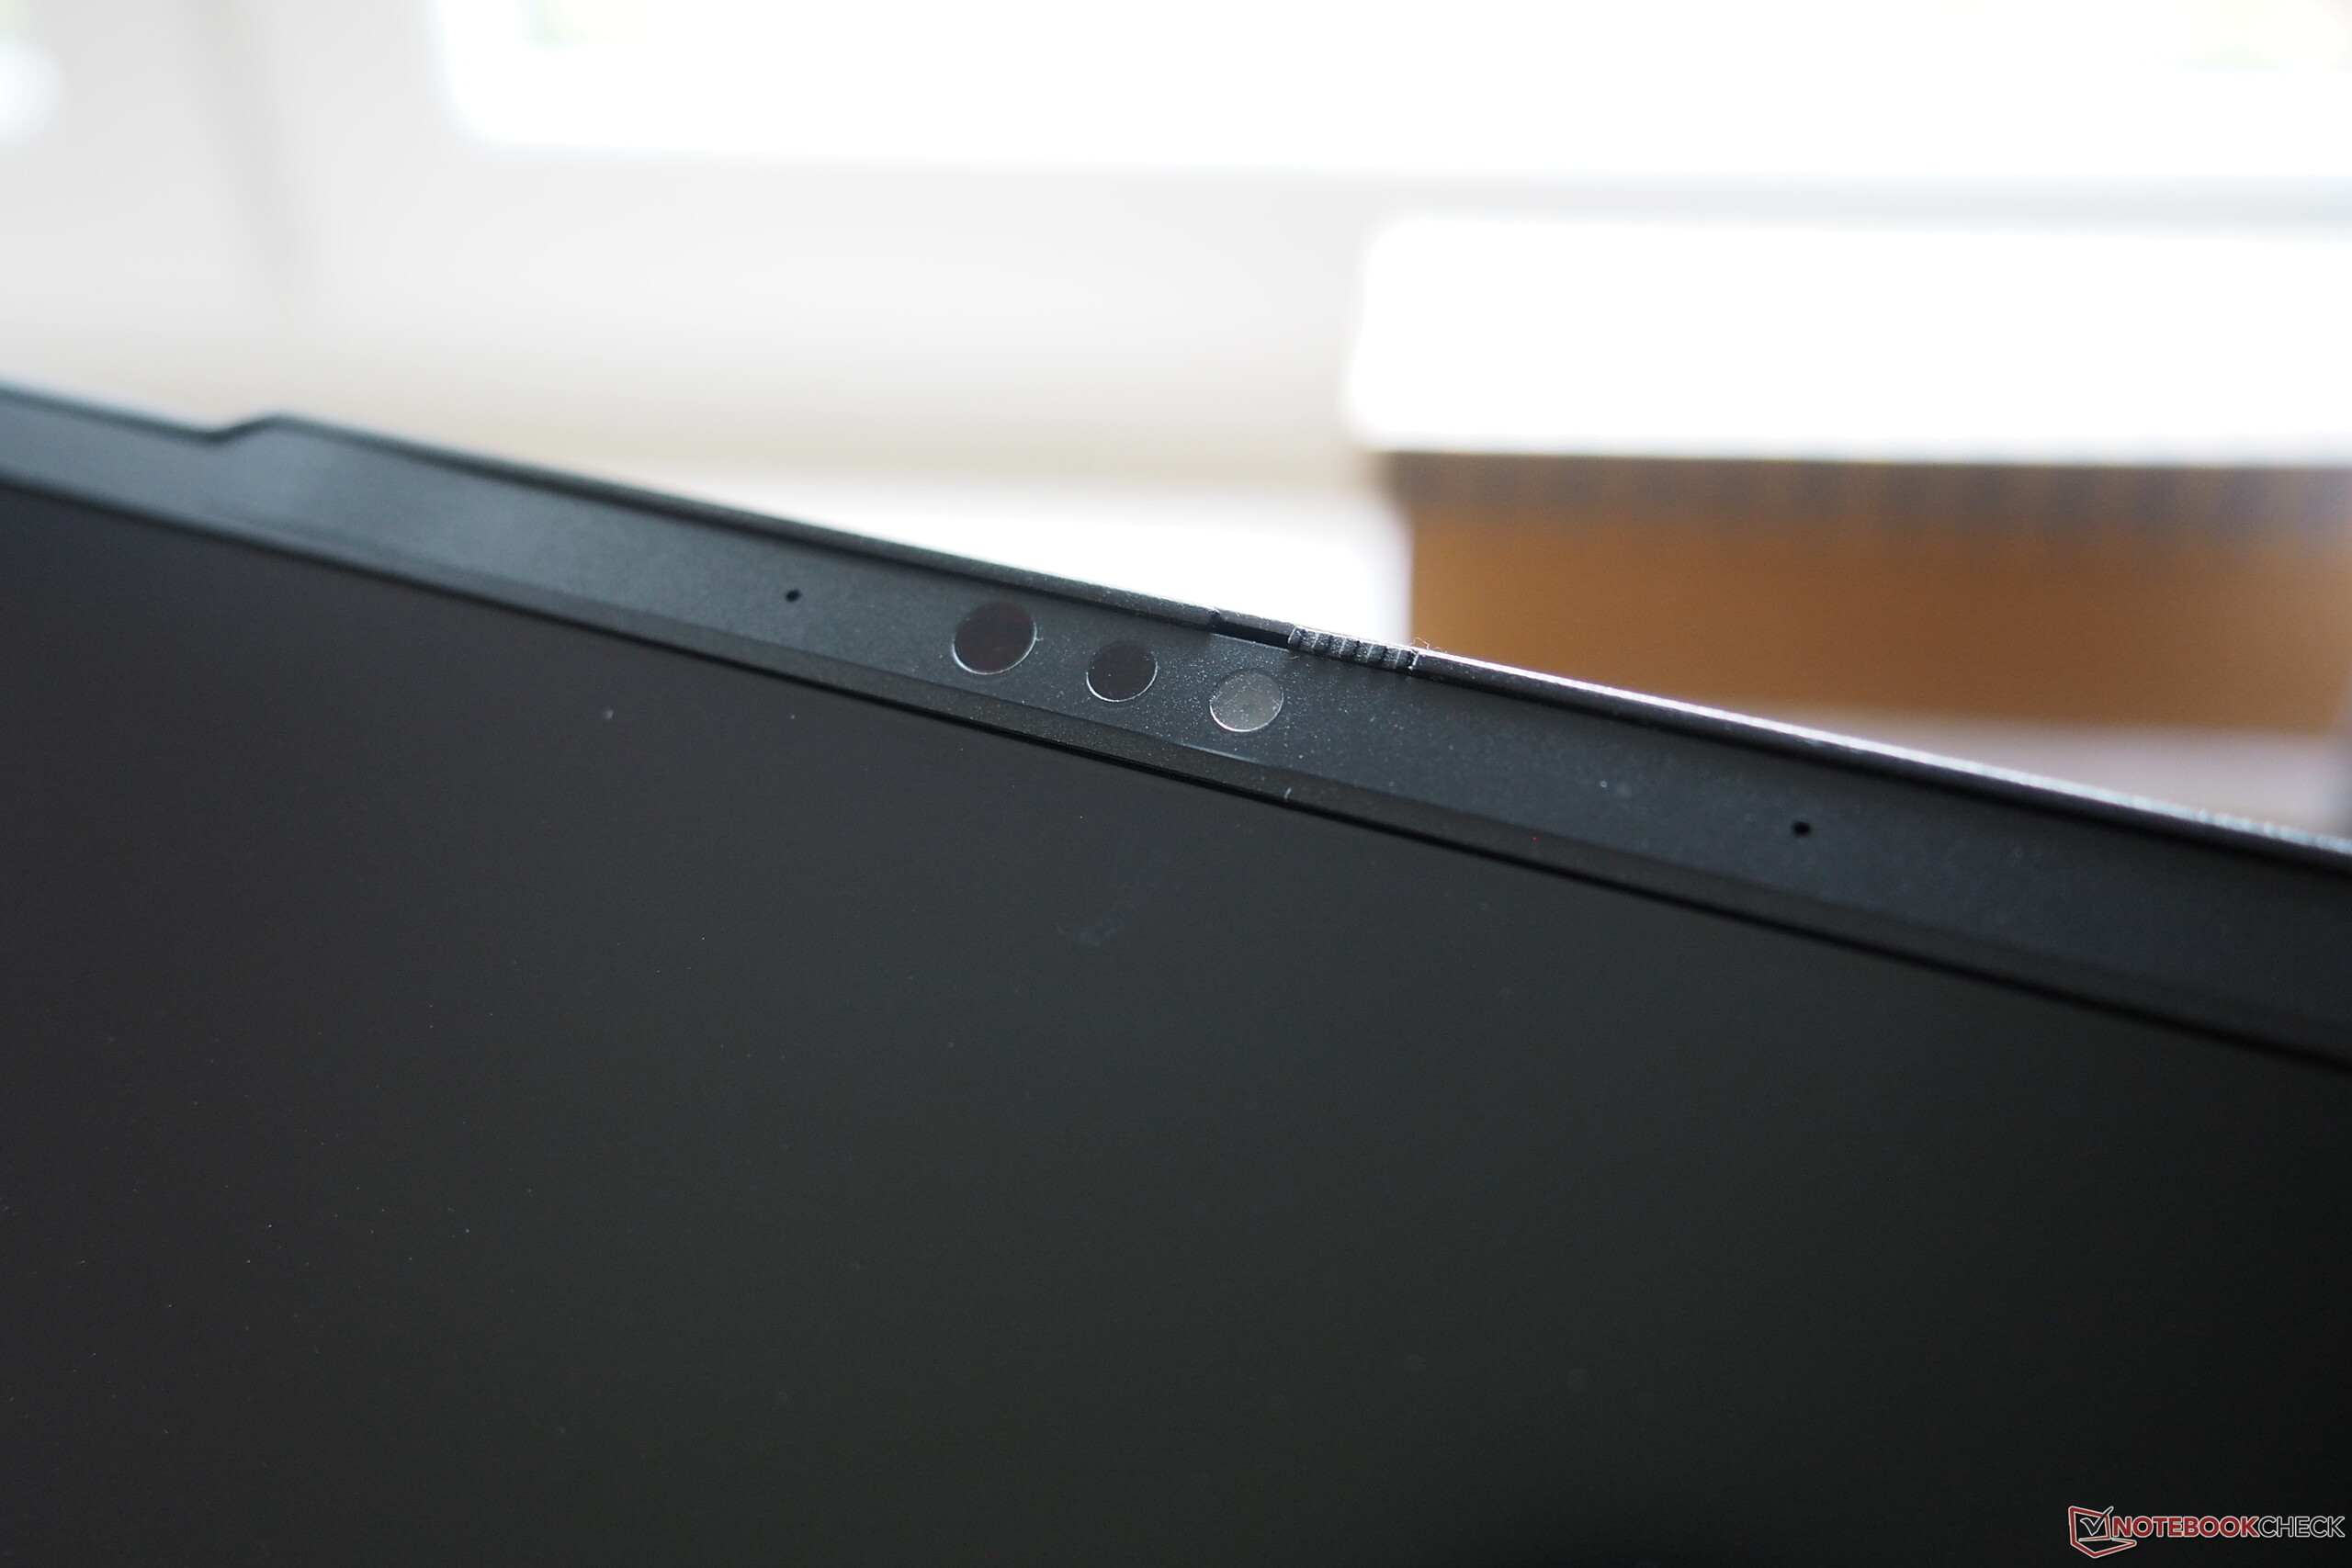
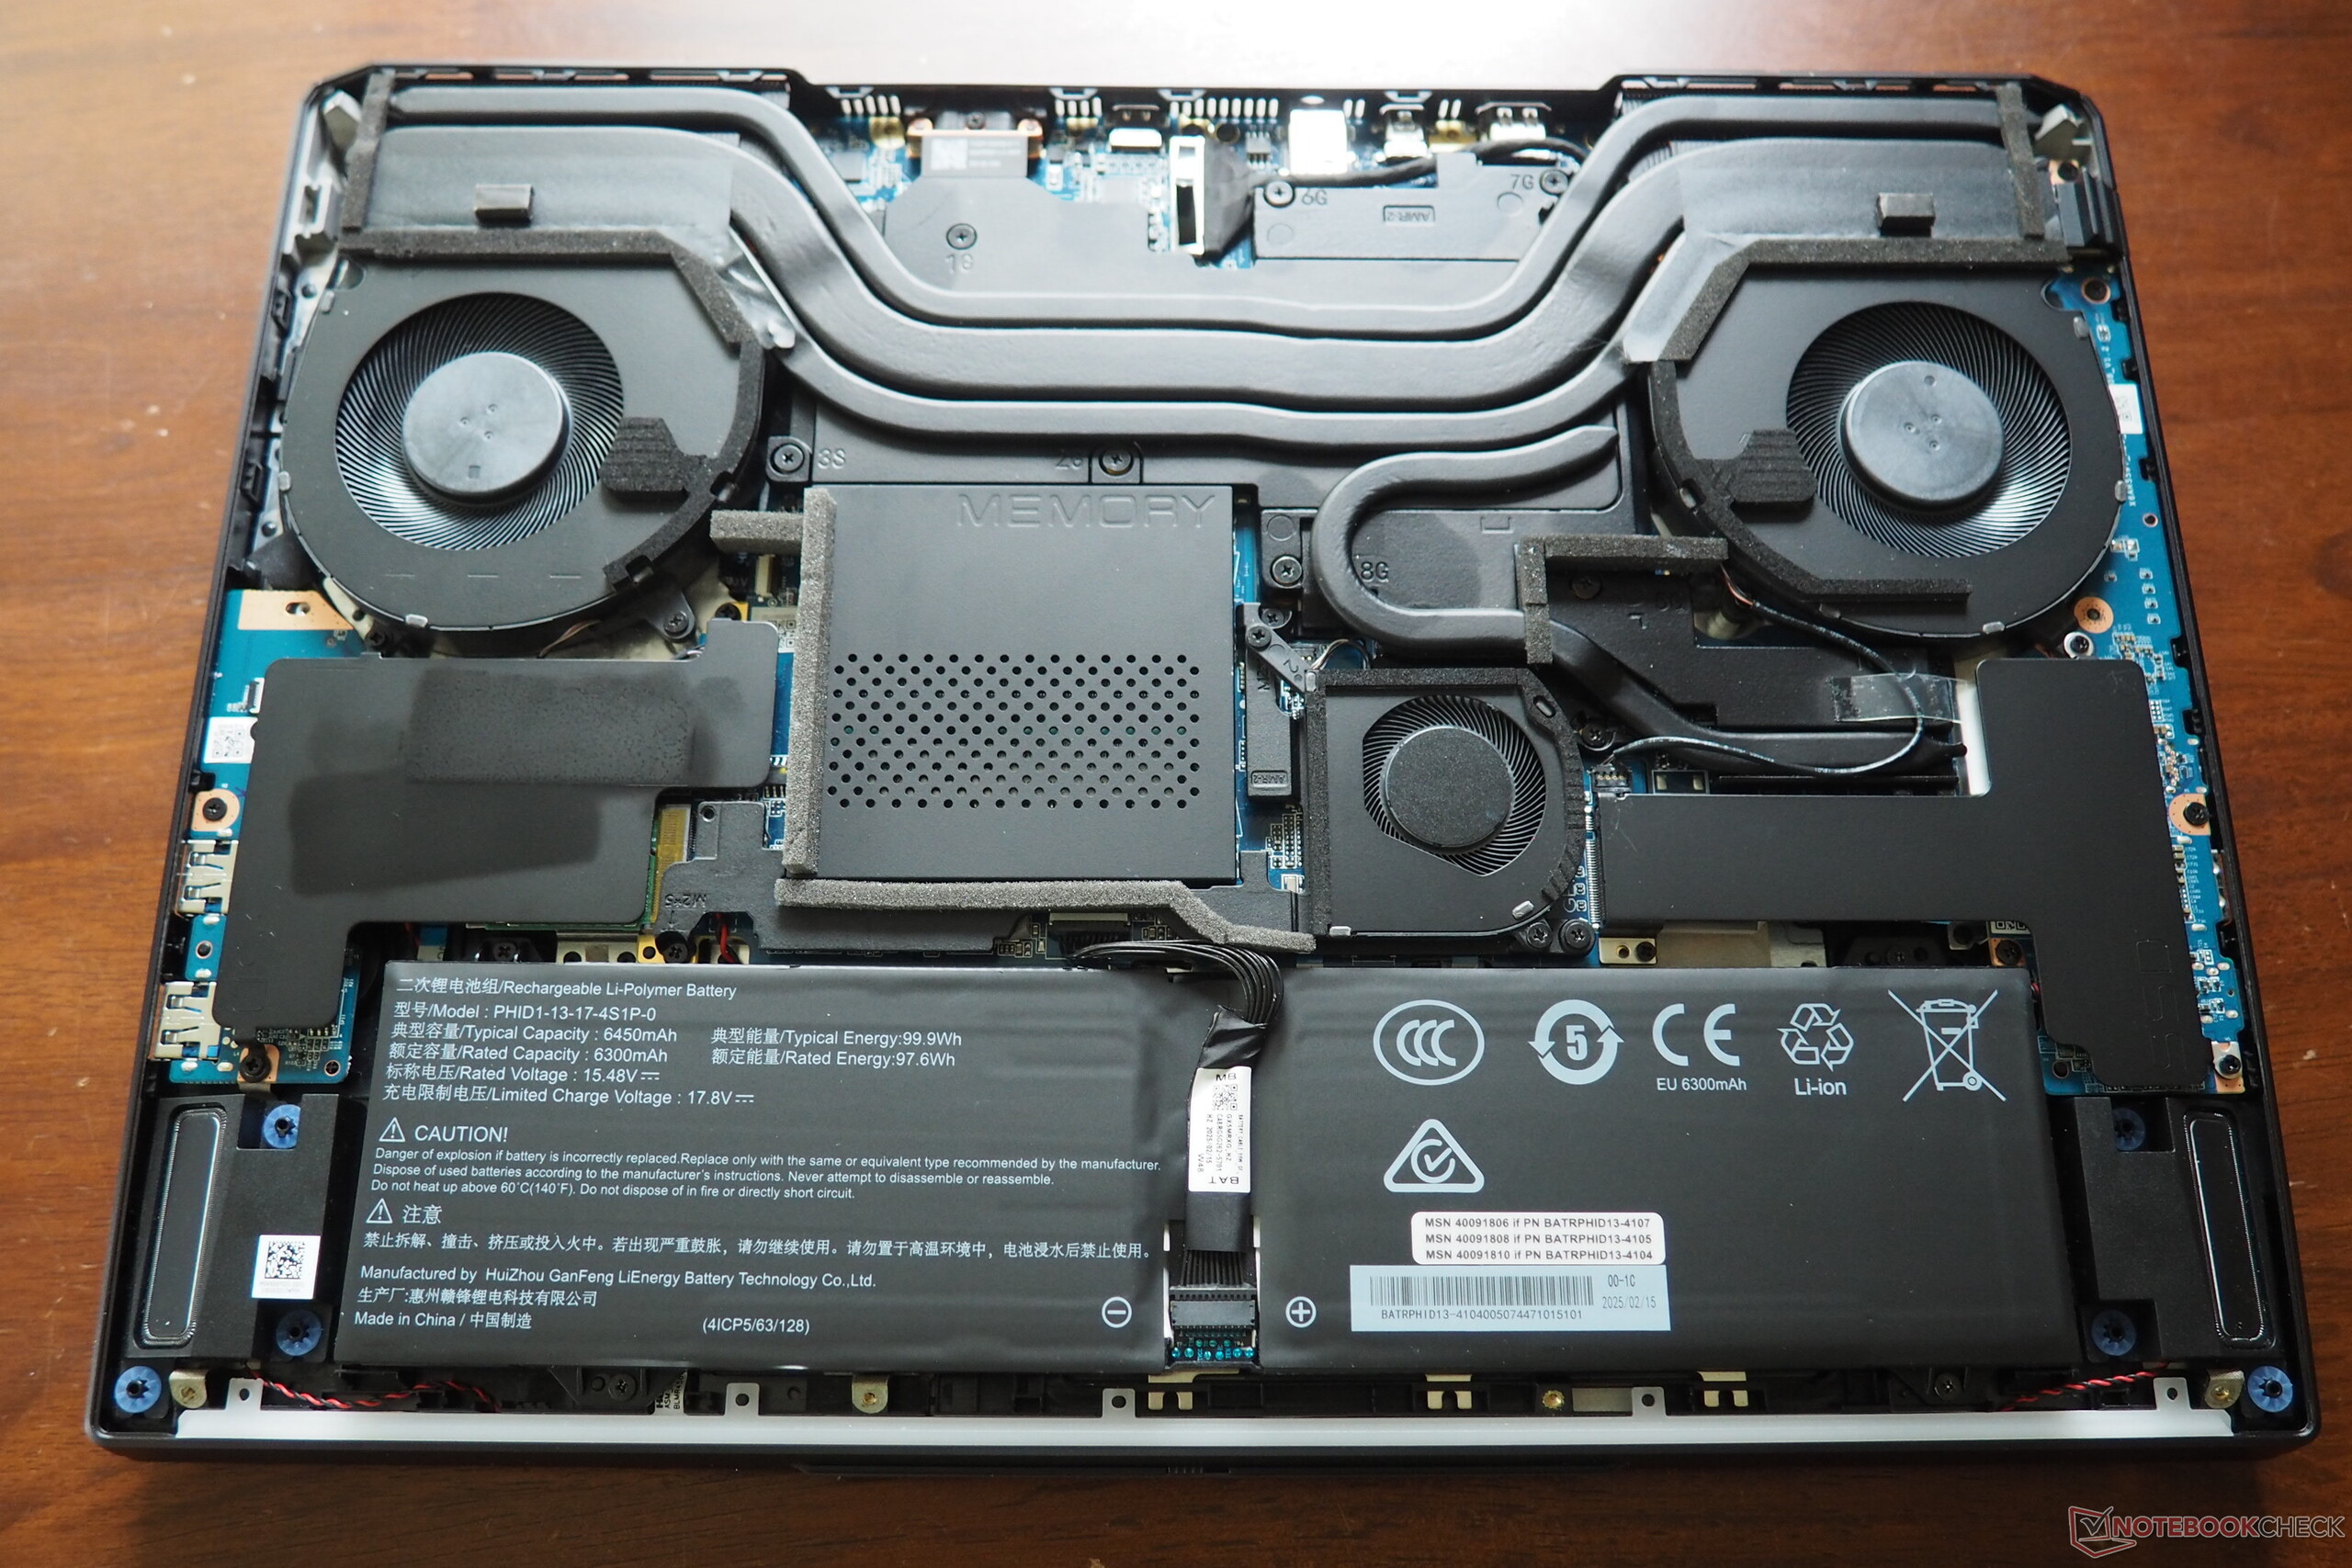
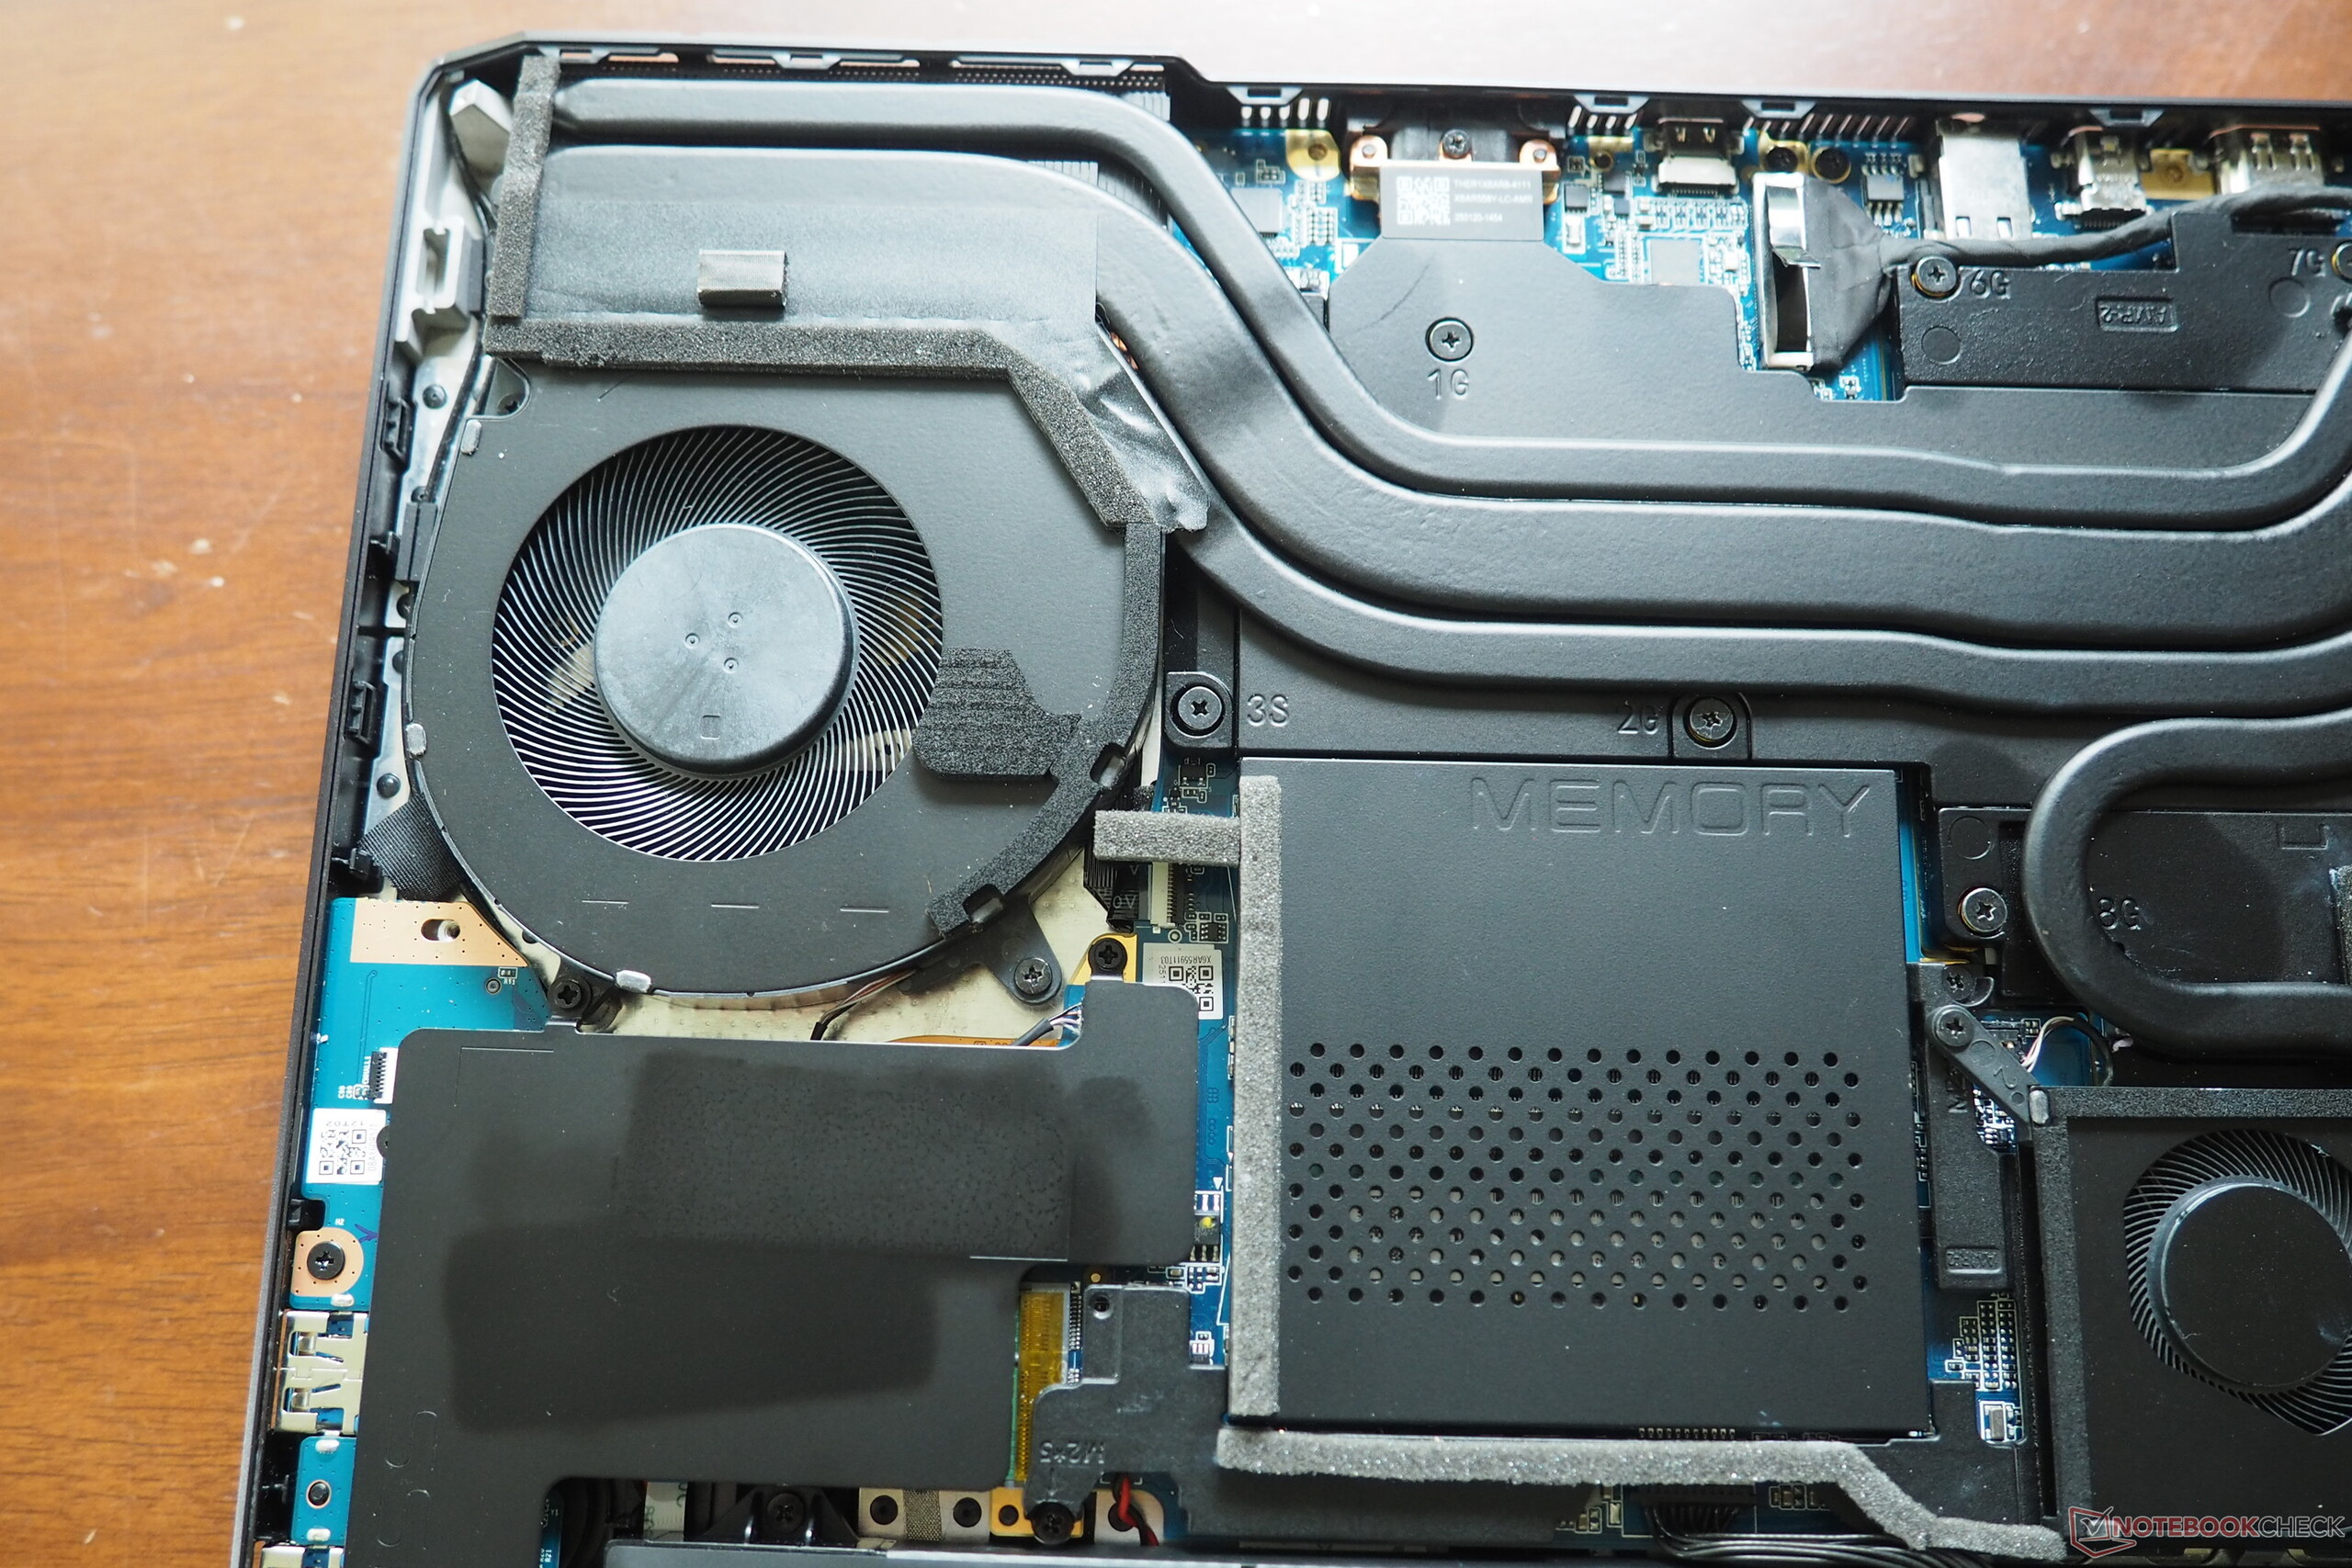
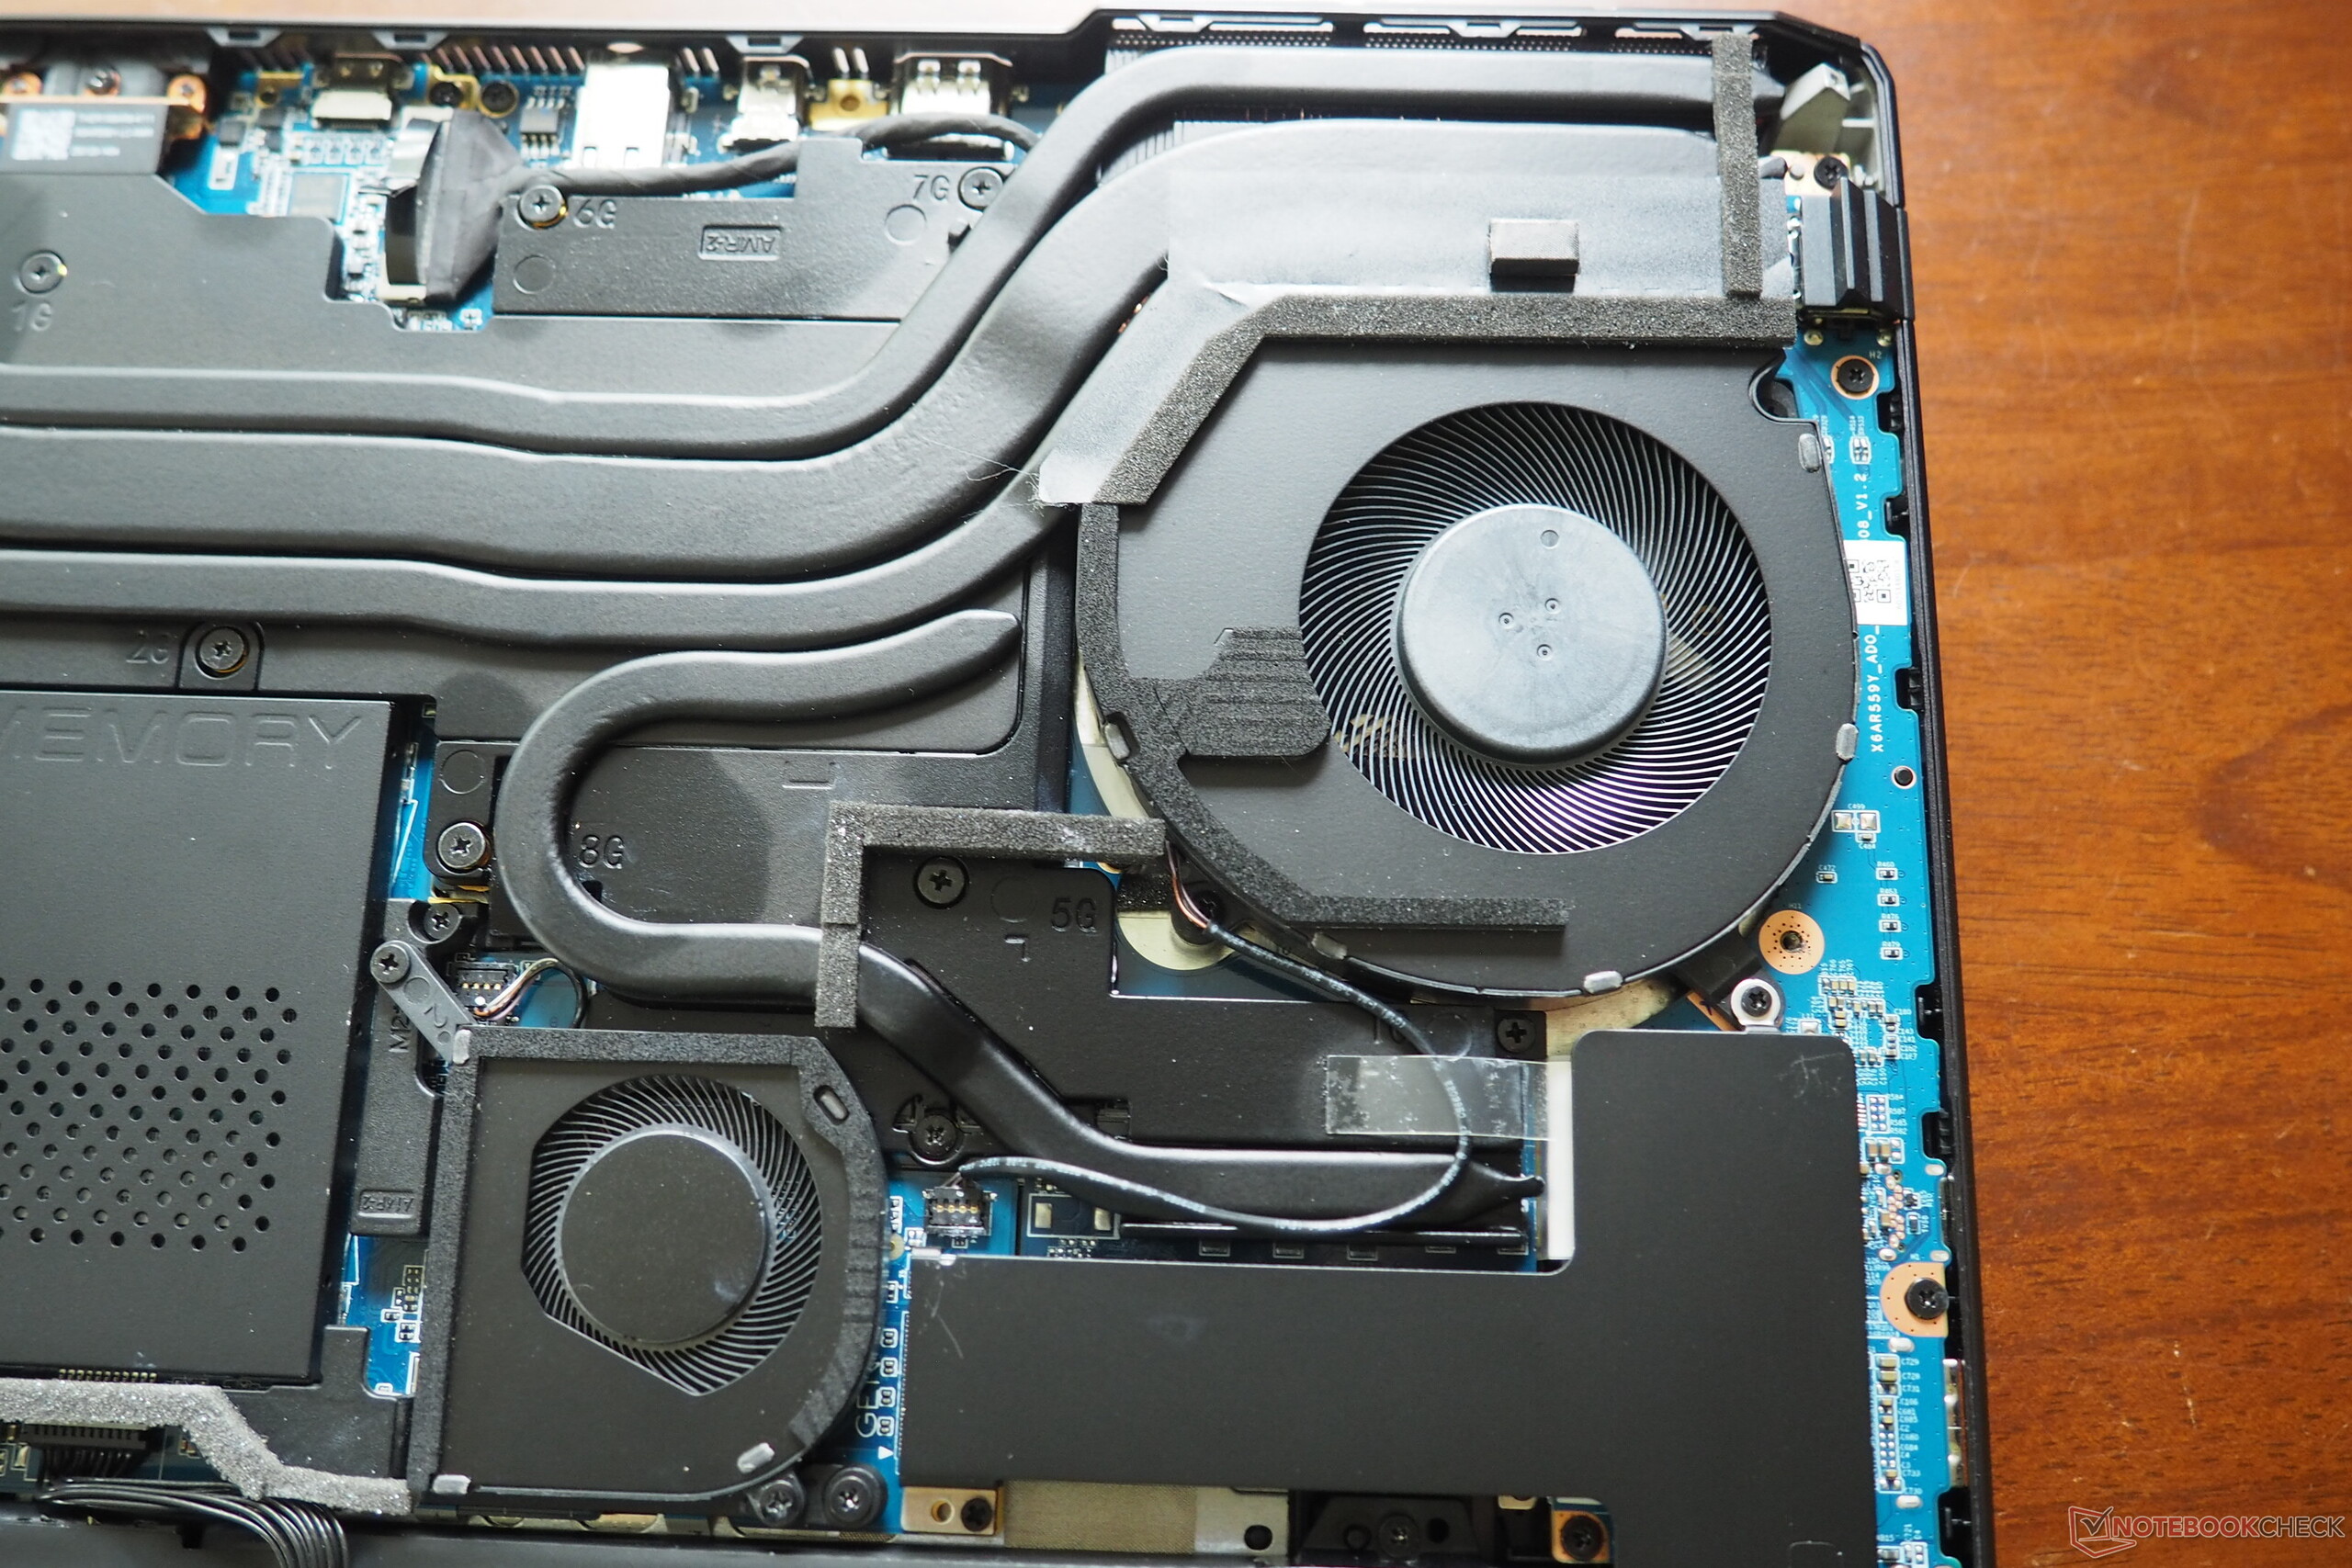
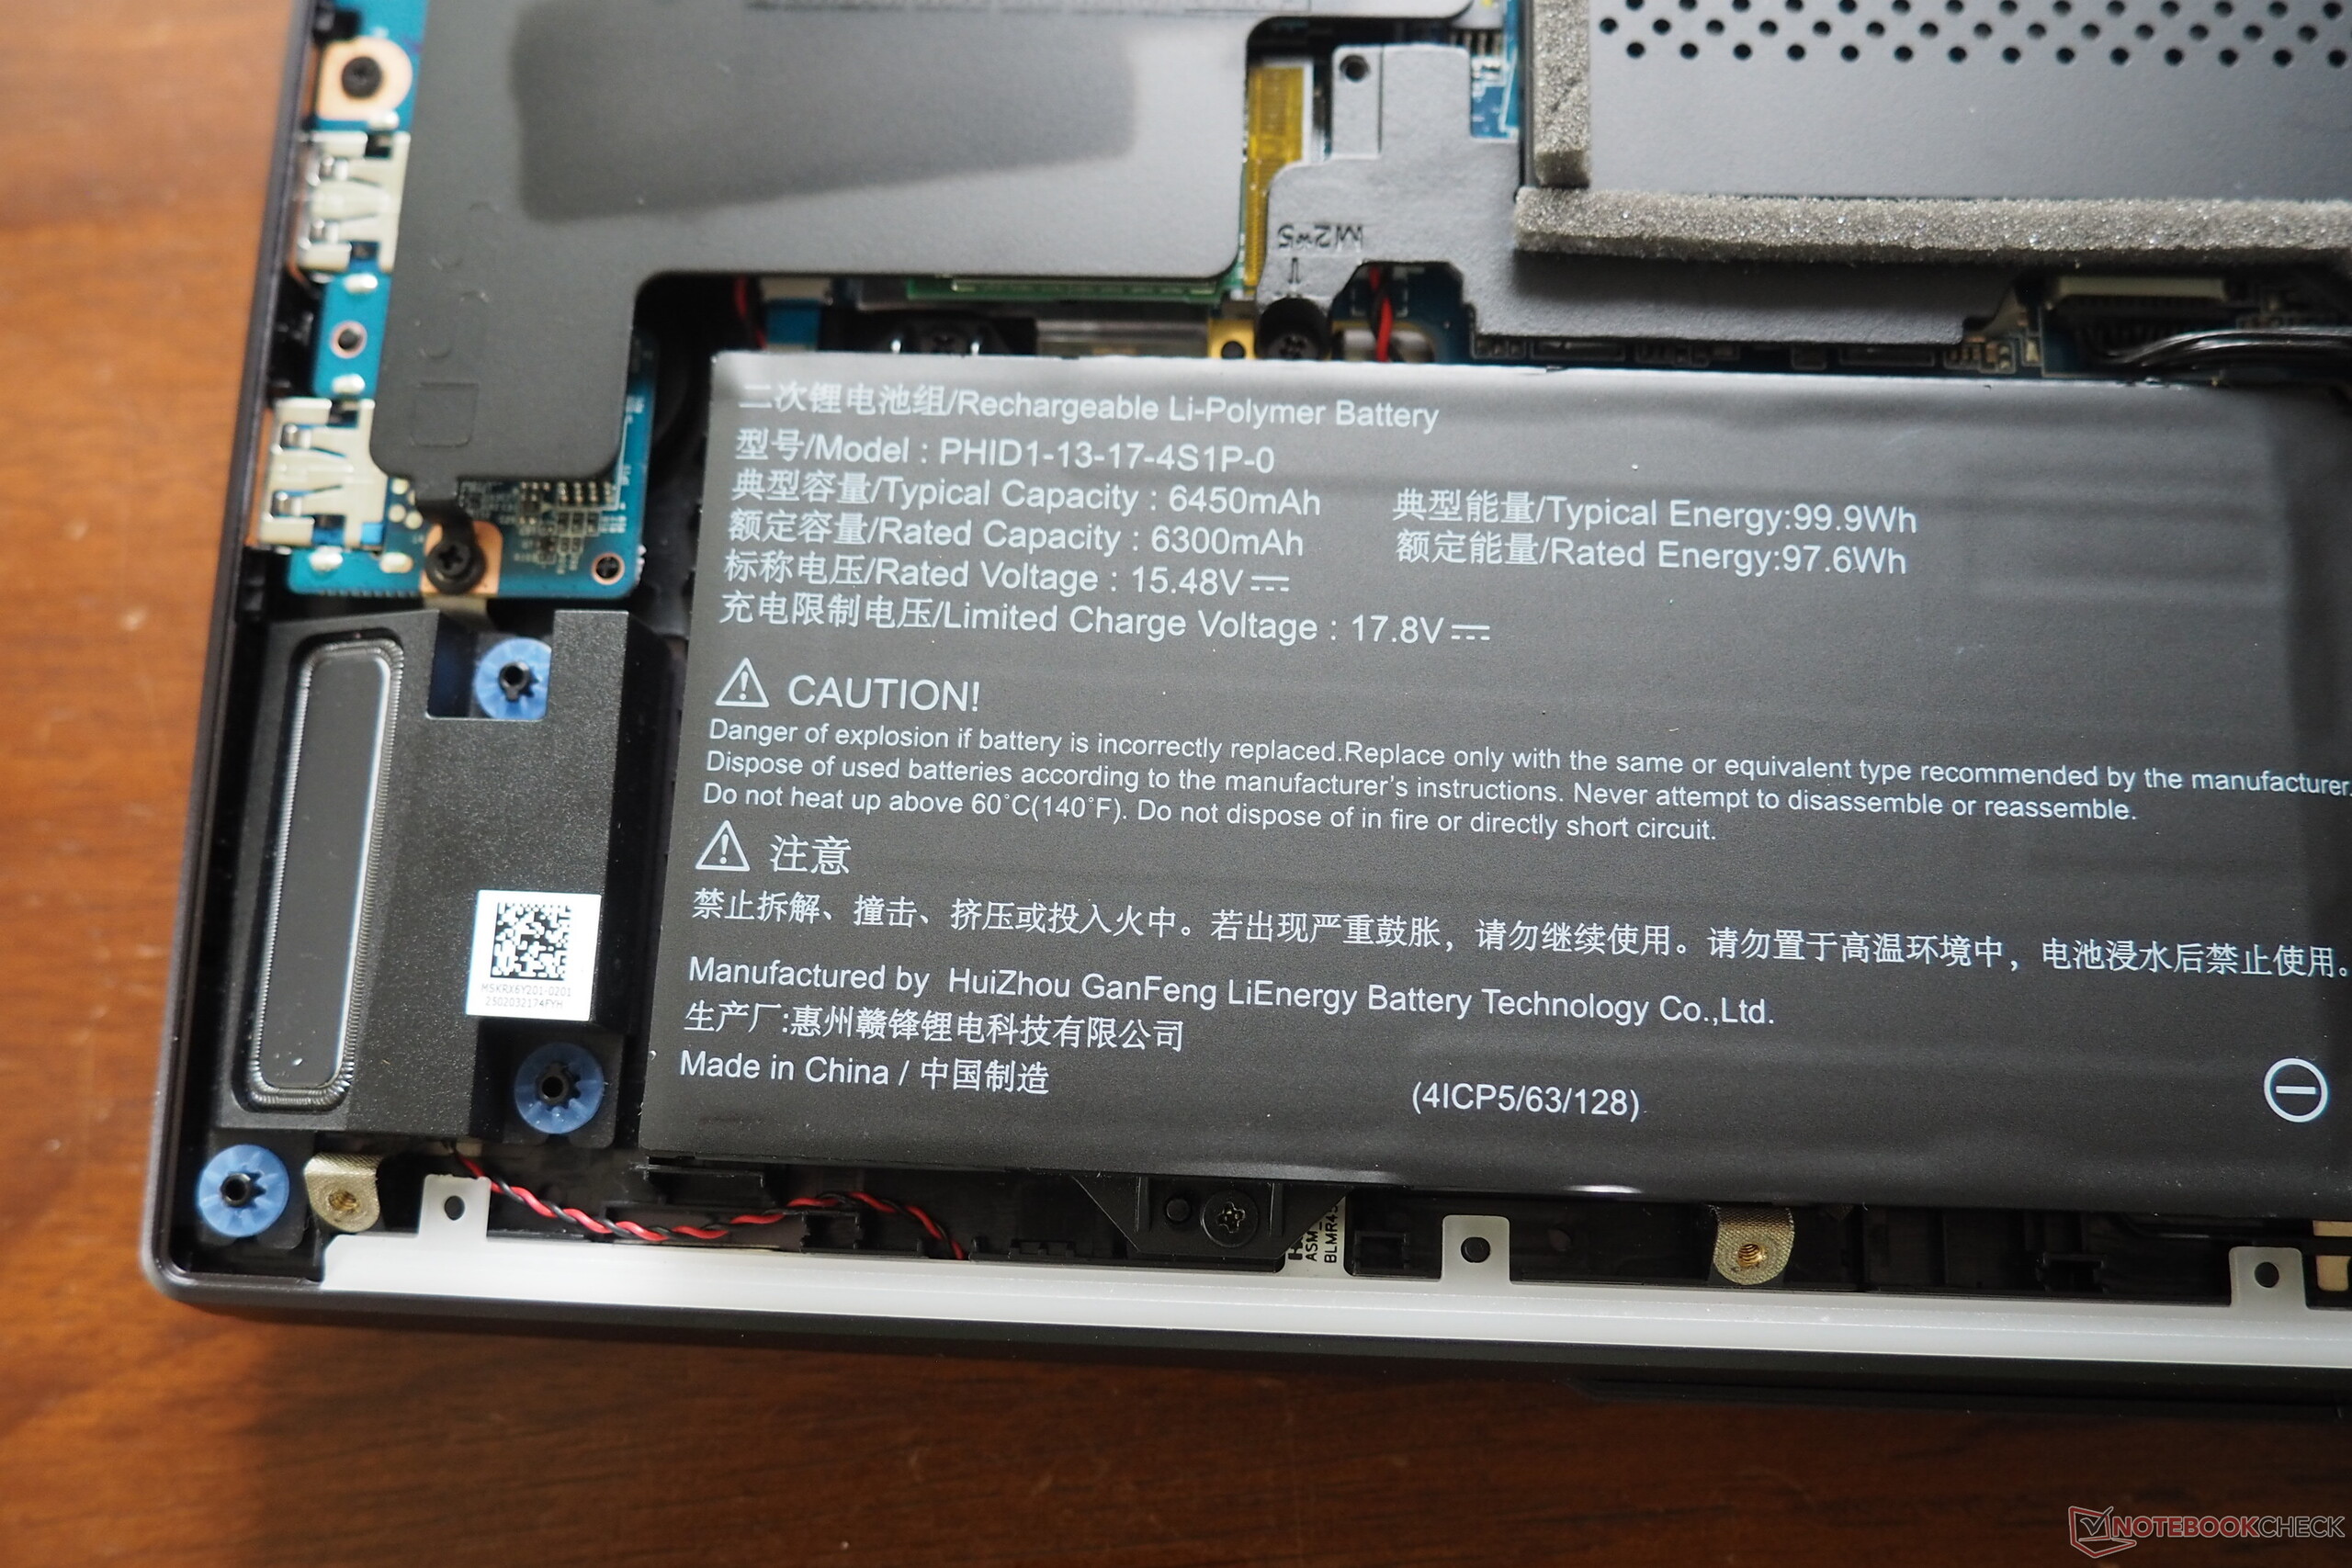
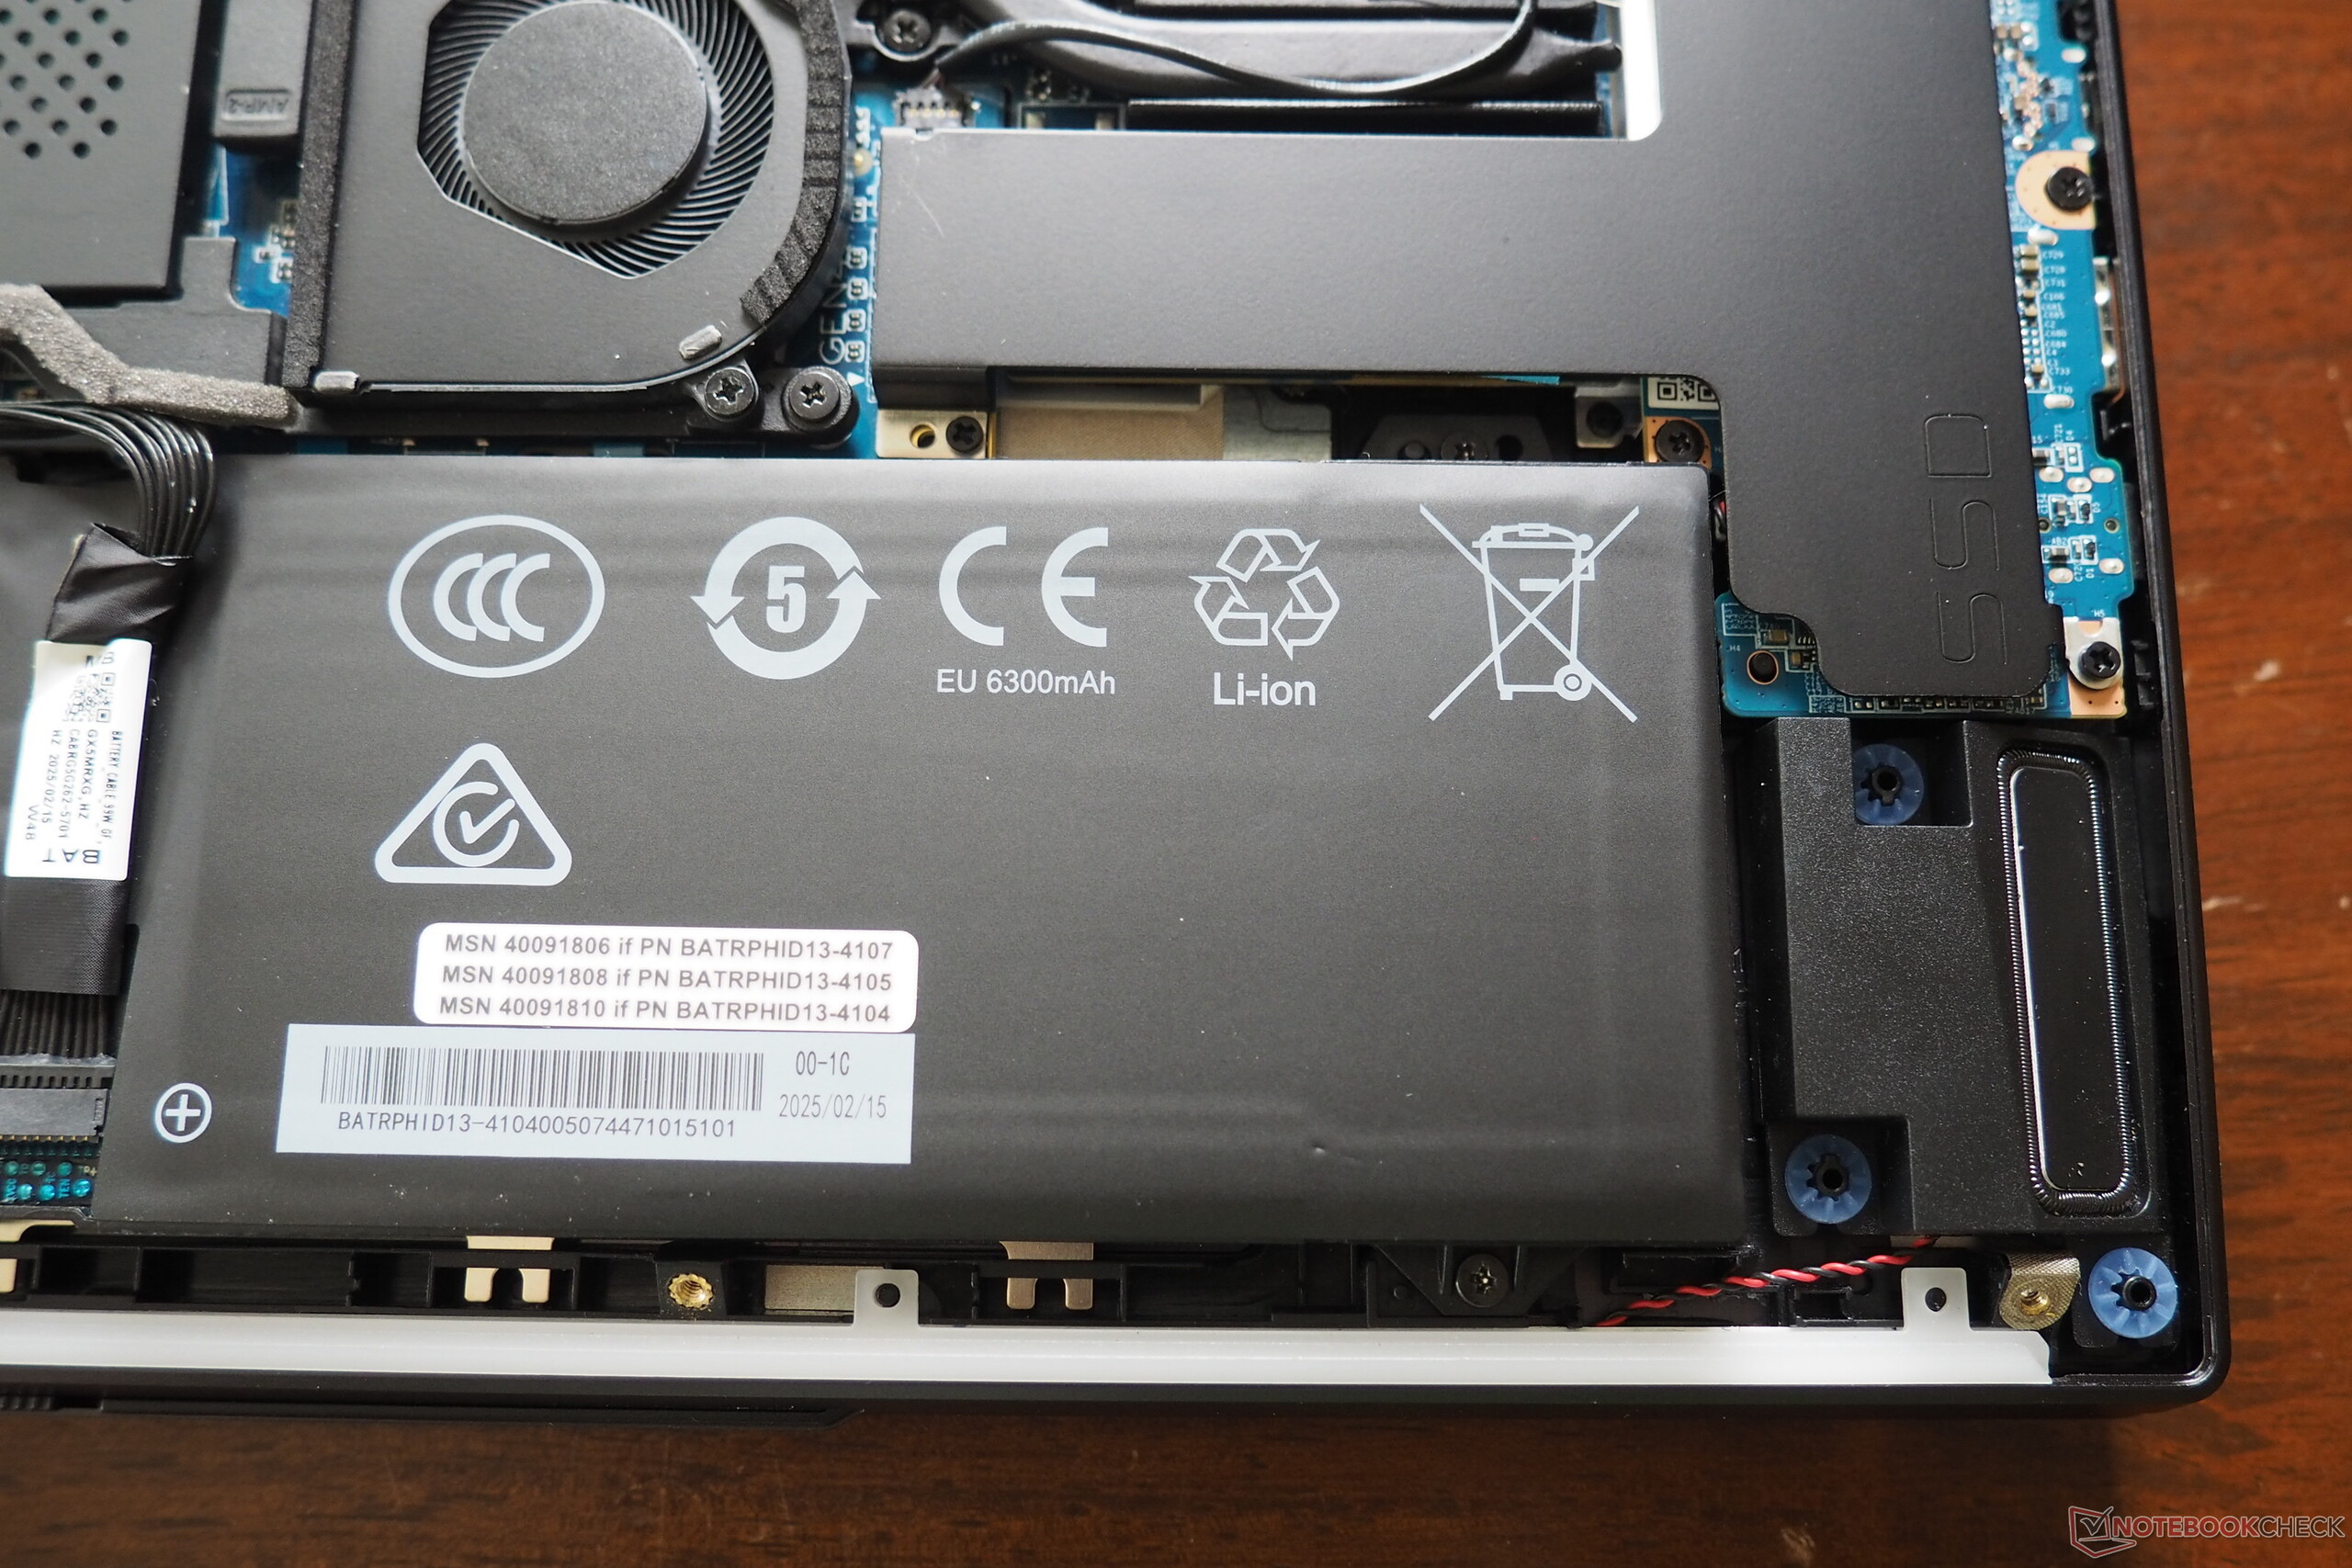
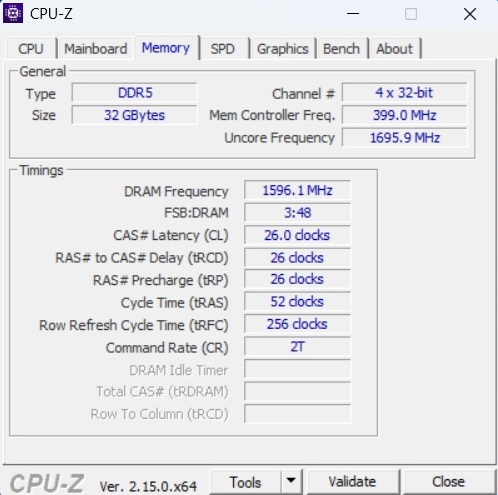
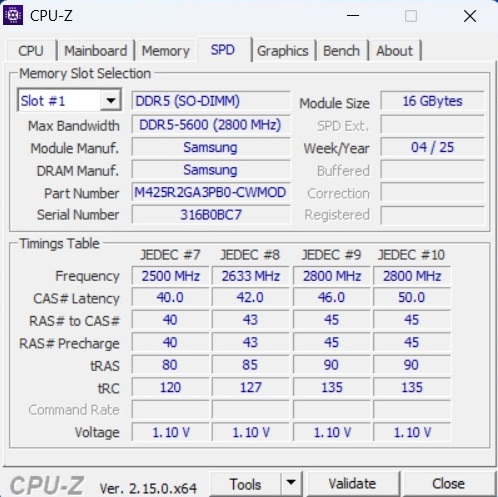
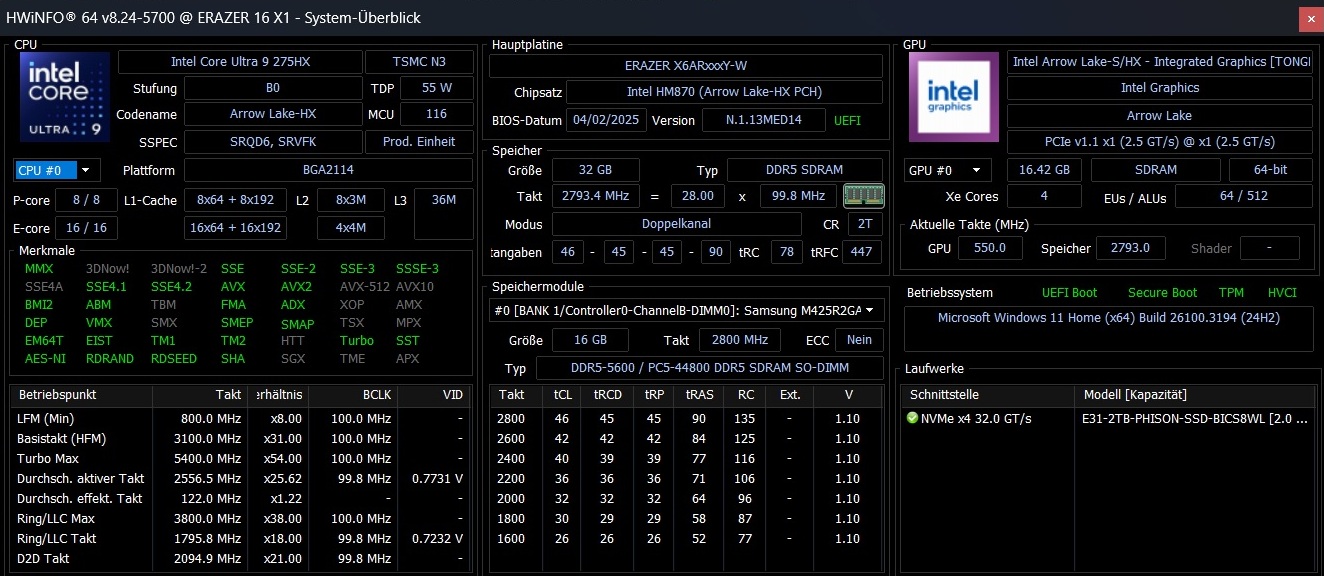
We would describe the image quality of the webcam as average: Thanks to its Full HD resolution, it is somewhat sharper than the HD cams of some competitors, but you shouldn't expect miracles. Medion deserves plus points for the physical coverage. The Beast 16 X1 can be serviced after removing 10 Phillips screws and the casing base. The 16-inch model accommodates two SO-DIMM banks and two M.2-2280 slots (1x PCIe 5, 1x PCIe 4), which are each hidden under heat sinks. Speaking of the cooling system: the gaming machine is equipped with three fans.
SD Card Reader
| SD Card Reader | |
| average JPG Copy Test (av. of 3 runs) | |
| Medion Erazer Beast 16 X1 Ultimate (AV PRO microSD 128 GB V60) | |
| Average of class Gaming (20.9 - 210, n=54, last 2 years) | |
| Schenker XMG Neo 16 E25 RTX 5090 Laptop (Angelbird AV Pro V60) | |
| maximum AS SSD Seq Read Test (1GB) | |
| Schenker XMG Neo 16 E25 RTX 5090 Laptop (Angelbird AV Pro V60) | |
| Medion Erazer Beast 16 X1 Ultimate (AV PRO microSD 128 GB V60) | |
| Average of class Gaming (25.5 - 261, n=51, last 2 years) | |
Communication
Webcam


Maintenance
Input devices
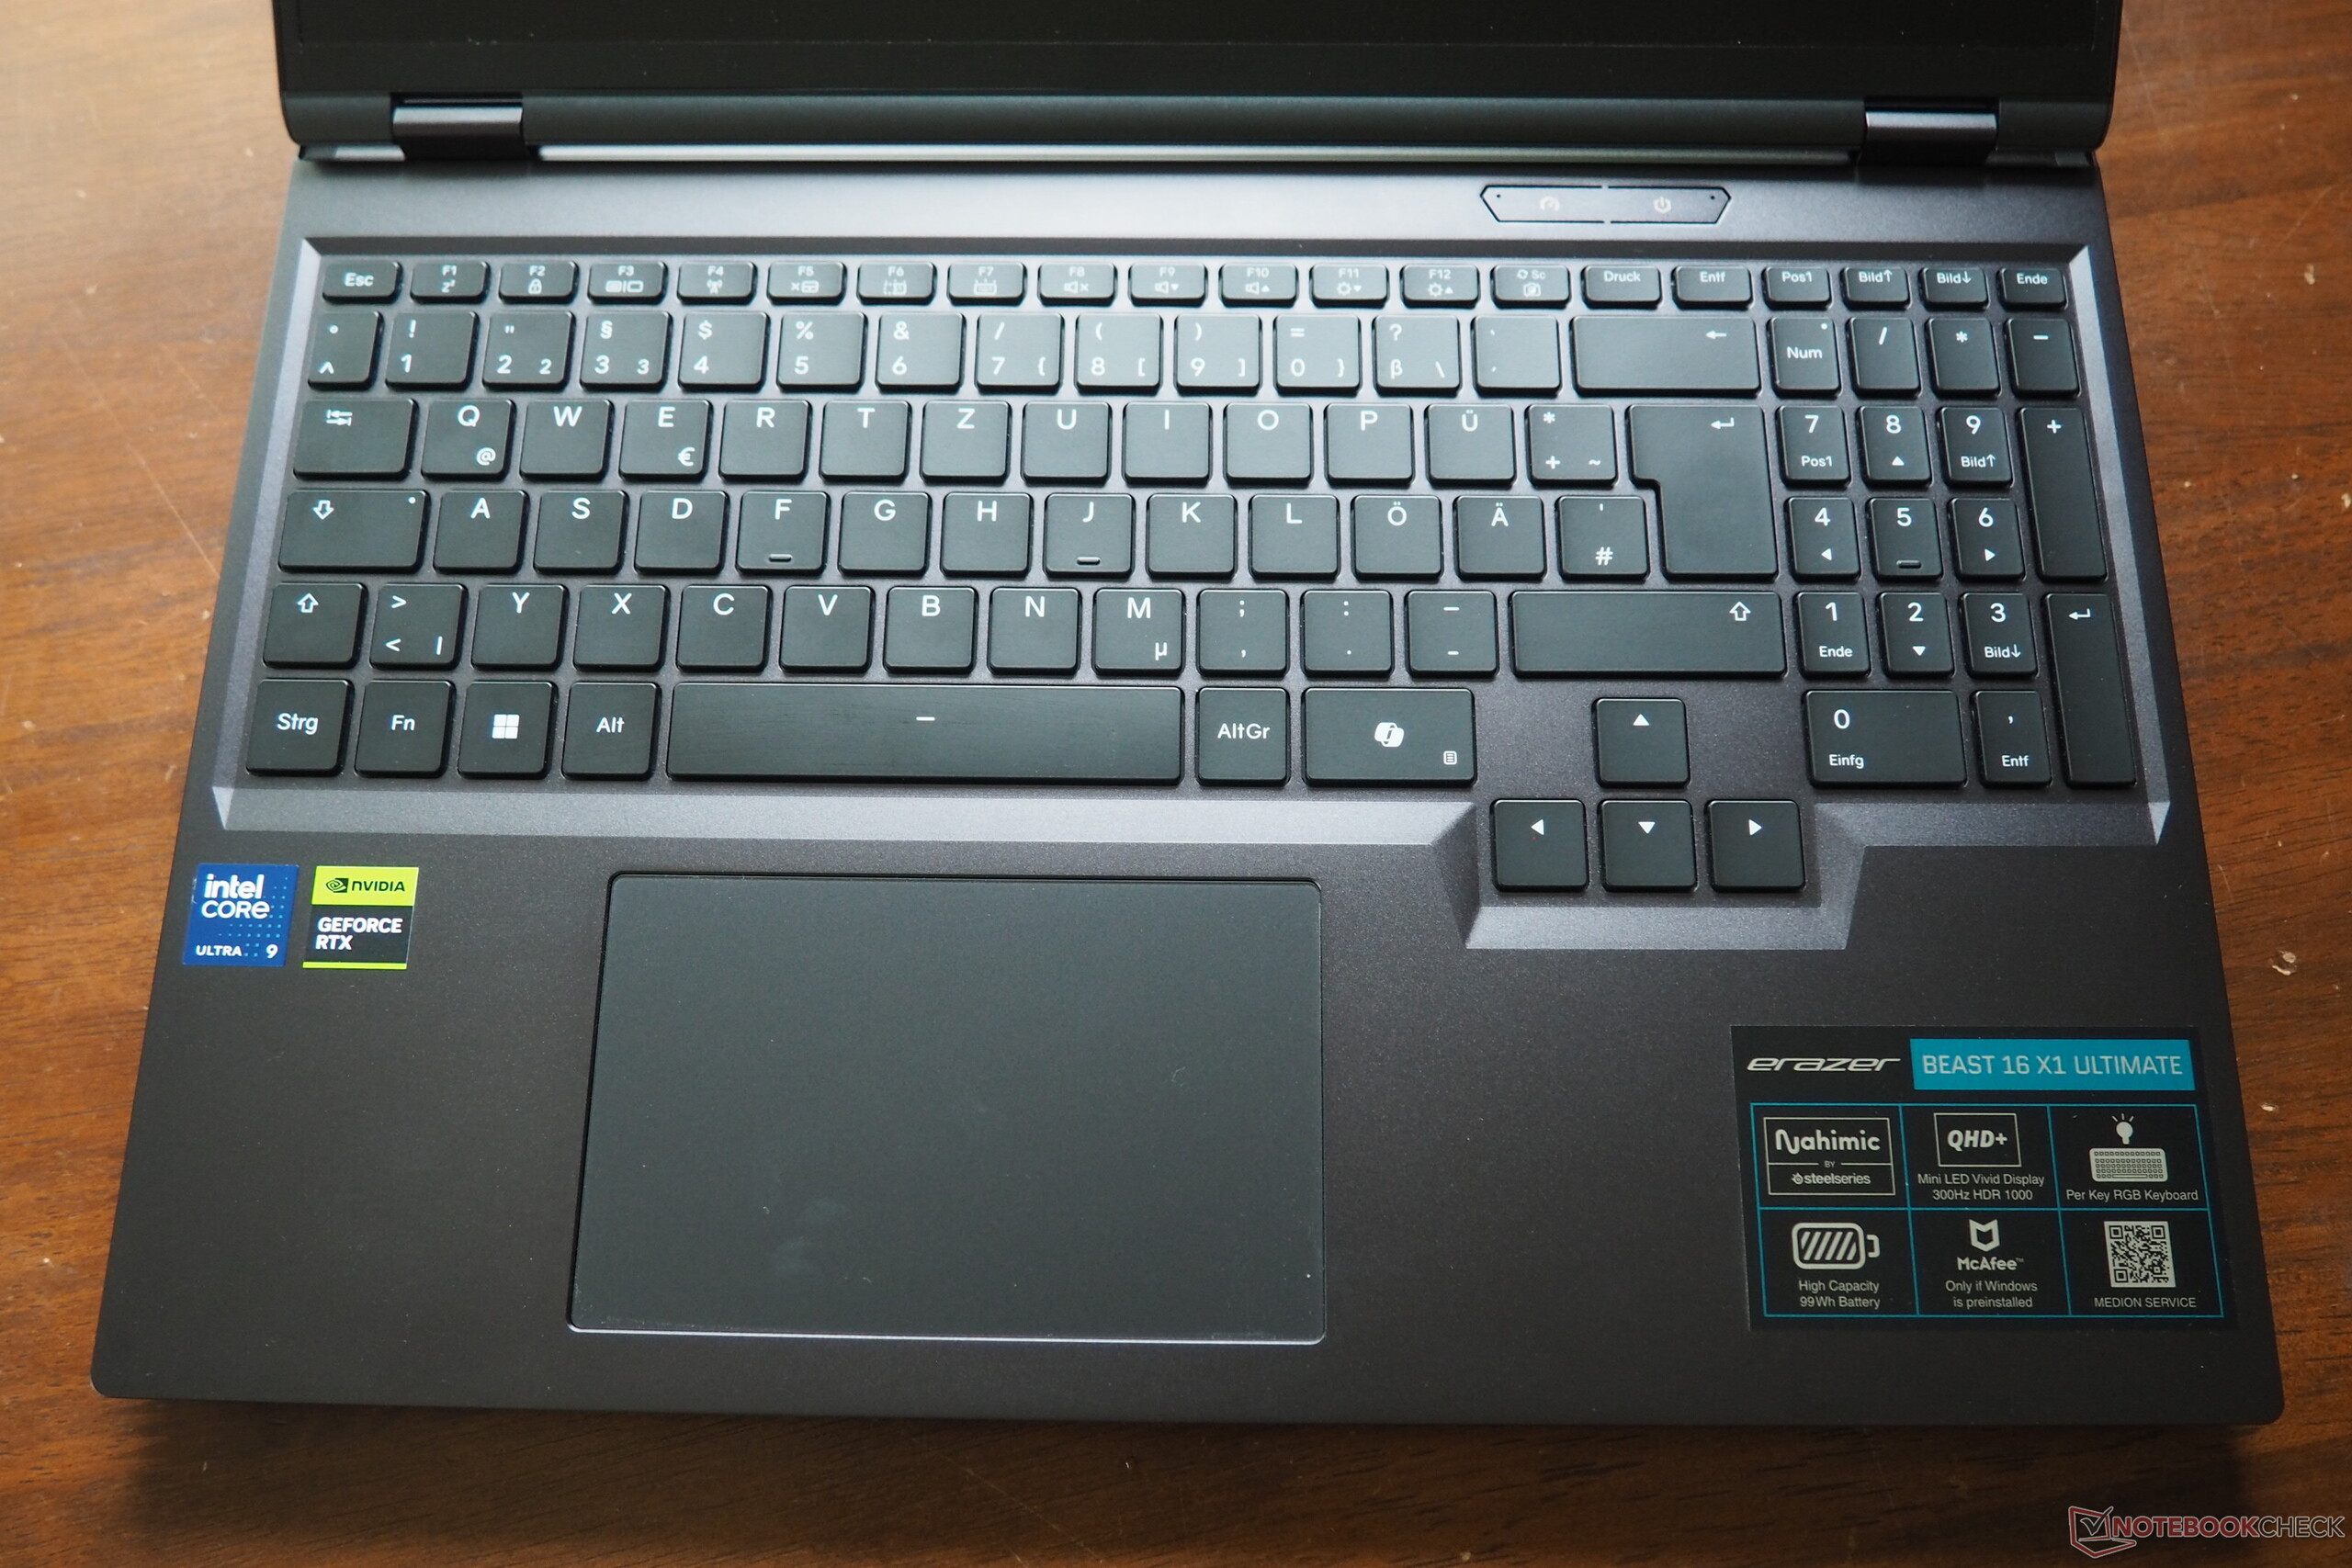
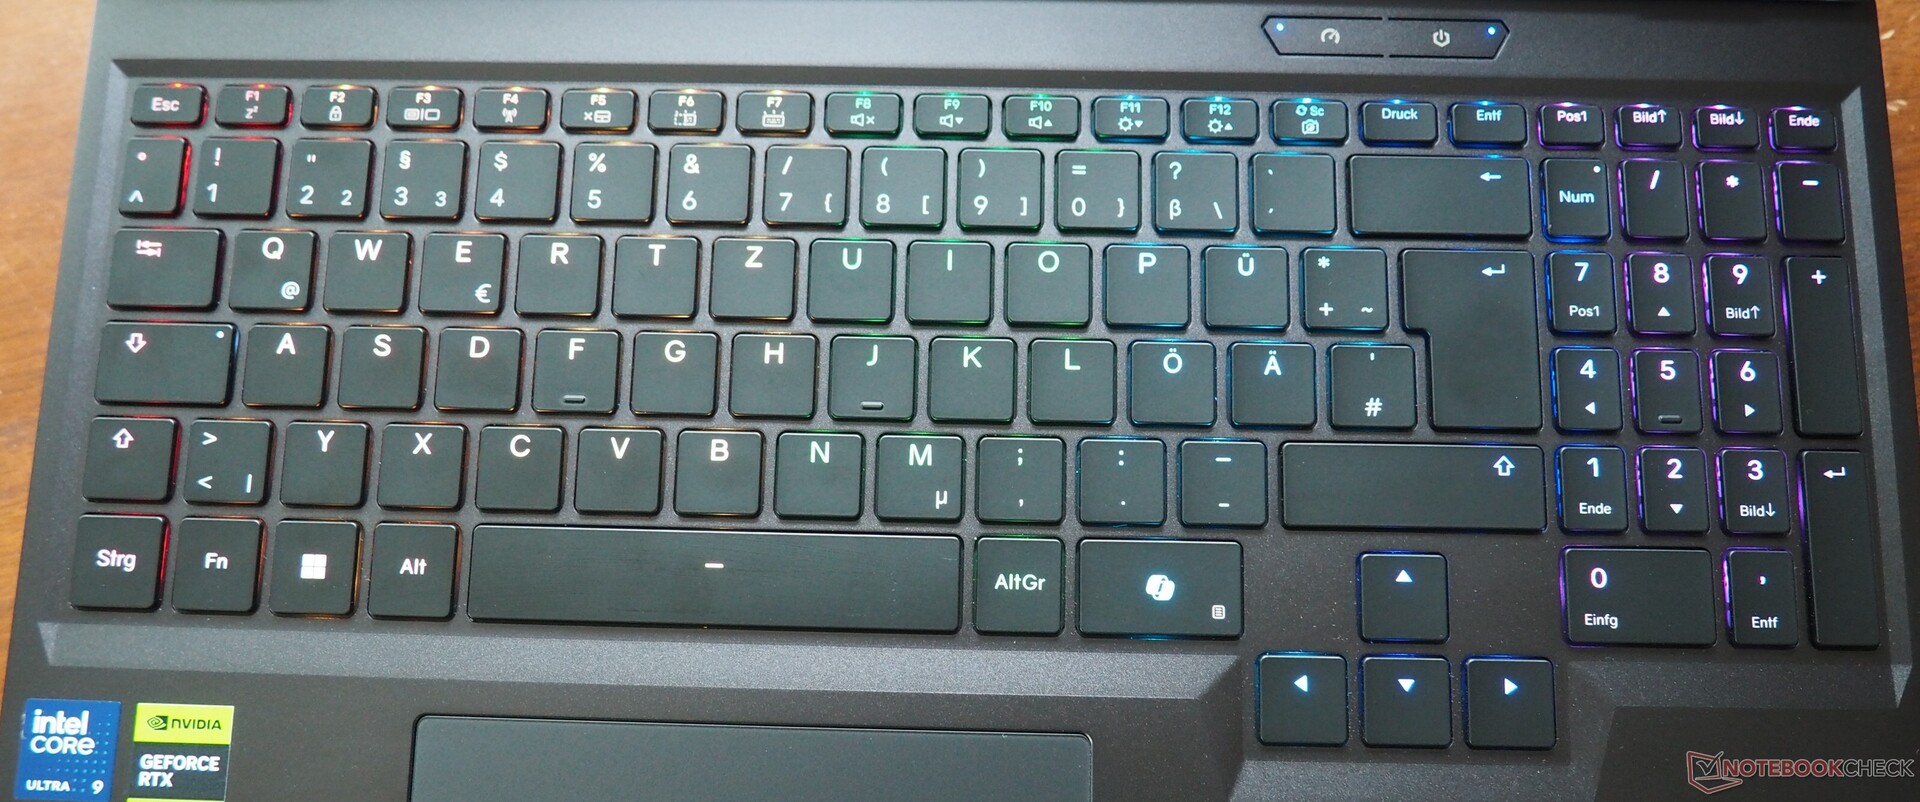
The keyboard of the Beast 16 X1 impresses with its very good feedback, which is almost on par with mechanical models. There is a dedicated numeric keypad on the right-hand side, whose keys are slightly narrower than the rest. Fans of directional arrows will rejoice at the normal dimensions of these keys. The built-in lighting (per-key RGB) can be adjusted to several levels.
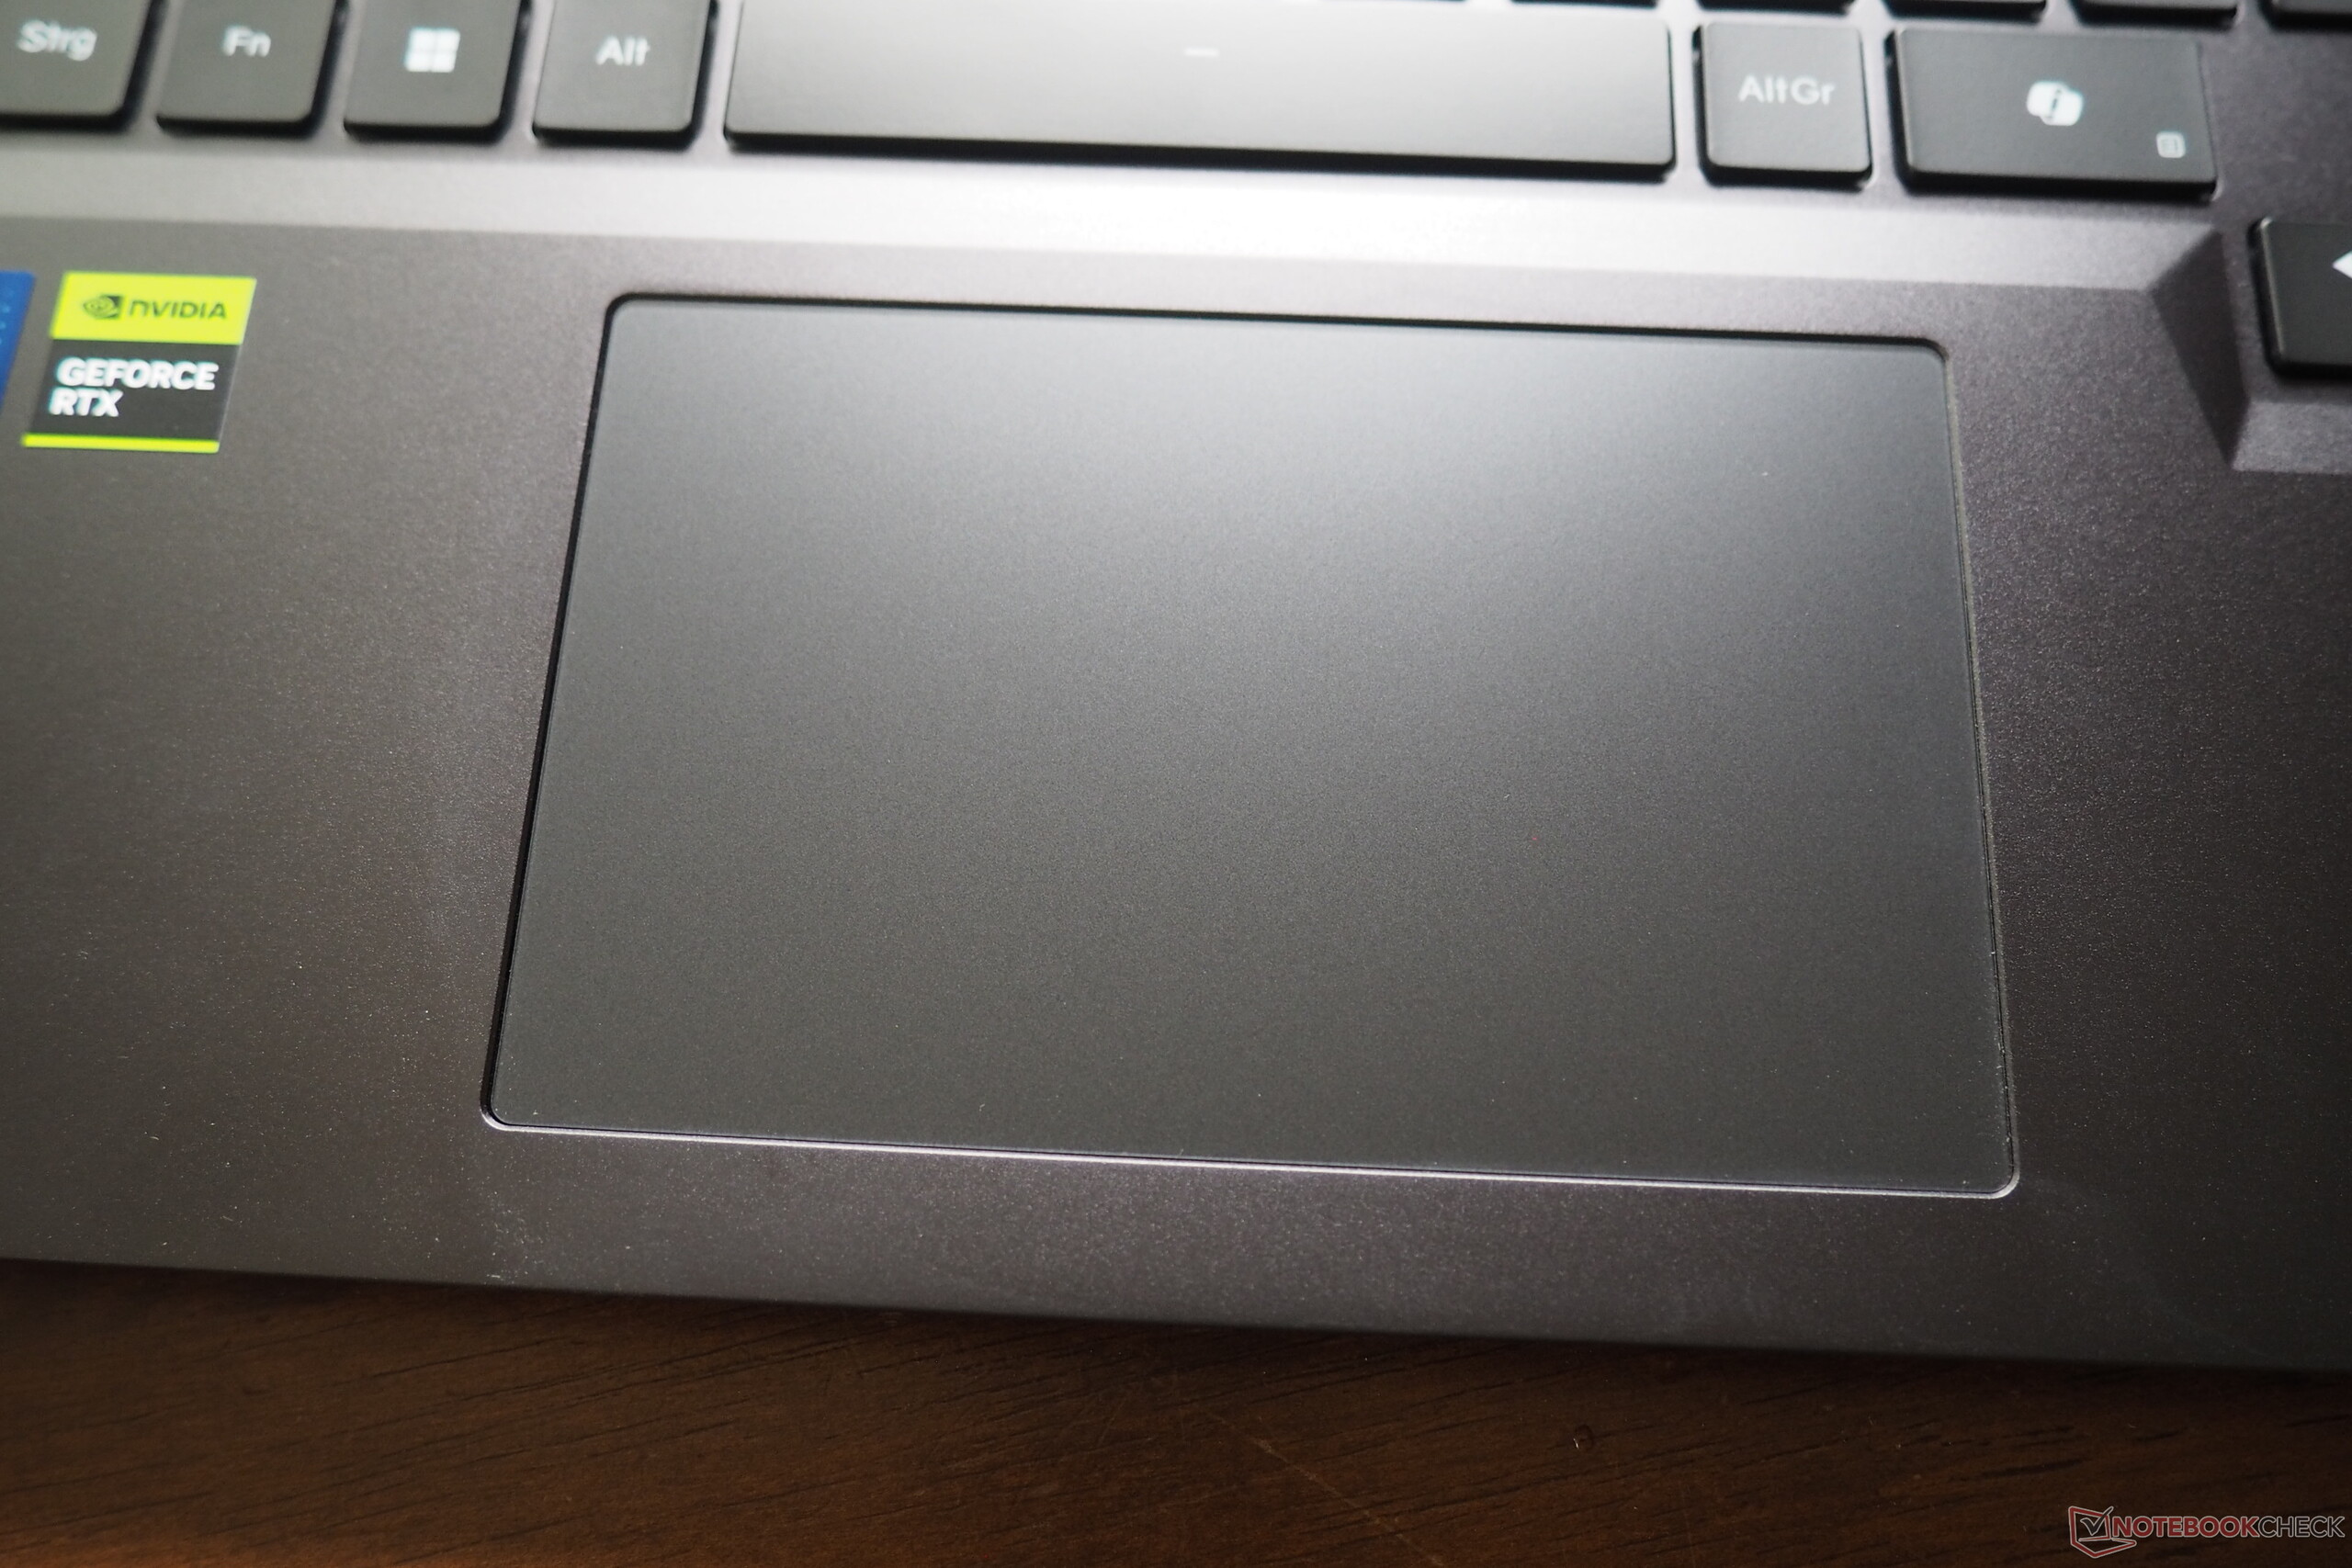
The touchpad is largely inconspicuous in a positive sense in terms of precision, gliding properties and gesture support. With a size of 12.4 x 7.6 cm (~4.9 x 3.0 in), it has been adequately dimensioned. The click areas at the lower edge do trigger somewhat loudly, but have a solid (haptic) feedback similar to the keyboard.
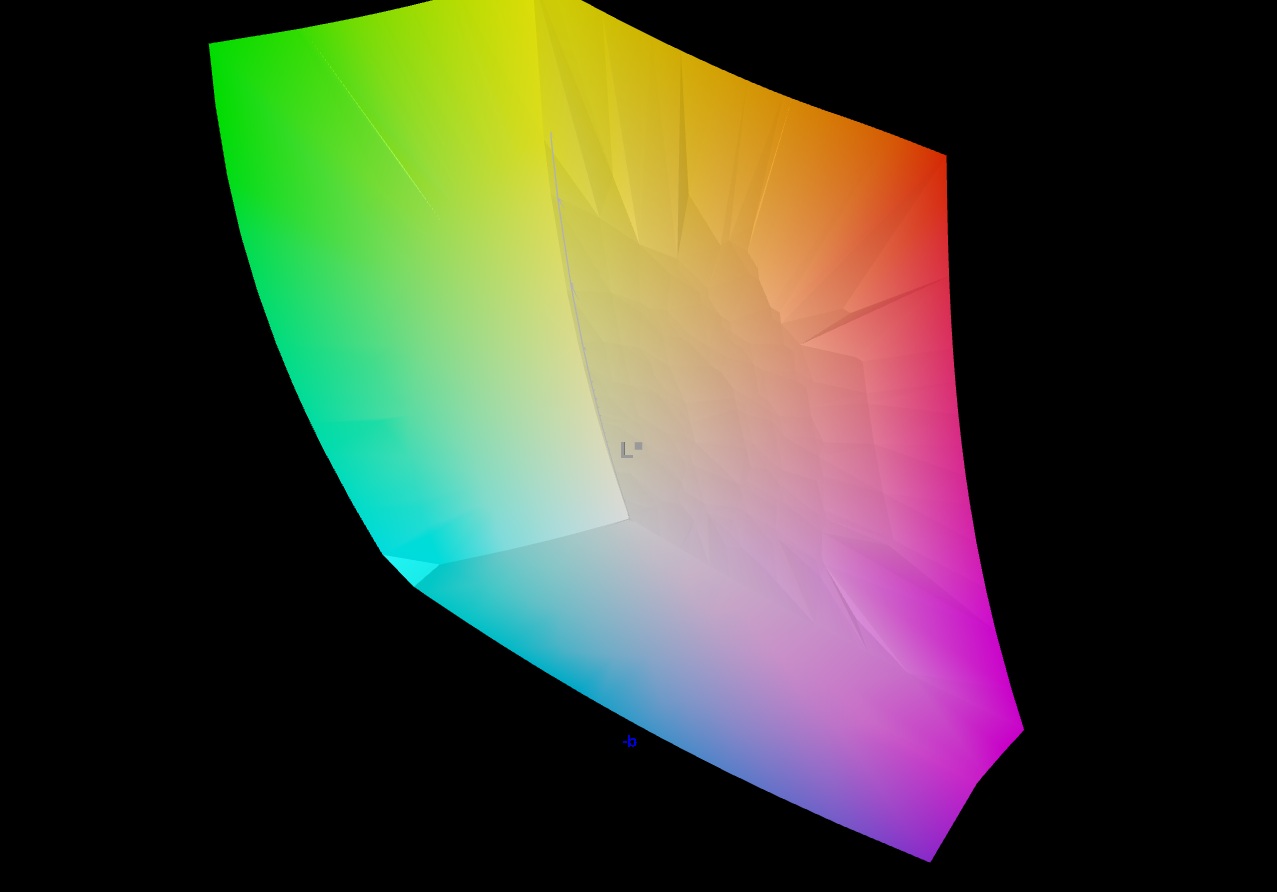
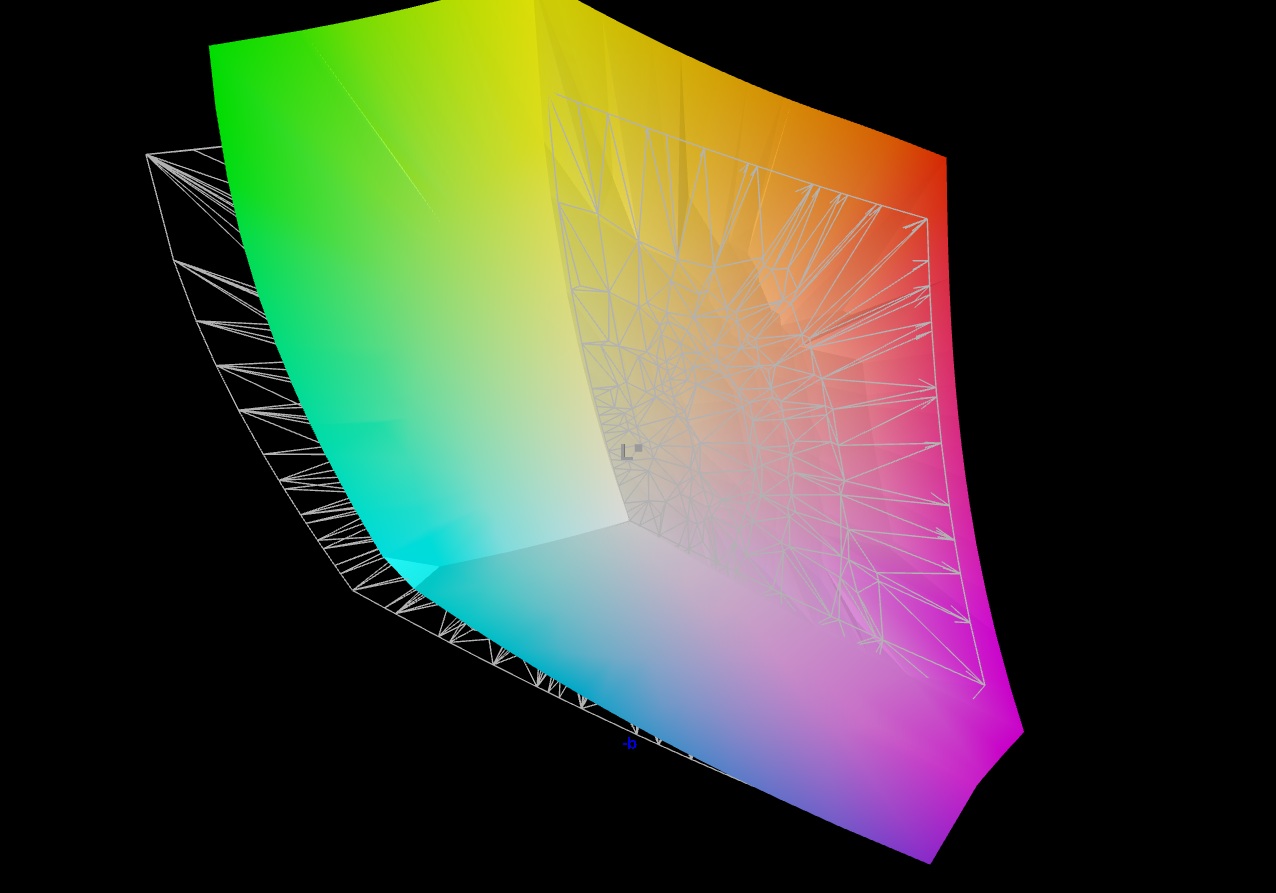
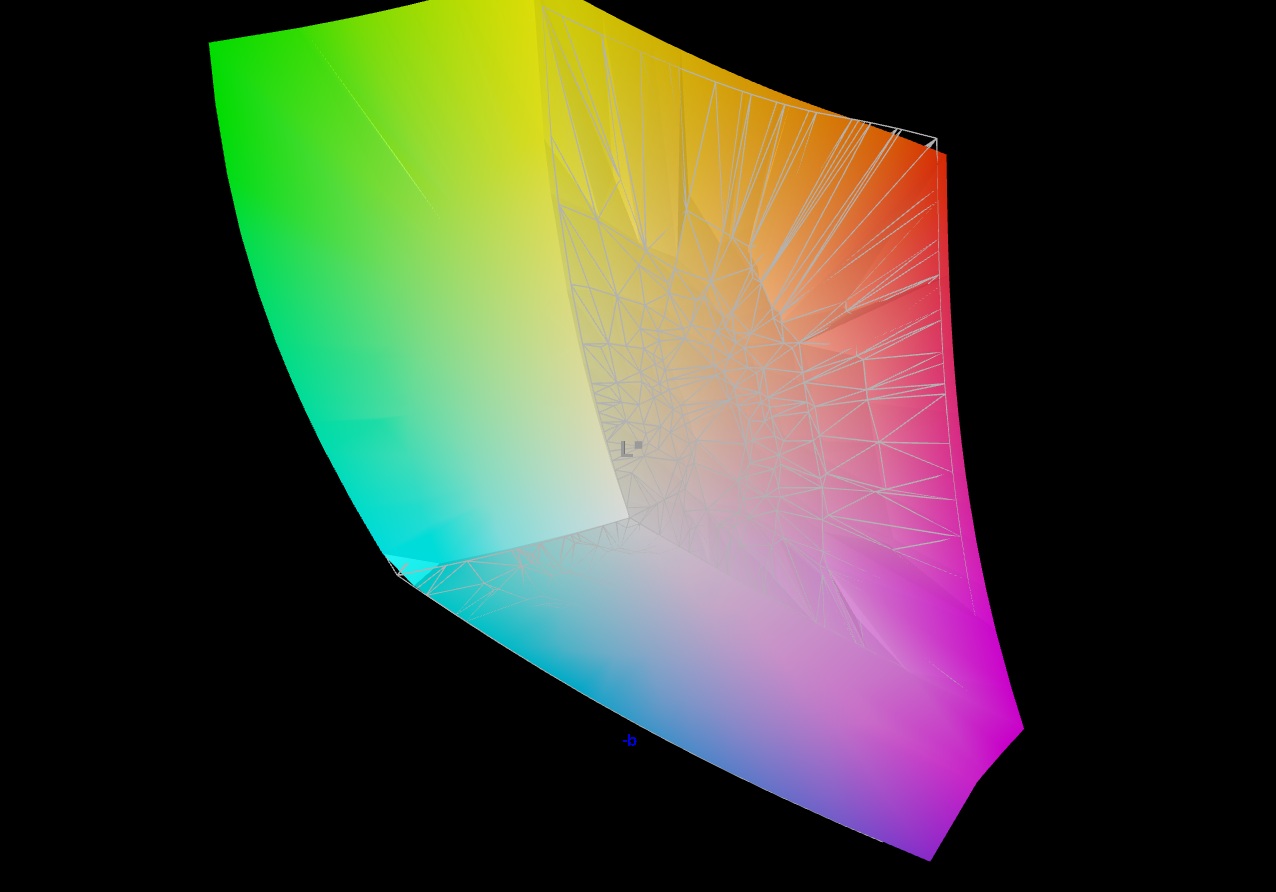
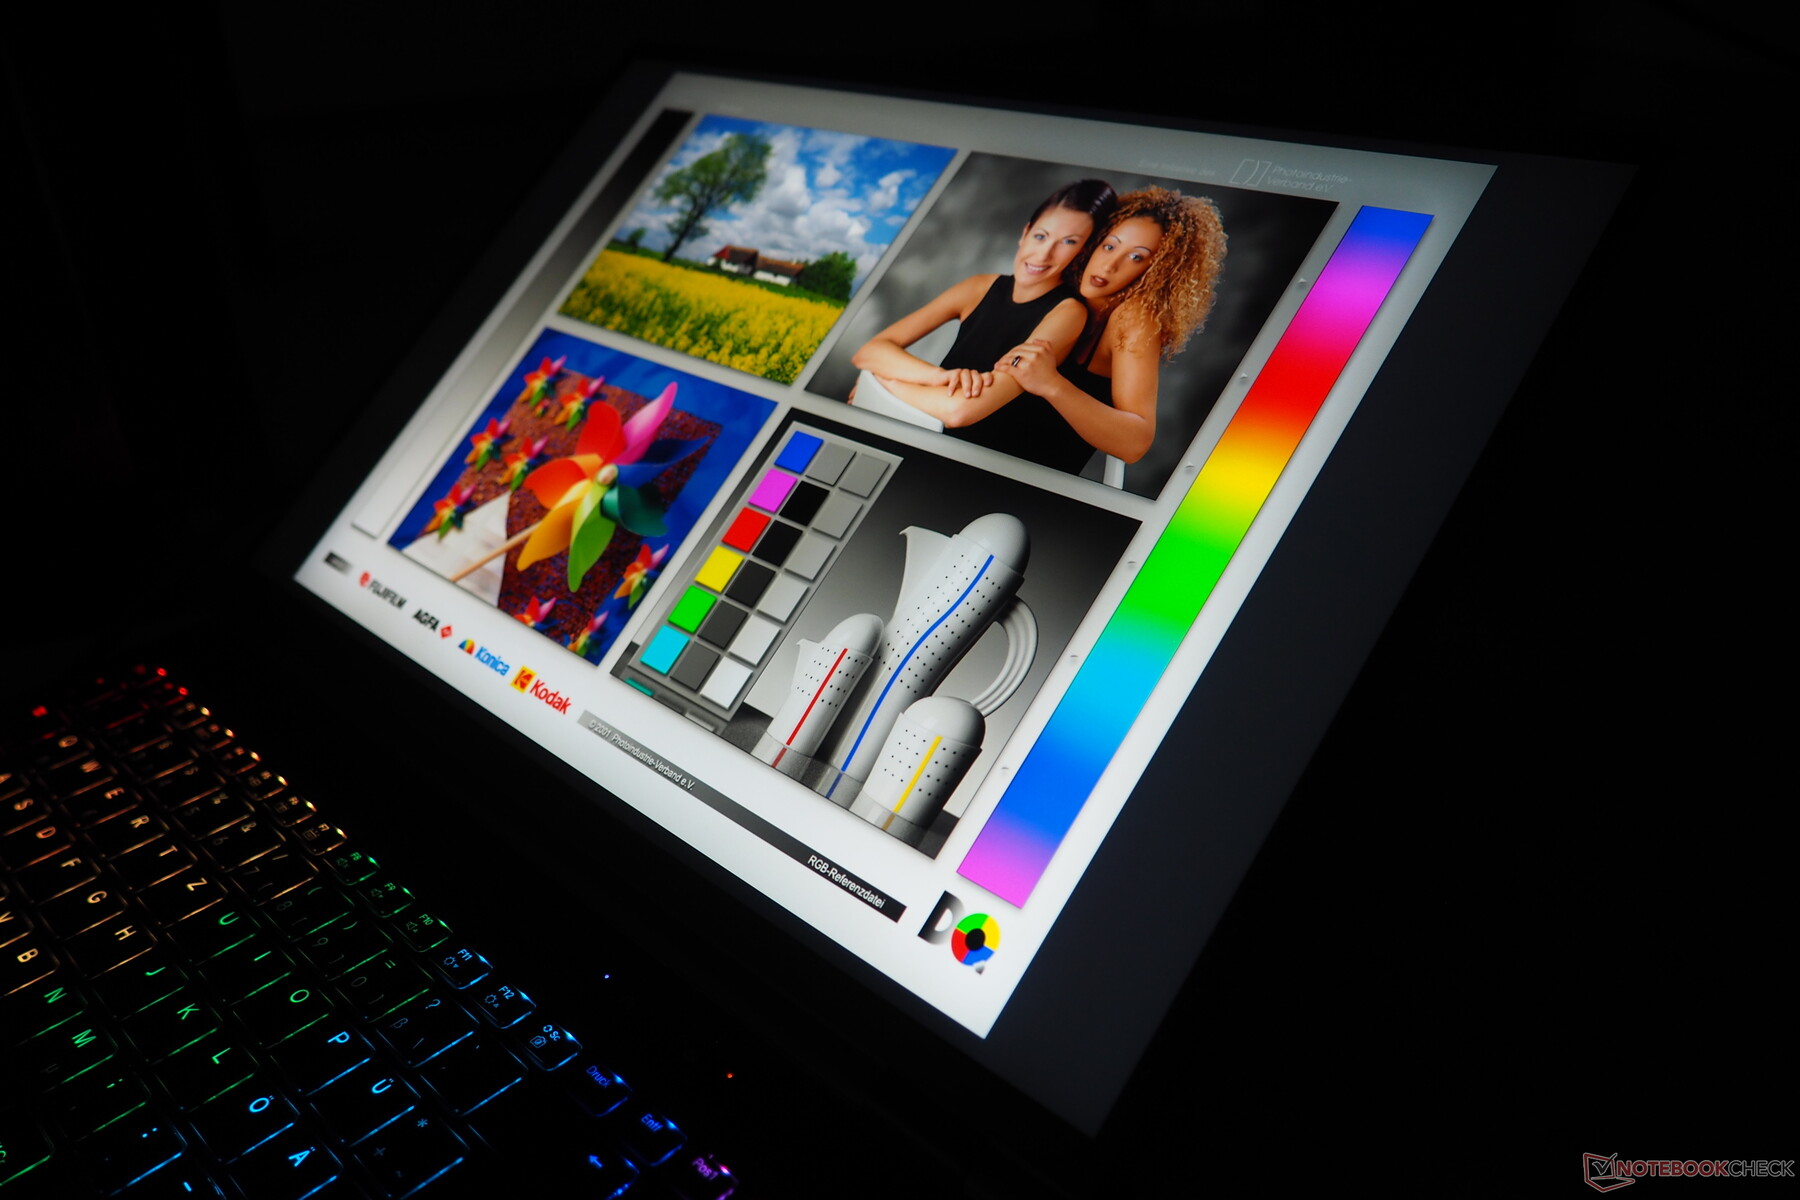
Display
One of the biggest highlights of the Beast 16 X1 is its first-class mini LED display. Even out of the box, the 16-inch screen offers a fairly high level of color accuracy.
| |||||||||||||||||||||||||
Brightness Distribution: 94 %
Center on Battery: 837 cd/m²
Contrast: ∞:1 (Black: 0 cd/m²)
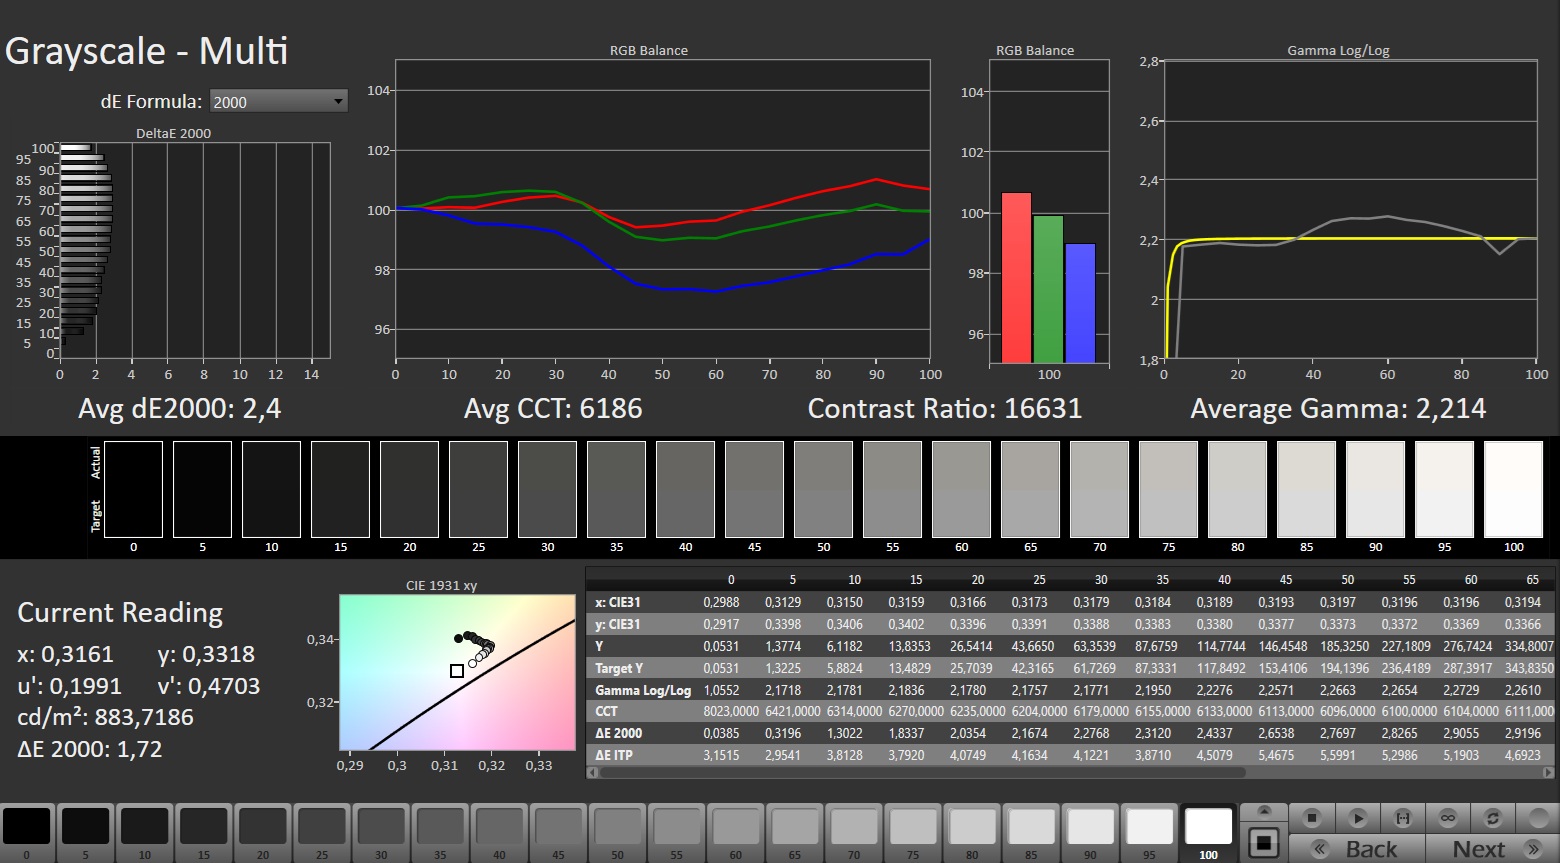
ΔE ColorChecker Calman: 1.59 | ∀{0.5-29.43 Ø4.73}
calibrated: 1.03
ΔE Greyscale Calman: 2.4 | ∀{0.09-98 Ø4.97}
86.9% AdobeRGB 1998 (Argyll 3D)
100% sRGB (Argyll 3D)
99.7% Display P3 (Argyll 3D)
Gamma: 2.214
CCT: 6186 K
| Medion Erazer Beast 16 X1 Ultimate NE160QDM-NM9 (BOE0D5A), Mini-LED, 2560x1600, 16", 300 Hz | Schenker XMG Neo 16 E25 RTX 5090 Laptop NE160QDM-NM9, Mini-LED, 2560x1600, 16", 300 Hz | HP Omen Max 16 ah000 Samsung ATNA60DL02-0, OLED, 2560x1600, 16", 240 Hz | Asus ROG Strix Scar 16 2025 NE160QDM-NM8, Mini-LED, 2560x1600, 16", 240 Hz | Lenovo Legion Pro 7i 16 Gen 10 Samsung ATNA60HU01-0, OLED, 2560x1600, 16", 240 Hz | Asus ROG Strix G16 G615 NE160QDM-NZC, IPS, 2560x1600, 16", 240 Hz | |
|---|---|---|---|---|---|---|
| Display | 1% | 4% | 1% | 3% | 1% | |
| Display P3 Coverage (%) | 99.7 | 99.9 0% | 99.7 0% | 99.9 0% | 99.5 0% | 99.1 -1% |
| sRGB Coverage (%) | 100 | 100 0% | 100 0% | 100 0% | 100 0% | 99.9 0% |
| AdobeRGB 1998 Coverage (%) | 86.9 | 88.5 2% | 98.2 13% | 88.4 2% | 94.4 9% | 89.1 3% |
| Response Times | -33% | 87% | 16% | 88% | 42% | |
| Response Time Grey 50% / Grey 80% * (ms) | 10 ? | 17.4 ? -74% | 0.29 ? 97% | 7 ? 30% | 0.28 ? 97% | 4.6 ? 54% |
| Response Time Black / White * (ms) | 8.6 ? | 13 ? -51% | 0.47 ? 95% | 8.4 ? 2% | 0.43 ? 95% | 6.1 ? 29% |
| PWM Frequency (Hz) | 20457 ? | 20253 | 960 ? | 20555 ? | 1438 ? | |
| PWM Amplitude * (%) | 100 | 75 25% | 31 69% | 29 71% | ||
| Screen | -29% | -30% | 23% | -17% | -4% | |
| Brightness middle (cd/m²) | 837 | 888 6% | 376.5 -55% | 754 -10% | 490.4 -41% | 545 -35% |
| Brightness (cd/m²) | 821 | 859 5% | 382 -53% | 773 -6% | 498 -39% | 536 -35% |
| Brightness Distribution (%) | 94 | 94 0% | 96 2% | 91 -3% | 97 3% | 89 -5% |
| Black Level * (cd/m²) | 0.07 | 0.41 | ||||
| Colorchecker dE 2000 * | 1.59 | 3.3 -108% | 3.67 -131% | 1 37% | 3.2 -101% | 1.6 -1% |
| Colorchecker dE 2000 max. * | 5.27 | 5.5 -4% | 7.24 -37% | 2 62% | 6.04 -15% | 4 24% |
| Colorchecker dE 2000 calibrated * | 1.03 | 1.5 -46% | 0.94 9% | 0.84 18% | 0.8 22% | |
| Greyscale dE 2000 * | 2.4 | 3.8 -58% | 1.1 54% | 1 58% | 1 58% | 2.4 -0% |
| Gamma | 2.214 99% | 2.46 89% | 2.25 98% | 2.14 103% | 2.24 98% | 2.25 98% |
| CCT | 6186 105% | 6267 104% | 6319 103% | 6493 100% | 6373 102% | 6737 96% |
| Contrast (:1) | 10771 | 1329 | ||||
| Total Average (Program / Settings) | -20% /
-23% | 20% /
5% | 13% /
16% | 25% /
12% | 13% /
5% |
* ... smaller is better
In general, the color space coverage of 100% sRGB or DCI-P3 and 87% AdobeRGB is impressive, although this also applies to the OLED or IPS panels of the competition. In terms of brightness (we tested in SDR mode; HDR can also be activated if desired), the Beast 16 X1 and the Neo 16 take the lead with an average of 821 cd/m², which is an excellent result.
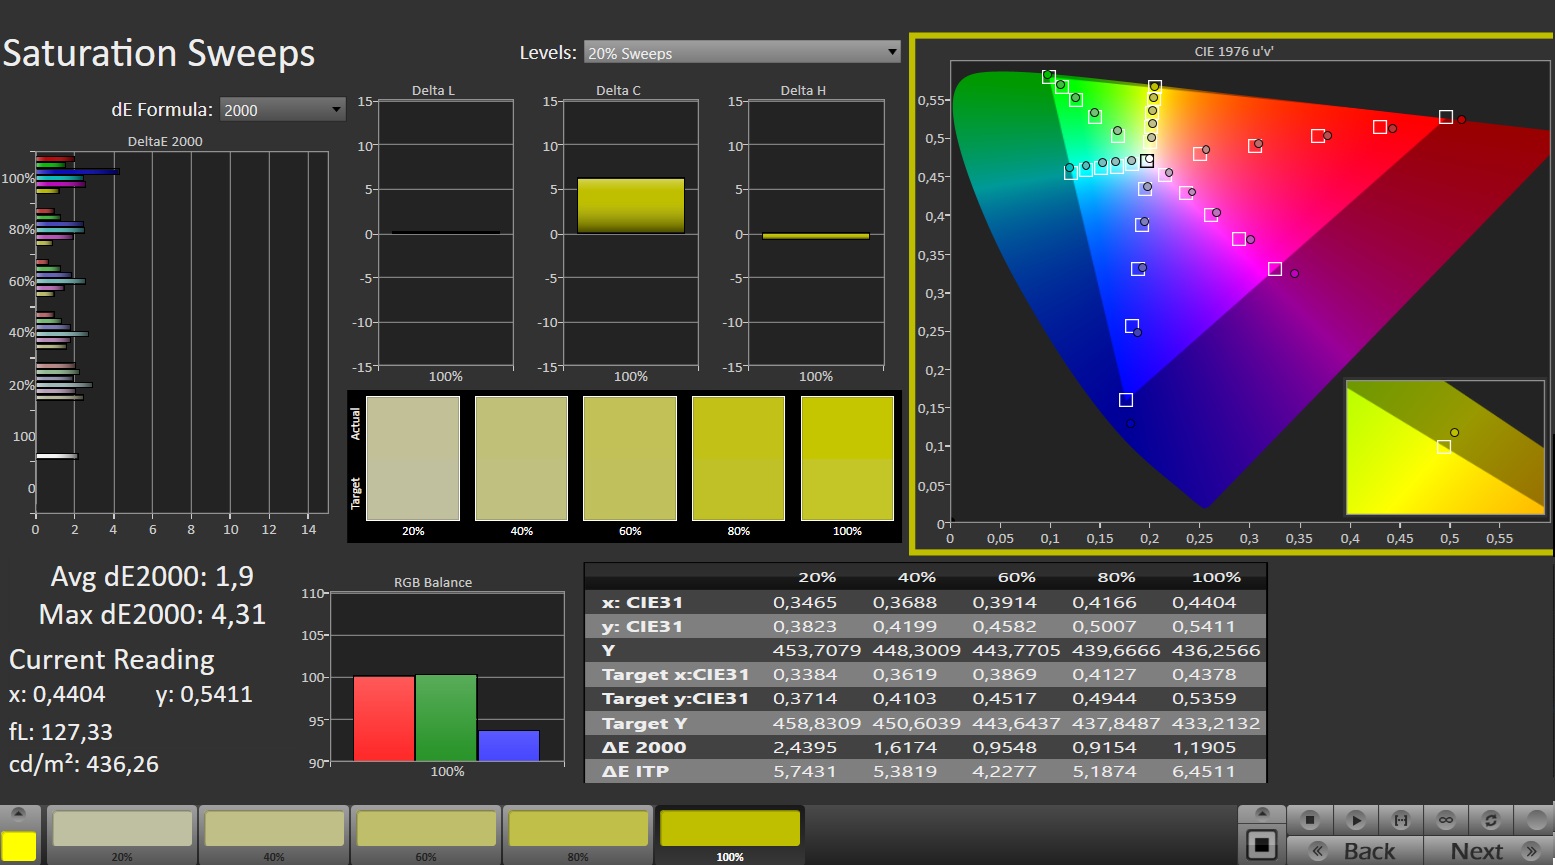
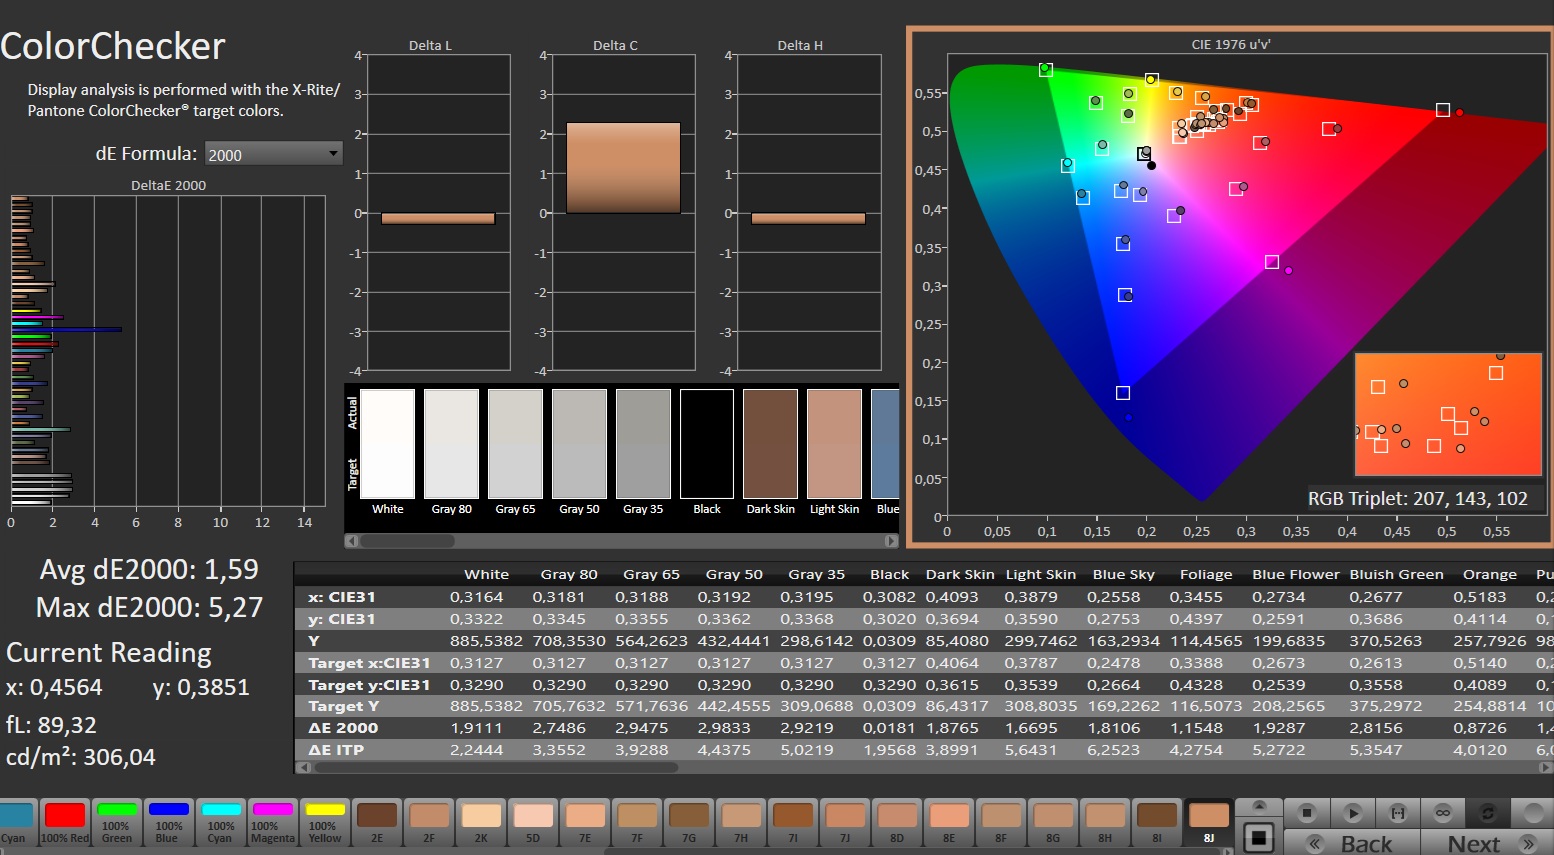
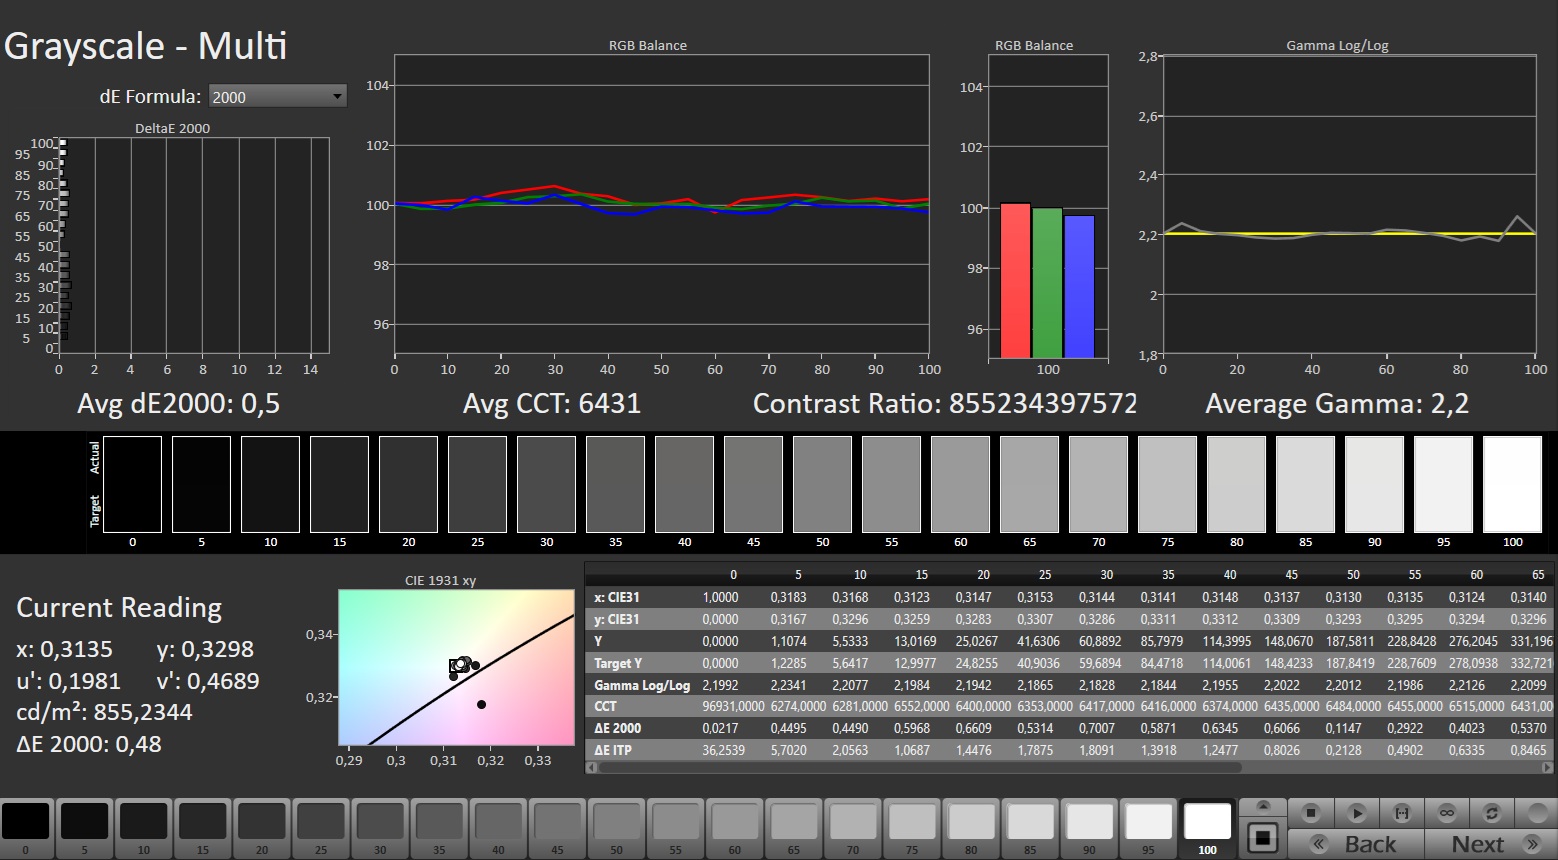
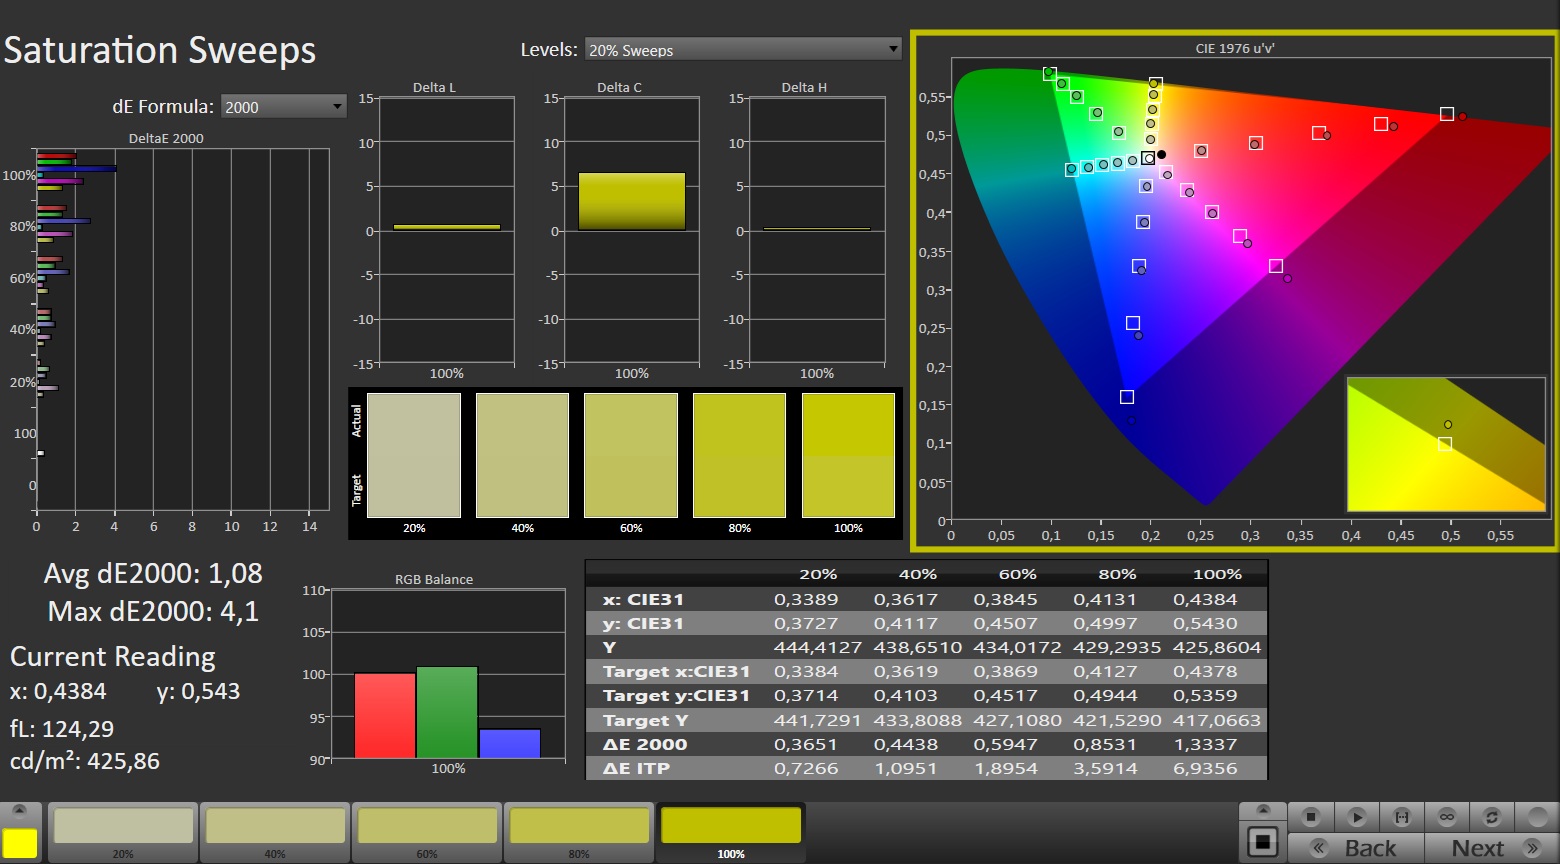

In combination with the low black level, this results in excellent contrast. The response times are more on the level of a typical IPS panel.
Unfortunately, the screen struggles with flickering up to a brightness level of 92%. However, the frequency is so high that even sensitive people should not have any problems.

Display Response Times
| ↔ Response Time Black to White | ||
|---|---|---|
| 8.6 ms ... rise ↗ and fall ↘ combined | ↗ 4.2 ms rise | 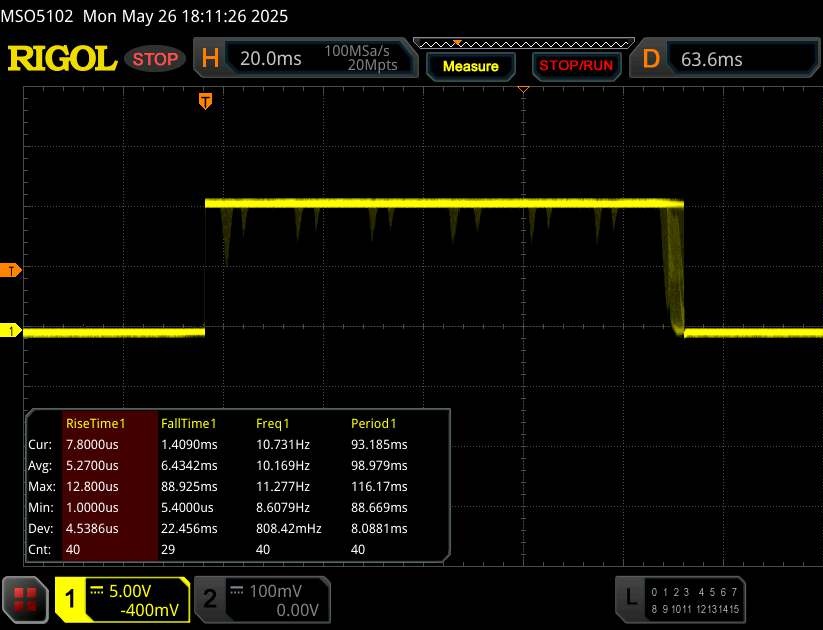 |
| ↘ 6.4 ms fall | ||
| The screen shows fast response rates in our tests and should be suited for gaming. In comparison, all tested devices range from 0.1 (minimum) to 240 (maximum) ms. » 24 % of all devices are better. This means that the measured response time is better than the average of all tested devices (19.9 ms). | ||
| ↔ Response Time 50% Grey to 80% Grey | ||
| 10 ms ... rise ↗ and fall ↘ combined | ↗ 4.7 ms rise | 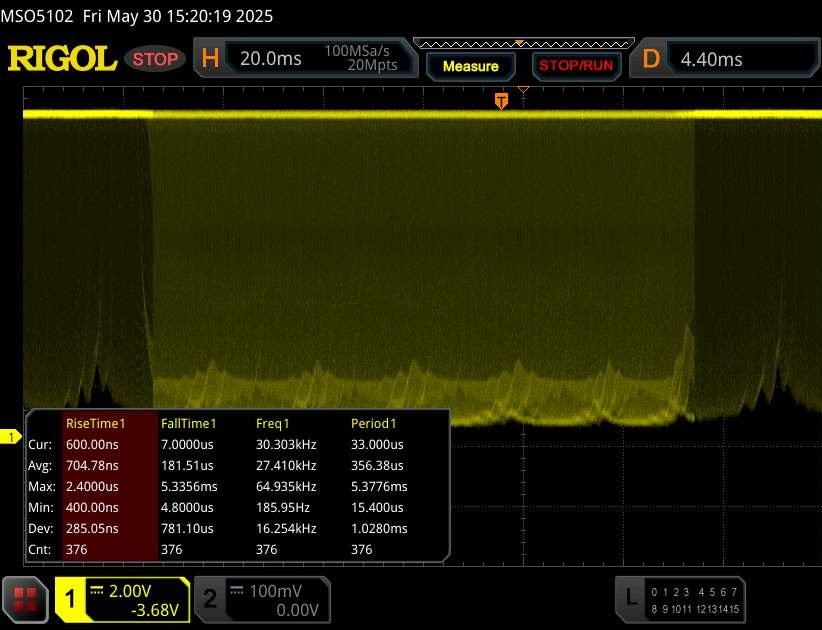 |
| ↘ 5.3 ms fall | ||
| The screen shows good response rates in our tests, but may be too slow for competitive gamers. In comparison, all tested devices range from 0.165 (minimum) to 636 (maximum) ms. » 23 % of all devices are better. This means that the measured response time is better than the average of all tested devices (31.1 ms). | ||
Screen Flickering / PWM (Pulse-Width Modulation)
| Screen flickering / PWM detected | 20457 Hz Amplitude: 100 % | ≤ 92 % brightness setting |  |
The display backlight flickers at 20457 Hz (worst case, e.g., utilizing PWM) Flickering detected at a brightness setting of 92 % and below. There should be no flickering or PWM above this brightness setting. The frequency of 20457 Hz is quite high, so most users sensitive to PWM should not notice any flickering. In comparison: 52 % of all tested devices do not use PWM to dim the display. If PWM was detected, an average of 7794 (minimum: 5 - maximum: 343500) Hz was measured. | |||
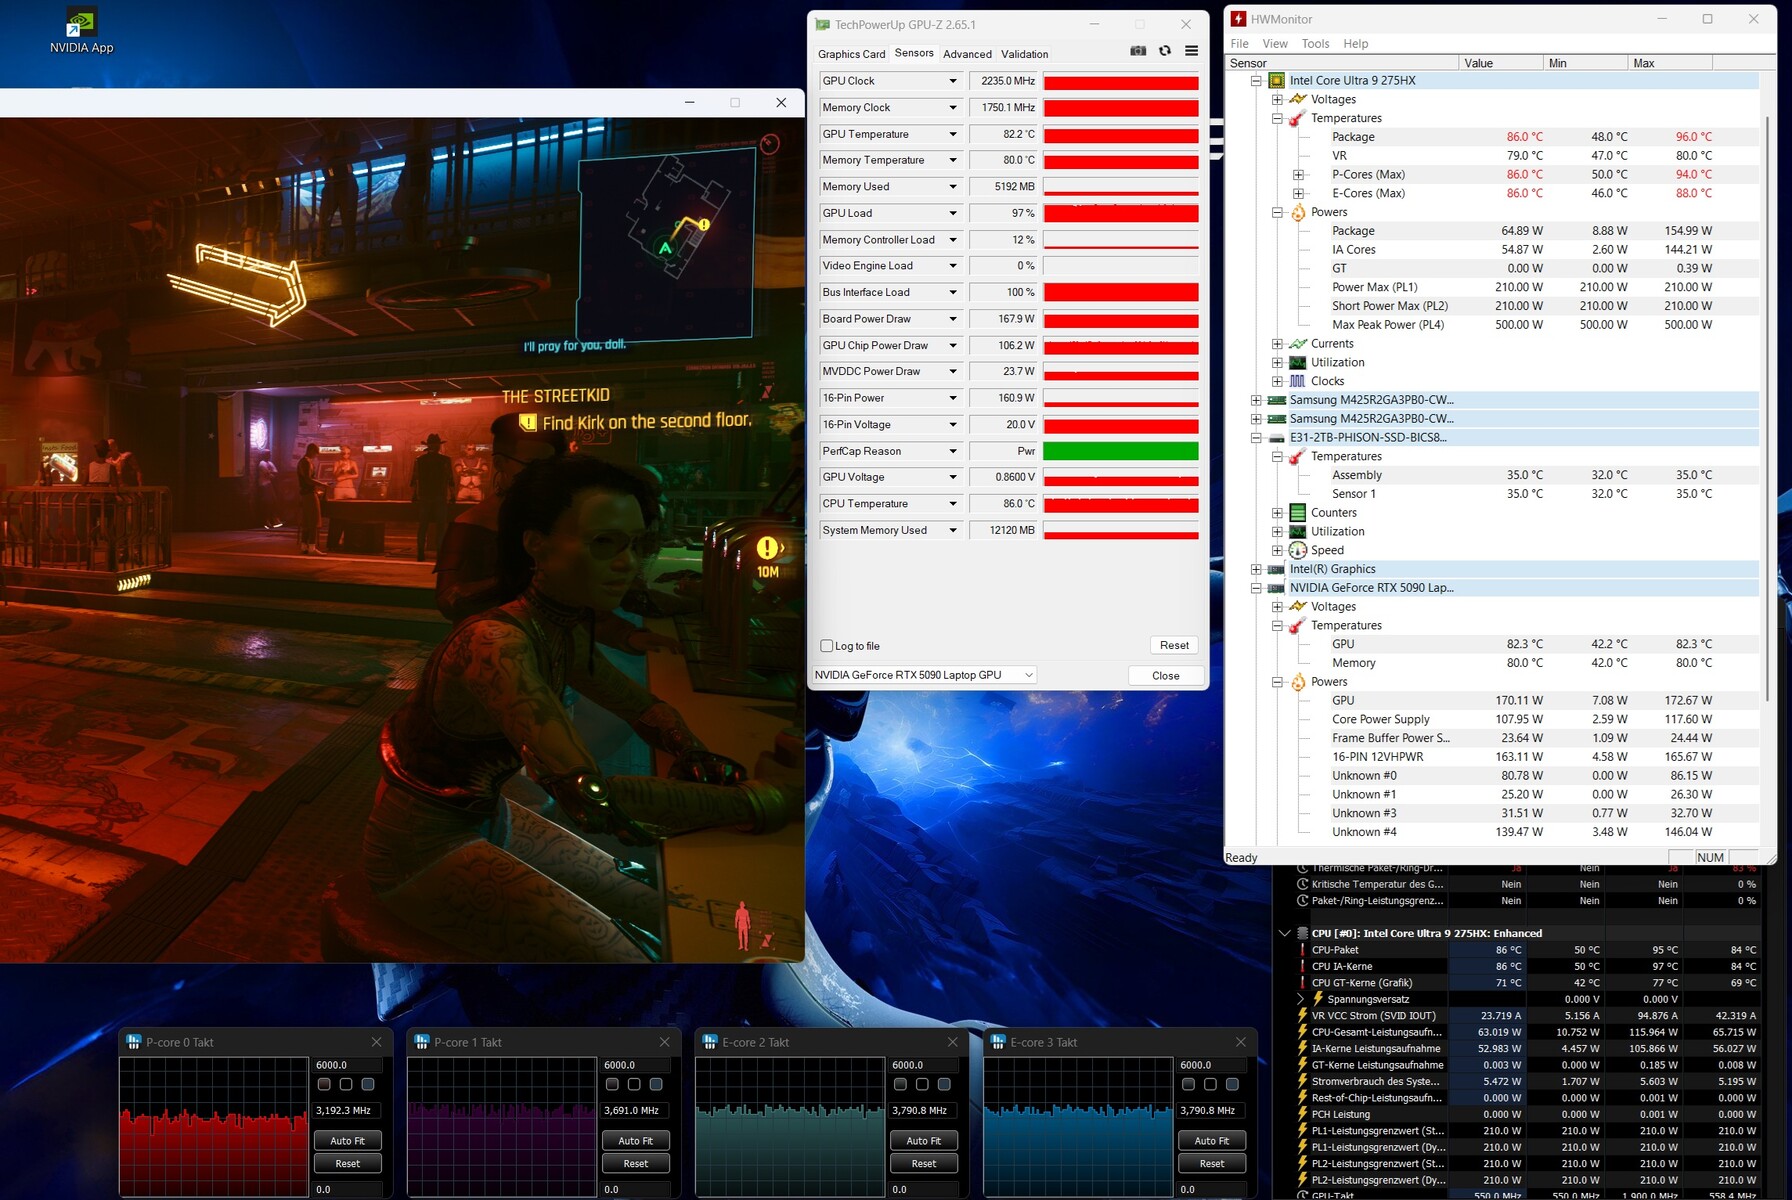
Performance
The Beast 16 X1 is available with either the RTX 5090 Laptop or the RTX 5080 Laptop so it belongs to the high-end segment in either case. With the latter GPU, the device costs around 1,000 Euros (~$1135) less, the surcharge for the RTX 5090 version is correspondingly high.
Test conditions
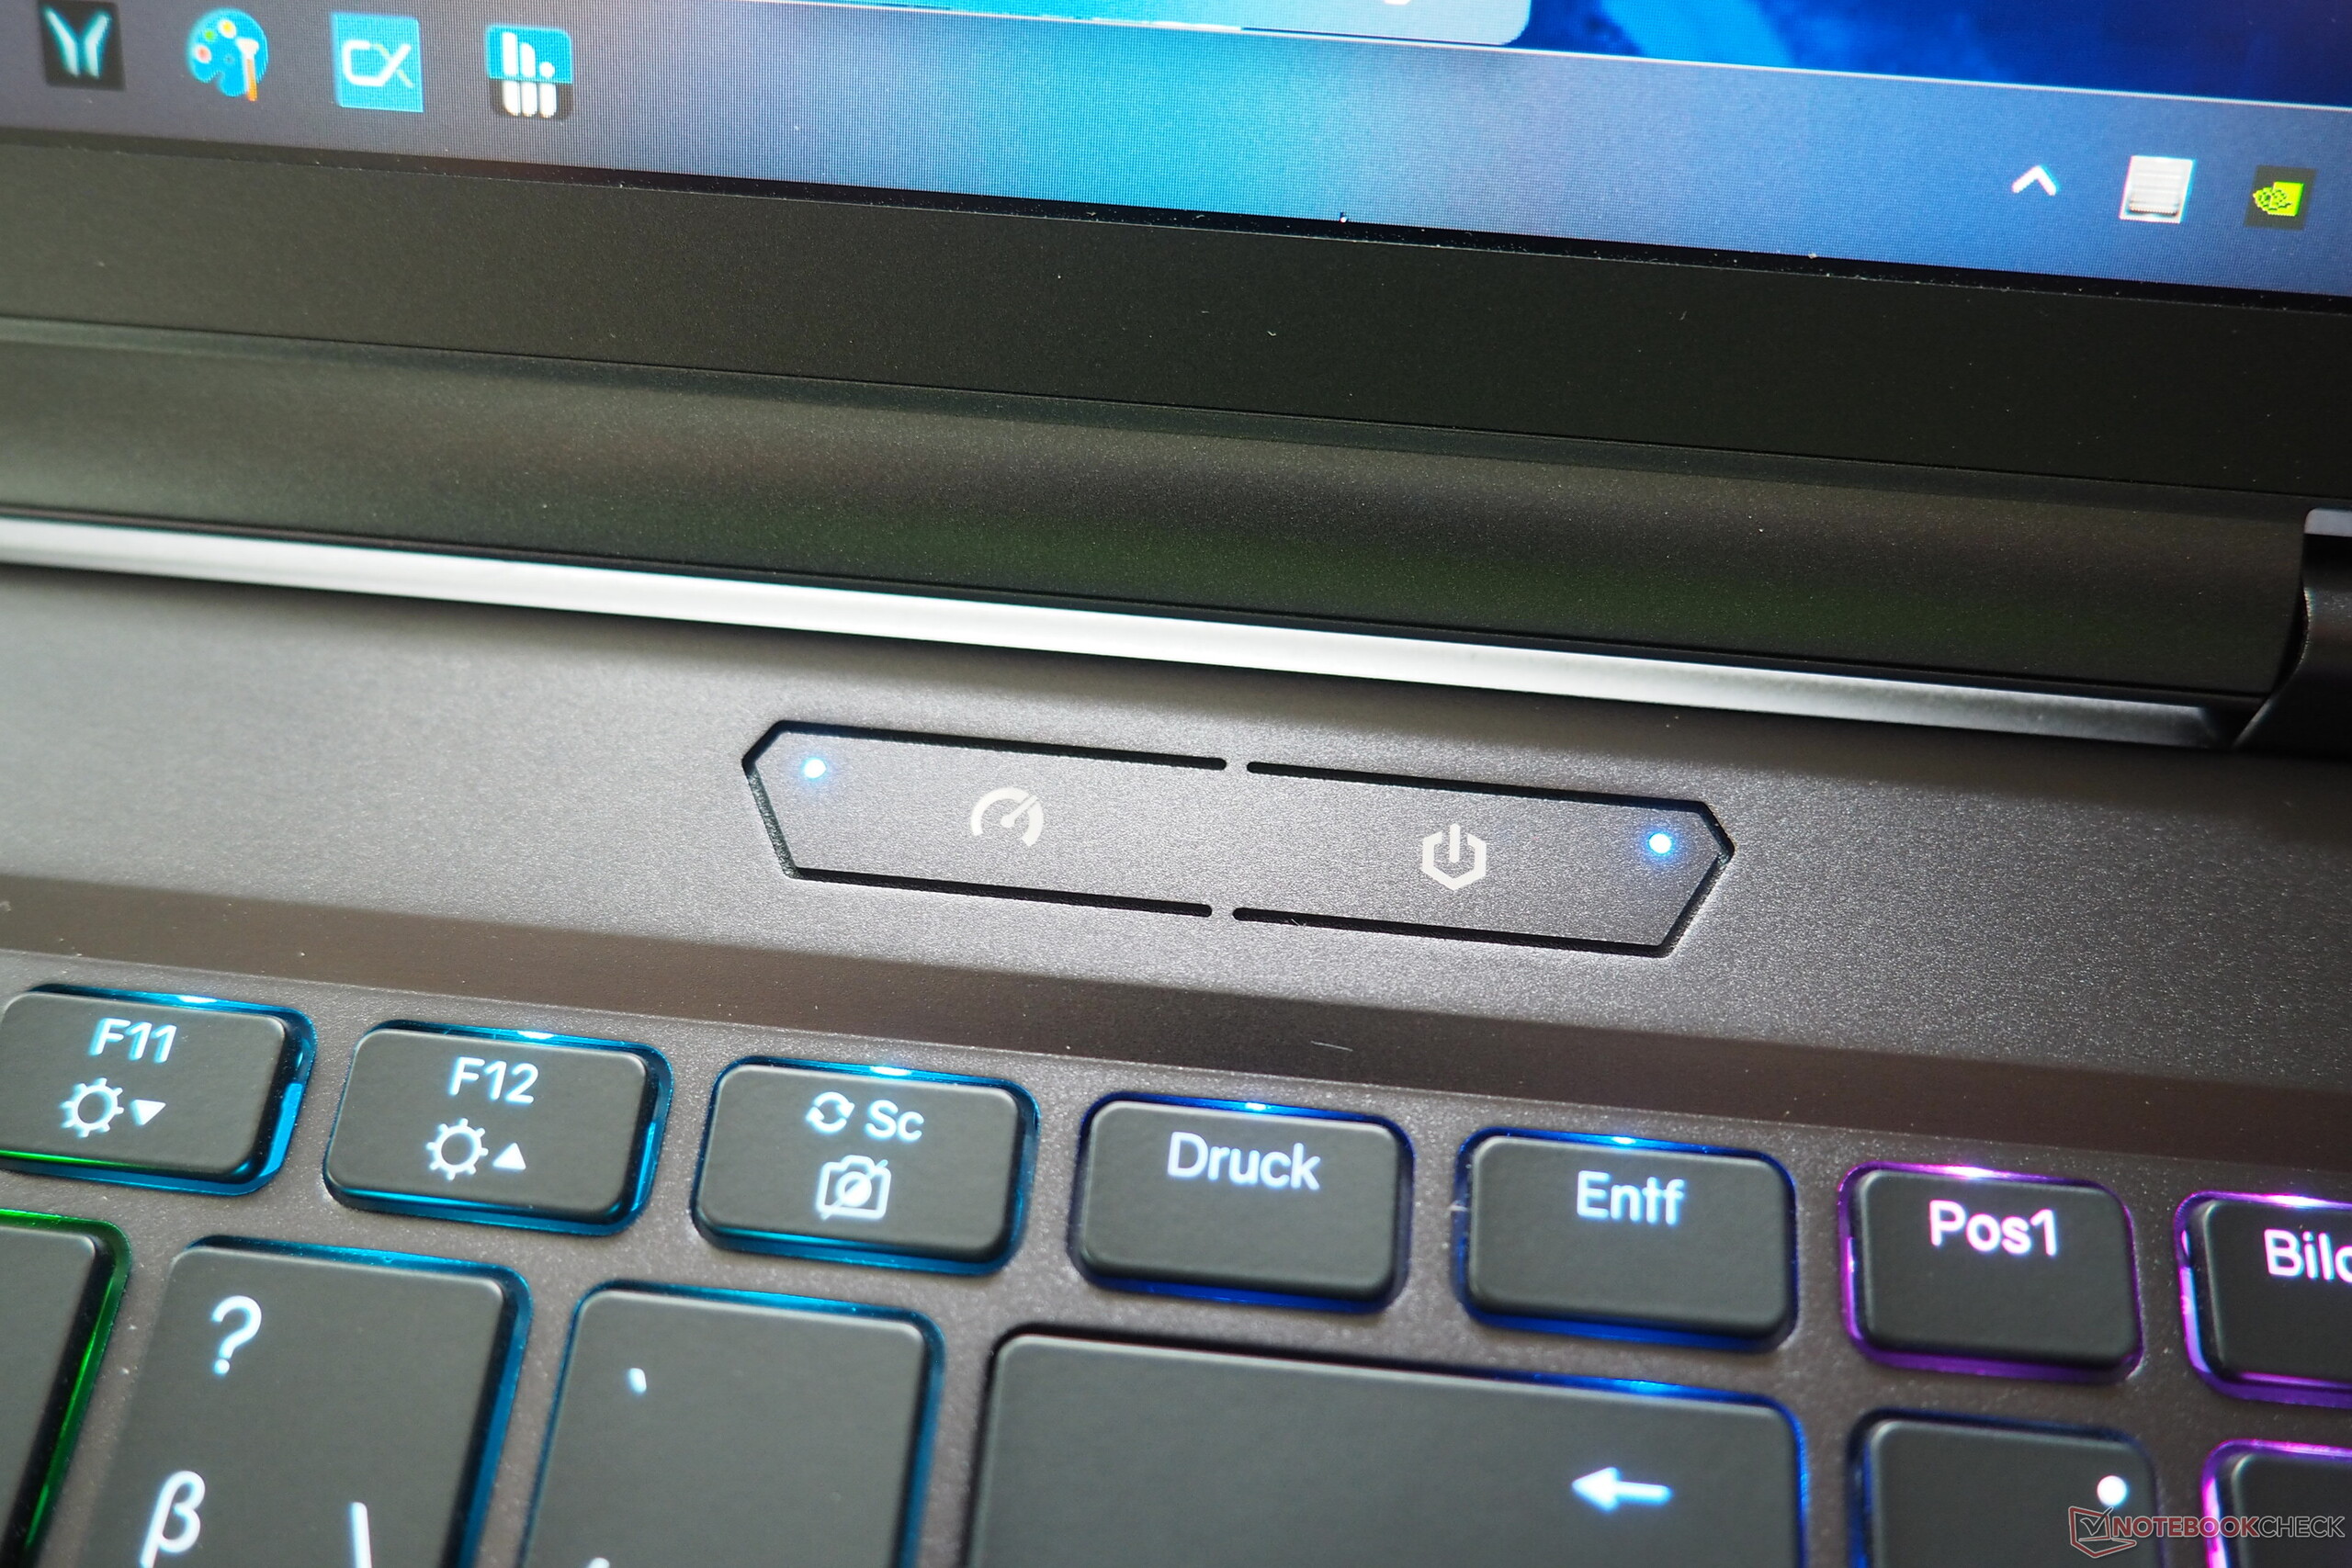
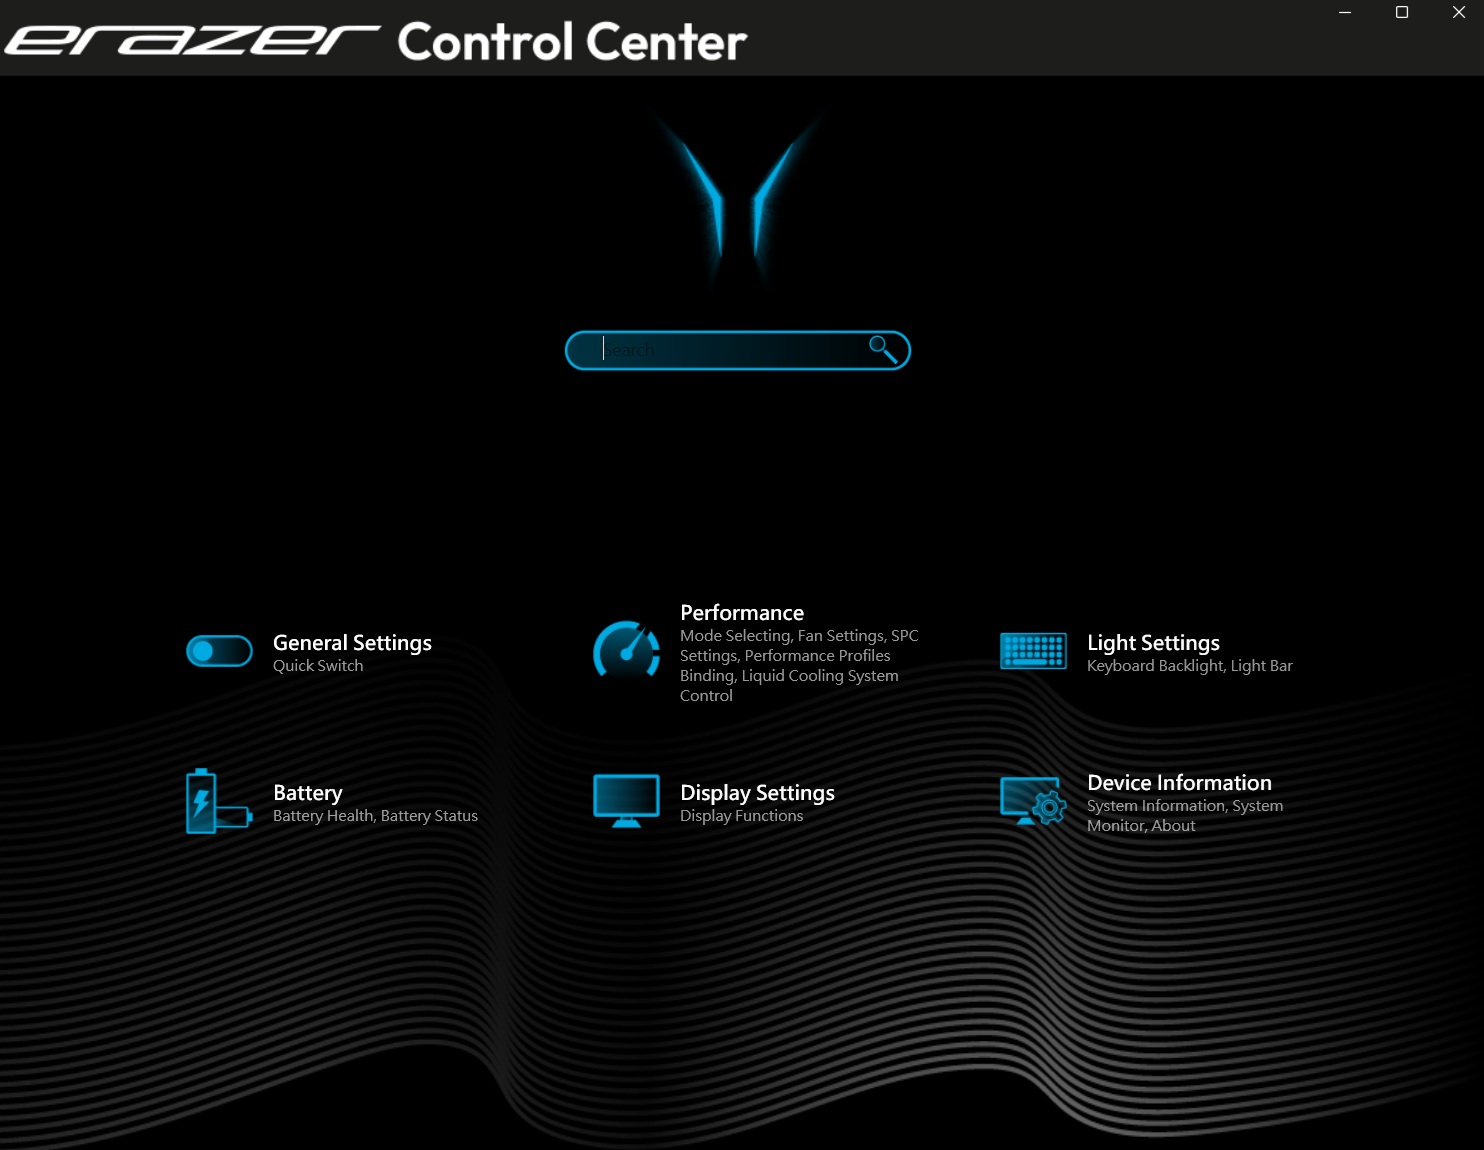
Practical: A special button (next to the power button) can be used to quickly switch between the operating modes. "Silence" lights up green, "Balance" blue and "Gaming" purple. The effects on the noise level and performance can be seen in the table below. With the exception of the battery test, our measurements were completed with the Gaming profile. There still seems to be a bug in the Erazer Control Center, which can also be used to switch modes: After (re)starting the notebook, only the Silent profile is ever selected here - at least in terms of the display.
| Erazer Control Center Mode | Silence | Balance | Gaming |
| Cyberpunk 2077 Noise | 42 dB(A) | 48 dB(A) | 55 dB(A) |
| Cyberpunk 2077 Performance (FHD/Ultra) | 83.8 fps | 148.6 fps | 158.5 fps |
| Cinebench R15 Multi Score | 3318 Points | 4494 Points | 6067 Points |
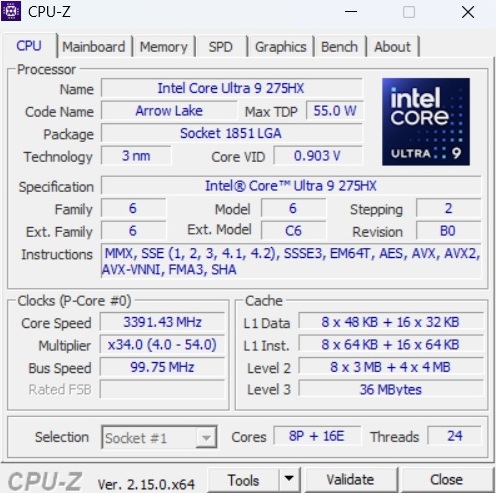
Processor
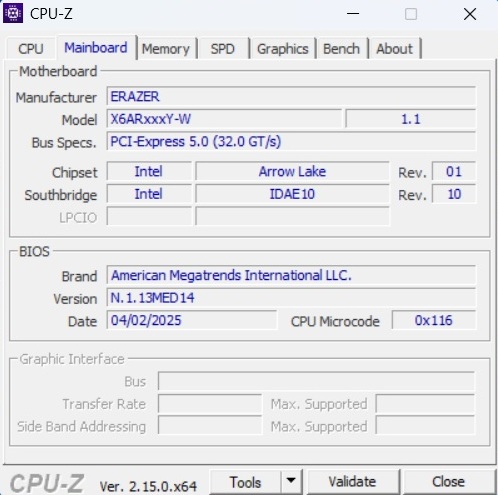
The Intel Core Ultra 9 275HX from the Arrow Lake generation leaves mixed feelings in the Beast 16 X1. At first glance, the results are at the expected level or even higher in some cases. However, as our Cinebench loop has shown, performance dips occur in the meantime under prolonged load, which the competition is spared from.
Cinebench R15 Multi Endurance test
* ... smaller is better
AIDA64: FP32 Ray-Trace | FPU Julia | CPU SHA3 | CPU Queen | FPU SinJulia | FPU Mandel | CPU AES | CPU ZLib | FP64 Ray-Trace | CPU PhotoWorxx
| Performance rating | |
| Schenker XMG Neo 16 E25 RTX 5090 Laptop | |
| Asus ROG Strix Scar 16 2025 | |
| Asus ROG Strix G16 G615 | |
| Medion Erazer Beast 16 X1 Ultimate | |
| Lenovo Legion Pro 7i 16 Gen 10 | |
| Average Intel Core Ultra 9 275HX | |
| HP Omen Max 16 ah000 | |
| Average of class Gaming | |
| AIDA64 / FP32 Ray-Trace | |
| Schenker XMG Neo 16 E25 RTX 5090 Laptop | |
| Asus ROG Strix Scar 16 2025 | |
| Asus ROG Strix G16 G615 | |
| Medion Erazer Beast 16 X1 Ultimate | |
| Lenovo Legion Pro 7i 16 Gen 10 | |
| Average Intel Core Ultra 9 275HX (28039 - 39895, n=30) | |
| HP Omen Max 16 ah000 | |
| Average of class Gaming (10227 - 85542, n=109, last 2 years) | |
| AIDA64 / FPU Julia | |
| Schenker XMG Neo 16 E25 RTX 5090 Laptop | |
| Asus ROG Strix G16 G615 | |
| Asus ROG Strix Scar 16 2025 | |
| Medion Erazer Beast 16 X1 Ultimate | |
| Lenovo Legion Pro 7i 16 Gen 10 | |
| Average Intel Core Ultra 9 275HX (140254 - 200744, n=30) | |
| HP Omen Max 16 ah000 | |
| Average of class Gaming (51376 - 238426, n=109, last 2 years) | |
| AIDA64 / CPU SHA3 | |
| Schenker XMG Neo 16 E25 RTX 5090 Laptop | |
| Asus ROG Strix Scar 16 2025 | |
| Asus ROG Strix G16 G615 | |
| Medion Erazer Beast 16 X1 Ultimate | |
| Lenovo Legion Pro 7i 16 Gen 10 | |
| Average Intel Core Ultra 9 275HX (6710 - 9817, n=30) | |
| HP Omen Max 16 ah000 | |
| Average of class Gaming (2180 - 9817, n=109, last 2 years) | |
| AIDA64 / CPU Queen | |
| Schenker XMG Neo 16 E25 RTX 5090 Laptop | |
| Medion Erazer Beast 16 X1 Ultimate | |
| Asus ROG Strix Scar 16 2025 | |
| Asus ROG Strix G16 G615 | |
| Lenovo Legion Pro 7i 16 Gen 10 | |
| Average Intel Core Ultra 9 275HX (113887 - 140937, n=30) | |
| HP Omen Max 16 ah000 | |
| Average of class Gaming (49785 - 173351, n=100, last 2 years) | |
| AIDA64 / FPU SinJulia | |
| Medion Erazer Beast 16 X1 Ultimate | |
| Average of class Gaming (4424 - 33636, n=109, last 2 years) | |
| Schenker XMG Neo 16 E25 RTX 5090 Laptop | |
| Lenovo Legion Pro 7i 16 Gen 10 | |
| Asus ROG Strix Scar 16 2025 | |
| Asus ROG Strix G16 G615 | |
| Average Intel Core Ultra 9 275HX (11172 - 14425, n=30) | |
| HP Omen Max 16 ah000 | |
| AIDA64 / FPU Mandel | |
| Asus ROG Strix G16 G615 | |
| Asus ROG Strix Scar 16 2025 | |
| Schenker XMG Neo 16 E25 RTX 5090 Laptop | |
| Medion Erazer Beast 16 X1 Ultimate | |
| Lenovo Legion Pro 7i 16 Gen 10 | |
| Average Intel Core Ultra 9 275HX (72596 - 104508, n=30) | |
| HP Omen Max 16 ah000 | |
| Average of class Gaming (25115 - 128721, n=109, last 2 years) | |
| AIDA64 / CPU AES | |
| Schenker XMG Neo 16 E25 RTX 5090 Laptop | |
| Medion Erazer Beast 16 X1 Ultimate | |
| Asus ROG Strix G16 G615 | |
| Lenovo Legion Pro 7i 16 Gen 10 | |
| Asus ROG Strix Scar 16 2025 | |
| Average Intel Core Ultra 9 275HX (105608 - 247074, n=30) | |
| HP Omen Max 16 ah000 | |
| Average of class Gaming (39258 - 247074, n=109, last 2 years) | |
| AIDA64 / CPU ZLib | |
| Schenker XMG Neo 16 E25 RTX 5090 Laptop | |
| Medion Erazer Beast 16 X1 Ultimate | |
| Asus ROG Strix G16 G615 | |
| Asus ROG Strix Scar 16 2025 | |
| Lenovo Legion Pro 7i 16 Gen 10 | |
| Average Intel Core Ultra 9 275HX (1582 - 2263, n=30) | |
| HP Omen Max 16 ah000 | |
| Average of class Gaming (574 - 2531, n=109, last 2 years) | |
| AIDA64 / FP64 Ray-Trace | |
| Asus ROG Strix Scar 16 2025 | |
| Asus ROG Strix G16 G615 | |
| Schenker XMG Neo 16 E25 RTX 5090 Laptop | |
| Medion Erazer Beast 16 X1 Ultimate | |
| Lenovo Legion Pro 7i 16 Gen 10 | |
| Average Intel Core Ultra 9 275HX (14847 - 21854, n=30) | |
| HP Omen Max 16 ah000 | |
| Average of class Gaming (5509 - 45446, n=109, last 2 years) | |
| AIDA64 / CPU PhotoWorxx | |
| Asus ROG Strix Scar 16 2025 | |
| Schenker XMG Neo 16 E25 RTX 5090 Laptop | |
| Lenovo Legion Pro 7i 16 Gen 10 | |
| Average Intel Core Ultra 9 275HX (37482 - 62916, n=30) | |
| Medion Erazer Beast 16 X1 Ultimate | |
| HP Omen Max 16 ah000 | |
| Asus ROG Strix G16 G615 | |
| Average of class Gaming (12271 - 89891, n=109, last 2 years) | |
System performance
In terms of system performance, however, the Medion laptop takes the top spot when it comes to the overall rating.
PCMark 10: Score | Essentials | Productivity | Digital Content Creation
CrossMark: Overall | Productivity | Creativity | Responsiveness
WebXPRT 3: Overall
WebXPRT 4: Overall
Mozilla Kraken 1.1: Total
| Performance rating | |
| Schenker XMG Neo 16 E25 RTX 5090 Laptop | |
| Asus ROG Strix G16 G615 | |
| Average Intel Core Ultra 9 275HX, NVIDIA GeForce RTX 5090 Laptop | |
| Asus ROG Strix Scar 16 2025 | |
| Medion Erazer Beast 16 X1 Ultimate | |
| Lenovo Legion Pro 7i 16 Gen 10 | |
| HP Omen Max 16 ah000 -1! | |
| Average of class Gaming | |
| PCMark 10 / Score | |
| Lenovo Legion Pro 7i 16 Gen 10 | |
| Schenker XMG Neo 16 E25 RTX 5090 Laptop | |
| Asus ROG Strix G16 G615 | |
| Asus ROG Strix Scar 16 2025 | |
| HP Omen Max 16 ah000 | |
| Average Intel Core Ultra 9 275HX, NVIDIA GeForce RTX 5090 Laptop (7474 - 9497, n=11) | |
| Medion Erazer Beast 16 X1 Ultimate | |
| Average of class Gaming (5828 - 11574, n=95, last 2 years) | |
| PCMark 10 / Essentials | |
| Medion Erazer Beast 16 X1 Ultimate | |
| Lenovo Legion Pro 7i 16 Gen 10 | |
| Asus ROG Strix G16 G615 | |
| Schenker XMG Neo 16 E25 RTX 5090 Laptop | |
| Asus ROG Strix Scar 16 2025 | |
| HP Omen Max 16 ah000 | |
| Average Intel Core Ultra 9 275HX, NVIDIA GeForce RTX 5090 Laptop (9994 - 11369, n=12) | |
| Average of class Gaming (8810 - 12600, n=99, last 2 years) | |
| PCMark 10 / Productivity | |
| Average of class Gaming (6845 - 18766, n=97, last 2 years) | |
| Average Intel Core Ultra 9 275HX, NVIDIA GeForce RTX 5090 Laptop (9122 - 10925, n=11) | |
| Lenovo Legion Pro 7i 16 Gen 10 | |
| Medion Erazer Beast 16 X1 Ultimate | |
| Schenker XMG Neo 16 E25 RTX 5090 Laptop | |
| Asus ROG Strix G16 G615 | |
| Asus ROG Strix Scar 16 2025 | |
| HP Omen Max 16 ah000 | |
| PCMark 10 / Digital Content Creation | |
| Lenovo Legion Pro 7i 16 Gen 10 | |
| Schenker XMG Neo 16 E25 RTX 5090 Laptop | |
| HP Omen Max 16 ah000 | |
| Asus ROG Strix G16 G615 | |
| Asus ROG Strix Scar 16 2025 | |
| Average Intel Core Ultra 9 275HX, NVIDIA GeForce RTX 5090 Laptop (9952 - 19234, n=11) | |
| Medion Erazer Beast 16 X1 Ultimate | |
| Average of class Gaming (7602 - 19657, n=97, last 2 years) | |
| CrossMark / Overall | |
| Schenker XMG Neo 16 E25 RTX 5090 Laptop | |
| Medion Erazer Beast 16 X1 Ultimate | |
| Average Intel Core Ultra 9 275HX, NVIDIA GeForce RTX 5090 Laptop (1995 - 2339, n=12) | |
| Asus ROG Strix G16 G615 | |
| Asus ROG Strix Scar 16 2025 | |
| Lenovo Legion Pro 7i 16 Gen 10 | |
| HP Omen Max 16 ah000 | |
| Average of class Gaming (1366 - 2409, n=97, last 2 years) | |
| CrossMark / Productivity | |
| Schenker XMG Neo 16 E25 RTX 5090 Laptop | |
| Medion Erazer Beast 16 X1 Ultimate | |
| Average Intel Core Ultra 9 275HX, NVIDIA GeForce RTX 5090 Laptop (1847 - 2211, n=12) | |
| Asus ROG Strix G16 G615 | |
| Asus ROG Strix Scar 16 2025 | |
| Lenovo Legion Pro 7i 16 Gen 10 | |
| Average of class Gaming (1386 - 2254, n=97, last 2 years) | |
| HP Omen Max 16 ah000 | |
| CrossMark / Creativity | |
| Schenker XMG Neo 16 E25 RTX 5090 Laptop | |
| Medion Erazer Beast 16 X1 Ultimate | |
| Asus ROG Strix Scar 16 2025 | |
| Average Intel Core Ultra 9 275HX, NVIDIA GeForce RTX 5090 Laptop (2170 - 2642, n=12) | |
| Asus ROG Strix G16 G615 | |
| Lenovo Legion Pro 7i 16 Gen 10 | |
| HP Omen Max 16 ah000 | |
| Average of class Gaming (1343 - 2729, n=97, last 2 years) | |
| CrossMark / Responsiveness | |
| Average Intel Core Ultra 9 275HX, NVIDIA GeForce RTX 5090 Laptop (1673 - 2217, n=12) | |
| Schenker XMG Neo 16 E25 RTX 5090 Laptop | |
| Asus ROG Strix G16 G615 | |
| Medion Erazer Beast 16 X1 Ultimate | |
| Average of class Gaming (1226 - 2334, n=97, last 2 years) | |
| Asus ROG Strix Scar 16 2025 | |
| HP Omen Max 16 ah000 | |
| Lenovo Legion Pro 7i 16 Gen 10 | |
| WebXPRT 3 / Overall | |
| HP Omen Max 16 ah000 | |
| Lenovo Legion Pro 7i 16 Gen 10 | |
| Schenker XMG Neo 16 E25 RTX 5090 Laptop | |
| Asus ROG Strix G16 G615 | |
| Average Intel Core Ultra 9 275HX, NVIDIA GeForce RTX 5090 Laptop (315 - 372, n=12) | |
| Asus ROG Strix Scar 16 2025 | |
| Medion Erazer Beast 16 X1 Ultimate | |
| Average of class Gaming (242 - 532, n=100, last 2 years) | |
| WebXPRT 4 / Overall | |
| Asus ROG Strix Scar 16 2025 | |
| Asus ROG Strix G16 G615 | |
| Medion Erazer Beast 16 X1 Ultimate | |
| Lenovo Legion Pro 7i 16 Gen 10 | |
| Schenker XMG Neo 16 E25 RTX 5090 Laptop | |
| Average Intel Core Ultra 9 275HX, NVIDIA GeForce RTX 5090 Laptop (301 - 341, n=11) | |
| Average of class Gaming (176.4 - 354, n=100, last 2 years) | |
| Mozilla Kraken 1.1 / Total | |
| Average of class Gaming (391 - 590, n=105, last 2 years) | |
| HP Omen Max 16 ah000 | |
| Asus ROG Strix Scar 16 2025 | |
| Average Intel Core Ultra 9 275HX, NVIDIA GeForce RTX 5090 Laptop (402 - 424, n=12) | |
| Medion Erazer Beast 16 X1 Ultimate | |
| Lenovo Legion Pro 7i 16 Gen 10 | |
| Asus ROG Strix G16 G615 | |
| Schenker XMG Neo 16 E25 RTX 5090 Laptop | |
* ... smaller is better
| PCMark 10 Score | 8518 points | |
Help | ||
| AIDA64 / Memory Copy | |
| Schenker XMG Neo 16 E25 RTX 5090 Laptop | |
| Asus ROG Strix G16 G615 | |
| Lenovo Legion Pro 7i 16 Gen 10 | |
| Asus ROG Strix Scar 16 2025 | |
| Medion Erazer Beast 16 X1 Ultimate | |
| Average Intel Core Ultra 9 275HX (56003 - 94460, n=30) | |
| HP Omen Max 16 ah000 | |
| Average of class Gaming (21750 - 129946, n=109, last 2 years) | |
| AIDA64 / Memory Read | |
| Schenker XMG Neo 16 E25 RTX 5090 Laptop | |
| Lenovo Legion Pro 7i 16 Gen 10 | |
| Asus ROG Strix Scar 16 2025 | |
| Medion Erazer Beast 16 X1 Ultimate | |
| Average Intel Core Ultra 9 275HX (55795 - 97151, n=30) | |
| HP Omen Max 16 ah000 | |
| Asus ROG Strix G16 G615 | |
| Average of class Gaming (22956 - 118858, n=109, last 2 years) | |
| AIDA64 / Memory Write | |
| Schenker XMG Neo 16 E25 RTX 5090 Laptop | |
| Lenovo Legion Pro 7i 16 Gen 10 | |
| Asus ROG Strix Scar 16 2025 | |
| Average Intel Core Ultra 9 275HX (55663 - 116129, n=30) | |
| HP Omen Max 16 ah000 | |
| Medion Erazer Beast 16 X1 Ultimate | |
| Average of class Gaming (22297 - 135096, n=109, last 2 years) | |
| Asus ROG Strix G16 G615 | |
| AIDA64 / Memory Latency | |
| HP Omen Max 16 ah000 | |
| Average Intel Core Ultra 9 275HX (105.8 - 161.6, n=30) | |
| Asus ROG Strix G16 G615 | |
| Asus ROG Strix Scar 16 2025 | |
| Medion Erazer Beast 16 X1 Ultimate | |
| Lenovo Legion Pro 7i 16 Gen 10 | |
| Schenker XMG Neo 16 E25 RTX 5090 Laptop | |
| Average of class Gaming (75.3 - 259, n=109, last 2 years) | |
* ... smaller is better
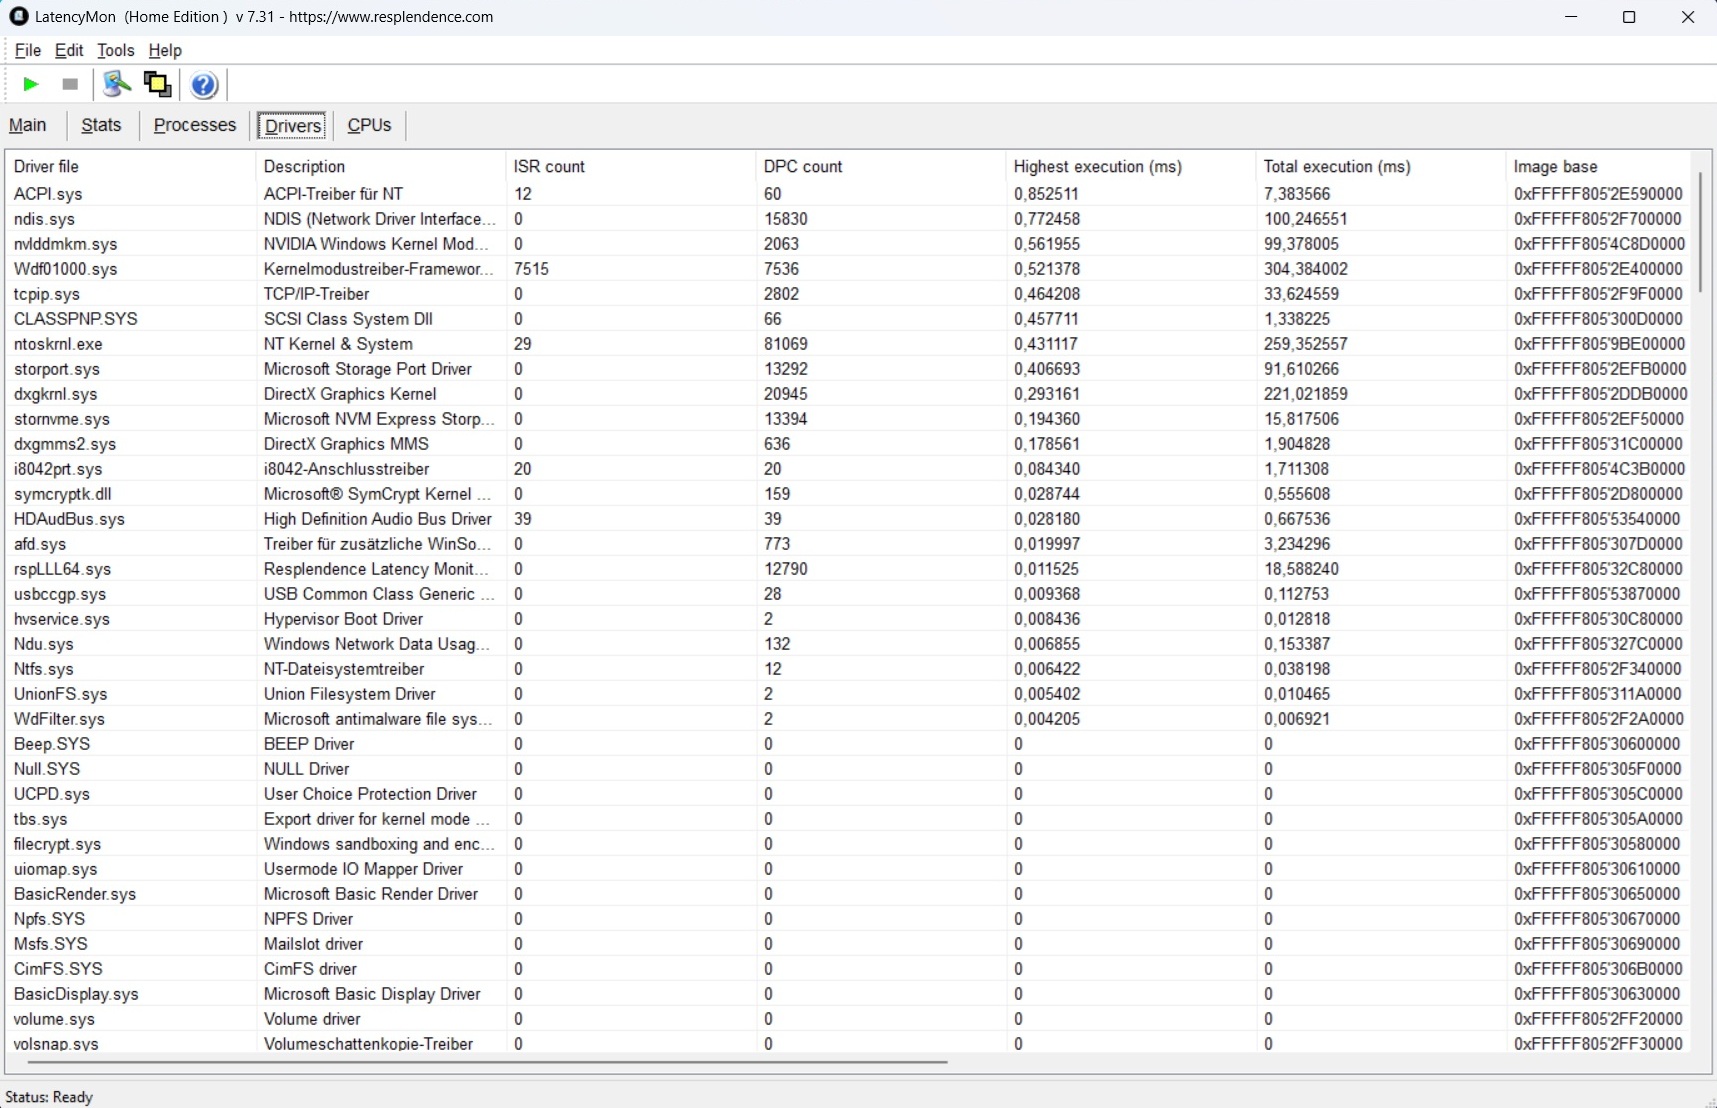
DPC latencies
The latencies also give no cause for complaint. According to the LatencyMon tool, there should be no problems with audio and video processing in real time.

| DPC Latencies / LatencyMon - interrupt to process latency (max), Web, Youtube, Prime95 | |
| Asus ROG Strix Scar 16 2025 | |
| HP Omen Max 16 ah000 | |
| Asus ROG Strix G16 G615 | |
| Schenker XMG Neo 16 E25 RTX 5090 Laptop | |
| Medion Erazer Beast 16 X1 Ultimate | |
| Lenovo Legion Pro 7i 16 Gen 10 | |
* ... smaller is better
Storage devices
The mass storage is also impressive. Sequentially, the built-in PCIe 5 drive from Phison achieves around 10,000 MB/s at best, although you could also expect a 4 TB model instead of 2 TB for the price. Top: In contrast to the CPU performance, the SSD performance remains stable.

* ... smaller is better
Continuous read load: DiskSpd Read Loop, Queue Depth 8
GPU performance
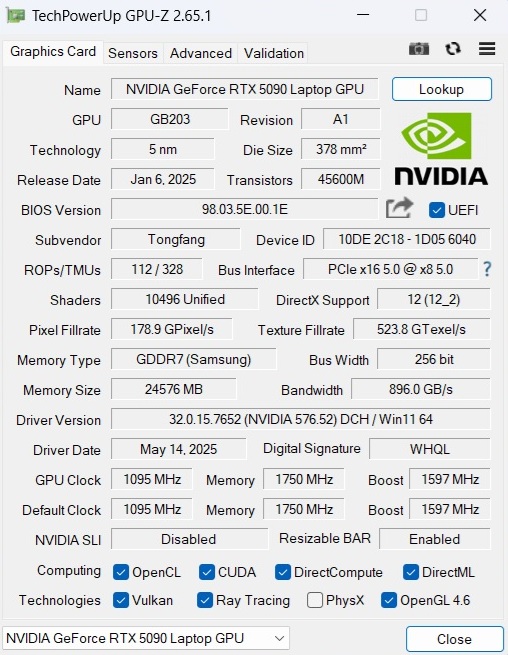
Compared to the RTX 5080, the RTX 5090 offers a full 24 GB of GDDR7 VRAM instead of 16 GB. In the GPU tests, the Beast 16 X1 delivers a very good performance and is often a few percent ahead of the competition or the previously determined average for the RTX 5090. However, the RTX 5080 is only partially left behind when you look at the opponents.
| 3DMark 11 Performance | 54178 points | |
| 3DMark Cloud Gate Standard Score | 75355 points | |
| 3DMark Fire Strike Score | 42189 points | |
| 3DMark Time Spy Score | 22368 points | |
Help | ||
Gaming performance
The situation is similar in the gaming tests. Here too, the RTX 5090 sometimes performs barely faster than the RTX 5080, especially at moderate resolutions (Full HD).
When using QHD resolutions, the distances increase and there are usually still enough reserves for maximum settings. Of the games tested, only F1 25 (with path tracing) and the moderately optimized Oblivion Remastered were not above the 60 FPS mark. If things get tight in the future, upscaling and (multi) frame generation can help. The performance increases that are possible as a result can be seen in the table below; including DLSS Quality and FG, the frame rate doubles in Stalker 2 for example.
| Stalker 2 | |
| 2560x1440 Epic Preset | |
| Average NVIDIA GeForce RTX 5090 Laptop (59.8 - 110.7, n=3) | |
| Medion Erazer Beast 16 X1 Ultimate | |
| Aorus Master 18 AM8H | |
| Average of class Gaming (29 - 110.7, n=13, last 2 years) | |
| 2560x1440 Epic Preset + Quality DLSS + FG | |
| Medion Erazer Beast 16 X1 Ultimate | |
| Average NVIDIA GeForce RTX 5090 Laptop (124.9 - 134.6, n=2) | |
| Aorus Master 18 AM8H | |
| Average of class Gaming (58.3 - 134.6, n=12, last 2 years) | |
| Doom: The Dark Ages | |
| 2560x1440 Ultra Nightmare AA:T | |
| Average NVIDIA GeForce RTX 5090 Laptop (77 - 92.2, n=3) | |
| Medion Erazer Beast 16 X1 Ultimate | |
| Asus ROG Strix G16 G615 | |
| Average of class Gaming (30.4 - 92.2, n=19, last 2 years) | |
| 2560x1440 Ultra Nightmare - DLSS Quality | |
| Medion Erazer Beast 16 X1 Ultimate | |
| Average NVIDIA GeForce RTX 5090 Laptop (102.3 - 107.3, n=2) | |
| Asus ROG Strix G16 G615 | |
| Average of class Gaming (48 - 107.3, n=18, last 2 years) | |
| F1 25 | |
| 2560x1440 Ultra Max Preset AA:T AF:16x | |
| Medion Erazer Beast 16 X1 Ultimate | |
| Average NVIDIA GeForce RTX 5090 Laptop (30.2 - 37.5, n=8) | |
| Average of class Gaming (5 - 37.5, n=24, last 2 years) | |
| 2560x1440 Ultra Max Preset + DLSS Quality AA:DLSS AF:16x | |
| Medion Erazer Beast 16 X1 Ultimate | |
| Average NVIDIA GeForce RTX 5090 Laptop (51.8 - 67.5, n=6) | |
| Average of class Gaming (9 - 67.5, n=22, last 2 years) | |
| The Elder Scrolls IV Oblivion Remastered | |
| 2560x1440 Ultra Preset AA:T | |
| Average NVIDIA GeForce RTX 5090 Laptop (41.7 - 45.9, n=2) | |
| Medion Erazer Beast 16 X1 Ultimate | |
| Average of class Gaming (12.7 - 45.9, n=14, last 2 years) | |
| 2560x1440 Ultra Preset + Quality DLSS | |
| Medion Erazer Beast 16 X1 Ultimate | |
| Average NVIDIA GeForce RTX 5090 Laptop (n=1) | |
| Average of class Gaming (25.3 - 59.7, n=12, last 2 years) | |
| Kingdom Come Deliverance 2 | |
| 2560x1440 Ultra Preset | |
| Average NVIDIA GeForce RTX 5090 Laptop (82.6 - 97.2, n=3) | |
| Medion Erazer Beast 16 X1 Ultimate | |
| Aorus Master 18 AM8H | |
| Average of class Gaming (36.8 - 97.2, n=13, last 2 years) | |
| 2560x1440 Ultra Preset + Quality DLSS | |
| Medion Erazer Beast 16 X1 Ultimate | |
| Average NVIDIA GeForce RTX 5090 Laptop (98.7 - 115.5, n=3) | |
| Aorus Master 18 AM8H | |
| Average of class Gaming (50.3 - 115.5, n=13, last 2 years) | |
| Until Dawn | |
| 2560x1440 Ultra Preset | |
| Average NVIDIA GeForce RTX 5090 Laptop (65.6 - 76.6, n=3) | |
| Medion Erazer Beast 16 X1 Ultimate | |
| Aorus Master 18 AM8H | |
| Average of class Gaming (30.4 - 76.6, n=11, last 2 years) | |
| 2560x1440 Ultra Preset + Quality DLSS + Ray Tracing | |
| Medion Erazer Beast 16 X1 Ultimate | |
| Average NVIDIA GeForce RTX 5090 Laptop (79.7 - 86.3, n=2) | |
| Aorus Master 18 AM8H | |
| Average of class Gaming (39.5 - 86.3, n=10, last 2 years) | |
| Space Marine 2 | |
| 2560x1440 Ultra Preset AA:T | |
| Average NVIDIA GeForce RTX 5090 Laptop (97.2 - 107.4, n=3) | |
| Aorus Master 18 AM8H | |
| Medion Erazer Beast 16 X1 Ultimate | |
| Average of class Gaming (48.2 - 107.4, n=11, last 2 years) | |
| 2560x1440 Ultra Preset + Quality DLSS | |
| Aorus Master 18 AM8H | |
| Average NVIDIA GeForce RTX 5090 Laptop (97.5 - 100.8, n=2) | |
| Medion Erazer Beast 16 X1 Ultimate | |
| Average of class Gaming (58.5 - 100.8, n=10, last 2 years) | |
| low | med. | high | ultra | QHD DLSS | QHD | |
|---|---|---|---|---|---|---|
| GTA V (2015) | 187.5 | 185.3 | 142.4 | 133.4 | ||
| Dota 2 Reborn (2015) | 234 | 204 | 193 | 176.4 | ||
| Final Fantasy XV Benchmark (2018) | 234 | 205 | 172.2 | |||
| X-Plane 11.11 (2018) | 161.6 | 139.2 | 114.2 | |||
| Baldur's Gate 3 (2023) | 217 | 202 | 200 | 151 | ||
| Cyberpunk 2077 (2023) | 188.1 | 171.9 | 158.5 | 110.8 | ||
| Star Wars Outlaws (2024) | 79.3 | 72.7 | 70 | 70.8 | 61 | |
| Space Marine 2 (2024) | 102.8 | 102.1 | 101.4 | 97.5 | 97.2 | |
| Until Dawn (2024) | 109.9 | 102.4 | 93.9 | 86.3 | 69.5 | |
| Stalker 2 (2024) | 106.1 | 92.6 | 81.8 | 134.6 | 65.4 | |
| Kingdom Come Deliverance 2 (2025) | 195.8 | 165.7 | 118.5 | 114.5 | 86 | |
| Civilization 7 (2025) | 231 | 225 | 184.9 | |||
| The Elder Scrolls IV Oblivion Remastered (2025) | 118.4 | 104.2 | 57.5 | 59.7 | 41.7 | |
| Doom: The Dark Ages (2025) | 124.3 | 113.9 | 111.3 | 107.3 | 82.1 | |
| F1 25 (2025) | 256 | 241 | 57 | 61 | 34 |
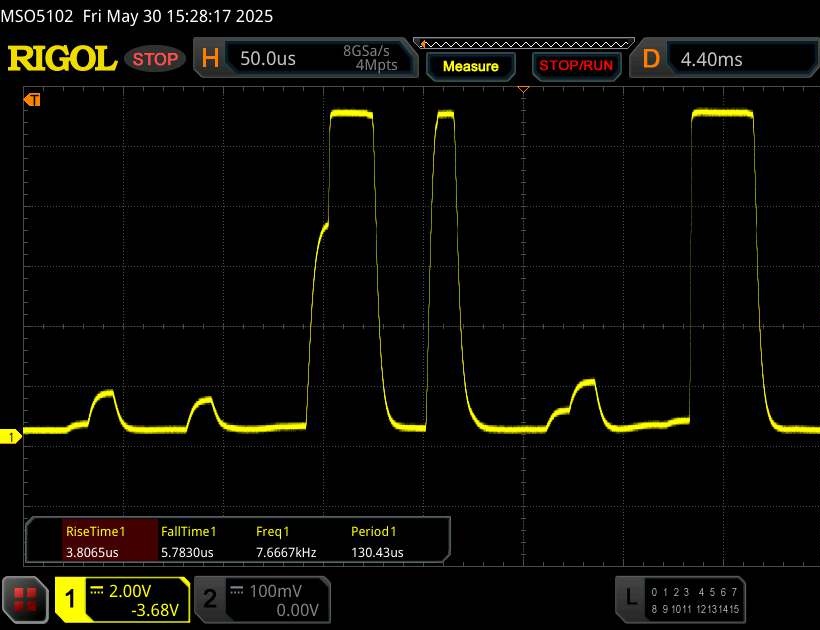
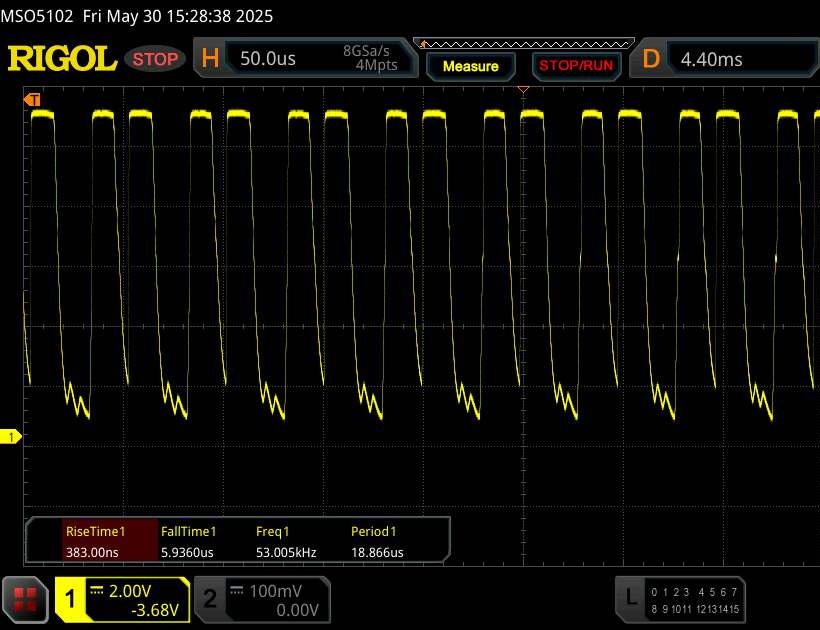
Prolonged GPU load leads to a slight drop in performance on the Beast 16 X1. However, the FPS loss is limited. Our Cyberpunk-Test illustrates the phenomenon (red line).
Cyberpunk 2077 Ultra settings FPS chart
Emissions
Noise emissions
The 16-incher is just as loud as the competition under load. Just under 55 dB(A) in typical gaming mode is clearly audible and calls for a headset. The Medion laptop is much quieter in idle mode, where the fans usually reach between 25 and 29 dB(A).
Noise level
| Idle |
| 25 / 27 / 29 dB(A) |
| Load |
| 52 / 55 dB(A) |
 | ||
30 dB silent 40 dB(A) audible 50 dB(A) loud |
||
min: | ||
| Medion Erazer Beast 16 X1 Ultimate GeForce RTX 5090 Laptop, Ultra 9 275HX | Schenker XMG Neo 16 E25 RTX 5090 Laptop GeForce RTX 5090 Laptop, Ultra 9 275HX | HP Omen Max 16 ah000 GeForce RTX 5090 Laptop, Ultra 9 275HX | Asus ROG Strix Scar 16 2025 GeForce RTX 5090 Laptop, Ultra 9 275HX | Lenovo Legion Pro 7i 16 Gen 10 GeForce RTX 5080 Laptop, Ultra 9 275HX | Asus ROG Strix G16 G615 GeForce RTX 5080 Laptop, Ultra 9 275HX | |
|---|---|---|---|---|---|---|
| Noise | 1% | -3% | 1% | 12% | 2% | |
| off / environment * (dB) | 24 | 24 -0% | 22.8 5% | 23.8 1% | 22.9 5% | 24 -0% |
| Idle Minimum * (dB) | 25 | 26 -4% | 29 -16% | 29 -16% | 22.9 8% | 24 4% |
| Idle Average * (dB) | 27 | 26 4% | 29 -7% | 29 -7% | 22.9 15% | 30.1 -11% |
| Idle Maximum * (dB) | 29 | 26 10% | 29 -0% | 29 -0% | 26.3 9% | 30.1 -4% |
| Load Average * (dB) | 52 | 52.4 -1% | 47.7 8% | 40.5 22% | 27.8 47% | 41.1 21% |
| Cyberpunk 2077 ultra * (dB) | 55 | 55.4 -1% | 54.8 -0% | 53.6 3% | 54.2 1% | 54.2 1% |
| Load Maximum * (dB) | 55 | 55.4 -1% | 61.1 -11% | 53.6 3% | 53.9 2% | 54.2 1% |
* ... smaller is better
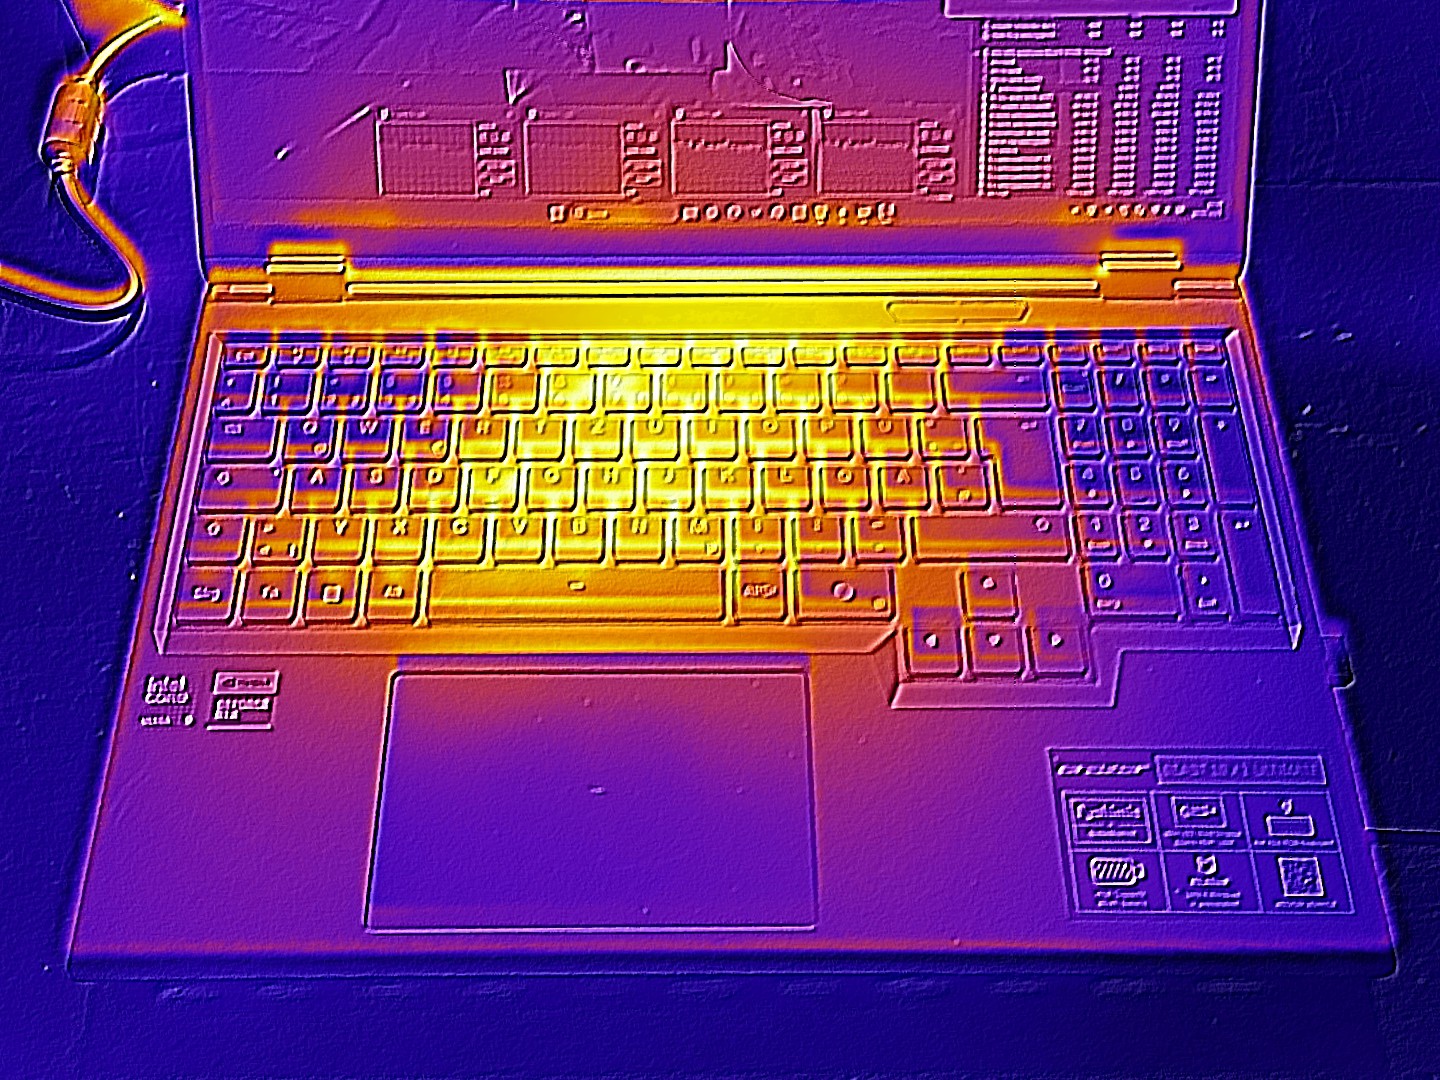
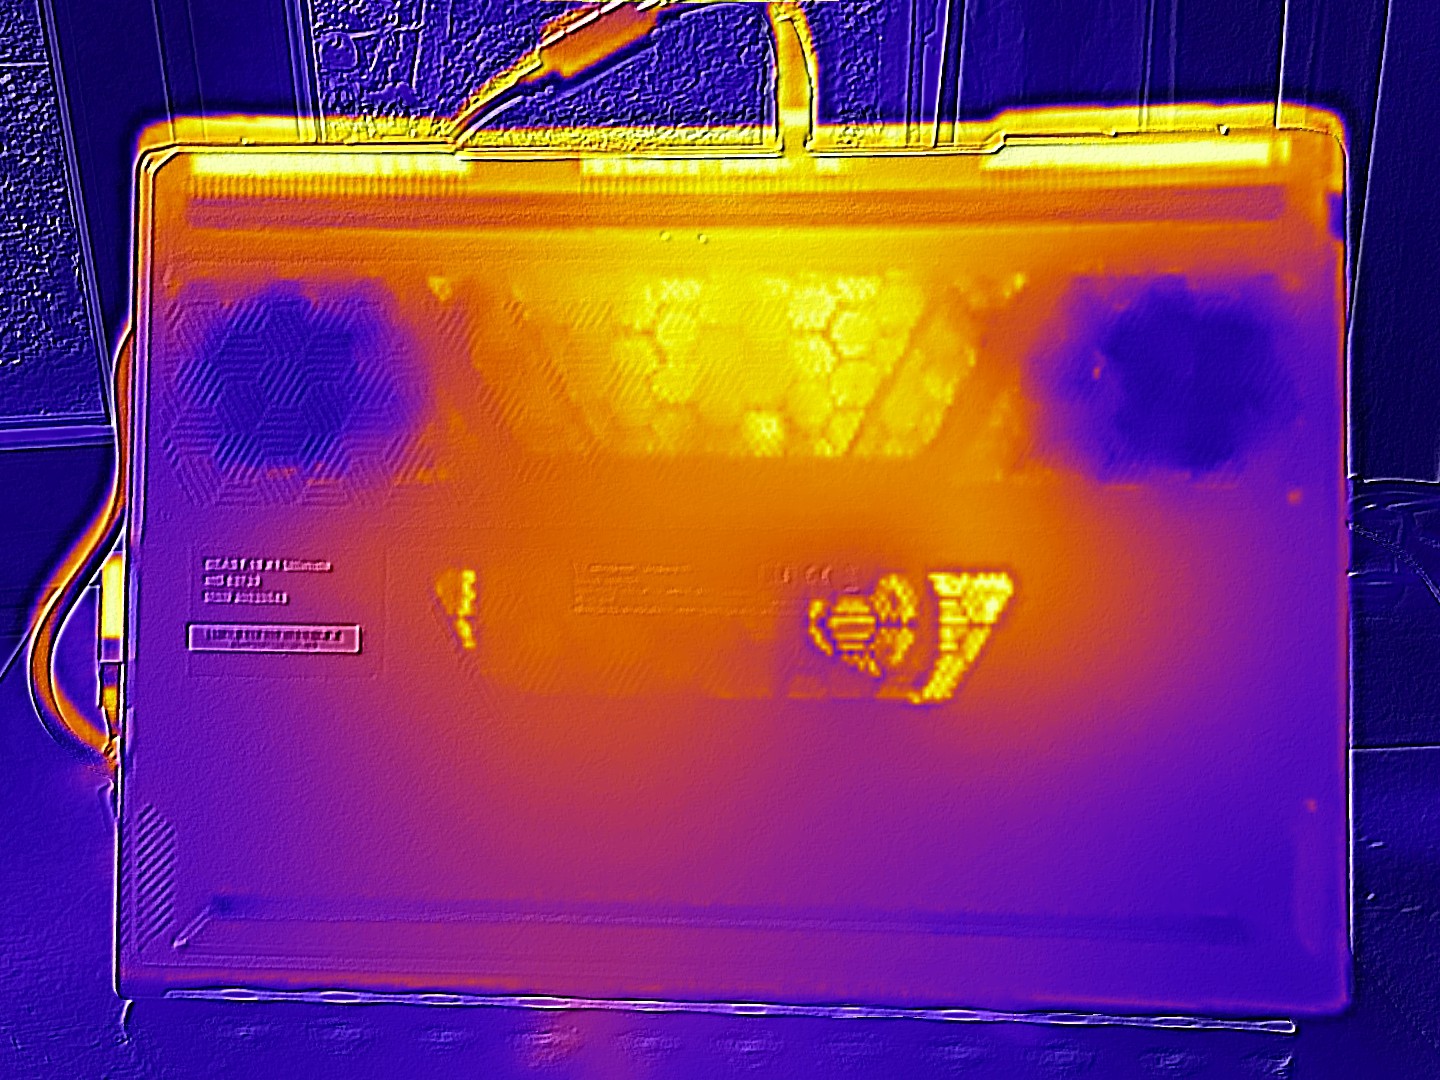
Temperature
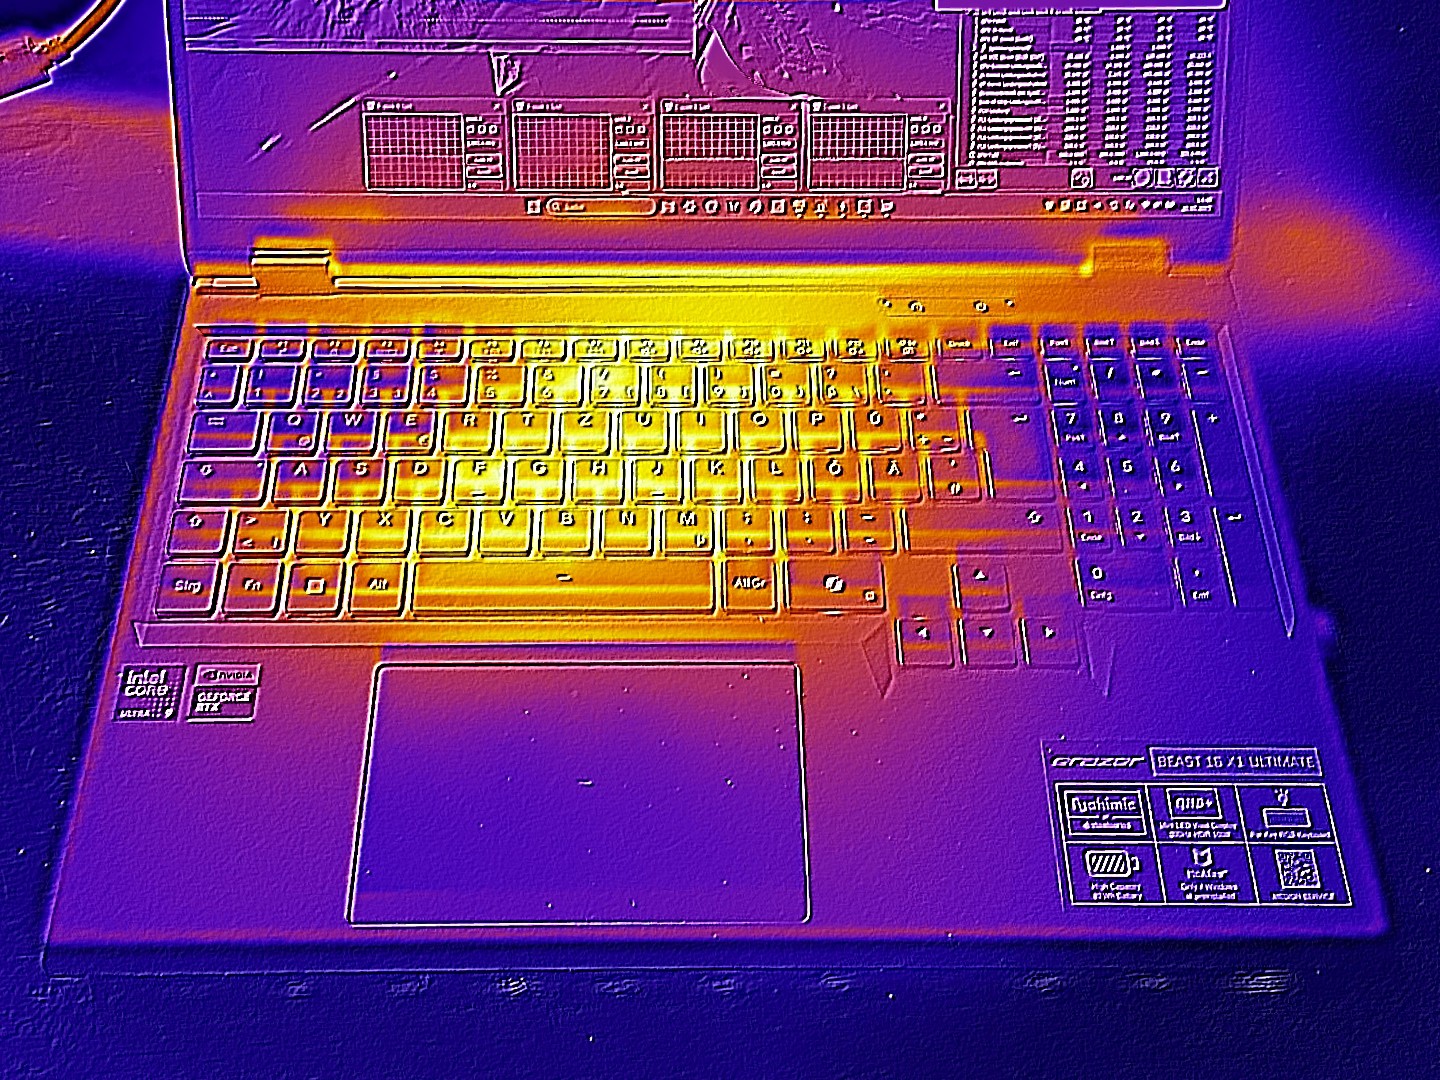
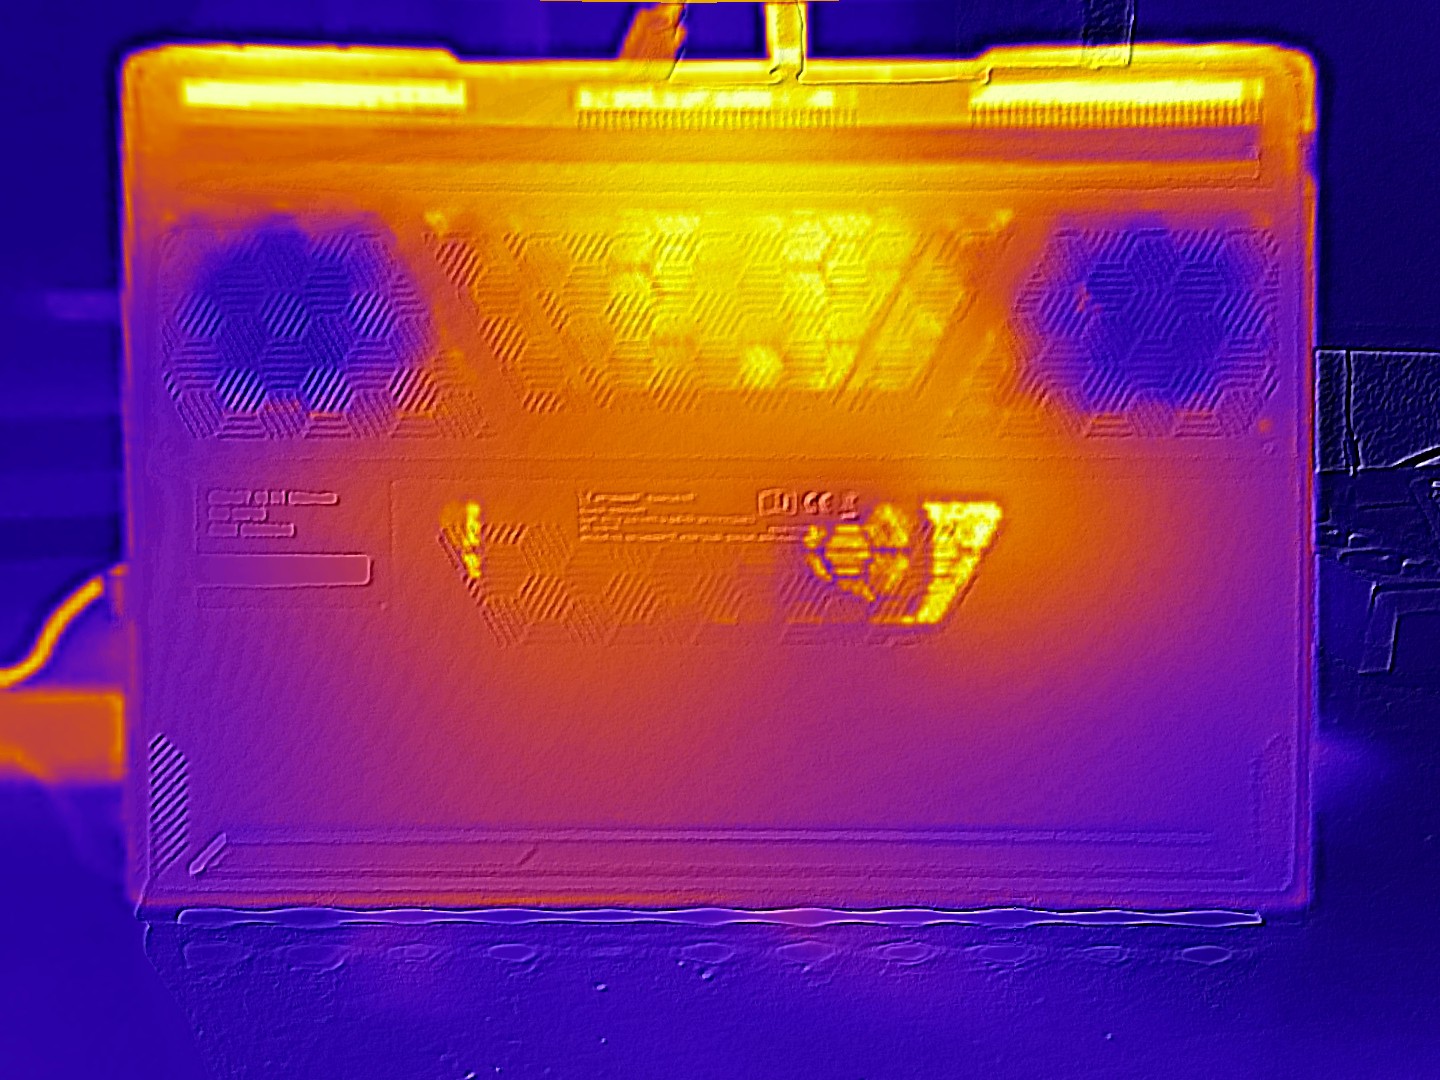
While the Beast 16 X1 remains pleasantly cool in idle mode (maximum 30 °C/86 °F), the casing surfaces can reach up to 49 °C (120.2 °F/top) and 45 °C (113 °F/bottom) under heavier load, which are neither particularly high nor low values compared to the competition.
(-) The maximum temperature on the upper side is 49 °C / 120 F, compared to the average of 40.4 °C / 105 F, ranging from 21.2 to 68.8 °C for the class Gaming.
(±) The bottom heats up to a maximum of 45 °C / 113 F, compared to the average of 43.2 °C / 110 F
(+) In idle usage, the average temperature for the upper side is 29.1 °C / 84 F, compared to the device average of 33.9 °C / 93 F.
(-) 3: The average temperature for the upper side is 40.2 °C / 104 F, compared to the average of 33.9 °C / 93 F for the class Gaming.
(±) The palmrests and touchpad can get very hot to the touch with a maximum of 37 °C / 98.6 F.
(-) The average temperature of the palmrest area of similar devices was 28.8 °C / 83.8 F (-8.2 °C / -14.8 F).
| Medion Erazer Beast 16 X1 Ultimate GeForce RTX 5090 Laptop, Ultra 9 275HX | Schenker XMG Neo 16 E25 RTX 5090 Laptop GeForce RTX 5090 Laptop, Ultra 9 275HX | HP Omen Max 16 ah000 GeForce RTX 5090 Laptop, Ultra 9 275HX | Asus ROG Strix Scar 16 2025 GeForce RTX 5090 Laptop, Ultra 9 275HX | Lenovo Legion Pro 7i 16 Gen 10 GeForce RTX 5080 Laptop, Ultra 9 275HX | Asus ROG Strix G16 G615 GeForce RTX 5080 Laptop, Ultra 9 275HX | |
|---|---|---|---|---|---|---|
| Heat | 2% | 6% | -7% | 1% | 8% | |
| Maximum Upper Side * (°C) | 49 | 47.8 2% | 42.8 13% | 44.2 10% | 42.6 13% | 39.6 19% |
| Maximum Bottom * (°C) | 45 | 46.7 -4% | 50.2 -12% | 48.1 -7% | 41.2 8% | 49.7 -10% |
| Idle Upper Side * (°C) | 30 | 28.4 5% | 27.6 8% | 33 -10% | 32.6 -9% | 26.3 12% |
| Idle Bottom * (°C) | 30 | 28.9 4% | 26.2 13% | 36.1 -20% | 32.4 -8% | 27.3 9% |
* ... smaller is better
Stress test
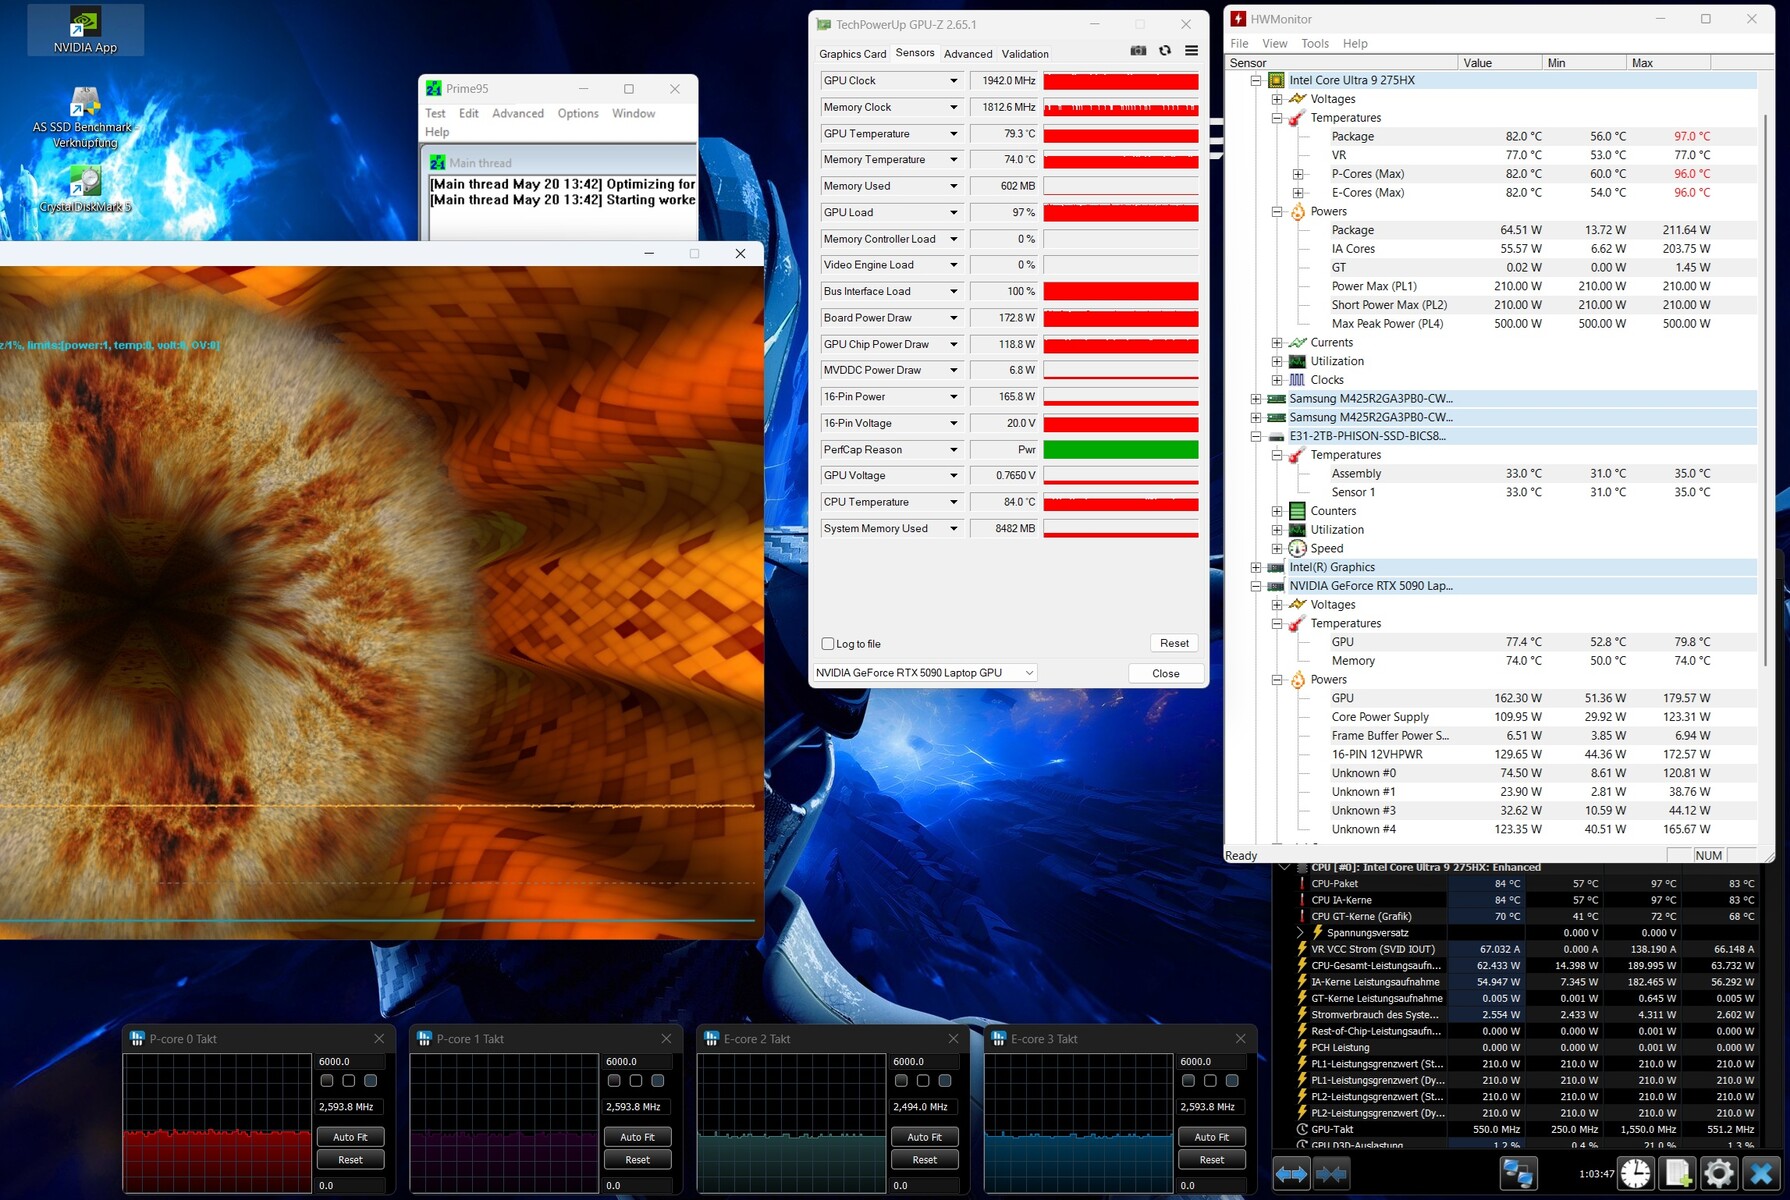
Our stress test with the FurMark and Prime95 tools was managed acceptably by the CPU and GPU at around 80 °C (176 °F). The temperatures were slightly higher in Cyberpunk 2077 due to the higher clock rates.
Speakers
The sound system of the Beast 16 X1 is surprisingly good by notebook standards and in no way has to hide behind its competitors. Compared to the HP Omen Max 16, the maximum volume is also higher.
Medion Erazer Beast 16 X1 Ultimate audio analysis
(+) | speakers can play relatively loud (85 dB)
Bass 100 - 315 Hz
(±) | reduced bass - on average 11.2% lower than median
(+) | bass is linear (6.8% delta to prev. frequency)
Mids 400 - 2000 Hz
(+) | balanced mids - only 4.7% away from median
(+) | mids are linear (4.6% delta to prev. frequency)
Highs 2 - 16 kHz
(+) | balanced highs - only 3.6% away from median
(±) | linearity of highs is average (8% delta to prev. frequency)
Overall 100 - 16.000 Hz
(+) | overall sound is linear (10.8% difference to median)
Compared to same class
» 7% of all tested devices in this class were better, 3% similar, 90% worse
» The best had a delta of 6%, average was 18%, worst was 132%
Compared to all devices tested
» 6% of all tested devices were better, 2% similar, 92% worse
» The best had a delta of 4%, average was 24%, worst was 134%
HP Omen Max 16 ah000 audio analysis
(±) | speaker loudness is average but good (77.9 dB)
Bass 100 - 315 Hz
(±) | reduced bass - on average 9.9% lower than median
(±) | linearity of bass is average (13.4% delta to prev. frequency)
Mids 400 - 2000 Hz
(+) | balanced mids - only 2.3% away from median
(+) | mids are linear (4.3% delta to prev. frequency)
Highs 2 - 16 kHz
(+) | balanced highs - only 1.9% away from median
(+) | highs are linear (4.8% delta to prev. frequency)
Overall 100 - 16.000 Hz
(+) | overall sound is linear (11.4% difference to median)
Compared to same class
» 9% of all tested devices in this class were better, 3% similar, 88% worse
» The best had a delta of 6%, average was 18%, worst was 132%
Compared to all devices tested
» 7% of all tested devices were better, 2% similar, 91% worse
» The best had a delta of 4%, average was 24%, worst was 134%
Energy management
Energy consumption
The conclusion regarding energy consumption is ambivalent. While the Beast 16 X1 tends to be more economical than the competition in idle mode, the consumption in 3D mode is slightly above average. Note: The dGPU is automatically activated when an external monitor is connected.
| Off / Standby | |
| Idle | |
| Load |
|
Key:
min: | |
| Medion Erazer Beast 16 X1 Ultimate GeForce RTX 5090 Laptop, Ultra 9 275HX | Schenker XMG Neo 16 E25 RTX 5090 Laptop GeForce RTX 5090 Laptop, Ultra 9 275HX | HP Omen Max 16 ah000 GeForce RTX 5090 Laptop, Ultra 9 275HX | Asus ROG Strix Scar 16 2025 GeForce RTX 5090 Laptop, Ultra 9 275HX | Lenovo Legion Pro 7i 16 Gen 10 GeForce RTX 5080 Laptop, Ultra 9 275HX | Asus ROG Strix G16 G615 GeForce RTX 5080 Laptop, Ultra 9 275HX | Average of class Gaming | |
|---|---|---|---|---|---|---|---|
| Power Consumption | -4% | -17% | -40% | -56% | -1% | 1% | |
| Idle Minimum * (Watt) | 13.1 | 11.8 10% | 9.9 24% | 22.5 -72% | 28.5 -118% | 10.8 18% | 13.2 ? -1% |
| Idle Average * (Watt) | 17.5 | 15.1 14% | 28.6 -63% | 32.2 -84% | 38.8 -122% | 17.7 -1% | 18.9 ? -8% |
| Idle Maximum * (Watt) | 23 | 15.8 31% | 47.1 -105% | 34.3 -49% | 45.6 -98% | 18.8 18% | 24.3 ? -6% |
| Load Average * (Watt) | 88 | 165.3 -88% | 141.8 -61% | 169.3 -92% | 132.2 -50% | 139.4 -58% | 108 ? -23% |
| Cyberpunk 2077 ultra * (Watt) | 299 | 296 1% | 253 15% | 294 2% | 318 -6% | 295 1% | |
| Cyberpunk 2077 ultra external monitor * (Watt) | 297 | 289 3% | 230 23% | 288 3% | 319 -7% | 291 2% | |
| Load Maximum * (Watt) | 428 | 415.5 3% | 233 46% | 371.5 13% | 384 10% | 359.3 16% | 254 ? 41% |
* ... smaller is better
Power consumption Cyberpunk / stress test
Power consumption with external monitor
Battery life
Medion provides the 16-inch device with a powerful 99 Wh battery, which led to a runtime of just under 8 hours in our WLAN test (brightness reduced to 150 cd/m²) - a relatively good result that is almost 1:1 with the ROG Strix G16 (90 Wh).
| Medion Erazer Beast 16 X1 Ultimate Ultra 9 275HX, GeForce RTX 5090 Laptop, 99 Wh | Schenker XMG Neo 16 E25 RTX 5090 Laptop Ultra 9 275HX, GeForce RTX 5090 Laptop, 99.8 Wh | HP Omen Max 16 ah000 Ultra 9 275HX, GeForce RTX 5090 Laptop, 83 Wh | Asus ROG Strix Scar 16 2025 Ultra 9 275HX, GeForce RTX 5090 Laptop, 90 Wh | Lenovo Legion Pro 7i 16 Gen 10 Ultra 9 275HX, GeForce RTX 5080 Laptop, 99 Wh | Asus ROG Strix G16 G615 Ultra 9 275HX, GeForce RTX 5080 Laptop, 90 Wh | Average of class Gaming | |
|---|---|---|---|---|---|---|---|
| Battery runtime | 20% | -27% | -18% | -32% | -1% | -11% | |
| WiFi v1.3 (h) | 7.9 | 9.5 20% | 5.8 -27% | 6.5 -18% | 5.4 -32% | 7.8 -1% | 7.02 ? -11% |
| H.264 (h) | 7.7 | 11 | 8.26 ? | ||||
| Load (h) | 2 | 1.2 | 0.8 | 1.5 | 1.47 ? | ||
| Reader / Idle (h) | 8.7 | 8.71 ? | |||||
| Cyberpunk 2077 ultra 150cd (h) | 0.8 |
Notebookcheck overall rating
The Medion Erazer Beast 16 X1 is a high-quality gaming and creator notebook with a brilliant display and strong performance, but also high noise levels.
Medion Erazer Beast 16 X1 Ultimate
- 05/30/2025 v8
Florian Glaser
 Total Sustainability Score:
 Possible alternatives in comparison
Image | Model / Review | Price | Weight | Height | Display |
|---|---|---|---|---|---|
1. 88.5%  | Medion Erazer Beast 16 X1 Ultimate Intel Core Ultra 9 275HX ⎘ NVIDIA GeForce RTX 5090 Laptop ⎘ 32 GB Memory, SSD | Amazon: List Price: 4300 EUR | 2.8 kg | 30 mm | 16.00" 2560x1600 189 PPI Mini-LED |
2. 81.9%  | HP Omen Max 16 ah000 Intel Core Ultra 9 275HX ⎘ NVIDIA GeForce RTX 5090 Laptop ⎘ 32 GB Memory, 2048 GB SSD | Amazon: List Price: 3800 USD | 2.8 kg | 24.9 mm | 16.00" 2560x1600 189 PPI OLED |
3. 88.4%  | Asus ROG Strix Scar 16 2025 Intel Core Ultra 9 275HX ⎘ NVIDIA GeForce RTX 5090 Laptop ⎘ 64 GB Memory, 2048 GB SSD | Amazon: List Price: 4999€ | 2.8 kg | 30.8 mm | 16.00" 2560x1600 189 PPI Mini-LED |
4. 87.5%  | Lenovo Legion Pro 7i 16 Gen 10 Intel Core Ultra 9 275HX ⎘ NVIDIA GeForce RTX 5080 Laptop ⎘ 32 GB Memory, 1024 GB SSD | Amazon: List Price: 4200 USD | 2.6 kg | 26.65 mm | 16.00" 2560x1600 189 PPI OLED |
5. 87.3%  | Asus ROG Strix G16 G615 Intel Core Ultra 9 275HX ⎘ NVIDIA GeForce RTX 5080 Laptop ⎘ 32 GB Memory, 1024 GB SSD | Amazon: 1. $1,269.99 ASUS ROG Strix G16 (2025) Ga... 2. $2,031.47 ASUS ROG Strix G16 (2025) Ga... 3. $2,879.00 ASUS ROG Strix G16 (2025) Ga... List Price: 3299€ | 2.6 kg | 30.8 mm | 16.00" 2560x1600 189 PPI IPS |
Transparency
The selection of devices to be reviewed is made by our editorial team. The test sample was provided to the author as a loan by the manufacturer or retailer for the purpose of this review. The lender had no influence on this review, nor did the manufacturer receive a copy of this review before publication. There was no obligation to publish this review. As an independent media company, Notebookcheck is not subjected to the authority of manufacturers, retailers or publishers.
This is how Notebookcheck is testing
Every year, Notebookcheck independently reviews hundreds of laptops and smartphones using standardized procedures to ensure that all results are comparable. We have continuously developed our test methods for around 20 years and set industry standards in the process. In our test labs, high-quality measuring equipment is utilized by experienced technicians and editors. These tests involve a multi-stage validation process. Our complex rating system is based on hundreds of well-founded measurements and benchmarks, which maintains objectivity. Further information on our test methods can be found here.

