The RTX 5080 Laptop is optimal for Gaming in WQHD - Asus ROG Strix G16 G615 review
Who really needs the RTX 5090 Laptop?
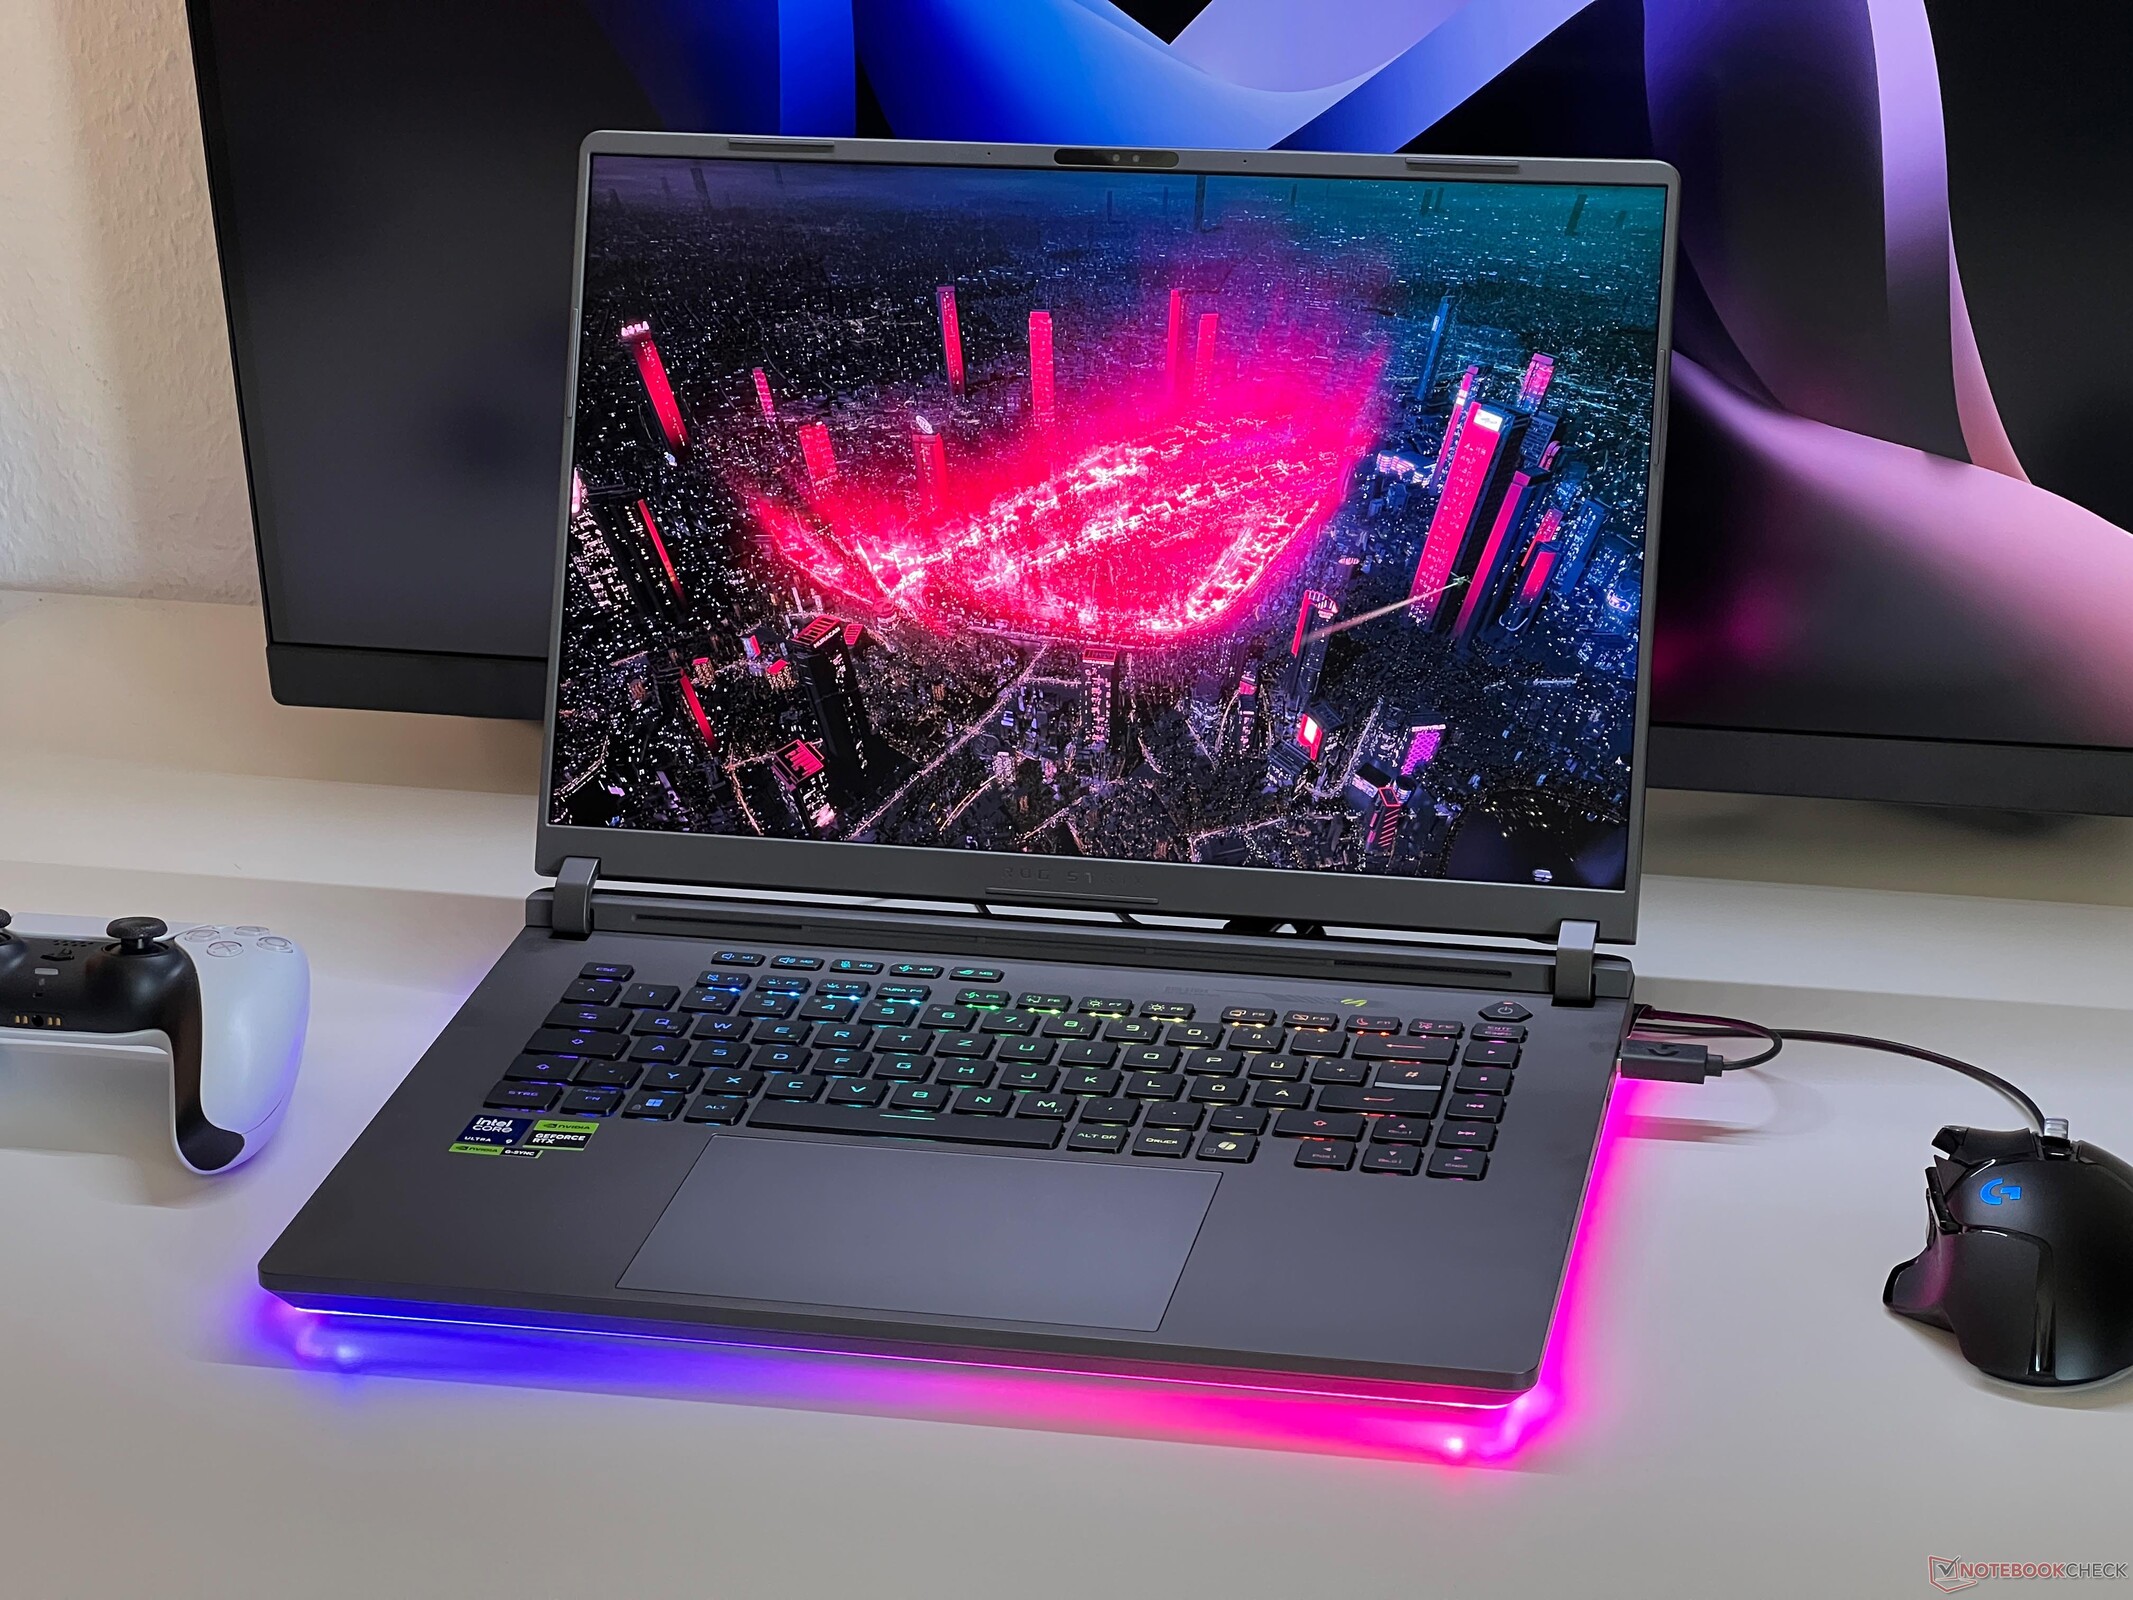
The new Asus ROG Strix G16 is available with the RTX 5080 Laptop GPU at most, but this won't much of a problem when gaming. The Strix G16 represents a good gaming package with a matte IPS display, a fast Core Ultra 9 275 HX, and very good maintenance options.Andreas Osthoff, 👁 Andreas Osthoff (translated by Mark Riege) Published 🇩🇪 🇫🇷 ...
Verdict - The ROG Strix G16 is a good gaming laptop
The new Asus ROG Strix G16 is a powerful gaming laptop that leaves a good overall impression in our test. The fact that the Mini-LED panel and the RTX 5090 Laptop are reserved for the more expensive Strix SCAR 16 doesn't represent much of a problem. The matte IPS panel with 240 Hz remains slightly behind in terms of its contrast, but on the other hand there won't be any PWM flickering and the image quality is very good overall. You only have to make do without HDR in this case.
The new GeForce RTX 5080 Laptop is very suitable for the native WQHD resolution, and together with the fast Intel Core Ultra 9 275HX, you will get plenty of gaming performance, although the old RTX 4080 Laptop won't be remaining behind by a lot. Thus, an upgrade will only really make sense for users of old RTX 3000 GPUs. The RTX 5090 Laptop would again be slightly faster but will only be able to really make use of its advantage in 4K. What is more annoying is the fact that Asus only offers the potentially better Ryzen 9 9955HX gaming processor in combination with the RTX 5070 Ti Laptop in an older case design.
The case is made exclusively from plastic, but the gray surfaces aren't quite as prone to pick up dirt as those of the black ROG Strix SCAR. The case quality is good overall, with the highlights being the illuminated LED bar around the bottom and the unlocking mechanism of the base place. Aside from their positioning, we also have no complaints about the connections, since two fast Thunderbolt 5 connections are already included. The keyboard is very comfortable but lacks a number pad. The battery life of the Strix G16 is also ahead of the competitors.
The probably closest competitor, the Lenovo Legion Pro 7i 16 G10, gets a slightly higher gaming performance from the RTX 5080 Laptop and offers a very good OLED display, although it is reflective and produces PWM flickering. In addition, the comparable configuration costs 300 Euros (~$341) more. In the near future, we will also test the XMG Neo 16 with the AMD Ryzen 9 9955HX and RTX 5080 Laptop, the engineering sample of which already left a very good impression.
Pros
Cons
Price and Availability
The ROG Strix G16 (2025) starts from $1800 from Asus in the US, with the RTX 5080 model costing $2700.
Table of Contents
- Verdict - The ROG Strix G16 is a good gaming laptop
- Specifications
- Case - Dark gray with a lot of illumination
- Equipment - Strix G16 with Thunderbolt 5
- Input Devices - A comfortable keyboard
- Display - IPS with 240 Hz and G-Sync
- Performance - Core Ultra 9 and RTX 5080 Laptop
- Emissions - Low temperatures
- Power Management - Gaming laptop with long battery life
- Notebookcheck Overall Rating
- Possible Alternatives in Comparison
The ROG Strix models are the high-end gaming laptops from Asus, and there are some differences between the Strix and Strix SCAR models. The flagship ROG SCAR models are available with the fastest GPU (RTX 5090 Laptop) and offer Mini-LED panels as well as additional illumination options in form of secondary displays on the display lid. In contrast, the regular ROG Strix (G16 or G18) is available with the RTX 5080 Laptop at most and includes IPS displays. The AMD models of the G16/G18 with the Ryzen 9 9955HX are even limited to the RTX 5070 Ti and also use a completely different case (without the new maintenance flap).
Today, we test the ROG Strix G16 G615 with the Intel Core Ultra 9 275HX, 32 GB of RAM, a 1-TB SSD, a WQHD-IPS panel with 240 Hz, and the GeForce RTX 5080 Laptop, available at an MSRP of 3,299 Euros (in Germany, ~$3,750).
Specifications
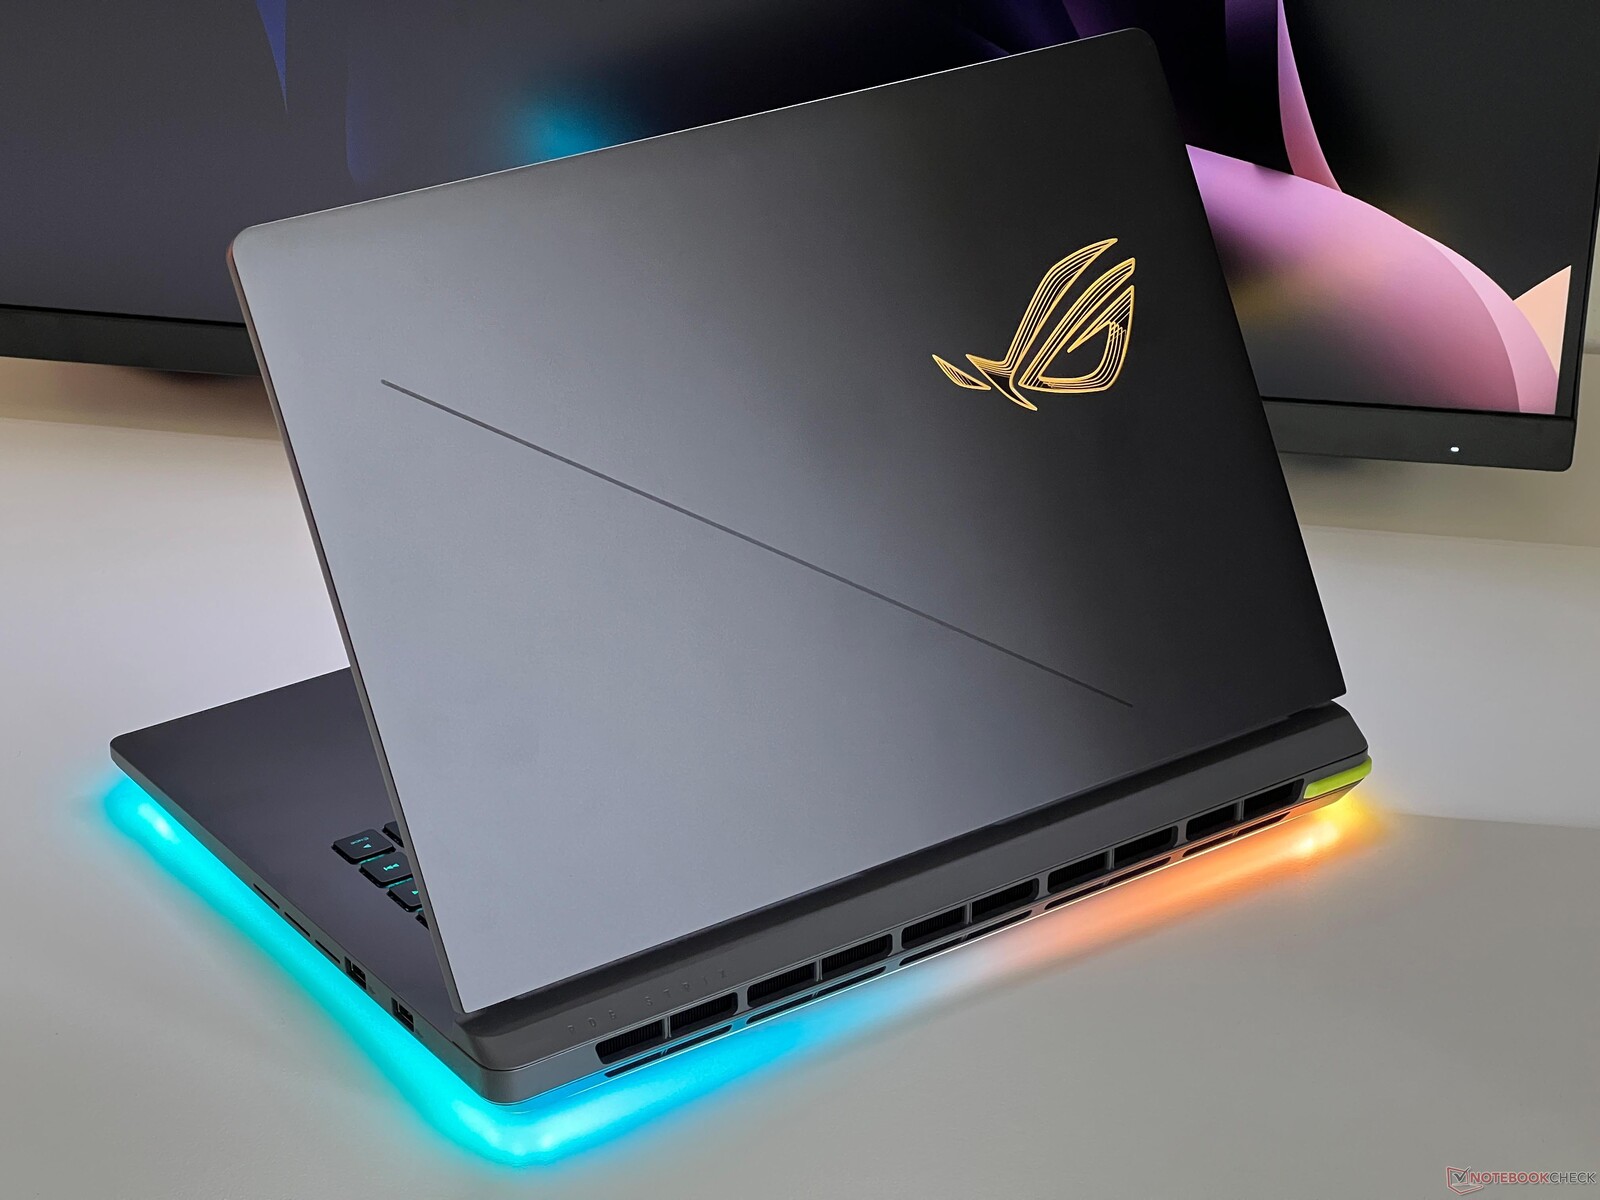
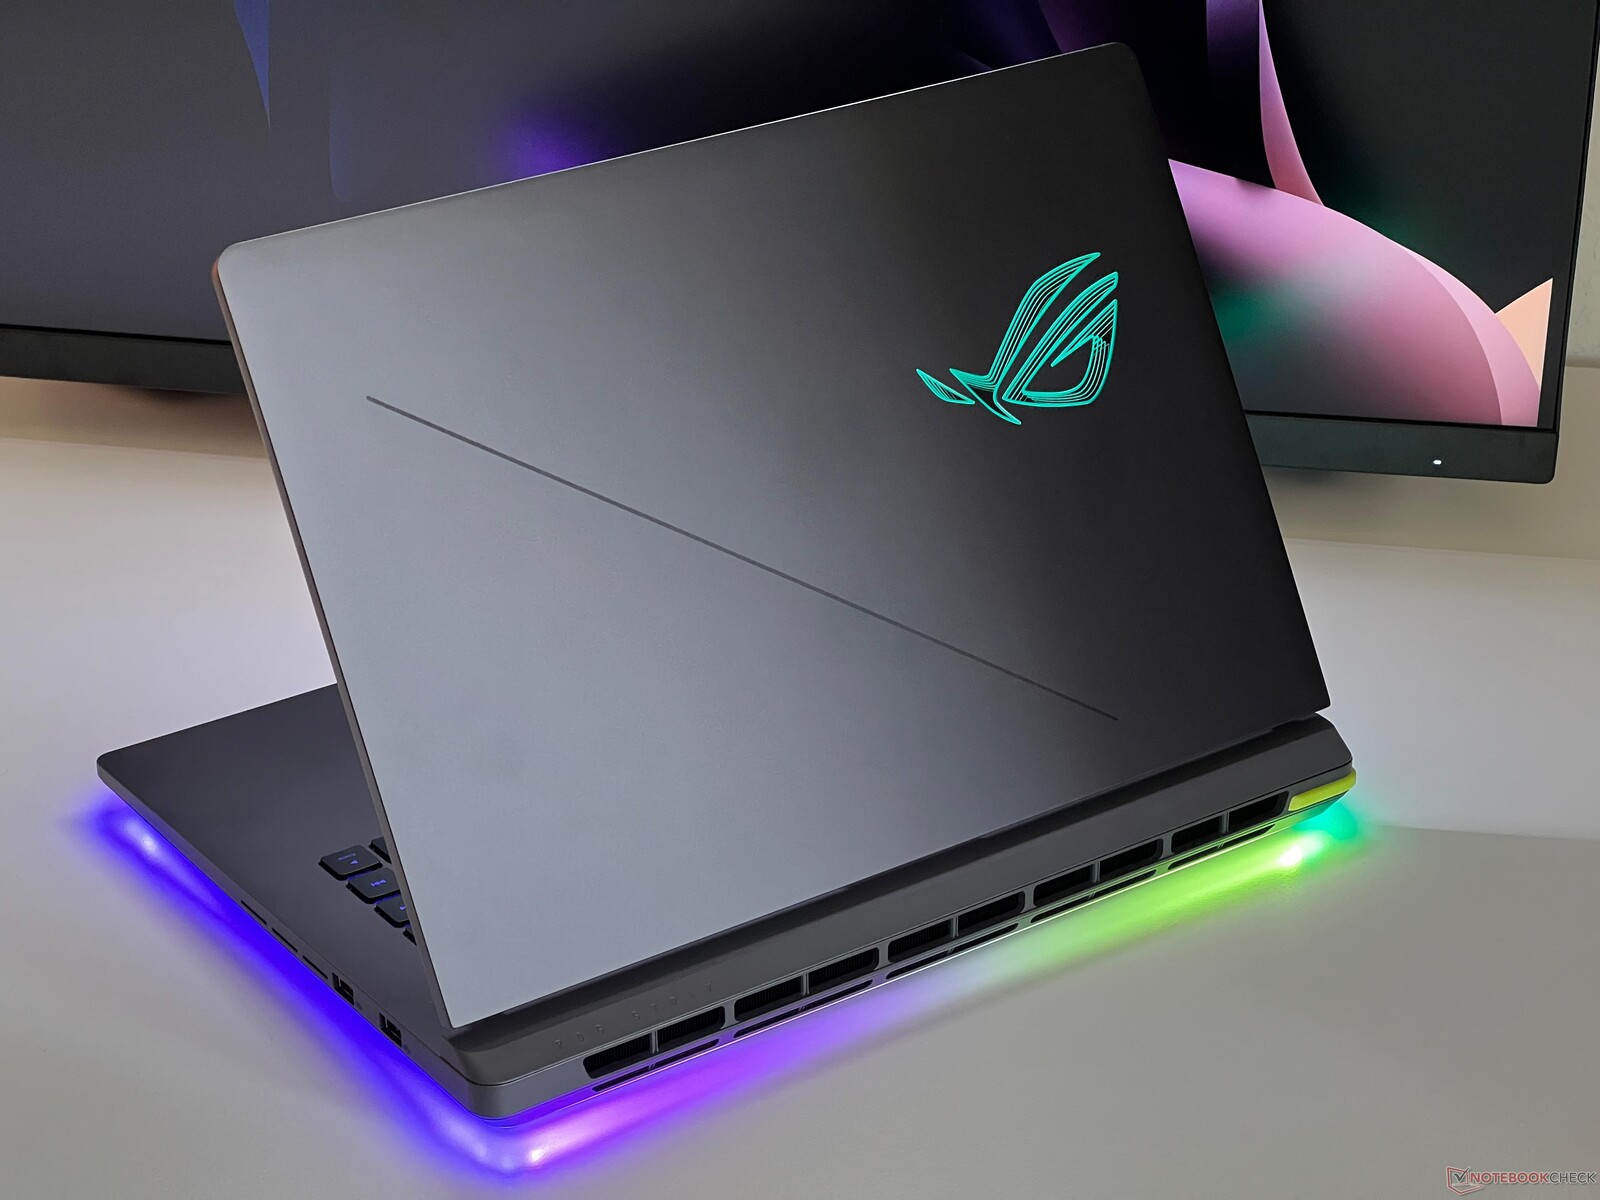
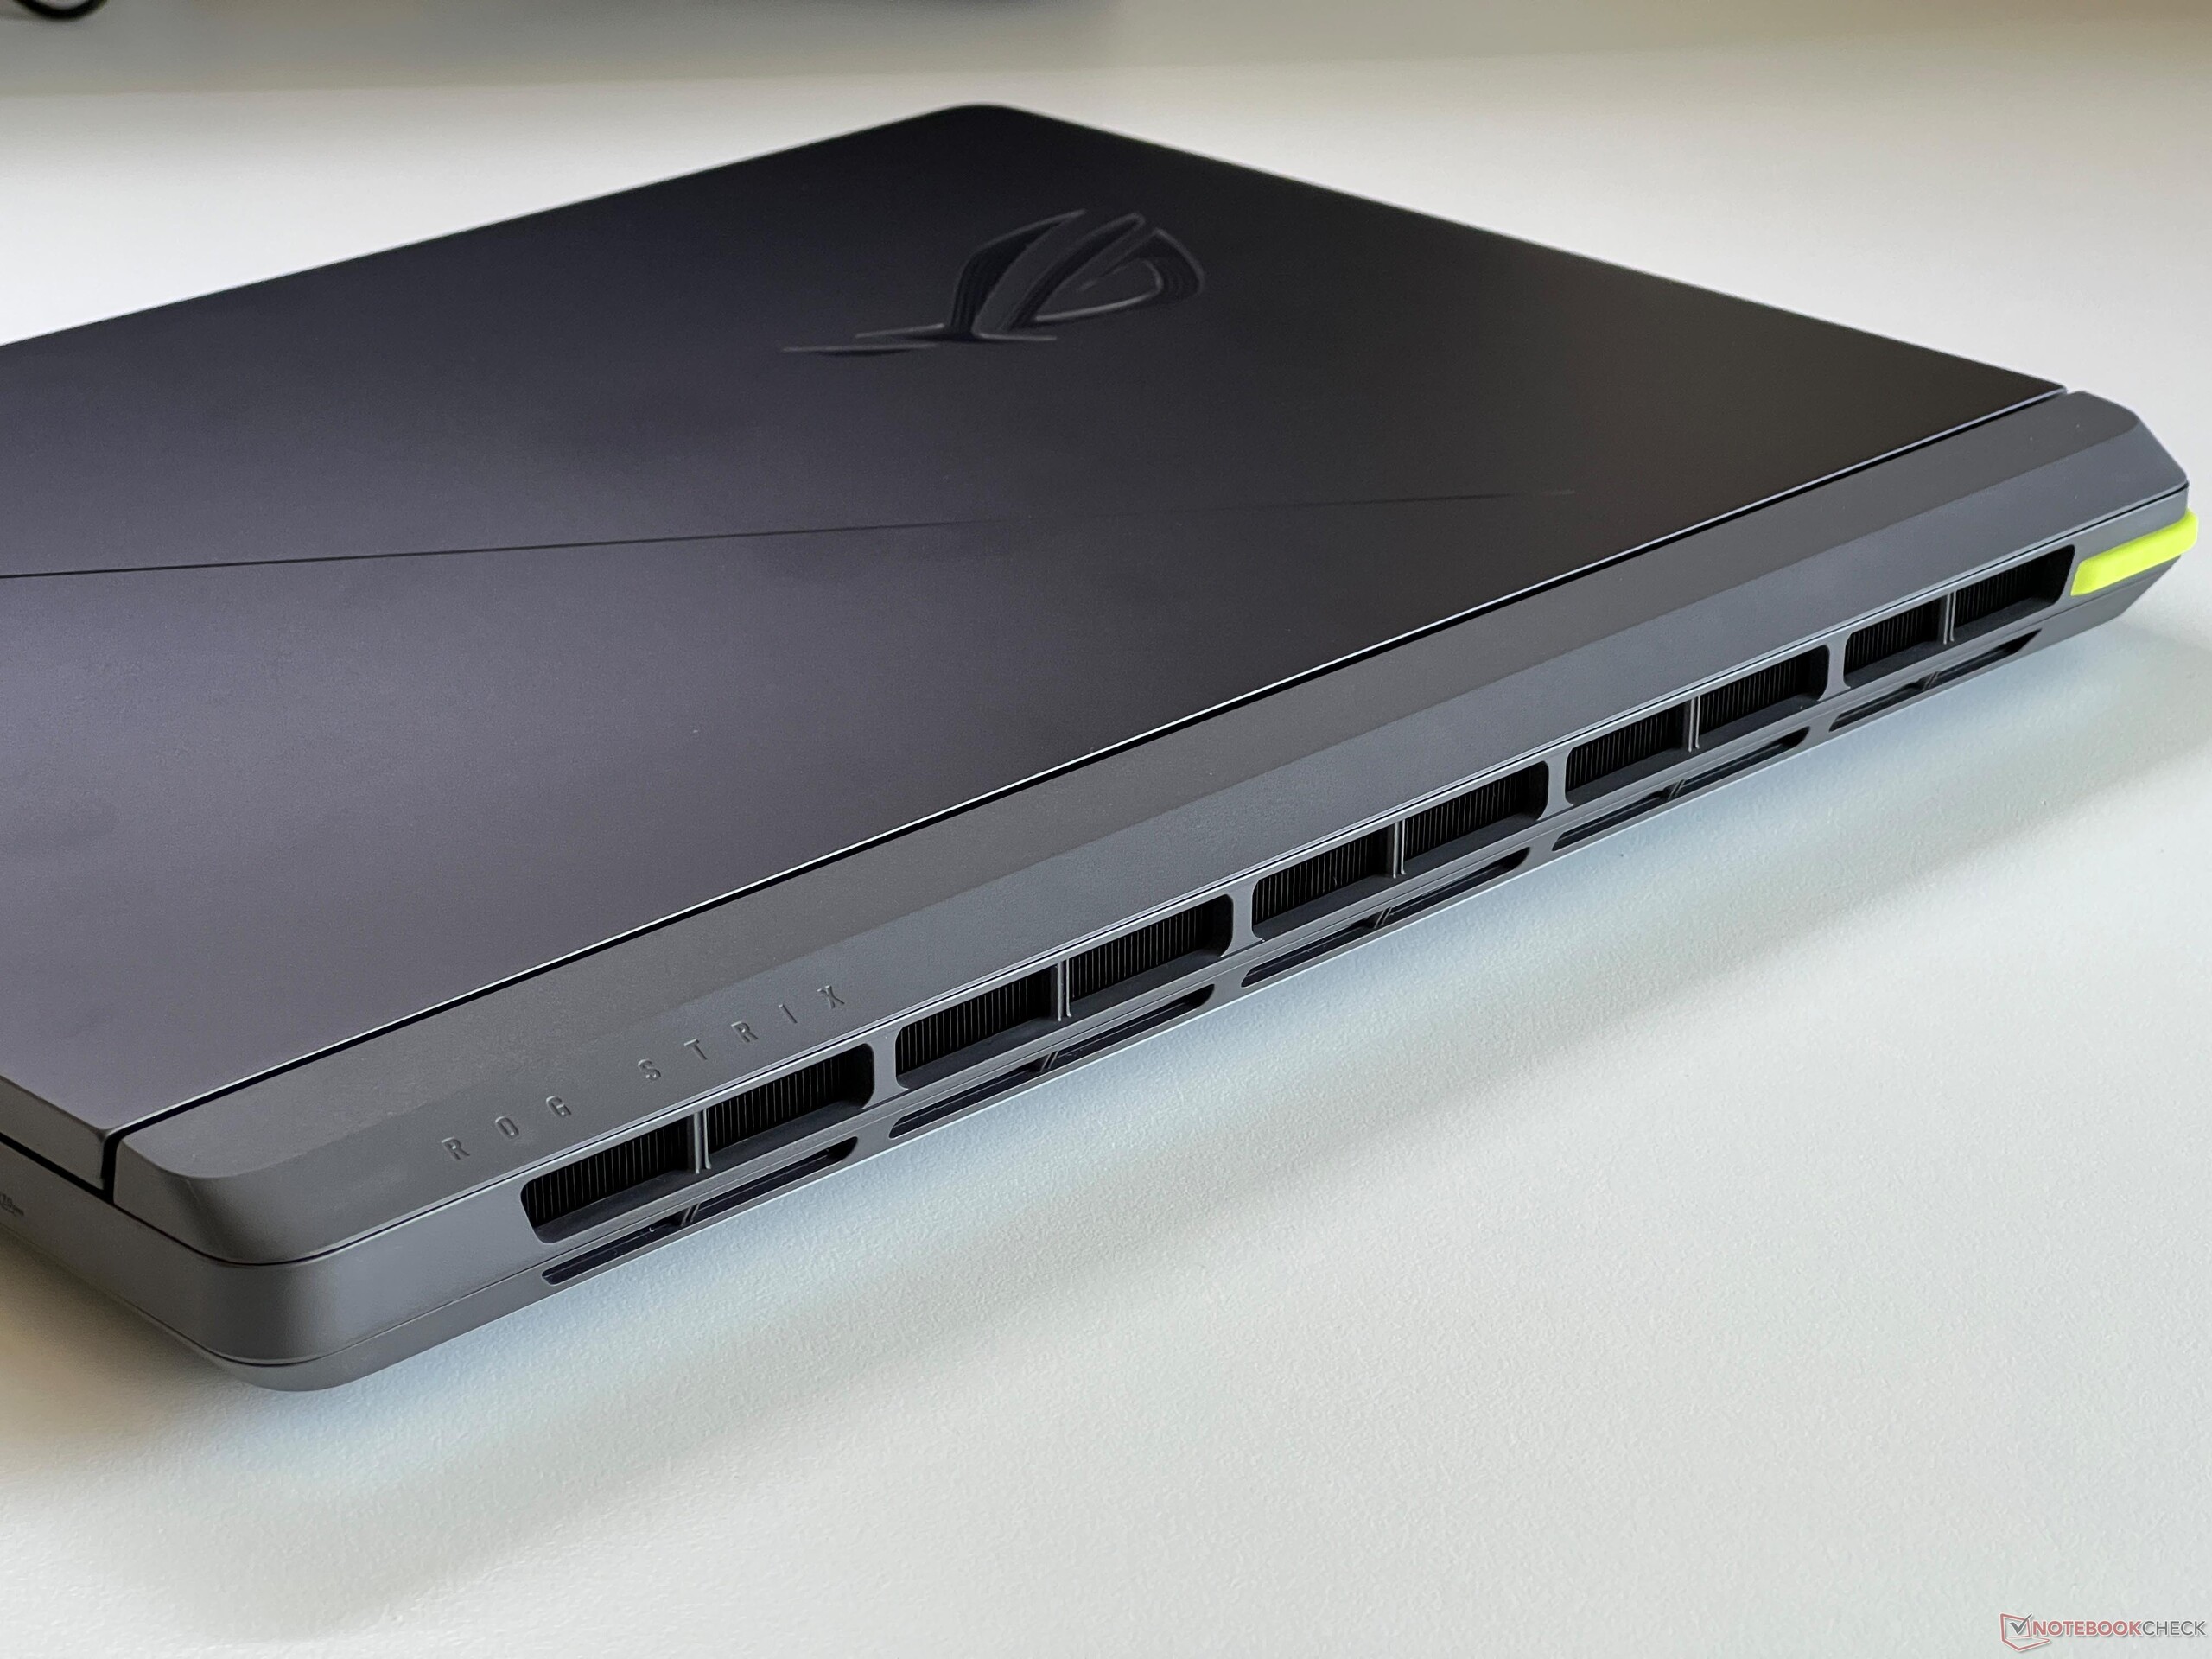
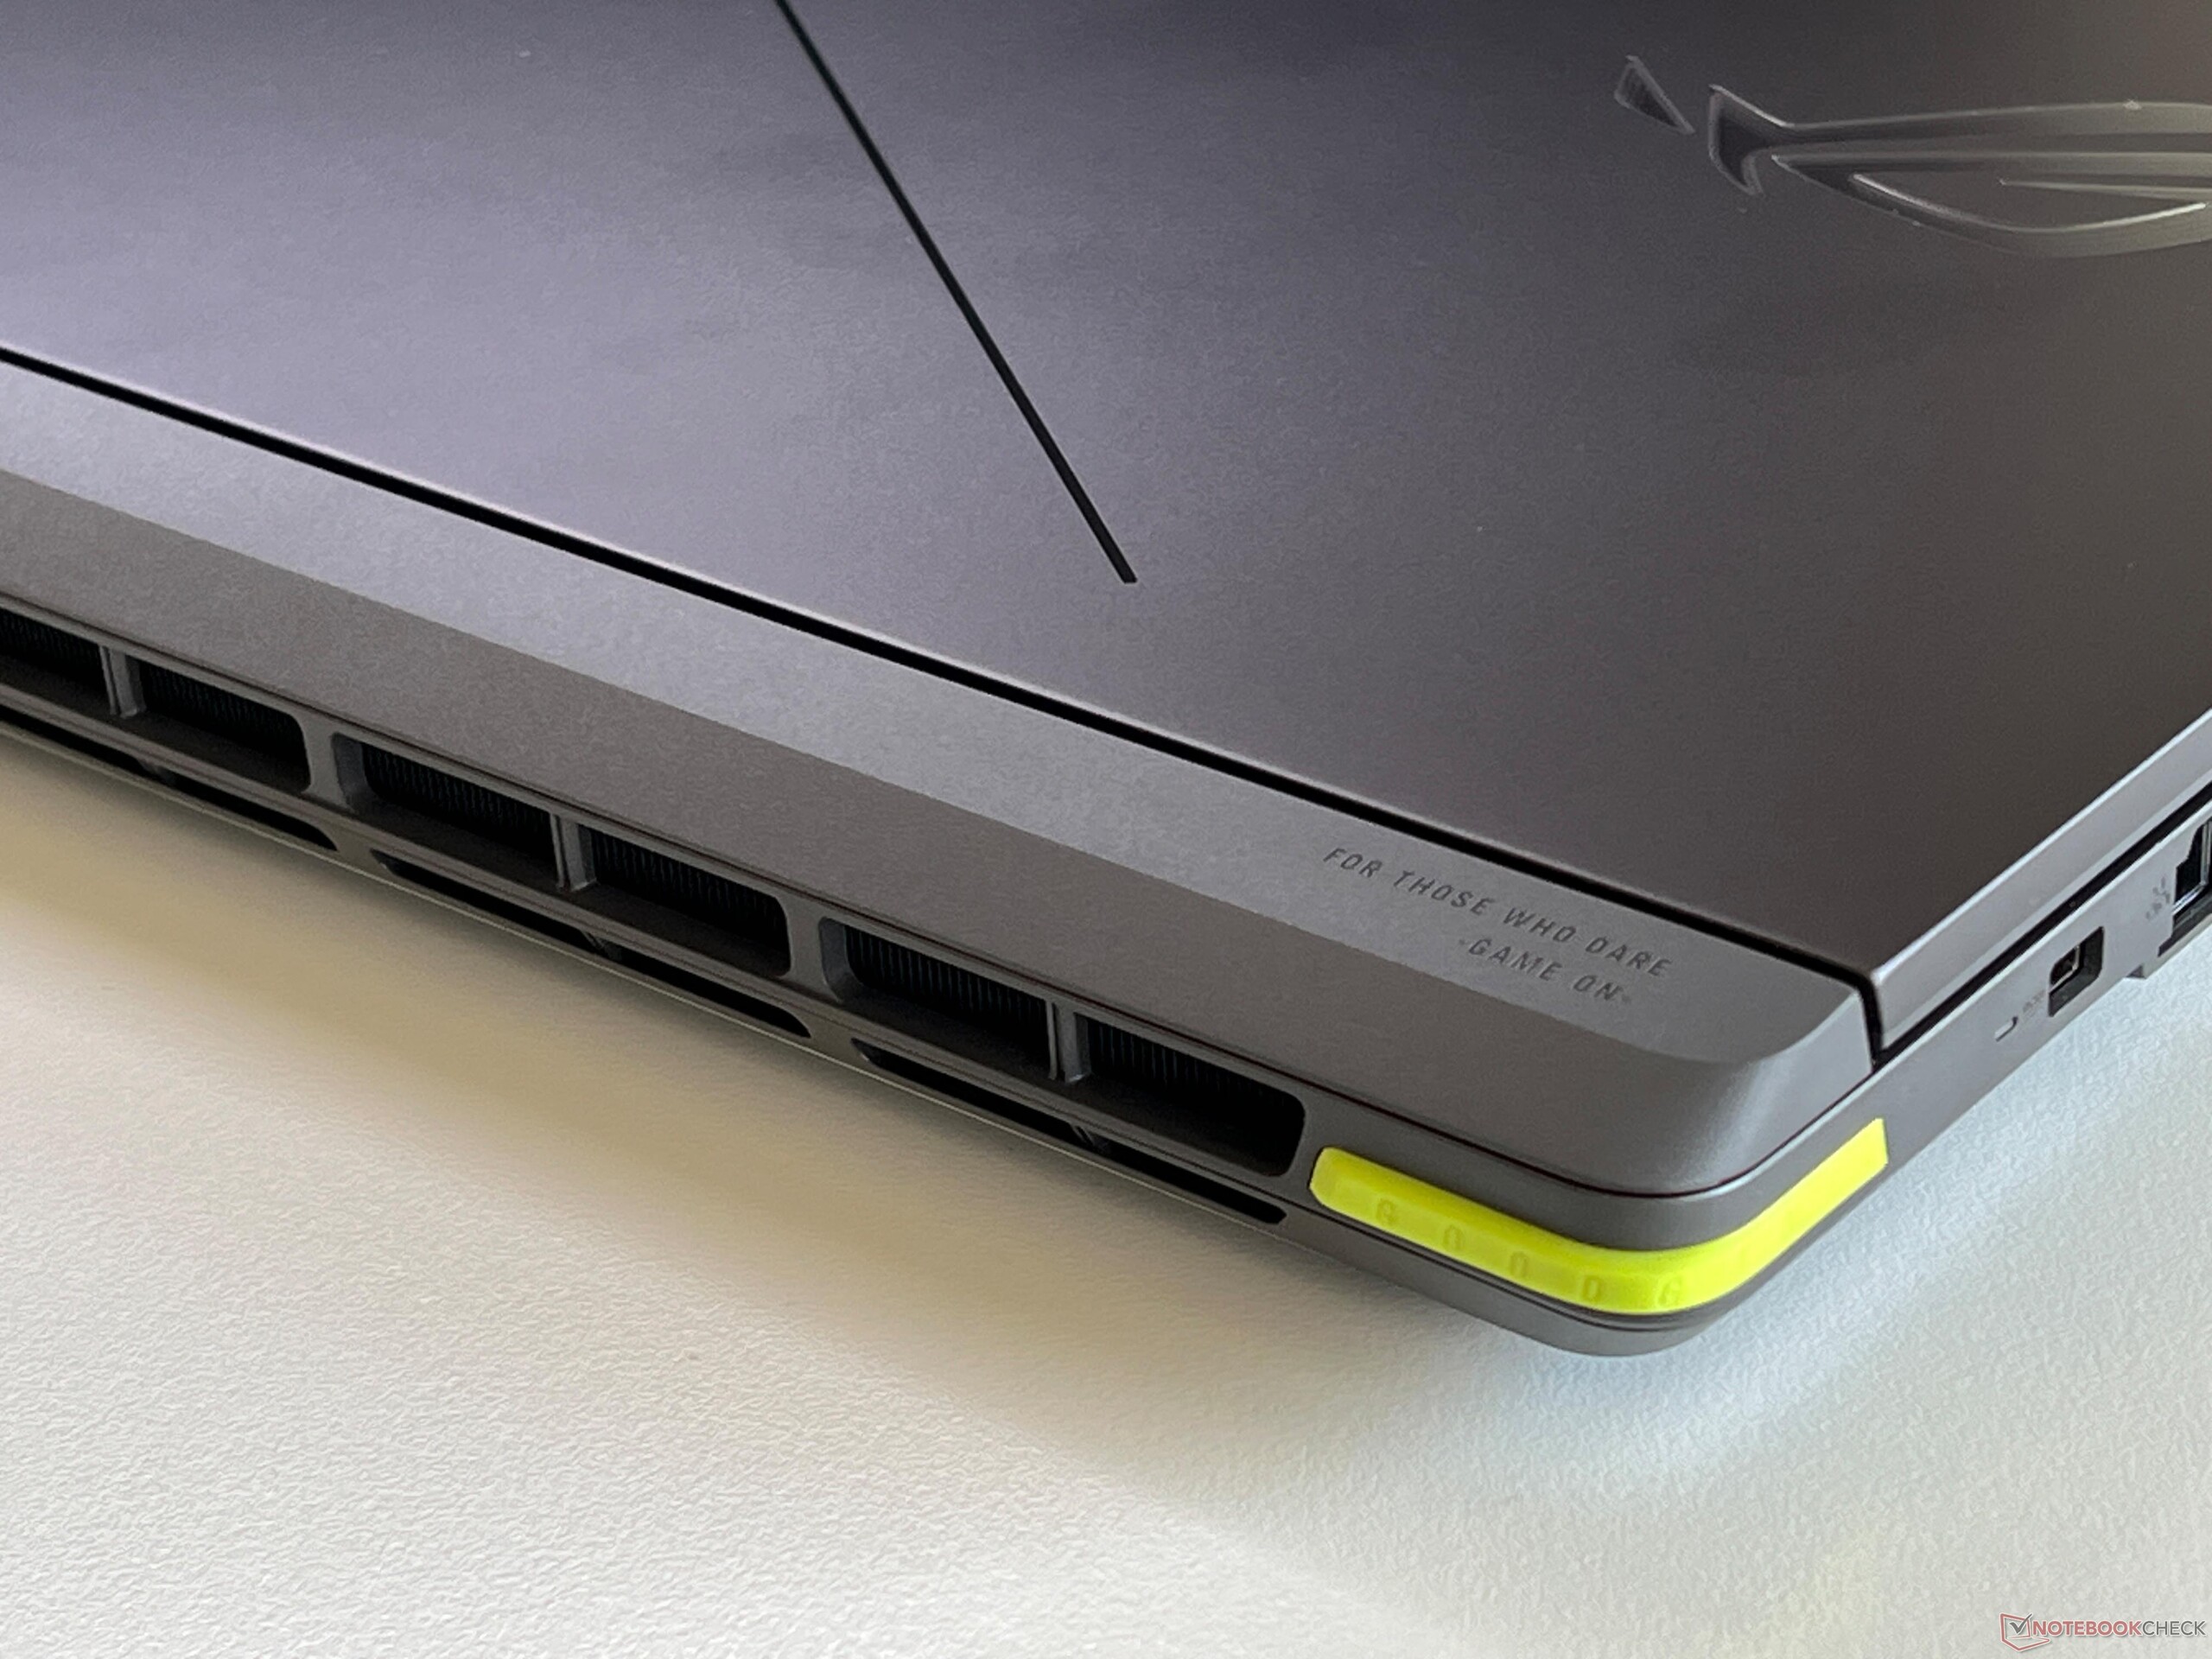
Case - Dark gray with a lot of illumination
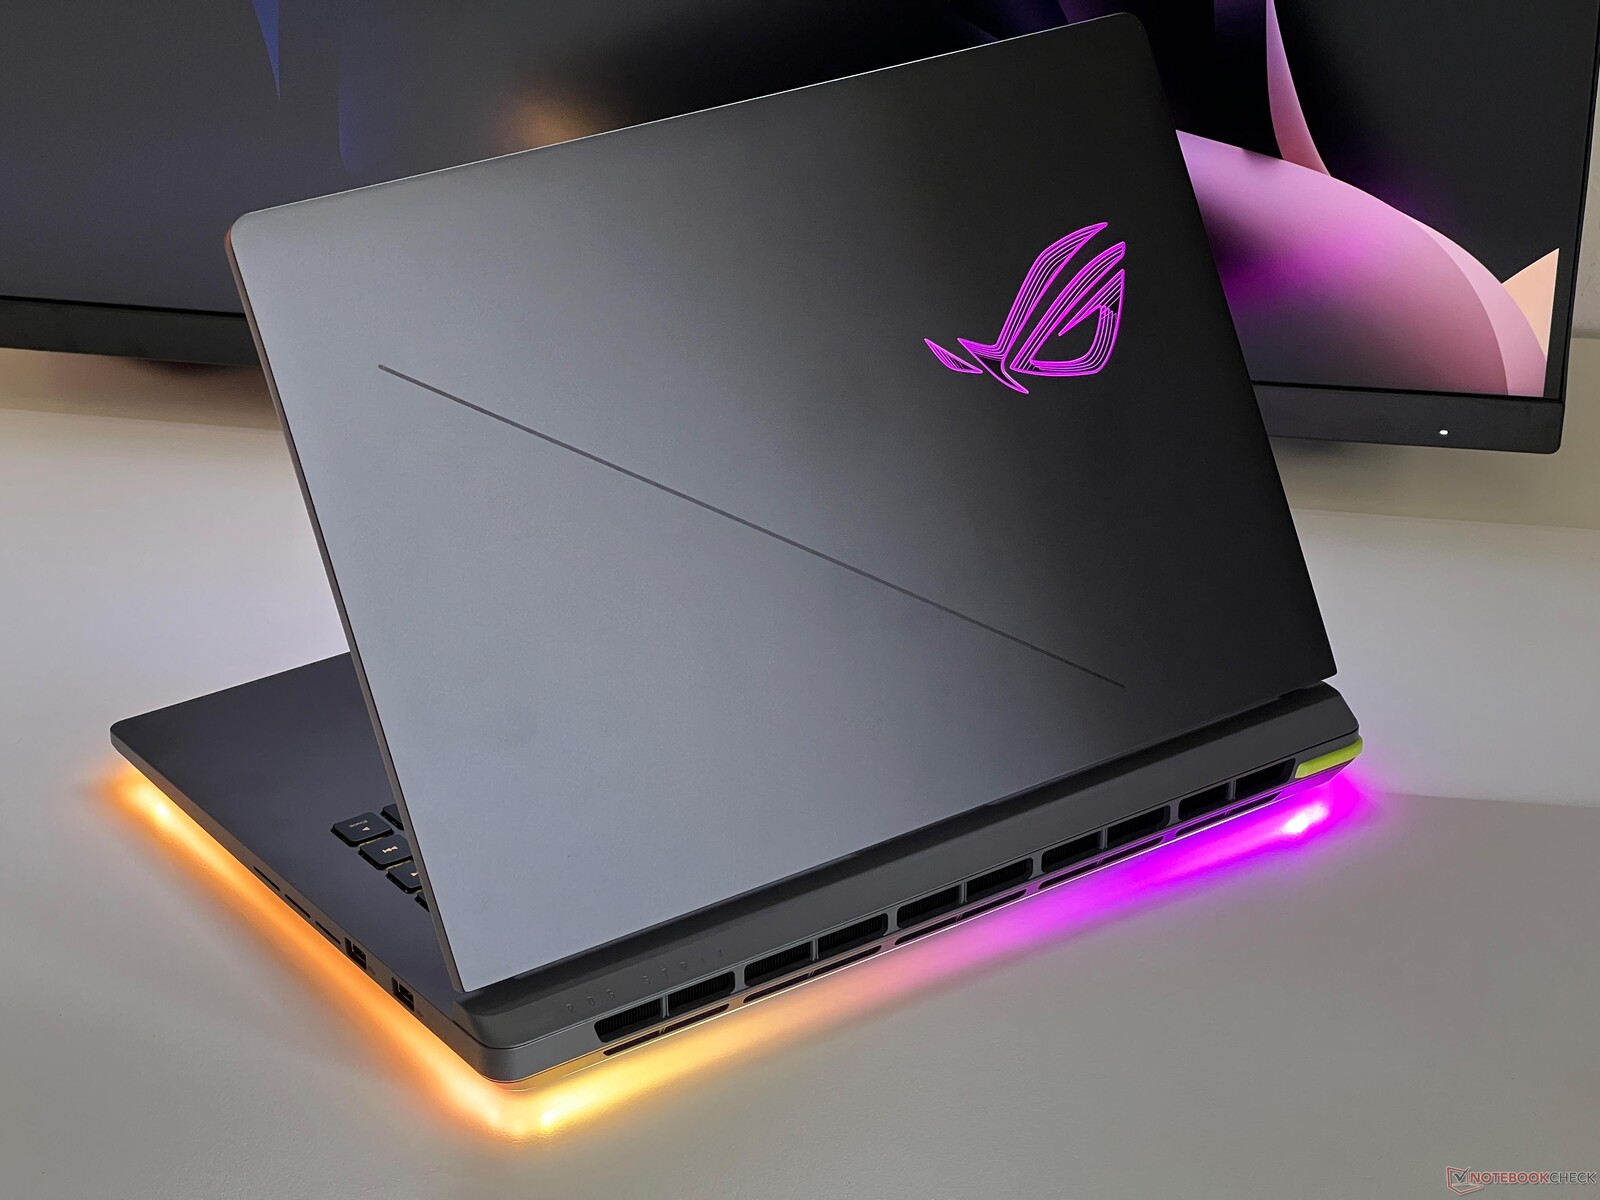
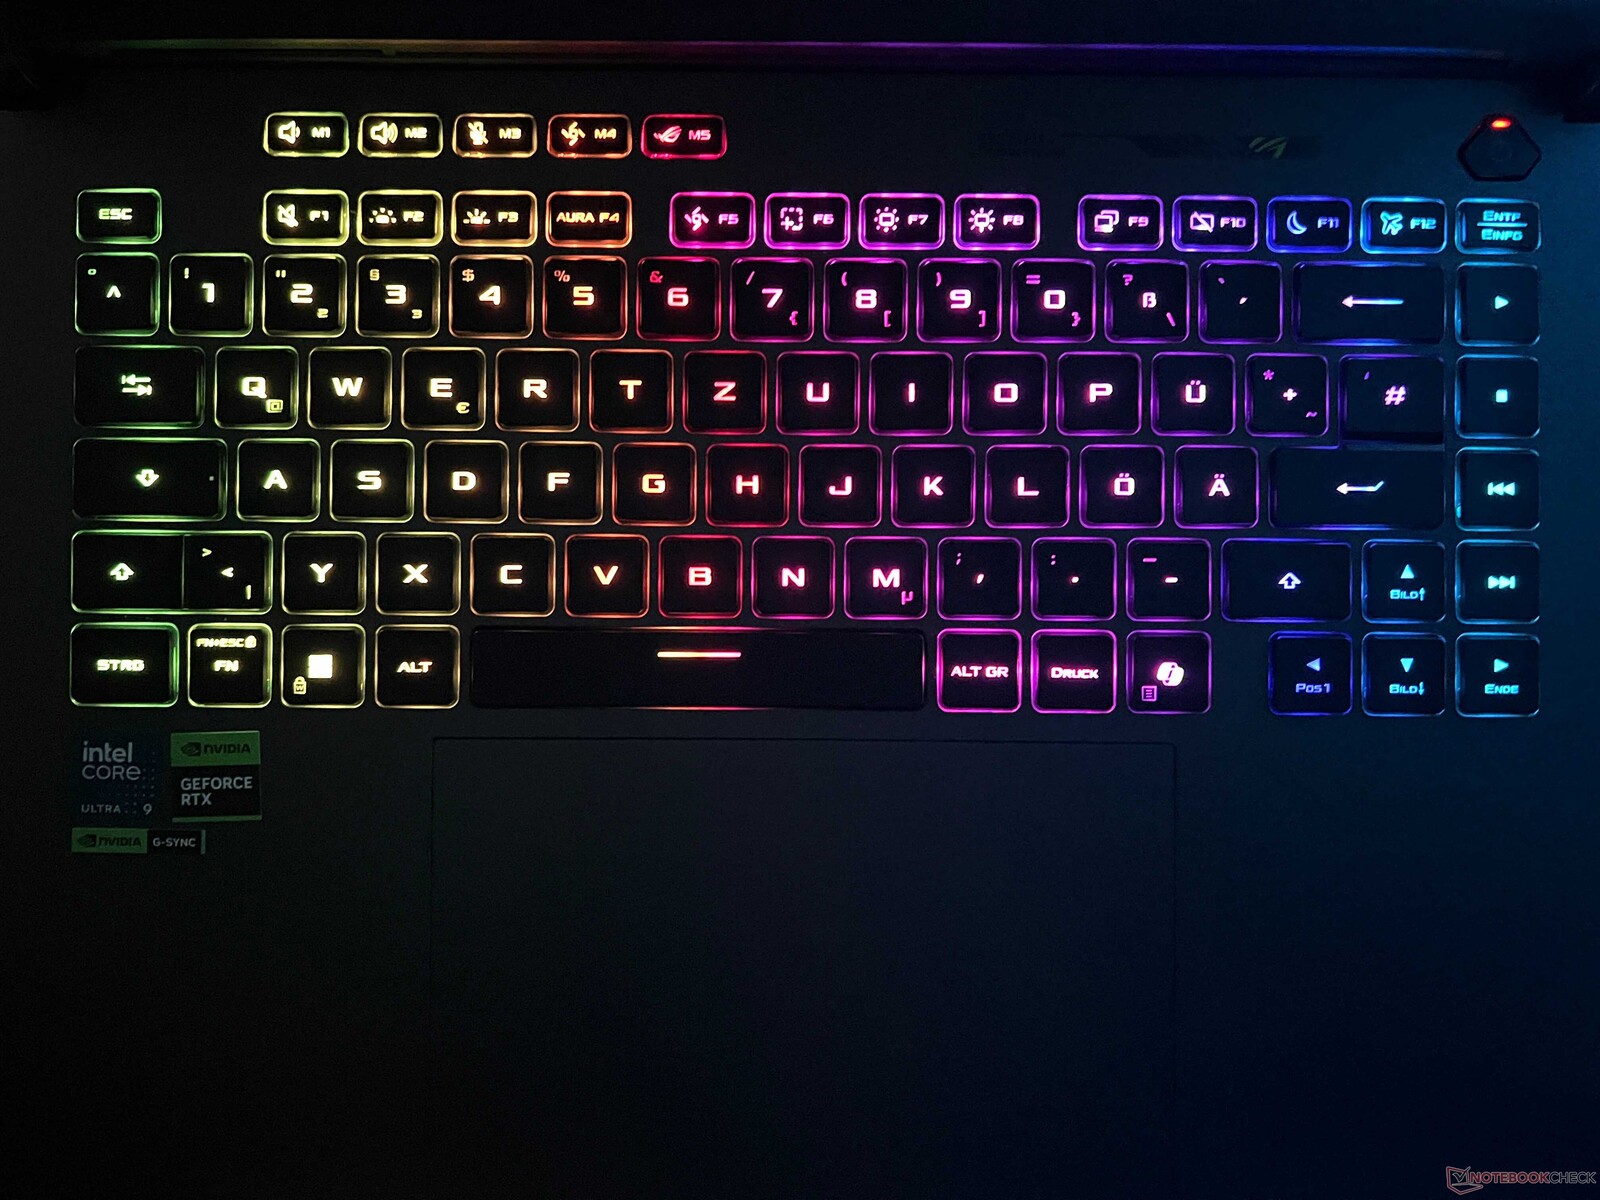
As already mentioned, the Strix G16 shares many common elements with the Strix SCAR series, including the plastic case, the illuminated LED bar running around the base, and the illuminated logo. You only won't get the additional DotMatrix display on the lid. In addition, there are two small design elements in neon green (ROG logo above the keyboard and small strip at the left back corner). You can go wild with the illumination, but you can also completely deactivate it for a less conspicuous look. The dark gray plastic surfaces aren't quite as prone to show fingerprints and dirt as the black surfaces of the Strix SCAR 18 we tested recently.
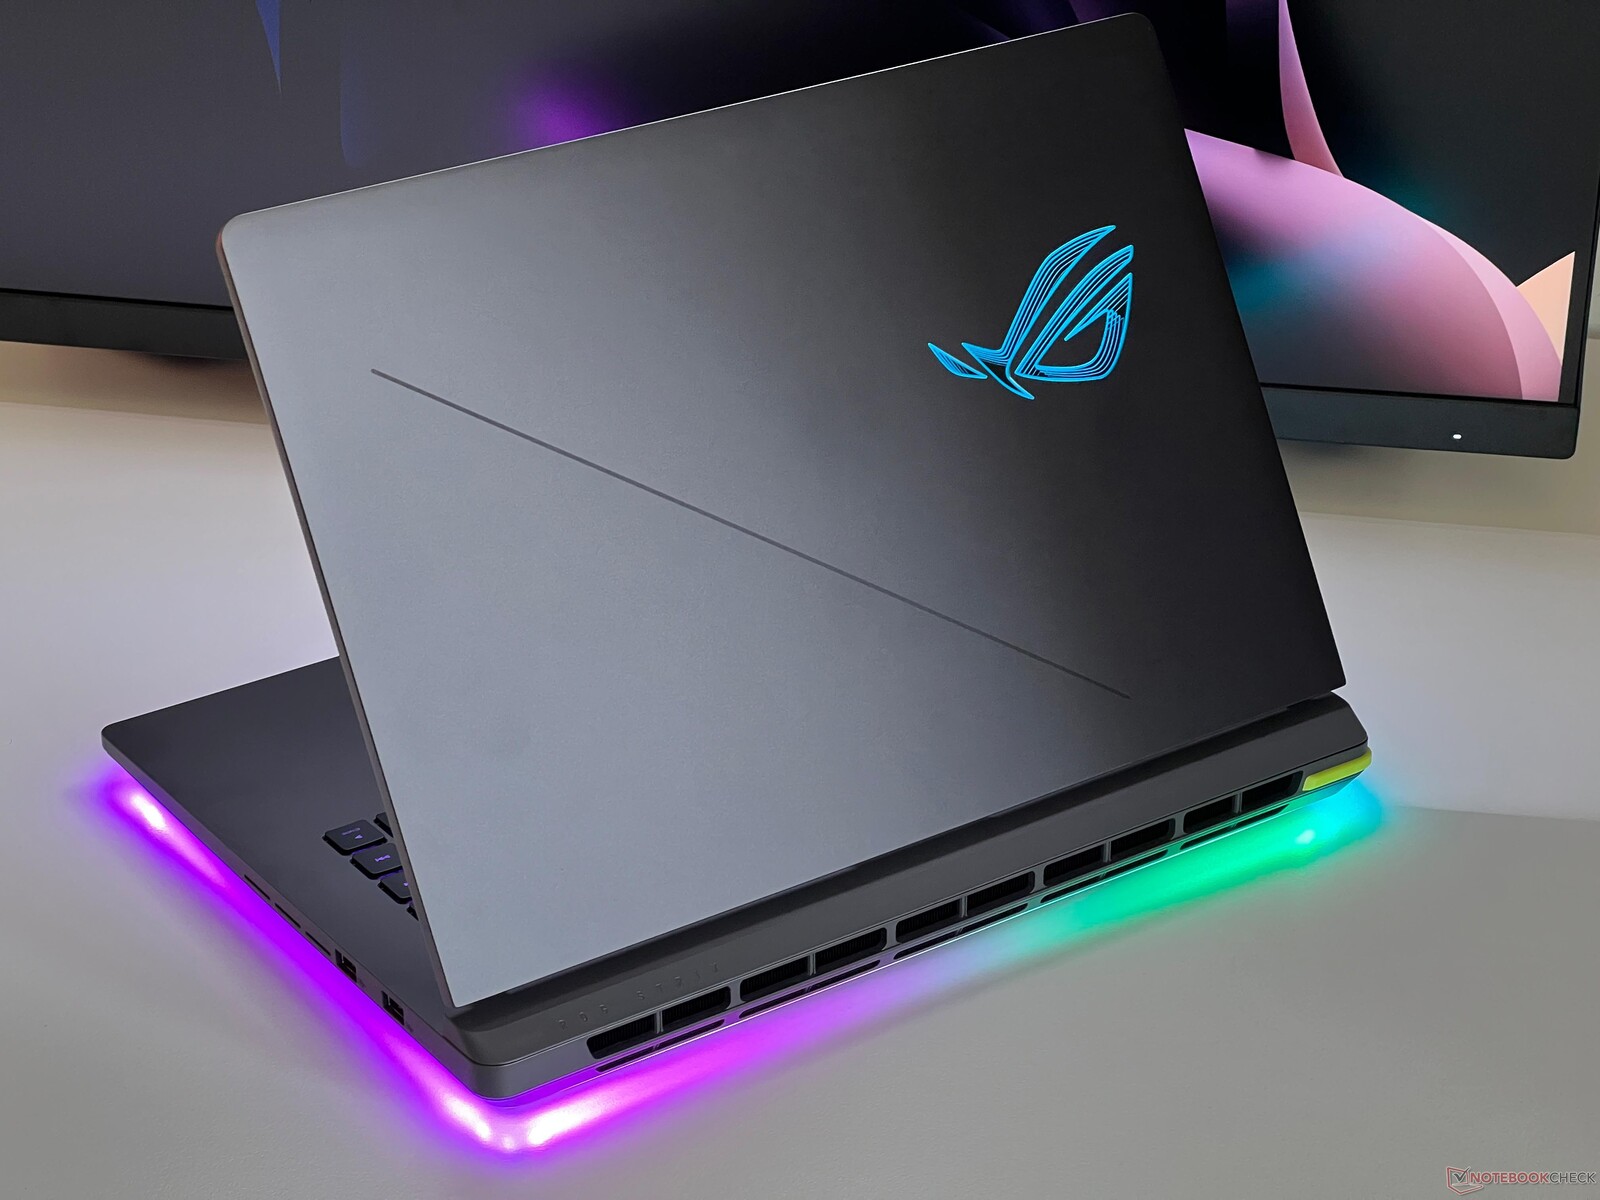
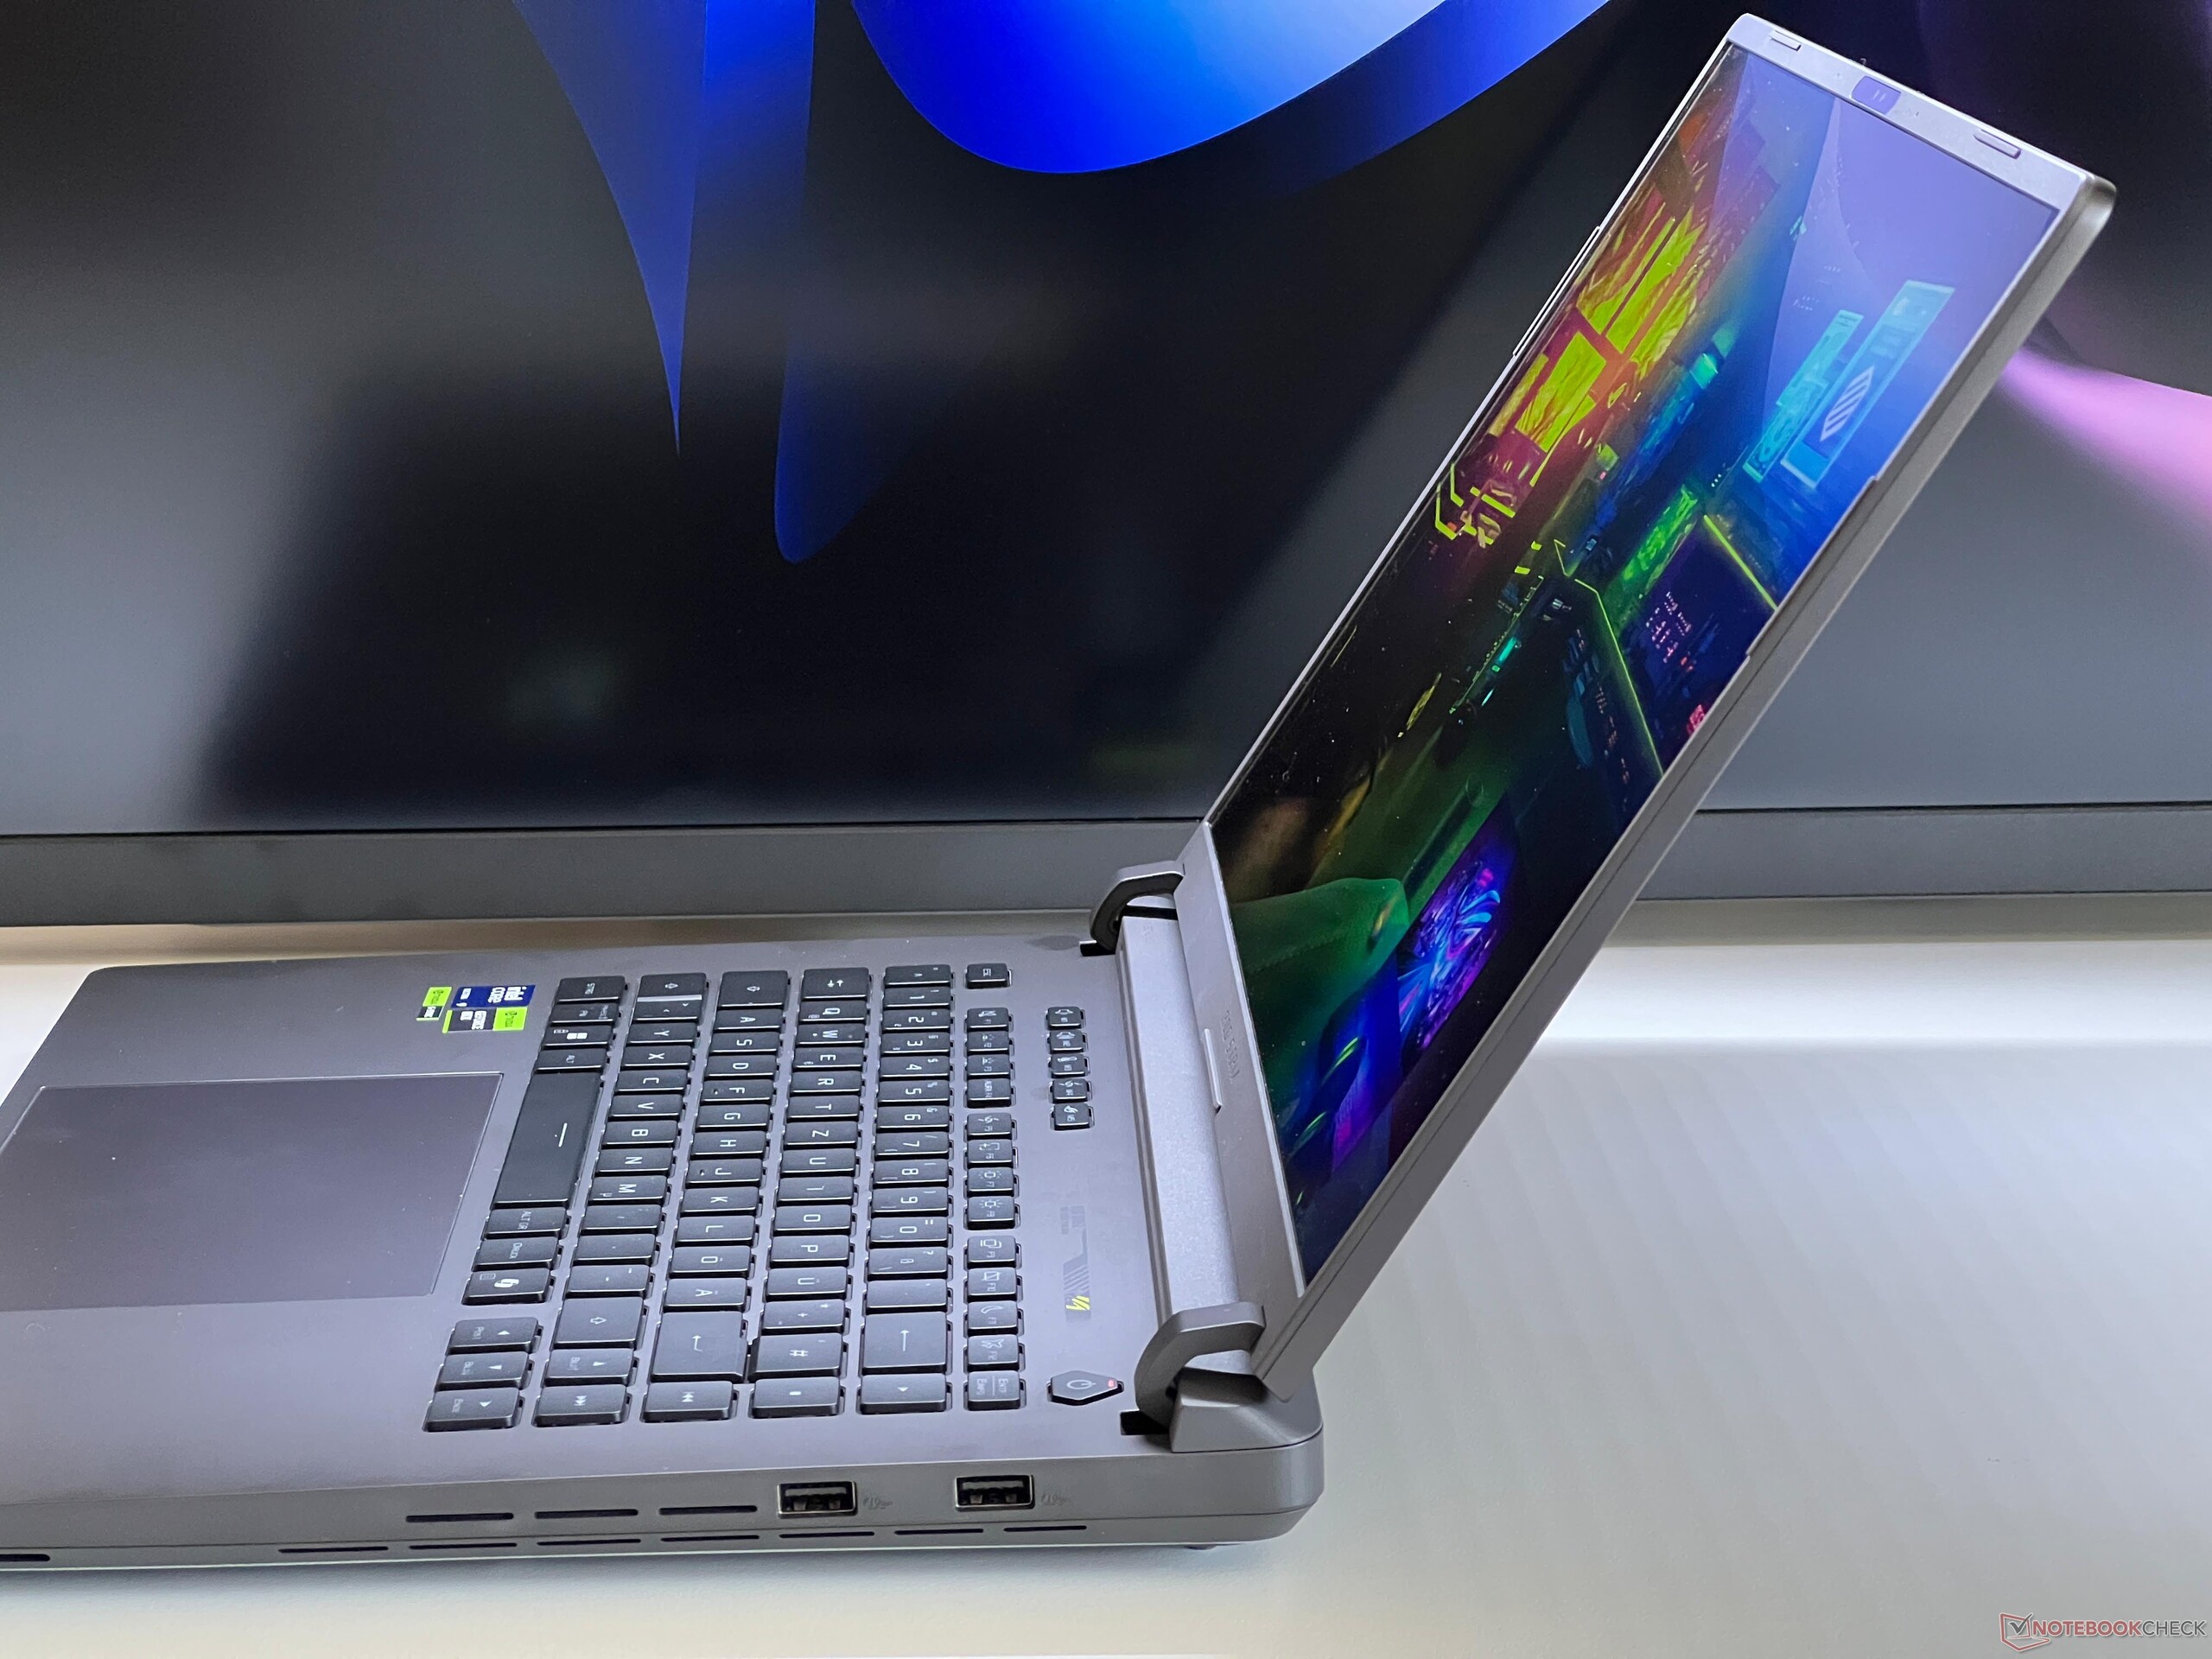
The quality of the case is very good overall, even if you should already be able to expect a metal case at this price point. Neither with the stability nor the workmanship did we find any kind of problems. The hinges also do a good job, but the maximum opening angle is only around 130 degrees.

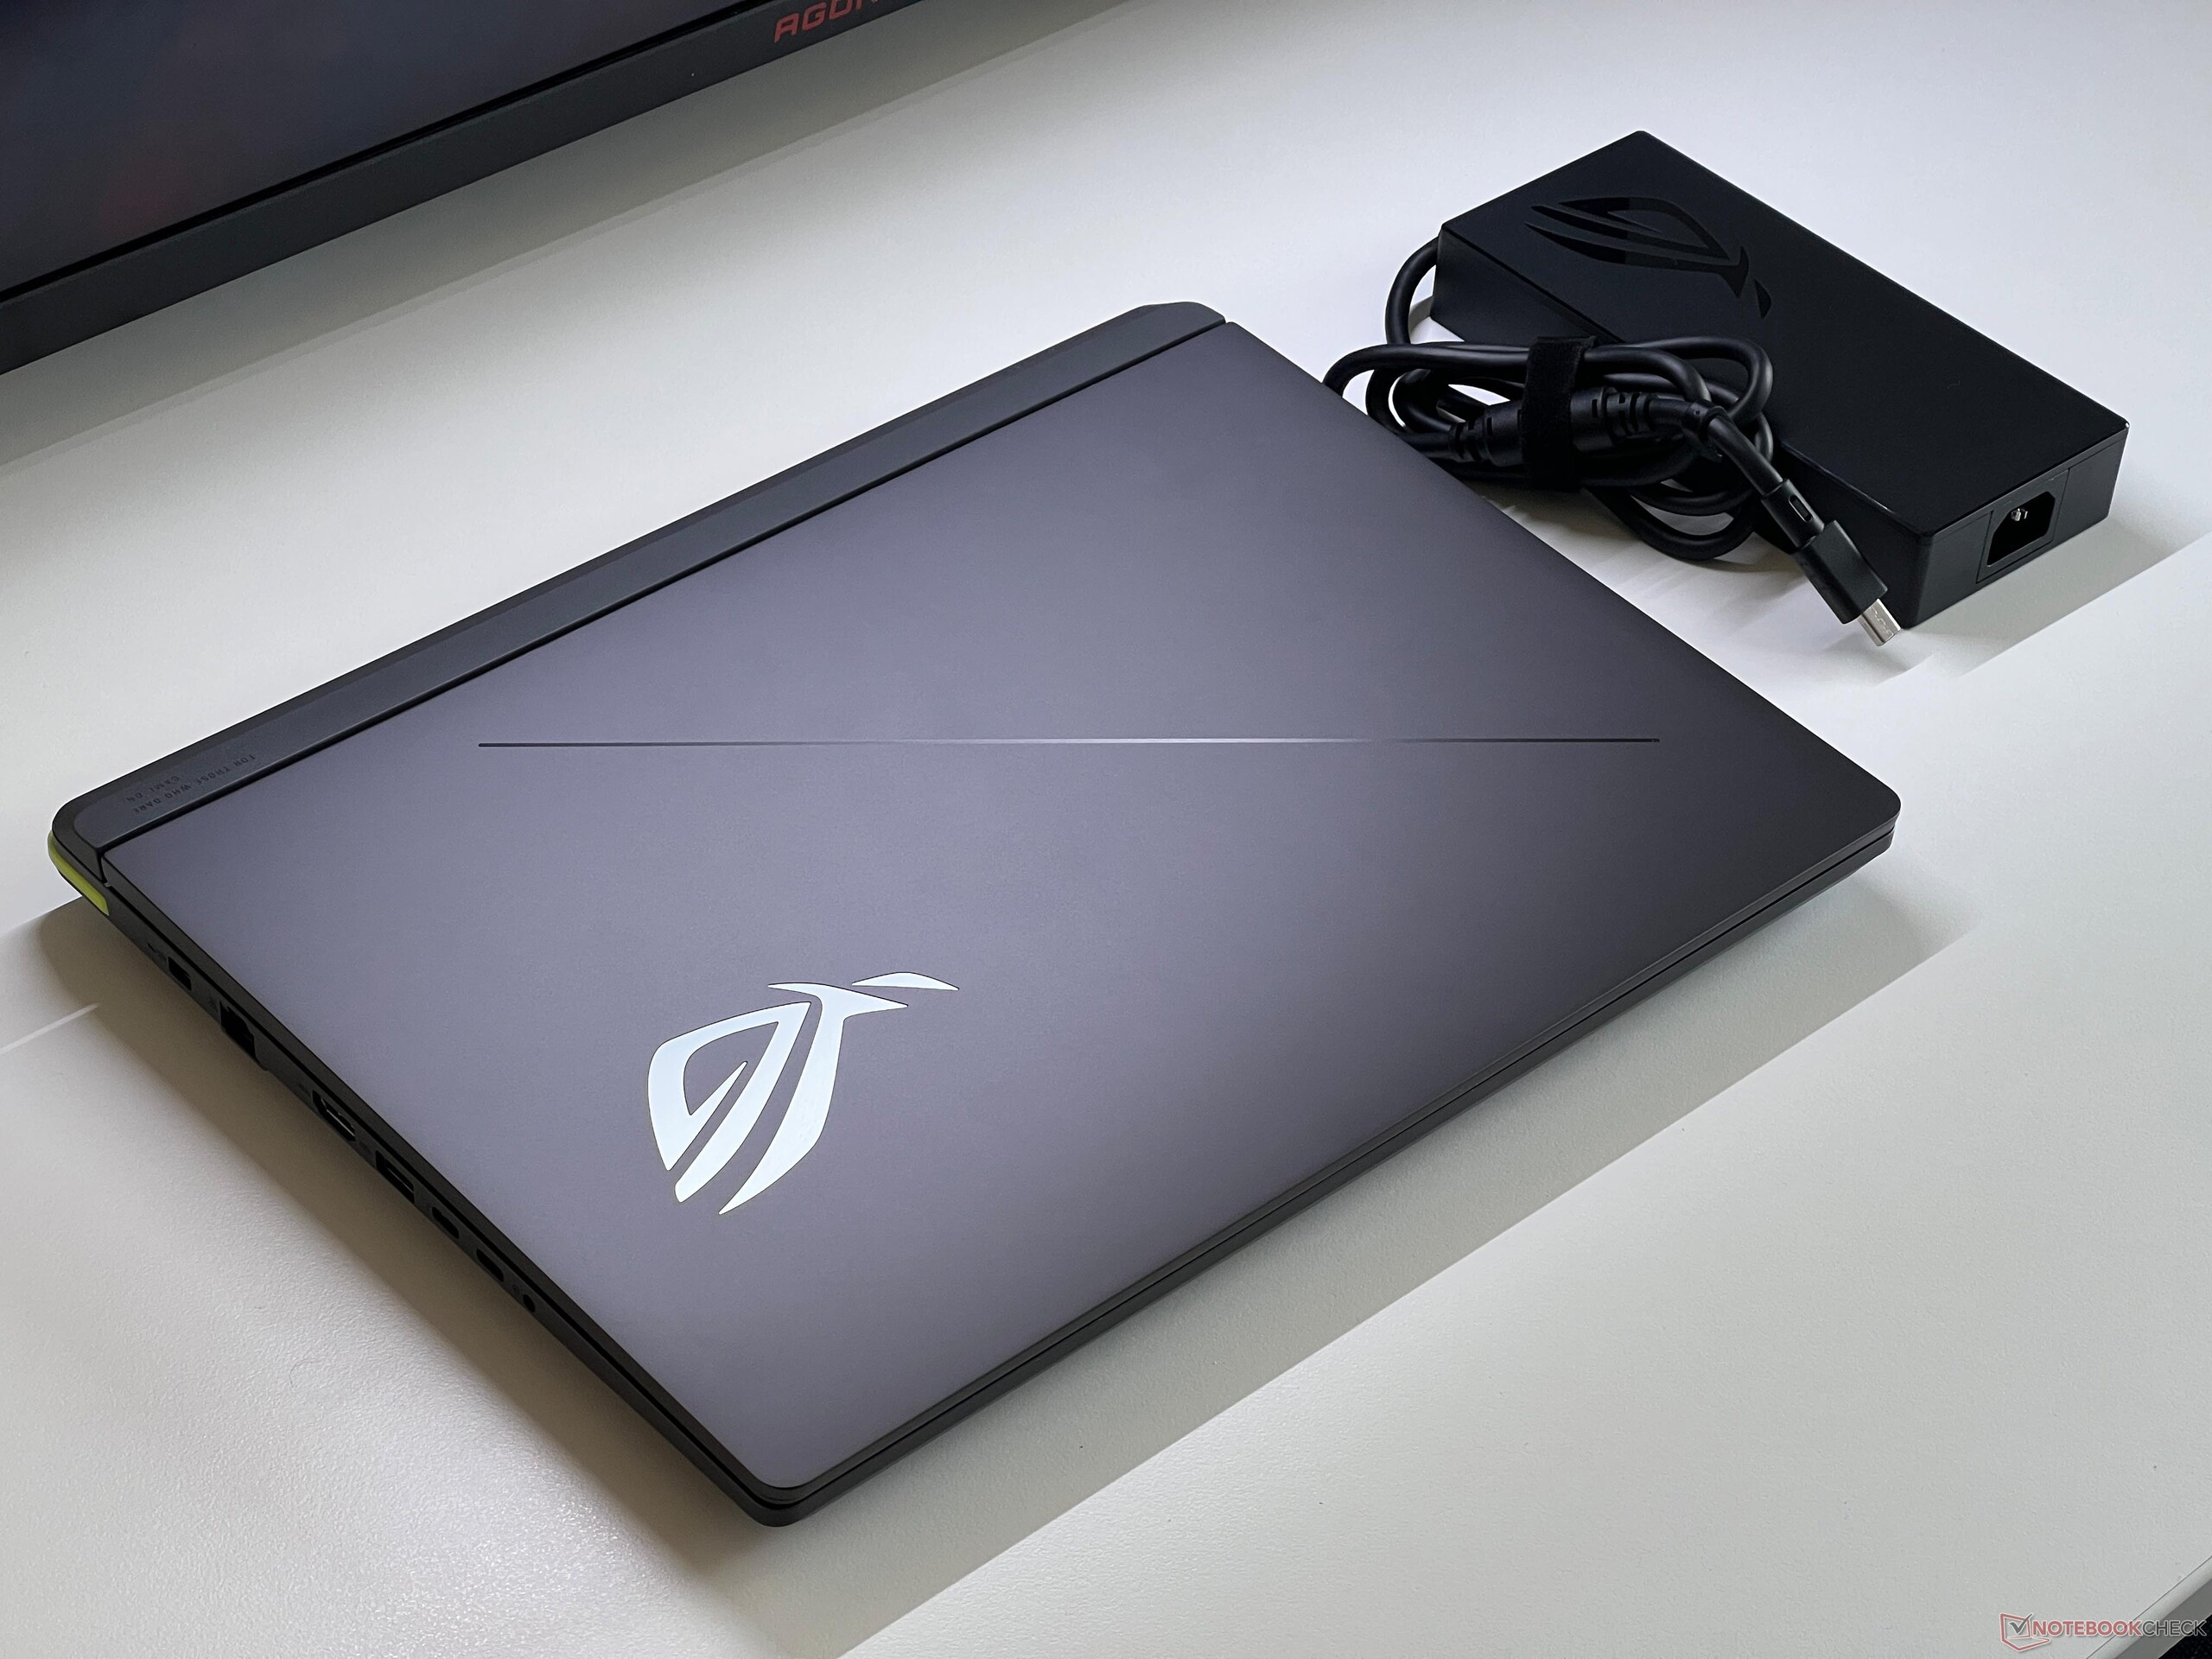

The differences between our comparison devices in terms of their footprint aren't very significant, since all of the laptops are relatively large. In this regard, devices such as the ROG Zephyrus G16 of course have an advantage. The weight of our test unit is 2.6 kg (~5.7 lbs), which also falls in the middle of the field. The 380-Watt charger adds another 1 kg (~2.2 lbs) to the weight.
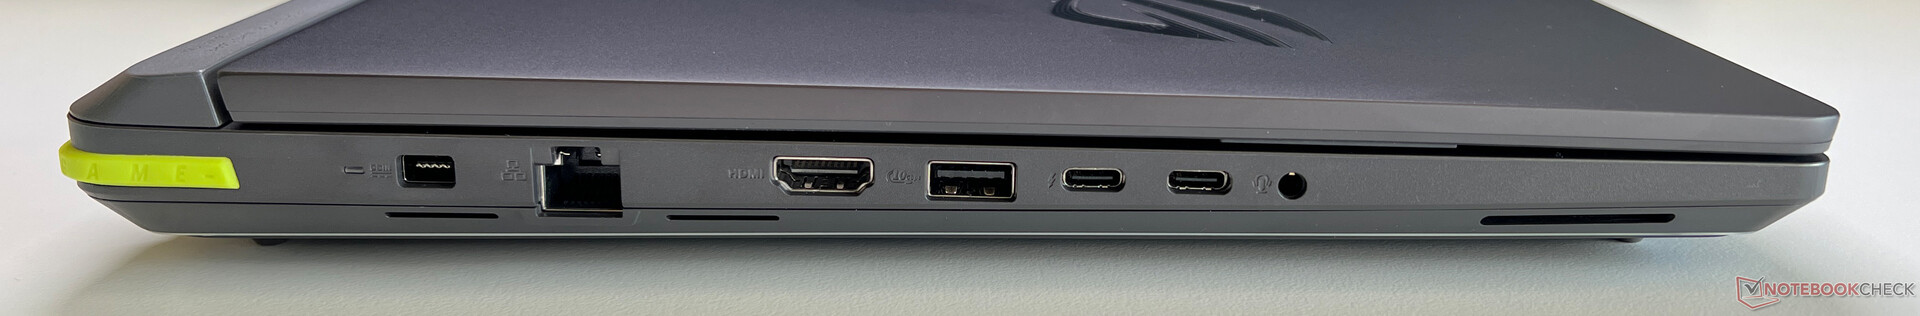
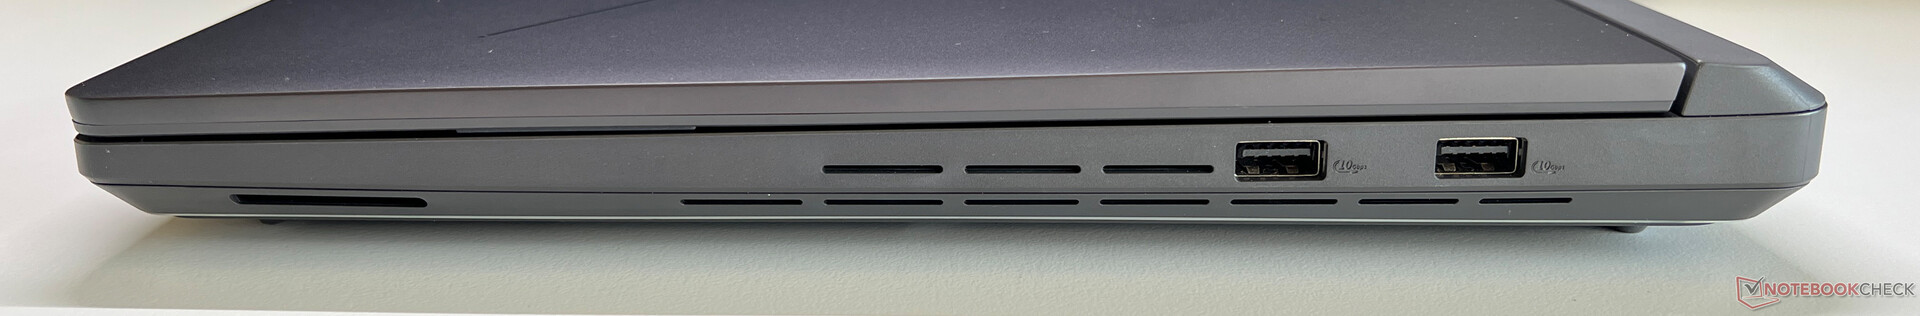
Equipment - Strix G16 with Thunderbolt 5
Since the whole back of the case is used for the cooling openings, all the connections are distributed over both sides. Particularly with network connections, power, or the image outputs, this isn't always an ideal solution. The Strix G16 already supports Thunderbolt 5, and there are sufficient connections overall. Even though this is not a Copilot+ laptop, functions such as the studio effects for the webcam or live subtitles are still supported.
Communication
In addition to the Ethernet connection (2.5 Gbit/s), a modern Wi-Fi 7 module including Bluetooth 5.4 support is also available. The connection speed is very good and stable in our standardized test with the Asus reference router.
| Networking | |
| Asus ROG Strix G16 G615 | |
| iperf3 transmit AXE11000 | |
| iperf3 receive AXE11000 | |
| Acer Predator Helios 16 PH16-72 | |
| iperf3 transmit AXE11000 | |
| iperf3 receive AXE11000 | |
| iperf3 transmit AXE11000 6GHz | |
| iperf3 receive AXE11000 6GHz | |
| Schenker XMG Neo 16 (Early 24) | |
| iperf3 transmit AXE11000 | |
| iperf3 receive AXE11000 | |
| Asus ROG Strix Scar 16 G634JZR | |
| iperf3 transmit AXE11000 | |
| iperf3 receive AXE11000 | |
| iperf3 transmit AXE11000 6GHz | |
| iperf3 receive AXE11000 6GHz | |
| HP Omen 16 (2024) | |
| iperf3 transmit AXE11000 | |
| iperf3 receive AXE11000 | |
| Lenovo Legion Pro 7 16IRX9H | |
| iperf3 transmit AXE11000 | |
| iperf3 receive AXE11000 | |
| Lenovo Legion Pro 7i 16 Gen 10 | |
| iperf3 transmit AXE11000 | |
| iperf3 receive AXE11000 | |
| iperf3 transmit AXE11000 6GHz | |
| iperf3 receive AXE11000 6GHz | |
Webcam
The 1080p webcam (without manual shutter) does its job, but the pictures it takes are nothing special. The built-in IR module supports face recognition via Windows Hello.


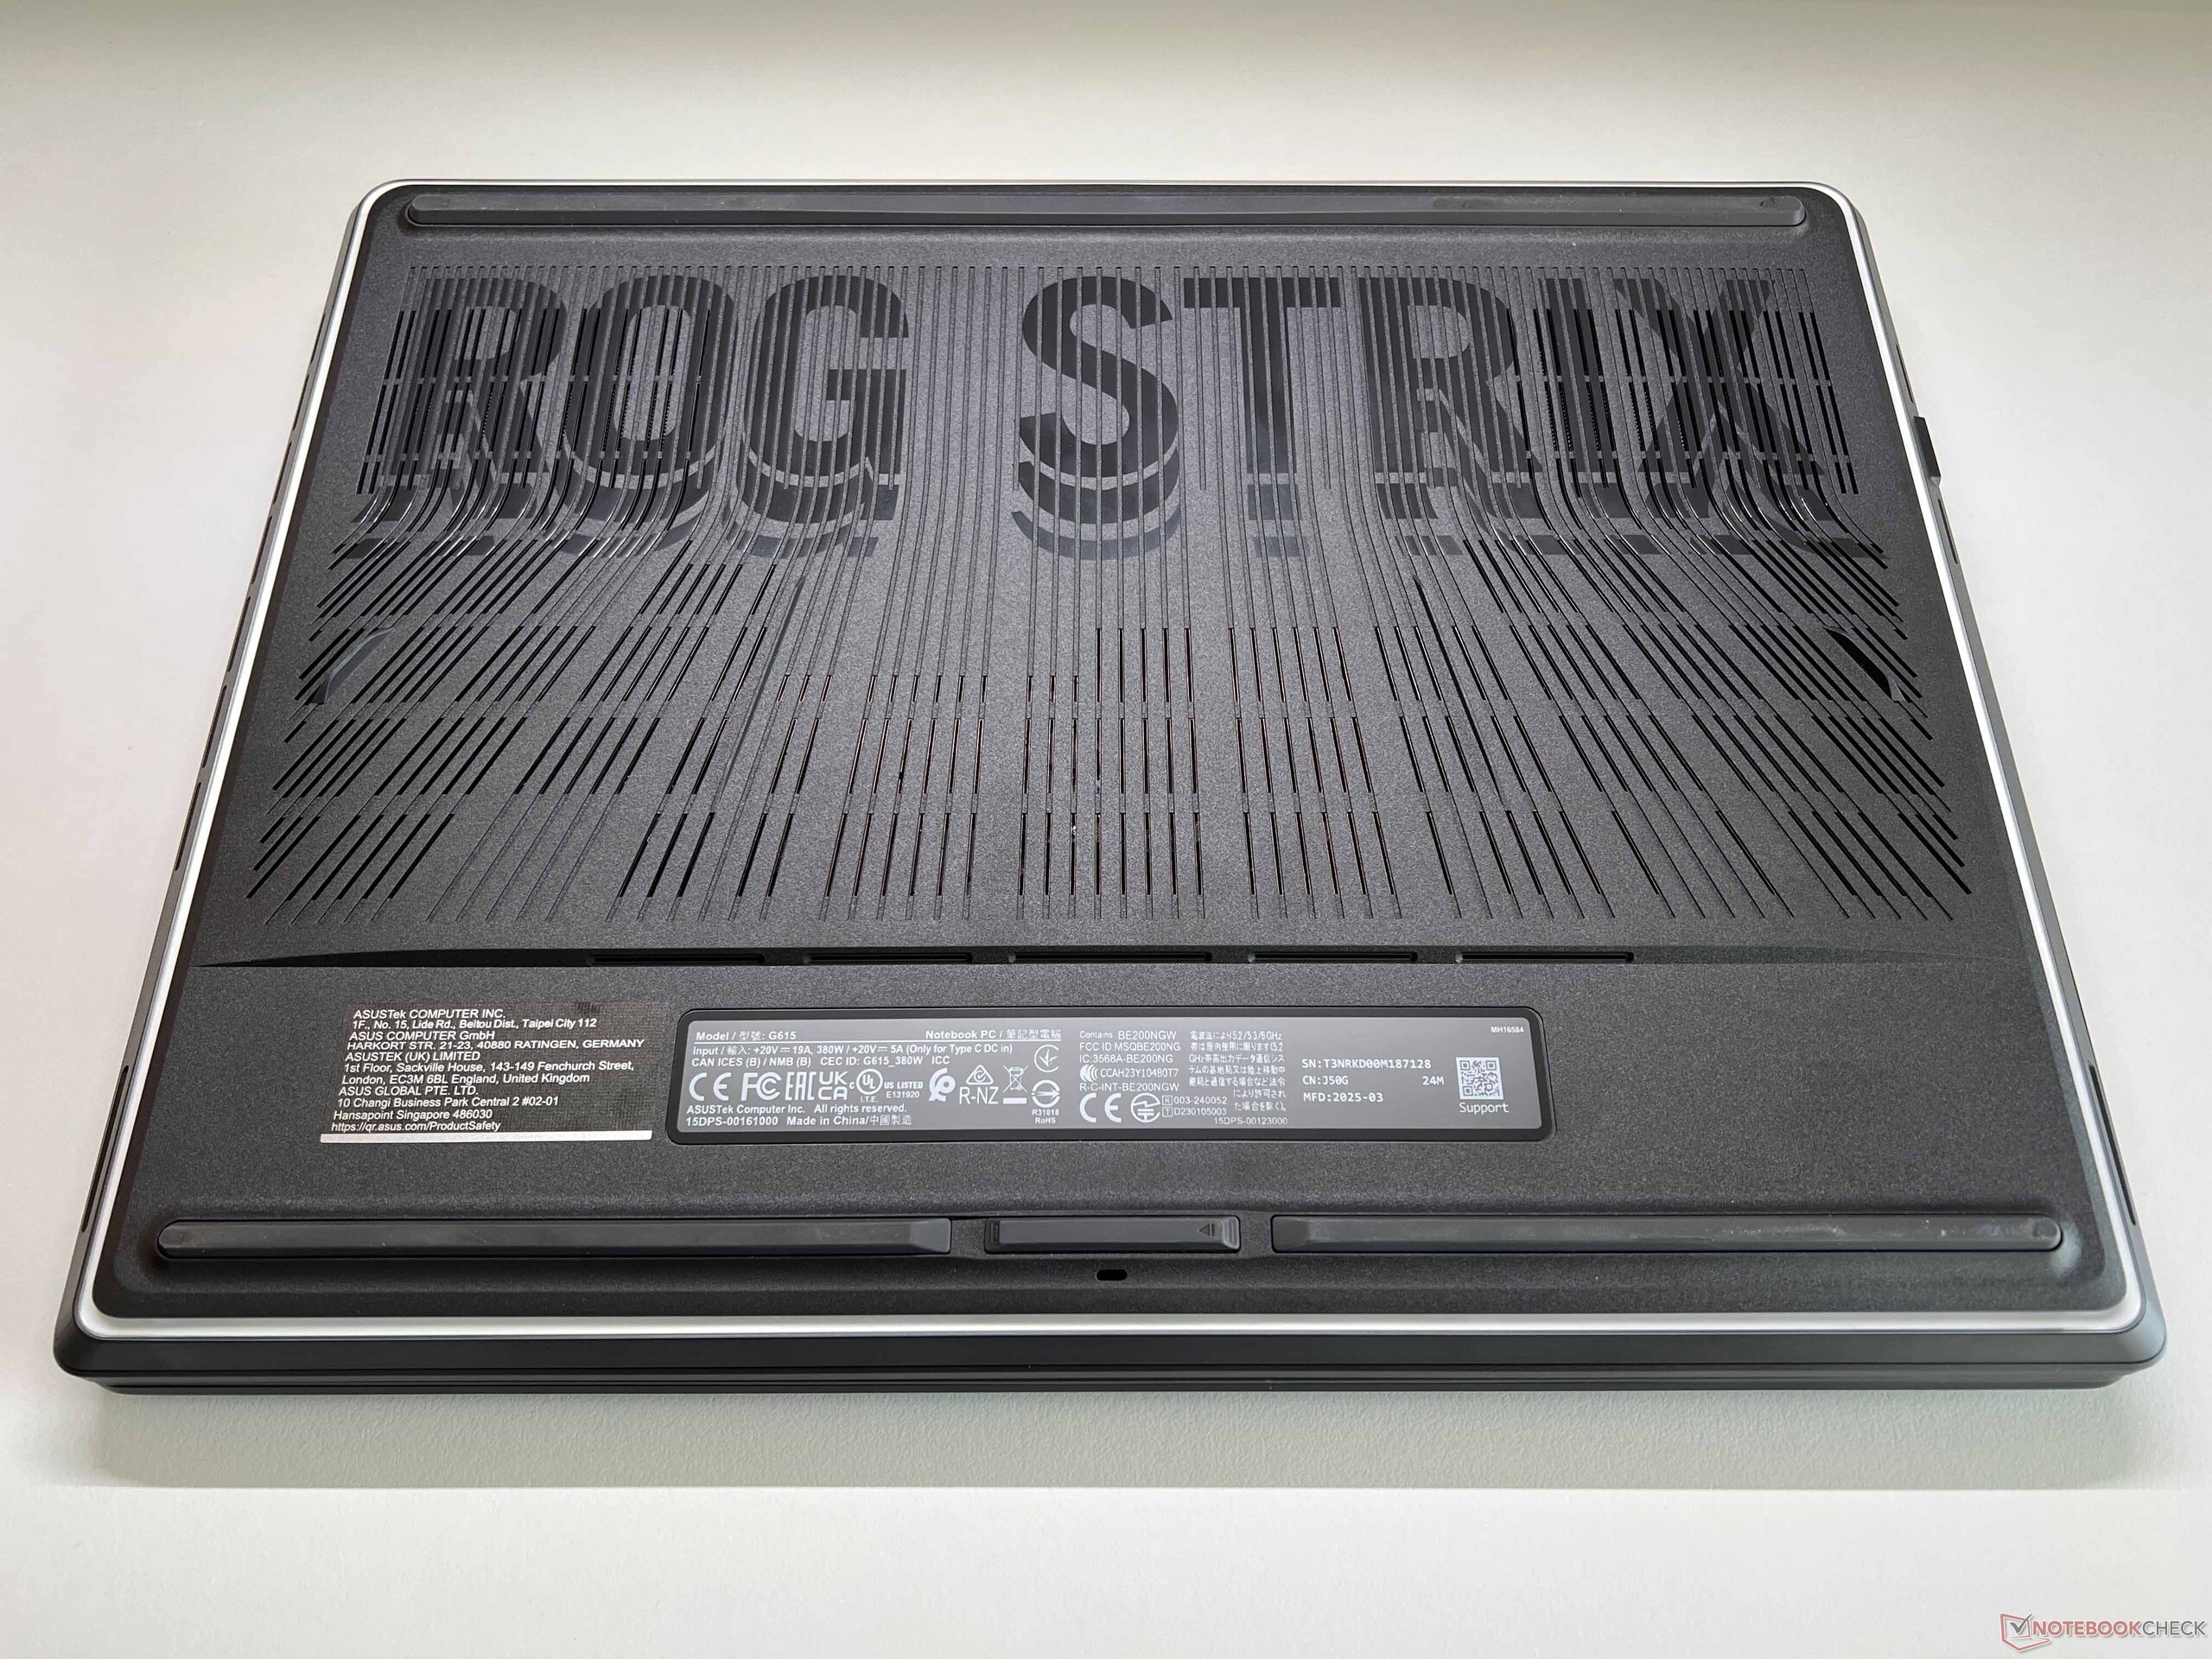
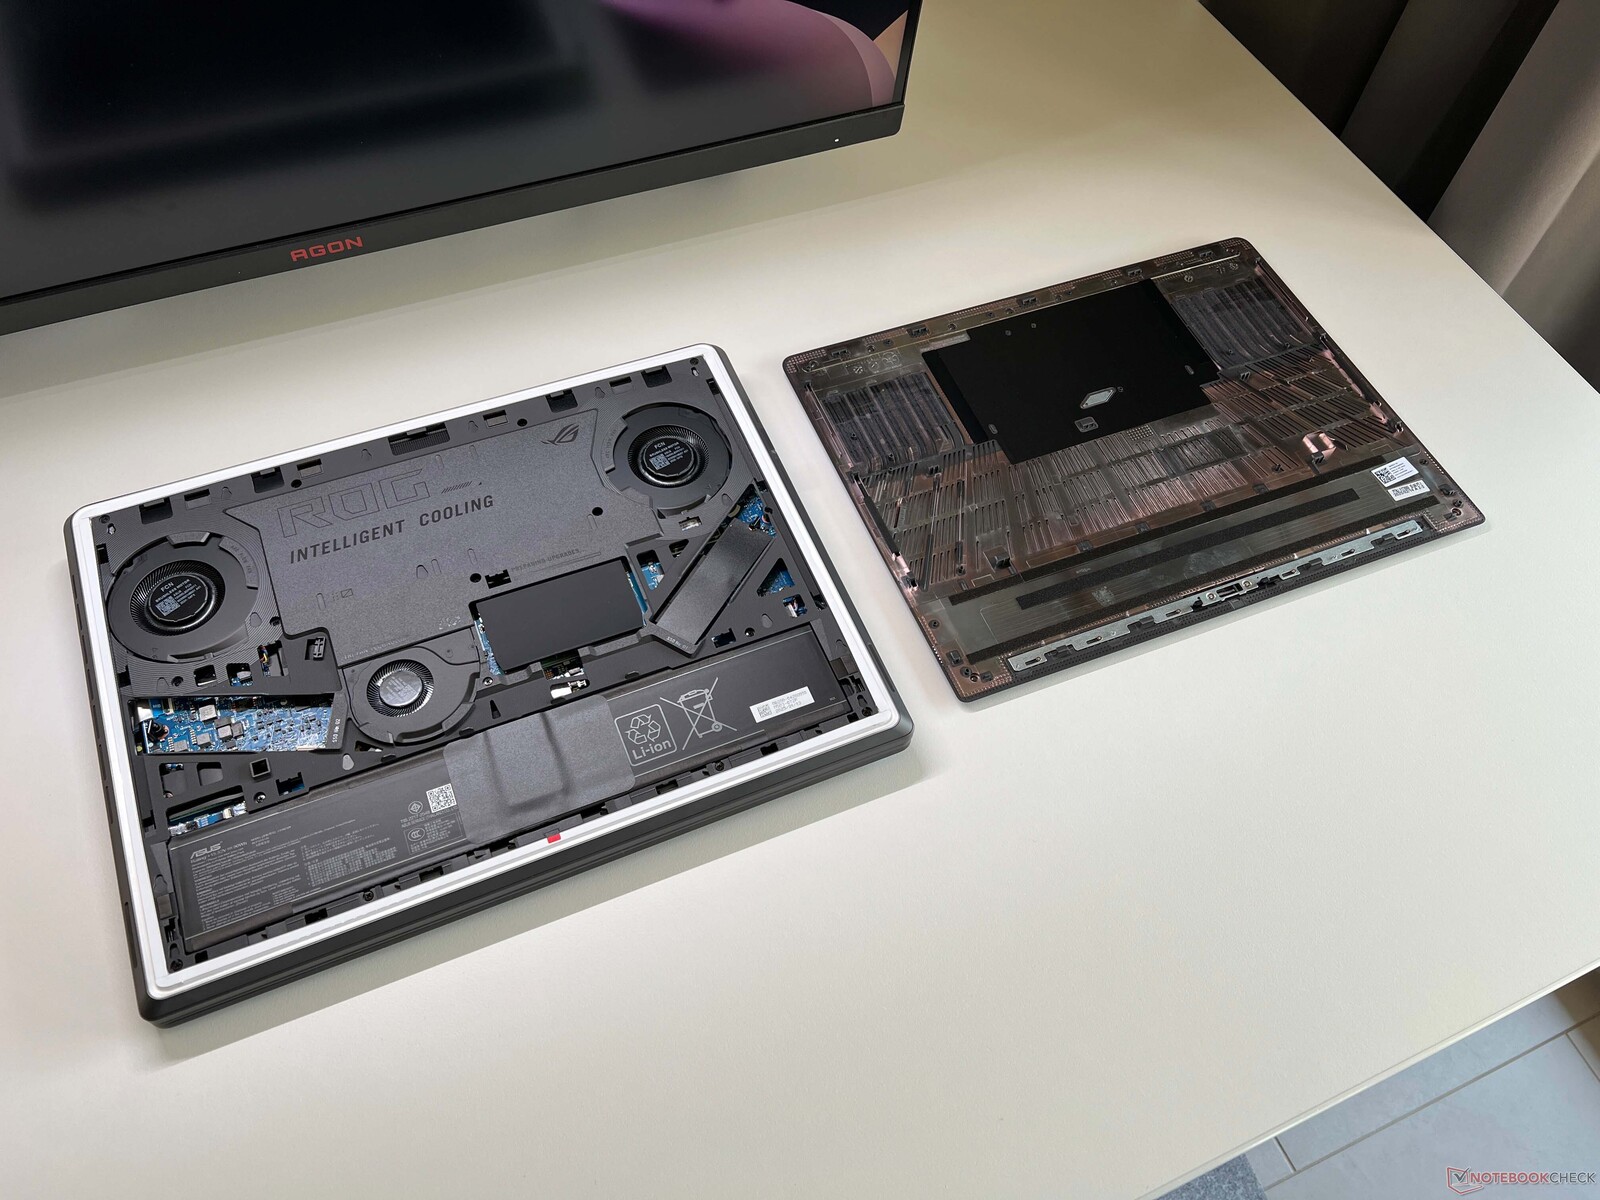
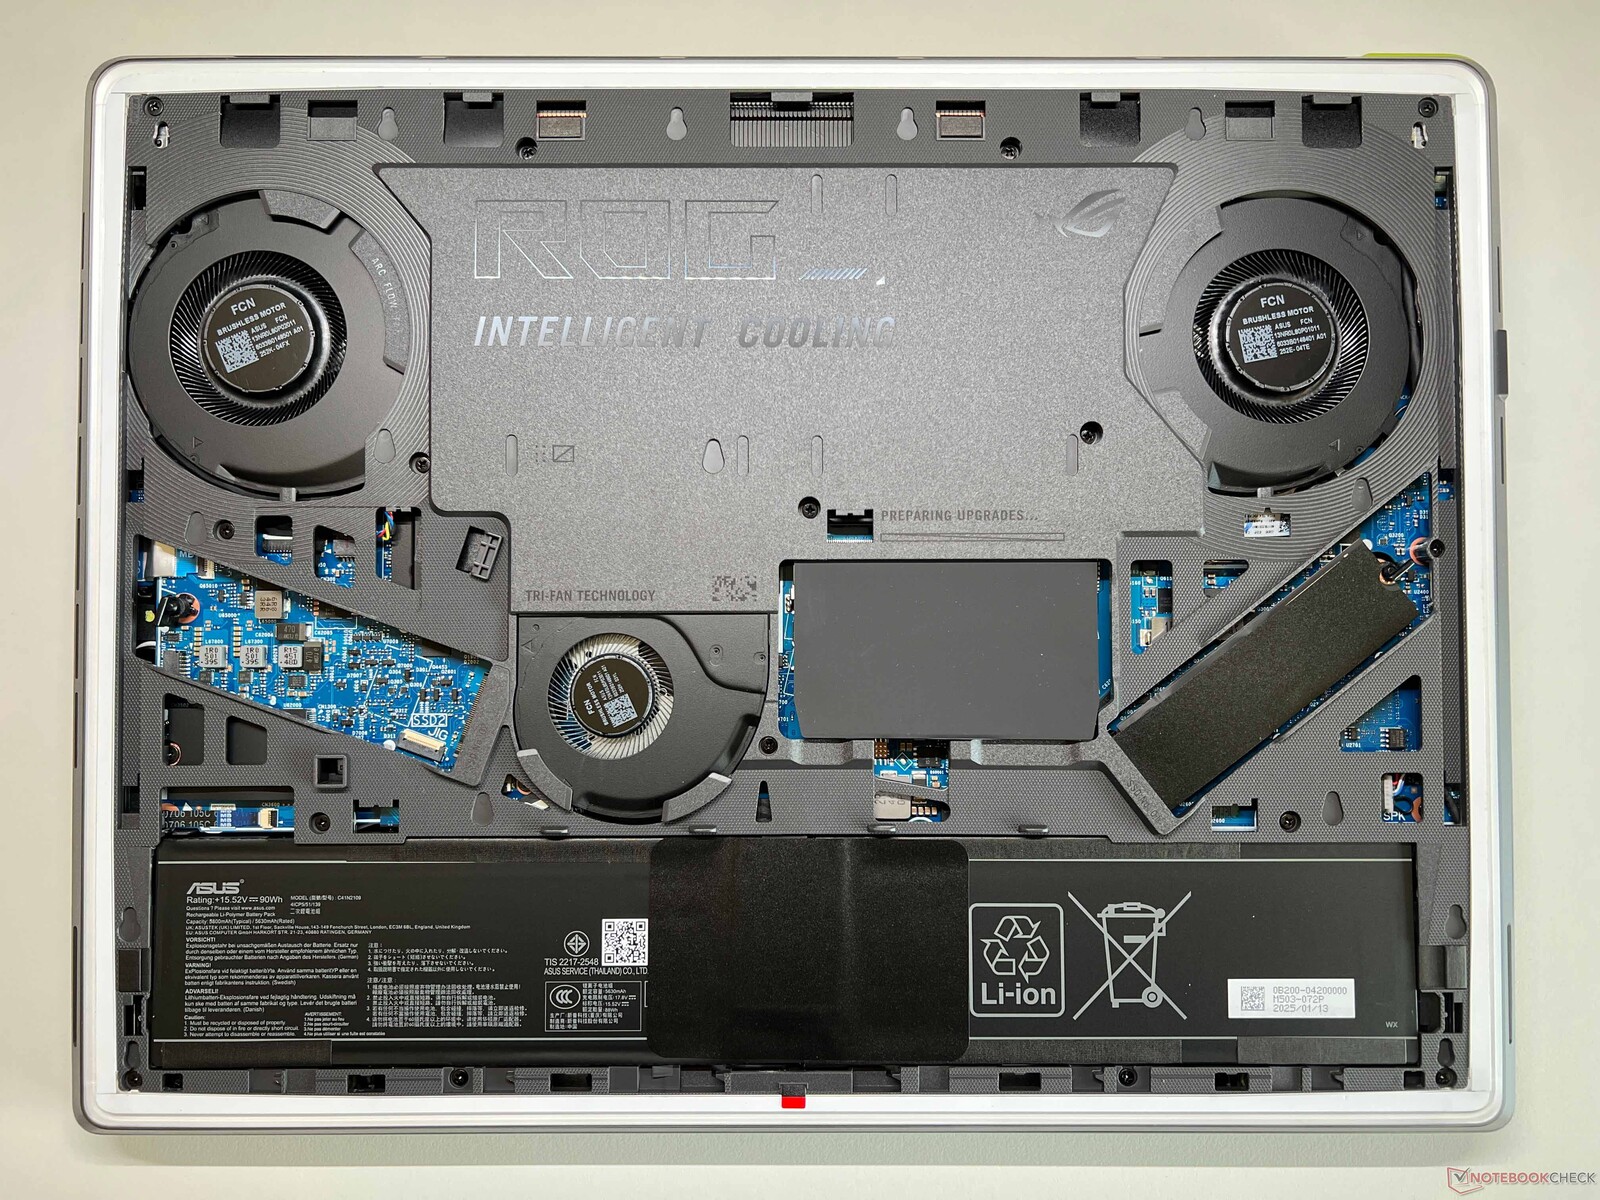
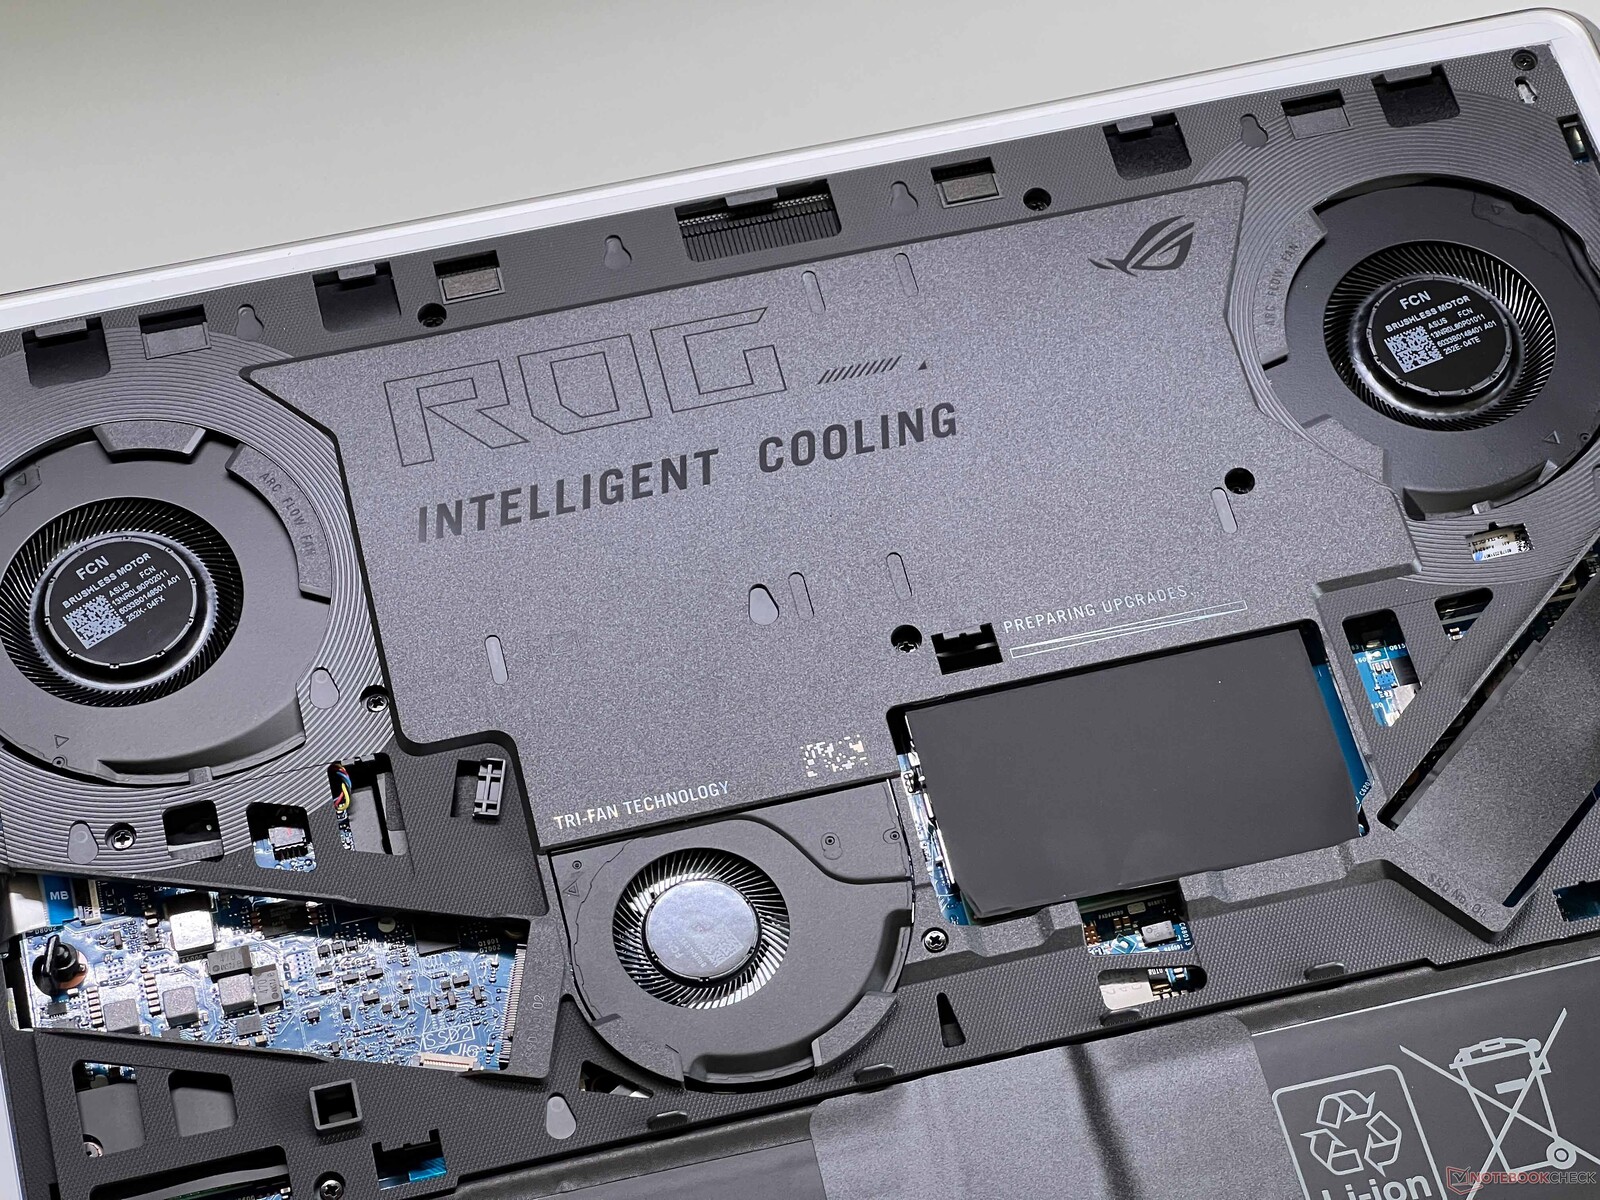
Maintenance

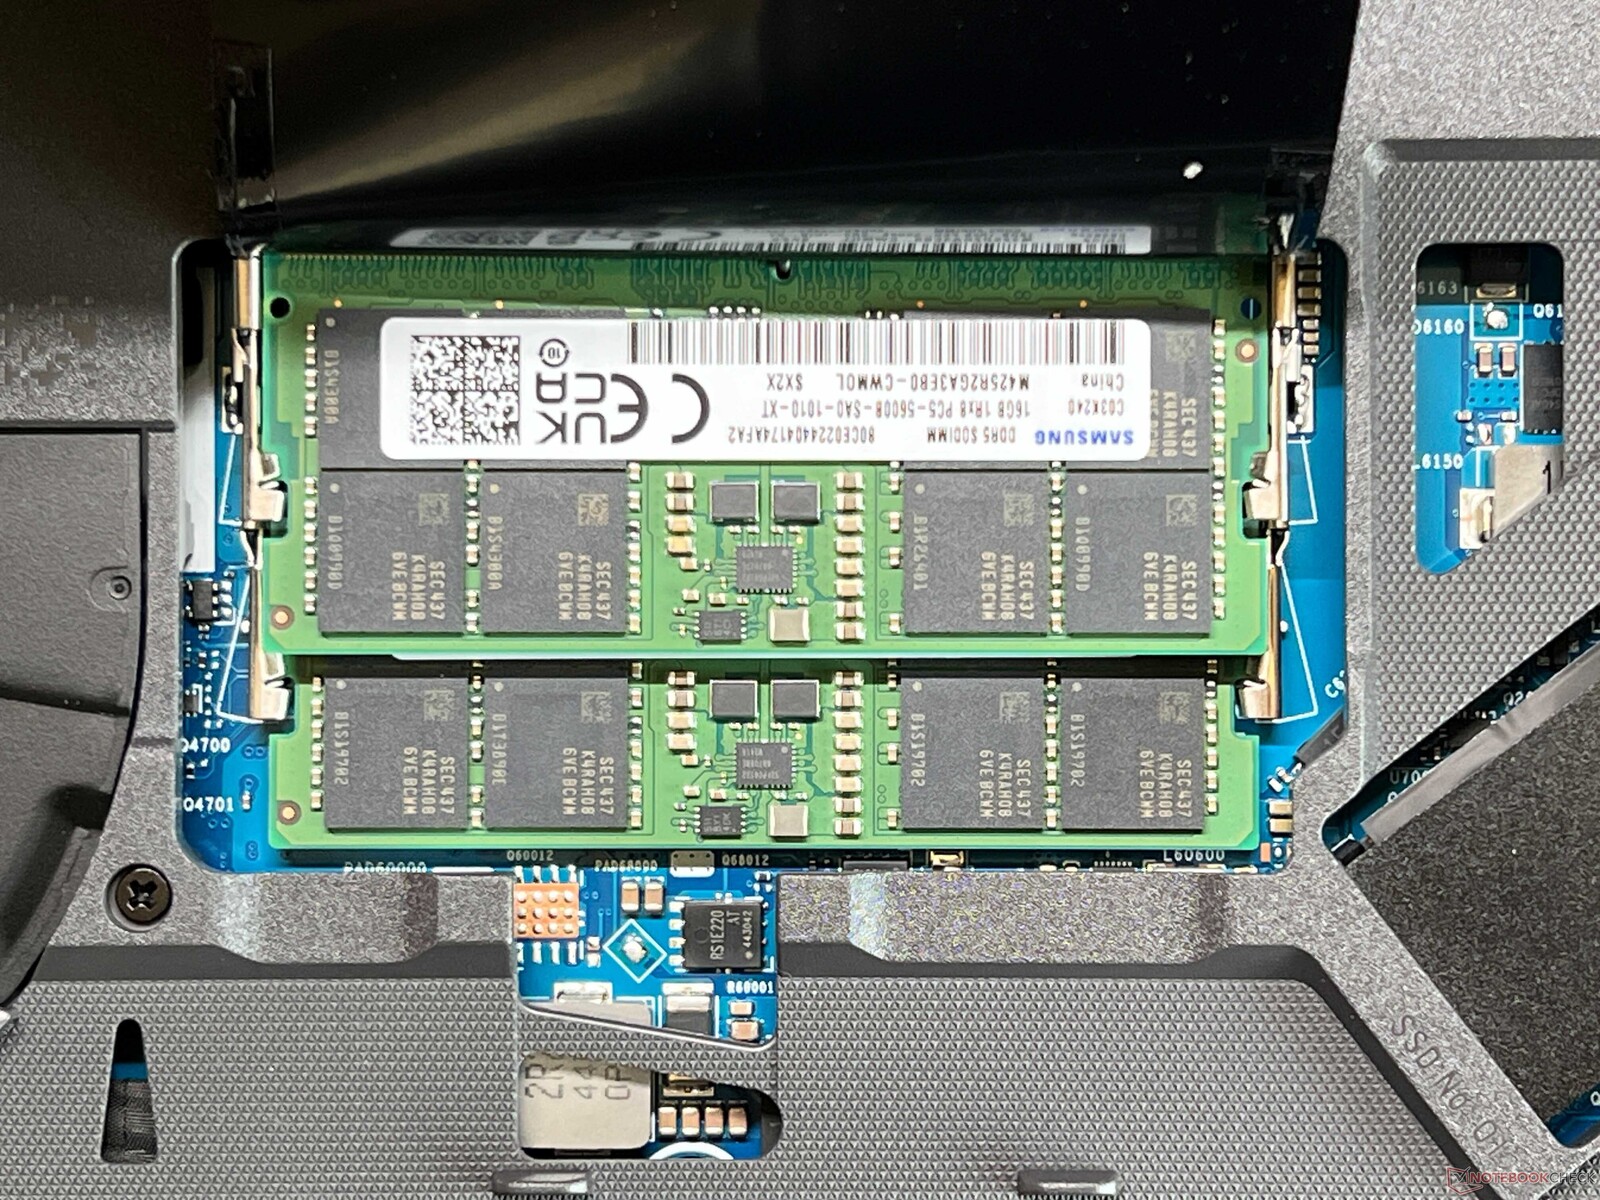
Accessing the components of the Strix G16 is extremely easy, since you can easily open a lock of the bottom plate with a small slider, allowing you to push the bottom plate toward the front to remove it. The insides of the laptop are dominated by the cooling system with its vapor chamber and three fans. The user also gets quick access to the two SSD slots and the two slots for the RAM modules.
Sustainability
Asus doesn't provide any information on the use of recycled materials or the CO2 footprint. The packaging consists mostly of cardboard and paper.
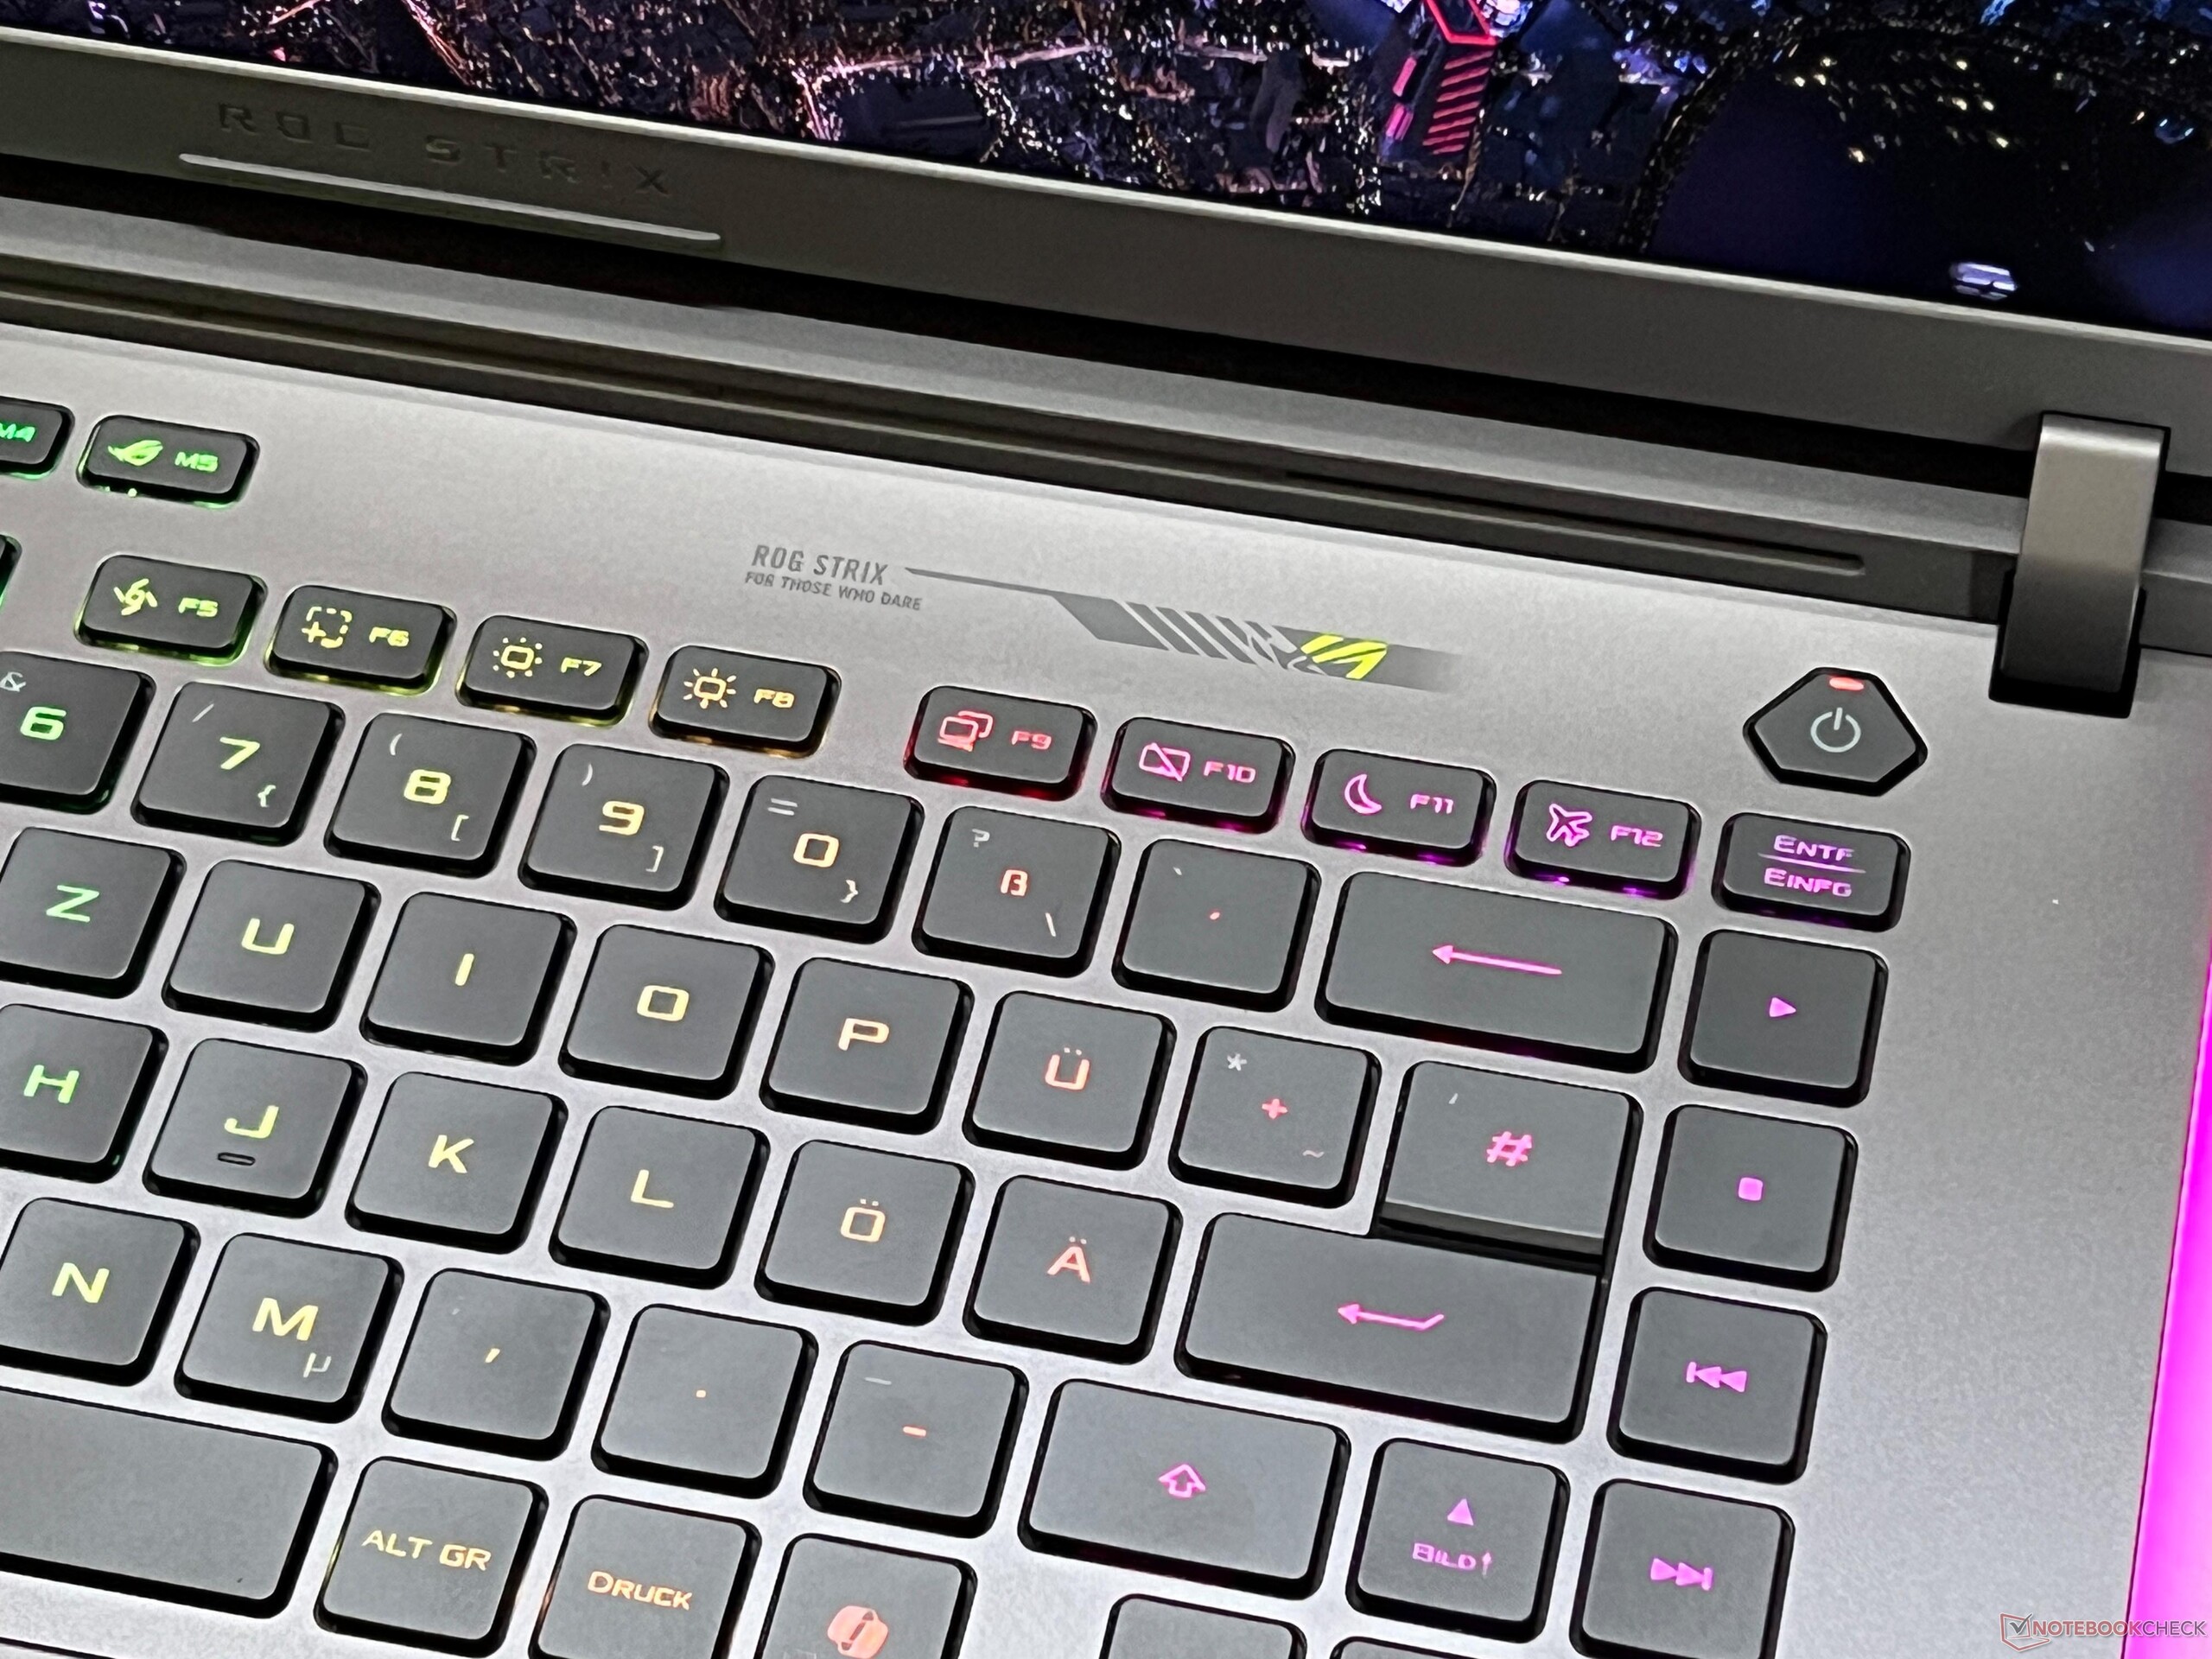
Input Devices - A comfortable keyboard
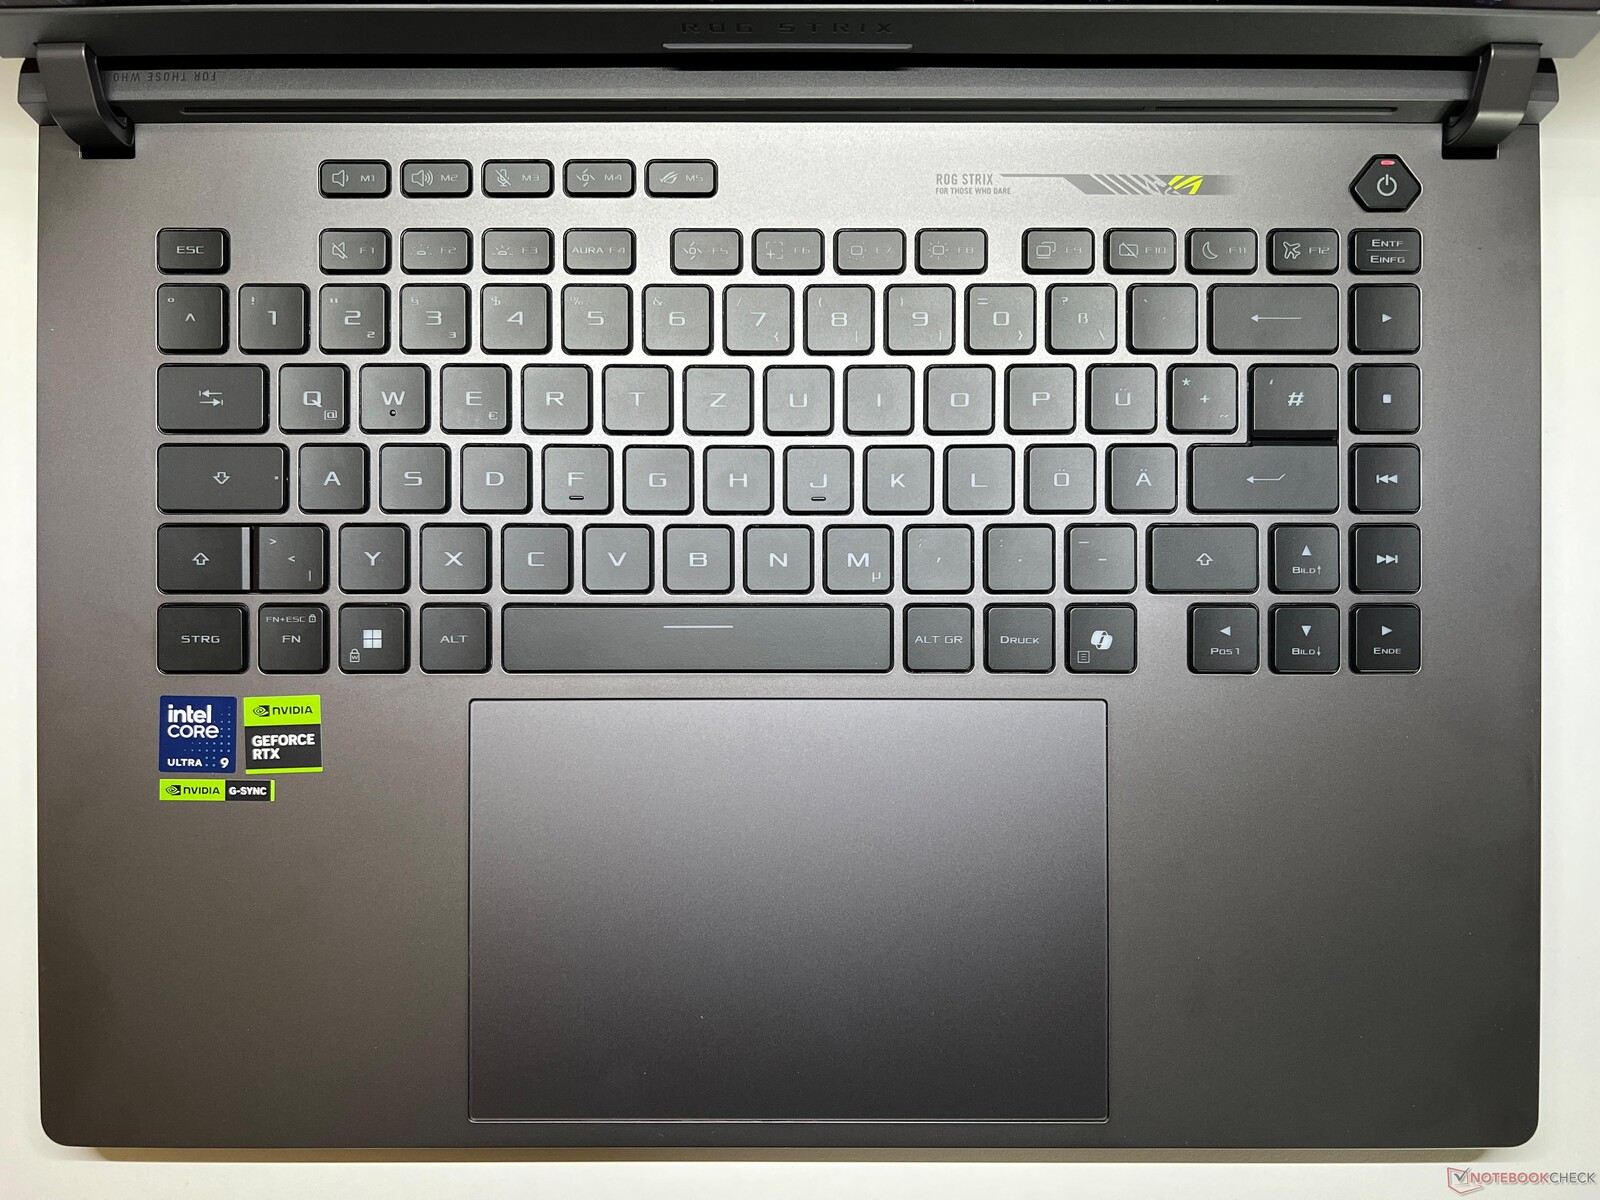
The Strix G16 uses a membrane keyboard with a sufficiently large stroke, leading to an overall very comfortable and quiet typing experience. The keys can be illuminated individually, which can of course also be synchronized with the rest of the case illumination. The keyboard layout is very good overall, and the size of the arrow keys is not reduced. However, it still takes a little time to get used to the additional column with the keys for controlling media on the right side.
Since Asus doesn't include a number block here, the very large ClickPad (15 x 9.8 cm, ~5.9 x 3.9 in) is positioned in the center of the base unit. Due to its good sliding characteristics, its operation works without a hitch. The mechanic clicks in the bottom area give good feedback with an even, subdued muffled clicking sound.
Display - IPS with 240 Hz and G-Sync

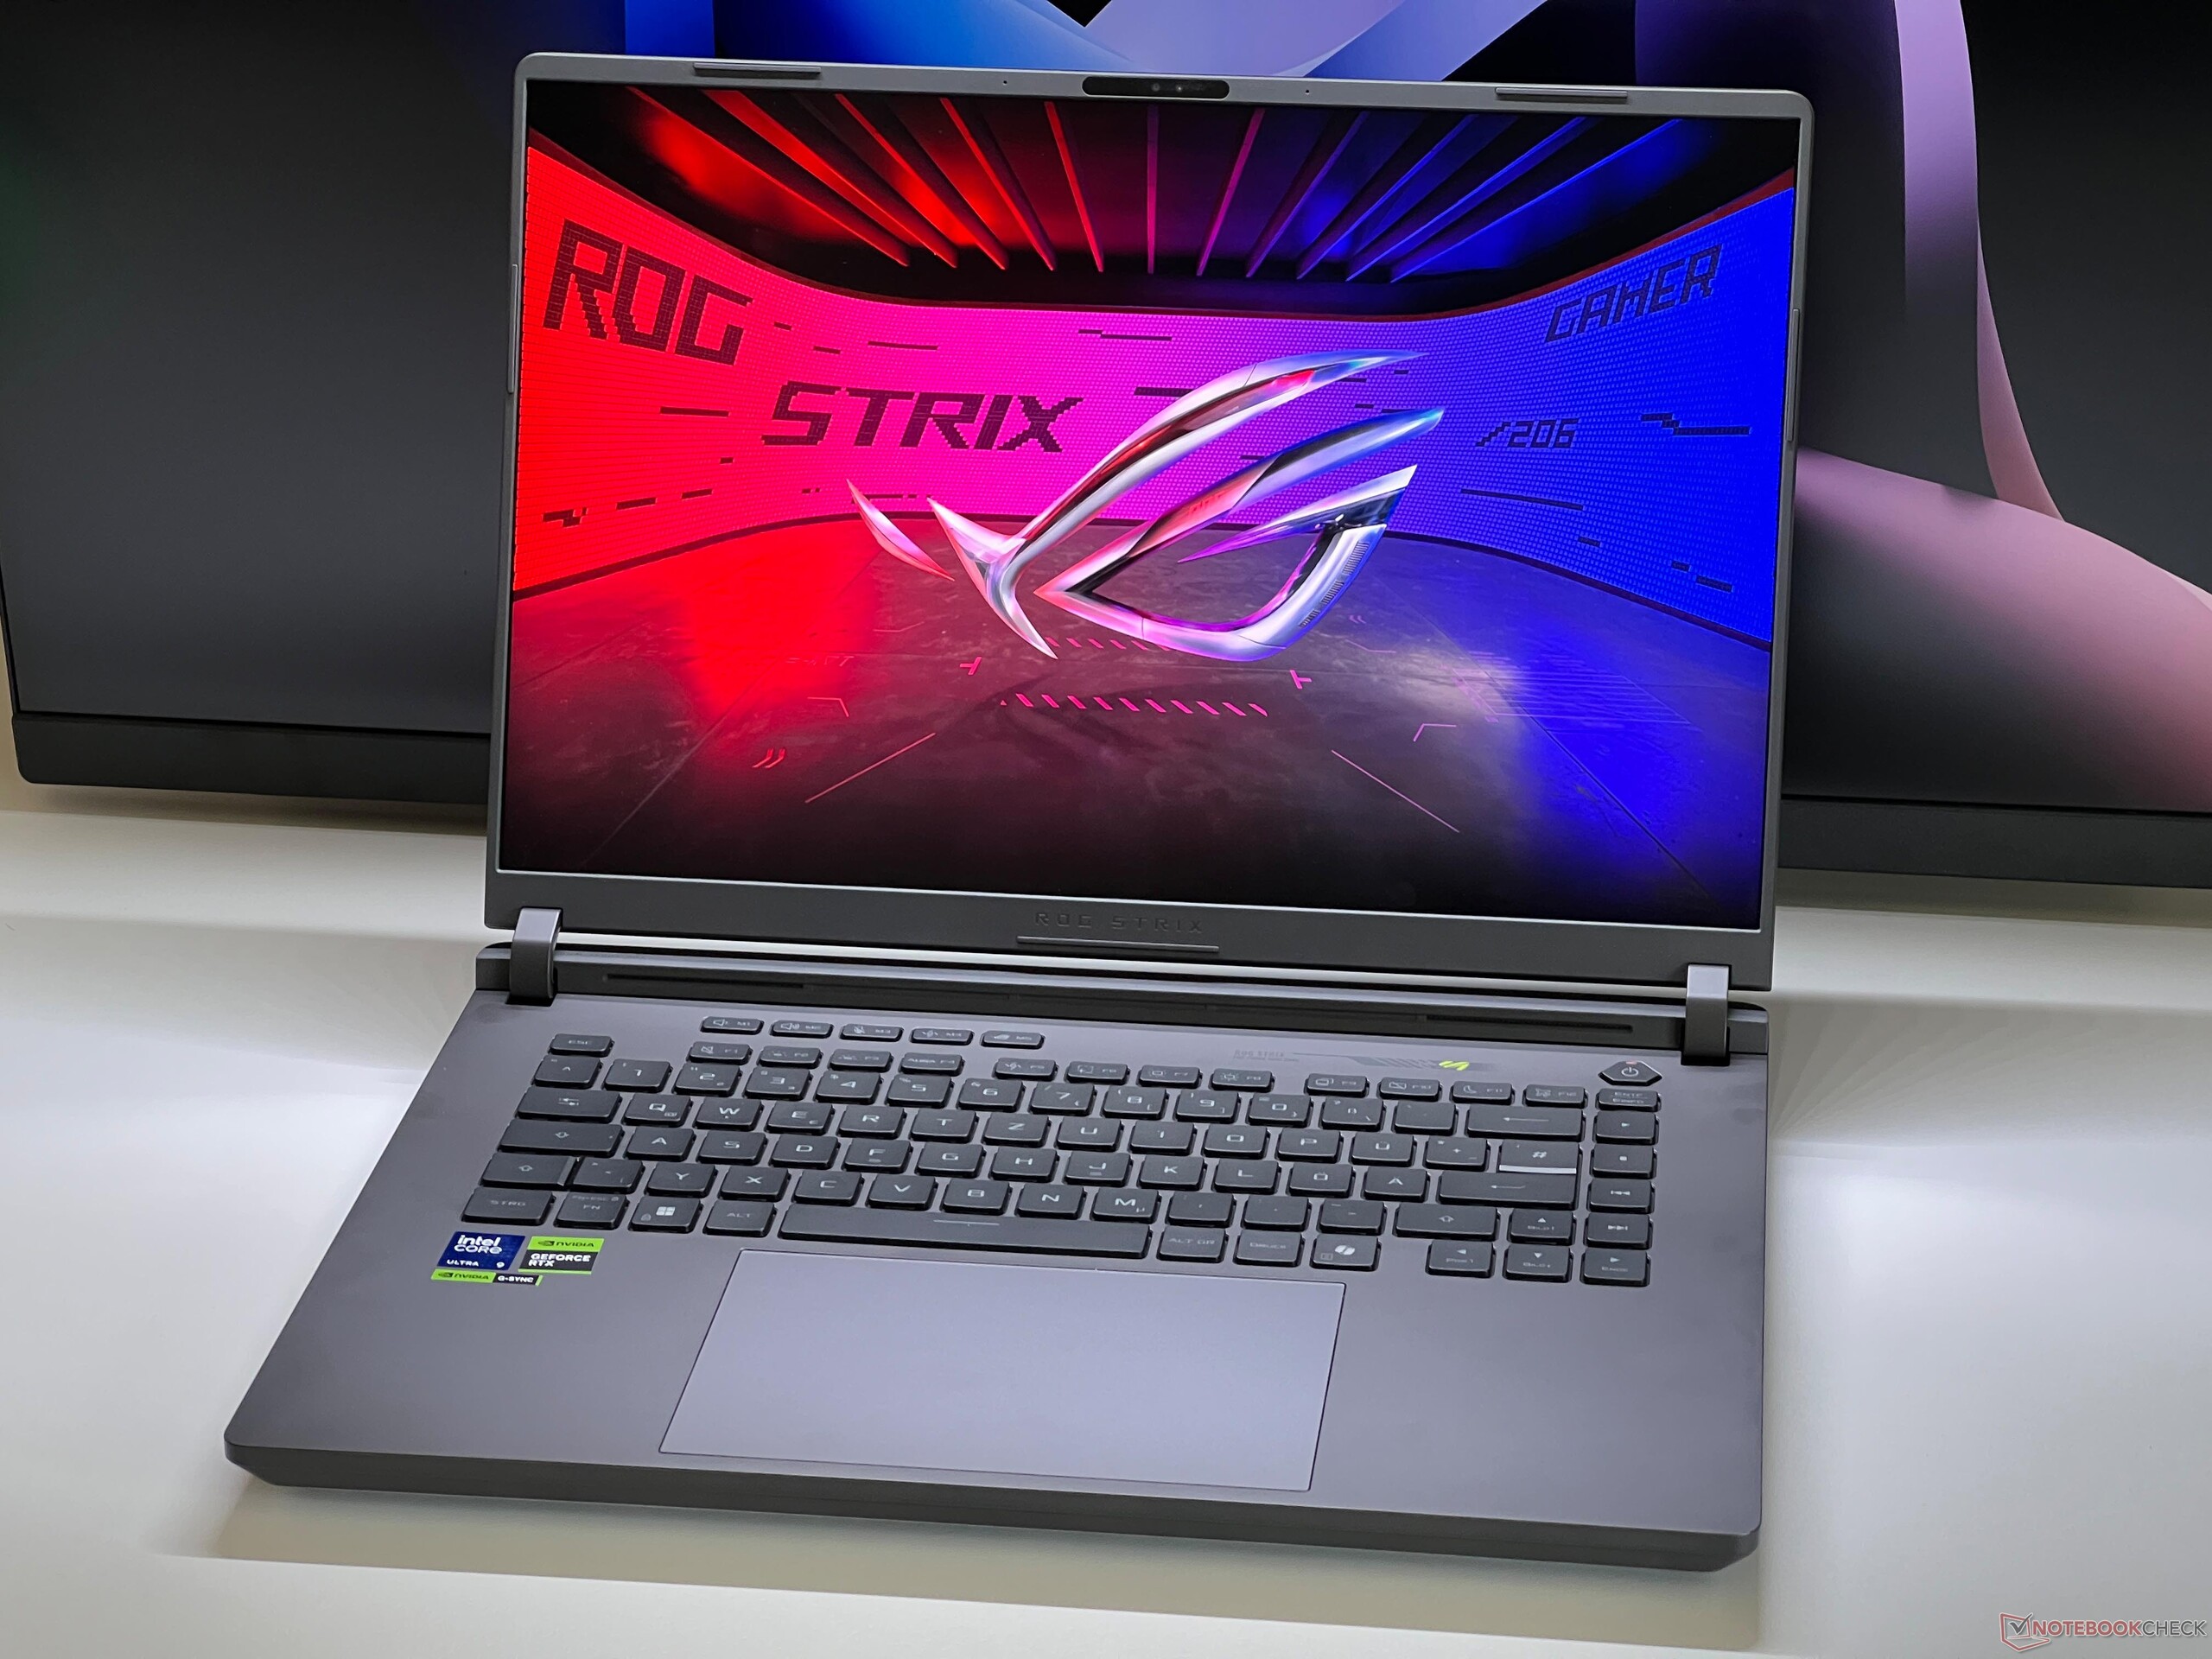
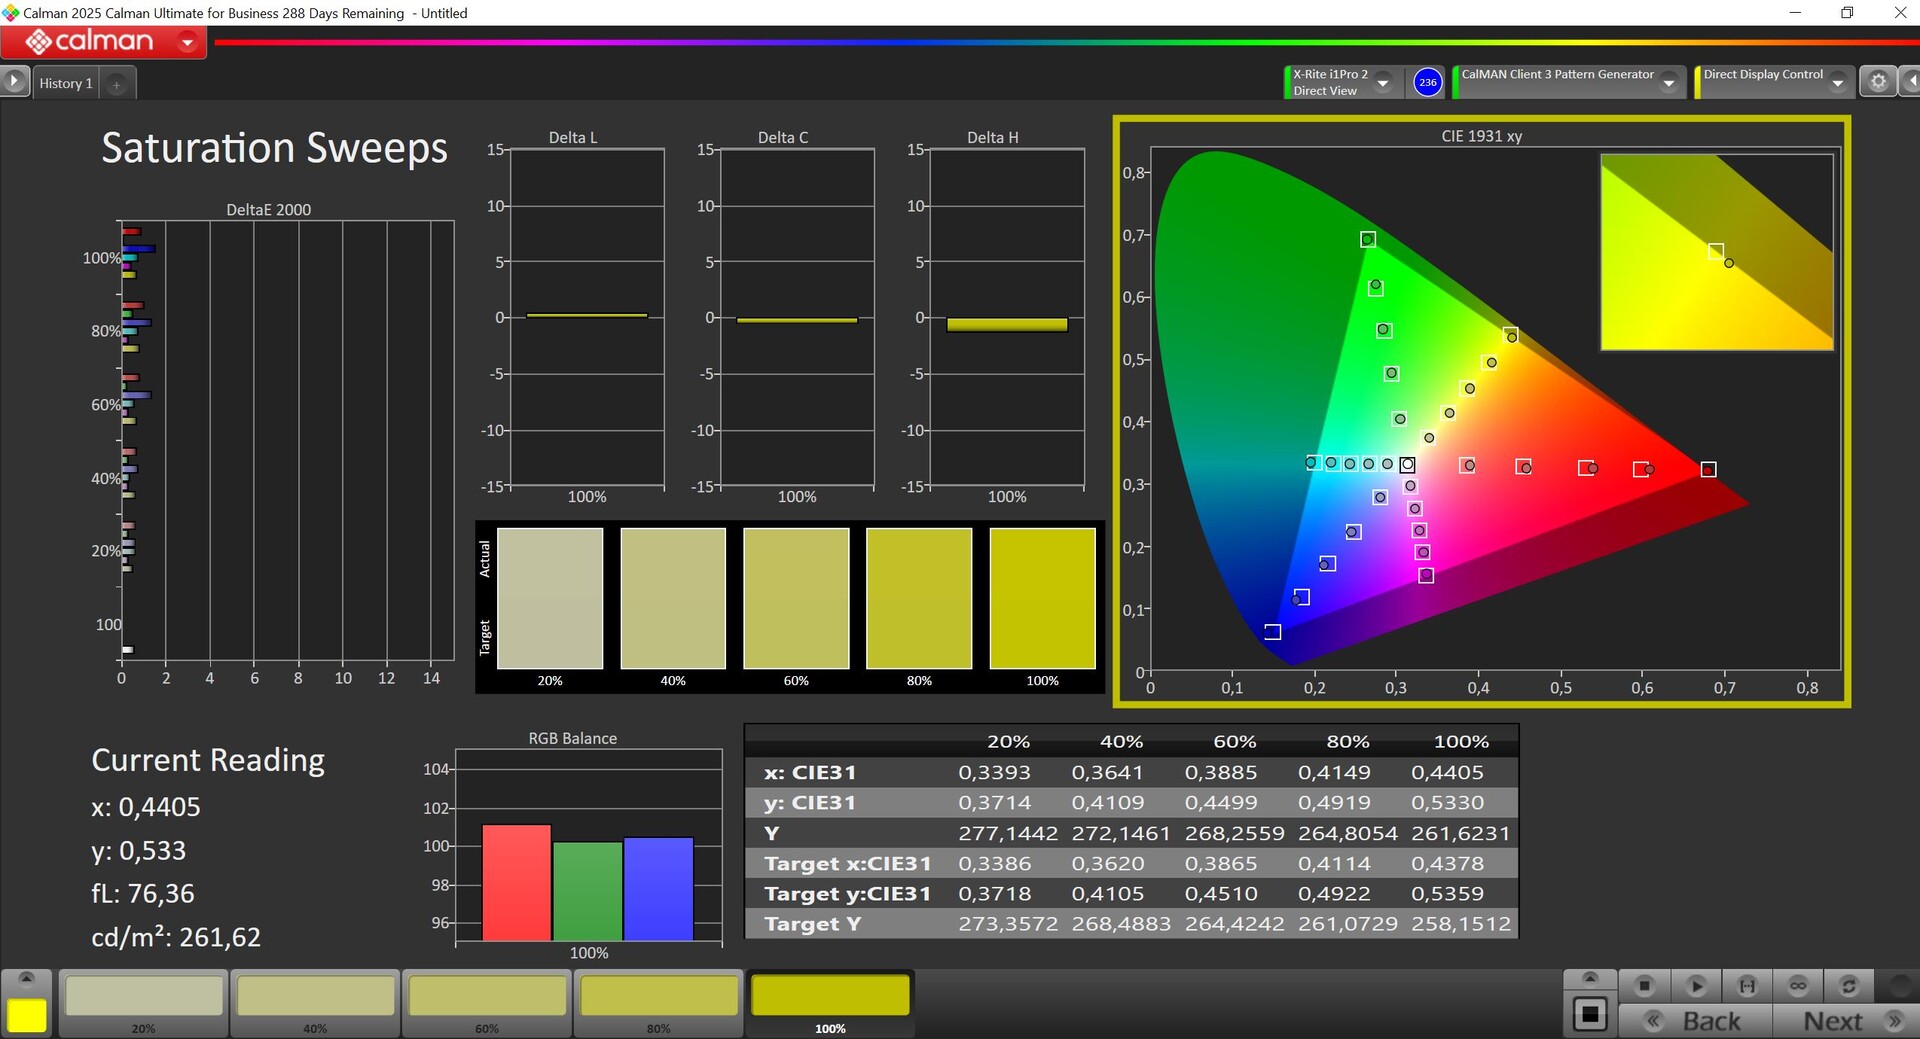
The ROG Strix G16 is offered exclusively with a large 16-inch IPS display with a resolution of 2560x1600 pixels (16:10, G-Sync). The subjective image quality of the matte panel is very good. Even bright areas don't have any problems with grainy impressions, but the contrast ratio is of course also smaller than in OLED or Mini-LED panels. On the other hand, there is no PWM flickering, the response times are very fast, and movements appear very smooth due to the 240 Hz refresh rate. At full brightness, you can see some slight halos in dark images. HDR content is not supported.
The panel reaches an average brightness of ~535 cd/m². At 0.41 cd/m², the black value is slightly elevated, leading also to a slightly lower maximum contrast ratio.
| |||||||||||||||||||||||||
Brightness Distribution: 89 %
Center on Battery: 545 cd/m²
Contrast: 1329:1 (Black: 0.41 cd/m²)
ΔE ColorChecker Calman: 1.6 | ∀{0.5-29.43 Ø4.72}
calibrated: 0.8
ΔE Greyscale Calman: 2.4 | ∀{0.09-98 Ø4.97}
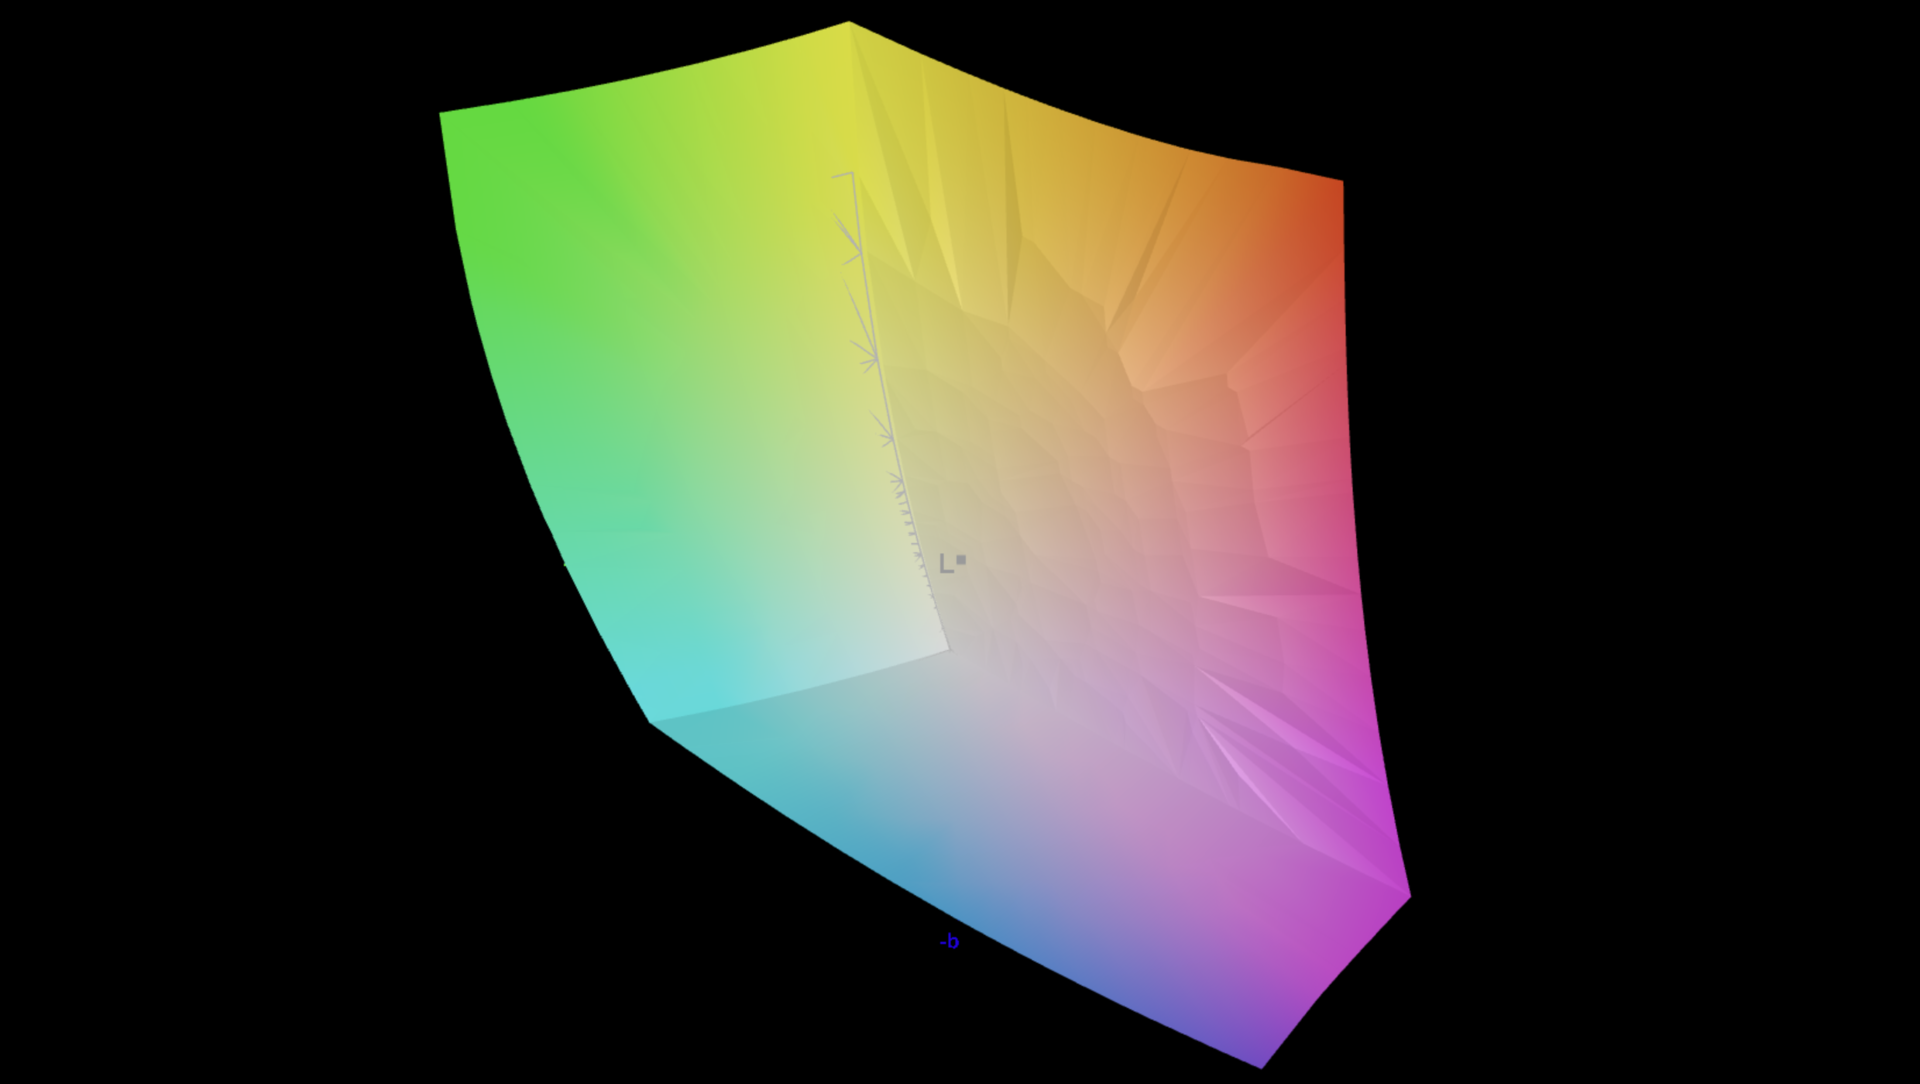
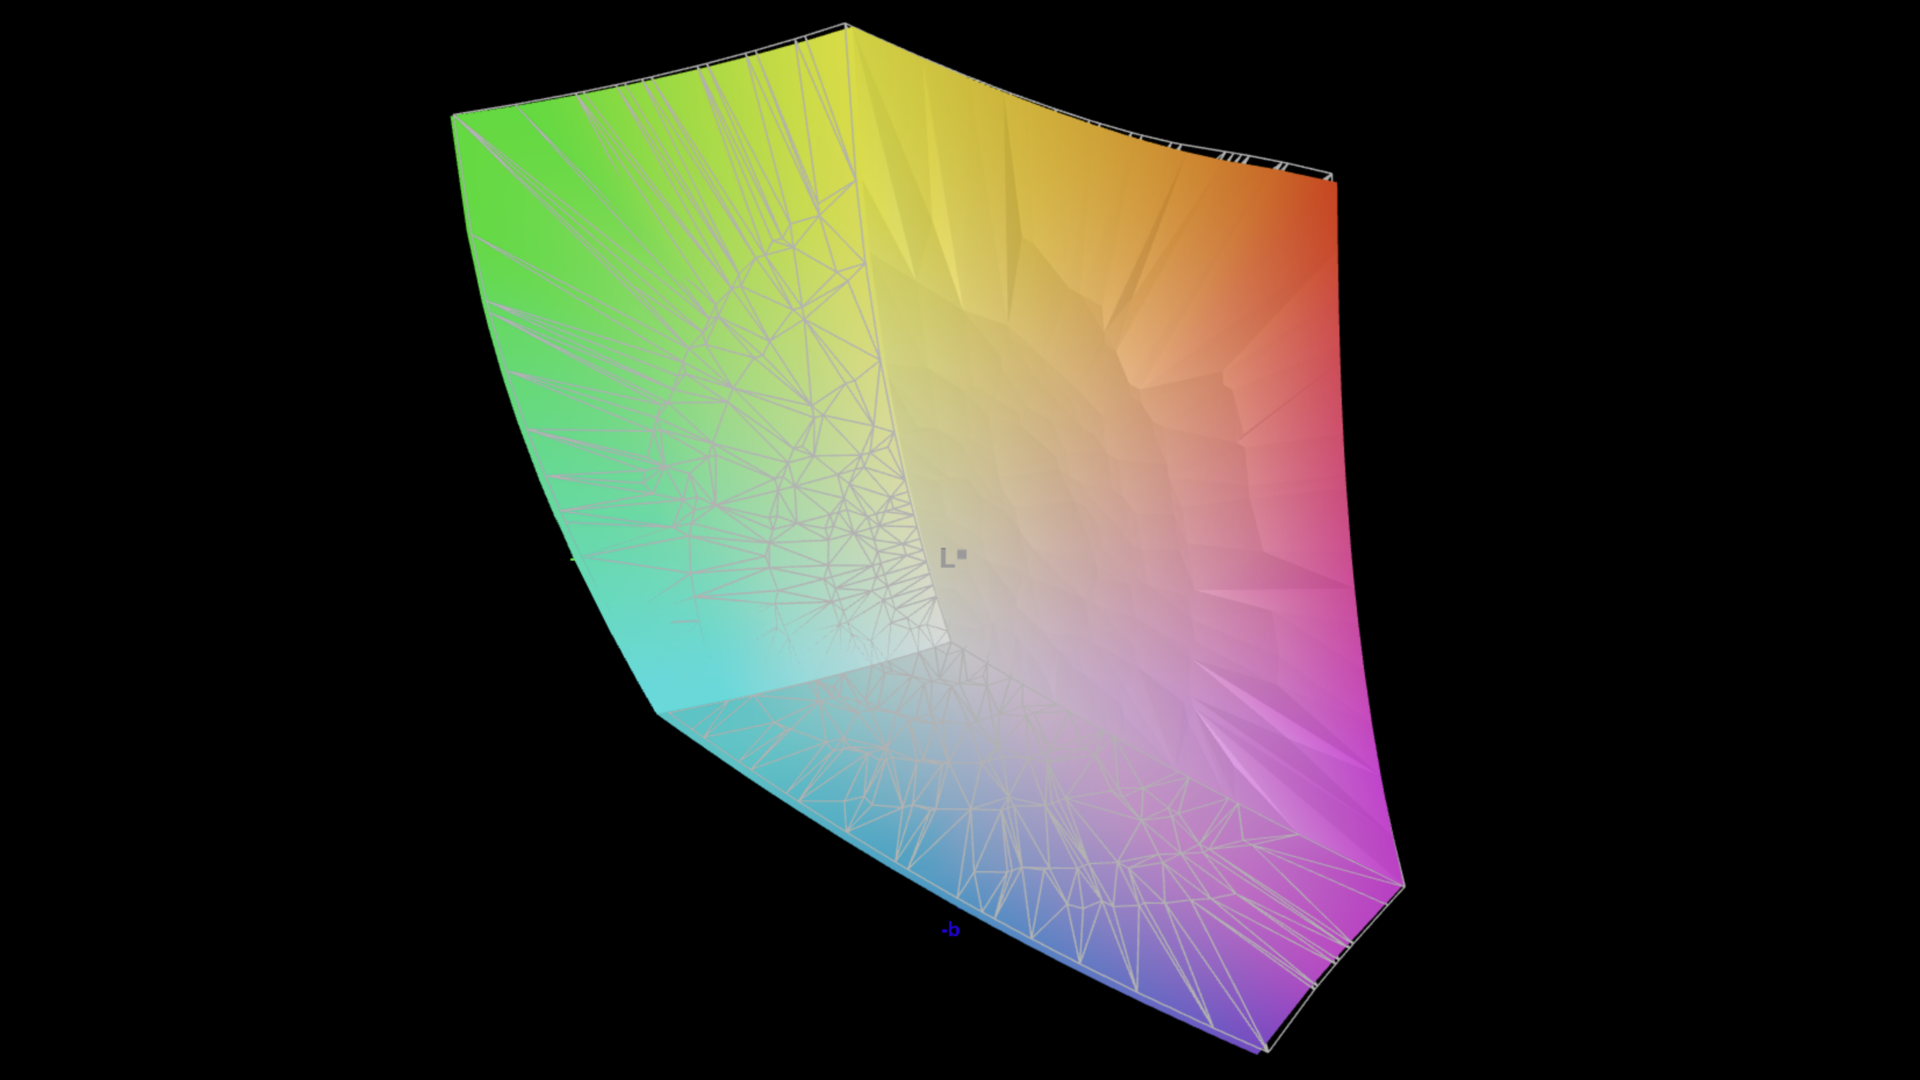
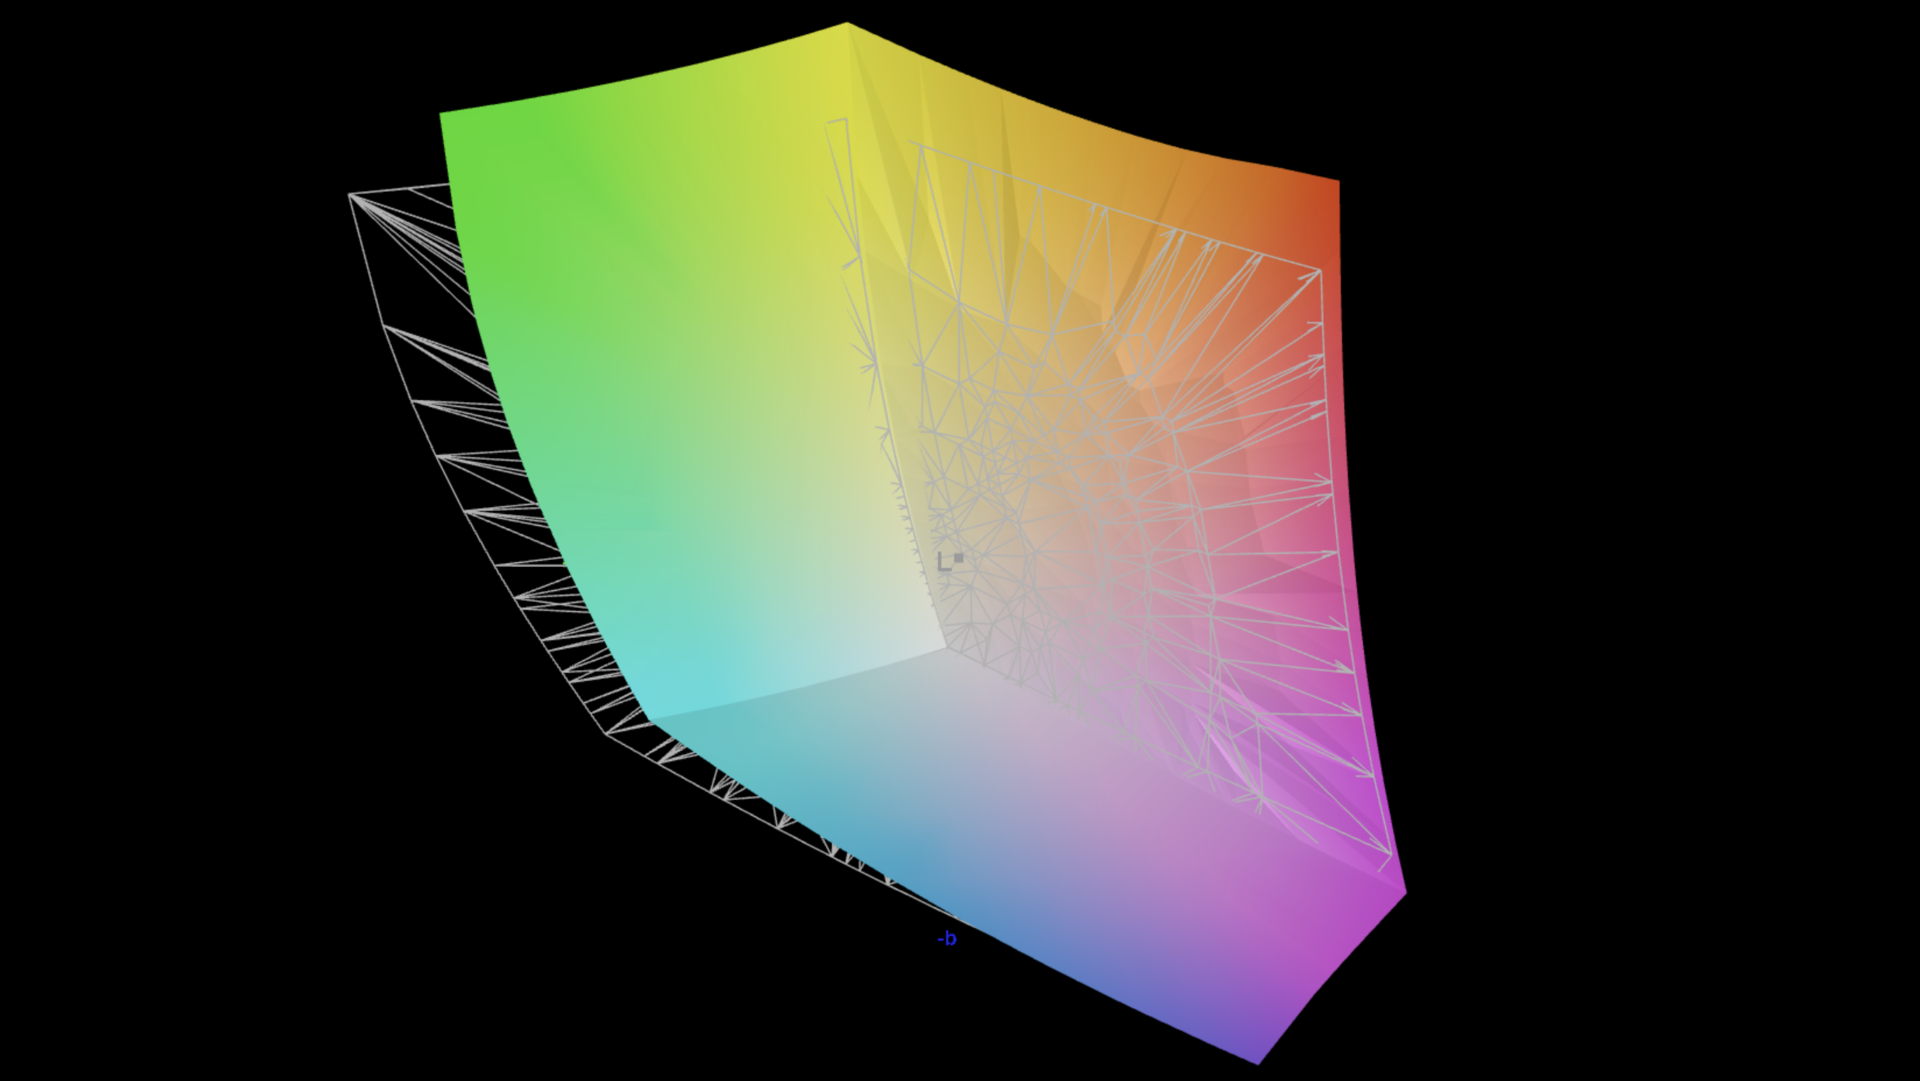
89.1% AdobeRGB 1998 (Argyll 3D)
99.9% sRGB (Argyll 3D)
99.1% Display P3 (Argyll 3D)
Gamma: 2.25
CCT: 6737 K
| Asus ROG Strix G16 G615 NE160QDM-NZC, IPS, 2560x1600, 16", 240 Hz | Acer Predator Helios 16 PH16-72 AUO43A8, IPS, 2560x1600, 16", 240 Hz | Schenker XMG Neo 16 (Early 24) BOE NE160QDM-NZA, IPS, 2560x1600, 16", 240 Hz | Asus ROG Strix Scar 16 G634JZR BOE NE160QDM-NM7, Mini LED, 2560x1600, 16", 240 Hz | HP Omen 16 (2024) BOE BOE0B7D, IPS, 2560x1440, 16.1", 240 Hz | Lenovo Legion Pro 7 16IRX9H BOE CQ NE16QDM-NZB, IPS, 2560x1600, 16", 240 Hz | Lenovo Legion Pro 7i 16 Gen 10 Samsung ATNA60HU01-0, OLED, 2560x1600, 16", 240 Hz | |
|---|---|---|---|---|---|---|---|
| Display | 2% | -17% | 1% | -18% | -1% | 2% | |
| HDR Peak Brightness (cd/m²) | 1020 | ||||||
| Display P3 Coverage (%) | 99.1 | 99.82 1% | 70.2 -29% | 99.8 1% | 68.6 -31% | 98.5 -1% | 99.5 0% |
| sRGB Coverage (%) | 99.9 | 100 0% | 98 -2% | 100 0% | 98.6 -1% | 99.9 0% | 100 0% |
| AdobeRGB 1998 Coverage (%) | 89.1 | 94.12 6% | 70.6 -21% | 90.8 2% | 70.6 -21% | 86.7 -3% | 94.4 6% |
| Response Times | -533% | -64% | -40% | -130% | -85% | 94% | |
| Response Time Grey 50% / Grey 80% * (ms) | 4.6 ? | 7.2 ? -57% | 11.2 ? -143% | 5 ? -9% | 14.1 ? -207% | 12.6 ? -174% | 0.28 ? 94% |
| Response Time Black / White * (ms) | 6.1 ? | 67.6 ? -1008% | 5.1 ? 16% | 10.4 ? -70% | 9.3 ? -52% | 5.8 ? 5% | 0.43 ? 93% |
| PWM Frequency (Hz) | 2630 | 2040 ? | 1438 ? | ||||
| PWM Amplitude * (%) | 100 | 29 | |||||
| Screen | 58394% | -41% | 10% | -17% | 12% | -15% | |
| Brightness middle (cd/m²) | 545 | 699 28% | 530 -3% | 490 -10% | 292 -46% | 487 -11% | 490.4 -10% |
| Brightness (cd/m²) | 536 | 672 25% | 497 -7% | 487 -9% | 291 -46% | 460 -14% | 498 -7% |
| Brightness Distribution (%) | 89 | 92 3% | 85 -4% | 94 6% | 85 -4% | 88 -1% | 97 9% |
| Black Level * (cd/m²) | 0.41 | 0.0001 100% | 0.53 -29% | 0.4 2% | 0.24 41% | 0.42 -2% | |
| Contrast (:1) | 1329 | 6990000 525859% | 1000 -25% | 1225 -8% | 1217 -8% | 1160 -13% | |
| Colorchecker dE 2000 * | 1.6 | 3.89 -143% | 3.21 -101% | 1.08 32% | 2.36 -48% | 1.12 30% | 3.2 -100% |
| Colorchecker dE 2000 max. * | 4 | 5.51 -38% | 5.8 -45% | 2.38 40% | 4.08 -2% | 2.26 44% | 6.04 -51% |
| Colorchecker dE 2000 calibrated * | 0.8 | 2.17 -171% | 1.44 -80% | 0.9 -13% | 0.93 -16% | 0.54 32% | 0.84 -5% |
| Greyscale dE 2000 * | 2.4 | 5.14 -114% | 4.2 -75% | 1.1 54% | 3 -25% | 1.4 42% | 1 58% |
| Gamma | 2.25 98% | 2.018 109% | 2.226 99% | 2.13 103% | 2.101 105% | 2.242 98% | 2.24 98% |
| CCT | 6737 96% | 7113 91% | 6448 101% | 6724 97% | 5976 109% | 6809 95% | 6373 102% |
| Total Average (Program / Settings) | 19288% /
37464% | -41% /
-39% | -10% /
1% | -55% /
-33% | -25% /
-5% | 27% /
7% |
* ... smaller is better

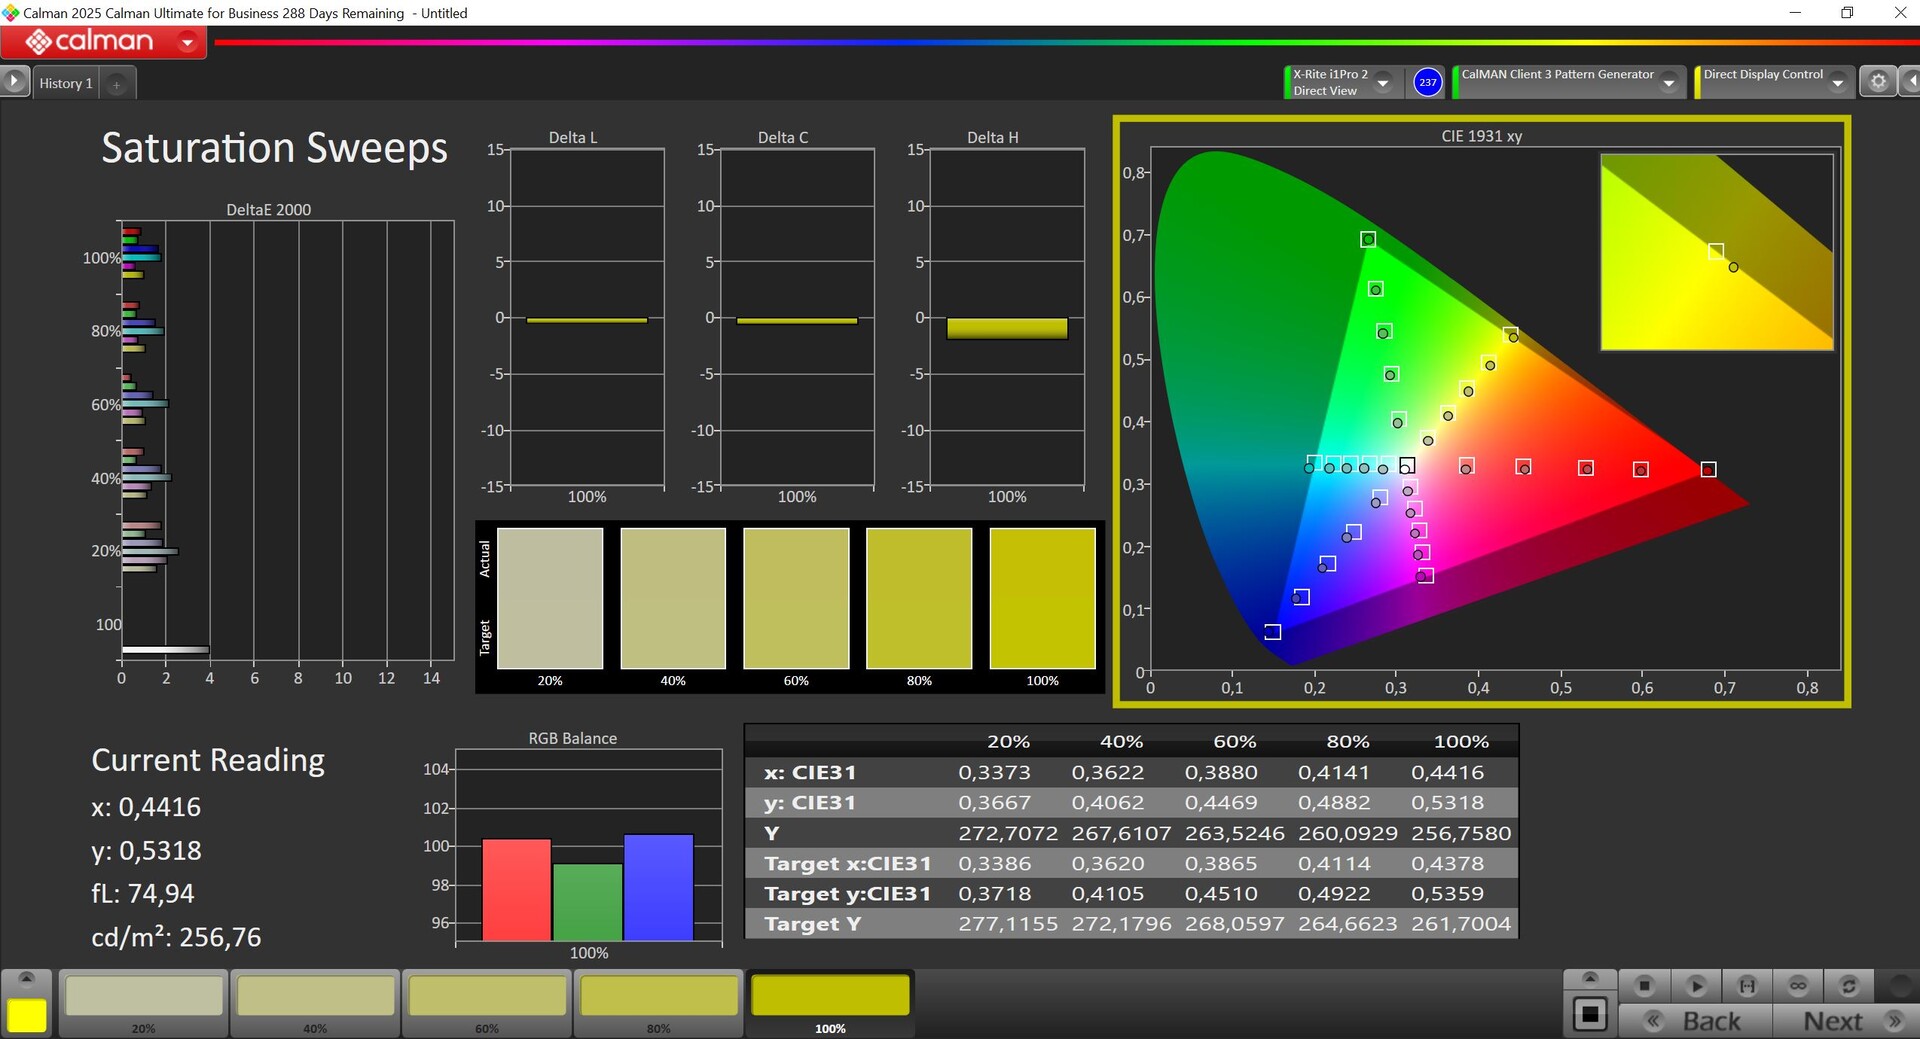

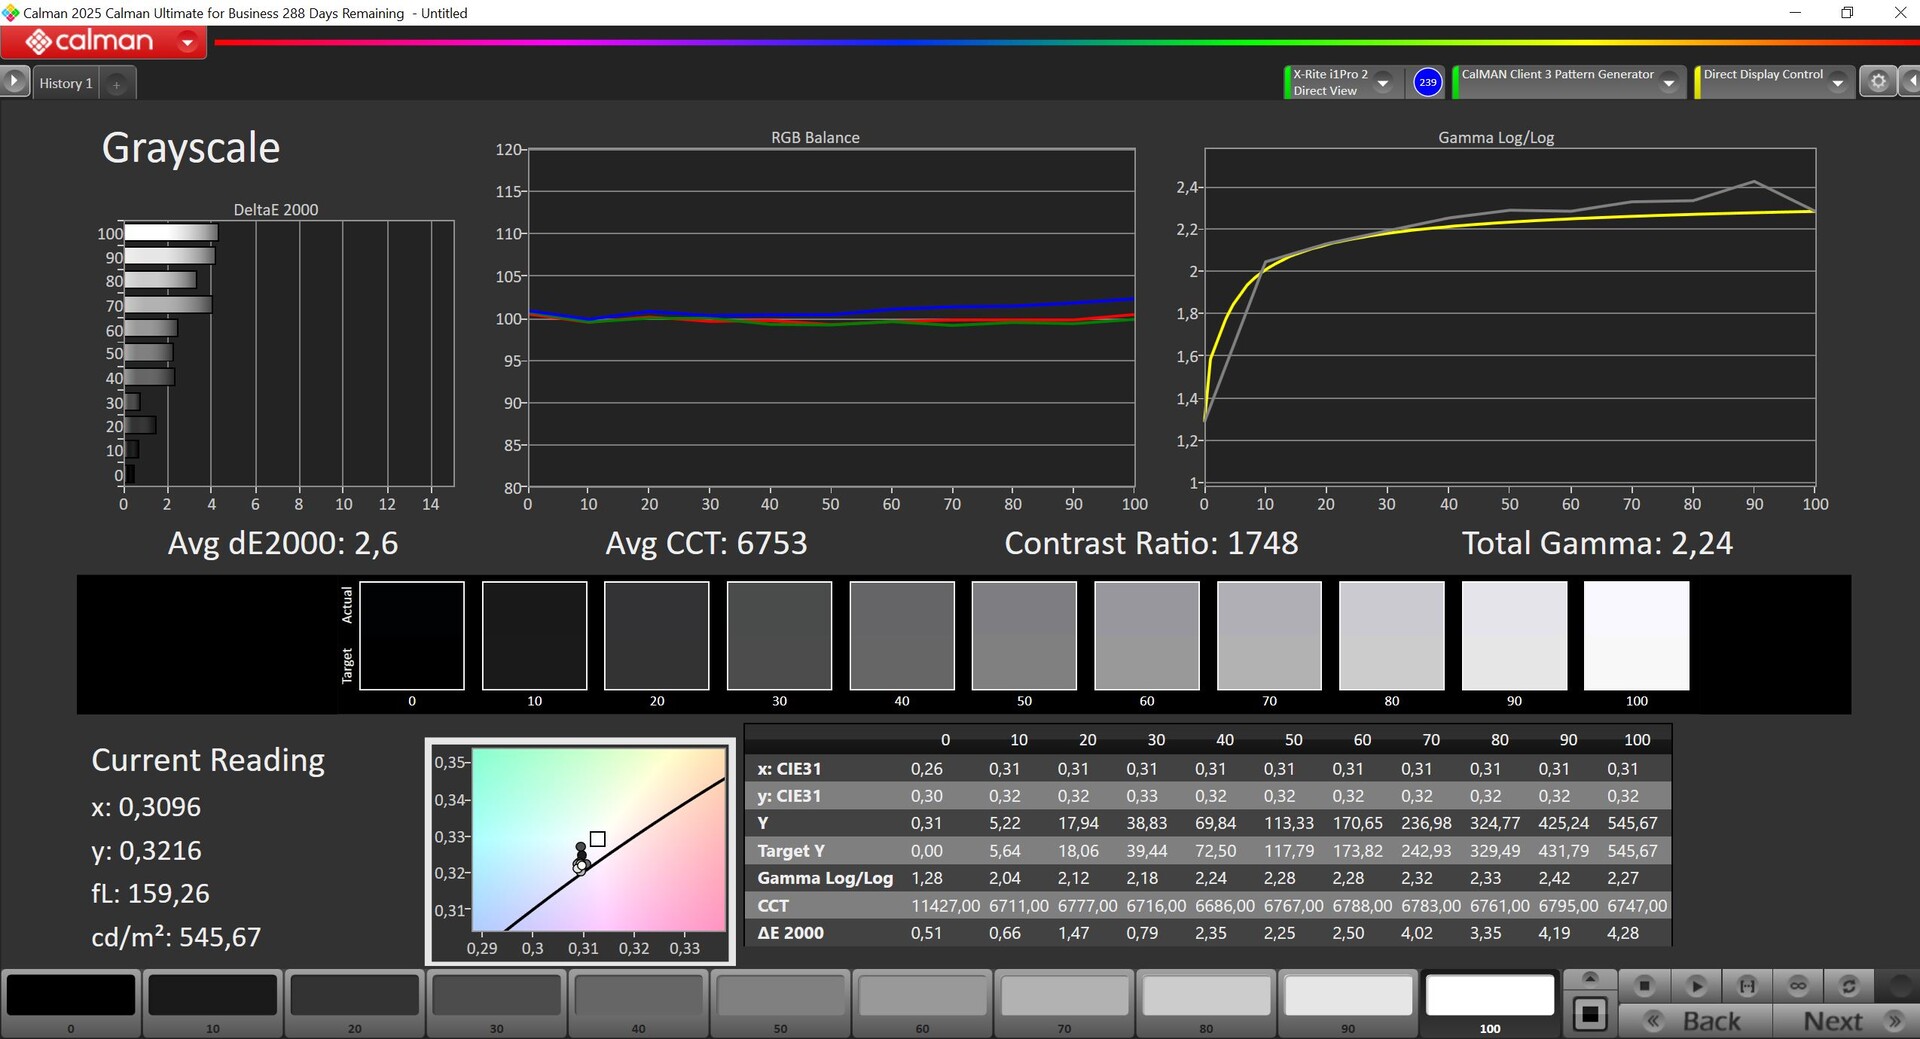


Asus offers various color profiles that we measure with the professional CalMAN software. All the profiles are basically very similar and already offer a decent image quality in the respective color spaces (P3 or sRGB), but we are only able to make use of the full potential of the panel when we apply our own calibration (the corresponding profile is available for free download from the link above). Thanks to the full color space coverage (P3 & sRGB), you can also use the display for image processing without any problems.


Display Response Times
| ↔ Response Time Black to White | ||
|---|---|---|
| 6.1 ms ... rise ↗ and fall ↘ combined | ↗ 1.6 ms rise | 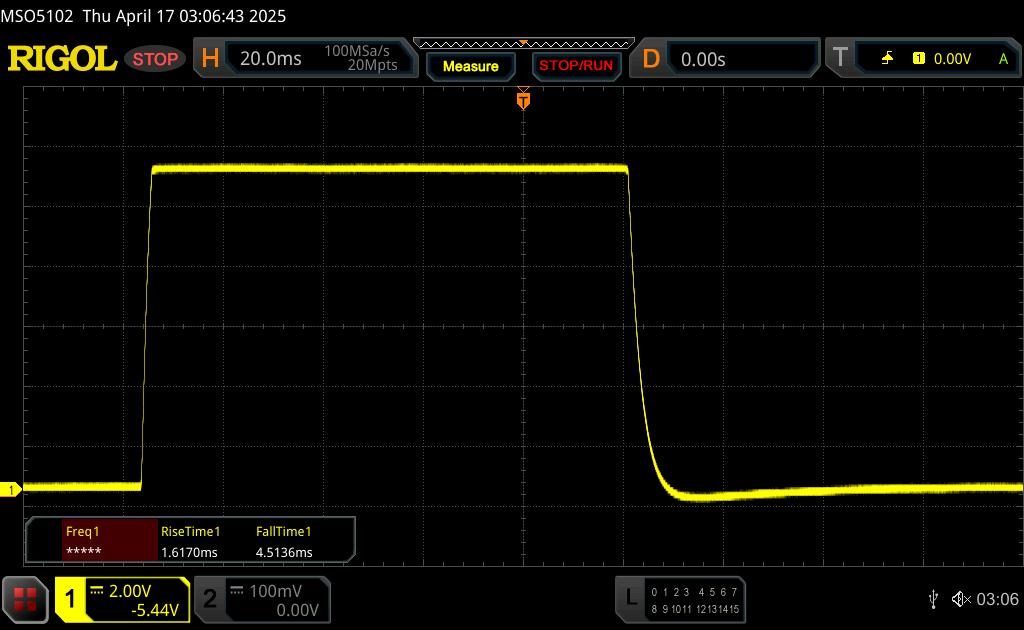 |
| ↘ 4.5 ms fall | ||
| The screen shows very fast response rates in our tests and should be very well suited for fast-paced gaming. In comparison, all tested devices range from 0.1 (minimum) to 240 (maximum) ms. » 20 % of all devices are better. This means that the measured response time is better than the average of all tested devices (19.8 ms). | ||
| ↔ Response Time 50% Grey to 80% Grey | ||
| 4.6 ms ... rise ↗ and fall ↘ combined | ↗ 2.1 ms rise | 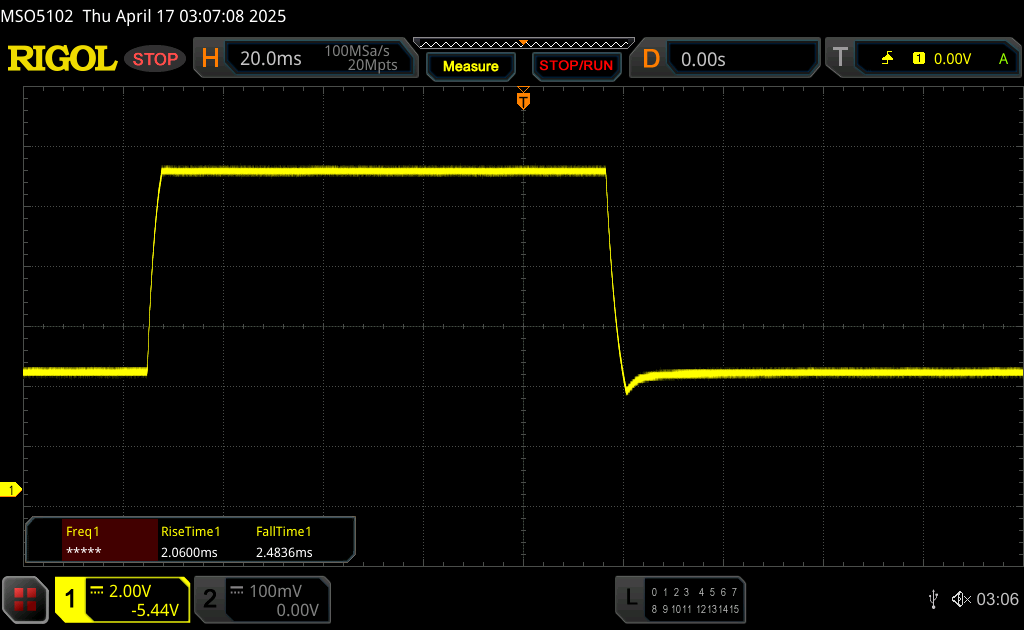 |
| ↘ 2.5 ms fall | ||
| The screen shows very fast response rates in our tests and should be very well suited for fast-paced gaming. In comparison, all tested devices range from 0.165 (minimum) to 636 (maximum) ms. » 16 % of all devices are better. This means that the measured response time is better than the average of all tested devices (31 ms). | ||
Screen Flickering / PWM (Pulse-Width Modulation)
| Screen flickering / PWM not detected | 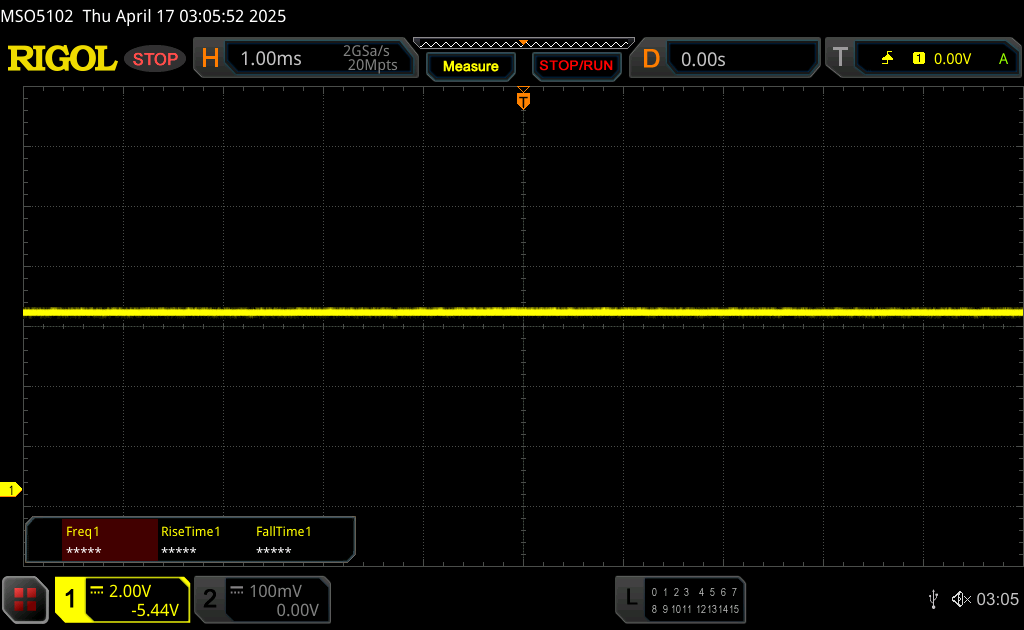 | ||
In comparison: 52 % of all tested devices do not use PWM to dim the display. If PWM was detected, an average of 7750 (minimum: 5 - maximum: 343500) Hz was measured. | |||


Performance - Core Ultra 9 and RTX 5080 Laptop
Test Conditions
The ROG Strix G16 offers the usual power profiles (Silent, Performance, Turbo) as well as a manual mode and additional modes for the GPU switching. The following table gives an overview of the profiles. In everyday operation, you can easily switch between the profiles with a key press. We run our benchmarks and measurements in Turbo mode (GPU mode: Standard). In battery operation, only the two profiles Quiet and Performance are available.
| Power Profile | CPU TDP | CB24 Multi | GPU TGP | Time Spy Graphics | Cyberpunk 2077 QHD Ultra | max. fan noise |
|---|---|---|---|---|---|---|
| Silent | 160/45 Watt | 1,490 Points | 55 Watt | 11,041 Points | 43.1 FPS | 36.1 dB(A) |
| Performance | 160/105 Watt | 2,033 Points | 160 Watt | 20,138 Points | 91.6 FPS | 49.3 dB(A) |
| Turbo | 175/150 Watt | 2,207 Pointse | 175 Watt | 21,571 Points | 99.5 FPS | 54.2 dB(A) |
| Battery (Performance) | 65/42 Watt | 1,627 Points | 55 Watt | 9,172 Points | 32 FPS | 34 dB(A) |
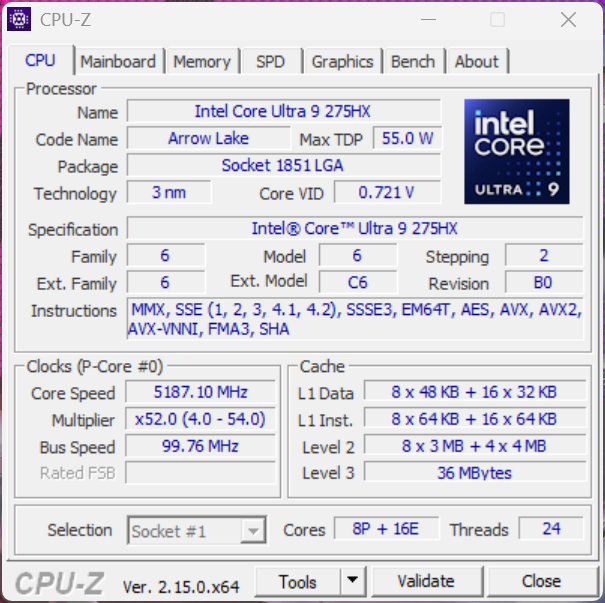
Processor - Core Ultra 9 275HX
Asus uses the new Intel Core Ultra 9 275HX of the Arrow Lake generation, which can consume a maximum of 175 watts before it levels out at 150 watts. The CPU performance is excellent, and the new Stix G16 is able to place at the top of our comparison field across all benchmarks. However, the advantage compared to fast implementations of the old Core i9-14900HX isn't particularly large.
Cinebench R15 Multi Constant Load Test
Cinebench 2024: CPU Multi Core | CPU Single Core
Cinebench R23: Multi Core | Single Core
Cinebench R20: CPU (Multi Core) | CPU (Single Core)
Cinebench R15: CPU Multi 64Bit | CPU Single 64Bit
Blender: v2.79 BMW27 CPU
7-Zip 18.03: 7z b 4 | 7z b 4 -mmt1
Geekbench 6.7: Multi-Core | Single-Core
Geekbench 5.5: Multi-Core | Single-Core
HWBOT x265 Benchmark v2.2: 4k Preset
LibreOffice : 20 Documents To PDF
R Benchmark 2.5: Overall mean
| CPU Performance rating | |
| Asus ROG Strix G16 G615 | |
| Schenker XMG Neo 16 (Early 24) | |
| Lenovo Legion Pro 7i 16 Gen 10 | |
| Average Intel Core Ultra 9 275HX | |
| Lenovo Legion Pro 7 16IRX9H | |
| Asus ROG Strix Scar 16 G634JZR | |
| Acer Predator Helios 16 PH16-72 | |
| HP Omen 16 (2024) | |
| Average of class Gaming | |
| Cinebench 2024 / CPU Multi Core | |
| Asus ROG Strix G16 G615 | |
| Lenovo Legion Pro 7i 16 Gen 10 | |
| Average Intel Core Ultra 9 275HX (1547 - 2288, n=27) | |
| Schenker XMG Neo 16 (Early 24) | |
| Lenovo Legion Pro 7 16IRX9H | |
| Asus ROG Strix Scar 16 G634JZR | |
| Acer Predator Helios 16 PH16-72 | |
| Average of class Gaming (486 - 2298, n=88, last 2 years) | |
| HP Omen 16 (2024) | |
| Cinebench 2024 / CPU Single Core | |
| Asus ROG Strix G16 G615 | |
| Lenovo Legion Pro 7i 16 Gen 10 | |
| Average Intel Core Ultra 9 275HX (123.1 - 138.2, n=27) | |
| Schenker XMG Neo 16 (Early 24) | |
| Lenovo Legion Pro 7 16IRX9H | |
| HP Omen 16 (2024) | |
| Asus ROG Strix Scar 16 G634JZR | |
| Acer Predator Helios 16 PH16-72 | |
| Average of class Gaming (95 - 138.2, n=88, last 2 years) | |
| Cinebench R23 / Multi Core | |
| Lenovo Legion Pro 7i 16 Gen 10 | |
| Schenker XMG Neo 16 (Early 24) | |
| Average Intel Core Ultra 9 275HX (30712 - 40970, n=31) | |
| Asus ROG Strix G16 G615 | |
| Lenovo Legion Pro 7 16IRX9H | |
| Asus ROG Strix Scar 16 G634JZR | |
| Acer Predator Helios 16 PH16-72 | |
| HP Omen 16 (2024) | |
| Average of class Gaming (10488 - 40970, n=106, last 2 years) | |
| Cinebench R23 / Single Core | |
| Schenker XMG Neo 16 (Early 24) | |
| Lenovo Legion Pro 7 16IRX9H | |
| HP Omen 16 (2024) | |
| Lenovo Legion Pro 7i 16 Gen 10 | |
| Average Intel Core Ultra 9 275HX (2009 - 2267, n=31) | |
| Asus ROG Strix Scar 16 G634JZR | |
| Asus ROG Strix G16 G615 | |
| Acer Predator Helios 16 PH16-72 | |
| Average of class Gaming (1166 - 2356, n=106, last 2 years) | |
| Cinebench R20 / CPU (Multi Core) | |
| Lenovo Legion Pro 7i 16 Gen 10 | |
| Average Intel Core Ultra 9 275HX (12026 - 16108, n=30) | |
| Asus ROG Strix G16 G615 | |
| Schenker XMG Neo 16 (Early 24) | |
| Lenovo Legion Pro 7 16IRX9H | |
| Asus ROG Strix Scar 16 G634JZR | |
| Acer Predator Helios 16 PH16-72 | |
| Average of class Gaming (4029 - 16108, n=105, last 2 years) | |
| HP Omen 16 (2024) | |
| Cinebench R20 / CPU (Single Core) | |
| Asus ROG Strix G16 G615 | |
| HP Omen 16 (2024) | |
| Average Intel Core Ultra 9 275HX (774 - 870, n=30) | |
| Schenker XMG Neo 16 (Early 24) | |
| Asus ROG Strix Scar 16 G634JZR | |
| Lenovo Legion Pro 7 16IRX9H | |
| Lenovo Legion Pro 7i 16 Gen 10 | |
| Acer Predator Helios 16 PH16-72 | |
| Average of class Gaming (442 - 895, n=105, last 2 years) | |
| Cinebench R15 / CPU Multi 64Bit | |
| Asus ROG Strix G16 G615 | |
| Lenovo Legion Pro 7i 16 Gen 10 | |
| Average Intel Core Ultra 9 275HX (4737 - 6271, n=30) | |
| Schenker XMG Neo 16 (Early 24) | |
| Asus ROG Strix Scar 16 G634JZR | |
| Lenovo Legion Pro 7 16IRX9H | |
| Acer Predator Helios 16 PH16-72 | |
| HP Omen 16 (2024) | |
| Average of class Gaming (1578 - 6271, n=104, last 2 years) | |
| Cinebench R15 / CPU Single 64Bit | |
| Asus ROG Strix G16 G615 | |
| Lenovo Legion Pro 7i 16 Gen 10 | |
| Average Intel Core Ultra 9 275HX (306 - 343, n=31) | |
| Asus ROG Strix Scar 16 G634JZR | |
| Lenovo Legion Pro 7 16IRX9H | |
| HP Omen 16 (2024) | |
| Schenker XMG Neo 16 (Early 24) | |
| Acer Predator Helios 16 PH16-72 | |
| Average of class Gaming (188.8 - 343, n=105, last 2 years) | |
| Blender / v2.79 BMW27 CPU | |
| HP Omen 16 (2024) | |
| Average of class Gaming (80 - 330, n=103, last 2 years) | |
| Acer Predator Helios 16 PH16-72 | |
| Asus ROG Strix Scar 16 G634JZR | |
| Lenovo Legion Pro 7 16IRX9H | |
| Average Intel Core Ultra 9 275HX (82 - 116, n=29) | |
| Schenker XMG Neo 16 (Early 24) | |
| Lenovo Legion Pro 7i 16 Gen 10 | |
| Asus ROG Strix G16 G615 | |
| 7-Zip 18.03 / 7z b 4 | |
| Schenker XMG Neo 16 (Early 24) | |
| Lenovo Legion Pro 7 16IRX9H | |
| Asus ROG Strix Scar 16 G634JZR | |
| Asus ROG Strix G16 G615 | |
| Lenovo Legion Pro 7i 16 Gen 10 | |
| Average Intel Core Ultra 9 275HX (98236 - 124155, n=30) | |
| Acer Predator Helios 16 PH16-72 | |
| Average of class Gaming (33491 - 148086, n=104, last 2 years) | |
| HP Omen 16 (2024) | |
| 7-Zip 18.03 / 7z b 4 -mmt1 | |
| Asus ROG Strix Scar 16 G634JZR | |
| Schenker XMG Neo 16 (Early 24) | |
| Lenovo Legion Pro 7 16IRX9H | |
| HP Omen 16 (2024) | |
| Asus ROG Strix G16 G615 | |
| Acer Predator Helios 16 PH16-72 | |
| Average Intel Core Ultra 9 275HX (6026 - 7149, n=30) | |
| Lenovo Legion Pro 7i 16 Gen 10 | |
| Average of class Gaming (4199 - 7436, n=104, last 2 years) | |
| Geekbench 6.7 / Multi-Core | |
| Asus ROG Strix G16 G615 | |
| Schenker XMG Neo 16 (Early 24) | |
| Average Intel Core Ultra 9 275HX (16033 - 21668, n=33) | |
| Lenovo Legion Pro 7i 16 Gen 10 | |
| Asus ROG Strix Scar 16 G634JZR | |
| Lenovo Legion Pro 7 16IRX9H | |
| Acer Predator Helios 16 PH16-72 | |
| HP Omen 16 (2024) | |
| Average of class Gaming (6625 - 22104, n=105, last 2 years) | |
| Geekbench 6.7 / Single-Core | |
| Schenker XMG Neo 16 (Early 24) | |
| HP Omen 16 (2024) | |
| Lenovo Legion Pro 7i 16 Gen 10 | |
| Average Intel Core Ultra 9 275HX (2843 - 3160, n=33) | |
| Lenovo Legion Pro 7 16IRX9H | |
| Asus ROG Strix Scar 16 G634JZR | |
| Asus ROG Strix G16 G615 | |
| Acer Predator Helios 16 PH16-72 | |
| Average of class Gaming (1490 - 3259, n=105, last 2 years) | |
| Geekbench 5.5 / Multi-Core | |
| Asus ROG Strix G16 G615 | |
| Schenker XMG Neo 16 (Early 24) | |
| Average Intel Core Ultra 9 275HX (19105 - 25855, n=31) | |
| Lenovo Legion Pro 7i 16 Gen 10 | |
| Asus ROG Strix Scar 16 G634JZR | |
| Acer Predator Helios 16 PH16-72 | |
| Lenovo Legion Pro 7 16IRX9H | |
| HP Omen 16 (2024) | |
| Average of class Gaming (6460 - 27010, n=104, last 2 years) | |
| Geekbench 5.5 / Single-Core | |
| Asus ROG Strix Scar 16 G634JZR | |
| Average Intel Core Ultra 9 275HX (2033 - 2292, n=31) | |
| Lenovo Legion Pro 7i 16 Gen 10 | |
| Schenker XMG Neo 16 (Early 24) | |
| Asus ROG Strix G16 G615 | |
| HP Omen 16 (2024) | |
| Lenovo Legion Pro 7 16IRX9H | |
| Acer Predator Helios 16 PH16-72 | |
| Average of class Gaming (986 - 2474, n=104, last 2 years) | |
| HWBOT x265 Benchmark v2.2 / 4k Preset | |
| Asus ROG Strix G16 G615 | |
| Lenovo Legion Pro 7i 16 Gen 10 | |
| Average Intel Core Ultra 9 275HX (30.7 - 43.8, n=30) | |
| Schenker XMG Neo 16 (Early 24) | |
| Lenovo Legion Pro 7 16IRX9H | |
| Asus ROG Strix Scar 16 G634JZR | |
| Average of class Gaming (11.5 - 44.3, n=104, last 2 years) | |
| Acer Predator Helios 16 PH16-72 | |
| HP Omen 16 (2024) | |
| LibreOffice / 20 Documents To PDF | |
| Average of class Gaming (33.2 - 88.8, n=104, last 2 years) | |
| Asus ROG Strix Scar 16 G634JZR | |
| HP Omen 16 (2024) | |
| Average Intel Core Ultra 9 275HX (33.2 - 62.1, n=30) | |
| Asus ROG Strix G16 G615 | |
| Lenovo Legion Pro 7i 16 Gen 10 | |
| Lenovo Legion Pro 7 16IRX9H | |
| Schenker XMG Neo 16 (Early 24) | |
| Acer Predator Helios 16 PH16-72 | |
| R Benchmark 2.5 / Overall mean | |
| Average of class Gaming (0.3439 - 0.759, n=105, last 2 years) | |
| Average Intel Core Ultra 9 275HX (0.3943 - 0.4568, n=30) | |
| Lenovo Legion Pro 7i 16 Gen 10 | |
| Asus ROG Strix G16 G615 | |
| Lenovo Legion Pro 7 16IRX9H | |
| Acer Predator Helios 16 PH16-72 | |
| HP Omen 16 (2024) | |
| Asus ROG Strix Scar 16 G634JZR | |
| Schenker XMG Neo 16 (Early 24) | |
* ... smaller is better
AIDA64: FP32 Ray-Trace | FPU Julia | CPU SHA3 | CPU Queen | FPU SinJulia | FPU Mandel | CPU AES | CPU ZLib | FP64 Ray-Trace | CPU PhotoWorxx
| Performance rating | |
| Asus ROG Strix G16 G615 | |
| Lenovo Legion Pro 7i 16 Gen 10 | |
| Average Intel Core Ultra 9 275HX | |
| Schenker XMG Neo 16 (Early 24) | |
| Asus ROG Strix Scar 16 G634JZR | |
| Lenovo Legion Pro 7 16IRX9H | |
| Average of class Gaming | |
| Acer Predator Helios 16 PH16-72 | |
| HP Omen 16 (2024) | |
| AIDA64 / FP32 Ray-Trace | |
| Asus ROG Strix G16 G615 | |
| Lenovo Legion Pro 7i 16 Gen 10 | |
| Average Intel Core Ultra 9 275HX (28039 - 39895, n=30) | |
| Average of class Gaming (10227 - 85542, n=103, last 2 years) | |
| Schenker XMG Neo 16 (Early 24) | |
| Lenovo Legion Pro 7 16IRX9H | |
| Asus ROG Strix Scar 16 G634JZR | |
| Acer Predator Helios 16 PH16-72 | |
| HP Omen 16 (2024) | |
| AIDA64 / FPU Julia | |
| Asus ROG Strix G16 G615 | |
| Lenovo Legion Pro 7i 16 Gen 10 | |
| Average Intel Core Ultra 9 275HX (140254 - 200744, n=30) | |
| Schenker XMG Neo 16 (Early 24) | |
| Lenovo Legion Pro 7 16IRX9H | |
| Average of class Gaming (51376 - 238426, n=103, last 2 years) | |
| Asus ROG Strix Scar 16 G634JZR | |
| Acer Predator Helios 16 PH16-72 | |
| HP Omen 16 (2024) | |
| AIDA64 / CPU SHA3 | |
| Asus ROG Strix G16 G615 | |
| Lenovo Legion Pro 7i 16 Gen 10 | |
| Average Intel Core Ultra 9 275HX (6710 - 9817, n=30) | |
| Schenker XMG Neo 16 (Early 24) | |
| Lenovo Legion Pro 7 16IRX9H | |
| Asus ROG Strix Scar 16 G634JZR | |
| Average of class Gaming (2180 - 9817, n=103, last 2 years) | |
| Acer Predator Helios 16 PH16-72 | |
| HP Omen 16 (2024) | |
| AIDA64 / CPU Queen | |
| Schenker XMG Neo 16 (Early 24) | |
| Asus ROG Strix Scar 16 G634JZR | |
| Lenovo Legion Pro 7 16IRX9H | |
| Acer Predator Helios 16 PH16-72 | |
| Asus ROG Strix G16 G615 | |
| Lenovo Legion Pro 7i 16 Gen 10 | |
| Average Intel Core Ultra 9 275HX (113887 - 140937, n=30) | |
| HP Omen 16 (2024) | |
| Average of class Gaming (49785 - 173351, n=90, last 2 years) | |
| AIDA64 / FPU SinJulia | |
| Schenker XMG Neo 16 (Early 24) | |
| Lenovo Legion Pro 7 16IRX9H | |
| Asus ROG Strix Scar 16 G634JZR | |
| Acer Predator Helios 16 PH16-72 | |
| Average of class Gaming (4424 - 33636, n=103, last 2 years) | |
| Lenovo Legion Pro 7i 16 Gen 10 | |
| Asus ROG Strix G16 G615 | |
| Average Intel Core Ultra 9 275HX (11172 - 14425, n=30) | |
| HP Omen 16 (2024) | |
| AIDA64 / FPU Mandel | |
| Asus ROG Strix G16 G615 | |
| Lenovo Legion Pro 7i 16 Gen 10 | |
| Average Intel Core Ultra 9 275HX (72596 - 104508, n=30) | |
| Schenker XMG Neo 16 (Early 24) | |
| Average of class Gaming (25115 - 128721, n=103, last 2 years) | |
| Lenovo Legion Pro 7 16IRX9H | |
| Asus ROG Strix Scar 16 G634JZR | |
| Acer Predator Helios 16 PH16-72 | |
| HP Omen 16 (2024) | |
| AIDA64 / CPU AES | |
| Asus ROG Strix Scar 16 G634JZR | |
| Schenker XMG Neo 16 (Early 24) | |
| Lenovo Legion Pro 7 16IRX9H | |
| Asus ROG Strix G16 G615 | |
| Lenovo Legion Pro 7i 16 Gen 10 | |
| Average Intel Core Ultra 9 275HX (105608 - 247074, n=30) | |
| Acer Predator Helios 16 PH16-72 | |
| Average of class Gaming (39258 - 247074, n=103, last 2 years) | |
| HP Omen 16 (2024) | |
| AIDA64 / CPU ZLib | |
| Schenker XMG Neo 16 (Early 24) | |
| Asus ROG Strix G16 G615 | |
| Lenovo Legion Pro 7 16IRX9H | |
| Lenovo Legion Pro 7i 16 Gen 10 | |
| Average Intel Core Ultra 9 275HX (1582 - 2263, n=30) | |
| Asus ROG Strix Scar 16 G634JZR | |
| Acer Predator Helios 16 PH16-72 | |
| Average of class Gaming (574 - 2531, n=103, last 2 years) | |
| HP Omen 16 (2024) | |
| AIDA64 / FP64 Ray-Trace | |
| Asus ROG Strix G16 G615 | |
| Lenovo Legion Pro 7i 16 Gen 10 | |
| Average Intel Core Ultra 9 275HX (14847 - 21854, n=30) | |
| Average of class Gaming (5509 - 45446, n=103, last 2 years) | |
| Schenker XMG Neo 16 (Early 24) | |
| Lenovo Legion Pro 7 16IRX9H | |
| Asus ROG Strix Scar 16 G634JZR | |
| Acer Predator Helios 16 PH16-72 | |
| HP Omen 16 (2024) | |
| AIDA64 / CPU PhotoWorxx | |
| Lenovo Legion Pro 7i 16 Gen 10 | |
| Average Intel Core Ultra 9 275HX (37482 - 62916, n=30) | |
| Asus ROG Strix Scar 16 G634JZR | |
| HP Omen 16 (2024) | |
| Schenker XMG Neo 16 (Early 24) | |
| Acer Predator Helios 16 PH16-72 | |
| Lenovo Legion Pro 7 16IRX9H | |
| Asus ROG Strix G16 G615 | |
| Average of class Gaming (12271 - 89891, n=103, last 2 years) | |
System Performance
The system performance is excellent, although the performance of all the competitors is very similar. There are no problems with the system stability in our test, and the laptop is always very responsive. During the graphics switching, there is a short wait (for example when starting a game), but this is normal.
CrossMark: Overall | Productivity | Creativity | Responsiveness
WebXPRT 3: Overall
WebXPRT 4: Overall
Mozilla Kraken 1.1: Total
| PCMark 10 / Score | |
| Lenovo Legion Pro 7i 16 Gen 10 | |
| Acer Predator Helios 16 PH16-72 | |
| Schenker XMG Neo 16 (Early 24) | |
| Lenovo Legion Pro 7 16IRX9H | |
| HP Omen 16 (2024) | |
| Asus ROG Strix G16 G615 | |
| Average Intel Core Ultra 9 275HX, NVIDIA GeForce RTX 5080 Laptop (7805 - 10409, n=9) | |
| Average of class Gaming (5828 - 11730, n=93, last 2 years) | |
| Asus ROG Strix Scar 16 G634JZR | |
| PCMark 10 / Essentials | |
| Acer Predator Helios 16 PH16-72 | |
| Lenovo Legion Pro 7 16IRX9H | |
| Asus ROG Strix Scar 16 G634JZR | |
| HP Omen 16 (2024) | |
| Lenovo Legion Pro 7i 16 Gen 10 | |
| Asus ROG Strix G16 G615 | |
| Schenker XMG Neo 16 (Early 24) | |
| Average Intel Core Ultra 9 275HX, NVIDIA GeForce RTX 5080 Laptop (10206 - 11472, n=9) | |
| Average of class Gaming (8810 - 11935, n=97, last 2 years) | |
| PCMark 10 / Productivity | |
| Schenker XMG Neo 16 (Early 24) | |
| HP Omen 16 (2024) | |
| Lenovo Legion Pro 7 16IRX9H | |
| Average of class Gaming (6845 - 21327, n=95, last 2 years) | |
| Acer Predator Helios 16 PH16-72 | |
| Average Intel Core Ultra 9 275HX, NVIDIA GeForce RTX 5080 Laptop (8319 - 20616, n=9) | |
| Lenovo Legion Pro 7i 16 Gen 10 | |
| Asus ROG Strix G16 G615 | |
| Asus ROG Strix Scar 16 G634JZR | |
| PCMark 10 / Digital Content Creation | |
| Lenovo Legion Pro 7i 16 Gen 10 | |
| Asus ROG Strix G16 G615 | |
| Average Intel Core Ultra 9 275HX, NVIDIA GeForce RTX 5080 Laptop (10505 - 19351, n=9) | |
| Asus ROG Strix Scar 16 G634JZR | |
| Schenker XMG Neo 16 (Early 24) | |
| HP Omen 16 (2024) | |
| Acer Predator Helios 16 PH16-72 | |
| Lenovo Legion Pro 7 16IRX9H | |
| Average of class Gaming (7602 - 19954, n=95, last 2 years) | |
| CrossMark / Overall | |
| Schenker XMG Neo 16 (Early 24) | |
| Lenovo Legion Pro 7 16IRX9H | |
| HP Omen 16 (2024) | |
| Acer Predator Helios 16 PH16-72 | |
| Asus ROG Strix G16 G615 | |
| Average Intel Core Ultra 9 275HX, NVIDIA GeForce RTX 5080 Laptop (1857 - 2244, n=9) | |
| Asus ROG Strix Scar 16 G634JZR | |
| Lenovo Legion Pro 7i 16 Gen 10 | |
| Average of class Gaming (1366 - 2409, n=94, last 2 years) | |
| CrossMark / Productivity | |
| Lenovo Legion Pro 7 16IRX9H | |
| Schenker XMG Neo 16 (Early 24) | |
| HP Omen 16 (2024) | |
| Acer Predator Helios 16 PH16-72 | |
| Asus ROG Strix G16 G615 | |
| Average Intel Core Ultra 9 275HX, NVIDIA GeForce RTX 5080 Laptop (1764 - 2122, n=9) | |
| Lenovo Legion Pro 7i 16 Gen 10 | |
| Asus ROG Strix Scar 16 G634JZR | |
| Average of class Gaming (1386 - 2254, n=94, last 2 years) | |
| CrossMark / Creativity | |
| Schenker XMG Neo 16 (Early 24) | |
| Lenovo Legion Pro 7 16IRX9H | |
| Asus ROG Strix G16 G615 | |
| Acer Predator Helios 16 PH16-72 | |
| Average Intel Core Ultra 9 275HX, NVIDIA GeForce RTX 5080 Laptop (2115 - 2498, n=9) | |
| HP Omen 16 (2024) | |
| Asus ROG Strix Scar 16 G634JZR | |
| Lenovo Legion Pro 7i 16 Gen 10 | |
| Average of class Gaming (1343 - 2729, n=94, last 2 years) | |
| CrossMark / Responsiveness | |
| Lenovo Legion Pro 7 16IRX9H | |
| HP Omen 16 (2024) | |
| Schenker XMG Neo 16 (Early 24) | |
| Acer Predator Helios 16 PH16-72 | |
| Asus ROG Strix G16 G615 | |
| Average Intel Core Ultra 9 275HX, NVIDIA GeForce RTX 5080 Laptop (1466 - 2096, n=9) | |
| Asus ROG Strix Scar 16 G634JZR | |
| Average of class Gaming (1226 - 2334, n=94, last 2 years) | |
| Lenovo Legion Pro 7i 16 Gen 10 | |
| WebXPRT 3 / Overall | |
| Lenovo Legion Pro 7i 16 Gen 10 | |
| Asus ROG Strix G16 G615 | |
| Lenovo Legion Pro 7 16IRX9H | |
| Average Intel Core Ultra 9 275HX, NVIDIA GeForce RTX 5080 Laptop (306 - 378, n=9) | |
| Schenker XMG Neo 16 (Early 24) | |
| Acer Predator Helios 16 PH16-72 | |
| HP Omen 16 (2024) | |
| Average of class Gaming (220 - 532, n=97, last 2 years) | |
| Asus ROG Strix Scar 16 G634JZR | |
| WebXPRT 4 / Overall | |
| Asus ROG Strix G16 G615 | |
| Lenovo Legion Pro 7i 16 Gen 10 | |
| Average Intel Core Ultra 9 275HX, NVIDIA GeForce RTX 5080 Laptop (285 - 336, n=9) | |
| Lenovo Legion Pro 7 16IRX9H | |
| HP Omen 16 (2024) | |
| Asus ROG Strix Scar 16 G634JZR | |
| Schenker XMG Neo 16 (Early 24) | |
| Acer Predator Helios 16 PH16-72 | |
| Average of class Gaming (165 - 354, n=97, last 2 years) | |
| Mozilla Kraken 1.1 / Total | |
| Average of class Gaming (391 - 590, n=99, last 2 years) | |
| Asus ROG Strix Scar 16 G634JZR | |
| Acer Predator Helios 16 PH16-72 | |
| Lenovo Legion Pro 7 16IRX9H | |
| HP Omen 16 (2024) | |
| Schenker XMG Neo 16 (Early 24) | |
| Average Intel Core Ultra 9 275HX, NVIDIA GeForce RTX 5080 Laptop (405 - 432, n=9) | |
| Lenovo Legion Pro 7i 16 Gen 10 | |
| Asus ROG Strix G16 G615 | |
* ... smaller is better
| PCMark 10 Score | 8856 points | |
Help | ||
| AIDA64 / Memory Copy | |
| Asus ROG Strix G16 G615 | |
| Lenovo Legion Pro 7i 16 Gen 10 | |
| Average Intel Core Ultra 9 275HX (56003 - 94460, n=30) | |
| HP Omen 16 (2024) | |
| Acer Predator Helios 16 PH16-72 | |
| Schenker XMG Neo 16 (Early 24) | |
| Asus ROG Strix Scar 16 G634JZR | |
| Lenovo Legion Pro 7 16IRX9H | |
| Average of class Gaming (21750 - 129946, n=103, last 2 years) | |
| AIDA64 / Memory Read | |
| Lenovo Legion Pro 7i 16 Gen 10 | |
| Asus ROG Strix Scar 16 G634JZR | |
| Schenker XMG Neo 16 (Early 24) | |
| HP Omen 16 (2024) | |
| Lenovo Legion Pro 7 16IRX9H | |
| Acer Predator Helios 16 PH16-72 | |
| Average Intel Core Ultra 9 275HX (55795 - 97151, n=30) | |
| Asus ROG Strix G16 G615 | |
| Average of class Gaming (22956 - 118858, n=103, last 2 years) | |
| AIDA64 / Memory Write | |
| Lenovo Legion Pro 7i 16 Gen 10 | |
| Average Intel Core Ultra 9 275HX (55663 - 116129, n=30) | |
| HP Omen 16 (2024) | |
| Schenker XMG Neo 16 (Early 24) | |
| Asus ROG Strix Scar 16 G634JZR | |
| Acer Predator Helios 16 PH16-72 | |
| Average of class Gaming (22297 - 135096, n=103, last 2 years) | |
| Asus ROG Strix G16 G615 | |
| Lenovo Legion Pro 7 16IRX9H | |
| AIDA64 / Memory Latency | |
| Average Intel Core Ultra 9 275HX (105.8 - 161.6, n=30) | |
| Asus ROG Strix G16 G615 | |
| Lenovo Legion Pro 7i 16 Gen 10 | |
| Average of class Gaming (75.3 - 259, n=103, last 2 years) | |
| HP Omen 16 (2024) | |
| Acer Predator Helios 16 PH16-72 | |
| Asus ROG Strix Scar 16 G634JZR | |
| Lenovo Legion Pro 7 16IRX9H | |
| Schenker XMG Neo 16 (Early 24) | |
* ... smaller is better
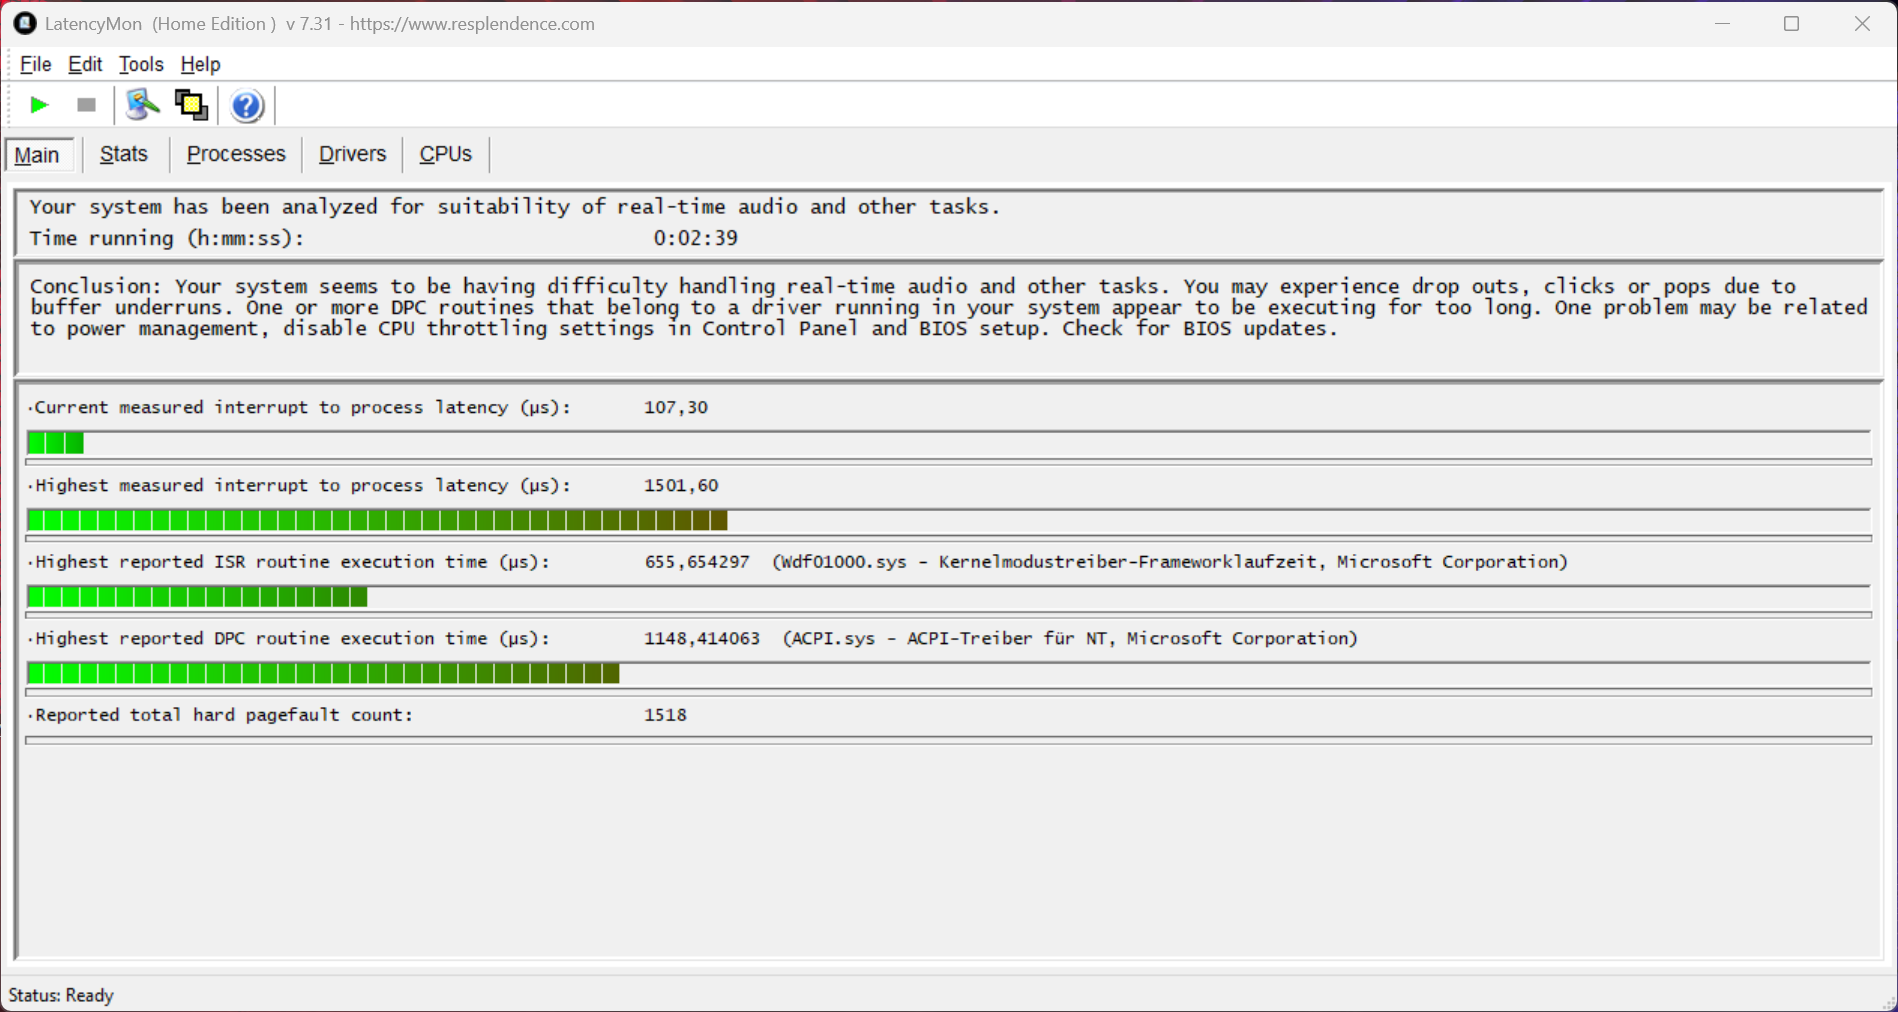
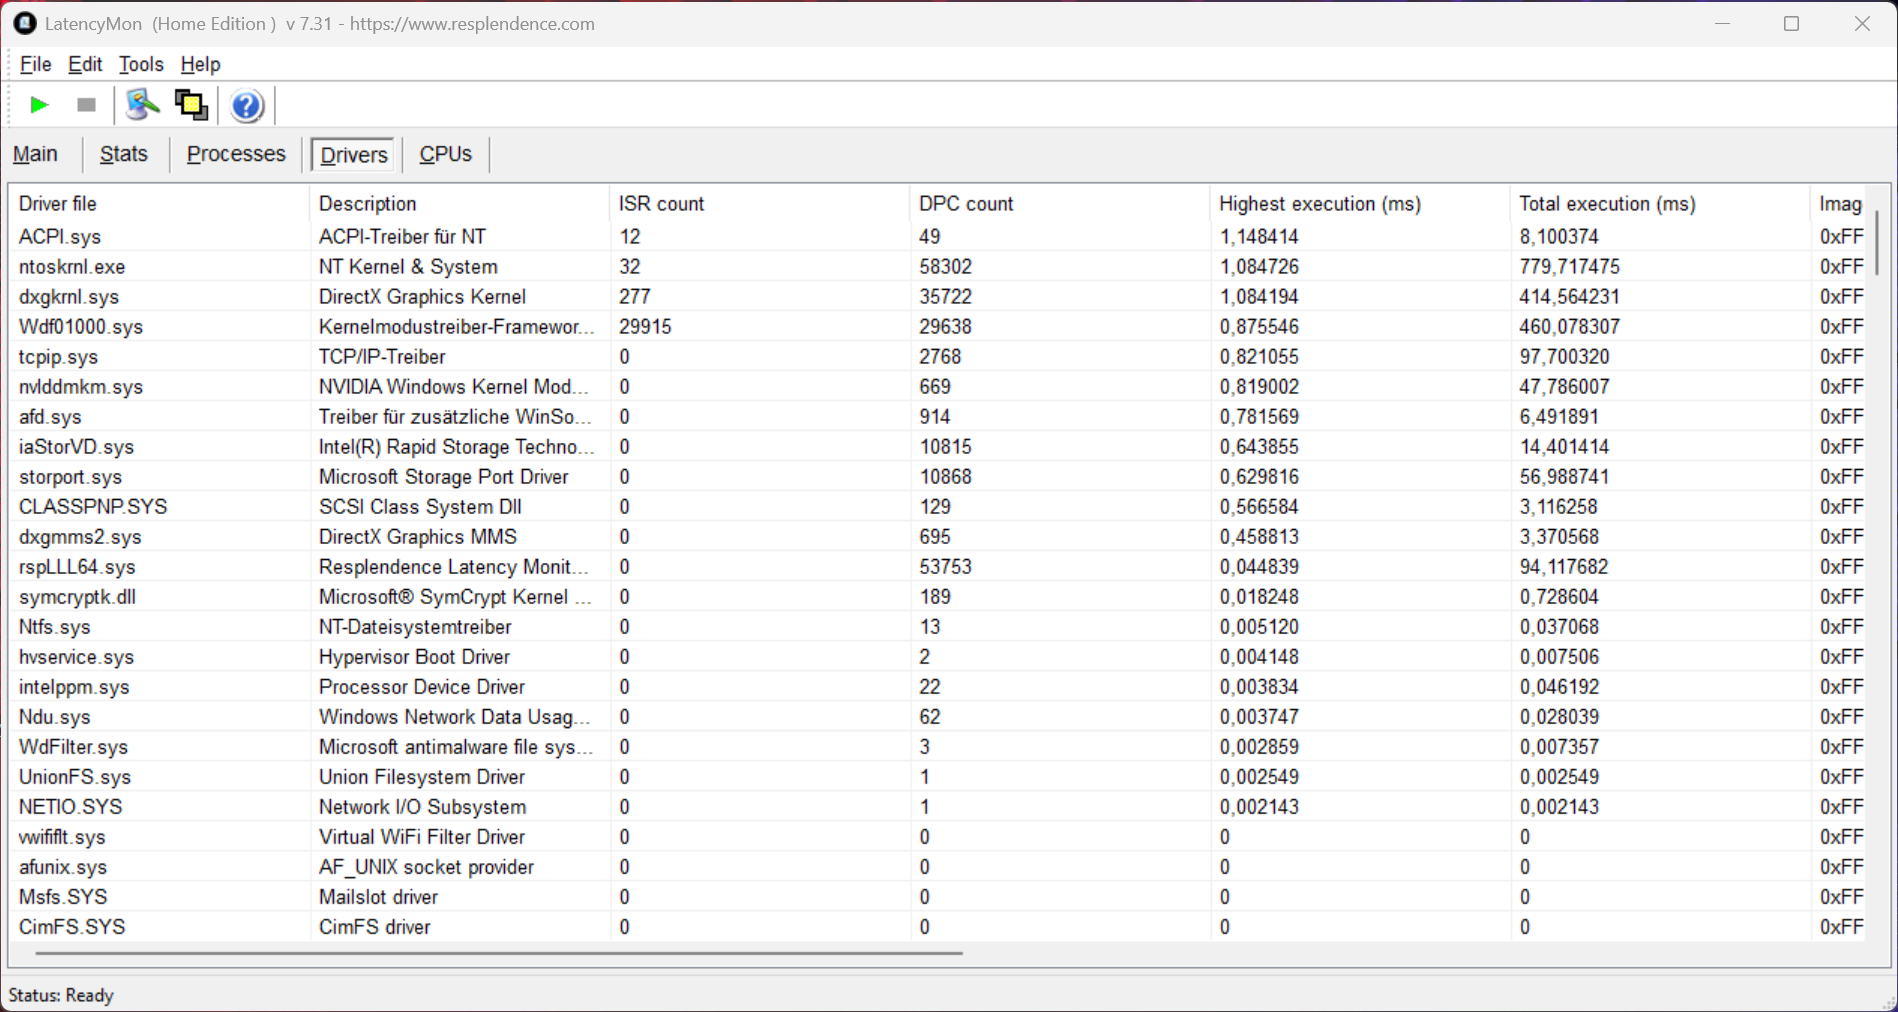
DPC Latencies
In our standardized latency test (surfing the Internet, playing 4K YouTube videos, CPU load), our test unit with its current BIOS version shows some slight limitations when using real-time audio applications.
| DPC Latencies / LatencyMon - interrupt to process latency (max), Web, Youtube, Prime95 | |
| Asus ROG Strix Scar 16 G634JZR | |
| Schenker XMG Neo 16 (Early 24) | |
| Acer Predator Helios 16 PH16-72 | |
| Asus ROG Strix G16 G615 | |
| Lenovo Legion Pro 7 16IRX9H | |
| HP Omen 16 (2024) | |
| Lenovo Legion Pro 7i 16 Gen 10 | |
* ... smaller is better
Storage Devices
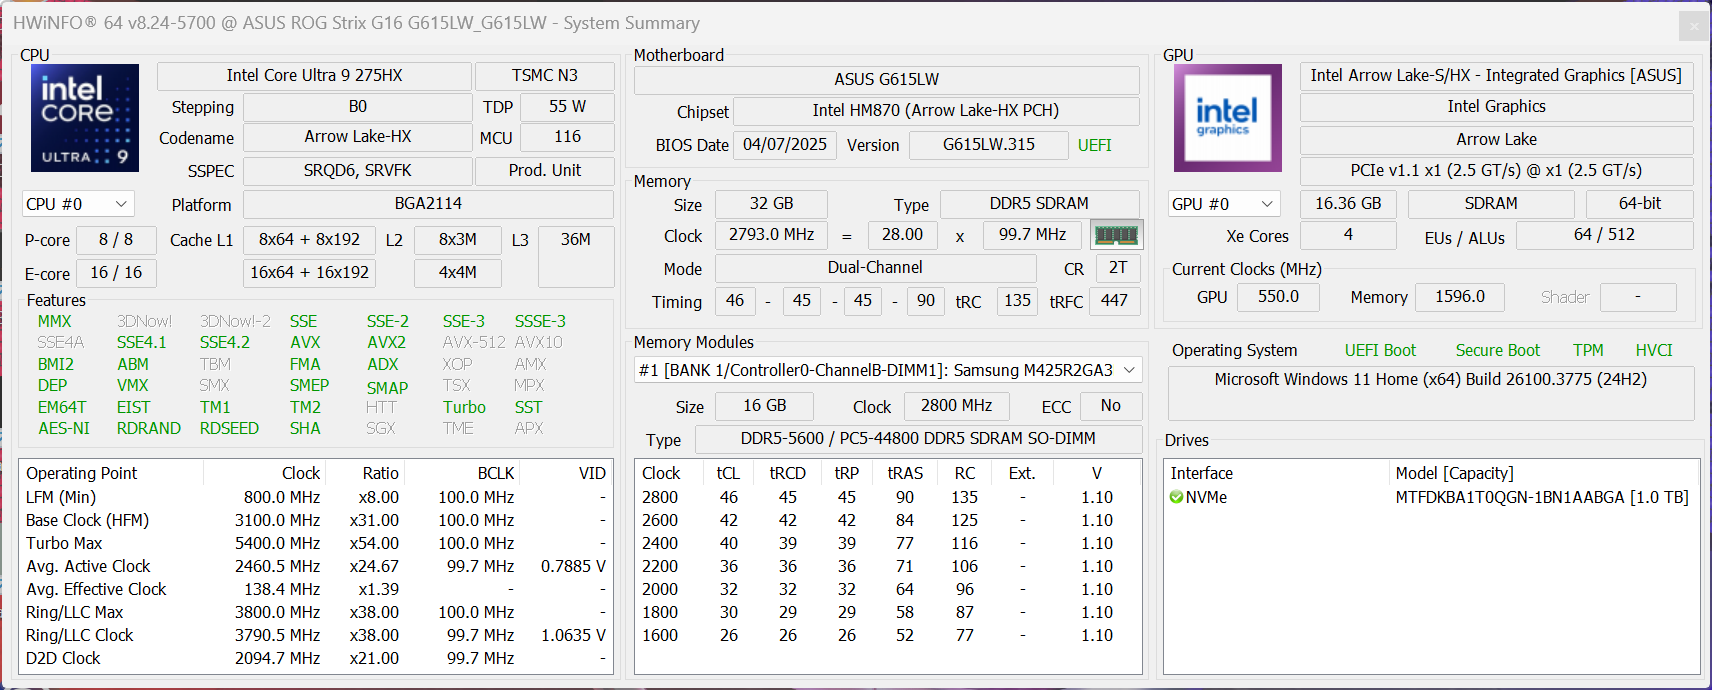
Our test unit uses the 1-TB version of the Micron 2500, with 840 GB still available to the user after the initial operation. The performance of the PCIe 4.0 SSD is very good and stable. With the second M.2-2280 slot, expanding the storage can be done easily without any problems and at a low price. The Strix G16 doesn't support PCIe 5.0.

* ... smaller is better
Constant Read Performance: DiskSpd Read Loop, Queue Depth 8
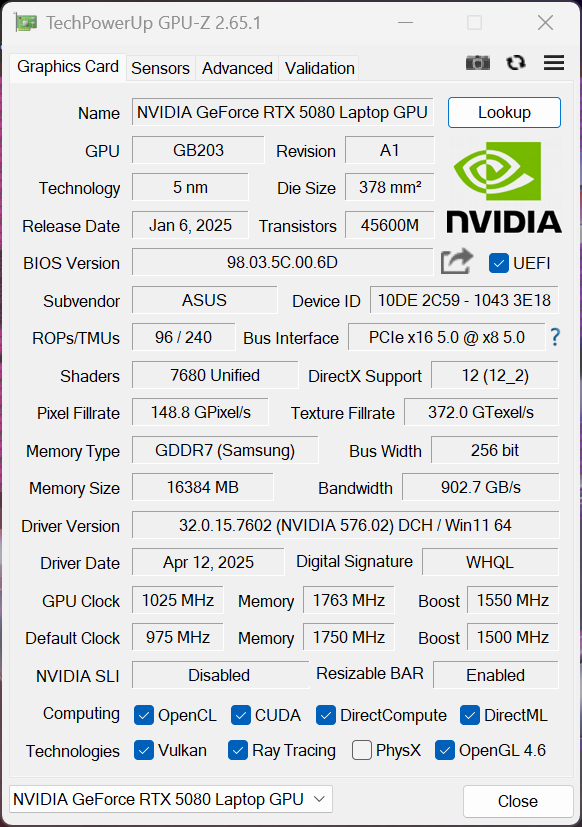
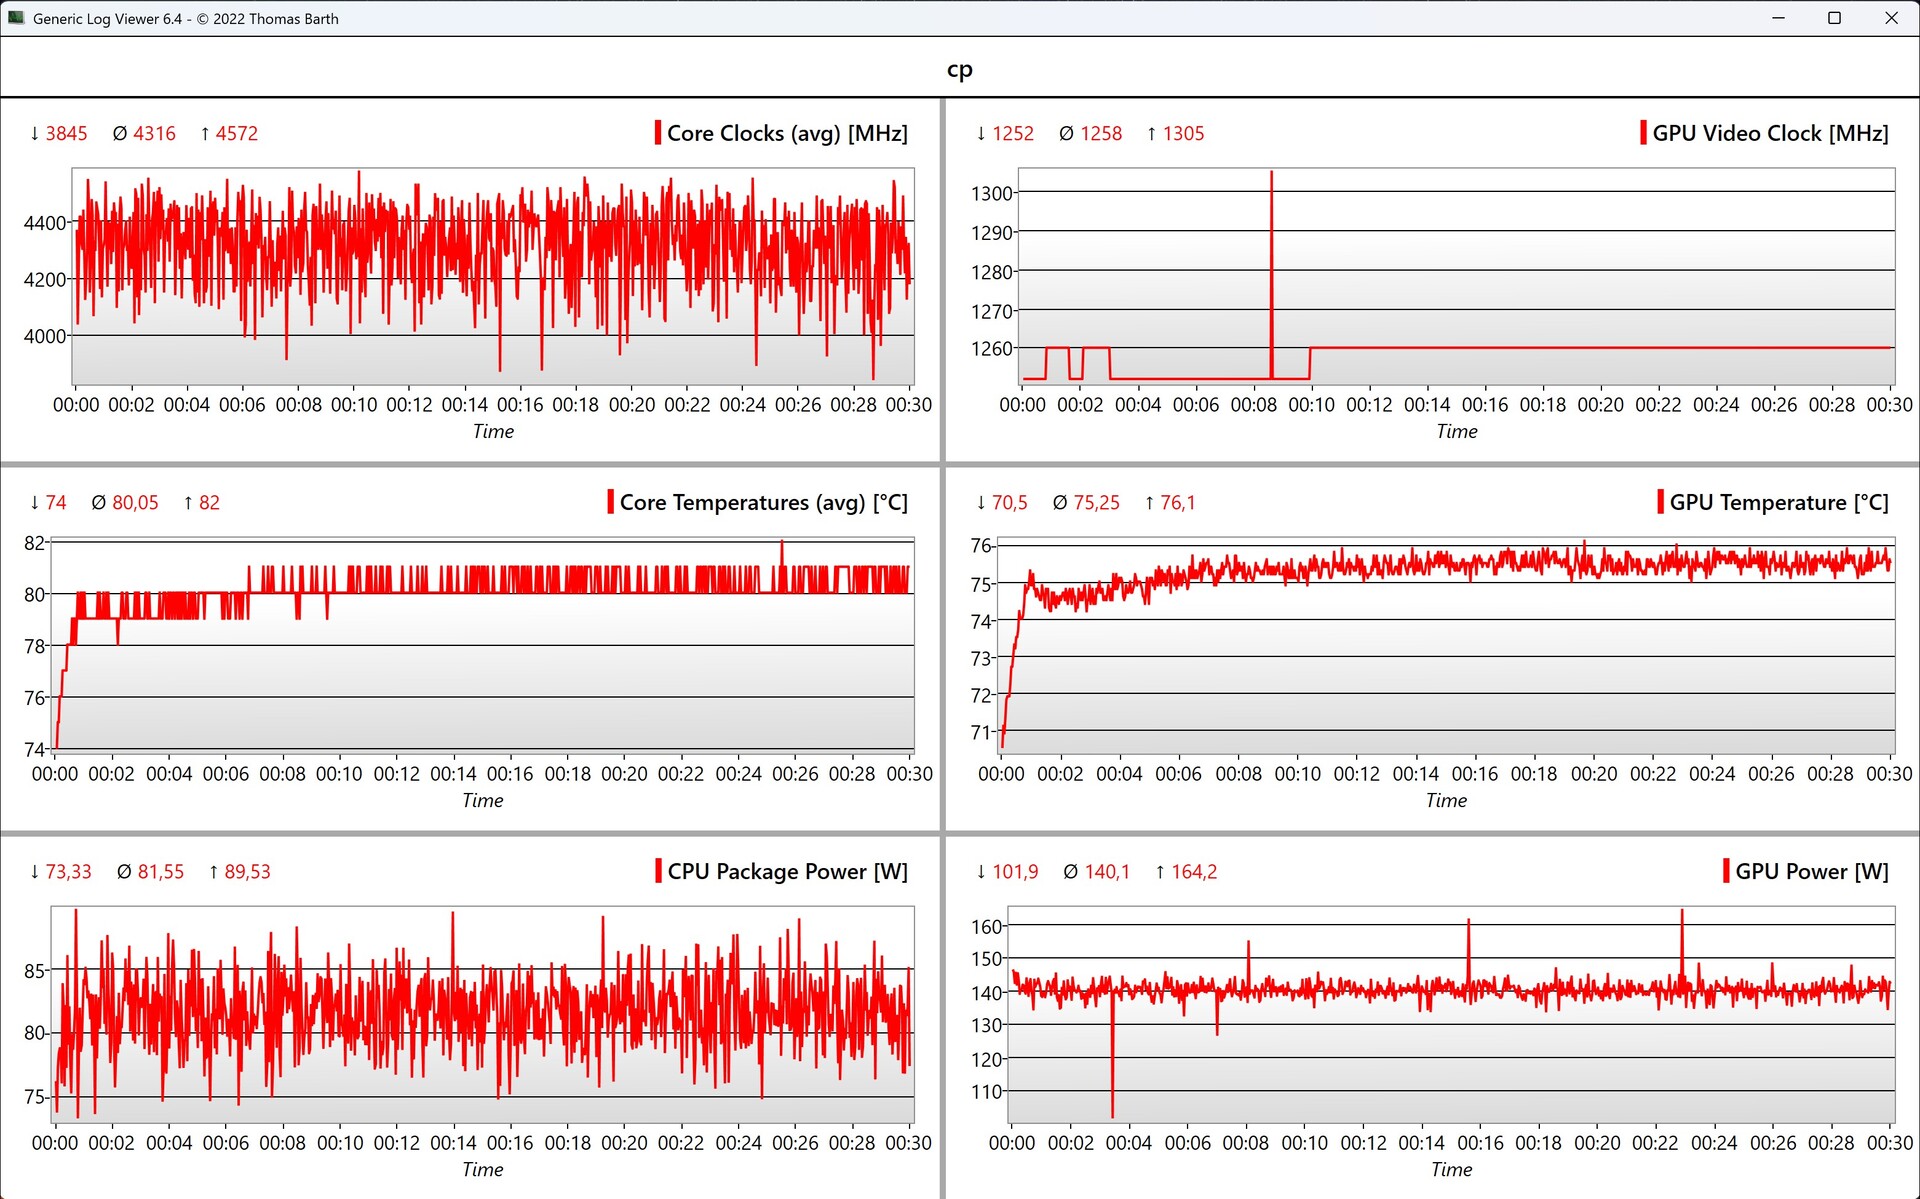
Graphics Card
Our test unit of the Strix G16 is equipped with the new GeForce RTX 5080 Laptop (16 GB VRAM), with the fastest version with a maximum TGP of 175 watts being used here (150 Watt + 25 Watt Dynamic Boost). The results are slightly mixed in the synthetic benchmarks, and we've already seen better results for the new 5080 Laptop, although the old RTX 4080 Laptop in the ROG Strix SCAR 16 is still surpassed. However, an upgrade from the new 4080 Laptop and much less the 4090 Laptop won't really make any sense. On the other hand, the advantage compared to the old 3080 Ti Laptop is clearly noticeable. Under constant load, the GPU performance remains completely stable.
| 3DMark 11 Performance | 45056 points | |
| 3DMark Fire Strike Score | 36371 points | |
| 3DMark Time Spy Score | 20753 points | |
| 3DMark Steel Nomad Score | 5156 points | |
| 3DMark Steel Nomad Light Score | 22259 points | |
| 3DMark Steel Nomad Light Unlimited Score | 21869 points | |
Help | ||
| Blender / v3.3 Classroom OPTIX/RTX | |
| Acer Predator Helios 16 PH16-72 | |
| Average of class Gaming (9 - 32, n=105, last 2 years) | |
| HP Omen 16 (2024) | |
| Lenovo Legion Pro 7 16IRX9H | |
| Average NVIDIA GeForce RTX 5080 Laptop (11 - 17, n=14) | |
| Asus ROG Strix Scar 16 G634JZR | |
| Schenker XMG Neo 16 (Early 24) | |
| Asus ROG Strix G16 G615 | |
| Blender / v3.3 Classroom CUDA | |
| Average of class Gaming (15 - 233, n=106, last 2 years) | |
| HP Omen 16 (2024) | |
| Acer Predator Helios 16 PH16-72 | |
| Average NVIDIA GeForce RTX 5080 Laptop (18 - 49, n=16) | |
| Asus ROG Strix Scar 16 G634JZR | |
| Lenovo Legion Pro 7 16IRX9H | |
| Asus ROG Strix G16 G615 | |
| Schenker XMG Neo 16 (Early 24) | |
| Blender / v3.3 Classroom CPU | |
| HP Omen 16 (2024) | |
| Average of class Gaming (122 - 565, n=101, last 2 years) | |
| Acer Predator Helios 16 PH16-72 | |
| Asus ROG Strix Scar 16 G634JZR | |
| Lenovo Legion Pro 7 16IRX9H | |
| Schenker XMG Neo 16 (Early 24) | |
| Average NVIDIA GeForce RTX 5080 Laptop (123 - 243, n=15) | |
| Asus ROG Strix G16 G615 | |
* ... smaller is better
Gaming Performance
The gaming performance is very good overall, and the new RTX 5080 Laptop strikes a very good figure particularly in the native WQHD resolution. We already saw in our analysis of the new GeForce GPUs that the 5090 Laptop is only really able to show its full power in the 4K resolution. With current games, the gaming performance is often at the level of the old RTX 4090 Laptop, and all the modern games can be played without any problems. But we also notice that the Lenovo Legion Pro 7i G10 offers a slightly higher gaming performance with identical core components.
Cyberpunk 2077 Ultra FPS Chart
However, if you want to use the maximum details including raytracing or path tracing (which looks extremely good), even the RTX 5080 Laptop hits its limits without upscaling. The following table makes this very clear using the two games Cyberpunk 2077 and Alan Wake 2. The performance can again be increased significantly using Multi Frame Generation (x4) in games that support it.
| Setting | Cyberpunk 2077 Phantom Liberty RT Overdrive |
Alan Wake 2 Custom (Everything High/Ultra + PT) |
|---|---|---|
| Native | 21.9 FPS | 34.2 FPS |
| DLSS Quality | 43.1 FPS | 56.9 FPS |
| DLSS Performance | 63.8 FPS | 75 FPS |
| DLSS Quality MFG x2 | 77.6 FPS | 98.9 FPS |
| DLSS Quality MFG x4 | 141.2 FPS | 173.9 FPS |
| low | med. | high | ultra | QHD DLSS | QHD | 4K DLSS | 4K | |
|---|---|---|---|---|---|---|---|---|
| GTA V (2015) | 164.1 | 156.2 | ||||||
| Dota 2 Reborn (2015) | 228 | 201 | 191.6 | 175.5 | ||||
| Final Fantasy XV Benchmark (2018) | 234 | 229 | 189.6 | 149.4 | ||||
| X-Plane 11.11 (2018) | 135.7 | 136.3 | 110.6 | |||||
| Strange Brigade (2018) | 553 | 406 | 386 | 367 | 283 | |||
| Baldur's Gate 3 (2023) | 244.8 | 209.1 | 185.4 | 180.3 | 133.1 | |||
| Cyberpunk 2077 (2023) | 187.9 | 180.5 | 160.9 | 144.3 | 110.6 | 99.5 | ||
| Alan Wake 2 (2023) | 112.6 | 76.5 | ||||||
| F1 24 (2024) | 318 | 127.5 | 129.1 | 84.5 | ||||
| Assassin's Creed Shadows (2025) | 58 | 60 | 50 | |||||
| Doom: The Dark Ages (2025) | 117.1 | 102.5 | 95.6 | 94.8 | 89.1 | 65 | 55 | 36.6 |
Emissions - Low temperatures
Noise Emissions
As usual, the fan noise depends significantly on the power profiles. In Silent mode, the Strix G16 impresses as a very quiet everyday companion (with the fan often deactivated, 36.1 dB(A) max.), but you definitely need headphones in Turbo mode while gaming, when the fans almost always keep running at around 30 dB(A) during idle operation. Our test unit doesn't produce any other electronic noises.
Noise level
| Idle |
| 24 / 30.1 / 30.1 dB(A) |
| Load |
| 41.1 / 54.2 dB(A) |
 | ||
30 dB silent 40 dB(A) audible 50 dB(A) loud |
||
min: | ||
| Asus ROG Strix G16 G615 GeForce RTX 5080 Laptop, Ultra 9 275HX, Micron 2500 1TB MTFDKBA1T0QGN | Acer Predator Helios 16 PH16-72 GeForce RTX 4080 Laptop GPU, i9-14900HX, Micron 3400 2TB MTFDKBA2T0TFH | Schenker XMG Neo 16 (Early 24) GeForce RTX 4090 Laptop GPU, i9-14900HX, Samsung 990 Pro 1 TB | Asus ROG Strix Scar 16 G634JZR GeForce RTX 4080 Laptop GPU, i9-14900HX, SK hynix PC801 HFS002TEJ9X101N | HP Omen 16 (2024) GeForce RTX 4080 Laptop GPU, i9-14900HX, SK hynix PC801 HFS001TEJ9X101N | Lenovo Legion Pro 7 16IRX9H GeForce RTX 4080 Laptop GPU, i9-14900HX, SK Hynix HFS001TEJ9X115N | Lenovo Legion Pro 7i 16 Gen 10 GeForce RTX 5080 Laptop, Ultra 9 275HX, SK Hynix HFS001TEJ9X115N | |
|---|---|---|---|---|---|---|---|
| Noise | 1% | -9% | -8% | -5% | -13% | 11% | |
| off / environment * (dB) | 24 | 26.1 -9% | 26 -8% | 21.07 12% | 25 -4% | 24 -0% | 22.9 5% |
| Idle Minimum * (dB) | 24 | 26.1 -9% | 28 -17% | 29.75 -24% | 29 -21% | 25 -4% | 22.9 5% |
| Idle Average * (dB) | 30.1 | 29.4 2% | 29 4% | 29.75 1% | 30 -0% | 30 -0% | 22.9 24% |
| Idle Maximum * (dB) | 30.1 | 31.9 -6% | 31 -3% | 29.75 1% | 31 -3% | 45 -50% | 26.3 13% |
| Load Average * (dB) | 41.1 | 51 -24% | 54.85 -33% | 46 -12% | 50 -22% | 27.8 32% | |
| Cyberpunk 2077 ultra * (dB) | 54.2 | 48.2 11% | 54.2 -0% | ||||
| Load Maximum * (dB) | 54.2 | 45.6 16% | 56 -3% | 58 -7% | 47 13% | 56 -3% | 53.9 1% |
| Witcher 3 ultra * (dB) | 54 | 57.8 | 47 | 54 |
* ... smaller is better
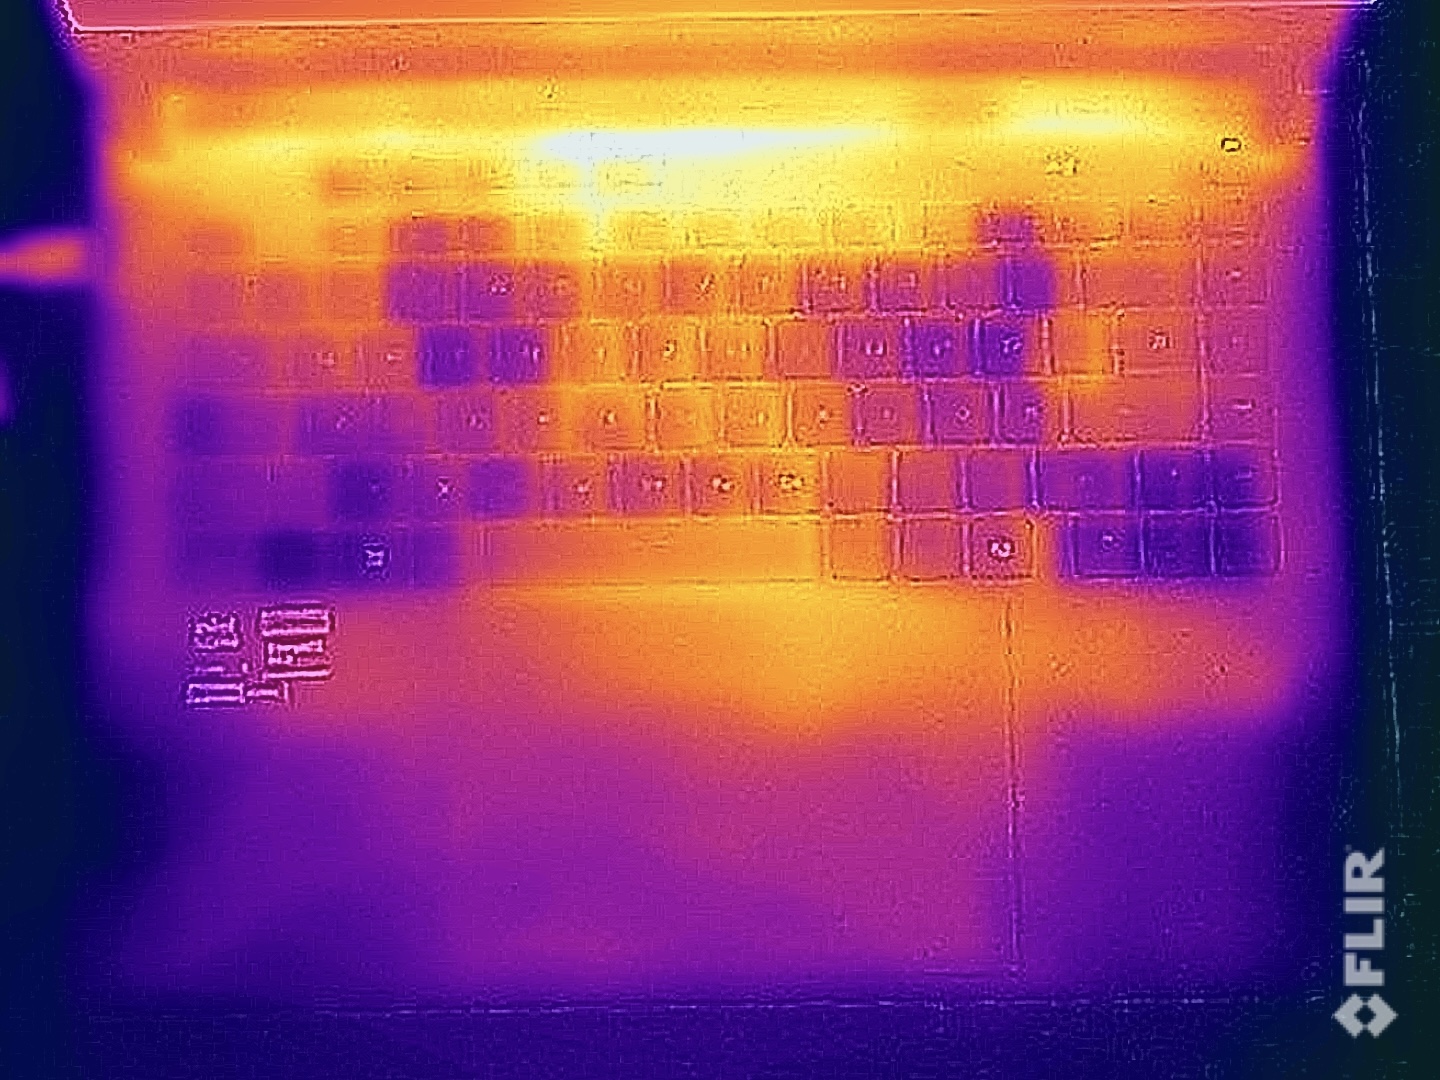
Temperatures
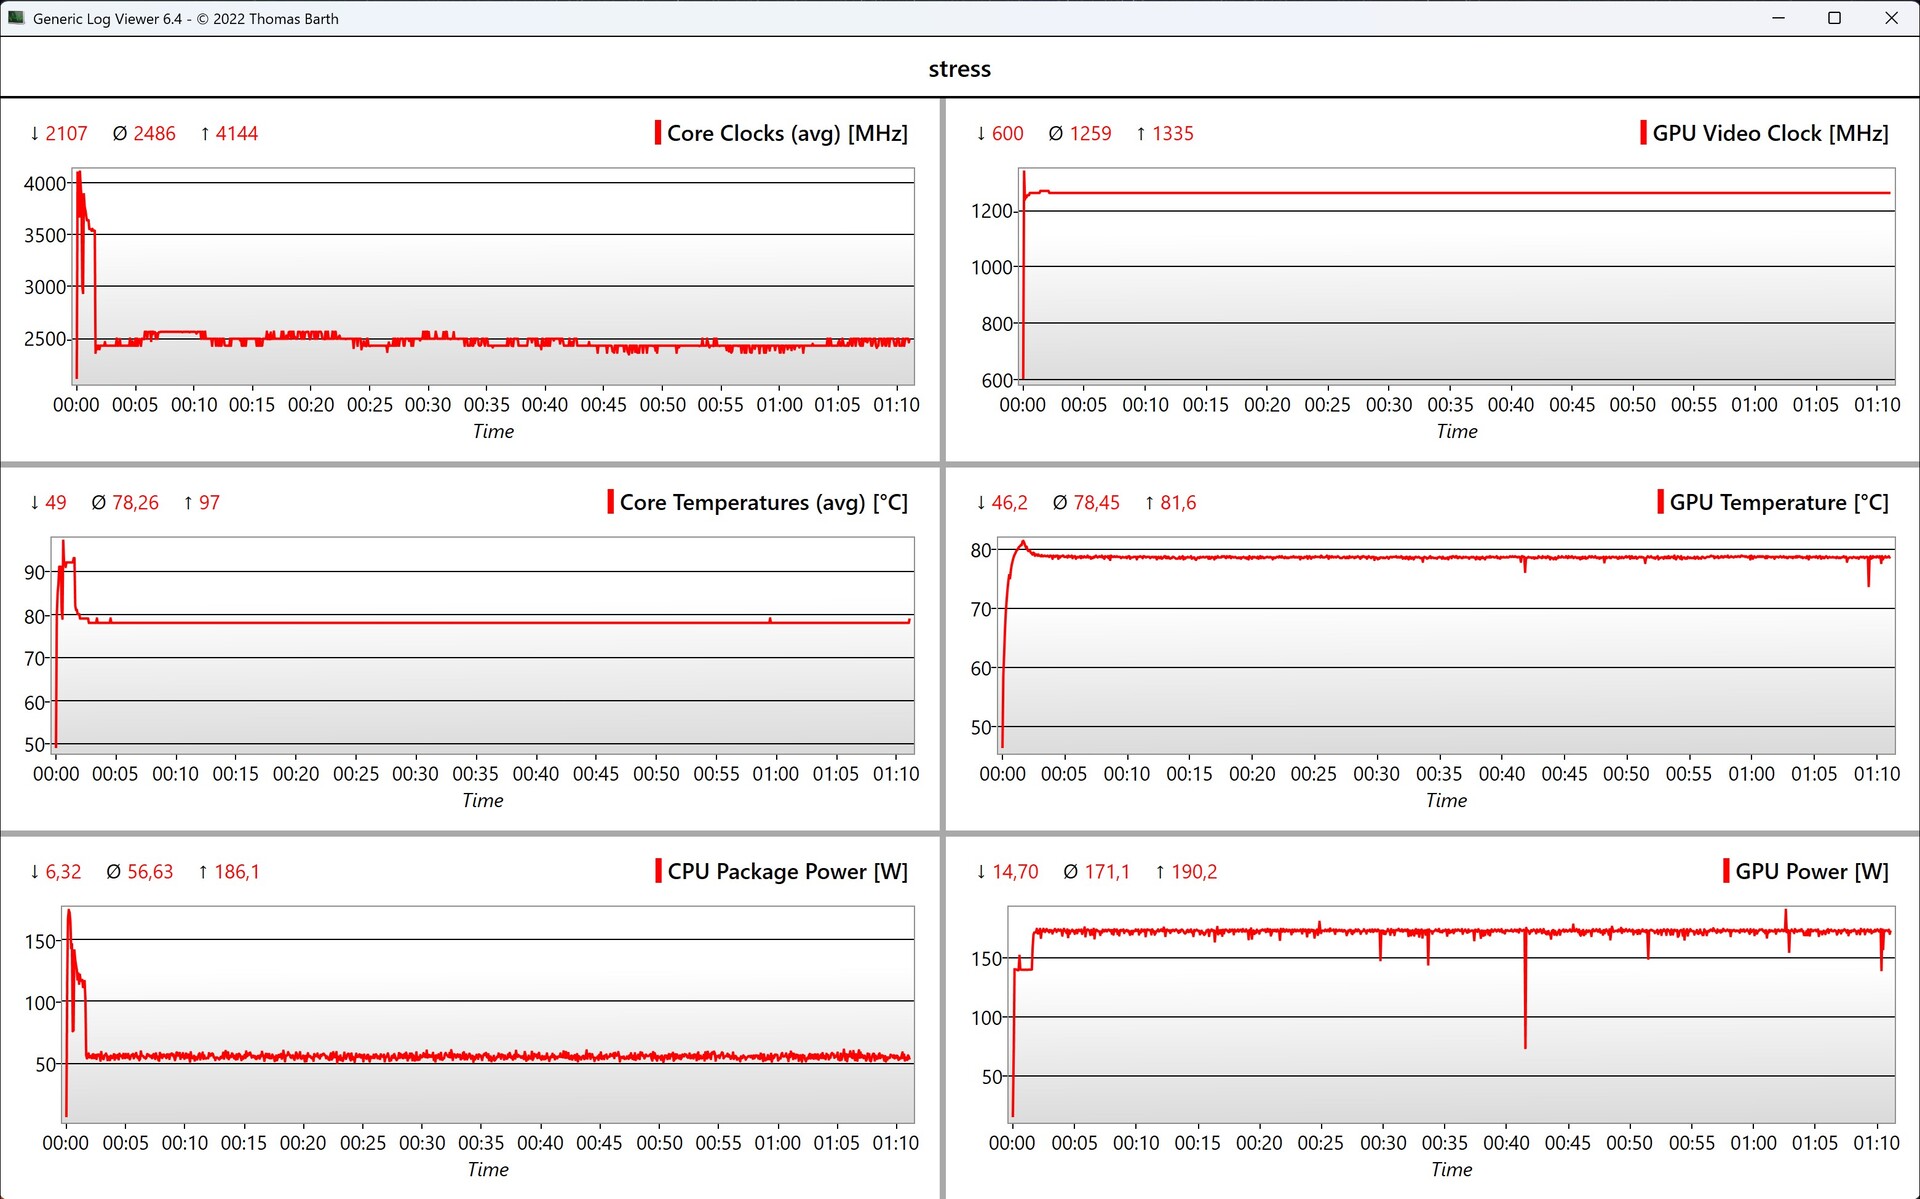
An advantage of the loud fans lies in the low surface temperatures, and even under extreme load, the device still remains very cool particularly on top of the base unit. However, the back area at the bottom gets quite warm (almost 50 °C, 122 °F), so you shouldn't place the Strix G16 on your lap. During the stress test, the CPU and GPU level out at around 56 and 170 watts respectively (32 and 44 watts in battery operation).
(+) The maximum temperature on the upper side is 39.6 °C / 103 F, compared to the average of 40.4 °C / 105 F, ranging from 21.2 to 68.8 °C for the class Gaming.
(-) The bottom heats up to a maximum of 49.7 °C / 121 F, compared to the average of 43.2 °C / 110 F
(+) In idle usage, the average temperature for the upper side is 25.8 °C / 78 F, compared to the device average of 33.9 °C / 93 F.
(±) 3: The average temperature for the upper side is 32.5 °C / 91 F, compared to the average of 33.9 °C / 93 F for the class Gaming.
(+) The palmrests and touchpad are cooler than skin temperature with a maximum of 31.3 °C / 88.3 F and are therefore cool to the touch.
(-) The average temperature of the palmrest area of similar devices was 28.8 °C / 83.8 F (-2.5 °C / -4.5 F).

| Asus ROG Strix G16 G615 Intel Core Ultra 9 275HX, NVIDIA GeForce RTX 5080 Laptop | Acer Predator Helios 16 PH16-72 Intel Core i9-14900HX, NVIDIA GeForce RTX 4080 Laptop GPU | Schenker XMG Neo 16 (Early 24) Intel Core i9-14900HX, NVIDIA GeForce RTX 4090 Laptop GPU | Asus ROG Strix Scar 16 G634JZR Intel Core i9-14900HX, NVIDIA GeForce RTX 4080 Laptop GPU | HP Omen 16 (2024) Intel Core i9-14900HX, NVIDIA GeForce RTX 4080 Laptop GPU | Lenovo Legion Pro 7 16IRX9H Intel Core i9-14900HX, NVIDIA GeForce RTX 4080 Laptop GPU | Lenovo Legion Pro 7i 16 Gen 10 Intel Core Ultra 9 275HX, NVIDIA GeForce RTX 5080 Laptop | |
|---|---|---|---|---|---|---|---|
| Heat | -14% | -9% | -18% | -6% | -24% | -9% | |
| Maximum Upper Side * (°C) | 39.6 | 37.5 5% | 47 -19% | 47.8 -21% | 47 -19% | 46 -16% | 42.6 -8% |
| Maximum Bottom * (°C) | 49.7 | 43.9 12% | 56 -13% | 52.2 -5% | 57 -15% | 49 1% | 41.2 17% |
| Idle Upper Side * (°C) | 26.3 | 31 -18% | 27 -3% | 32.4 -23% | 25 5% | 38 -44% | 32.6 -24% |
| Idle Bottom * (°C) | 27.3 | 42 -54% | 27 1% | 33 -21% | 26 5% | 37 -36% | 32.4 -19% |
* ... smaller is better
Speakers
The stereo speakers do a very good job and belong to the best of our comparison field. However, they are still unable to prevail against the fan noise while gaming.
Asus ROG Strix G16 G615 audio analysis
(+) | speakers can play relatively loud (82.2 dB)
Bass 100 - 315 Hz
(±) | reduced bass - on average 7.5% lower than median
(±) | linearity of bass is average (7.4% delta to prev. frequency)
Mids 400 - 2000 Hz
(+) | balanced mids - only 2.9% away from median
(+) | mids are linear (3.6% delta to prev. frequency)
Highs 2 - 16 kHz
(+) | balanced highs - only 2.8% away from median
(±) | linearity of highs is average (8.3% delta to prev. frequency)
Overall 100 - 16.000 Hz
(+) | overall sound is linear (9.4% difference to median)
Compared to same class
» 3% of all tested devices in this class were better, 2% similar, 95% worse
» The best had a delta of 6%, average was 18%, worst was 132%
Compared to all devices tested
» 3% of all tested devices were better, 1% similar, 96% worse
» The best had a delta of 4%, average was 23%, worst was 134%
Acer Predator Helios 16 PH16-72 audio analysis
(±) | speaker loudness is average but good (81.9 dB)
Bass 100 - 315 Hz
(±) | reduced bass - on average 14.2% lower than median
(±) | linearity of bass is average (11.7% delta to prev. frequency)
Mids 400 - 2000 Hz
(±) | higher mids - on average 8.3% higher than median
(±) | linearity of mids is average (8.8% delta to prev. frequency)
Highs 2 - 16 kHz
(+) | balanced highs - only 4.2% away from median
(+) | highs are linear (6% delta to prev. frequency)
Overall 100 - 16.000 Hz
(±) | linearity of overall sound is average (19% difference to median)
Compared to same class
» 63% of all tested devices in this class were better, 8% similar, 29% worse
» The best had a delta of 6%, average was 18%, worst was 132%
Compared to all devices tested
» 45% of all tested devices were better, 7% similar, 48% worse
» The best had a delta of 4%, average was 23%, worst was 134%
Schenker XMG Neo 16 (Early 24) audio analysis
(+) | speakers can play relatively loud (86 dB)
Bass 100 - 315 Hz
(-) | nearly no bass - on average 16.3% lower than median
(±) | linearity of bass is average (8.6% delta to prev. frequency)
Mids 400 - 2000 Hz
(+) | balanced mids - only 3% away from median
(+) | mids are linear (3.6% delta to prev. frequency)
Highs 2 - 16 kHz
(+) | balanced highs - only 2.5% away from median
(+) | highs are linear (4.9% delta to prev. frequency)
Overall 100 - 16.000 Hz
(+) | overall sound is linear (12.4% difference to median)
Compared to same class
» 14% of all tested devices in this class were better, 4% similar, 82% worse
» The best had a delta of 6%, average was 18%, worst was 132%
Compared to all devices tested
» 11% of all tested devices were better, 2% similar, 87% worse
» The best had a delta of 4%, average was 23%, worst was 134%
Asus ROG Strix Scar 16 G634JZR audio analysis
(±) | speaker loudness is average but good (79 dB)
Bass 100 - 315 Hz
(±) | reduced bass - on average 7.1% lower than median
(±) | linearity of bass is average (9% delta to prev. frequency)
Mids 400 - 2000 Hz
(±) | higher mids - on average 5.5% higher than median
(+) | mids are linear (3.3% delta to prev. frequency)
Highs 2 - 16 kHz
(+) | balanced highs - only 1.4% away from median
(+) | highs are linear (2.6% delta to prev. frequency)
Overall 100 - 16.000 Hz
(+) | overall sound is linear (9.8% difference to median)
Compared to same class
» 5% of all tested devices in this class were better, 1% similar, 94% worse
» The best had a delta of 6%, average was 18%, worst was 132%
Compared to all devices tested
» 4% of all tested devices were better, 1% similar, 95% worse
» The best had a delta of 4%, average was 23%, worst was 134%
HP Omen 16 (2024) audio analysis
(±) | speaker loudness is average but good (78 dB)
Bass 100 - 315 Hz
(-) | nearly no bass - on average 15.2% lower than median
(±) | linearity of bass is average (14.3% delta to prev. frequency)
Mids 400 - 2000 Hz
(+) | balanced mids - only 4.8% away from median
(+) | mids are linear (5% delta to prev. frequency)
Highs 2 - 16 kHz
(+) | balanced highs - only 2% away from median
(+) | highs are linear (4.1% delta to prev. frequency)
Overall 100 - 16.000 Hz
(+) | overall sound is linear (14.7% difference to median)
Compared to same class
» 29% of all tested devices in this class were better, 7% similar, 64% worse
» The best had a delta of 6%, average was 18%, worst was 132%
Compared to all devices tested
» 19% of all tested devices were better, 4% similar, 77% worse
» The best had a delta of 4%, average was 23%, worst was 134%
Lenovo Legion Pro 7 16IRX9H audio analysis
(+) | speakers can play relatively loud (84 dB)
Bass 100 - 315 Hz
(±) | reduced bass - on average 8.9% lower than median
(±) | linearity of bass is average (7.4% delta to prev. frequency)
Mids 400 - 2000 Hz
(+) | balanced mids - only 2.8% away from median
(+) | mids are linear (4% delta to prev. frequency)
Highs 2 - 16 kHz
(+) | balanced highs - only 3% away from median
(+) | highs are linear (5% delta to prev. frequency)
Overall 100 - 16.000 Hz
(+) | overall sound is linear (8.4% difference to median)
Compared to same class
» 2% of all tested devices in this class were better, 1% similar, 97% worse
» The best had a delta of 6%, average was 18%, worst was 132%
Compared to all devices tested
» 2% of all tested devices were better, 1% similar, 97% worse
» The best had a delta of 4%, average was 23%, worst was 134%
Power Management - Gaming laptop with long battery life
Power Consumption
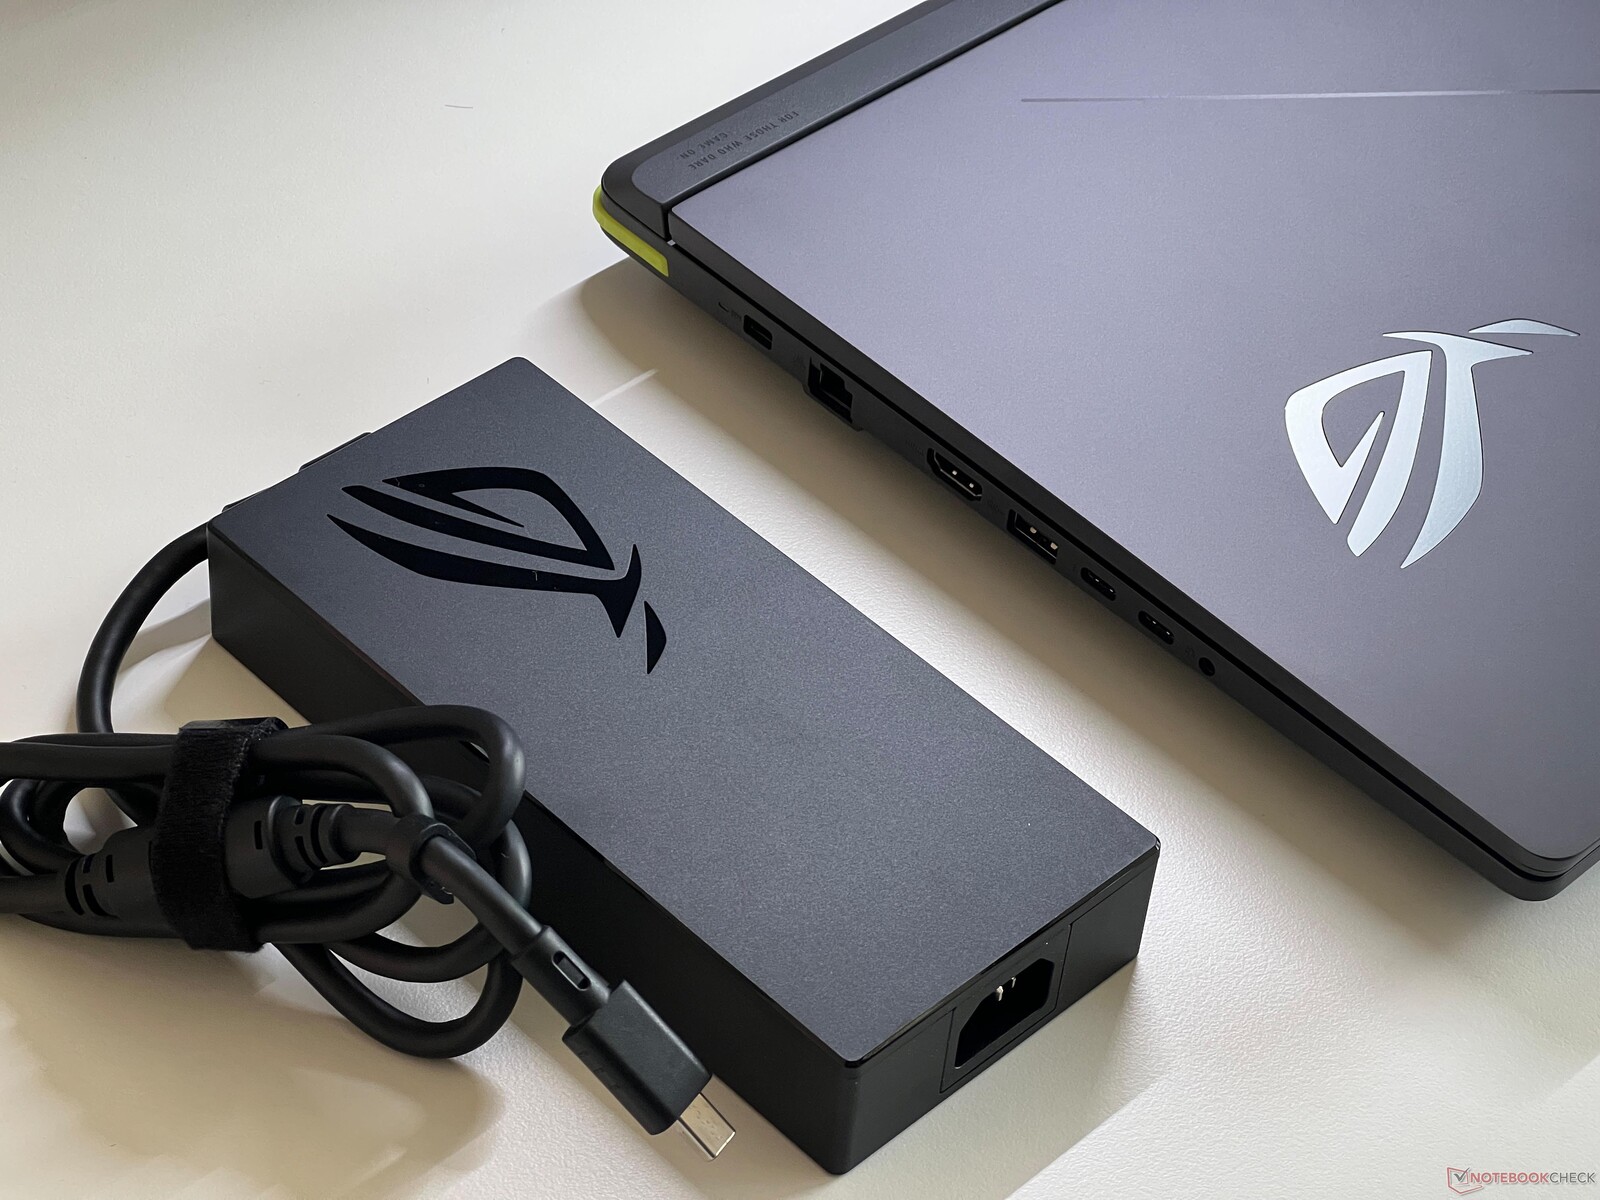
During idle operation, the Strix G16 is relatively efficient, consuming a maximum of 18 watts. But this changes under load, which isn't very surprising with the high power limits. During the stress test, we measure around 360 watts for a few seconds, before the consumption levels out at around 300 watts. You can expect a similar value during gaming, so the included 380-Watt charger is completely sufficient. At 1.8 watts, the standby consumption is too high, even though all of the illumination is already deactivated (the illuminated light strip produces a pulsating effect during standby by default).
| Off / Standby | |
| Idle | |
| Load |
|
Key:
min: | |
| Asus ROG Strix G16 G615 Ultra 9 275HX, GeForce RTX 5080 Laptop, Micron 2500 1TB MTFDKBA1T0QGN, IPS, 2560x1600, 16" | Acer Predator Helios 16 PH16-72 i9-14900HX, GeForce RTX 4080 Laptop GPU, Micron 3400 2TB MTFDKBA2T0TFH, IPS, 2560x1600, 16" | Schenker XMG Neo 16 (Early 24) i9-14900HX, GeForce RTX 4090 Laptop GPU, Samsung 990 Pro 1 TB, IPS, 2560x1600, 16" | Asus ROG Strix Scar 16 G634JZR i9-14900HX, GeForce RTX 4080 Laptop GPU, SK hynix PC801 HFS002TEJ9X101N, Mini LED, 2560x1600, 16" | HP Omen 16 (2024) i9-14900HX, GeForce RTX 4080 Laptop GPU, SK hynix PC801 HFS001TEJ9X101N, IPS, 2560x1440, 16.1" | Lenovo Legion Pro 7 16IRX9H i9-14900HX, GeForce RTX 4080 Laptop GPU, SK Hynix HFS001TEJ9X115N, IPS, 2560x1600, 16" | Lenovo Legion Pro 7i 16 Gen 10 Ultra 9 275HX, GeForce RTX 5080 Laptop, SK Hynix HFS001TEJ9X115N, OLED, 2560x1600, 16" | Average NVIDIA GeForce RTX 5080 Laptop | Average of class Gaming | |
|---|---|---|---|---|---|---|---|---|---|
| Power Consumption | -64% | 2% | -5% | -6% | -31% | -64% | -32% | -1% | |
| Idle Minimum * (Watt) | 10.8 | 31.5 -192% | 6 44% | 10.71 1% | 9 17% | 16 -48% | 28.5 -164% | 19.1 ? -77% | 13 ? -20% |
| Idle Average * (Watt) | 17.7 | 31.5 -78% | 16 10% | 14.75 17% | 16 10% | 21 -19% | 38.8 -119% | 25.3 ? -43% | 18.7 ? -6% |
| Idle Maximum * (Watt) | 18.8 | 47.5 -153% | 28 -49% | 30 -60% | 35 -86% | 36 -91% | 45.6 -143% | 30.4 ? -62% | 24.3 ? -29% |
| Load Average * (Watt) | 139.4 | 130 7% | 135 3% | 129 7% | 132 5% | 132.2 5% | 128.5 ? 8% | 109.7 ? 21% | |
| Cyberpunk 2077 ultra * (Watt) | 295 | 231 22% | 318 -8% | ||||||
| Cyberpunk 2077 ultra external monitor * (Watt) | 291 | 270 7% | 319 -10% | ||||||
| Load Maximum * (Watt) | 359.3 | 313 13% | 361 -0% | 307 15% | 285 21% | 360 -0% | 384 -7% | 314 ? 13% | 257 ? 28% |
| Witcher 3 ultra * (Watt) | 302 | 286 | 150.8 | 267 |
* ... smaller is better
Power Consumption Cyberpunk / Stress Test
Power Consumption with External Monitor
Battery Life
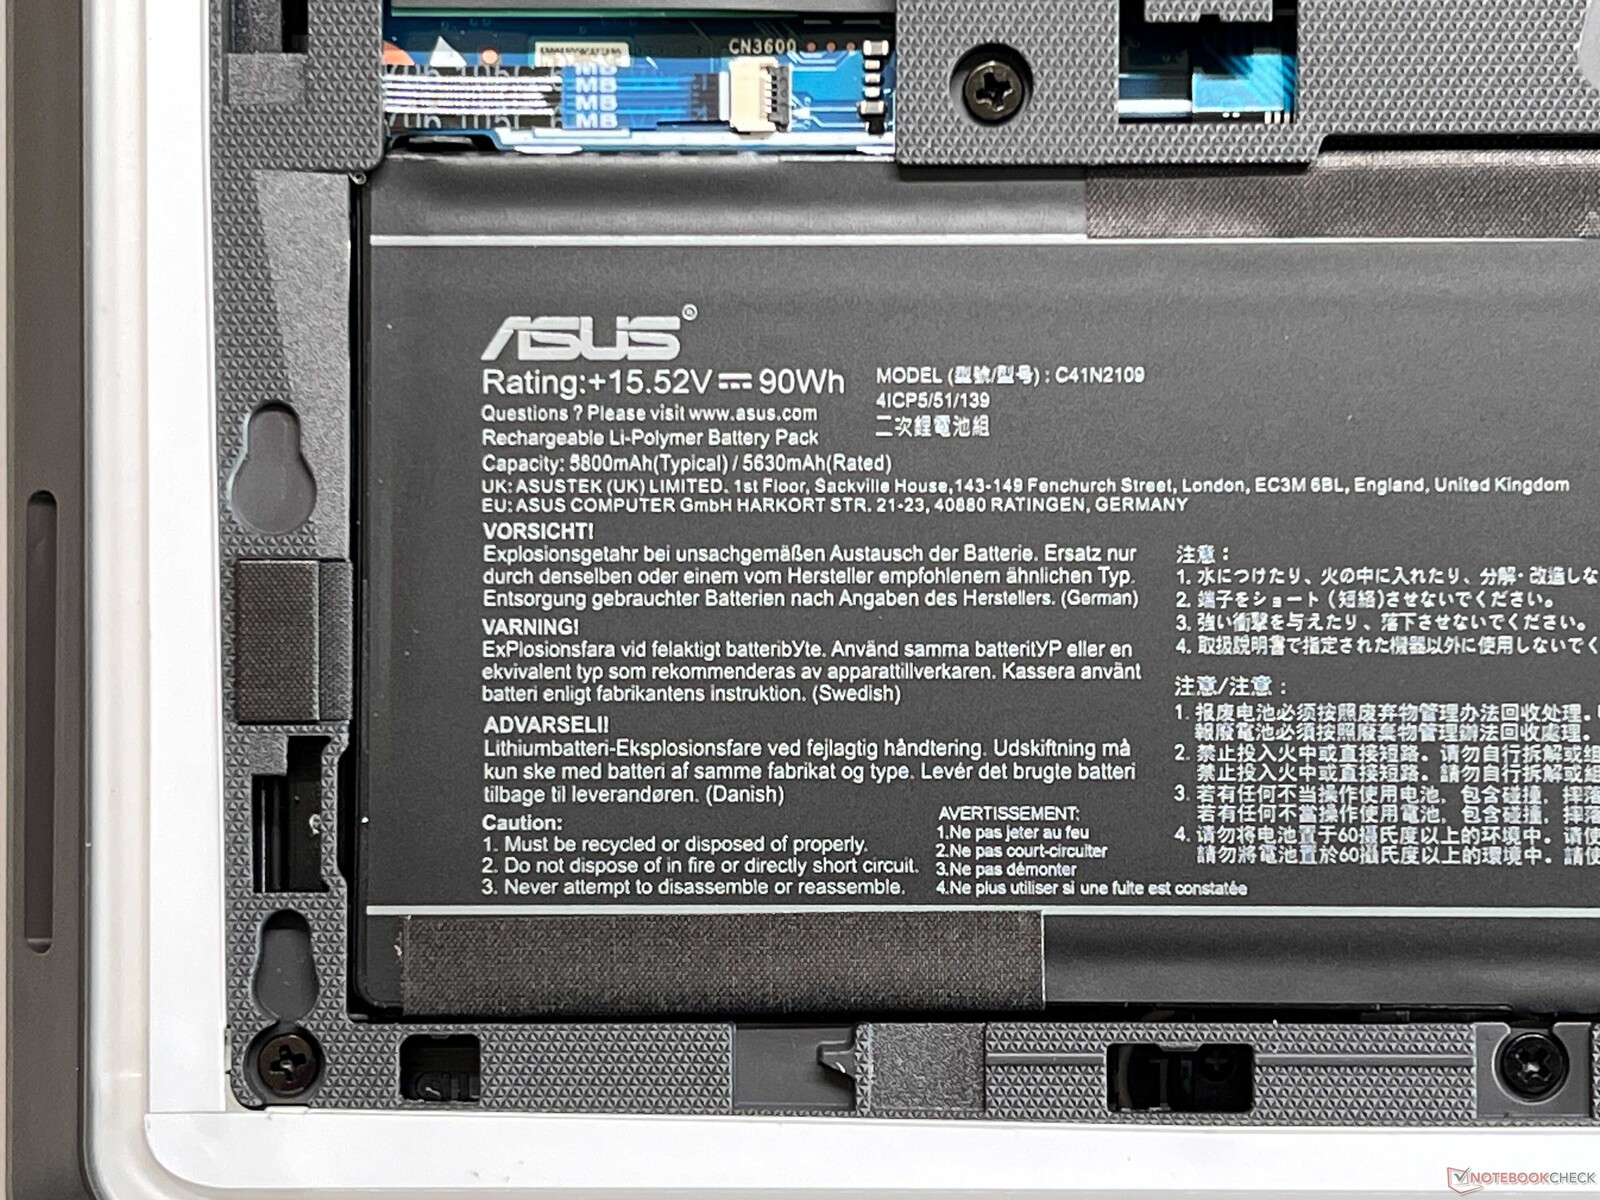
Gaming laptops aren't known for their long battery life, but the Strix G16 (90 Wh battery) is a positive surprise and also able to surpass its competitors. It lasts for almost 8 hours in our WLAN test (6.5h at full brightness) and for almost 11 hours playing videos. When gaming, the battery is depleted after about 48 minutes in our test, though.
| Asus ROG Strix G16 G615 Ultra 9 275HX, GeForce RTX 5080 Laptop, 90 Wh | Acer Predator Helios 16 PH16-72 i9-14900HX, GeForce RTX 4080 Laptop GPU, 90 Wh | Schenker XMG Neo 16 (Early 24) i9-14900HX, GeForce RTX 4090 Laptop GPU, 99.8 Wh | Asus ROG Strix Scar 16 G634JZR i9-14900HX, GeForce RTX 4080 Laptop GPU, 90 Wh | HP Omen 16 (2024) i9-14900HX, GeForce RTX 4080 Laptop GPU, 83 Wh | Lenovo Legion Pro 7 16IRX9H i9-14900HX, GeForce RTX 4080 Laptop GPU, 99.9 Wh | Lenovo Legion Pro 7i 16 Gen 10 Ultra 9 275HX, GeForce RTX 5080 Laptop, 99 Wh | Average of class Gaming | |
|---|---|---|---|---|---|---|---|---|
| Battery runtime | -21% | -10% | -27% | -24% | -21% | -39% | -10% | |
| H.264 (h) | 11 | 7 -36% | 7.5 -32% | 8.64 ? -21% | ||||
| WiFi v1.3 (h) | 7.8 | 4.6 -41% | 5.8 -26% | 7.2 -8% | 5.9 -24% | 6.2 -21% | 5.4 -31% | 7.11 ? -9% |
| Cyberpunk 2077 ultra 150cd (h) | 0.8 | 0.8 0% | ||||||
| Load (h) | 1.5 | 2 33% | 0.9 -40% | 0.8 -47% | 1.502 ? 0% | |||
| Witcher 3 ultra (h) | 1 |
Notebookcheck Overall Rating
Asus ROG Strix G16 G615
- 04/25/2025 v8
Andreas Osthoff
 Total Sustainability Score:
 Possible Alternatives in Comparison
Image | Model / Review | Price | Weight | Height | Display |
|---|---|---|---|---|---|
1. 87.3%  | Asus ROG Strix G16 G615 Intel Core Ultra 9 275HX ⎘ NVIDIA GeForce RTX 5080 Laptop ⎘ 32 GB Memory, 1024 GB SSD | Amazon: 1. $1,243.56 ASUS ROG Strix G16 (2025) Ga... 2. $2,179.00 ASUS ROG Strix G16 (2025) Ga... 3. $2,879.00 ASUS ROG Strix G16 (2025) Ga... List Price: 3299€ | 2.6 kg | 30.8 mm | 16.00" 2560x1600 189 PPI IPS |
2. 86%  | Acer Predator Helios 16 PH16-72 Intel Core i9-14900HX ⎘ NVIDIA GeForce RTX 4080 Laptop GPU ⎘ 32 GB Memory, 2048 GB SSD | Amazon: | 2.7 kg | 29.6 mm | 16.00" 2560x1600 189 PPI IPS |
3. 85.5%  | Schenker XMG Neo 16 (Early 24) Intel Core i9-14900HX ⎘ NVIDIA GeForce RTX 4090 Laptop GPU ⎘ 32 GB Memory, 1024 GB SSD | Amazon: List Price: 3800 Euro | 2.5 kg | 26.6 mm | 16.00" 2560x1600 189 PPI IPS |
4. 87.6% v7 (old)  | Asus ROG Strix Scar 16 G634JZR Intel Core i9-14900HX ⎘ NVIDIA GeForce RTX 4080 Laptop GPU ⎘ 32 GB Memory, 2048 GB SSD | Amazon: List Price: 3199 EUR | 2.7 kg | 30.4 mm | 16.00" 2560x1600 189 PPI Mini LED |
5. 86.7% v7 (old)  | HP Omen 16 (2024) Intel Core i9-14900HX ⎘ NVIDIA GeForce RTX 4080 Laptop GPU ⎘ 32 GB Memory, 1024 GB SSD | Amazon: 1. $1,789.00 HP Omen 16 2024 Gaming Lapto... 2. $1,119.99 HP OMEN 16 inch Laptop, FHD ... 3. $1,499.99 HP Omen 16 Slim Gaming Lapto... List Price: 3200 Euro | 2.4 kg | 23.5 mm | 16.10" 2560x1440 182 PPI IPS |
6. 89.5% v7 (old)  | Lenovo Legion Pro 7 16IRX9H Intel Core i9-14900HX ⎘ NVIDIA GeForce RTX 4080 Laptop GPU ⎘ 32 GB Memory, 1024 GB SSD | Amazon: List Price: 2999 Euro | 2.7 kg | 21.95 mm | 16.00" 2560x1600 189 PPI IPS |
Transparency
The selection of devices to be reviewed is made by our editorial team. The test sample was provided to the author as a loan by the manufacturer or retailer for the purpose of this review. The lender had no influence on this review, nor did the manufacturer receive a copy of this review before publication. There was no obligation to publish this review. As an independent media company, Notebookcheck is not subjected to the authority of manufacturers, retailers or publishers.
This is how Notebookcheck is testing
Every year, Notebookcheck independently reviews hundreds of laptops and smartphones using standardized procedures to ensure that all results are comparable. We have continuously developed our test methods for around 20 years and set industry standards in the process. In our test labs, high-quality measuring equipment is utilized by experienced technicians and editors. These tests involve a multi-stage validation process. Our complex rating system is based on hundreds of well-founded measurements and benchmarks, which maintains objectivity. Further information on our test methods can be found here.

