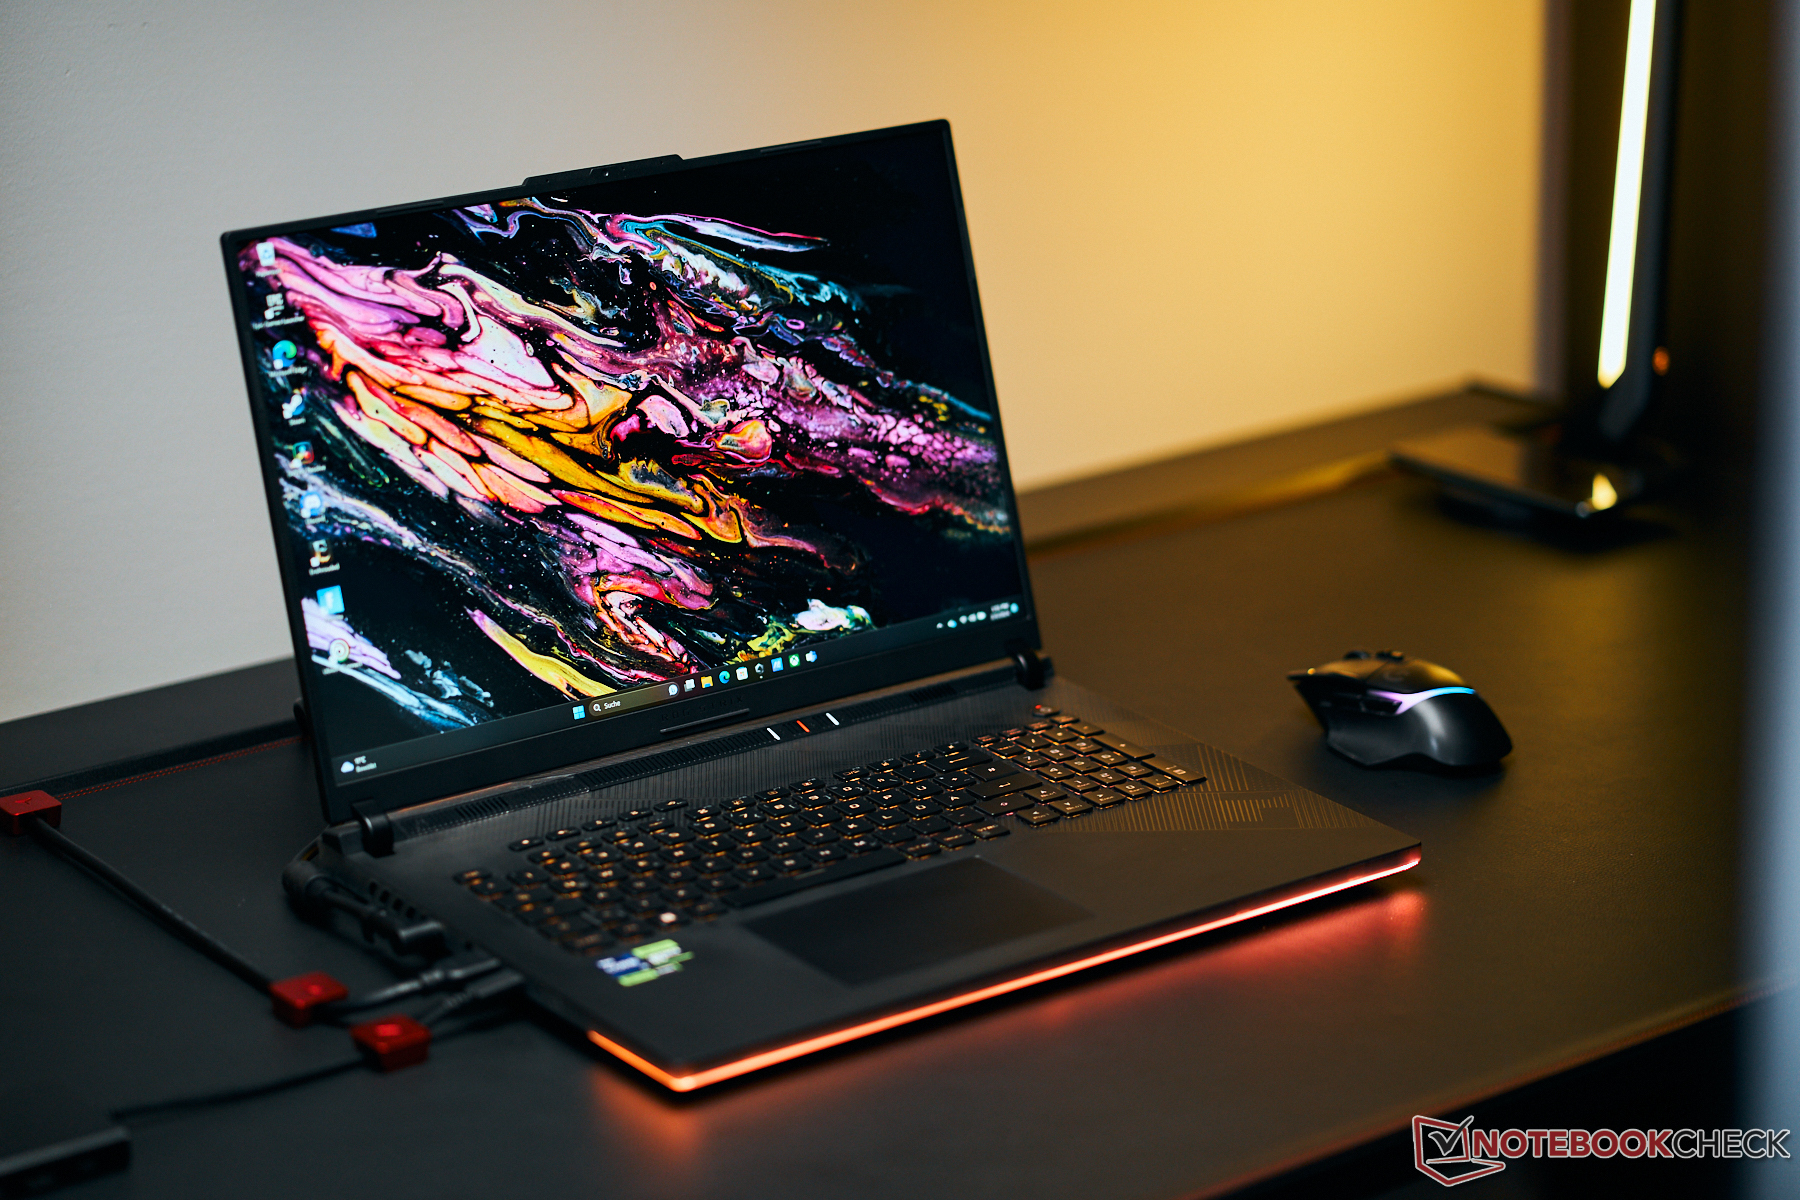
Asus ROG Strix Scar 18 (2024) review: Gaming laptop with RTX 4090 and mini-LED panel
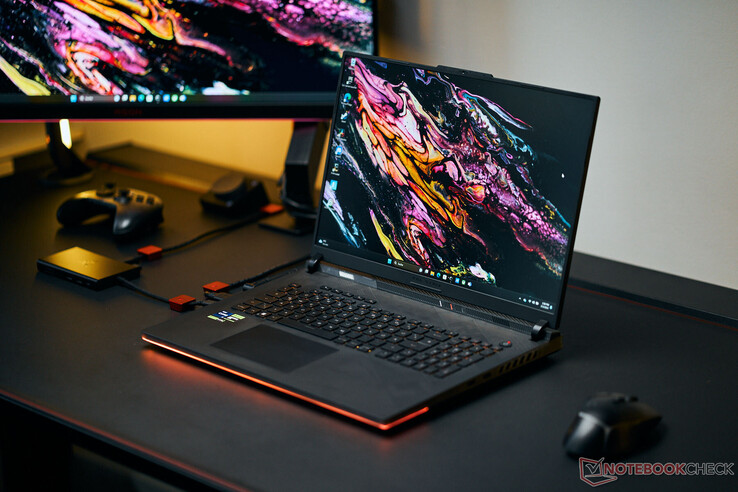
With the ROG Strix Scar 18, ASUS targets gamers and creators that don't lack the necessary funds: Our test configuration of the high-end champion is available starting from about 4,500 Euros (~$4,848). The price is driven to such heights by the powerful hardware and a very bright mini-LED display in the 16:10 format with accurate colors and a diagonal of 18 inches. The competitors include devices such as the Alienware m18 R1, the Acer Predator Helios 18, the Razer Blade 18, and the MSI Titan 18 HX A14VIG.
The laptop is the sibling of the Scar 18 that we tested last year and shares an identical build. Besides the display, the CPU generation represents the only change, with Raptor Lake Refresh replacing Raptor Lake.
Possible Competitors in Comparison
Rating | Date | Model | Weight | Height | Size | Resolution | Price |
|---|---|---|---|---|---|---|---|
| 88.3 % v7 (old) | 02 / 2024 | Asus ROG Strix Scar 18 G834JYR (2024) i9-14900HX, GeForce RTX 4090 Laptop GPU | 3.1 kg | 30.8 mm | 18.00" | 2560x1600 | |
| 89.2 % v7 (old) | 11 / 2023 | Alienware m18 R1 AMD R9 7945HX, Radeon RX 7900M | 3.9 kg | 26.7 mm | 18.00" | 1920x1200 | |
| 90.7 % v7 (old) | 04 / 2023 | Alienware m18 R1 i9-13980HX, GeForce RTX 4090 Laptop GPU | 3.9 kg | 26.7 mm | 18.00" | 1920x1200 | |
| 88.3 % v7 (old) | 10 / 2023 | Acer Predator Helios 18 N23Q2 i9-13900HX, GeForce RTX 4080 Laptop GPU | 3.2 kg | 29.15 mm | 18.00" | 2560x1600 | |
| 91.4 % v7 (old) | 02 / 2023 | Razer Blade 18 RTX 4070 i9-13950HX, GeForce RTX 4070 Laptop GPU | 3 kg | 21.9 mm | 18.00" | 2560x1600 | |
| 88.8 % v7 (old) | 01 / 2024 | MSI Titan 18 HX A14VIG i9-14900HX, GeForce RTX 4090 Laptop GPU | 3.6 kg | 32.1 mm | 18.00" | 3840x2400 |
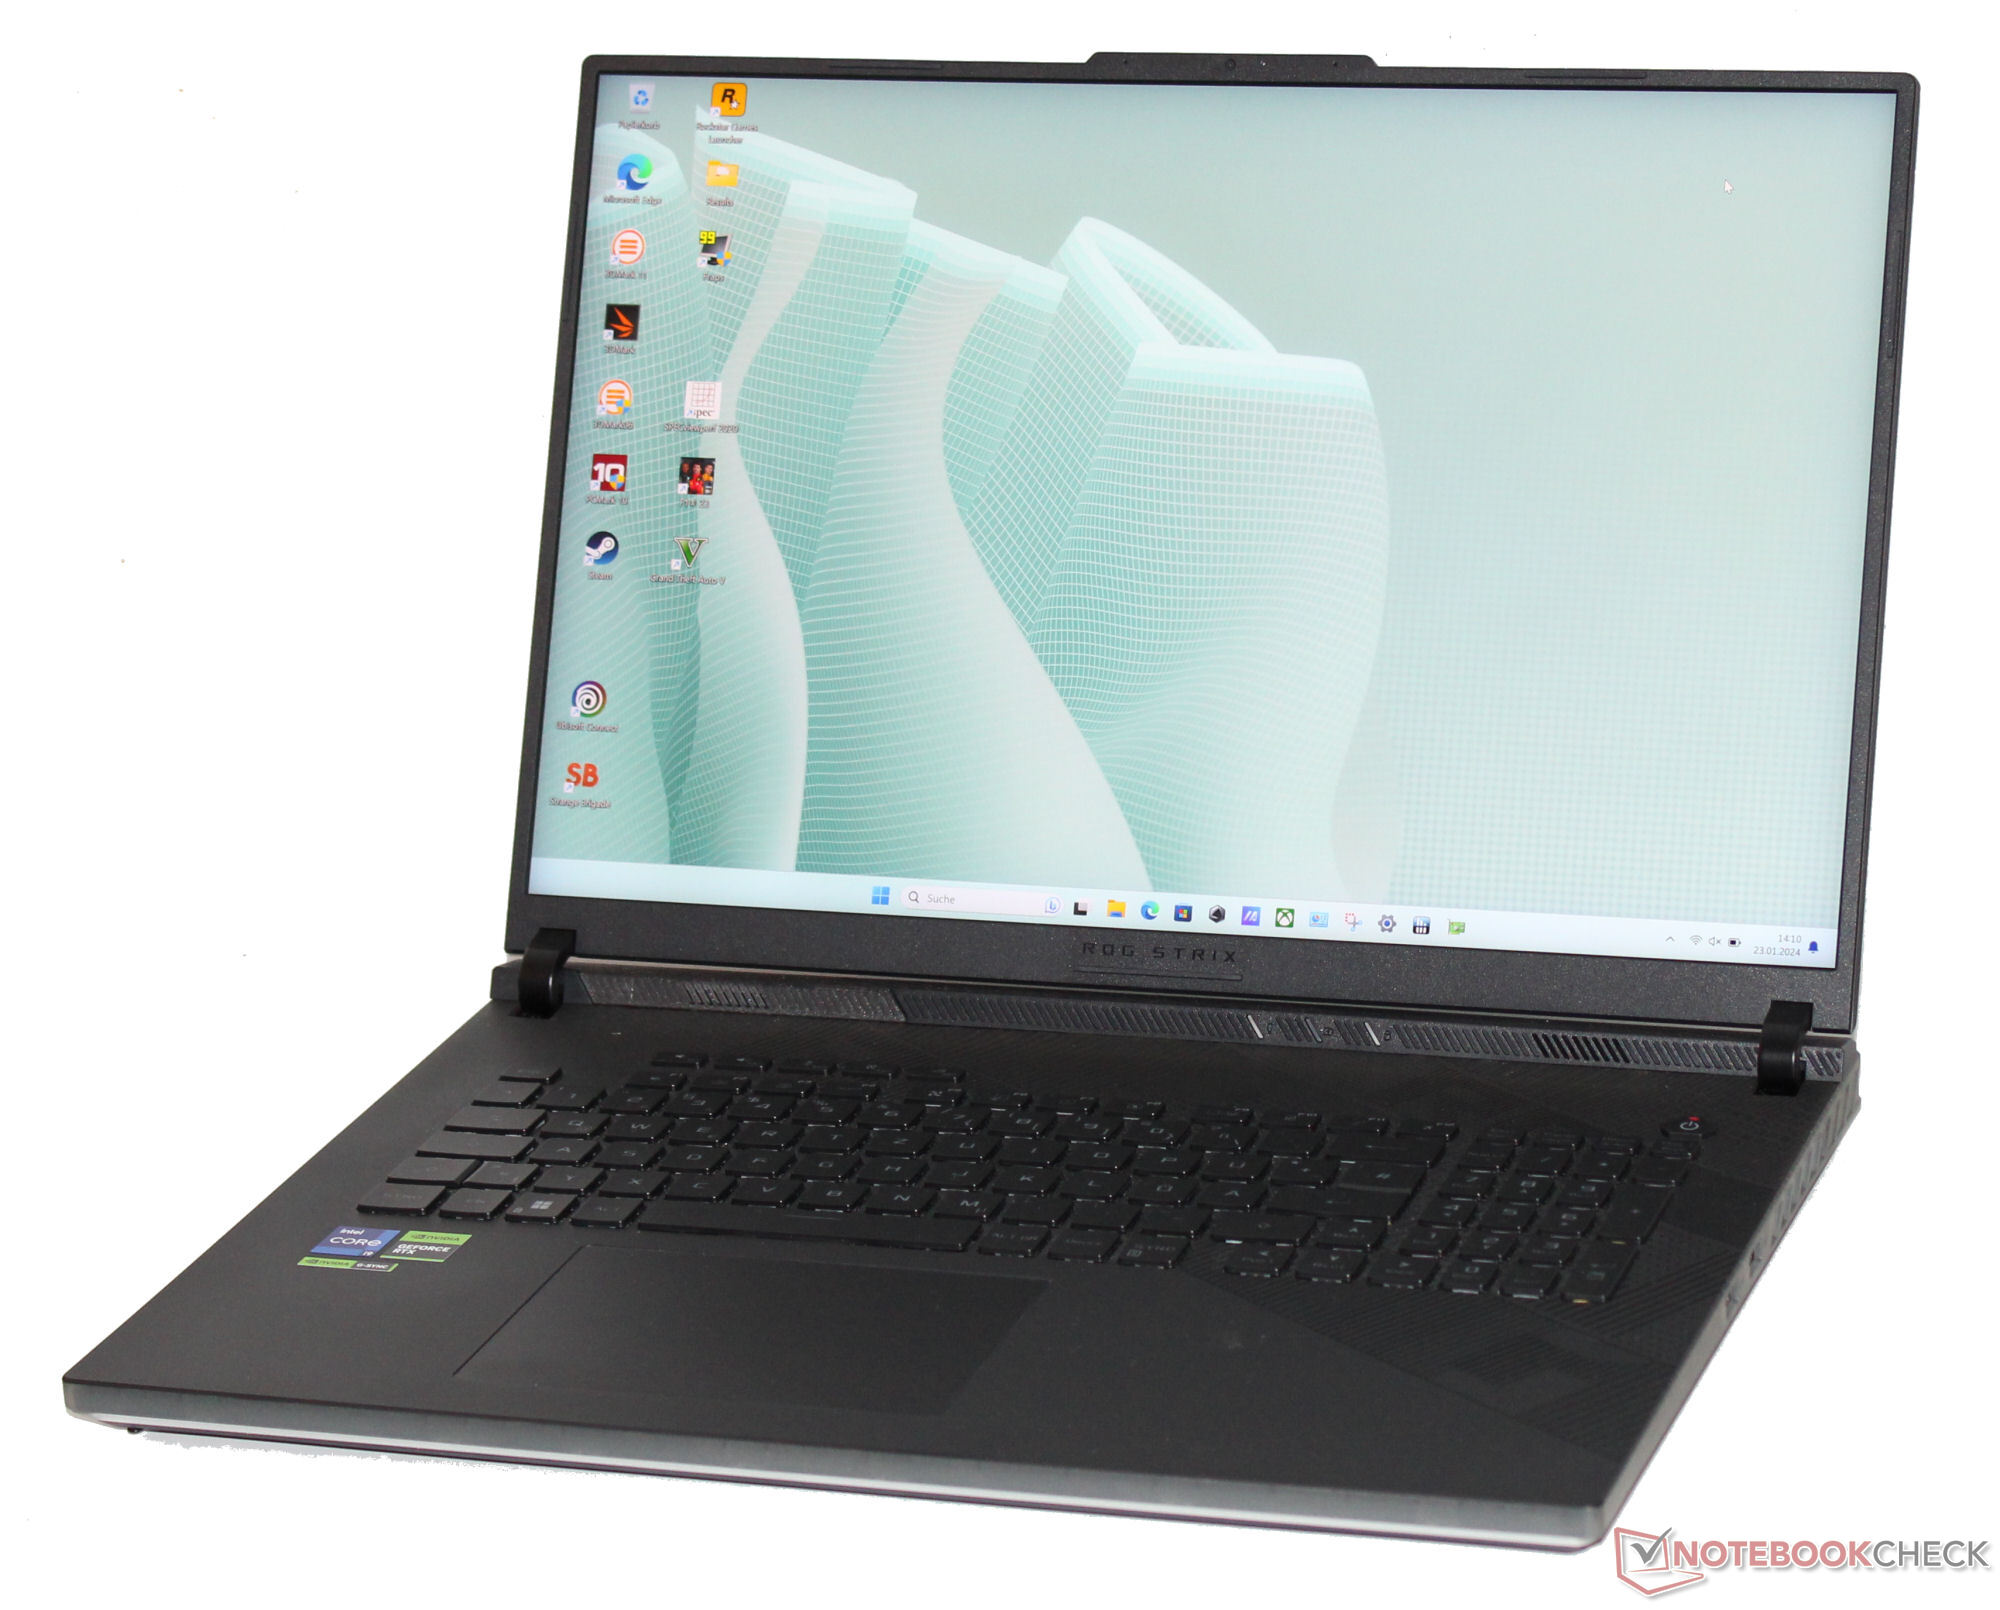
Case - A lot of plastic and only little aluminum
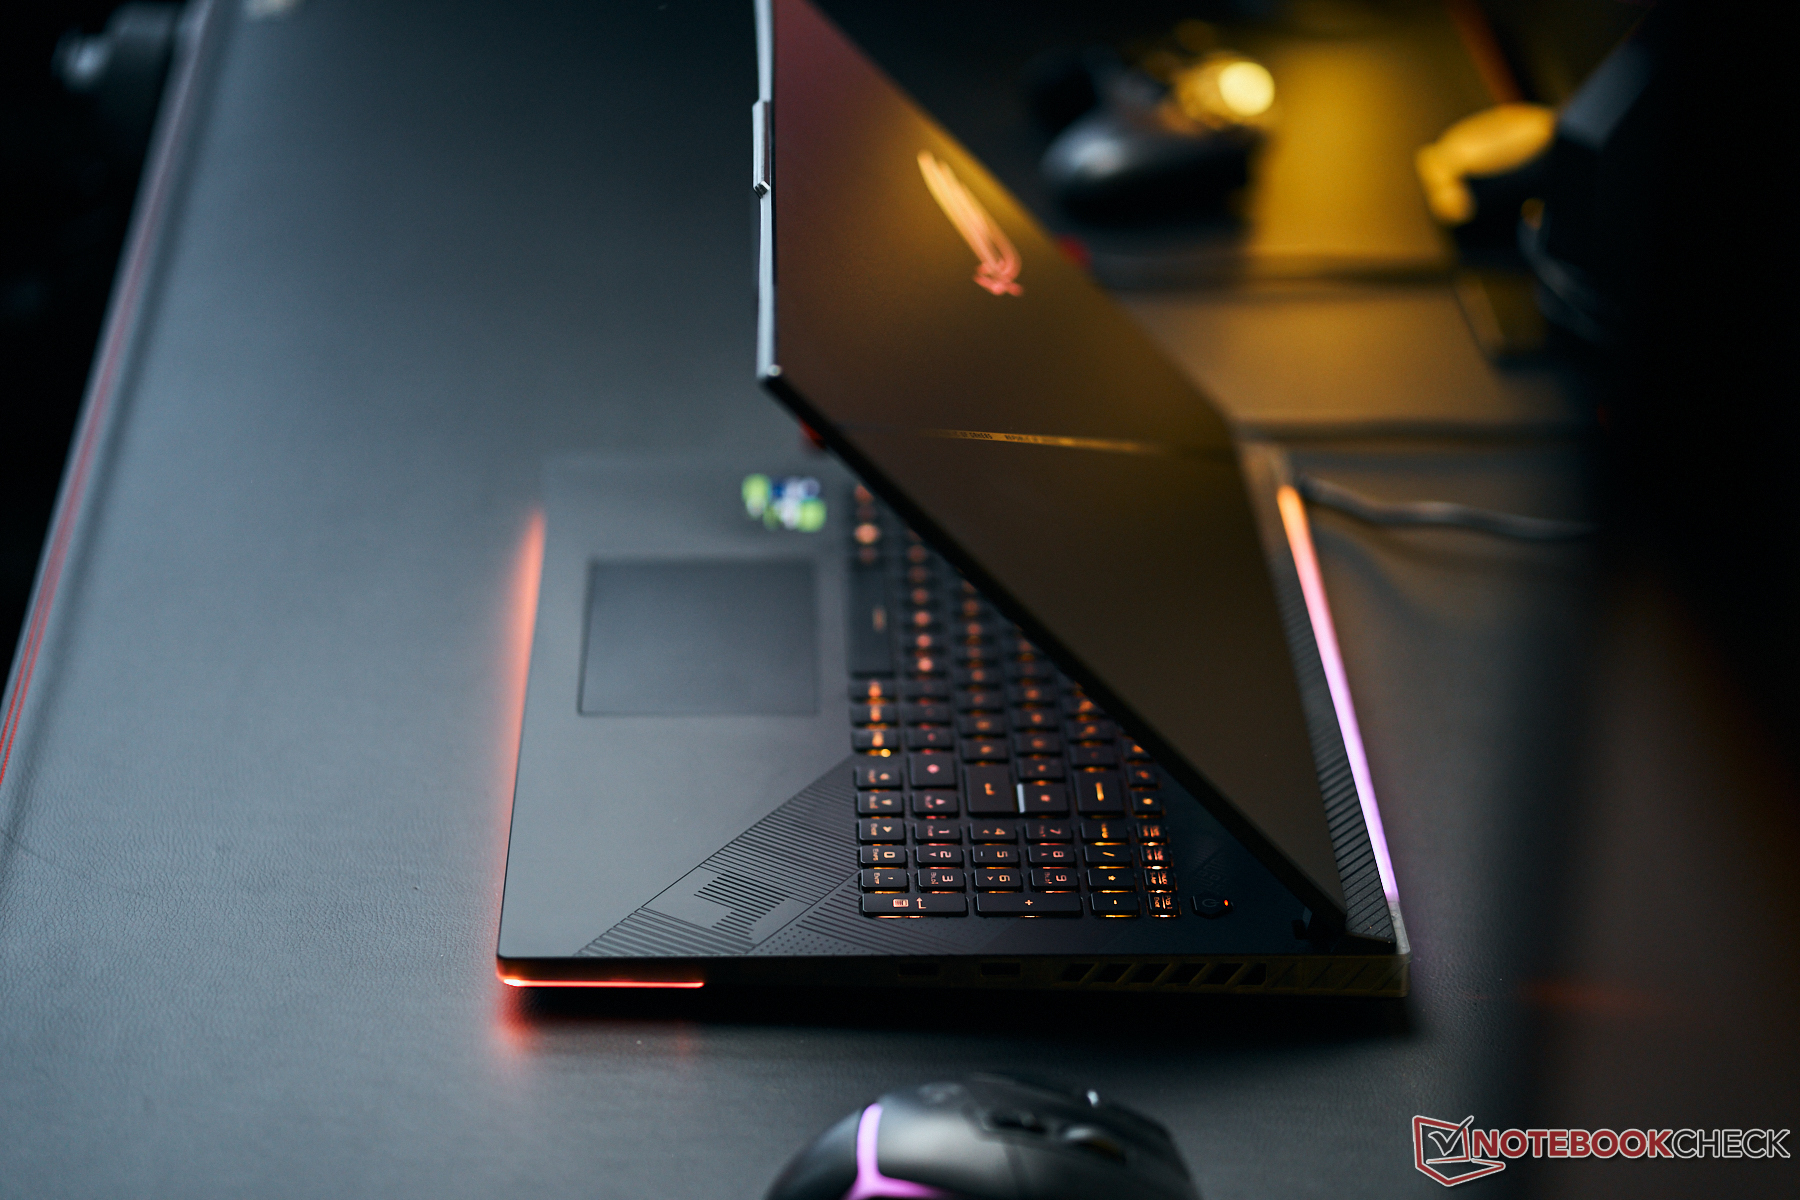
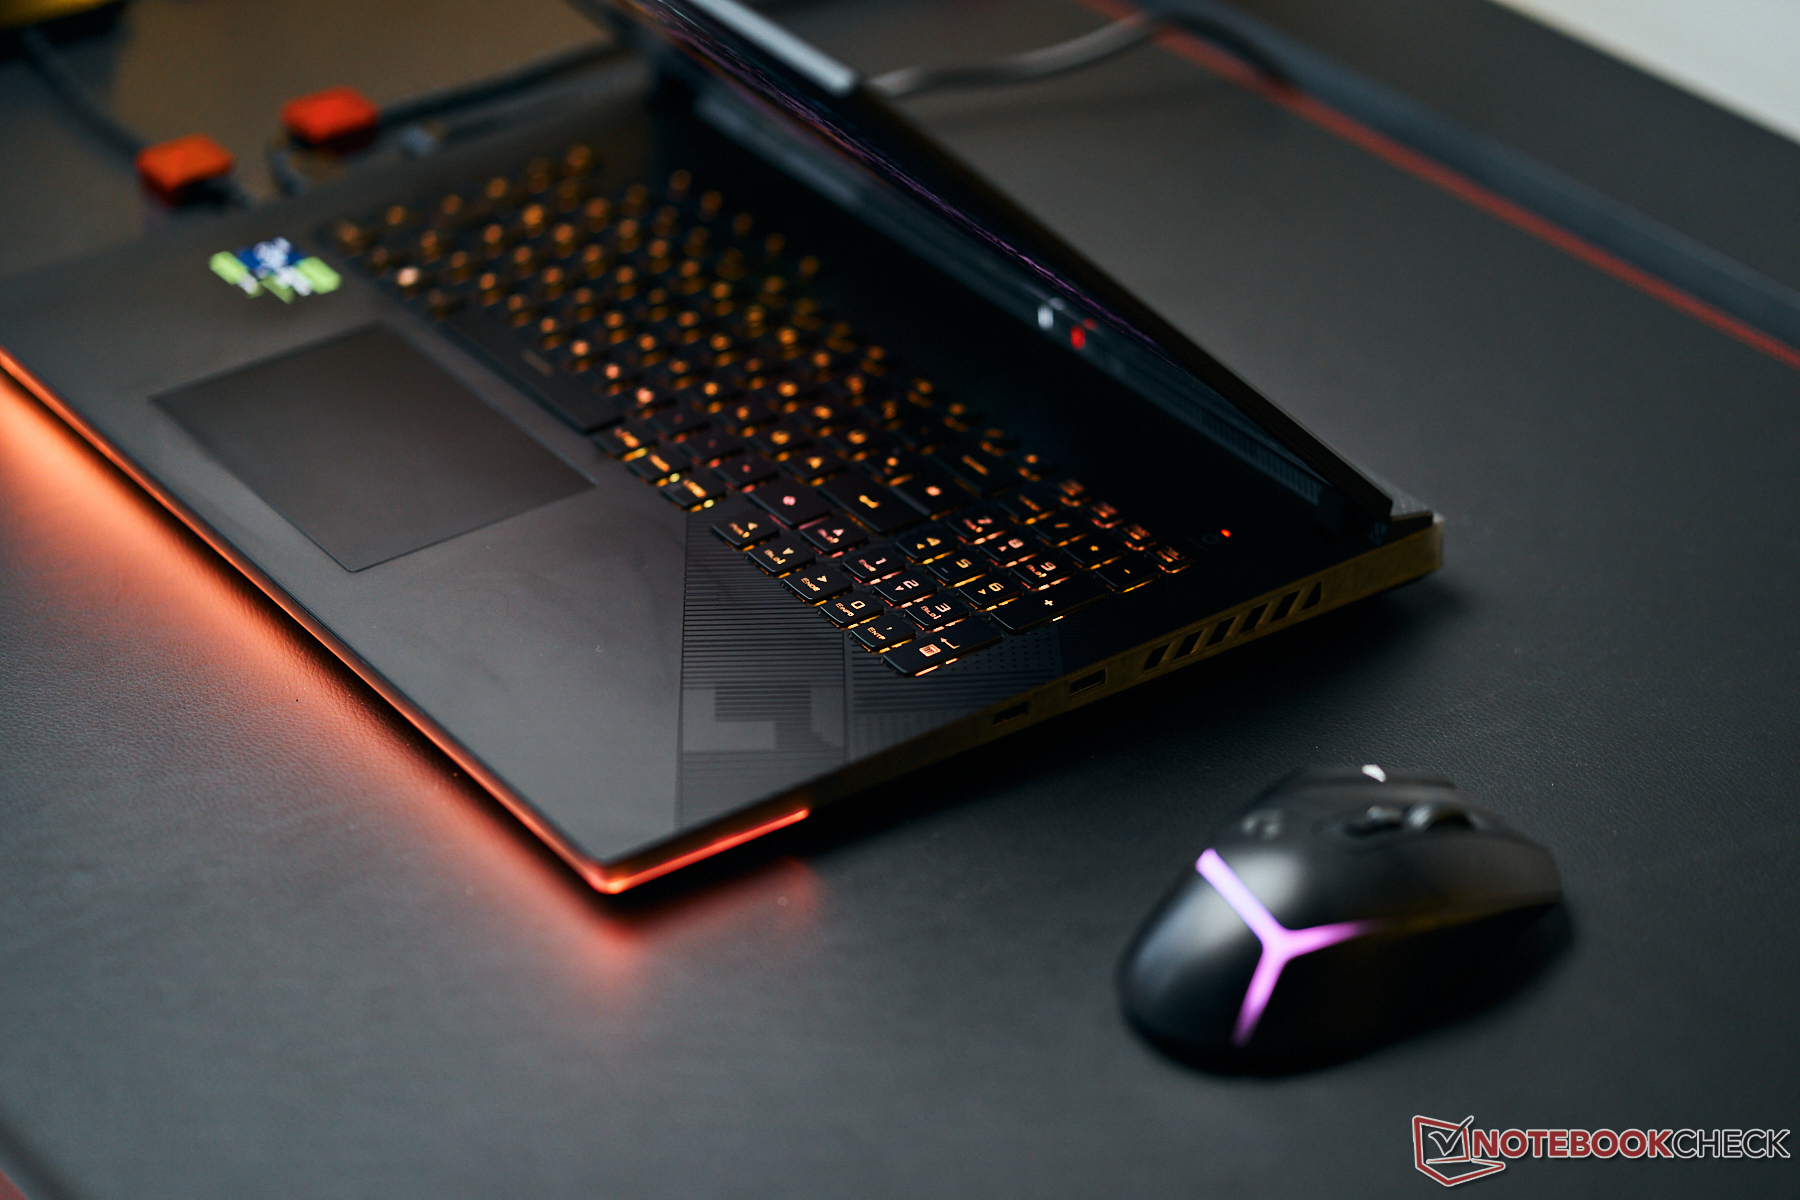
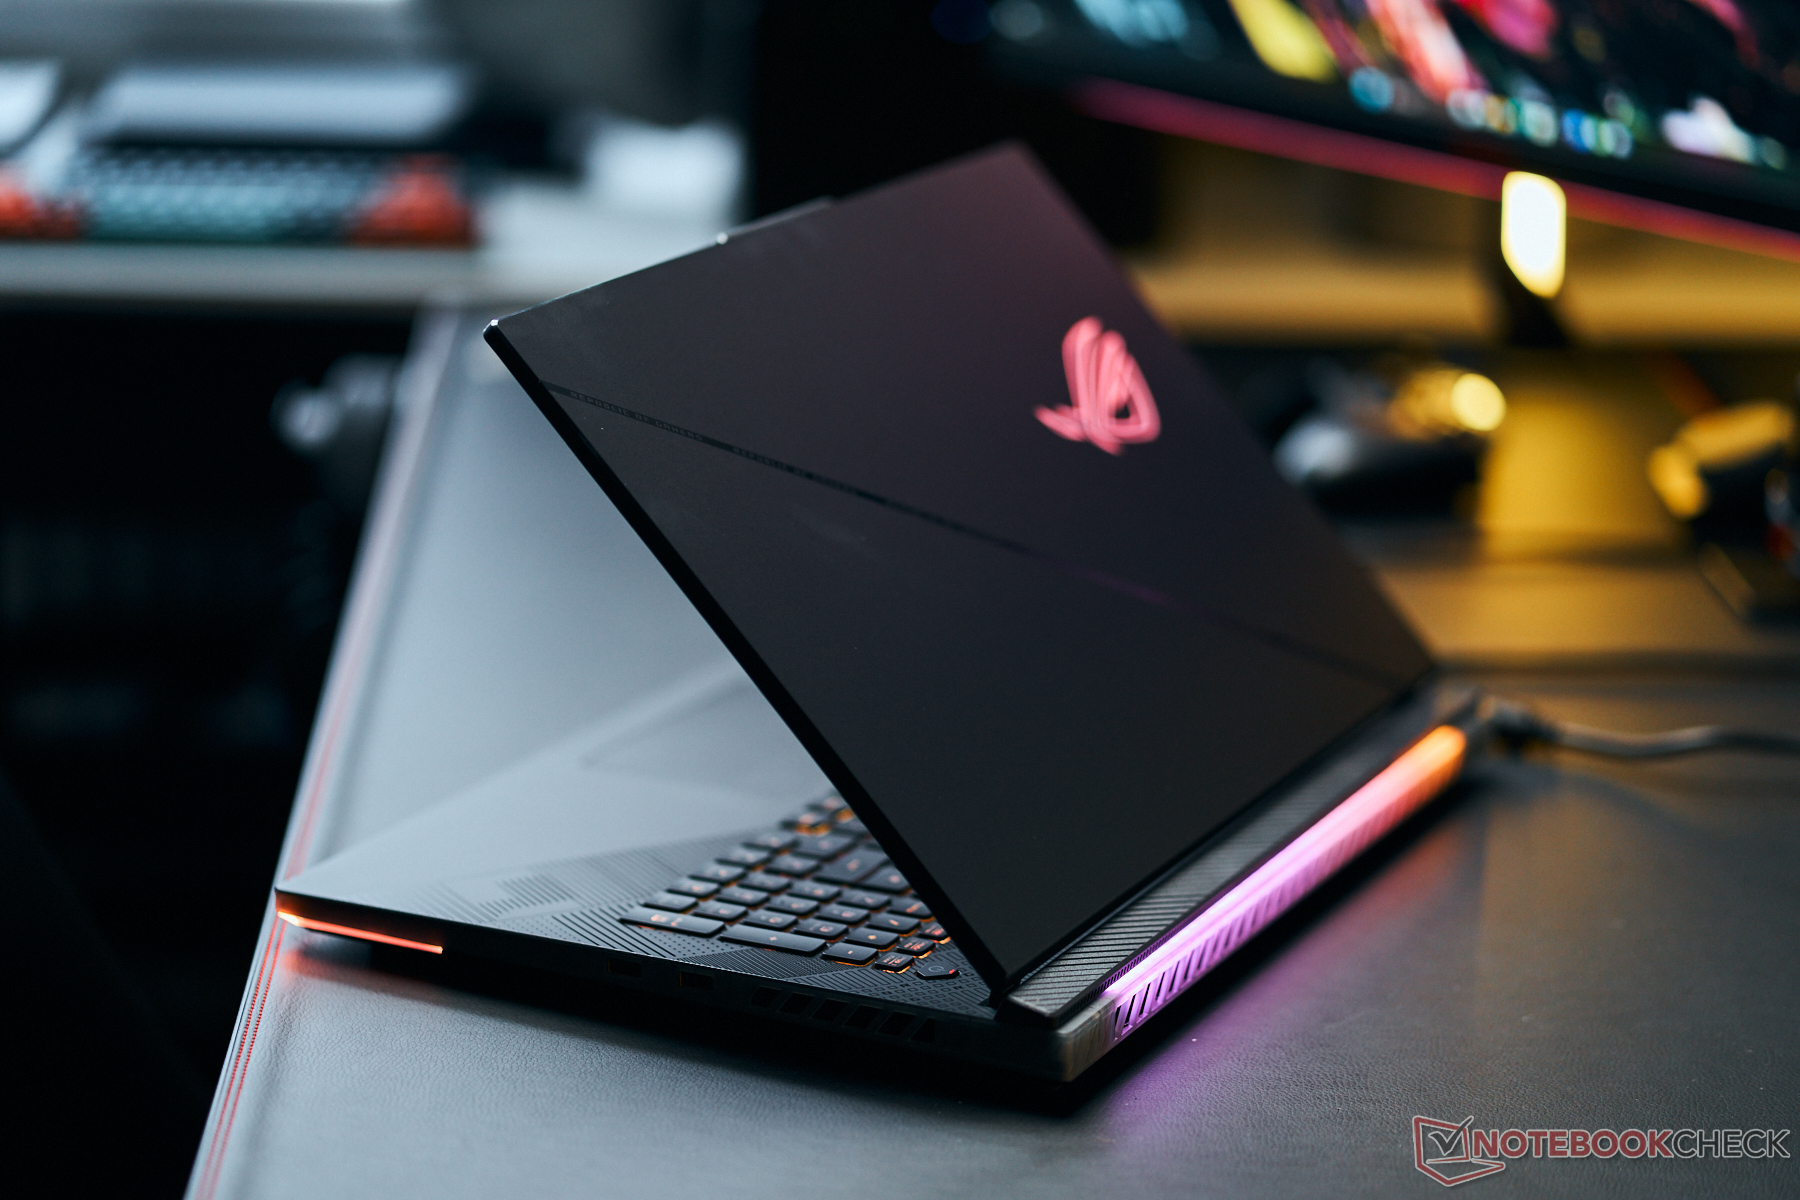
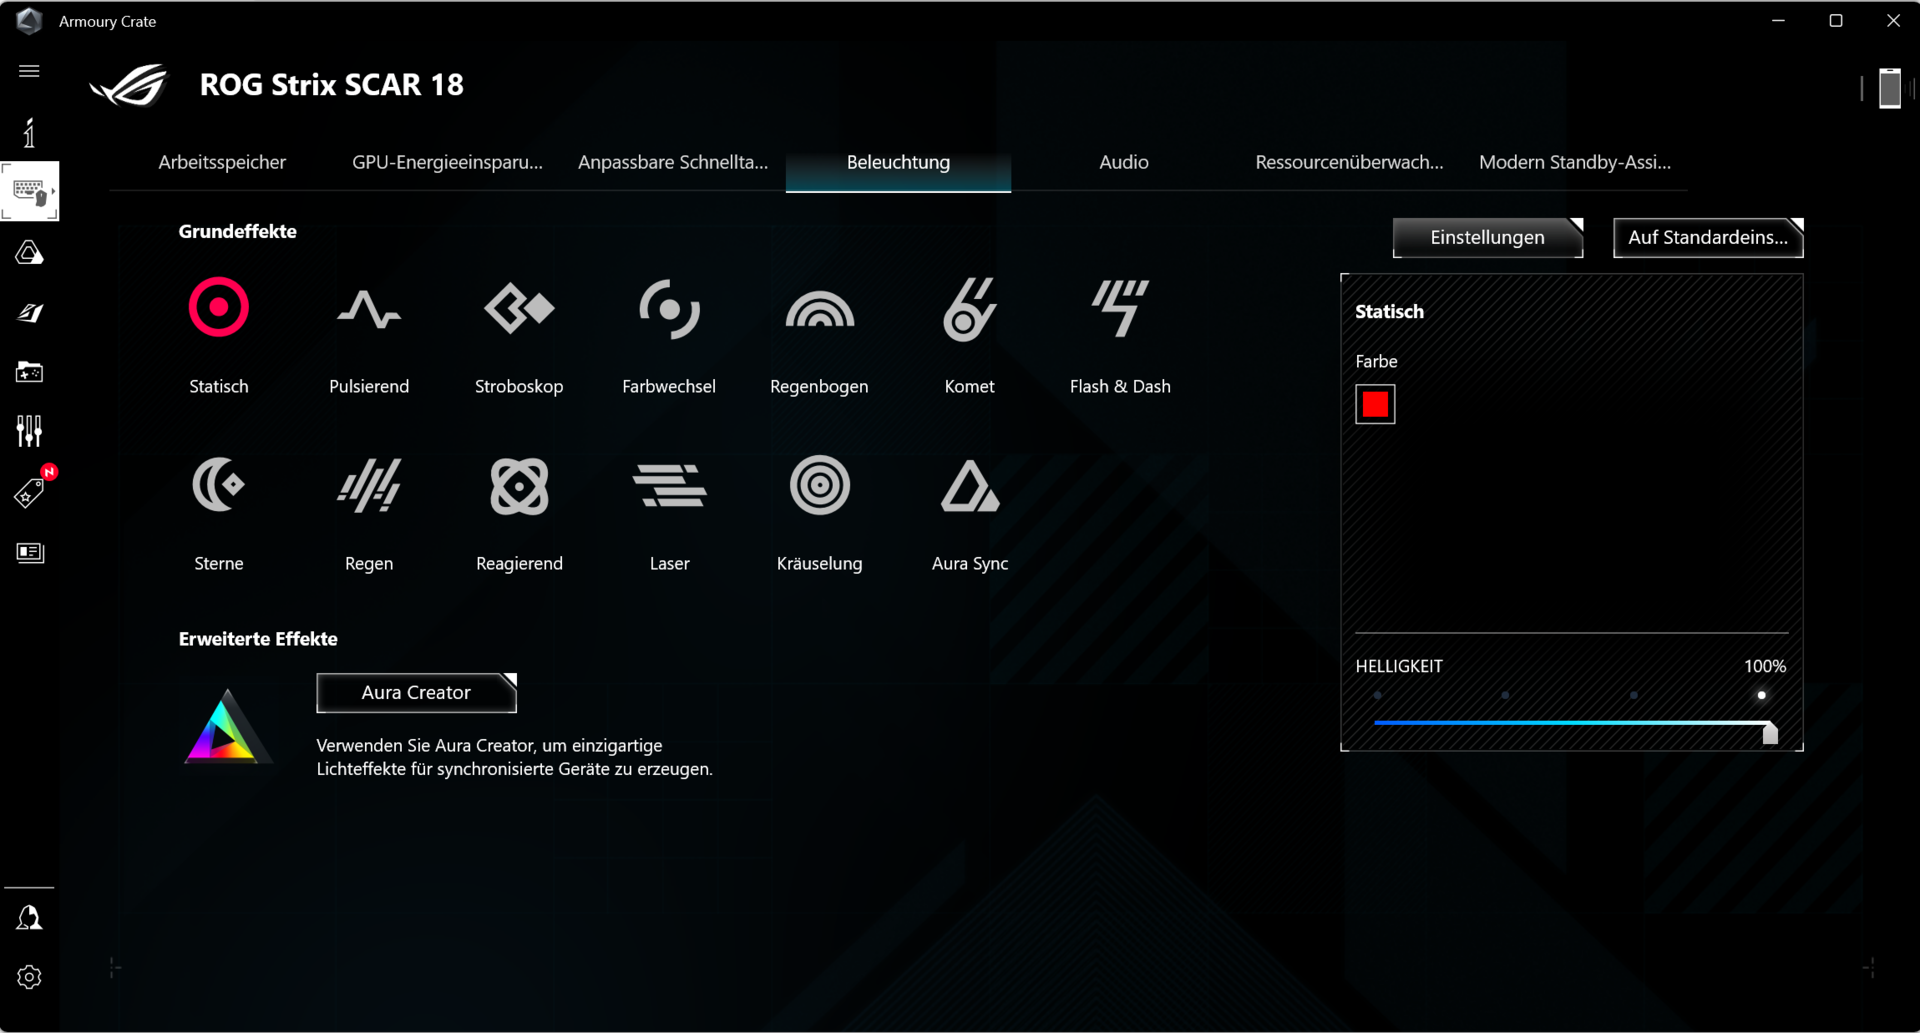
Despite its hefty price level, the usage of high-quality materials remains limited, with only the back of the Scar's display lid made from aluminum and the rest of the components made of plastic. Some parts of the plastic (above the keyboard and on the short sides) let some light shine through. LED bands on the front and back and an illuminated logo on the display lid bring some life into the black case.
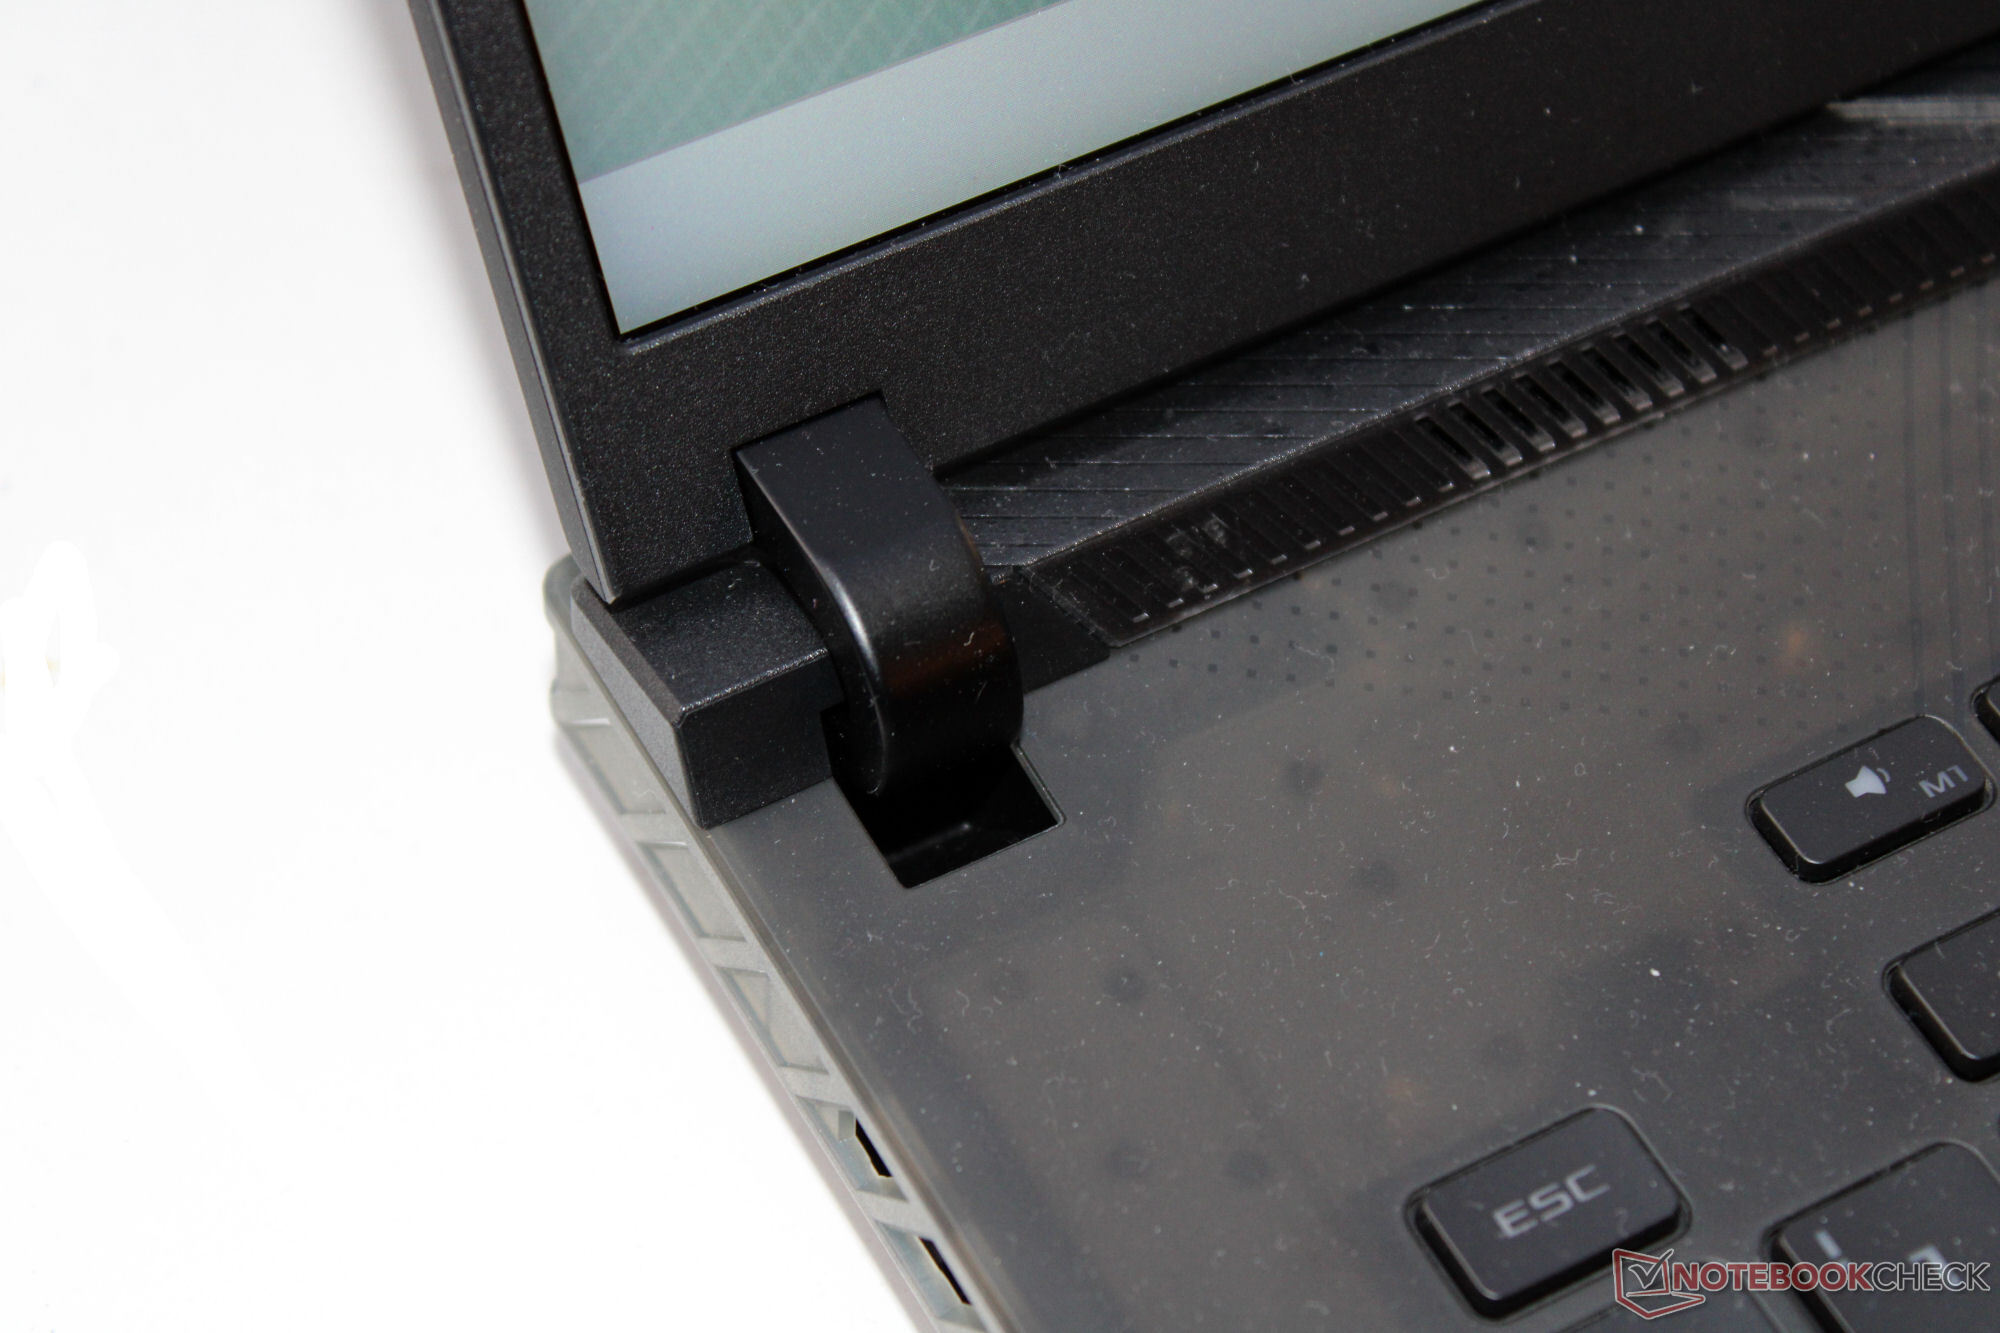
We don't see any faults in the workmanship and the material gaps are small and even. While the lid can only be twisted slightly, the response of the base unit is more pronounced. An expensive laptop costing several thousand Euros should do better here. Pressure on the display lid doesn't cause any image artifacts. The hinges hold the lid in place firmly, but the display still wobbles slightly when moving the laptop. The maximum opening angle is 130 degrees, and it can be opened using a single hand.


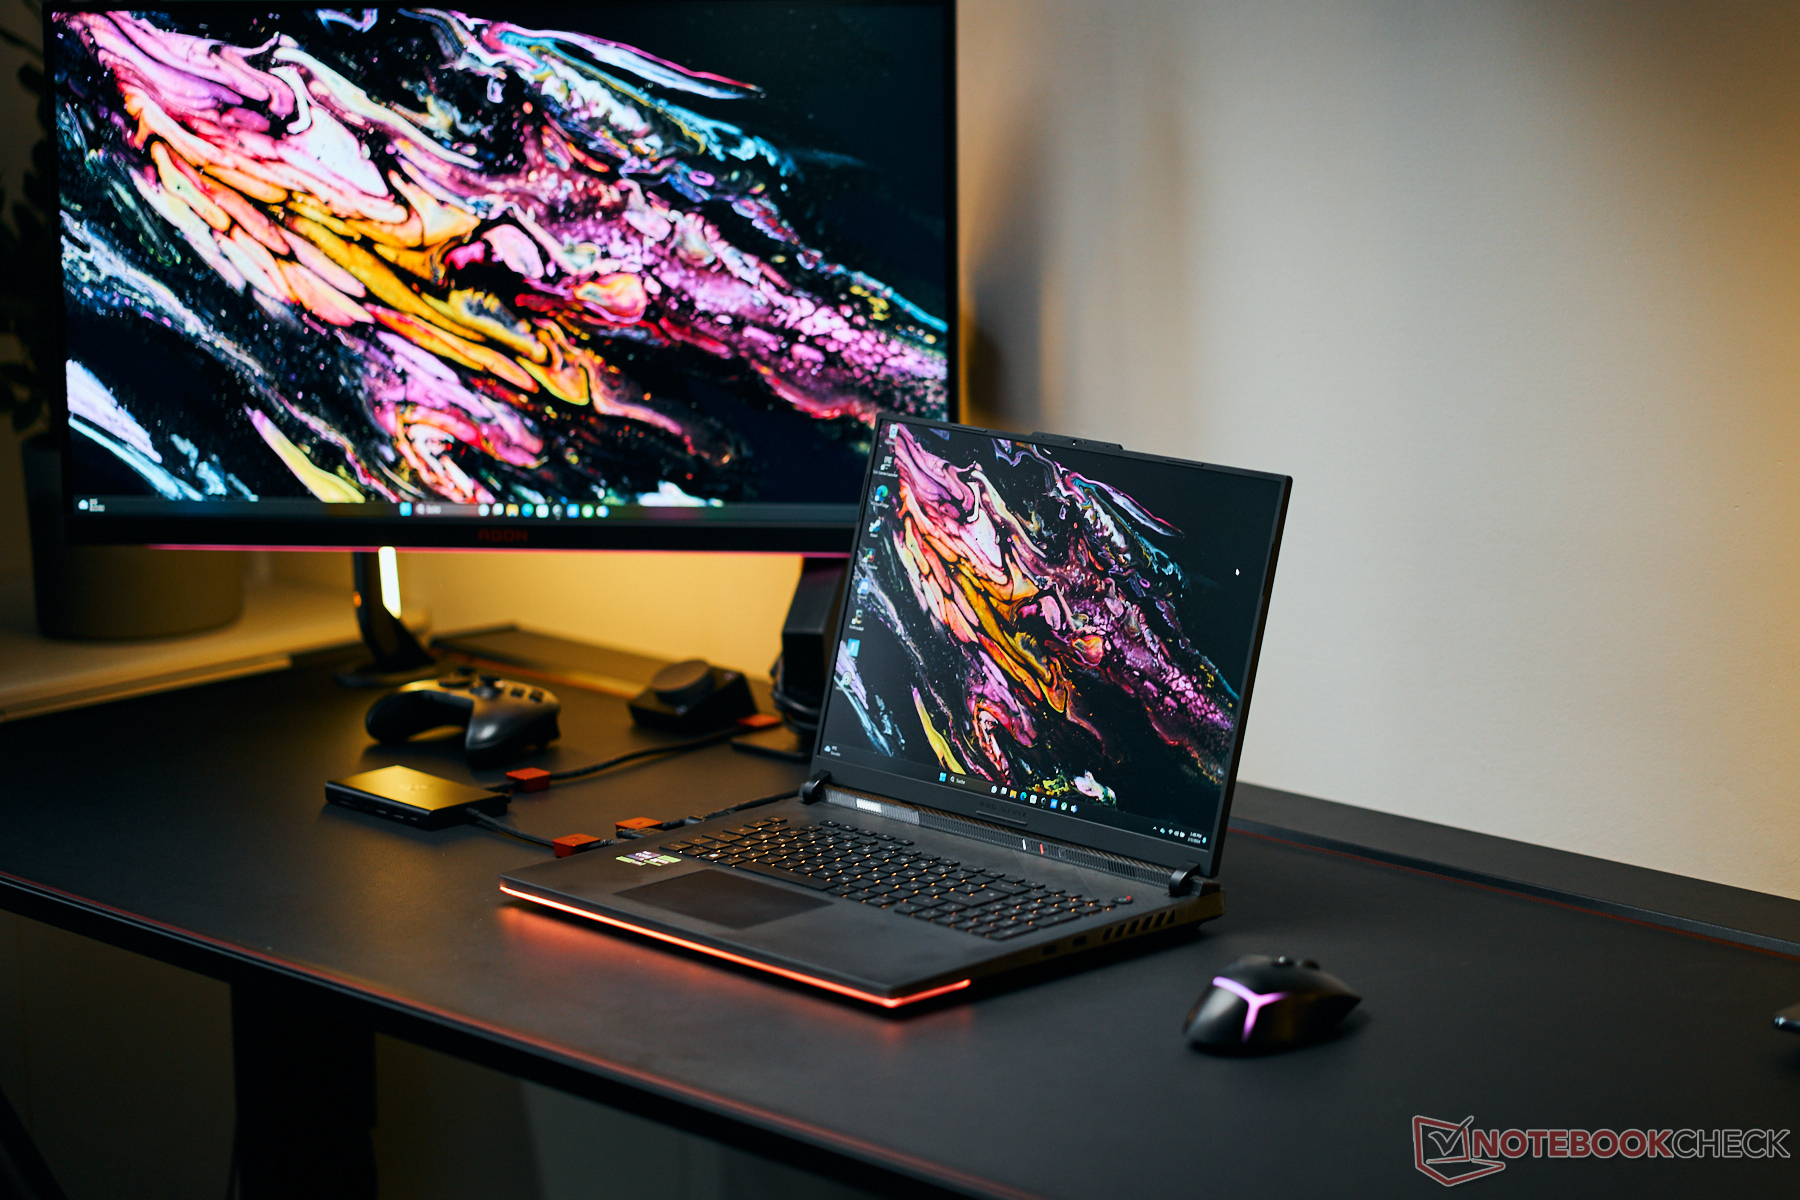
The Scar 18 is one of the most compact and lightest devices in our comparison field and is only surpassed by the Blade 18 in these regards.
Equipment - Asus Strix offers Thunderbolt 4
The Asus laptop offers two USB-A ports (USB 3.2 Gen 2) and two USB-C ports (1x Thunderbolt 4, 1x USB 3.2 Gen 2). Both of the USB-C ports are able to output a DisplayPort signal, and the USB 3.2 Gen 2 port also supports Power Delivery. The connections are completed by an HDMI port, an audio port, and a Gigabit Ethernet port. The laptop doesn't include a storage card reader.
There are no ports on the back of the laptop, and all the ports are positioned on the left and right case sides. Cables running toward the back would block some of the fan openings on the sides of the laptop. This is for example the case for the power cable (angled power plug). Right-handed users might only be annoyed by the USB-A ports that are only placed on the right side.


Communication
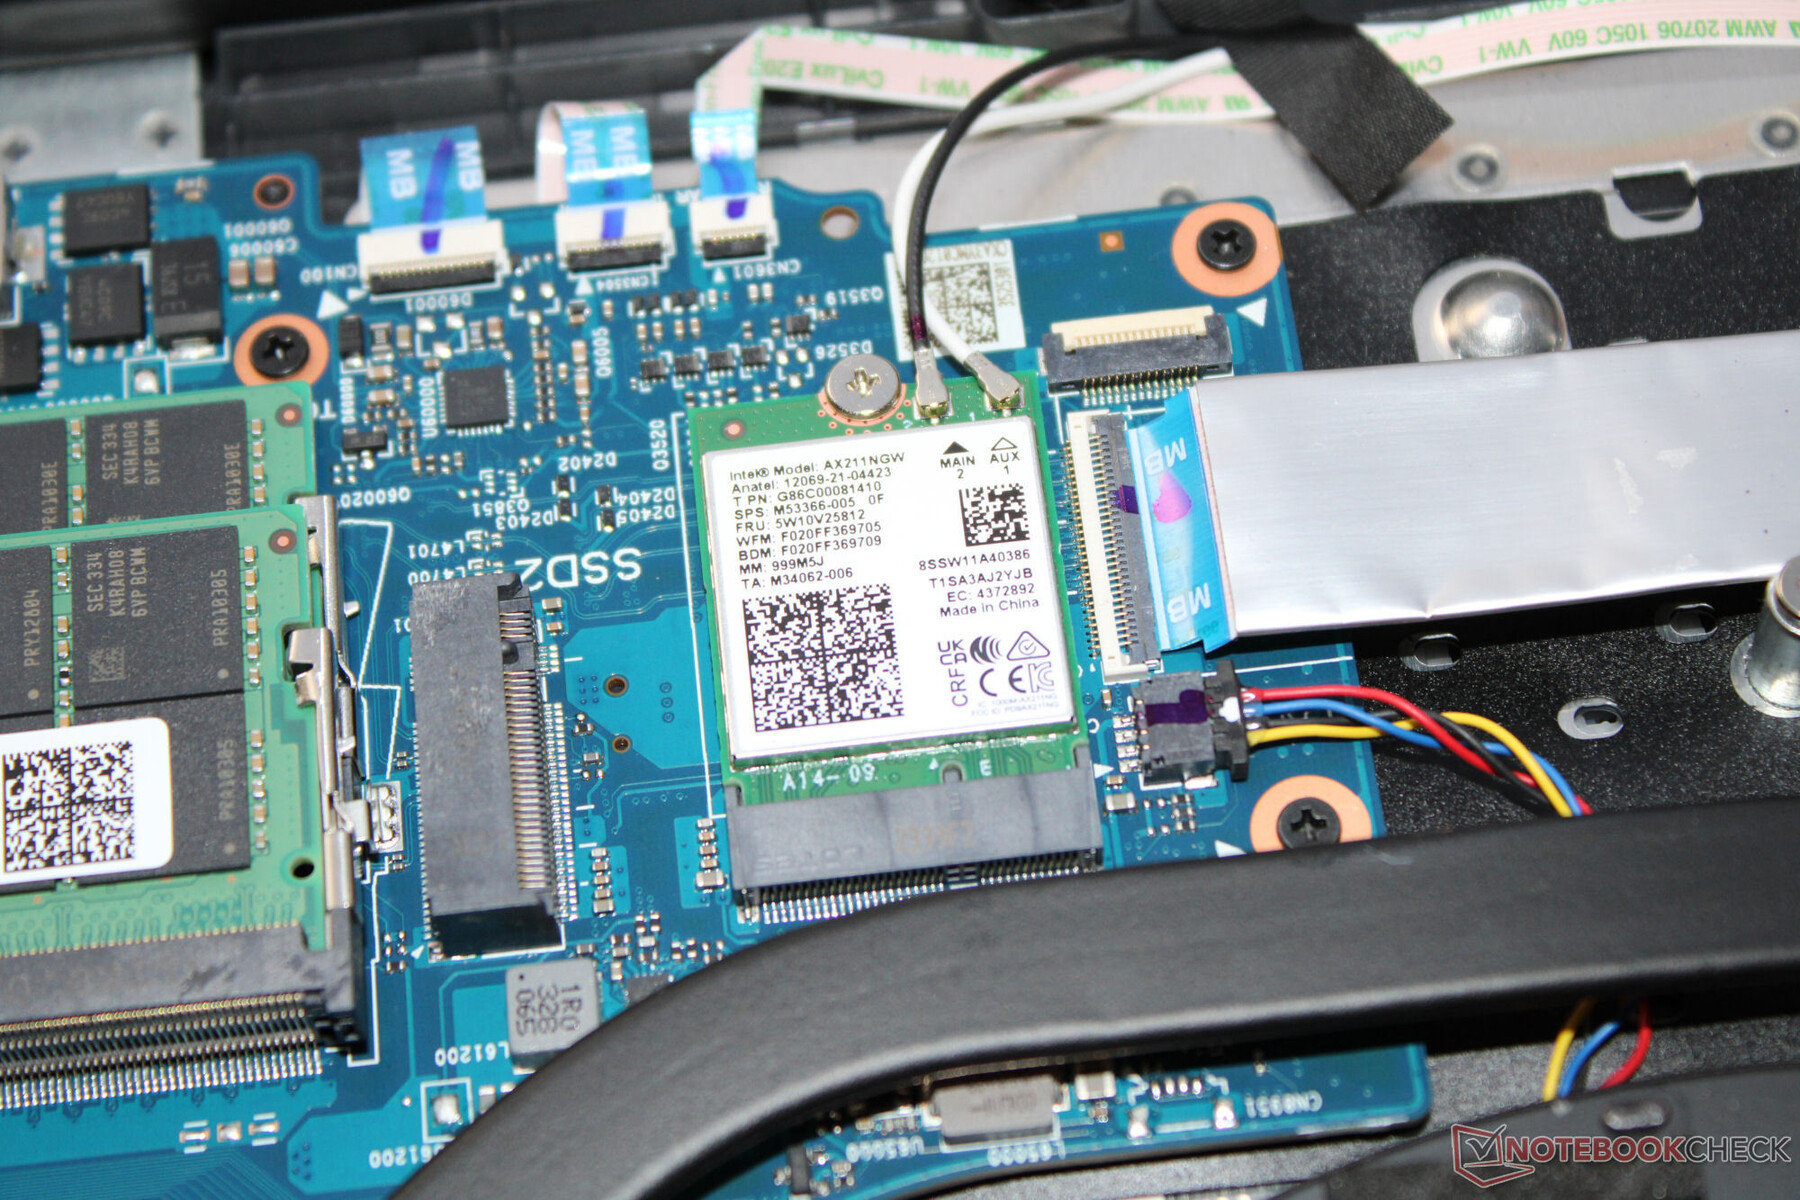
Under optimal conditions (no other Wi-Fi devices in close proximity, close distance between laptop and server PC), the laptop reaches good to very good Wi-Fi transfer rates. The Strix uses a Wi-Fi 6E chip (Intel AX211), and wired connections are handled by a Realtek controller (RTL8125; 2.5 Gbit/s).
Webcam
While Asus mostly uses top quality hardware, the webcam is an exception, with only a meager 0.9-MP model (max. 1280x720 pixels) being used here. The image quality is unconvincing, but a color deviation of about 8 (target DeltaE < 3) is still okay. The camera doesn't include a manual shutter.

 GeForce RTX 4090 Laptop GPU, i9-14900HX, Samsung PM9A1a MZVL22T0HDLB")
 GeForce RTX 4090 Laptop GPU, i9-14900HX, Samsung PM9A1a MZVL22T0HDLB")
Accessories
The laptop doesn't include any additional accessories besides the usual documents.
Maintenance
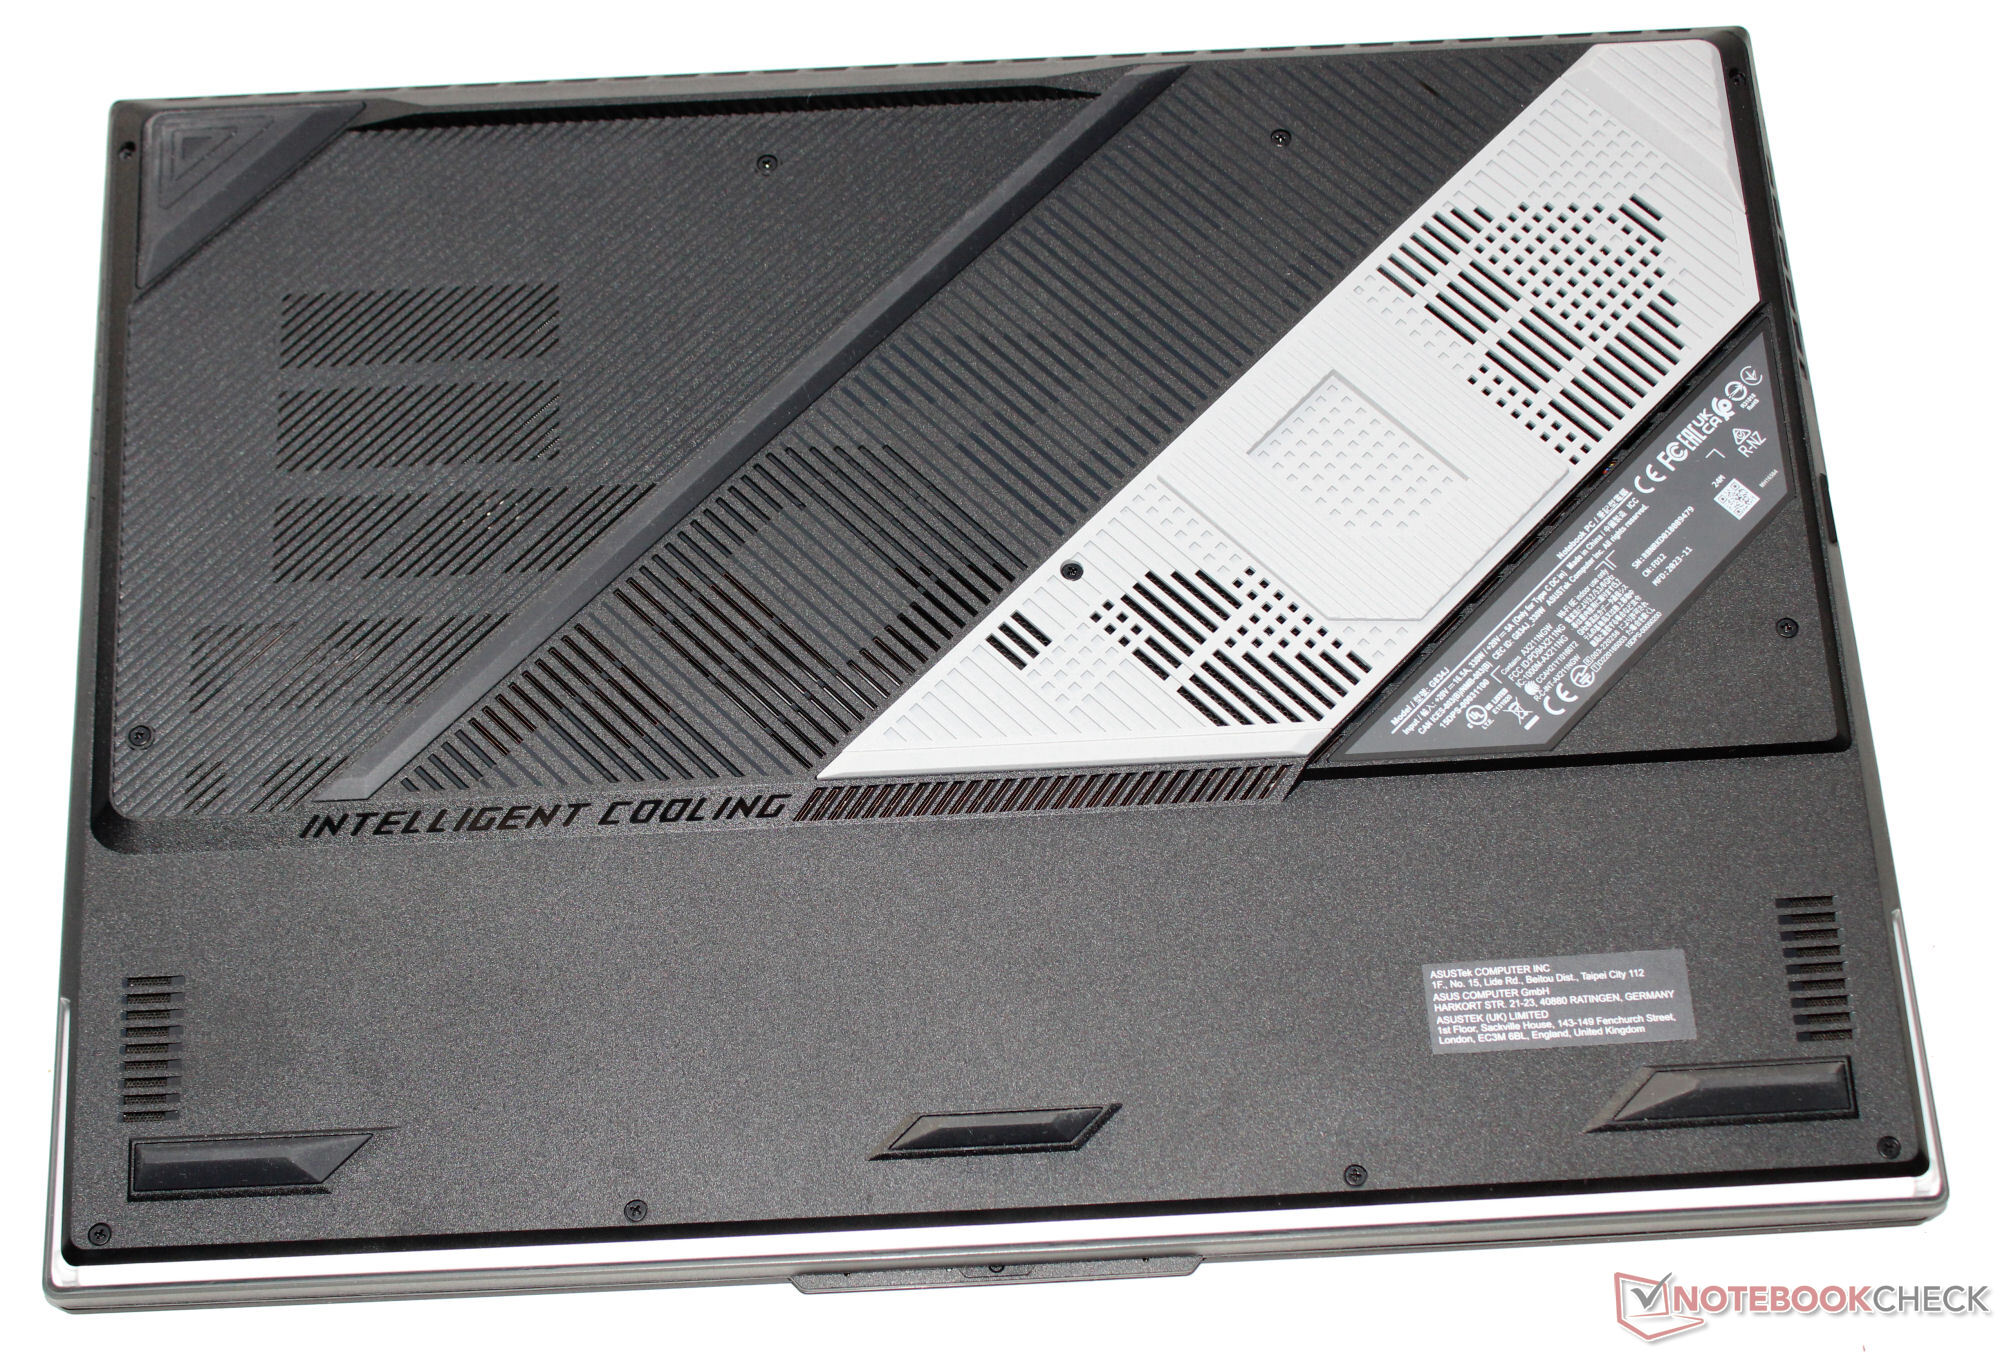
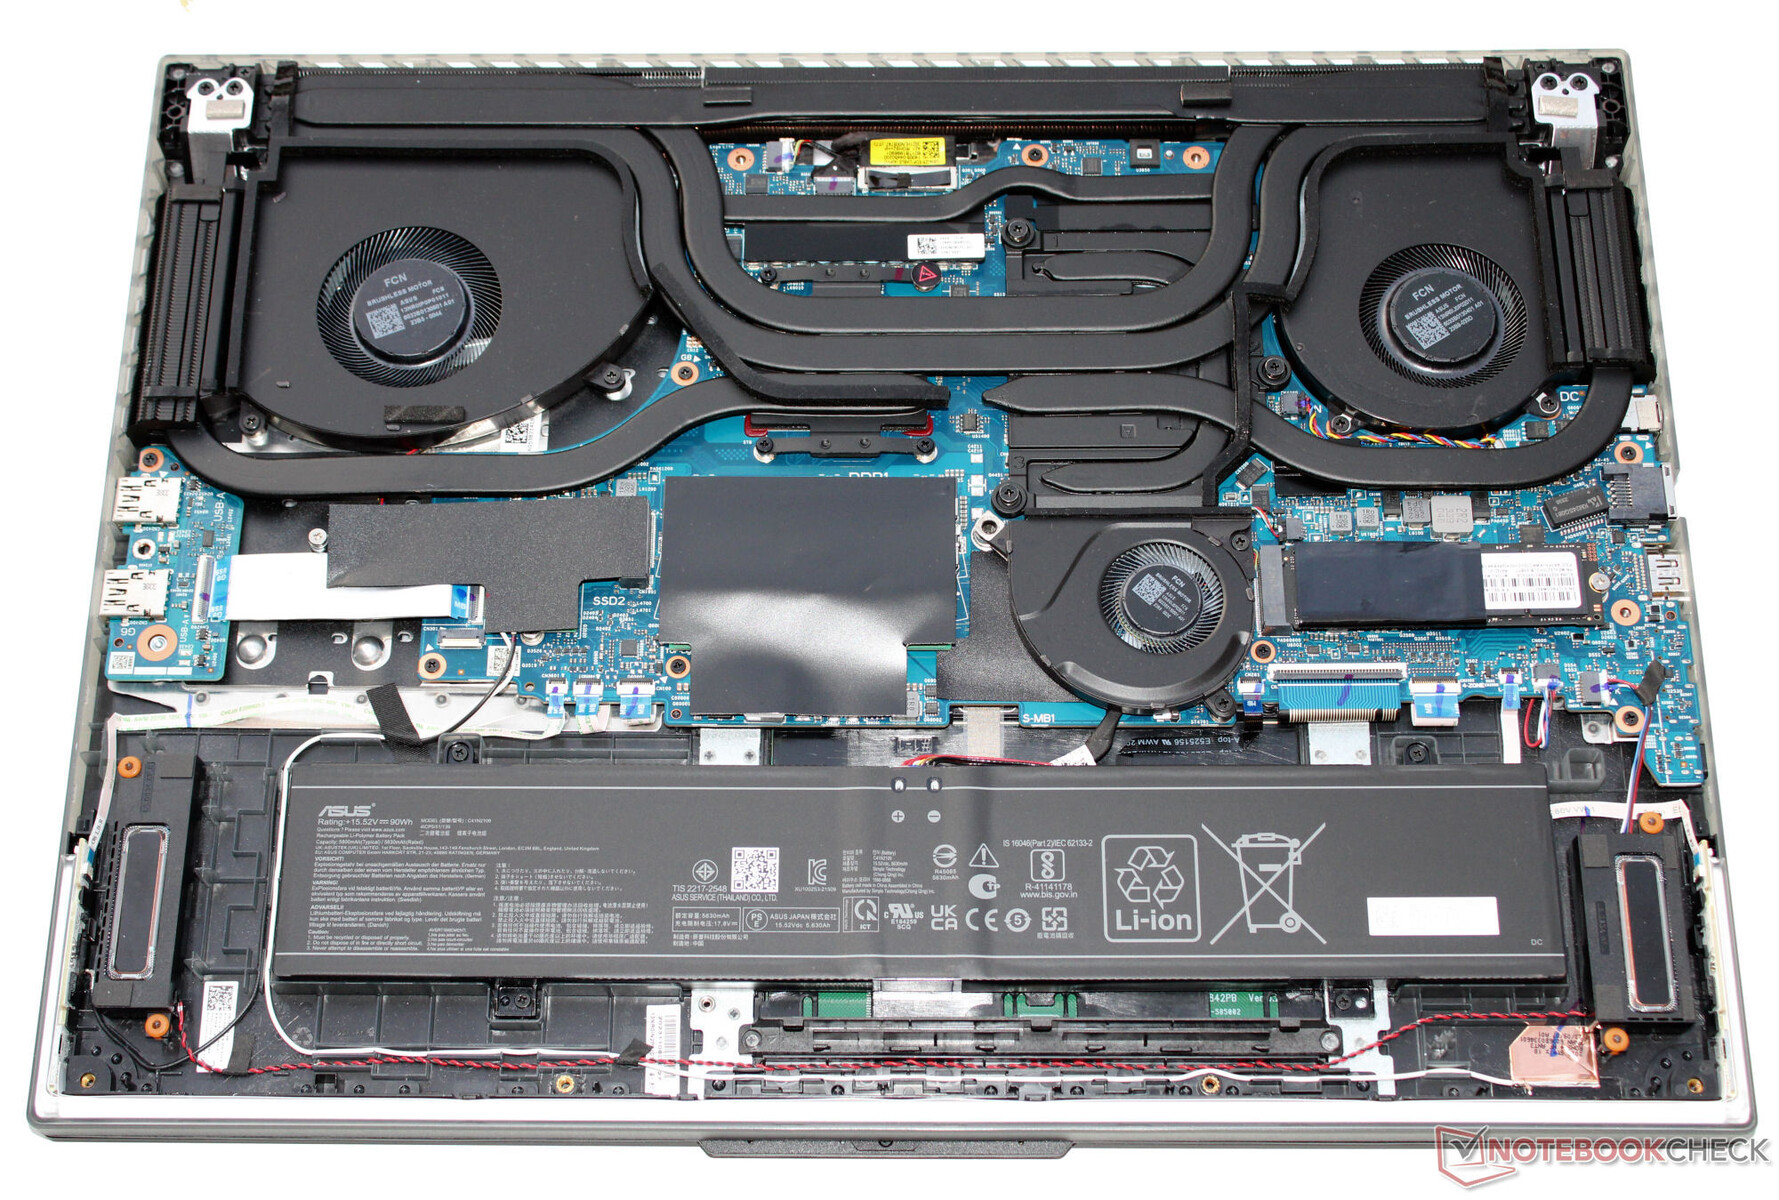
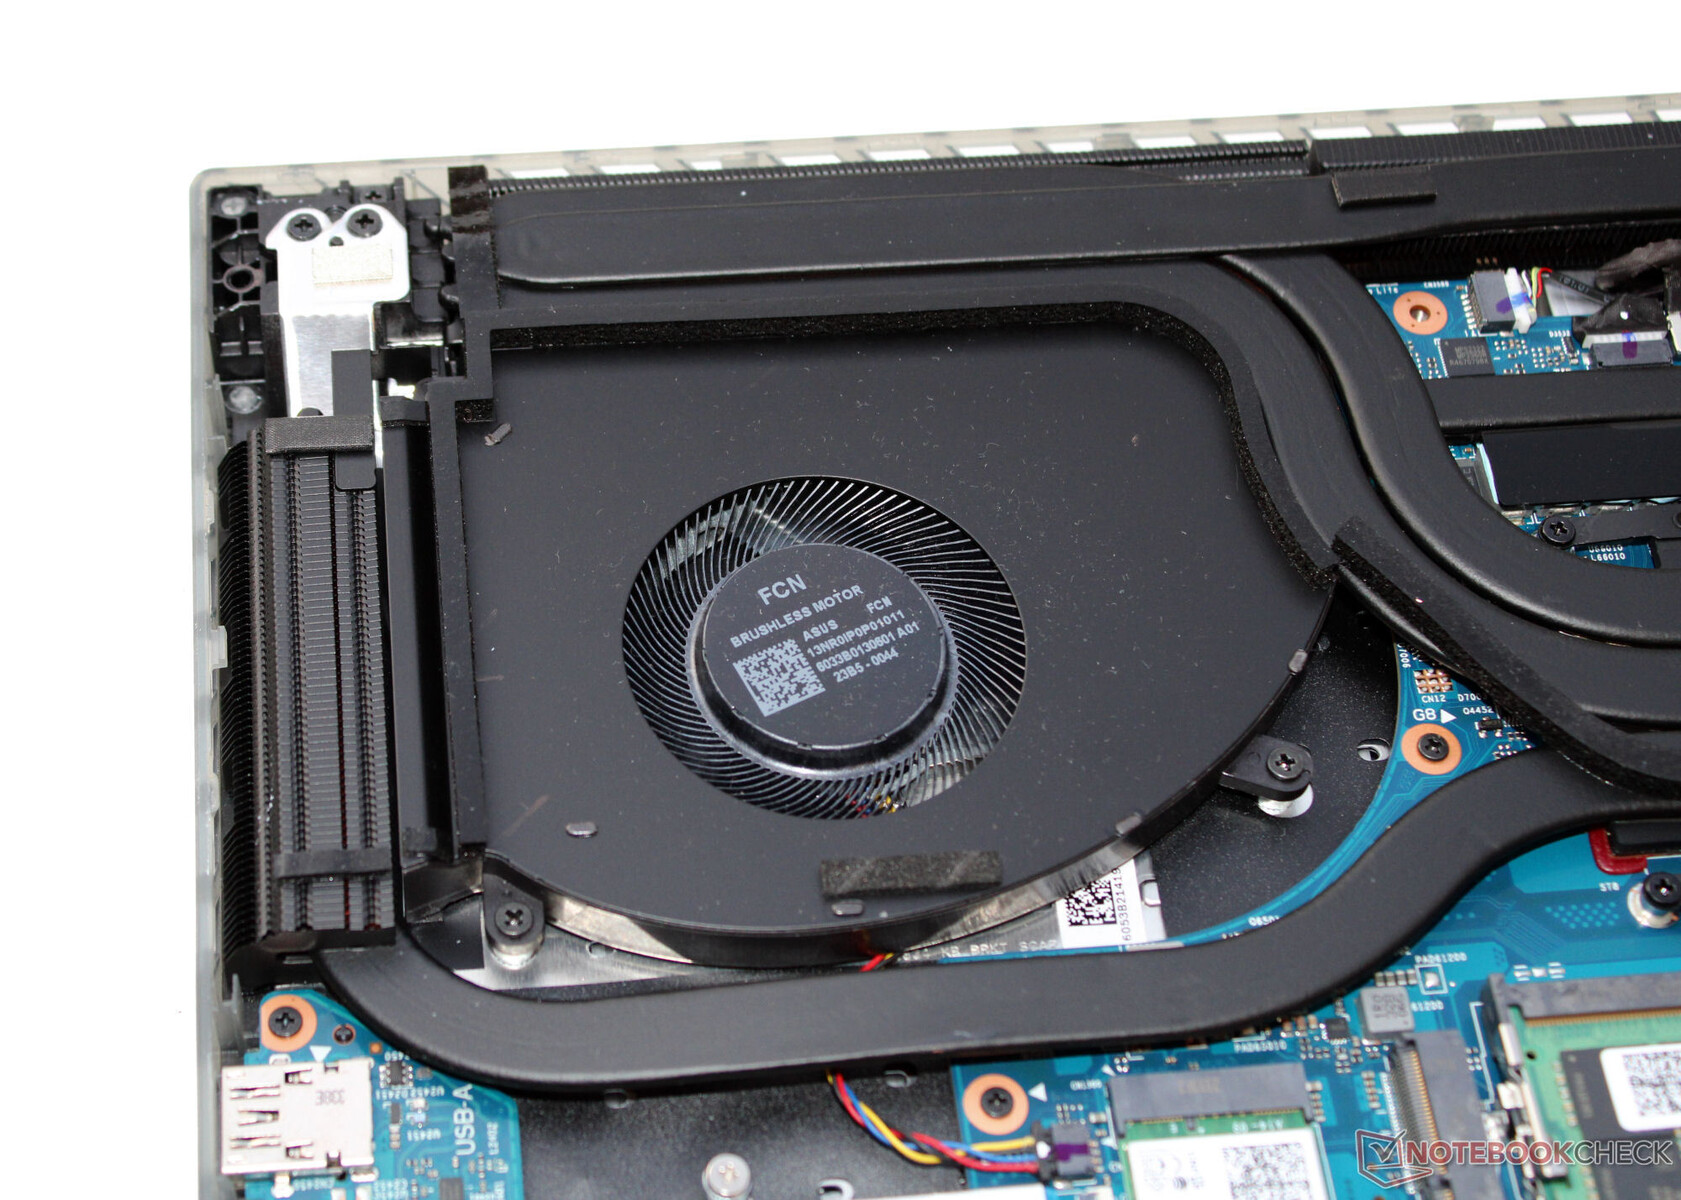
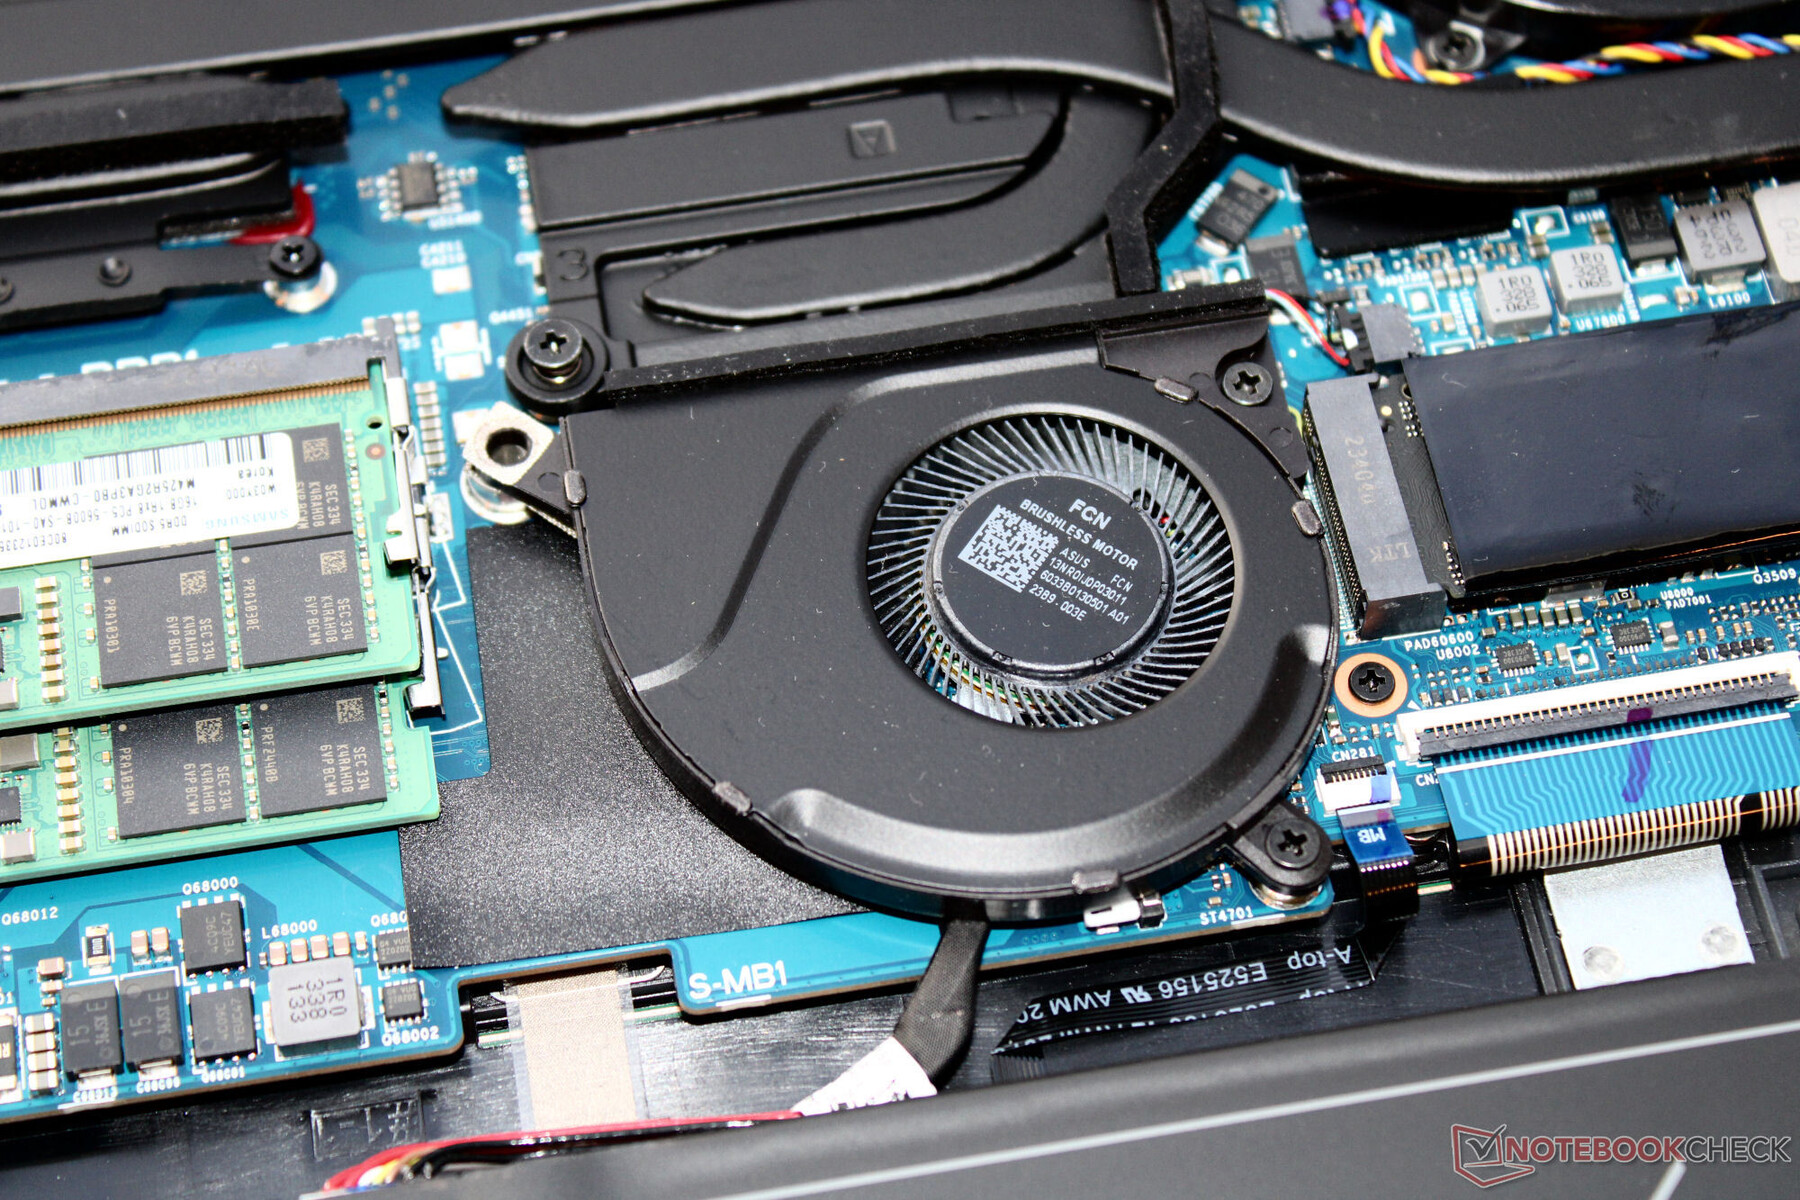
To open the laptop, you have to remove all the screws on the case bottom. You can then lift up the case plate using a prying tool. After removing the case plate, you get access to the storage banks (occupied), the SSD (PCIe 4, M.2-2280), the second SSD slot (PCIe 4, M.2-2280), the WLAN module, the BIOS battery, the fans, and the battery (screwed, not glued).
The keyboard cannot be replaced easily. In order to do that, you'd have to replace the whole top of the base, which would require taking the laptop completely apart.


Warranty
Asus offers a two-year warranty for the 18-inch laptop in Germany. A warranty extension to three years would cost about 200 Euros (~$215).
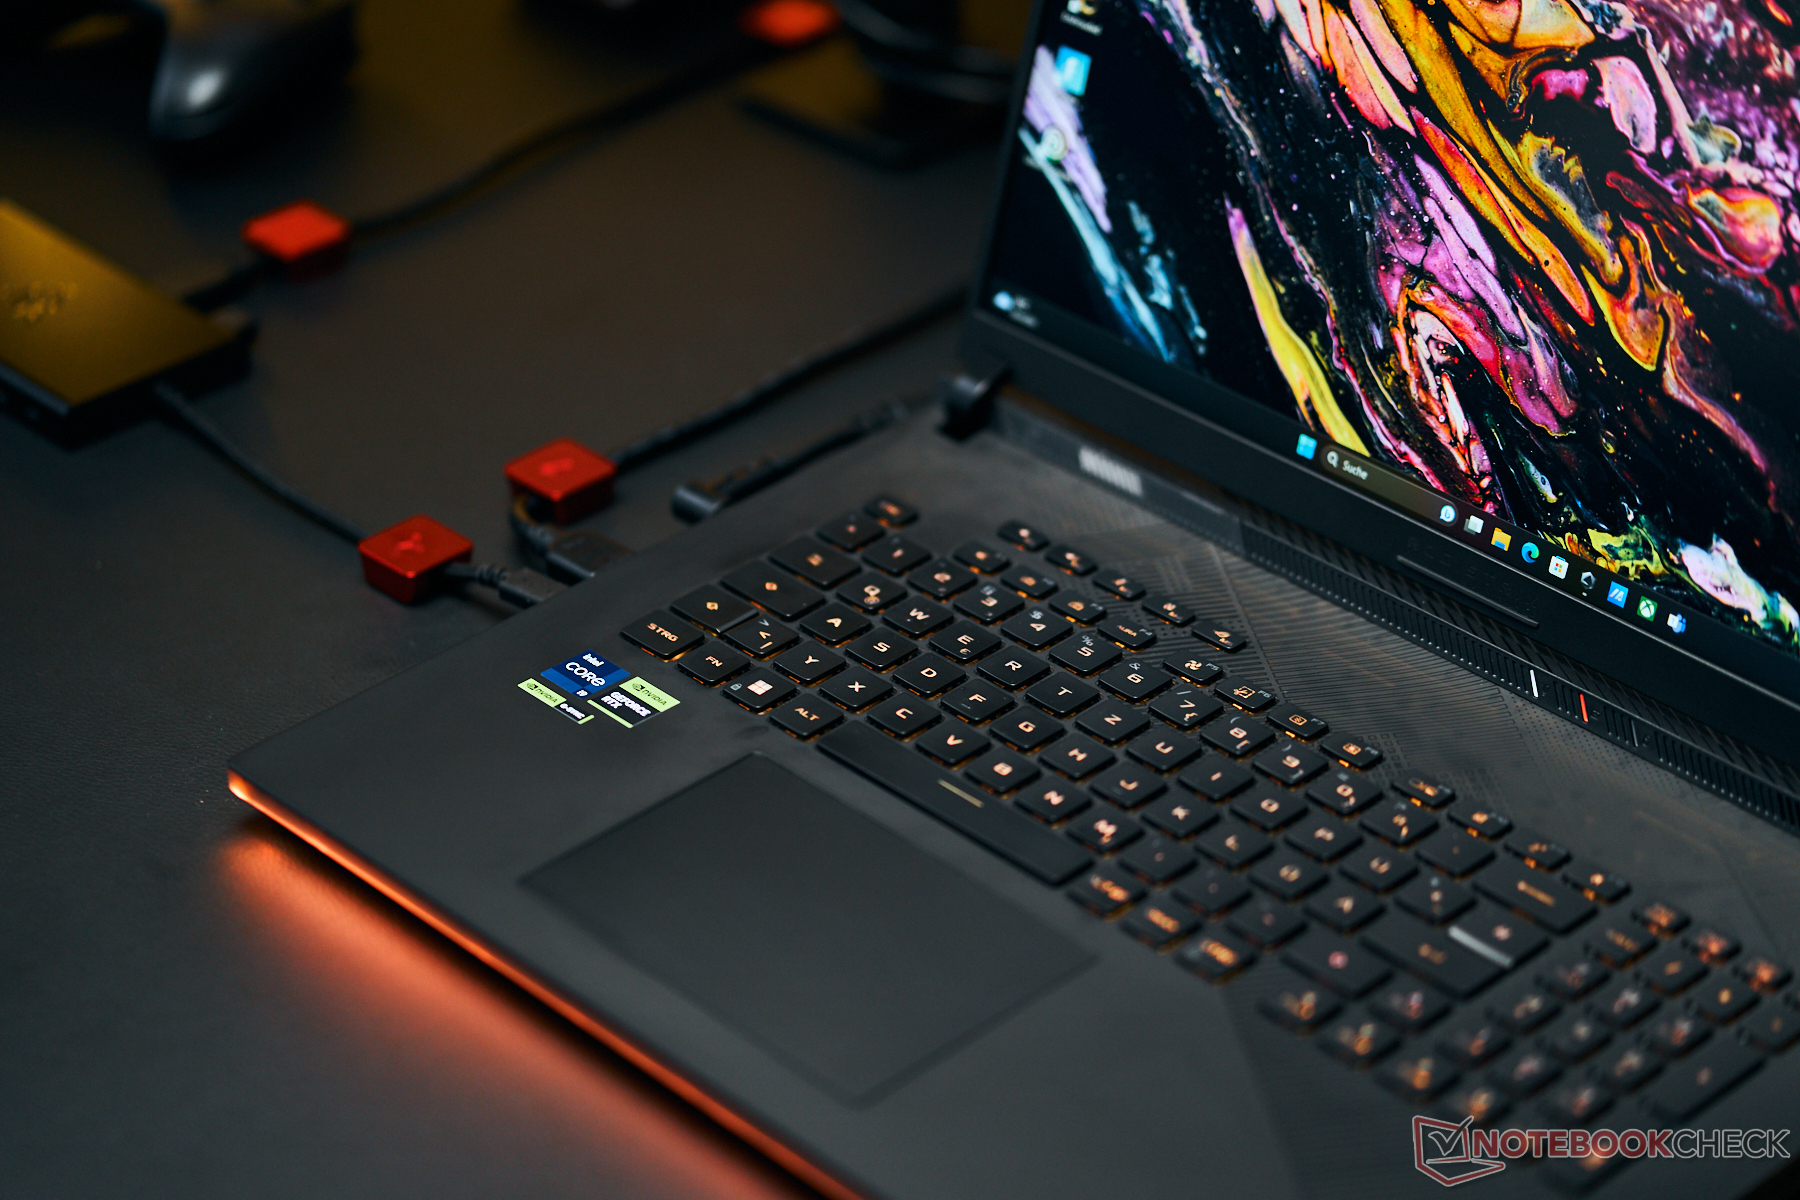
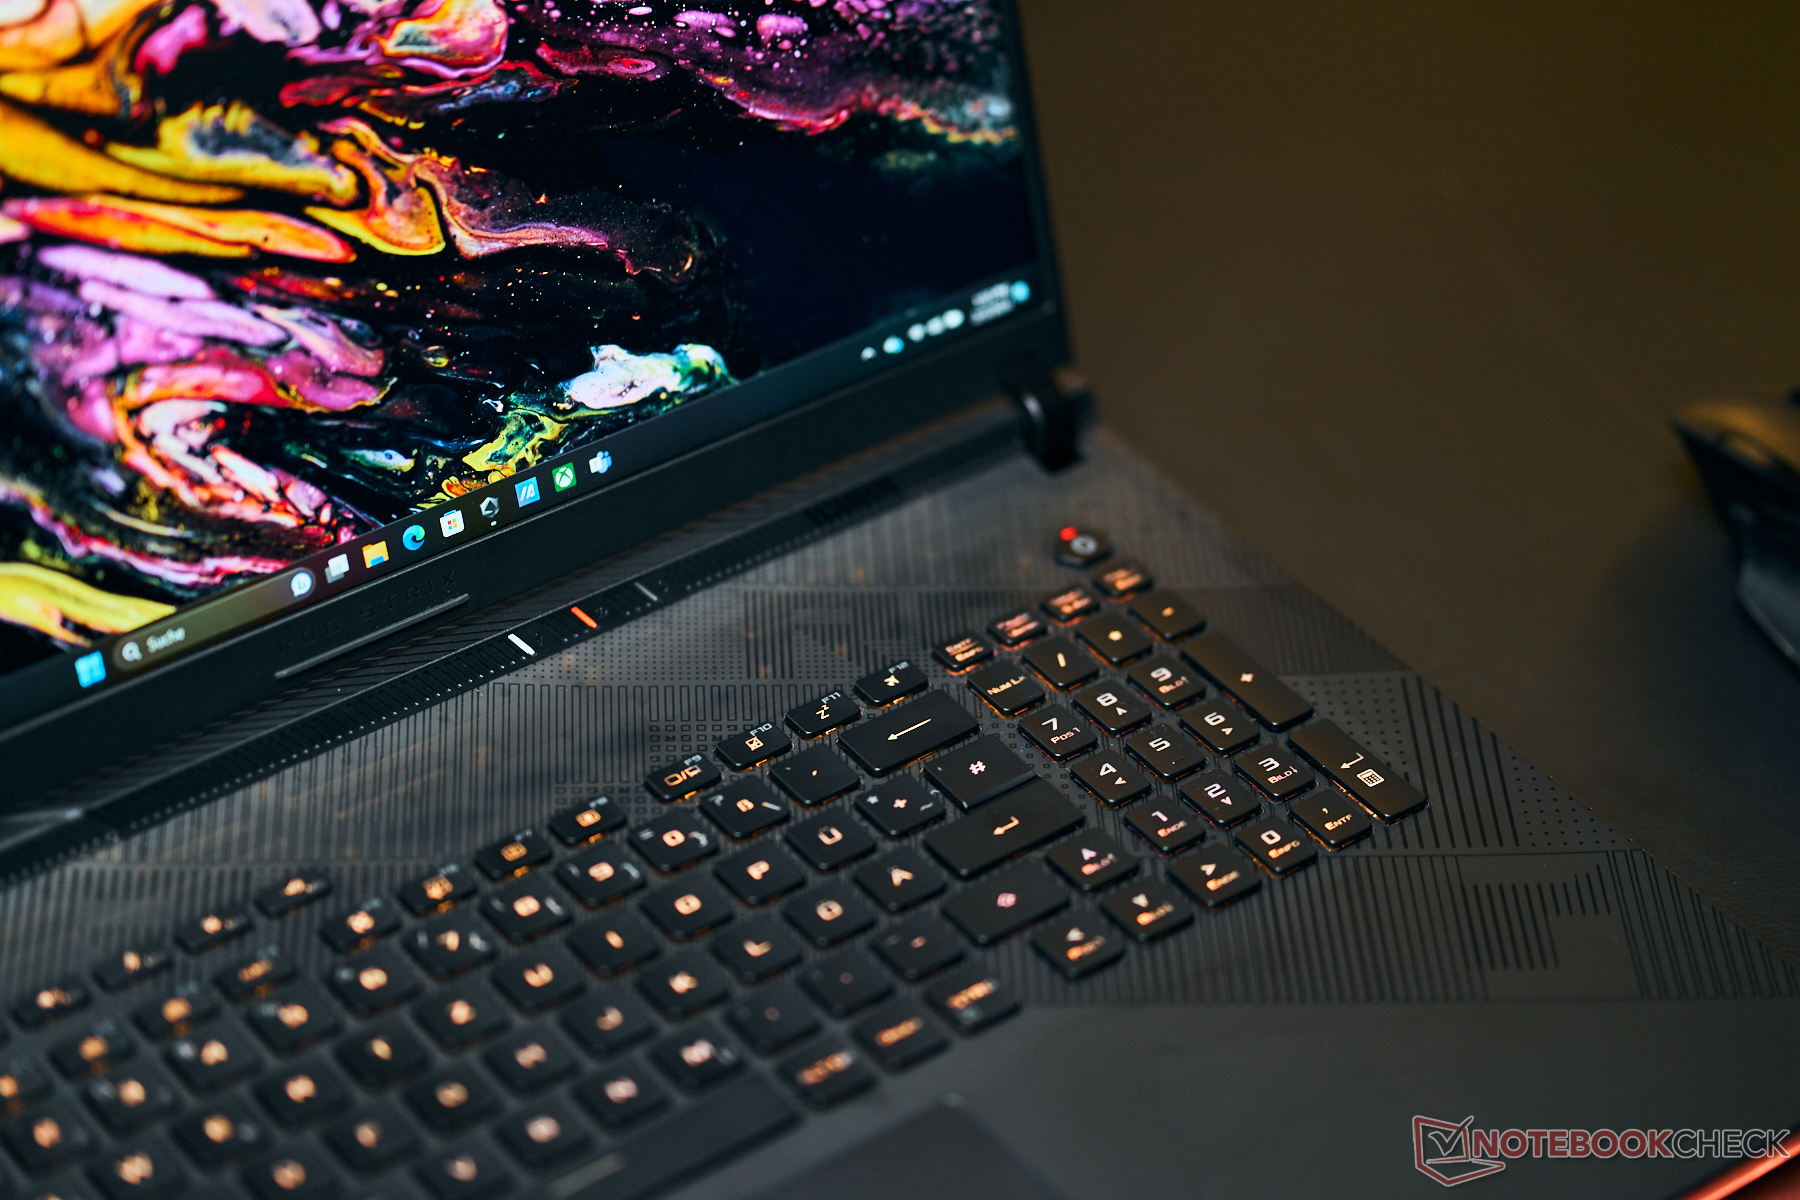
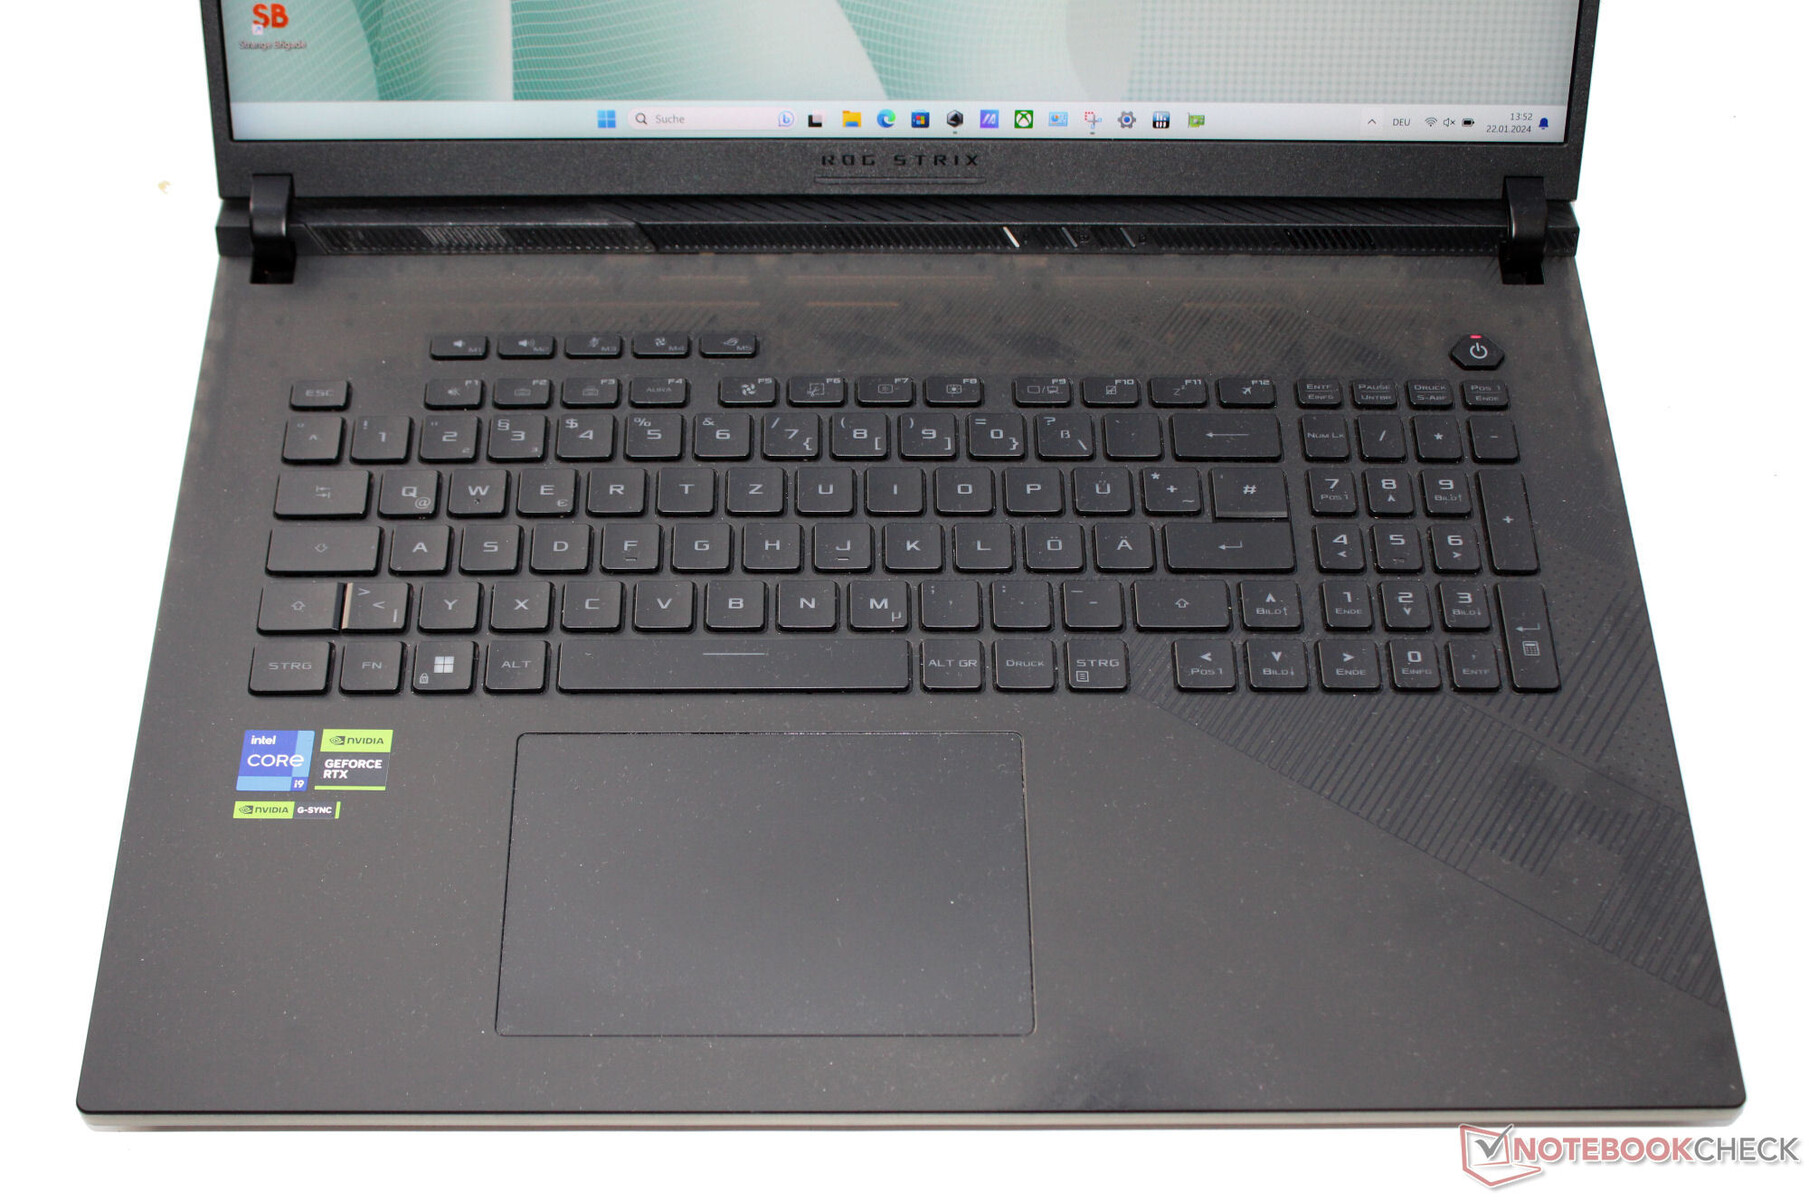
Input Devices - Asus computer with single key RGB illumination
Keyboard
The concave keys of the illuminated chiclet keyboard offer a medium stroke and clear pressure point. The key resistance is basically okay but could have turned out slightly crisper subjectively. While typing, the right half of the keyboard has some give that is minimal at best. However, this did not turn out to be any hindrance. A positive aspect is that all four arrow keys have the regular size. Overall, Asus delivers a keyboard that is suitable for everyday tasks here.
Touchpad
A ClickPad (~13 x 8.5 cm, ~5.1 x 3.35 in) whose smooth surface facilitates sliding of the fingers serves as mouse replacement. It offers a short stroke and clear pressure point.
Display - Mini-LED with DCI-P3 color space coverage
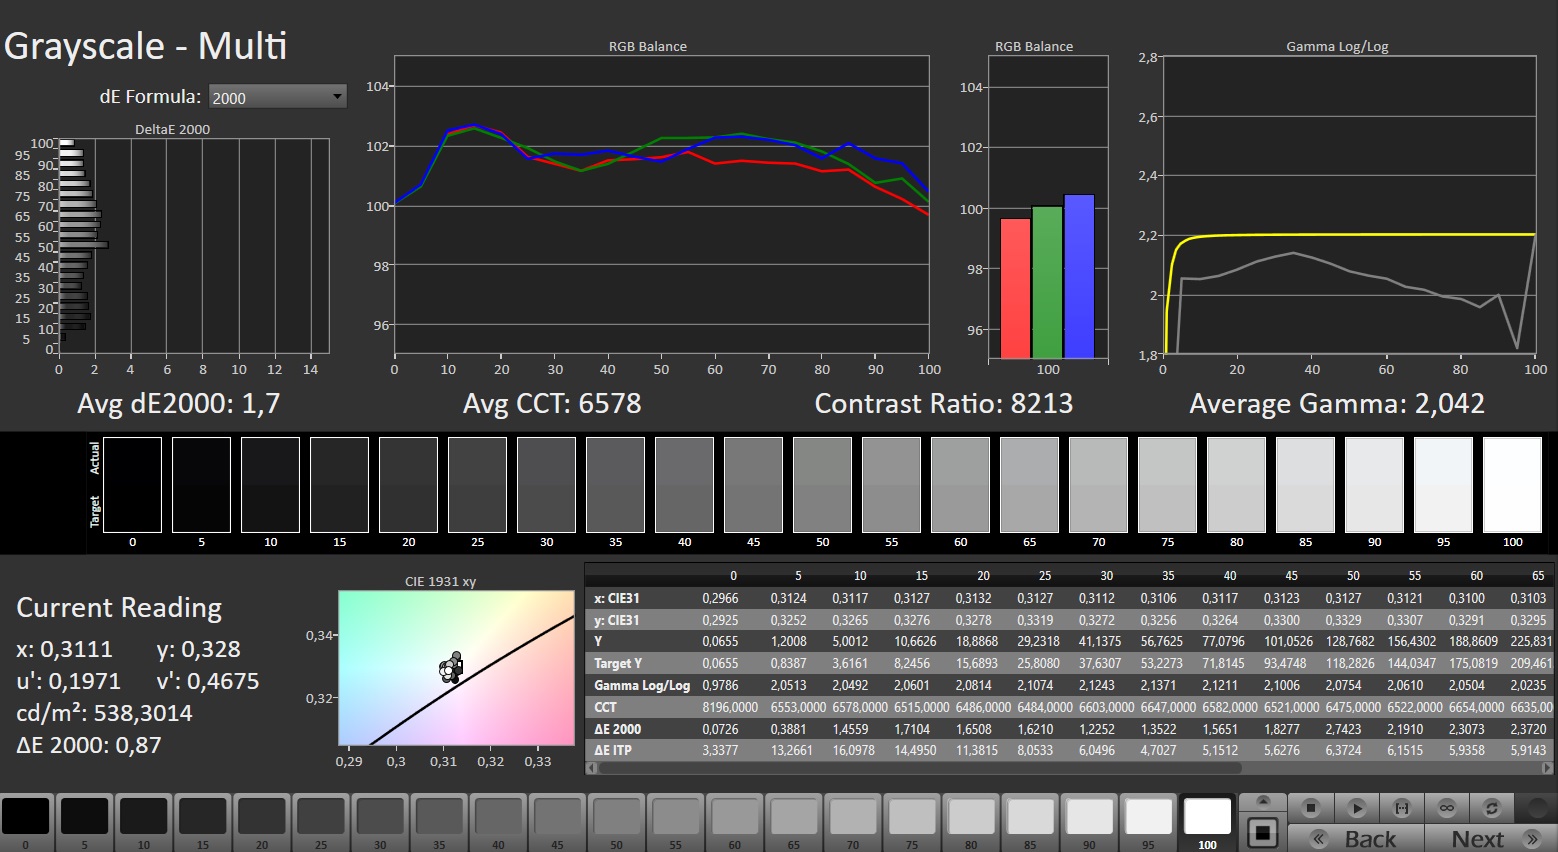
The Scar 18 offers an 18-inch mini-LED display (2560x1600 pixels) in the 16:10 format. Its positive aspects include the high brightness, excellent contrast and black value, and the matte surface. The fast 240-Hz panel also supports HDR and G-Sync.
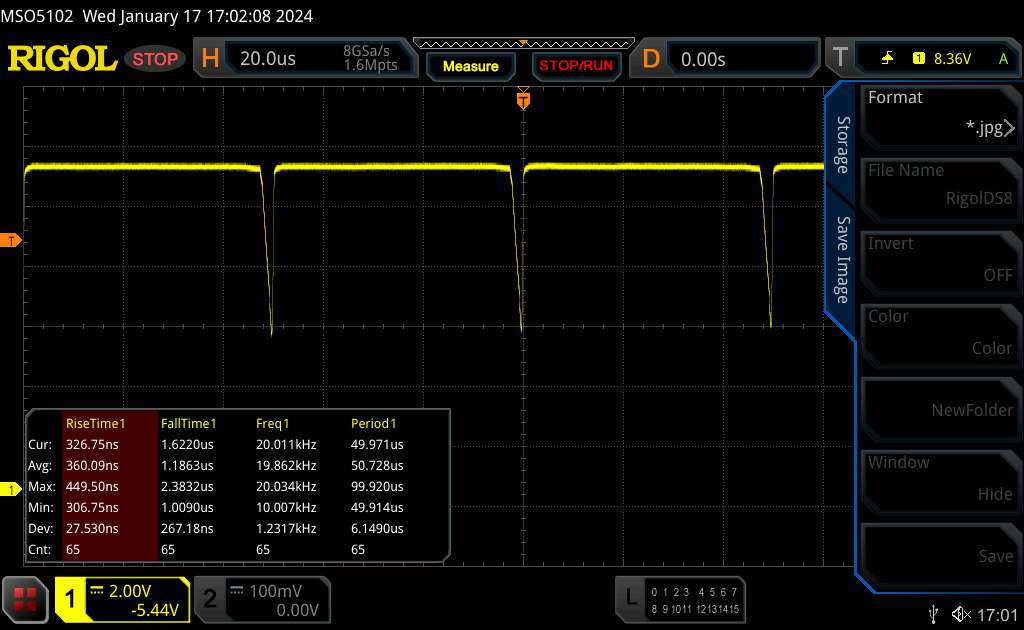
On the other hand, the display isn't completely free from PWM flickering, although that shouldn't play much of a role in everyday operation: We measure a high-frequency flickering (5,733 Hz) at brightness values smaller than 94 cd/m².
| |||||||||||||||||||||||||
Brightness Distribution: 89 %
Center on Battery: 937 cd/m²
Contrast: 14197:1 (Black: 0.066 cd/m²)
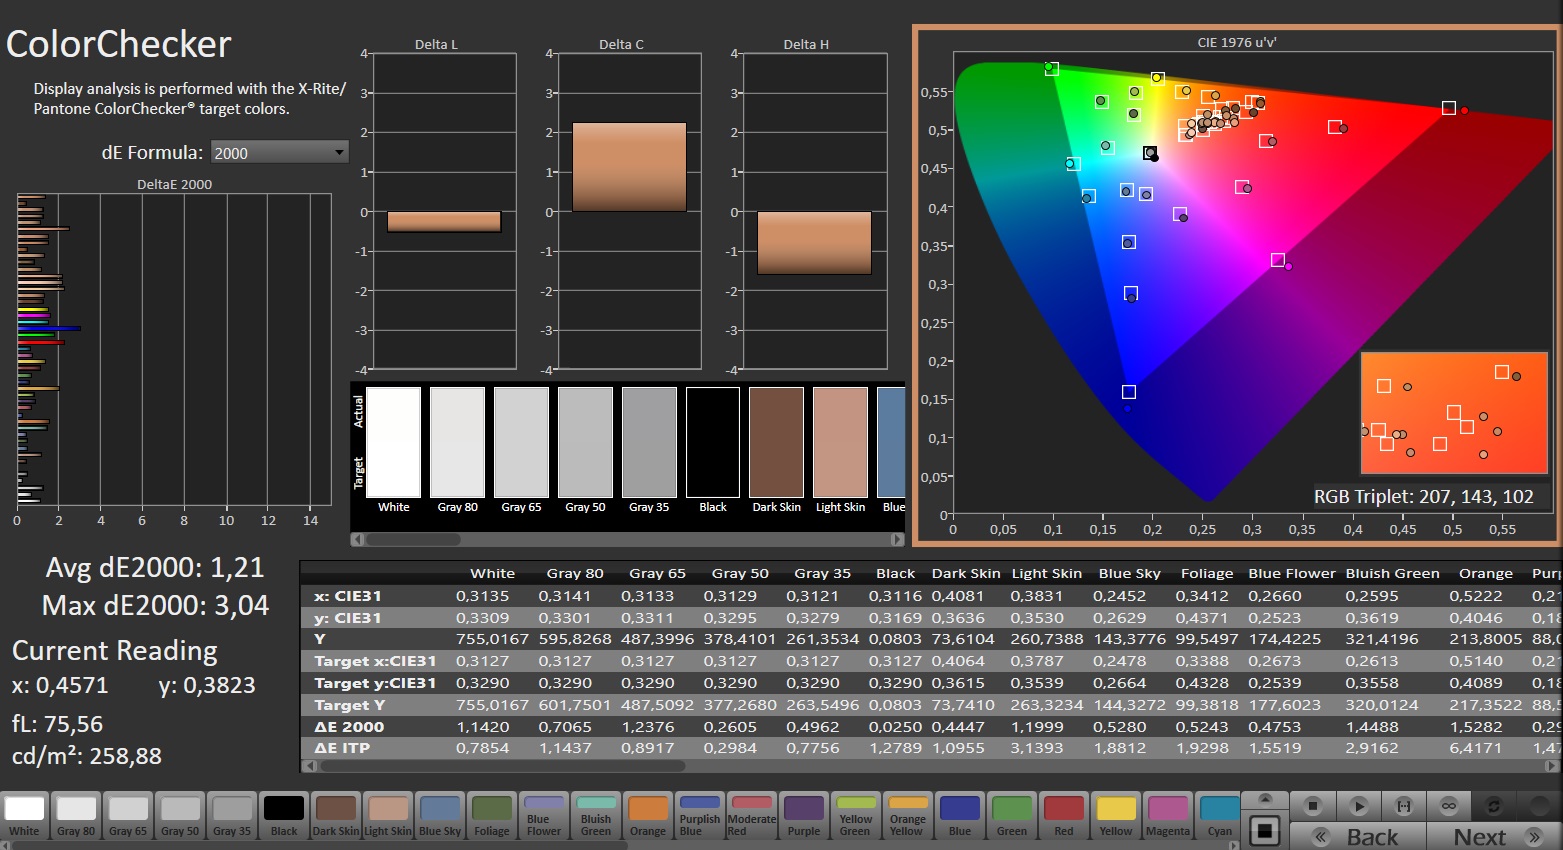
ΔE ColorChecker Calman: 1.52 | ∀{0.5-29.43 Ø4.73}
calibrated: 1.21
ΔE Greyscale Calman: 1.7 | ∀{0.09-98 Ø4.97}
90% AdobeRGB 1998 (Argyll 3D)
100% sRGB (Argyll 3D)
99.9% Display P3 (Argyll 3D)
Gamma: 2.042
CCT: 6578 K
| Asus ROG Strix Scar 18 G834JYR (2024) BOE NE180QDM-NM1, Mini LED, 2560x1600, 18" | Alienware m18 R1 AMD BOE NE18NZ1, IPS, 1920x1200, 18" | Alienware m18 R1 Chi Mei 180JME, IPS, 1920x1200, 18" | Acer Predator Helios 18 N23Q2 AUO45A8 (B180QAN01.2), IPS, 2560x1600, 18" | Razer Blade 18 RTX 4070 AU Optronics B180QAN01.0, IPS, 2560x1600, 18" | MSI Titan 18 HX A14VIG AU Optronics B180ZAN01.0, Mini-LED, 3840x2400, 18" | Asus ROG Strix Scar 18 2023 G834JY-N6005W NE180QDM-NZ2, IPS, 2560x1600, 18" | |
|---|---|---|---|---|---|---|---|
| Display | -1% | -1% | 1% | -3% | -2% | -3% | |
| Display P3 Coverage (%) | 99.9 | 98.5 -1% | 97.7 -2% | 99.8 0% | 96.9 -3% | 98.1 -2% | 97.2 -3% |
| sRGB Coverage (%) | 100 | 99.7 0% | 100 0% | 100 0% | 99.8 0% | 99.8 0% | 99.9 0% |
| AdobeRGB 1998 Coverage (%) | 90 | 88.7 -1% | 89.8 0% | 91.8 2% | 85.3 -5% | 86.2 -4% | 84.9 -6% |
| Response Times | 44% | 41% | -15% | 45% | -318% | 37% | |
| Response Time Grey 50% / Grey 80% * (ms) | 12 ? | 2.8 ? 77% | 3 ? 75% | 7.6 ? 37% | 4.2 ? 65% | 8.6 ? 28% | 5.41 ? 55% |
| Response Time Black / White * (ms) | 10.7 ? | 9.6 ? 10% | 9.9 ? 7% | 17.8 ? -66% | 8 ? 25% | 81.8 ? -664% | 8.62 ? 19% |
| PWM Frequency (Hz) | 5733 ? | 2509 | 2592 ? | ||||
| Screen | -42% | -64% | -114% | -142% | -85% | -211% | |
| Brightness middle (cd/m²) | 937 | 319.6 -66% | 372.8 -60% | 360 -62% | 549.6 -41% | 467.5 -50% | 490 -48% |
| Brightness (cd/m²) | 934 | 304 -67% | 367 -61% | 355 -62% | 524 -44% | 459 -51% | 468 -50% |
| Brightness Distribution (%) | 89 | 87 -2% | 97 9% | 92 3% | 89 0% | 90 1% | 86 -3% |
| Black Level * (cd/m²) | 0.066 | 0.25 -279% | 0.32 -385% | 0.21 -218% | 0.53 -703% | 0.54 -718% | |
| Contrast (:1) | 14197 | 1278 -91% | 1165 -92% | 1714 -88% | 1037 -93% | 907 -94% | |
| Colorchecker dE 2000 * | 1.52 | 1.22 20% | 1.92 -26% | 3.82 -151% | 3.32 -118% | 3.77 -148% | 4.97 -227% |
| Colorchecker dE 2000 max. * | 2.82 | 3.1 -10% | 3.65 -29% | 7.38 -162% | 6.63 -135% | 6.12 -117% | 11.02 -291% |
| Colorchecker dE 2000 calibrated * | 1.21 | 0.47 61% | 0.51 58% | 2.24 -85% | 2.7 -123% | 2.94 -143% | 2.97 -145% |
| Greyscale dE 2000 * | 1.7 | 0.8 53% | 1.5 12% | 5.06 -198% | 2 -18% | 3.2 -88% | 7.2 -324% |
| Gamma | 2.042 108% | 2.23 99% | 2.34 94% | 2.52 87% | 2.29 96% | 2.43 91% | 2.161 102% |
| CCT | 6578 99% | 6471 100% | 6607 98% | 5657 115% | 6319 103% | 6478 100% | 6515 100% |
| Total Average (Program / Settings) | 0% /
-21% | -8% /
-35% | -43% /
-75% | -33% /
-85% | -135% /
-103% | -59% /
-131% |
* ... smaller is better
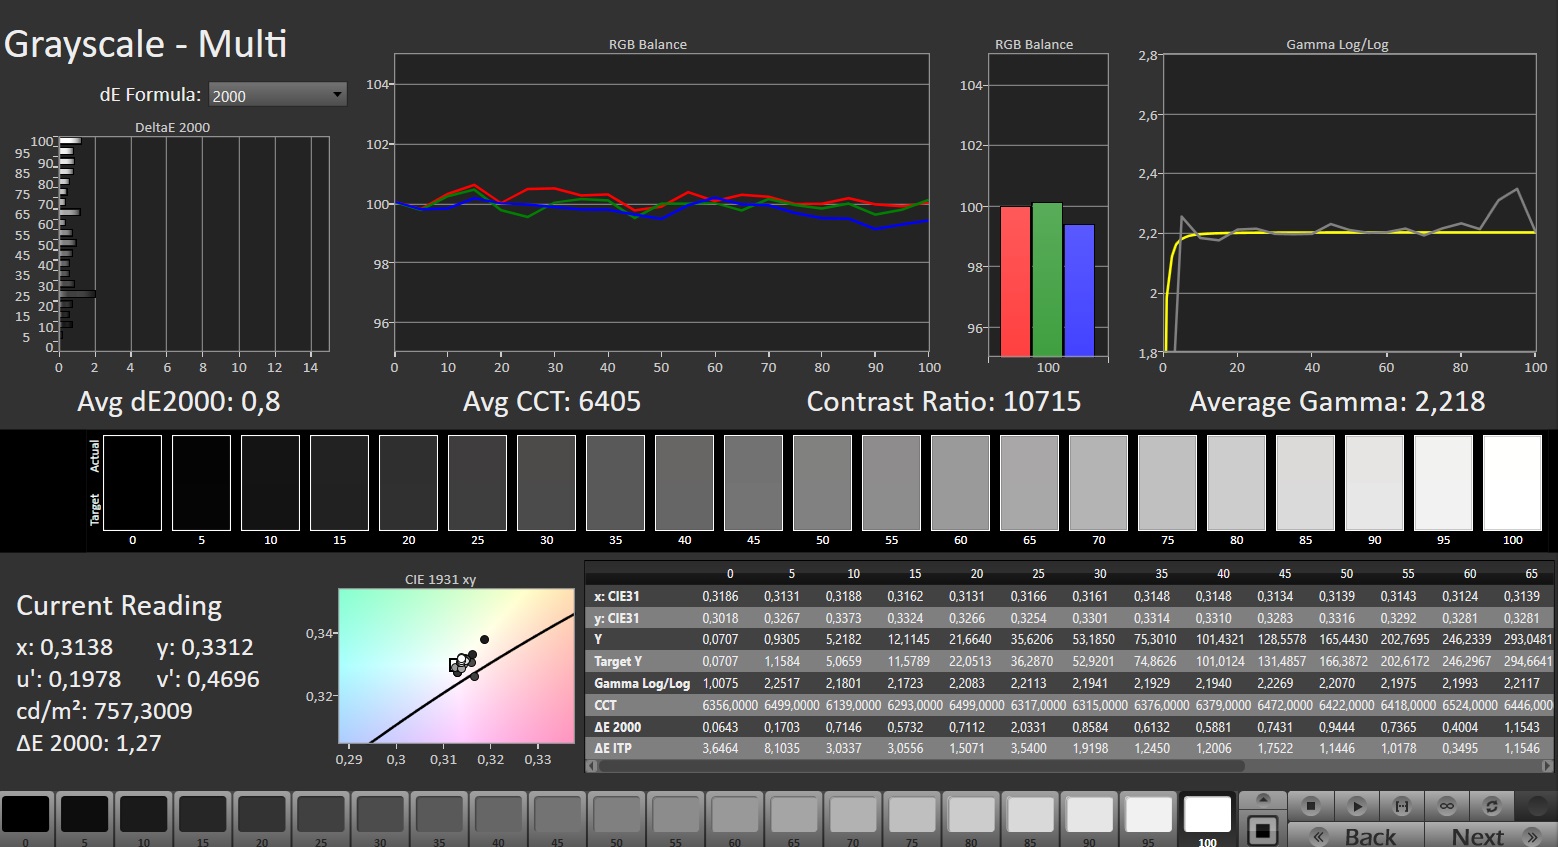
Color accuracy is a given with the sRGB and DCI-P3 color spaces covered completely and the Adobe RGB color space to 90%. Thanks to the Pantone certification, the color reproduction is already very good in the state of delivery, and with a deviation of 1.52 the target of DeltaE < 3 is reached. While an additional calibration still achieves a slight improvement, this primarily concerns a more balanced grayscale.


Display Response Times
| ↔ Response Time Black to White | ||
|---|---|---|
| 10.7 ms ... rise ↗ and fall ↘ combined | ↗ 7.6 ms rise |  |
| ↘ 3.1 ms fall | ||
| The screen shows good response rates in our tests, but may be too slow for competitive gamers. In comparison, all tested devices range from 0.1 (minimum) to 240 (maximum) ms. » 29 % of all devices are better. This means that the measured response time is better than the average of all tested devices (19.9 ms). | ||
| ↔ Response Time 50% Grey to 80% Grey | ||
| 12 ms ... rise ↗ and fall ↘ combined | ↗ 8 ms rise | |
| ↘ 4 ms fall | ||
| The screen shows good response rates in our tests, but may be too slow for competitive gamers. In comparison, all tested devices range from 0.165 (minimum) to 636 (maximum) ms. » 25 % of all devices are better. This means that the measured response time is better than the average of all tested devices (31.1 ms). | ||
Screen Flickering / PWM (Pulse-Width Modulation)
| Screen flickering / PWM detected | 5733 Hz | |
| ≤ 94 cd/m² brightness | ||
The display backlight flickers at 5733 Hz (worst case, e.g., utilizing PWM) Flickering detected at a brightness setting of 94 cd/m² and below. There should be no flickering or PWM above this brightness setting. The frequency of 5733 Hz is quite high, so most users sensitive to PWM should not notice any flickering. Flickering occurs at relatively low brightness settings, so extended use at this brightness setting or lower can cause eyestrain. In comparison: 52 % of all tested devices do not use PWM to dim the display. If PWM was detected, an average of 7798 (minimum: 5 - maximum: 343500) Hz was measured. | ||

The IPS panel has stable viewing angles and can be read from almost any angle. The high maximum brightness also allows for reading the screen contents outdoors.


Performance - The Scar 18 offers high-end hardware
The Asus ROG Strix Scar 18 is a high-end laptop in the 18-inch format. The necessary computing performance is delivered by Raptor Lake Refresh and Ada Lovelace hardware. Prices start from 3,600 Euros (~$3,878), and our current test unit is available for about 4,500 Euros (~$4,848).


Test Conditions
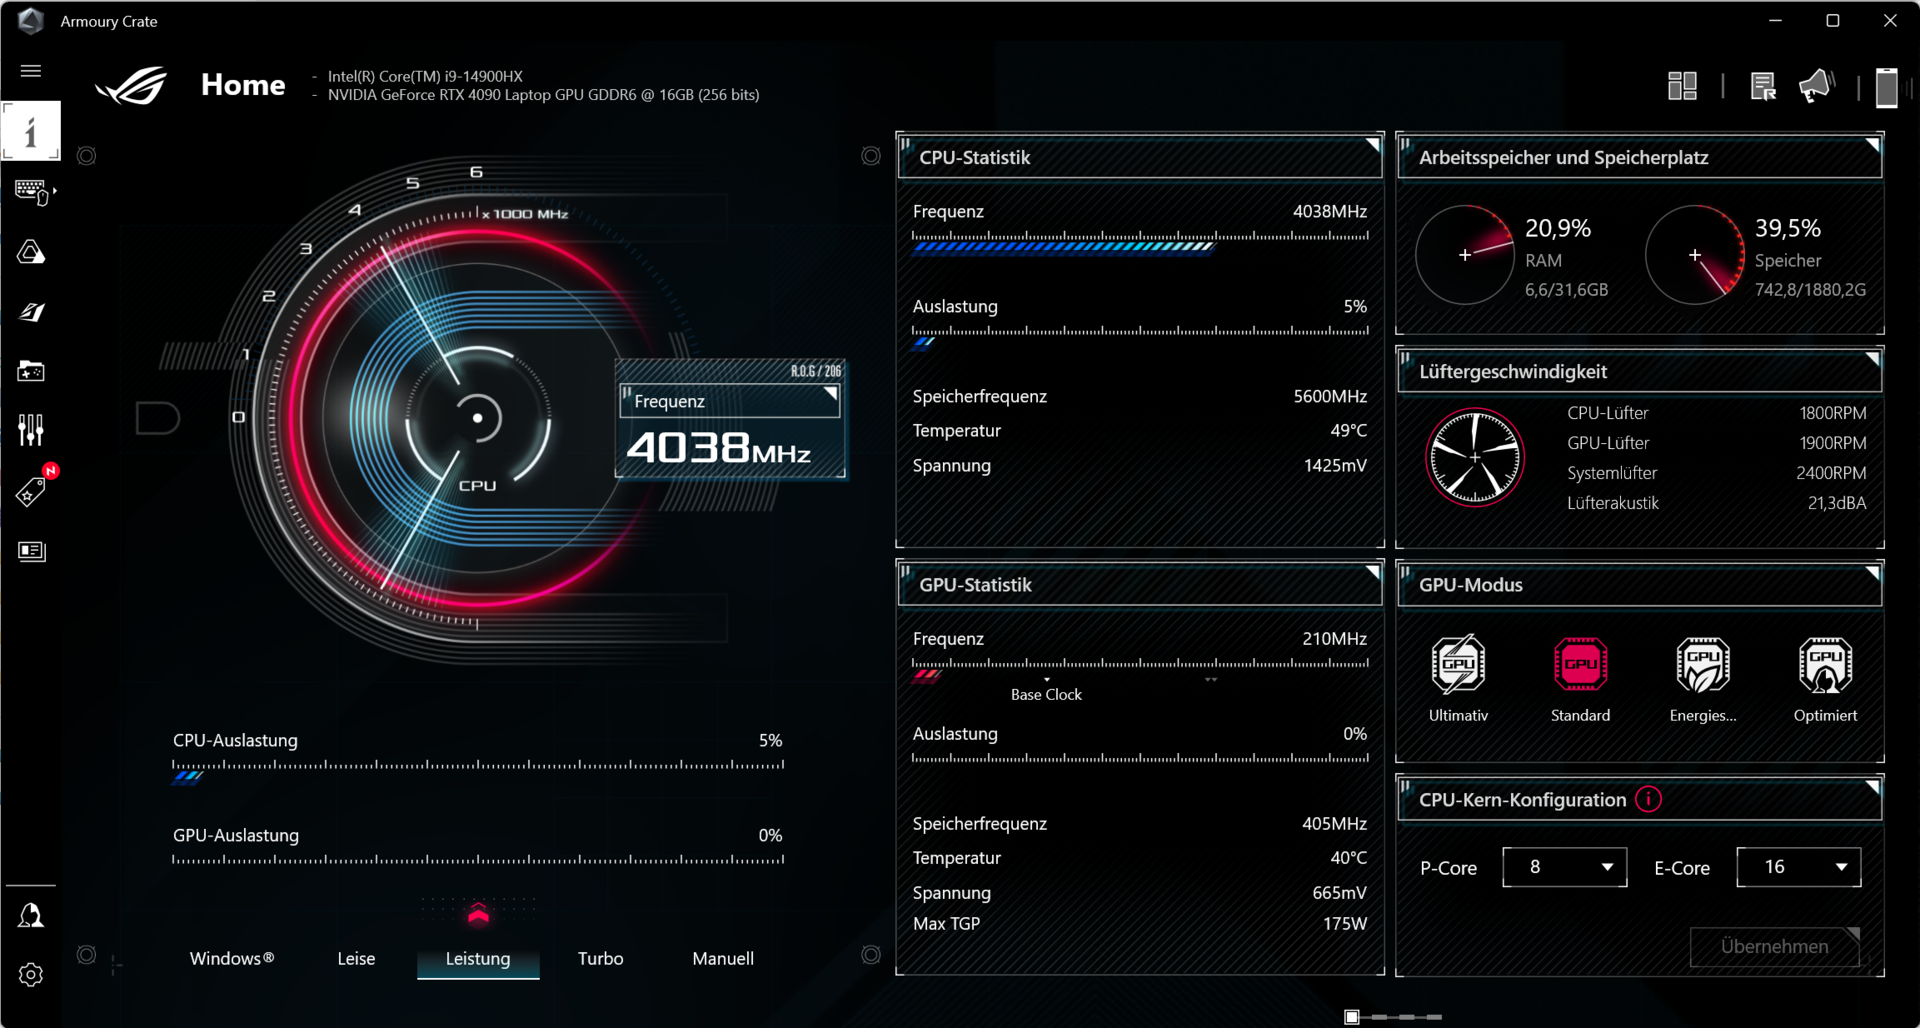
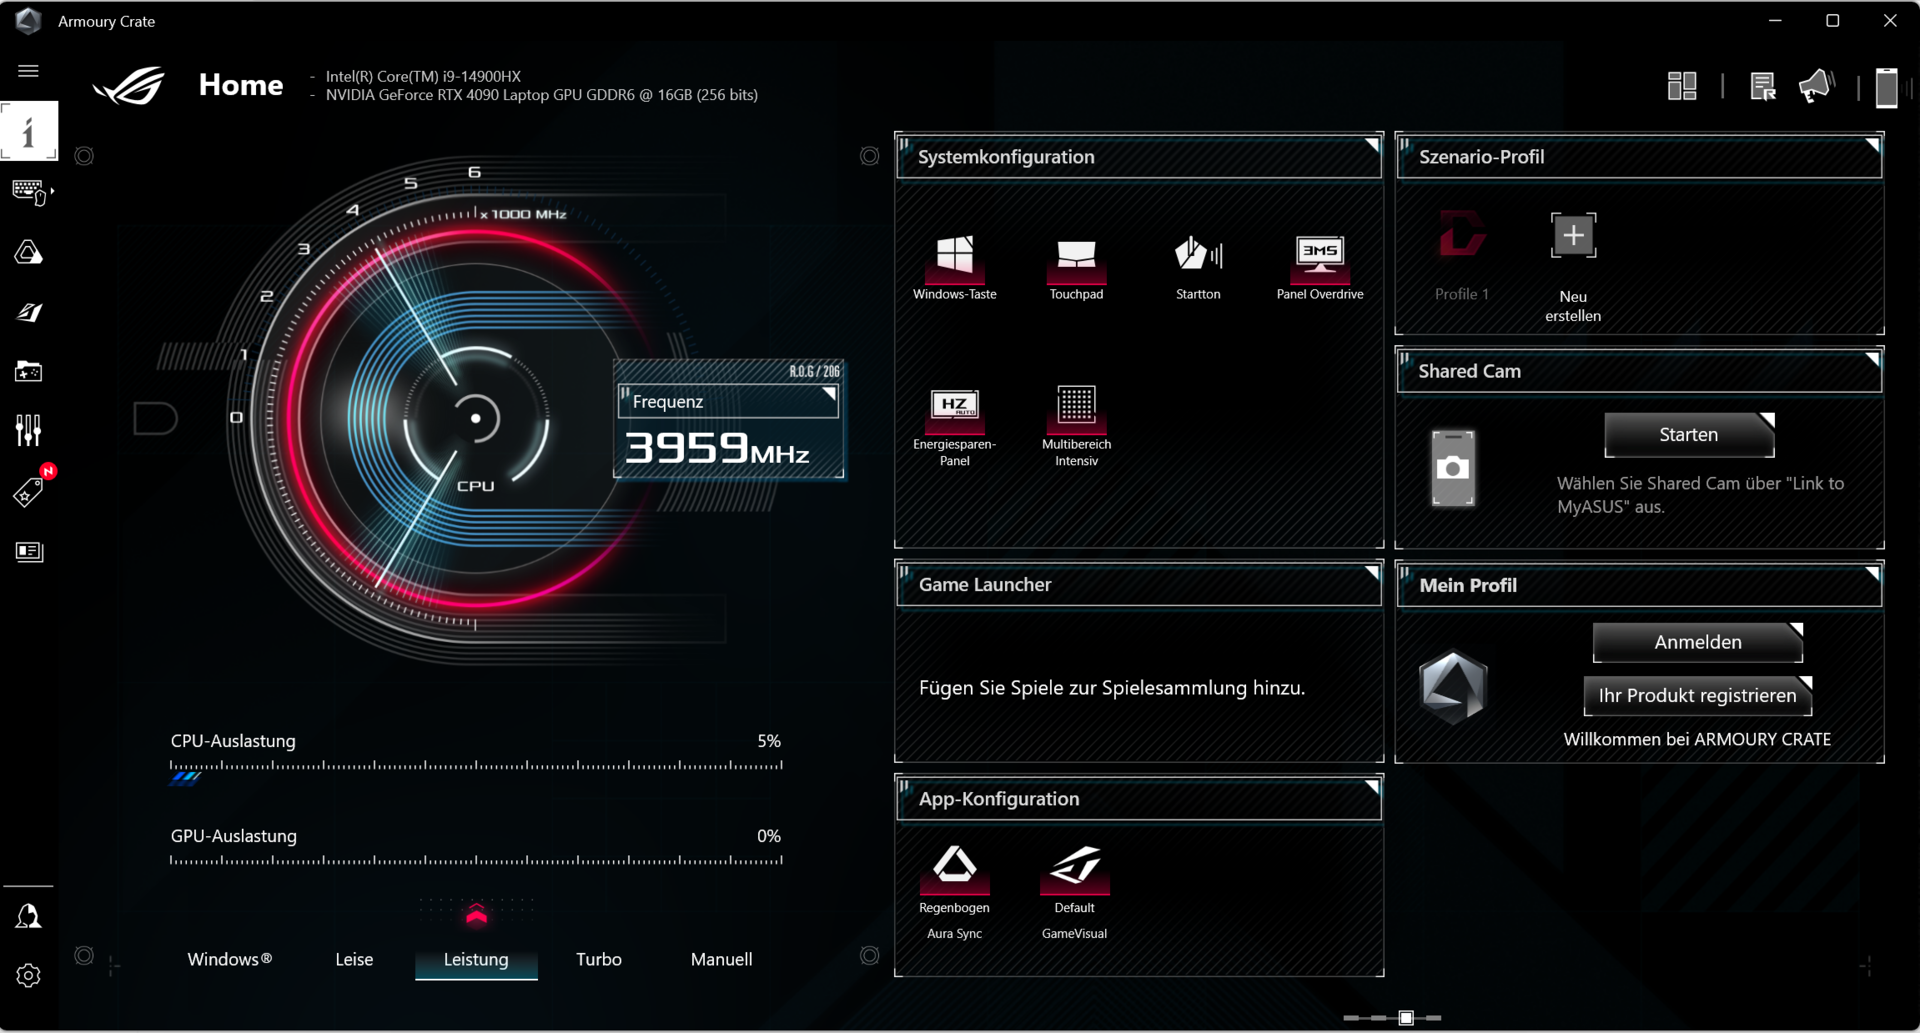
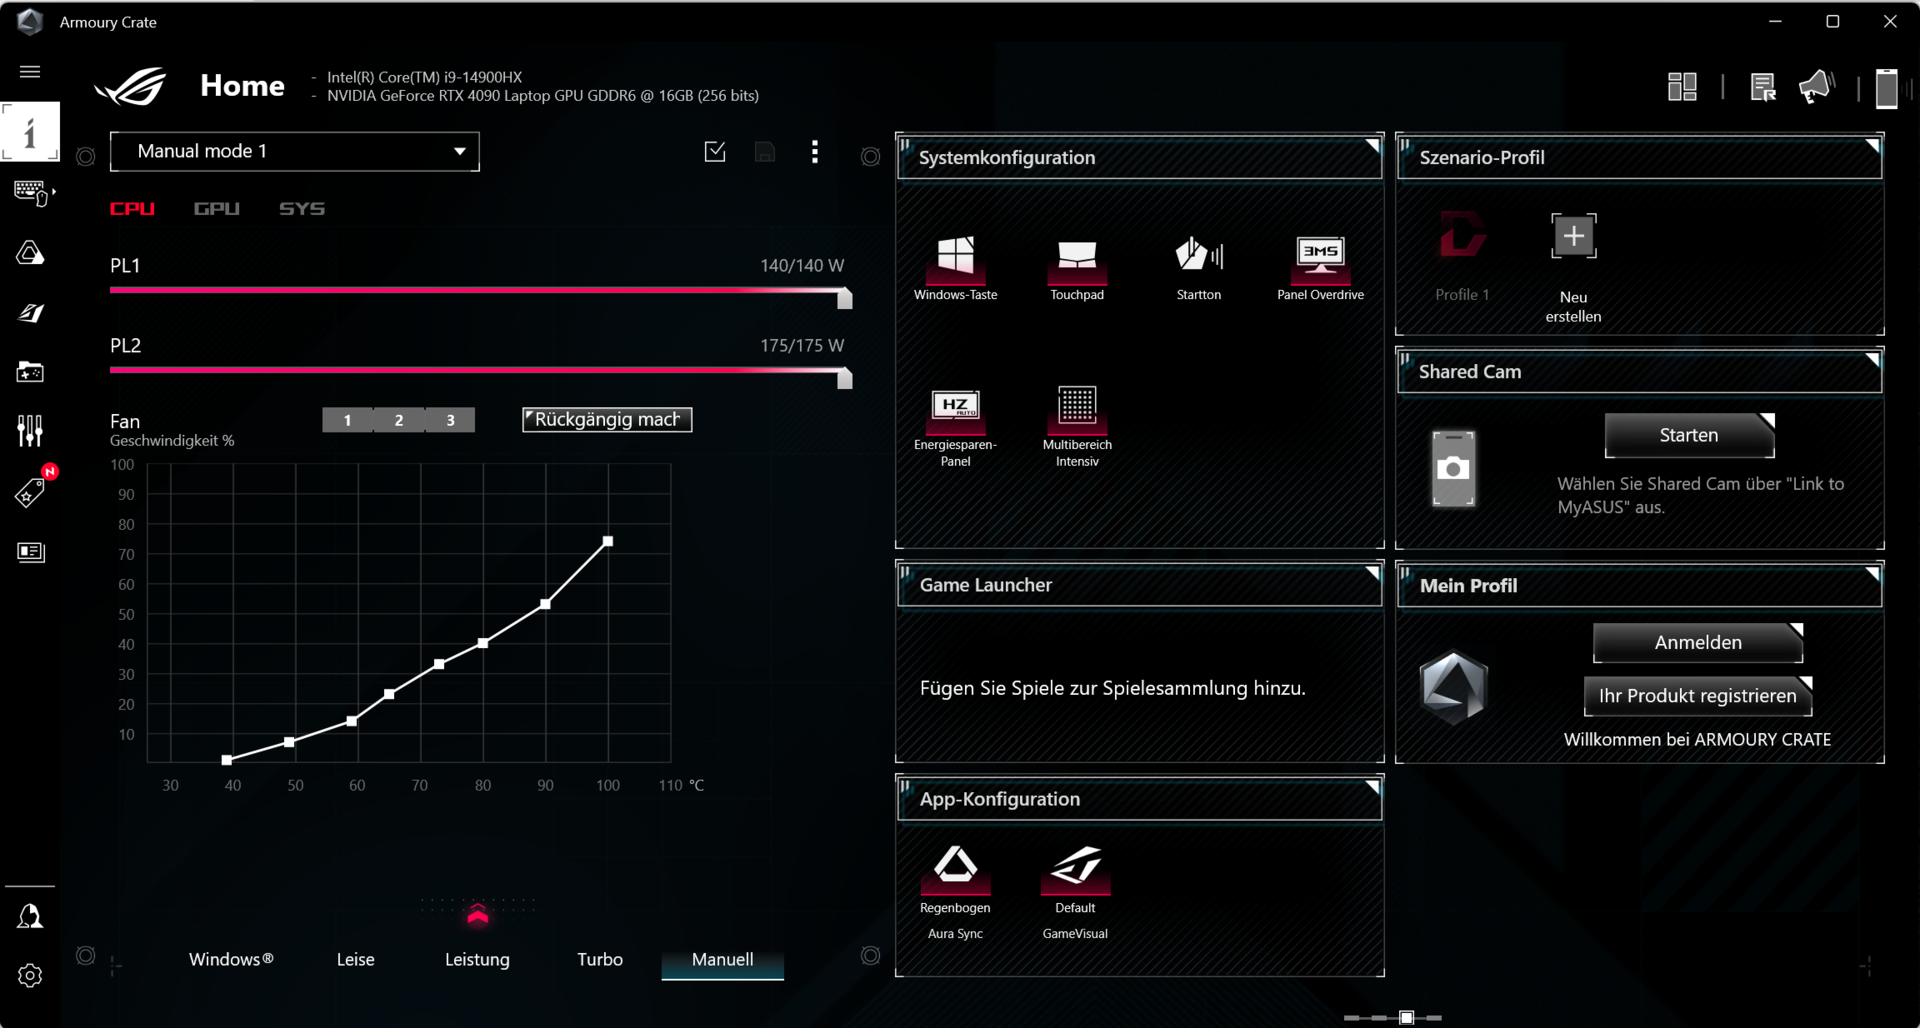
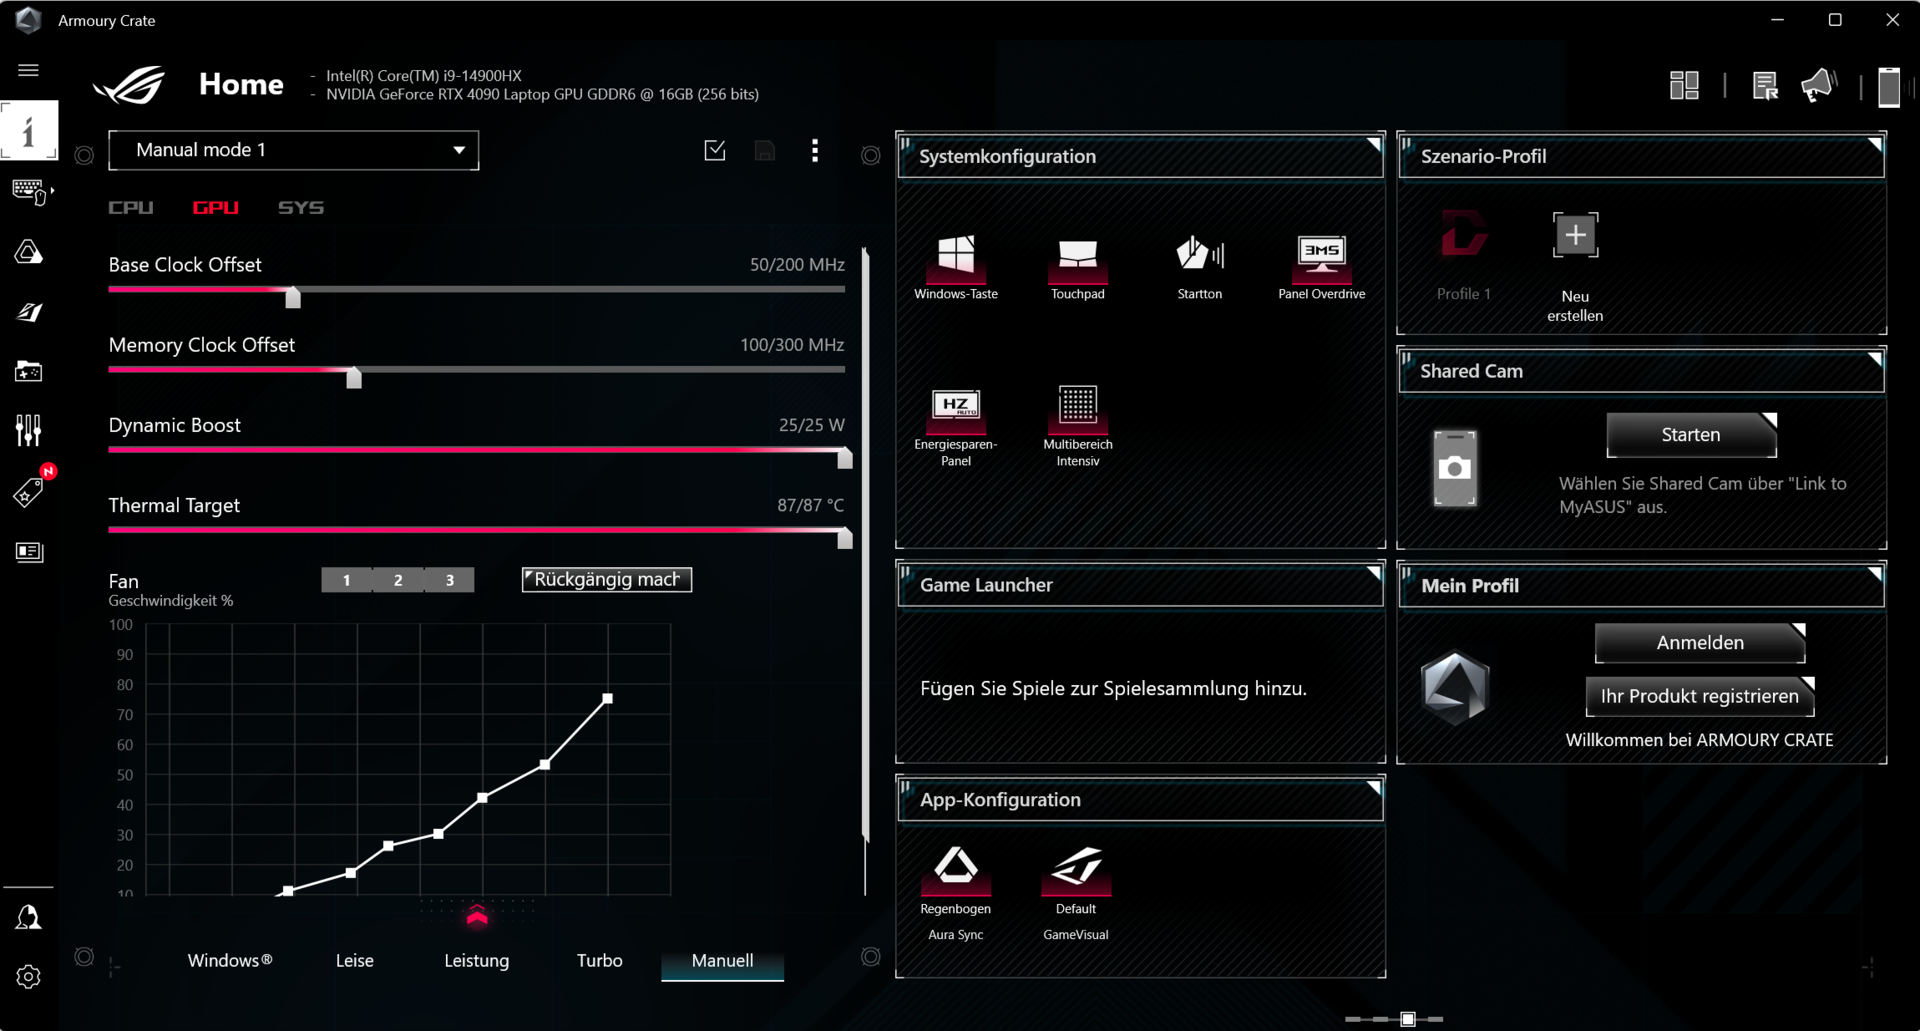
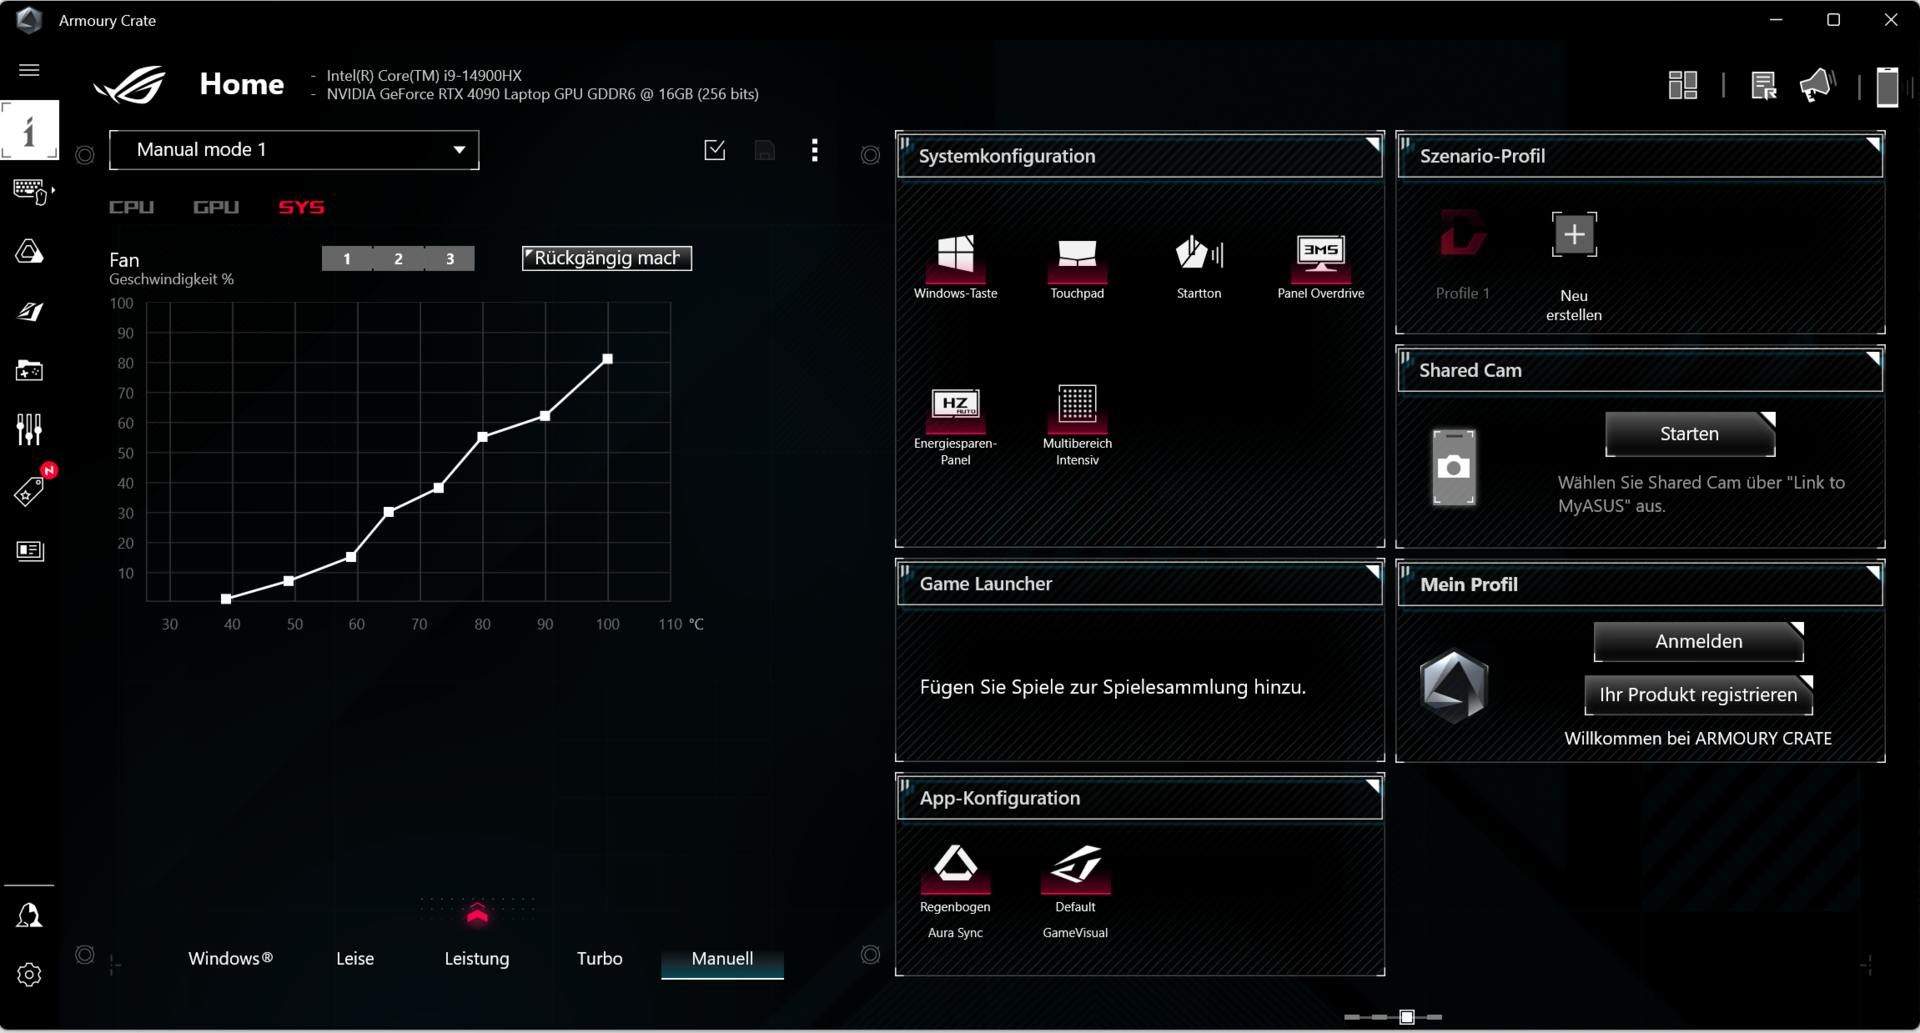
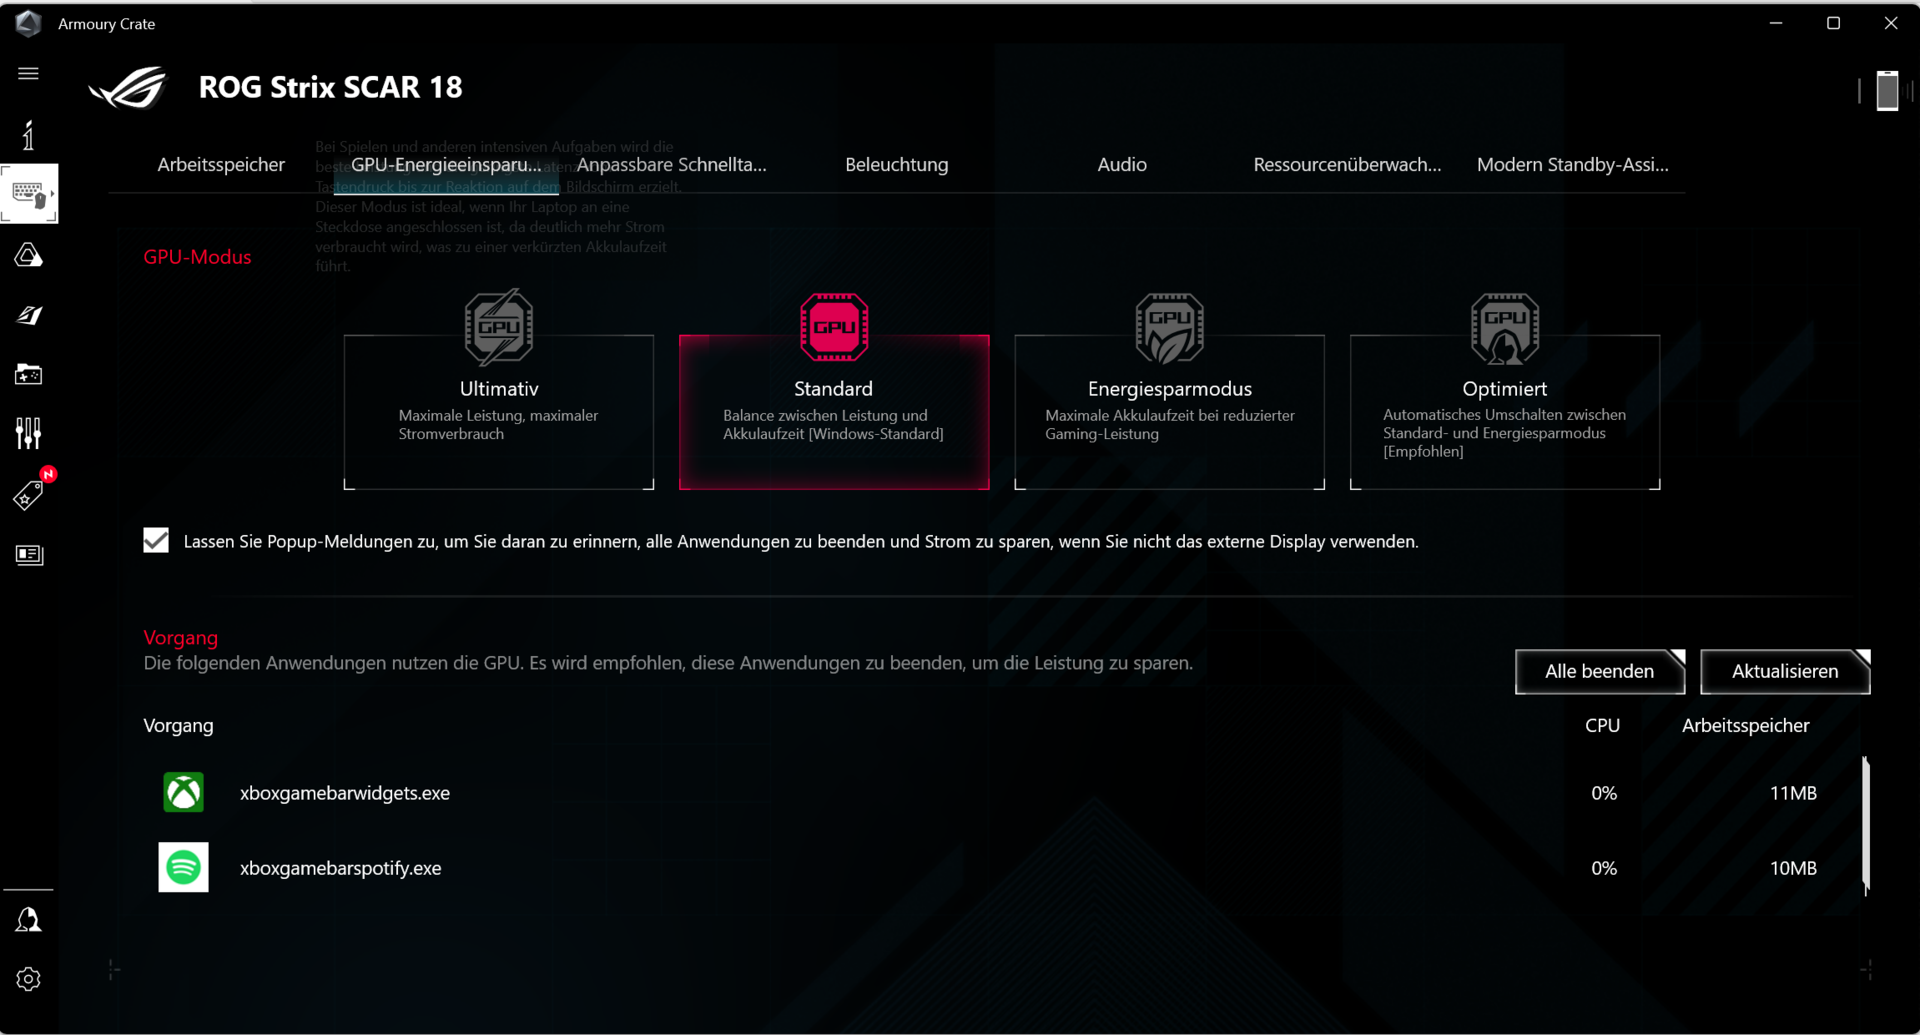
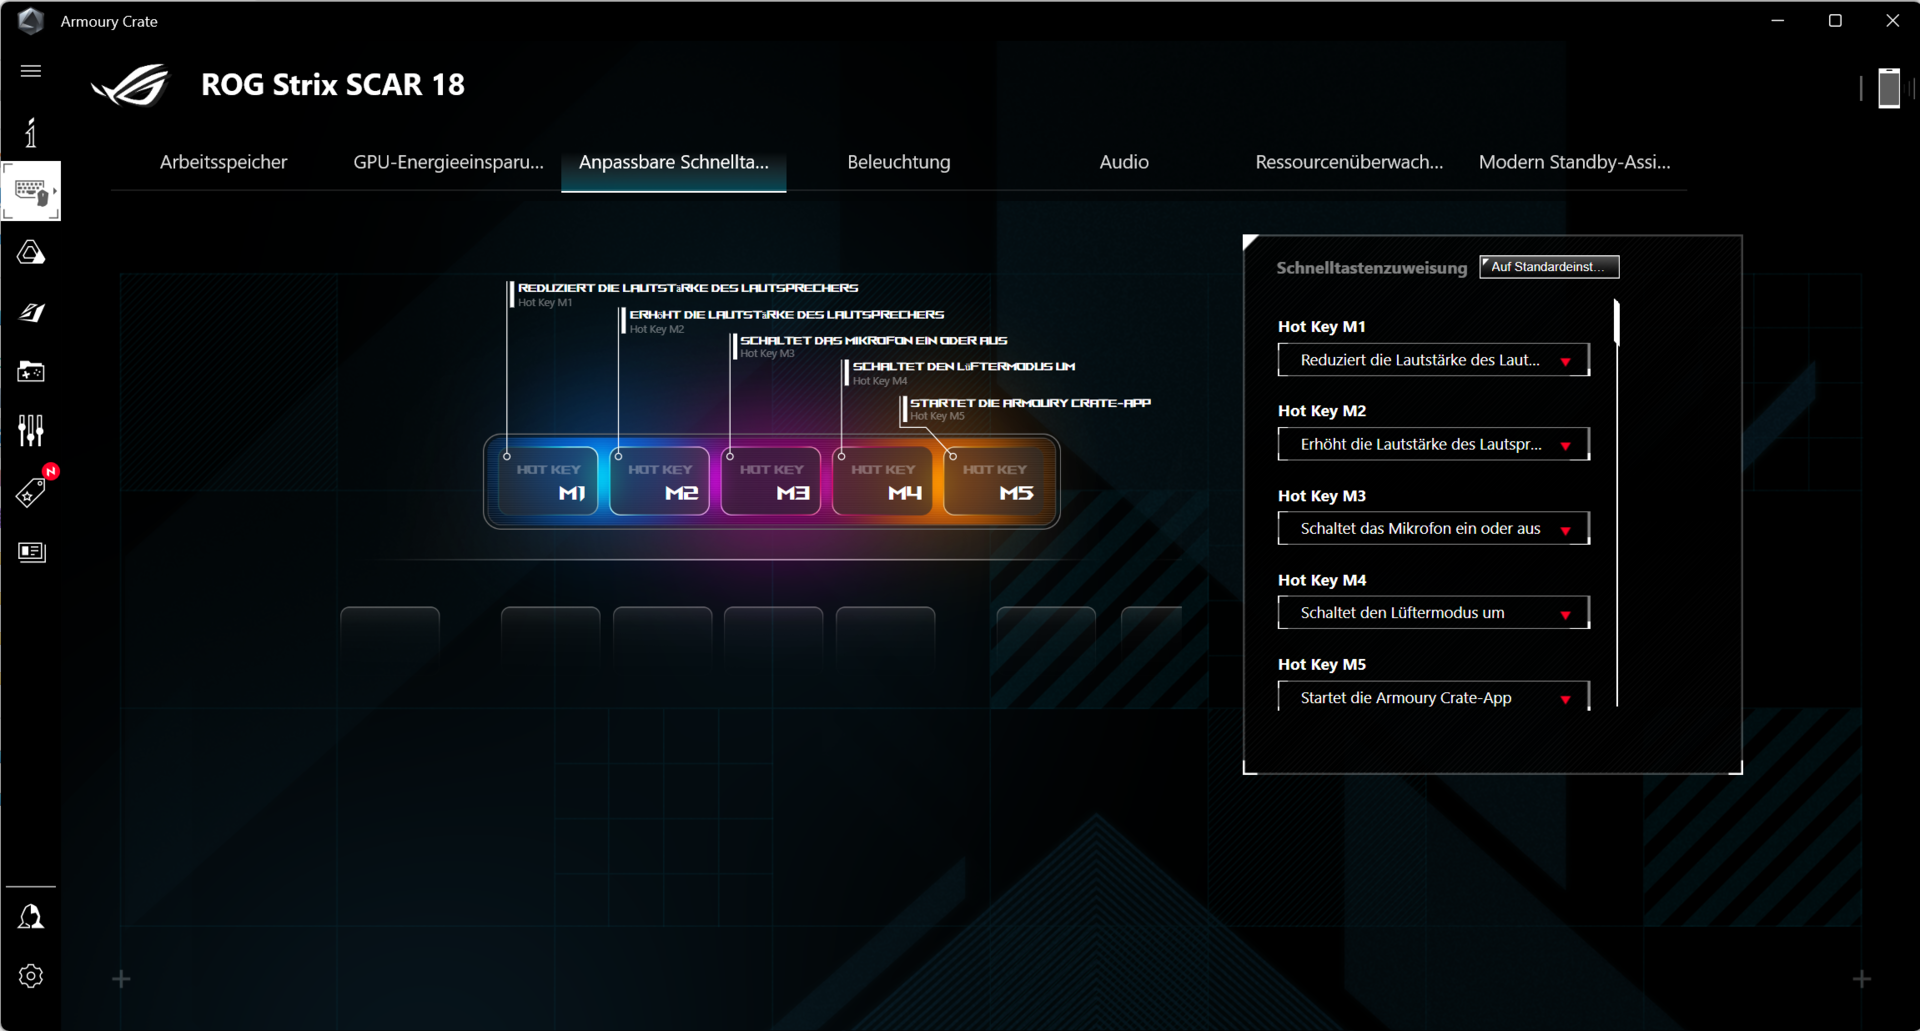
Three power modes preconfigured by Asus are available (see table), and you can switch between them using the Fn + F5 key combination. We use "Performance" for our benchmarks and "Silent" for our battery tests. The GPU mode is set to "Standard". The control center ("Armory Crate") of the laptop allows creating individual profiles ("Manual") including setting the Power Limits, the Dynamic Boost, and the fan curves.
| Performance | Turbo | Silent | |
|---|---|---|---|
| Power Limit 1 (HWInfo) | 110 Watt | 175 Watt | 65 Watt |
| Power Limit 2 (HWInfo) | 120 Watt | 175 Watt | 100 Watt |
| Noise (The Witcher 3) | 50 dB(A) | 56 dB(A) | 35 dB(A) |
| Performance (The Witcher 3) | ~188 fps | ~183 fps | ~68 fps |
Processor
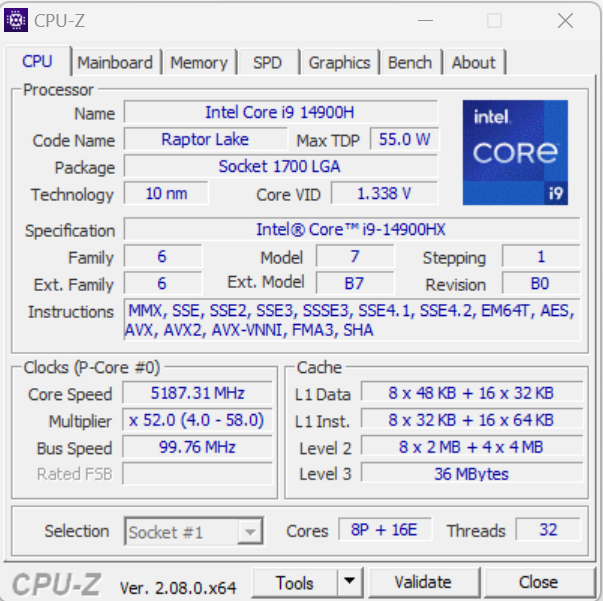
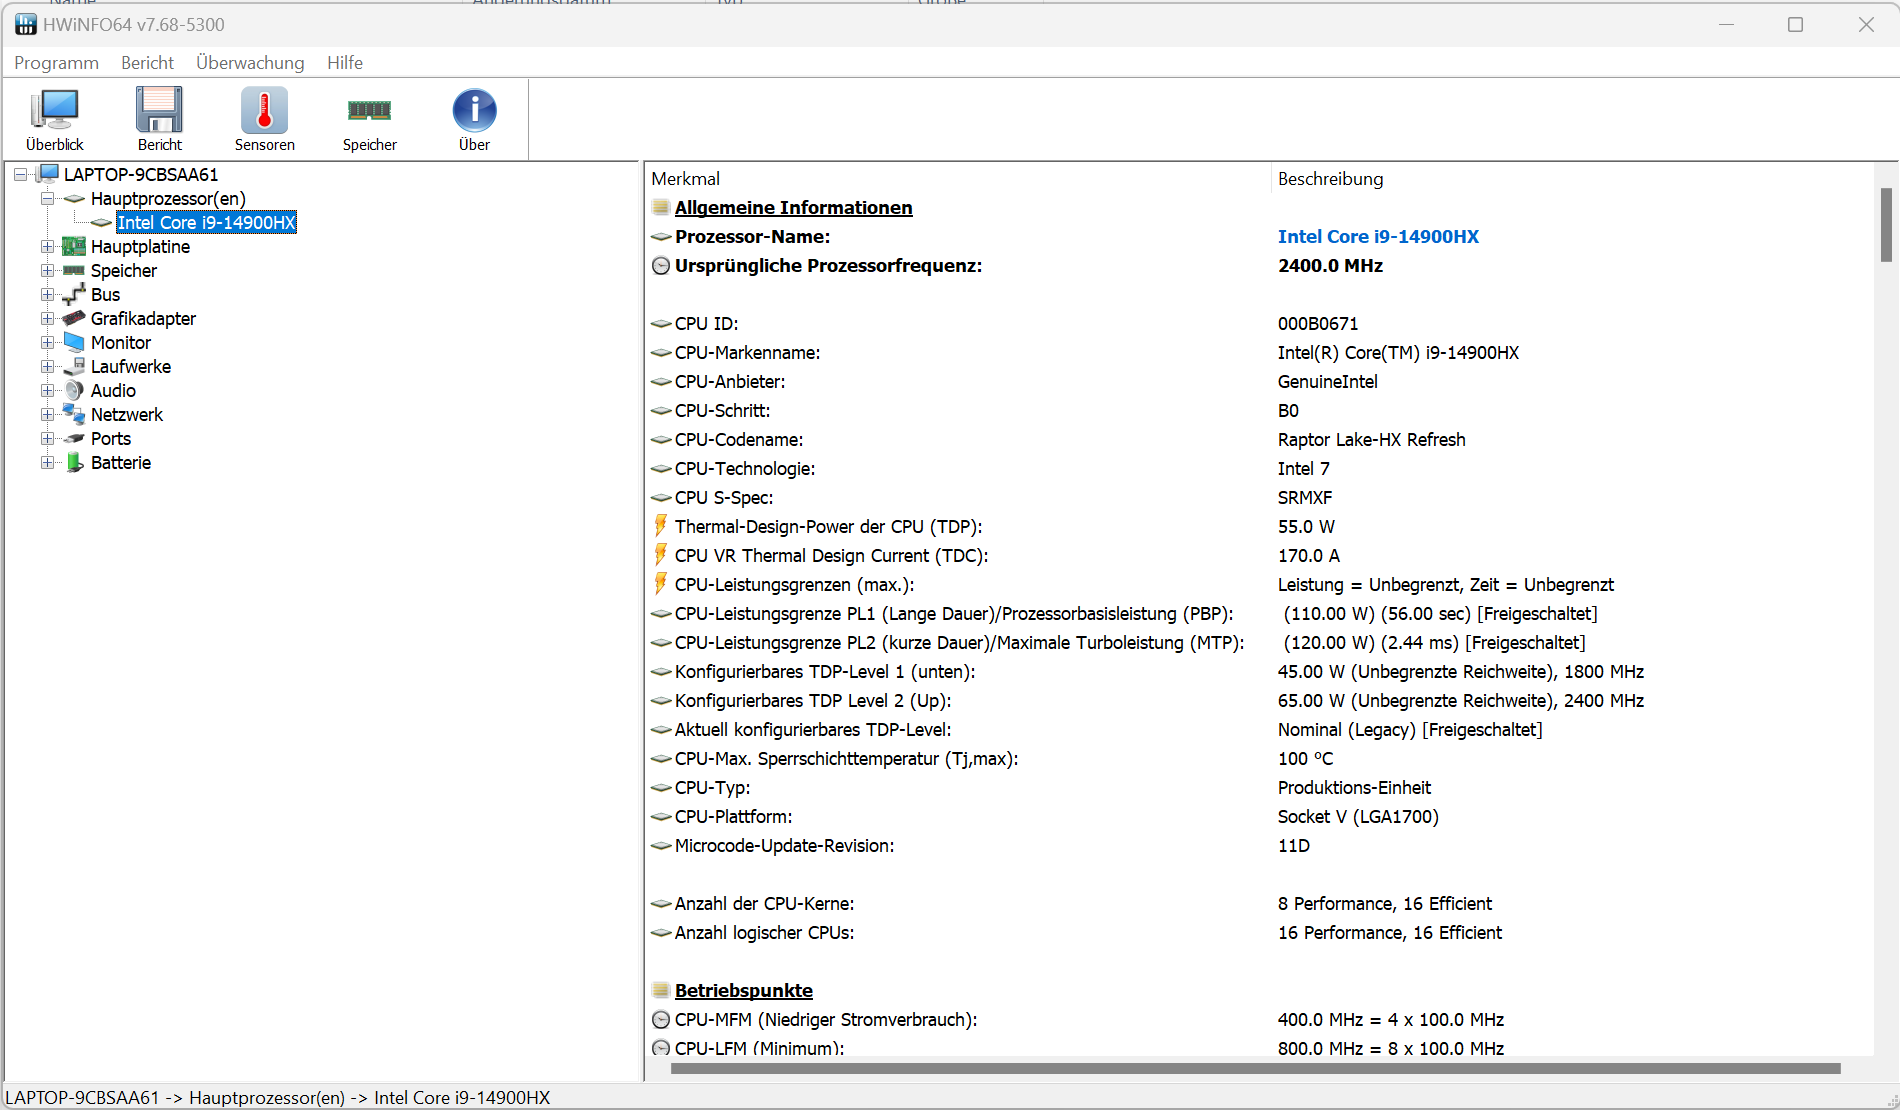
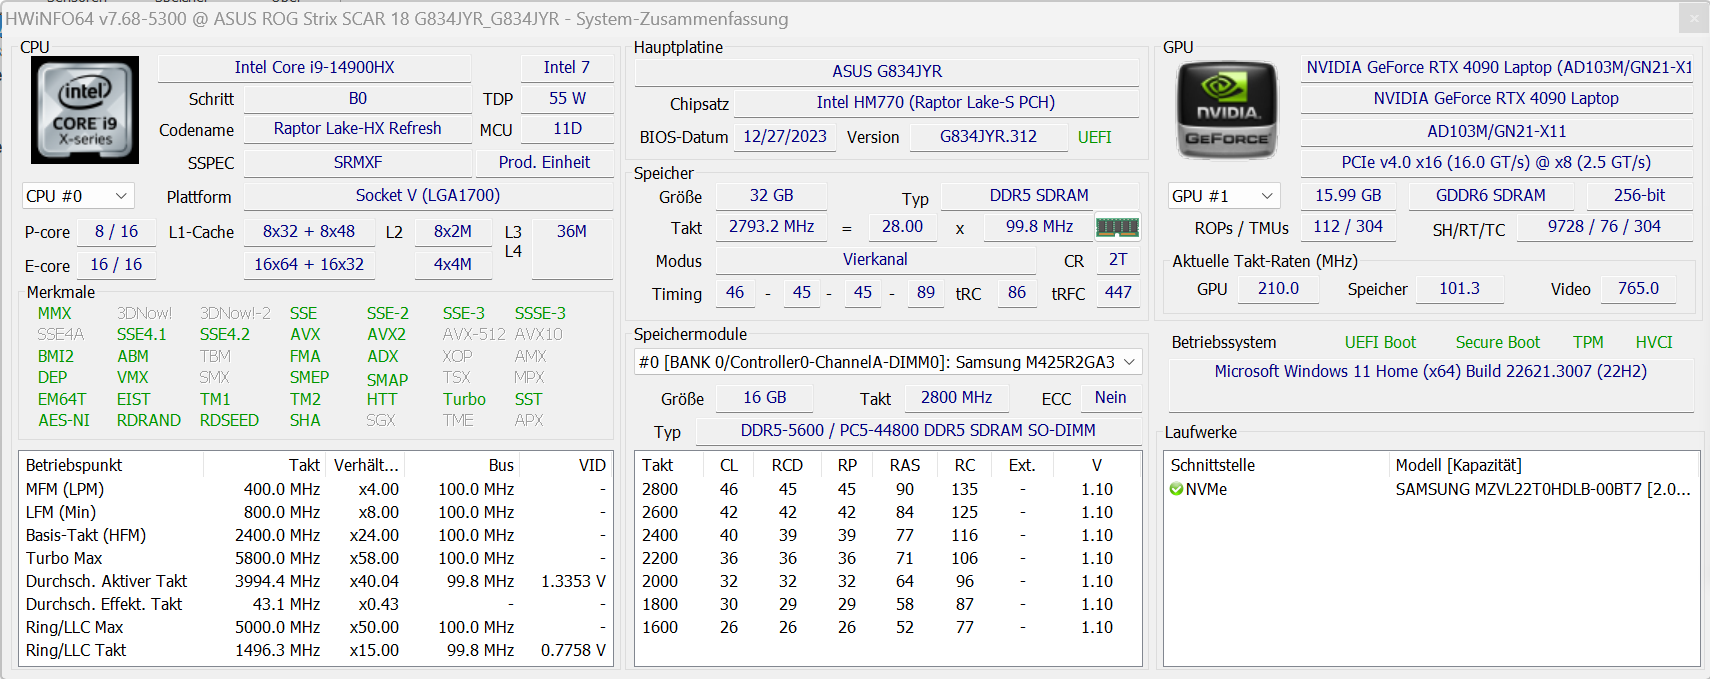
The 24 CPU cores (8P + 16E = 32 threads) of the Core i9-14900HX (Raptor Lake) reach maximum clock speeds of 5.8 GHz (P cores) and 4.1 GHz (E cores). The CPU responds to constant multithread load (CB15 Loop) with a Turbo speed that remains constantly high. You can find more information on the Core i9 in our analysis.
The selection of the power profile only influences the single-thread performance to a limited sense but has more influence on the multithread performance. Selecting "Performance" results in benchmark values that are below the CPU average determined so far, while "Turbo" increases the results slightly above the average. The single-thread performance, which is more relevant in everyday operation, ranges at the same level in mains and in battery operation, but the multithread performance drops significantly in battery operation.

Cinebench R15 Multi Constant Load Test


| CPU Performance rating - Percent | |
| Alienware m18 R1 AMD | |
| Asus ROG Strix Scar 18 G834JYR (2024) | |
| Asus ROG Strix Scar 18 2023 G834JY-N6005W -2! | |
| Alienware m18 R1 -2! | |
| MSI Titan 18 HX A14VIG | |
| Acer Predator Helios 18 N23Q2 | |
| Asus ROG Strix Scar 18 G834JYR (2024) | |
| Average Intel Core i9-14900HX | |
| Razer Blade 18 RTX 4070 -2! | |
| Average of class Gaming | |
| Cinebench R20 | |
| CPU (Multi Core) | |
| Alienware m18 R1 AMD | |
| Alienware m18 R1 | |
| Asus ROG Strix Scar 18 G834JYR (2024) (Turbo) | |
| MSI Titan 18 HX A14VIG | |
| Asus ROG Strix Scar 18 2023 G834JY-N6005W | |
| Acer Predator Helios 18 N23Q2 | |
| Average Intel Core i9-14900HX (6579 - 13832, n=37) | |
| Razer Blade 18 RTX 4070 | |
| Asus ROG Strix Scar 18 G834JYR (2024) | |
| Average of class Gaming (4029 - 16108, n=112, last 2 years) | |
| CPU (Single Core) | |
| Asus ROG Strix Scar 18 G834JYR (2024) (Turbo) | |
| Asus ROG Strix Scar 18 G834JYR (2024) | |
| Asus ROG Strix Scar 18 2023 G834JY-N6005W | |
| Average Intel Core i9-14900HX (657 - 859, n=37) | |
| MSI Titan 18 HX A14VIG | |
| Alienware m18 R1 | |
| Acer Predator Helios 18 N23Q2 | |
| Razer Blade 18 RTX 4070 | |
| Average of class Gaming (442 - 895, n=112, last 2 years) | |
| Alienware m18 R1 AMD | |
| Cinebench R15 | |
| CPU Multi 64Bit | |
| Alienware m18 R1 AMD | |
| Alienware m18 R1 | |
| MSI Titan 18 HX A14VIG | |
| Asus ROG Strix Scar 18 2023 G834JY-N6005W | |
| Asus ROG Strix Scar 18 G834JYR (2024) (Turbo) | |
| Acer Predator Helios 18 N23Q2 | |
| Razer Blade 18 RTX 4070 | |
| Average Intel Core i9-14900HX (3263 - 5589, n=38) | |
| Asus ROG Strix Scar 18 G834JYR (2024) | |
| Average of class Gaming (1578 - 6271, n=113, last 2 years) | |
| CPU Single 64Bit | |
| Asus ROG Strix Scar 18 2023 G834JY-N6005W | |
| Alienware m18 R1 AMD | |
| Asus ROG Strix Scar 18 G834JYR (2024) (Turbo) | |
| Average Intel Core i9-14900HX (247 - 323, n=37) | |
| Alienware m18 R1 | |
| Asus ROG Strix Scar 18 G834JYR (2024) | |
| MSI Titan 18 HX A14VIG | |
| Razer Blade 18 RTX 4070 | |
| Acer Predator Helios 18 N23Q2 | |
| Average of class Gaming (188.8 - 343, n=112, last 2 years) | |
| Blender - v2.79 BMW27 CPU | |
| Average of class Gaming (80 - 330, n=110, last 2 years) | |
| Average Intel Core i9-14900HX (91 - 206, n=37) | |
| Asus ROG Strix Scar 18 G834JYR (2024) | |
| Razer Blade 18 RTX 4070 | |
| Asus ROG Strix Scar 18 G834JYR (2024) (Turbo) | |
| Acer Predator Helios 18 N23Q2 | |
| MSI Titan 18 HX A14VIG | |
| Asus ROG Strix Scar 18 2023 G834JY-N6005W | |
| Alienware m18 R1 | |
| Alienware m18 R1 AMD | |
| Geekbench 6.7 | |
| Multi-Core | |
| Asus ROG Strix Scar 18 G834JYR (2024) (6.2.1, Turbo) | |
| Acer Predator Helios 18 N23Q2 | |
| Asus ROG Strix Scar 18 G834JYR (2024) (6.2.1) | |
| Average Intel Core i9-14900HX (13158 - 19665, n=37) | |
| MSI Titan 18 HX A14VIG (6.2.1) | |
| Alienware m18 R1 AMD | |
| Average of class Gaming (6625 - 22104, n=112, last 2 years) | |
| Single-Core | |
| Asus ROG Strix Scar 18 G834JYR (2024) (6.2.1, Turbo) | |
| Asus ROG Strix Scar 18 G834JYR (2024) (6.2.1) | |
| Average Intel Core i9-14900HX (2419 - 3129, n=37) | |
| Acer Predator Helios 18 N23Q2 | |
| Alienware m18 R1 AMD | |
| MSI Titan 18 HX A14VIG (6.2.1) | |
| Average of class Gaming (1490 - 3259, n=112, last 2 years) | |
| HWBOT x265 Benchmark v2.2 - 4k Preset | |
| Alienware m18 R1 AMD | |
| Asus ROG Strix Scar 18 2023 G834JY-N6005W | |
| Alienware m18 R1 | |
| Asus ROG Strix Scar 18 G834JYR (2024) (Turbo) | |
| Razer Blade 18 RTX 4070 | |
| MSI Titan 18 HX A14VIG | |
| Acer Predator Helios 18 N23Q2 | |
| Average Intel Core i9-14900HX (16.8 - 38.9, n=37) | |
| Asus ROG Strix Scar 18 G834JYR (2024) | |
| Average of class Gaming (11.5 - 44.3, n=111, last 2 years) | |
| LibreOffice - 20 Documents To PDF | |
| Acer Predator Helios 18 N23Q2 | |
| Average of class Gaming (19 - 88.8, n=111, last 2 years) | |
| Alienware m18 R1 | |
| MSI Titan 18 HX A14VIG (6.3.4.2) | |
| Asus ROG Strix Scar 18 G834JYR (2024) (6.3.4.2) | |
| Razer Blade 18 RTX 4070 | |
| Average Intel Core i9-14900HX (19 - 85.1, n=37) | |
| Alienware m18 R1 AMD (6.3.4.2) | |
| Asus ROG Strix Scar 18 G834JYR (2024) (6.3.4.2, Turbo) | |
| Asus ROG Strix Scar 18 2023 G834JY-N6005W | |
| R Benchmark 2.5 - Overall mean | |
| Average of class Gaming (0.3439 - 0.759, n=112, last 2 years) | |
| Alienware m18 R1 AMD | |
| Acer Predator Helios 18 N23Q2 | |
| Razer Blade 18 RTX 4070 | |
| Asus ROG Strix Scar 18 G834JYR (2024) | |
| Alienware m18 R1 | |
| MSI Titan 18 HX A14VIG | |
| Average Intel Core i9-14900HX (0.3604 - 0.4859, n=37) | |
| Asus ROG Strix Scar 18 2023 G834JY-N6005W | |
| Asus ROG Strix Scar 18 G834JYR (2024) (Turbo) | |
* ... smaller is better
AIDA64: FP32 Ray-Trace | FPU Julia | CPU SHA3 | CPU Queen | FPU SinJulia | FPU Mandel | CPU AES | CPU ZLib | FP64 Ray-Trace | CPU PhotoWorxx
| Performance rating | |
| Alienware m18 R1 AMD | |
| Acer Predator Helios 18 N23Q2 | |
| Alienware m18 R1 | |
| MSI Titan 18 HX A14VIG | |
| Asus ROG Strix Scar 18 2023 G834JY-N6005W | |
| Asus ROG Strix Scar 18 G834JYR (2024) | |
| Razer Blade 18 RTX 4070 | |
| Asus ROG Strix Scar 18 G834JYR (2024) | |
| Average Intel Core i9-14900HX | |
| Average of class Gaming | |
| AIDA64 / FP32 Ray-Trace | |
| Alienware m18 R1 AMD (v6.85.6300) | |
| Average of class Gaming (10227 - 85542, n=110, last 2 years) | |
| Alienware m18 R1 (v6.85.6300) | |
| MSI Titan 18 HX A14VIG (v6.92.6600) | |
| Asus ROG Strix Scar 18 2023 G834JY-N6005W (v6.85.6300) | |
| Acer Predator Helios 18 N23Q2 (v6.85.6300) | |
| Asus ROG Strix Scar 18 G834JYR (2024) (v6.92.6600, Turbo) | |
| Razer Blade 18 RTX 4070 (v6.85.6300) | |
| Asus ROG Strix Scar 18 G834JYR (2024) (v6.92.6600) | |
| Average Intel Core i9-14900HX (13098 - 33474, n=36) | |
| AIDA64 / FPU Julia | |
| Alienware m18 R1 AMD (v6.85.6300) | |
| MSI Titan 18 HX A14VIG (v6.92.6600) | |
| Alienware m18 R1 (v6.85.6300) | |
| Asus ROG Strix Scar 18 2023 G834JY-N6005W (v6.85.6300) | |
| Asus ROG Strix Scar 18 G834JYR (2024) (v6.92.6600, Turbo) | |
| Acer Predator Helios 18 N23Q2 (v6.85.6300) | |
| Average of class Gaming (51376 - 238426, n=110, last 2 years) | |
| Razer Blade 18 RTX 4070 (v6.85.6300) | |
| Asus ROG Strix Scar 18 G834JYR (2024) (v6.92.6600) | |
| Average Intel Core i9-14900HX (67573 - 166040, n=36) | |
| AIDA64 / CPU SHA3 | |
| Alienware m18 R1 AMD (v6.85.6300) | |
| MSI Titan 18 HX A14VIG (v6.92.6600) | |
| Alienware m18 R1 (v6.85.6300) | |
| Asus ROG Strix Scar 18 2023 G834JY-N6005W (v6.85.6300) | |
| Acer Predator Helios 18 N23Q2 (v6.85.6300) | |
| Asus ROG Strix Scar 18 G834JYR (2024) (v6.92.6600, Turbo) | |
| Razer Blade 18 RTX 4070 (v6.85.6300) | |
| Asus ROG Strix Scar 18 G834JYR (2024) (v6.92.6600) | |
| Average Intel Core i9-14900HX (3589 - 7979, n=36) | |
| Average of class Gaming (2180 - 9817, n=110, last 2 years) | |
| AIDA64 / CPU Queen | |
| Alienware m18 R1 AMD (v6.85.6300) | |
| MSI Titan 18 HX A14VIG (v6.92.6600) | |
| Alienware m18 R1 (v6.85.6300) | |
| Asus ROG Strix Scar 18 G834JYR (2024) (v6.92.6600) | |
| Asus ROG Strix Scar 18 G834JYR (2024) (v6.92.6600, Turbo) | |
| Asus ROG Strix Scar 18 2023 G834JY-N6005W (v6.85.6300) | |
| Average Intel Core i9-14900HX (118405 - 148966, n=36) | |
| Razer Blade 18 RTX 4070 (v6.85.6300) | |
| Acer Predator Helios 18 N23Q2 (v6.85.6300) | |
| Average of class Gaming (49785 - 173351, n=101, last 2 years) | |
| AIDA64 / FPU SinJulia | |
| Alienware m18 R1 AMD (v6.85.6300) | |
| MSI Titan 18 HX A14VIG (v6.92.6600) | |
| Asus ROG Strix Scar 18 2023 G834JY-N6005W (v6.85.6300) | |
| Alienware m18 R1 (v6.85.6300) | |
| Asus ROG Strix Scar 18 G834JYR (2024) (v6.92.6600, Turbo) | |
| Asus ROG Strix Scar 18 G834JYR (2024) (v6.92.6600) | |
| Razer Blade 18 RTX 4070 (v6.85.6300) | |
| Acer Predator Helios 18 N23Q2 (v6.85.6300) | |
| Average Intel Core i9-14900HX (10475 - 18517, n=36) | |
| Average of class Gaming (4424 - 33636, n=110, last 2 years) | |
| AIDA64 / FPU Mandel | |
| Alienware m18 R1 AMD (v6.85.6300) | |
| Alienware m18 R1 (v6.85.6300) | |
| MSI Titan 18 HX A14VIG (v6.92.6600) | |
| Asus ROG Strix Scar 18 2023 G834JY-N6005W (v6.85.6300) | |
| Average of class Gaming (25115 - 128721, n=110, last 2 years) | |
| Acer Predator Helios 18 N23Q2 (v6.85.6300) | |
| Asus ROG Strix Scar 18 G834JYR (2024) (v6.92.6600, Turbo) | |
| Razer Blade 18 RTX 4070 (v6.85.6300) | |
| Asus ROG Strix Scar 18 G834JYR (2024) (v6.92.6600) | |
| Average Intel Core i9-14900HX (32543 - 83662, n=36) | |
| AIDA64 / CPU AES | |
| Acer Predator Helios 18 N23Q2 (v6.85.6300) | |
| Alienware m18 R1 AMD (v6.85.6300) | |
| Average Intel Core i9-14900HX (86964 - 241777, n=36) | |
| MSI Titan 18 HX A14VIG (v6.92.6600) | |
| Alienware m18 R1 (v6.85.6300) | |
| Asus ROG Strix Scar 18 2023 G834JY-N6005W (v6.85.6300) | |
| Asus ROG Strix Scar 18 G834JYR (2024) (v6.92.6600, Turbo) | |
| Asus ROG Strix Scar 18 G834JYR (2024) (v6.92.6600) | |
| Razer Blade 18 RTX 4070 (v6.85.6300) | |
| Average of class Gaming (39258 - 247074, n=110, last 2 years) | |
| AIDA64 / CPU ZLib | |
| Alienware m18 R1 AMD (v6.85.6300) | |
| MSI Titan 18 HX A14VIG (v6.92.6600) | |
| Asus ROG Strix Scar 18 2023 G834JY-N6005W (v6.85.6300) | |
| Alienware m18 R1 (v6.85.6300) | |
| Acer Predator Helios 18 N23Q2 (v6.85.6300) | |
| Asus ROG Strix Scar 18 G834JYR (2024) (v6.92.6600, Turbo) | |
| Razer Blade 18 RTX 4070 (v6.85.6300) | |
| Average Intel Core i9-14900HX (1054 - 2292, n=36) | |
| Asus ROG Strix Scar 18 G834JYR (2024) | |
| Average of class Gaming (574 - 2531, n=110, last 2 years) | |
| AIDA64 / FP64 Ray-Trace | |
| Alienware m18 R1 AMD (v6.85.6300) | |
| Average of class Gaming (5509 - 45446, n=110, last 2 years) | |
| Alienware m18 R1 (v6.85.6300) | |
| MSI Titan 18 HX A14VIG (v6.92.6600) | |
| Asus ROG Strix Scar 18 2023 G834JY-N6005W (v6.85.6300) | |
| Acer Predator Helios 18 N23Q2 (v6.85.6300) | |
| Asus ROG Strix Scar 18 G834JYR (2024) (v6.92.6600, Turbo) | |
| Razer Blade 18 RTX 4070 (v6.85.6300) | |
| Asus ROG Strix Scar 18 G834JYR (2024) (v6.92.6600) | |
| Average Intel Core i9-14900HX (6809 - 18349, n=36) | |
| AIDA64 / CPU PhotoWorxx | |
| Alienware m18 R1 (v6.85.6300) | |
| Acer Predator Helios 18 N23Q2 (v6.85.6300) | |
| Asus ROG Strix Scar 18 G834JYR (2024) (v6.92.6600) | |
| Asus ROG Strix Scar 18 G834JYR (2024) (v6.92.6600, Turbo) | |
| Razer Blade 18 RTX 4070 (v6.85.6300) | |
| Average Intel Core i9-14900HX (23903 - 54702, n=36) | |
| Average of class Gaming (12271 - 89891, n=110, last 2 years) | |
| Asus ROG Strix Scar 18 2023 G834JY-N6005W (v6.85.6300) | |
| Alienware m18 R1 AMD (v6.85.6300) | |
| MSI Titan 18 HX A14VIG (v6.92.6600) | |
System Performance
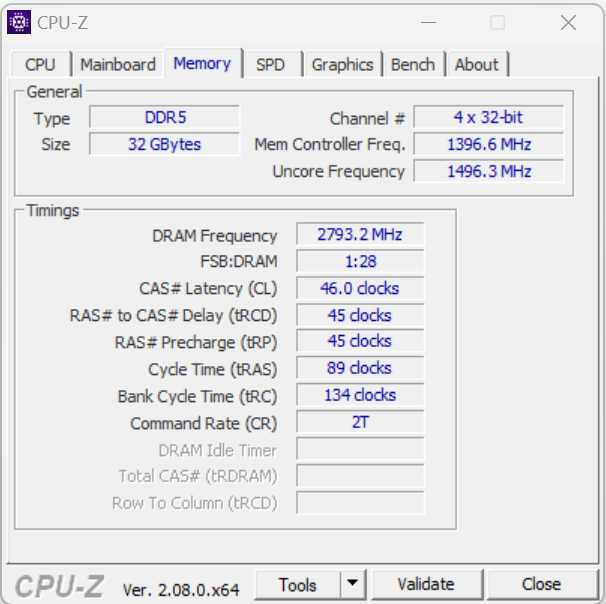
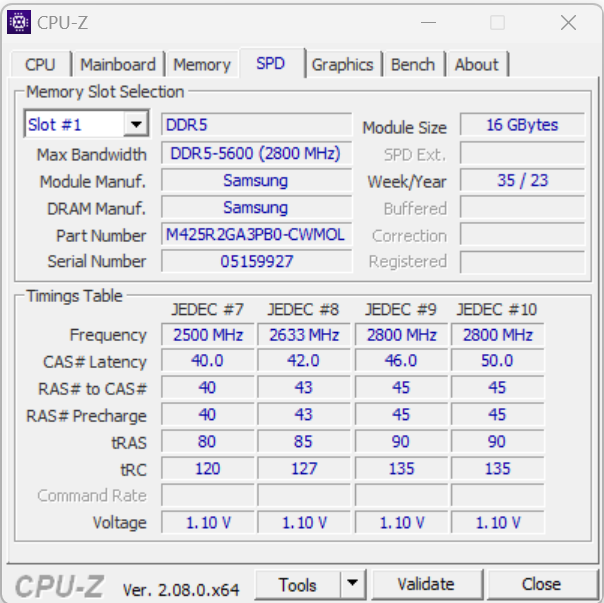
The smoothly running system doesn't show any lack in computing performance, and the laptop handles gaming, rendering, and other tasks flawlessly. The transfer rates of the working memory range at a normal level for DDR5-5600 RAM.

CrossMark: Overall | Productivity | Creativity | Responsiveness
WebXPRT 3: Overall
WebXPRT 4: Overall
Mozilla Kraken 1.1: Total
| PCMark 10 / Score | |
| Alienware m18 R1 AMD | |
| MSI Titan 18 HX A14VIG | |
| Asus ROG Strix Scar 18 G834JYR (2024) | |
| Asus ROG Strix Scar 18 2023 G834JY-N6005W | |
| Alienware m18 R1 | |
| Average Intel Core i9-14900HX, NVIDIA GeForce RTX 4090 Laptop GPU (8230 - 9234, n=13) | |
| Acer Predator Helios 18 N23Q2 | |
| Average of class Gaming (5828 - 11574, n=96, last 2 years) | |
| Razer Blade 18 RTX 4070 | |
| PCMark 10 / Essentials | |
| Alienware m18 R1 AMD | |
| Razer Blade 18 RTX 4070 | |
| MSI Titan 18 HX A14VIG | |
| Asus ROG Strix Scar 18 G834JYR (2024) | |
| Alienware m18 R1 | |
| Average Intel Core i9-14900HX, NVIDIA GeForce RTX 4090 Laptop GPU (10778 - 11628, n=13) | |
| Acer Predator Helios 18 N23Q2 | |
| Average of class Gaming (8810 - 12600, n=100, last 2 years) | |
| PCMark 10 / Productivity | |
| Alienware m18 R1 AMD | |
| Average of class Gaming (6845 - 18766, n=98, last 2 years) | |
| Average Intel Core i9-14900HX, NVIDIA GeForce RTX 4090 Laptop GPU (9458 - 11759, n=13) | |
| Asus ROG Strix Scar 18 G834JYR (2024) | |
| Acer Predator Helios 18 N23Q2 | |
| MSI Titan 18 HX A14VIG | |
| Alienware m18 R1 | |
| Razer Blade 18 RTX 4070 | |
| PCMark 10 / Digital Content Creation | |
| Alienware m18 R1 AMD | |
| MSI Titan 18 HX A14VIG | |
| Alienware m18 R1 | |
| Asus ROG Strix Scar 18 G834JYR (2024) | |
| Average Intel Core i9-14900HX, NVIDIA GeForce RTX 4090 Laptop GPU (13219 - 16462, n=13) | |
| Acer Predator Helios 18 N23Q2 | |
| Average of class Gaming (7602 - 19657, n=98, last 2 years) | |
| Razer Blade 18 RTX 4070 | |
| CrossMark / Overall | |
| Asus ROG Strix Scar 18 G834JYR (2024) | |
| Acer Predator Helios 18 N23Q2 | |
| Alienware m18 R1 | |
| Razer Blade 18 RTX 4070 | |
| Average Intel Core i9-14900HX, NVIDIA GeForce RTX 4090 Laptop GPU (1877 - 2344, n=10) | |
| Asus ROG Strix Scar 18 2023 G834JY-N6005W | |
| Average of class Gaming (1366 - 2409, n=98, last 2 years) | |
| Alienware m18 R1 AMD | |
| MSI Titan 18 HX A14VIG | |
| CrossMark / Productivity | |
| Acer Predator Helios 18 N23Q2 | |
| Asus ROG Strix Scar 18 G834JYR (2024) | |
| Alienware m18 R1 | |
| Razer Blade 18 RTX 4070 | |
| Average Intel Core i9-14900HX, NVIDIA GeForce RTX 4090 Laptop GPU (1738 - 2162, n=10) | |
| Asus ROG Strix Scar 18 2023 G834JY-N6005W | |
| Average of class Gaming (1386 - 2254, n=98, last 2 years) | |
| Alienware m18 R1 AMD | |
| MSI Titan 18 HX A14VIG | |
| CrossMark / Creativity | |
| Asus ROG Strix Scar 18 G834JYR (2024) | |
| Alienware m18 R1 | |
| Asus ROG Strix Scar 18 2023 G834JY-N6005W | |
| Acer Predator Helios 18 N23Q2 | |
| Razer Blade 18 RTX 4070 | |
| Average Intel Core i9-14900HX, NVIDIA GeForce RTX 4090 Laptop GPU (2195 - 2660, n=10) | |
| Average of class Gaming (1343 - 2729, n=98, last 2 years) | |
| Alienware m18 R1 AMD | |
| MSI Titan 18 HX A14VIG | |
| CrossMark / Responsiveness | |
| Acer Predator Helios 18 N23Q2 | |
| Asus ROG Strix Scar 18 G834JYR (2024) | |
| Alienware m18 R1 | |
| Razer Blade 18 RTX 4070 | |
| Average Intel Core i9-14900HX, NVIDIA GeForce RTX 4090 Laptop GPU (1478 - 2327, n=10) | |
| Average of class Gaming (1226 - 2334, n=98, last 2 years) | |
| Asus ROG Strix Scar 18 2023 G834JY-N6005W | |
| Alienware m18 R1 AMD | |
| MSI Titan 18 HX A14VIG | |
| WebXPRT 3 / Overall | |
| Alienware m18 R1 AMD | |
| Razer Blade 18 RTX 4070 | |
| Alienware m18 R1 | |
| Asus ROG Strix Scar 18 2023 G834JY-N6005W | |
| MSI Titan 18 HX A14VIG | |
| Average Intel Core i9-14900HX, NVIDIA GeForce RTX 4090 Laptop GPU (279 - 339, n=10) | |
| Asus ROG Strix Scar 18 G834JYR (2024) | |
| Acer Predator Helios 18 N23Q2 | |
| Average of class Gaming (242 - 532, n=101, last 2 years) | |
| WebXPRT 4 / Overall | |
| Asus ROG Strix Scar 18 2023 G834JY-N6005W | |
| Alienware m18 R1 | |
| Asus ROG Strix Scar 18 G834JYR (2024) | |
| Razer Blade 18 RTX 4070 | |
| Alienware m18 R1 AMD | |
| Average Intel Core i9-14900HX, NVIDIA GeForce RTX 4090 Laptop GPU (246 - 309, n=8) | |
| MSI Titan 18 HX A14VIG | |
| Average of class Gaming (176.4 - 354, n=101, last 2 years) | |
| Mozilla Kraken 1.1 / Total | |
| Average of class Gaming (391 - 590, n=106, last 2 years) | |
| Razer Blade 18 RTX 4070 | |
| Alienware m18 R1 AMD | |
| Alienware m18 R1 | |
| Acer Predator Helios 18 N23Q2 | |
| Average Intel Core i9-14900HX, NVIDIA GeForce RTX 4090 Laptop GPU (428 - 535, n=11) | |
| MSI Titan 18 HX A14VIG | |
| Asus ROG Strix Scar 18 G834JYR (2024) | |
| Asus ROG Strix Scar 18 2023 G834JY-N6005W | |
* ... smaller is better
| PCMark 10 Score | 8801 points | |
Help | ||
| AIDA64 / Memory Copy | |
| Asus ROG Strix Scar 18 G834JYR (2024) | |
| Alienware m18 R1 | |
| Acer Predator Helios 18 N23Q2 | |
| Razer Blade 18 RTX 4070 | |
| Average Intel Core i9-14900HX (38028 - 83392, n=36) | |
| Average of class Gaming (21750 - 129946, n=110, last 2 years) | |
| Asus ROG Strix Scar 18 2023 G834JY-N6005W | |
| MSI Titan 18 HX A14VIG | |
| Alienware m18 R1 AMD | |
| AIDA64 / Memory Read | |
| Alienware m18 R1 | |
| Asus ROG Strix Scar 18 G834JYR (2024) | |
| Acer Predator Helios 18 N23Q2 | |
| Razer Blade 18 RTX 4070 | |
| Average Intel Core i9-14900HX (43306 - 87568, n=36) | |
| Asus ROG Strix Scar 18 2023 G834JY-N6005W | |
| Average of class Gaming (22956 - 118858, n=110, last 2 years) | |
| Alienware m18 R1 AMD | |
| MSI Titan 18 HX A14VIG | |
| AIDA64 / Memory Write | |
| Alienware m18 R1 | |
| Asus ROG Strix Scar 18 G834JYR (2024) | |
| Average of class Gaming (22297 - 135096, n=110, last 2 years) | |
| Razer Blade 18 RTX 4070 | |
| Acer Predator Helios 18 N23Q2 | |
| Average Intel Core i9-14900HX (37146 - 80589, n=36) | |
| Asus ROG Strix Scar 18 2023 G834JY-N6005W | |
| Alienware m18 R1 AMD | |
| MSI Titan 18 HX A14VIG | |
| AIDA64 / Memory Latency | |
| Average of class Gaming (75.3 - 259, n=110, last 2 years) | |
| MSI Titan 18 HX A14VIG | |
| Alienware m18 R1 AMD | |
| Asus ROG Strix Scar 18 2023 G834JY-N6005W | |
| Average Intel Core i9-14900HX (76.1 - 105, n=36) | |
| Razer Blade 18 RTX 4070 | |
| Acer Predator Helios 18 N23Q2 | |
| Asus ROG Strix Scar 18 G834JYR (2024) | |
| Alienware m18 R1 | |
* ... smaller is better
DPC Latencies
The standardized Latency Monitor test (with web surfing, 4k video reproduction, and Prime95 high load) reveals some conspicuous behavior, and the system doesn't appear to be suited for real-time video and audio processing. Future software updates could bring some improvements or might even make things worse.

| DPC Latencies / LatencyMon - interrupt to process latency (max), Web, Youtube, Prime95 | |
| Acer Predator Helios 18 N23Q2 | |
| Alienware m18 R1 | |
| MSI Titan 18 HX A14VIG | |
| Razer Blade 18 RTX 4070 | |
| Alienware m18 R1 AMD | |
| Asus ROG Strix Scar 18 G834JYR (2024) | |
| Asus ROG Strix Scar 18 2023 G834JY-N6005W | |
* ... smaller is better
Storage Solution
The Scar 18 can accept a total of two PCIe 4 SSDs in the M.2-2280 format, with RAID-0 also being supported. The 2-TB Samsung SSD of our test unit delivers excellent data rates. Another positive aspect is the lack of any thermally caused throttling.

* ... smaller is better
Disk Throttling: DiskSpd Read Loop, Queue Depth 8
Graphics Card
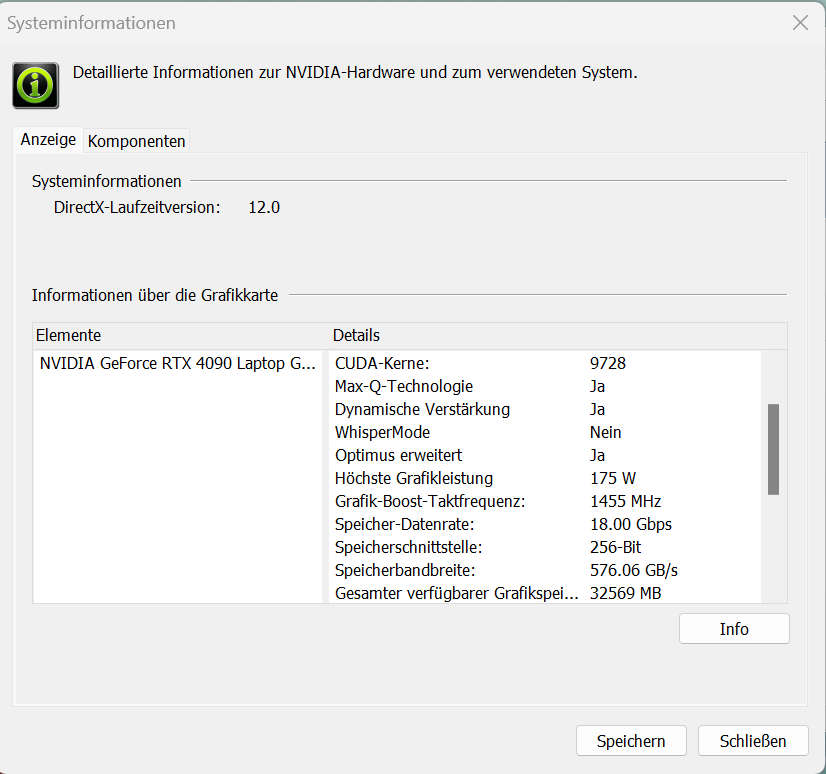
With the GeForce RTX 4090, Asus uses Nvidia's current top model among the mobile GPUs. It offers 9,728 shader units, a 256-bit storage bus, and can also use fast GDDR6 storage (16,384 MB). The RTX 4090 is granted a maximum TGP of 175 watts (150 W + 25 W Dynamic Boost) - more isn't possible.
In "Performance" mode, the benchmark results range below the average determined for the RTX 4090 until now, while "Turbo" results in values at the same level as the average. Advanced Optimus is supported, with switching between the dGPU and Optimus not requiring a reboot.


| 3DMark 11 Performance | 42985 points | |
| 3DMark Cloud Gate Standard Score | 65110 points | |
| 3DMark Fire Strike Score | 33620 points | |
| 3DMark Time Spy Score | 19507 points | |
Help | ||
| V-Ray Benchmark Next 4.10 | |
| GPU | |
| Asus ROG Strix Scar 18 2023 G834JY-N6005W (v4.10.07 ) | |
| Average NVIDIA GeForce RTX 4090 Laptop GPU (873 - 1334, n=30) | |
| Asus ROG Strix Scar 18 G834JYR (2024) (v4.10.07 ) | |
| Acer Predator Helios 18 N23Q2 (v4.10.07 ) | |
| Average of class Gaming (427 - 1333, n=106, last 2 years) | |
| CPU | |
| Asus ROG Strix Scar 18 2023 G834JY-N6005W (v4.10.07 ) | |
| Acer Predator Helios 18 N23Q2 (v4.10.07 ) | |
| Average NVIDIA GeForce RTX 4090 Laptop GPU (18206 - 37629, n=30) | |
| Asus ROG Strix Scar 18 G834JYR (2024) (v4.10.07 ) | |
| Average of class Gaming (10048 - 45327, n=105, last 2 years) | |
* ... smaller is better
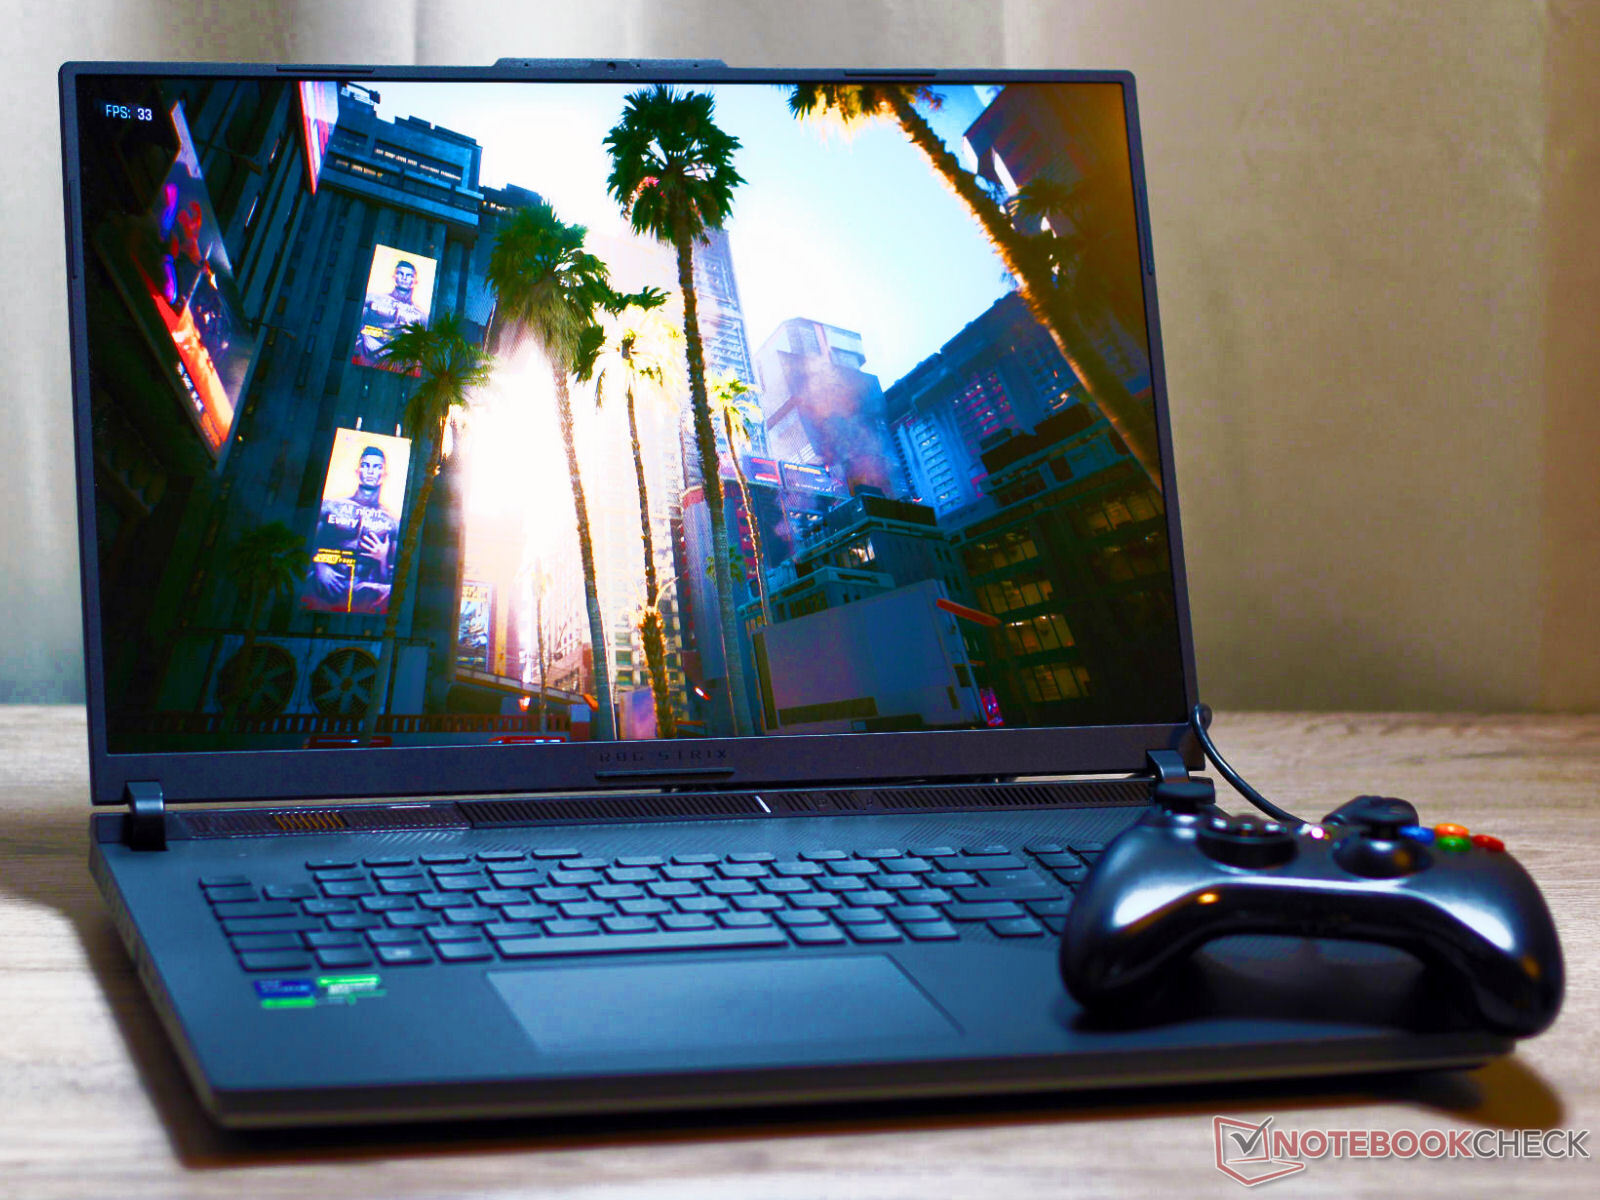
Gaming Performance
The Scar 18 allows QHD+ gaming at maximum settings. Higher resolutions can be used if you connect the corresponding monitor. Games with support for DLSS 3 and Frame Generation allow maximum settings and additional raytracing effects in 4k resolution.
In "Performance" mode, the frame rates of our tested games range below the RTX 4090 average that has been determined so far. Selecting "Turbo" can result in a slight increase, and the same goes for the "Ultimate" GPU mode.
| The Witcher 3 - 1920x1080 Ultra Graphics & Postprocessing (HBAO+) | |
| Alienware m18 R1 | |
| MSI Titan 18 HX A14VIG | |
| Average NVIDIA GeForce RTX 4090 Laptop GPU (139.2 - 216, n=35) | |
| Asus ROG Strix Scar 18 G834JYR (2024) | |
| Acer Predator Helios 18 N23Q2 | |
| Average of class Gaming (95 - 240, n=8, last 2 years) | |
| Alienware m18 R1 AMD | |
| Razer Blade 18 RTX 4070 | |
| Call of Duty Modern Warfare 3 2023 | |
| 1920x1080 Extreme Preset | |
| Average NVIDIA GeForce RTX 4090 Laptop GPU (148 - 205, n=7) | |
| Asus ROG Strix Scar 18 G834JYR (2024) | |
| Average of class Gaming (27 - 95, n=3, last 2 years) | |
| 2560x1440 Extreme Preset | |
| Asus ROG Strix Scar 18 G834JYR (2024) | |
| Average NVIDIA GeForce RTX 4090 Laptop GPU (113 - 162, n=7) | |
| Average of class Gaming (54 - 66, n=2, last 2 years) | |
| The Finals | |
| 1920x1080 Epic Preset | |
| Asus ROG Strix Scar 18 G834JYR (2024) | |
| Average NVIDIA GeForce RTX 4090 Laptop GPU (174.1 - 211, n=2) | |
| Average of class Gaming (n=1last 2 years) | |
| 2560x1440 Epic Preset | |
| Asus ROG Strix Scar 18 G834JYR (2024) | |
| Average NVIDIA GeForce RTX 4090 Laptop GPU (137.2 - 147.4, n=2) | |
| Average of class Gaming (n=1last 2 years) | |
| 1920x1080 Epic Preset + Epic RTX Global Illumination | |
| Asus ROG Strix Scar 18 G834JYR (2024) | |
| Average NVIDIA GeForce RTX 4090 Laptop GPU (159.8 - 190.8, n=2) | |
| Palworld | |
| 1920x1080 Epic Preset AA:TSR | |
| Asus ROG Strix Scar 18 G834JYR (2024) | |
| Average NVIDIA GeForce RTX 4090 Laptop GPU (138.8 - 150.9, n=2) | |
| Average of class Gaming (n=1last 2 years) | |
| 2560x1440 Epic Preset AA:TSR | |
| Asus ROG Strix Scar 18 G834JYR (2024) | |
| Average NVIDIA GeForce RTX 4090 Laptop GPU (110.5 - 119.8, n=2) | |
| Enshrouded | |
| 1920x1080 Max. Quality AA:FX | |
| Average NVIDIA GeForce RTX 4090 Laptop GPU (79 - 101.5, n=3) | |
| Asus ROG Strix Scar 18 G834JYR (2024) | |
| Average of class Gaming (n=1last 2 years) | |
| 2560x1440 Max. Quality AA:FX | |
| Asus ROG Strix Scar 18 G834JYR (2024) | |
| Average NVIDIA GeForce RTX 4090 Laptop GPU (61.8 - 76, n=3) | |
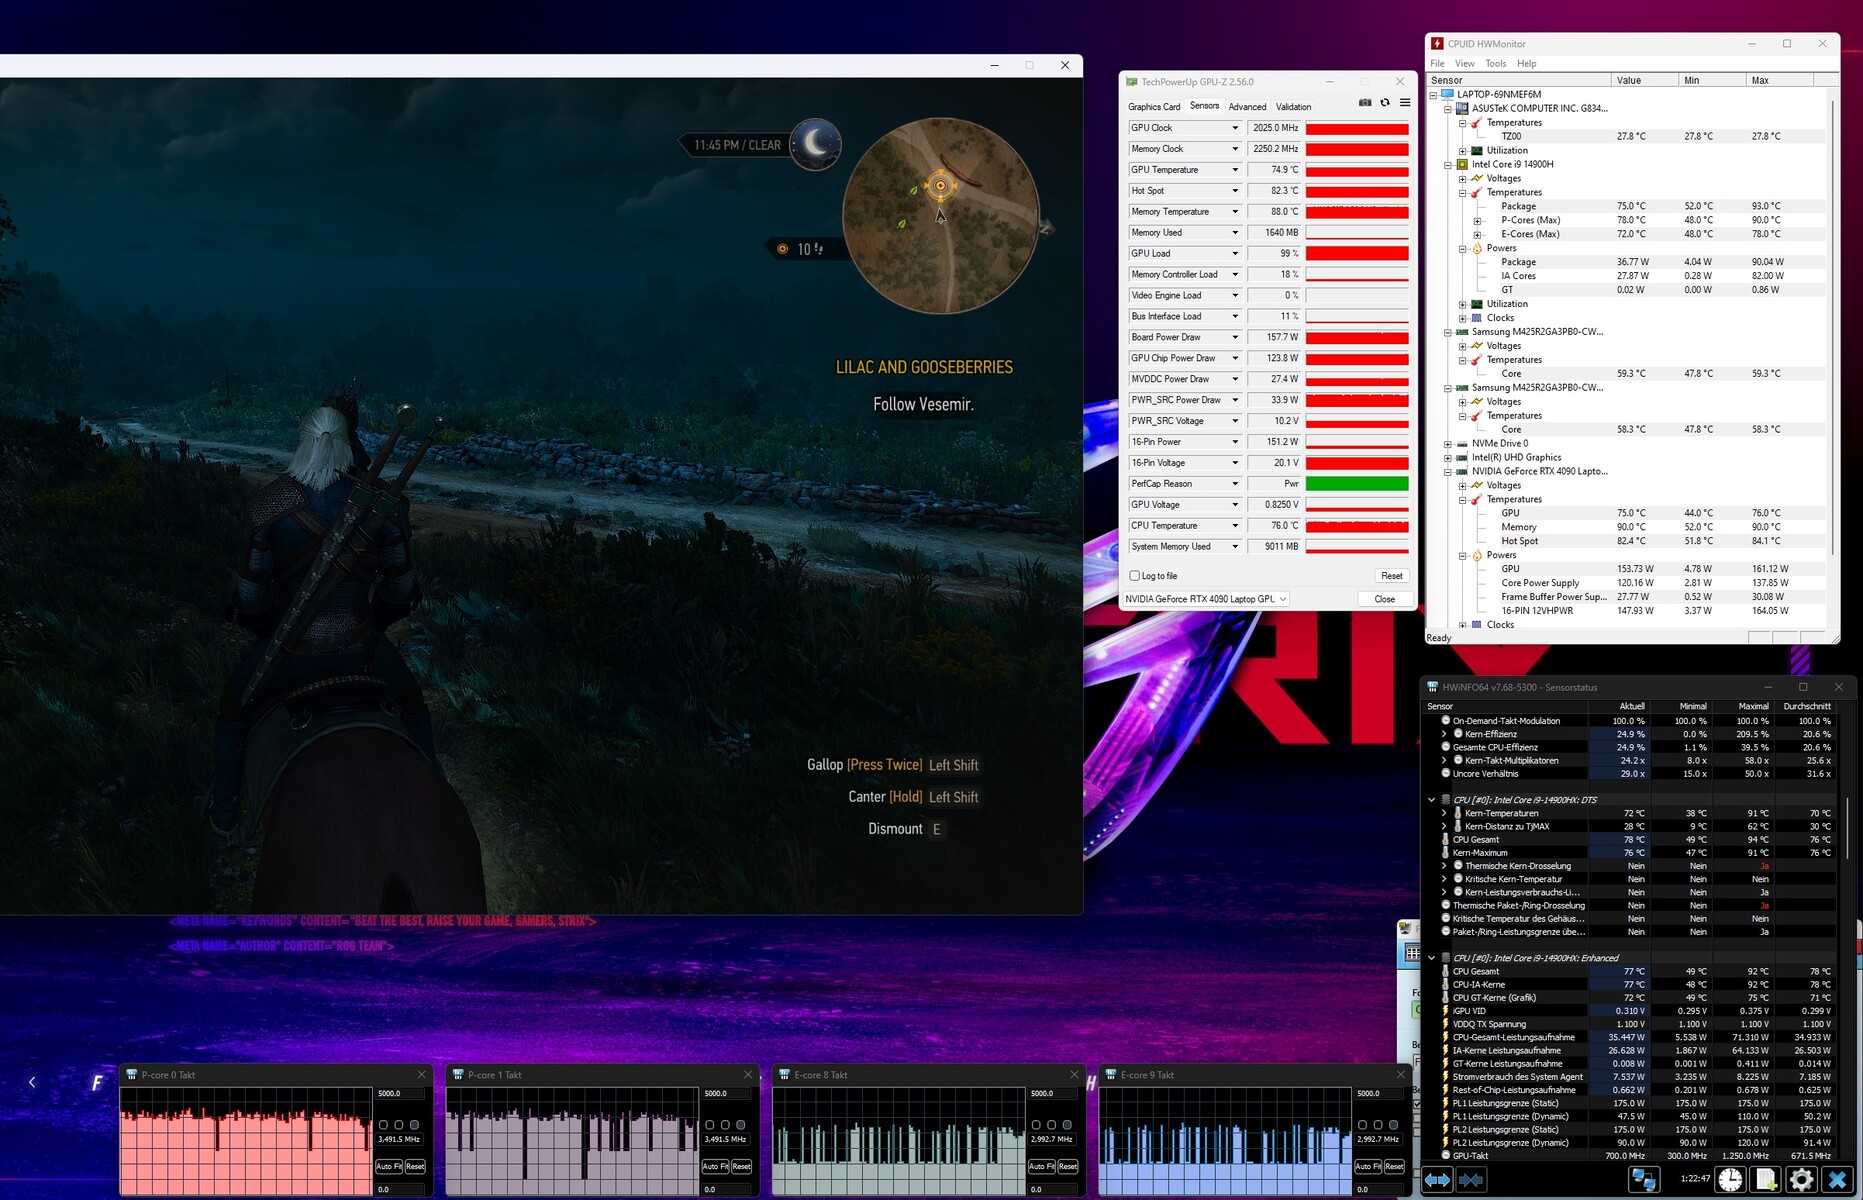
To evaluate whether the frame rates remain fairly constant over a longer time period, we run the game "The Witcher 3" for about 60 minutes in Full-HD resolution at maximum quality settings. The gaming character is not moved. We do not observe any drop in the frame rates.
The Witcher 3 FPS Chart

| low | med. | high | ultra | QHD | |
|---|---|---|---|---|---|
| GTA V (2015) | 187.5 | 187.1 | 181.2 | 136 | 129.6 |
| The Witcher 3 (2015) | 579.6 | 501.7 | 342.8 | 189.4 | 151.5 |
| Dota 2 Reborn (2015) | 219 | 194.5 | 173.9 | 161.3 | |
| Final Fantasy XV Benchmark (2018) | 221 | 198.1 | 166.1 | 143.6 | |
| X-Plane 11.11 (2018) | 197.9 | 172.4 | 136.8 | ||
| Far Cry 5 (2018) | 176 | 163 | 156 | 145 | 145 |
| Strange Brigade (2018) | 429 | 350 | 341 | 331 | 279 |
| Starfield (2023) | 112.7 | 100 | 84.2 | 78.4 | 66 |
| Cyberpunk 2077 (2023) | 134.8 | 121.5 | 117.7 | 112.1 | 83.8 |
| Call of Duty Modern Warfare 3 2023 (2023) | 229 | 210 | 169 | 162 | 162 |
| The Finals (2023) | 228 | 216 | 214 | 211 | 147.4 |
| Palworld (2024) | 211 | 180.9 | 151.3 | 150.9 | 119.8 |
| Enshrouded (2024) | 135.2 | 120.1 | 100.8 | 87.6 | 68.9 |
Emissions - The G834JYR can run quietly
Noise Emissions
Under full load, the noise level increases up to 52 dB(A) in "Performance" mode. With "Turbo," the value increases even slightly higher - as a comparison with the Scar 18 from 2023 shows. Its operation can also be quieter in general: if you forgo performance by selecting the "Silent" mode, the noise level decreases to 35 dB(A). During idle or in everyday operation (Office, Internet), often only one of the two fans is running and occasionally both remain silent, particularly when using the "Silent" profile.
Noise level
| Idle |
| 27 / 28 / 32 dB(A) |
| Load |
| 50 / 52 dB(A) |
 | ||
30 dB silent 40 dB(A) audible 50 dB(A) loud |
||
min: | ||
| Asus ROG Strix Scar 18 G834JYR (2024) i9-14900HX, GeForce RTX 4090 Laptop GPU | Alienware m18 R1 AMD R9 7945HX, Radeon RX 7900M | Alienware m18 R1 i9-13980HX, GeForce RTX 4090 Laptop GPU | Acer Predator Helios 18 N23Q2 i9-13900HX, GeForce RTX 4080 Laptop GPU | Razer Blade 18 RTX 4070 i9-13950HX, GeForce RTX 4070 Laptop GPU | MSI Titan 18 HX A14VIG i9-14900HX, GeForce RTX 4090 Laptop GPU | Asus ROG Strix Scar 18 2023 G834JY-N6005W i9-13980HX, GeForce RTX 4090 Laptop GPU | |
|---|---|---|---|---|---|---|---|
| Noise | 8% | 12% | 6% | 10% | 5% | 2% | |
| off / environment * (dB) | 24 | 22.4 7% | 22.8 5% | 23 4% | 23.5 2% | 22.8 5% | 23.9 -0% |
| Idle Minimum * (dB) | 27 | 23 15% | 23 15% | 23 15% | 23.8 12% | 23.8 12% | 23.9 11% |
| Idle Average * (dB) | 28 | 23.4 16% | 23 18% | 23 18% | 23.8 15% | 23.8 15% | 32.6 -16% |
| Idle Maximum * (dB) | 32 | 33.5 -5% | 23 28% | 23 28% | 26.8 16% | 28 12% | 32.6 -2% |
| Load Average * (dB) | 50 | 33.5 33% | 35.6 29% | 45.26 9% | 37.3 25% | 38 24% | 35.9 28% |
| Witcher 3 ultra * (dB) | 50 | 53.6 -7% | 51.3 -3% | 59.82 -20% | 48 4% | 57.3 -15% | |
| Load Maximum * (dB) | 52 | 53.6 -3% | 56.7 -9% | 59.94 -15% | 53.5 -3% | 62.8 -21% | 55.8 -7% |
* ... smaller is better
Temperatures
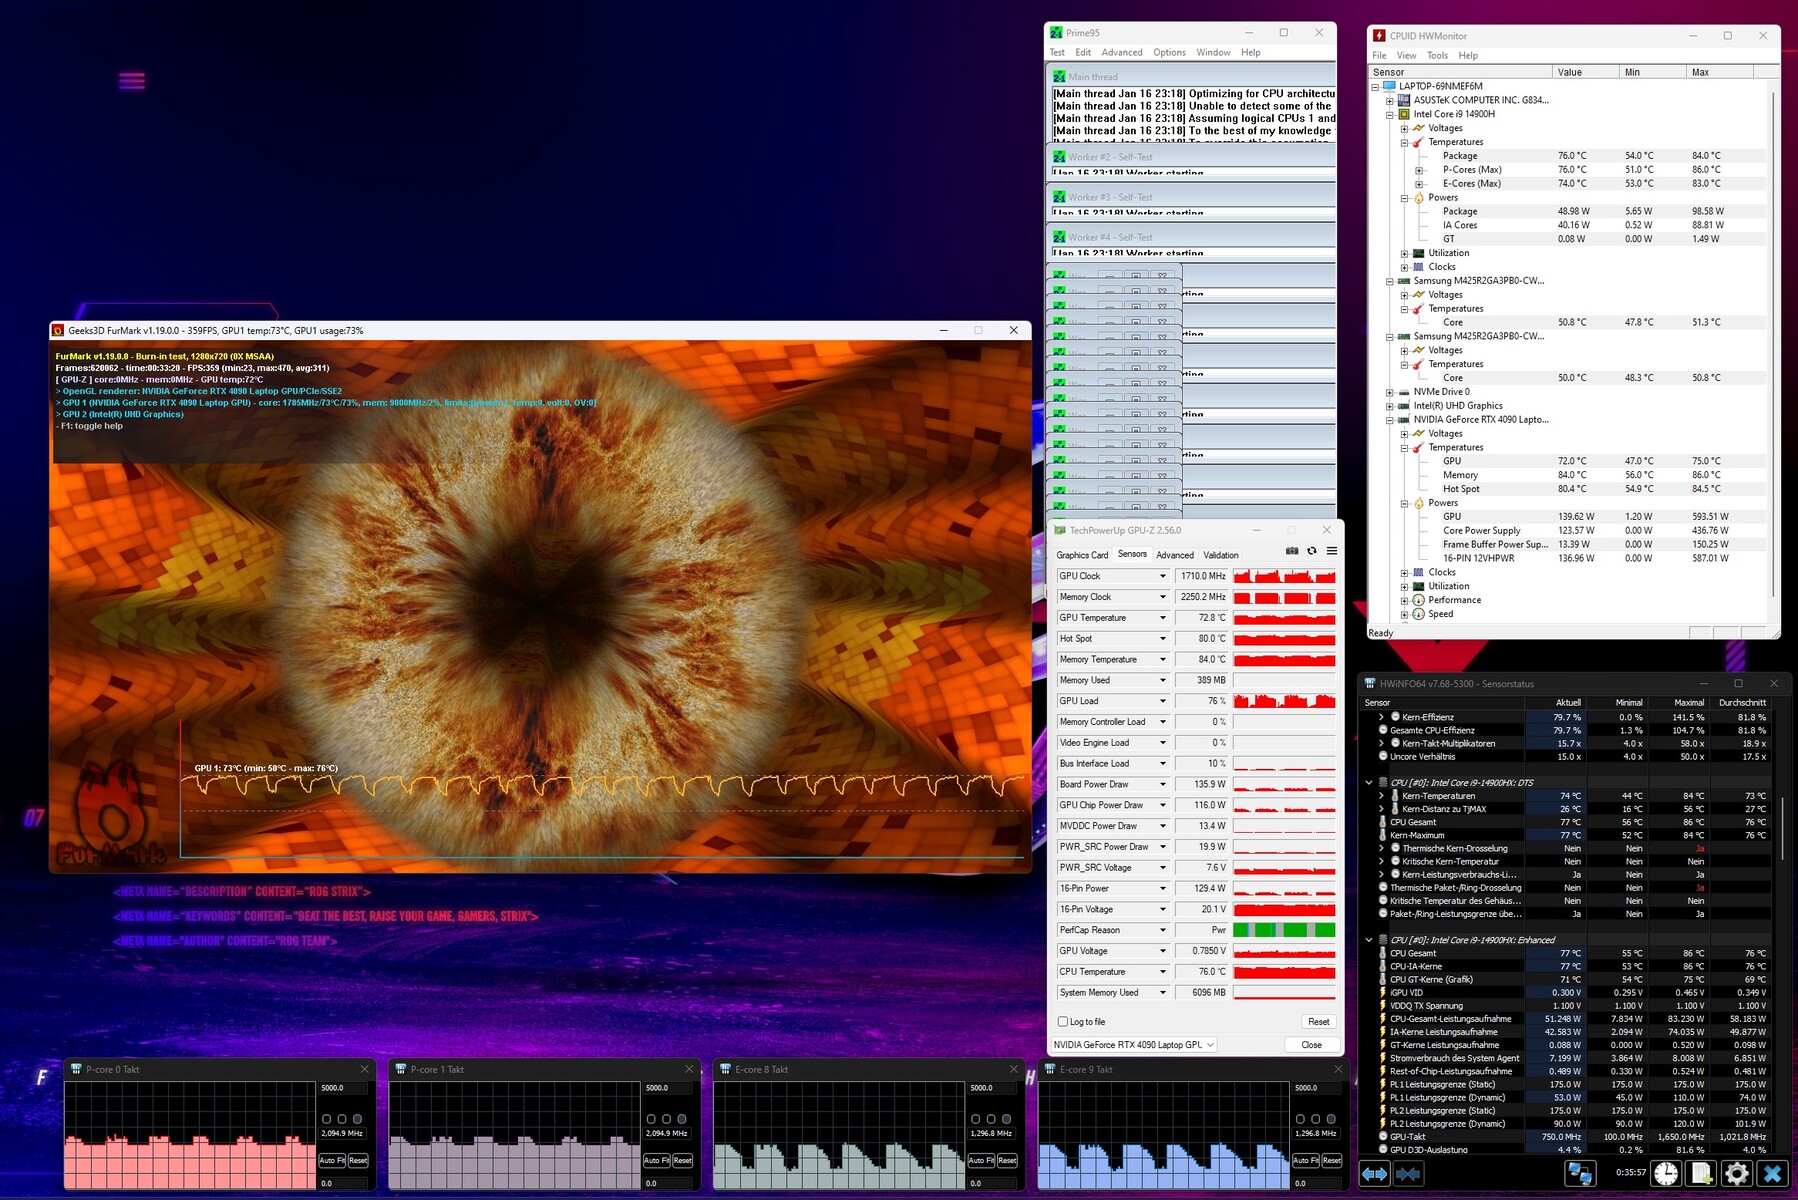
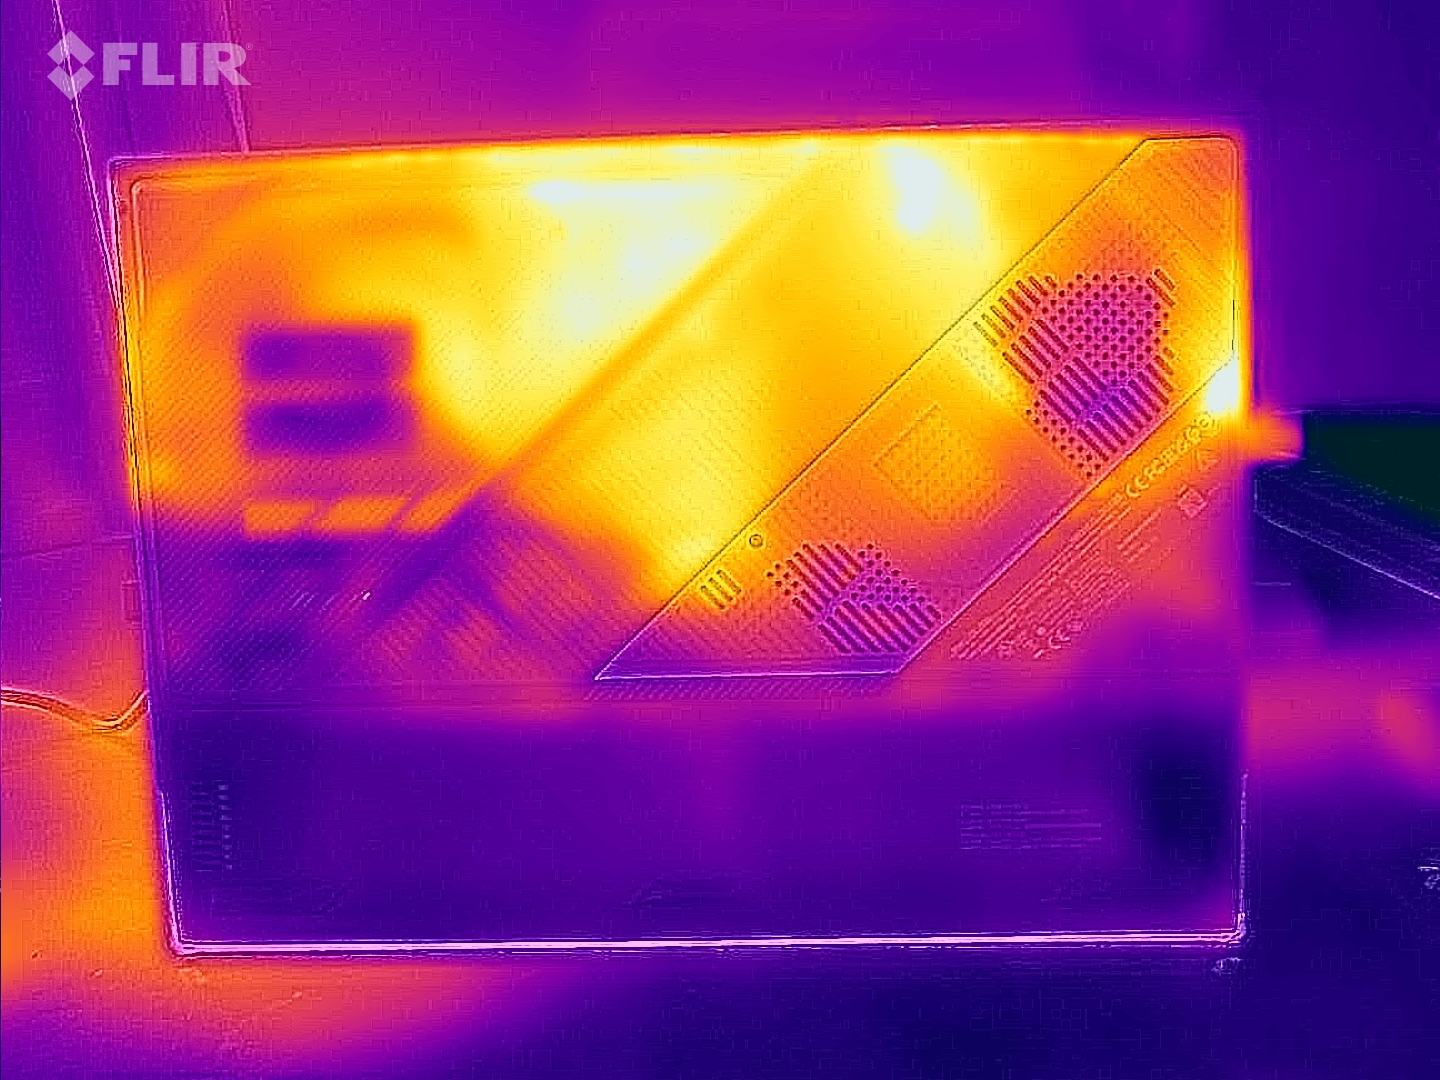
The stress test and Witcher 3 test result in a noticeable but not excessive warming of the laptop. At some spots, values above 50 ºC (122 ºF) are reached. However, during everyday operation (Office, Internet), the temperatures remain within the green range.
(-) The maximum temperature on the upper side is 49 °C / 120 F, compared to the average of 40.4 °C / 105 F, ranging from 21.2 to 68.8 °C for the class Gaming.
(-) The bottom heats up to a maximum of 47 °C / 117 F, compared to the average of 43.2 °C / 110 F
(+) In idle usage, the average temperature for the upper side is 27.3 °C / 81 F, compared to the device average of 33.9 °C / 93 F.
(-) Playing The Witcher 3, the average temperature for the upper side is 39.1 °C / 102 F, compared to the device average of 33.9 °C / 93 F.
(+) The palmrests and touchpad are reaching skin temperature as a maximum (35 °C / 95 F) and are therefore not hot.
(-) The average temperature of the palmrest area of similar devices was 28.8 °C / 83.8 F (-6.2 °C / -11.2 F).
| Asus ROG Strix Scar 18 G834JYR (2024) Intel Core i9-14900HX, NVIDIA GeForce RTX 4090 Laptop GPU | Alienware m18 R1 AMD AMD Ryzen 9 7945HX, AMD Radeon RX 7900M | Alienware m18 R1 Intel Core i9-13980HX, NVIDIA GeForce RTX 4090 Laptop GPU | Acer Predator Helios 18 N23Q2 Intel Core i9-13900HX, NVIDIA GeForce RTX 4080 Laptop GPU | Razer Blade 18 RTX 4070 Intel Core i9-13950HX, NVIDIA GeForce RTX 4070 Laptop GPU | MSI Titan 18 HX A14VIG Intel Core i9-14900HX, NVIDIA GeForce RTX 4090 Laptop GPU | Asus ROG Strix Scar 18 2023 G834JY-N6005W Intel Core i9-13980HX, NVIDIA GeForce RTX 4090 Laptop GPU | |
|---|---|---|---|---|---|---|---|
| Heat | 8% | 13% | -8% | 7% | 2% | -3% | |
| Maximum Upper Side * (°C) | 49 | 40.2 18% | 39 20% | 35 29% | 39.2 20% | 37.8 23% | 54 -10% |
| Maximum Bottom * (°C) | 47 | 37.4 20% | 36.4 23% | 56 -19% | 35.6 24% | 37.6 20% | 46 2% |
| Idle Upper Side * (°C) | 29 | 31.6 -9% | 29.2 -1% | 34 -17% | 31.8 -10% | 34.8 -20% | 30 -3% |
| Idle Bottom * (°C) | 31 | 30.6 1% | 27.8 10% | 39 -26% | 33.2 -7% | 36 -16% | 31 -0% |
* ... smaller is better
Stress Test
The stress test (with Prime95 and Furmark running constantly) represents an extreme scenario to evaluate the system stability under full load. The CPU reaches maximum speeds of 2.5 to 2.6 GHz (P cores) and 2.2 to 2.3 GHz (E cores). The GPU (1.9 to 2 GHz) begins the test at almost full speed, and the speed drops slightly as the test continues. In addition, the GPU is regularly throttled significantly.


Speakers
The four speakers produce a very decent sound together. For an even better sound experience, you can use a headset or external speakers.
Asus ROG Strix Scar 18 G834JYR (2024) audio analysis
(+) | speakers can play relatively loud (82 dB)
Bass 100 - 315 Hz
(±) | reduced bass - on average 5.6% lower than median
(+) | bass is linear (6.8% delta to prev. frequency)
Mids 400 - 2000 Hz
(±) | higher mids - on average 5.7% higher than median
(+) | mids are linear (2.8% delta to prev. frequency)
Highs 2 - 16 kHz
(±) | reduced highs - on average 7.2% lower than median
(±) | linearity of highs is average (7.2% delta to prev. frequency)
Overall 100 - 16.000 Hz
(+) | overall sound is linear (13% difference to median)
Compared to same class
» 18% of all tested devices in this class were better, 3% similar, 79% worse
» The best had a delta of 6%, average was 18%, worst was 132%
Compared to all devices tested
» 13% of all tested devices were better, 2% similar, 85% worse
» The best had a delta of 4%, average was 24%, worst was 134%
MSI Titan 18 HX A14VIG audio analysis
(+) | speakers can play relatively loud (89.2 dB)
Bass 100 - 315 Hz
(-) | nearly no bass - on average 17.6% lower than median
(±) | linearity of bass is average (8% delta to prev. frequency)
Mids 400 - 2000 Hz
(+) | balanced mids - only 1.8% away from median
(+) | mids are linear (3.7% delta to prev. frequency)
Highs 2 - 16 kHz
(+) | balanced highs - only 1.2% away from median
(+) | highs are linear (2% delta to prev. frequency)
Overall 100 - 16.000 Hz
(+) | overall sound is linear (9.9% difference to median)
Compared to same class
» 5% of all tested devices in this class were better, 2% similar, 94% worse
» The best had a delta of 6%, average was 18%, worst was 132%
Compared to all devices tested
» 4% of all tested devices were better, 1% similar, 95% worse
» The best had a delta of 4%, average was 24%, worst was 134%
Power Management - The Asus ROG reaches a fairly good battery life
Power Consumption
During the Witcher 3 test, the power consumption remains constant at an expected level, and during the stress test the consumption varies. This variation can be traced back to a significant reduction of the GPU speed that occurs regularly. The 330-Watt charger provides a sufficient amount of power.
| Off / Standby | |
| Idle | |
| Load |
|
Key:
min: | |
| Asus ROG Strix Scar 18 G834JYR (2024) i9-14900HX, GeForce RTX 4090 Laptop GPU | Alienware m18 R1 AMD R9 7945HX, Radeon RX 7900M | Alienware m18 R1 i9-13980HX, GeForce RTX 4090 Laptop GPU | Acer Predator Helios 18 N23Q2 i9-13900HX, GeForce RTX 4080 Laptop GPU | Razer Blade 18 RTX 4070 i9-13950HX, GeForce RTX 4070 Laptop GPU | MSI Titan 18 HX A14VIG i9-14900HX, GeForce RTX 4090 Laptop GPU | Asus ROG Strix Scar 18 2023 G834JY-N6005W i9-13980HX, GeForce RTX 4090 Laptop GPU | Average of class Gaming | |
|---|---|---|---|---|---|---|---|---|
| Power Consumption | -112% | -48% | -4% | -40% | -40% | -35% | 6% | |
| Idle Minimum * (Watt) | 14 | 30.3 -116% | 21.6 -54% | 16 -14% | 24.5 -75% | 13.2 6% | 17.3 -24% | 13.3 ? 5% |
| Idle Average * (Watt) | 17 | 55.6 -227% | 25.2 -48% | 19 -12% | 34.1 -101% | 25.4 -49% | 27 -59% | 19 ? -12% |
| Idle Maximum * (Watt) | 24 | 101.1 -321% | 56.7 -136% | 21.3 11% | 47.7 -99% | 53.5 -123% | 46 -92% | 24.5 ? -2% |
| Load Average * (Watt) | 143 | 160.3 -12% | 164.1 -15% | 124 13% | 140 2% | 151.4 -6% | 133 7% | 108.1 ? 24% |
| Witcher 3 ultra * (Watt) | 251 | 216 14% | 311 -24% | 289 -15% | 202 20% | 336 -34% | ||
| Load Maximum * (Watt) | 302 | 332.1 -10% | 338.9 -12% | 319 -6% | 261 14% | 395.2 -31% | 329 -9% | 254 ? 16% |
* ... smaller is better
Power Consumption The Witcher 3 / Stress Test
Power Consumption With External Monitor
Battery Life
In our WLAN test loading web sites via script and or video test playing the short film Big Buck Bunny (H.264 coding, FHD) in a constant loop, the 18-inch laptop reaches runtimes of 7:41 h and 7:27 h respectively. So the Scar 18 delivers very good values overall and is able to surpass the competitors by significant margins, despite their battery capacities being larger in parts.
| Asus ROG Strix Scar 18 G834JYR (2024) i9-14900HX, GeForce RTX 4090 Laptop GPU, 90 Wh | Alienware m18 R1 AMD R9 7945HX, Radeon RX 7900M, 97 Wh | Alienware m18 R1 i9-13980HX, GeForce RTX 4090 Laptop GPU, 97 Wh | Acer Predator Helios 18 N23Q2 i9-13900HX, GeForce RTX 4080 Laptop GPU, 90 Wh | Razer Blade 18 RTX 4070 i9-13950HX, GeForce RTX 4070 Laptop GPU, 91.7 Wh | MSI Titan 18 HX A14VIG i9-14900HX, GeForce RTX 4090 Laptop GPU, 99.9 Wh | Asus ROG Strix Scar 18 2023 G834JY-N6005W i9-13980HX, GeForce RTX 4090 Laptop GPU, 90 Wh | Average of class Gaming | |
|---|---|---|---|---|---|---|---|---|
| Battery runtime | -61% | -45% | -16% | -26% | -32% | -15% | -0% | |
| Reader / Idle (h) | 10.2 | 4.5 -56% | 5.6 -45% | 7 -31% | 5.9 -42% | 8.71 ? -15% | ||
| H.264 (h) | 7.5 | 4.8 -36% | 7 -7% | 8.26 ? 10% | ||||
| WiFi v1.3 (h) | 7.7 | 1.4 -82% | 4.3 -44% | 4.4 -43% | 4 -48% | 4.2 -45% | 7.1 -8% | 7.01 ? -9% |
| Load (h) | 1.3 | 0.7 -46% | 0.7 -46% | 1.7 31% | 1.3 0% | 1.2 -8% | 0.9 -31% | 1.47 ? 13% |
| Witcher 3 ultra (h) | 0.9 |
Pros
Cons
Verdict - Room for improvement
Video and image processing, streaming, rendering, and gaming are included in the main usage scenarios of the laptop. While the GeForce RTX 4090 and Core i9-14900HX deliver the necessary performance, they don't reach any new records. The emissions range at the high levels that are usual for this device class.
With ROG Strix Scar 18 (2024), Asus delivers a powerful high-end laptop at a hefty price.
The highlight of the laptop is its mini-LED display (2560x1600 pixels, DCI-P3, Dolby Vision, 240 Hz) with a diagonal of 18 inches in the 16:10 format. Its positive aspects include a maximum brightness of almost 1,000 cd/m², a very good black value, and a high color accuracy.
The USB-C ports (1x USB 3.2 Gen 2, 1x Thunderbolt 4) facilitate its integration into existing workplace setups and open up some expansion options such as an externe GPU or docking station. Both USB-C ports can be used for DisplayPort signal output, and the USB 3.2 Gen 2 port also supports Power Delivery. All this is accompanied by a very good battery life.
An alternative might be the MSI Titan 18 HX A14VIG, which is able to get a slightly higher performance from the same CPU/GPU combination, offers a 4k mini-LED display, and scores with two TB4 ports. However, the MSI laptop doesn't come close to reaching the battery life of the Strix.
Price and Availability
The Asus ROG Strix Scar 18 (2024) is available for around $3,000 from the Asus store and for the same price also from Amazon, for example. A configuration similar to our test unit is available for ~$3,900 from Amazon.
Asus ROG Strix Scar 18 G834JYR (2024)
- 02/07/2024 v7 (old)
Sascha Mölck
Transparency
The selection of devices to be reviewed is made by our editorial team. The test sample was provided to the author as a loan by the manufacturer or retailer for the purpose of this review. The lender had no influence on this review, nor did the manufacturer receive a copy of this review before publication. There was no obligation to publish this review. As an independent media company, Notebookcheck is not subjected to the authority of manufacturers, retailers or publishers.
This is how Notebookcheck is testing
Every year, Notebookcheck independently reviews hundreds of laptops and smartphones using standardized procedures to ensure that all results are comparable. We have continuously developed our test methods for around 20 years and set industry standards in the process. In our test labs, high-quality measuring equipment is utilized by experienced technicians and editors. These tests involve a multi-stage validation process. Our complex rating system is based on hundreds of well-founded measurements and benchmarks, which maintains objectivity. Further information on our test methods can be found here.
Price comparison

