Verdict: Power and pitfalls come at an eye-watering premium
The MSI Titan 18 HX AI showcases Intel's Core Ultra 9 285HX and Nvidia's RTX 5090 Laptop GPU in a familiar magnesium-aluminum chassis. Key changes this year include dual Thunderbolt 5 ports, heatsink for the Gen5 SSD, and an additional NVMe slot.
The Core Ultra 9 285HX matches but doesn't always exceed the Core Ultra 9 275HX in competing laptops. The RTX 5090 Laptop GPU's native rendering barely outpaces the RTX 4090, though multi-frame generation enables smoother gameplay at maximum settings.
MSI's vapor chamber cooling can sustain 261 W combined power draw, but at the cost of significant heat and noise emissions.
The vibrant 4K 120 Hz mini-LED display is great for HDR but lacks any form of adaptive sync — a huge omission in our opinion. Standby power draw in dGPU mode is nearly as much as the TDP of U-series CPUs and requires immediate fixing.
Other aspects that felt compromising include lack of Advanced Optimus, a slow SD card reader, mediocre webcam, and an underwhelming haptic touchpad. The SteelSeries mechanical keyboard restricts Cherry MX switches to just the typing area, which feels like a needless cost-cutting measure.
For those with $6,000+ to spare for a desktop replacement, the MSI Titan 18 HX AI delivers uncompromising power despite some glaring trade-offs. The rest of us are better served by more balanced alternatives.
Pros
Cons
Price and Availability
The tested configuration of the MSI Titan 18 HX AI with 2 TB storage can be had from Amazon US for $4,899. A 6 TB variant is available on Best Buy $6,599.99.
The MSI Titan 18 HX AI with 4 TB storage is listed on Amazon India but pricing information is not yet available.
Table of Contents
- Verdict: Power and pitfalls come at an eye-watering premium
- Specifications
- Chassis: Predecessor's premium design preserved
- Connectivity: Titan 18 gets a Thunderbolt 5 upgrade
- Input Devices: Cherry MX mechanical keyboard paired with a finicky haptic touchpad
- Display: Bright 4K 120 Hz mini-LED that rivals OLEDs but no G-Sync
- Performance: Flagship Core Ultra 9 285HX is virtually indistinguishable from the Core Ultra 9 275HX
- Emissions: High noise levels and surface temps despite a vapor chamber
- Energy Management: High power appetite with poor battery endurance
- Notebookcheck's impression of the MSI Titan 18 HX AI
- Potential competitors in comparison
MSI's annual Titan refresh continues to showcase Intel and Nvidia's flagship silicon.
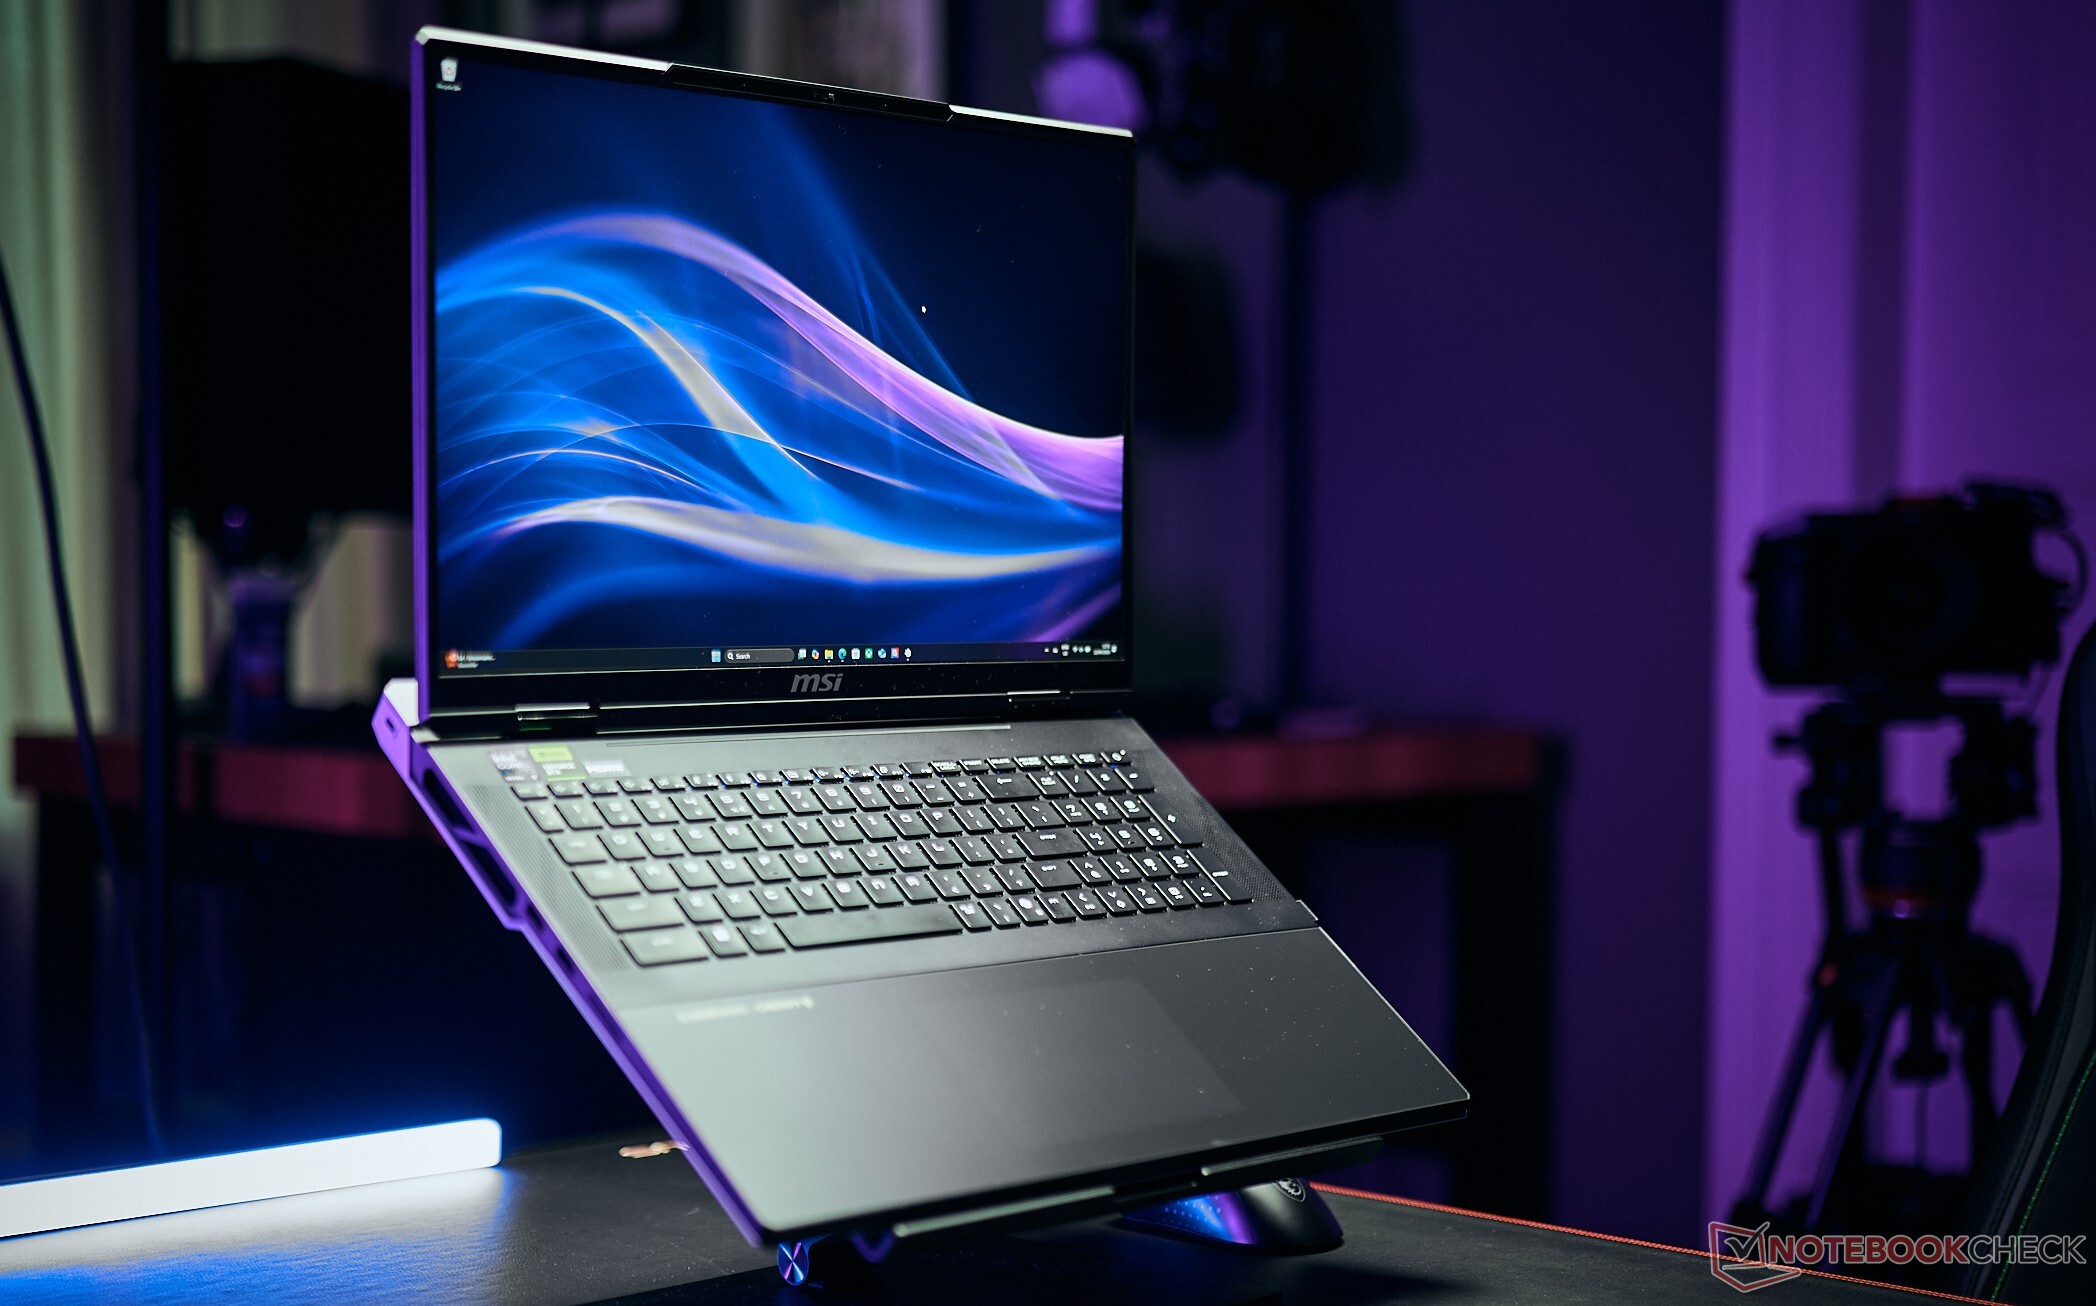
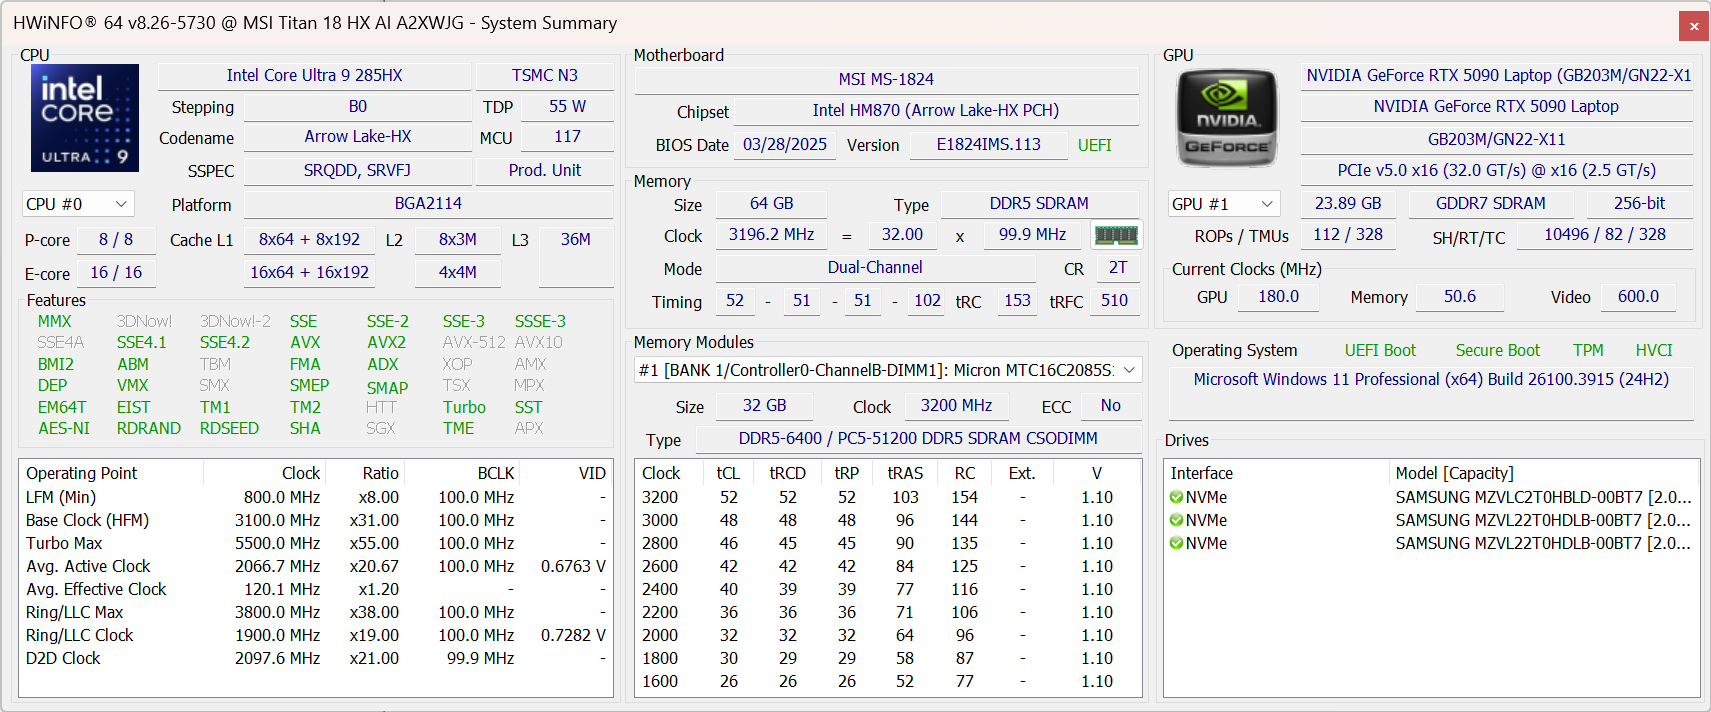
While maintaining the Titan 18 HX A14VIG's exterior, this year's Titan 18 HX AI debuts the Intel Arrow Lake-HX Core Ultra 9 285HX paired with a 175 W Nvidia Blackwell GeForce RTX 5090 Laptop GPU.
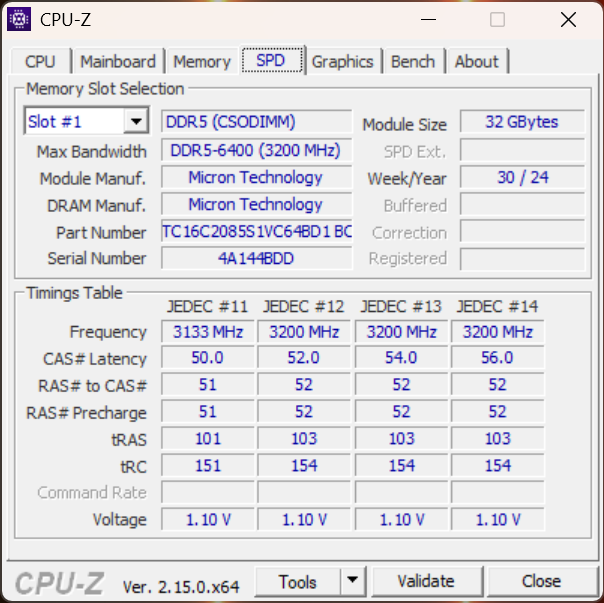
Our unit also features 64 GB of DDR5-6400 RAM, a massive 6 TB of NVMe SSD storage, and a SteelSeries Cherry MX Ultra Low Profile mechanical keyboard.
This configuration will set you back by a budget-busting $6,600.
In this review, we see if the MSI Titan 18 HX AI A2XWJG really merits putting such a massive dent in your wallet.
Specifications
Chassis: Predecessor's premium design preserved
The chassis remains unchanged from last year's Titan 18 HX A14VIG. You get the same magnesium-aluminum alloy build in a Core Black finish and a silver tone on the rear extension with blue accents. RGB lighting is limited to the MSI logo on the display lid.
A standout design element is the haptic touchpad, which integrates seamlessly with the glass palm rest that spans the entire length of the laptop. While helping create a clean aesthetic, this glass surface is a fingerprint magnet.
The display opens with one finger despite the substantial weight and demonstrates high quality hinges. Both the screen and the keyboard deck show little to no flexing even under deliberate pressure.


Connectivity: Titan 18 gets a Thunderbolt 5 upgrade
Port selection and placement remain largely the same, with the notable upgrade to Thunderbolt 5 ports in this iteration.
USB ports are distributed along the sides and are spaced adequately without any connectivity hindrance.


SD Card Reader
The Titan 18 HX AI's built-in SD Express Reader shows no major improvement in average and sequential read speeds over the previous generation.
The card reader's performance is a far cry away from the ones found in the Aorus Master 18 and the Schenker XMG Neo 16 E25.
| SD Card Reader | |
| average JPG Copy Test (av. of 3 runs) | |
| Medion Erazer Beast 18 X1 MD62731 (AV PRO microSD 128 GB V60) | |
| Aorus Master 18 AM8H (AV PRO microSD 128 GB V60) | |
| Razer Blade 16 2025 RTX 5090 (Angelbird AV Pro V60) | |
| Average of class Gaming (20.9 - 210, n=54, last 2 years) | |
| Schenker XMG Neo 16 E25 RTX 5090 Laptop (Angelbird AV Pro V60) | |
| MSI Titan 18 HX A14VIG (Toshiba Exceria Pro SDXC 64 GB UHS-II) | |
| MSI Titan 18 HX AI A2XWJG (AV PRO microSD 128 GB V60) | |
| maximum AS SSD Seq Read Test (1GB) | |
| Schenker XMG Neo 16 E25 RTX 5090 Laptop (Angelbird AV Pro V60) | |
| Aorus Master 18 AM8H (AV PRO microSD 128 GB V60) | |
| Razer Blade 16 2025 RTX 5090 (Angelbird AV Pro V60) | |
| Medion Erazer Beast 18 X1 MD62731 (AV PRO microSD 128 GB V60) | |
| Average of class Gaming (25.5 - 261, n=51, last 2 years) | |
| MSI Titan 18 HX AI A2XWJG (AV PRO microSD 128 GB V60) | |
| MSI Titan 18 HX A14VIG (Toshiba Exceria Pro SDXC 64 GB UHS-II) | |
Communication
The 6 GHz 6E band delivers slightly enhanced performance over 5 GHz, with marginally higher average and maximum speeds in both transmit and receive when tested with our reference Asus ROG Rapture GT-AXE11000 router.
Both the 5 GHz and 6 GHz 6E bands perform inconsistently in transmit throughput with noticeable fluctuations.
| Networking / iperf3 transmit AXE11000 | |
| Razer Blade 16 2025 RTX 5090 | |
| Schenker XMG Neo 16 E25 RTX 5090 Laptop (iperf 3.1.3) | |
| Asus Strix Scar 18 G835LX | |
| Asus ROG Strix Scar 16 2025 (iperf 3.1.3) | |
| MSI Titan 18 HX AI A2XWJG (iperf 3.1.3) | |
| Aorus Master 18 AM8H (iperf 3.1.3) | |
| Average of class Gaming (560 - 1862, n=95, last 2 years) | |
| Average Intel Killer Wi-Fi 7 BE1750x BE200NGW (658 - 1814, n=13) | |
| MSI Titan 18 HX A14VIG (iperf 3.1.3) | |
| Medion Erazer Beast 18 X1 MD62731 (iperf 3.1.3) | |
| Networking / iperf3 receive AXE11000 | |
| Aorus Master 18 AM8H (iperf 3.1.3) | |
| Schenker XMG Neo 16 E25 RTX 5090 Laptop (iperf 3.1.3) | |
| Razer Blade 16 2025 RTX 5090 | |
| MSI Titan 18 HX AI A2XWJG (iperf 3.1.3) | |
| Medion Erazer Beast 18 X1 MD62731 (iperf 3.1.3) | |
| Asus Strix Scar 18 G835LX | |
| Asus ROG Strix Scar 16 2025 (iperf 3.1.3) | |
| Average of class Gaming (680 - 1745, n=95, last 2 years) | |
| Average Intel Killer Wi-Fi 7 BE1750x BE200NGW (777 - 1696, n=13) | |
| MSI Titan 18 HX A14VIG (iperf 3.1.3) | |
| Networking / iperf3 transmit AXE11000 6GHz | |
| MSI Titan 18 HX AI A2XWJG (iperf 3.1.3) | |
| Average of class Gaming (723 - 2355, n=38, last 2 years) | |
| Average Intel Killer Wi-Fi 7 BE1750x BE200NGW (648 - 2355, n=12) | |
| MSI Titan 18 HX A14VIG (iperf 3.1.3) | |
| Networking / iperf3 receive AXE11000 6GHz | |
| MSI Titan 18 HX AI A2XWJG (iperf 3.1.3) | |
| Average of class Gaming (975 - 1775, n=37, last 2 years) | |
| Average Intel Killer Wi-Fi 7 BE1750x BE200NGW (975 - 1730, n=12) | |
| MSI Titan 18 HX A14VIG (iperf 3.1.3) | |
Webcam
Unfortunately, the image quality of the FHD webcam is nothing to write home about. It gets you by for basic video conferencing, but the images lack focus and sharpness even in good ambient lighting.
A physical shutter is offered for added privacy.

")
")
Security
In addition to the now ubiquitous TPM 2.0 chip, the Titan 18 HX AI comes with Windows Hello facial recognition for biometric logins.
Accessories and Warranty
Inbox accessories include an MSI M18 wireless/wired gaming mouse and an MSI USB 3.2 Type-A/Type-C 256 GB OTG drive apart from the usual paperwork and the 400 W power adapter.
MSI offers a standard warranty of one year or two years depending on the region of purchase.
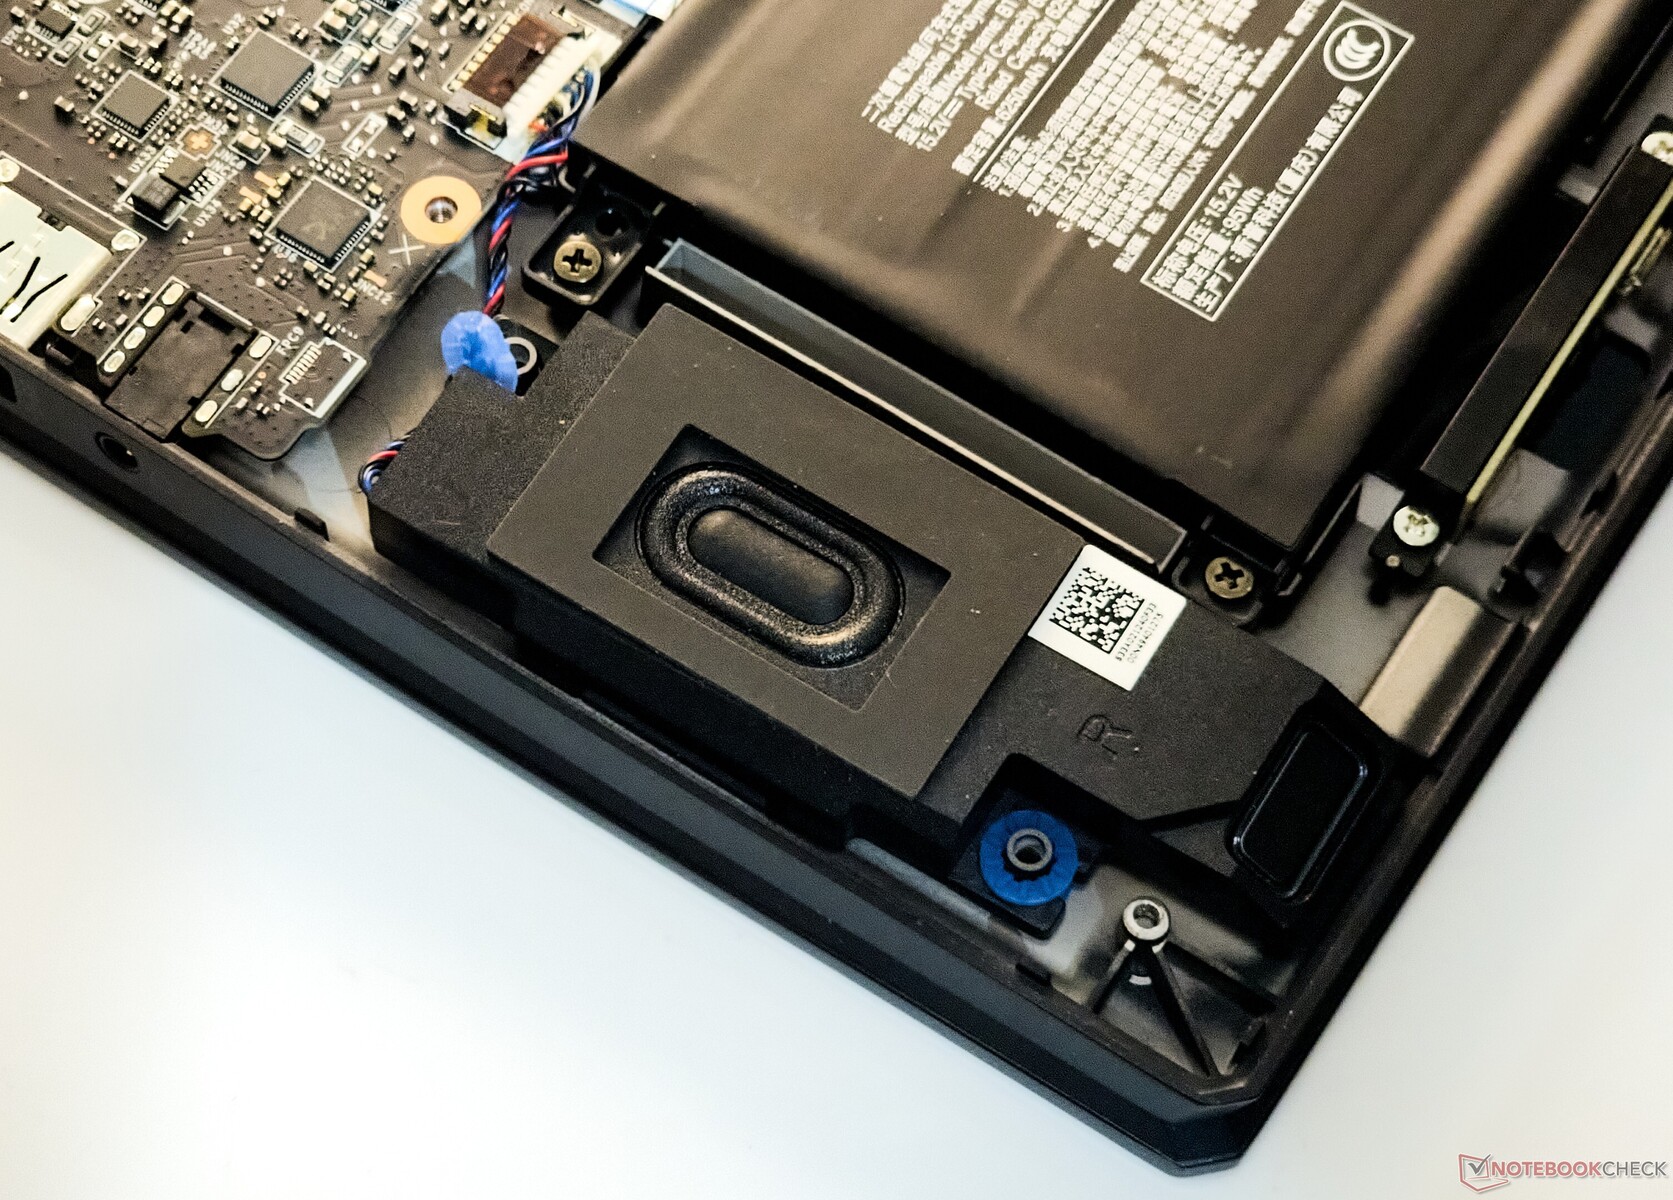
Maintenance
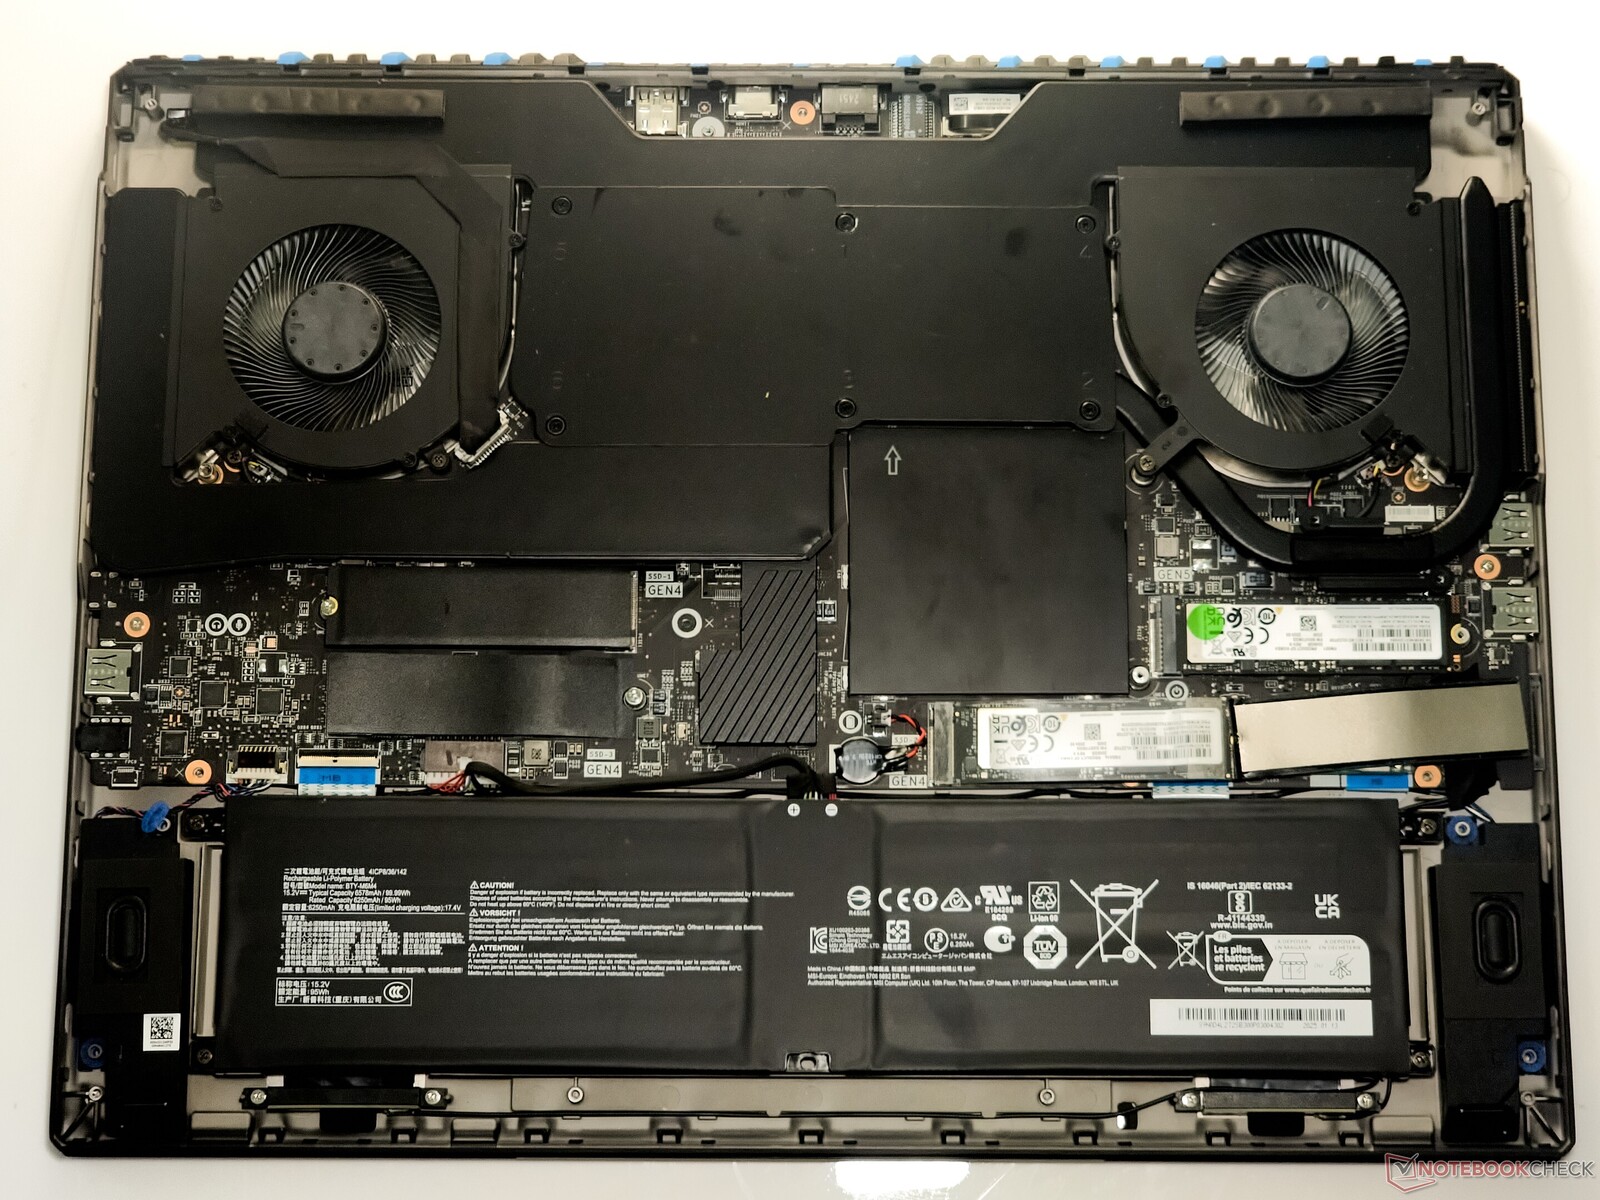
Accessing the Titan 18 HX AI's busy internals is pretty straightforward — just undo the 12 Philips screws of equal length and the back panel can be pried open with some effort.
The internal layout differs slightly from last year's Titan 18 owing to the presence of an additional PCIe Gen4 NVMe M.2 slot (total of 3x PCIe Gen4 and 1x PCIe Gen5 slots). The Gen5 SSD receives a dedicated heatpipe.
The 2x CSODIMMs (reduced from four in the previous generation) are enclosed within a metallic shield secured with adhesive and clips, which makes its removal somewhat cumbersome.
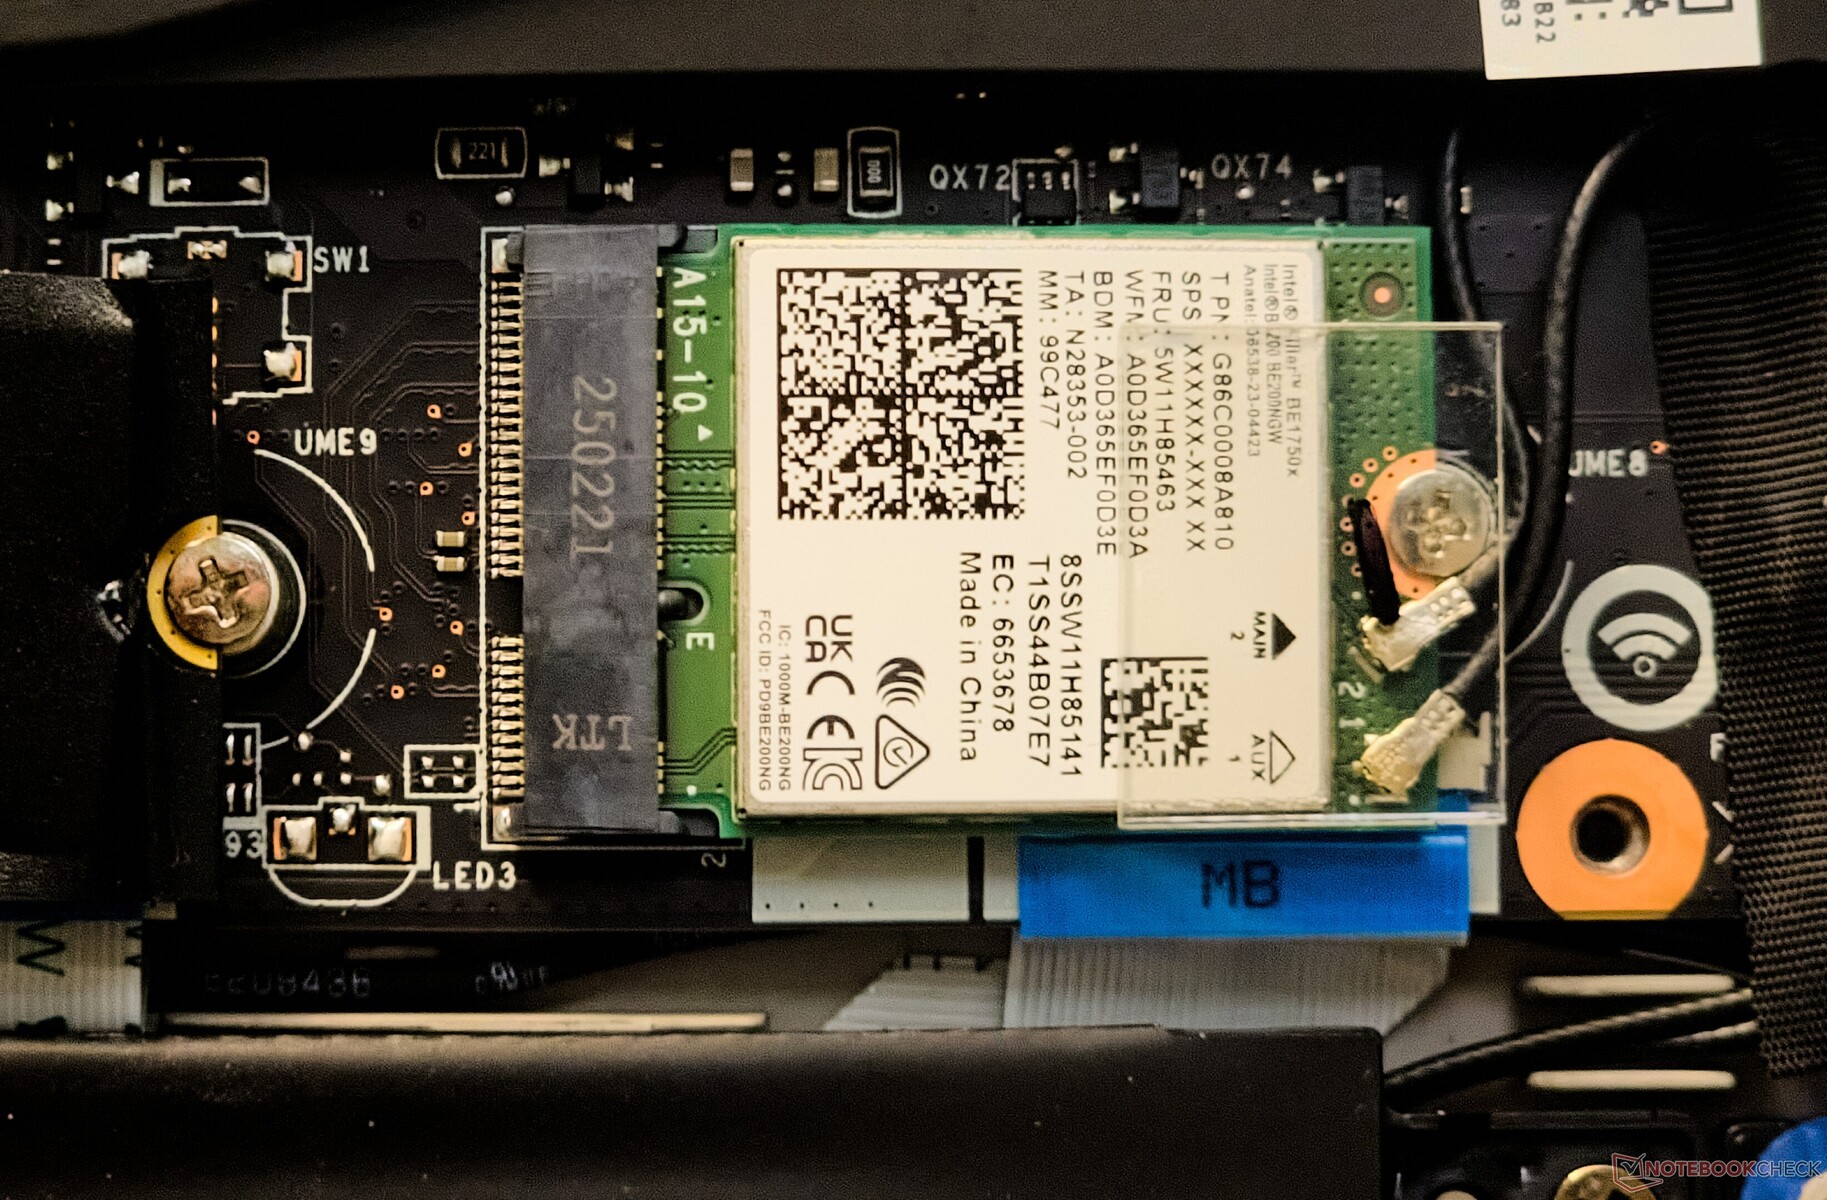
The Intel Killer Wi-Fi 7 BE1750x WLAN module can be replaced, and the battery can be unscrewed if needed.

Sustainability
MSI says that it aims to achieve net-zero emissions by 2050. The Titan 18 HX AI comes in recyclable cardboard packaging with minimal use of plastic. The laptop is ErP-ready and is Energy Star and RoHS-compliant.
Input Devices: Cherry MX mechanical keyboard paired with a finicky haptic touchpad
Keyboard
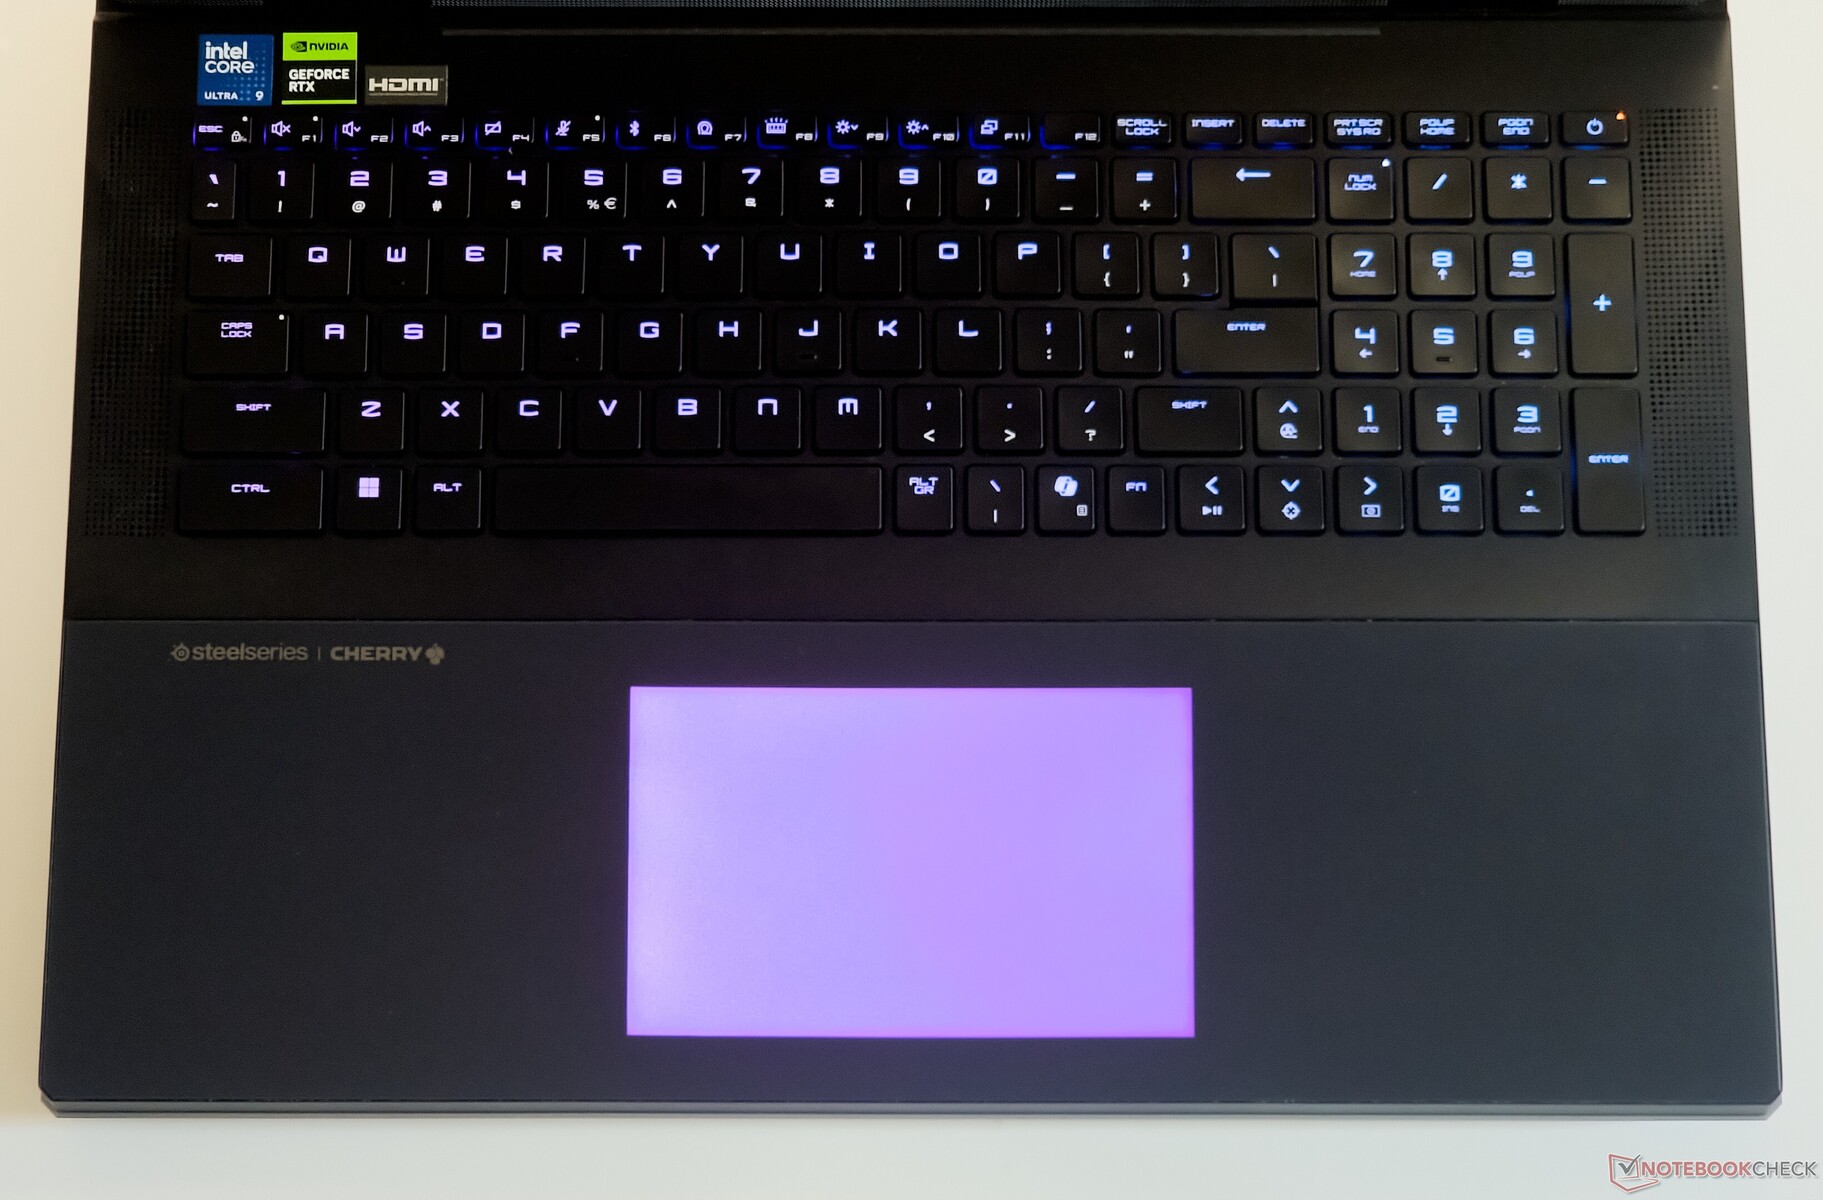
The SteelSeries mechanical keyboard with Cherry MX Ultra-Low Profile switches offers deep travel and satisfying tactility, which augurs great for typing and gaming. However, the short right Shift key can take some time getting used to, and there are no standalone Home and End keys.
A four-stage backlight helps in glorious RGB illumination that can be customized via the SteelSeries GG app. Secondary function keys light up distinctly when the Fn key is pressed.
Unlike what we've seen with the Alienware m18 R1, for example, not all keys get Cherry MX love — the function row, numpad, arrow keys, and keys to the right of the spacebar all remain membrane-based.
Touchpad
The RGB-illuminated 13 cm x 8.5 cm haptic touchpad sits flush with the palm rests. While aesthetically pleasing, it doesn't serve much practical purpose and locating it is a challenge without illumination.
The haptics aren't particularly convincing, and there's no software control for adjusting the feedback.
Clicks and right-clicks can at times go unregistered and multi-touch drag and drop can quickly start to feel a bit of a chore. Windows Precision gestures are fully supported.
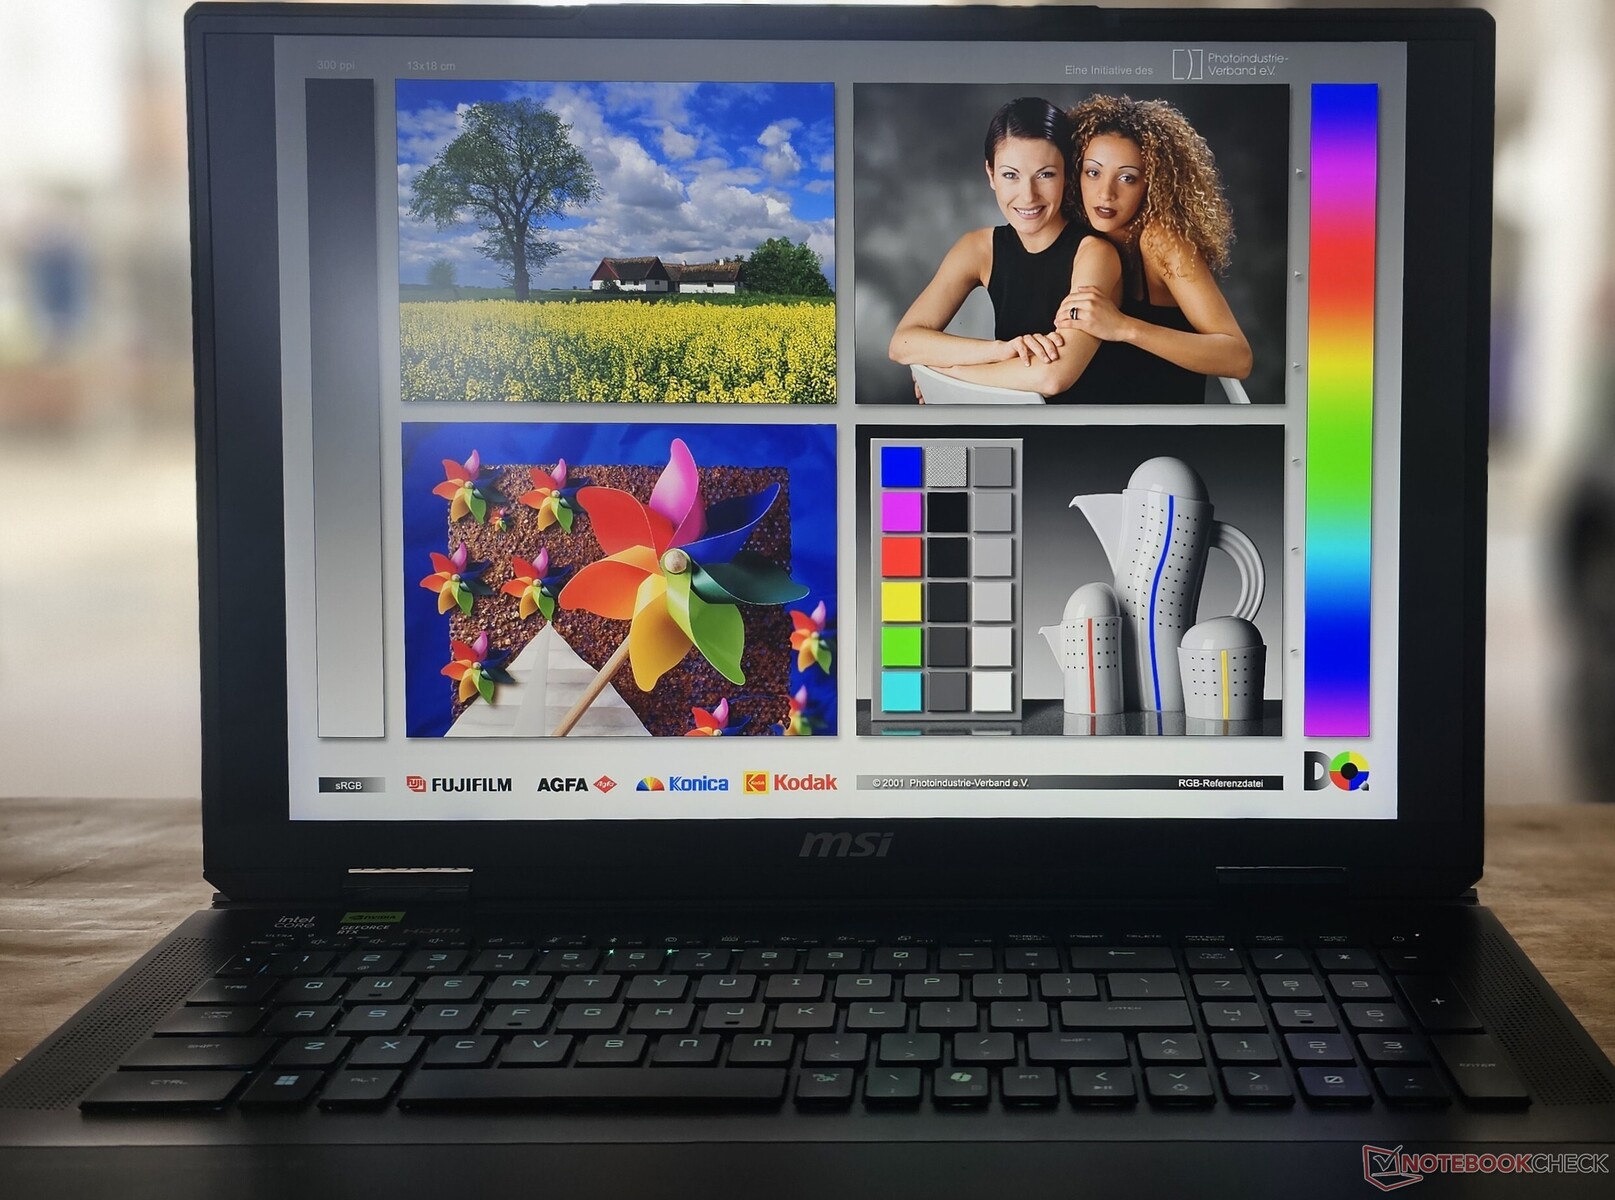
Display: Bright 4K 120 Hz mini-LED that rivals OLEDs but no G-Sync
The Titan 18 HX AI continues to feature the same AUO mini-LED panel as last year's model, so the display characteristics remain largely similar.
The display reaches a bright 680 nits average in SDR mode when plugged in, with a peak measured brightness of 717 nits. On battery, this drops down to 456 nits, which is still in the realm of typical peak SDR values offered by most laptops.
The mini-LED panel delivers excellent brightness uniformity and near-infinite contrast with OLED-quality blacks.
The display is VESA DisplayHDR 1000-certified — we measured 1,153 nits in HDR mode with a 10% window. No perceivable backlight bleeding was observed, but the mouse pointer had a faint halo on a completely black screen.
Unfortunately, the Titan 18's display lacks adaptive sync or Nvidia G-Sync — a major oversight for a laptop of this kind.


| |||||||||||||||||||||||||
Brightness Distribution: 88 %
Center on Battery: 456 cd/m²
Contrast: ∞:1 (Black: 0 cd/m²)
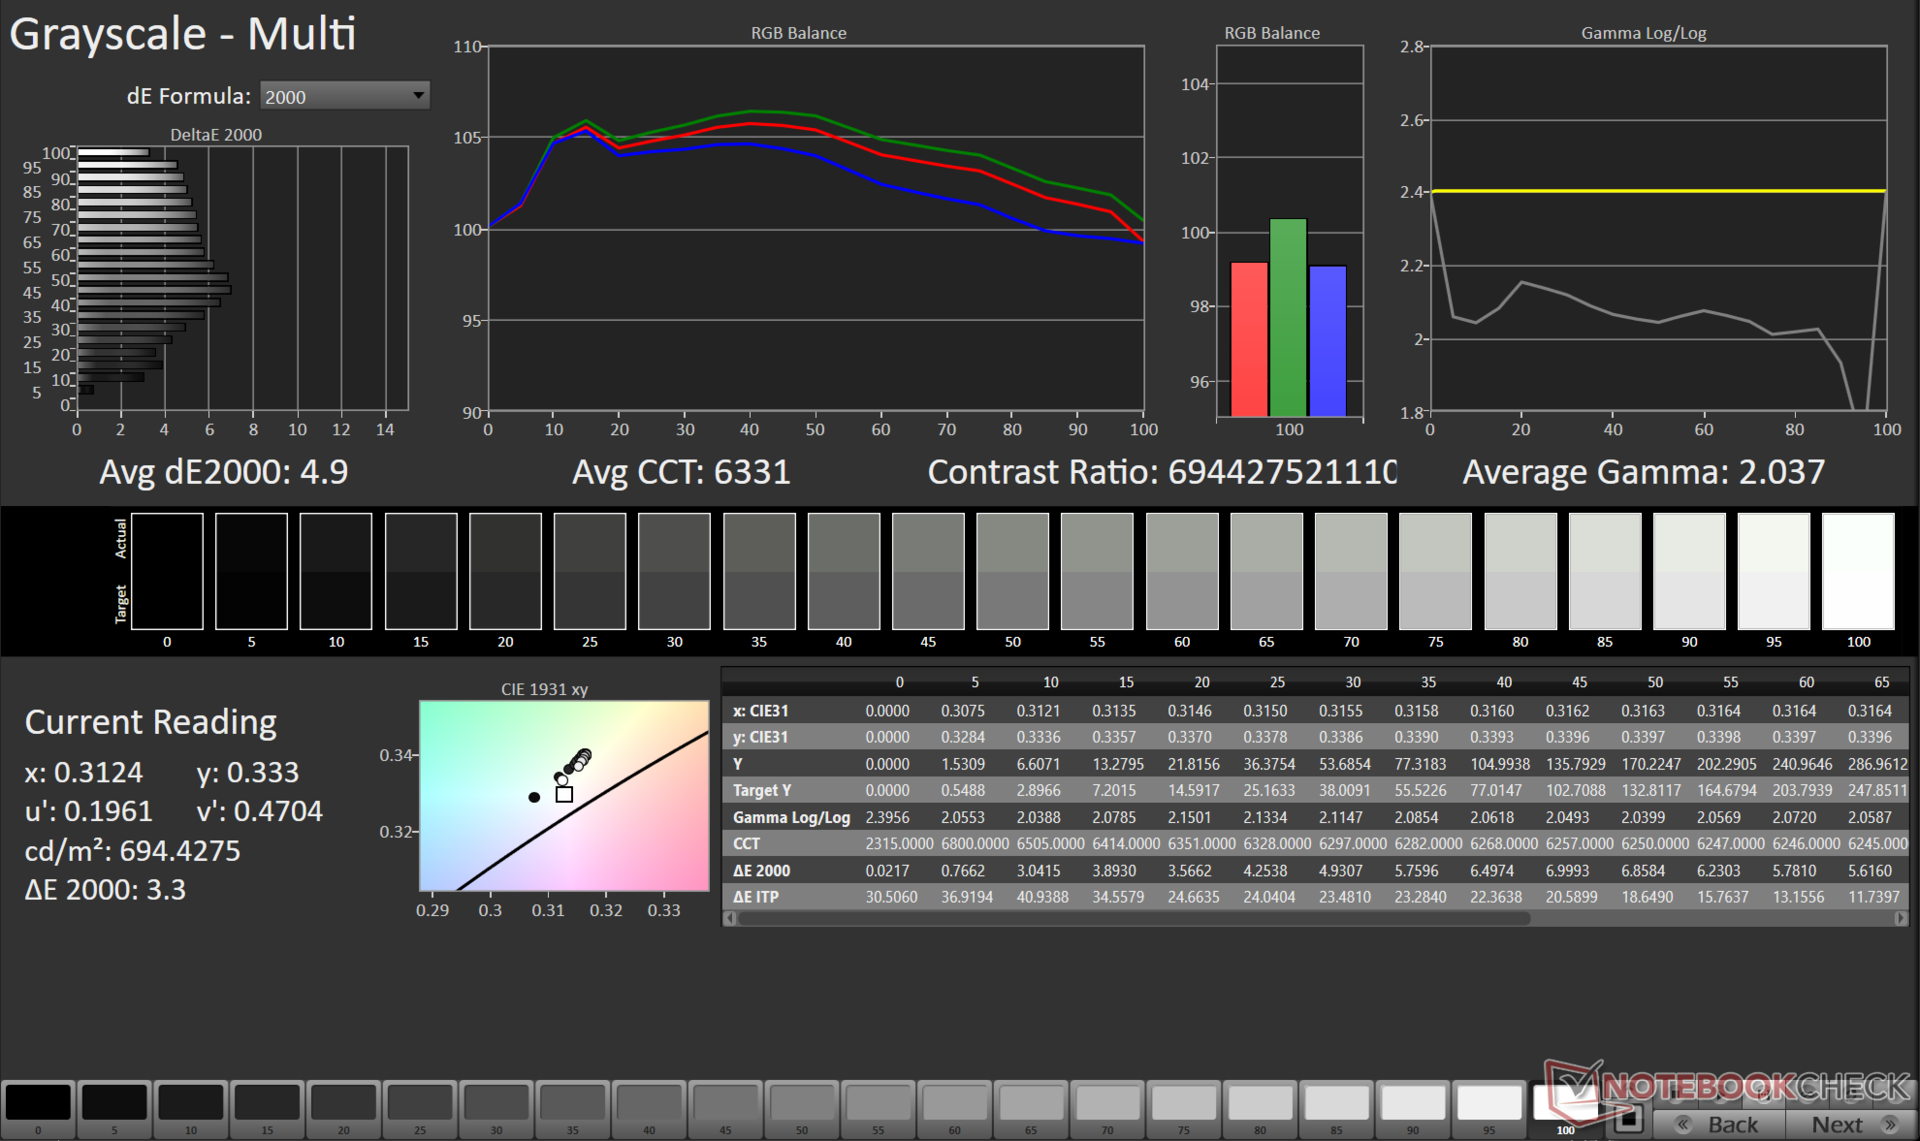
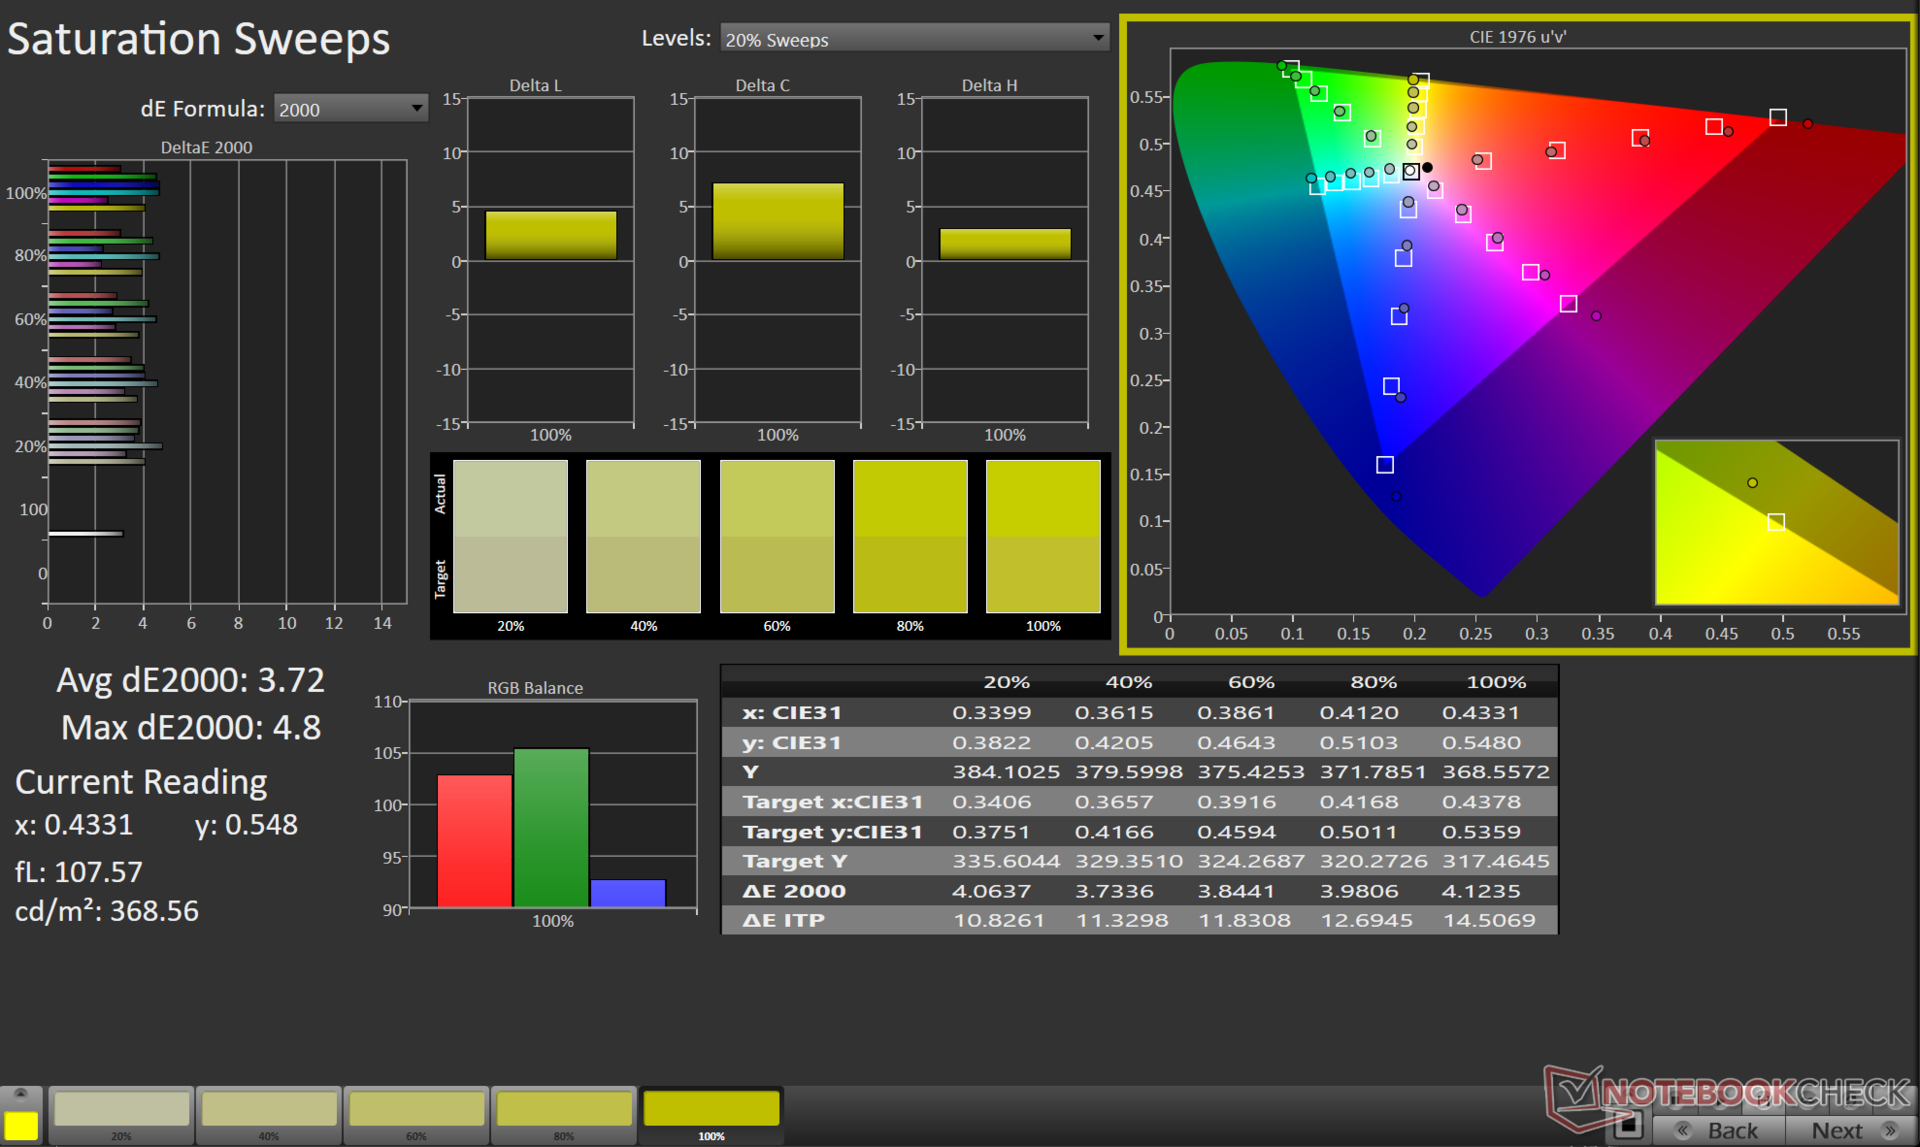
ΔE ColorChecker Calman: 4.11 | ∀{0.5-29.43 Ø4.73}
calibrated: 2.5
ΔE Greyscale Calman: 4.9 | ∀{0.09-98 Ø4.97}
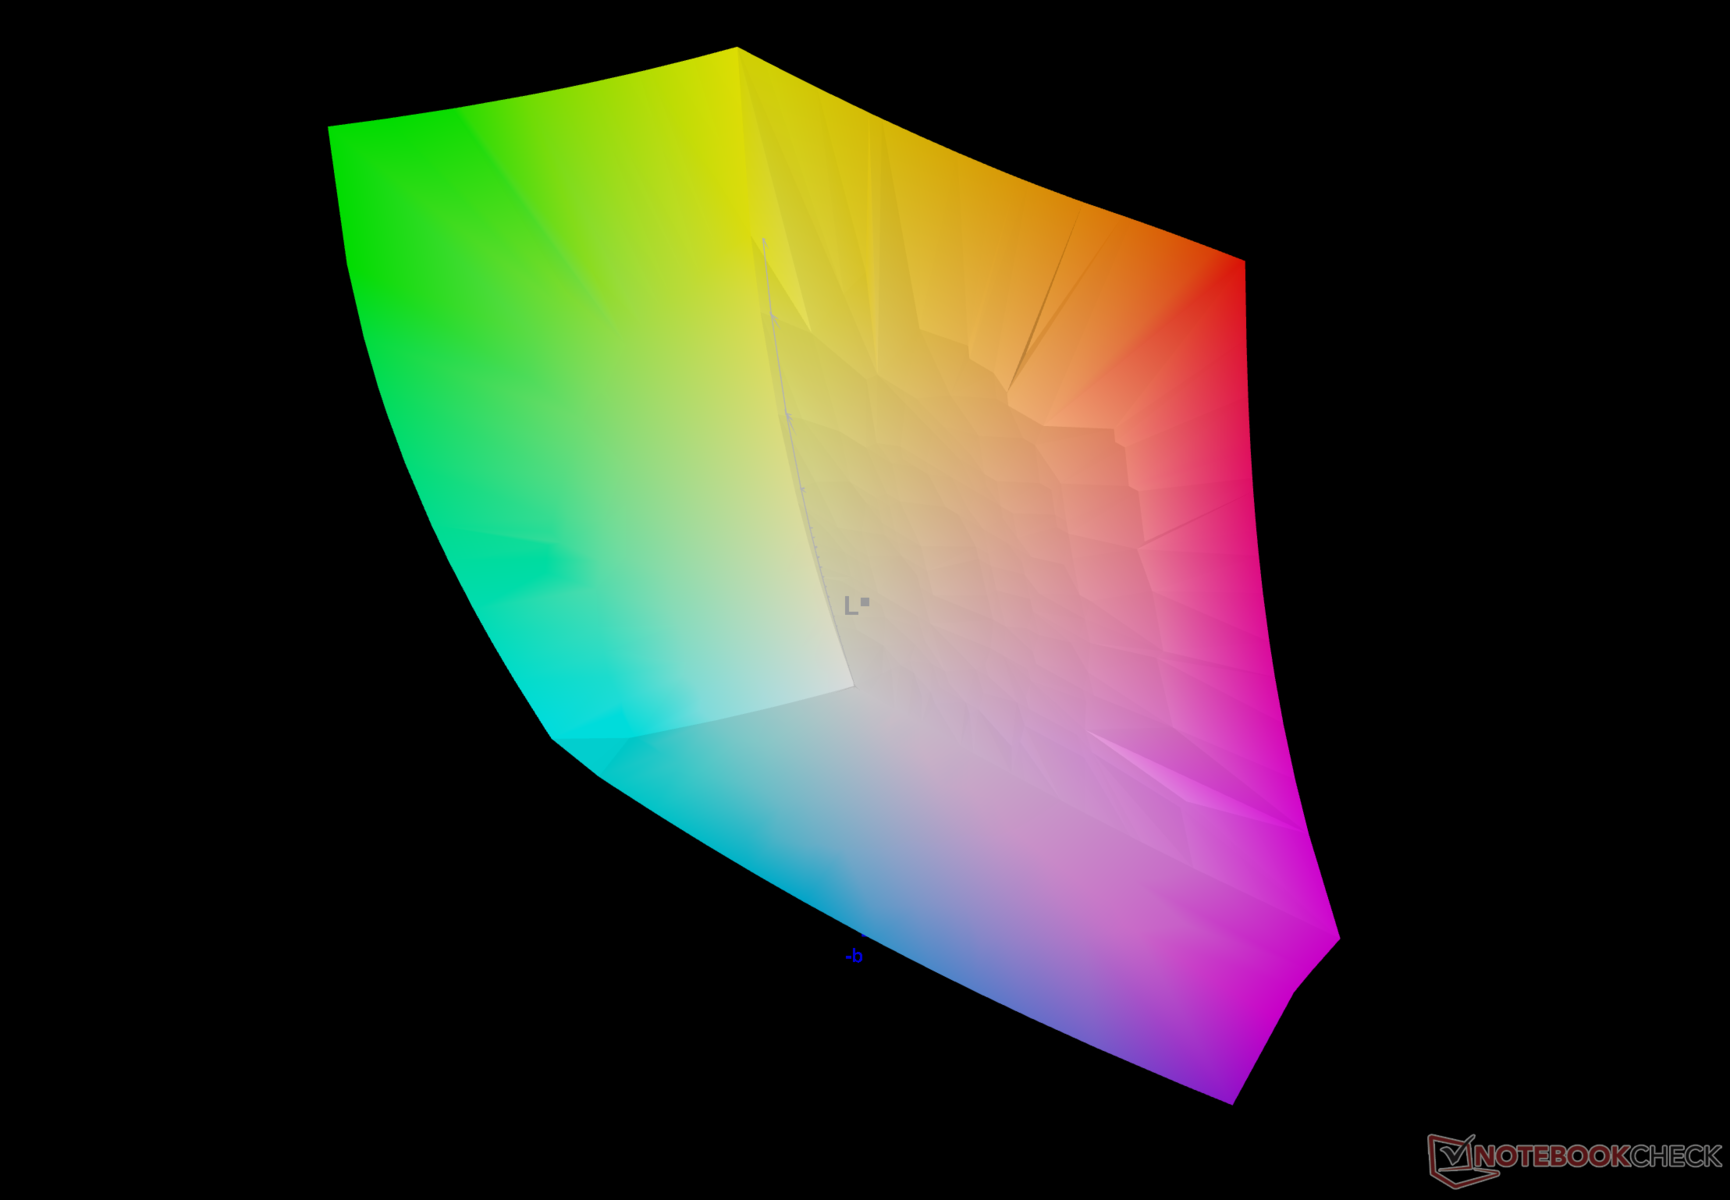
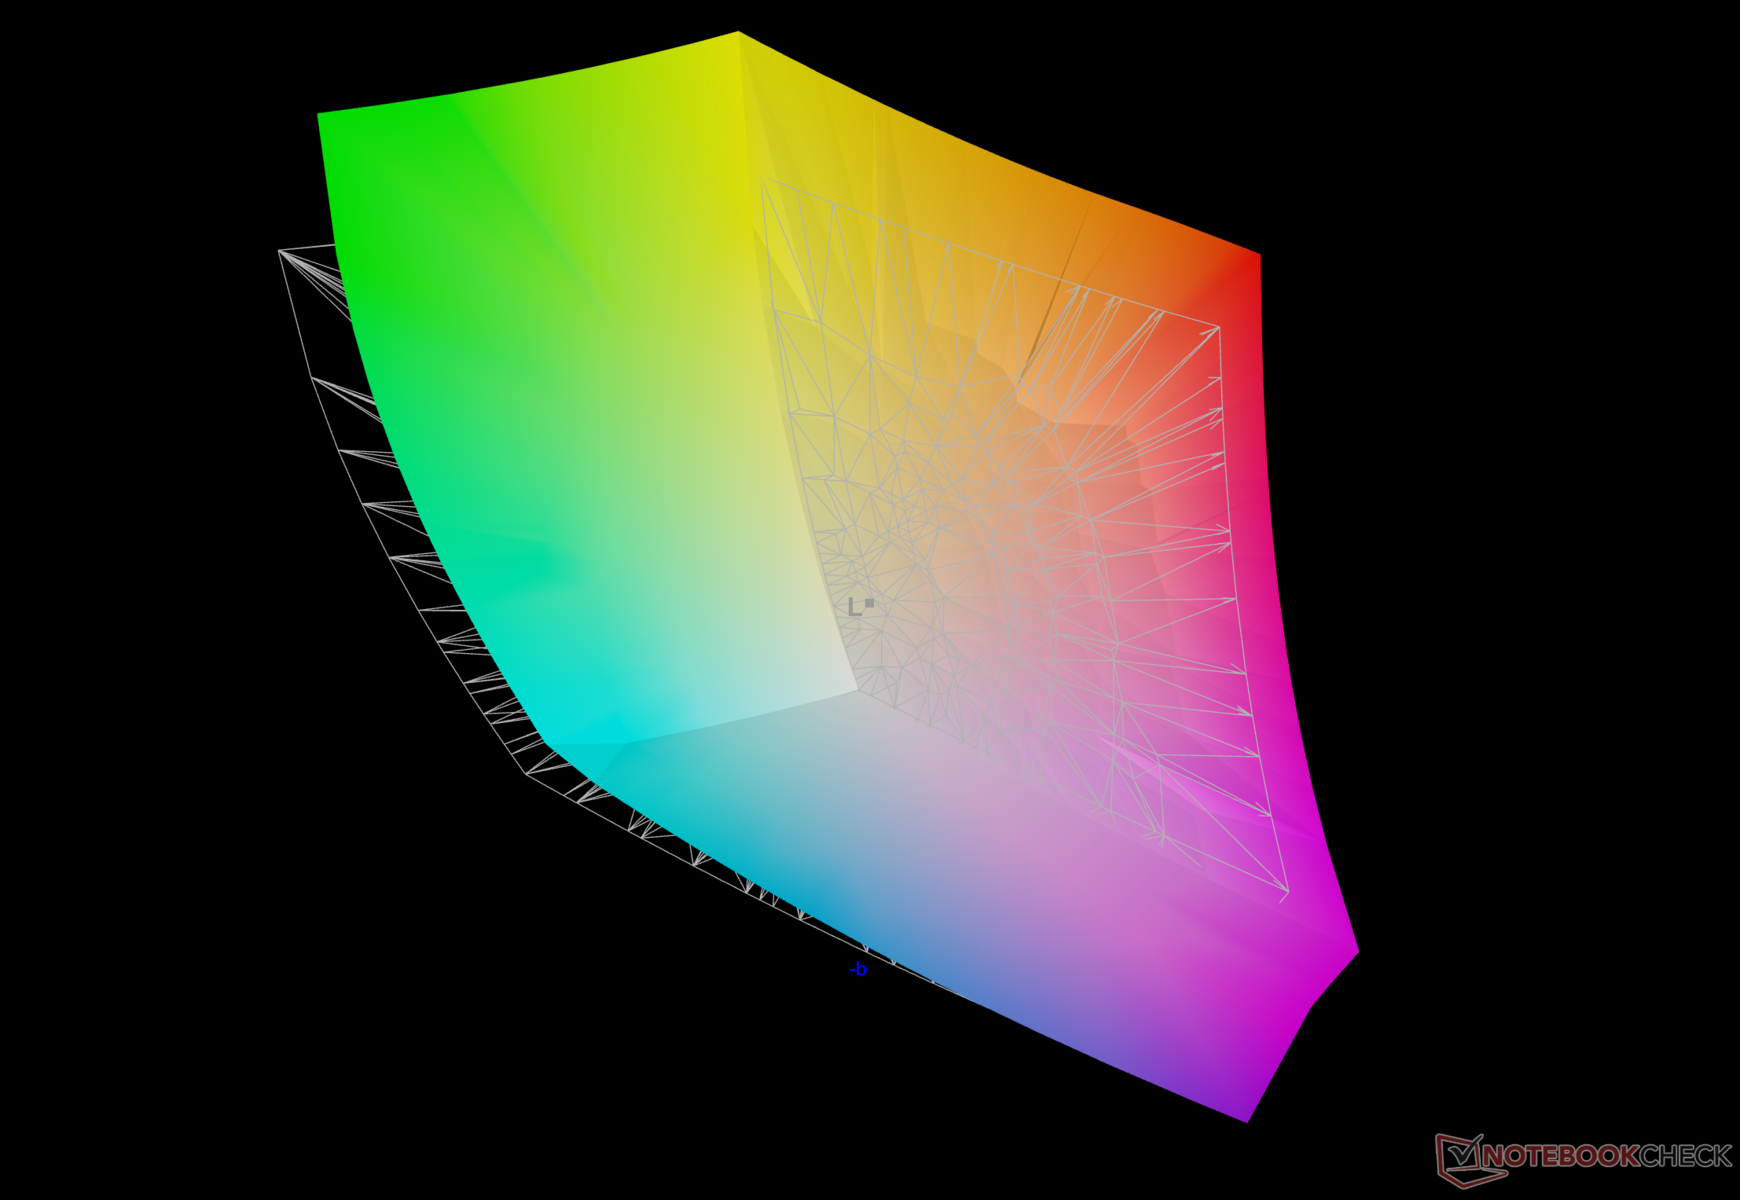
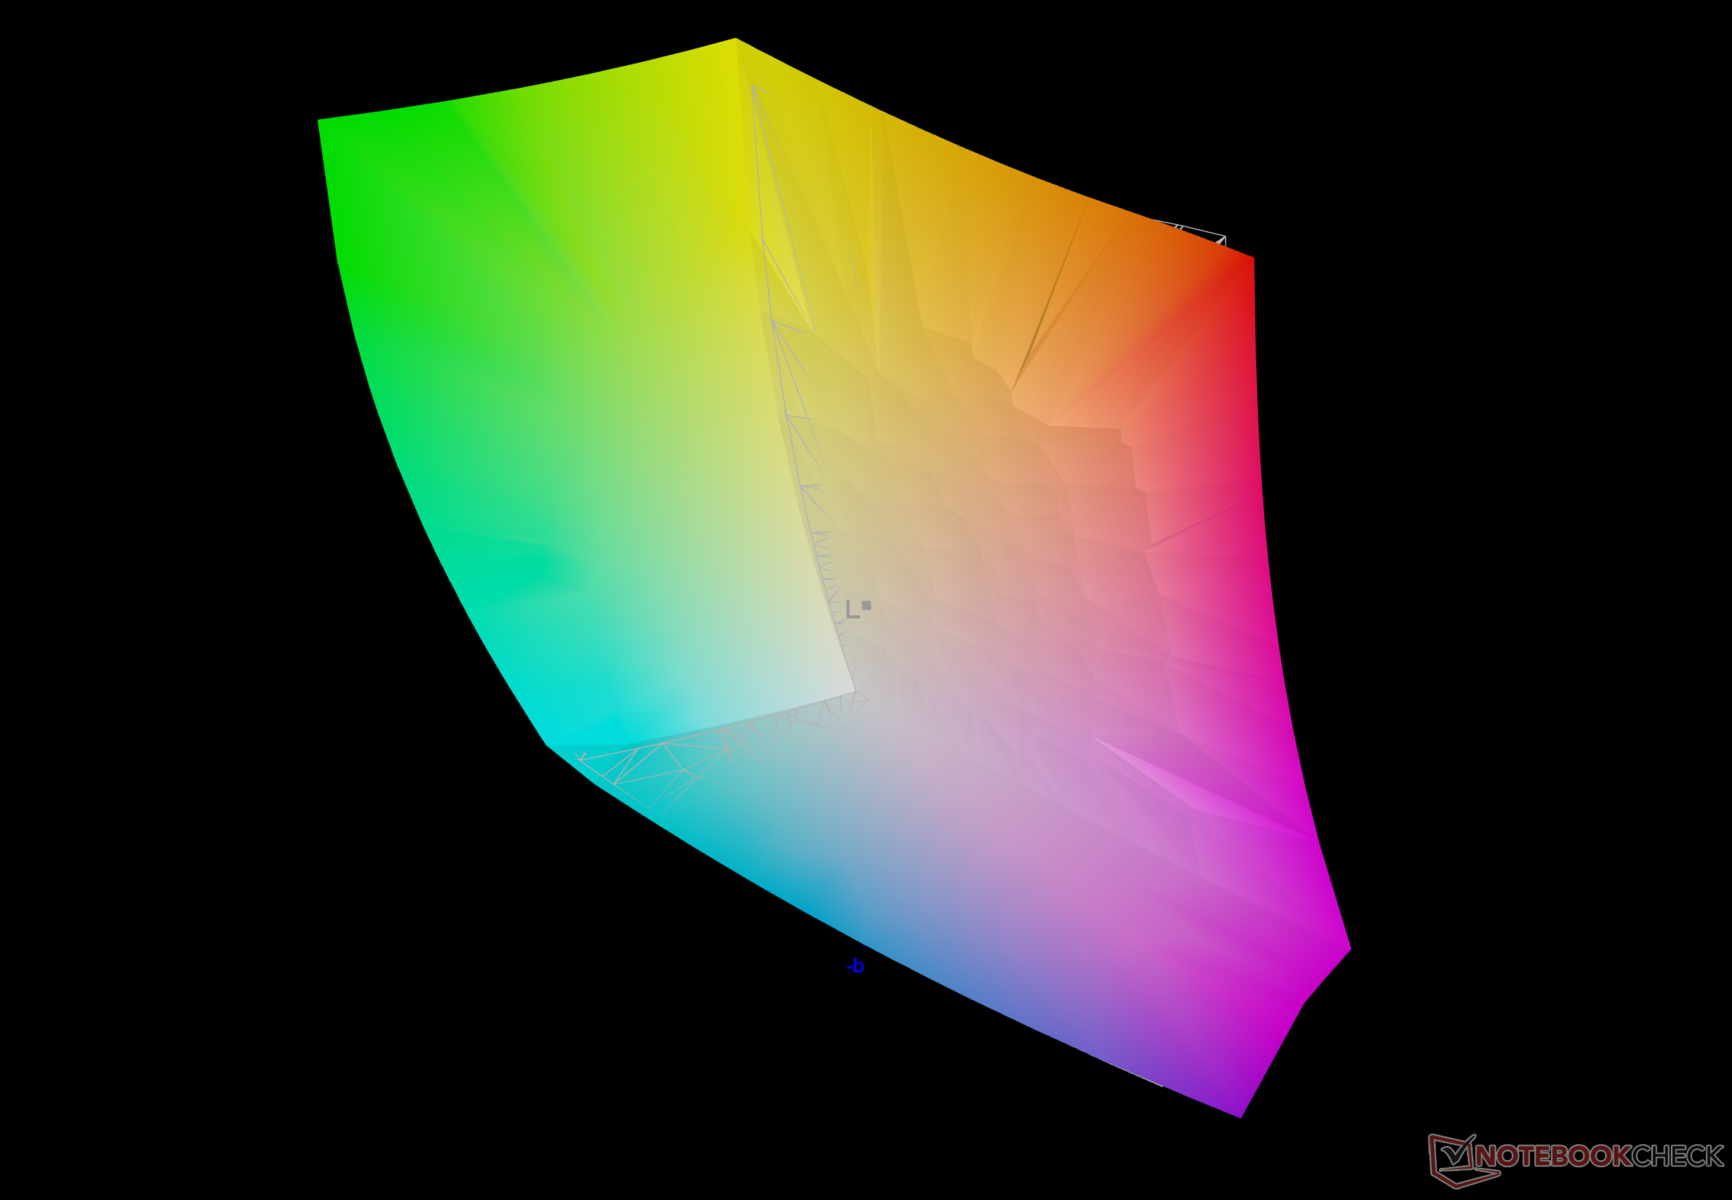
90.4% AdobeRGB 1998 (Argyll 3D)
99.9% sRGB (Argyll 3D)
99.7% Display P3 (Argyll 3D)
Gamma: 2.03
CCT: 6331 K
| MSI Titan 18 HX AI A2XWJG AU Optronics B180ZAN01.0, Mini-LED, 3840x2160, 18", 120 Hz | Aorus Master 18 AM8H NE180QDM-NM1 (BOE0C58), Mini-LED, 2560x1600, 18", 240 Hz | Asus Strix Scar 18 G835LX N180QDM-NM2, Mini-LED, 2560x1600, 18", 240 Hz | Medion Erazer Beast 18 X1 MD62731 BOEhydis NE180QDM-NZ2, IPS, 2560x1600, 18", 240 Hz | Razer Blade 16 2025 RTX 5090 ATNA60DL04-0, OLED, 2560x1600, 16", 240 Hz | MSI Titan 18 HX A14VIG AU Optronics B180ZAN01.0, Mini-LED, 3840x2400, 18", 120 Hz | |
|---|---|---|---|---|---|---|
| Display | -1% | -2% | -3% | -3% | -2% | |
| HDR Peak Brightness (cd/m²) | 1153 | |||||
| Display P3 Coverage (%) | 99.7 | 99.9 0% | 99 -1% | 97.1 -3% | 96.1 -4% | 98.1 -2% |
| sRGB Coverage (%) | 99.9 | 100 0% | 100 0% | 99.9 0% | 99.9 0% | 99.8 0% |
| AdobeRGB 1998 Coverage (%) | 90.4 | 87.7 -3% | 87.2 -4% | 84.7 -6% | 85 -6% | 86.2 -5% |
| Response Times | -47% | -18% | 44% | 69% | -222% | |
| Response Time Grey 50% / Grey 80% * (ms) | 8.8 ? | 16.4 ? -86% | 7.4 ? 16% | 5.6 ? 36% | 0.2 ? 98% | 8.6 ? 2% |
| Response Time Black / White * (ms) | 15 ? | 8.1 ? 46% | 10.4 ? 31% | 7.3 ? 51% | 0.25 ? 98% | 81.8 ? -445% |
| PWM Frequency (Hz) | 15430 ? | 1398 ? | 20610 ? | 960 ? | 2592 ? | |
| PWM Amplitude * (%) | 50 | 100 -100% | 100 -100% | 44 12% | ||
| Screen | 15% | 37% | -5% | 18% | -5% | |
| Brightness middle (cd/m²) | 704 | 438 -38% | 764 9% | 478 -32% | 391 -44% | 467.5 -34% |
| Brightness (cd/m²) | 680 | 451 -34% | 747 10% | 456 -33% | 393 -42% | 459 -32% |
| Brightness Distribution (%) | 88 | 90 2% | 93 6% | 89 1% | 98 11% | 90 2% |
| Black Level * (cd/m²) | 0.13 | 0.1 | 0.4 | |||
| Colorchecker dE 2000 * | 4.11 | 1.25 70% | 1.2 71% | 3.94 4% | 1.2 71% | 3.77 8% |
| Colorchecker dE 2000 max. * | 6.43 | 4.93 23% | 2.8 56% | 8.6 -34% | 3.2 50% | 6.12 5% |
| Colorchecker dE 2000 calibrated * | 2.5 | 0.75 70% | 2.94 -18% | |||
| Greyscale dE 2000 * | 4.9 | 1.7 65% | 1.5 69% | 5.5 -12% | 1.8 63% | 3.2 35% |
| Gamma | 2.03 108% | 2.173 101% | 2.17 101% | 2.212 99% | 2.2 100% | 2.43 91% |
| CCT | 6331 103% | 6518 100% | 6556 99% | 7059 92% | 6493 100% | 6478 100% |
| Contrast (:1) | 3369 | 7640 | 1195 | |||
| Total Average (Program / Settings) | -11% /
-5% | 6% /
14% | 12% /
4% | 28% /
26% | -76% /
-40% |
* ... smaller is better
The mini-LED panel completely covers the sRGB, Display P3 color spaces and 90% of the Adobe RGB gamut. This results in a great viewing experience and facilitates photo and video editing workflows that require expanded color spaces.
Our calibration routine using the X-Rite i1Basic Pro 3 spectrophotometer and Calman Ultimate software from Portrait Displays shows a marked improvement in Grayscale average DeltaE 2000 value from 4.9 to 1.4 and that of ColorChecker from 4.11 to 2.5.

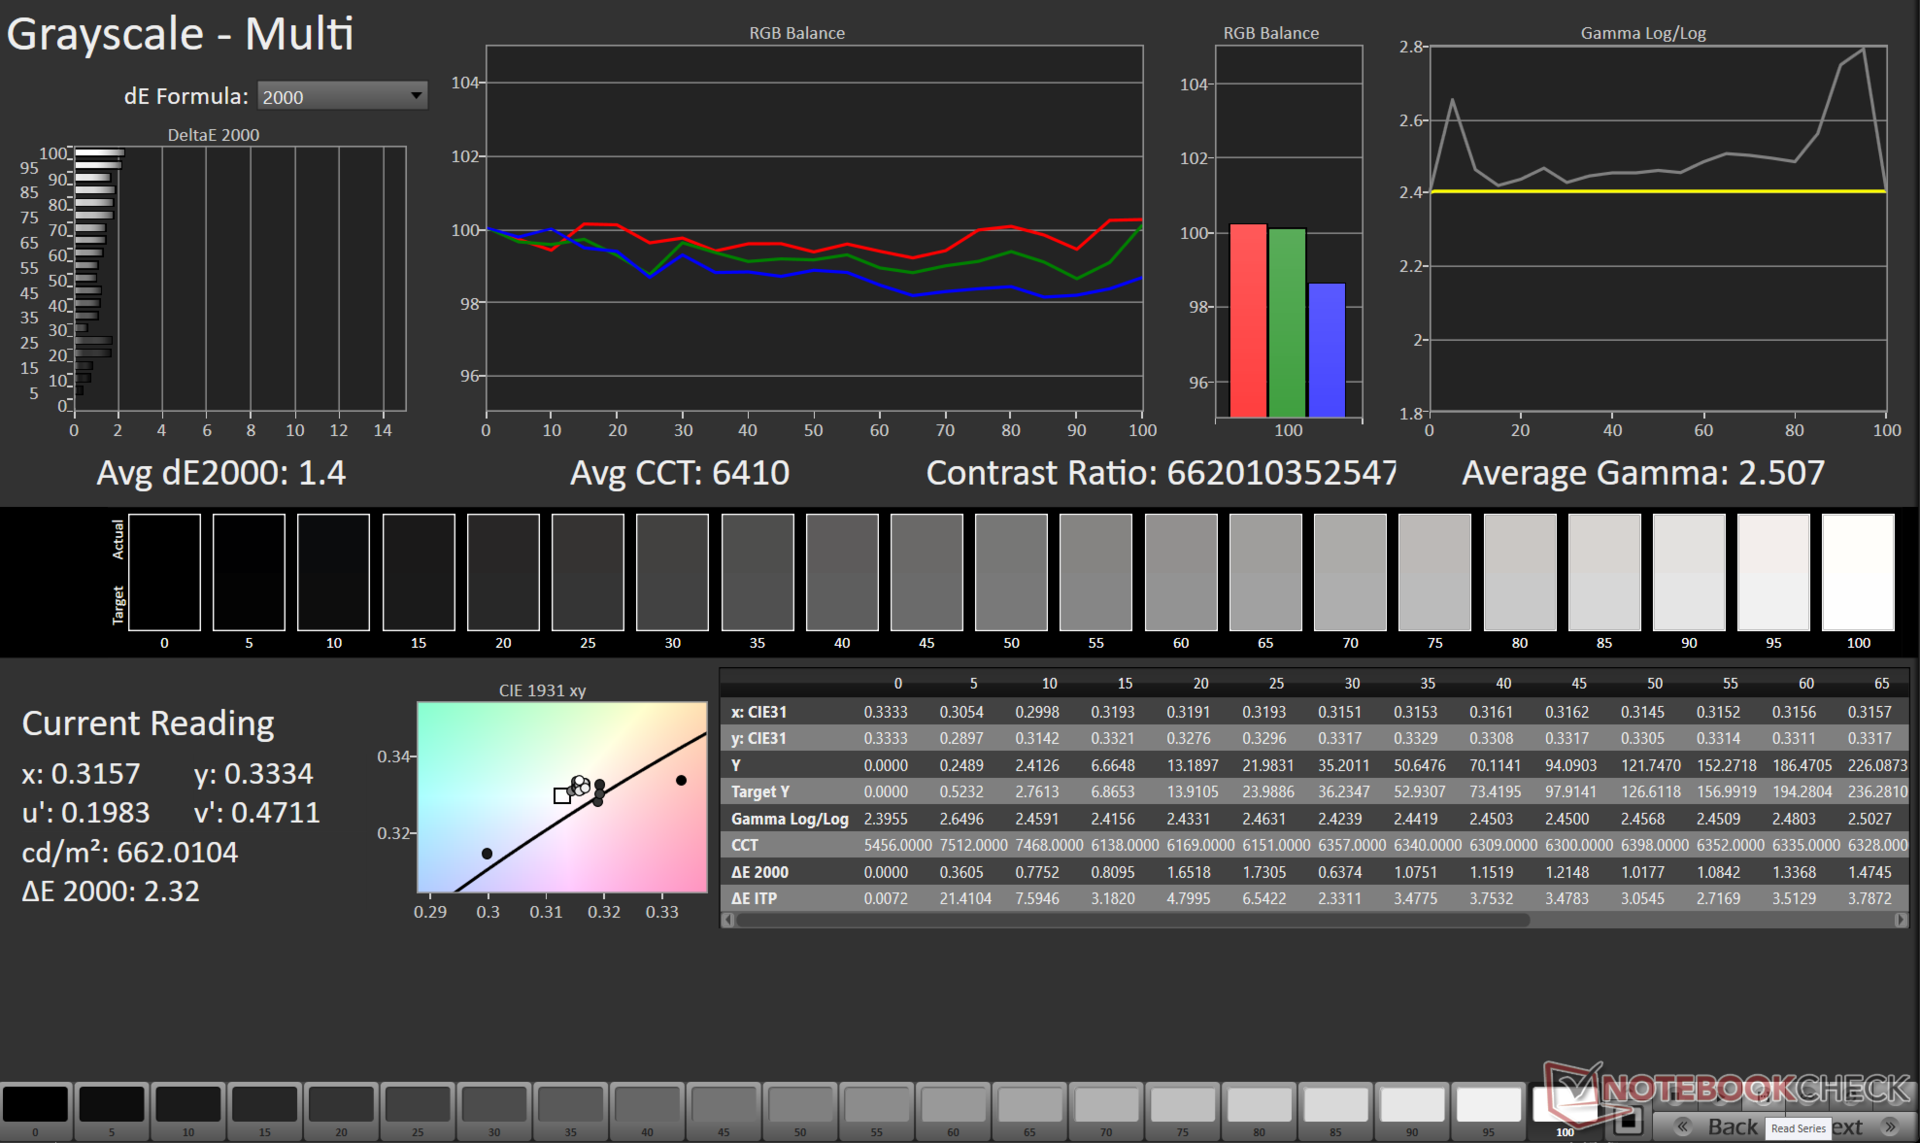


Our calibrated ICC file can be downloaded from the link above.
Display Response Times
| ↔ Response Time Black to White | ||
|---|---|---|
| 15 ms ... rise ↗ and fall ↘ combined | ↗ 8.8 ms rise |  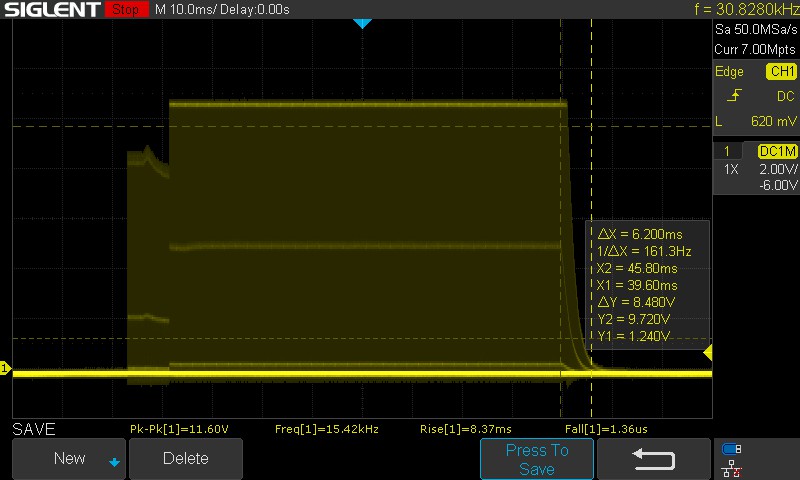 |
| ↘ 6.2 ms fall | ||
| The screen shows good response rates in our tests, but may be too slow for competitive gamers. In comparison, all tested devices range from 0.1 (minimum) to 240 (maximum) ms. » 36 % of all devices are better. This means that the measured response time is better than the average of all tested devices (19.9 ms). | ||
| ↔ Response Time 50% Grey to 80% Grey | ||
| 8.8 ms ... rise ↗ and fall ↘ combined | ↗ 3.8 ms rise |  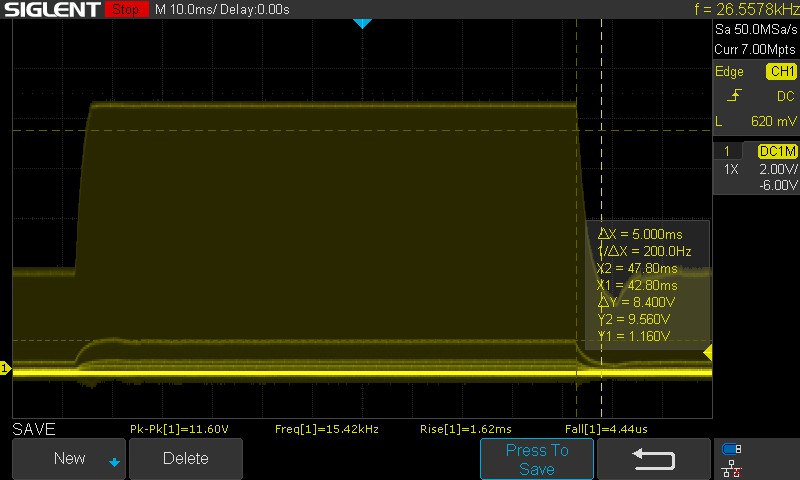 |
| ↘ 5 ms fall | ||
| The screen shows fast response rates in our tests and should be suited for gaming. In comparison, all tested devices range from 0.165 (minimum) to 636 (maximum) ms. » 22 % of all devices are better. This means that the measured response time is better than the average of all tested devices (31.1 ms). | ||
We had to manually estimate the response times due to the high background PWM characteristic of mini-LED panels.
The panel uses overdrive by default. Disabling overdrive increases the 50% grey to 80% grey response times from 8.8 ms to 12.6 ms.
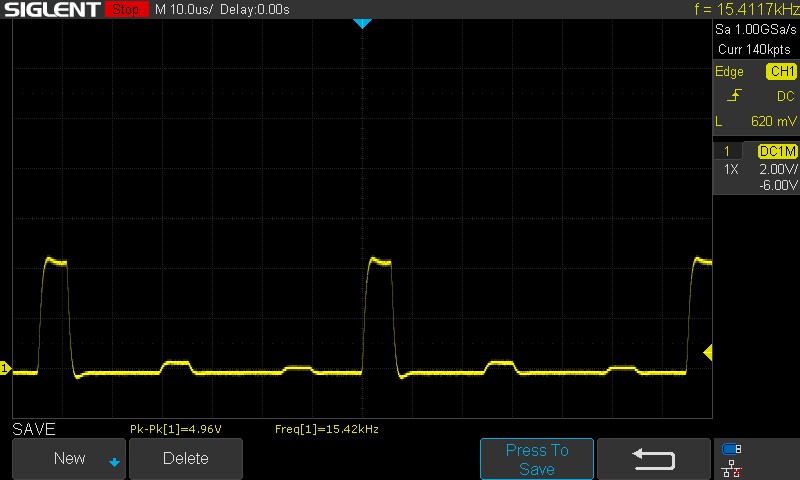
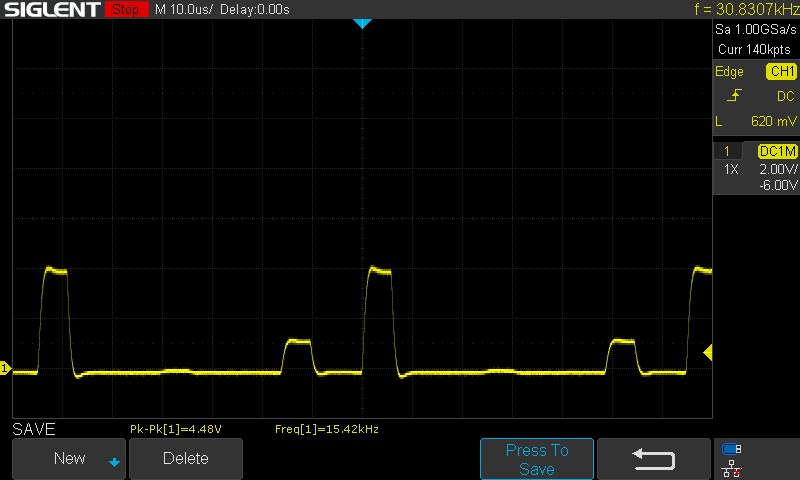
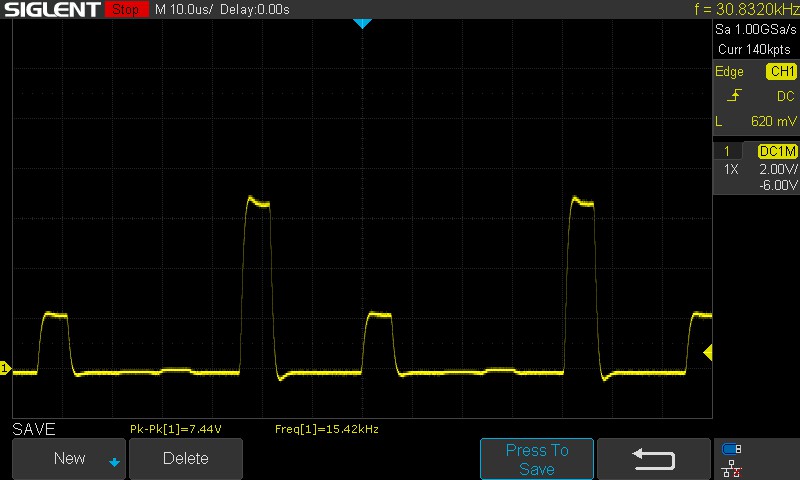
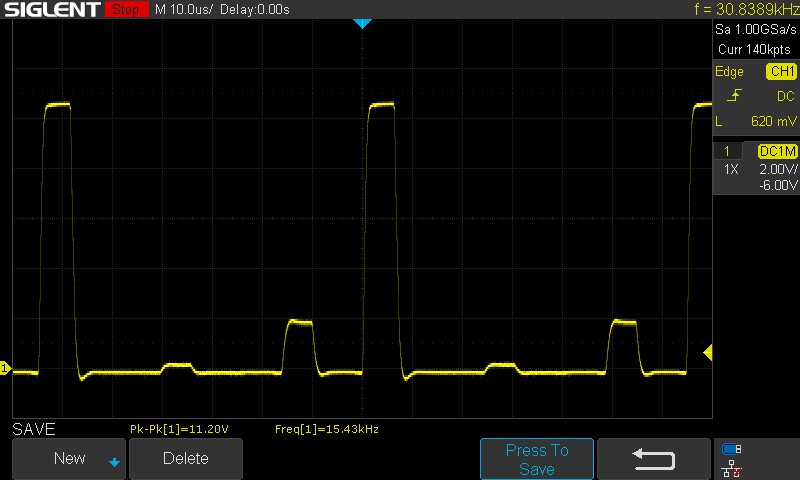
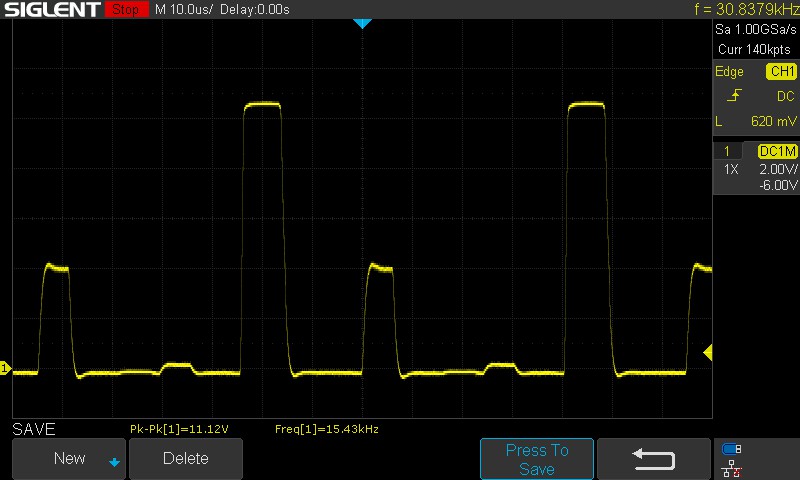
Screen Flickering / PWM (Pulse-Width Modulation)
| Screen flickering / PWM detected | 15430 Hz Amplitude: 50 % | ≤ 100 % brightness setting |  |
The display backlight flickers at 15430 Hz (worst case, e.g., utilizing PWM) Flickering detected at a brightness setting of 100 % and below. There should be no flickering or PWM above this brightness setting. The frequency of 15430 Hz is quite high, so most users sensitive to PWM should not notice any flickering. In comparison: 52 % of all tested devices do not use PWM to dim the display. If PWM was detected, an average of 7794 (minimum: 5 - maximum: 343500) Hz was measured. | |||
The detected PWM frequency remains at a high 15.42 kHz across all tested brightness levels.

For more information, check out our primer on "Why PWM is such a headache". Our PWM Ranking table provides a list of measured PWM across all reviewed devices.
The bright display lends itself to legible viewing outdoors. Viewing angles are quite stable with only minor loss of brightness at the extremes.

Performance: Flagship Core Ultra 9 285HX is virtually indistinguishable from the Core Ultra 9 275HX
MSI offers the Titan 18 HX AI A2XWJG in two SKUs. Both offer the same Intel Core Ultra 9 285HX and Nvidia GeForce RTX 5090 Laptop combination and differ only in terms of max memory configured (48 GBx2 or 32 GBx2).
Testing Conditions
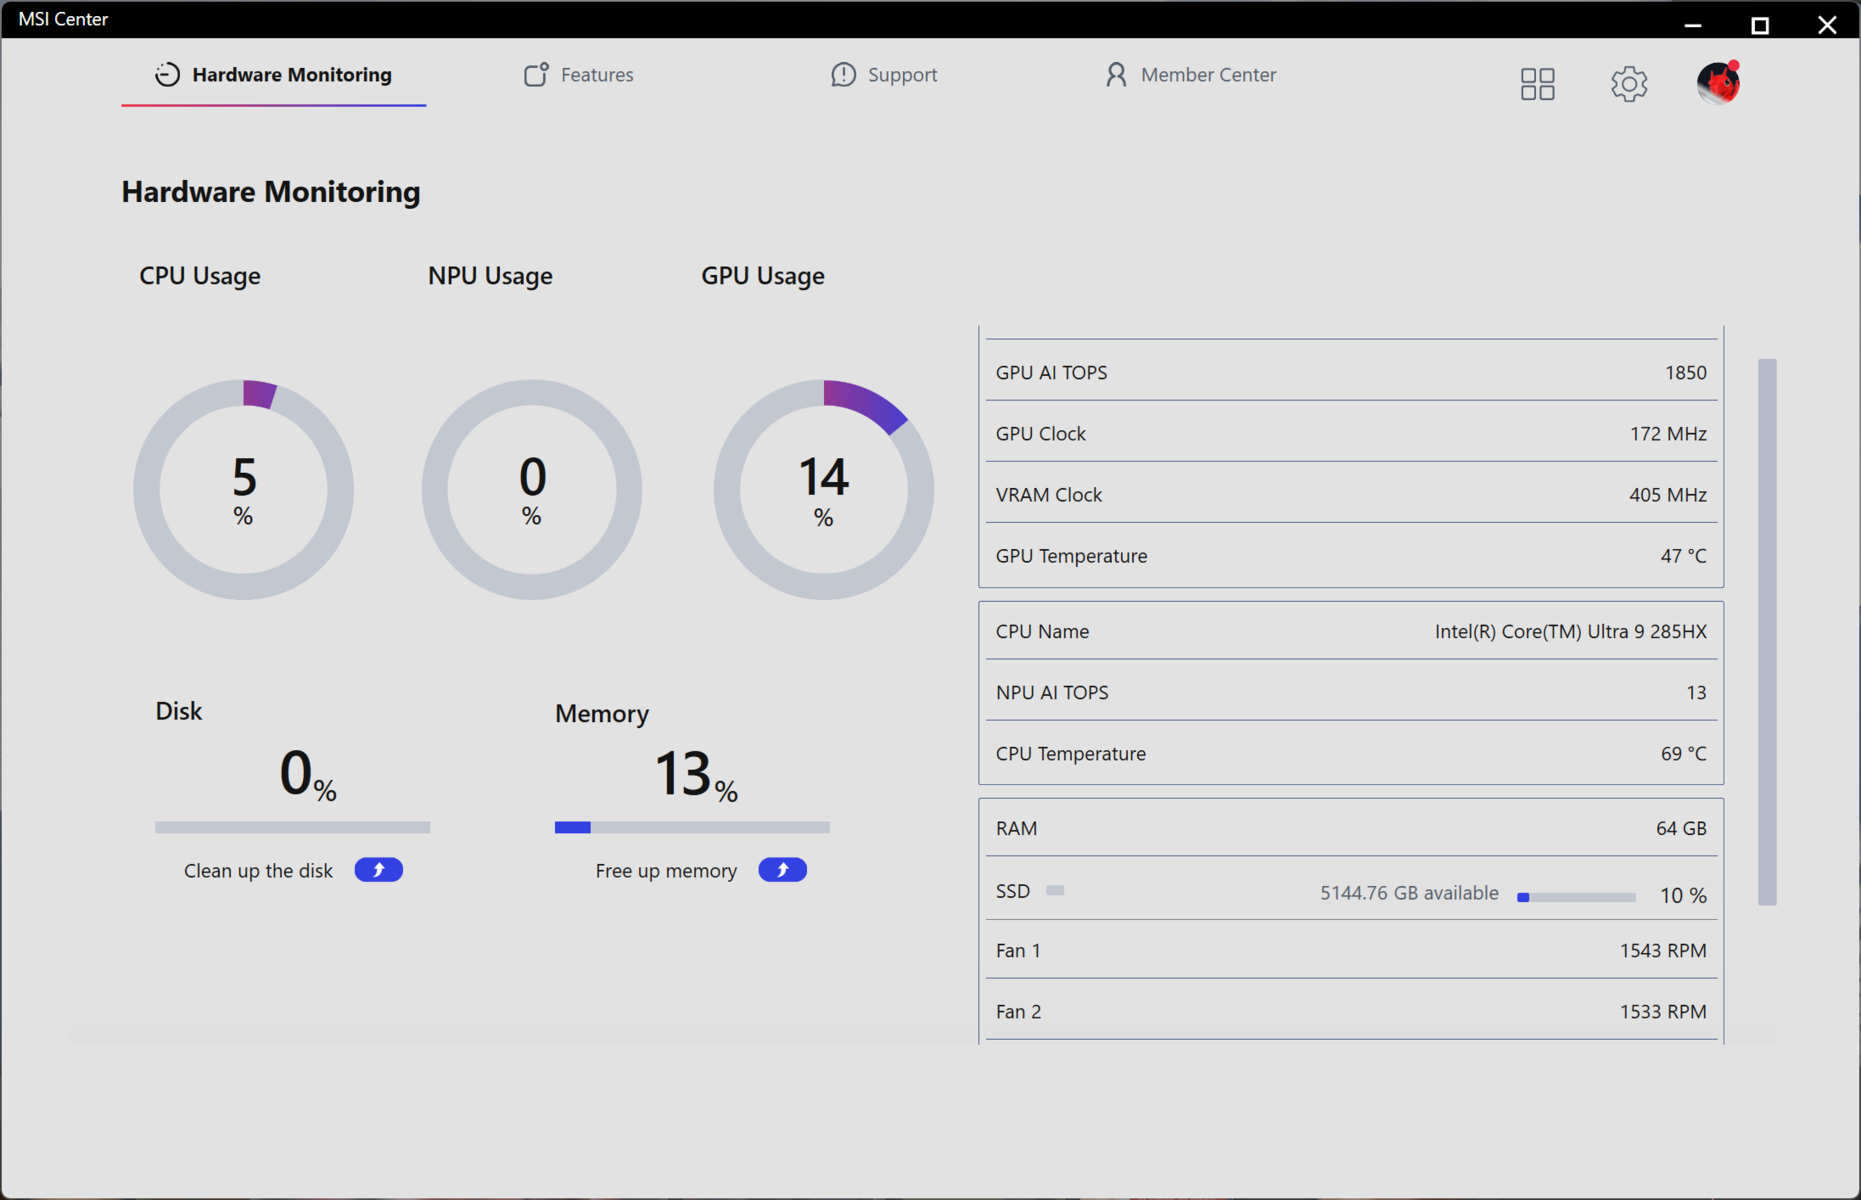
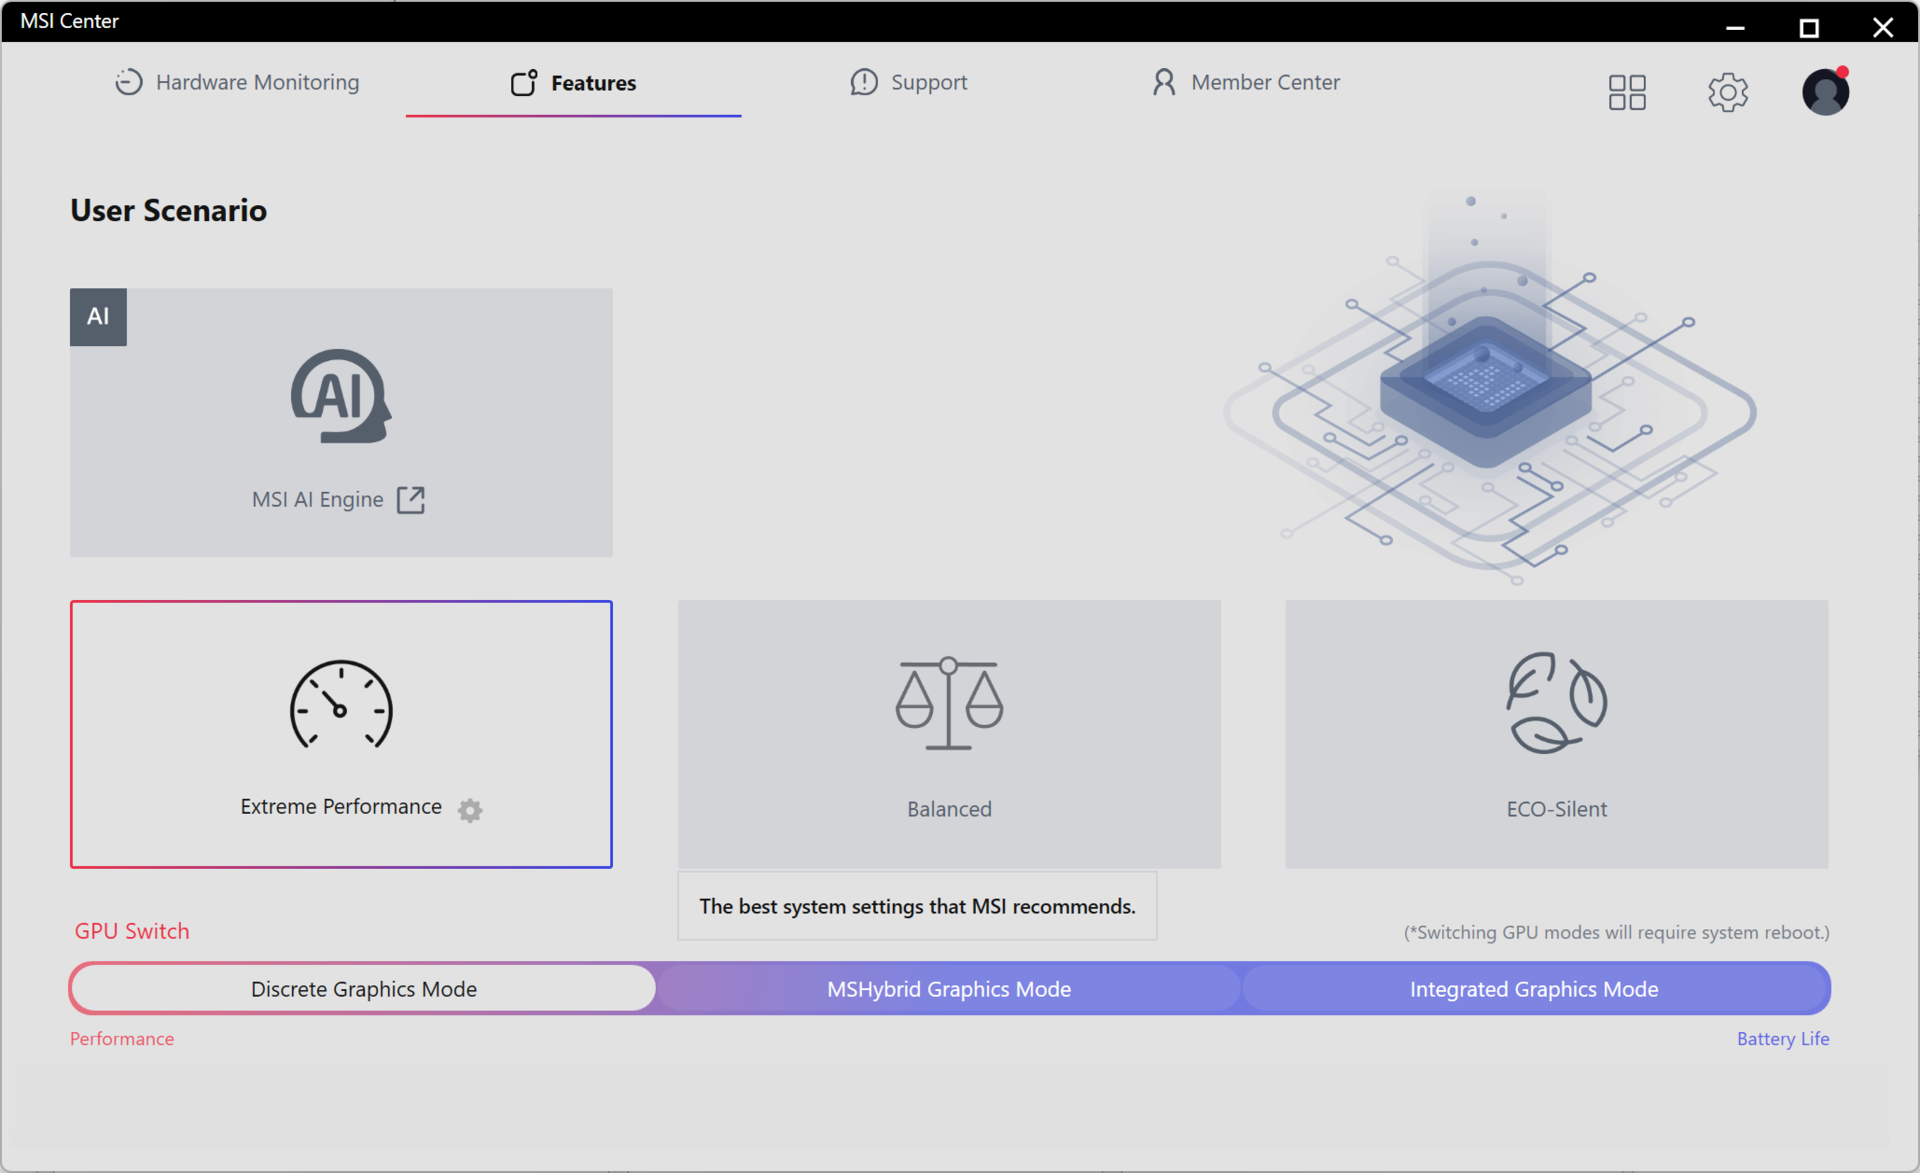
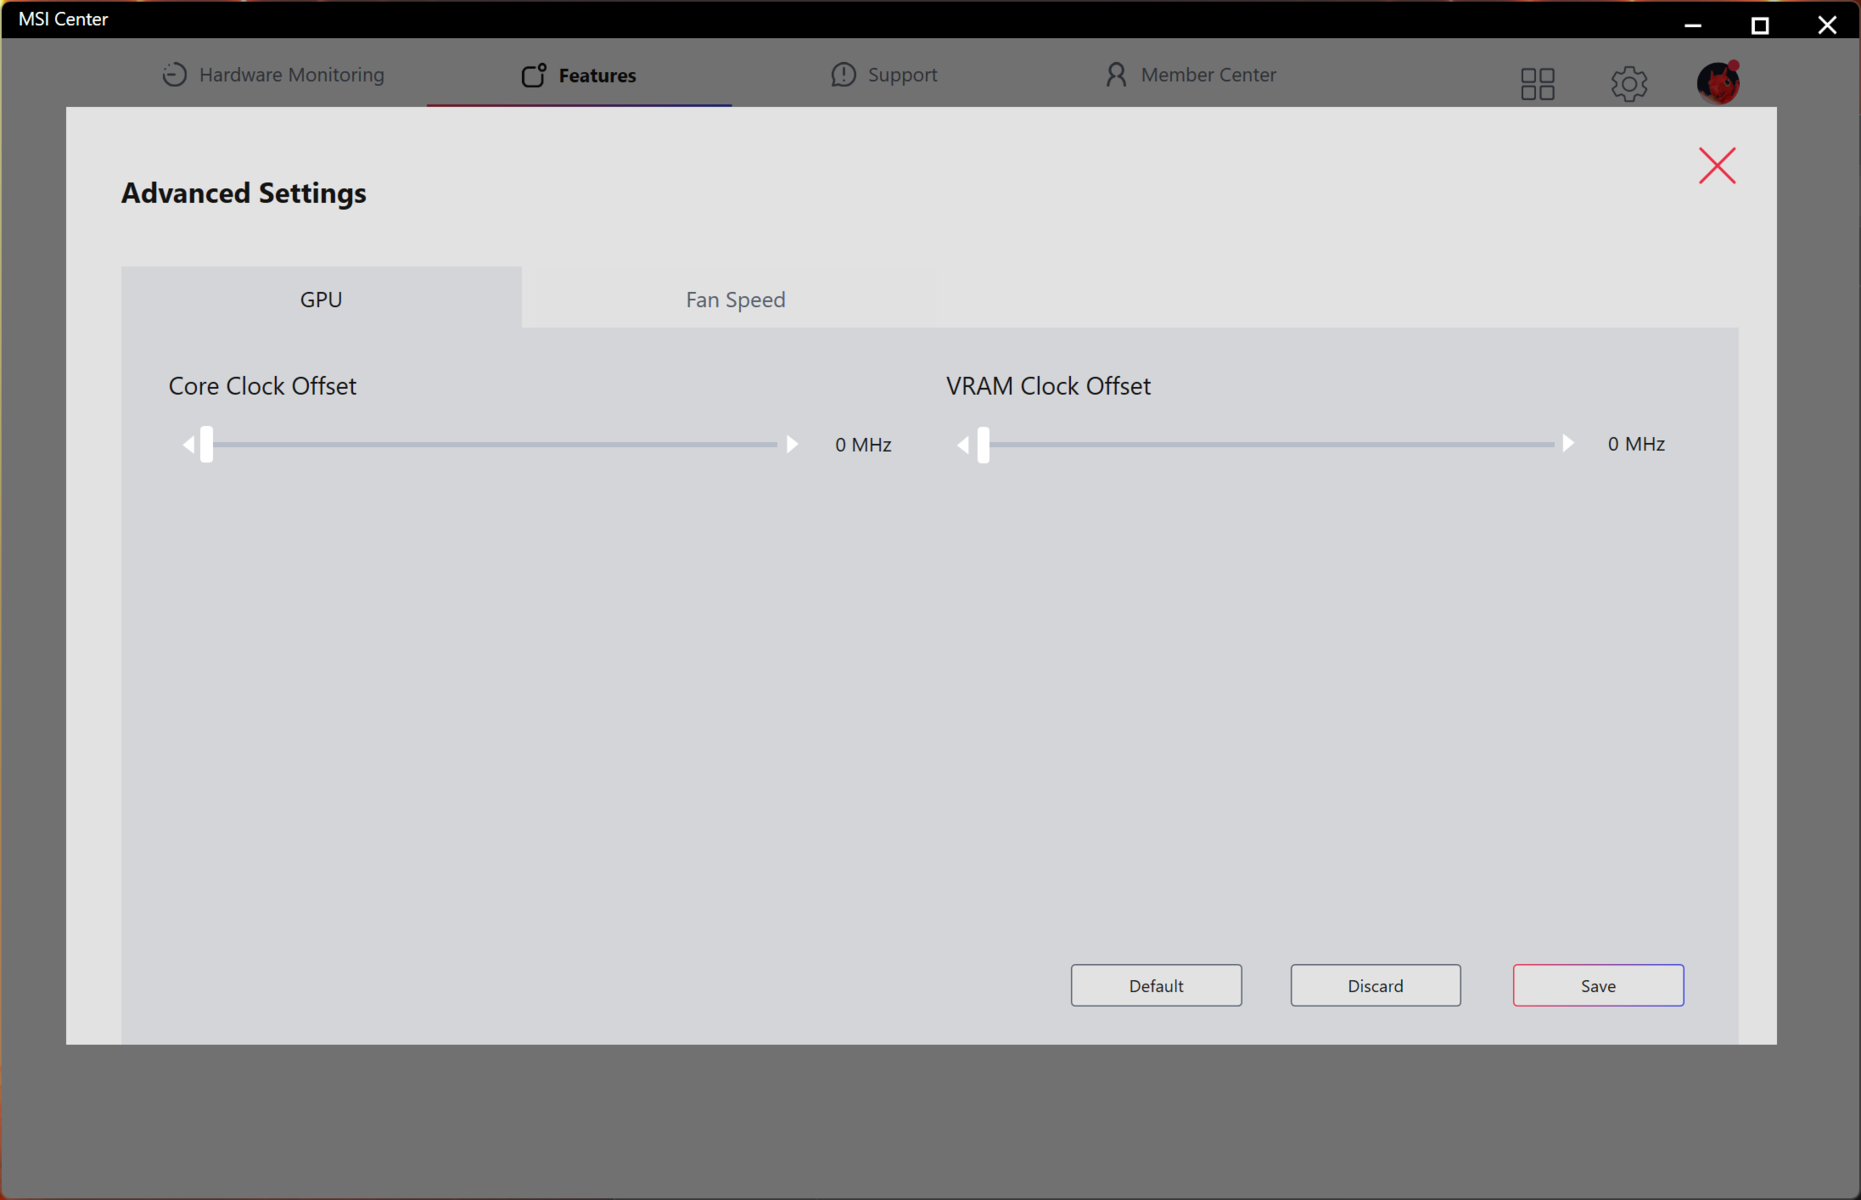
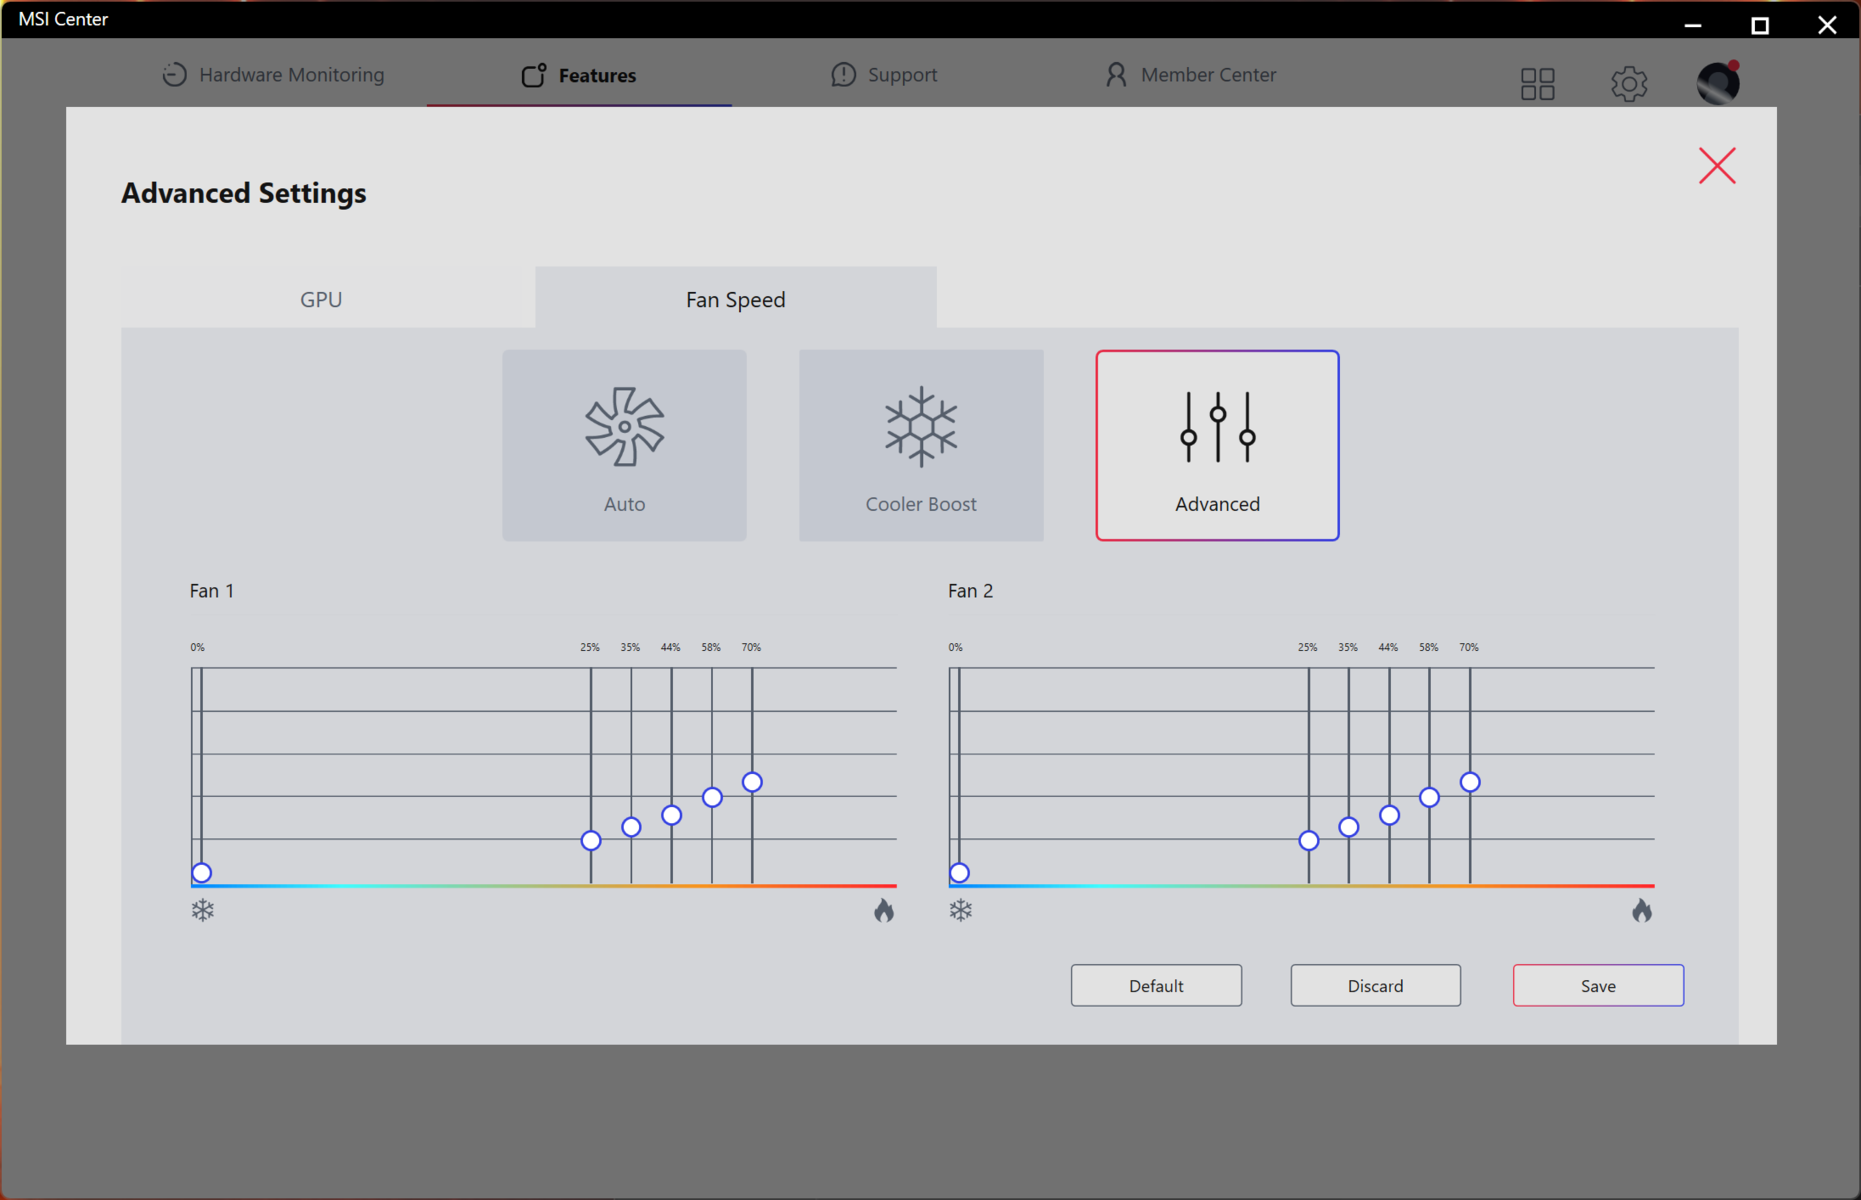
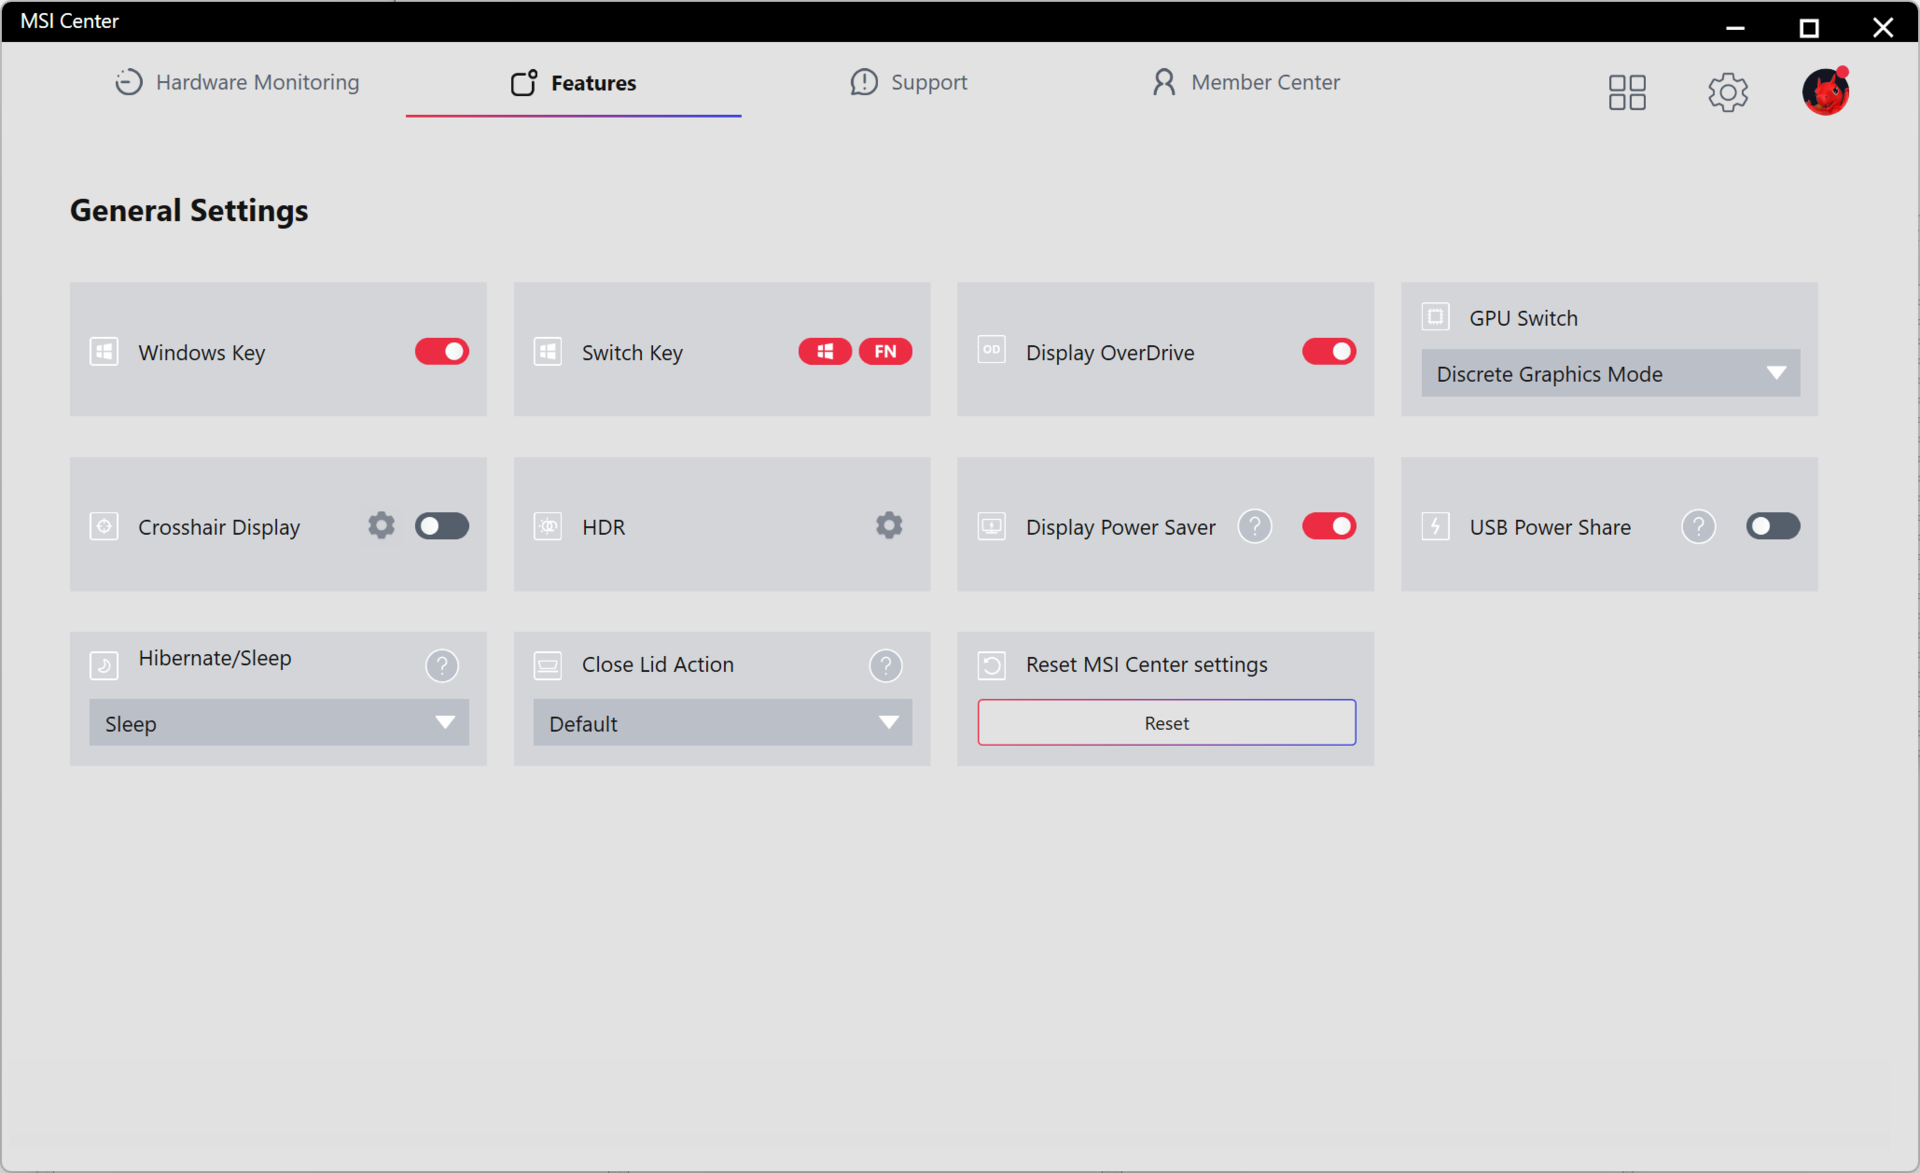
MSI Center provides a centralized interface for configuring the Titan 18 HX AI's performance. We had some initial hiccups in getting the software to initialize, but a few uninstalls and reinstalls did the trick.
We used the Extreme Performance mode for all benchmarks and the ECO-Silent mode for battery tests.
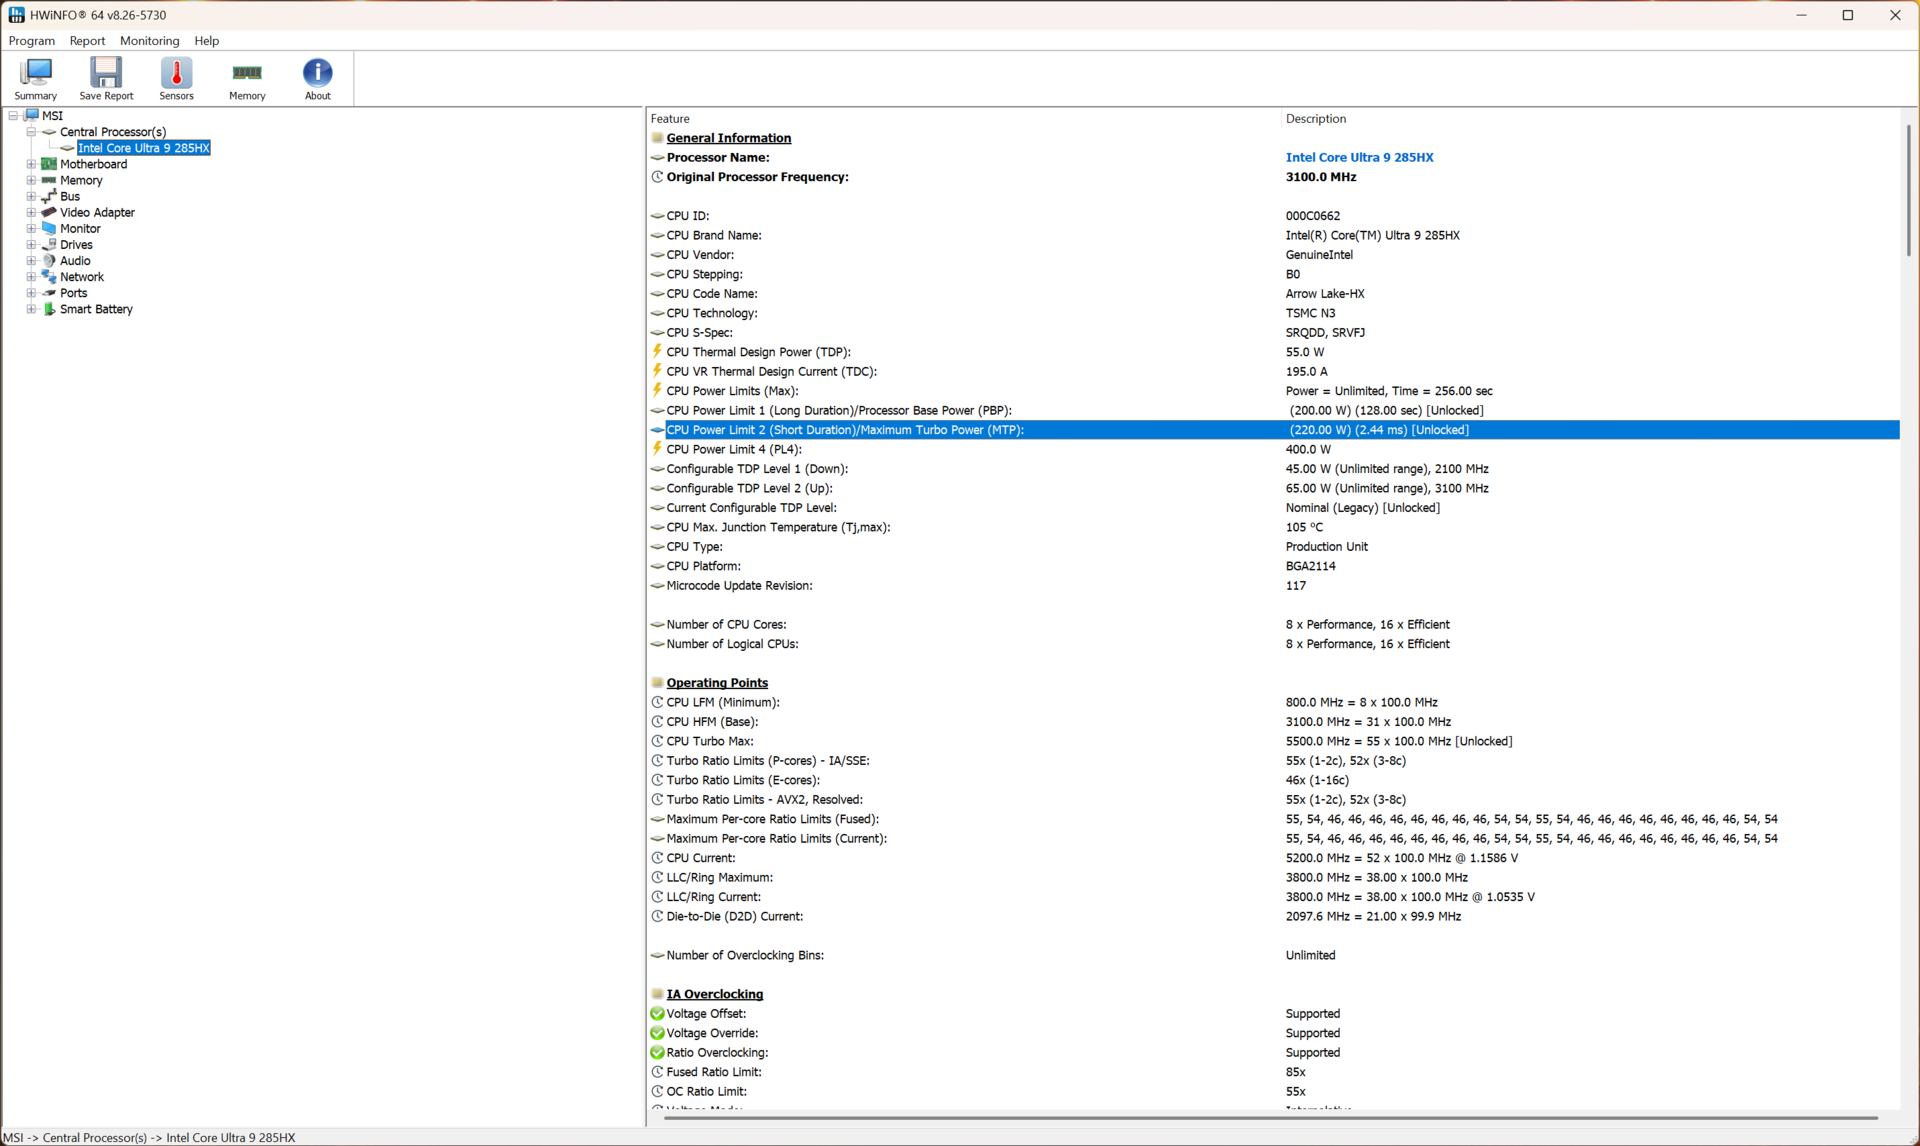
| Performance mode | PL1 (PBP) / Tau | PL2 (MTP) / Tau | GPU TGP | Cinebench R15 Multi score | Cinebench R15 Multi score (30 loops) |
|---|---|---|---|---|---|
| ECO-Silent | 15 W / 128 s | 15 W / 2.44 ms | 96 W | 660 (-88.5%) | 683 (-87.97%) |
| MSI AI Engine | 140 W / 128 s | 220 W / 2.44 ms | 150 W | 5744 (-0.27%) | 5600 (-1.37%) |
| Balanced | 140 W / 128 s | 220 W / 2.44 ms | 150 W | 5726 (-0.59%) | 5605 (-1.28%) |
| Extreme Performance | 200 W / 128 s | 220 W / 2.44 ms | 175 W | 5760 (100%) | 5678 (100%) |
| On Battery | 55 W / 128 s | 55 W / 2.44 ms | 24 W | 1648 (-71%) | 1404 (-75%) |
Processor
The Core Ultra 9 285HX is nearly identical to the Core Ultra 9 275HX, save for 100 MHz higher P-core clocks.
In single-core Cinebench and Geekbench tests, the Titan 18 HX AI trails Core Ultra 9 275HX-powered laptops like the Schenker XMG Neo 16 E25 and Asus ROG Strix Scar 18, although it compensates in multi-core performance.
The Arrow Lake-HX-based Titan 18 HX AI is 17% faster overall compared to last year's iteration based on the Intel Core i9-14900HX, while tying in with the XMG Neo 16 A25's AMD Ryzen 9 9955HX3D in cumulative CPU performance.
No CPU throttling was observed during a Cinebench R15 multi-core loop, save for a minor dip during the 8th loop of the run.
On battery, the Core Ultra 9 285HX runs at a 55 W PL1=PL2. This results in Cinebench R23 multi-core performance nose-diving by 70.8% while the single-core score dip is more manageable at 13.8%.
Cinebench R15 Multi Loop
Cinebench R23: Multi Core | Single Core
Cinebench R20: CPU (Multi Core) | CPU (Single Core)
Cinebench R15: CPU Multi 64Bit | CPU Single 64Bit
Blender: v2.79 BMW27 CPU
7-Zip 18.03: 7z b 4 | 7z b 4 -mmt1
Geekbench 6.7: Multi-Core | Single-Core
Geekbench 5.5: Multi-Core | Single-Core
HWBOT x265 Benchmark v2.2: 4k Preset
LibreOffice : 20 Documents To PDF
R Benchmark 2.5: Overall mean
| CPU Performance rating | |
| Schenker XMG Neo 16 E25 RTX 5090 Laptop | |
| Schenker XMG Neo 16 A25 5090 | |
| Asus Strix Scar 18 G835LX | |
| MSI Titan 18 HX AI A2XWJG | |
| Asus ROG Strix Scar 16 2025 | |
| Average Intel Core Ultra 9 285HX | |
| Aorus Master 18 AM8H | |
| Medion Erazer Beast 18 X1 MD62731 | |
| MSI Titan 18 HX A14VIG | |
| Razer Blade 16 2025 RTX 5090 | |
| Average of class Gaming | |
| Cinebench R23 / Multi Core | |
| Schenker XMG Neo 16 E25 RTX 5090 Laptop | |
| MSI Titan 18 HX AI A2XWJG | |
| Schenker XMG Neo 16 A25 5090 | |
| Asus Strix Scar 18 G835LX | |
| Asus ROG Strix Scar 16 2025 | |
| Average Intel Core Ultra 9 285HX (34955 - 40117, n=6) | |
| Aorus Master 18 AM8H | |
| MSI Titan 18 HX A14VIG | |
| Medion Erazer Beast 18 X1 MD62731 | |
| Average of class Gaming (10488 - 40970, n=112, last 2 years) | |
| Razer Blade 16 2025 RTX 5090 | |
| Cinebench R23 / Single Core | |
| Schenker XMG Neo 16 E25 RTX 5090 Laptop | |
| Medion Erazer Beast 18 X1 MD62731 | |
| Asus Strix Scar 18 G835LX | |
| MSI Titan 18 HX AI A2XWJG | |
| Average Intel Core Ultra 9 285HX (2057 - 2303, n=6) | |
| Schenker XMG Neo 16 A25 5090 | |
| MSI Titan 18 HX A14VIG | |
| Asus ROG Strix Scar 16 2025 | |
| Aorus Master 18 AM8H | |
| Razer Blade 16 2025 RTX 5090 | |
| Average of class Gaming (1166 - 2356, n=112, last 2 years) | |
| Cinebench R20 / CPU (Multi Core) | |
| Schenker XMG Neo 16 E25 RTX 5090 Laptop | |
| MSI Titan 18 HX AI A2XWJG | |
| Asus Strix Scar 18 G835LX | |
| Schenker XMG Neo 16 A25 5090 | |
| Asus ROG Strix Scar 16 2025 | |
| Average Intel Core Ultra 9 285HX (13152 - 15751, n=6) | |
| Aorus Master 18 AM8H | |
| Medion Erazer Beast 18 X1 MD62731 | |
| MSI Titan 18 HX A14VIG | |
| Average of class Gaming (4029 - 16108, n=111, last 2 years) | |
| Razer Blade 16 2025 RTX 5090 | |
| Cinebench R20 / CPU (Single Core) | |
| Schenker XMG Neo 16 E25 RTX 5090 Laptop | |
| Asus Strix Scar 18 G835LX | |
| Medion Erazer Beast 18 X1 MD62731 | |
| Schenker XMG Neo 16 A25 5090 | |
| Asus ROG Strix Scar 16 2025 | |
| MSI Titan 18 HX AI A2XWJG | |
| Average Intel Core Ultra 9 285HX (799 - 884, n=6) | |
| MSI Titan 18 HX A14VIG | |
| Aorus Master 18 AM8H | |
| Razer Blade 16 2025 RTX 5090 | |
| Average of class Gaming (442 - 895, n=111, last 2 years) | |
| Cinebench R15 / CPU Multi 64Bit | |
| Schenker XMG Neo 16 E25 RTX 5090 Laptop | |
| MSI Titan 18 HX AI A2XWJG | |
| Asus Strix Scar 18 G835LX | |
| Schenker XMG Neo 16 A25 5090 | |
| Asus ROG Strix Scar 16 2025 | |
| Average Intel Core Ultra 9 285HX (5427 - 6232, n=6) | |
| Aorus Master 18 AM8H | |
| Medion Erazer Beast 18 X1 MD62731 | |
| MSI Titan 18 HX A14VIG | |
| Average of class Gaming (1578 - 6271, n=111, last 2 years) | |
| Razer Blade 16 2025 RTX 5090 | |
| Cinebench R15 / CPU Single 64Bit | |
| Asus Strix Scar 18 G835LX | |
| Asus ROG Strix Scar 16 2025 | |
| Schenker XMG Neo 16 E25 RTX 5090 Laptop | |
| Medion Erazer Beast 18 X1 MD62731 | |
| Schenker XMG Neo 16 A25 5090 | |
| Aorus Master 18 AM8H | |
| MSI Titan 18 HX AI A2XWJG | |
| Average Intel Core Ultra 9 285HX (307 - 340, n=6) | |
| Razer Blade 16 2025 RTX 5090 | |
| MSI Titan 18 HX A14VIG | |
| Average of class Gaming (188.8 - 343, n=111, last 2 years) | |
| Blender / v2.79 BMW27 CPU | |
| Average of class Gaming (80 - 330, n=109, last 2 years) | |
| Razer Blade 16 2025 RTX 5090 | |
| Medion Erazer Beast 18 X1 MD62731 | |
| MSI Titan 18 HX A14VIG | |
| Aorus Master 18 AM8H | |
| Average Intel Core Ultra 9 285HX (83 - 103, n=6) | |
| Asus Strix Scar 18 G835LX | |
| Asus ROG Strix Scar 16 2025 | |
| MSI Titan 18 HX AI A2XWJG | |
| Schenker XMG Neo 16 E25 RTX 5090 Laptop | |
| Schenker XMG Neo 16 A25 5090 | |
| 7-Zip 18.03 / 7z b 4 | |
| Schenker XMG Neo 16 A25 5090 | |
| MSI Titan 18 HX AI A2XWJG | |
| Schenker XMG Neo 16 E25 RTX 5090 Laptop | |
| Asus Strix Scar 18 G835LX | |
| MSI Titan 18 HX A14VIG | |
| Asus ROG Strix Scar 16 2025 | |
| Average Intel Core Ultra 9 285HX (99260 - 128778, n=6) | |
| Aorus Master 18 AM8H | |
| Medion Erazer Beast 18 X1 MD62731 | |
| Average of class Gaming (33491 - 148086, n=110, last 2 years) | |
| Razer Blade 16 2025 RTX 5090 | |
| 7-Zip 18.03 / 7z b 4 -mmt1 | |
| Schenker XMG Neo 16 A25 5090 | |
| Schenker XMG Neo 16 E25 RTX 5090 Laptop | |
| Medion Erazer Beast 18 X1 MD62731 | |
| Asus Strix Scar 18 G835LX | |
| MSI Titan 18 HX AI A2XWJG | |
| Aorus Master 18 AM8H | |
| Average Intel Core Ultra 9 285HX (6422 - 6822, n=6) | |
| Asus ROG Strix Scar 16 2025 | |
| MSI Titan 18 HX A14VIG | |
| Average of class Gaming (4199 - 7436, n=110, last 2 years) | |
| Razer Blade 16 2025 RTX 5090 | |
| Geekbench 6.7 / Multi-Core | |
| MSI Titan 18 HX AI A2XWJG | |
| Asus Strix Scar 18 G835LX | |
| Asus ROG Strix Scar 16 2025 | |
| Schenker XMG Neo 16 E25 RTX 5090 Laptop | |
| Schenker XMG Neo 16 A25 5090 | |
| Average Intel Core Ultra 9 285HX (18212 - 22104, n=6) | |
| Aorus Master 18 AM8H | |
| Medion Erazer Beast 18 X1 MD62731 | |
| MSI Titan 18 HX A14VIG | |
| Average of class Gaming (6625 - 22104, n=111, last 2 years) | |
| Razer Blade 16 2025 RTX 5090 | |
| Geekbench 6.7 / Single-Core | |
| Schenker XMG Neo 16 A25 5090 | |
| Asus Strix Scar 18 G835LX | |
| Medion Erazer Beast 18 X1 MD62731 | |
| Schenker XMG Neo 16 E25 RTX 5090 Laptop | |
| MSI Titan 18 HX AI A2XWJG | |
| Asus ROG Strix Scar 16 2025 | |
| Aorus Master 18 AM8H | |
| Average Intel Core Ultra 9 285HX (2907 - 3088, n=6) | |
| Razer Blade 16 2025 RTX 5090 | |
| MSI Titan 18 HX A14VIG | |
| Average of class Gaming (1490 - 3259, n=111, last 2 years) | |
| Geekbench 5.5 / Multi-Core | |
| MSI Titan 18 HX AI A2XWJG | |
| Asus Strix Scar 18 G835LX | |
| Schenker XMG Neo 16 E25 RTX 5090 Laptop | |
| Asus ROG Strix Scar 16 2025 | |
| Schenker XMG Neo 16 A25 5090 | |
| Average Intel Core Ultra 9 285HX (18992 - 27010, n=6) | |
| Aorus Master 18 AM8H | |
| MSI Titan 18 HX A14VIG | |
| Medion Erazer Beast 18 X1 MD62731 | |
| Average of class Gaming (6460 - 27010, n=110, last 2 years) | |
| Razer Blade 16 2025 RTX 5090 | |
| Geekbench 5.5 / Single-Core | |
| Schenker XMG Neo 16 A25 5090 | |
| Asus Strix Scar 18 G835LX | |
| Schenker XMG Neo 16 E25 RTX 5090 Laptop | |
| Medion Erazer Beast 18 X1 MD62731 | |
| Asus ROG Strix Scar 16 2025 | |
| MSI Titan 18 HX AI A2XWJG | |
| Aorus Master 18 AM8H | |
| Average Intel Core Ultra 9 285HX (2121 - 2232, n=6) | |
| Razer Blade 16 2025 RTX 5090 | |
| MSI Titan 18 HX A14VIG | |
| Average of class Gaming (986 - 2474, n=110, last 2 years) | |
| HWBOT x265 Benchmark v2.2 / 4k Preset | |
| MSI Titan 18 HX AI A2XWJG | |
| Schenker XMG Neo 16 E25 RTX 5090 Laptop | |
| Schenker XMG Neo 16 A25 5090 | |
| Asus Strix Scar 18 G835LX | |
| Asus ROG Strix Scar 16 2025 | |
| Average Intel Core Ultra 9 285HX (35.3 - 44.3, n=6) | |
| Aorus Master 18 AM8H | |
| Medion Erazer Beast 18 X1 MD62731 | |
| MSI Titan 18 HX A14VIG | |
| Razer Blade 16 2025 RTX 5090 | |
| Average of class Gaming (11.5 - 44.3, n=110, last 2 years) | |
| LibreOffice / 20 Documents To PDF | |
| Aorus Master 18 AM8H | |
| Average of class Gaming (19 - 88.8, n=110, last 2 years) | |
| Medion Erazer Beast 18 X1 MD62731 | |
| MSI Titan 18 HX AI A2XWJG | |
| Razer Blade 16 2025 RTX 5090 | |
| Schenker XMG Neo 16 A25 5090 | |
| MSI Titan 18 HX A14VIG | |
| Average Intel Core Ultra 9 285HX (38 - 49.1, n=6) | |
| Asus Strix Scar 18 G835LX | |
| Schenker XMG Neo 16 E25 RTX 5090 Laptop | |
| Asus ROG Strix Scar 16 2025 | |
| R Benchmark 2.5 / Overall mean | |
| Average of class Gaming (0.3439 - 0.759, n=111, last 2 years) | |
| Average Intel Core Ultra 9 285HX (0.4012 - 0.4444, n=6) | |
| Asus ROG Strix Scar 16 2025 | |
| Aorus Master 18 AM8H | |
| Schenker XMG Neo 16 E25 RTX 5090 Laptop | |
| MSI Titan 18 HX AI A2XWJG | |
| Medion Erazer Beast 18 X1 MD62731 | |
| Razer Blade 16 2025 RTX 5090 | |
| Asus Strix Scar 18 G835LX | |
| MSI Titan 18 HX A14VIG | |
| Schenker XMG Neo 16 A25 5090 | |
* ... smaller is better
AIDA64: FP32 Ray-Trace | FPU Julia | CPU SHA3 | CPU Queen | FPU SinJulia | FPU Mandel | CPU AES | CPU ZLib | FP64 Ray-Trace | CPU PhotoWorxx
| Performance rating | |
| Schenker XMG Neo 16 A25 5090 | |
| MSI Titan 18 HX AI A2XWJG | |
| Schenker XMG Neo 16 E25 RTX 5090 Laptop | |
| Asus Strix Scar 18 G835LX | |
| Asus ROG Strix Scar 16 2025 | |
| Average Intel Core Ultra 9 285HX | |
| Aorus Master 18 AM8H | |
| MSI Titan 18 HX A14VIG | |
| Razer Blade 16 2025 RTX 5090 | |
| Medion Erazer Beast 18 X1 MD62731 | |
| Average of class Gaming | |
| AIDA64 / FP32 Ray-Trace | |
| Schenker XMG Neo 16 A25 5090 | |
| MSI Titan 18 HX AI A2XWJG | |
| Schenker XMG Neo 16 E25 RTX 5090 Laptop | |
| Asus ROG Strix Scar 16 2025 | |
| Asus Strix Scar 18 G835LX | |
| Razer Blade 16 2025 RTX 5090 | |
| Average Intel Core Ultra 9 285HX (29076 - 42341, n=6) | |
| Aorus Master 18 AM8H | |
| Average of class Gaming (10227 - 85542, n=109, last 2 years) | |
| MSI Titan 18 HX A14VIG | |
| Medion Erazer Beast 18 X1 MD62731 | |
| AIDA64 / FPU Julia | |
| Schenker XMG Neo 16 A25 5090 | |
| MSI Titan 18 HX AI A2XWJG | |
| Schenker XMG Neo 16 E25 RTX 5090 Laptop | |
| Asus Strix Scar 18 G835LX | |
| Asus ROG Strix Scar 16 2025 | |
| Average Intel Core Ultra 9 285HX (161276 - 210885, n=6) | |
| Aorus Master 18 AM8H | |
| MSI Titan 18 HX A14VIG | |
| Razer Blade 16 2025 RTX 5090 | |
| Medion Erazer Beast 18 X1 MD62731 | |
| Average of class Gaming (51376 - 238426, n=109, last 2 years) | |
| AIDA64 / CPU SHA3 | |
| MSI Titan 18 HX AI A2XWJG | |
| Schenker XMG Neo 16 E25 RTX 5090 Laptop | |
| Schenker XMG Neo 16 A25 5090 | |
| Asus Strix Scar 18 G835LX | |
| Asus ROG Strix Scar 16 2025 | |
| Average Intel Core Ultra 9 285HX (7757 - 9815, n=6) | |
| Aorus Master 18 AM8H | |
| MSI Titan 18 HX A14VIG | |
| Medion Erazer Beast 18 X1 MD62731 | |
| Average of class Gaming (2180 - 9817, n=109, last 2 years) | |
| Razer Blade 16 2025 RTX 5090 | |
| AIDA64 / CPU Queen | |
| Schenker XMG Neo 16 A25 5090 | |
| MSI Titan 18 HX A14VIG | |
| MSI Titan 18 HX AI A2XWJG | |
| Schenker XMG Neo 16 E25 RTX 5090 Laptop | |
| Asus Strix Scar 18 G835LX | |
| Asus ROG Strix Scar 16 2025 | |
| Average Intel Core Ultra 9 285HX (134345 - 141681, n=6) | |
| Aorus Master 18 AM8H | |
| Average of class Gaming (49785 - 173351, n=100, last 2 years) | |
| Medion Erazer Beast 18 X1 MD62731 | |
| Razer Blade 16 2025 RTX 5090 | |
| AIDA64 / FPU SinJulia | |
| Schenker XMG Neo 16 A25 5090 | |
| Razer Blade 16 2025 RTX 5090 | |
| MSI Titan 18 HX A14VIG | |
| MSI Titan 18 HX AI A2XWJG | |
| Average of class Gaming (4424 - 33636, n=109, last 2 years) | |
| Schenker XMG Neo 16 E25 RTX 5090 Laptop | |
| Asus Strix Scar 18 G835LX | |
| Asus ROG Strix Scar 16 2025 | |
| Average Intel Core Ultra 9 285HX (12559 - 14431, n=6) | |
| Aorus Master 18 AM8H | |
| Medion Erazer Beast 18 X1 MD62731 | |
| AIDA64 / FPU Mandel | |
| Schenker XMG Neo 16 A25 5090 | |
| MSI Titan 18 HX AI A2XWJG | |
| Asus Strix Scar 18 G835LX | |
| Asus ROG Strix Scar 16 2025 | |
| Schenker XMG Neo 16 E25 RTX 5090 Laptop | |
| Average Intel Core Ultra 9 285HX (84053 - 108922, n=6) | |
| Aorus Master 18 AM8H | |
| Razer Blade 16 2025 RTX 5090 | |
| Medion Erazer Beast 18 X1 MD62731 | |
| MSI Titan 18 HX A14VIG | |
| Average of class Gaming (25115 - 128721, n=109, last 2 years) | |
| AIDA64 / CPU AES | |
| Schenker XMG Neo 16 A25 5090 | |
| MSI Titan 18 HX A14VIG | |
| Schenker XMG Neo 16 E25 RTX 5090 Laptop | |
| Asus Strix Scar 18 G835LX | |
| MSI Titan 18 HX AI A2XWJG | |
| Asus ROG Strix Scar 16 2025 | |
| Average Intel Core Ultra 9 285HX (119553 - 134195, n=6) | |
| Aorus Master 18 AM8H | |
| Medion Erazer Beast 18 X1 MD62731 | |
| Average of class Gaming (39258 - 247074, n=109, last 2 years) | |
| Razer Blade 16 2025 RTX 5090 | |
| AIDA64 / CPU ZLib | |
| Schenker XMG Neo 16 A25 5090 | |
| MSI Titan 18 HX AI A2XWJG | |
| Schenker XMG Neo 16 E25 RTX 5090 Laptop | |
| Asus Strix Scar 18 G835LX | |
| Asus ROG Strix Scar 16 2025 | |
| MSI Titan 18 HX A14VIG | |
| Average Intel Core Ultra 9 285HX (1886 - 2267, n=6) | |
| Aorus Master 18 AM8H | |
| Medion Erazer Beast 18 X1 MD62731 | |
| Average of class Gaming (574 - 2531, n=109, last 2 years) | |
| Razer Blade 16 2025 RTX 5090 | |
| AIDA64 / FP64 Ray-Trace | |
| Schenker XMG Neo 16 A25 5090 | |
| MSI Titan 18 HX AI A2XWJG | |
| Asus Strix Scar 18 G835LX | |
| Asus ROG Strix Scar 16 2025 | |
| Schenker XMG Neo 16 E25 RTX 5090 Laptop | |
| Razer Blade 16 2025 RTX 5090 | |
| Average Intel Core Ultra 9 285HX (15059 - 22312, n=6) | |
| Aorus Master 18 AM8H | |
| Average of class Gaming (5509 - 45446, n=109, last 2 years) | |
| MSI Titan 18 HX A14VIG | |
| Medion Erazer Beast 18 X1 MD62731 | |
| AIDA64 / CPU PhotoWorxx | |
| MSI Titan 18 HX AI A2XWJG | |
| Asus ROG Strix Scar 16 2025 | |
| Asus Strix Scar 18 G835LX | |
| Schenker XMG Neo 16 E25 RTX 5090 Laptop | |
| Razer Blade 16 2025 RTX 5090 | |
| Average Intel Core Ultra 9 285HX (39232 - 62611, n=6) | |
| Aorus Master 18 AM8H | |
| Medion Erazer Beast 18 X1 MD62731 | |
| Average of class Gaming (12271 - 89891, n=109, last 2 years) | |
| Schenker XMG Neo 16 A25 5090 | |
| MSI Titan 18 HX A14VIG | |
Refer to our dedicated Intel Core Ultra 9 285HX page for more information and performance comparisons.
System Performance
The Titan 18 HX AI hardly breaks any sweat in handling daily productivity tasks. We find an 18% improvement in overall scores compared to last year's Titan 18 HX.
PCMark 10: Score | Essentials | Productivity | Digital Content Creation
CrossMark: Overall | Productivity | Creativity | Responsiveness
AIDA64: Memory Copy | Memory Read | Memory Write | Memory Latency
WebXPRT 3: Overall
WebXPRT 4: Overall
Mozilla Kraken 1.1: Total
| Performance rating | |
| Schenker XMG Neo 16 E25 RTX 5090 Laptop | |
| MSI Titan 18 HX AI A2XWJG | |
| Average Intel Core Ultra 9 285HX, NVIDIA GeForce RTX 5090 Laptop | |
| Asus Strix Scar 18 G835LX | |
| Asus ROG Strix Scar 16 2025 | |
| Schenker XMG Neo 16 A25 5090 | |
| Aorus Master 18 AM8H | |
| Razer Blade 16 2025 RTX 5090 -4! | |
| Medion Erazer Beast 18 X1 MD62731 | |
| Average of class Gaming | |
| MSI Titan 18 HX A14VIG | |
| PCMark 10 / Score | |
| Schenker XMG Neo 16 A25 5090 | |
| Schenker XMG Neo 16 E25 RTX 5090 Laptop | |
| MSI Titan 18 HX A14VIG | |
| Asus ROG Strix Scar 16 2025 | |
| MSI Titan 18 HX AI A2XWJG | |
| Average Intel Core Ultra 9 285HX, NVIDIA GeForce RTX 5090 Laptop (n=1) | |
| Asus Strix Scar 18 G835LX | |
| Aorus Master 18 AM8H | |
| Medion Erazer Beast 18 X1 MD62731 | |
| Average of class Gaming (5828 - 11574, n=95, last 2 years) | |
| Razer Blade 16 2025 RTX 5090 | |
| PCMark 10 / Essentials | |
| Schenker XMG Neo 16 A25 5090 | |
| MSI Titan 18 HX A14VIG | |
| Schenker XMG Neo 16 E25 RTX 5090 Laptop | |
| Asus ROG Strix Scar 16 2025 | |
| Aorus Master 18 AM8H | |
| Asus Strix Scar 18 G835LX | |
| MSI Titan 18 HX AI A2XWJG | |
| Average Intel Core Ultra 9 285HX, NVIDIA GeForce RTX 5090 Laptop (n=1) | |
| Average of class Gaming (8810 - 12600, n=99, last 2 years) | |
| Razer Blade 16 2025 RTX 5090 | |
| Medion Erazer Beast 18 X1 MD62731 | |
| PCMark 10 / Productivity | |
| Schenker XMG Neo 16 A25 5090 | |
| Average of class Gaming (6845 - 18766, n=97, last 2 years) | |
| Razer Blade 16 2025 RTX 5090 | |
| MSI Titan 18 HX A14VIG | |
| Medion Erazer Beast 18 X1 MD62731 | |
| MSI Titan 18 HX AI A2XWJG | |
| Average Intel Core Ultra 9 285HX, NVIDIA GeForce RTX 5090 Laptop (n=1) | |
| Asus Strix Scar 18 G835LX | |
| Schenker XMG Neo 16 E25 RTX 5090 Laptop | |
| Aorus Master 18 AM8H | |
| Asus ROG Strix Scar 16 2025 | |
| PCMark 10 / Digital Content Creation | |
| Schenker XMG Neo 16 E25 RTX 5090 Laptop | |
| Schenker XMG Neo 16 A25 5090 | |
| Asus ROG Strix Scar 16 2025 | |
| MSI Titan 18 HX AI A2XWJG | |
| Average Intel Core Ultra 9 285HX, NVIDIA GeForce RTX 5090 Laptop (n=1) | |
| Asus Strix Scar 18 G835LX | |
| Aorus Master 18 AM8H | |
| MSI Titan 18 HX A14VIG | |
| Medion Erazer Beast 18 X1 MD62731 | |
| Average of class Gaming (7602 - 19657, n=97, last 2 years) | |
| Razer Blade 16 2025 RTX 5090 | |
| CrossMark / Overall | |
| Aorus Master 18 AM8H | |
| Schenker XMG Neo 16 E25 RTX 5090 Laptop | |
| MSI Titan 18 HX AI A2XWJG | |
| Average Intel Core Ultra 9 285HX, NVIDIA GeForce RTX 5090 Laptop (n=1) | |
| Asus Strix Scar 18 G835LX | |
| Schenker XMG Neo 16 A25 5090 | |
| Asus ROG Strix Scar 16 2025 | |
| Average of class Gaming (1366 - 2409, n=97, last 2 years) | |
| MSI Titan 18 HX A14VIG | |
| Medion Erazer Beast 18 X1 MD62731 | |
| CrossMark / Productivity | |
| Aorus Master 18 AM8H | |
| Schenker XMG Neo 16 E25 RTX 5090 Laptop | |
| Asus Strix Scar 18 G835LX | |
| MSI Titan 18 HX AI A2XWJG | |
| Average Intel Core Ultra 9 285HX, NVIDIA GeForce RTX 5090 Laptop (n=1) | |
| Schenker XMG Neo 16 A25 5090 | |
| Asus ROG Strix Scar 16 2025 | |
| Average of class Gaming (1386 - 2254, n=97, last 2 years) | |
| Medion Erazer Beast 18 X1 MD62731 | |
| MSI Titan 18 HX A14VIG | |
| CrossMark / Creativity | |
| MSI Titan 18 HX AI A2XWJG | |
| Average Intel Core Ultra 9 285HX, NVIDIA GeForce RTX 5090 Laptop (n=1) | |
| Schenker XMG Neo 16 A25 5090 | |
| Schenker XMG Neo 16 E25 RTX 5090 Laptop | |
| Asus Strix Scar 18 G835LX | |
| Asus ROG Strix Scar 16 2025 | |
| Aorus Master 18 AM8H | |
| Average of class Gaming (1343 - 2729, n=97, last 2 years) | |
| MSI Titan 18 HX A14VIG | |
| Medion Erazer Beast 18 X1 MD62731 | |
| CrossMark / Responsiveness | |
| Aorus Master 18 AM8H | |
| Schenker XMG Neo 16 E25 RTX 5090 Laptop | |
| Asus Strix Scar 18 G835LX | |
| Schenker XMG Neo 16 A25 5090 | |
| MSI Titan 18 HX AI A2XWJG | |
| Average Intel Core Ultra 9 285HX, NVIDIA GeForce RTX 5090 Laptop (n=1) | |
| Average of class Gaming (1226 - 2334, n=97, last 2 years) | |
| Asus ROG Strix Scar 16 2025 | |
| MSI Titan 18 HX A14VIG | |
| Medion Erazer Beast 18 X1 MD62731 | |
| AIDA64 / Memory Copy | |
| MSI Titan 18 HX AI A2XWJG | |
| Average Intel Core Ultra 9 285HX, NVIDIA GeForce RTX 5090 Laptop (n=1) | |
| Razer Blade 16 2025 RTX 5090 | |
| Schenker XMG Neo 16 E25 RTX 5090 Laptop | |
| Asus Strix Scar 18 G835LX | |
| Asus ROG Strix Scar 16 2025 | |
| Medion Erazer Beast 18 X1 MD62731 | |
| Aorus Master 18 AM8H | |
| Average of class Gaming (21750 - 129946, n=109, last 2 years) | |
| Schenker XMG Neo 16 A25 5090 | |
| MSI Titan 18 HX A14VIG | |
| AIDA64 / Memory Read | |
| Razer Blade 16 2025 RTX 5090 | |
| MSI Titan 18 HX AI A2XWJG | |
| Average Intel Core Ultra 9 285HX, NVIDIA GeForce RTX 5090 Laptop (n=1) | |
| Schenker XMG Neo 16 E25 RTX 5090 Laptop | |
| Asus ROG Strix Scar 16 2025 | |
| Medion Erazer Beast 18 X1 MD62731 | |
| Asus Strix Scar 18 G835LX | |
| Aorus Master 18 AM8H | |
| Average of class Gaming (22956 - 118858, n=109, last 2 years) | |
| Schenker XMG Neo 16 A25 5090 | |
| MSI Titan 18 HX A14VIG | |
| AIDA64 / Memory Write | |
| Razer Blade 16 2025 RTX 5090 | |
| MSI Titan 18 HX AI A2XWJG | |
| Average Intel Core Ultra 9 285HX, NVIDIA GeForce RTX 5090 Laptop (n=1) | |
| Schenker XMG Neo 16 E25 RTX 5090 Laptop | |
| Asus Strix Scar 18 G835LX | |
| Asus ROG Strix Scar 16 2025 | |
| Medion Erazer Beast 18 X1 MD62731 | |
| Average of class Gaming (22297 - 135096, n=109, last 2 years) | |
| Aorus Master 18 AM8H | |
| Schenker XMG Neo 16 A25 5090 | |
| MSI Titan 18 HX A14VIG | |
| AIDA64 / Memory Latency | |
| Aorus Master 18 AM8H | |
| Asus ROG Strix Scar 16 2025 | |
| Medion Erazer Beast 18 X1 MD62731 | |
| Asus Strix Scar 18 G835LX | |
| Schenker XMG Neo 16 E25 RTX 5090 Laptop | |
| Average of class Gaming (75.3 - 259, n=109, last 2 years) | |
| MSI Titan 18 HX A14VIG | |
| MSI Titan 18 HX AI A2XWJG | |
| Average Intel Core Ultra 9 285HX, NVIDIA GeForce RTX 5090 Laptop (n=1) | |
| Razer Blade 16 2025 RTX 5090 | |
| Schenker XMG Neo 16 A25 5090 | |
| WebXPRT 3 / Overall | |
| MSI Titan 18 HX AI A2XWJG | |
| Average Intel Core Ultra 9 285HX, NVIDIA GeForce RTX 5090 Laptop (n=1) | |
| Schenker XMG Neo 16 E25 RTX 5090 Laptop | |
| Asus Strix Scar 18 G835LX | |
| Asus ROG Strix Scar 16 2025 | |
| Schenker XMG Neo 16 A25 5090 | |
| Medion Erazer Beast 18 X1 MD62731 | |
| MSI Titan 18 HX A14VIG | |
| Razer Blade 16 2025 RTX 5090 | |
| Average of class Gaming (242 - 532, n=100, last 2 years) | |
| Aorus Master 18 AM8H | |
| WebXPRT 4 / Overall | |
| Asus ROG Strix Scar 16 2025 | |
| Asus Strix Scar 18 G835LX | |
| Schenker XMG Neo 16 E25 RTX 5090 Laptop | |
| Medion Erazer Beast 18 X1 MD62731 | |
| Schenker XMG Neo 16 A25 5090 | |
| Aorus Master 18 AM8H | |
| MSI Titan 18 HX AI A2XWJG | |
| Average Intel Core Ultra 9 285HX, NVIDIA GeForce RTX 5090 Laptop (n=1) | |
| MSI Titan 18 HX A14VIG | |
| Average of class Gaming (176.4 - 354, n=100, last 2 years) | |
| Razer Blade 16 2025 RTX 5090 | |
| Mozilla Kraken 1.1 / Total | |
| Average of class Gaming (391 - 590, n=105, last 2 years) | |
| MSI Titan 18 HX A14VIG | |
| Razer Blade 16 2025 RTX 5090 | |
| Aorus Master 18 AM8H | |
| Medion Erazer Beast 18 X1 MD62731 | |
| Asus ROG Strix Scar 16 2025 | |
| Asus Strix Scar 18 G835LX | |
| MSI Titan 18 HX AI A2XWJG | |
| Average Intel Core Ultra 9 285HX, NVIDIA GeForce RTX 5090 Laptop (n=1) | |
| Schenker XMG Neo 16 E25 RTX 5090 Laptop | |
| Schenker XMG Neo 16 A25 5090 | |
* ... smaller is better
| PCMark 8 Home Score Accelerated v2 | 5564 points | |
| PCMark 8 Work Score Accelerated v2 | 3012 points | |
| PCMark 10 Score | 8795 points | |
Help | ||
DPC Latency
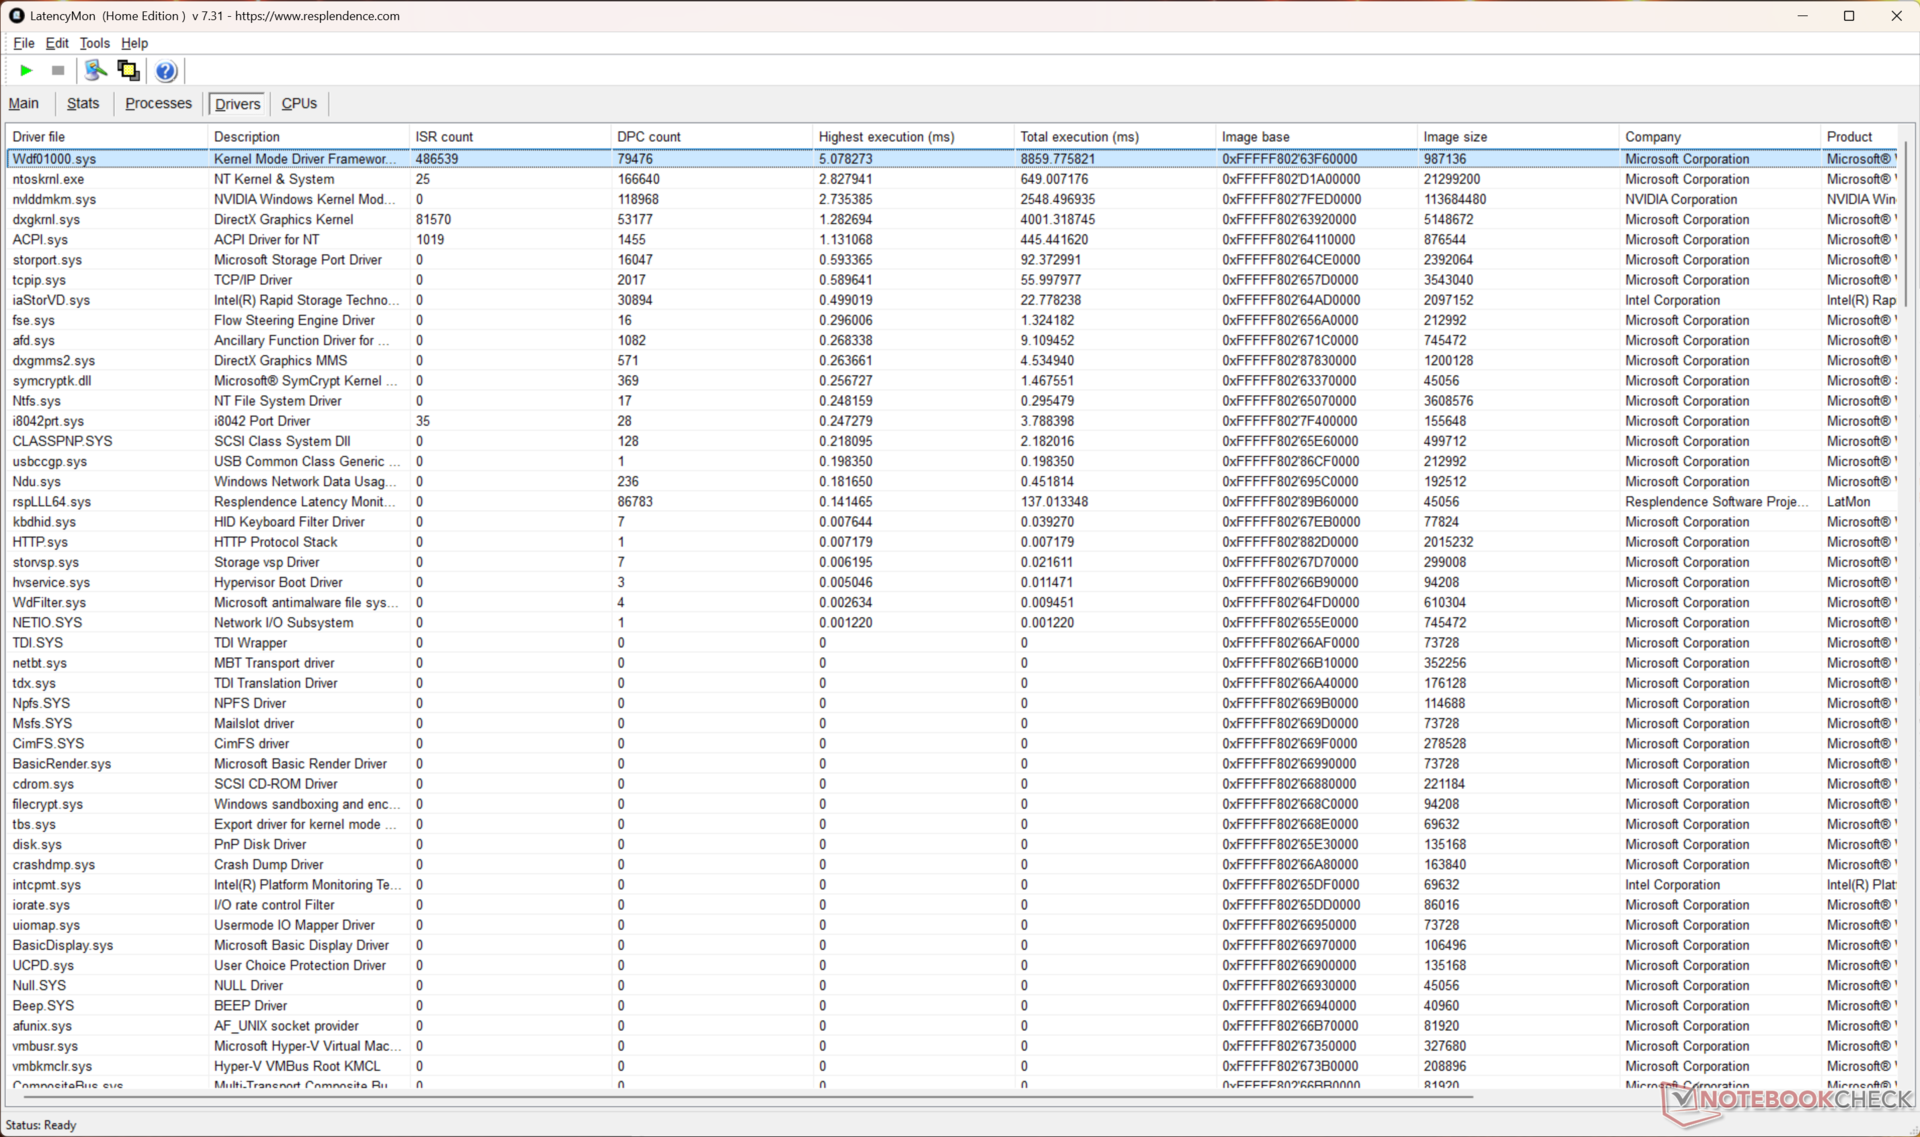
The Titan 18 HX AI shows a high 1,398.5 μs interrupt-to-process latency in our routine latency measurement.
While a lot better than the competition, it could still potentially present issues in real-time audio and video workflows.
| DPC Latencies / LatencyMon - interrupt to process latency (max), Web, Youtube, Prime95 | |
| Medion Erazer Beast 18 X1 MD62731 | |
| MSI Titan 18 HX A14VIG | |
| Asus ROG Strix Scar 16 2025 | |
| Aorus Master 18 AM8H | |
| Schenker XMG Neo 16 E25 RTX 5090 Laptop | |
| MSI Titan 18 HX AI A2XWJG | |
| Asus Strix Scar 18 G835LX | |
| Razer Blade 16 2025 RTX 5090 | |
| Schenker XMG Neo 16 A25 5090 | |
* ... smaller is better
An overview of measured latency across reviewed laptops can be found in our DPC Latency ranking table.
Storage Devices
A total of three NVMe SSDs (1x PCIe Gen5 and 2x PCIe Gen4) configured in RAID 0 came installed in our unit. This allows for extremely high sequential read speeds of up to 15 GB/s at a queue depth of 8.
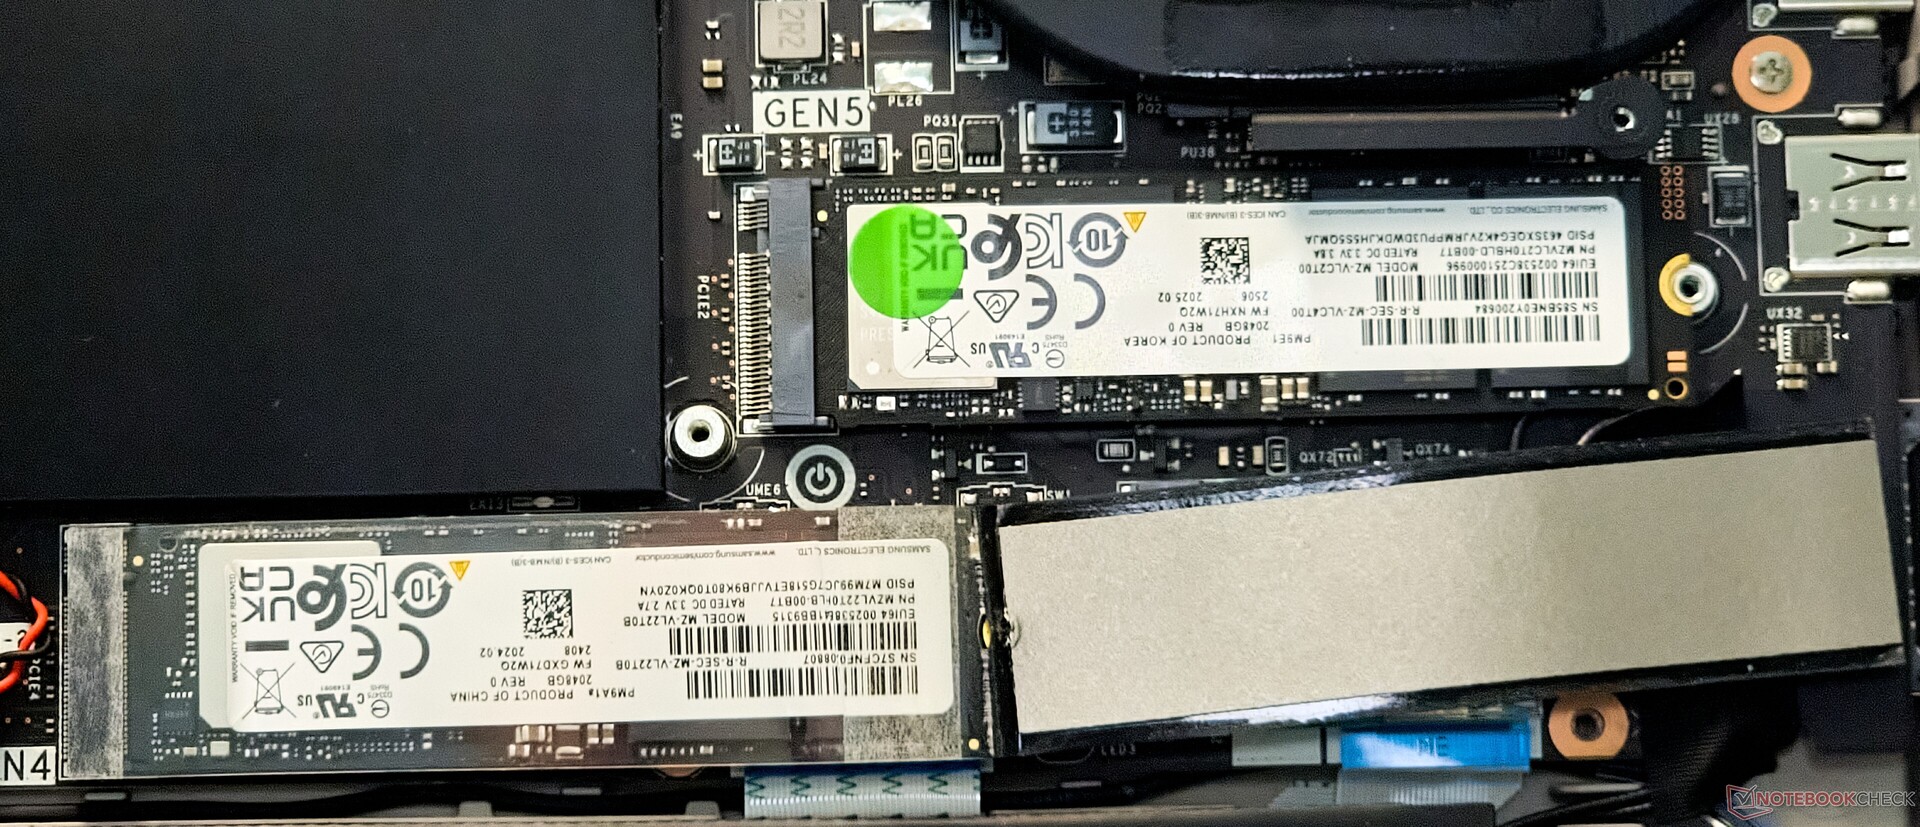
However, the array's performance decreases drastically in 4K reads and writes, and in lower queue depth sequential tests.
Our unit still had room to accommodate another PCIe Gen4 SSD, but there's no scope for installing 2.5-inch SATA drives internally.

* ... smaller is better
Disk Throttling: DiskSpd Read Loop, Queue Depth 8
Refer to our dedicated SSD benchmarks section for more storage performance comparisons.
GPU Performance
The Nvidia GeForce RTX 5090 Laptop GPU in the Titan 18 HX AI runs at 175 W in the Extreme Performance profile.
However, performance gains over a 175 W RTX 4090 Laptop GPU are barely noticeable in 3DMark tests.
Advanced Optimus is not supported. Time Spy Graphics scores drop by a massive 78.8% on battery power.


| 3DMark 11 Performance | 50365 points | |
| 3DMark Ice Storm Standard Score | 298917 points | |
| 3DMark Cloud Gate Standard Score | 80657 points | |
| 3DMark Fire Strike Score | 39279 points | |
| 3DMark Fire Strike Extreme Score | 30016 points | |
| 3DMark Time Spy Score | 22155 points | |
| 3DMark Steel Nomad Score | 6163 points | |
| 3DMark Steel Nomad Light Score | 26098 points | |
| 3DMark Steel Nomad Light Unlimited Score | 26099 points | |
Help | ||
| Blender / v3.3 Classroom OPTIX/RTX | |
| Average of class Gaming (9 - 32, n=111, last 2 years) | |
| Asus ROG Strix Scar 16 2025 | |
| Razer Blade 16 2025 RTX 5090 | |
| Medion Erazer Beast 18 X1 MD62731 | |
| Average NVIDIA GeForce RTX 5090 Laptop (9 - 18, n=21) | |
| Schenker XMG Neo 16 E25 RTX 5090 Laptop | |
| MSI Titan 18 HX A14VIG | |
| Asus Strix Scar 18 G835LX | |
| MSI Titan 18 HX AI A2XWJG | |
| Schenker XMG Neo 16 A25 5090 | |
| Blender / v3.3 Classroom CUDA | |
| Average of class Gaming (15 - 228, n=111, last 2 years) | |
| Asus ROG Strix Scar 16 2025 | |
| Razer Blade 16 2025 RTX 5090 | |
| Medion Erazer Beast 18 X1 MD62731 | |
| MSI Titan 18 HX A14VIG | |
| Average NVIDIA GeForce RTX 5090 Laptop (15 - 37, n=20) | |
| Schenker XMG Neo 16 E25 RTX 5090 Laptop | |
| Asus Strix Scar 18 G835LX | |
| MSI Titan 18 HX AI A2XWJG | |
| Schenker XMG Neo 16 A25 5090 | |
| Blender / v3.3 Classroom CPU | |
| Average of class Gaming (122 - 565, n=107, last 2 years) | |
| Razer Blade 16 2025 RTX 5090 | |
| Medion Erazer Beast 18 X1 MD62731 | |
| MSI Titan 18 HX A14VIG | |
| Average NVIDIA GeForce RTX 5090 Laptop (123 - 282, n=21) | |
| Aorus Master 18 AM8H | |
| Asus ROG Strix Scar 16 2025 | |
| Asus Strix Scar 18 G835LX | |
| Schenker XMG Neo 16 E25 RTX 5090 Laptop | |
| MSI Titan 18 HX AI A2XWJG | |
| Schenker XMG Neo 16 A25 5090 | |
* ... smaller is better
Gaming Performance
The Core Ultra 9 285HX and RTX 5090 Laptop GPU combination enables the Titan 18 HX AI to inch ahead of the competition in gaming but falls just short of the Ryzen 9 9955HX3D-powered XMG Neo 16 A25.
Overall gains compared to last year's RTX 4090 Laptop GPU variant are a modest 11% at 1080p Ultra.
The RTX 5090 Laptop GPU struggles in attaining 60 fps at native 4K Ultra in modern AAA titles.
Enabling full ray tracing or path tracing will inevitably require use of upscaling technologies like DLSS4, Ray reconstruction, and multi frame generation (MFG) to attain high frame rates that match the display's 120 Hz refresh rate.
| Black Myth: Wukong | |
| 2560x1440 cinematic TSR 100 | |
| MSI Titan 18 HX AI A2XWJG | |
| Average NVIDIA GeForce RTX 5090 Laptop (42 - 50, n=8) | |
| Razer Blade 16 2025 RTX 5090 | |
| Average of class Gaming (19 - 50, n=25, last 2 years) | |
| 3840x2160 cinematic TSR 100 | |
| MSI Titan 18 HX AI A2XWJG | |
| Average NVIDIA GeForce RTX 5090 Laptop (26 - 33, n=8) | |
| Razer Blade 16 2025 RTX 5090 | |
| Average of class Gaming (7 - 33, n=19, last 2 years) | |
| 2560x1440 cinematic RT: Very High DLSS 68 FG | |
| MSI Titan 18 HX AI A2XWJG | |
| Average NVIDIA GeForce RTX 5090 Laptop (76 - 85, n=8) | |
| Razer Blade 16 2025 RTX 5090 | |
| Average of class Gaming (29 - 85, n=23, last 2 years) | |
| 3840x2160 cinematic RT: Very High DLSS 68 FG | |
| Average NVIDIA GeForce RTX 5090 Laptop (43 - 47, n=7) | |
| MSI Titan 18 HX AI A2XWJG | |
| Average of class Gaming (25.1 - 47, n=14, last 2 years) | |
| Indiana Jones and the Great Circle | |
| 2560x1440 Very Ultra Preset | |
| Schenker XMG Neo 16 A25 5090 | |
| MSI Titan 18 HX AI A2XWJG | |
| Average NVIDIA GeForce RTX 5090 Laptop (66.1 - 121.9, n=16) | |
| Asus Strix Scar 18 G835LX | |
| Schenker XMG Neo 16 E25 RTX 5090 Laptop | |
| Asus ROG Strix Scar 16 2025 | |
| Razer Blade 16 2025 RTX 5090 | |
| Average of class Gaming (4.2 - 121.9, n=33, last 2 years) | |
| 3840x2160 Very Ultra Preset | |
| MSI Titan 18 HX AI A2XWJG | |
| Average NVIDIA GeForce RTX 5090 Laptop (48.2 - 73, n=13) | |
| Asus Strix Scar 18 G835LX | |
| Schenker XMG Neo 16 E25 RTX 5090 Laptop | |
| Razer Blade 16 2025 RTX 5090 | |
| Average of class Gaming (5.3 - 73, n=19, last 2 years) | |
| 2560x1440 Very Ultra Preset + Full Path Tracing + Quality DLSS + Frame Generation | |
| Average NVIDIA GeForce RTX 5090 Laptop (72.9 - 180, n=8) | |
| MSI Titan 18 HX AI A2XWJG | |
| Average of class Gaming (20.2 - 91.5, n=12, last 2 years) | |
| Razer Blade 16 2025 RTX 5090 | |
Cyberpunk 2077 1080p Ultra FPS chart
There were no major throttling issues while during an extended run of Cyberpunk 2077: Phantom Liberty at 1080p Ultra, indicating robust GPU cooling.
| low | med. | high | ultra | QHD DLSS | QHD FSR | QHD | 4K DLSS | 4K FSR | 4K | |
|---|---|---|---|---|---|---|---|---|---|---|
| GTA V (2015) | 185.2 | 184.5 | 180.4 | 162.4 | 160.1 | 179.9 | ||||
| Dota 2 Reborn (2015) | 229 | 207 | 198.3 | 184.7 | ||||||
| Final Fantasy XV Benchmark (2018) | 234 | 236 | 212 | 179.5 | 106.4 | |||||
| X-Plane 11.11 (2018) | 108.9 | 148.3 | 120.9 | |||||||
| Strange Brigade (2018) | 617 | 482 | 473 | 437 | 339 | 164.2 | ||||
| Baldur's Gate 3 (2023) | 225.3 | 158.4 | 135.5 | 84.1 | ||||||
| Cyberpunk 2077 (2023) | 178.7 | 177.3 | 166.4 | 157.5 | 128.1 | 115.6 | 46.2 | 53.1 | ||
| Alan Wake 2 (2023) | 125.2 | 84.5 | 45.9 | |||||||
| F1 24 (2024) | 343 | 369 | 357 | 157.8 | 159.3 | 156.1 | 105 | 80.8 | 77.7 | 51.3 |
| Black Myth: Wukong (2024) | 63 | 70 | 49 | 48 | 33 | |||||
| Indiana Jones and the Great Circle (2024) | 133.9 | 105.9 | 66.4 | |||||||
| Monster Hunter Wilds (2025) | 88.9 | 73.3 | 46.8 | |||||||
| Assassin's Creed Shadows (2025) | 62 | 54 | 59 | 41 | ||||||
| F1 25 (2025) | 279 | 268 | 252 | 58.8 | 64 | 35.8 | 32.2 | 16.7 |
More information can be found in our dedicated Nvidia GeForce RTX 5090 Laptop GPU page.
Also, refer to our comprehensive analysis of the RTX 5090 Laptop GPU for additional MFG and content creation performance numbers.
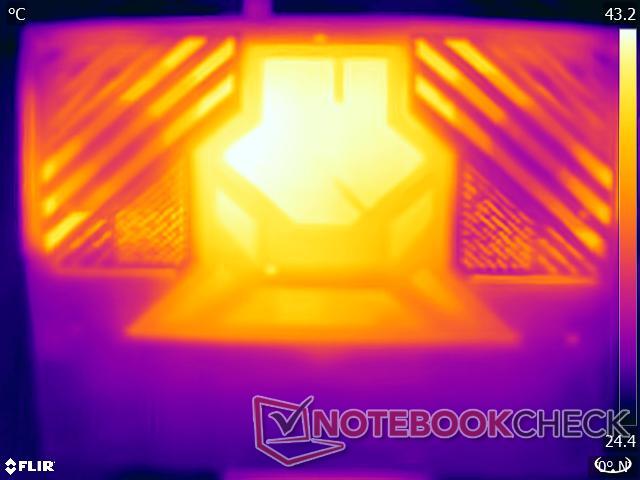
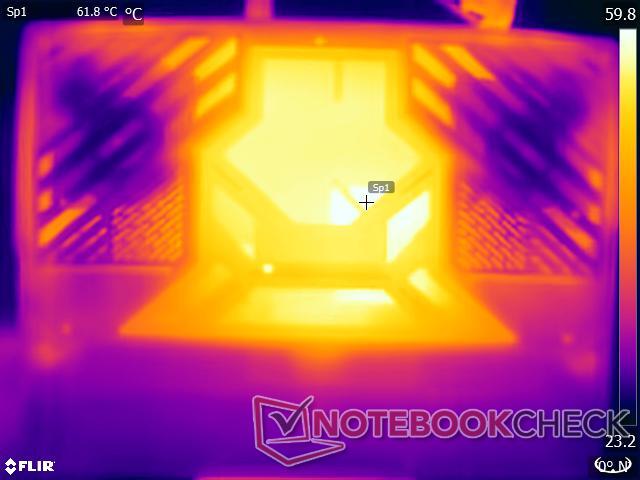
Emissions: High noise levels and surface temps despite a vapor chamber
System Noise
Fan noise is understandably on the higher side given the powerful internals.
The ECO-Silent mode maintains noise levels below 40 db(A), making this ideal for less-demanding tasks in quiet environments.
We recommend using headphones when using the Extreme Performance profile as the fans can reach nearly 60 db(A) under intense loads and during gaming.
Noise level
| Idle |
| 27.68 / 27.68 / 31.54 dB(A) |
| Load |
| 44 / 58.9 dB(A) |
 | ||
30 dB silent 40 dB(A) audible 50 dB(A) loud |
||
min: | ||
| Performance mode (PL1 / PL2 / GPU TGP) | Idle dB(A) | Load average dB(A) | Load maximum dB(A) | Cyberpunk 2077 1080p Ultra dB(A) |
|---|---|---|---|---|
| ECO-Silent (15 / 15 / 96 W) | 27.68 | 37.60 | 37.81 | 37.31 / 50 fps |
| Balanced (140 / 220 / 150 W) | 27.68 | 43.71 | 51.90 | 52.61 / 160 fps |
| Extreme Performance (200 / 220 / 175 W) | 31.54 | 44 | 58.87 | 58.70 / 173 fps |
| MSI Titan 18 HX AI A2XWJG Ultra 9 285HX, GeForce RTX 5090 Laptop | Aorus Master 18 AM8H Ultra 9 275HX, GeForce RTX 5090 Laptop | Asus Strix Scar 18 G835LX Ultra 9 275HX, GeForce RTX 5090 Laptop | Schenker XMG Neo 16 A25 5090 R9 9955HX3D, GeForce RTX 5090 Laptop | Medion Erazer Beast 18 X1 MD62731 Ultra 9 275HX, GeForce RTX 5080 Laptop | Razer Blade 16 2025 RTX 5090 Ryzen AI 9 HX 370, GeForce RTX 5090 Laptop | MSI Titan 18 HX A14VIG i9-14900HX, GeForce RTX 4090 Laptop GPU | |
|---|---|---|---|---|---|---|---|
| Noise | 0% | 3% | 6% | -9% | 5% | 10% | |
| off / environment * (dB) | 25.56 | 25 2% | 23.3 9% | 24.1 6% | 25 2% | 24.1 6% | 22.8 11% |
| Idle Minimum * (dB) | 27.68 | 26 6% | 29.8 -8% | 25.6 8% | 25 10% | 24.1 13% | 23.8 14% |
| Idle Average * (dB) | 27.68 | 29 -5% | 29.8 -8% | 25.6 8% | 39 -41% | 30.6 -11% | 23.8 14% |
| Idle Maximum * (dB) | 31.54 | 34 -8% | 29.8 6% | 25.6 19% | 42 -33% | 30.6 3% | 28 11% |
| Load Average * (dB) | 44 | 50 -14% | 42.9 2% | 47.2 -7% | 52 -18% | 45.5 -3% | 38 14% |
| Cyberpunk 2077 ultra * (dB) | 58.7 | 52 11% | 53.7 9% | 55.5 5% | 53 10% | 48.2 18% | |
| Load Maximum * (dB) | 58.9 | 53 10% | 53.7 9% | 55.5 6% | 55 7% | 53.4 9% | 62.8 -7% |
| Witcher 3 ultra * (dB) | 57.3 |
* ... smaller is better
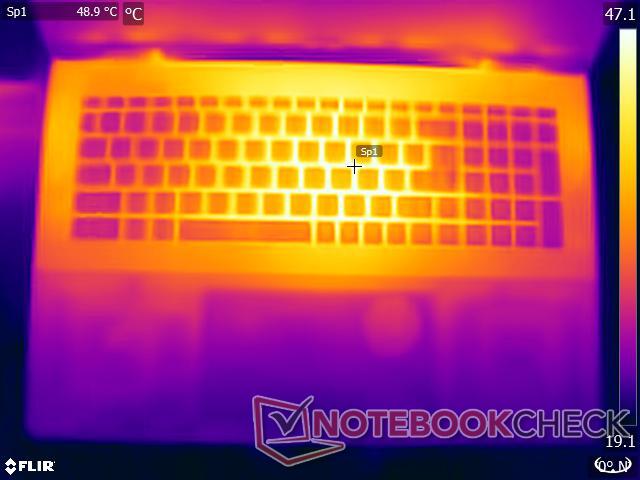
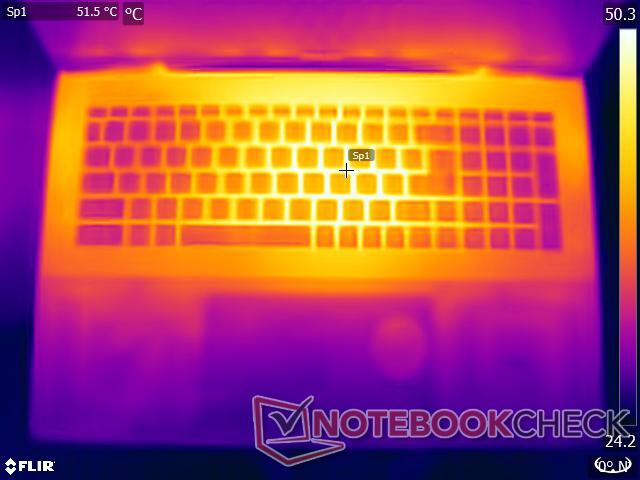
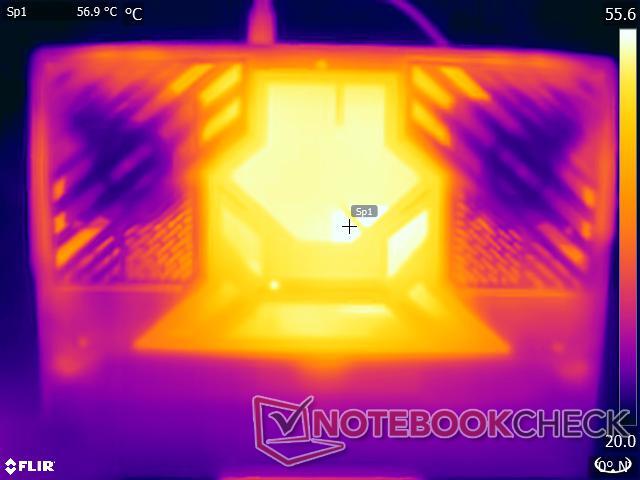
Temperature
The Titan 18 HX AI's vapor chamber keeps the hardware operating without throttling, though this comes at the cost of higher surface temperatures during heavy use.
We recorded a maximum temperature of 53.6 °C on the chassis bottom under a combined Prime95 in-place large FFTs and FurMark (1,280x720, no AA) load. The touchpad and palm rests remained relatively cool during stress tests.
The Titan 18 HX AI is not portable enough for continuous use on the lap. Nevertheless, we do not recommend placing the device on your lap when running intensive tasks.
(-) The maximum temperature on the upper side is 48.2 °C / 119 F, compared to the average of 40.4 °C / 105 F, ranging from 21.2 to 68.8 °C for the class Gaming.
(-) The bottom heats up to a maximum of 53.6 °C / 128 F, compared to the average of 43.2 °C / 110 F
(±) In idle usage, the average temperature for the upper side is 33.8 °C / 93 F, compared to the device average of 33.9 °C / 93 F.
(-) 3: The average temperature for the upper side is 42.6 °C / 109 F, compared to the average of 33.9 °C / 93 F for the class Gaming.
(+) The palmrests and touchpad are reaching skin temperature as a maximum (34.5 °C / 94.1 F) and are therefore not hot.
(-) The average temperature of the palmrest area of similar devices was 28.8 °C / 83.8 F (-5.7 °C / -10.3 F).
| MSI Titan 18 HX AI A2XWJG Intel Core Ultra 9 285HX, NVIDIA GeForce RTX 5090 Laptop | Aorus Master 18 AM8H Intel Core Ultra 9 275HX, NVIDIA GeForce RTX 5090 Laptop | Asus Strix Scar 18 G835LX Intel Core Ultra 9 275HX, NVIDIA GeForce RTX 5090 Laptop | Schenker XMG Neo 16 A25 5090 AMD Ryzen 9 9955HX3D, NVIDIA GeForce RTX 5090 Laptop | Medion Erazer Beast 18 X1 MD62731 Intel Core Ultra 9 275HX, NVIDIA GeForce RTX 5080 Laptop | Razer Blade 16 2025 RTX 5090 AMD Ryzen AI 9 HX 370, NVIDIA GeForce RTX 5090 Laptop | MSI Titan 18 HX A14VIG Intel Core i9-14900HX, NVIDIA GeForce RTX 4090 Laptop GPU | |
|---|---|---|---|---|---|---|---|
| Heat | 7% | 17% | 16% | 13% | 13% | 17% | |
| Maximum Upper Side * (°C) | 48.2 | 50 -4% | 45.6 5% | 46.3 4% | 47 2% | 48.3 -0% | 37.8 22% |
| Maximum Bottom * (°C) | 53.6 | 46 14% | 46 14% | 44.3 17% | 48 10% | 53.3 1% | 37.6 30% |
| Idle Upper Side * (°C) | 37.2 | 36 3% | 28.9 22% | 30 19% | 29 22% | 28.3 24% | 34.8 6% |
| Idle Bottom * (°C) | 40.4 | 35 13% | 29.2 28% | 31.1 23% | 33 18% | 30.3 25% | 36 11% |
* ... smaller is better
Stress Test
Stressing the Titan 18 HX AI with Prime95 sees the Core Ultra 9 285HX briefly hitting 4.29 GHz at 221W before settling to a sustained 3.97 GHz at 174W.
The laptop prioritizes graphics performance upon adding FurMark throttling the CPU to 3.2 GHz/91W while the RTX 5090 maintains 1.8 GHz at 170W TGP.
In a more real-world stress test with Cyberpunk 2077 at 1080p Ultra, the RTX 5090 Laptop GPU sustains higher 2.2 GHz clocks while consuming 169 W average. The Core Ultra 9 285HX now runs at 4.2 GHz average while utilizing just 91 W.
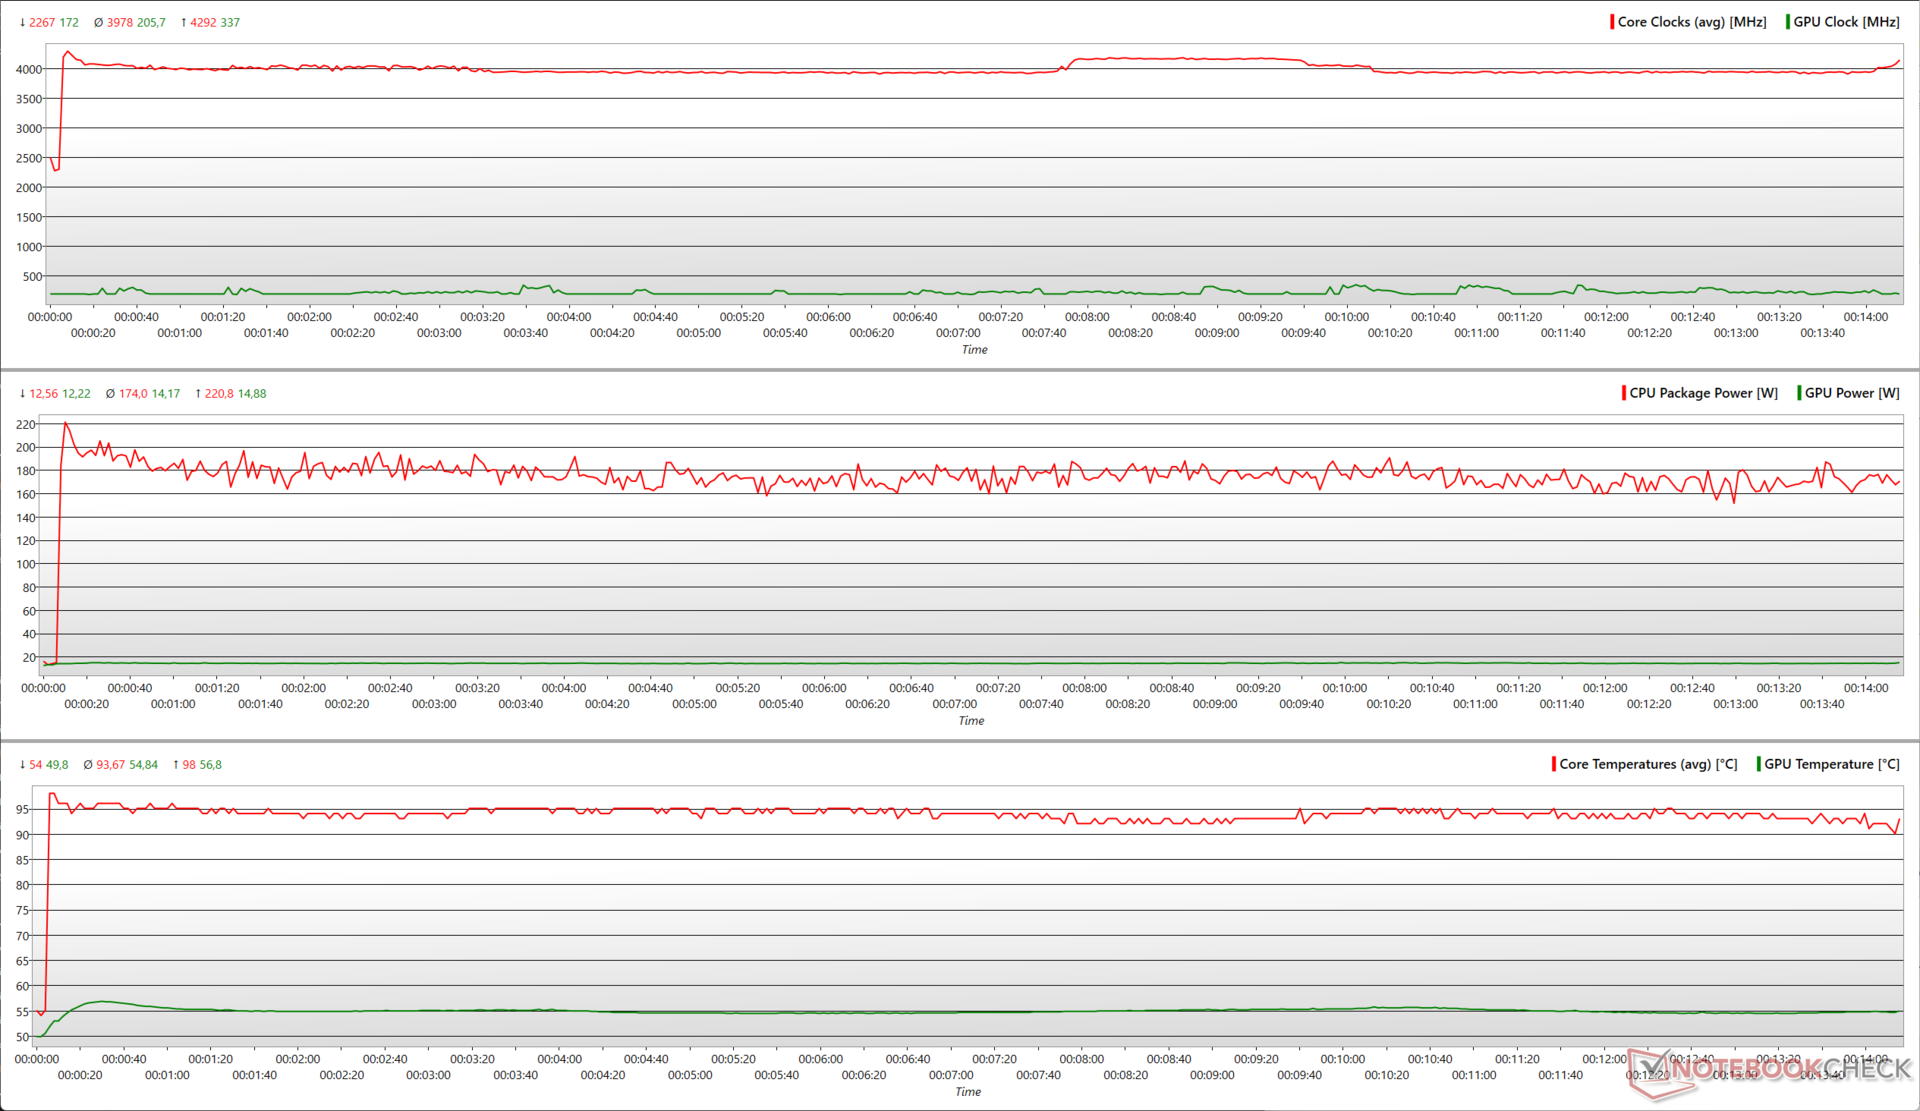
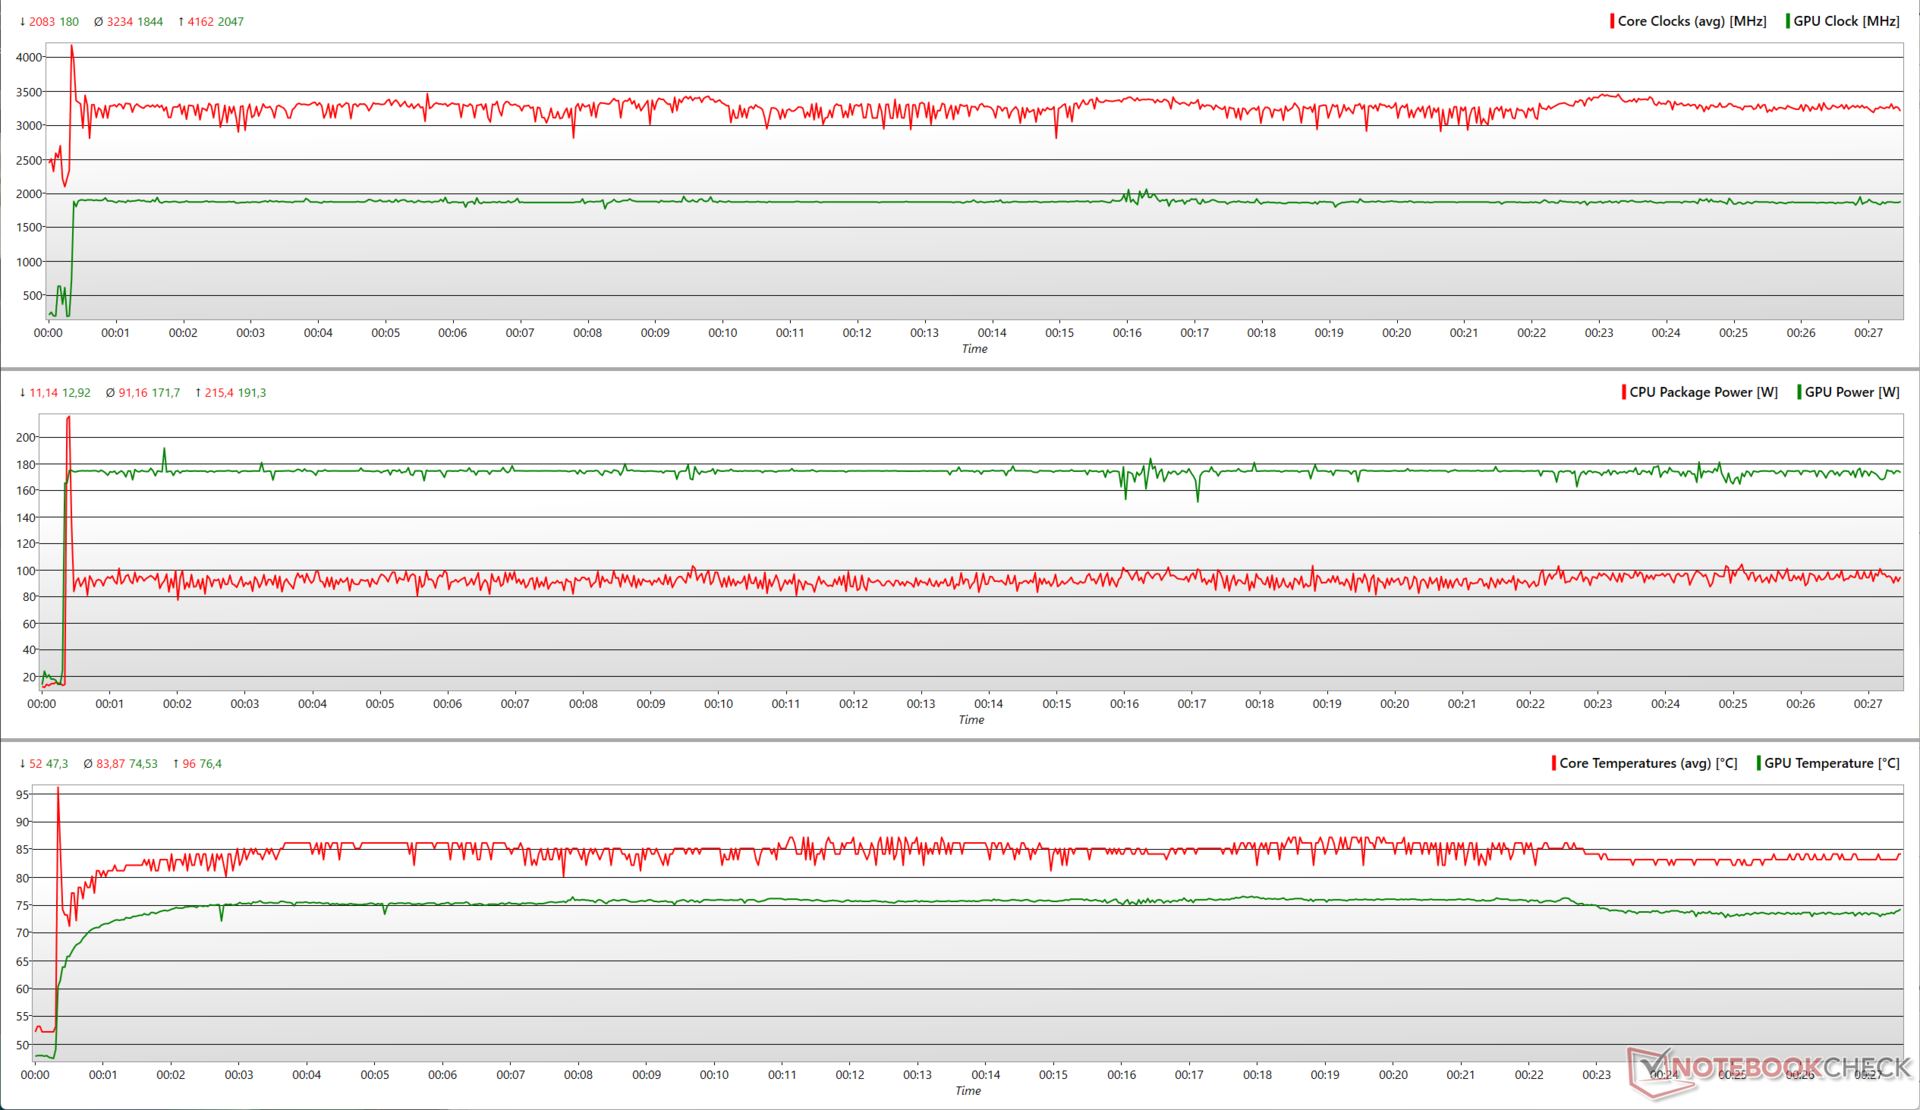
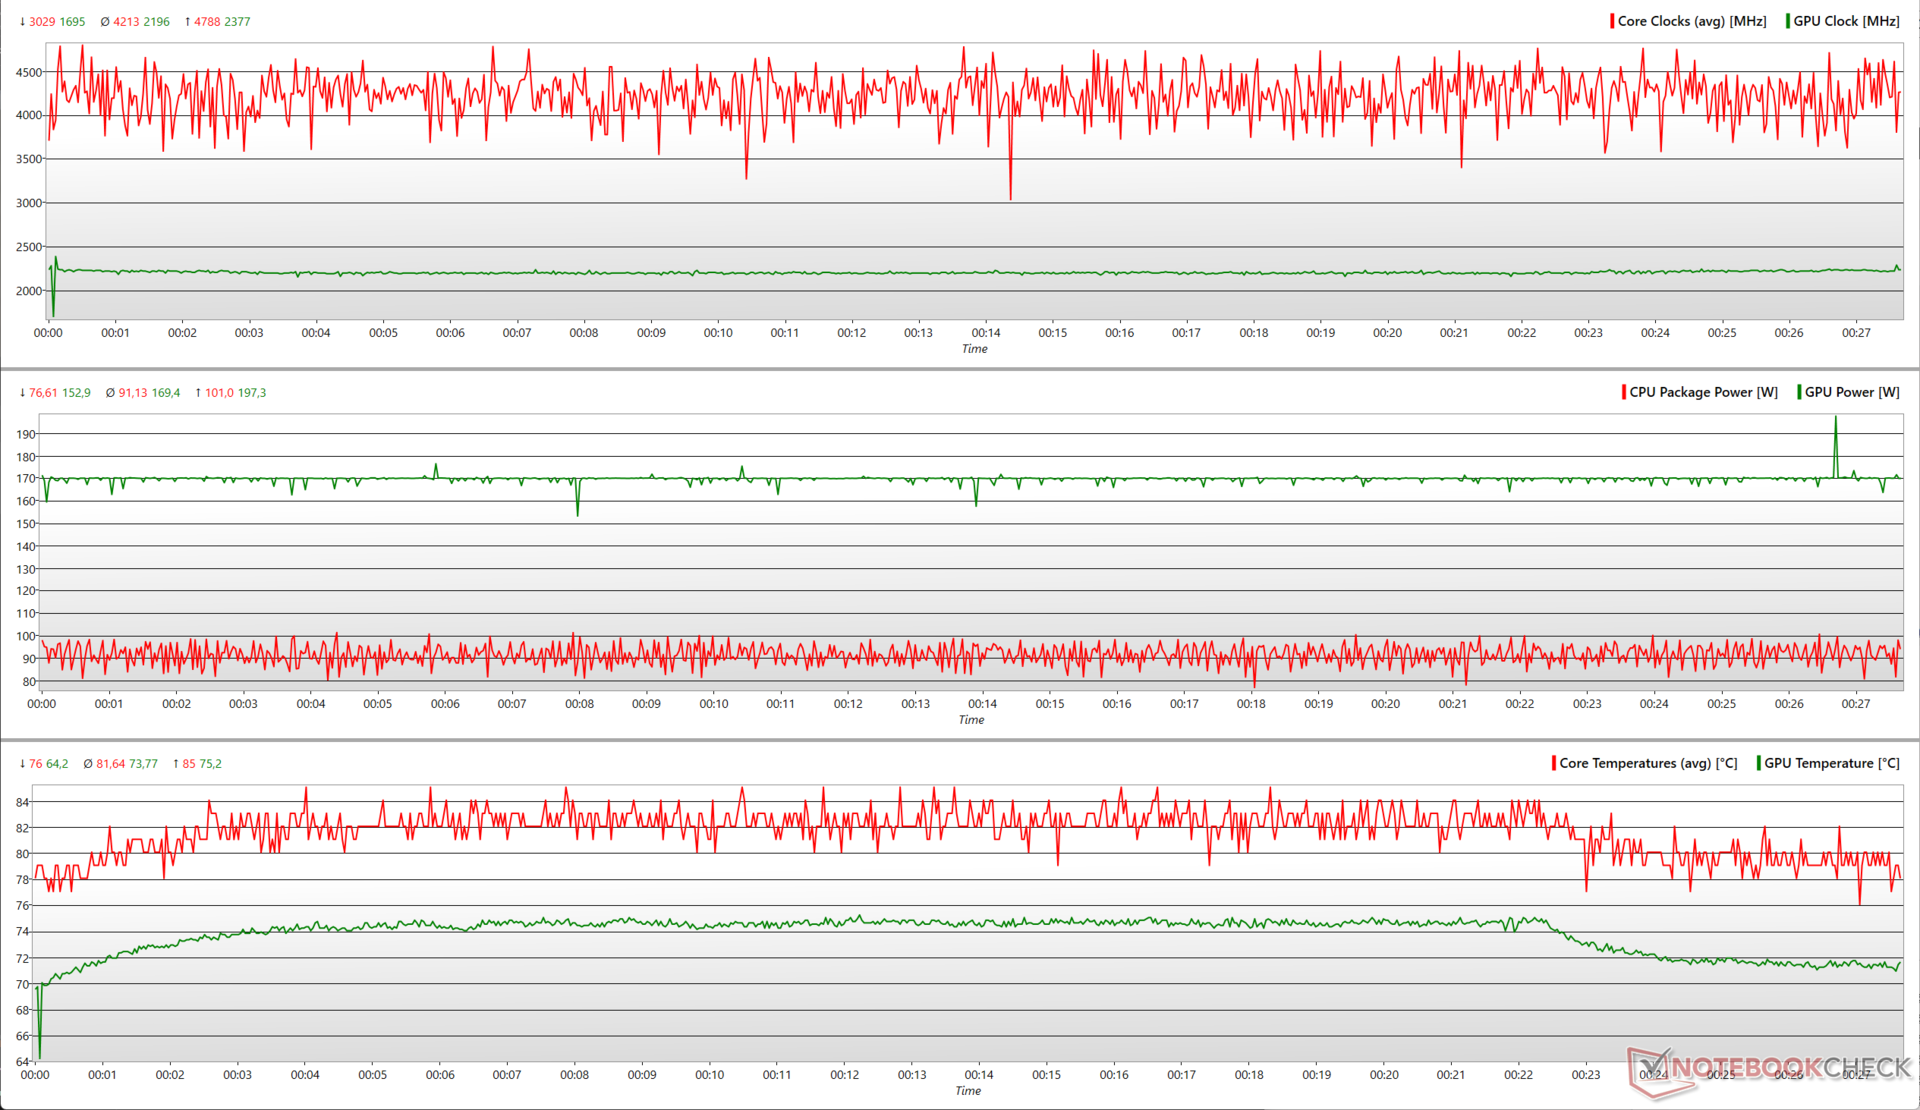
| Stress Test | CPU Clock (GHz) | GPU Clock (MHz) | Average CPU Temperature (°C) | Average GPU Temperature (°C) |
| System Idle | 2.19 | 180 | 52 | 47 |
| Prime95 | 3.95 | 180 | 91 | 54.5 |
| Prime95 + FurMark | 3.07 | 1,860 | 83 | 74.2 |
| Cyberpunk 2077 1080p Ultra | 4.44 | 2.21 | 81 | 72.6 |
Speakers
The Titan 18 HX AI uses a four-speaker system comprised of two speakers and two woofers. At a sound pressure level (SPL) of 87.4 db(A), the speakers produce sufficiently loud sound without perceivable distortions.
The woofers do not deliver a great low frequency response, but the audio doesn't sound tinny unlike many laptop speakers. Mids and highs are reproduced fairly well.
A 3.5 mm combo audio jack and Bluetooth 5.4 enable connecting external speakers or headphones for better audio quality.
MSI Titan 18 HX AI A2XWJG audio analysis
(+) | speakers can play relatively loud (87.4 dB)
Bass 100 - 315 Hz
(-) | nearly no bass - on average 20% lower than median
(±) | linearity of bass is average (8% delta to prev. frequency)
Mids 400 - 2000 Hz
(±) | higher mids - on average 8.1% higher than median
(+) | mids are linear (6.7% delta to prev. frequency)
Highs 2 - 16 kHz
(+) | balanced highs - only 2.5% away from median
(+) | highs are linear (5.3% delta to prev. frequency)
Overall 100 - 16.000 Hz
(±) | linearity of overall sound is average (16.5% difference to median)
Compared to same class
» 42% of all tested devices in this class were better, 7% similar, 51% worse
» The best had a delta of 6%, average was 18%, worst was 132%
Compared to all devices tested
» 28% of all tested devices were better, 6% similar, 66% worse
» The best had a delta of 4%, average was 24%, worst was 134%
Apple MacBook Pro 16 2021 M1 Pro audio analysis
(+) | speakers can play relatively loud (84.7 dB)
Bass 100 - 315 Hz
(+) | good bass - only 3.8% away from median
(+) | bass is linear (5.2% delta to prev. frequency)
Mids 400 - 2000 Hz
(+) | balanced mids - only 1.3% away from median
(+) | mids are linear (2.1% delta to prev. frequency)
Highs 2 - 16 kHz
(+) | balanced highs - only 1.9% away from median
(+) | highs are linear (2.7% delta to prev. frequency)
Overall 100 - 16.000 Hz
(+) | overall sound is linear (4.6% difference to median)
Compared to same class
» 0% of all tested devices in this class were better, 0% similar, 100% worse
» The best had a delta of 5%, average was 17%, worst was 45%
Compared to all devices tested
» 0% of all tested devices were better, 0% similar, 100% worse
» The best had a delta of 4%, average was 24%, worst was 134%
Energy Management: High power appetite with poor battery endurance
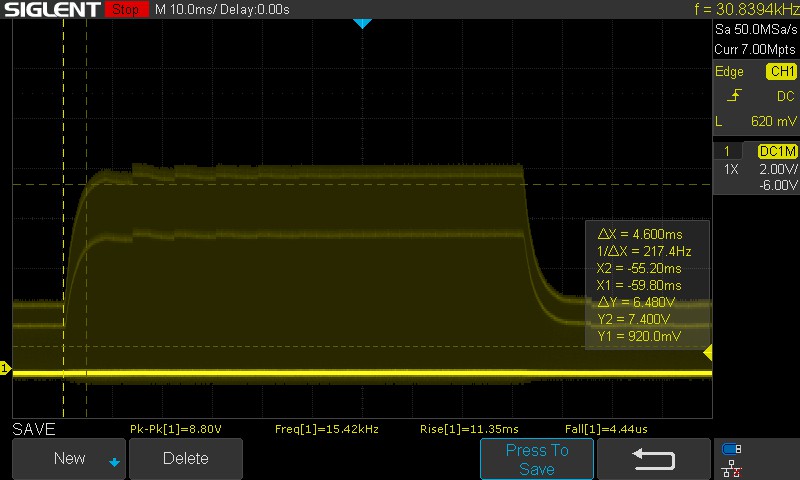
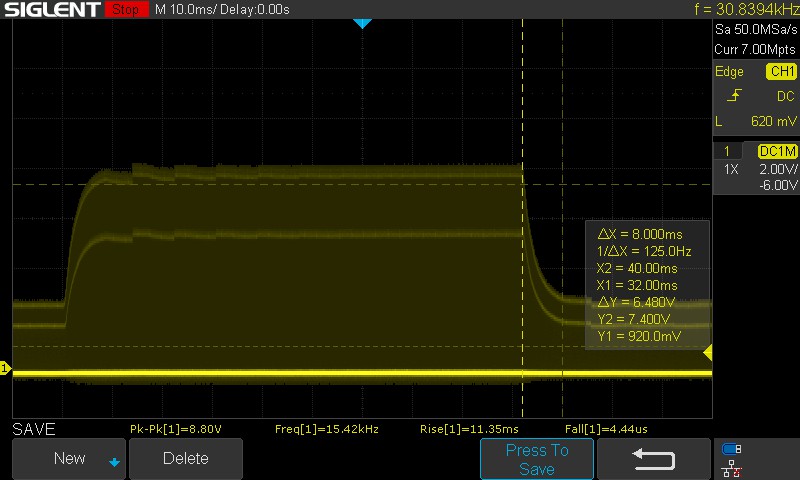
Power Consumption
The combination of a Core Ultra 9 285HX and a 175 W RTX 5090 Laptop GPU together with a bright 4K 120 Hz mini-LED makes the Titan 18 HX AI an energy guzzler.
We used the MSHybrid mode for recording power measurements as the dGPU MUX resulted in a significantly high average consumption of 21.6 W in standby mode alone.
The supplied 400 W adapter provides adequate headroom to meet the Titan 18 HX AI's peak power demands during intensive workloads.
| Off / Standby | |
| Idle | |
| Load |
|
Key:
min: | |
| MSI Titan 18 HX AI A2XWJG Ultra 9 285HX, GeForce RTX 5090 Laptop, Mini-LED, 3840x2160, 18" | Aorus Master 18 AM8H Ultra 9 275HX, GeForce RTX 5090 Laptop, Mini-LED, 2560x1600, 18" | Asus Strix Scar 18 G835LX Ultra 9 275HX, GeForce RTX 5090 Laptop, Mini-LED, 2560x1600, 18" | Schenker XMG Neo 16 A25 5090 R9 9955HX3D, GeForce RTX 5090 Laptop, Mini-LED, 2560x1600, 16" | Medion Erazer Beast 18 X1 MD62731 Ultra 9 275HX, GeForce RTX 5080 Laptop, IPS, 2560x1600, 18" | Razer Blade 16 2025 RTX 5090 Ryzen AI 9 HX 370, GeForce RTX 5090 Laptop, OLED, 2560x1600, 16" | MSI Titan 18 HX A14VIG i9-14900HX, GeForce RTX 4090 Laptop GPU, Mini-LED, 3840x2400, 18" | Average NVIDIA GeForce RTX 5090 Laptop | Average of class Gaming | |
|---|---|---|---|---|---|---|---|---|---|
| Power Consumption | -14% | -8% | 13% | 30% | 38% | -13% | 5% | 25% | |
| Idle Minimum * (Watt) | 19.01 | 29 -53% | 11.4 40% | 13.2 31% | 7.9 58% | 10.9 43% | 13.2 31% | 16.2 ? 15% | 13.2 ? 31% |
| Idle Average * (Watt) | 30.92 | 33 -7% | 39.2 -27% | 16.8 46% | 11.5 63% | 13.5 56% | 25.4 18% | 24.3 ? 21% | 18.9 ? 39% |
| Idle Maximum * (Watt) | 33.84 | 48 -42% | 40.2 -19% | 17.1 49% | 16.6 51% | 13.7 60% | 53.5 -58% | 30.3 ? 10% | 24.3 ? 28% |
| Load Average * (Watt) | 105.4 | 141 -34% | 161.2 -53% | 164.2 -56% | 130 -23% | 120.2 -14% | 151.4 -44% | 135.3 ? -28% | 108 ? -2% |
| Cyberpunk 2077 ultra * (Watt) | 343 | 283 17% | 303 12% | 284 17% | 253 26% | 178.2 48% | |||
| Cyberpunk 2077 ultra external monitor * (Watt) | 330 | 283 14% | 295 11% | 282 15% | 245 26% | 177.6 46% | |||
| Load Maximum * (Watt) | 354 | 340 4% | 430.9 -22% | 392.8 -11% | 330 7% | 246.1 30% | 395.2 -12% | 336 ? 5% | 254 ? 28% |
| Witcher 3 ultra * (Watt) | 336 |
* ... smaller is better
Power consumption: Cyberpunk 2077 / Stress test
Power consumption: External monitor
Battery Life
Despite a 99 Whr battery and running in the ECO-Silent preset in MSHybrid mode at a 60 Hz refresh rate, the Titan 18 HX AI barely lasts three hours during 1080p H.264 video playback at 150 nits.
Wi-Fi browsing at the same brightness extends the run time to short of 4.5 hours.

Other Core Ultra 9 275HX-powered laptops in the comparison are able to offer much longer battery run times.
It takes about two hours to fully charge the laptop from zero battery. The two Thunderbolt 5 ports can also be used for charging albeit at a significantly slower rate.
| MSI Titan 18 HX AI A2XWJG Ultra 9 285HX, GeForce RTX 5090 Laptop, 99 Wh | Aorus Master 18 AM8H Ultra 9 275HX, GeForce RTX 5090 Laptop, 99 Wh | Asus Strix Scar 18 G835LX Ultra 9 275HX, GeForce RTX 5090 Laptop, 90 Wh | Schenker XMG Neo 16 A25 5090 R9 9955HX3D, GeForce RTX 5090 Laptop, 99.8 Wh | Medion Erazer Beast 18 X1 MD62731 Ultra 9 275HX, GeForce RTX 5080 Laptop, 99 Wh | Razer Blade 16 2025 RTX 5090 Ryzen AI 9 HX 370, GeForce RTX 5090 Laptop, 90 Wh | MSI Titan 18 HX A14VIG i9-14900HX, GeForce RTX 4090 Laptop GPU, 99.9 Wh | Average of class Gaming | |
|---|---|---|---|---|---|---|---|---|
| Battery runtime | 21% | 15% | 37% | 84% | 105% | -11% | 79% | |
| H.264 (h) | 3 | 5.8 93% | 9.9 230% | 8.26 ? 175% | ||||
| WiFi v1.3 (h) | 4.3 | 4.9 14% | 5.5 28% | 5.9 37% | 7.9 84% | 7.9 84% | 4.2 -2% | 7.02 ? 63% |
| Cyberpunk 2077 ultra 150cd (h) | 1.2 | 0.7 -42% | 1.2 0% | |||||
| Load (h) | 1.5 | 1.9 27% | 1.2 -20% | 1.2 -20% | 1.47 ? -2% | |||
| Reader / Idle (h) | 5.8 | 5.9 | 8.71 ? |
Notebookcheck's impression of the MSI Titan 18 HX AI
While there are some tangible improvements overall, the MSI Titan 18 HX AI does not yet warrant an immediate splurge of $6,600 as there are definitely areas for improvement.
MSI Titan 18 HX AI A2XWJG
- 06/02/2025 v8
Vaidyanathan Subramaniam
 Total Sustainability Score:
 Potential competitors in comparison
Image | Model / Review | Price | Weight | Height | Display |
|---|---|---|---|---|---|
1. 86.1%  | MSI Titan 18 HX AI A2XWJG Intel Core Ultra 9 285HX ⎘ NVIDIA GeForce RTX 5090 Laptop ⎘ 64 GB Memory, 6000 GB SSD | Amazon: List Price: 6600 USD | 3.6 kg | 32.05 mm | 18.00" 3840x2160 245 PPI Mini-LED |
2. 86.8%  | Aorus Master 18 AM8H Intel Core Ultra 9 275HX ⎘ NVIDIA GeForce RTX 5090 Laptop ⎘ 64 GB Memory, 2048 GB SSD | Amazon: List Price: 5000 EUR | 3.4 kg | 31 mm | 18.00" 2560x1600 168 PPI Mini-LED |
3. 88%  | Asus Strix Scar 18 G835LX Intel Core Ultra 9 275HX ⎘ NVIDIA GeForce RTX 5090 Laptop ⎘ 64 GB Memory, 2048 GB SSD | Amazon: List Price: 5799€ | 3.3 kg | 32 mm | 18.00" 2560x1600 168 PPI Mini-LED |
4. 82.5%  | Medion Erazer Beast 18 X1 MD62731 Intel Core Ultra 9 275HX ⎘ NVIDIA GeForce RTX 5080 Laptop ⎘ 32 GB Memory, SSD | Amazon: List Price: 3700 EUR | 3.6 kg | 30.4 mm | 18.00" 2560x1600 168 PPI IPS |
5. 90%  | Schenker XMG Neo 16 E25 RTX 5090 Laptop Intel Core Ultra 9 275HX ⎘ NVIDIA GeForce RTX 5090 Laptop ⎘ 32 GB Memory, 1024 GB SSD | Amazon: List Price: 4450€ | 2.9 kg | 27.9 mm | 16.00" 2560x1600 189 PPI Mini-LED |
6. 89.4%  | Schenker XMG Neo 16 A25 5090 AMD Ryzen 9 9955HX3D ⎘ NVIDIA GeForce RTX 5090 Laptop ⎘ 32 GB Memory, 1024 GB NVMe | Amazon: List Price: 4480€ | 2.9 kg | 27.9 mm | 16.00" 2560x1600 189 PPI Mini-LED |
7. 88.4%  | Asus ROG Strix Scar 16 2025 Intel Core Ultra 9 275HX ⎘ NVIDIA GeForce RTX 5090 Laptop ⎘ 64 GB Memory, 2048 GB SSD | Amazon: List Price: 4999€ | 2.8 kg | 30.8 mm | 16.00" 2560x1600 189 PPI Mini-LED |
8. 87%  | Razer Blade 16 2025 RTX 5090 AMD Ryzen AI 9 HX 370 ⎘ NVIDIA GeForce RTX 5090 Laptop ⎘ 32 GB Memory, 2048 GB SSD | Amazon: List Price: 4399€ | 2.1 kg | 17.4 mm | 16.00" 2560x1600 189 PPI OLED |
Transparency
The selection of devices to be reviewed is made by our editorial team. The test sample was provided to the author as a loan by the manufacturer or retailer for the purpose of this review. The lender had no influence on this review, nor did the manufacturer receive a copy of this review before publication. There was no obligation to publish this review. As an independent media company, Notebookcheck is not subjected to the authority of manufacturers, retailers or publishers.
This is how Notebookcheck is testing
Every year, Notebookcheck independently reviews hundreds of laptops and smartphones using standardized procedures to ensure that all results are comparable. We have continuously developed our test methods for around 20 years and set industry standards in the process. In our test labs, high-quality measuring equipment is utilized by experienced technicians and editors. These tests involve a multi-stage validation process. Our complex rating system is based on hundreds of well-founded measurements and benchmarks, which maintains objectivity. Further information on our test methods can be found here.
