MSI Raider 18 HX A14V review: Titan performance without the Titan price
")
Larger 18-inch gaming laptops are making a comeback of sorts as the lineup continues to steadily expand. MSI already offers the "ultimate" 18-inch gaming experience with the Titan 18 HX, but this latest Raider 18 HX model is one tier down in terms of features to lower the barrier of entry.
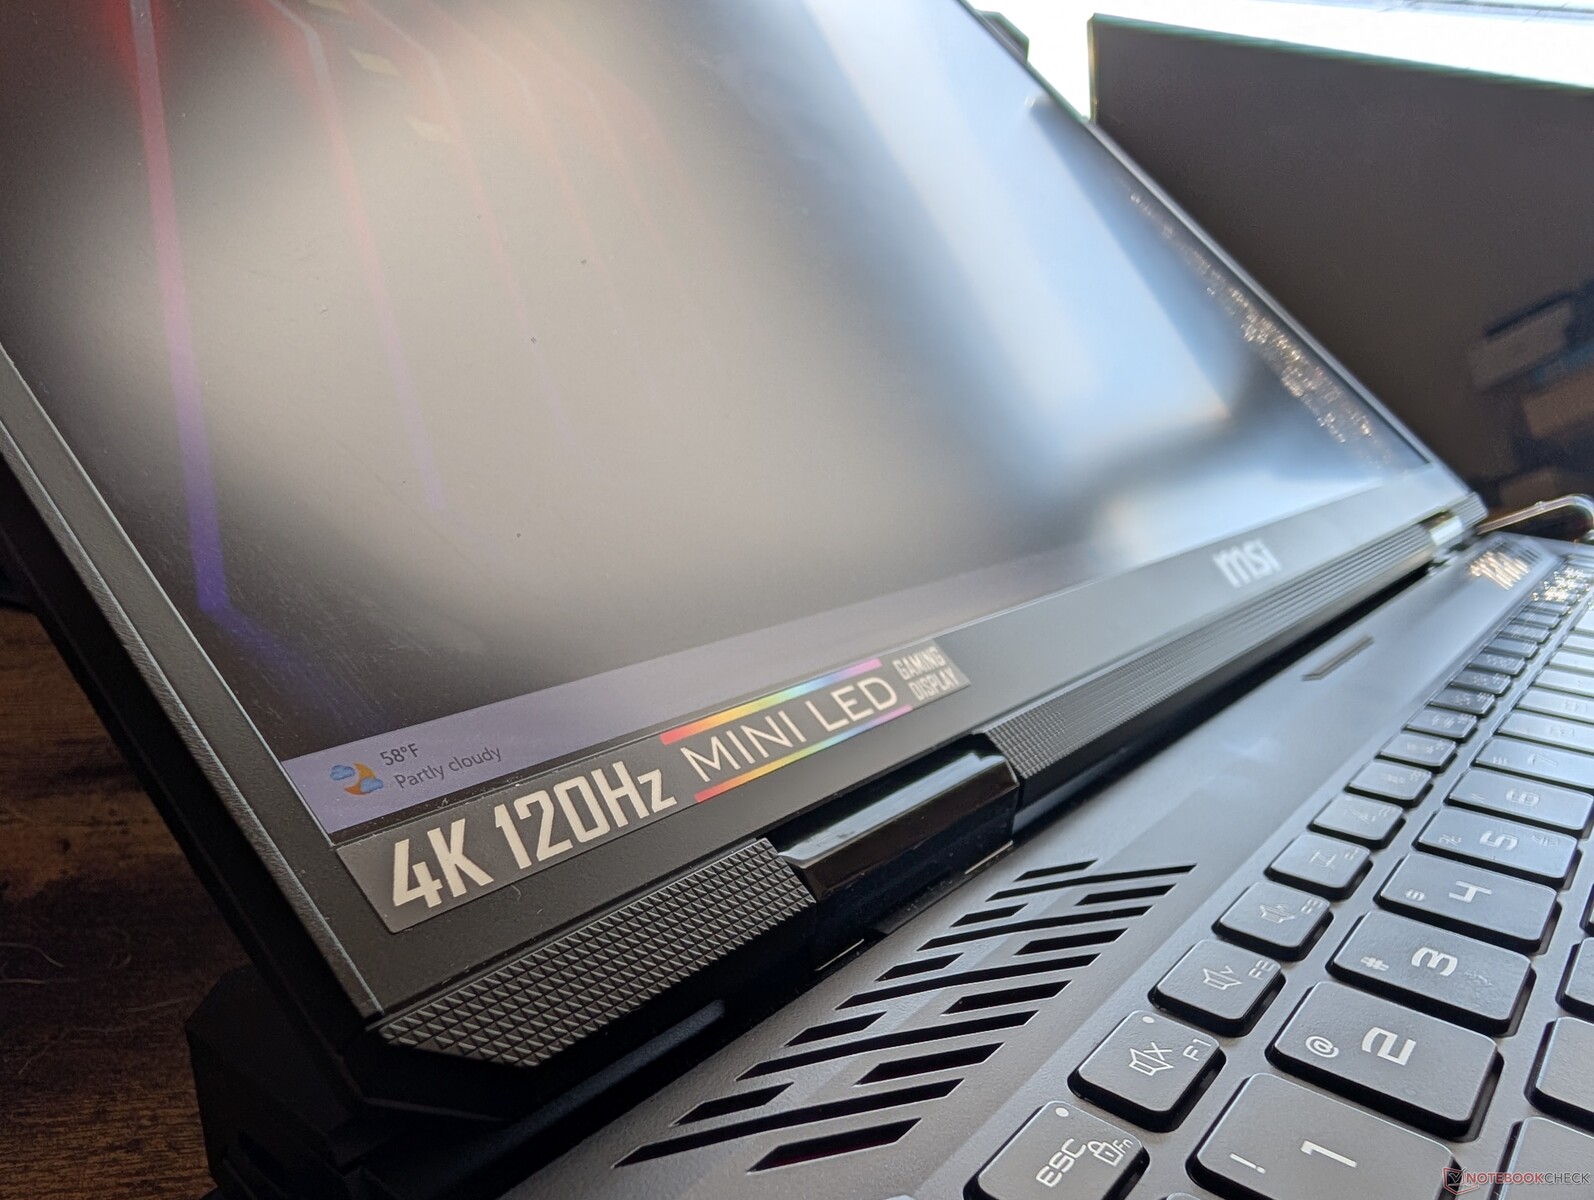
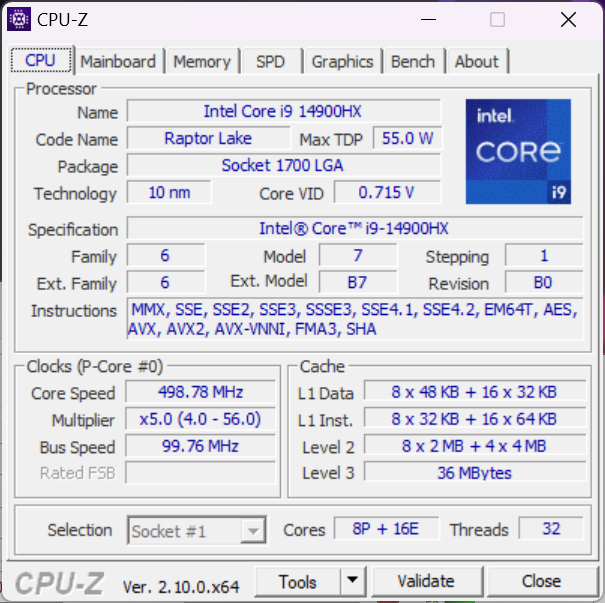
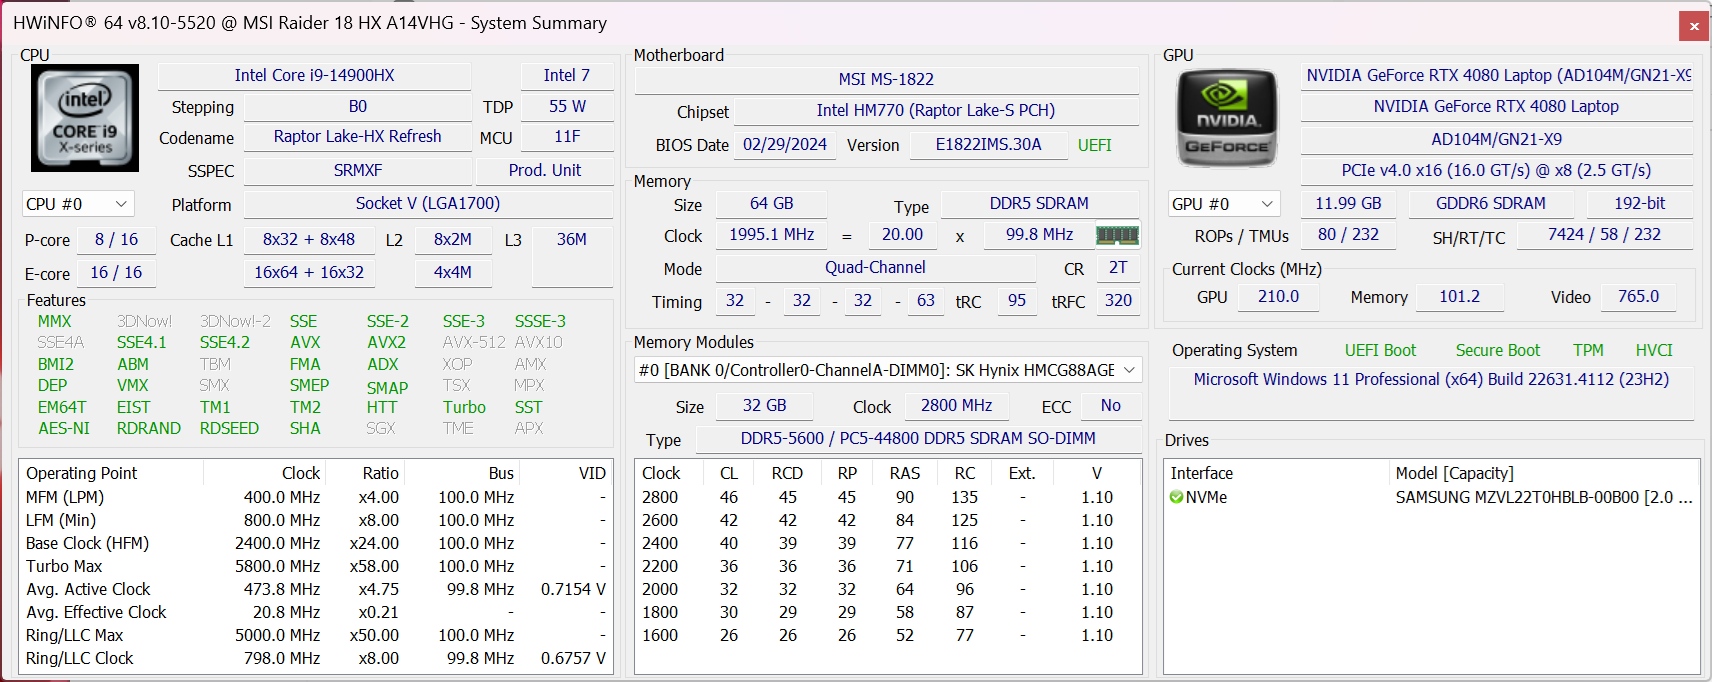
Our test unit is a middle configuration with the Raptor Lake-R Core i9-14900HX CPU, 175 W GeForce RTX 4080 GPU, and 3840 x 2400 120 Hz Mini-LED display for approximately $3200 retail. Other SKUs include the Zen 4 Ryzen 9 7945HX, RTX 4070, RTX 4090, or QHD+ 2560 x 1600 240 Hz IPS display instead.
Competitors to the Raider 18 HX include other 18-inch gaming laptops like the Razer Blade 18, Alienware m18 R2, or Asus ROG Strix G18.
More MSI reviews:
Potential Competitors in Comparison
Rating | Version | Date | Model | Weight | Height | Size | Resolution | Price |
|---|---|---|---|---|---|---|---|---|
| 84.7 % | v8 | 09 / 2024 | MSI Raider 18 HX A14V i9-14900HX, GeForce RTX 4080 Laptop GPU | 3.6 kg | 32 mm | 18.00" | 3840x2400 | |
| 90.5 % v7 (old) | v7 (old) | 05 / 2024 | Razer Blade 18 2024 RZ09-0509 i9-14900HX, GeForce RTX 4090 Laptop GPU | 3.1 kg | 21.9 mm | 18.00" | 2560x1600 | |
| 89.5 % v7 (old) | v7 (old) | 03 / 2024 | Alienware m18 R2 i9-14900HX, GeForce RTX 4090 Laptop GPU | 4 kg | 26.7 mm | 18.00" | 2560x1600 | |
| 88.8 % v7 (old) | v7 (old) | 01 / 2024 | MSI Titan 18 HX A14VIG i9-14900HX, GeForce RTX 4090 Laptop GPU | 3.6 kg | 32.1 mm | 18.00" | 3840x2400 | |
| 87.4 % v7 (old) | v7 (old) | 03 / 2023 | Asus ROG Strix G18 G814JI i7-13650HX, GeForce RTX 4070 Laptop GPU | 3 kg | 31 mm | 18.00" | 2560x1600 | |
| 87.1 % v7 (old) | v7 (old) | 03 / 2024 | Acer Predator Helios 18 PH18-72-98MW i9-14900HX, GeForce RTX 4090 Laptop GPU | 3.3 kg | 29.5 mm | 18.00" | 2560x1600 |
Note: We have recently updated our rating system and the results of version 8 are not comparable with the results of version 7. More information is available here .
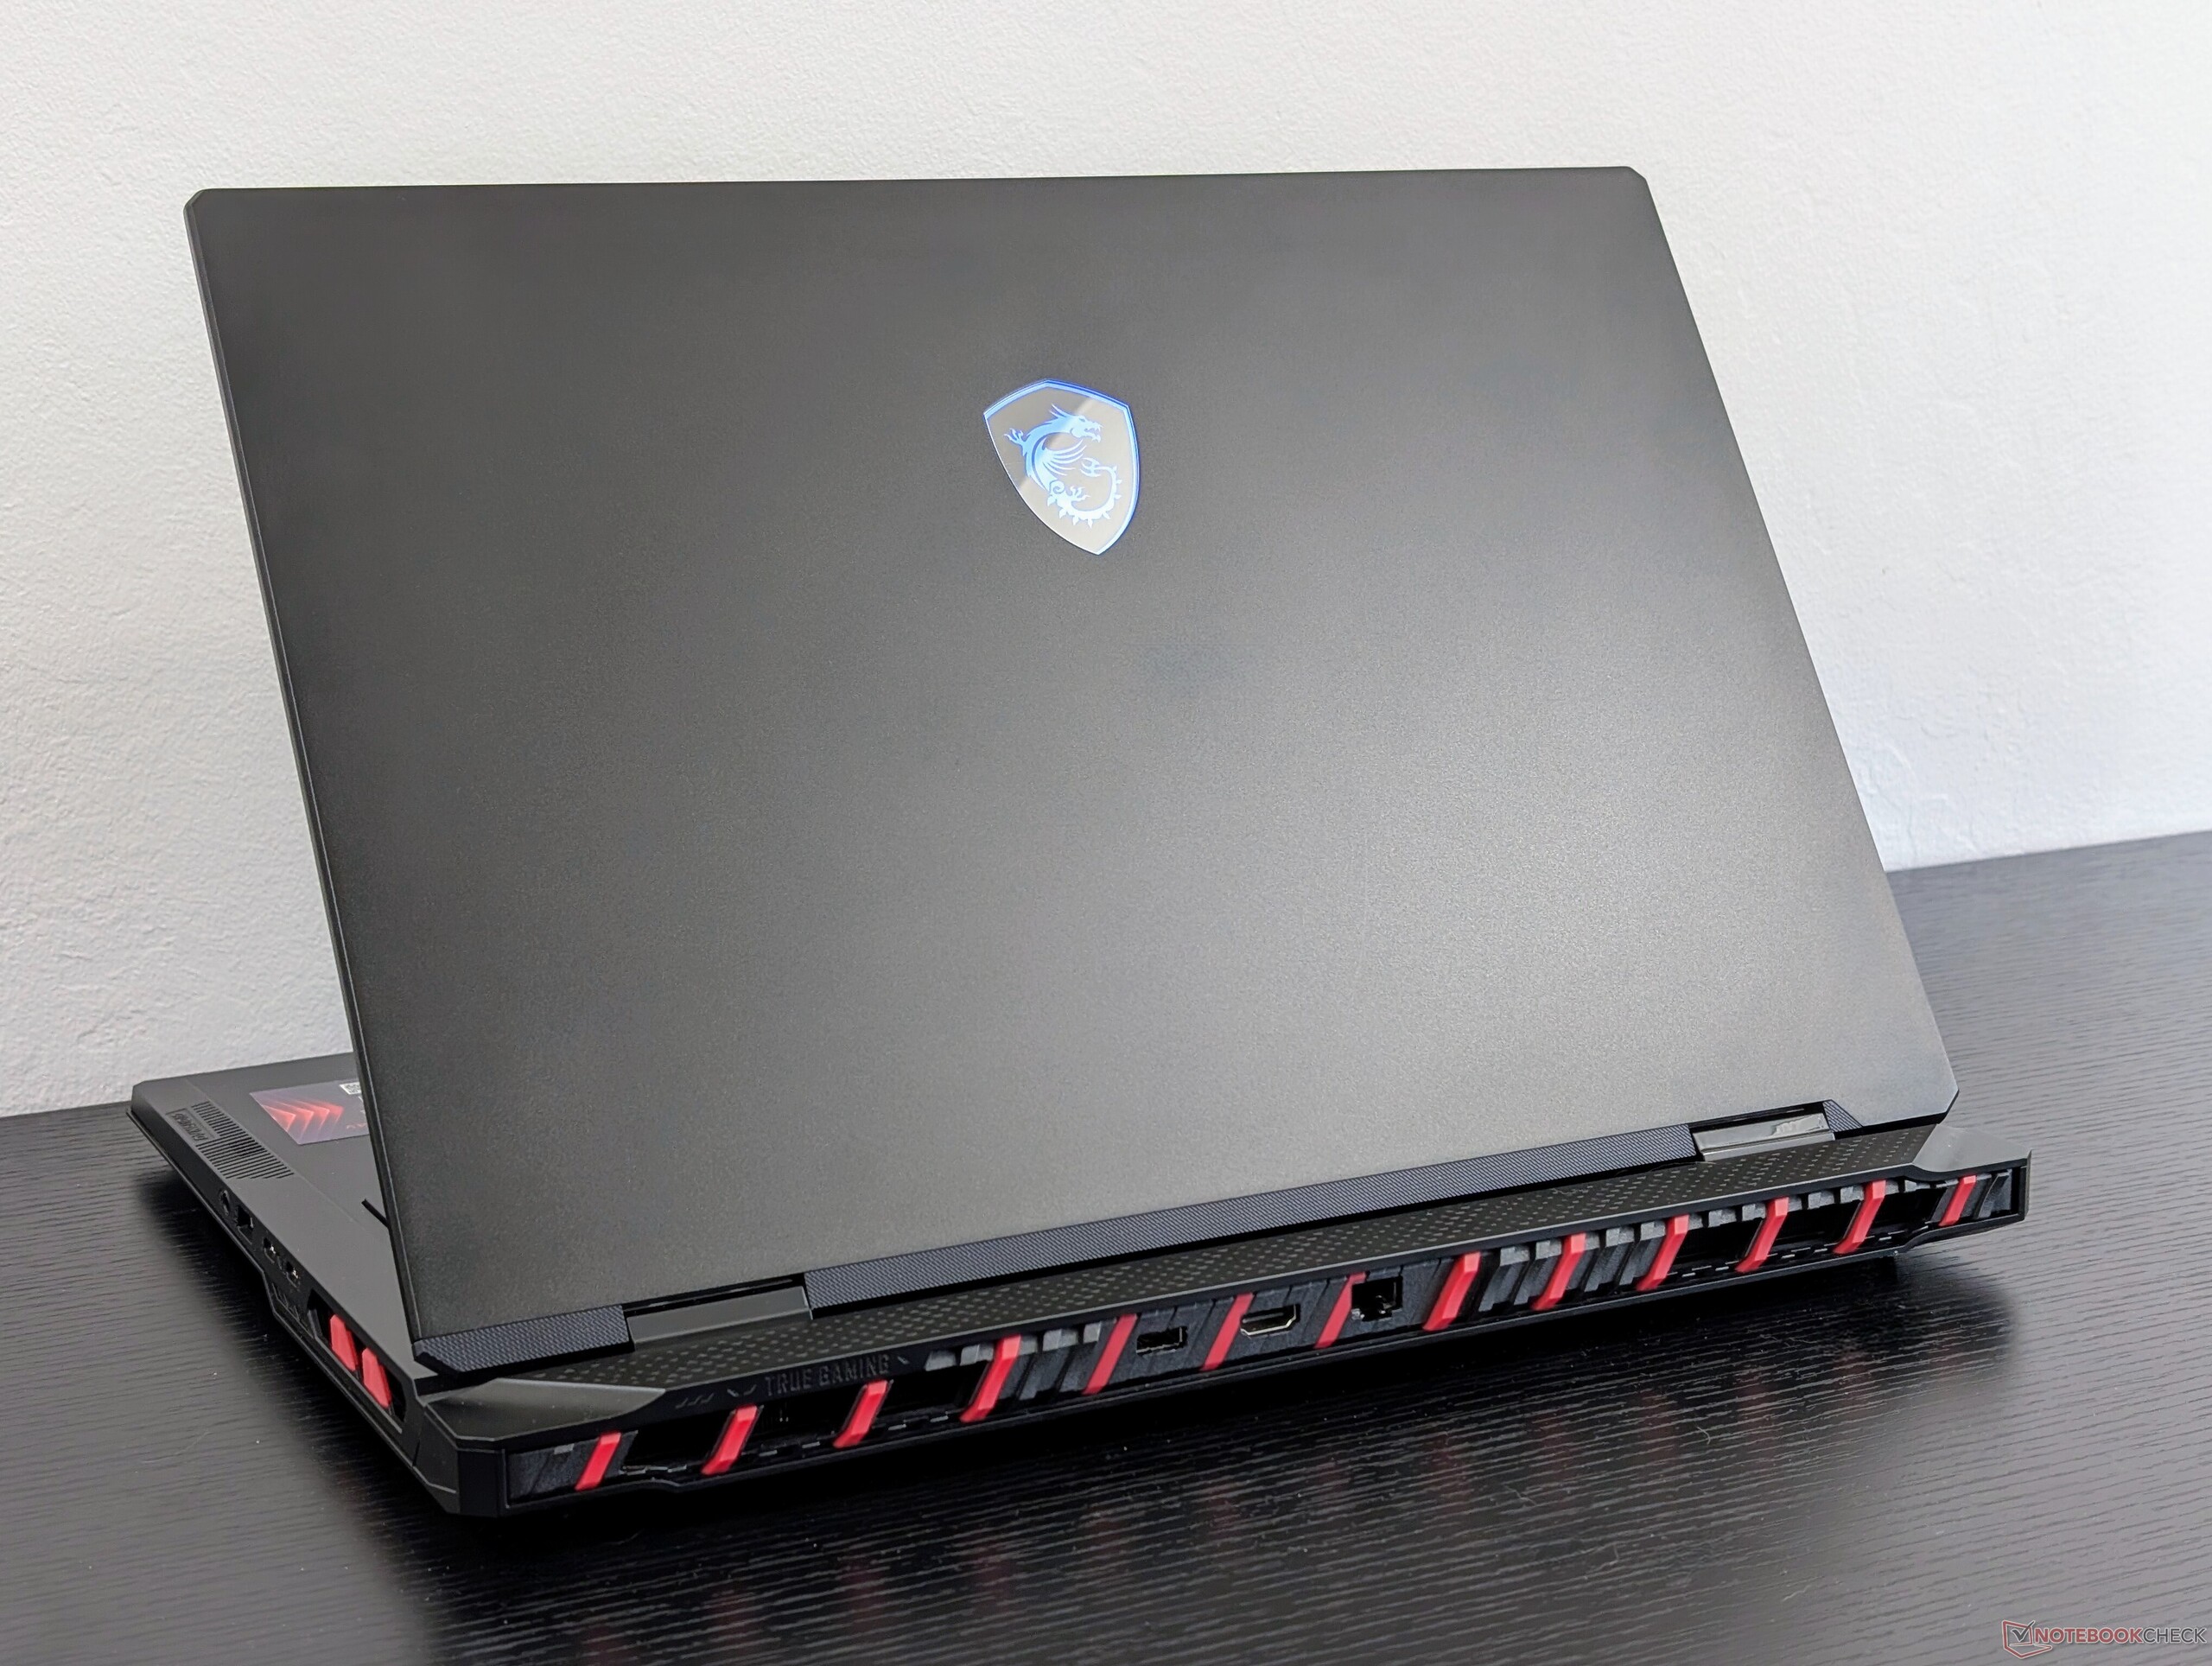
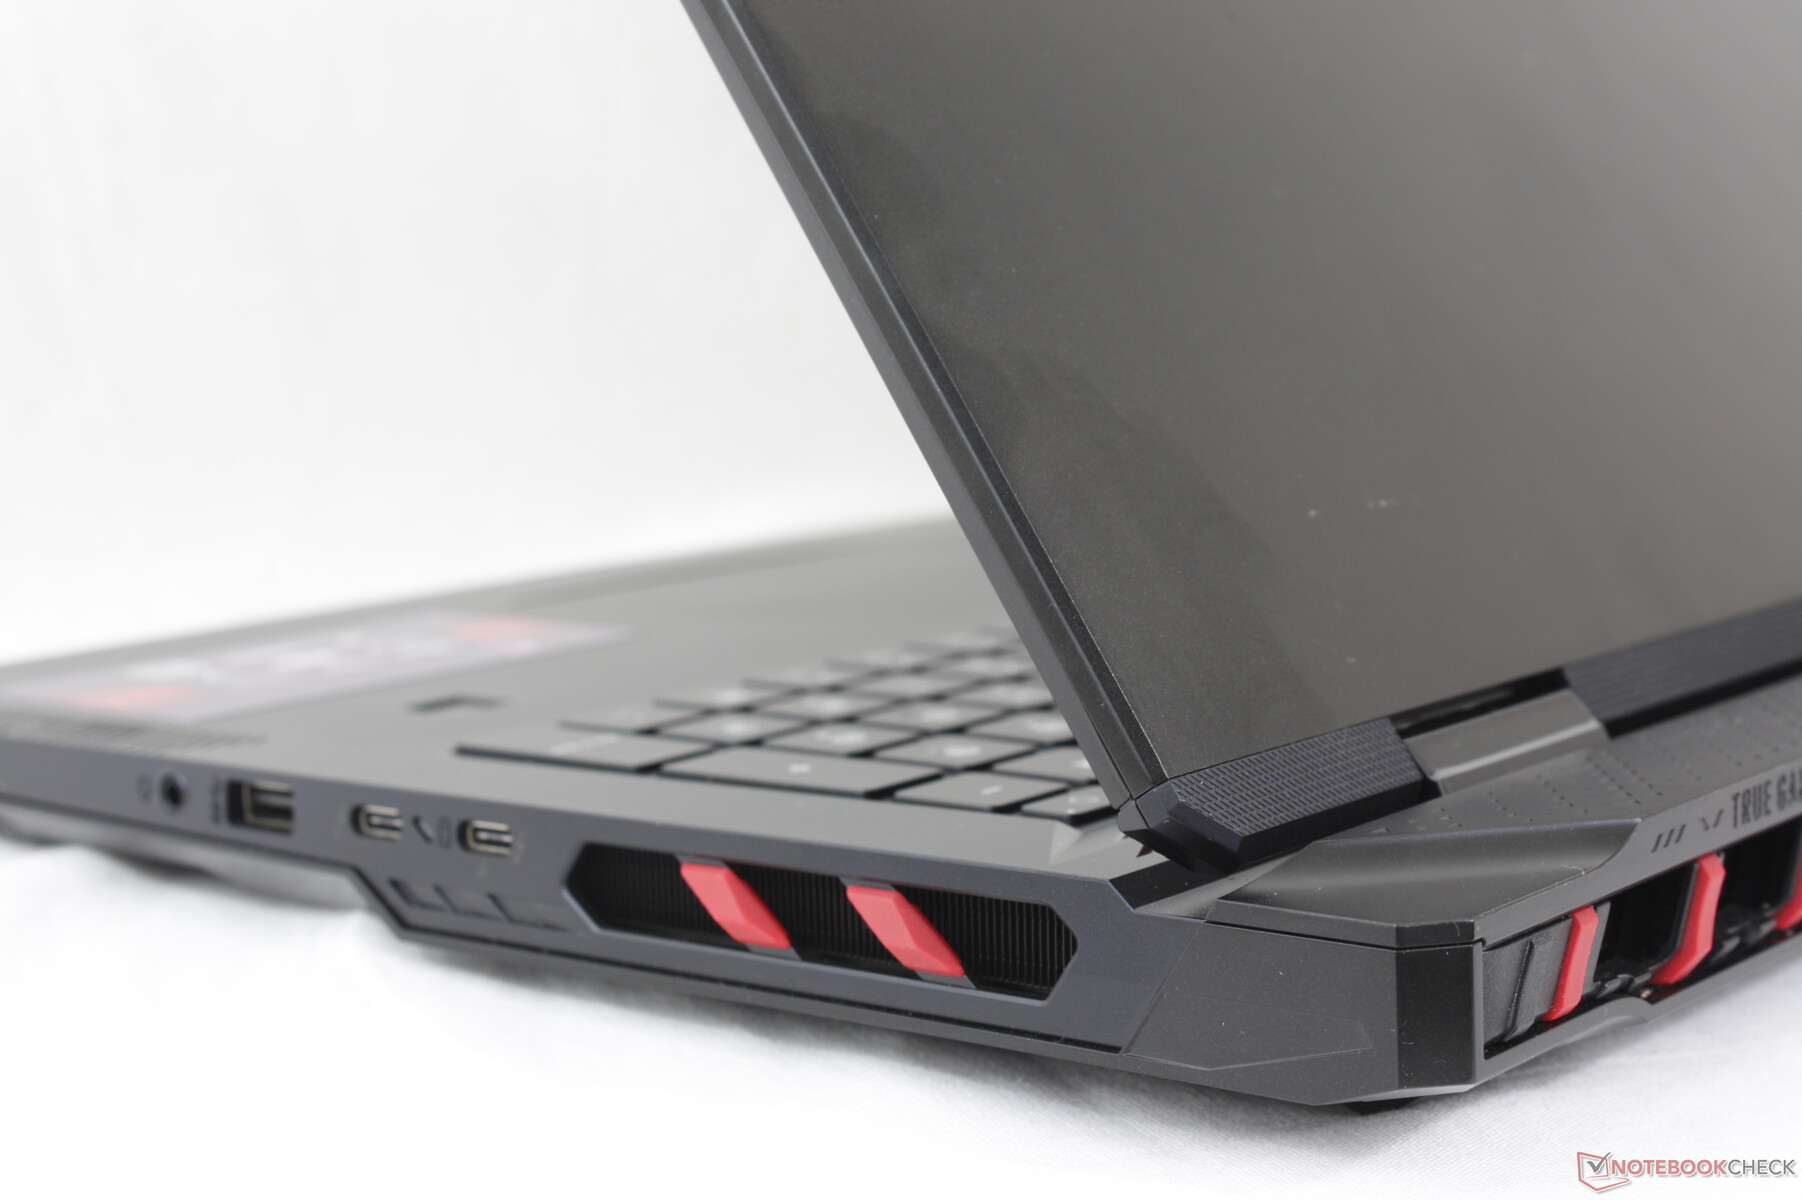
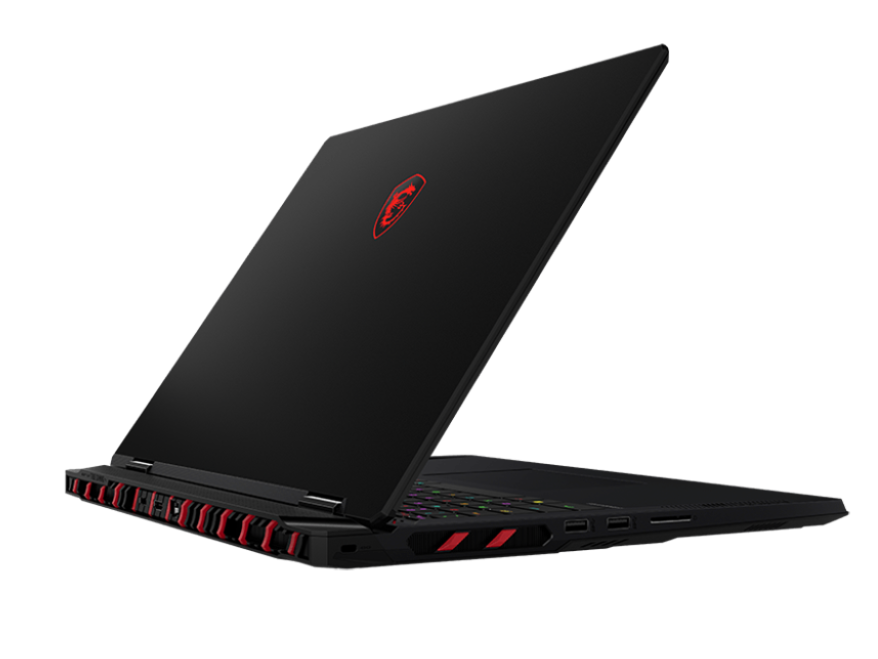
Case — From Blue Dragon To Red
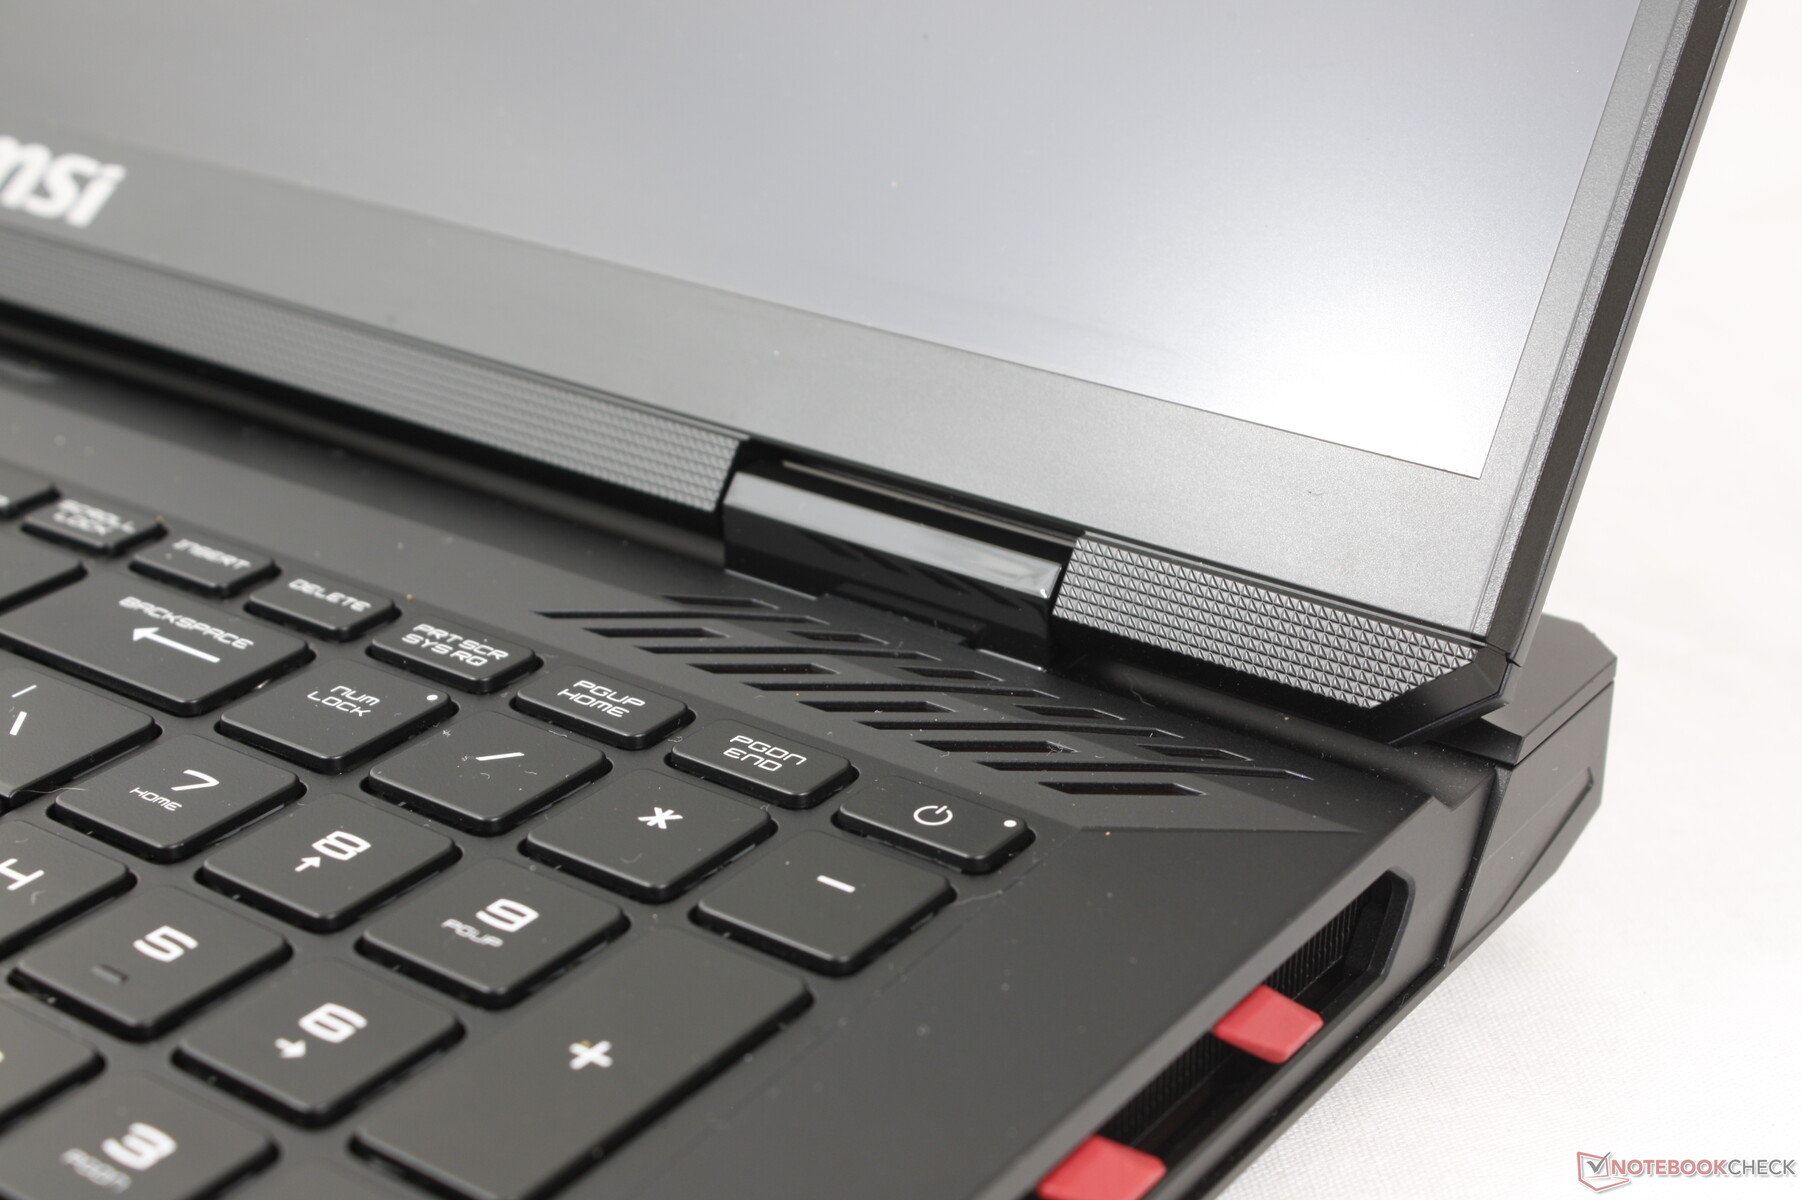
The chassis is a derivative of the Titan 18 HX. The red accents of the Titan are instead blue on the new Raider and most surfaces are jet black instead of gray or silver for an overall darker look. MSI has also added an LED bar along the front edge of the system whereas this was missing on the Titan. The changes are largely aesthetic and so the Raider still feels as strong as its more expensive sibling since the underlying materials and skeleton are the same.
Perhaps the most notable visual difference between the Raider 18 HX and Titan 18 HX is the redesigned keyboard deck. While the Titan 18 HX has a flatter deck with a fancy glass panel extending across the palm rests and clickpad, the Raider takes a more traditional approach with no glass and just a basic clickpad.
Dimensions and weight are essentially identical to the Titan 18 HX despite all the external differences between them. The model is therefore in the middle of the pack as far as portability goes as alternatives like the Alienware m18 R2 are heavier and larger while the ROG Strix G18 or Blade 18 are each much lighter.
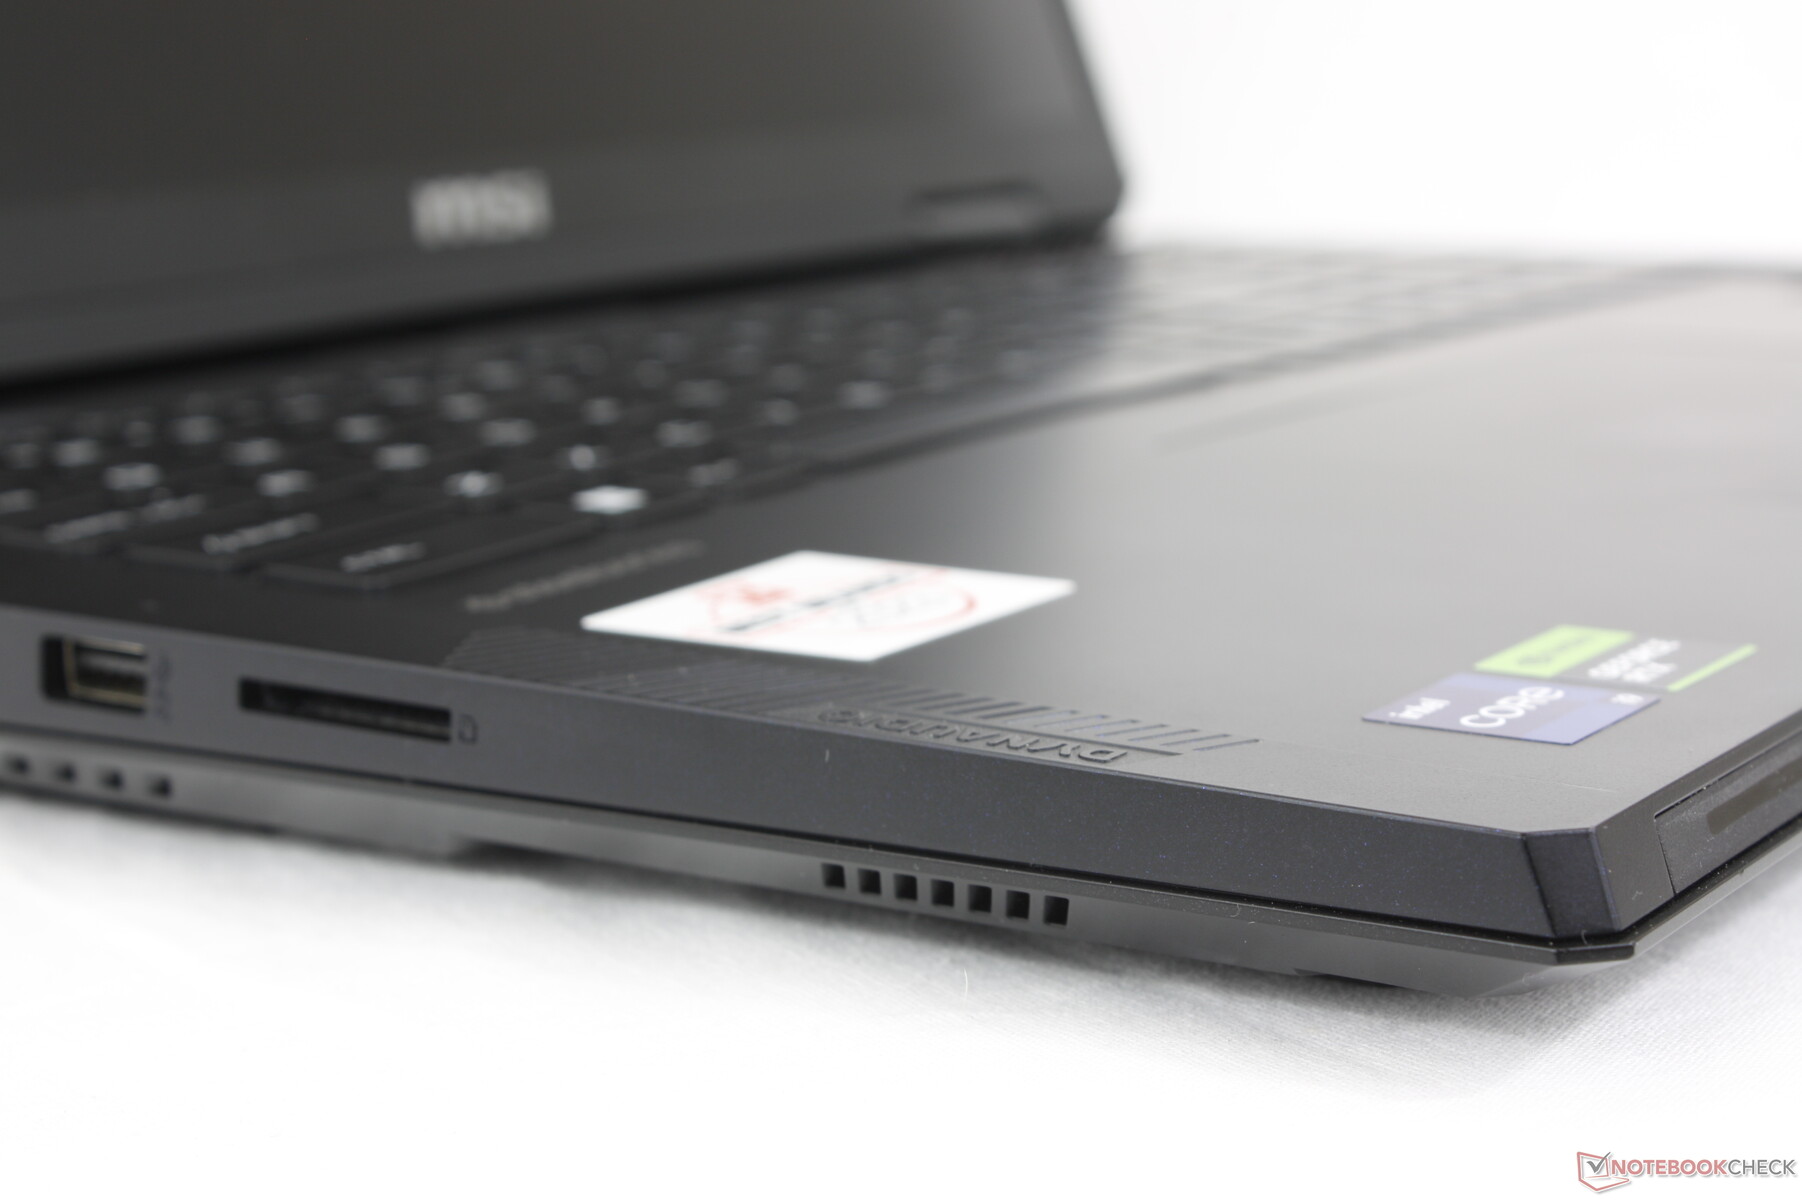
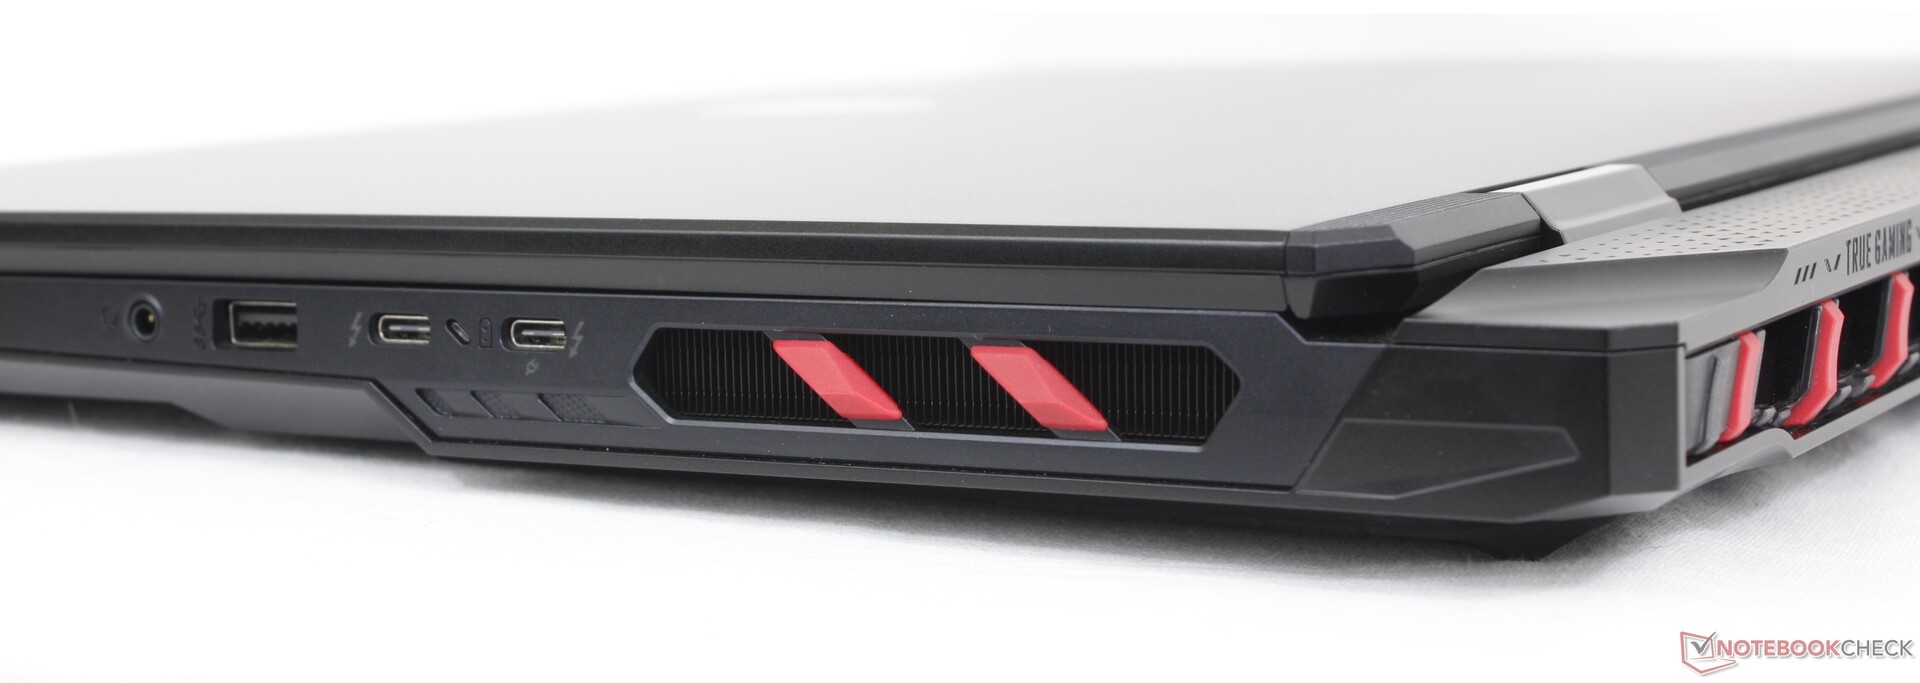
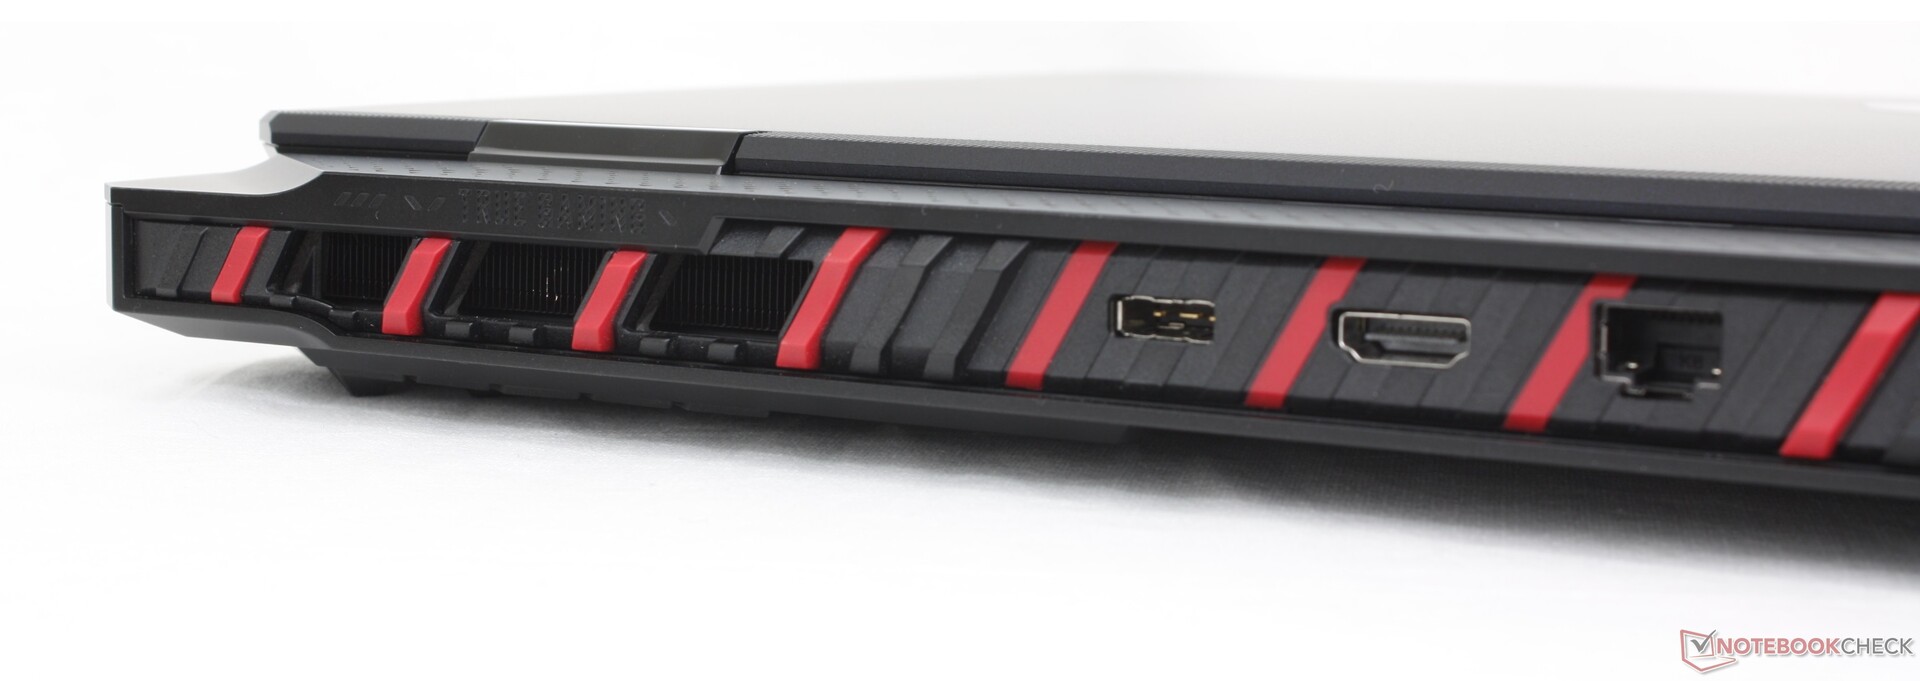
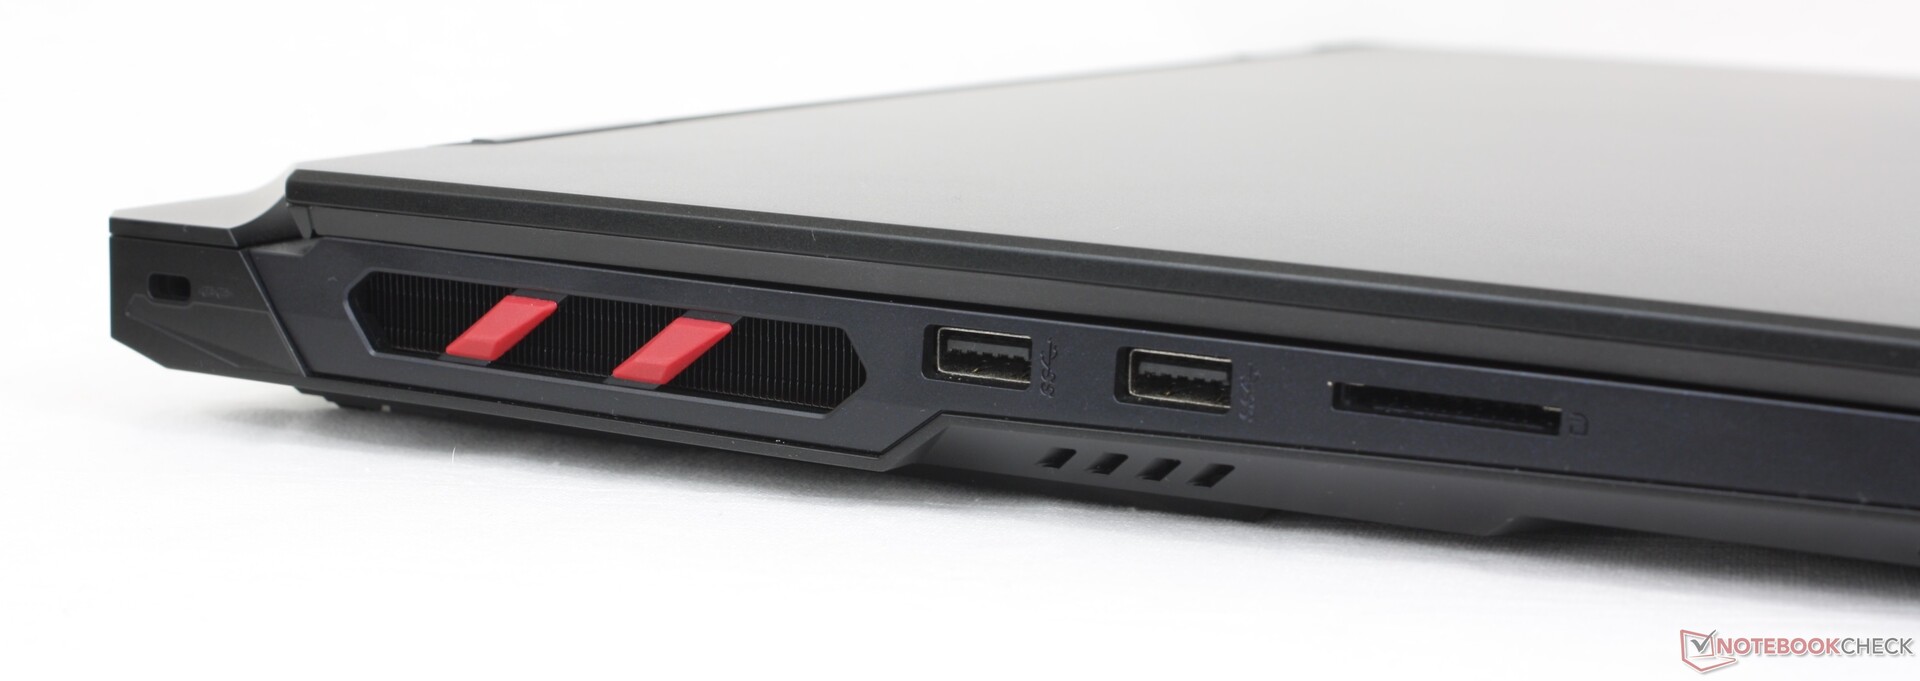
Connectivity
Ports and positioning are identical to the Titan 18 HX which is a big hint about what to expect underneath the hood. The integrated options are comparable to what you'll find on the Blade 18 or ROG Strix G18 albeit in very different arrangements.
Keep in mind that only one of the two USB-C ports support Power Delivery. Both are otherwise compatible with DisplayPort.

SD Card Reader
At around 90 MB/s, the integrated SD reader is decent but otherwise slow relative to the high price of the Raider 18 HX. The SD card readers on the Razer Blade 18 or Alienware m18 R2, for example, are over two times faster in comparison.
| SD Card Reader | |
| average JPG Copy Test (av. of 3 runs) | |
| Alienware m18 R2 (Toshiba Exceria Pro SDXC 64 GB UHS-II) | |
| Razer Blade 18 2024 RZ09-0509 (Toshiba Exceria Pro SDXC 64 GB UHS-II) | |
| Acer Predator Helios 18 PH18-72-98MW (AV PRO microSD 128 GB V60) | |
| MSI Raider 18 HX A14V (Toshiba Exceria Pro SDXC 64 GB UHS-II) | |
| MSI Titan 18 HX A14VIG (Toshiba Exceria Pro SDXC 64 GB UHS-II) | |
| maximum AS SSD Seq Read Test (1GB) | |
| Razer Blade 18 2024 RZ09-0509 (Toshiba Exceria Pro SDXC 64 GB UHS-II) | |
| Alienware m18 R2 (Toshiba Exceria Pro SDXC 64 GB UHS-II) | |
| MSI Titan 18 HX A14VIG (Toshiba Exceria Pro SDXC 64 GB UHS-II) | |
| MSI Raider 18 HX A14V (Toshiba Exceria Pro SDXC 64 GB UHS-II) | |
| Acer Predator Helios 18 PH18-72-98MW (AV PRO microSD 128 GB V60) | |
Communication
The Killer BE1750x comes standard for Wi-Fi 7 and Bluetooth 5.4 connectivity. Transfer rates are steady and reliable when paired to our Wi-Fi 6E test router.
Webcam
A 2 MP webcam with IR and physical shutter come standard much like on the Titan 18 HX. Interestingly, the camera would exhibit similar brightness issues as well.


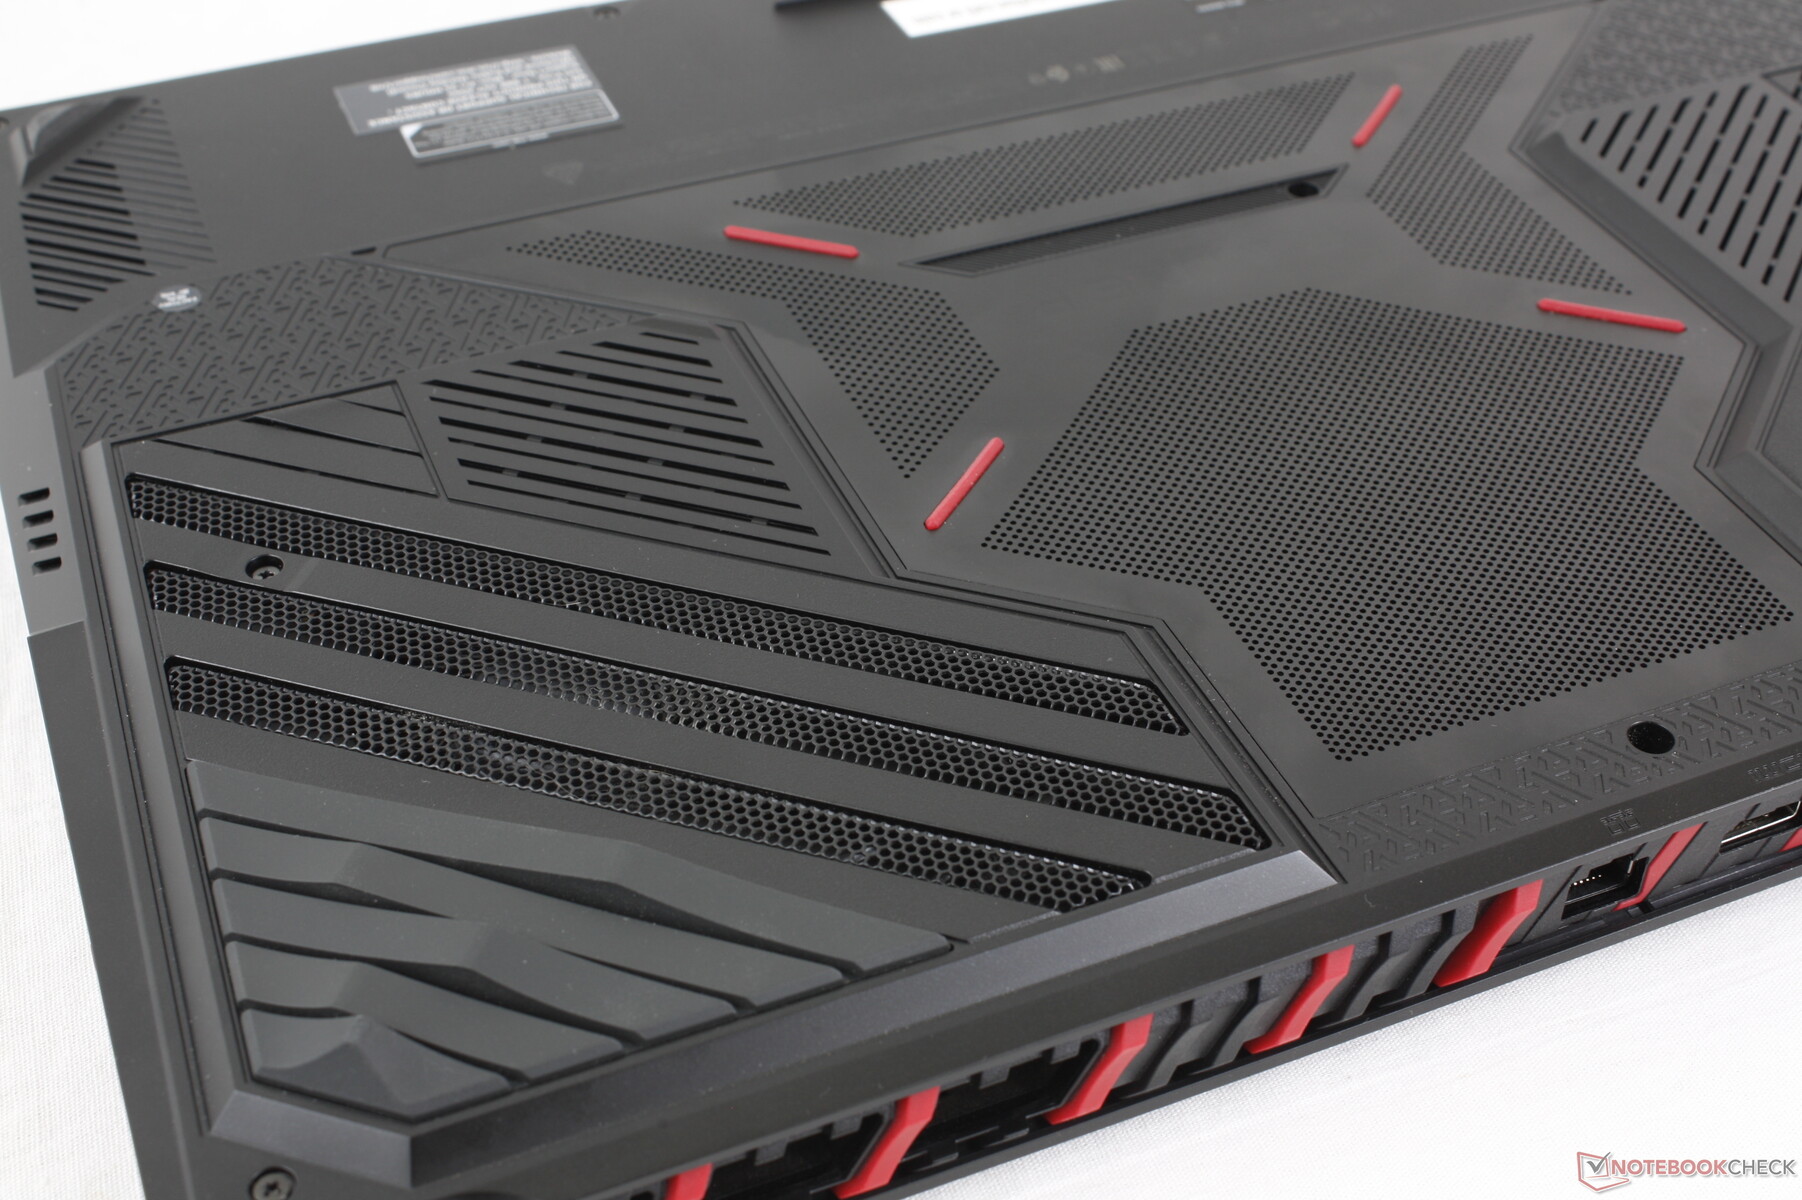
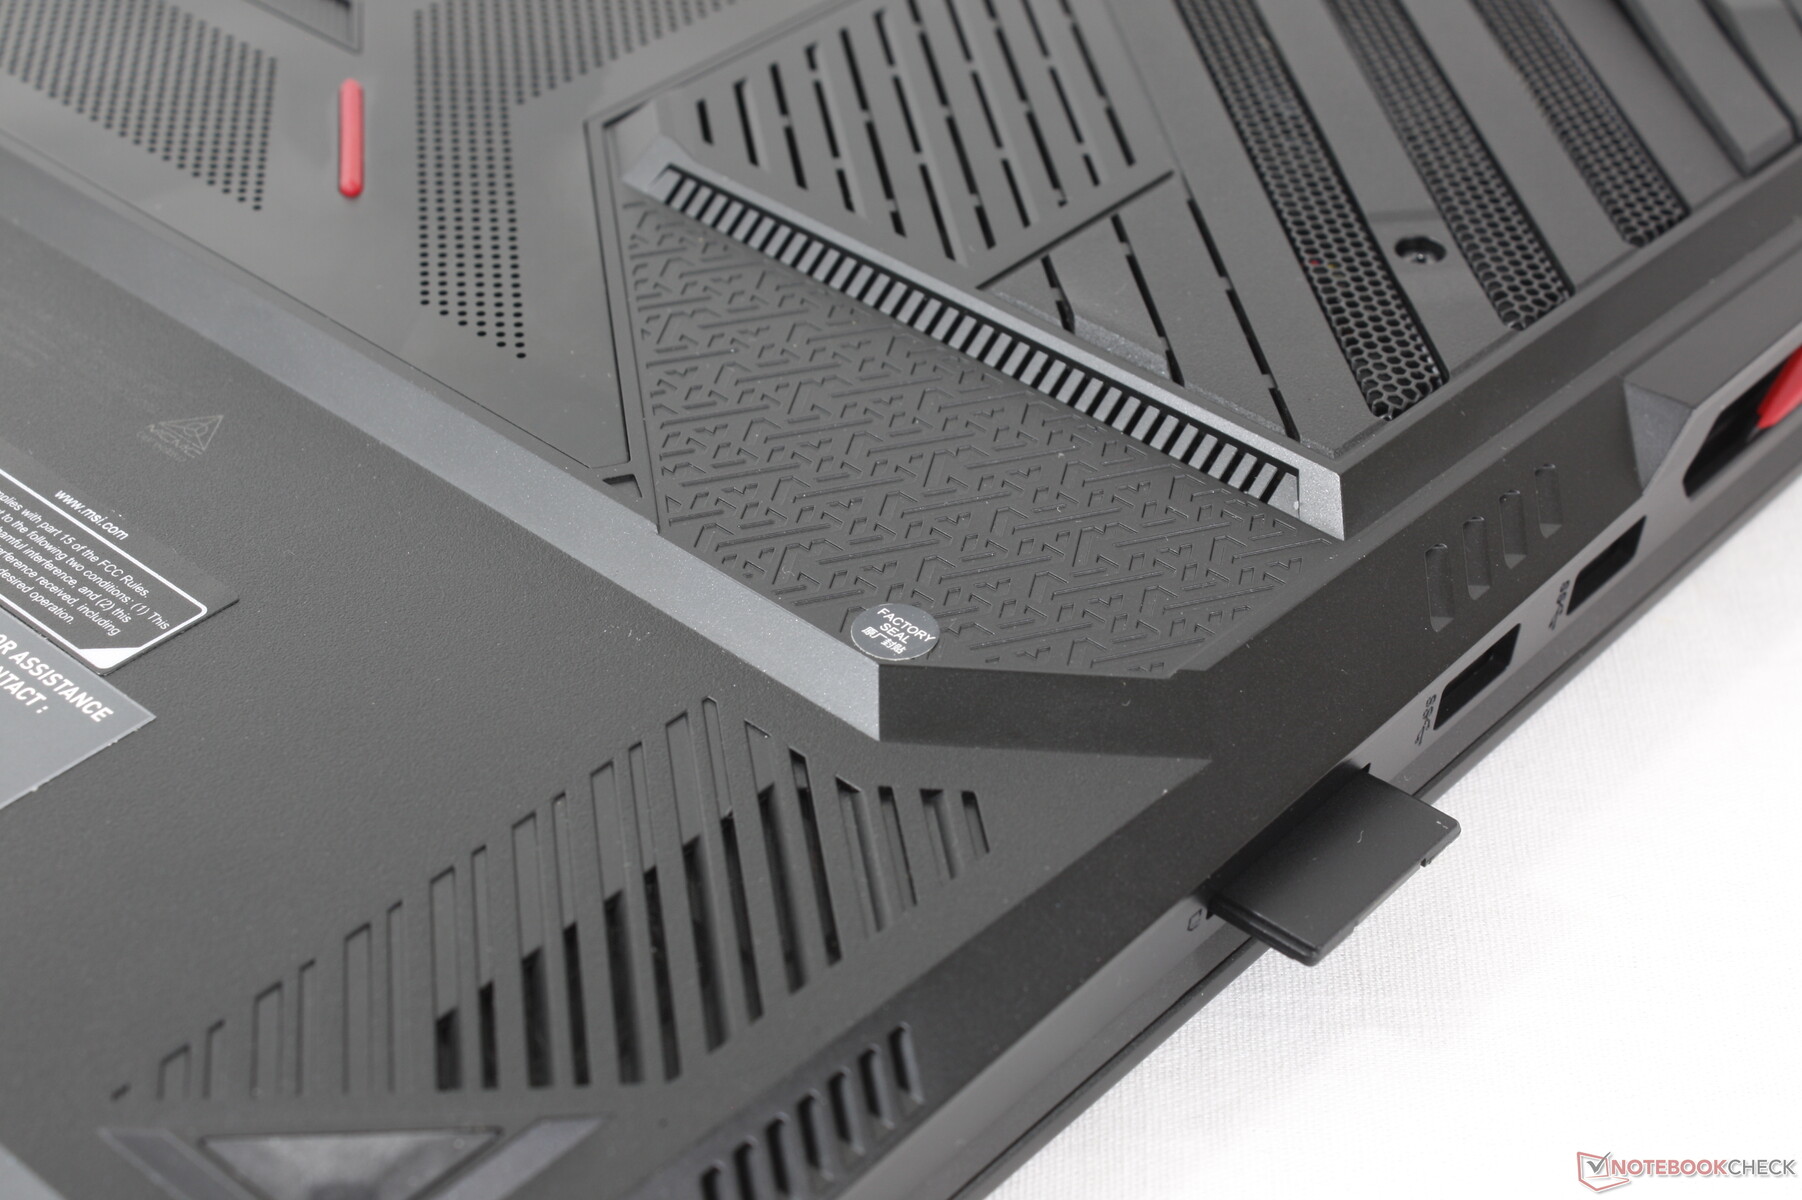
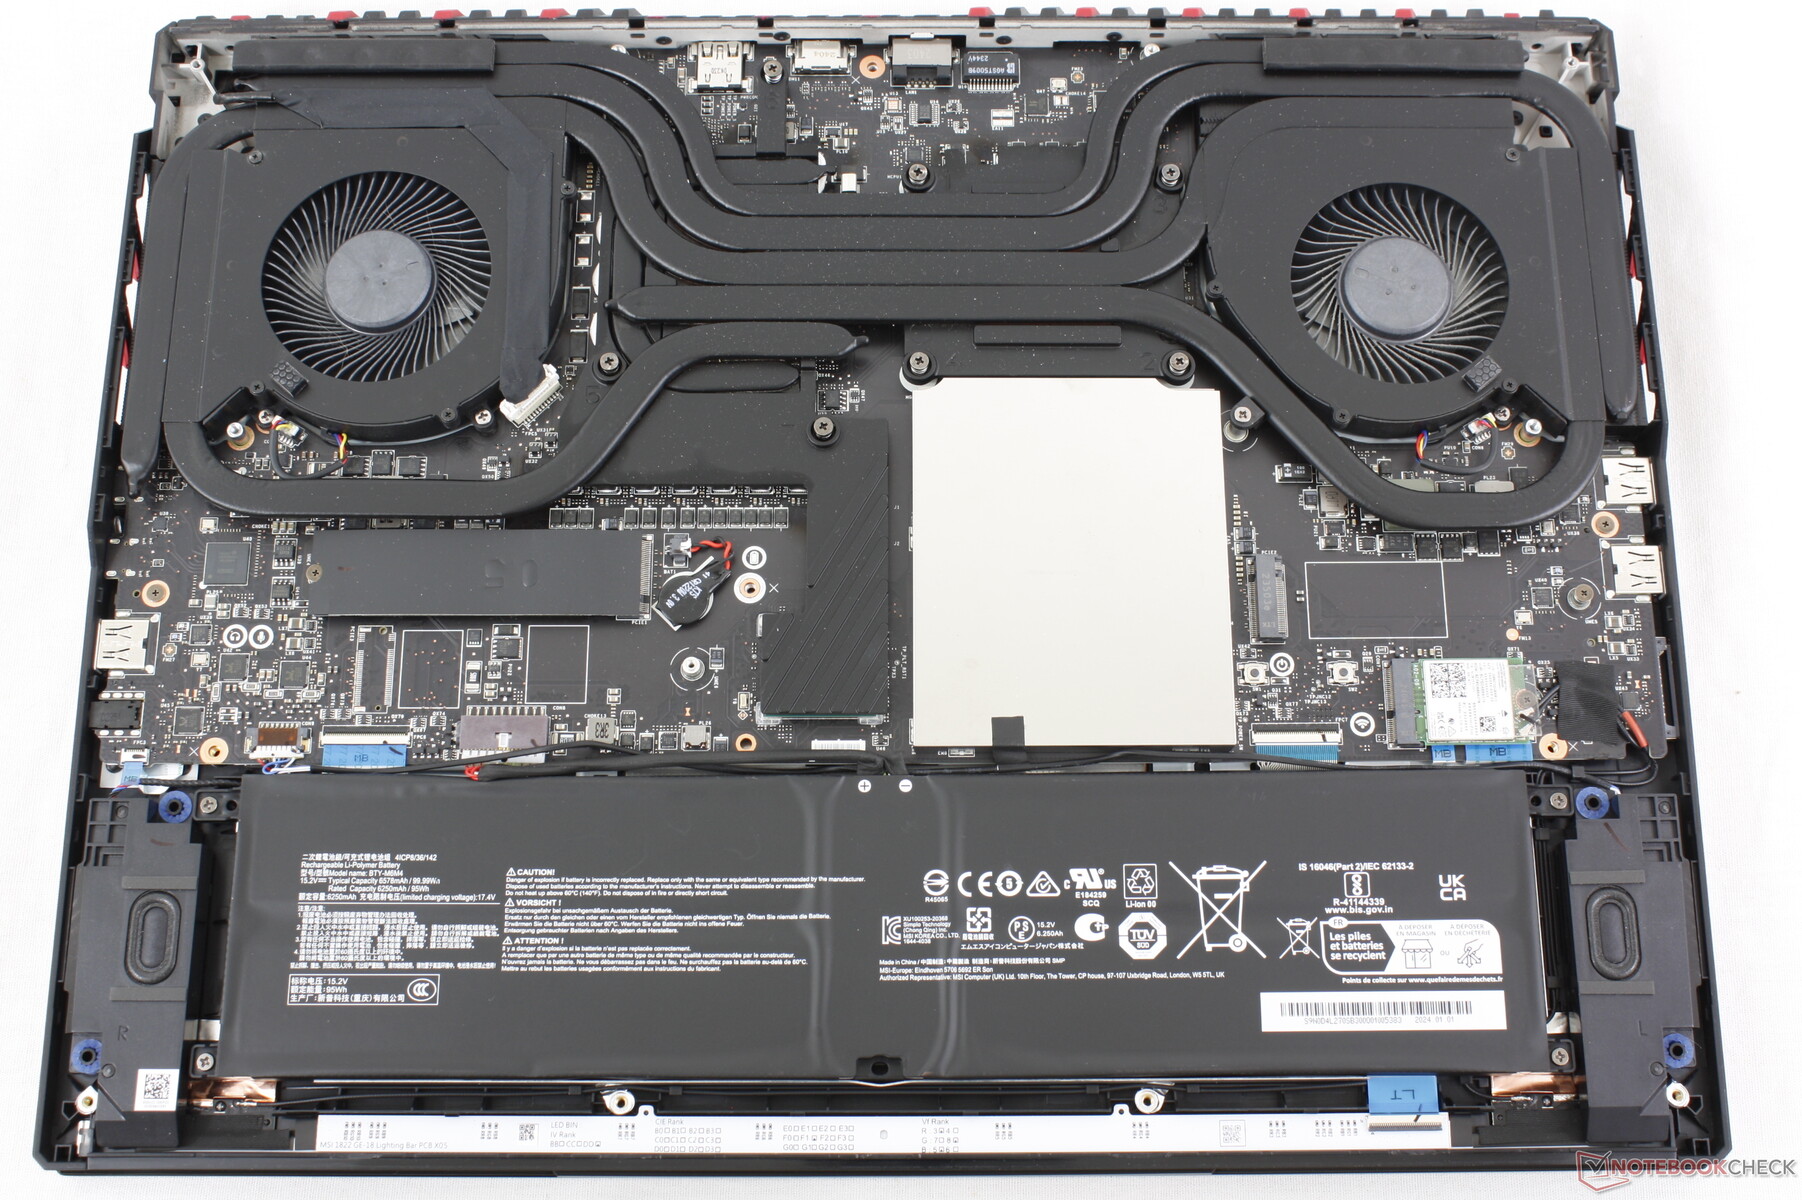
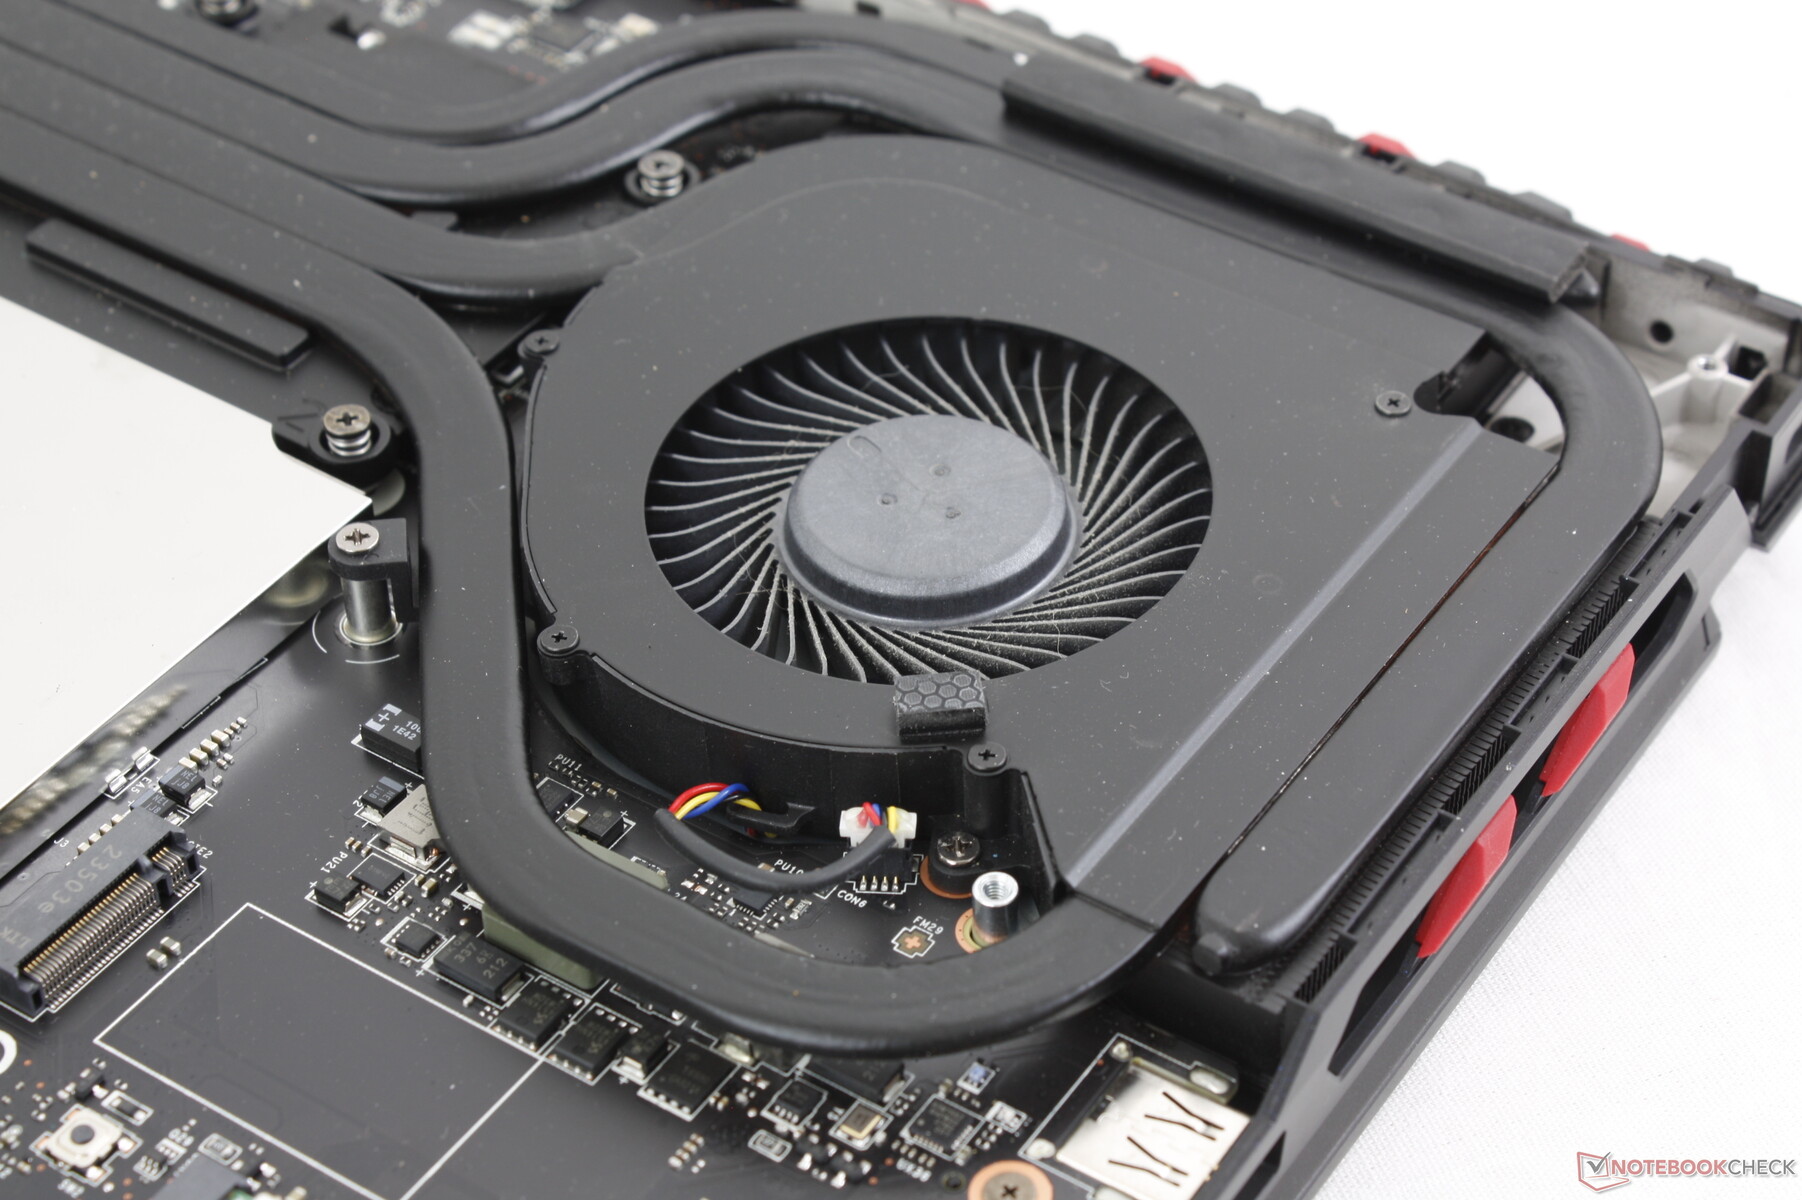
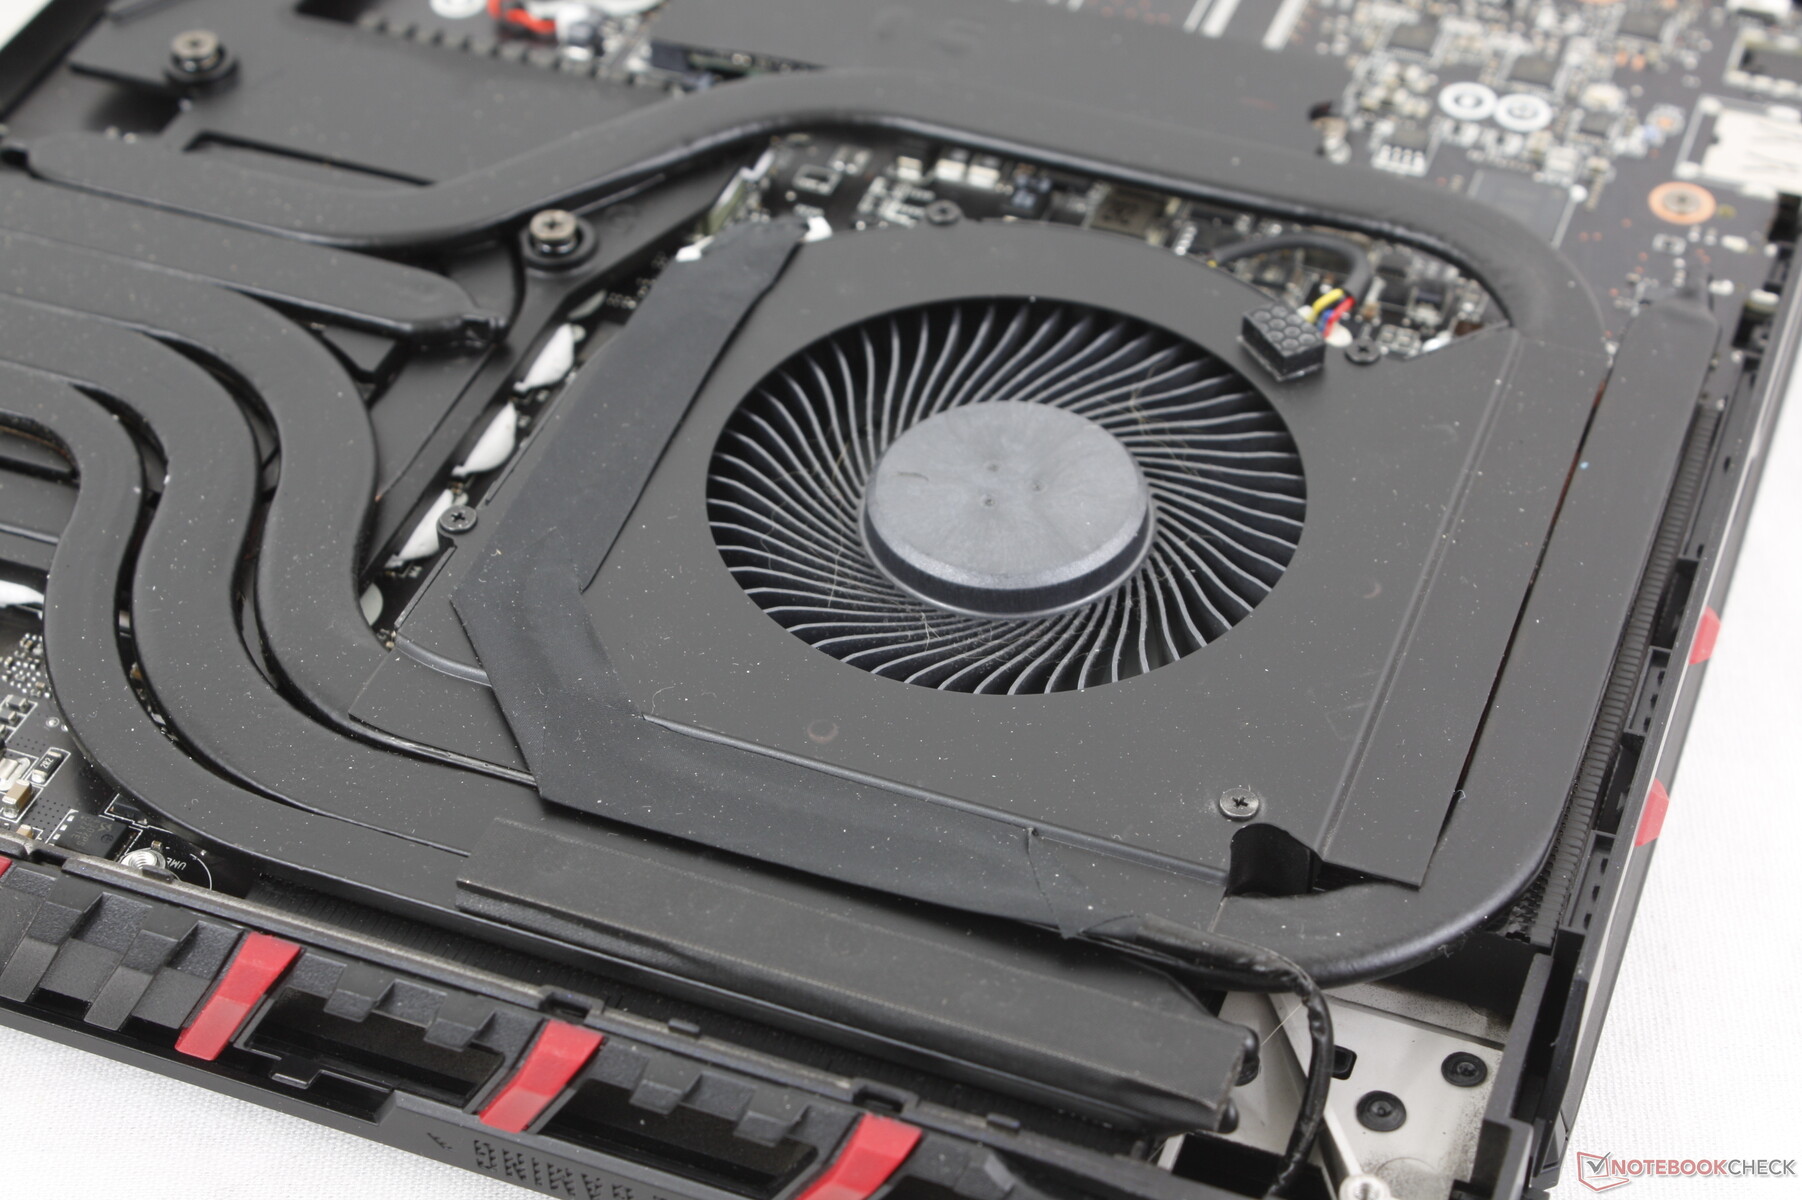
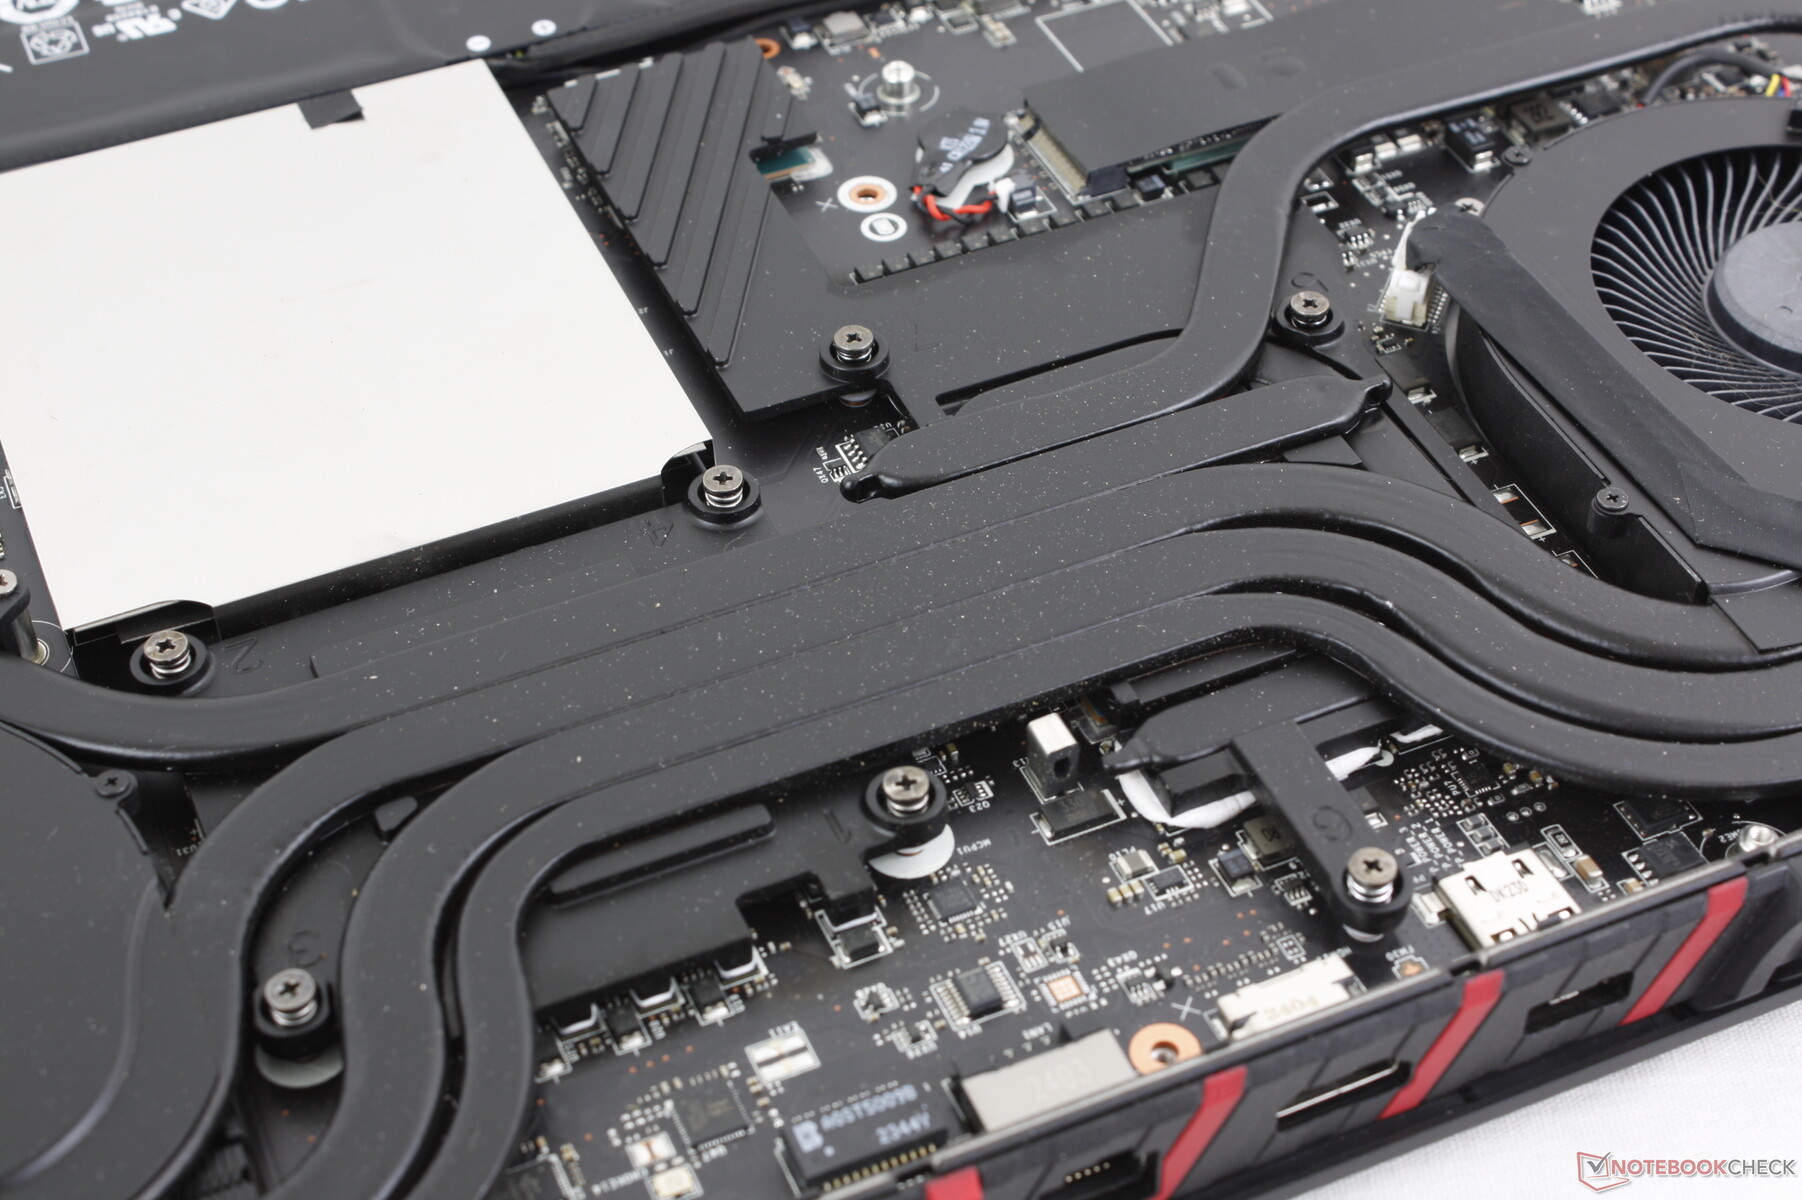
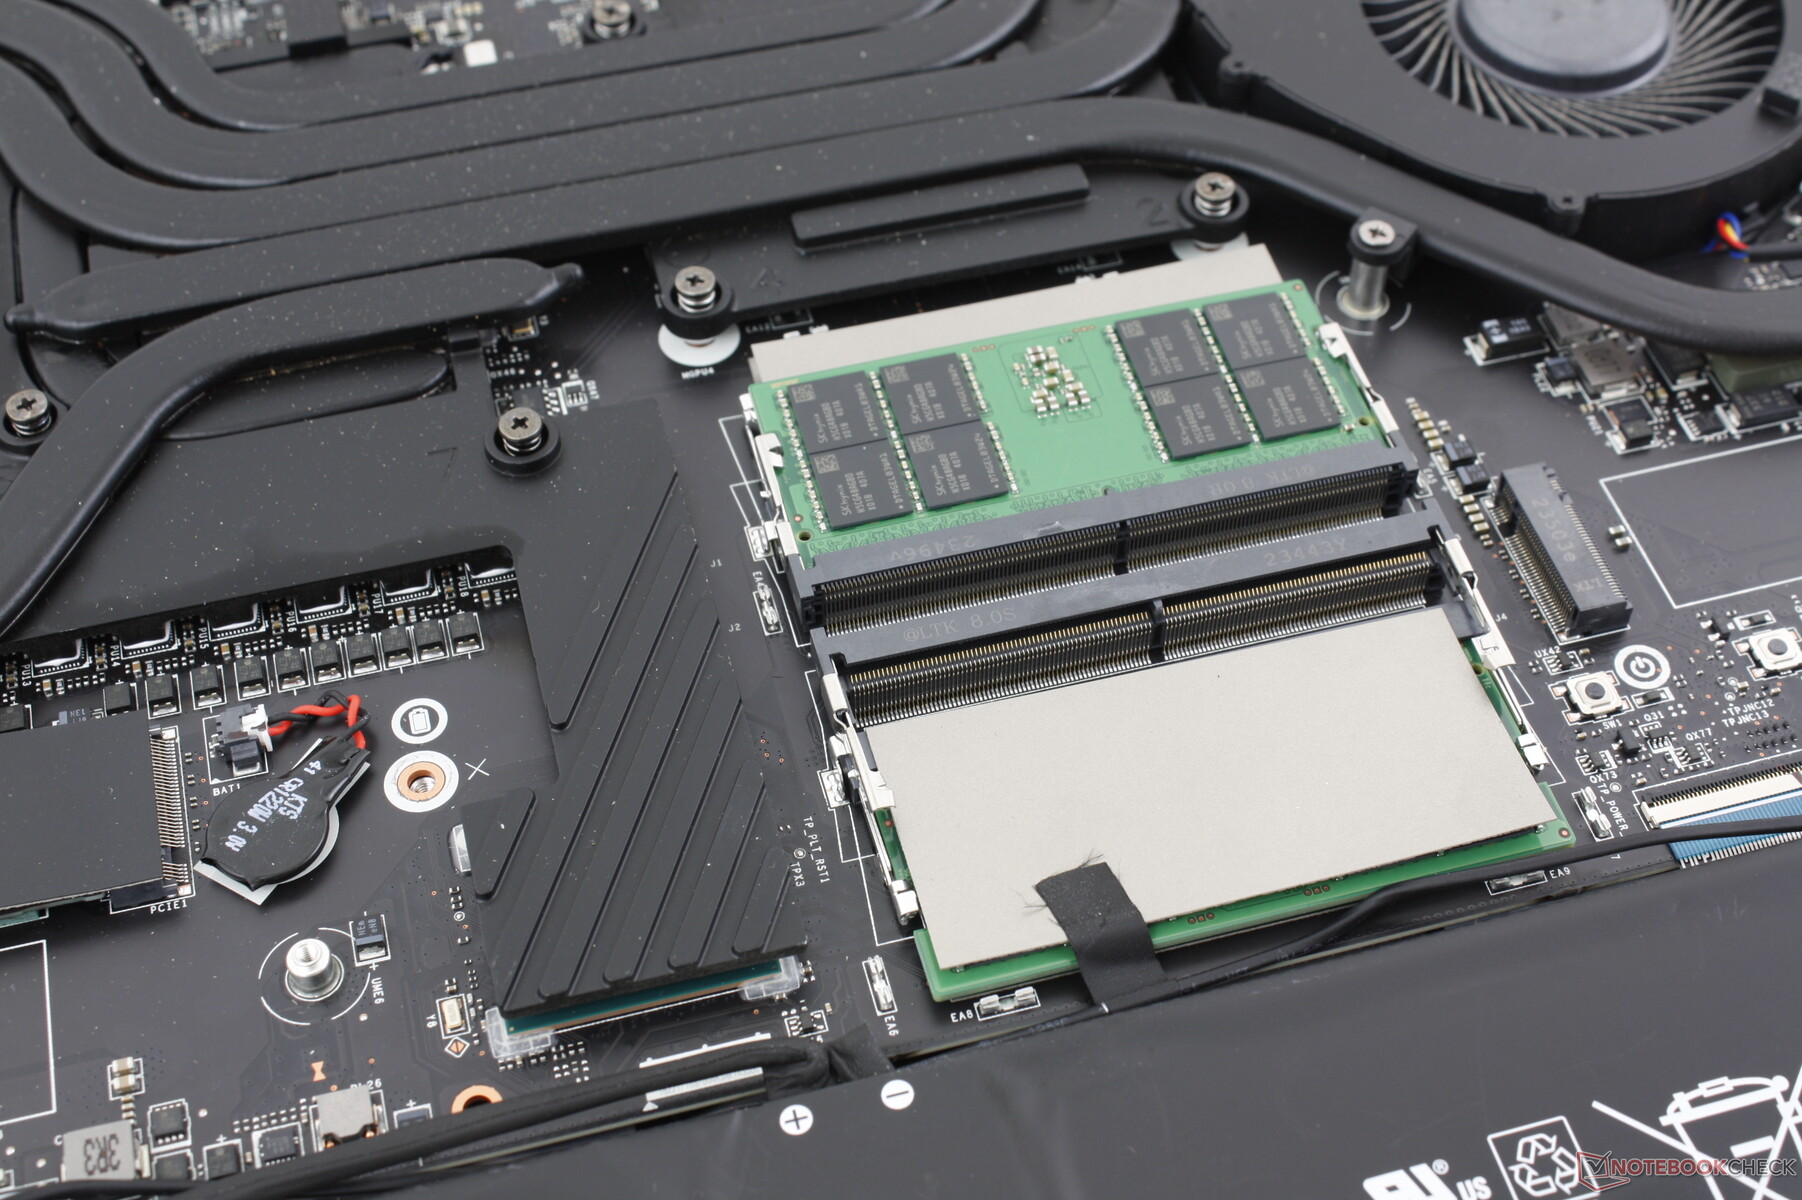
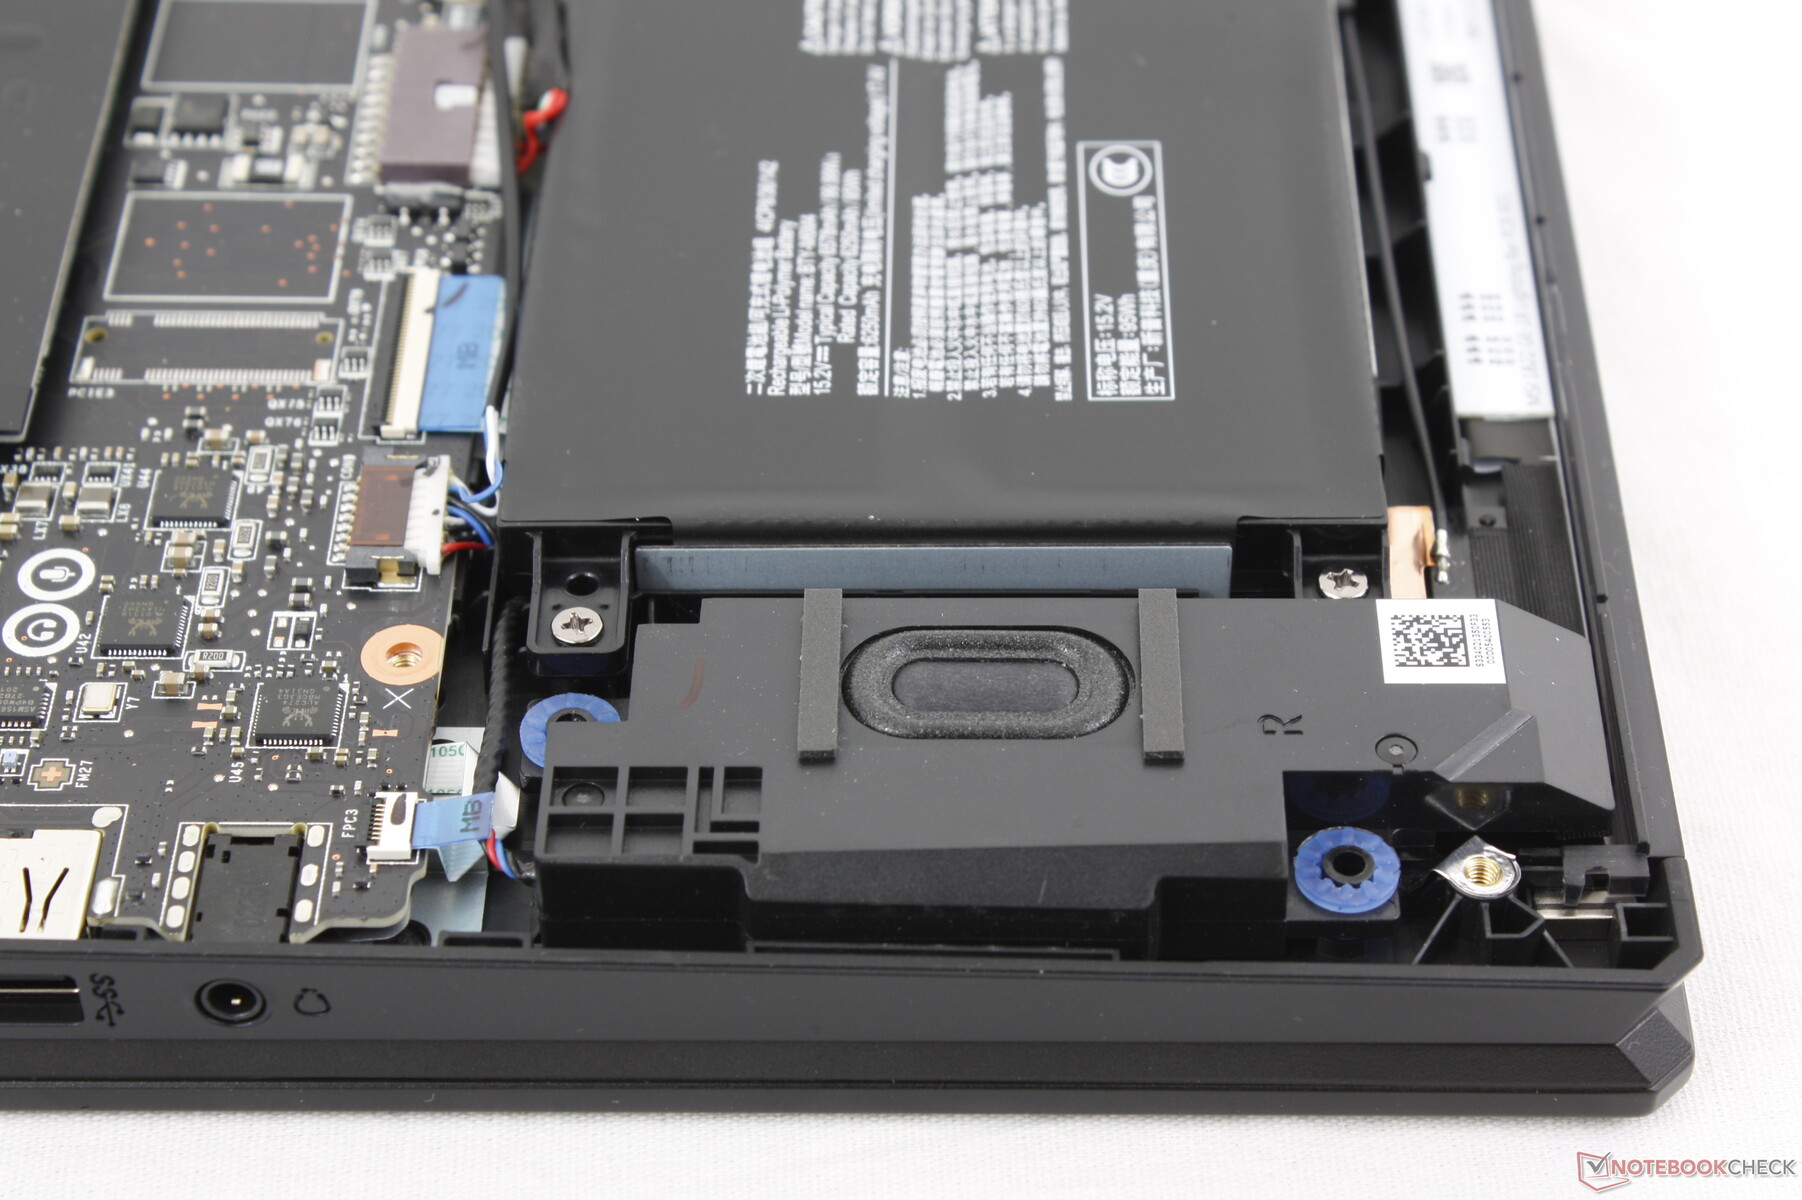
Maintenance
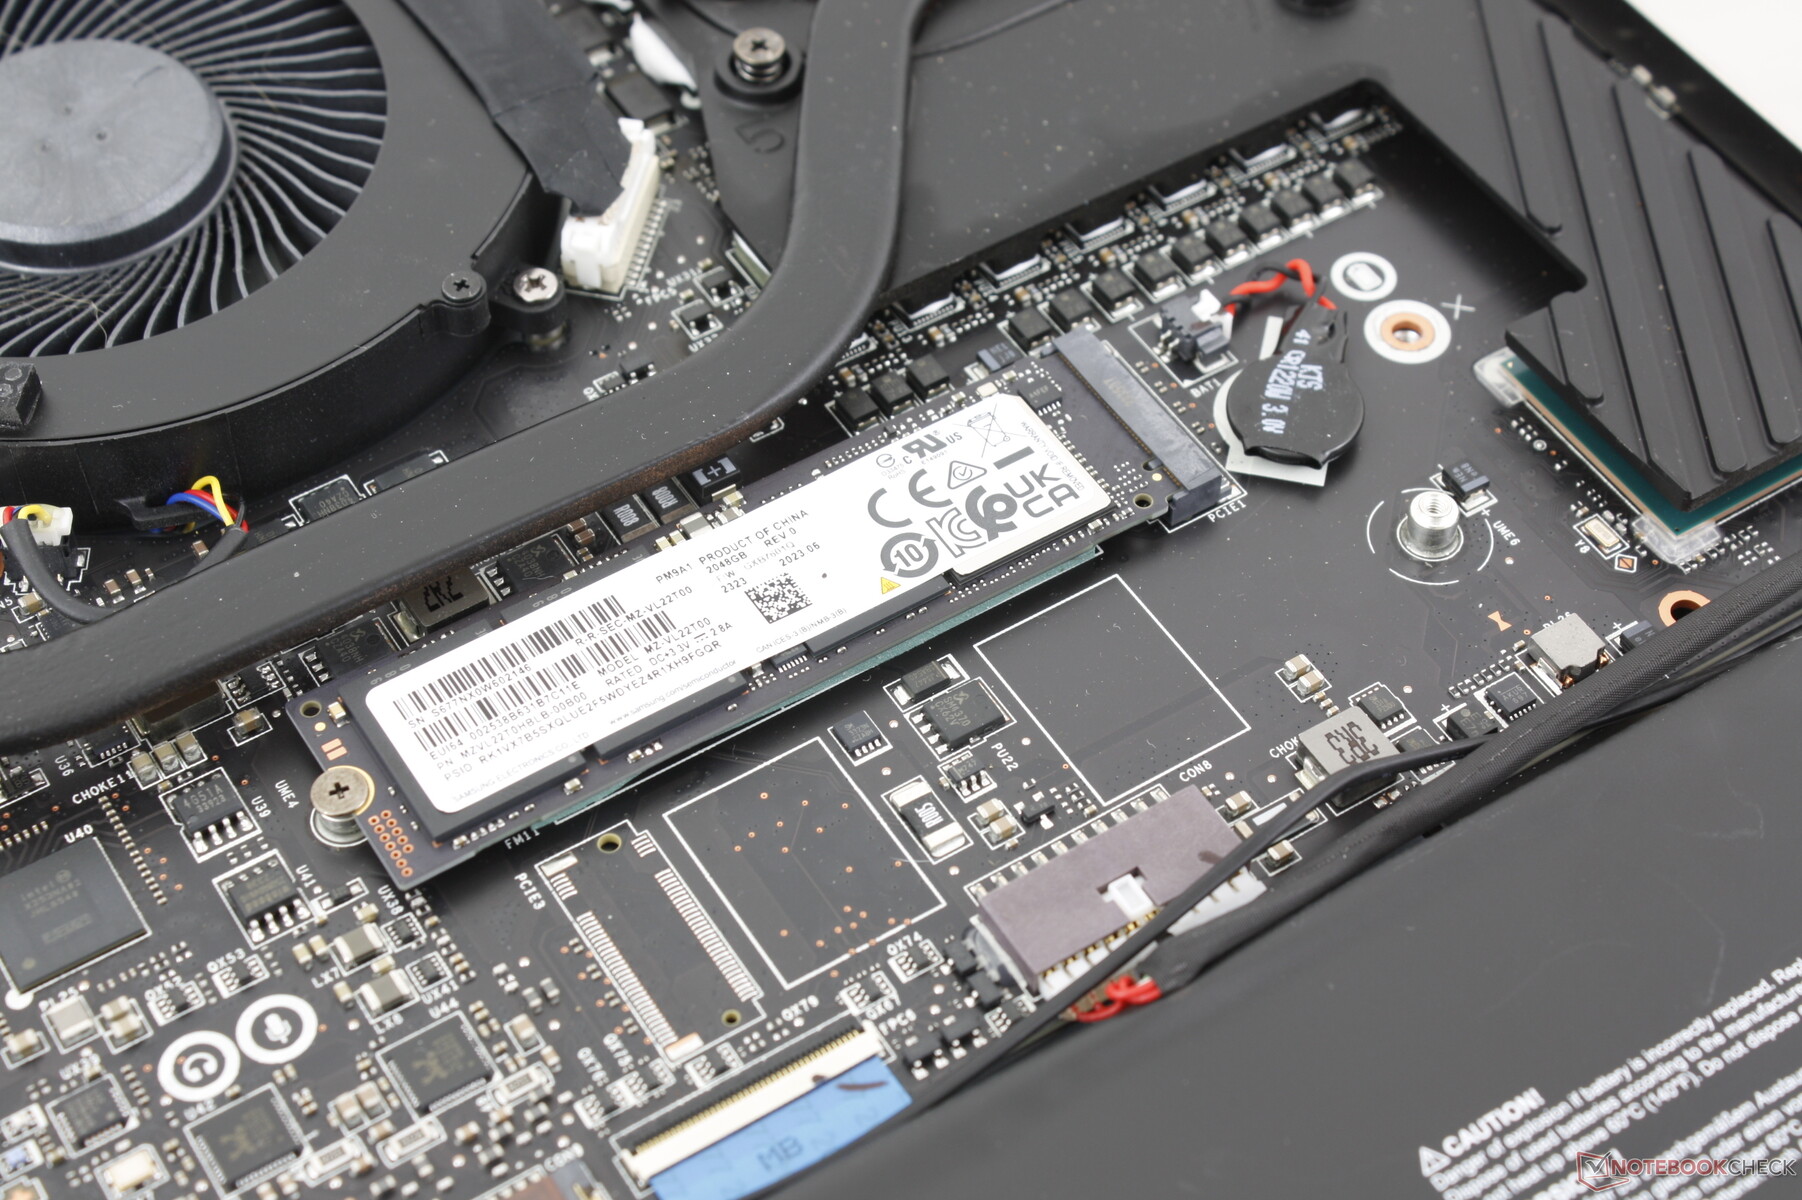
The bottom panel is secured by 12 Phillips screws for relatively easy removal. However, MSI continues to be one of the few makers with an anti-tamper sticker covering one of the screws which must be broken for even simple upgrades like RAM or storage.
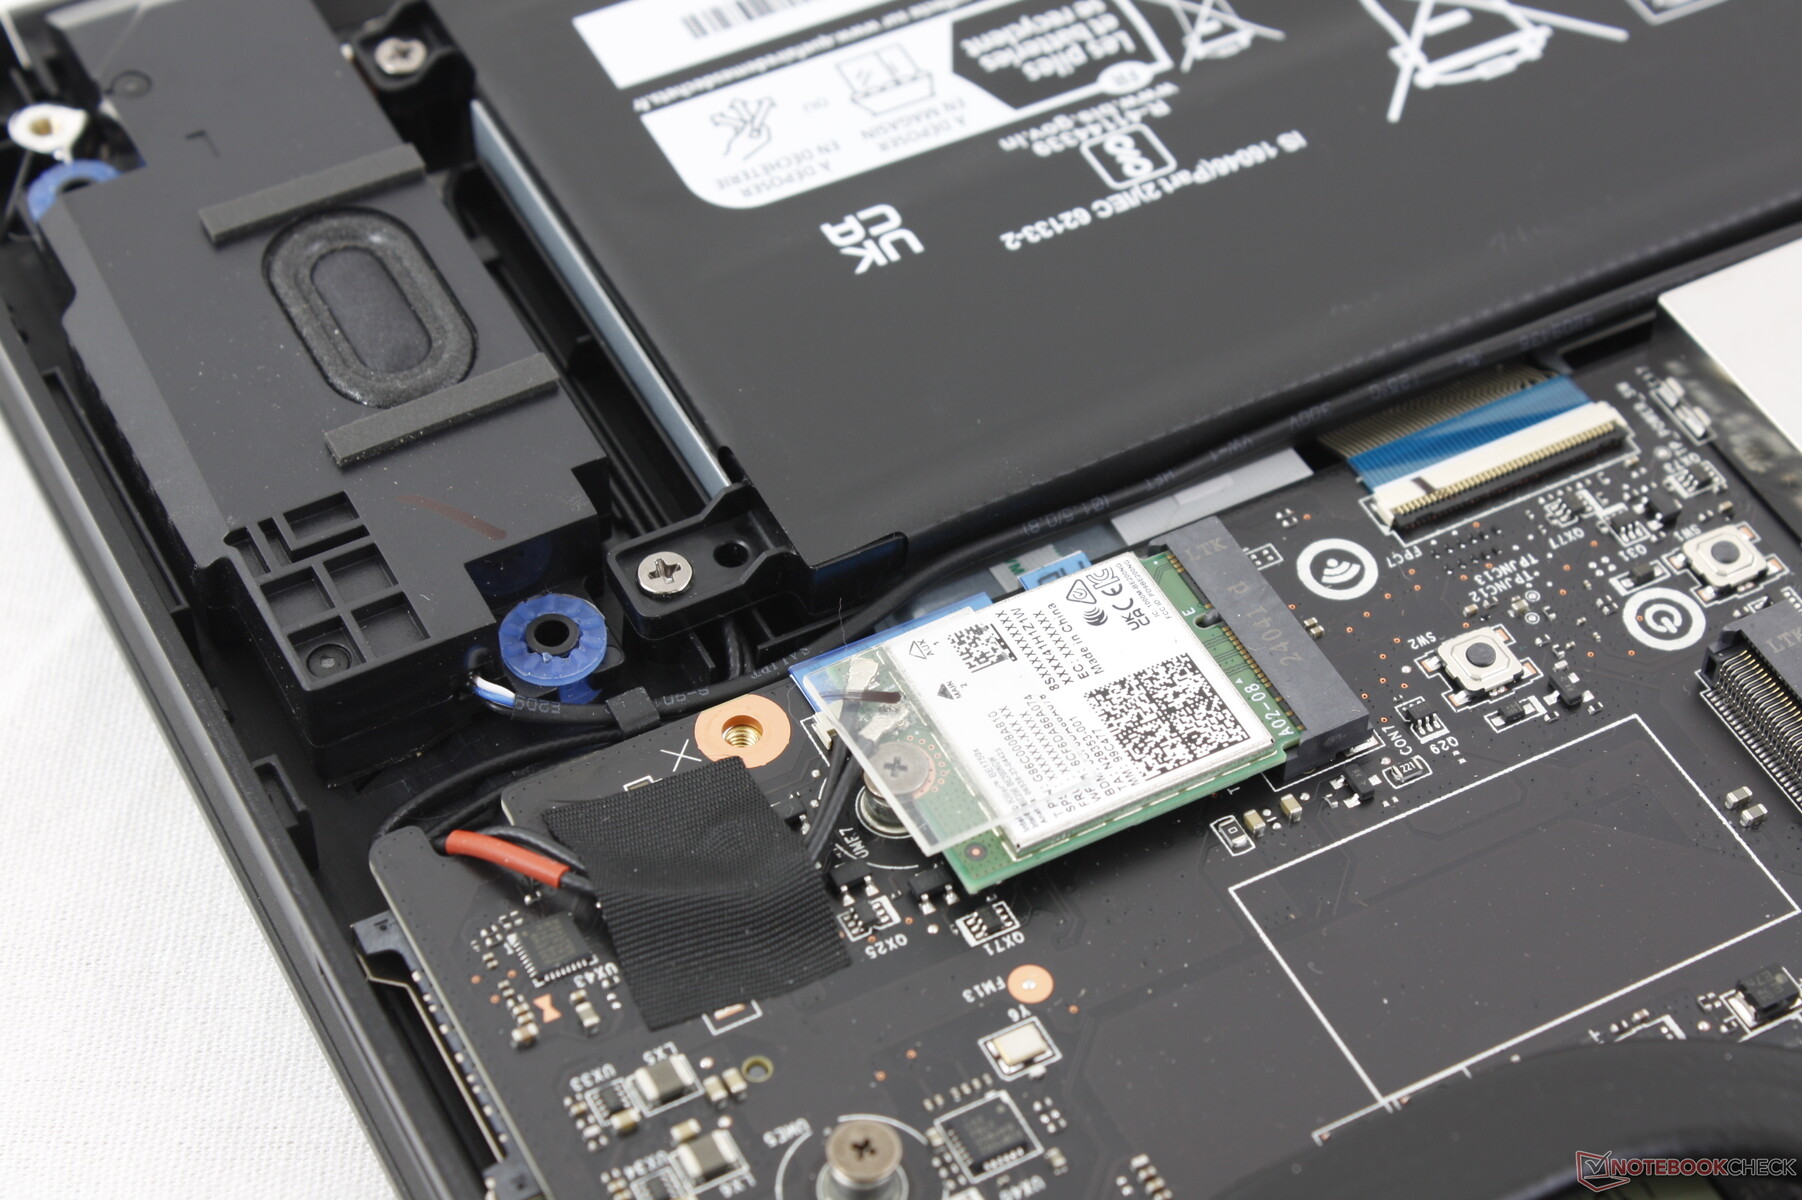
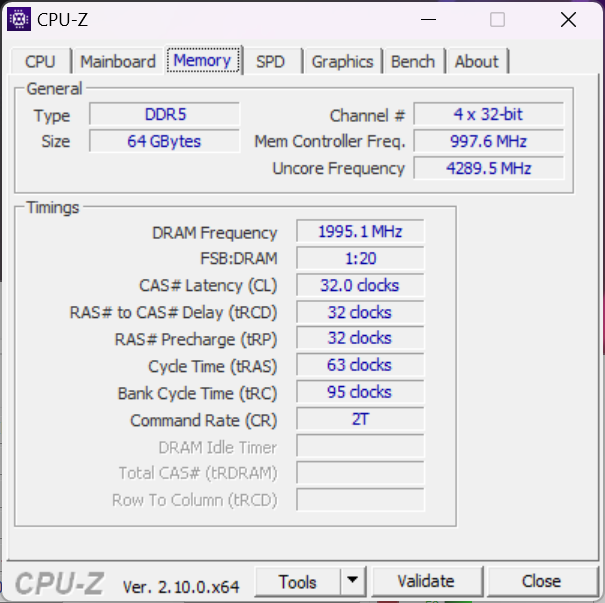
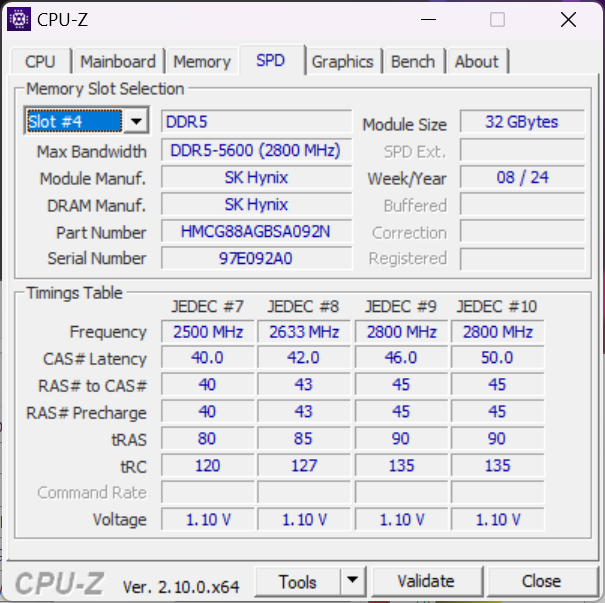
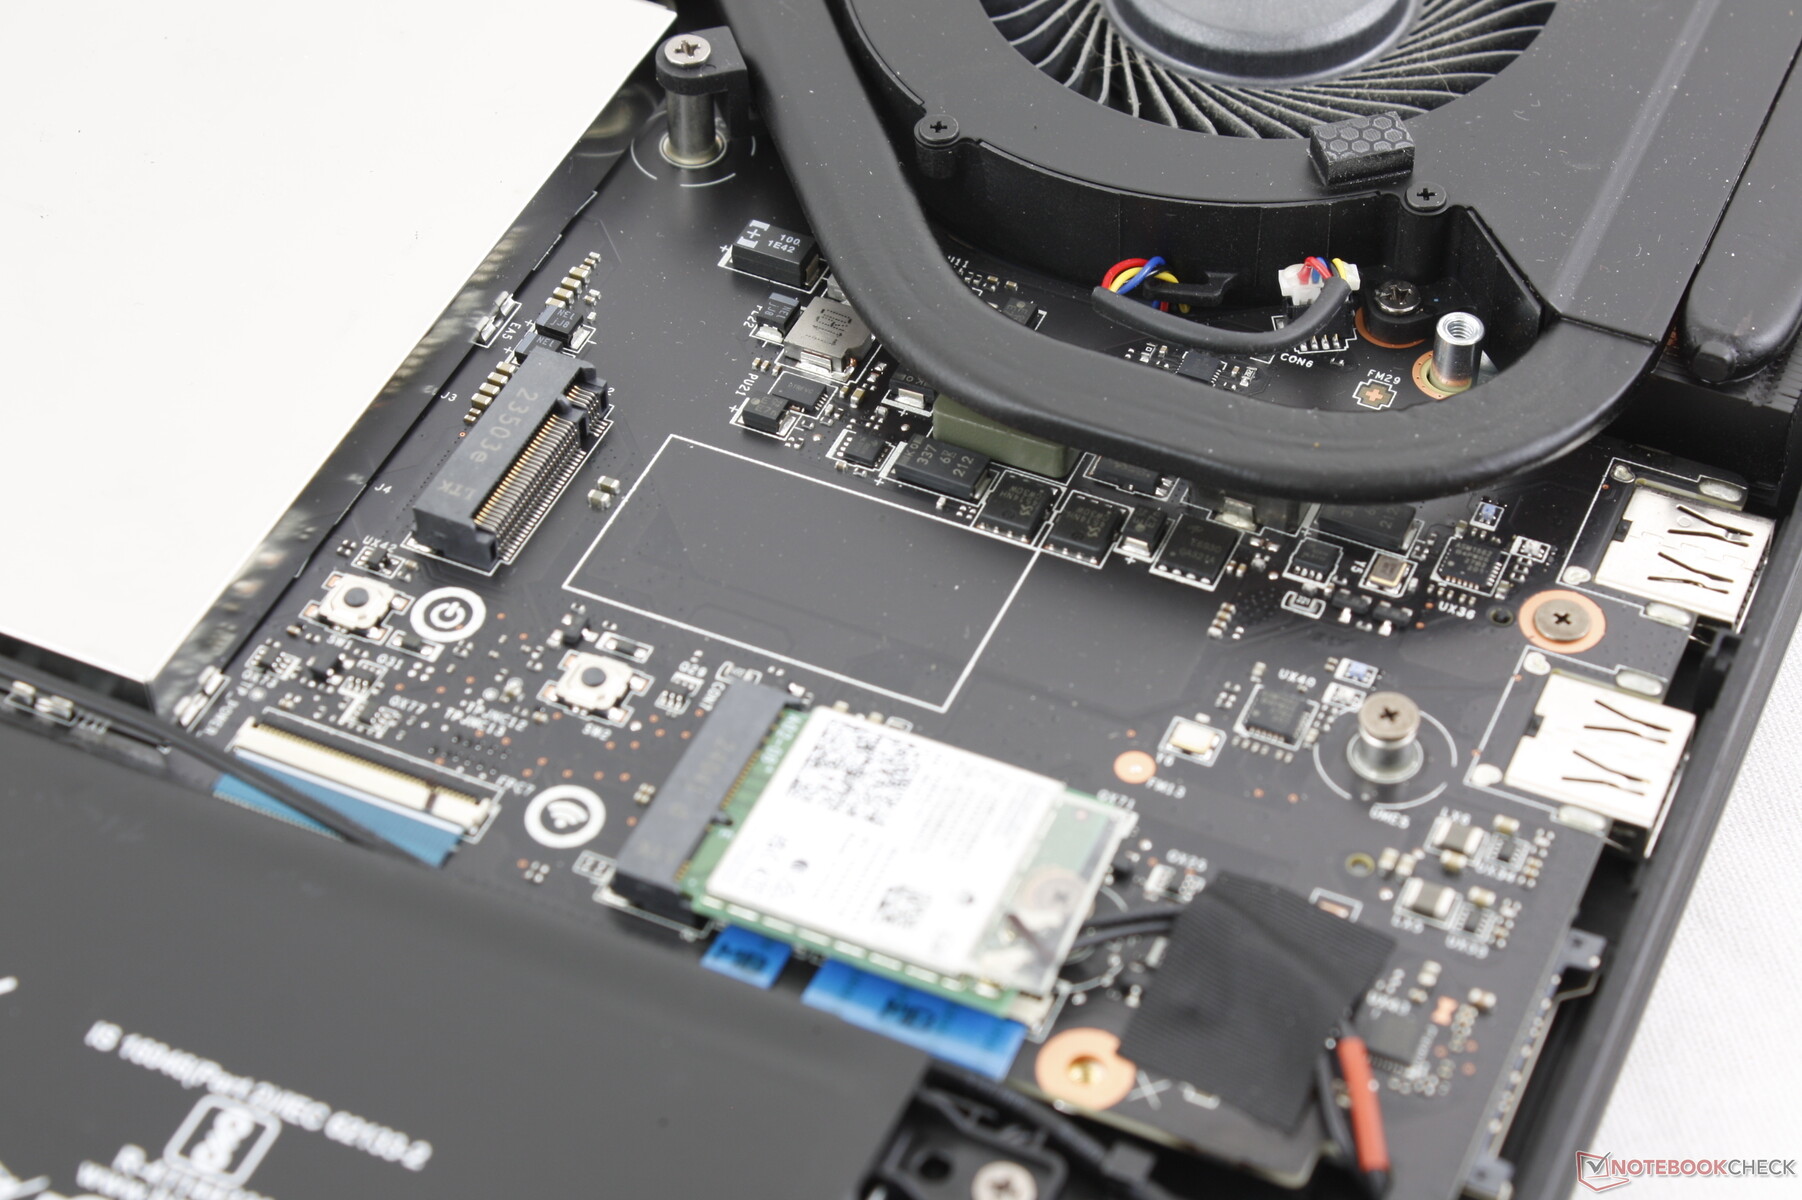
The Raider 18 HX shares many of the same internal components as the Titan 18 HX. Users have access to two M.2 2280 SSD slots and four DDR5 SODIMM slots. Note that the third M.2 SSD slot has been removed from this model; users must upgrade to the Titan 18 HX for such a feature.

Sustainability
The packaging is fully recyclable and almost all cardboard with only a bit of plastic wrapping for the user's manual. However, there is no information on any recycled materials used during manufacturing of the system.
Accessories And Warranty
There are no extras in the box other than the AC adapter and paperwork. Older Raider models would ship with a velvet cleaning cloth, but this appears to be no longer be the case.
The usual one-year limited manufacturer warranty applies if purchased in the US.
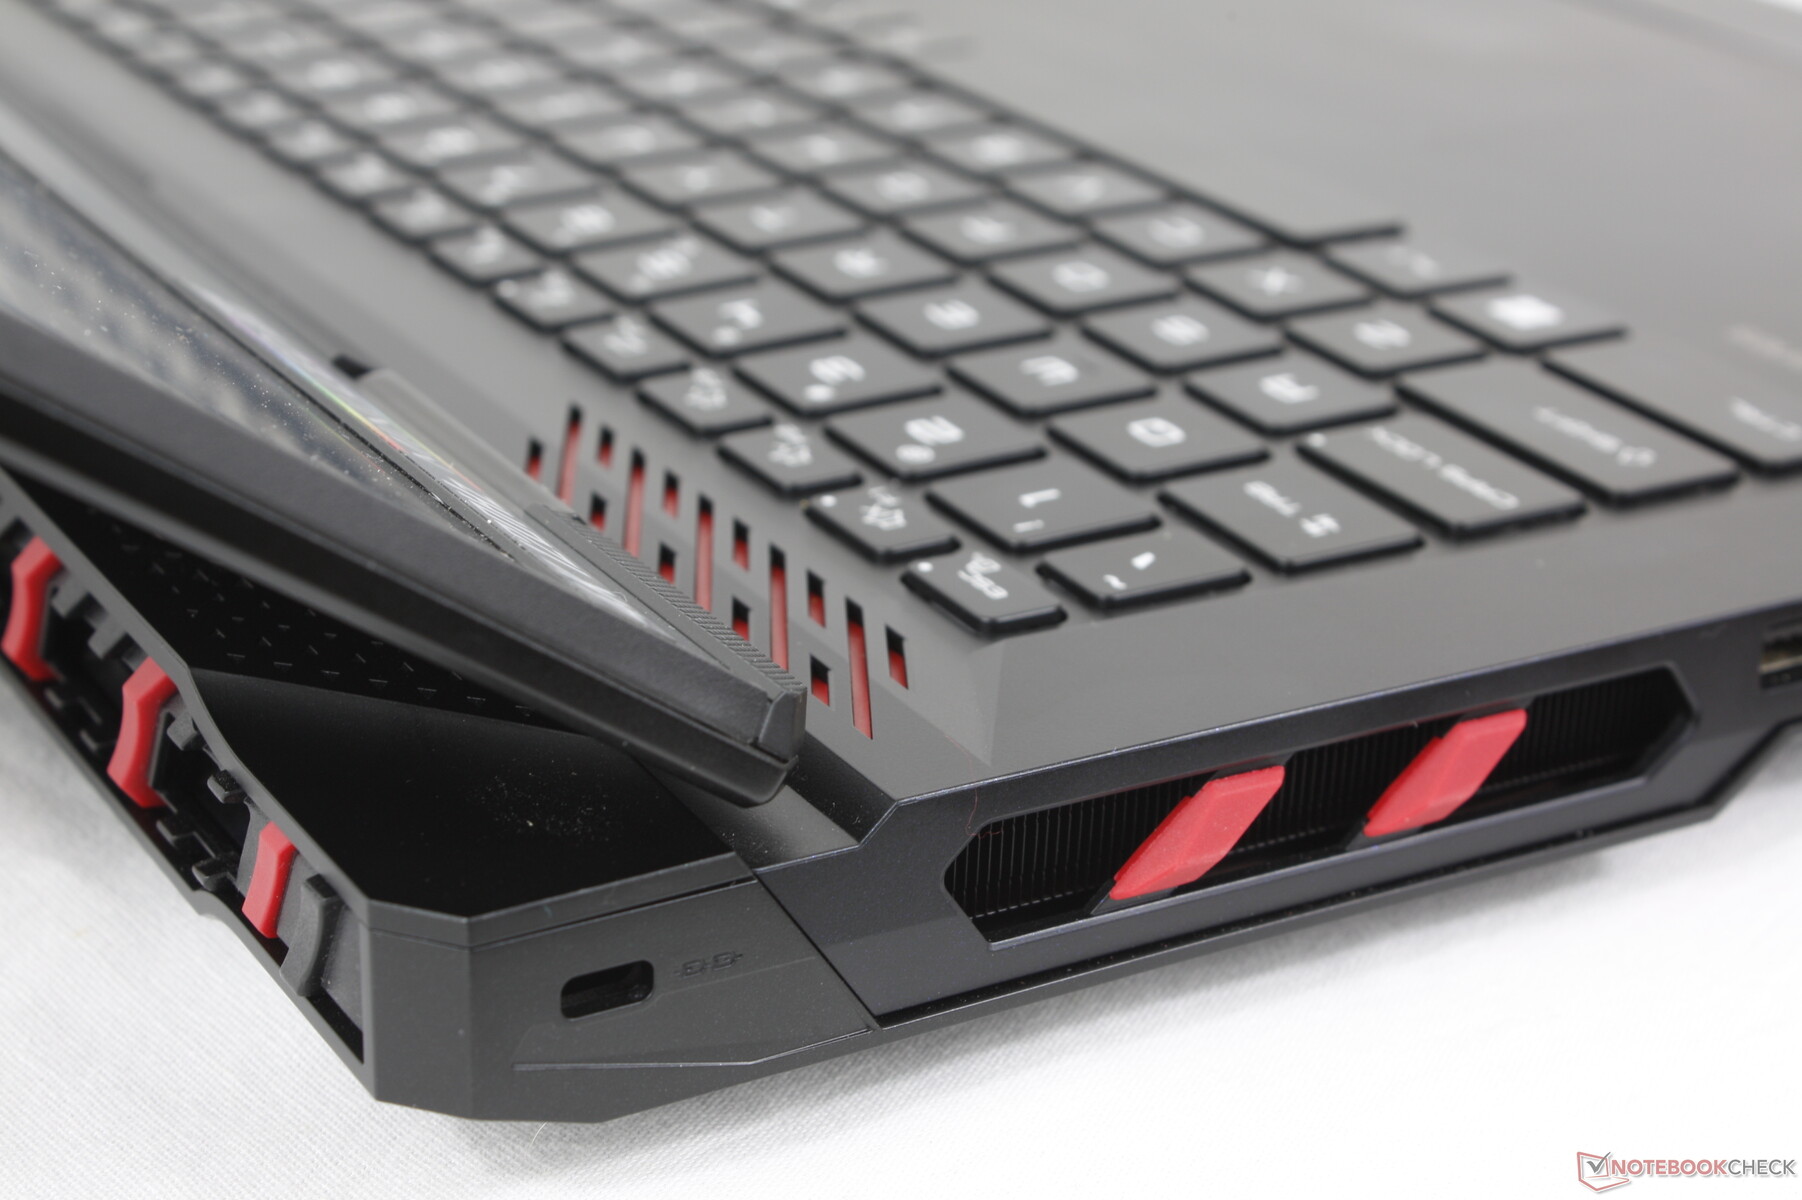
Input Devices — Familiar Over Fancy
Keyboard
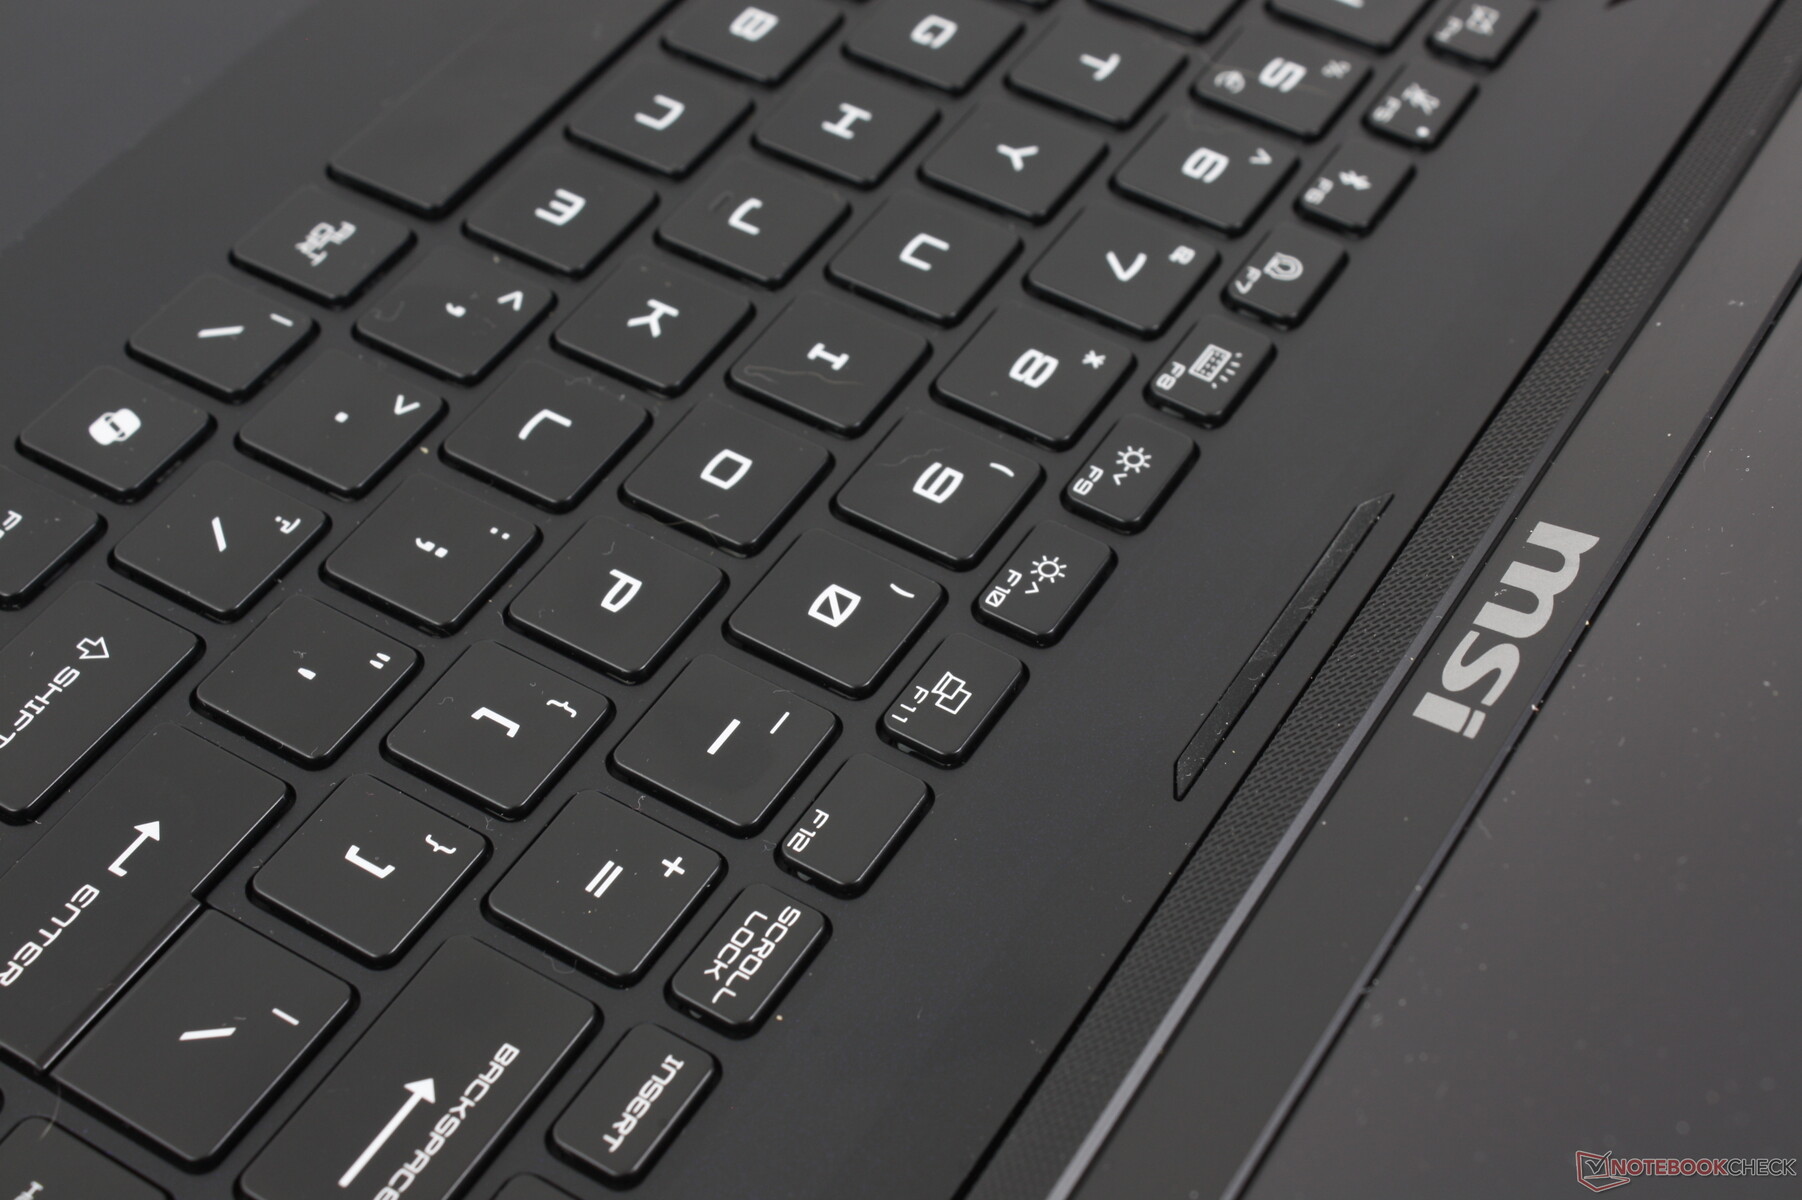
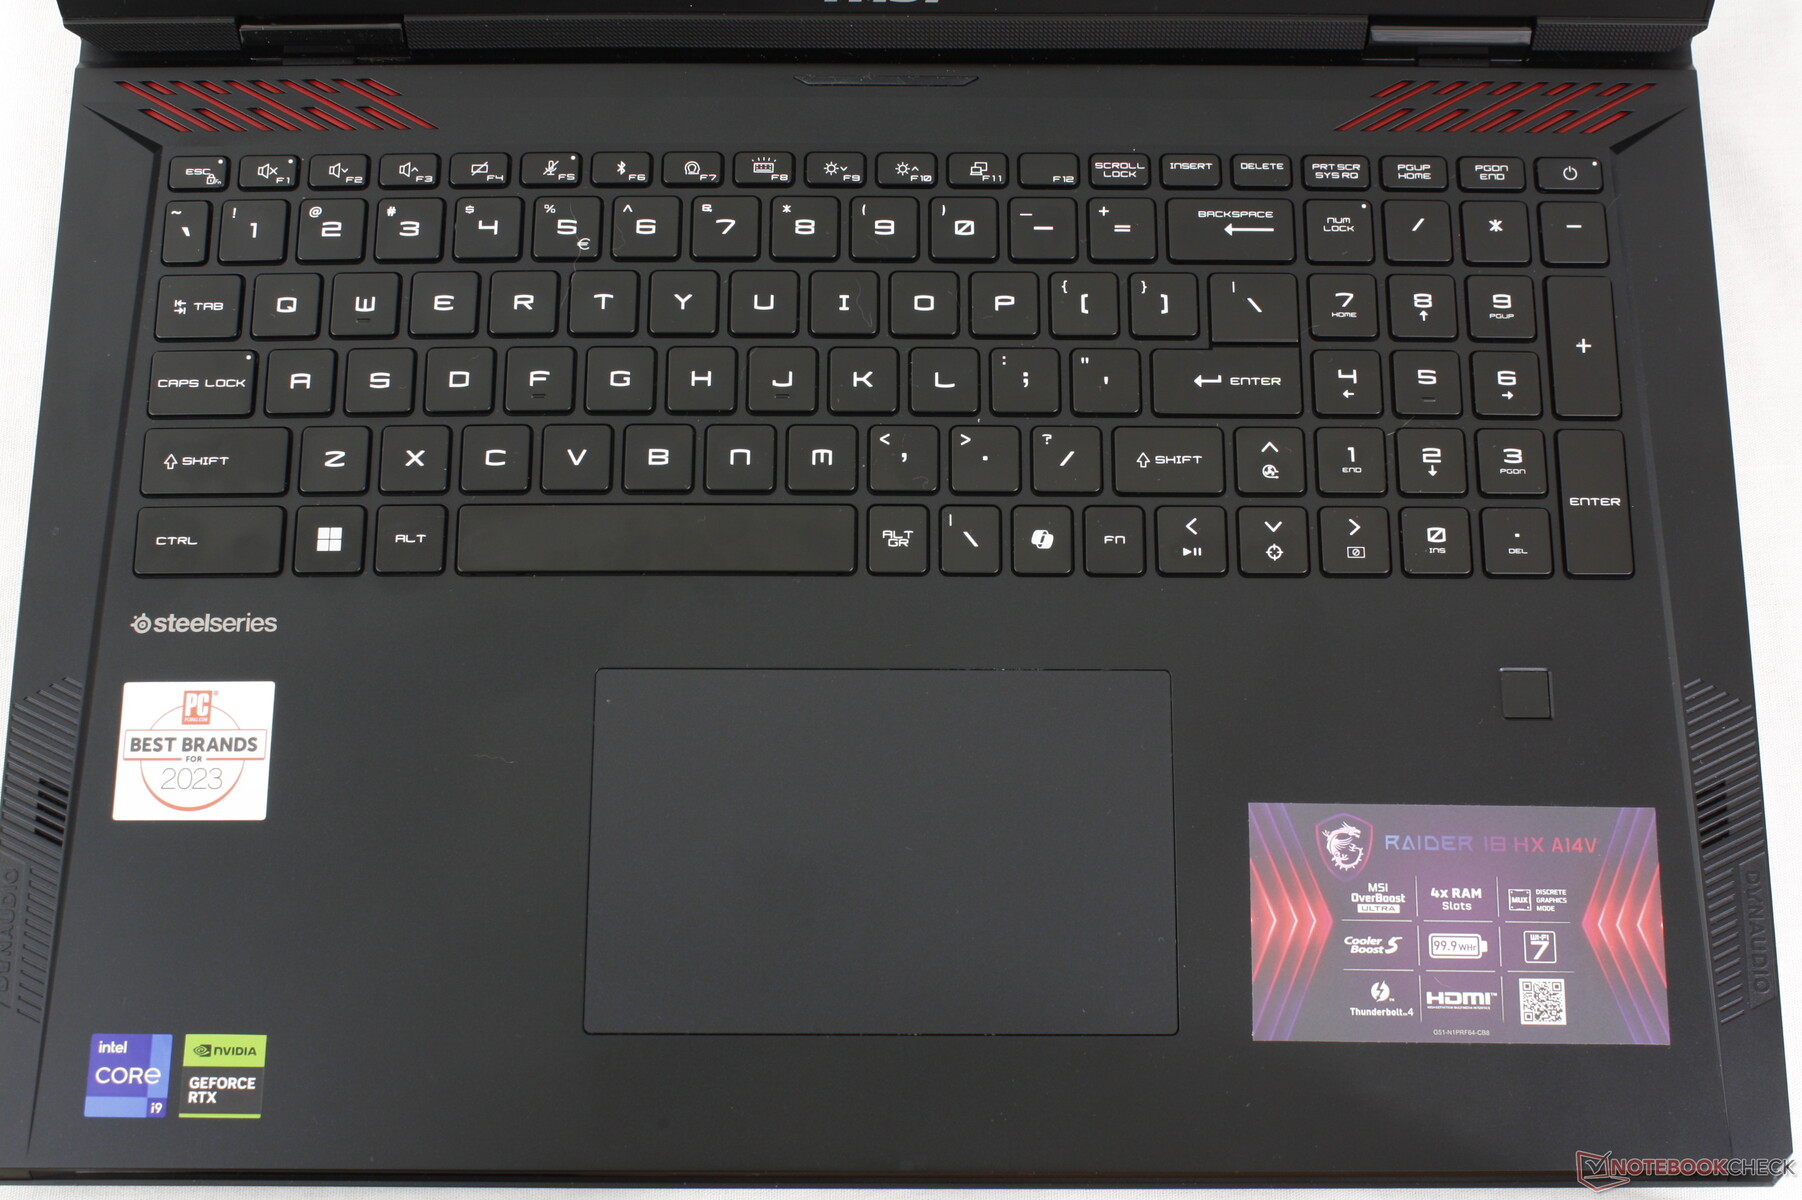
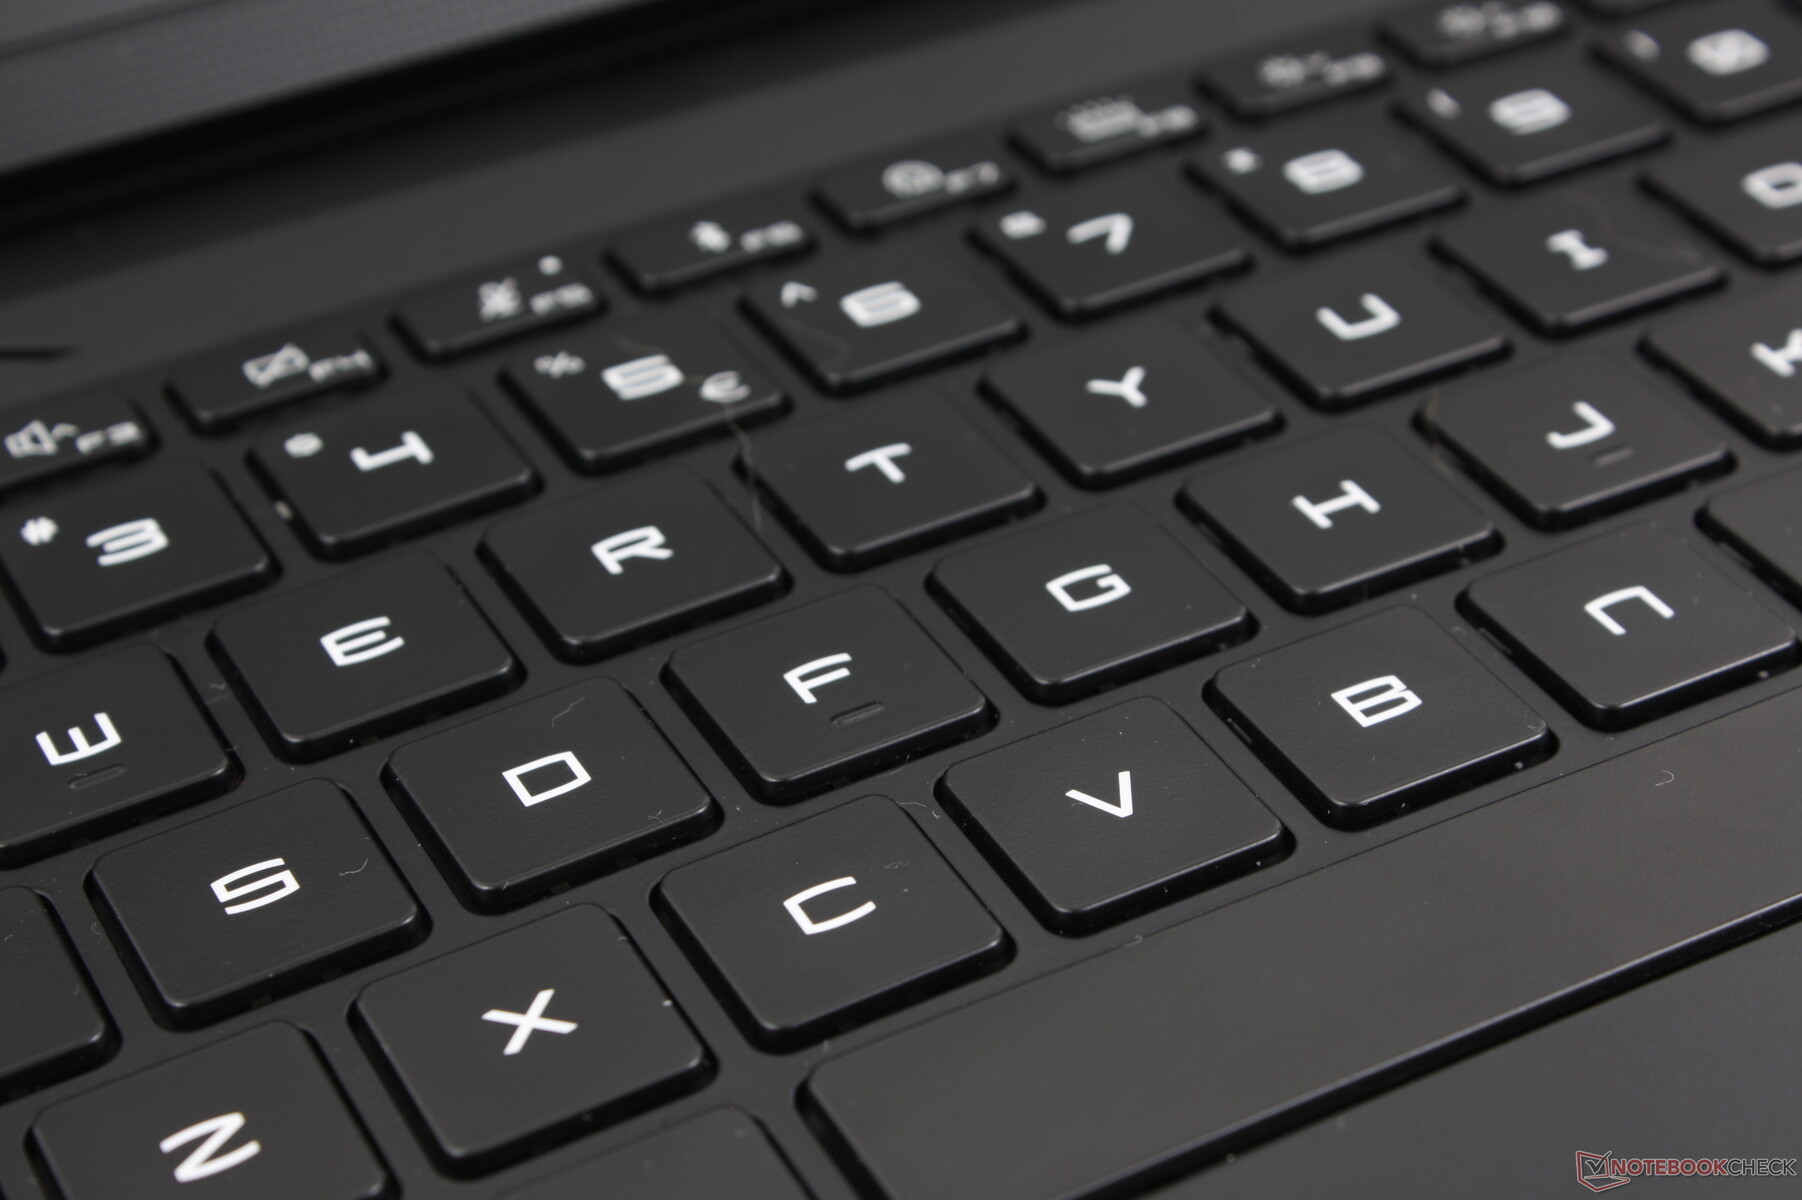
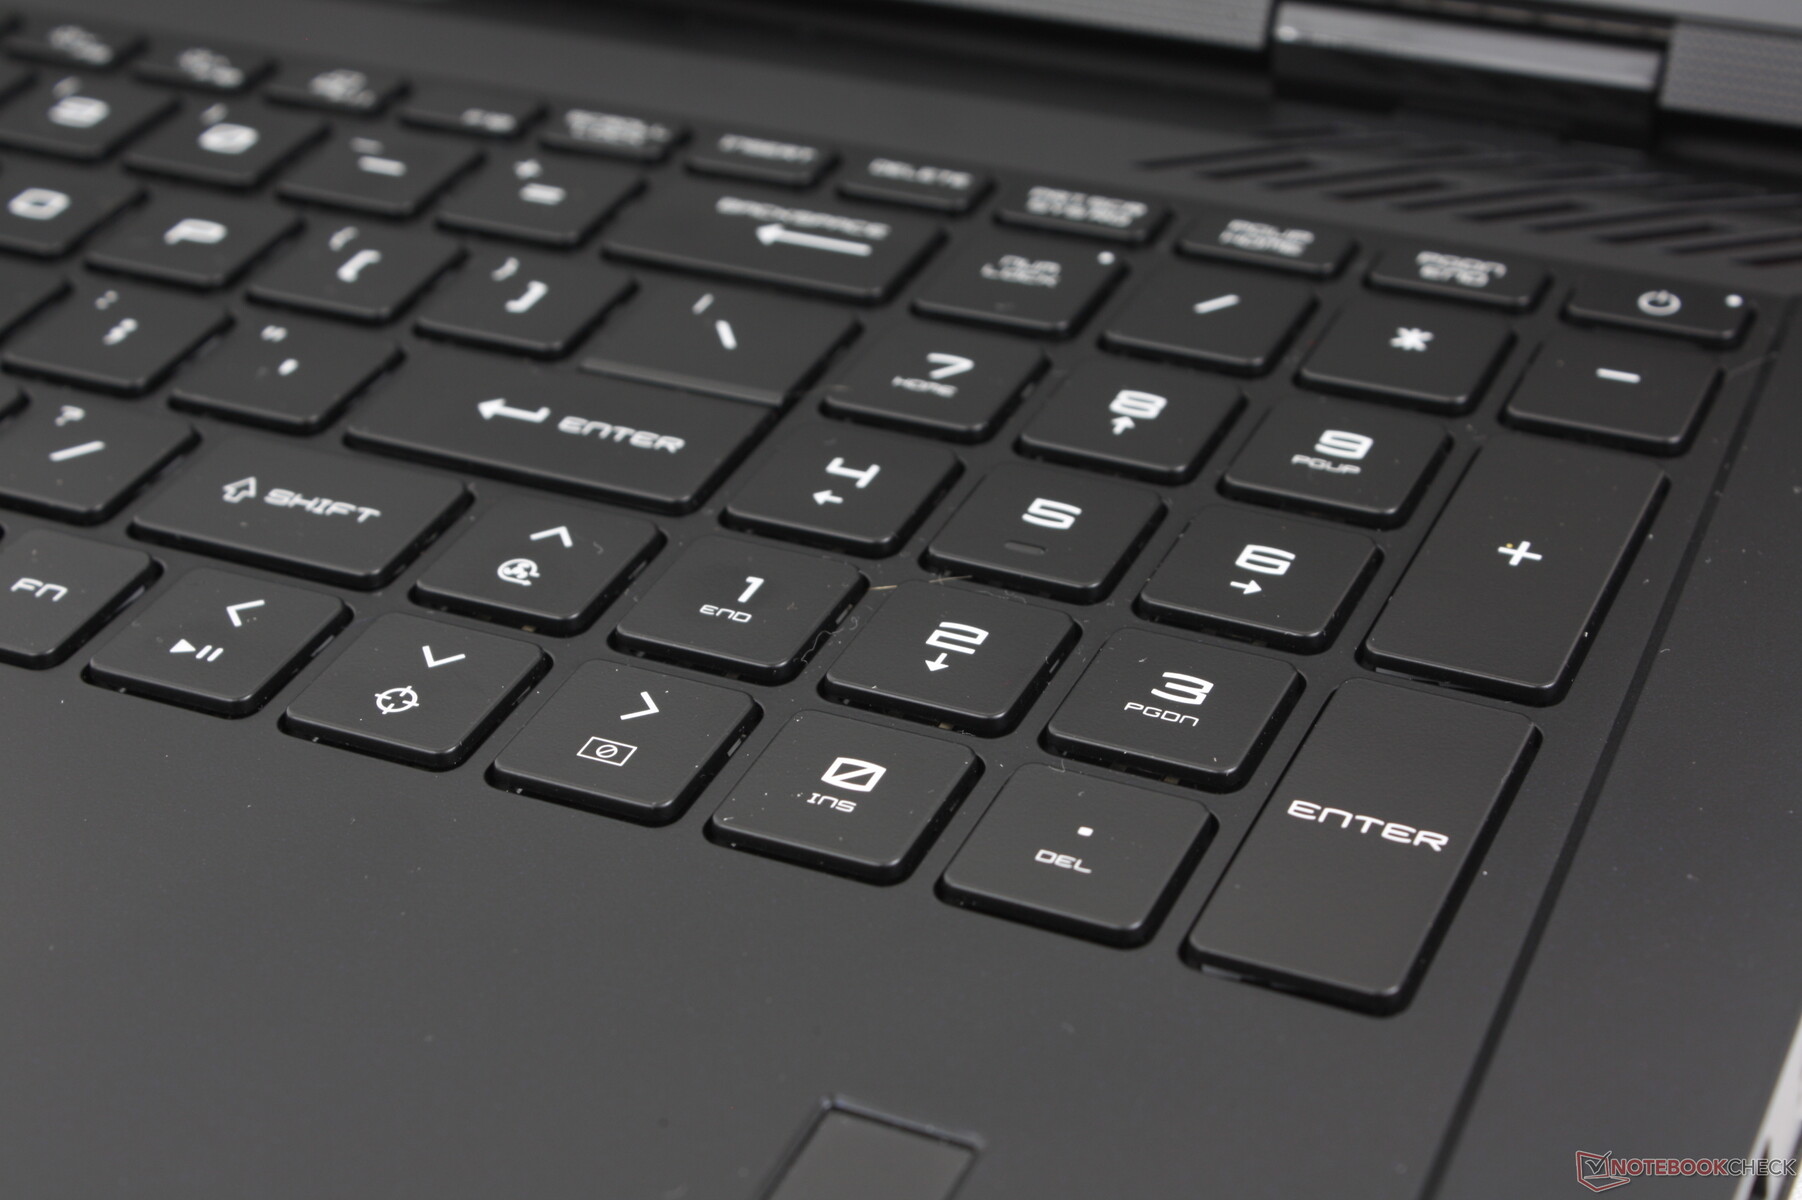
The keyboard is visually identical to the one on the Titan 18 HX but with one very important difference: The lack of any CherryMX mechanical options. Typing on the Raider 18 HX is therefore closer to typing on more traditional laptop keyboards like on the MSI Stealth 16 or older generation Raider models. Feedback is nowhere near as clicky or firm, but the softer clatter may be preferable for environments like conference rooms, classrooms, libraries, or dorm rooms.
We especially appreciate the full-size numpad and arrow keys as these are usually narrower and smaller than the main QWERTY keys on most other laptops. Spreadsheet work is therefore more comfortable on the Raider 18 HX than on the Blade 18 or ROG Strix G18.
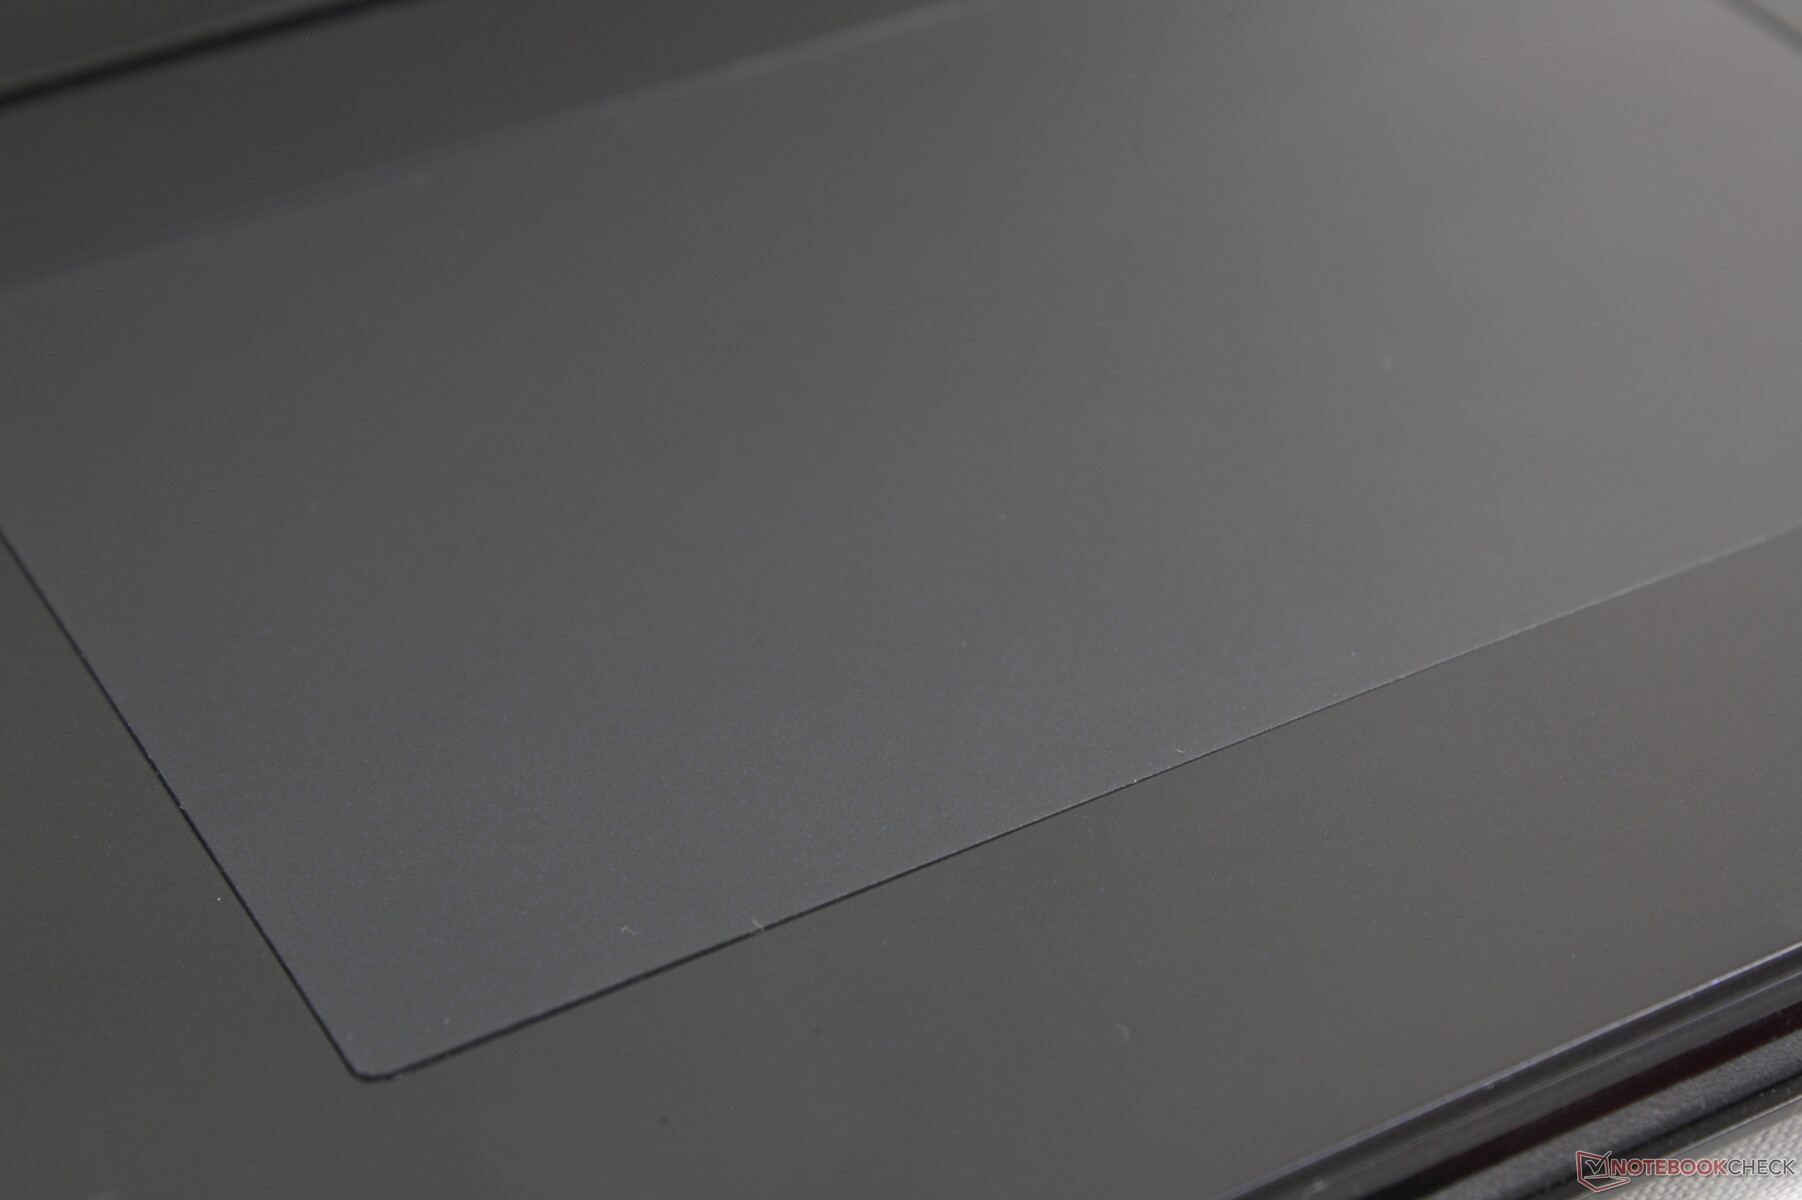
Touchpad
Unlike the fancy LED-lit edge-less clickpad on the Titan 18 HX, the Raider 18 HX utilizes a traditional clickpad for a more familiar feel. Size remains exactly the same (13 x 8.2 cm) and it's arguably more comfortable to use as it's not trying to be anything new or fix a problem that wasn't there in the first place. Traction is ultra-smooth with just a bit of sticking at slower speeds for accuracy.
Pressing down to input a click is unfortunately still shallow and soft with unsatisfying feedback. A stronger and firmer click would have been preferable or even the return of dedicated mouse keys as the keyboard deck is quite spacious.
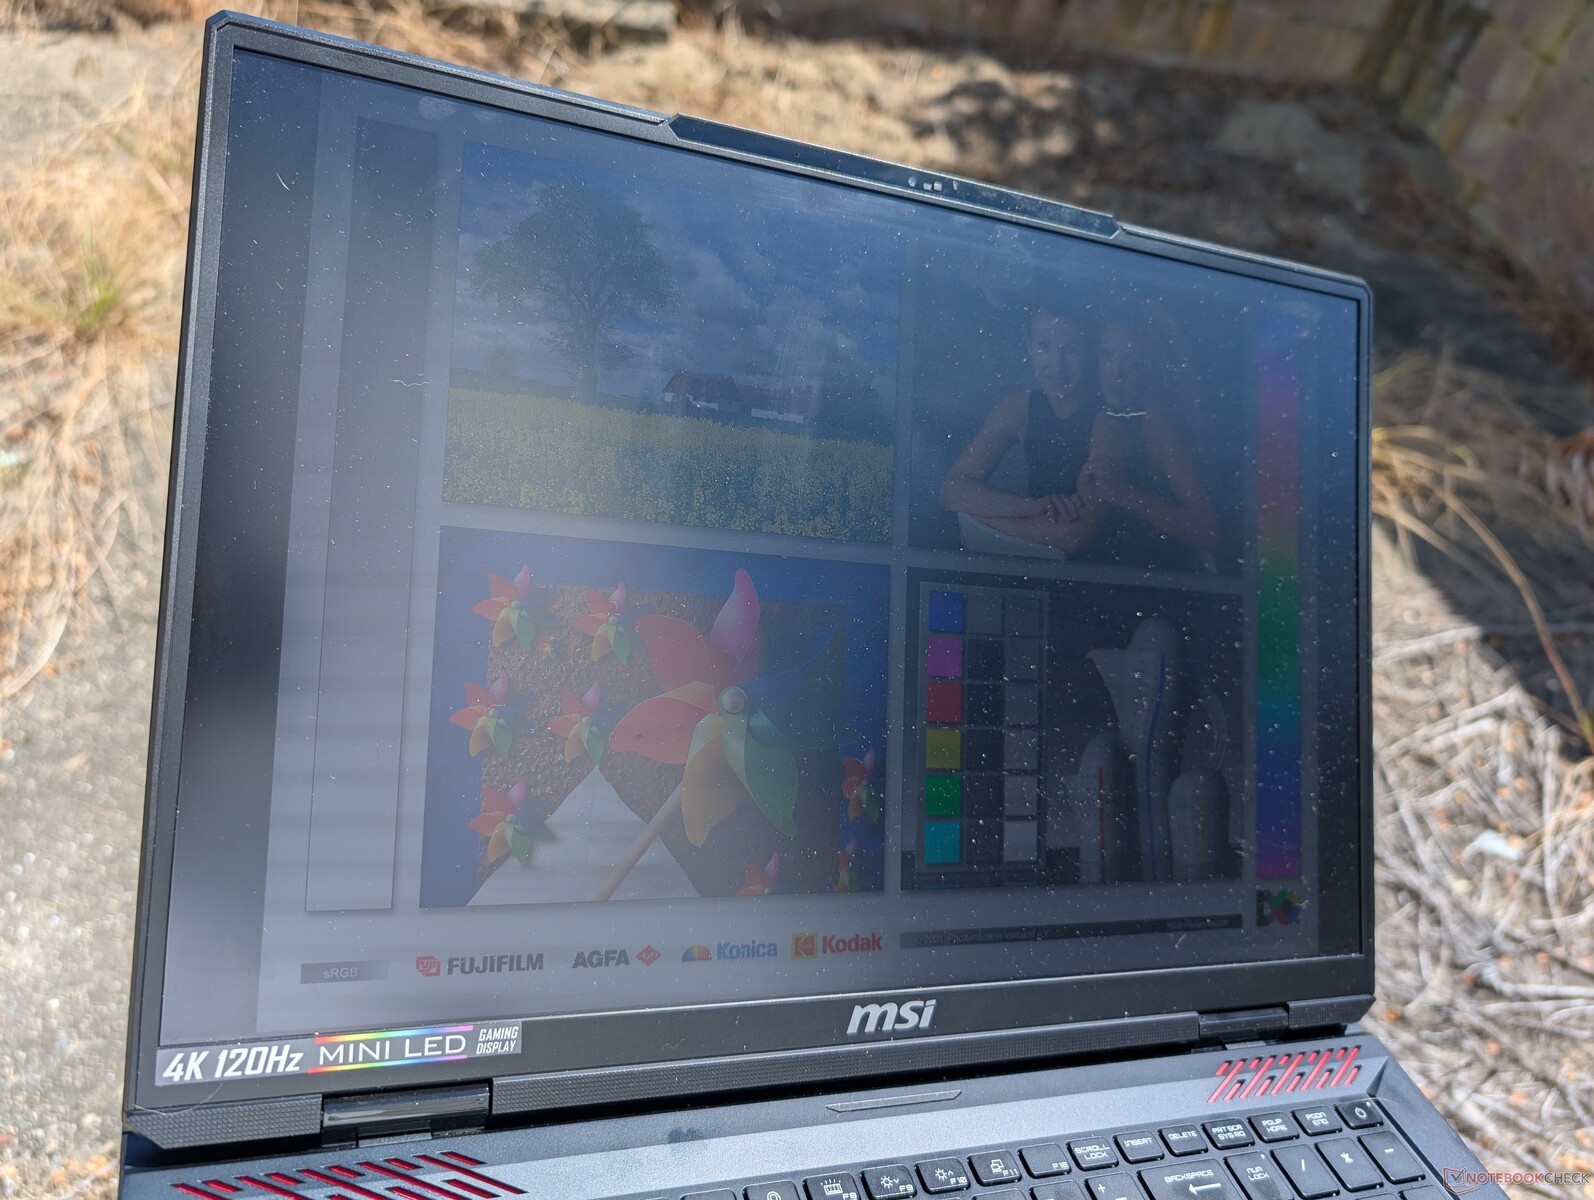
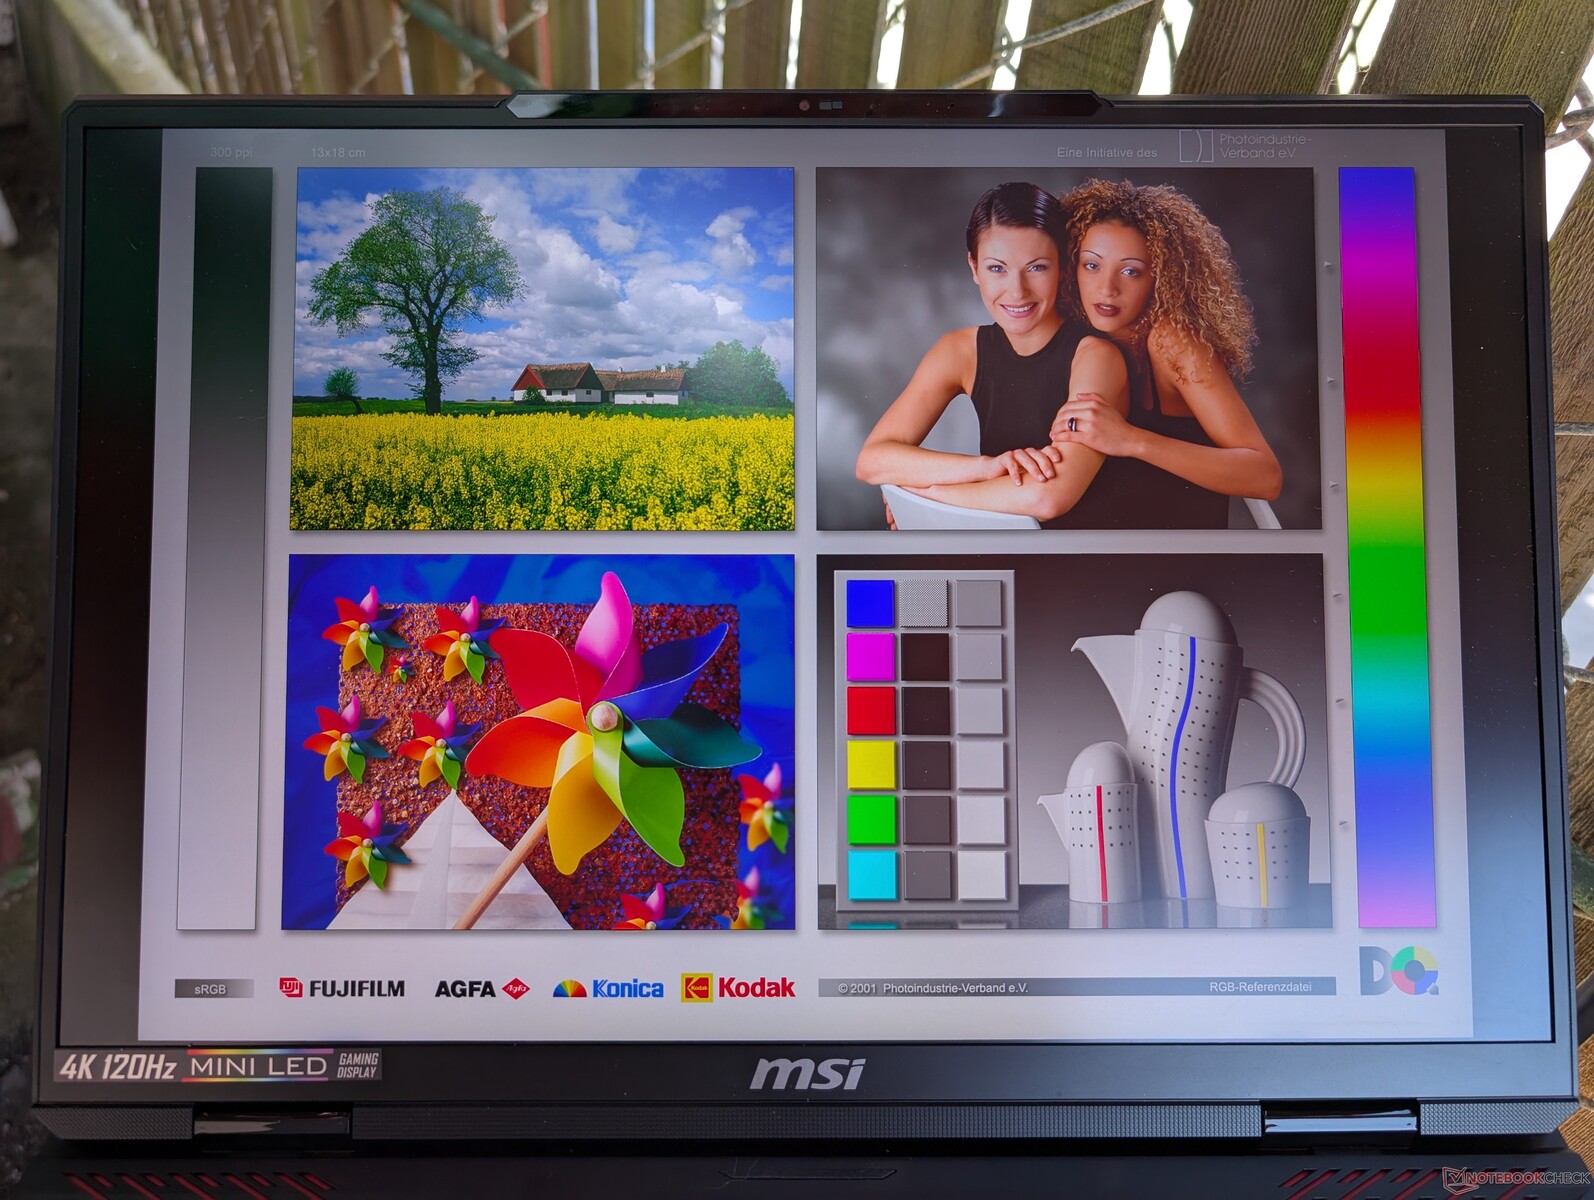
Display — Titan 18 HX Experience For Less
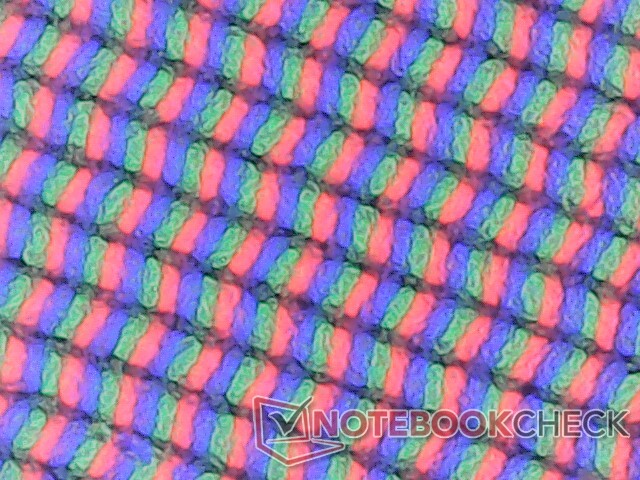
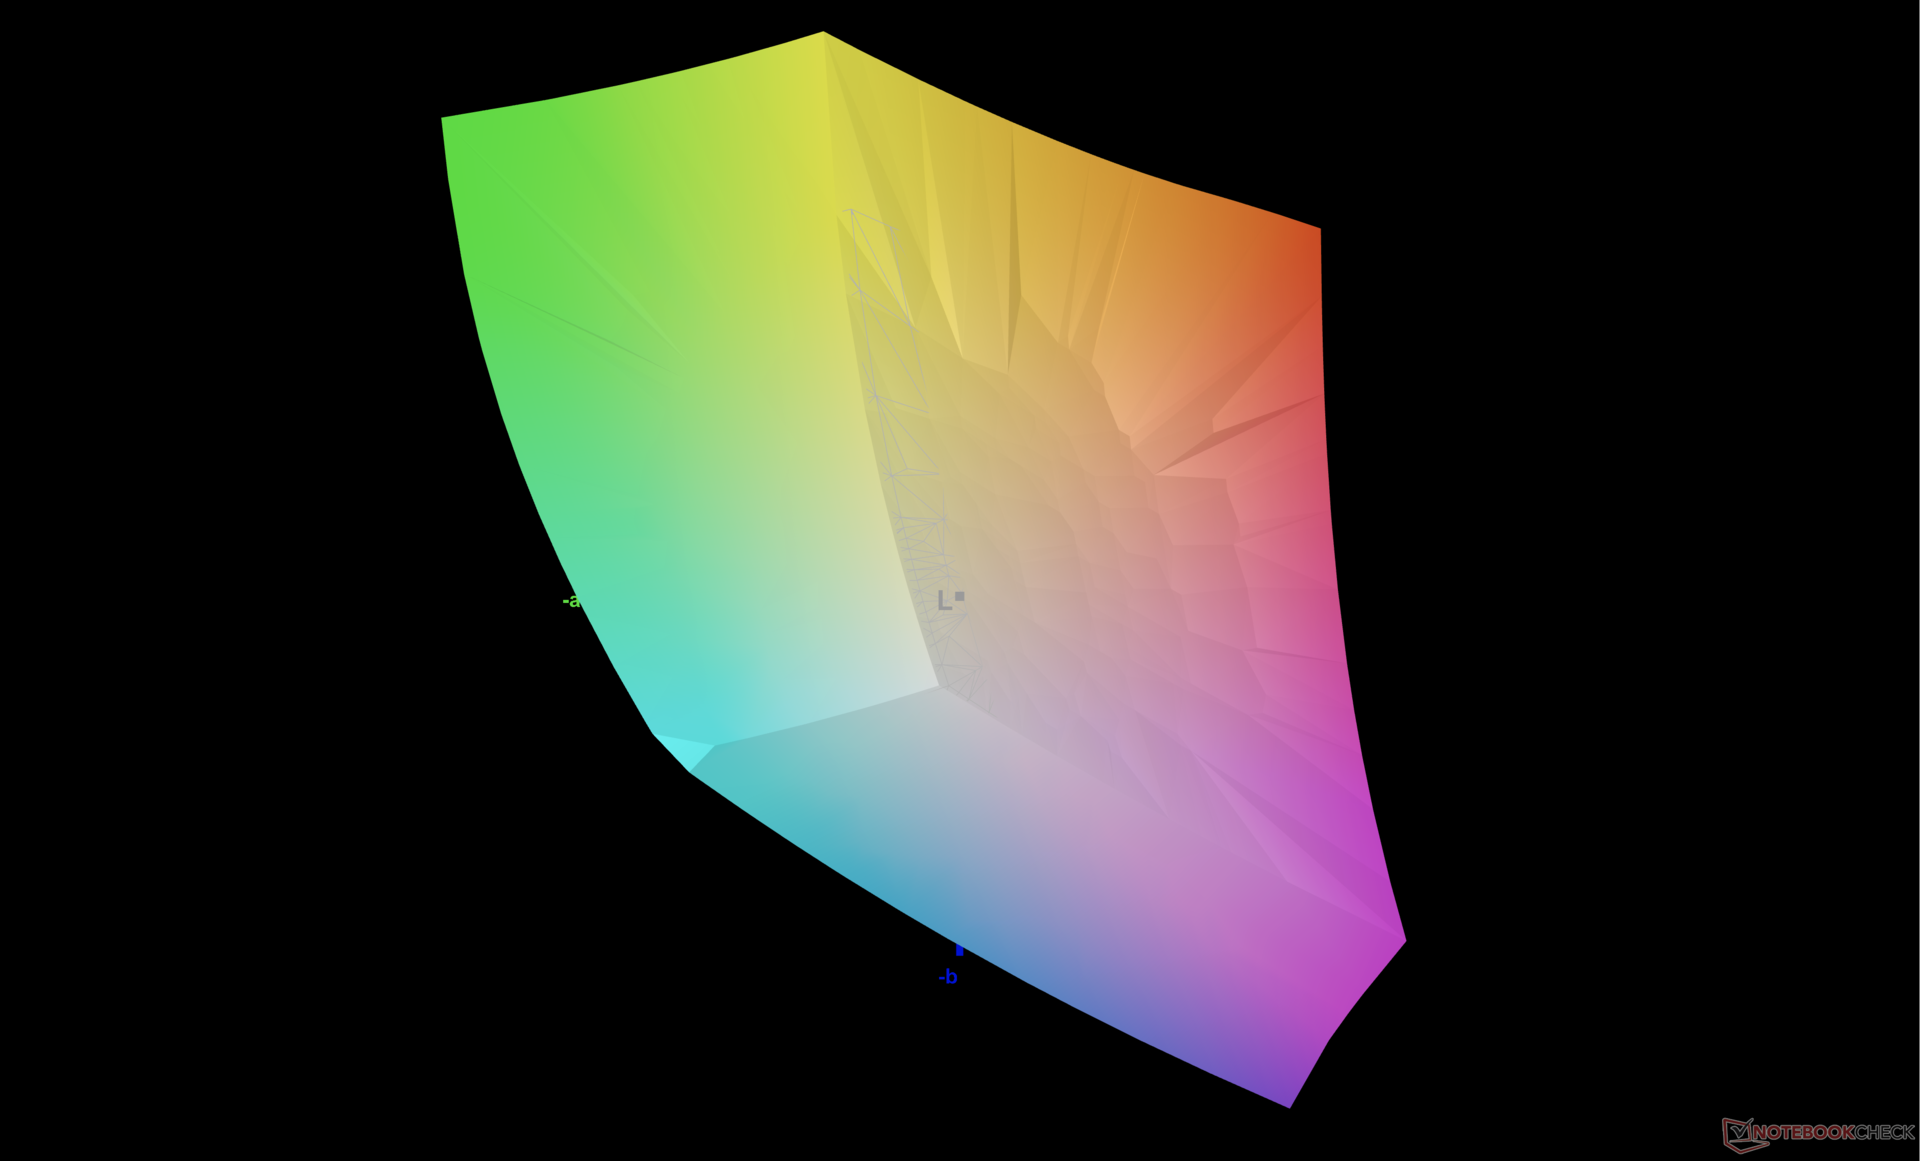
The Raider 18 HX ships with the exact same AU Optronics B180ZAN01.0 120 Hz mini-LED panel as found on the Titan 18 HX for a virtually identical viewing experience. Maximum brightness tops out at almost 600 nits when HDR is off or 935 nits when HDR is on. When compared to IPS or OLED, mini-LED provides a better HDR viewing experience since it is able to reach higher brightness levels than either at the cost of higher power consumption. IPS or OLED laptops would typically support HDR600 at best while mini-LED panels often promise HDR1000.
| |||||||||||||||||||||||||
Brightness Distribution: 94 %
Center on Battery: 392.2 cd/m²
Contrast: ∞:1 (Black: 0 cd/m²)
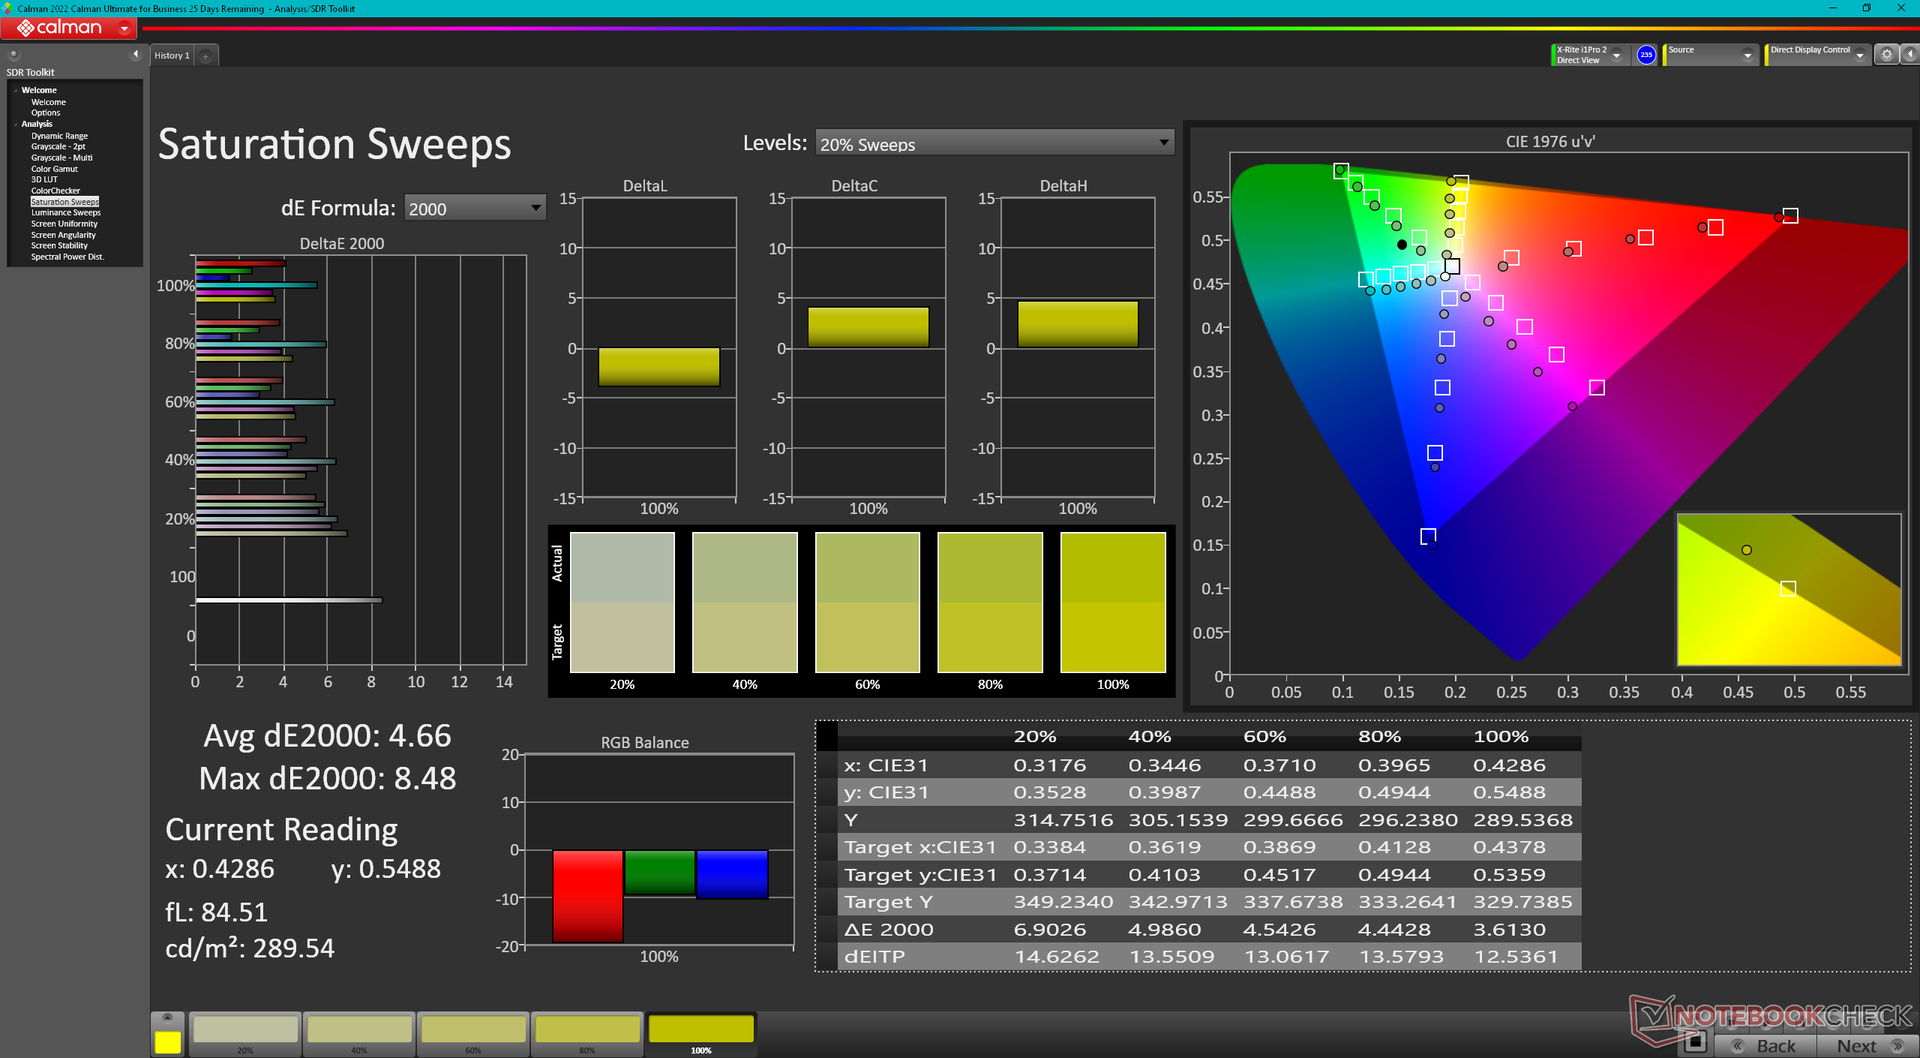
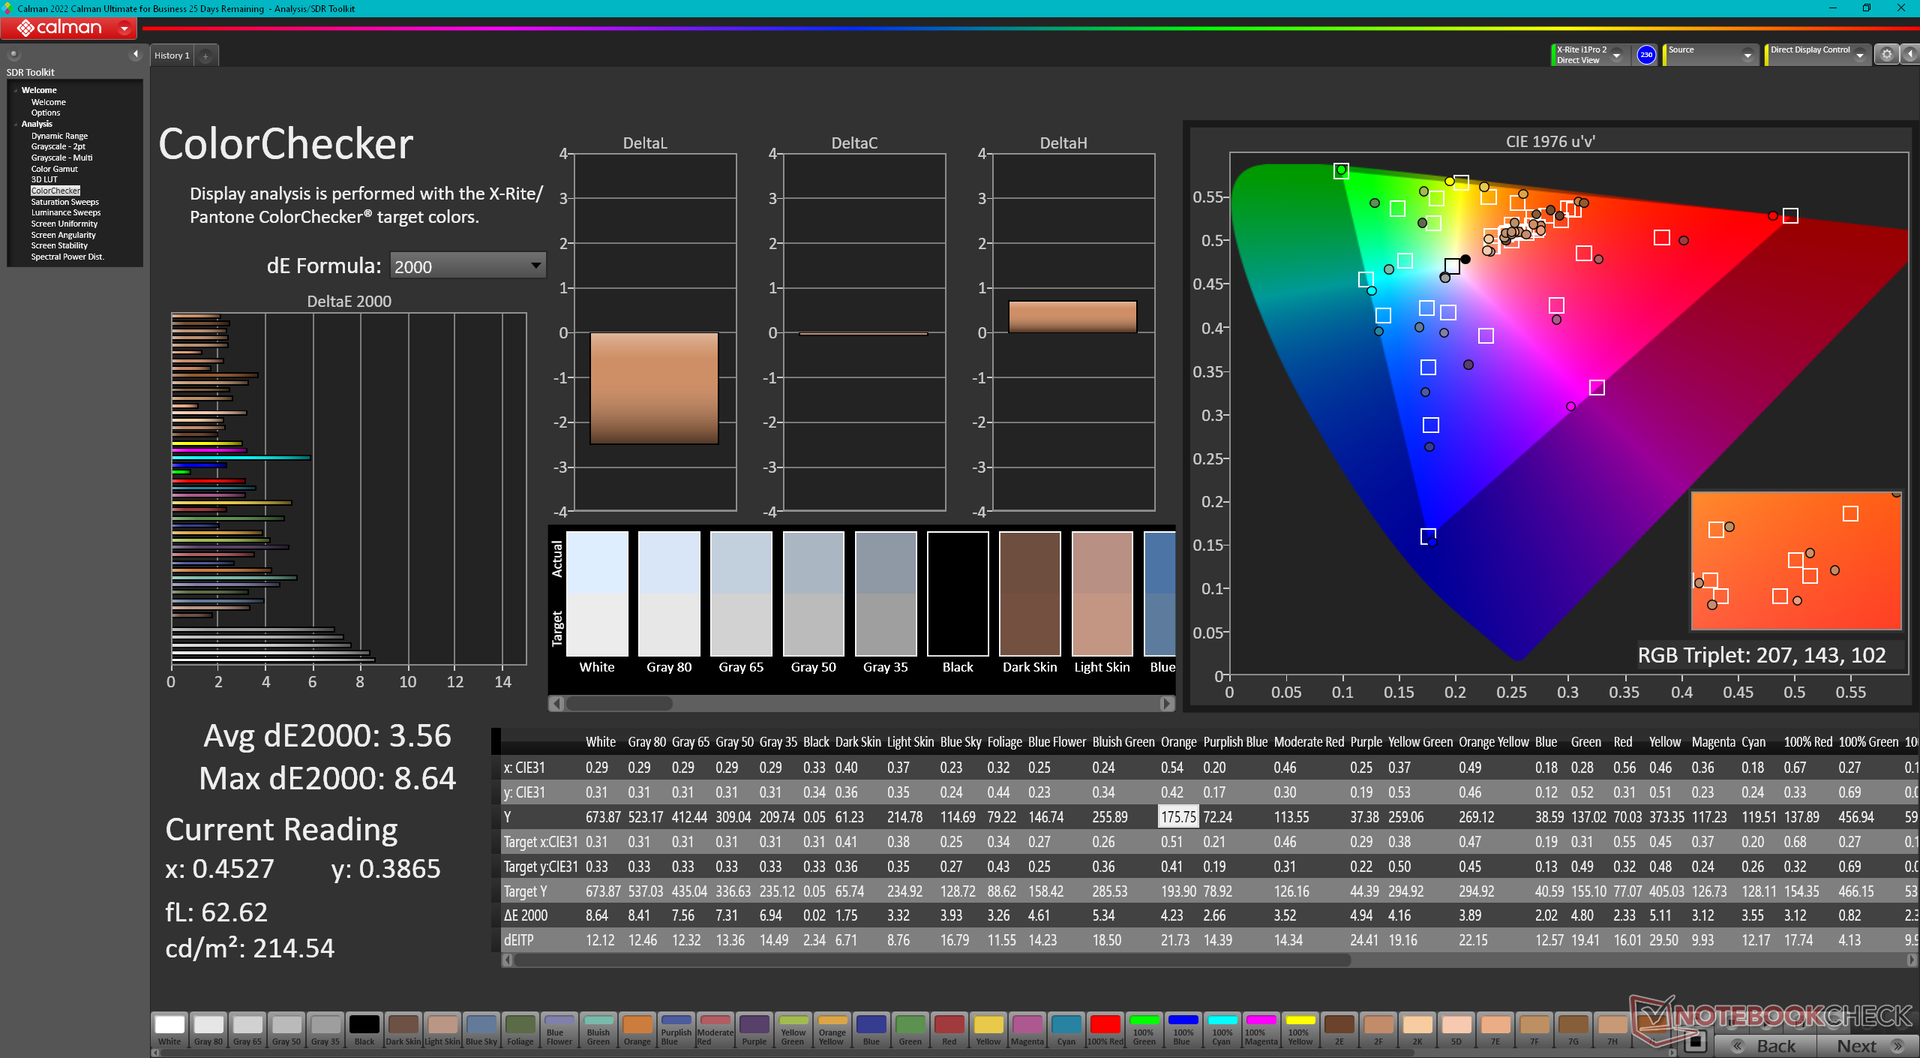
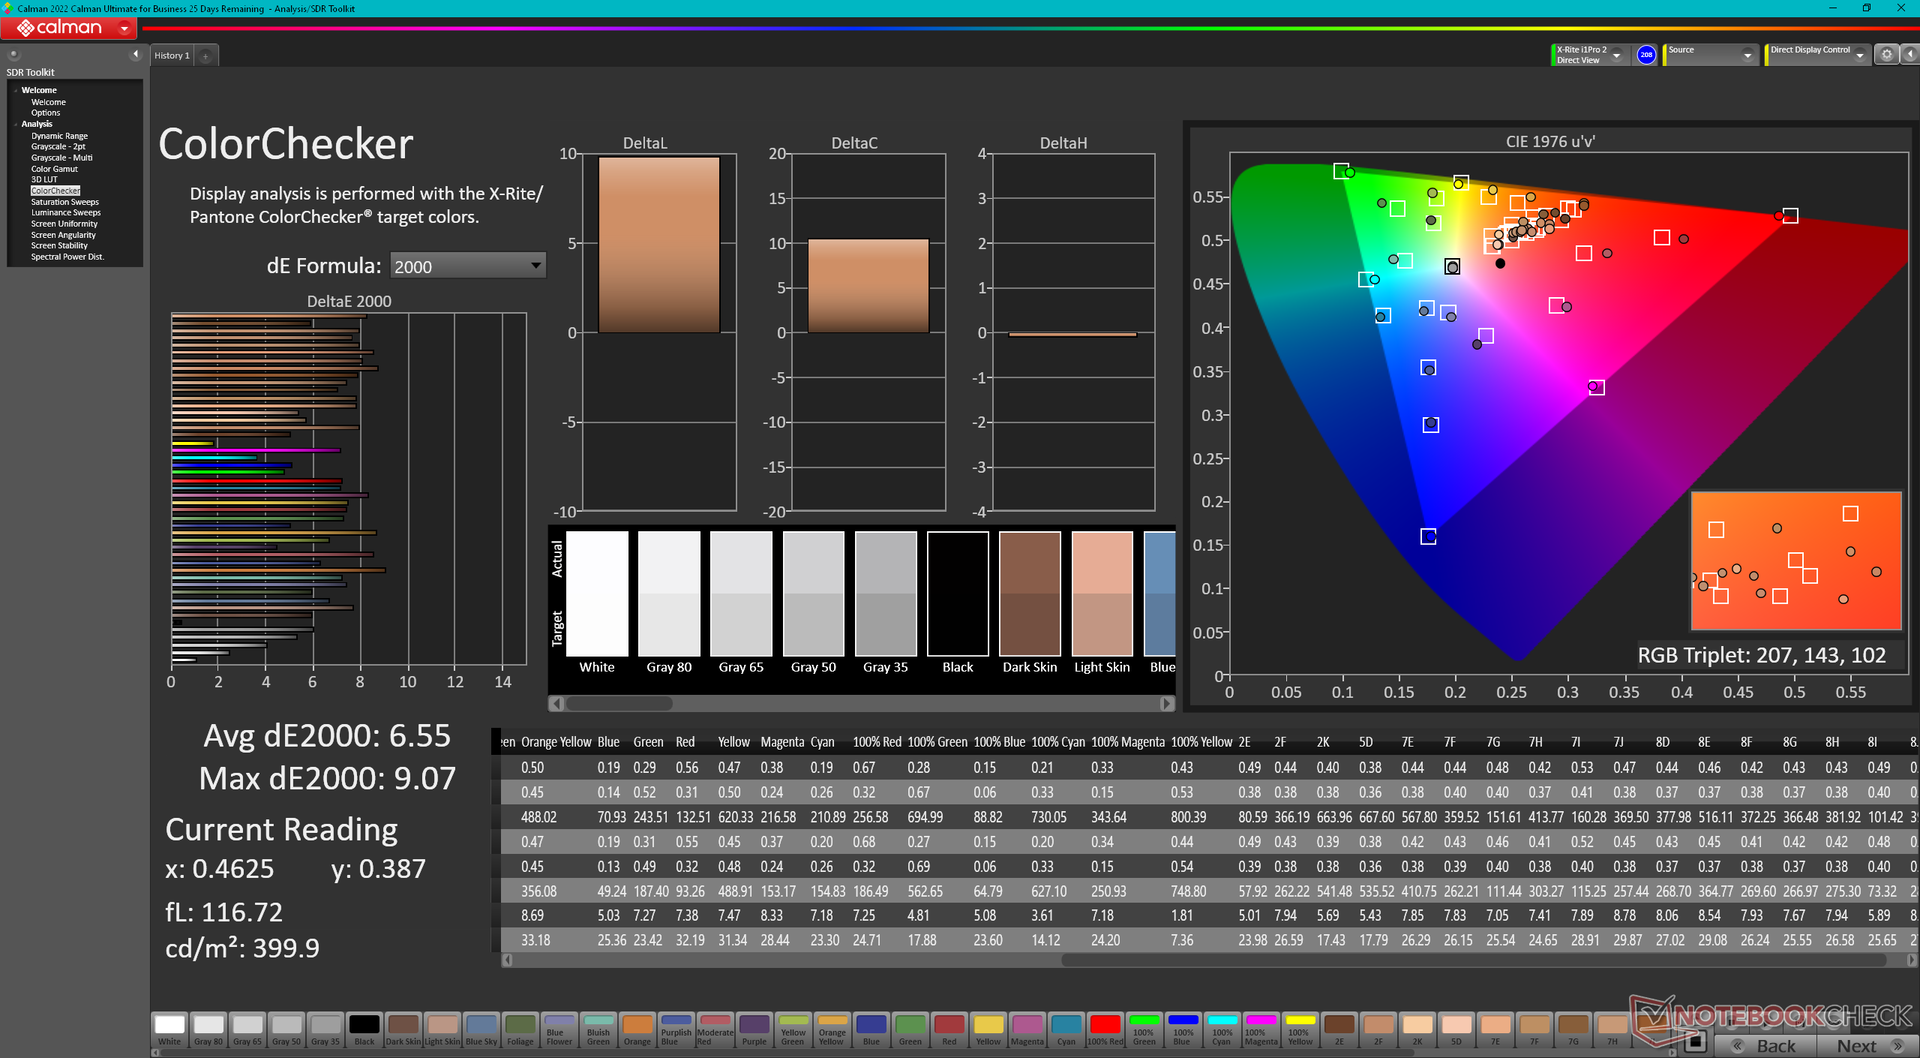
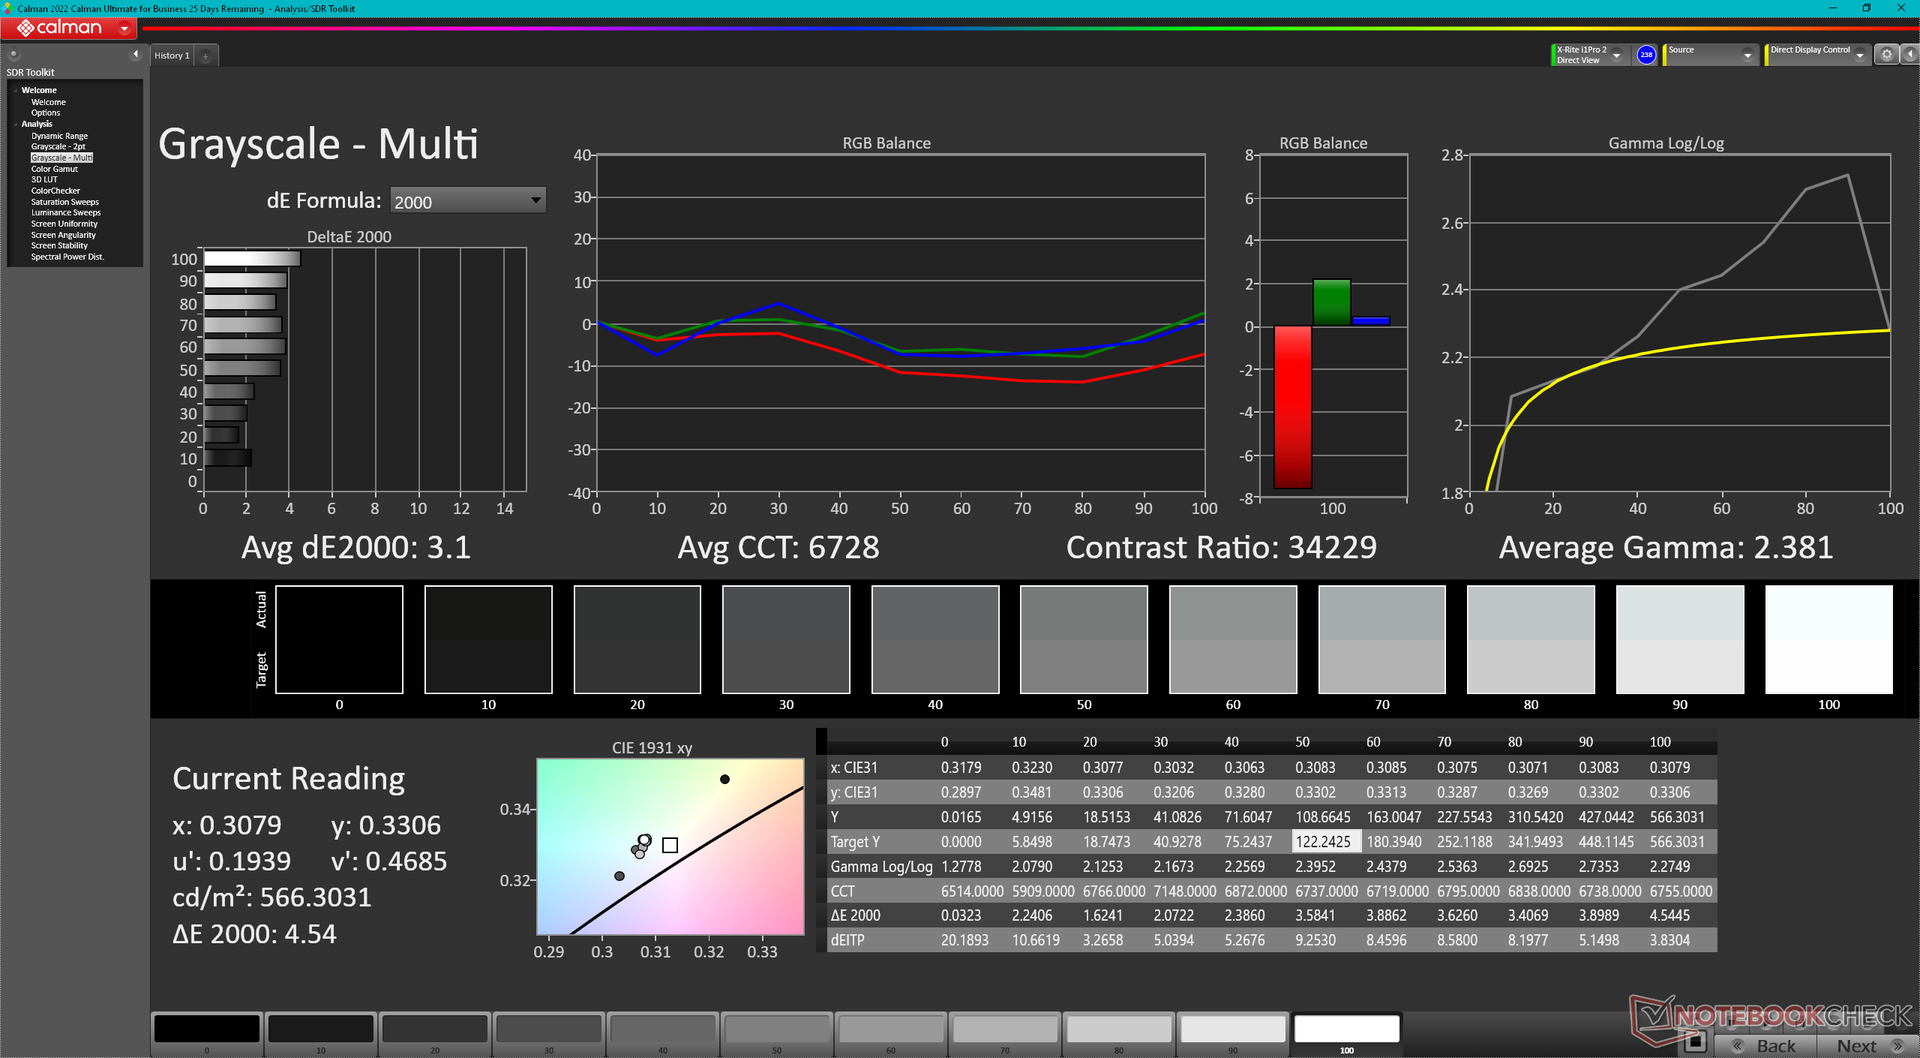
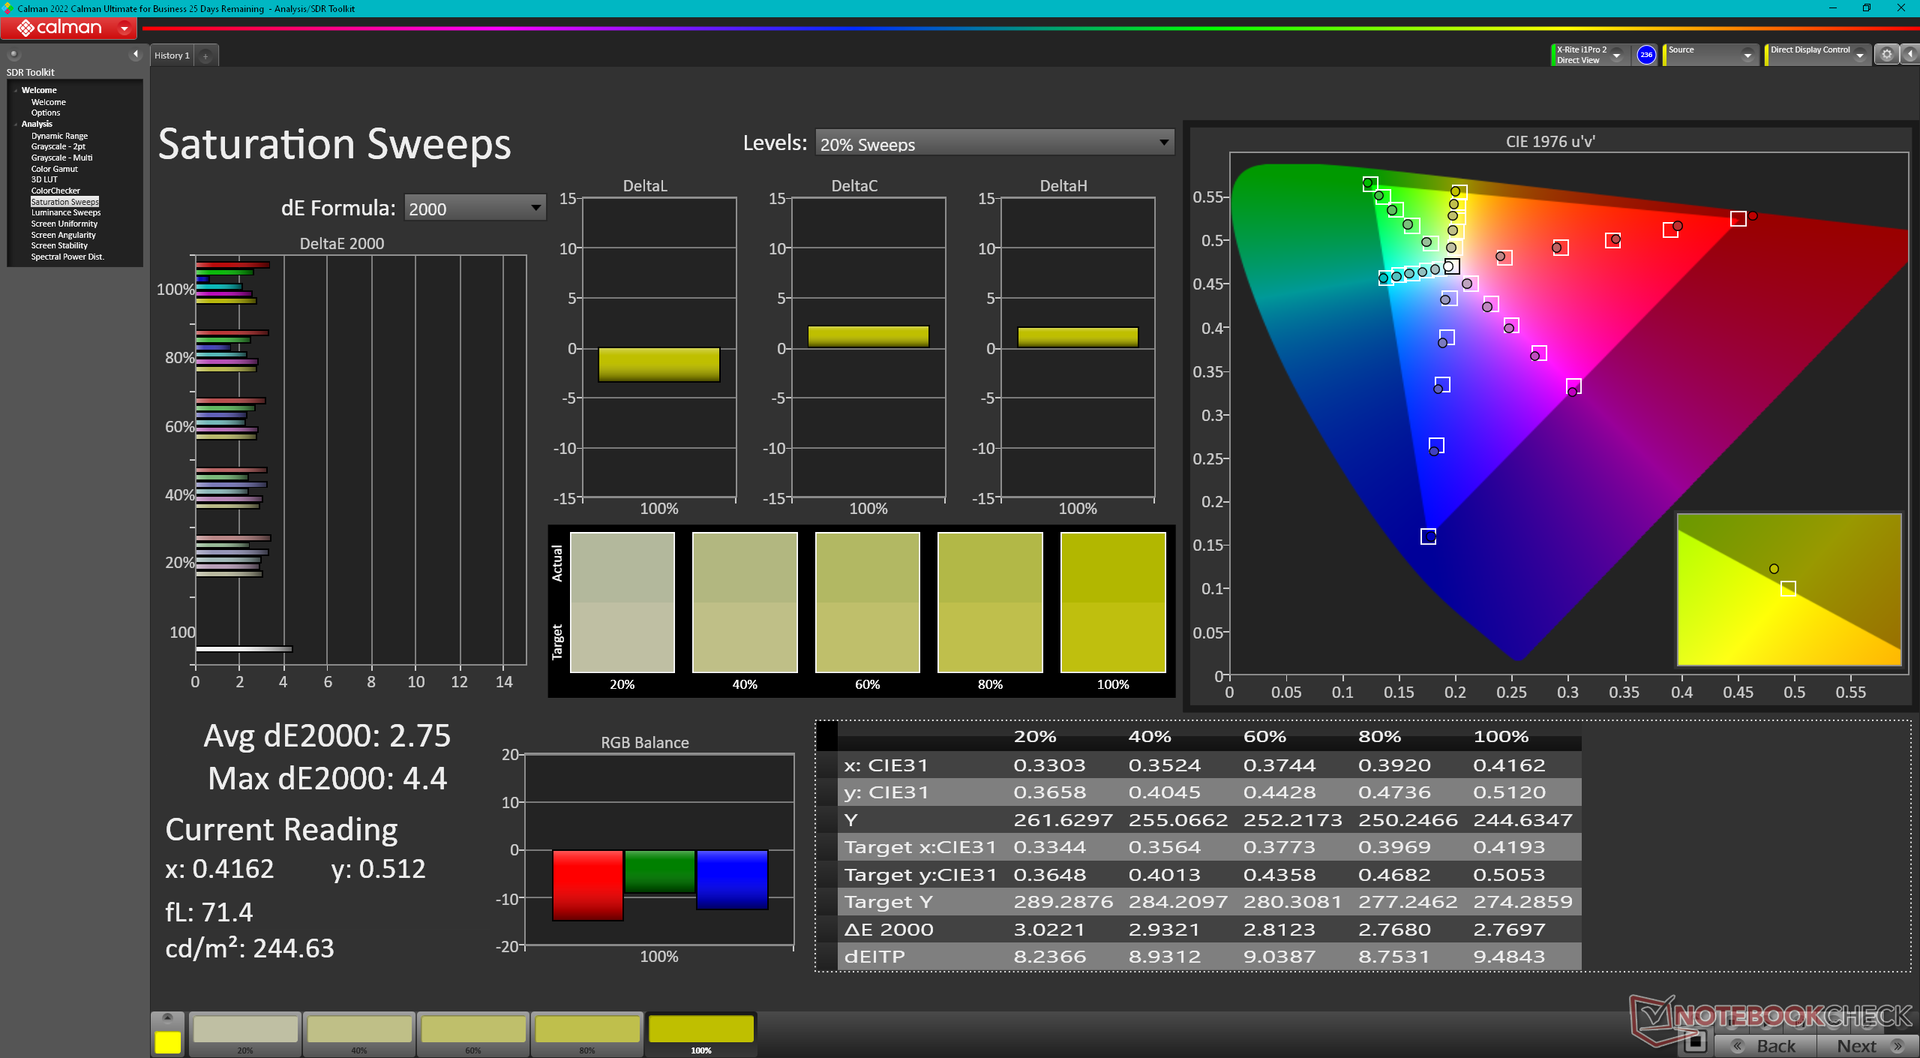
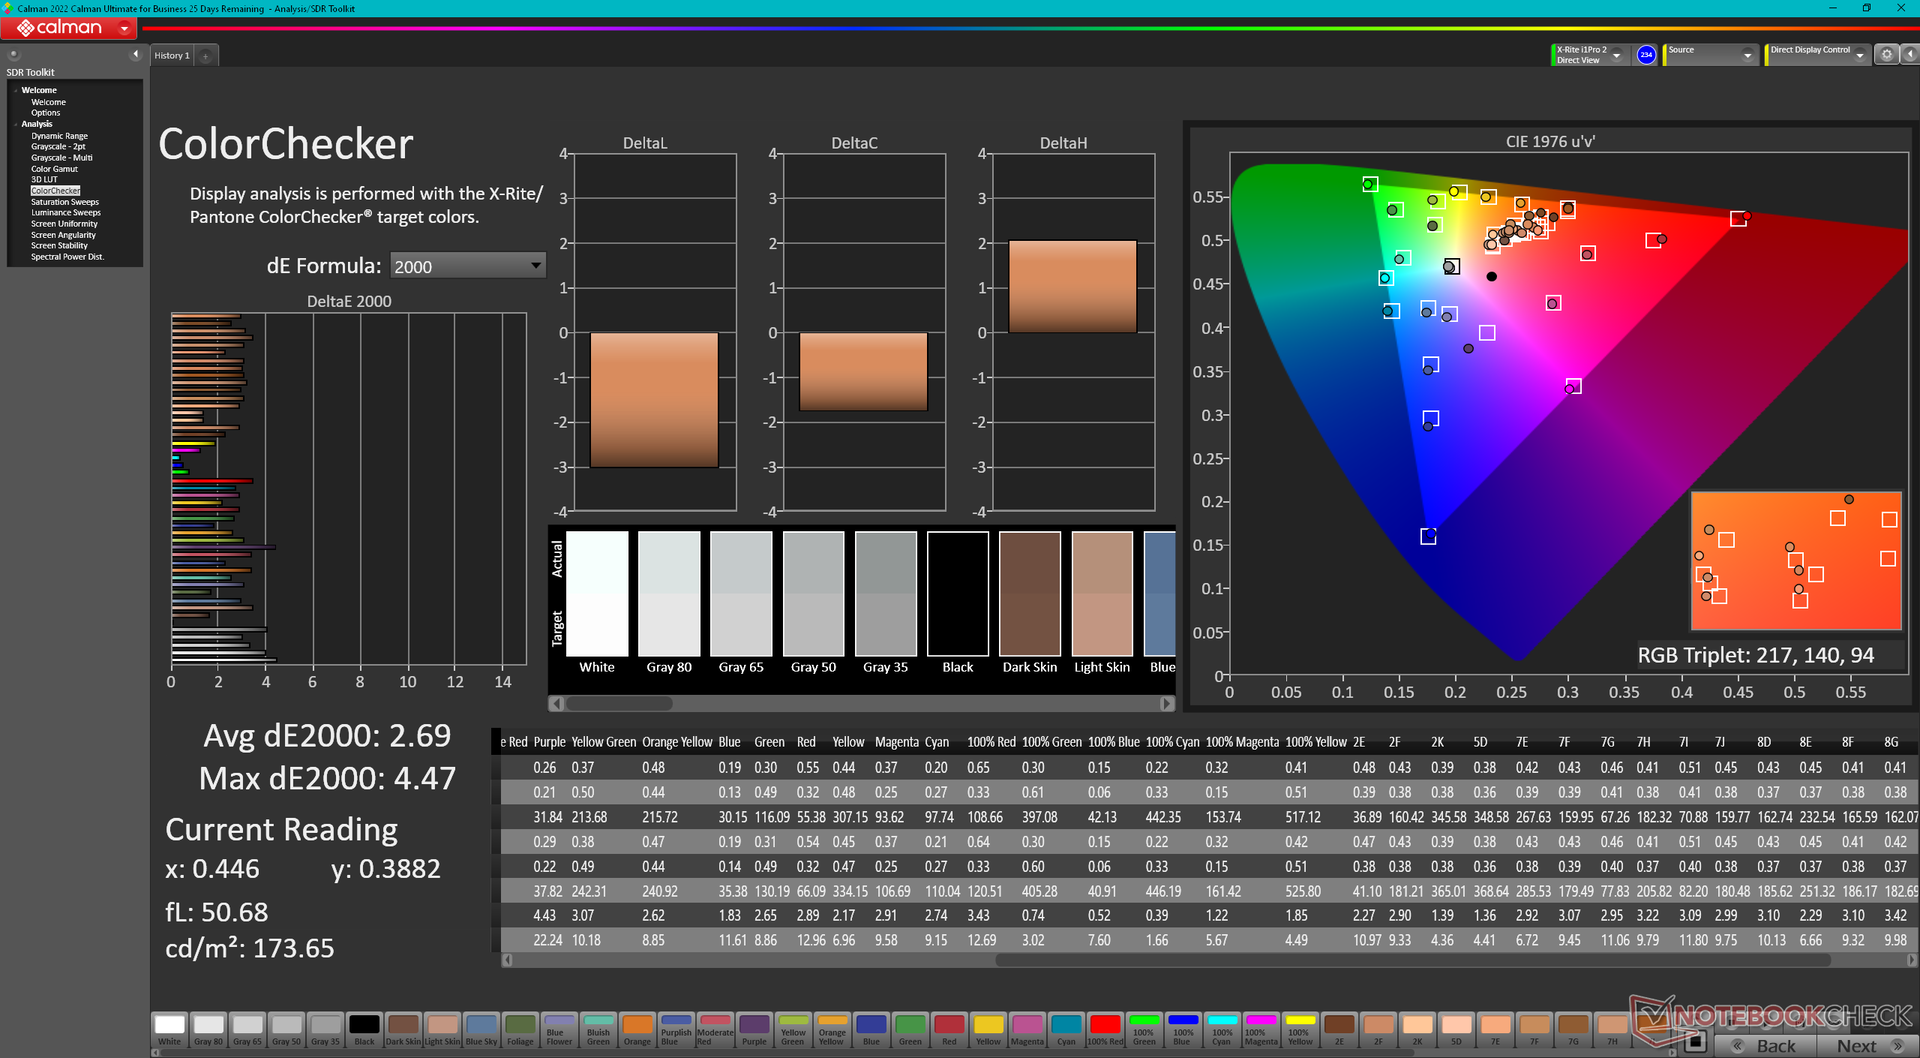
ΔE ColorChecker Calman: 3.56 | ∀{0.5-29.43 Ø4.73}
calibrated: 2.69
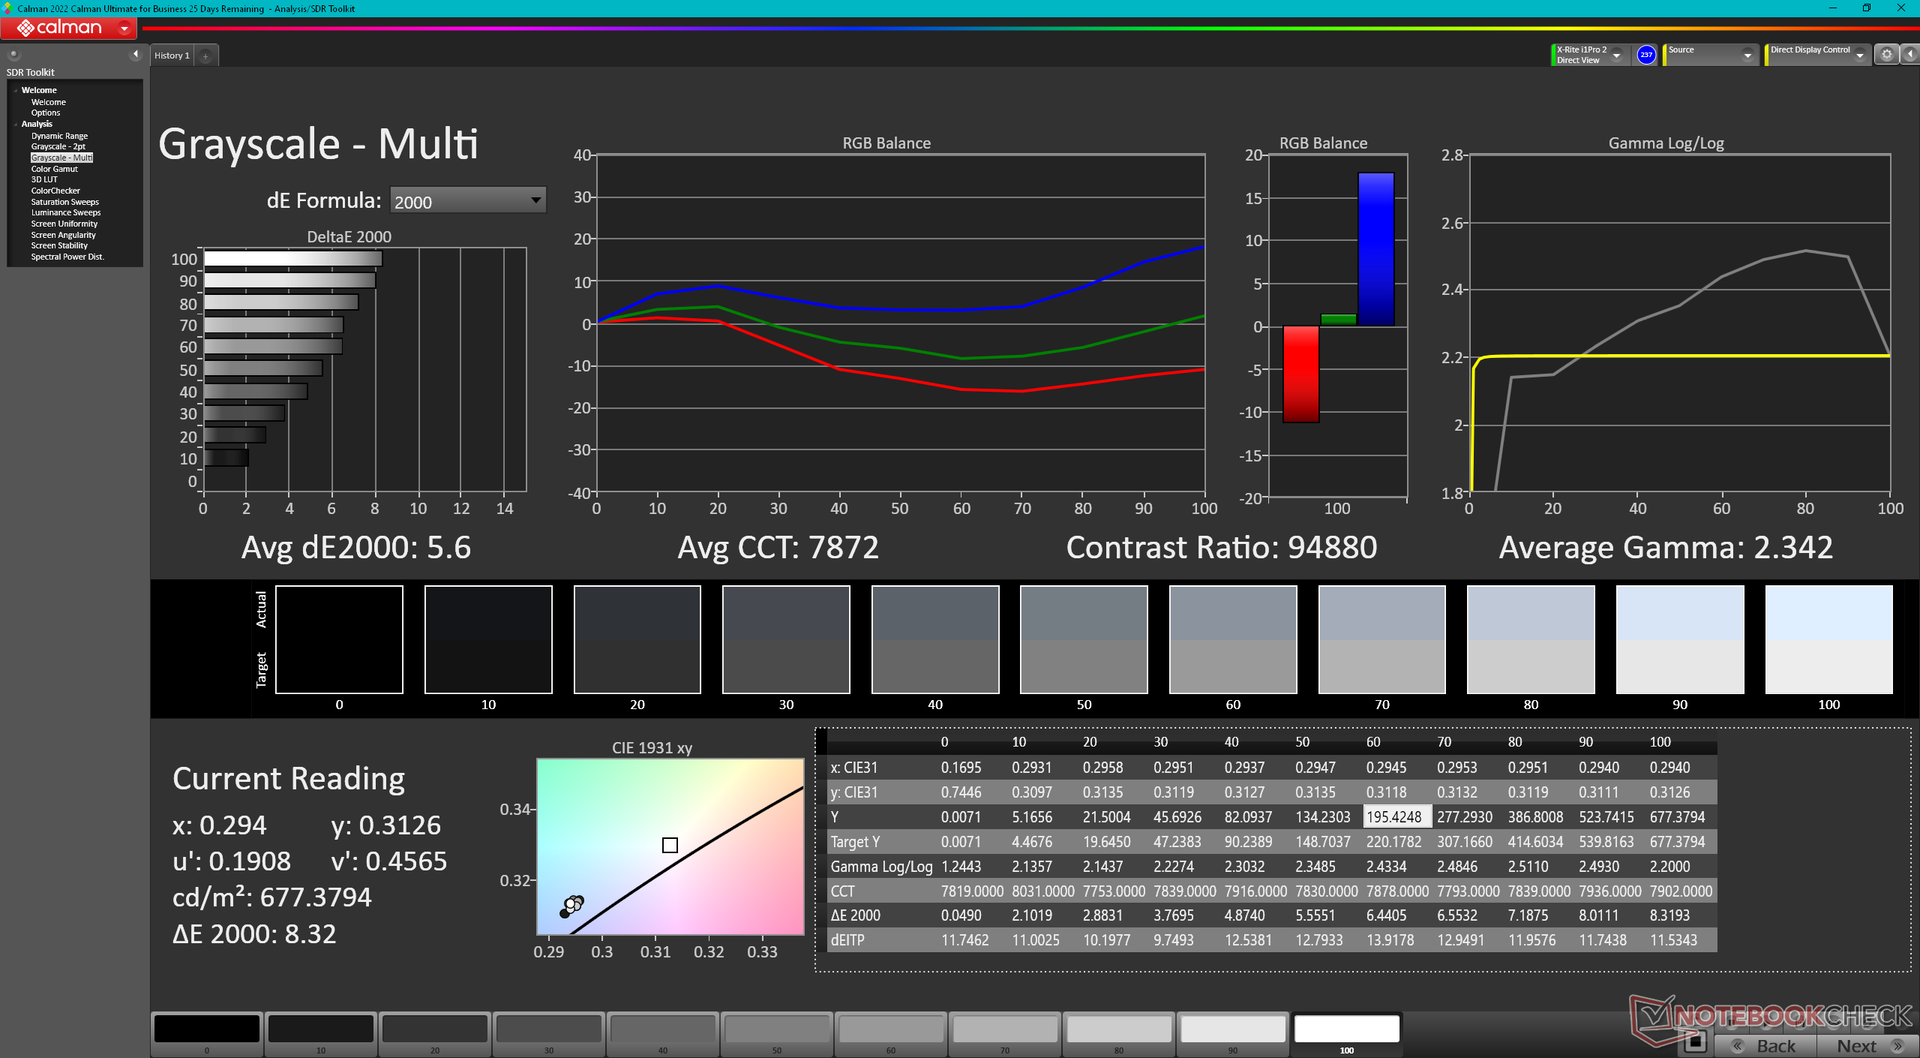
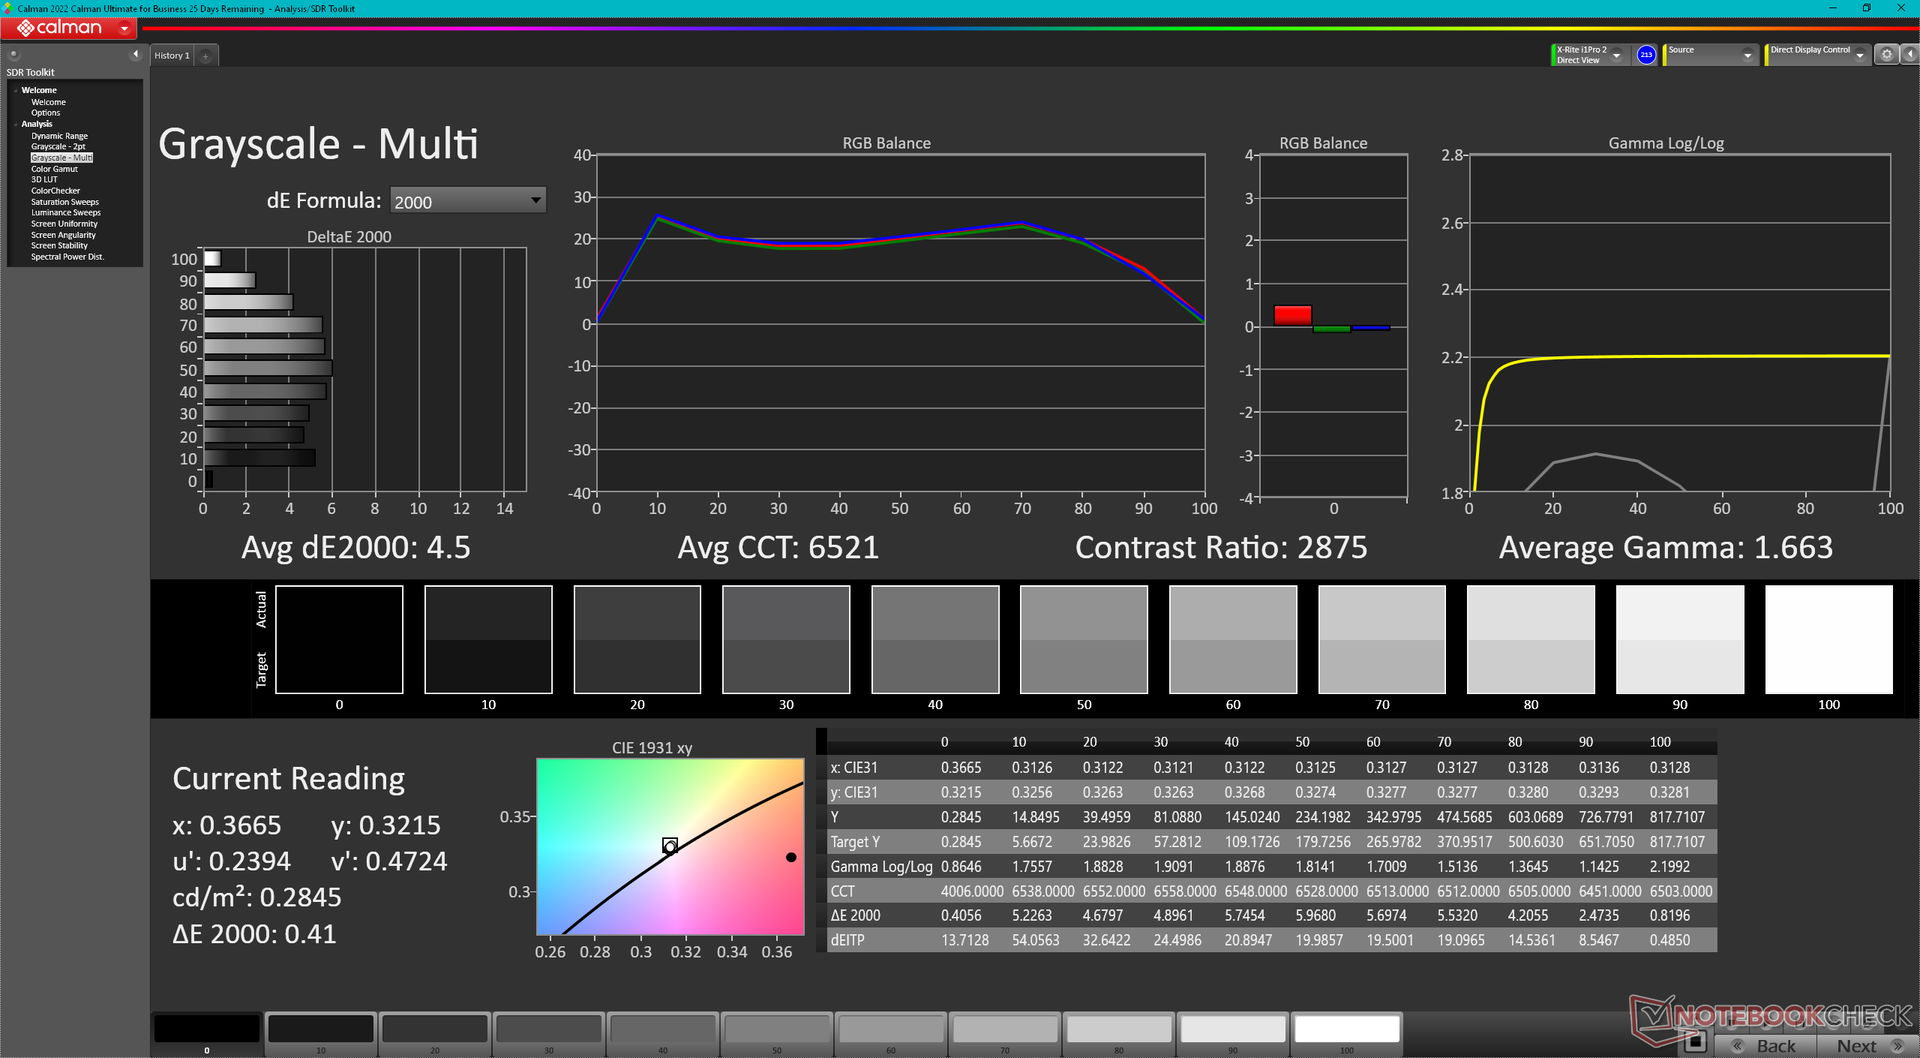
ΔE Greyscale Calman: 5.6 | ∀{0.09-98 Ø4.97}
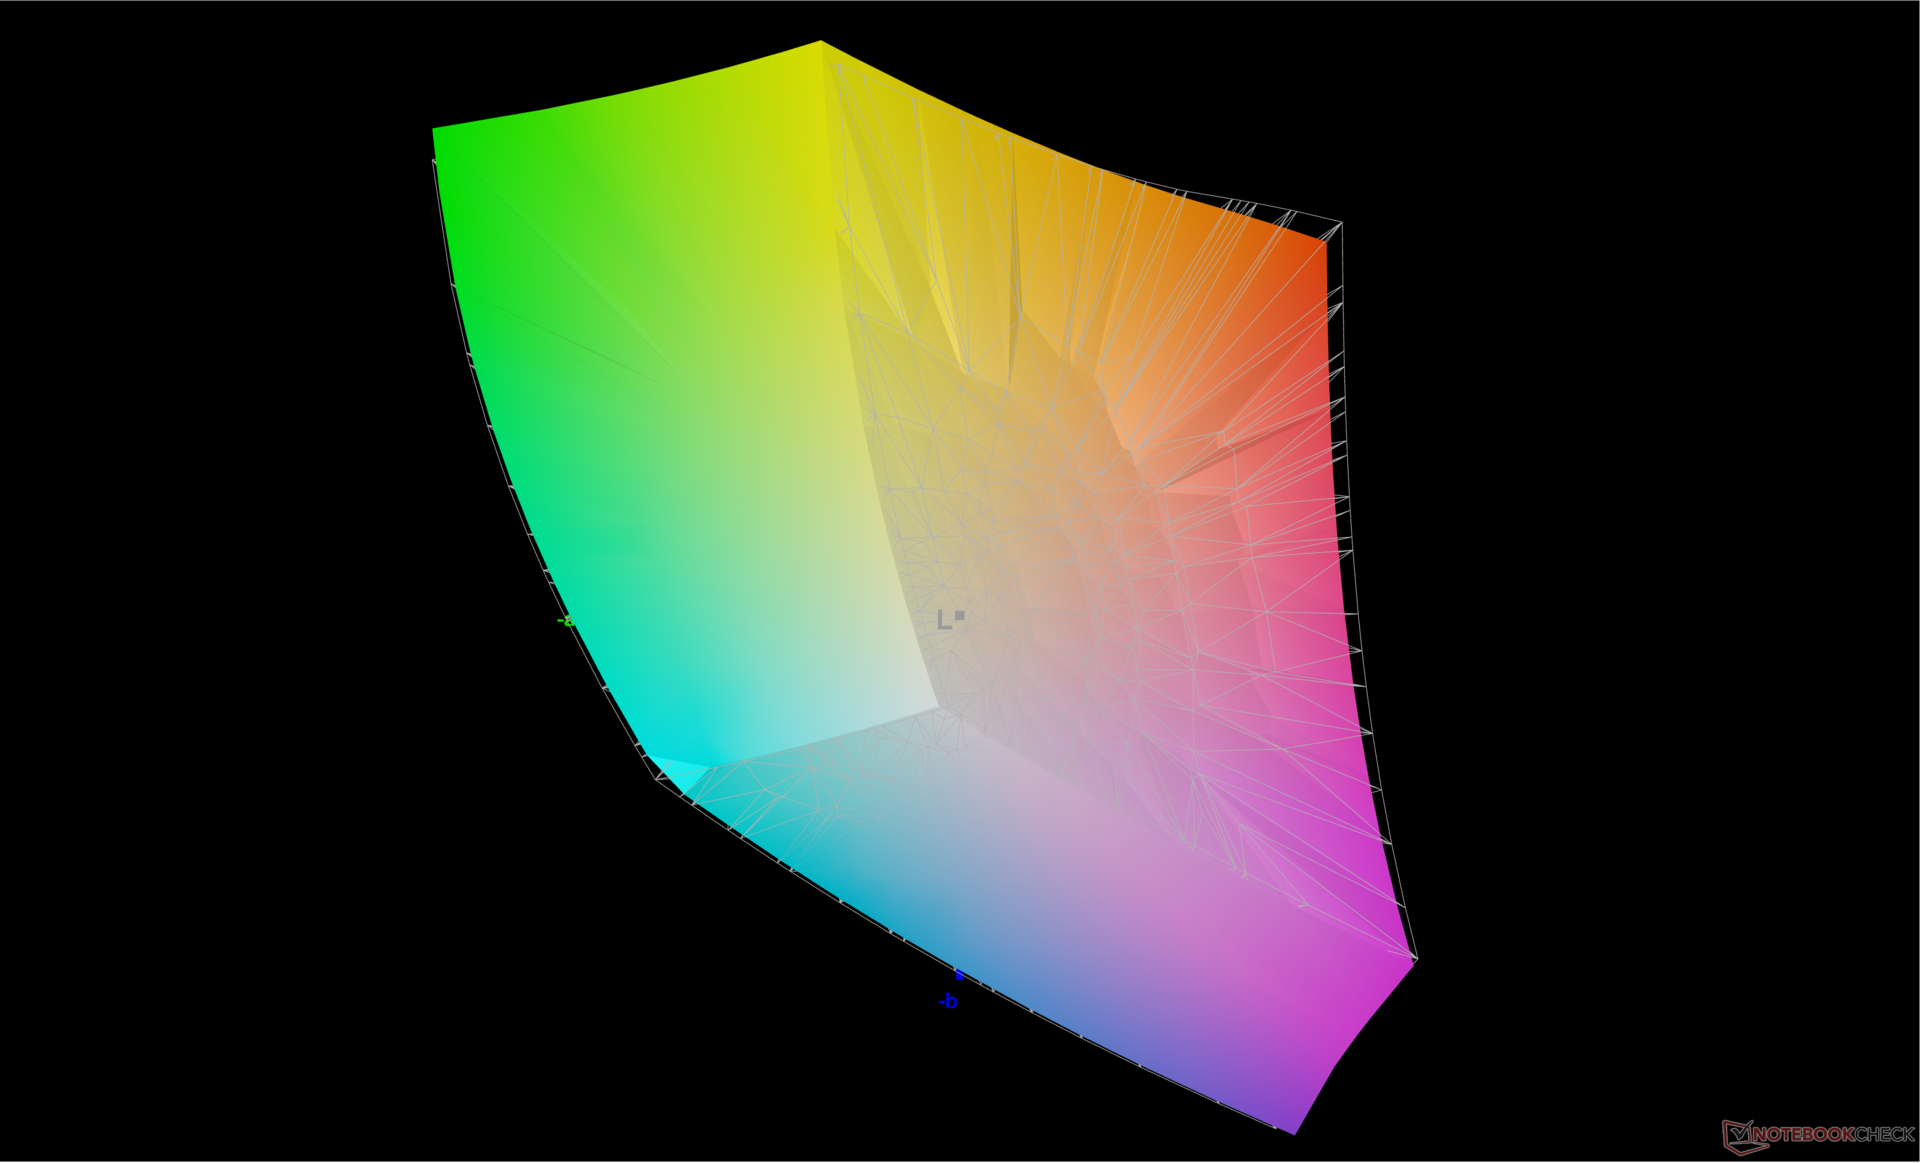
84.8% AdobeRGB 1998 (Argyll 3D)
99.9% sRGB (Argyll 3D)
96.6% Display P3 (Argyll 3D)
Gamma: 2.34
CCT: 7872 K
| MSI Raider 18 HX A14V AU Optronics B180ZAN1.0, Mini-LED, 3840x2400, 18", 120 Hz | Razer Blade 18 2024 RZ09-0509 BOE NE180QDM-NM1, Mini-LED, 2560x1600, 18", 300 Hz | Alienware m18 R2 BOE NE18NZ1, IPS, 2560x1600, 18", 165 Hz | MSI Titan 18 HX A14VIG AU Optronics B180ZAN01.0, Mini-LED, 3840x2400, 18", 120 Hz | Asus ROG Strix G18 G814JI NE180QDM-NZ2 (BOE0B35), IPS, 2560x1600, 18", 240 Hz | Acer Predator Helios 18 PH18-72-98MW B180QAN01.2 (AUO45A8), Mini-LED, 2560x1600, 18", 250 Hz | |
|---|---|---|---|---|---|---|
| Display | 1% | 2% | 1% | 1% | 4% | |
| Display P3 Coverage (%) | 96.6 | 99 2% | 97.8 1% | 98.1 2% | 98.1 2% | 99.7 3% |
| sRGB Coverage (%) | 99.9 | 100 0% | 99.5 0% | 99.8 0% | 99.9 0% | 100 0% |
| AdobeRGB 1998 Coverage (%) | 84.8 | 86.9 2% | 88.9 5% | 86.2 2% | 85.6 1% | 91.6 8% |
| Response Times | 55% | 68% | 5% | 67% | 50% | |
| Response Time Grey 50% / Grey 80% * (ms) | 10.4 ? | 7.6 ? 27% | 5.3 ? 49% | 8.6 ? 17% | 5.6 ? 46% | 8 ? 23% |
| Response Time Black / White * (ms) | 75.8 ? | 14 ? 82% | 10.4 ? 86% | 81.8 ? -8% | 9 ? 88% | 17.6 ? 77% |
| PWM Frequency (Hz) | 2606.2 ? | 26444 ? | 2592 ? | 4832 ? | ||
| PWM Amplitude * (%) | 90 | |||||
| Screen | 29% | 8% | 2% | 23% | 24% | |
| Brightness middle (cd/m²) | 575.7 | 605.4 5% | 271.8 -53% | 467.5 -19% | 471 -18% | 722 25% |
| Brightness (cd/m²) | 574 | 600 5% | 275 -52% | 459 -20% | 422 -26% | 724 26% |
| Brightness Distribution (%) | 94 | 97 3% | 78 -17% | 90 -4% | 83 -12% | 93 -1% |
| Black Level * (cd/m²) | 0.62 | 0.27 | 0.47 | 0.04 | ||
| Colorchecker dE 2000 * | 3.56 | 1.53 57% | 2.48 30% | 3.77 -6% | 2.05 42% | 3.4 4% |
| Colorchecker dE 2000 max. * | 8.64 | 4.15 52% | 5.59 35% | 6.12 29% | 4.15 52% | 5.32 38% |
| Colorchecker dE 2000 calibrated * | 2.69 | 0.56 79% | 2.94 -9% | 0.8 70% | 1.6 41% | |
| Greyscale dE 2000 * | 5.6 | 2.6 54% | 3.7 34% | 3.2 43% | 2.8 50% | 3.8 32% |
| Gamma | 2.34 94% | 2.22 99% | 2.2 100% | 2.43 91% | 2.204 100% | 2.383 92% |
| CCT | 7872 83% | 6843 95% | 6355 102% | 6478 100% | 7122 91% | 7051 92% |
| Contrast (:1) | 976 | 1007 | 1002 | 18050 | ||
| Total Average (Program / Settings) | 28% /
26% | 26% /
16% | 3% /
2% | 30% /
25% | 26% /
23% |
* ... smaller is better
Color temperature when set to Display P3 and HDR off is quite cool at 7872. Enabling HDR automatically disables any MSI TrueColor settings, but color temperature also automatically becomes warmer at 6521 for more accurate colors. MSI does not advertise factory calibration for this Raider model.
Display Response Times
| ↔ Response Time Black to White | ||
|---|---|---|
| 75.8 ms ... rise ↗ and fall ↘ combined | ↗ 71 ms rise | 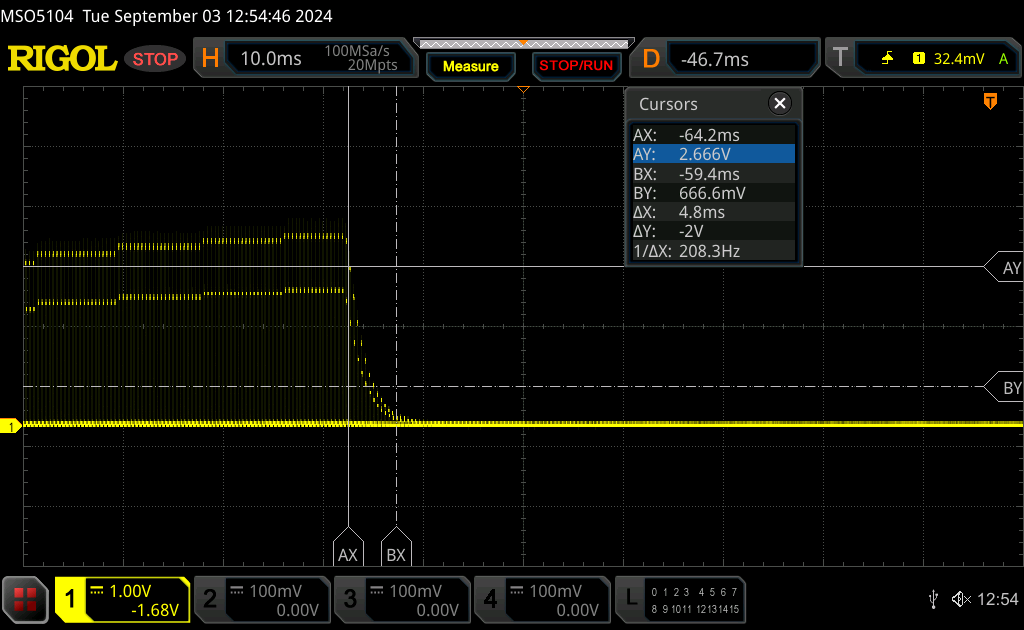 |
| ↘ 4.8 ms fall | ||
| The screen shows slow response rates in our tests and will be unsatisfactory for gamers. In comparison, all tested devices range from 0.1 (minimum) to 240 (maximum) ms. » 100 % of all devices are better. This means that the measured response time is worse than the average of all tested devices (19.9 ms). | ||
| ↔ Response Time 50% Grey to 80% Grey | ||
| 10.4 ms ... rise ↗ and fall ↘ combined | ↗ 4.8 ms rise | 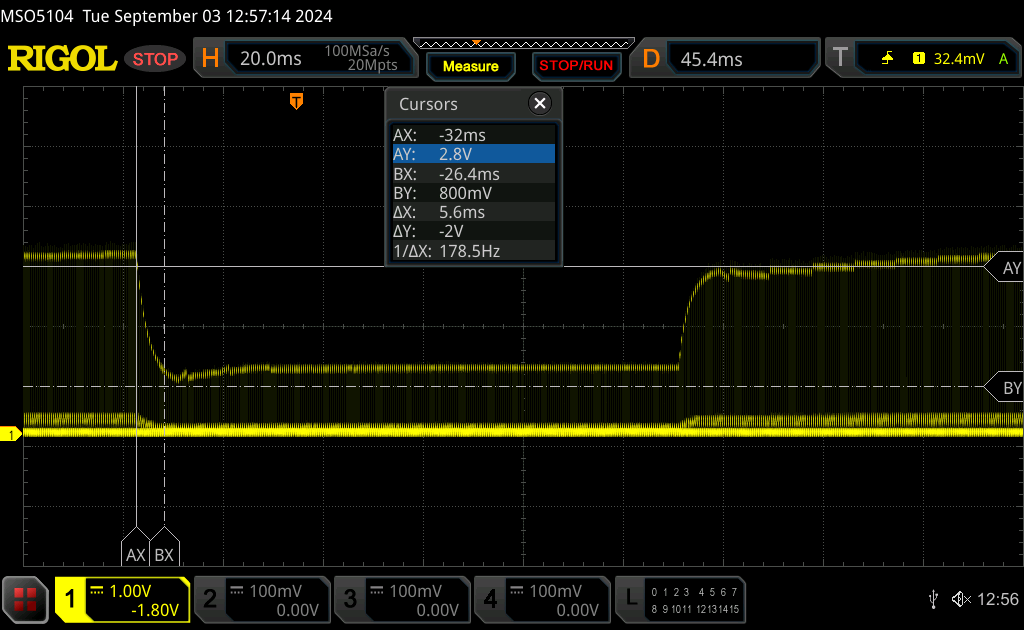 |
| ↘ 5.6 ms fall | ||
| The screen shows good response rates in our tests, but may be too slow for competitive gamers. In comparison, all tested devices range from 0.165 (minimum) to 636 (maximum) ms. » 24 % of all devices are better. This means that the measured response time is better than the average of all tested devices (31.1 ms). | ||
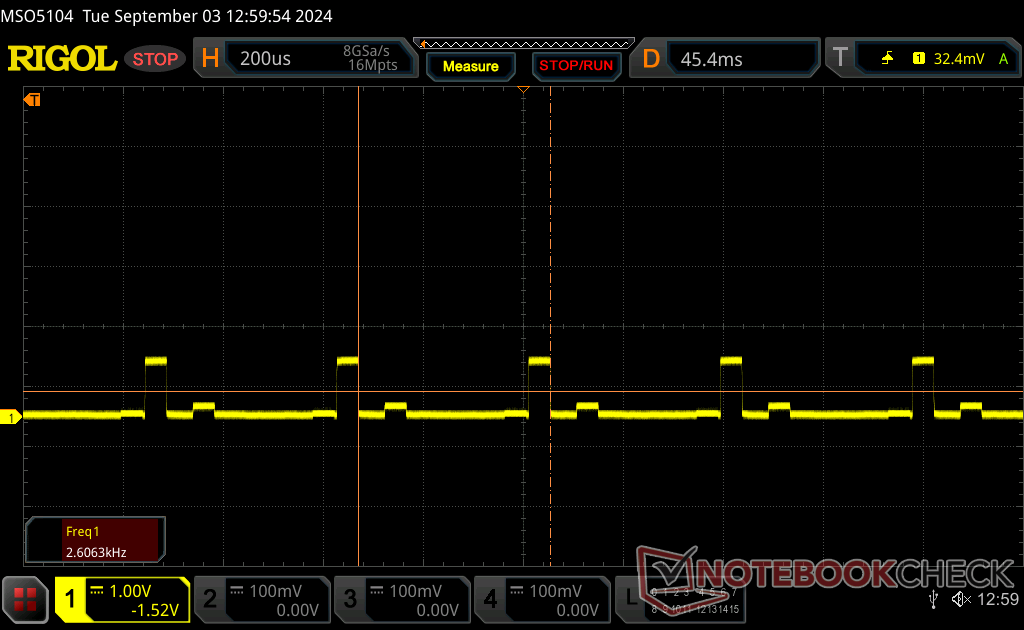
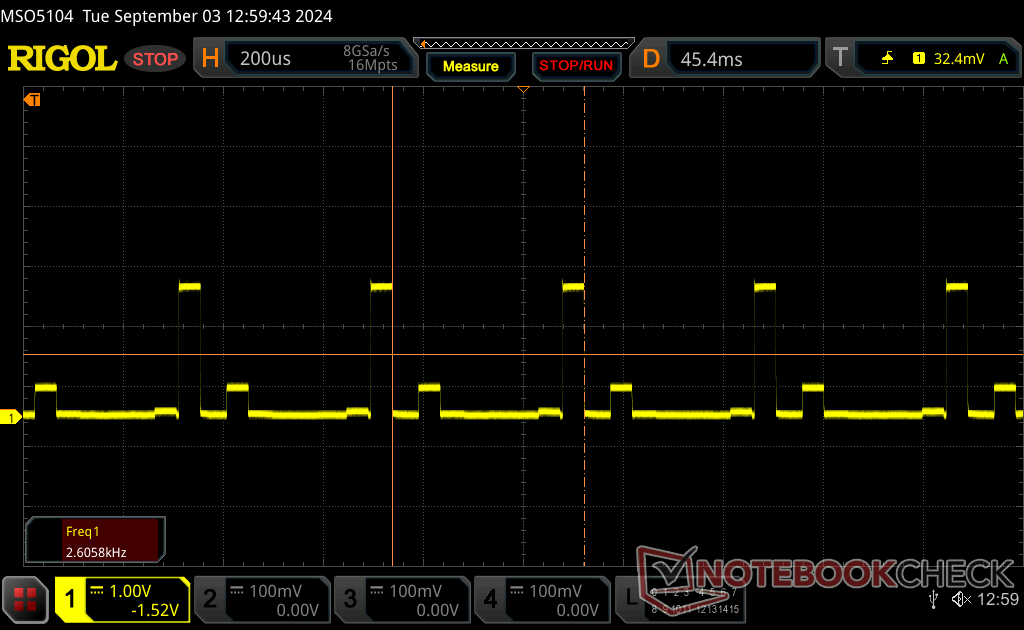
Screen Flickering / PWM (Pulse-Width Modulation)
| Screen flickering / PWM detected | 2606.2 Hz Amplitude: 90 % | ≤ 100 % brightness setting | 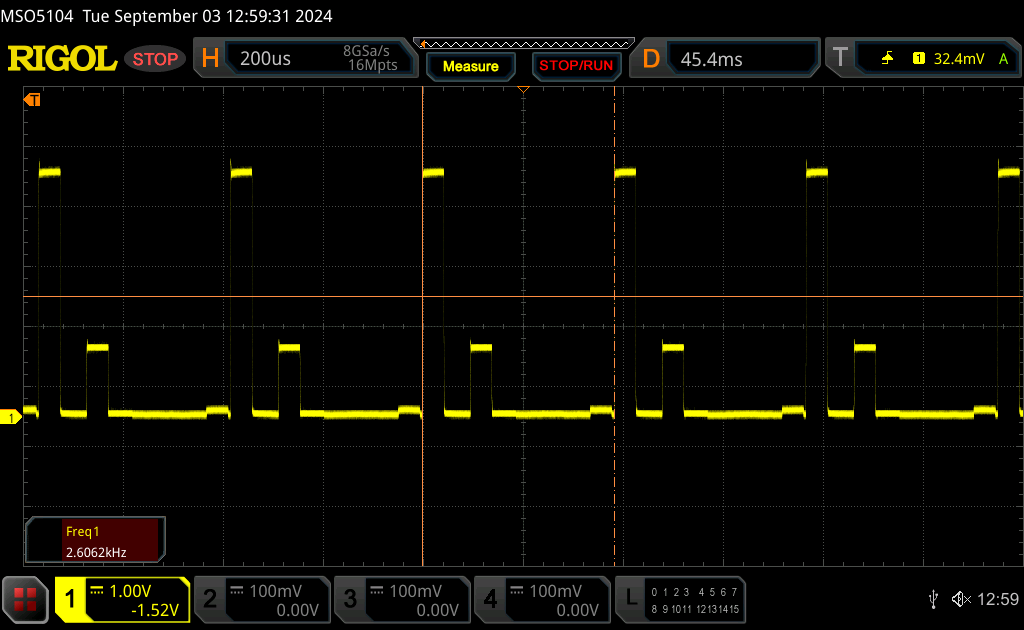 |
The display backlight flickers at 2606.2 Hz (worst case, e.g., utilizing PWM) Flickering detected at a brightness setting of 100 % and below. There should be no flickering or PWM above this brightness setting. The frequency of 2606.2 Hz is quite high, so most users sensitive to PWM should not notice any flickering. In comparison: 52 % of all tested devices do not use PWM to dim the display. If PWM was detected, an average of 7797 (minimum: 5 - maximum: 343500) Hz was measured. | |||


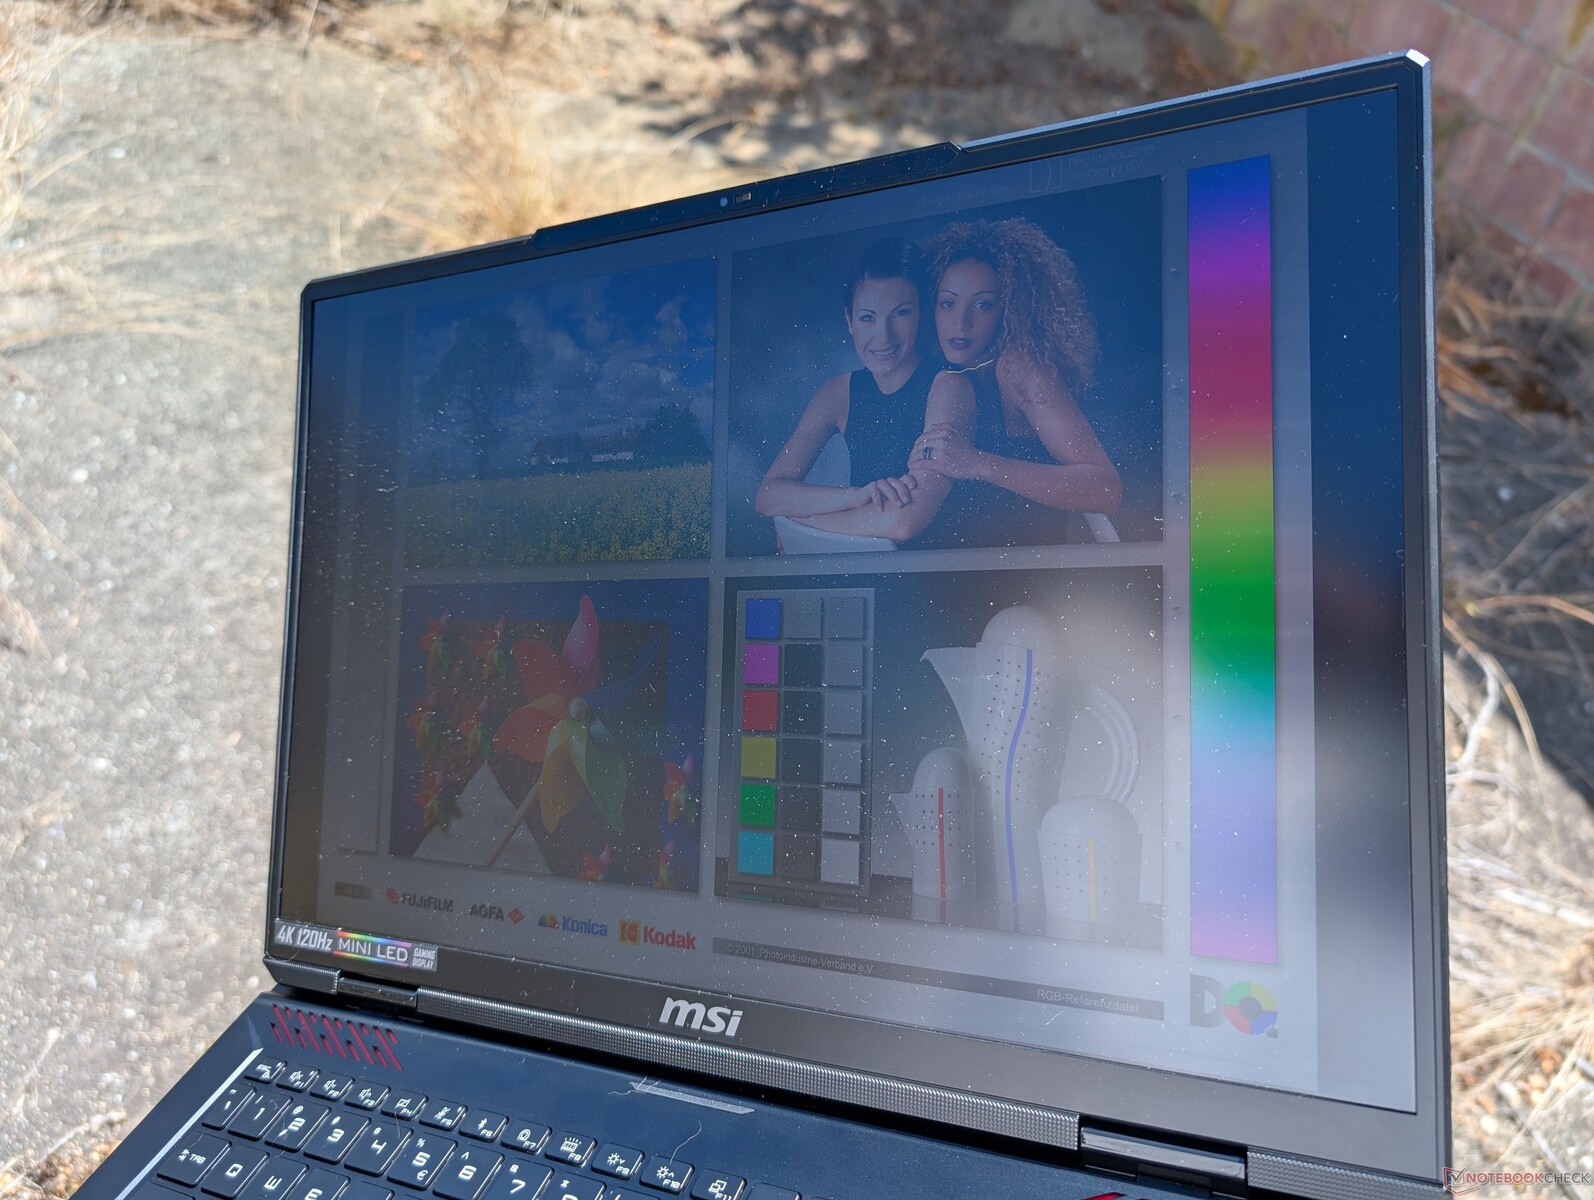
Outdoor visibility is only decent under shade and not so great under sunlight. Running on battery power reduces maximum brightness to just 392 nits and Windows HDR becomes automatically disabled.
Performance — New CPU Name, Same CPU Performance
Testing Conditions
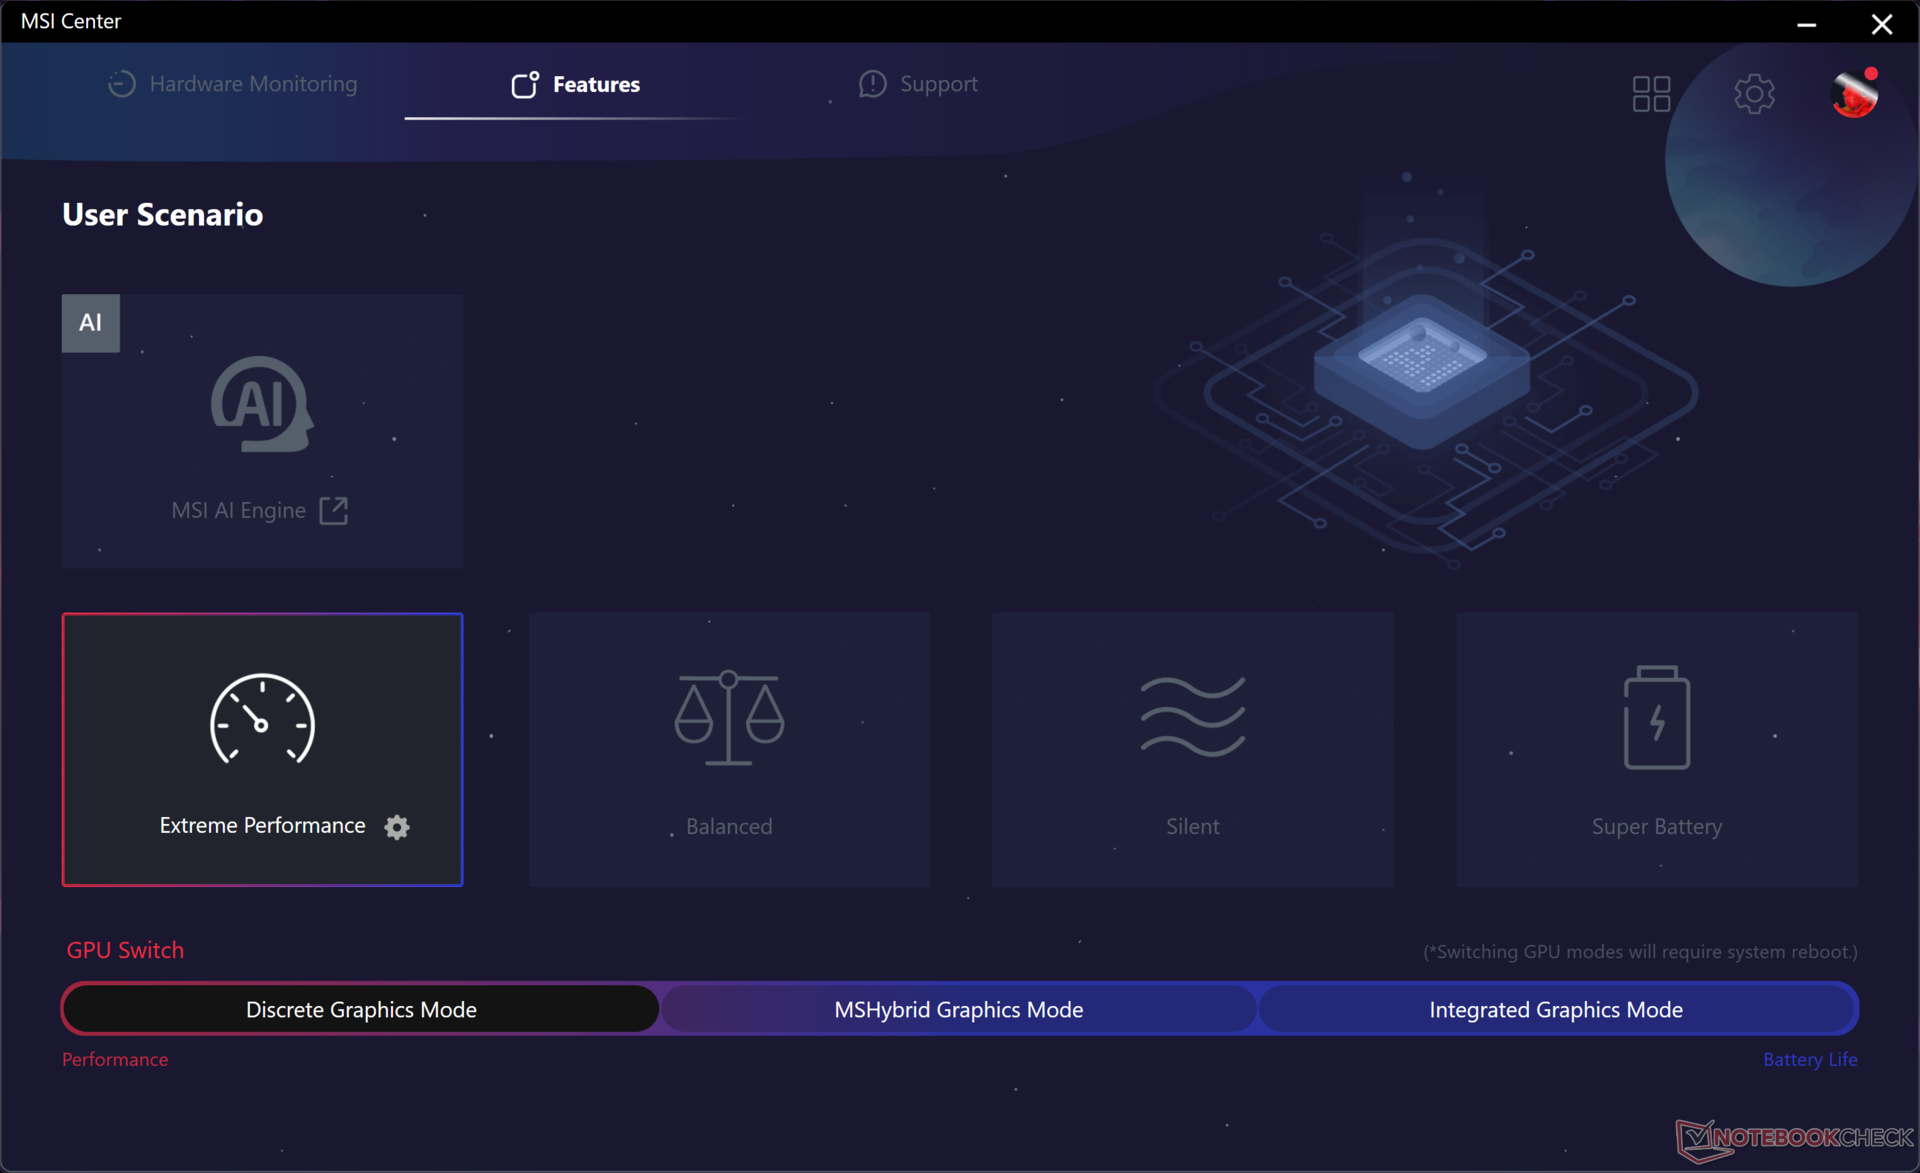
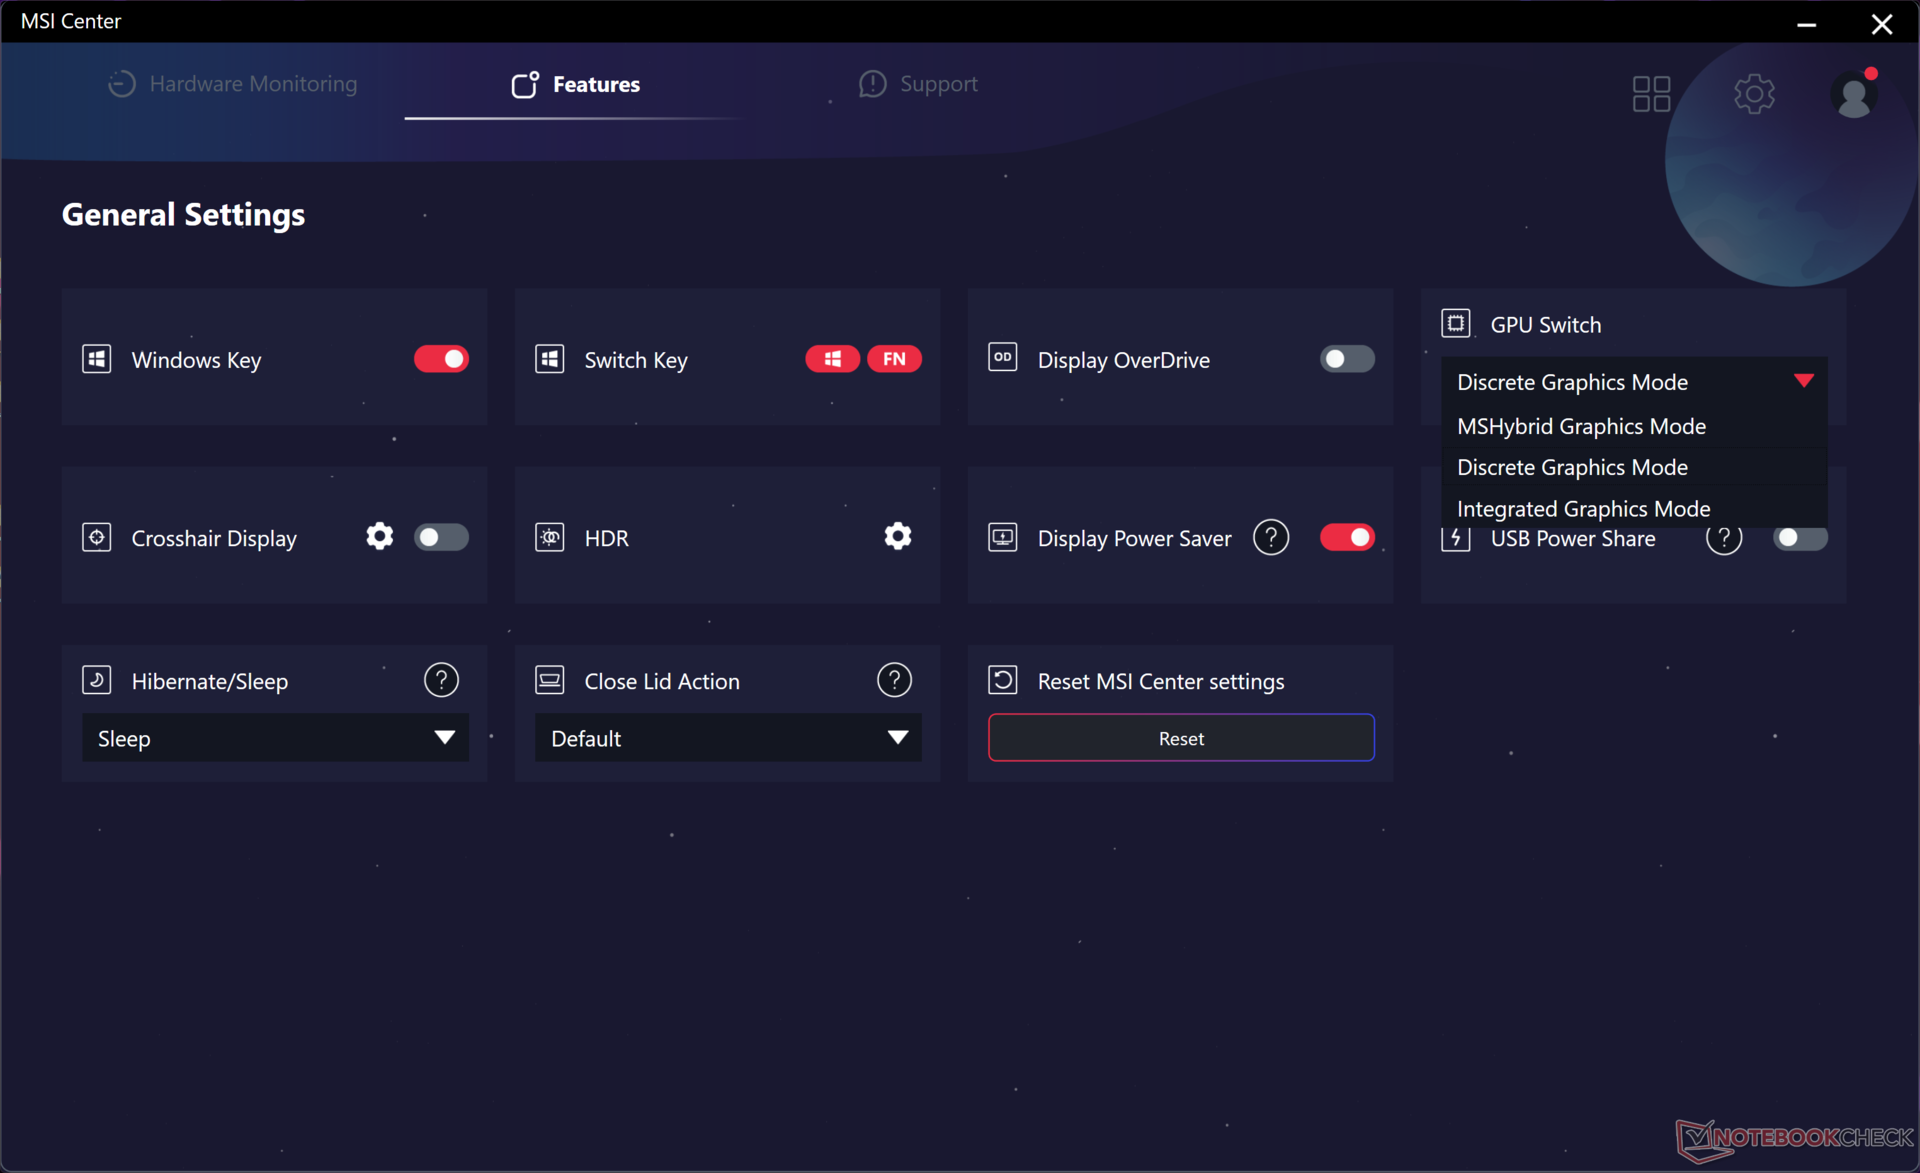
We set the GPU to discrete graphics mode, Windows to Performance mode, and MSI Center to Extreme Performance mode prior to running the benchmarks below. Cooler Boost mode (i.e., maximum fan mode) is another setting within Extreme Performance mode, but this option is generally not needed for maximum performance as our findings will show. This is consistent with our experience on other MSI laptops that feature the same Cooler Boost feature.
MUX is supported for switching between dGPU, iGPU, and MSHybrid modes but Advanced Optimus is not just like on the Titan 18 HX. Indeed, a key drawback of the 4K mini-LED panel is its lack of G-Sync support.
Processor
The Core i9-14900HX is merely a rebranded Core i9-13900HX and so it provides only marginal benefits at best. Even so, it remains one of the fastest CPUs available on laptops when it comes to traditional performance metrics like CineBench or Blender rendering. The CPU complements the Meteor Lake Core Ultra 9 185H which trades away some raw performance for an integrated NPU to accelerate AI tasks.
Performance sustainability is excellent with no major dips in clock rates when stressed unlike what we observed on the Acer Predator Helios 18 equipped with the same Core i9-14900HX CPU.
Switching to the AMD-based Ryzen 9 7945HX configuration is expected to boost multi-thread performance by about 10 to 15 percent while taking a 10 to 15 percent hit to single-thread performance.
Cinebench R15 Multi Loop
Cinebench R23: Multi Core | Single Core
Cinebench R20: CPU (Multi Core) | CPU (Single Core)
Cinebench R15: CPU Multi 64Bit | CPU Single 64Bit
Blender: v2.79 BMW27 CPU
7-Zip 18.03: 7z b 4 | 7z b 4 -mmt1
Geekbench 6.7: Multi-Core | Single-Core
Geekbench 5.5: Multi-Core | Single-Core
HWBOT x265 Benchmark v2.2: 4k Preset
LibreOffice : 20 Documents To PDF
R Benchmark 2.5: Overall mean
* ... smaller is better
AIDA64: FP32 Ray-Trace | FPU Julia | CPU SHA3 | CPU Queen | FPU SinJulia | FPU Mandel | CPU AES | CPU ZLib | FP64 Ray-Trace | CPU PhotoWorxx
| Performance rating | |
| Alienware m18 R2 | |
| MSI Titan 18 HX A14VIG | |
| MSI Raider 18 HX A14V | |
| Average Intel Core i9-14900HX | |
| Razer Blade 18 2024 RZ09-0509 | |
| Acer Predator Helios 18 PH18-72-98MW | |
| Asus ROG Strix G18 G814JI | |
| AIDA64 / FP32 Ray-Trace | |
| MSI Titan 18 HX A14VIG | |
| Alienware m18 R2 | |
| MSI Raider 18 HX A14V | |
| Razer Blade 18 2024 RZ09-0509 | |
| Average Intel Core i9-14900HX (13098 - 33474, n=36) | |
| Acer Predator Helios 18 PH18-72-98MW | |
| Asus ROG Strix G18 G814JI | |
| AIDA64 / FPU Julia | |
| MSI Titan 18 HX A14VIG | |
| Alienware m18 R2 | |
| MSI Raider 18 HX A14V | |
| Razer Blade 18 2024 RZ09-0509 | |
| Average Intel Core i9-14900HX (67573 - 166040, n=36) | |
| Acer Predator Helios 18 PH18-72-98MW | |
| Asus ROG Strix G18 G814JI | |
| AIDA64 / CPU SHA3 | |
| MSI Titan 18 HX A14VIG | |
| Alienware m18 R2 | |
| MSI Raider 18 HX A14V | |
| Razer Blade 18 2024 RZ09-0509 | |
| Average Intel Core i9-14900HX (3589 - 7979, n=36) | |
| Acer Predator Helios 18 PH18-72-98MW | |
| Asus ROG Strix G18 G814JI | |
| AIDA64 / CPU Queen | |
| MSI Titan 18 HX A14VIG | |
| MSI Raider 18 HX A14V | |
| Alienware m18 R2 | |
| Acer Predator Helios 18 PH18-72-98MW | |
| Average Intel Core i9-14900HX (118405 - 148966, n=36) | |
| Razer Blade 18 2024 RZ09-0509 | |
| Asus ROG Strix G18 G814JI | |
| AIDA64 / FPU SinJulia | |
| MSI Titan 18 HX A14VIG | |
| MSI Raider 18 HX A14V | |
| Alienware m18 R2 | |
| Razer Blade 18 2024 RZ09-0509 | |
| Average Intel Core i9-14900HX (10475 - 18517, n=36) | |
| Acer Predator Helios 18 PH18-72-98MW | |
| Asus ROG Strix G18 G814JI | |
| AIDA64 / FPU Mandel | |
| Alienware m18 R2 | |
| MSI Titan 18 HX A14VIG | |
| MSI Raider 18 HX A14V | |
| Razer Blade 18 2024 RZ09-0509 | |
| Average Intel Core i9-14900HX (32543 - 83662, n=36) | |
| Acer Predator Helios 18 PH18-72-98MW | |
| Asus ROG Strix G18 G814JI | |
| AIDA64 / CPU AES | |
| Average Intel Core i9-14900HX (86964 - 241777, n=36) | |
| MSI Titan 18 HX A14VIG | |
| Alienware m18 R2 | |
| MSI Raider 18 HX A14V | |
| Razer Blade 18 2024 RZ09-0509 | |
| Acer Predator Helios 18 PH18-72-98MW | |
| Asus ROG Strix G18 G814JI | |
| AIDA64 / CPU ZLib | |
| MSI Titan 18 HX A14VIG | |
| Alienware m18 R2 | |
| MSI Raider 18 HX A14V | |
| Razer Blade 18 2024 RZ09-0509 | |
| Average Intel Core i9-14900HX (1054 - 2292, n=36) | |
| Acer Predator Helios 18 PH18-72-98MW | |
| Asus ROG Strix G18 G814JI | |
| AIDA64 / FP64 Ray-Trace | |
| Alienware m18 R2 | |
| MSI Titan 18 HX A14VIG | |
| MSI Raider 18 HX A14V | |
| Razer Blade 18 2024 RZ09-0509 | |
| Average Intel Core i9-14900HX (6809 - 18349, n=36) | |
| Acer Predator Helios 18 PH18-72-98MW | |
| Asus ROG Strix G18 G814JI | |
| AIDA64 / CPU PhotoWorxx | |
| Alienware m18 R2 | |
| Razer Blade 18 2024 RZ09-0509 | |
| Acer Predator Helios 18 PH18-72-98MW | |
| Average Intel Core i9-14900HX (23903 - 54702, n=36) | |
| Asus ROG Strix G18 G814JI | |
| MSI Raider 18 HX A14V | |
| MSI Titan 18 HX A14VIG | |
Stress Test
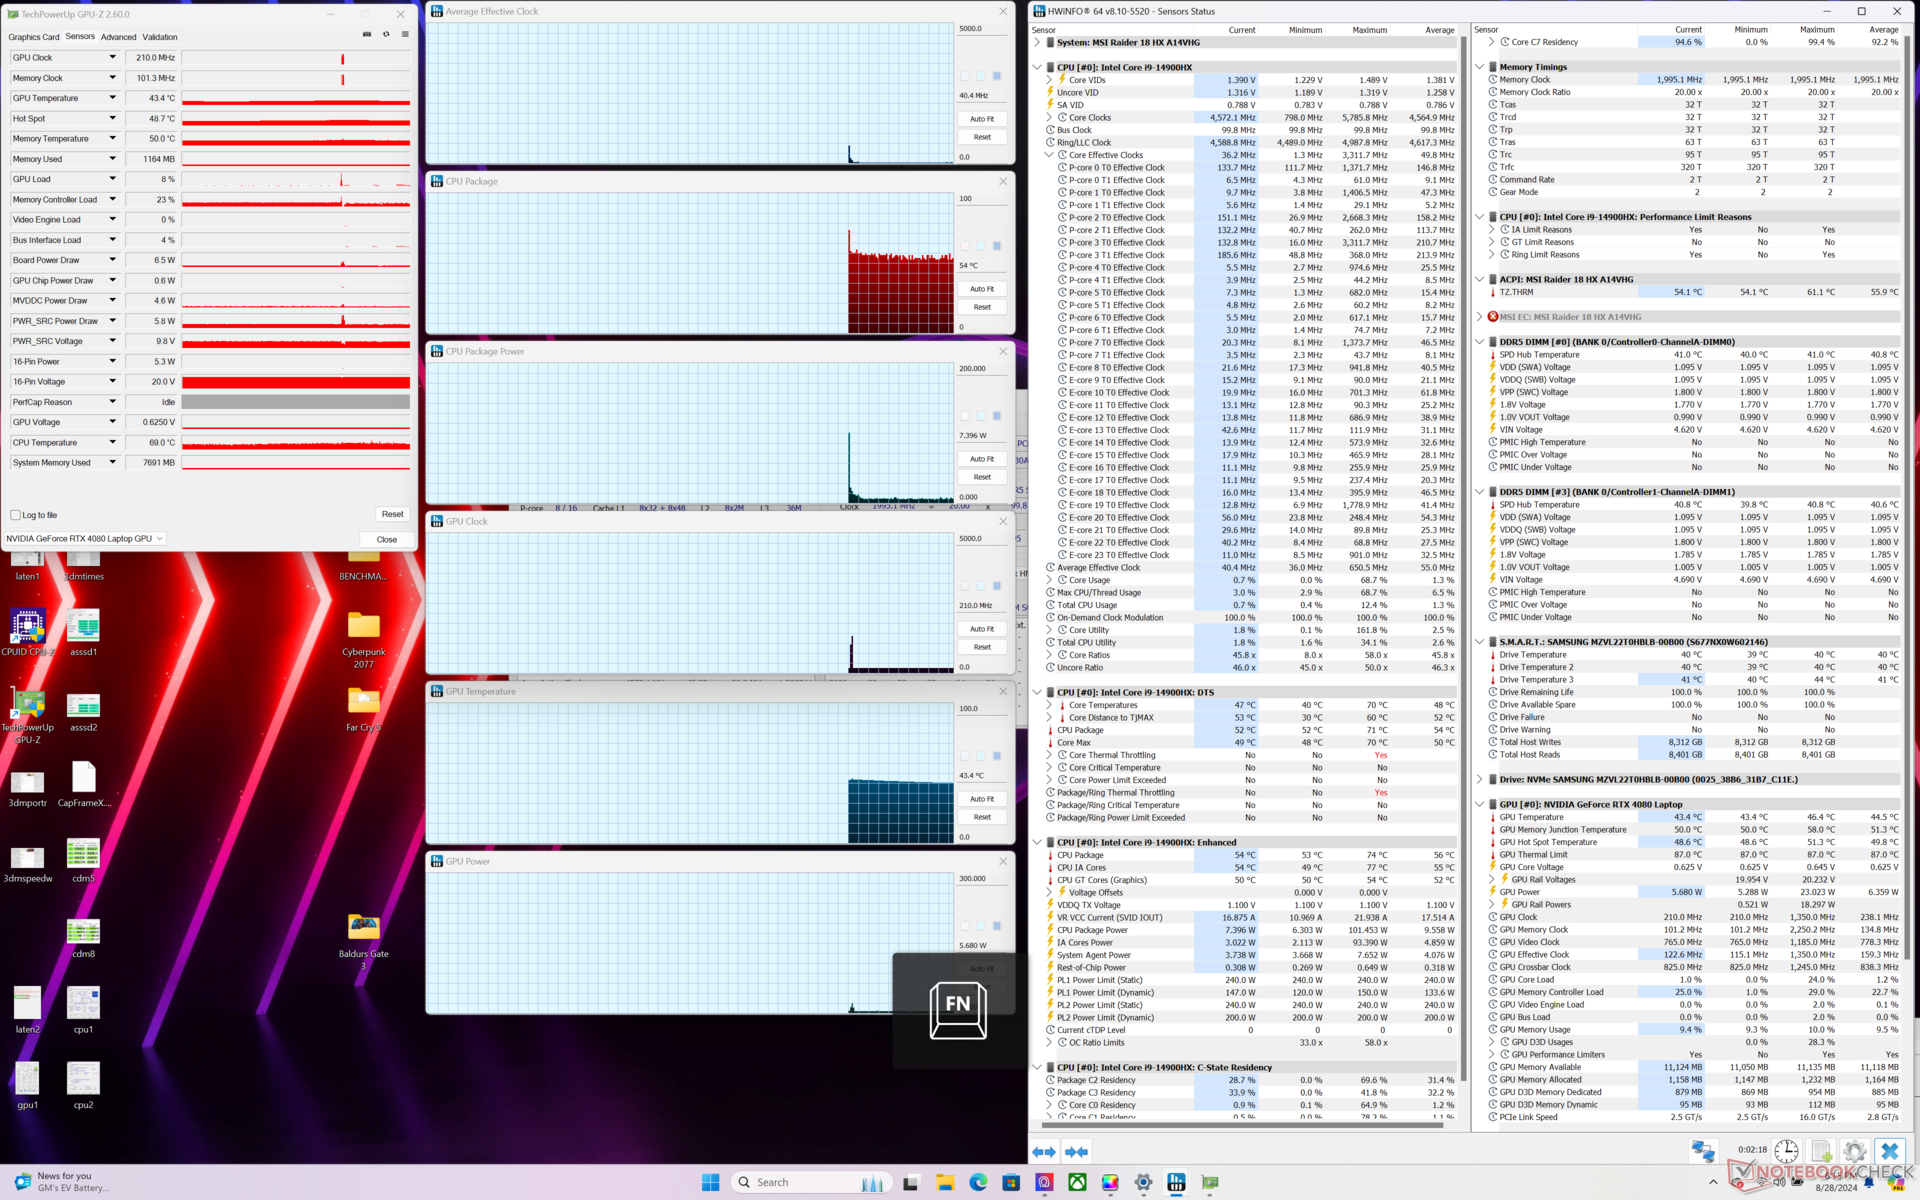
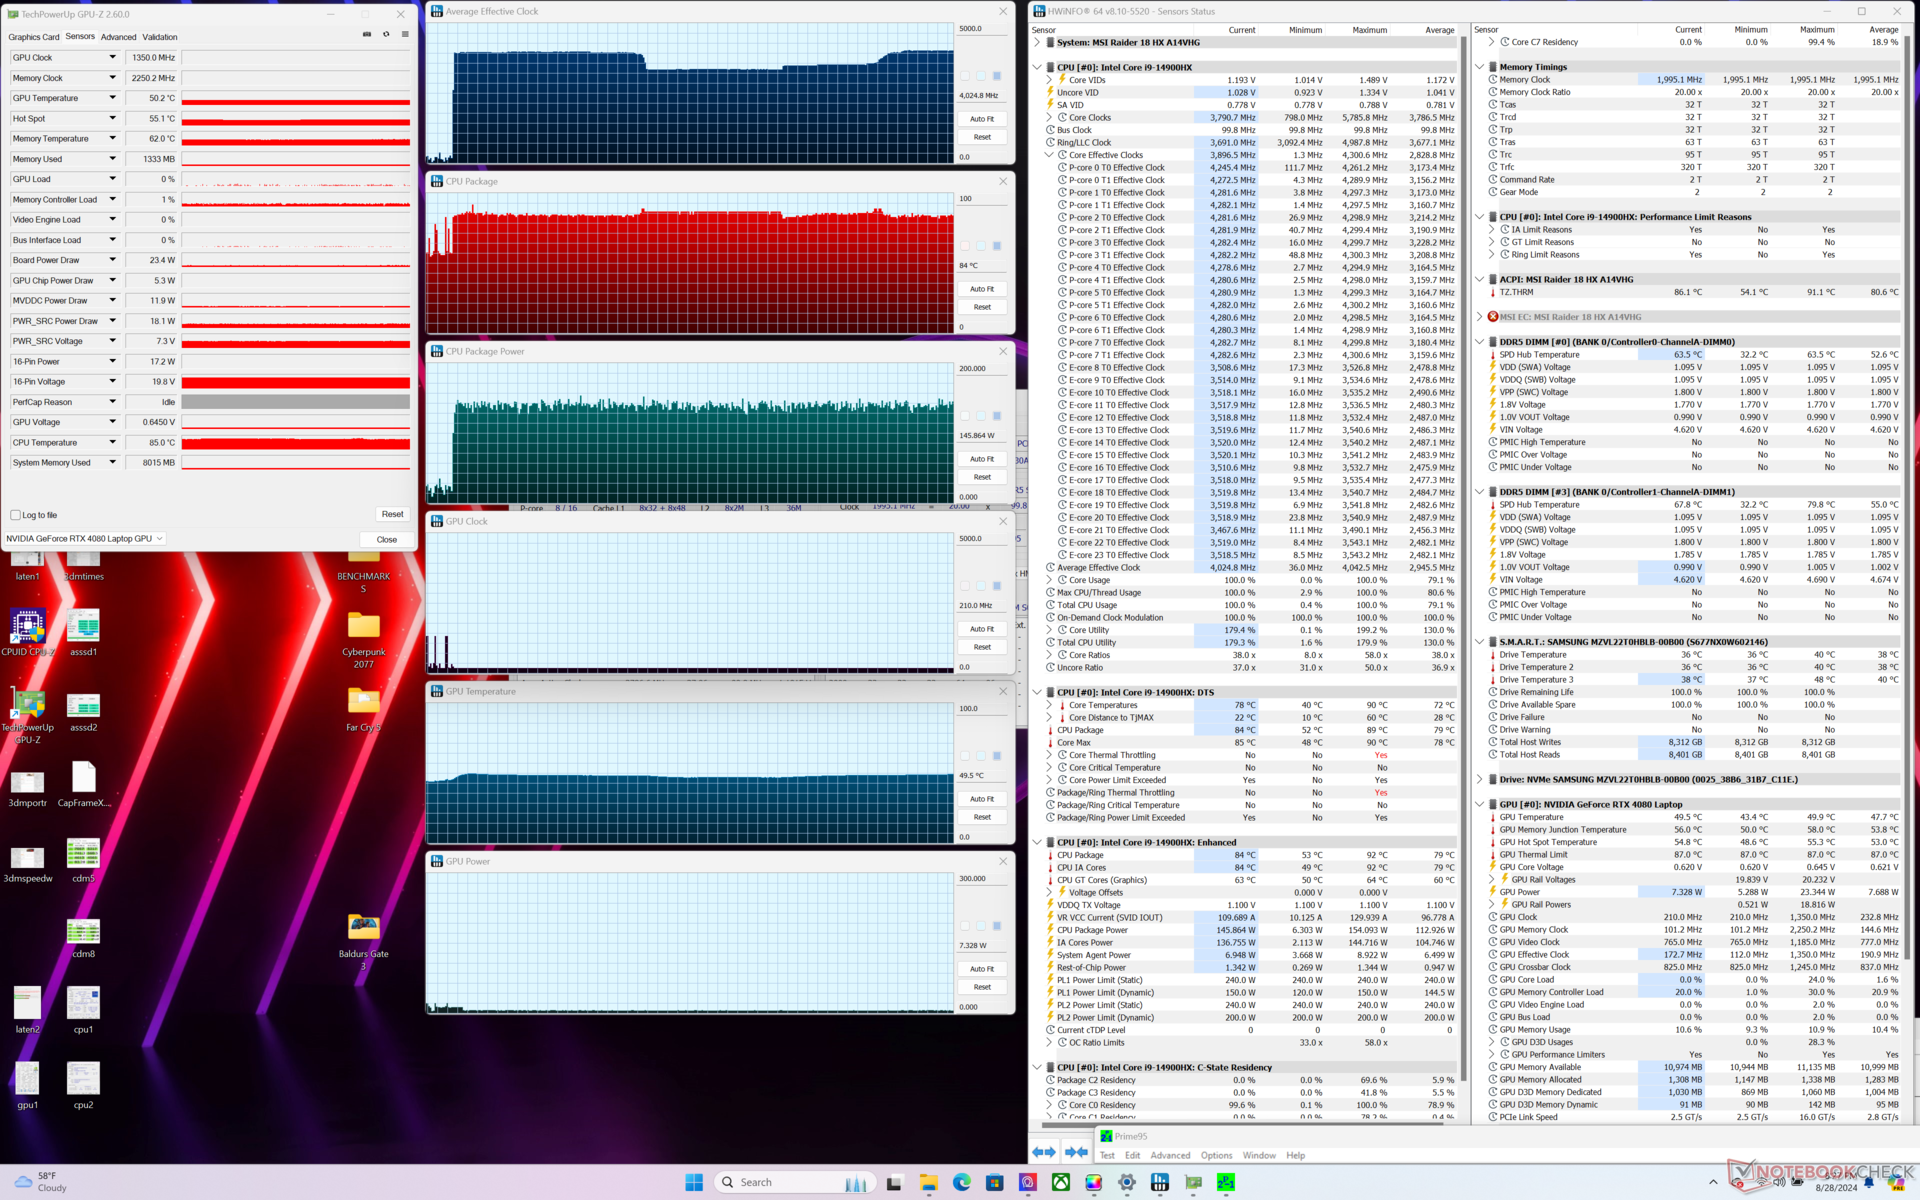
The CPU would boost to 4 GHz, 86 C, and 145 W when initiating Prime95 stress with no major dips in clock rates or performance over time. The large chassis and cooling solution can extract more performance from the Core i9-14900HX when compared to smaller systems with the same processor such as the RedMagic Titan 16 Pro which throttles quite heavily.
Running on Extreme Performance mode with Cooler Boost on provides no tangible performance benefits over Cooler Boost off when gaming. GPU clock rates, memory clock rates, and board power draw when running Cyberpunk 2077 would stabilize at 2550 MHz, 2250 MHz, and 159 W, respectively, between the two settings. Core temperatures are slightly cooler by a few degrees C with Cooler Boost on since fan noise is louder, but that is the only notable advantage.
Dropping down to Balanced mode reduces GPU clock rates and board power draw to 2295 MHz and 150 W, respectively, which are only marginally slower than Extreme Performance mode. The performance deltas between Balanced and Extreme Performance modes are therefore smaller than what one might expect.
GPU temperatures are warmer than on the Razer Blade 18 by up to 9 C when gaming even though our MSI is the thicker and heavier system.

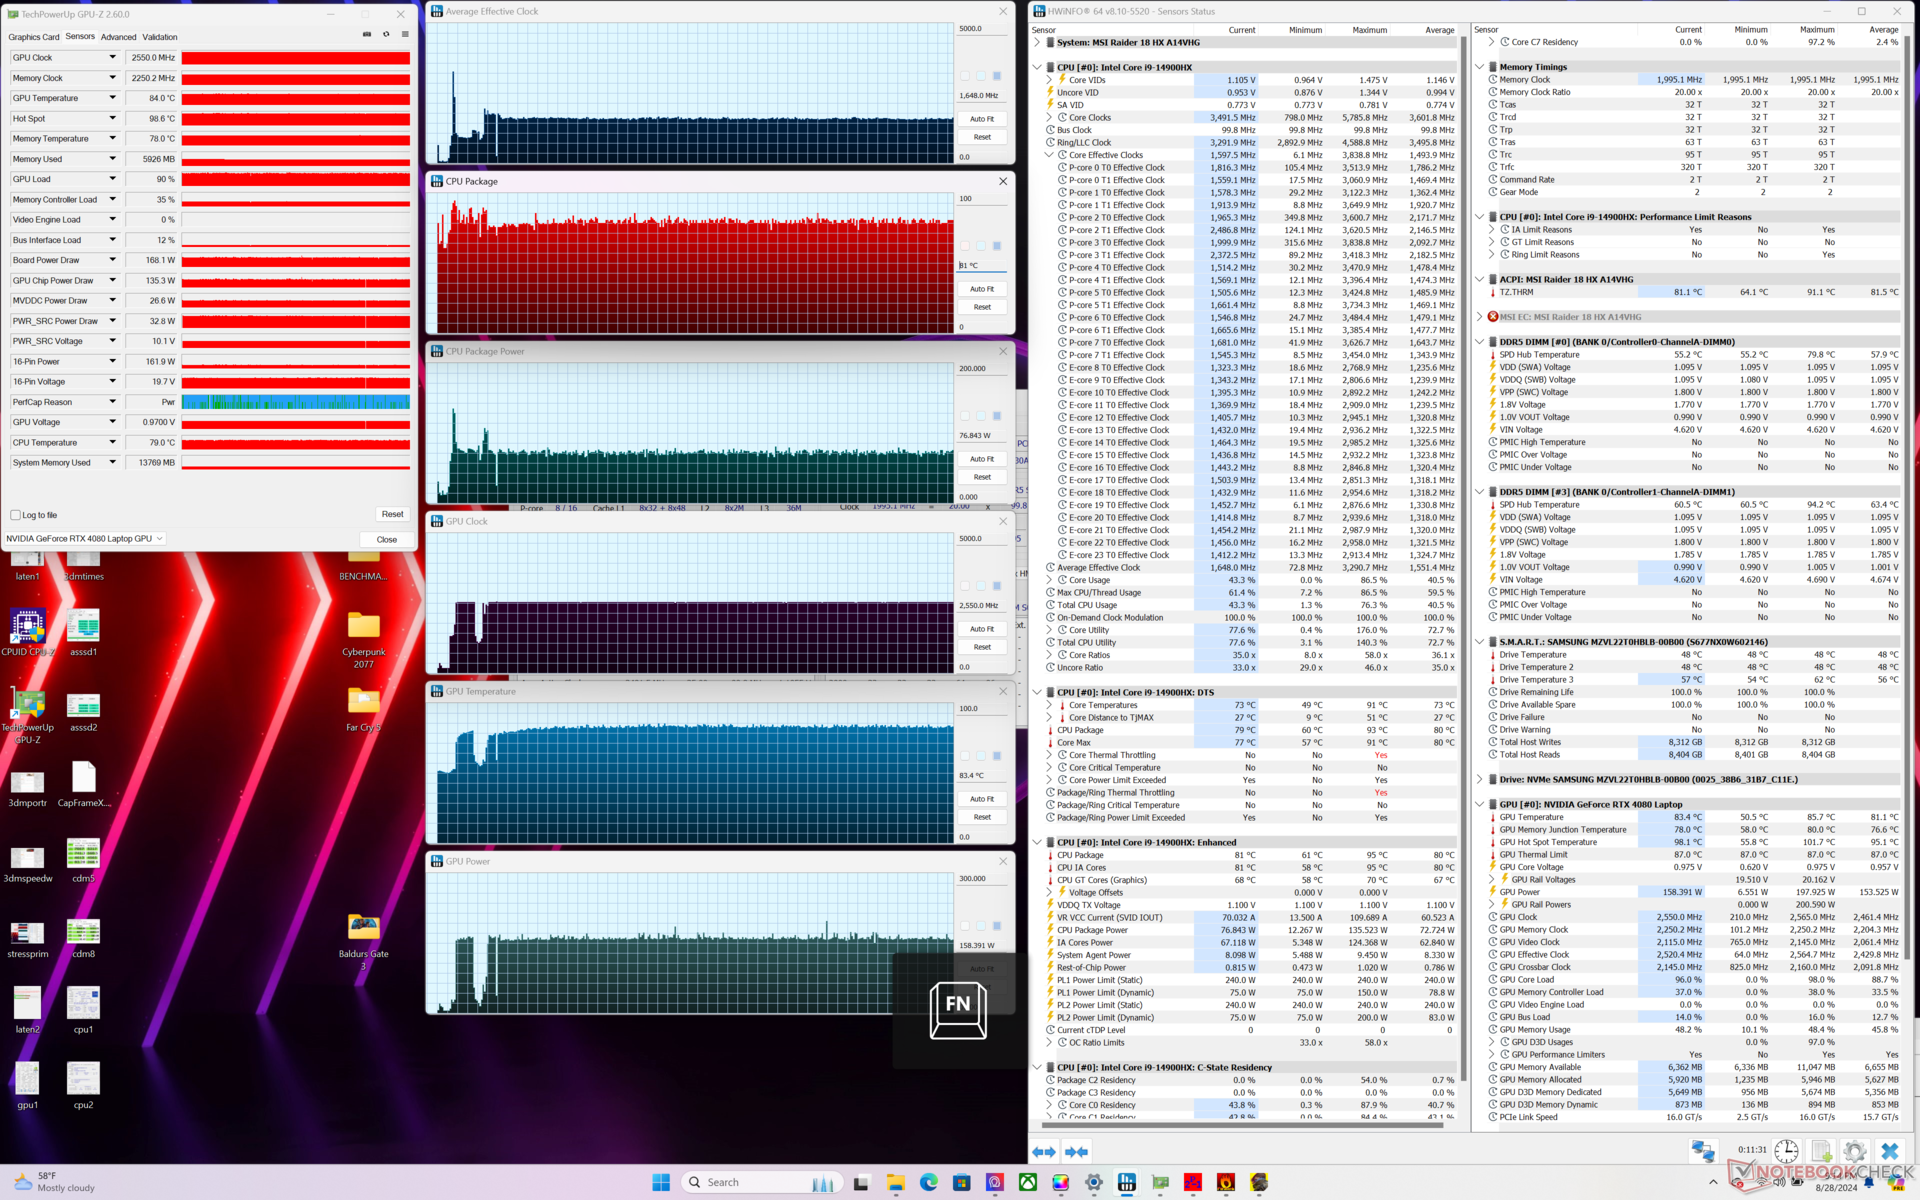
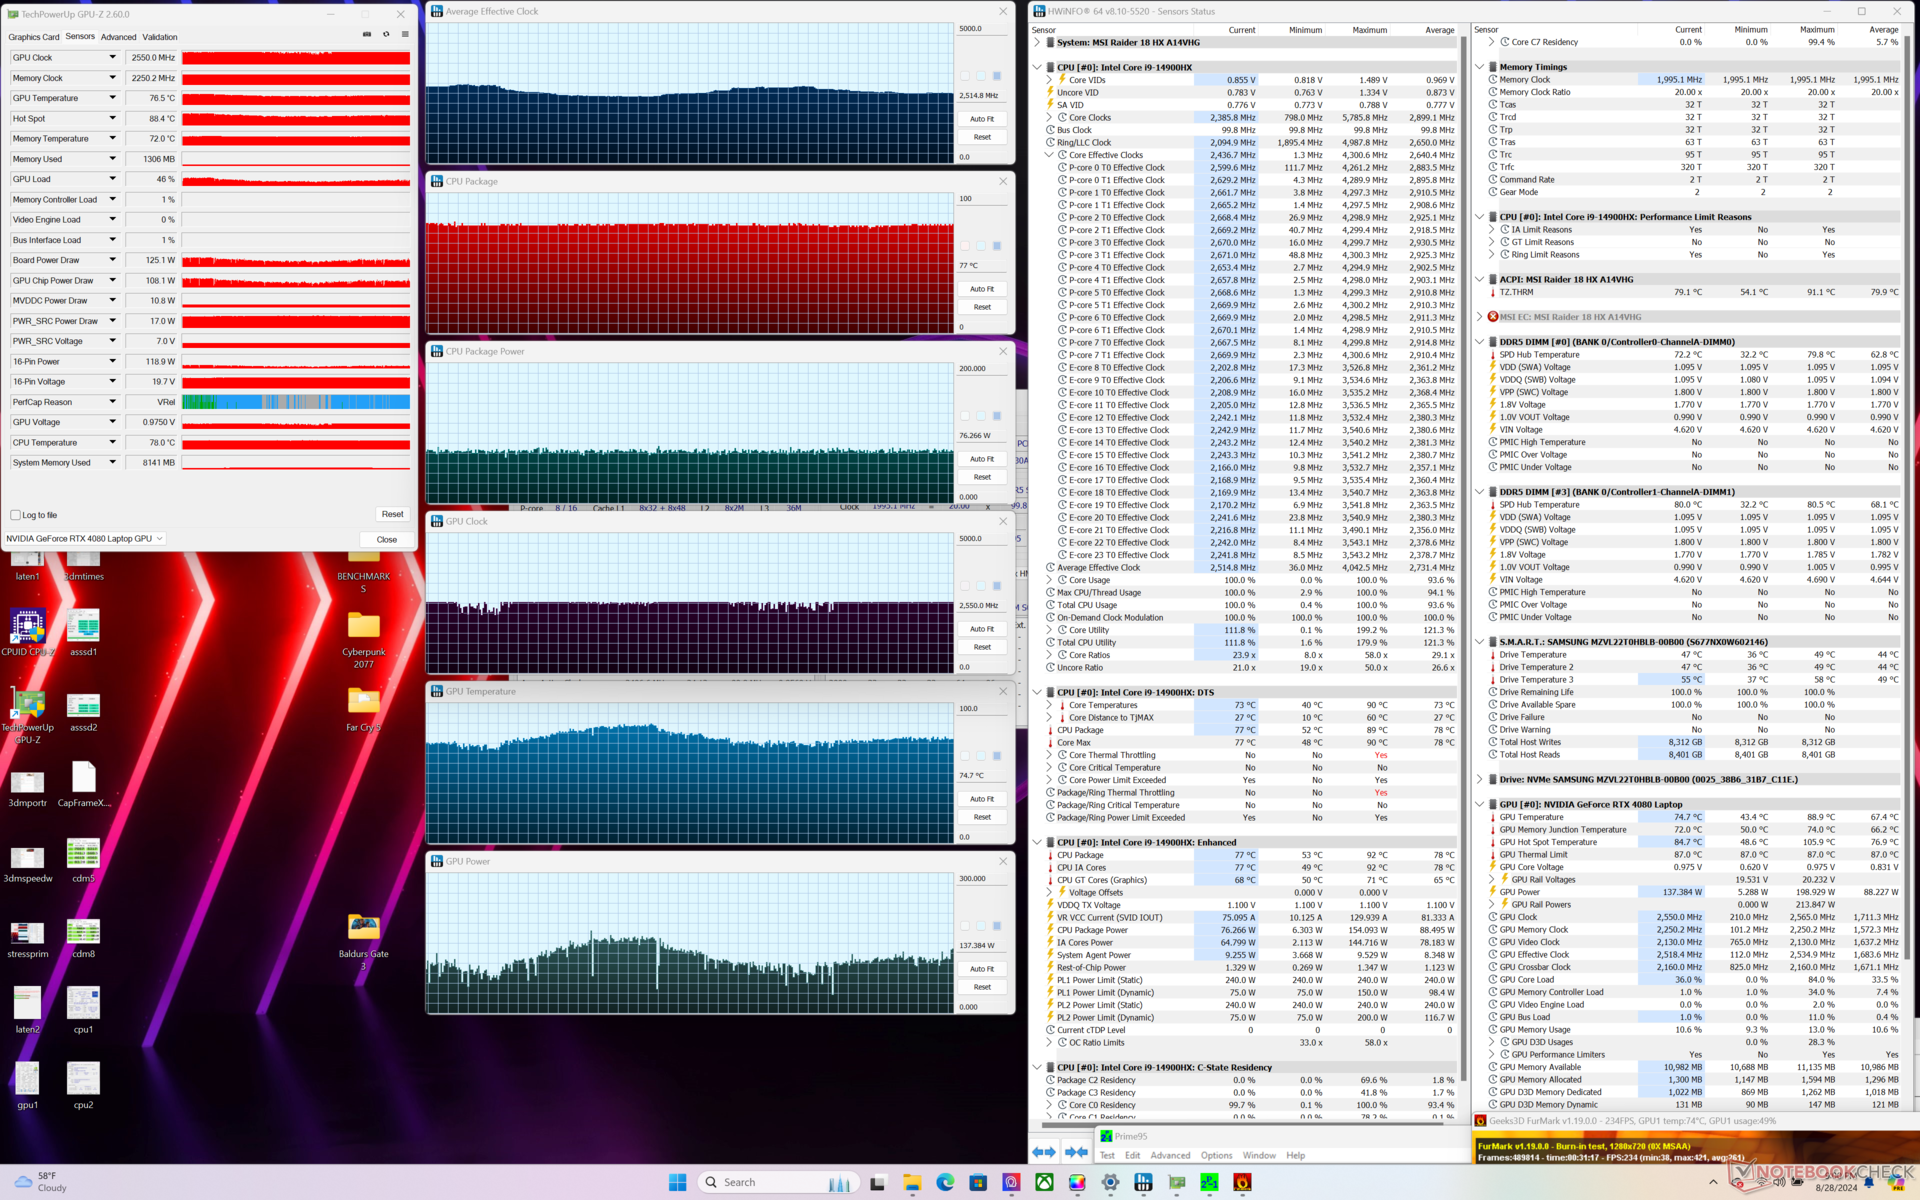
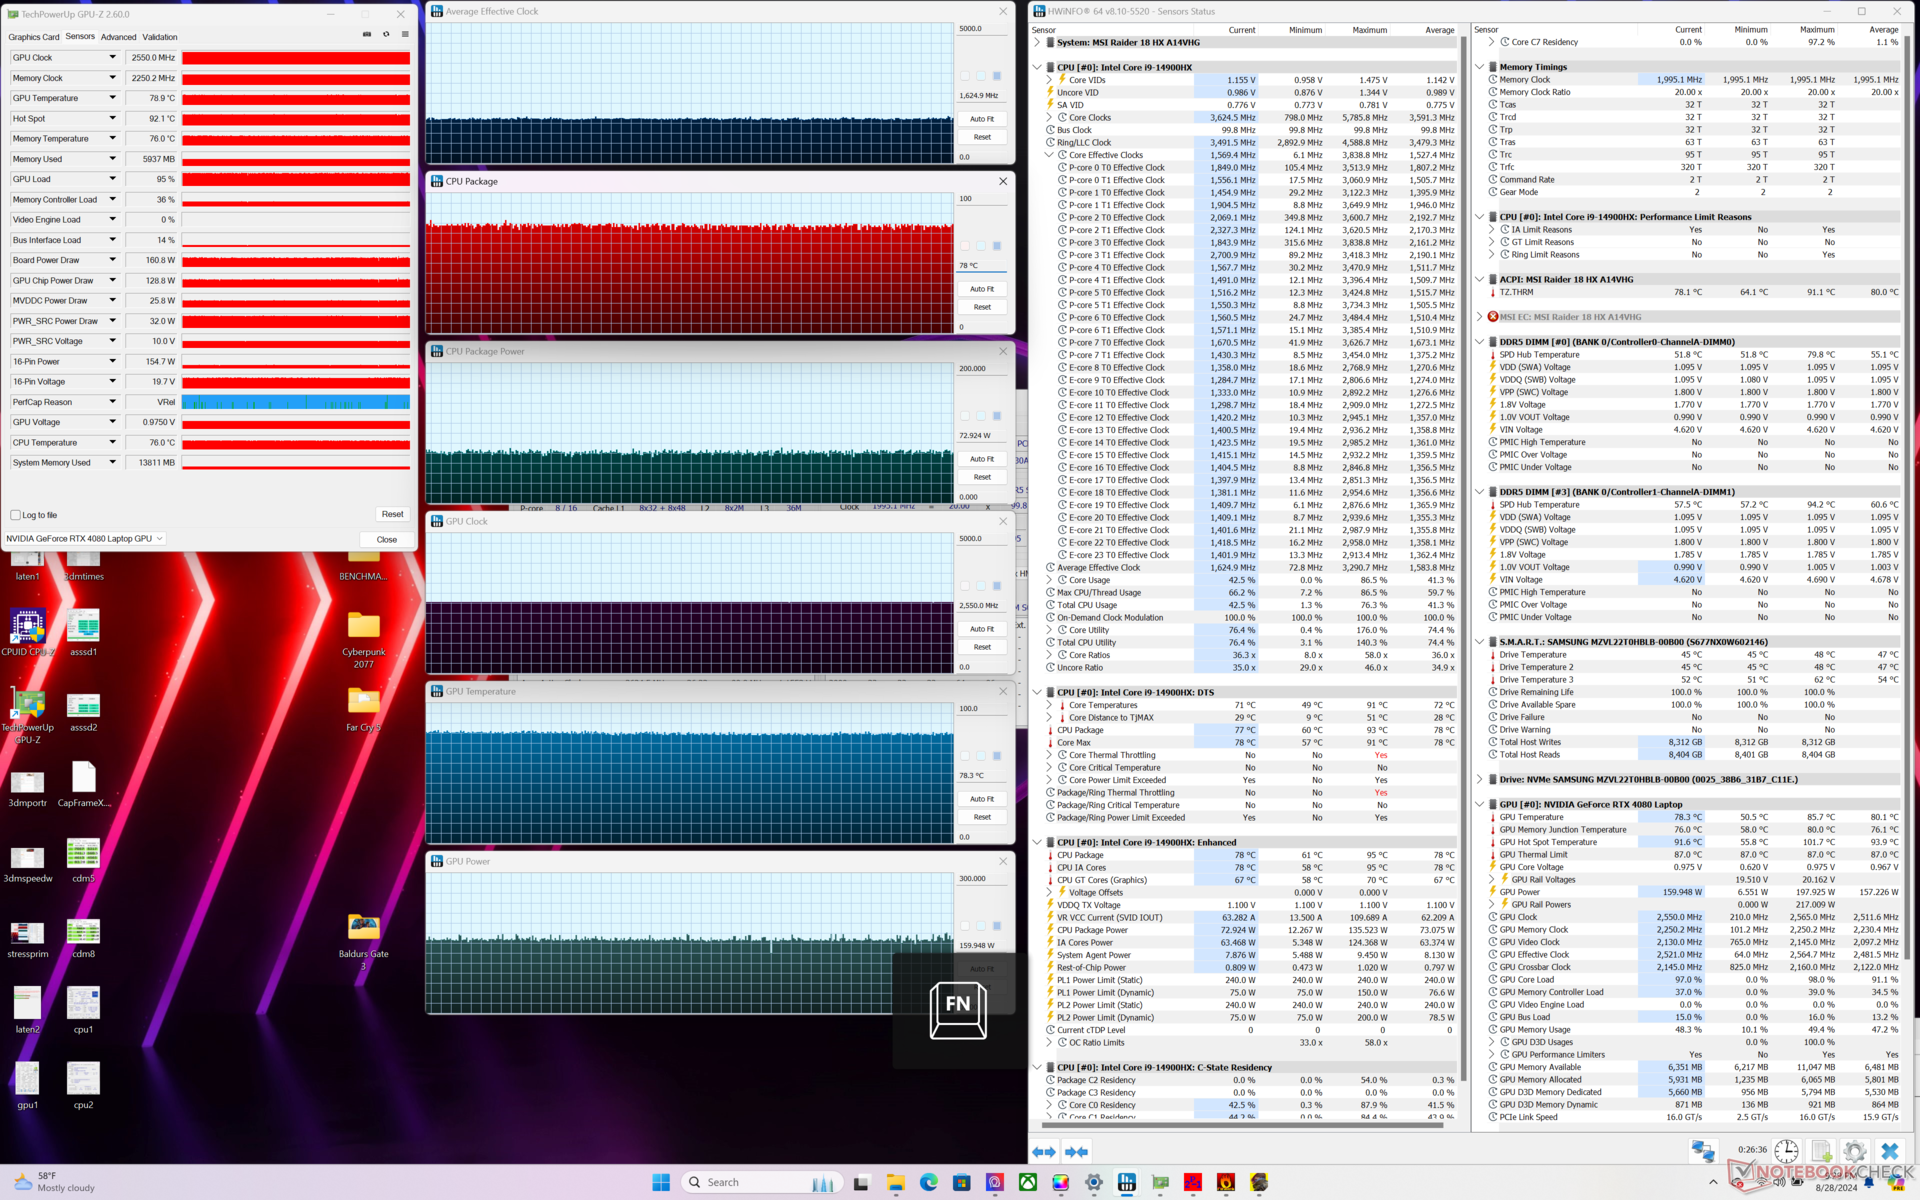
| Average CPU Clock (GHz) | GPU Clock (MHz) | Average CPU Temperature (°C) | Average GPU Temperature (°C) | |
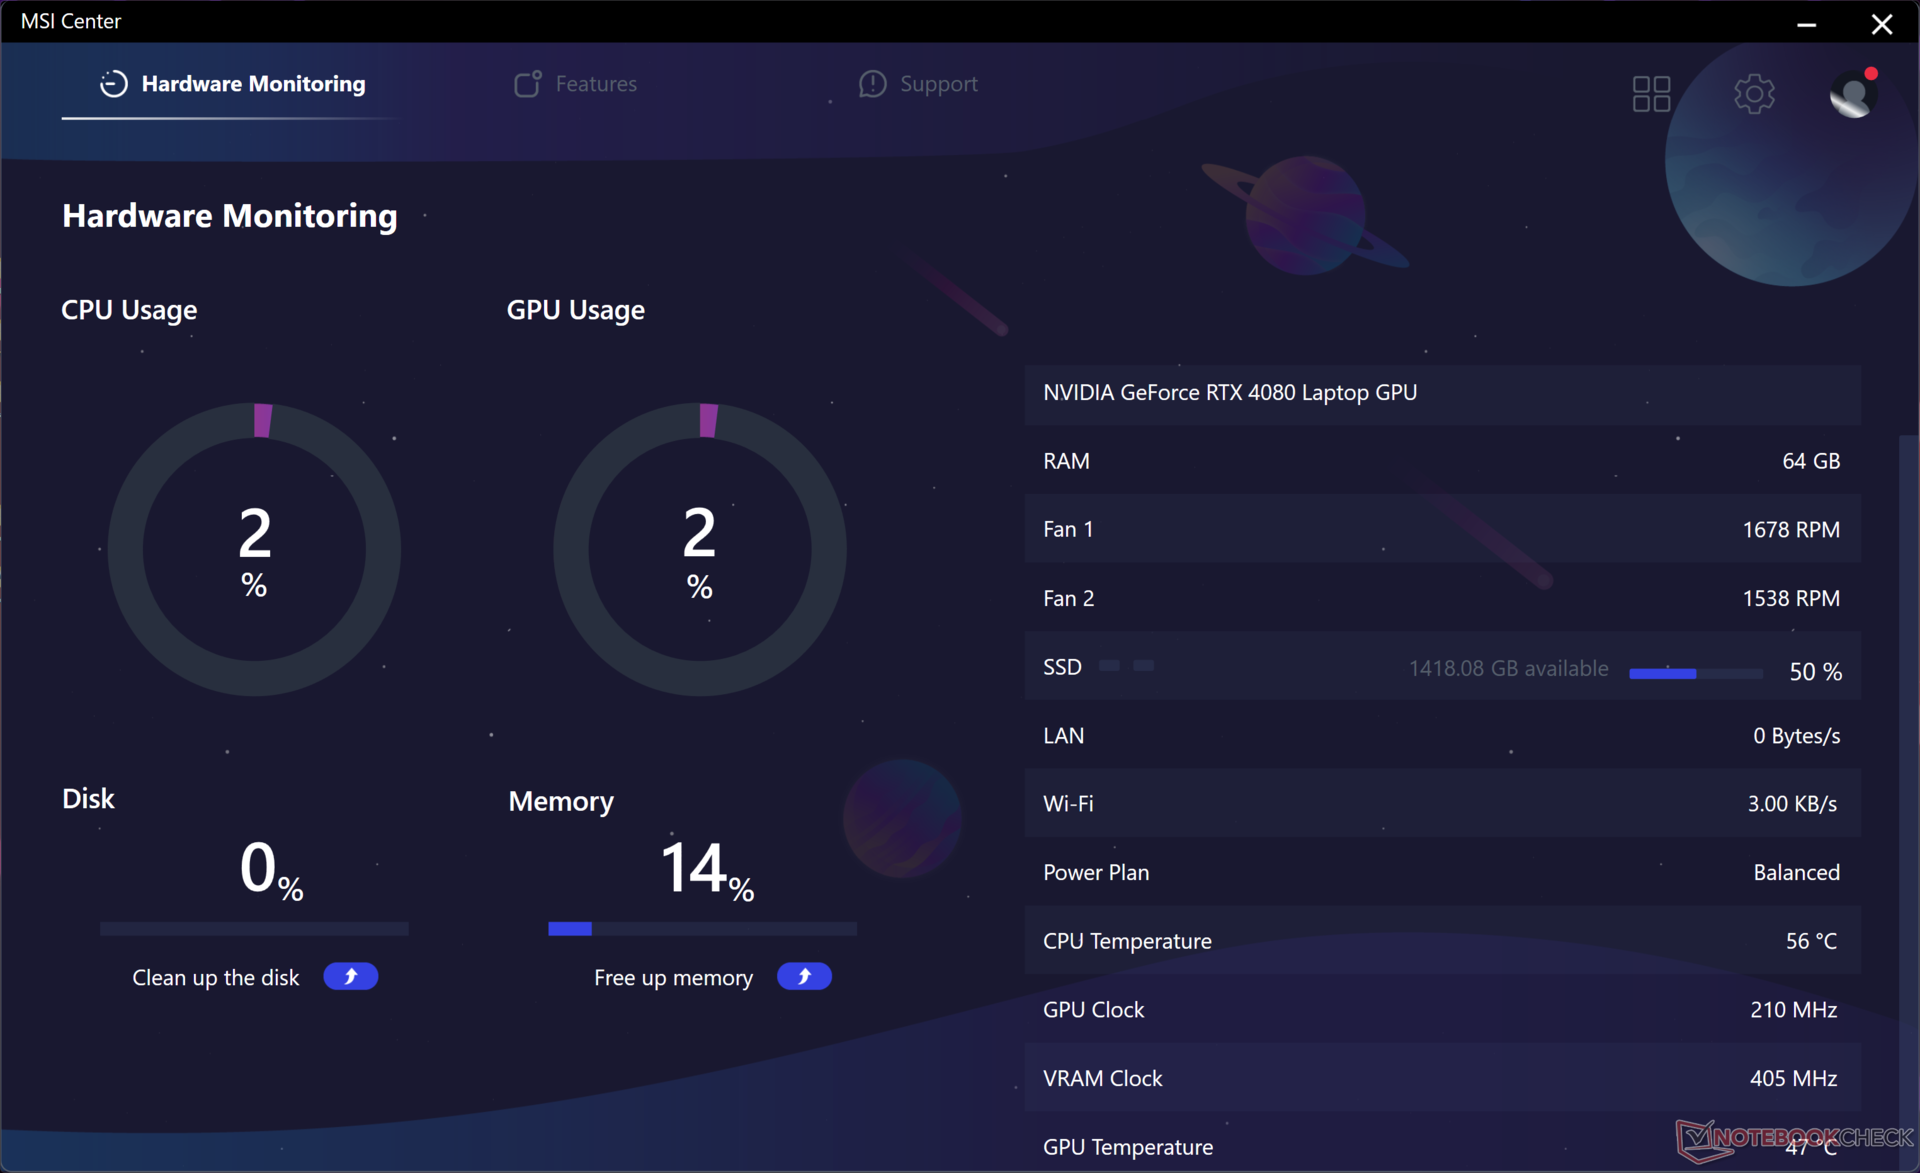
| System Idle | -- | -- | 54 | 43 |
| Prime95 Stress | 4.0 | -- | 84 | 50 |
| Prime95 + FurMark Stress | 2.5 | 2550 | 77 | 75 |
| Cyberpunk 2077 Stress (Balanced mode) | 1.5 | 2295 | 78 | 85 |
| Cyberpunk 2077 Stress (Extreme Performance w/ Cooler Boost off) | 1.7 | 2550 | 81 | 83 |
| Cyberpunk 2077 Stress (Extreme Performance w/ Cooler Boost on) | 1.6 | 2550 | 78 | 78 |
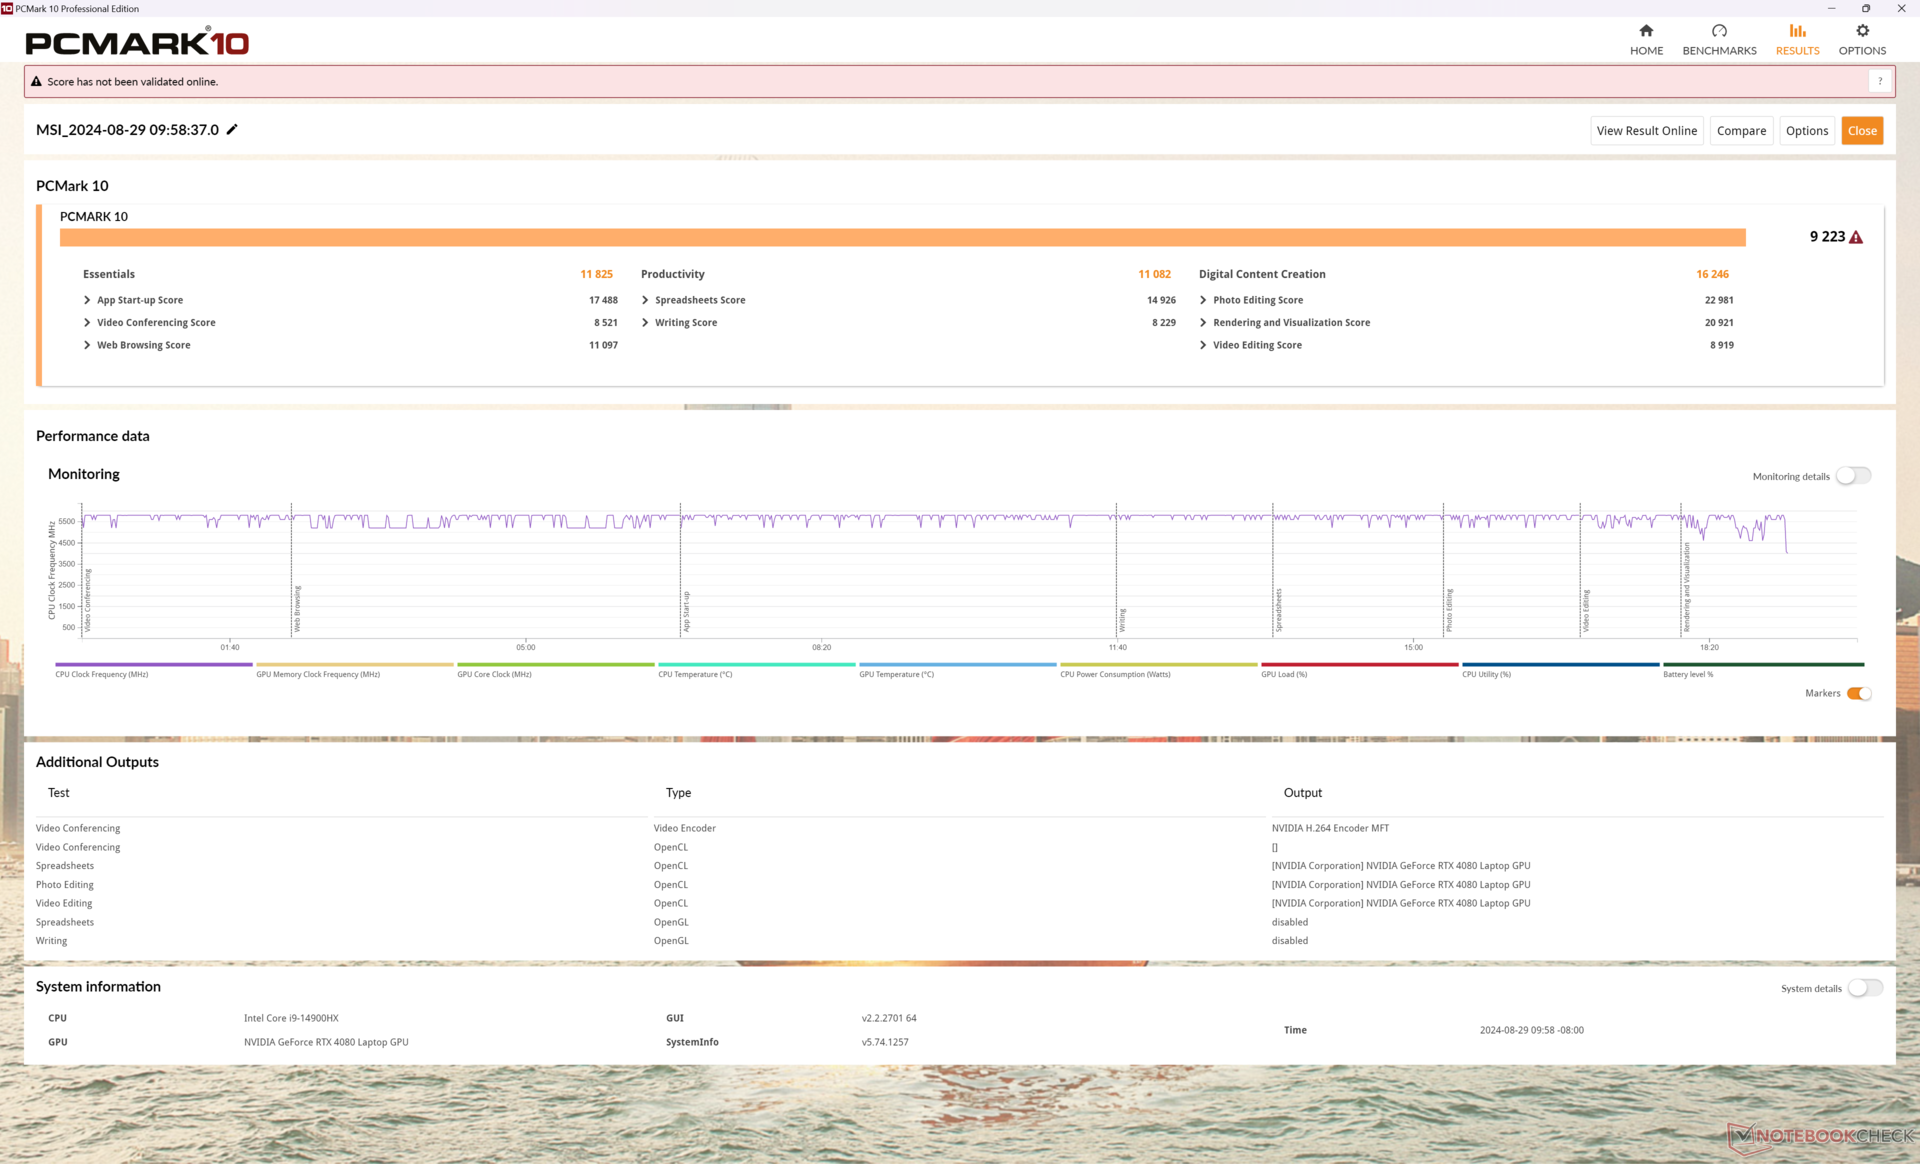
System Performance
PCMark 10 scores are comparable to the MSI Titan 18 HX to show that day-to-day tasks aren't really any slower on the Raider 18 HX even though it is essentially a tone-downed Titan.
We experienced strange login issues with our test unit when switching between dGPU and iGPU modes that would force us to reset the PIN each time.
CrossMark: Overall | Productivity | Creativity | Responsiveness
WebXPRT 3: Overall
WebXPRT 4: Overall
Mozilla Kraken 1.1: Total
| PCMark 10 / Score | |
| Alienware m18 R2 | |
| MSI Raider 18 HX A14V | |
| MSI Titan 18 HX A14VIG | |
| Razer Blade 18 2024 RZ09-0509 | |
| Average Intel Core i9-14900HX, NVIDIA GeForce RTX 4080 Laptop GPU (7703 - 9223, n=7) | |
| Acer Predator Helios 18 PH18-72-98MW | |
| Asus ROG Strix G18 G814JI | |
| PCMark 10 / Essentials | |
| MSI Raider 18 HX A14V | |
| Average Intel Core i9-14900HX, NVIDIA GeForce RTX 4080 Laptop GPU (11255 - 12600, n=7) | |
| MSI Titan 18 HX A14VIG | |
| Alienware m18 R2 | |
| Razer Blade 18 2024 RZ09-0509 | |
| Acer Predator Helios 18 PH18-72-98MW | |
| Asus ROG Strix G18 G814JI | |
| PCMark 10 / Productivity | |
| Alienware m18 R2 | |
| MSI Raider 18 HX A14V | |
| Average Intel Core i9-14900HX, NVIDIA GeForce RTX 4080 Laptop GPU (6662 - 11410, n=7) | |
| MSI Titan 18 HX A14VIG | |
| Razer Blade 18 2024 RZ09-0509 | |
| Acer Predator Helios 18 PH18-72-98MW | |
| Asus ROG Strix G18 G814JI | |
| PCMark 10 / Digital Content Creation | |
| MSI Titan 18 HX A14VIG | |
| Alienware m18 R2 | |
| MSI Raider 18 HX A14V | |
| Razer Blade 18 2024 RZ09-0509 | |
| Average Intel Core i9-14900HX, NVIDIA GeForce RTX 4080 Laptop GPU (14211 - 16246, n=7) | |
| Acer Predator Helios 18 PH18-72-98MW | |
| Asus ROG Strix G18 G814JI | |
| CrossMark / Overall | |
| Average Intel Core i9-14900HX, NVIDIA GeForce RTX 4080 Laptop GPU (1992 - 2334, n=7) | |
| MSI Raider 18 HX A14V | |
| Alienware m18 R2 | |
| Razer Blade 18 2024 RZ09-0509 | |
| MSI Titan 18 HX A14VIG | |
| CrossMark / Productivity | |
| Average Intel Core i9-14900HX, NVIDIA GeForce RTX 4080 Laptop GPU (1812 - 2204, n=7) | |
| MSI Raider 18 HX A14V | |
| Razer Blade 18 2024 RZ09-0509 | |
| Alienware m18 R2 | |
| MSI Titan 18 HX A14VIG | |
| CrossMark / Creativity | |
| Average Intel Core i9-14900HX, NVIDIA GeForce RTX 4080 Laptop GPU (2327 - 2500, n=7) | |
| Alienware m18 R2 | |
| MSI Raider 18 HX A14V | |
| Razer Blade 18 2024 RZ09-0509 | |
| MSI Titan 18 HX A14VIG | |
| CrossMark / Responsiveness | |
| Average Intel Core i9-14900HX, NVIDIA GeForce RTX 4080 Laptop GPU (1520 - 2254, n=7) | |
| MSI Raider 18 HX A14V | |
| Alienware m18 R2 | |
| Razer Blade 18 2024 RZ09-0509 | |
| MSI Titan 18 HX A14VIG | |
| WebXPRT 3 / Overall | |
| Razer Blade 18 2024 RZ09-0509 | |
| MSI Raider 18 HX A14V | |
| Average Intel Core i9-14900HX, NVIDIA GeForce RTX 4080 Laptop GPU (310 - 345, n=7) | |
| MSI Titan 18 HX A14VIG | |
| Alienware m18 R2 | |
| Asus ROG Strix G18 G814JI | |
| Asus ROG Strix G18 G814JI | |
| WebXPRT 4 / Overall | |
| MSI Raider 18 HX A14V | |
| Average Intel Core i9-14900HX, NVIDIA GeForce RTX 4080 Laptop GPU (300 - 321, n=7) | |
| Alienware m18 R2 | |
| MSI Titan 18 HX A14VIG | |
| Asus ROG Strix G18 G814JI | |
| Asus ROG Strix G18 G814JI | |
| Mozilla Kraken 1.1 / Total | |
| Asus ROG Strix G18 G814JI | |
| Asus ROG Strix G18 G814JI | |
| MSI Titan 18 HX A14VIG | |
| Razer Blade 18 2024 RZ09-0509 | |
| MSI Raider 18 HX A14V | |
| Acer Predator Helios 18 PH18-72-98MW | |
| Average Intel Core i9-14900HX, NVIDIA GeForce RTX 4080 Laptop GPU (437 - 446, n=7) | |
| Alienware m18 R2 | |
* ... smaller is better
| PCMark 10 Score | 9223 points | |
Help | ||
| AIDA64 / Memory Copy | |
| Alienware m18 R2 | |
| Acer Predator Helios 18 PH18-72-98MW | |
| Razer Blade 18 2024 RZ09-0509 | |
| Average Intel Core i9-14900HX (38028 - 83392, n=36) | |
| MSI Raider 18 HX A14V | |
| Asus ROG Strix G18 G814JI | |
| MSI Titan 18 HX A14VIG | |
| AIDA64 / Memory Read | |
| Alienware m18 R2 | |
| Acer Predator Helios 18 PH18-72-98MW | |
| Razer Blade 18 2024 RZ09-0509 | |
| Average Intel Core i9-14900HX (43306 - 87568, n=36) | |
| Asus ROG Strix G18 G814JI | |
| MSI Raider 18 HX A14V | |
| MSI Titan 18 HX A14VIG | |
| AIDA64 / Memory Write | |
| Alienware m18 R2 | |
| Average Intel Core i9-14900HX (37146 - 80589, n=36) | |
| Acer Predator Helios 18 PH18-72-98MW | |
| Razer Blade 18 2024 RZ09-0509 | |
| MSI Raider 18 HX A14V | |
| Asus ROG Strix G18 G814JI | |
| MSI Titan 18 HX A14VIG | |
| AIDA64 / Memory Latency | |
| MSI Titan 18 HX A14VIG | |
| MSI Raider 18 HX A14V | |
| Razer Blade 18 2024 RZ09-0509 | |
| Alienware m18 R2 | |
| Average Intel Core i9-14900HX (76.1 - 105, n=36) | |
| Asus ROG Strix G18 G814JI | |
| Acer Predator Helios 18 PH18-72-98MW | |
* ... smaller is better
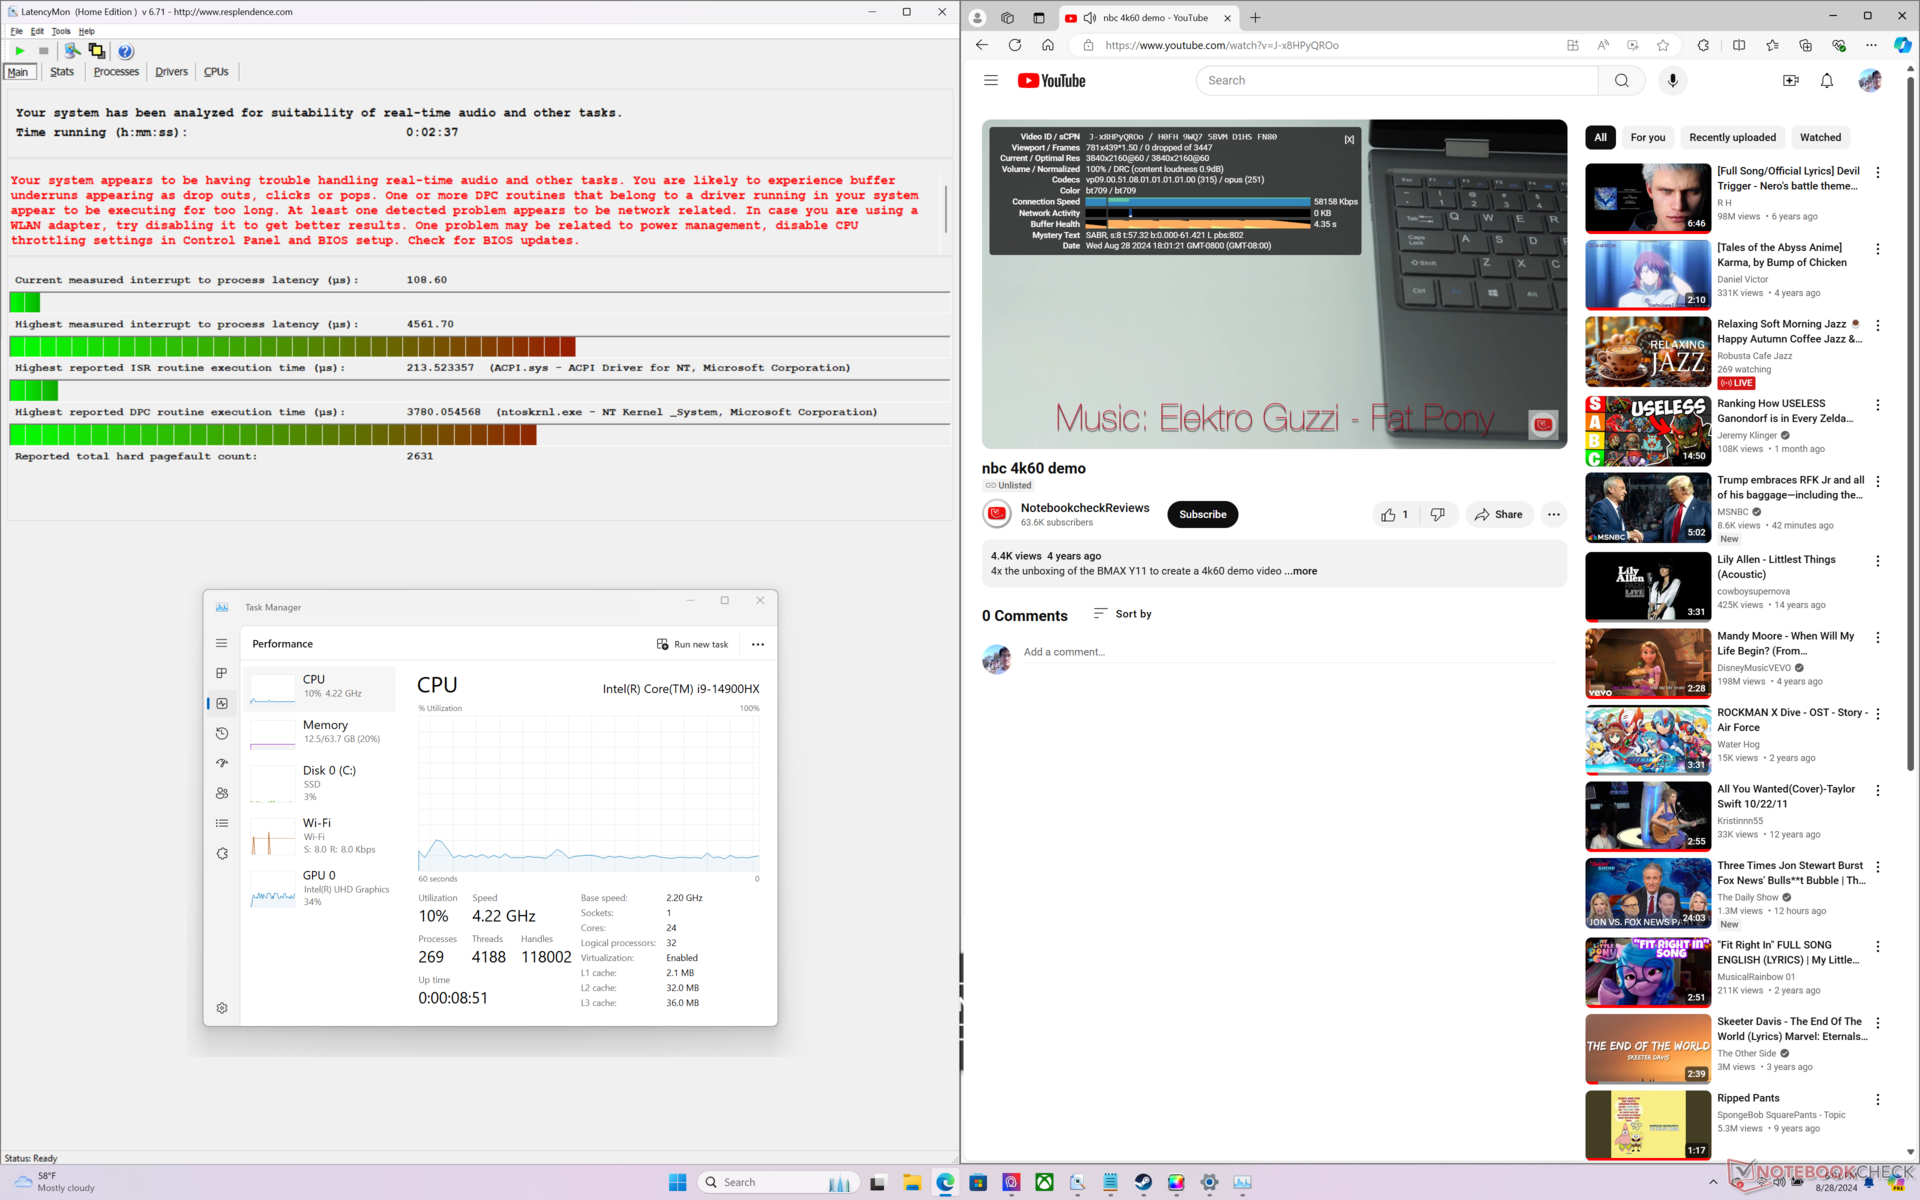
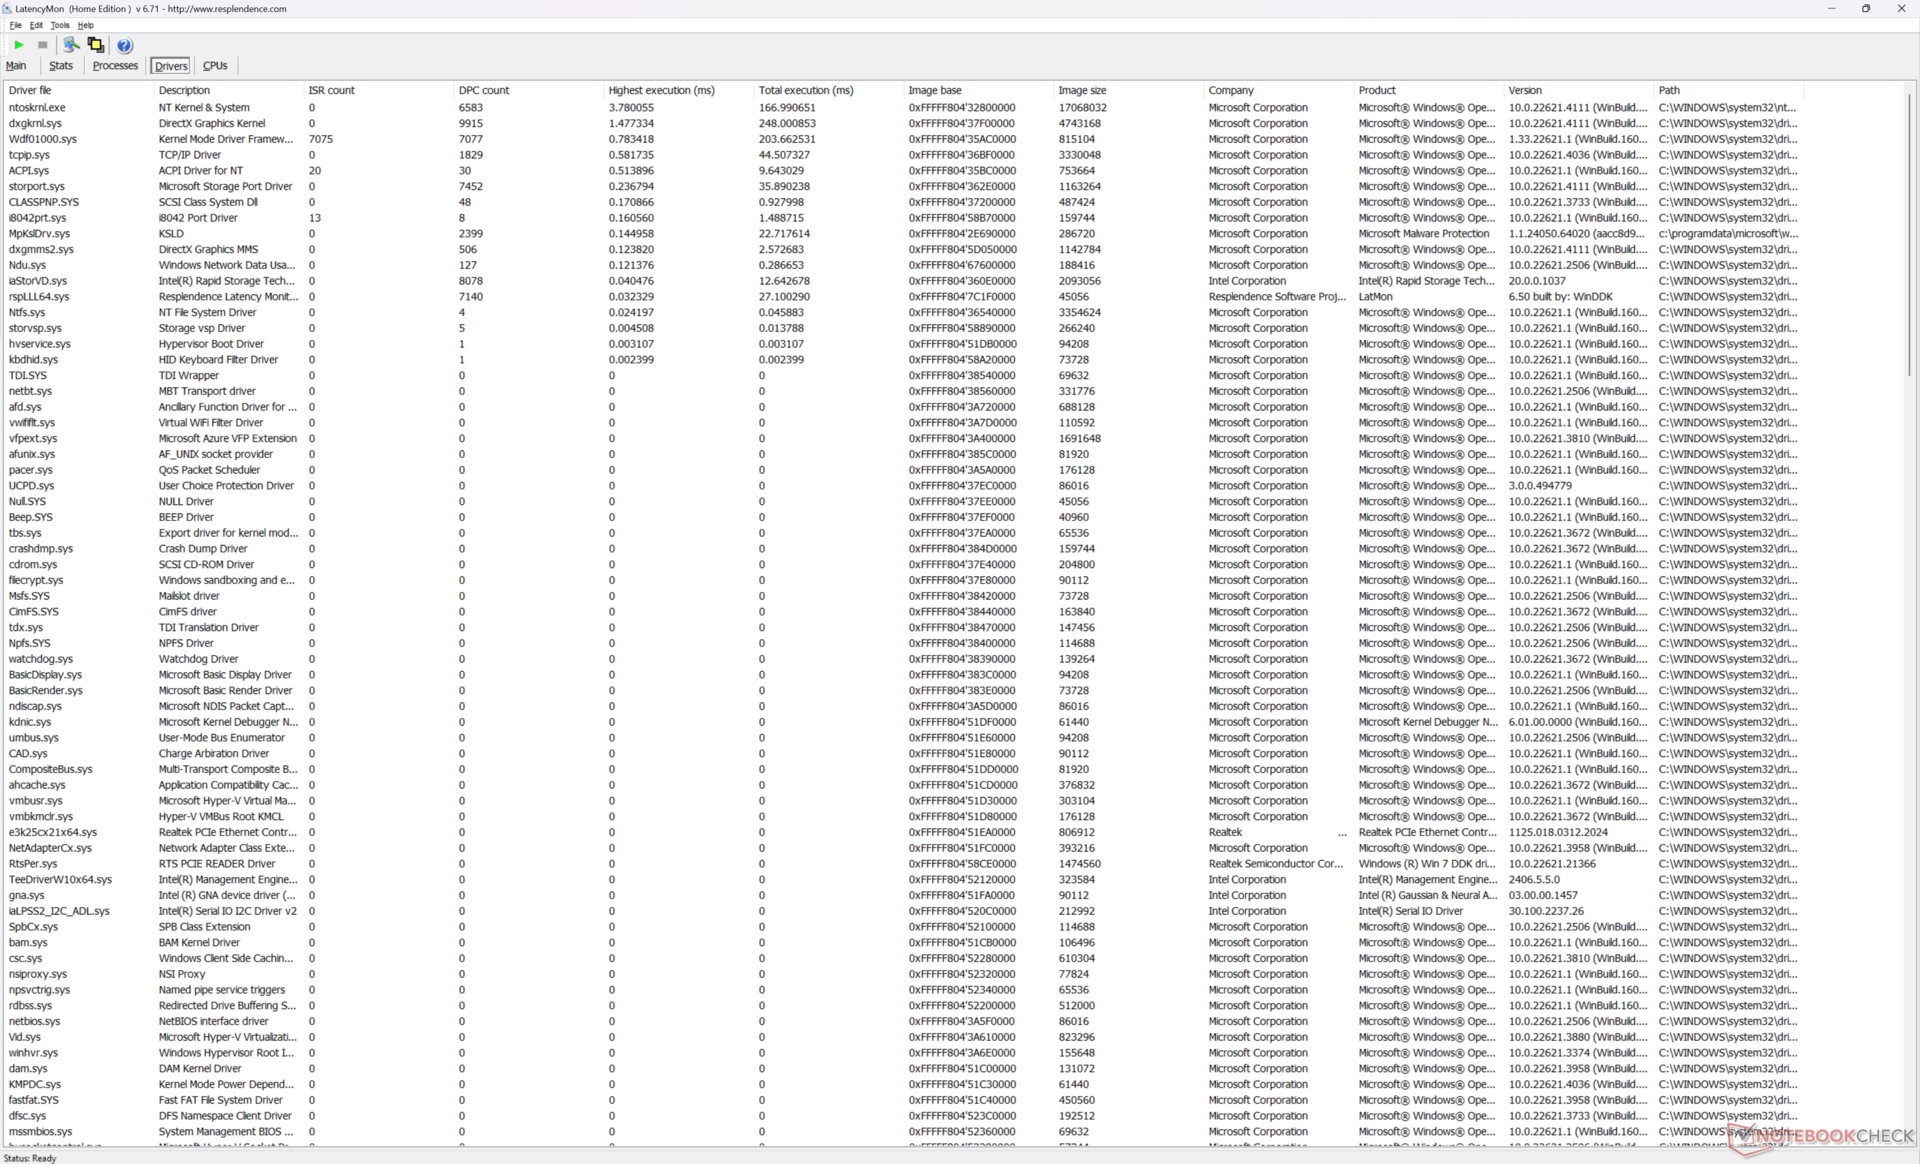
DPC Latency
LatencyMon reveals DPC issues when opening multiple tabs of our homepage even when set to iGPU mode. 4K video playback at 60 FPS is otherwise perfect with no dropped frames recorded.
| DPC Latencies / LatencyMon - interrupt to process latency (max), Web, Youtube, Prime95 | |
| MSI Raider 18 HX A14V | |
| Acer Predator Helios 18 PH18-72-98MW | |
| Alienware m18 R2 | |
| MSI Titan 18 HX A14VIG | |
| Razer Blade 18 2024 RZ09-0509 | |
| Asus ROG Strix G18 G814JI | |
* ... smaller is better
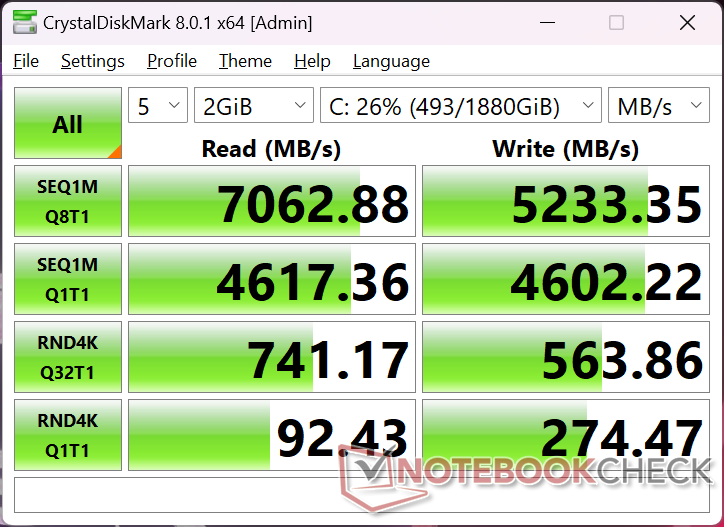
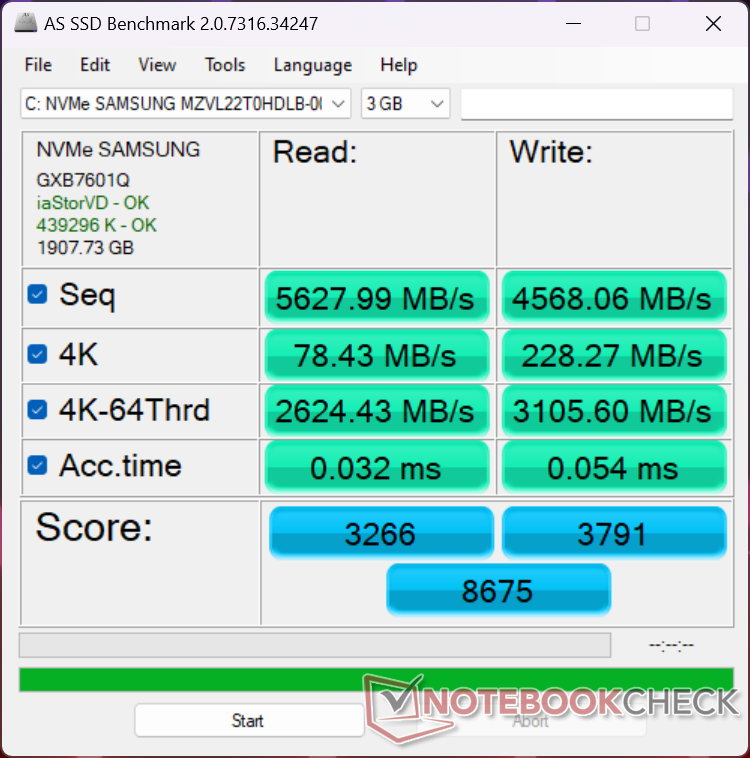
Storage Devices
Our unit ships with the Samsung PM9A1a MZVL22T0HDLB PCIe4 SSD commonly found on high-end laptops. Transfer rates are stable at ~7000 MB/s even when stressed and they can be faster still if configured with a PCIe5 drive. However, the lack of an included heat spreader may mean that PCIe5 drives are more likely to throttle.

| Drive Performance rating - Percent | |
| Alienware m18 R2 | |
| MSI Raider 18 HX A14V | |
| Acer Predator Helios 18 PH18-72-98MW | |
| MSI Titan 18 HX A14VIG | |
| Razer Blade 18 2024 RZ09-0509 | |
| Asus ROG Strix G18 G814JI | |
* ... smaller is better
Disk Throttling: DiskSpd Read Loop, Queue Depth 8
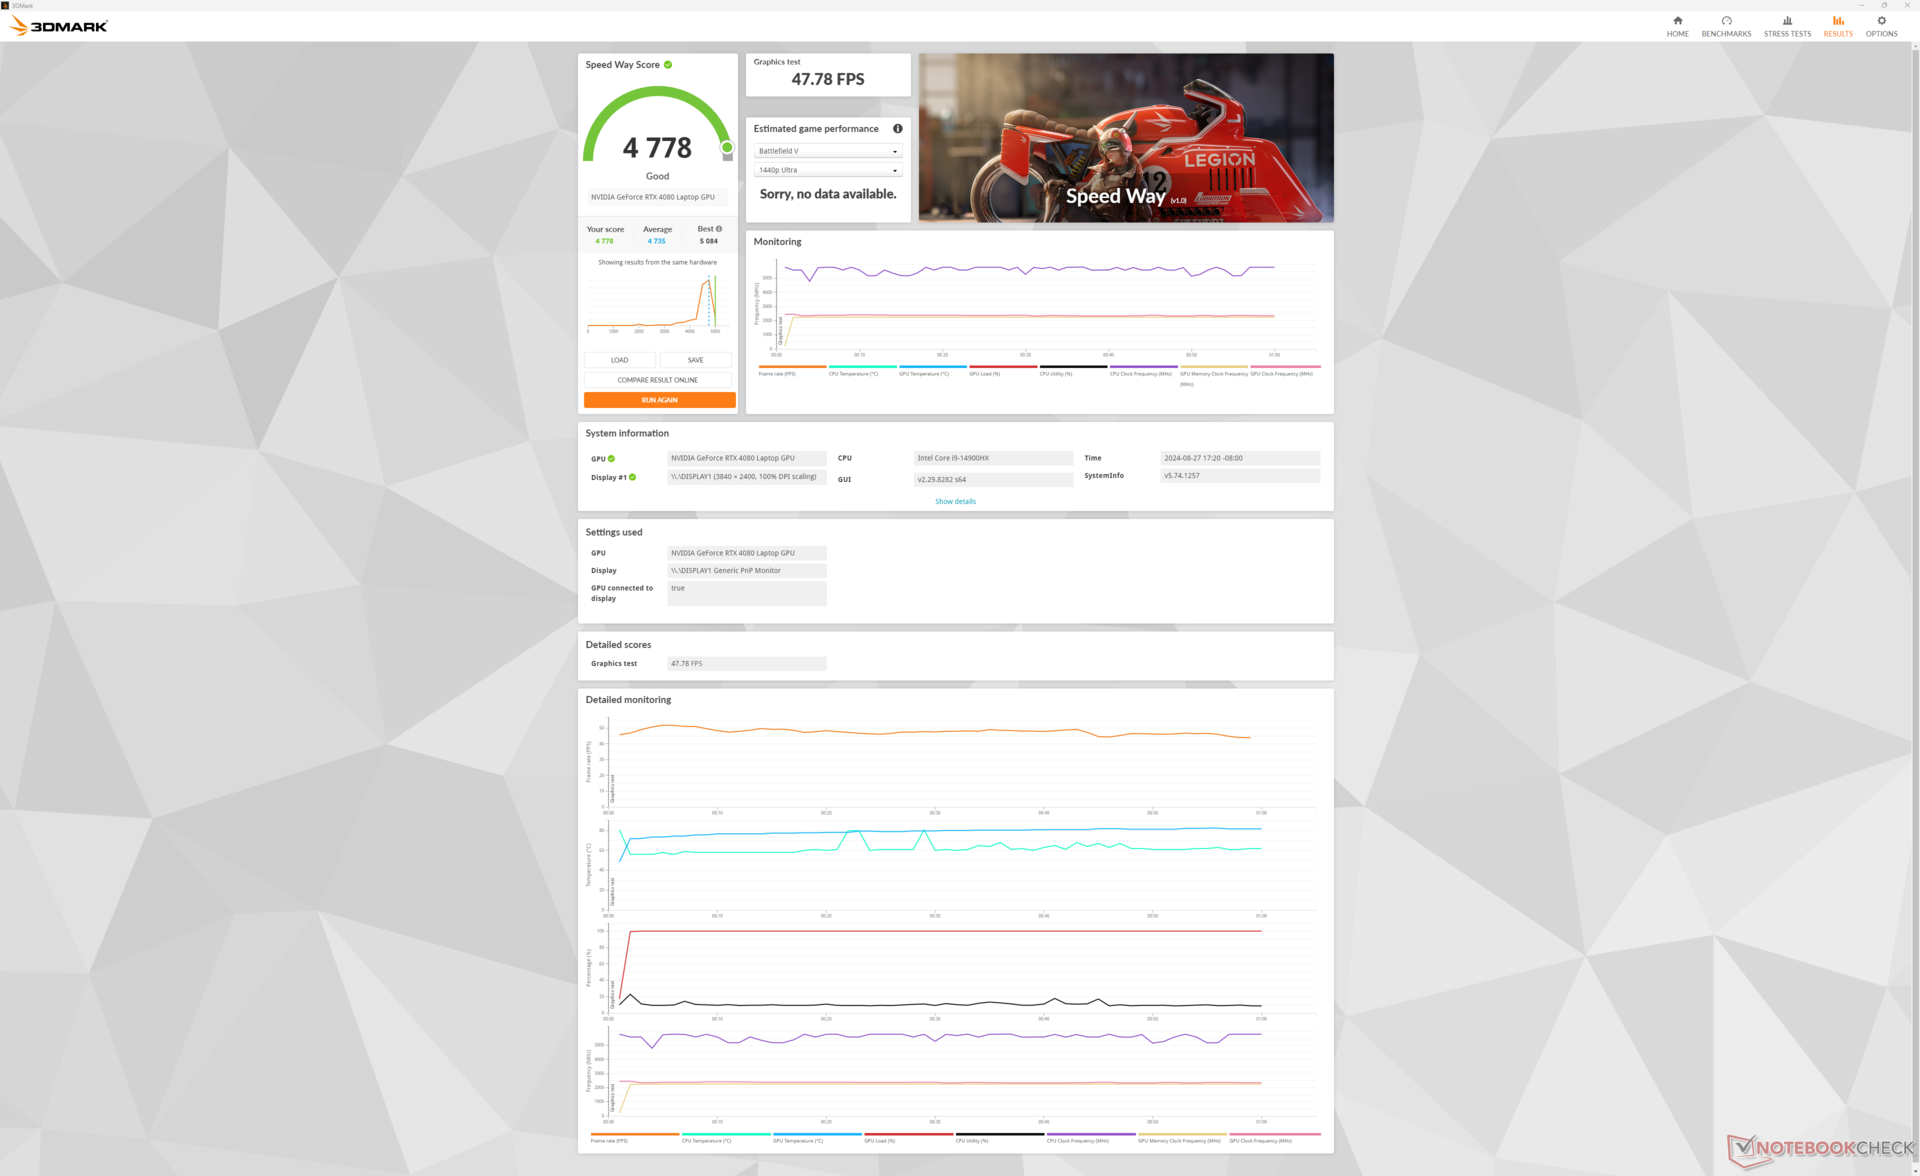
GPU Performance — 175 W TGP Graphics
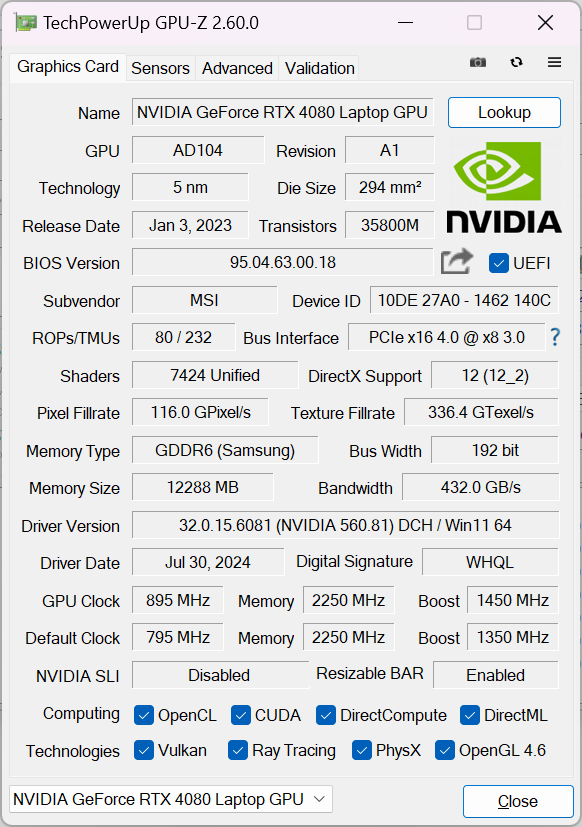
Unlike thinner laptops that may ship with weaker 80 W GeForce RTX 4080 graphics, the larger Raider 18 HX ships with a more powerful 175 W (150 W + 25 W dynamic boost) version. Performance is about 5 percent faster than the average laptop in our database with the same GPU while upgrading to the RTX 4090 will boost performance by another 10 percent.
Keep in mind that overall performance is still 30 to 35 percent slower than the desktop version of the GeForce RTX 4080 even though the mobile version shares the same name. Our mobile RTX 4080 is therefore closer in performance to the desktop RTX 4070.
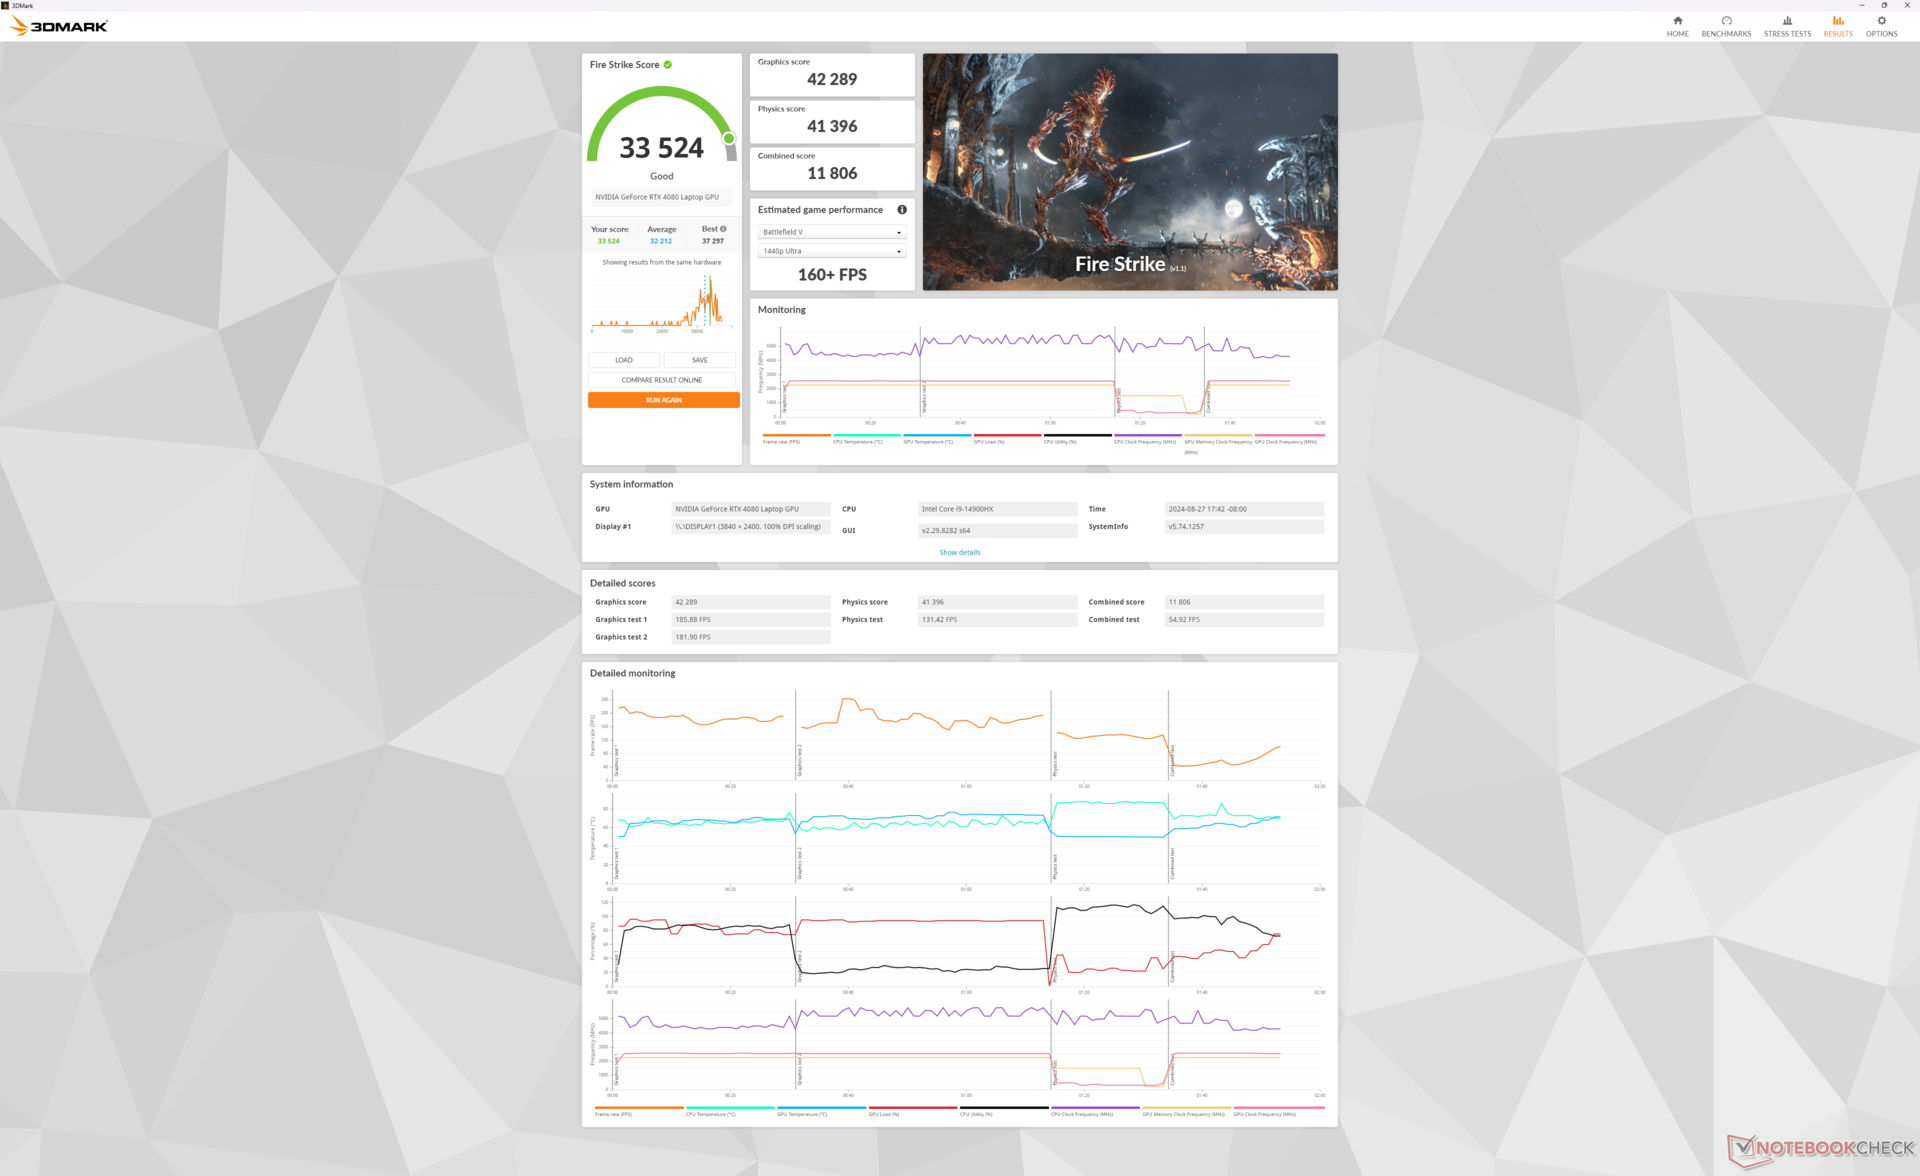
| Power Profile | Graphics Score | Physics Score | Combined Score |
| Extreme Performance (Cooler Boost on) | 42289 | 41396 | 11806 |
| Extreme Performance (Cooler Boost off) | 41778 (-1%) | 40723 (-2%) | 11968 (-1%) |
| Balanced Mode | 41673 (-2%) | 41013 (-1%) | 10404 (-12%) |
| Battery Power | 21731 (-49%) | 17988 (-57%) | 5809 (-51%) |
Dropping from Extreme Performance mode to Balanced mode impacts performance only slightly which aligns with out Stress Test observations above. Enabling Cooler Boost makes little difference as well except for reducing core temperatures by increasing fan noise significantly.
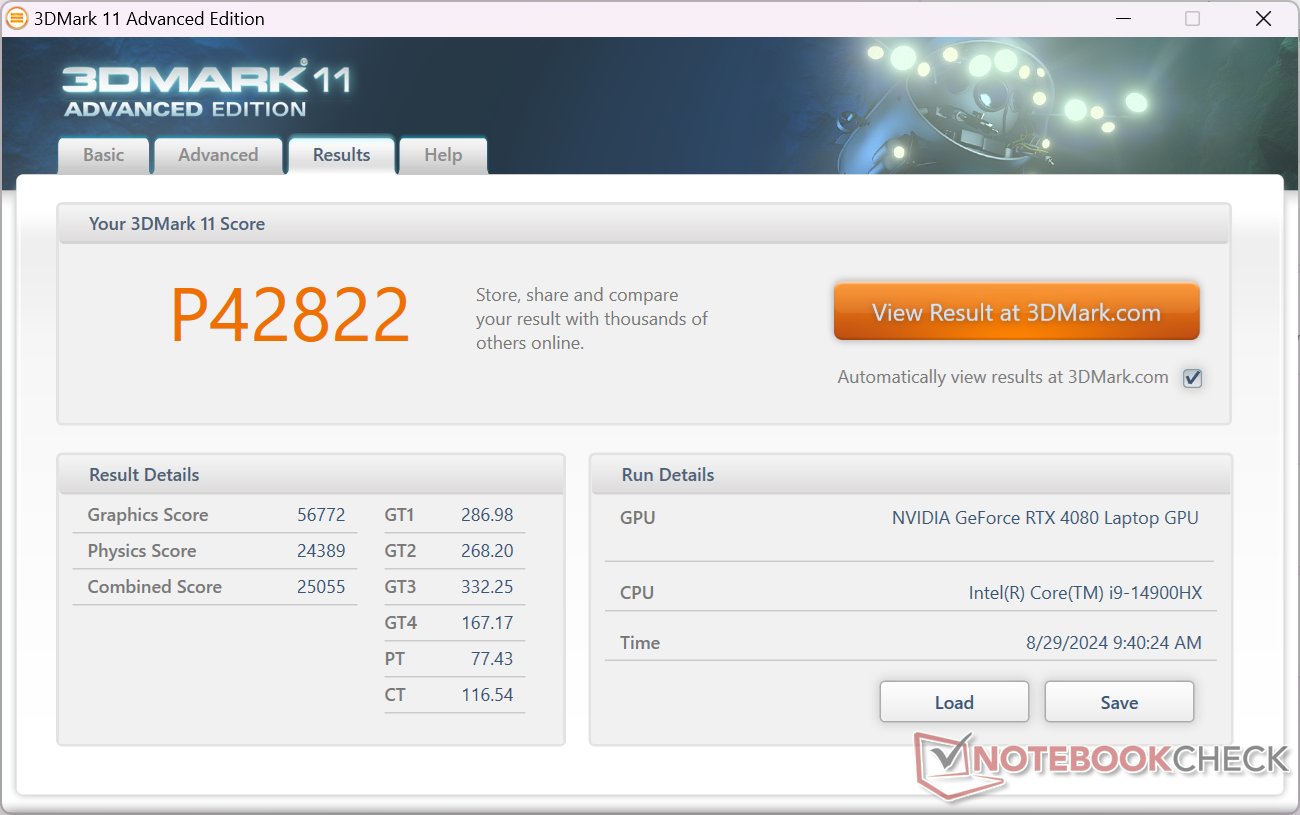
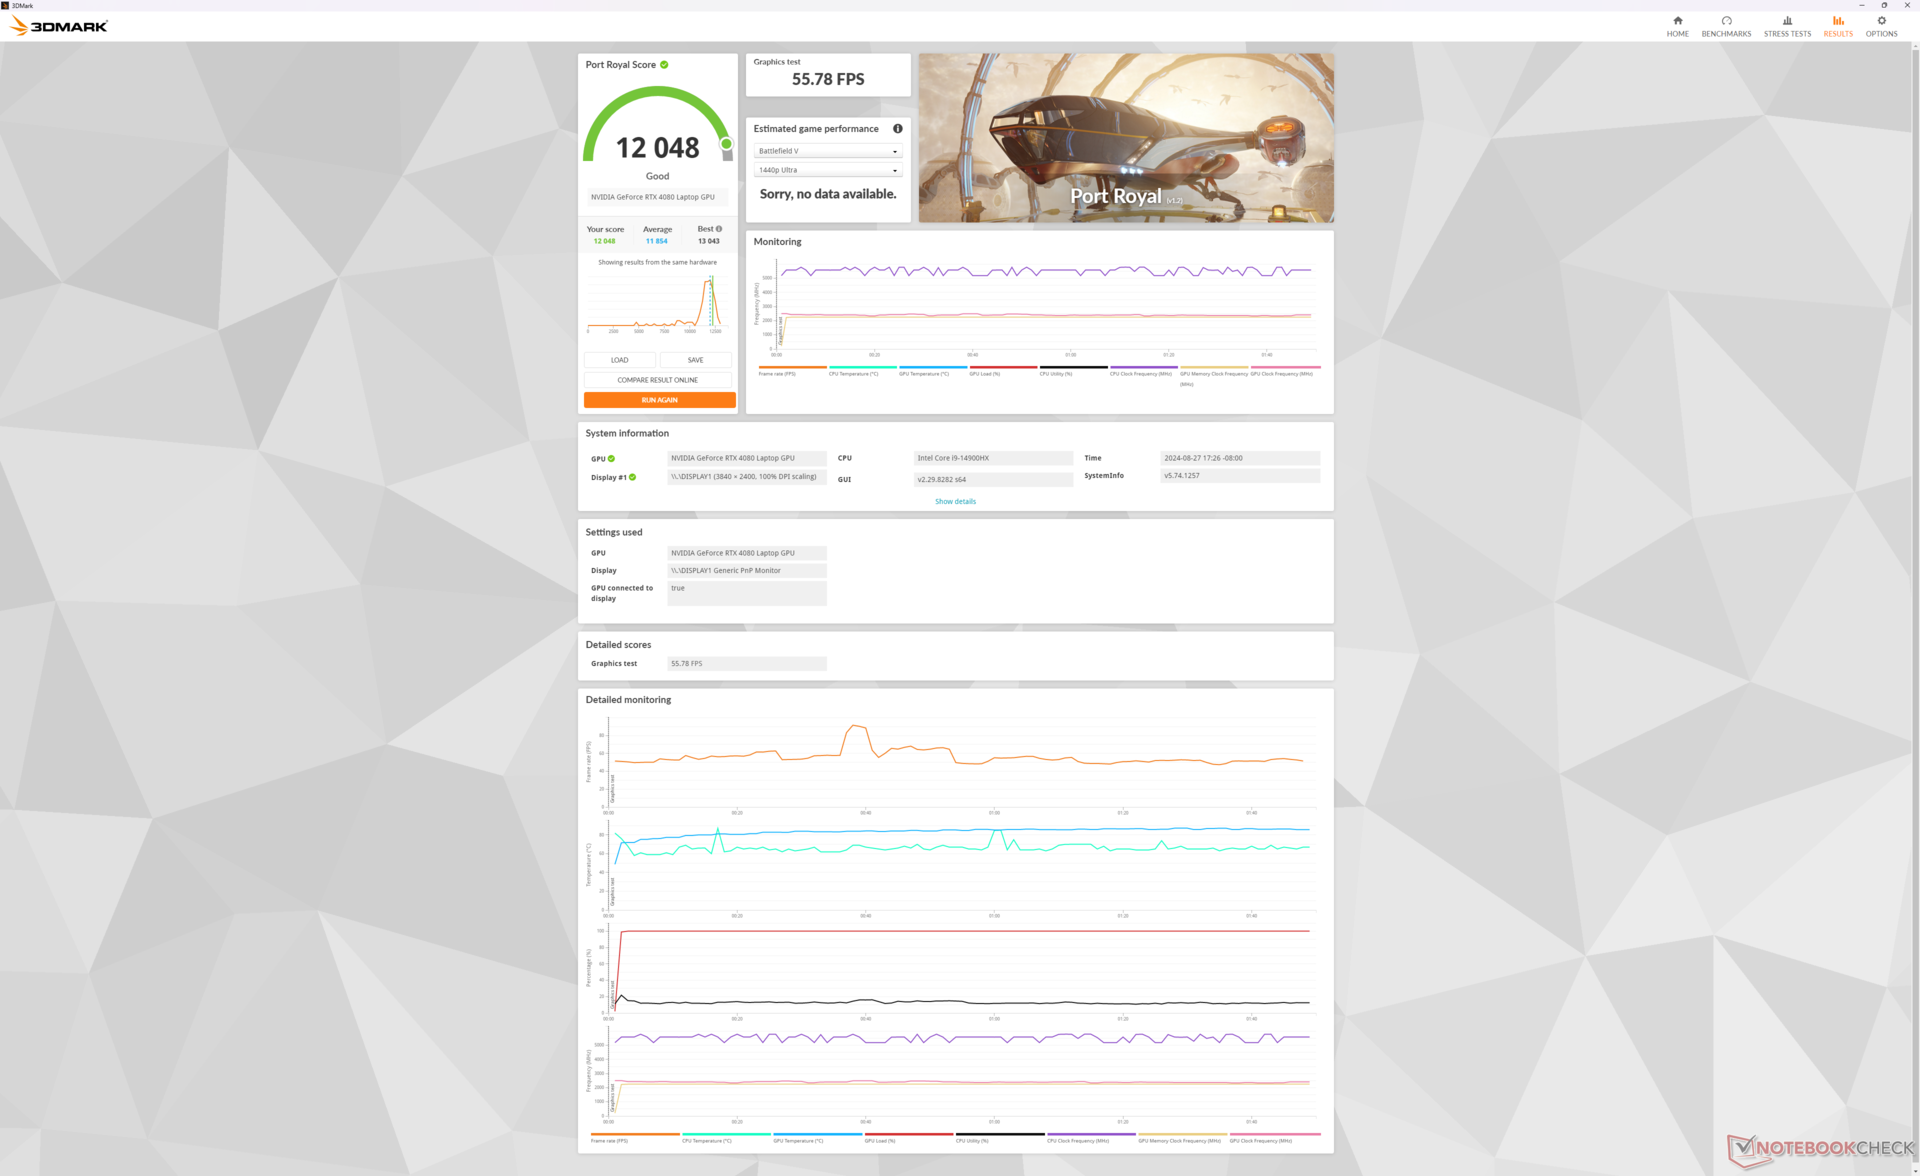

| 3DMark 11 Performance | 42822 points | |
| 3DMark Fire Strike Score | 33524 points | |
| 3DMark Time Spy Score | 18608 points | |
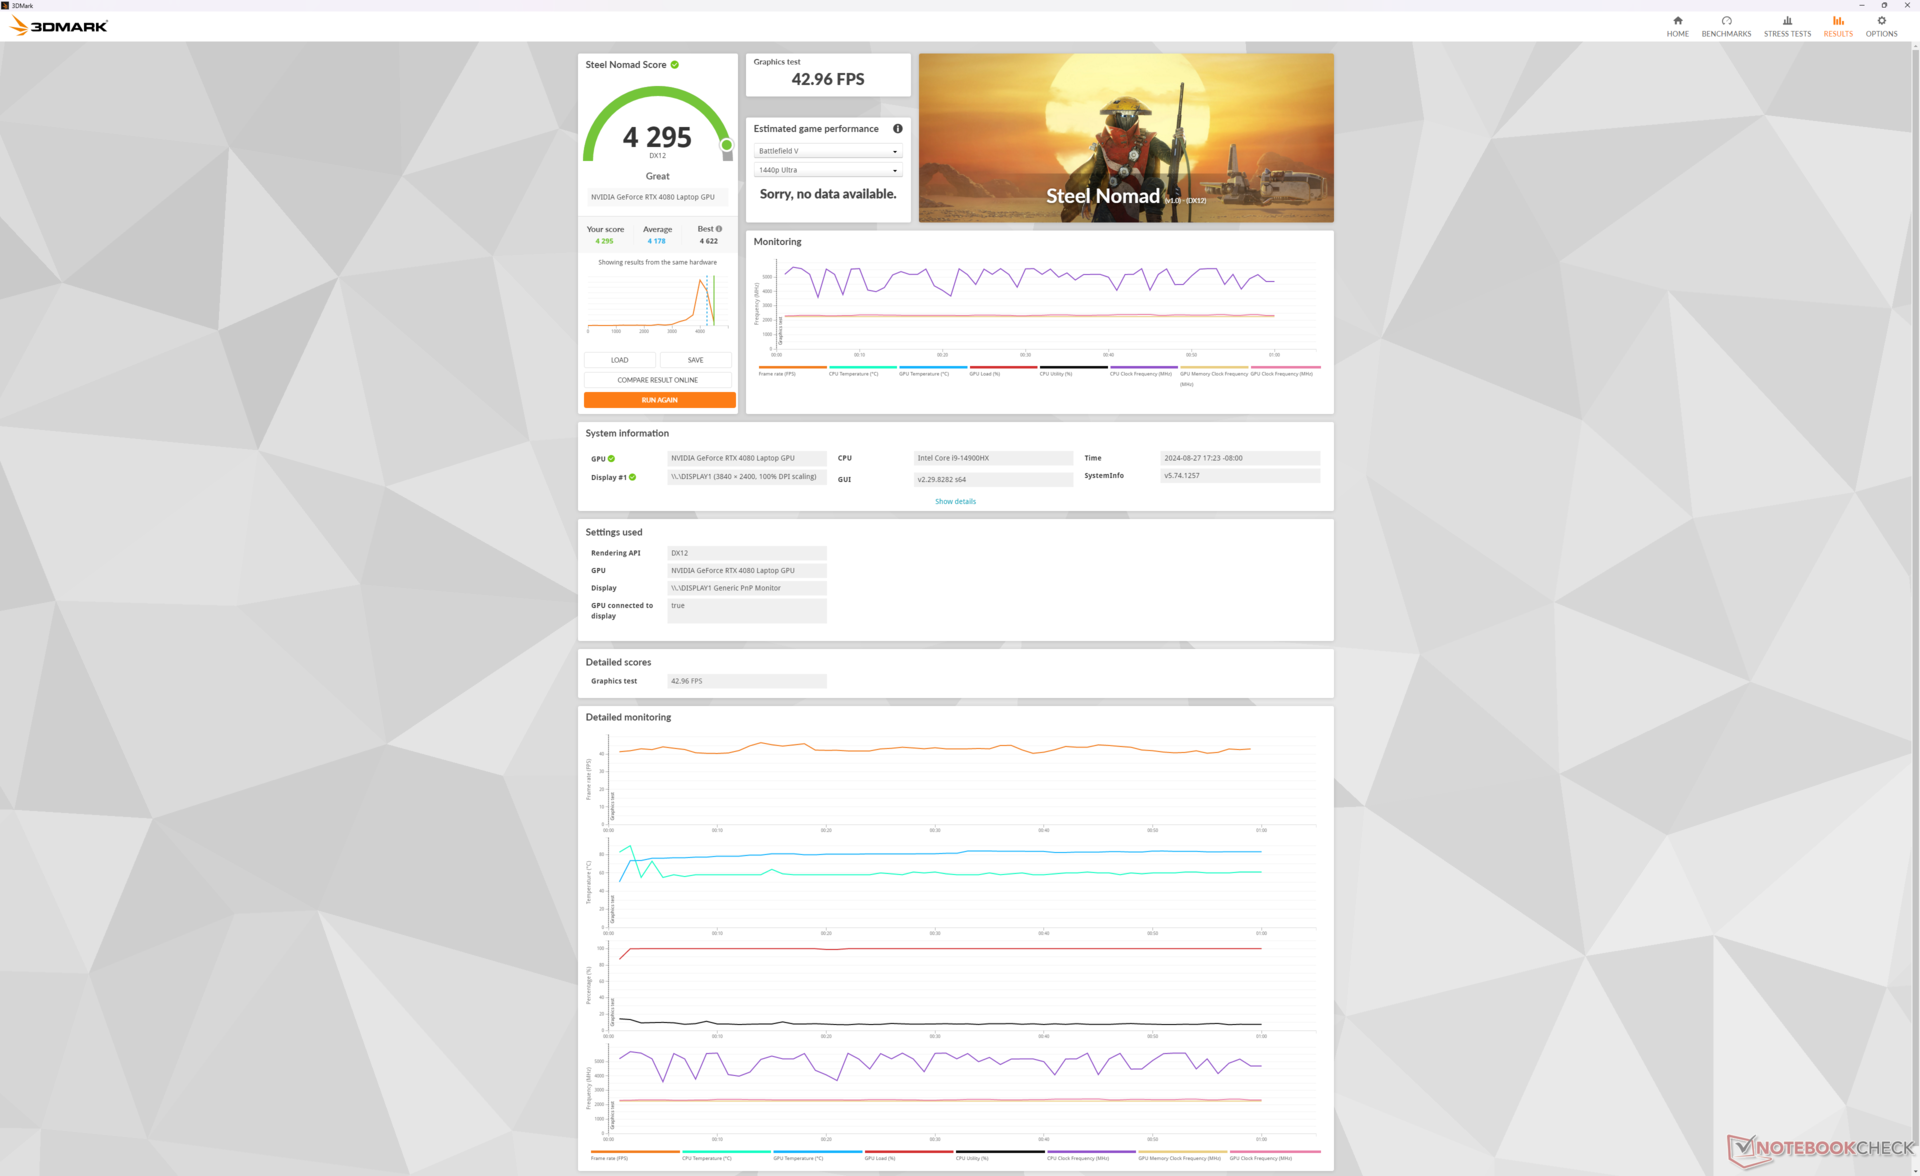
| 3DMark Steel Nomad Score | 4295 points | |
Help | ||
* ... smaller is better
Gaming Performance
Modern titles run decently well at the native 4K UHD+ resolution. DLSS is recommended when running more demanding titles like Cyberpunk 2077 to boost frame rates closer to 60 FPS.
Strangely, Baldur's Gate 3 would fail to launch on our unit even after multiple system resets in DX11 or DX12 modes.
| Performance rating - Percent | |
| Alienware m18 R2 | |
| MSI Titan 18 HX A14VIG | |
| MSI Raider 18 HX A14V | |
| Razer Blade 18 2024 RZ09-0509 -1! | |
| Acer Predator Helios 18 PH18-72-98MW | |
| Asus ROG Strix G18 G814JI | |
| GTA V - 1920x1080 Highest AA:4xMSAA + FX AF:16x | |
| MSI Raider 18 HX A14V | |
| MSI Titan 18 HX A14VIG | |
| Alienware m18 R2 | |
| Acer Predator Helios 18 PH18-72-98MW | |
| Razer Blade 18 2024 RZ09-0509 | |
| Asus ROG Strix G18 G814JI | |
| Final Fantasy XV Benchmark - 1920x1080 High Quality | |
| Alienware m18 R2 | |
| MSI Titan 18 HX A14VIG | |
| MSI Raider 18 HX A14V | |
| Acer Predator Helios 18 PH18-72-98MW | |
| Razer Blade 18 2024 RZ09-0509 | |
| Asus ROG Strix G18 G814JI | |
| Strange Brigade - 1920x1080 ultra AA:ultra AF:16 | |
| MSI Titan 18 HX A14VIG | |
| Alienware m18 R2 | |
| MSI Raider 18 HX A14V | |
| Razer Blade 18 2024 RZ09-0509 | |
| Acer Predator Helios 18 PH18-72-98MW | |
| Asus ROG Strix G18 G814JI | |
| Dota 2 Reborn - 1920x1080 ultra (3/3) best looking | |
| Acer Predator Helios 18 PH18-72-98MW | |
| MSI Titan 18 HX A14VIG | |
| MSI Raider 18 HX A14V | |
| Alienware m18 R2 | |
| Razer Blade 18 2024 RZ09-0509 | |
| Asus ROG Strix G18 G814JI | |
| X-Plane 11.11 - 1920x1080 high (fps_test=3) | |
| MSI Raider 18 HX A14V | |
| Alienware m18 R2 | |
| Razer Blade 18 2024 RZ09-0509 | |
| MSI Titan 18 HX A14VIG | |
| Acer Predator Helios 18 PH18-72-98MW | |
| Asus ROG Strix G18 G814JI | |
| Far Cry 5 - 1920x1080 Ultra Preset AA:T | |
| Alienware m18 R2 | |
| MSI Titan 18 HX A14VIG | |
| MSI Raider 18 HX A14V | |
| Asus ROG Strix G18 G814JI | |
| Acer Predator Helios 18 PH18-72-98MW | |
| Tiny Tina's Wonderlands | |
| 1920x1080 High Preset (DX12) | |
| Alienware m18 R2 | |
| MSI Raider 18 HX A14V | |
| Average NVIDIA GeForce RTX 4080 Laptop GPU (166.7 - 213, n=6) | |
| 1920x1080 Badass Preset (DX12) | |
| Alienware m18 R2 | |
| MSI Raider 18 HX A14V | |
| Alienware m18 R1 AMD | |
| Average NVIDIA GeForce RTX 4080 Laptop GPU (112.9 - 167.1, n=9) | |
| 2560x1440 Badass Preset (DX12) | |
| Alienware m18 R2 | |
| MSI Raider 18 HX A14V | |
| Alienware m18 R1 AMD | |
| Average NVIDIA GeForce RTX 4080 Laptop GPU (85 - 114.8, n=9) | |
| 3840x2160 Badass Preset (DX12) | |
| Alienware m18 R2 | |
| MSI Raider 18 HX A14V | |
| Alienware m18 R1 AMD | |
| Average NVIDIA GeForce RTX 4080 Laptop GPU (46.4 - 60.9, n=9) | |
Cyberpunk 2077 ultra FPS Chart
| low | med. | high | ultra | QHD | 4K | |
|---|---|---|---|---|---|---|
| GTA V (2015) | 185.1 | 183.8 | 181.6 | 143.4 | 134.6 | 158.3 |
| Dota 2 Reborn (2015) | 218 | 193.1 | 184.6 | 172.5 | 166.4 | |
| Final Fantasy XV Benchmark (2018) | 223 | 212 | 177 | 141.8 | 78.6 | |
| X-Plane 11.11 (2018) | 199 | 178.5 | 143.5 | 119.3 | ||
| Far Cry 5 (2018) | 173 | 163 | 151 | 149 | 96 | |
| Strange Brigade (2018) | 504 | 408 | 378 | 349 | 246 | 122.6 |
| Tiny Tina's Wonderlands (2022) | 352.5 | 292.6 | 203.3 | 159.4 | 111.2 | 60.9 |
| F1 22 (2022) | 305 | 299 | 271 | 121.2 | 77.8 | 39.8 |
| Cyberpunk 2077 (2023) | 150.6 | 150 | 140.7 | 125.5 | 82.5 | 35.1 |
Emissions — Quiet When Idling, Loud When Gaming
System Noise
Fan noise and behavior are similar to the Titan 18 HX despite their cooling solution differences. The fans are prone to pulsing even when web browsing on Balanced mode or Silent mode much like on the Titan, but the noise increase is thankfully not sharp enough to be distracting.
MSI Center directly impacts the gaming experience as fan noise is closely tied to your selected power profile. Running Cyberpunk 2077 on Balanced mode, Extreme Performance mode w/ Cooler Boost off, and Extreme Performance mode w/ Cooler Boost on would result in a stable fan noise of 52.8 dB(A), 59.4 dB(A), and 62.7 dB(A), respectively. The noise difference between Balanced and Extreme Performance modes is significant even though the performance deficit between them is small meaning that Balanced mode is recommended for most gaming scenarios. Cooler Boost is therefore mostly useful for manual overclocking as it otherwise provides no major gaming benefits when on stock settings.
The low to mid 50 dB(A) range when gaming is most similar to the Blade 18 or Alienware m18 R2. Headphones are recommended especially if gaming on Extreme Performance mode.
Noise level
| Idle |
| 28.6 / 28.6 / 31.3 dB(A) |
| Load |
| 44.1 / 62.7 dB(A) |
 | ||
30 dB silent 40 dB(A) audible 50 dB(A) loud |
||
min: | ||
| MSI Raider 18 HX A14V GeForce RTX 4080 Laptop GPU, i9-14900HX, Samsung PM9A1 MZVL22T0HBLB | Razer Blade 18 2024 RZ09-0509 GeForce RTX 4090 Laptop GPU, i9-14900HX | Alienware m18 R2 GeForce RTX 4090 Laptop GPU, i9-14900HX, SK Hynix PC811 HFS002TEM9X152N | MSI Titan 18 HX A14VIG GeForce RTX 4090 Laptop GPU, i9-14900HX, 2x Samsung PM9A1a MZVL22T0HDLB (RAID 0) | Asus ROG Strix G18 G814JI GeForce RTX 4070 Laptop GPU, i7-13650HX, Micron 2400 MTFDKBA1T0QFM | Acer Predator Helios 18 PH18-72-98MW GeForce RTX 4090 Laptop GPU, i9-14900HX, 2x SK Hynix HFS001TEJ9X115N (RAID 0) | |
|---|---|---|---|---|---|---|
| Noise | 7% | 11% | 10% | 8% | -12% | |
| off / environment * (dB) | 23.3 | 23.4 -0% | 23.6 -1% | 22.8 2% | 25 -7% | 25 -7% |
| Idle Minimum * (dB) | 28.6 | 23.9 16% | 23.8 17% | 23.8 17% | 26 9% | 30 -5% |
| Idle Average * (dB) | 28.6 | 28.2 1% | 26.1 9% | 23.8 17% | 28 2% | 36 -26% |
| Idle Maximum * (dB) | 31.3 | 29 7% | 31.5 -1% | 28 11% | 29 7% | 44 -41% |
| Load Average * (dB) | 44.1 | 36.8 17% | 31.5 29% | 38 14% | 41 7% | 48 -9% |
| Cyberpunk 2077 ultra * (dB) | 59.4 | |||||
| Load Maximum * (dB) | 62.7 | 61.1 3% | 56.6 10% | 62.8 -0% | 46 27% | 51 19% |
| Witcher 3 ultra * (dB) | 54.1 | 52.1 | 57.3 | 44 | 49 |
* ... smaller is better
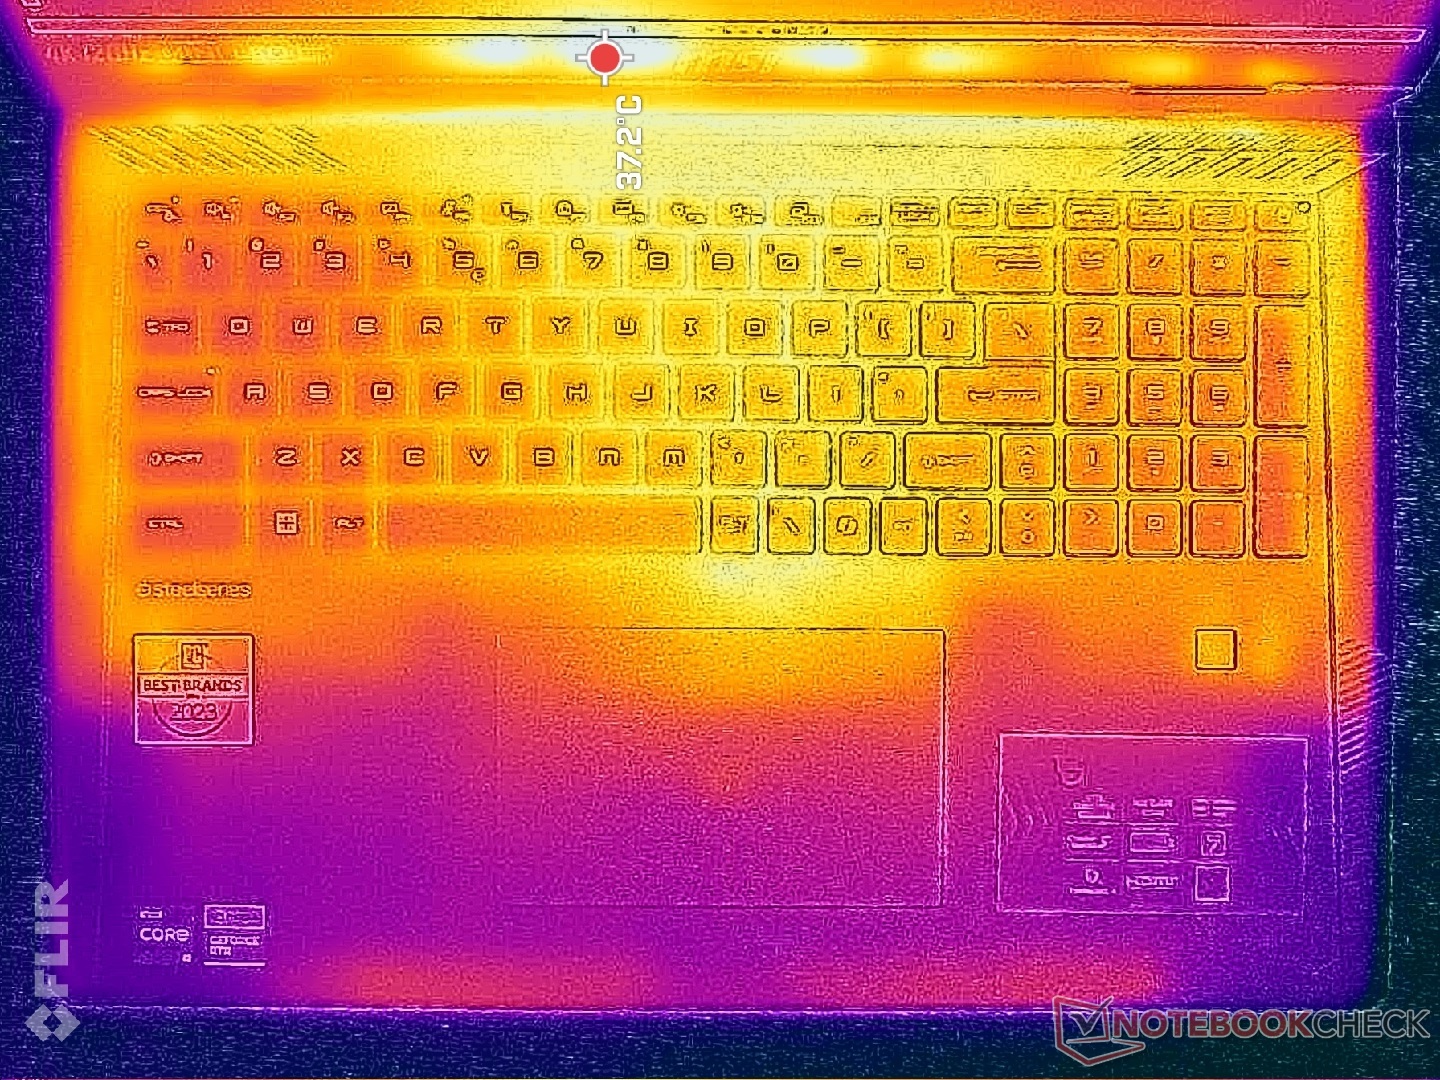
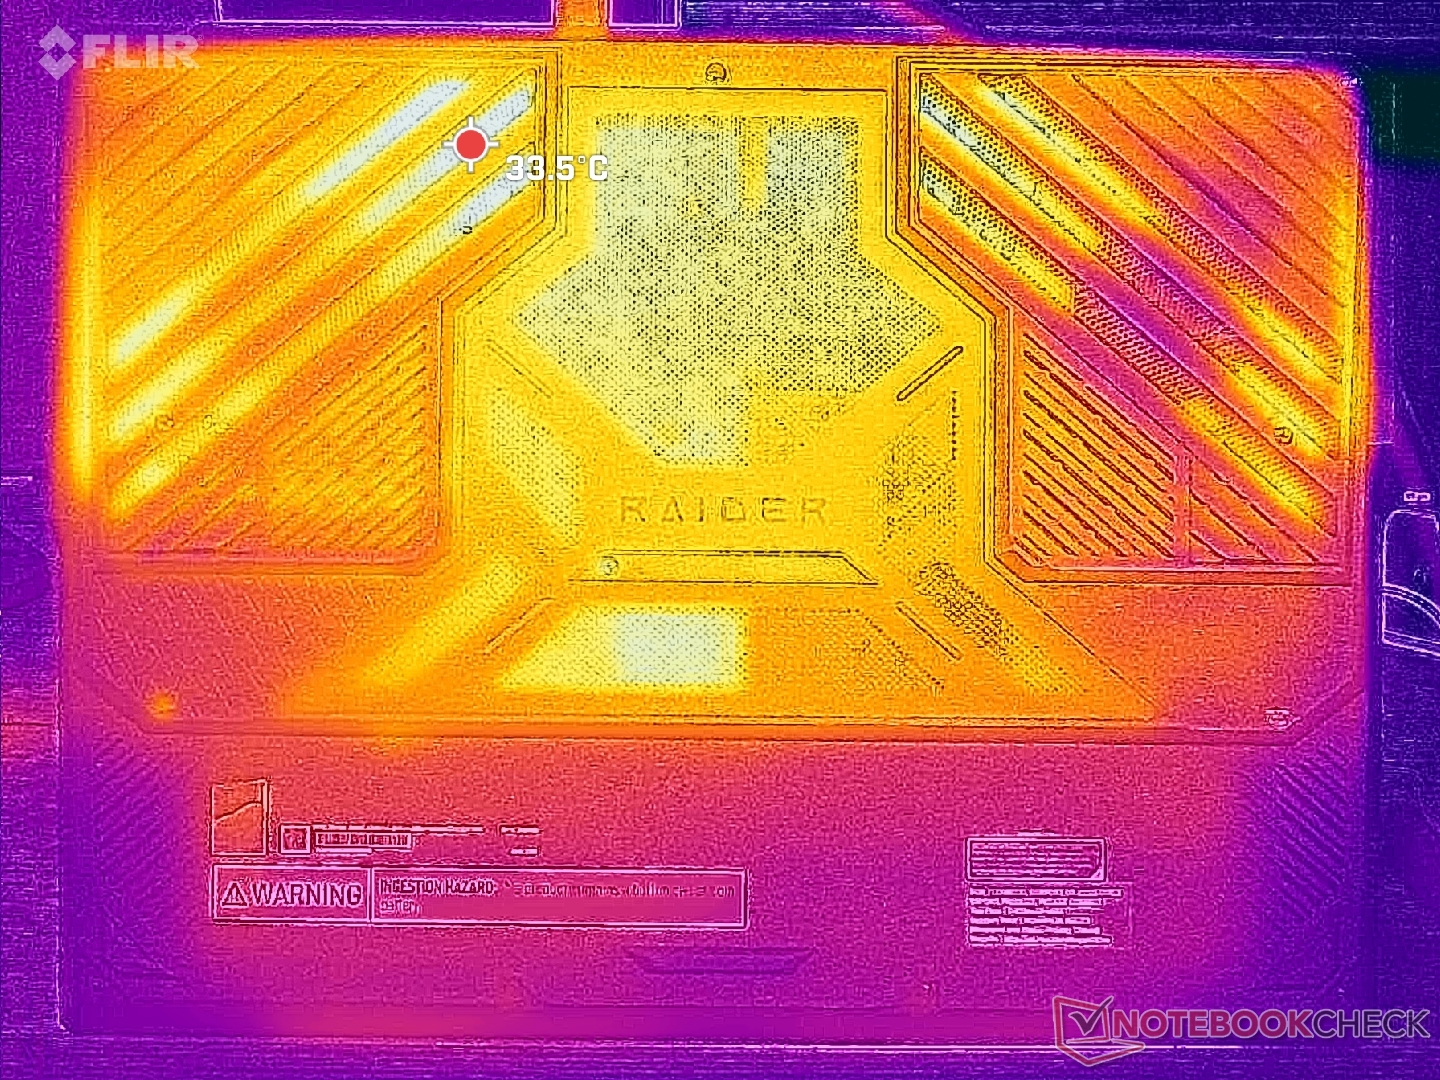
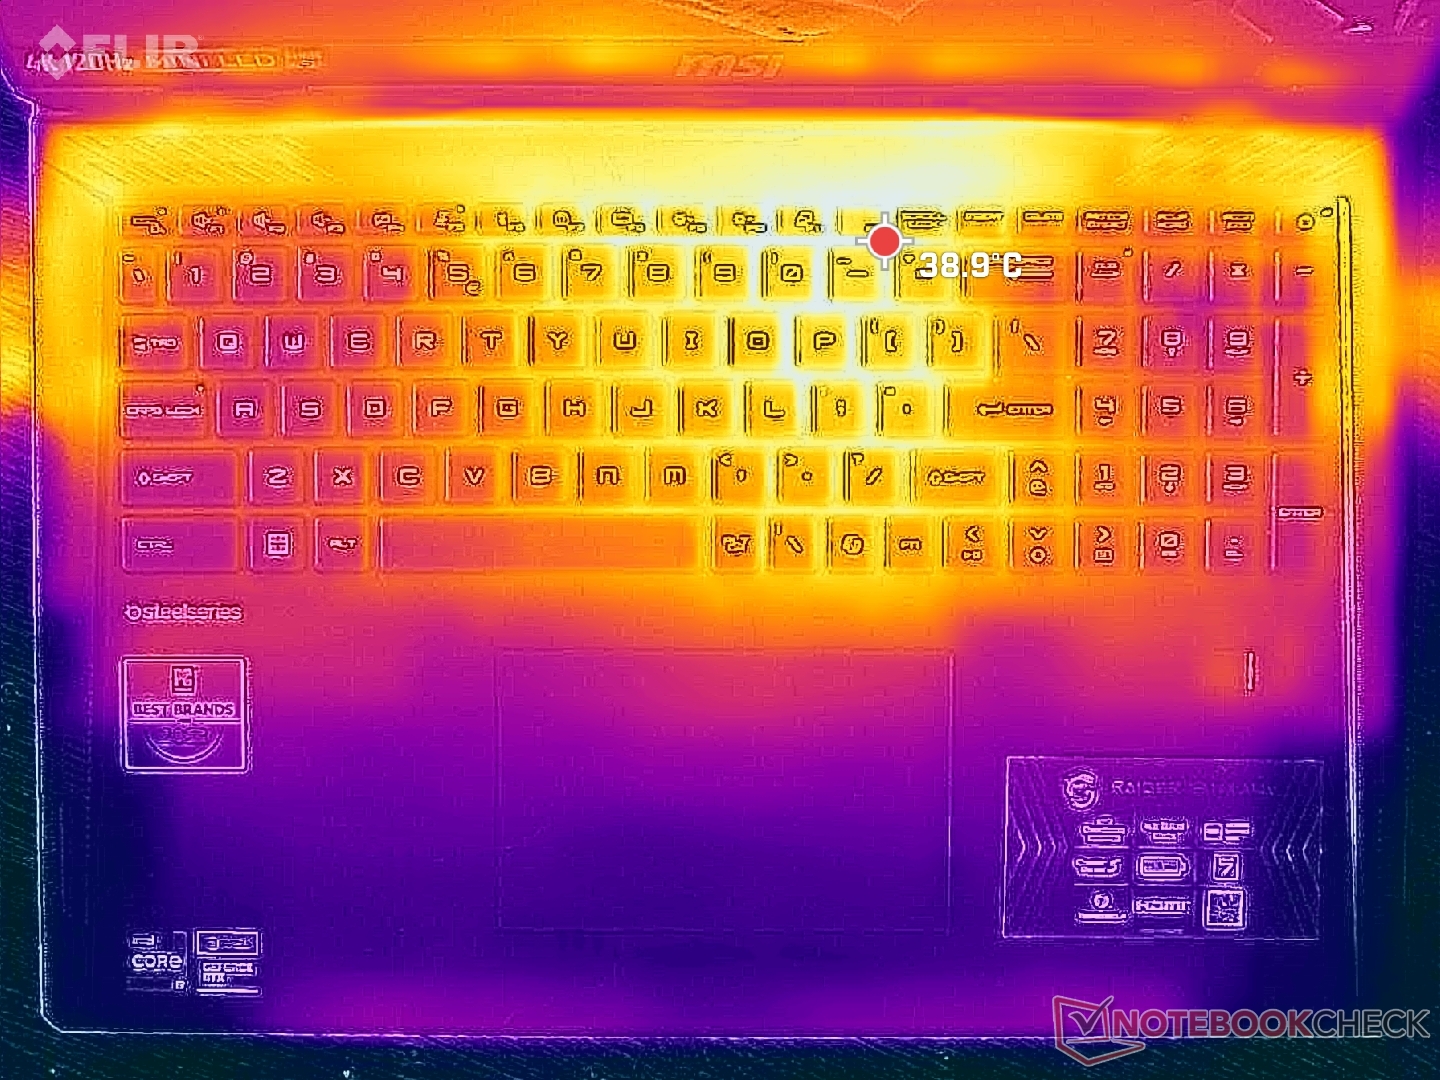
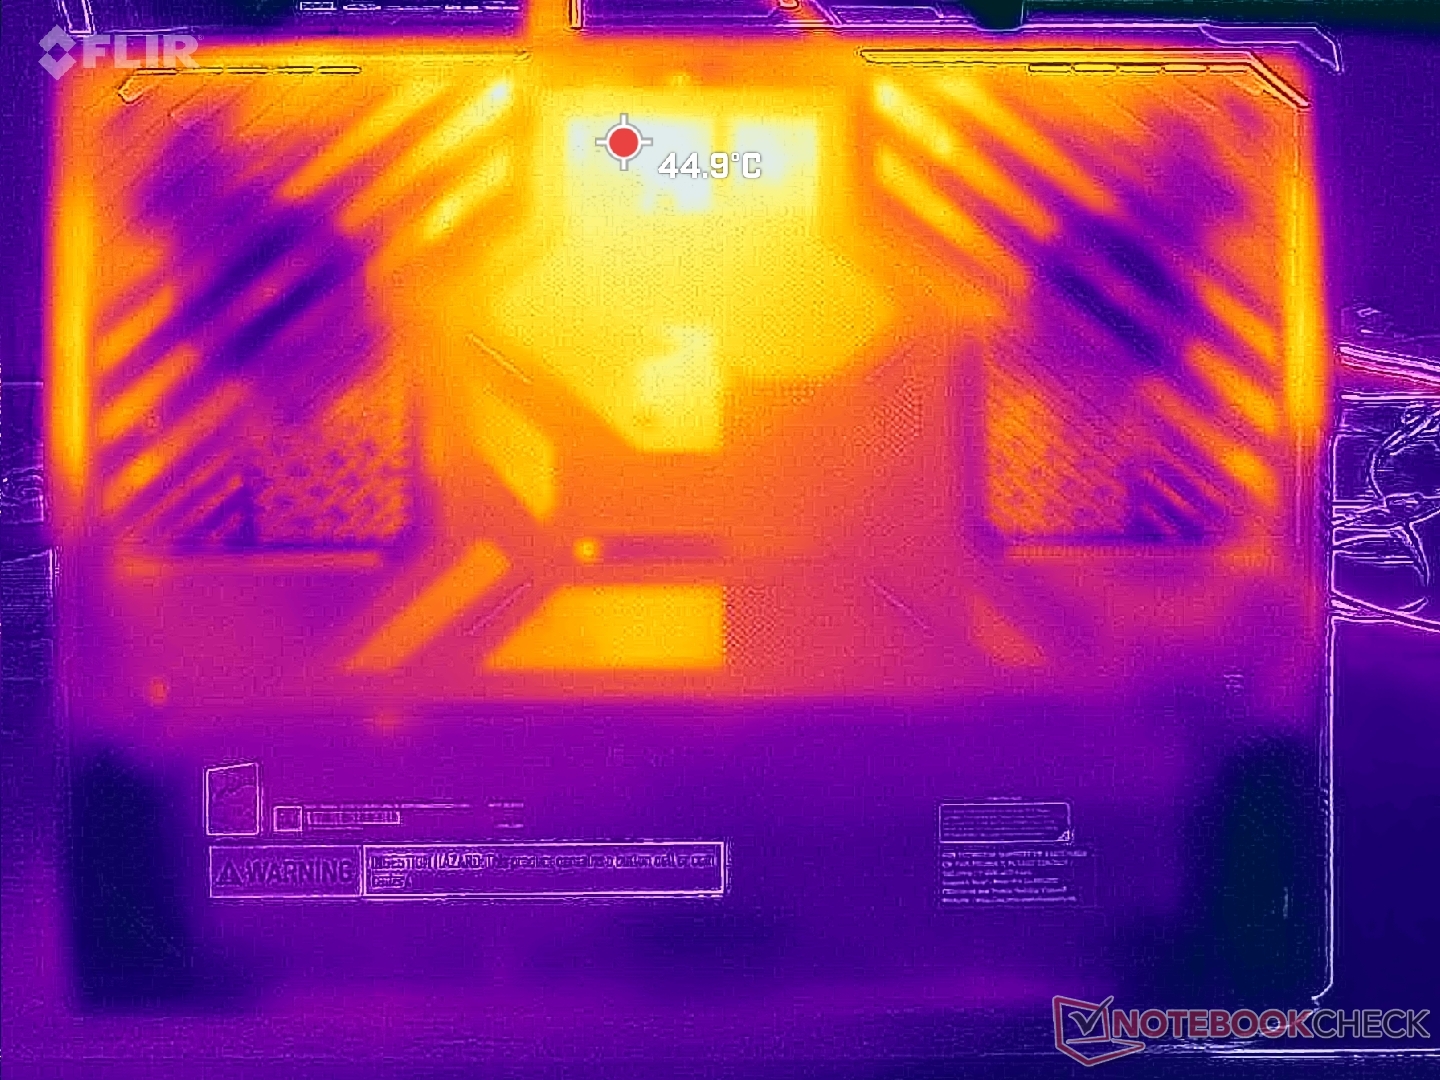
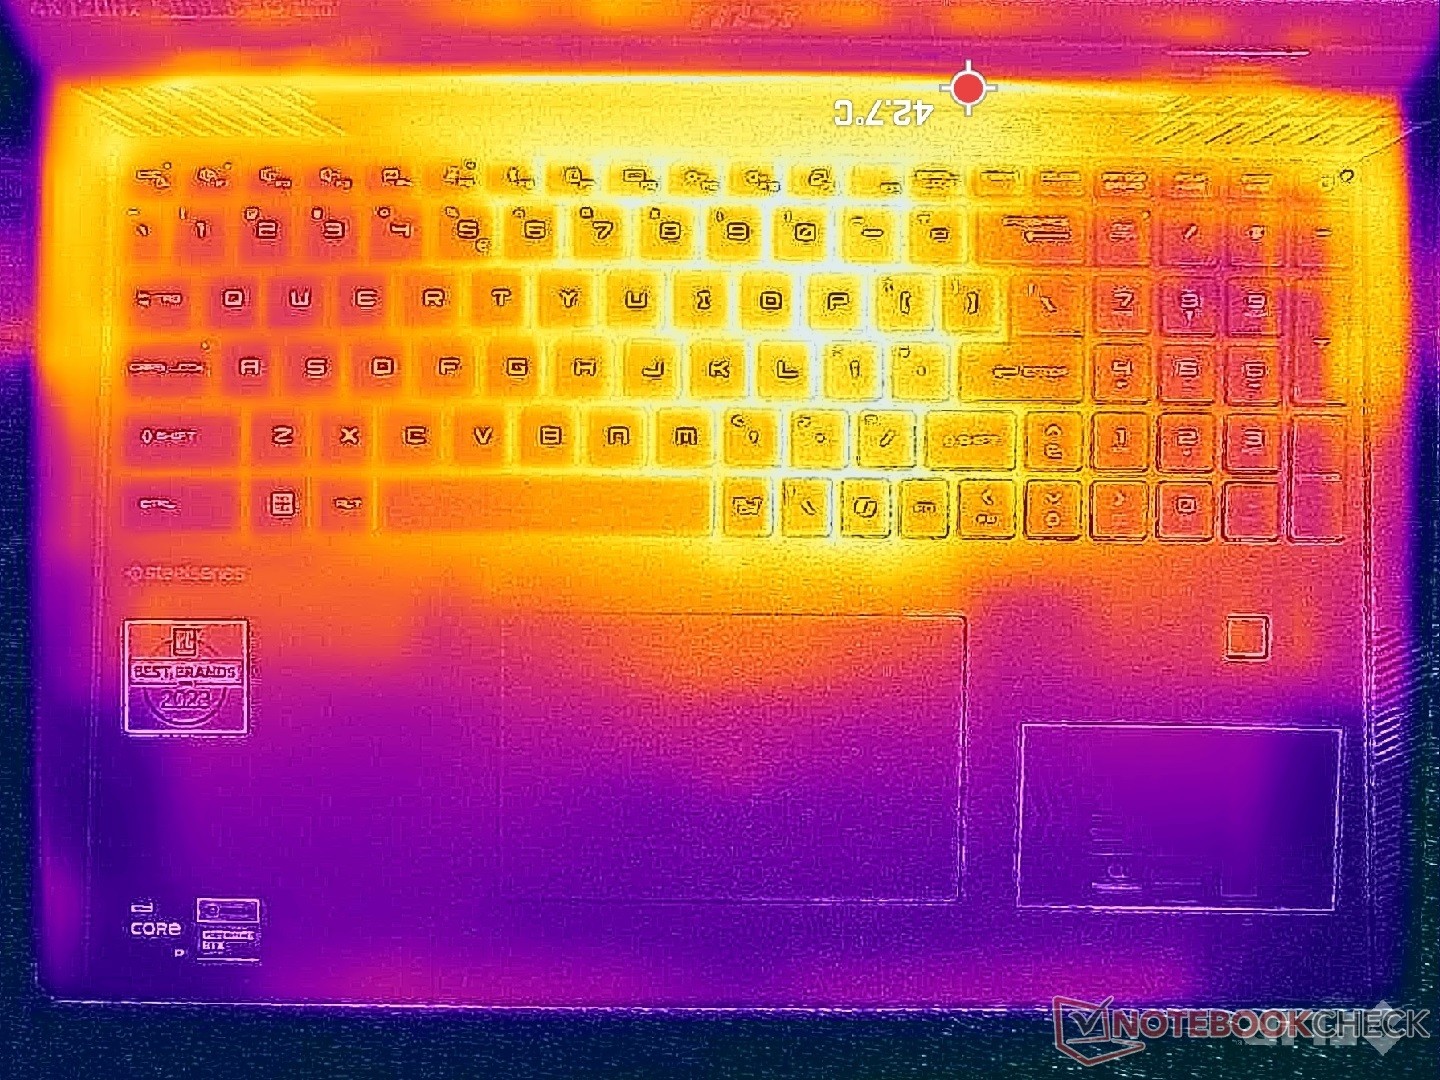
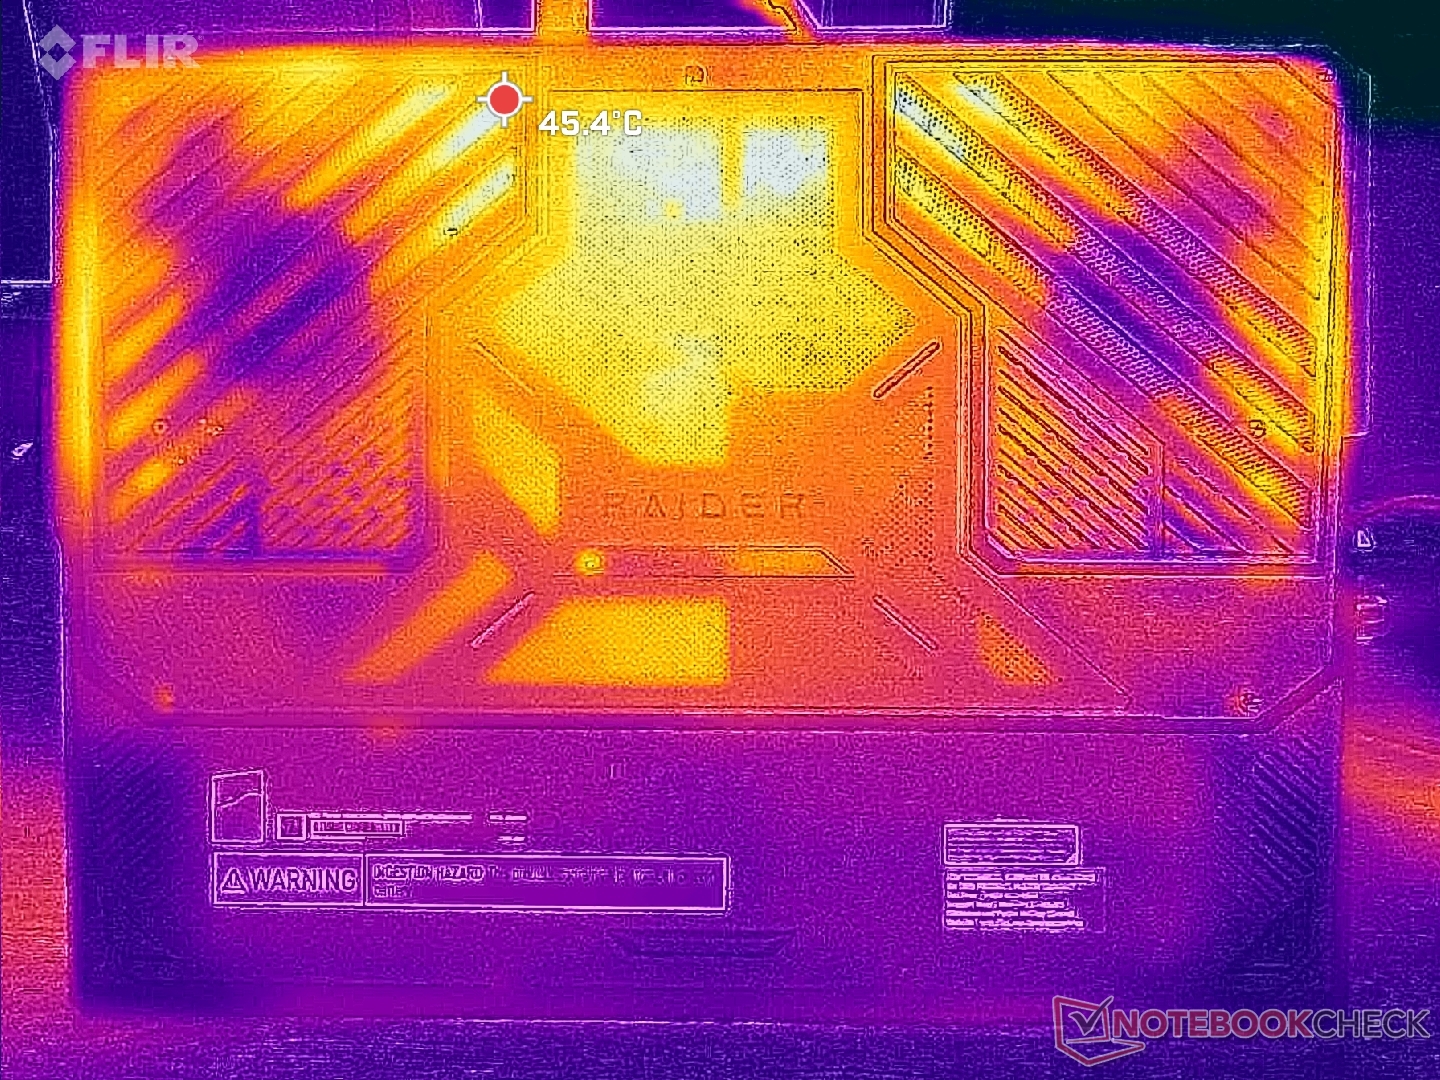
Temperature
Hot spots can reach just over 40 C when gaming just like on the Titan 18 HX. The hotter areas are toward the keyboard center and so the WASD keys, numpad, and palm rests would remain much cooler and more comfortable to the skin.
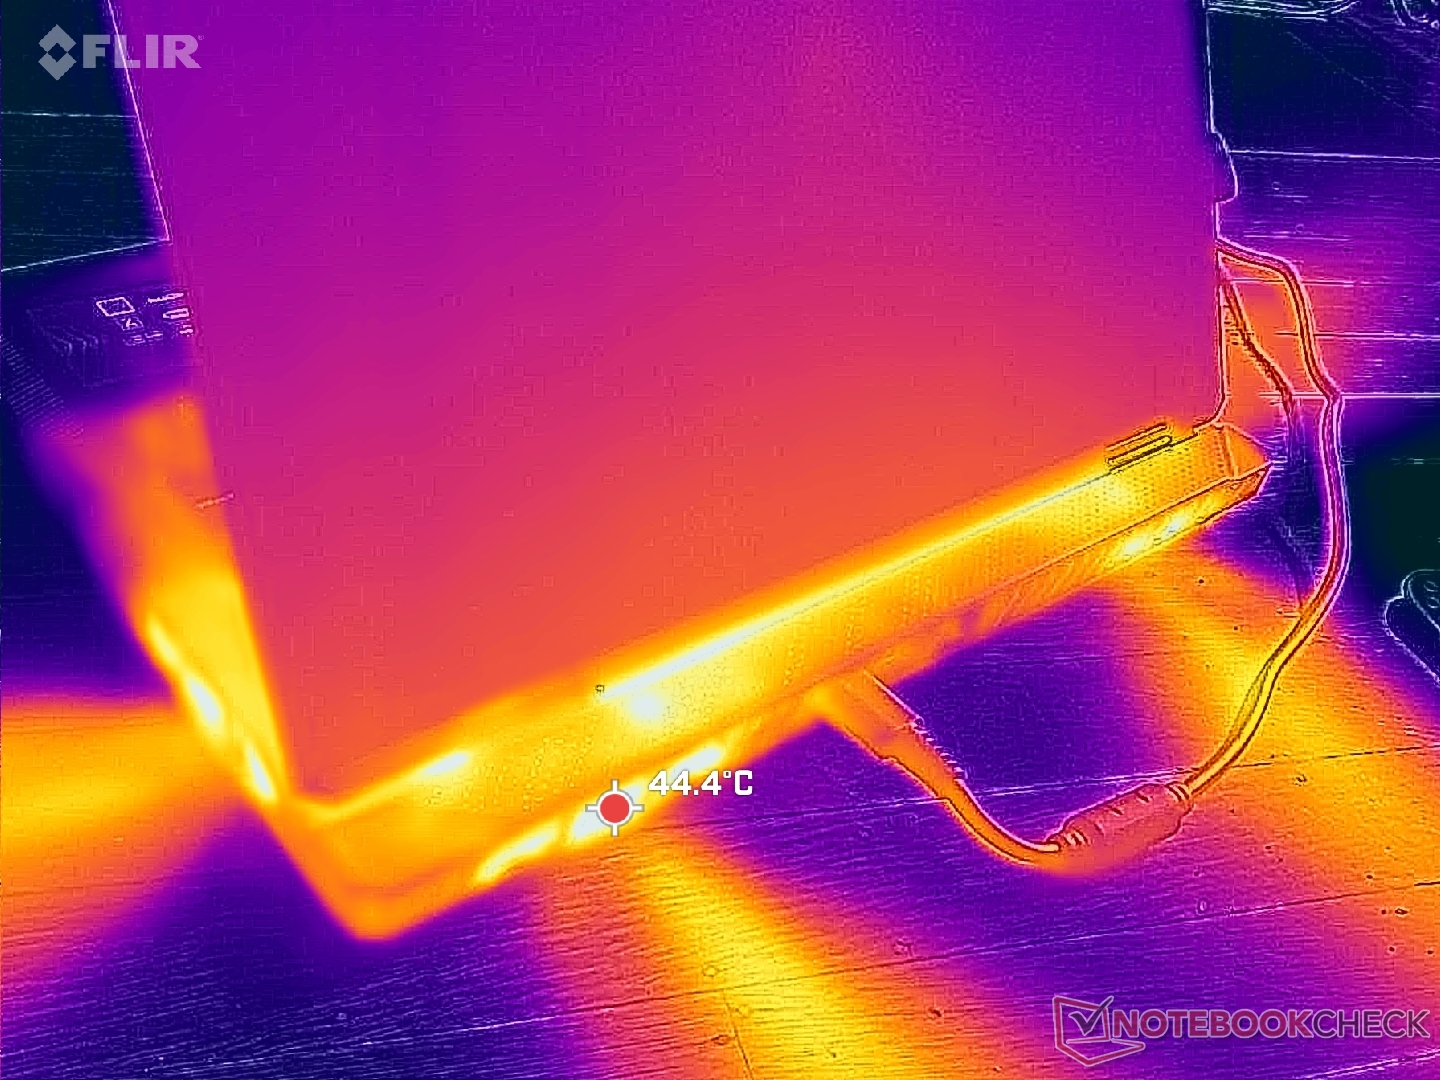
(±) The maximum temperature on the upper side is 40.8 °C / 105 F, compared to the average of 40.4 °C / 105 F, ranging from 21.2 to 68.8 °C for the class Gaming.
(±) The bottom heats up to a maximum of 43.4 °C / 110 F, compared to the average of 43.2 °C / 110 F
(±) In idle usage, the average temperature for the upper side is 33.7 °C / 93 F, compared to the device average of 33.9 °C / 93 F.
(±) 3: The average temperature for the upper side is 34.4 °C / 94 F, compared to the average of 33.9 °C / 93 F for the class Gaming.
(+) The palmrests and touchpad are reaching skin temperature as a maximum (32.6 °C / 90.7 F) and are therefore not hot.
(-) The average temperature of the palmrest area of similar devices was 28.8 °C / 83.8 F (-3.8 °C / -6.9 F).
| MSI Raider 18 HX A14V Intel Core i9-14900HX, NVIDIA GeForce RTX 4080 Laptop GPU | Razer Blade 18 2024 RZ09-0509 Intel Core i9-14900HX, NVIDIA GeForce RTX 4090 Laptop GPU | Alienware m18 R2 Intel Core i9-14900HX, NVIDIA GeForce RTX 4090 Laptop GPU | MSI Titan 18 HX A14VIG Intel Core i9-14900HX, NVIDIA GeForce RTX 4090 Laptop GPU | Asus ROG Strix G18 G814JI Intel Core i7-13650HX, NVIDIA GeForce RTX 4070 Laptop GPU | Acer Predator Helios 18 PH18-72-98MW Intel Core i9-14900HX, NVIDIA GeForce RTX 4090 Laptop GPU | |
|---|---|---|---|---|---|---|
| Heat | -1% | -5% | 6% | 5% | -6% | |
| Maximum Upper Side * (°C) | 40.8 | 43.2 -6% | 41.2 -1% | 37.8 7% | 45 -10% | 43 -5% |
| Maximum Bottom * (°C) | 43.4 | 42.6 2% | 34.6 20% | 37.6 13% | 47 -8% | 59 -36% |
| Idle Upper Side * (°C) | 36.4 | 36 1% | 42.8 -18% | 34.8 4% | 28 23% | 32 12% |
| Idle Bottom * (°C) | 36.4 | 36.4 -0% | 43.6 -20% | 36 1% | 31 15% | 34 7% |
* ... smaller is better
Speakers
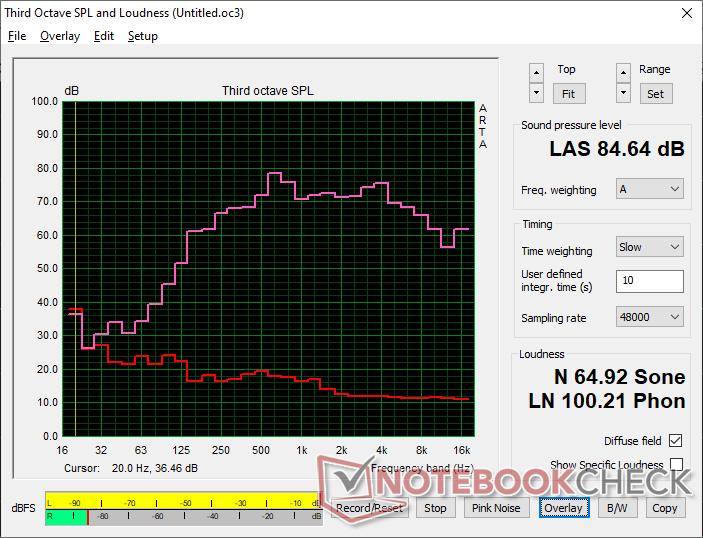
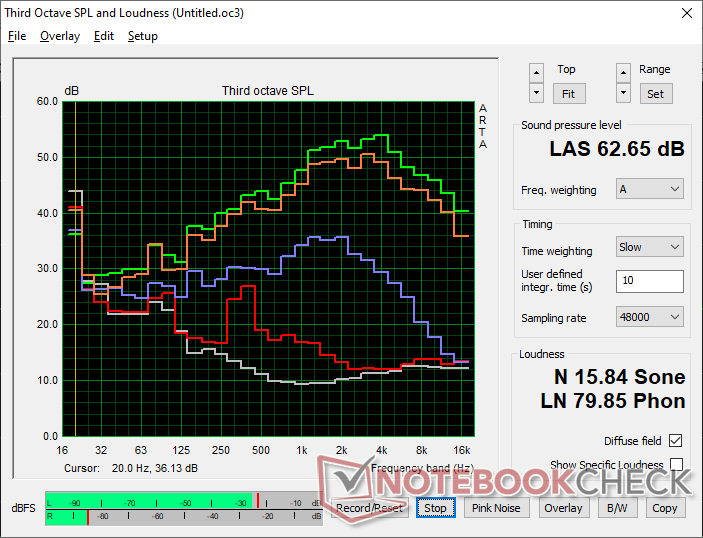
MSI Raider 18 HX A14V audio analysis
(+) | speakers can play relatively loud (84.6 dB)
Bass 100 - 315 Hz
(±) | reduced bass - on average 9.2% lower than median
(±) | linearity of bass is average (9.2% delta to prev. frequency)
Mids 400 - 2000 Hz
(+) | balanced mids - only 4.3% away from median
(+) | mids are linear (5.1% delta to prev. frequency)
Highs 2 - 16 kHz
(+) | balanced highs - only 3.8% away from median
(+) | highs are linear (4.9% delta to prev. frequency)
Overall 100 - 16.000 Hz
(+) | overall sound is linear (11.9% difference to median)
Compared to same class
» 12% of all tested devices in this class were better, 4% similar, 84% worse
» The best had a delta of 6%, average was 18%, worst was 132%
Compared to all devices tested
» 9% of all tested devices were better, 2% similar, 89% worse
» The best had a delta of 4%, average was 24%, worst was 134%
Apple MacBook Pro 16 2021 M1 Pro audio analysis
(+) | speakers can play relatively loud (84.7 dB)
Bass 100 - 315 Hz
(+) | good bass - only 3.8% away from median
(+) | bass is linear (5.2% delta to prev. frequency)
Mids 400 - 2000 Hz
(+) | balanced mids - only 1.3% away from median
(+) | mids are linear (2.1% delta to prev. frequency)
Highs 2 - 16 kHz
(+) | balanced highs - only 1.9% away from median
(+) | highs are linear (2.7% delta to prev. frequency)
Overall 100 - 16.000 Hz
(+) | overall sound is linear (4.6% difference to median)
Compared to same class
» 0% of all tested devices in this class were better, 0% similar, 100% worse
» The best had a delta of 5%, average was 17%, worst was 45%
Compared to all devices tested
» 0% of all tested devices were better, 0% similar, 100% worse
» The best had a delta of 4%, average was 24%, worst was 134%
Energy Management
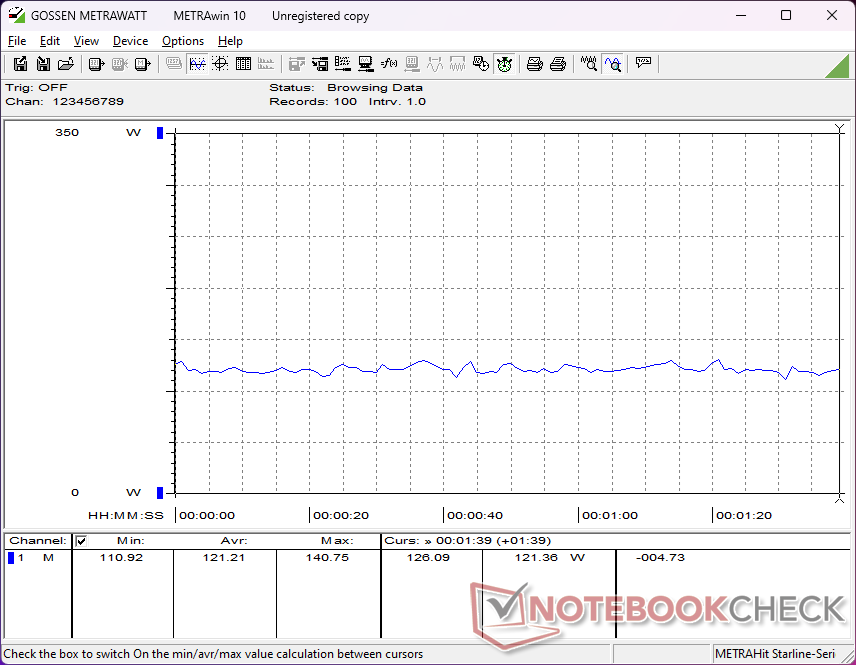
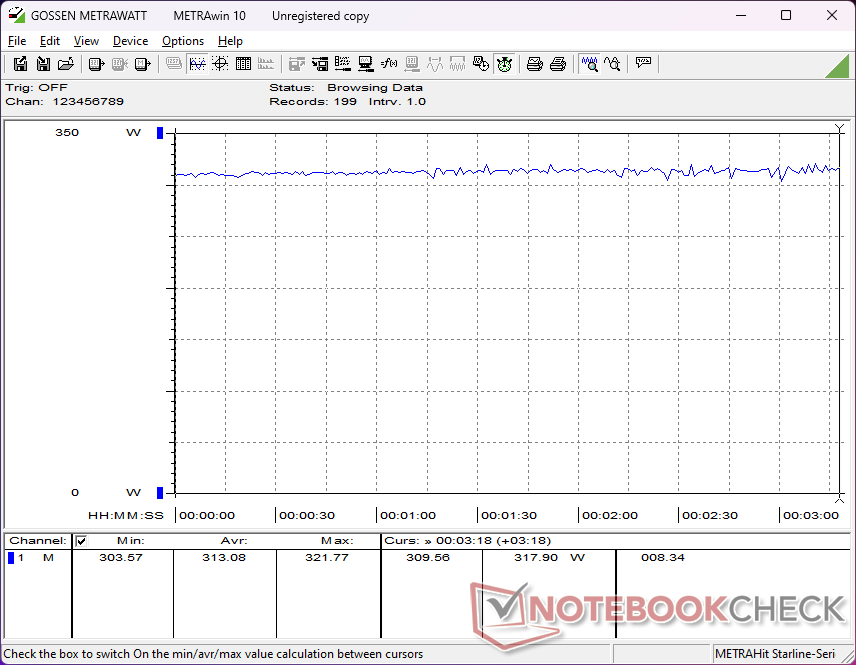
Power Consumption
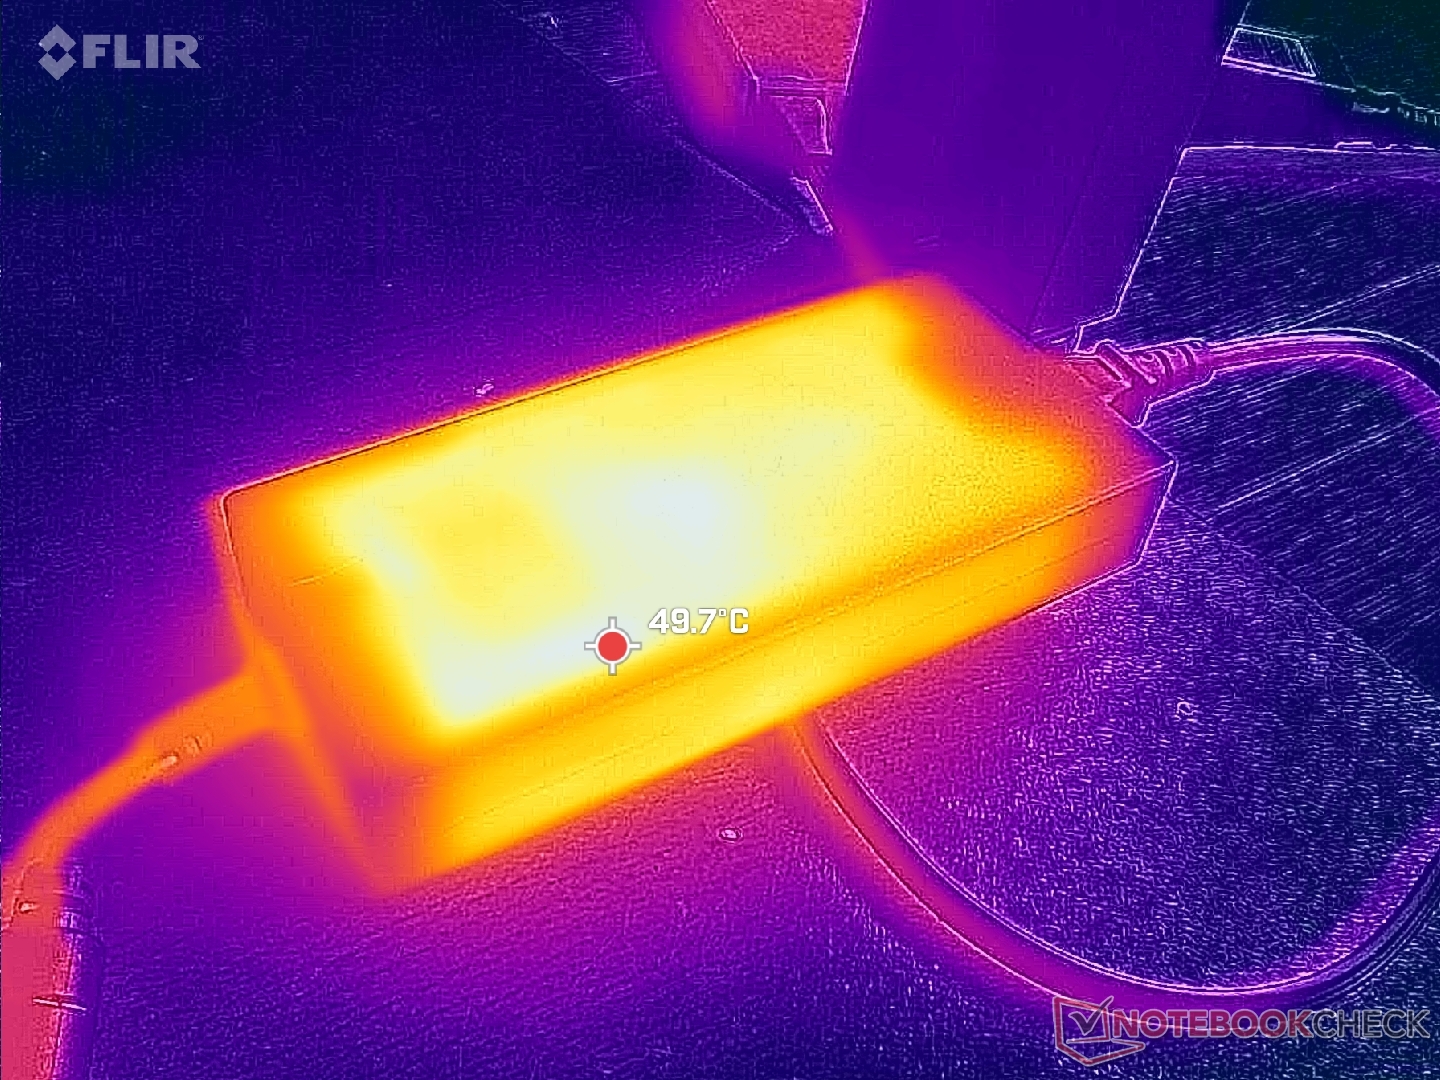
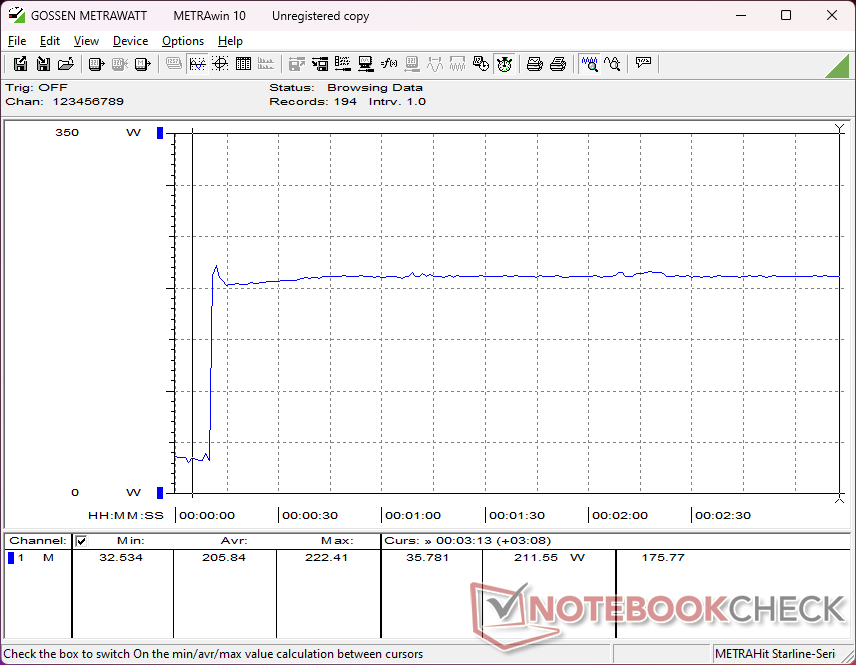
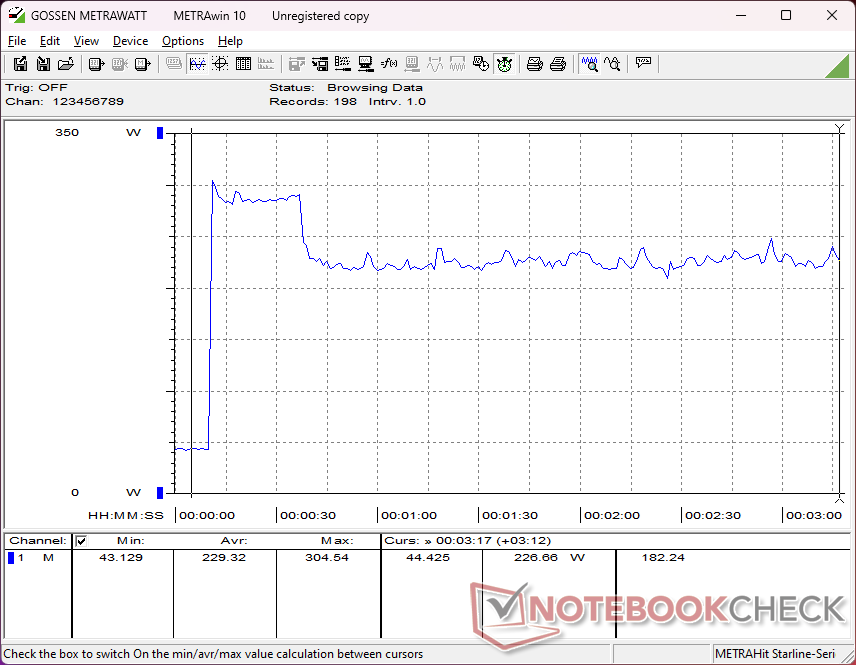
Overall consumption is very high as to be expected from an 18-inch DTR equipped with a demanding 4K mini-LED panel. Idling on desktop consumes between 27 W and 48 W depending on the brightness setting, GPU setting, and power profile setting. Gaming would demand just over 300 W compared to only 220 W on the Acer Predator Helios 18.
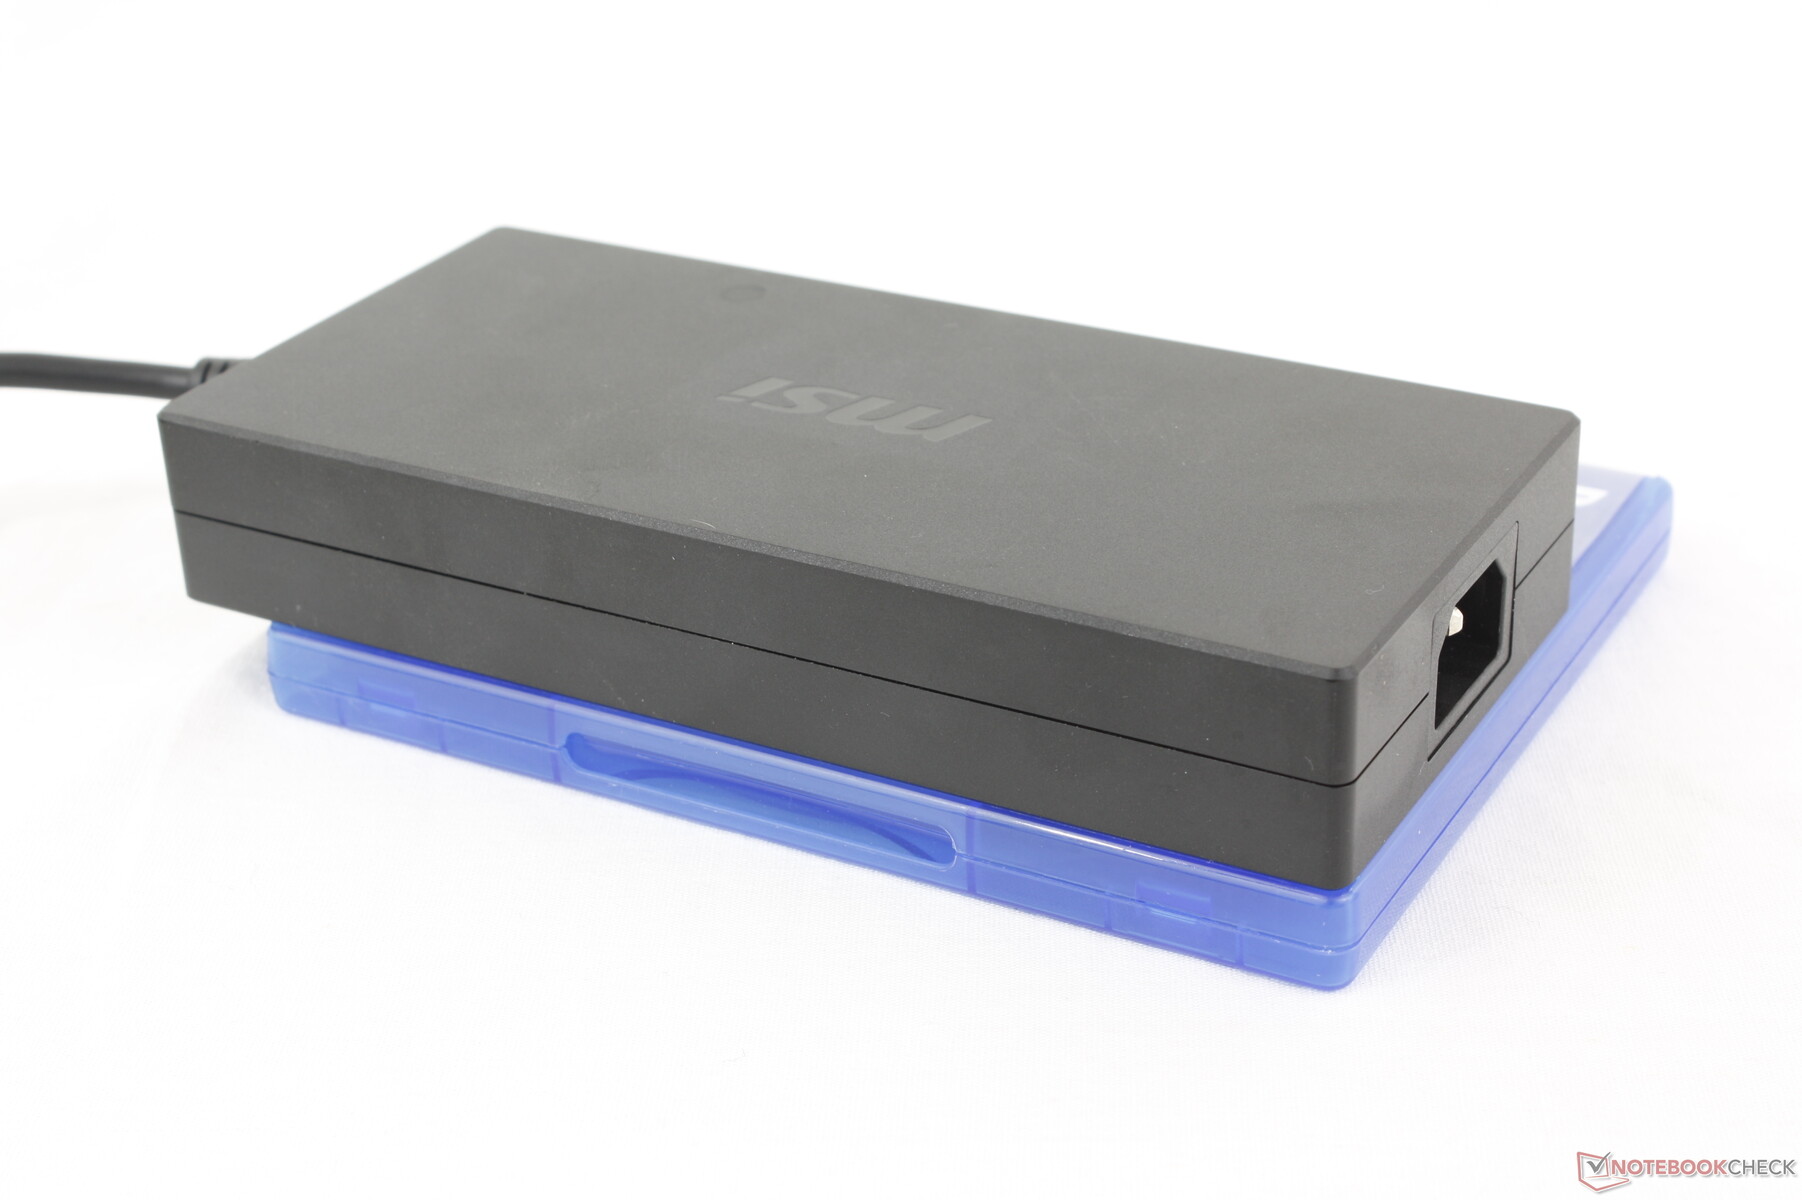
We're able to record a consumption of up to 322 W from the large 330 W AC adapter. When compared to the 400 W AC adapter for the Titan 18 HX, the 330 W one is slightly smaller (~18.4 x 8.4 x 3.1 cm vs. ~18.8 x 8.8 x 3.2 cm). Consumption when running CPU-intensive tasks is generally lower on the Raider 18 HX even though it ships with the same CPU as the Titan 18 HX which aligns with the slightly slower CPU performance as recorded in our CineBench section above.
| Off / Standby | |
| Idle | |
| Load |
|
Key:
min: | |
| MSI Raider 18 HX A14V i9-14900HX, GeForce RTX 4080 Laptop GPU, Samsung PM9A1 MZVL22T0HBLB, Mini-LED, 3840x2400, 18" | Razer Blade 18 2024 RZ09-0509 i9-14900HX, GeForce RTX 4090 Laptop GPU, , Mini-LED, 2560x1600, 18" | Alienware m18 R2 i9-14900HX, GeForce RTX 4090 Laptop GPU, SK Hynix PC811 HFS002TEM9X152N, IPS, 2560x1600, 18" | MSI Titan 18 HX A14VIG i9-14900HX, GeForce RTX 4090 Laptop GPU, 2x Samsung PM9A1a MZVL22T0HDLB (RAID 0), Mini-LED, 3840x2400, 18" | Asus ROG Strix G18 G814JI i7-13650HX, GeForce RTX 4070 Laptop GPU, Micron 2400 MTFDKBA1T0QFM, IPS, 2560x1600, 18" | Acer Predator Helios 18 PH18-72-98MW i9-14900HX, GeForce RTX 4090 Laptop GPU, 2x SK Hynix HFS001TEJ9X115N (RAID 0), Mini-LED, 2560x1600, 18" | |
|---|---|---|---|---|---|---|
| Power Consumption | -2% | 8% | 5% | 42% | -2% | |
| Idle Minimum * (Watt) | 27.7 | 25.4 8% | 10.6 62% | 13.2 52% | 8 71% | 31 -12% |
| Idle Average * (Watt) | 38.3 | 37.7 2% | 20.9 45% | 25.4 34% | 15 61% | 35 9% |
| Idle Maximum * (Watt) | 47.1 | 57.9 -23% | 40 15% | 53.5 -14% | 26 45% | 43 9% |
| Load Average * (Watt) | 121.2 | 128.4 -6% | 201.1 -66% | 151.4 -25% | 102 16% | 144 -19% |
| Cyberpunk 2077 ultra * (Watt) | 313 | |||||
| Cyberpunk 2077 ultra external monitor * (Watt) | 306 | |||||
| Load Maximum * (Watt) | 321.8 | 297.9 7% | 378.9 -18% | 395.2 -23% | 267 17% | 318 1% |
| Witcher 3 ultra * (Watt) | 273.1 | 358 | 336 | 178.6 | 228 |
* ... smaller is better
Power Consumption Cyberpunk / Stress Test
Power Consumption external Monitor
Battery Life
Runtimes are short due to the demanding hardware. We're able to record just over 3 hours of real-world WLAN usage even when set to Battery Saver mode and iGPU mode whereas the ROG Strix G18 can last for over twice as long with its IPS display. Battery capacity is already at its legal maximum of 99.9 Wh.
Charging from empty to full capacity takes almost 2.5 hours which is a bit longer than on most other laptops. Charging with third-party USB-C AC adapters will be even slower.
| MSI Raider 18 HX A14V i9-14900HX, GeForce RTX 4080 Laptop GPU, 99.9 Wh | Razer Blade 18 2024 RZ09-0509 i9-14900HX, GeForce RTX 4090 Laptop GPU, 91.7 Wh | Alienware m18 R2 i9-14900HX, GeForce RTX 4090 Laptop GPU, 97 Wh | MSI Titan 18 HX A14VIG i9-14900HX, GeForce RTX 4090 Laptop GPU, 99.9 Wh | Asus ROG Strix G18 G814JI i7-13650HX, GeForce RTX 4070 Laptop GPU, 90 Wh | Acer Predator Helios 18 PH18-72-98MW i9-14900HX, GeForce RTX 4090 Laptop GPU, 90 Wh | |
|---|---|---|---|---|---|---|
| Battery runtime | 20% | 45% | 18% | 101% | -9% | |
| Reader / Idle (h) | 4.4 | 6.6 50% | 5.9 34% | 11.7 166% | ||
| WiFi v1.3 (h) | 3.3 | 4.4 33% | 4.8 45% | 4.2 27% | 8.1 145% | 3.2 -3% |
| Load (h) | 1.3 | 1 -23% | 1.2 -8% | 1.2 -8% | 1.1 -15% |
Pros
Cons
Verdict — A Titan At Heart
When we reviewed the Titan 18 HX earlier this year, we praised its performance but were shocked upon learning of its >$5000 USD asking price. The fact that the CPU and GPU were effectively nothing new only made the model that much less appealing. The Raider 18 HX addresses the exorbitantly high price of the Titan 18 HX by trimming the fat while keeping the same CPU, GPU, and display options. Raider owners lose out on the backlit clickpad, vapor chamber cooling, mechanical keys, and tertiary M.2 SSD support, but such luxury features are easy to part with when the gaming experience between the Raider and Titan is otherwise exactly the same. In fact, one can argue that the Raider is more comfortable to use as its traditional clickpad and membraned-based keyboard feel more familiar than the atypical approach on the Titan.
The Raider 18 HX squeezes every ounce of performance it can from the Core i9 CPU and 175 W GPU even if it has to be bigger, heavier, and oftentimes louder than many of its competitors.
When compared to other 18-inch gaming laptops, the Raider 18 HX offers a more spacious typing experience and four SODIMM slots whereas alternatives like the Blade 18 or ROG Strix G18 have no numpad at all or can support only two SODIMM modules. However, the MSI system is still noticeably larger and heavier than most of the competition and it doesn't necessarily run any quieter to make up for it. CPU and GPU performance may be slightly faster, but many users may not notice in practice. In this case, you'll have to value the easier servicing and 4K mini-LED options of the Raider to justify its weight.
Price and Availability
The MSI Raider 18 HX as configured in our review is now available on Amazon for $3190. Alternative, the IPS version is also available for $3290.
Note: We have recently updated our rating system and the results of version 8 are not comparable with the results of version 7. More information is available here .
MSI Raider 18 HX A14V
- 09/03/2024 v8
Allen Ngo
 Total Sustainability Score:
 Transparency
The selection of devices to be reviewed is made by our editorial team. The test sample was provided to the author as a loan by the manufacturer or retailer for the purpose of this review. The lender had no influence on this review, nor did the manufacturer receive a copy of this review before publication. There was no obligation to publish this review. As an independent media company, Notebookcheck is not subjected to the authority of manufacturers, retailers or publishers.
This is how Notebookcheck is testing
Every year, Notebookcheck independently reviews hundreds of laptops and smartphones using standardized procedures to ensure that all results are comparable. We have continuously developed our test methods for around 20 years and set industry standards in the process. In our test labs, high-quality measuring equipment is utilized by experienced technicians and editors. These tests involve a multi-stage validation process. Our complex rating system is based on hundreds of well-founded measurements and benchmarks, which maintains objectivity. Further information on our test methods can be found here.
Price comparison
