MSI Vector 16 HX laptop review: Titan performance without the Titan price

Not to be confused with the demised Maingear Vector, the MSI Vector 16 HX succeeds last year's GP68 by introducing new 14th gen Intel Raptor Lake-HX CPU options and a revised chassis design over the aging 15.6-inch GP66. The model made its debut earlier this year at CES 2024 alongside a host of other announcements like the MSI Claw and Titan 18 HX.
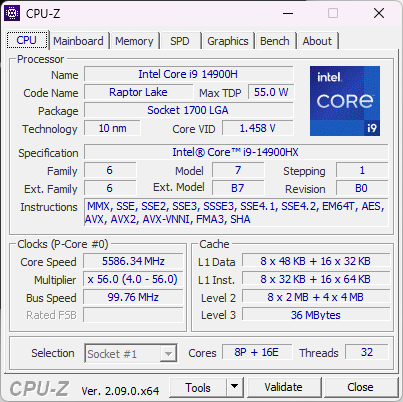
Our review unit is a high-end configuration with the Core i9-14900HX CPU, 175 GeForce RTX 4080 GPU, and 1600p 240 Hz IPS display for approximately $2700 USD retail. Other configurations can be found with RTX 4090, 4070, or 4060 graphics and a 1200p 144 Hz display, but all options at the moment include the same Core i9-14900HX CPU.
Alternatives to the Vector 16 HX include other midrange to high-end 16-inch gaming laptops like the Lenovo Legion 5i 16, Asus TUF Gaming A16 , Alienware m16 R1, or HP Omen 16.
More MSI reviews:
Potential Competitors in Comparison
Rating | Date | Model | Weight | Height | Size | Resolution | Price |
|---|---|---|---|---|---|---|---|
| 88 % v7 (old) | 02 / 2024 | MSI Vector 16 HX A14V i9-14900HX, GeForce RTX 4080 Laptop GPU | 2.7 kg | 28.55 mm | 16.00" | 2560x1600 | |
| 86.9 % v7 (old) | 03 / 2022 | MSI Vector GP66 12UGS i9-12900H, GeForce RTX 3070 Ti Laptop GPU | 2.3 kg | 23.4 mm | 15.60" | 1920x1080 | |
| 89.1 % v7 (old) | 01 / 2024 | Lenovo Legion 5 16IRX G9 i7-14650HX, GeForce RTX 4060 Laptop GPU | 2.4 kg | 25.2 mm | 16.00" | 2560x1600 | |
| 85.1 % v7 (old) | 09 / 2023 | HP Victus 16-r0077ng i7-13700H, GeForce RTX 4070 Laptop GPU | 2.4 kg | 24 mm | 16.10" | 1920x1080 | |
| 86.9 % v7 (old) | 06 / 2023 | Asus TUF Gaming A16 FA617XS R9 7940HS, Radeon RX 7600S | 2.2 kg | 22.1 mm | 16.00" | 1920x1200 | |
| 86.1 % v7 (old) | 10 / 2022 | Dell G16 7620 i7-12700H, GeForce RTX 3060 Laptop GPU | 2.6 kg | 26.9 mm | 16.00" | 2560x1600 |
Case — Strong, But Nothing Fancy
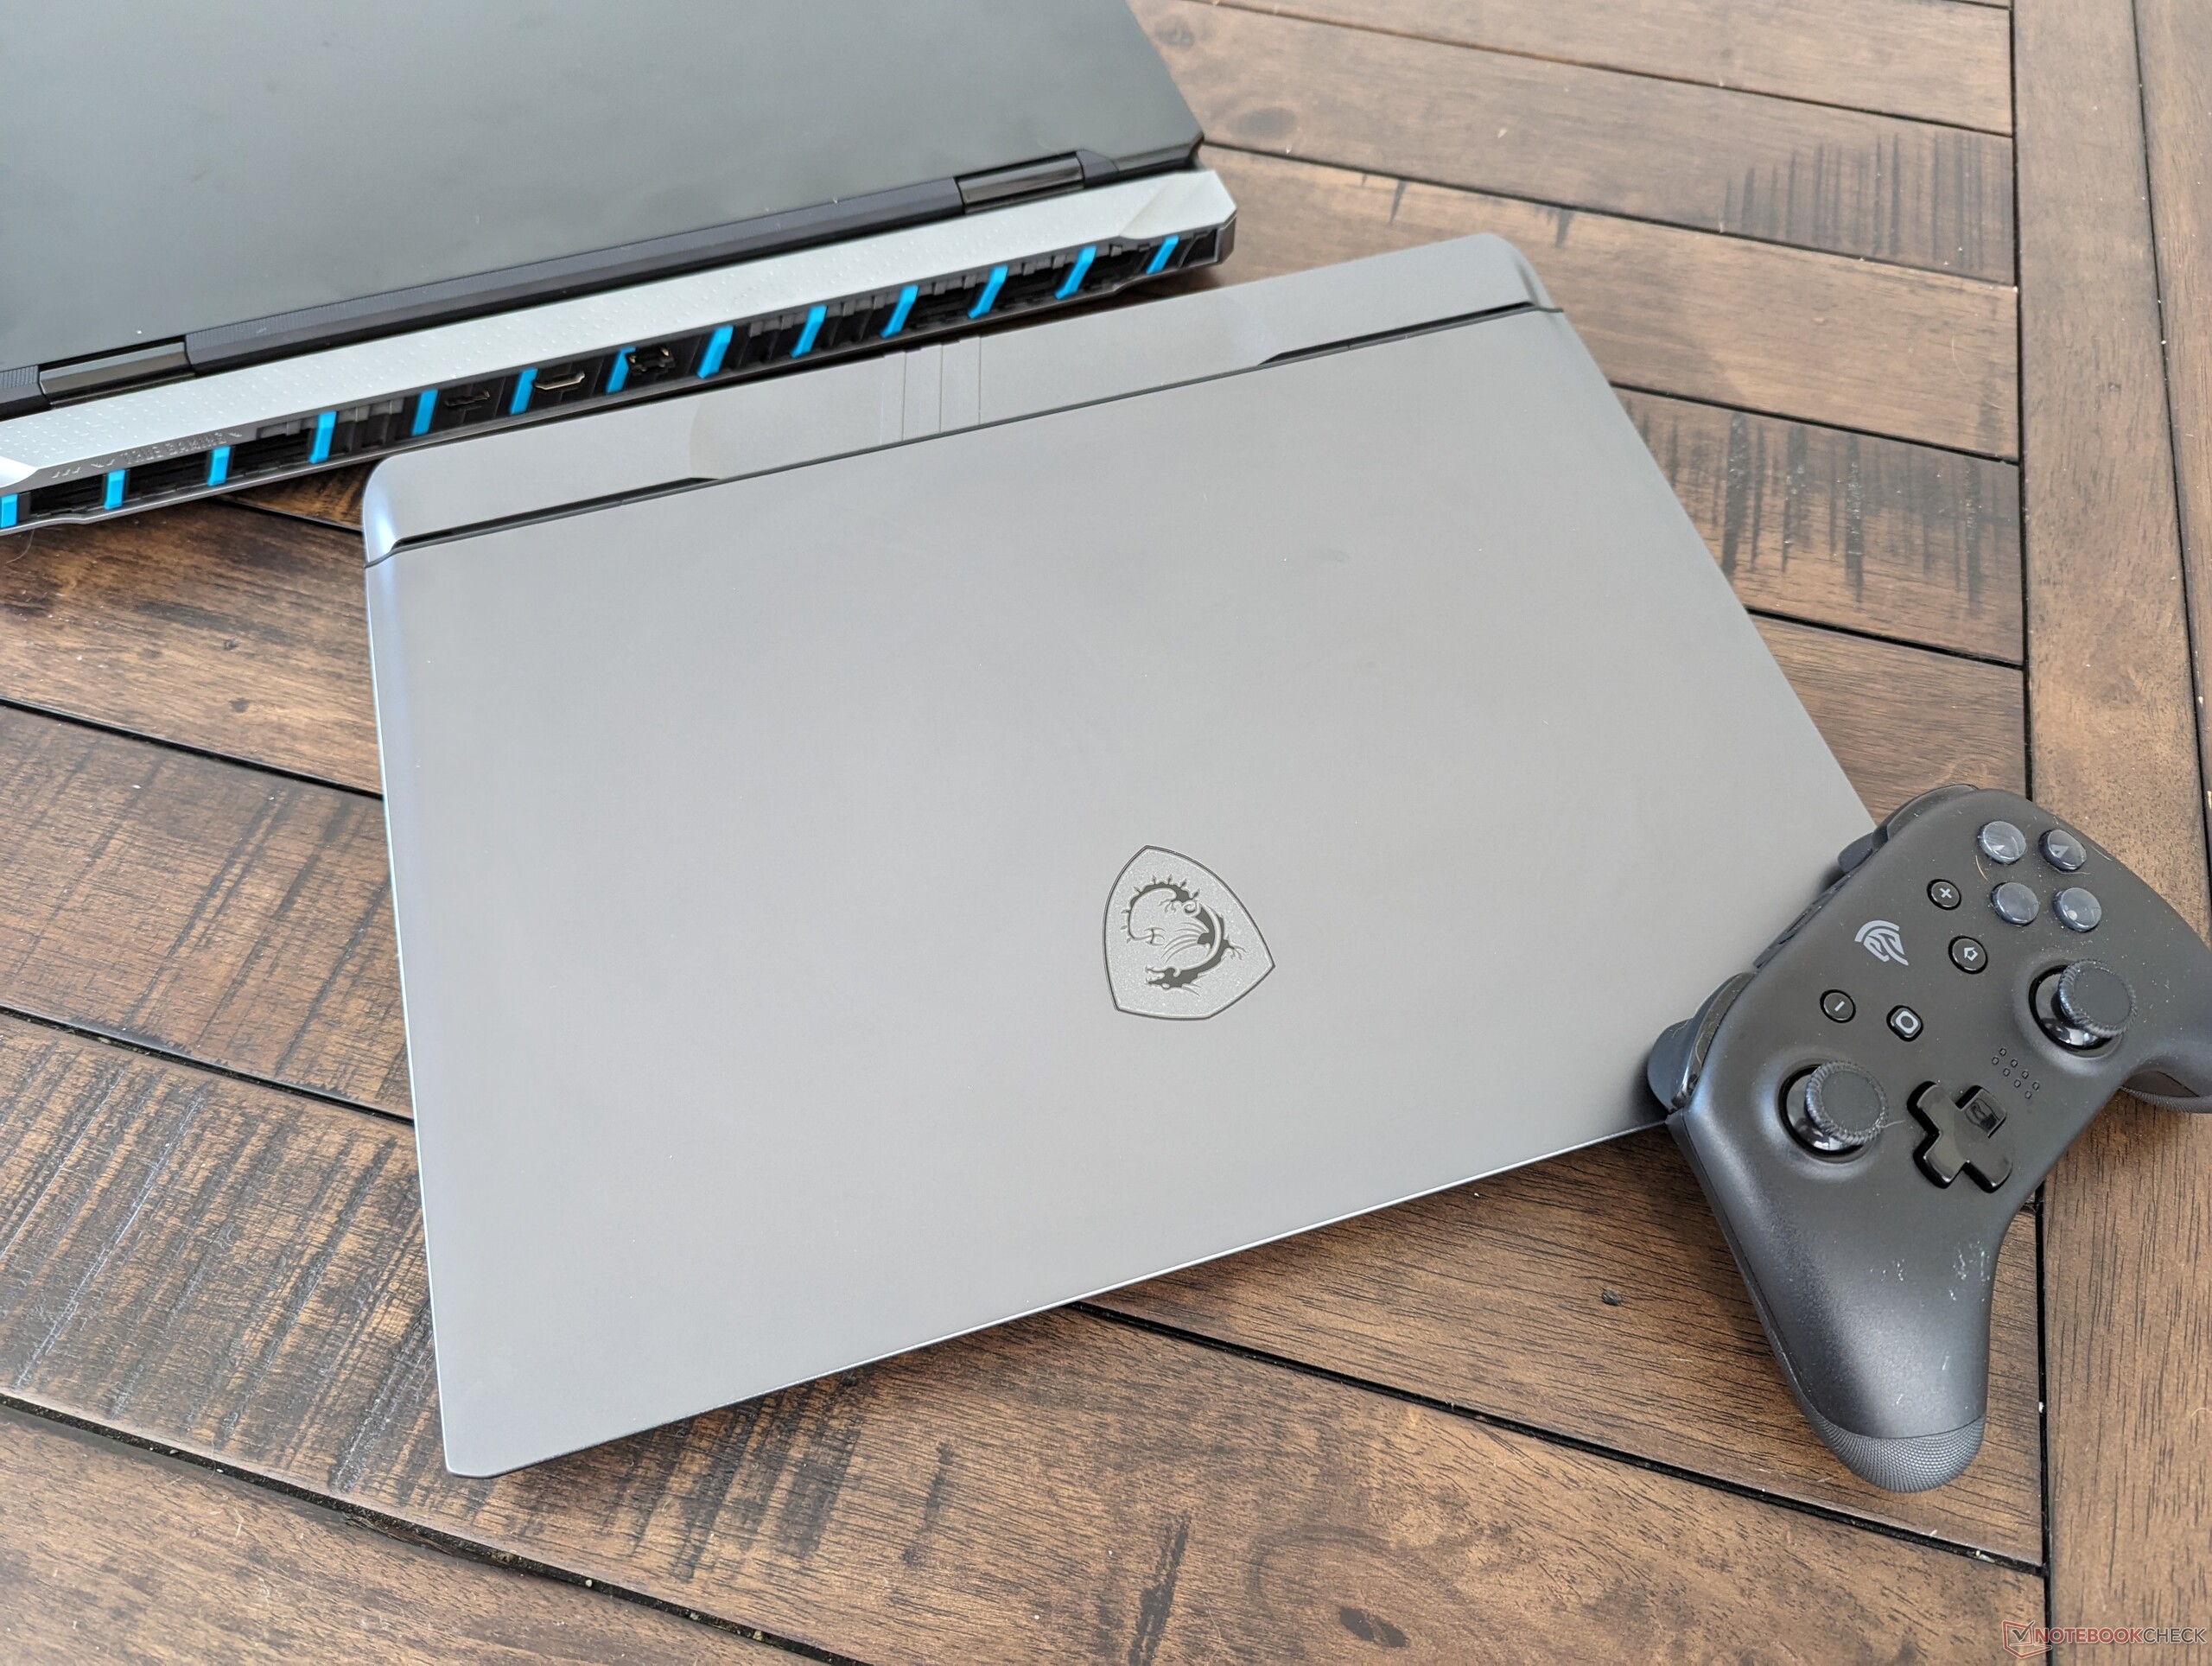
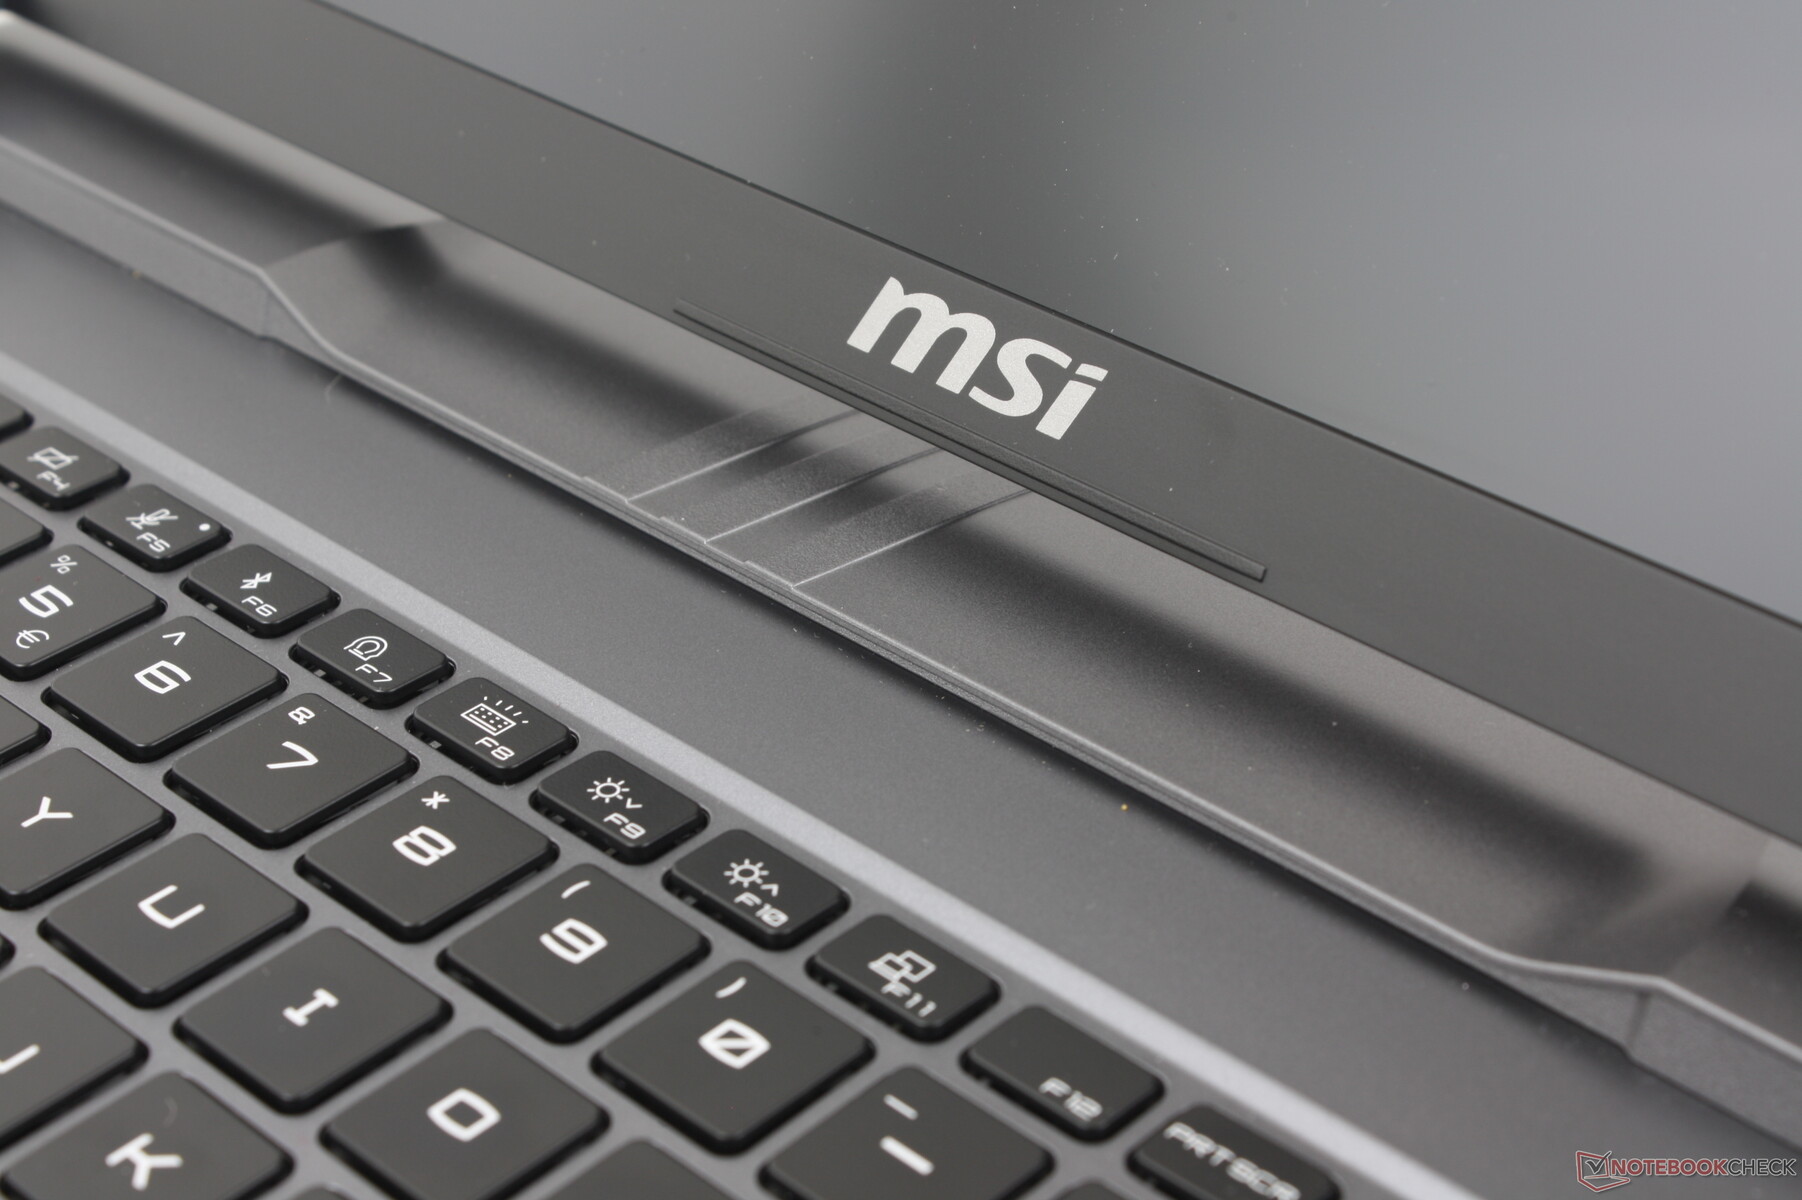
Aside from the metal alloy outer lid, most of the base is plastic for a less luxurious experience when compared to the pricier Titan HX. The Vector series isn't supposed to be top of the line, but we expect a bit more nonetheless considering the ~$2000 asking price. Its keyboard deck and bottom panel lack the premium feel of alternatives like the Razer Blade 16 or Alienware m16 R1.
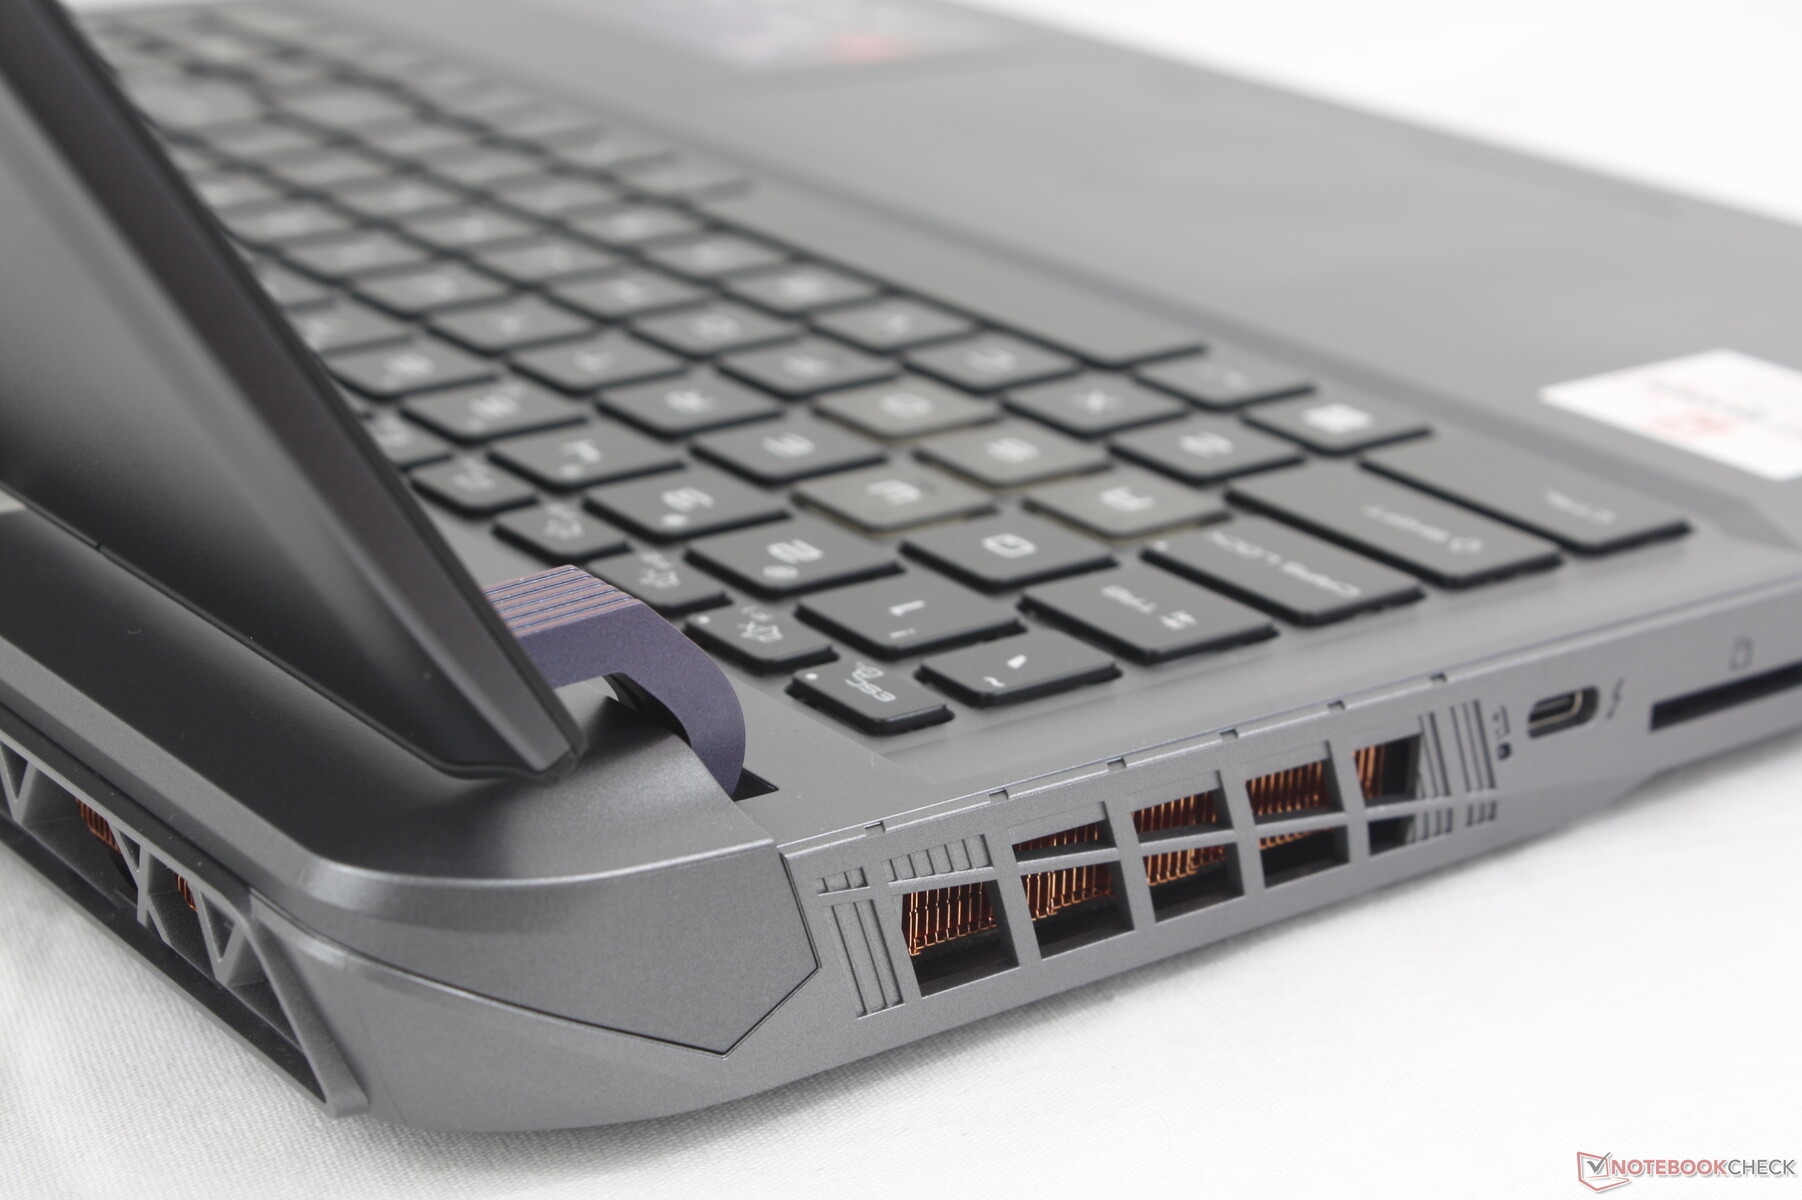
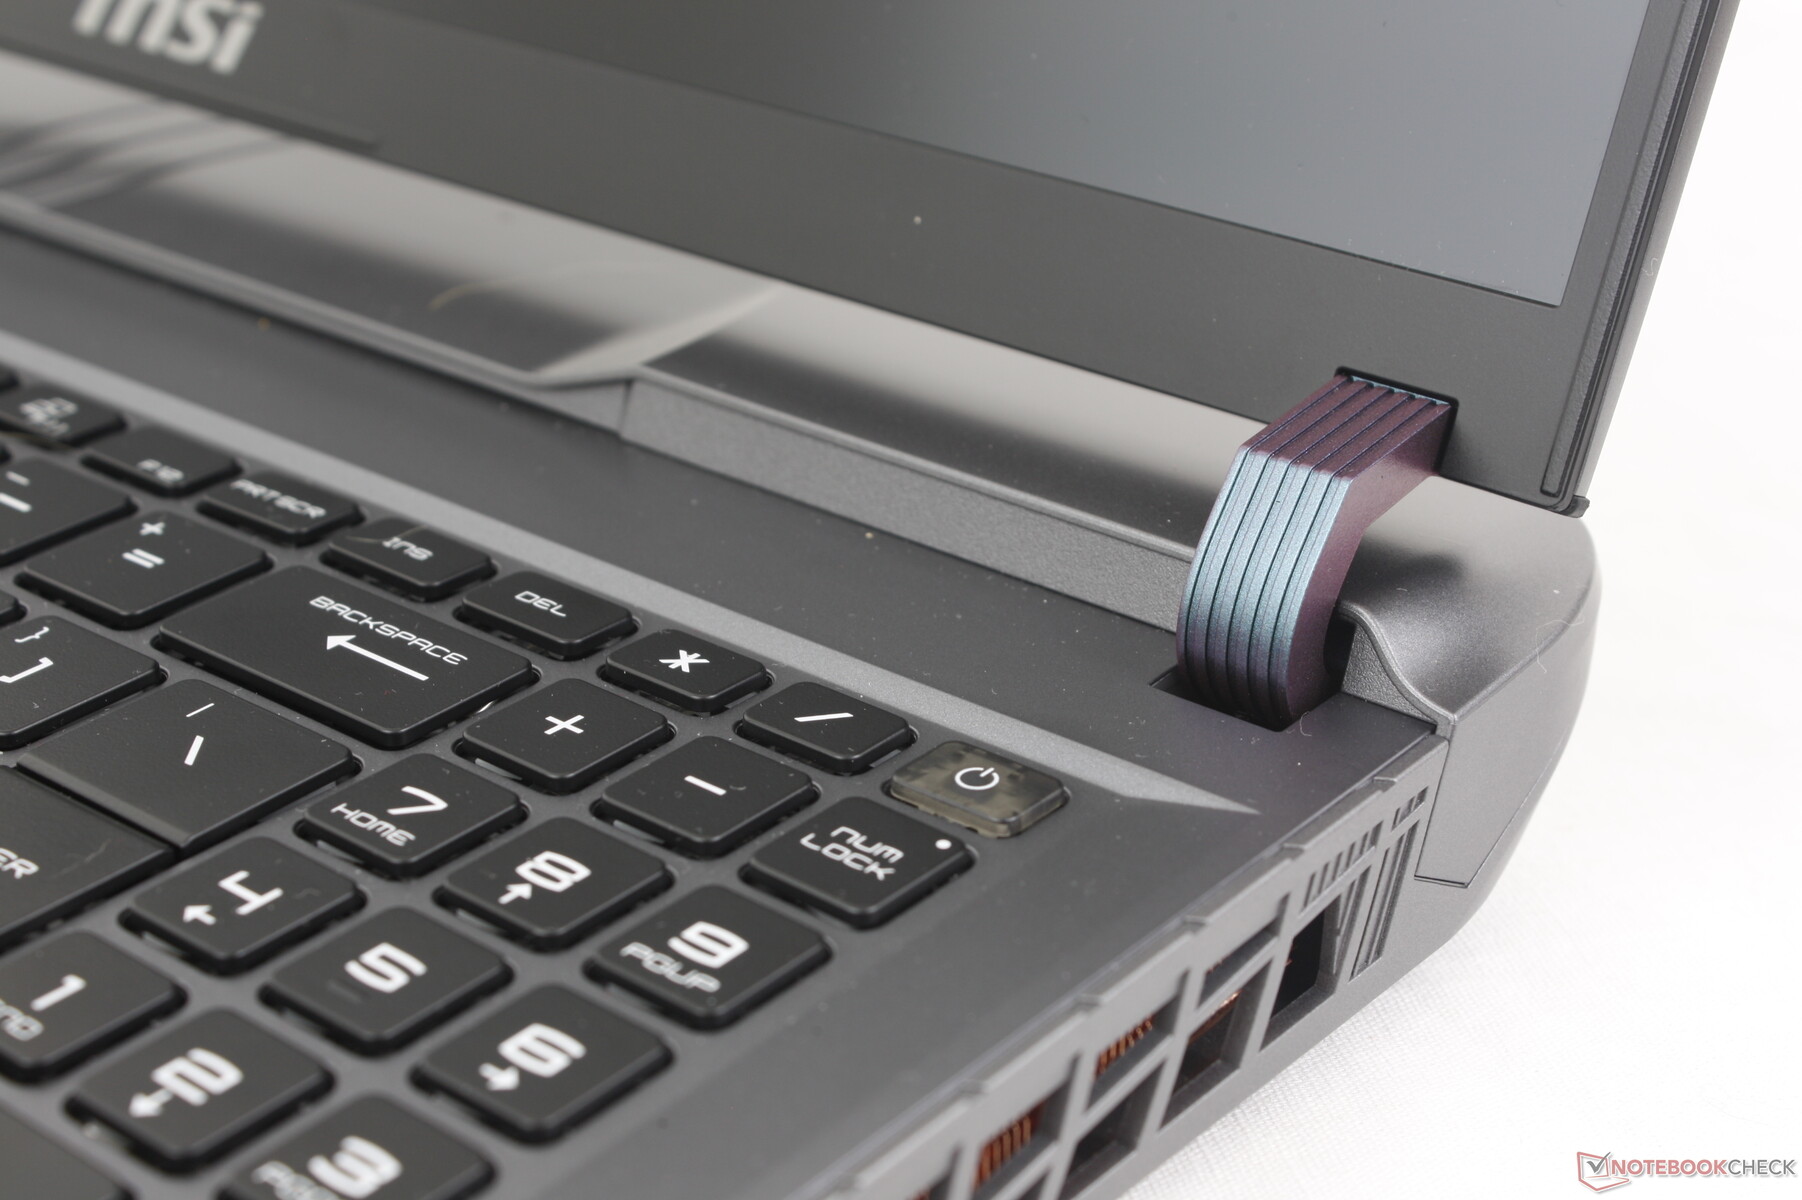
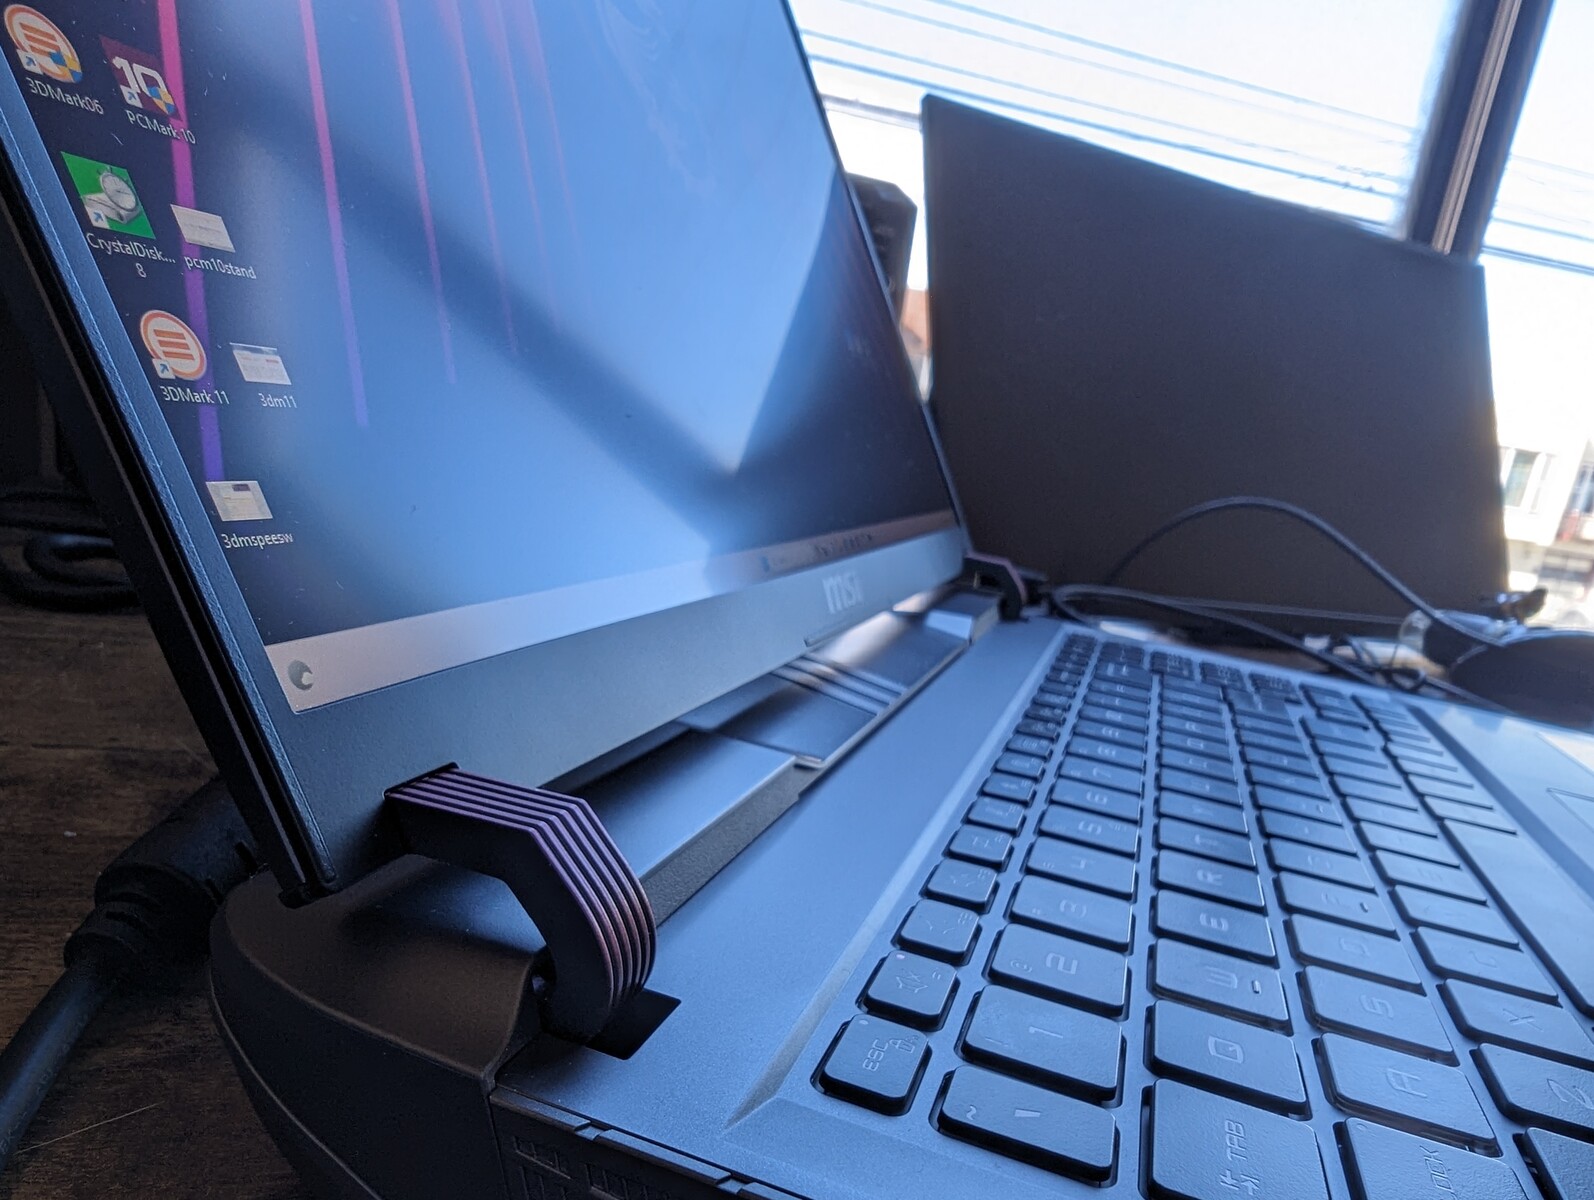
Fortunately, chassis rigidity is excellent from top to bottom including the lid where it tends to be noticeably weaker on other laptops. The redesigned hinges in particular are now much larger and firmer than before to be reminiscent of the hinges on the Asus Strix Scar 17. However, their curvature limits the maximum angle that you can open the display to only 130 degrees.
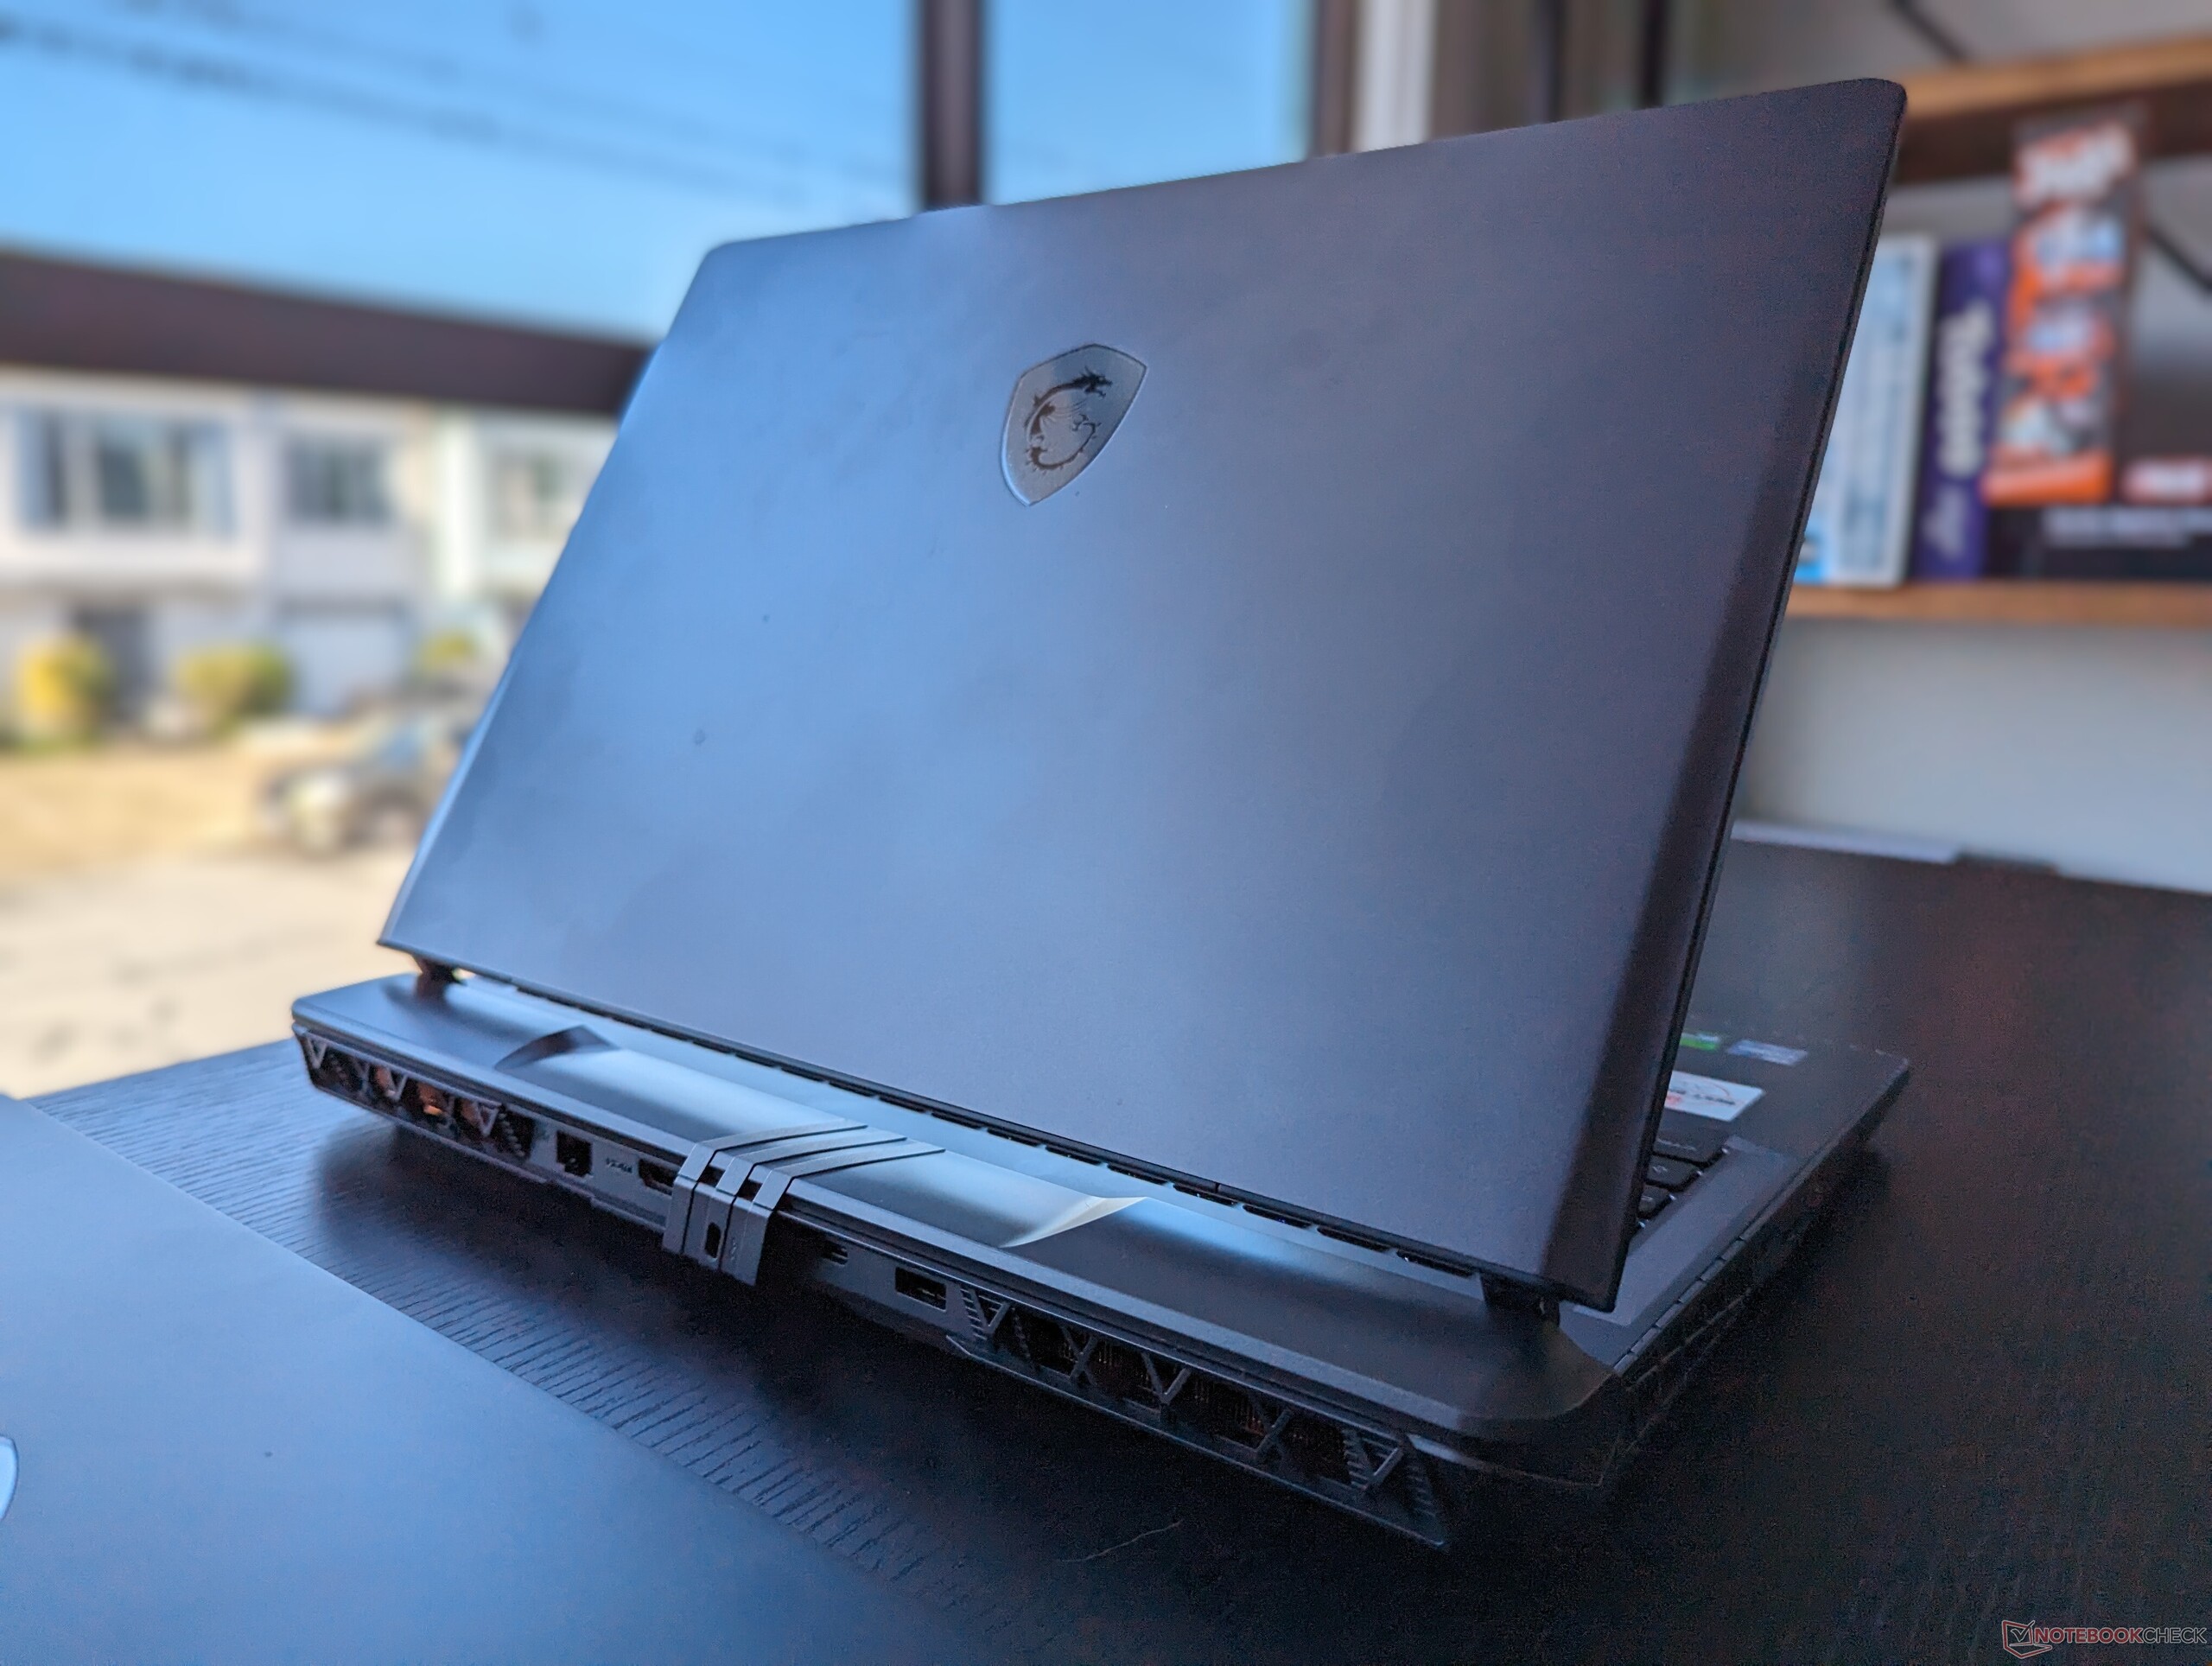
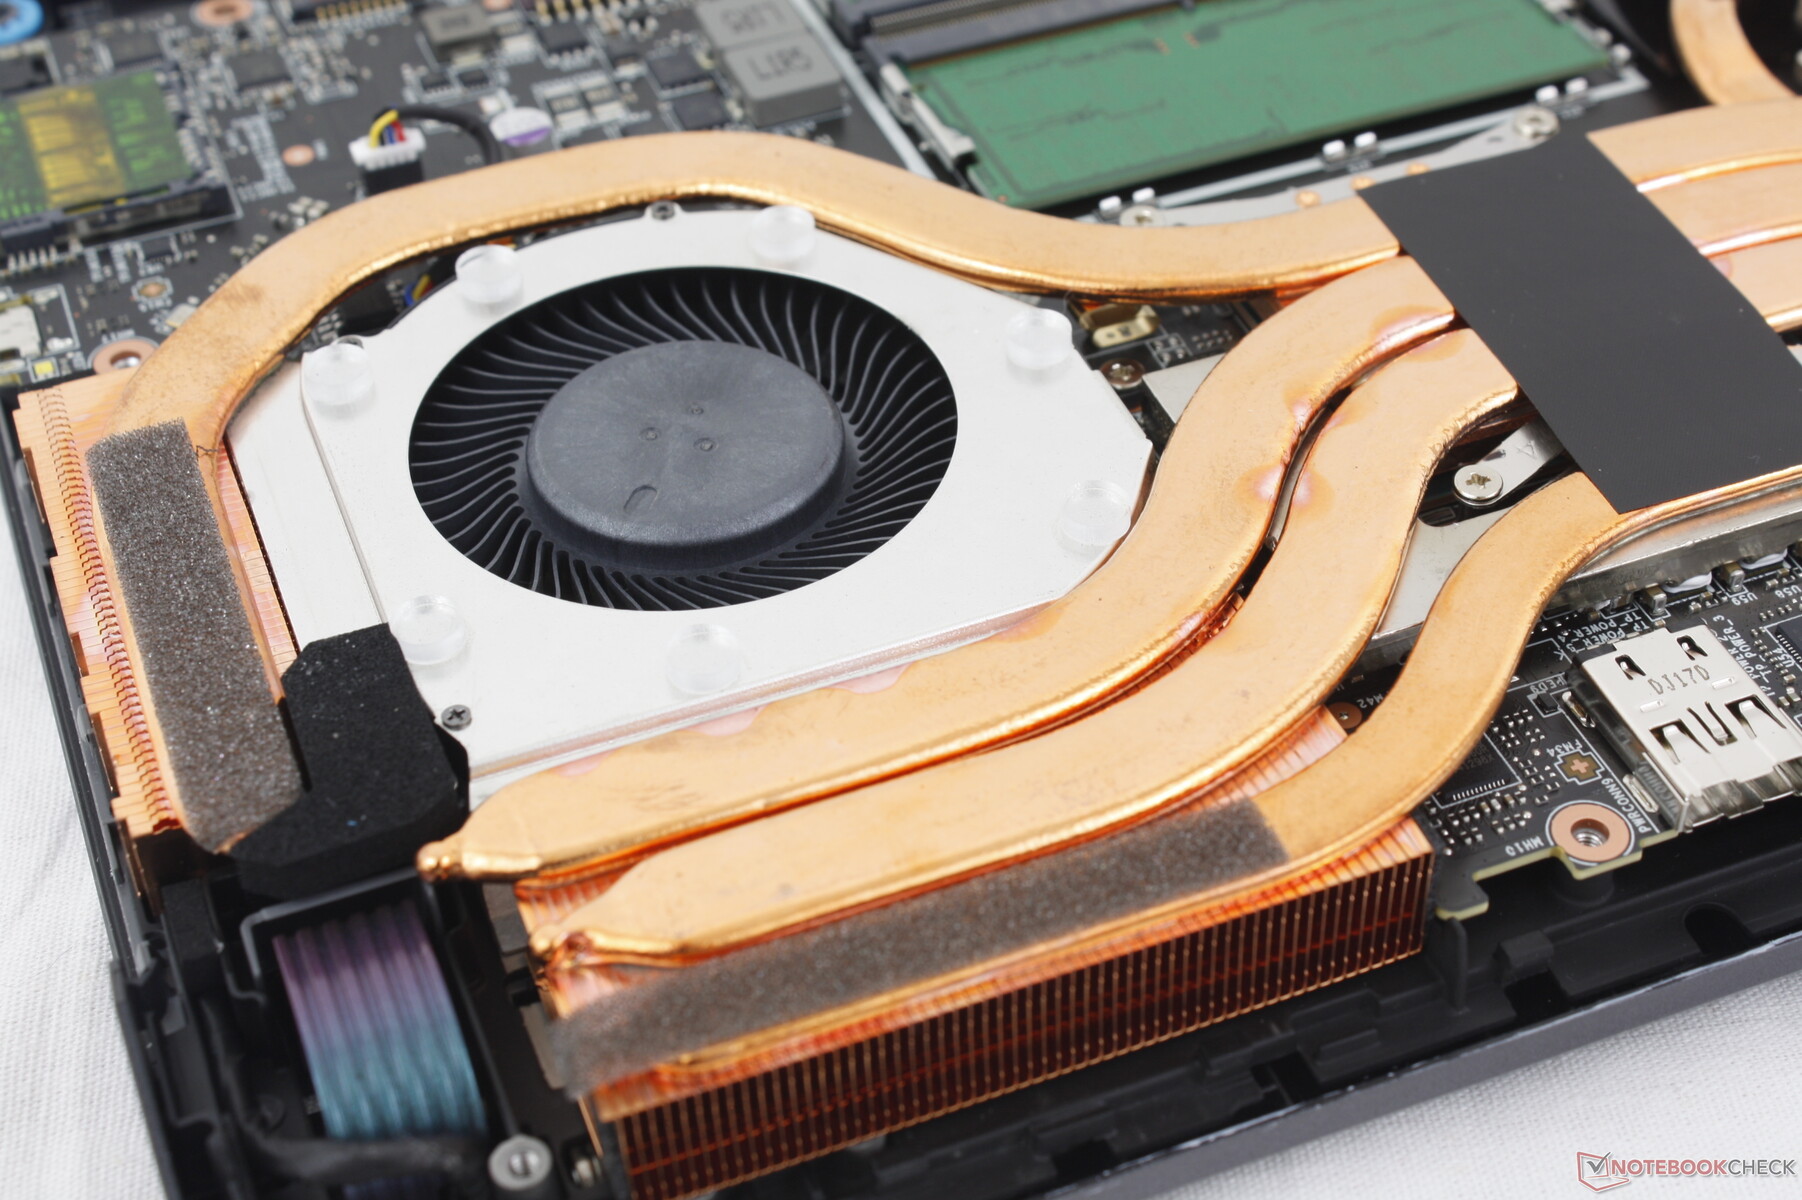
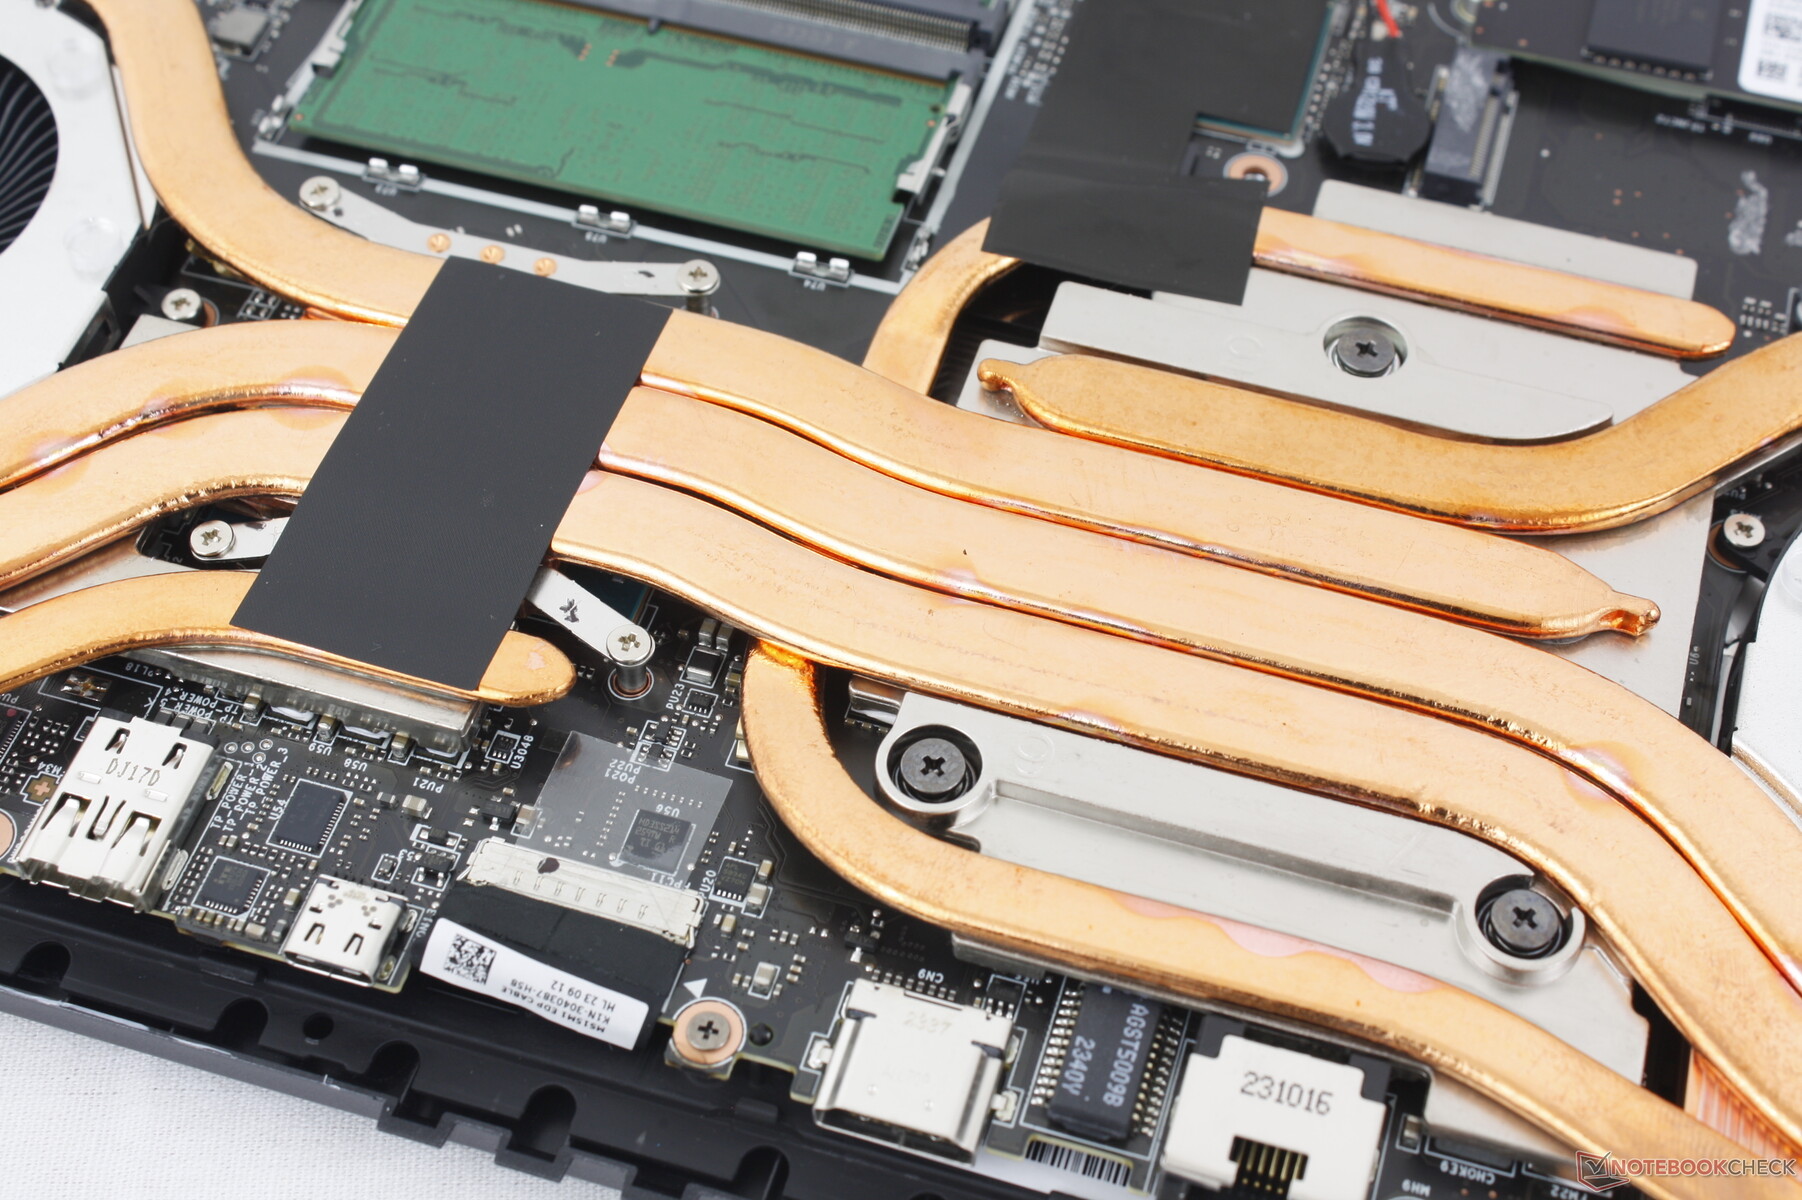
The Vector 16 HX is a big laptop and there's no way around it. Its ambitious 175 W TGP target (or 240 W when combined with CPU) necessitates a beefier cooling solution and larger chassis design than most other 16-inch models. The MSI is even larger and heavier than last year's Dell G16 7620 which was already quite sizable. It's thankfully not quite as heavy as the 18-inch Razer Blade 18 or Asus ROG Strix Scar 18, but it's not exactly portable, either.

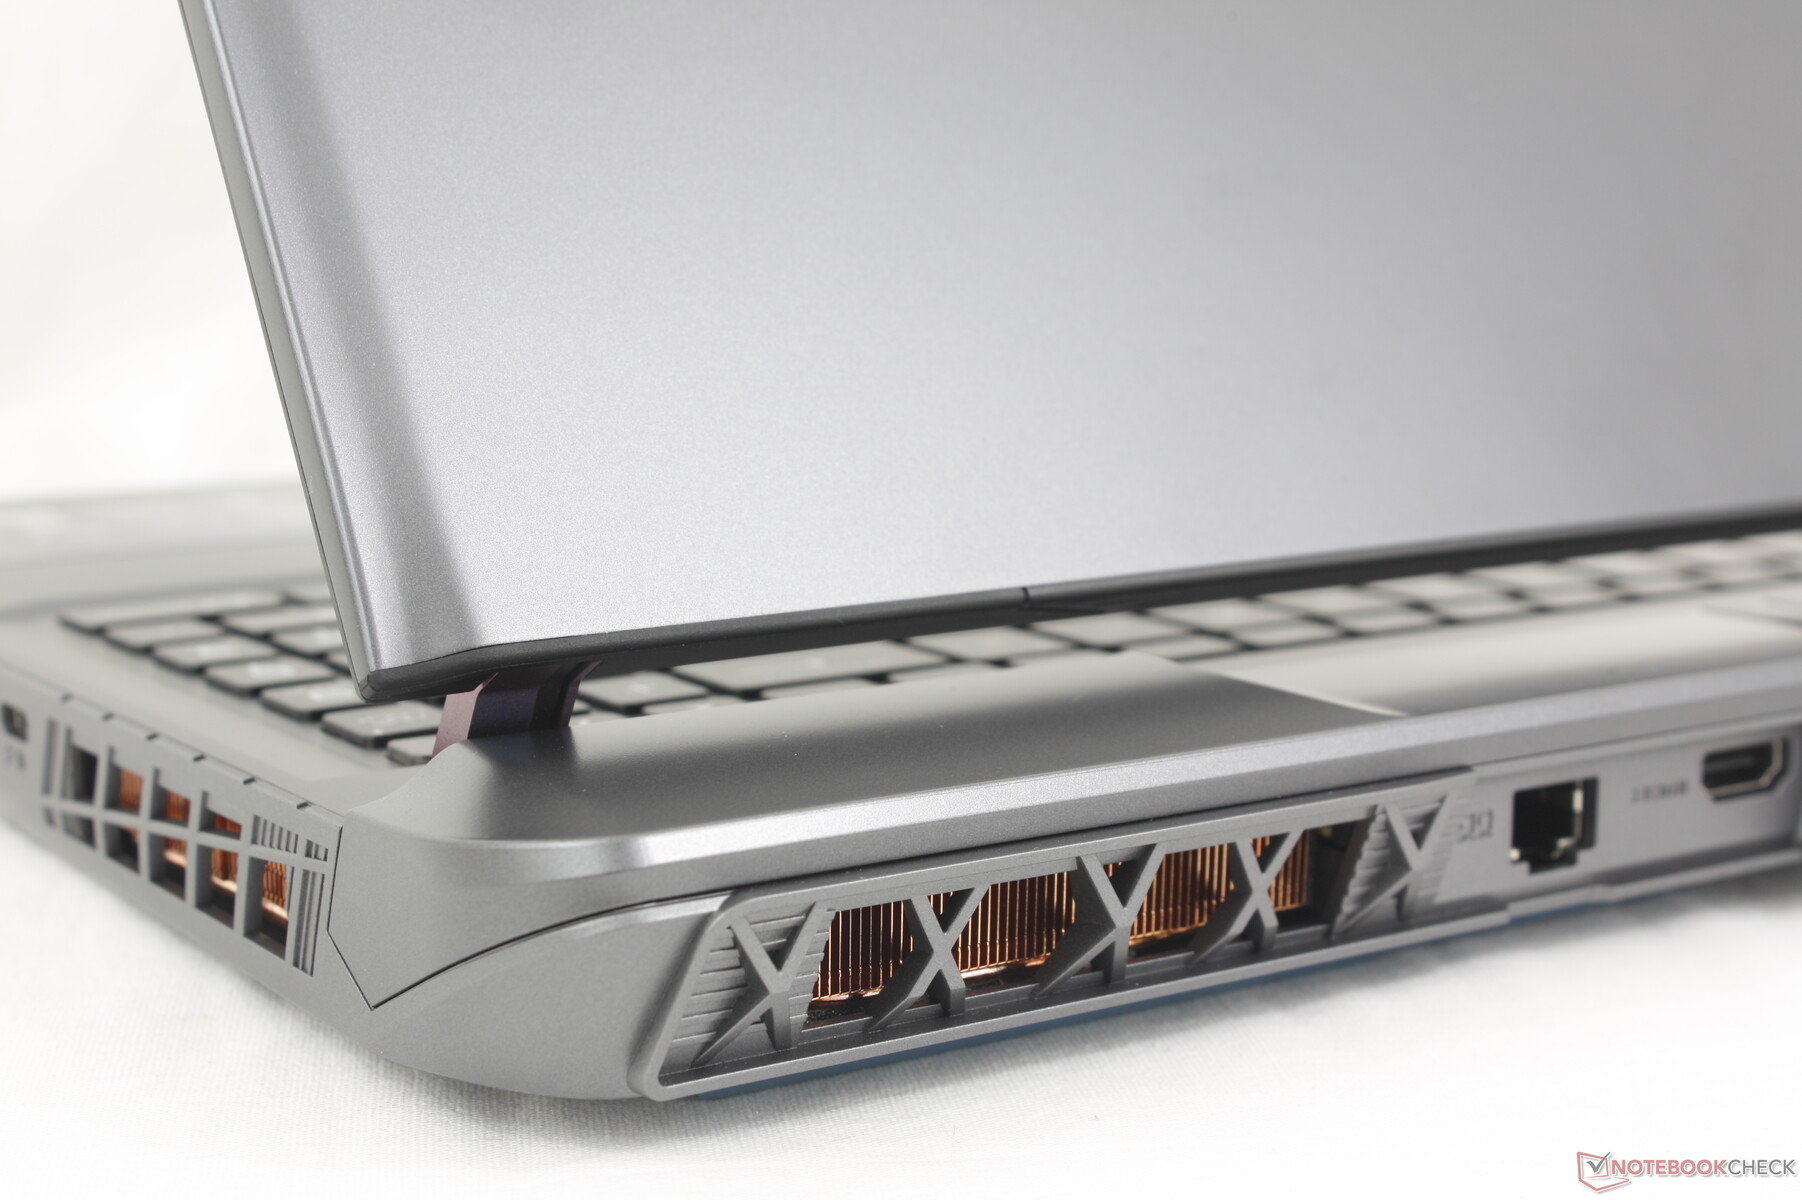
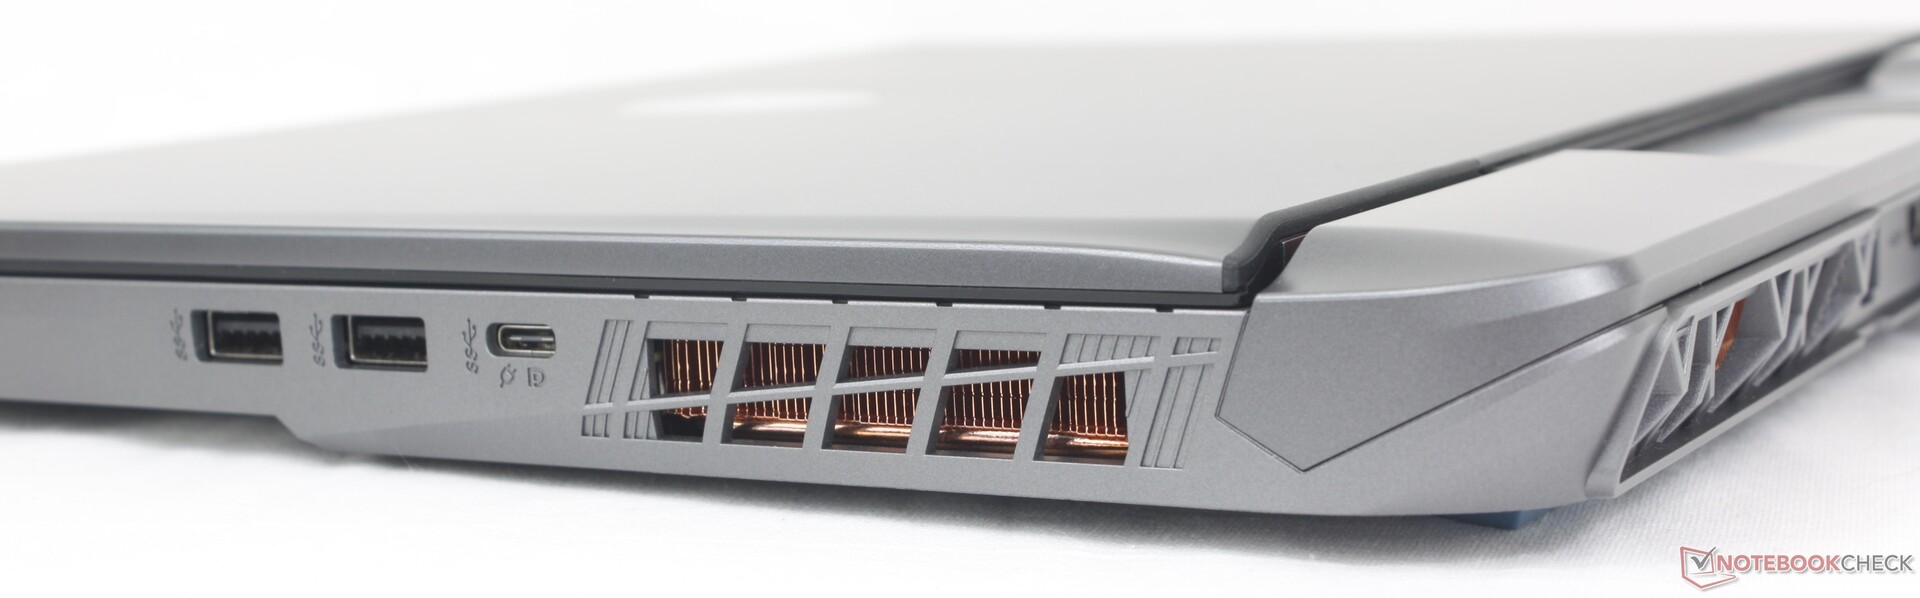
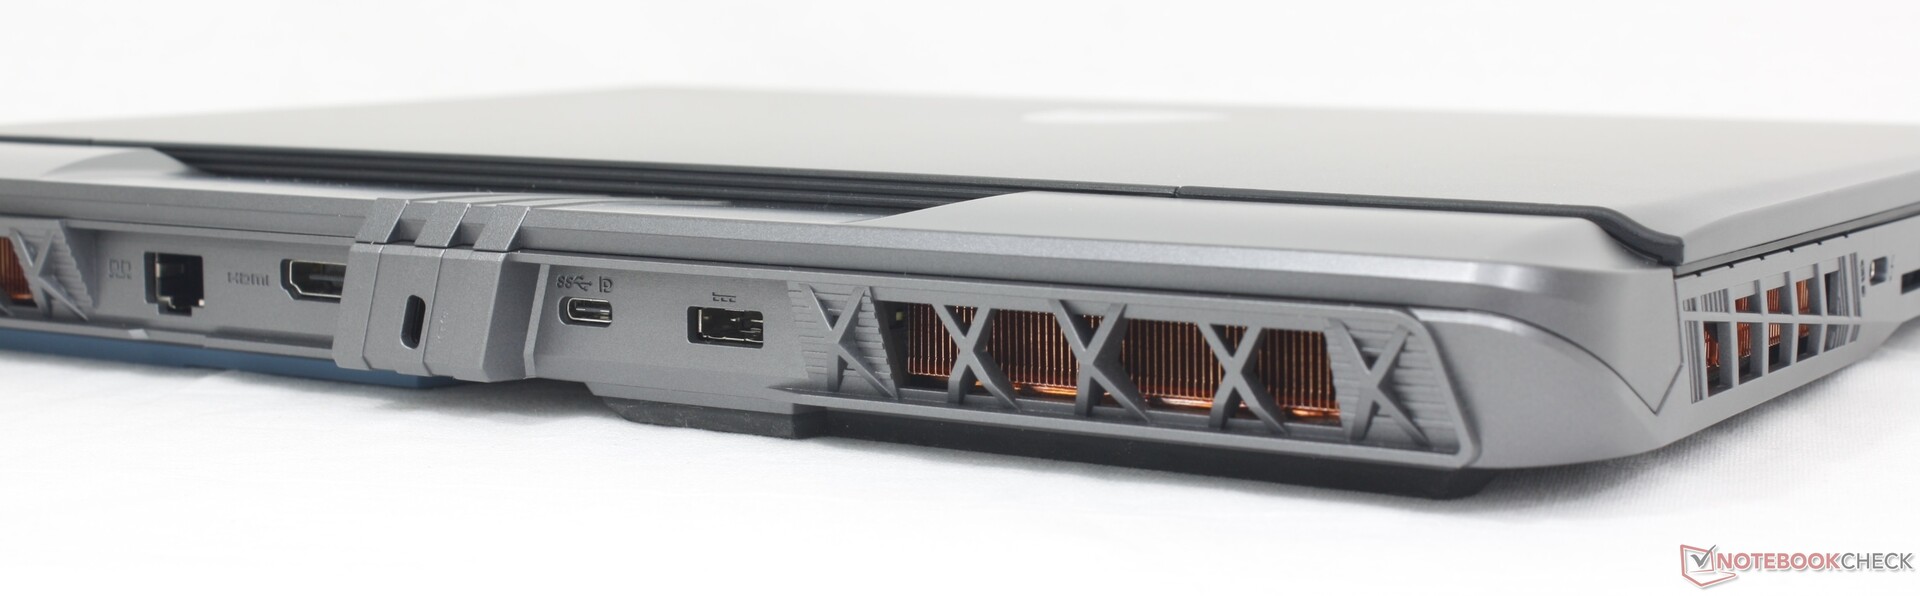
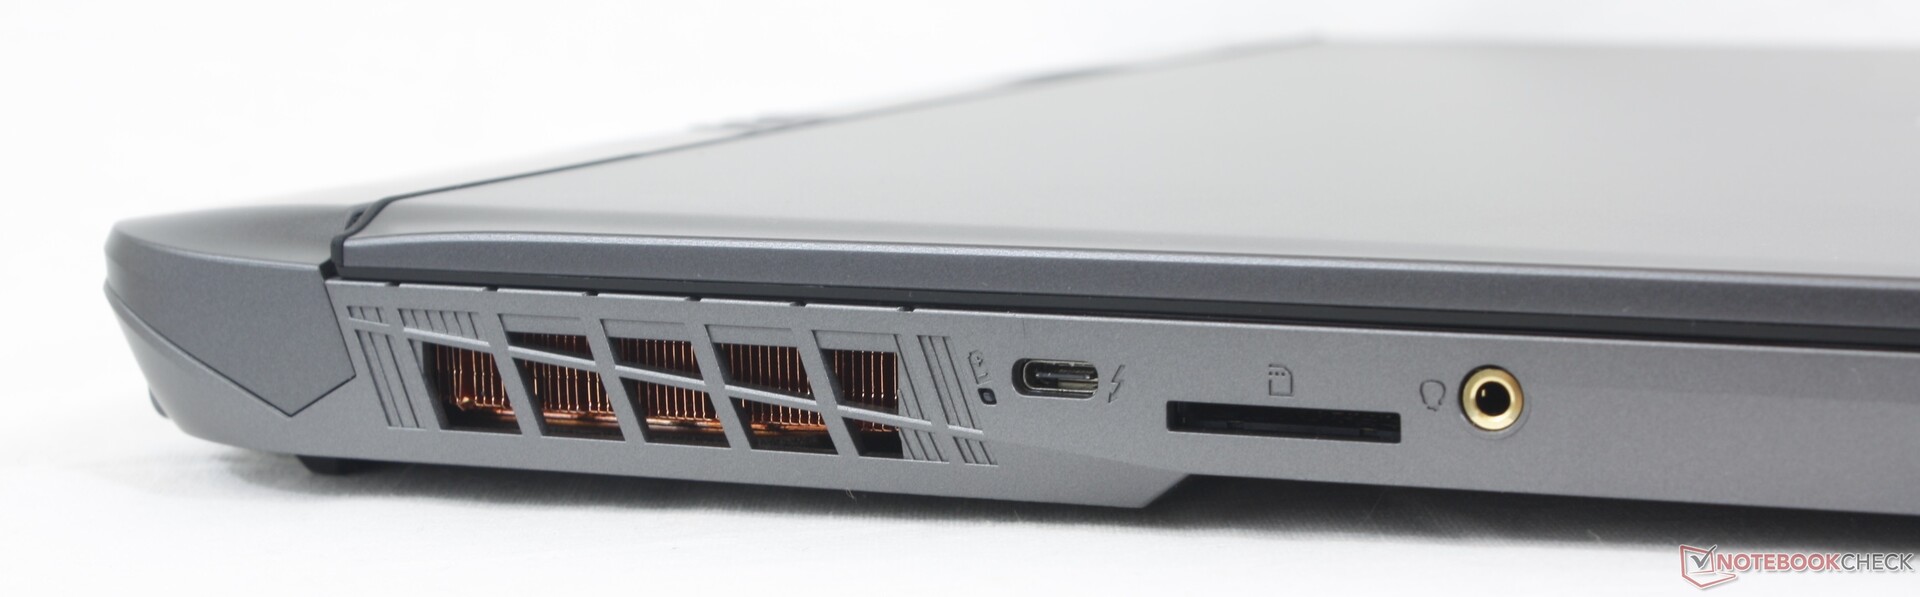
Connectivity
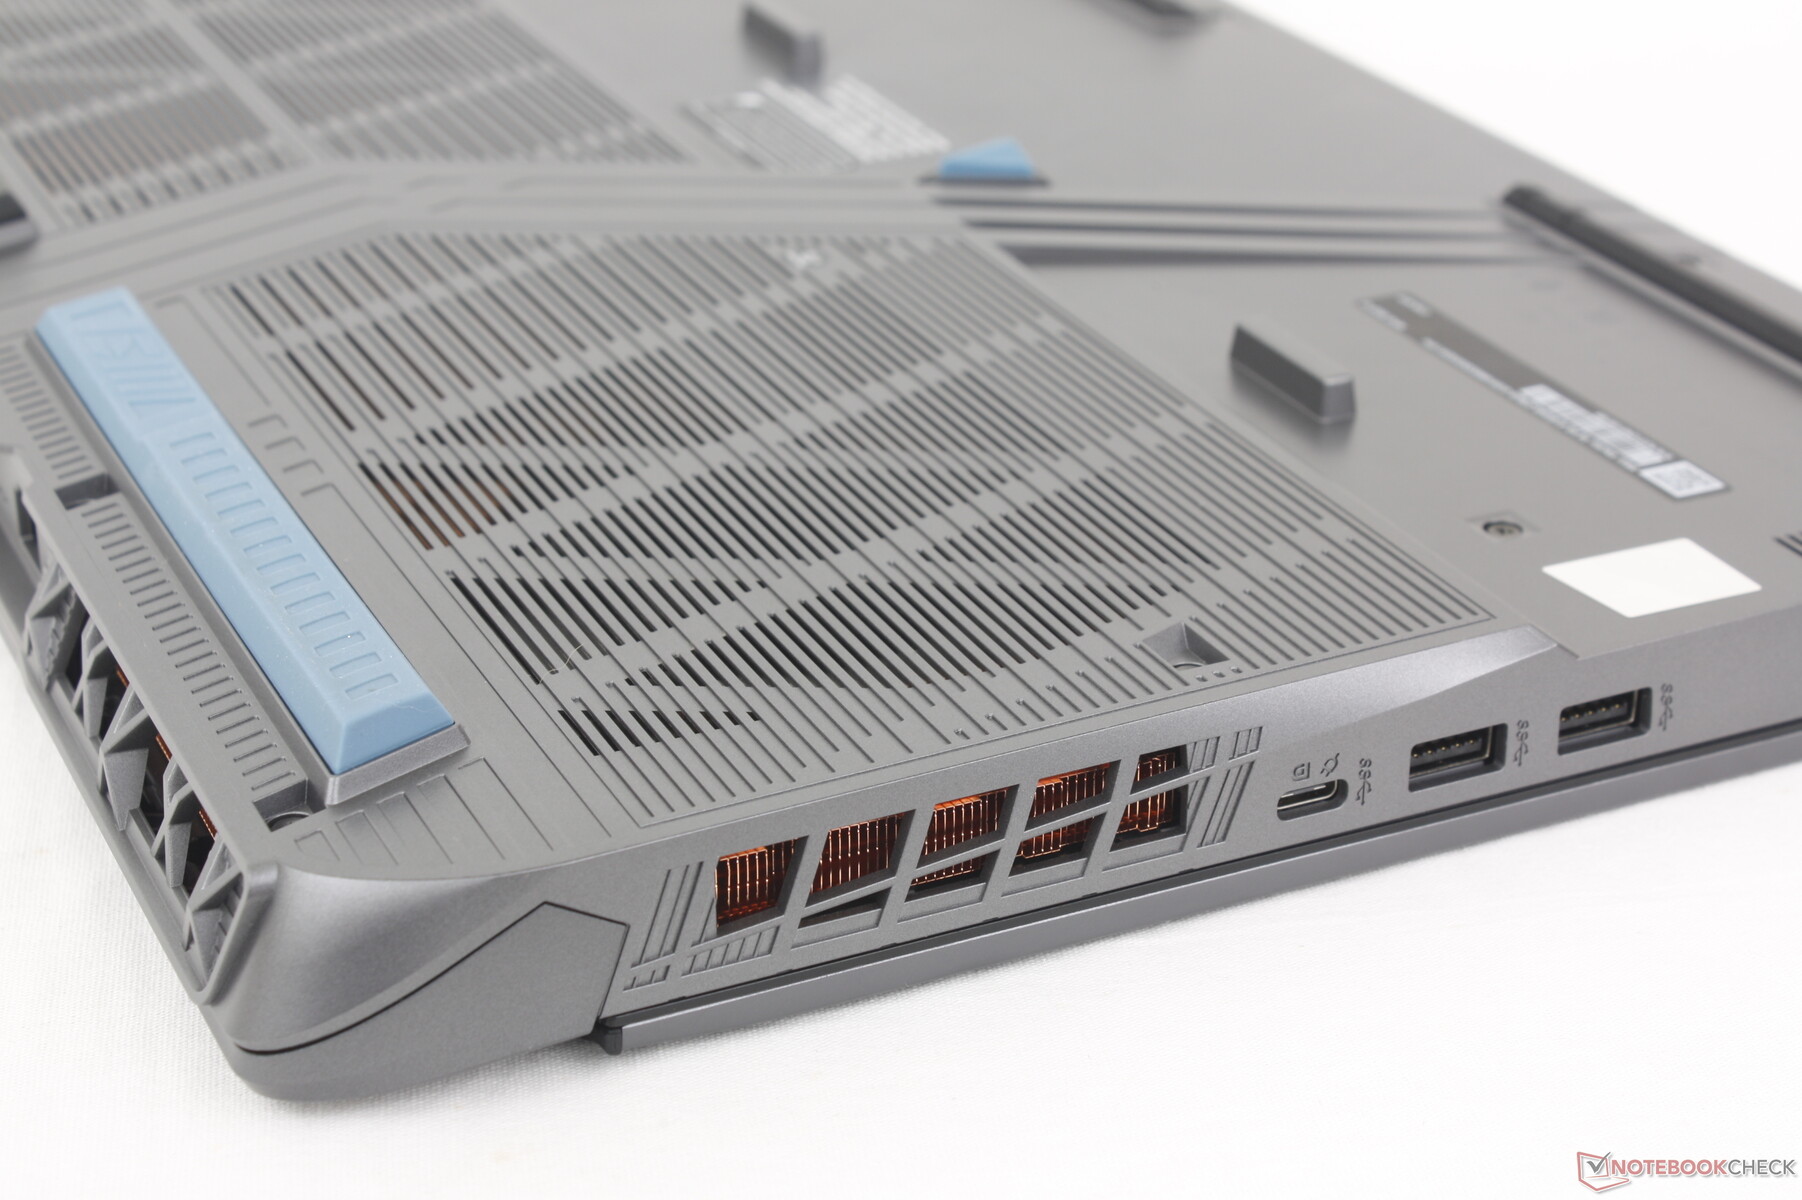
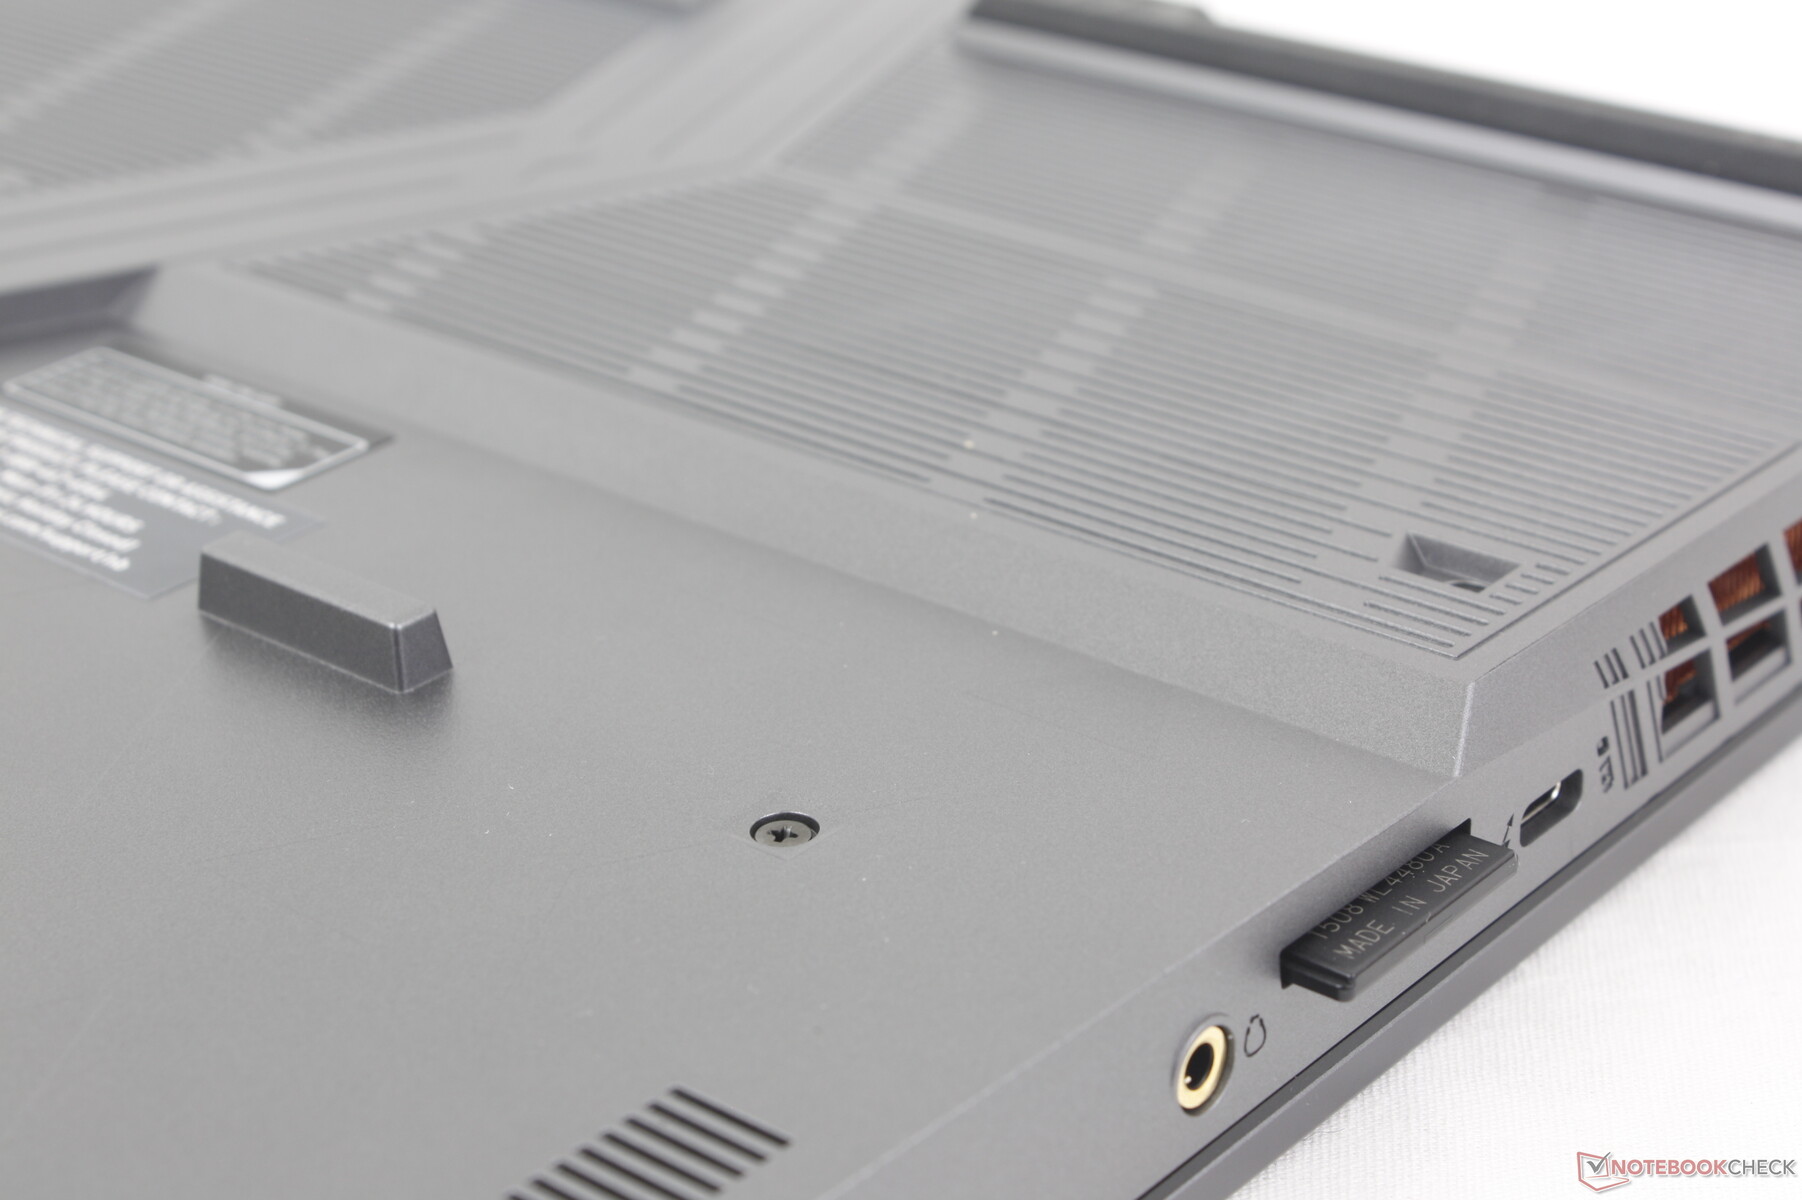
MSI has revised the ports when compared to the GP66. New to the Vector 16 HX are the SD card reader and additional USB-C ports now with proper Thunderbolt support. In return, however, the newer model has fewer USB-A ports and has dropped the dedicated mini-DisplayPort. This still compares favorably against competitors like the Dell G16 or Asus TUF Gaming A16 which have fewer USB-C ports or no SD card reader.
Note that the AC adapter port is identical to the one on the Titan 18 HX even though their AC adapter sizes may be different.
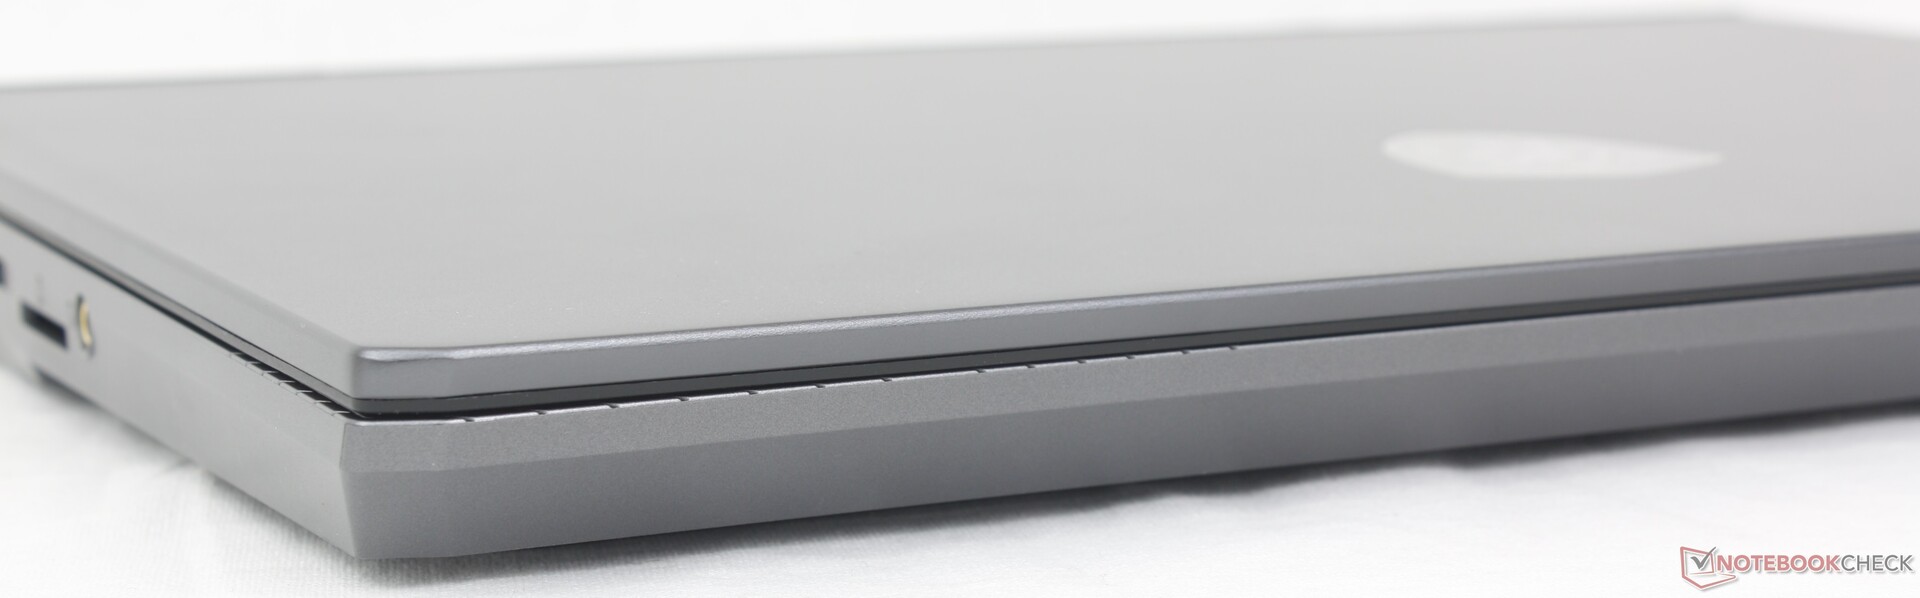
SD Card Reader
Transfer rates from the integrated SD card reader are decent at around 90 MB/s to be 2x to 3x faster than the card reader found on the new Lenovo Legion 5 16. However, the reader on the MSI is not spring-loaded and so an inserted SD card can be difficult to remove with larger fingers.
| SD Card Reader | |
| average JPG Copy Test (av. of 3 runs) | |
| MSI Vector 16 HX A14V (Toshiba Exceria Pro SDXC 64 GB UHS-II) | |
| Lenovo Legion 5 16IRX G9 | |
| maximum AS SSD Seq Read Test (1GB) | |
| MSI Vector 16 HX A14V (Toshiba Exceria Pro SDXC 64 GB UHS-II) | |
| Lenovo Legion 5 16IRX G9 | |
Communication
The Killer BE1750x is compatible with Wi-Fi 7 and Bluetooth 5.4 even though Wi-Fi 7 routers are not yet mainstream. Its inclusion is therefore more about future-proofing since most users today don't have Wi-Fi 7 routers. Transfer rates are nonetheless steady and reliable when paired to our Asus AXE11000 Wi-Fi 6E test router.

| Networking | |
| iperf3 transmit AX12 | |
| MSI Vector GP66 12UGS | |
| iperf3 receive AX12 | |
| MSI Vector GP66 12UGS | |
| iperf3 transmit AXE11000 | |
| Lenovo Legion 5 16IRX G9 | |
| MSI Vector 16 HX A14V | |
| Dell G16 7620 | |
| Asus TUF Gaming A16 FA617XS | |
| HP Victus 16-r0077ng | |
| iperf3 receive AXE11000 | |
| Lenovo Legion 5 16IRX G9 | |
| MSI Vector 16 HX A14V | |
| Dell G16 7620 | |
| Asus TUF Gaming A16 FA617XS | |
| HP Victus 16-r0077ng | |
| iperf3 transmit AXE11000 6GHz | |
| MSI Vector 16 HX A14V | |
| iperf3 receive AXE11000 6GHz | |
| MSI Vector 16 HX A14V | |
Webcam
The integrated webcam is a measly 1 MP since the Vector isn't designed for frequent videoconferencing. IR is not supported either, but it at least includes a physical shutter for privacy purposes.


Maintenance
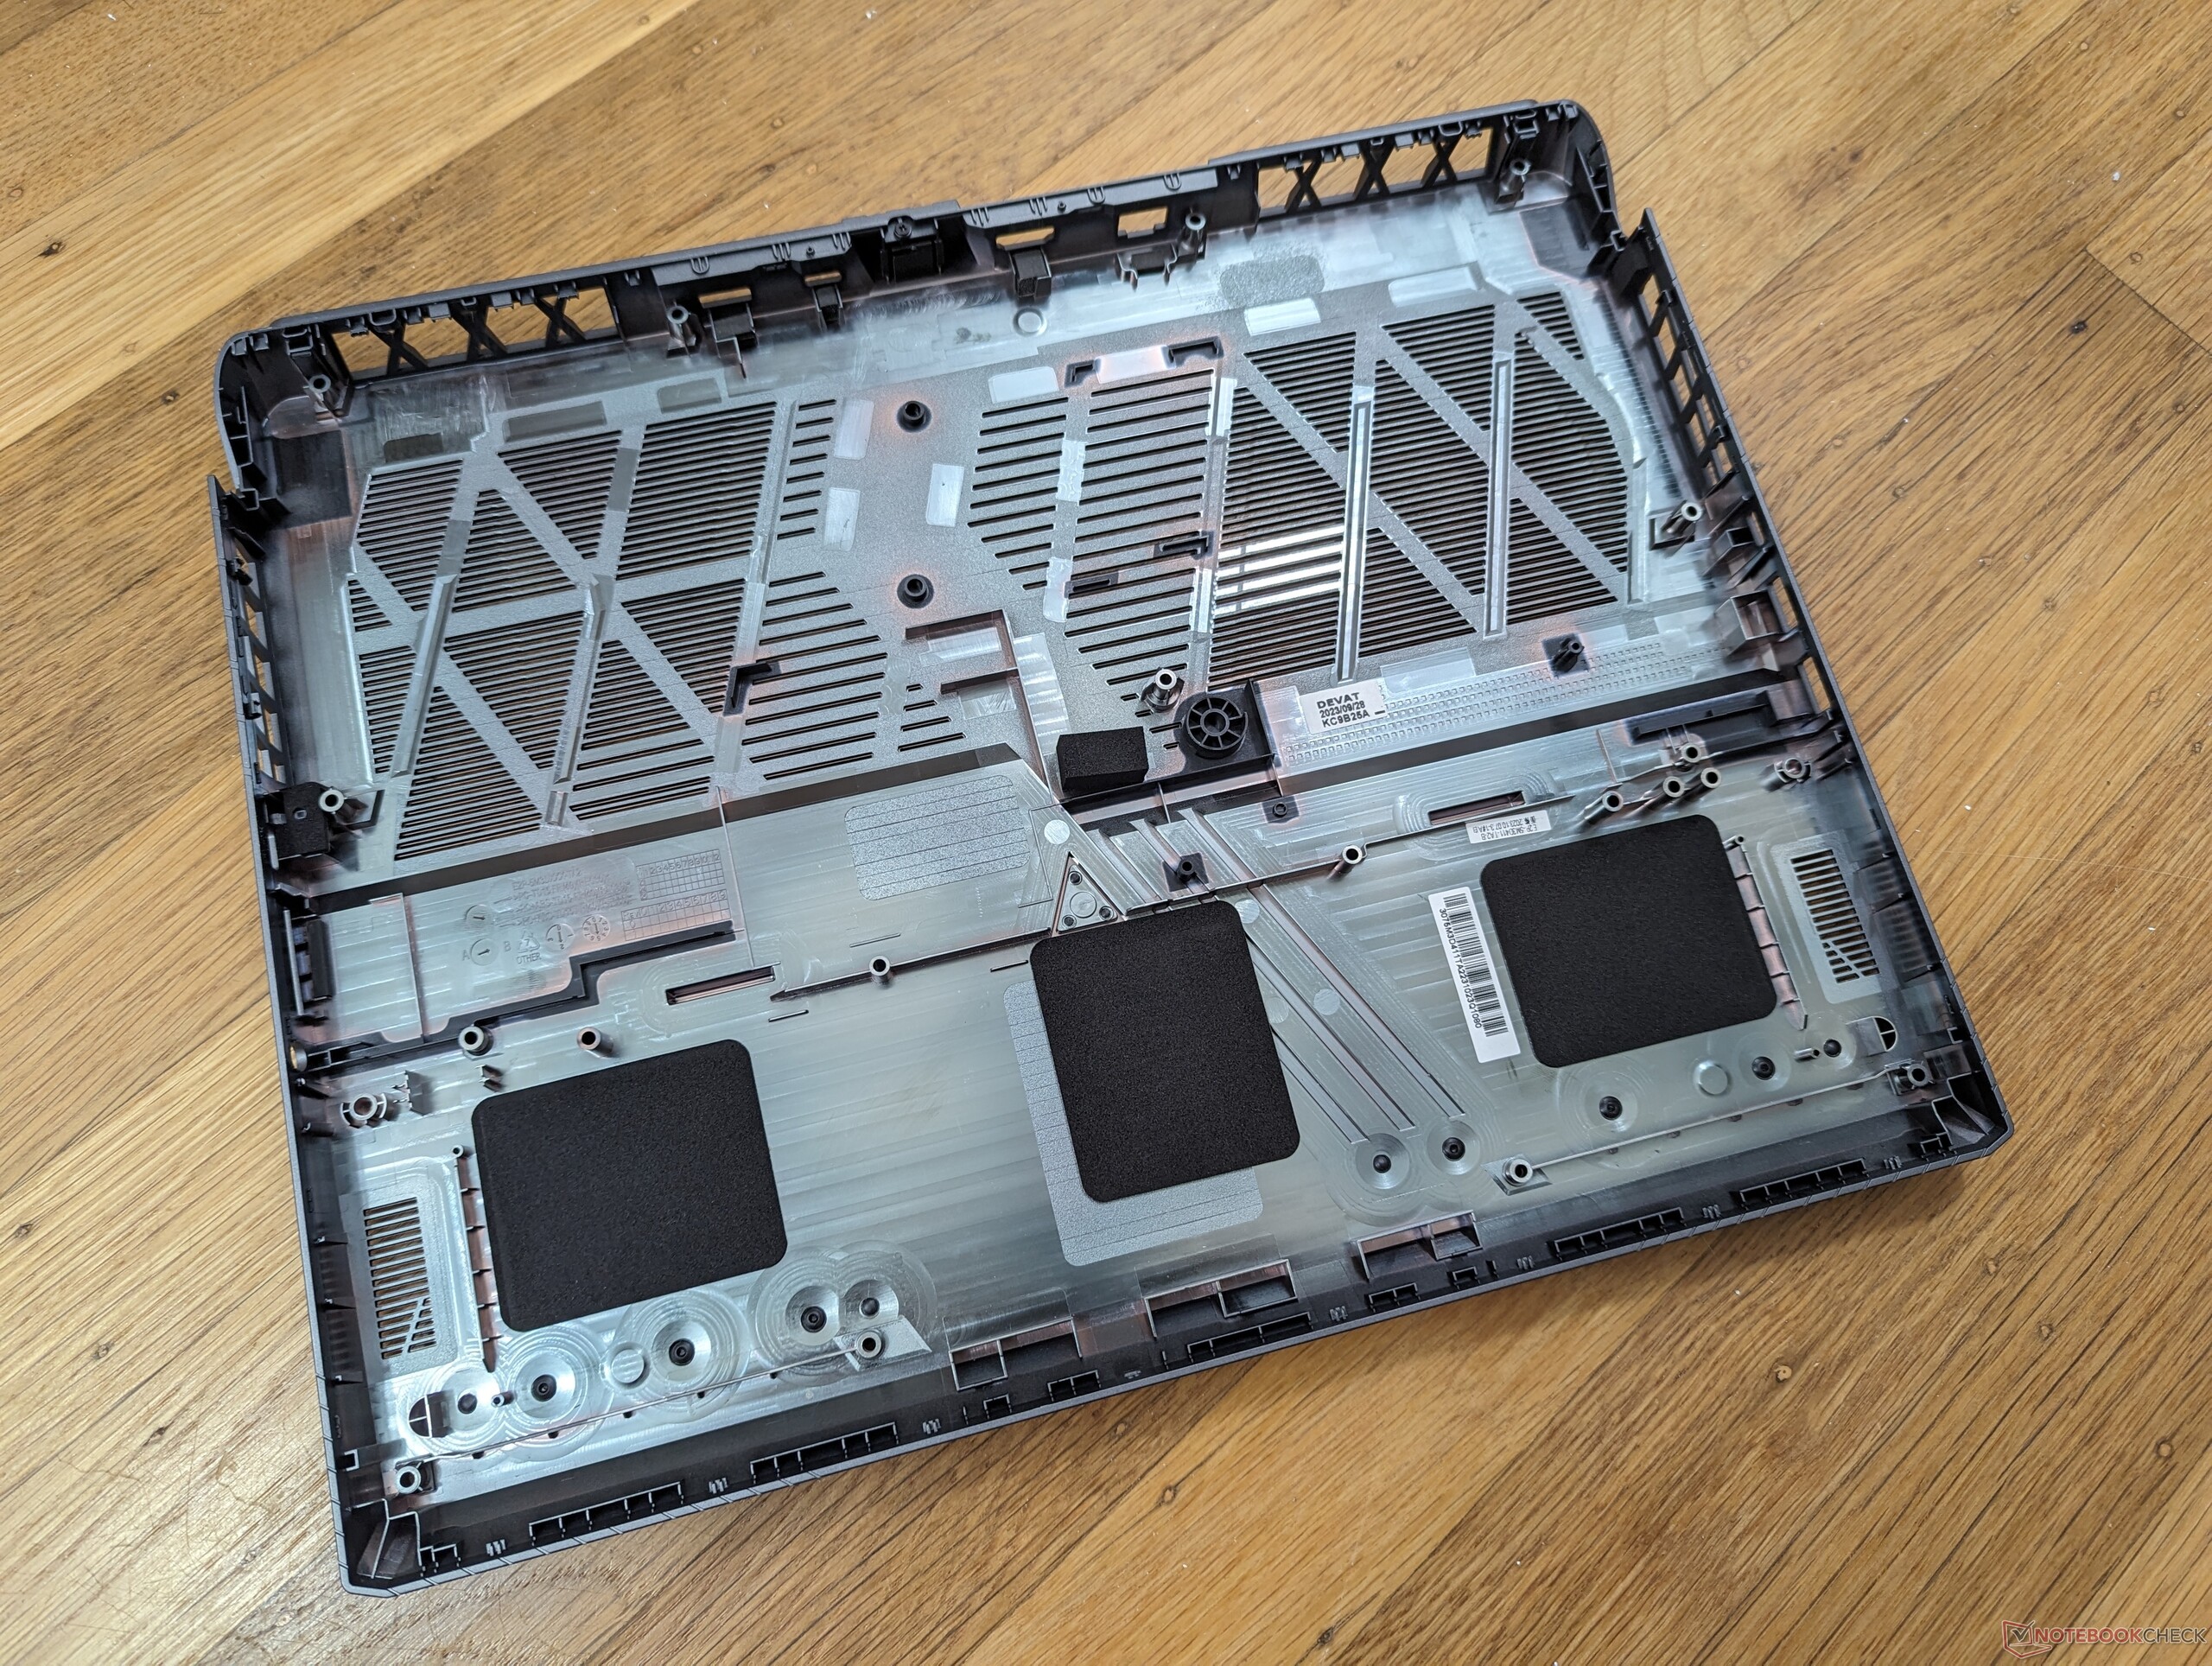
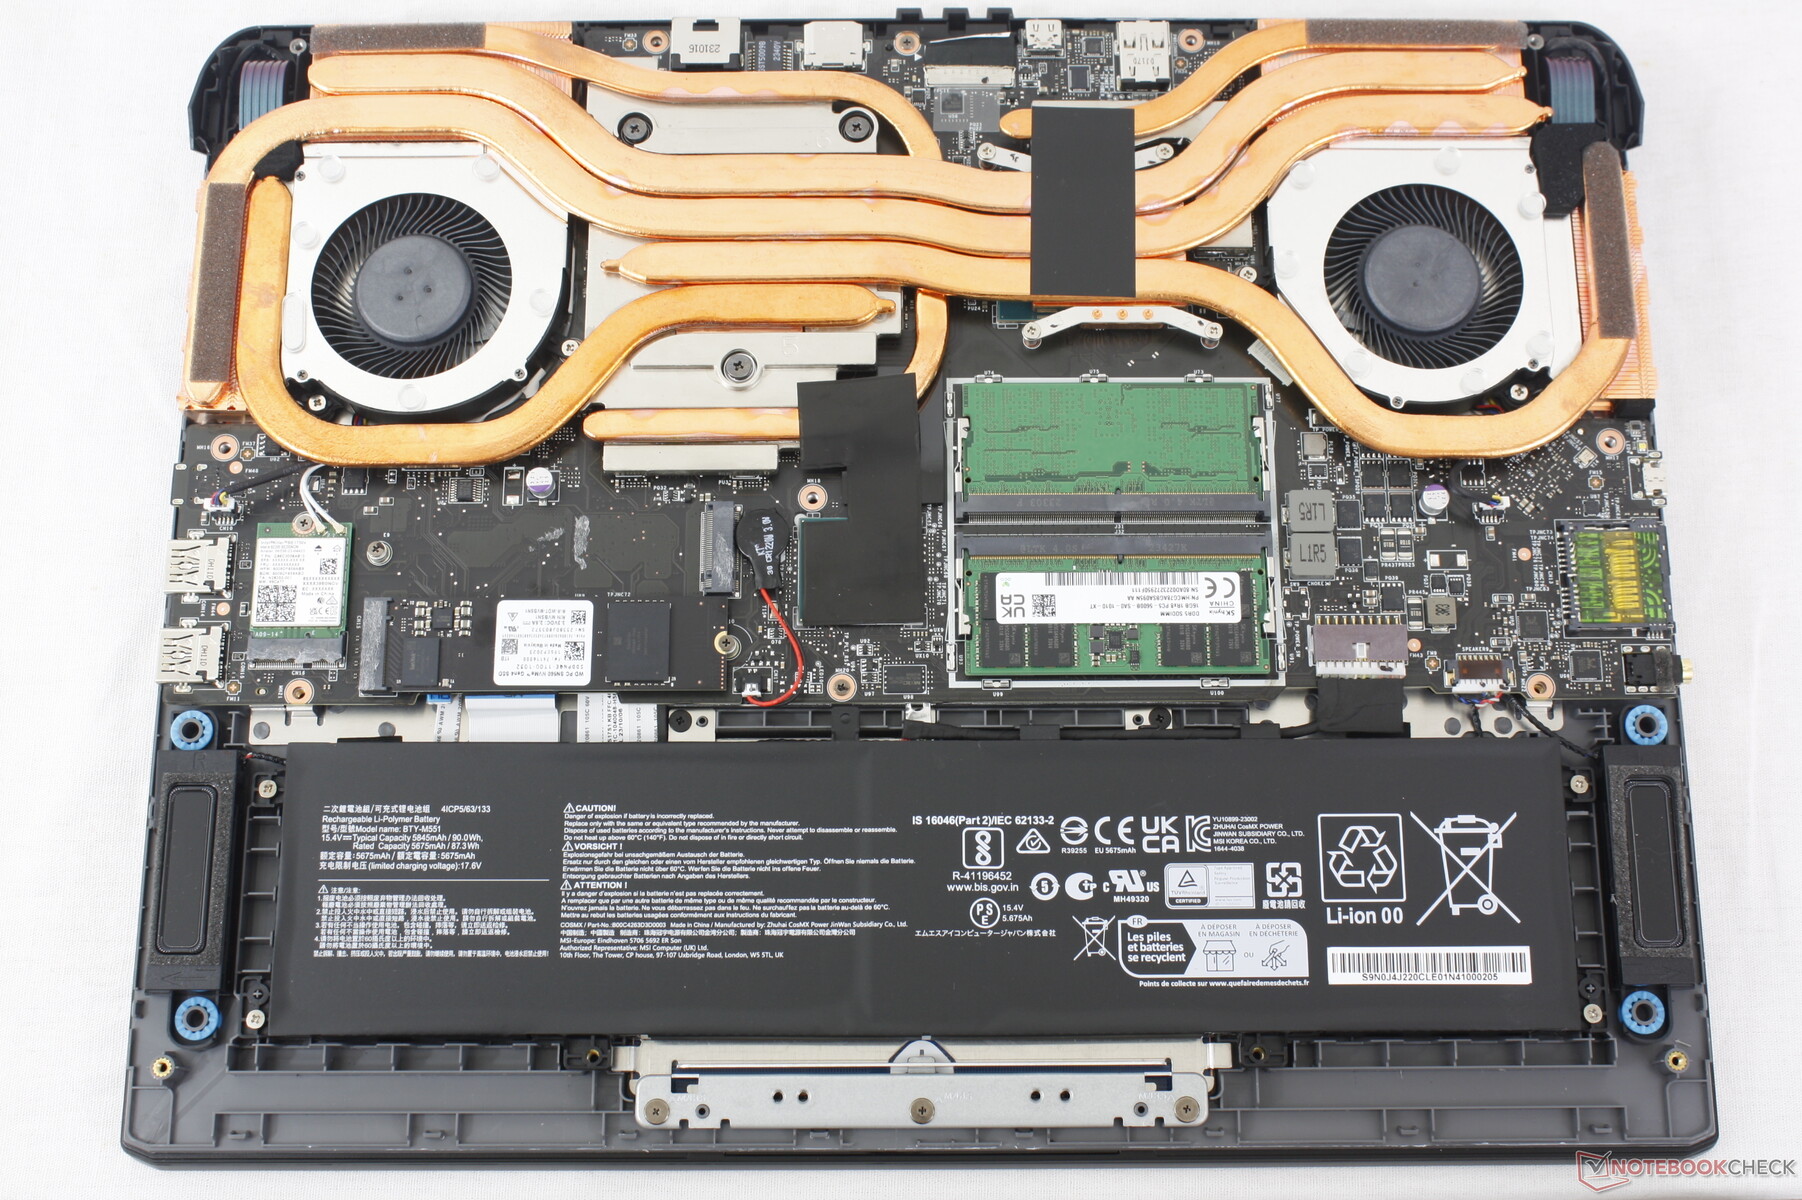
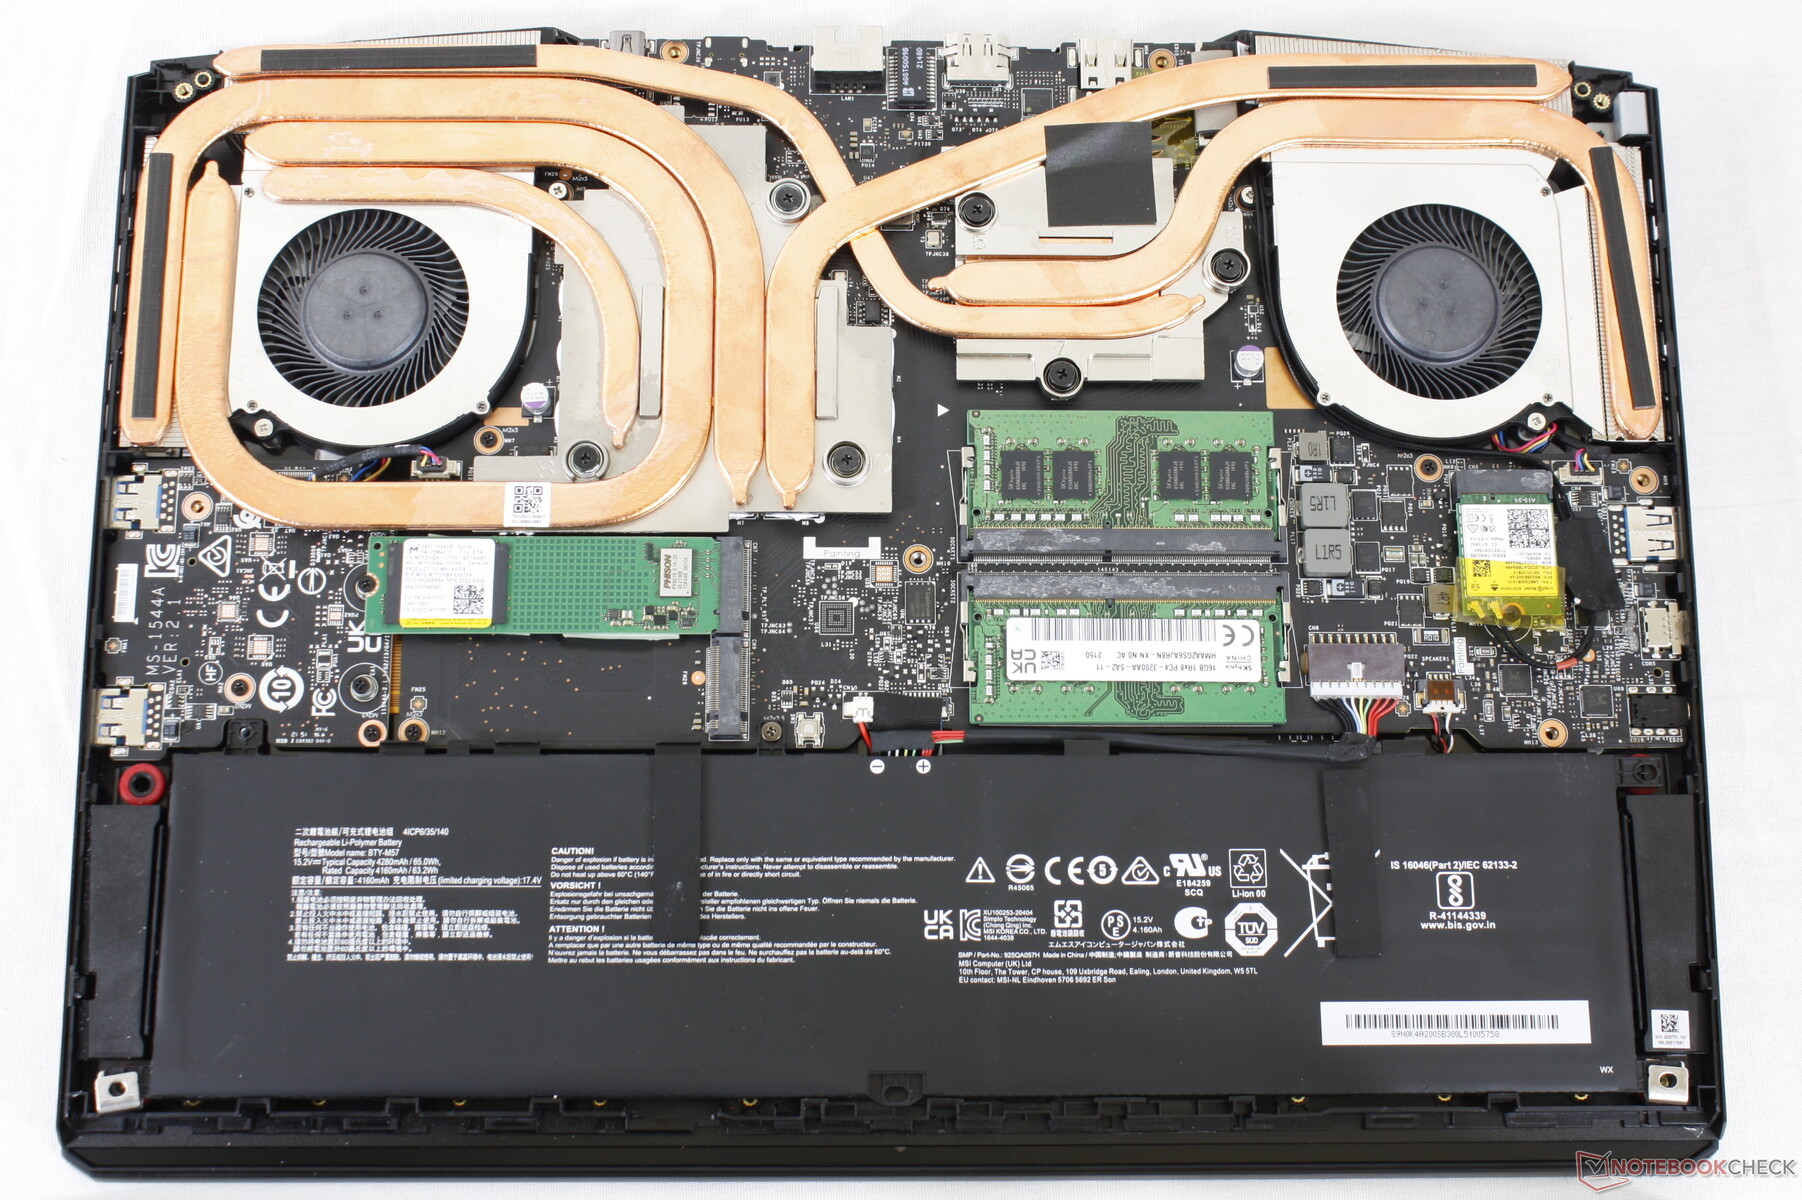
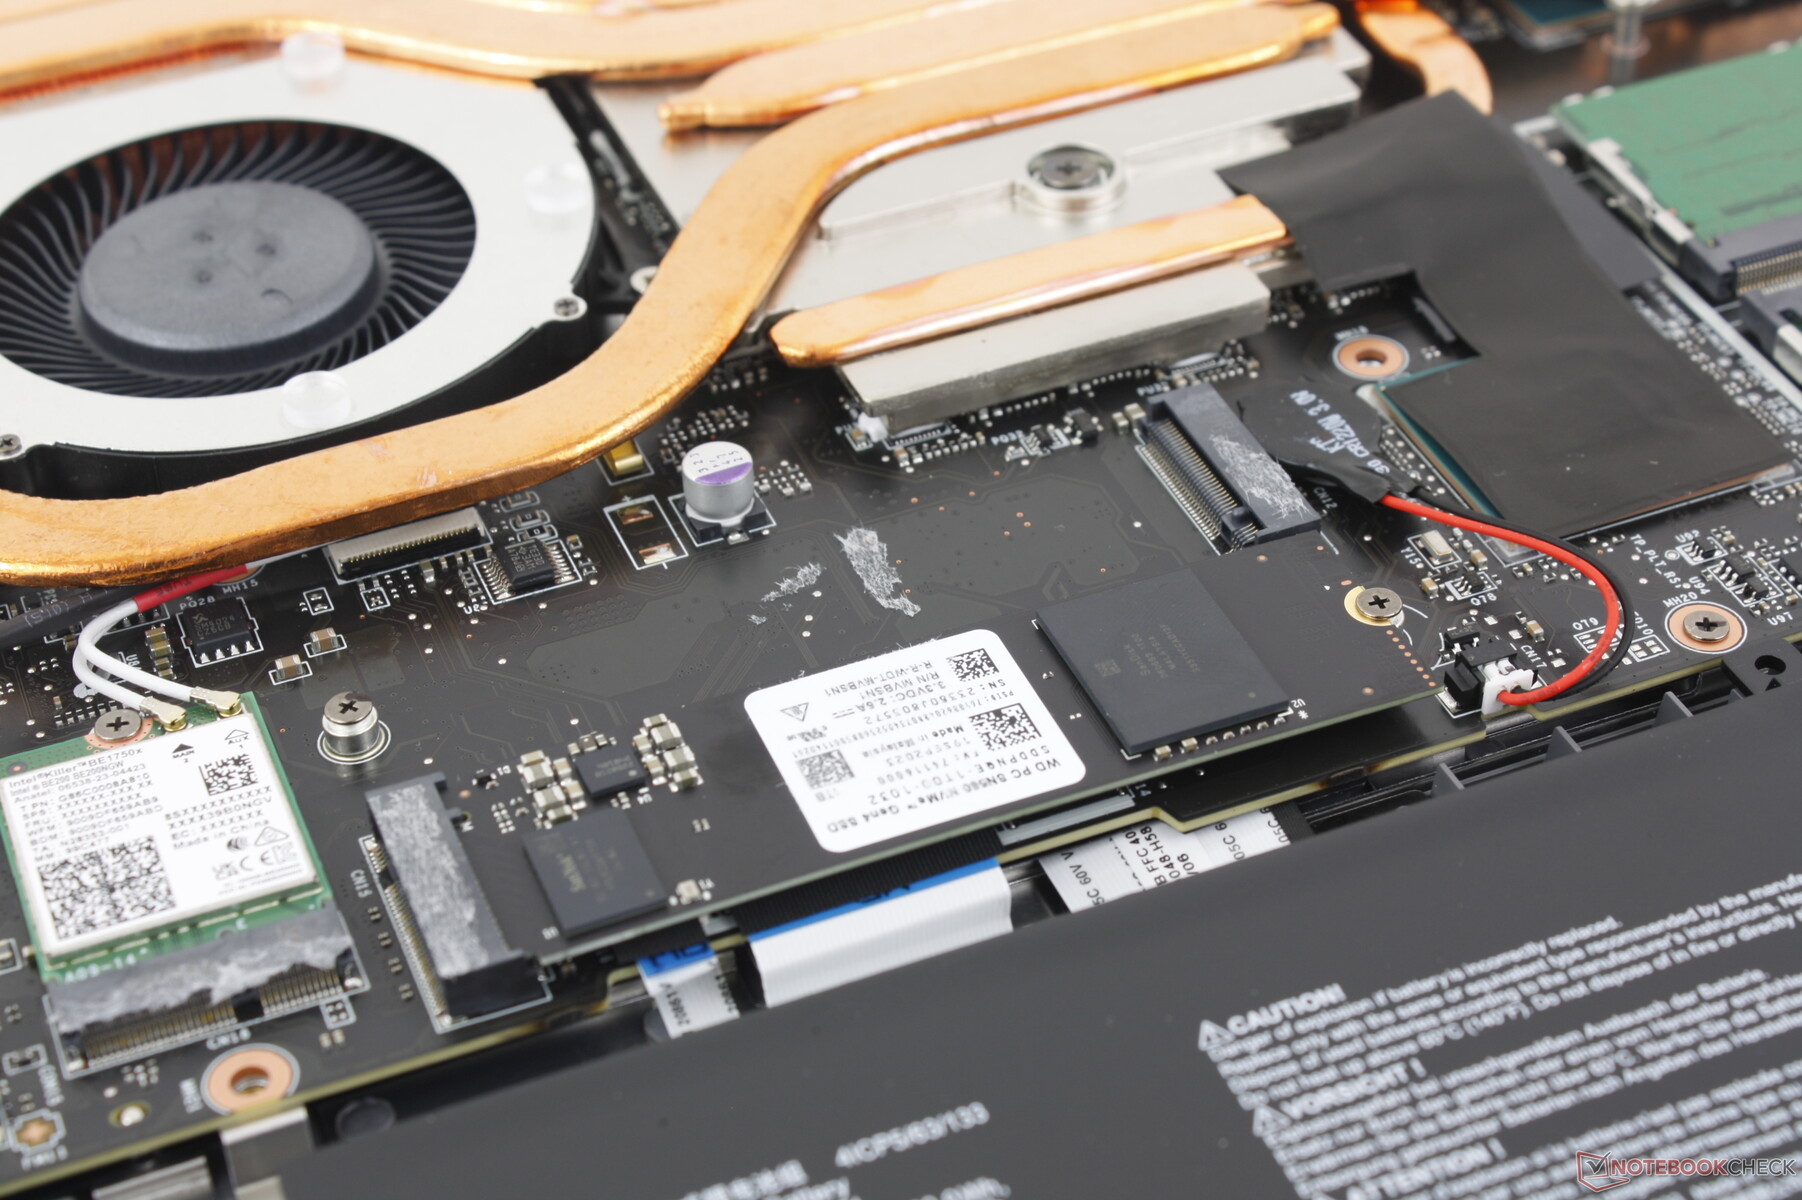
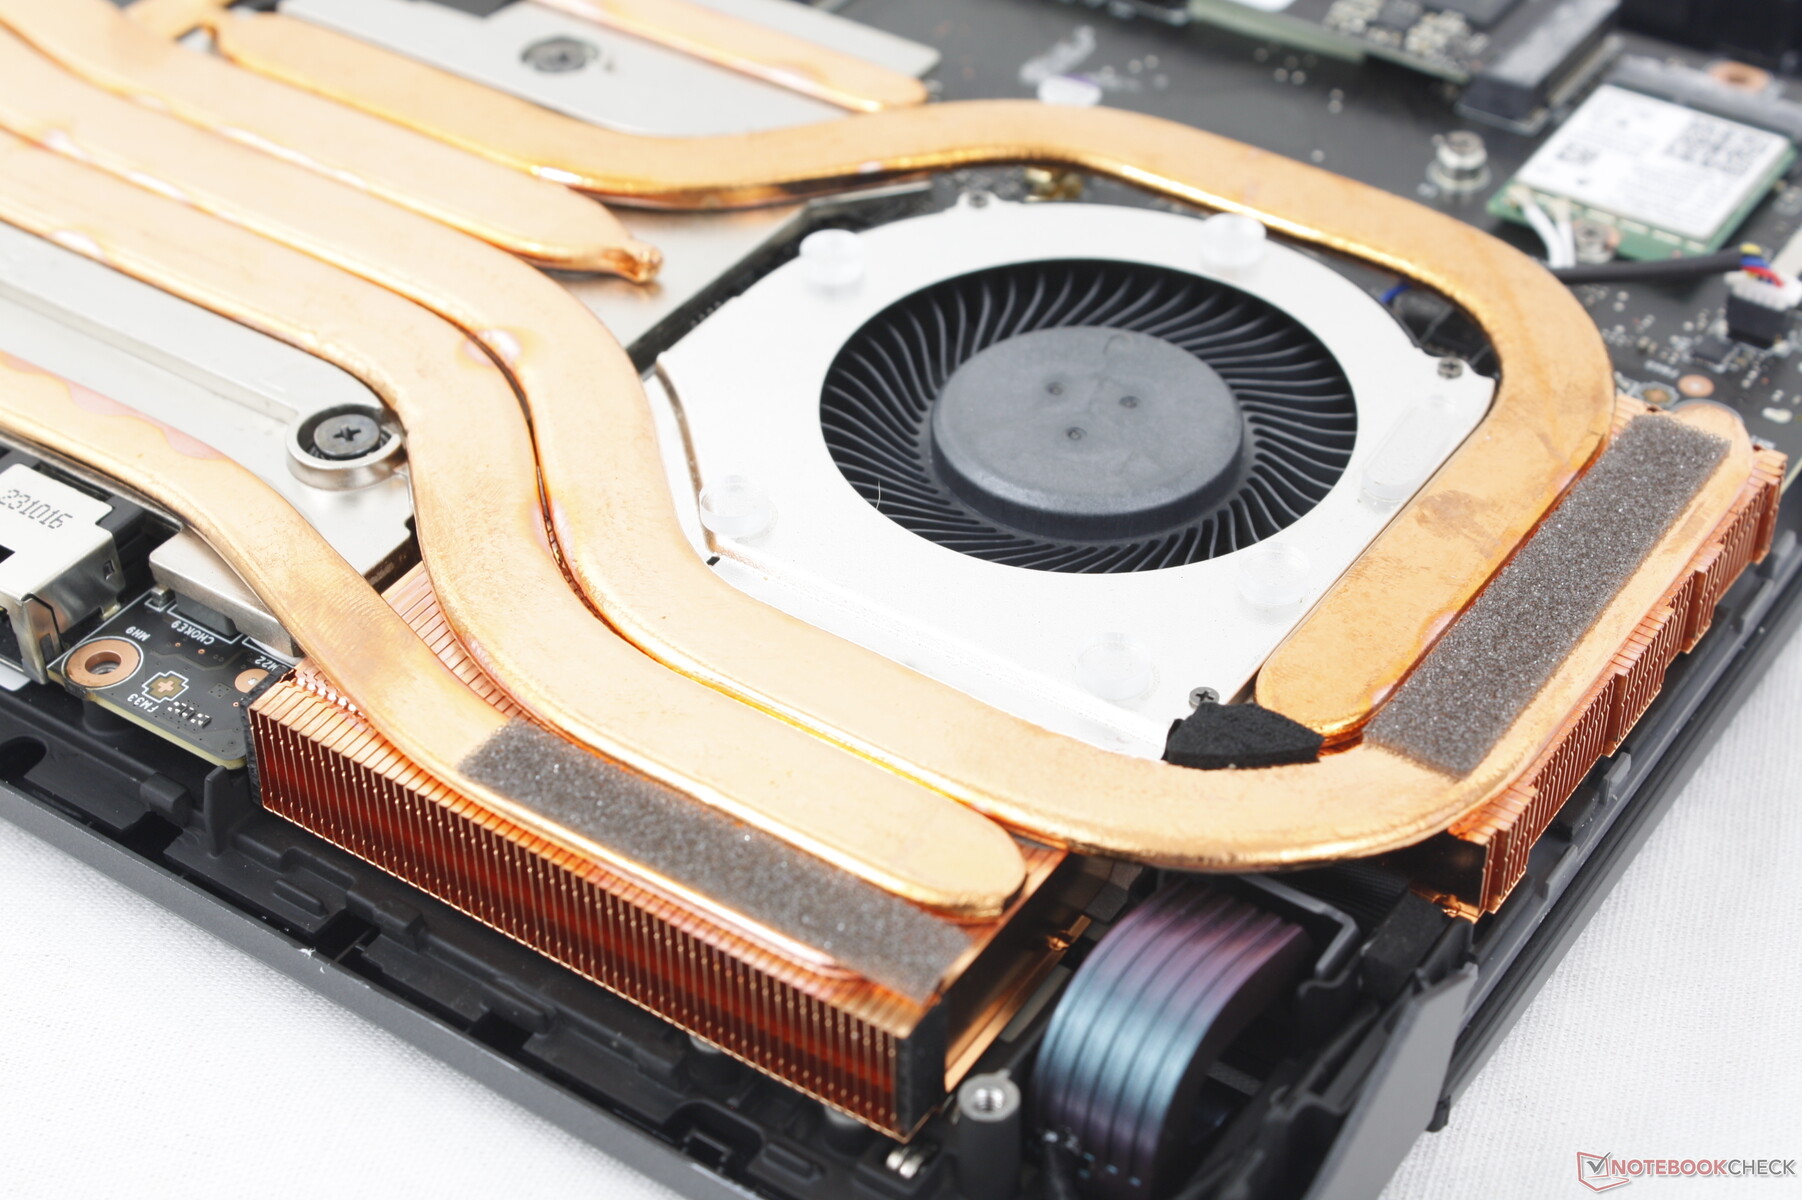
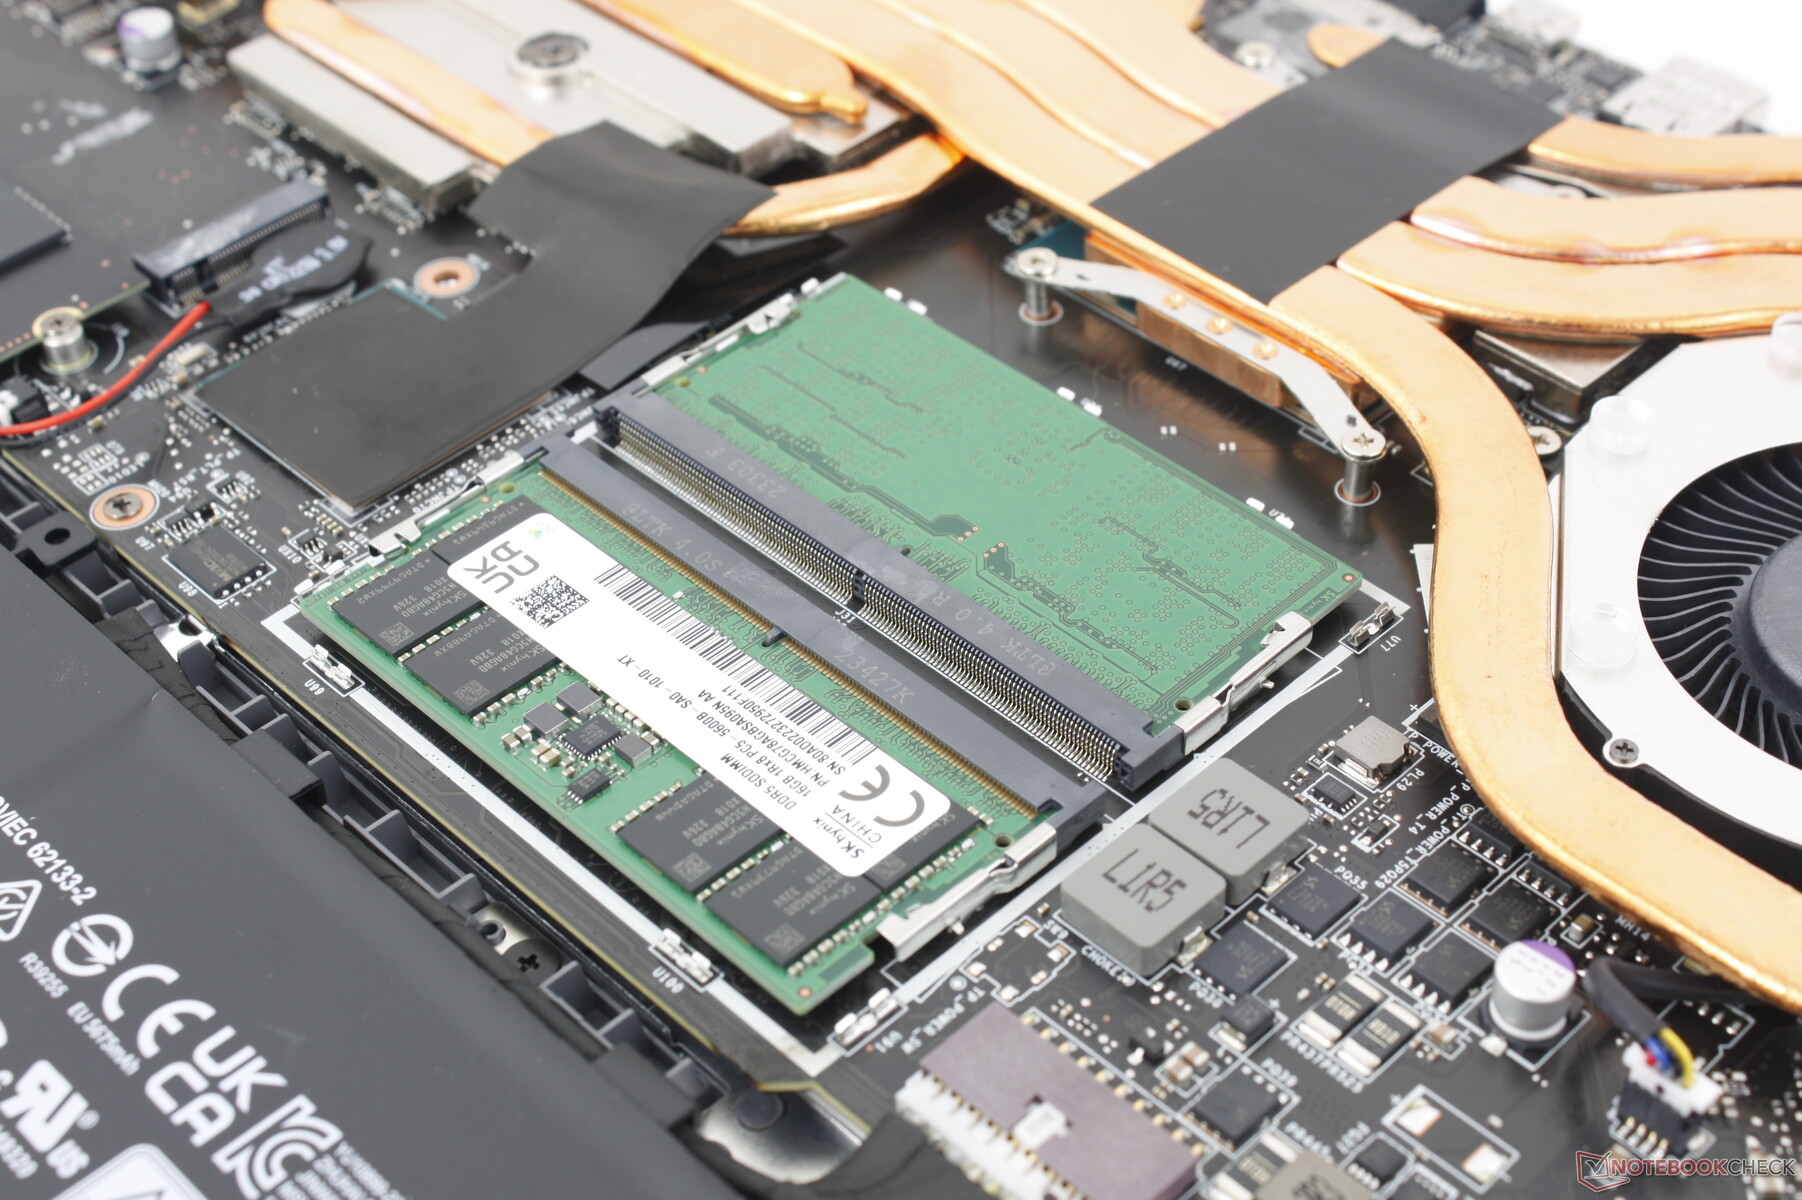
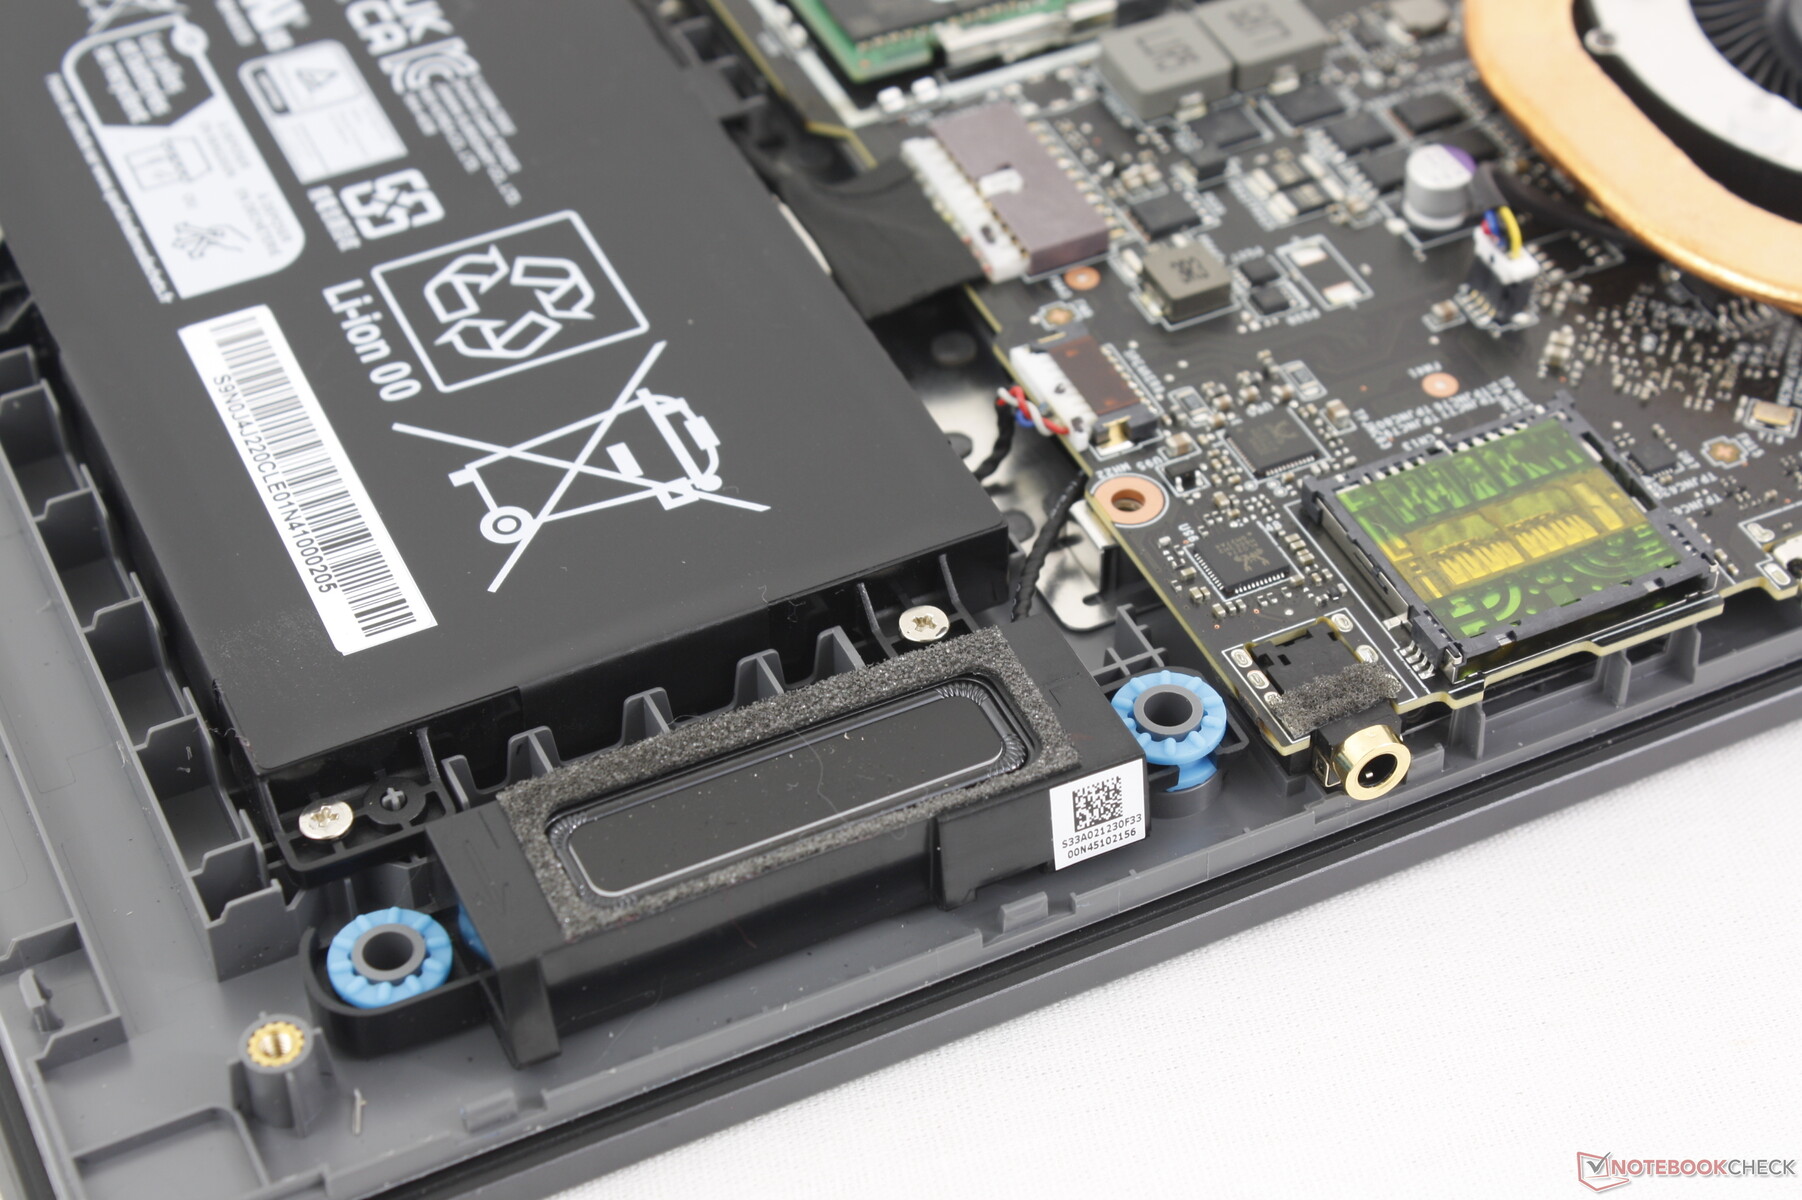
The bottom panel is secured by 13 Phillips screws. Unfortunately, removing the panel can be difficult as the edges and corners have significant curves to make the process more troublesome than it needs to be. In comparison, the bottom panel on the Razer Blade 16 is much flatter and with fewer latches for easier removal. A flat edge is recommended when servicing the Vector 16 HX.
Once inside, users will have access to 2x M.2 storage bays, 2x SODIMM slots, battery, and the WLAN module just like on the older Vector GP66 design.
Accessories And Warranty
There are no extras included in the box other than the AC adapter and paperwork. The usual one-year limited manufacturer warranty applies if purchased in the US.
Input Devices — Simple And Functional
Keyboard
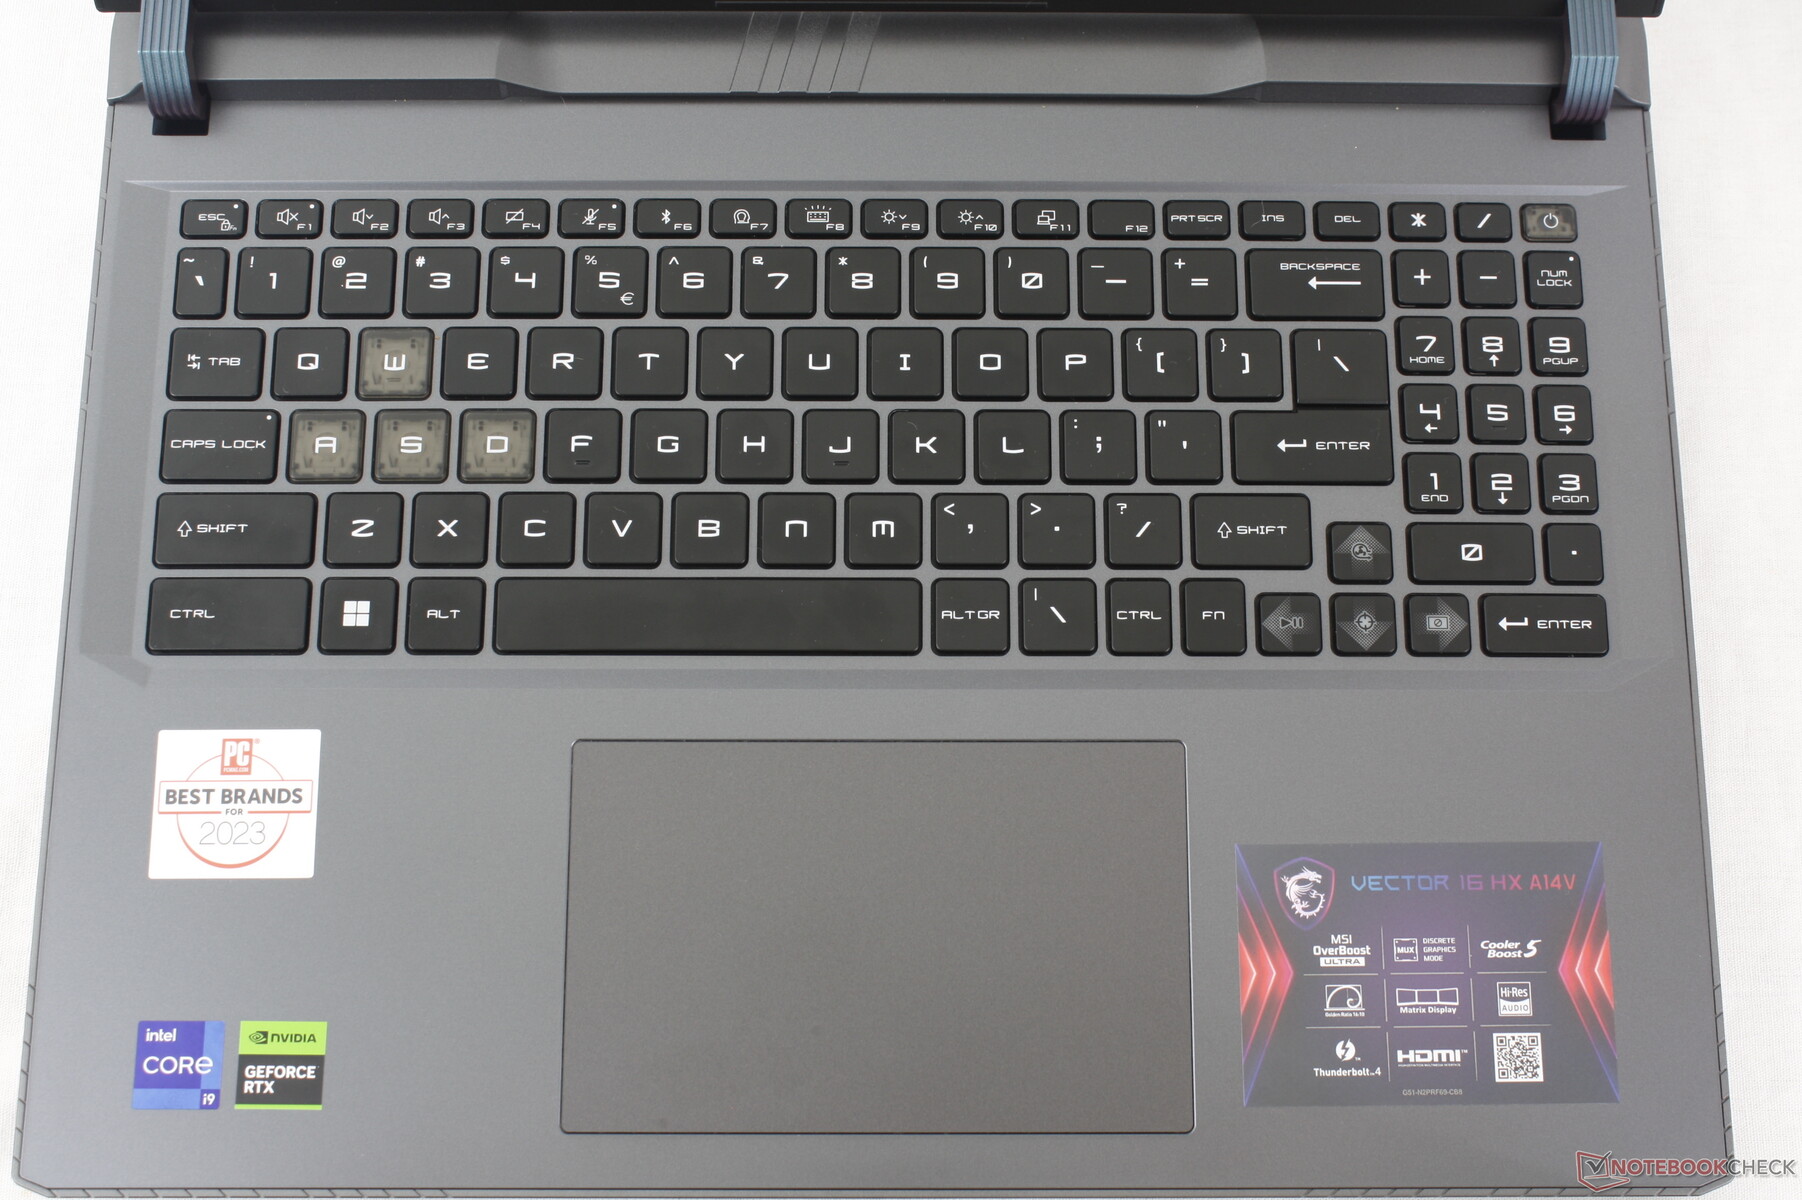
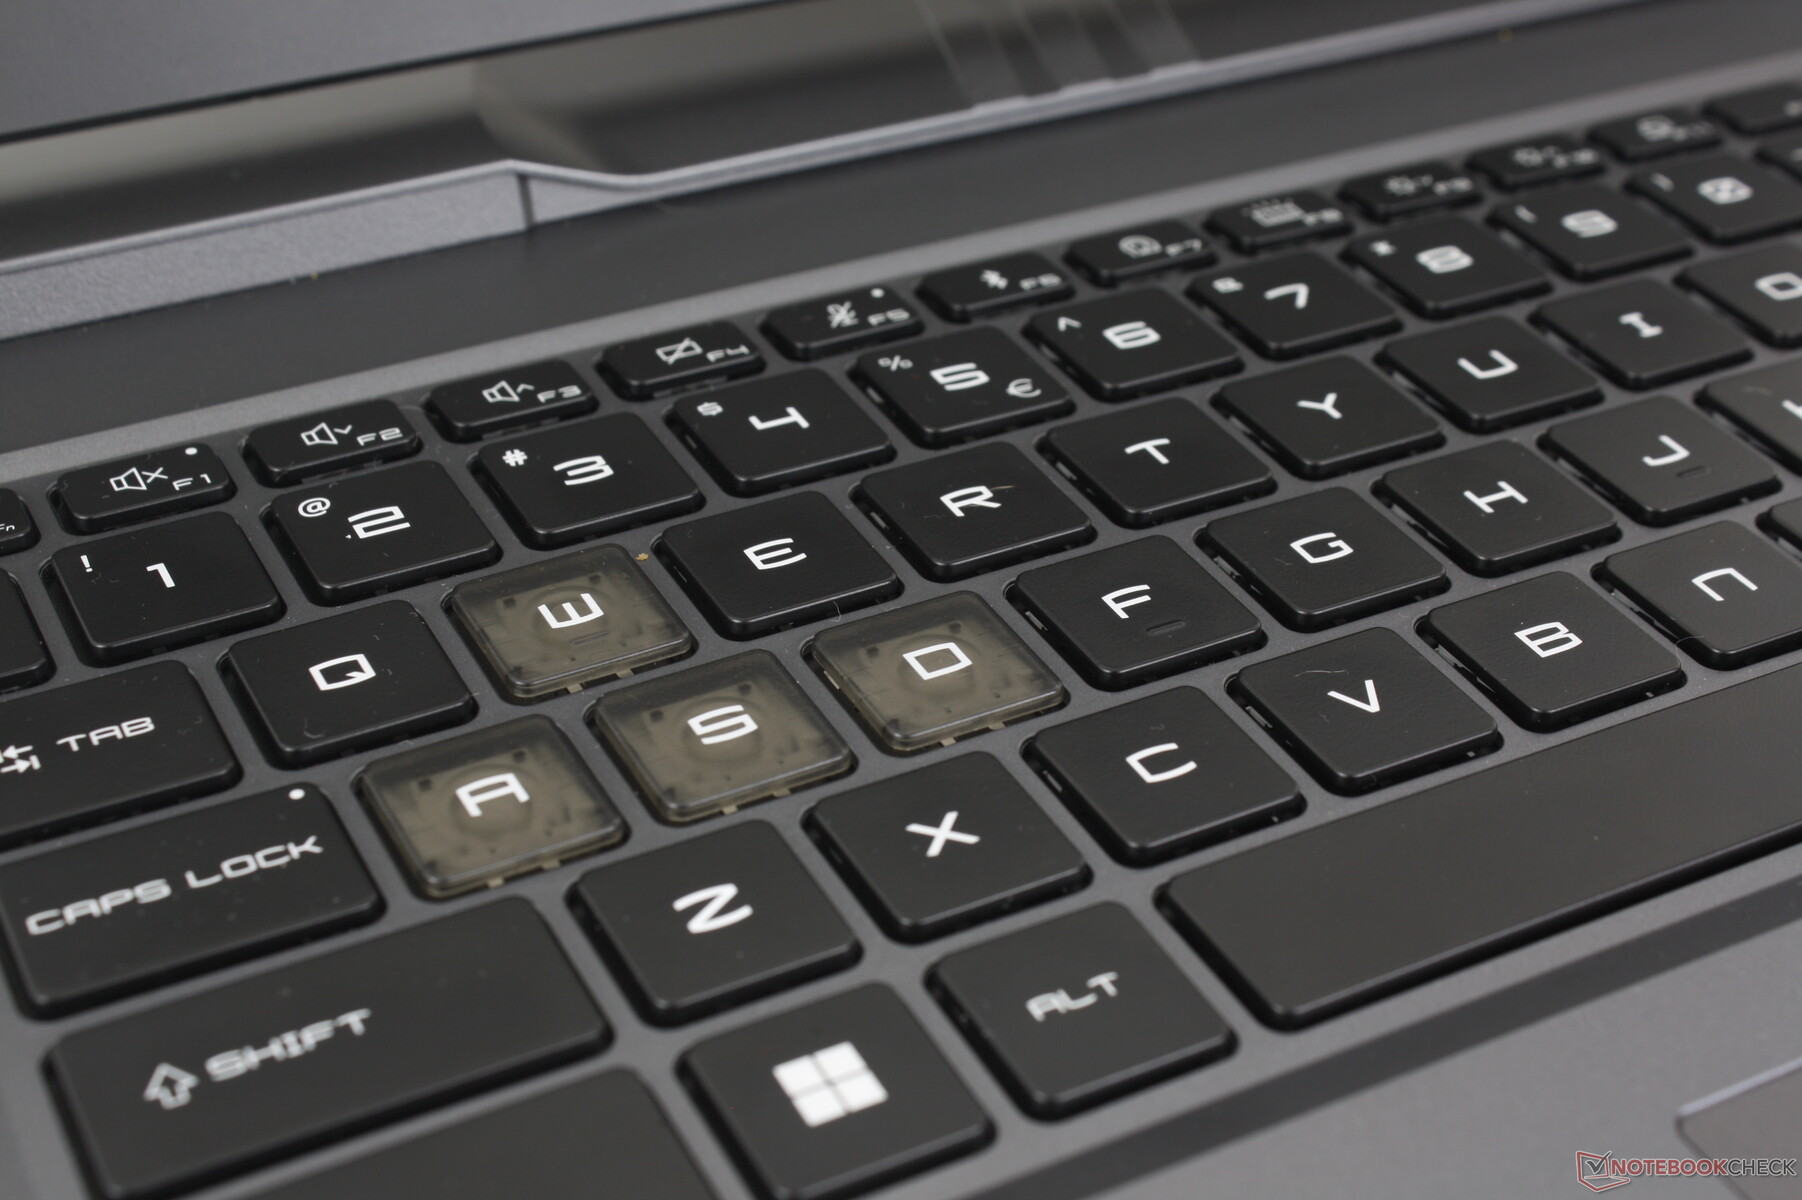
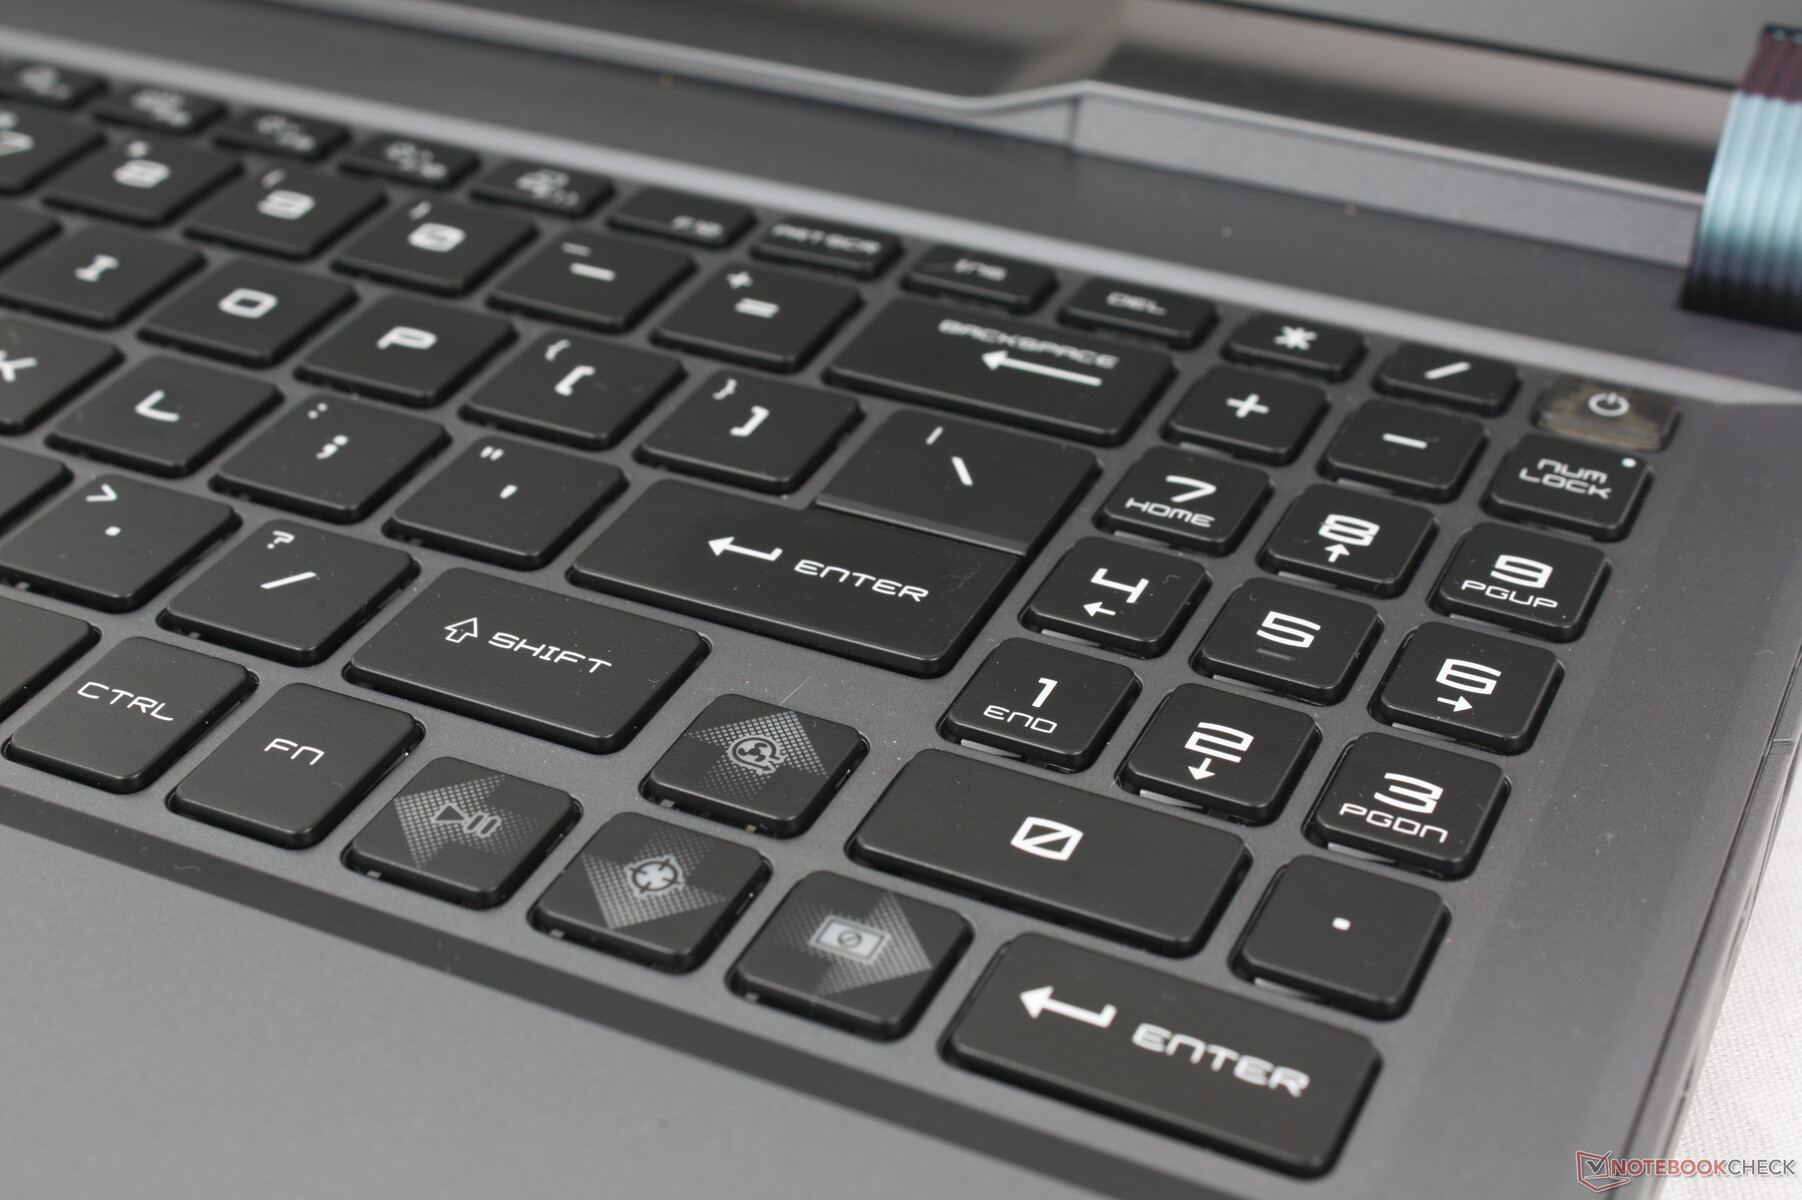
MSI has revamped the keyboard layout when compared to the older Vector GP66 design. The awkward Fn/Ctrl keys on the GP66 are now properly separated and there is a new numpad as well whereas many other gaming laptops typically omit the numpad altogether. Unfortunately, the Arrow keys are smaller than before while the narrow numpad keys aren't very comfortable to use. Their implementation therefore feels like an afterthought when compared to the otherwise larger and more comfortable QWERTY keys.
Per-key RGB lighting comes standard to illuminate all keys and symbols.
Touchpad
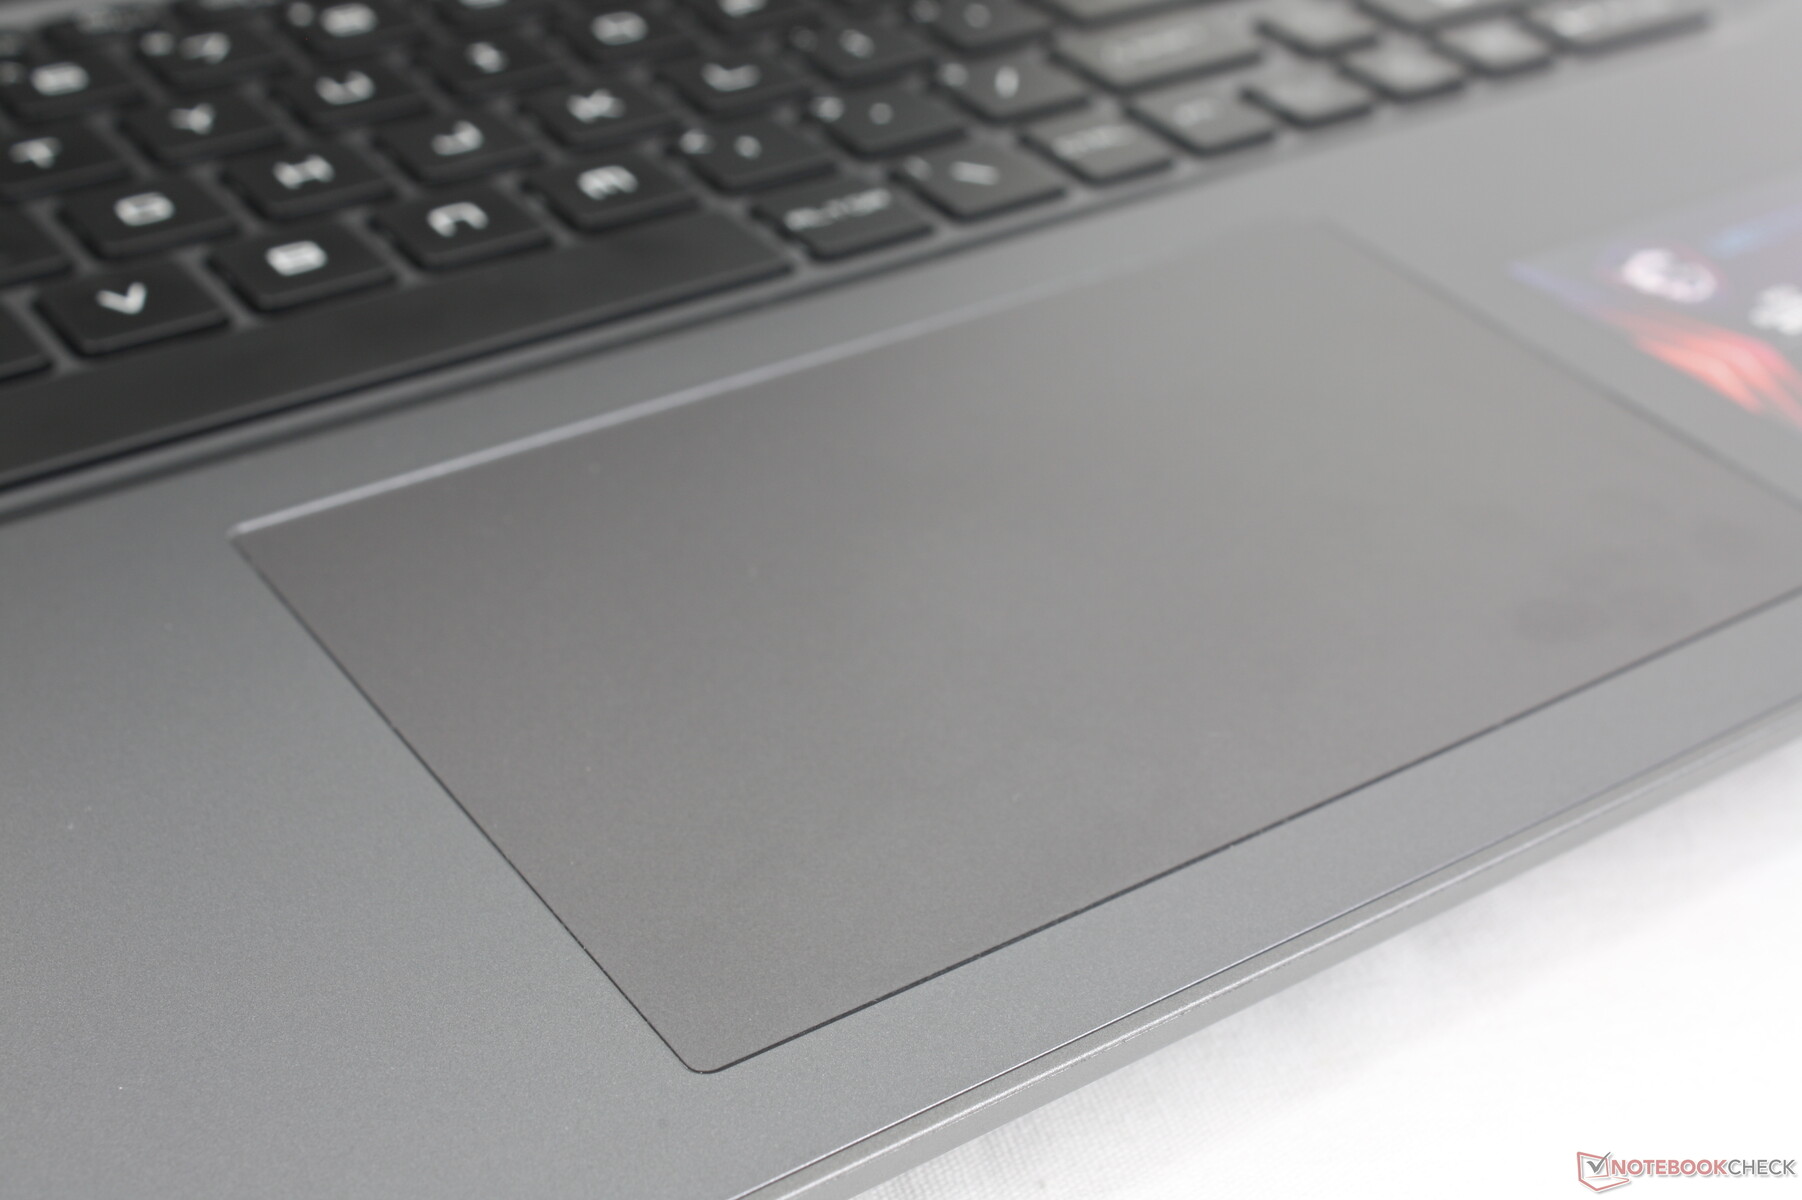
At approximately 13.2 x 8.2 cm, the clickpad is more spacious than on the Dell G16 7620 (10.5 x 6 cm) and older Vector GP66 (10.5 x 6.5 cm). Traction is very smooth with only very slight sticking when gliding at slower speeds. Feedback when pressing down is also quite firm despite the relatively quiet clatter. Clickpads are usually subpar on gaming laptops, but we're glad to see a a sizable half-decent one on the Vector 16 HX.
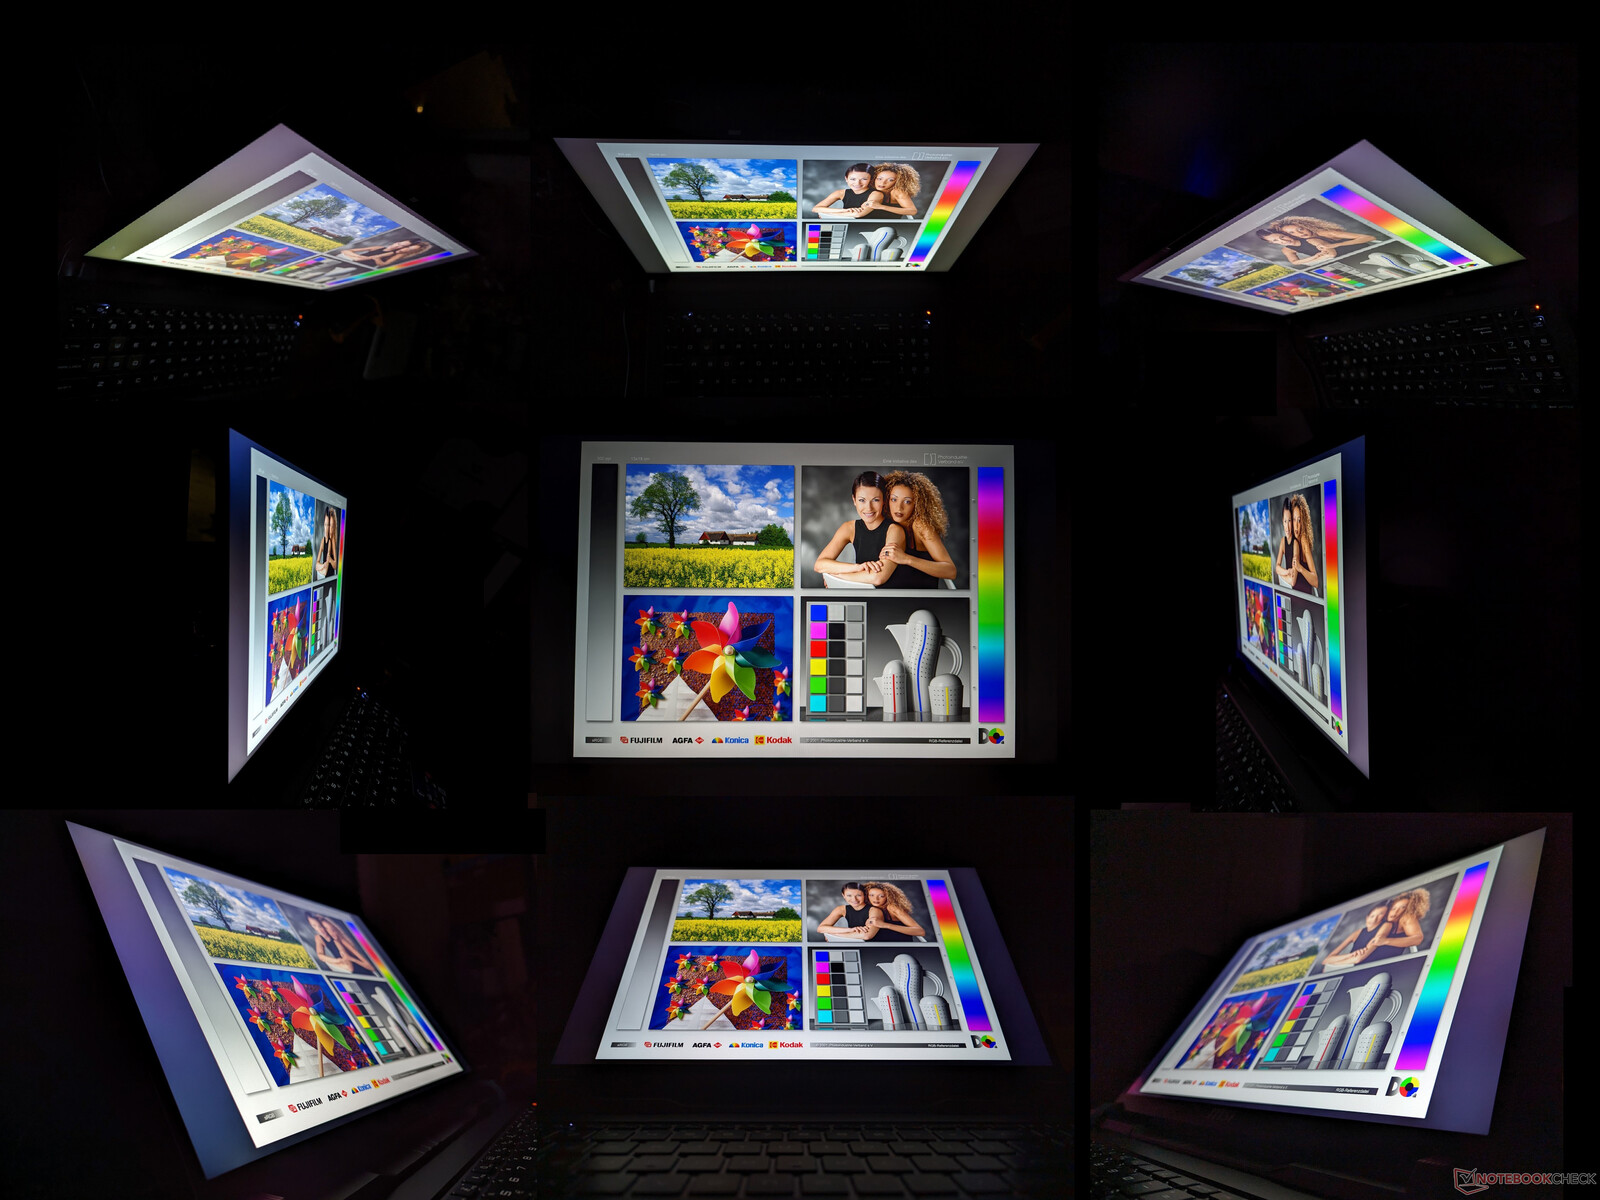
Display — All IPS With No G-Sync
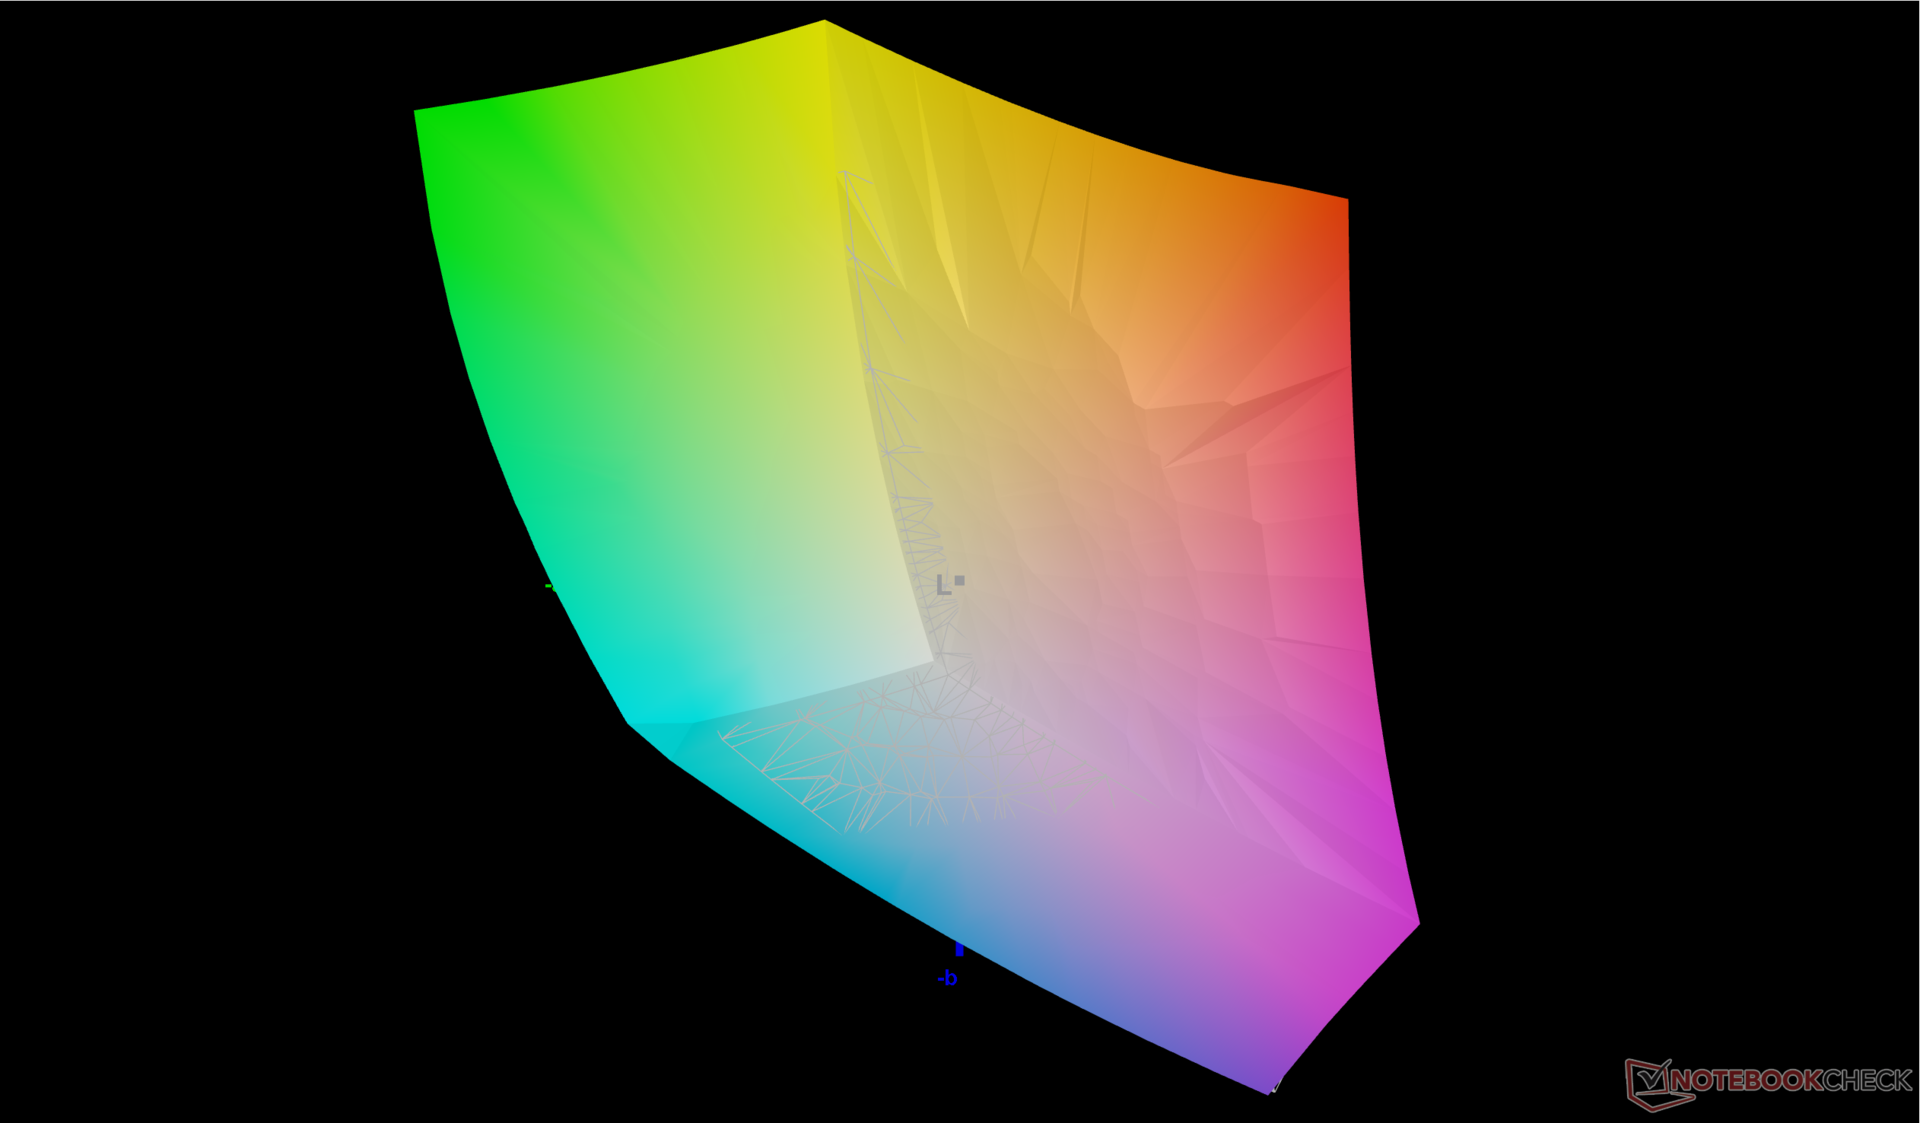
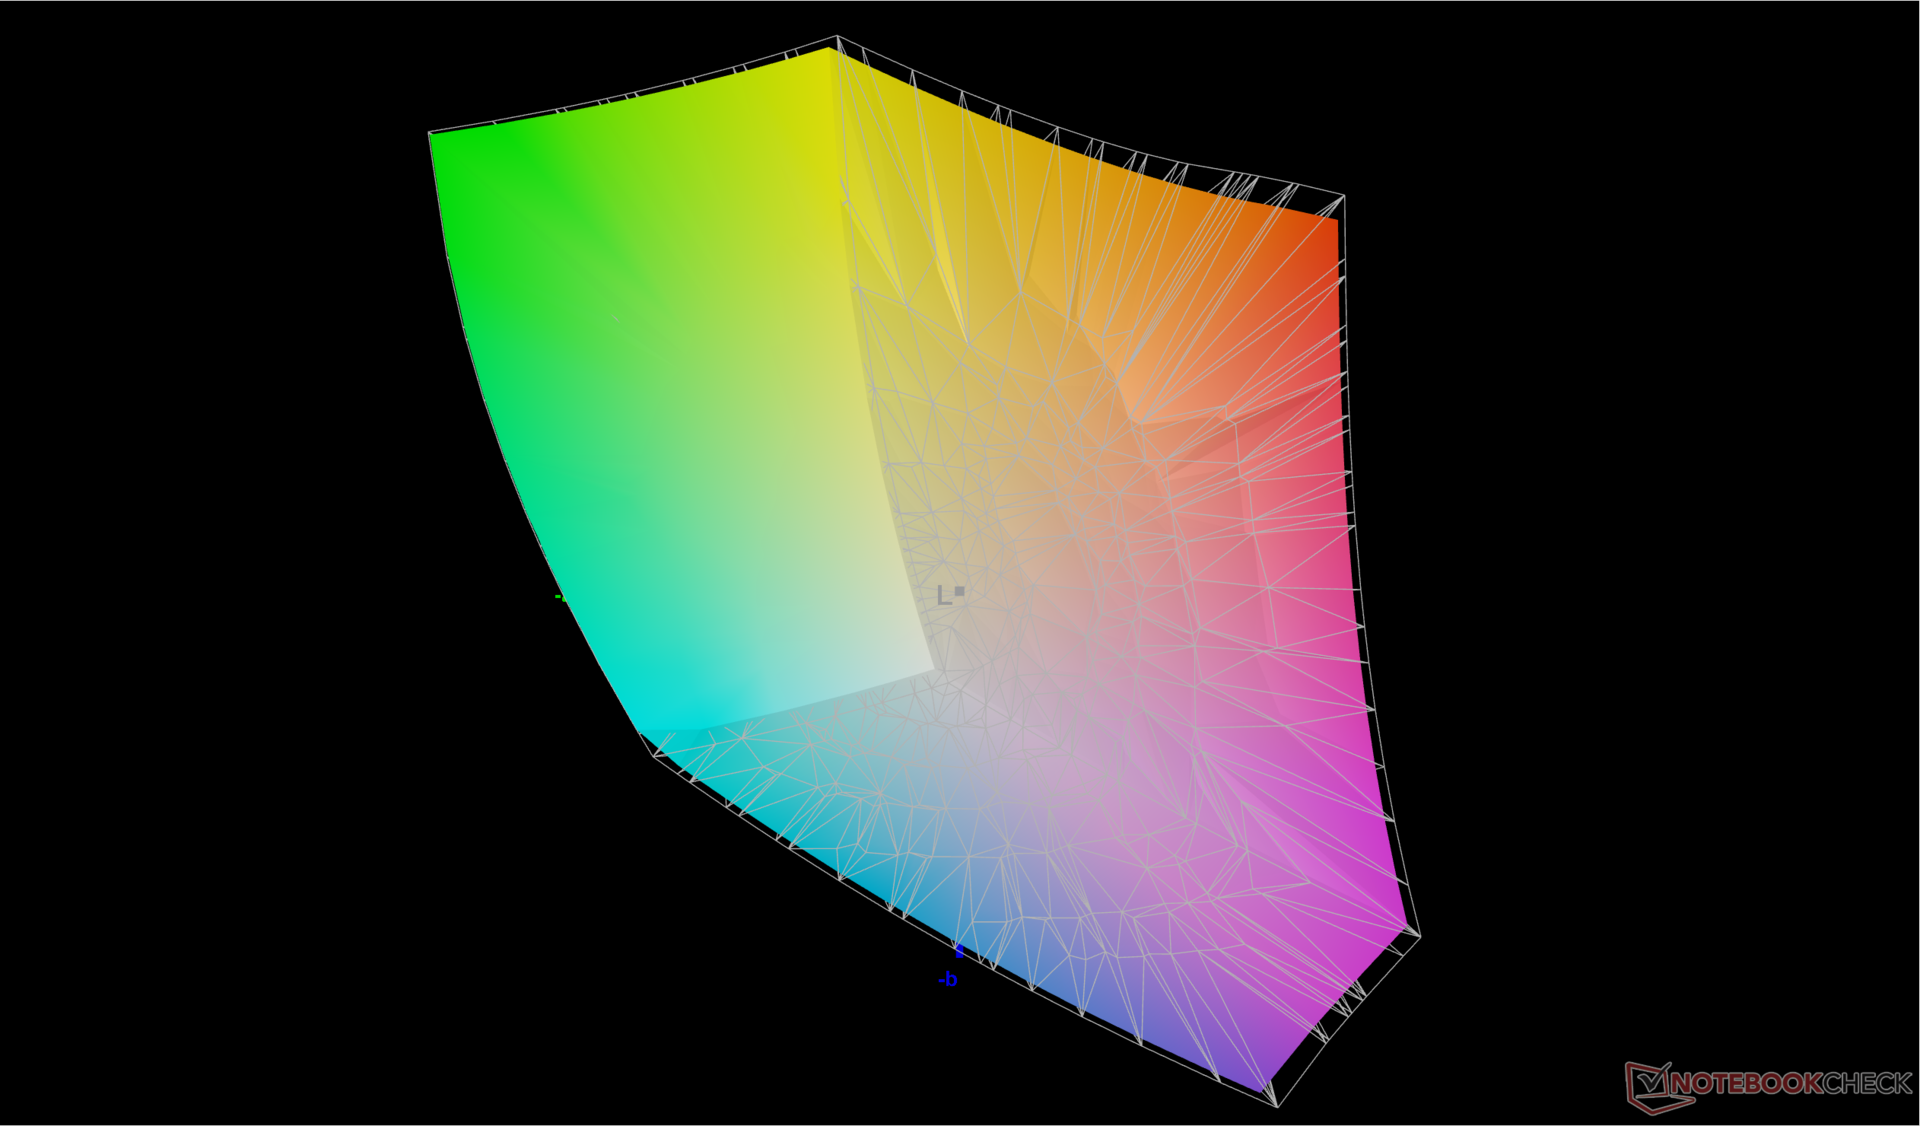
This is the first system in our database to ship with the high-end Chi Mei N160GME-GTB panel. Its properties are very similar to the NE160QDM-NZ3 as found on the recent Lenovo Legion 5 16 but with one notable improvement: full DCI-P3 coverage instead of only sRGB. Otherwise, users can expect the same fast 240 Hz native refresh rate, ~1300:1 contrast ratio, and fast response times as on the Lenovo machine.
G-Sync is notably absent on all current configurations of the Vector 16 HX. The refresh rate is also fixed at either 60 Hz or 240 Hz whereas panels with variable refresh rate are becoming common.
Keep in mind that the less expensive 1200p 144 Hz configuration will likely have different attributes than our 1600p 240 Hz configuration in terms of brightness, colors, and more.

| |||||||||||||||||||||||||
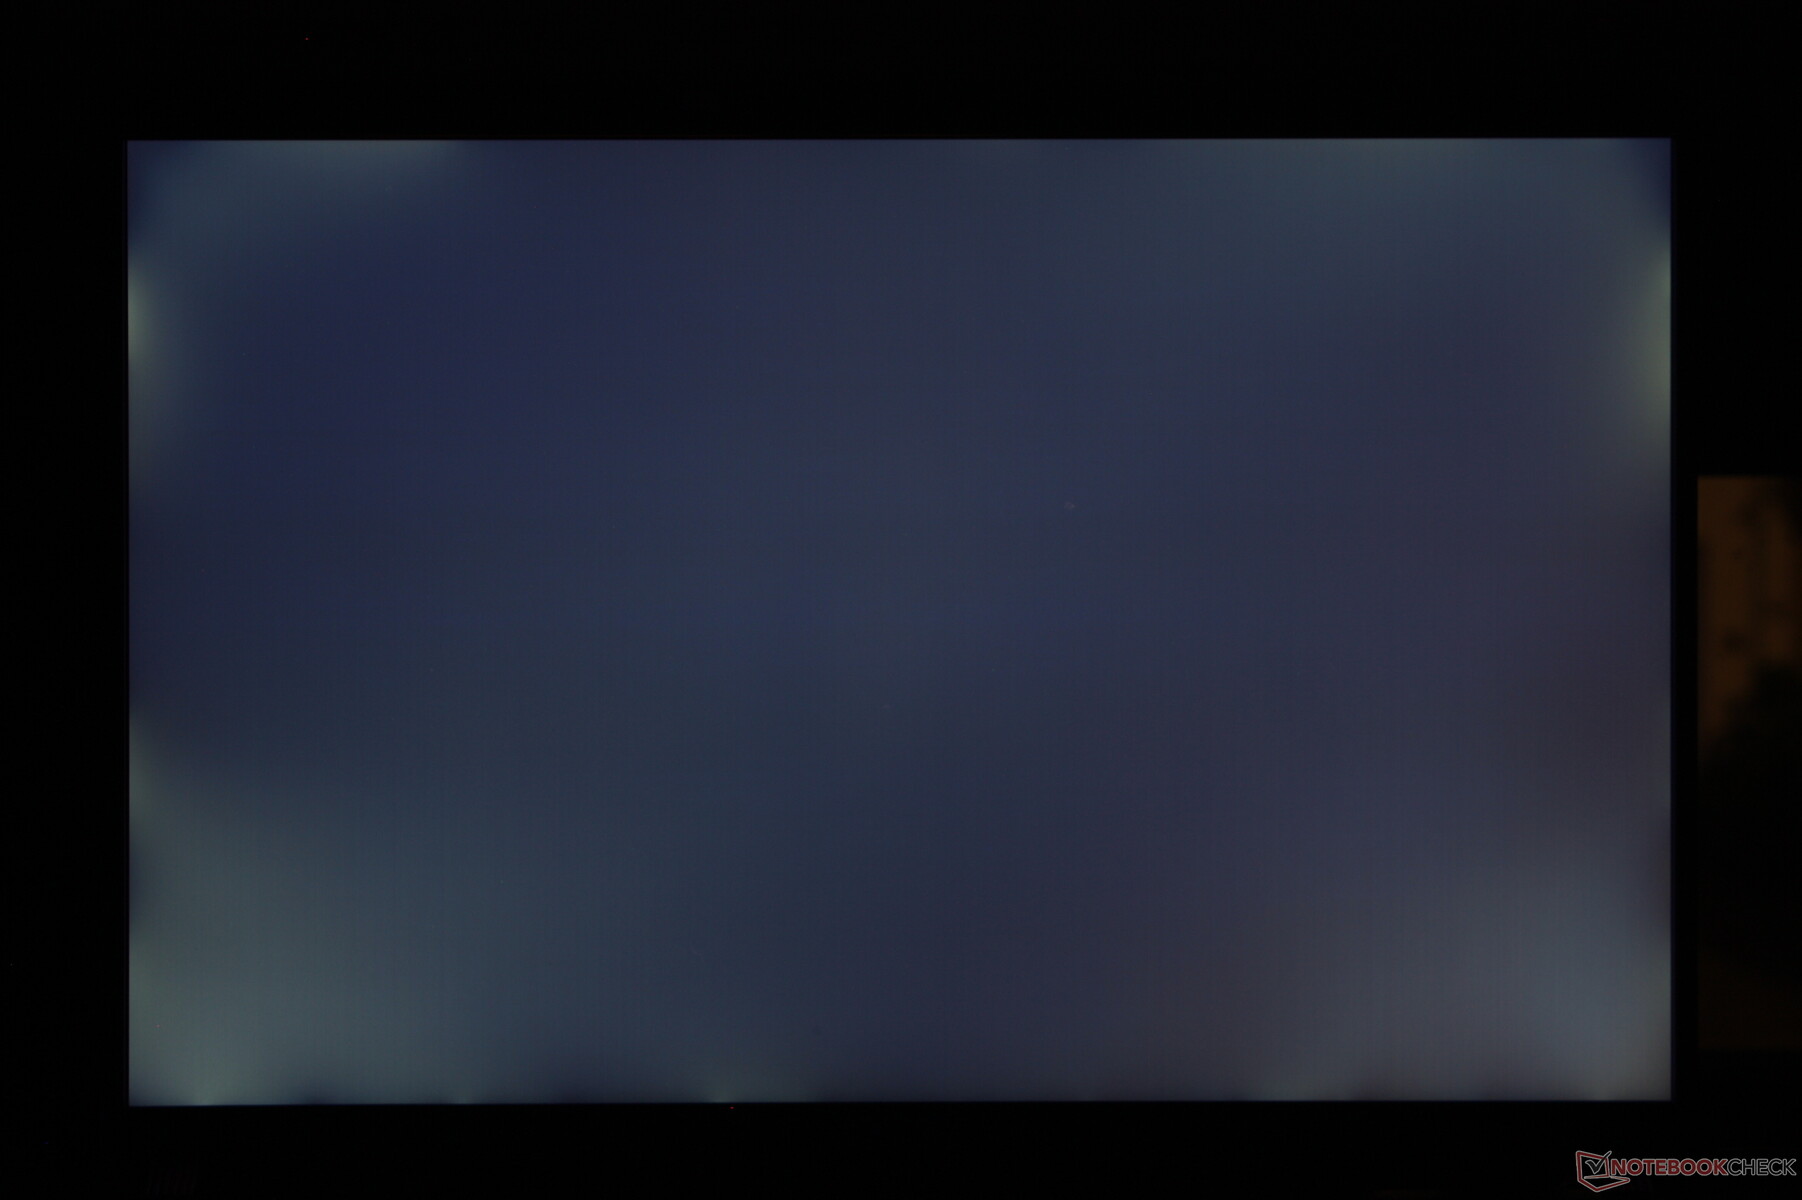
Brightness Distribution: 83 %
Center on Battery: 557.2 cd/m²
Contrast: 1359:1 (Black: 0.41 cd/m²)
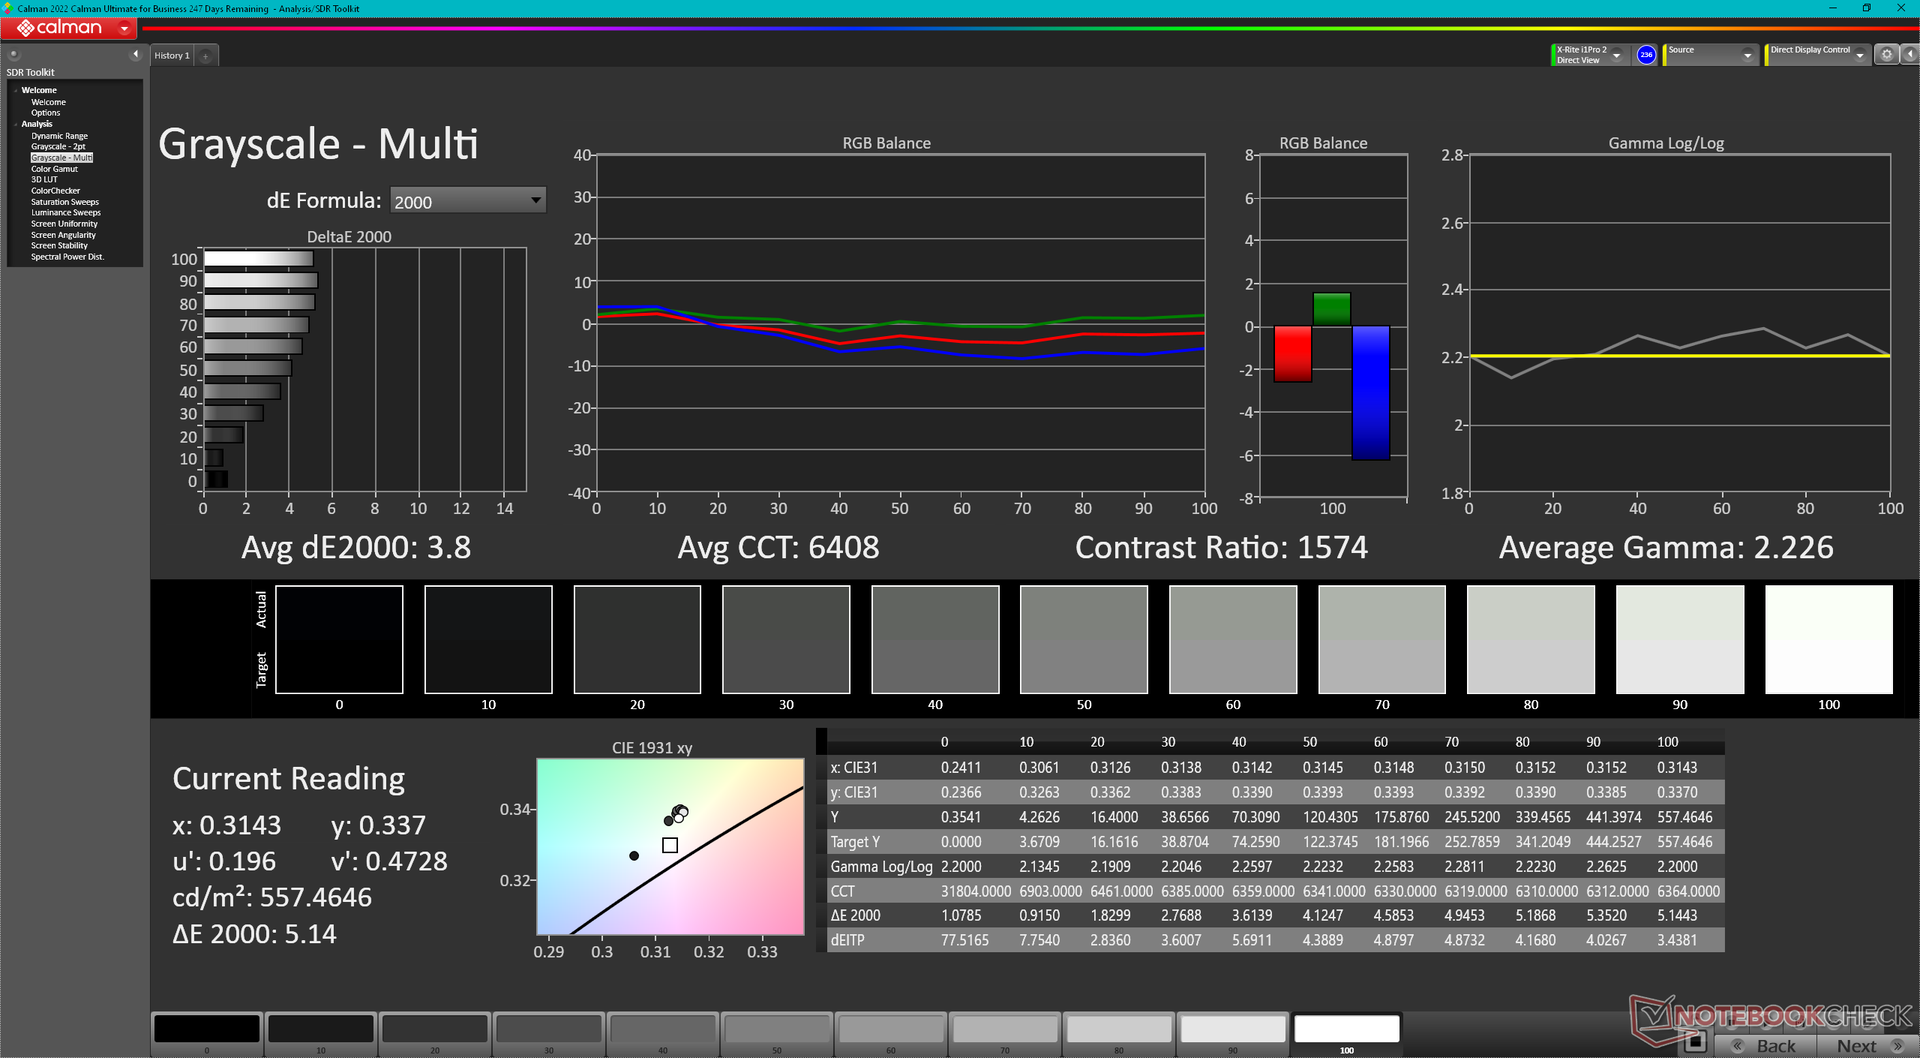
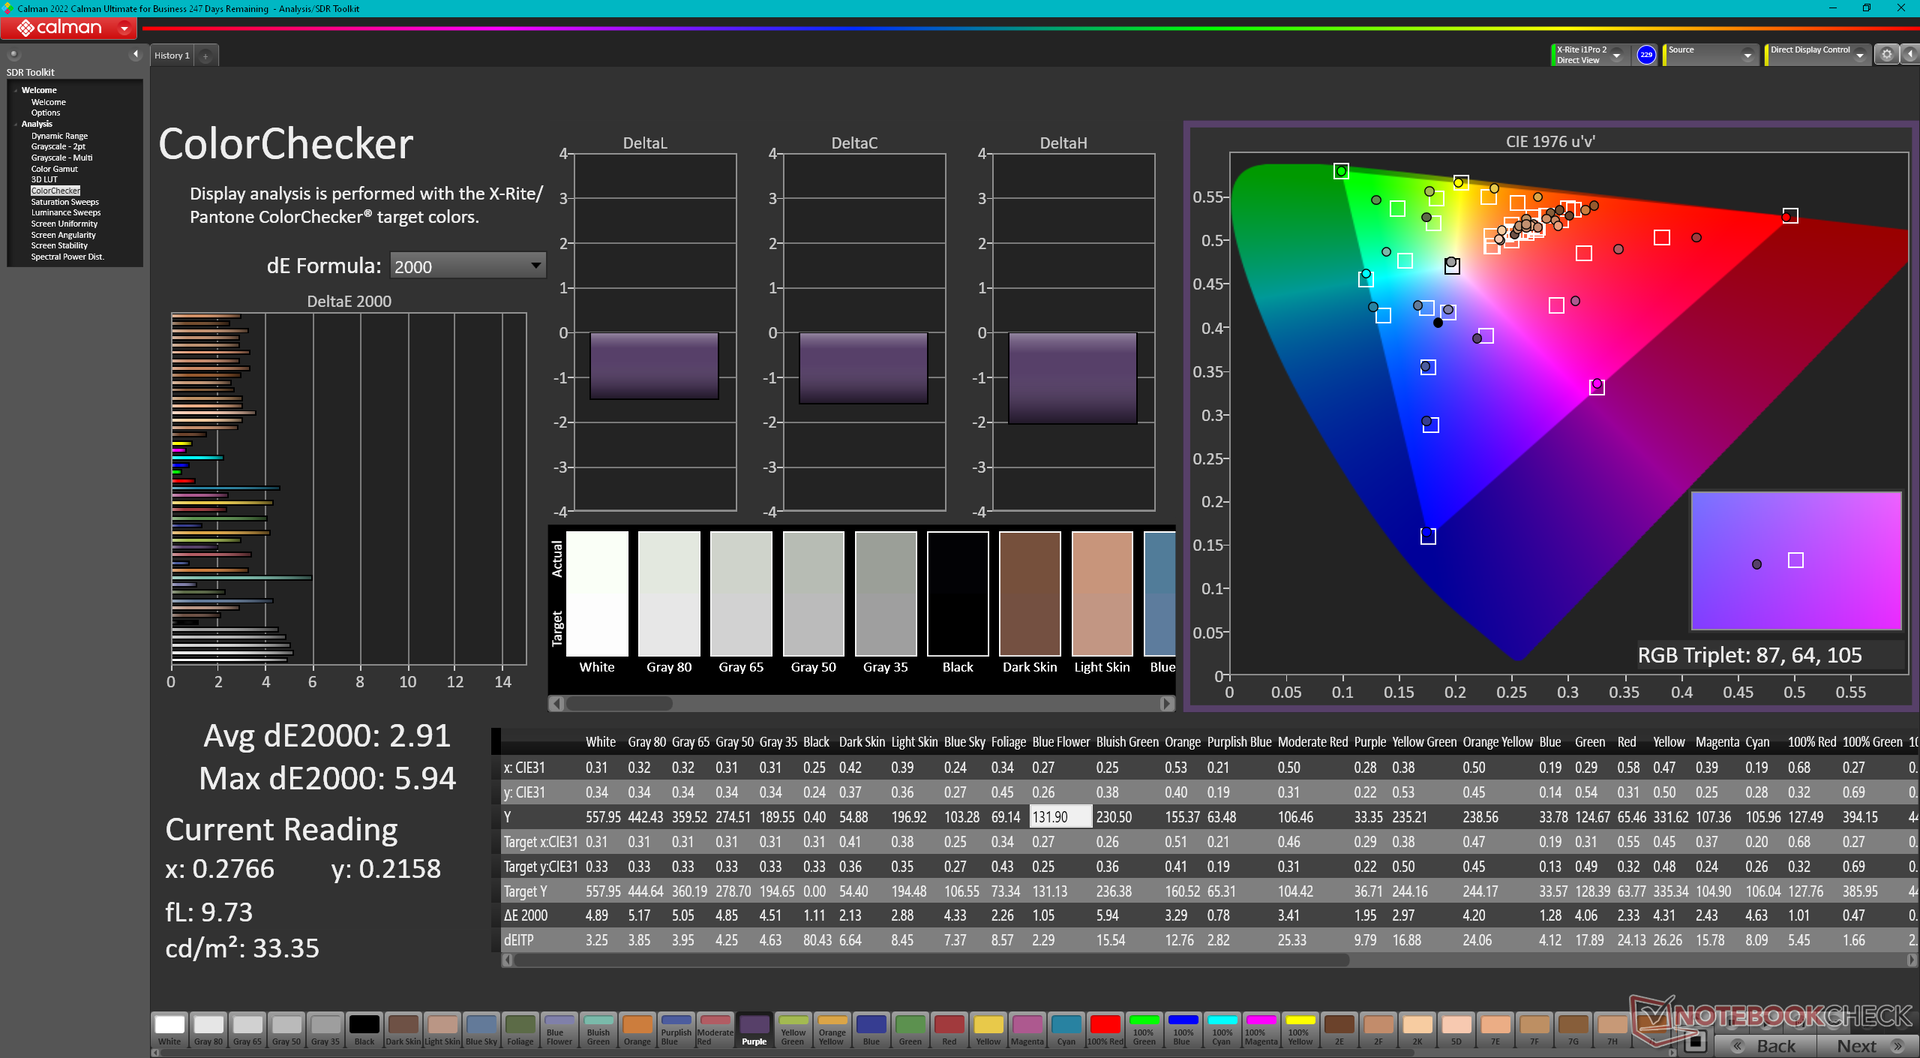
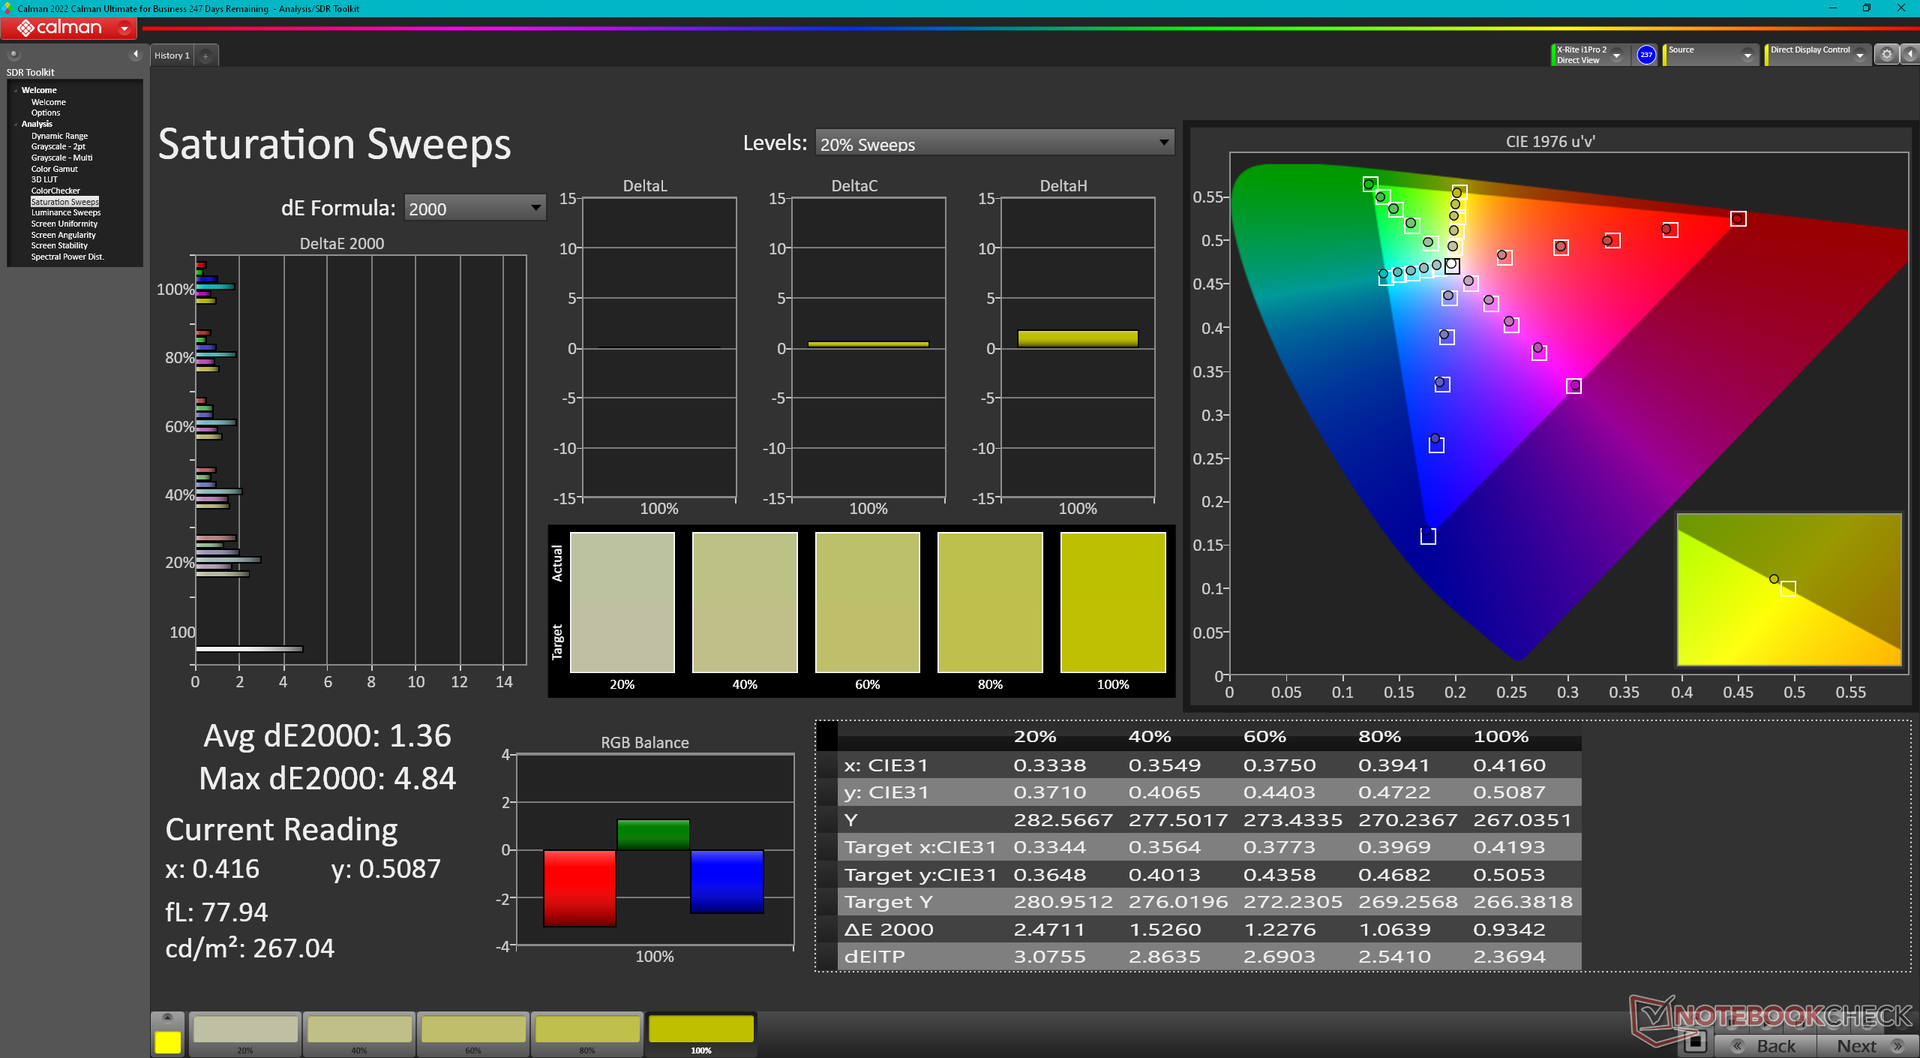
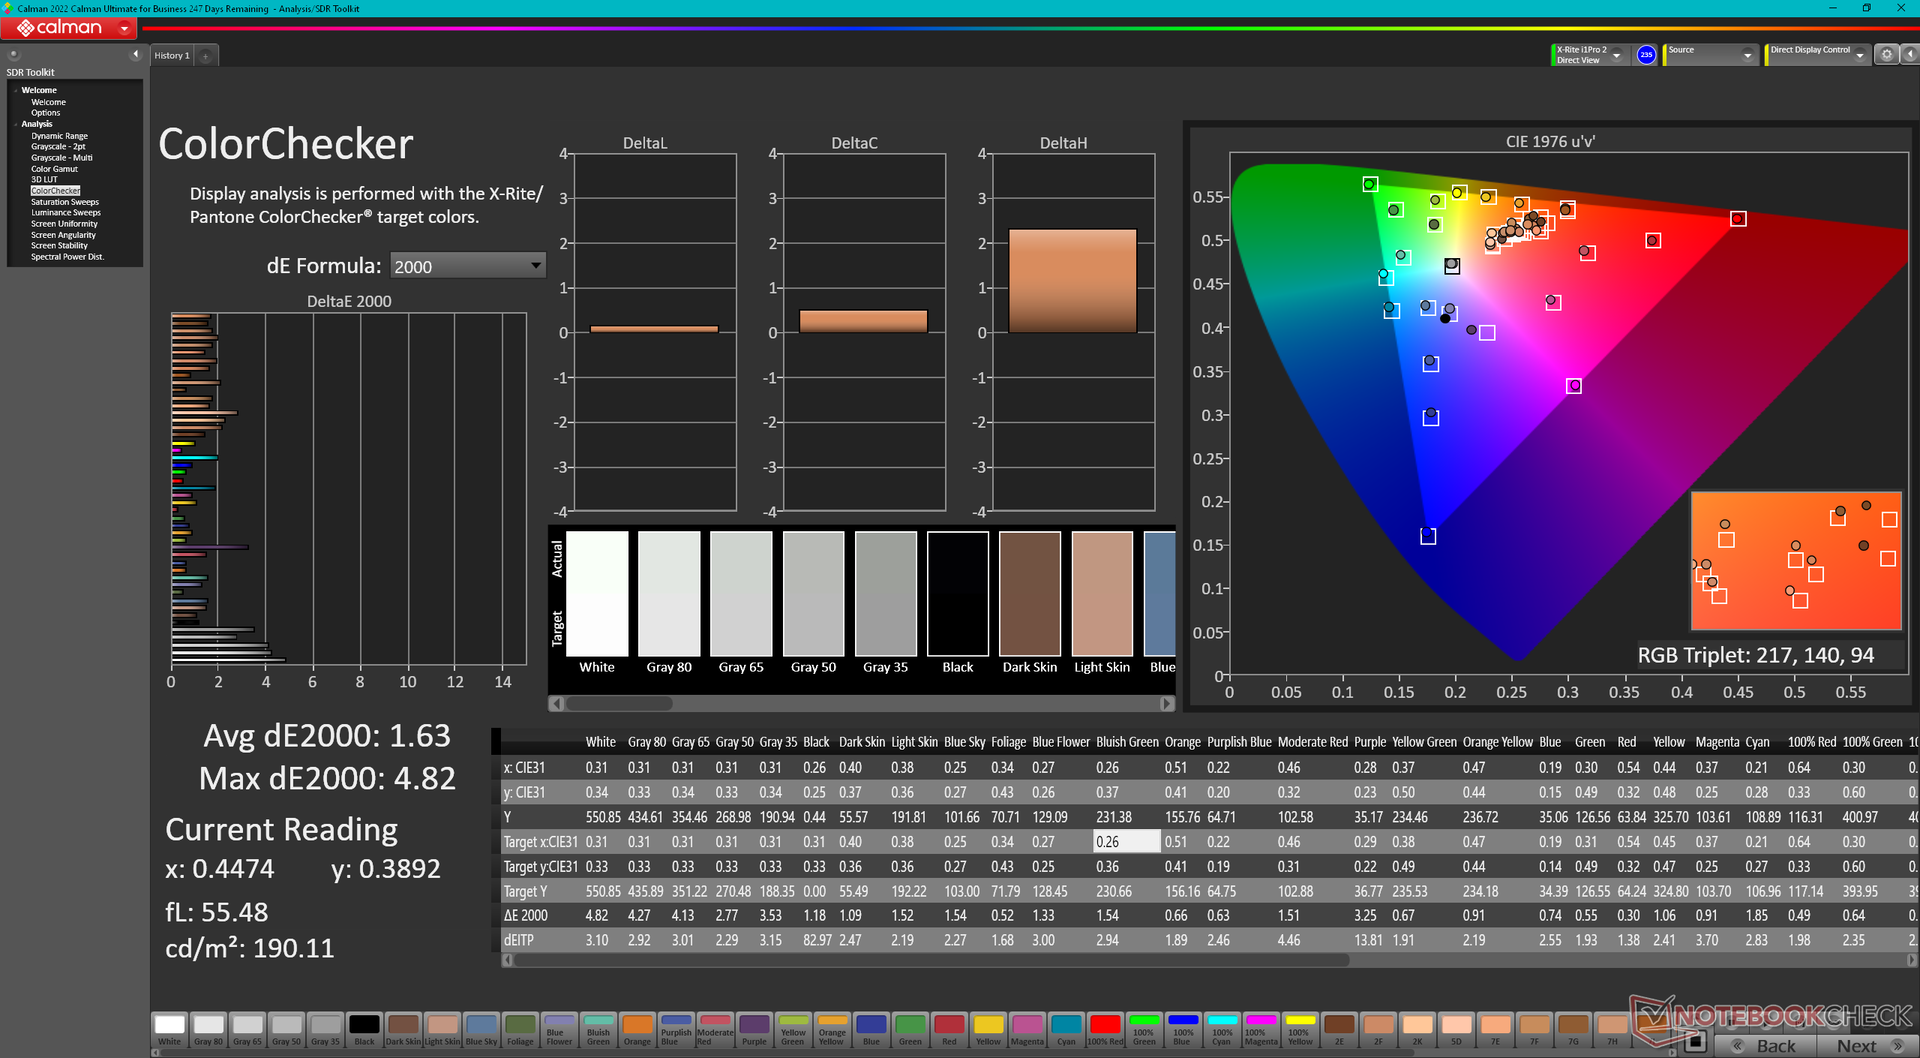
ΔE ColorChecker Calman: 2.91 | ∀{0.5-29.43 Ø4.72}
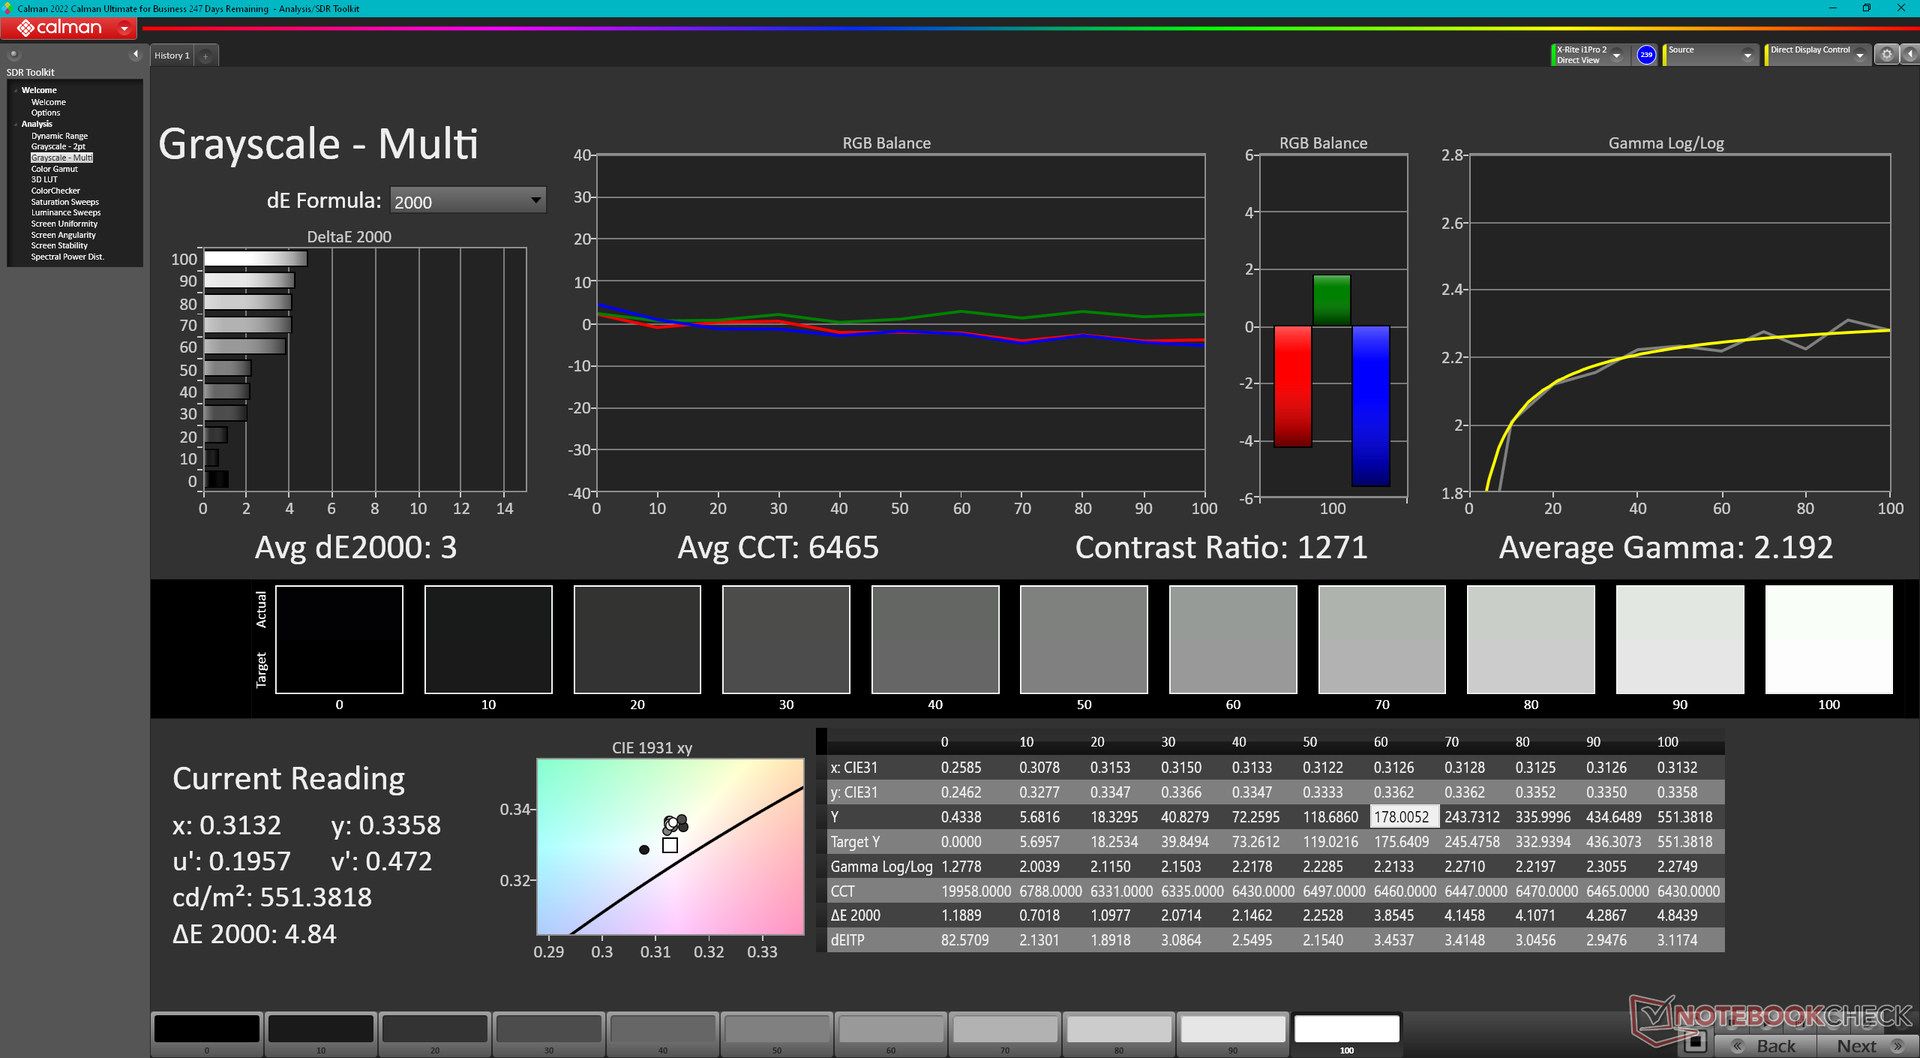
calibrated: 1.63
ΔE Greyscale Calman: 3.8 | ∀{0.09-98 Ø4.97}
85.4% AdobeRGB 1998 (Argyll 3D)
99.7% sRGB (Argyll 3D)
95.4% Display P3 (Argyll 3D)
Gamma: 2.23
CCT: 6408 K
| MSI Vector 16 HX A14V Chi Mei N160GME-GTB, IPS, 2560x1600, 16" | MSI Vector GP66 12UGS BOE NE156FHM-NZ3, IPS, 1920x1080, 15.6" | Lenovo Legion 5 16IRX G9 NE160QDM-NZ3, IPS, 2560x1600, 16" | HP Victus 16-r0077ng CMN162D, IPS, 1920x1080, 16.1" | Asus TUF Gaming A16 FA617XS BOE NE160WUM-NX2, IPS, 1920x1200, 16" | Dell G16 7620 BOE NE16QDM, IPS, 2560x1600, 16" | |
|---|---|---|---|---|---|---|
| Display | -14% | -12% | -17% | -15% | -16% | |
| Display P3 Coverage (%) | 95.4 | 70.1 -27% | 72.4 -24% | 66.7 -30% | 69.3 -27% | 68.3 -28% |
| sRGB Coverage (%) | 99.7 | 99.5 0% | 100 0% | 98 -2% | 97.3 -2% | 98 -2% |
| AdobeRGB 1998 Coverage (%) | 85.4 | 72.1 -16% | 74.1 -13% | 69 -19% | 70.7 -17% | 70.5 -17% |
| Response Times | 7% | -48% | -53% | -81% | -21% | |
| Response Time Grey 50% / Grey 80% * (ms) | 5.7 ? | 5.8 ? -2% | 12.5 ? -119% | 13.3 ? -133% | 15.6 ? -174% | 8.6 ? -51% |
| Response Time Black / White * (ms) | 11.4 ? | 9.6 ? 16% | 8.7 ? 24% | 8.2 ? 28% | 10 ? 12% | 10.4 ? 9% |
| PWM Frequency (Hz) | ||||||
| Screen | -3% | 29% | 17% | 13% | 5% | |
| Brightness middle (cd/m²) | 557.2 | 353.1 -37% | 526 -6% | 308 -45% | 301 -46% | 369.4 -34% |
| Brightness (cd/m²) | 506 | 325 -36% | 500 -1% | 285 -44% | 294 -42% | 348 -31% |
| Brightness Distribution (%) | 83 | 85 2% | 87 5% | 85 2% | 94 13% | 83 0% |
| Black Level * (cd/m²) | 0.41 | 0.38 7% | 0.33 20% | 0.25 39% | 0.21 49% | 0.32 22% |
| Contrast (:1) | 1359 | 929 -32% | 1594 17% | 1232 -9% | 1433 5% | 1154 -15% |
| Colorchecker dE 2000 * | 2.91 | 2.24 23% | 1.2 59% | 1.3 55% | 1.79 38% | 1.78 39% |
| Colorchecker dE 2000 max. * | 5.94 | 5 16% | 2.1 65% | 2.76 54% | 3.48 41% | 4.41 26% |
| Colorchecker dE 2000 calibrated * | 1.63 | 1.02 37% | 1 39% | 0.92 44% | 1.2 26% | 1.22 25% |
| Greyscale dE 2000 * | 3.8 | 4 -5% | 1.3 66% | 1.7 55% | 2.5 34% | 3.2 16% |
| Gamma | 2.23 99% | 2.24 98% | 2.23 99% | 2.167 102% | 2.265 97% | 2.2 100% |
| CCT | 6408 101% | 6864 95% | 6391 102% | 6767 96% | 6157 106% | 6750 96% |
| Total Average (Program / Settings) | -3% /
-4% | -10% /
9% | -18% /
-0% | -28% /
-6% | -11% /
-3% |
* ... smaller is better
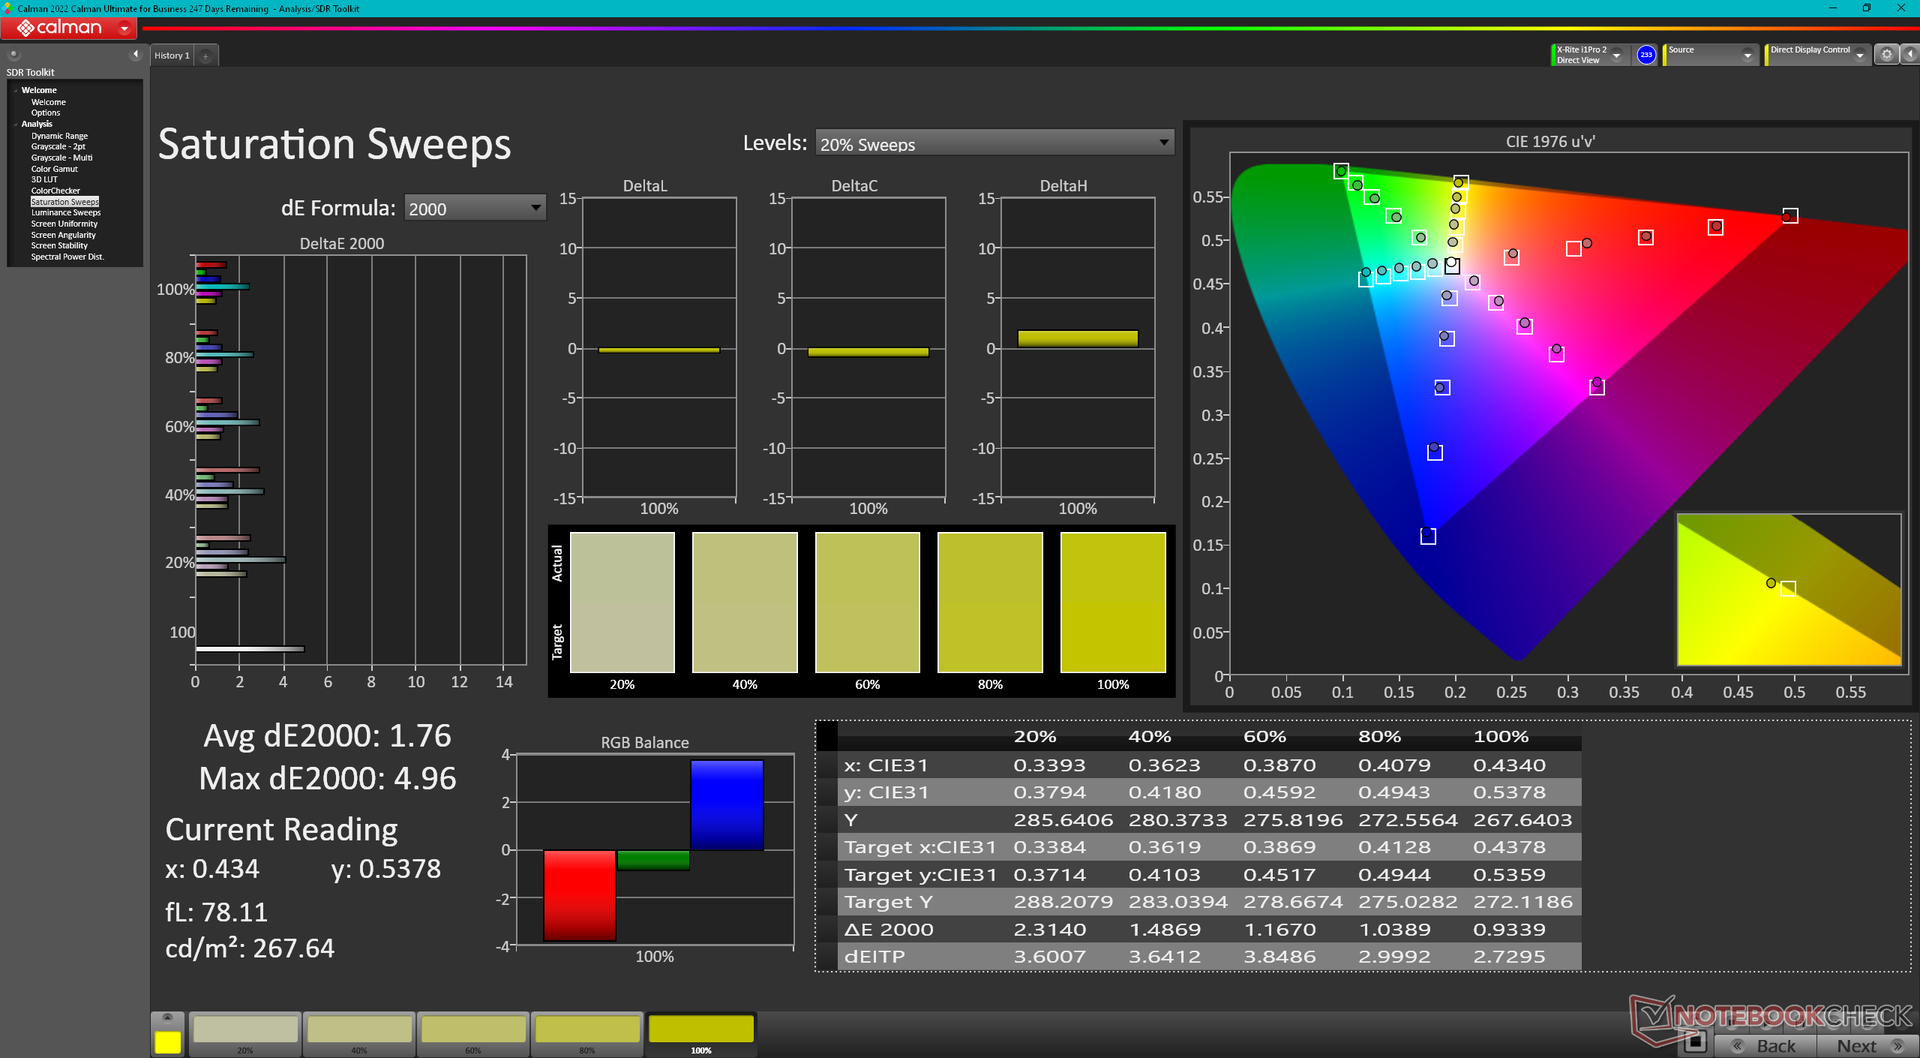
While the display doesn't come pre-calibrated, its colors are already relatively accurate. Average grayscale and color deltaE values are only 3.8 and 2.91, respectively, against the P3 standard. Our calibrated ICM profile is available for free above to improve accuracy closer to the deltaE <2 standard.
Display Response Times
| ↔ Response Time Black to White | ||
|---|---|---|
| 11.4 ms ... rise ↗ and fall ↘ combined | ↗ 6.5 ms rise | 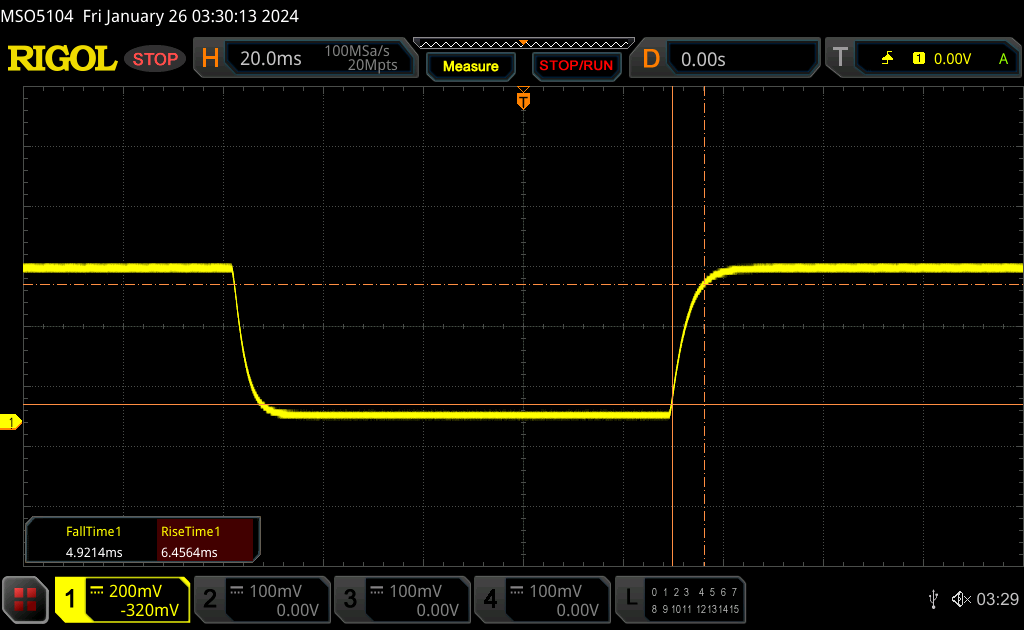 |
| ↘ 4.9 ms fall | ||
| The screen shows good response rates in our tests, but may be too slow for competitive gamers. In comparison, all tested devices range from 0.1 (minimum) to 240 (maximum) ms. » 31 % of all devices are better. This means that the measured response time is better than the average of all tested devices (19.8 ms). | ||
| ↔ Response Time 50% Grey to 80% Grey | ||
| 5.7 ms ... rise ↗ and fall ↘ combined | ↗ 2.8 ms rise | 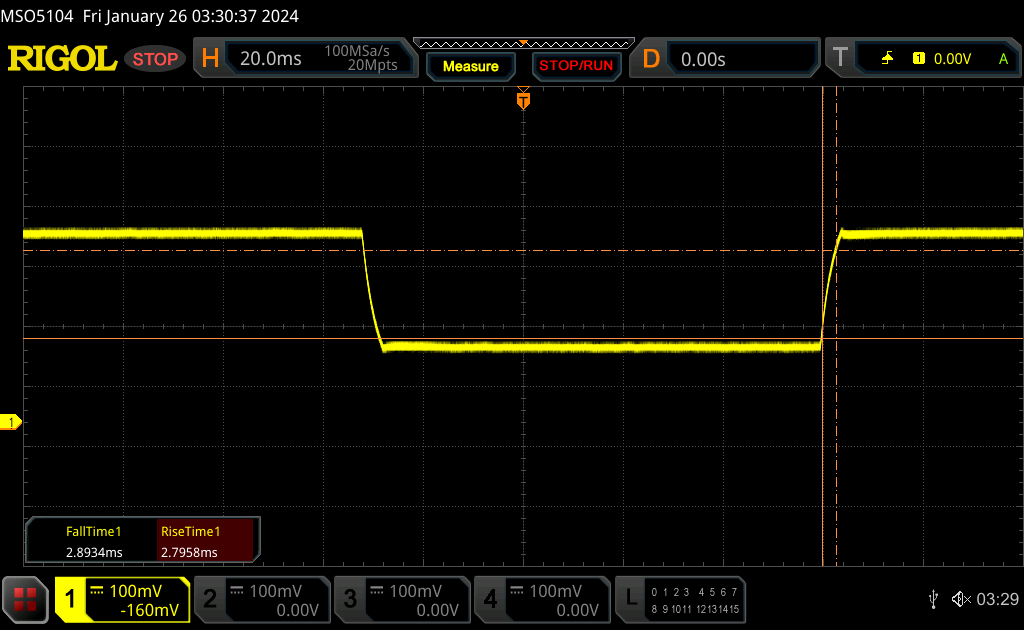 |
| ↘ 2.9 ms fall | ||
| The screen shows very fast response rates in our tests and should be very well suited for fast-paced gaming. In comparison, all tested devices range from 0.165 (minimum) to 636 (maximum) ms. » 18 % of all devices are better. This means that the measured response time is better than the average of all tested devices (31 ms). | ||
Screen Flickering / PWM (Pulse-Width Modulation)
| Screen flickering / PWM not detected | 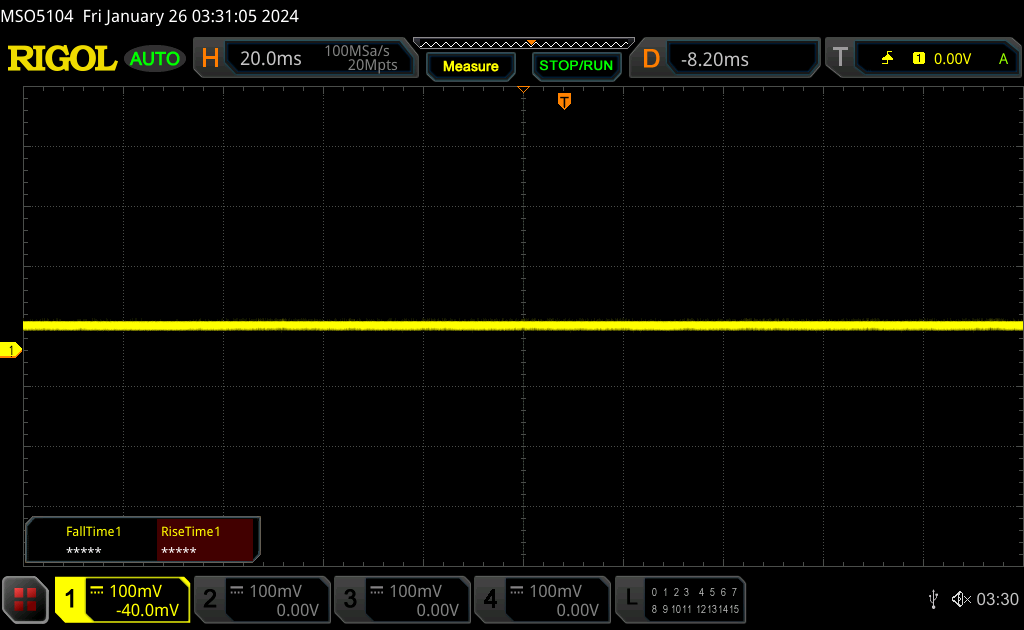 | ||
In comparison: 52 % of all tested devices do not use PWM to dim the display. If PWM was detected, an average of 7747 (minimum: 5 - maximum: 343500) Hz was measured. | |||
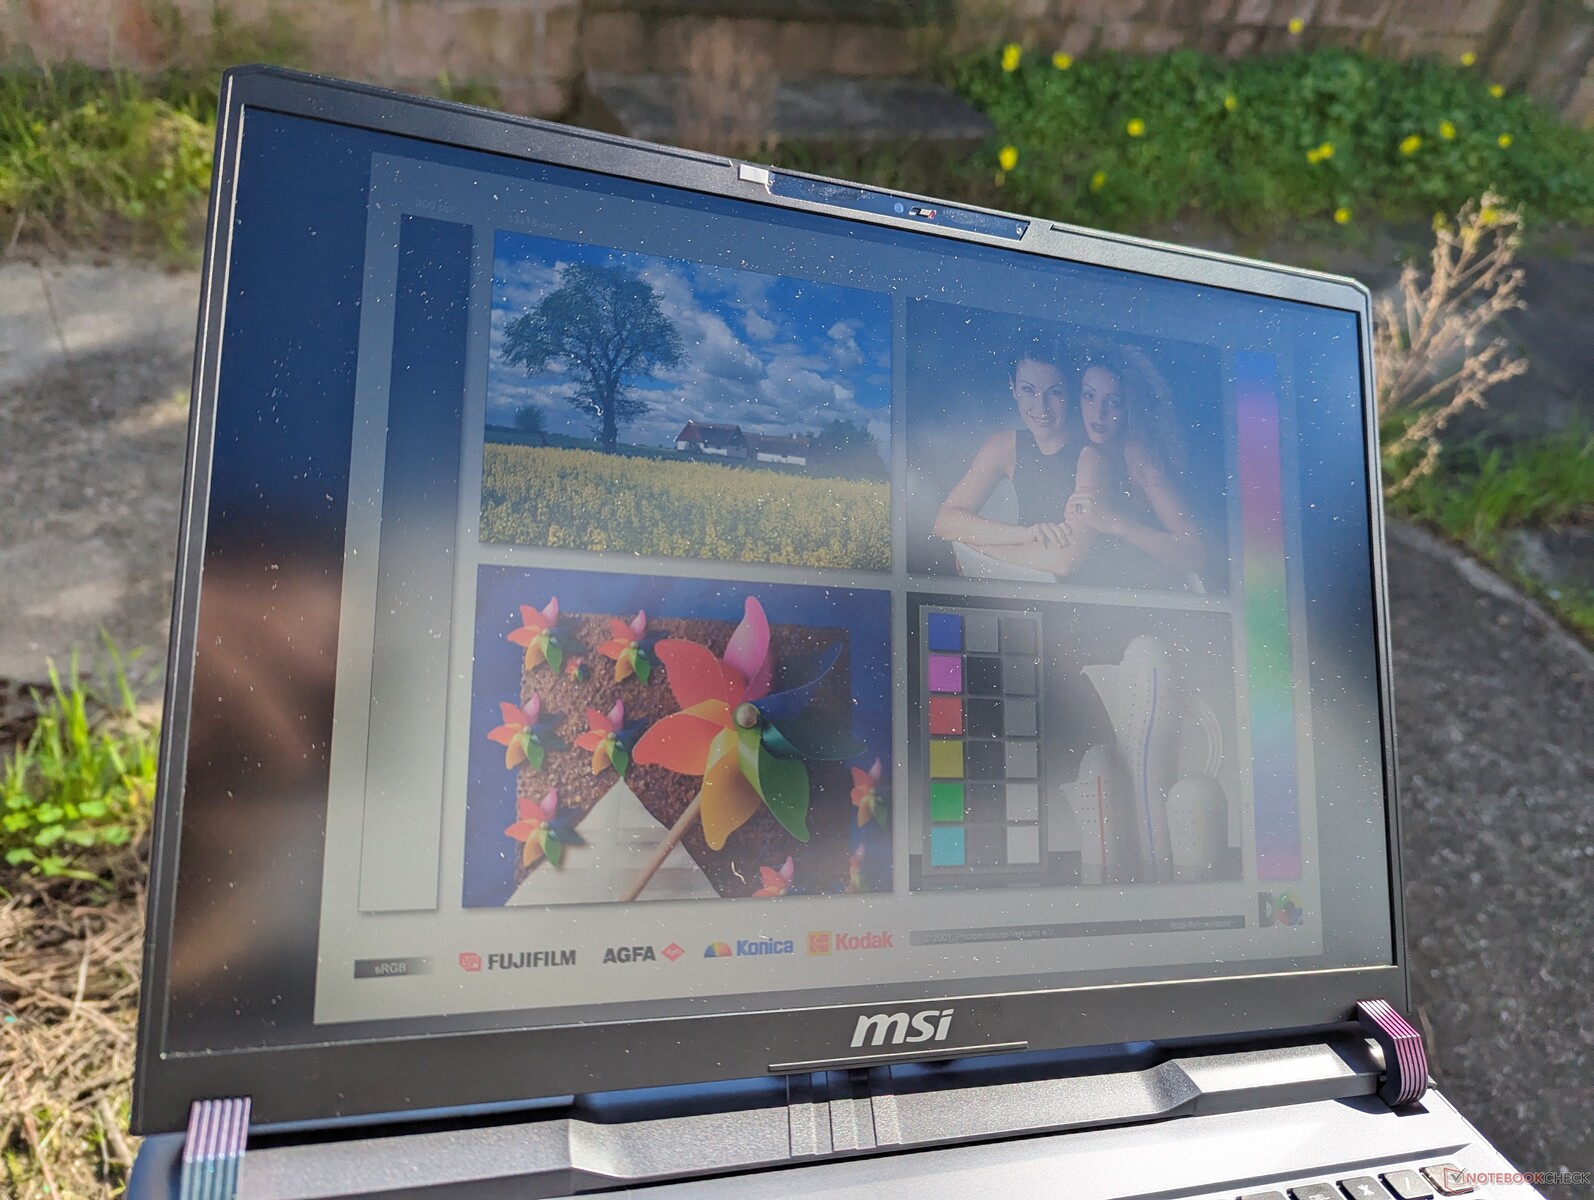
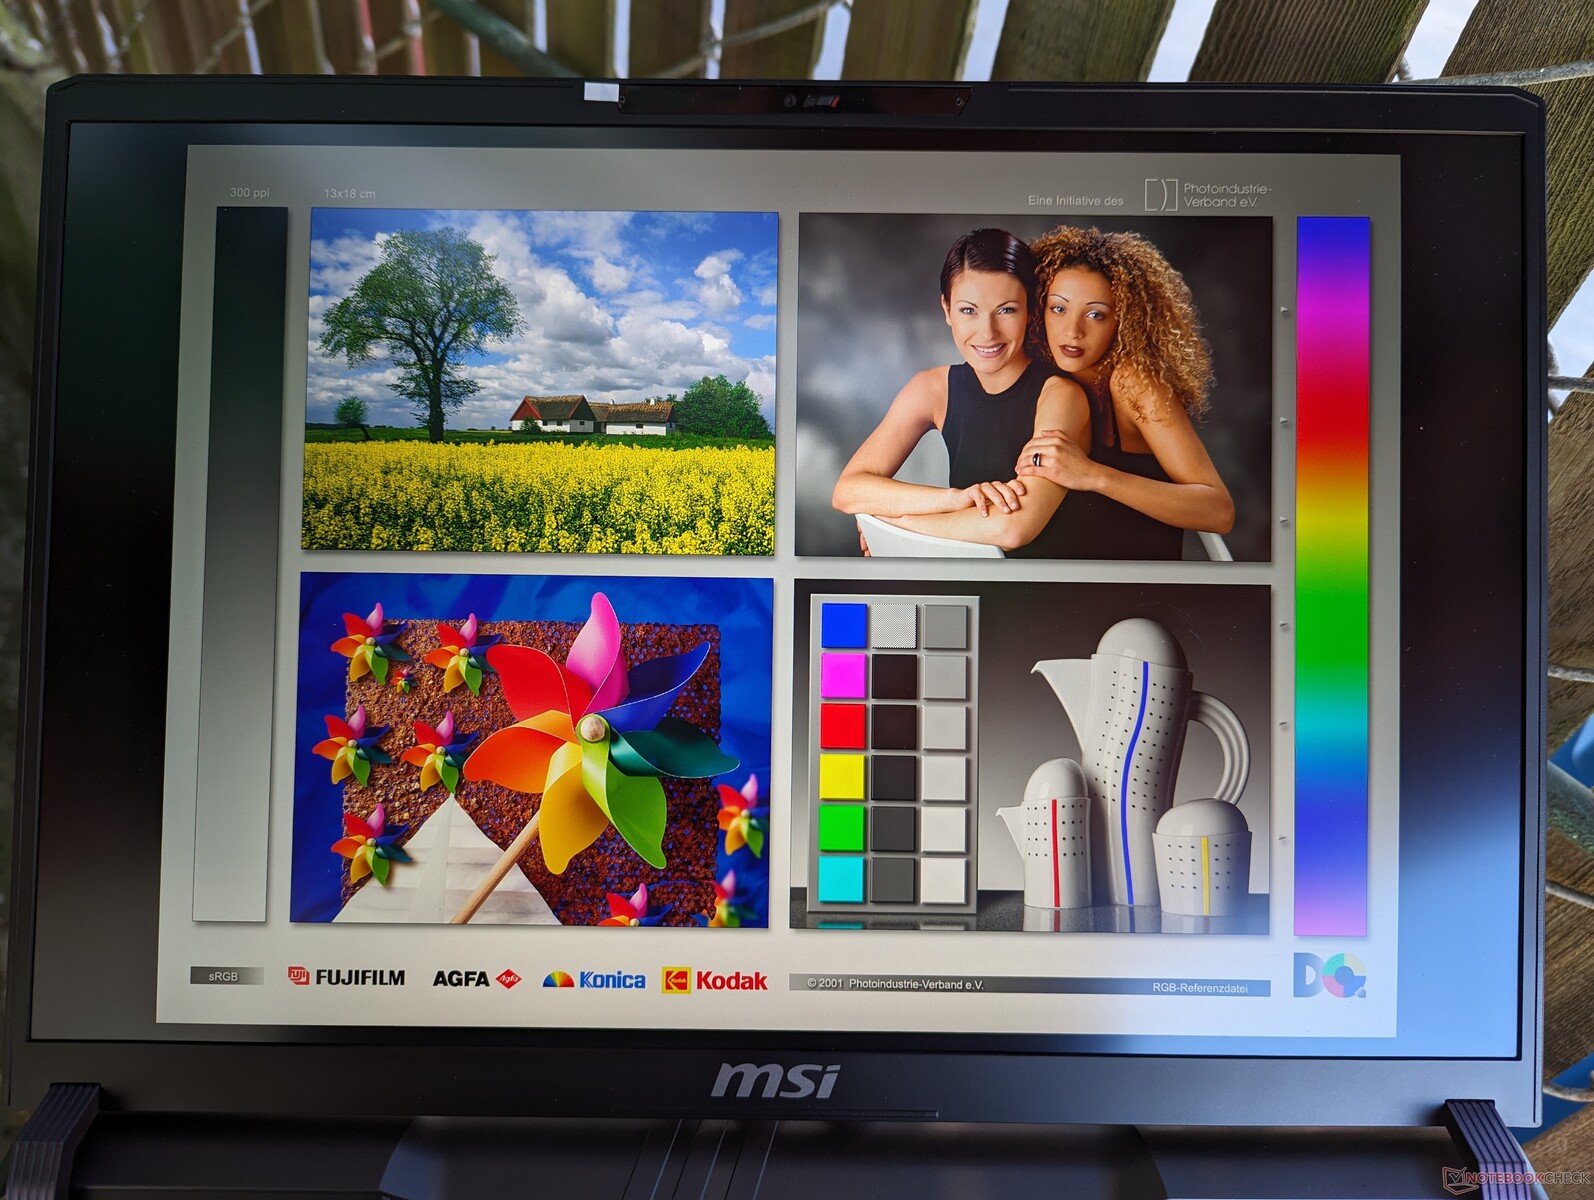
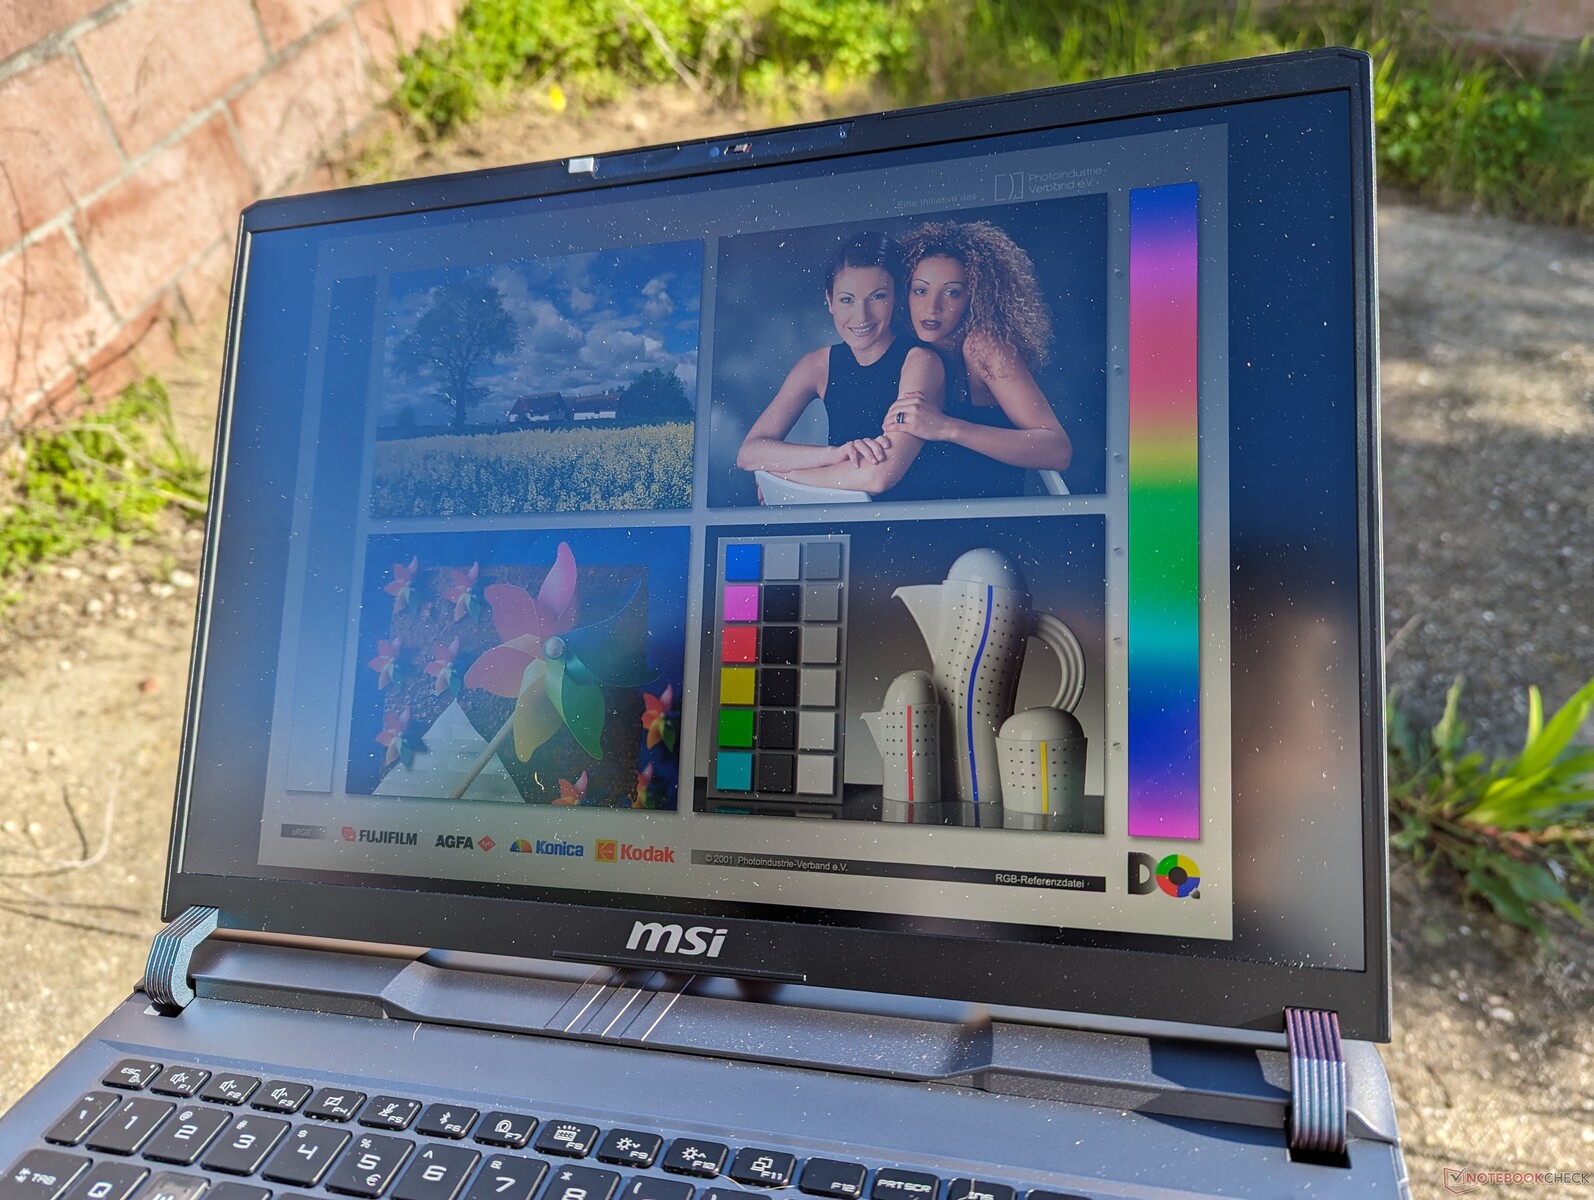
The matte display is relatively bright for an IPS panel at around 550 nits compared to only 300 nits on the HP Victus 16 or Asus TUF Gaming A16. Viewability is tolerable when under shade but the screen is otherwise still too dim when under brighter outdoor conditions.
Performance
Testing Conditions
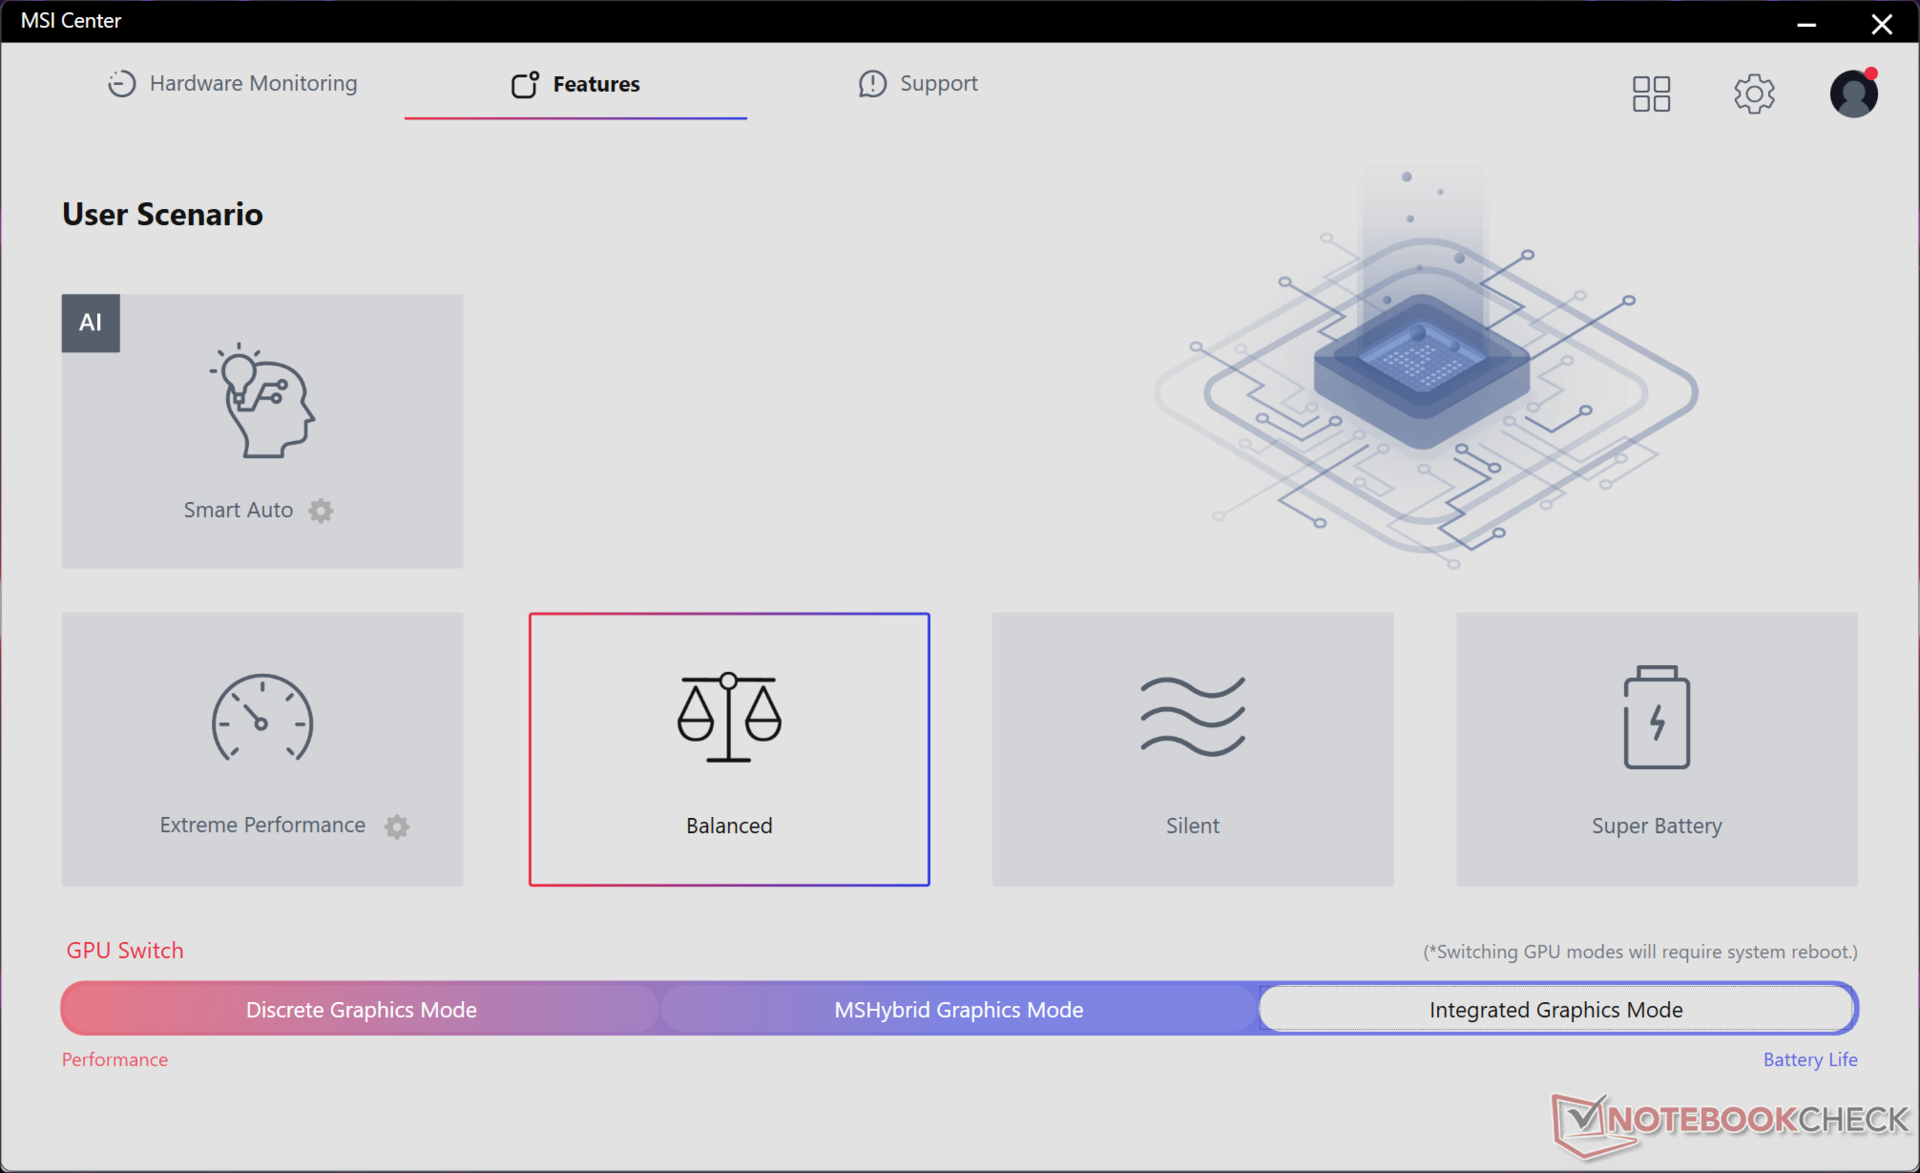
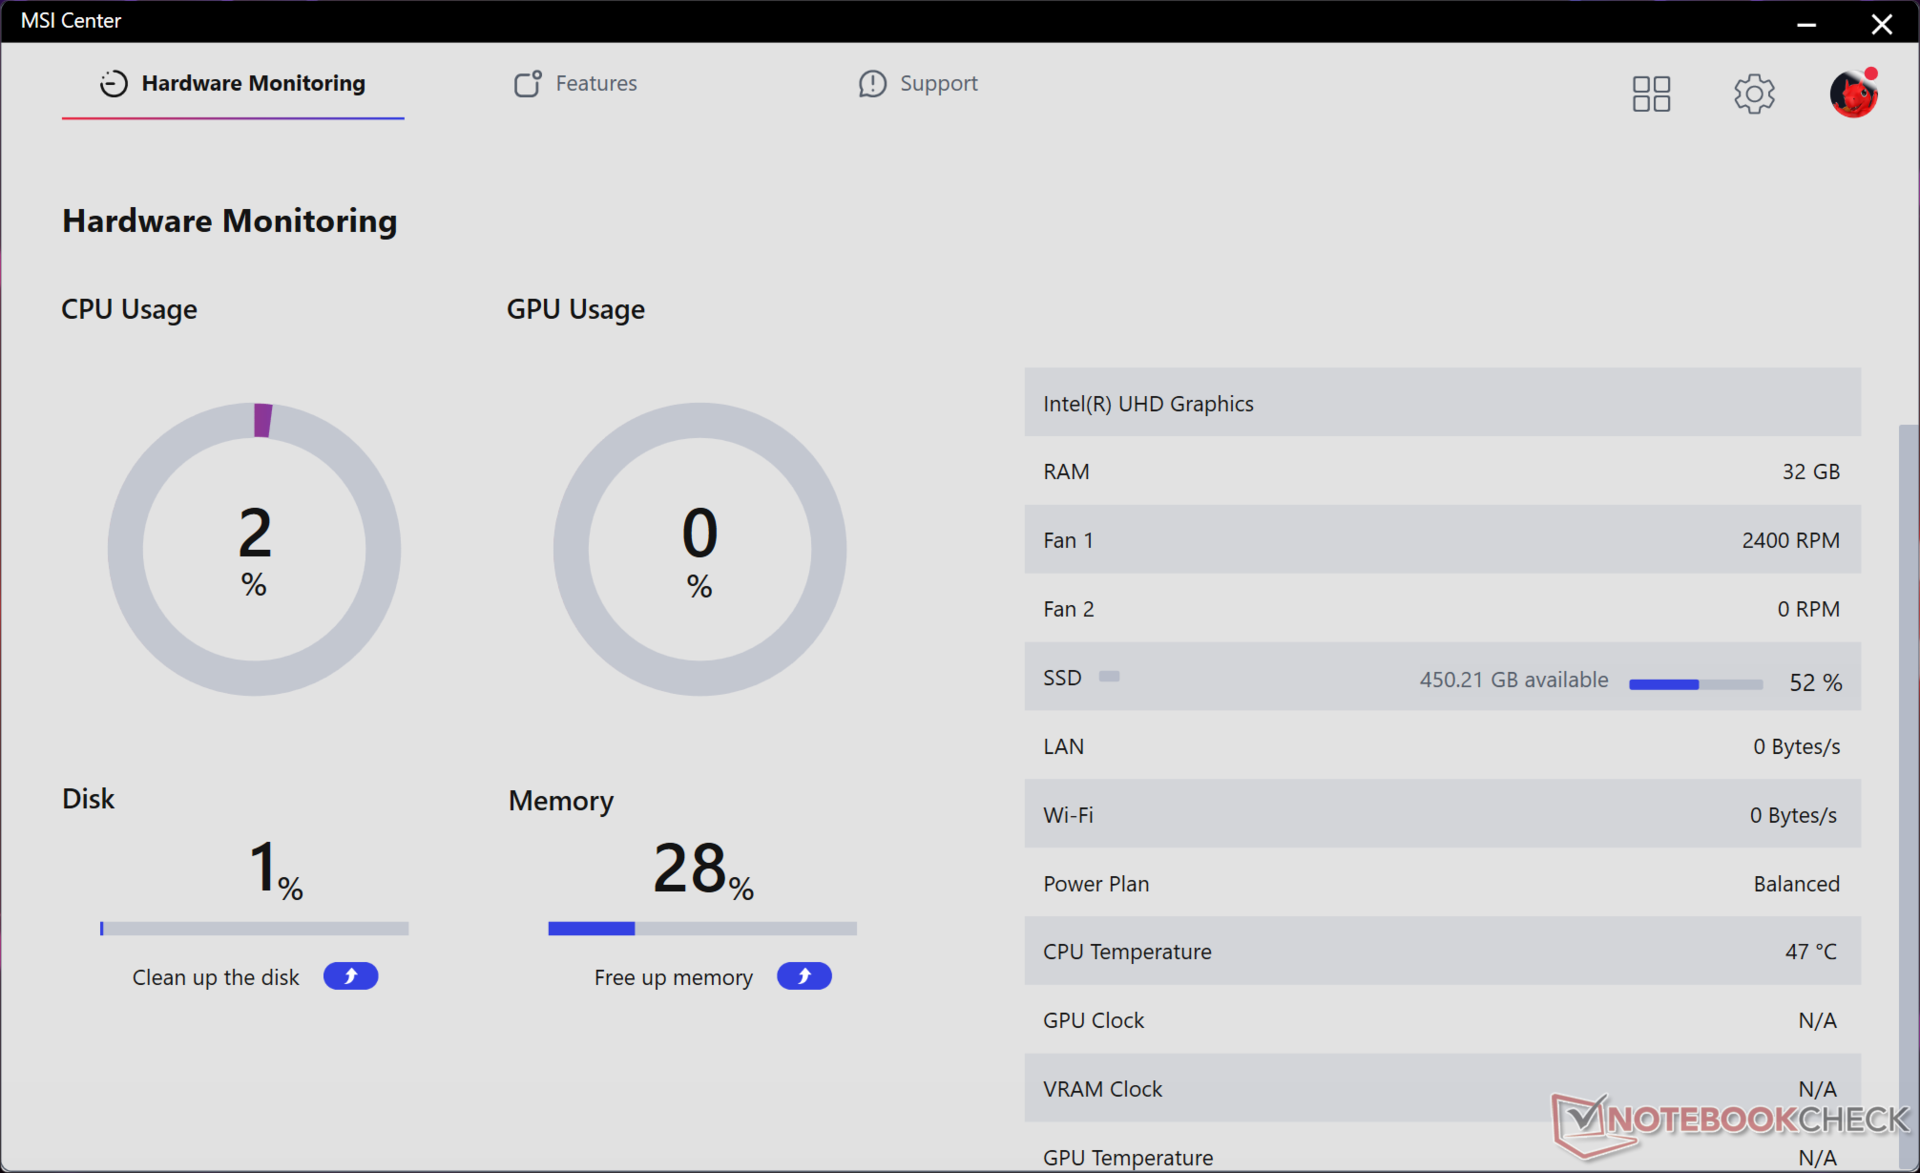
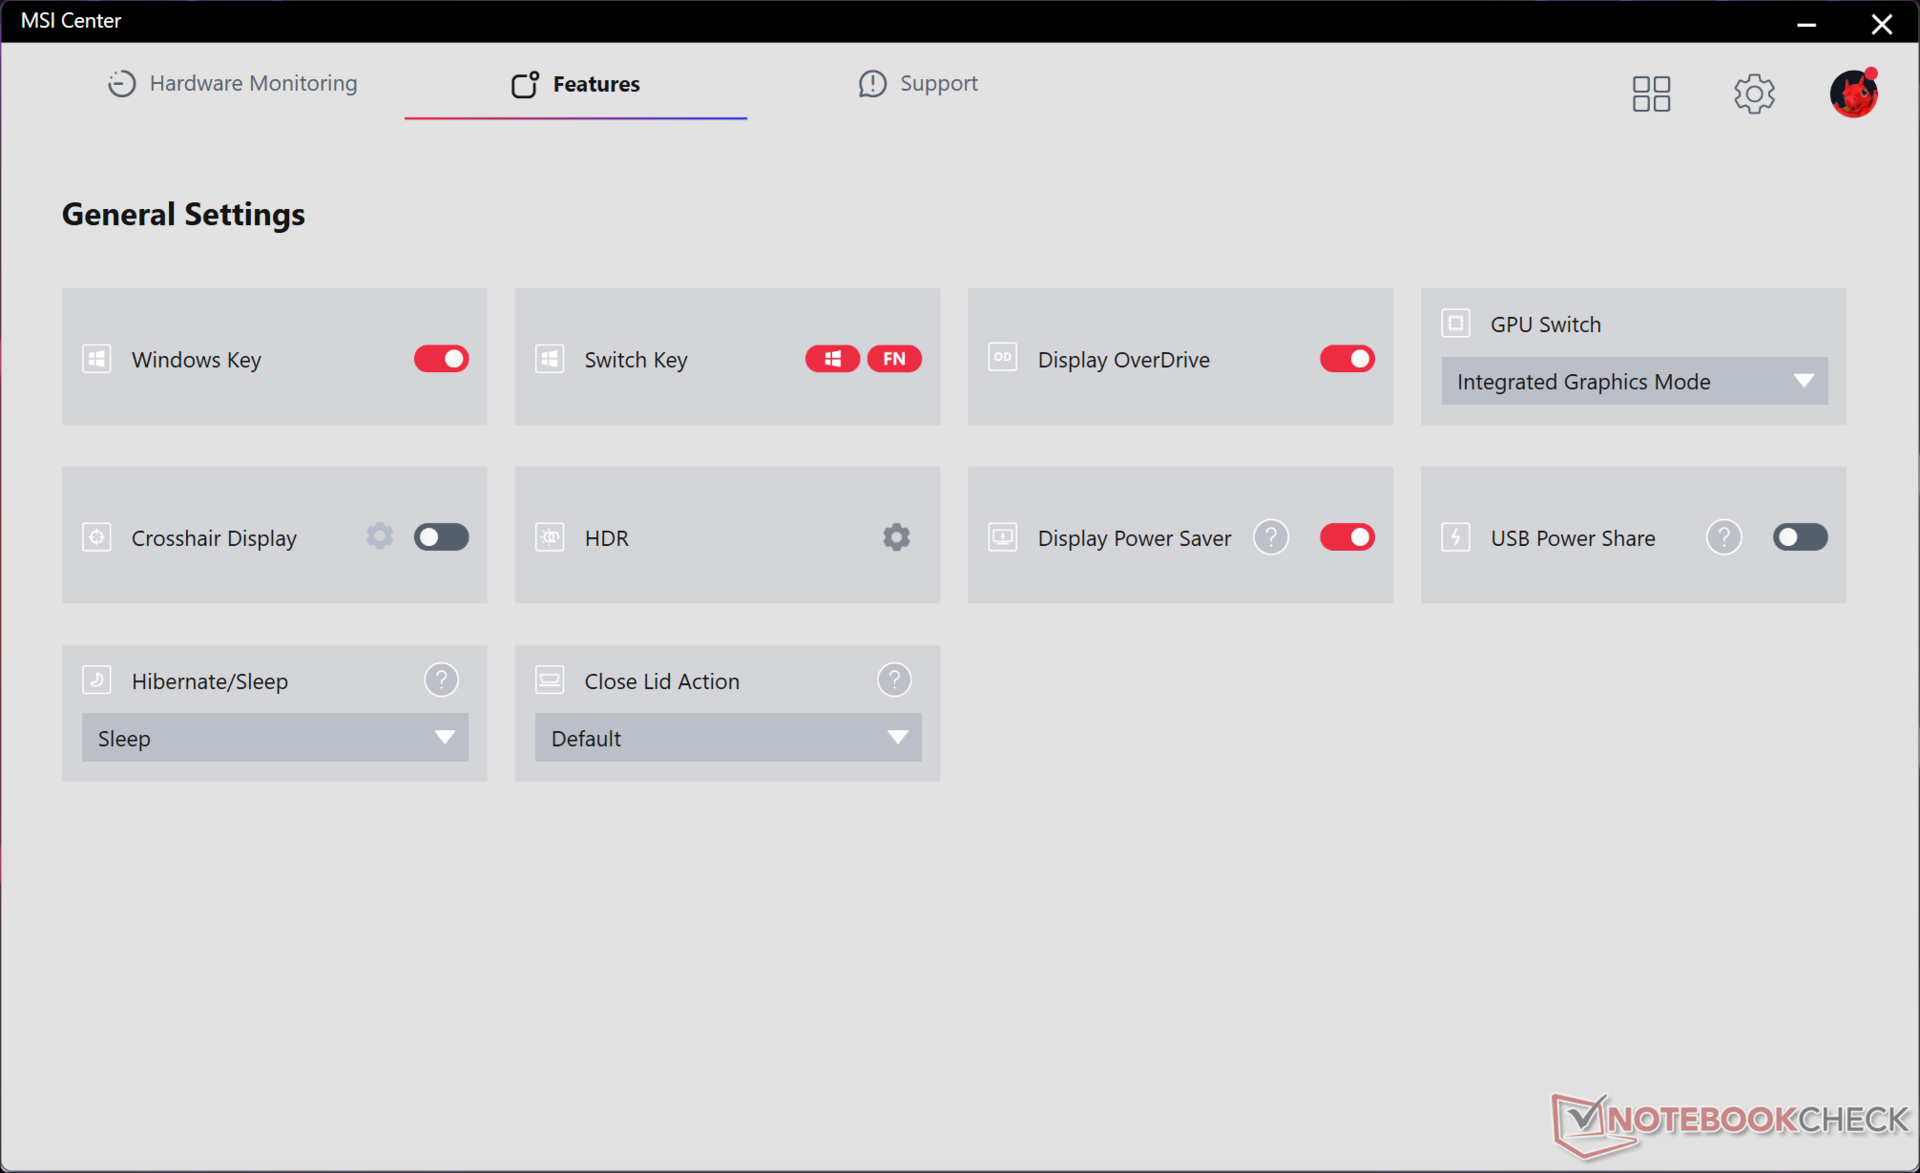
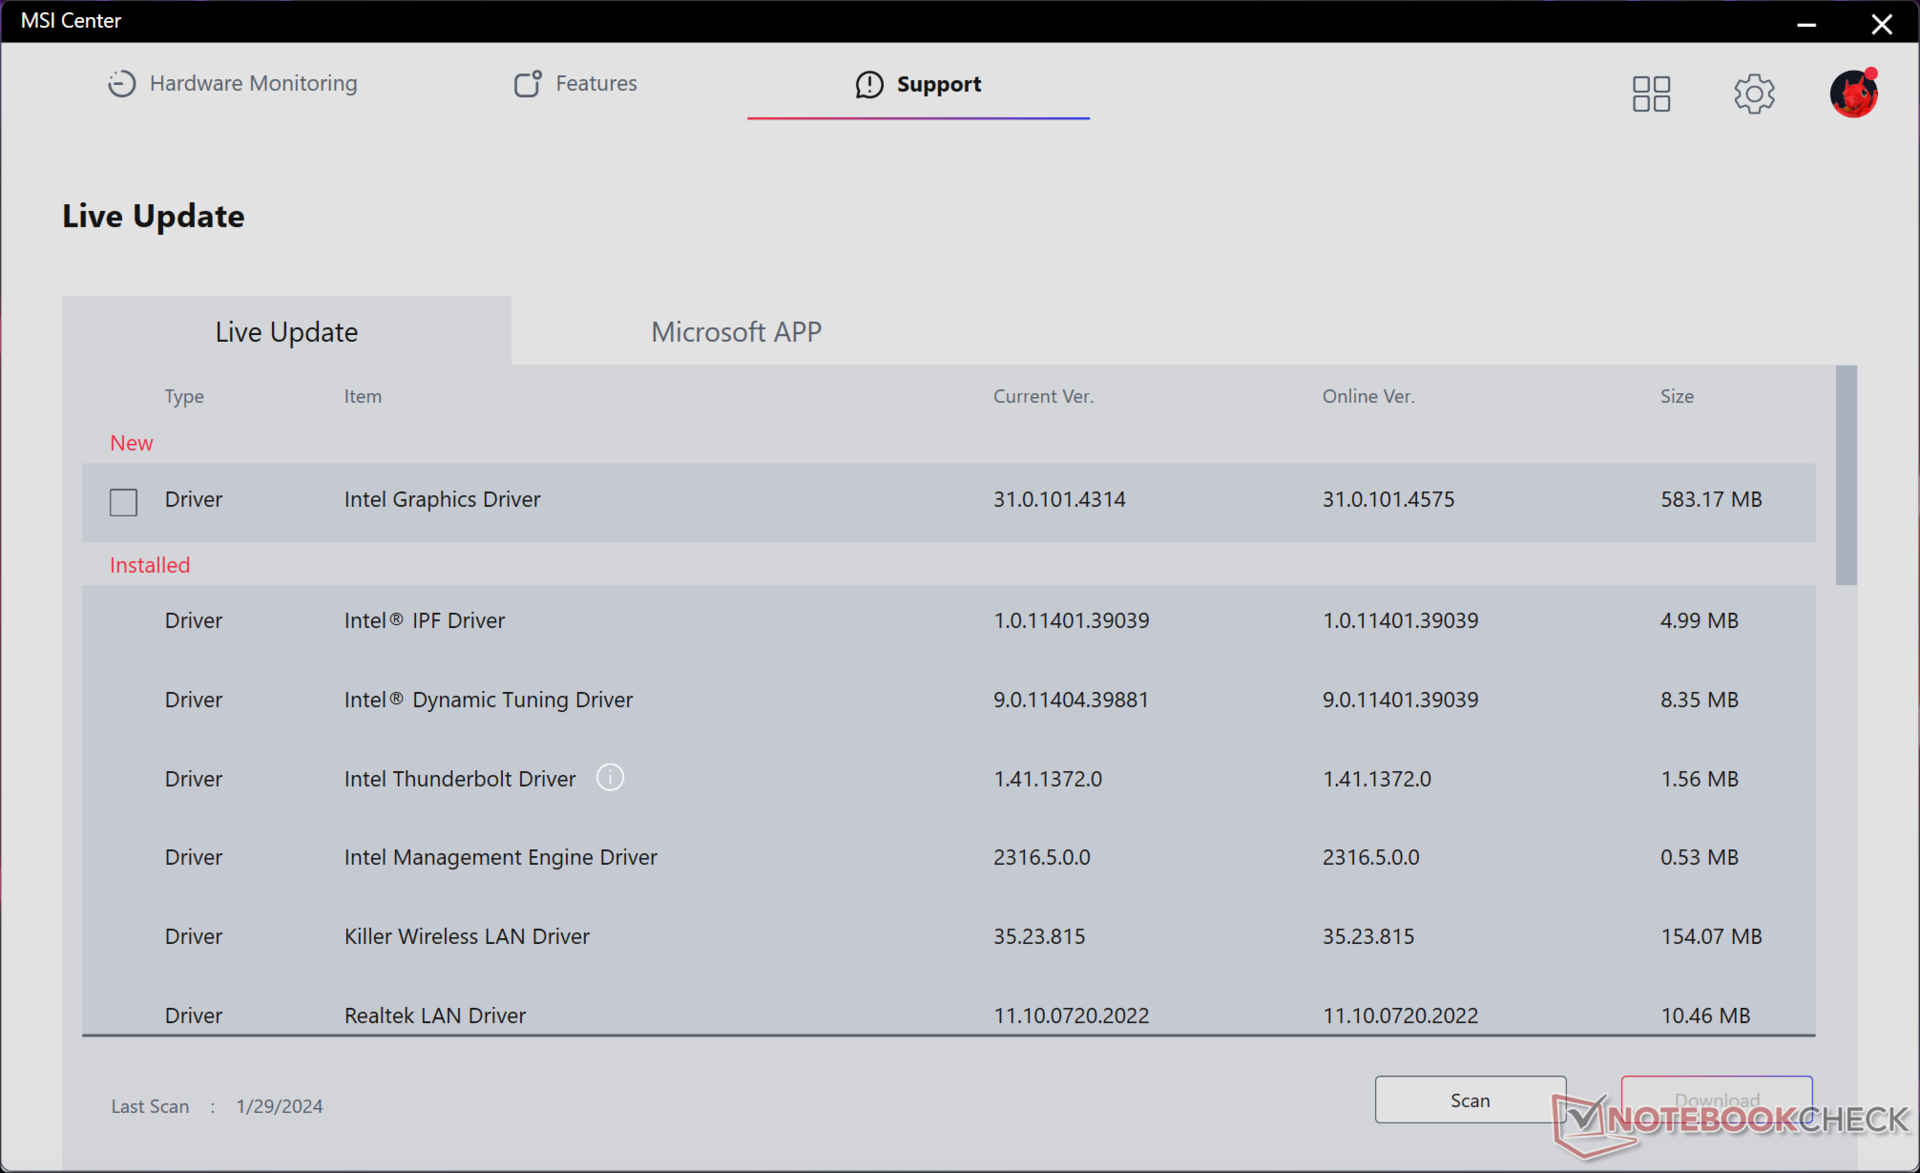
We set our unit to dGPU mode and Extreme Performance mode with Cooler Boost active prior to running the benchmarks below. Owners should become familiar with the pre-installed MSI Center software as it is the hub for system updates, system vitals, toggling features, and adjusting MUX settings and power profiles. Switching between dGPU and iGPU modes requires rebooting which can take even longer than a regular cold boot.
Processor
Much like what we discovered on the Titan 18 HX, the Core i9-14900HX is just a minor boost over the last generation Core i9-13980HX by up to 10 percent. The year-over-year benefits are therefore only marginal especially since the 14th gen Raptor Lake-HX refresh series lacks the new dedicated NPU as found on the 14th gen Meteor Lake series. Of course, the Core i9-13980HX was one of the fastest mobile CPUs of 2023 and so the Core i9-14900HX is absolutely no slouch. Users upgrading from 12th gen or older Intel gaming laptops should still see significant performance boosts.
Cinebench R15 Multi Loop
Cinebench R23: Multi Core | Single Core
Cinebench R20: CPU (Multi Core) | CPU (Single Core)
Cinebench R15: CPU Multi 64Bit | CPU Single 64Bit
Blender: v2.79 BMW27 CPU
7-Zip 18.03: 7z b 4 | 7z b 4 -mmt1
Geekbench 6.7: Multi-Core | Single-Core
Geekbench 5.5: Multi-Core | Single-Core
HWBOT x265 Benchmark v2.2: 4k Preset
LibreOffice : 20 Documents To PDF
R Benchmark 2.5: Overall mean
| CPU Performance rating | |
| MSI Vector 16 HX A14V | |
| Asus Zephyrus Duo 16 GX650PY-NM006W -2! | |
| Average Intel Core i9-14900HX | |
| Alienware m16 R1 AMD | |
| Lenovo Legion 5 16IRX G9 | |
| Alienware m16 R1 Intel | |
| Lenovo Legion Pro 5 16ARX8 -2! | |
| Asus TUF Gaming A16 FA617XS -2! | |
| MSI Vector GP66 12UGS -2! | |
| Lenovo Legion Slim 7 16APH8 | |
| Lenovo LOQ 16IRH8 | |
| Dell G16 7620 -2! | |
| HP Victus 16-r0077ng | |
| Geekbench 6.7 / Multi-Core | |
| MSI Vector 16 HX A14V | |
| Average Intel Core i9-14900HX (13158 - 19665, n=37) | |
| Lenovo Legion 5 16IRX G9 | |
| Alienware m16 R1 Intel | |
| Lenovo LOQ 16IRH8 | |
| Lenovo Legion Slim 7 16APH8 | |
| Alienware m16 R1 AMD | |
| HP Victus 16-r0077ng | |
| Geekbench 6.7 / Single-Core | |
| MSI Vector 16 HX A14V | |
| Average Intel Core i9-14900HX (2419 - 3129, n=37) | |
| Lenovo Legion 5 16IRX G9 | |
| Alienware m16 R1 AMD | |
| Alienware m16 R1 Intel | |
| Lenovo Legion Slim 7 16APH8 | |
| Lenovo LOQ 16IRH8 | |
| HP Victus 16-r0077ng | |
Cinebench R23: Multi Core | Single Core
Cinebench R20: CPU (Multi Core) | CPU (Single Core)
Cinebench R15: CPU Multi 64Bit | CPU Single 64Bit
Blender: v2.79 BMW27 CPU
7-Zip 18.03: 7z b 4 | 7z b 4 -mmt1
Geekbench 6.7: Multi-Core | Single-Core
Geekbench 5.5: Multi-Core | Single-Core
HWBOT x265 Benchmark v2.2: 4k Preset
LibreOffice : 20 Documents To PDF
R Benchmark 2.5: Overall mean
* ... smaller is better
AIDA64: FP32 Ray-Trace | FPU Julia | CPU SHA3 | CPU Queen | FPU SinJulia | FPU Mandel | CPU AES | CPU ZLib | FP64 Ray-Trace | CPU PhotoWorxx
| Performance rating | |
| MSI Vector 16 HX A14V | |
| Average Intel Core i9-14900HX | |
| Asus TUF Gaming A16 FA617XS | |
| Lenovo Legion 5 16IRX G9 | |
| Dell G16 7620 | |
| HP Victus 16-r0077ng | |
| MSI Vector GP66 12UGS | |
| AIDA64 / FP32 Ray-Trace | |
| MSI Vector 16 HX A14V | |
| Asus TUF Gaming A16 FA617XS | |
| Average Intel Core i9-14900HX (13098 - 33474, n=36) | |
| Lenovo Legion 5 16IRX G9 | |
| Dell G16 7620 | |
| HP Victus 16-r0077ng | |
| MSI Vector GP66 12UGS | |
| AIDA64 / FPU Julia | |
| MSI Vector 16 HX A14V | |
| Average Intel Core i9-14900HX (67573 - 166040, n=36) | |
| Asus TUF Gaming A16 FA617XS | |
| Lenovo Legion 5 16IRX G9 | |
| Dell G16 7620 | |
| HP Victus 16-r0077ng | |
| MSI Vector GP66 12UGS | |
| AIDA64 / CPU SHA3 | |
| MSI Vector 16 HX A14V | |
| Average Intel Core i9-14900HX (3589 - 7979, n=36) | |
| Asus TUF Gaming A16 FA617XS | |
| Lenovo Legion 5 16IRX G9 | |
| Dell G16 7620 | |
| HP Victus 16-r0077ng | |
| MSI Vector GP66 12UGS | |
| AIDA64 / CPU Queen | |
| MSI Vector 16 HX A14V | |
| Average Intel Core i9-14900HX (118405 - 148966, n=36) | |
| Asus TUF Gaming A16 FA617XS | |
| MSI Vector GP66 12UGS | |
| Dell G16 7620 | |
| Lenovo Legion 5 16IRX G9 | |
| HP Victus 16-r0077ng | |
| AIDA64 / FPU SinJulia | |
| MSI Vector 16 HX A14V | |
| Asus TUF Gaming A16 FA617XS | |
| Average Intel Core i9-14900HX (10475 - 18517, n=36) | |
| Lenovo Legion 5 16IRX G9 | |
| Dell G16 7620 | |
| MSI Vector GP66 12UGS | |
| HP Victus 16-r0077ng | |
| AIDA64 / FPU Mandel | |
| MSI Vector 16 HX A14V | |
| Asus TUF Gaming A16 FA617XS | |
| Average Intel Core i9-14900HX (32543 - 83662, n=36) | |
| Lenovo Legion 5 16IRX G9 | |
| HP Victus 16-r0077ng | |
| Dell G16 7620 | |
| MSI Vector GP66 12UGS | |
| AIDA64 / CPU AES | |
| Average Intel Core i9-14900HX (86964 - 241777, n=36) | |
| MSI Vector 16 HX A14V | |
| MSI Vector GP66 12UGS | |
| Lenovo Legion 5 16IRX G9 | |
| Asus TUF Gaming A16 FA617XS | |
| Dell G16 7620 | |
| HP Victus 16-r0077ng | |
| AIDA64 / CPU ZLib | |
| MSI Vector 16 HX A14V | |
| Average Intel Core i9-14900HX (1054 - 2292, n=36) | |
| Lenovo Legion 5 16IRX G9 | |
| Asus TUF Gaming A16 FA617XS | |
| MSI Vector GP66 12UGS | |
| Dell G16 7620 | |
| HP Victus 16-r0077ng | |
| AIDA64 / FP64 Ray-Trace | |
| MSI Vector 16 HX A14V | |
| Asus TUF Gaming A16 FA617XS | |
| Average Intel Core i9-14900HX (6809 - 18349, n=36) | |
| Lenovo Legion 5 16IRX G9 | |
| Dell G16 7620 | |
| HP Victus 16-r0077ng | |
| MSI Vector GP66 12UGS | |
| AIDA64 / CPU PhotoWorxx | |
| MSI Vector 16 HX A14V | |
| Average Intel Core i9-14900HX (23903 - 54702, n=36) | |
| HP Victus 16-r0077ng | |
| Dell G16 7620 | |
| Lenovo Legion 5 16IRX G9 | |
| Asus TUF Gaming A16 FA617XS | |
| MSI Vector GP66 12UGS | |
System Performance
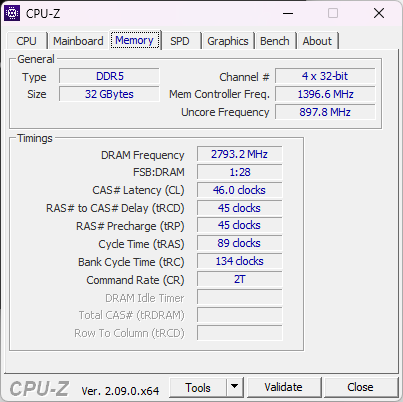
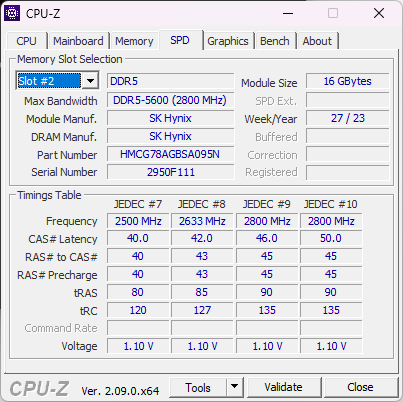
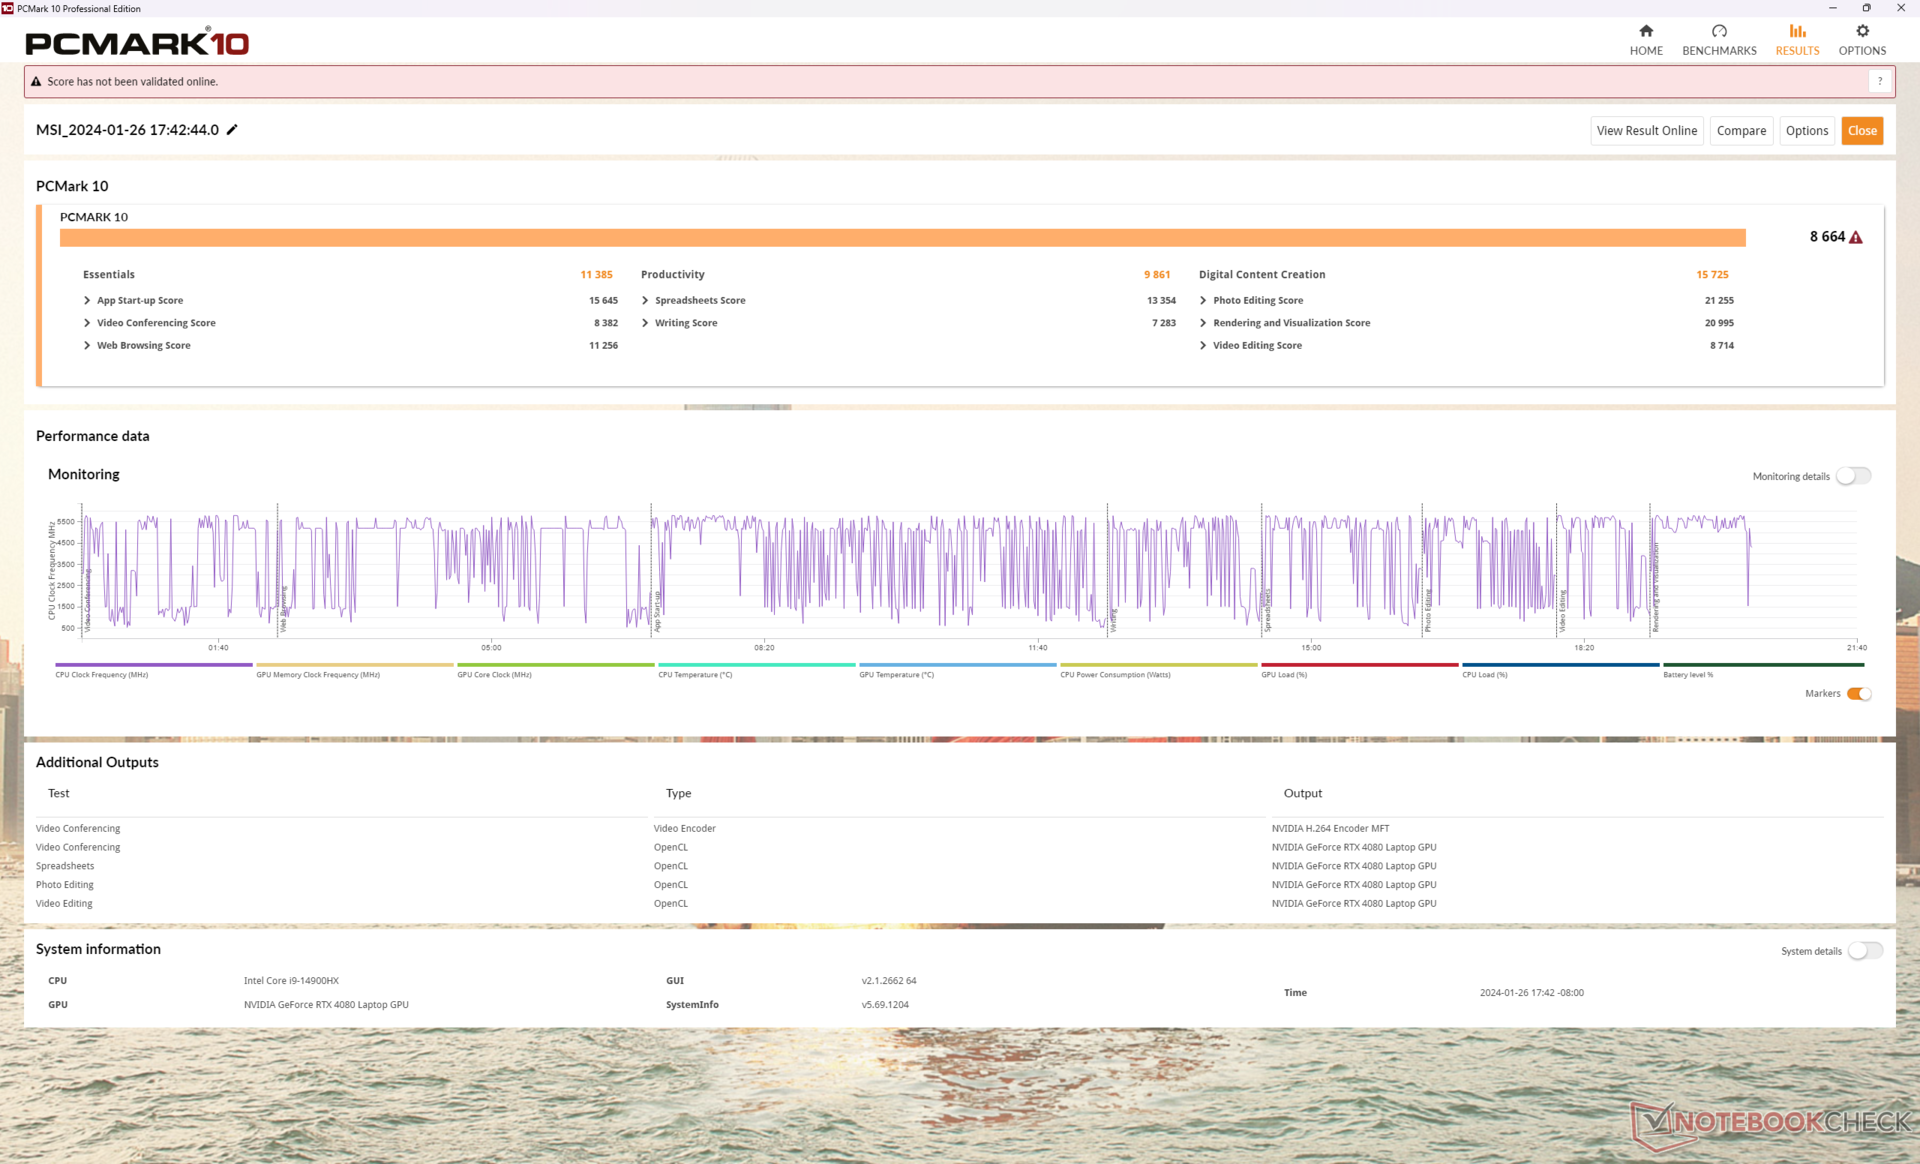
PCMark results are some of the highest of any upper midrange gaming laptop owing to the new 14th gen CPU and full-power 175 W GeForce RTX 4080 GPU. RAM performance is also faster than expected with read and write speeds that are about 70 percent faster than on the older Vector GP66 design.
CrossMark: Overall | Productivity | Creativity | Responsiveness
WebXPRT 3: Overall
WebXPRT 4: Overall
Mozilla Kraken 1.1: Total
| PCMark 10 / Score | |
| Average Intel Core i9-14900HX, NVIDIA GeForce RTX 4080 Laptop GPU (7703 - 9223, n=7) | |
| MSI Vector 16 HX A14V | |
| MSI Vector GP66 12UGS | |
| Asus TUF Gaming A16 FA617XS | |
| Lenovo Legion 5 16IRX G9 | |
| Dell G16 7620 | |
| HP Victus 16-r0077ng | |
| PCMark 10 / Essentials | |
| Average Intel Core i9-14900HX, NVIDIA GeForce RTX 4080 Laptop GPU (11255 - 12600, n=7) | |
| MSI Vector 16 HX A14V | |
| MSI Vector GP66 12UGS | |
| Asus TUF Gaming A16 FA617XS | |
| Lenovo Legion 5 16IRX G9 | |
| HP Victus 16-r0077ng | |
| Dell G16 7620 | |
| PCMark 10 / Productivity | |
| Asus TUF Gaming A16 FA617XS | |
| Average Intel Core i9-14900HX, NVIDIA GeForce RTX 4080 Laptop GPU (6662 - 11410, n=7) | |
| MSI Vector GP66 12UGS | |
| MSI Vector 16 HX A14V | |
| Lenovo Legion 5 16IRX G9 | |
| HP Victus 16-r0077ng | |
| Dell G16 7620 | |
| PCMark 10 / Digital Content Creation | |
| MSI Vector 16 HX A14V | |
| Average Intel Core i9-14900HX, NVIDIA GeForce RTX 4080 Laptop GPU (14211 - 16246, n=7) | |
| MSI Vector GP66 12UGS | |
| Lenovo Legion 5 16IRX G9 | |
| Asus TUF Gaming A16 FA617XS | |
| Dell G16 7620 | |
| HP Victus 16-r0077ng | |
| CrossMark / Overall | |
| MSI Vector 16 HX A14V | |
| Average Intel Core i9-14900HX, NVIDIA GeForce RTX 4080 Laptop GPU (1992 - 2334, n=7) | |
| Lenovo Legion 5 16IRX G9 | |
| Dell G16 7620 | |
| Asus TUF Gaming A16 FA617XS | |
| CrossMark / Productivity | |
| MSI Vector 16 HX A14V | |
| Average Intel Core i9-14900HX, NVIDIA GeForce RTX 4080 Laptop GPU (1812 - 2204, n=7) | |
| Lenovo Legion 5 16IRX G9 | |
| Asus TUF Gaming A16 FA617XS | |
| Dell G16 7620 | |
| CrossMark / Creativity | |
| MSI Vector 16 HX A14V | |
| Average Intel Core i9-14900HX, NVIDIA GeForce RTX 4080 Laptop GPU (2327 - 2500, n=7) | |
| Lenovo Legion 5 16IRX G9 | |
| Asus TUF Gaming A16 FA617XS | |
| Dell G16 7620 | |
| CrossMark / Responsiveness | |
| MSI Vector 16 HX A14V | |
| Average Intel Core i9-14900HX, NVIDIA GeForce RTX 4080 Laptop GPU (1520 - 2254, n=7) | |
| Lenovo Legion 5 16IRX G9 | |
| Dell G16 7620 | |
| Asus TUF Gaming A16 FA617XS | |
| WebXPRT 3 / Overall | |
| Average Intel Core i9-14900HX, NVIDIA GeForce RTX 4080 Laptop GPU (310 - 345, n=7) | |
| MSI Vector 16 HX A14V | |
| Lenovo Legion 5 16IRX G9 | |
| MSI Vector GP66 12UGS | |
| HP Victus 16-r0077ng | |
| HP Victus 16-r0077ng | |
| Dell G16 7620 | |
| WebXPRT 4 / Overall | |
| Average Intel Core i9-14900HX, NVIDIA GeForce RTX 4080 Laptop GPU (300 - 321, n=7) | |
| MSI Vector 16 HX A14V | |
| Lenovo Legion 5 16IRX G9 | |
| Asus TUF Gaming A16 FA617XS | |
| Dell G16 7620 | |
| HP Victus 16-r0077ng | |
| HP Victus 16-r0077ng | |
| Mozilla Kraken 1.1 / Total | |
| Dell G16 7620 | |
| HP Victus 16-r0077ng | |
| HP Victus 16-r0077ng | |
| MSI Vector GP66 12UGS | |
| Asus TUF Gaming A16 FA617XS | |
| Lenovo Legion 5 16IRX G9 | |
| MSI Vector 16 HX A14V | |
| Average Intel Core i9-14900HX, NVIDIA GeForce RTX 4080 Laptop GPU (437 - 446, n=7) | |
* ... smaller is better
| PCMark 10 Score | 8664 points | |
Help | ||
| AIDA64 / Memory Copy | |
| MSI Vector 16 HX A14V | |
| Average Intel Core i9-14900HX (38028 - 83392, n=36) | |
| HP Victus 16-r0077ng | |
| Lenovo Legion 5 16IRX G9 | |
| Asus TUF Gaming A16 FA617XS | |
| Dell G16 7620 | |
| MSI Vector GP66 12UGS | |
| AIDA64 / Memory Read | |
| MSI Vector 16 HX A14V | |
| Average Intel Core i9-14900HX (43306 - 87568, n=36) | |
| Lenovo Legion 5 16IRX G9 | |
| HP Victus 16-r0077ng | |
| Dell G16 7620 | |
| Asus TUF Gaming A16 FA617XS | |
| MSI Vector GP66 12UGS | |
| AIDA64 / Memory Write | |
| MSI Vector 16 HX A14V | |
| Asus TUF Gaming A16 FA617XS | |
| Average Intel Core i9-14900HX (37146 - 80589, n=36) | |
| HP Victus 16-r0077ng | |
| Dell G16 7620 | |
| Lenovo Legion 5 16IRX G9 | |
| MSI Vector GP66 12UGS | |
| AIDA64 / Memory Latency | |
| Dell G16 7620 | |
| HP Victus 16-r0077ng | |
| MSI Vector GP66 12UGS | |
| Asus TUF Gaming A16 FA617XS | |
| Lenovo Legion 5 16IRX G9 | |
| Average Intel Core i9-14900HX (76.1 - 105, n=36) | |
| MSI Vector 16 HX A14V | |
* ... smaller is better
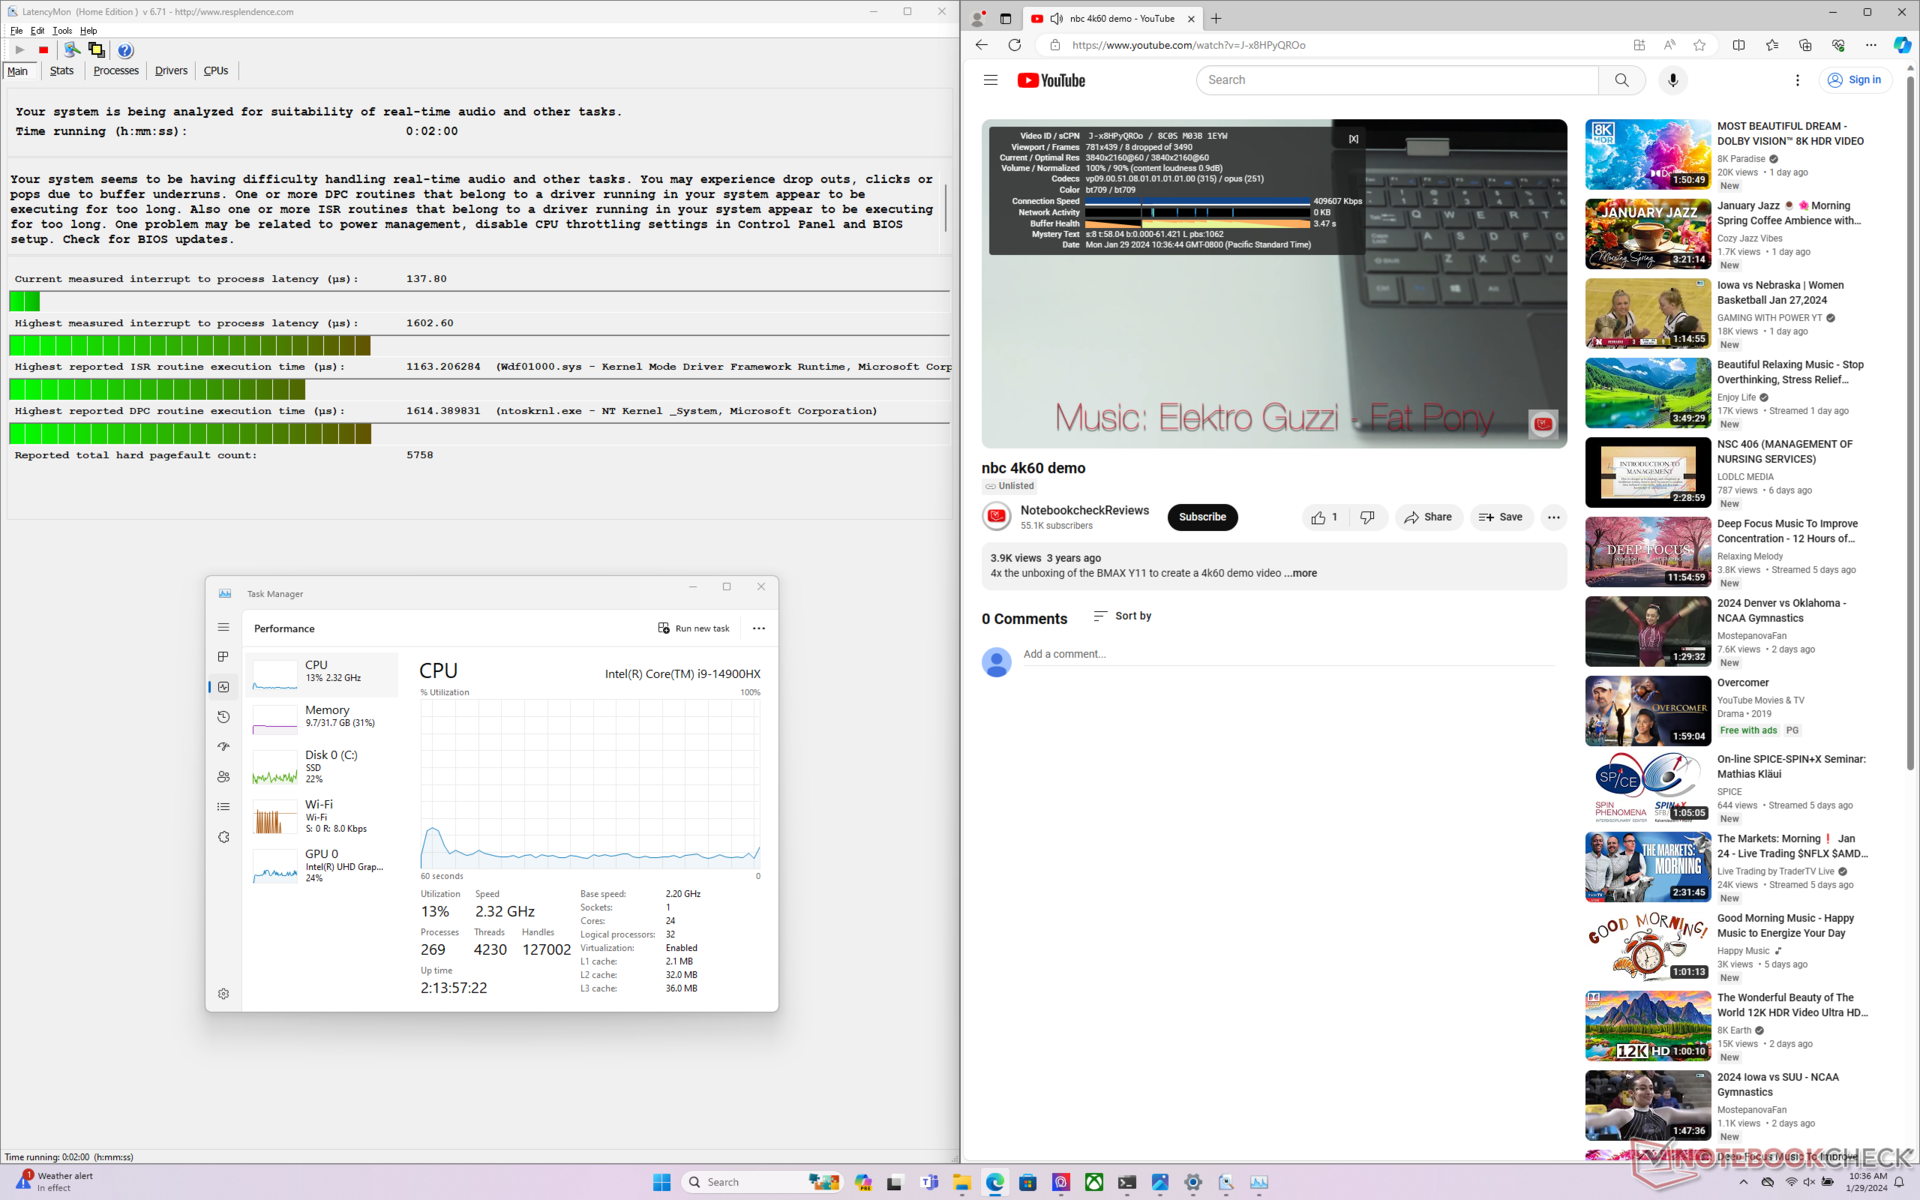
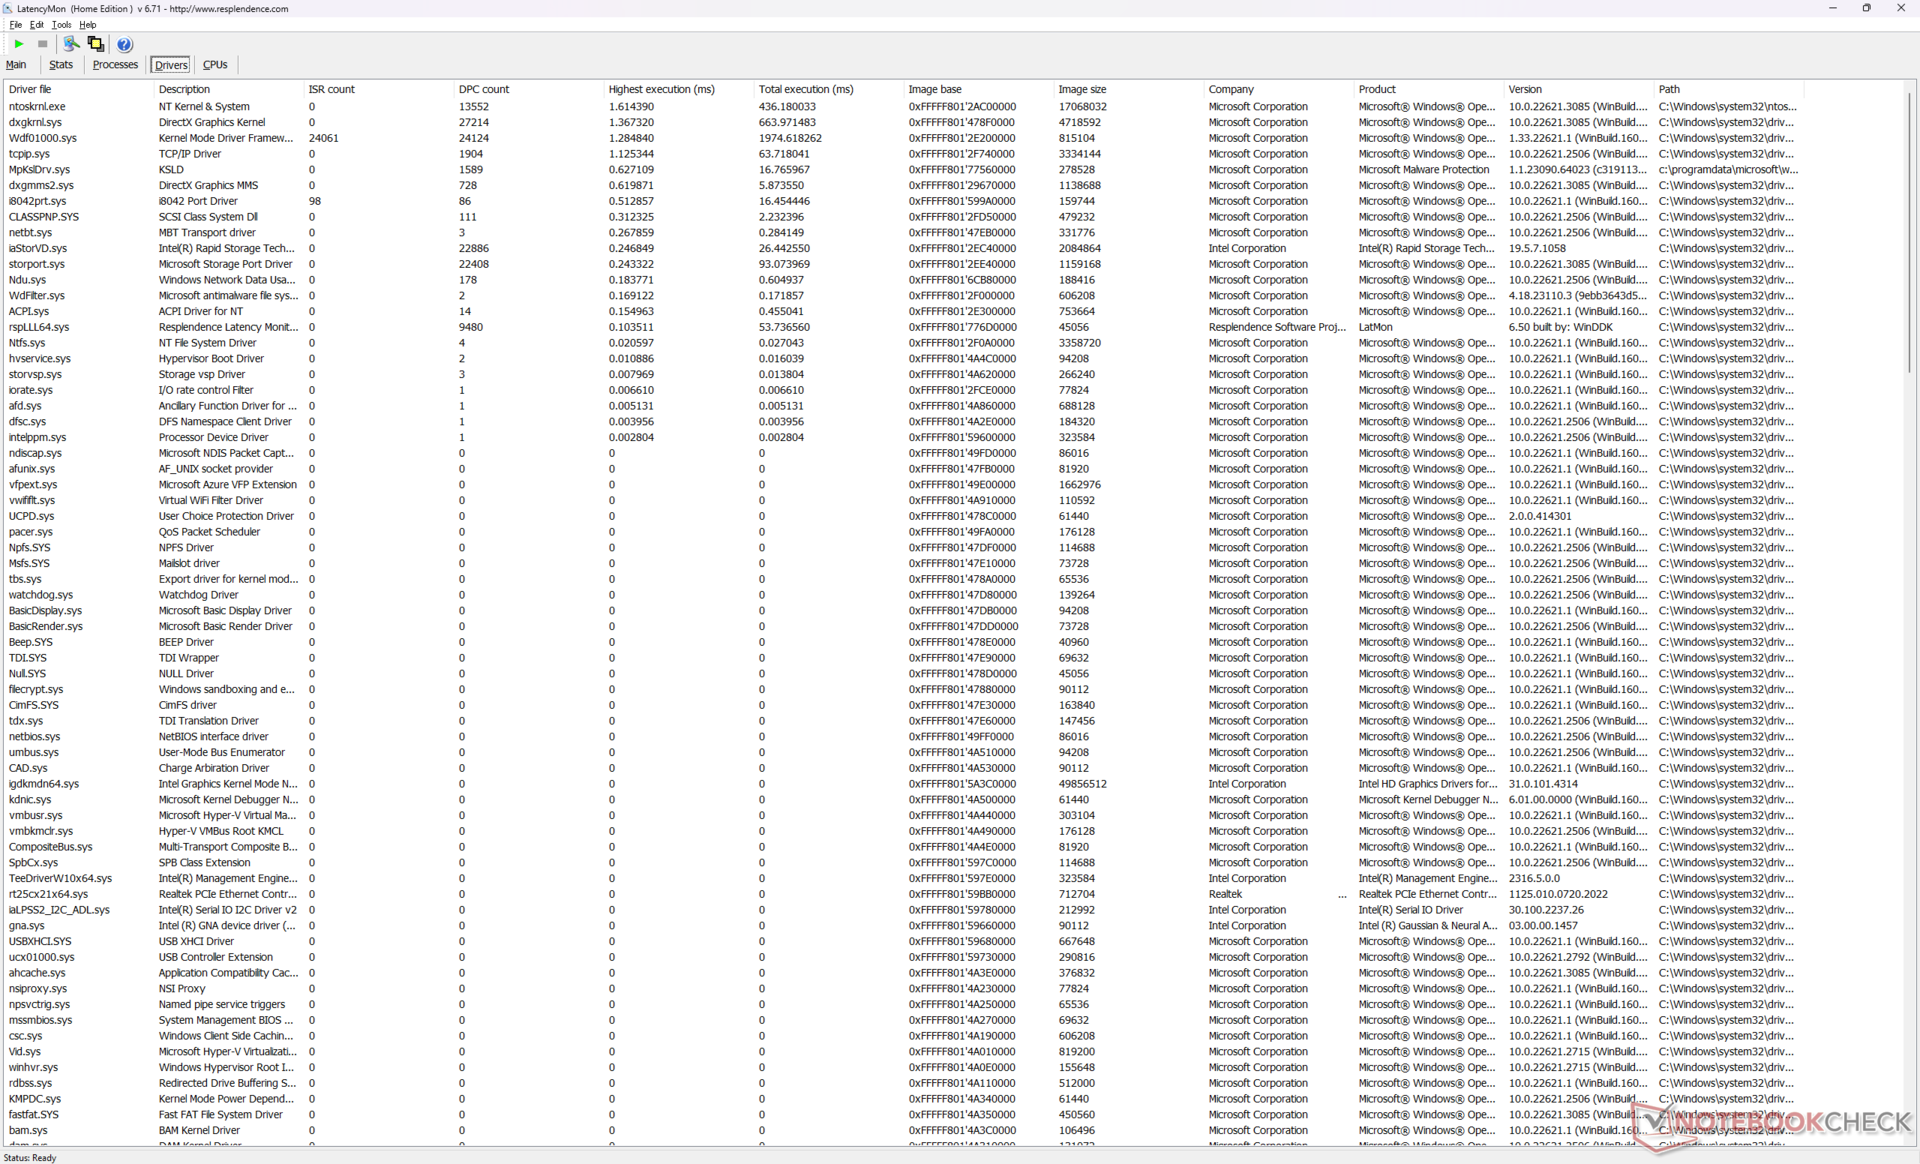
DPC Latency
LatencyMon reveals DPC issues when opening multiple tabs of our homepage as well as 8 dropped frames during a minute-long 4K60 test video. The dropped frames would occur at almost regular intervals to suggest an issue related to background activity or an underlying driver.
| DPC Latencies / LatencyMon - interrupt to process latency (max), Web, Youtube, Prime95 | |
| MSI Vector GP66 12UGS | |
| Lenovo Legion 5 16IRX G9 | |
| HP Victus 16-r0077ng | |
| MSI Vector 16 HX A14V | |
| Asus TUF Gaming A16 FA617XS | |
| Dell G16 7620 | |
* ... smaller is better
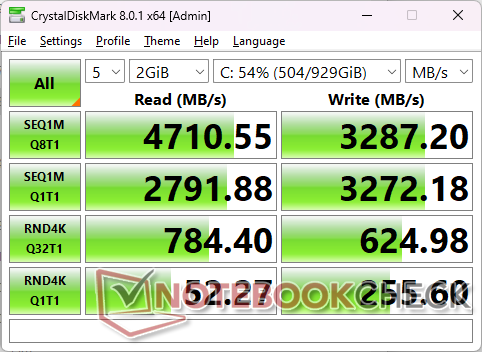
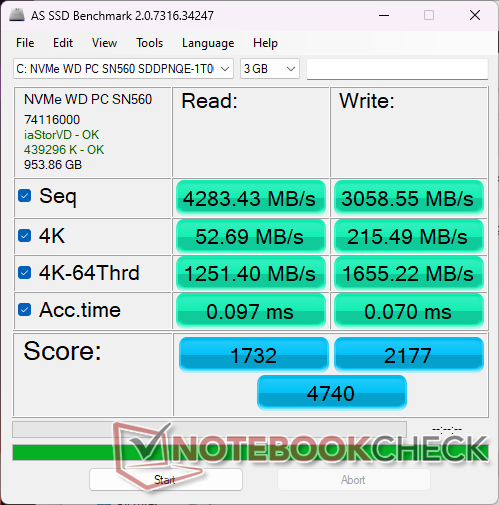
Storage Devices
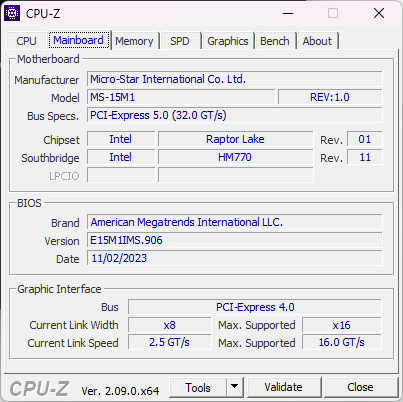
Our test unit comes configured with the midrange 1 TB Western Digital PC SN560 PCIe4 x4 NVMe SSD for steady transfer rates of around 4900 MB/s even when under stress. The model supports PCIe5 x4 SSDs as well much like on the larger Titan 18 HX, but low availability of PCIe5 SSDs means that the vast majority of configurations in the wild at the moment are only shipping with PCIe4 drives.

| Drive Performance rating - Percent | |
| Lenovo Legion 5 16IRX G9 | |
| Dell G16 7620 | |
| MSI Vector GP66 12UGS | |
| HP Victus 16-r0077ng | |
| MSI Vector 16 HX A14V | |
| Asus TUF Gaming A16 FA617XS | |
* ... smaller is better
Disk Throttling: DiskSpd Read Loop, Queue Depth 8
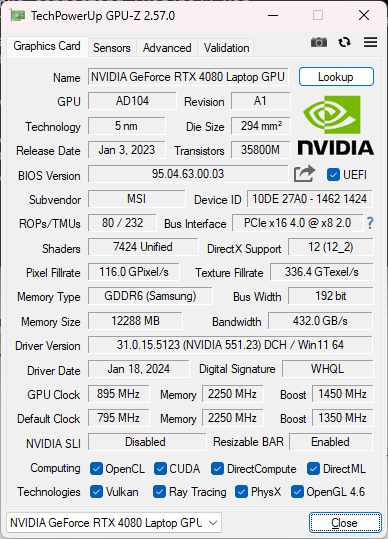
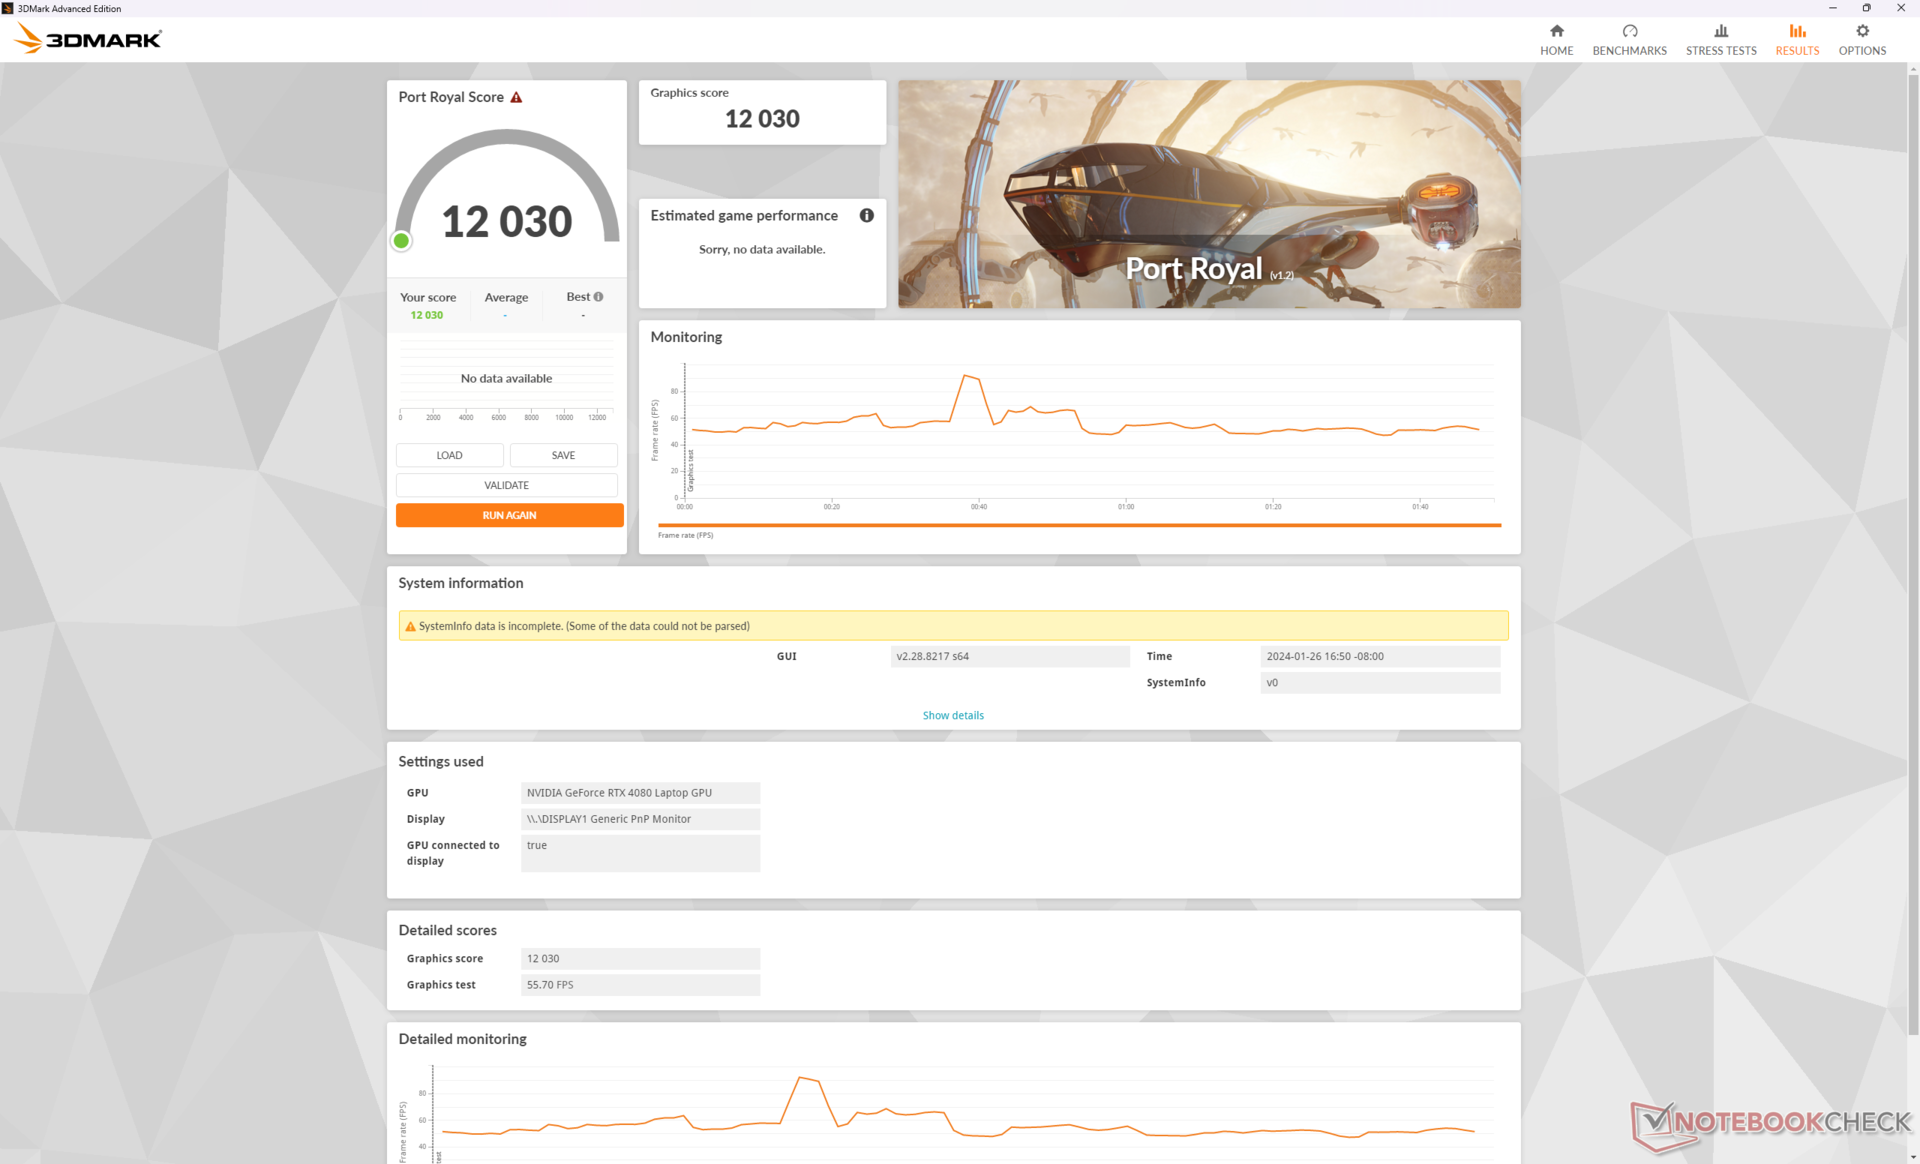
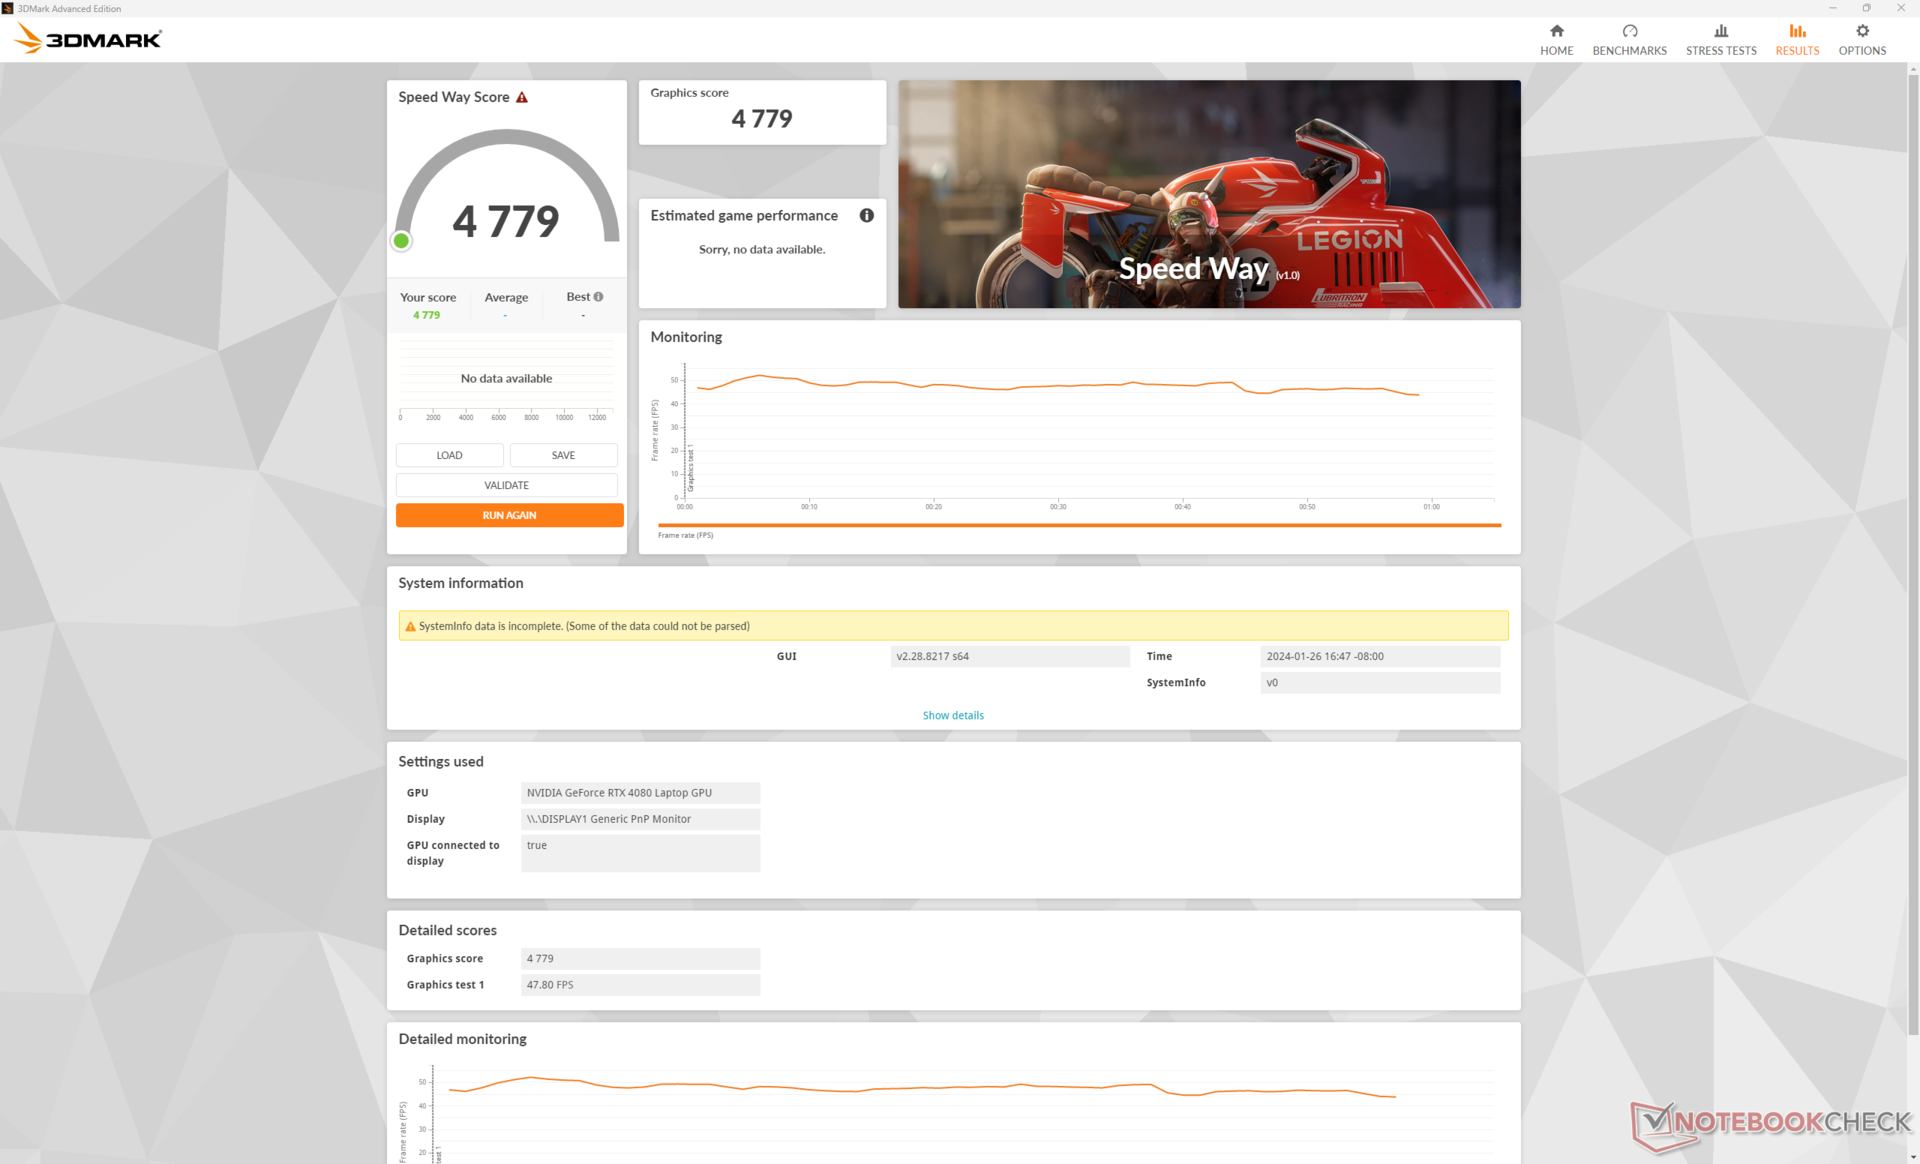
GPU Performance — Where The Vector Shines
Whereas most other gaming laptops target lower TGP values including the outgoing GP66, the Vector 16 HX targets the maximum of 175 W for faster performance. Consequently, our MSI system is about 8 to 10 percent faster than the average laptop in our database equipped with the same mobile GeForce RTX 4080 GPU. It's not that wide of a margin, but power users and gamers who want to squeeze as much GPU performance as possible from their machines will want to consider the Vector 16 HX over alternatives with the same graphics options like the HP Omen 16.
Upgrading to the RTX 4090 configuration is expected to boost graphics performance by about 10 percent while dropping down to the RTX 4070 and RTX 4060 should decrease performance by about 30 to 35 percent and 40 to 45 percent, respectively.
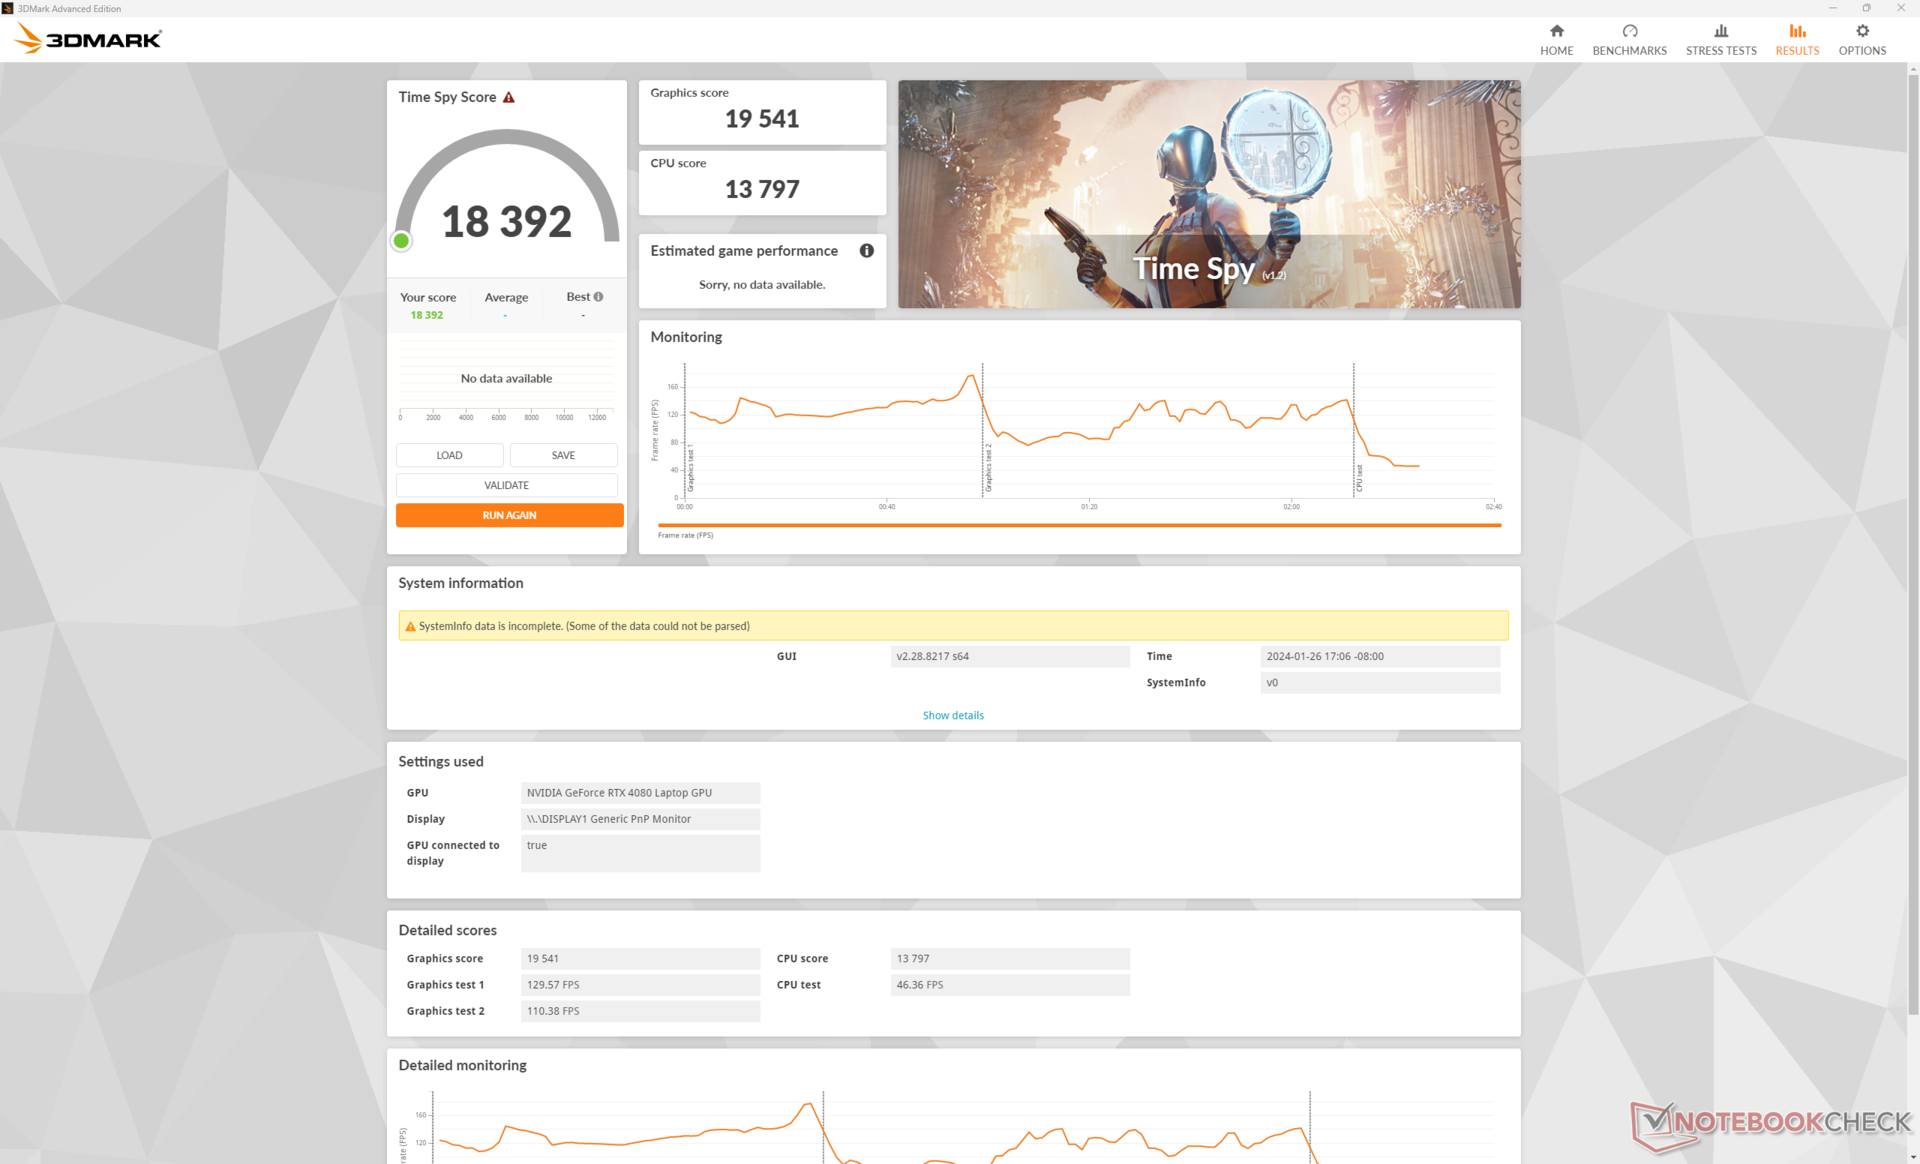
| Power Profile | Physics Score | Graphics Score | Combined Score |
| Extreme Performance (w/ Cooler Boost on) | 13797 | 19541 | 18392 |
| Extreme Performance (w/ Cooler Boost off) | 14118 (-0%) | 19471 (-0%) | 18423 (-0%) |
| Balanced Mode | 13858 (-0%) | 16466 (-16%) | 16013 (-13%) |
| Battery Power | 8307 (-40%) | 8955 (-54%) | 8851 (-52%) |
Much like on other MSI gaming laptops with Cooler Boost, performance appears to be unaffected by the feature so long as you're on Extreme Performance mode based on our Time Spy scores in the table above. Dropping to Balanced mode, however, will reduce graphics performance by about 16 percent.
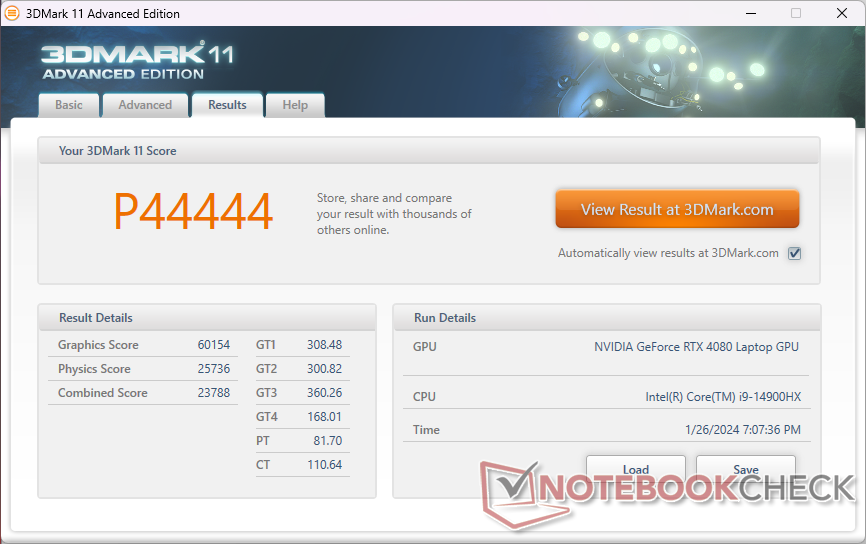
| 3DMark 11 Performance | 44444 points | |
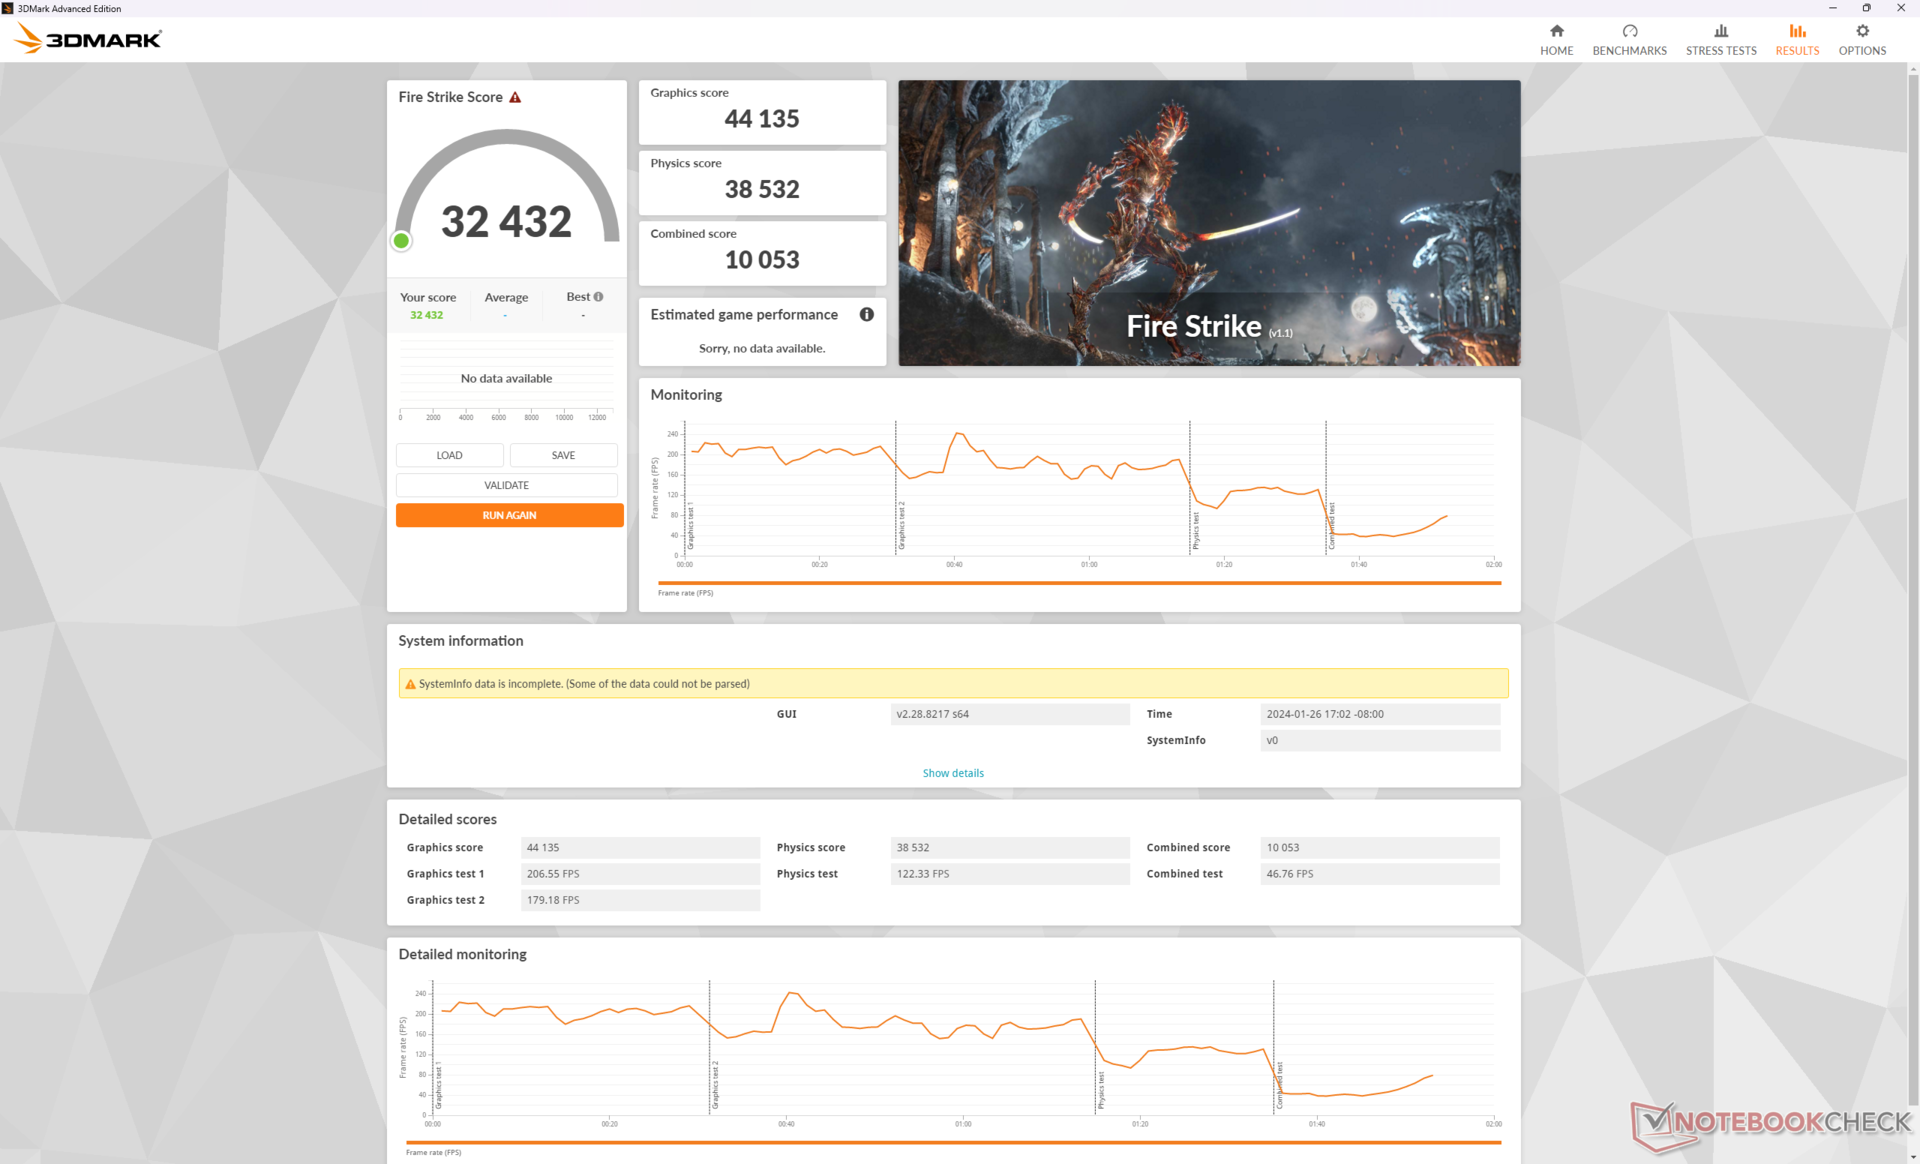
| 3DMark Fire Strike Score | 32432 points | |
| 3DMark Time Spy Score | 18392 points | |
Help | ||
* ... smaller is better
Gaming Performance
All current titles run smoothly at the native 1600p display resolution with most settings on maximum. However, you may want to consider enabling v-sync or limiting the frame rate to 120 due to the lack of G-Sync. Baldur's Gate, for example, averages 129 FPS at 1440p which can result in screen tearing on the 240 Hz display if frame rates are unlocked.
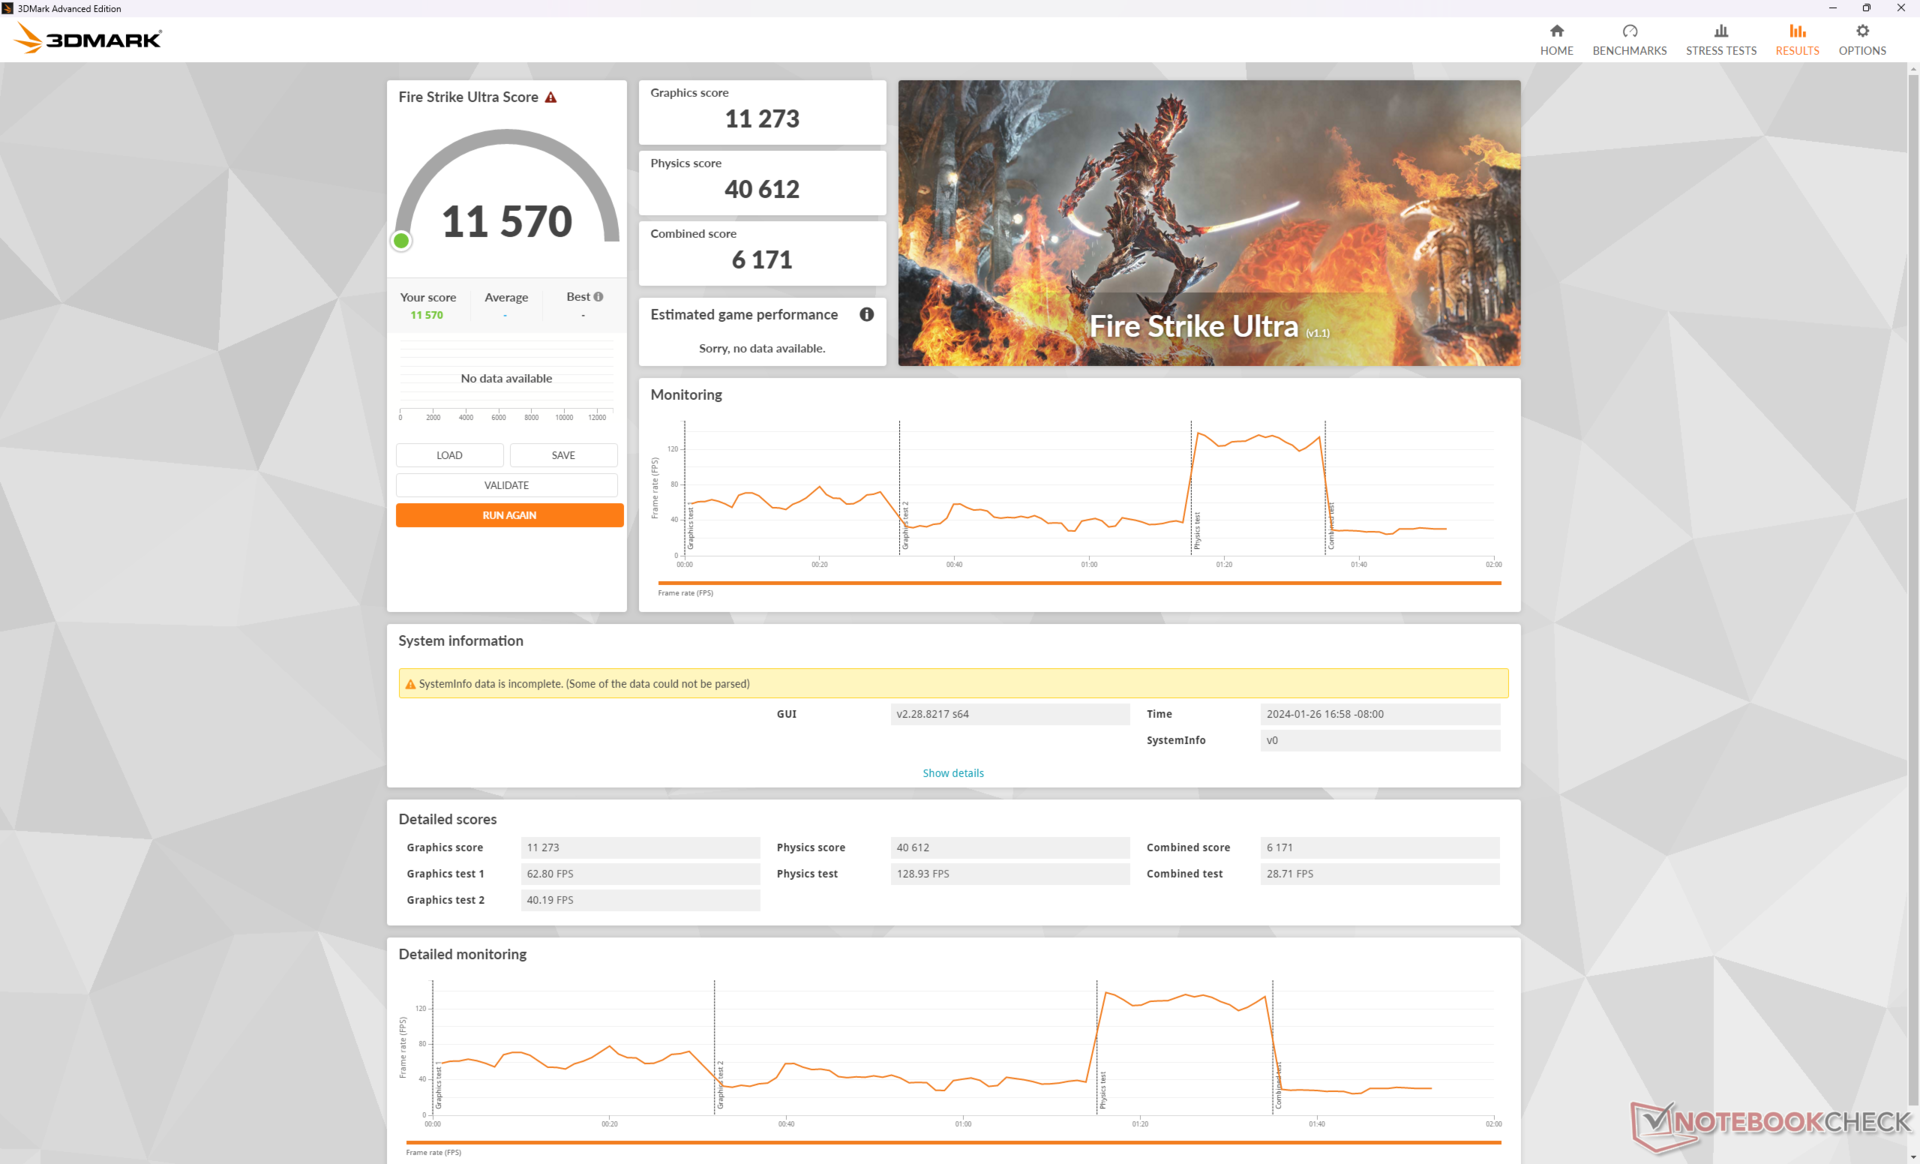
DLSS is recommended if gaming on 4K as the mobile RTX 4080 is significantly weaker than its desktop counterpart. Cyberpunk 2077 would average just 18.5 FPS at native 4K Ultra RT settings, but enabling both DLSS Auto and frame generation would boost the average to 75.8 FPS.
| Performance rating - Percent | |
| MSI Vector 16 HX A14V | |
| Lenovo Legion 5 16IRX G9 | |
| MSI Vector GP66 12UGS | |
| HP Victus 16-r0077ng | |
| Dell G16 7620 | |
| Asus TUF Gaming A16 FA617XS | |
| The Witcher 3 - 1920x1080 Ultra Graphics & Postprocessing (HBAO+) | |
| MSI Vector 16 HX A14V | |
| MSI Vector GP66 12UGS | |
| HP Victus 16-r0077ng | |
| Asus TUF Gaming A16 FA617XS | |
| Lenovo Legion 5 16IRX G9 | |
| Dell G16 7620 | |
| GTA V - 1920x1080 Highest AA:4xMSAA + FX AF:16x | |
| MSI Vector 16 HX A14V | |
| MSI Vector GP66 12UGS | |
| Lenovo Legion 5 16IRX G9 | |
| HP Victus 16-r0077ng | |
| Dell G16 7620 | |
| Asus TUF Gaming A16 FA617XS | |
| Final Fantasy XV Benchmark - 1920x1080 High Quality | |
| MSI Vector 16 HX A14V | |
| MSI Vector GP66 12UGS | |
| HP Victus 16-r0077ng | |
| Lenovo Legion 5 16IRX G9 | |
| Dell G16 7620 | |
| Asus TUF Gaming A16 FA617XS | |
| Strange Brigade - 1920x1080 ultra AA:ultra AF:16 | |
| MSI Vector 16 HX A14V | |
| MSI Vector GP66 12UGS | |
| Lenovo Legion 5 16IRX G9 | |
| HP Victus 16-r0077ng | |
| Asus TUF Gaming A16 FA617XS | |
| Dell G16 7620 | |
| Dota 2 Reborn - 1920x1080 ultra (3/3) best looking | |
| MSI Vector 16 HX A14V | |
| Lenovo Legion 5 16IRX G9 | |
| MSI Vector GP66 12UGS | |
| Dell G16 7620 | |
| HP Victus 16-r0077ng | |
| Asus TUF Gaming A16 FA617XS | |
| X-Plane 11.11 - 1920x1080 high (fps_test=3) | |
| MSI Vector 16 HX A14V | |
| Lenovo Legion 5 16IRX G9 | |
| MSI Vector GP66 12UGS | |
| Dell G16 7620 | |
| HP Victus 16-r0077ng | |
| Asus TUF Gaming A16 FA617XS | |
| Baldur's Gate 3 | |
| 1920x1080 High Preset AA:T | |
| MSI Vector 16 HX A14V | |
| Average NVIDIA GeForce RTX 4080 Laptop GPU (122.2 - 183.5, n=4) | |
| Framework Laptop 16 | |
| Lenovo ThinkPad Z16 Gen 2 | |
| 1920x1080 Ultra Preset AA:T | |
| MSI Vector 16 HX A14V | |
| Average NVIDIA GeForce RTX 4080 Laptop GPU (111.8 - 181.2, n=7) | |
| Framework Laptop 16 | |
| Lenovo ThinkPad Z16 Gen 2 | |
| 2560x1440 Ultra Preset AA:T | |
| MSI Vector 16 HX A14V | |
| Average NVIDIA GeForce RTX 4080 Laptop GPU (88.3 - 129.3, n=7) | |
| Framework Laptop 16 | |
| Lenovo ThinkPad Z16 Gen 2 | |
| 3840x2160 Ultra Preset AA:T | |
| MSI Vector 16 HX A14V | |
| Average NVIDIA GeForce RTX 4080 Laptop GPU (48.8 - 68.4, n=5) | |
| Framework Laptop 16 | |
Witcher 3 FPS Chart
| low | med. | high | ultra | QHD | 4K | |
|---|---|---|---|---|---|---|
| GTA V (2015) | 187.1 | 185.7 | 181.9 | 136.5 | 128.8 | 158.6 |
| The Witcher 3 (2015) | 640 | 513.3 | 384.6 | 183.3 | 121.2 | |
| Dota 2 Reborn (2015) | 217 | 194.8 | 186.7 | 175 | 168.4 | |
| Final Fantasy XV Benchmark (2018) | 232 | 219 | 178.8 | 142 | 79.5 | |
| X-Plane 11.11 (2018) | 204 | 177.4 | 137.7 | 118.1 | ||
| Far Cry 5 (2018) | 180 | 167 | 161 | 154 | 97 | |
| Strange Brigade (2018) | 505 | 405 | 378 | 349 | 248 | 123.2 |
| Tiny Tina's Wonderlands (2022) | 344 | 297.1 | 212.8 | 167.1 | 114.8 | 60.3 |
| F1 22 (2022) | 339 | 324 | 297 | 81.2 | 76.9 | 39.6 |
| Baldur's Gate 3 (2023) | 228.5 | 204.3 | 183.5 | 181.2 | 129.3 | 68.4 |
| Cyberpunk 2077 (2023) | 143.4 | 135.3 | 127.1 | 118.6 | 79.4 | 36.6 |
Emissions — Loud And Proud
System Noise
The system is quite loud even when simply idling on desktop on the Balanced or Silent power profiles. Fan noise when running Witcher 3 on Extreme Performance mode would settle at 62 dB(A) regardless of the Cooler Boost setting. The 60+ dB(A) range is home to some of the loudest laptops in our database to the point where headphones are recommended for a better gaming experience.
Gaming on Balanced mode will lower the fan noise ceiling significantly to the 54 dB(A) range. Though still loud, it is nowhere near as bad as on Extreme Performance mode. Users may therefore want to game on Balanced mode instead of Extreme Performance mode even though it entails a 16 percent drop on GPU performance as mentioned above.
Noise level
| Idle |
| 33.5 / 33.5 / 33.5 dB(A) |
| Load |
| 52.1 / 62 dB(A) |
 | ||
30 dB silent 40 dB(A) audible 50 dB(A) loud |
||
min: | ||
| MSI Vector 16 HX A14V GeForce RTX 4080 Laptop GPU, i9-14900HX, WD PC SN560 SDDPNQE-1T00 | MSI Vector GP66 12UGS GeForce RTX 3070 Ti Laptop GPU, i9-12900H | Lenovo Legion 5 16IRX G9 GeForce RTX 4060 Laptop GPU, i7-14650HX, Samsung PM9A1 MZVL21T0HCLR | HP Victus 16-r0077ng GeForce RTX 4070 Laptop GPU, i7-13700H, Kioxia XG8 KXG80ZNV1T02 | Asus TUF Gaming A16 FA617XS Radeon RX 7600S, R9 7940HS, Micron 2400 MTFDKBA512QFM | Dell G16 7620 GeForce RTX 3060 Laptop GPU, i7-12700H, WDC PC SN810 512GB | |
|---|---|---|---|---|---|---|
| Noise | 17% | 11% | 14% | 15% | 18% | |
| off / environment * (dB) | 23.2 | 22.9 1% | 24 -3% | 25 -8% | 25 -8% | 23.2 -0% |
| Idle Minimum * (dB) | 33.5 | 23.4 30% | 24 28% | 28 16% | 25 25% | 28.3 16% |
| Idle Average * (dB) | 33.5 | 23.4 30% | 28.8 14% | 29 13% | 26 22% | 28.8 14% |
| Idle Maximum * (dB) | 33.5 | 27.4 18% | 32 4% | 30 10% | 28 16% | 28.9 14% |
| Load Average * (dB) | 52.1 | 36 31% | 45.5 13% | 43 17% | 43 17% | 32.4 38% |
| Witcher 3 ultra * (dB) | 62 | 58.2 6% | 53.1 14% | 46 26% | 51 18% | 48.3 22% |
| Load Maximum * (dB) | 62 | 58 6% | 55.7 10% | 48 23% | 53 15% | 48.1 22% |
* ... smaller is better
Temperature
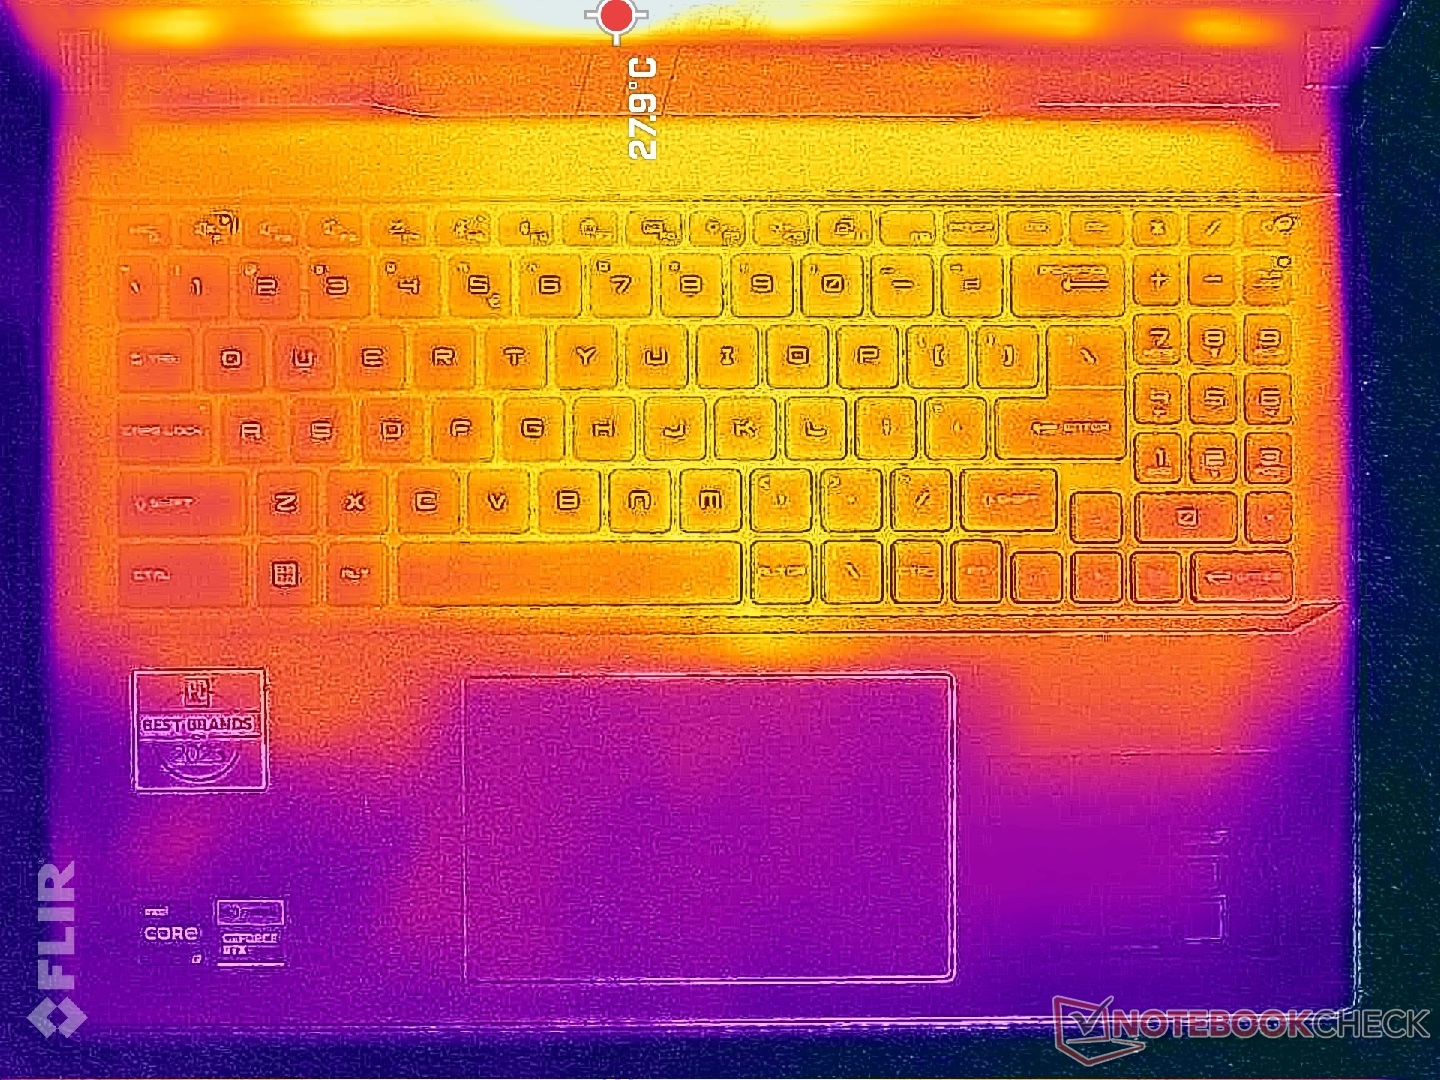
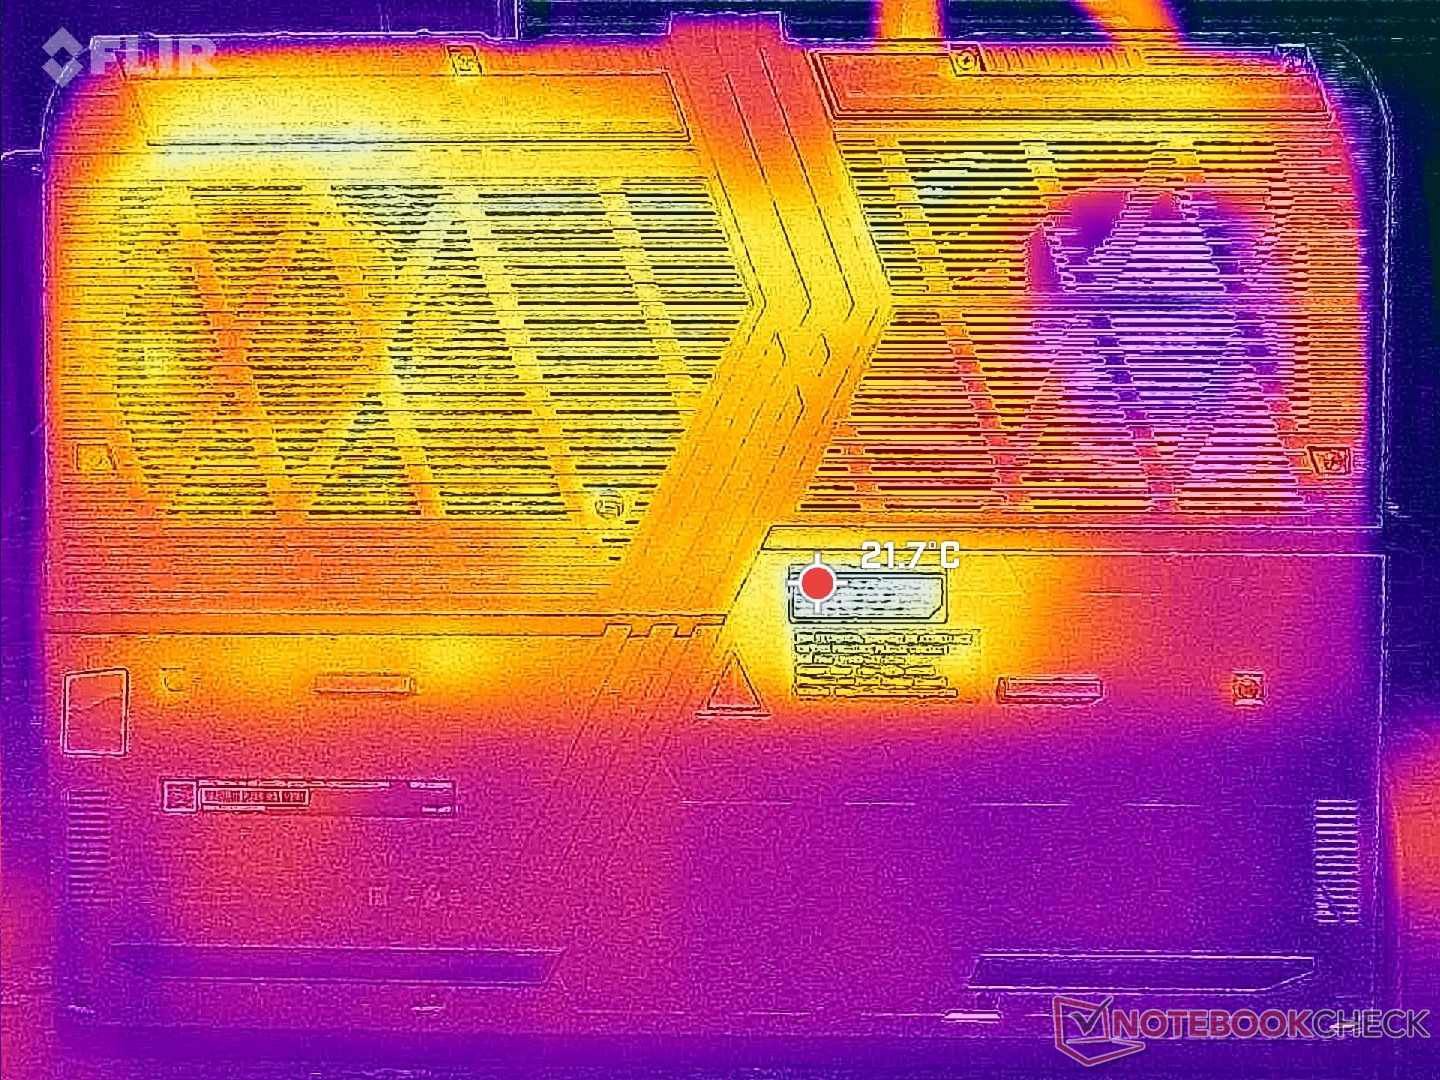
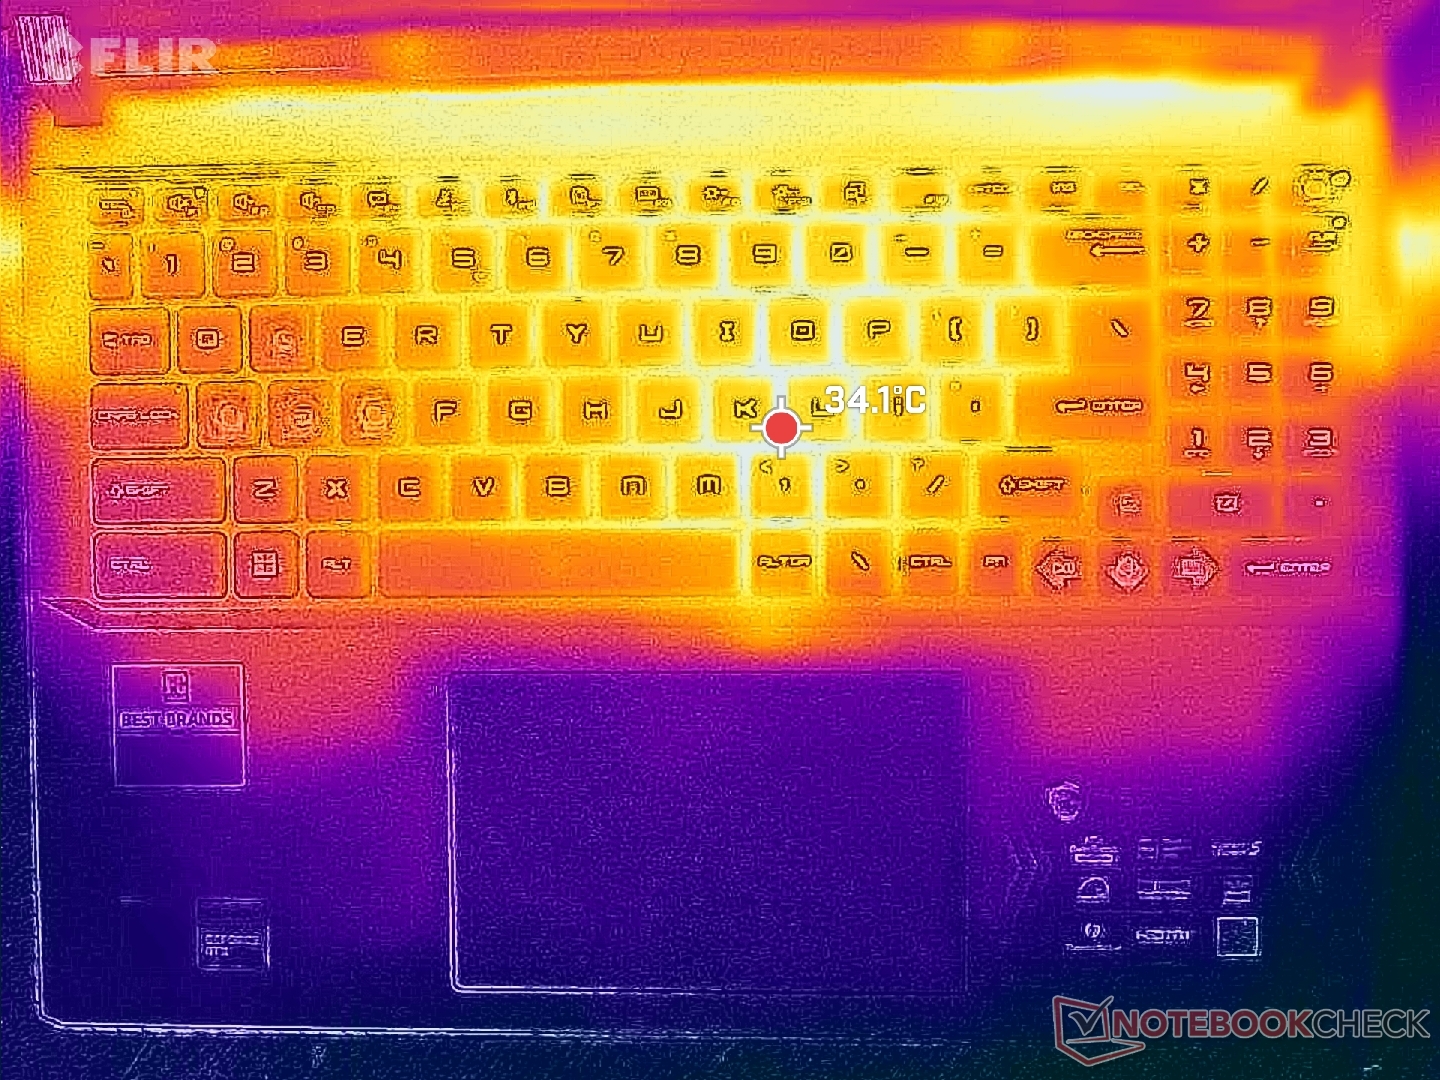
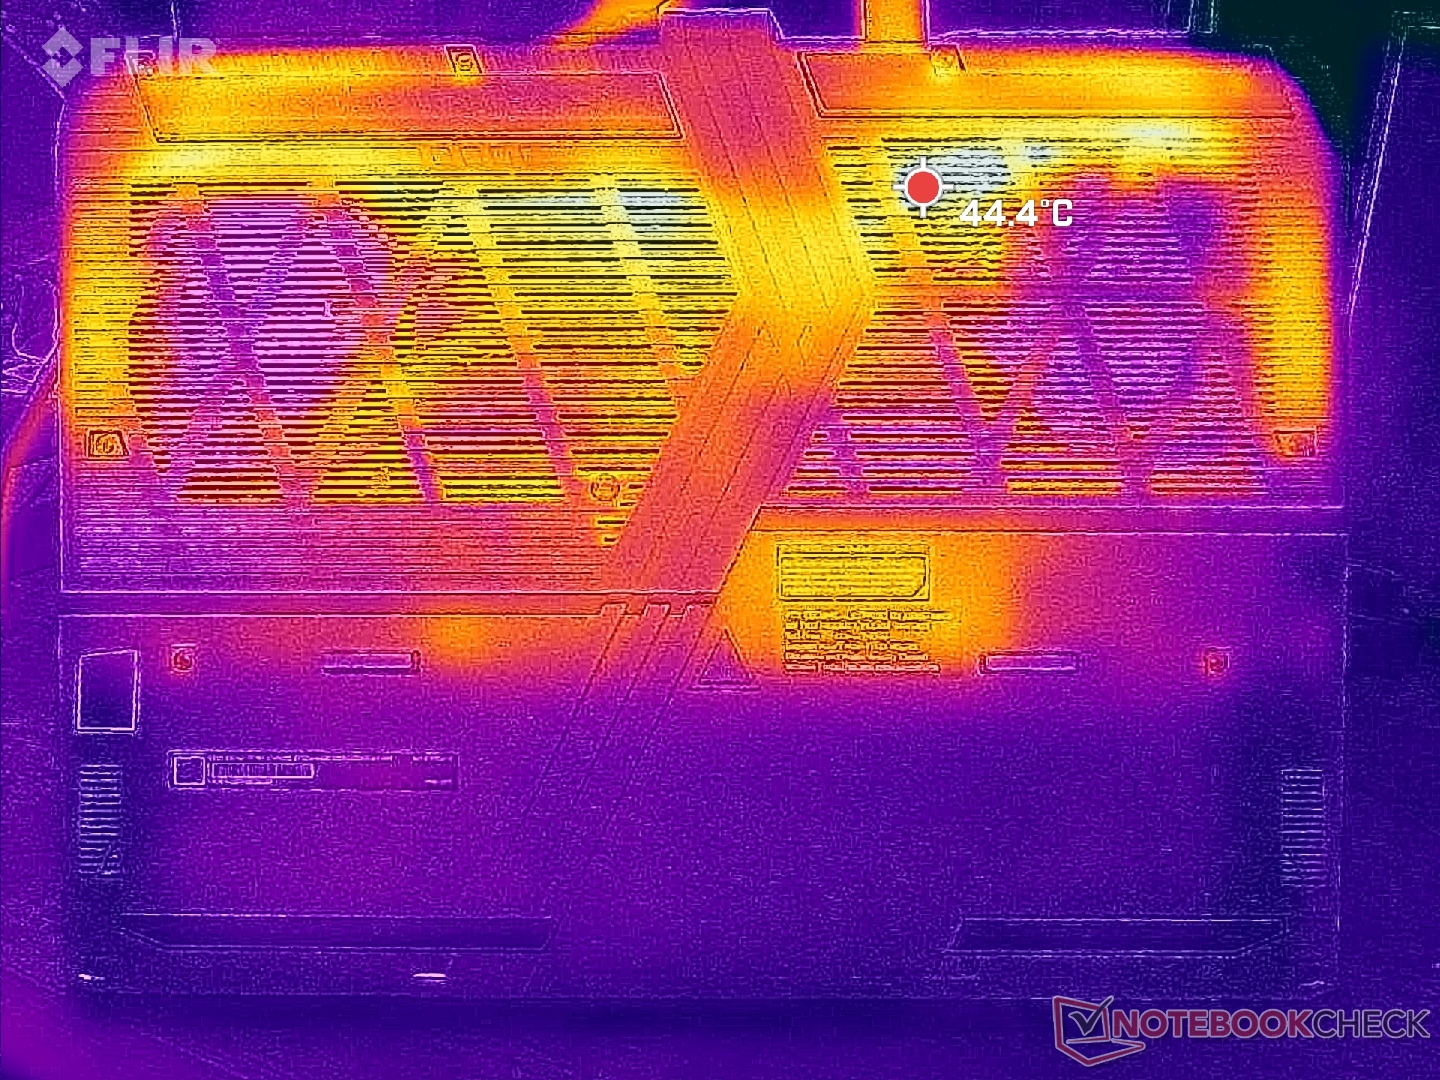
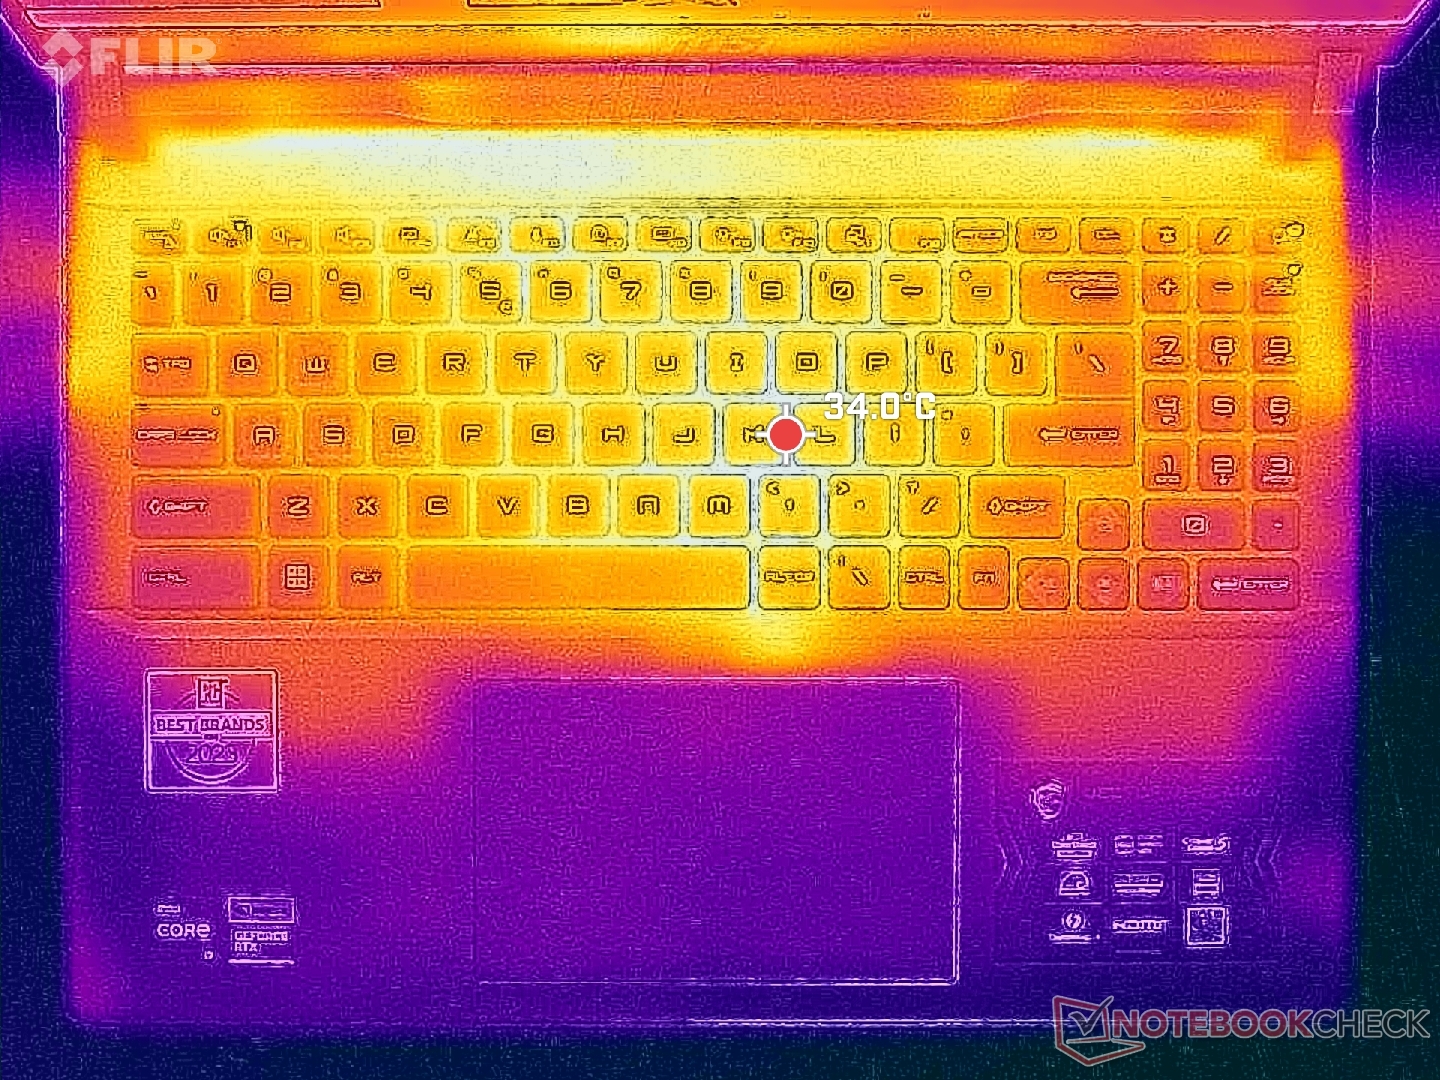
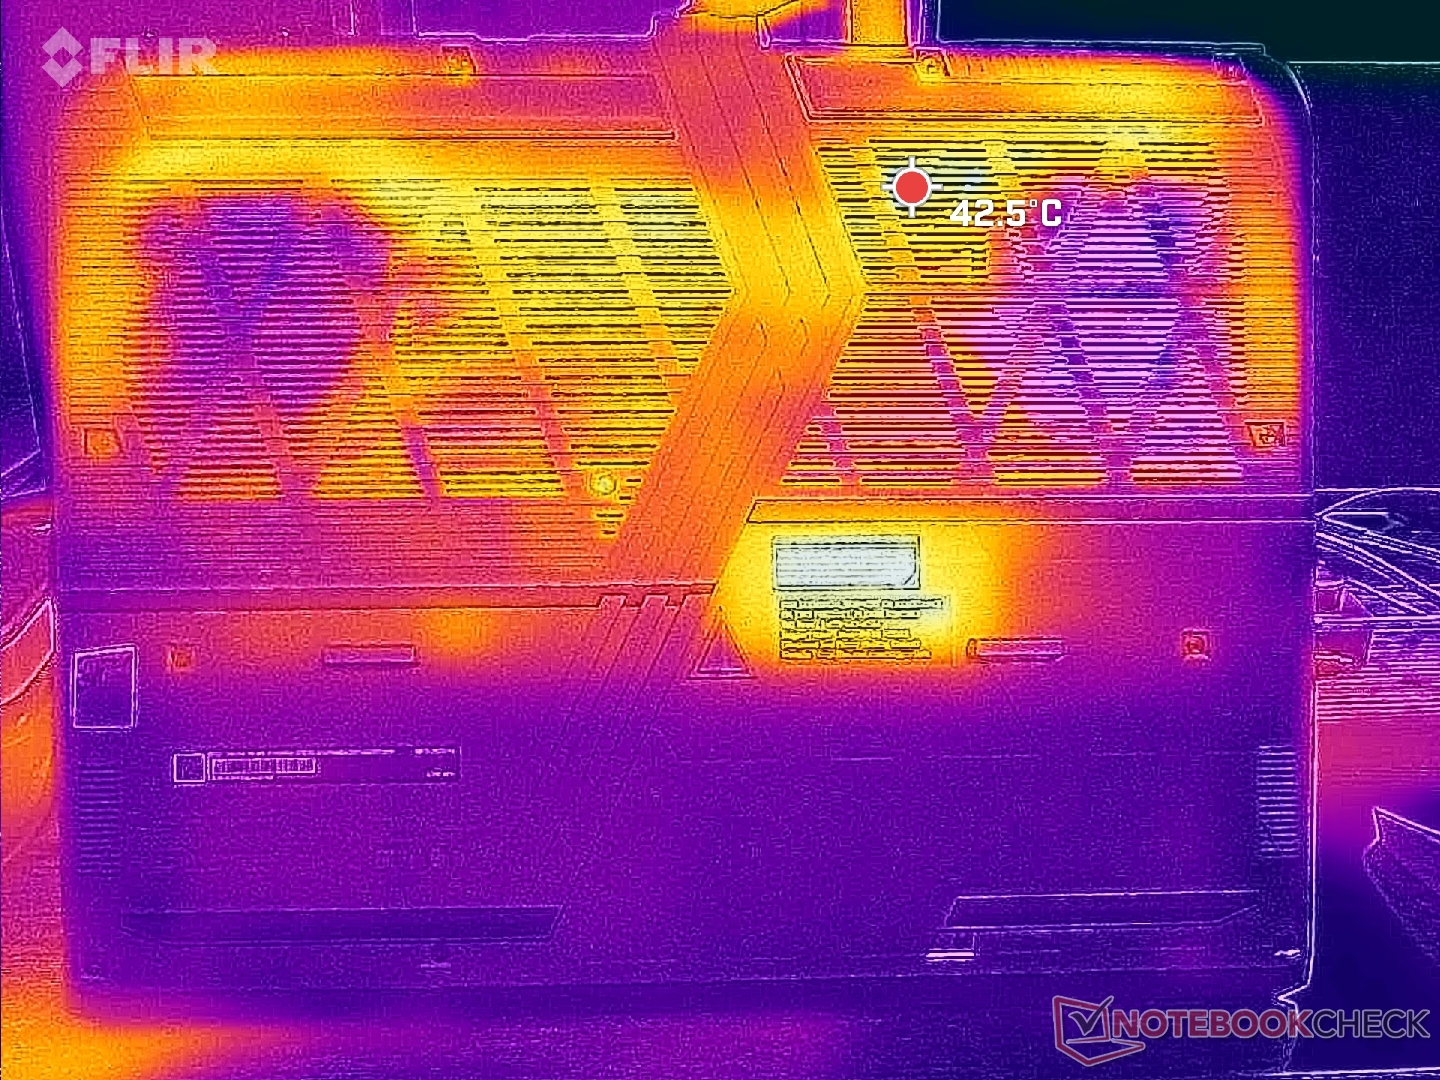
Surface temperatures are cooler than most other gaming laptops owing to the plastic base, ample ventilation grilles, and thick chassis design. In fact, this is one of the coolest gaming laptops we've tested with an RTX 4080. When running Witcher 3, the hot spot on the keyboard center would reach only 34 C compared to 39 C on the Legion 5i 16 G9 or older Vector GP66.
(+) The maximum temperature on the upper side is 36.4 °C / 98 F, compared to the average of 40.4 °C / 105 F, ranging from 21.2 to 68.8 °C for the class Gaming.
(+) The bottom heats up to a maximum of 35.6 °C / 96 F, compared to the average of 43.2 °C / 110 F
(+) In idle usage, the average temperature for the upper side is 24.5 °C / 76 F, compared to the device average of 33.9 °C / 93 F.
(+) Playing The Witcher 3, the average temperature for the upper side is 30.4 °C / 87 F, compared to the device average of 33.9 °C / 93 F.
(+) The palmrests and touchpad are cooler than skin temperature with a maximum of 24 °C / 75.2 F and are therefore cool to the touch.
(+) The average temperature of the palmrest area of similar devices was 28.8 °C / 83.8 F (+4.8 °C / 8.6 F).
| MSI Vector 16 HX A14V Intel Core i9-14900HX, NVIDIA GeForce RTX 4080 Laptop GPU | MSI Vector GP66 12UGS Intel Core i9-12900H, NVIDIA GeForce RTX 3070 Ti Laptop GPU | Lenovo Legion 5 16IRX G9 Intel Core i7-14650HX, NVIDIA GeForce RTX 4060 Laptop GPU | HP Victus 16-r0077ng Intel Core i7-13700H, NVIDIA GeForce RTX 4070 Laptop GPU | Asus TUF Gaming A16 FA617XS AMD Ryzen 9 7940HS, AMD Radeon RX 7600S | Dell G16 7620 Intel Core i7-12700H, NVIDIA GeForce RTX 3060 Laptop GPU | |
|---|---|---|---|---|---|---|
| Heat | -25% | -20% | -35% | -26% | -15% | |
| Maximum Upper Side * (°C) | 36.4 | 40.2 -10% | 40.4 -11% | 51 -40% | 53 -46% | 47.6 -31% |
| Maximum Bottom * (°C) | 35.6 | 43.8 -23% | 43.8 -23% | 54 -52% | 48 -35% | 54 -52% |
| Idle Upper Side * (°C) | 26.6 | 34.8 -31% | 30.3 -14% | 37 -39% | 30 -13% | 23 14% |
| Idle Bottom * (°C) | 27 | 37 -37% | 35.3 -31% | 29 -7% | 30 -11% | 24.6 9% |
* ... smaller is better
Stress Test
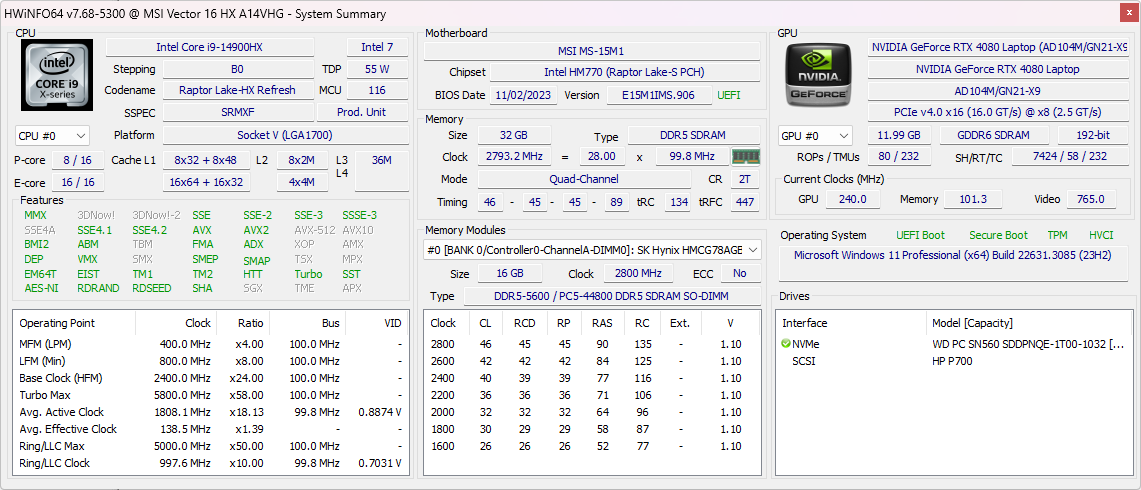
When initiating Prime95 stress, the CPU would boost to 4.2 GHz and 180 W until core temperature hits 87 C about a minute later. Thereafter, it would drop to ~3.3 GHz, 140 W, and 82 C. Results would remain the same even if Cooler Boost is enabled.
Running Witcher 3 on Extreme Performance mode to represent typical gaming loads would result in steady GPU values of 2535 MHz clock, 77 C core temperature, and 165 W board power draw according to HWiNFO. Results would remain almost the same regardless of the Cooler Boost setting. Dropping to the quieter Balanced mode, however, would reduce the GPU clock and board power draw to just 2055 MHz and 120 W, respectively, which reflects the notable performance drop mentioned in our GPU Performance section above.
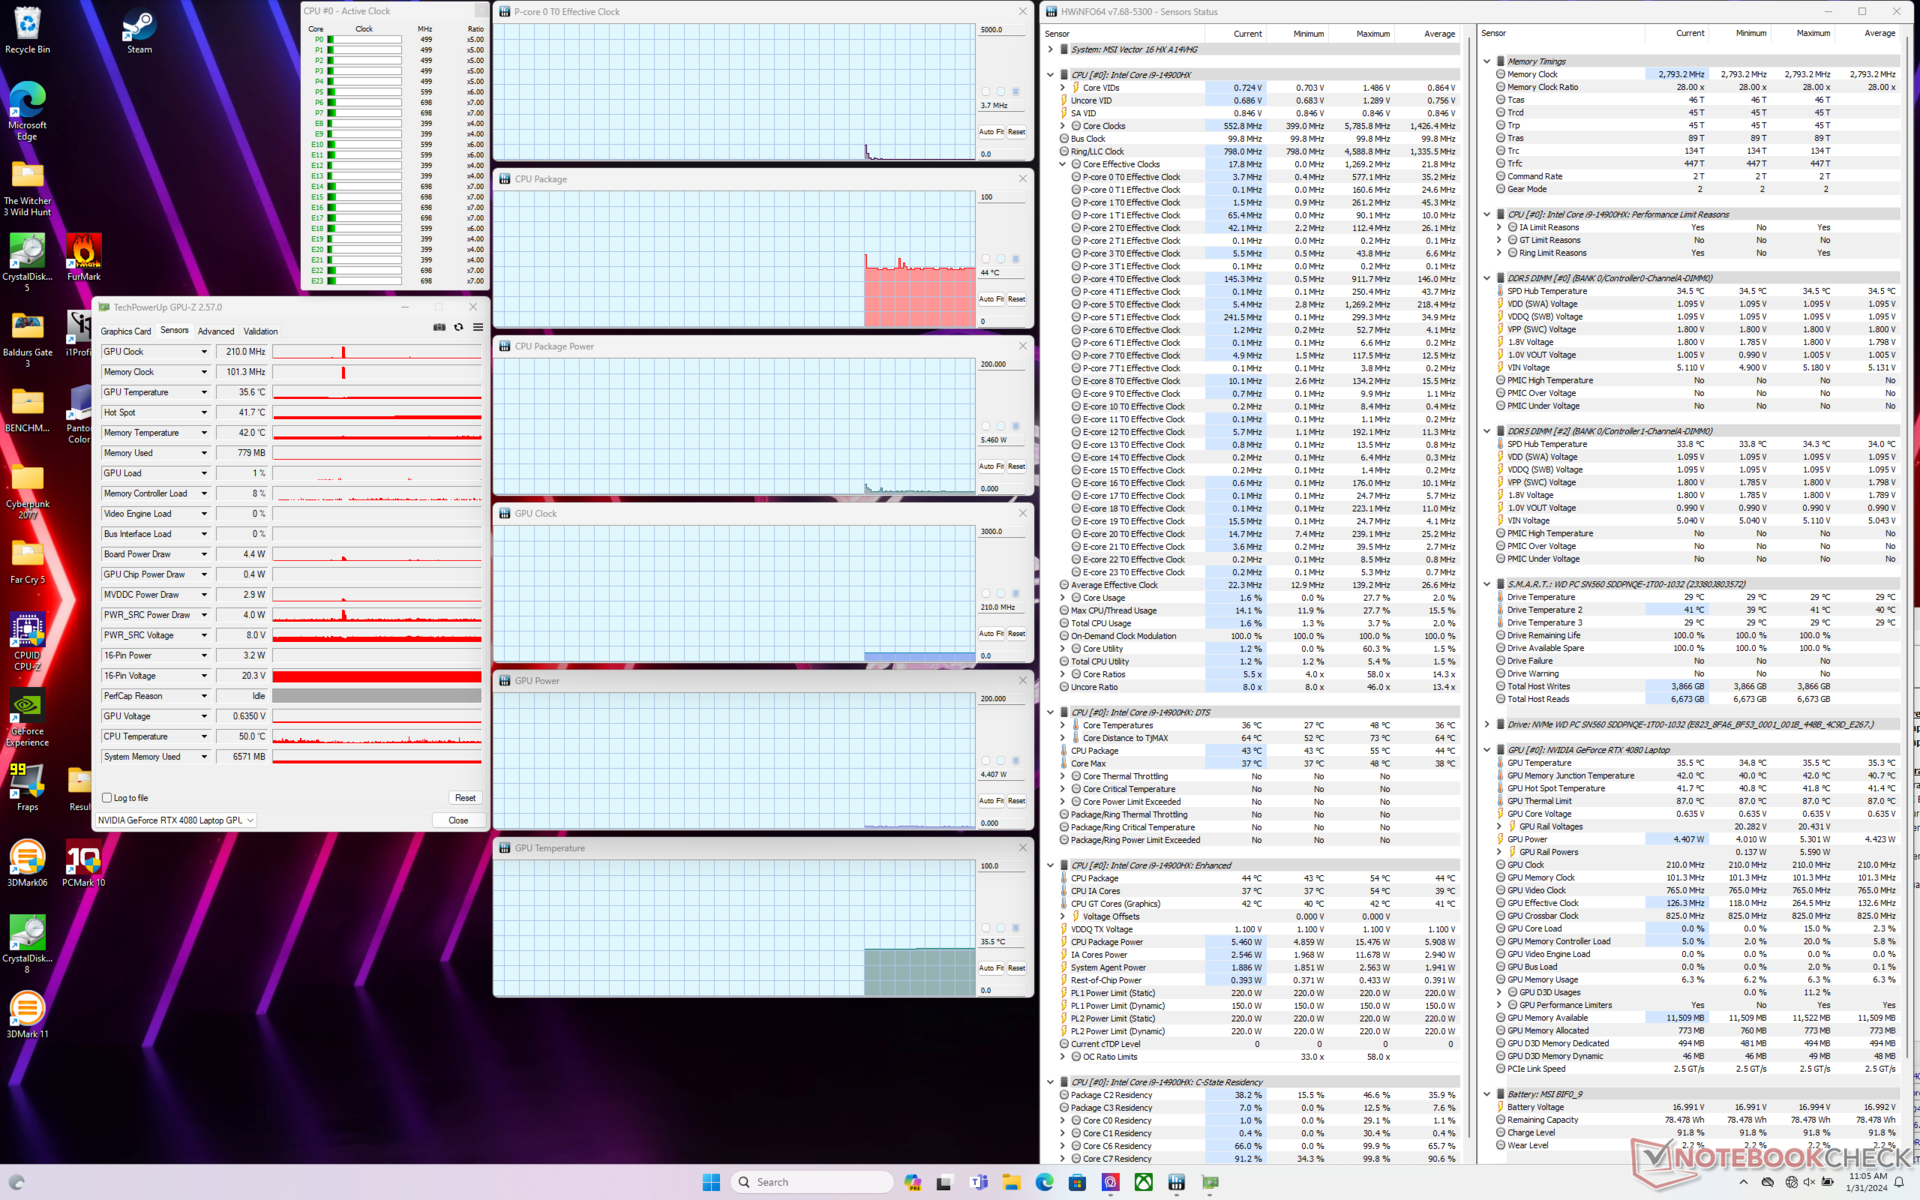
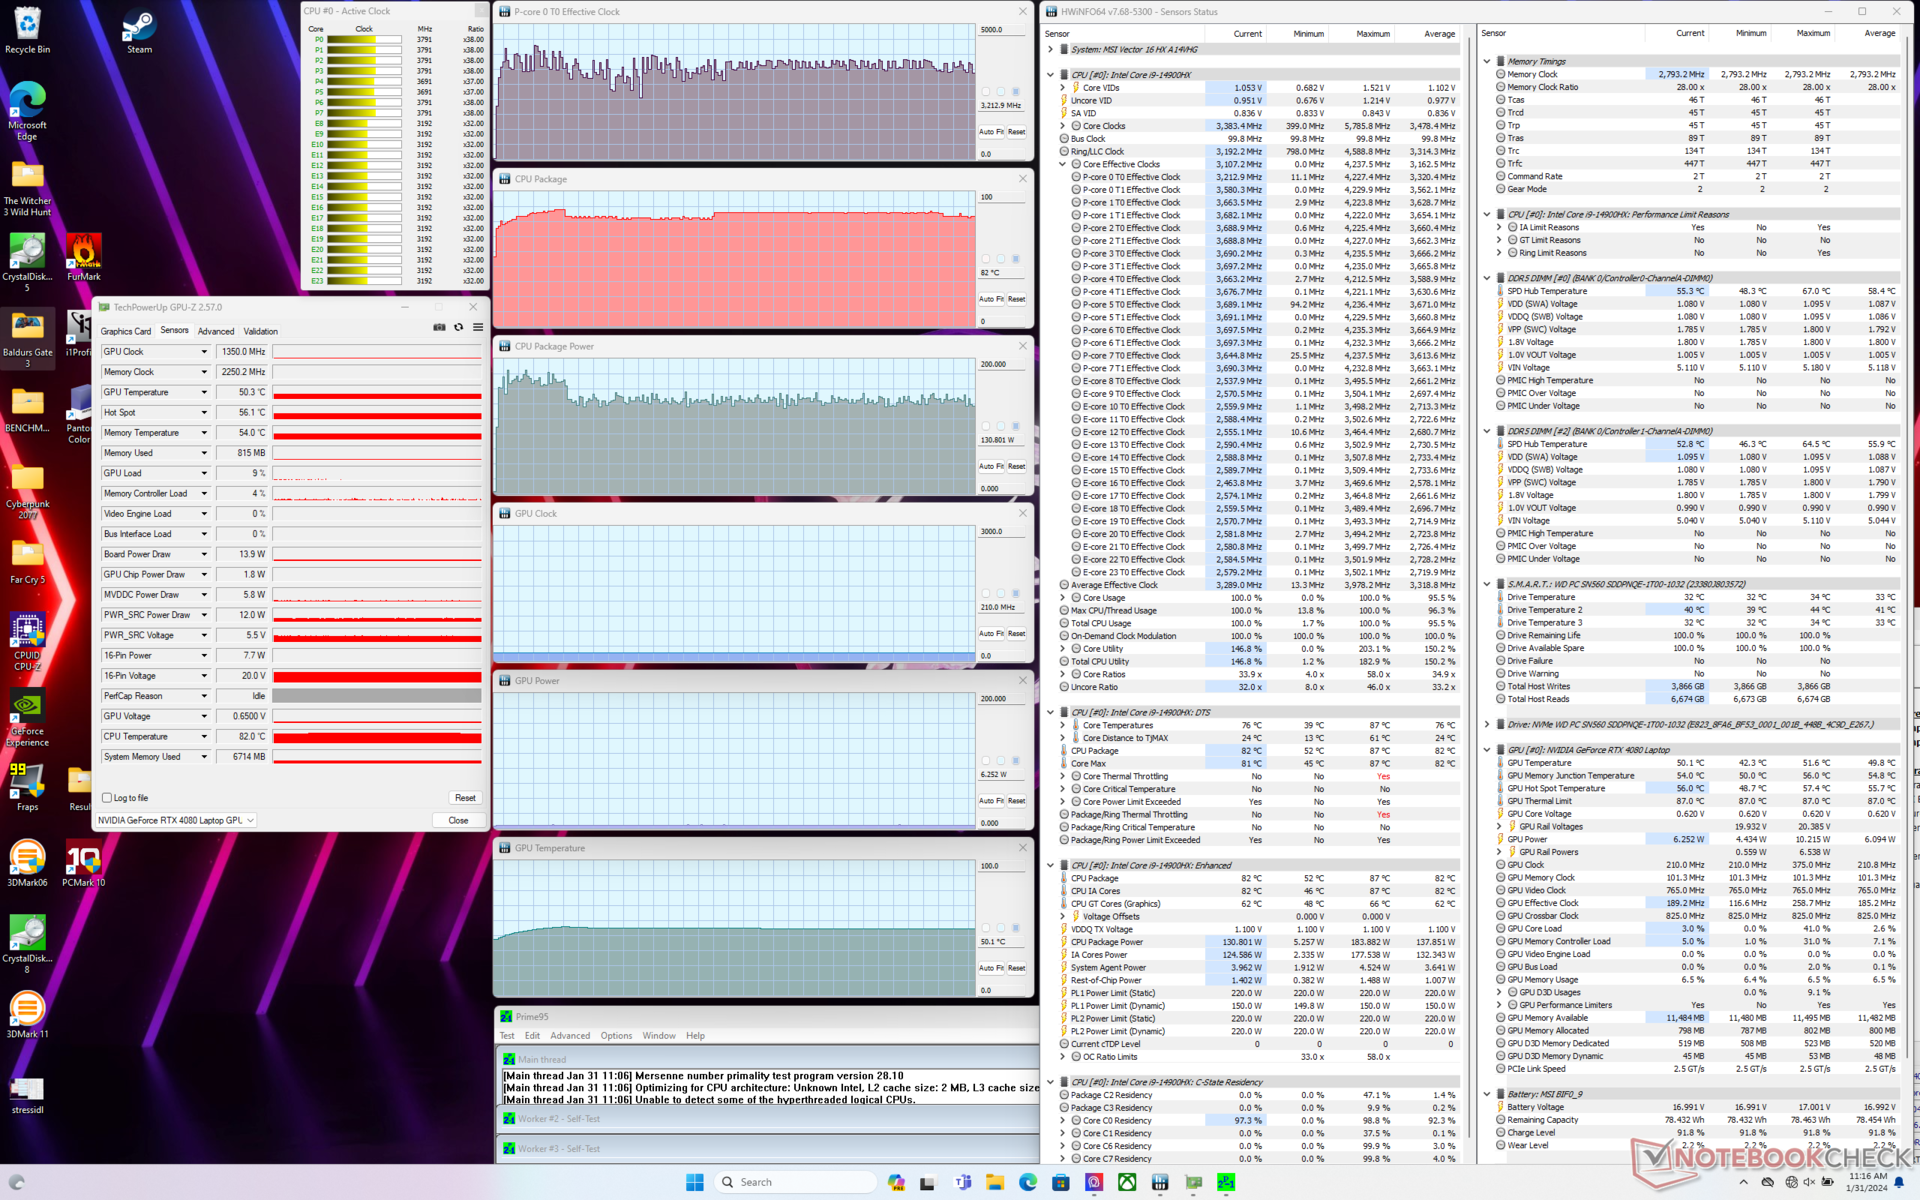
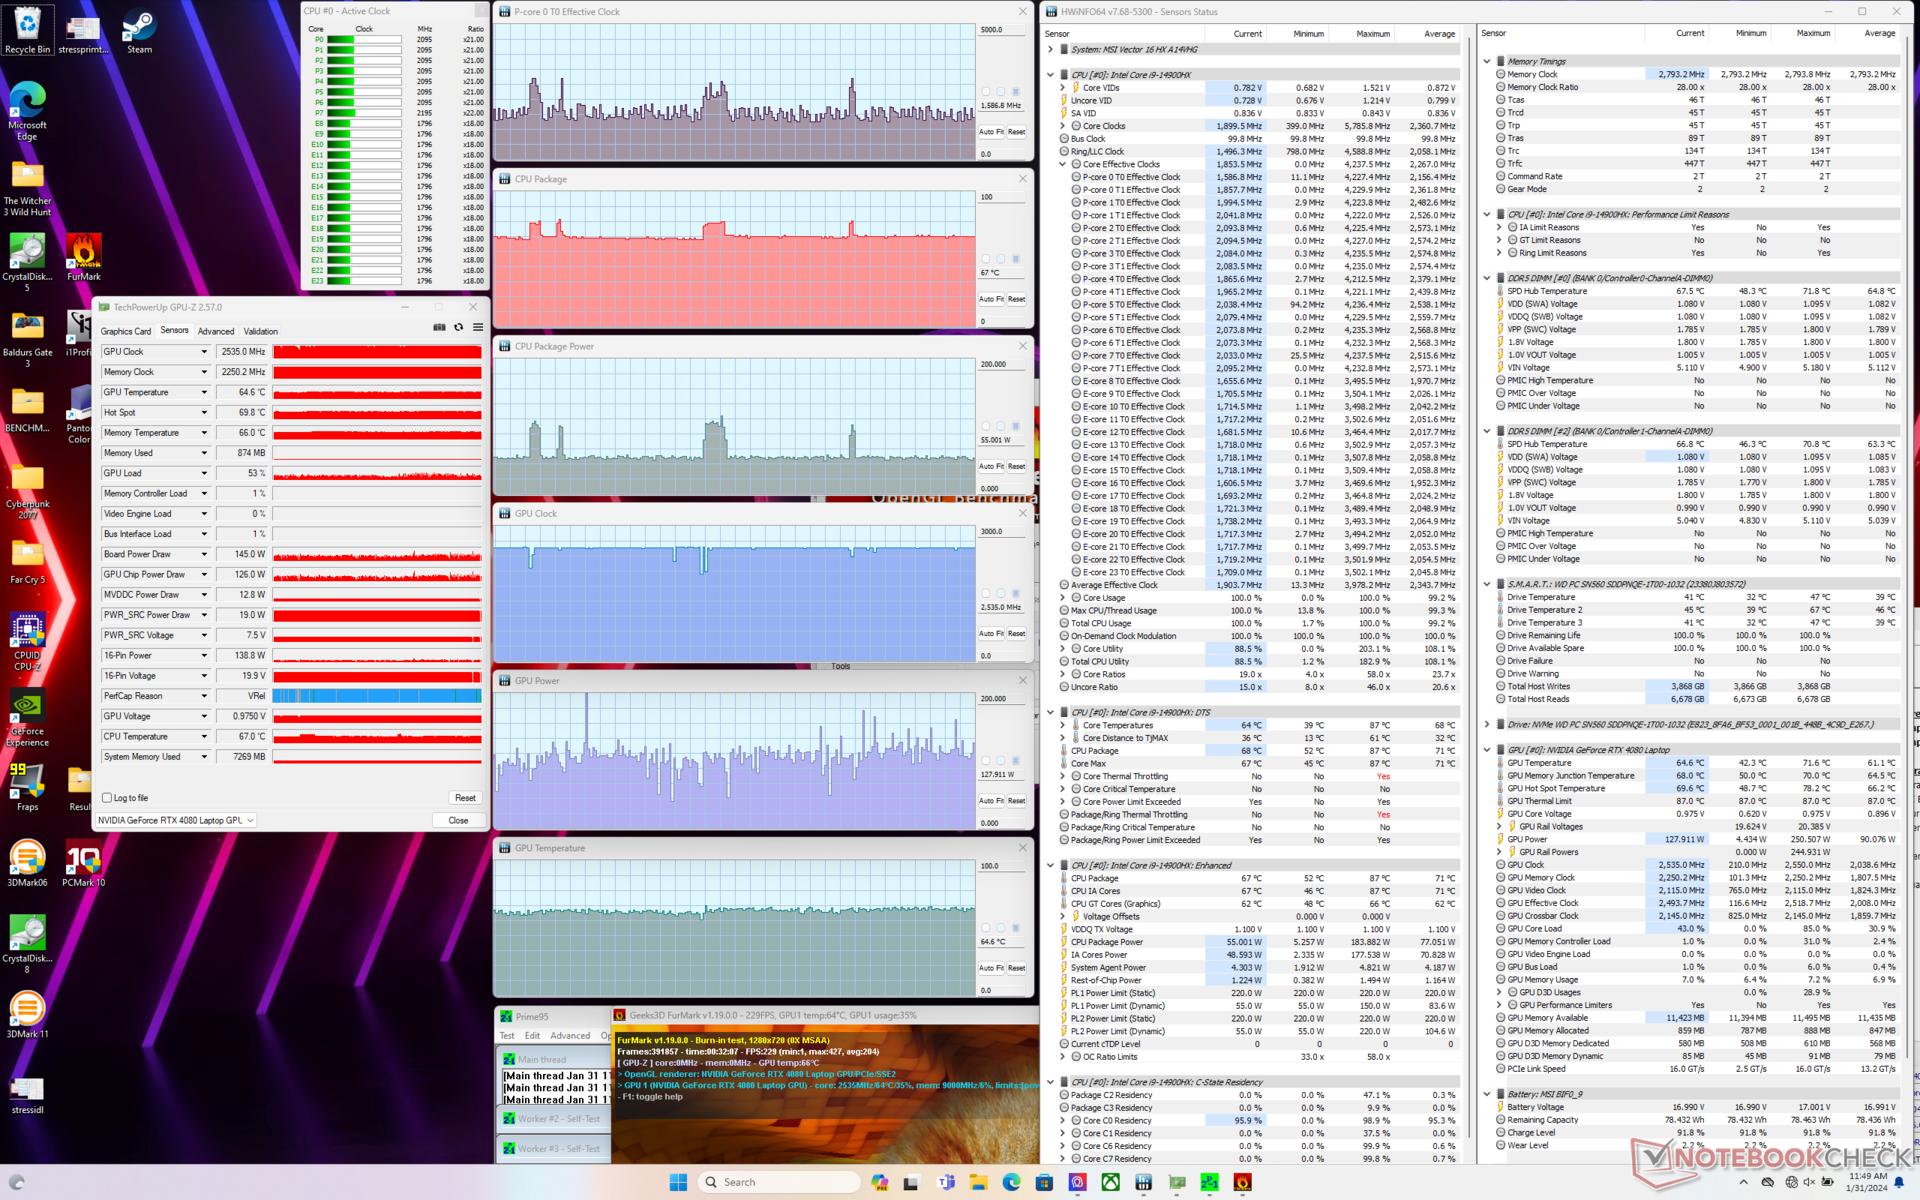
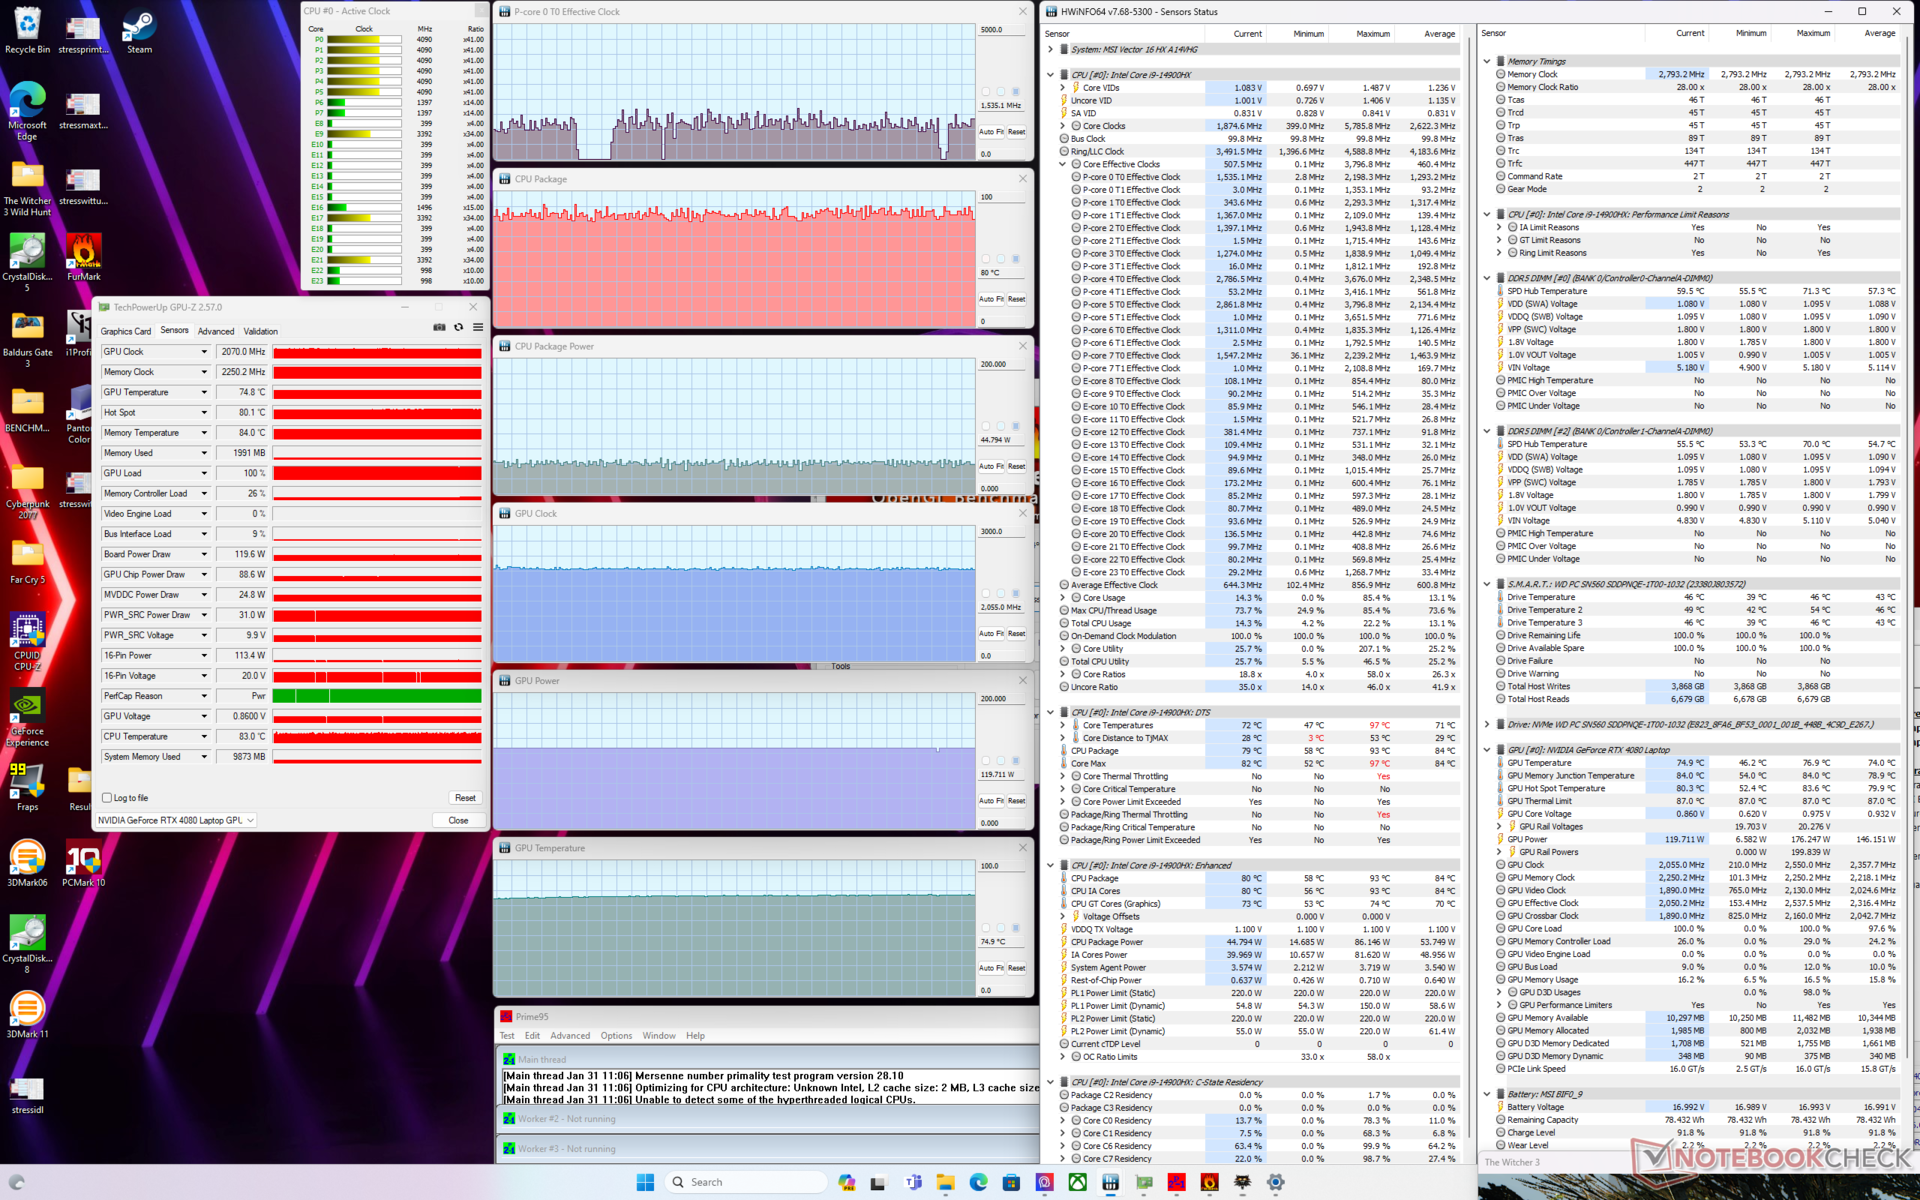
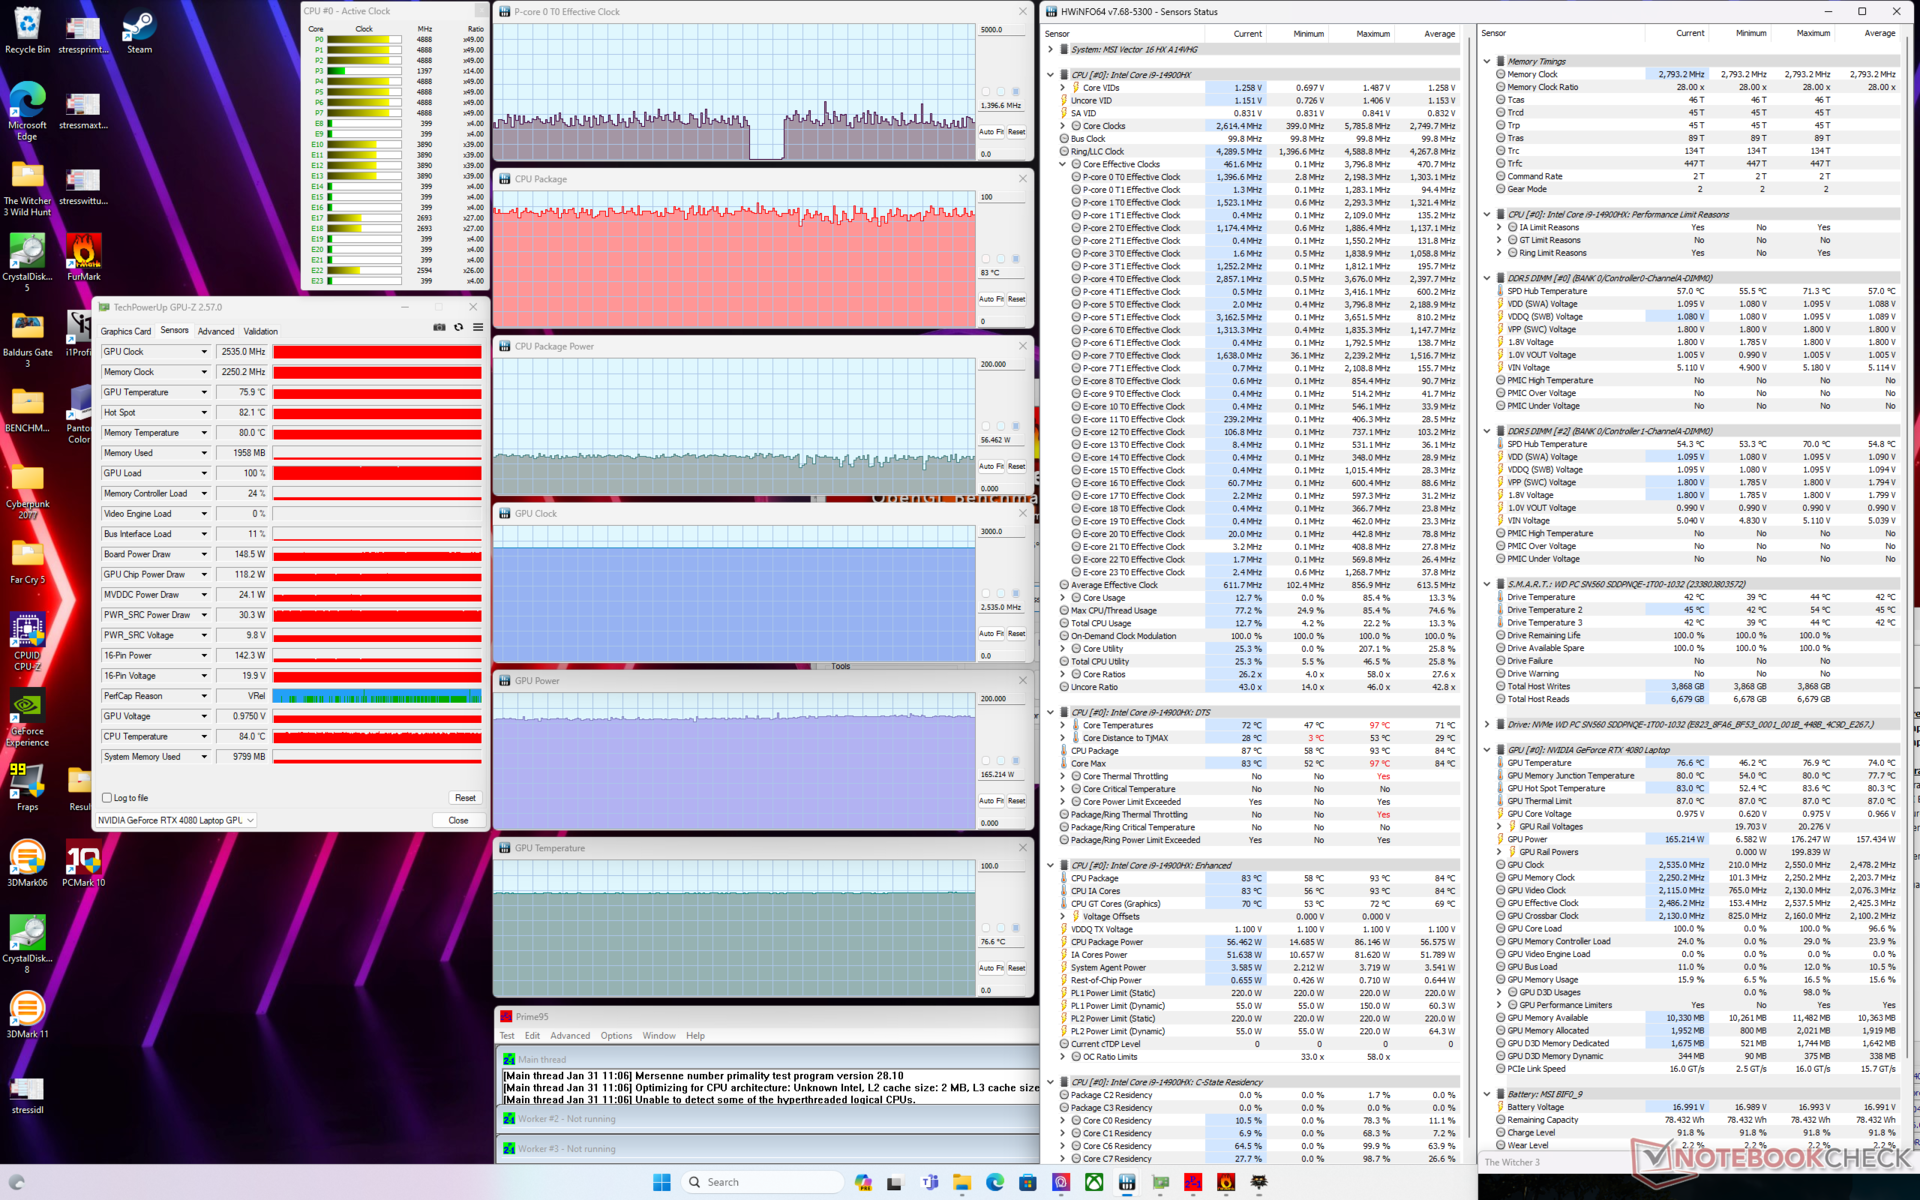

| CPU Clock (GHz) | GPU Clock (MHz) | Average CPU Temperature (°C) | Average GPU Temperature (°C) | |
| System Idle | -- | -- | 44 | 36 |
| Prime95 Stress | 3.3 | -- | 82 | 50 |
| Prime95 + FurMark Stress (Extreme Performance w/ Cooler Boost on) | ~1.7 | 2535 | 67 | 65 |
| Witcher 3 Stress (Balanced mode) | ~1.5 | 2055 | 81 | 75 |
| Witcher 3 Stress (Extreme Performance w/ Cooler Boost off) | ~1.5 | 2535 | 83 | 77 |
| Witcher 3 Stress (Extreme Performance w/ Cooler Boost on) | ~1.5 | 2535 | 85 | 77 |
Speakers
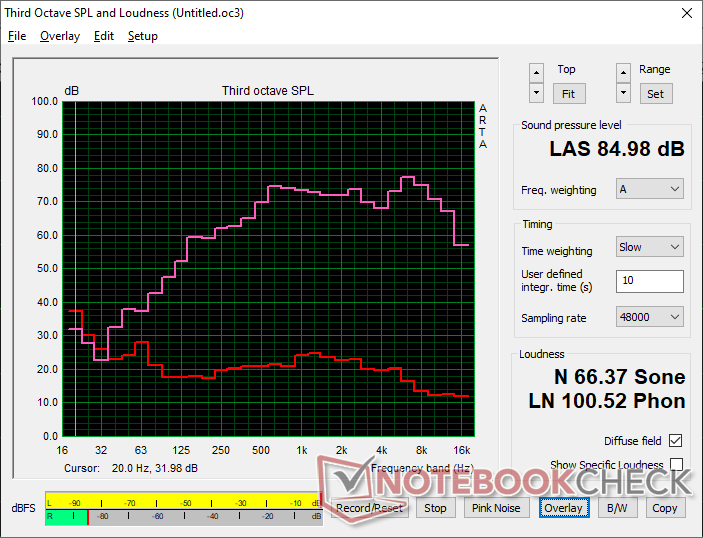
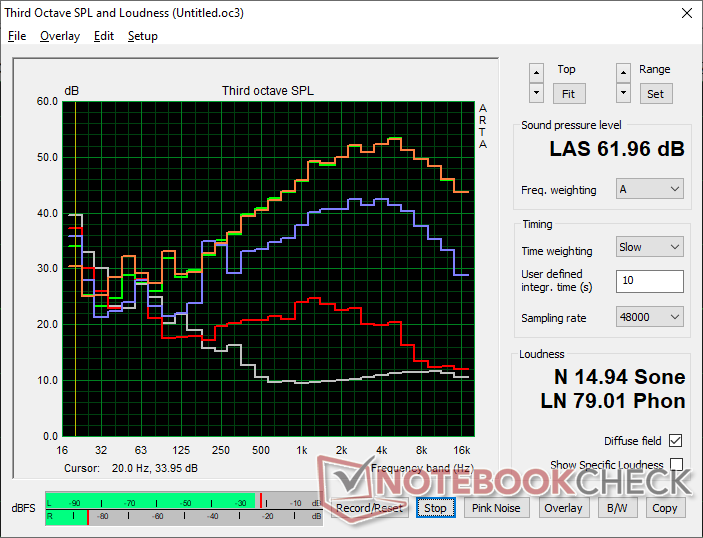
MSI Vector 16 HX A14V audio analysis
(+) | speakers can play relatively loud (85 dB)
Bass 100 - 315 Hz
(±) | reduced bass - on average 12.7% lower than median
(+) | bass is linear (6.8% delta to prev. frequency)
Mids 400 - 2000 Hz
(+) | balanced mids - only 3% away from median
(+) | mids are linear (3.6% delta to prev. frequency)
Highs 2 - 16 kHz
(+) | balanced highs - only 3.1% away from median
(+) | highs are linear (6.7% delta to prev. frequency)
Overall 100 - 16.000 Hz
(+) | overall sound is linear (12.6% difference to median)
Compared to same class
» 16% of all tested devices in this class were better, 4% similar, 81% worse
» The best had a delta of 6%, average was 18%, worst was 132%
Compared to all devices tested
» 11% of all tested devices were better, 3% similar, 86% worse
» The best had a delta of 4%, average was 23%, worst was 134%
Apple MacBook Pro 16 2021 M1 Pro audio analysis
(+) | speakers can play relatively loud (84.7 dB)
Bass 100 - 315 Hz
(+) | good bass - only 3.8% away from median
(+) | bass is linear (5.2% delta to prev. frequency)
Mids 400 - 2000 Hz
(+) | balanced mids - only 1.3% away from median
(+) | mids are linear (2.1% delta to prev. frequency)
Highs 2 - 16 kHz
(+) | balanced highs - only 1.9% away from median
(+) | highs are linear (2.7% delta to prev. frequency)
Overall 100 - 16.000 Hz
(+) | overall sound is linear (4.6% difference to median)
Compared to same class
» 0% of all tested devices in this class were better, 0% similar, 100% worse
» The best had a delta of 5%, average was 17%, worst was 45%
Compared to all devices tested
» 0% of all tested devices were better, 0% similar, 100% worse
» The best had a delta of 4%, average was 23%, worst was 134%
Energy Management
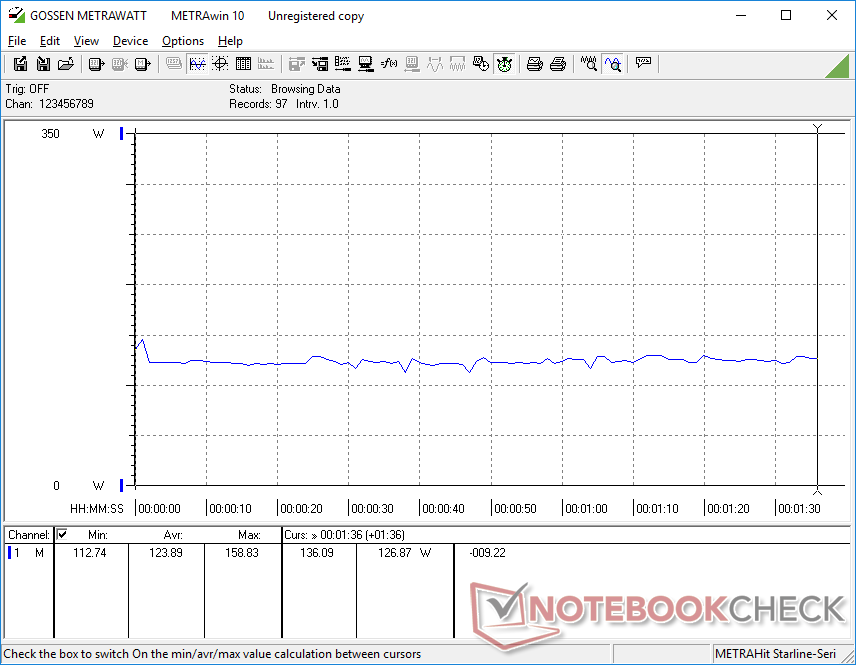
Power Consumption
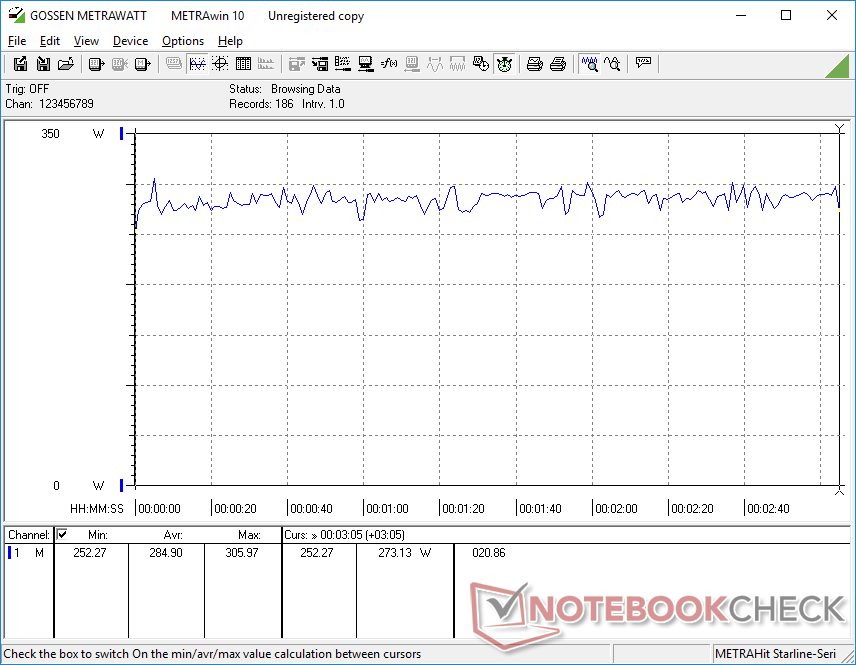
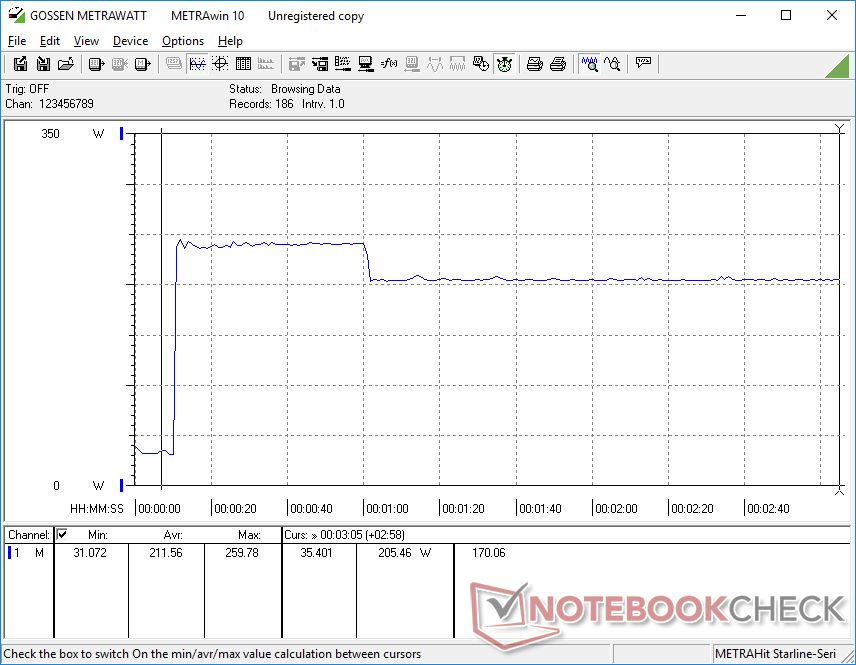
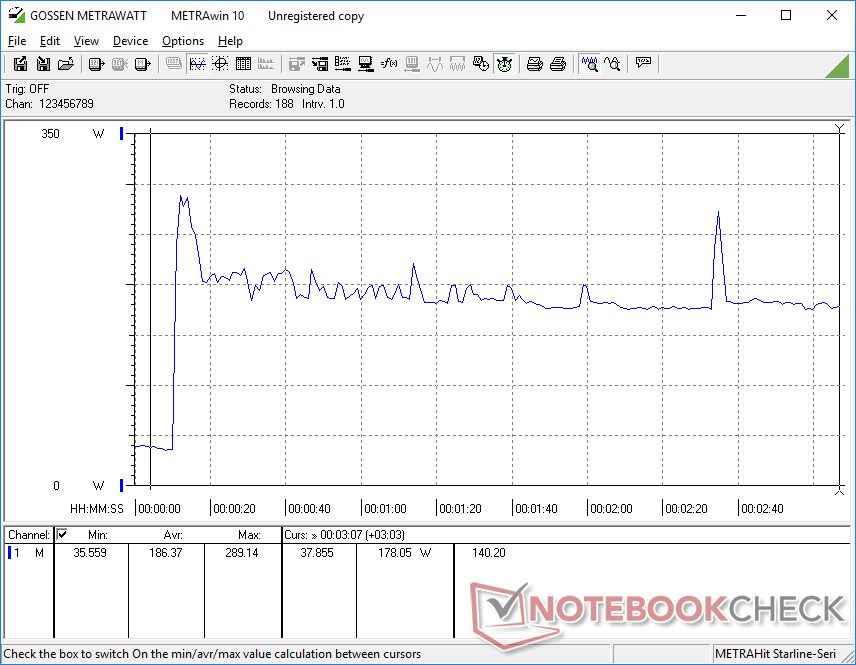
The Vector 16 HX may be faster than the outgoing Vector GP66, but it's also much more power-hungry. Running Witcher 3 and Prime95 demands 27 percent and 58 percent more power, respectively, when compared to the older model. Even so, the performance gains are much greater than the power gains for higher performance-per-watt.
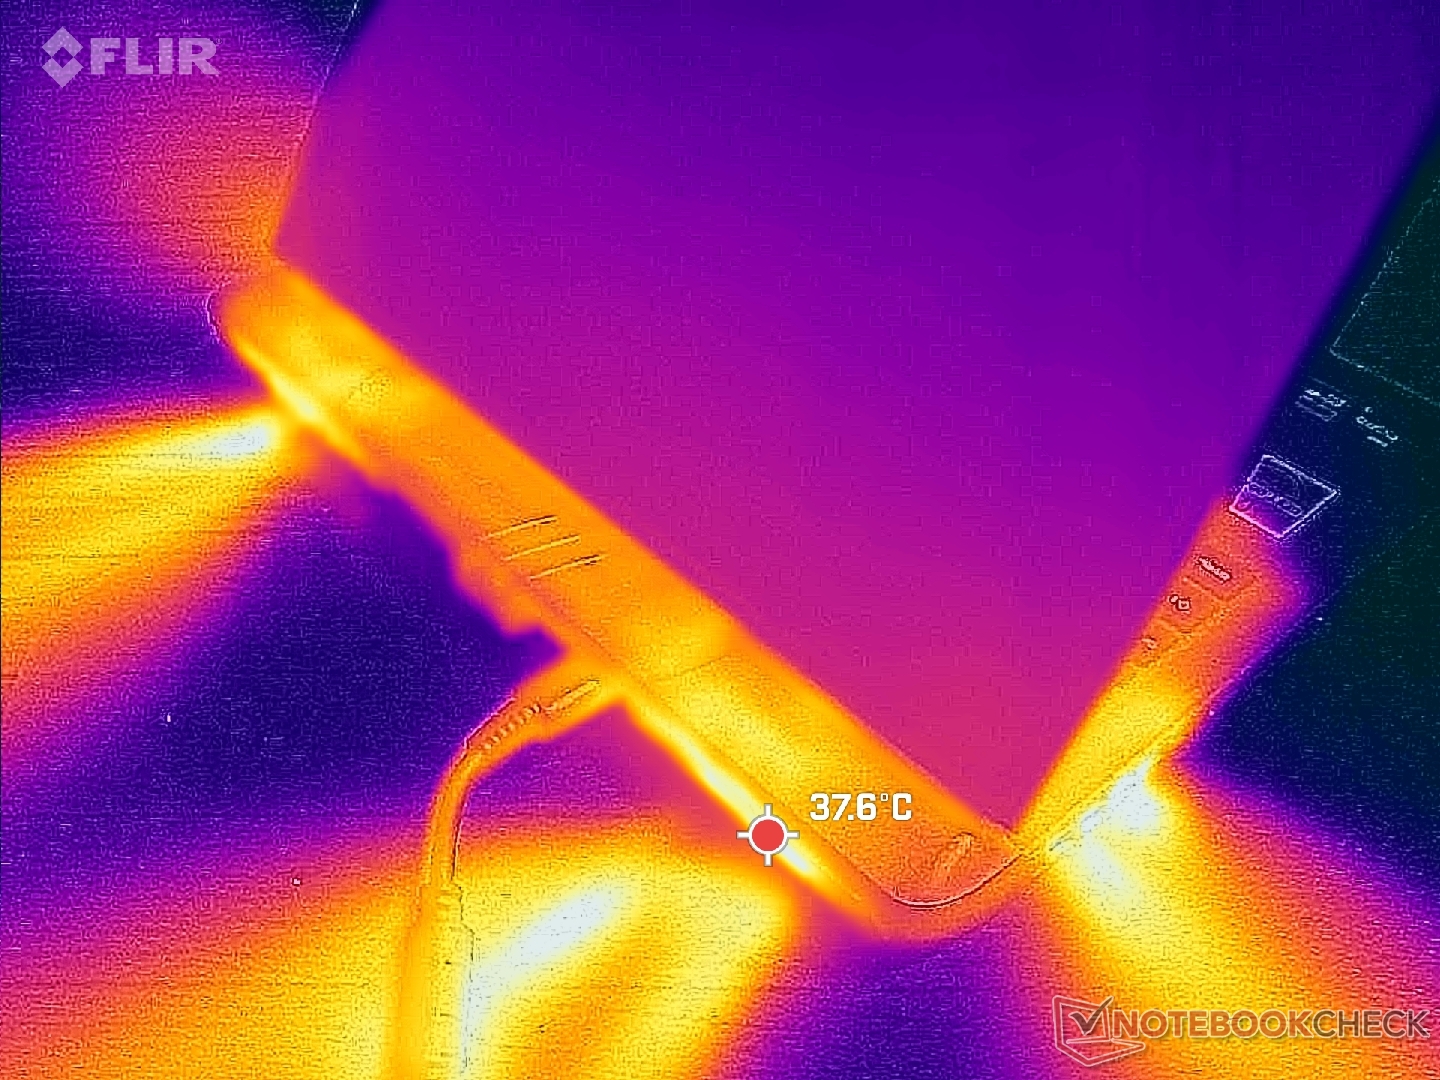
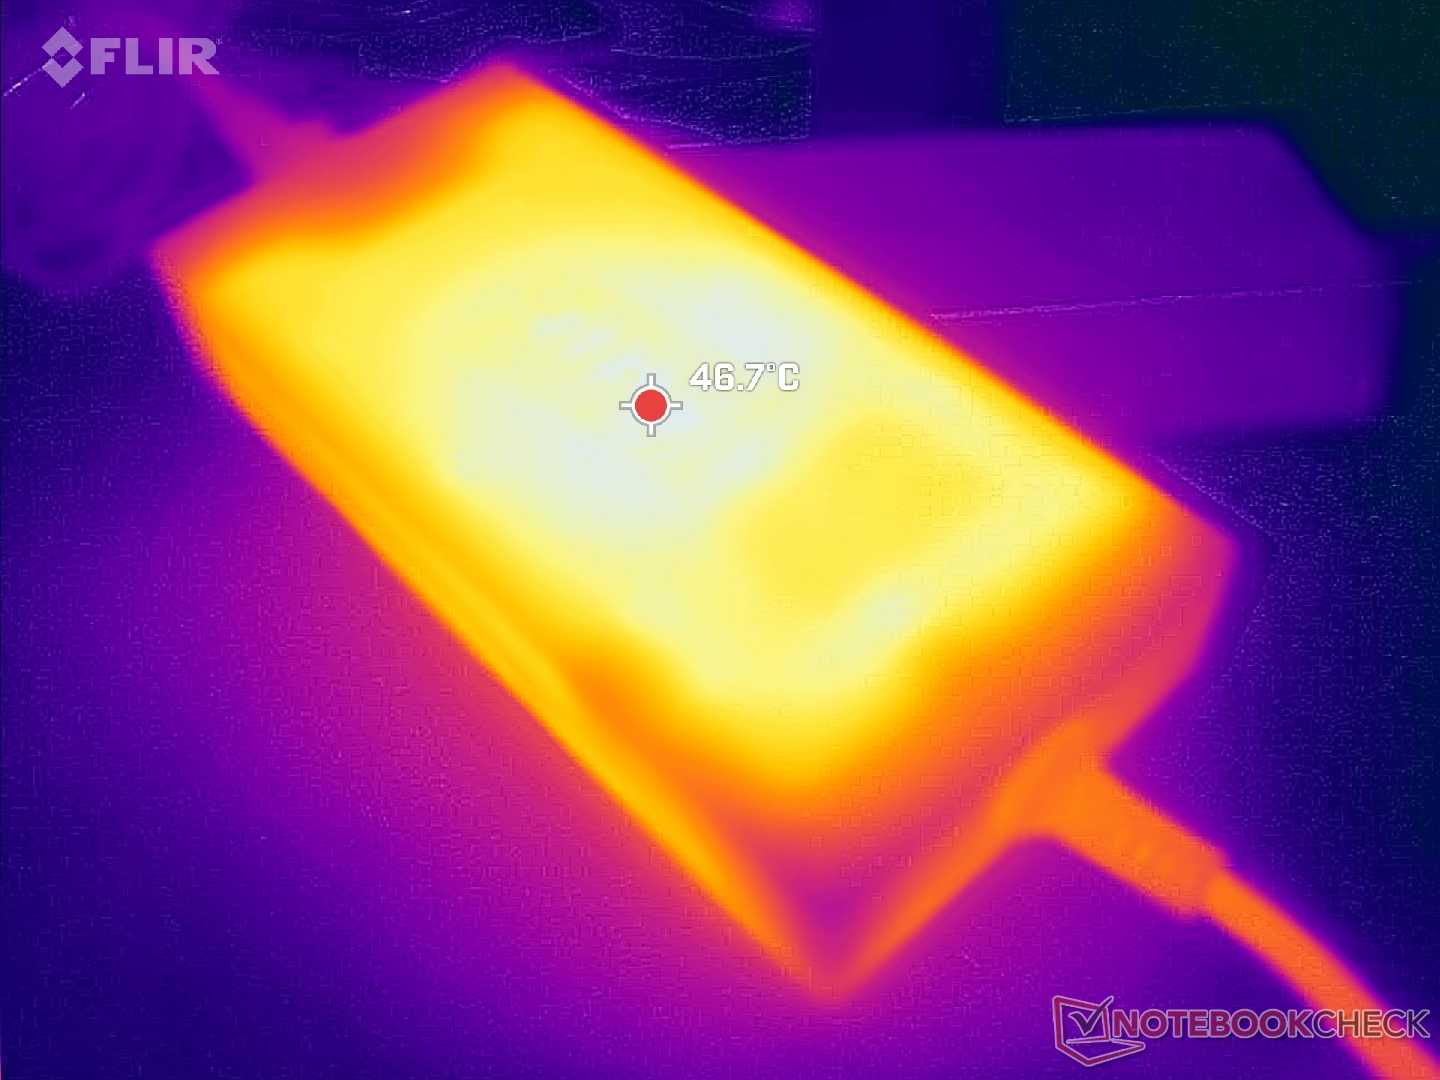
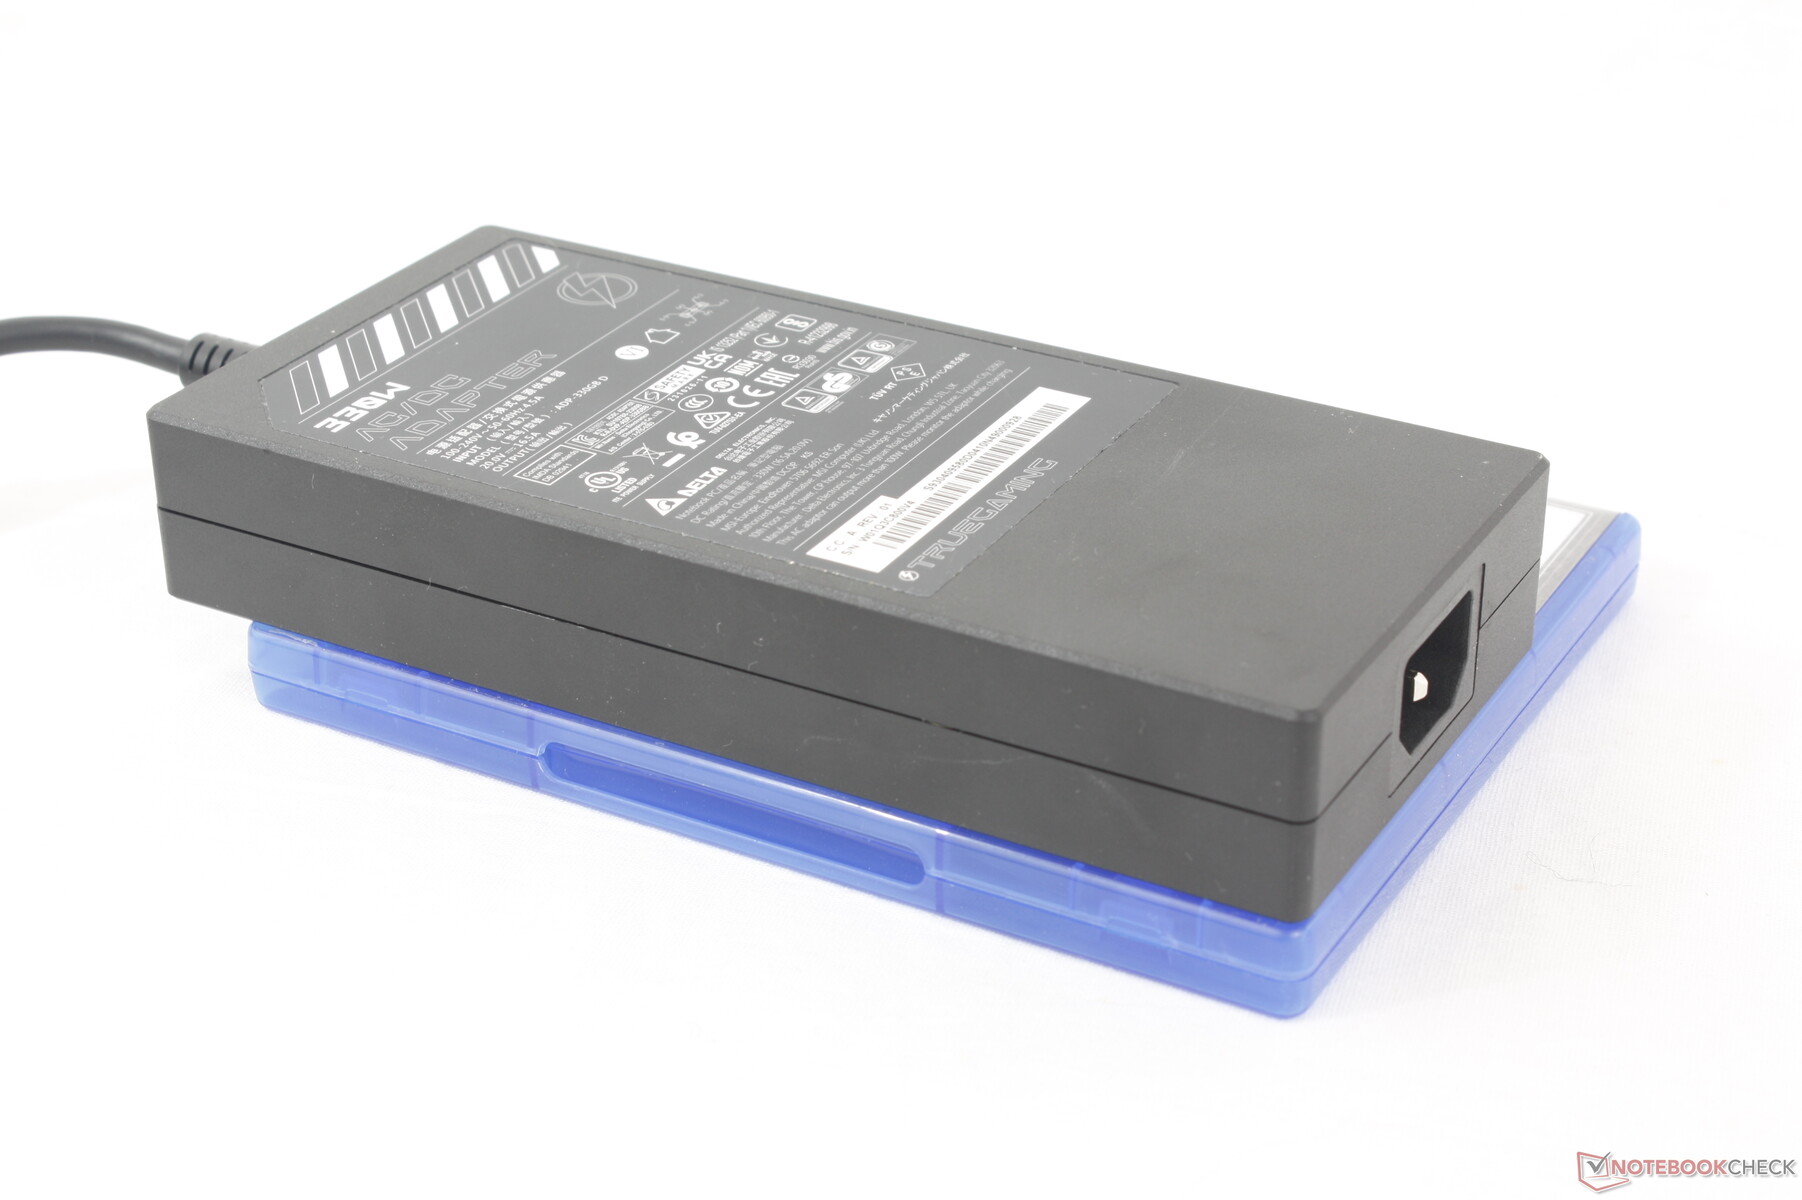
The system ships with either a 280 W or 330 W AC adapter depending on the configuration. The new 330 W AC adapter is relatively slim at ~18.5 x 8.5 x 3.2 cm which is about the same size as the ~18 x 8.5 x 3.5 cm 280 W AC adapter for the older GP66.
| Off / Standby | |
| Idle | |
| Load |
|
Key:
min: | |
| MSI Vector 16 HX A14V i9-14900HX, GeForce RTX 4080 Laptop GPU, WD PC SN560 SDDPNQE-1T00, IPS, 2560x1600, 16" | MSI Vector GP66 12UGS i9-12900H, GeForce RTX 3070 Ti Laptop GPU, , IPS, 1920x1080, 15.6" | Lenovo Legion 5 16IRX G9 i7-14650HX, GeForce RTX 4060 Laptop GPU, Samsung PM9A1 MZVL21T0HCLR, IPS, 2560x1600, 16" | HP Victus 16-r0077ng i7-13700H, GeForce RTX 4070 Laptop GPU, Kioxia XG8 KXG80ZNV1T02, IPS, 1920x1080, 16.1" | Asus TUF Gaming A16 FA617XS R9 7940HS, Radeon RX 7600S, Micron 2400 MTFDKBA512QFM, IPS, 1920x1200, 16" | Dell G16 7620 i7-12700H, GeForce RTX 3060 Laptop GPU, WDC PC SN810 512GB, IPS, 2560x1600, 16" | |
|---|---|---|---|---|---|---|
| Power Consumption | -2% | 20% | 38% | 47% | 18% | |
| Idle Minimum * (Watt) | 15.8 | 17.5 -11% | 15.4 3% | 8 49% | 7 56% | 14.4 9% |
| Idle Average * (Watt) | 23.3 | 20.1 14% | 19.7 15% | 13 44% | 10 57% | 17.8 24% |
| Idle Maximum * (Watt) | 30 | 47.3 -58% | 20.7 31% | 22 27% | 15 50% | 31.5 -5% |
| Load Average * (Watt) | 123.9 | 107.3 13% | 102.6 17% | 86 31% | 86 31% | 101.2 18% |
| Witcher 3 ultra * (Watt) | 285 | 225 21% | 191.3 33% | 141.8 50% | 160.6 44% | 176.9 38% |
| Load Maximum * (Watt) | 306 | 277.7 9% | 246.6 19% | 233 24% | 172 44% | 242.9 21% |
* ... smaller is better
Power Consumption Witcher 3 / Stresstest
Power Consumption external Monitor
Battery Life
While battery capacity has increased significantly from 65 Wh to 90 Wh over the older Vector GP66 design, actual runtimes have not. WLAN browsing on the Balanced power profile with the iGPU active still clocks in at about 5.5 hours before automatic shutdown. Other 16-inch systems like the Lenovo Legion 5 16 or HP Victus 16 are able to last four a couple of hours longer each in comparison.
Charging from empty to full capacity takes almost 2.5 hours with the included AC adapter. The system can be recharged via USB-C through the port along the right edge.
| MSI Vector 16 HX A14V i9-14900HX, GeForce RTX 4080 Laptop GPU, 90 Wh | MSI Vector GP66 12UGS i9-12900H, GeForce RTX 3070 Ti Laptop GPU, 65 Wh | Lenovo Legion 5 16IRX G9 i7-14650HX, GeForce RTX 4060 Laptop GPU, 80 Wh | HP Victus 16-r0077ng i7-13700H, GeForce RTX 4070 Laptop GPU, 83 Wh | Asus TUF Gaming A16 FA617XS R9 7940HS, Radeon RX 7600S, 90 Wh | Dell G16 7620 i7-12700H, GeForce RTX 3060 Laptop GPU, 84 Wh | |
|---|---|---|---|---|---|---|
| Battery runtime | -17% | -4% | 29% | 60% | -31% | |
| Reader / Idle (h) | 10.7 | 7.9 -26% | 20.3 90% | 7.1 -34% | ||
| WiFi v1.3 (h) | 5.5 | 5.7 4% | 7.4 35% | 7.1 29% | 12.4 125% | 5 -9% |
| Load (h) | 1.4 | 1 -29% | 0.8 -43% | 0.9 -36% | 0.7 -50% | |
| H.264 (h) | 9.6 | 12.4 |
Pros
Cons
Verdict — Fast And Chonky
Gaming laptops walk a fine line between portability and performance with the current trend leaning towards portability. The MSI Vector 16 HX unabashedly favors performance even if it means a thicker, bigger, and louder system. Indeed, it is one of the largest and loudest 16-inch gaming laptops currently in the market.
The MSI Vector 16 HX isn't shy when it comes to fan noise or size. In turn, it edges out other gaming laptops with the same GeForce RTX 4080 or 4090 GPU in terms of performance.
The big size and loud fans aren't for naught as the model excels when it comes to performance. The 175 W GeForce RTX 4080 GPU is about 10 percent faster than average to be neck-to-neck with even some laptops sporting the RTX 4090. This fact alone will likely attract performance hunters who don't mind sacrificing a bit of portability for that extra horsepower. The girthy chassis is also rigid and with a strong lid which is not something we can say for many thinner alternatives.
A few aspects could certainly be better. If MSI wants to stick with a big design, then serviceability should be made easier and liquid cooling or vapor chamber should be considered in an effort to reduce fan noise. The numpad or at least the arrow keys should be made larger much like the arrow keys on the Lenovo Legion 5 16.
Price and Availability
MSI Vector 16 HX A14V
- 02/03/2024 v7 (old)
Allen Ngo
