Verdict: A powerful HP laptop ideal for programmers
The HP ZBook 8 G1i 14 is a workstation laptop that shows impressive improvement over the old ZBook Firefly line: Dual fan cooling lets the performance shine, and the port selection is improved as well, as it the battery life. We also have to praise the excellent HP keyboard.
With the chosen configuration, programmers, who need CPU power but not necessarily GPU performance, should be well served. If more GPU power is needed, a dedicated GPU is available - a version of the ZBook we will review, soon.
Pros
Cons
Price and Availability
The HP ZBook 8 G1i 14 starts at $1,679 when configured in HP's US online store.
Table of Contents
- Verdict: A powerful HP laptop ideal for programmers
- Specifications: Intel ARC graphics and WQXGA screen
- Case and Connectivity: Like a thicker HP EliteBook 8
- Input Devices: Very comfortable HP ZBook keyboard
- Display: WQXGA screen could be brighter
- Performance: Intel Arrow Lake H matches Strix Point
- Emissions & Power Consumption: HP ZBook speakers are strong
- Notebookcheck Rating
- Potential Competitors in Comparison
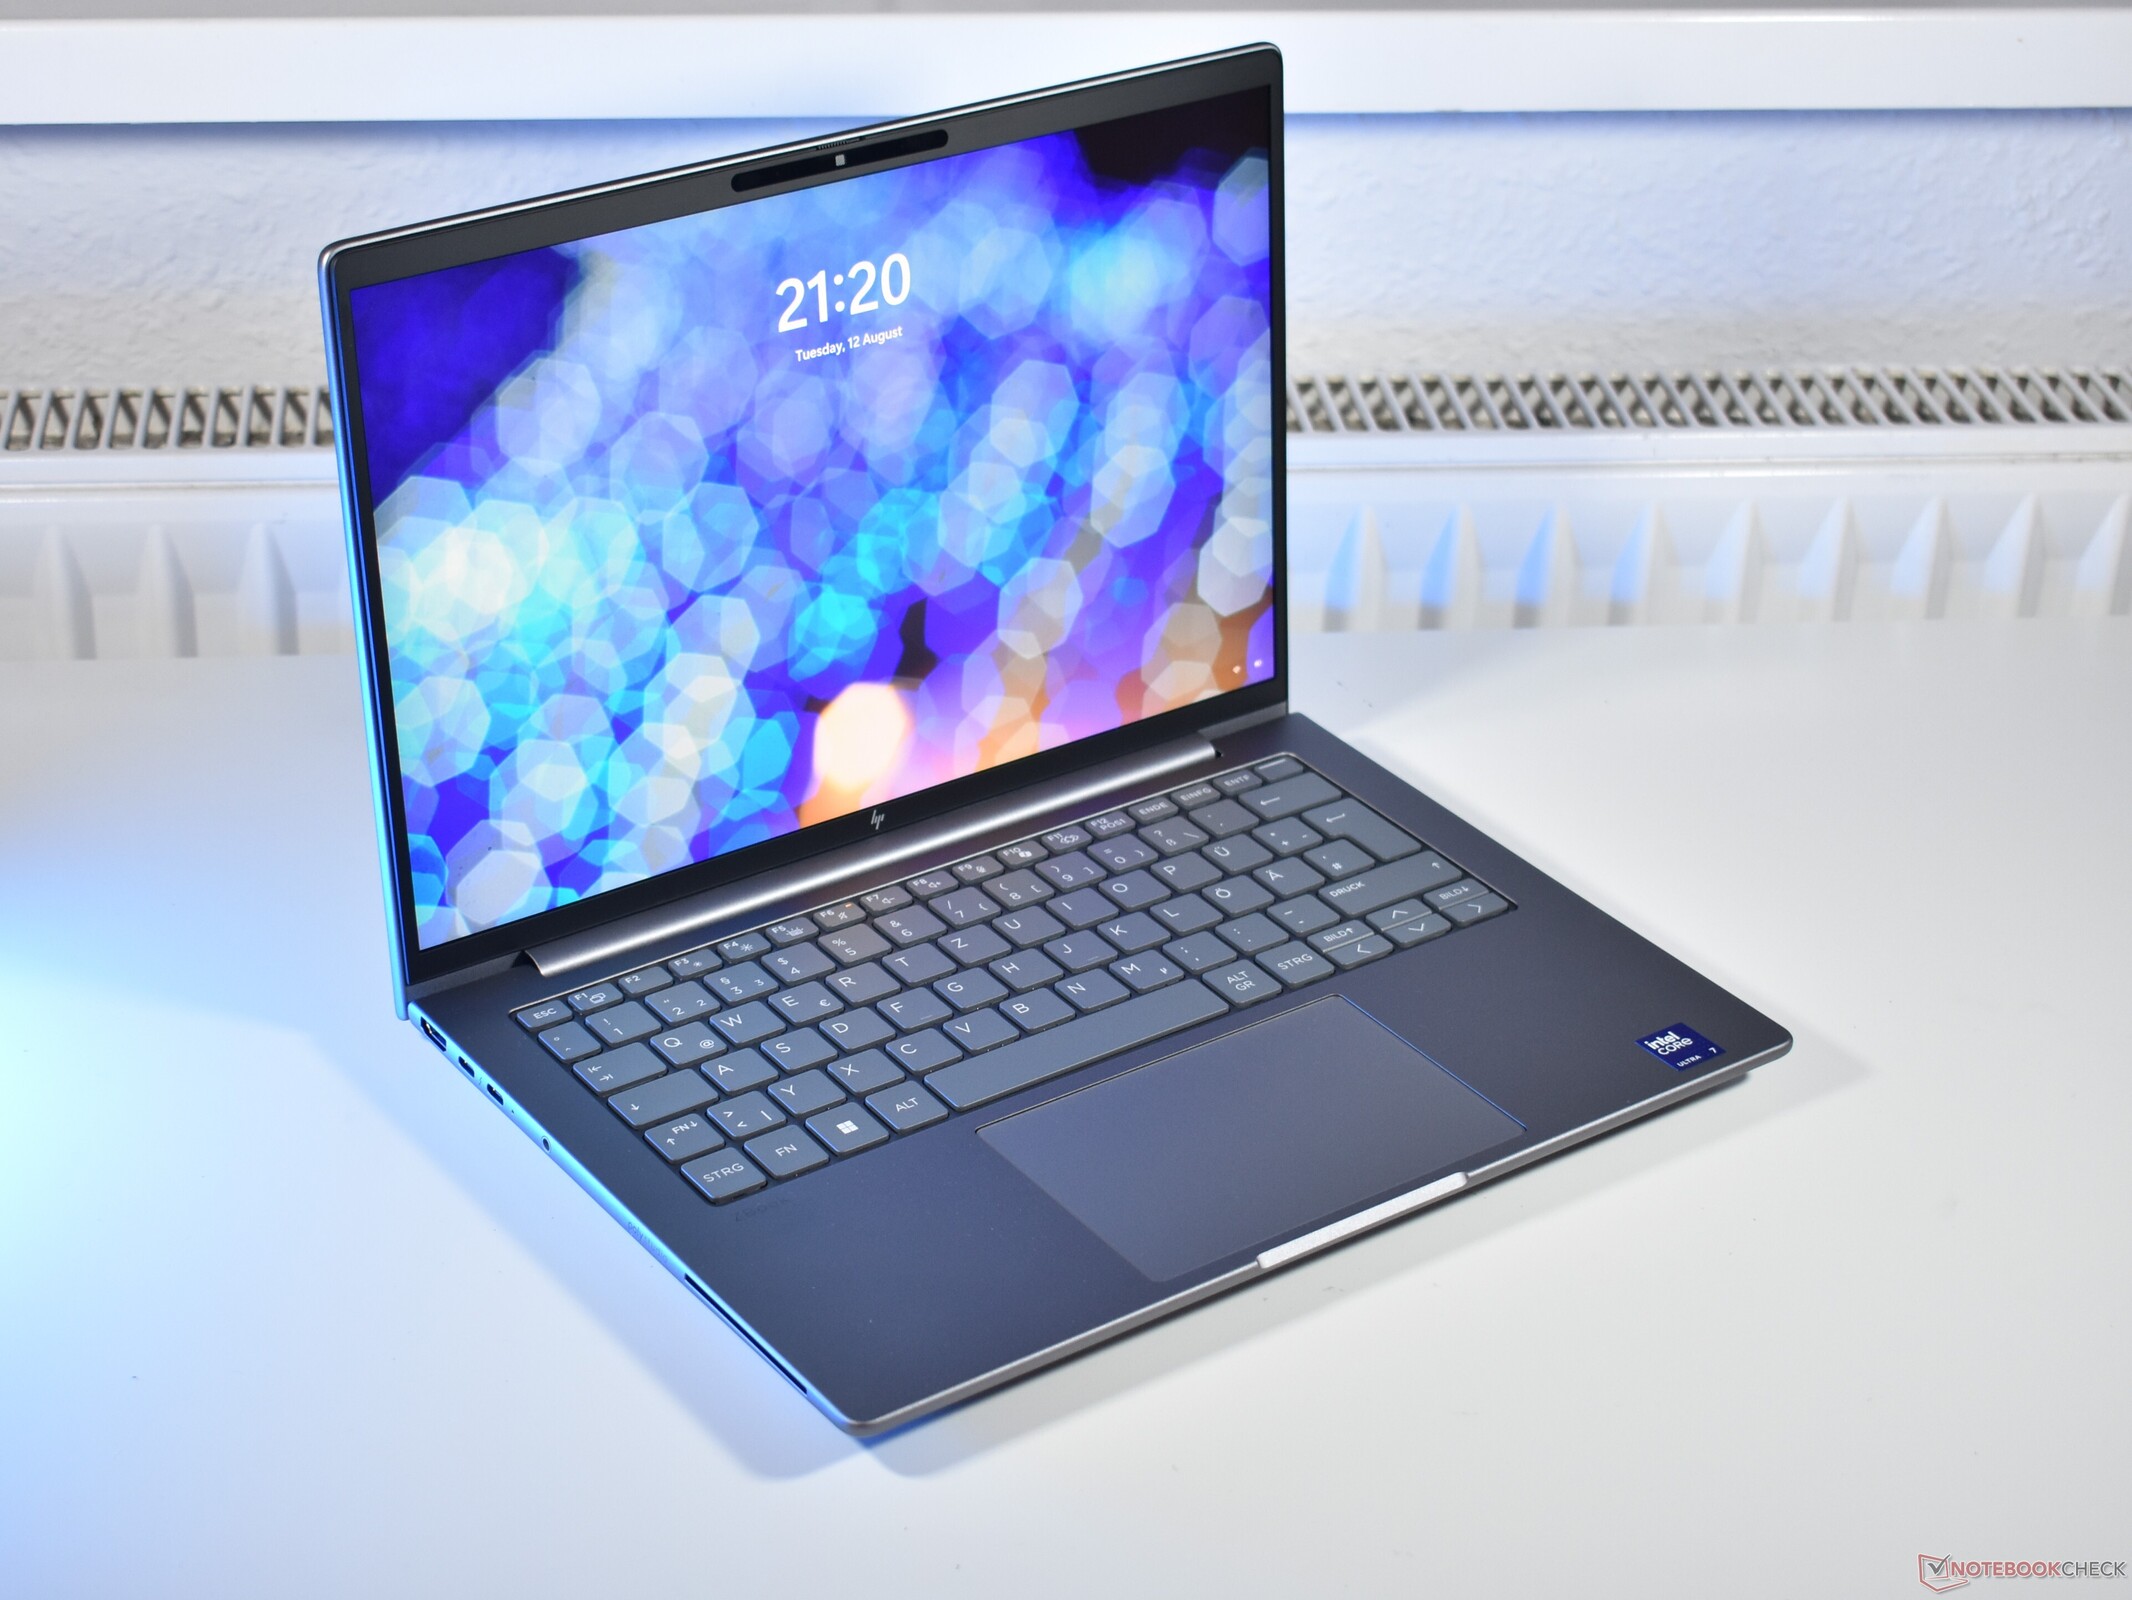
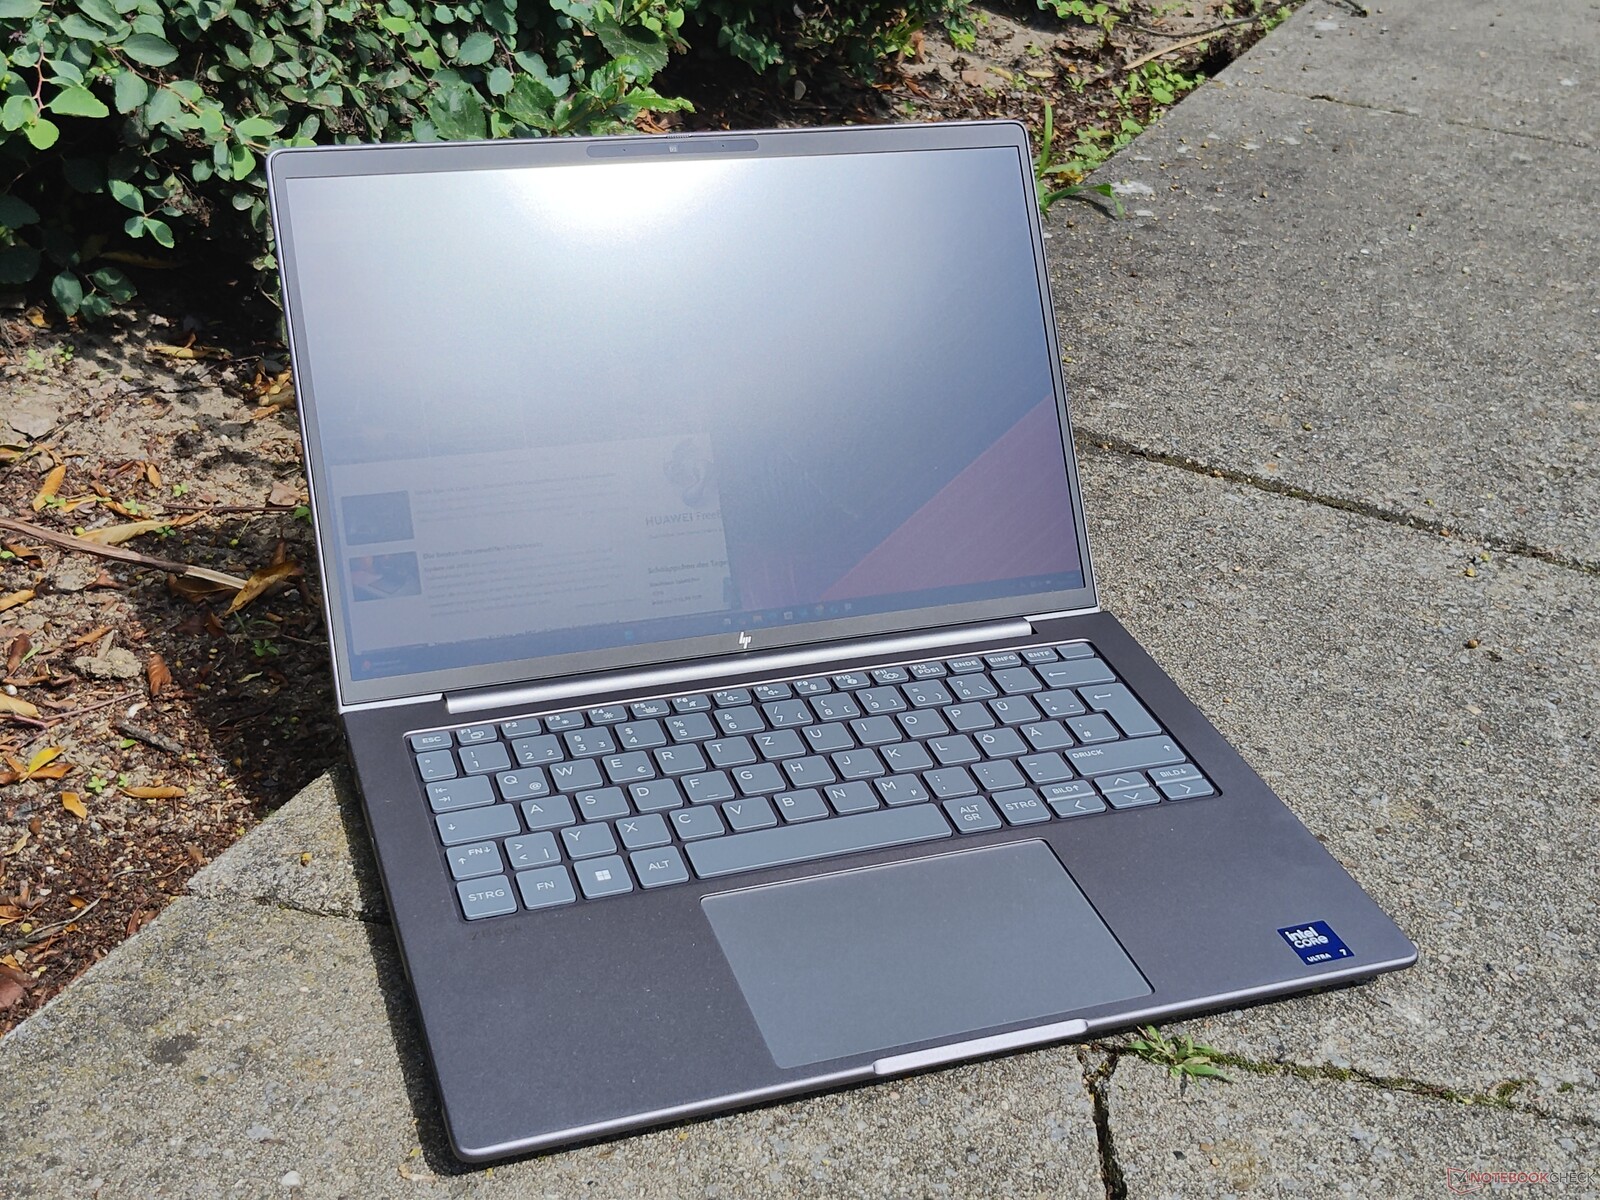
Bye bye, Firefly: HP bids the old name of its entry level ZBook line farewell. Of course, the workstation laptops themselves do not go away, they just continue with a new name. Hence, the HP ZBook 8 was born, a name that signals the close relation of this line with the office line HP EliteBook 8. In this review, we are taking a look at the HP ZBook 8 G1i 14. Our specific model interestingly leaves out the dedicated graphics otherwise obligatory for mobile workstations, instead opting for the integrated Intel graphics.
Specifications: Intel ARC graphics and WQXGA screen
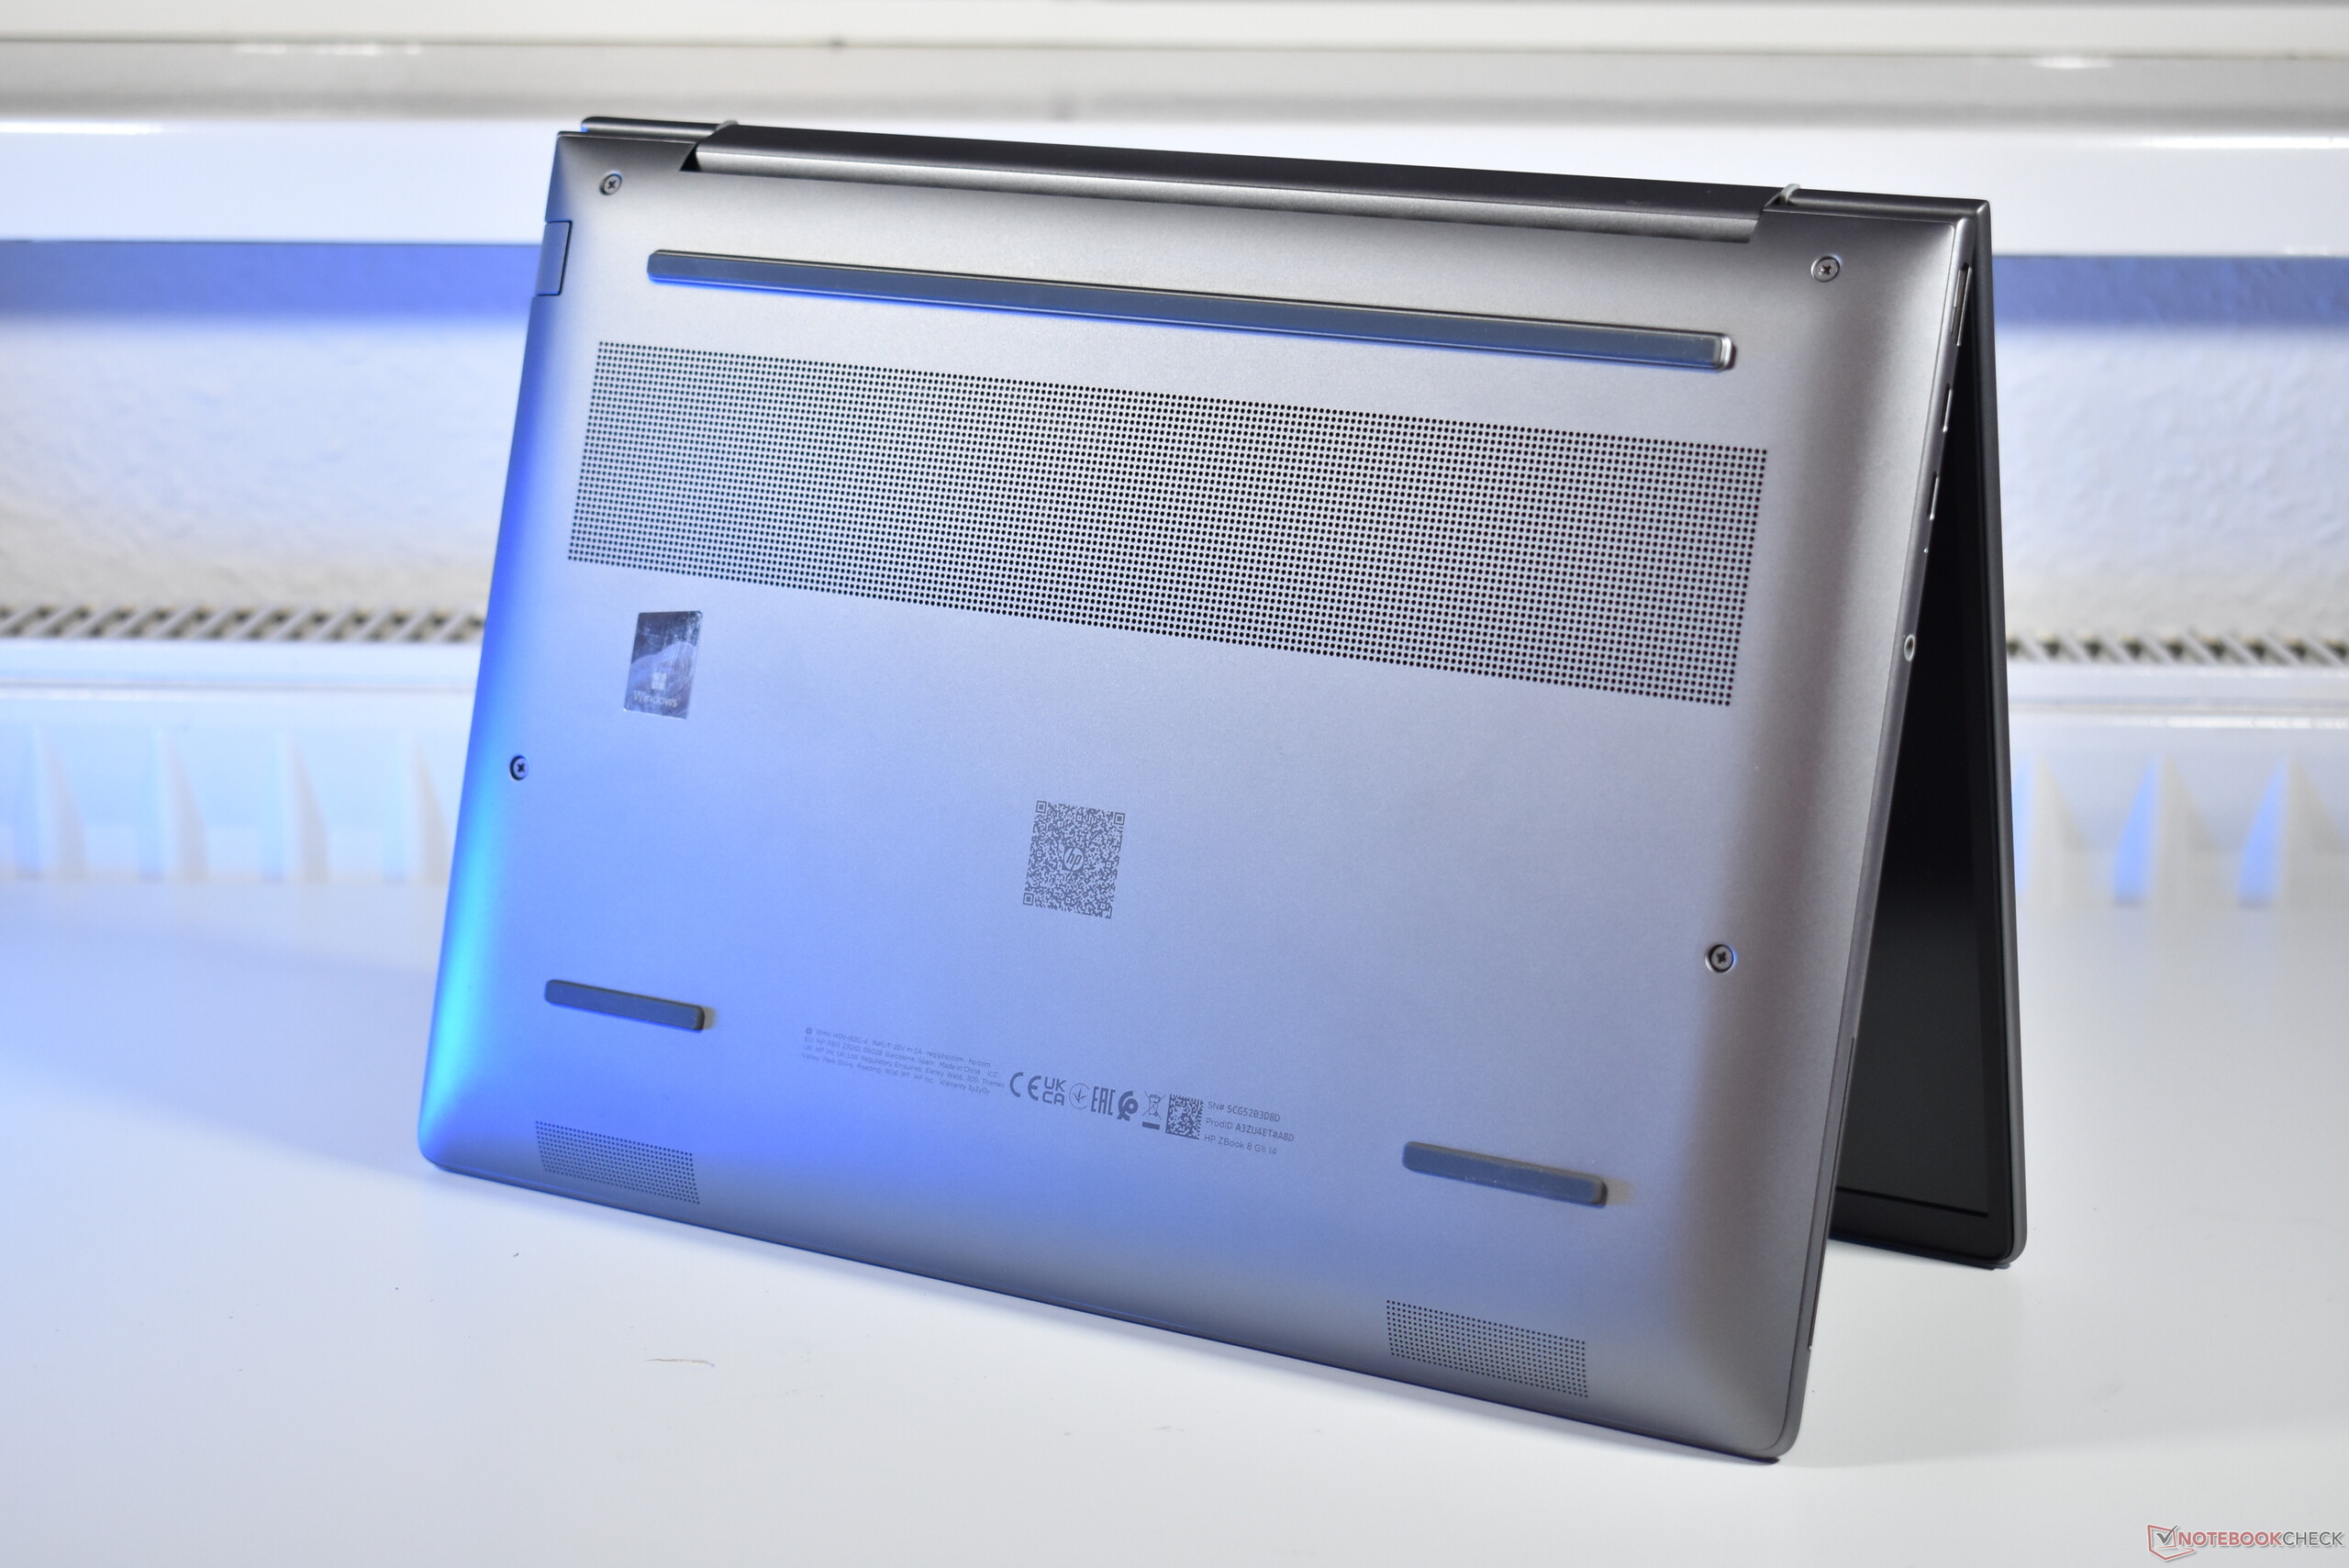
Case and Connectivity: Like a thicker HP EliteBook 8
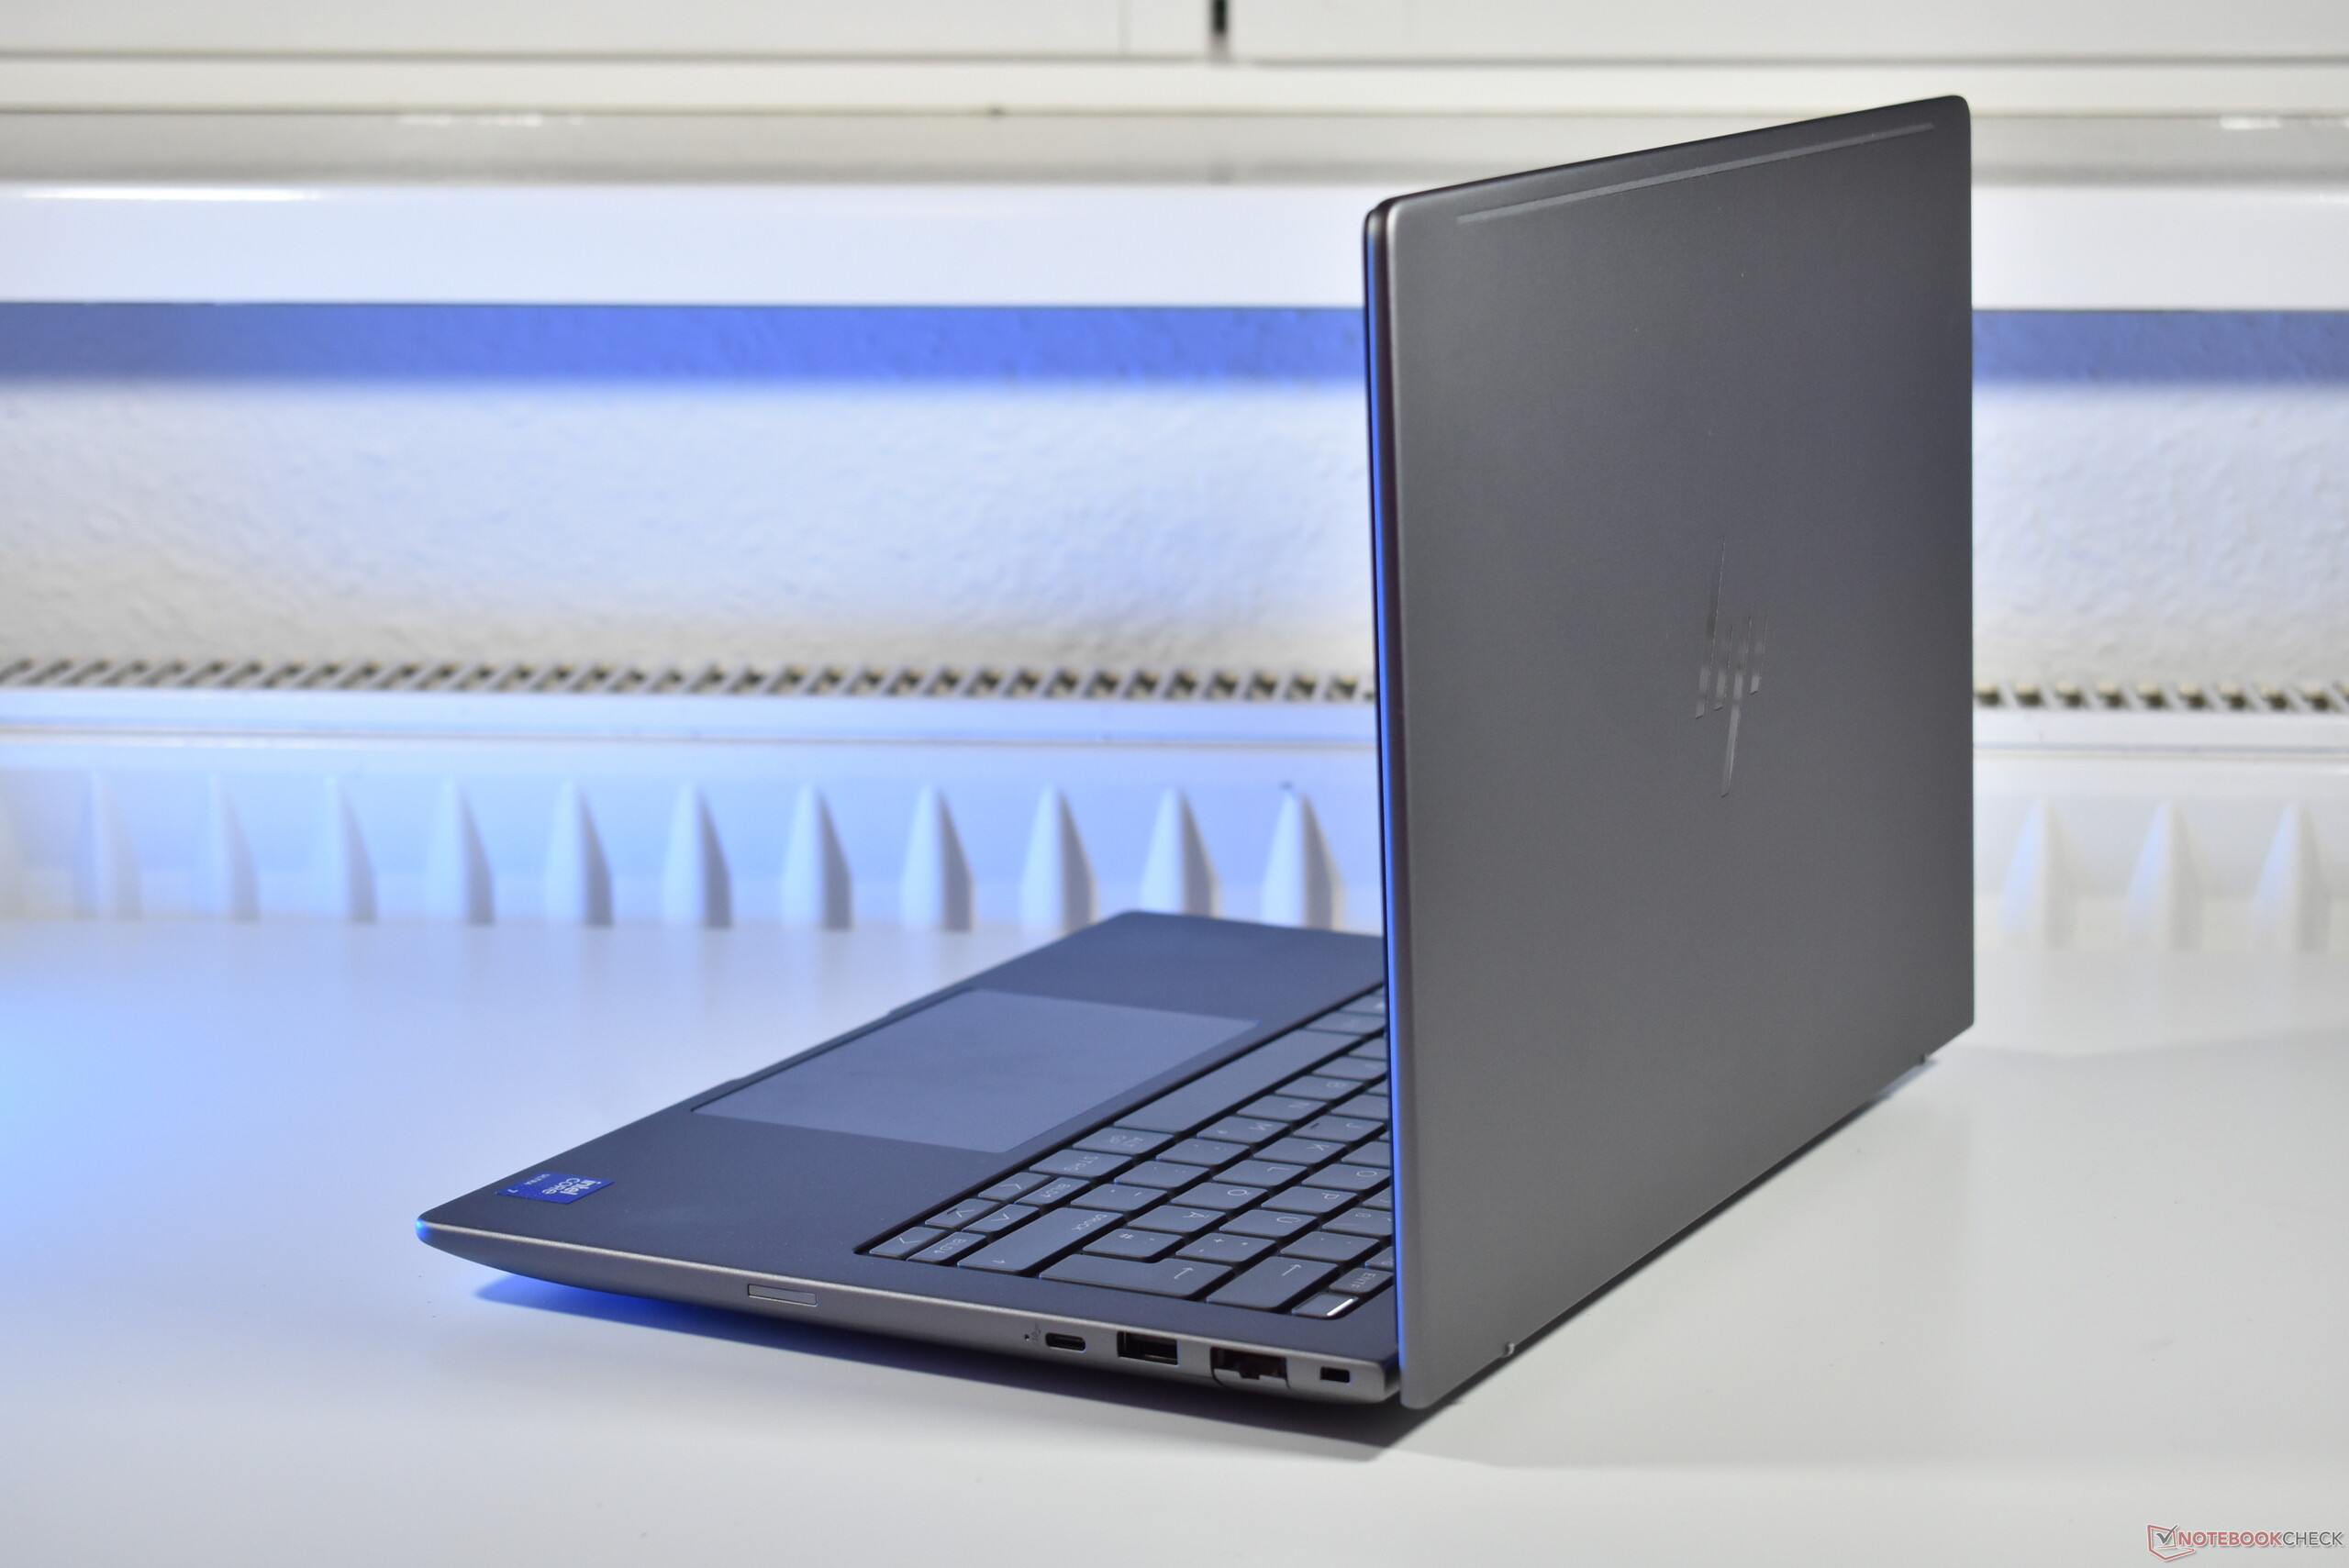
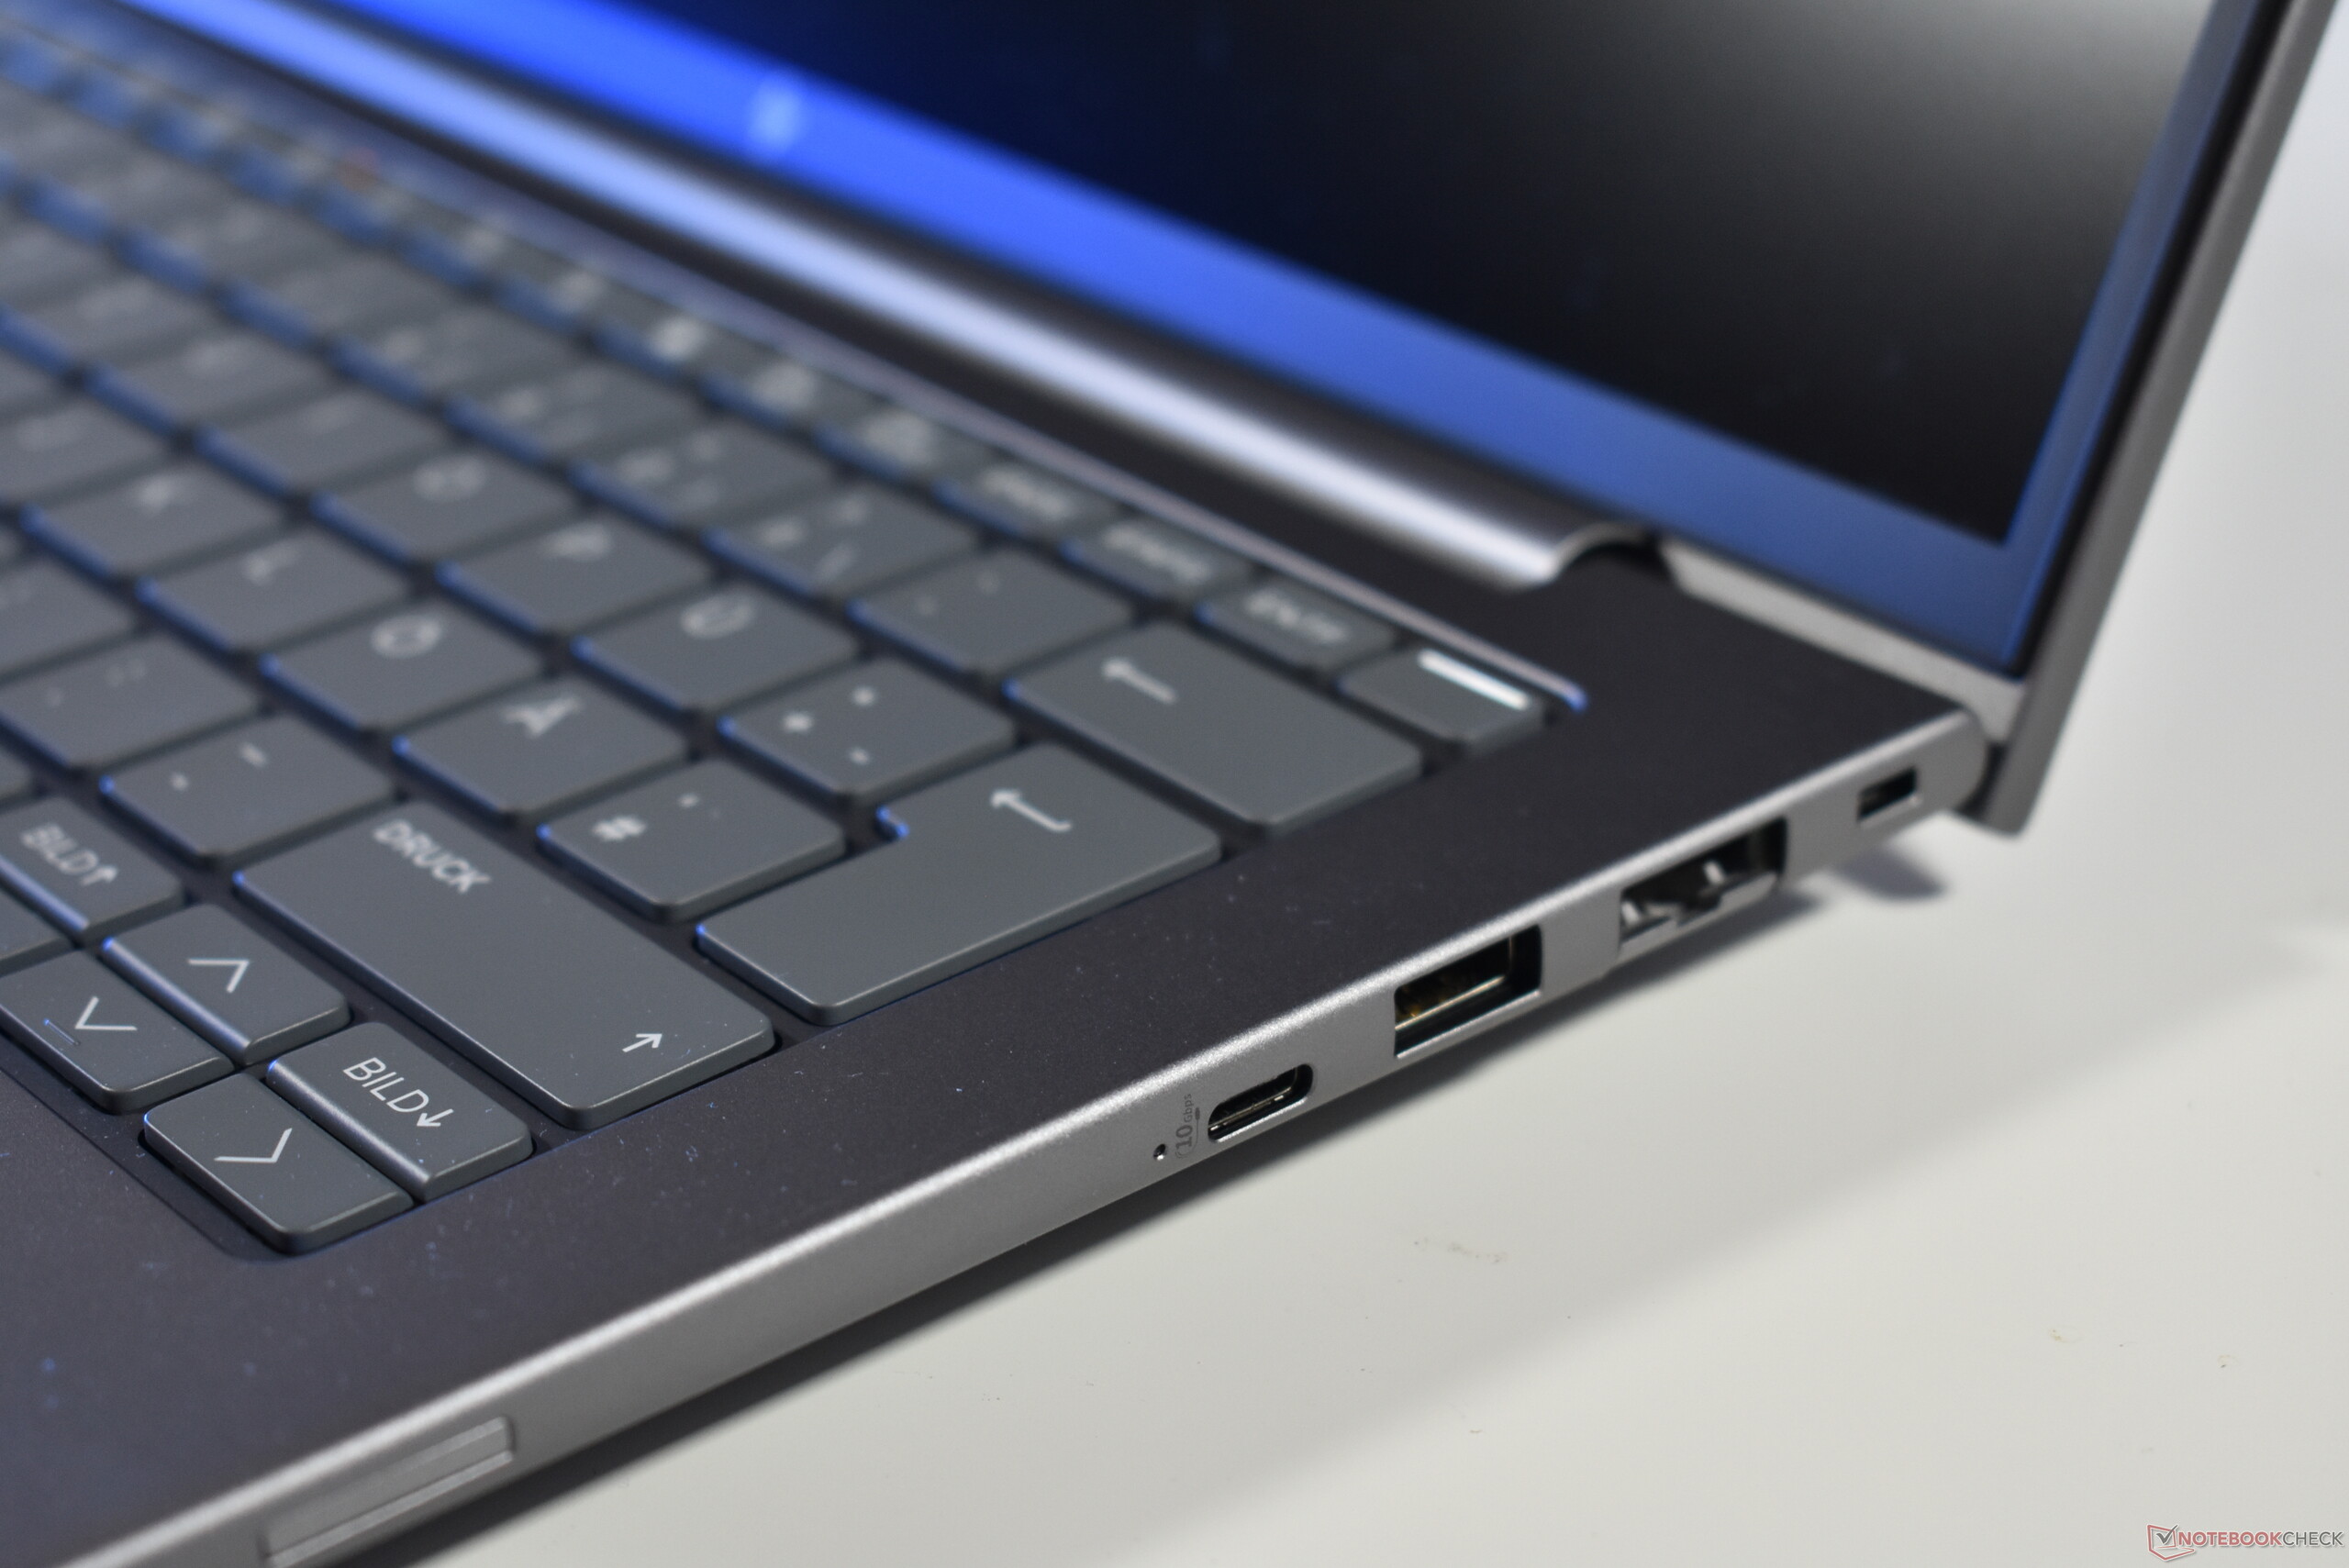
The HP ZBook 8 G1i 14 looks like the older brother of the HP EliteBook 8 G1a 14 we recently reviewed. This is not a coincidence, as both use the same basic design and share parts such as the touchpad and keyboard. The ZBook is just a bit darker than the EliteBook, and a bit thicker. In terms of build quality, the ZBook is just a good as its office counterpart with an all aluminum chassis.
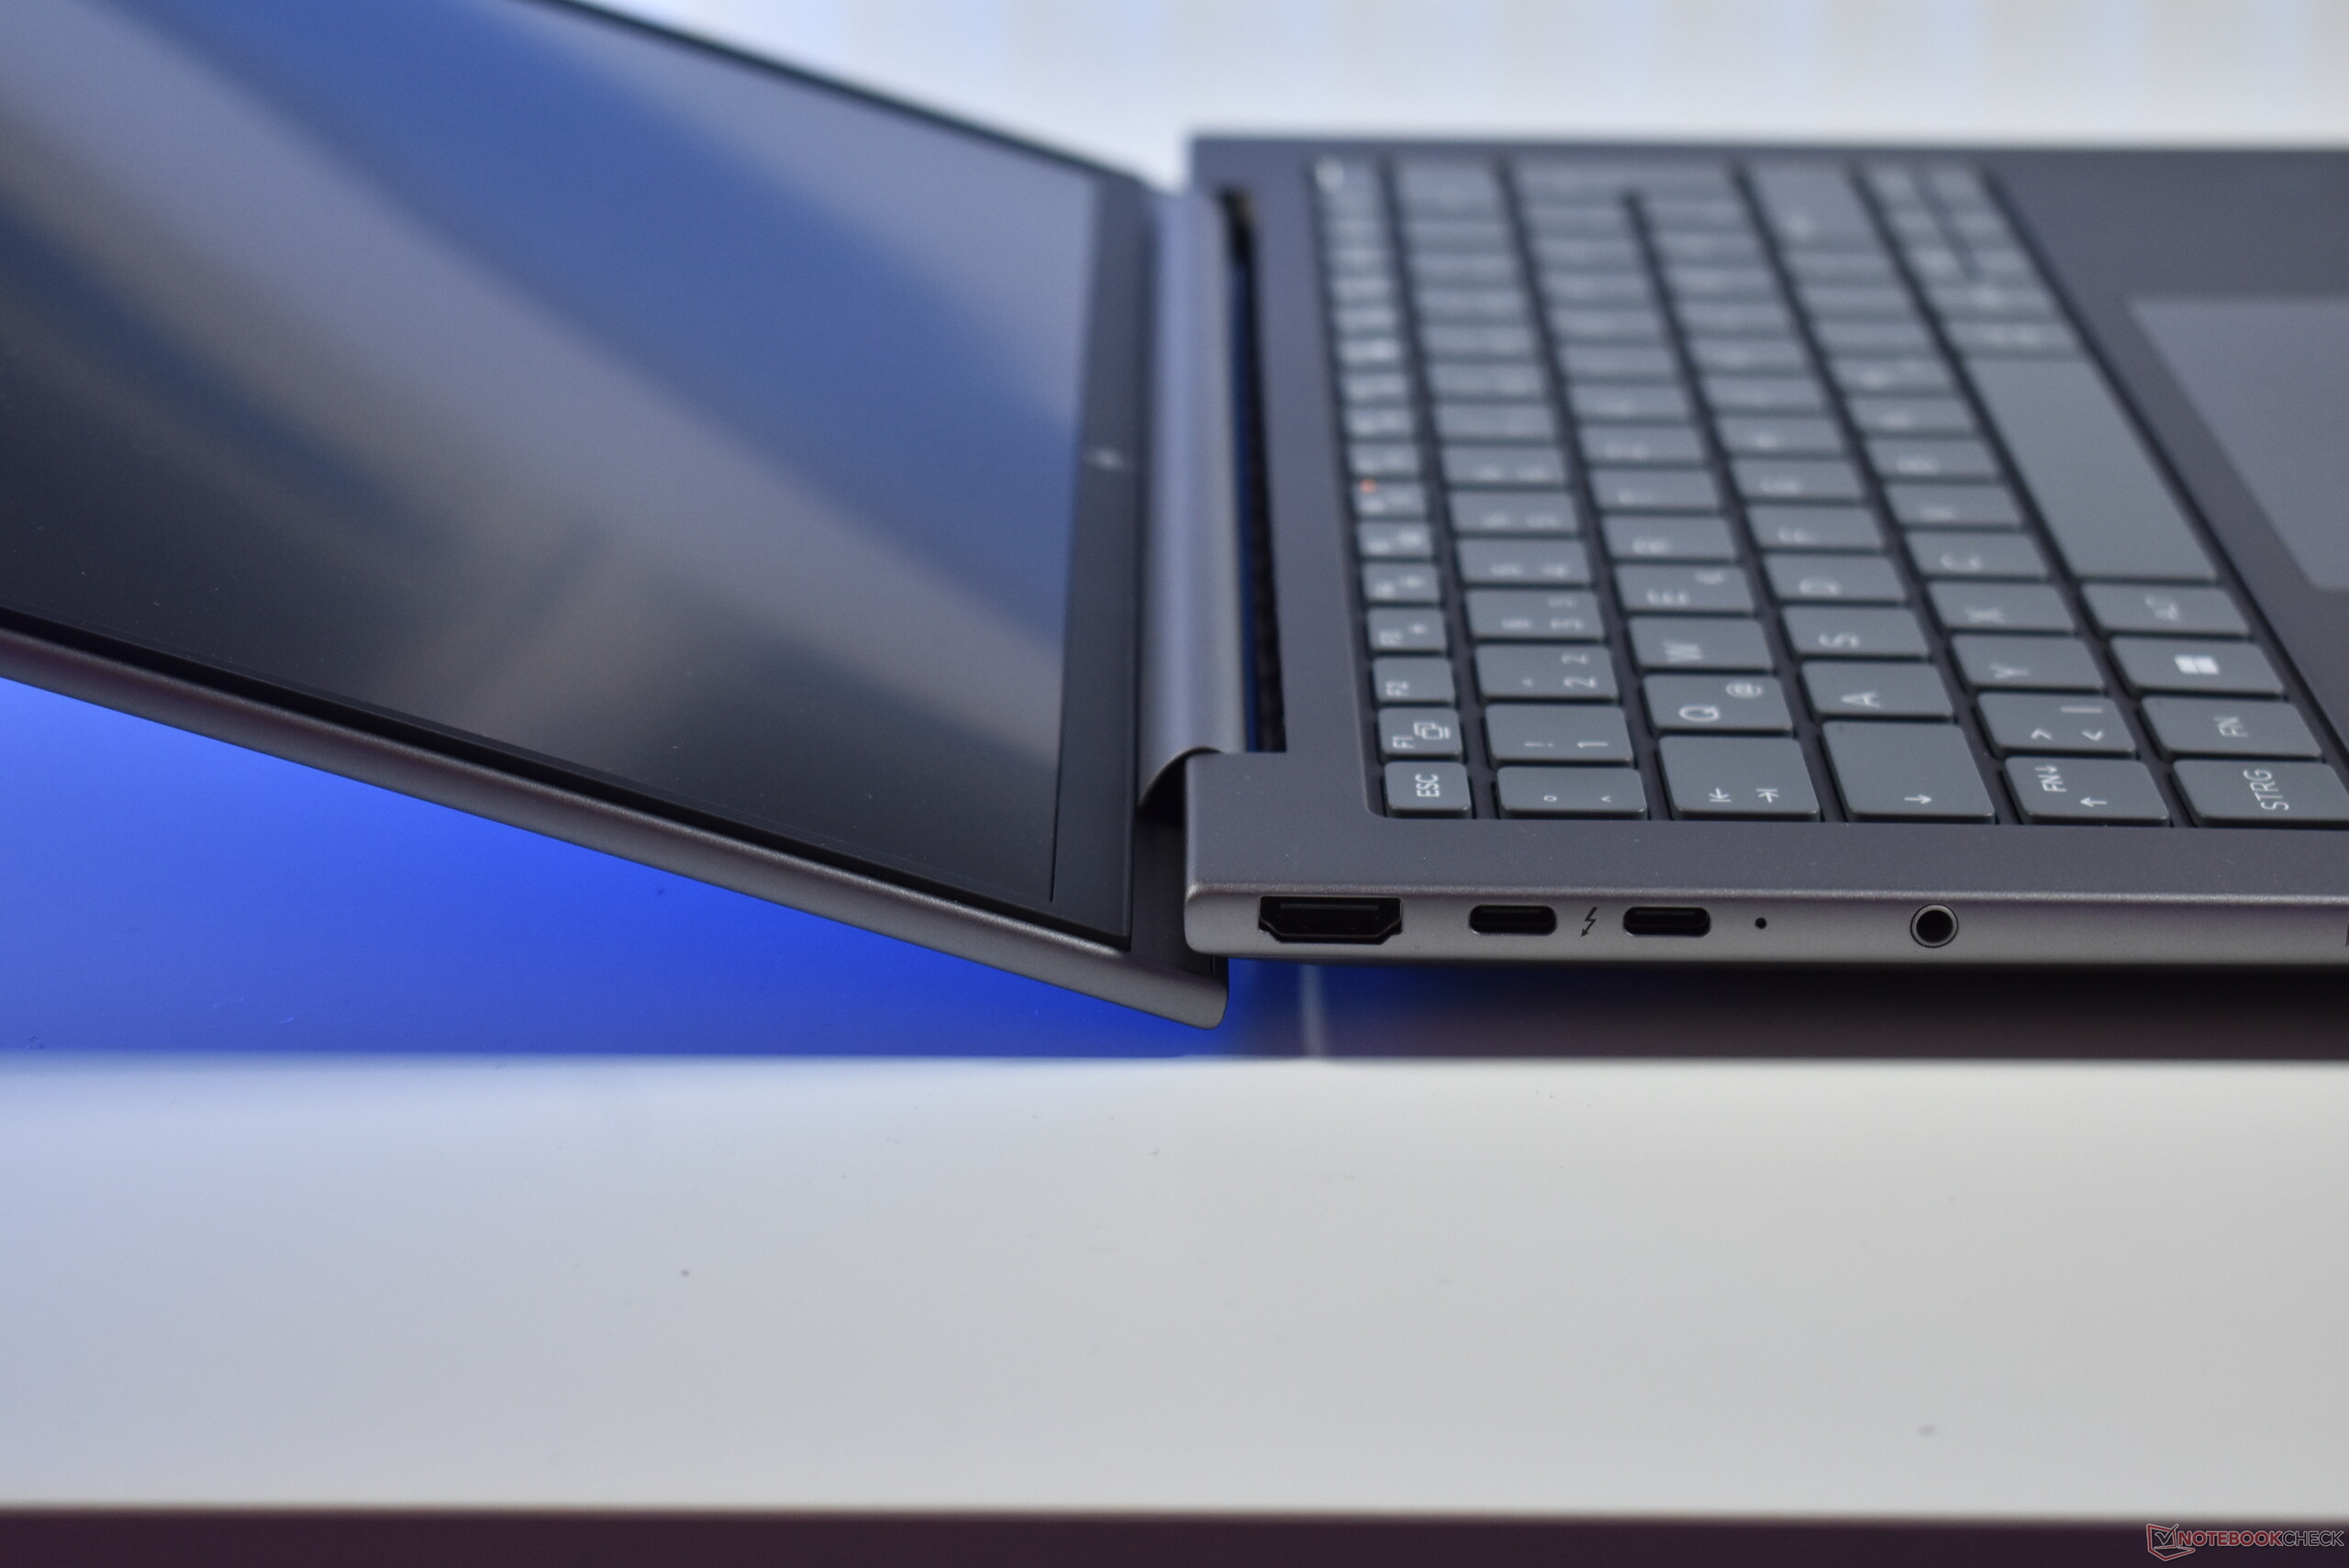
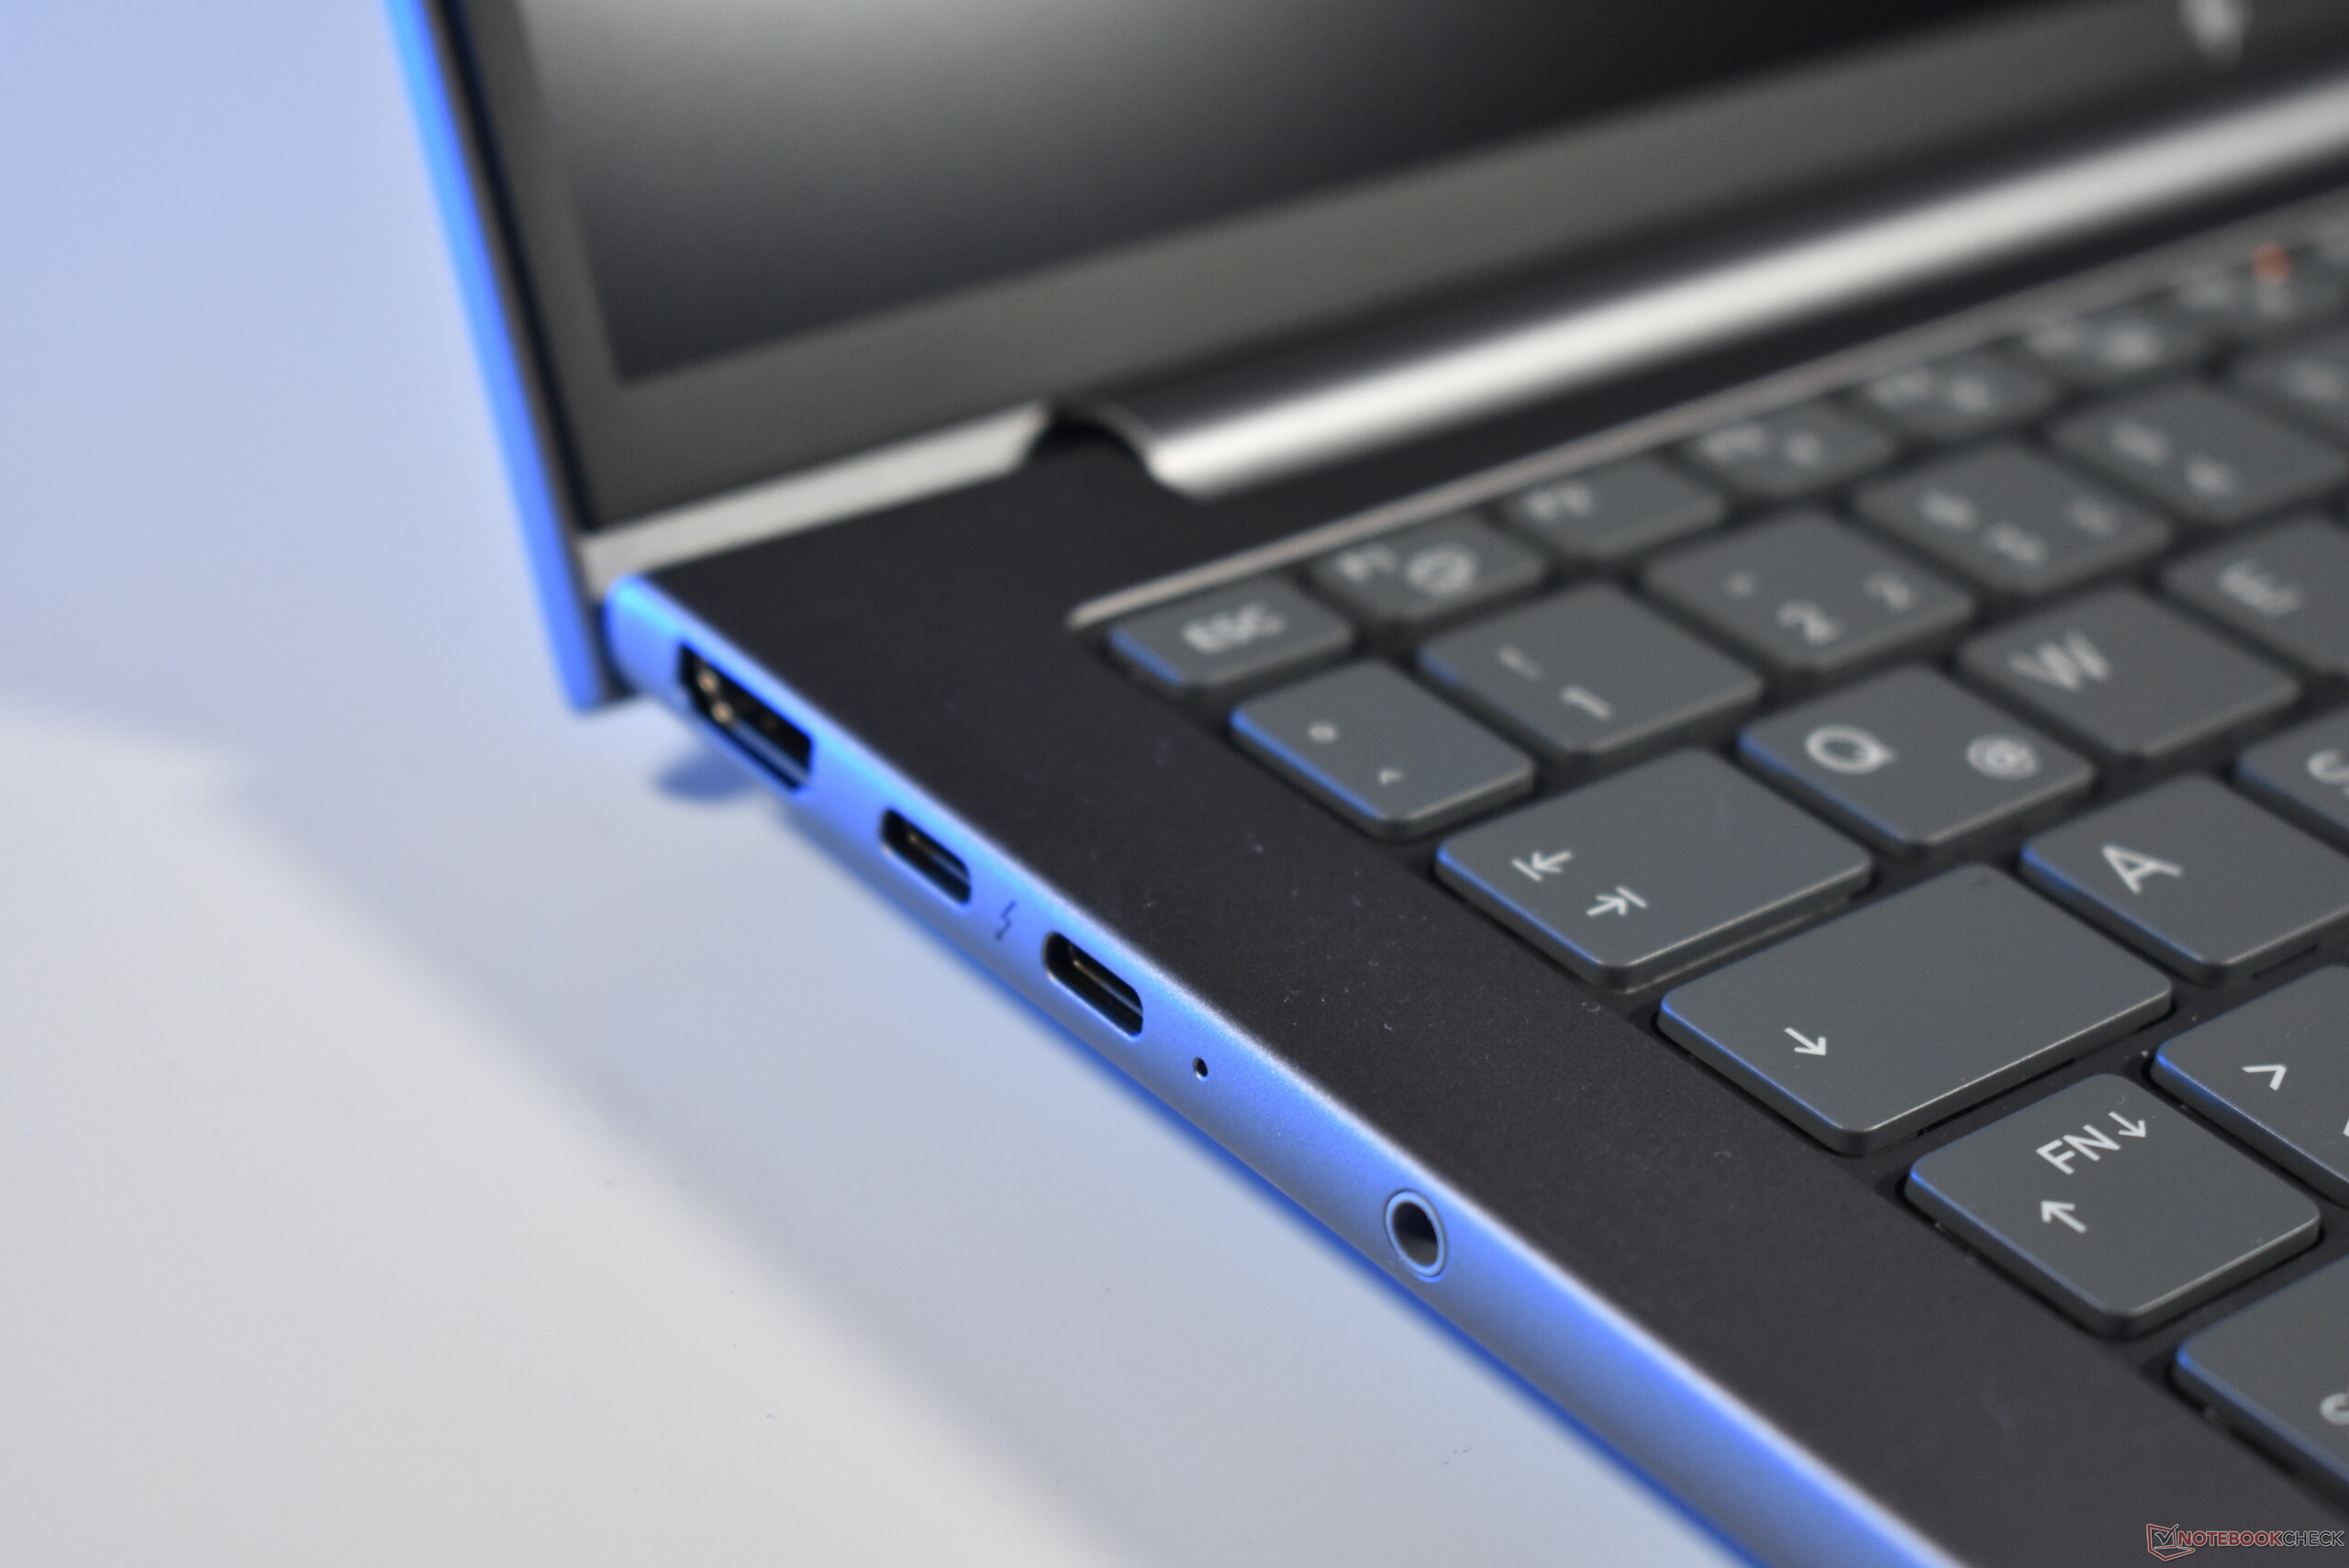
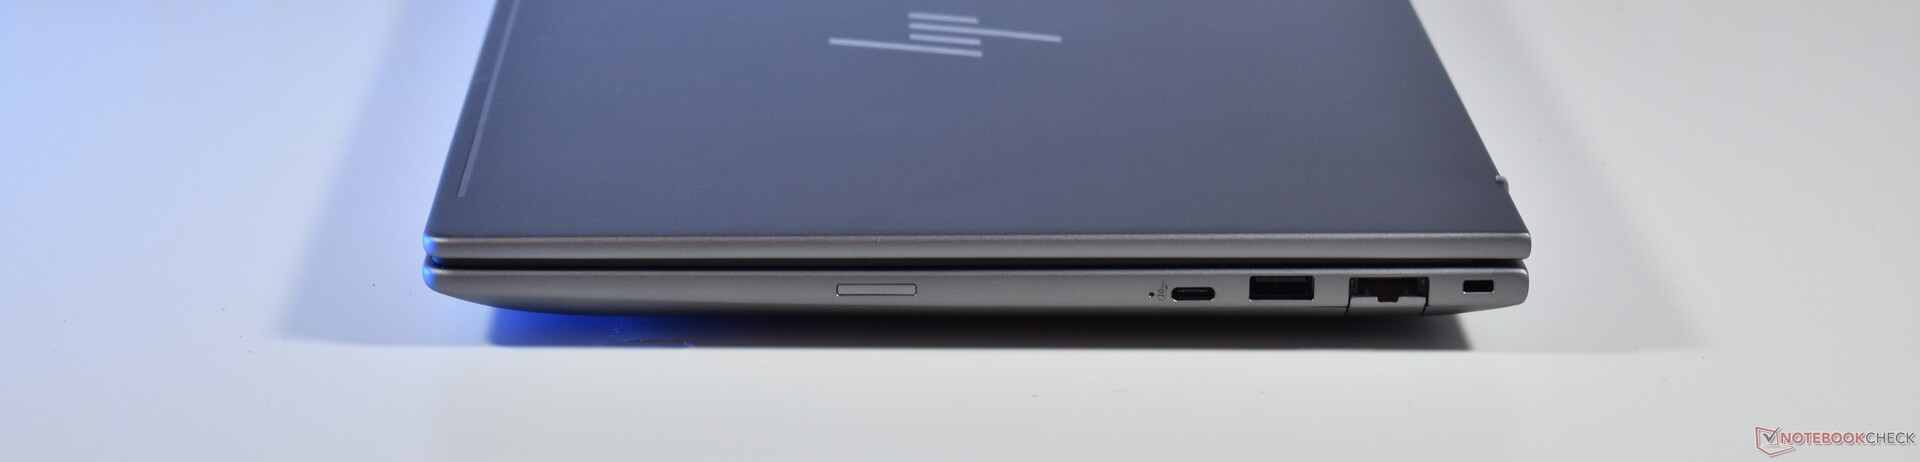
Compared with the older ZBook Firefly 14, one of the USB-A ports has disappeared in favor of a third USB-C. Folks with a lot of older accessories may not like this change, but the USB-C is more powerful and enables charging from the right side, too. Additionally, the new ZBook 8 G1i 14 now has a RJ45-Ethernet port, a very welcome change.
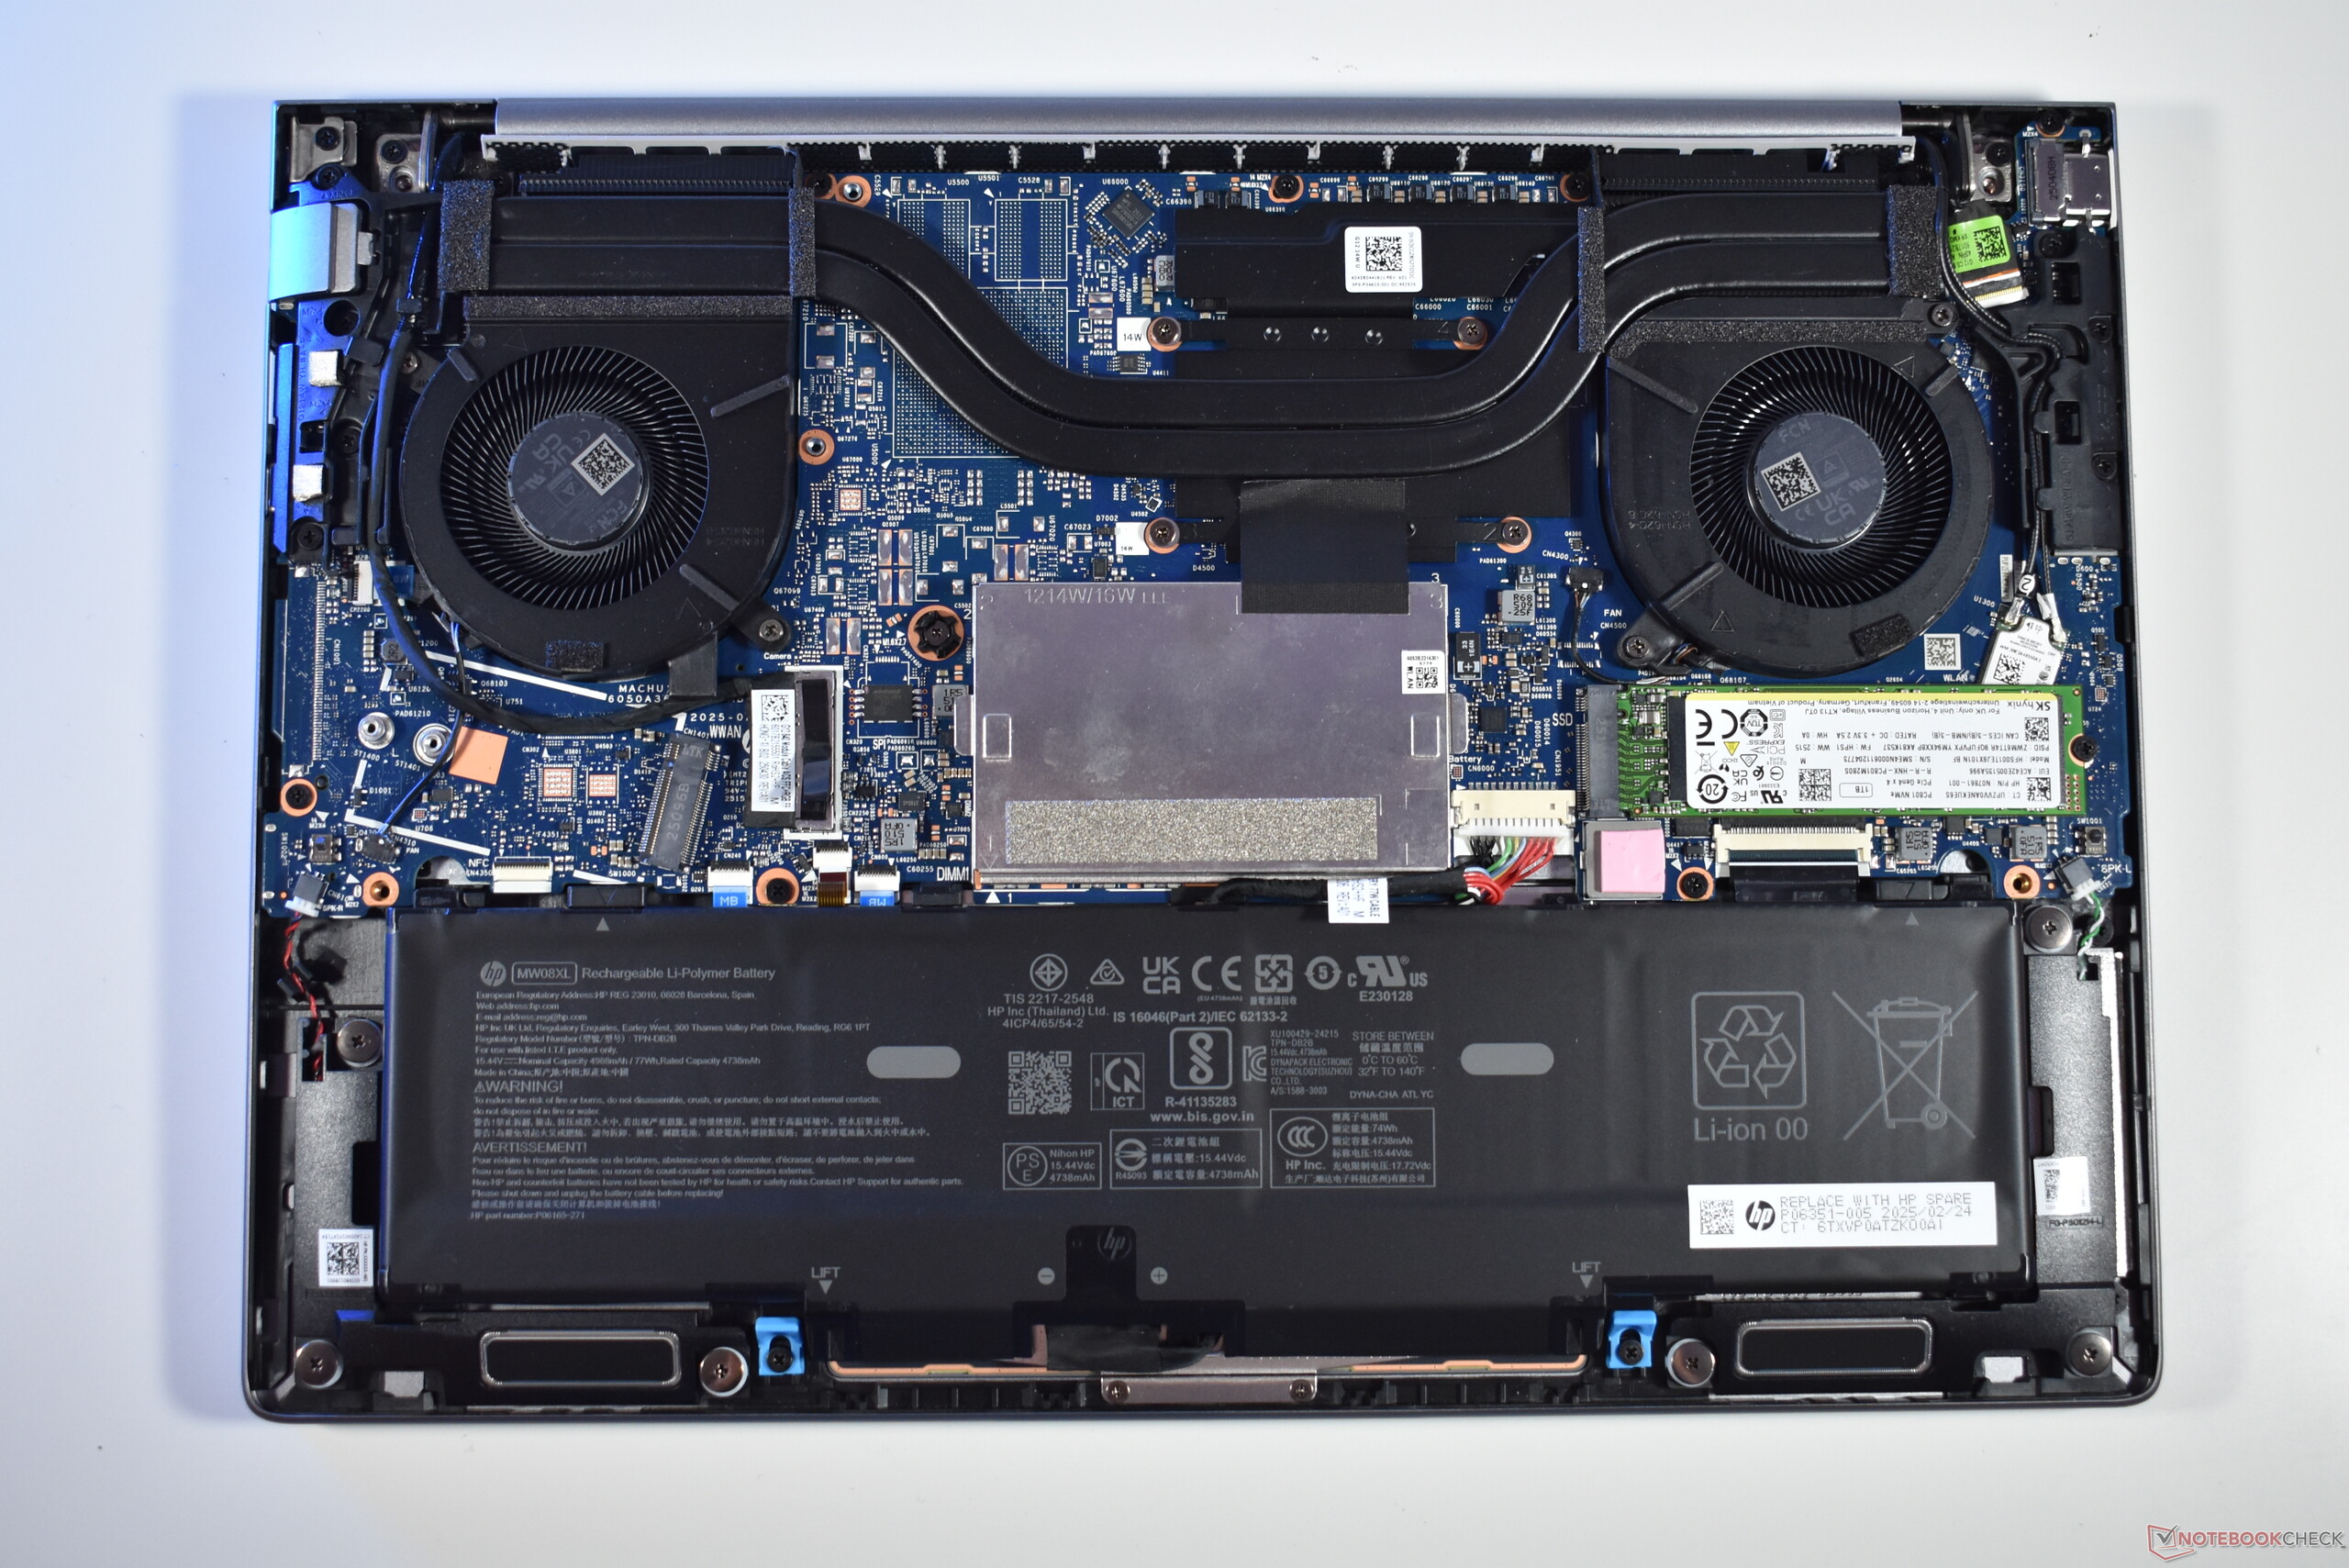
An additional change is the introduction of a second cooling fan, the older ZBook Firefly used a single fan - the second fan is also a difference to the EliteBook 8. Despite this change, the ZBook 8 G1i 14 still retains the two SO-DIMM slots as well as the modular M.2 2280 SSD.


Input Devices: Very comfortable HP ZBook keyboard
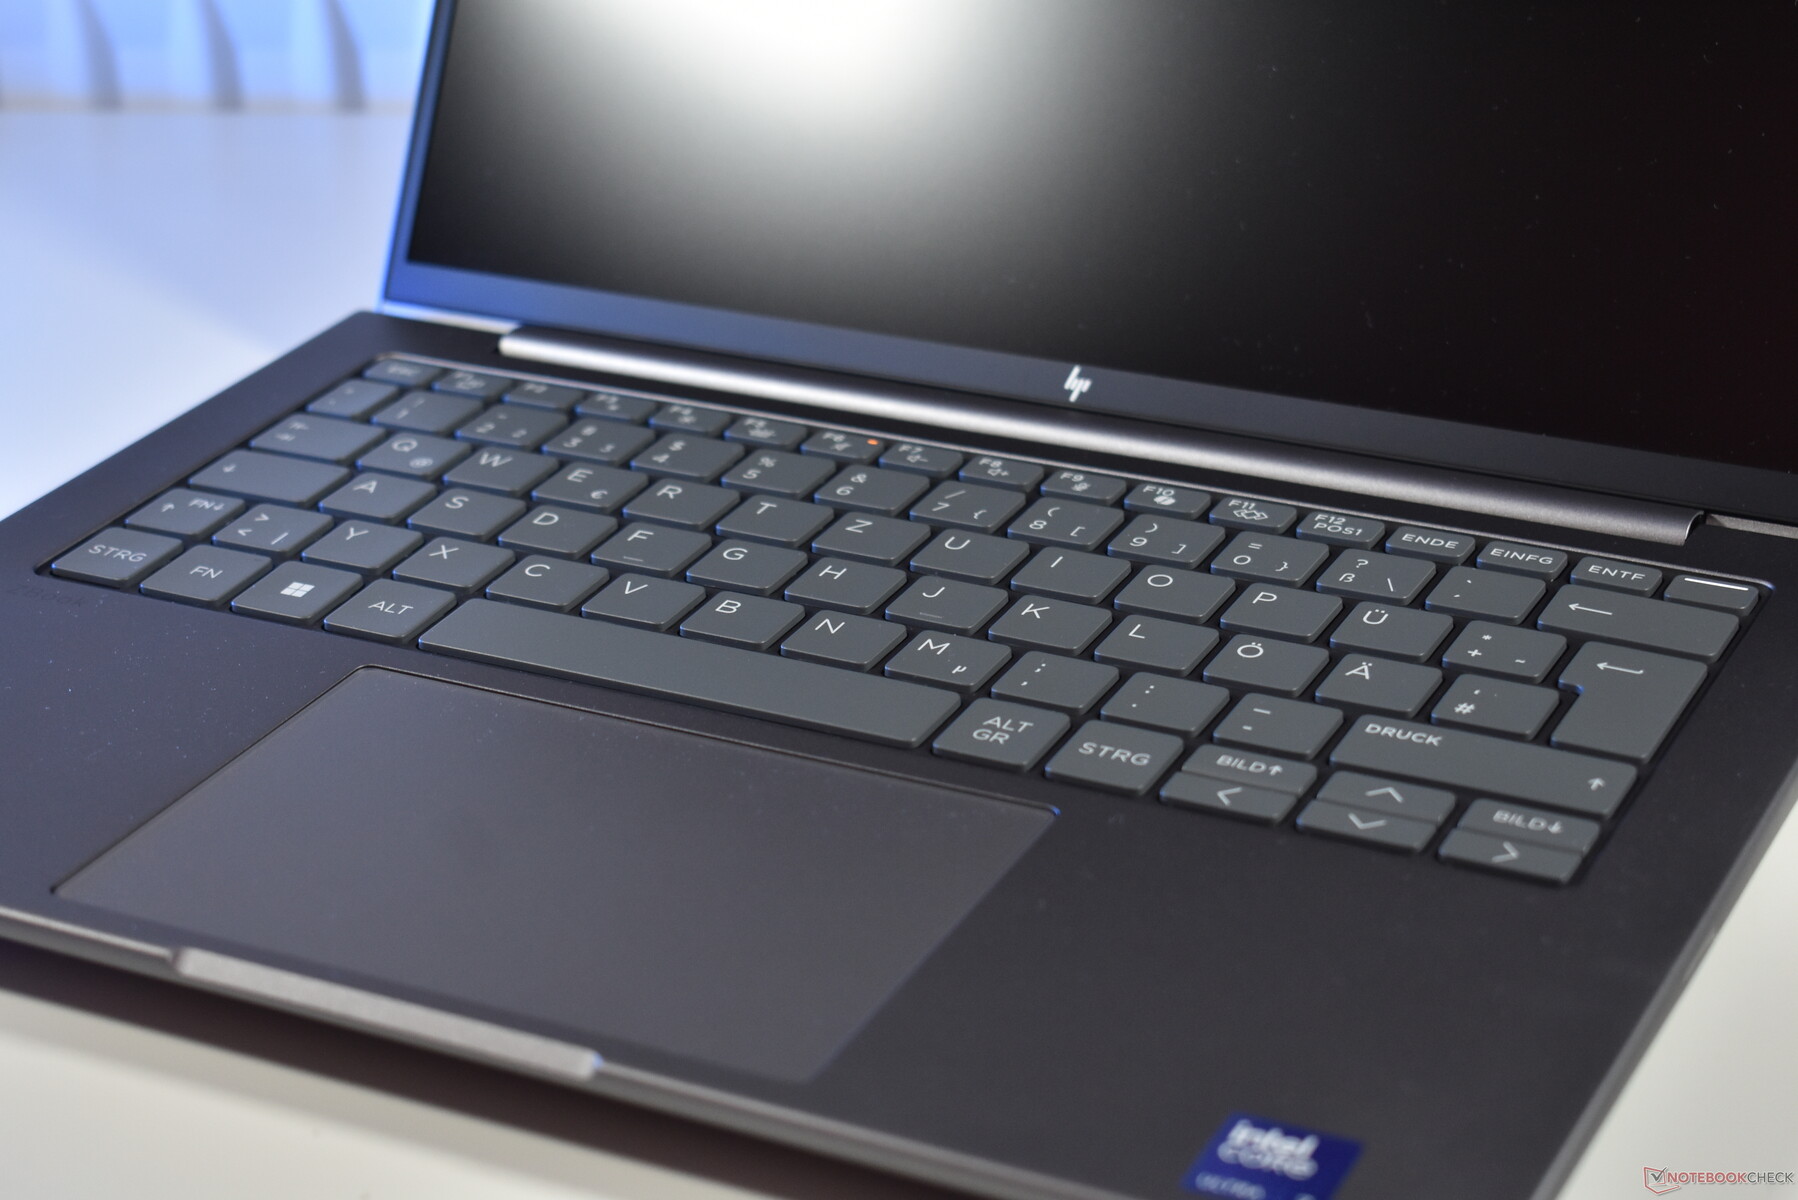
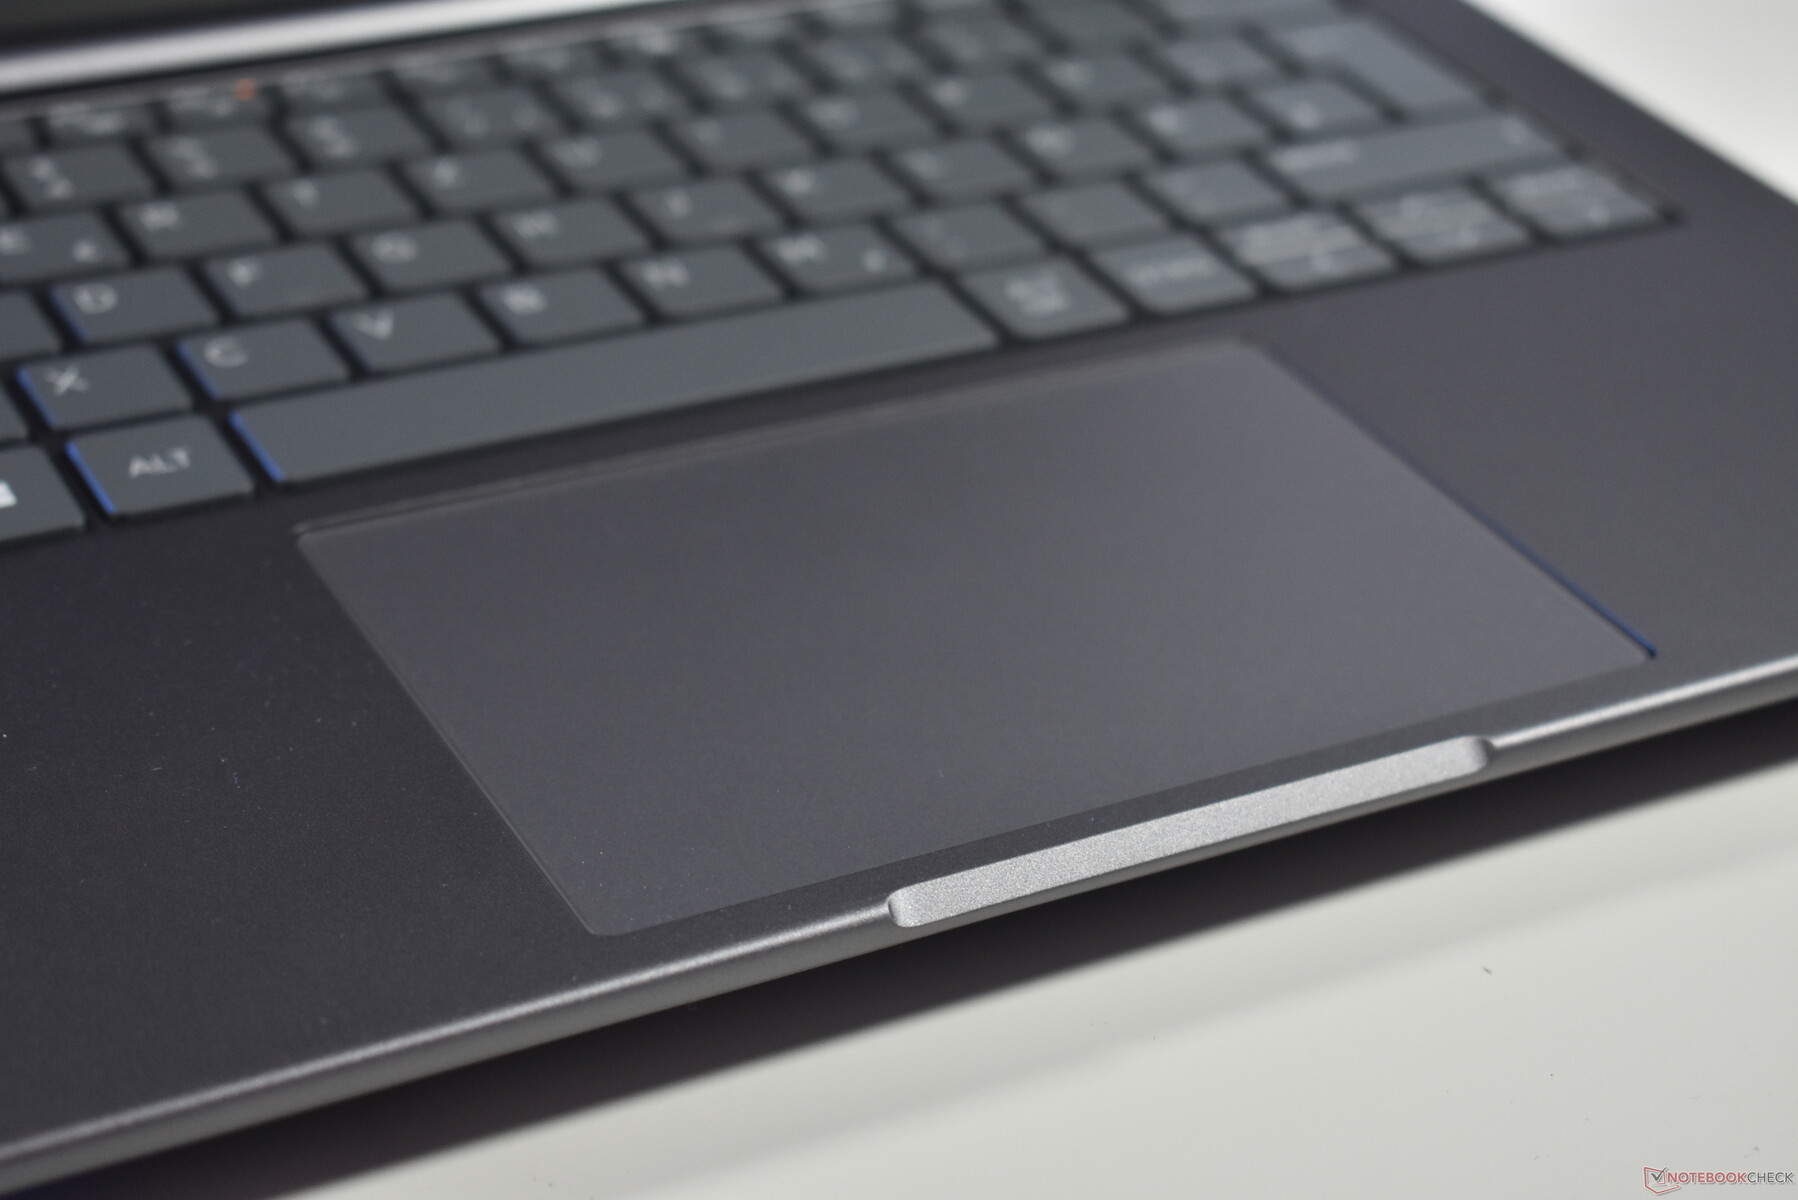
What we said about the keyboard of the HP EliteBook 8 G1a 14 basically applies here as well: It is an excellent keyboard, thanks to the very tactile 1.5 mm travel Chiclet keys. The layout has room for improvement, but typing and working with the HP ZBook 8 G1i is a pleasure thanks to the keyboard. Very solid as well is the glass trackpad that measures 12.5 x 8 cm. The only way it could be improved would be by using a haptic solution instead of a mechanical one, since that would enable the user to click anywhere.
Display: WQXGA screen could be brighter

HP makes choosing the right display for the HP ZBook 8 G1i 14 not easy, as there are a total of seven different matte 14-inch 16:10 IPS screens:
- WUXGA (1,920 x 1,080), 300 cd/m², 62.5 % sRGB
- WUXGA (1,920 x 1,080), 300 cd/m², 62.5 % sRGB, Touch
- WUXGA (1,920 x 1,080), 400 cd/m², 100 % sRGB, Low Power
- WUXGA (1,920 x 1,080), 800 cd/m², 100 % sRGB, SureView 5
- WUXGA (1,920 x 1,080), 800 cd/m², 100 % sRGB, SureView 5, Touch
- WQXGA/2.5K (2,560 x 1,600), 400 cd/m², 100 % AdobeRGB / DCI-P3, 120 Hz VRR
- WQXGA/2.5K (2,560 x 1,600), 500 cd/m², 100 % DCI-P3, 120 Hz, Dreamcolor
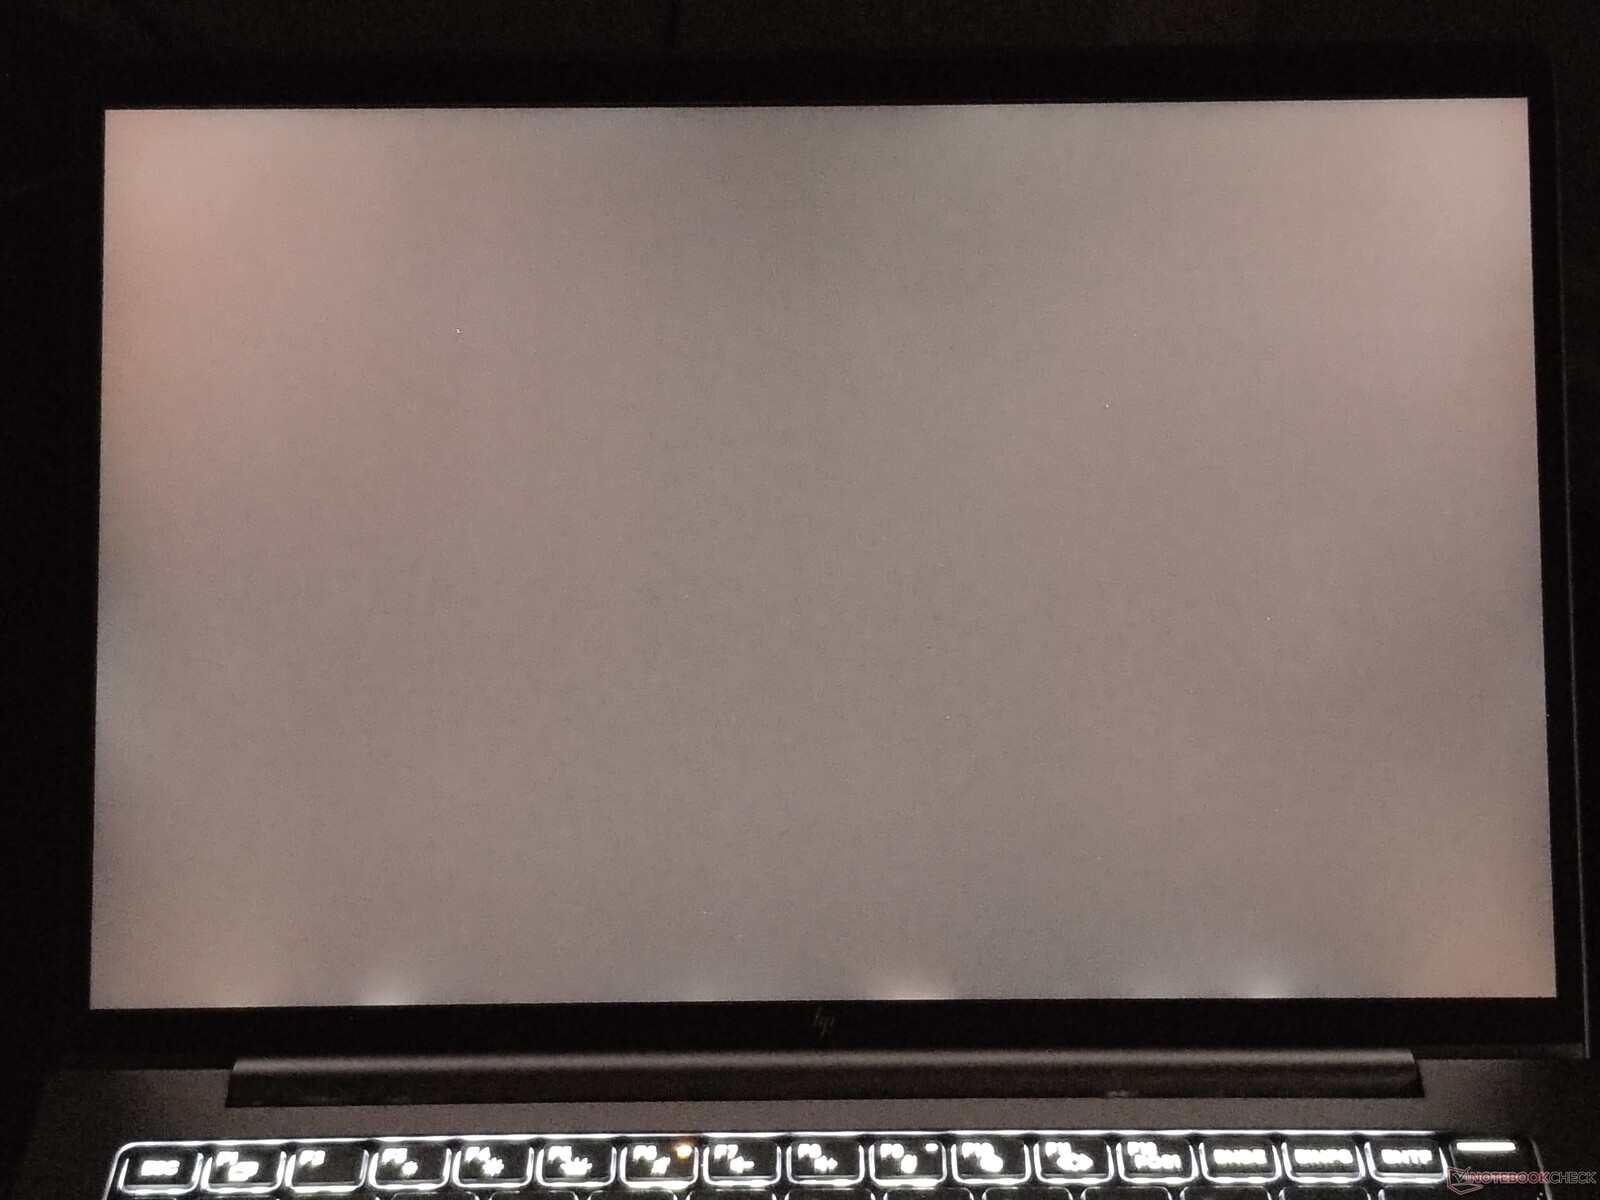
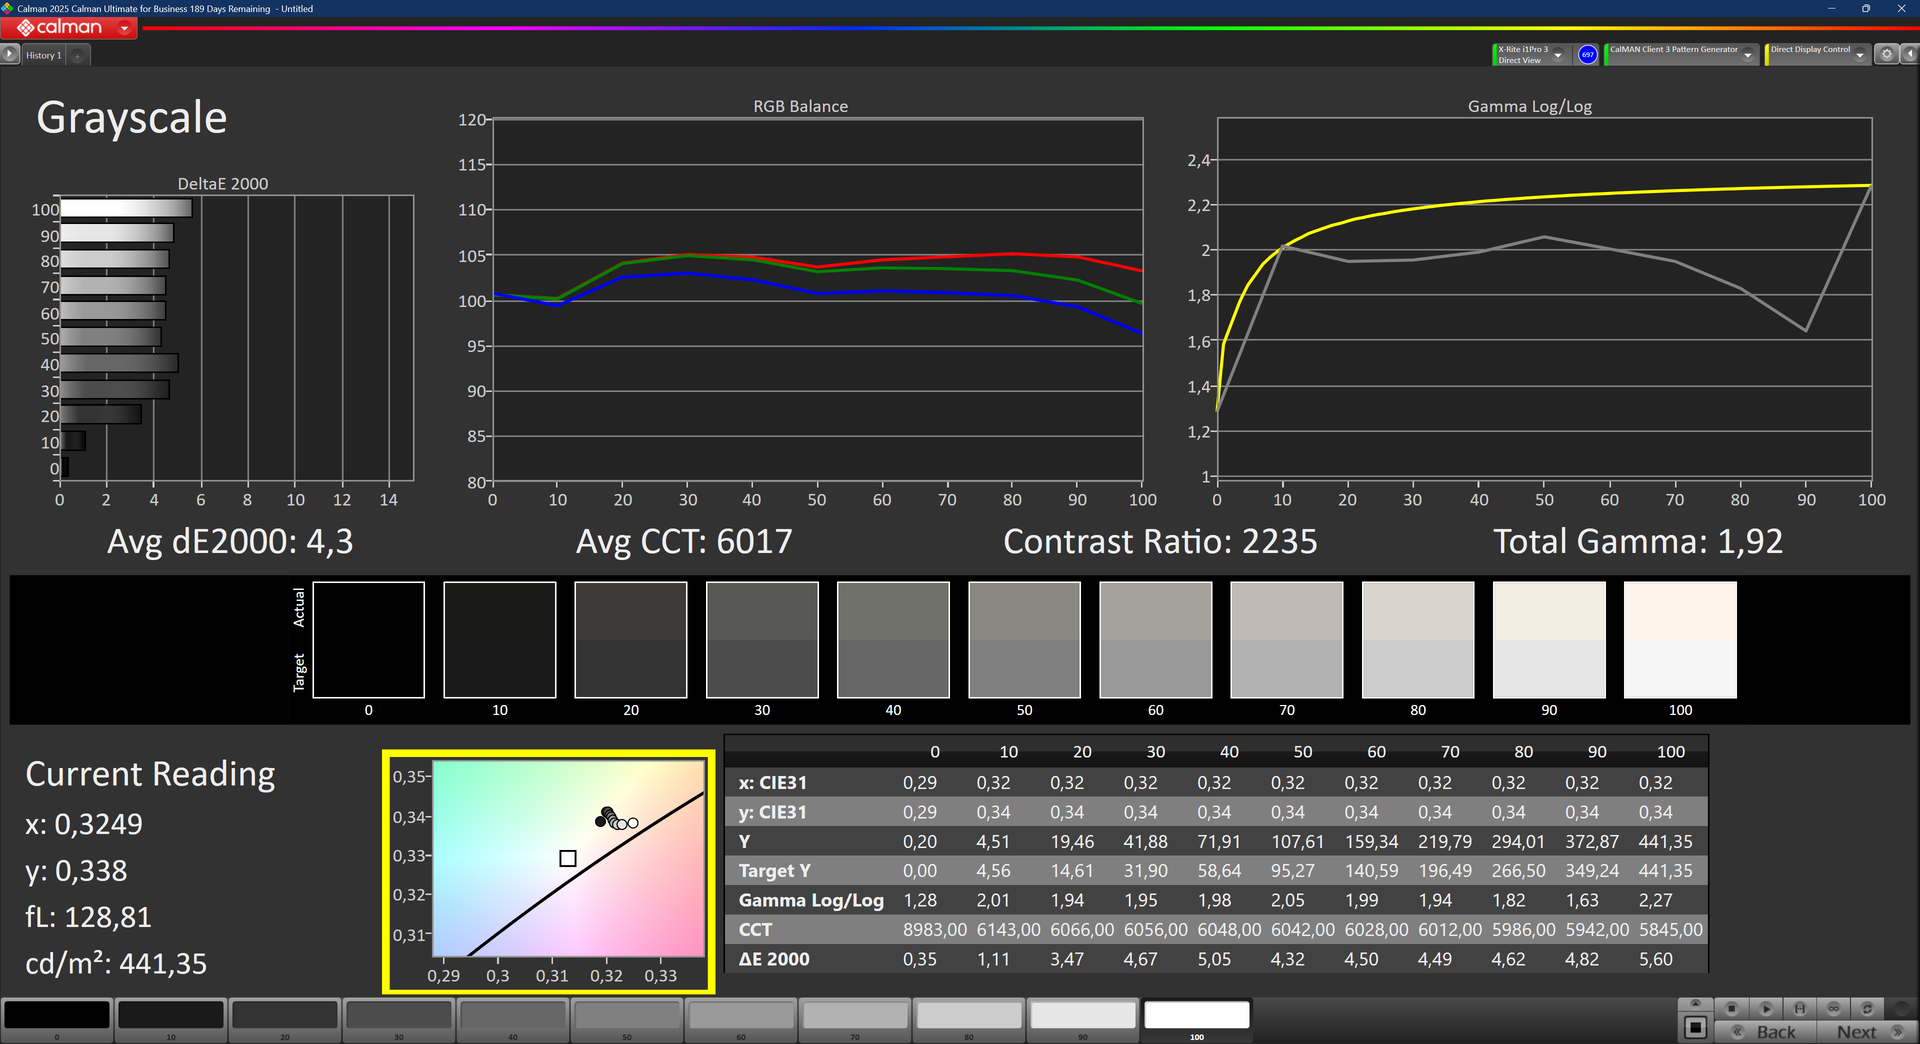
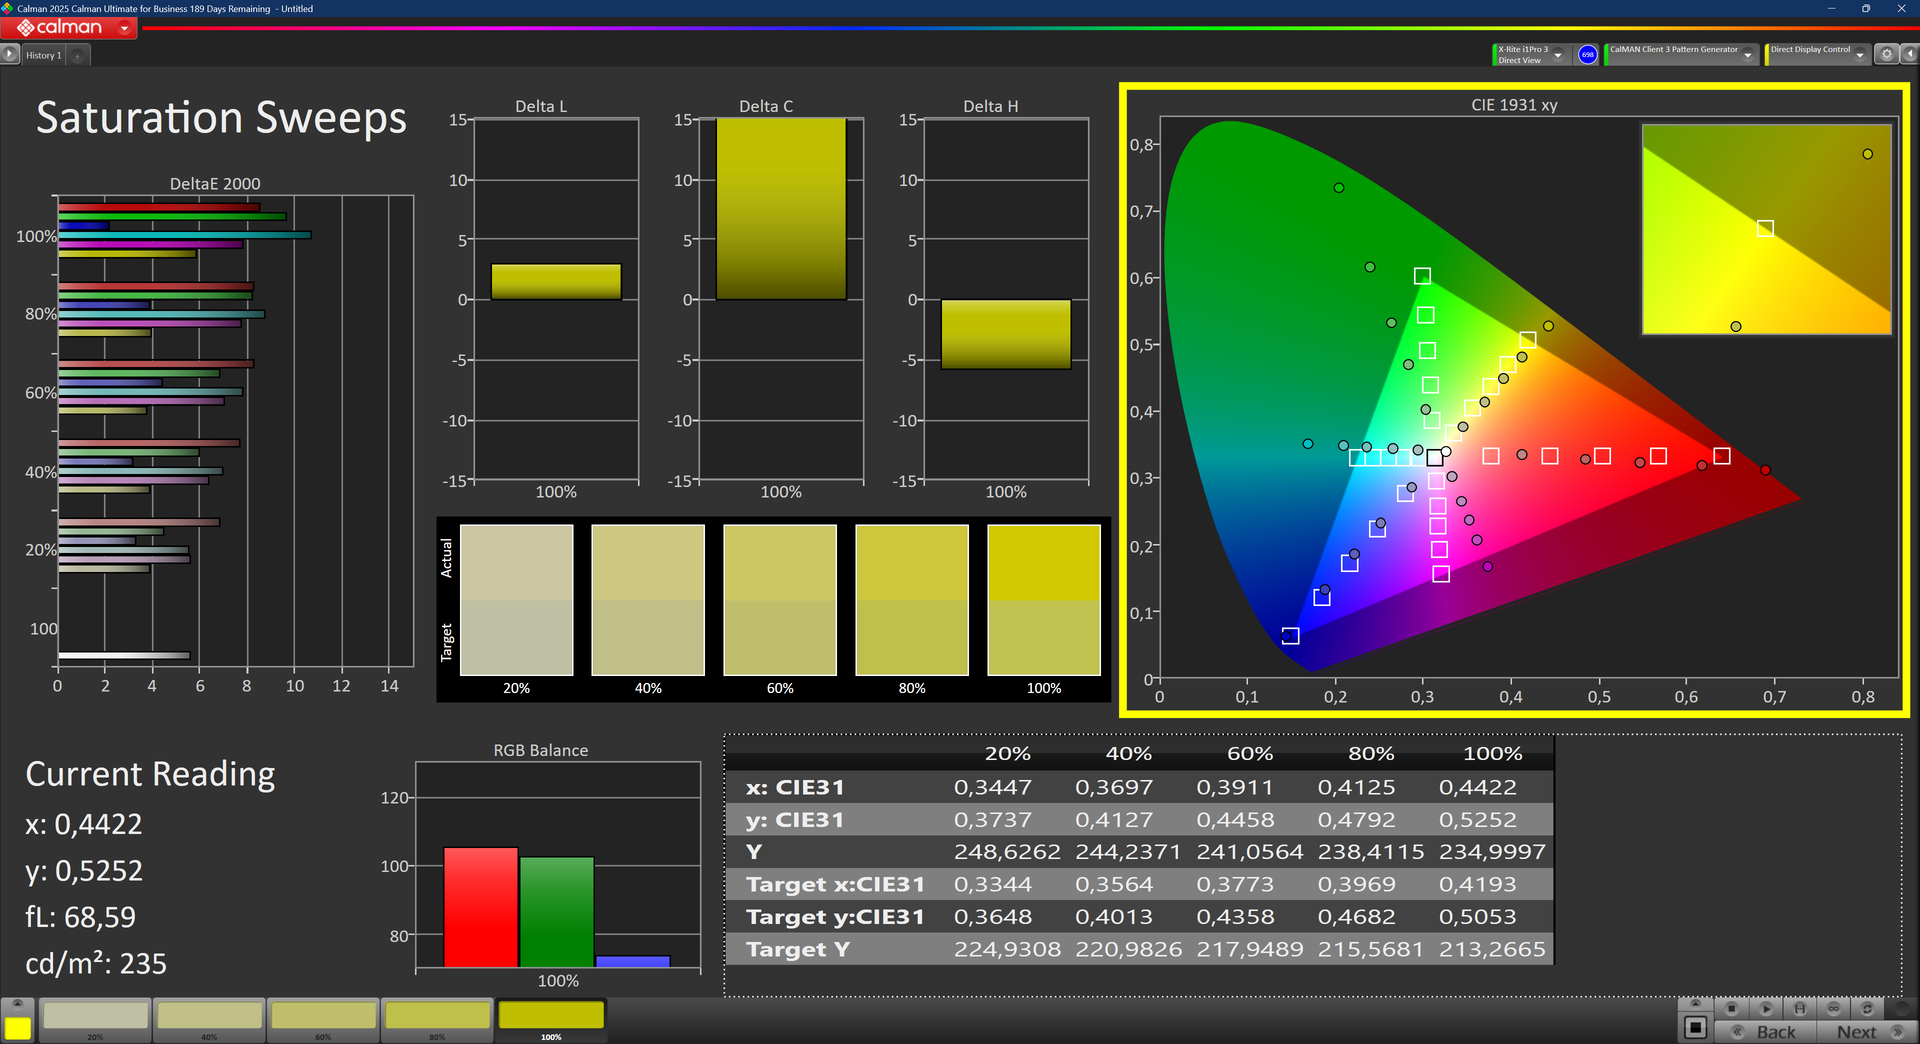
The WQXGA screen sports a good brightness of over 400 cd/m², although that is less than the older ZBook Firefly. The colors of the screen are excellent and thanks to the 120 Hz VRR refresh rate, the panel does not feel sluggish, despite the response times not being the best. Overall, it is a very nice panel for color work, although around 400 cd/m² are a bit limited nowadays for a premium screen option.
| |||||||||||||||||||||||||
Brightness Distribution: 92 %
Center on Battery: 441 cd/m²
Contrast: 2205:1 (Black: 0.2 cd/m²)
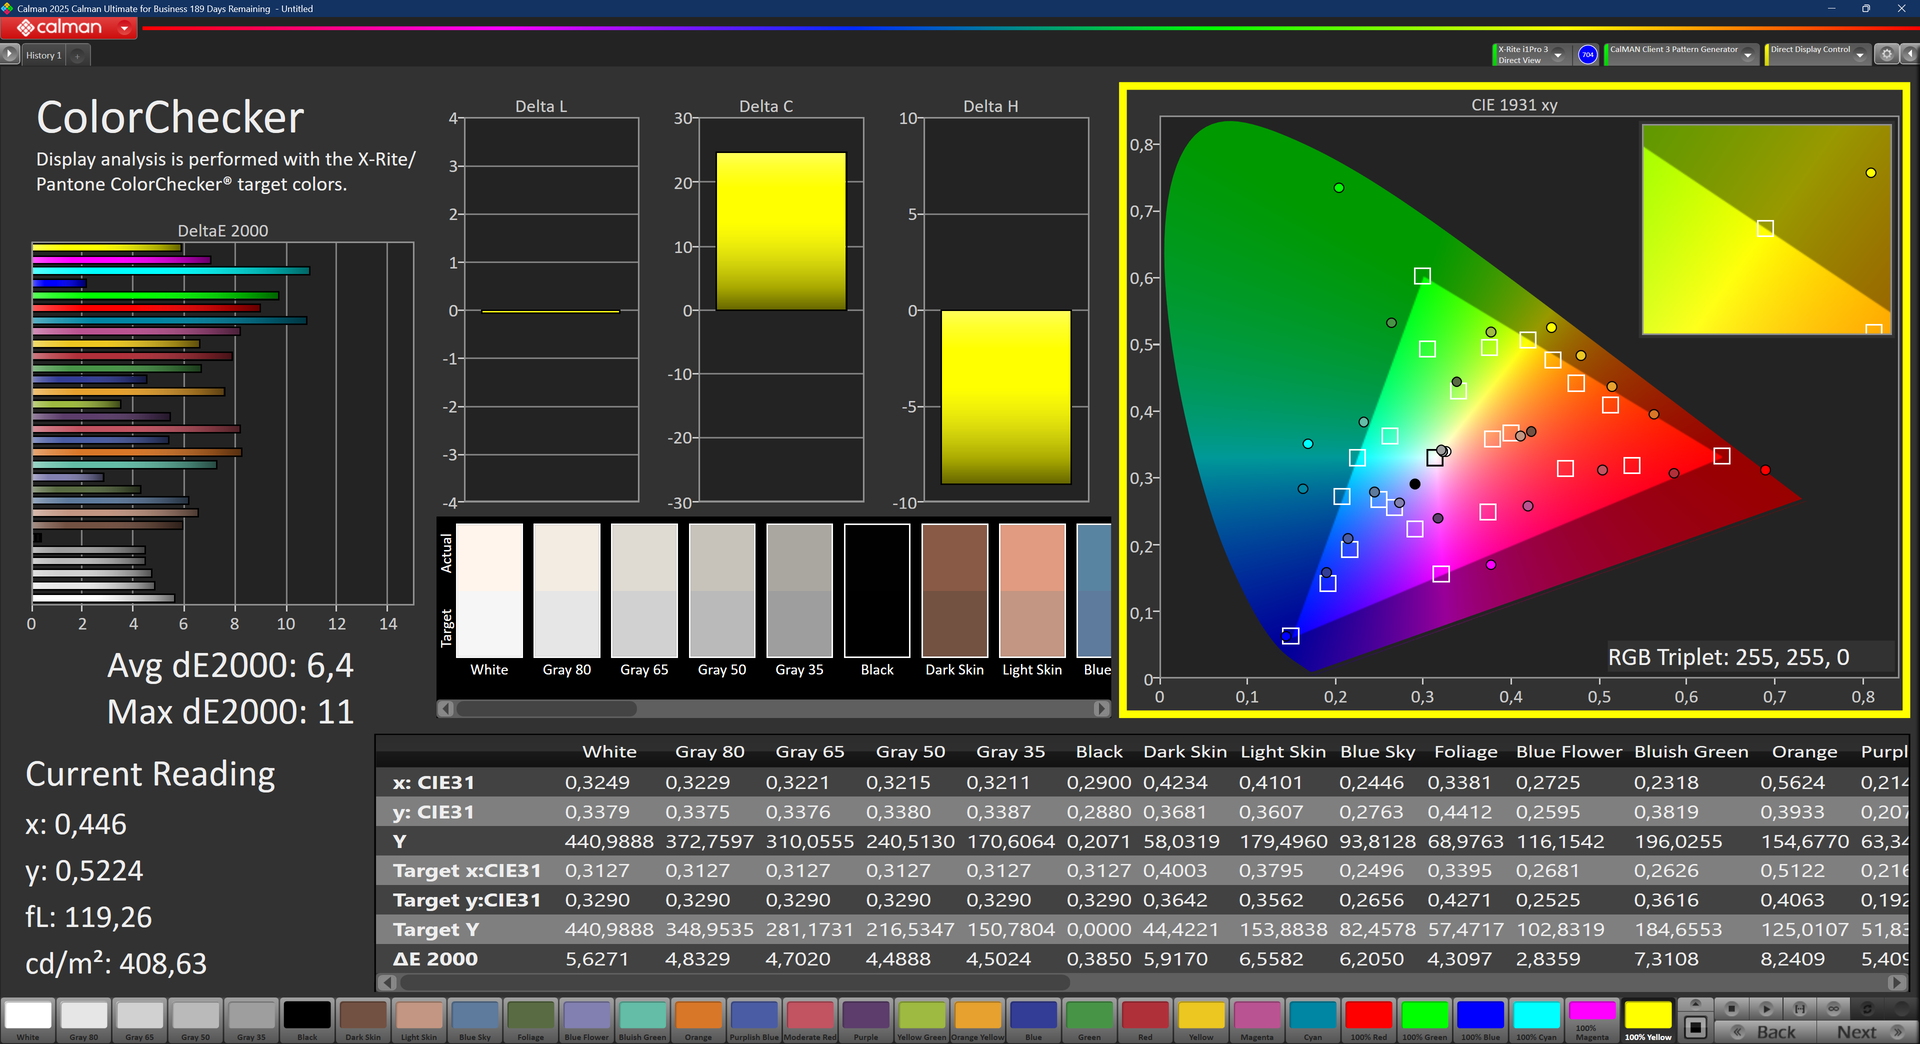
ΔE ColorChecker Calman: 6.4 | ∀{0.5-29.43 Ø4.72}
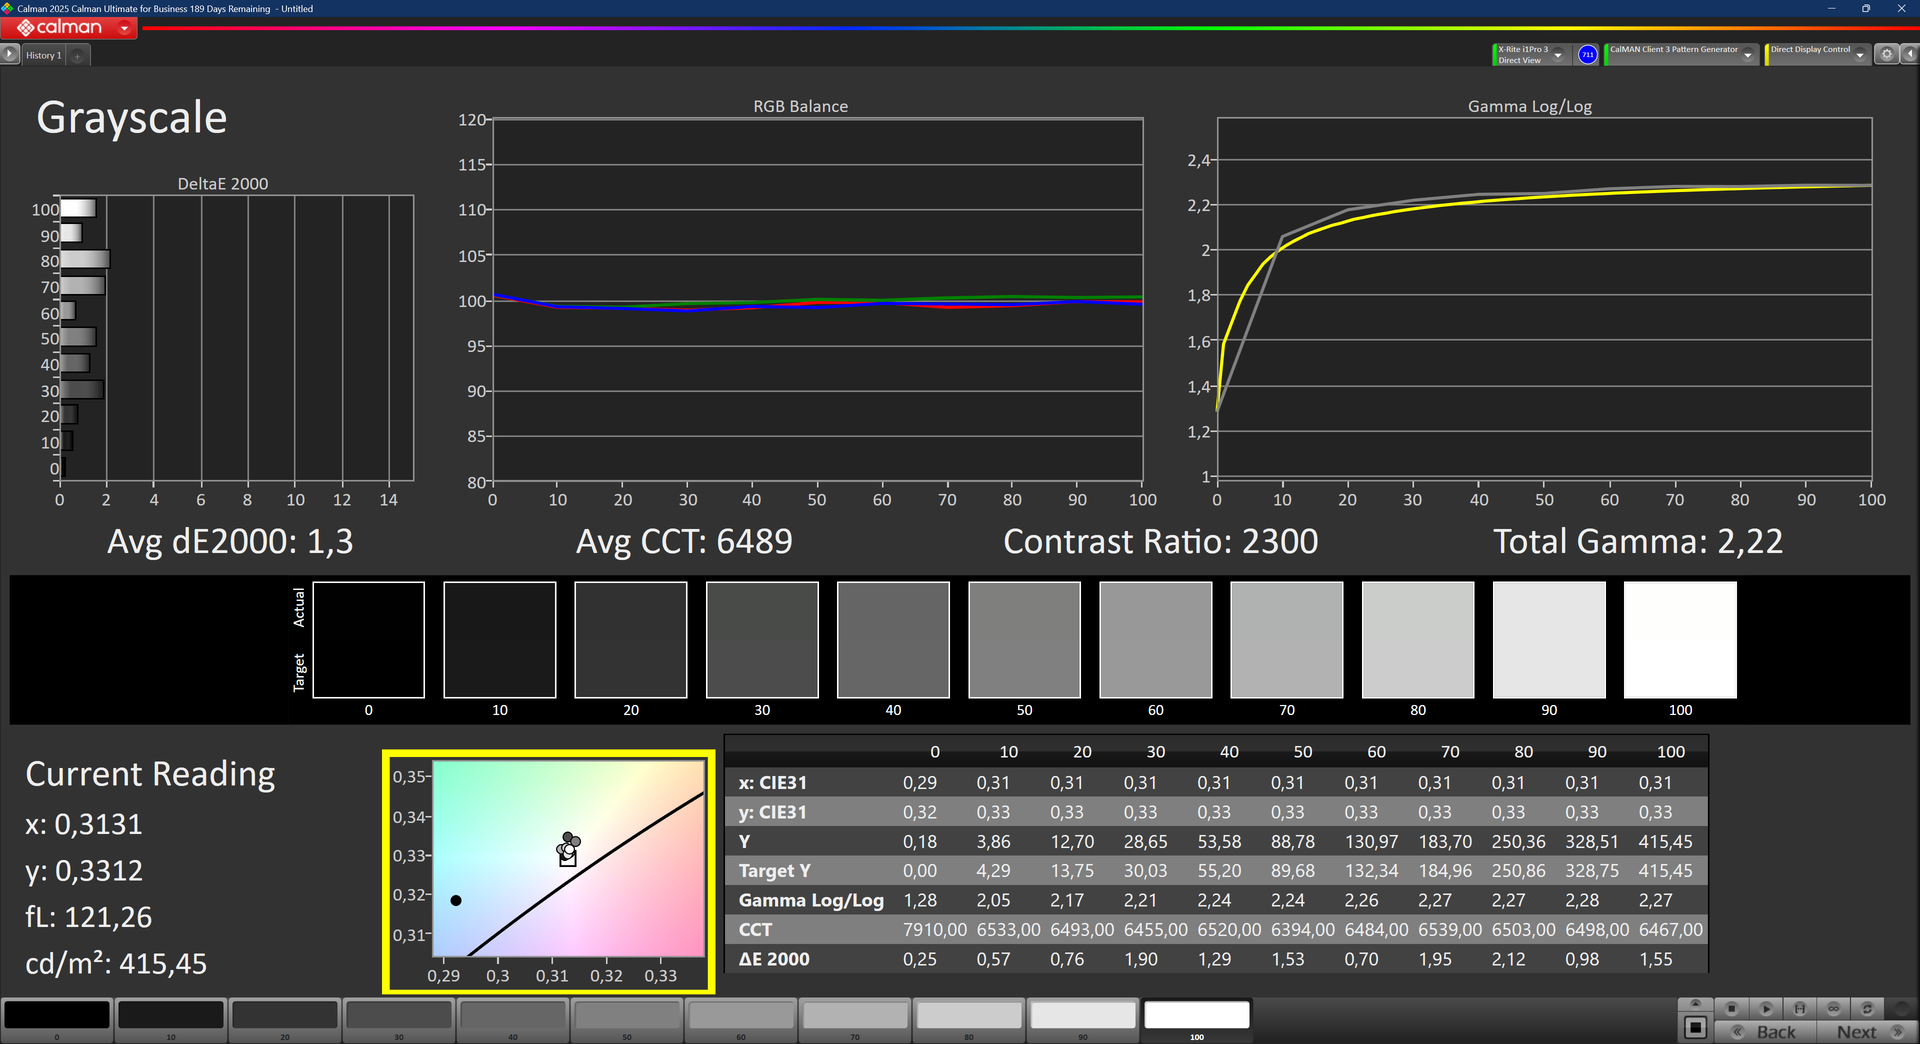
calibrated: 4.8
ΔE Greyscale Calman: 4.3 | ∀{0.09-98 Ø4.97}
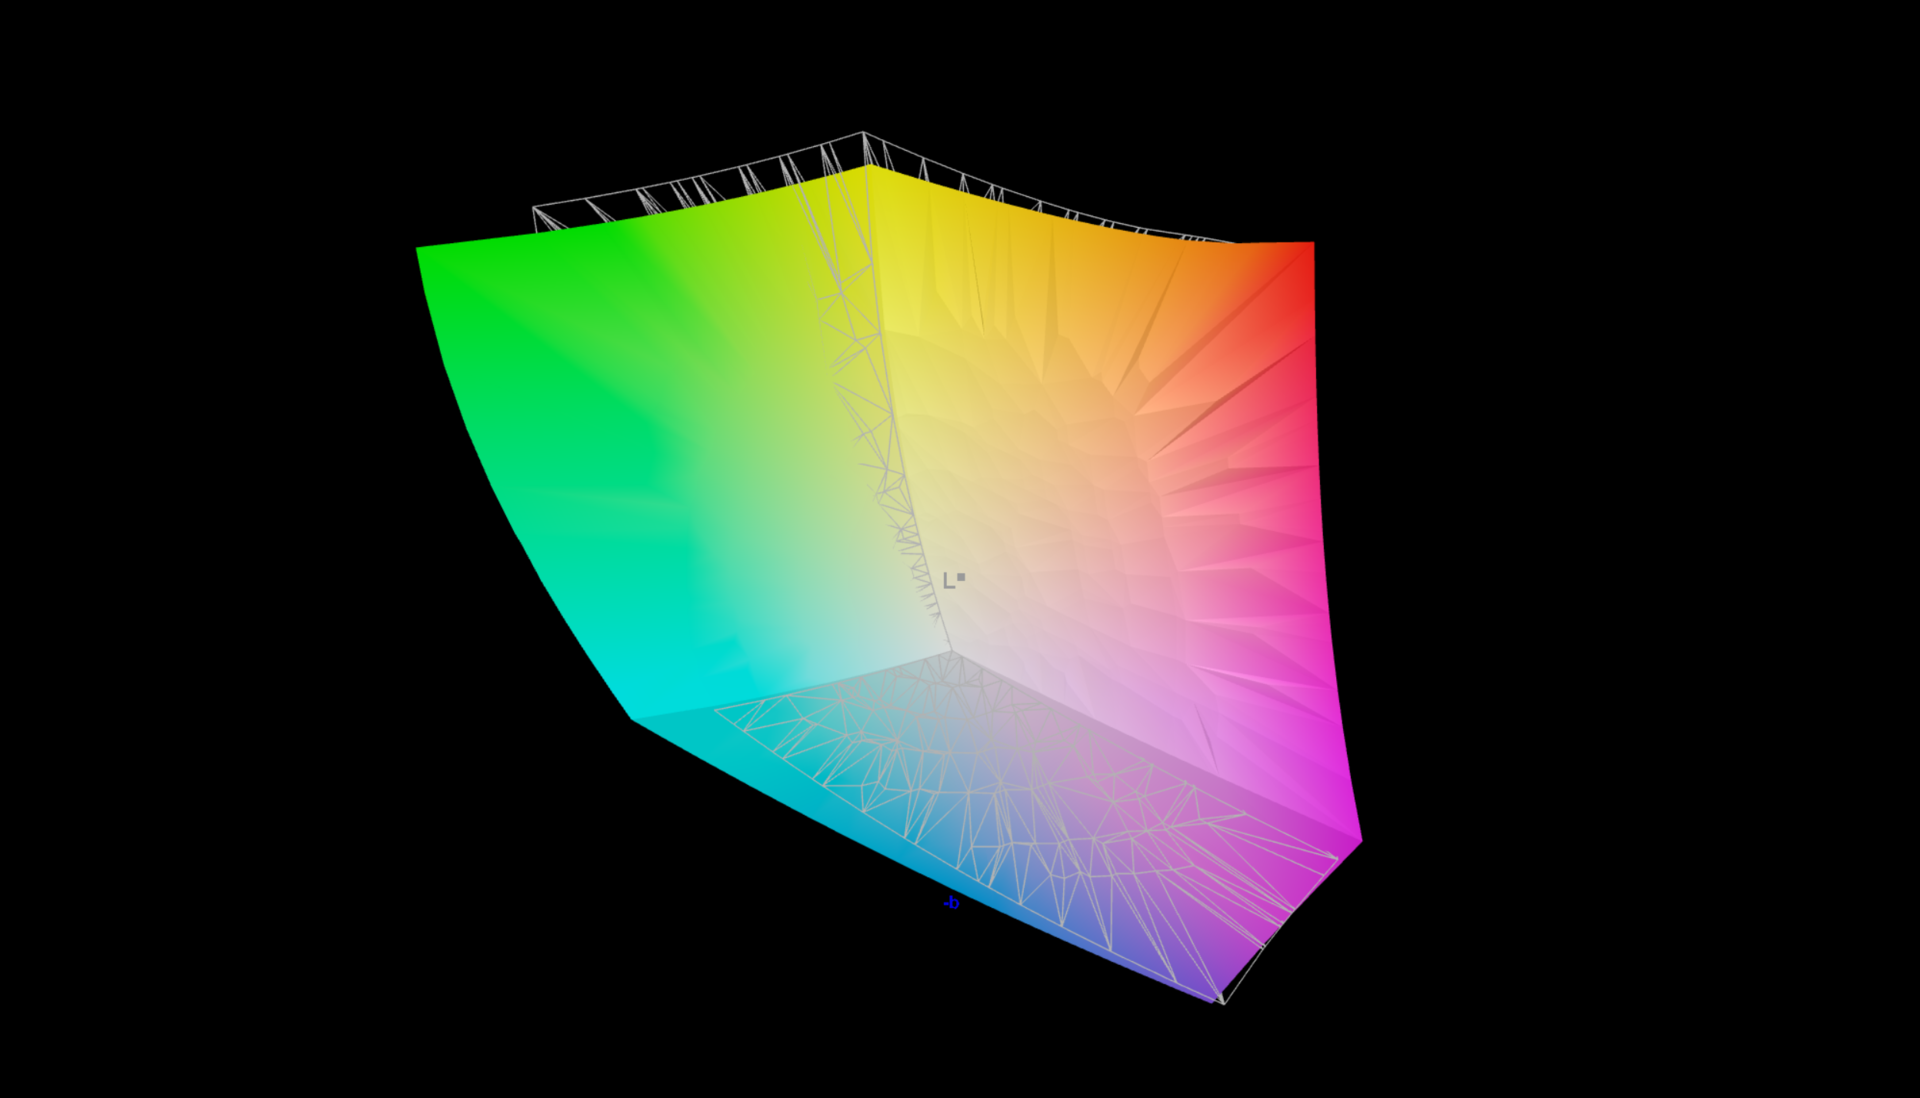
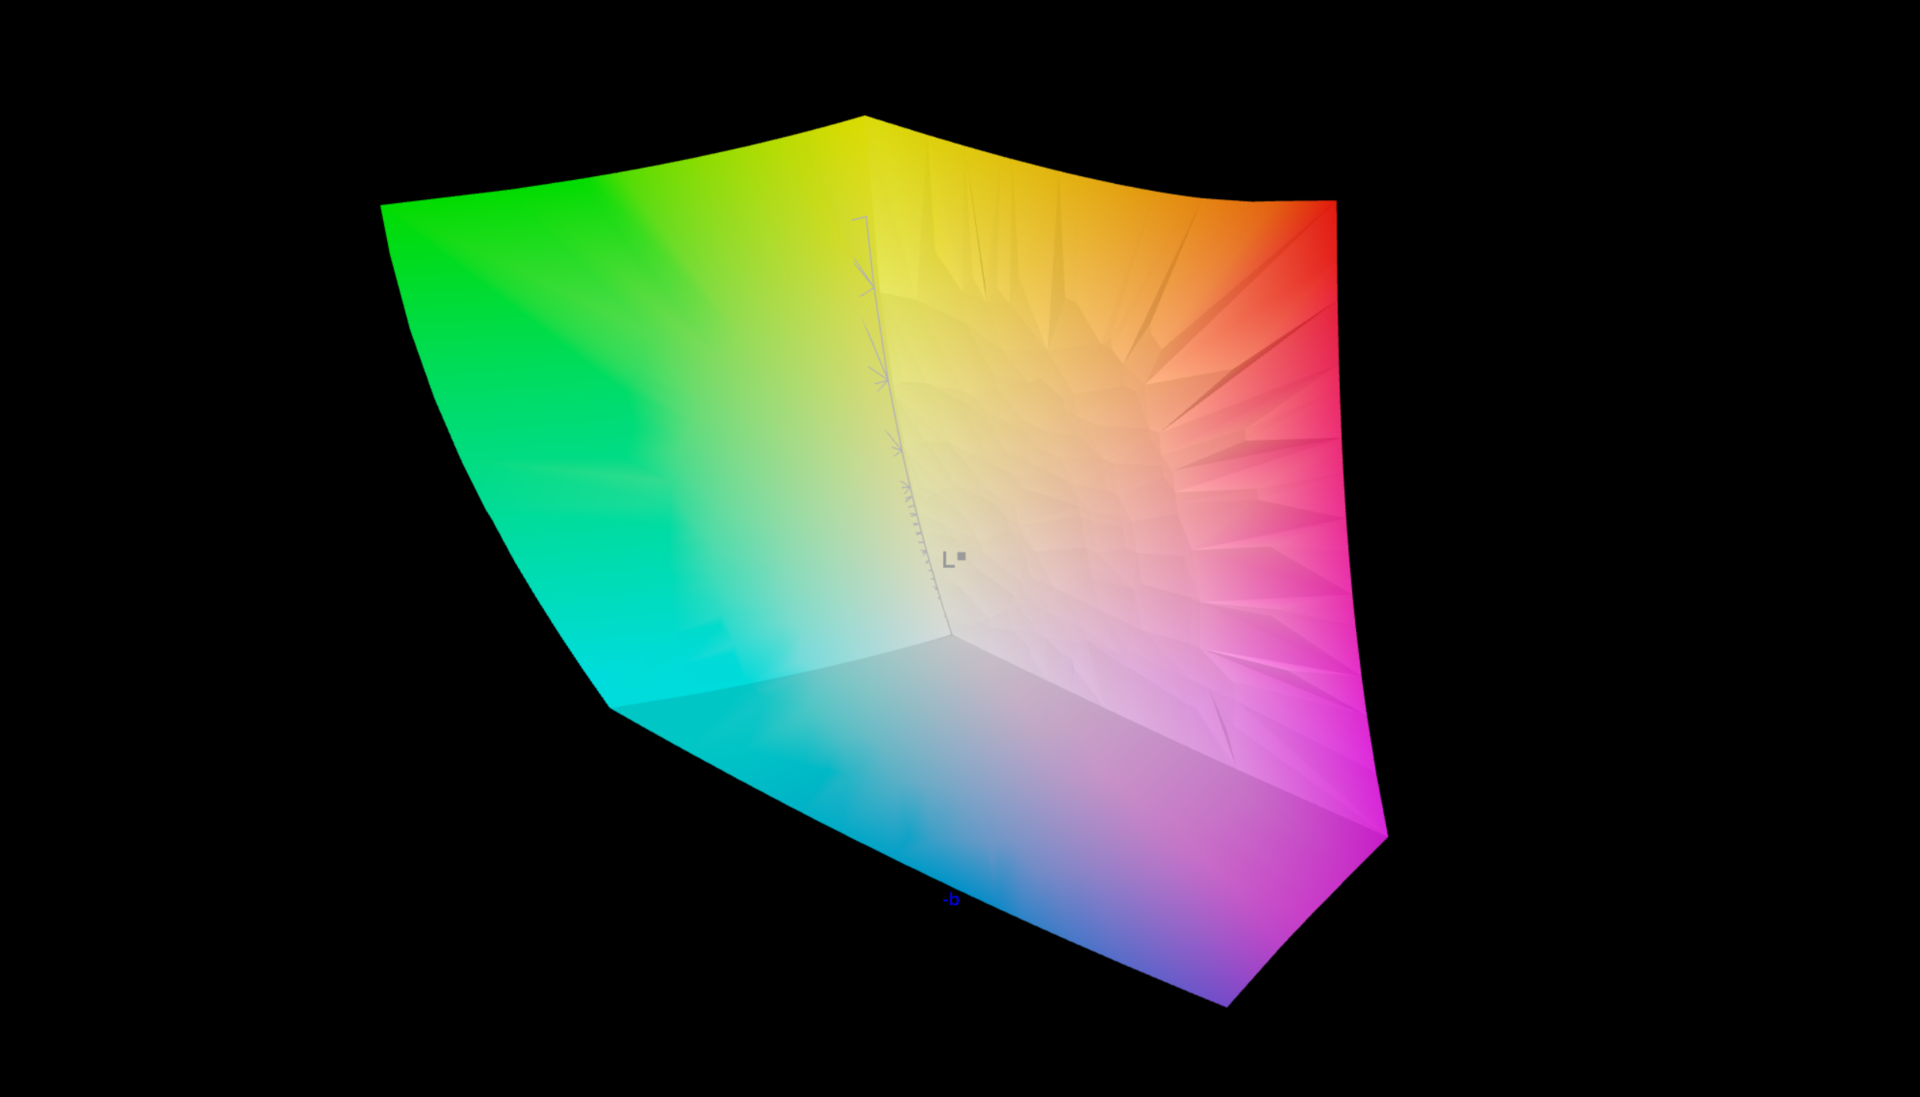
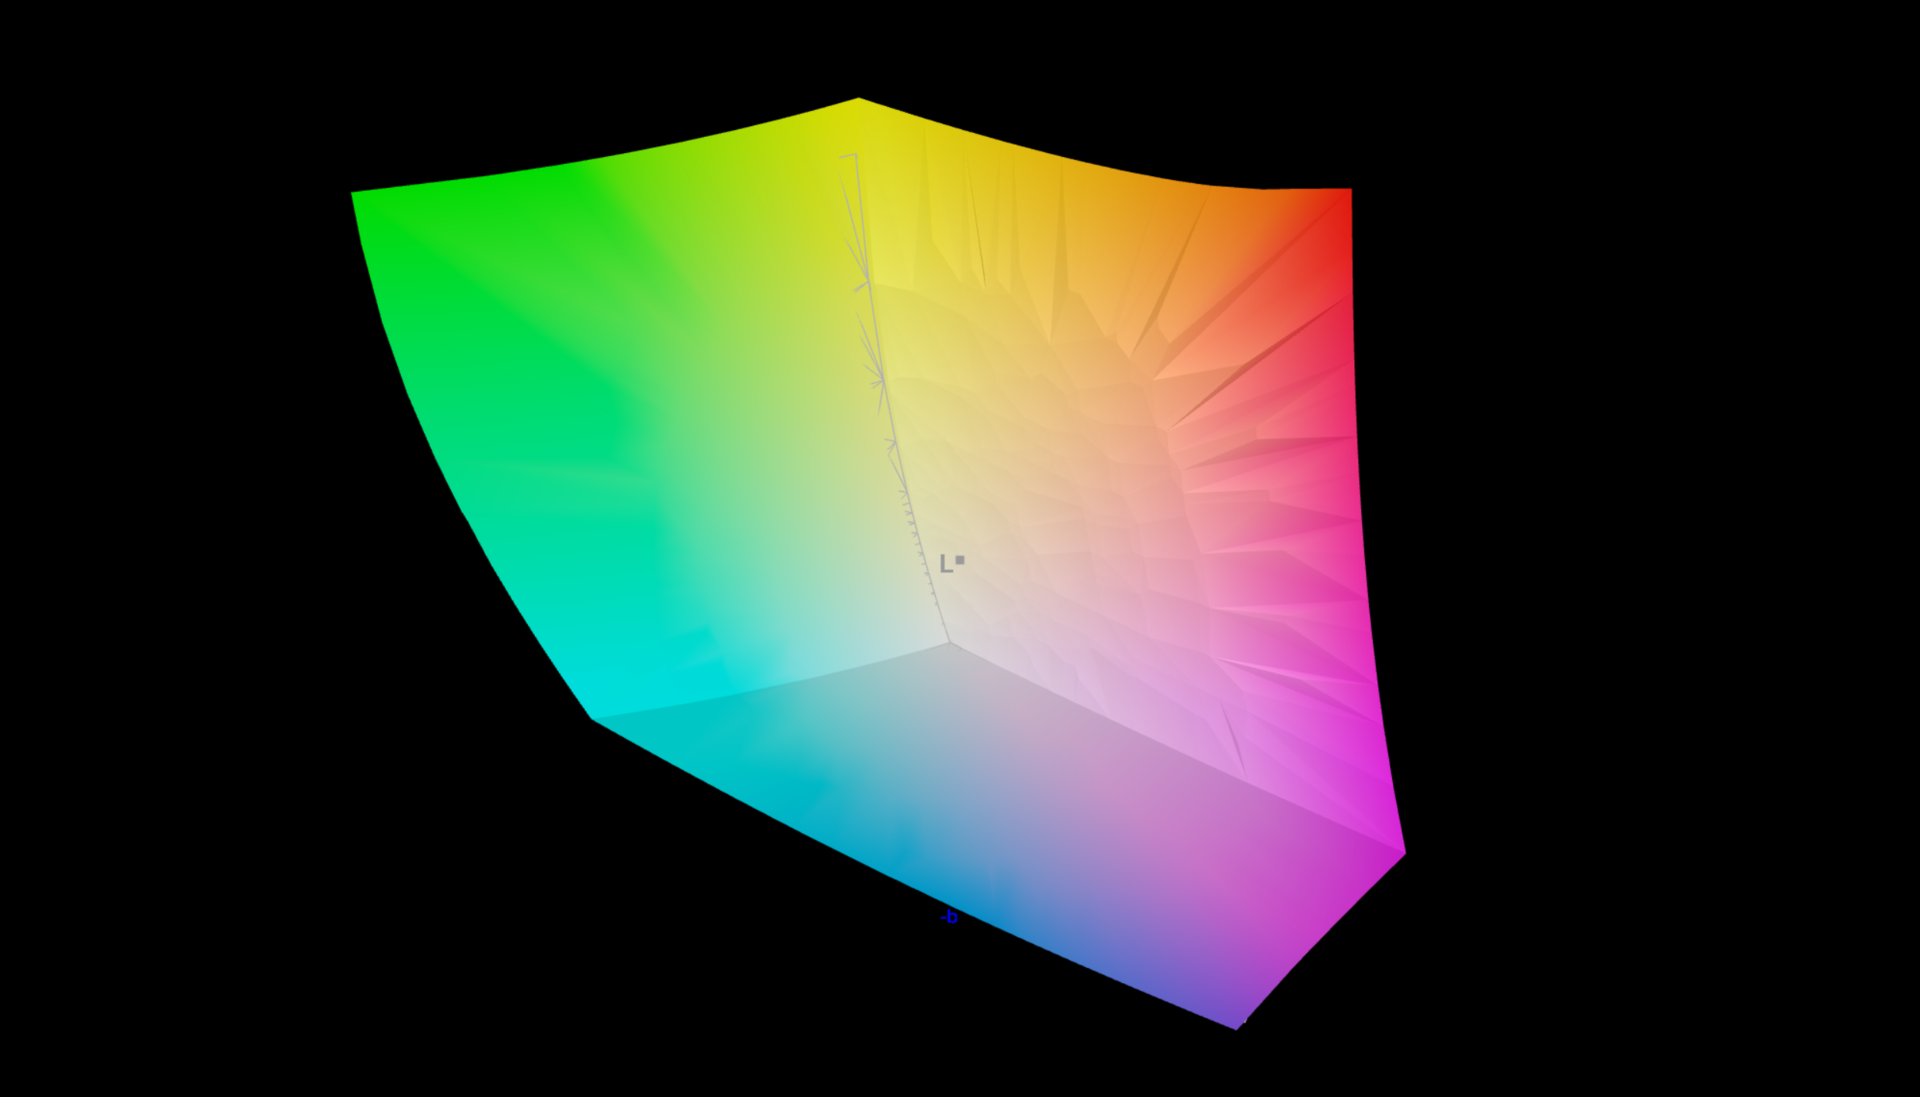
99.9% AdobeRGB 1998 (Argyll 3D)
99.9% sRGB (Argyll 3D)
95.8% Display P3 (Argyll 3D)
Gamma: 1.92
CCT: 6017 K
| HP ZBook 8 G1i 14 LGD07B5, IPS LED, 2560x1600, 14", 120 Hz | HP ZBook Firefly 14 G11 AUO6DA8, IPS, 2560x1600, 14", 120 Hz | Lenovo ThinkPad P14s Gen 6 21RV0017GE NE140WUM-N6M, IPS LED, 1920x1200, 14", 60 Hz | HP ZBook Ultra G1a 14 Samsung SDC41B3, OLED, 2880x1800, 14", 120 Hz | Dell Precision 5000 5490 AU Optronics B140QAN, IPS, 2560x1600, 14", 60 Hz | |
|---|---|---|---|---|---|
| Display | -3% | -21% | 0% | -12% | |
| Display P3 Coverage (%) | 95.8 | 98.9 3% | 67.1 -30% | 99.7 4% | 79.7 -17% |
| sRGB Coverage (%) | 99.9 | 99.9 0% | 98.6 -1% | 100 0% | 100 0% |
| AdobeRGB 1998 Coverage (%) | 99.9 | 86.6 -13% | 69.2 -31% | 95.6 -4% | 79.5 -20% |
| Response Times | 61% | 3% | 78% | -62% | |
| Response Time Grey 50% / Grey 80% * (ms) | 30.3 ? | 12.3 ? 59% | 31.1 ? -3% | 0.94 ? 97% | 52.3 ? -73% |
| Response Time Black / White * (ms) | 22.2 ? | 8.3 ? 63% | 20.5 ? 8% | 1.01 ? 95% | 33.3 ? -50% |
| PWM Frequency (Hz) | 24000 ? | 492.6 | |||
| PWM Amplitude * (%) | 75 | 43 43% | |||
| Screen | 10% | 21% | 34% | 16% | |
| Brightness middle (cd/m²) | 441 | 554.1 26% | 558 27% | 384.7 -13% | 485.1 10% |
| Brightness (cd/m²) | 417 | 540 29% | 545 31% | 387 -7% | 471 13% |
| Brightness Distribution (%) | 92 | 93 1% | 91 -1% | 99 8% | 90 -2% |
| Black Level * (cd/m²) | 0.2 | 0.58 -190% | 0.32 -60% | 0.38 -90% | |
| Contrast (:1) | 2205 | 955 -57% | 1744 -21% | 1277 -42% | |
| Colorchecker dE 2000 * | 6.4 | 2.54 60% | 2.7 58% | 3.36 48% | 2.15 66% |
| Colorchecker dE 2000 max. * | 11 | 4.99 55% | 5.3 52% | 6.45 41% | 5.39 51% |
| Colorchecker dE 2000 calibrated * | 4.8 | 0.56 88% | 0.7 85% | 0.65 86% | 0.67 86% |
| Greyscale dE 2000 * | 4.3 | 1 77% | 3.5 19% | 1 77% | 2 53% |
| Gamma | 1.92 115% | 2.3 96% | 2.1 105% | 2.26 97% | 2.3 96% |
| CCT | 6017 108% | 6556 99% | 7191 90% | 6380 102% | 6826 95% |
| Total Average (Program / Settings) | 23% /
14% | 1% /
10% | 37% /
37% | -19% /
-1% |
* ... smaller is better


Display Response Times
| ↔ Response Time Black to White | ||
|---|---|---|
| 22.2 ms ... rise ↗ and fall ↘ combined | ↗ 9.3 ms rise | 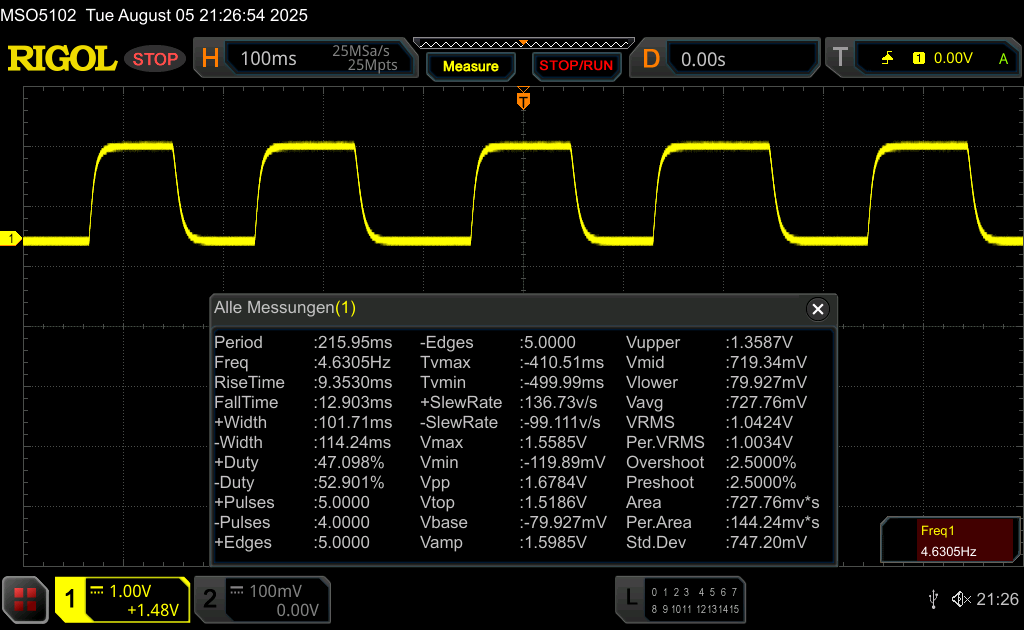 |
| ↘ 12.9 ms fall | ||
| The screen shows good response rates in our tests, but may be too slow for competitive gamers. In comparison, all tested devices range from 0.1 (minimum) to 240 (maximum) ms. » 51 % of all devices are better. This means that the measured response time is worse than the average of all tested devices (19.8 ms). | ||
| ↔ Response Time 50% Grey to 80% Grey | ||
| 30.3 ms ... rise ↗ and fall ↘ combined | ↗ 13.3 ms rise | 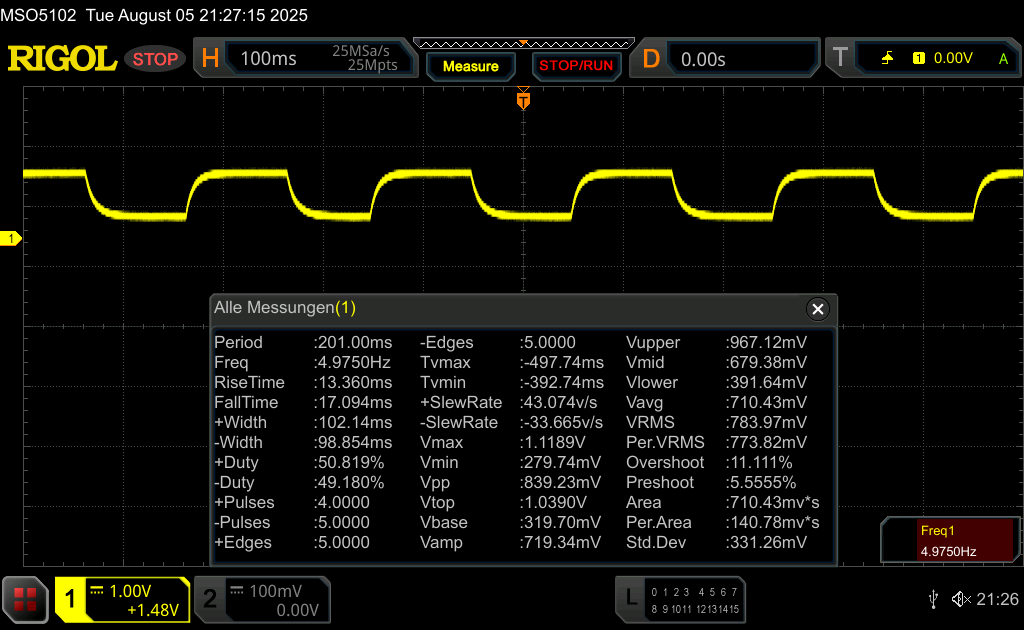 |
| ↘ 17 ms fall | ||
| The screen shows slow response rates in our tests and will be unsatisfactory for gamers. In comparison, all tested devices range from 0.165 (minimum) to 636 (maximum) ms. » 41 % of all devices are better. This means that the measured response time is similar to the average of all tested devices (31 ms). | ||
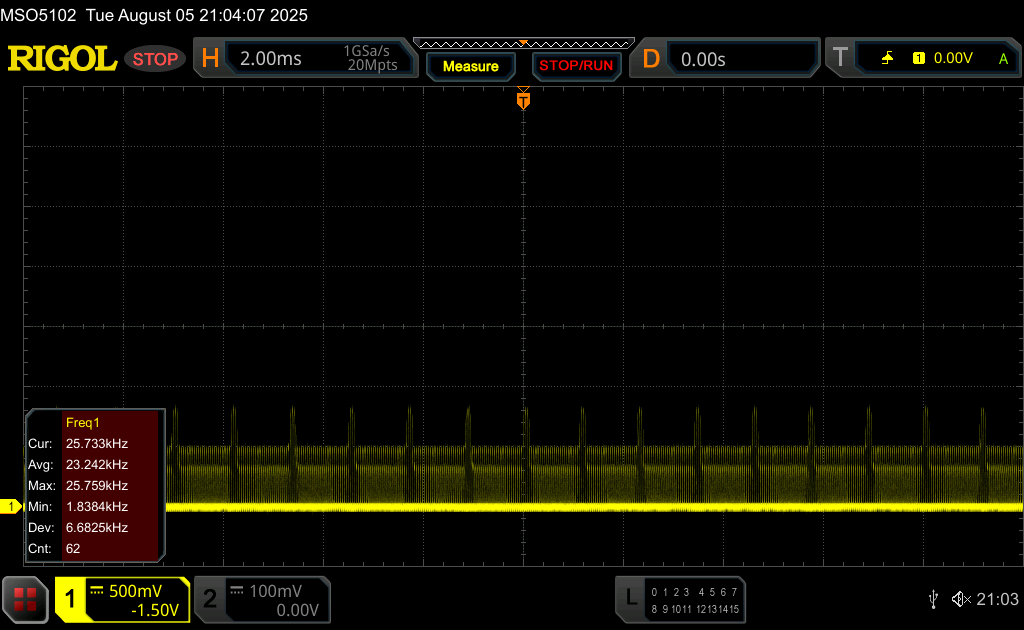
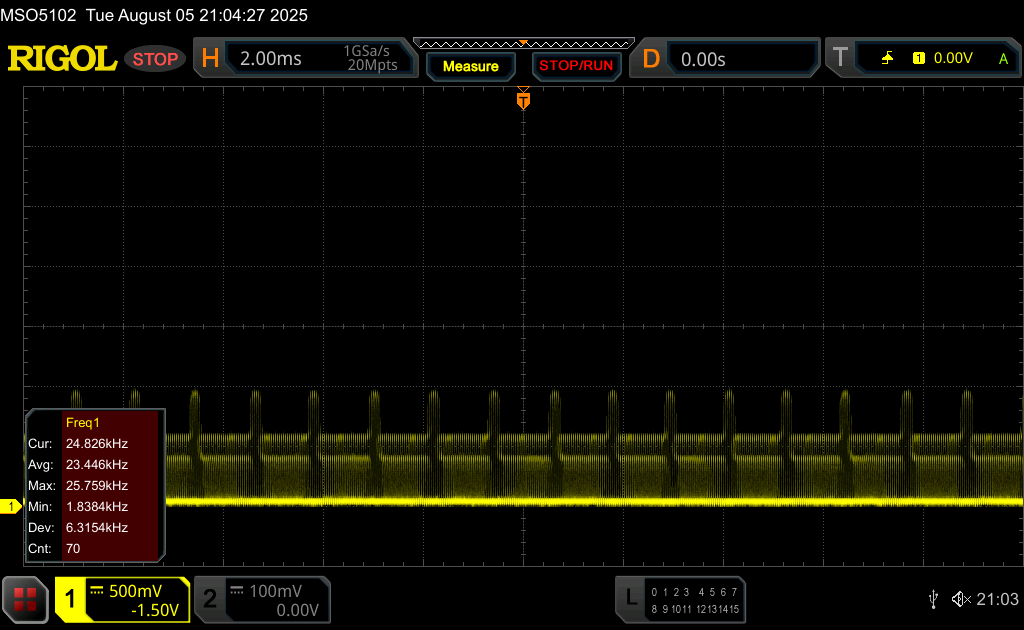
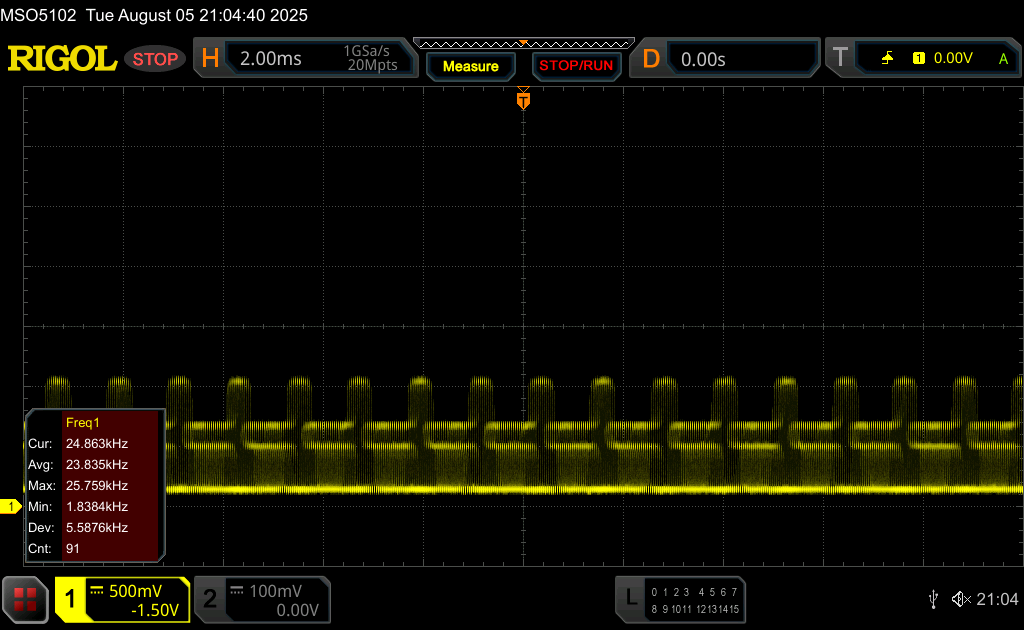
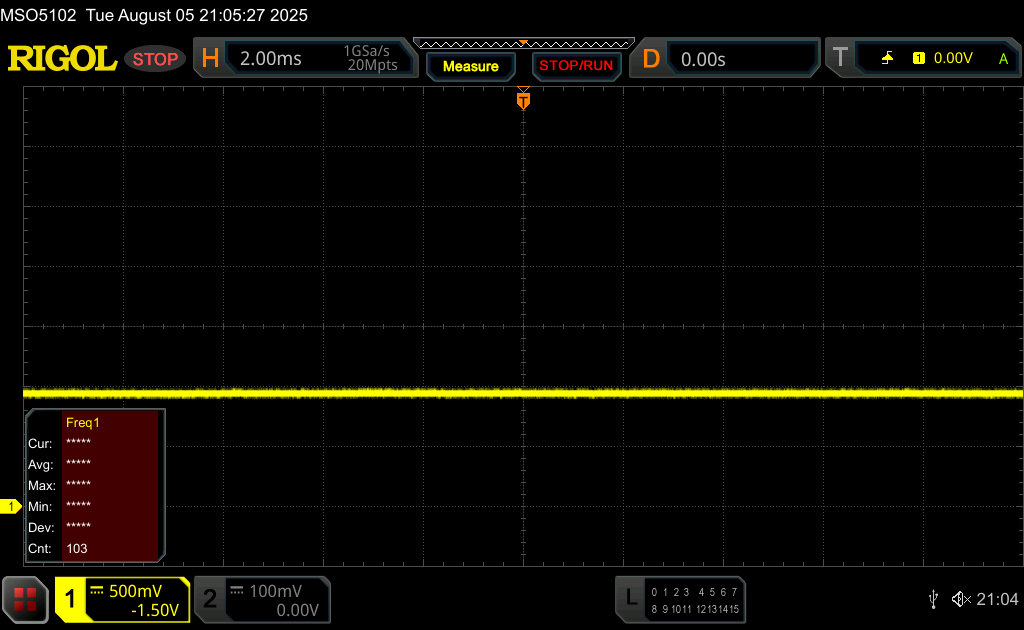
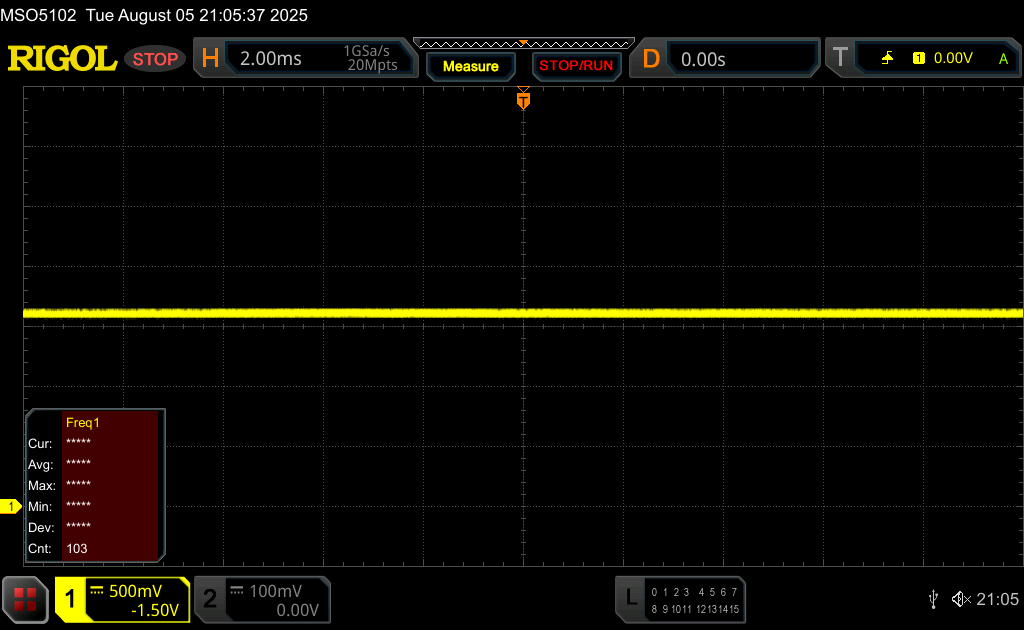
Screen Flickering / PWM (Pulse-Width Modulation)
| Screen flickering / PWM detected | 24000 Hz Amplitude: 75 % | ≤ 74 % brightness setting | 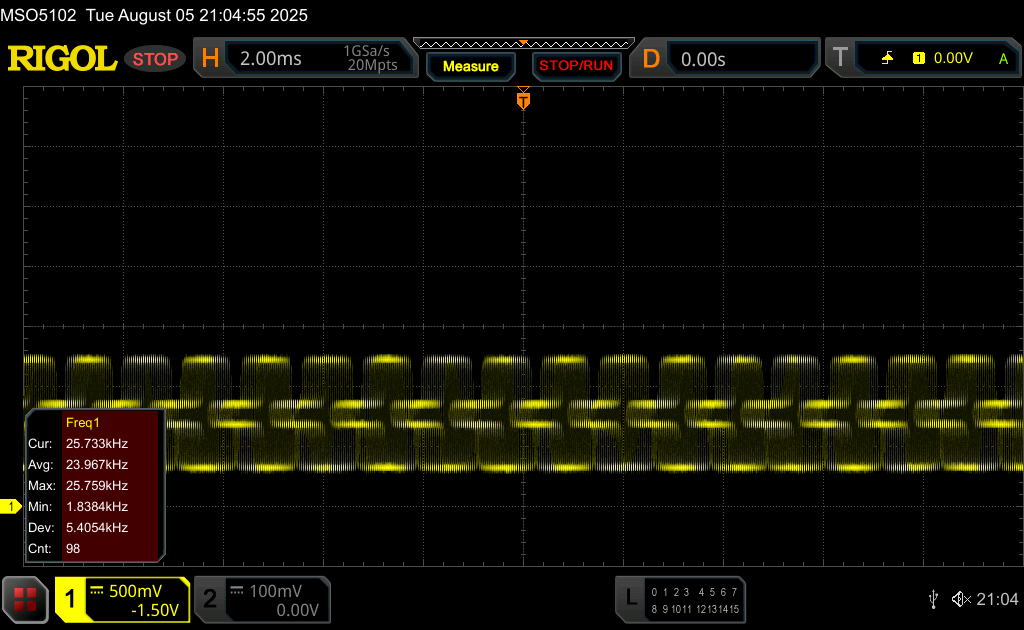 |
The display backlight flickers at 24000 Hz (worst case, e.g., utilizing PWM) Flickering detected at a brightness setting of 74 % and below. There should be no flickering or PWM above this brightness setting. The frequency of 24000 Hz is quite high, so most users sensitive to PWM should not notice any flickering. In comparison: 52 % of all tested devices do not use PWM to dim the display. If PWM was detected, an average of 7750 (minimum: 5 - maximum: 343500) Hz was measured. | |||
Performance: Intel Arrow Lake H matches Strix Point
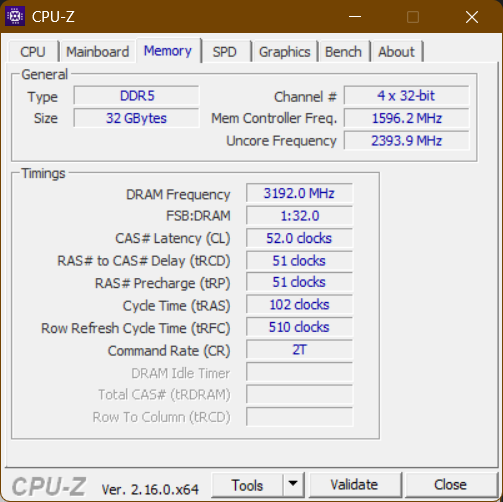
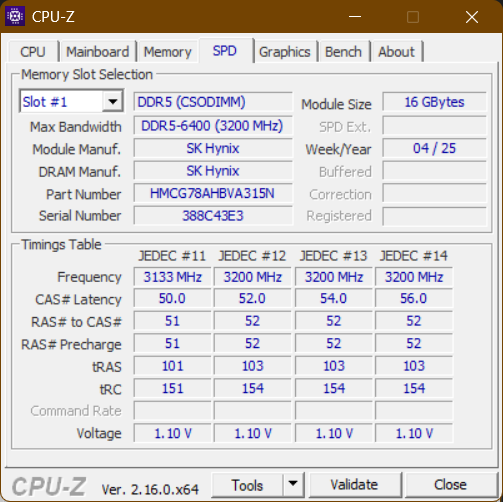
HP offers a selection of both Arrow Lake U and Arrow Lake H CPUs, ranging from 12 to 16 cores in total for the nine CPUs offered. There are four possible GPUs, three from Intel and the Nvidia RTX 500 Ada as the single dedicated GPU. Up to 64 GB of DDR5-5600 RAM (2x SO-DIMM) and a single M.2 2280 NVMe PCIe 4.0 SSD with up to 2 TB capacity are available.

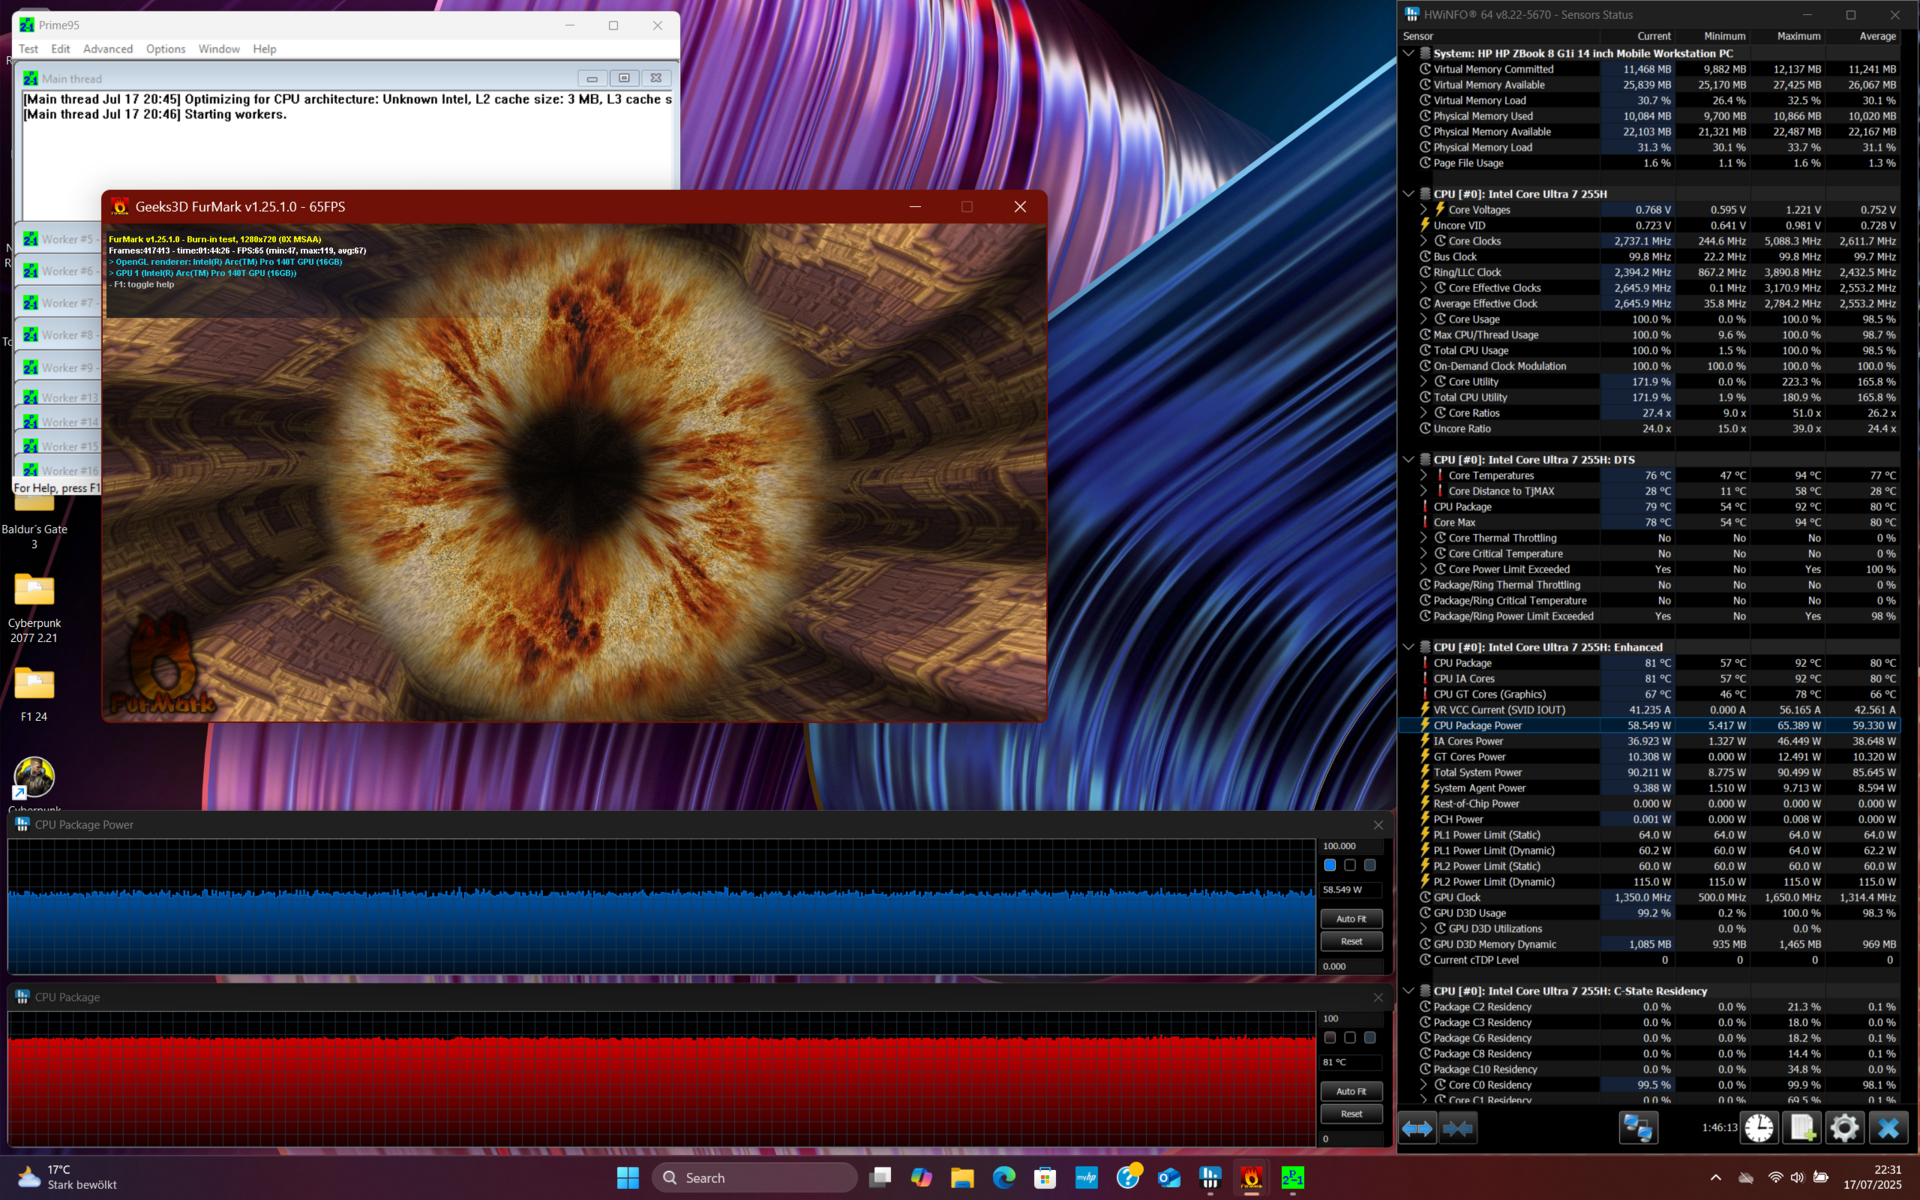
Testing Conditions
We tested our review device with the power mode "Best performance". The power limits for the processor are as such:
- Best energy efficiency: PL1 40 W / PL2 60 W
- Balanced: PL1 60 W / PL2 60 W
- Best performance: PL1 60 W / PL2 60 W
Processor
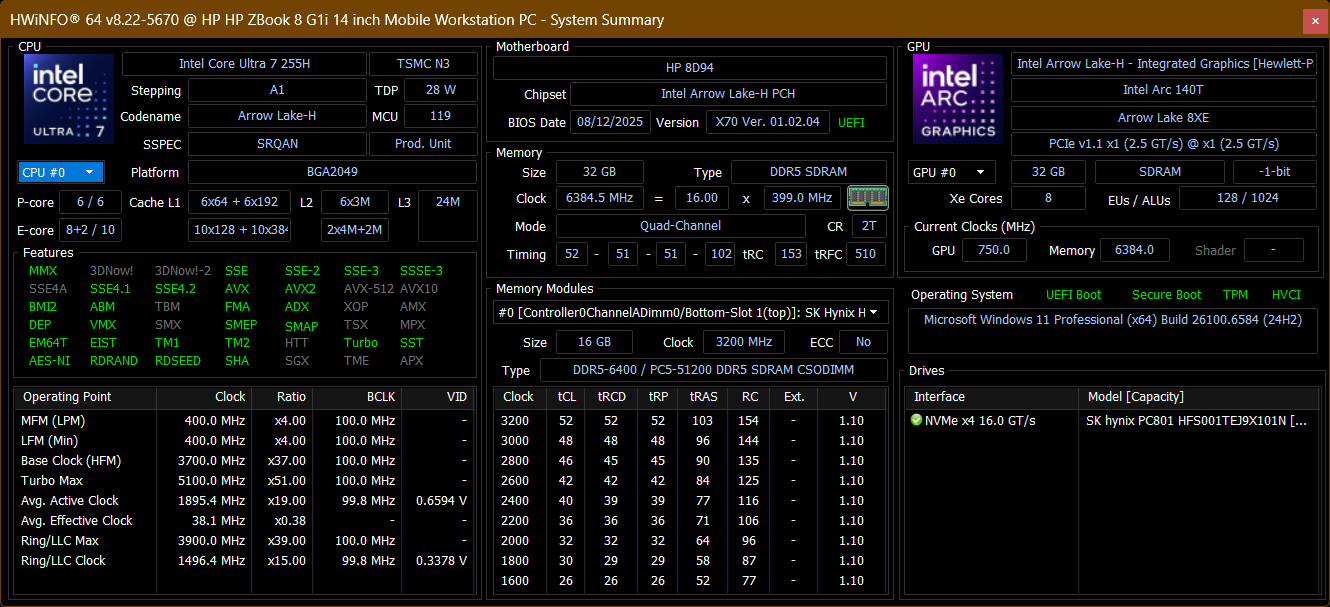
The Intel Core Ultra 255H is an Arrow Lake H processor with 16 cores in total (six Lion Cove P cores, up to 5.1 GHz; eight Skymont E cores, up to 4.4 GHz; two Low Power E cores, up to 2.5 GHz). The processor has a typical TDP rating of 28 W, but it can consume up to 115 W if set by the manufacturer to do so. More benchmark comparisons are possible with our CPU benchmark list.
Performance is clearly improved over the ZBook Firefly G11, but this is to be expected, as the sustained TDP is increased from 26 W to 60 W, thanks to the new dual fan cooling system. The Intel CPU does slightly better than the AMD chips in terms of singlecore loads, but the AMD Strix Halo is far better when it comes to multicore tasks. It is a tie with the Strix Point chip of the Lenovo ThinkPad P14s Gen 6 AMD, but it should be mentioned that this chip only consumes 36 W under sustained load.
CPU performance is not throttled in battery mode.
Cinebench R15 Multi Loop
Cinebench R23: Multi Core | Single Core
Cinebench R20: CPU (Multi Core) | CPU (Single Core)
Cinebench R15: CPU Multi 64Bit | CPU Single 64Bit
Blender: v2.79 BMW27 CPU
7-Zip 18.03: 7z b 4 | 7z b 4 -mmt1
Geekbench 6.7: Multi-Core | Single-Core
Geekbench 5.5: Multi-Core | Single-Core
HWBOT x265 Benchmark v2.2: 4k Preset
LibreOffice : 20 Documents To PDF
R Benchmark 2.5: Overall mean
| CPU Performance rating | |
| HP ZBook Ultra G1a 14 | |
| Average of class Workstation | |
| HP ZBook 8 G1i 14 | |
| Average Intel Core Ultra 7 255H | |
| Lenovo ThinkPad P14s Gen 6 21RV0017GE | |
| Dell Precision 5000 5490 | |
| HP ZBook Firefly 14 G11 | |
| Cinebench R23 / Multi Core | |
| HP ZBook Ultra G1a 14 | |
| Average of class Workstation (14621 - 38520, n=24, last 2 years) | |
| HP ZBook 8 G1i 14 | |
| Average Intel Core Ultra 7 255H (16105 - 22578, n=20) | |
| Lenovo ThinkPad P14s Gen 6 21RV0017GE | |
| Dell Precision 5000 5490 | |
| HP ZBook Firefly 14 G11 | |
| Cinebench R23 / Single Core | |
| Average Intel Core Ultra 7 255H (1874 - 2152, n=20) | |
| HP ZBook 8 G1i 14 | |
| Average of class Workstation (1712 - 2228, n=24, last 2 years) | |
| HP ZBook Ultra G1a 14 | |
| Lenovo ThinkPad P14s Gen 6 21RV0017GE | |
| Dell Precision 5000 5490 | |
| HP ZBook Firefly 14 G11 | |
| Cinebench R20 / CPU (Multi Core) | |
| HP ZBook Ultra G1a 14 | |
| Average of class Workstation (5760 - 15043, n=24, last 2 years) | |
| Average Intel Core Ultra 7 255H (6356 - 8860, n=19) | |
| HP ZBook 8 G1i 14 | |
| Lenovo ThinkPad P14s Gen 6 21RV0017GE | |
| Dell Precision 5000 5490 | |
| HP ZBook Firefly 14 G11 | |
| Cinebench R20 / CPU (Single Core) | |
| Average Intel Core Ultra 7 255H (743 - 826, n=19) | |
| HP ZBook 8 G1i 14 | |
| HP ZBook Ultra G1a 14 | |
| Average of class Workstation (671 - 857, n=24, last 2 years) | |
| Lenovo ThinkPad P14s Gen 6 21RV0017GE | |
| Dell Precision 5000 5490 | |
| HP ZBook Firefly 14 G11 | |
| Cinebench R15 / CPU Multi 64Bit | |
| HP ZBook Ultra G1a 14 | |
| Average of class Workstation (2489 - 5810, n=24, last 2 years) | |
| Lenovo ThinkPad P14s Gen 6 21RV0017GE | |
| Average Intel Core Ultra 7 255H (2414 - 3444, n=19) | |
| HP ZBook 8 G1i 14 | |
| Dell Precision 5000 5490 | |
| HP ZBook Firefly 14 G11 | |
| Cinebench R15 / CPU Single 64Bit | |
| HP ZBook Ultra G1a 14 | |
| HP ZBook 8 G1i 14 | |
| Average Intel Core Ultra 7 255H (258 - 322, n=20) | |
| Average of class Workstation (191.4 - 328, n=24, last 2 years) | |
| HP ZBook Firefly 14 G11 | |
| Dell Precision 5000 5490 | |
| Lenovo ThinkPad P14s Gen 6 21RV0017GE | |
| Blender / v2.79 BMW27 CPU | |
| HP ZBook Firefly 14 G11 | |
| Dell Precision 5000 5490 | |
| Average Intel Core Ultra 7 255H (156 - 293, n=19) | |
| HP ZBook 8 G1i 14 | |
| Lenovo ThinkPad P14s Gen 6 21RV0017GE | |
| Average of class Workstation (91 - 222, n=24, last 2 years) | |
| HP ZBook Ultra G1a 14 | |
| 7-Zip 18.03 / 7z b 4 | |
| HP ZBook Ultra G1a 14 | |
| Average of class Workstation (60489 - 116969, n=24, last 2 years) | |
| Lenovo ThinkPad P14s Gen 6 21RV0017GE | |
| Dell Precision 5000 5490 | |
| HP ZBook 8 G1i 14 | |
| Average Intel Core Ultra 7 255H (42155 - 70397, n=20) | |
| HP ZBook Firefly 14 G11 | |
| 7-Zip 18.03 / 7z b 4 -mmt1 | |
| Average of class Workstation (5126 - 6960, n=24, last 2 years) | |
| Lenovo ThinkPad P14s Gen 6 21RV0017GE | |
| Average Intel Core Ultra 7 255H (4589 - 6385, n=20) | |
| HP ZBook 8 G1i 14 | |
| HP ZBook Ultra G1a 14 | |
| Dell Precision 5000 5490 | |
| HP ZBook Firefly 14 G11 | |
| Geekbench 6.7 / Multi-Core | |
| HP ZBook Ultra G1a 14 | |
| Average of class Workstation (12721 - 20887, n=24, last 2 years) | |
| HP ZBook 8 G1i 14 | |
| Average Intel Core Ultra 7 255H (11979 - 17489, n=20) | |
| Lenovo ThinkPad P14s Gen 6 21RV0017GE | |
| Dell Precision 5000 5490 | |
| HP ZBook Firefly 14 G11 | |
| Geekbench 6.7 / Single-Core | |
| HP ZBook 8 G1i 14 | |
| Lenovo ThinkPad P14s Gen 6 21RV0017GE | |
| Average Intel Core Ultra 7 255H (2712 - 2939, n=20) | |
| Average of class Workstation (2389 - 3065, n=24, last 2 years) | |
| HP ZBook Ultra G1a 14 | |
| HP ZBook Firefly 14 G11 | |
| Dell Precision 5000 5490 | |
| Geekbench 5.5 / Multi-Core | |
| HP ZBook Ultra G1a 14 | |
| Average of class Workstation (11542 - 25554, n=24, last 2 years) | |
| HP ZBook 8 G1i 14 | |
| Average Intel Core Ultra 7 255H (11348 - 17218, n=19) | |
| Lenovo ThinkPad P14s Gen 6 21RV0017GE | |
| Dell Precision 5000 5490 | |
| HP ZBook Firefly 14 G11 | |
| Geekbench 5.5 / Single-Core | |
| Lenovo ThinkPad P14s Gen 6 21RV0017GE | |
| HP ZBook 8 G1i 14 | |
| HP ZBook Ultra G1a 14 | |
| Average Intel Core Ultra 7 255H (1938 - 2121, n=19) | |
| Average of class Workstation (1783 - 2183, n=24, last 2 years) | |
| HP ZBook Firefly 14 G11 | |
| Dell Precision 5000 5490 | |
| HWBOT x265 Benchmark v2.2 / 4k Preset | |
| HP ZBook Ultra G1a 14 | |
| Average of class Workstation (17.8 - 40.5, n=24, last 2 years) | |
| Lenovo ThinkPad P14s Gen 6 21RV0017GE | |
| HP ZBook 8 G1i 14 | |
| Average Intel Core Ultra 7 255H (13.7 - 26.5, n=19) | |
| Dell Precision 5000 5490 | |
| HP ZBook Firefly 14 G11 | |
| LibreOffice / 20 Documents To PDF | |
| HP ZBook Ultra G1a 14 | |
| Lenovo ThinkPad P14s Gen 6 21RV0017GE | |
| HP ZBook Firefly 14 G11 | |
| Average Intel Core Ultra 7 255H (41.1 - 61.6, n=19) | |
| Average of class Workstation (37.1 - 74.7, n=24, last 2 years) | |
| HP ZBook 8 G1i 14 | |
| Dell Precision 5000 5490 | |
| R Benchmark 2.5 / Overall mean | |
| Dell Precision 5000 5490 | |
| HP ZBook Firefly 14 G11 | |
| Average Intel Core Ultra 7 255H (0.4233 - 0.515, n=19) | |
| HP ZBook 8 G1i 14 | |
| Average of class Workstation (0.3825 - 0.603, n=24, last 2 years) | |
| Lenovo ThinkPad P14s Gen 6 21RV0017GE | |
| HP ZBook Ultra G1a 14 | |
* ... smaller is better
AIDA64: FP32 Ray-Trace | FPU Julia | CPU SHA3 | CPU Queen | FPU SinJulia | FPU Mandel | CPU AES | CPU ZLib | FP64 Ray-Trace | CPU PhotoWorxx
| Performance rating | |
| HP ZBook Ultra G1a 14 | |
| Average of class Workstation | |
| Lenovo ThinkPad P14s Gen 6 21RV0017GE | |
| HP ZBook 8 G1i 14 | |
| Average Intel Core Ultra 7 255H | |
| Dell Precision 5000 5490 | |
| HP ZBook Firefly 14 G11 | |
| AIDA64 / FP32 Ray-Trace | |
| HP ZBook Ultra G1a 14 | |
| Lenovo ThinkPad P14s Gen 6 21RV0017GE | |
| Average of class Workstation (15143 - 61611, n=24, last 2 years) | |
| HP ZBook 8 G1i 14 | |
| Average Intel Core Ultra 7 255H (13863 - 24741, n=17) | |
| Dell Precision 5000 5490 | |
| HP ZBook Firefly 14 G11 | |
| AIDA64 / FPU Julia | |
| HP ZBook Ultra G1a 14 | |
| Average of class Workstation (81575 - 186971, n=24, last 2 years) | |
| Lenovo ThinkPad P14s Gen 6 21RV0017GE | |
| HP ZBook 8 G1i 14 | |
| Average Intel Core Ultra 7 255H (71030 - 119222, n=17) | |
| Dell Precision 5000 5490 | |
| HP ZBook Firefly 14 G11 | |
| AIDA64 / CPU SHA3 | |
| HP ZBook Ultra G1a 14 | |
| Average of class Workstation (3833 - 8975, n=24, last 2 years) | |
| Lenovo ThinkPad P14s Gen 6 21RV0017GE | |
| HP ZBook 8 G1i 14 | |
| Average Intel Core Ultra 7 255H (3408 - 5548, n=17) | |
| Dell Precision 5000 5490 | |
| HP ZBook Firefly 14 G11 | |
| AIDA64 / CPU Queen | |
| HP ZBook Ultra G1a 14 | |
| Average of class Workstation (60778 - 144411, n=24, last 2 years) | |
| Dell Precision 5000 5490 | |
| Lenovo ThinkPad P14s Gen 6 21RV0017GE | |
| HP ZBook Firefly 14 G11 | |
| HP ZBook 8 G1i 14 | |
| Average Intel Core Ultra 7 255H (59098 - 68460, n=16) | |
| AIDA64 / FPU SinJulia | |
| HP ZBook Ultra G1a 14 | |
| Lenovo ThinkPad P14s Gen 6 21RV0017GE | |
| Average of class Workstation (8165 - 29343, n=24, last 2 years) | |
| Dell Precision 5000 5490 | |
| HP ZBook 8 G1i 14 | |
| HP ZBook Firefly 14 G11 | |
| Average Intel Core Ultra 7 255H (6716 - 9006, n=17) | |
| AIDA64 / FPU Mandel | |
| HP ZBook Ultra G1a 14 | |
| Average of class Workstation (40055 - 98153, n=24, last 2 years) | |
| Lenovo ThinkPad P14s Gen 6 21RV0017GE | |
| HP ZBook 8 G1i 14 | |
| Average Intel Core Ultra 7 255H (37031 - 63347, n=17) | |
| Dell Precision 5000 5490 | |
| HP ZBook Firefly 14 G11 | |
| AIDA64 / CPU AES | |
| HP ZBook Ultra G1a 14 | |
| Average of class Workstation (73133 - 187841, n=24, last 2 years) | |
| Lenovo ThinkPad P14s Gen 6 21RV0017GE | |
| Dell Precision 5000 5490 | |
| HP ZBook 8 G1i 14 | |
| Average Intel Core Ultra 7 255H (58402 - 83568, n=17) | |
| HP ZBook Firefly 14 G11 | |
| AIDA64 / CPU ZLib | |
| HP ZBook Ultra G1a 14 | |
| Average of class Workstation (929 - 2148, n=24, last 2 years) | |
| Lenovo ThinkPad P14s Gen 6 21RV0017GE | |
| HP ZBook 8 G1i 14 | |
| Average Intel Core Ultra 7 255H (822 - 1316, n=17) | |
| Dell Precision 5000 5490 | |
| HP ZBook Firefly 14 G11 | |
| AIDA64 / FP64 Ray-Trace | |
| HP ZBook Ultra G1a 14 | |
| Lenovo ThinkPad P14s Gen 6 21RV0017GE | |
| Average of class Workstation (7813 - 32891, n=24, last 2 years) | |
| HP ZBook 8 G1i 14 | |
| Average Intel Core Ultra 7 255H (7384 - 13231, n=17) | |
| Dell Precision 5000 5490 | |
| HP ZBook Firefly 14 G11 | |
| AIDA64 / CPU PhotoWorxx | |
| HP ZBook Ultra G1a 14 | |
| Average Intel Core Ultra 7 255H (23836 - 65787, n=17) | |
| HP ZBook 8 G1i 14 | |
| Dell Precision 5000 5490 | |
| Average of class Workstation (37151 - 93684, n=24, last 2 years) | |
| Lenovo ThinkPad P14s Gen 6 21RV0017GE | |
| HP ZBook Firefly 14 G11 | |
System Performance
Achieving the best scores in the system performance benchmarks, the HP ZBook 8 G1i 14 also performs very good in everyday usage.
PCMark 10: Score | Essentials | Productivity | Digital Content Creation
CrossMark: Overall | Productivity | Creativity | Responsiveness
WebXPRT 3: Overall
WebXPRT 4: Overall
Mozilla Kraken 1.1: Total
| Performance rating | |
| Average of class Workstation | |
| HP ZBook 8 G1i 14 | |
| Average Intel Core Ultra 7 255H, Intel Arc Graphics 140T | |
| HP ZBook Ultra G1a 14 | |
| Lenovo ThinkPad P14s Gen 6 21RV0017GE | |
| Dell Precision 5000 5490 | |
| HP ZBook Firefly 14 G11 | |
| PCMark 10 / Score | |
| Average of class Workstation (6563 - 10409, n=20, last 2 years) | |
| HP ZBook Ultra G1a 14 | |
| HP ZBook 8 G1i 14 | |
| Average Intel Core Ultra 7 255H, Intel Arc Graphics 140T (6878 - 9156, n=13) | |
| Lenovo ThinkPad P14s Gen 6 21RV0017GE | |
| Dell Precision 5000 5490 | |
| HP ZBook Firefly 14 G11 | |
| PCMark 10 / Essentials | |
| Dell Precision 5000 5490 | |
| HP ZBook 8 G1i 14 | |
| Lenovo ThinkPad P14s Gen 6 21RV0017GE | |
| Average Intel Core Ultra 7 255H, Intel Arc Graphics 140T (10637 - 11556, n=13) | |
| HP ZBook Ultra G1a 14 | |
| Average of class Workstation (9622 - 11157, n=20, last 2 years) | |
| HP ZBook Firefly 14 G11 | |
| PCMark 10 / Productivity | |
| Average of class Workstation (8789 - 20616, n=20, last 2 years) | |
| Average Intel Core Ultra 7 255H, Intel Arc Graphics 140T (7598 - 15694, n=13) | |
| Lenovo ThinkPad P14s Gen 6 21RV0017GE | |
| HP ZBook 8 G1i 14 | |
| HP ZBook Firefly 14 G11 | |
| Dell Precision 5000 5490 | |
| HP ZBook Ultra G1a 14 | |
| PCMark 10 / Digital Content Creation | |
| HP ZBook Ultra G1a 14 | |
| HP ZBook 8 G1i 14 | |
| Average of class Workstation (8108 - 15631, n=20, last 2 years) | |
| Average Intel Core Ultra 7 255H, Intel Arc Graphics 140T (10461 - 12552, n=13) | |
| Dell Precision 5000 5490 | |
| Lenovo ThinkPad P14s Gen 6 21RV0017GE | |
| HP ZBook Firefly 14 G11 | |
| CrossMark / Overall | |
| Average of class Workstation (1307 - 2267, n=23, last 2 years) | |
| HP ZBook Ultra G1a 14 | |
| Average Intel Core Ultra 7 255H, Intel Arc Graphics 140T (1610 - 2018, n=13) | |
| HP ZBook 8 G1i 14 | |
| Lenovo ThinkPad P14s Gen 6 21RV0017GE | |
| Dell Precision 5000 5490 | |
| HP ZBook Firefly 14 G11 | |
| CrossMark / Productivity | |
| Average Intel Core Ultra 7 255H, Intel Arc Graphics 140T (1566 - 1908, n=13) | |
| Average of class Workstation (1130 - 2122, n=23, last 2 years) | |
| HP ZBook 8 G1i 14 | |
| Lenovo ThinkPad P14s Gen 6 21RV0017GE | |
| Dell Precision 5000 5490 | |
| HP ZBook Ultra G1a 14 | |
| HP ZBook Firefly 14 G11 | |
| CrossMark / Creativity | |
| HP ZBook Ultra G1a 14 | |
| Average of class Workstation (1657 - 2725, n=23, last 2 years) | |
| HP ZBook 8 G1i 14 | |
| Lenovo ThinkPad P14s Gen 6 21RV0017GE | |
| Average Intel Core Ultra 7 255H, Intel Arc Graphics 140T (1827 - 2396, n=13) | |
| Dell Precision 5000 5490 | |
| HP ZBook Firefly 14 G11 | |
| CrossMark / Responsiveness | |
| Average of class Workstation (993 - 2096, n=23, last 2 years) | |
| Average Intel Core Ultra 7 255H, Intel Arc Graphics 140T (1194 - 1781, n=13) | |
| Lenovo ThinkPad P14s Gen 6 21RV0017GE | |
| HP ZBook Ultra G1a 14 | |
| Dell Precision 5000 5490 | |
| HP ZBook 8 G1i 14 | |
| HP ZBook Firefly 14 G11 | |
| WebXPRT 3 / Overall | |
| Lenovo ThinkPad P14s Gen 6 21RV0017GE | |
| HP ZBook 8 G1i 14 | |
| Average of class Workstation (260 - 360, n=24, last 2 years) | |
| Average Intel Core Ultra 7 255H, Intel Arc Graphics 140T (273 - 327, n=13) | |
| HP ZBook Firefly 14 G11 | |
| Dell Precision 5000 5490 | |
| HP ZBook Ultra G1a 14 | |
| WebXPRT 4 / Overall | |
| HP ZBook 8 G1i 14 | |
| Average Intel Core Ultra 7 255H, Intel Arc Graphics 140T (247 - 317, n=13) | |
| Average of class Workstation (189.2 - 326, n=24, last 2 years) | |
| Lenovo ThinkPad P14s Gen 6 21RV0017GE | |
| Dell Precision 5000 5490 | |
| HP ZBook Firefly 14 G11 | |
| HP ZBook Ultra G1a 14 | |
| Mozilla Kraken 1.1 / Total | |
| Dell Precision 5000 5490 | |
| HP ZBook Firefly 14 G11 | |
| Average of class Workstation (411 - 538, n=24, last 2 years) | |
| Average Intel Core Ultra 7 255H, Intel Arc Graphics 140T (427 - 510, n=13) | |
| Lenovo ThinkPad P14s Gen 6 21RV0017GE | |
| HP ZBook 8 G1i 14 | |
| HP ZBook Ultra G1a 14 | |
* ... smaller is better
| PCMark 10 Score | 7865 points | |
Help | ||
| AIDA64 / Memory Copy | |
| HP ZBook Ultra G1a 14 | |
| Dell Precision 5000 5490 | |
| Average Intel Core Ultra 7 255H (39188 - 110930, n=17) | |
| HP ZBook 8 G1i 14 | |
| Average of class Workstation (56003 - 164795, n=24, last 2 years) | |
| HP ZBook Firefly 14 G11 | |
| Lenovo ThinkPad P14s Gen 6 21RV0017GE | |
| AIDA64 / Memory Read | |
| HP ZBook Ultra G1a 14 | |
| HP ZBook 8 G1i 14 | |
| Dell Precision 5000 5490 | |
| Lenovo ThinkPad P14s Gen 6 21RV0017GE | |
| Average Intel Core Ultra 7 255H (43703 - 90552, n=17) | |
| Average of class Workstation (55795 - 121563, n=24, last 2 years) | |
| HP ZBook Firefly 14 G11 | |
| AIDA64 / Memory Write | |
| HP ZBook Ultra G1a 14 | |
| Dell Precision 5000 5490 | |
| Average of class Workstation (55663 - 214520, n=24, last 2 years) | |
| Lenovo ThinkPad P14s Gen 6 21RV0017GE | |
| Average Intel Core Ultra 7 255H (36438 - 87199, n=17) | |
| HP ZBook 8 G1i 14 | |
| HP ZBook Firefly 14 G11 | |
| AIDA64 / Memory Latency | |
| HP ZBook Ultra G1a 14 | |
| Dell Precision 5000 5490 | |
| Average of class Workstation (84.5 - 165.2, n=24, last 2 years) | |
| Average Intel Core Ultra 7 255H (107.6 - 147.2, n=17) | |
| HP ZBook Firefly 14 G11 | |
| HP ZBook 8 G1i 14 | |
| Lenovo ThinkPad P14s Gen 6 21RV0017GE | |
* ... smaller is better
DPC Latency
The HP laptop did not exhibit DPC latency related problems in our testing.
| DPC Latencies / LatencyMon - interrupt to process latency (max), Web, Youtube, Prime95 | |
| HP ZBook Firefly 14 G11 | |
| Dell Precision 5000 5490 | |
| HP ZBook 8 G1i 14 | |
| Lenovo ThinkPad P14s Gen 6 21RV0017GE | |
* ... smaller is better
Storage Devices
HP uses a fast SK Hynix M.2 2280 SSD that is connected to the system via NVMe PCIe 4.0. While the SSD is indeed a good one, it does suffer a bit from thermal throttling under load. Its speed gets throttled down by about half under sustained load.

* ... smaller is better
Disk Throttling: DiskSpd Read Loop, Queue Depth 8
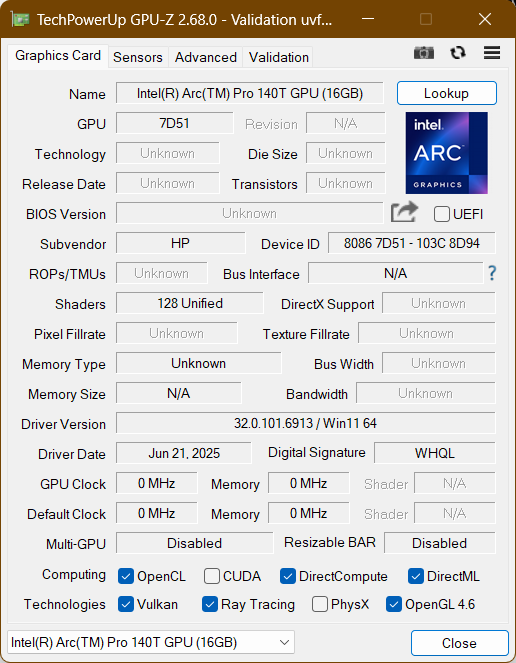
GPU Performance
The GPU of the ZBook 8 G1i 14 is one of the more interesting aspects. Usually, workstations use a dedicated GPU, but HP uses the integrated Intel solution. Some AMD-based workstations have embraced this approach for a few years, with varying success. In this case, it is clearly not a very powerful solution, as the Intel ARC 140T can not even compete with the integrated AMD iGPU of Strix Point. It is certainly usable for very basic rendering, but not for bigger projects. In the SPECviewperf benchmark, it places last.
| 3DMark 11 Performance | 13217 points | |
| 3DMark Fire Strike Score | 7981 points | |
| 3DMark Time Spy Score | 4294 points | |
Help | ||
* ... smaller is better
| Performance rating - Percent | |
| Average of class Workstation | |
| HP ZBook Ultra G1a 14 | |
| Dell Precision 5000 5490 -1! | |
| HP ZBook Firefly 14 G11 -1! | |
| Lenovo ThinkPad P14s Gen 6 21RV0017GE | |
| HP ZBook 8 G1i 14 | |
| Cyberpunk 2077 - 1920x1080 Ultra Preset (FSR off) | |
| HP ZBook Ultra G1a 14 | |
| Average of class Workstation (21.5 - 152.4, n=24, last 2 years) | |
| Dell Precision 5000 5490 | |
| Lenovo ThinkPad P14s Gen 6 21RV0017GE | |
| HP ZBook 8 G1i 14 | |
| HP ZBook Firefly 14 G11 | |
| Baldur's Gate 3 - 1920x1080 Ultra Preset AA:T | |
| HP ZBook Ultra G1a 14 | |
| Average of class Workstation (23.7 - 205, n=25, last 2 years) | |
| Dell Precision 5000 5490 | |
| HP ZBook Firefly 14 G11 | |
| HP ZBook 8 G1i 14 | |
| Lenovo ThinkPad P14s Gen 6 21RV0017GE | |
| GTA V - 1920x1080 Highest AA:4xMSAA + FX AF:16x | |
| Average of class Workstation (18.1 - 156.1, n=24, last 2 years) | |
| HP ZBook Ultra G1a 14 | |
| Lenovo ThinkPad P14s Gen 6 21RV0017GE | |
| HP ZBook 8 G1i 14 | |
| Final Fantasy XV Benchmark - 1920x1080 High Quality | |
| Average of class Workstation (26.4 - 197.6, n=24, last 2 years) | |
| HP ZBook Ultra G1a 14 | |
| Dell Precision 5000 5490 | |
| HP ZBook 8 G1i 14 | |
| HP ZBook Firefly 14 G11 | |
| Lenovo ThinkPad P14s Gen 6 21RV0017GE | |
| Dota 2 Reborn - 1920x1080 ultra (3/3) best looking | |
| HP ZBook Ultra G1a 14 | |
| Average of class Workstation (50.7 - 178.4, n=24, last 2 years) | |
| Dell Precision 5000 5490 | |
| HP ZBook Firefly 14 G11 | |
| HP ZBook 8 G1i 14 | |
| Lenovo ThinkPad P14s Gen 6 21RV0017GE | |
| X-Plane 11.11 - 1920x1080 high (fps_test=3) | |
| HP ZBook Firefly 14 G11 | |
| Average of class Workstation (30.5 - 139.7, n=24, last 2 years) | |
| Dell Precision 5000 5490 | |
| HP ZBook Ultra G1a 14 | |
| Lenovo ThinkPad P14s Gen 6 21RV0017GE | |
| HP ZBook 8 G1i 14 | |
Cyberpunk 2077 ultra FPS Chart
| low | med. | high | ultra | QHD | |
|---|---|---|---|---|---|
| GTA V (2015) | 179.2 | 169.1 | 44.4 | 18.1 | 12.3 |
| Dota 2 Reborn (2015) | 105.6 | 91.2 | 69.6 | 83.2 | |
| Final Fantasy XV Benchmark (2018) | 88.7 | 44.9 | 31.7 | 23.4 | |
| X-Plane 11.11 (2018) | 58.8 | 47.3 | 36.1 | ||
| Baldur's Gate 3 (2023) | 41.5 | 32.6 | 28.3 | 27.8 | 19.5 |
| Cyberpunk 2077 (2023) | 38.4 | 30.8 | 27.5 | 24.8 | 15.8 |
| F1 25 (2025) | 70.8 | 59.4 | 46.9 | 9.58 |
Emissions & Power Consumption: HP ZBook speakers are strong
System Noise
Overall, the HP ZBook 8 G1i 14 is not a loud system, as the fans stay turned off during normal everyday usage. Even under sustained max load, when the fans do turn on, they do not go crazy, with a maximum of 44.1 dB(a).
Coil whine was not a problem with this HP laptop.
Noise level
| Idle |
| 24.9 / 24.9 / 30.3 dB(A) |
| Load |
| 44.1 / 44.1 dB(A) |
 | ||
30 dB silent 40 dB(A) audible 50 dB(A) loud |
||
min: | ||
| HP ZBook 8 G1i 14 Arc 140T, Ultra 7 255H, SK hynix PC801 HFS001TEJ9X101N | HP ZBook Firefly 14 G11 RTX A500 Laptop GPU, Ultra 7 165H, Kioxia XG8 KXG80ZNV512G | Lenovo ThinkPad P14s Gen 6 21RV0017GE Radeon 890M, Ryzen AI 9 HX PRO 370, SK hynix PC801 HFS001TEJ9X162N | HP ZBook Ultra G1a 14 Radeon 8060S, Ryzen AI Max+ PRO 395, WDC PC SN810 2TB | Dell Precision 5000 5490 RTX 3000 Ada Generation Laptop, Ultra 9 185H, Kioxia XG8 KXG80ZNV1T02 | |
|---|---|---|---|---|---|
| Noise | 3% | 4% | -1% | 5% | |
| off / environment * (dB) | 24.9 | 24.3 2% | 24.5 2% | 23.9 4% | 22.8 8% |
| Idle Minimum * (dB) | 24.9 | 24.6 1% | 24.5 2% | 23.9 4% | 23.8 4% |
| Idle Average * (dB) | 24.9 | 25.2 -1% | 24.5 2% | 23.9 4% | 23.8 4% |
| Idle Maximum * (dB) | 30.3 | 26.8 12% | 24.5 19% | 26.8 12% | 24.7 18% |
| Load Average * (dB) | 44.1 | 38.9 12% | 36.5 17% | 42.2 4% | 38.9 12% |
| Cyberpunk 2077 ultra * (dB) | 40.4 | 41.8 -3% | 44.7 -11% | 49.1 -22% | |
| Load Maximum * (dB) | 44.1 | 45.8 -4% | 44.9 -2% | 49.2 -12% | 51.4 -17% |
| Witcher 3 ultra * (dB) | 49.9 |
* ... smaller is better
Temperature
With just above 40.3 degrees Celsius or 105 F, the HP ZBook 8 G1i 14 does not get very hot at all under load. The palmrest area also stays pretty cool, even under sustained load.
There is no throttling during the stress test.
(±) The maximum temperature on the upper side is 40.3 °C / 105 F, compared to the average of 38.2 °C / 101 F, ranging from 22.2 to 69.8 °C for the class Workstation.
(+) The bottom heats up to a maximum of 38.4 °C / 101 F, compared to the average of 41.1 °C / 106 F
(+) In idle usage, the average temperature for the upper side is 27.4 °C / 81 F, compared to the device average of 32 °C / 90 F.
(±) 3: The average temperature for the upper side is 32.3 °C / 90 F, compared to the average of 32 °C / 90 F for the class Workstation.
(+) The palmrests and touchpad are cooler than skin temperature with a maximum of 29.3 °C / 84.7 F and are therefore cool to the touch.
(±) The average temperature of the palmrest area of similar devices was 27.8 °C / 82 F (-1.5 °C / -2.7 F).
| HP ZBook 8 G1i 14 Intel Core Ultra 7 255H, Intel Arc Graphics 140T | HP ZBook Firefly 14 G11 Intel Core Ultra 7 165H, NVIDIA RTX A500 Laptop GPU | Lenovo ThinkPad P14s Gen 6 21RV0017GE AMD Ryzen AI 9 HX PRO 370, AMD Radeon 890M | HP ZBook Ultra G1a 14 AMD Ryzen AI Max+ PRO 395, AMD Radeon 8060S | Dell Precision 5000 5490 Intel Core Ultra 9 185H, NVIDIA RTX 3000 Ada Generation Laptop | |
|---|---|---|---|---|---|
| Heat | -7% | -14% | -6% | -4% | |
| Maximum Upper Side * (°C) | 40.3 | 42.8 -6% | 50.5 -25% | 41.4 -3% | 43.2 -7% |
| Maximum Bottom * (°C) | 38.4 | 44 -15% | 50.2 -31% | 36.6 5% | 38.4 -0% |
| Idle Upper Side * (°C) | 29.4 | 30.6 -4% | 29.1 1% | 34 -16% | 31.6 -7% |
| Idle Bottom * (°C) | 30.3 | 31.4 -4% | 30.1 1% | 33.6 -11% | 30.6 -1% |
* ... smaller is better
Speakers
A complete blowout: The speakers of the HP ZBook laptop are well above the speakers of the competing Lenovo ThinkPad P14s Gen 6 AMD. Both in terms of volume and speaker quality, the HP device outdoes the ThinkPad laptop.
HP ZBook 8 G1i 14 audio analysis
(+) | speakers can play relatively loud (87.8 dB)
Bass 100 - 315 Hz
(-) | nearly no bass - on average 15% lower than median
(±) | linearity of bass is average (11.7% delta to prev. frequency)
Mids 400 - 2000 Hz
(+) | balanced mids - only 2% away from median
(+) | mids are linear (3.4% delta to prev. frequency)
Highs 2 - 16 kHz
(+) | balanced highs - only 4.3% away from median
(+) | highs are linear (5.3% delta to prev. frequency)
Overall 100 - 16.000 Hz
(+) | overall sound is linear (10.6% difference to median)
Compared to same class
» 9% of all tested devices in this class were better, 5% similar, 87% worse
» The best had a delta of 7%, average was 17%, worst was 35%
Compared to all devices tested
» 6% of all tested devices were better, 1% similar, 93% worse
» The best had a delta of 4%, average was 23%, worst was 134%
Lenovo ThinkPad P14s Gen 6 21RV0017GE audio analysis
(±) | speaker loudness is average but good (78 dB)
Bass 100 - 315 Hz
(-) | nearly no bass - on average 16.2% lower than median
(±) | linearity of bass is average (12.4% delta to prev. frequency)
Mids 400 - 2000 Hz
(±) | higher mids - on average 6% higher than median
(+) | mids are linear (3.3% delta to prev. frequency)
Highs 2 - 16 kHz
(+) | balanced highs - only 1.9% away from median
(+) | highs are linear (3.9% delta to prev. frequency)
Overall 100 - 16.000 Hz
(±) | linearity of overall sound is average (17.4% difference to median)
Compared to same class
» 53% of all tested devices in this class were better, 10% similar, 37% worse
» The best had a delta of 7%, average was 17%, worst was 35%
Compared to all devices tested
» 33% of all tested devices were better, 8% similar, 58% worse
» The best had a delta of 4%, average was 23%, worst was 134%
Power Consumption
Power consumption is slightly lower when idling, but slightly higher under load, when compared to the HP ZBook Firefly G11. This makes sense, as the lack of a dedicated GPU and more efficient Arrow Lake CPU would improve the efficiency when idling, but the higher power limit with the dual fan cooling would increase it under load.
The HP laptop stays within the envelope of the 100 W USB-C charger.
| Off / Standby | |
| Idle | |
| Load |
|
Key:
min: | |
Power Consumption Cyberpunk / Stress Test
Power Consumption external Monitor
Battery Life
Despite using a high resolution screen and an H class CPU, the battery life of the HP ZBook 8 G1i 14 is good. 12 hrs in our Wi-Fi web surfing test (150 cd/m² screen brightness) is respectable, especially in the power-hungry workstation category.
| HP ZBook 8 G1i 14 Ultra 7 255H, Arc 140T, 77 Wh | HP ZBook Firefly 14 G11 Ultra 7 165H, RTX A500 Laptop GPU, 56 Wh | Lenovo ThinkPad P14s Gen 6 21RV0017GE Ryzen AI 9 HX PRO 370, Radeon 890M, 57 Wh | HP ZBook Ultra G1a 14 Ryzen AI Max+ PRO 395, Radeon 8060S, 74.5 Wh | Dell Precision 5000 5490 Ultra 9 185H, RTX 3000 Ada Generation Laptop, 72 Wh | Average of class Workstation | |
|---|---|---|---|---|---|---|
| Battery runtime | -28% | -11% | -42% | -8% | 1% | |
| WiFi v1.3 (h) | 12 | 8.6 -28% | 9.3 -22% | 7 -42% | 11 -8% | 8.52 ? -29% |
| Load (h) | 1.1 | 1.1 0% | 1.429 ? 30% |
Notebookcheck Rating
The HP ZBook 8 G1i is a very good choice for a powerful work laptop. Our specific configuration is especially well suited for CPU heavy tasks. The device does not have any huge weaknesses.
HP ZBook 8 G1i 14
- 10/14/2025 v8
Benjamin Herzig
 Total Sustainability Score:
 Potential Competitors in Comparison
Image | Model / Review | Price | Weight | Height | Display |
|---|---|---|---|---|---|
1. 82%  | HP ZBook 8 G1i 14 Intel Core Ultra 7 255H ⎘ Intel Arc Graphics 140T ⎘ 32 GB Memory, 1024 GB SSD | Amazon: List Price: 1860 Euro | 1.7 kg | 23 mm | 14.00" 2560x1600 216 PPI IPS LED |
2. 80.3%  | HP ZBook Firefly 14 G11 Intel Core Ultra 7 165H ⎘ NVIDIA RTX A500 Laptop GPU ⎘ 32 GB Memory, 512 GB SSD | Amazon: List Price: 3500 USD | 1.5 kg | 19.2 mm | 14.00" 2560x1600 216 PPI IPS |
3. 81.6%  | Lenovo ThinkPad P14s Gen 6 21RV0017GE AMD Ryzen AI 9 HX PRO 370 ⎘ AMD Radeon 890M ⎘ 64 GB Memory, 1024 GB SSD | Amazon: List Price: 2289 Euro | 1.4 kg | 22 mm | 14.00" 1920x1200 162 PPI IPS LED |
4. 87.4%  | HP ZBook Ultra G1a 14 AMD Ryzen AI Max+ PRO 395 ⎘ AMD Radeon 8060S ⎘ 128 GB Memory, 2048 GB SSD | Amazon: List Price: 4000 USD | 1.6 kg | 18.5 mm | 14.00" 2880x1800 243 PPI OLED |
5. 89.3% v7 (old)  | Dell Precision 5000 5490 Intel Core Ultra 9 185H ⎘ NVIDIA RTX 3000 Ada Generation Laptop ⎘ 64 GB Memory, 1024 GB SSD | Amazon: List Price: 3800 USD | 1.6 kg | 18.95 mm | 14.00" 2560x1600 216 PPI IPS |
Transparency
The selection of devices to be reviewed is made by our editorial team. The test sample was provided to the author as a loan by the manufacturer or retailer for the purpose of this review. The lender had no influence on this review, nor did the manufacturer receive a copy of this review before publication. There was no obligation to publish this review. As an independent media company, Notebookcheck is not subjected to the authority of manufacturers, retailers or publishers.
This is how Notebookcheck is testing
Every year, Notebookcheck independently reviews hundreds of laptops and smartphones using standardized procedures to ensure that all results are comparable. We have continuously developed our test methods for around 20 years and set industry standards in the process. In our test labs, high-quality measuring equipment is utilized by experienced technicians and editors. These tests involve a multi-stage validation process. Our complex rating system is based on hundreds of well-founded measurements and benchmarks, which maintains objectivity. Further information on our test methods can be found here.
