MSI Thin GF63 12VE laptop review: GeForce RTX 4050 gaming with 8 GB of RAM
Verdict — Get The 16 GB Configuration
The <$900 price point is enough to get any budget gamer interested in the MSI GF63. Its specifications check off a lot of boxes including the fast 144 Hz refresh rate, GeForce RTX 4050 GPU, relatively new 12th gen Core i5 or i7 H-series CPU, and 512 GB of storage. This isn't a slow machine at its core and it's only going to get cheaper now that GeForce RTX 50 laptops are hitting the market. The MSI system is also lighter than many alternatives including the Acer Nitro V 15 or Lenovo LOQ 15.
Unfortunately, the user experience remains unchanged from the 2020 model meaning the chassis still feels cheap and any end-user servicing requires breaking an anti-tamper factory sticker. SKUs with 8 GB of RAM should therefore be avoided as the limited memory impacts overall performance while the factory sticker dissuades any sort of upgrades.
Pros
Cons
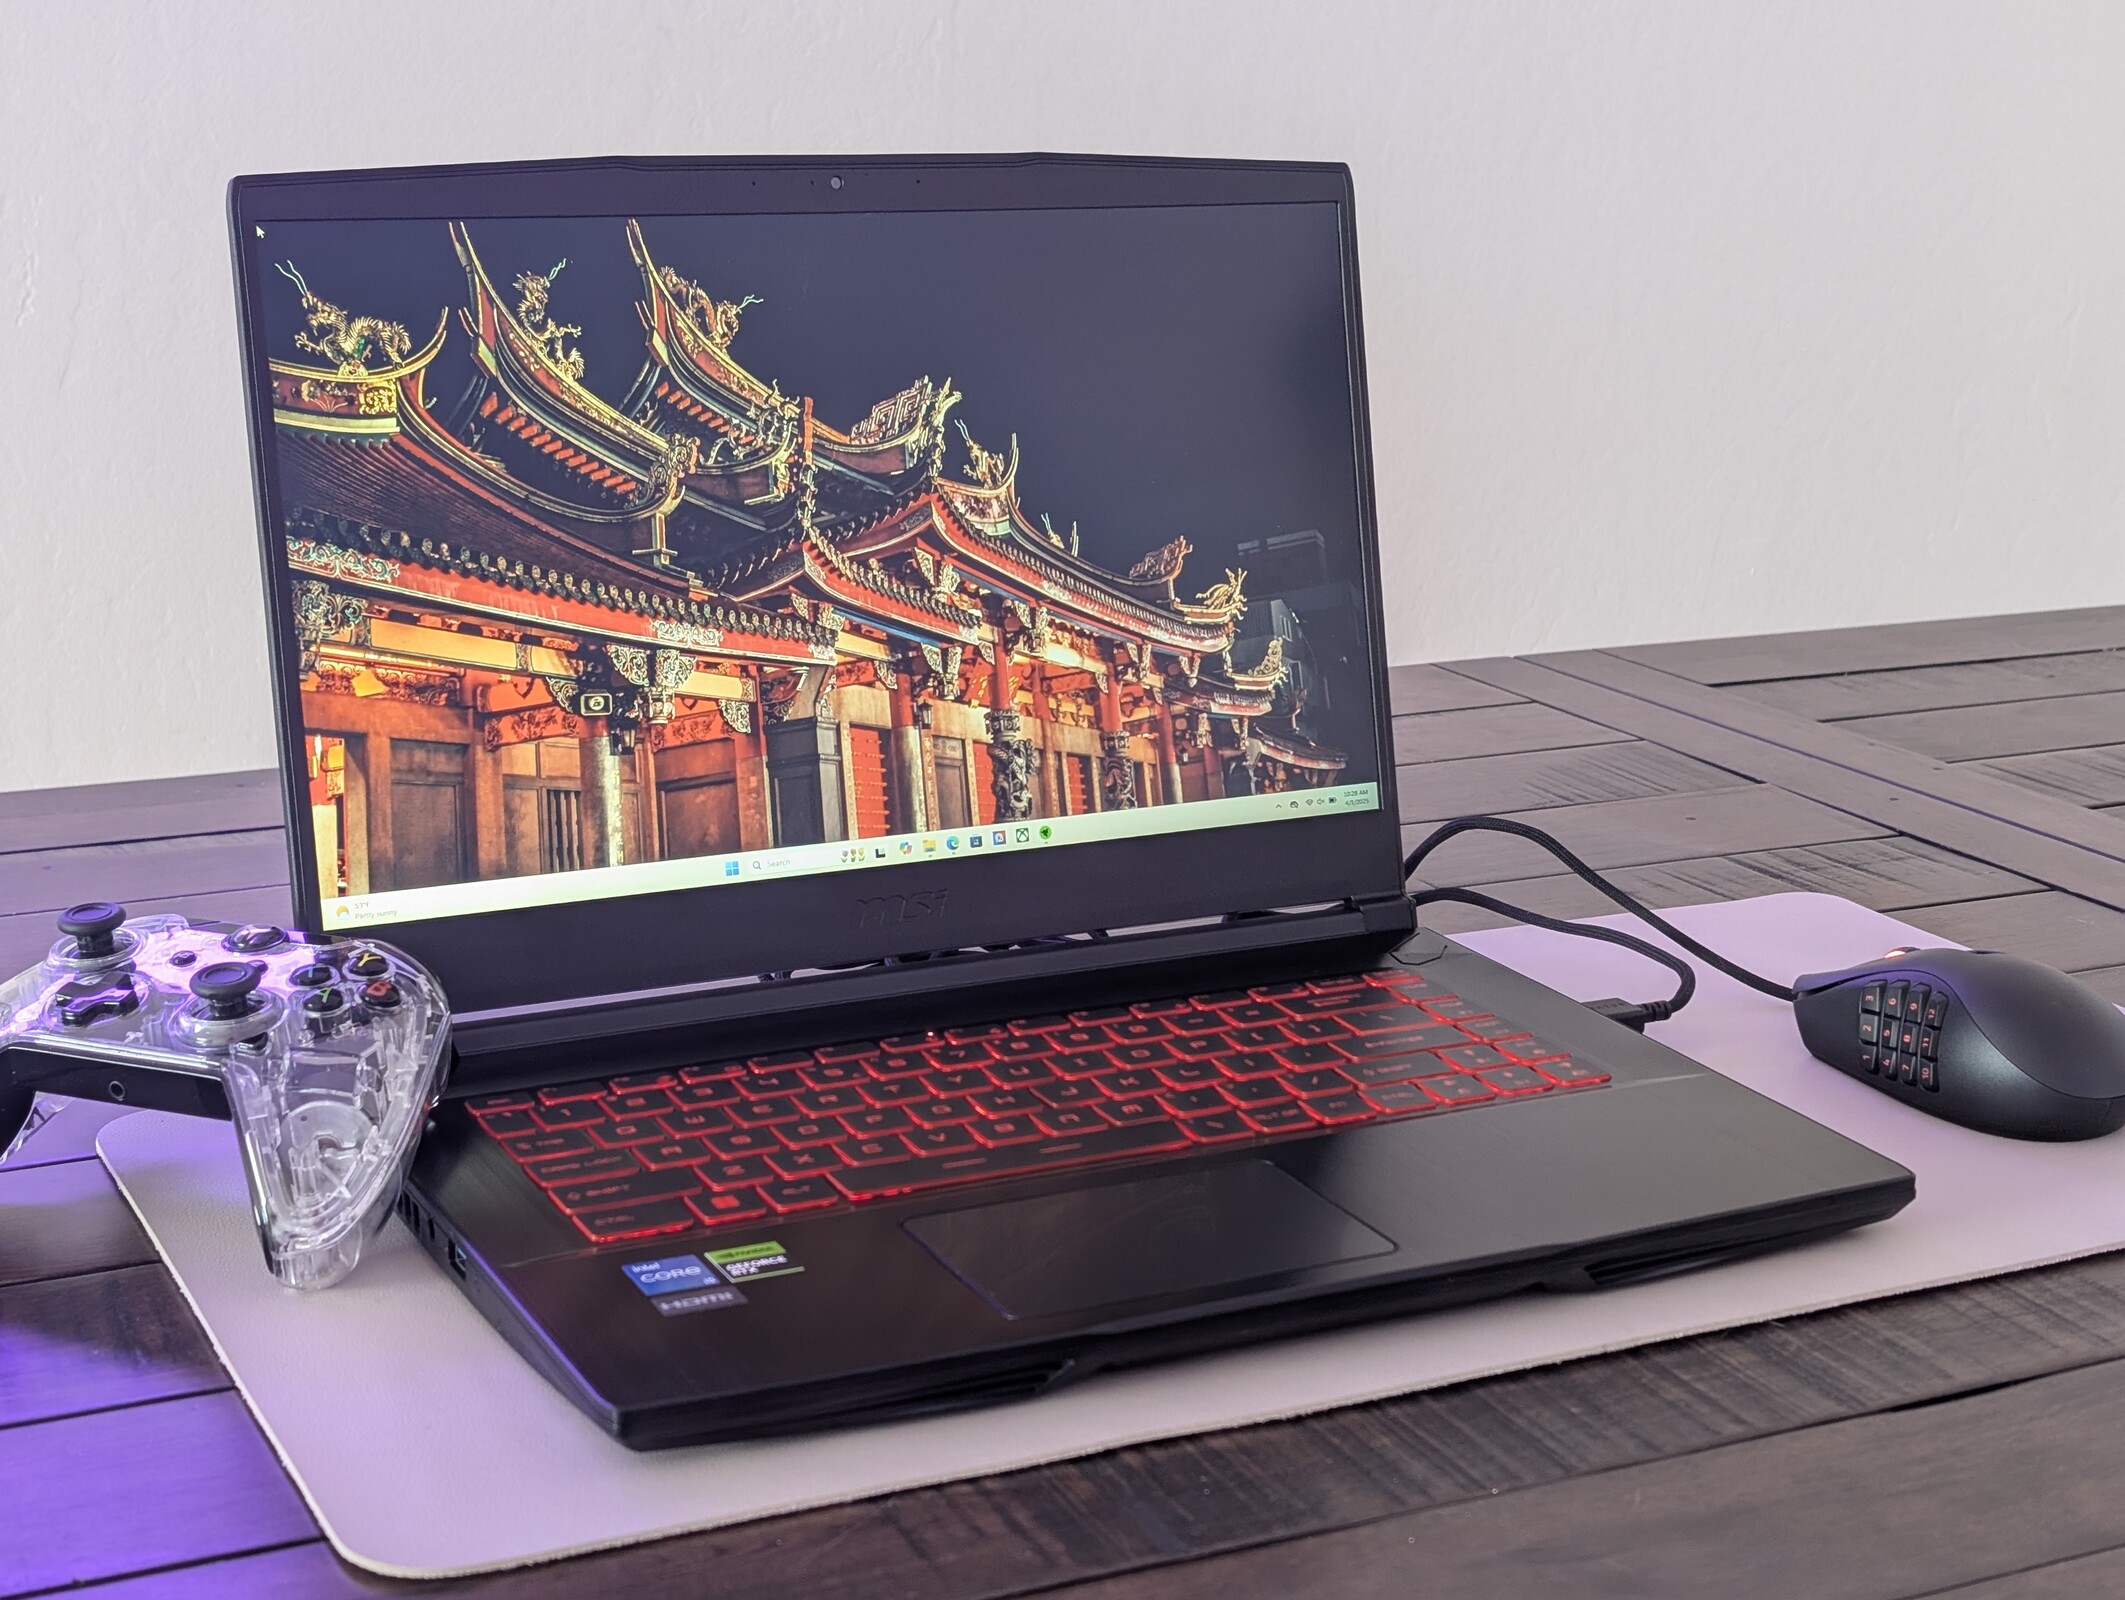
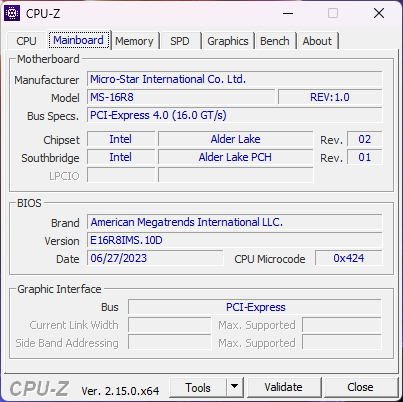
The GF63 is MSI's least expensive lineup of gaming laptops designed for budget-conscious gamers who want GeForce RTX graphics without all the bells and whistles. It's been 5 years since we reviewed the last GF63 and so this latest model comes with much newer Intel Alder Lake and Ada Lovelace GPU options.
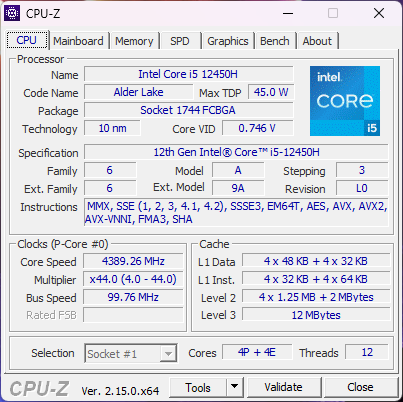
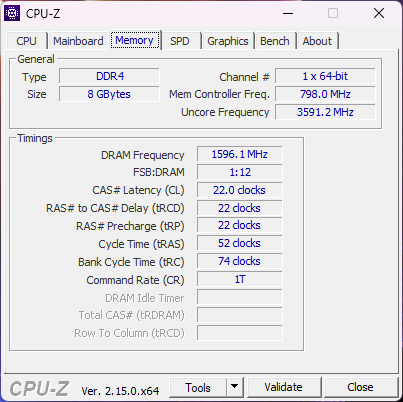
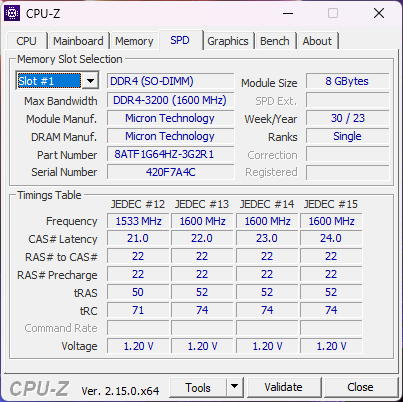
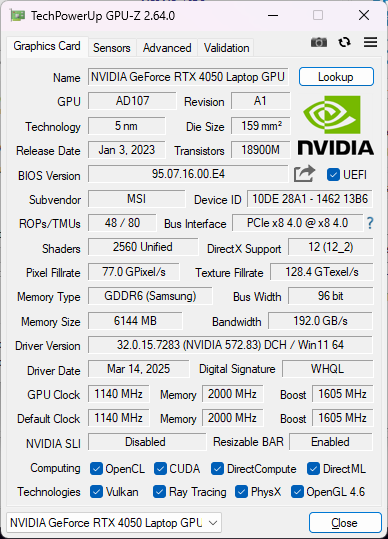
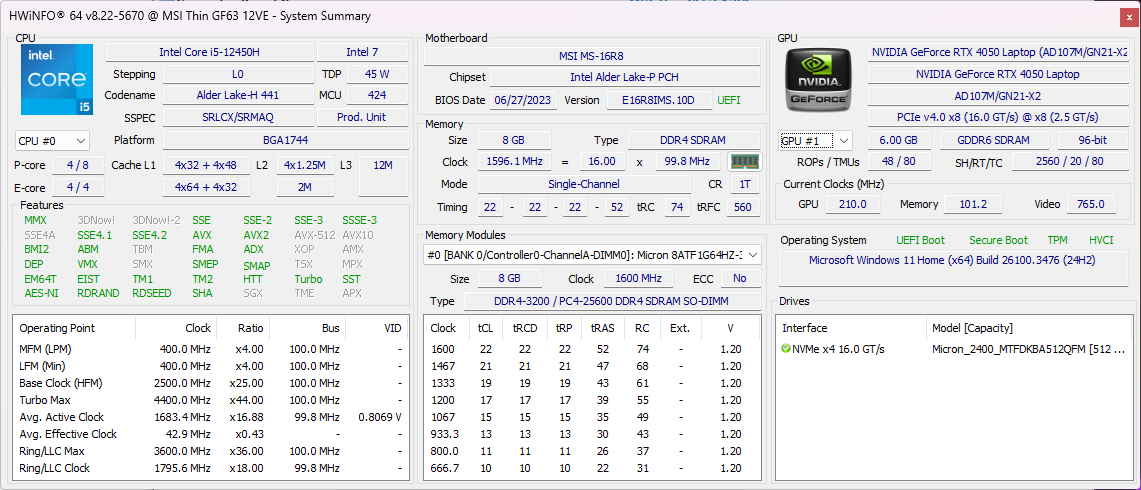
Our test unit is a low-end configuration widely available at retailers like Target and Amazon. It ships with the Core i5-12450H, 6 GB RTX 4050, 8 GB of RAM, and 144 Hz 1080p IPS display for approximately $850 to $900. SKUs with the Core i7-12650H, RTX 4060, and double the RAM are also available.
Competitors include other entry-level gaming laptops like the Lenovo LOQ 15, Asus TUF A15, or Acer Nitro V 15.
More MSI reviews:
Specifications
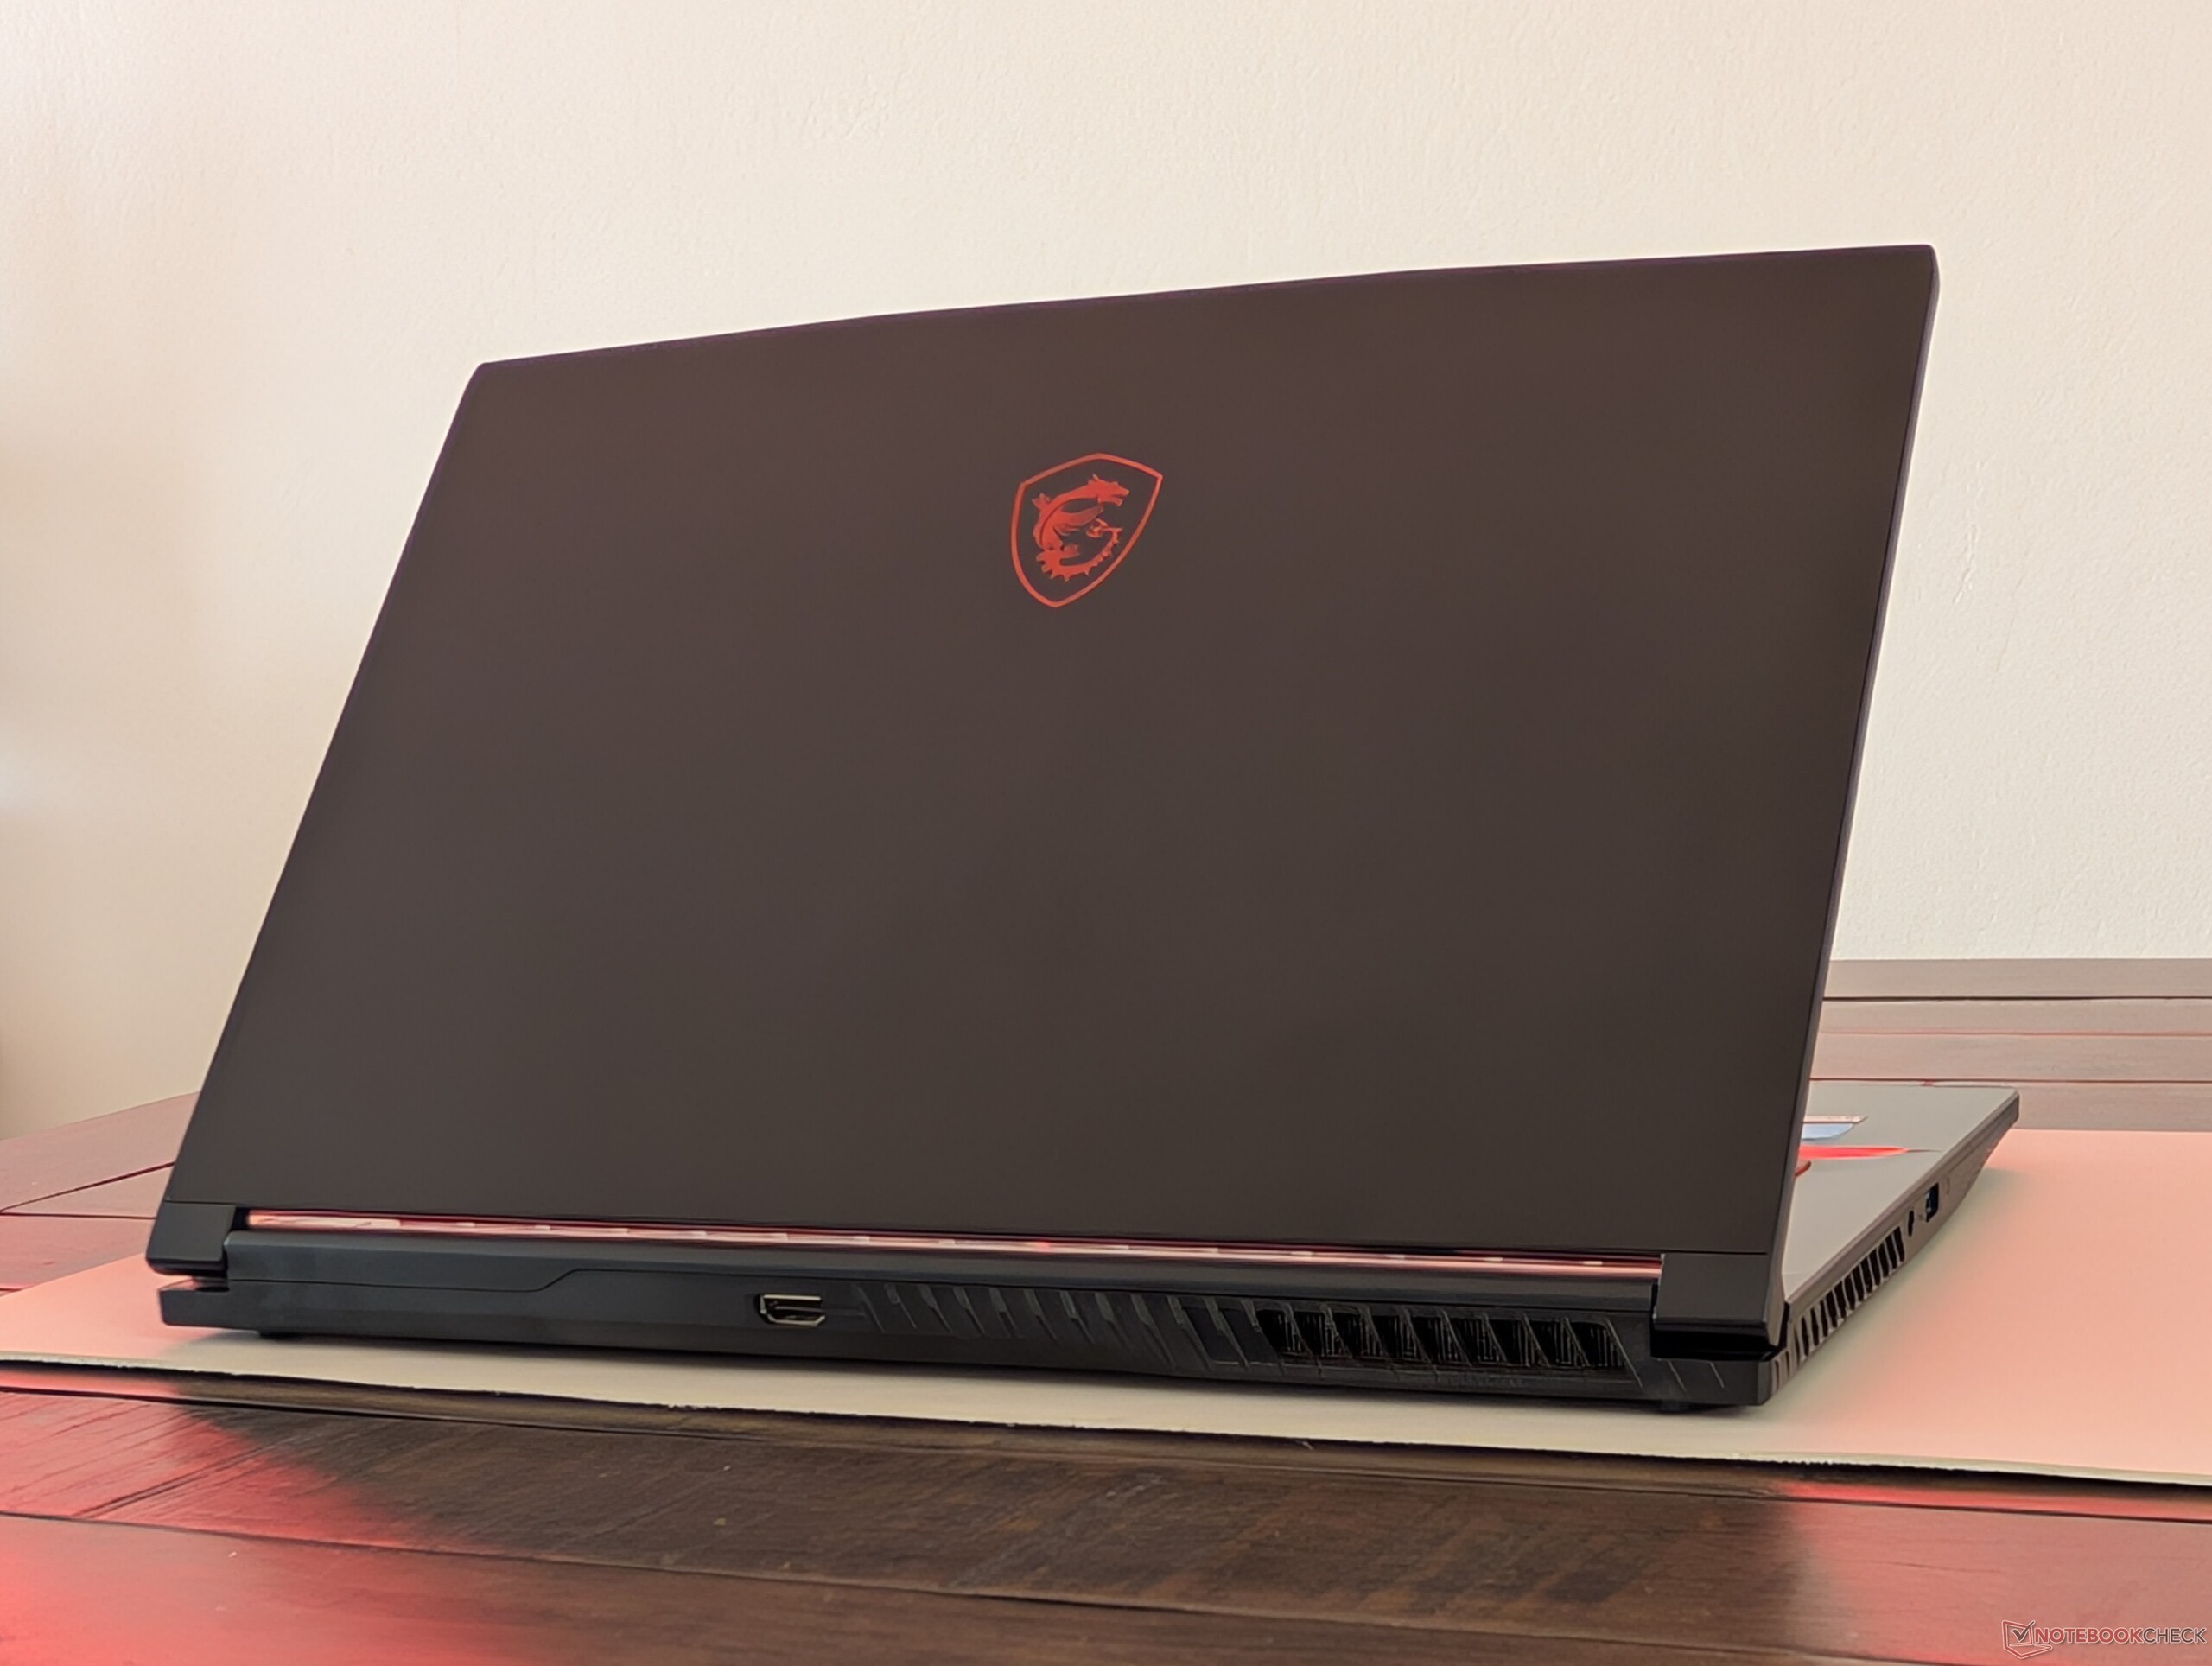
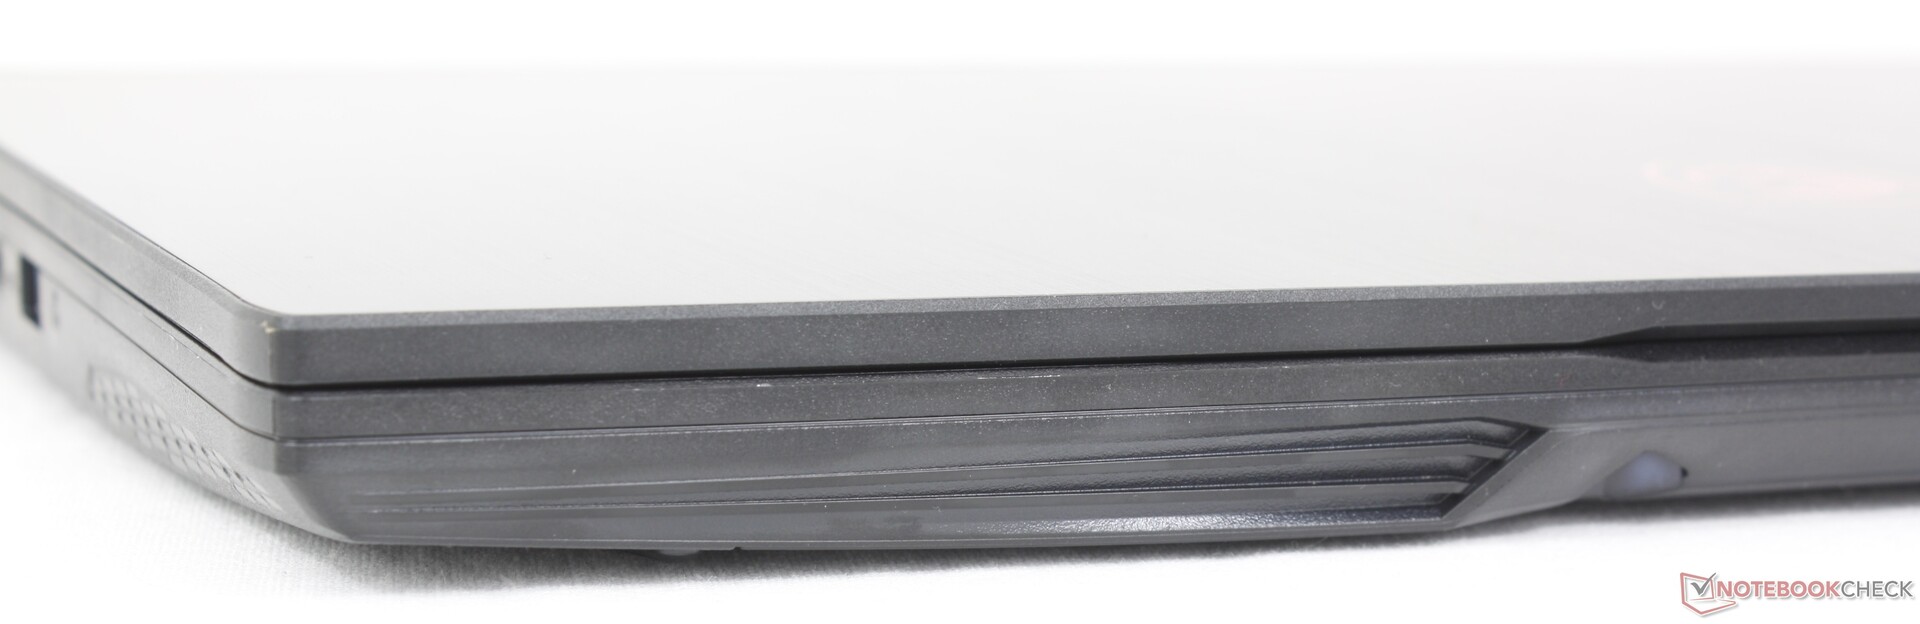
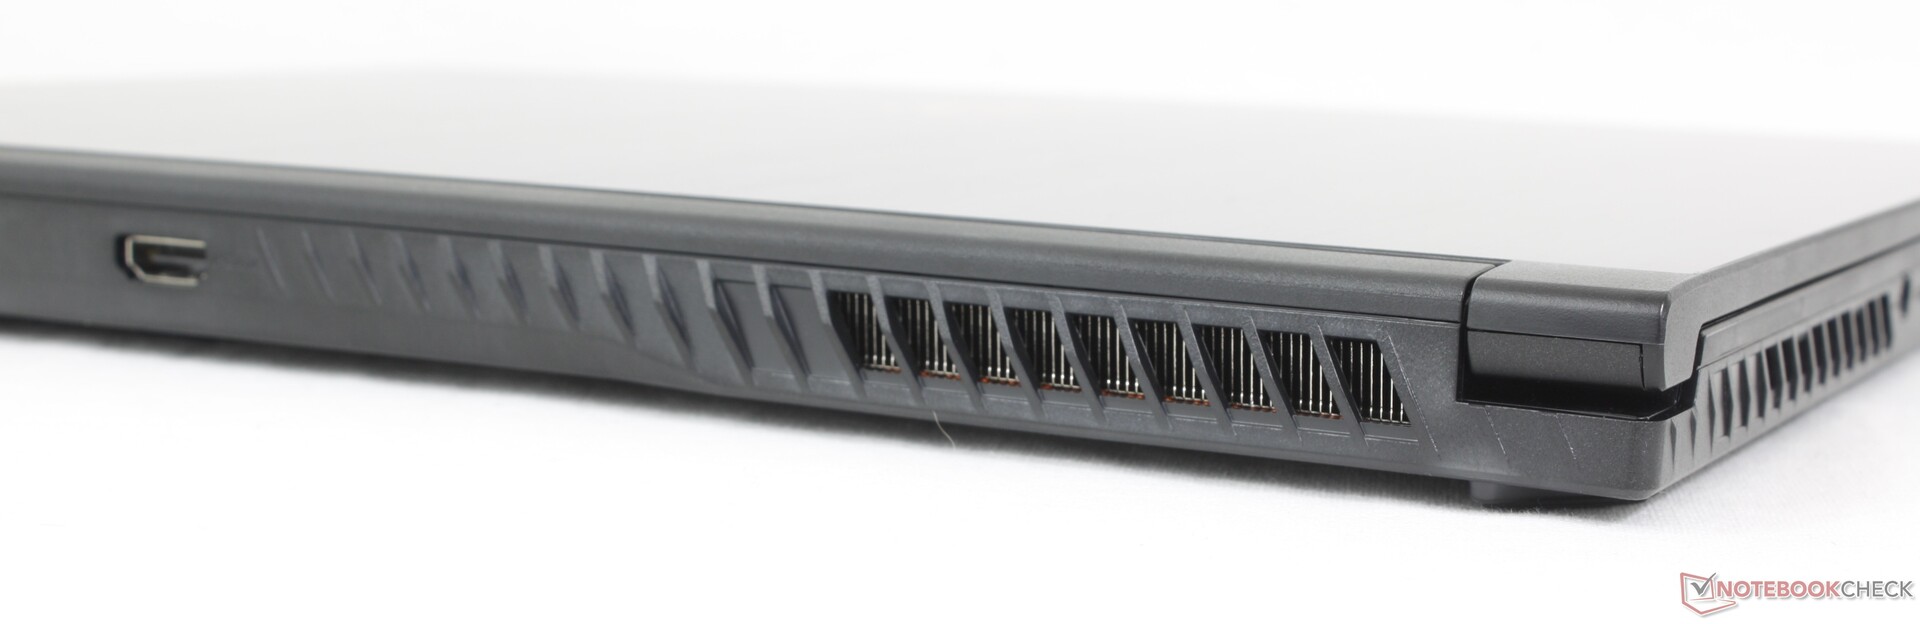
Case
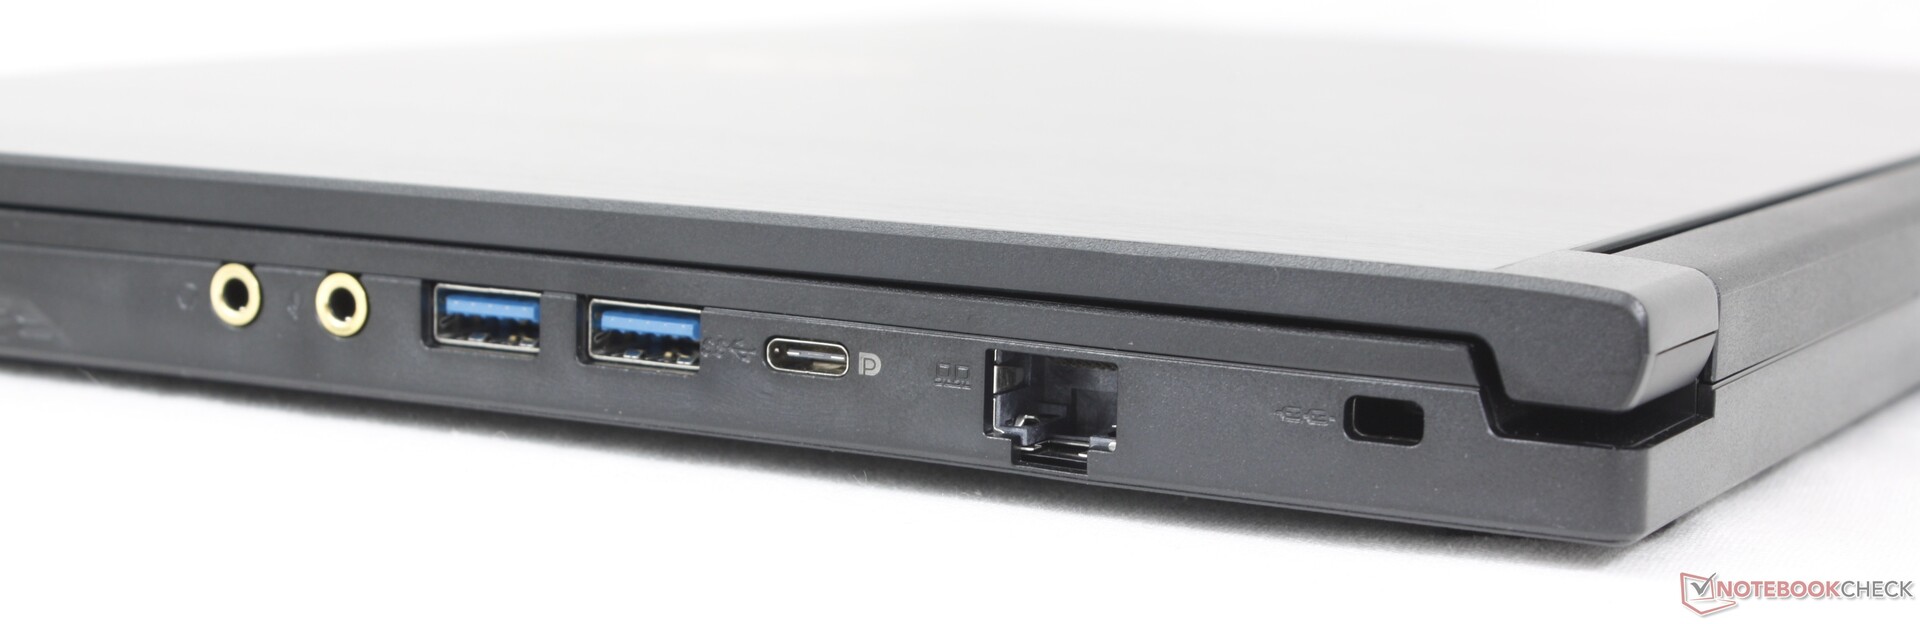
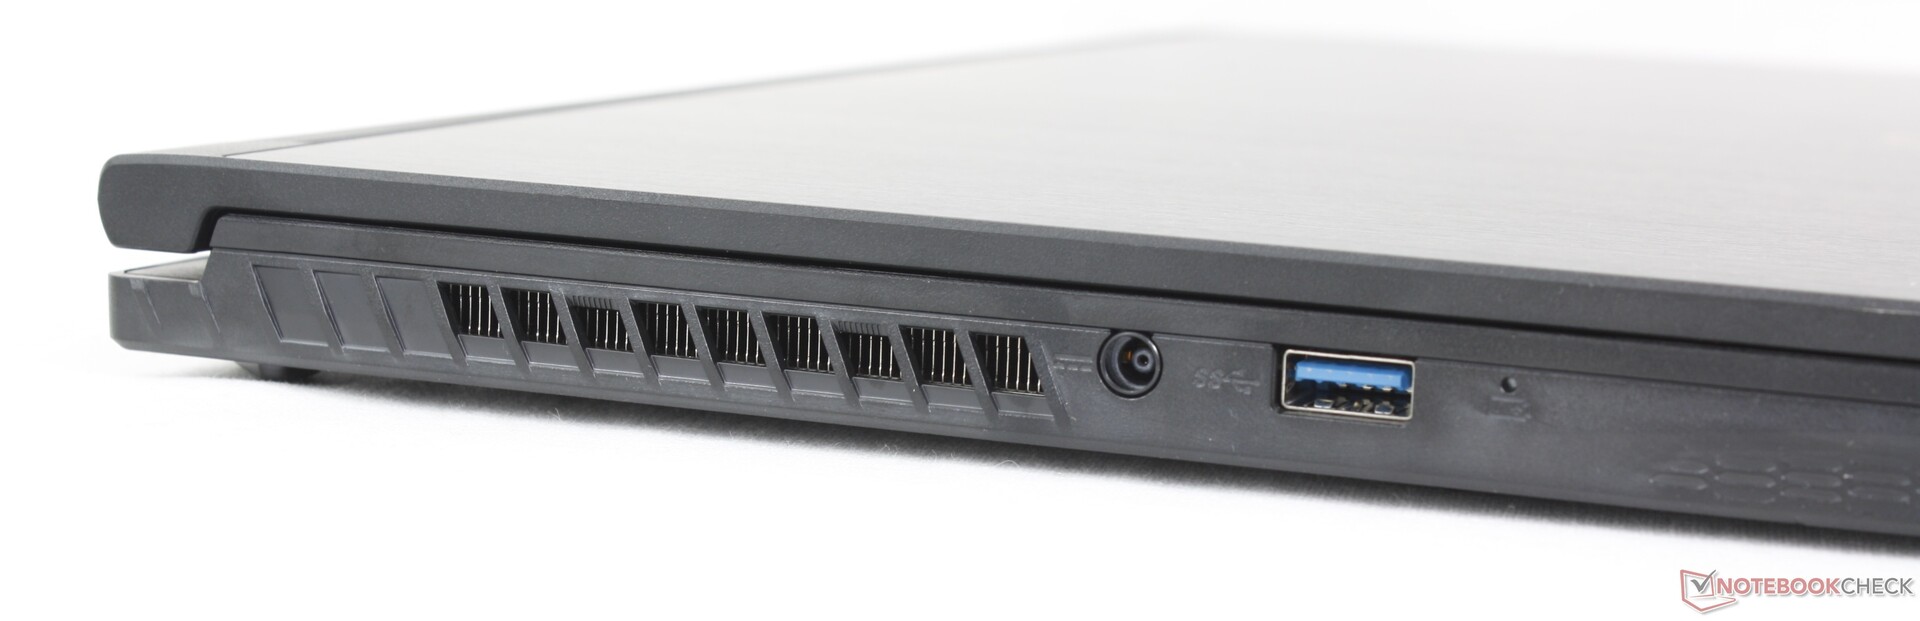
Connectivity
Communication
| Networking | |
| iperf3 transmit AX12 | |
| MSI GF63 Thin 9SC | |
| iperf3 receive AX12 | |
| MSI GF63 Thin 9SC | |
| iperf3 transmit AXE11000 | |
| Asus TUF A15 FA507 | |
| MSI Thin GF63 12VE | |
| Lenovo LOQ 15IRX9 | |
| Acer Nitro V 15 ANV15-51-582S | |
| HP Victus 15-fa1057ng | |
| iperf3 receive AXE11000 | |
| Lenovo LOQ 15IRX9 | |
| Acer Nitro V 15 ANV15-51-582S | |
| Asus TUF A15 FA507 | |
| MSI Thin GF63 12VE | |
| HP Victus 15-fa1057ng | |
Webcam
There is no IR sensor or physical camera slider. Instead, the camera can shut off electronically via a hotkey.


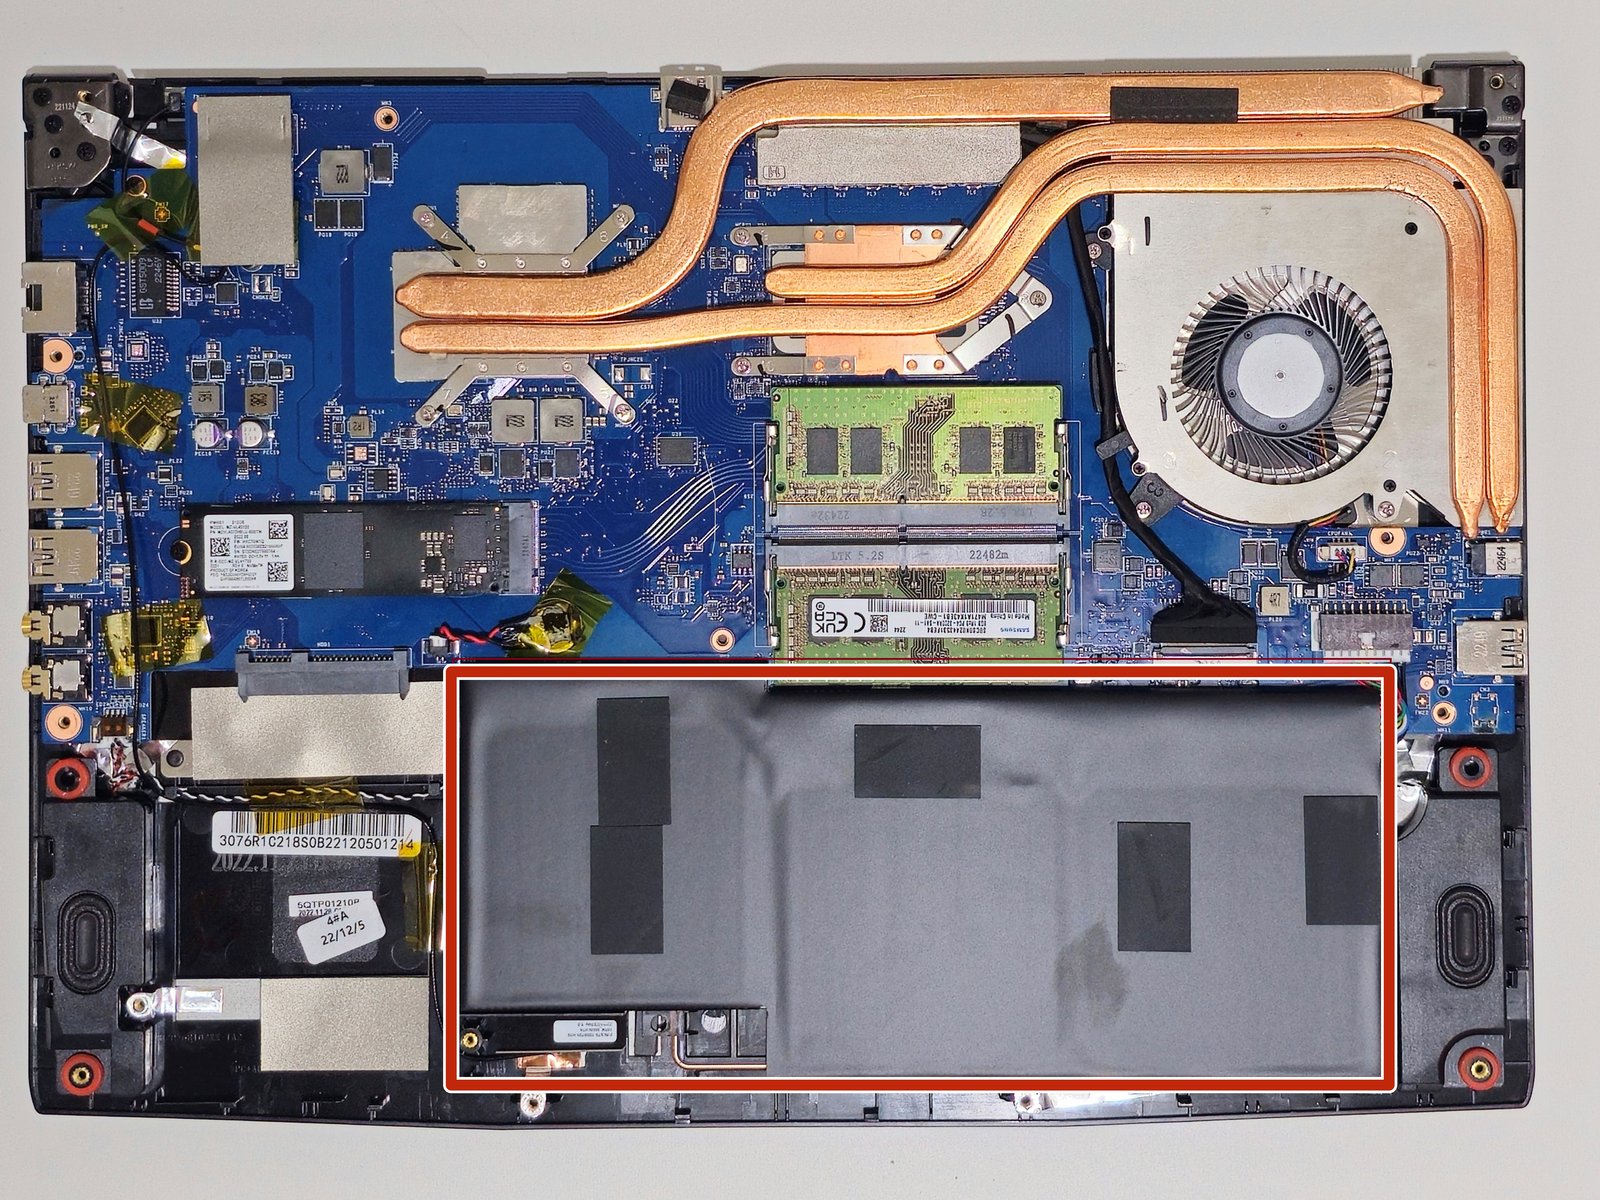
Maintenance
Removing the bottom panel requires tearing an anti-tamper sticker. It should otherwise come off easily with just a Phillips screwdriver.
Sustainability
MSI advertises no sustainability measures for the GF63 series. The packaging, however, is mostly paper and cardboard.
Accessories And Warranty
There are no extras in the box. The standard one-year limited manufacturer warranty applies.
Input Devices
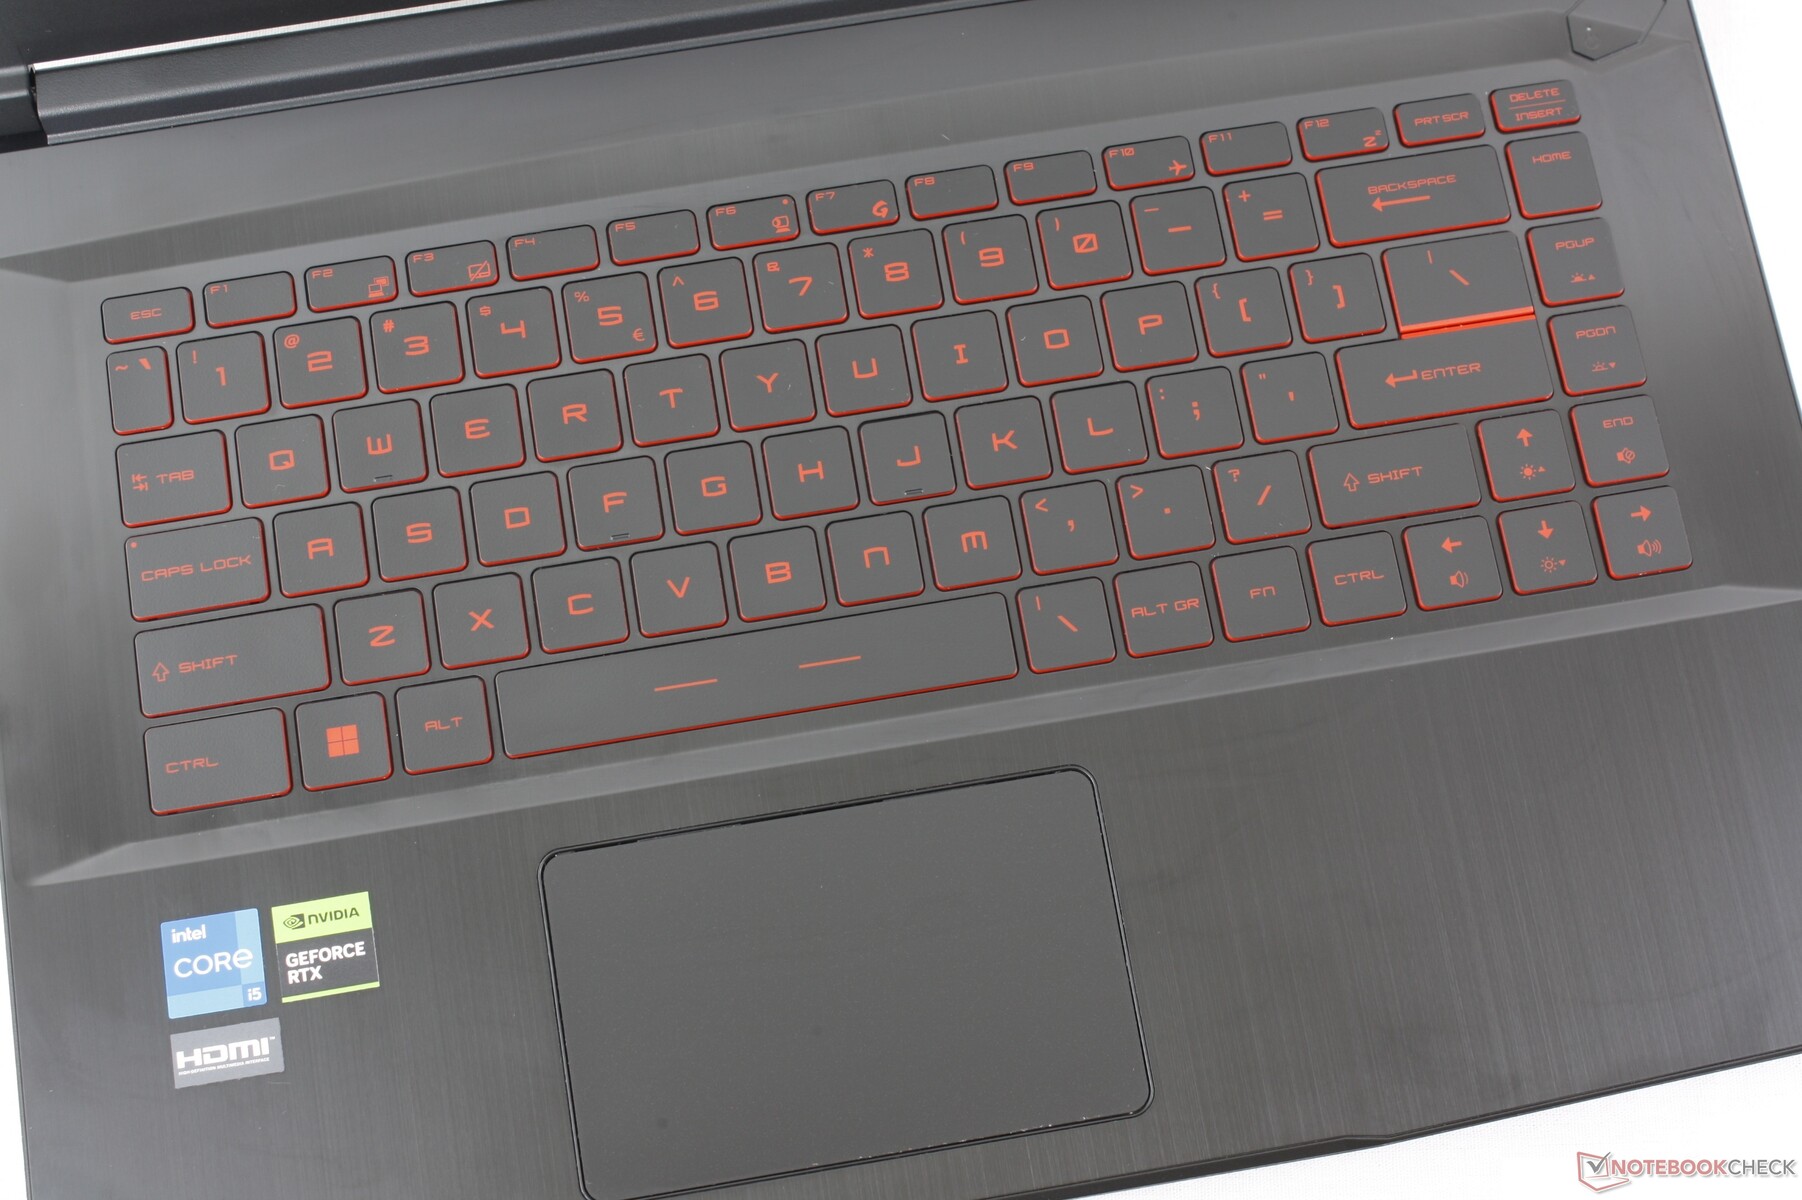
Keyboard And Touchpad
There are no changes to the clickpad or red-backlit keyboard when compared to the 2020 model. Even the size of the clickpad remains the same.
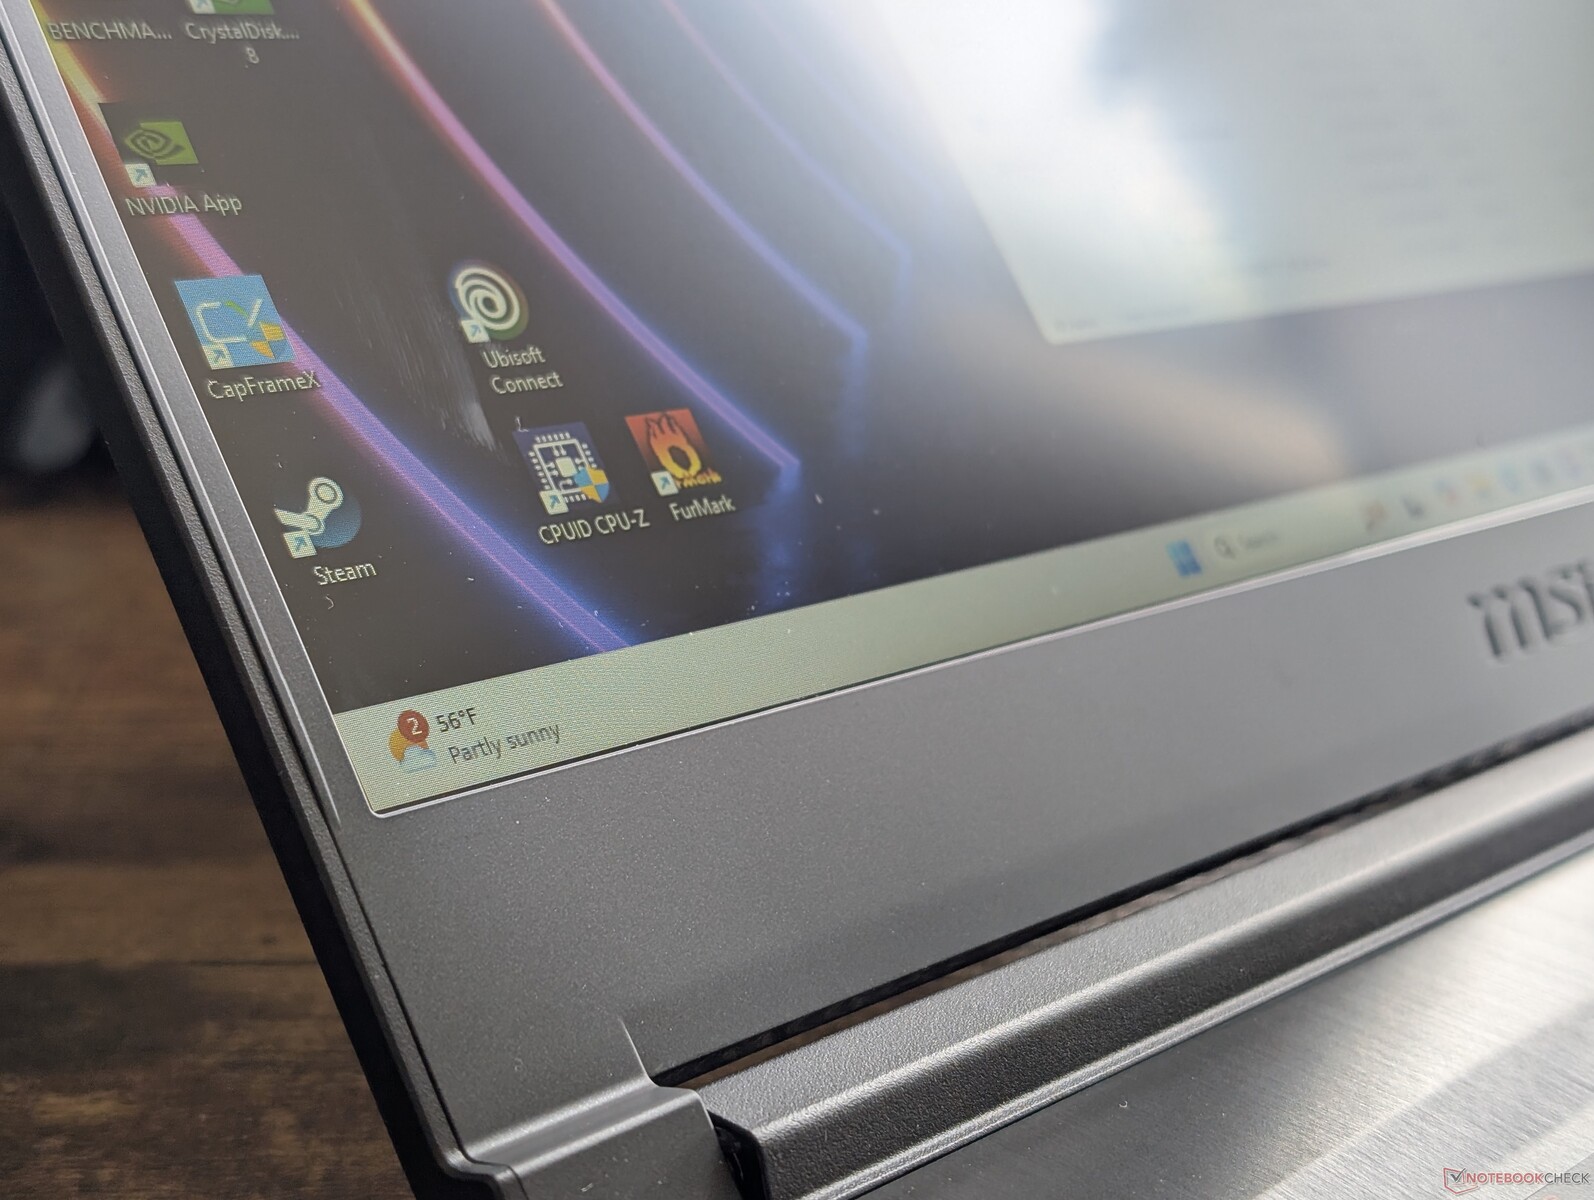
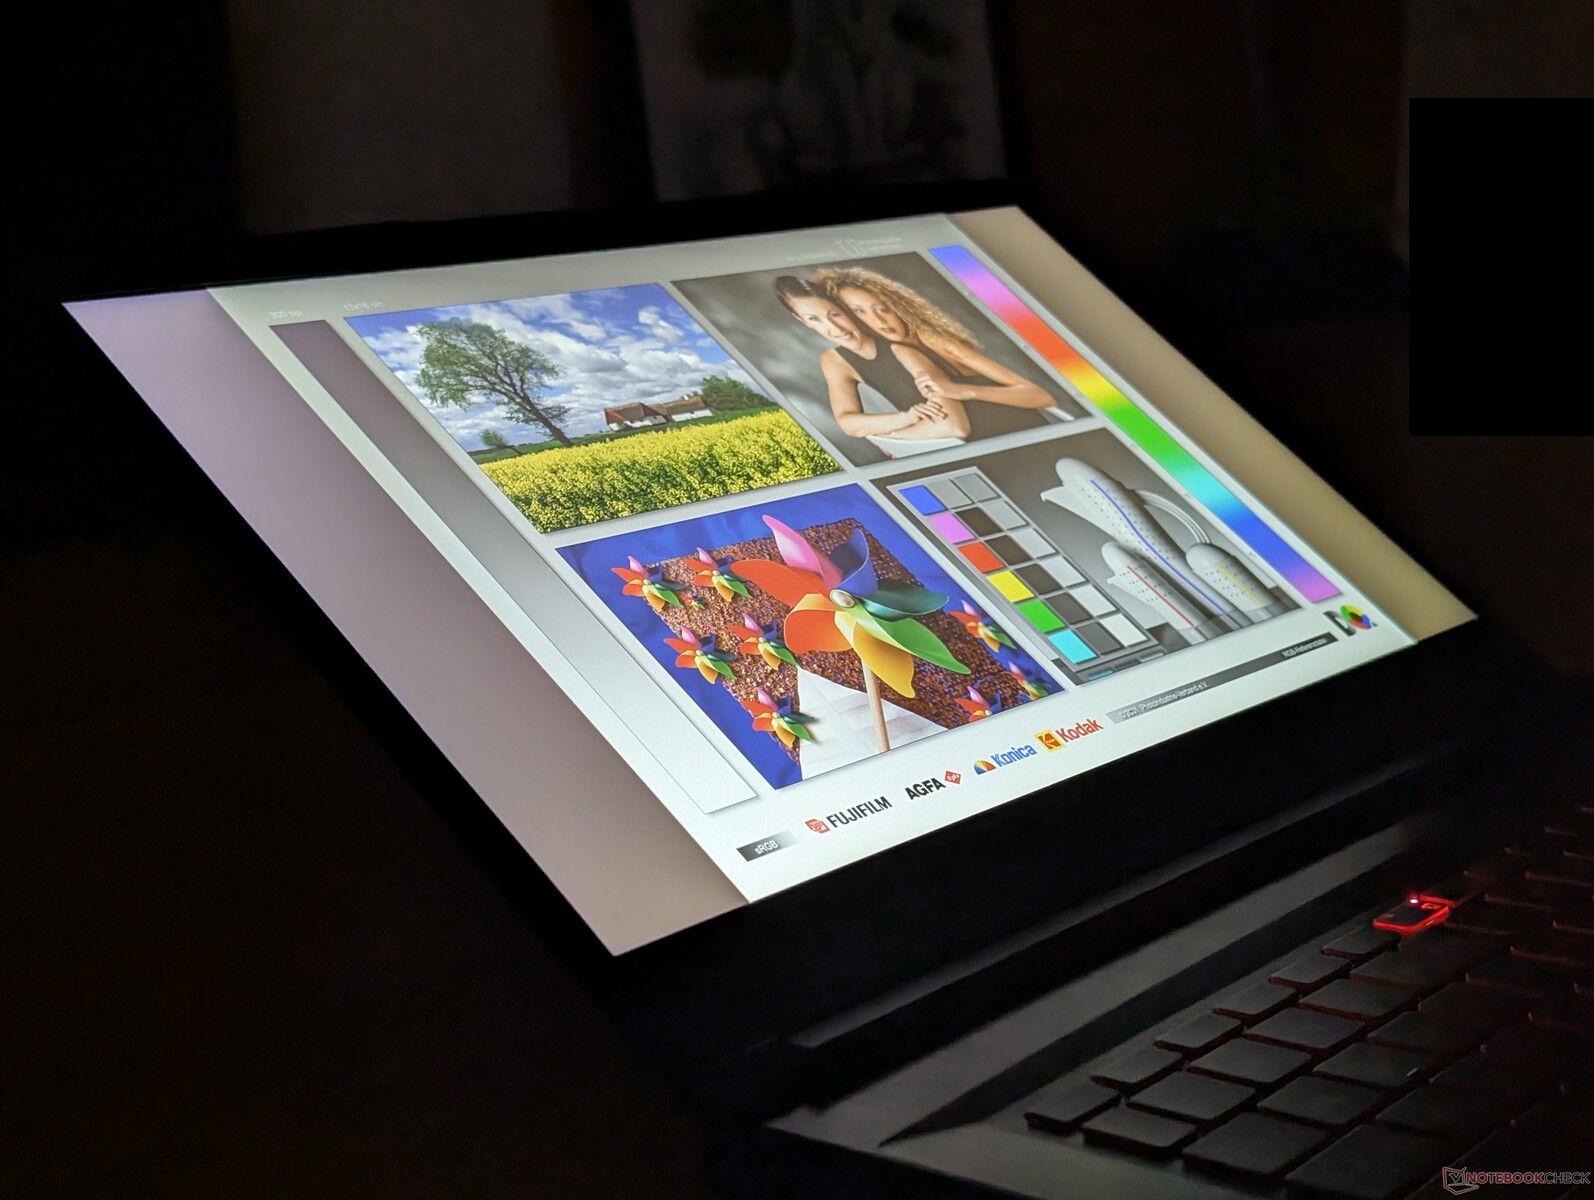
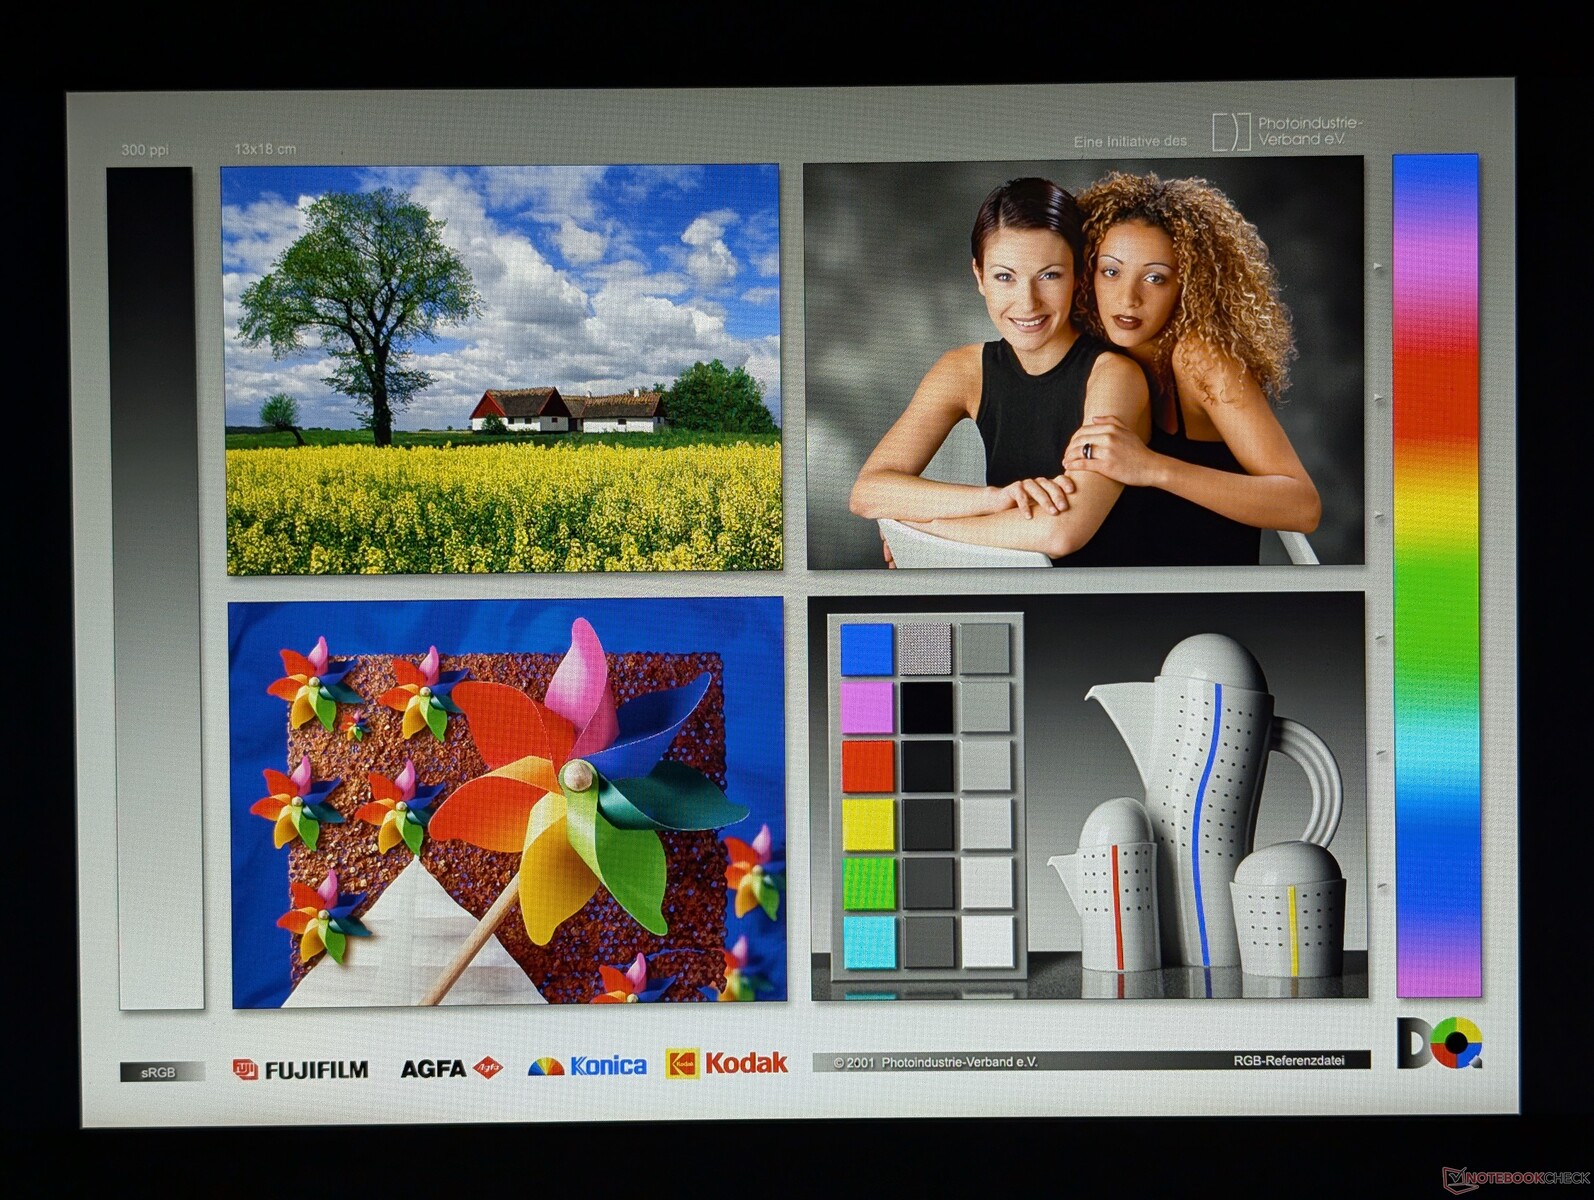
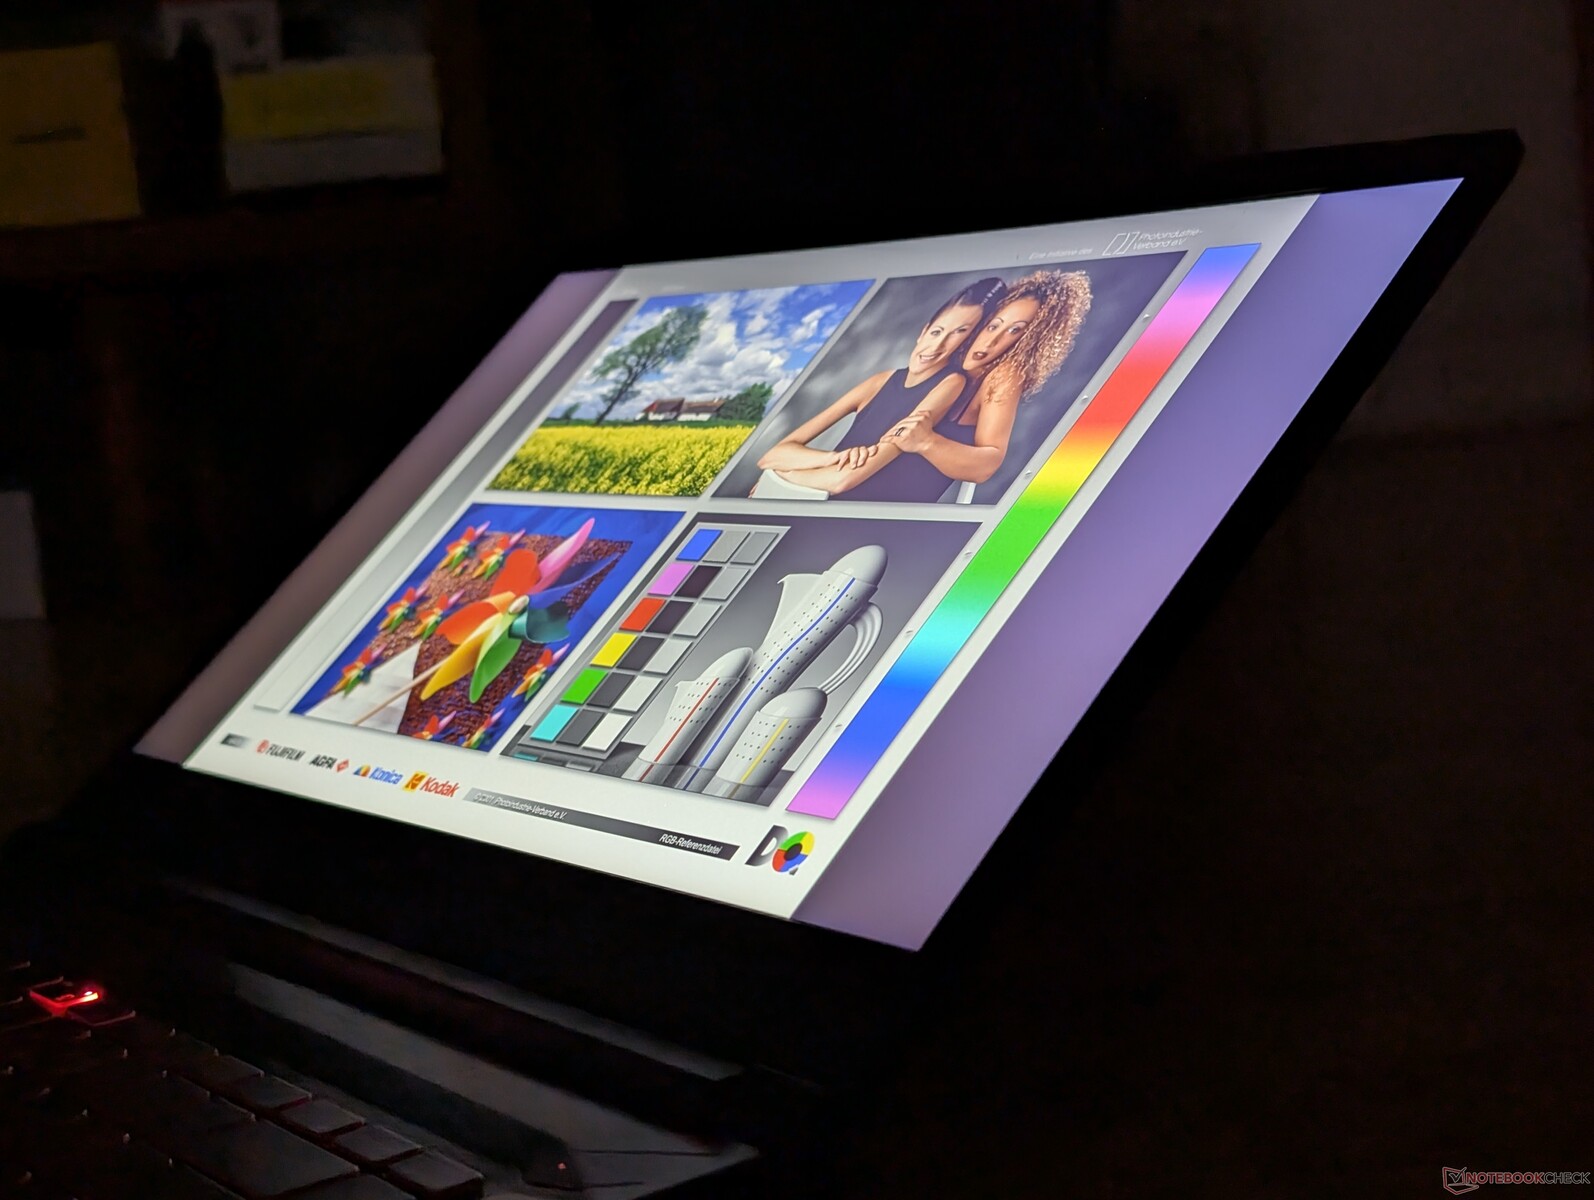
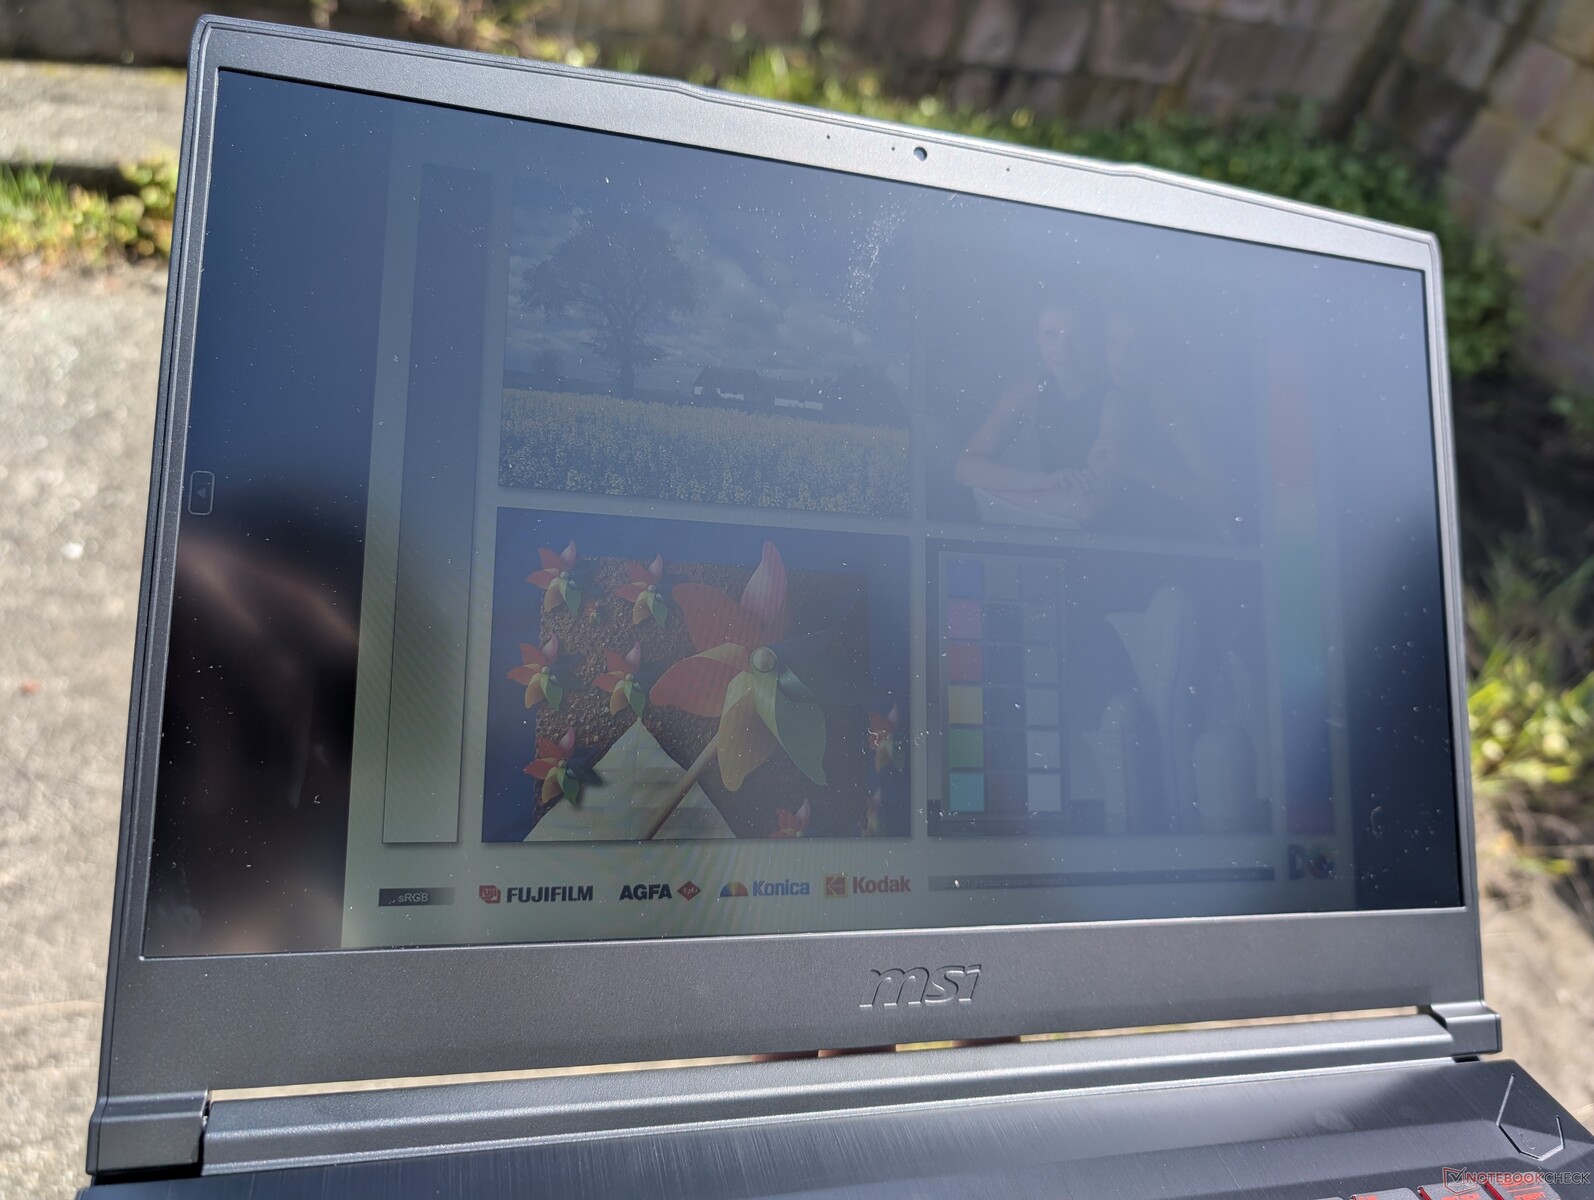
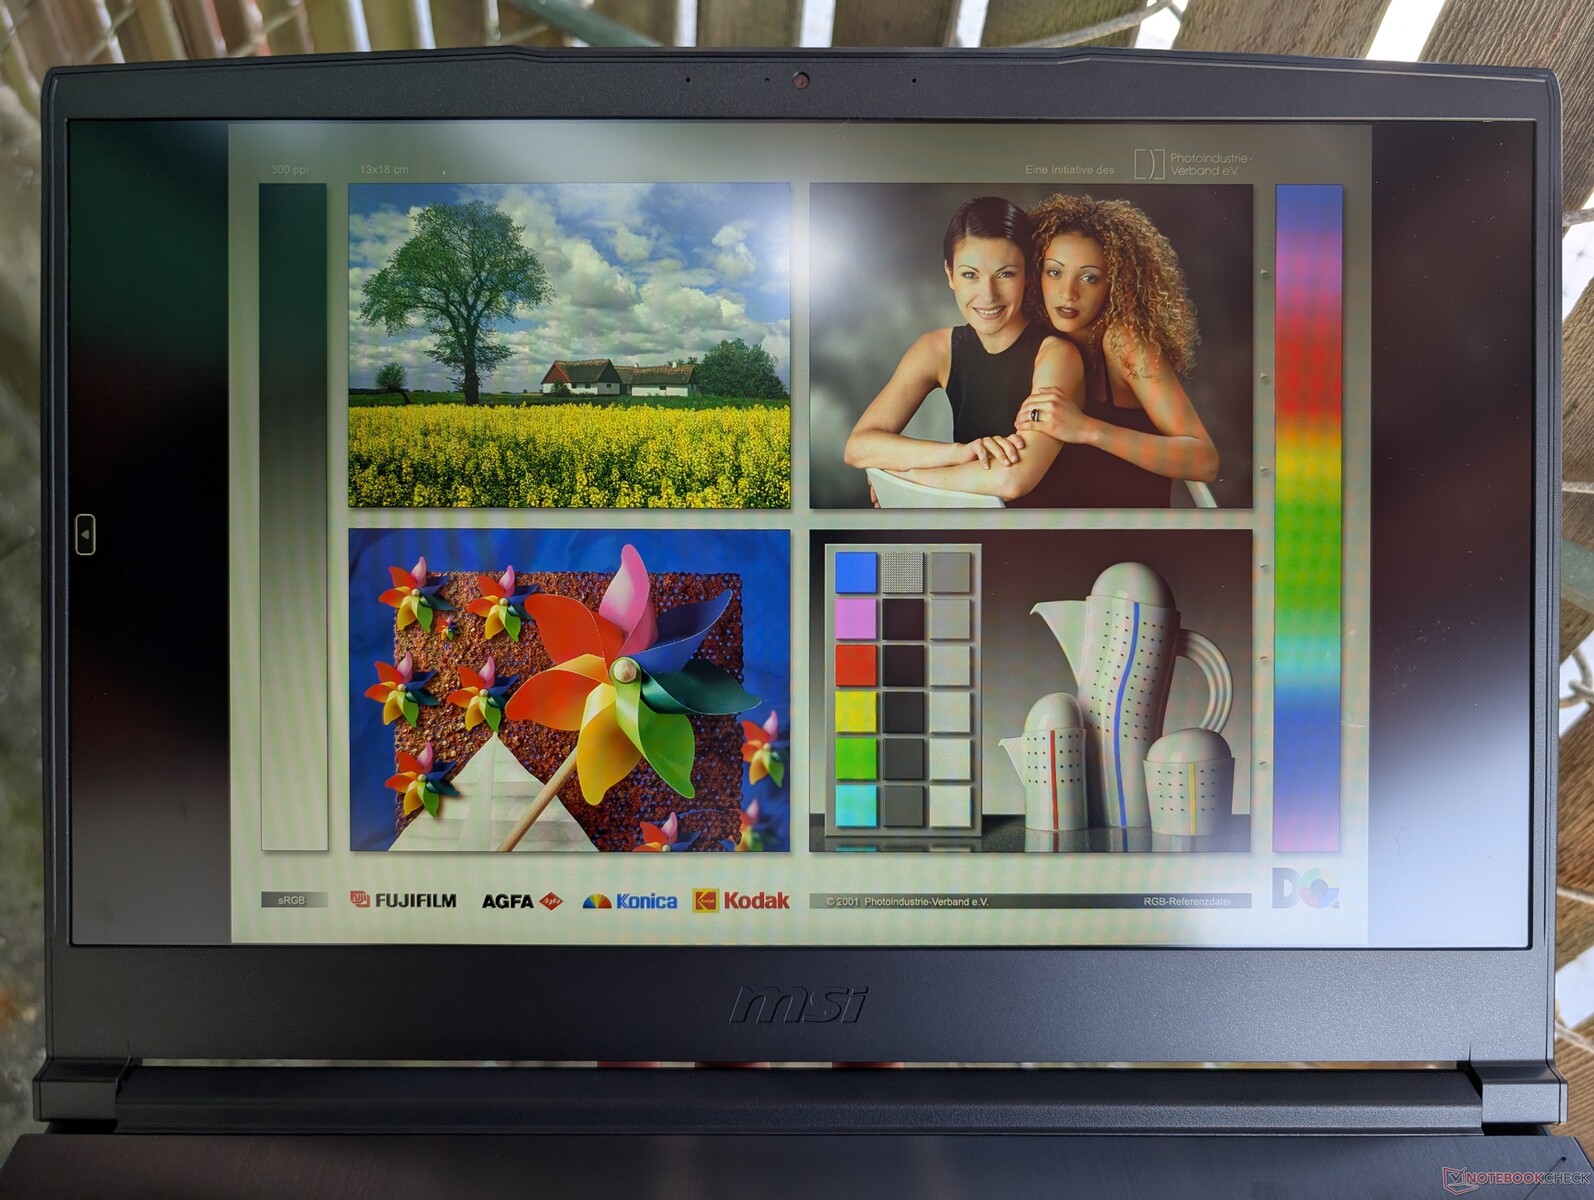
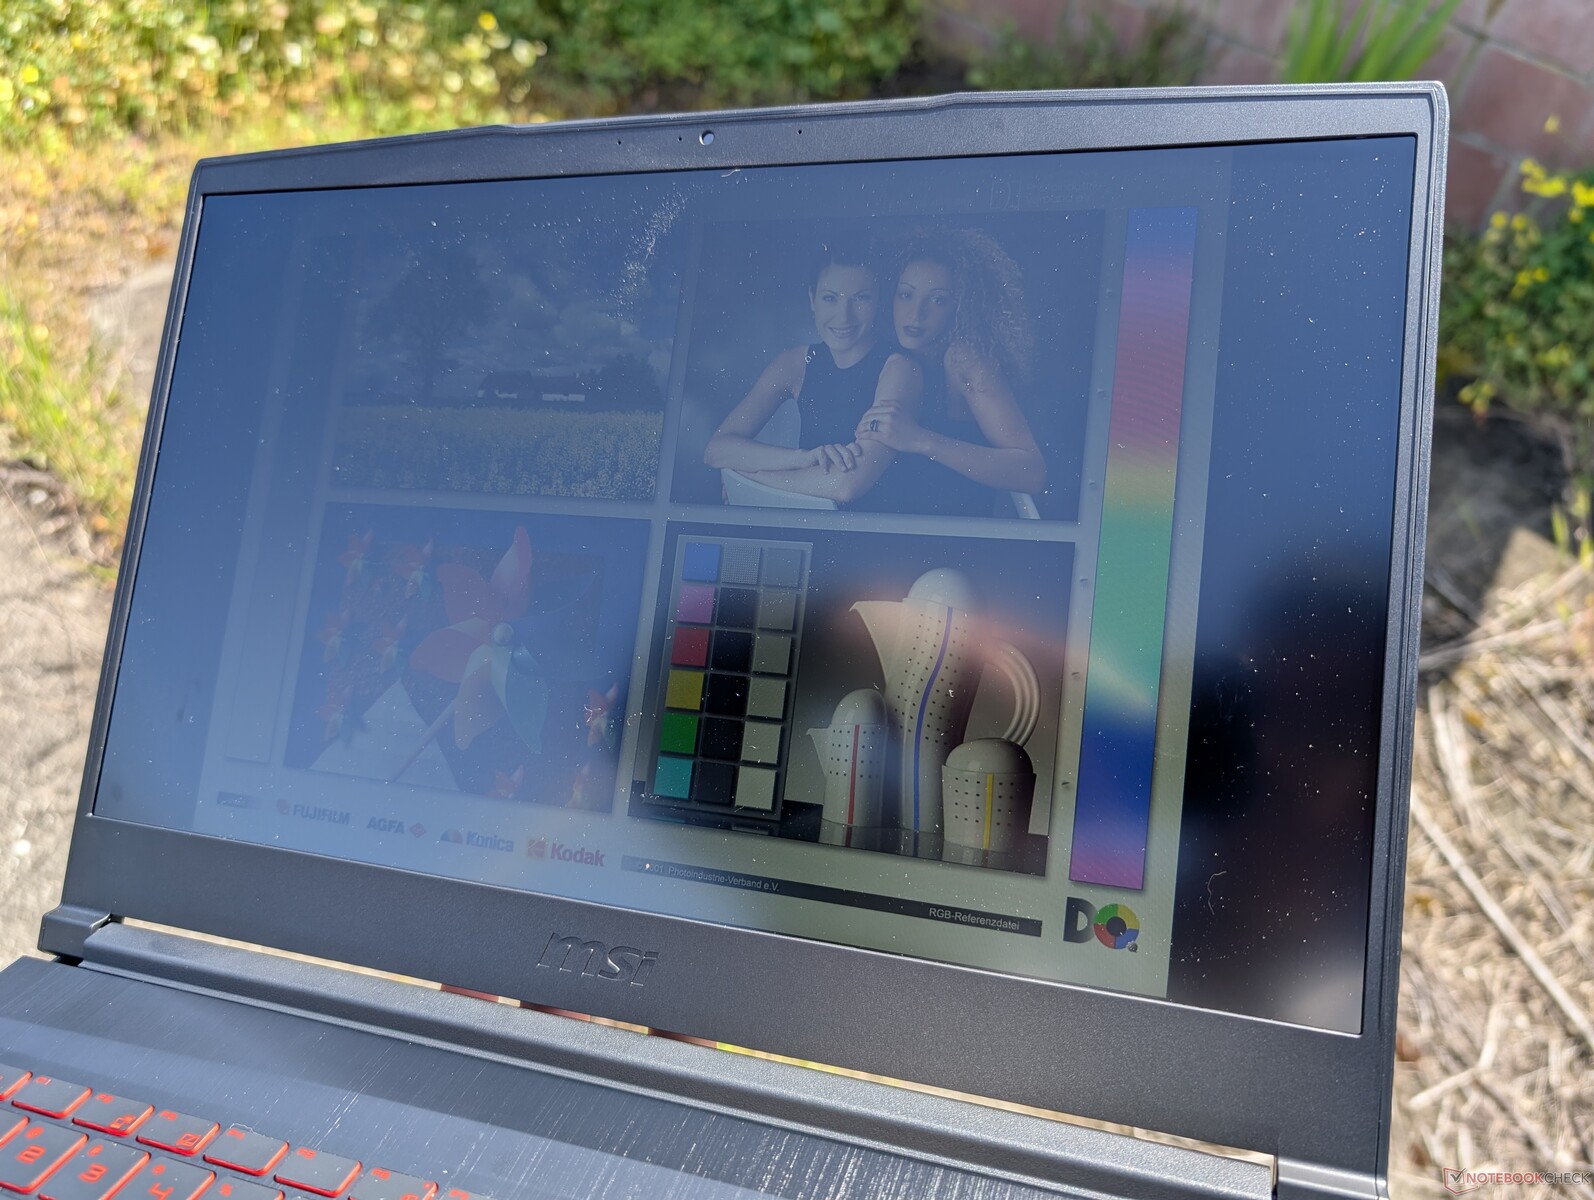
Display
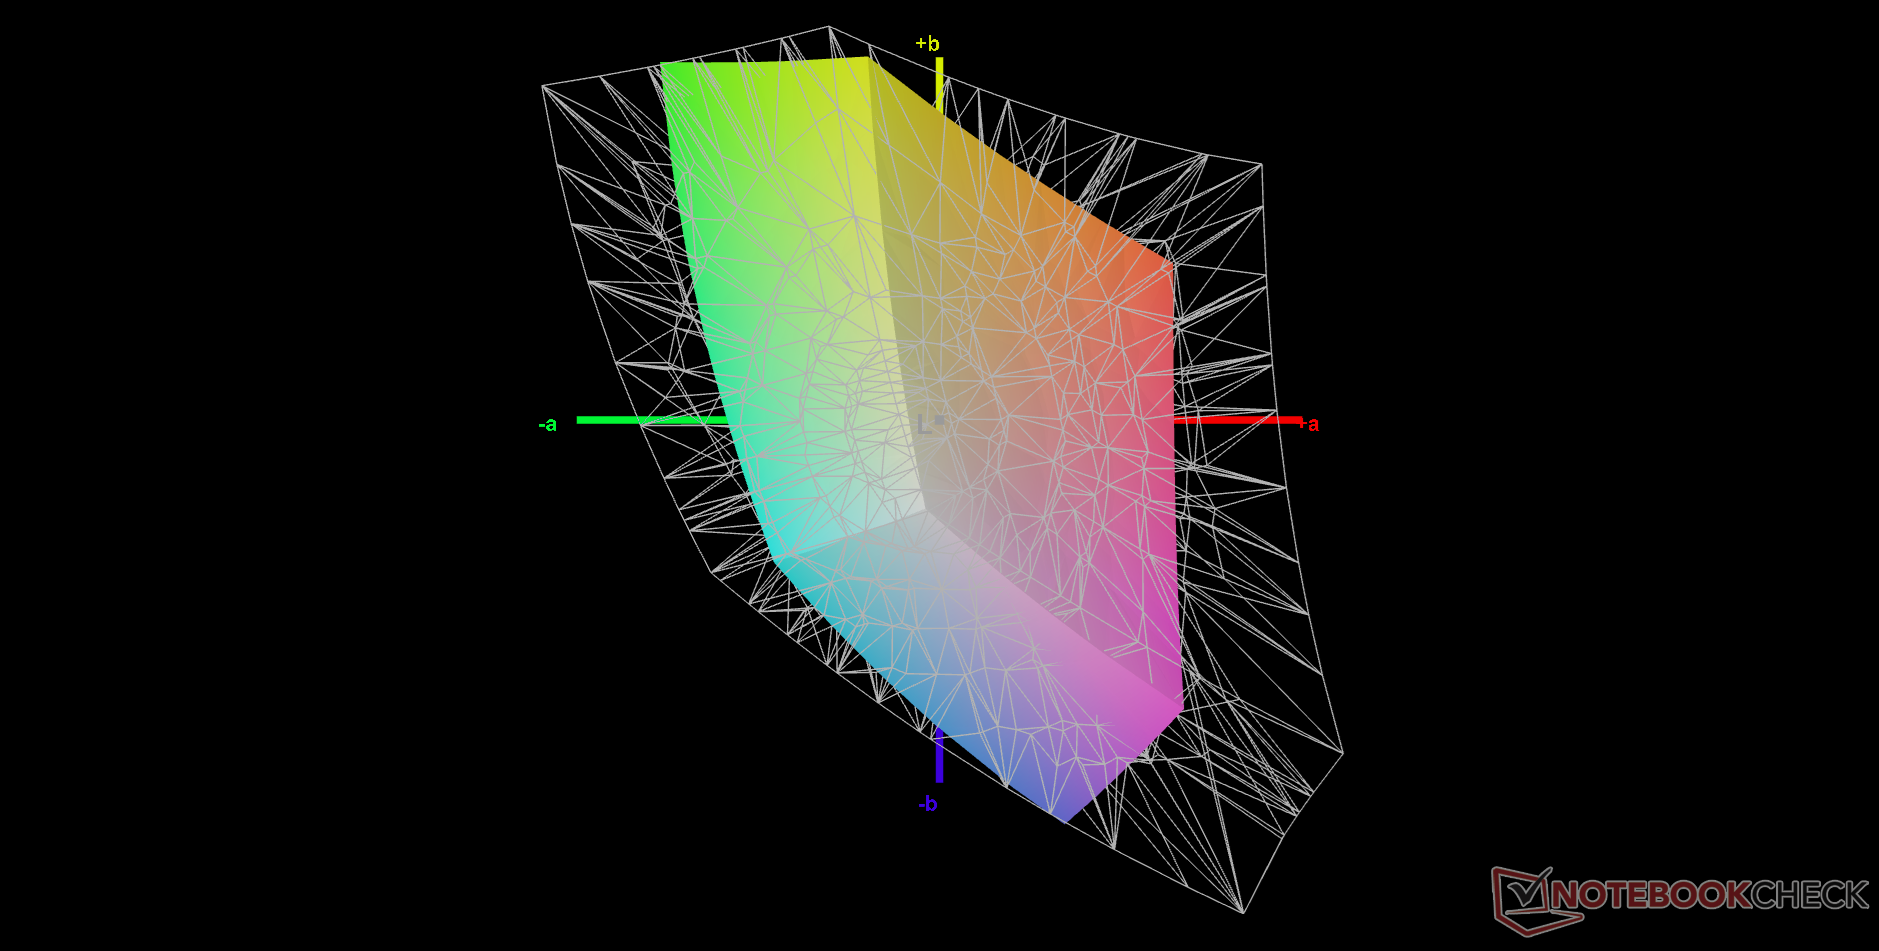
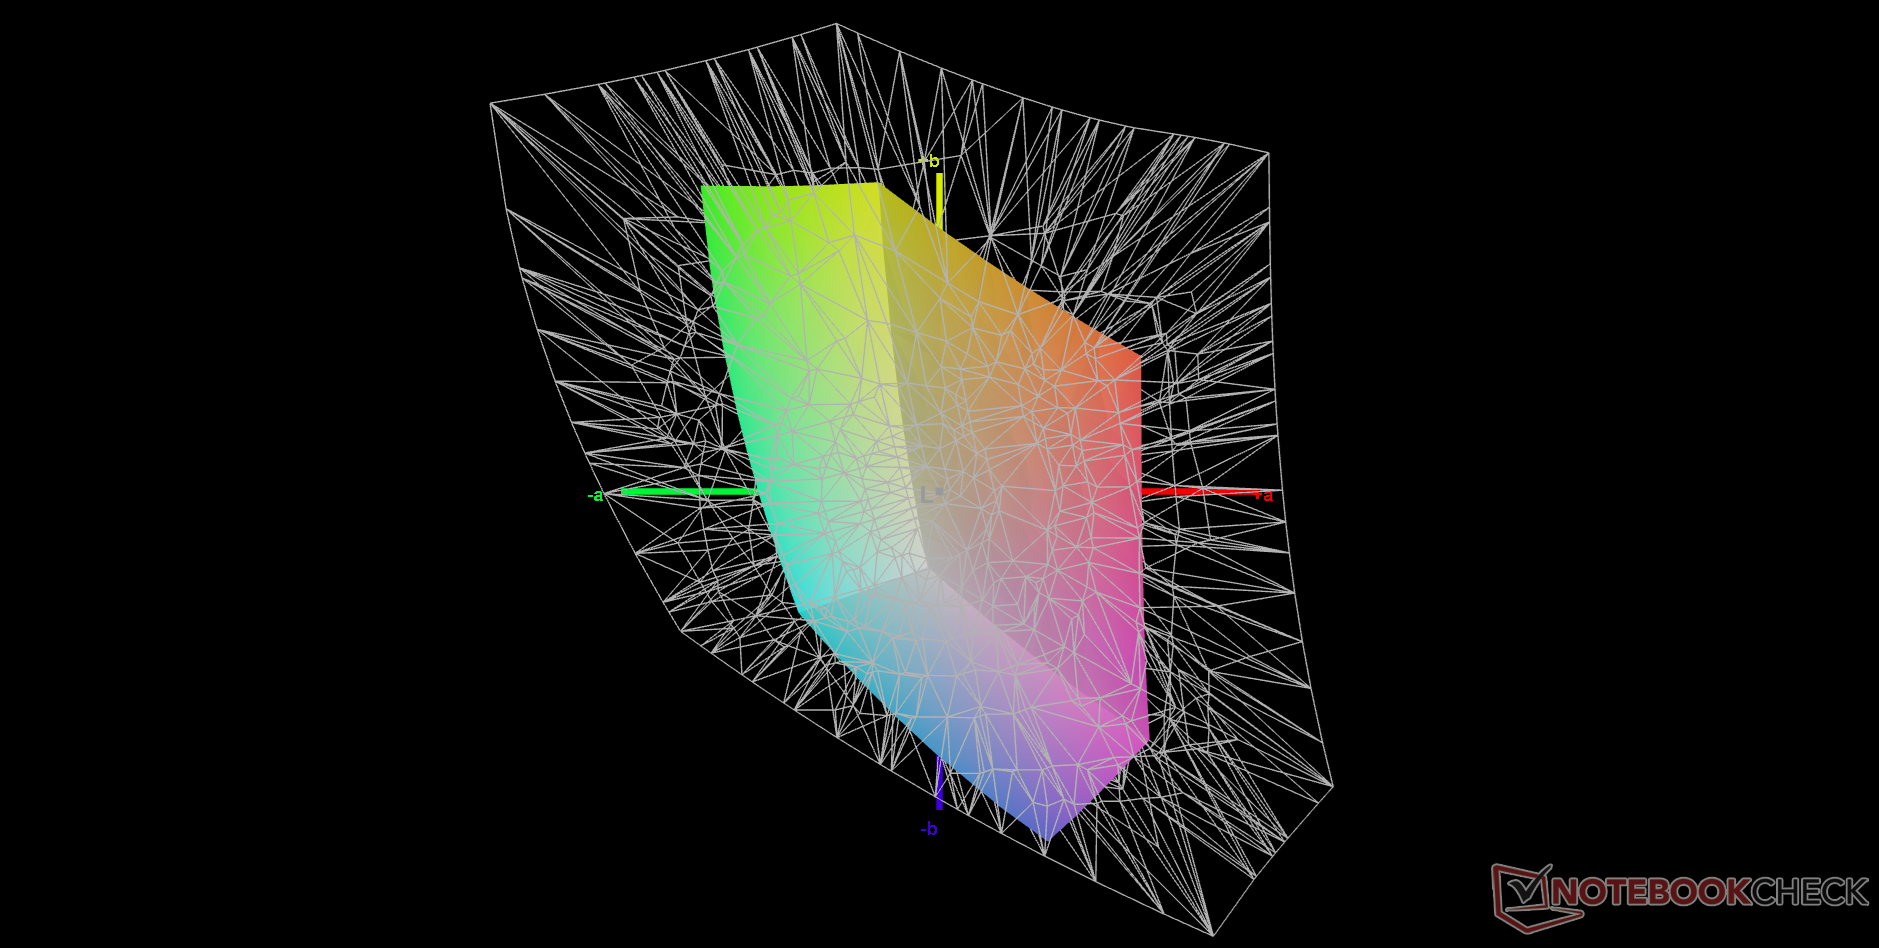
Our AU Optronics B156HAN08.4 IPS panel is an upgrade over the AU Optronics B156HAN02.1 on the 2020 GF63 in terms of native refresh rate and response times. However, sRGB coverage and brightness remain weak.
| |||||||||||||||||||||||||
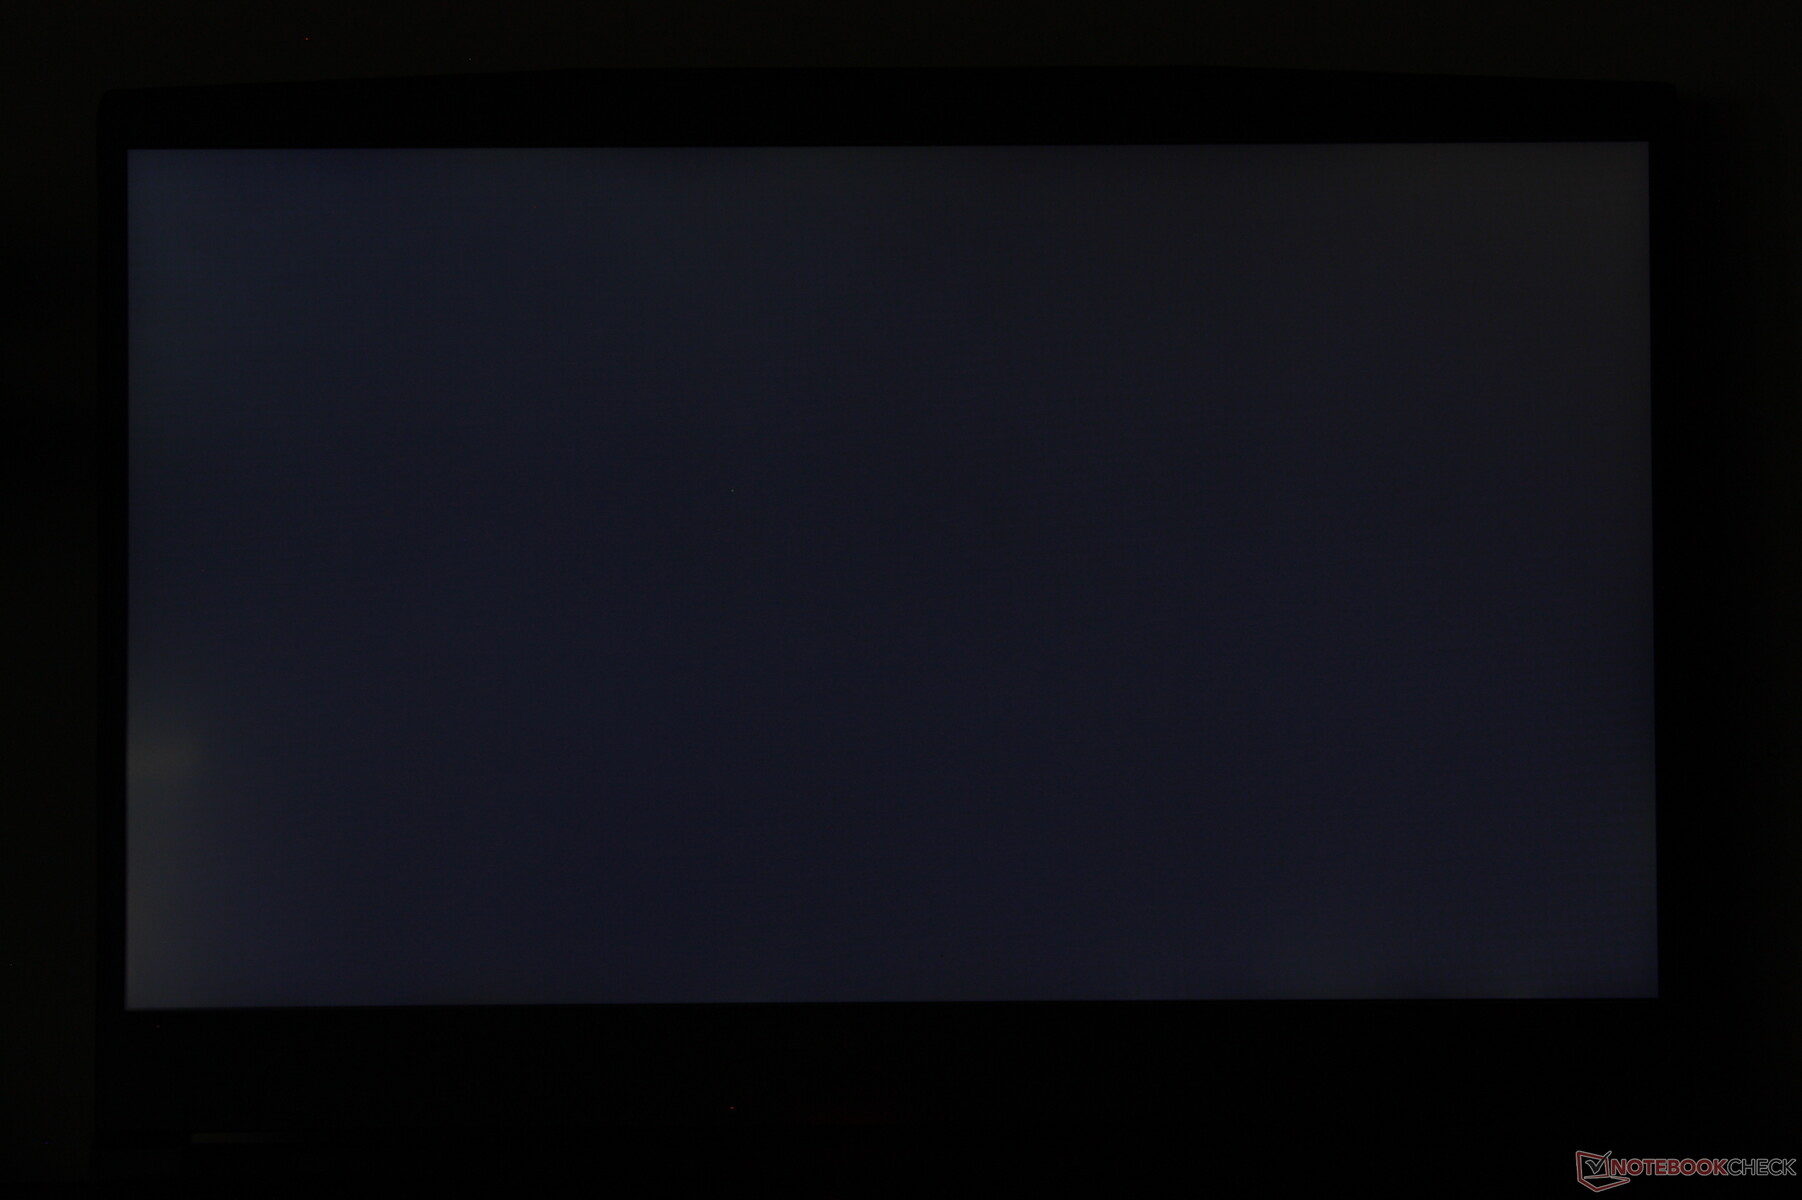
Brightness Distribution: 96 %
Center on Battery: 248.6 cd/m²
Contrast: 1381:1 (Black: 0.18 cd/m²)
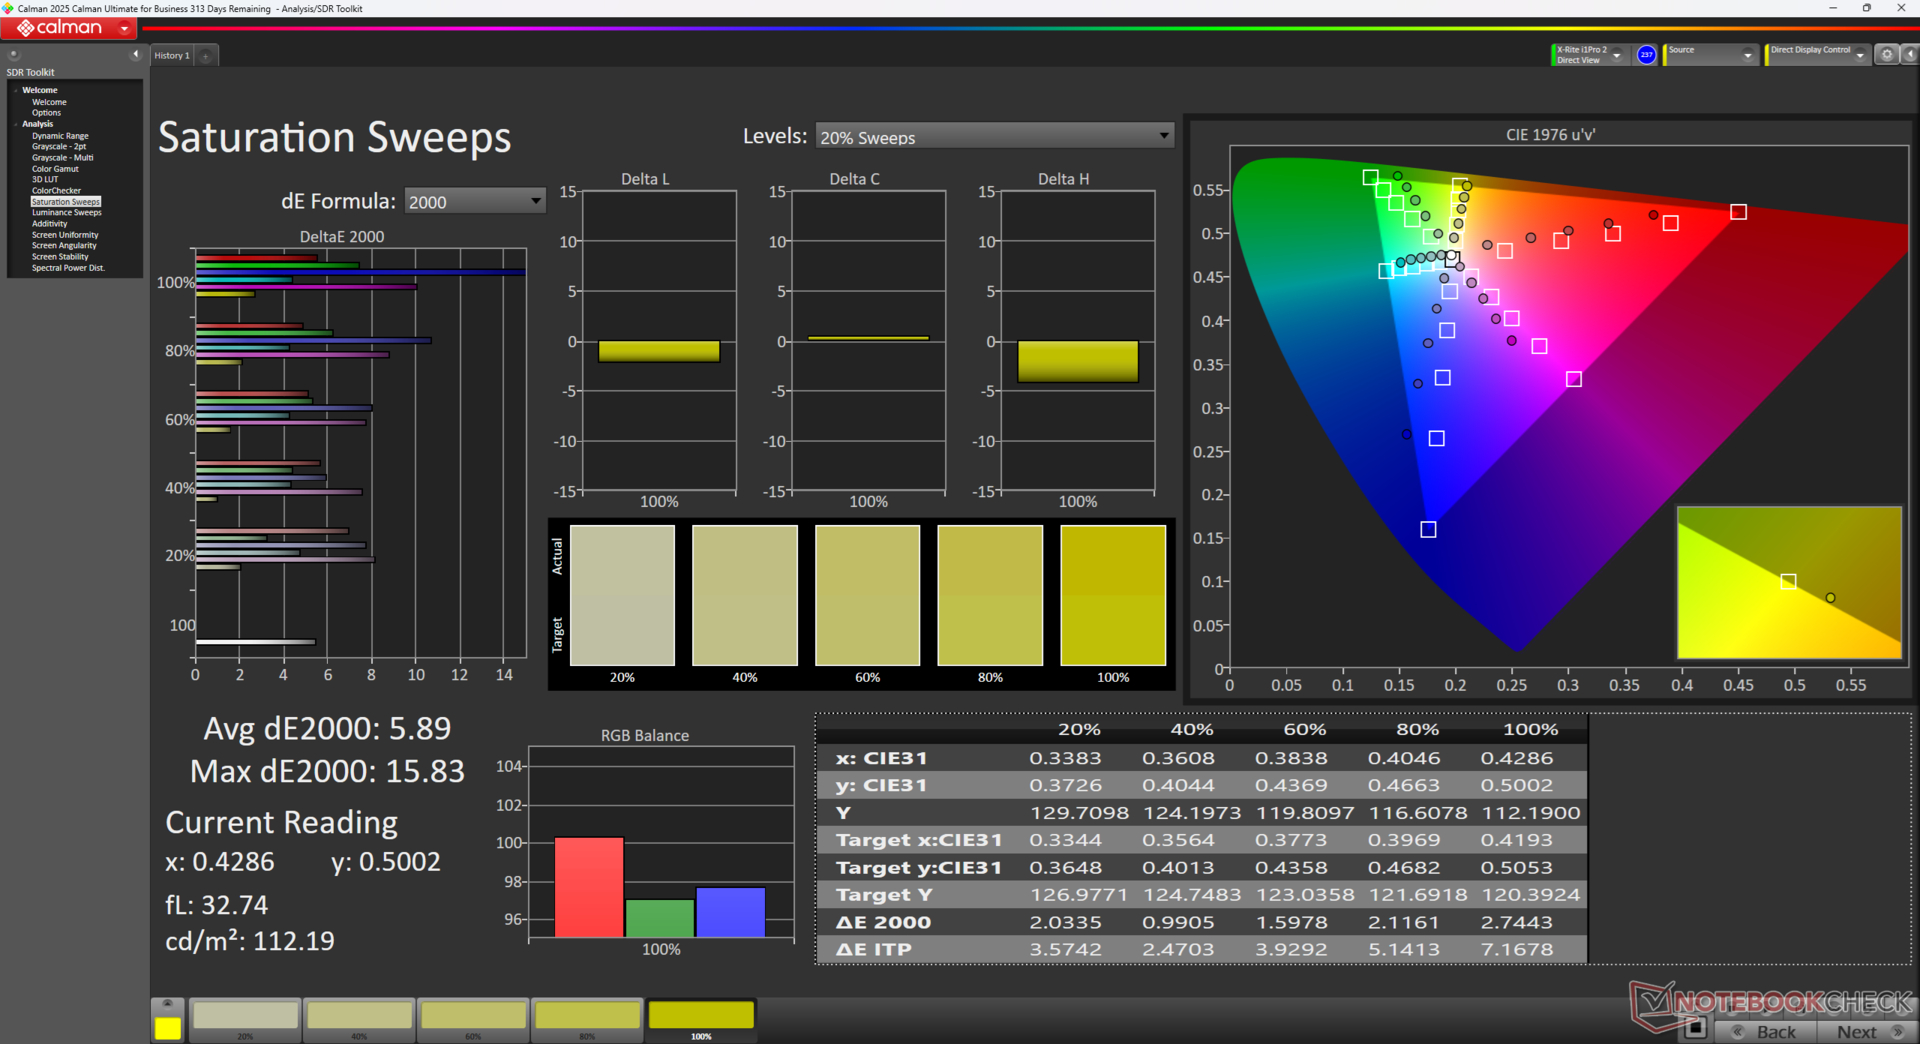
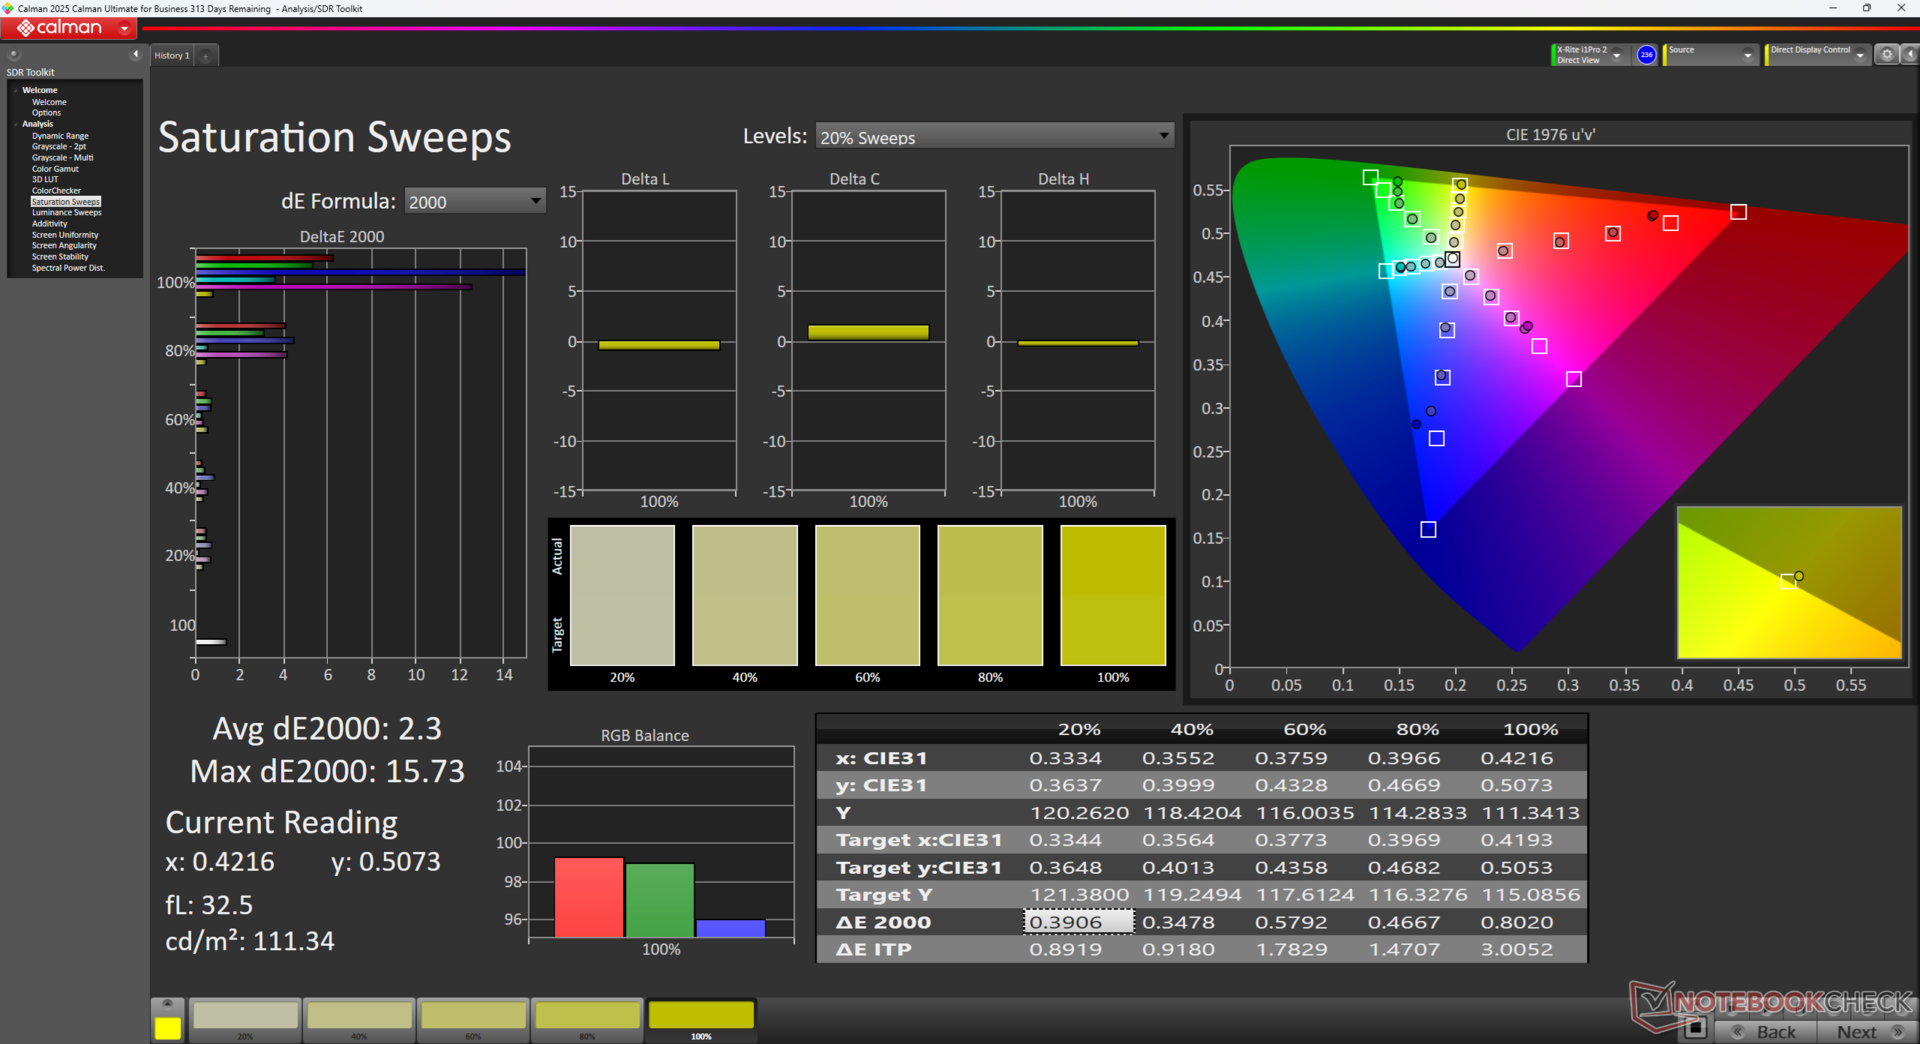
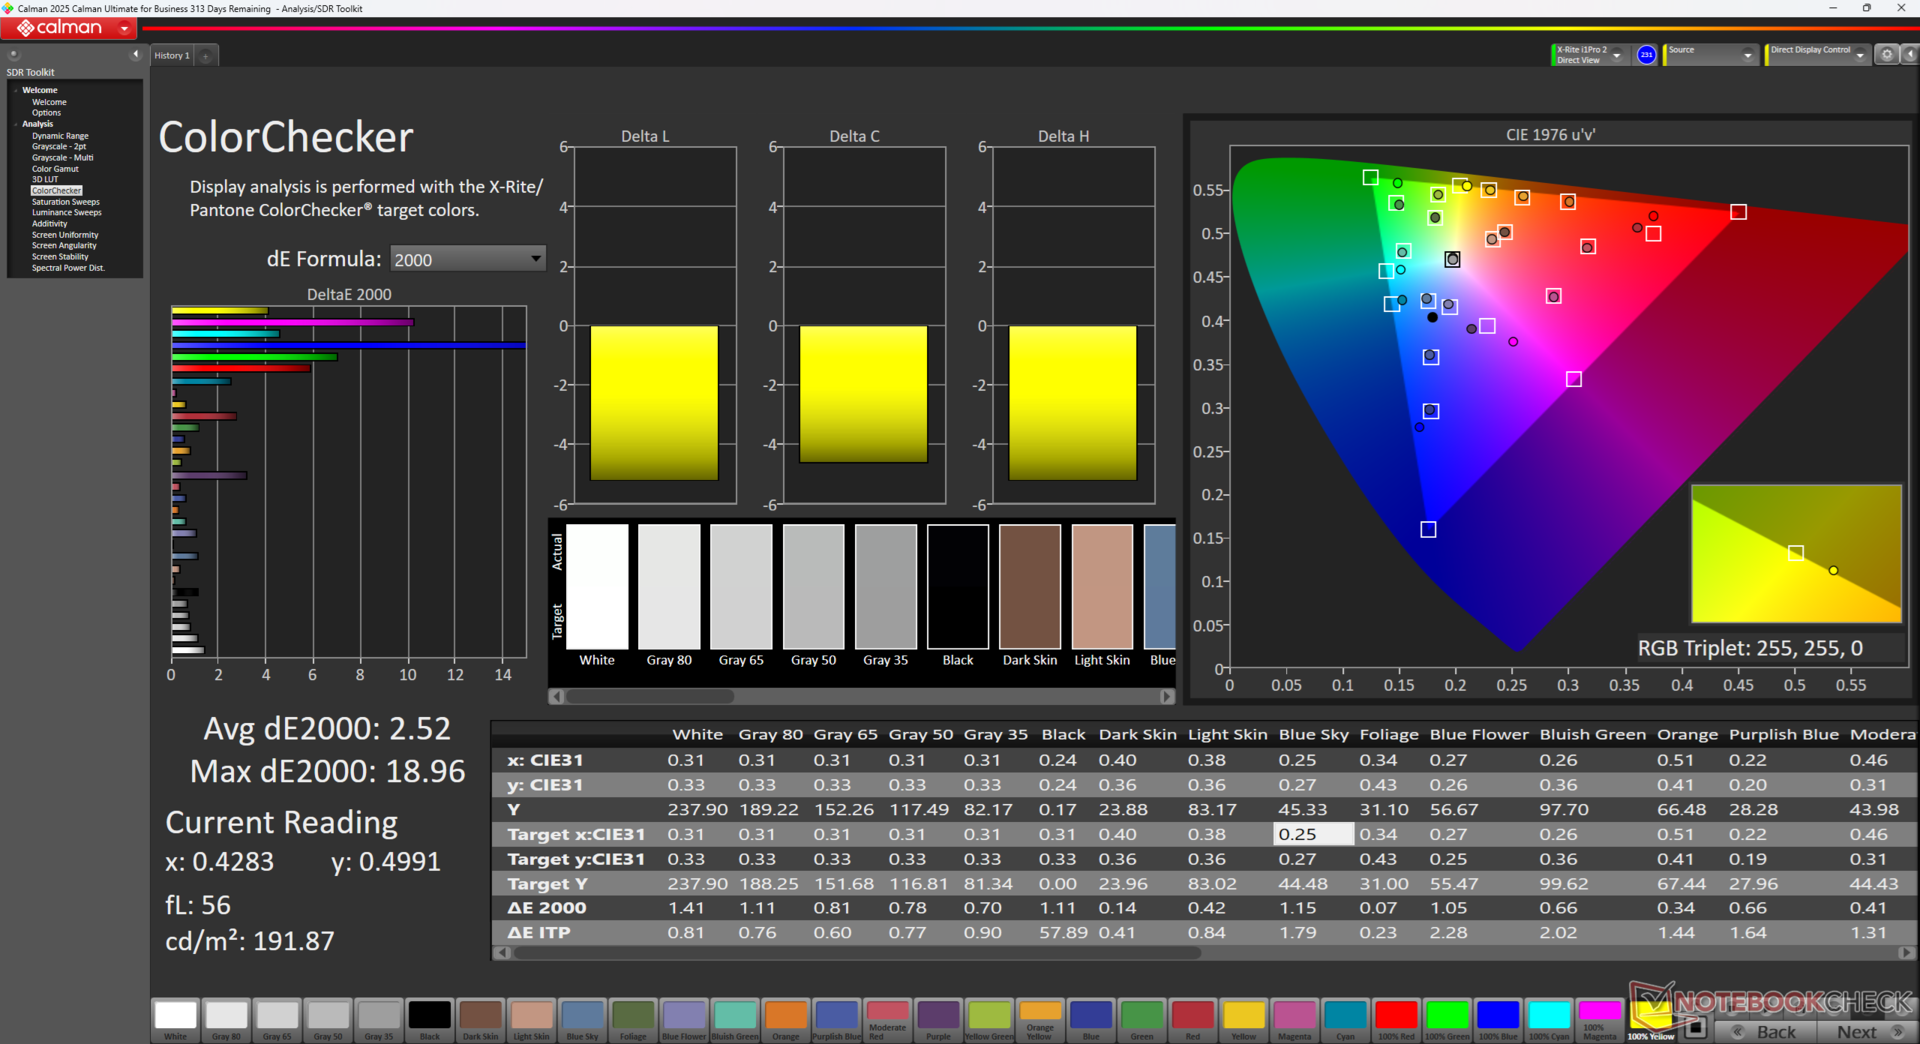
ΔE ColorChecker Calman: 5.85 | ∀{0.5-29.43 Ø4.73}
calibrated: 2.52
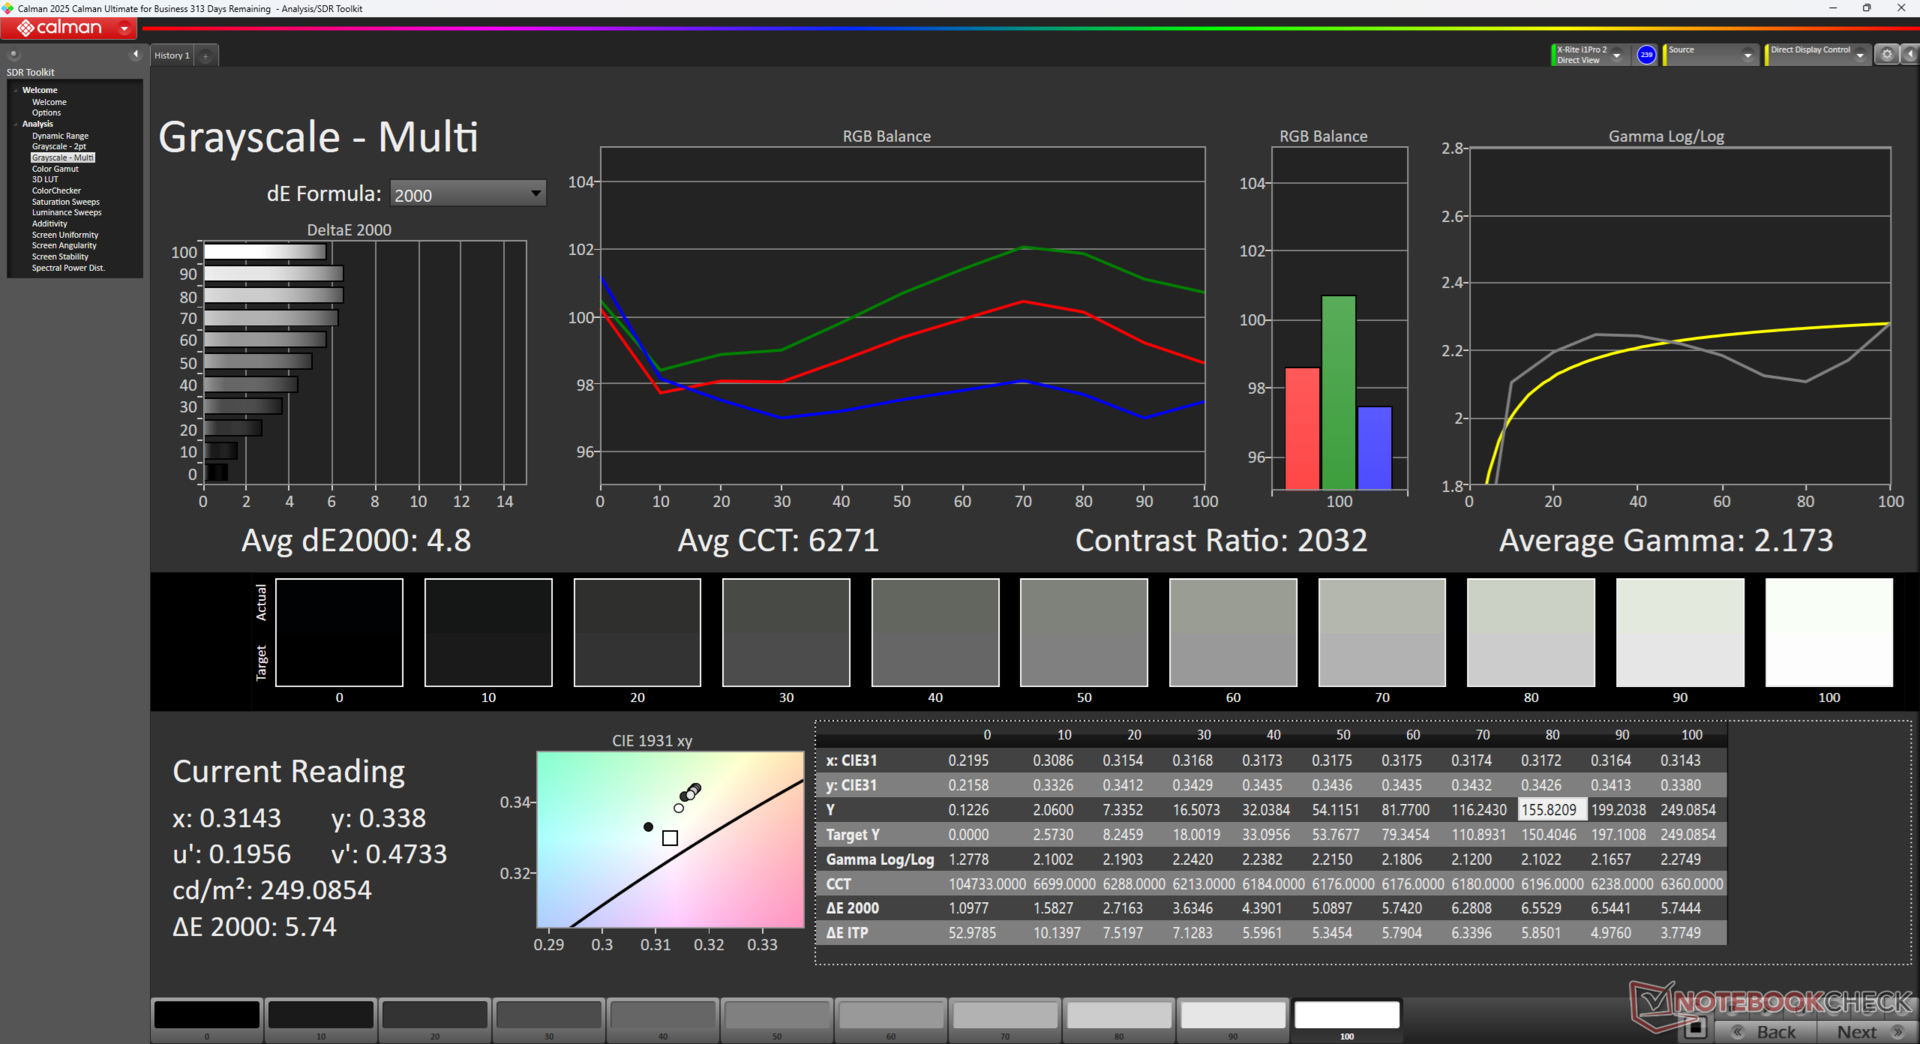
ΔE Greyscale Calman: 4.8 | ∀{0.09-98 Ø4.97}
40.5% AdobeRGB 1998 (Argyll 3D)
58.4% sRGB (Argyll 3D)
39.2% Display P3 (Argyll 3D)
Gamma: 2.17
CCT: 6271 K
| MSI Thin GF63 12VE AU Optronics B156HAN08.4, IPS, 1920x1080, 15.6", 144 Hz | MSI GF63 Thin 9SC AU Optronics B156HAN02.1 (AUO21ED), IPS, 1920x1080, 15.6", Hz | Lenovo LOQ 15IRX9 BOE NJ NE156FHM-NX9, IPS, 1920x1080, 15.6", 144 Hz | HP Victus 15-fa1057ng BOE094D, IPS, 1920x1080, 15.6", 144 Hz | Acer Nitro V 15 ANV15-51-582S LG LP156WFJ-SPB4 (LGD0742), IPS, 1920x1080, 15.6", 144 Hz | Asus TUF A15 FA507 N156HMA-GA1, IPS, 1920x1080, 15.6", 144 Hz | |
|---|---|---|---|---|---|---|
| Display | -4% | 79% | -0% | 2% | 65% | |
| Display P3 Coverage (%) | 39.2 | 37.76 -4% | 73.7 88% | 39.2 0% | 40 2% | 64.9 66% |
| sRGB Coverage (%) | 58.4 | 56.5 -3% | 99.1 70% | 57.9 -1% | 60 3% | 96.5 65% |
| AdobeRGB 1998 Coverage (%) | 40.5 | 39.01 -4% | 72.6 79% | 40.5 0% | 41.4 2% | 66.6 64% |
| Response Times | -60% | -35% | 16% | -26% | -7% | |
| Response Time Grey 50% / Grey 80% * (ms) | 25.6 ? | 44.8 ? -75% | 42.2 ? -65% | 23.8 ? 7% | 34.2 ? -34% | 30.4 ? -19% |
| Response Time Black / White * (ms) | 21.8 ? | 31.6 ? -45% | 22.6 ? -4% | 16.3 ? 25% | 25.8 ? -18% | 20.8 ? 5% |
| PWM Frequency (Hz) | ||||||
| Screen | 4% | 27% | -12% | -14% | 34% | |
| Brightness middle (cd/m²) | 248.6 | 260 5% | 306 23% | 273 10% | 292 17% | 288 16% |
| Brightness (cd/m²) | 257 | 249 -3% | 287 12% | 249 -3% | 263 2% | 271 5% |
| Brightness Distribution (%) | 96 | 92 -4% | 88 -8% | 84 -12% | 80 -17% | 91 -5% |
| Black Level * (cd/m²) | 0.18 | 0.23 -28% | 0.21 -17% | 0.28 -56% | 0.25 -39% | 0.17 6% |
| Contrast (:1) | 1381 | 1130 -18% | 1457 6% | 975 -29% | 1168 -15% | 1694 23% |
| Colorchecker dE 2000 * | 5.85 | 4.1 30% | 2.25 62% | 5.19 11% | 7.15 -22% | 1.9 68% |
| Colorchecker dE 2000 max. * | 18.57 | 7.93 57% | 4.84 74% | 21.16 -14% | 15.51 16% | 3.3 82% |
| Colorchecker dE 2000 calibrated * | 2.52 | 3.56 -41% | 1.45 42% | 4.54 -80% | 4.13 -64% | 0.9 64% |
| Greyscale dE 2000 * | 4.8 | 2.83 41% | 2.4 50% | 1.7 65% | 4.9 -2% | 2.7 44% |
| Gamma | 2.17 101% | 2.53 87% | 2.259 97% | 2.148 102% | 2.014 109% | 2.32 95% |
| CCT | 6271 104% | 6158 106% | 6790 96% | 6819 95% | 7178 91% | 6535 99% |
| Color Space (Percent of AdobeRGB 1998) (%) | 36 | |||||
| Color Space (Percent of sRGB) (%) | 56 | |||||
| Total Average (Program / Settings) | -20% /
-7% | 24% /
29% | 1% /
-6% | -13% /
-12% | 31% /
35% |
* ... smaller is better


Display Response Times
| ↔ Response Time Black to White | ||
|---|---|---|
| 21.8 ms ... rise ↗ and fall ↘ combined | ↗ 11.2 ms rise | 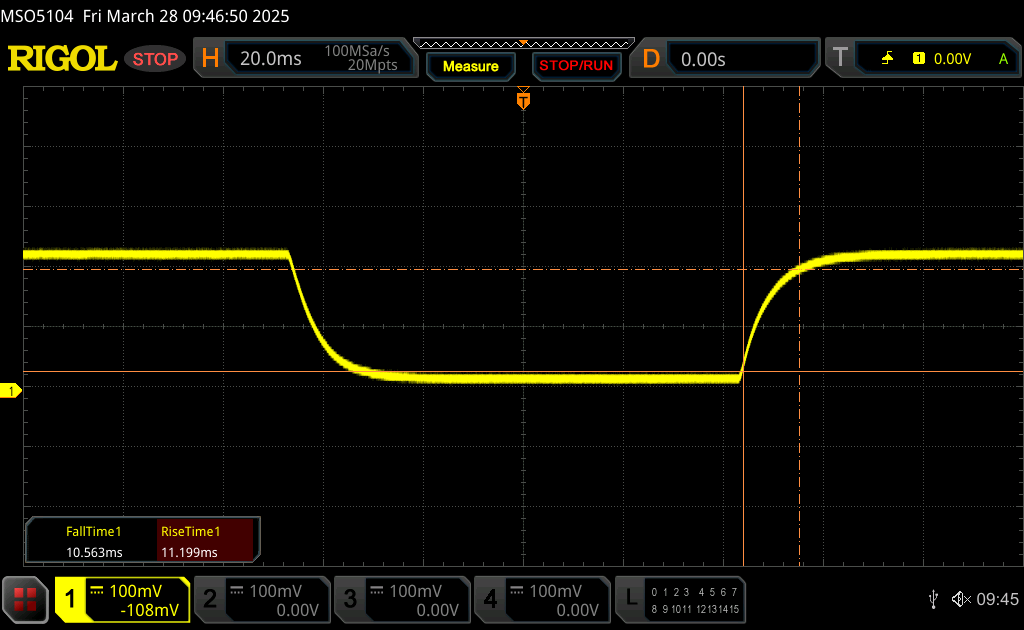 |
| ↘ 10.6 ms fall | ||
| The screen shows good response rates in our tests, but may be too slow for competitive gamers. In comparison, all tested devices range from 0.1 (minimum) to 240 (maximum) ms. » 48 % of all devices are better. This means that the measured response time is similar to the average of all tested devices (19.9 ms). | ||
| ↔ Response Time 50% Grey to 80% Grey | ||
| 25.6 ms ... rise ↗ and fall ↘ combined | ↗ 12.2 ms rise | 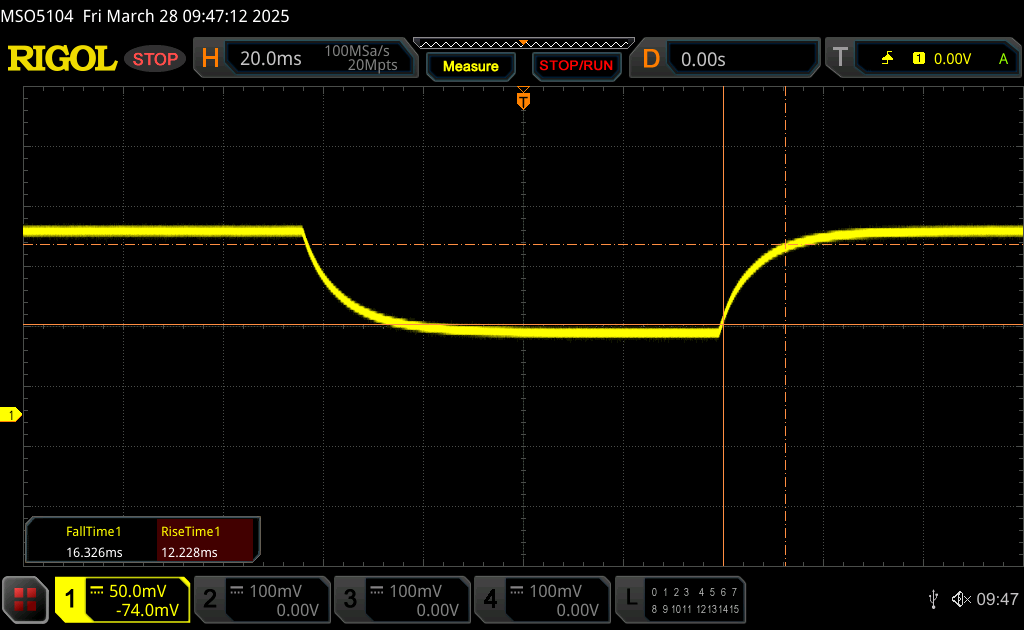 |
| ↘ 13.4 ms fall | ||
| The screen shows relatively slow response rates in our tests and may be too slow for gamers. In comparison, all tested devices range from 0.165 (minimum) to 636 (maximum) ms. » 36 % of all devices are better. This means that the measured response time is better than the average of all tested devices (31.1 ms). | ||
Screen Flickering / PWM (Pulse-Width Modulation)
| Screen flickering / PWM not detected | 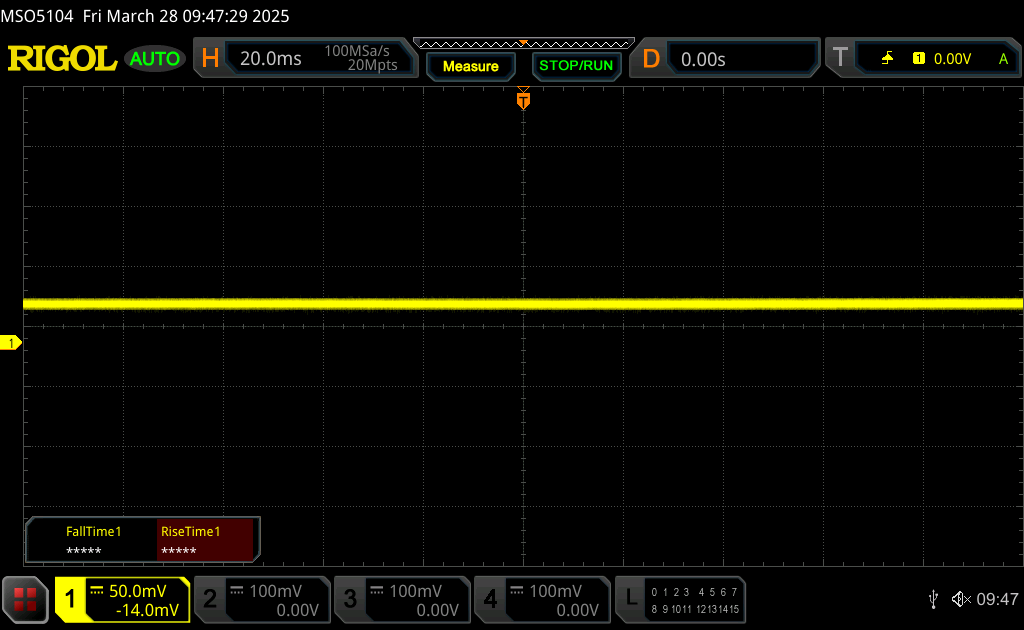 | ||
In comparison: 52 % of all tested devices do not use PWM to dim the display. If PWM was detected, an average of 7794 (minimum: 5 - maximum: 343500) Hz was measured. | |||
Performance
Testing Conditions
We set MSI Center to Extreme Performance mode prior to running the benchmarks below.
Processor
Cinebench R15 Multi Loop
Cinebench R23: Multi Core | Single Core
Cinebench R20: CPU (Multi Core) | CPU (Single Core)
Cinebench R15: CPU Multi 64Bit | CPU Single 64Bit
Blender: v2.79 BMW27 CPU
7-Zip 18.03: 7z b 4 | 7z b 4 -mmt1
Geekbench 6.7: Multi-Core | Single-Core
Geekbench 5.5: Multi-Core | Single-Core
HWBOT x265 Benchmark v2.2: 4k Preset
LibreOffice : 20 Documents To PDF
R Benchmark 2.5: Overall mean
| CPU Performance rating | |
| Asus TUF Gaming A15 FA507UV | |
| Gigabyte G5 KF5 2024 | |
| Lenovo LOQ 15IRH8 Core i7 | |
| Lenovo LOQ 15IRX9 | |
| HP Victus 15 fa0020nr -2! | |
| Gigabyte G5 KE -2! | |
| HP Victus 15-fa1057ng -4! | |
| Acer Nitro V 15 ANV15-51-582S | |
| Average Intel Core i5-12450H | |
| MSI Thin GF63 12VE | |
| Lenovo IdeaPad Gaming 3 15ARH7 -2! | |
| Cinebench R20 / CPU (Multi Core) | |
| Asus TUF Gaming A15 FA507UV | |
| Lenovo LOQ 15IRX9 | |
| HP Victus 15 fa0020nr | |
| Lenovo LOQ 15IRH8 Core i7 | |
| Gigabyte G5 KF5 2024 | |
| HP Victus 15-fa1057ng | |
| Gigabyte G5 KE | |
| Acer Nitro V 15 ANV15-51-582S | |
| MSI Thin GF63 12VE | |
| Lenovo IdeaPad Gaming 3 15ARH7 | |
| Average Intel Core i5-12450H (2952 - 4105, n=6) | |
| Cinebench R20 / CPU (Single Core) | |
| Lenovo LOQ 15IRH8 Core i7 | |
| Gigabyte G5 KF5 2024 | |
| HP Victus 15 fa0020nr | |
| Asus TUF Gaming A15 FA507UV | |
| HP Victus 15-fa1057ng | |
| Acer Nitro V 15 ANV15-51-582S | |
| Lenovo LOQ 15IRX9 | |
| Average Intel Core i5-12450H (622 - 646, n=6) | |
| Gigabyte G5 KE | |
| MSI Thin GF63 12VE | |
| Lenovo IdeaPad Gaming 3 15ARH7 | |
| Cinebench R15 / CPU Multi 64Bit | |
| Asus TUF Gaming A15 FA507UV | |
| HP Victus 15 fa0020nr | |
| Lenovo LOQ 15IRX9 | |
| Gigabyte G5 KF5 2024 | |
| Lenovo LOQ 15IRH8 Core i7 | |
| HP Victus 15-fa1057ng | |
| Gigabyte G5 KE | |
| Acer Nitro V 15 ANV15-51-582S | |
| Lenovo IdeaPad Gaming 3 15ARH7 | |
| MSI Thin GF63 12VE | |
| Average Intel Core i5-12450H (1150 - 1591, n=6) | |
| Cinebench R15 / CPU Single 64Bit | |
| Asus TUF Gaming A15 FA507UV | |
| Gigabyte G5 KF5 2024 | |
| Lenovo LOQ 15IRH8 Core i7 | |
| HP Victus 15 fa0020nr | |
| Gigabyte G5 KE | |
| HP Victus 15-fa1057ng | |
| Acer Nitro V 15 ANV15-51-582S | |
| Lenovo LOQ 15IRX9 | |
| Average Intel Core i5-12450H (225 - 239, n=6) | |
| Lenovo IdeaPad Gaming 3 15ARH7 | |
| MSI Thin GF63 12VE | |
| Geekbench 6.7 / Multi-Core | |
| Gigabyte G5 KF5 2024 | |
| Lenovo LOQ 15IRX9 | |
| Asus TUF Gaming A15 FA507UV | |
| Lenovo LOQ 15IRH8 Core i7 | |
| Acer Nitro V 15 ANV15-51-582S | |
| Average Intel Core i5-12450H (7081 - 9109, n=7) | |
| MSI Thin GF63 12VE | |
| Geekbench 6.7 / Single-Core | |
| Asus TUF Gaming A15 FA507UV | |
| Lenovo LOQ 15IRH8 Core i7 | |
| Gigabyte G5 KF5 2024 | |
| Lenovo LOQ 15IRX9 | |
| Acer Nitro V 15 ANV15-51-582S | |
| Average Intel Core i5-12450H (2155 - 2293, n=7) | |
| MSI Thin GF63 12VE | |
| Geekbench 5.5 / Multi-Core | |
| Lenovo LOQ 15IRX9 | |
| Asus TUF Gaming A15 FA507UV | |
| Gigabyte G5 KF5 2024 | |
| Lenovo LOQ 15IRH8 Core i7 | |
| HP Victus 15 fa0020nr | |
| Gigabyte G5 KE | |
| Acer Nitro V 15 ANV15-51-582S | |
| Average Intel Core i5-12450H (6777 - 8330, n=7) | |
| MSI Thin GF63 12VE | |
| Lenovo IdeaPad Gaming 3 15ARH7 | |
| Geekbench 5.5 / Single-Core | |
| Asus TUF Gaming A15 FA507UV | |
| Lenovo LOQ 15IRH8 Core i7 | |
| Gigabyte G5 KF5 2024 | |
| HP Victus 15 fa0020nr | |
| Lenovo LOQ 15IRX9 | |
| Acer Nitro V 15 ANV15-51-582S | |
| Gigabyte G5 KE | |
| Average Intel Core i5-12450H (1527 - 1665, n=7) | |
| MSI Thin GF63 12VE | |
| Lenovo IdeaPad Gaming 3 15ARH7 | |
| HWBOT x265 Benchmark v2.2 / 4k Preset | |
| Asus TUF Gaming A15 FA507UV | |
| Gigabyte G5 KF5 2024 | |
| Lenovo LOQ 15IRX9 | |
| Gigabyte G5 KE | |
| Lenovo LOQ 15IRH8 Core i7 | |
| HP Victus 15 fa0020nr | |
| HP Victus 15-fa1057ng | |
| Acer Nitro V 15 ANV15-51-582S | |
| Lenovo IdeaPad Gaming 3 15ARH7 | |
| MSI Thin GF63 12VE | |
| Average Intel Core i5-12450H (8.78 - 12.3, n=6) | |
| LibreOffice / 20 Documents To PDF | |
| HP Victus 15-fa1057ng | |
| MSI Thin GF63 12VE | |
| Acer Nitro V 15 ANV15-51-582S | |
| Lenovo LOQ 15IRX9 | |
| Lenovo IdeaPad Gaming 3 15ARH7 | |
| Gigabyte G5 KE | |
| Gigabyte G5 KF5 2024 | |
| HP Victus 15 fa0020nr | |
| Average Intel Core i5-12450H (41.1 - 60.3, n=7) | |
| Asus TUF Gaming A15 FA507UV | |
| Lenovo LOQ 15IRH8 Core i7 | |
| R Benchmark 2.5 / Overall mean | |
| MSI Thin GF63 12VE | |
| Lenovo IdeaPad Gaming 3 15ARH7 | |
| Average Intel Core i5-12450H (0.4949 - 0.54, n=7) | |
| Acer Nitro V 15 ANV15-51-582S | |
| HP Victus 15-fa1057ng | |
| Gigabyte G5 KE | |
| Lenovo LOQ 15IRX9 | |
| HP Victus 15 fa0020nr | |
| Lenovo LOQ 15IRH8 Core i7 | |
| Gigabyte G5 KF5 2024 | |
| Asus TUF Gaming A15 FA507UV | |
* ... smaller is better
AIDA64: FP32 Ray-Trace | FPU Julia | CPU SHA3 | CPU Queen | FPU SinJulia | FPU Mandel | CPU AES | CPU ZLib | FP64 Ray-Trace | CPU PhotoWorxx
| Performance rating | |
| Asus TUF A15 FA507 | |
| Lenovo LOQ 15IRX9 | |
| HP Victus 15-fa1057ng | |
| Acer Nitro V 15 ANV15-51-582S | |
| MSI Thin GF63 12VE | |
| Average Intel Core i5-12450H | |
| AIDA64 / FP32 Ray-Trace | |
| Asus TUF A15 FA507 | |
| Lenovo LOQ 15IRX9 | |
| HP Victus 15-fa1057ng | |
| Acer Nitro V 15 ANV15-51-582S | |
| MSI Thin GF63 12VE | |
| Average Intel Core i5-12450H (7229 - 10474, n=6) | |
| AIDA64 / FPU Julia | |
| Asus TUF A15 FA507 | |
| Lenovo LOQ 15IRX9 | |
| Acer Nitro V 15 ANV15-51-582S | |
| HP Victus 15-fa1057ng | |
| MSI Thin GF63 12VE | |
| Average Intel Core i5-12450H (37583 - 51636, n=6) | |
| AIDA64 / CPU SHA3 | |
| Lenovo LOQ 15IRX9 | |
| Asus TUF A15 FA507 | |
| Acer Nitro V 15 ANV15-51-582S | |
| HP Victus 15-fa1057ng | |
| MSI Thin GF63 12VE | |
| Average Intel Core i5-12450H (1724 - 2359, n=6) | |
| AIDA64 / CPU Queen | |
| Asus TUF A15 FA507 | |
| Lenovo LOQ 15IRX9 | |
| HP Victus 15-fa1057ng | |
| Acer Nitro V 15 ANV15-51-582S | |
| MSI Thin GF63 12VE | |
| Average Intel Core i5-12450H (59539 - 68897, n=6) | |
| AIDA64 / FPU SinJulia | |
| Asus TUF A15 FA507 | |
| Lenovo LOQ 15IRX9 | |
| HP Victus 15-fa1057ng | |
| Acer Nitro V 15 ANV15-51-582S | |
| MSI Thin GF63 12VE | |
| Average Intel Core i5-12450H (5007 - 6147, n=6) | |
| AIDA64 / FPU Mandel | |
| Asus TUF A15 FA507 | |
| Lenovo LOQ 15IRX9 | |
| HP Victus 15-fa1057ng | |
| Acer Nitro V 15 ANV15-51-582S | |
| MSI Thin GF63 12VE | |
| Average Intel Core i5-12450H (18516 - 25115, n=6) | |
| AIDA64 / CPU AES | |
| Acer Nitro V 15 ANV15-51-582S | |
| Lenovo LOQ 15IRX9 | |
| Asus TUF A15 FA507 | |
| Average Intel Core i5-12450H (46835 - 78537, n=6) | |
| HP Victus 15-fa1057ng | |
| MSI Thin GF63 12VE | |
| AIDA64 / CPU ZLib | |
| Lenovo LOQ 15IRX9 | |
| HP Victus 15-fa1057ng | |
| Acer Nitro V 15 ANV15-51-582S | |
| MSI Thin GF63 12VE | |
| Asus TUF A15 FA507 | |
| Average Intel Core i5-12450H (490 - 708, n=6) | |
| AIDA64 / FP64 Ray-Trace | |
| Asus TUF A15 FA507 | |
| Lenovo LOQ 15IRX9 | |
| HP Victus 15-fa1057ng | |
| Acer Nitro V 15 ANV15-51-582S | |
| MSI Thin GF63 12VE | |
| Average Intel Core i5-12450H (4025 - 5614, n=6) | |
| AIDA64 / CPU PhotoWorxx | |
| Lenovo LOQ 15IRX9 | |
| Asus TUF A15 FA507 | |
| HP Victus 15-fa1057ng | |
| Average Intel Core i5-12450H (12271 - 28682, n=6) | |
| Acer Nitro V 15 ANV15-51-582S | |
| MSI Thin GF63 12VE | |
System Performance
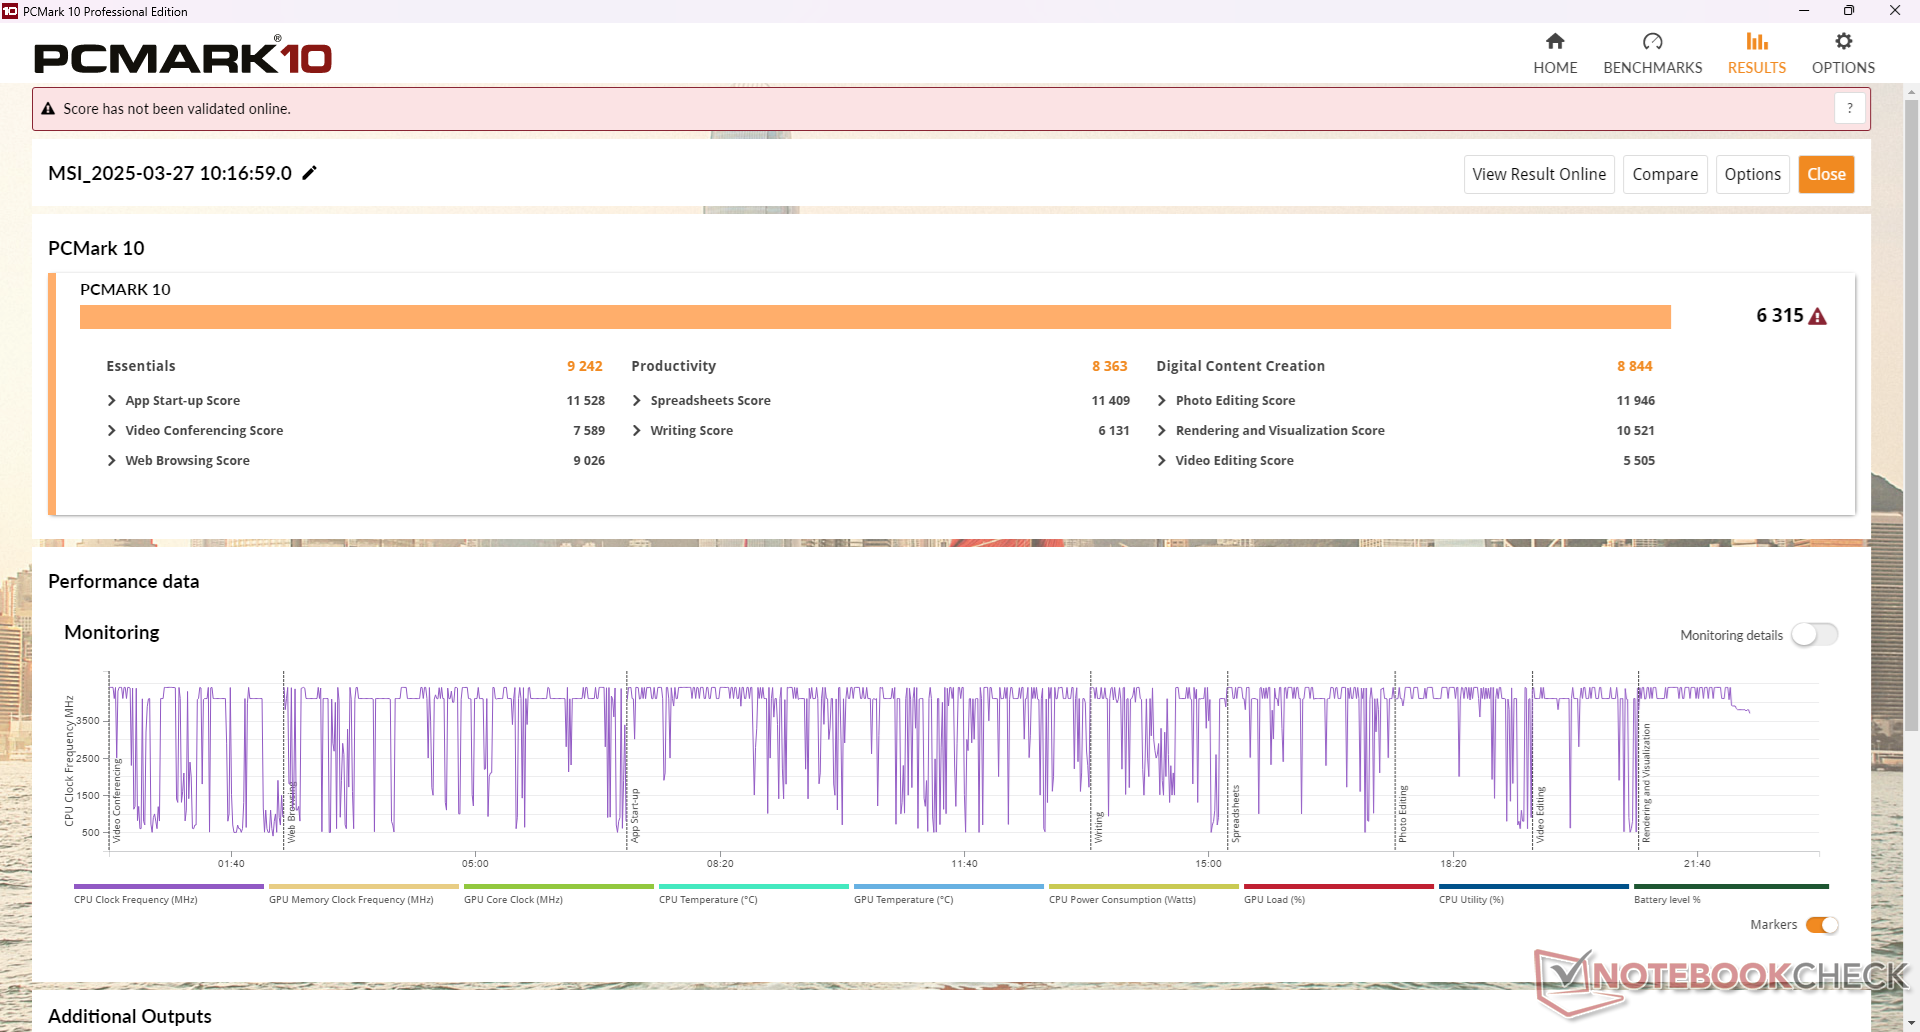
PCMark scores are slightly lower than many Core i5 competitors due in part to the limited 8 GB of single-channel RAM on our test unit.
CrossMark: Overall | Productivity | Creativity | Responsiveness
WebXPRT 3: Overall
WebXPRT 4: Overall
Mozilla Kraken 1.1: Total
| PCMark 10 / Score | |
| Asus TUF A15 FA507 | |
| Lenovo LOQ 15IRX9 | |
| HP Victus 15-fa1057ng | |
| Acer Nitro V 15 ANV15-51-582S | |
| MSI Thin GF63 12VE | |
| Average Intel Core i5-12450H, NVIDIA GeForce RTX 4050 Laptop GPU (n=1) | |
| MSI GF63 Thin 9SC | |
| PCMark 10 / Essentials | |
| Asus TUF A15 FA507 | |
| HP Victus 15-fa1057ng | |
| Acer Nitro V 15 ANV15-51-582S | |
| Lenovo LOQ 15IRX9 | |
| MSI Thin GF63 12VE | |
| Average Intel Core i5-12450H, NVIDIA GeForce RTX 4050 Laptop GPU (n=1) | |
| MSI GF63 Thin 9SC | |
| PCMark 10 / Productivity | |
| Asus TUF A15 FA507 | |
| HP Victus 15-fa1057ng | |
| Lenovo LOQ 15IRX9 | |
| Acer Nitro V 15 ANV15-51-582S | |
| MSI Thin GF63 12VE | |
| Average Intel Core i5-12450H, NVIDIA GeForce RTX 4050 Laptop GPU (n=1) | |
| MSI GF63 Thin 9SC | |
| PCMark 10 / Digital Content Creation | |
| Lenovo LOQ 15IRX9 | |
| Asus TUF A15 FA507 | |
| HP Victus 15-fa1057ng | |
| Acer Nitro V 15 ANV15-51-582S | |
| MSI Thin GF63 12VE | |
| Average Intel Core i5-12450H, NVIDIA GeForce RTX 4050 Laptop GPU (n=1) | |
| MSI GF63 Thin 9SC | |
| CrossMark / Overall | |
| Lenovo LOQ 15IRX9 | |
| Asus TUF A15 FA507 | |
| MSI Thin GF63 12VE | |
| Average Intel Core i5-12450H, NVIDIA GeForce RTX 4050 Laptop GPU (n=1) | |
| CrossMark / Productivity | |
| Lenovo LOQ 15IRX9 | |
| MSI Thin GF63 12VE | |
| Average Intel Core i5-12450H, NVIDIA GeForce RTX 4050 Laptop GPU (n=1) | |
| Asus TUF A15 FA507 | |
| CrossMark / Creativity | |
| Lenovo LOQ 15IRX9 | |
| Asus TUF A15 FA507 | |
| MSI Thin GF63 12VE | |
| Average Intel Core i5-12450H, NVIDIA GeForce RTX 4050 Laptop GPU (n=1) | |
| CrossMark / Responsiveness | |
| Lenovo LOQ 15IRX9 | |
| MSI Thin GF63 12VE | |
| Average Intel Core i5-12450H, NVIDIA GeForce RTX 4050 Laptop GPU (n=1) | |
| Asus TUF A15 FA507 | |
| WebXPRT 3 / Overall | |
| Asus TUF A15 FA507 | |
| HP Victus 15-fa1057ng | |
| Acer Nitro V 15 ANV15-51-582S | |
| Lenovo LOQ 15IRX9 | |
| MSI Thin GF63 12VE | |
| Average Intel Core i5-12450H, NVIDIA GeForce RTX 4050 Laptop GPU (n=1) | |
| WebXPRT 4 / Overall | |
| Lenovo LOQ 15IRX9 | |
| Acer Nitro V 15 ANV15-51-582S | |
| MSI Thin GF63 12VE | |
| Average Intel Core i5-12450H, NVIDIA GeForce RTX 4050 Laptop GPU (n=1) | |
| Asus TUF A15 FA507 | |
| Mozilla Kraken 1.1 / Total | |
| Asus TUF A15 FA507 | |
| MSI Thin GF63 12VE | |
| Average Intel Core i5-12450H, NVIDIA GeForce RTX 4050 Laptop GPU (n=1) | |
| Acer Nitro V 15 ANV15-51-582S | |
| Lenovo LOQ 15IRX9 | |
| HP Victus 15-fa1057ng | |
* ... smaller is better
| PCMark 10 Score | 6315 points | |
Help | ||
| AIDA64 / Memory Copy | |
| Lenovo LOQ 15IRX9 | |
| Asus TUF A15 FA507 | |
| HP Victus 15-fa1057ng | |
| Average Intel Core i5-12450H (21750 - 43918, n=6) | |
| Acer Nitro V 15 ANV15-51-582S | |
| MSI Thin GF63 12VE | |
| AIDA64 / Memory Read | |
| Lenovo LOQ 15IRX9 | |
| Asus TUF A15 FA507 | |
| HP Victus 15-fa1057ng | |
| Average Intel Core i5-12450H (22956 - 47555, n=6) | |
| Acer Nitro V 15 ANV15-51-582S | |
| MSI Thin GF63 12VE | |
| AIDA64 / Memory Write | |
| Lenovo LOQ 15IRX9 | |
| Asus TUF A15 FA507 | |
| HP Victus 15-fa1057ng | |
| Average Intel Core i5-12450H (22297 - 46963, n=6) | |
| Acer Nitro V 15 ANV15-51-582S | |
| MSI Thin GF63 12VE | |
| AIDA64 / Memory Latency | |
| MSI Thin GF63 12VE | |
| Lenovo LOQ 15IRX9 | |
| Acer Nitro V 15 ANV15-51-582S | |
| HP Victus 15-fa1057ng | |
| Average Intel Core i5-12450H (76.5 - 100.9, n=6) | |
| Asus TUF A15 FA507 | |
* ... smaller is better
DPC Latency
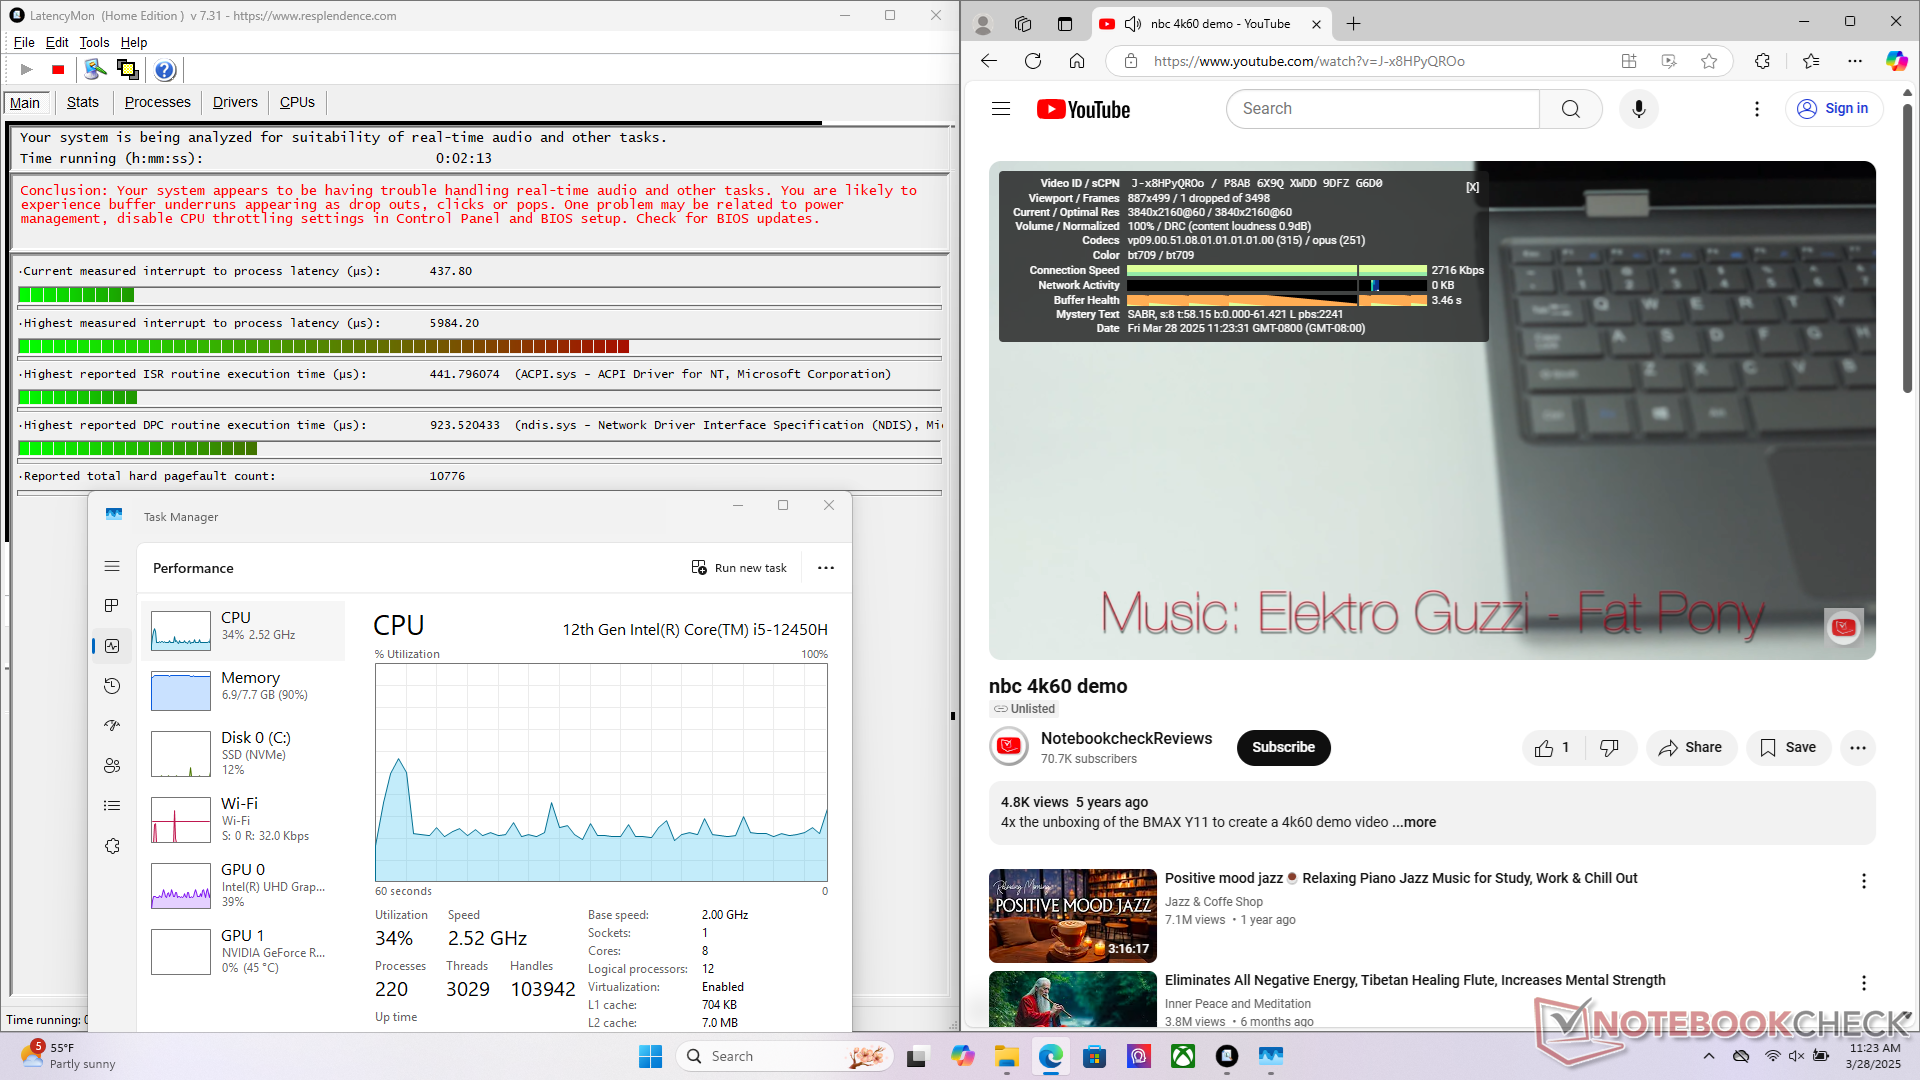
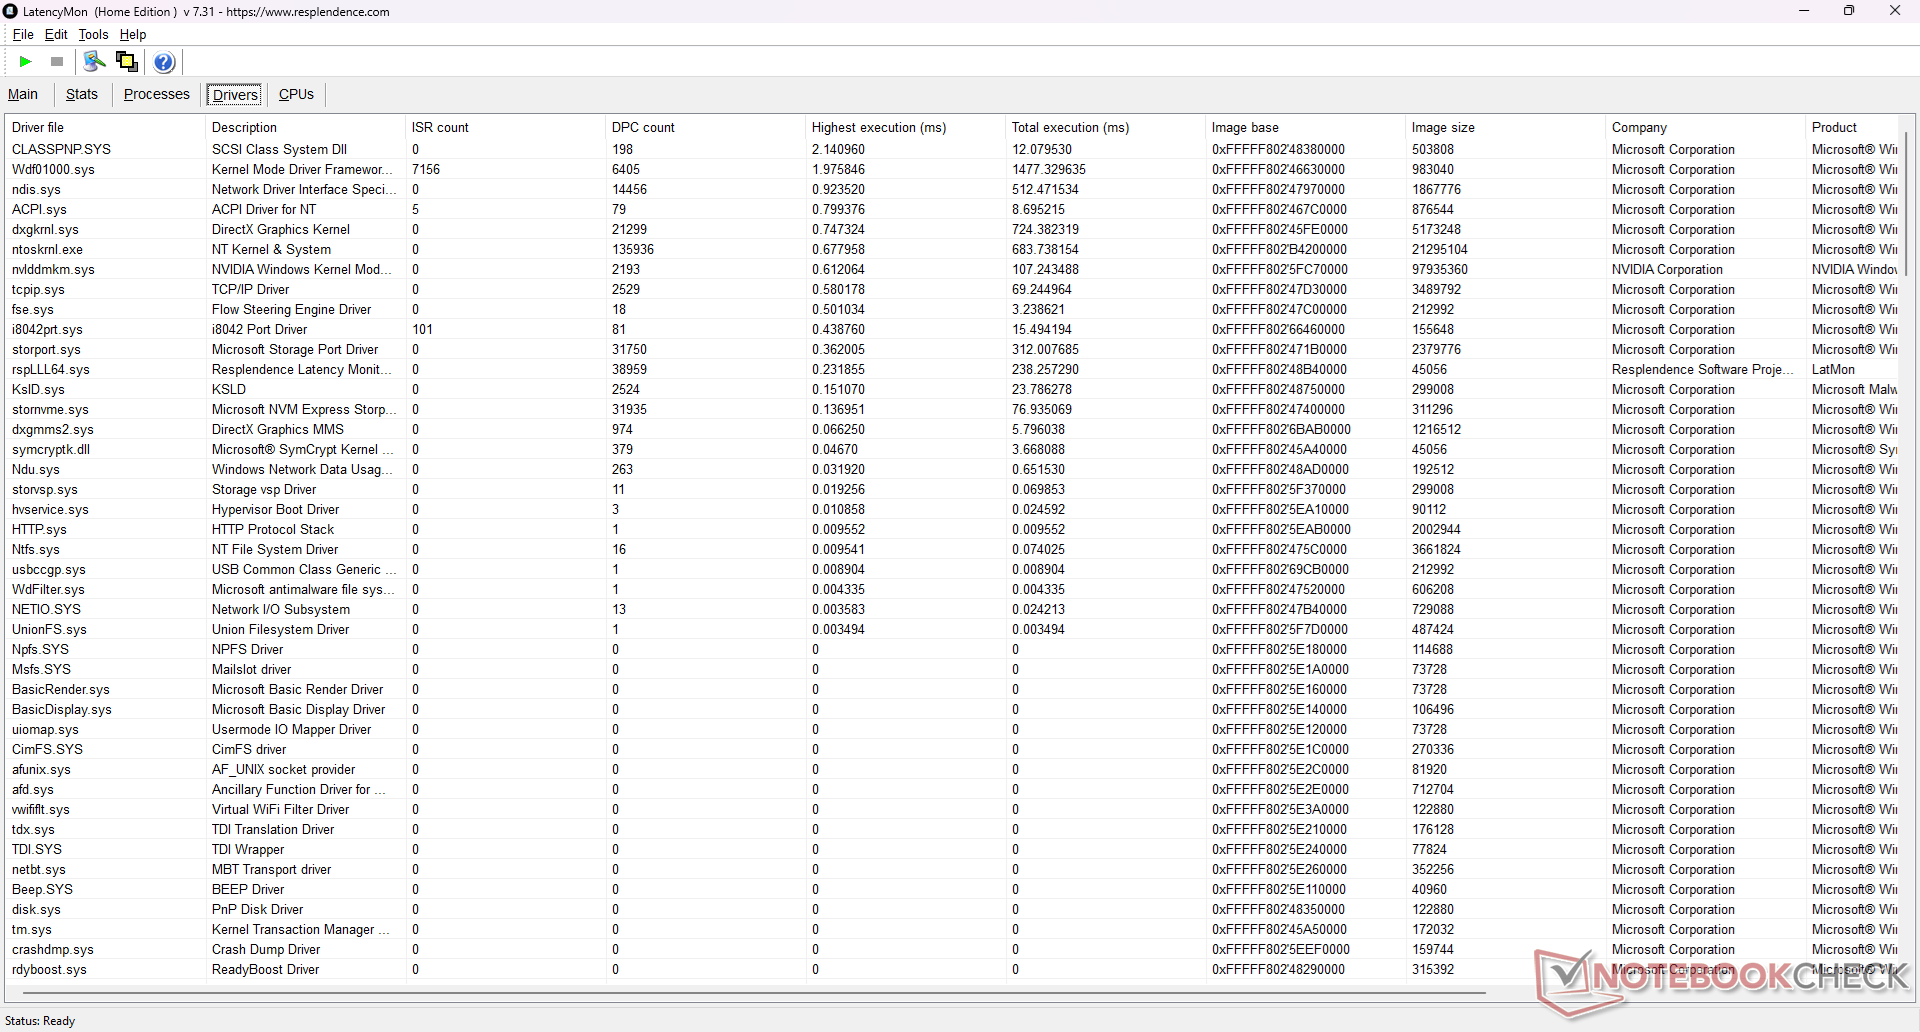
| DPC Latencies / LatencyMon - interrupt to process latency (max), Web, Youtube, Prime95 | |
| MSI Thin GF63 12VE | |
| HP Victus 15-fa1057ng | |
| Lenovo LOQ 15IRX9 | |
| Acer Nitro V 15 ANV15-51-582S | |
* ... smaller is better
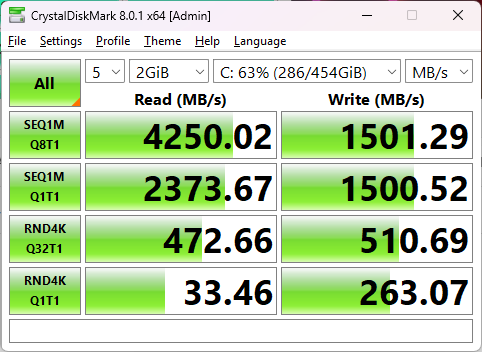
Storage Devices
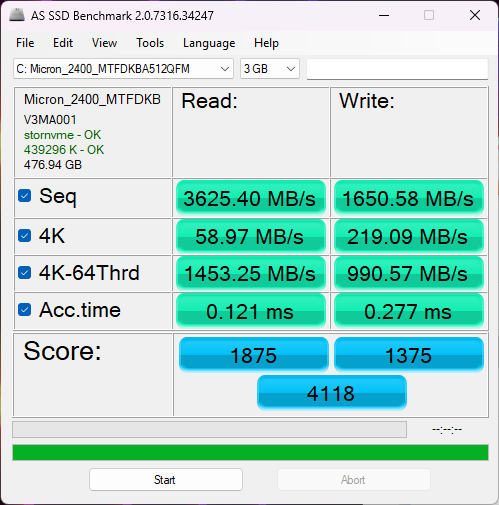

| Drive Performance rating - Percent | |
| Acer Nitro V 15 ANV15-51-582S | |
| Lenovo LOQ 15IRX9 | |
| HP Victus 15-fa1057ng | |
| MSI Thin GF63 12VE | |
| Asus TUF A15 FA507 | |
| MSI GF63 Thin 9SC -8! | |
* ... smaller is better
Disk Throttling: DiskSpd Read Loop, Queue Depth 8
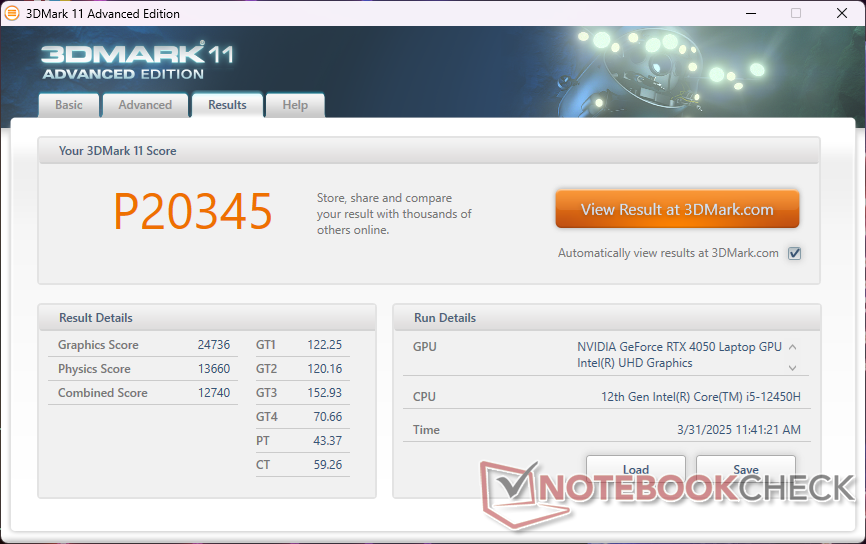
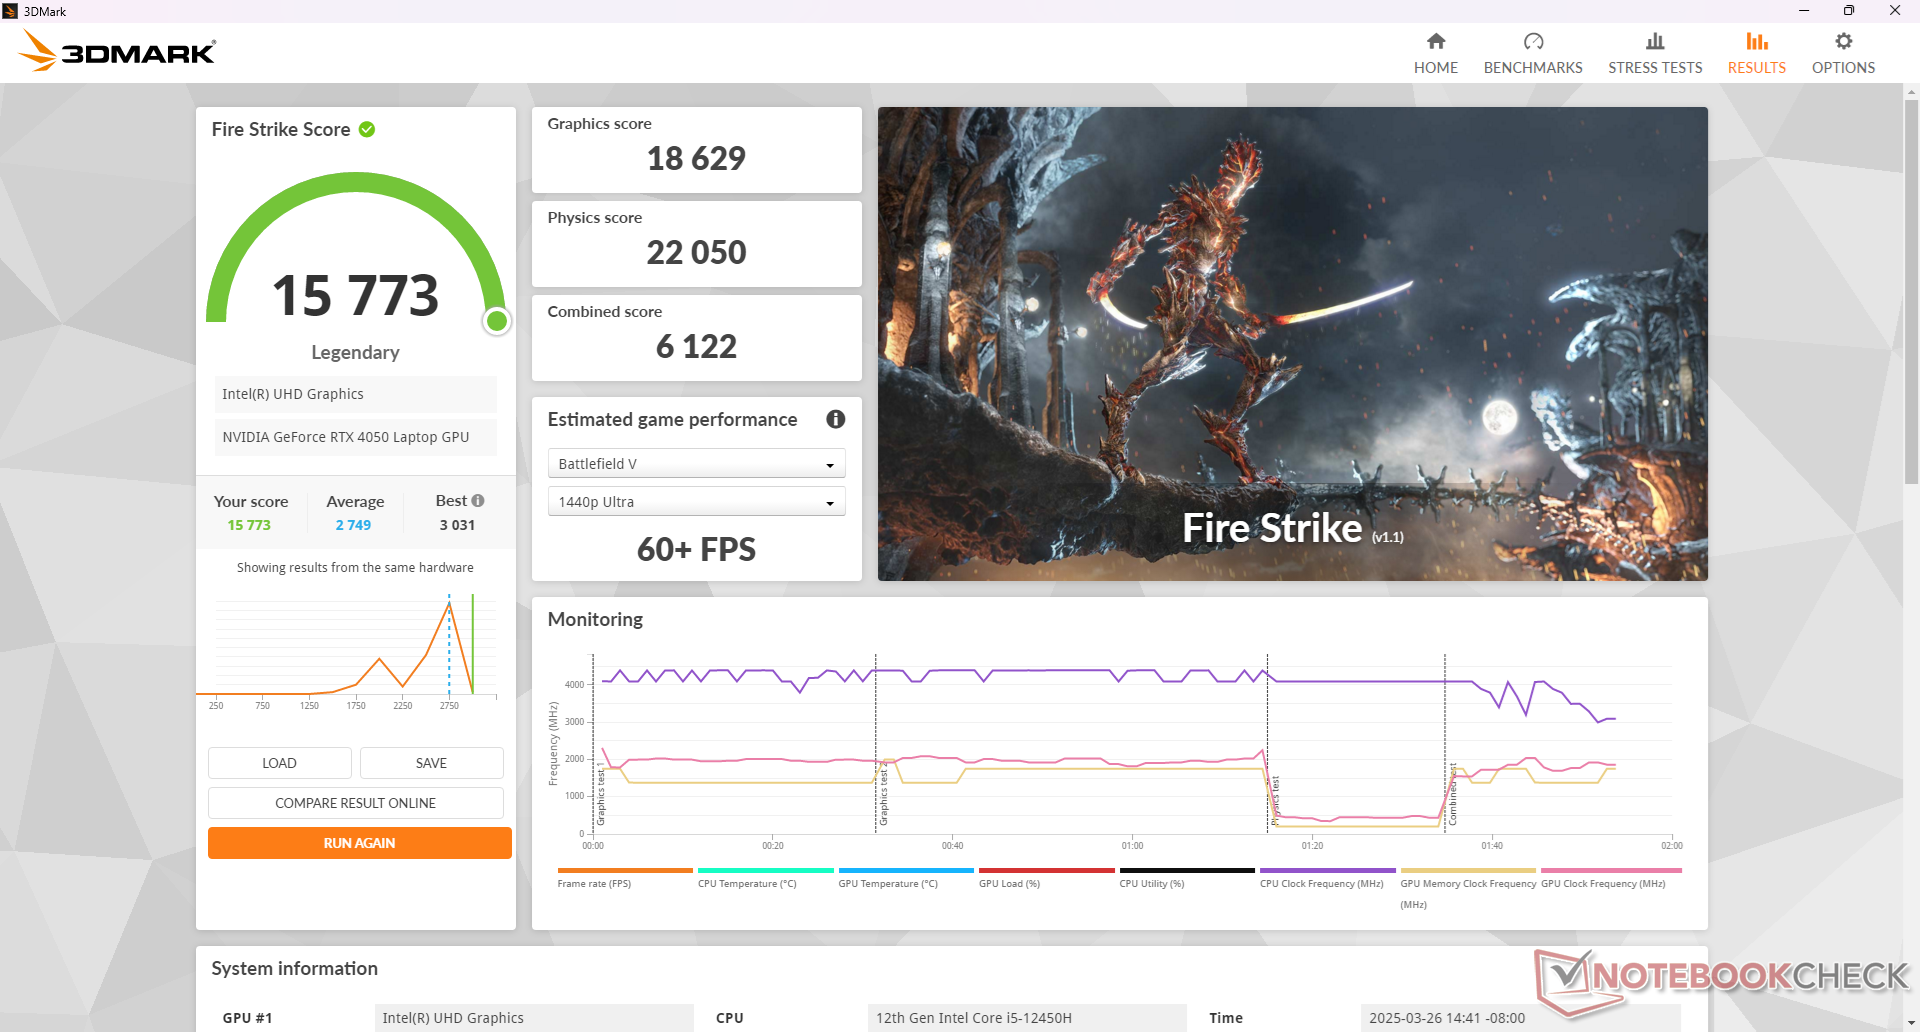
GPU Performance
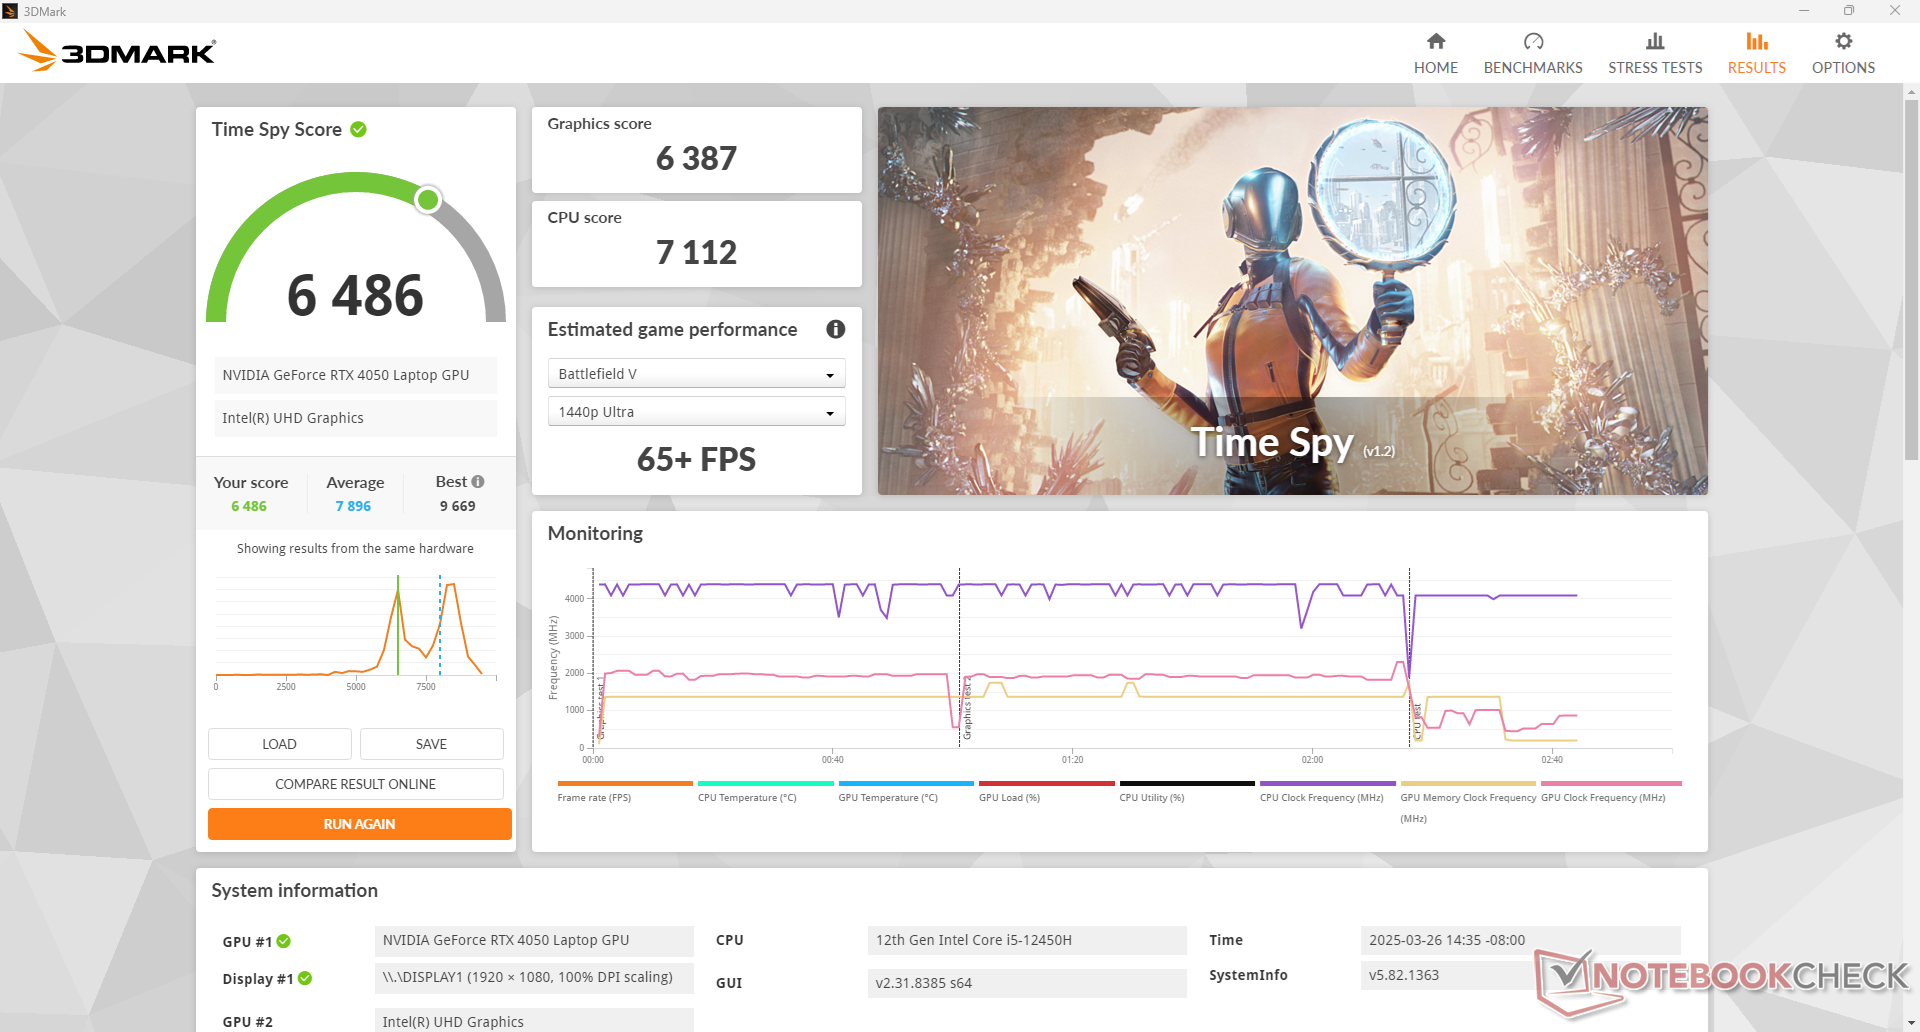
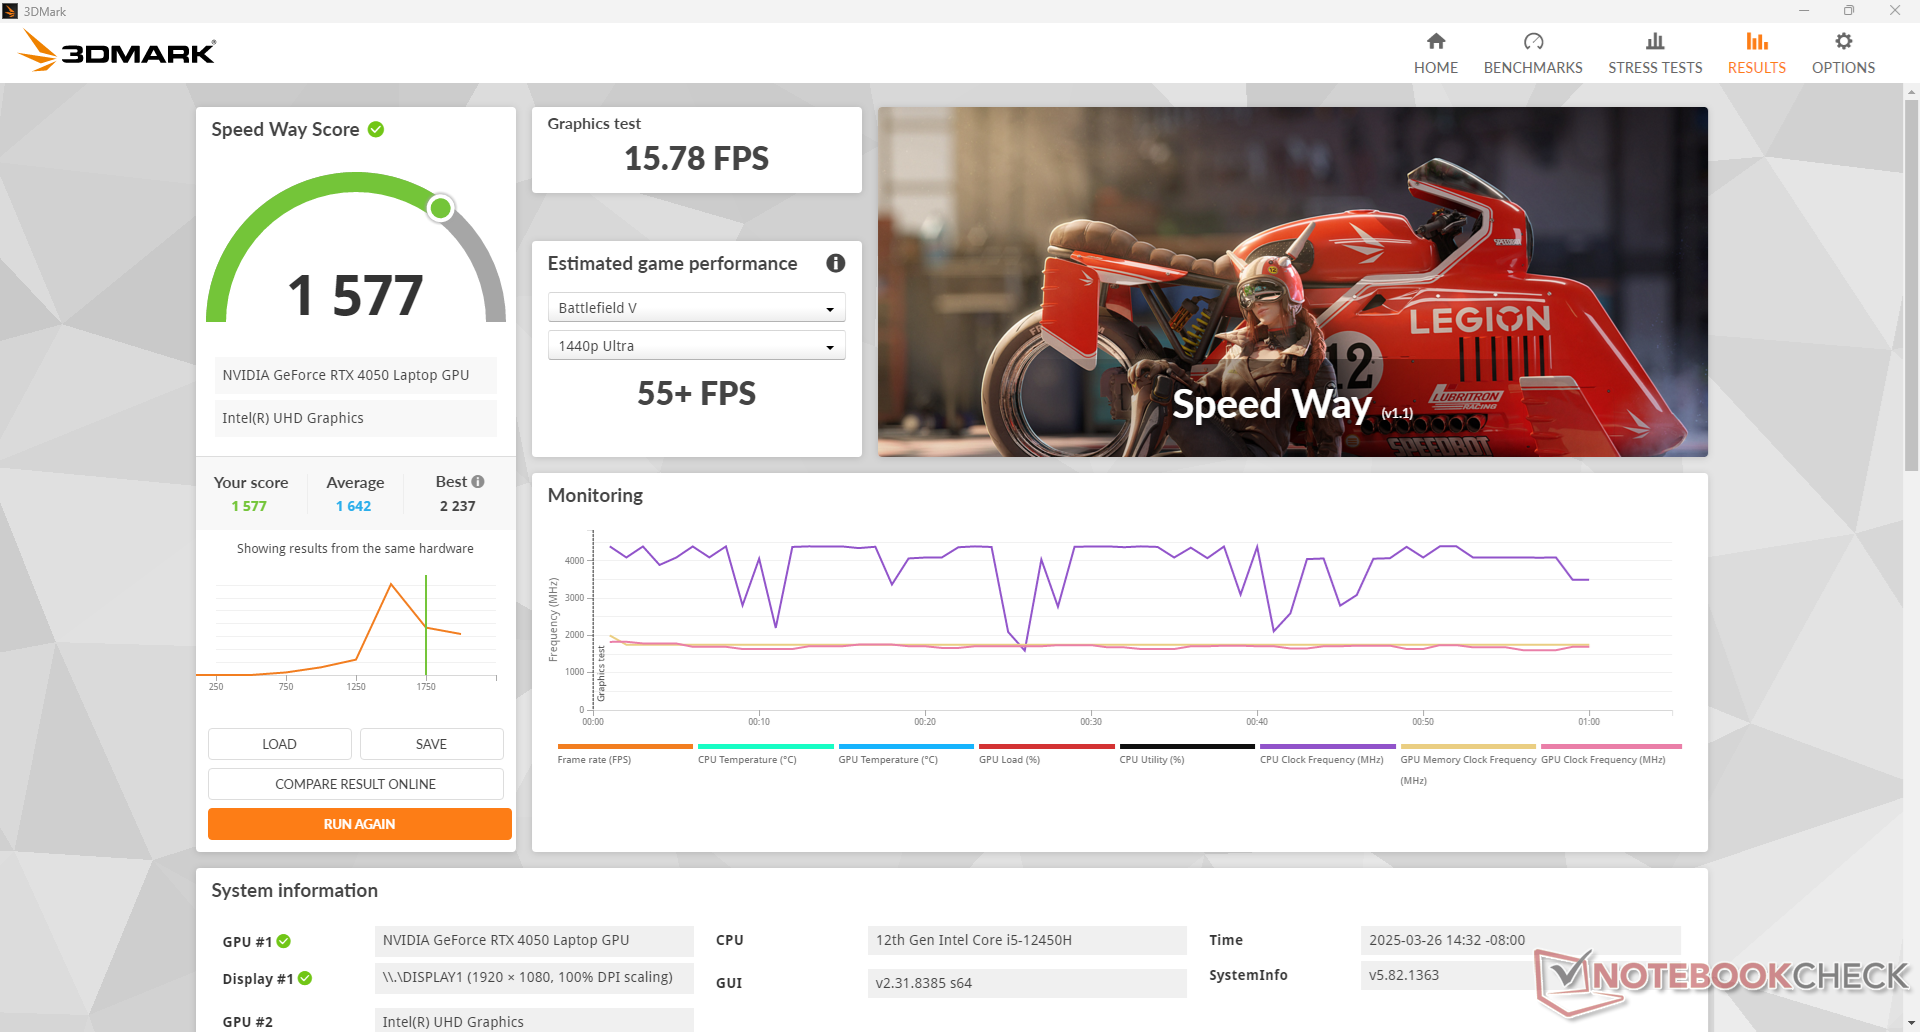
Graphics performance is below average when compared to other laptops with the same RTX 4050 GPU due largely to our limited 8 GB of system RAM.
| 3DMark Performance rating - Percent | |
| Asus TUF Gaming A15 FA507UV -1! | |
| Lenovo LOQ 15IRX9 -1! | |
| Gigabyte G5 KF5 2024 -1! | |
| Gigabyte G5 KE | |
| Lenovo LOQ 15IRH8 Core i7 | |
| Average NVIDIA GeForce RTX 4050 Laptop GPU | |
| HP Victus 15-fa1057ng -1! | |
| Acer Nitro V 15 ANV15-51-582S -1! | |
| MSI Thin GF63 12VE | |
| Lenovo IdeaPad Gaming 3 15ARH7 -1! | |
| HP Victus 15 fa0020nr | |
| 3DMark 11 Performance | 20345 points | |
| 3DMark Fire Strike Score | 15773 points | |
| 3DMark Time Spy Score | 6486 points | |
Help | ||
* ... smaller is better
| Tiny Tina's Wonderlands | |
| 1280x720 Lowest Preset (DX12) | |
| Average NVIDIA GeForce RTX 4050 Laptop GPU (109.3 - 250, n=4) | |
| MSI Thin GF63 12VE | |
| 1920x1080 Low Preset (DX12) | |
| Average NVIDIA GeForce RTX 4050 Laptop GPU (104.5 - 183.3, n=7) | |
| MSI Thin GF63 12VE | |
| 1920x1080 Medium Preset (DX12) | |
| Average NVIDIA GeForce RTX 4050 Laptop GPU (93.4 - 149.2, n=7) | |
| MSI Thin GF63 12VE | |
| 1920x1080 High Preset (DX12) | |
| Average NVIDIA GeForce RTX 4050 Laptop GPU (63.3 - 99.5, n=7) | |
| MSI Thin GF63 12VE | |
| 1920x1080 Badass Preset (DX12) | |
| Average NVIDIA GeForce RTX 4050 Laptop GPU (49.8 - 77.3, n=7) | |
| MSI Thin GF63 12VE | |
| F1 22 | |
| 1280x720 Ultra Low Preset AA:T AF:16x | |
| Lenovo LOQ 15IRH8 Core i7 | |
| Average NVIDIA GeForce RTX 4050 Laptop GPU (175.1 - 364, n=16) | |
| Gigabyte G5 KE | |
| MSI Thin GF63 12VE | |
| 1920x1080 Low Preset AA:T AF:16x | |
| Lenovo LOQ 15IRH8 Core i7 | |
| Gigabyte G5 KE | |
| Average NVIDIA GeForce RTX 4050 Laptop GPU (100.9 - 244, n=22) | |
| MSI Thin GF63 12VE | |
| 1920x1080 Medium Preset AA:T AF:16x | |
| Lenovo LOQ 15IRH8 Core i7 | |
| Gigabyte G5 KE | |
| Average NVIDIA GeForce RTX 4050 Laptop GPU (101.8 - 234, n=21) | |
| MSI Thin GF63 12VE | |
| 1920x1080 High Preset AA:T AF:16x | |
| Lenovo LOQ 15IRH8 Core i7 | |
| Gigabyte G5 KE | |
| Average NVIDIA GeForce RTX 4050 Laptop GPU (94.4 - 174.7, n=22) | |
| MSI Thin GF63 12VE | |
| 1920x1080 Ultra High Preset AA:T AF:16x | |
| Gigabyte G5 KE | |
| Lenovo LOQ 15IRH8 Core i7 | |
| Average NVIDIA GeForce RTX 4050 Laptop GPU (10.9 - 56.4, n=24) | |
| MSI Thin GF63 12VE | |
| Baldur's Gate 3 | |
| 1280x720 Low Preset AA:SM | |
| Gigabyte G5 KF5 2024 | |
| Average NVIDIA GeForce RTX 4050 Laptop GPU (108.6 - 148.9, n=3) | |
| MSI Thin GF63 12VE | |
| 1920x1080 Low Preset AA:SM | |
| Asus TUF Gaming A15 FA507UV | |
| Gigabyte G5 KF5 2024 | |
| Average NVIDIA GeForce RTX 4050 Laptop GPU (73.4 - 112.3, n=8) | |
| MSI Thin GF63 12VE | |
| 1920x1080 Medium Preset AA:T | |
| Asus TUF Gaming A15 FA507UV | |
| Gigabyte G5 KF5 2024 | |
| Average NVIDIA GeForce RTX 4050 Laptop GPU (56 - 91.9, n=10) | |
| MSI Thin GF63 12VE | |
| 1920x1080 High Preset AA:T | |
| Asus TUF Gaming A15 FA507UV | |
| Gigabyte G5 KF5 2024 | |
| Average NVIDIA GeForce RTX 4050 Laptop GPU (49.8 - 83.5, n=10) | |
| MSI Thin GF63 12VE | |
| 1920x1080 Ultra Preset AA:T | |
| Asus TUF Gaming A15 FA507UV | |
| Gigabyte G5 KF5 2024 | |
| MSI Thin GF63 12VE | |
| Average NVIDIA GeForce RTX 4050 Laptop GPU (48.3 - 81.3, n=11) | |
| Cyberpunk 2077 | |
| 1280x720 Low Preset (FSR off) | |
| Lenovo LOQ 15IRX9 | |
| Asus TUF Gaming A15 FA507UV | |
| Gigabyte G5 KF5 2024 | |
| Average NVIDIA GeForce RTX 4050 Laptop GPU (83.1 - 122, n=5) | |
| MSI Thin GF63 12VE | |
| 1920x1080 Low Preset (FSR off) | |
| Asus TUF Gaming A15 FA507UV | |
| Lenovo LOQ 15IRX9 | |
| Gigabyte G5 KF5 2024 | |
| Average NVIDIA GeForce RTX 4050 Laptop GPU (67.2 - 103.1, n=8) | |
| MSI Thin GF63 12VE | |
| 1920x1080 Medium Preset (FSR off) | |
| Asus TUF Gaming A15 FA507UV | |
| Lenovo LOQ 15IRX9 | |
| Gigabyte G5 KF5 2024 | |
| Average NVIDIA GeForce RTX 4050 Laptop GPU (50.1 - 88.6, n=9) | |
| MSI Thin GF63 12VE | |
| 1920x1080 High Preset (FSR off) | |
| Asus TUF Gaming A15 FA507UV | |
| Lenovo LOQ 15IRX9 | |
| Gigabyte G5 KF5 2024 | |
| Average NVIDIA GeForce RTX 4050 Laptop GPU (42.4 - 75, n=11) | |
| MSI Thin GF63 12VE | |
| 1920x1080 Ultra Preset (FSR off) | |
| Asus TUF Gaming A15 FA507UV | |
| Lenovo LOQ 15IRX9 | |
| Gigabyte G5 KF5 2024 | |
| Average NVIDIA GeForce RTX 4050 Laptop GPU (35.8 - 67.3, n=11) | |
| MSI Thin GF63 12VE | |
Cyberpunk 2077 ultra FPS Chart
| low | med. | high | ultra | |
|---|---|---|---|---|
| GTA V (2015) | 150.9 | 142.2 | 110.7 | 67.1 |
| Dota 2 Reborn (2015) | 122.7 | 108.6 | 95.9 | 90.5 |
| Final Fantasy XV Benchmark (2018) | 123.2 | 85.7 | 64.2 | |
| X-Plane 11.11 (2018) | 70.1 | 63.8 | 55.5 | |
| Far Cry 5 (2018) | 97 | 84 | 82 | 70 |
| Strange Brigade (2018) | 299 | 160.9 | 129.5 | 113.6 |
| Tiny Tina's Wonderlands (2022) | 113 | 95.6 | 72.1 | 55 |
| F1 22 (2022) | 129.2 | 126.3 | 99.3 | 40.1 |
| Baldur's Gate 3 (2023) | 82.1 | 71.3 | 64 | 63.8 |
| Cyberpunk 2077 (2023) | 76.4 | 65.1 | 55.7 | 47.3 |
Emissions
System Noise
Note than fan noise when gaming on Balanced mode is the same as gaming on Performance mode (47.7 dB(A)). It is therefore recommended to game on Performance mode as there is no significant increase in fan noise.
Noise level
| Idle |
| 24.3 / 24.3 / 24.3 dB(A) |
| Load |
| 36.2 / 59.3 dB(A) |
 | ||
30 dB silent 40 dB(A) audible 50 dB(A) loud |
||
min: | ||
| MSI Thin GF63 12VE GeForce RTX 4050 Laptop GPU, i5-12450H, Micron 2400 MTFDKBA512QFM | MSI GF63 Thin 9SC GeForce GTX 1650 Max-Q, i5-9300H, Toshiba KBG30ZMV512G | Lenovo LOQ 15IRX9 GeForce RTX 4060 Laptop GPU, i5-13450HX, Micron 2400 MTFDKCD1T0QFM | HP Victus 15-fa1057ng GeForce RTX 4050 Laptop GPU, i5-13500H, Kioxia XG8 KXG80ZNV512G | Acer Nitro V 15 ANV15-51-582S GeForce RTX 4050 Laptop GPU, i5-13420H, SK hynix PC801 HFS512GEJ9X115N | Asus TUF A15 FA507 GeForce RTX 4050 Laptop GPU, R7 7735HS, Micron 2400 MTFDKBA512QFM | |
|---|---|---|---|---|---|---|
| Noise | -27% | -17% | -11% | -12% | 10% | |
| off / environment * (dB) | 24.3 | 30 -23% | 25 -3% | 25 -3% | 25 -3% | 23.3 4% |
| Idle Minimum * (dB) | 24.3 | 35 -44% | 26 -7% | 29 -19% | 25 -3% | 23.3 4% |
| Idle Average * (dB) | 24.3 | 36 -48% | 34 -40% | 30 -23% | 29 -19% | 23.3 4% |
| Idle Maximum * (dB) | 24.3 | 37 -52% | 36 -48% | 31 -28% | 30 -23% | 23.3 4% |
| Load Average * (dB) | 36.2 | 44 -22% | 48 -33% | 40 -10% | 49 -35% | 29.6 18% |
| Cyberpunk 2077 ultra * (dB) | 47.7 | 48 -1% | ||||
| Load Maximum * (dB) | 59.3 | 43 27% | 50 16% | 48 19% | 51 14% | 43 27% |
| Witcher 3 ultra * (dB) | 41 | 42 | 49 | 43 |
* ... smaller is better
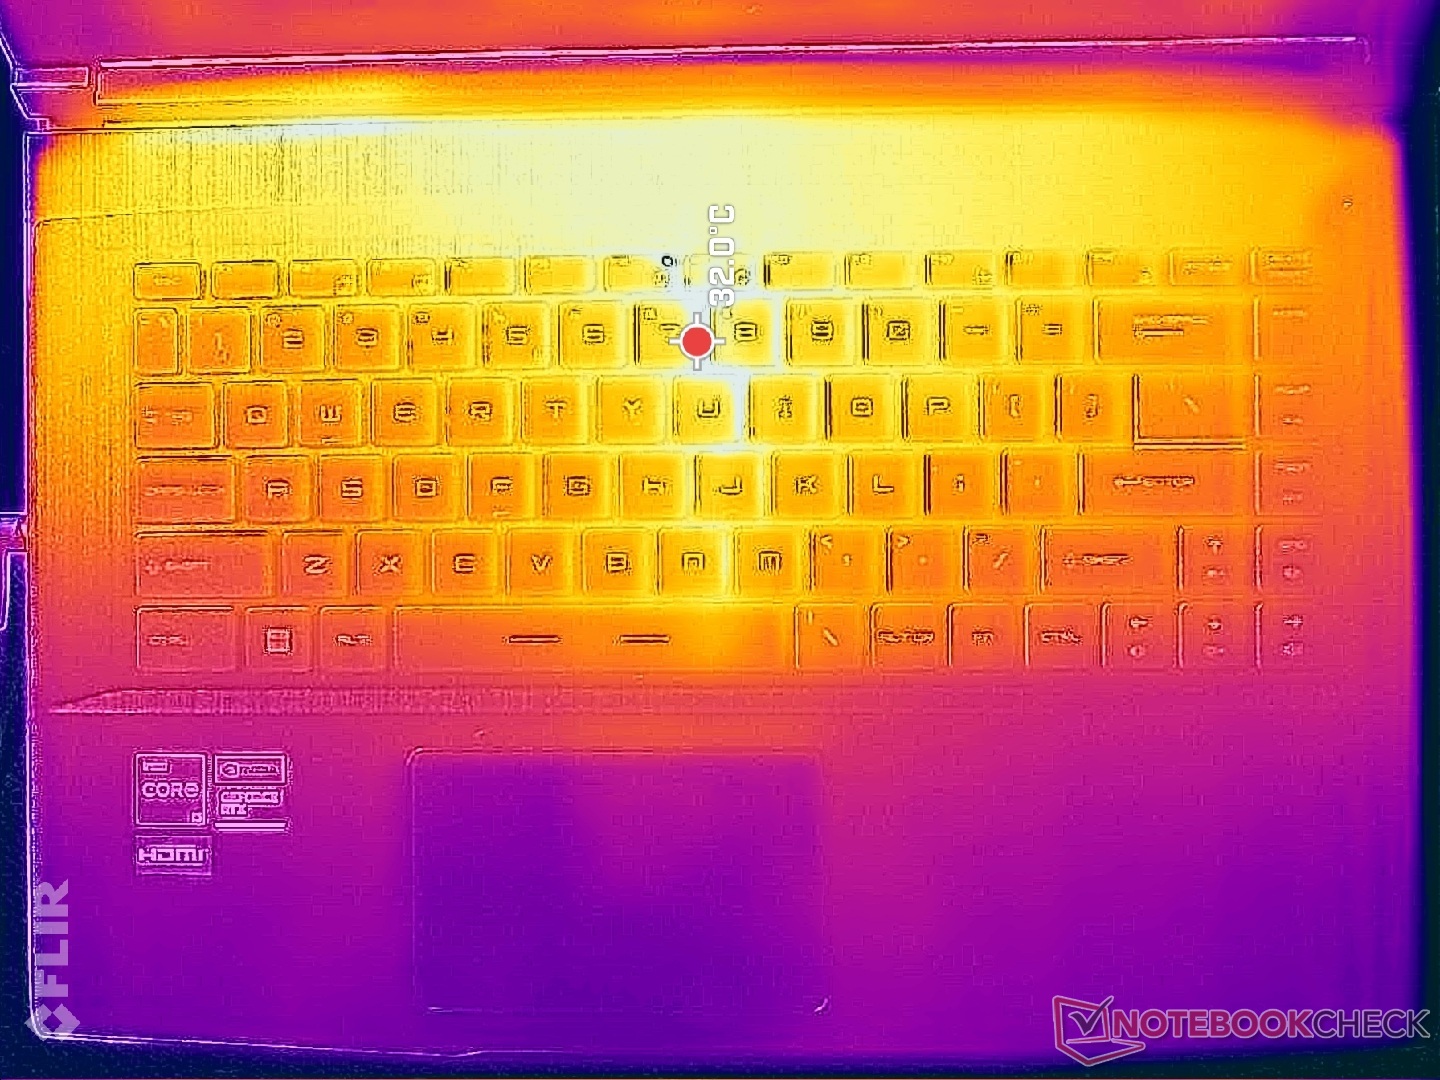
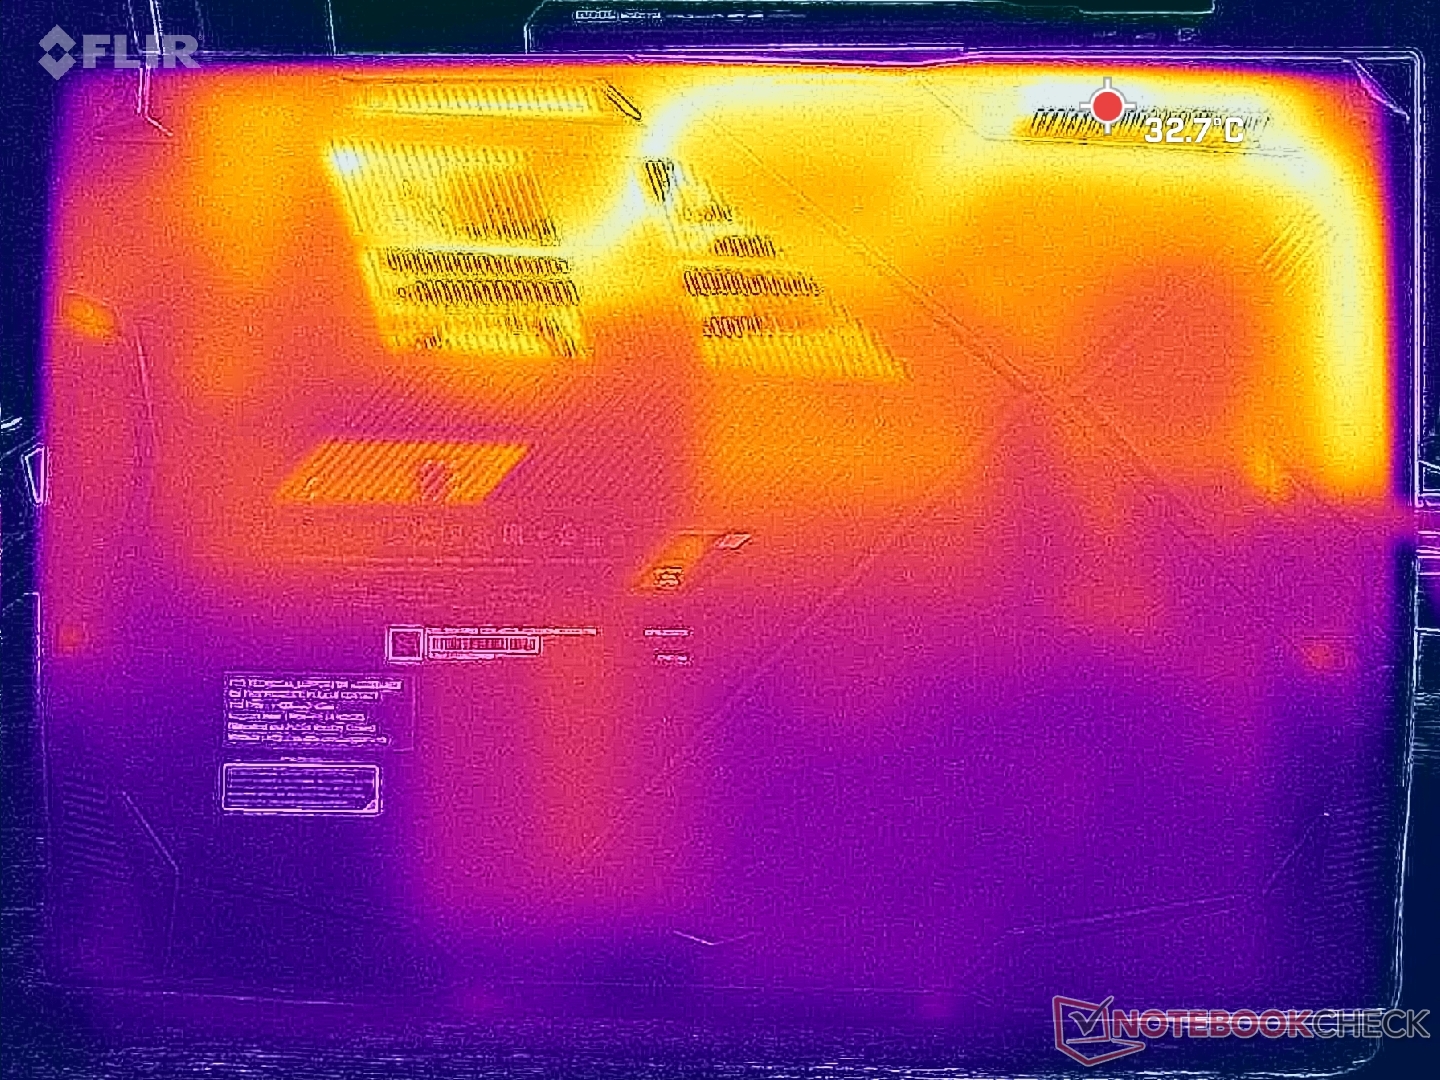
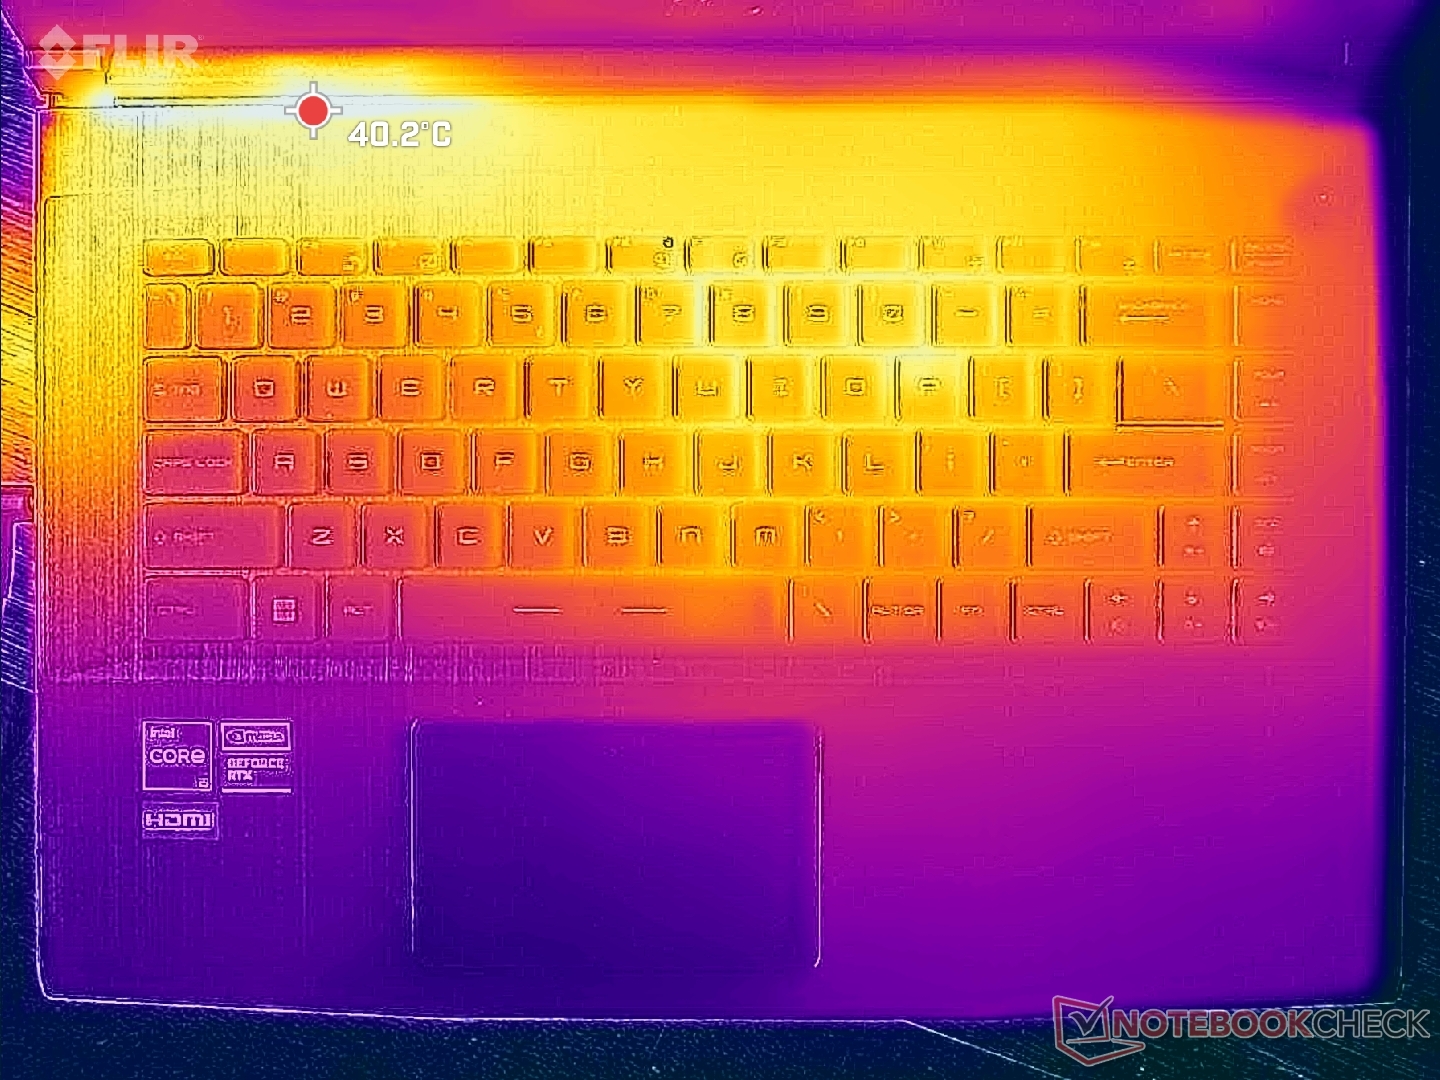
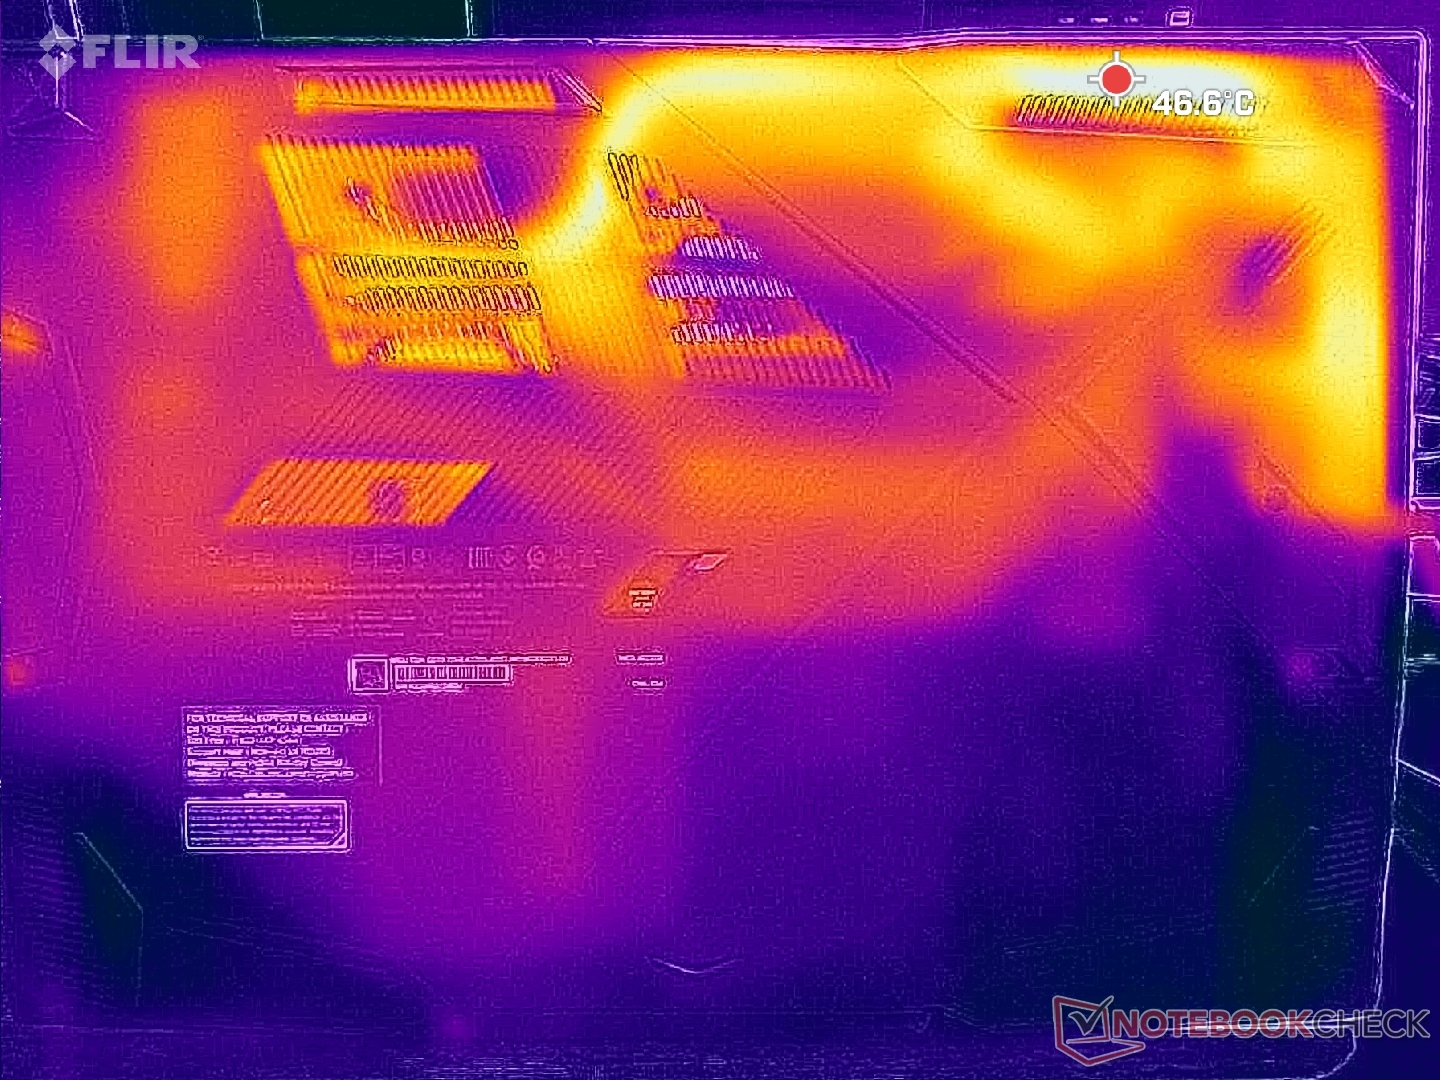
Temperature
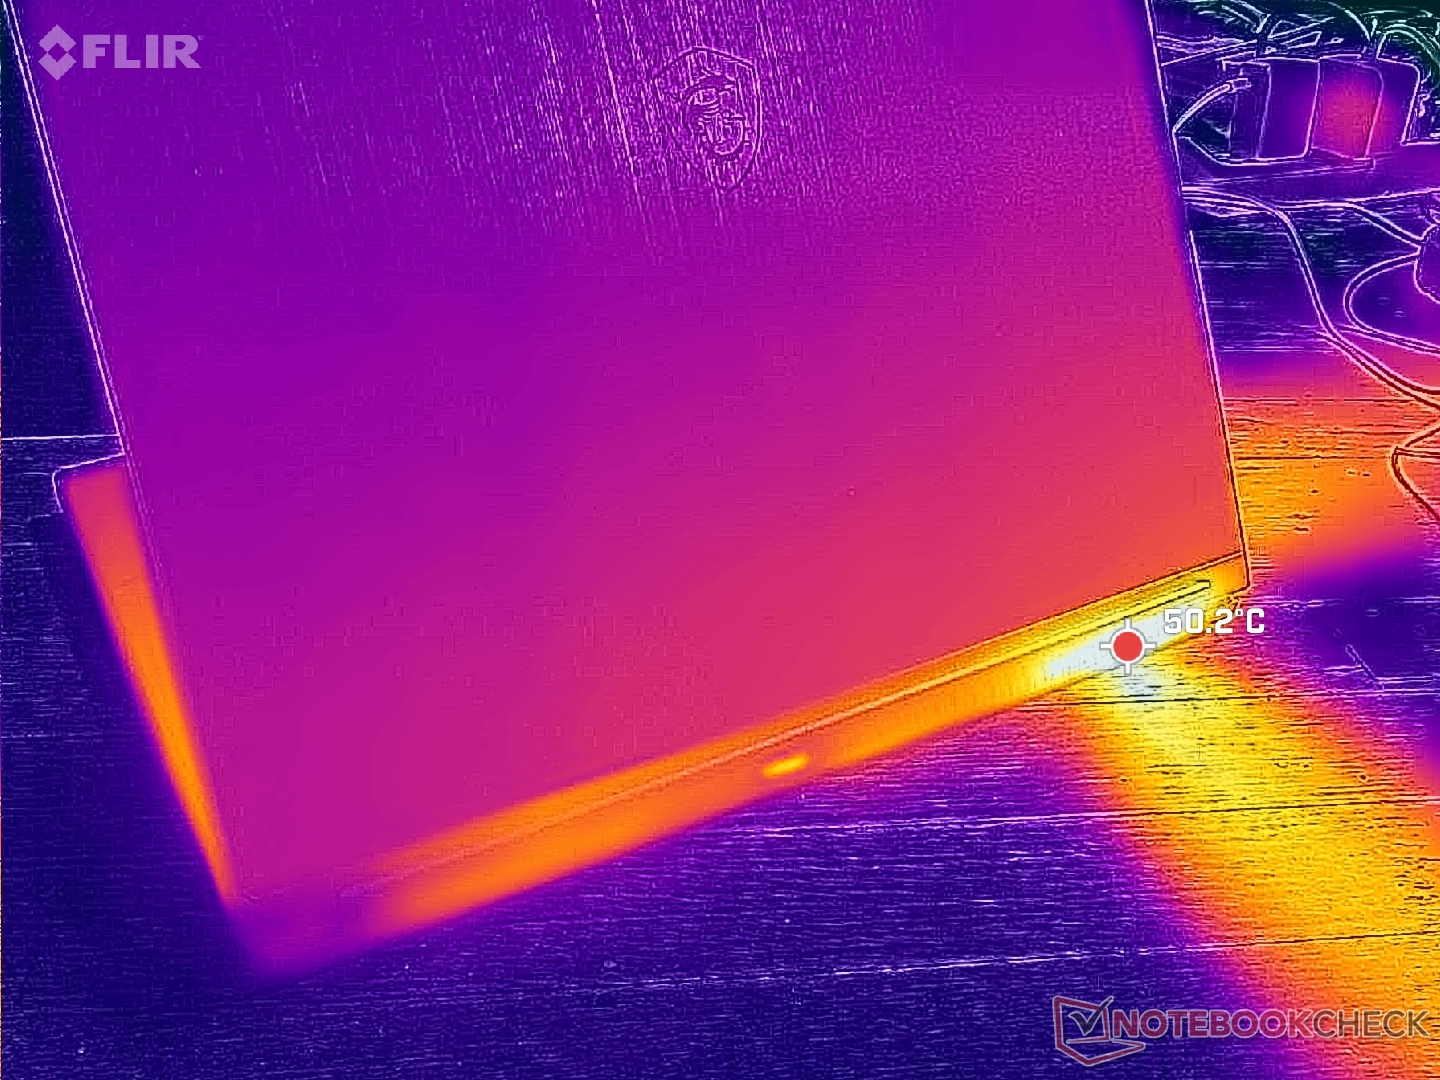
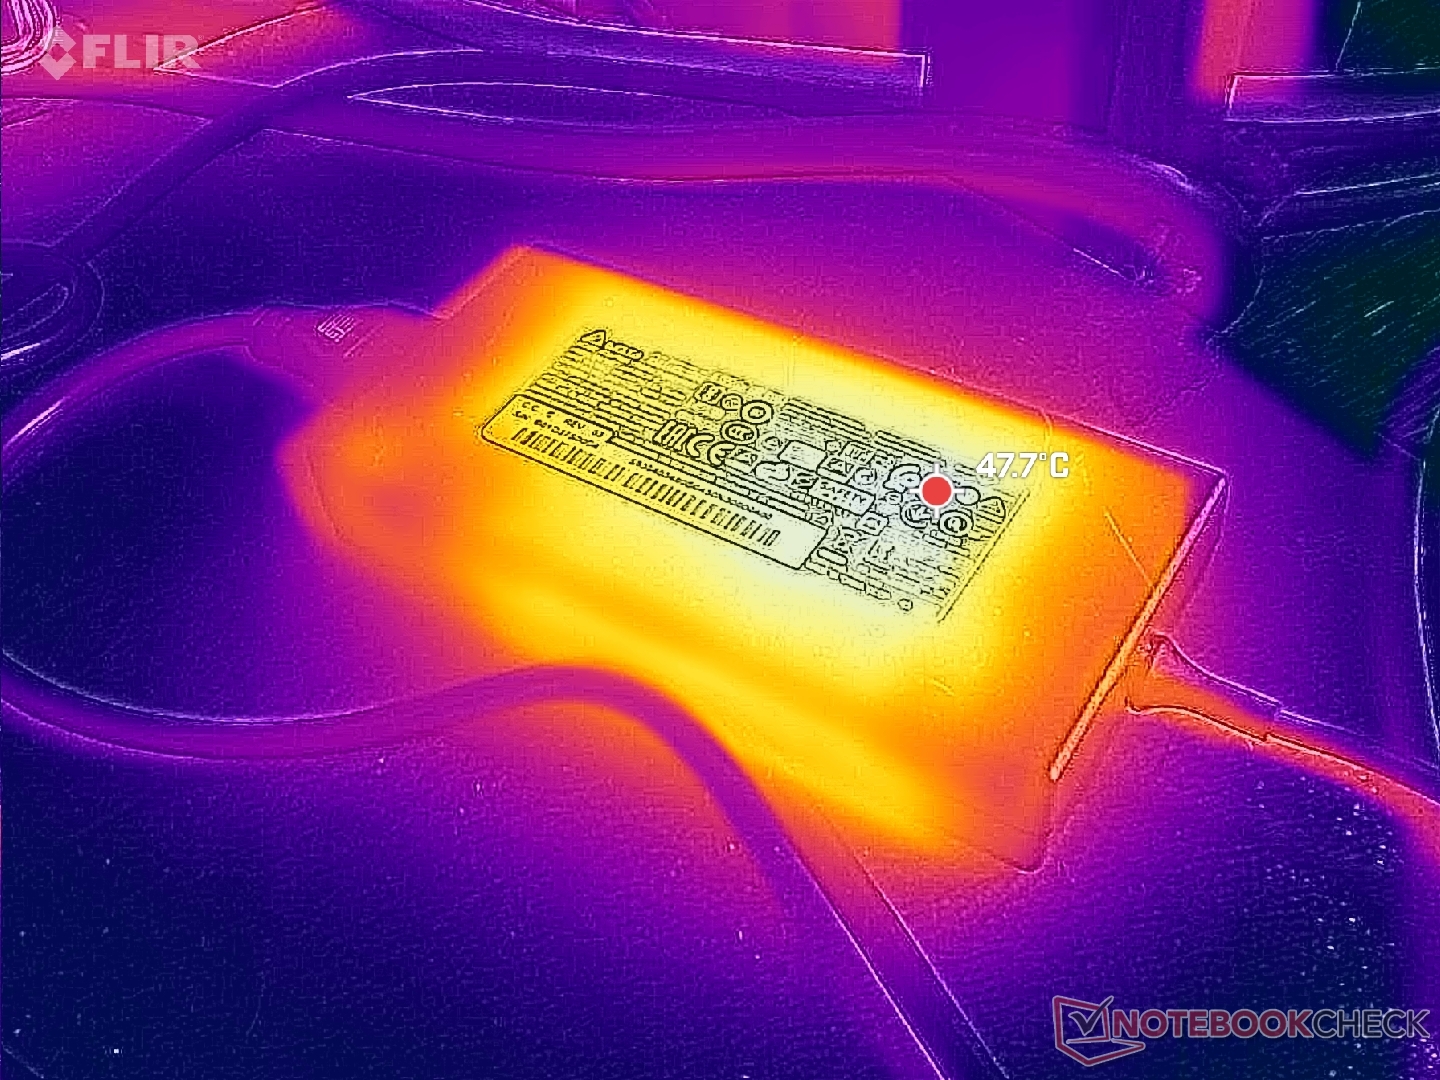
(+) The maximum temperature on the upper side is 39.8 °C / 104 F, compared to the average of 40.4 °C / 105 F, ranging from 21.2 to 68.8 °C for the class Gaming.
(+) The bottom heats up to a maximum of 37.6 °C / 100 F, compared to the average of 43.2 °C / 110 F
(+) In idle usage, the average temperature for the upper side is 28.5 °C / 83 F, compared to the device average of 33.9 °C / 93 F.
(+) The palmrests and touchpad are cooler than skin temperature with a maximum of 24.6 °C / 76.3 F and are therefore cool to the touch.
(+) The average temperature of the palmrest area of similar devices was 28.8 °C / 83.8 F (+4.2 °C / 7.5 F).
| MSI Thin GF63 12VE Intel Core i5-12450H, NVIDIA GeForce RTX 4050 Laptop GPU | MSI GF63 Thin 9SC Intel Core i5-9300H, NVIDIA GeForce GTX 1650 Max-Q | Lenovo LOQ 15IRX9 Intel Core i5-13450HX, NVIDIA GeForce RTX 4060 Laptop GPU | HP Victus 15-fa1057ng Intel Core i5-13500H, NVIDIA GeForce RTX 4050 Laptop GPU | Acer Nitro V 15 ANV15-51-582S Intel Core i5-13420H, NVIDIA GeForce RTX 4050 Laptop GPU | Asus TUF A15 FA507 AMD Ryzen 7 7735HS, NVIDIA GeForce RTX 4050 Laptop GPU | |
|---|---|---|---|---|---|---|
| Heat | 2% | -17% | 11% | 0% | 1% | |
| Maximum Upper Side * (°C) | 39.8 | 47 -18% | 47 -18% | 42 -6% | 46 -16% | 48.9 -23% |
| Maximum Bottom * (°C) | 37.6 | 47 -25% | 58 -54% | 42 -12% | 48 -28% | 44.6 -19% |
| Idle Upper Side * (°C) | 32.8 | 26 21% | 32 2% | 24 27% | 27 18% | 27.1 17% |
| Idle Bottom * (°C) | 37.6 | 26 31% | 36 4% | 24 36% | 28 26% | 27.5 27% |
* ... smaller is better
Stress Test
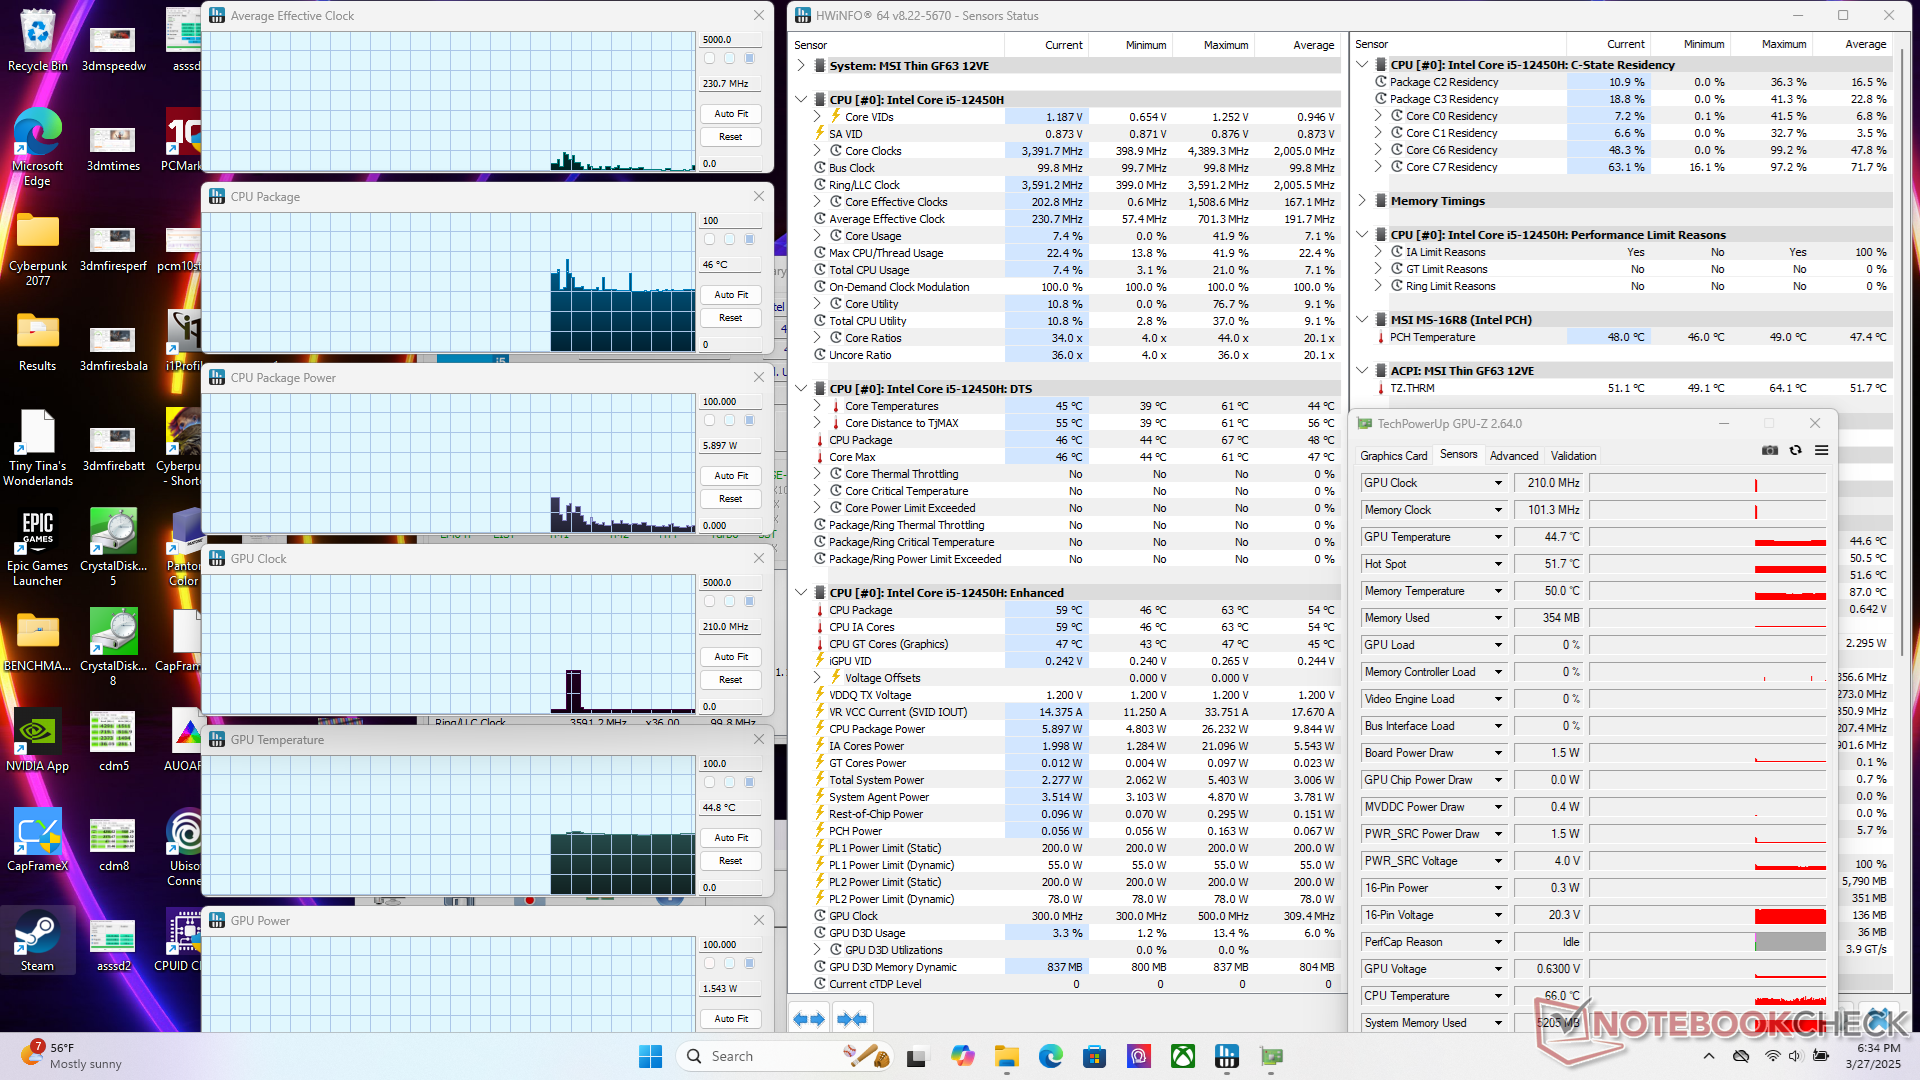
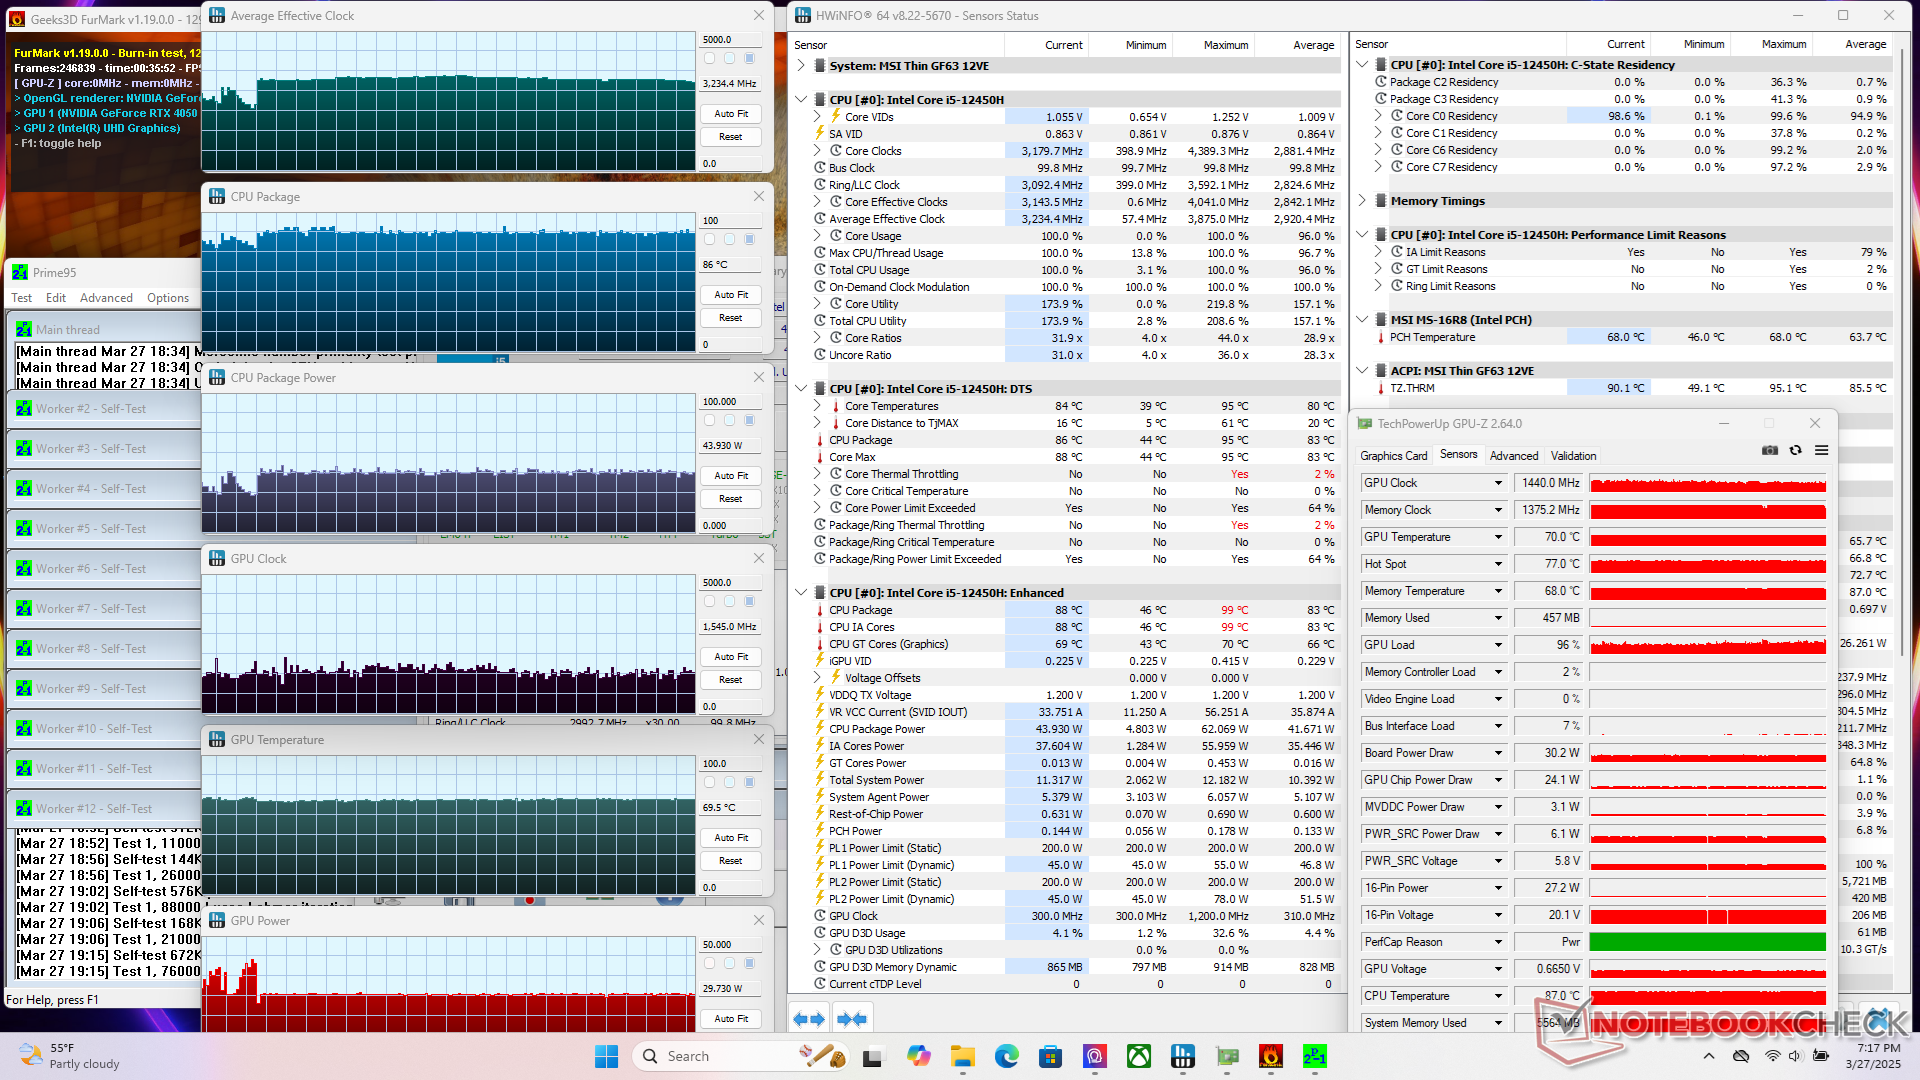
The CPU would boost to 62 W, 88 C, and 3.9 GHz when initiating Prime95 stress before falling to 2.8 GHz and 53 W a few moments later. CPU and GPU temperatures when gaming are decent for a gaming laptop at <80 C even when just running on Balanced mode.
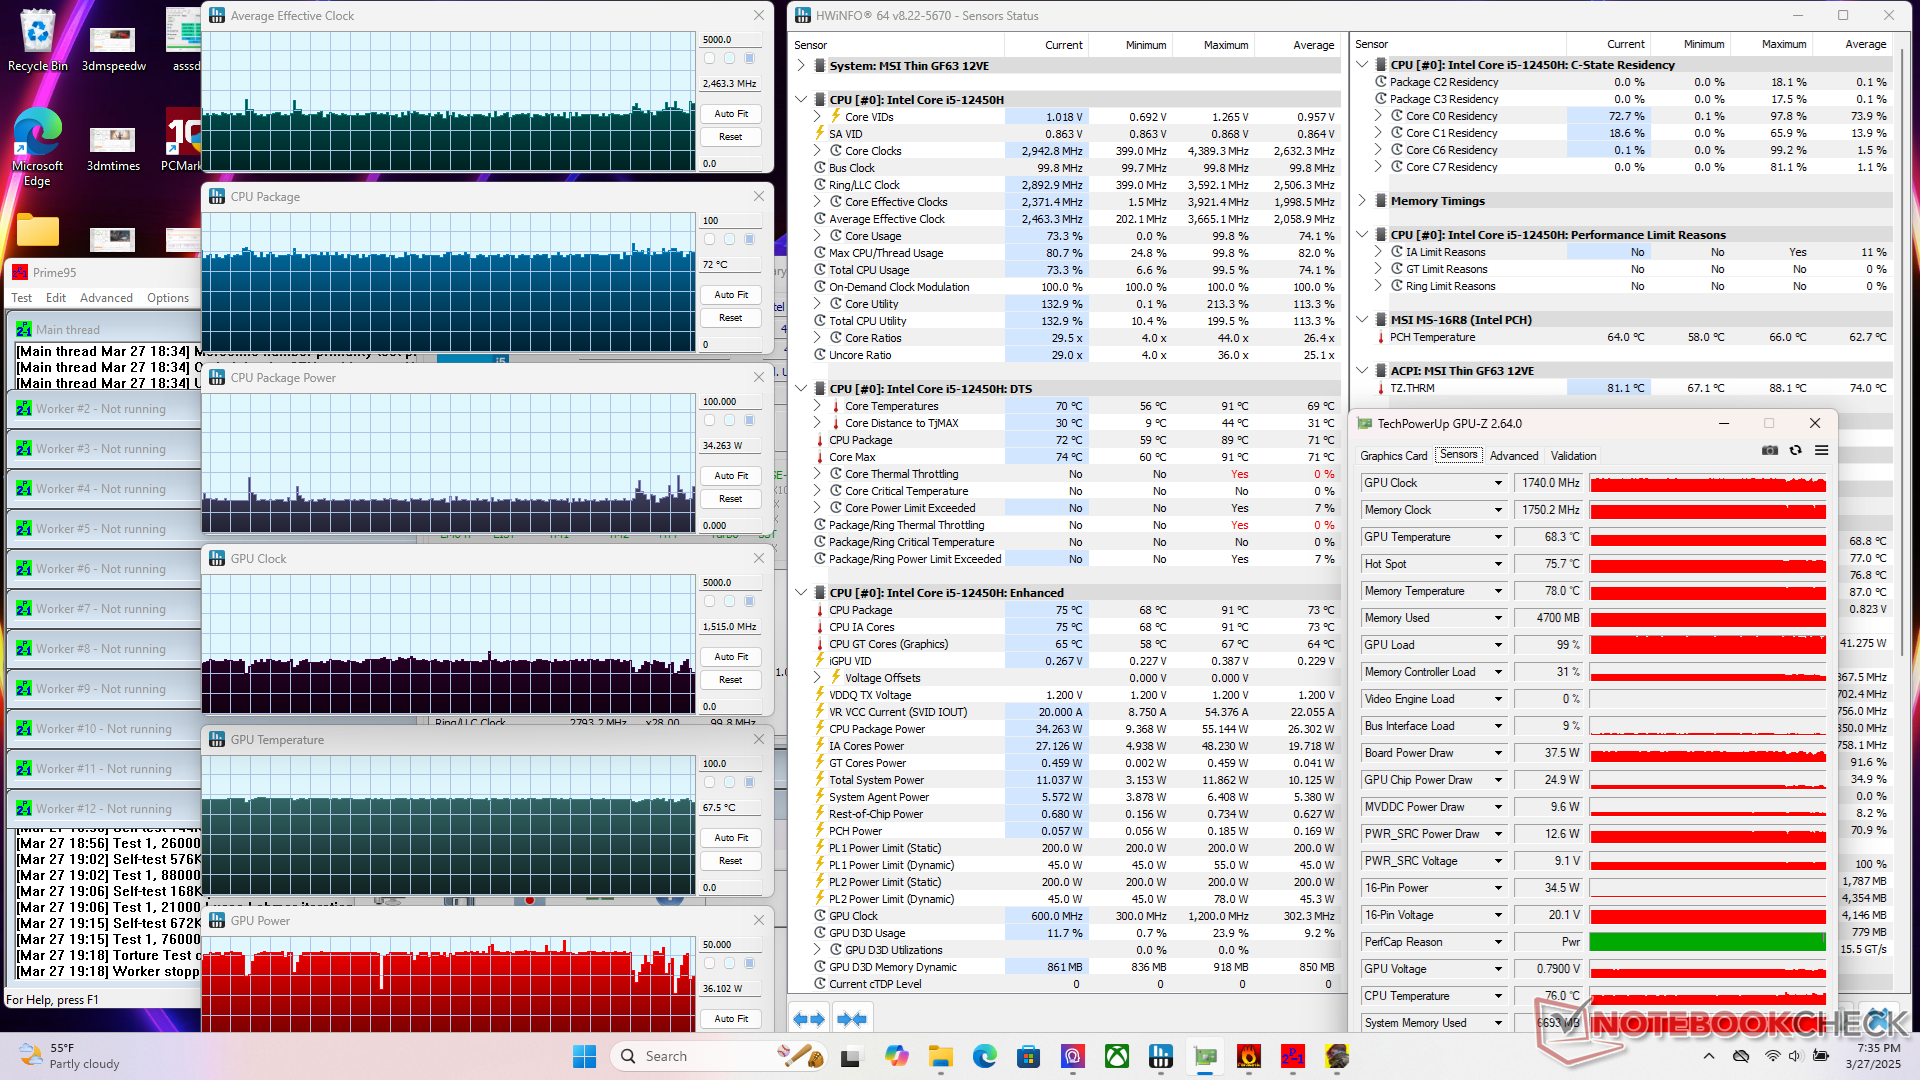
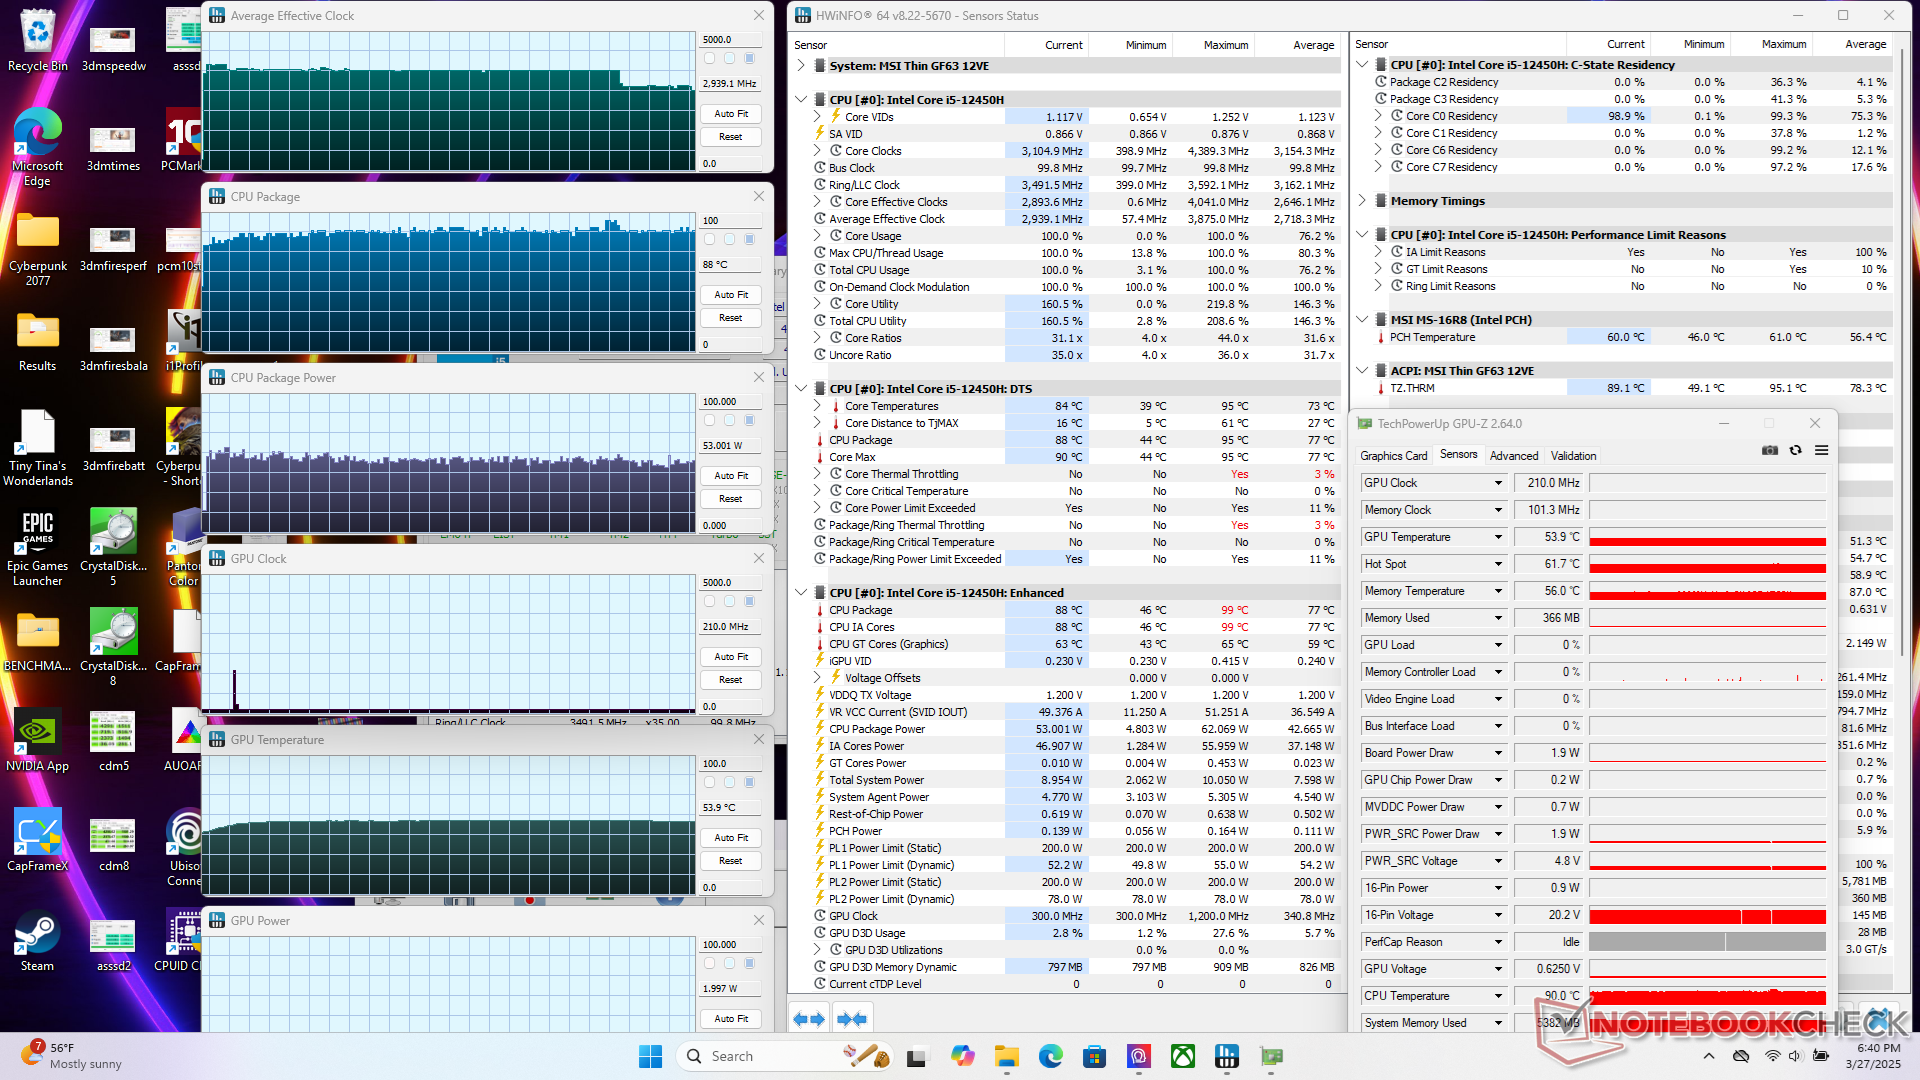
| Average CPU Clock (GHz) | GPU Clock (MHz) | Average CPU Temperature (°C) | Average GPU Temperature (°C) | |
| System Idle | -- | -- | 46 | 45 |
| Prime95 Stress | 2.9 | -- | 88 | 54 |
| Prime95 + FurMark Stress | 3.2 | 1440 | 86 | 70 |
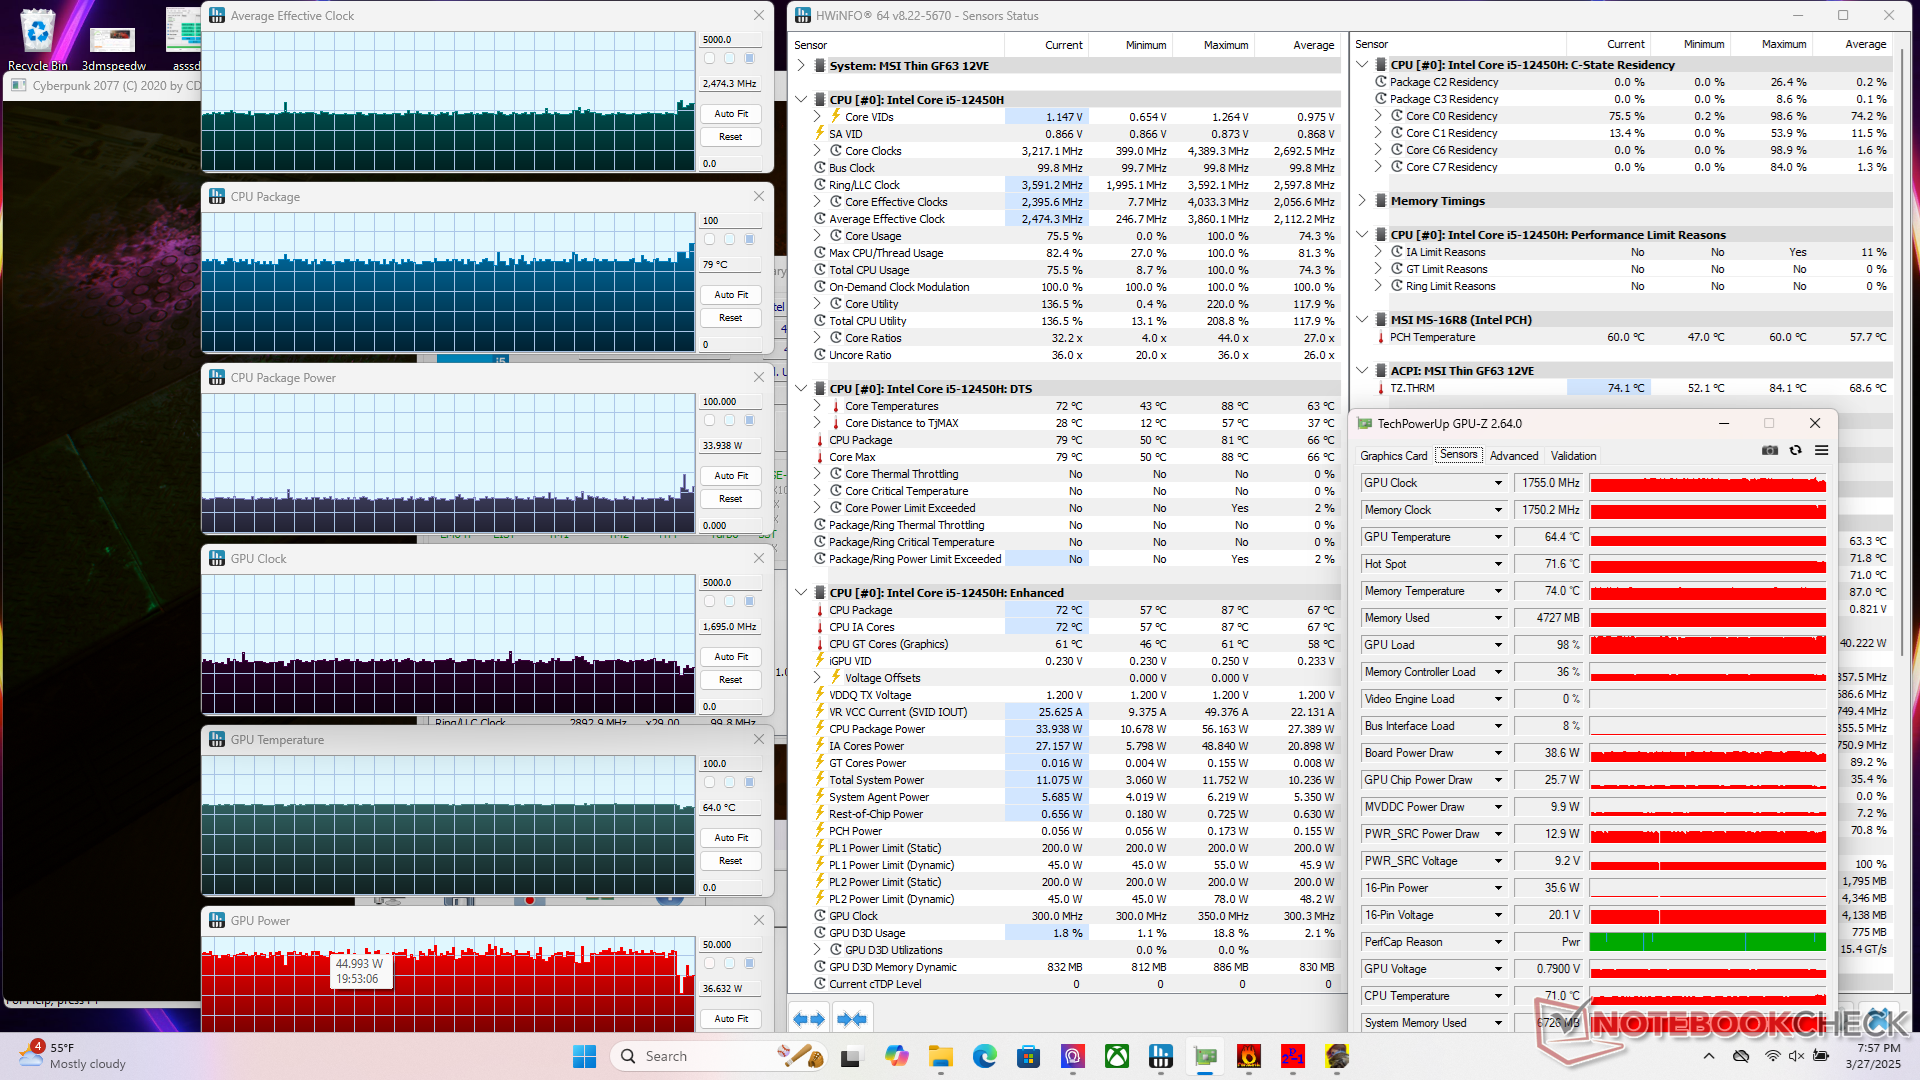
| Cyberpunk 2077 Stress (Balanced mode) | 2.4 | 1740 | 72 | 68 |
| Cyberpunk 2077 Stress (Performance mode) | 2.4 | 1755 | 79 | 64 |
Speakers
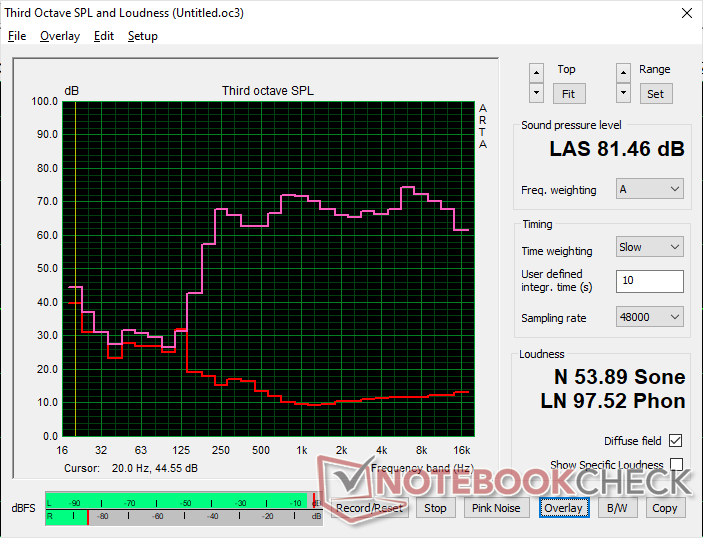
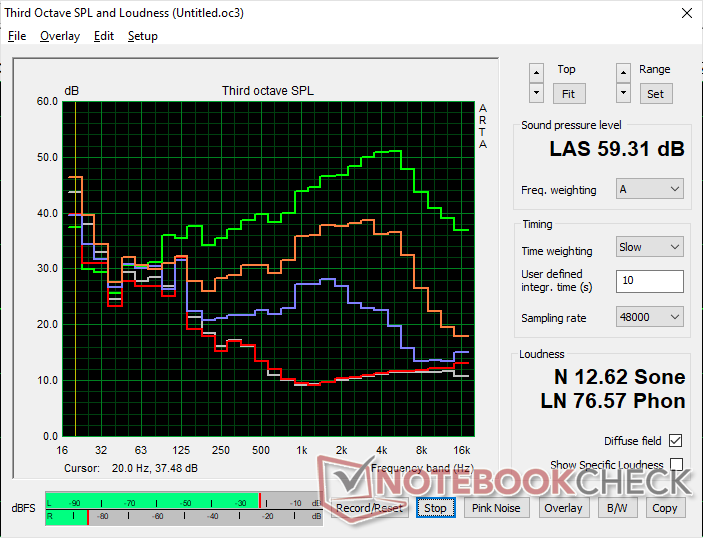
MSI Thin GF63 12VE audio analysis
(±) | speaker loudness is average but good (81.5 dB)
Bass 100 - 315 Hz
(-) | nearly no bass - on average 18.4% lower than median
(±) | linearity of bass is average (14.2% delta to prev. frequency)
Mids 400 - 2000 Hz
(+) | balanced mids - only 2.9% away from median
(+) | mids are linear (4.3% delta to prev. frequency)
Highs 2 - 16 kHz
(+) | balanced highs - only 2.9% away from median
(+) | highs are linear (4% delta to prev. frequency)
Overall 100 - 16.000 Hz
(+) | overall sound is linear (13.8% difference to median)
Compared to same class
» 21% of all tested devices in this class were better, 7% similar, 72% worse
» The best had a delta of 6%, average was 18%, worst was 132%
Compared to all devices tested
» 15% of all tested devices were better, 4% similar, 81% worse
» The best had a delta of 4%, average was 24%, worst was 134%
Apple MacBook Pro 16 2021 M1 Pro audio analysis
(+) | speakers can play relatively loud (84.7 dB)
Bass 100 - 315 Hz
(+) | good bass - only 3.8% away from median
(+) | bass is linear (5.2% delta to prev. frequency)
Mids 400 - 2000 Hz
(+) | balanced mids - only 1.3% away from median
(+) | mids are linear (2.1% delta to prev. frequency)
Highs 2 - 16 kHz
(+) | balanced highs - only 1.9% away from median
(+) | highs are linear (2.7% delta to prev. frequency)
Overall 100 - 16.000 Hz
(+) | overall sound is linear (4.6% difference to median)
Compared to same class
» 0% of all tested devices in this class were better, 0% similar, 100% worse
» The best had a delta of 5%, average was 17%, worst was 45%
Compared to all devices tested
» 0% of all tested devices were better, 0% similar, 100% worse
» The best had a delta of 4%, average was 24%, worst was 134%
Energy Management
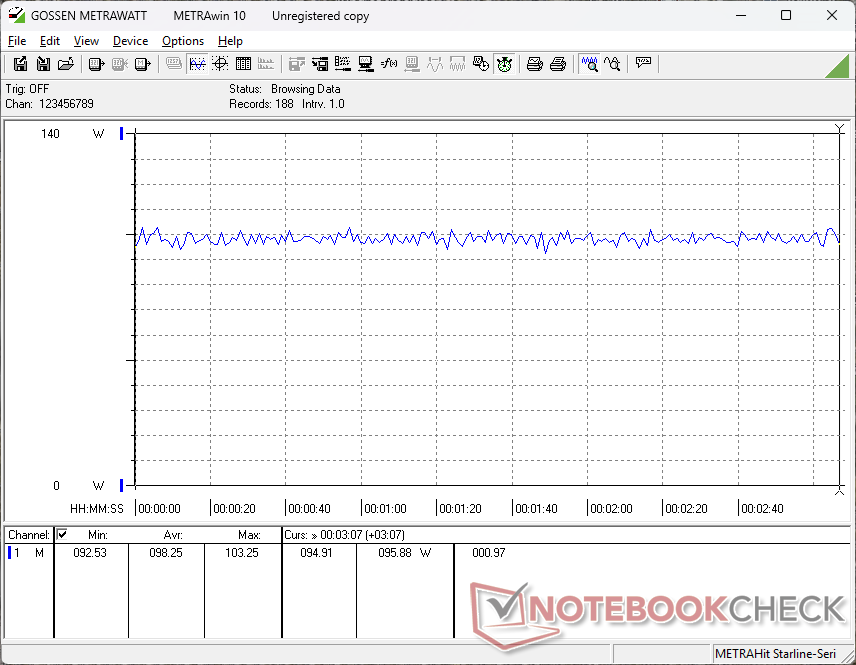
Power Consumption
| Off / Standby | |
| Idle | |
| Load |
|
Key:
min: | |
| MSI Thin GF63 12VE i5-12450H, GeForce RTX 4050 Laptop GPU, Micron 2400 MTFDKBA512QFM, IPS, 1920x1080, 15.6" | MSI GF63 Thin 9SC i5-9300H, GeForce GTX 1650 Max-Q, Toshiba KBG30ZMV512G, IPS, 1920x1080, 15.6" | Lenovo LOQ 15IRX9 i5-13450HX, GeForce RTX 4060 Laptop GPU, Micron 2400 MTFDKCD1T0QFM, IPS, 1920x1080, 15.6" | HP Victus 15-fa1057ng i5-13500H, GeForce RTX 4050 Laptop GPU, Kioxia XG8 KXG80ZNV512G, IPS, 1920x1080, 15.6" | Acer Nitro V 15 ANV15-51-582S i5-13420H, GeForce RTX 4050 Laptop GPU, SK hynix PC801 HFS512GEJ9X115N, IPS, 1920x1080, 15.6" | Asus TUF A15 FA507 R7 7735HS, GeForce RTX 4050 Laptop GPU, Micron 2400 MTFDKBA512QFM, IPS, 1920x1080, 15.6" | |
|---|---|---|---|---|---|---|
| Power Consumption | -18% | -83% | -20% | -8% | -32% | |
| Idle Minimum * (Watt) | 4.3 | 7 -63% | 13 -202% | 5 -16% | 7 -63% | 8 -86% |
| Idle Average * (Watt) | 9.2 | 9 2% | 18 -96% | 9 2% | 8 13% | 12.1 -32% |
| Idle Maximum * (Watt) | 16.4 | 13 21% | 24 -46% | 22 -34% | 11 33% | 12.5 24% |
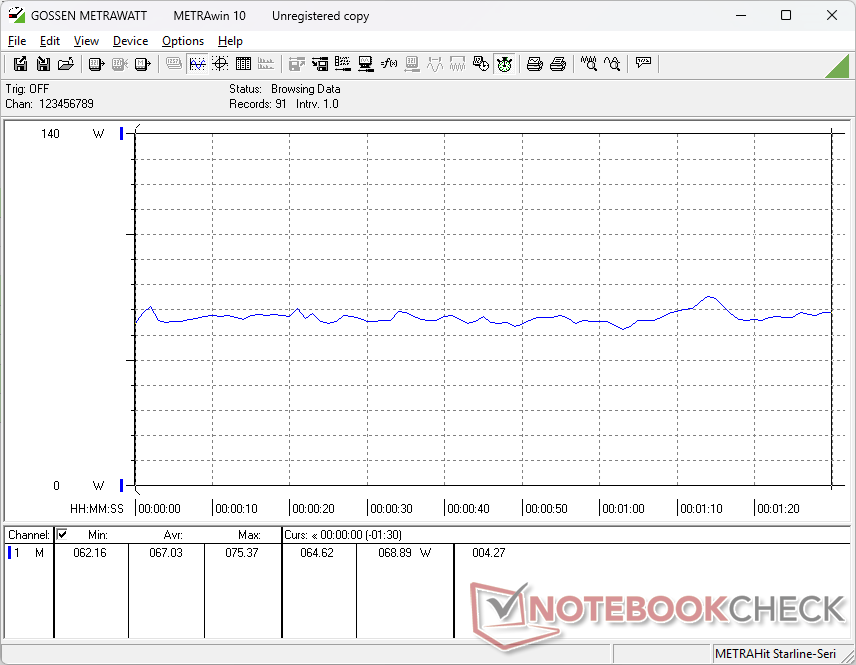
| Load Average * (Watt) | 67 | 79 -18% | 85 -27% | 72 -7% | 76 -13% | 74.9 -12% |
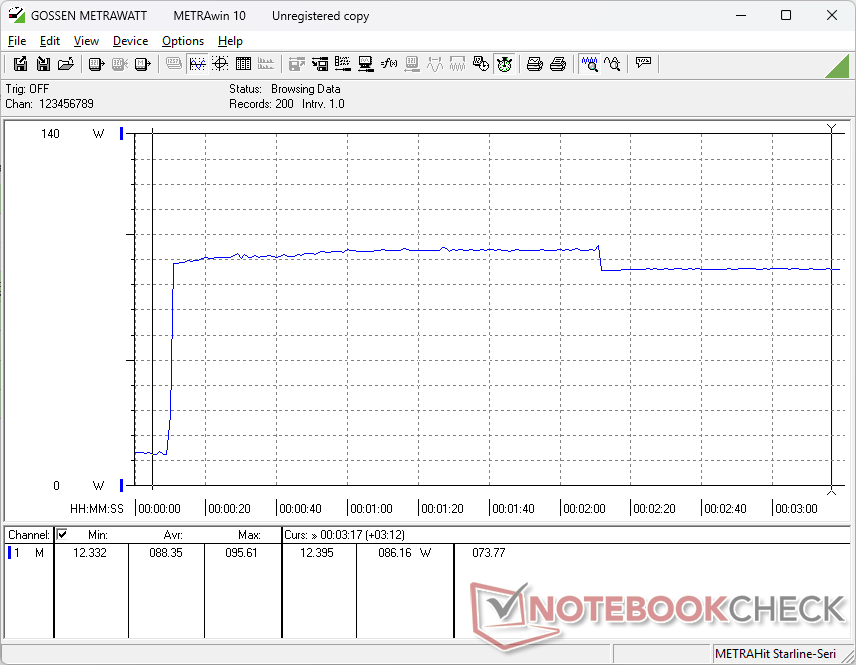
| Cyberpunk 2077 ultra external monitor * (Watt) | 94.2 | 150.9 -60% | ||||
| Cyberpunk 2077 ultra * (Watt) | 98.2 | 155.7 -59% | ||||
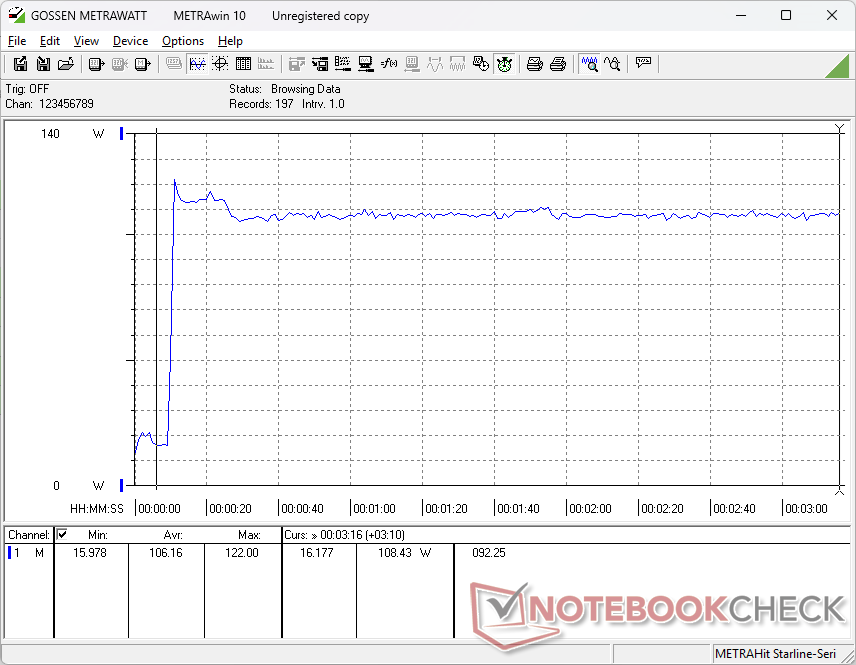
| Load Maximum * (Watt) | 122 | 164 -34% | 232 -90% | 176 -44% | 136 -11% | 185 -52% |
| Witcher 3 ultra * (Watt) | 73 | 113 | 98.2 | 136.6 |
* ... smaller is better
Power Consumption Cyberpunk / Stress Test
Power Consumption external Monitor
Battery Life
| MSI Thin GF63 12VE i5-12450H, GeForce RTX 4050 Laptop GPU, 52.4 Wh | MSI GF63 Thin 9SC i5-9300H, GeForce GTX 1650 Max-Q, 51 Wh | Lenovo LOQ 15IRX9 i5-13450HX, GeForce RTX 4060 Laptop GPU, 60 Wh | HP Victus 15-fa1057ng i5-13500H, GeForce RTX 4050 Laptop GPU, 70 Wh | Acer Nitro V 15 ANV15-51-582S i5-13420H, GeForce RTX 4050 Laptop GPU, 57 Wh | Asus TUF A15 FA507 R7 7735HS, GeForce RTX 4050 Laptop GPU, 90 Wh | |
|---|---|---|---|---|---|---|
| Battery runtime | 22% | 47% | 108% | 161% | 225% | |
| WiFi v1.3 (h) | 3.6 | 4.4 22% | 5.3 47% | 7.5 108% | 9.4 161% | 11.7 225% |
| Reader / Idle (h) | 8.5 | 21.5 | ||||
| Load (h) | 1.2 | 1.7 | 1 | |||
| H.264 (h) | 12.5 |
Notebookcheck Rating
MSI Thin GF63 12VE
- 04/03/2025 v8
Allen Ngo
 Total Sustainability Score:
 Potential Competitors in Comparison
Image | Model / Review | Price | Weight | Height | Display |
|---|---|---|---|---|---|
1. 74%  | MSI Thin GF63 12VE Intel Core i5-12450H ⎘ NVIDIA GeForce RTX 4050 Laptop GPU ⎘ 8 GB Memory, 512 GB SSD | Amazon: List Price: 900 USD | 1.8 kg | 21.7 mm | 15.60" 1920x1080 141 PPI IPS |
2. 77.6% v7 (old)  | MSI GF63 Thin 9SC Intel Core i5-9300H ⎘ NVIDIA GeForce GTX 1650 Max-Q ⎘ 8 GB Memory, 512 GB SSD | Amazon: 1. $645.87 msi GF63 Thin 9SC-068 15.6" ... 2. $729.00 msi GF63 Thin 9SC-066 15.6" ... 3. $689.99 msi GF63 Thin 9SCX-005 15. 6... List Price: 975 EUR | 1.8 kg | 22 mm | 15.60" 1920x1080 141 PPI IPS |
3. 79%  | Lenovo LOQ 15IRX9 Intel Core i5-13450HX ⎘ NVIDIA GeForce RTX 4060 Laptop GPU ⎘ 16 GB Memory, 1024 GB SSD | Amazon: List Price: 1149 Euro | 2.4 kg | 23.9 mm | 15.60" 1920x1080 141 PPI IPS |
4. 84% v7 (old)  | HP Victus 15-fa1057ng Intel Core i5-13500H ⎘ NVIDIA GeForce RTX 4050 Laptop GPU ⎘ 16 GB Memory, 512 GB SSD | Amazon: 1. $798.00 HP Victus 15-FA100 2024 Gami... 2. $679.00 HP Victus 15.6" FHD 144Hz Ga... 3. $719.00 HP Victus 15 Gaming Laptop 1... List Price: 1000 EUR | 2.3 kg | 24 mm | 15.60" 1920x1080 141 PPI IPS |
5. 82.8% v7 (old)  | Acer Nitro V 15 ANV15-51-582S Intel Core i5-13420H ⎘ NVIDIA GeForce RTX 4050 Laptop GPU ⎘ 16 GB Memory, 512 GB SSD | Amazon: 1. $72.95 LCDBros Screen for Acer Nitr... 2. $76.67 HPDELGB Replacement for Acer... 3. $22.99 Deal4GO CPU & GPU Graphics C... List Price: 900 EUR | 2.1 kg | 23.5 mm | 15.60" 1920x1080 141 PPI IPS |
6. 86.3% v7 (old)  | Asus TUF A15 FA507 AMD Ryzen 7 7735HS ⎘ NVIDIA GeForce RTX 4050 Laptop GPU ⎘ 16 GB Memory, 512 GB SSD | Amazon: 1. $899.00 ASUS TUF Gaming A15 Gaming L... 2. $1,129.99 ASUS TUF Gaming F16 (2025) G... 3. $989.00 ASUS TUF Gaming A15 Gaming L... List Price: 1199€ | 2.2 kg | 24.9 mm | 15.60" 1920x1080 141 PPI IPS |
Transparency
The selection of devices to be reviewed is made by our editorial team. The test sample was freely purchased by the author at his/her own expense. The lender had no influence on this review, nor did the manufacturer receive a copy of this review before publication. There was no obligation to publish this review. As an independent media company, Notebookcheck is not subjected to the authority of manufacturers, retailers or publishers.
This is how Notebookcheck is testing
Every year, Notebookcheck independently reviews hundreds of laptops and smartphones using standardized procedures to ensure that all results are comparable. We have continuously developed our test methods for around 20 years and set industry standards in the process. In our test labs, high-quality measuring equipment is utilized by experienced technicians and editors. These tests involve a multi-stage validation process. Our complex rating system is based on hundreds of well-founded measurements and benchmarks, which maintains objectivity. Further information on our test methods can be found here.
