MSI Claw 8 AI+ review - The best gaming handheld thanks to Intel Lunar Lake?
Massive improvement.
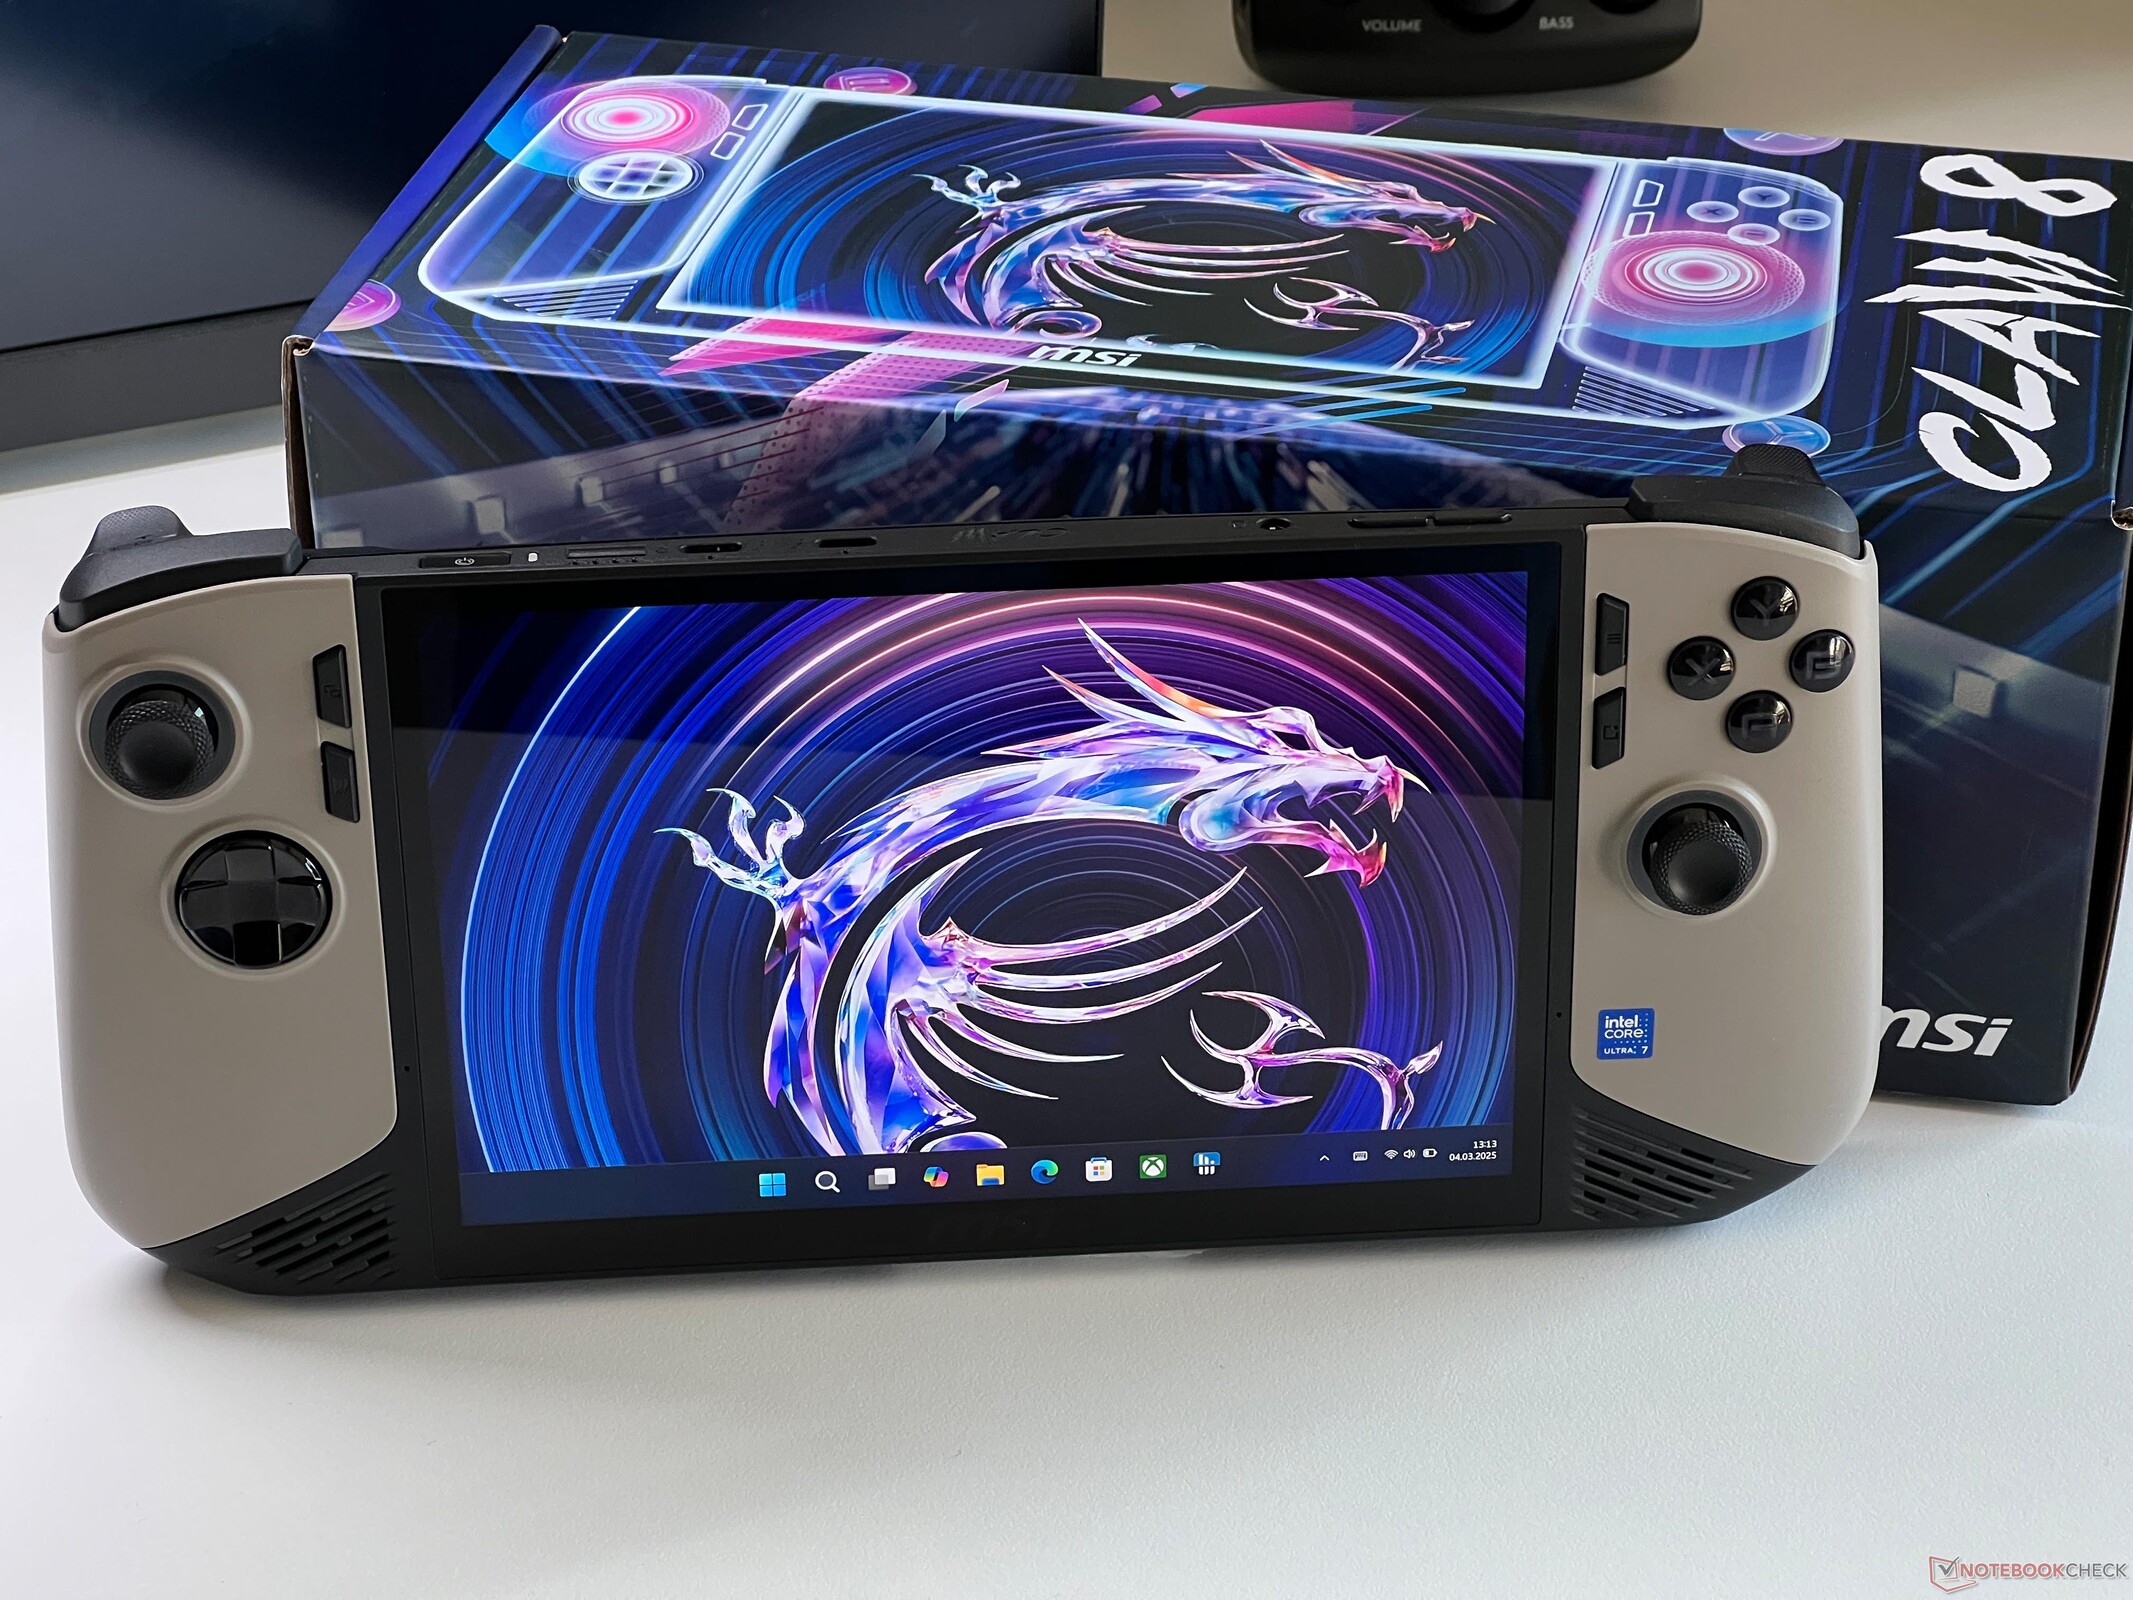
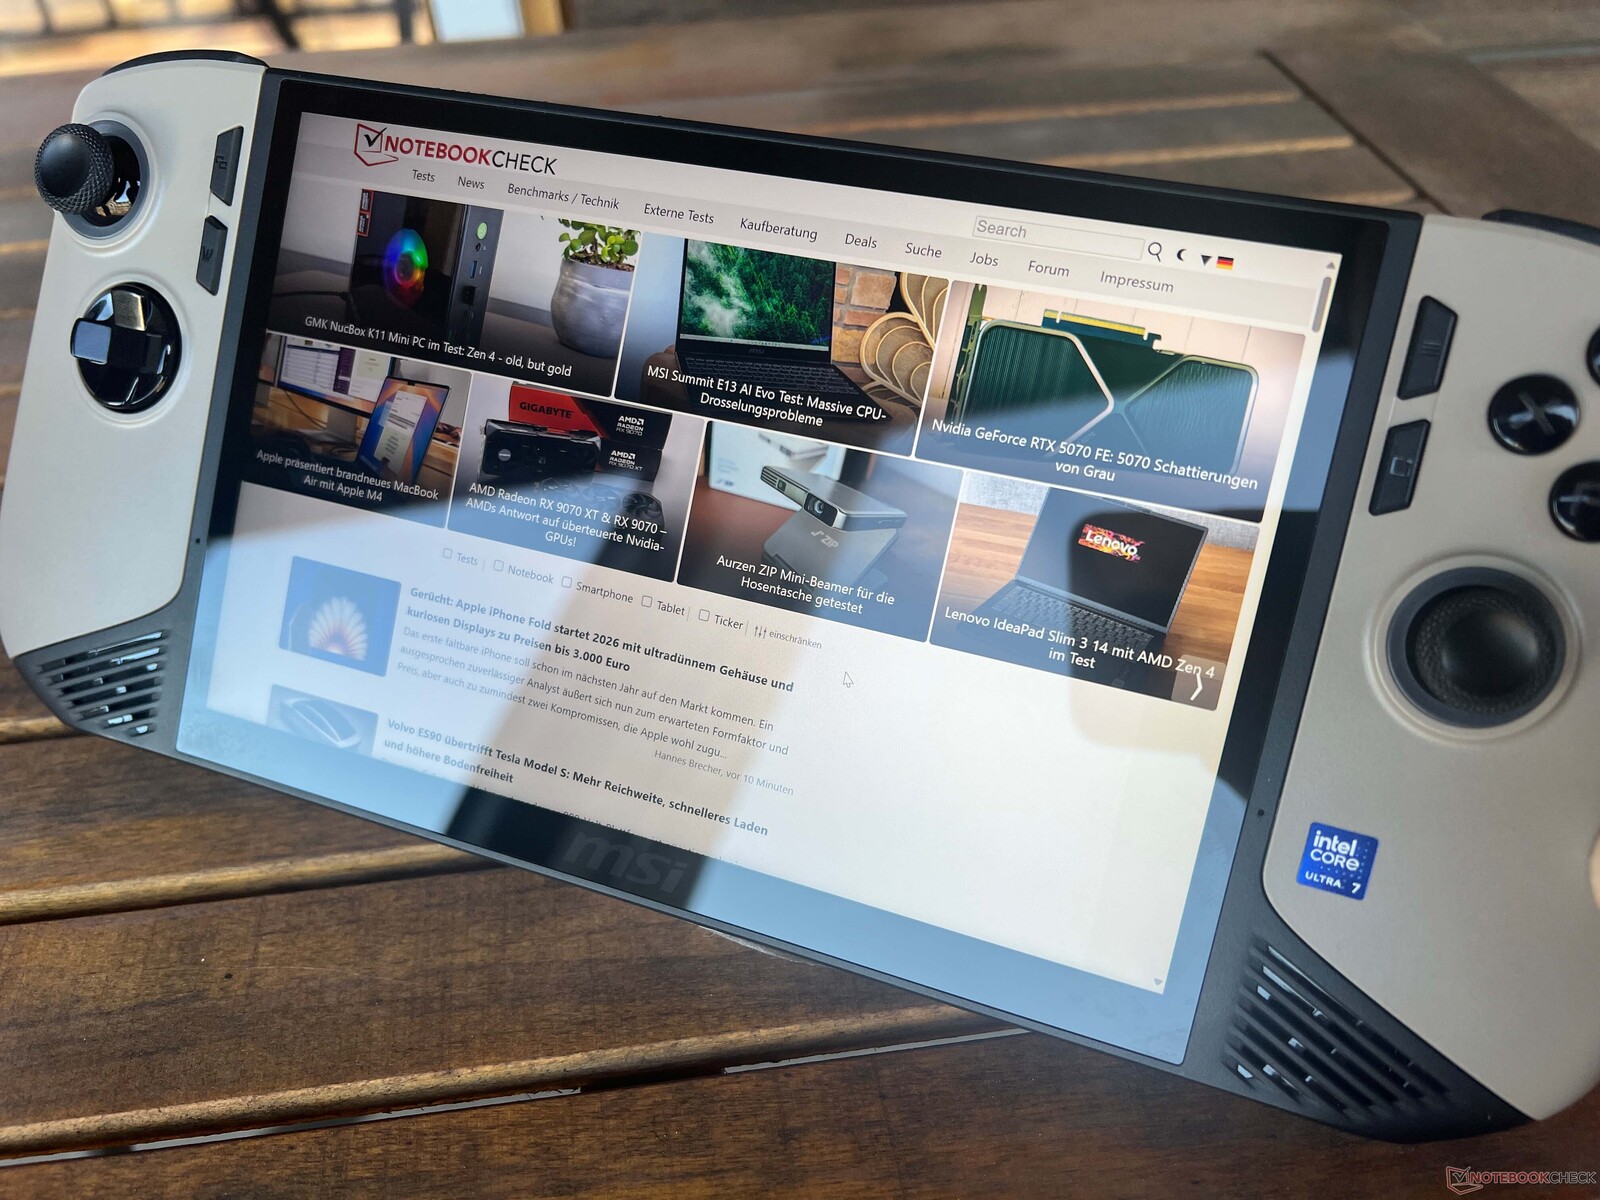
MSI's new Claw 8 AI+ is a massive improvement of the manufacturer's first gaming handheld. Adding to this is its more efficient Lunar Lake processor from Intel, as well as a larger 8-inch display with a 120-Hz refresh rate and VRR, and a big 80-Wh battery.Andreas Osthoff, 👁 Andreas Osthoff (translated by Daisy Dickson) Published 🇩🇪 🇫🇷 ...
Verdict - The MSI Claw 8 AI+ is one of the best gaming handhelds, but is also very expensive
MSI has improved the second generation of its gaming handheld massively, but this was much needed after how poorly the original performed. Its inefficient Meteor Lake processor was particularly problematic. Thanks to the new Claw 8 AI+'s Lunar Lake chip, however, this model does a lot better. This means better gaming performance (also compared to the ROG Ally X), lower consumption and longer runtimes. Its fans have also gotten quieter, but MSI should really take a look at their fluctuating speed under constant load.
In terms of connectivity, the device's second USB-C port is a very welcome addition and its larger IPS screen is also impressive with its 120-Hz refresh rate and VRR, but its response times are slightly worse than the predecessor model model.
The MSI software works well overall, but is sometimes a little laggy and its range of functions can't keep up with its Asus counterpart. The handheld's energy profiles are also a little awkward, as its AI engine only provides reduced performance. Its price of $899.99 is justified in our eyes given its performance and features, but it is of course no bargain.
Pros
Cons
Price and availability
The MSI Claw 8 AI+ retails for $899.99 and is available via major online retailers such as Amazon.
Possible alternatives compared
Image | Model / Review | Price | Weight | Height | Display |
|---|---|---|---|---|---|
1. 84.7%  | MSI Claw 8 AI+ Intel Core Ultra 7 258V ⎘ Intel Arc Graphics 140V ⎘ 32 GB Memory, 512 GB SSD | Amazon: List Price: 999€ | 793 g | 30 mm | 8.00" 1920x1200 283 PPI IPS |
2. 84.6%  | Asus ROG Ally X AMD Ryzen Z1 Extreme ⎘ AMD Radeon 780M ⎘ 24 GB Memory, 1024 GB SSD | Amazon: List Price: 899€ | 685 g | 36.9 mm | 7.00" 1920x1080 315 PPI IPS |
3. 78.2%  | Lenovo Legion Go S AMD Ryzen Z2 Go ⎘ AMD Radeon 680M ⎘ 16 GB Memory, 512 GB SSD | Amazon: List Price: 700€ | 738 g | 22.6 mm | 8.00" 1920x1200 283 PPI IPS-Grade |
4. 88.9% v7 (old)  | Valve Steam Deck 1 TB OLED AMD Steam Deck OLED APU ⎘ AMD Radeon Steam Deck 8CU ⎘ 16 GB Memory, 1024 GB SSD | Amazon: $871.91 List Price: 679€ | 640 g | 49 mm | 7.40" 1280x800 204 PPI OLED |
5. 80.2%  | GPD Pocket 4 AMD Ryzen AI 9 HX 370 ⎘ AMD Radeon 890M ⎘ 32 GB Memory | Amazon: $1,475.95 List Price: 1400 USD | 777 g | 22.2 mm | 8.80" 2560x1600 343 PPI IPS |
6. 77.4% 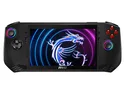 | MSI Claw Intel Core Ultra 7 155H ⎘ Intel Arc 8-Core iGPU ⎘ 16 GB Memory, 1024 GB SSD | Amazon: List Price: 849€ | 672 g | 33 mm | 7.00" 1920x1080 315 PPI IPS |
7. 84.9% v7 (old)  | ONEXPLAYER 2 Pro AR18 AMD Ryzen 7 7840U ⎘ AMD Radeon 780M ⎘ 32 GB Memory | Amazon: 1. $25.99 Voikoli Protective Eva Hard ... 2. $12.95 Mr.Shield Screen Protector c... 3. $1,969.00 WEELIAO ONEXPLAYER X1 PRO AM... List Price: 1017 USD | 876 g | 43 mm | 8.40" 2560x1600 IPS |
Table of Contents
- Verdict - The MSI Claw 8 AI+ is one of the best gaming handhelds, but is also very expensive
- Specifications
- Case & connectivity
- Software - MSI Center M
- Input devices - Hall-Effect triggers & sticks
- Display - 8-inch IPS with a 120-Hz refresh rate and VRR
- Performance - Lunar Lake with 32 GB RAM
- Emissions & energy
- Notebookcheck total rating
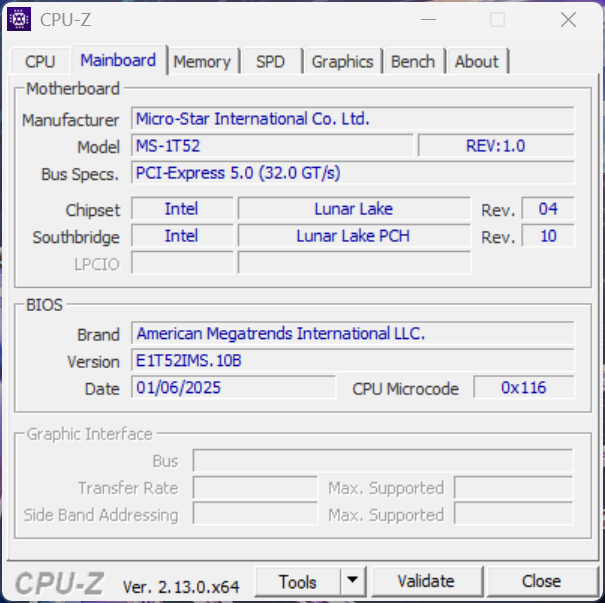
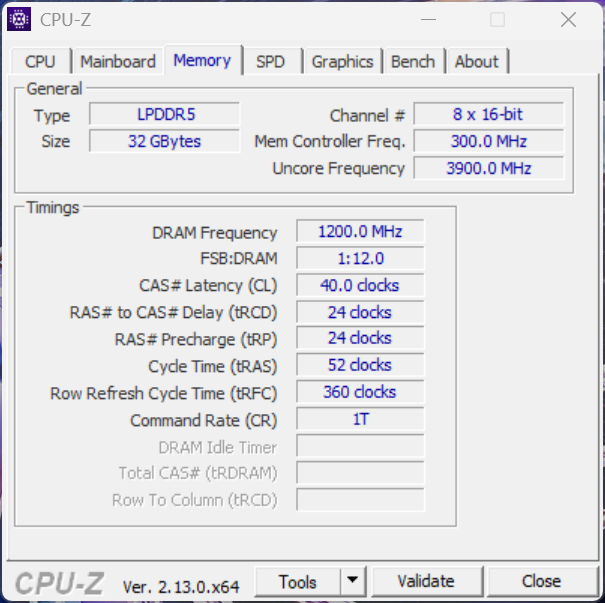
MSI's Claw 8 AI+ is the second and significantly improved generation of the manufacturer's gaming handheld, which still uses Intel processors. Our test device is the MSI Claw 8 AI+ AV2M-015 version for $899.99 featuring the Intel Core Ultra 7 258V (Lunar Lake), 32 GB RAM, a 1-TB SSD and a new 8-inch IPS display with a refresh rate of 120 Hz and VRR.
Specifications
Case & connectivity
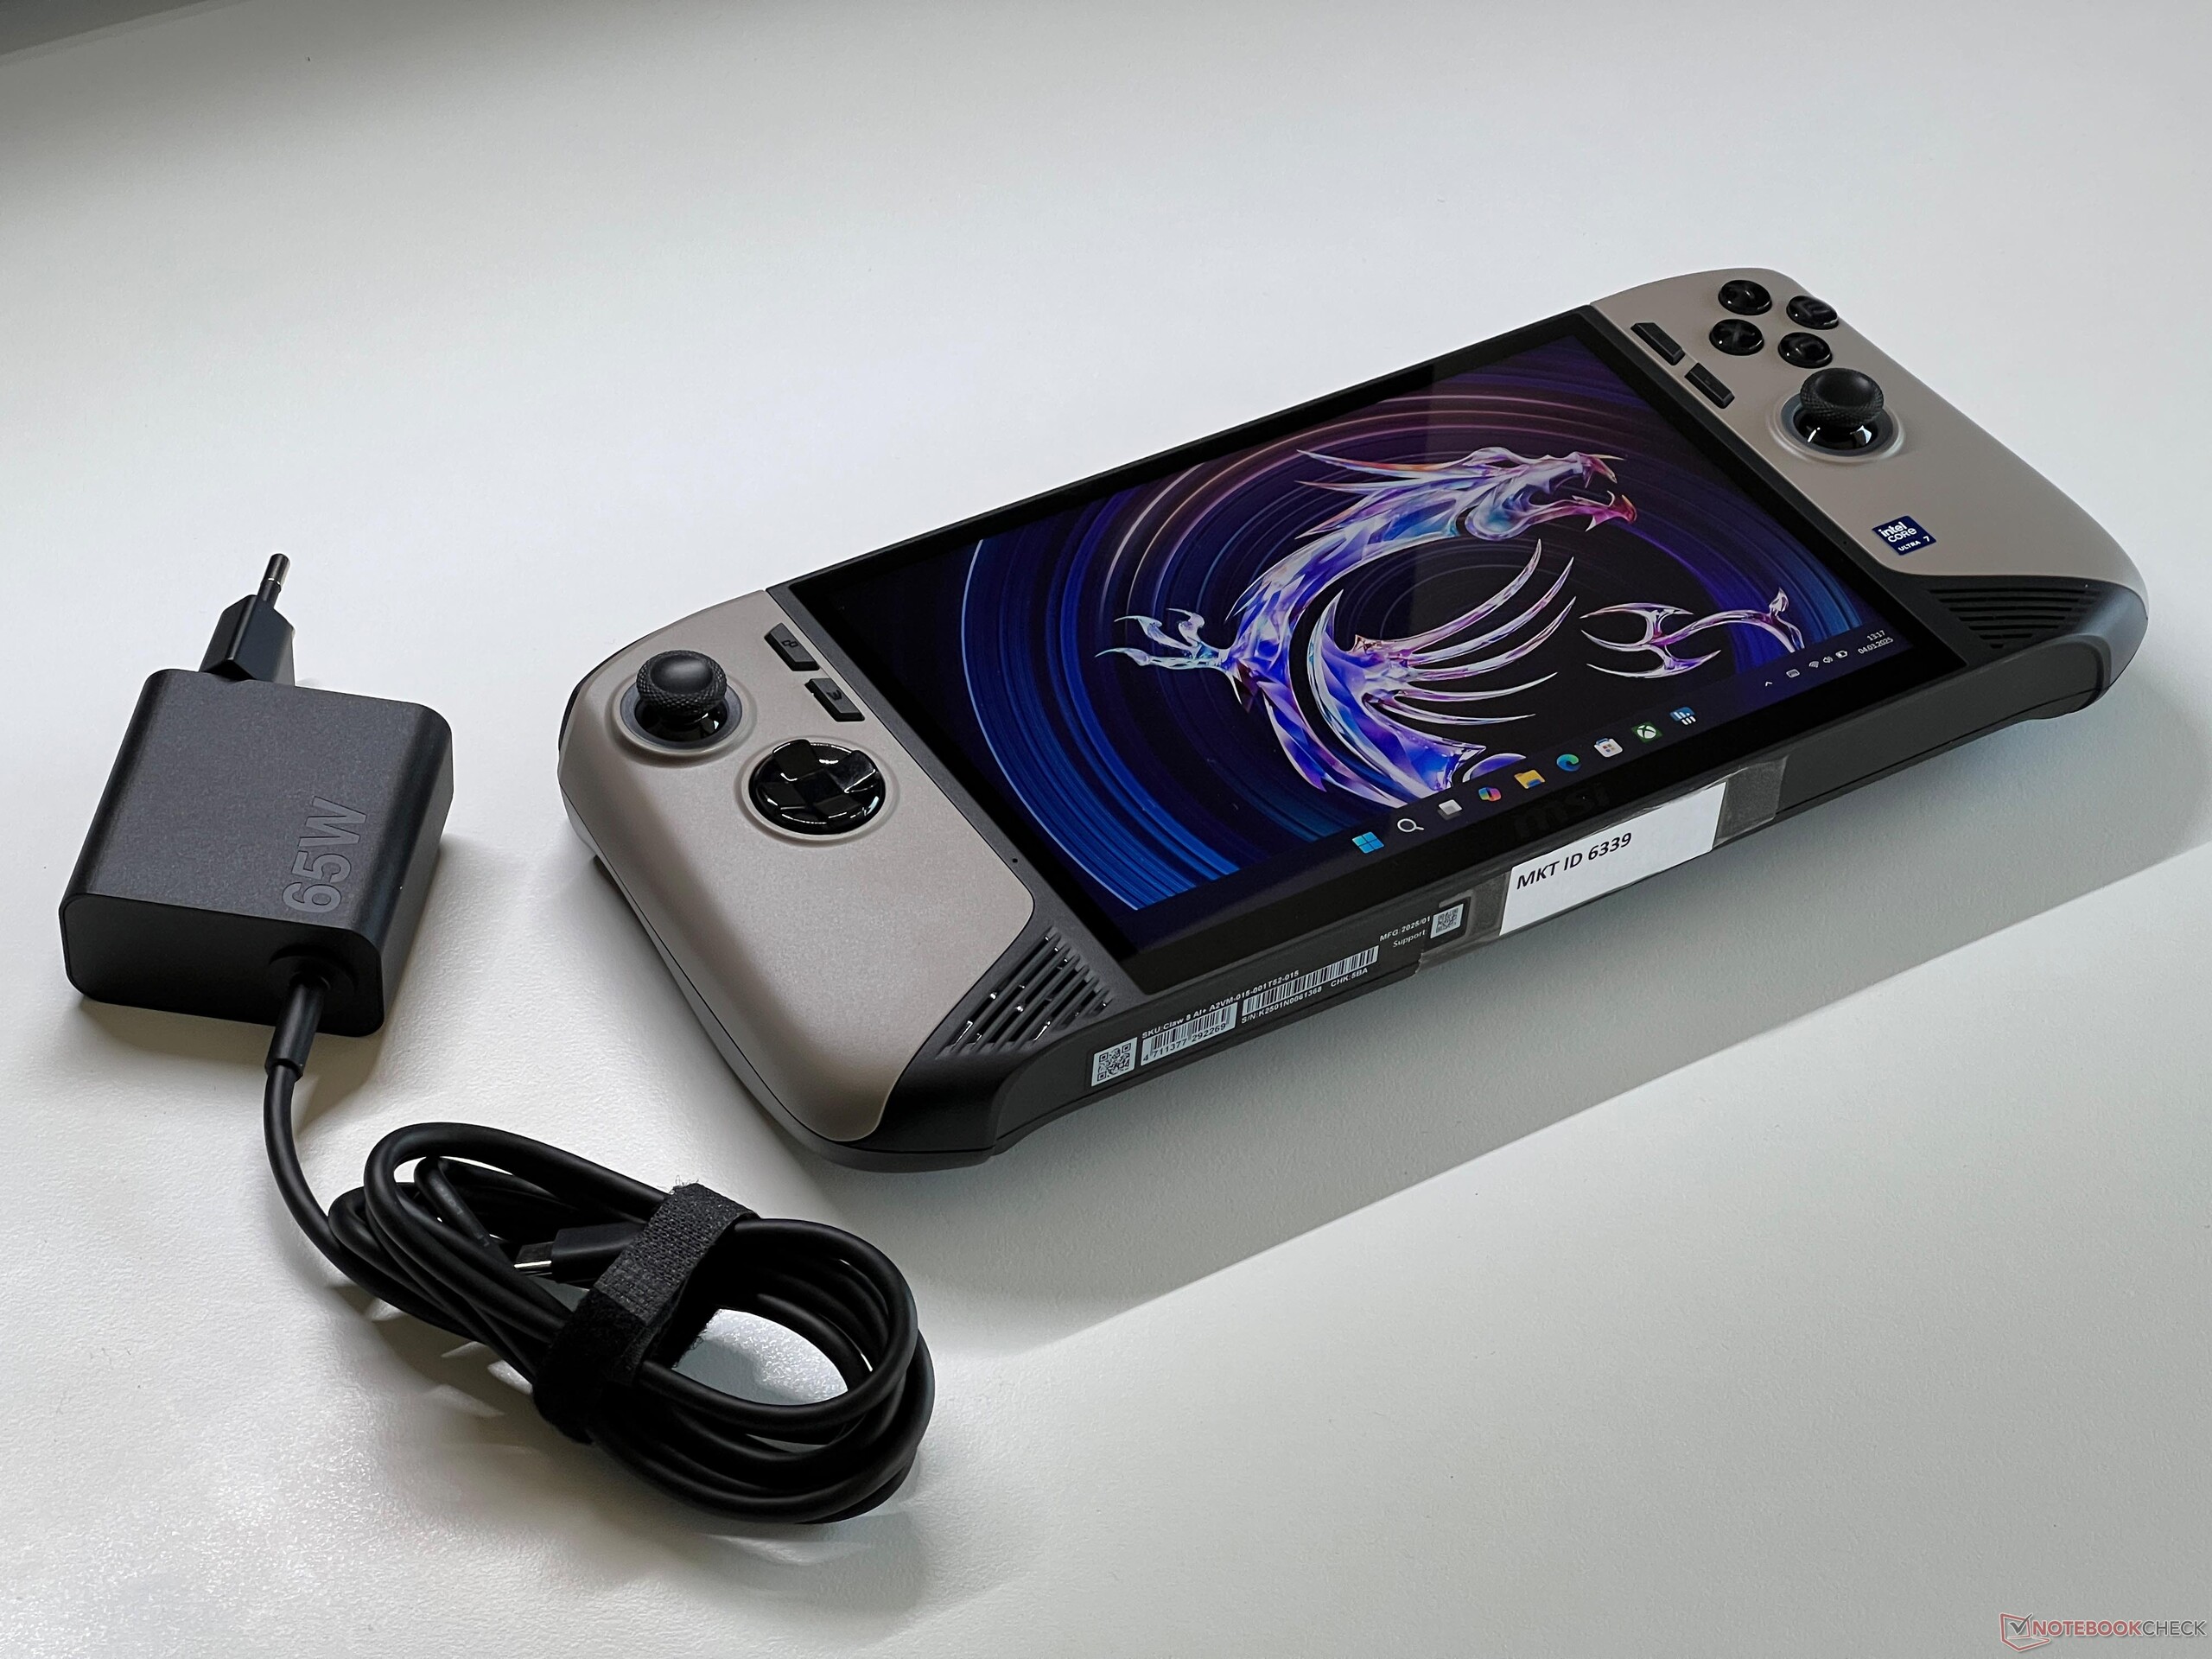
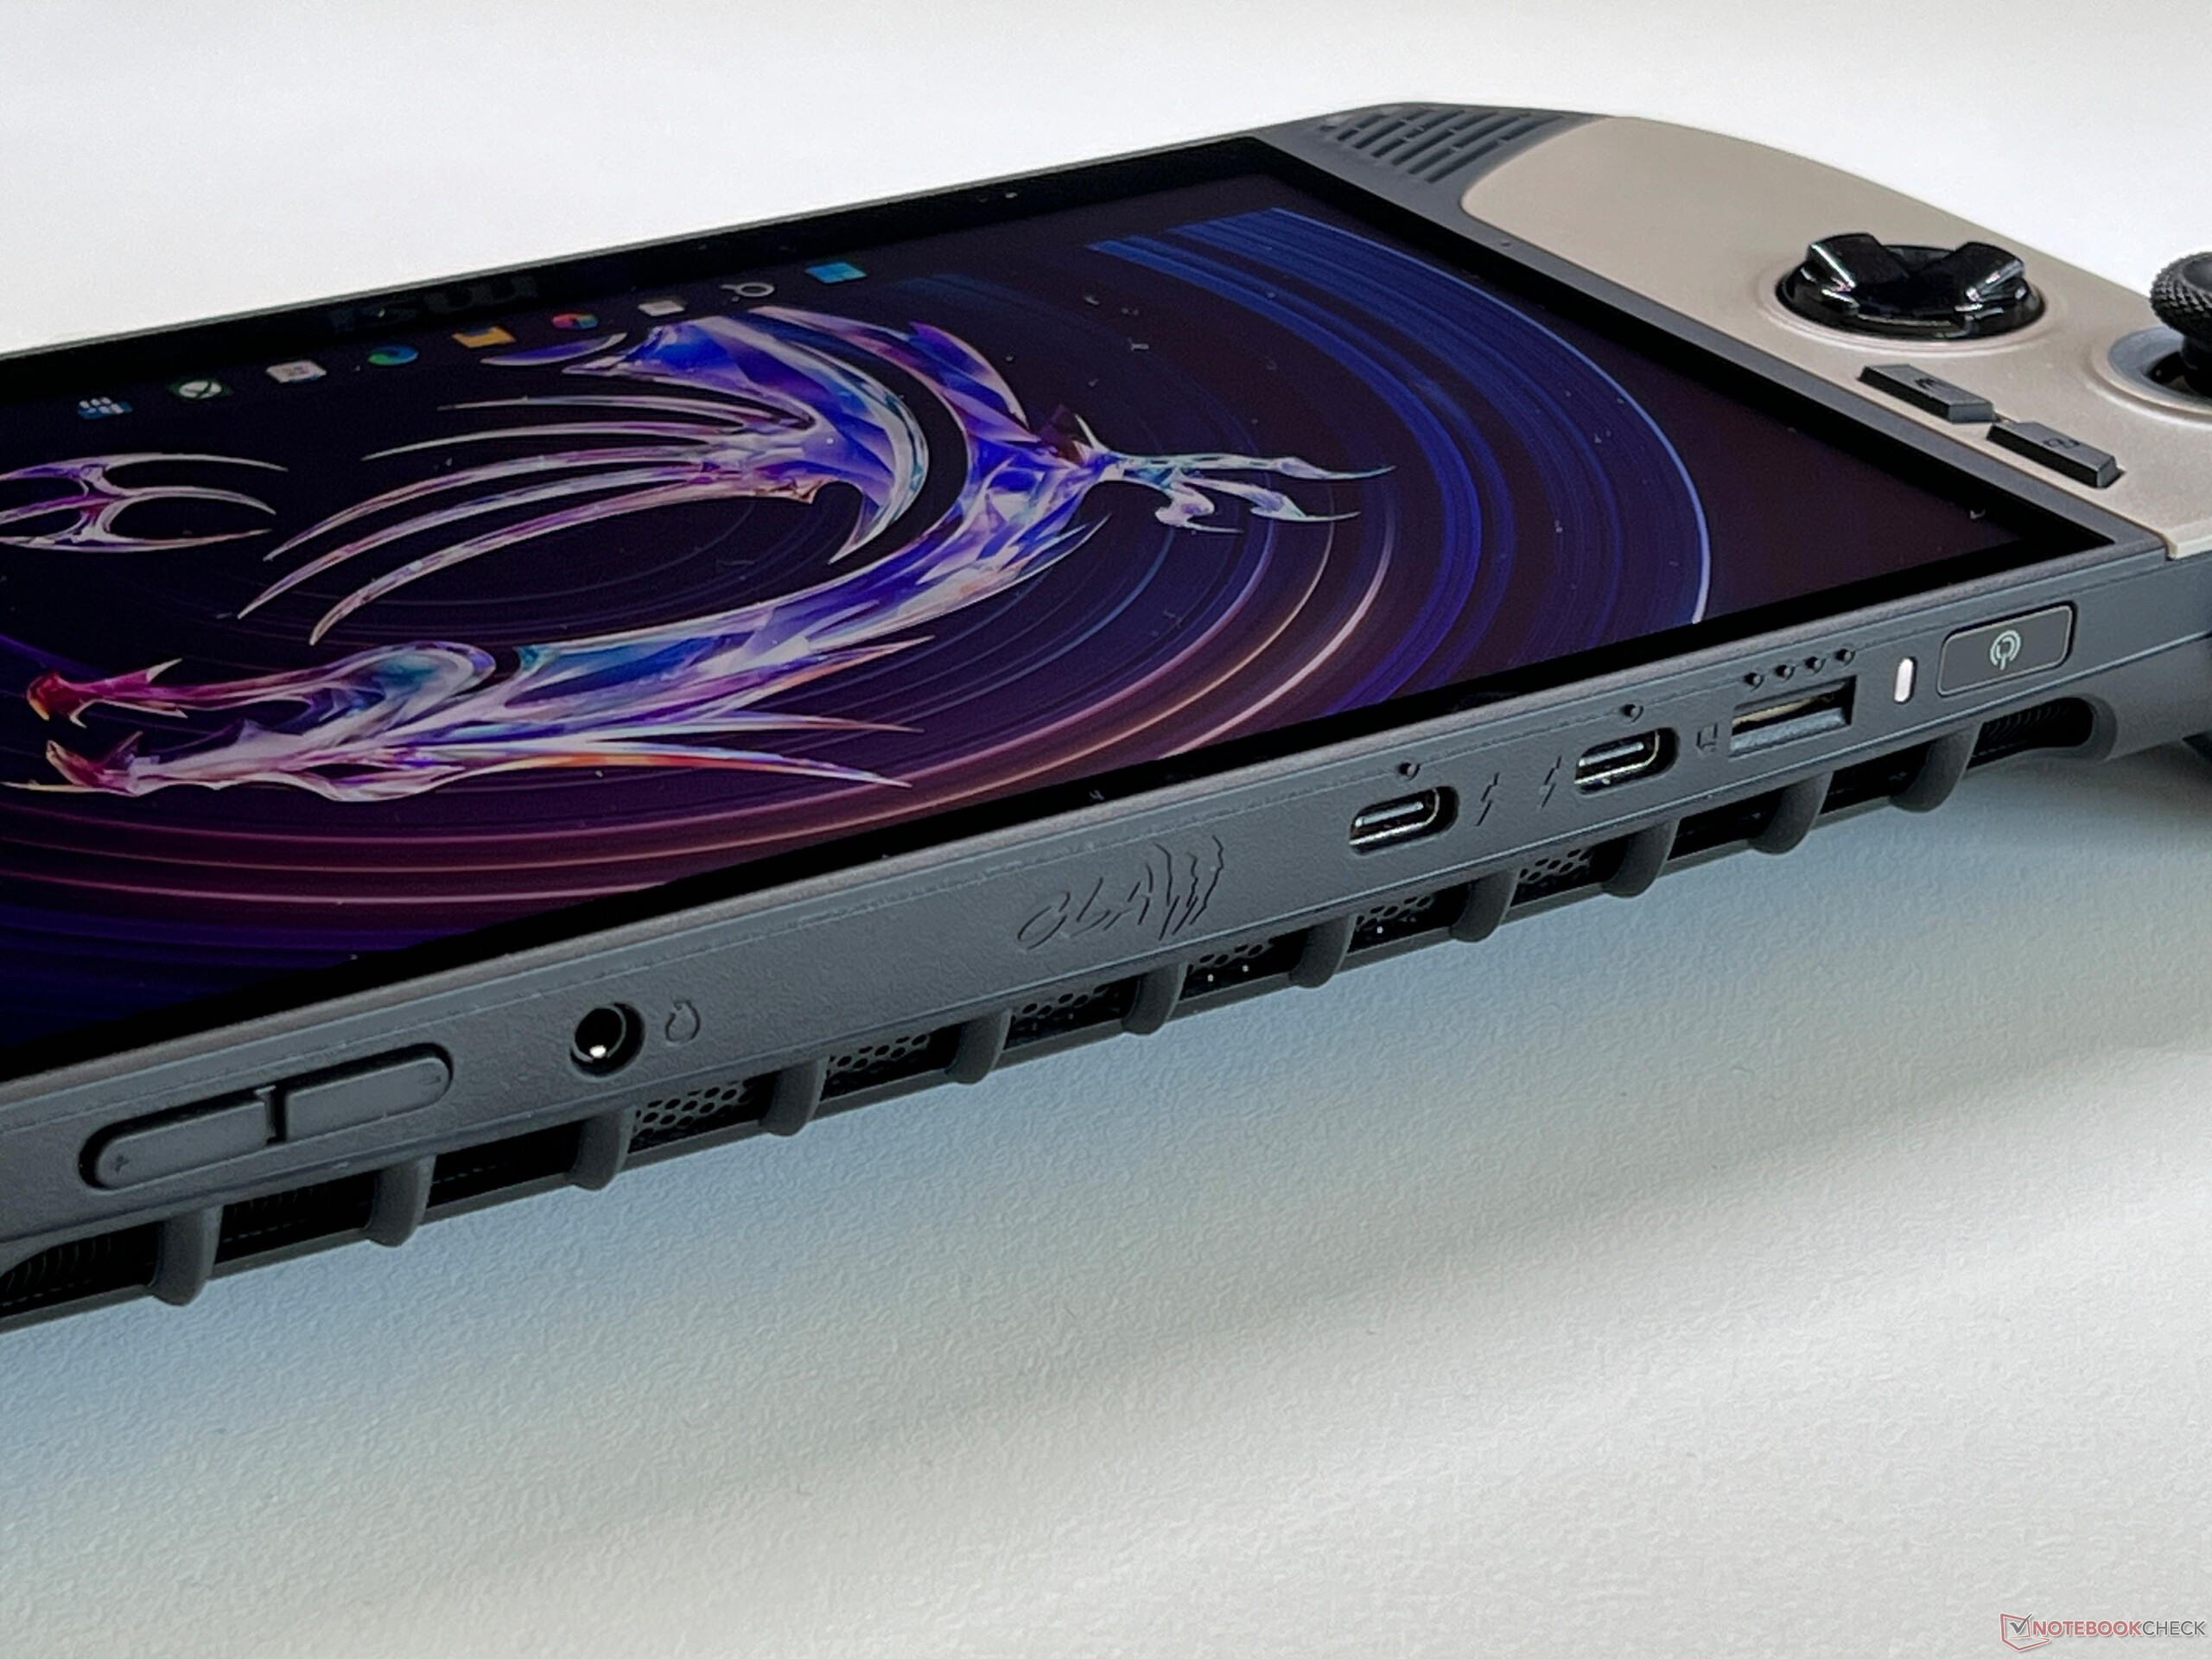
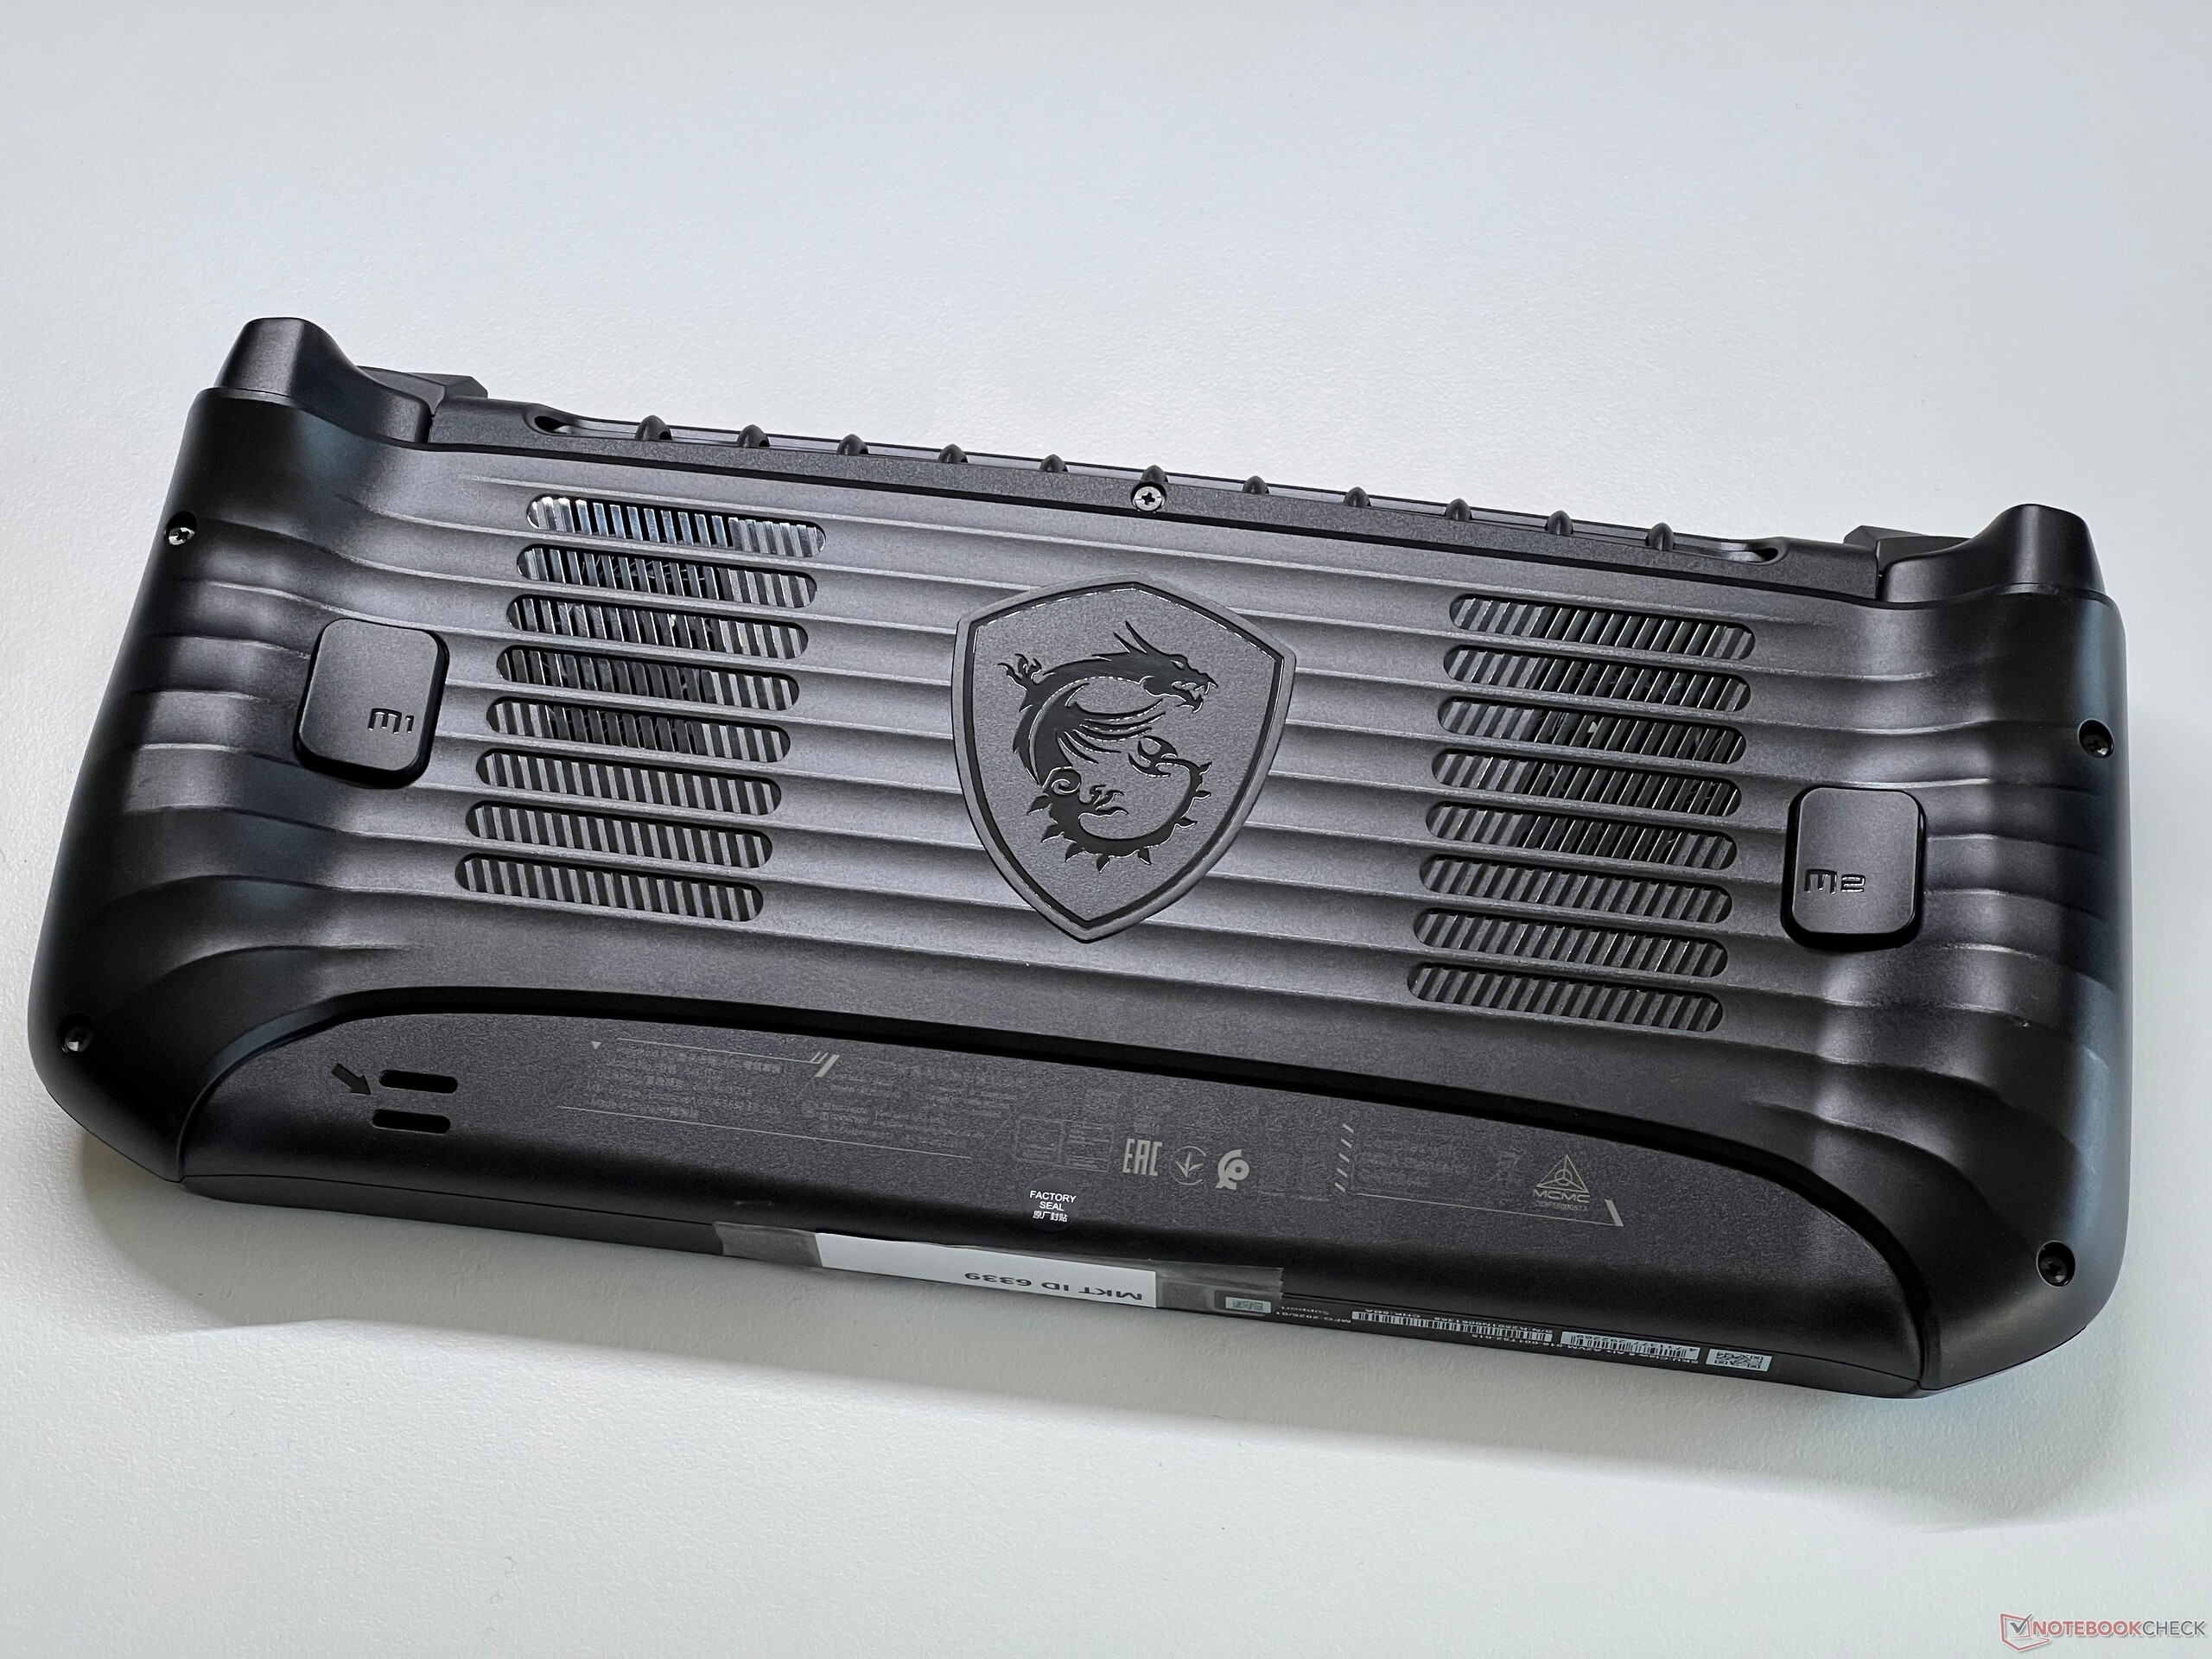
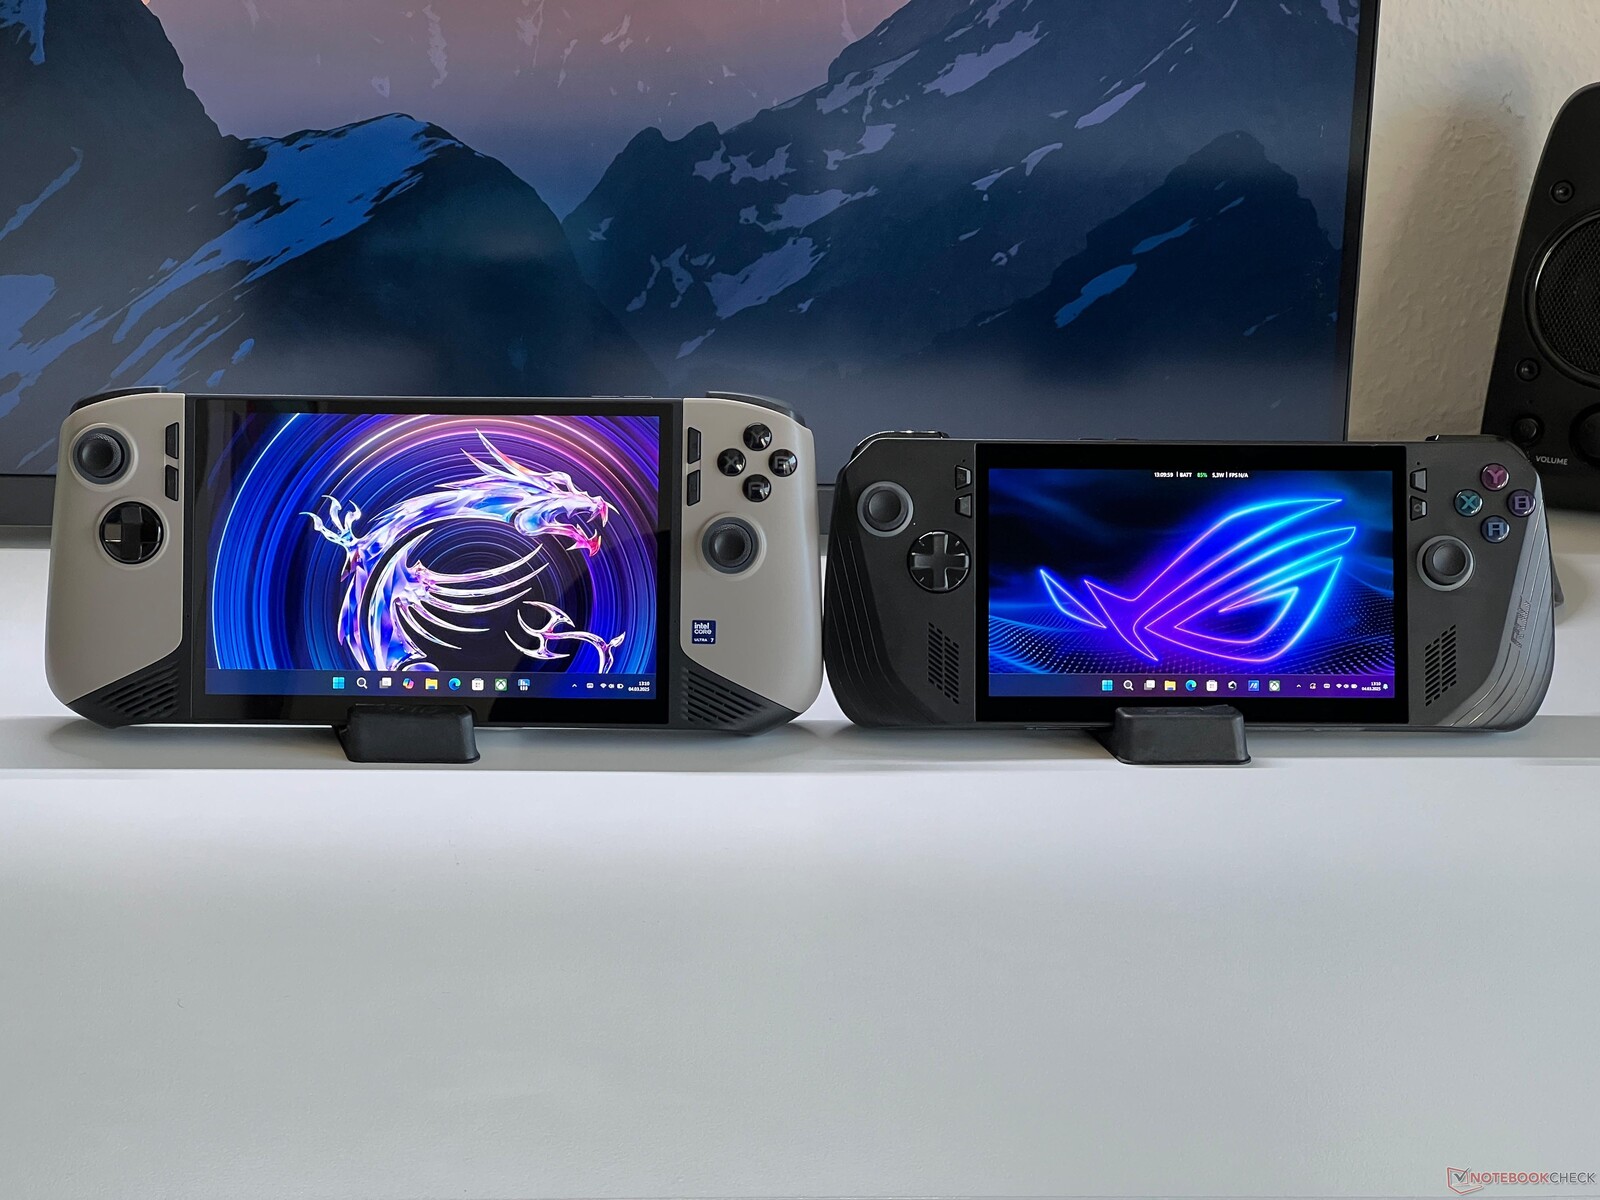
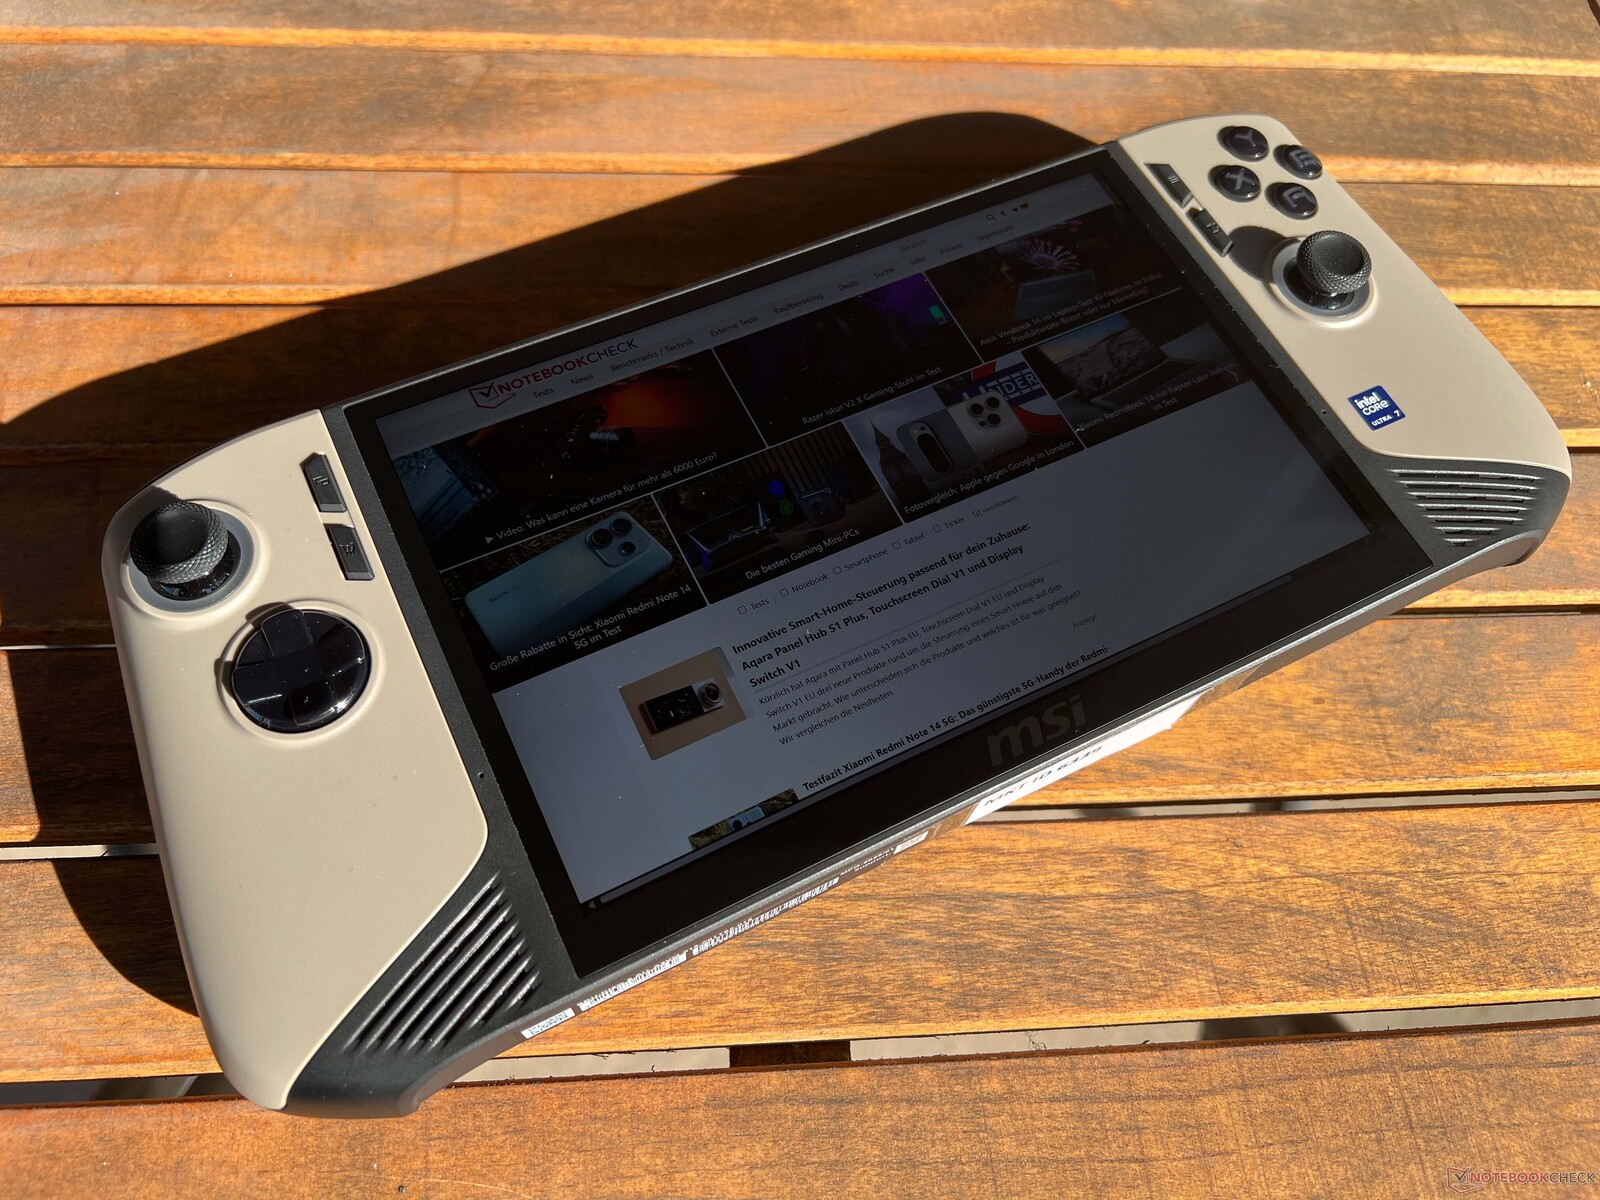
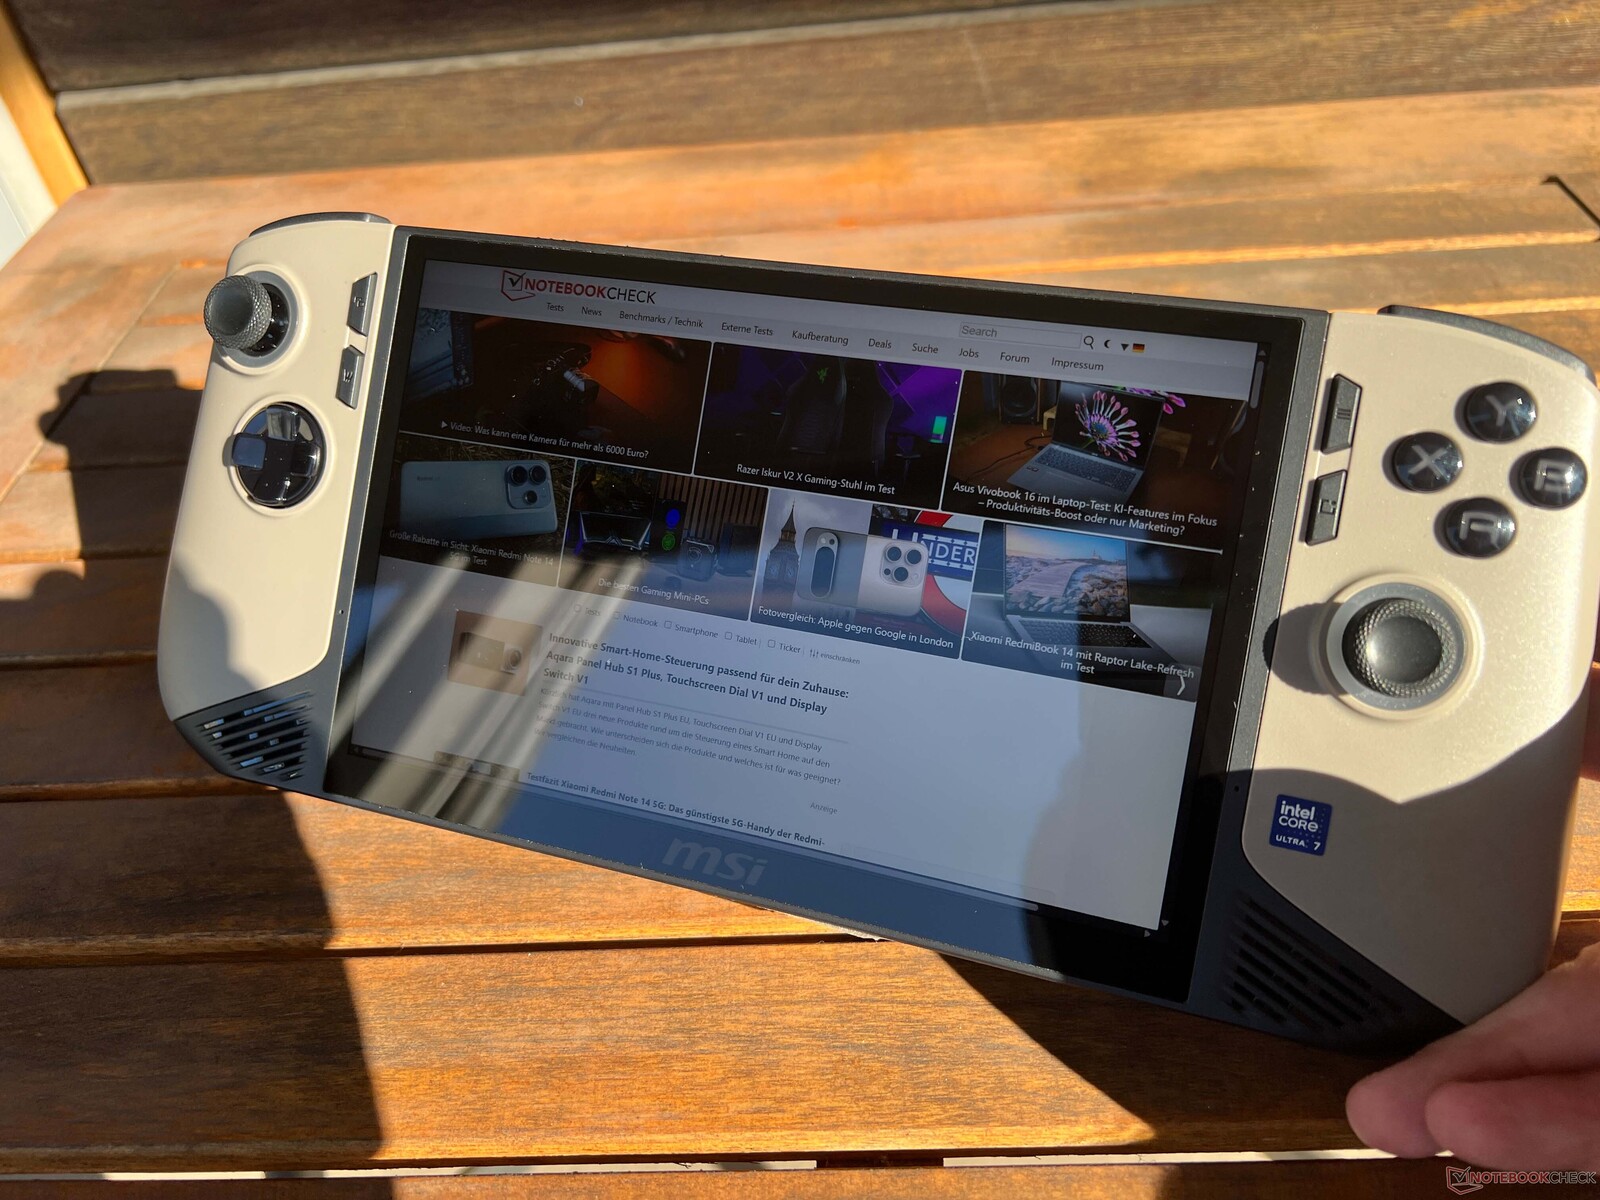
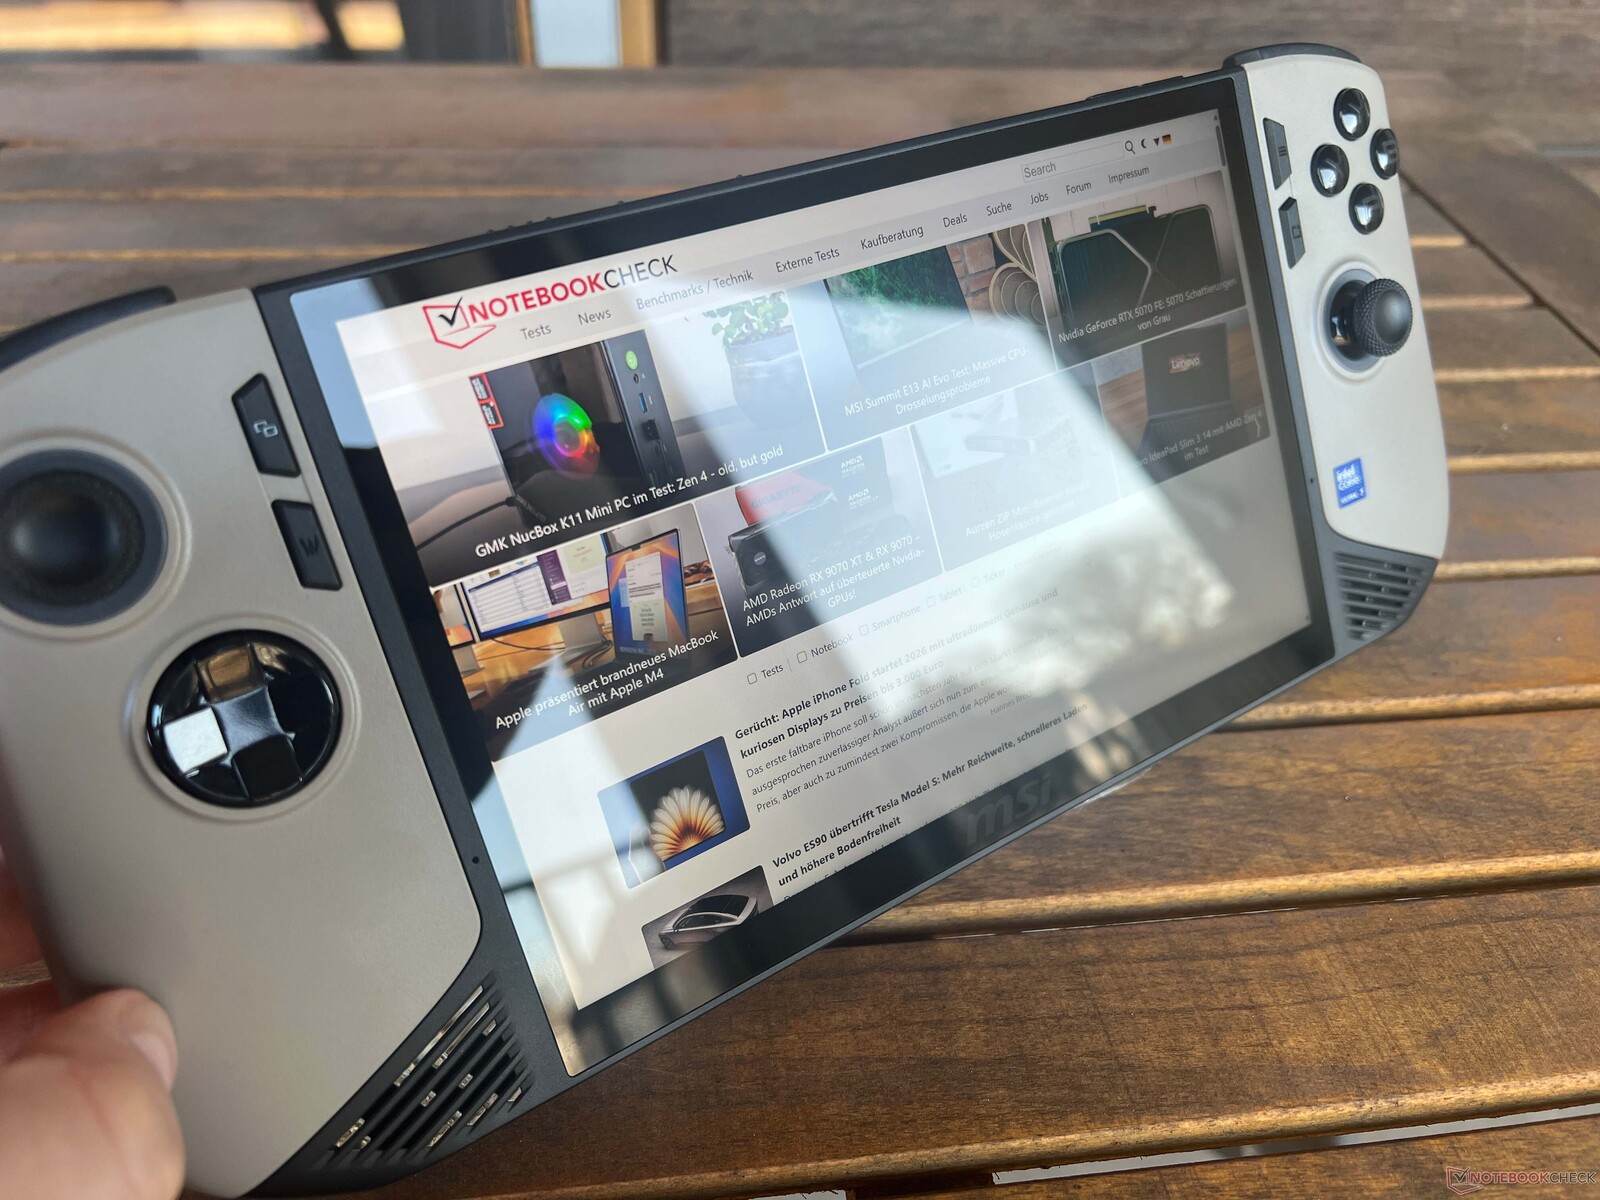
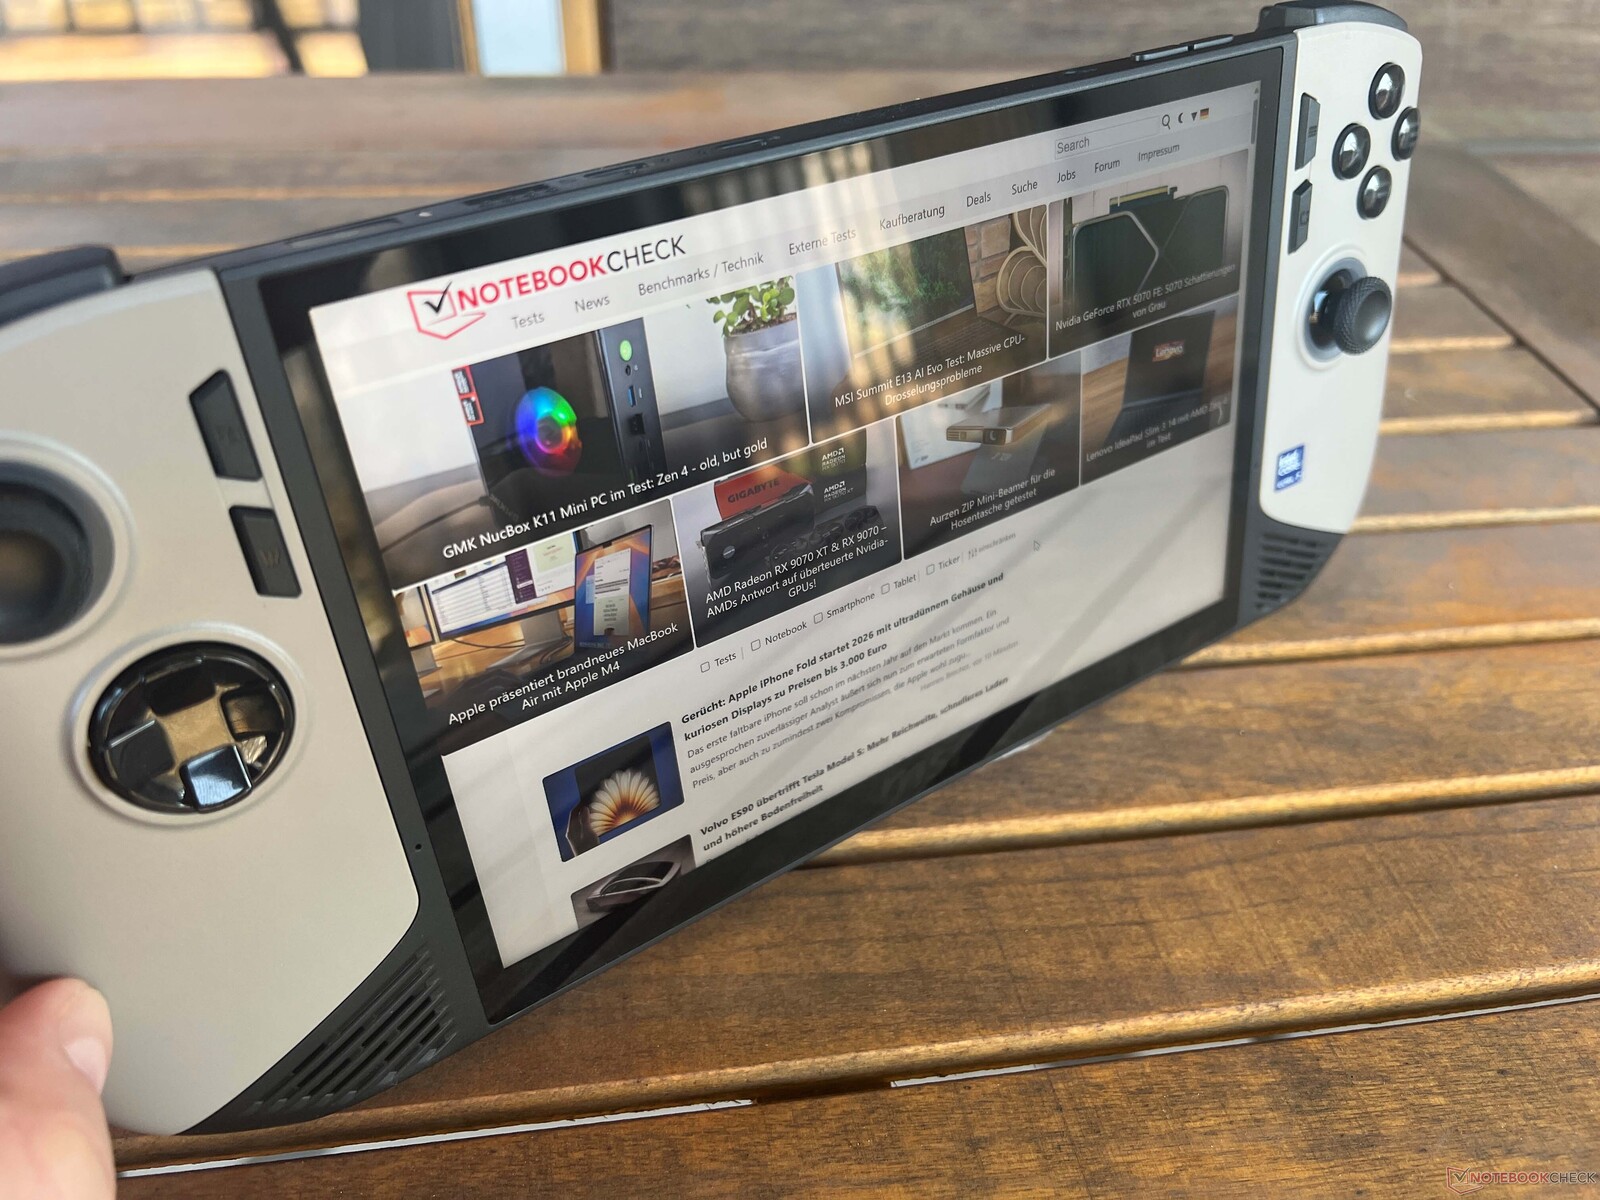
MSI has made significant changes to the handheld's design, as in addition to a larger case, its handles are now sand-colored, which looks great. This gives the device a more premium look and sets it apart from its competitors, which are generally just black. The two sticks once again feature LED rings. Despite its larger case, the Claw 8 feels good in your hands and we were able to play for longer periods of time without any problems. Its stability and build quality are really good and we noted no creaking noises.
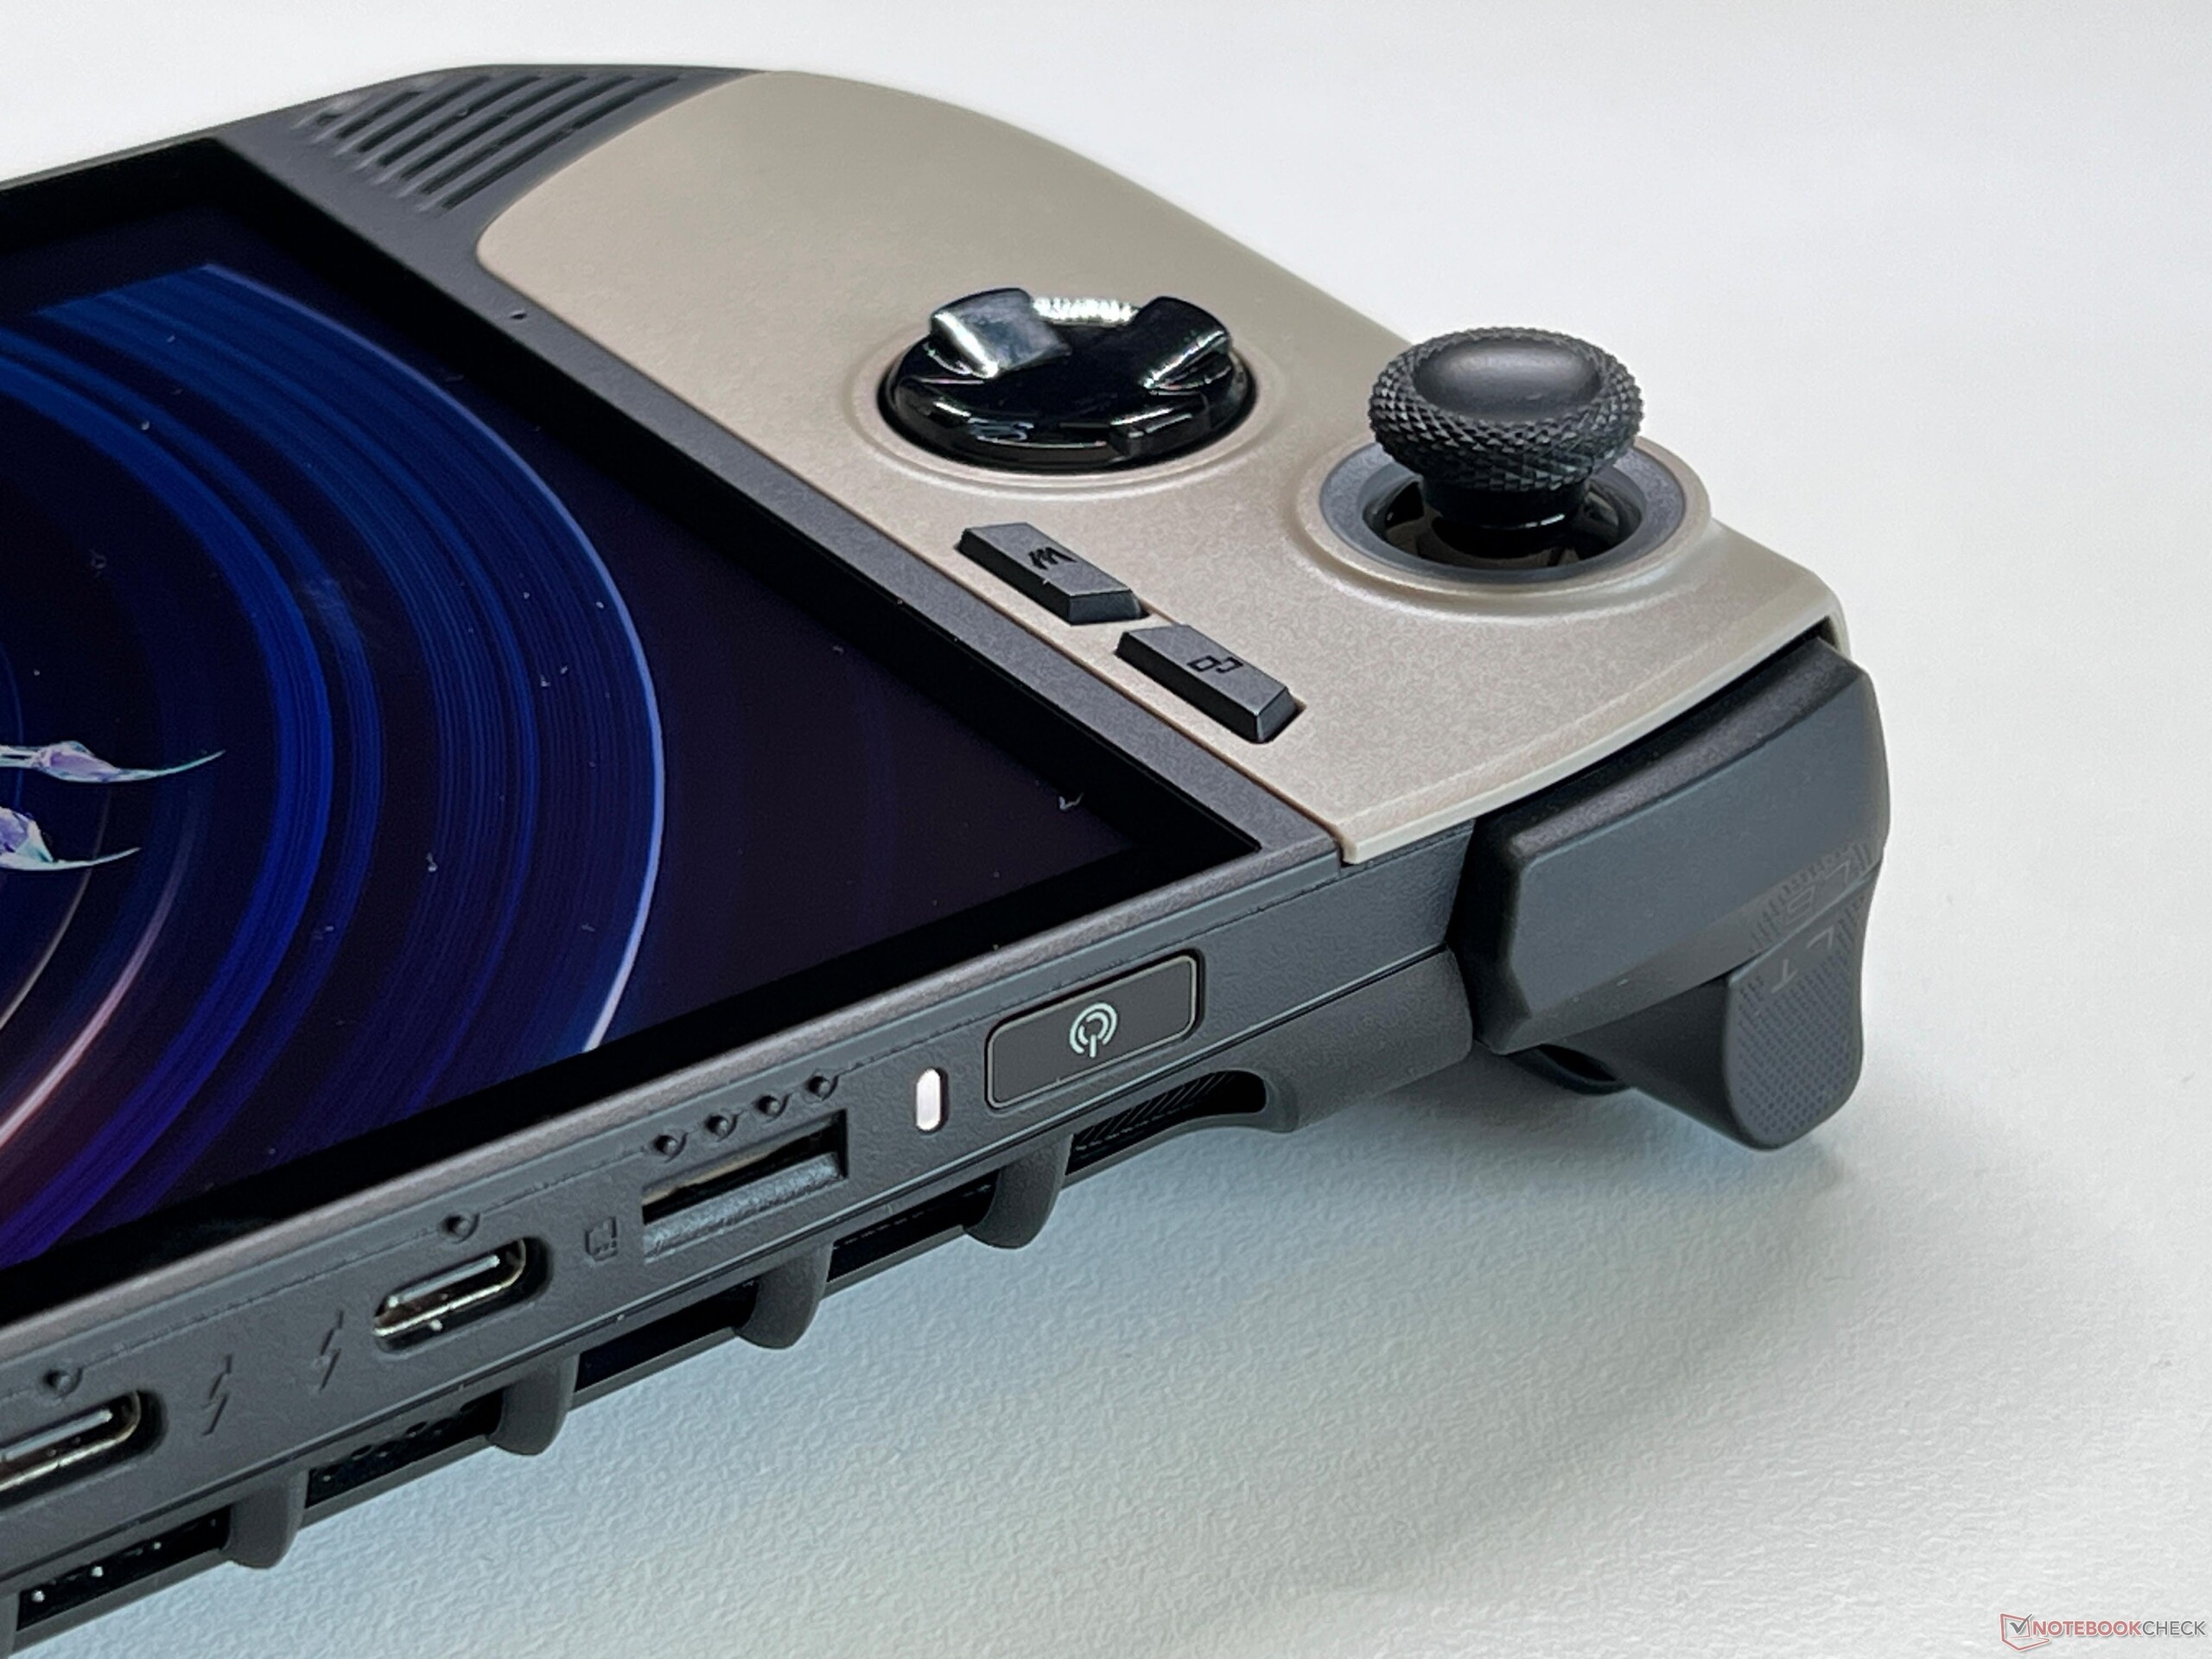
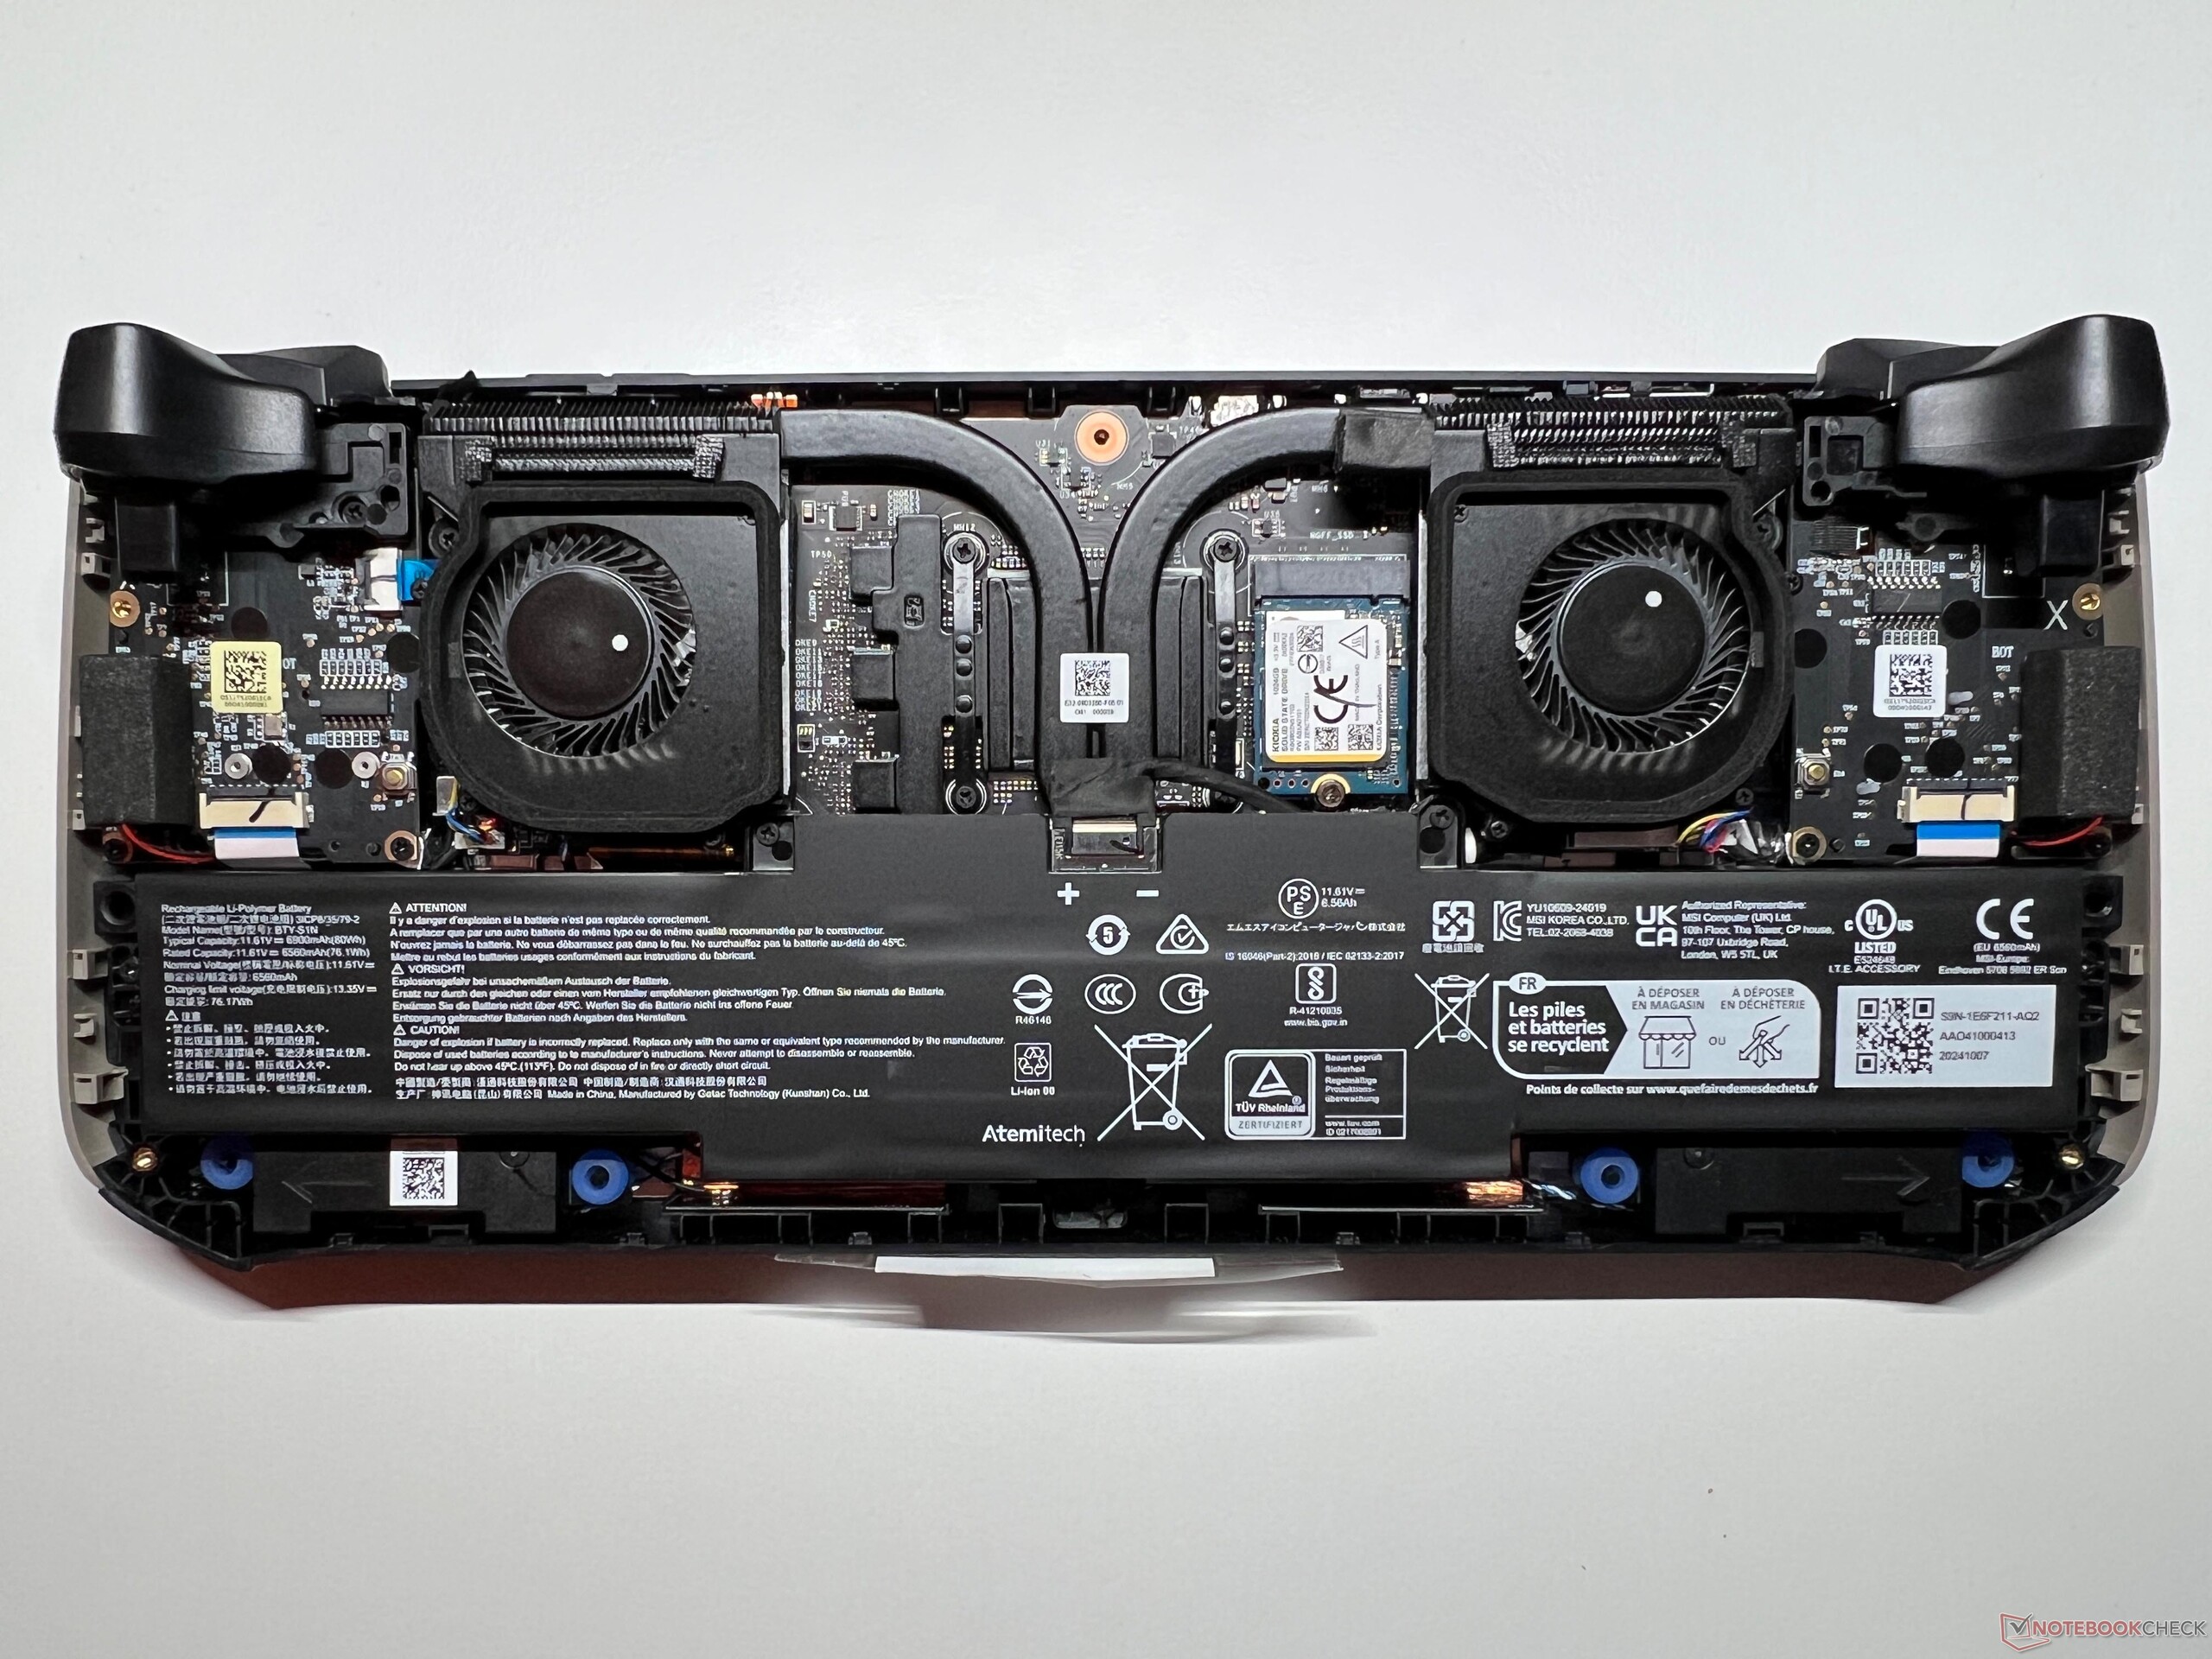
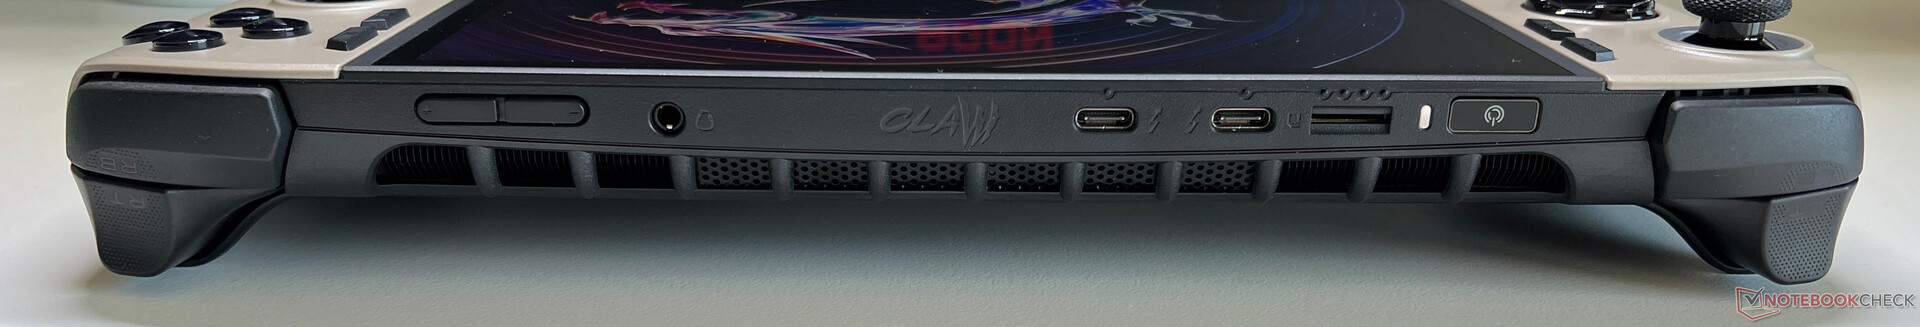
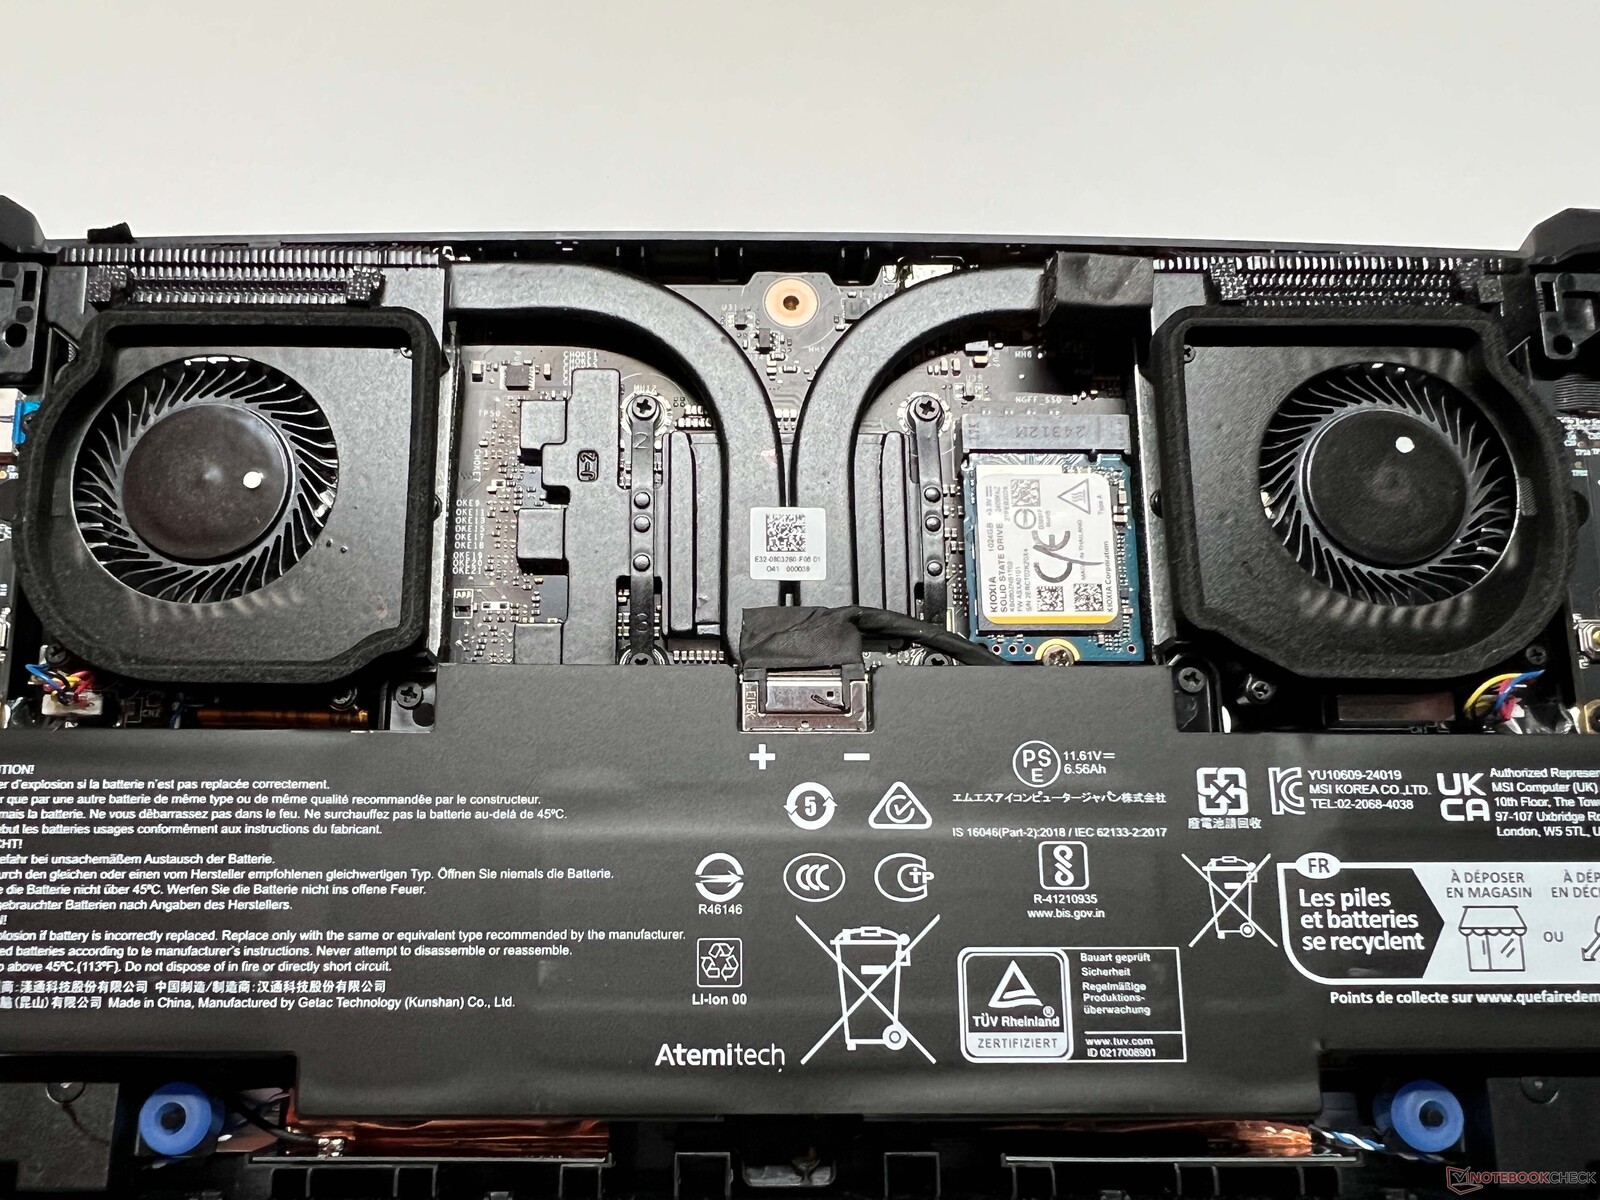
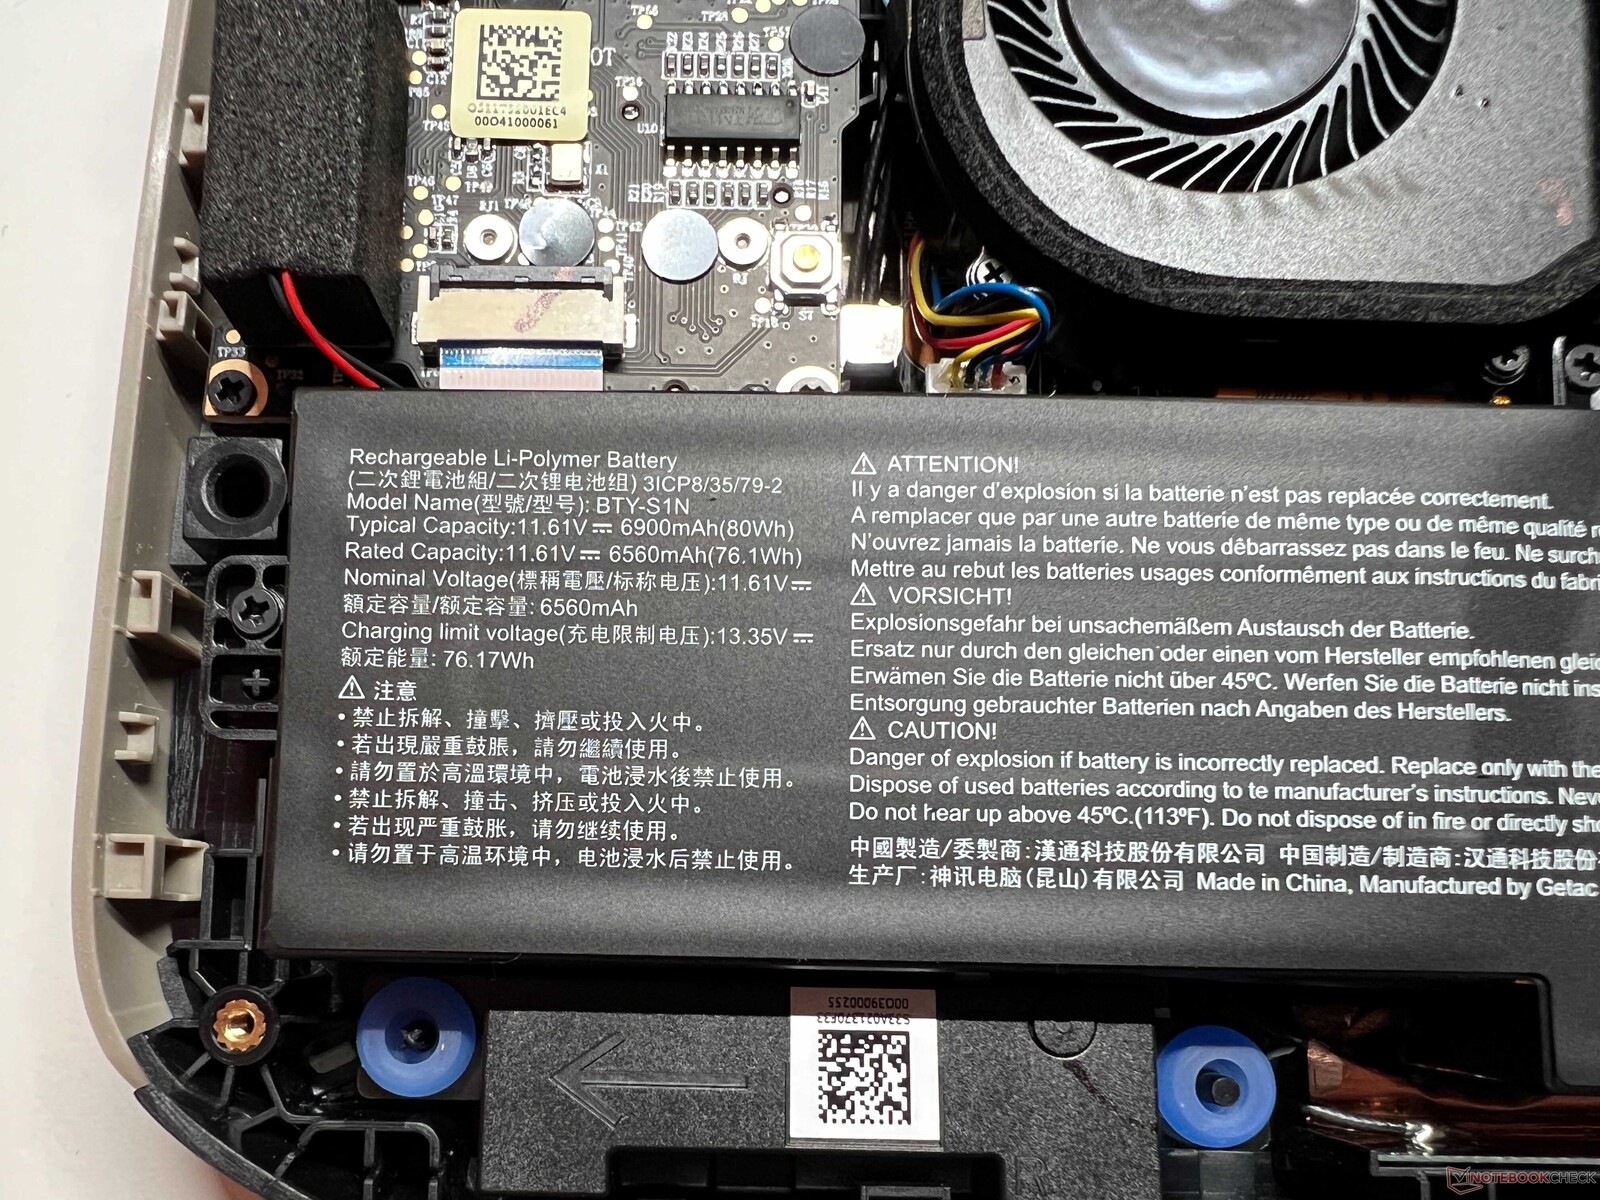
The back of the case can be easily removed and the M.2-2230 SSD and battery can be replaced if necessary. There is now a second Thunderbolt 4 port available, and the device's fast microSD reader and Wi-Fi 7 module are still present. It is a Copilot+ device, but it doesn't have a webcam installed. Part of its packaging can be converted into a stand.

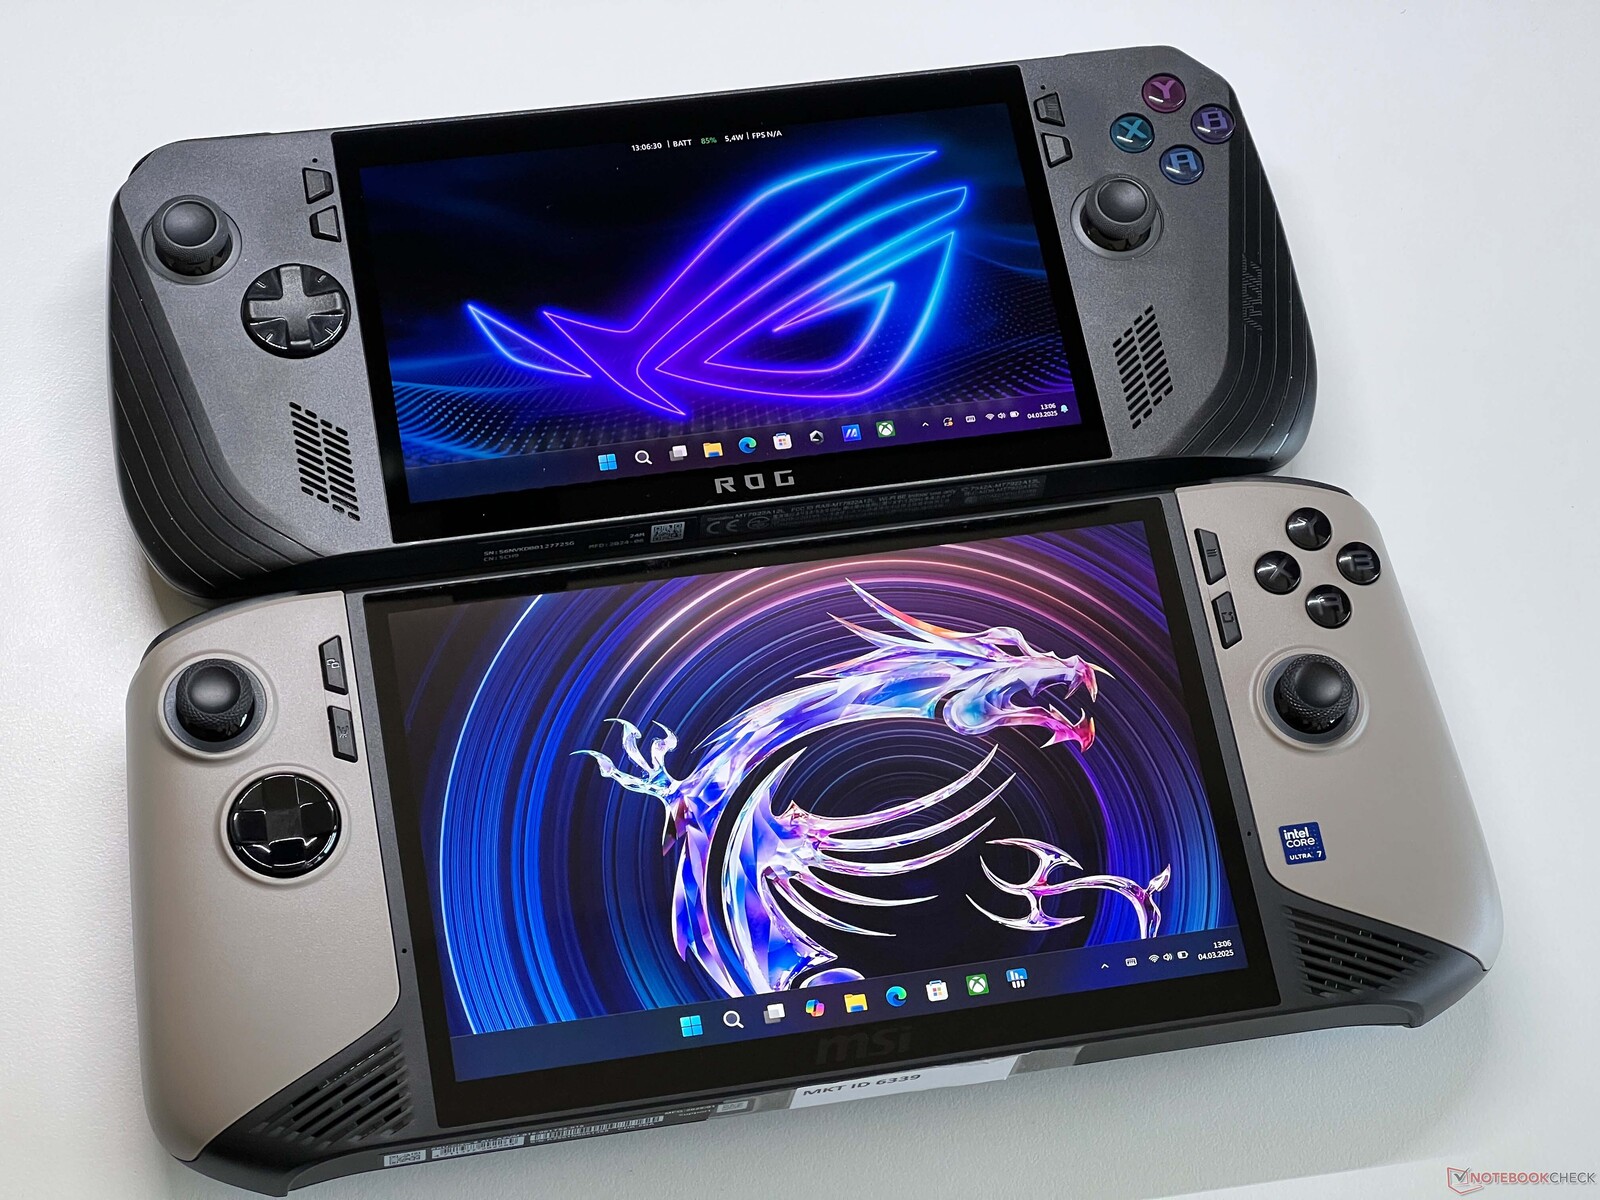
In direct comparison with the ROG Ally X, you immediately notice the difference made by its 8-inch display, but of course the handheld is also noticeably larger overall. Moreover, the Claw 8 weighs around 100 grams more.
| SD Card Reader | |
| average JPG Copy Test (av. of 3 runs) | |
| MSI Claw 8 AI+ (Angelbird AV Pro V60) | |
| Average of class Handheld / UMPC (32.9 - 569, n=10, last 2 years) | |
| ONEXPLAYER 2 Pro AR18 (Angelbird AV PRO microSD) | |
| MSI Claw (Angelbird AV Pro V60) | |
| Asus ROG Ally X (Angelbird AV Pro v60) | |
| Lenovo Legion Go S | |
| Valve Steam Deck 1 TB OLED | |
| GPD Pocket 4 (AV Pro SD microSD 128 GB V60) | |
| maximum AS SSD Seq Read Test (1GB) | |
| Asus ROG Ally X (Angelbird AV Pro v60) | |
| ONEXPLAYER 2 Pro AR18 (Angelbird AV PRO microSD) | |
| Average of class Handheld / UMPC (74.7 - 817, n=10, last 2 years) | |
| MSI Claw 8 AI+ (Angelbird AV Pro V60) | |
| MSI Claw (Angelbird AV Pro V60) | |
| Lenovo Legion Go S | |
| GPD Pocket 4 (AV Pro SD microSD 128 GB V60) | |
| Networking | |
| MSI Claw 8 AI+ | |
| iperf3 transmit AXE11000 | |
| iperf3 receive AXE11000 | |
| Lenovo Legion Go S | |
| iperf3 transmit AXE11000 | |
| iperf3 receive AXE11000 | |
| iperf3 transmit AXE11000 6GHz | |
| iperf3 receive AXE11000 6GHz | |
| GPD Pocket 4 | |
| iperf3 transmit AXE11000 | |
| iperf3 receive AXE11000 | |
| iperf3 transmit AXE11000 6GHz | |
| iperf3 receive AXE11000 6GHz | |
| Asus ROG Ally X | |
| iperf3 transmit AXE11000 | |
| iperf3 receive AXE11000 | |
| MSI Claw | |
| iperf3 transmit AXE11000 | |
| iperf3 receive AXE11000 | |
| Valve Steam Deck 1 TB OLED | |
| iperf3 transmit AXE11000 | |
| iperf3 receive AXE11000 | |
| iperf3 transmit AXE11000 6GHz | |
| iperf3 receive AXE11000 6GHz | |
| ONEXPLAYER 2 Pro AR18 | |
| iperf3 transmit AXE11000 | |
| iperf3 receive AXE11000 | |
| iperf3 transmit AXE11000 6GHz | |
| iperf3 receive AXE11000 6GHz | |
Sustainability
MSI hasn't provided any information on the device's sustainability, use of recycled materials or environmental certificates. Its packaging is mainly made of cardboard and can be recycled.
Software - MSI Center M
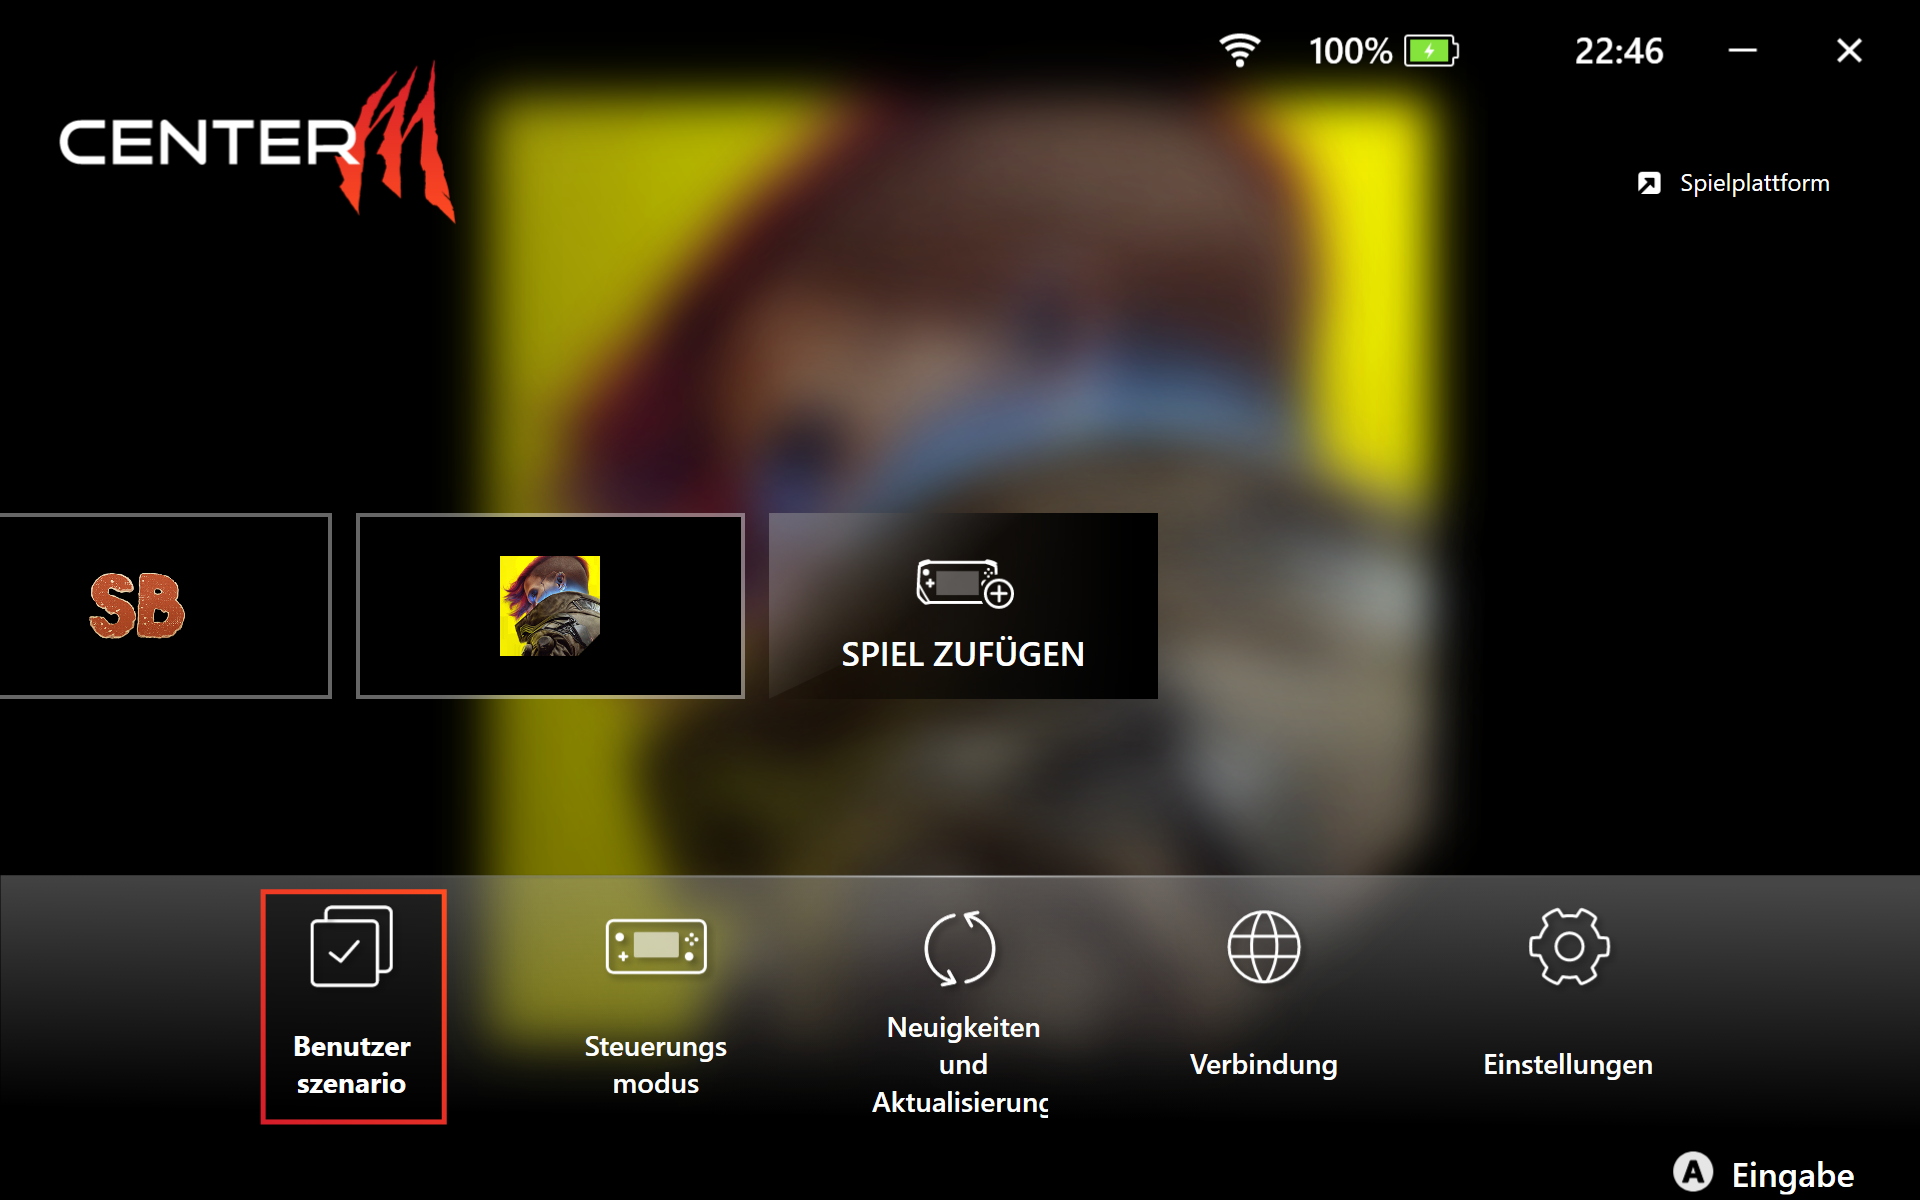
Anyone who has ever used Windows on a small touchscreen knows how awkward it is to operate. This makes the software supplied by the manufacturer all the more important for user experience. In the case of the Claw 8, as with its predecessor, the software it uses is MSI Center M, which opens automatically at startup. Installed games are displayed here and you can access all the settings. A customizable quick menu is also available, which can be used to adjust important settings (e.g. brightness, performance mode, performance monitoring, etc.) at any time. As with the old model, the app generally works well, although its overall range of functions is noticeably smaller than the ArmoryCrate SE software on the Asus ROG Ally X, and it is occasionally a little laggy.
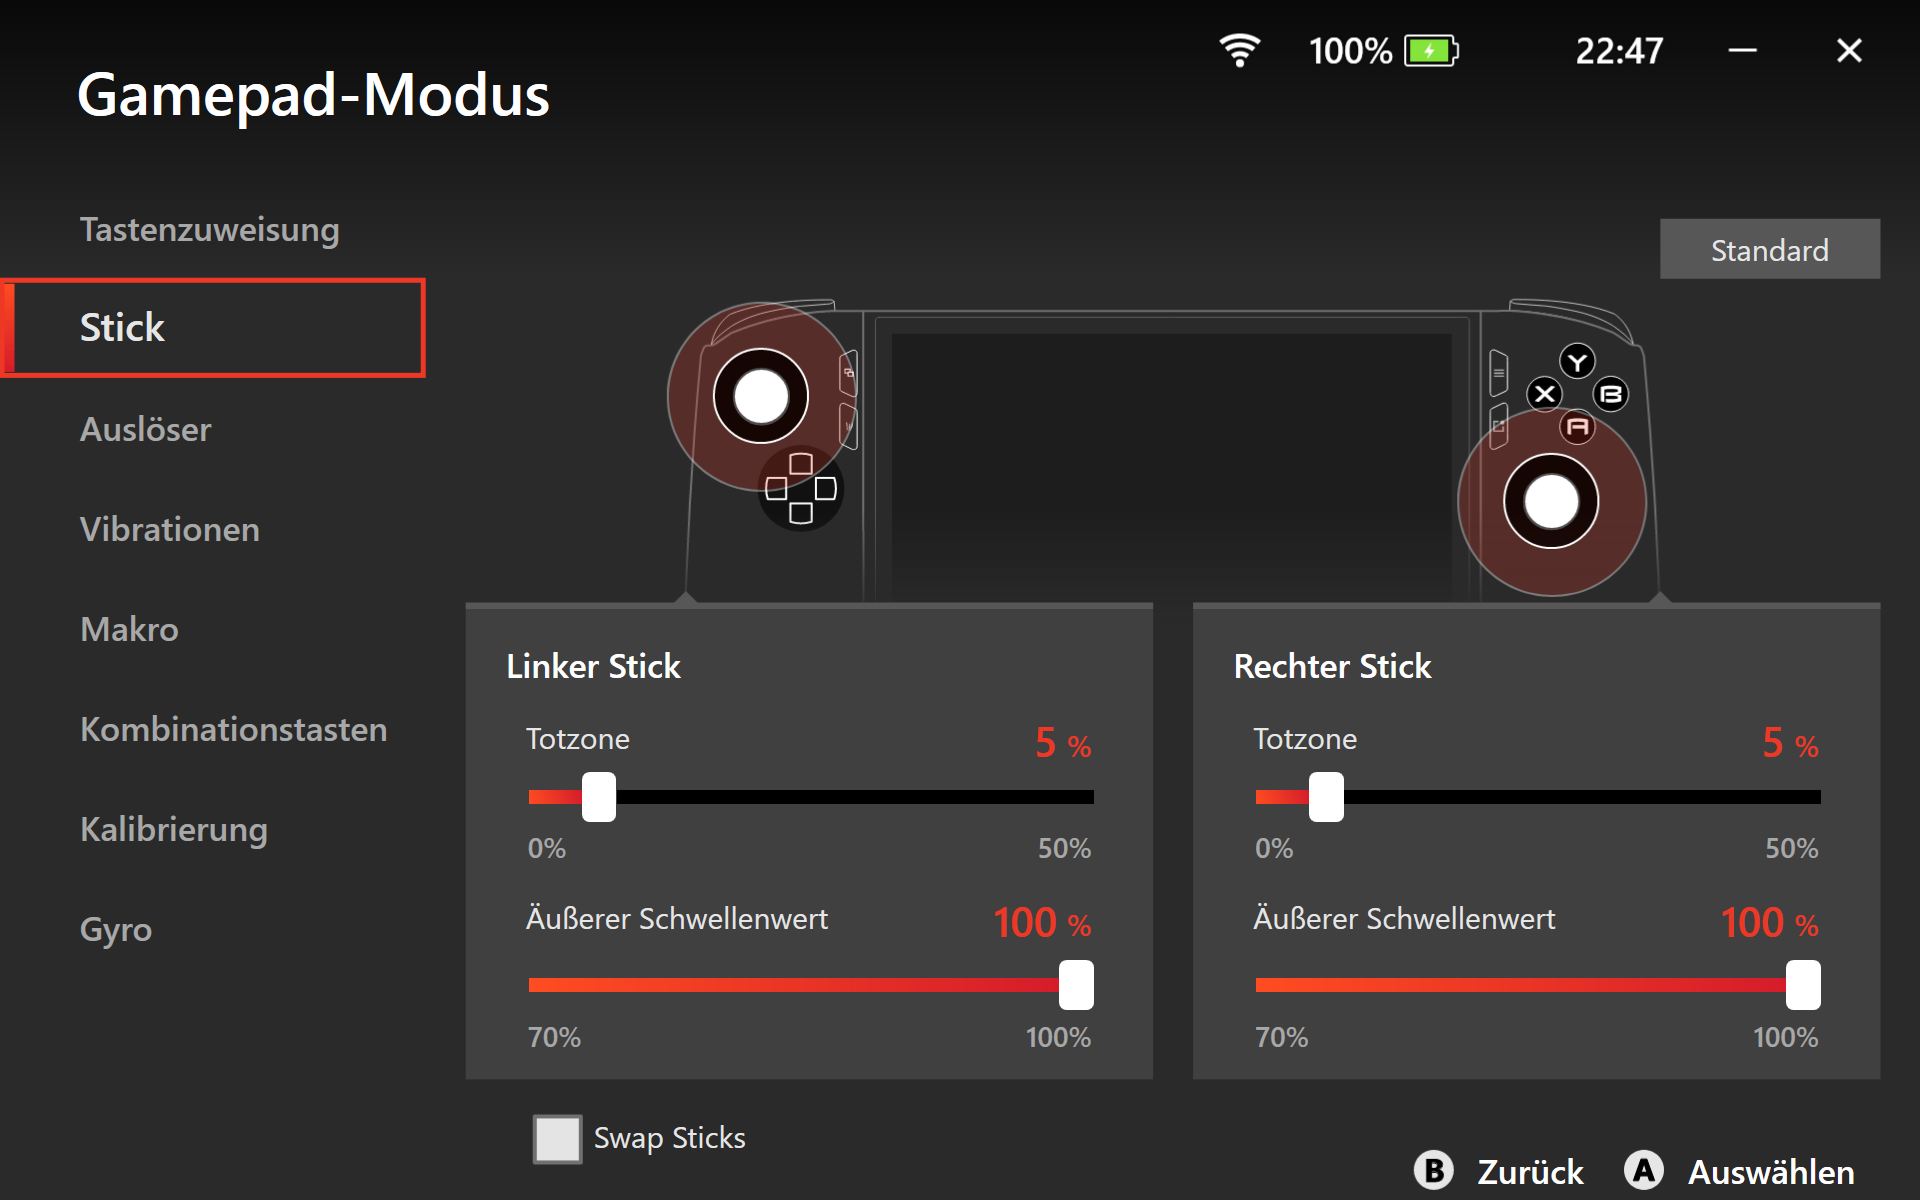
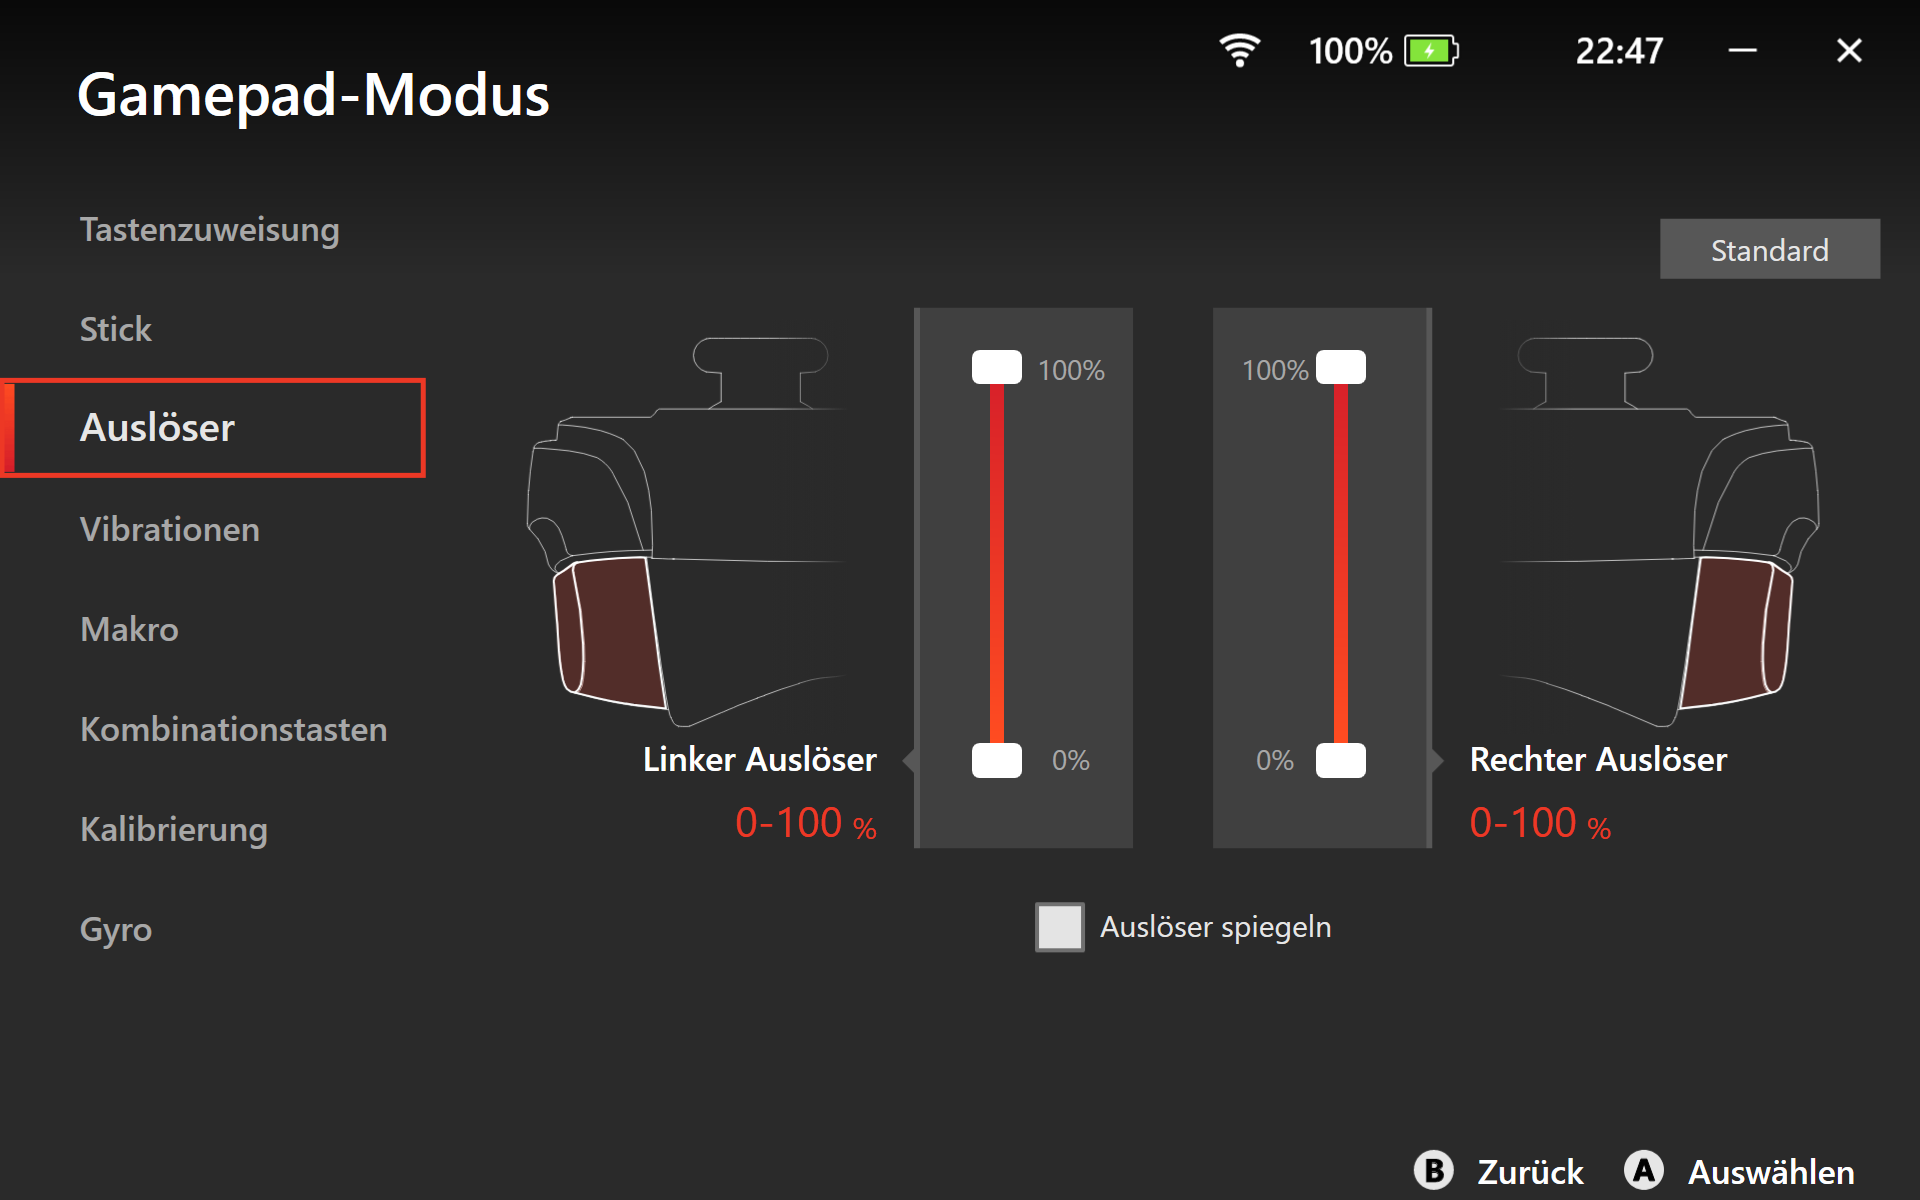
Input devices - Hall-Effect triggers & sticks
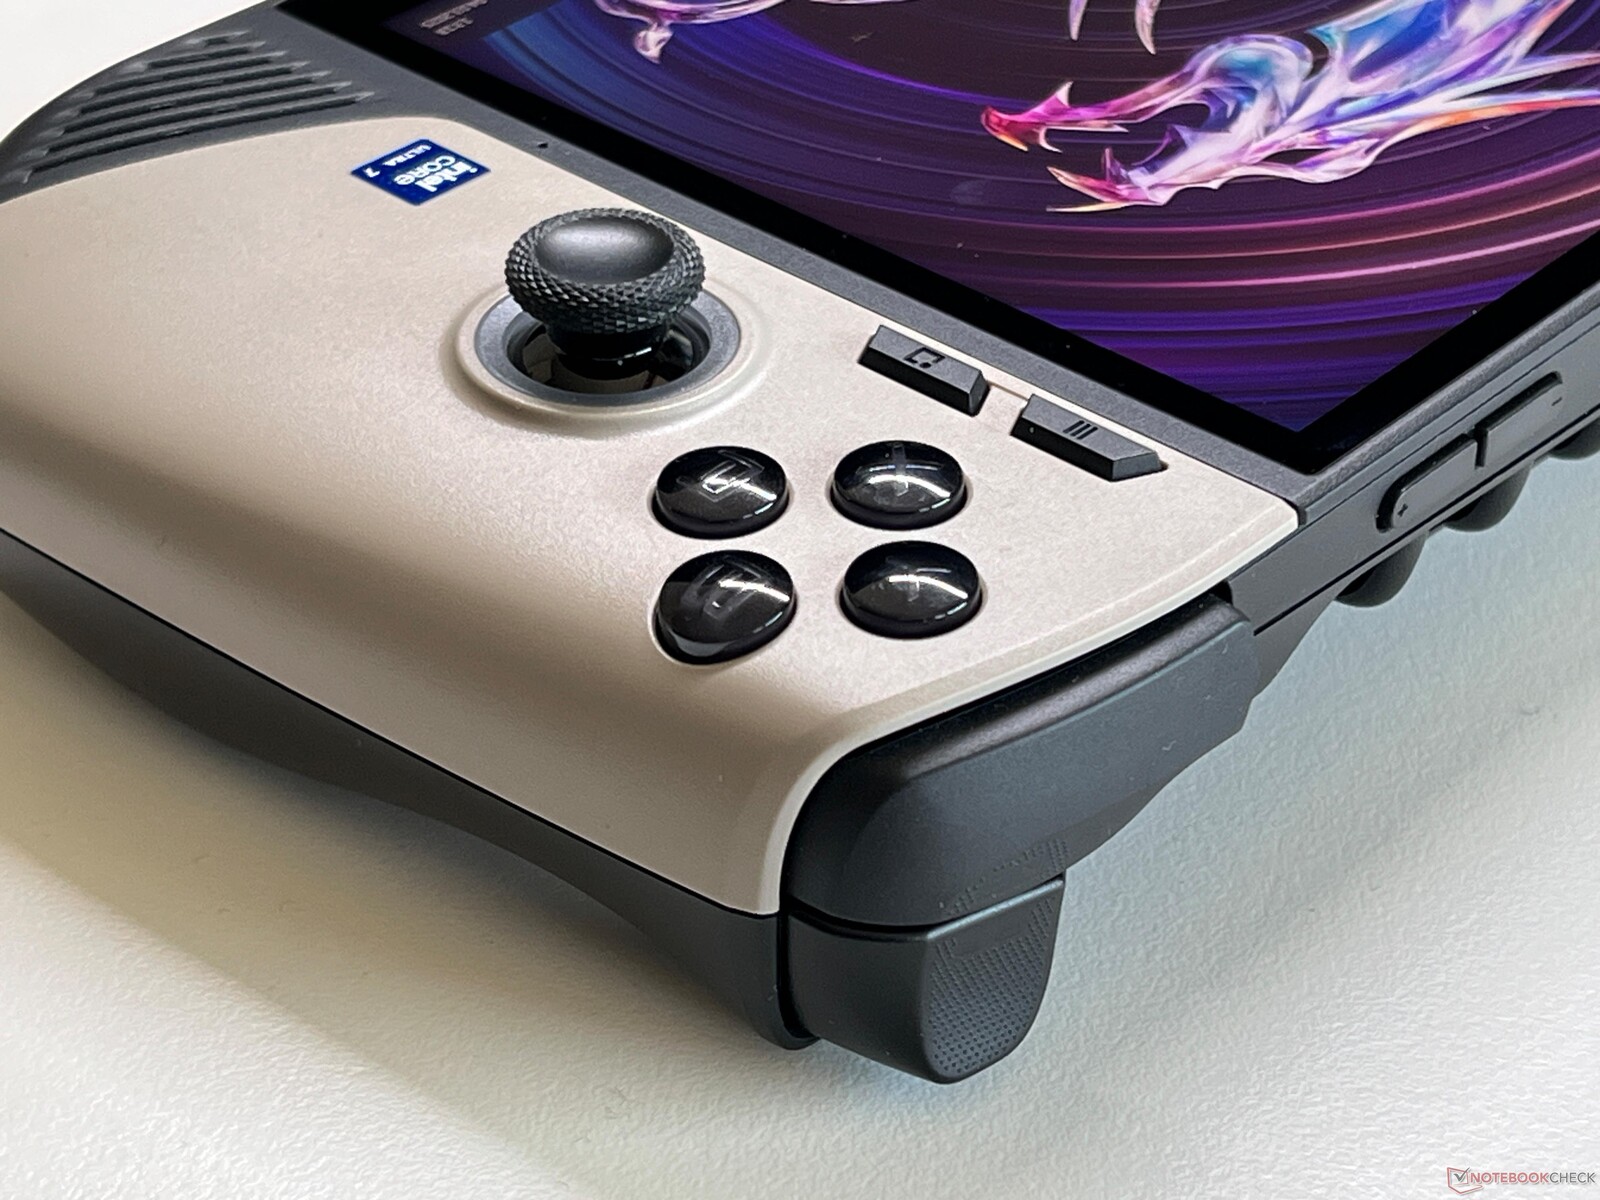
MSI continues to use Hall Effect triggers and sticks for the Claw 8, which work very well in practice. The triggers in particular offer a little more resistance than the Ally X, for example, which feels a bit better when playing games. The D-pad is precise and quite quiet, while the regular buttons on the right-hand side are inconspicuous. Configuration options for the sticks and triggers are also available via the MSI software. The handheld's capacitive touchscreen can of course also be used for inputs.

Display - 8-inch IPS with a 120-Hz refresh rate and VRR
MSI has increased the size of the handheld's screen from 7 inches (16:9) to 8 inches (16:10, 1,920 x 1,080 pixels). Still, its basic features including its 120-Hz refresh rate and VRR support are the same. Furthermore, its picture quality is very good, even if its black levels and contrast levels naturally cannot keep up with those of OLED panels. No PWM flickering is used, but its response times have become slightly slower.
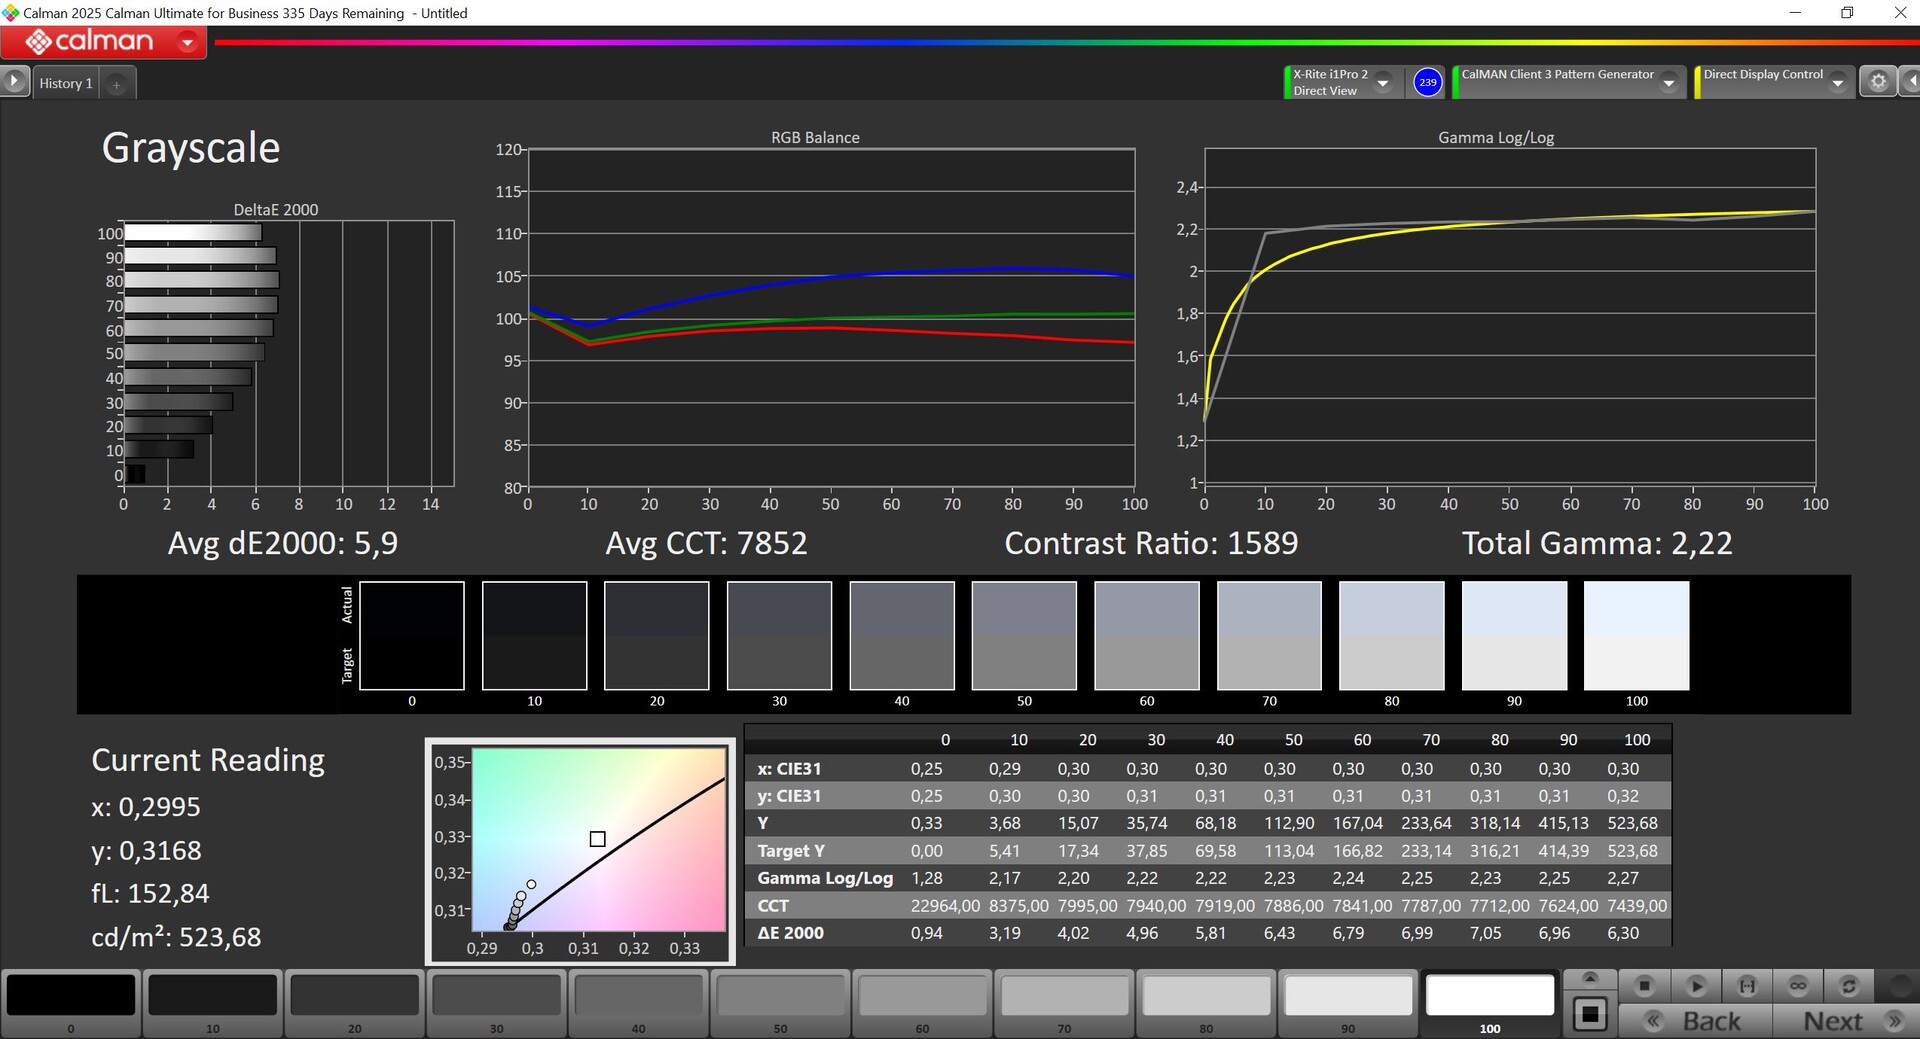
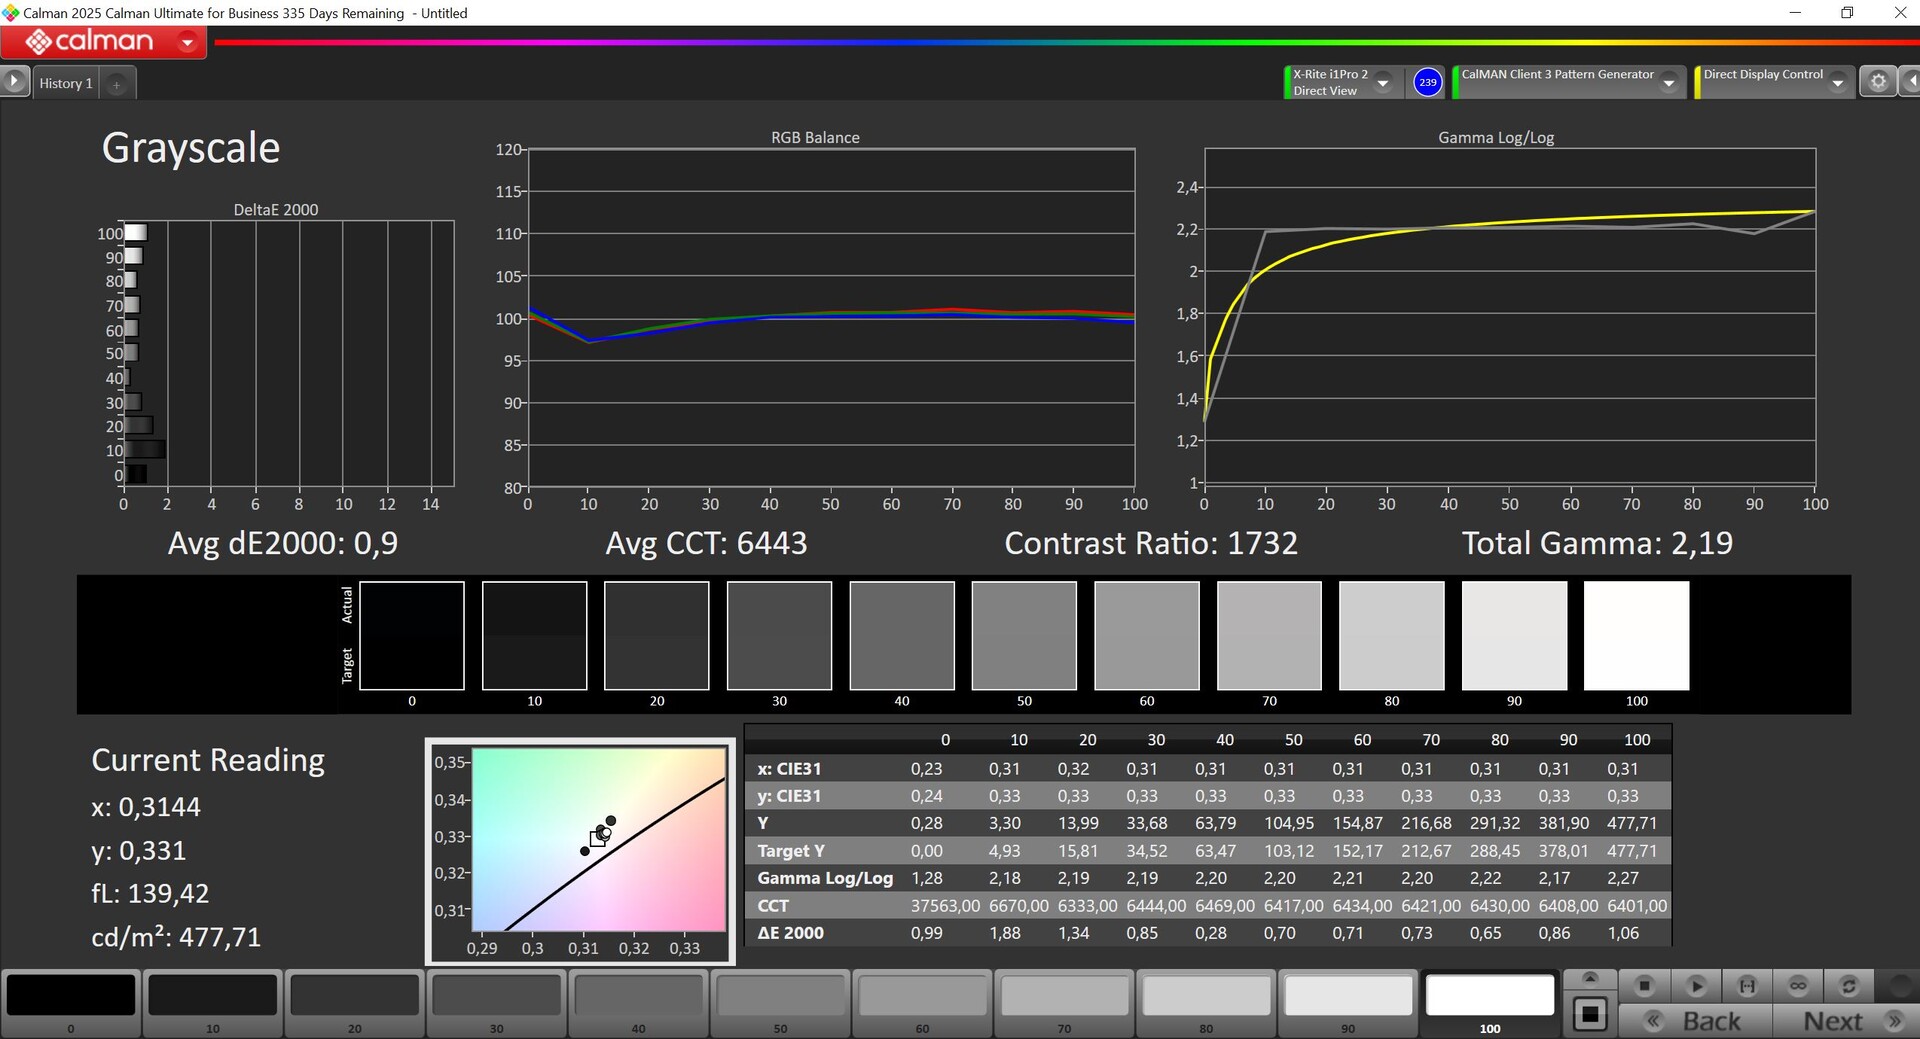
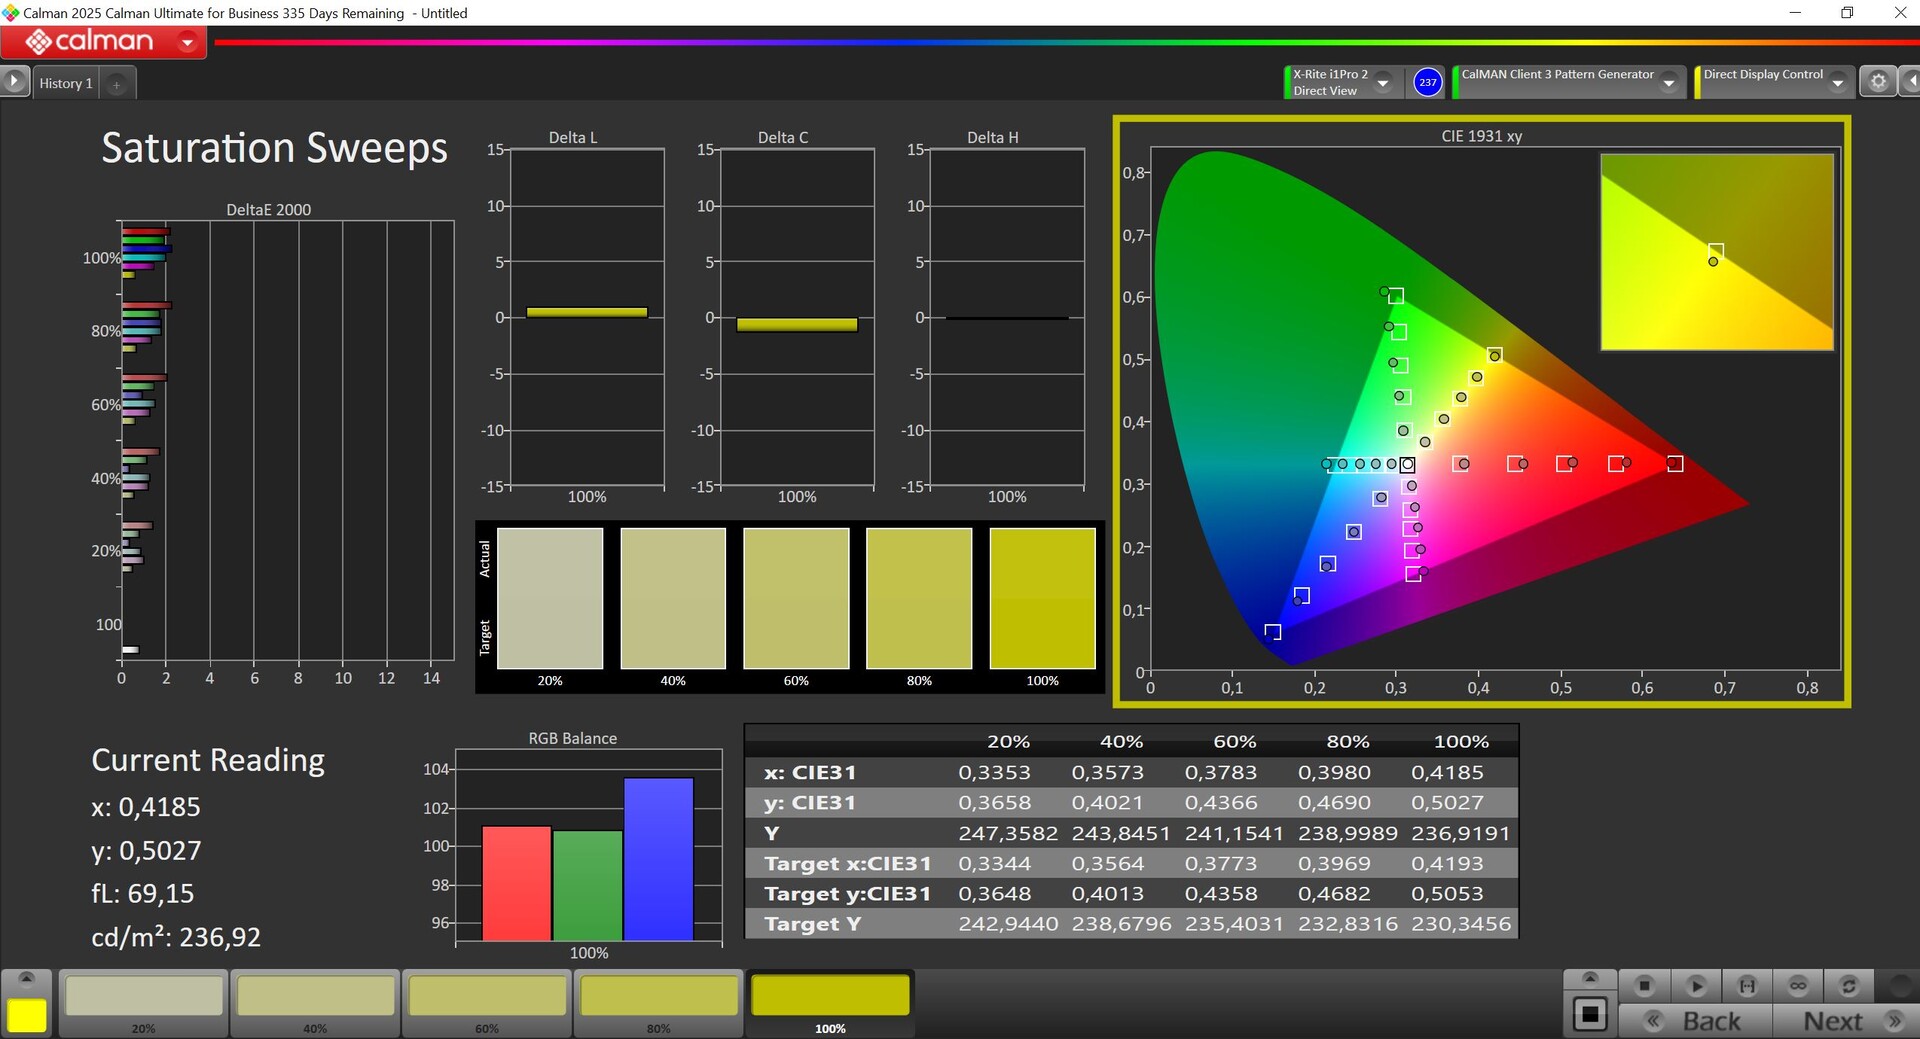
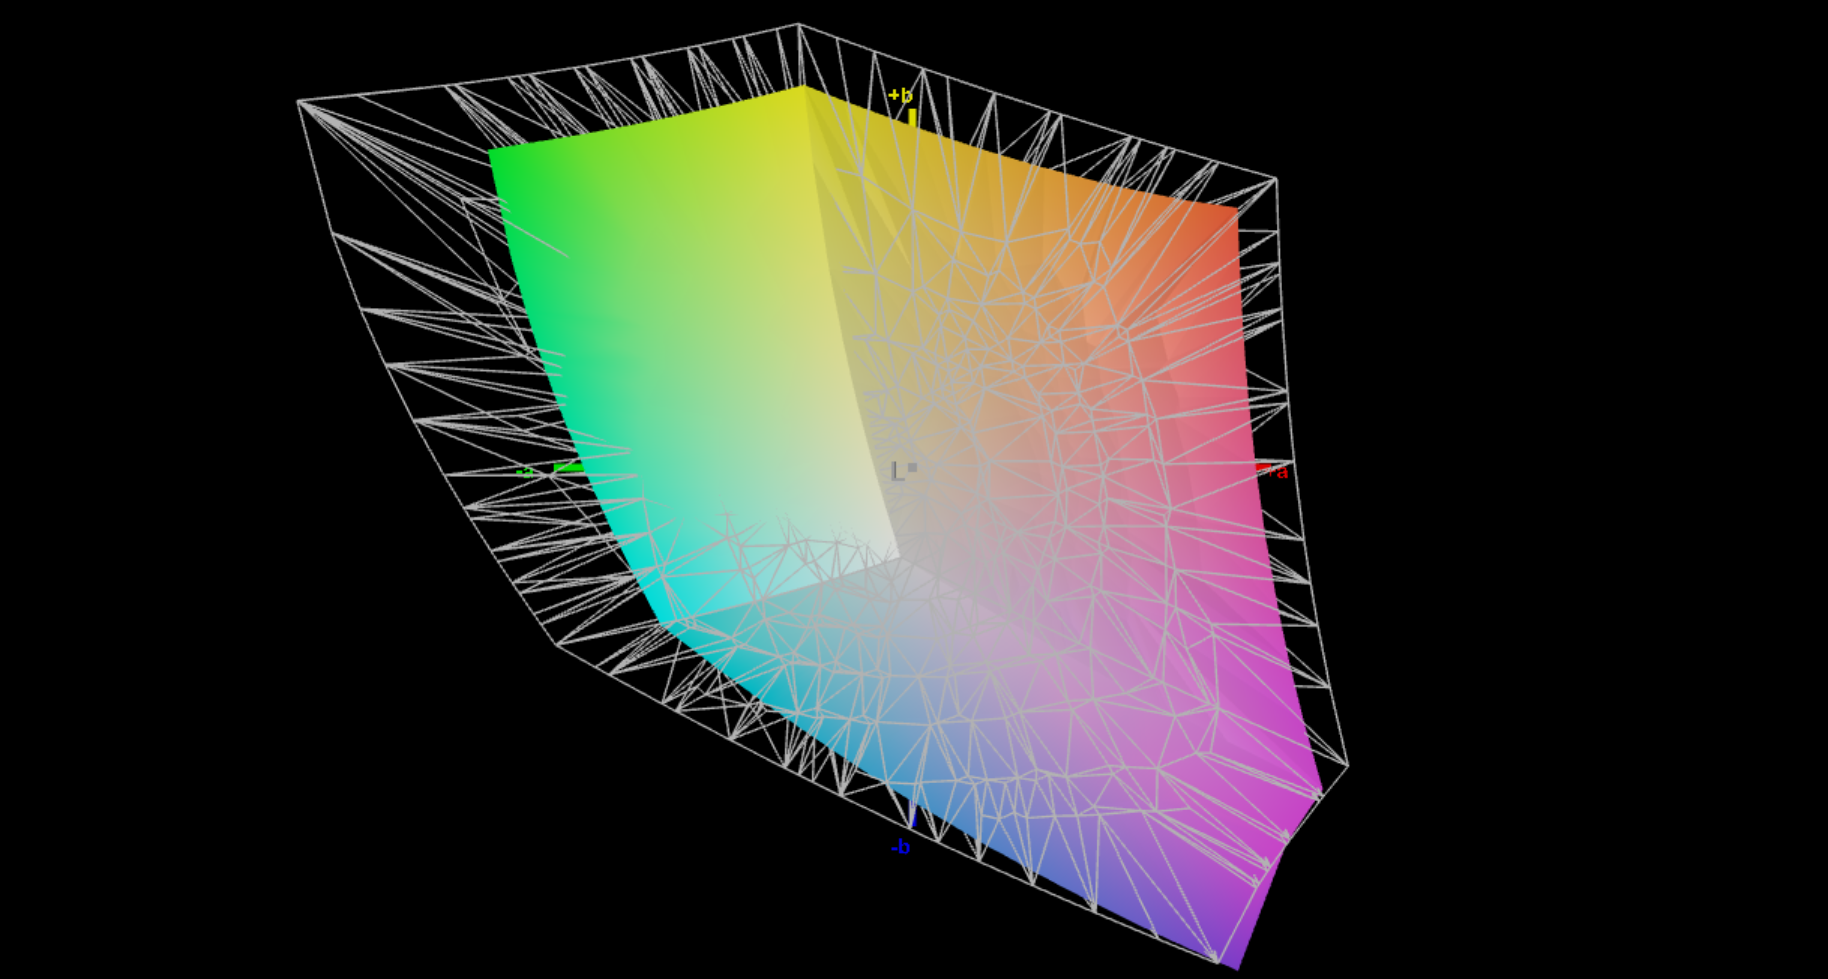
In our analysis using the professional CalMAN software, we measured an average brightness of 524 cd/m² and a good contrast ratio of more than 1,500:1. However, this brightness comes at the price of a too-cool color temperature and we noted a blue cast in the picture—in general, its factory calibration isn't particularly good. We were able to significantly improve this with our own calibration (our profile is available to download for free on the right), but this also reduces its maximum brightness by around 50 cd/m². The display fully covers the sRGB color space.
| |||||||||||||||||||||||||
Brightness Distribution: 93 %
Center on Battery: 524 cd/m²
Contrast: 1588:1 (Black: 0.33 cd/m²)
ΔE ColorChecker Calman: 3.5 | ∀{0.5-29.43 Ø4.72}
calibrated: 1.3
ΔE Greyscale Calman: 5.9 | ∀{0.09-98 Ø4.97}
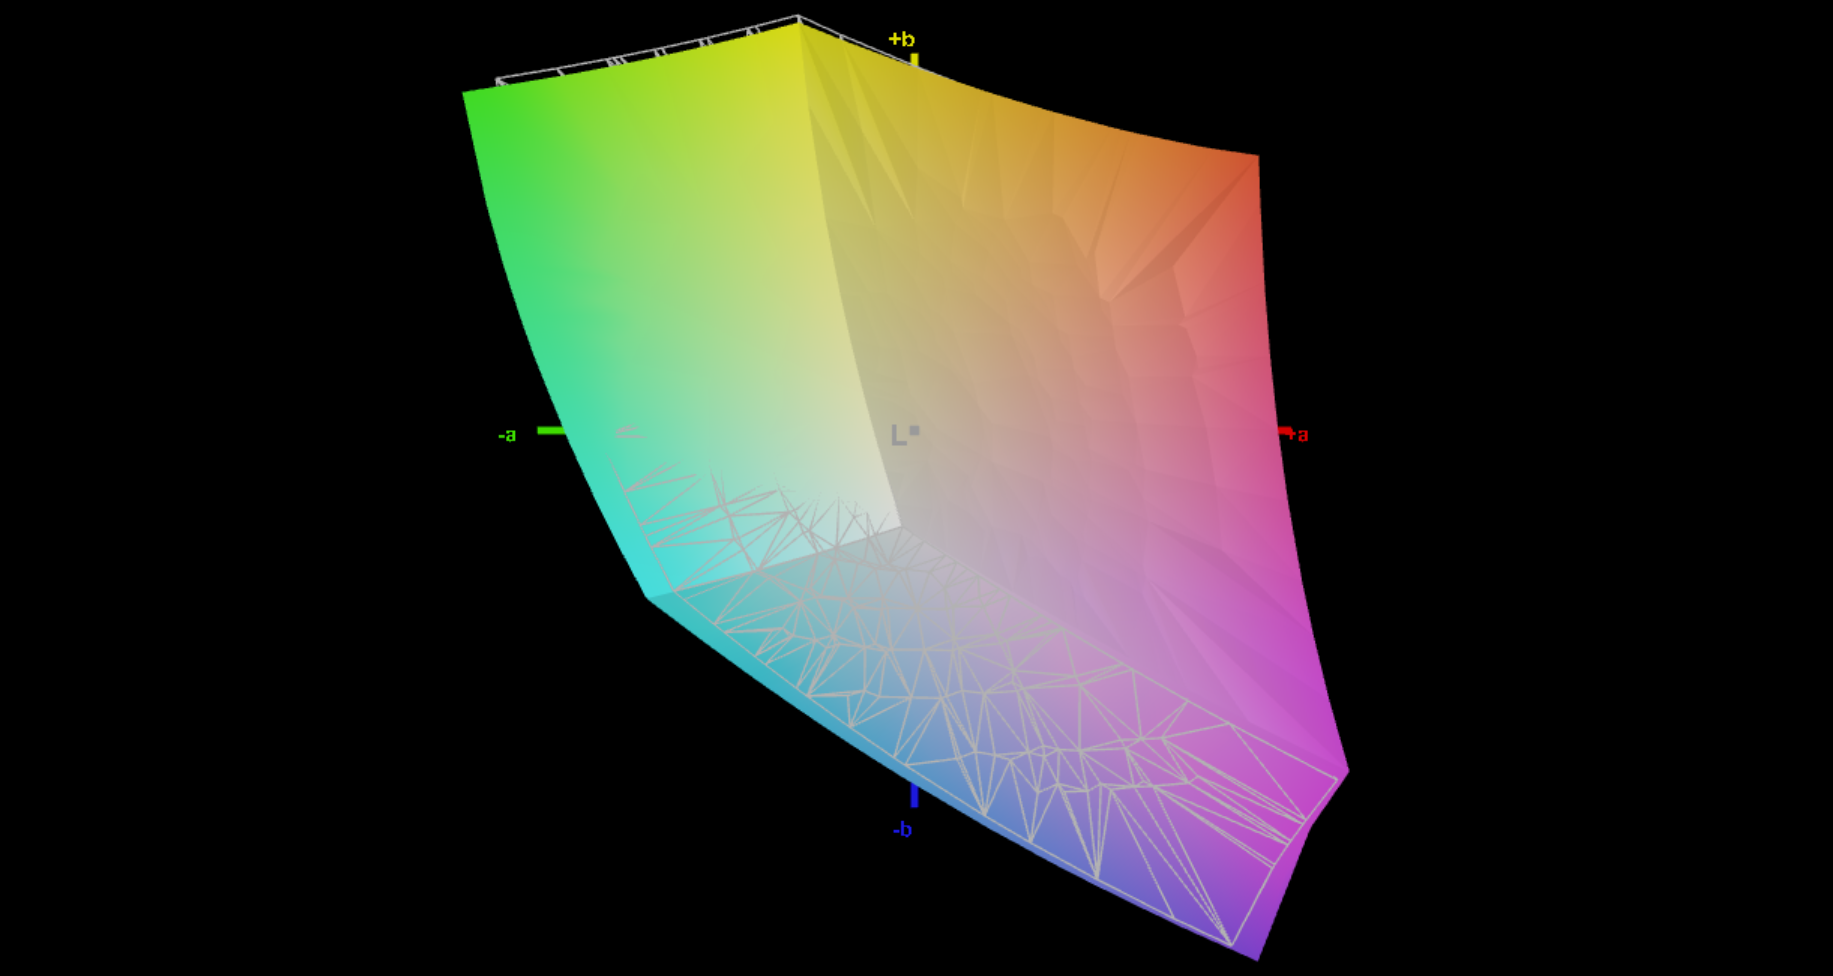
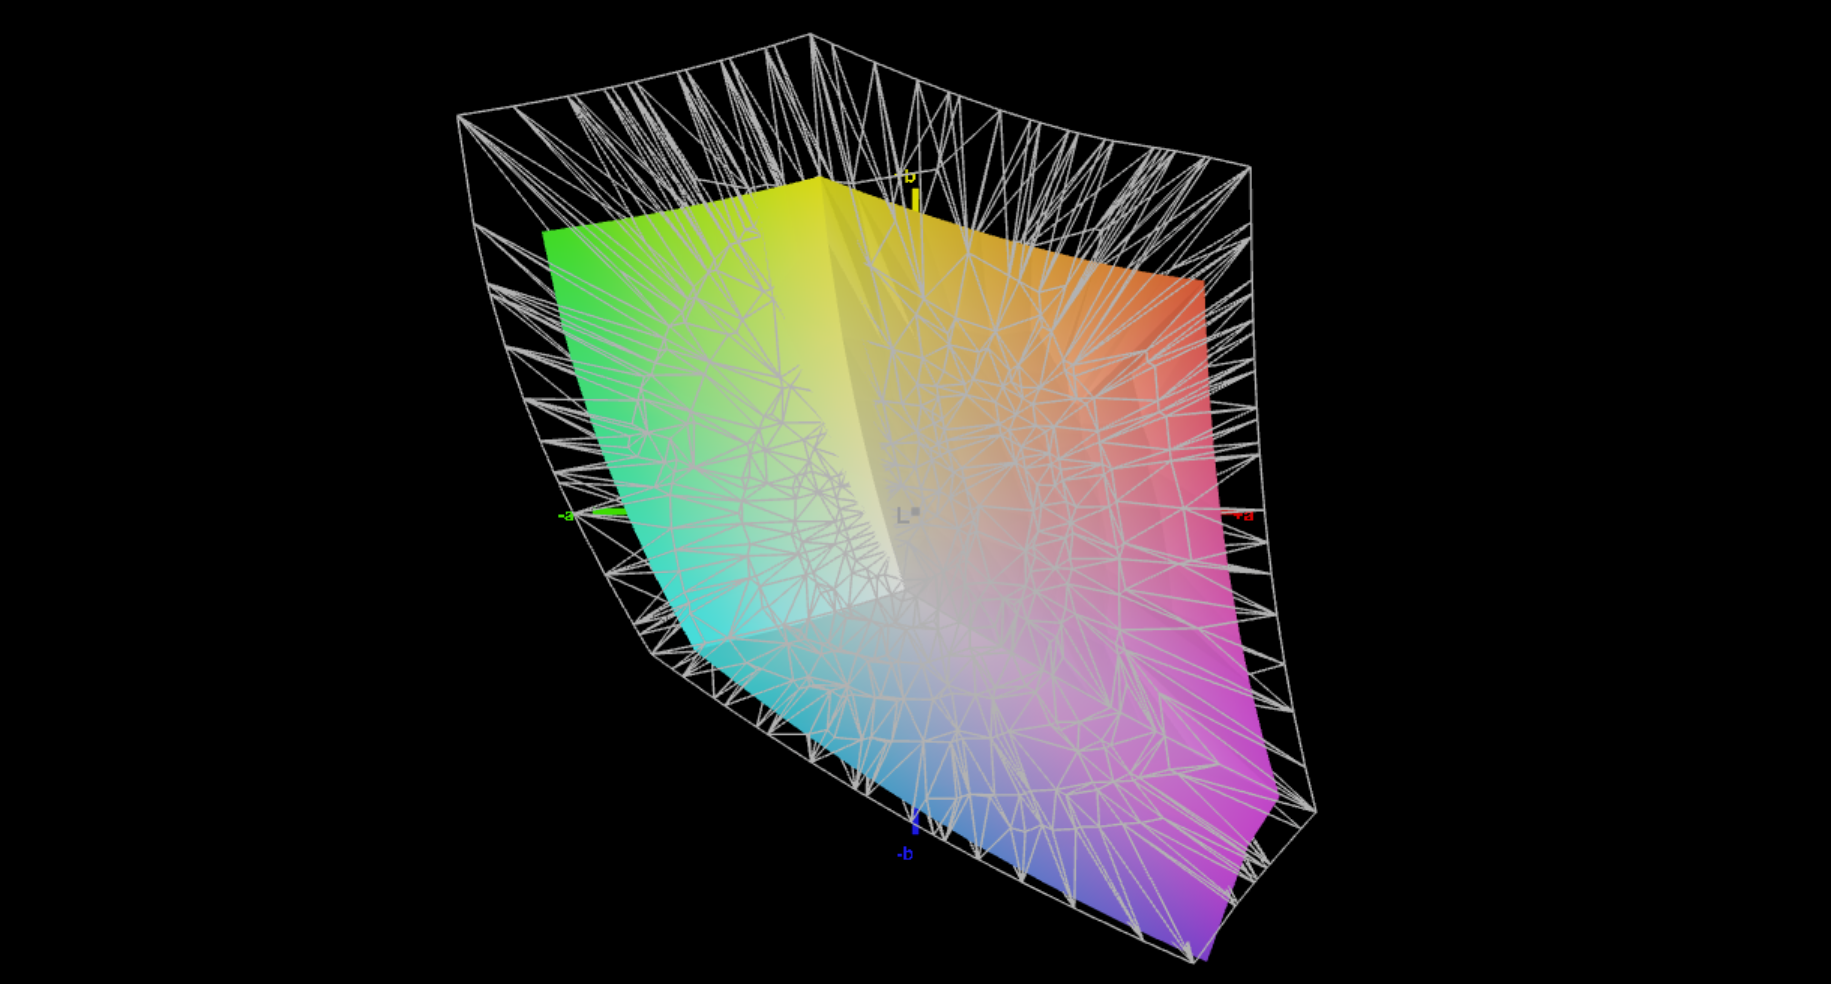
72.9% AdobeRGB 1998 (Argyll 3D)
98.5% sRGB (Argyll 3D)
71.1% Display P3 (Argyll 3D)
Gamma: 2.22
CCT: 7852 K
| MSI Claw 8 AI+ PN8007QB1-2, IPS, 1920x1200, 8", 120 Hz | Lenovo Legion Go S LEN91C1, IPS-Grade, 1920x1200, 8", 120 Hz | GPD Pocket 4 YHB03P24, IPS, 2560x1600, 8.8", 144 Hz | Asus ROG Ally X TL070FVXS01-0, IPS, 1920x1080, 7", 120 Hz | MSI Claw TL070FVXS02-0, IPS, 1920x1080, 7", 120 Hz | Valve Steam Deck 1 TB OLED ANX7530 U, OLED, 1280x800, 7.4", 90 Hz | ONEXPLAYER 2 Pro AR18 FLQ8423-24L0, IPS, 2560x1600, 8.4", 60 Hz | |
|---|---|---|---|---|---|---|---|
| Display | -2% | 18% | -6% | -5% | 25% | 14% | |
| Display P3 Coverage (%) | 71.1 | 69.71 -2% | 92.7 30% | 66.2 -7% | 67 -6% | 99.6 40% | 91.9 29% |
| sRGB Coverage (%) | 98.5 | 99.02 1% | 99.6 1% | 93.4 -5% | 94.4 -4% | 100 2% | 99.3 1% |
| AdobeRGB 1998 Coverage (%) | 72.9 | 70.34 -4% | 90 23% | 68.5 -6% | 69.4 -5% | 96.1 32% | 81.6 12% |
| Response Times | -36% | -17% | 61% | 59% | 51% | -31% | |
| Response Time Grey 50% / Grey 80% * (ms) | 23.7 ? | 30.8 ? -30% | 27.9 ? -18% | 9.7 ? 59% | 9.2 ? 61% | 9 ? 62% | 25.5 ? -8% |
| Response Time Black / White * (ms) | 14.9 ? | 21.2 ? -42% | 17.2 ? -15% | 5.7 ? 62% | 6.6 ? 56% | 9 ? 40% | 22.73 ? -53% |
| PWM Frequency (Hz) | 360 ? | ||||||
| Screen | -42% | -9% | -1% | 4% | 143% | -4% | |
| Brightness middle (cd/m²) | 524 | 538.8 3% | 511.2 -2% | 484 -8% | 477 -9% | 485 -7% | 318 -39% |
| Brightness (cd/m²) | 514 | 509 -1% | 524 2% | 456 -11% | 461 -10% | 482 -6% | 287 -44% |
| Brightness Distribution (%) | 93 | 93 0% | 84 -10% | 88 -5% | 88 -5% | 98 5% | 48 -48% |
| Black Level * (cd/m²) | 0.33 | 0.46 -39% | 0.4 -21% | 0.35 -6% | 0.32 3% | 0.03 91% | 0.1118 66% |
| Contrast (:1) | 1588 | 1171 -26% | 1278 -20% | 1383 -13% | 1491 -6% | 16167 918% | 2844 79% |
| Colorchecker dE 2000 * | 3.5 | 7.2 -106% | 4.54 -30% | 2.9 17% | 2.6 26% | 2 43% | 4.81 -37% |
| Colorchecker dE 2000 max. * | 7.3 | 12.5 -71% | 8.96 -23% | 7.1 3% | 5.8 21% | 5 32% | 6.93 5% |
| Colorchecker dE 2000 calibrated * | 1.3 | 2.3 -77% | 0.95 27% | 1.4 -8% | 1.5 -15% | 1.53 -18% | |
| Greyscale dE 2000 * | 5.9 | 9.5 -61% | 6.4 -8% | 4.5 24% | 3.9 34% | 2 66% | 6.12 -4% |
| Gamma | 2.22 99% | 2.44 90% | 2.26 97% | 2.24 98% | 2.17 101% | 2 110% | 2.003 110% |
| CCT | 7852 83% | 9485 69% | 8125 80% | 7534 86% | 7250 90% | 6336 103% | 7707 84% |
| Total Average (Program / Settings) | -27% /
-33% | -3% /
-5% | 18% /
7% | 19% /
10% | 73% /
101% | -7% /
-4% |
* ... smaller is better


Display Response Times
| ↔ Response Time Black to White | ||
|---|---|---|
| 14.9 ms ... rise ↗ and fall ↘ combined | ↗ 7.8 ms rise | 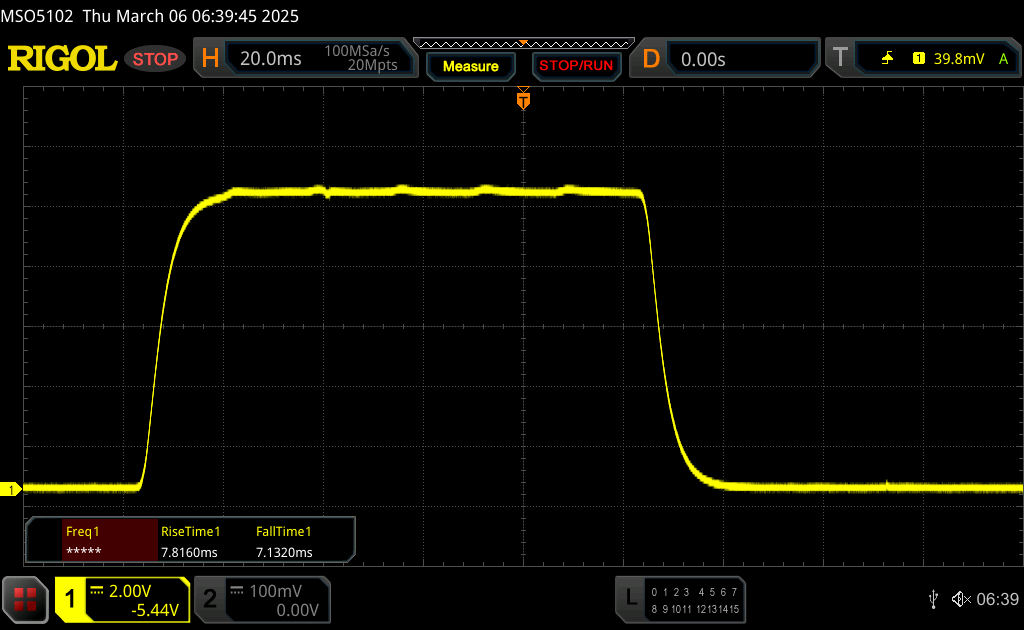 |
| ↘ 7.1 ms fall | ||
| The screen shows good response rates in our tests, but may be too slow for competitive gamers. In comparison, all tested devices range from 0.1 (minimum) to 240 (maximum) ms. » 36 % of all devices are better. This means that the measured response time is better than the average of all tested devices (19.8 ms). | ||
| ↔ Response Time 50% Grey to 80% Grey | ||
| 23.7 ms ... rise ↗ and fall ↘ combined | ↗ 11 ms rise | 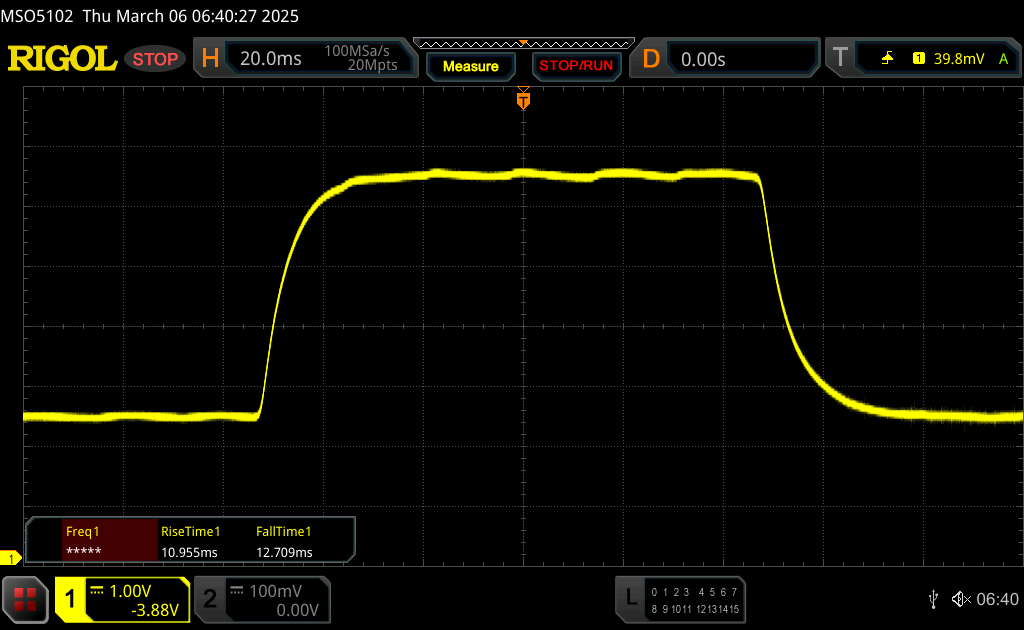 |
| ↘ 12.7 ms fall | ||
| The screen shows good response rates in our tests, but may be too slow for competitive gamers. In comparison, all tested devices range from 0.165 (minimum) to 636 (maximum) ms. » 34 % of all devices are better. This means that the measured response time is better than the average of all tested devices (31 ms). | ||
Screen Flickering / PWM (Pulse-Width Modulation)
| Screen flickering / PWM not detected | 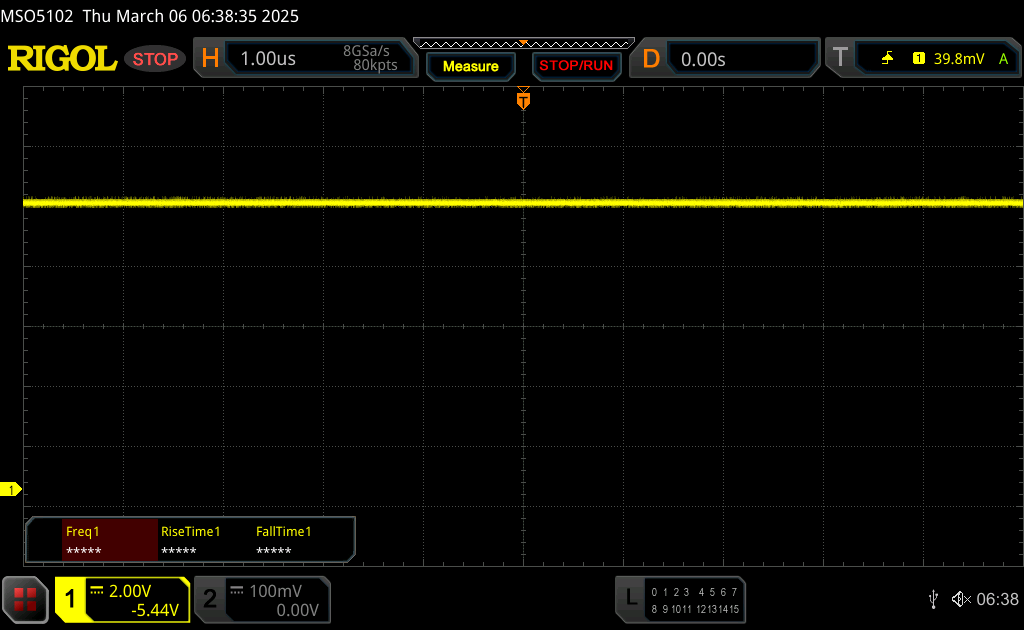 | ||
In comparison: 52 % of all tested devices do not use PWM to dim the display. If PWM was detected, an average of 7763 (minimum: 5 - maximum: 343500) Hz was measured. | |||
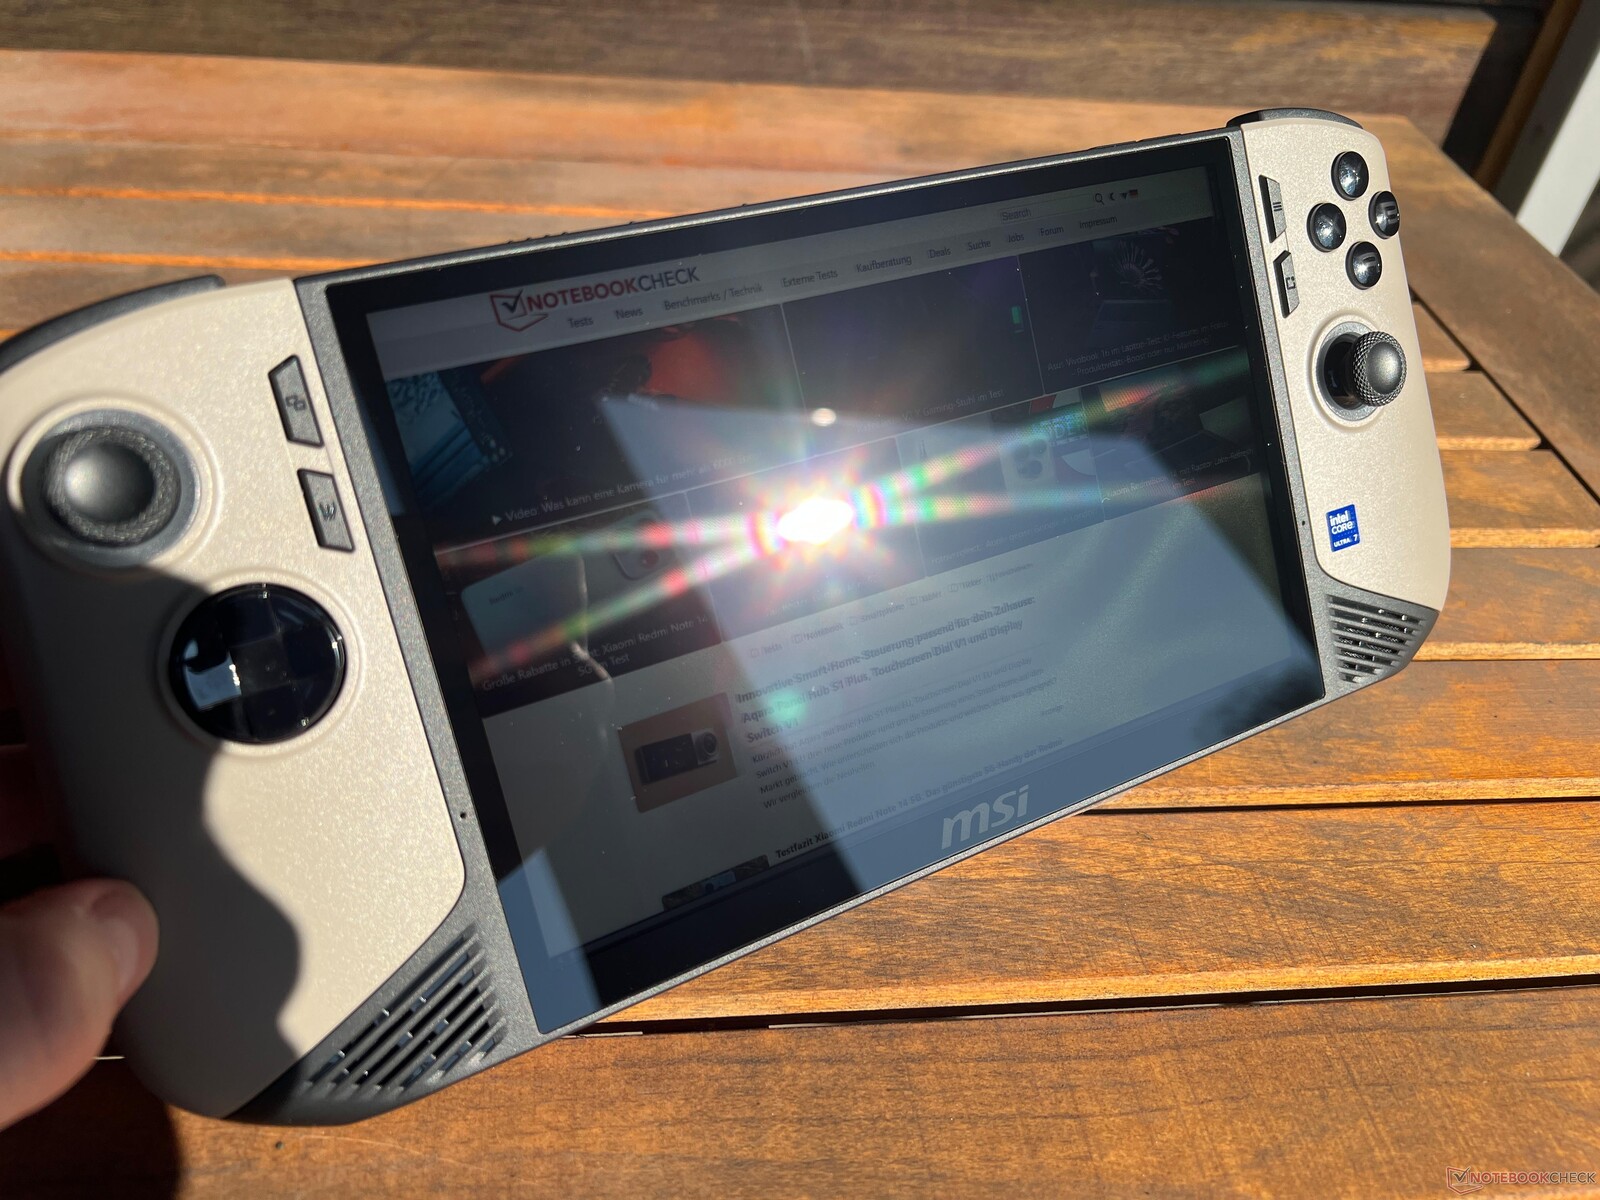
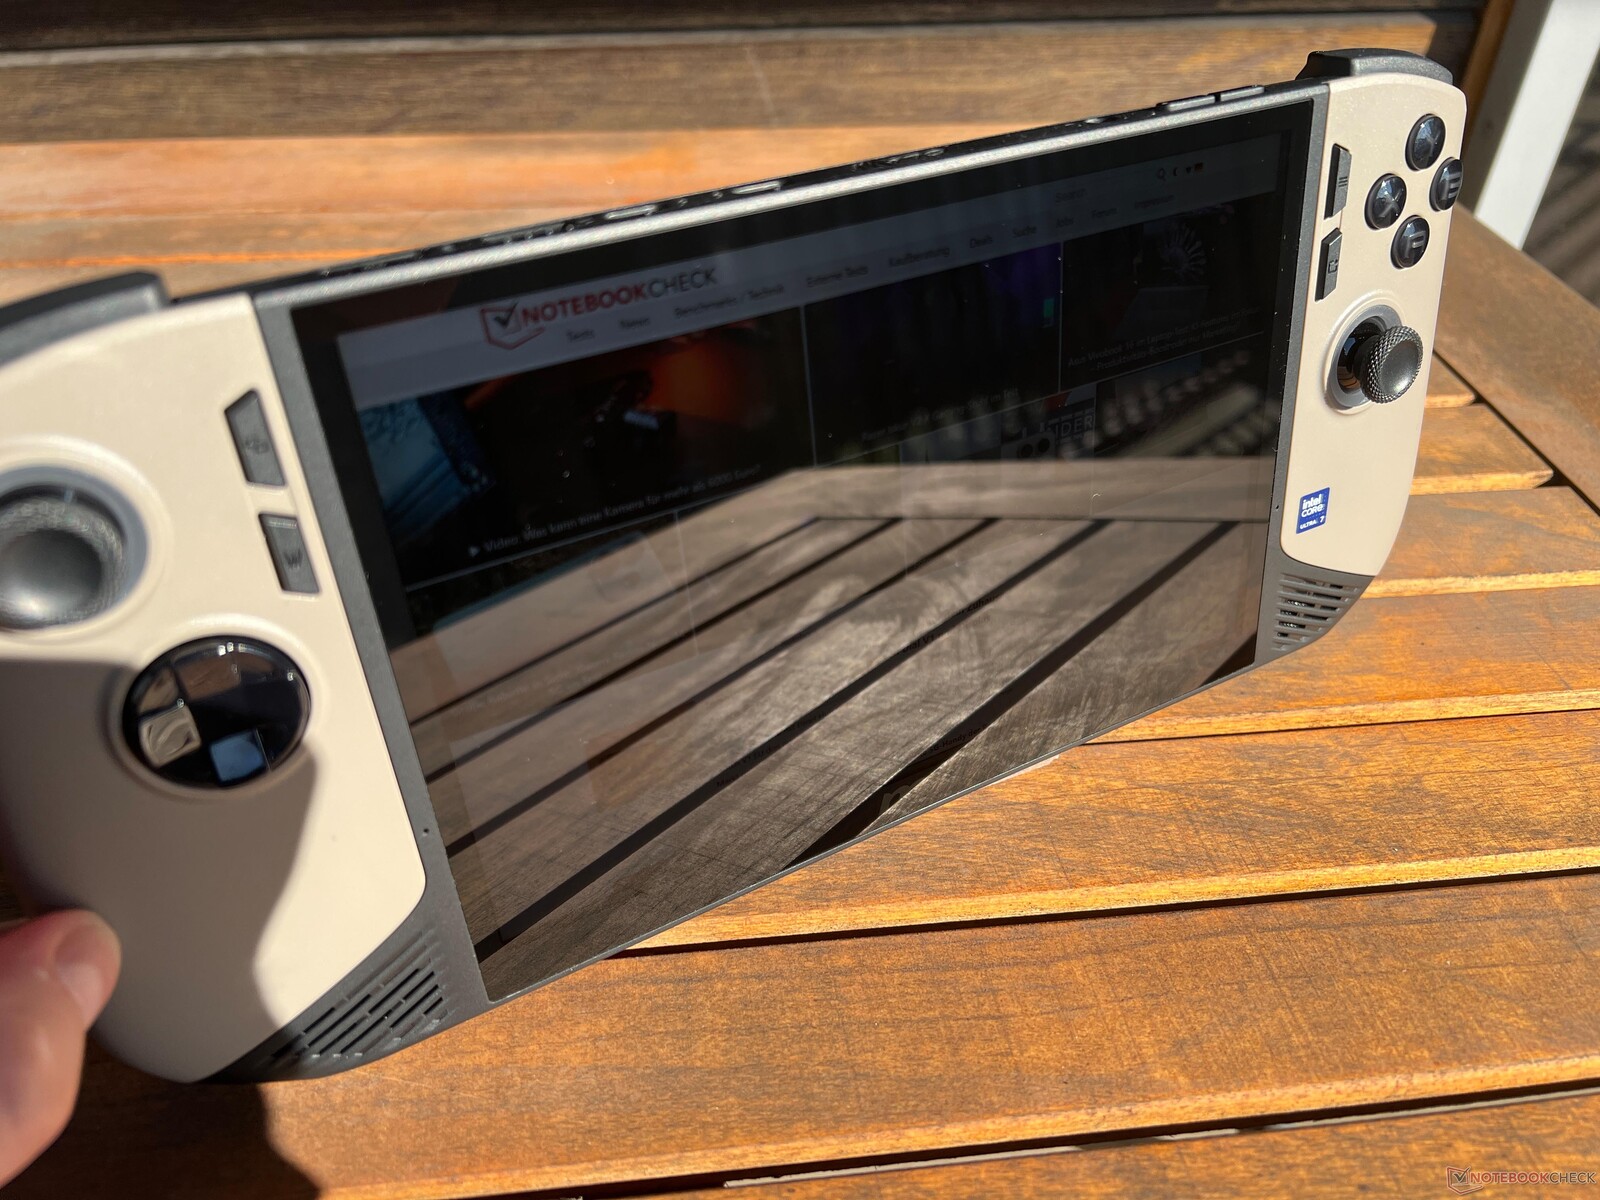

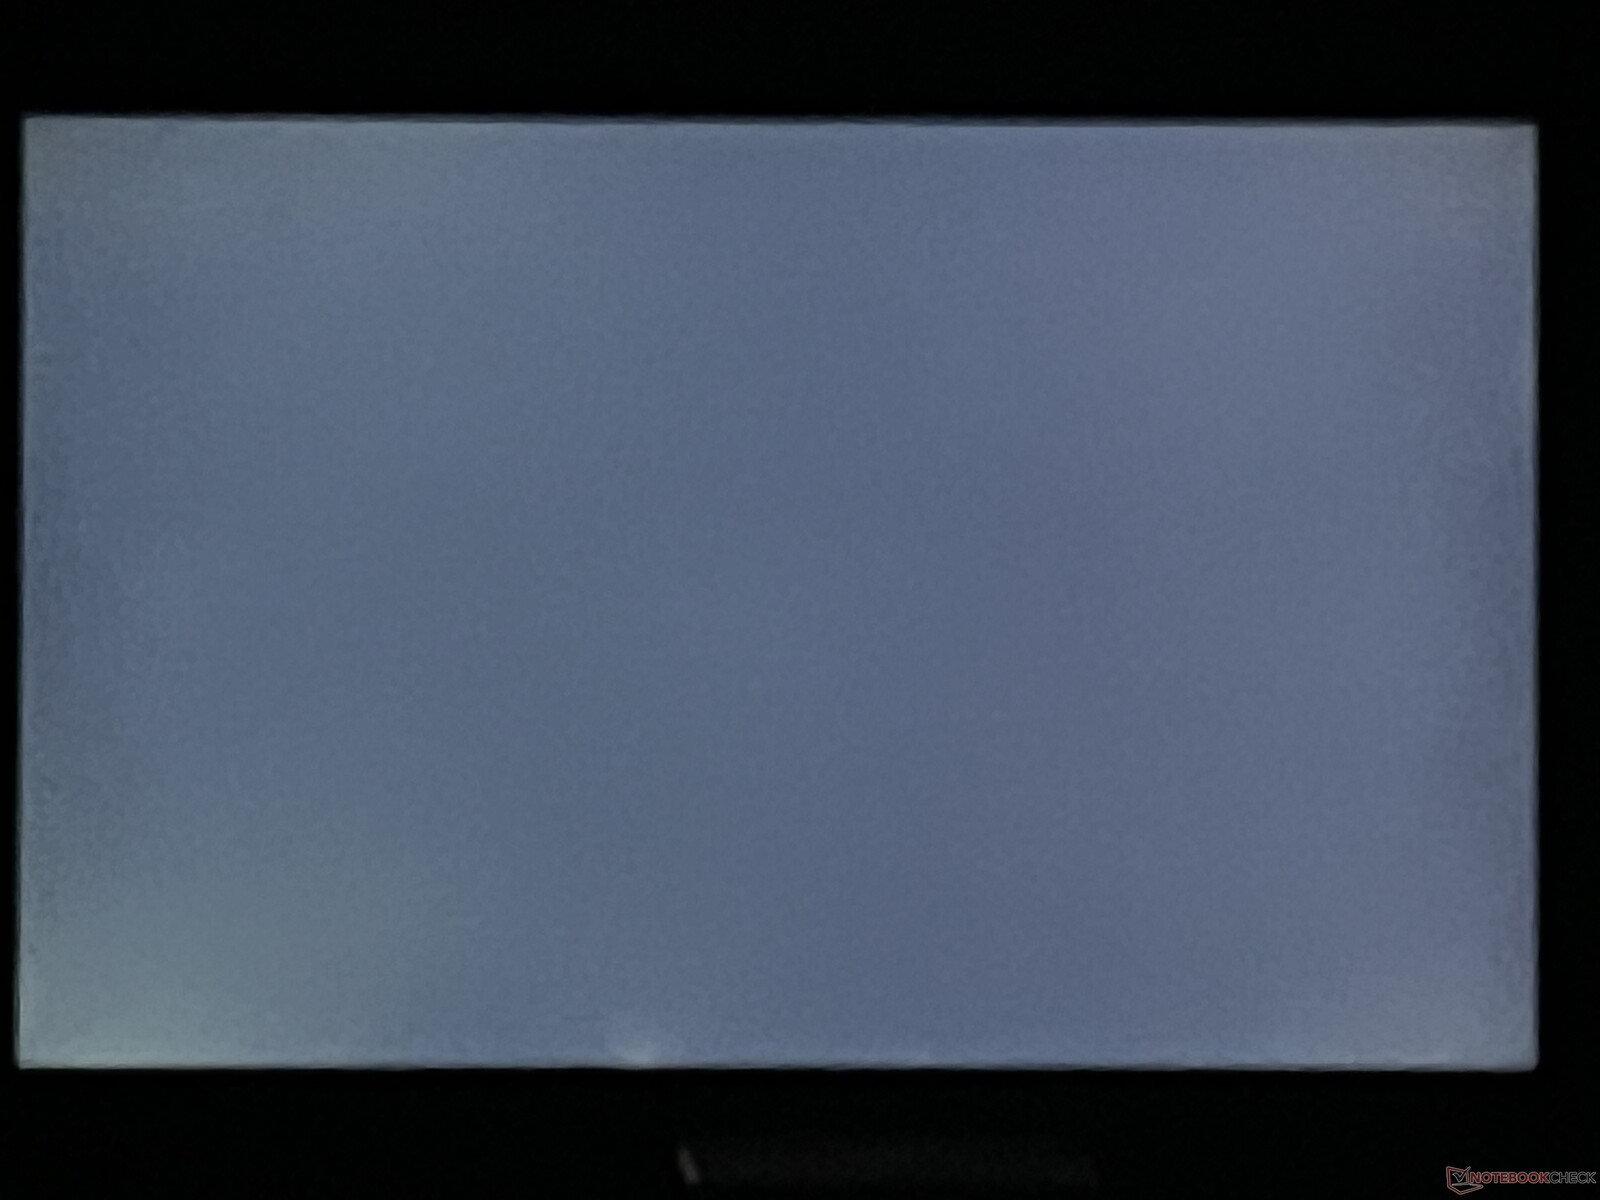
In the blazing sun, the handheld struggles as a result of its reflective touchscreen, but this is no surprise. There are no problems with its viewing angle stability.

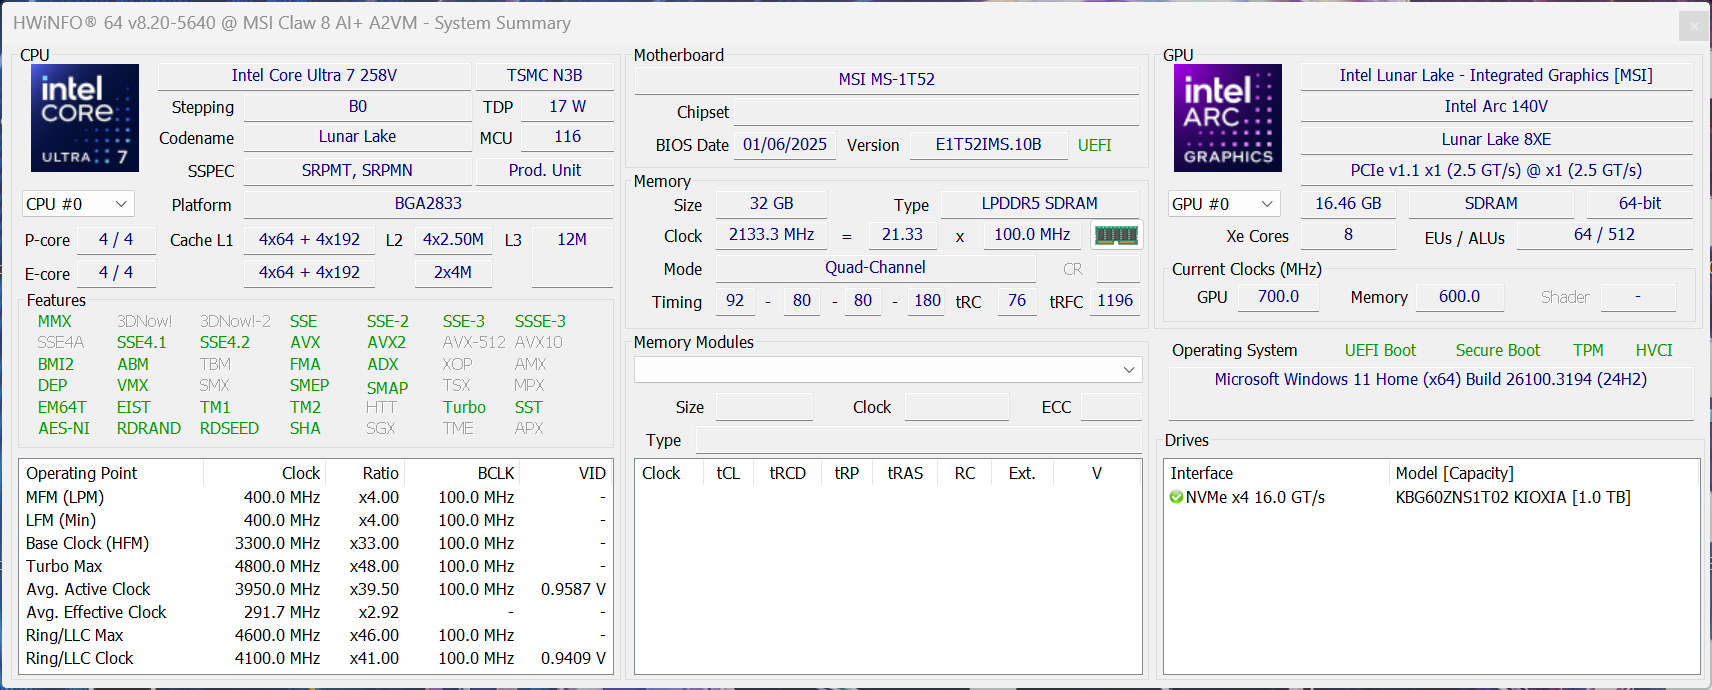
Performance - Lunar Lake with 32 GB RAM
Testing conditions
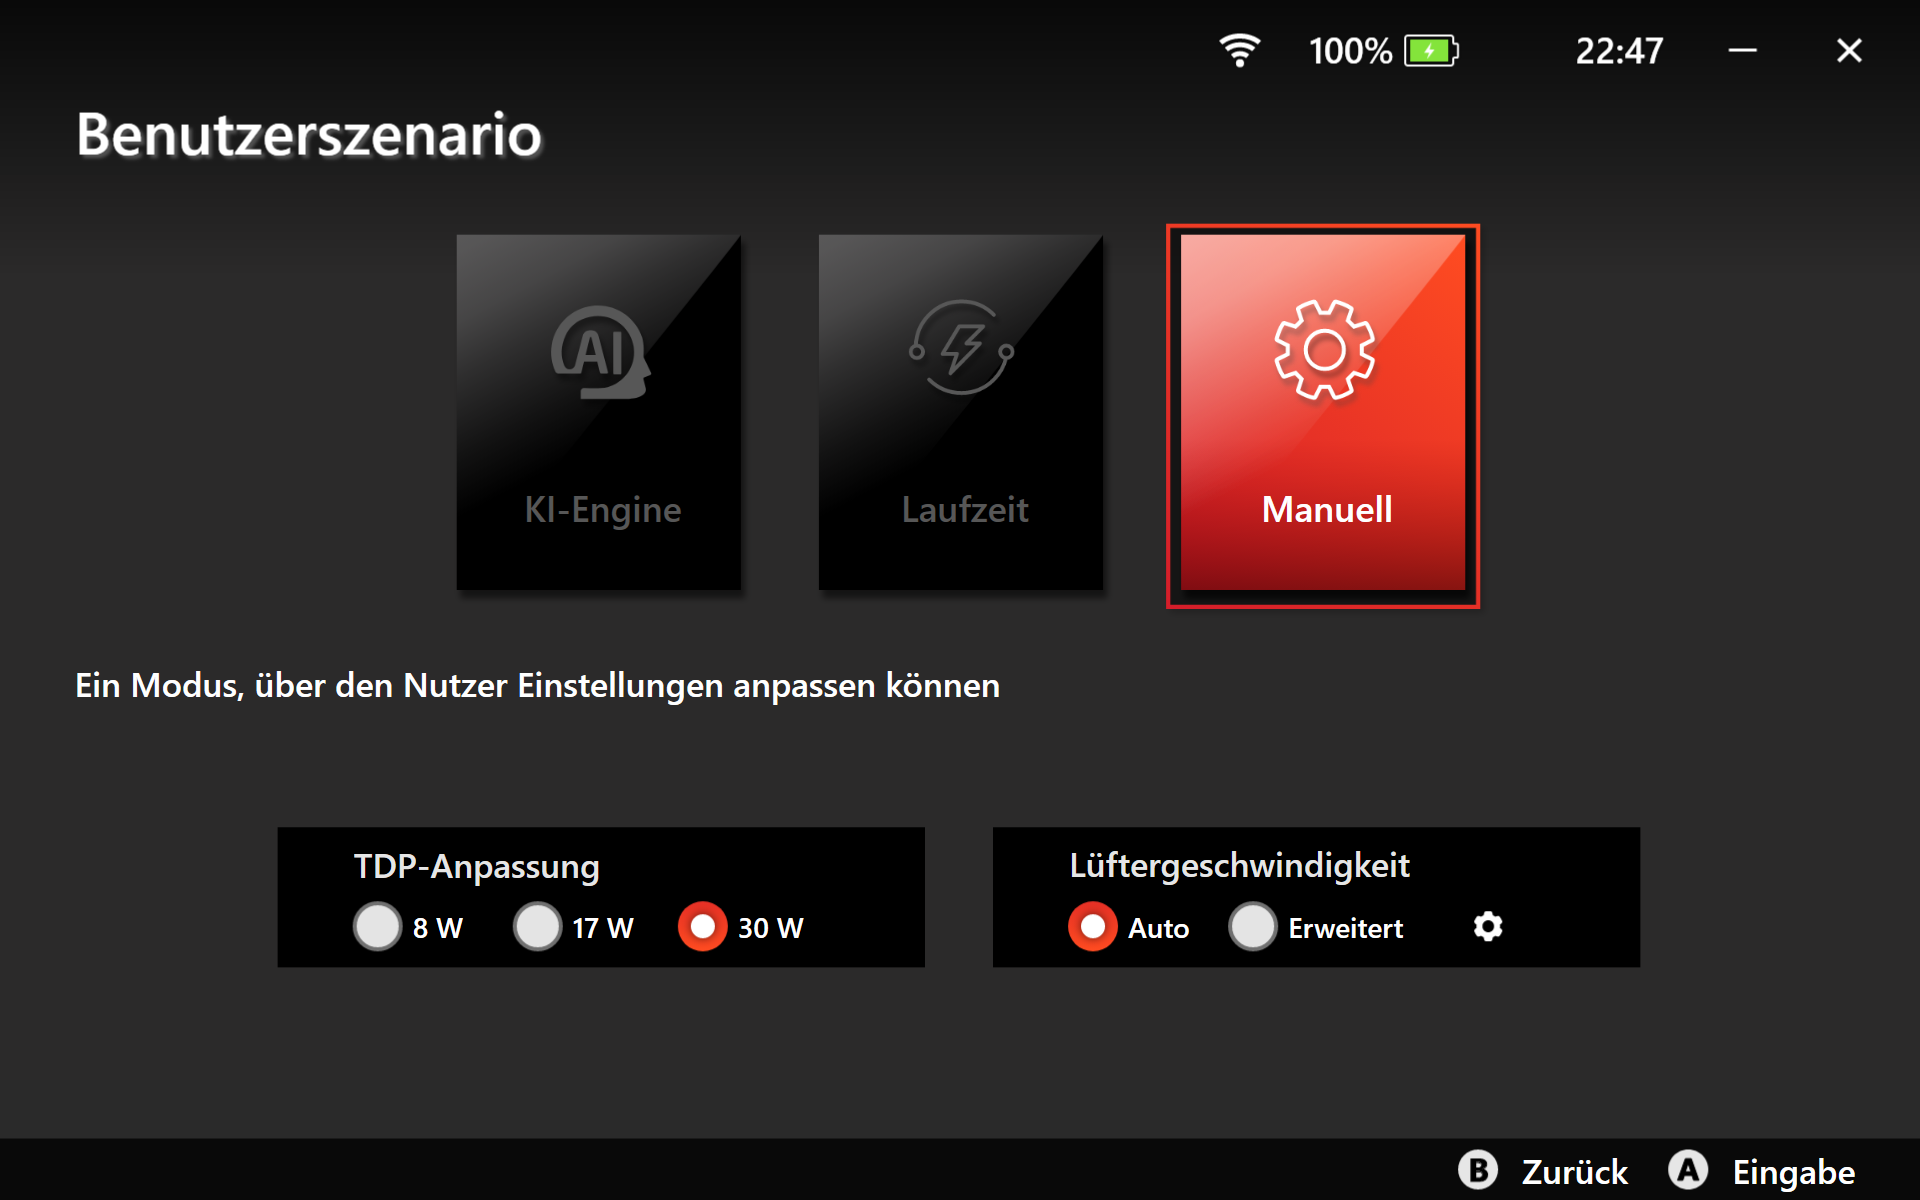
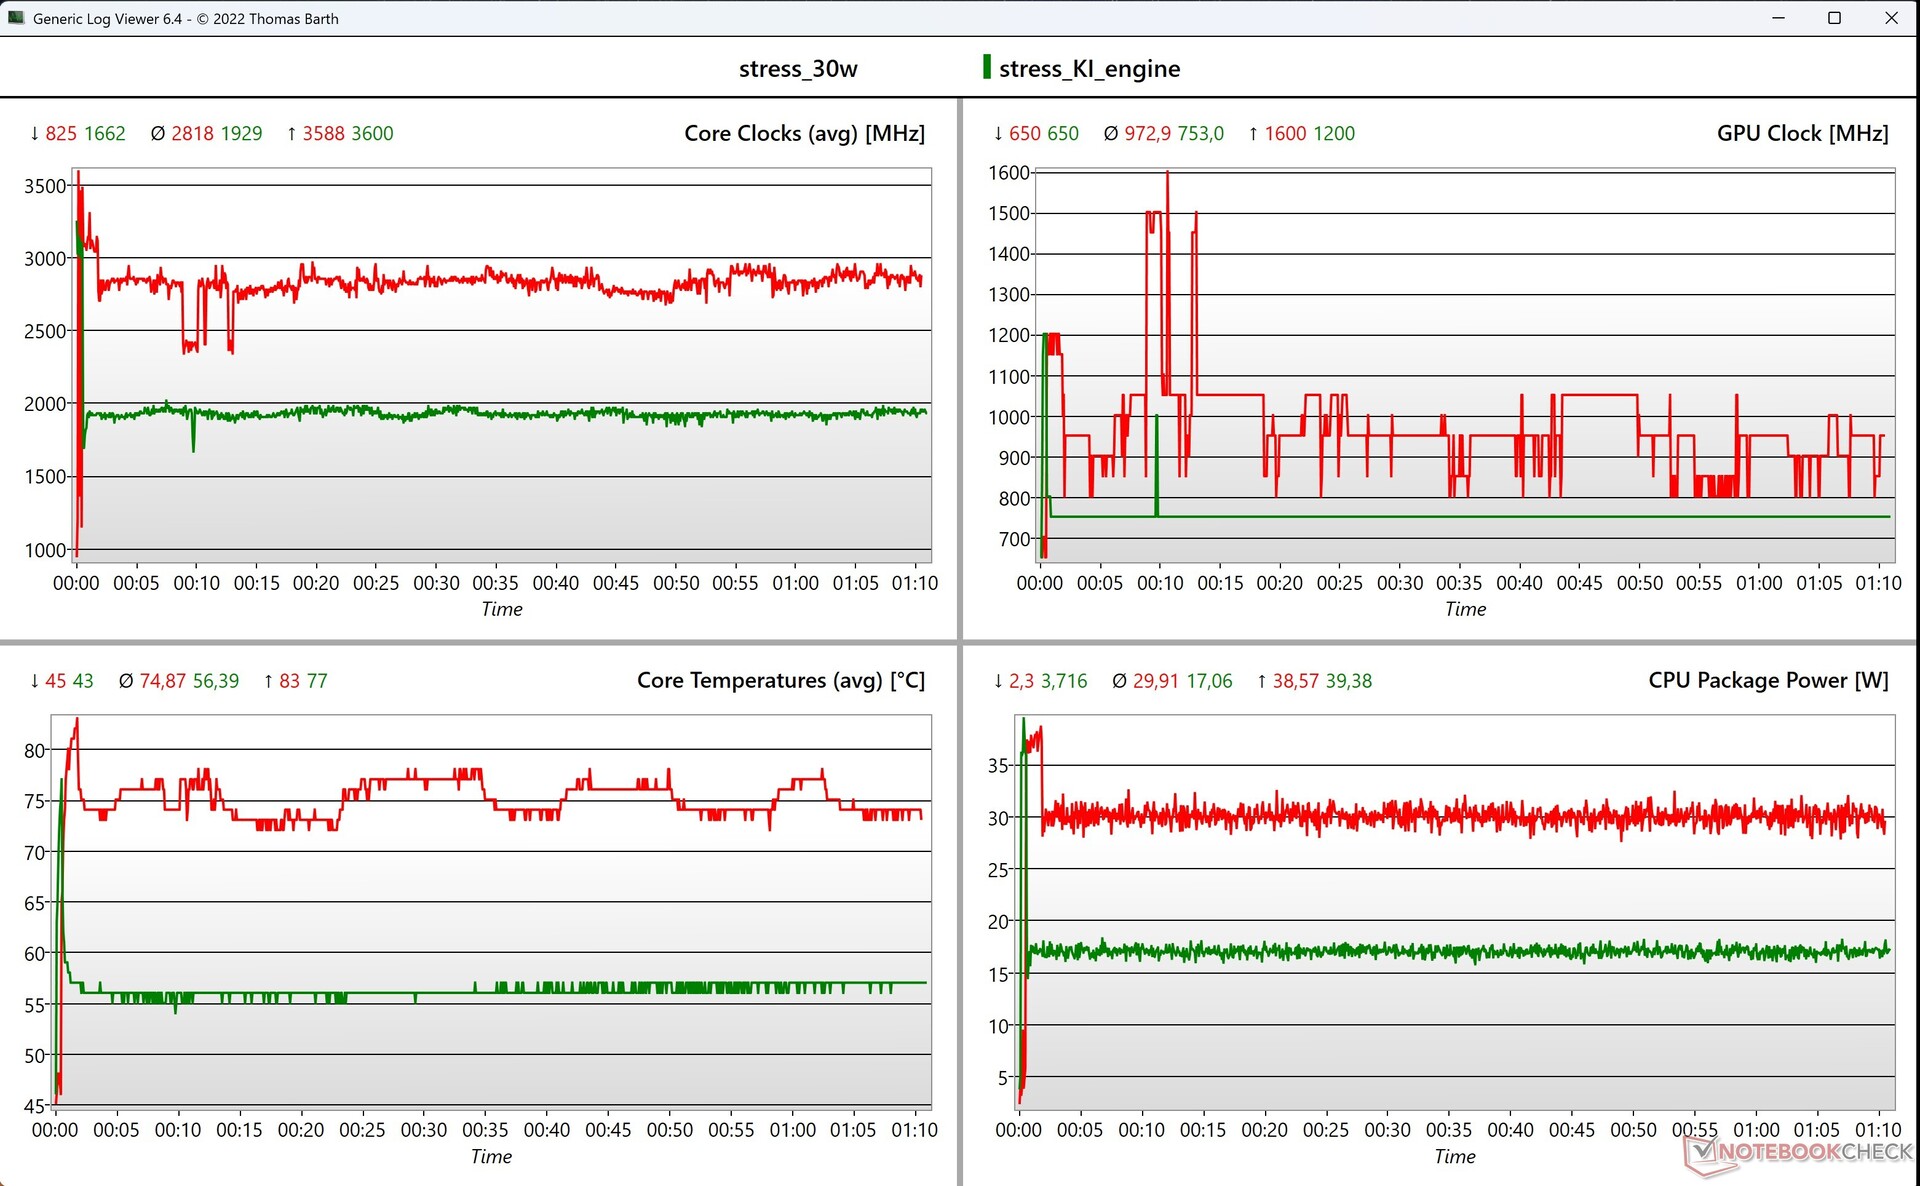
The Claw 8 features three different energy profiles (endurance, AI engine, manual), with AI engine being selected by default. Depending on the usage, the device is supposed to automatically select the optimum power parameters, but during our test, it simply remained at 17 watts. To get the highest possible gaming performance, you have to use manual mode, where you can then choose between TDP limits of 8, 17 and 30 watts (but only in the M Center app, not the quick menu). We carried out the following benchmarks and measurements in manual mode and 30 watts.
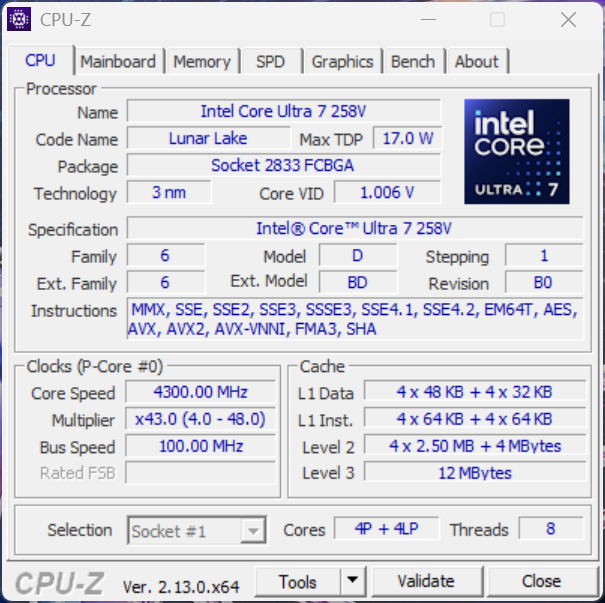
Processor - Core Ultra 7 258V
The Core Ultra 7 258V from Intel's Lunar Lake generation has 8 cores and can consume a maximum of 37/30 watts in the MSI Claw. Lunar Lake chips' multi-core performance is weaker than the old Meteor Lake chips and AMD CPUs due to their lower number of cores, but their single-core performance is better than before. Even if you use the Claw 8 AI+ as a normal PC, its performance is perfectly adequate for most everyday tasks. The loss of performance under constant load is minimal and we noted no further reduction in battery operation.
Cinebench R15 Multi continuous test
Cinebench R23: Multi Core | Single Core
Cinebench R20: CPU (Multi Core) | CPU (Single Core)
Cinebench R15: CPU Multi 64Bit | CPU Single 64Bit
Blender: v2.79 BMW27 CPU
7-Zip 18.03: 7z b 4 | 7z b 4 -mmt1
Geekbench 6.7: Multi-Core | Single-Core
Geekbench 5.5: Multi-Core | Single-Core
HWBOT x265 Benchmark v2.2: 4k Preset
LibreOffice : 20 Documents To PDF
R Benchmark 2.5: Overall mean
| CPU Performance rating | |
| GPD Pocket 4 | |
| Asus ROG Ally X | |
| MSI Claw | |
| ONEXPLAYER 2 Pro AR18 | |
| MSI Claw 8 AI+ | |
| Average Intel Core Ultra 7 258V | |
| Average of class Handheld / UMPC | |
| Valve Steam Deck 1 TB OLED -6! | |
| Lenovo Legion Go S | |
| Cinebench R23 / Multi Core | |
| GPD Pocket 4 | |
| Asus ROG Ally X | |
| MSI Claw | |
| ONEXPLAYER 2 Pro AR18 | |
| Average of class Handheld / UMPC (4953 - 16841, n=14, last 2 years) | |
| MSI Claw 8 AI+ | |
| Average Intel Core Ultra 7 258V (7920 - 11097, n=25) | |
| Lenovo Legion Go S | |
| Valve Steam Deck 1 TB OLED | |
| Cinebench R23 / Single Core | |
| GPD Pocket 4 | |
| Average Intel Core Ultra 7 258V (1664 - 1957, n=25) | |
| MSI Claw 8 AI+ | |
| MSI Claw | |
| Asus ROG Ally X | |
| ONEXPLAYER 2 Pro AR18 | |
| Average of class Handheld / UMPC (1071 - 2006, n=14, last 2 years) | |
| Lenovo Legion Go S | |
| Cinebench R20 / CPU (Multi Core) | |
| GPD Pocket 4 | |
| Asus ROG Ally X | |
| ONEXPLAYER 2 Pro AR18 | |
| MSI Claw | |
| Average of class Handheld / UMPC (1904 - 6577, n=12, last 2 years) | |
| MSI Claw 8 AI+ | |
| Average Intel Core Ultra 7 258V (3130 - 4314, n=24) | |
| Lenovo Legion Go S | |
| Valve Steam Deck 1 TB OLED | |
| Cinebench R20 / CPU (Single Core) | |
| GPD Pocket 4 | |
| Average Intel Core Ultra 7 258V (643 - 749, n=24) | |
| MSI Claw 8 AI+ | |
| MSI Claw | |
| ONEXPLAYER 2 Pro AR18 | |
| Asus ROG Ally X | |
| Average of class Handheld / UMPC (390 - 787, n=12, last 2 years) | |
| Lenovo Legion Go S | |
| Valve Steam Deck 1 TB OLED | |
| Cinebench R15 / CPU Multi 64Bit | |
| GPD Pocket 4 | |
| Asus ROG Ally X | |
| ONEXPLAYER 2 Pro AR18 | |
| MSI Claw | |
| Average of class Handheld / UMPC (855 - 2533, n=12, last 2 years) | |
| MSI Claw 8 AI+ | |
| Average Intel Core Ultra 7 258V (1280 - 1656, n=24) | |
| Lenovo Legion Go S | |
| Valve Steam Deck 1 TB OLED | |
| Cinebench R15 / CPU Single 64Bit | |
| GPD Pocket 4 | |
| MSI Claw 8 AI+ | |
| Average Intel Core Ultra 7 258V (258 - 298, n=24) | |
| ONEXPLAYER 2 Pro AR18 | |
| Asus ROG Ally X | |
| MSI Claw | |
| Average of class Handheld / UMPC (155.1 - 304, n=12, last 2 years) | |
| Lenovo Legion Go S | |
| Blender / v2.79 BMW27 CPU | |
| Lenovo Legion Go S | |
| Average Intel Core Ultra 7 258V (315 - 484, n=24) | |
| MSI Claw 8 AI+ | |
| Average of class Handheld / UMPC (189 - 588, n=12, last 2 years) | |
| MSI Claw | |
| ONEXPLAYER 2 Pro AR18 | |
| Asus ROG Ally X | |
| GPD Pocket 4 | |
| 7-Zip 18.03 / 7z b 4 | |
| GPD Pocket 4 | |
| Asus ROG Ally X | |
| ONEXPLAYER 2 Pro AR18 | |
| MSI Claw | |
| Average of class Handheld / UMPC (23417 - 66618, n=11, last 2 years) | |
| MSI Claw 8 AI+ | |
| Average Intel Core Ultra 7 258V (24486 - 36724, n=24) | |
| Lenovo Legion Go S | |
| Valve Steam Deck 1 TB OLED | |
| 7-Zip 18.03 / 7z b 4 -mmt1 | |
| GPD Pocket 4 | |
| Asus ROG Ally X | |
| ONEXPLAYER 2 Pro AR18 | |
| MSI Claw 8 AI+ | |
| Average Intel Core Ultra 7 258V (4769 - 5869, n=24) | |
| MSI Claw | |
| Average of class Handheld / UMPC (3675 - 6143, n=12, last 2 years) | |
| Lenovo Legion Go S | |
| Valve Steam Deck 1 TB OLED | |
| Geekbench 6.7 / Multi-Core | |
| GPD Pocket 4 | |
| Asus ROG Ally X | |
| MSI Claw 8 AI+ | |
| Average Intel Core Ultra 7 258V (8964 - 11334, n=24) | |
| MSI Claw | |
| Average of class Handheld / UMPC (3950 - 13426, n=13, last 2 years) | |
| ONEXPLAYER 2 Pro AR18 | |
| Lenovo Legion Go S | |
| Valve Steam Deck 1 TB OLED | |
| Geekbench 6.7 / Single-Core | |
| GPD Pocket 4 | |
| Average Intel Core Ultra 7 258V (2593 - 2795, n=24) | |
| MSI Claw 8 AI+ | |
| Asus ROG Ally X | |
| MSI Claw | |
| Average of class Handheld / UMPC (1333 - 2904, n=13, last 2 years) | |
| ONEXPLAYER 2 Pro AR18 | |
| Lenovo Legion Go S | |
| Valve Steam Deck 1 TB OLED | |
| Geekbench 5.5 / Multi-Core | |
| GPD Pocket 4 | |
| Asus ROG Ally X | |
| MSI Claw | |
| MSI Claw 8 AI+ | |
| Average Intel Core Ultra 7 258V (7574 - 9918, n=24) | |
| Average of class Handheld / UMPC (3932 - 13086, n=13, last 2 years) | |
| ONEXPLAYER 2 Pro AR18 | |
| Valve Steam Deck 1 TB OLED | |
| Lenovo Legion Go S | |
| Geekbench 5.5 / Single-Core | |
| GPD Pocket 4 | |
| Average Intel Core Ultra 7 258V (1891 - 2046, n=24) | |
| MSI Claw 8 AI+ | |
| Asus ROG Ally X | |
| MSI Claw | |
| Average of class Handheld / UMPC (875 - 2134, n=13, last 2 years) | |
| ONEXPLAYER 2 Pro AR18 | |
| Valve Steam Deck 1 TB OLED | |
| Lenovo Legion Go S | |
| HWBOT x265 Benchmark v2.2 / 4k Preset | |
| GPD Pocket 4 | |
| Asus ROG Ally X | |
| ONEXPLAYER 2 Pro AR18 | |
| MSI Claw | |
| Average of class Handheld / UMPC (6.21 - 20.8, n=12, last 2 years) | |
| MSI Claw 8 AI+ | |
| Average Intel Core Ultra 7 258V (7.11 - 14.2, n=24) | |
| Lenovo Legion Go S | |
| LibreOffice / 20 Documents To PDF | |
| Lenovo Legion Go S | |
| Average of class Handheld / UMPC (41.1 - 92.8, n=12, last 2 years) | |
| ONEXPLAYER 2 Pro AR18 | |
| Asus ROG Ally X | |
| GPD Pocket 4 | |
| Average Intel Core Ultra 7 258V (41.1 - 62.8, n=24) | |
| MSI Claw | |
| MSI Claw 8 AI+ | |
| R Benchmark 2.5 / Overall mean | |
| Lenovo Legion Go S | |
| Average of class Handheld / UMPC (0.4167 - 0.756, n=12, last 2 years) | |
| ONEXPLAYER 2 Pro AR18 | |
| MSI Claw | |
| Average Intel Core Ultra 7 258V (0.443 - 0.542, n=24) | |
| Asus ROG Ally X | |
| MSI Claw 8 AI+ | |
| GPD Pocket 4 | |
* ... smaller is better
AIDA64: FP32 Ray-Trace | FPU Julia | CPU SHA3 | CPU Queen | FPU SinJulia | FPU Mandel | CPU AES | CPU ZLib | FP64 Ray-Trace | CPU PhotoWorxx
| Performance rating | |
| GPD Pocket 4 | |
| Asus ROG Ally X | |
| ONEXPLAYER 2 Pro AR18 | |
| Average of class Handheld / UMPC | |
| MSI Claw | |
| MSI Claw 8 AI+ | |
| Average Intel Core Ultra 7 258V | |
| Lenovo Legion Go S | |
| AIDA64 / FP32 Ray-Trace | |
| GPD Pocket 4 | |
| Asus ROG Ally X | |
| ONEXPLAYER 2 Pro AR18 | |
| ONEXPLAYER 2 Pro AR18 | |
| Average of class Handheld / UMPC (6544 - 26450, n=12, last 2 years) | |
| MSI Claw 8 AI+ | |
| Average Intel Core Ultra 7 258V (8454 - 12781, n=26) | |
| MSI Claw | |
| Lenovo Legion Go S | |
| AIDA64 / FPU Julia | |
| Asus ROG Ally X | |
| GPD Pocket 4 | |
| ONEXPLAYER 2 Pro AR18 | |
| ONEXPLAYER 2 Pro AR18 | |
| Average of class Handheld / UMPC (36464 - 99389, n=12, last 2 years) | |
| MSI Claw 8 AI+ | |
| MSI Claw | |
| Average Intel Core Ultra 7 258V (40875 - 63401, n=26) | |
| Lenovo Legion Go S | |
| AIDA64 / CPU SHA3 | |
| GPD Pocket 4 | |
| Asus ROG Ally X | |
| ONEXPLAYER 2 Pro AR18 | |
| ONEXPLAYER 2 Pro AR18 | |
| Average of class Handheld / UMPC (1157 - 4484, n=12, last 2 years) | |
| MSI Claw | |
| MSI Claw 8 AI+ | |
| Average Intel Core Ultra 7 258V (1930 - 2817, n=26) | |
| Lenovo Legion Go S | |
| AIDA64 / CPU Queen | |
| Asus ROG Ally X | |
| ONEXPLAYER 2 Pro AR18 | |
| GPD Pocket 4 | |
| MSI Claw | |
| Average of class Handheld / UMPC (41744 - 95230, n=11, last 2 years) | |
| MSI Claw 8 AI+ | |
| Average Intel Core Ultra 7 258V (48816 - 49818, n=24) | |
| Lenovo Legion Go S | |
| AIDA64 / FPU SinJulia | |
| GPD Pocket 4 | |
| Asus ROG Ally X | |
| ONEXPLAYER 2 Pro AR18 | |
| ONEXPLAYER 2 Pro AR18 | |
| Average of class Handheld / UMPC (4023 - 16980, n=12, last 2 years) | |
| MSI Claw | |
| Lenovo Legion Go S | |
| MSI Claw 8 AI+ | |
| Average Intel Core Ultra 7 258V (3817 - 4440, n=26) | |
| AIDA64 / FPU Mandel | |
| Asus ROG Ally X | |
| GPD Pocket 4 | |
| ONEXPLAYER 2 Pro AR18 | |
| ONEXPLAYER 2 Pro AR18 | |
| Average of class Handheld / UMPC (19153 - 52245, n=12, last 2 years) | |
| MSI Claw 8 AI+ | |
| Average Intel Core Ultra 7 258V (21670 - 33565, n=26) | |
| MSI Claw | |
| Lenovo Legion Go S | |
| AIDA64 / CPU AES | |
| ONEXPLAYER 2 Pro AR18 | |
| ONEXPLAYER 2 Pro AR18 | |
| Asus ROG Ally X | |
| GPD Pocket 4 | |
| MSI Claw | |
| Average of class Handheld / UMPC (18552 - 119040, n=11, last 2 years) | |
| Average Intel Core Ultra 7 258V (30957 - 40753, n=26) | |
| MSI Claw 8 AI+ | |
| Lenovo Legion Go S | |
| AIDA64 / CPU ZLib | |
| GPD Pocket 4 | |
| Asus ROG Ally X | |
| ONEXPLAYER 2 Pro AR18 | |
| ONEXPLAYER 2 Pro AR18 | |
| MSI Claw | |
| Average of class Handheld / UMPC (356 - 1112, n=12, last 2 years) | |
| MSI Claw 8 AI+ | |
| Average Intel Core Ultra 7 258V (422 - 632, n=26) | |
| Lenovo Legion Go S | |
| AIDA64 / FP64 Ray-Trace | |
| GPD Pocket 4 | |
| Asus ROG Ally X | |
| ONEXPLAYER 2 Pro AR18 | |
| ONEXPLAYER 2 Pro AR18 | |
| Average of class Handheld / UMPC (3585 - 14181, n=12, last 2 years) | |
| MSI Claw 8 AI+ | |
| Average Intel Core Ultra 7 258V (4258 - 6930, n=26) | |
| MSI Claw | |
| Lenovo Legion Go S | |
| AIDA64 / CPU PhotoWorxx | |
| MSI Claw 8 AI+ | |
| Average Intel Core Ultra 7 258V (44223 - 59245, n=26) | |
| MSI Claw | |
| GPD Pocket 4 | |
| Average of class Handheld / UMPC (19472 - 59897, n=12, last 2 years) | |
| Asus ROG Ally X | |
| ONEXPLAYER 2 Pro AR18 | |
| ONEXPLAYER 2 Pro AR18 | |
| Lenovo Legion Go S | |
System performance
Thanks to its modern components, the Claw 8 AI+ is a very responsive device and we had no stability problems during our test.
CrossMark: Overall | Productivity | Creativity | Responsiveness
WebXPRT 3: Overall
WebXPRT 4: Overall
Mozilla Kraken 1.1: Total
| PCMark 10 / Score | |
| GPD Pocket 4 | |
| MSI Claw 8 AI+ | |
| Asus ROG Ally X | |
| Average Intel Core Ultra 7 258V, Intel Arc Graphics 140V (6265 - 7420, n=23) | |
| Average of class Handheld / UMPC (3592 - 9701, n=12, last 2 years) | |
| MSI Claw | |
| ONEXPLAYER 2 Pro AR18 | |
| Lenovo Legion Go S | |
| PCMark 10 / Essentials | |
| GPD Pocket 4 | |
| MSI Claw 8 AI+ | |
| Asus ROG Ally X | |
| Average Intel Core Ultra 7 258V, Intel Arc Graphics 140V (9295 - 11467, n=23) | |
| Average of class Handheld / UMPC (7542 - 11262, n=12, last 2 years) | |
| MSI Claw | |
| ONEXPLAYER 2 Pro AR18 | |
| Lenovo Legion Go S | |
| PCMark 10 / Productivity | |
| Average of class Handheld / UMPC (5015 - 19236, n=12, last 2 years) | |
| GPD Pocket 4 | |
| Asus ROG Ally X | |
| MSI Claw 8 AI+ | |
| Average Intel Core Ultra 7 258V, Intel Arc Graphics 140V (7357 - 13600, n=23) | |
| MSI Claw | |
| ONEXPLAYER 2 Pro AR18 | |
| Lenovo Legion Go S | |
| PCMark 10 / Digital Content Creation | |
| MSI Claw 8 AI+ | |
| GPD Pocket 4 | |
| Average Intel Core Ultra 7 258V, Intel Arc Graphics 140V (8160 - 10308, n=23) | |
| Asus ROG Ally X | |
| MSI Claw | |
| Average of class Handheld / UMPC (3326 - 12612, n=12, last 2 years) | |
| ONEXPLAYER 2 Pro AR18 | |
| Lenovo Legion Go S | |
| CrossMark / Overall | |
| GPD Pocket 4 | |
| MSI Claw 8 AI+ | |
| MSI Claw | |
| Asus ROG Ally X | |
| Average Intel Core Ultra 7 258V, Intel Arc Graphics 140V (1275 - 1742, n=22) | |
| Average of class Handheld / UMPC (865 - 1881, n=11, last 2 years) | |
| ONEXPLAYER 2 Pro AR18 | |
| Lenovo Legion Go S | |
| Valve Steam Deck 1 TB OLED | |
| CrossMark / Productivity | |
| GPD Pocket 4 | |
| MSI Claw 8 AI+ | |
| MSI Claw | |
| Asus ROG Ally X | |
| Average Intel Core Ultra 7 258V, Intel Arc Graphics 140V (1267 - 1684, n=22) | |
| Average of class Handheld / UMPC (878 - 1719, n=11, last 2 years) | |
| ONEXPLAYER 2 Pro AR18 | |
| Lenovo Legion Go S | |
| Valve Steam Deck 1 TB OLED | |
| CrossMark / Creativity | |
| GPD Pocket 4 | |
| MSI Claw 8 AI+ | |
| Average Intel Core Ultra 7 258V, Intel Arc Graphics 140V (1393 - 1977, n=22) | |
| Asus ROG Ally X | |
| MSI Claw | |
| Average of class Handheld / UMPC (891 - 2150, n=11, last 2 years) | |
| ONEXPLAYER 2 Pro AR18 | |
| Lenovo Legion Go S | |
| Valve Steam Deck 1 TB OLED | |
| CrossMark / Responsiveness | |
| GPD Pocket 4 | |
| MSI Claw | |
| MSI Claw 8 AI+ | |
| Asus ROG Ally X | |
| Average of class Handheld / UMPC (759 - 1677, n=11, last 2 years) | |
| ONEXPLAYER 2 Pro AR18 | |
| Average Intel Core Ultra 7 258V, Intel Arc Graphics 140V (999 - 1411, n=22) | |
| Valve Steam Deck 1 TB OLED | |
| Lenovo Legion Go S | |
| WebXPRT 3 / Overall | |
| GPD Pocket 4 | |
| MSI Claw 8 AI+ | |
| Asus ROG Ally X | |
| Average Intel Core Ultra 7 258V, Intel Arc Graphics 140V (219 - 317, n=22) | |
| MSI Claw | |
| Average of class Handheld / UMPC (170.3 - 325, n=13, last 2 years) | |
| ONEXPLAYER 2 Pro AR18 | |
| Lenovo Legion Go S | |
| WebXPRT 4 / Overall | |
| MSI Claw 8 AI+ | |
| Average Intel Core Ultra 7 258V, Intel Arc Graphics 140V (199.5 - 291, n=22) | |
| GPD Pocket 4 | |
| MSI Claw | |
| Asus ROG Ally X | |
| Average of class Handheld / UMPC (134.4 - 291, n=13, last 2 years) | |
| Lenovo Legion Go S | |
| Valve Steam Deck 1 TB OLED | |
| Mozilla Kraken 1.1 / Total | |
| Lenovo Legion Go S | |
| Average of class Handheld / UMPC (428 - 931, n=12, last 2 years) | |
| Asus ROG Ally X | |
| MSI Claw | |
| ONEXPLAYER 2 Pro AR18 | |
| Average Intel Core Ultra 7 258V, Intel Arc Graphics 140V (468 - 559, n=24) | |
| MSI Claw 8 AI+ | |
| GPD Pocket 4 | |
* ... smaller is better
| PCMark 10 Score | 7314 points | |
Help | ||
| AIDA64 / Memory Copy | |
| Average Intel Core Ultra 7 258V (104408 - 114336, n=24) | |
| MSI Claw 8 AI+ | |
| GPD Pocket 4 | |
| MSI Claw | |
| Average of class Handheld / UMPC (33517 - 107929, n=12, last 2 years) | |
| Asus ROG Ally X | |
| Lenovo Legion Go S | |
| ONEXPLAYER 2 Pro AR18 | |
| ONEXPLAYER 2 Pro AR18 | |
| Valve Steam Deck 1 TB OLED | |
| AIDA64 / Memory Read | |
| GPD Pocket 4 | |
| MSI Claw 8 AI+ | |
| Average Intel Core Ultra 7 258V (82846 - 89417, n=24) | |
| MSI Claw | |
| Average of class Handheld / UMPC (25476 - 103022, n=12, last 2 years) | |
| Asus ROG Ally X | |
| Lenovo Legion Go S | |
| ONEXPLAYER 2 Pro AR18 | |
| ONEXPLAYER 2 Pro AR18 | |
| Valve Steam Deck 1 TB OLED | |
| AIDA64 / Memory Write | |
| MSI Claw 8 AI+ | |
| Average Intel Core Ultra 7 258V (108824 - 117989, n=24) | |
| Asus ROG Ally X | |
| GPD Pocket 4 | |
| Average of class Handheld / UMPC (25595 - 117883, n=12, last 2 years) | |
| MSI Claw | |
| ONEXPLAYER 2 Pro AR18 | |
| ONEXPLAYER 2 Pro AR18 | |
| Lenovo Legion Go S | |
| Valve Steam Deck 1 TB OLED | |
| AIDA64 / Memory Latency | |
| MSI Claw | |
| ONEXPLAYER 2 Pro AR18 | |
| ONEXPLAYER 2 Pro AR18 | |
| Lenovo Legion Go S | |
| Asus ROG Ally X | |
| Average of class Handheld / UMPC (99.8 - 147.6, n=12, last 2 years) | |
| Valve Steam Deck 1 TB OLED | |
| GPD Pocket 4 | |
| MSI Claw 8 AI+ | |
| Average Intel Core Ultra 7 258V (95 - 101.7, n=24) | |
* ... smaller is better
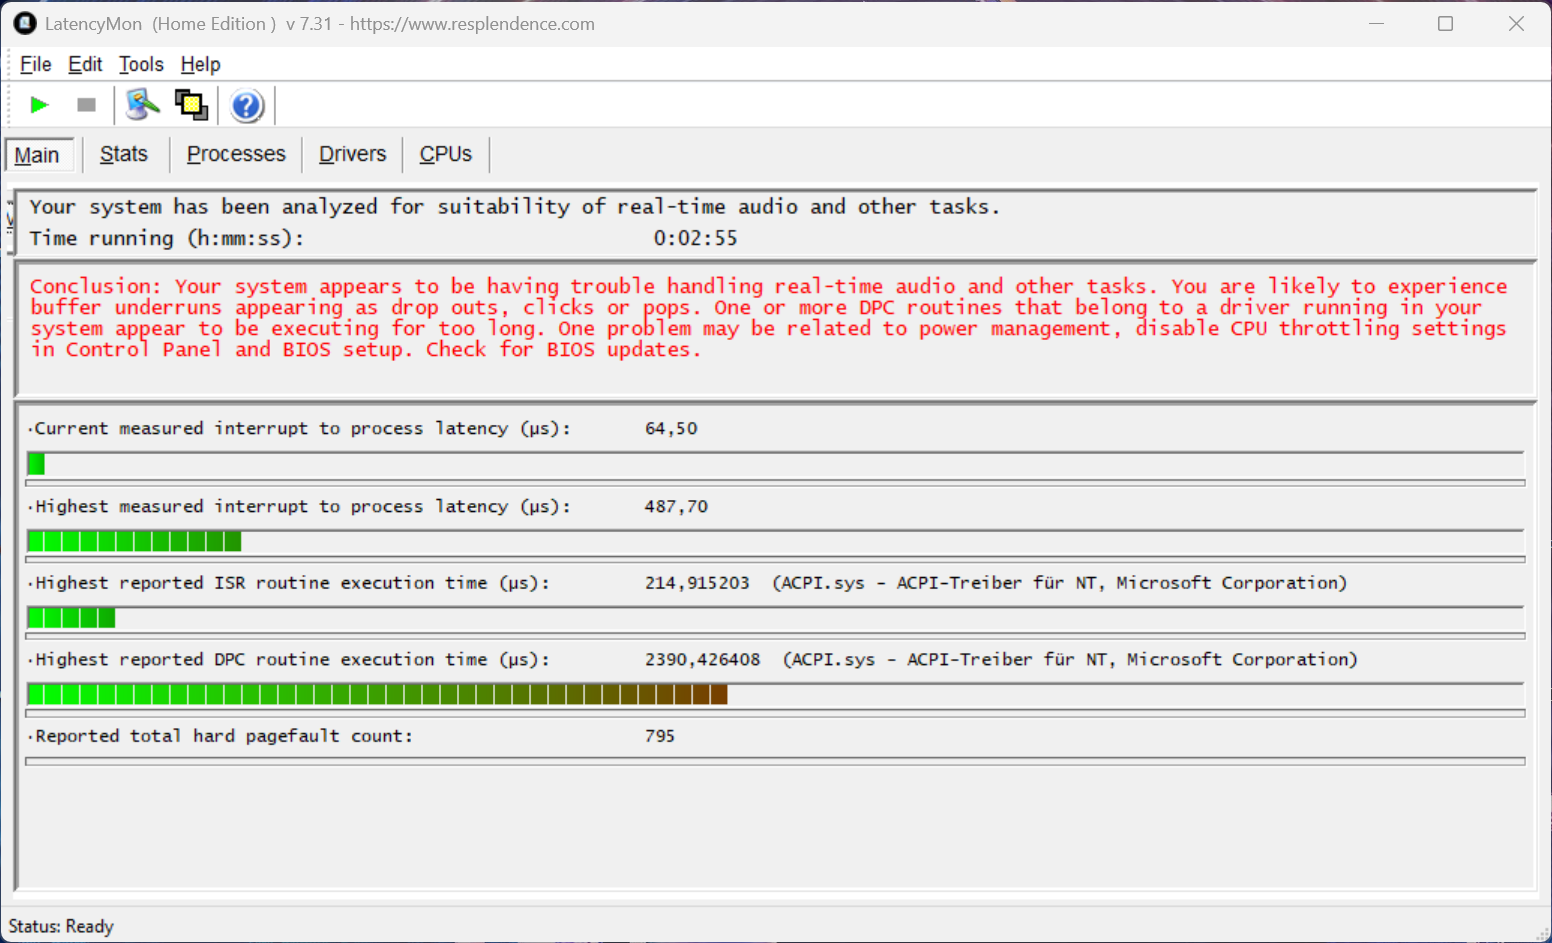
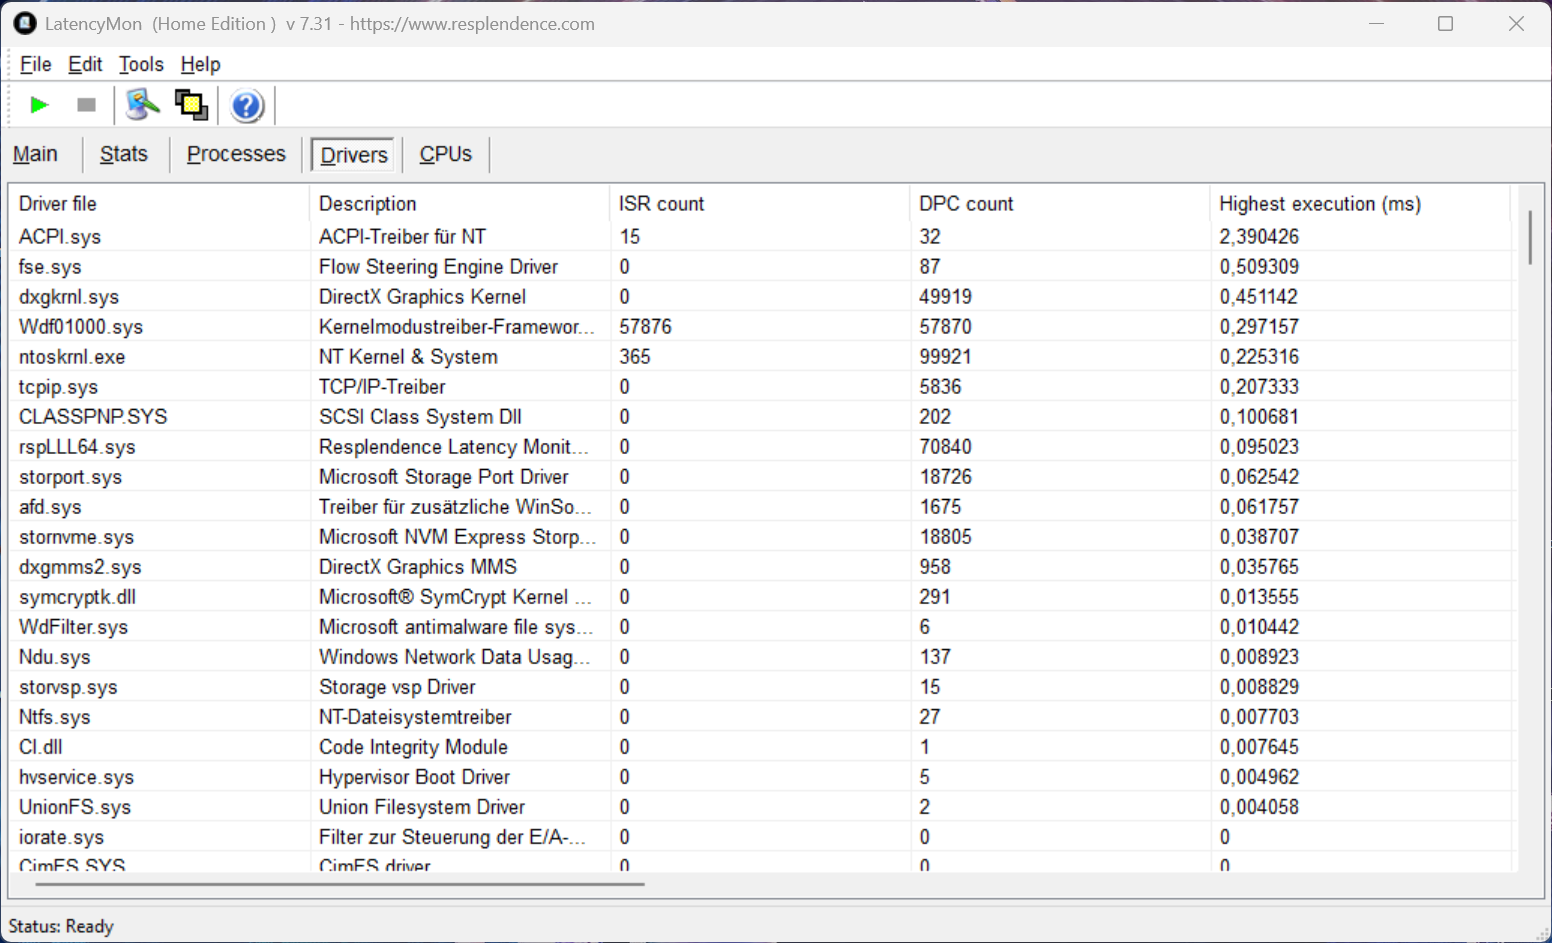
DPC latencies
During our latency test, the test device with the current BIOS version showed no limitations whatsoever. One driver did fail a little, but the important interrupt-to-process latency value was very low.
| DPC Latencies / LatencyMon - interrupt to process latency (max), Web, Youtube, Prime95 | |
| MSI Claw | |
| Asus ROG Ally X | |
| Lenovo Legion Go S | |
| ONEXPLAYER 2 Pro AR18 | |
| MSI Claw 8 AI+ | |
| GPD Pocket 4 | |
* ... smaller is better
Storage device
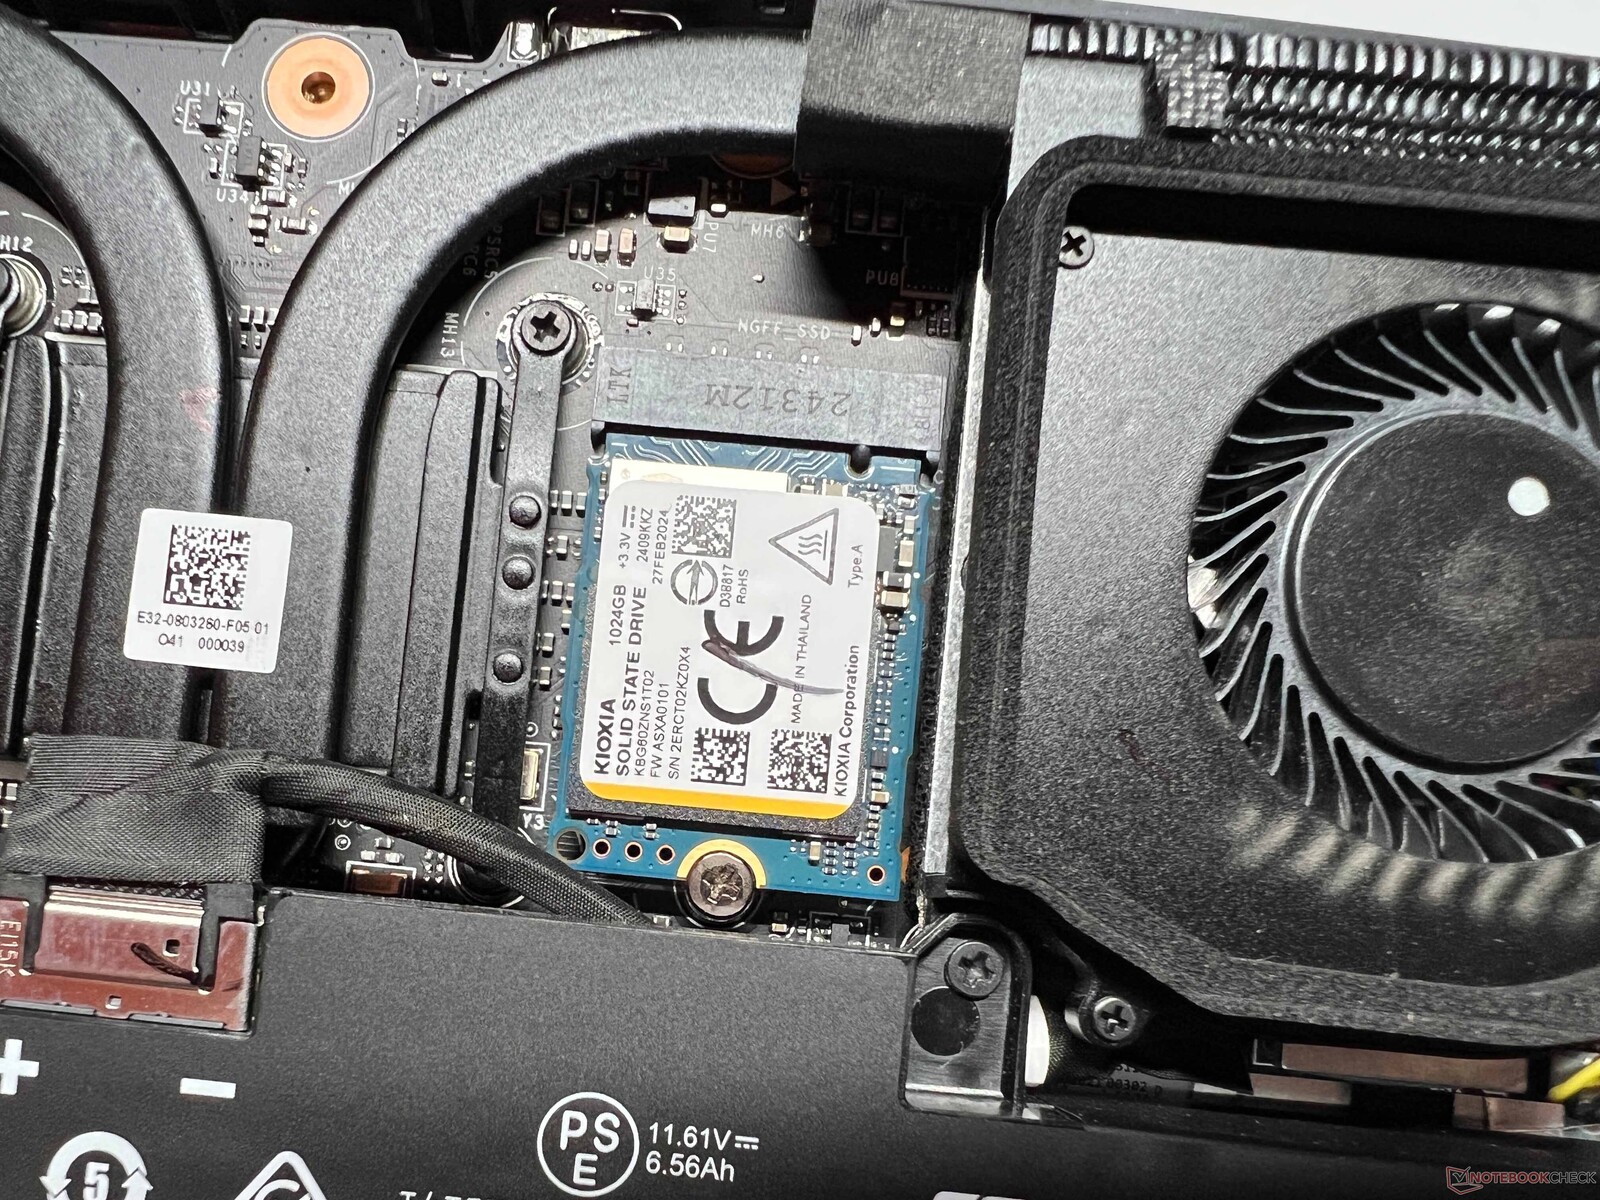
MSI has installed a compact 1TB M.2-2230 SSD from Kioxia (869 GB free after first start-up), which can be replaced without any problems. The PCIe 4.0 SSD's transfer rates were very good during our test and remained completely stable.

| Drive Performance rating - Percent | |
| ONEXPLAYER 2 Pro AR18 -11! | |
| GPD Pocket 4 | |
| MSI Claw 8 AI+ | |
| Average of class Handheld / UMPC | |
| Average Kioxia BG6 KBG60ZNS1T02 | |
| Lenovo Legion Go S | |
| Asus ROG Ally X | |
| MSI Claw | |
| Valve Steam Deck 1 TB OLED -11! | |
* ... smaller is better
Reading continuous performance: DiskSpd Read Loop, Queue Depth 8
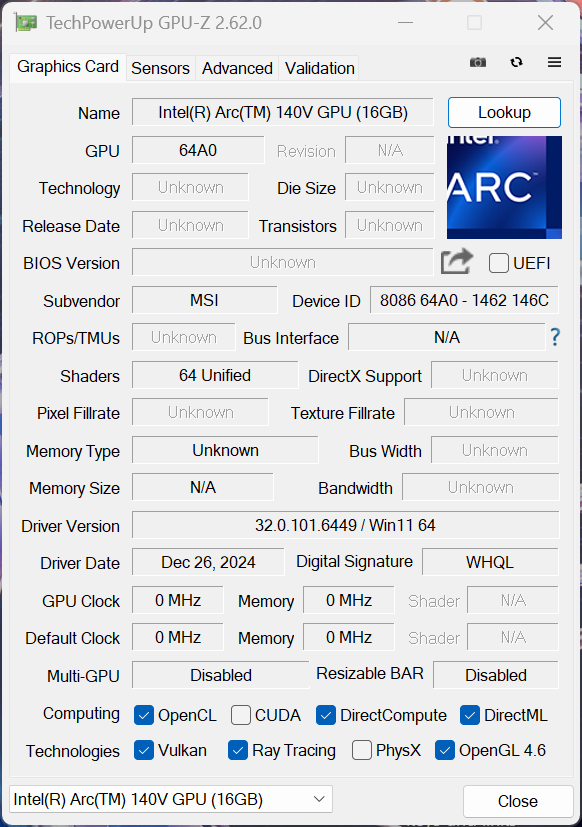
Graphics card
The Intel Arc Graphics 140V's graphics performance is very good, with the Claw 8 coming in at the top of our comparison group in the synthetic benchmarks. However, gaming performance is of course more important and the Lunar Lake processor also performed very well in this respect. During our standard tests, the Claw 8 was only beaten by the significantly more expensive GDP Pocket, but the old Claw was outperformed by 25% and the ROG Ally X by around 10%. During our tests, GTA V kept crashing at startup, which is why we cannot provide any results here. Apart from that, however, there were no problems. Its gaming performance remains completely stable, both during longer sessions and on battery power.
| 3DMark Performance rating - Percent | |
| Average of class Handheld / UMPC | |
| MSI Claw 8 AI+ | |
| Average Intel Arc Graphics 140V | |
| Asus ROG Ally X | |
| GPD Pocket 4 | |
| MSI Claw | |
| ONEXPLAYER 2 Pro AR18 | |
| Lenovo Legion Go S -1! | |
| 3DMark 11 Performance | 11827 points | |
| 3DMark Fire Strike Score | 9075 points | |
| 3DMark Time Spy Score | 4448 points | |
| 3DMark Steel Nomad Score | 812 points | |
| 3DMark Steel Nomad Light Score | 3289 points | |
| 3DMark Steel Nomad Light Unlimited Score | 3267 points | |
Help | ||
| Blender / v3.3 Classroom CPU | |
| Lenovo Legion Go S | |
| Average Intel Arc Graphics 140V (506 - 772, n=37) | |
| MSI Claw 8 AI+ | |
| Average of class Handheld / UMPC (290 - 1026, n=12, last 2 years) | |
| MSI Claw | |
| ONEXPLAYER 2 Pro AR18 | |
| Asus ROG Ally X | |
| GPD Pocket 4 | |
| Blender / v3.3 Classroom HIP/AMD | |
| Lenovo Legion Go S | |
| Average of class Handheld / UMPC (n=1last 2 years) | |
* ... smaller is better
| Performance rating - Percent | |
| GPD Pocket 4 | |
| MSI Claw 8 AI+ | |
| Average of class Handheld / UMPC | |
| Asus ROG Ally X | |
| ONEXPLAYER 2 Pro AR18 -2! | |
| MSI Claw | |
| Lenovo Legion Go S | |
| Valve Steam Deck 1 TB OLED -4! | |
| Cyberpunk 2077 - 1920x1080 Ultra Preset (FSR off) | |
| MSI Claw 8 AI+ | |
| Average of class Handheld / UMPC (12.4 - 91.4, n=18, last 2 years) | |
| GPD Pocket 4 | |
| Asus ROG Ally X | |
| MSI Claw | |
| Lenovo Legion Go S | |
| Baldur's Gate 3 - 1920x1080 Ultra Preset AA:T | |
| Average of class Handheld / UMPC (16.8 - 118.8, n=16, last 2 years) | |
| GPD Pocket 4 | |
| MSI Claw 8 AI+ | |
| Asus ROG Ally X | |
| MSI Claw | |
| Lenovo Legion Go S | |
| Final Fantasy XV Benchmark - 1920x1080 High Quality | |
| MSI Claw 8 AI+ | |
| GPD Pocket 4 | |
| Average of class Handheld / UMPC (17.9 - 50.3, n=16, last 2 years) | |
| Asus ROG Ally X | |
| ONEXPLAYER 2 Pro AR18 | |
| MSI Claw | |
| Lenovo Legion Go S | |
| Valve Steam Deck 1 TB OLED | |
| Strange Brigade - 1920x1080 ultra AA:ultra AF:16 | |
| MSI Claw 8 AI+ | |
| GPD Pocket 4 | |
| Average of class Handheld / UMPC (33.6 - 96.8, n=17, last 2 years) | |
| Asus ROG Ally X | |
| ONEXPLAYER 2 Pro AR18 | |
| MSI Claw | |
| Lenovo Legion Go S | |
| Valve Steam Deck 1 TB OLED | |
| Dota 2 Reborn - 1920x1080 ultra (3/3) best looking | |
| GPD Pocket 4 | |
| MSI Claw 8 AI+ | |
| Asus ROG Ally X | |
| Average of class Handheld / UMPC (30.8 - 103.8, n=16, last 2 years) | |
| MSI Claw | |
| ONEXPLAYER 2 Pro AR18 | |
| Lenovo Legion Go S | |
| X-Plane 11.11 - 1920x1080 high (fps_test=3) | |
| GPD Pocket 4 | |
| MSI Claw | |
| Average of class Handheld / UMPC (22.7 - 50.5, n=16, last 2 years) | |
| Asus ROG Ally X | |
| MSI Claw 8 AI+ | |
| ONEXPLAYER 2 Pro AR18 | |
| Lenovo Legion Go S | |
Cyberpunk 2077 ultra FPS diagram
| low | med. | high | ultra | |
|---|---|---|---|---|
| GTA V (2015) | 0 game wont start | |||
| Dota 2 Reborn (2015) | 100.7 | 94 | 84.1 | 82.2 |
| Final Fantasy XV Benchmark (2018) | 87.6 | 87.6 | 34.4 | |
| X-Plane 11.11 (2018) | 43.3 | 36.5 | 32.2 | |
| Strange Brigade (2018) | 227 | 81.7 | 67.9 | 56.1 |
| Baldur's Gate 3 (2023) | 40.4 | 33.5 | 29.2 | 28.7 |
| Cyberpunk 2077 (2023) | 46.8 | 37.4 | 31.4 | 28.5 |
| F1 24 (2024) | 85.7 | 76.2 | 59.5 | 20.1 |
| Assassin's Creed Shadows (2025) | 18 |
Emissions & energy
Noise emissions
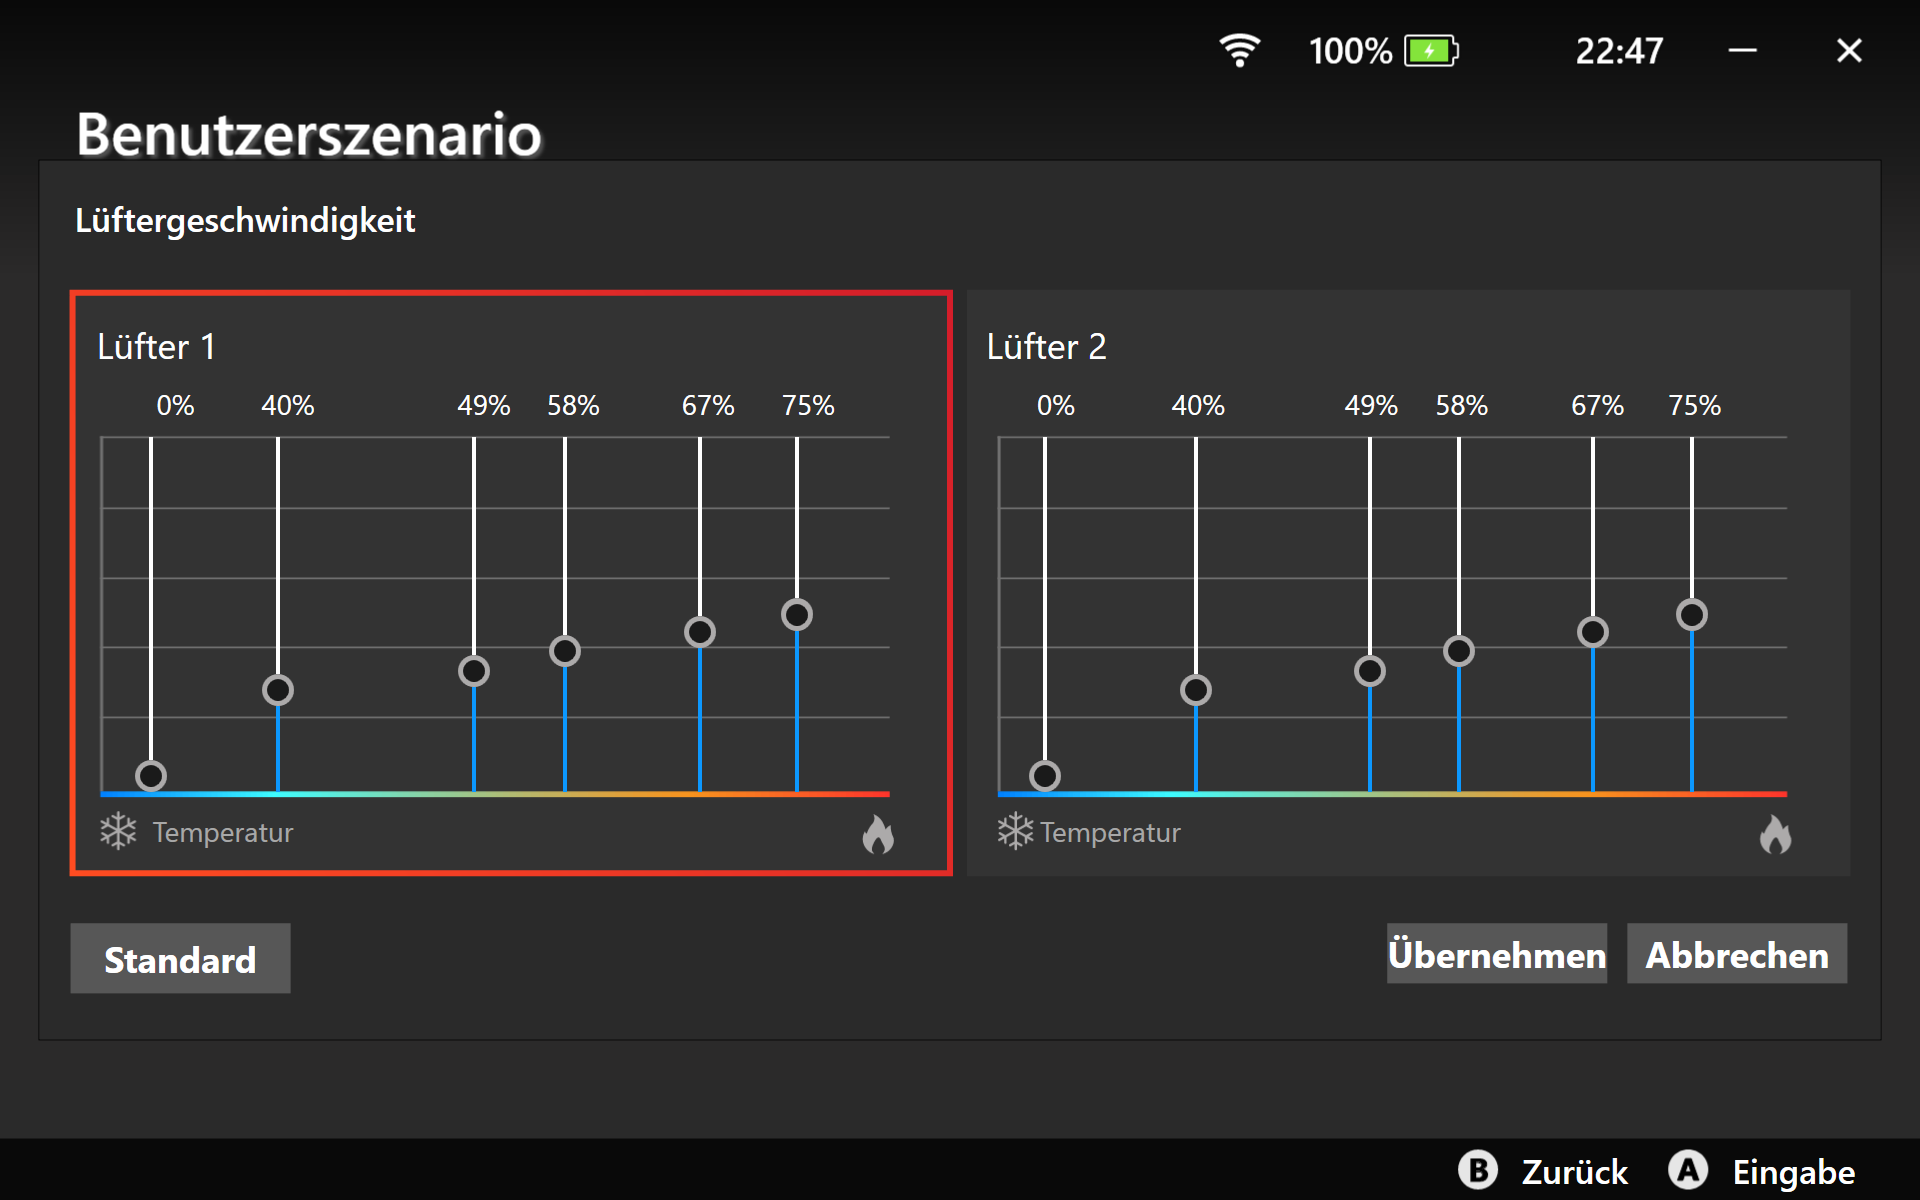
The handheld's two fans start up quite quickly, especially in the most powerful mode, but their fluctuating behavior during gaming is more of an issue. In manual mode at 30 watts, the device's noise emissions vary between 37.3-41.4 dB(A), although its TDP remains absolutely constant. We also observed this behavior in AI mode (37/17 watts), but in the range of 33.4-37.3 dB(A). There were no other electronic noises coming from our test device during our test.
Noise level
| Idle |
| 24.7 / 24.7 / 28.9 dB(A) |
| Load |
| 37.3 / 41.4 dB(A) |
 | ||
30 dB silent 40 dB(A) audible 50 dB(A) loud |
||
min: | ||
| MSI Claw 8 AI+ Arc 140V, Core Ultra 7 258V, Kioxia BG6 KBG60ZNS1T02 | Lenovo Legion Go S Radeon 680M, Z2 Go, SK hynix PVC10 HFS512GEM4X182N | GPD Pocket 4 Radeon 890M, Ryzen AI 9 HX 370 | Asus ROG Ally X Radeon 780M, Z1 Extreme, WD PC SN560 SDDPNQE-1T00 | MSI Claw Arc 8-Core, Ultra 7 155H, Kioxia BG5 KBG50ZNS1T02 | Valve Steam Deck 1 TB OLED Radeon Radeon Steam Deck 8CU, Steam Deck OLED APU, Phison ESMP001TKB5C3 | ONEXPLAYER 2 Pro AR18 Radeon 780M, R7 7840U | |
|---|---|---|---|---|---|---|---|
| Noise | -5% | -7% | -3% | -9% | 5% | 1% | |
| off / environment * (dB) | 24.7 | 25.6 -4% | 22.8 8% | 24.7 -0% | 25.7 -4% | 24.7 -0% | 24.4 1% |
| Idle Minimum * (dB) | 24.7 | 25.6 -4% | 25.8 -4% | 24.7 -0% | 25.7 -4% | 25 -1% | 24.4 1% |
| Idle Average * (dB) | 24.7 | 25.6 -4% | 25.8 -4% | 24.7 -0% | 31.7 -28% | 25 -1% | 24.4 1% |
| Idle Maximum * (dB) | 28.9 | 28.37 2% | 31 -7% | 28.5 1% | 31.7 -10% | 25 13% | 30.6 -6% |
| Load Average * (dB) | 37.3 | 47 -26% | 42.6 -14% | 36.6 2% | 31.3 16% | 36 3% | |
| Cyberpunk 2077 ultra * (dB) | 41.4 | 43.1 -4% | 43.3 -5% | 42.6 -3% | 45.5 -10% | ||
| Load Maximum * (dB) | 41.4 | 48.5 -17% | 45.1 -9% | 42.6 -3% | 45.5 -10% | 40.8 1% | 39.3 5% |
* ... smaller is better
Temperature
Its surface temperatures are very low overall and the handheld's handles in particular hardly heat up. Warm air is dissipated at the top of the device. The respective TDP values were kept constant during the stress test.
(+) The maximum temperature on the upper side is 36.6 °C / 98 F, compared to the average of 37.9 °C / 100 F, ranging from 26.6 to 55 °C for the class Handheld / UMPC.
(+) The bottom heats up to a maximum of 34.8 °C / 95 F, compared to the average of 36.7 °C / 98 F
(+) In idle usage, the average temperature for the upper side is 26.6 °C / 80 F, compared to the device average of 32.8 °C / 91 F.
(±) 3: The average temperature for the upper side is 34.8 °C / 95 F, compared to the average of 32.8 °C / 91 F for the class Handheld / UMPC.
(+) The palmrests and touchpad are reaching skin temperature as a maximum (35.3 °C / 95.5 F) and are therefore not hot.
(-) The average temperature of the palmrest area of similar devices was 32.4 °C / 90.3 F (-2.9 °C / -5.2 F).


| MSI Claw 8 AI+ Intel Core Ultra 7 258V, Intel Arc Graphics 140V | Lenovo Legion Go S AMD Ryzen Z2 Go, AMD Radeon 680M | GPD Pocket 4 AMD Ryzen AI 9 HX 370, AMD Radeon 890M | Asus ROG Ally X AMD Ryzen Z1 Extreme, AMD Radeon 780M | MSI Claw Intel Core Ultra 7 155H, Intel Arc 8-Core iGPU | |
|---|---|---|---|---|---|
| Heat | -9% | 1% | -8% | -14% | |
| Maximum Upper Side * (°C) | 36.6 | 40 -9% | 33.8 8% | 42.7 -17% | 41.8 -14% |
| Maximum Bottom * (°C) | 34.8 | 35.5 -2% | 35.2 -1% | 39.7 -14% | 35.9 -3% |
| Idle Upper Side * (°C) | 27.5 | 32.5 -18% | 26.6 3% | 28 -2% | 31.6 -15% |
| Idle Bottom * (°C) | 27.2 | 29.2 -7% | 28.6 -5% | 27.2 -0% | 33.6 -24% |
* ... smaller is better
Speakers
The device's two stereo speakers are very good and have been improved once again compared to the old MSI Claw.
MSI Claw 8 AI+ audio analysis
(+) | speakers can play relatively loud (85 dB)
Bass 100 - 315 Hz
(±) | reduced bass - on average 14.5% lower than median
(±) | linearity of bass is average (8.8% delta to prev. frequency)
Mids 400 - 2000 Hz
(+) | balanced mids - only 2.1% away from median
(+) | mids are linear (2.1% delta to prev. frequency)
Highs 2 - 16 kHz
(+) | balanced highs - only 2.4% away from median
(+) | highs are linear (4.2% delta to prev. frequency)
Overall 100 - 16.000 Hz
(+) | overall sound is linear (11.9% difference to median)
Compared to same class
» 0% of all tested devices in this class were better, 13% similar, 88% worse
» The best had a delta of 12%, average was 17%, worst was 23%
Compared to all devices tested
» 9% of all tested devices were better, 2% similar, 89% worse
» The best had a delta of 4%, average was 23%, worst was 134%
Lenovo Legion Go S audio analysis
(±) | speaker loudness is average but good (80.4 dB)
Bass 100 - 315 Hz
(-) | nearly no bass - on average 18% lower than median
(±) | linearity of bass is average (7.4% delta to prev. frequency)
Mids 400 - 2000 Hz
(±) | higher mids - on average 7.5% higher than median
(±) | linearity of mids is average (9% delta to prev. frequency)
Highs 2 - 16 kHz
(+) | balanced highs - only 3.9% away from median
(±) | linearity of highs is average (10% delta to prev. frequency)
Overall 100 - 16.000 Hz
(±) | linearity of overall sound is average (20% difference to median)
Compared to same class
» 71% of all tested devices in this class were better, 13% similar, 17% worse
» The best had a delta of 12%, average was 17%, worst was 23%
Compared to all devices tested
» 51% of all tested devices were better, 8% similar, 41% worse
» The best had a delta of 4%, average was 23%, worst was 134%
GPD Pocket 4 audio analysis
(+) | speakers can play relatively loud (91.9 dB)
Bass 100 - 315 Hz
(-) | nearly no bass - on average 21.5% lower than median
(+) | bass is linear (5.2% delta to prev. frequency)
Mids 400 - 2000 Hz
(+) | balanced mids - only 4.9% away from median
(+) | mids are linear (4.8% delta to prev. frequency)
Highs 2 - 16 kHz
(±) | higher highs - on average 6.1% higher than median
(±) | linearity of highs is average (8.1% delta to prev. frequency)
Overall 100 - 16.000 Hz
(±) | linearity of overall sound is average (17.6% difference to median)
Compared to same class
» 46% of all tested devices in this class were better, 17% similar, 38% worse
» The best had a delta of 12%, average was 17%, worst was 23%
Compared to all devices tested
» 35% of all tested devices were better, 8% similar, 57% worse
» The best had a delta of 4%, average was 23%, worst was 134%
Asus ROG Ally X audio analysis
(+) | speakers can play relatively loud (88.2 dB)
Bass 100 - 315 Hz
(-) | nearly no bass - on average 26% lower than median
(±) | linearity of bass is average (7.7% delta to prev. frequency)
Mids 400 - 2000 Hz
(+) | balanced mids - only 3.9% away from median
(+) | mids are linear (3.6% delta to prev. frequency)
Highs 2 - 16 kHz
(+) | balanced highs - only 1.1% away from median
(+) | highs are linear (1.8% delta to prev. frequency)
Overall 100 - 16.000 Hz
(+) | overall sound is linear (14.7% difference to median)
Compared to same class
» 25% of all tested devices in this class were better, 13% similar, 63% worse
» The best had a delta of 12%, average was 17%, worst was 23%
Compared to all devices tested
» 19% of all tested devices were better, 4% similar, 77% worse
» The best had a delta of 4%, average was 23%, worst was 134%
MSI Claw audio analysis
(+) | speakers can play relatively loud (87.2 dB)
Bass 100 - 315 Hz
(-) | nearly no bass - on average 17.2% lower than median
(±) | linearity of bass is average (9.2% delta to prev. frequency)
Mids 400 - 2000 Hz
(+) | balanced mids - only 4.3% away from median
(+) | mids are linear (4.3% delta to prev. frequency)
Highs 2 - 16 kHz
(+) | balanced highs - only 3.7% away from median
(+) | highs are linear (4.5% delta to prev. frequency)
Overall 100 - 16.000 Hz
(+) | overall sound is linear (14.9% difference to median)
Compared to same class
» 29% of all tested devices in this class were better, 8% similar, 63% worse
» The best had a delta of 12%, average was 17%, worst was 23%
Compared to all devices tested
» 20% of all tested devices were better, 4% similar, 76% worse
» The best had a delta of 4%, average was 23%, worst was 134%
Valve Steam Deck 1 TB OLED audio analysis
(+) | speakers can play relatively loud (82.7 dB)
Bass 100 - 315 Hz
(-) | nearly no bass - on average 22% lower than median
(±) | linearity of bass is average (14.7% delta to prev. frequency)
Mids 400 - 2000 Hz
(+) | balanced mids - only 1% away from median
(+) | mids are linear (2.1% delta to prev. frequency)
Highs 2 - 16 kHz
(+) | balanced highs - only 1.9% away from median
(+) | highs are linear (6.1% delta to prev. frequency)
Overall 100 - 16.000 Hz
(+) | overall sound is linear (12.9% difference to median)
Compared to same class
» 17% of all tested devices in this class were better, 8% similar, 75% worse
» The best had a delta of 12%, average was 17%, worst was 23%
Compared to all devices tested
» 12% of all tested devices were better, 3% similar, 85% worse
» The best had a delta of 4%, average was 23%, worst was 134%
ONEXPLAYER 2 Pro AR18 audio analysis
(+) | speakers can play relatively loud (85.8 dB)
Bass 100 - 315 Hz
(±) | reduced bass - on average 13.7% lower than median
(±) | linearity of bass is average (8.7% delta to prev. frequency)
Mids 400 - 2000 Hz
(±) | higher mids - on average 7.1% higher than median
(+) | mids are linear (4.9% delta to prev. frequency)
Highs 2 - 16 kHz
(+) | balanced highs - only 4.6% away from median
(+) | highs are linear (6.6% delta to prev. frequency)
Overall 100 - 16.000 Hz
(+) | overall sound is linear (14.4% difference to median)
Compared to same class
» 25% of all tested devices in this class were better, 8% similar, 67% worse
» The best had a delta of 12%, average was 17%, worst was 23%
Compared to all devices tested
» 18% of all tested devices were better, 4% similar, 78% worse
» The best had a delta of 4%, average was 23%, worst was 134%
Power consumption
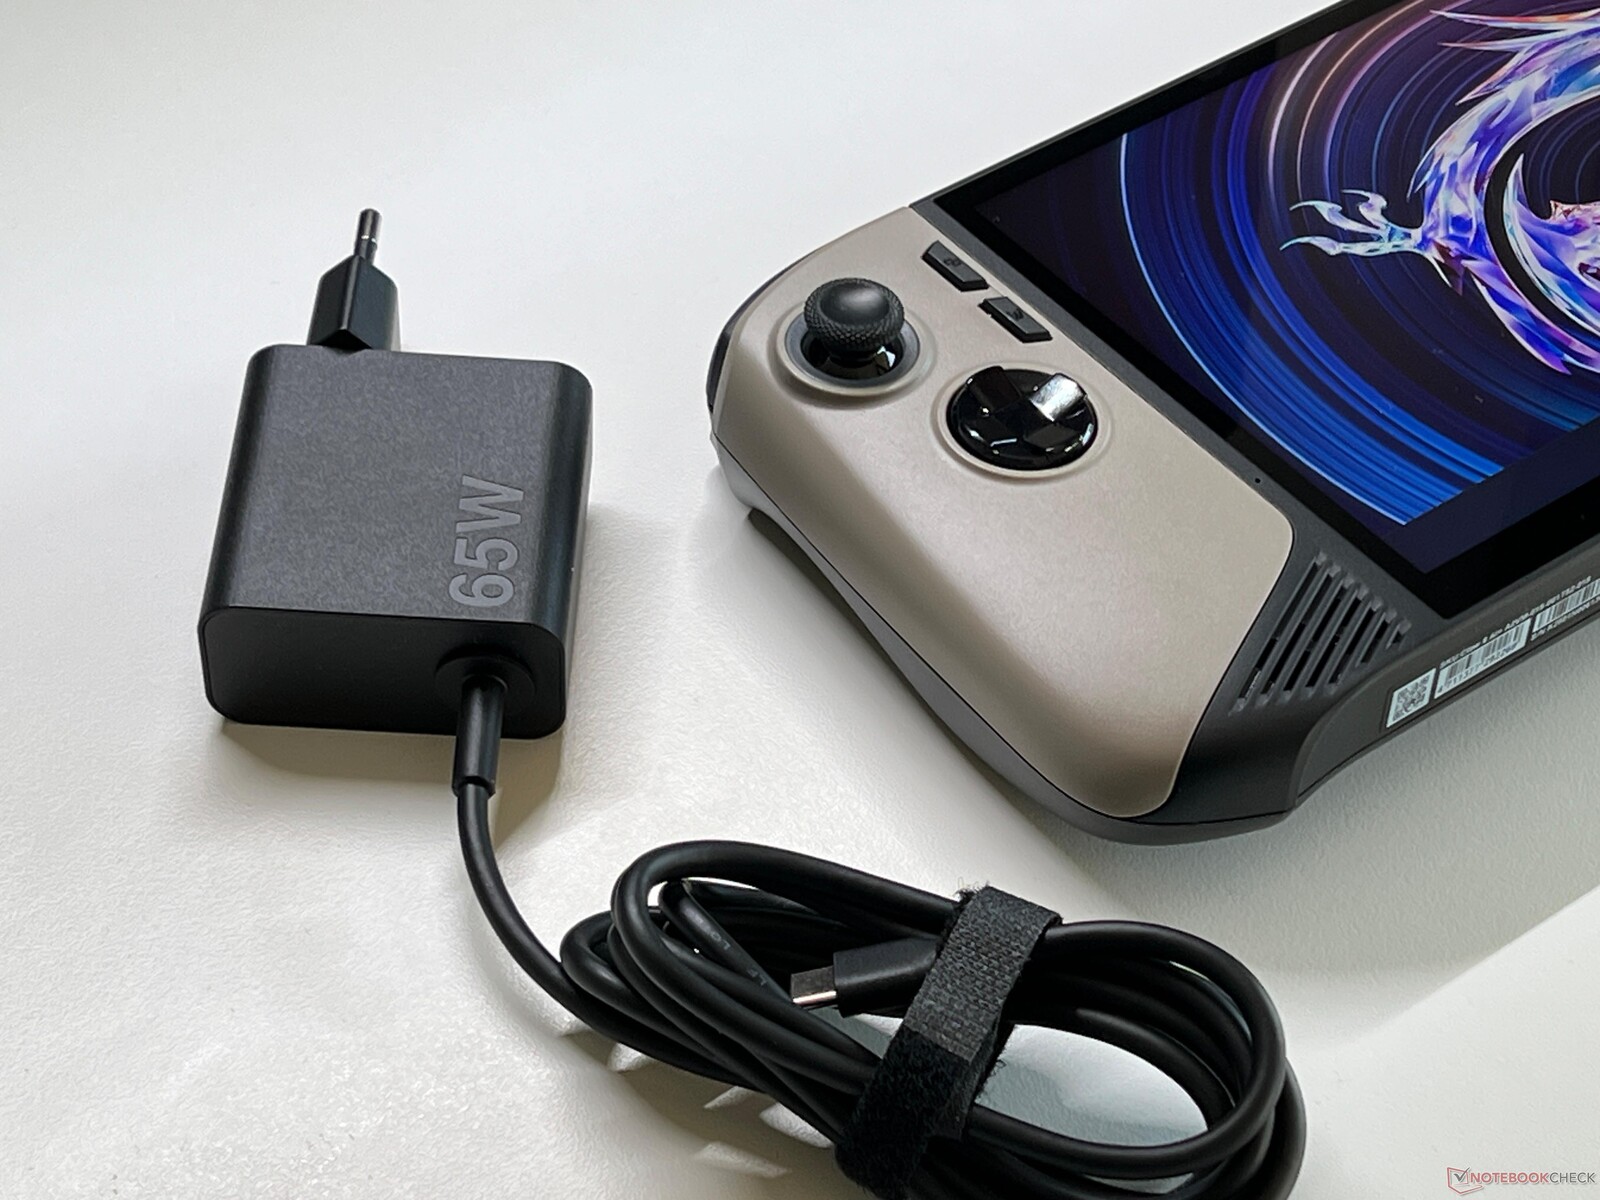
Despite its larger display, the Claw 8 is more frugal than its predecessor and the other competitors when idling. We measured a maximum consumption of 59 watts in the stress test, which then leveled off at 50 watts after about a minute. When gaming, we noted around 46 watts. The included 65-watt plug-in power supply (192 grams) is therefore sufficiently sized.
| Off / Standby | |
| Idle | |
| Load |
|
Key:
min: | |
| MSI Claw 8 AI+ Core Ultra 7 258V, Arc 140V, Kioxia BG6 KBG60ZNS1T02, IPS, 1920x1200, 8" | Lenovo Legion Go S Z2 Go, Radeon 680M, SK hynix PVC10 HFS512GEM4X182N, IPS-Grade, 1920x1200, 8" | GPD Pocket 4 Ryzen AI 9 HX 370, Radeon 890M, , IPS, 2560x1600, 8.8" | Asus ROG Ally X Z1 Extreme, Radeon 780M, WD PC SN560 SDDPNQE-1T00, IPS, 1920x1080, 7" | MSI Claw Ultra 7 155H, Arc 8-Core, Kioxia BG5 KBG50ZNS1T02, IPS, 1920x1080, 7" | Valve Steam Deck 1 TB OLED Steam Deck OLED APU, Radeon Radeon Steam Deck 8CU, Phison ESMP001TKB5C3, OLED, 1280x800, 7.4" | ONEXPLAYER 2 Pro AR18 R7 7840U, Radeon 780M, , IPS, 2560x1600, 8.4" | |
|---|---|---|---|---|---|---|---|
| Power Consumption | -41% | -28% | -19% | -60% | -1% | -42% | |
| Idle Minimum * (Watt) | 3.2 | 5.3 -66% | 6 -88% | 4.3 -34% | 7.8 -144% | 4.5 -41% | 6.66 -108% |
| Idle Average * (Watt) | 6.3 | 9.4 -49% | 8.8 -40% | 6.7 -6% | 11.5 -83% | 7.21 -14% | 7.11 -13% |
| Idle Maximum * (Watt) | 6.6 | 15.5 -135% | 9.2 -39% | 7.5 -14% | 11.8 -79% | 9.66 -46% | 11.7 -77% |
| Load Average * (Watt) | 40.6 | 53.1 -31% | 48.2 -19% | 53.1 -31% | 22.86 44% | 46.708 -15% | |
| Cyberpunk 2077 ultra * (Watt) | 47 | 47.6 -1% | 50.1 -7% | 61.3 -30% | 54.4 -16% | ||
| Cyberpunk 2077 ultra external monitor * (Watt) | 46.7 | 45.4 3% | 45.7 2% | 53.9 -15% | |||
| Load Maximum * (Watt) | 59.3 | 57.8 3% | 56.4 5% | 66.8 -13% | 64.6 -9% | 27.8 53% | 56.7 4% |
| Witcher 3 ultra * (Watt) | 53.1 |
* ... smaller is better
Power consumption Cyberpunk / stress test
Power consumption with external monitor
Runtimes
MSI has increased the handheld's battery capacity to 80 Wh and together with its low consumption values, this results in very good runtimes. When gaming, it depends heavily on the selected energy profile: In the fastest mode, Cyberpunk ran for 01:45 hours (~25fps) during our test, whereas in AI engine mode resulted in just under 3.5 hours (~19fps).
During the normal WLAN test at 150 cd/m² (29% of our test device's maximum brightness), we measured almost 24 hours and even at full brightness, it lasted more than 16.5 hours (60 Hz in each case), which are enormous runtimes.

| MSI Claw 8 AI+ Core Ultra 7 258V, Arc 140V, 80 Wh | Lenovo Legion Go S Z2 Go, Radeon 680M, 55.5 Wh | GPD Pocket 4 Ryzen AI 9 HX 370, Radeon 890M, 45 Wh | Asus ROG Ally X Z1 Extreme, Radeon 780M, 80 Wh | MSI Claw Ultra 7 155H, Arc 8-Core, 53 Wh | Valve Steam Deck 1 TB OLED Steam Deck OLED APU, Radeon Radeon Steam Deck 8CU, 50 Wh | ONEXPLAYER 2 Pro AR18 R7 7840U, Radeon 780M, 65 Wh | Average of class Handheld / UMPC | |
|---|---|---|---|---|---|---|---|---|
| Battery runtime | -35% | -74% | -8% | -48% | -61% | -54% | -50% | |
| WiFi v1.3 (h) | 23.6 | 8.6 -64% | 6.2 -74% | 15.8 -33% | 7.8 -67% | 9.3 -61% | 10.8 -54% | 11.7 ? -50% |
| Cyberpunk 2077 ultra 150cd (h) | 1.8 | 1.7 -6% | 2.1 17% | 1.3 -28% | ||||
| Gaming (h) | 4.2 | 1.683 ? | ||||||
| Witcher 3 ultra (h) | 1.2 |
Notebookcheck total rating
MSI Claw 8 AI+
- 03/06/2025 v8
Andreas Osthoff
 Total Sustainability Score:
 Transparency
The selection of devices to be reviewed is made by our editorial team. The test sample was provided to the author as a loan by the manufacturer or retailer for the purpose of this review. The lender had no influence on this review, nor did the manufacturer receive a copy of this review before publication. There was no obligation to publish this review. As an independent media company, Notebookcheck is not subjected to the authority of manufacturers, retailers or publishers.
This is how Notebookcheck is testing
Every year, Notebookcheck independently reviews hundreds of laptops and smartphones using standardized procedures to ensure that all results are comparable. We have continuously developed our test methods for around 20 years and set industry standards in the process. In our test labs, high-quality measuring equipment is utilized by experienced technicians and editors. These tests involve a multi-stage validation process. Our complex rating system is based on hundreds of well-founded measurements and benchmarks, which maintains objectivity. Further information on our test methods can be found here.

