Ryzen 5 6600H performance debut: Lenovo IdeaPad Gaming 3 15ARH7 Laptop Review
The IdeaPad Gaming 3 series is home to some of Lenovo's most inexpensive gaming laptops to contrast the midrange Legion 5 Pro series and higher-end Legion 7 series. This latest 2022 model is notable for being one of the first to carry the AMD Zen 3+ Ryzen 5 6600H CPU to replace the 10th gen Intel solution in the 2020 IdeaPad Gaming 3i. It also introduces a new chassis design to further distinguish itself from older generation models.
Configurations include either the Ryzen 5 6600H or Ryzen 7 6800H CPU with either the 85 W GeForce RTX 3050 or 3050 Ti GPU. The same 120 Hz 1080p IPS panel is on all SKUs. Our specific review unit with the 6600H, RTX 3050, 256 GB SSD, and 8 GB RAM is the lowest-end option for approximately $800 USD retail.
Competitors include other budget 15.6- or 16-inch gaming laptops like the Acer Nitro 5, HP Victus, Asus TUF Dash 15, or the MSI GF series.
More Lenovo reviews:
Potential Competitors in Comparison
Rating | Date | Model | Weight | Height | Size | Resolution | Price |
|---|---|---|---|---|---|---|---|
| 80.8 % v7 (old) | 09 / 2022 | Lenovo IdeaPad Gaming 3 15ARH7 R5 6600H, GeForce RTX 3050 4GB Laptop GPU | 2.4 kg | 21.8 mm | 15.60" | 1920x1080 | |
| 78.4 % v7 (old) | 07 / 2020 | Lenovo IdeaPad Gaming 3i 15IMH05 i5-10300H, GeForce GTX 1650 Mobile | 2.2 kg | 24.9 mm | 15.60" | 1920x1080 | |
| 82.6 % v7 (old) | 05 / 2022 | Lenovo Legion 5 15ACH6A-82NW0010GE R5 5600H, Radeon RX 6600M | 2.5 kg | 25.75 mm | 15.60" | 1920x1080 | |
| 82.3 % v7 (old) | 09 / 2022 | Gigabyte A5 K1 R5 5600H, GeForce RTX 3060 Laptop GPU | 2.2 kg | 34 mm | 15.60" | 1920x1080 | |
| 85.8 % v7 (old) | 07 / 2022 | Asus TUF Dash F15 FX517ZR i7-12650H, GeForce RTX 3070 Laptop GPU | 2 kg | 20.7 mm | 15.60" | 2560x1440 | |
| 81 % v7 (old) | 06 / 2022 | Dell G15 5510 i5-10500H, GeForce RTX 3050 4GB Laptop GPU | 2.5 kg | 23 mm | 15.60" | 1920x1080 |
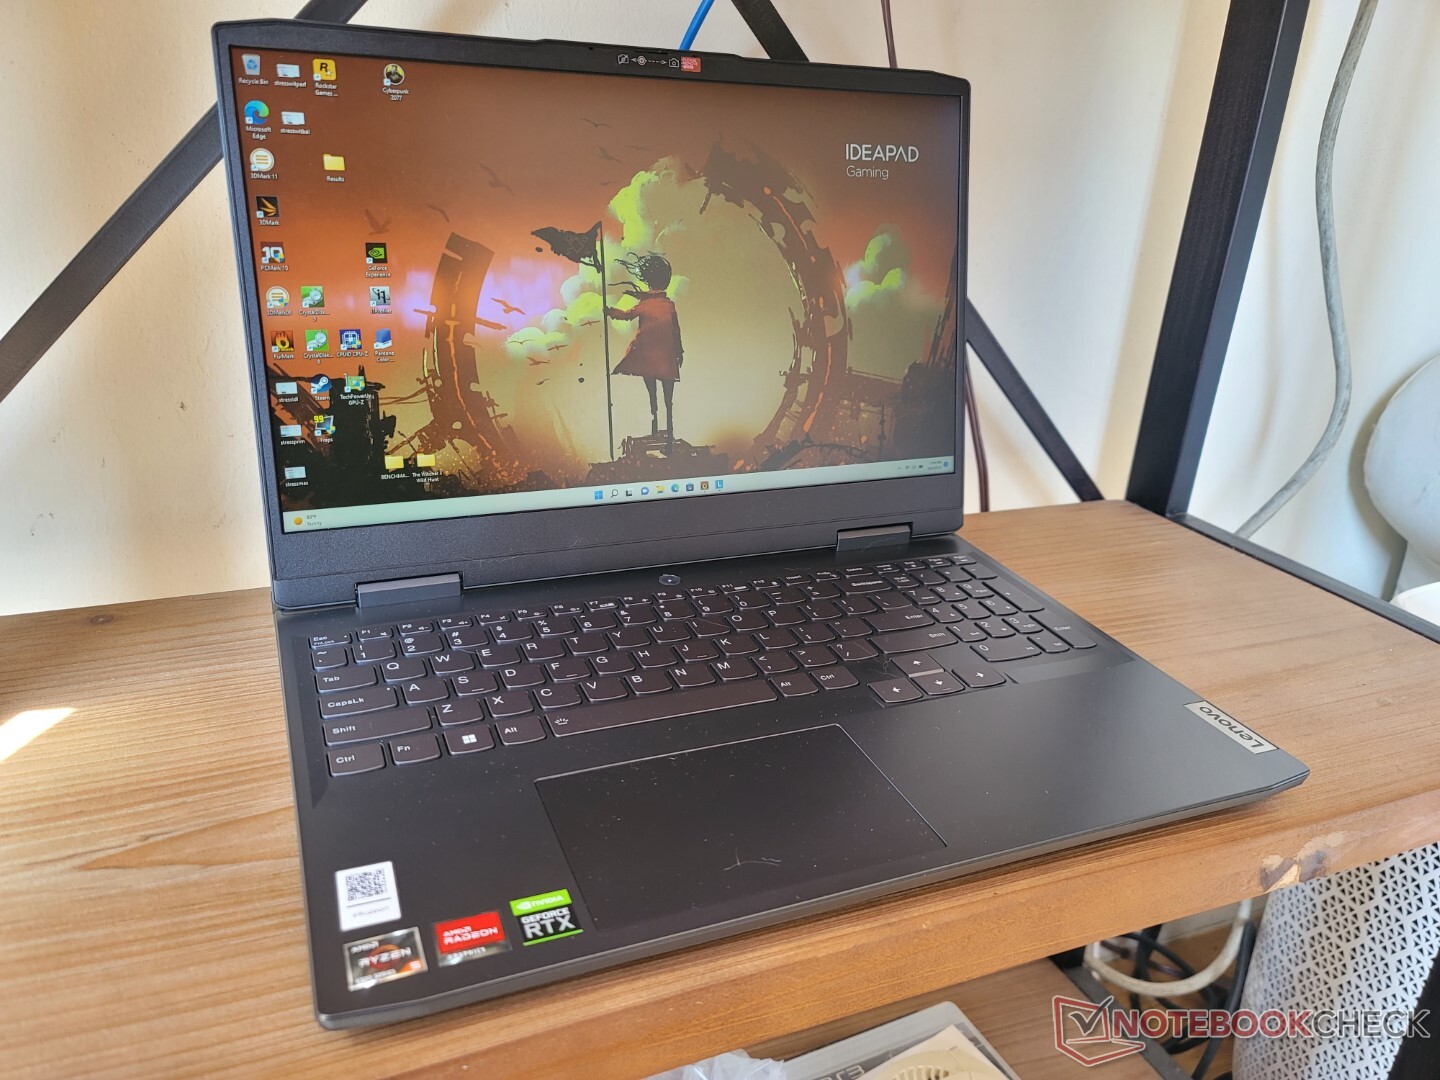
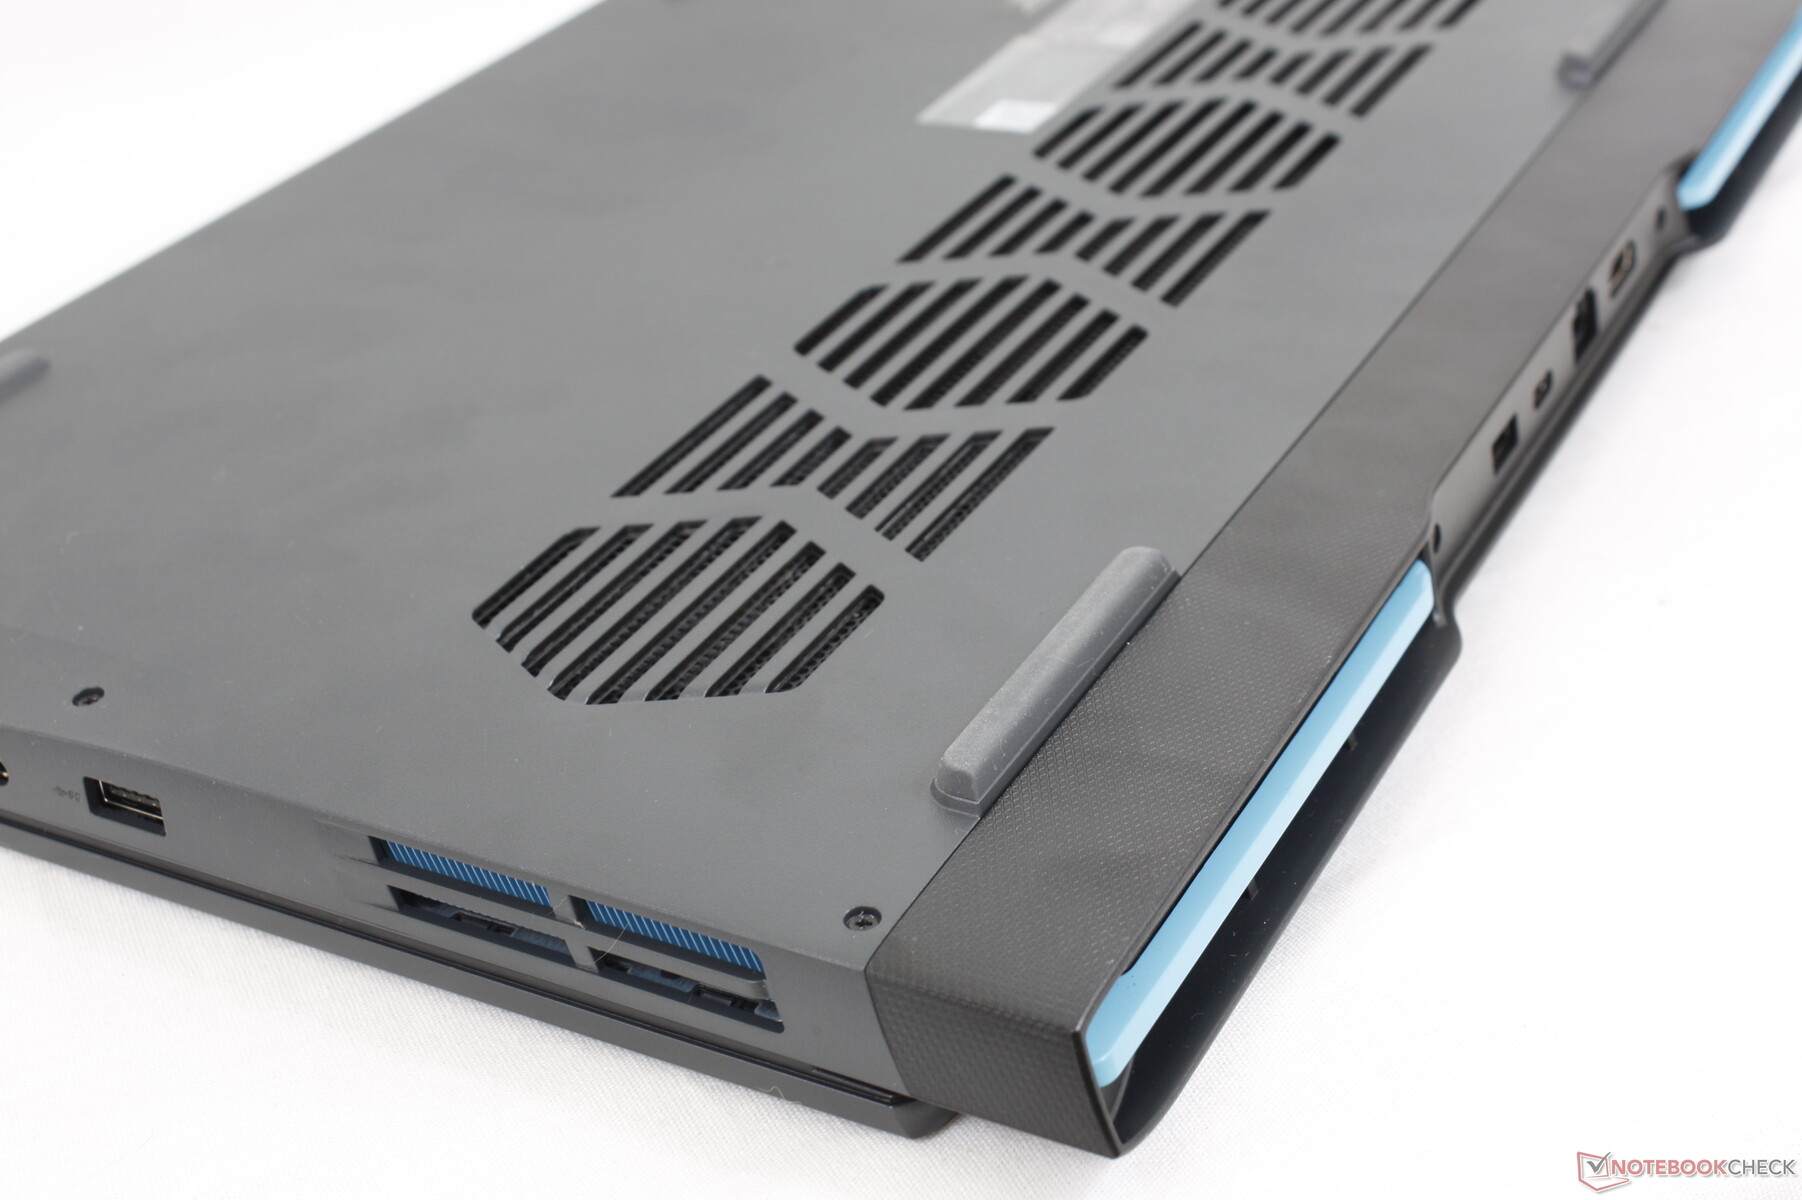
Case — New Look Inspired By Legion
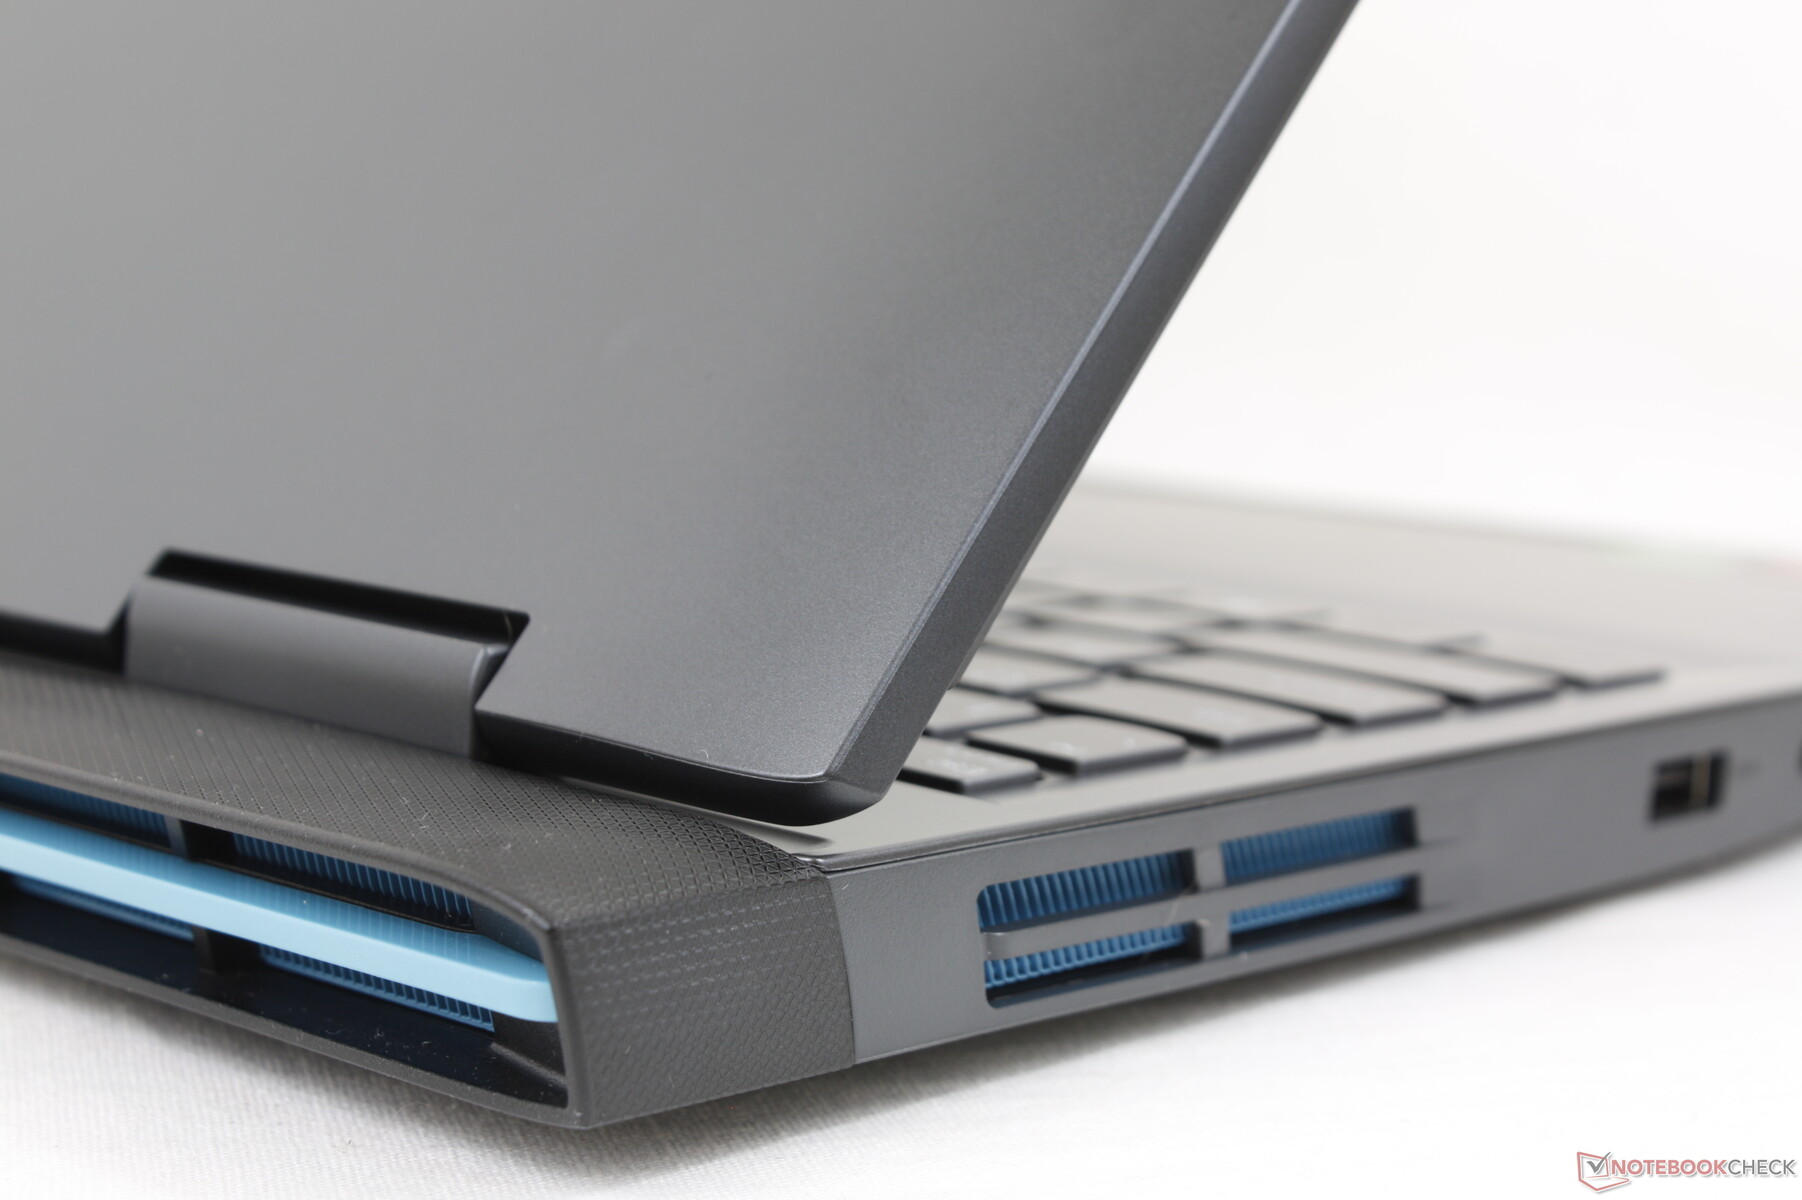
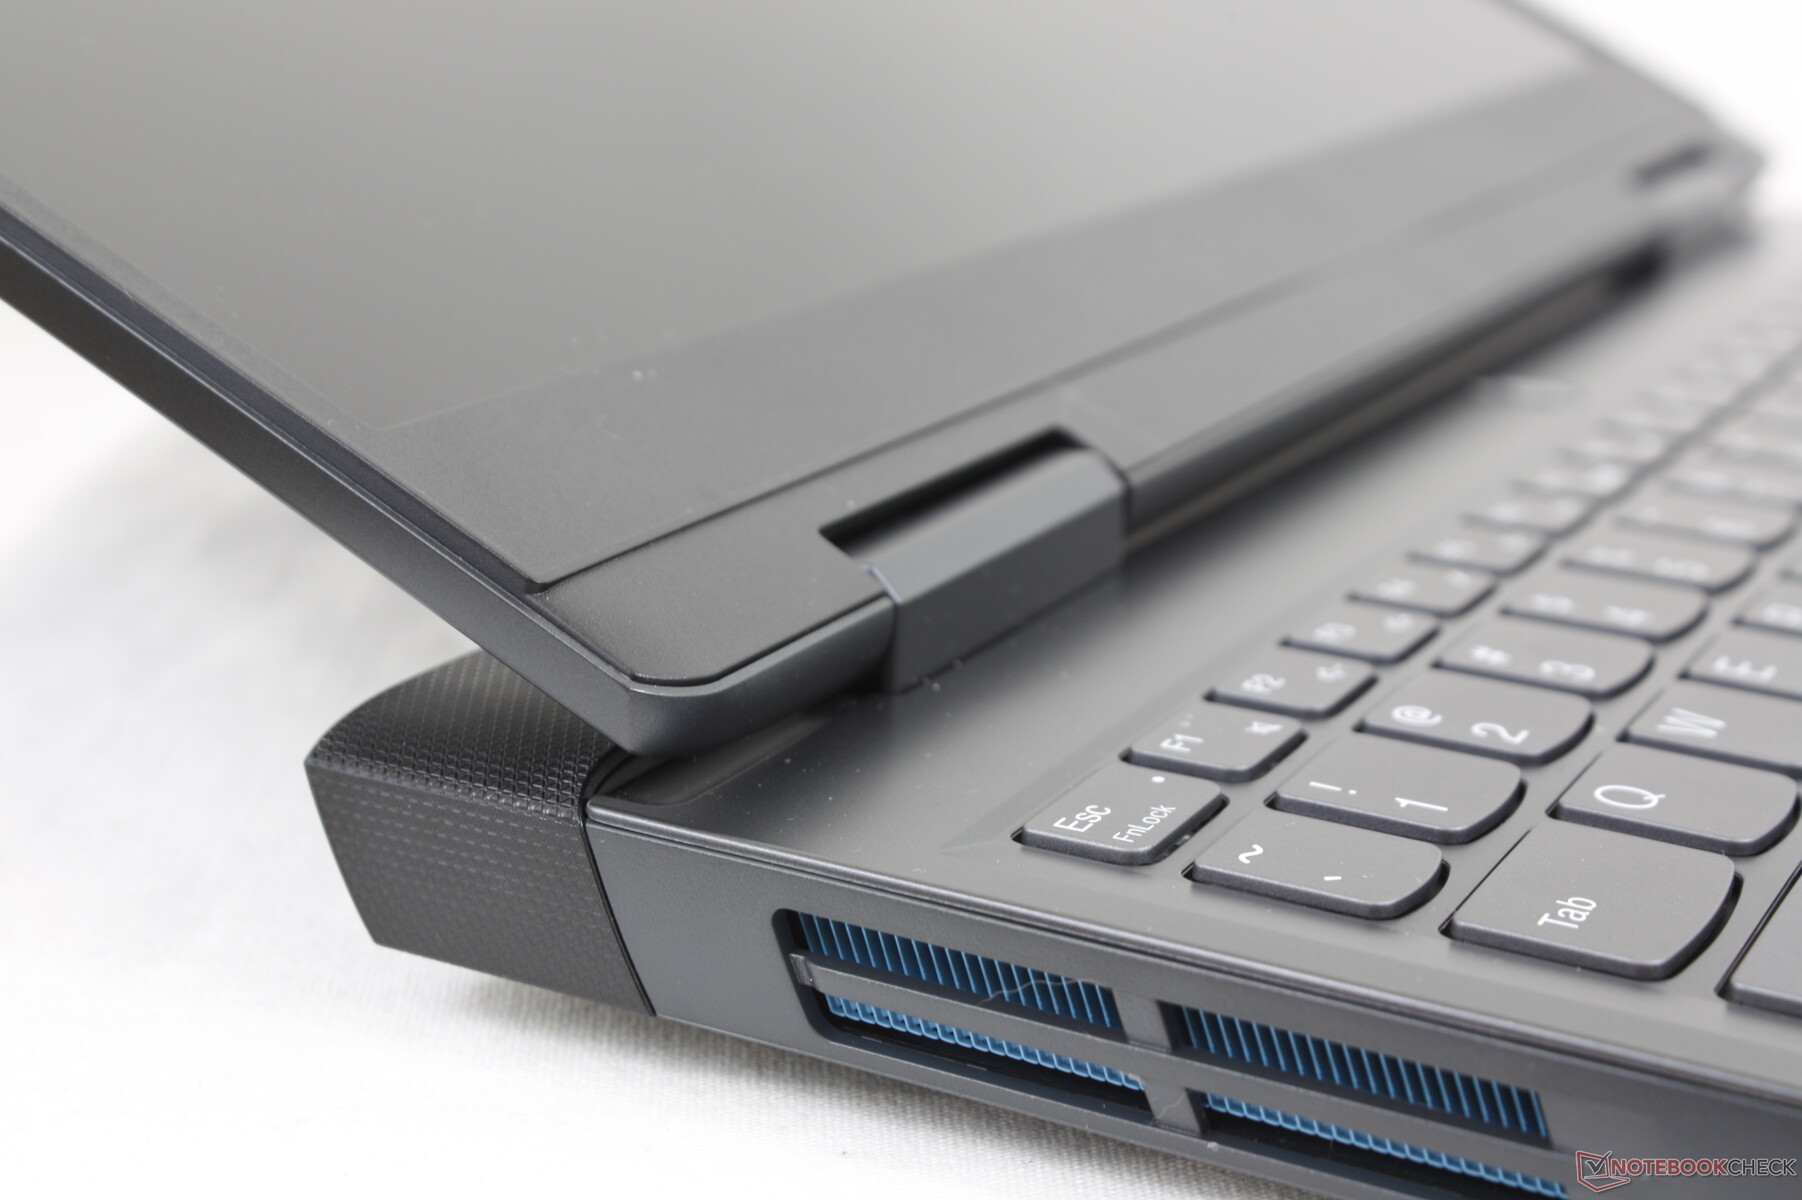
The redesigned chassis can be best described as a cheaper version of the Legion 5; whereas the latter consists mostly of metal alloy, the new IdeaPad Gaming 3 15 is mostly polycarbonate and plastic. The most noticeable visual change from the 2020 IdeaPad design relates to the new rear design intended to improve cooling but at the cost of a larger footprint and heavier weight.
Chassis rigidity is pretty good around the base as twists and depressions are minimal relative to other inexpensive gaming laptops like the MSI GF63 or or HP Pavilion Gaming 15. The hinges, however, are a different story as the display tends to teeter more than we would like when adjusting angles. Creaking becomes audible when the display is opened all the way which could be a potential problem several years down the line.
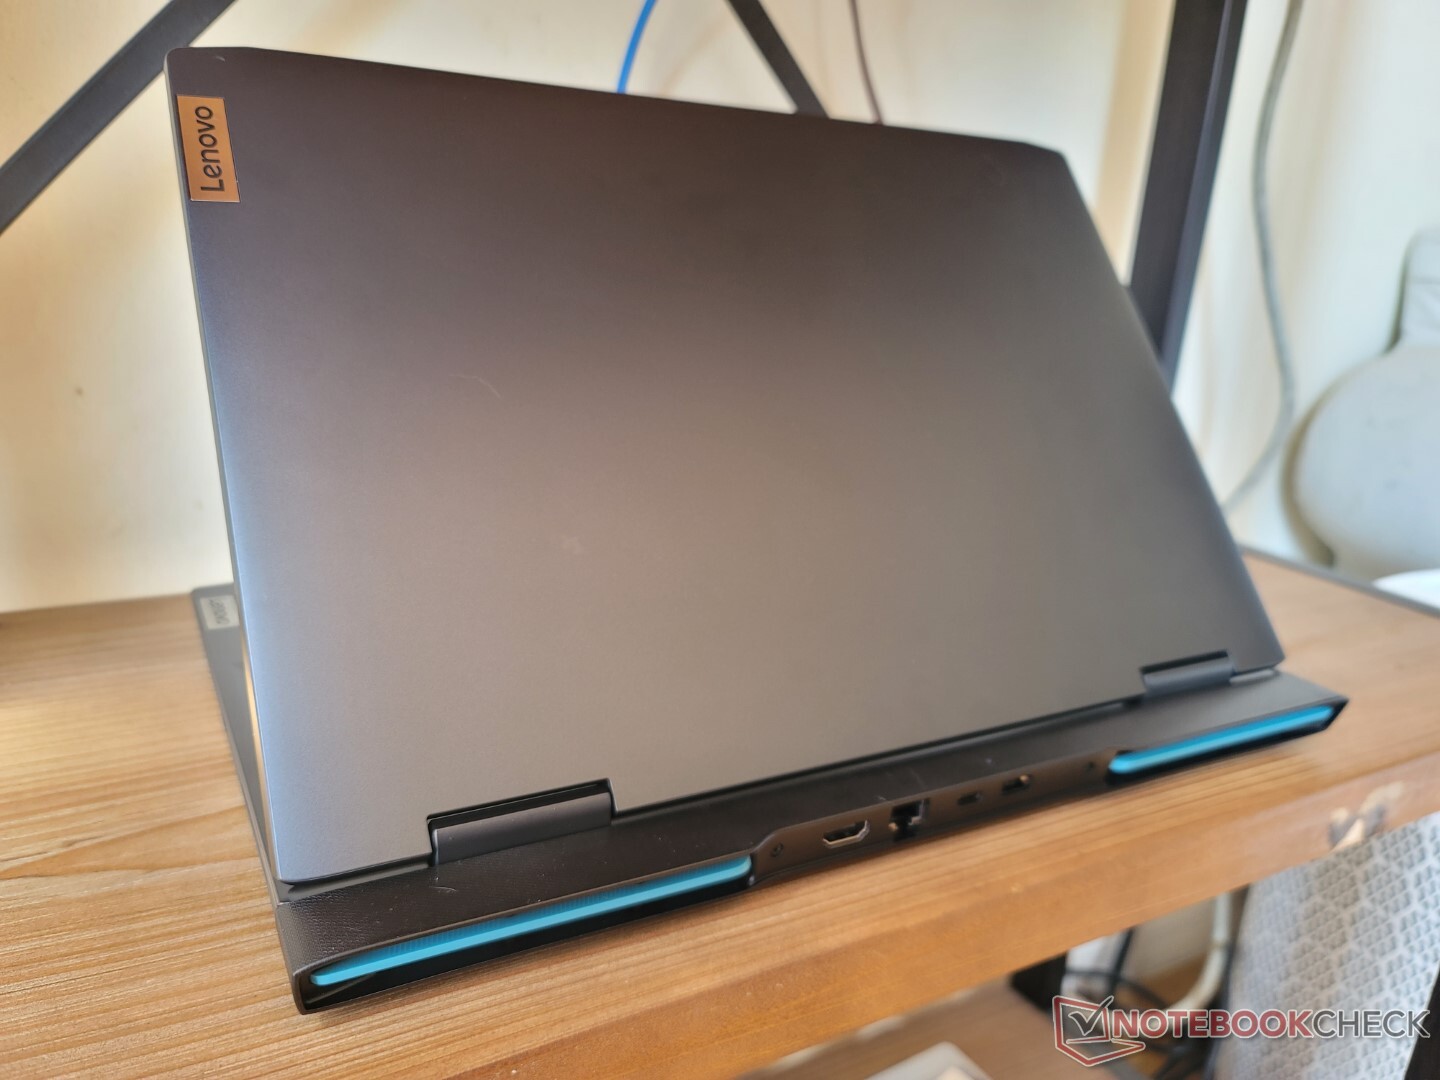
When compared to the 2020 IdeaPad Gaming 3, our 2022 model is larger and heavier by about 200 g. It's also thinner by a few millimeters, but the slightly thinner profile does little to appease the noticeably bulkier chassis. The size and weight gain can be attributed to the new elongated rear inspired by the Legion series.
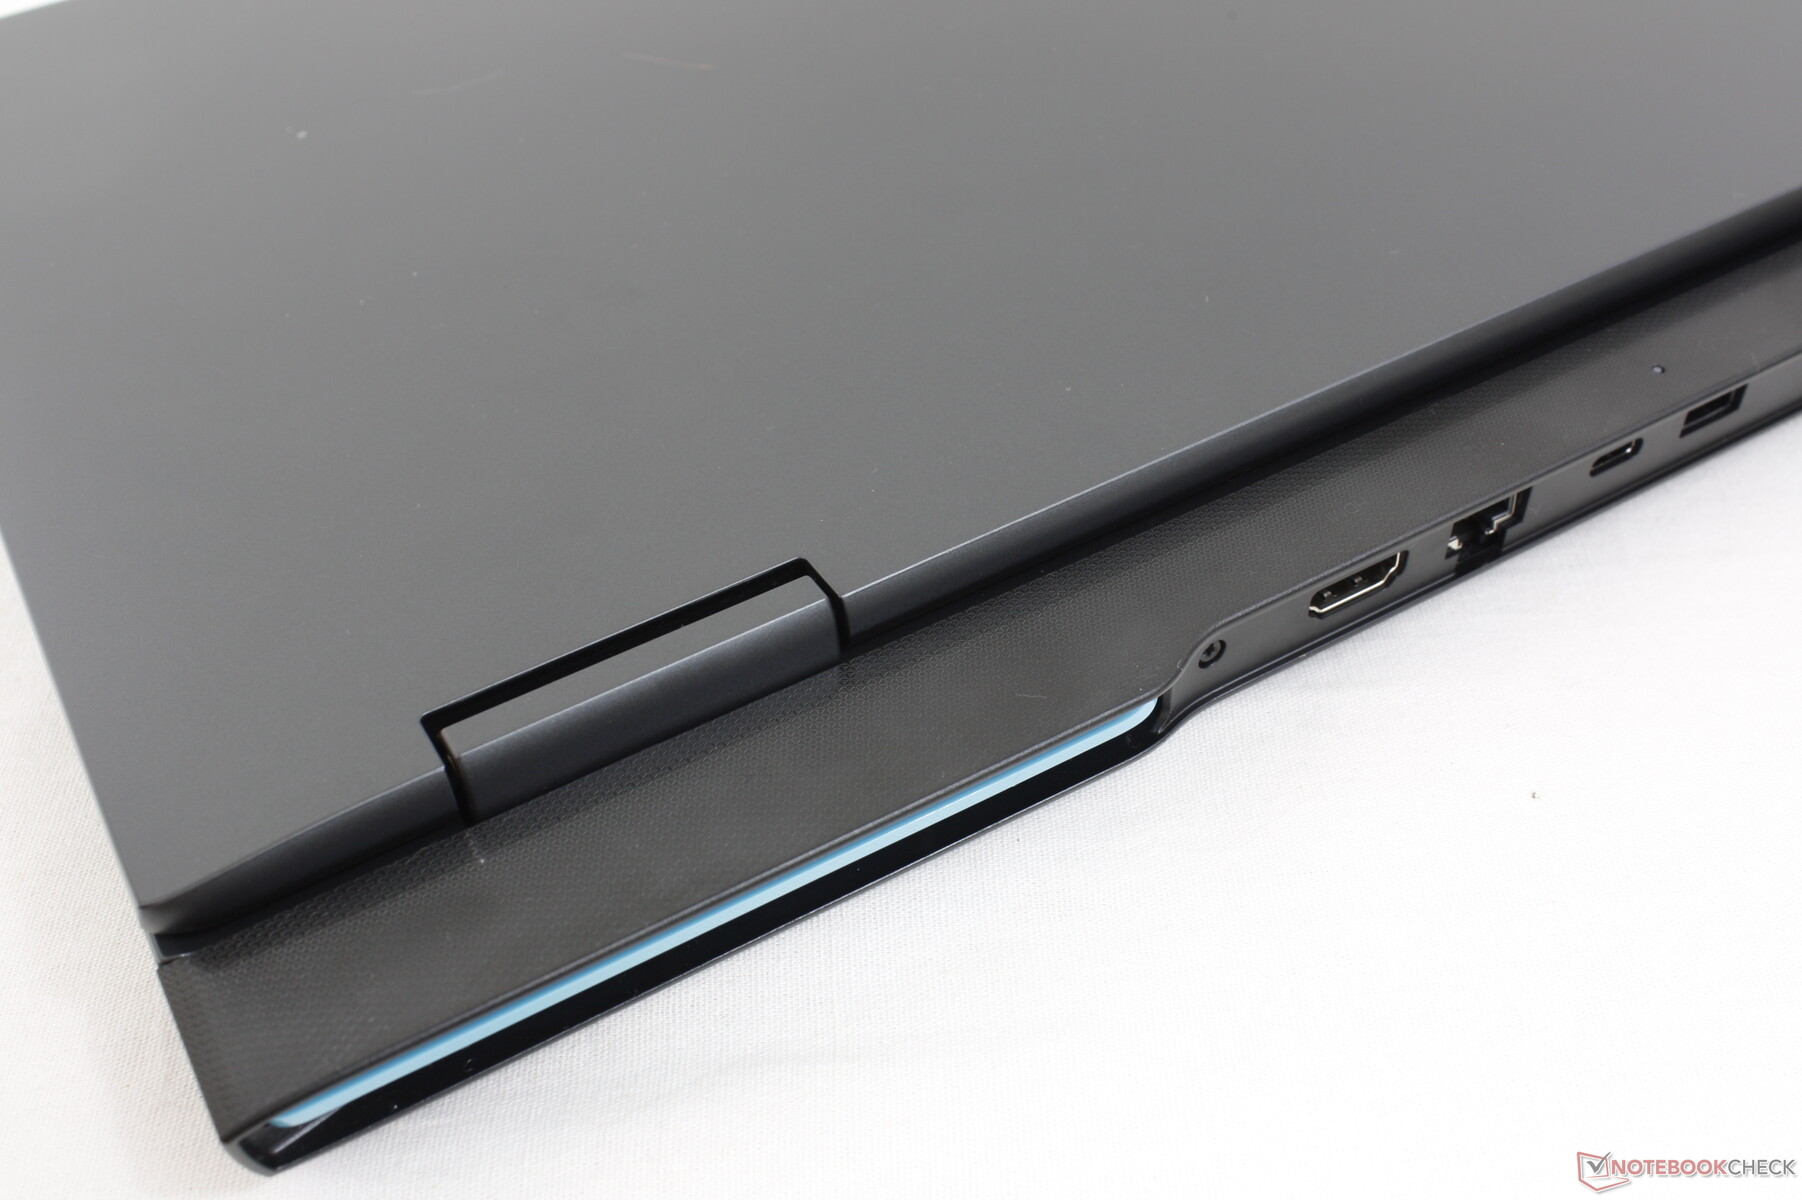
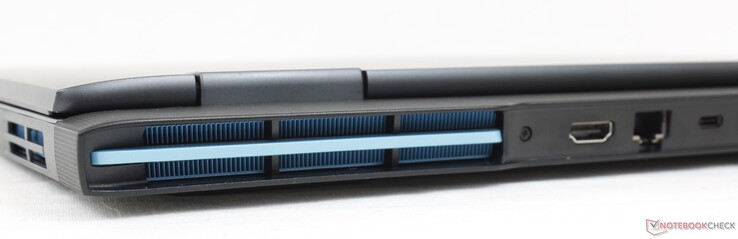
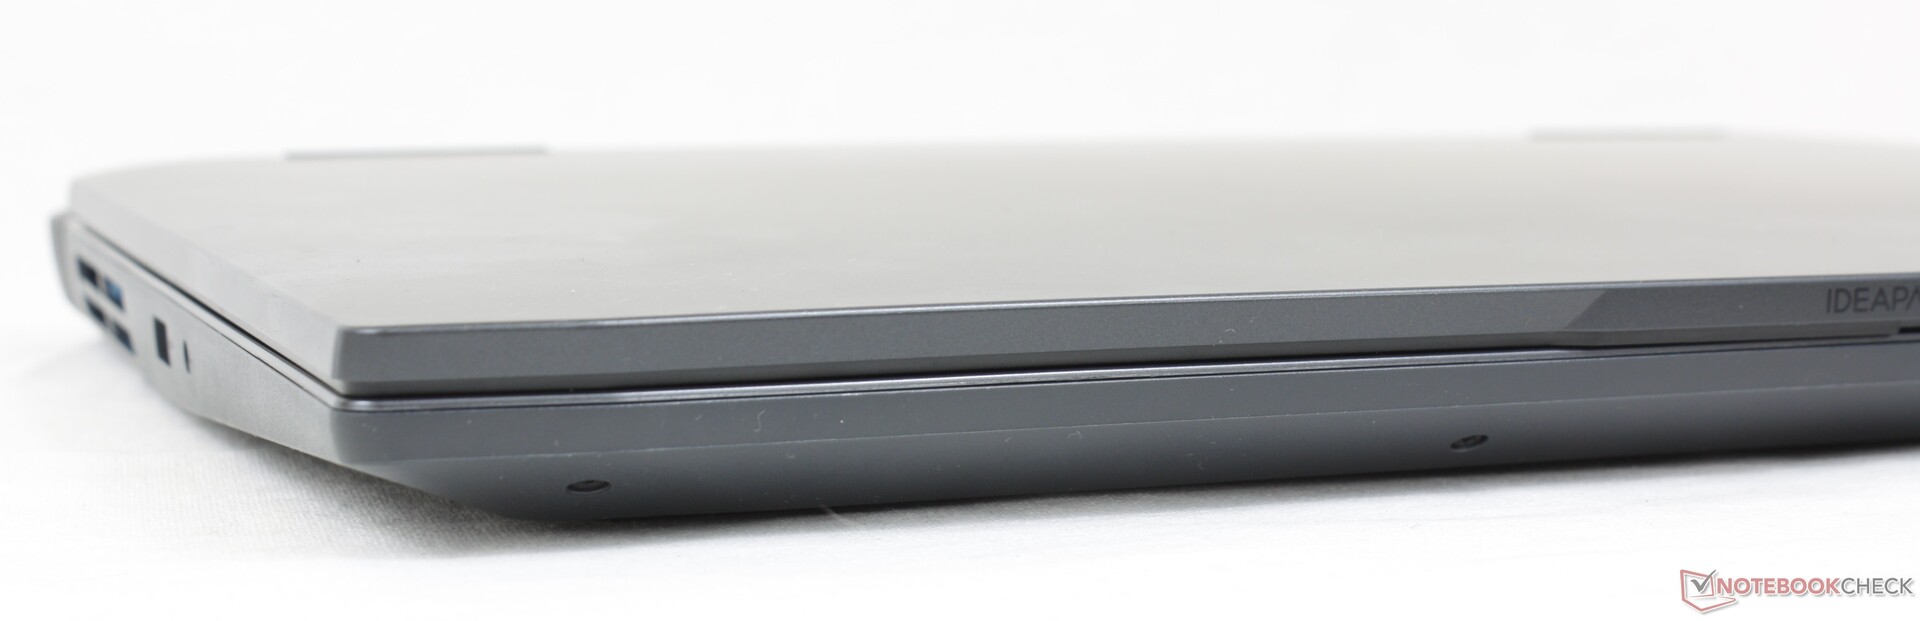
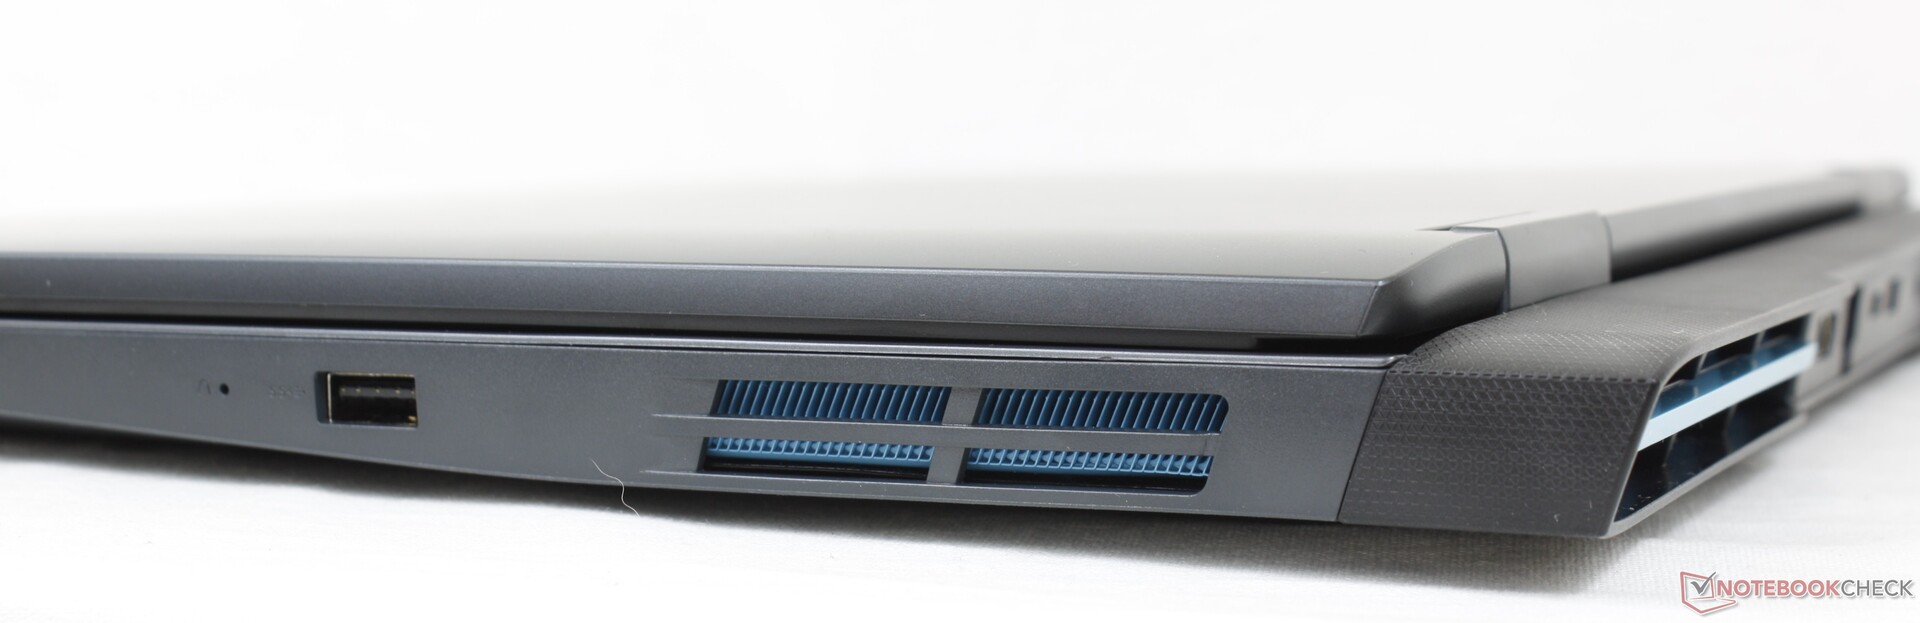
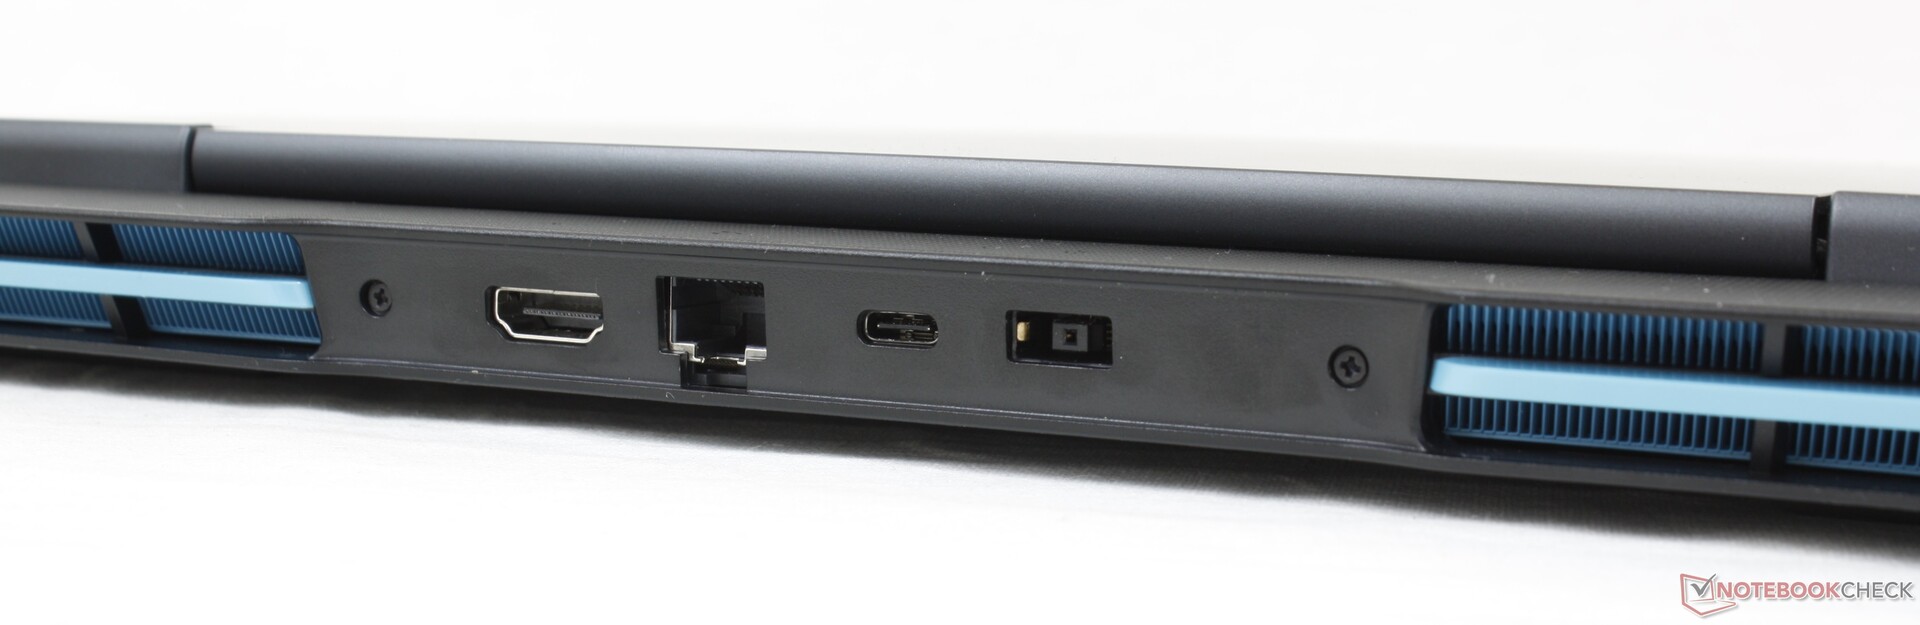
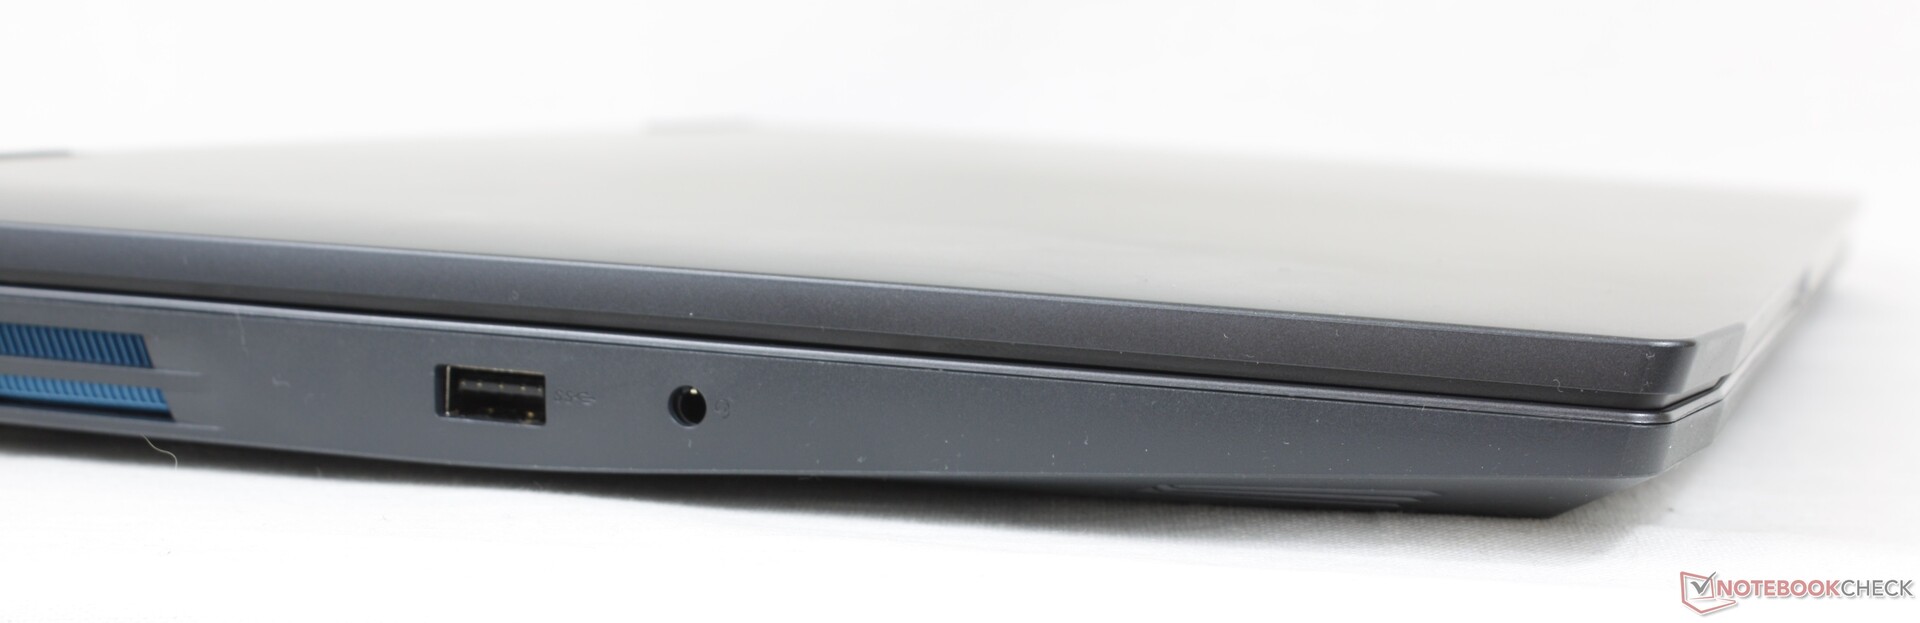
Connectivity — No Thunderbolt Support
Port options are decent and comparable to other budget gaming laptops. Port positioning is a mixed bag, however, since most ports are along the rear of the unit where they can be difficult to reach. Keep in mind that Thunderbolt is not supported unlike on many Intel-powered gaming laptops.
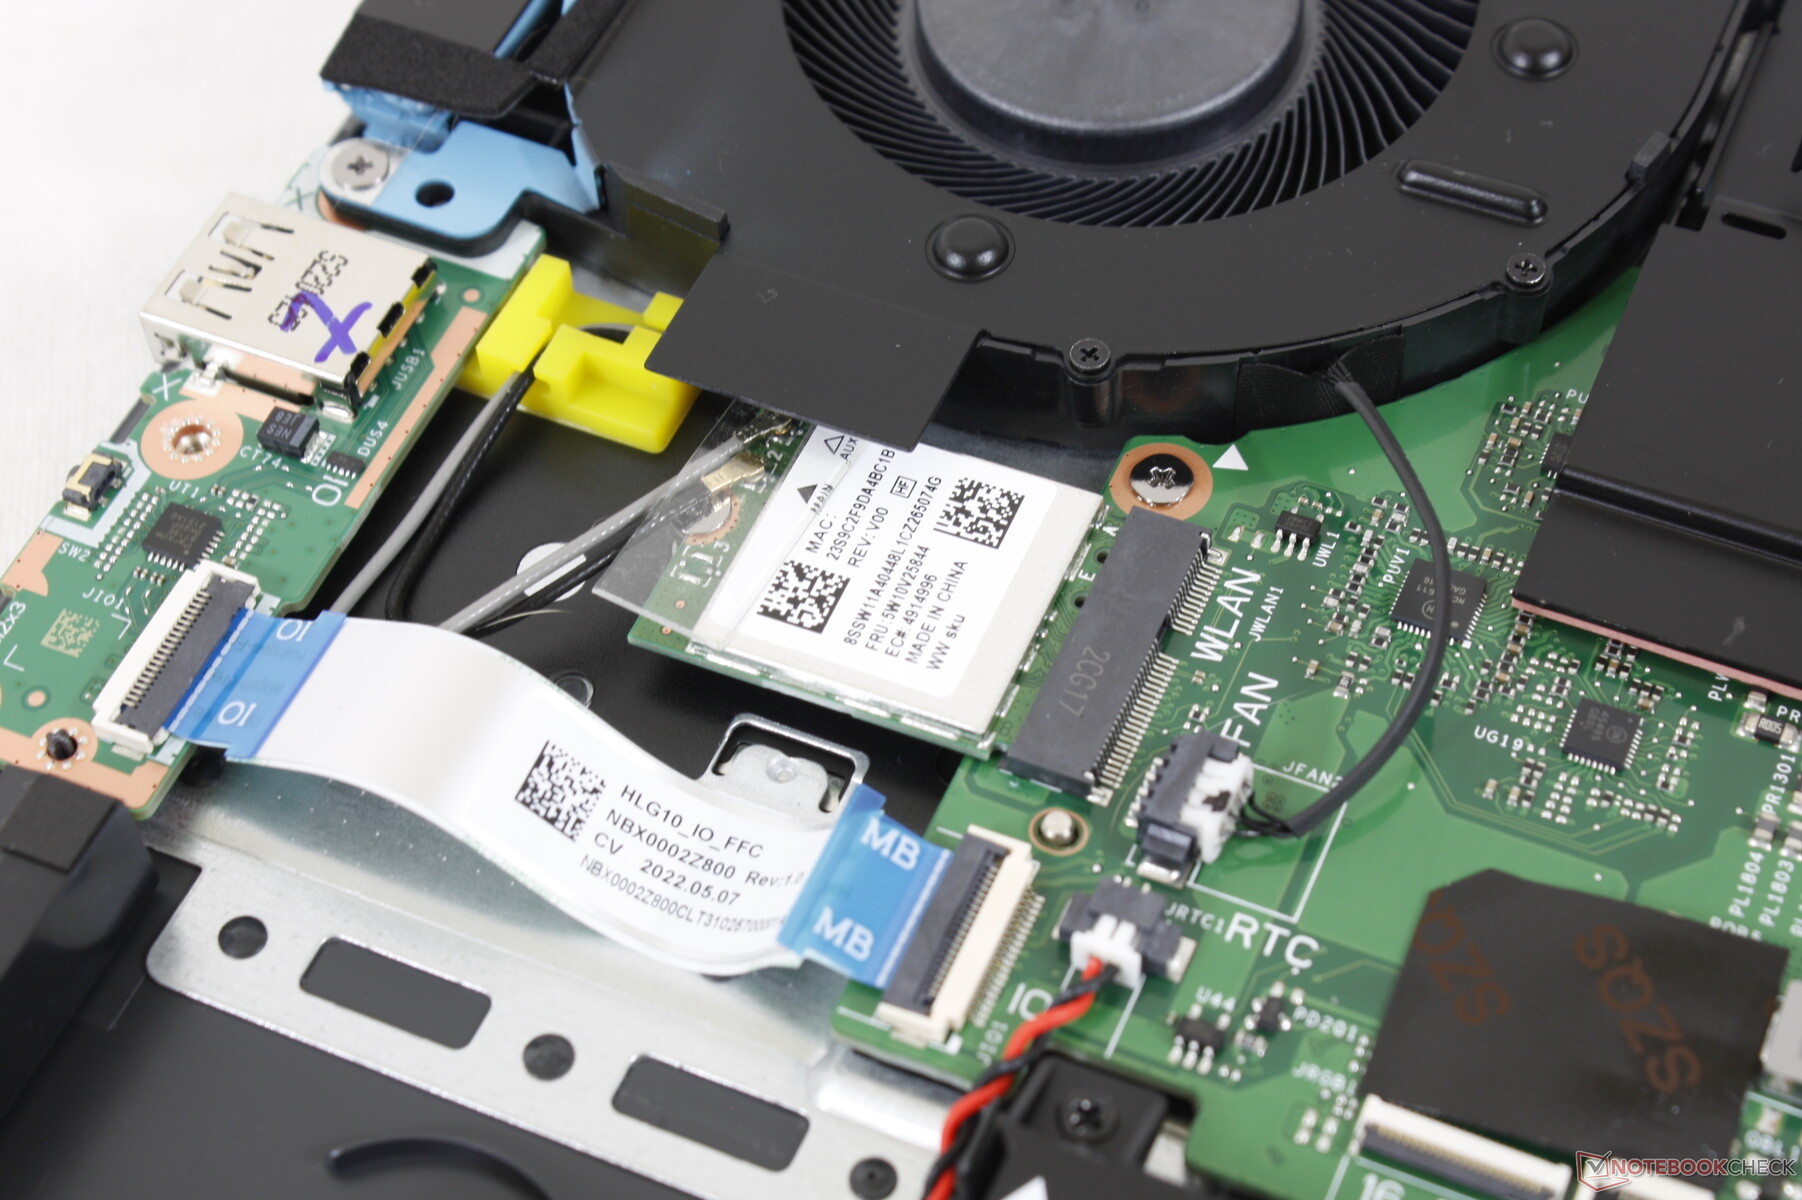
Communication
The unit ships with a Realtek RTL8852BE for Wi-Fi 6 and Bluetooth 5.1 connectivity instead of an Intel AX module likely to save on costs. Transfer rates are significantly slower, but they are nevertheless steady and fast enough for most purposes including 4K video streaming or downloads.
| Networking | |
| iperf3 transmit AX12 | |
| Lenovo Legion 5 15ACH6A-82NW0010GE | |
| Lenovo IdeaPad Gaming 3i 15IMH05 | |
| iperf3 receive AX12 | |
| Lenovo Legion 5 15ACH6A-82NW0010GE | |
| Lenovo IdeaPad Gaming 3i 15IMH05 | |
| iperf3 receive AXE11000 | |
| Gigabyte A5 K1 | |
| Dell G15 5510 | |
| Asus TUF Dash F15 FX517ZR | |
| Lenovo IdeaPad Gaming 3 15ARH7 | |
| iperf3 transmit AXE11000 | |
| Gigabyte A5 K1 | |
| Asus TUF Dash F15 FX517ZR | |
| Lenovo IdeaPad Gaming 3 15ARH7 | |
Webcam
The integrated webcam is only 1 MP for a muddy picture. While there is a shutter for privacy, there is no IR for Hello support.


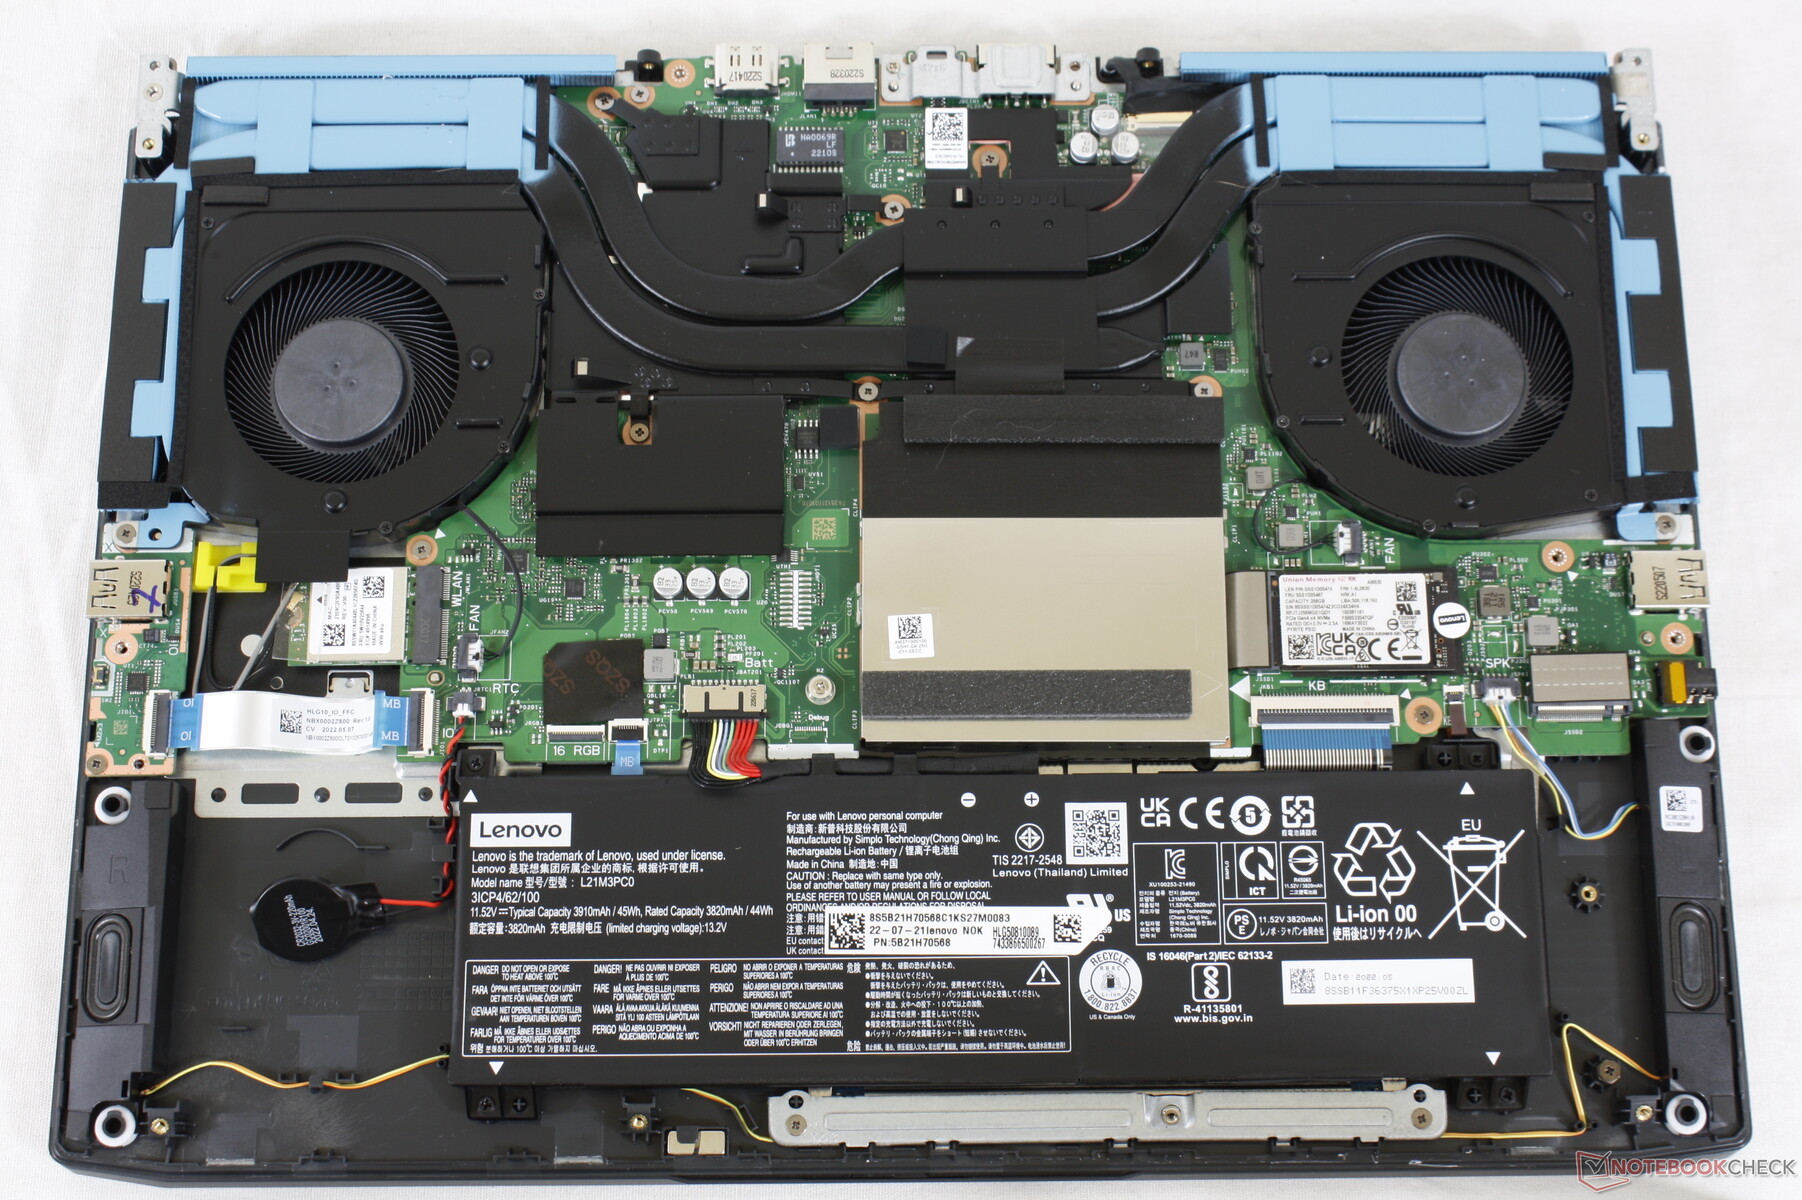
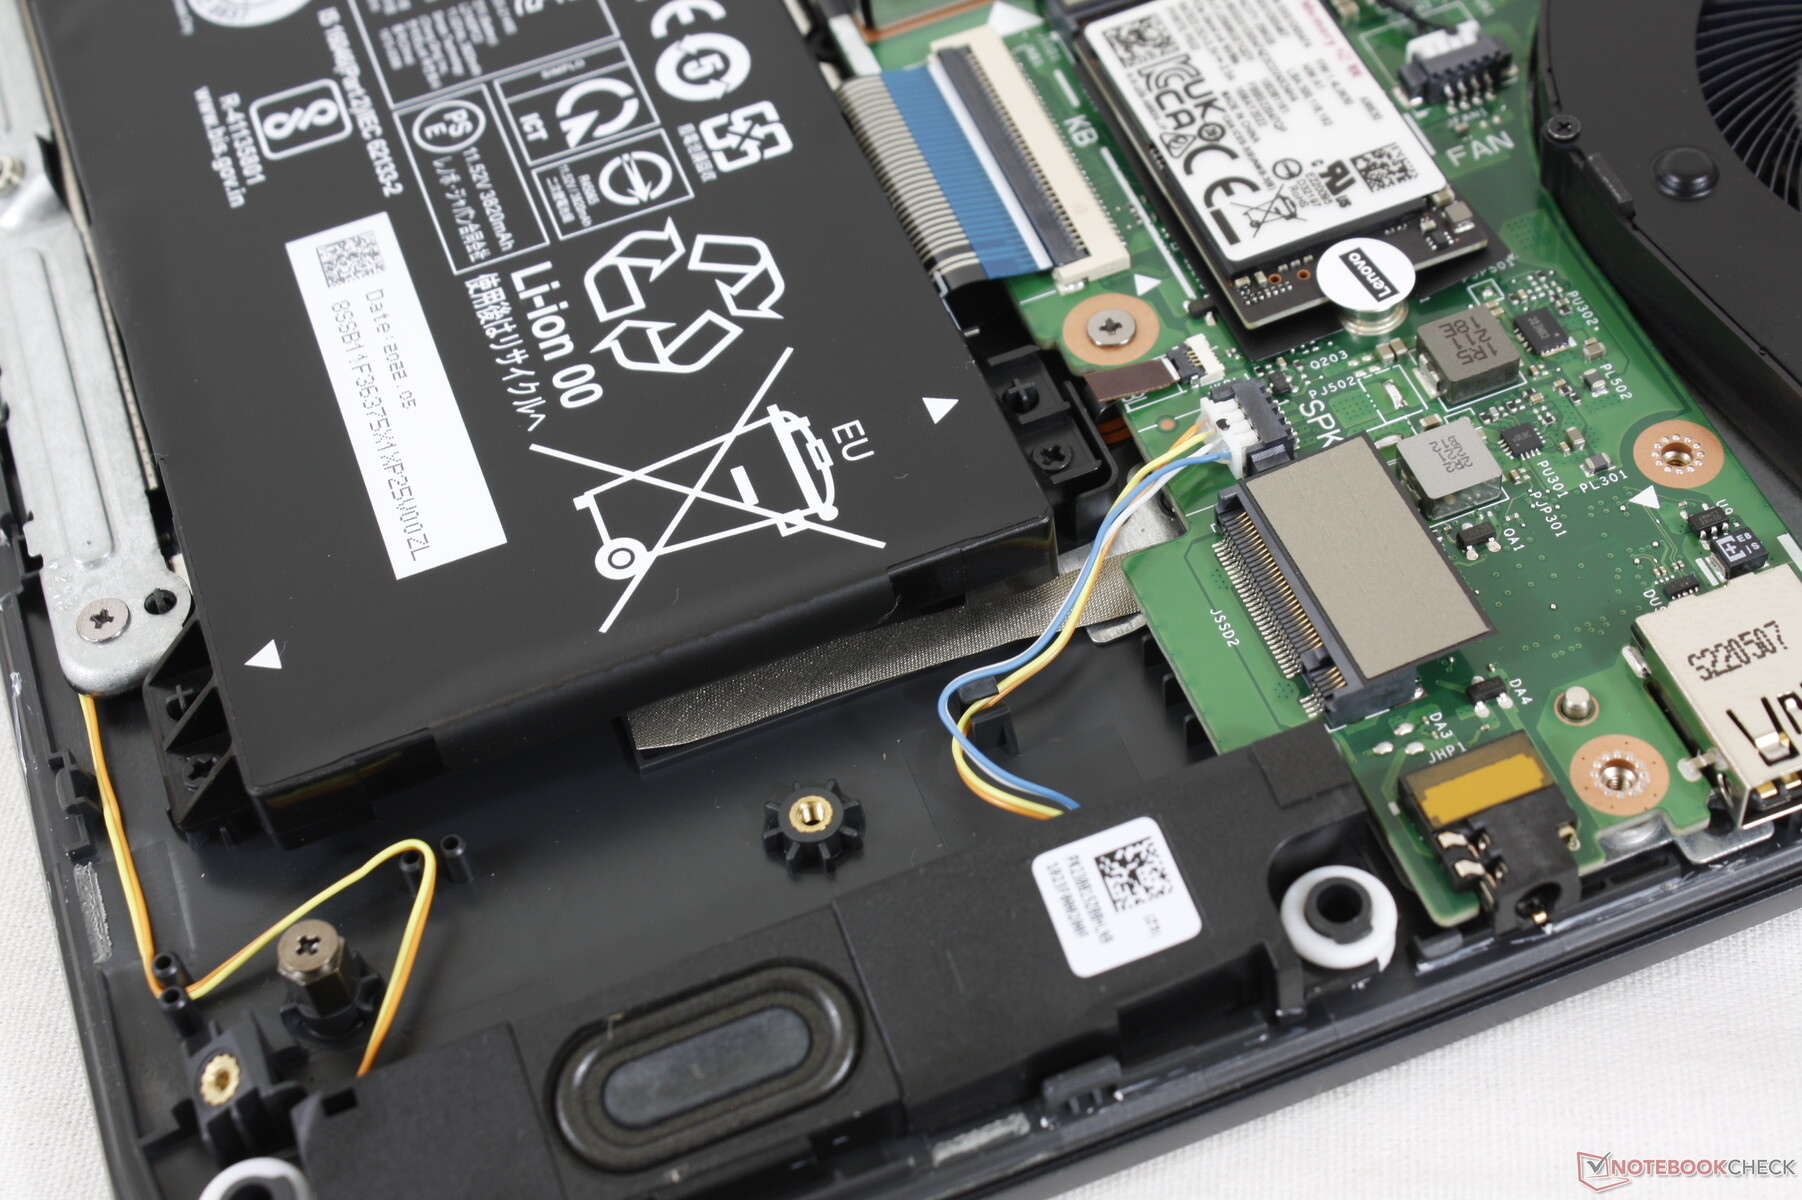
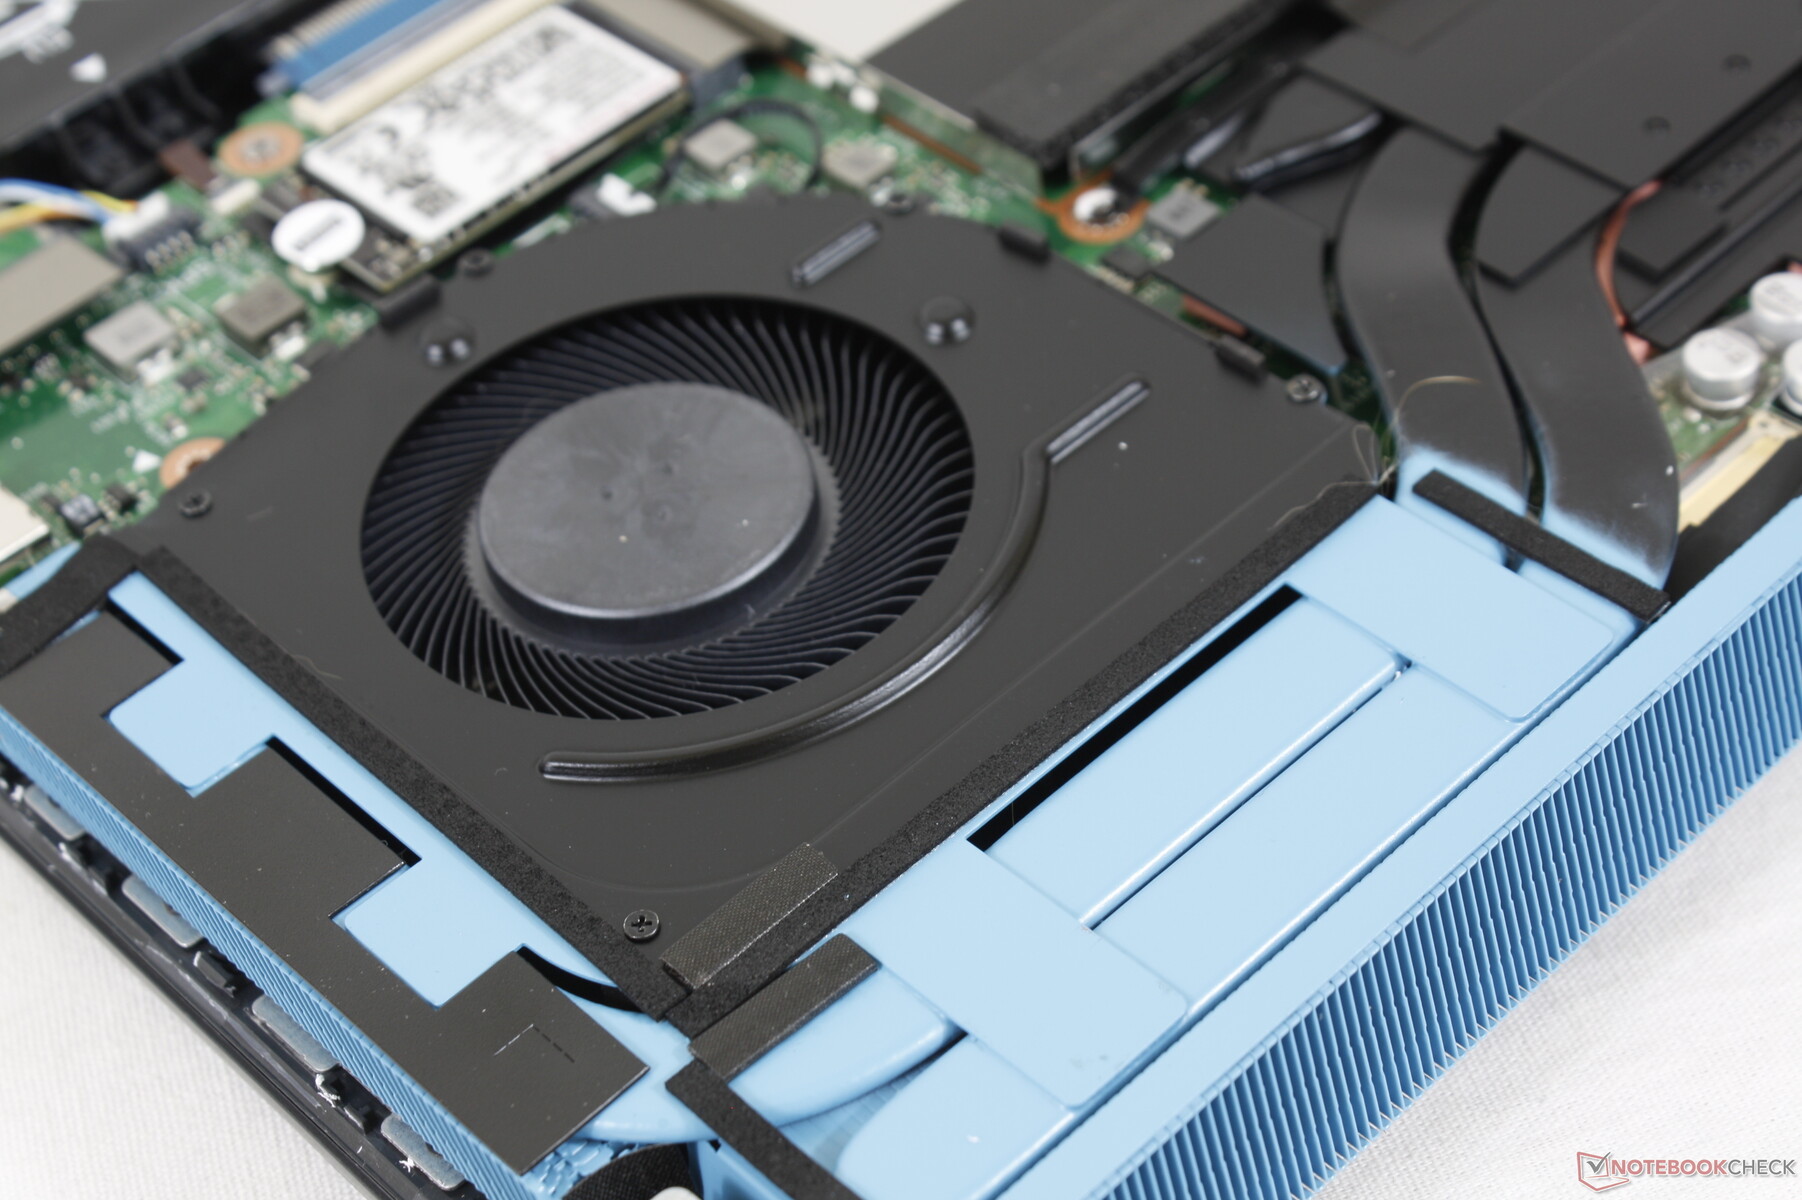
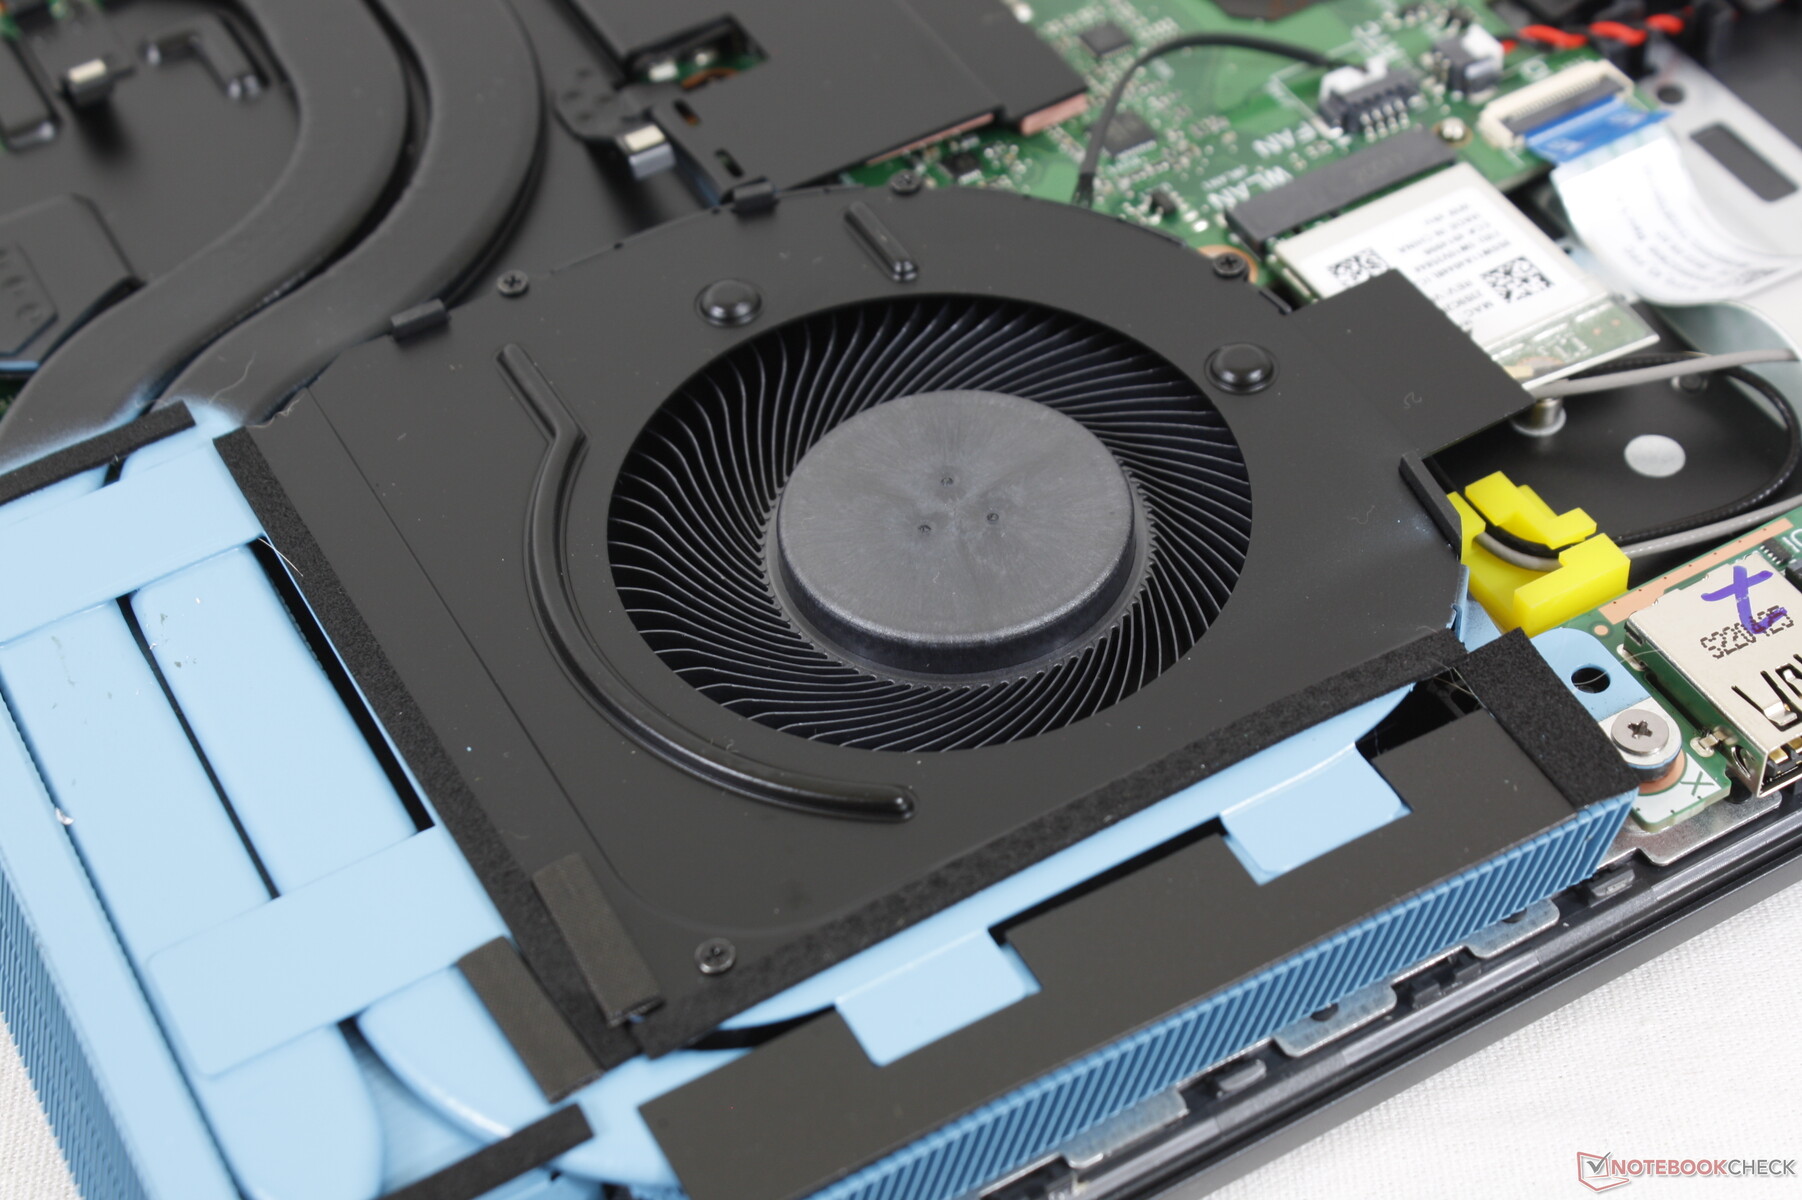
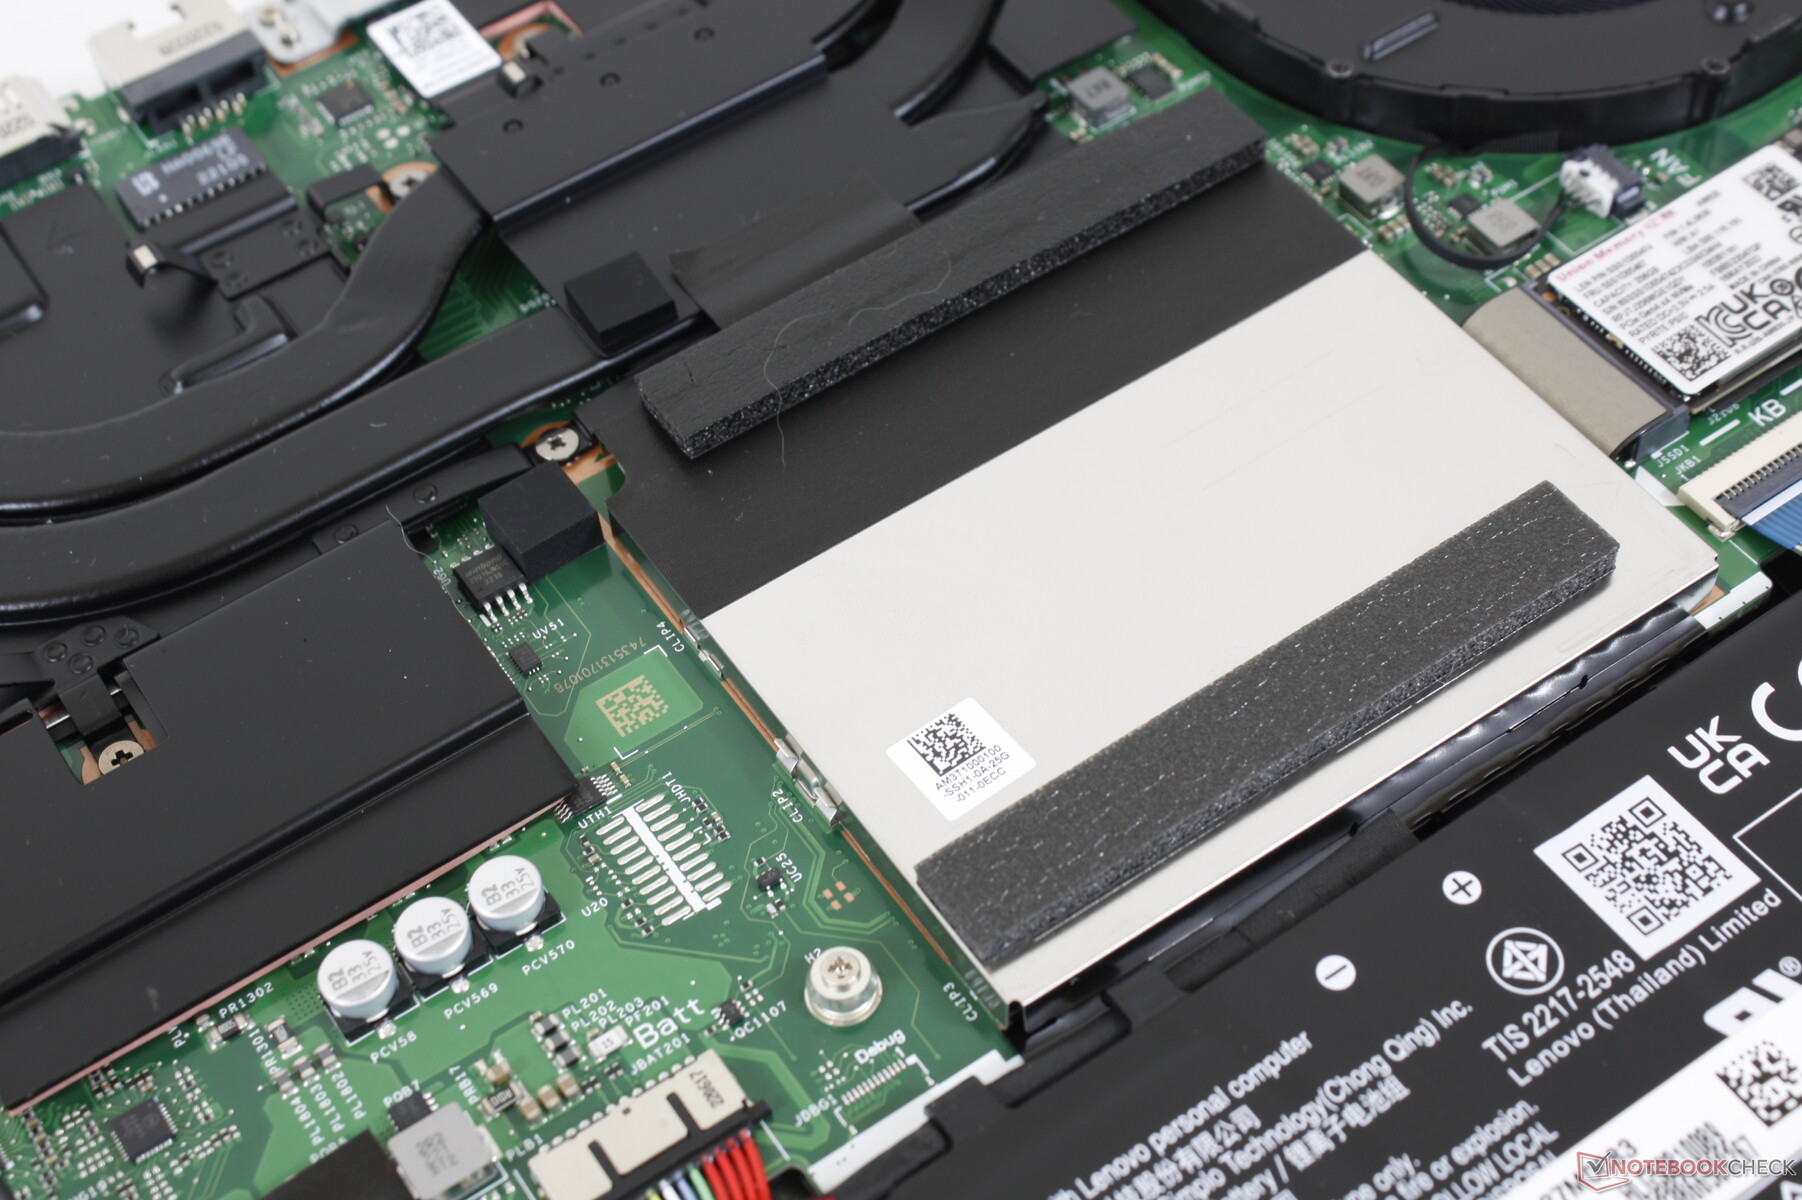
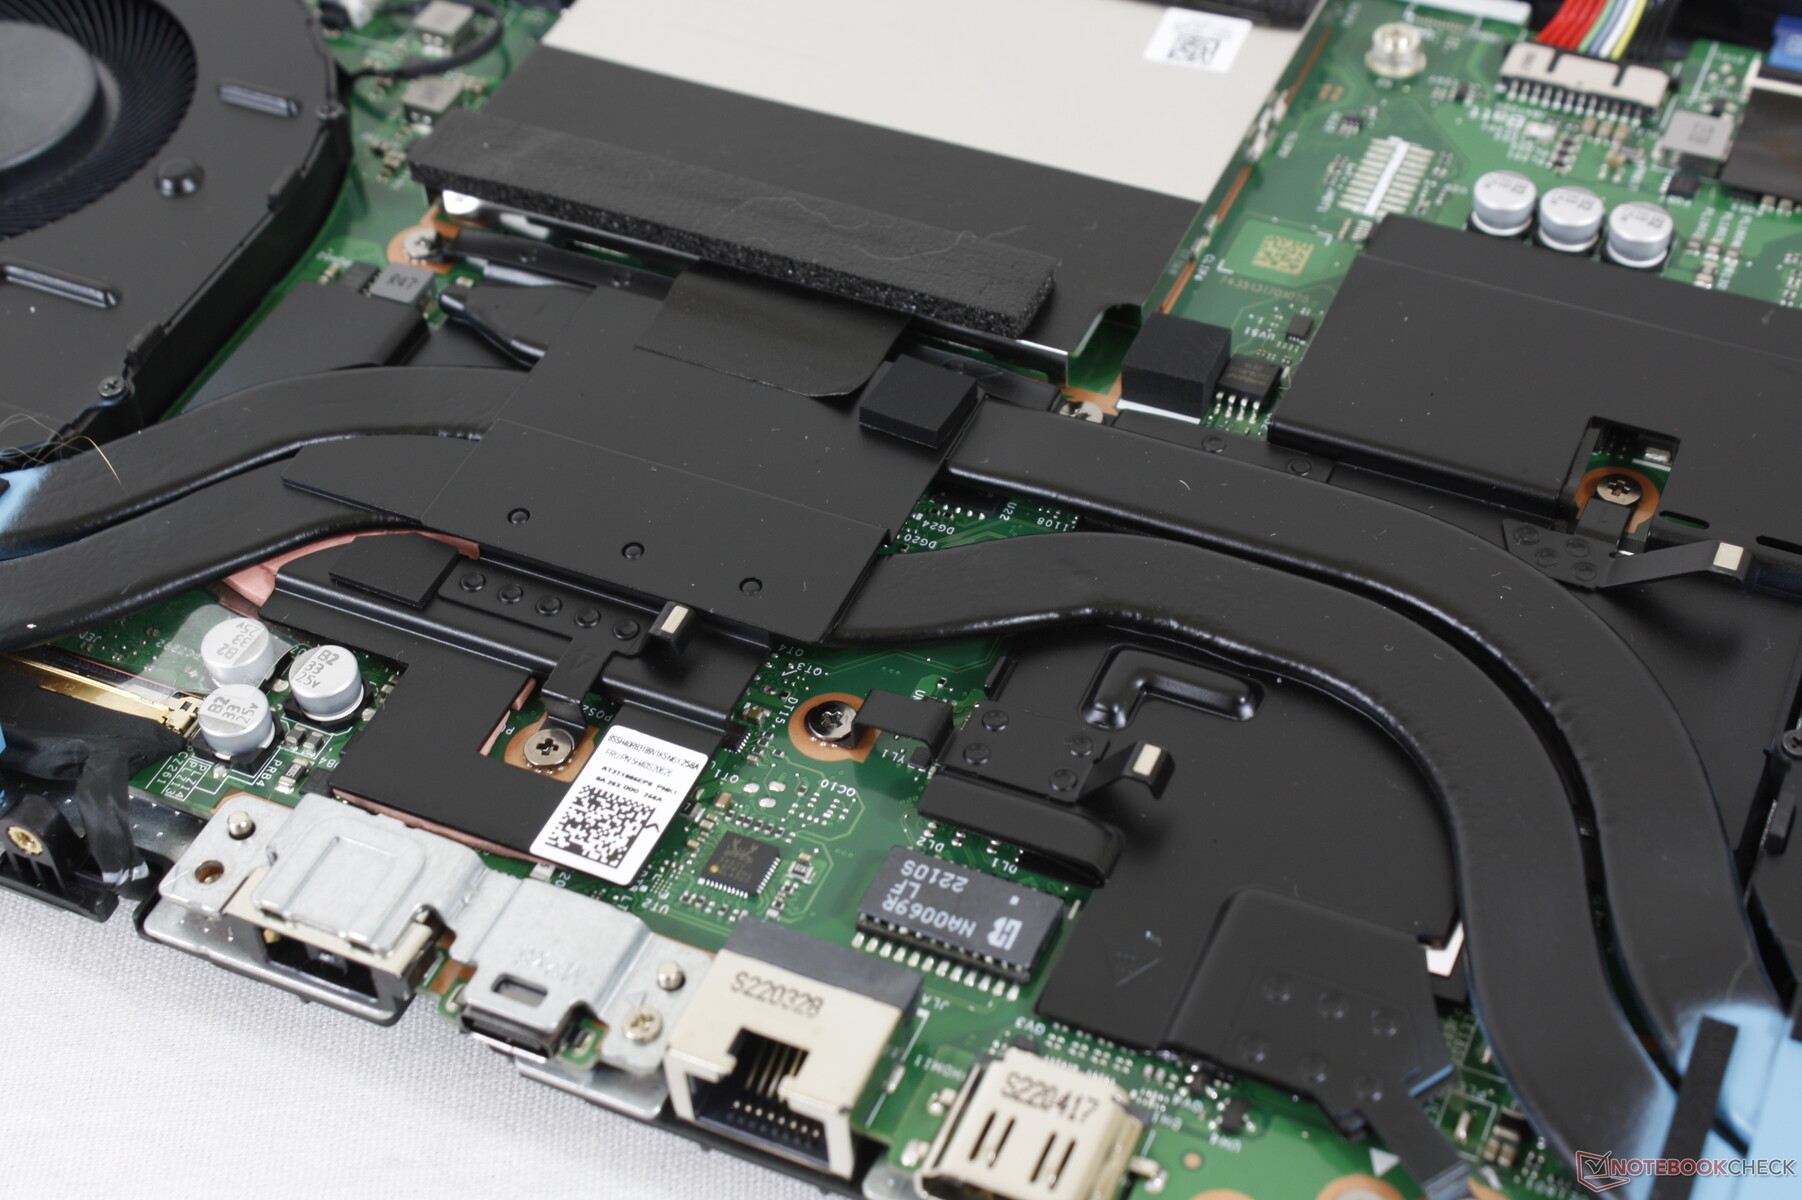
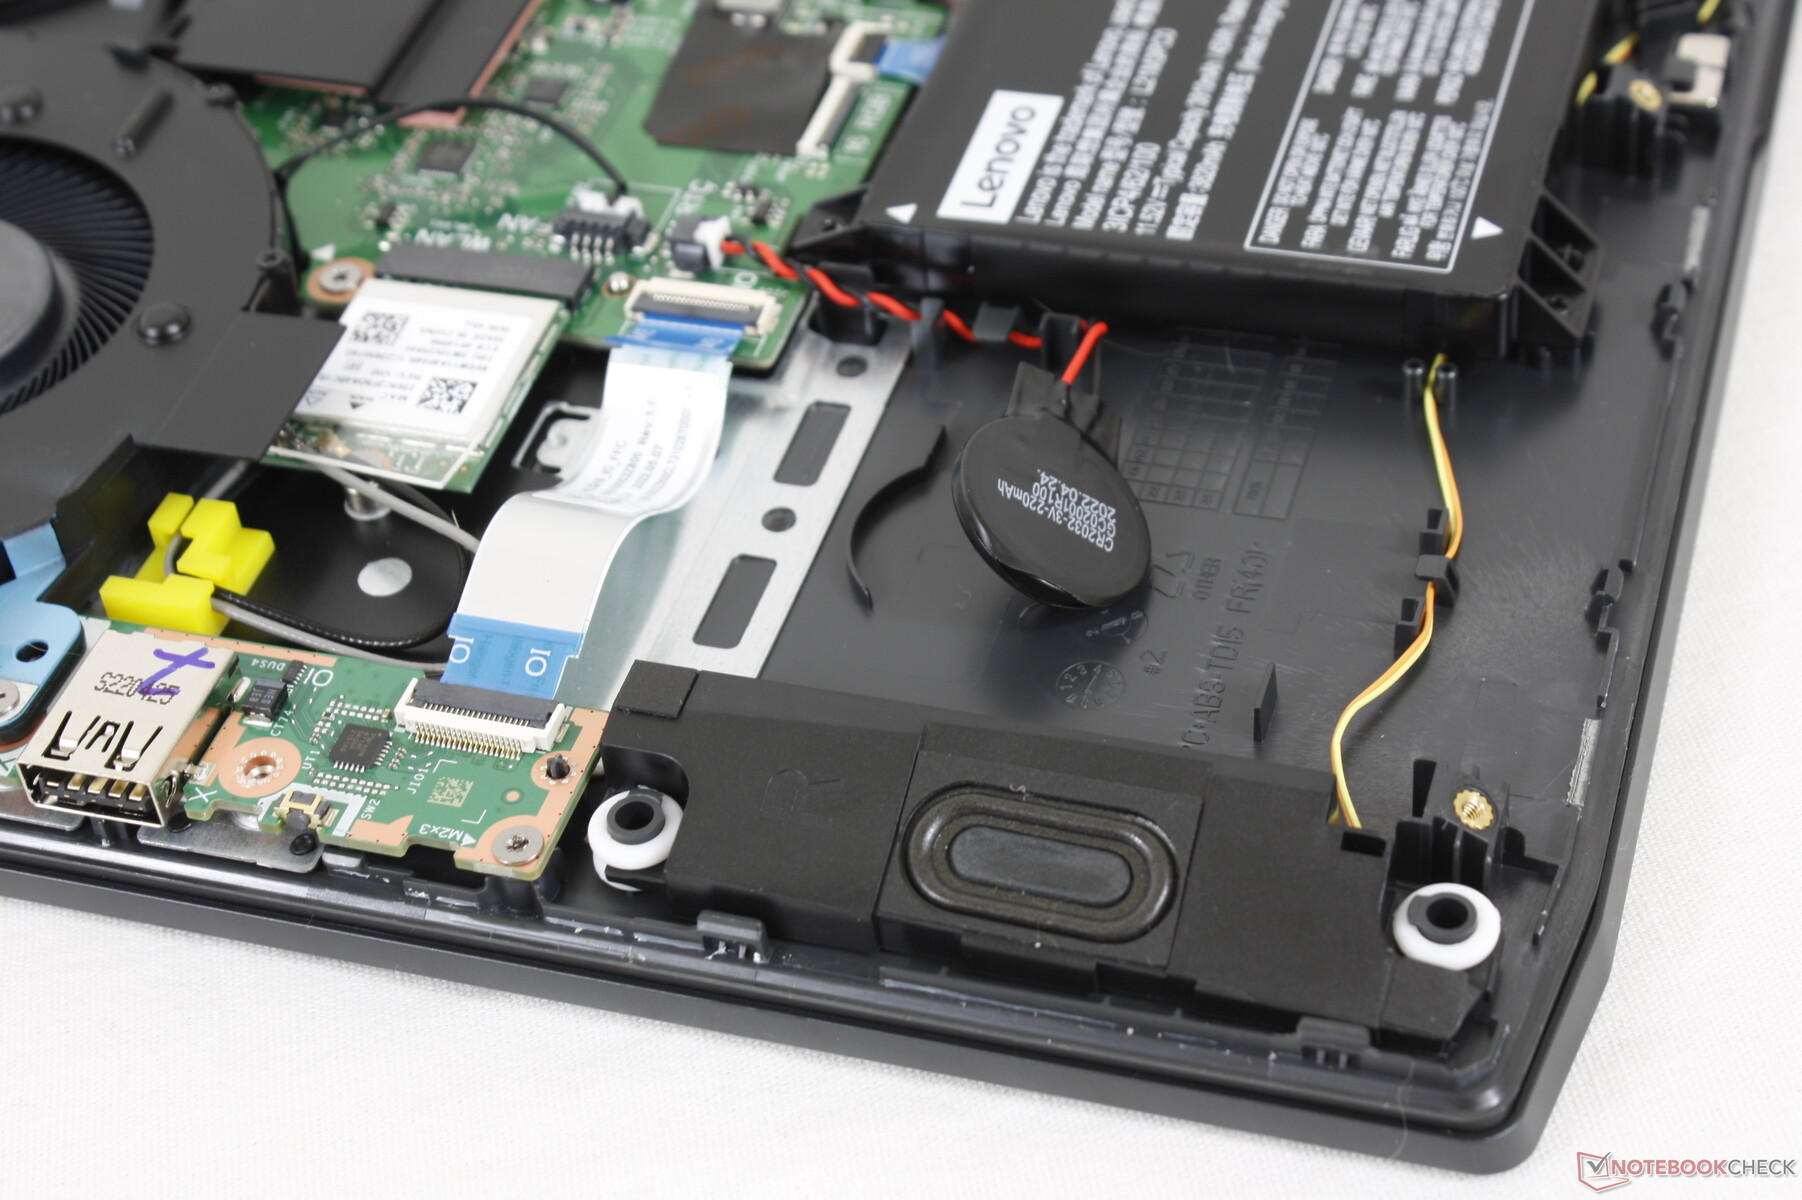
Maintenance — Too Difficult To Open
The bottom panel is very difficult to remove. It is secured by 12 Philips screws, but only 8 are easily accessible. To access the other 4, the rear shell must be detached first which is secured by 2 more screws near the back ports. Removing this rear shell from the body is an extra step not present on most other gaming laptops. It's clear that Lenovo didn't design the IdeaPad Gaming 3 15 to be easily upgradeable by the end user which is a shame since there are actually many upgrade paths including 2x SODIMM slots and 2x M.2 storage bays.
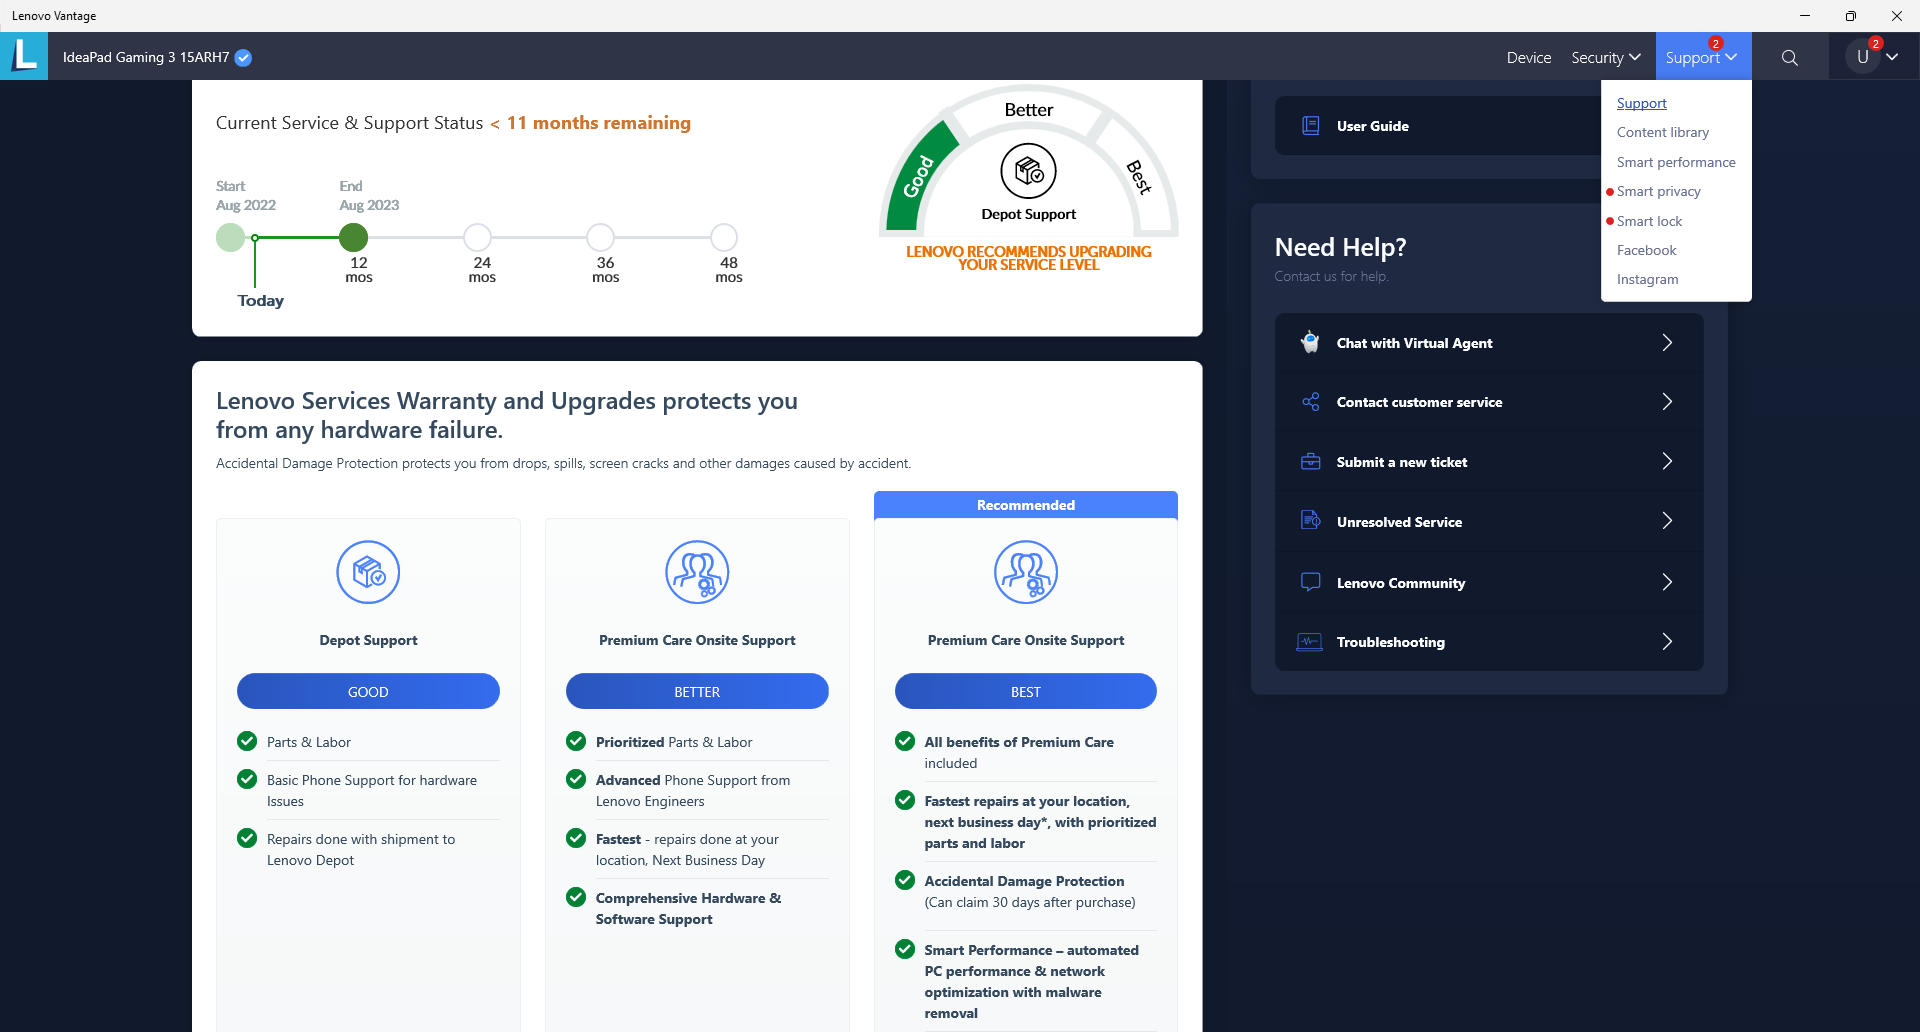
Accessories and Warranty
There are no extras in the box beyond the AC adapter and paperwork. The usual one-year limited warranty applies if purchased in the US.
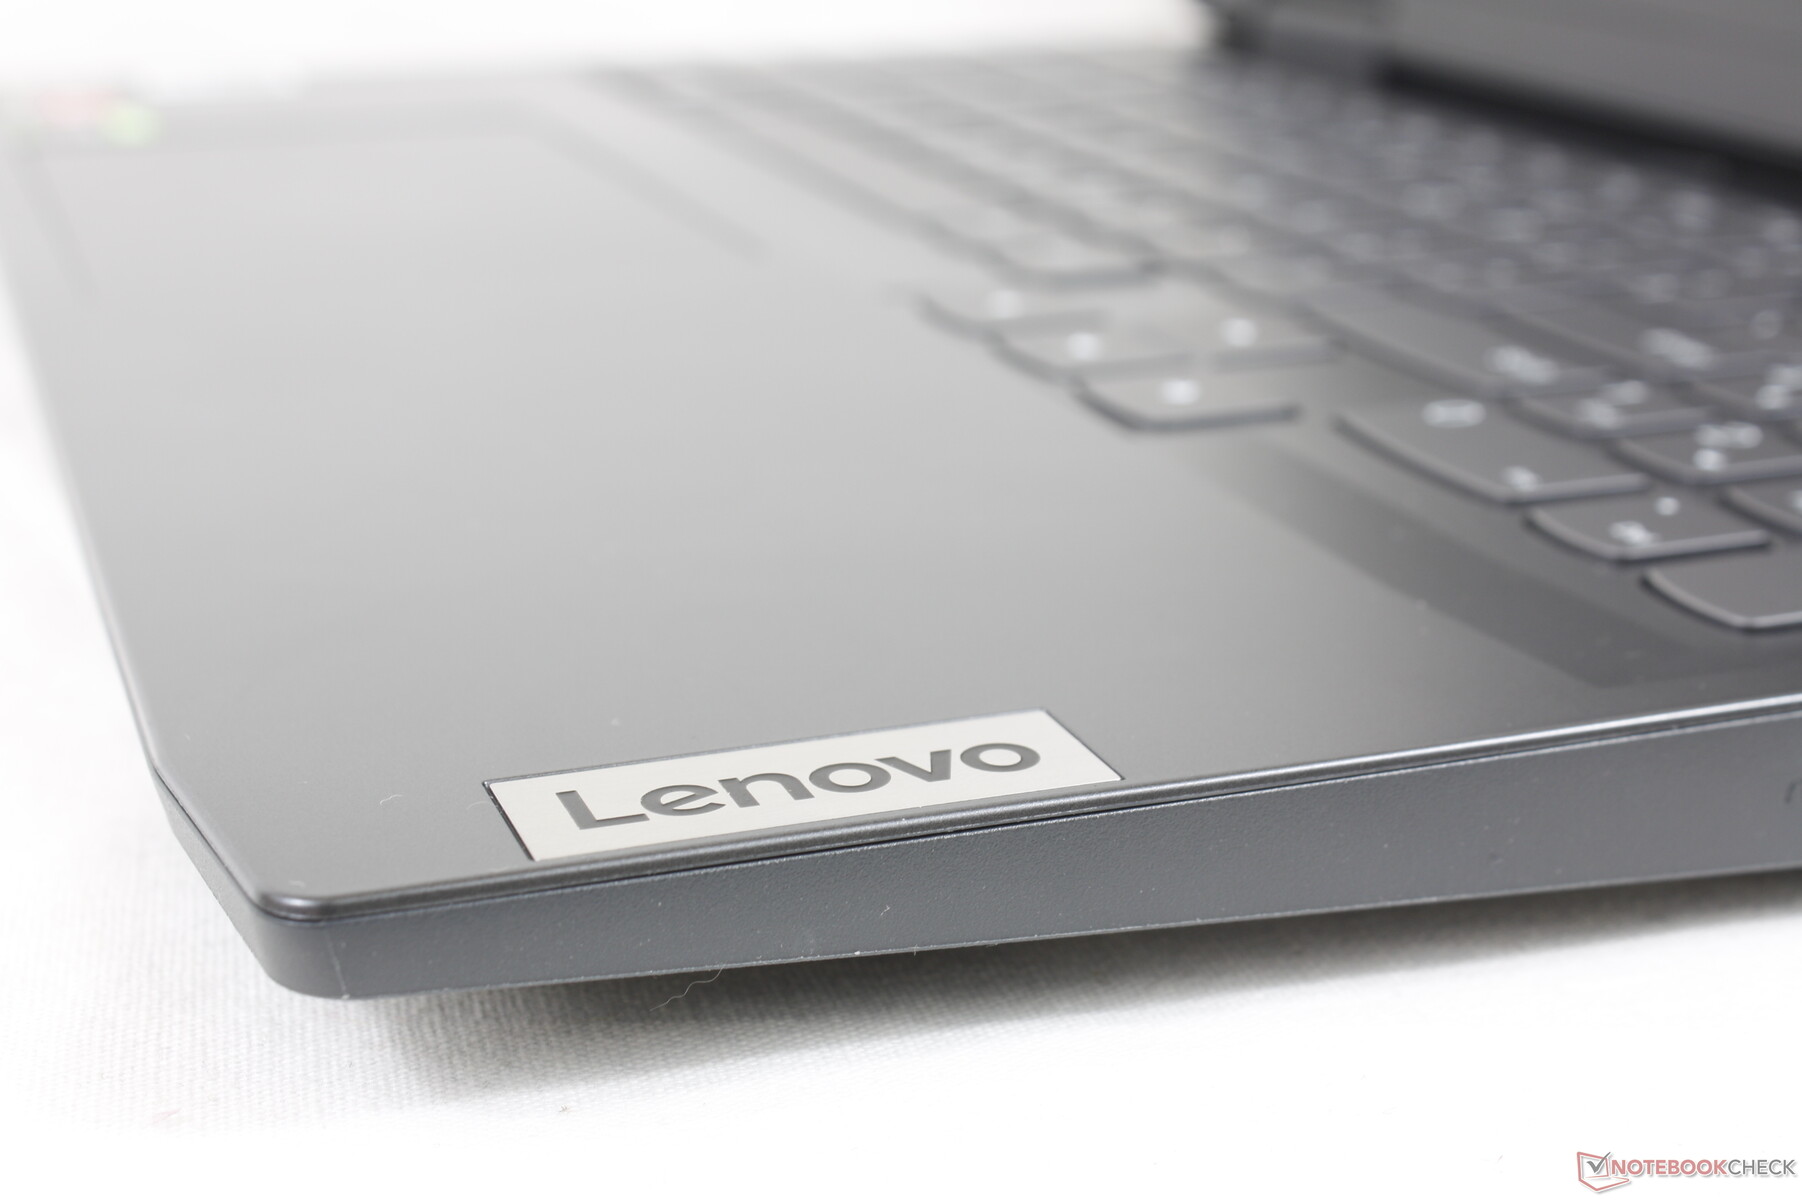
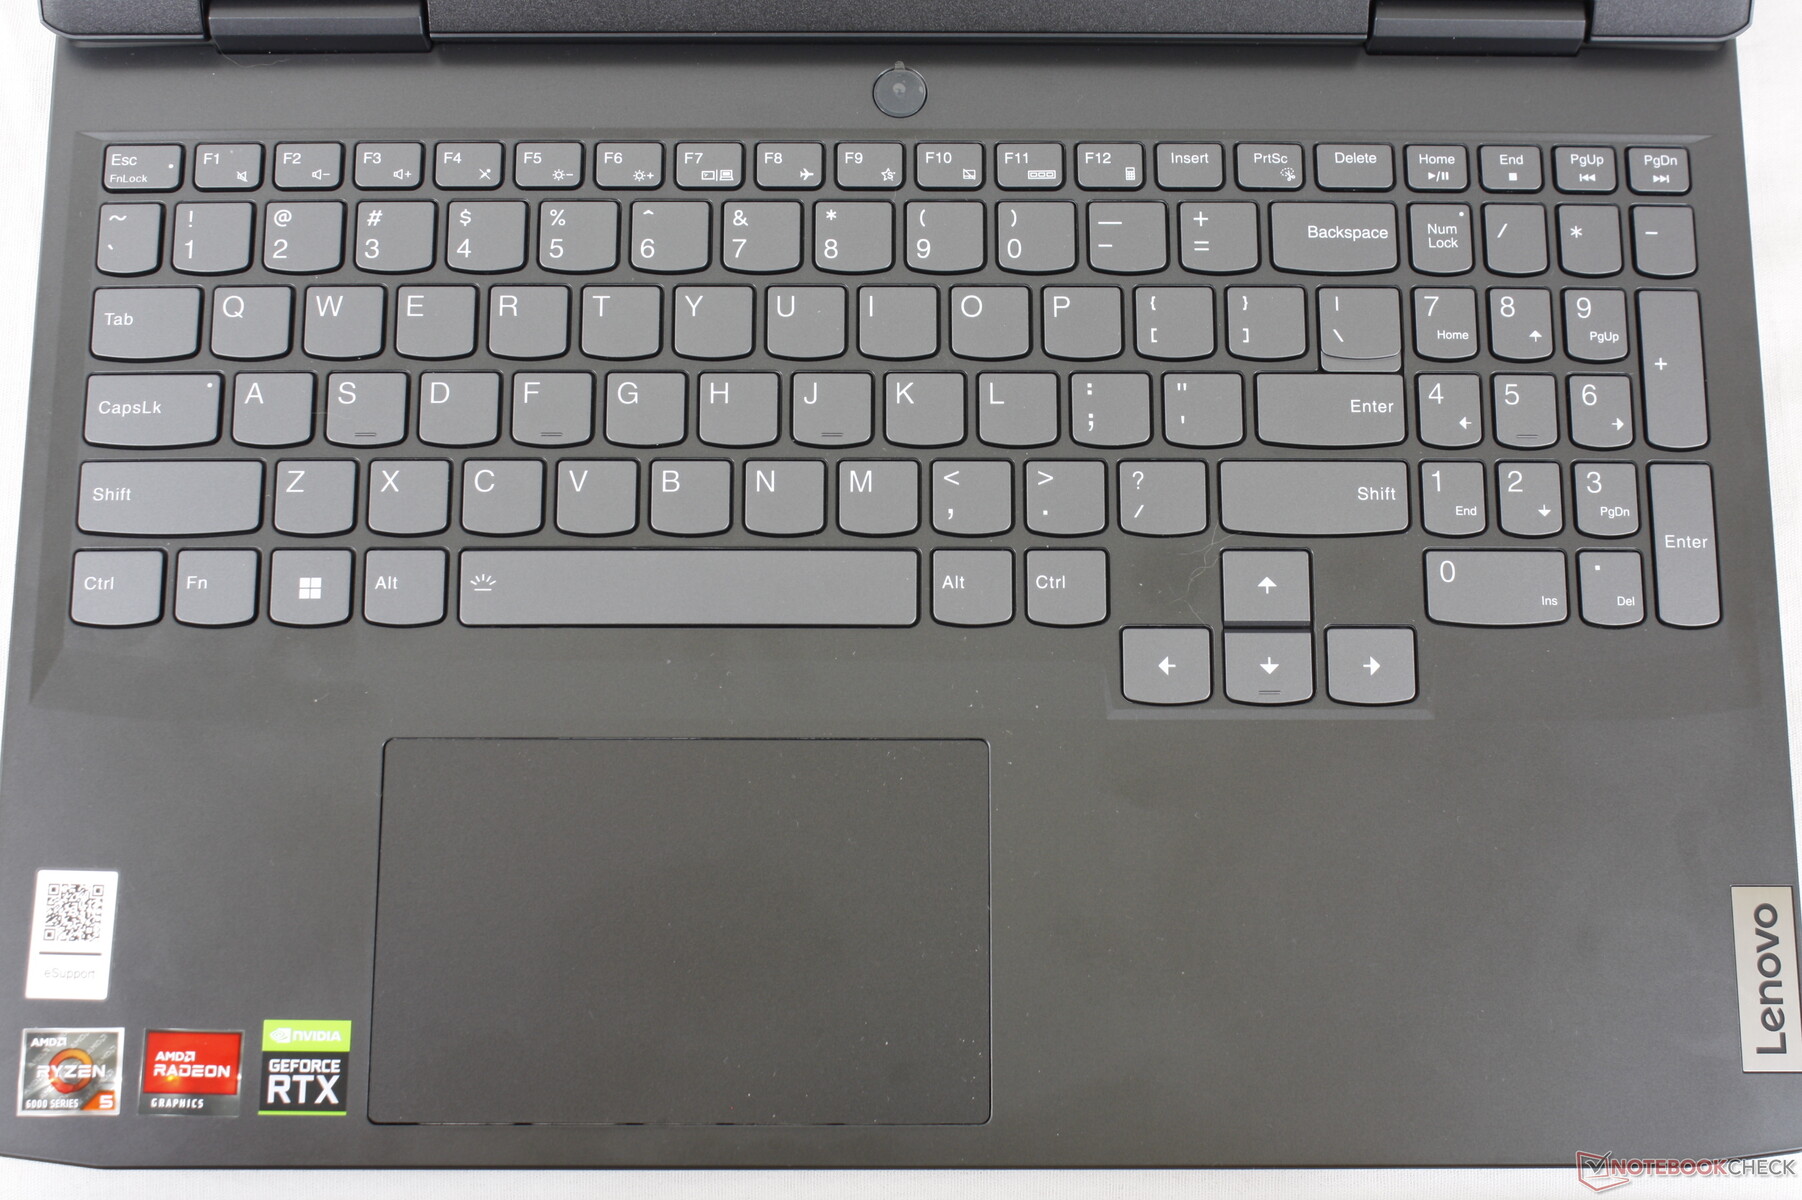
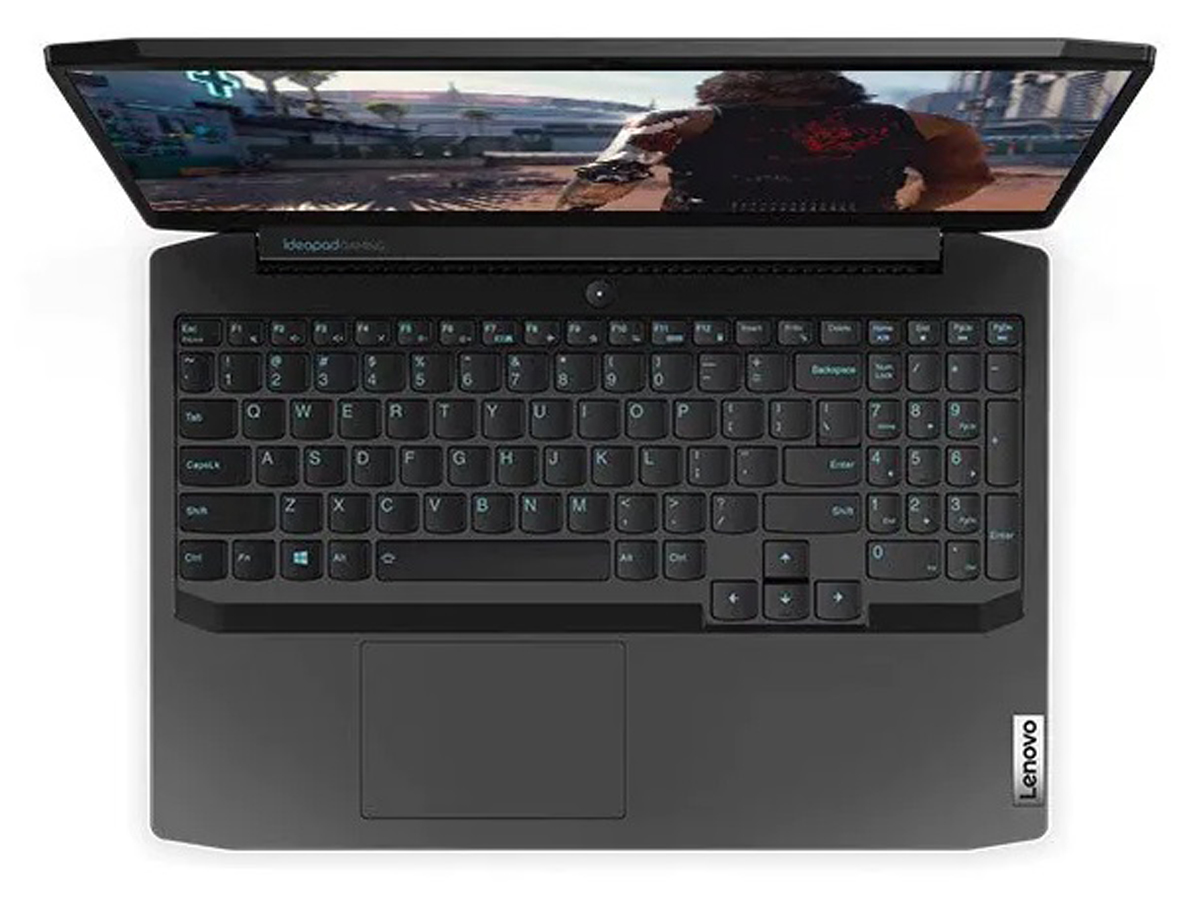
Input Devices — Classic IdeaPad
Keyboard
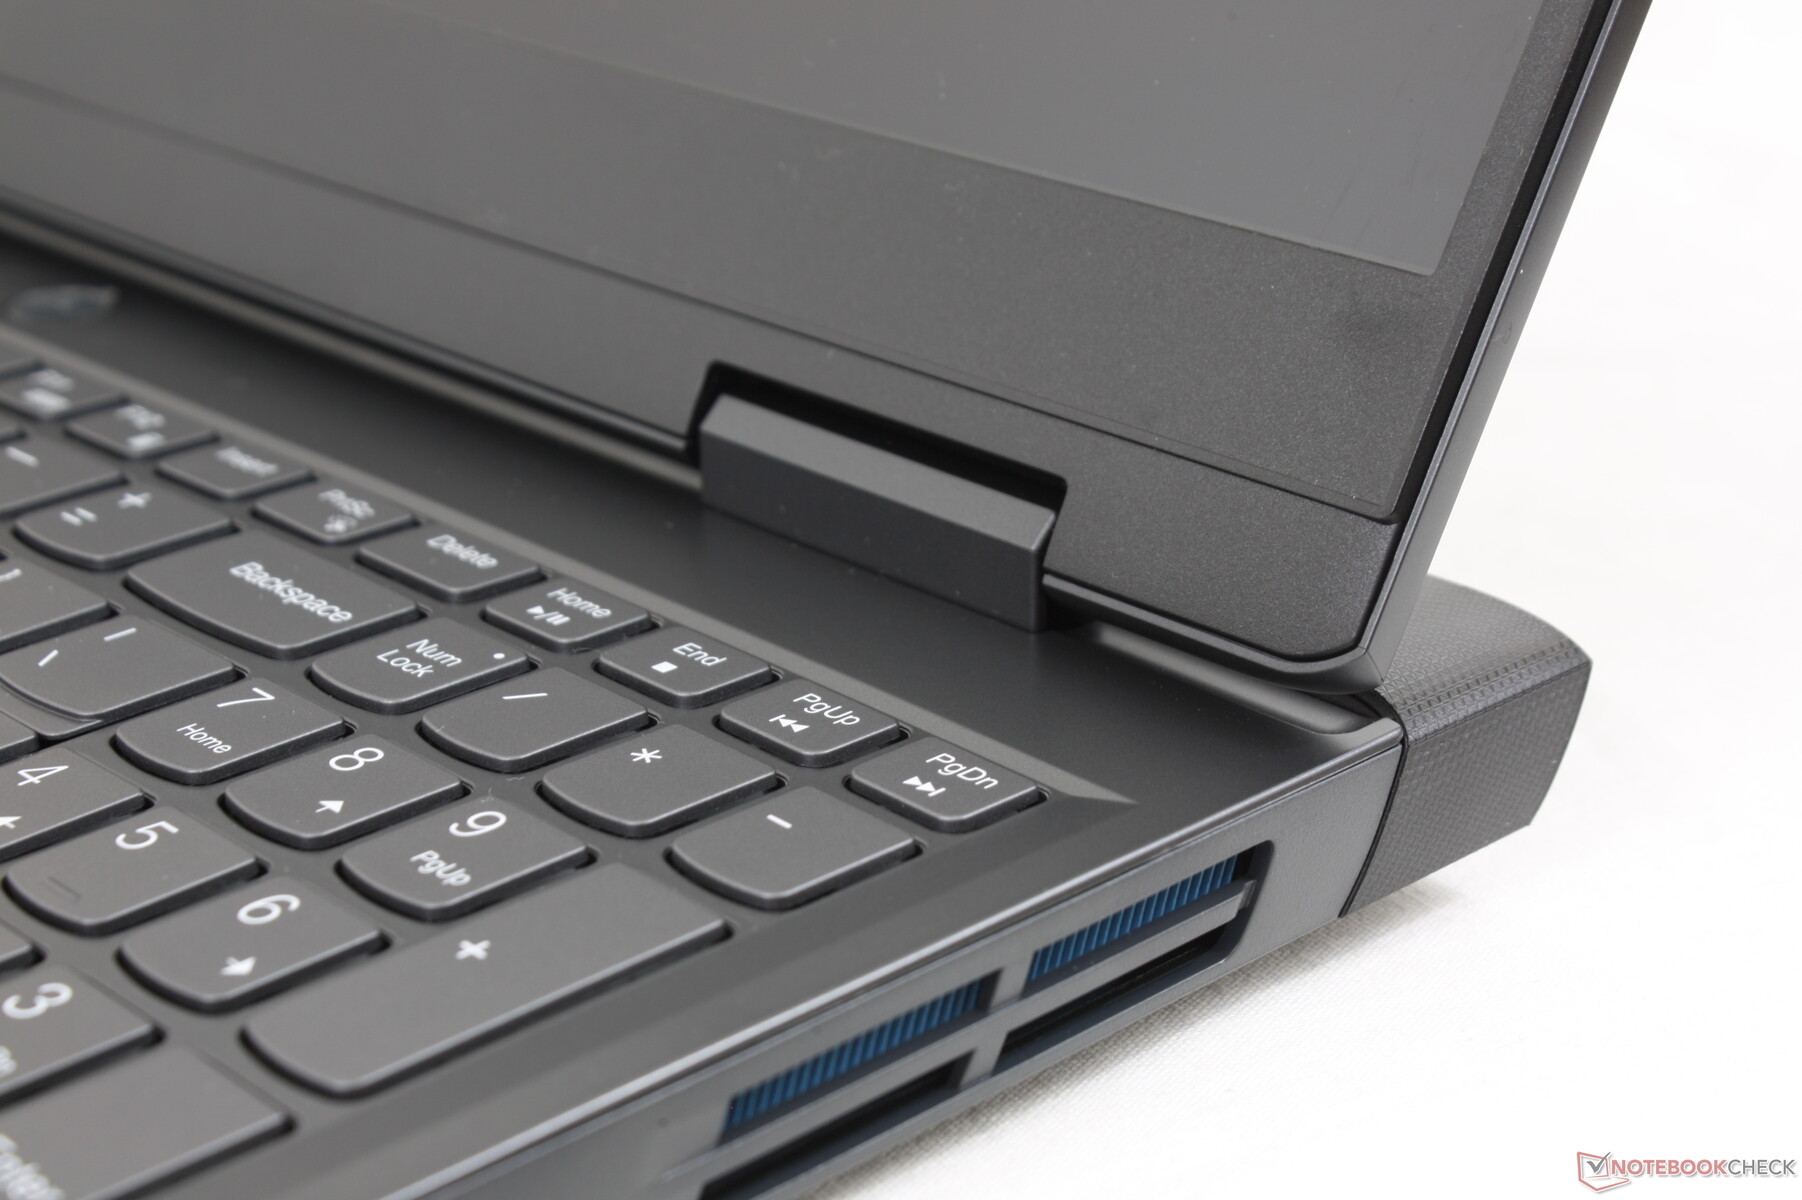
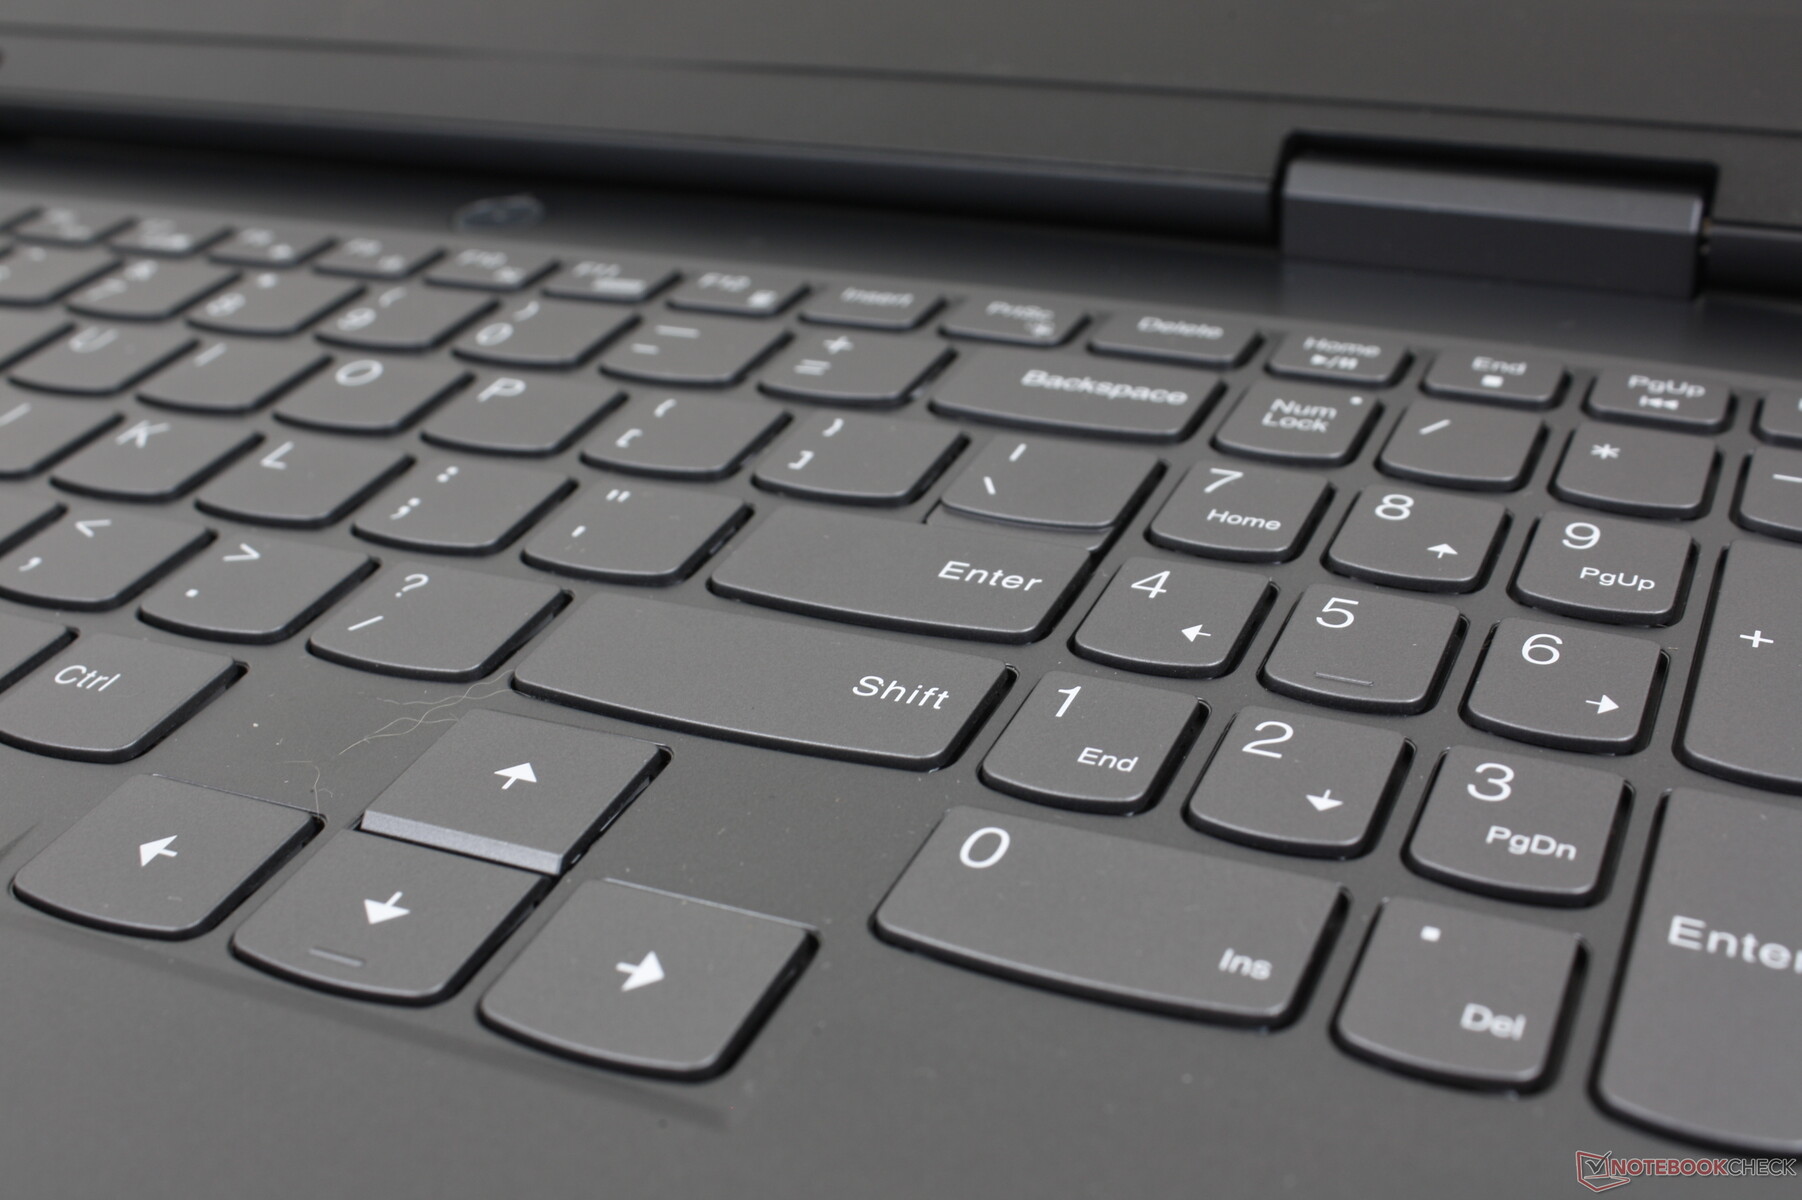
The letters and symbols on each key are now white whereas they were light blue on the 2020 IdeaPad Gaming 3i. Otherwise, everything from the size and feel of the keys remain unchanged for essentially the same typing experience between the two models despite all the chassis changes. Key feedback is on the light and shallow side to be similar to many budget to midrange Ultrabooks like the Asus VivoBook or standard IdeaPad.
A two-level white backlight comes standard to illuminate the printing on each key including the smaller secondary symbols.
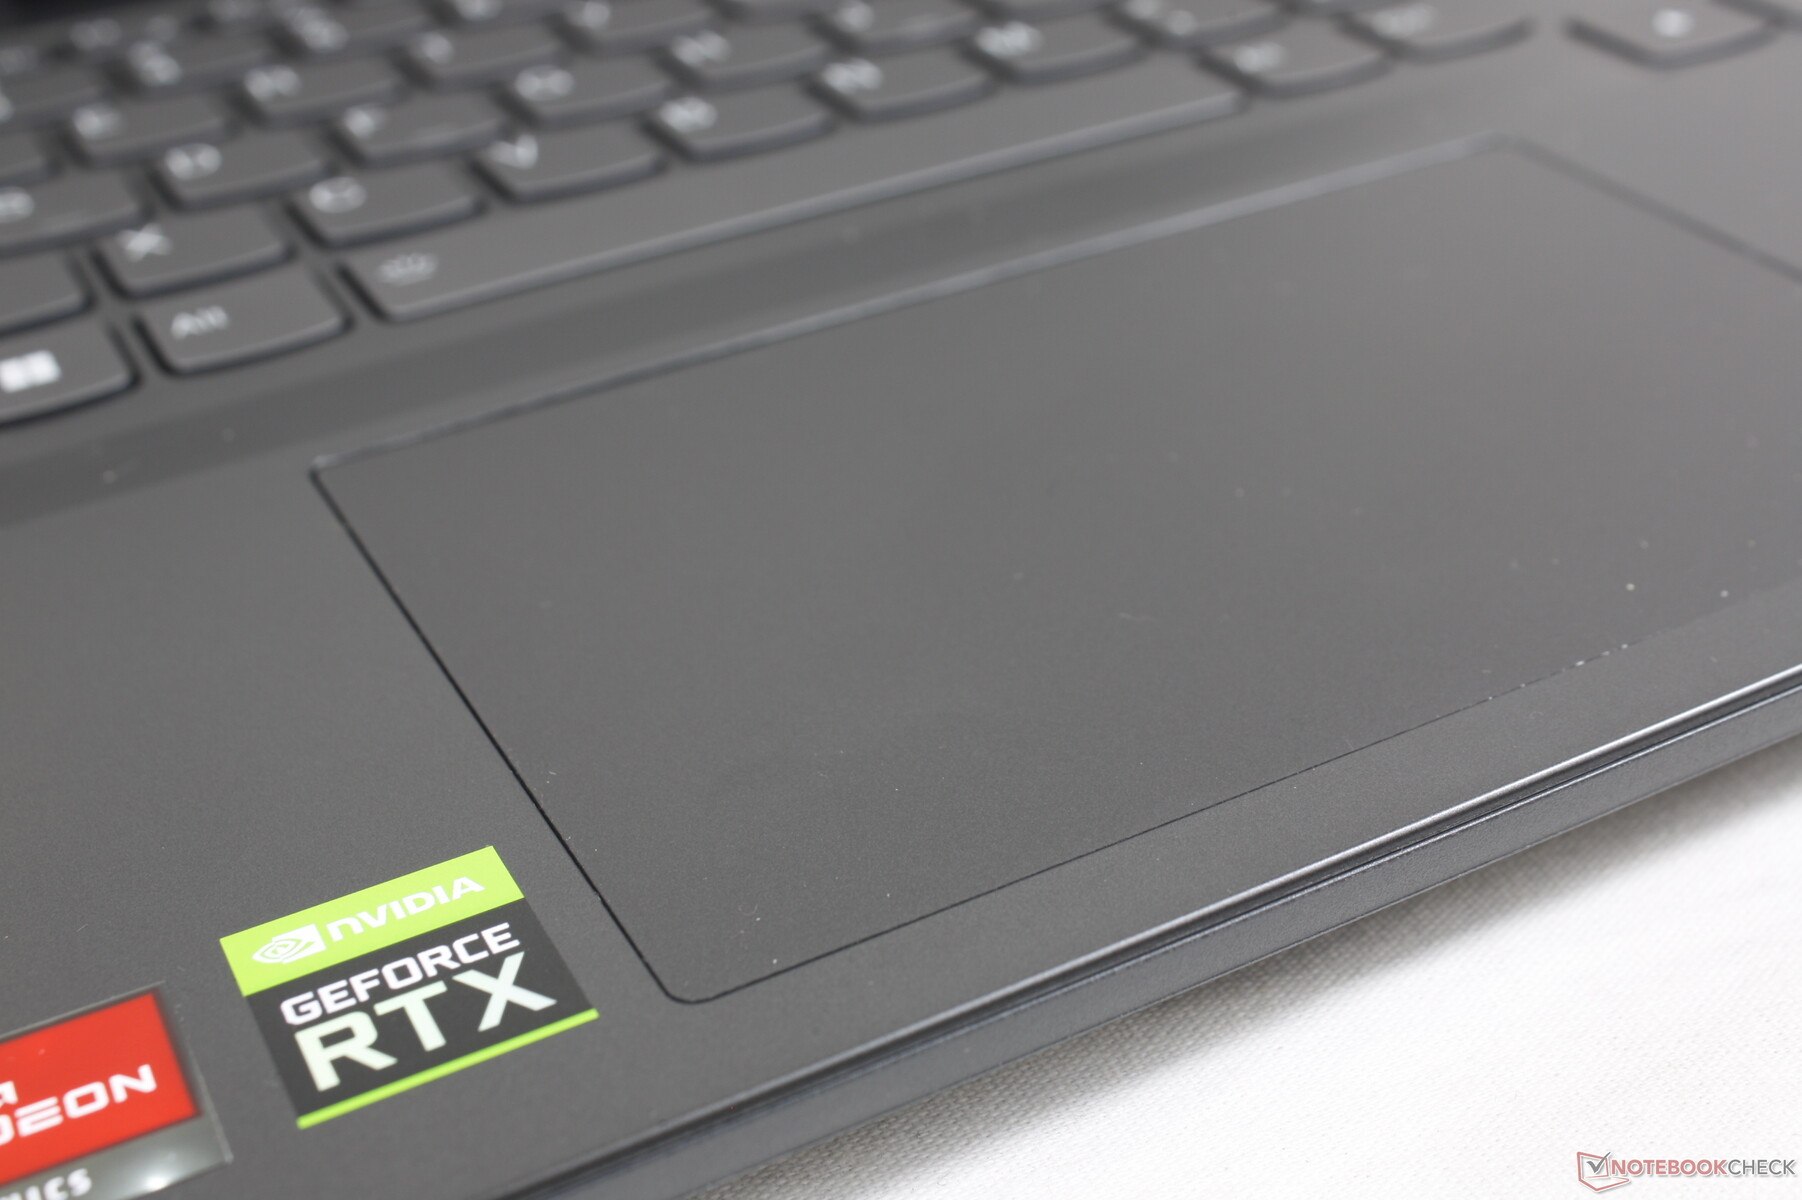
Touchpad
The clickpad is larger than the clickpad on the MSI Bravo 15 (12.5 x 7.5 cm vs. 10.5 x 6.5 cm). Unfortunately, both traction and feedback are stickier and spongier, respectively, than on most other laptops for a poorer user experience. The finger sticks frequently when gliding at medium speeds and clicking isn't satisfying because of the squishy feedback.

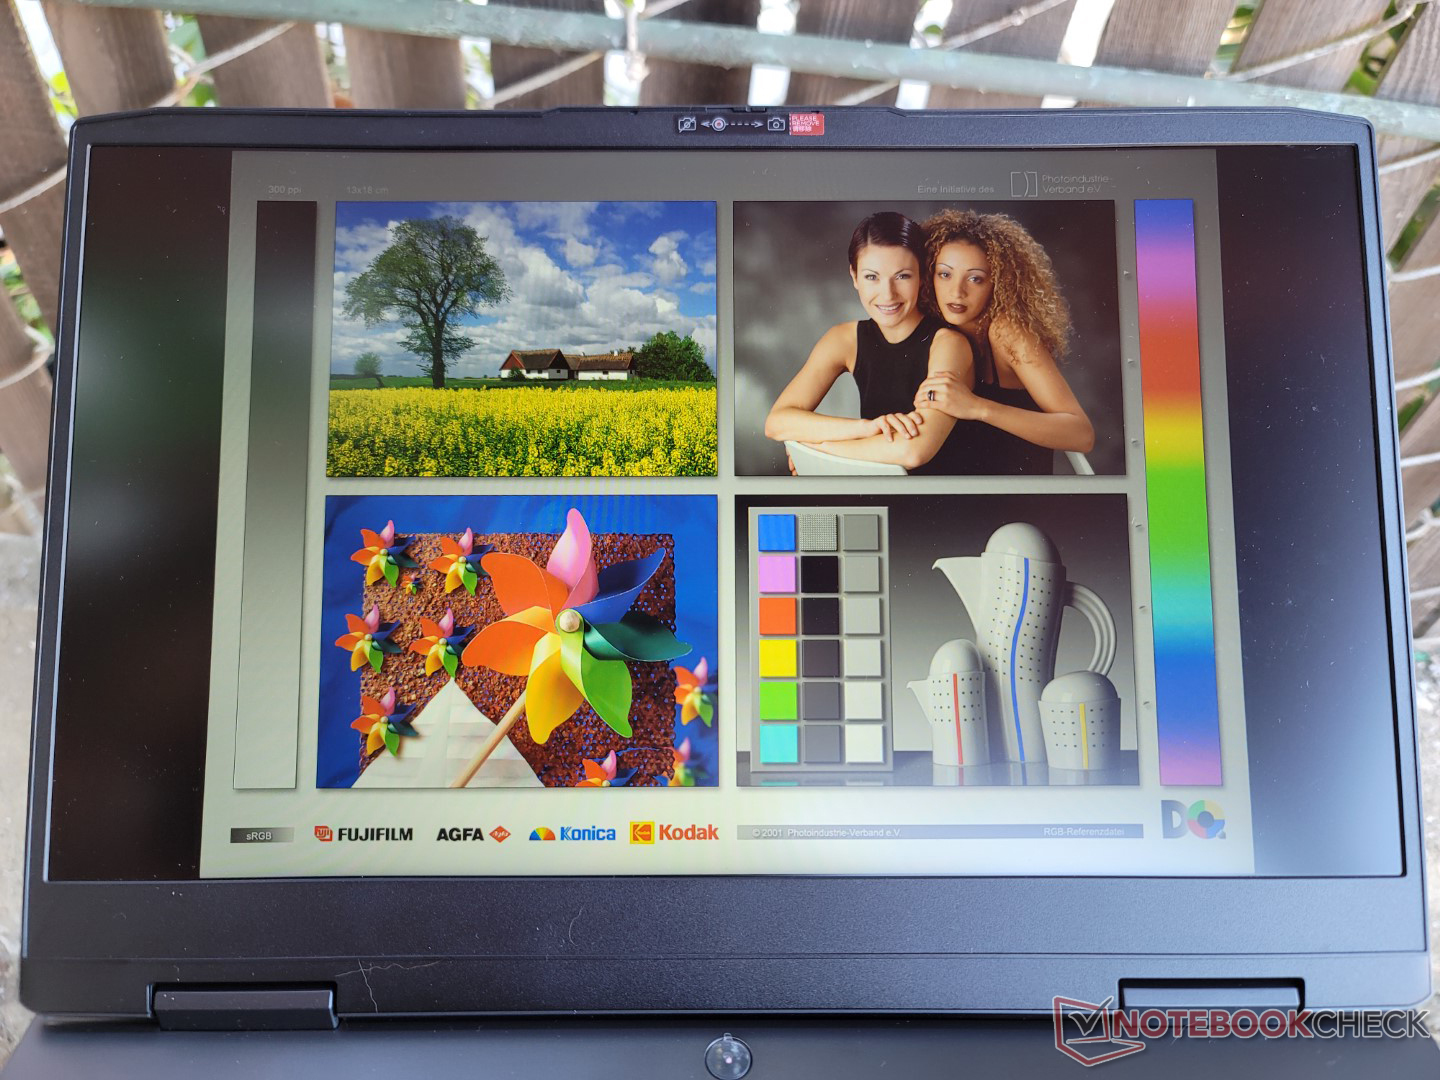
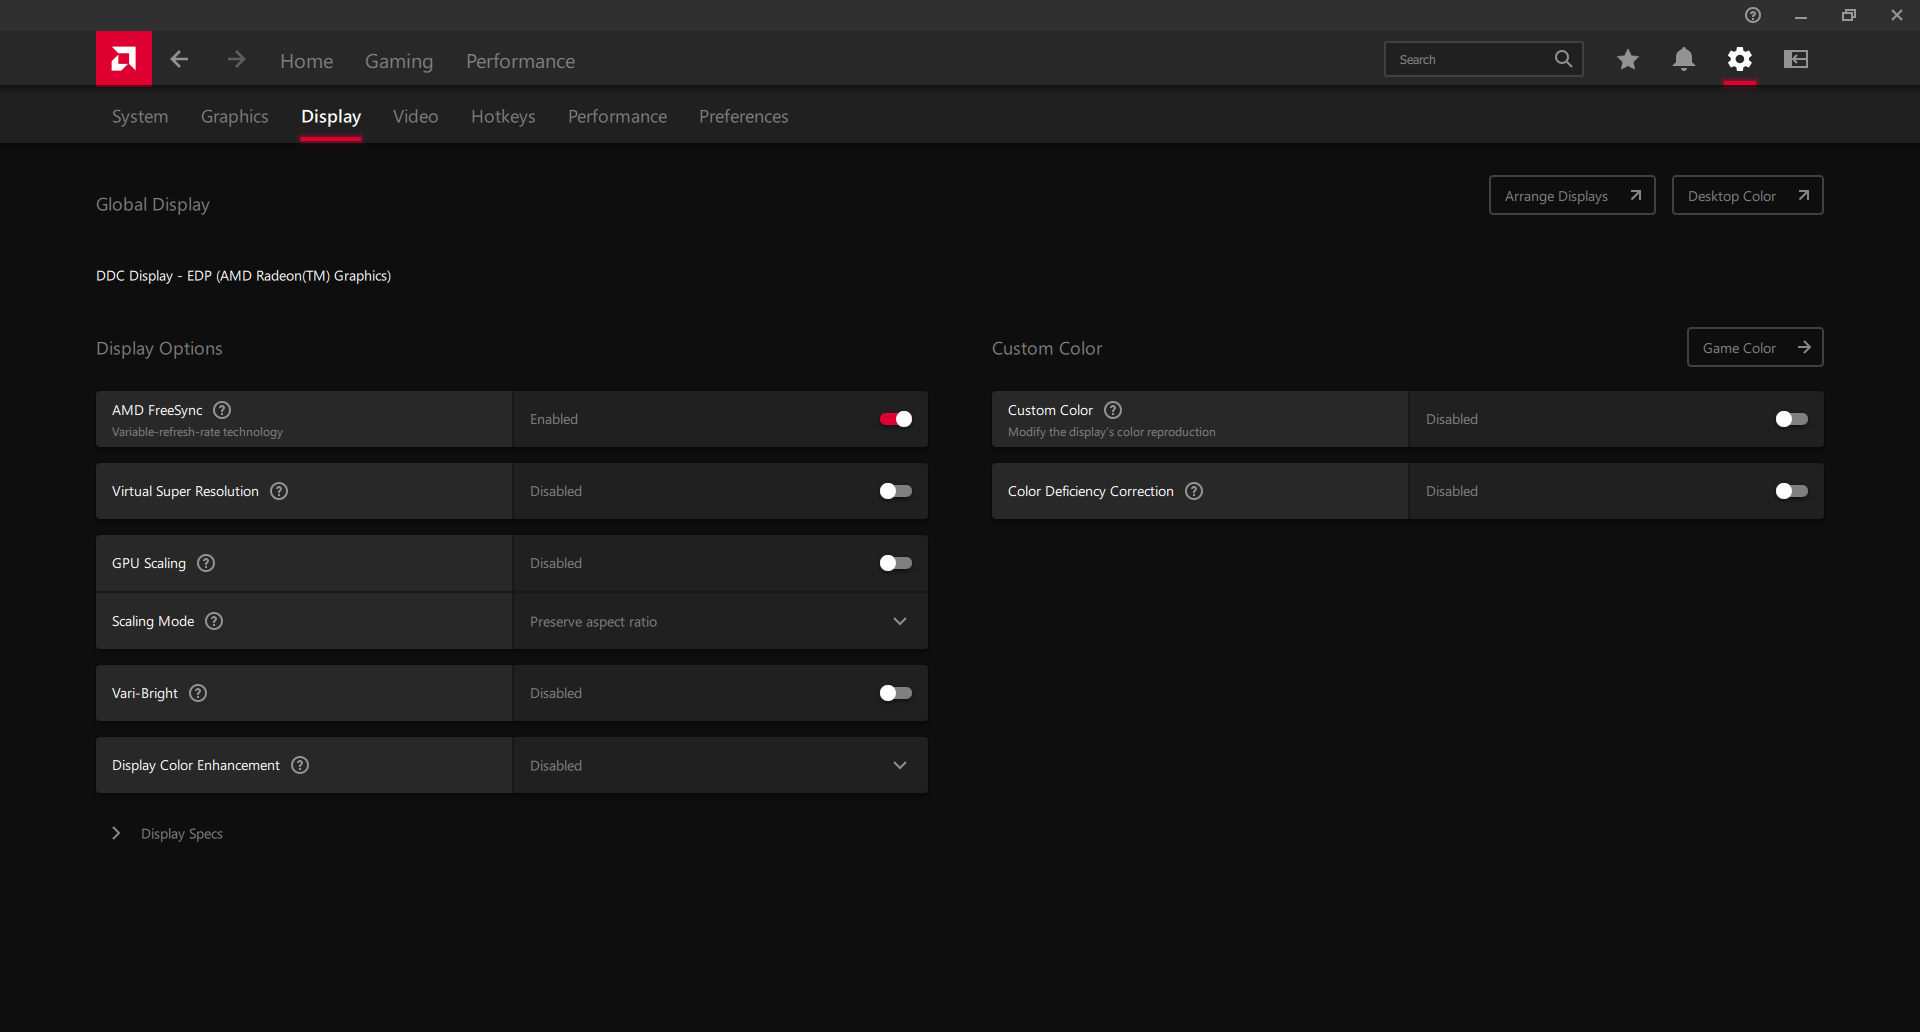
Display — FreeSync And 120 Hz Come Standard
Positive traits about the display include support for native 120 Hz refresh rate and FreeSync. Black-white and gray-gray response times are also decent at about 9 to 10 ms each. For gaming purposes, the display gets the job done when it comes to minimizing ghosting and screen tearing.
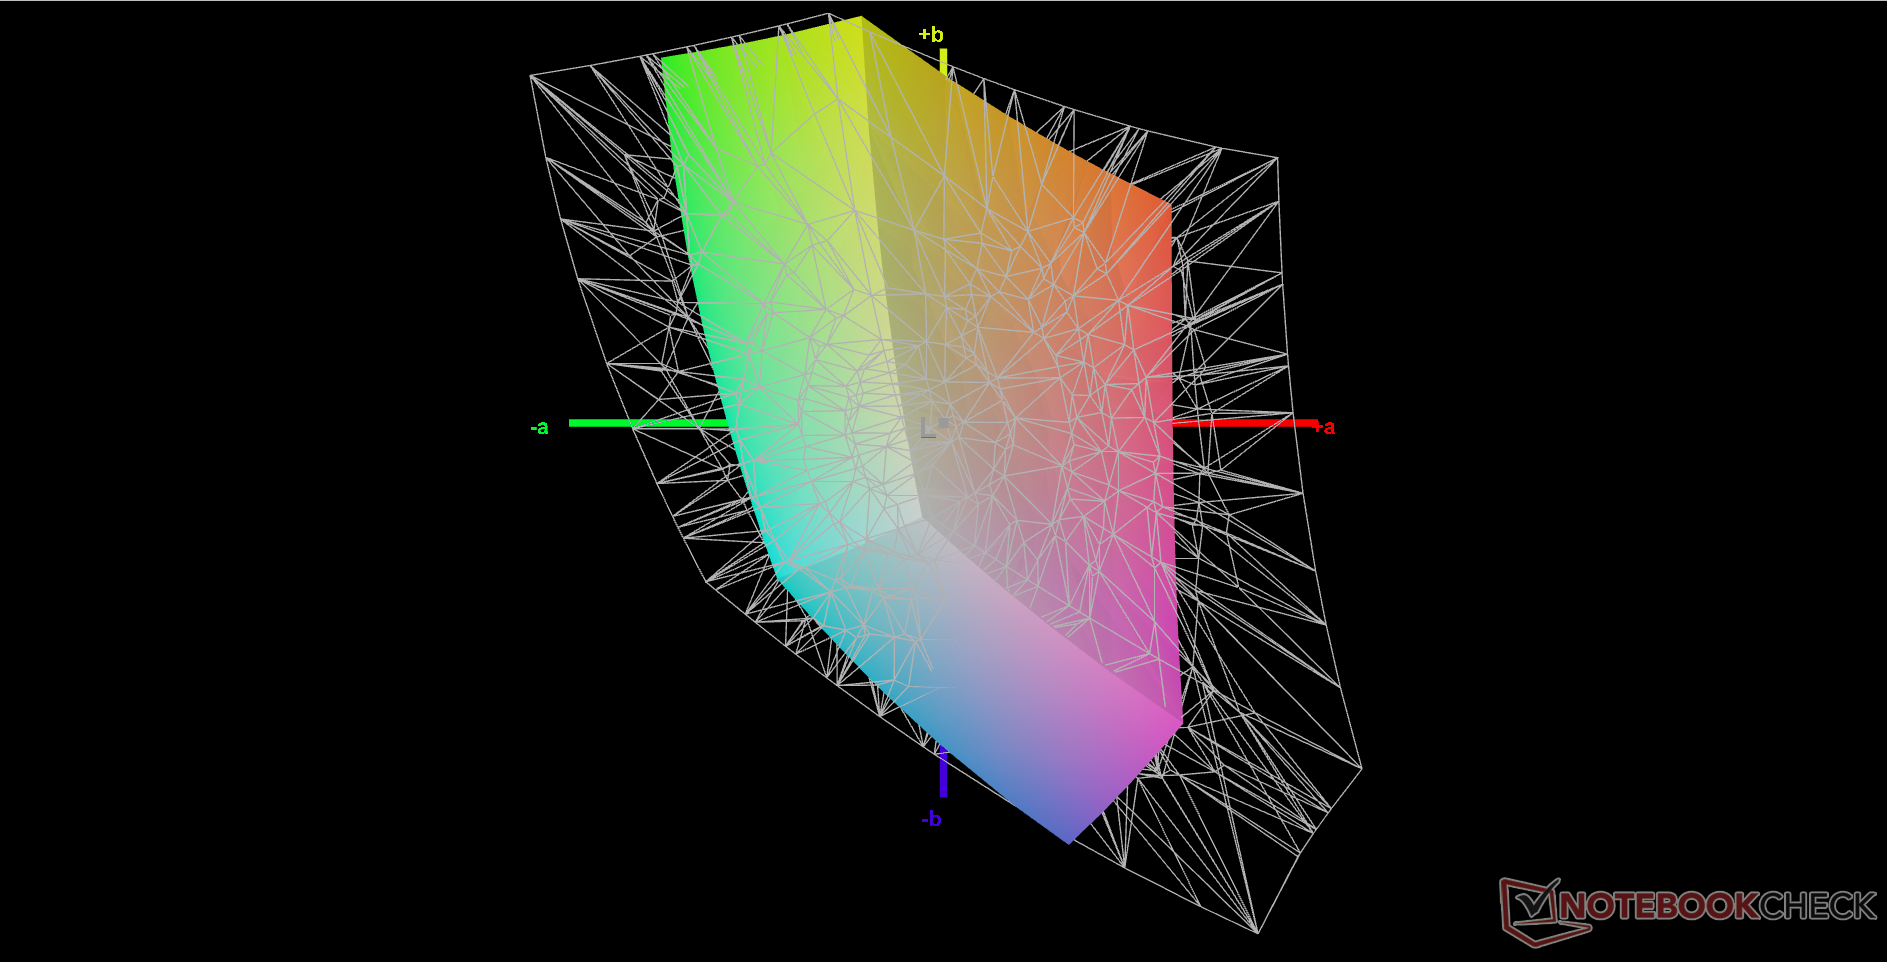
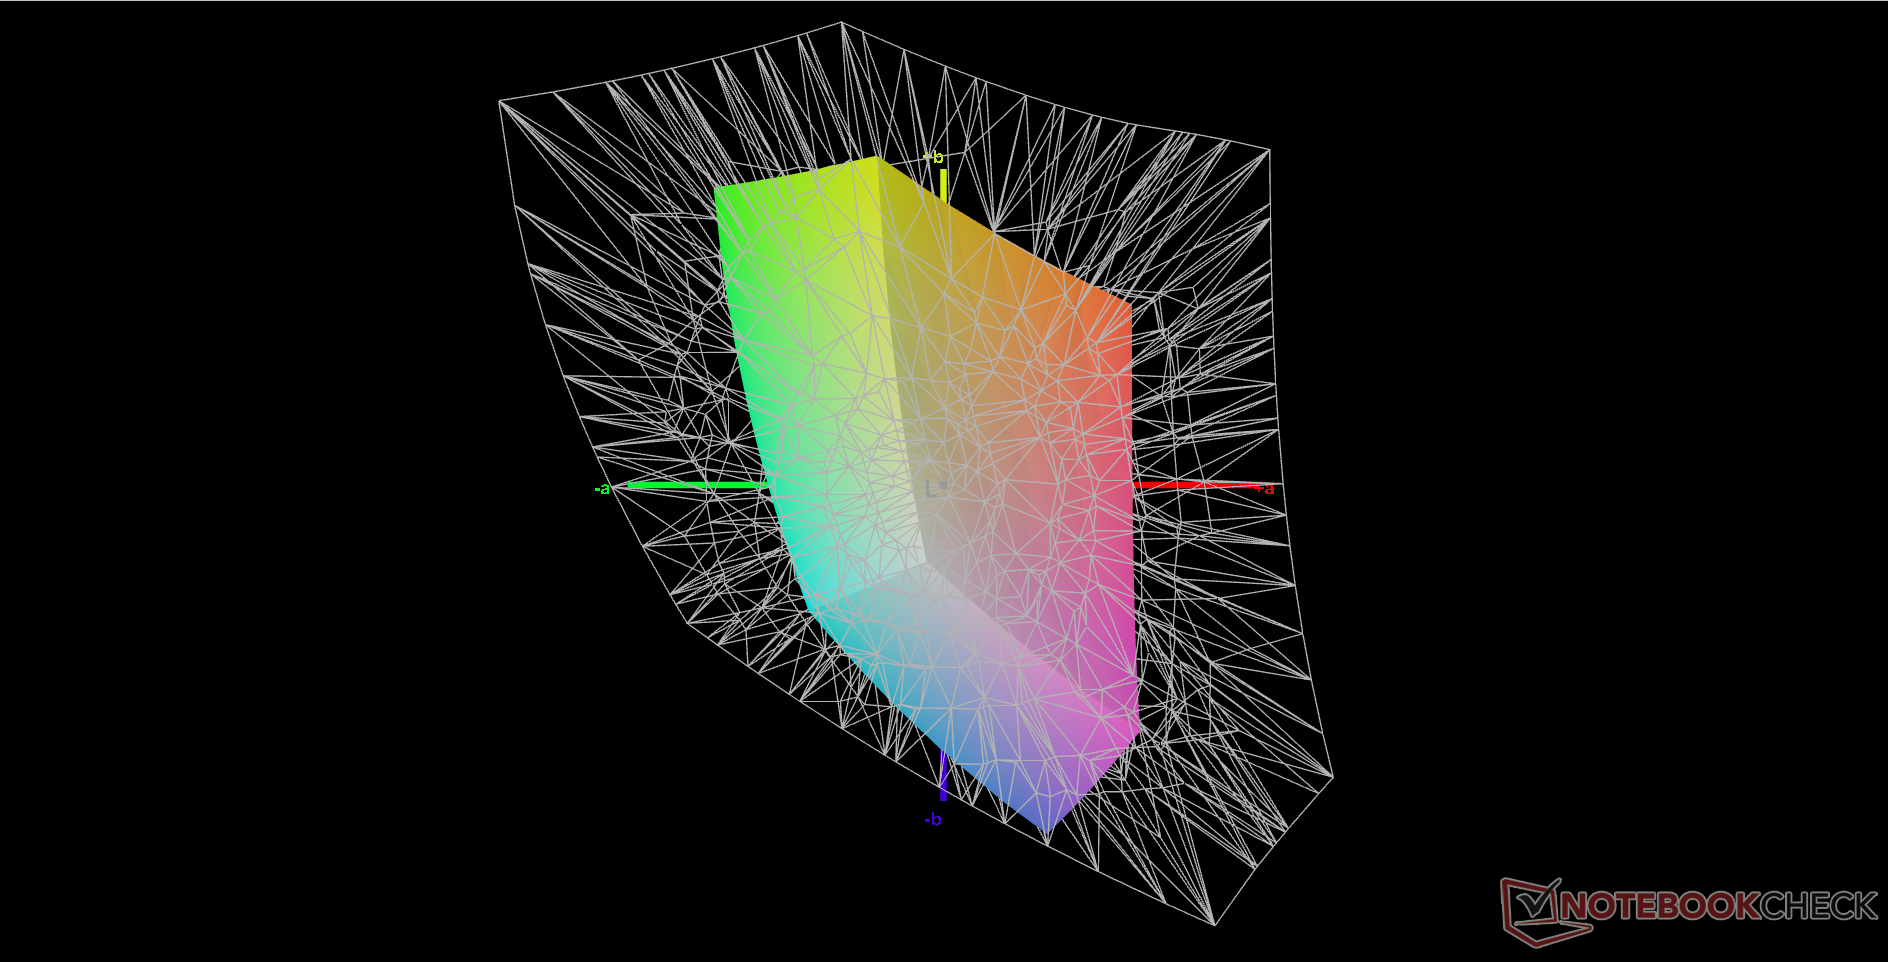
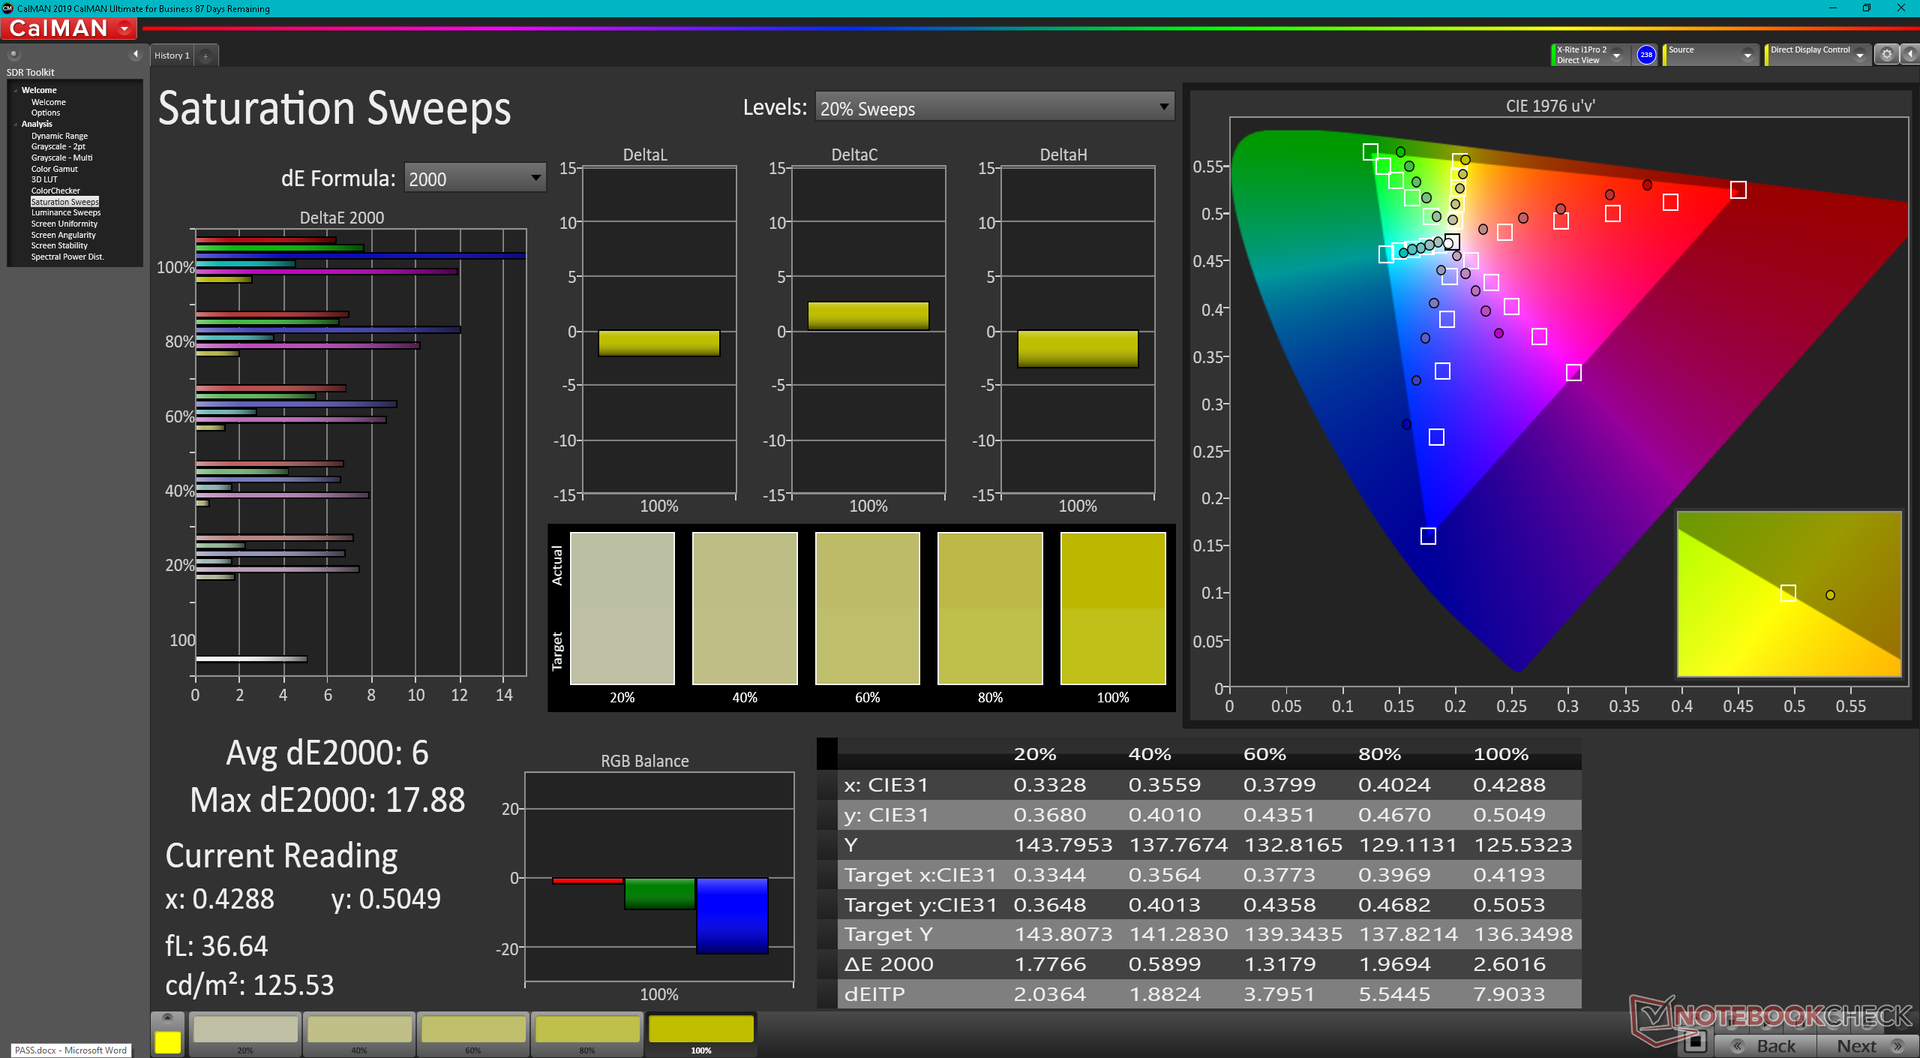
The worst aspect about the display is its limited color profile at just 58 percent of sRGB to be indicative of a budget panel unfit for most editors. Lenovo wants users to upgrade to its Legion series of laptops instead for improved colors and a brighter backlight since there are no other display options to choose from on this particular IdeaPad model.
Note that while the panel here shares the same LEN156FHD ID as on the ThinkBook 15 G4 or IdeaPad 5 15ALC05, they are still very different in certain aspects. For example, the displays on the aforementioned ThinkBook or IdeaPad 5 do not support 120 Hz or FreeSync.


| |||||||||||||||||||||||||
Brightness Distribution: 86 %
Center on Battery: 287.8 cd/m²
Contrast: 959:1 (Black: 0.3 cd/m²)
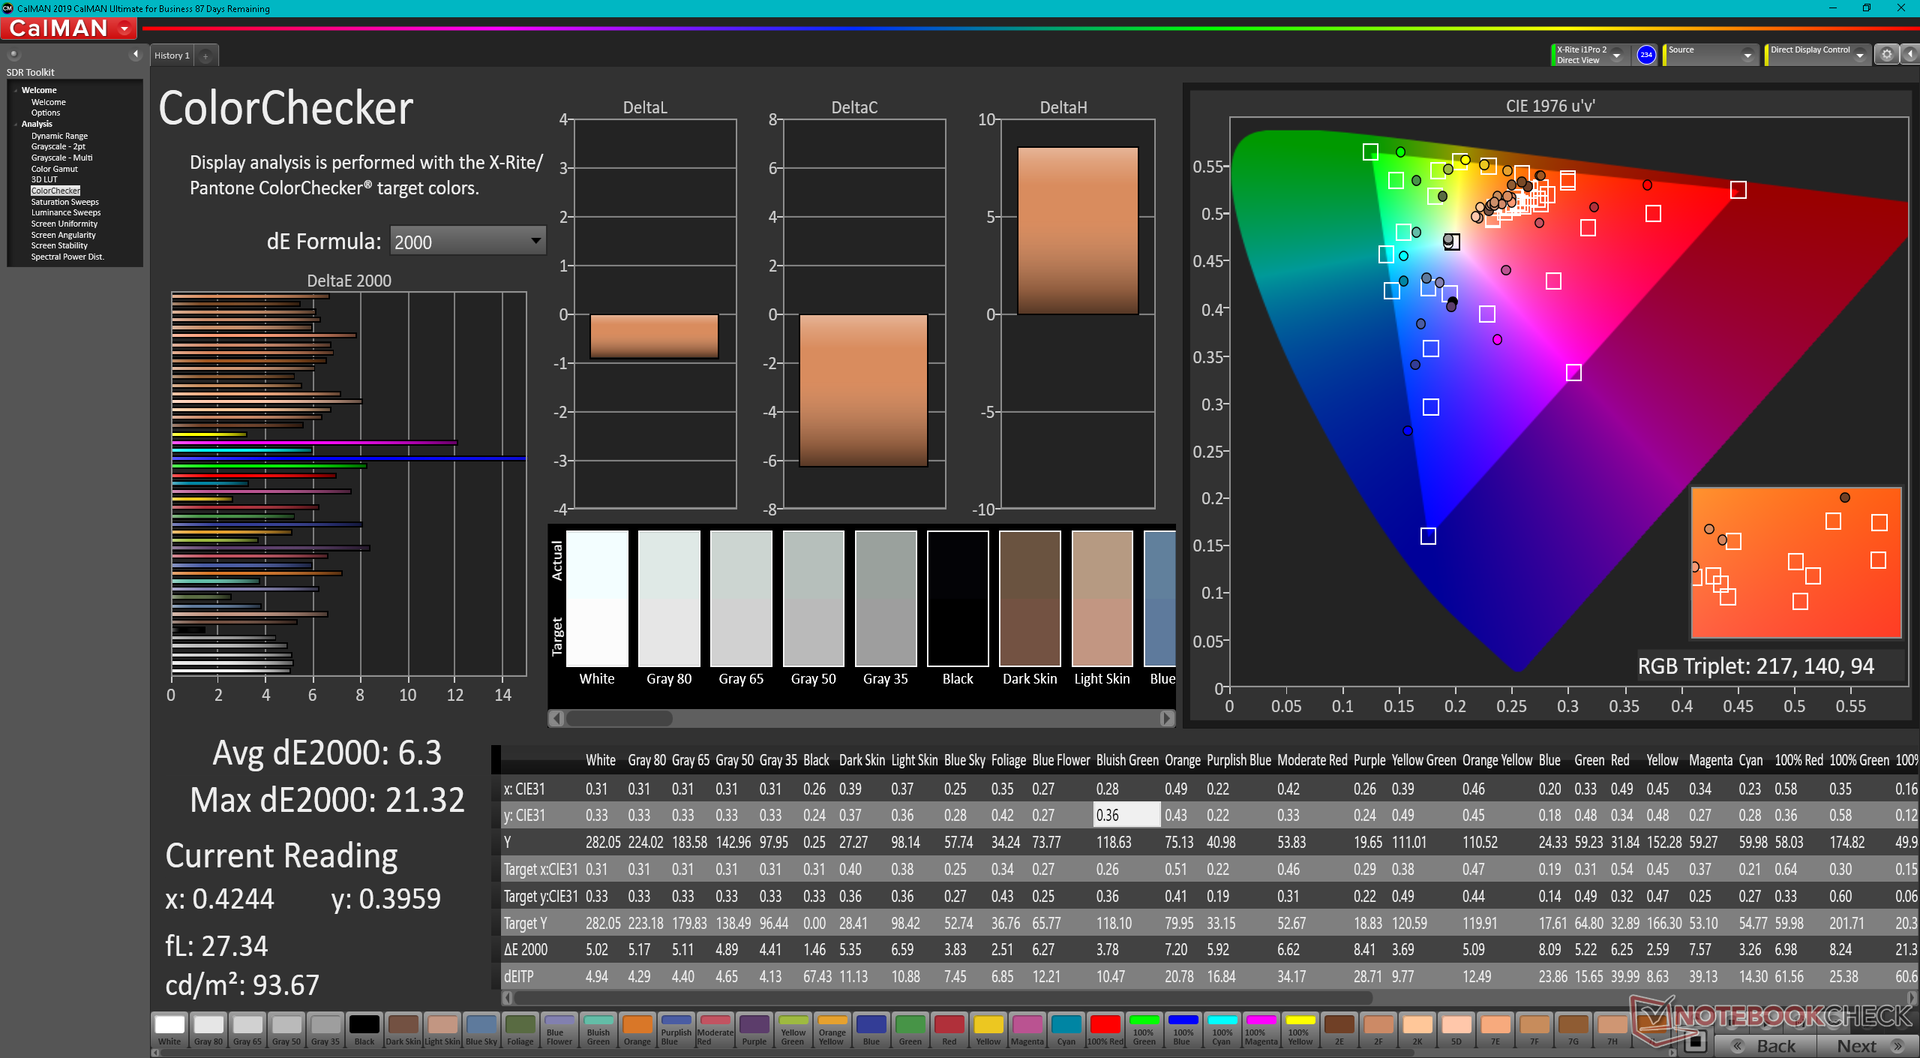
ΔE ColorChecker Calman: 6.3 | ∀{0.5-29.43 Ø4.75}
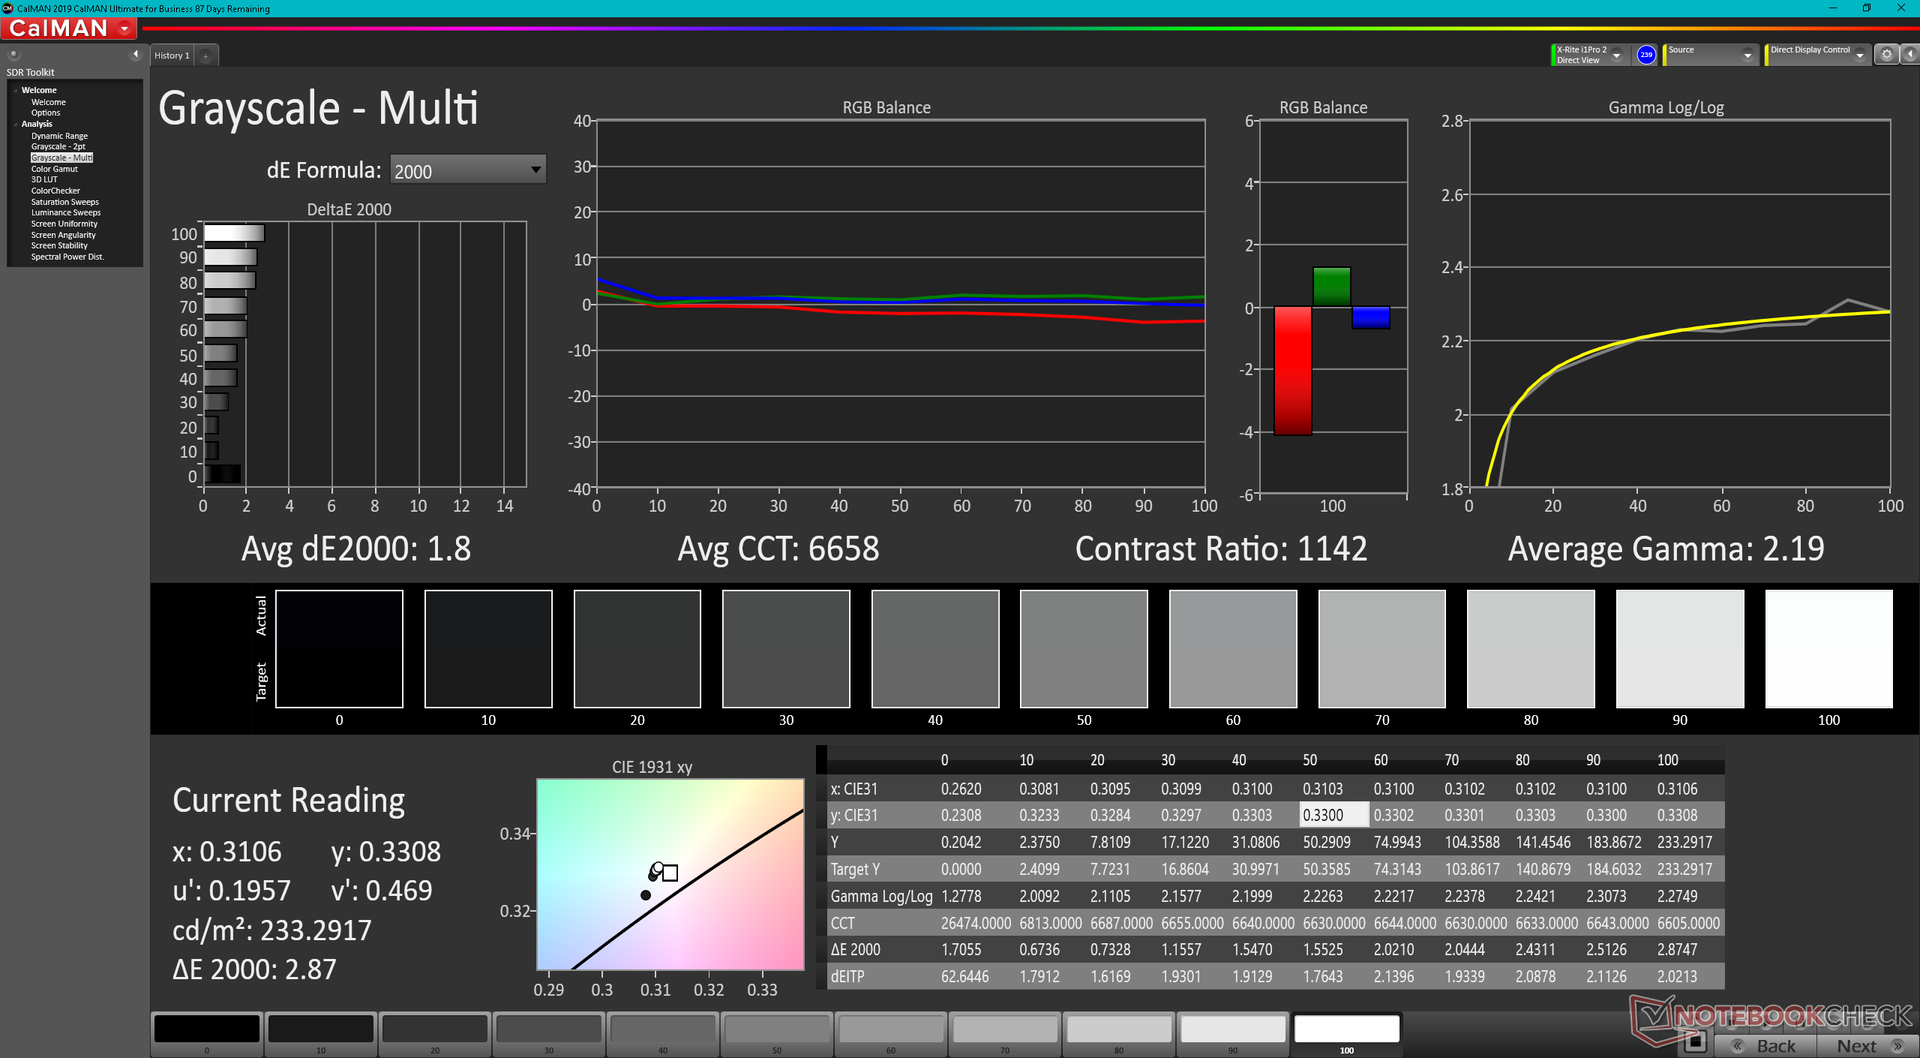
calibrated: 2.53
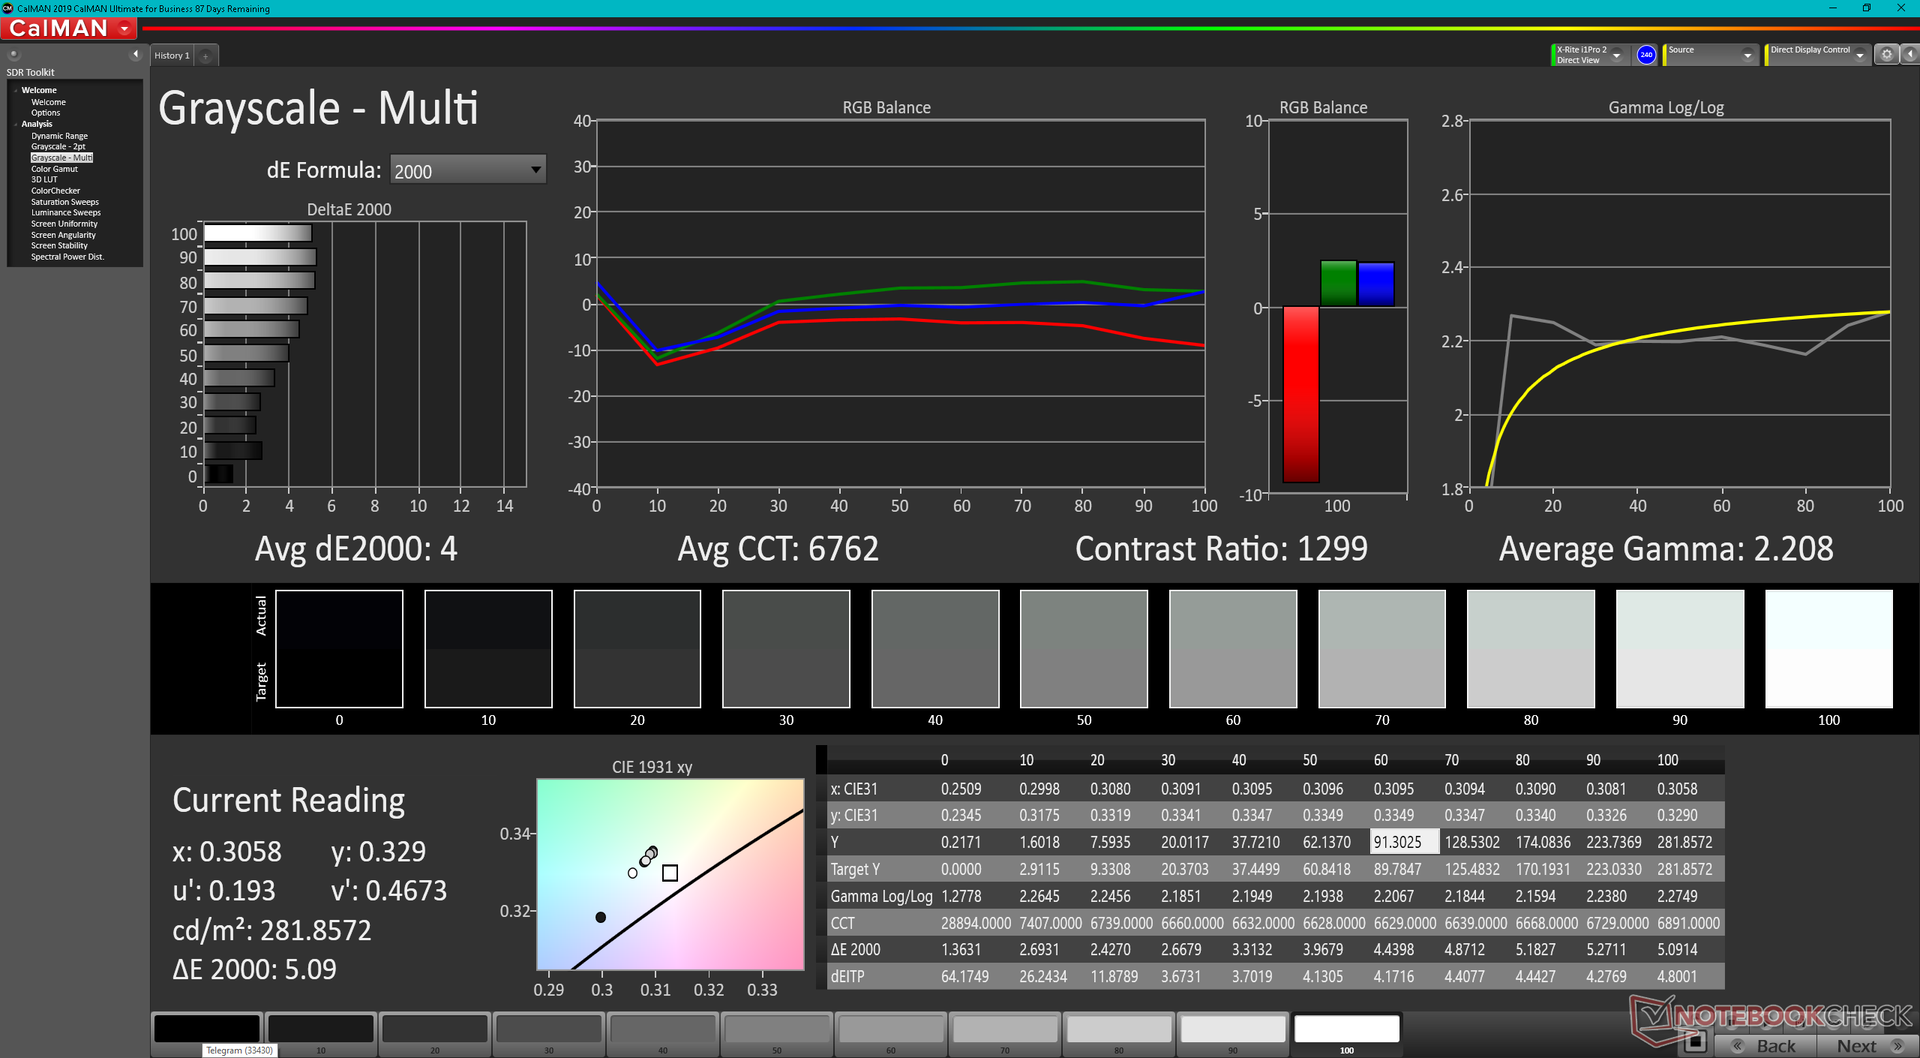
ΔE Greyscale Calman: 4 | ∀{0.09-98 Ø5}
40.7% AdobeRGB 1998 (Argyll 3D)
58% sRGB (Argyll 3D)
39.4% Display P3 (Argyll 3D)
Gamma: 2.21
CCT: 6762 K
| Lenovo IdeaPad Gaming 3 15ARH7 LEN156FHD, IPS, 1920x1080, 15.6" | Lenovo IdeaPad Gaming 3i 15IMH05 BOE CQ NV156FHM-NX1, IPS, 1920x1080, 15.6" | Lenovo Legion 5 15ACH6A-82NW0010GE LGD06A5, IPS, 1920x1080, 15.6" | Gigabyte A5 K1 BOEhydis NV156FHM-N4K (BOE08B3), IPS, 1920x1080, 15.6" | Asus TUF Dash F15 FX517ZR BOE CQ NE156QHM-NY1, IPS, 2560x1440, 15.6" | Dell G15 5510 YMHWH_156HRA (CMN1522), IPS, 1920x1080, 15.6" | |
|---|---|---|---|---|---|---|
| Display | -3% | 76% | 61% | 111% | 6% | |
| Display P3 Coverage (%) | 39.4 | 38.04 -3% | 71.1 80% | 64.4 63% | 98.4 150% | 41.6 6% |
| sRGB Coverage (%) | 58 | 56.6 -2% | 99.1 71% | 92.5 59% | 99.9 72% | 62.2 7% |
| AdobeRGB 1998 Coverage (%) | 40.7 | 39.3 -3% | 72.3 78% | 66.1 62% | 85.9 111% | 43 6% |
| Response Times | -6% | 48% | 39% | 61% | -37% | |
| Response Time Grey 50% / Grey 80% * (ms) | 20.8 ? | 25 ? -20% | 15 ? 28% | 14.5 ? 30% | 5.6 ? 73% | 33.3 ? -60% |
| Response Time Black / White * (ms) | 18.4 ? | 17 ? 8% | 6 ? 67% | 9.5 ? 48% | 9.4 ? 49% | 20.7 ? -13% |
| PWM Frequency (Hz) | ||||||
| Screen | -16% | 24% | 19% | 31% | 12% | |
| Brightness middle (cd/m²) | 287.8 | 305 6% | 371 29% | 295 3% | 286 -1% | 288 0% |
| Brightness (cd/m²) | 268 | 294 10% | 328 22% | 281 5% | 266 -1% | 264 -1% |
| Brightness Distribution (%) | 86 | 70 -19% | 85 -1% | 83 -3% | 87 1% | 88 2% |
| Black Level * (cd/m²) | 0.3 | 0.405 -35% | 0.32 -7% | 0.29 3% | 0.25 17% | 0.24 20% |
| Contrast (:1) | 959 | 753 -21% | 1159 21% | 1017 6% | 1144 19% | 1200 25% |
| Colorchecker dE 2000 * | 6.3 | 6.01 5% | 3.25 48% | 4.36 31% | 2.14 66% | 3.67 42% |
| Colorchecker dE 2000 max. * | 21.32 | 21.9 -3% | 6.33 70% | 6.92 68% | 5.22 76% | 18.12 15% |
| Colorchecker dE 2000 calibrated * | 2.53 | 5.12 -102% | 1.11 56% | 1.2 53% | 0.67 74% | 3.22 -27% |
| Greyscale dE 2000 * | 4 | 3.23 19% | 4.94 -24% | 3.9 2% | 2.8 30% | 2.6 35% |
| Gamma | 2.21 100% | 2.43 91% | 2.45 90% | 2.106 104% | 2.23 99% | 2.187 101% |
| CCT | 6762 96% | 6818 95% | 6064 107% | 7300 89% | 7092 92% | 6971 93% |
| Color Space (Percent of AdobeRGB 1998) (%) | 36 | |||||
| Color Space (Percent of sRGB) (%) | 56 | |||||
| Total Average (Program / Settings) | -8% /
-11% | 49% /
38% | 40% /
31% | 68% /
53% | -6% /
4% |
* ... smaller is better
The display is not calibrated at factory which is to be expected for a budget gaming laptop. Nonetheless, average grayscale and color deltaE values out of the box actually aren't terrible at 4 and 6.3, respectively. Calibrating the display ourselves would improve these values to 1.8 and 2.53, respectively, but saturated colors remain very inaccurate due to the narrow gamut mentioned above.


Display Response Times
| ↔ Response Time Black to White | ||
|---|---|---|
| 18.4 ms ... rise ↗ and fall ↘ combined | ↗ 10 ms rise | 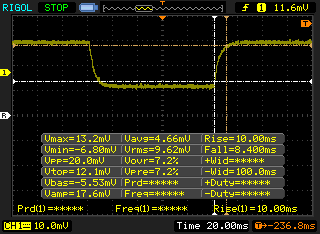 |
| ↘ 8.4 ms fall | ||
| The screen shows good response rates in our tests, but may be too slow for competitive gamers. In comparison, all tested devices range from 0.1 (minimum) to 240 (maximum) ms. » 40 % of all devices are better. This means that the measured response time is similar to the average of all tested devices (20.1 ms). | ||
| ↔ Response Time 50% Grey to 80% Grey | ||
| 20.8 ms ... rise ↗ and fall ↘ combined | ↗ 11.2 ms rise | 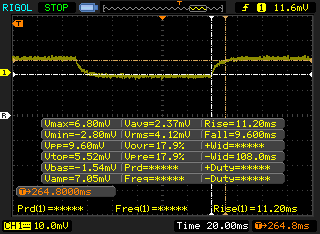 |
| ↘ 9.6 ms fall | ||
| The screen shows good response rates in our tests, but may be too slow for competitive gamers. In comparison, all tested devices range from 0.165 (minimum) to 636 (maximum) ms. » 32 % of all devices are better. This means that the measured response time is better than the average of all tested devices (31.4 ms). | ||
Screen Flickering / PWM (Pulse-Width Modulation)
| Screen flickering / PWM not detected | 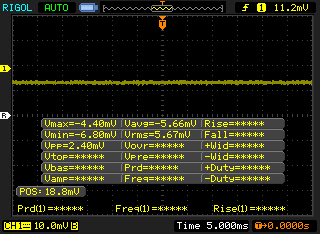 | ||
In comparison: 53 % of all tested devices do not use PWM to dim the display. If PWM was detected, an average of 7986 (minimum: 5 - maximum: 343500) Hz was measured. | |||
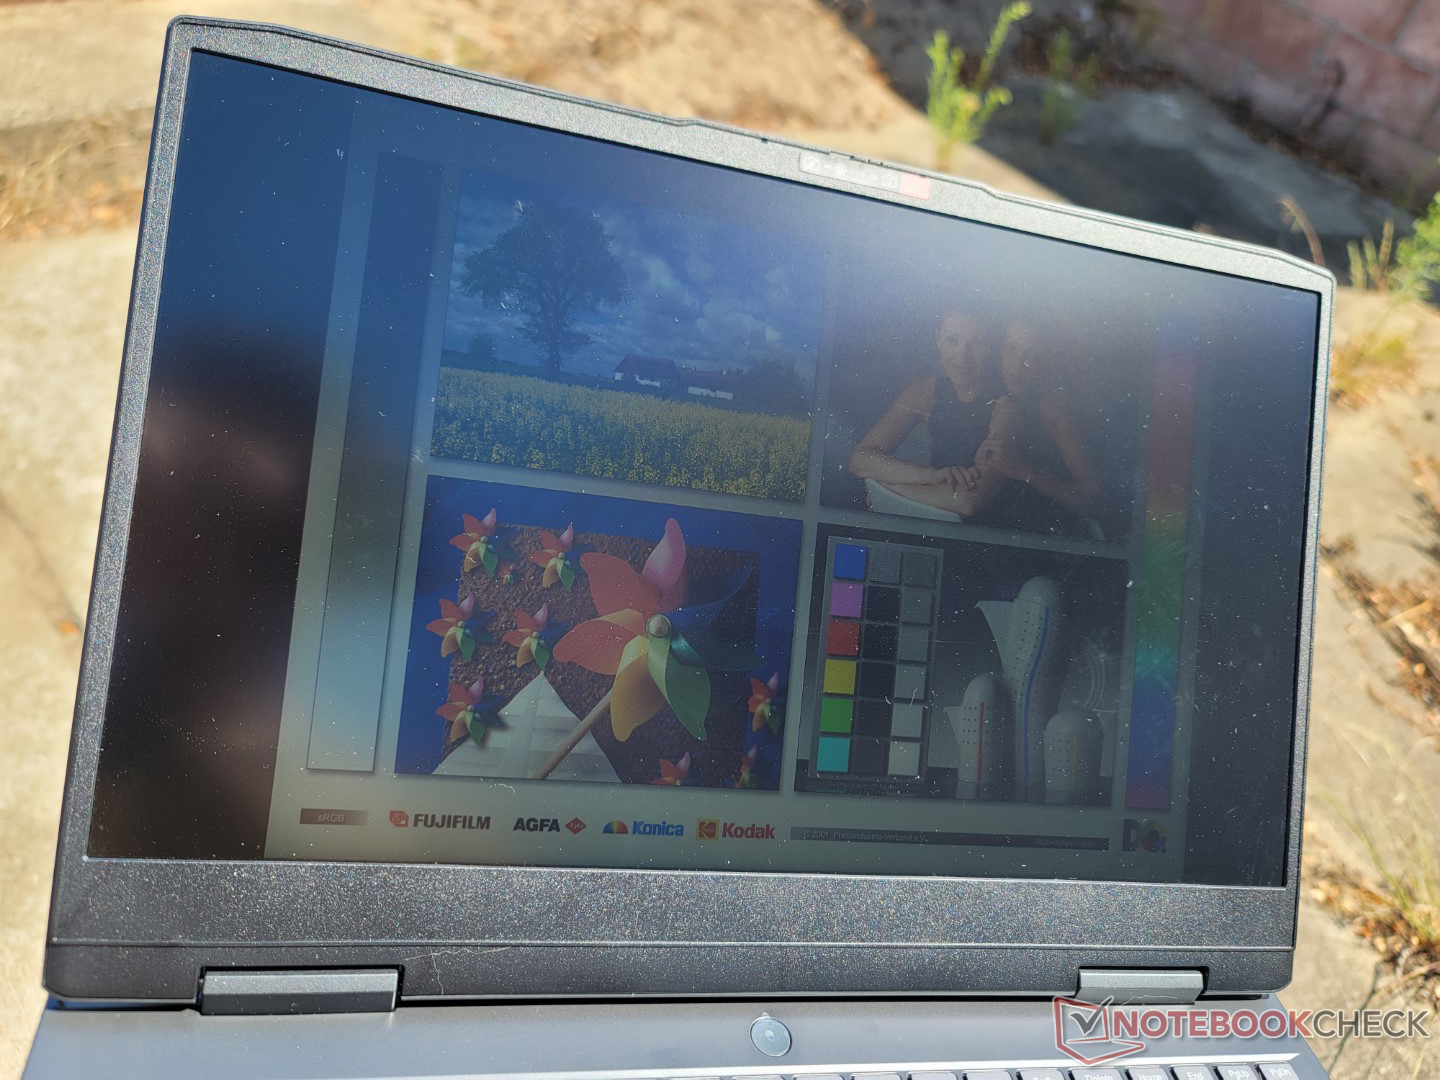
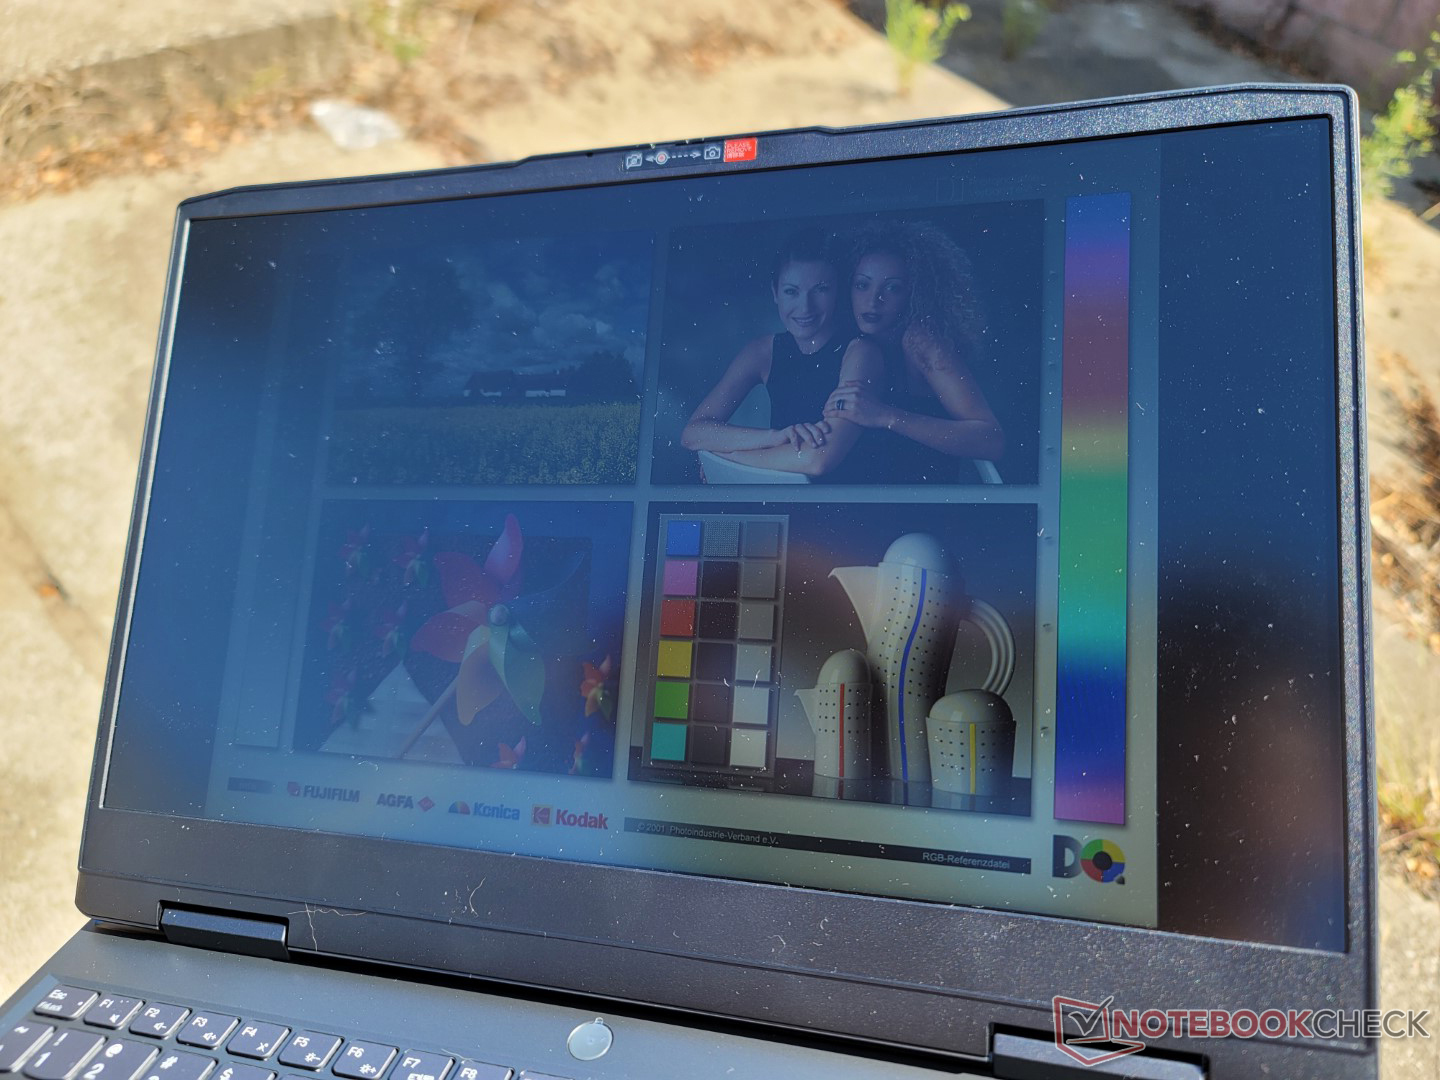
Outdoor visibility is not any better or worse than most other budget or even high-end gaming laptops since these types of systems are not designed to be used outdoors on a frequent basis. You'll want to work under shade whenever possible or else the screen becomes washed out.

Performance
Testing Conditions
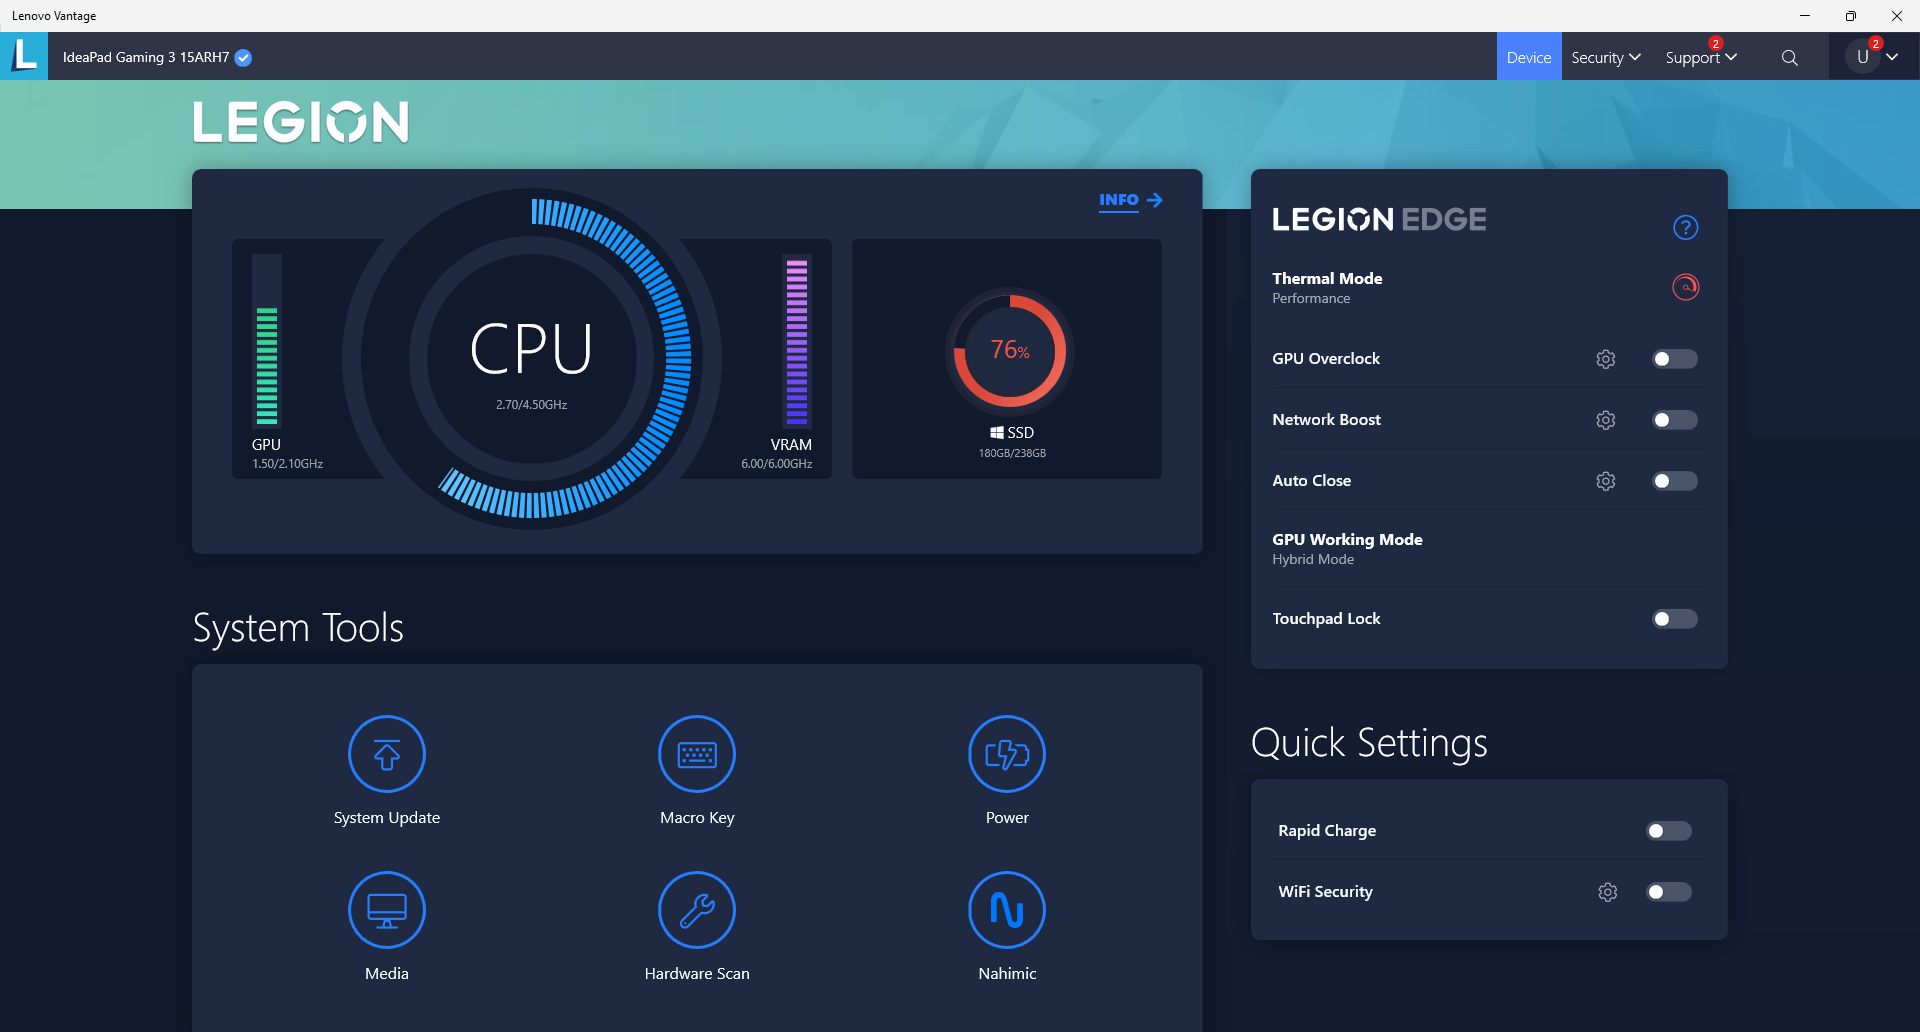
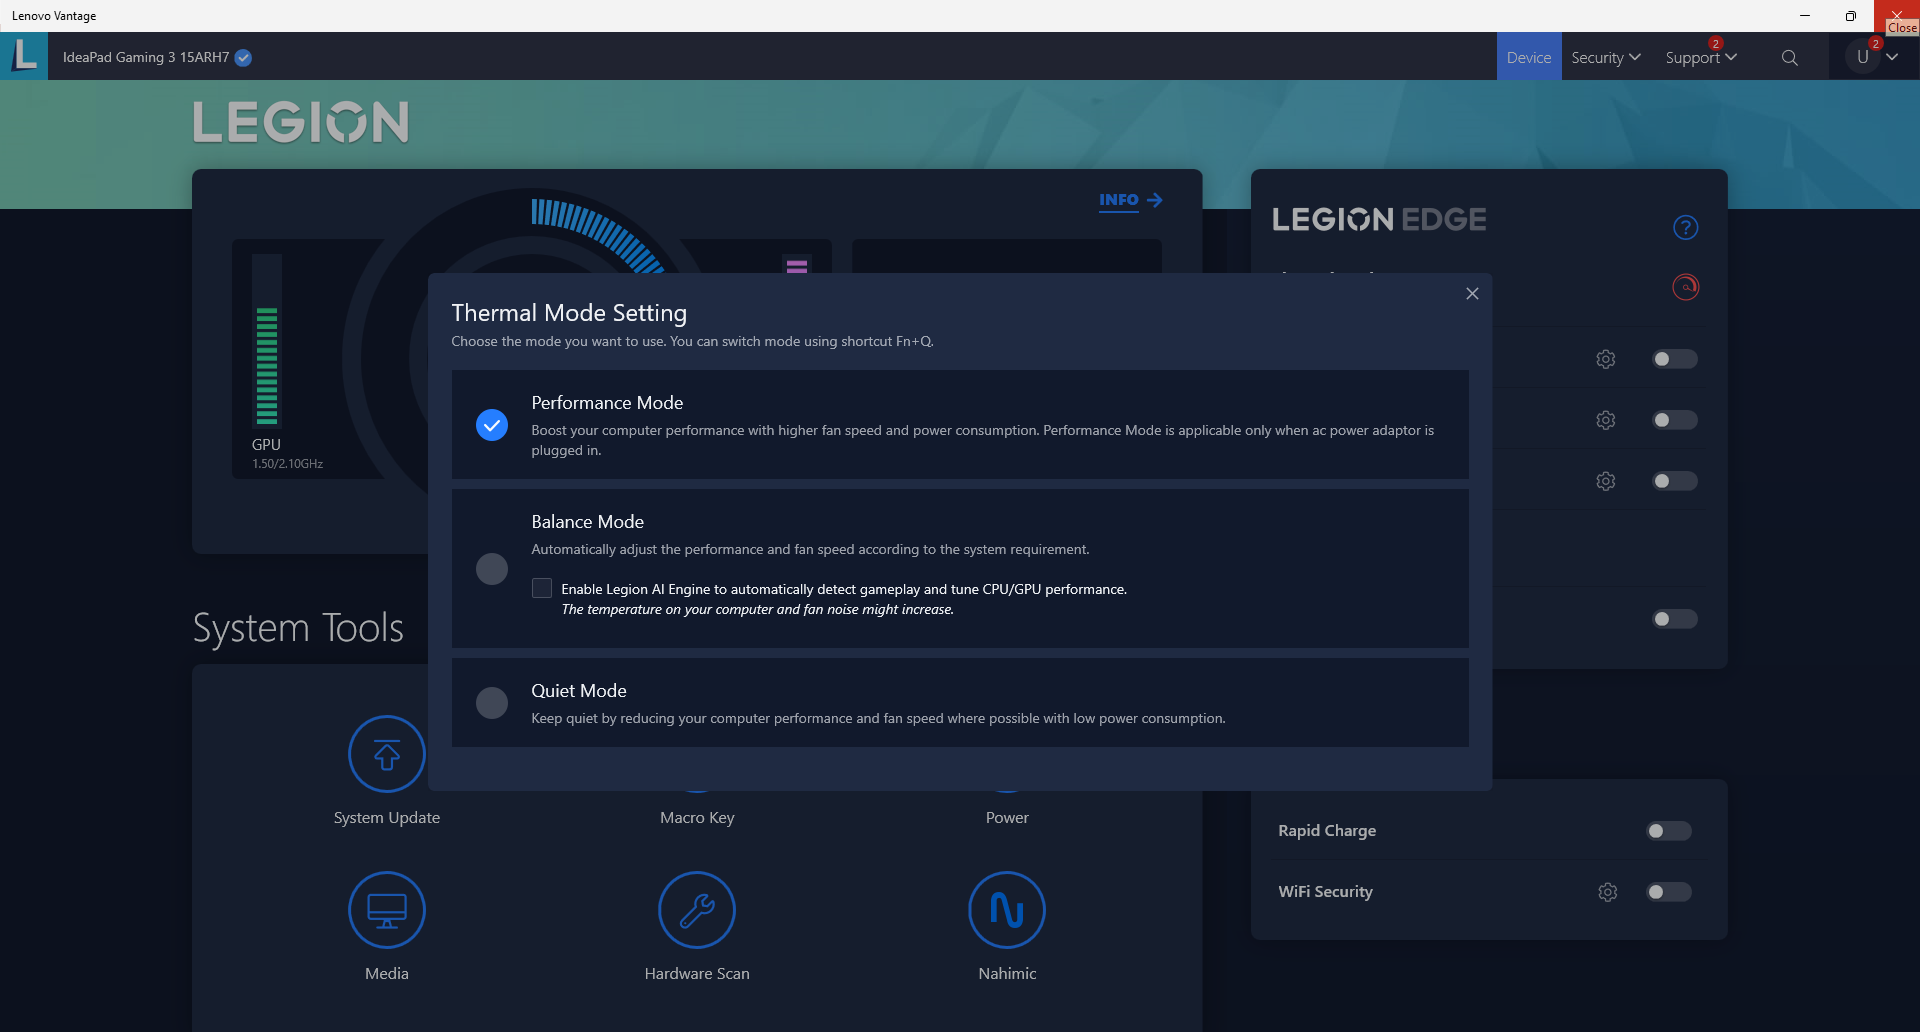
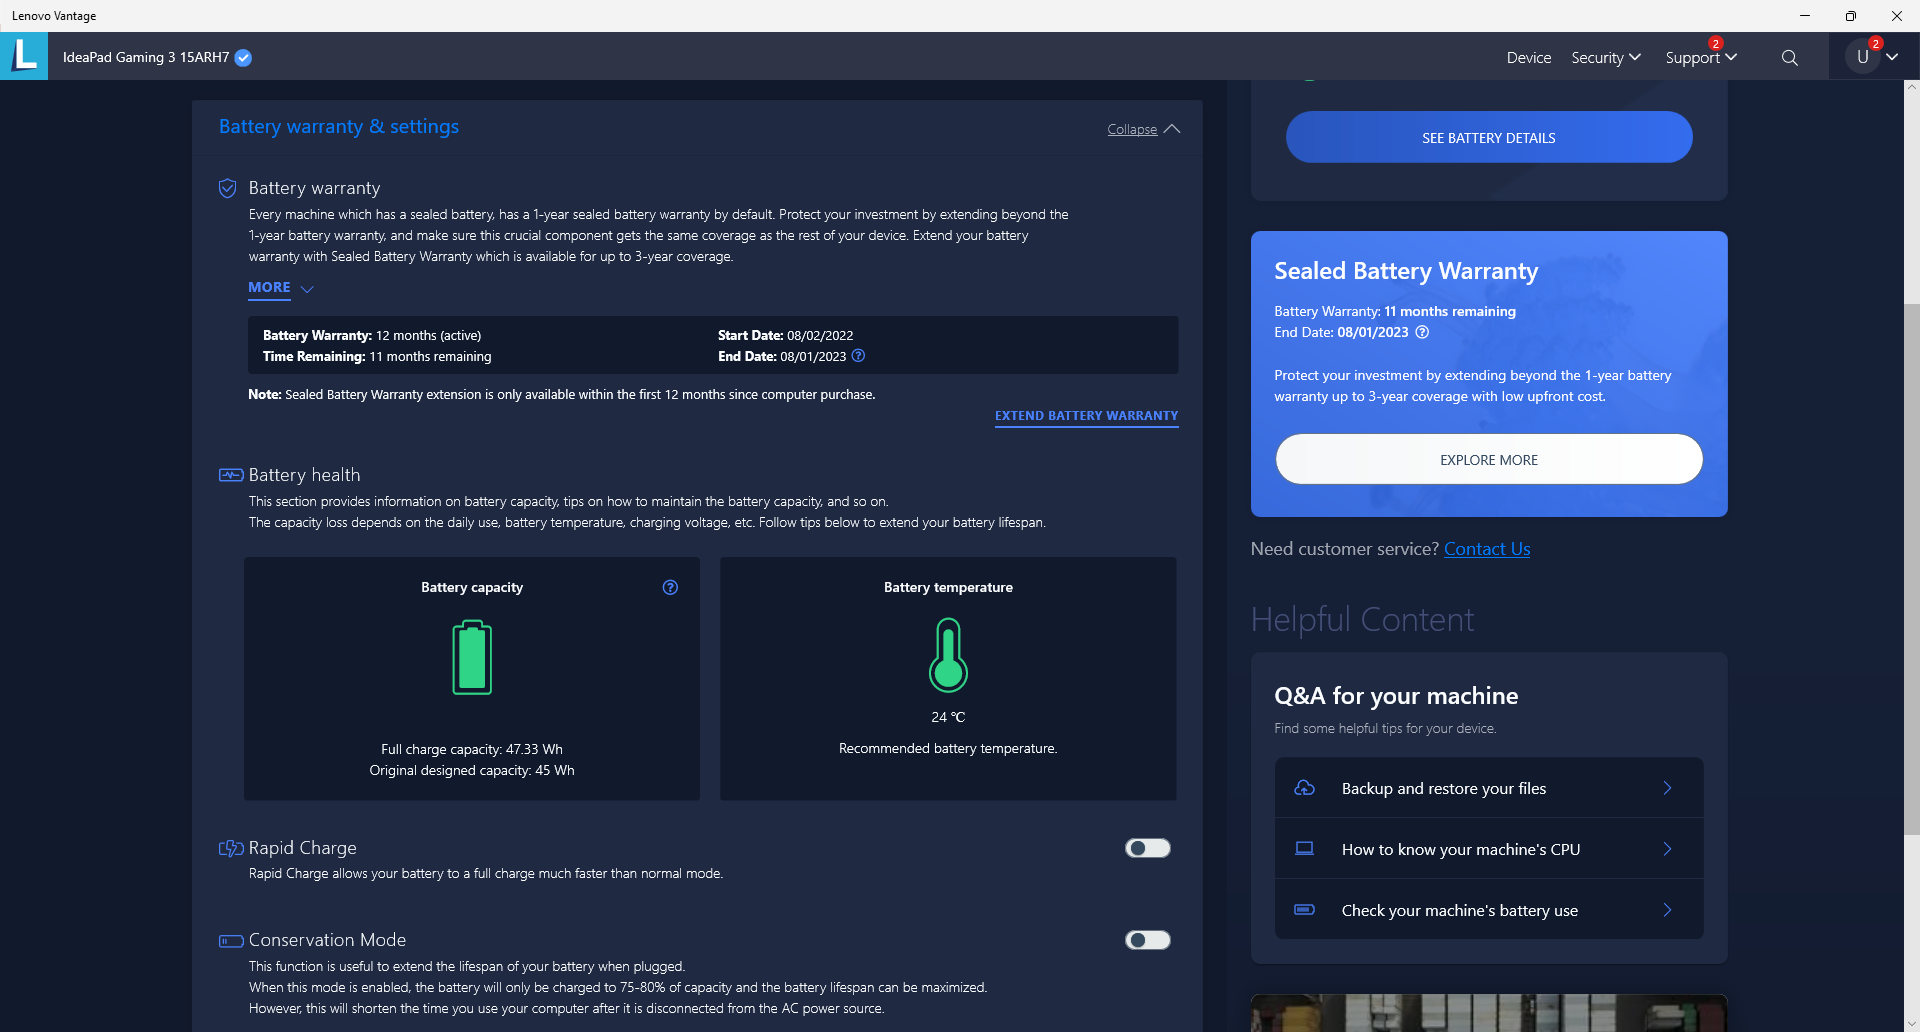
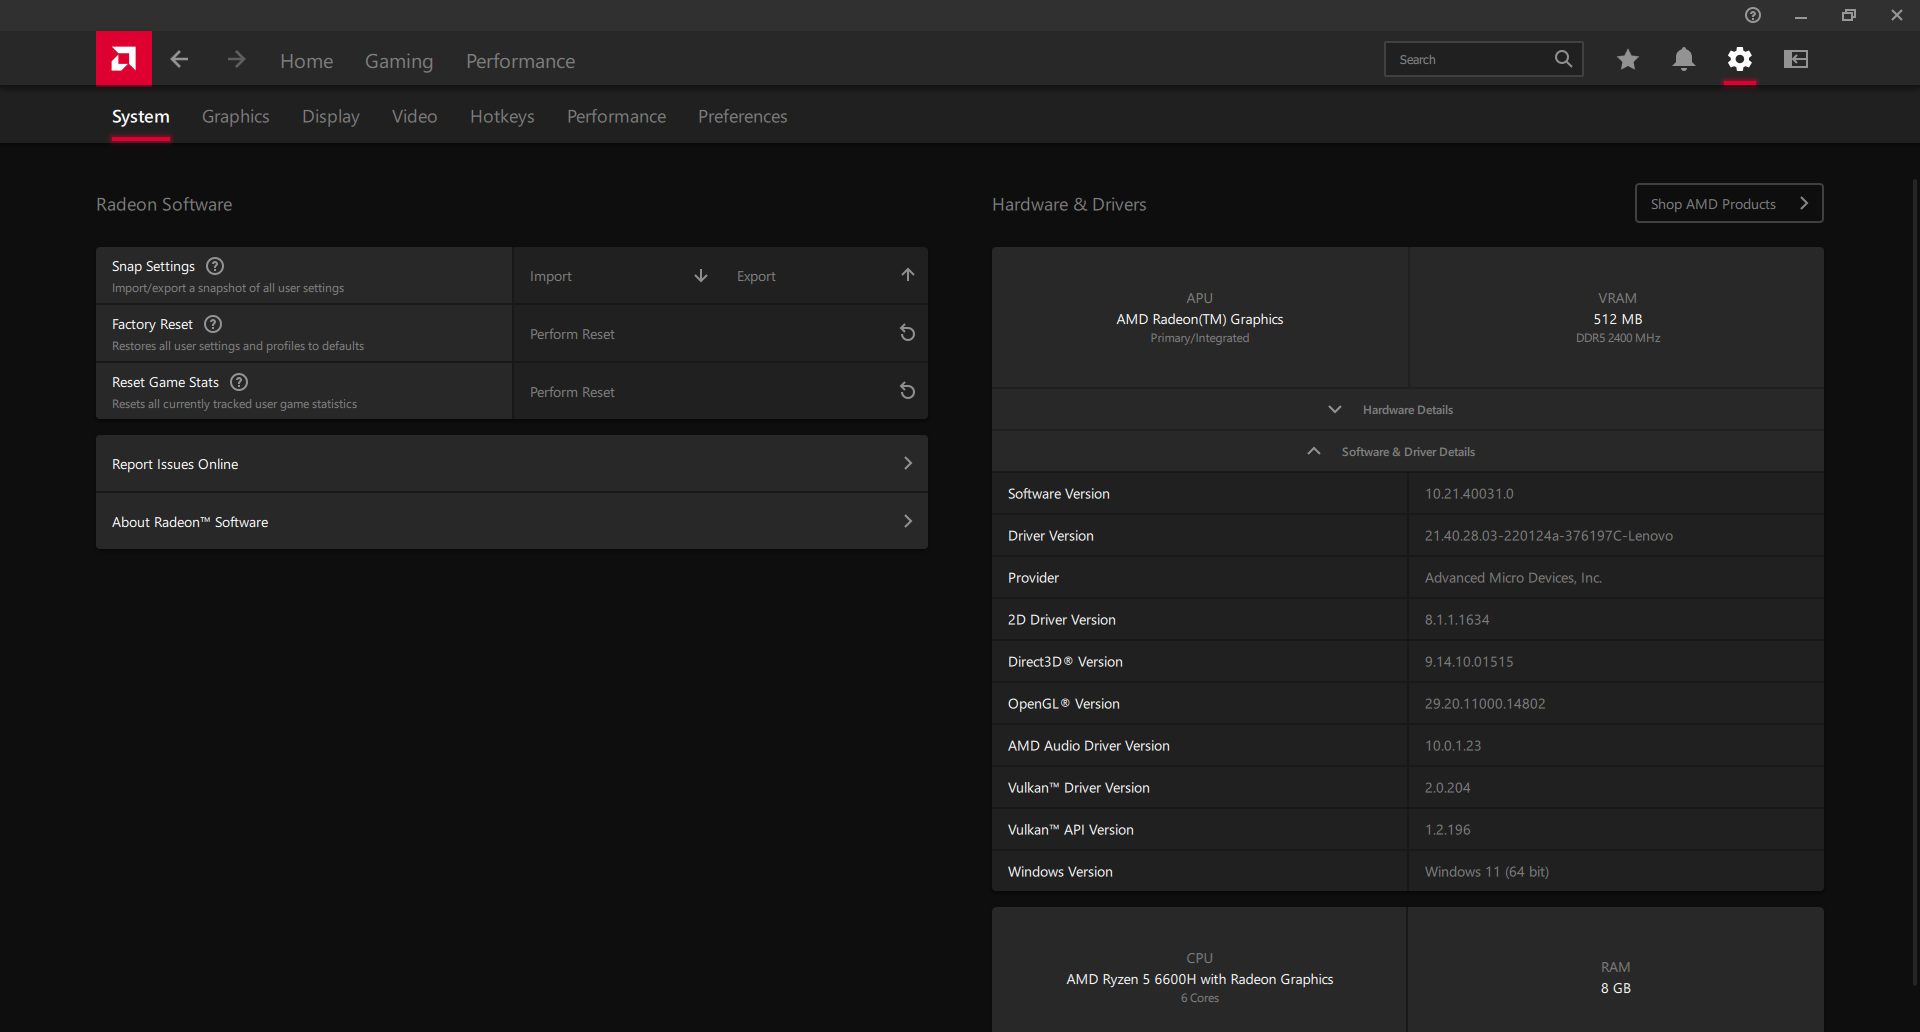
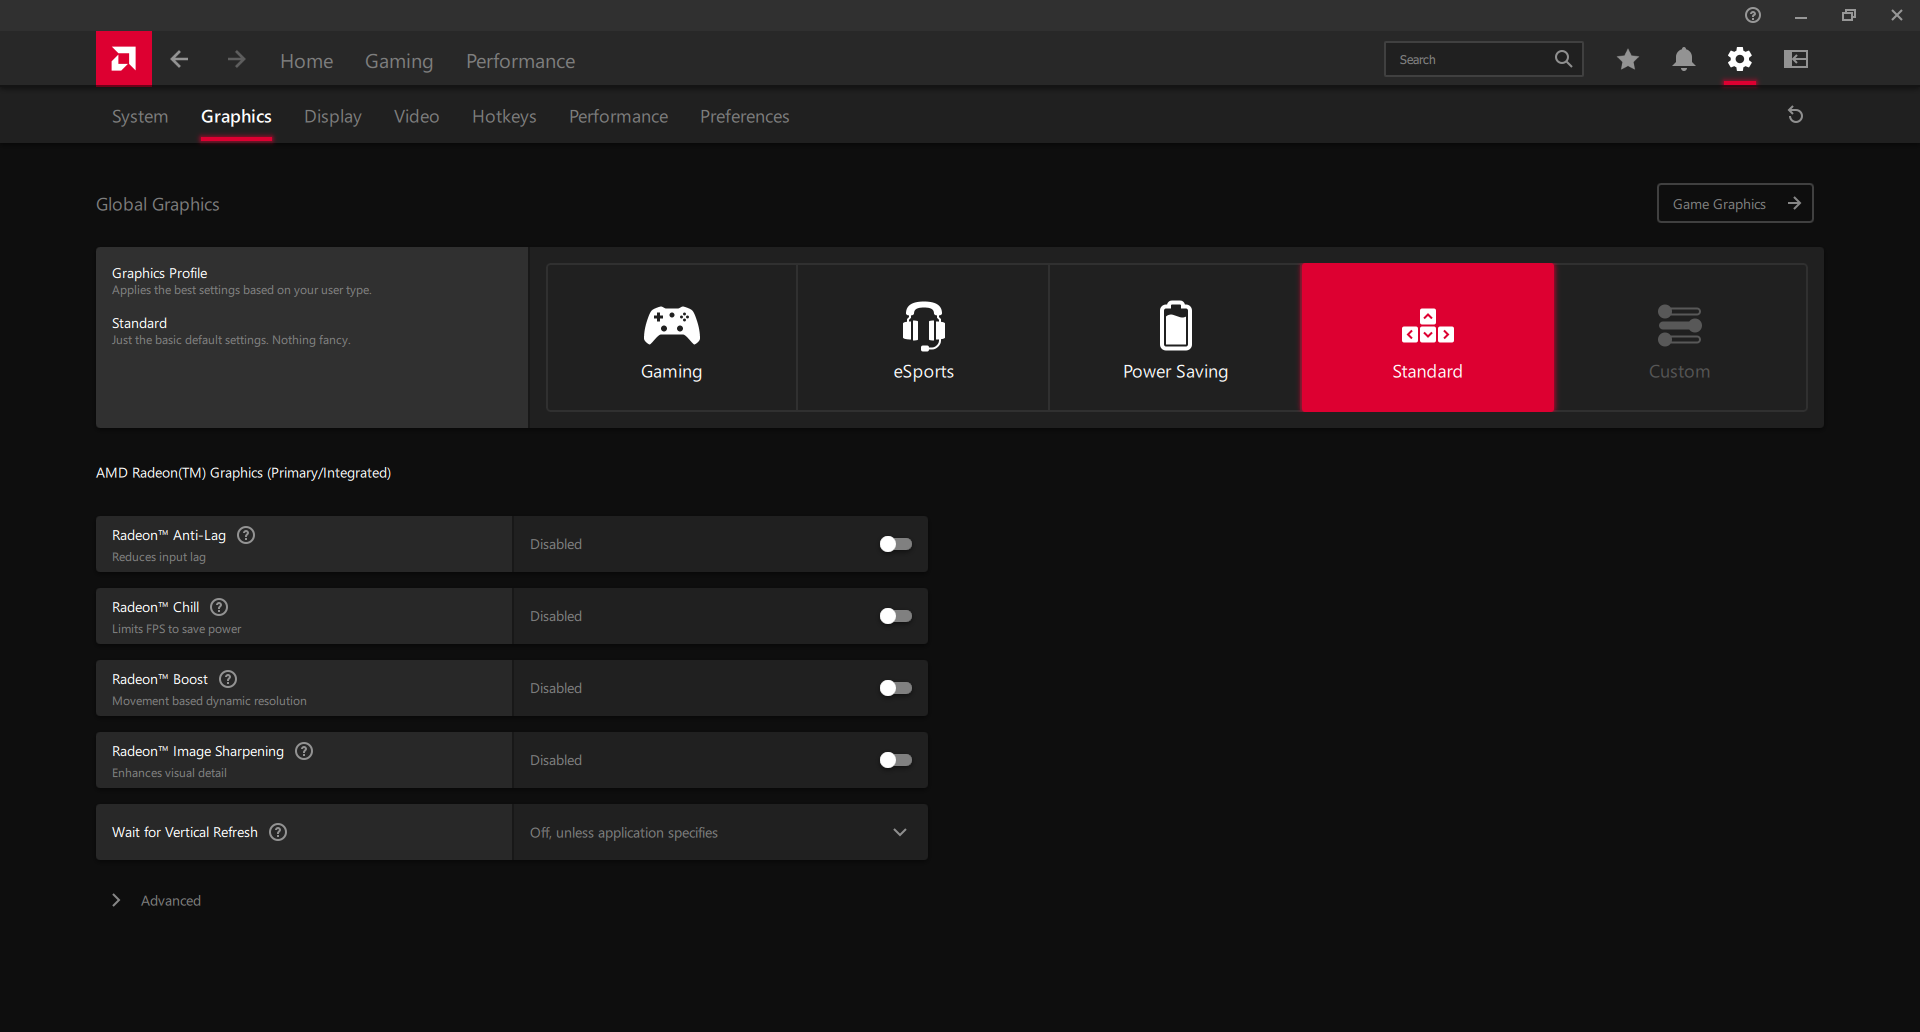
Our unit was set to Performance mode in both Windows and the pre-installed Lenovo Vantage software prior to running the benchmarks below. We also made sure that the Nvidia GPU was active via the Nvidia control panel and that the Global Graphics settings on the Radeon software was set to Standard. It's recommended that users become familiar with both Vantage and the Radeon software as they serve as control hubs for Lenovo updates and most display settings, respectively.
There is no MUX switch which is to be expected on a budget gaming machine.

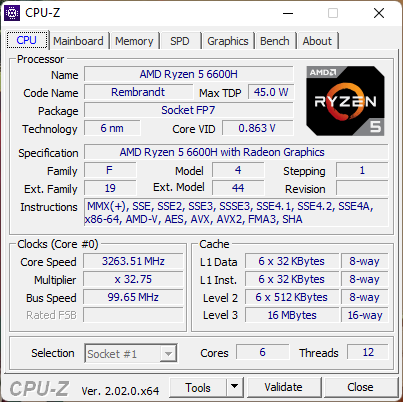
Processor — Performs Like The Ryzen 5 5600H
The Zen 3 Ryzen 5 5600H was already an appreciable boost over the Zen 2 Ryzen 5 4600H. Thus, moving from the Zen 3 Ryzen 5 5600H to the Zen3+ Ryzen 5 6600H is expected to offer just minor CPU benefits at best. The benefits are so minor, in fact, that benchmark results are nearly the same between them. The Gigabyte A5 K1 with the 5600H, for example, is within just a few percentage points from the 6600H in our Lenovo. The last generation Ryzen 7 5800H or Core i7-11800H are therefore still faster processors hands down.
See our dedicated page on the Ryzen 5 6600H for an overview of the processor.
Cinebench R15 Multi Loop
Cinebench R23: Multi Core | Single Core
Cinebench R15: CPU Multi 64Bit | CPU Single 64Bit
Blender: v2.79 BMW27 CPU
7-Zip 18.03: 7z b 4 | 7z b 4 -mmt1
Geekbench 5.5: Multi-Core | Single-Core
HWBOT x265 Benchmark v2.2: 4k Preset
LibreOffice : 20 Documents To PDF
R Benchmark 2.5: Overall mean
Cinebench R23: Multi Core | Single Core
Cinebench R15: CPU Multi 64Bit | CPU Single 64Bit
Blender: v2.79 BMW27 CPU
7-Zip 18.03: 7z b 4 | 7z b 4 -mmt1
Geekbench 5.5: Multi-Core | Single-Core
HWBOT x265 Benchmark v2.2: 4k Preset
LibreOffice : 20 Documents To PDF
R Benchmark 2.5: Overall mean
* ... smaller is better
AIDA64: FP32 Ray-Trace | FPU Julia | CPU SHA3 | CPU Queen | FPU SinJulia | FPU Mandel | CPU AES | CPU ZLib | FP64 Ray-Trace | CPU PhotoWorxx
| Performance rating | |
| Asus TUF Dash F15 FX517ZR | |
| Average AMD Ryzen 5 6600H | |
| Lenovo IdeaPad Gaming 3 15ARH7 | |
| Lenovo Legion 5 15ACH6A-82NW0010GE | |
| Gigabyte A5 K1 | |
| Dell G15 5510 | |
| Lenovo IdeaPad Gaming 3i 15IMH05 | |
| AIDA64 / FP32 Ray-Trace | |
| Asus TUF Dash F15 FX517ZR | |
| Lenovo Legion 5 15ACH6A-82NW0010GE | |
| Gigabyte A5 K1 | |
| Lenovo IdeaPad Gaming 3 15ARH7 | |
| Average AMD Ryzen 5 6600H (10645 - 12871, n=4) | |
| Dell G15 5510 | |
| Lenovo IdeaPad Gaming 3i 15IMH05 | |
| AIDA64 / FPU Julia | |
| Lenovo Legion 5 15ACH6A-82NW0010GE | |
| Gigabyte A5 K1 | |
| Lenovo IdeaPad Gaming 3 15ARH7 | |
| Average AMD Ryzen 5 6600H (66739 - 78277, n=4) | |
| Asus TUF Dash F15 FX517ZR | |
| Dell G15 5510 | |
| Lenovo IdeaPad Gaming 3i 15IMH05 | |
| AIDA64 / CPU SHA3 | |
| Asus TUF Dash F15 FX517ZR | |
| Lenovo Legion 5 15ACH6A-82NW0010GE | |
| Lenovo IdeaPad Gaming 3 15ARH7 | |
| Average AMD Ryzen 5 6600H (2231 - 2689, n=4) | |
| Gigabyte A5 K1 | |
| Dell G15 5510 | |
| Lenovo IdeaPad Gaming 3i 15IMH05 | |
| AIDA64 / CPU Queen | |
| Asus TUF Dash F15 FX517ZR | |
| Average AMD Ryzen 5 6600H (77711 - 82119, n=4) | |
| Lenovo IdeaPad Gaming 3 15ARH7 | |
| Gigabyte A5 K1 | |
| Lenovo Legion 5 15ACH6A-82NW0010GE | |
| Dell G15 5510 | |
| Lenovo IdeaPad Gaming 3i 15IMH05 | |
| AIDA64 / FPU SinJulia | |
| Average AMD Ryzen 5 6600H (9184 - 9739, n=4) | |
| Lenovo IdeaPad Gaming 3 15ARH7 | |
| Gigabyte A5 K1 | |
| Lenovo Legion 5 15ACH6A-82NW0010GE | |
| Asus TUF Dash F15 FX517ZR | |
| Dell G15 5510 | |
| Lenovo IdeaPad Gaming 3i 15IMH05 | |
| AIDA64 / FPU Mandel | |
| Lenovo Legion 5 15ACH6A-82NW0010GE | |
| Gigabyte A5 K1 | |
| Lenovo IdeaPad Gaming 3 15ARH7 | |
| Average AMD Ryzen 5 6600H (36591 - 43222, n=4) | |
| Asus TUF Dash F15 FX517ZR | |
| Dell G15 5510 | |
| Lenovo IdeaPad Gaming 3i 15IMH05 | |
| AIDA64 / CPU AES | |
| Lenovo IdeaPad Gaming 3 15ARH7 | |
| Lenovo Legion 5 15ACH6A-82NW0010GE | |
| Average AMD Ryzen 5 6600H (43461 - 104138, n=4) | |
| Asus TUF Dash F15 FX517ZR | |
| Gigabyte A5 K1 | |
| Dell G15 5510 | |
| Lenovo IdeaPad Gaming 3i 15IMH05 | |
| AIDA64 / CPU ZLib | |
| Asus TUF Dash F15 FX517ZR | |
| Lenovo IdeaPad Gaming 3 15ARH7 | |
| Lenovo Legion 5 15ACH6A-82NW0010GE | |
| Gigabyte A5 K1 | |
| Average AMD Ryzen 5 6600H (523 - 660, n=4) | |
| Dell G15 5510 | |
| Lenovo IdeaPad Gaming 3i 15IMH05 | |
| AIDA64 / FP64 Ray-Trace | |
| Asus TUF Dash F15 FX517ZR | |
| Lenovo Legion 5 15ACH6A-82NW0010GE | |
| Gigabyte A5 K1 | |
| Lenovo IdeaPad Gaming 3 15ARH7 | |
| Average AMD Ryzen 5 6600H (5659 - 6911, n=4) | |
| Dell G15 5510 | |
| Lenovo IdeaPad Gaming 3i 15IMH05 | |
| AIDA64 / CPU PhotoWorxx | |
| Asus TUF Dash F15 FX517ZR | |
| Average AMD Ryzen 5 6600H (16218 - 29621, n=4) | |
| Gigabyte A5 K1 | |
| Lenovo IdeaPad Gaming 3i 15IMH05 | |
| Lenovo IdeaPad Gaming 3 15ARH7 | |
| Dell G15 5510 | |
| Lenovo Legion 5 15ACH6A-82NW0010GE | |
System Performance
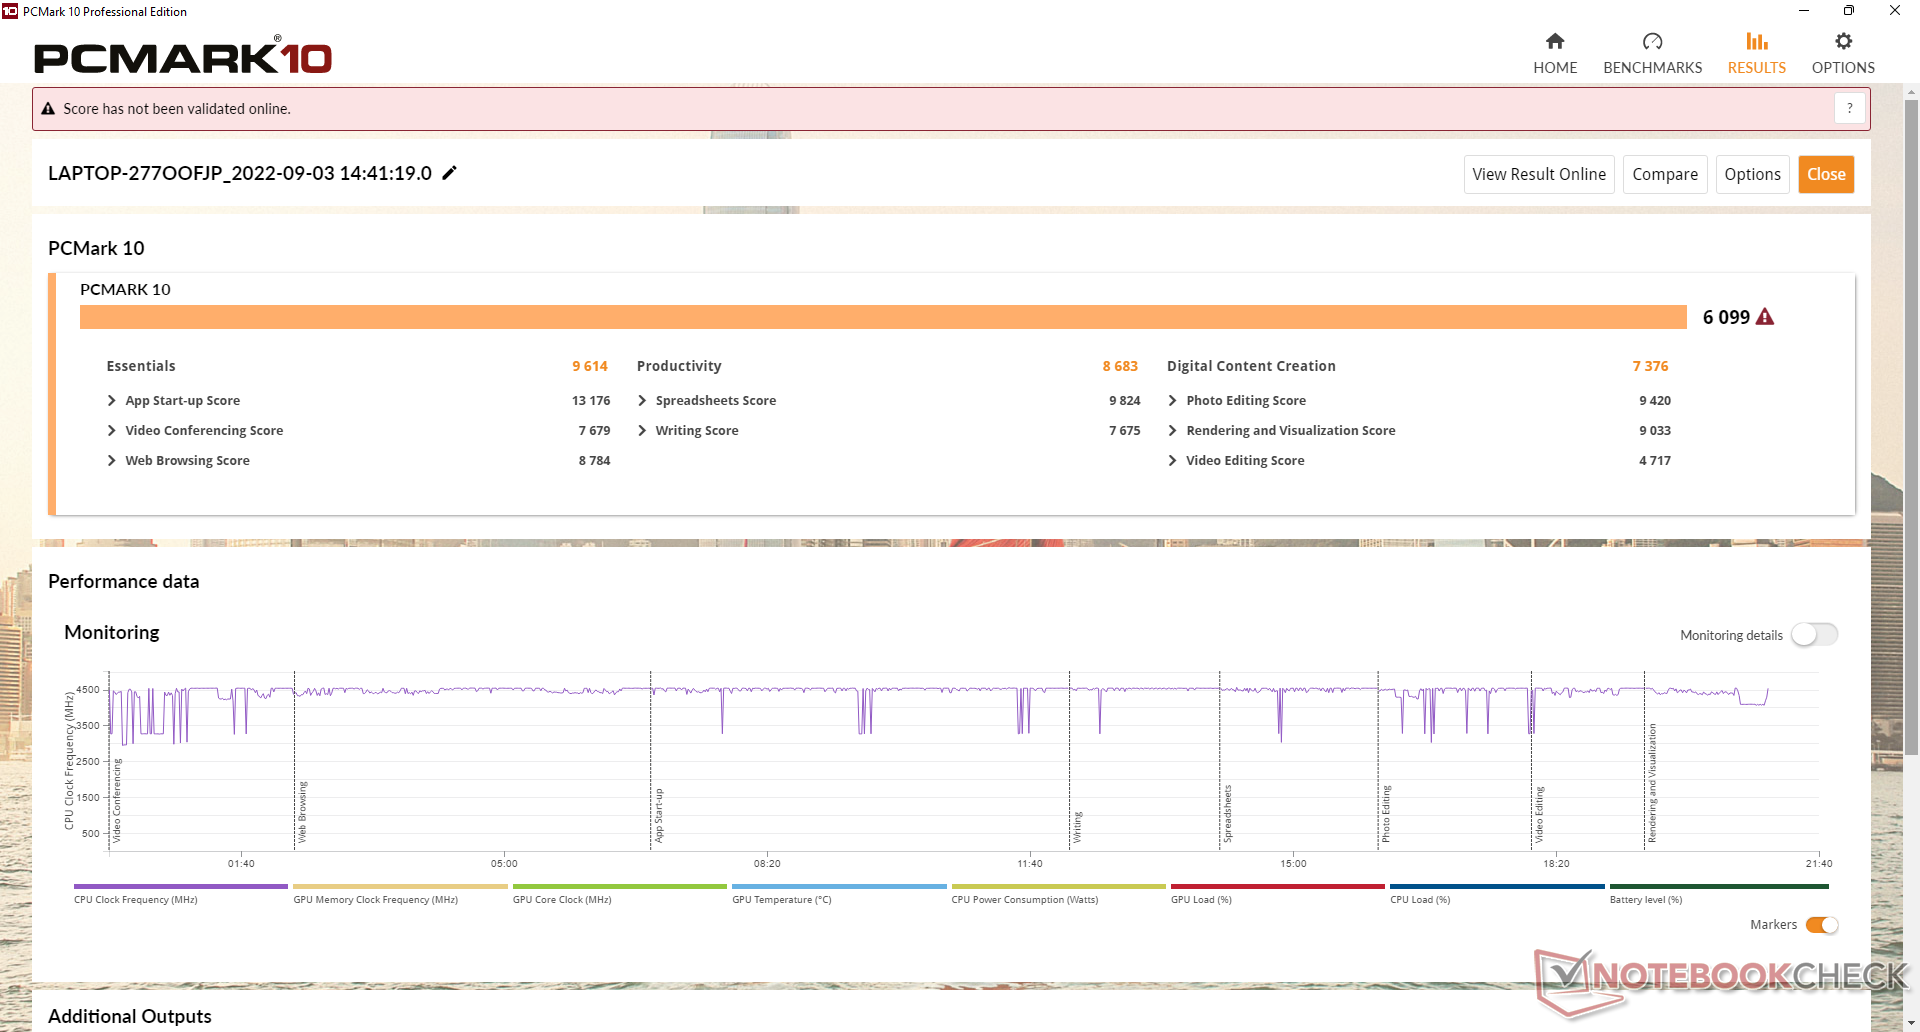
PCMark scores are consistently above the older IdeaPad Gaming 3i 15IMH05 but still below the Legion 5 15ACH6A with the more powerful Radeon RX 6600M GPU. The Digital Content Creation subscore in particular is noticeably better than on the IdeaPad Gaming 3i 15IMH05 because of the generational leap in graphics performance.
CrossMark: Overall | Productivity | Creativity | Responsiveness
| PCMark 10 / Score | |
| Lenovo Legion 5 15ACH6A-82NW0010GE | |
| Asus TUF Dash F15 FX517ZR | |
| Gigabyte A5 K1 | |
| Lenovo IdeaPad Gaming 3 15ARH7 | |
| Average AMD Ryzen 5 6600H, NVIDIA GeForce RTX 3050 4GB Laptop GPU (n=1) | |
| Dell G15 5510 | |
| Lenovo IdeaPad Gaming 3i 15IMH05 | |
| PCMark 10 / Essentials | |
| Lenovo Legion 5 15ACH6A-82NW0010GE | |
| Gigabyte A5 K1 | |
| Asus TUF Dash F15 FX517ZR | |
| Lenovo IdeaPad Gaming 3 15ARH7 | |
| Average AMD Ryzen 5 6600H, NVIDIA GeForce RTX 3050 4GB Laptop GPU (n=1) | |
| Lenovo IdeaPad Gaming 3i 15IMH05 | |
| Dell G15 5510 | |
| PCMark 10 / Productivity | |
| Asus TUF Dash F15 FX517ZR | |
| Lenovo Legion 5 15ACH6A-82NW0010GE | |
| Gigabyte A5 K1 | |
| Lenovo IdeaPad Gaming 3 15ARH7 | |
| Average AMD Ryzen 5 6600H, NVIDIA GeForce RTX 3050 4GB Laptop GPU (n=1) | |
| Lenovo IdeaPad Gaming 3i 15IMH05 | |
| Dell G15 5510 | |
| PCMark 10 / Digital Content Creation | |
| Lenovo Legion 5 15ACH6A-82NW0010GE | |
| Asus TUF Dash F15 FX517ZR | |
| Gigabyte A5 K1 | |
| Lenovo IdeaPad Gaming 3 15ARH7 | |
| Average AMD Ryzen 5 6600H, NVIDIA GeForce RTX 3050 4GB Laptop GPU (n=1) | |
| Dell G15 5510 | |
| Lenovo IdeaPad Gaming 3i 15IMH05 | |
| CrossMark / Overall | |
| Asus TUF Dash F15 FX517ZR | |
| Lenovo IdeaPad Gaming 3 15ARH7 | |
| Average AMD Ryzen 5 6600H, NVIDIA GeForce RTX 3050 4GB Laptop GPU (n=1) | |
| CrossMark / Productivity | |
| Asus TUF Dash F15 FX517ZR | |
| Lenovo IdeaPad Gaming 3 15ARH7 | |
| Average AMD Ryzen 5 6600H, NVIDIA GeForce RTX 3050 4GB Laptop GPU (n=1) | |
| CrossMark / Creativity | |
| Asus TUF Dash F15 FX517ZR | |
| Lenovo IdeaPad Gaming 3 15ARH7 | |
| Average AMD Ryzen 5 6600H, NVIDIA GeForce RTX 3050 4GB Laptop GPU (n=1) | |
| CrossMark / Responsiveness | |
| Asus TUF Dash F15 FX517ZR | |
| Lenovo IdeaPad Gaming 3 15ARH7 | |
| Average AMD Ryzen 5 6600H, NVIDIA GeForce RTX 3050 4GB Laptop GPU (n=1) | |
| PCMark 10 Score | 6099 points | |
Help | ||
| AIDA64 / Memory Copy | |
| Asus TUF Dash F15 FX517ZR | |
| Average AMD Ryzen 5 6600H (28335 - 50886, n=4) | |
| Gigabyte A5 K1 | |
| Lenovo Legion 5 15ACH6A-82NW0010GE | |
| Dell G15 5510 | |
| Lenovo IdeaPad Gaming 3i 15IMH05 | |
| Lenovo IdeaPad Gaming 3 15ARH7 | |
| AIDA64 / Memory Read | |
| Asus TUF Dash F15 FX517ZR | |
| Gigabyte A5 K1 | |
| Average AMD Ryzen 5 6600H (34300 - 51684, n=4) | |
| Lenovo Legion 5 15ACH6A-82NW0010GE | |
| Lenovo IdeaPad Gaming 3i 15IMH05 | |
| Dell G15 5510 | |
| Lenovo IdeaPad Gaming 3 15ARH7 | |
| AIDA64 / Memory Write | |
| Asus TUF Dash F15 FX517ZR | |
| Average AMD Ryzen 5 6600H (31788 - 55160, n=4) | |
| Gigabyte A5 K1 | |
| Dell G15 5510 | |
| Lenovo IdeaPad Gaming 3i 15IMH05 | |
| Lenovo IdeaPad Gaming 3 15ARH7 | |
| Lenovo Legion 5 15ACH6A-82NW0010GE | |
| AIDA64 / Memory Latency | |
| Asus TUF Dash F15 FX517ZR | |
| Average AMD Ryzen 5 6600H (81.7 - 112.7, n=4) | |
| Lenovo Legion 5 15ACH6A-82NW0010GE | |
| Lenovo IdeaPad Gaming 3 15ARH7 | |
| Dell G15 5510 | |
| Gigabyte A5 K1 | |
| Lenovo IdeaPad Gaming 3i 15IMH05 | |
* ... smaller is better
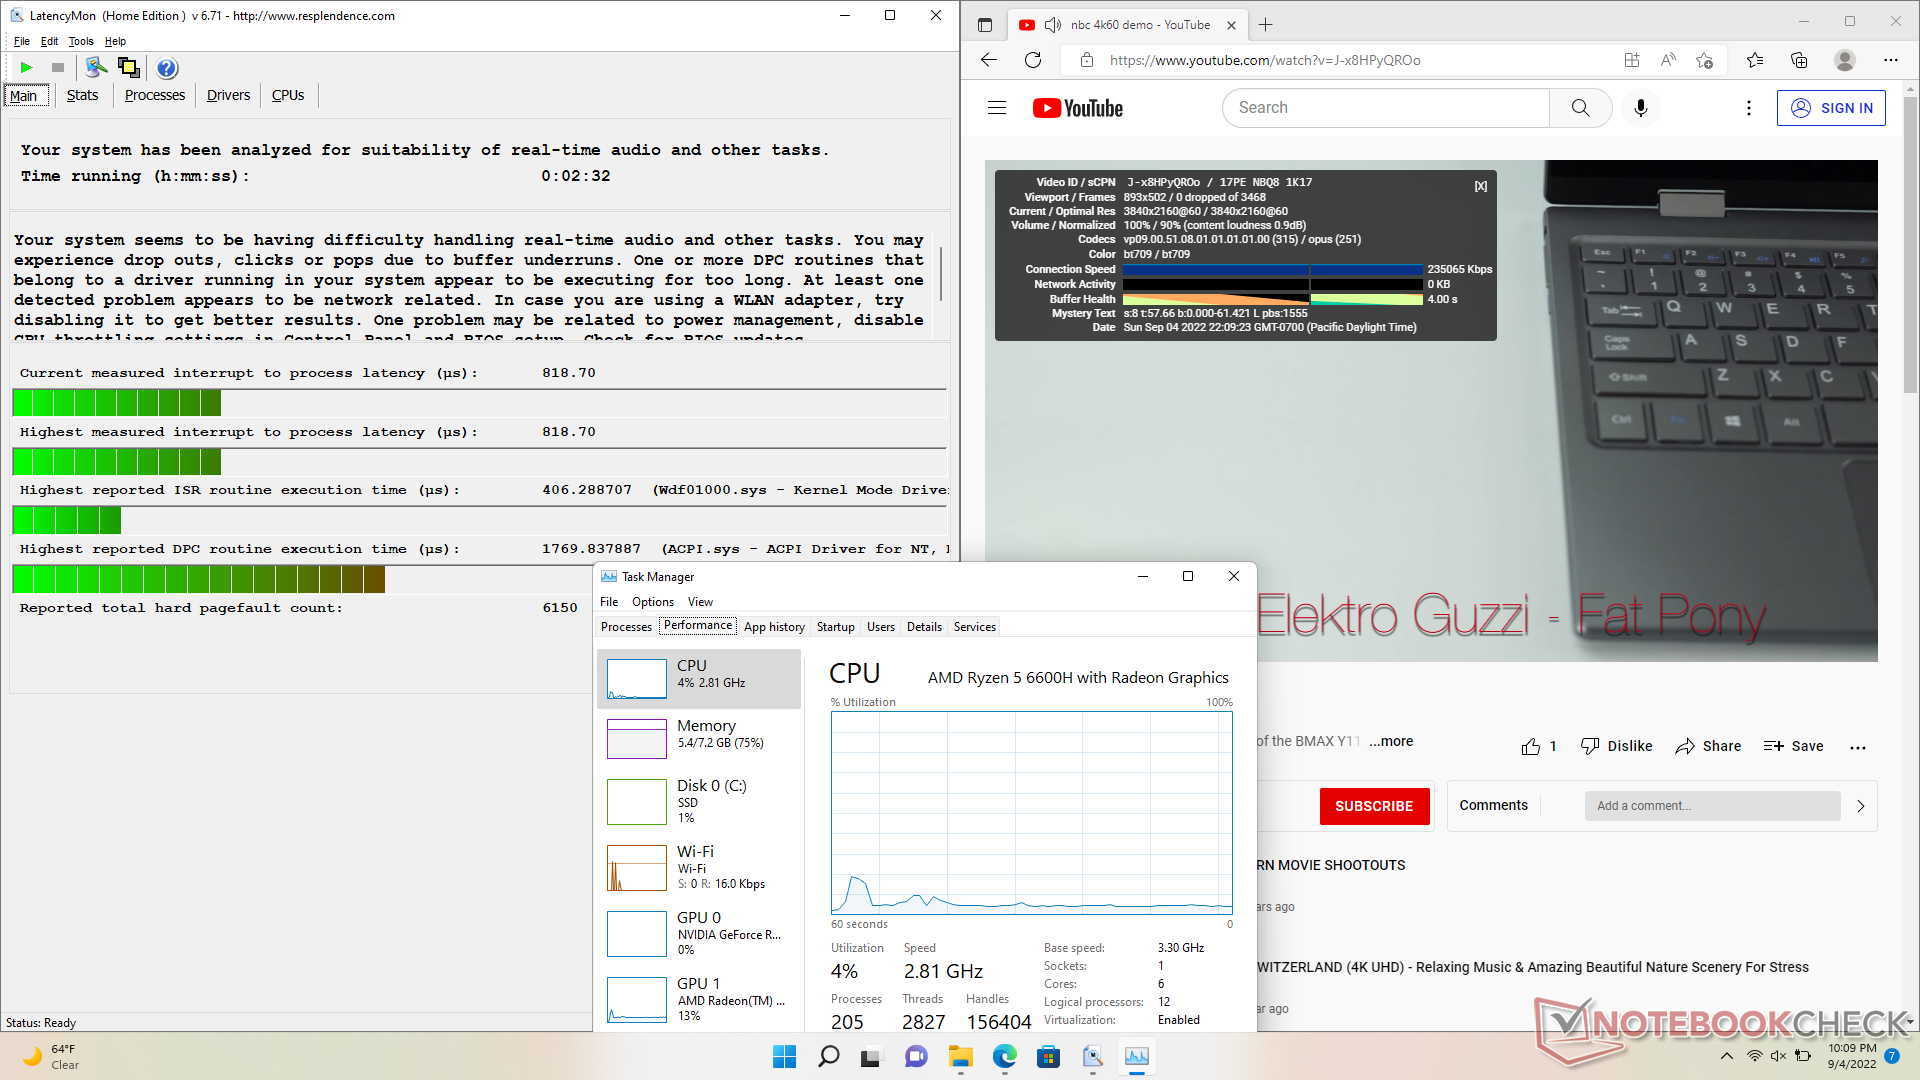
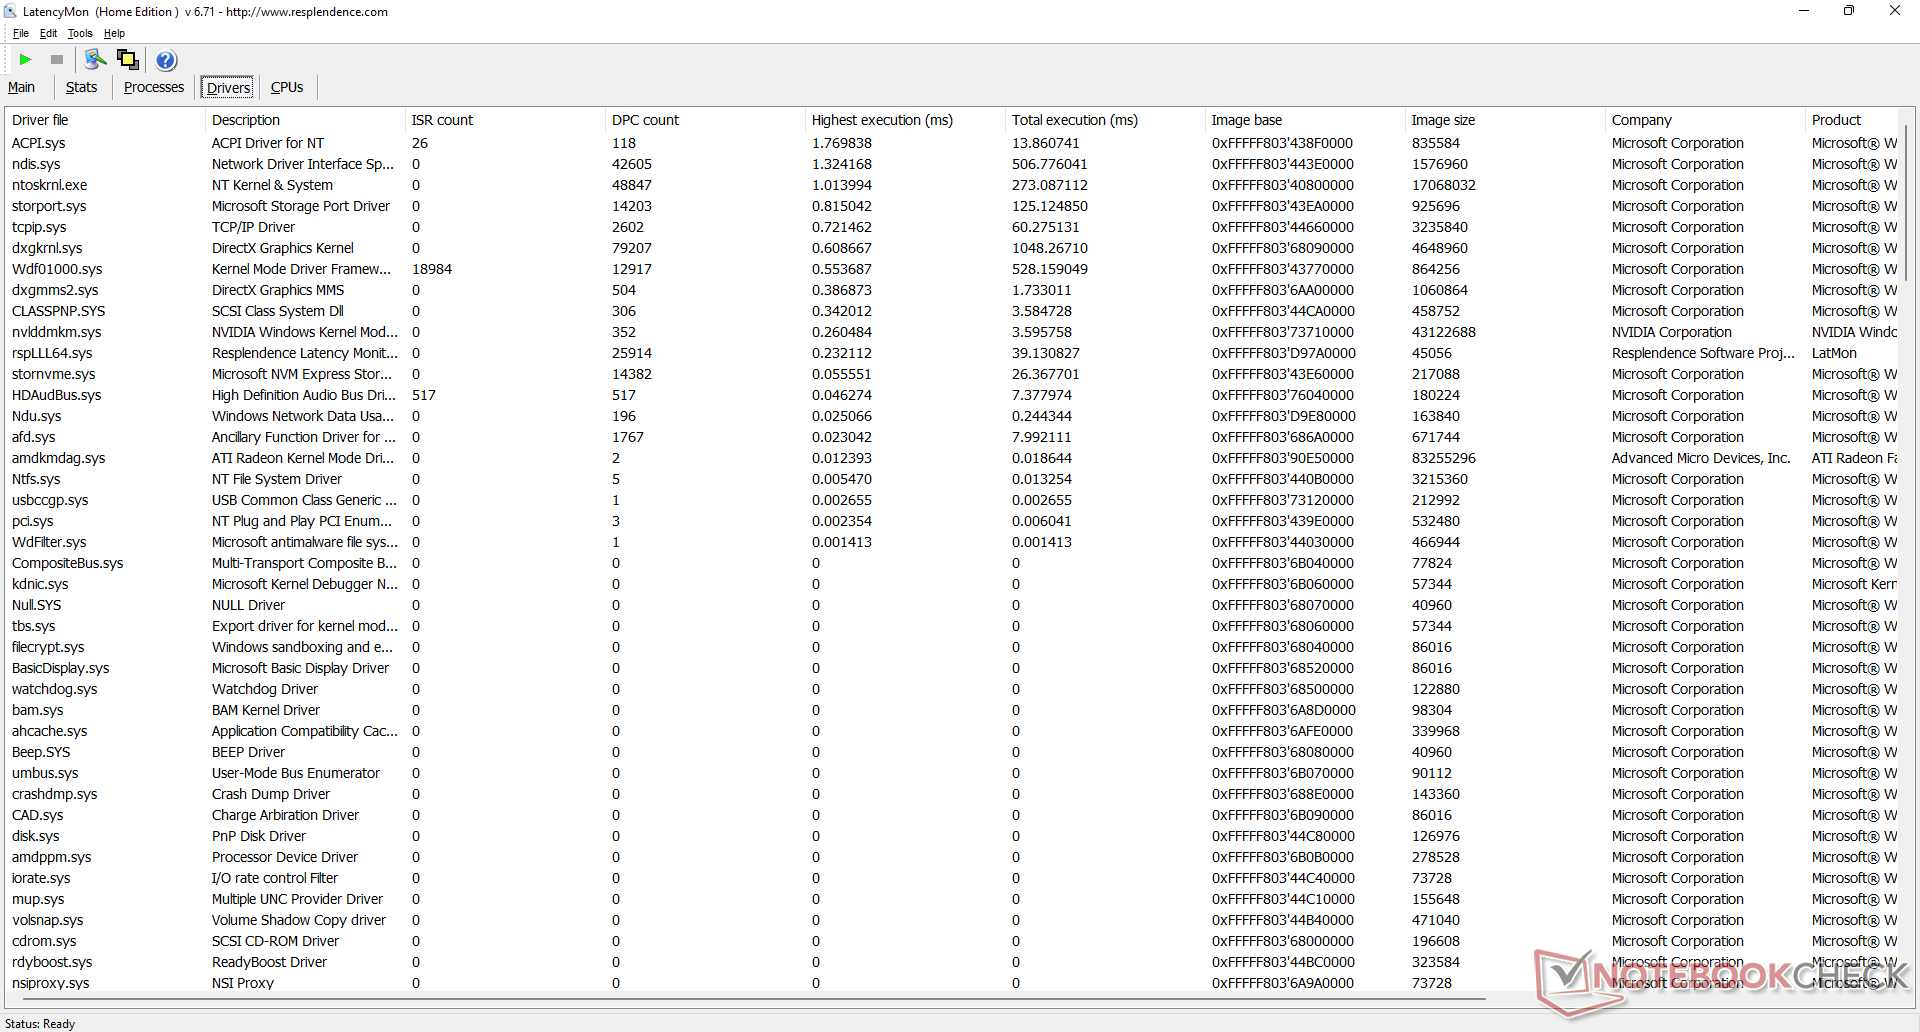
DPC Latency
LatencyMon reveals minor DPC issues when opening multiple browser tabs of our homepage. 4K video playback at 60 FPS is otherwise perfect with 0 dropped frames and at a lower iGPU utilization when compared to Intel Core U-series Iris Xe (13 percent vs. ~40 percent).
| DPC Latencies / LatencyMon - interrupt to process latency (max), Web, Youtube, Prime95 | |
| Dell G15 5510 | |
| Gigabyte A5 K1 | |
| Lenovo Legion 5 15ACH6A-82NW0010GE | |
| Lenovo IdeaPad Gaming 3 15ARH7 | |
| Lenovo IdeaPad Gaming 3i 15IMH05 | |
| Asus TUF Dash F15 FX517ZR | |
* ... smaller is better
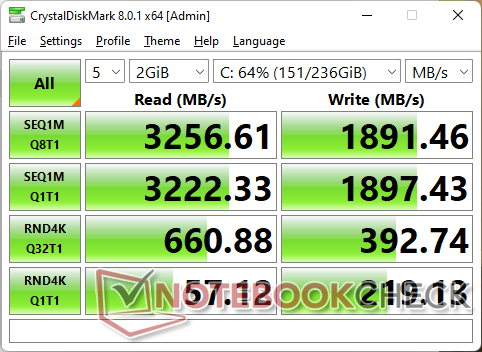
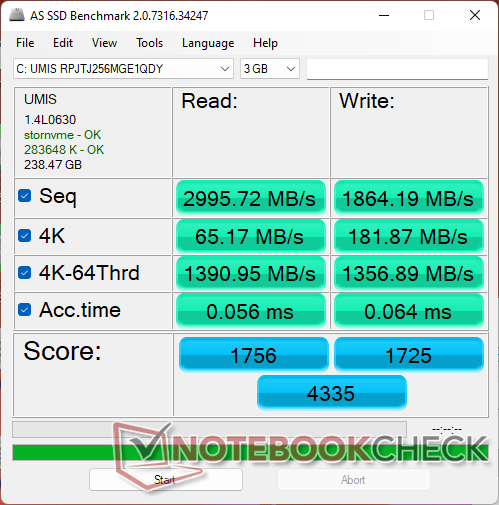
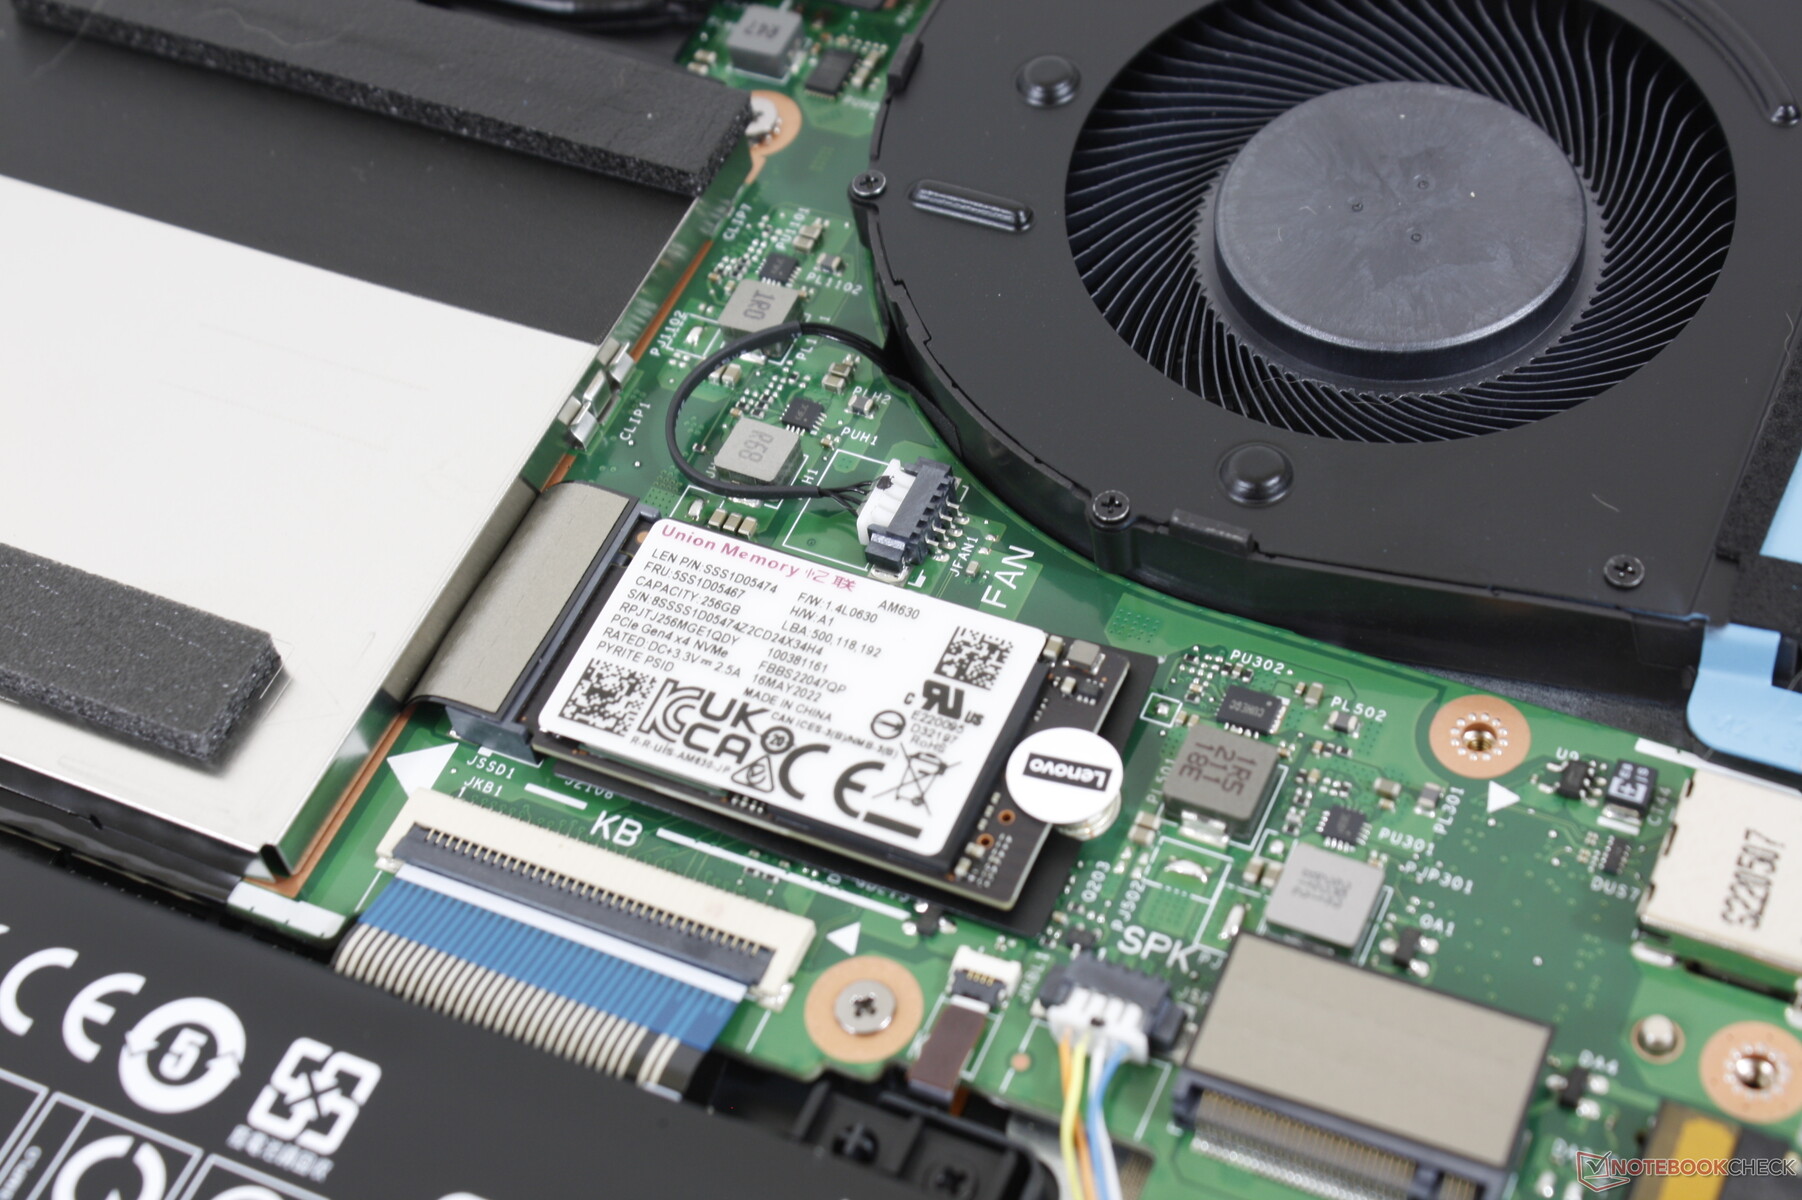
Storage Devices — Up To Two PCIe4 x4 SSDs
Though the system can support up to two M.2 PCIe4 x4 NVMe SSDs simultaneously, the 256 GB PCIe4 x4 Lenovo AM630 SSD in our test unit is slow relative to other PCIe4 x4 SSDs. The Samsung PM9A1, for example, can reach speeds of up to 7000 MB/s compared to only ~3000 MB/s on our IdeaPad. Furthermore, the drive in our unit would throttle down to the 2000 MB/s range when running DiskSpd in a loop as shown by the graph below meaning it can't sustain its maximum transfer rates for long periods. For a budget gaming laptop, however, this isn't a particularly critical complaint.

| Drive Performance rating - Percent | |
| Lenovo IdeaPad Gaming 3 15ARH7 | |
| Asus TUF Dash F15 FX517ZR | |
| Gigabyte A5 K1 | |
| Dell G15 5510 | |
| Lenovo Legion 5 15ACH6A-82NW0010GE | |
| Lenovo IdeaPad Gaming 3i 15IMH05 | |
* ... smaller is better
Disk Throttling: DiskSpd Read Loop, Queue Depth 8
GPU Performance
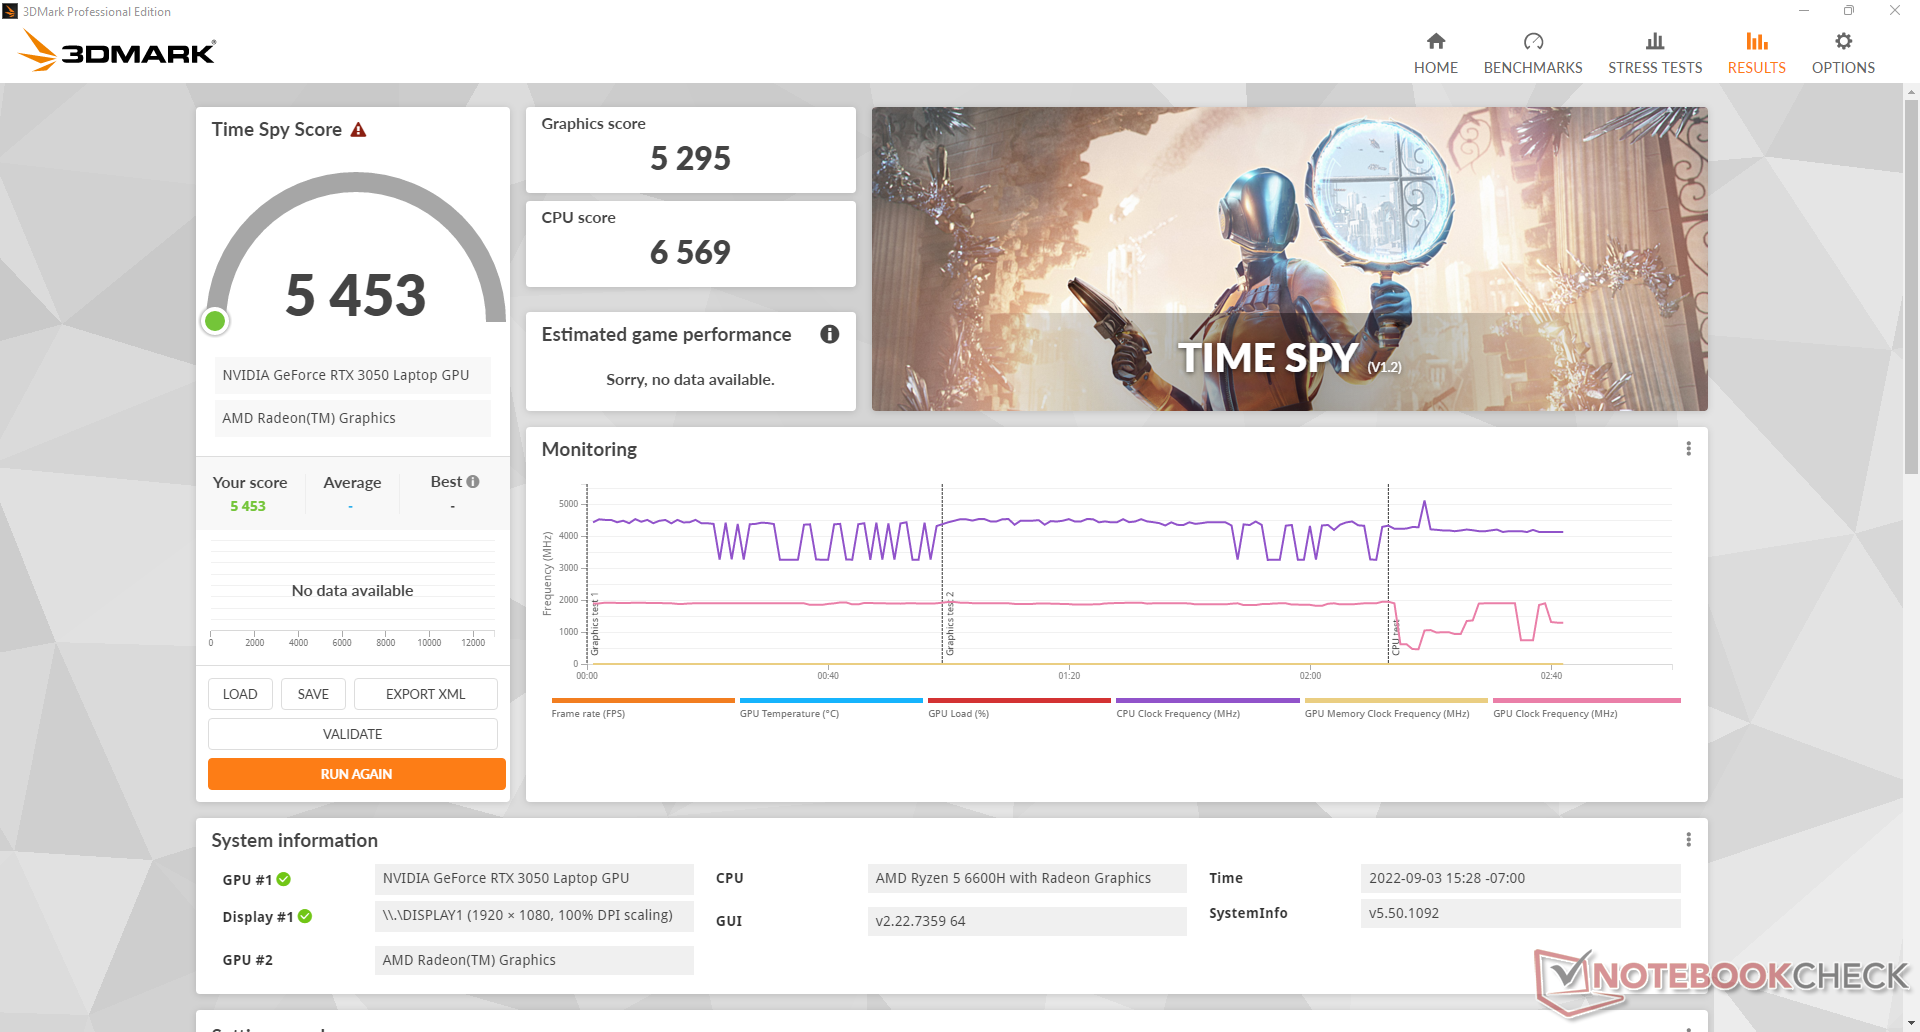
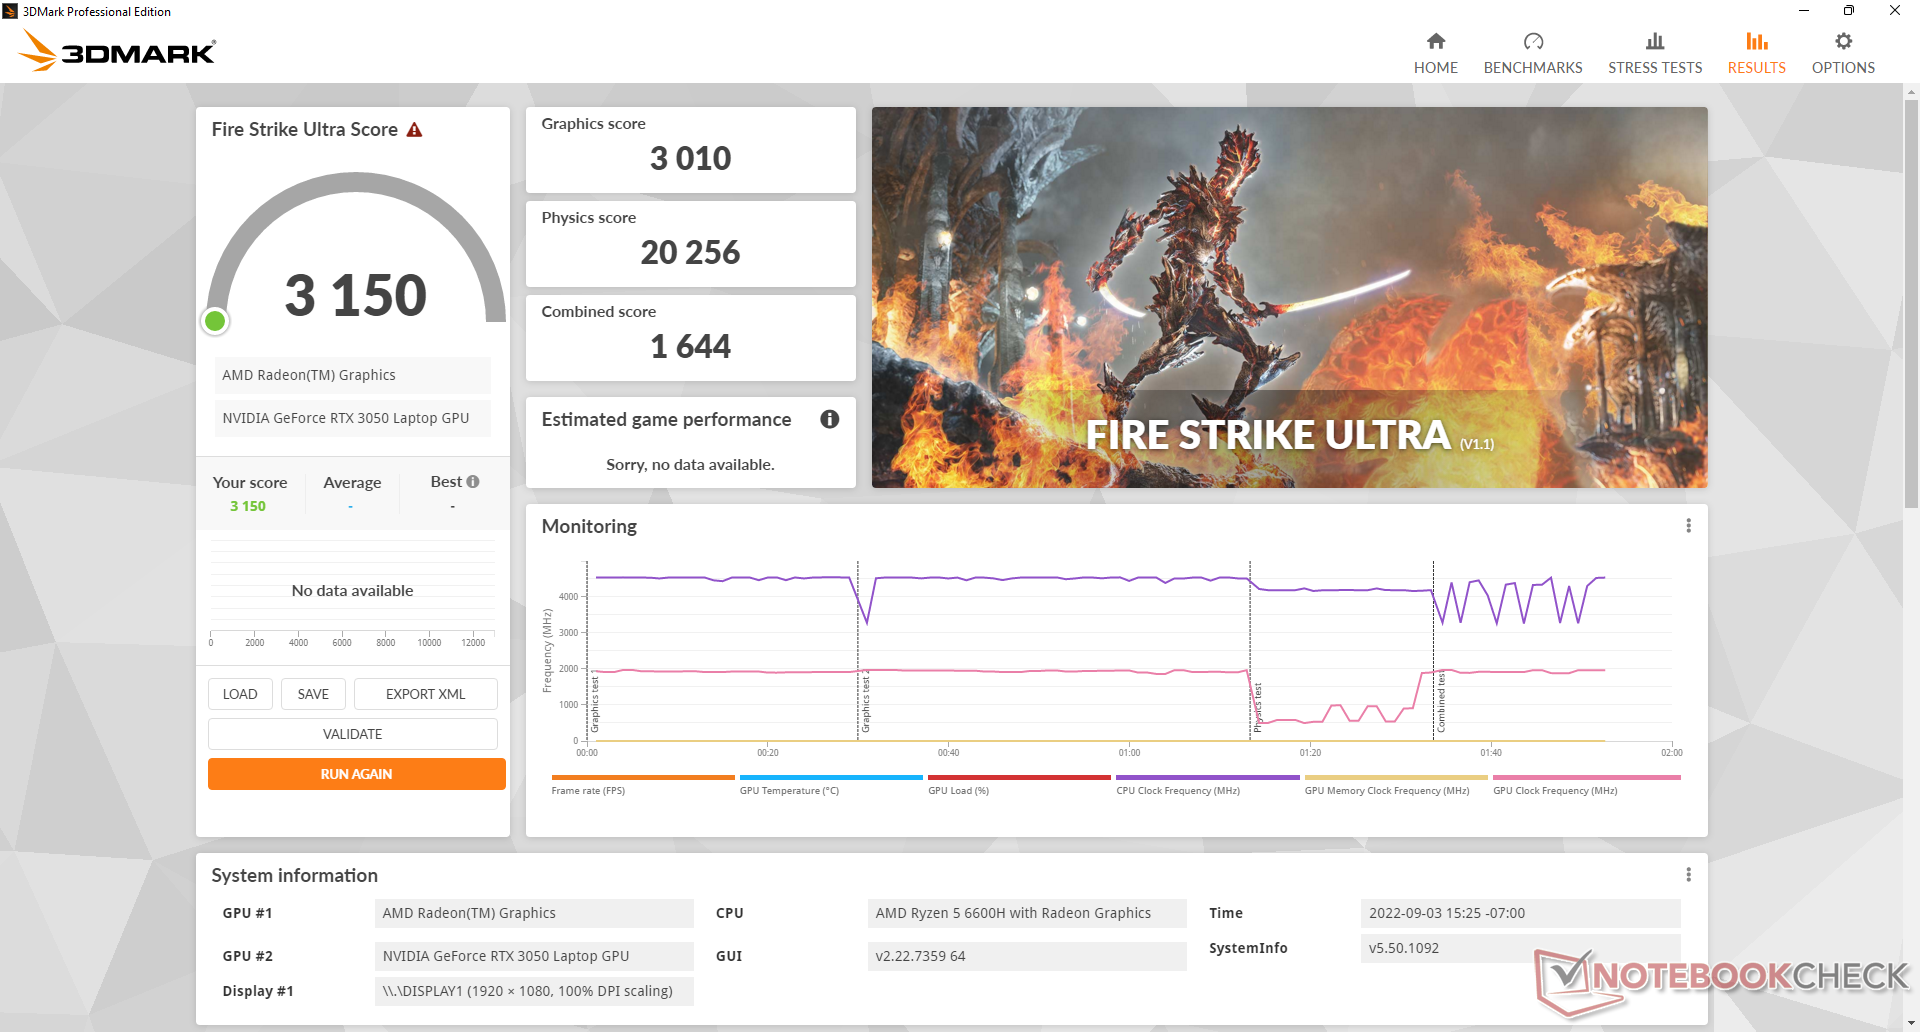
Graphics performance is about 15 percent faster than the average laptop in our database equipped with the same GeForce RTX 3050 GPU. Upgrading to the RTX 3050 Ti will likely only boost performance by another 10 percent based on our experience with other RTX 3050 Ti laptops. Users looking for an RTX 3060 option will have to consider the pricier Legion series instead.
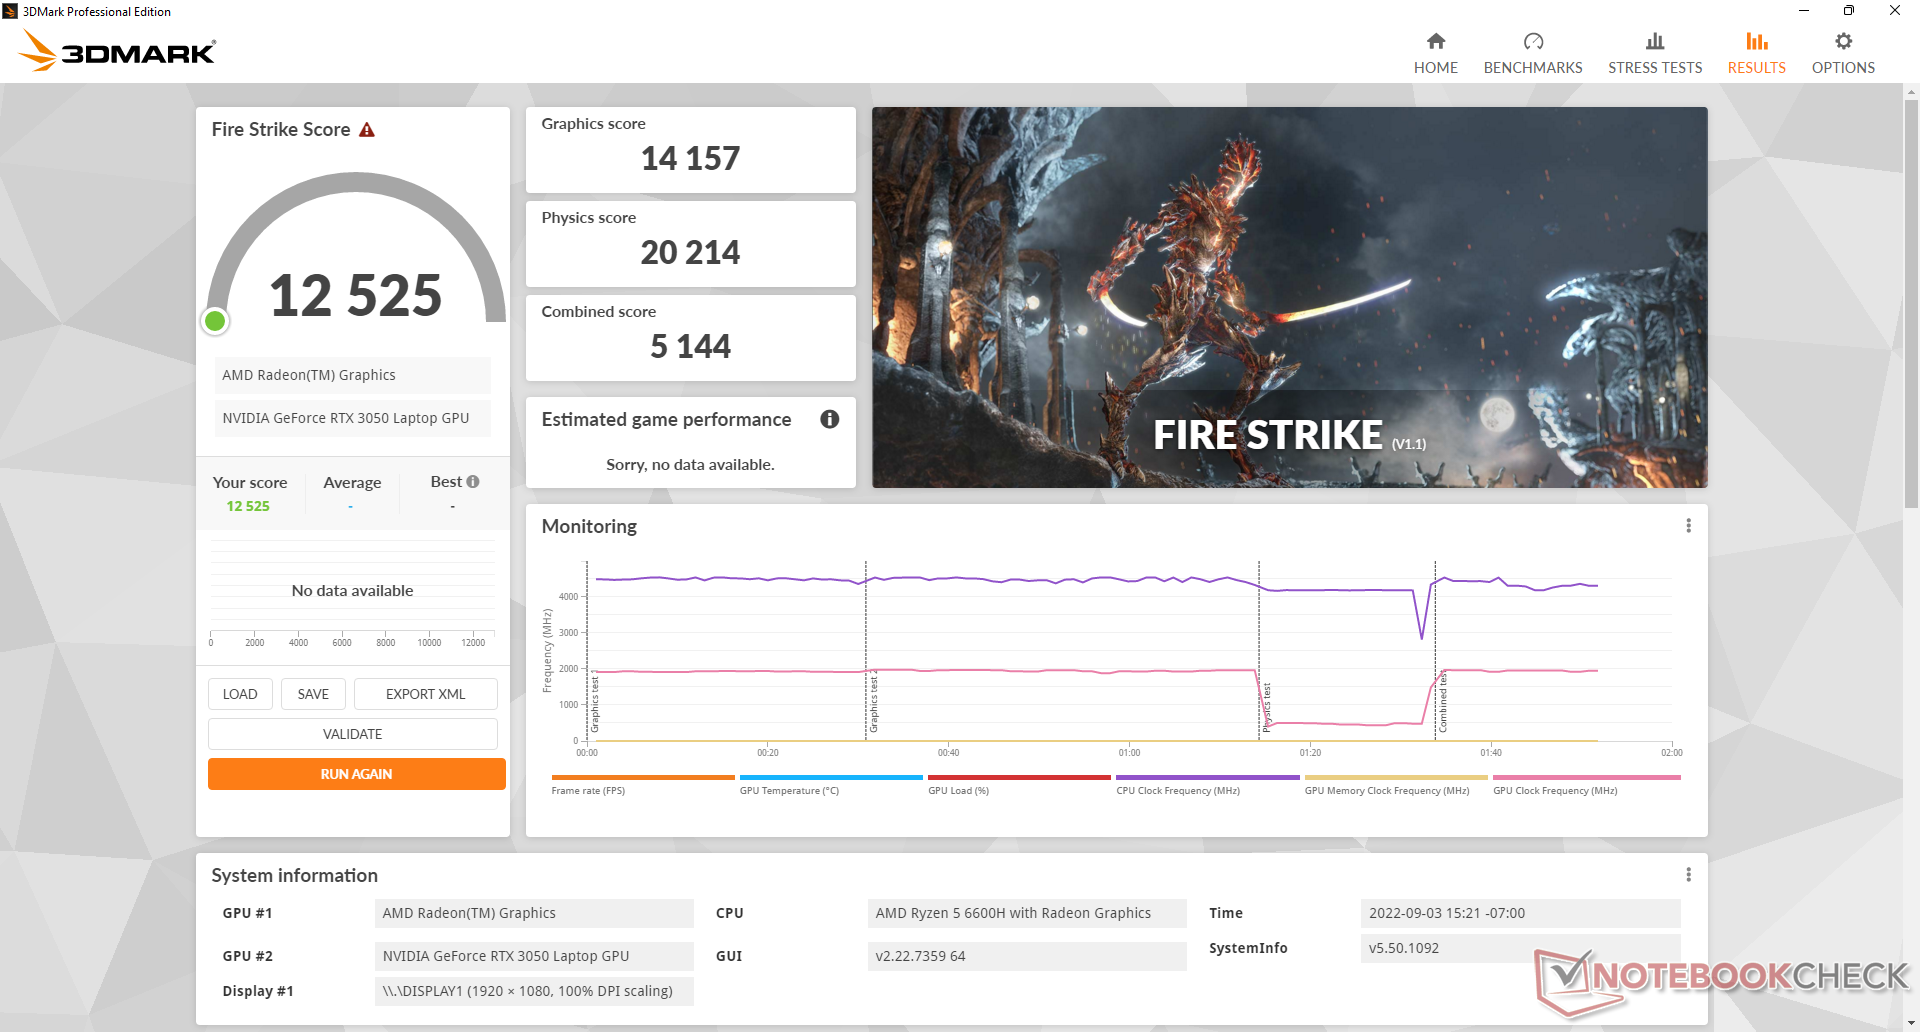
Performance is reduced if running on the Balanced power profile. A Fire Strike test on Balanced mode would reduce Graphics performance by 8 percent (14157 vs. 12978 points) while CPU performance remains about the same.
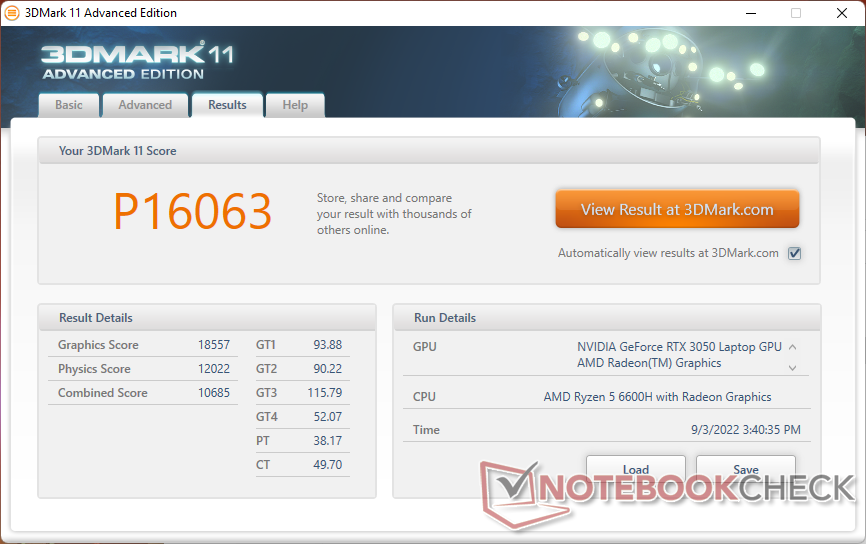
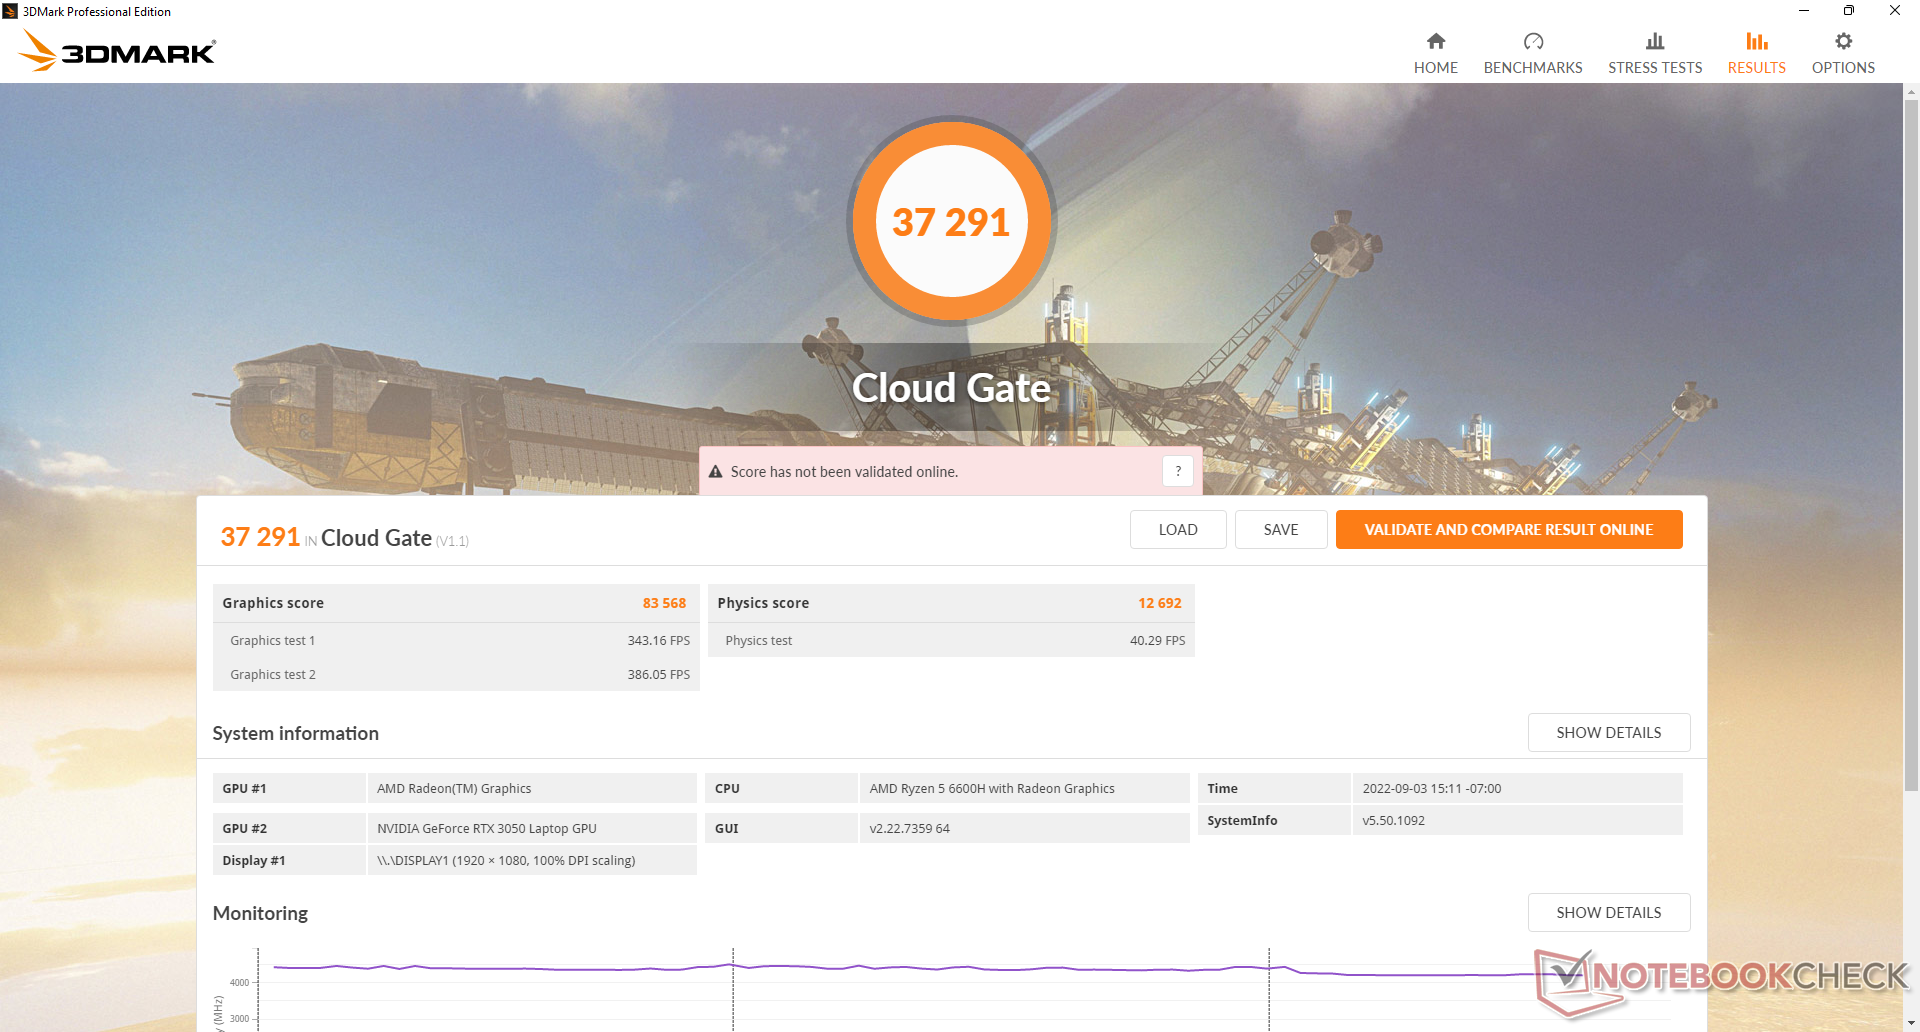

| 3DMark 11 Performance | 16063 points | |
| 3DMark Cloud Gate Standard Score | 37291 points | |
| 3DMark Fire Strike Score | 12525 points | |
| 3DMark Time Spy Score | 5453 points | |
Help | ||
Witcher 3 FPS Chart
| low | med. | high | ultra | |
|---|---|---|---|---|
| GTA V (2015) | 144 | 133.3 | 103.5 | 60.3 |
| The Witcher 3 (2015) | 213.9 | 167.7 | 105.1 | 55.8 |
| Dota 2 Reborn (2015) | 117.2 | 106.4 | 100.6 | 95.2 |
| Final Fantasy XV Benchmark (2018) | 116.4 | 73.6 | 53.5 | |
| X-Plane 11.11 (2018) | 84.4 | 77.1 | 63.6 | |
| Strange Brigade (2018) | 248 | 134.7 | 109.1 | 95.1 |
| Cyberpunk 2077 1.6 (2022) | 72.9 | 62.4 | 45.5 | 36.5 |
Emissions — Almost 50 dB(A) When Gaming
System Noise
Fan noise when idling can be as low as 23.8 or as high as 27.3 dB(A) if on the Performance power profile setting. Thus, Performance mode is not recommended if simply web browsing or streaming. Expect a noise level of around 31.4 dB(A) or lower under most daily loads.
The fans can be as loud as 49.3 dB(A) when gaming on Performance mode which is comparable to most other gaming laptops including Lenovo's own Legion 5 15. Fan noise would drop significantly to 43.9 dB(A) if gaming on the Balanced power profile instead, but this comes at a slight cost to graphics performance as noted above. Some gamers may find the lowered performance to be well worth it for an overall quieter machine, however.
Noise level
| Idle |
| 23.8 / 23.8 / 27.2 dB(A) |
| Load |
| 34.8 / 49.4 dB(A) |
 | ||
30 dB silent 40 dB(A) audible 50 dB(A) loud |
||
min: | ||
| Lenovo IdeaPad Gaming 3 15ARH7 GeForce RTX 3050 4GB Laptop GPU, R5 6600H, Lenovo UMIS AM630 RPJTJ256MGE1QDY | Lenovo IdeaPad Gaming 3i 15IMH05 GeForce GTX 1650 Mobile, i5-10300H, SK hynix BC511 HFM512GDHTNI-87A0B | Lenovo Legion 5 15ACH6A-82NW0010GE Radeon RX 6600M, R5 5600H, Micron 2210 MTFDHBA512QFD | Gigabyte A5 K1 GeForce RTX 3060 Laptop GPU, R5 5600H, ESR512GTLG-E6GBTNB4 | Asus TUF Dash F15 FX517ZR GeForce RTX 3070 Laptop GPU, i7-12650H, Samsung PM991a MZVLQ1T0HBLB | Dell G15 5510 GeForce RTX 3050 4GB Laptop GPU, i5-10500H, SK Hynix BC711 HFM512GD3HX015N | |
|---|---|---|---|---|---|---|
| Noise | -20% | -16% | -22% | -15% | -10% | |
| off / environment * (dB) | 23.3 | 30.7 -32% | 25 -7% | 26 -12% | 26 -12% | 26 -12% |
| Idle Minimum * (dB) | 23.8 | 30.7 -29% | 25 -5% | 26 -9% | 26 -9% | 26 -9% |
| Idle Average * (dB) | 23.8 | 30.7 -29% | 25 -5% | 29 -22% | 32 -34% | 27 -13% |
| Idle Maximum * (dB) | 27.2 | 30.7 -13% | 34.5 -27% | 32 -18% | 33 -21% | 33 -21% |
| Load Average * (dB) | 34.8 | 49.7 -43% | 51.1 -47% | 57 -64% | 48 -38% | 45 -29% |
| Witcher 3 ultra * (dB) | 49.3 | 47 5% | 56 -14% | 47 5% | 45 9% | |
| Load Maximum * (dB) | 49.4 | 50.3 -2% | 51.3 -4% | 58 -17% | 49 1% | 47 5% |
* ... smaller is better
Temperature
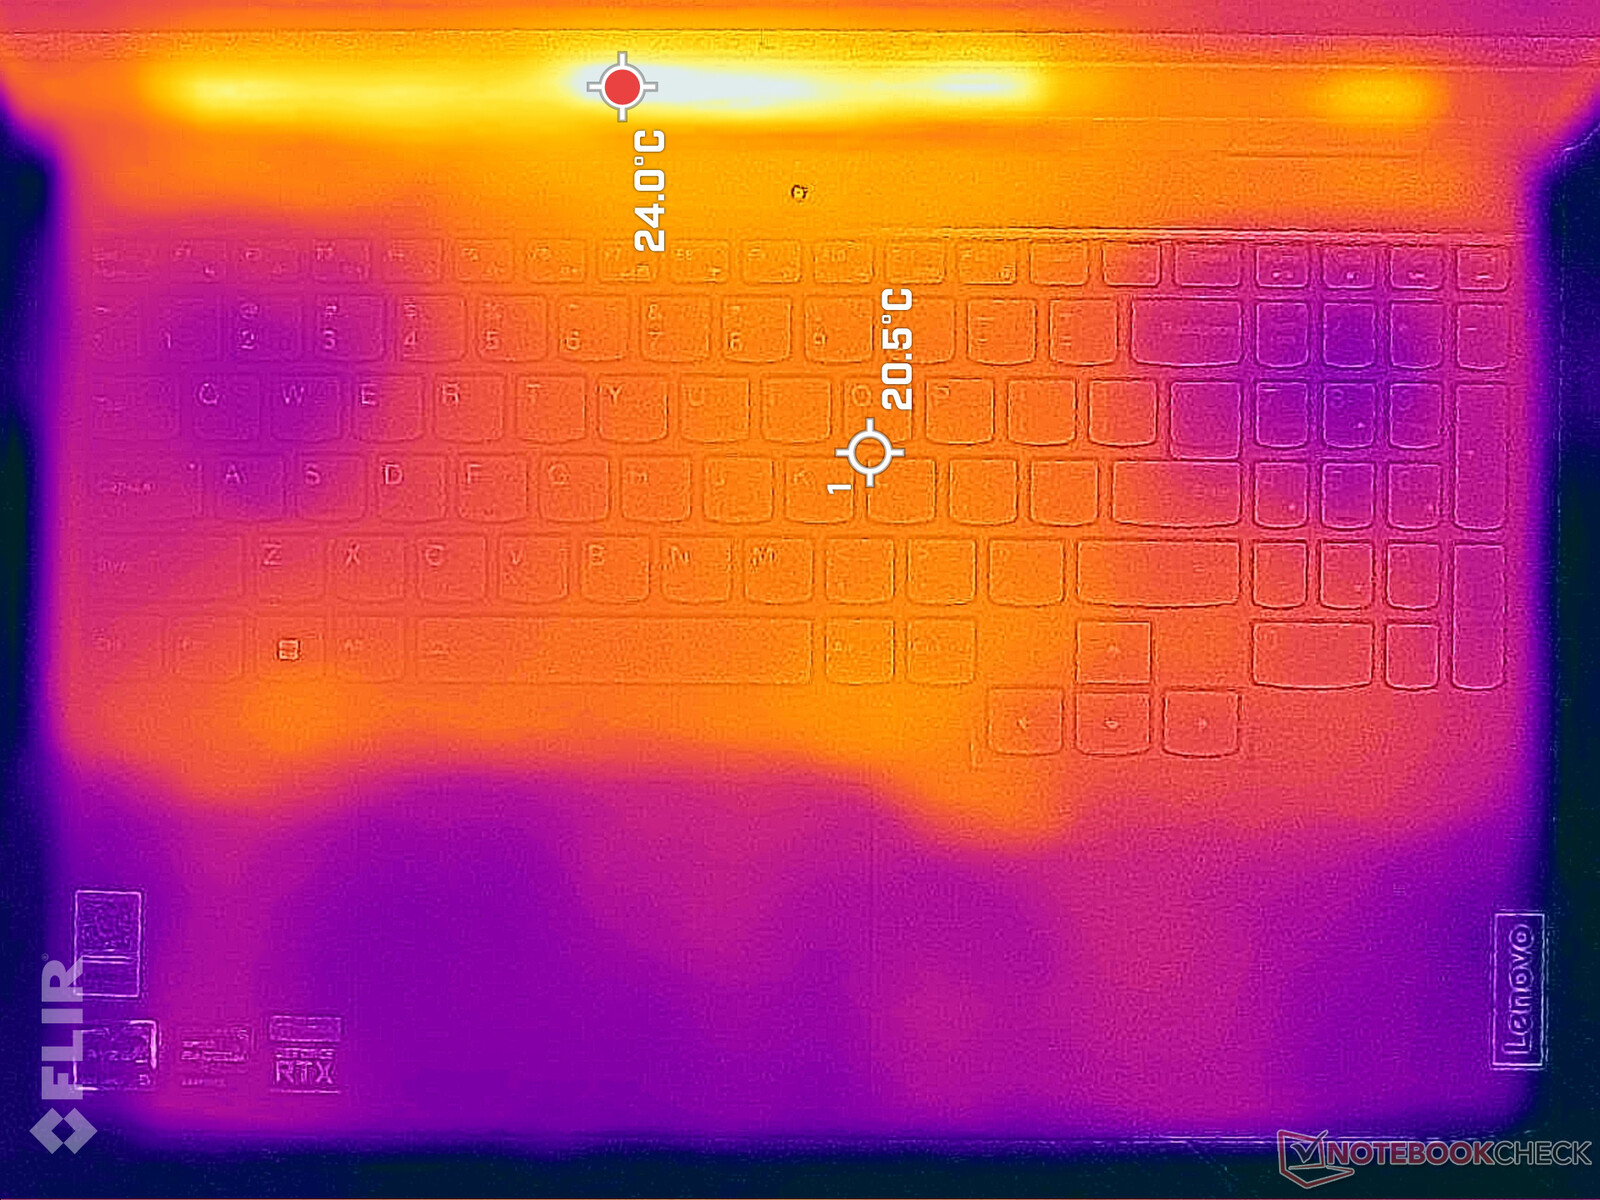
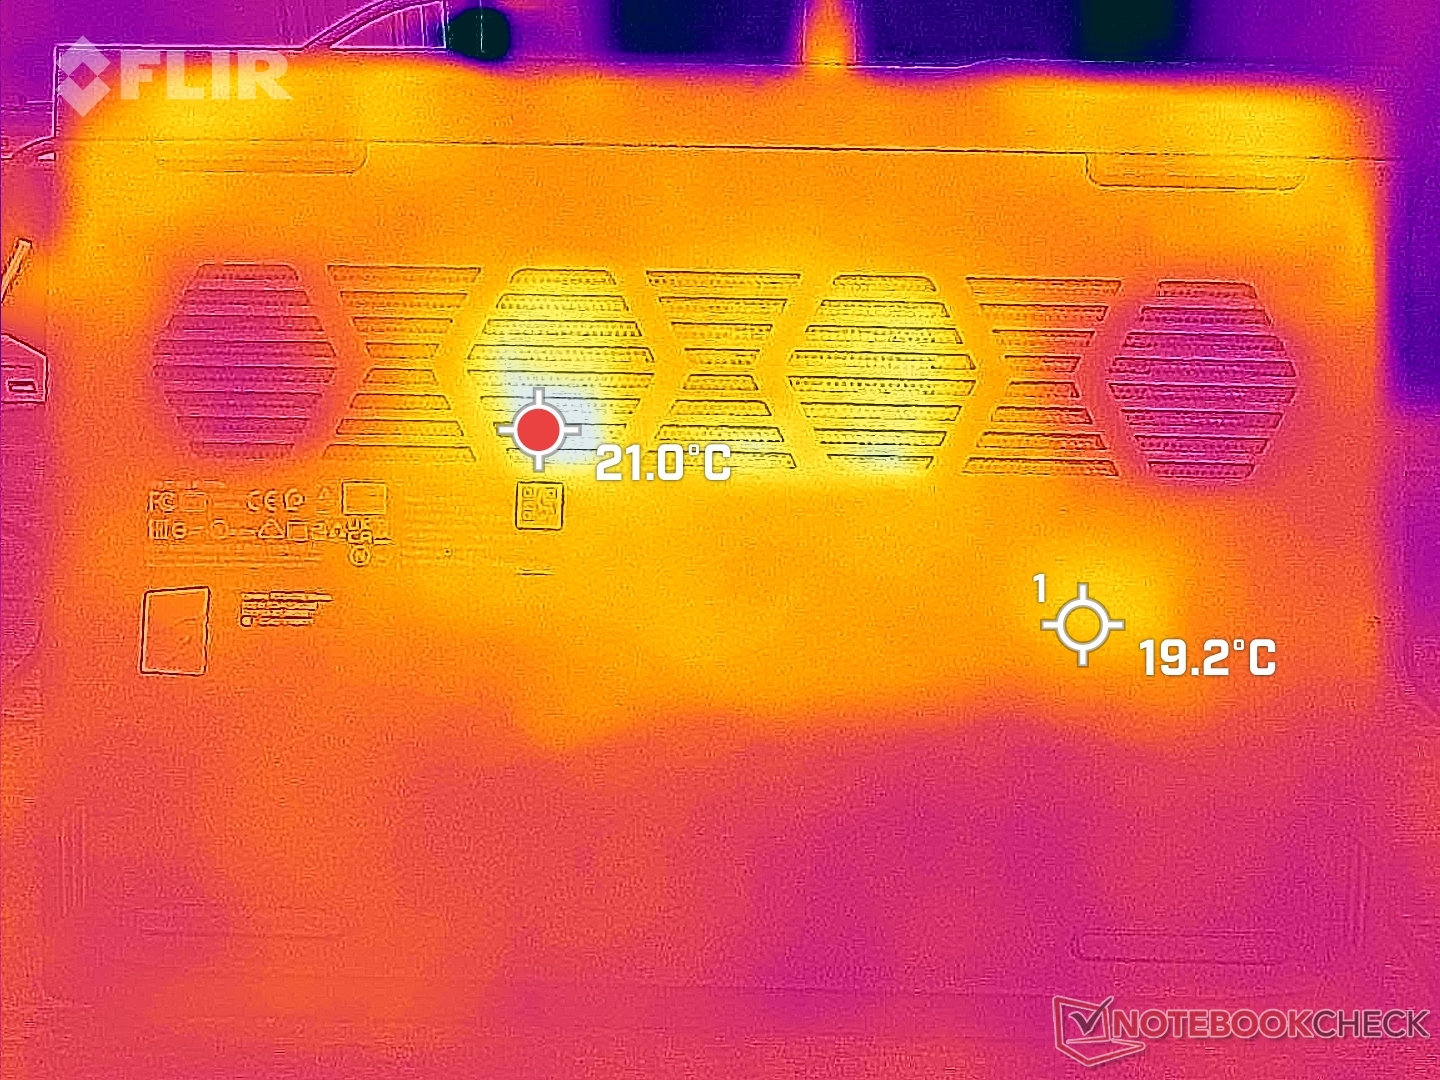
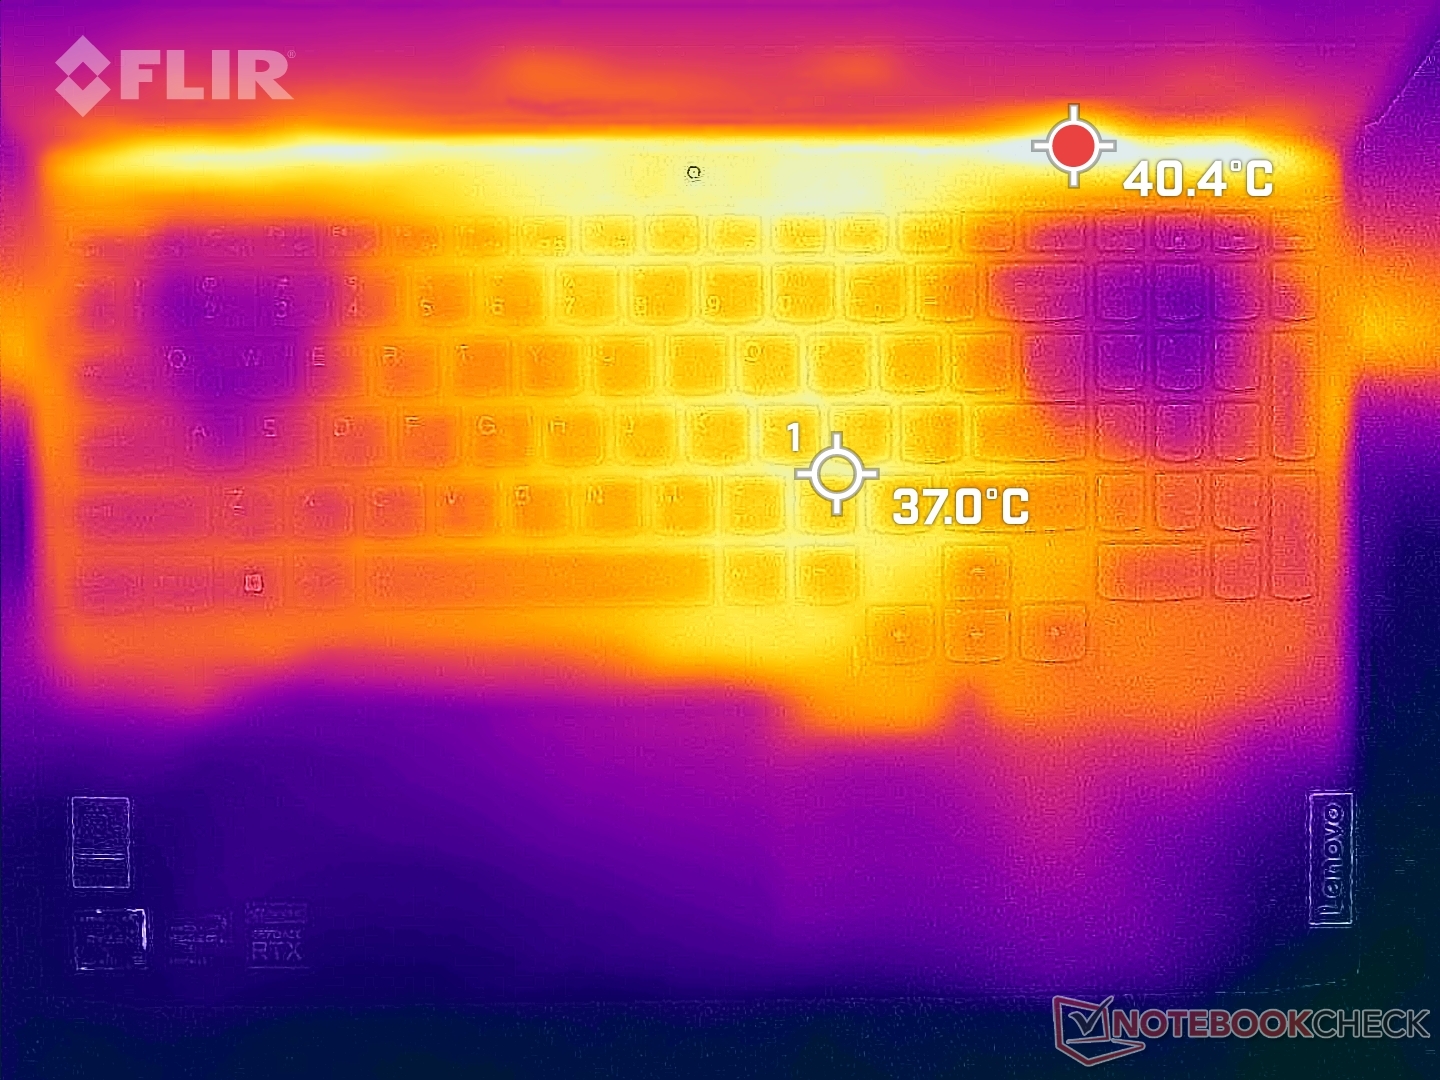
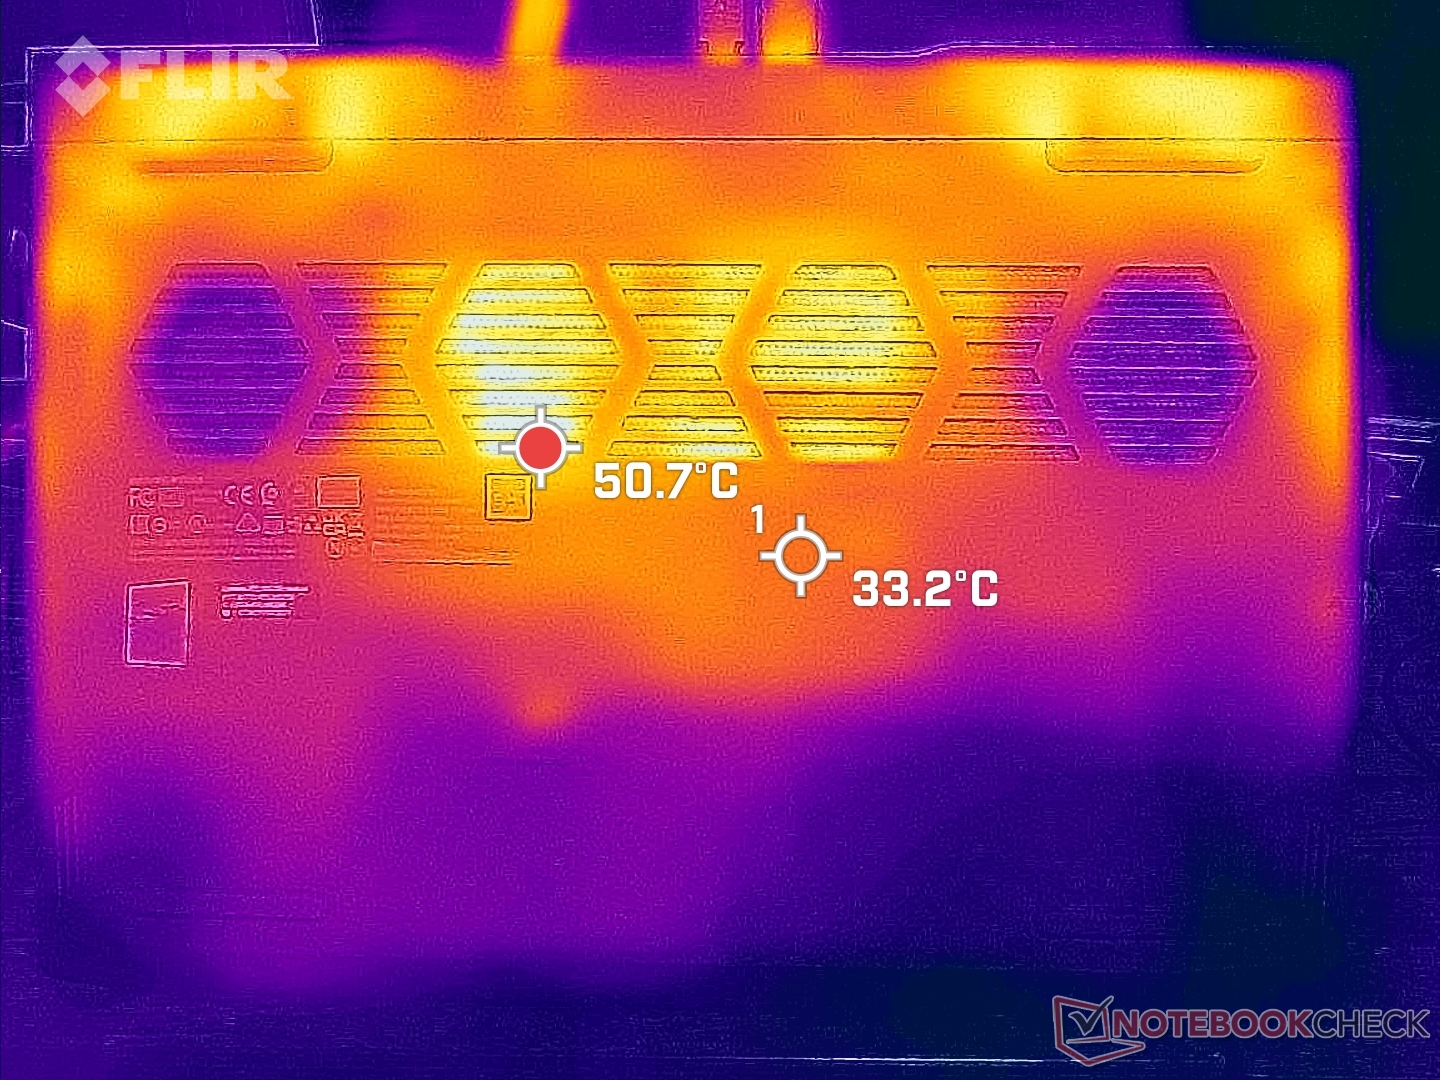
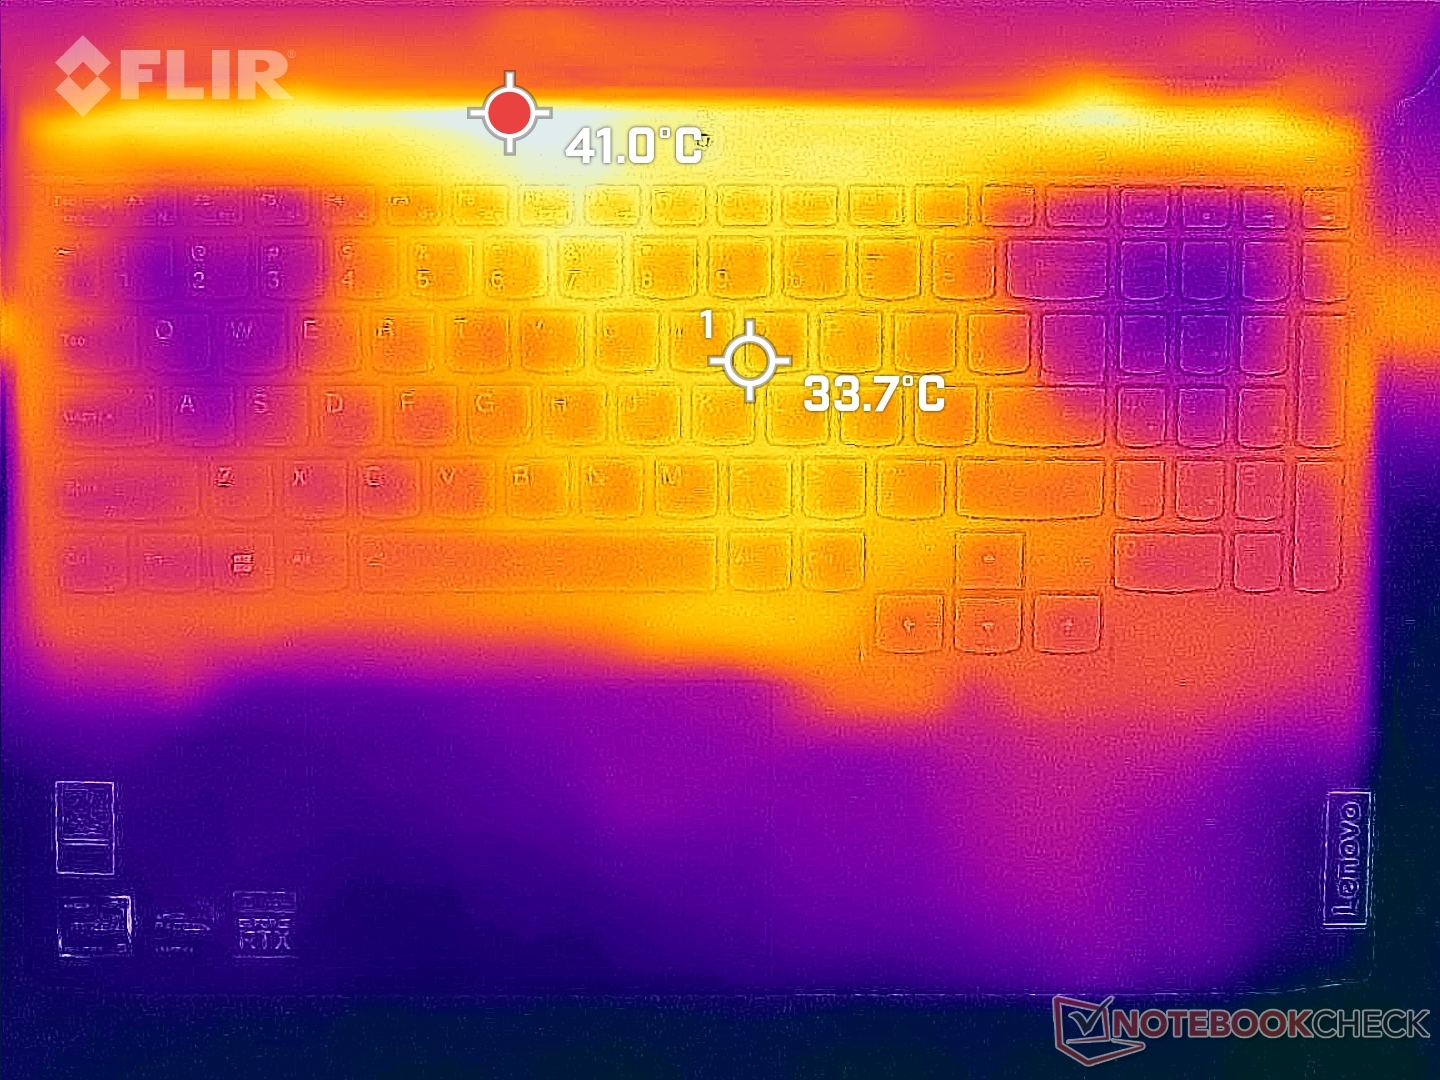
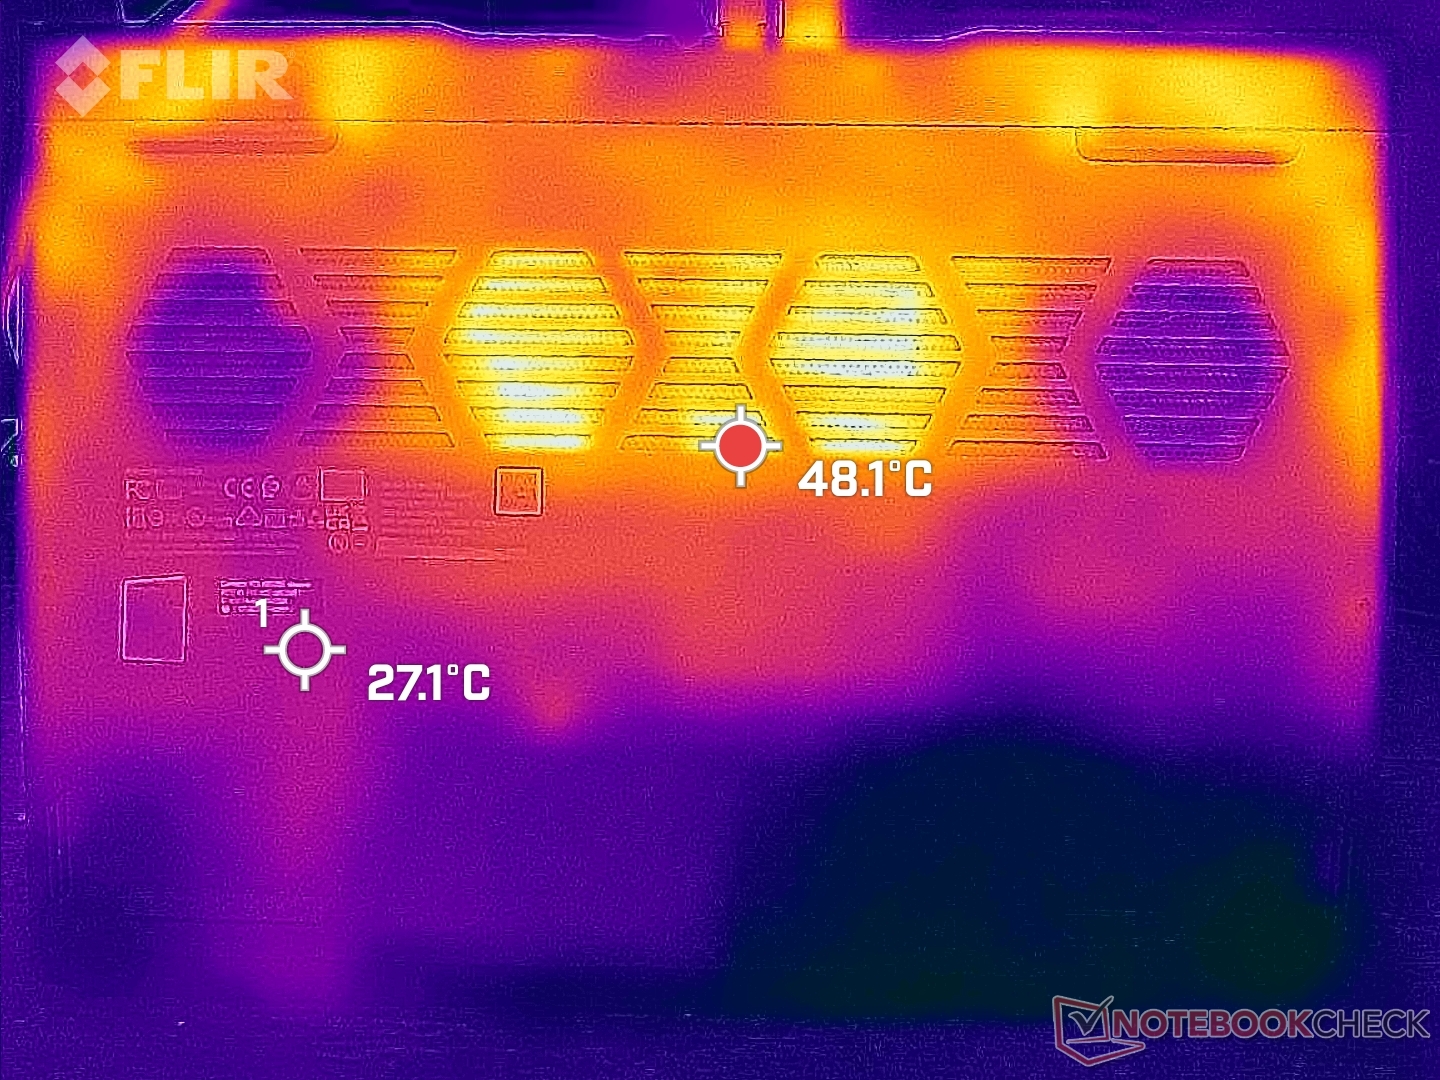
Surface temperatures are warmest near the keyboard center while the WASD and numpad keys are much cooler since fresh air is pulled through these keys as shown by the temperature maps below. This is better than on the older IdeaPad Gaming 3i 15IMH05 or Dell G15 5510 which have warmer WASD keys in comparison. The keyboard hot spot can reach 43 C when gaming which is still comparable to the hot spots on the aforementioned IdeaPad and Dell G15.
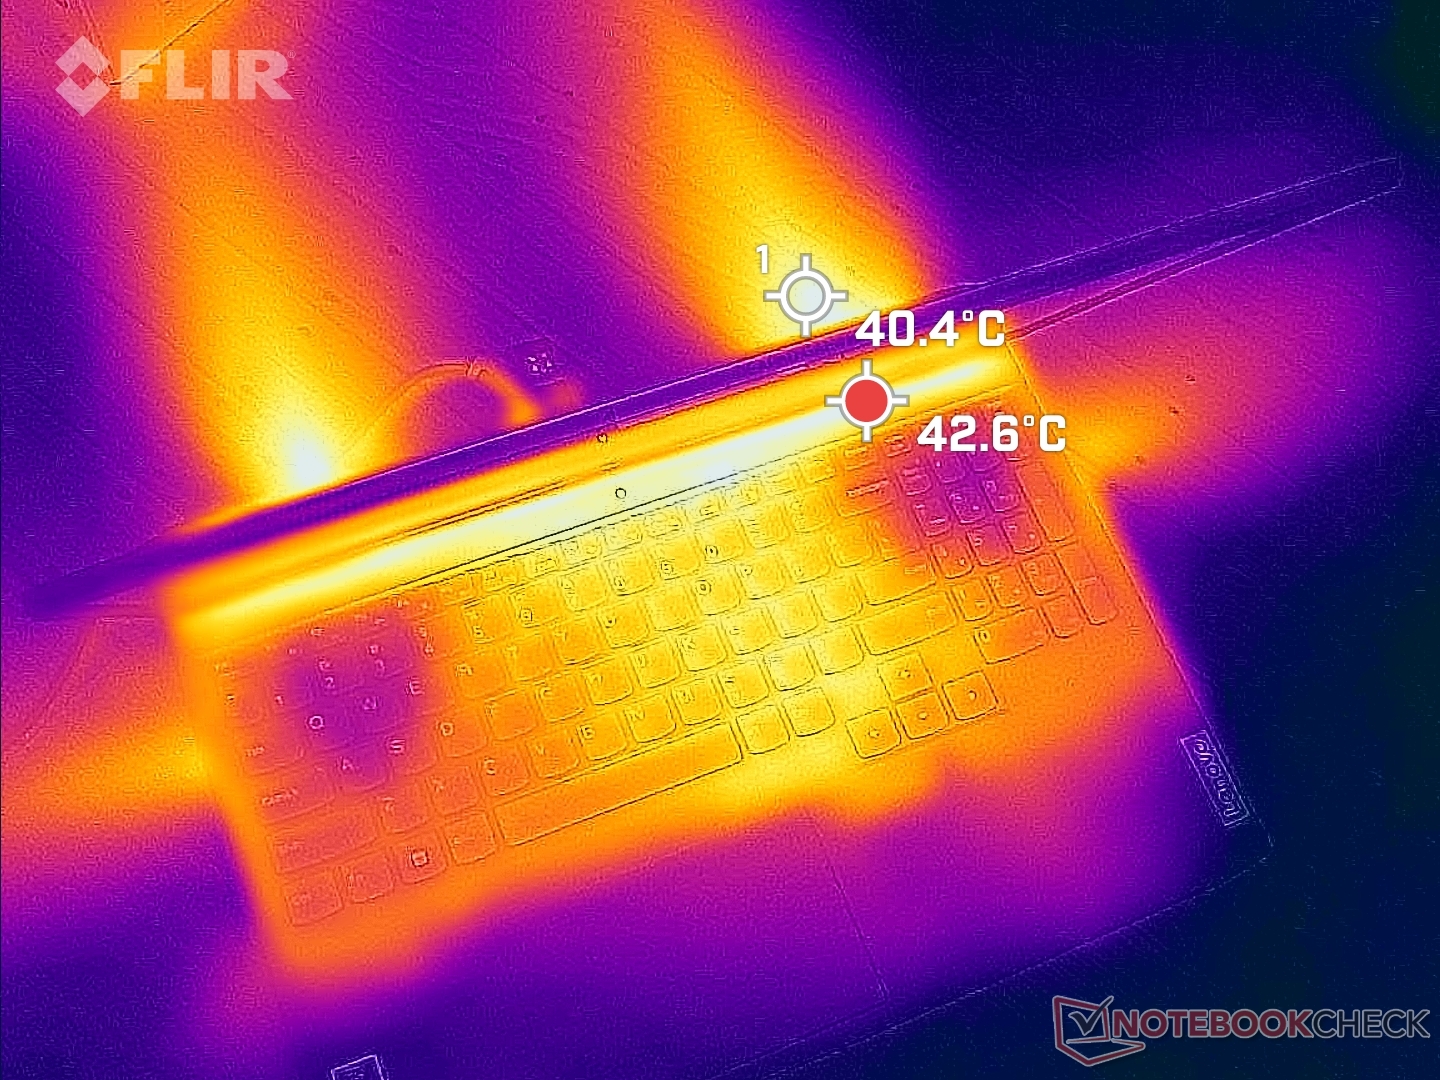
(-) The maximum temperature on the upper side is 47.6 °C / 118 F, compared to the average of 40.4 °C / 105 F, ranging from 21.2 to 68.8 °C for the class Gaming.
(-) The bottom heats up to a maximum of 46.6 °C / 116 F, compared to the average of 43.3 °C / 110 F
(+) In idle usage, the average temperature for the upper side is 25.7 °C / 78 F, compared to the device average of 33.9 °C / 93 F.
(±) Playing The Witcher 3, the average temperature for the upper side is 36.4 °C / 98 F, compared to the device average of 33.9 °C / 93 F.
(+) The palmrests and touchpad are reaching skin temperature as a maximum (34.2 °C / 93.6 F) and are therefore not hot.
(-) The average temperature of the palmrest area of similar devices was 28.8 °C / 83.8 F (-5.4 °C / -9.8 F).
| Lenovo IdeaPad Gaming 3 15ARH7 AMD Ryzen 5 6600H, NVIDIA GeForce RTX 3050 4GB Laptop GPU | Lenovo IdeaPad Gaming 3i 15IMH05 Intel Core i5-10300H, NVIDIA GeForce GTX 1650 Mobile | Lenovo Legion 5 15ACH6A-82NW0010GE AMD Ryzen 5 5600H, AMD Radeon RX 6600M | Gigabyte A5 K1 AMD Ryzen 5 5600H, NVIDIA GeForce RTX 3060 Laptop GPU | Asus TUF Dash F15 FX517ZR Intel Core i7-12650H, NVIDIA GeForce RTX 3070 Laptop GPU | Dell G15 5510 Intel Core i5-10500H, NVIDIA GeForce RTX 3050 4GB Laptop GPU | |
|---|---|---|---|---|---|---|
| Heat | 0% | -5% | -11% | -19% | -2% | |
| Maximum Upper Side * (°C) | 47.6 | 43 10% | 39.9 16% | 50 -5% | 52 -9% | 52 -9% |
| Maximum Bottom * (°C) | 46.6 | 50.6 -9% | 43.8 6% | 51 -9% | 52 -12% | 49 -5% |
| Idle Upper Side * (°C) | 27.2 | 27.2 -0% | 34.1 -25% | 30 -10% | 33 -21% | 26 4% |
| Idle Bottom * (°C) | 27.2 | 27.5 -1% | 31.7 -17% | 33 -21% | 36 -32% | 26 4% |
* ... smaller is better
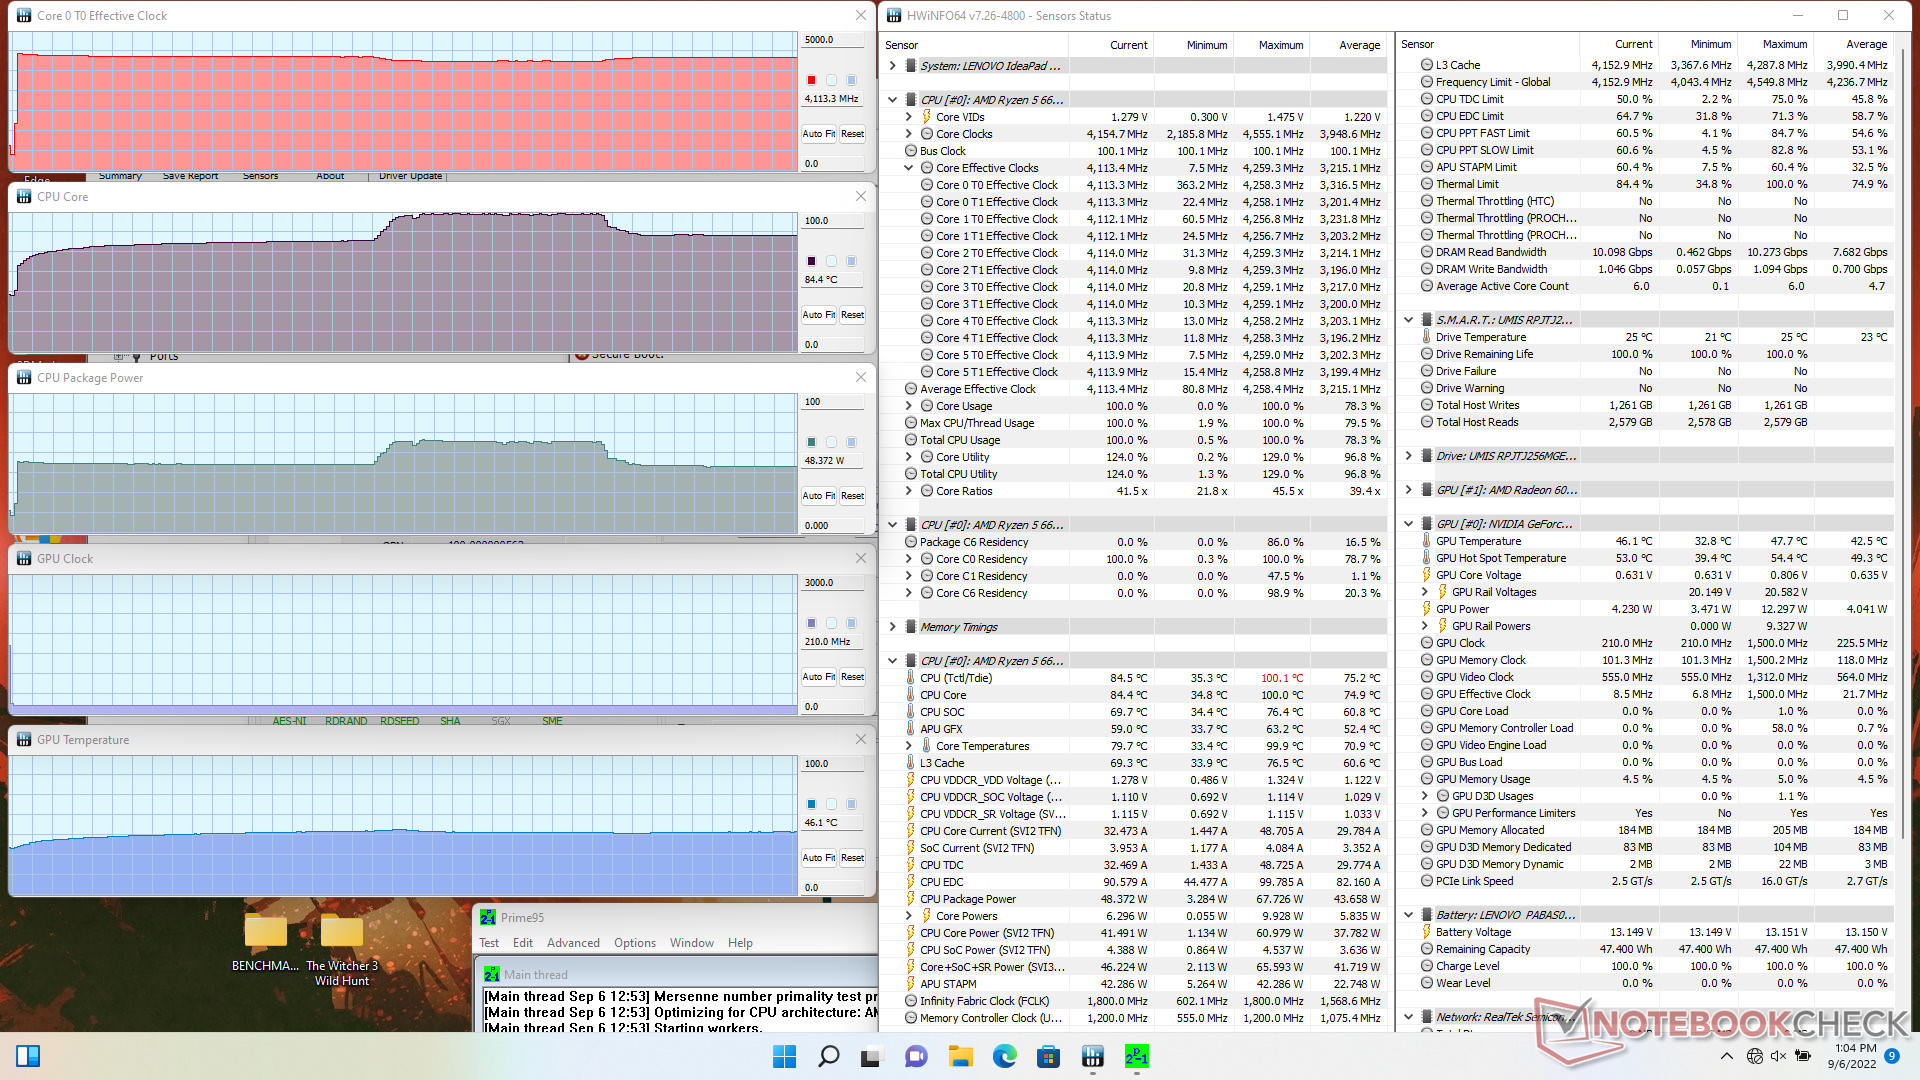
Stress Test
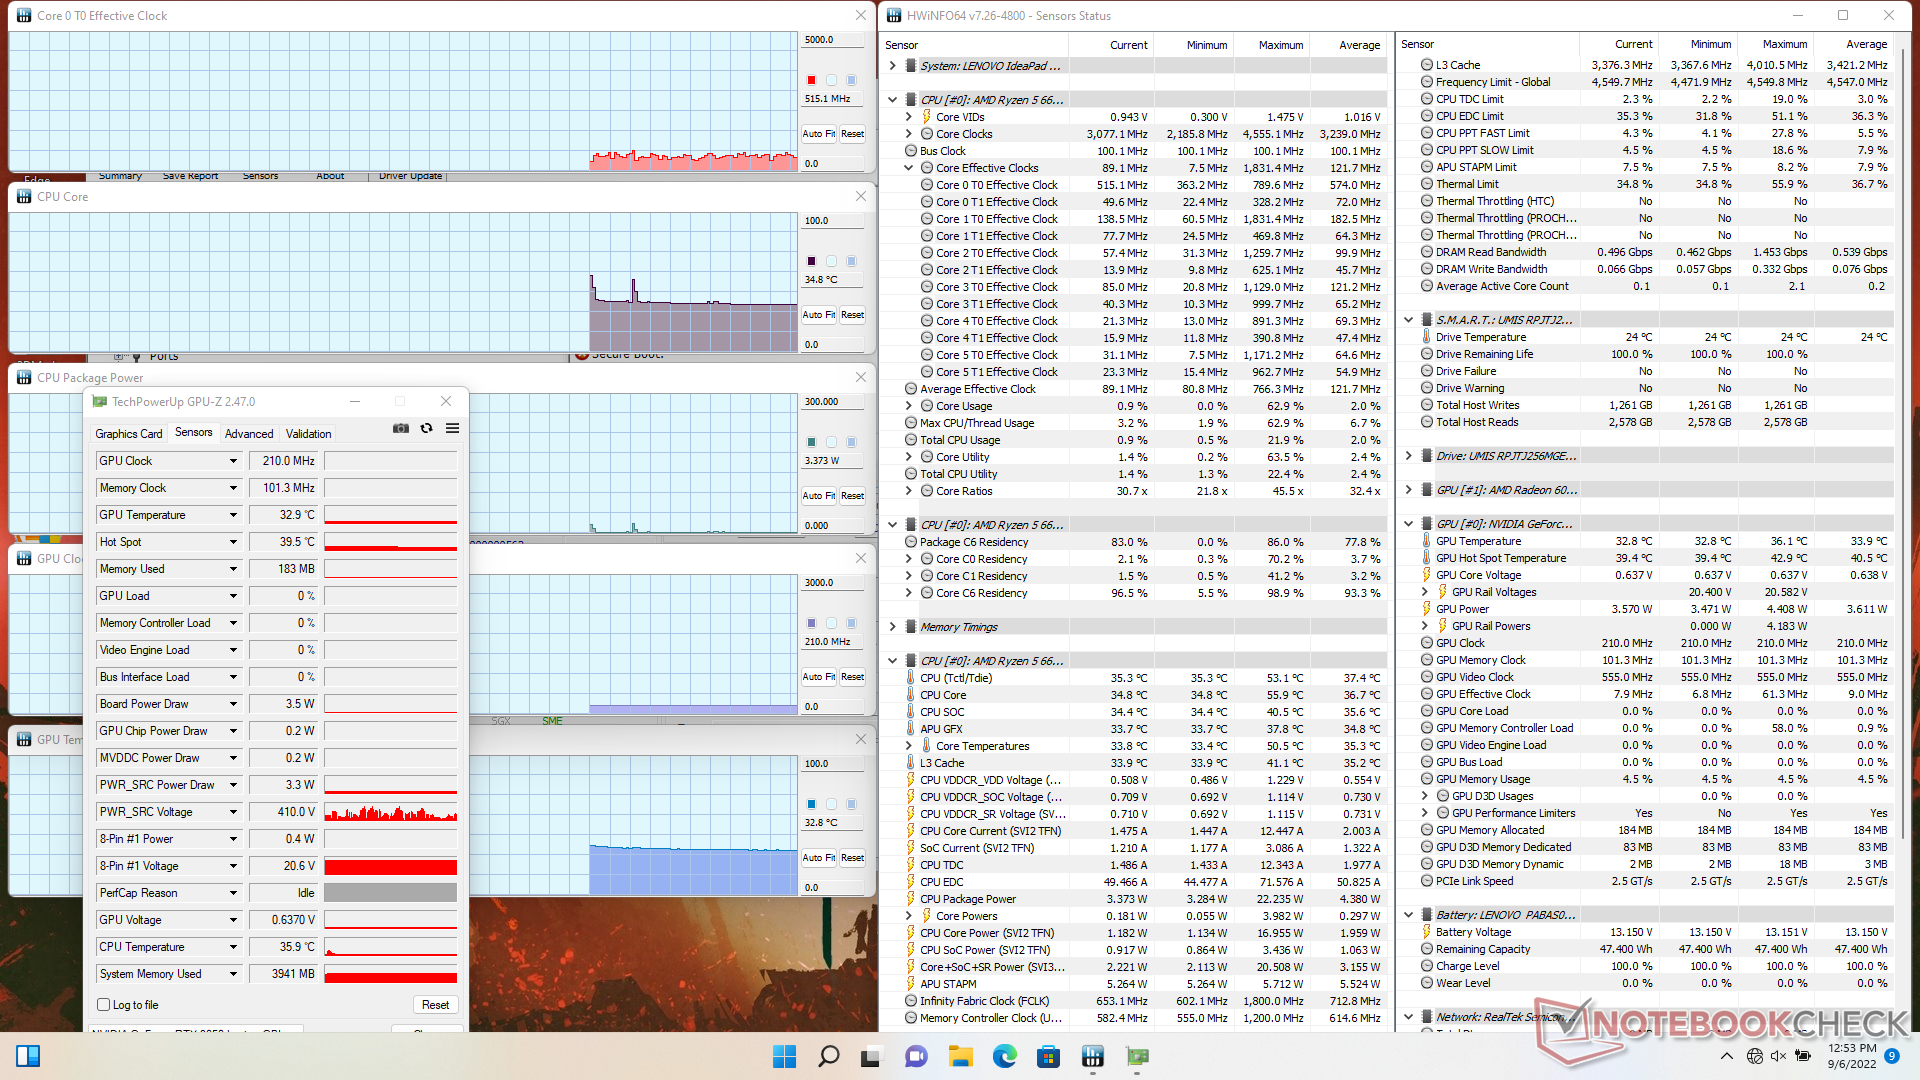
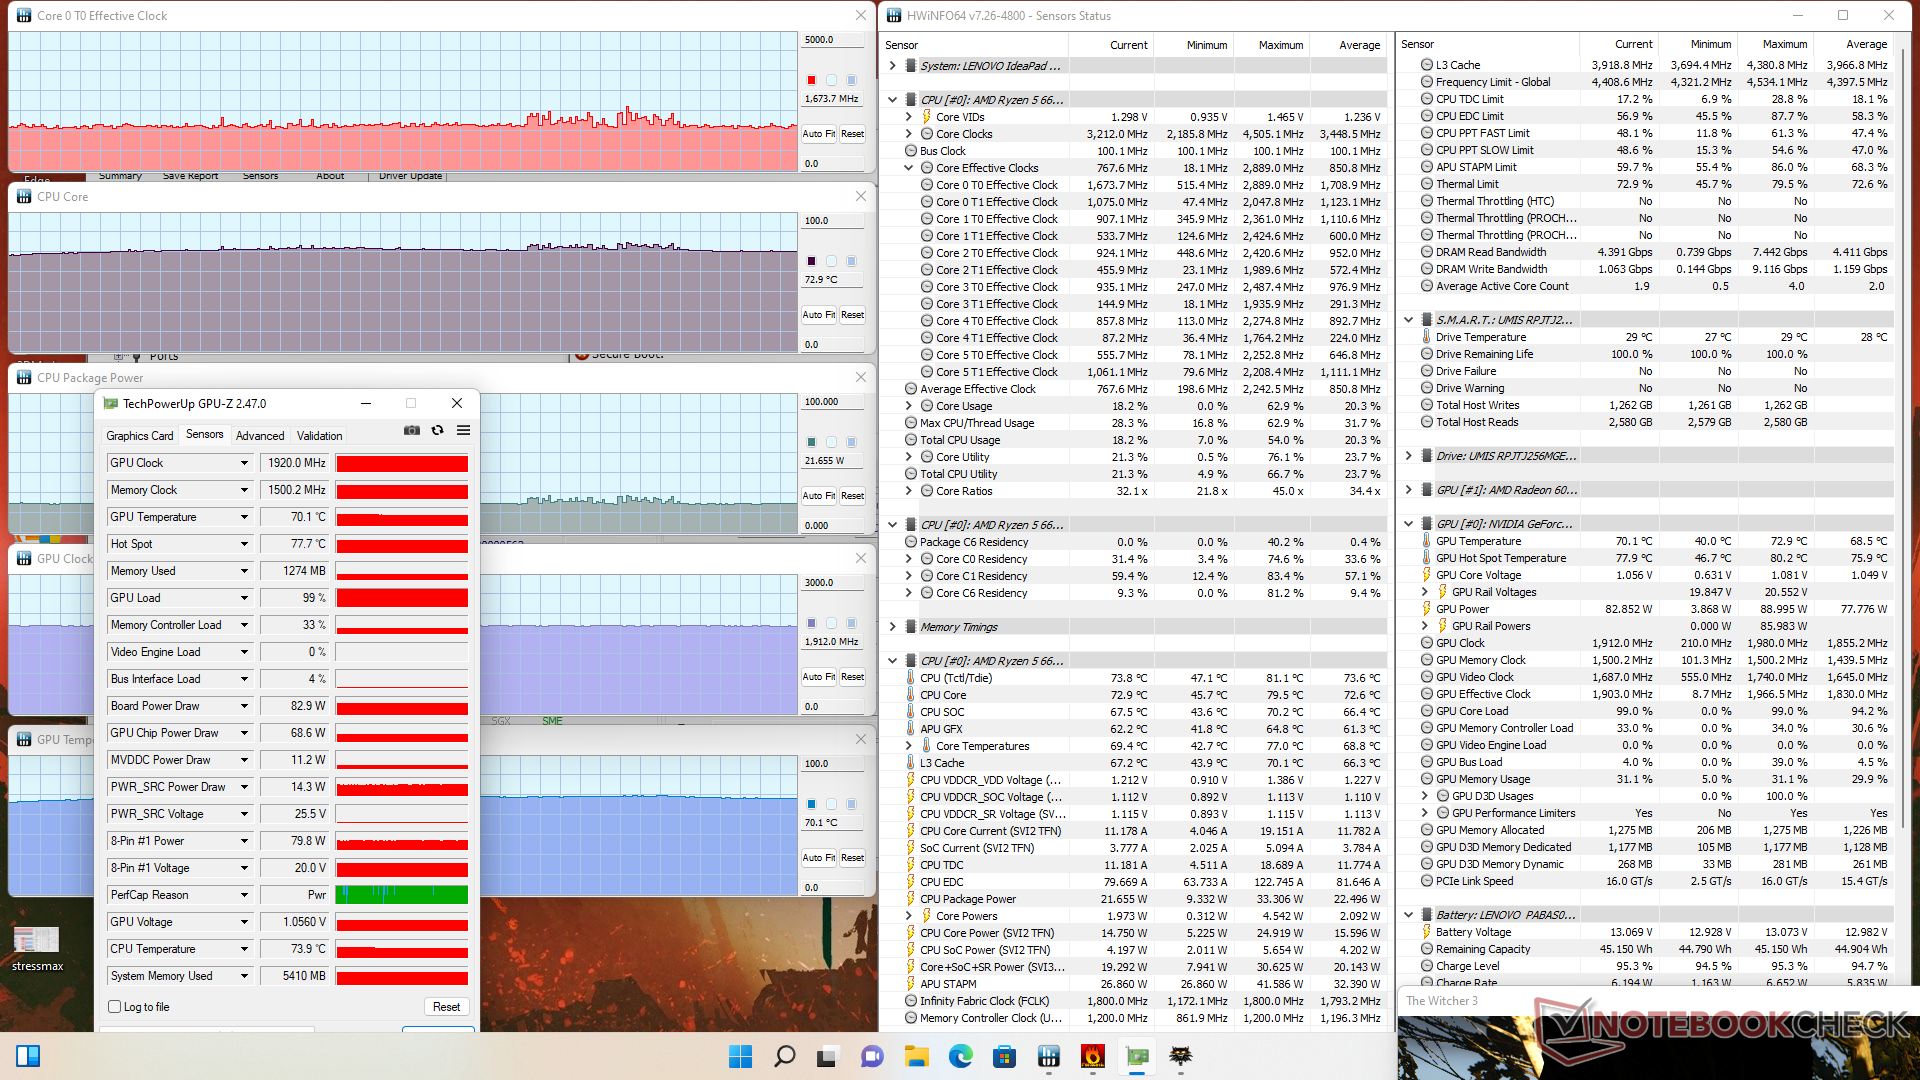
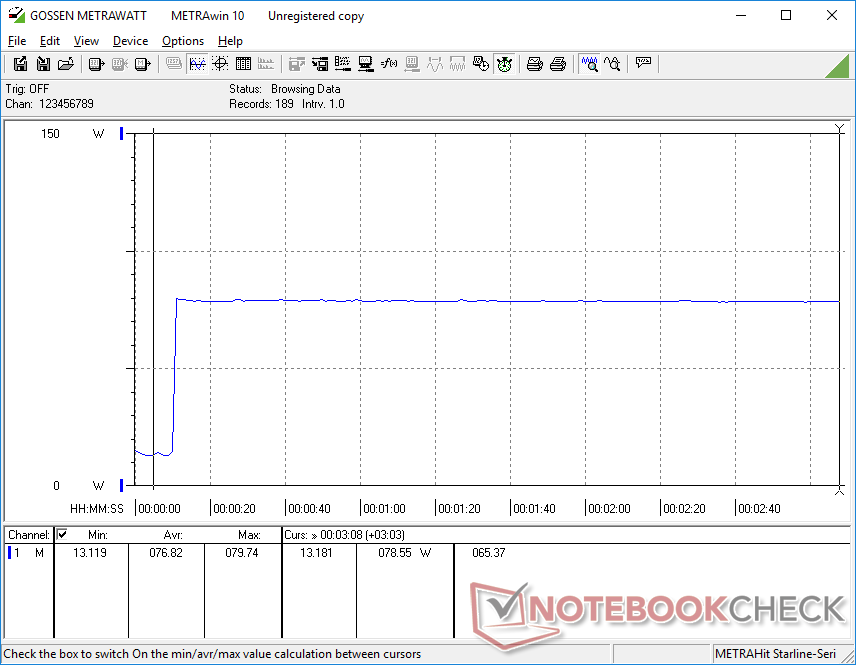
When running Prime95 to stress the CPU, clock rates and temperature would spike to 4.3 GHz and 70 C, respectively, with a board power draw of 51 W. Interestingly, core temperature and board power draw after a few minutes would spike to 67 W and 100 C, respectively, before falling back down to 48 W and 84 C as shown by the screenshot below. The processor does not suffer from any throttling even when subjected to 100 percent utilization for long periods which is consistent with our CineBench R15 xT results from above.
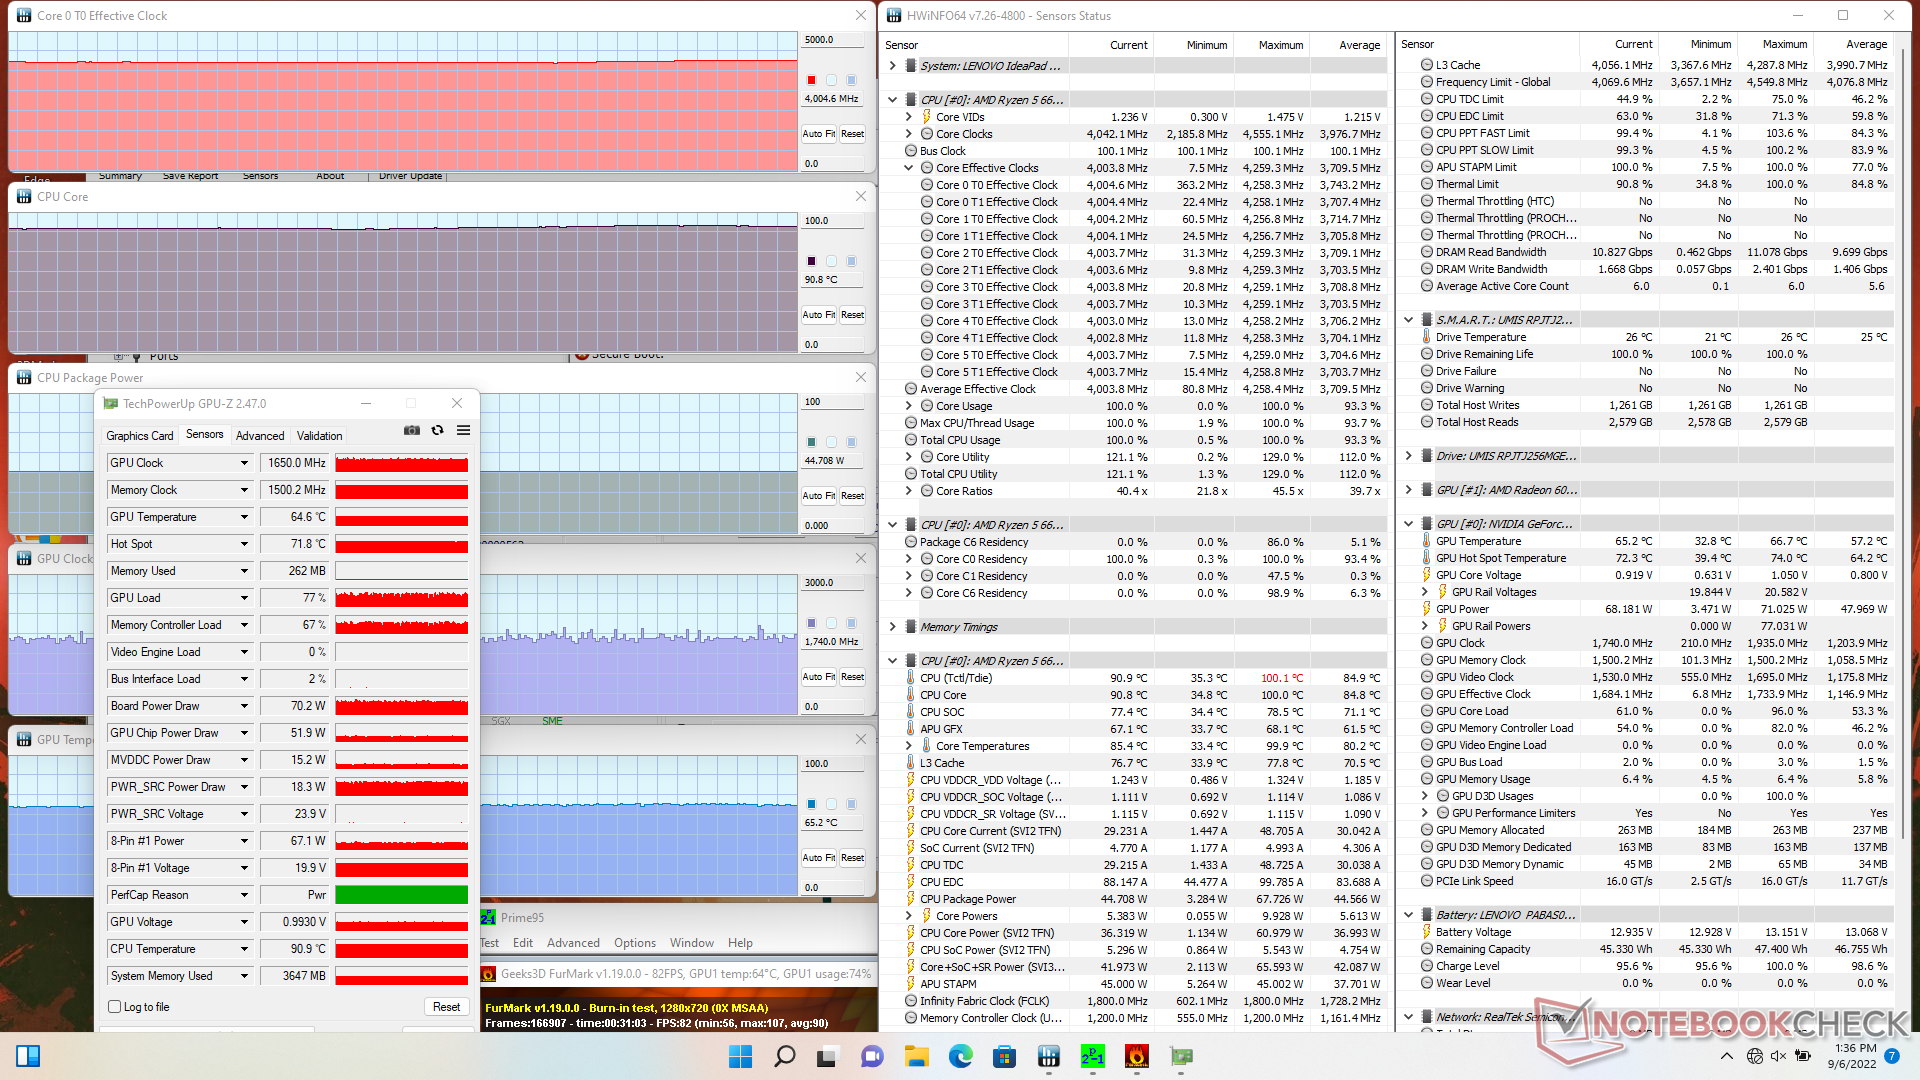
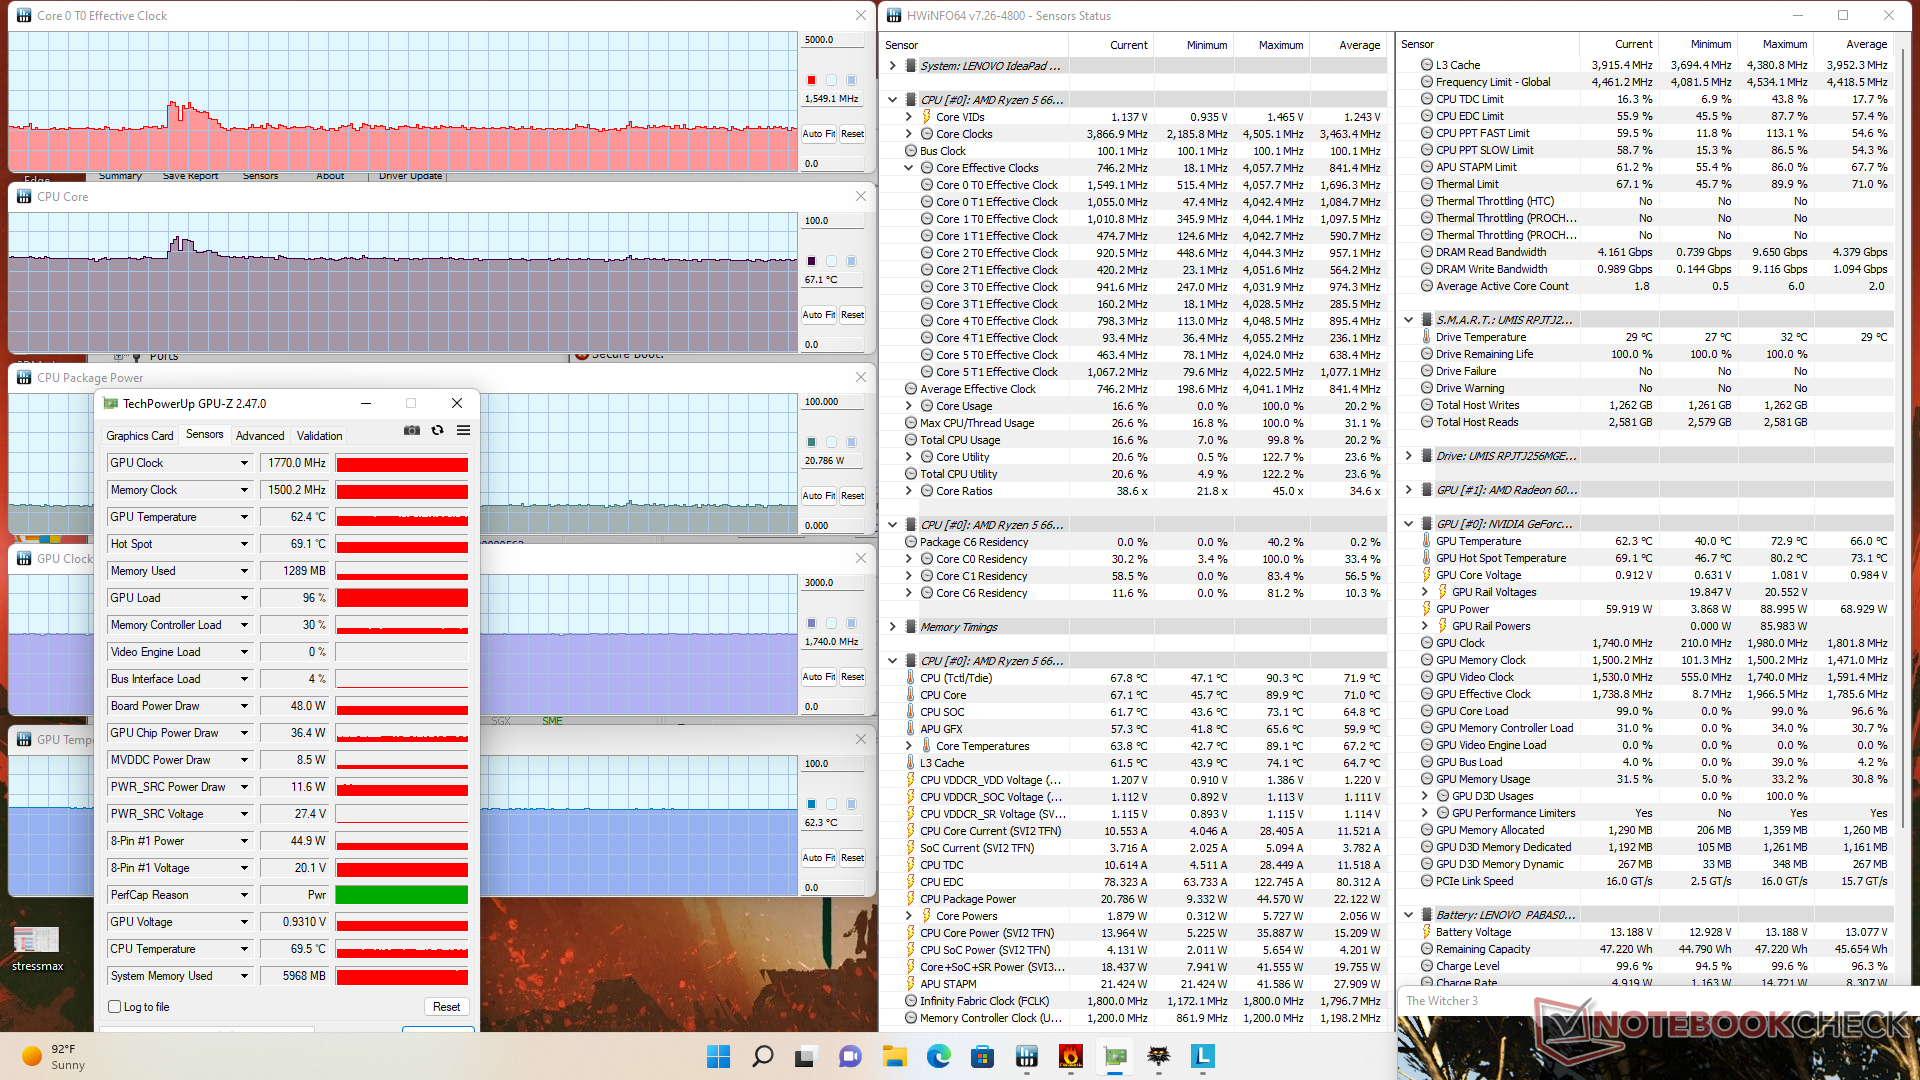
GPU clock rates, temperature and board power draw when running Witcher 3 on Performance mode would stabilize at 1920 MHz, 70 C, and 83 W, respectively, compared to 1770 MHz, 62 C, and 48 W when on Balanced mode. Since fan noise is reduced on Balanced mode, users must endure the maximum fan noise of the laptop on Performance mode if they wish to exploit the GPU to its fullest.
Running on batteries limits GPU power more than CPU power. A Fire Strike test on batteries would return Physics and Graphics scores 19770 and 9119 points, respectively, compared to 20214 and 14157 points when on mains.
| CPU Clock (GHz) | GPU Clock (MHz) | Average CPU Temperature (°C) | Average GPU Temperature (°C) | |
| System Idle | -- | -- | 35 | 33 |
| Prime95 Stress | 4.0 - 4.1 | -- | 85 | 46 |
| Prime95 + FurMark Stress | 4.0 | 1650 | 91 | 65 |
| Witcher 3 Stress (Performance mode) | 1.7 | 1920 | 73 | 70 |
| Witcher 3 Stress (Balanced mode) | 1.6 | 1770 | 67 | 62 |
Speakers
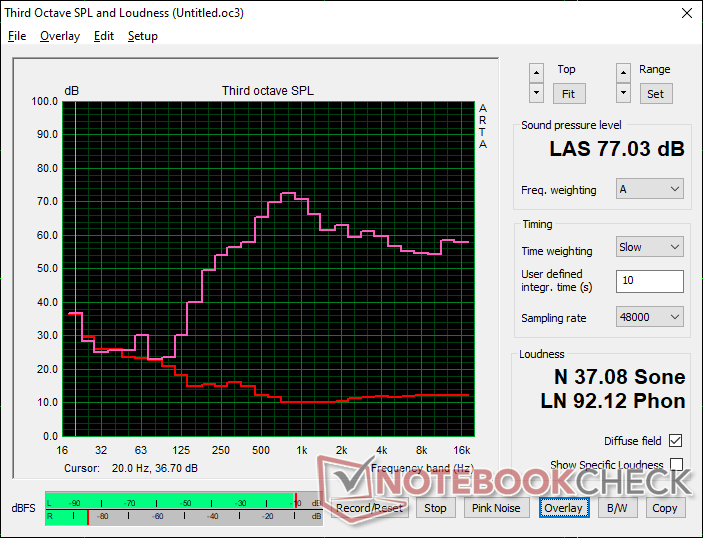
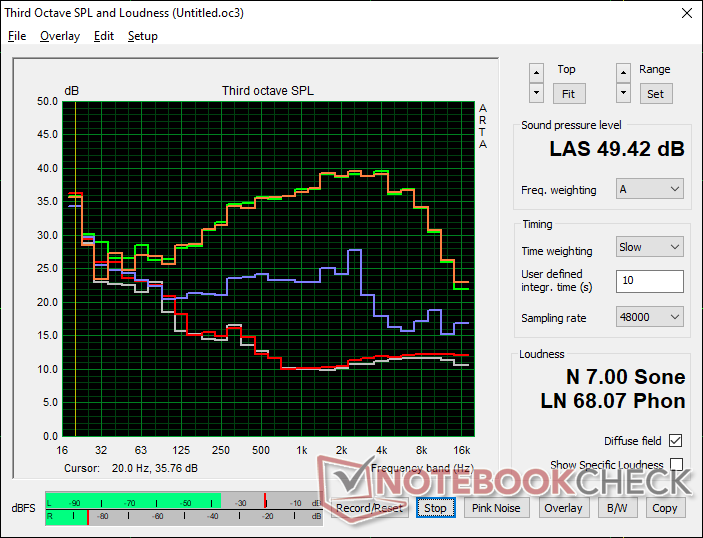
Lenovo IdeaPad Gaming 3 15ARH7 audio analysis
(±) | speaker loudness is average but good (77 dB)
Bass 100 - 315 Hz
(-) | nearly no bass - on average 15.6% lower than median
(±) | linearity of bass is average (12.2% delta to prev. frequency)
Mids 400 - 2000 Hz
(±) | higher mids - on average 8% higher than median
(±) | linearity of mids is average (7.7% delta to prev. frequency)
Highs 2 - 16 kHz
(+) | balanced highs - only 2.5% away from median
(+) | highs are linear (3.8% delta to prev. frequency)
Overall 100 - 16.000 Hz
(±) | linearity of overall sound is average (18.8% difference to median)
Compared to same class
» 62% of all tested devices in this class were better, 8% similar, 30% worse
» The best had a delta of 6%, average was 18%, worst was 132%
Compared to all devices tested
» 43% of all tested devices were better, 8% similar, 49% worse
» The best had a delta of 4%, average was 24%, worst was 134%
Apple MacBook Pro 16 2021 M1 Pro audio analysis
(+) | speakers can play relatively loud (84.7 dB)
Bass 100 - 315 Hz
(+) | good bass - only 3.8% away from median
(+) | bass is linear (5.2% delta to prev. frequency)
Mids 400 - 2000 Hz
(+) | balanced mids - only 1.3% away from median
(+) | mids are linear (2.1% delta to prev. frequency)
Highs 2 - 16 kHz
(+) | balanced highs - only 1.9% away from median
(+) | highs are linear (2.7% delta to prev. frequency)
Overall 100 - 16.000 Hz
(+) | overall sound is linear (4.6% difference to median)
Compared to same class
» 0% of all tested devices in this class were better, 0% similar, 100% worse
» The best had a delta of 5%, average was 17%, worst was 45%
Compared to all devices tested
» 0% of all tested devices were better, 0% similar, 100% worse
» The best had a delta of 4%, average was 24%, worst was 134%
Energy Management — Similar To Last Generation
Power Consumption
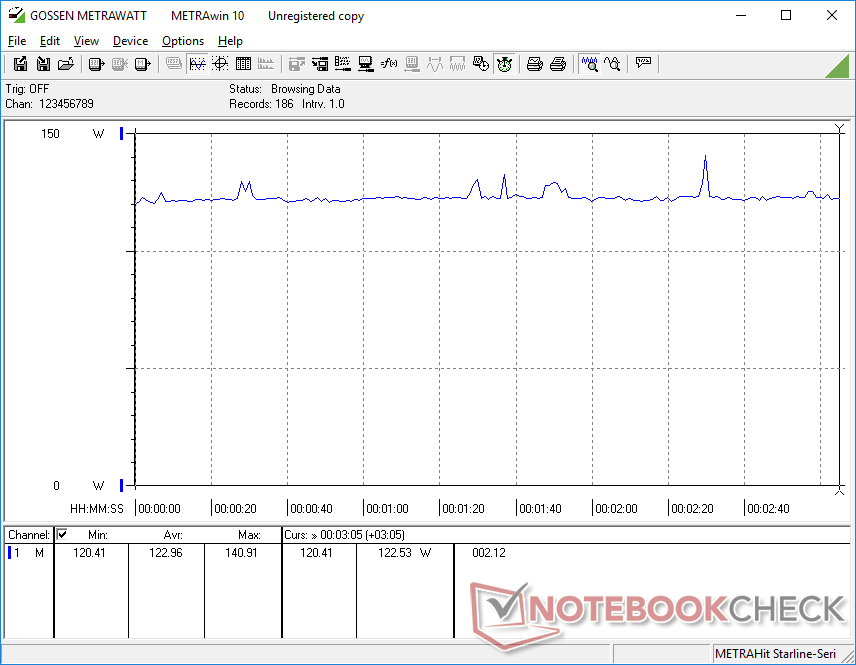
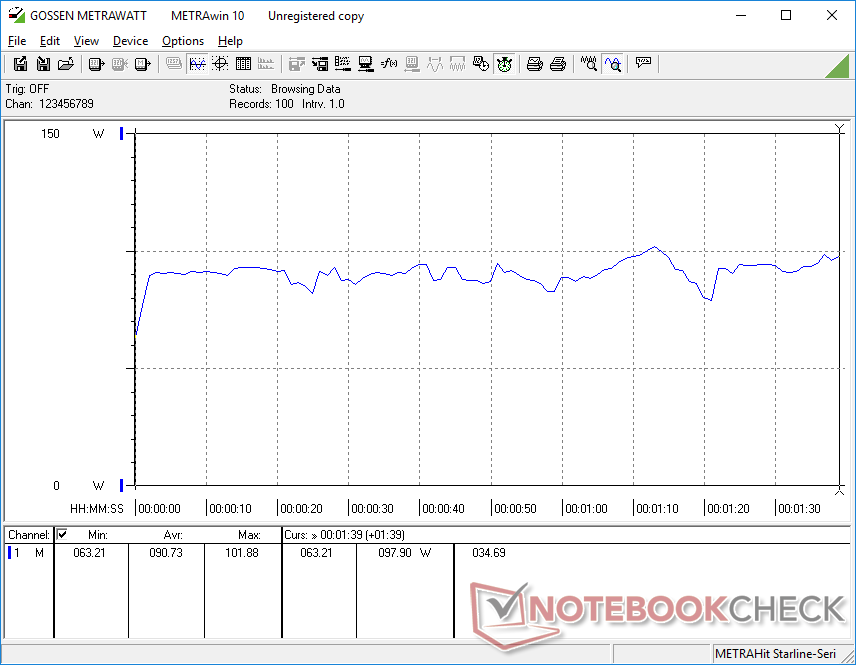
Consumption ranges between 90 W and 123 W when gaming compared to 103 W and 140 W on the Dell G5 5510 equipped with the same GPU but a 10th gen Core i5-10500H CPU. Consumption is generally lower on our Lenovo when running Prime95 as well despite its 40 percent performance boost over the Core i5 for superior performance-per-watt. However, it's not any more efficient than the Ryzen 5 5600H which makes the 6600H feel even more like a rebrand.
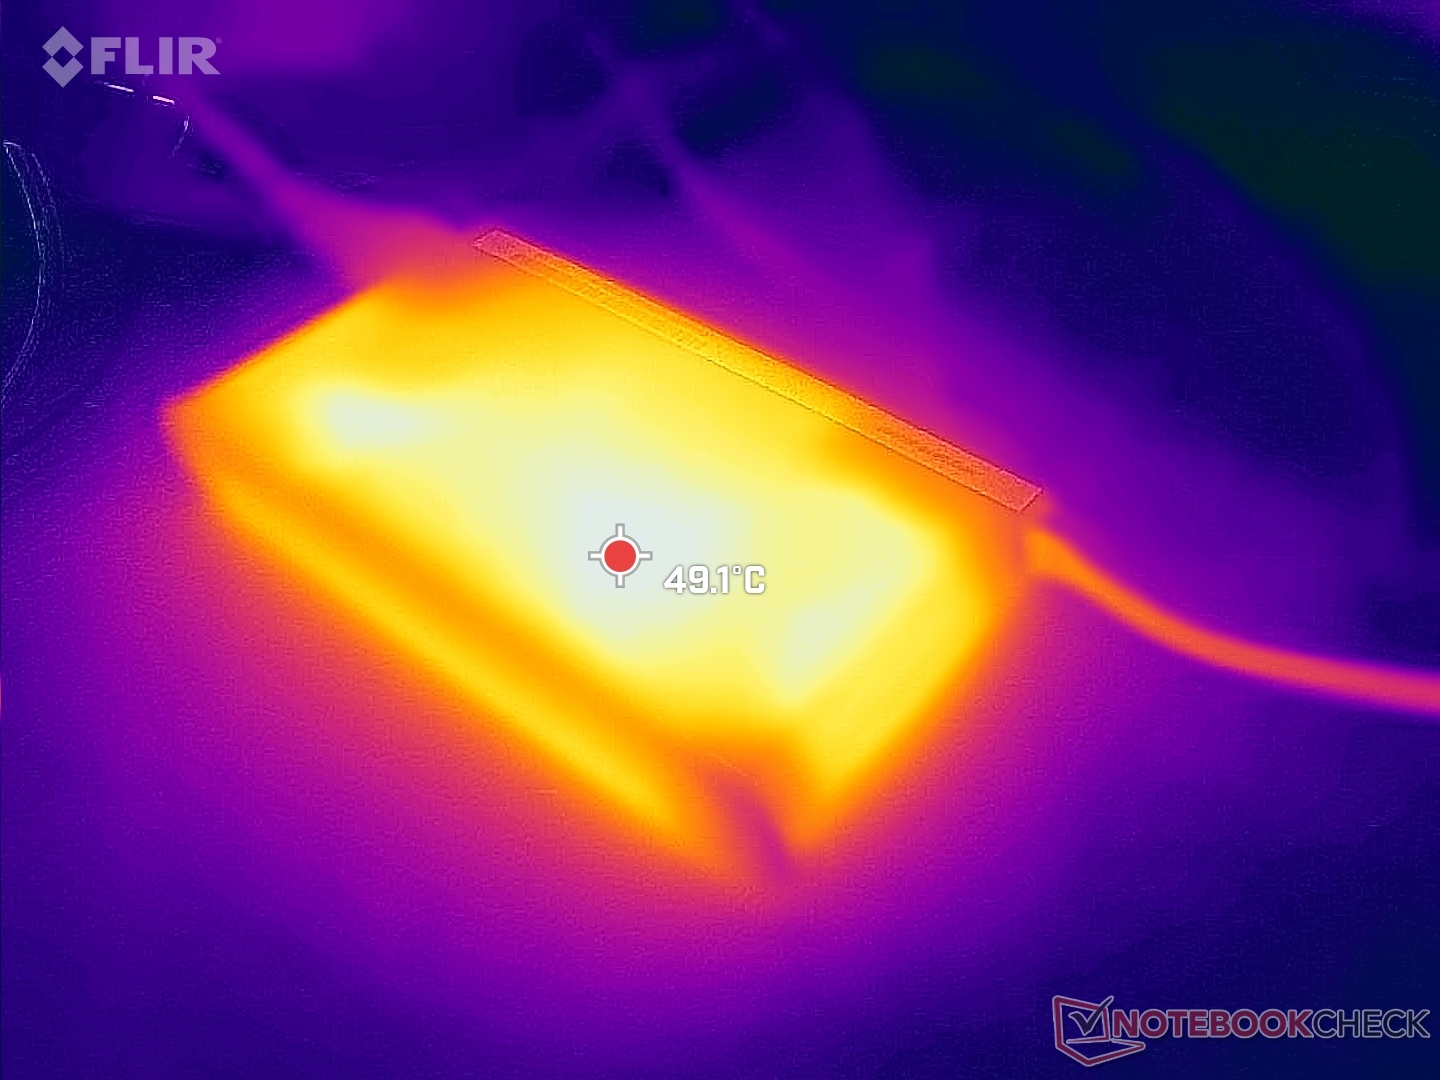
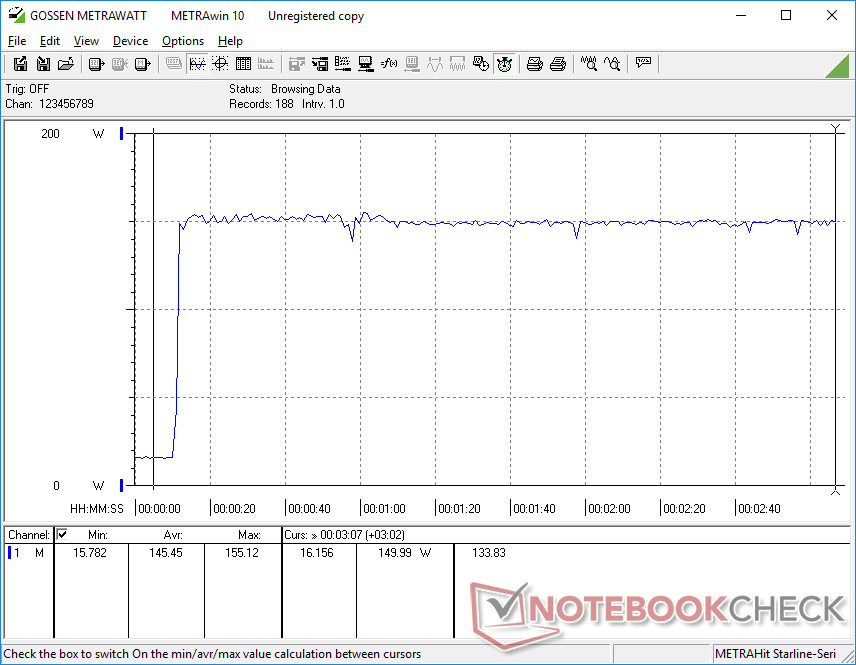
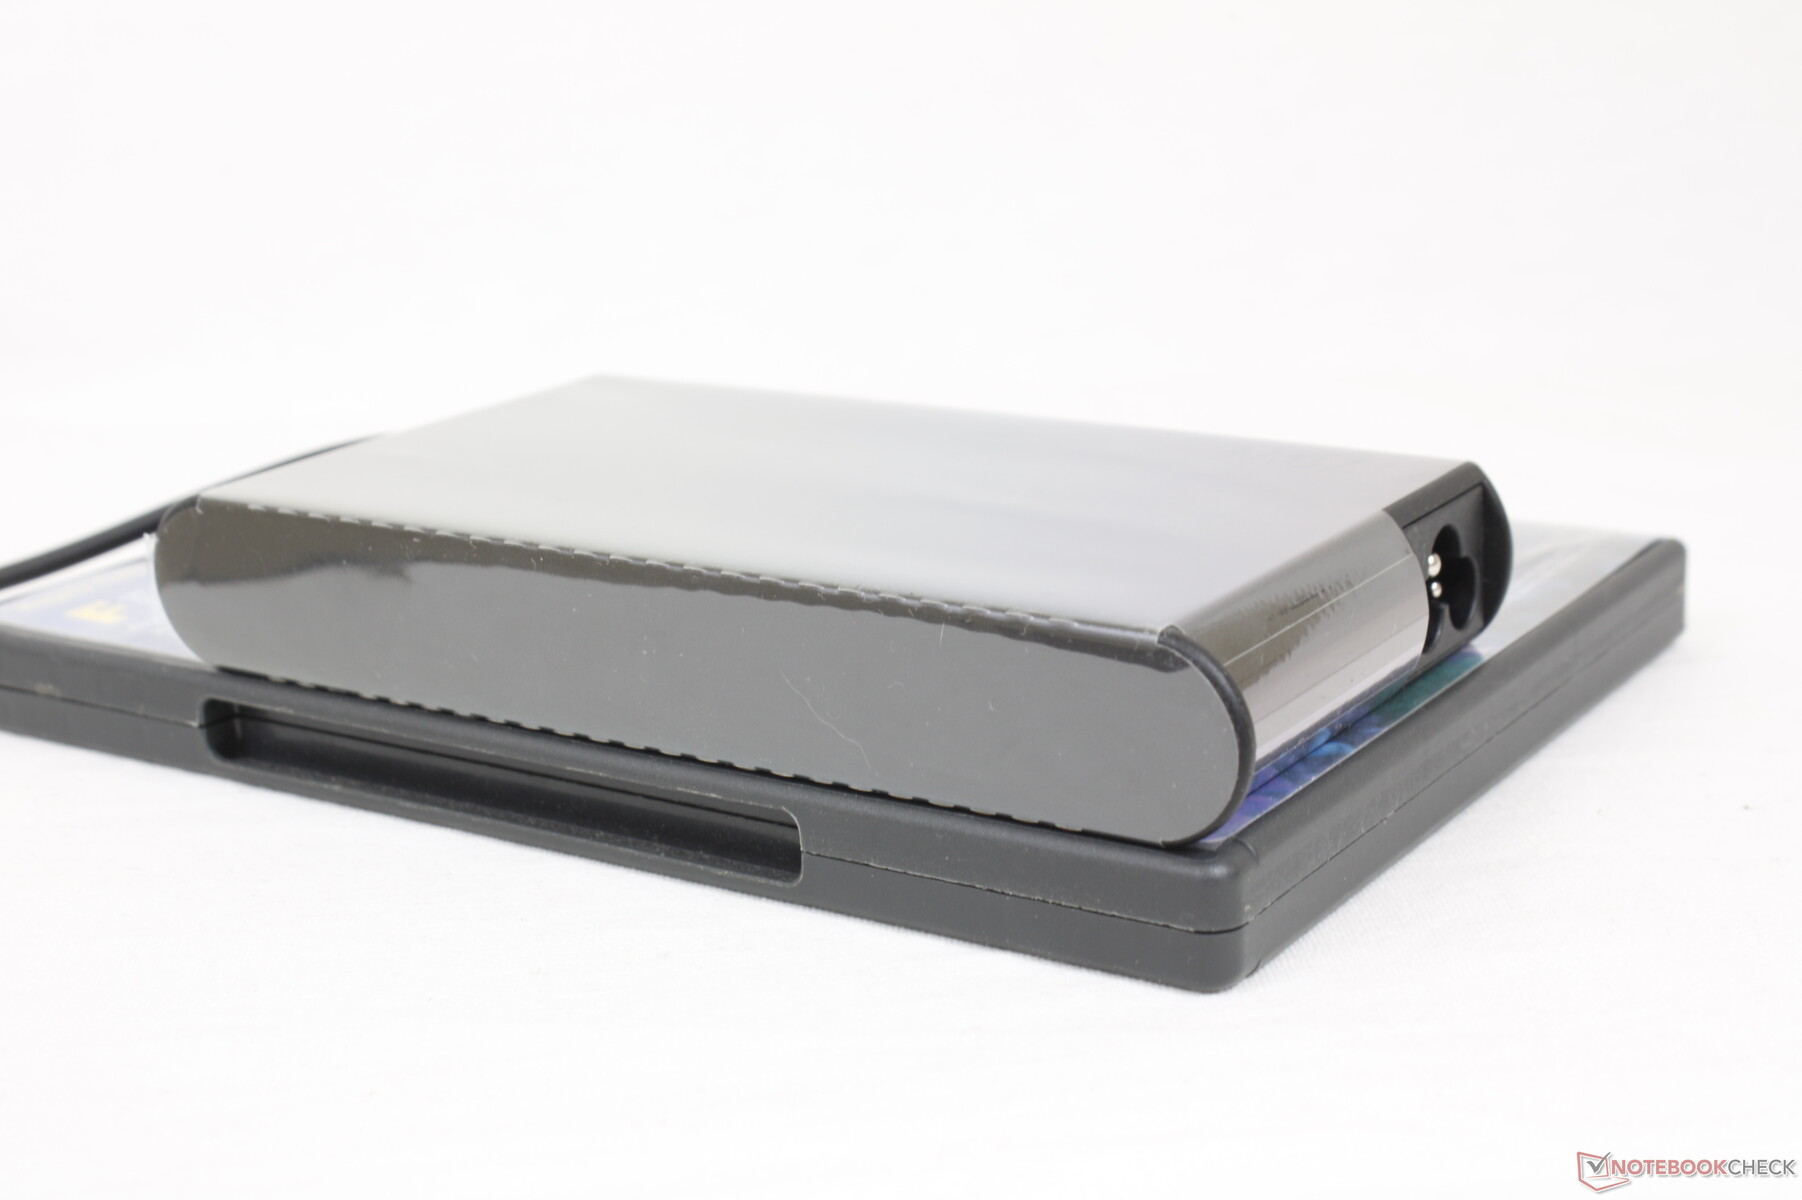
We're able to measure a maximum consumption of 156 W from the small-medium (~14.8 x 7.8 x 2.2 cm) 170 W AC adapter when running Prime95 and FurMark simultaneously. The battery charge level would actually drop from 100 percent to 95 percent over the course of half an hour before returning to 100 percent once we ended the stress test.
| Off / Standby | |
| Idle | |
| Load |
|
Key:
min: | |
| Lenovo IdeaPad Gaming 3 15ARH7 R5 6600H, GeForce RTX 3050 4GB Laptop GPU, Lenovo UMIS AM630 RPJTJ256MGE1QDY, IPS, 1920x1080, 15.6" | Lenovo IdeaPad Gaming 3i 15IMH05 i5-10300H, GeForce GTX 1650 Mobile, SK hynix BC511 HFM512GDHTNI-87A0B, IPS, 1920x1080, 15.6" | Lenovo Legion 5 15ACH6A-82NW0010GE R5 5600H, Radeon RX 6600M, Micron 2210 MTFDHBA512QFD, IPS, 1920x1080, 15.6" | Gigabyte A5 K1 R5 5600H, GeForce RTX 3060 Laptop GPU, ESR512GTLG-E6GBTNB4, IPS, 1920x1080, 15.6" | Asus TUF Dash F15 FX517ZR i7-12650H, GeForce RTX 3070 Laptop GPU, Samsung PM991a MZVLQ1T0HBLB, IPS, 2560x1440, 15.6" | Dell G15 5510 i5-10500H, GeForce RTX 3050 4GB Laptop GPU, SK Hynix BC711 HFM512GD3HX015N, IPS, 1920x1080, 15.6" | |
|---|---|---|---|---|---|---|
| Power Consumption | 8% | -39% | -34% | -30% | 5% | |
| Idle Minimum * (Watt) | 7.7 | 5.1 34% | 10 -30% | 10 -30% | 10 -30% | 3 61% |
| Idle Average * (Watt) | 9.1 | 8.2 10% | 13.2 -45% | 12 -32% | 14 -54% | 8 12% |
| Idle Maximum * (Watt) | 15.6 | 10.6 32% | 15.6 -0% | 17 -9% | 20 -28% | 13 17% |
| Load Average * (Watt) | 90.7 | 128 -41% | 178 -96% | 113 -25% | 122 -35% | 103 -14% |
| Witcher 3 ultra * (Watt) | 122.9 | 109 11% | 181 -47% | 181.4 -48% | 138.6 -13% | 139.5 -14% |
| Load Maximum * (Watt) | 155.2 | 150 3% | 180 -16% | 245 -58% | 189 -22% | 204 -31% |
* ... smaller is better
Power Consumption Witcher 3 / Stresstest
Power Consumption external Monitor
Battery Life
Battery capacity is small at just 45 Wh which is a typical range for budget gaming laptops. Real-world web browsing on the Balanced power profile with the integrated GPU active would last for about 6.5 hours before needing to recharge much like what we observed on the IdeaPad Gaming 3i.
Charging from empty to full with the included proprietary AC adapter takes about 1.5 to 2 hours. We can confirm that most USB-C chargers can also recharge the system.
We should mention that the battery life on Power Saver mode (or Lenovo Quiet mode) with the iGPU active and the display brightness set to minimum is unusually short at just 2 hours and 22 minutes. We repeated this test just to be sure and the results would not change. It's possible that the system suffers from a power consumption bug when under certain settings and battery conditions.
| Lenovo IdeaPad Gaming 3 15ARH7 R5 6600H, GeForce RTX 3050 4GB Laptop GPU, 45 Wh | Lenovo IdeaPad Gaming 3i 15IMH05 i5-10300H, GeForce GTX 1650 Mobile, 45 Wh | Lenovo Legion 5 15ACH6A-82NW0010GE R5 5600H, Radeon RX 6600M, 80 Wh | Gigabyte A5 K1 R5 5600H, GeForce RTX 3060 Laptop GPU, 48.96 Wh | Asus TUF Dash F15 FX517ZR i7-12650H, GeForce RTX 3070 Laptop GPU, 76 Wh | Dell G15 5510 i5-10500H, GeForce RTX 3050 4GB Laptop GPU, 56 Wh | |
|---|---|---|---|---|---|---|
| Battery runtime | 171% | 199% | 6% | 171% | 125% | |
| Reader / Idle (h) | 2.4 | 12.4 417% | 12.8 433% | 10.8 350% | 11.3 371% | |
| WiFi v1.3 (h) | 6.5 | 6.3 -3% | 9.2 42% | 6.9 6% | 7 8% | 6 -8% |
| Load (h) | 0.9 | 1.8 100% | 2 122% | 2.3 156% | 1 11% | |
| H.264 (h) | 7.3 | 5.8 |
Pros
Cons
Verdict — New Ryzen 5 6600U CPU Doesn't Offer Much For Gaming Laptops
The biggest difference between the Ryzen 5 5600H and Ryzen 5 6600H is that the former ships with integrated Radeon RX Vega graphics while the latter ships with the integrated Radeon 660M for significantly faster iGPU performance. Otherwise, the two processors are nearly identical in terms of CPU performance. The problem with this on gaming laptops is that nearly all gaming laptop models already ship with faster discrete graphics which render the integrated solution almost useless in the vast majority of cases. Thus, in order to maximize gaming performance, you'll want to skip the Radeon 660M or 680M and instead aim for a faster GPU like the RTX 3060 even if it means settling for a last generation Ryzen 5 5600H or Ryzen 7 5800H AMD CPU.
The Ryzen 5 6600H is therefore at its best on laptops and mini PCs with no dedicated GPU option. Only then can the performance and efficiency of the integrated Radeon 660M really shine.
As for the Lenovo laptop itself, it certainly deserves praise for its large arrow keys, low starting price, and standard 120 Hz 1080p IPS display with both FreeSync and decent response times. Colors are poor, but that's a common drawback on inexpensive gaming laptops such as this. Our most crucial criticisms instead relate to the difficult serviceability and heavy weight of the laptop. Budget alternatives like the MSI GF63, Acer Nitro 5, HP Pavilion Gaming 15, or Asus TUF Dash series are all lighter and easier to upgrade. Attempting to add more RAM or storage in the IdeaPad Gaming 3 is annoyingly more inconvenient in comparison.
Price and Availability
The Lenovo IdeaPad Gaming 3 15ARH7 is now widely available at major online resellers like Walmart, Best Buy, and Amazon for $969 USD. Note that these SKUs are all shipping with the slightly faster GeForce RTX 3050 Ti GPU instead of the RTX 3050. Our configuration with the RTX 3050 is not nearly as common at the moment.
Lenovo IdeaPad Gaming 3 15ARH7
- 09/09/2022 v7 (old)
Allen Ngo
Price comparison
