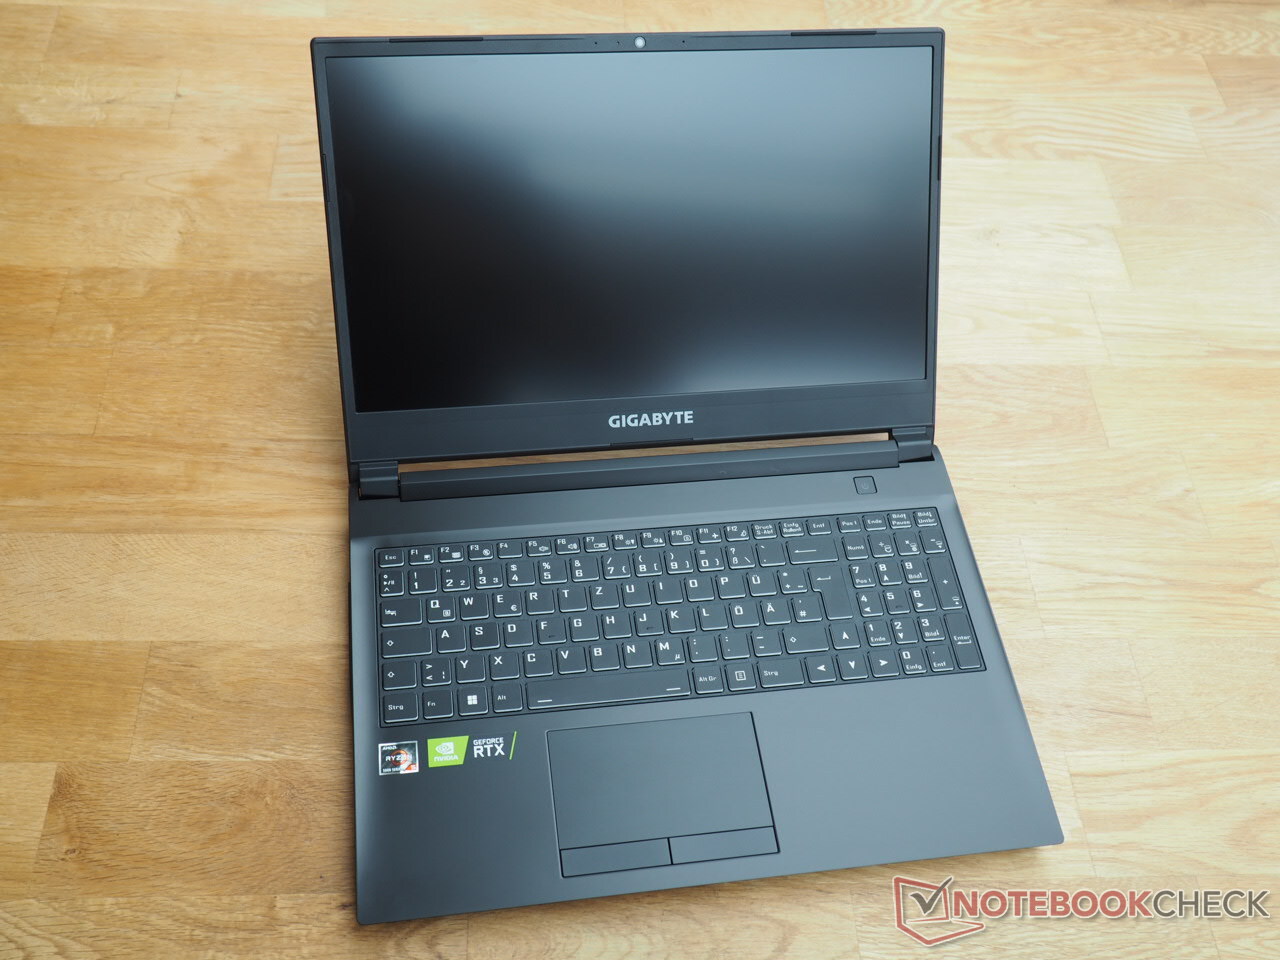
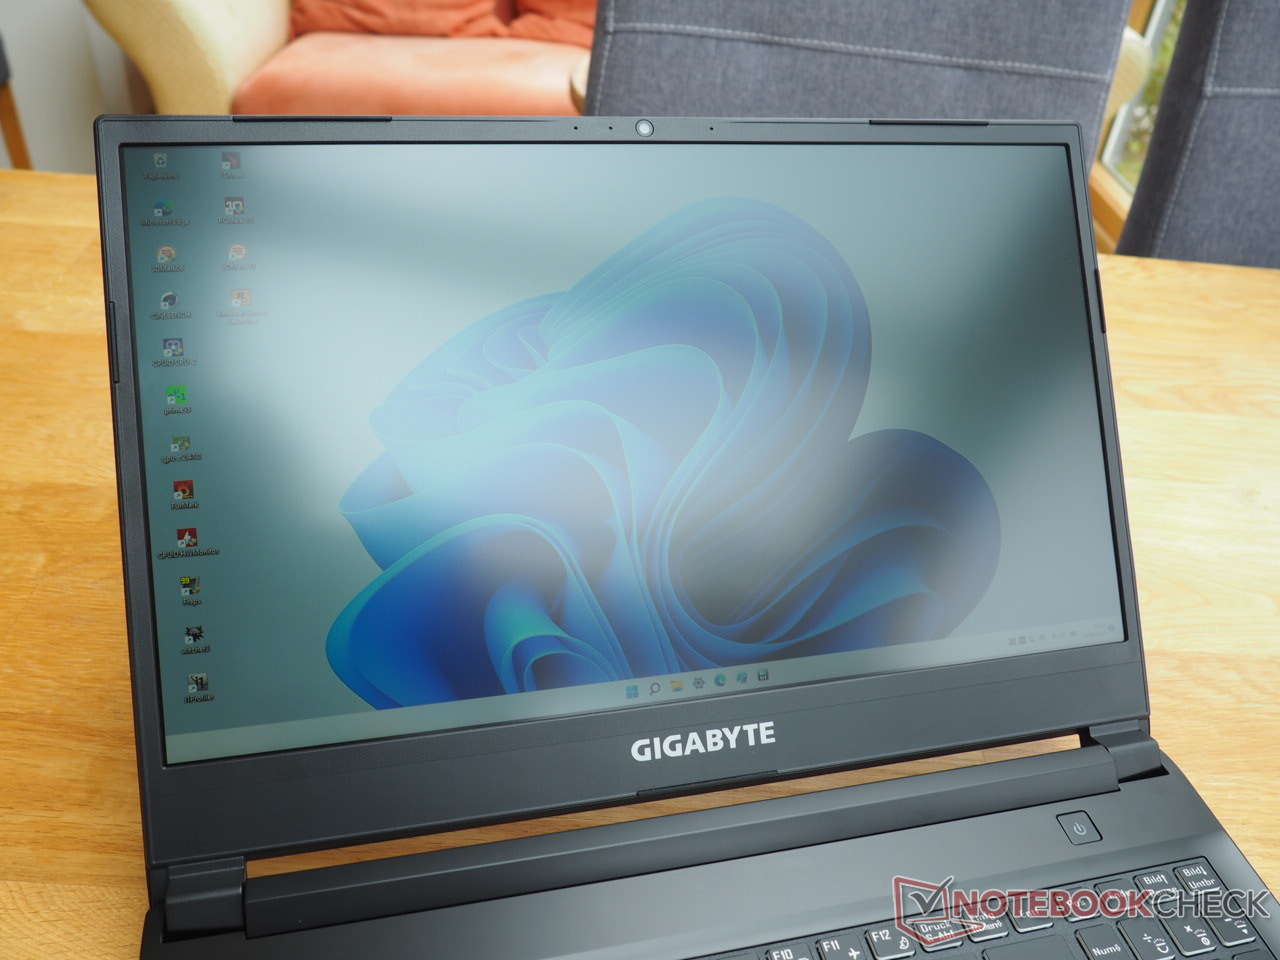
Gigabyte A5 K1 review: Old-school gaming notebook

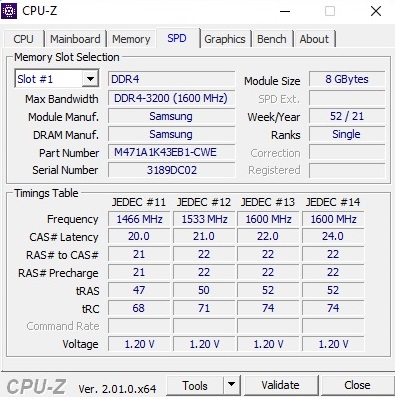
After we had already tested the just under 1,800 Euros (~$1788) A5 X1 with Ryzen 9 5900HX and GeForce RTX 3070, Gigabyte has now sent us the much cheaper A5 K1, which also has 16 GB of DDR4 RAM (2x 8 GB Dual Channel) and a 512 GB NVMe-based SSD, but has to make do with less CPU and GPU power. However, a Ryzen 5 5600H and a GeForce RTX 3060 are very respectable for around 900 Euros (~$894). In this price range you often only get a GeForce RTX 3050 or 3050 Ti. Gigabyte (or the barebone manufacturer Clevo) uses a matte 144 Hz panel with 1920 x 1080 pixels for the display. Attention: The computer actually only comes with FreeDOS. However, Gigabyte was kind enough to install Windows 11 Pro for us in advance.
The A5 K1's competitors include other 15-inch gamers with GeForce RTX 3060 or the equal Radeon RX 6600M like the Asus TUF Gaming F15 FX507ZM, the Lenovo Legion 5 15ACH6A and the MSI Alpha 15 B5EEK, which are, except for the Legion, much more expensive. The latter notebooks appear in the tables as comparison devices.
Possible competitors in comparison
Rating | Date | Model | Weight | Height | Size | Resolution | Price |
|---|---|---|---|---|---|---|---|
| 82.3 % v7 (old) | 09 / 2022 | Gigabyte A5 K1 R5 5600H, GeForce RTX 3060 Laptop GPU | 2.2 kg | 34 mm | 15.60" | 1920x1080 | |
| 87.2 % v7 (old) | 03 / 2022 | Asus TUF Gaming F15 FX507ZM i7-12700H, GeForce RTX 3060 Laptop GPU | 2.1 kg | 24.95 mm | 15.60" | 1920x1080 | |
| 82.6 % v7 (old) | 05 / 2022 | Lenovo Legion 5 15ACH6A-82NW0010GE R5 5600H, Radeon RX 6600M | 2.5 kg | 25.75 mm | 15.60" | 1920x1080 | |
| 82.6 % v7 (old) | 01 / 2022 | MSI Alpha 15 B5EEK-008 R7 5800H, Radeon RX 6600M | 2.4 kg | 23.95 mm | 15.60" | 1920x1080 | |
| 84.1 % v7 (old) | 01 / 2022 | Gigabyte A5 X1 R9 5900HX, GeForce RTX 3070 Laptop GPU | 2.2 kg | 25.3 mm | 15.60" | 1920x1080 |
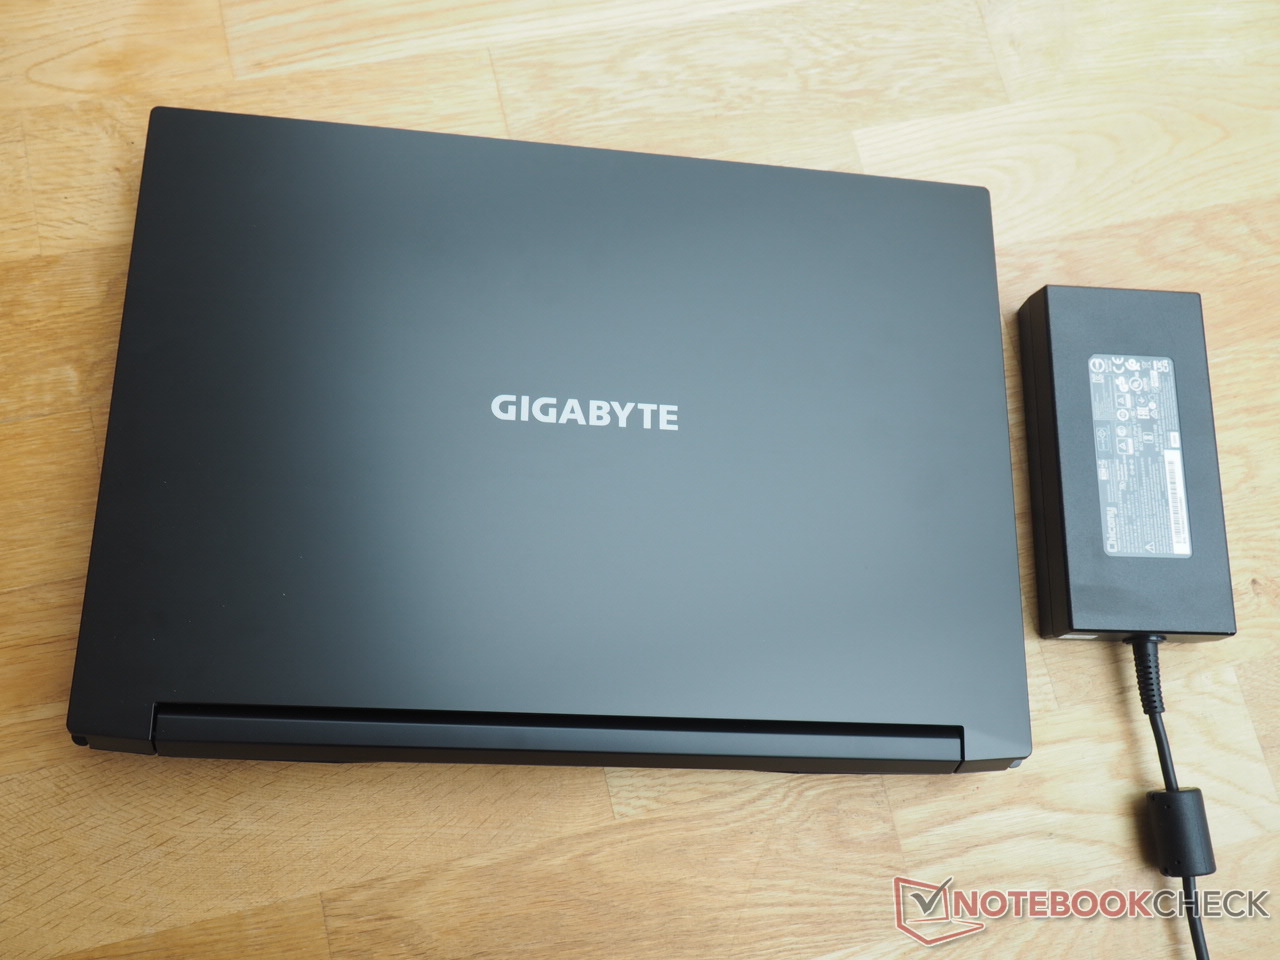
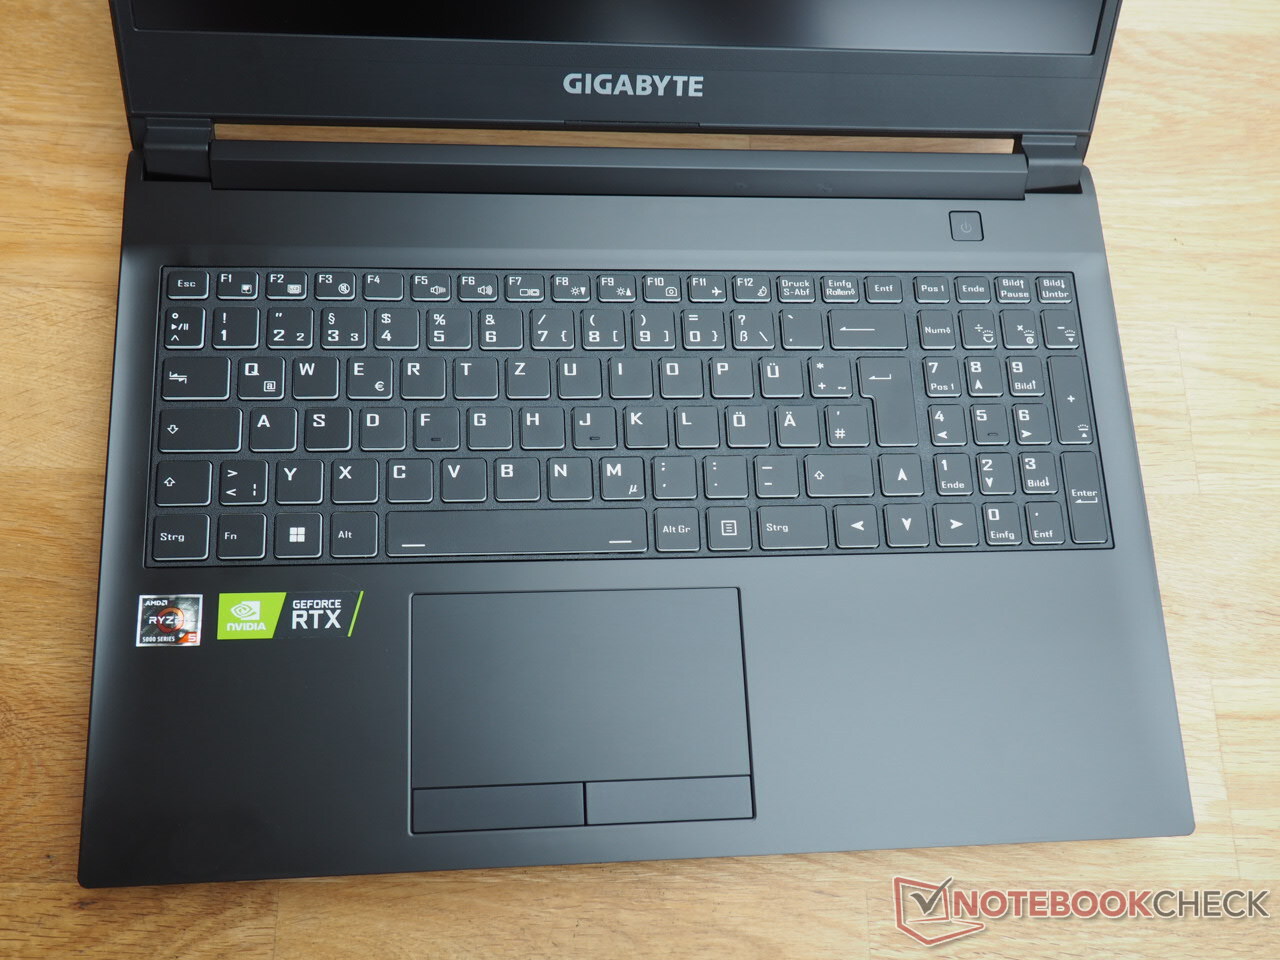
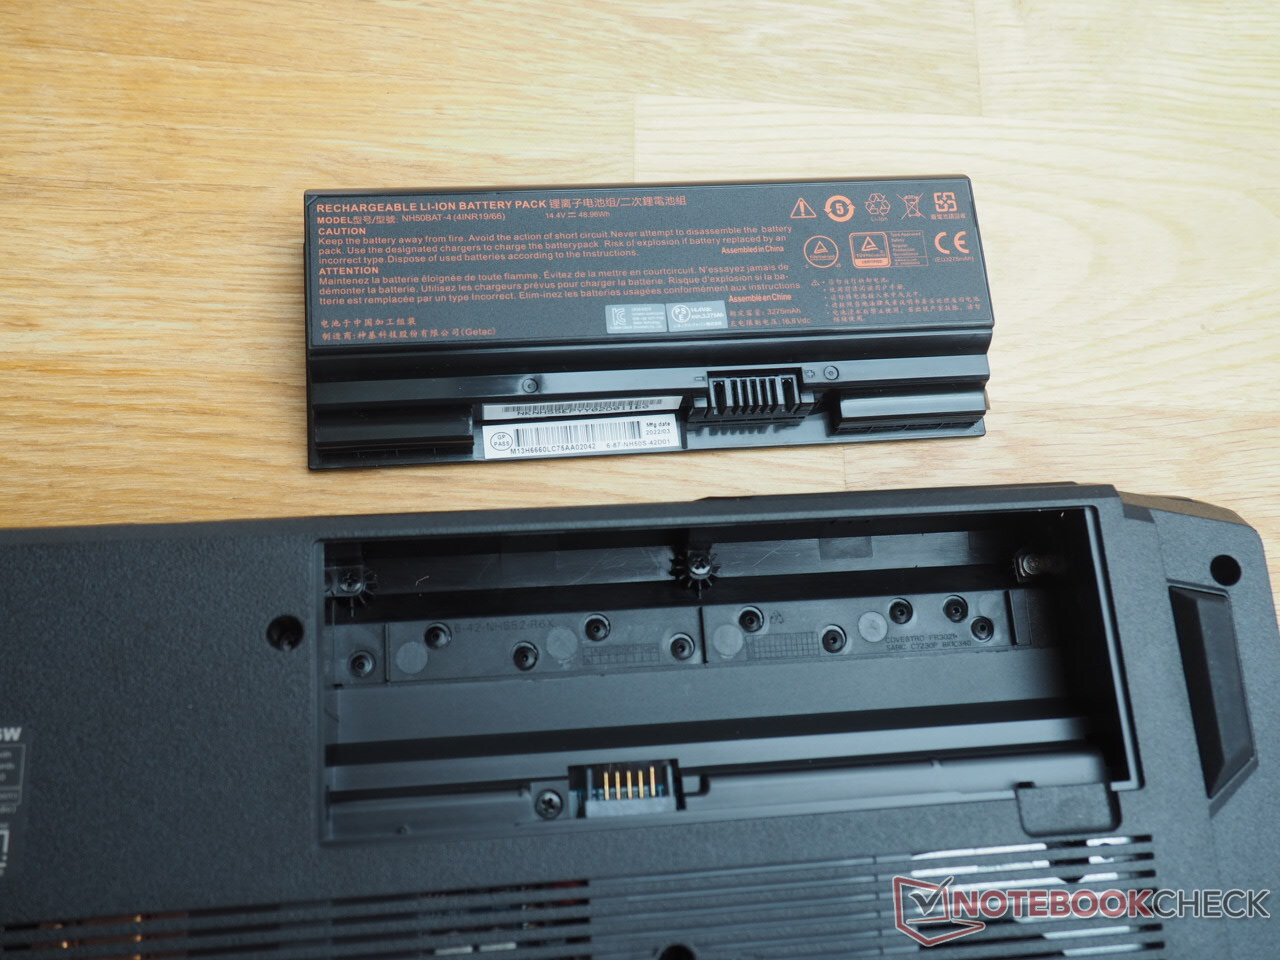
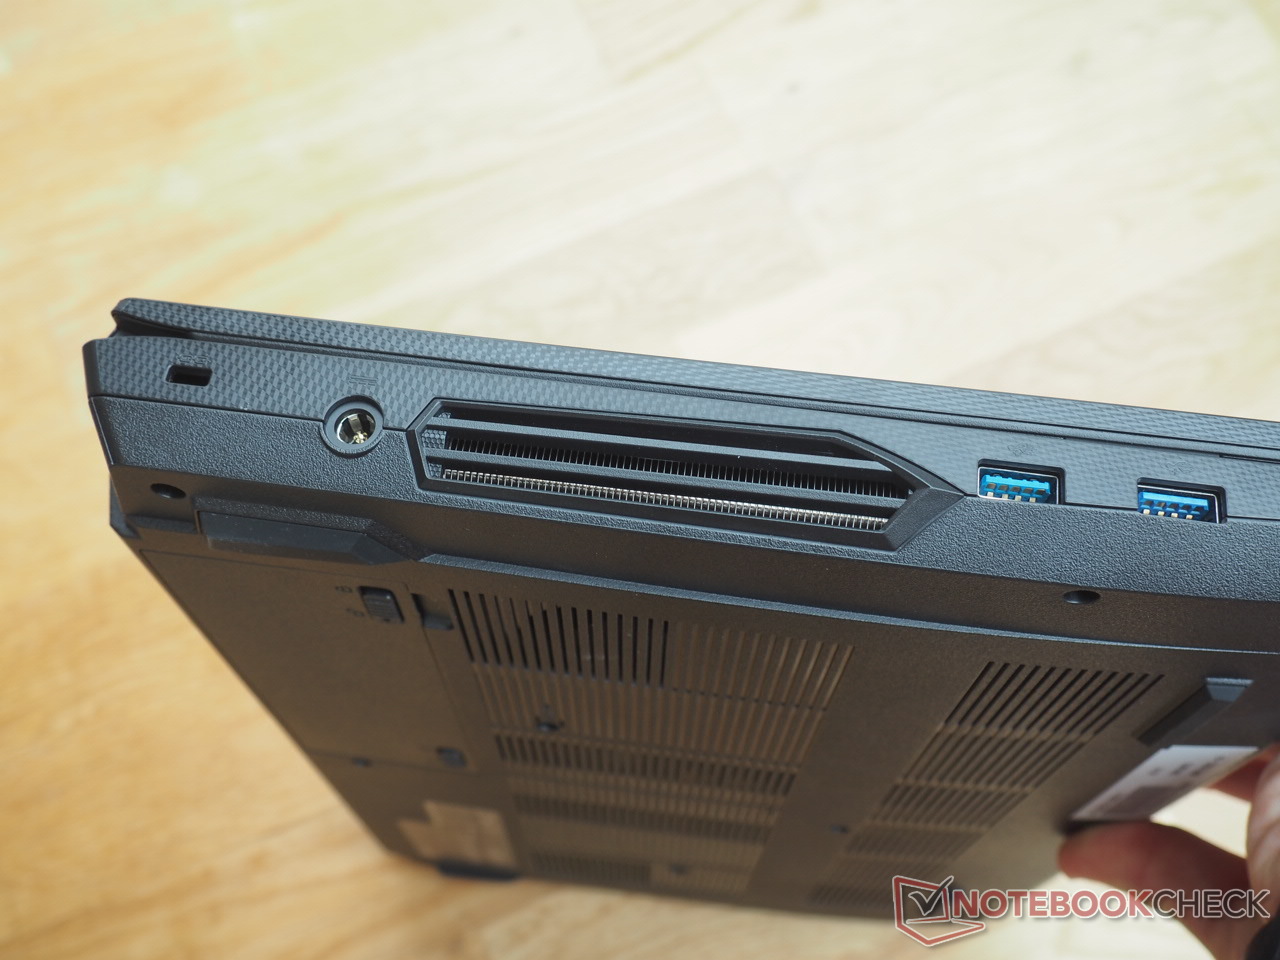
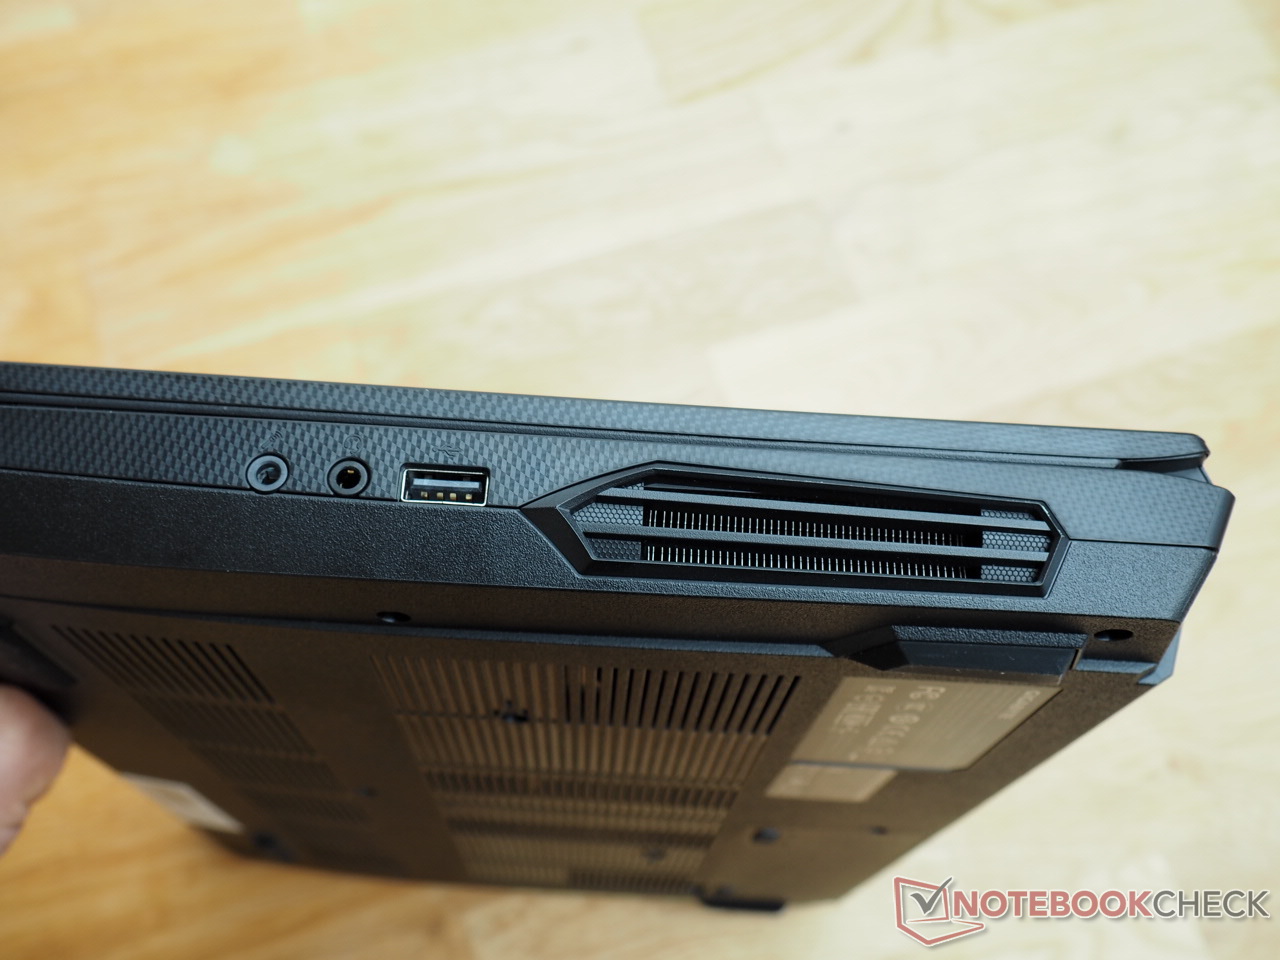
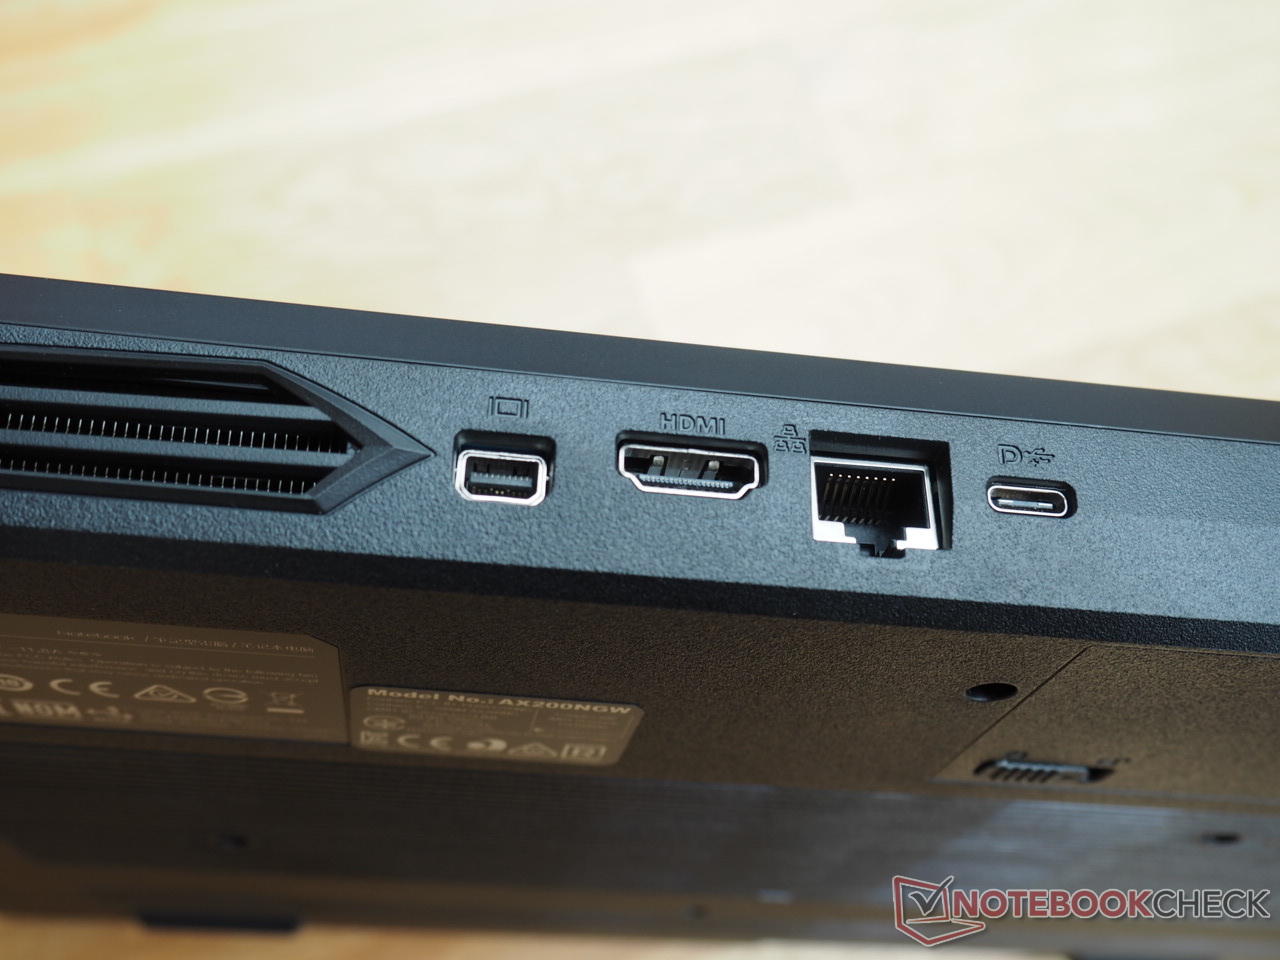
Since the chassis is identical in construction to the A5 X1 except for minimal changes (the sides are now textured/structured in places), we will not re-evaluate the case, ports and input devices in this article. You can find the corresponding information in the linked test report.
Communication
| Networking | |
| iperf3 transmit AXE11000 | |
| Gigabyte A5 K1 | |
| Average of class Gaming (560 - 1862, n=96, last 2 years) | |
| Average Intel Wi-Fi 6 AX200 (429 - 1748, n=28) | |
| iperf3 receive AXE11000 | |
| Gigabyte A5 K1 | |
| Average of class Gaming (680 - 1745, n=96, last 2 years) | |
| Average Intel Wi-Fi 6 AX200 (451 - 1746, n=28) | |
Webcam


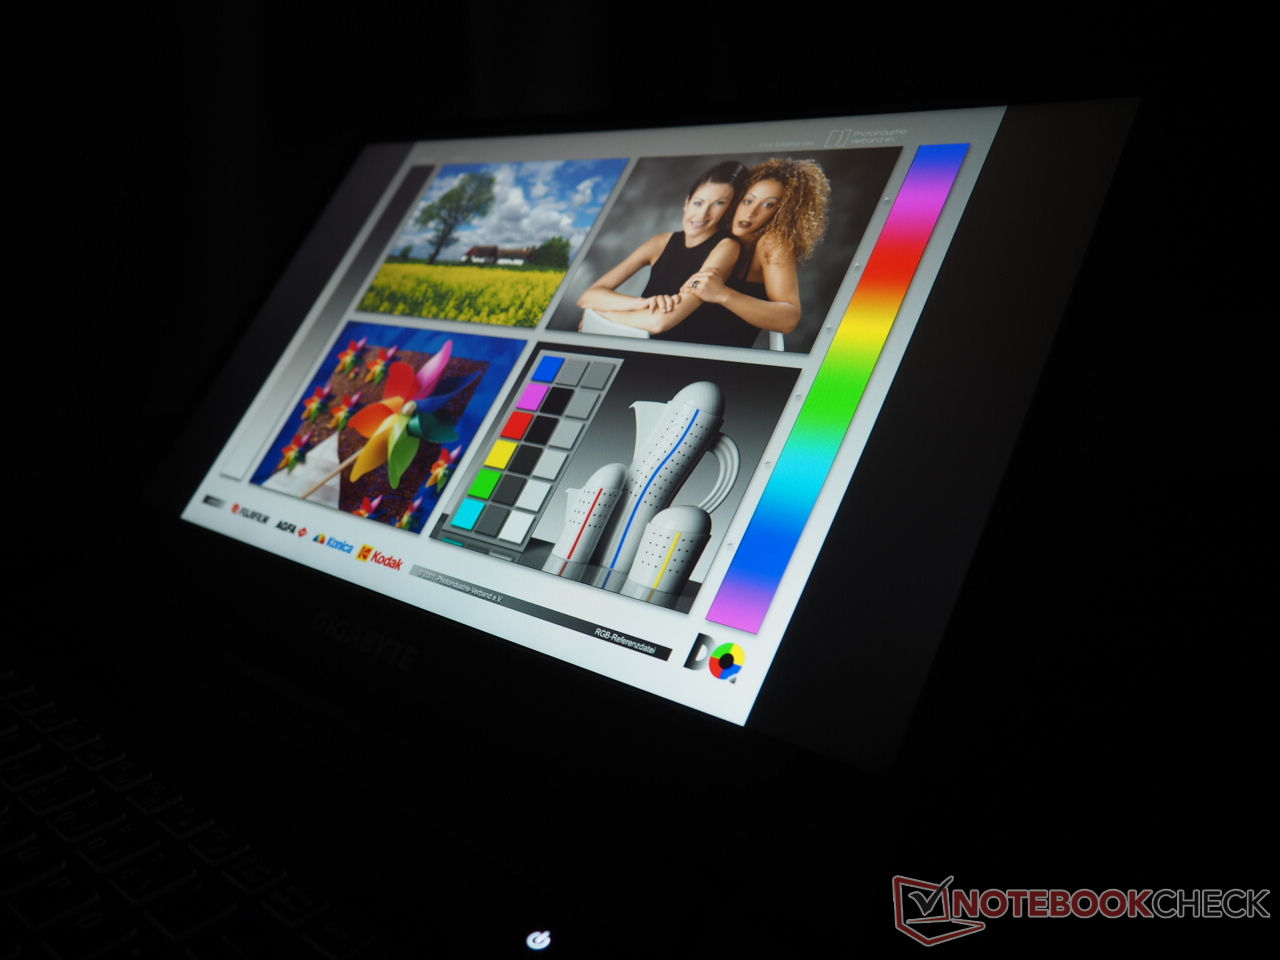
Display
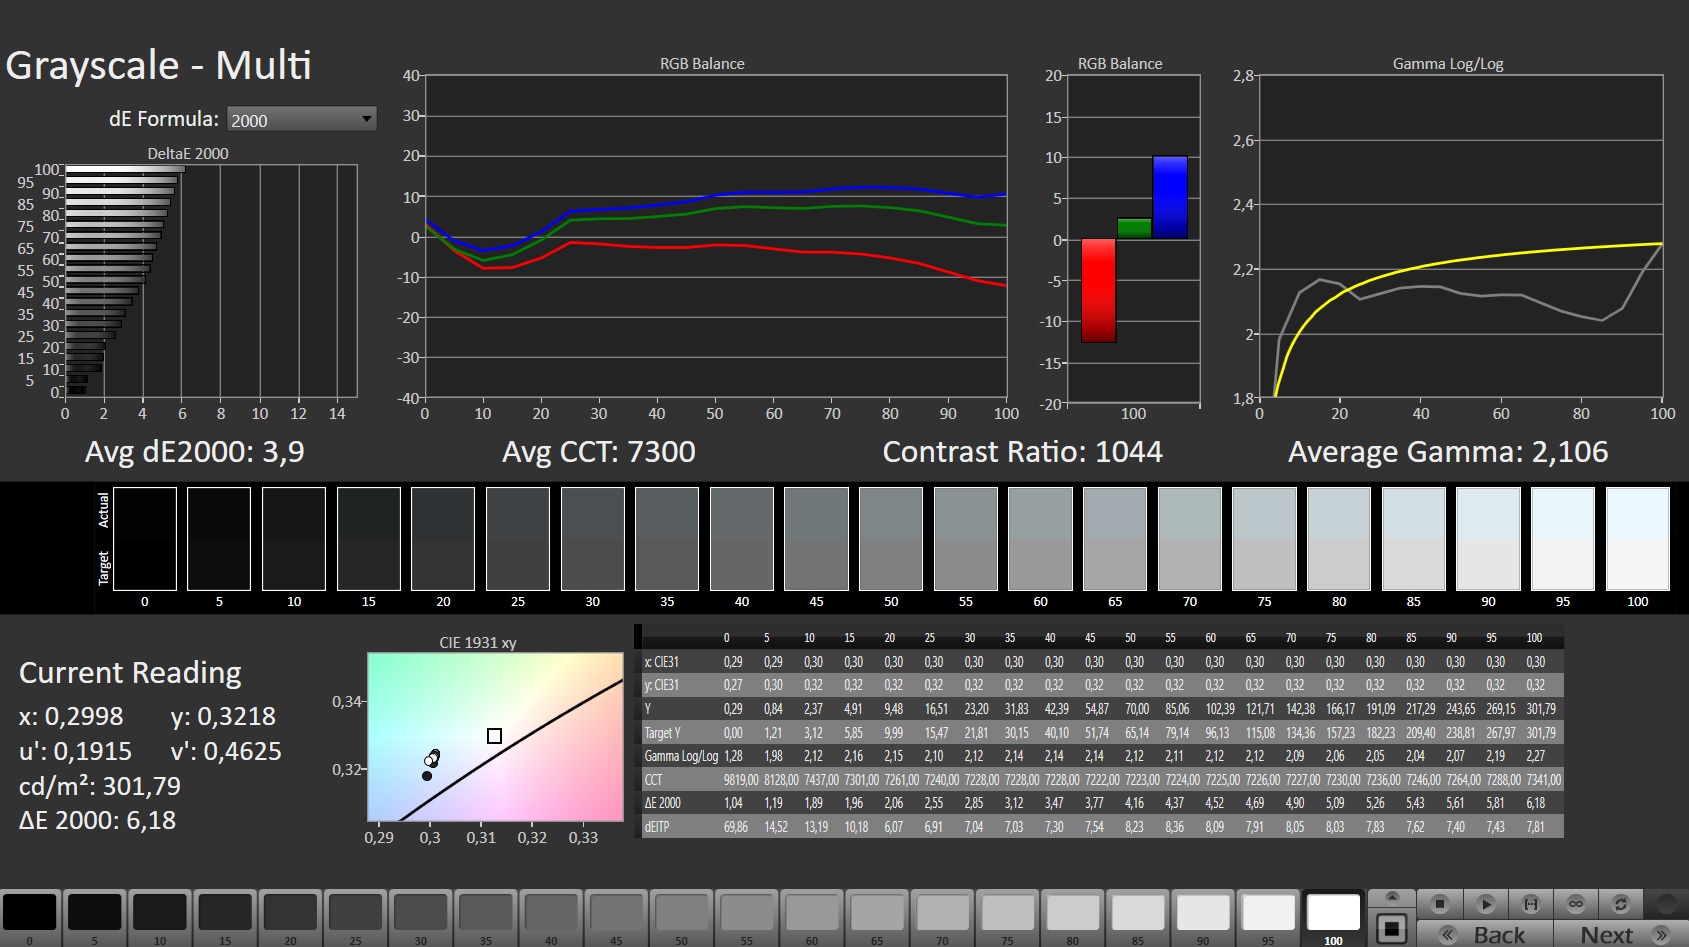
The screen scores a bit weaker compared to the A5 X1, but is still on a pretty good level overall.
| |||||||||||||||||||||||||
Brightness Distribution: 83 %
Center on Battery: 295 cd/m²
Contrast: 1017:1 (Black: 0.29 cd/m²)
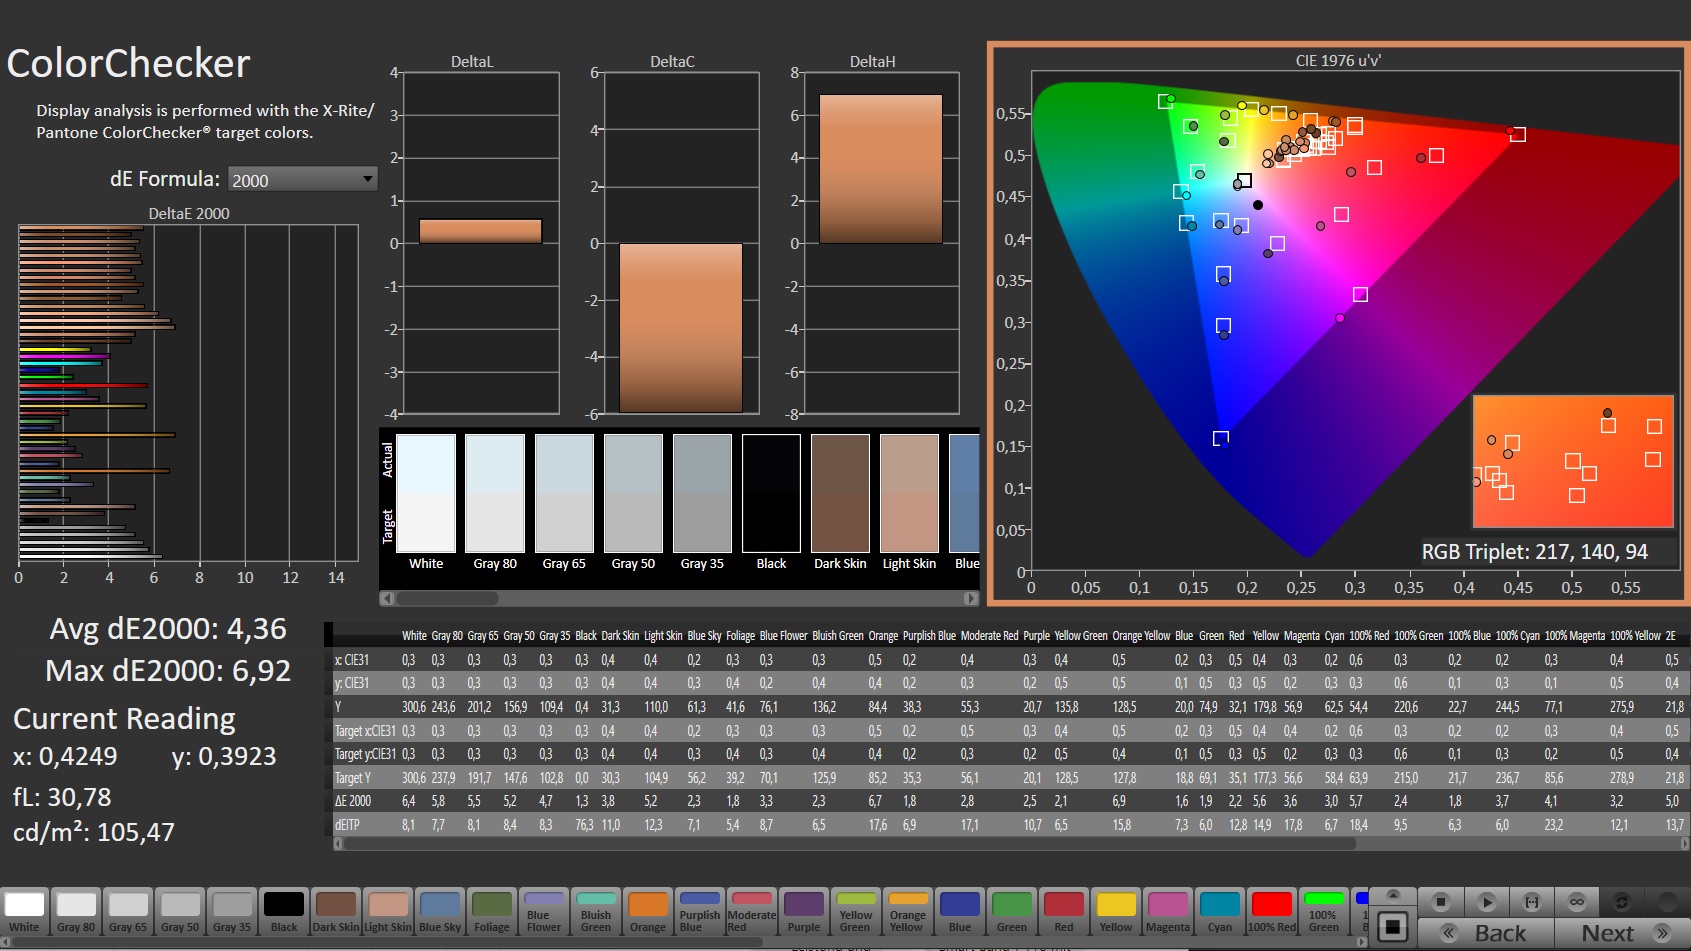
ΔE ColorChecker Calman: 4.36 | ∀{0.5-29.43 Ø4.73}
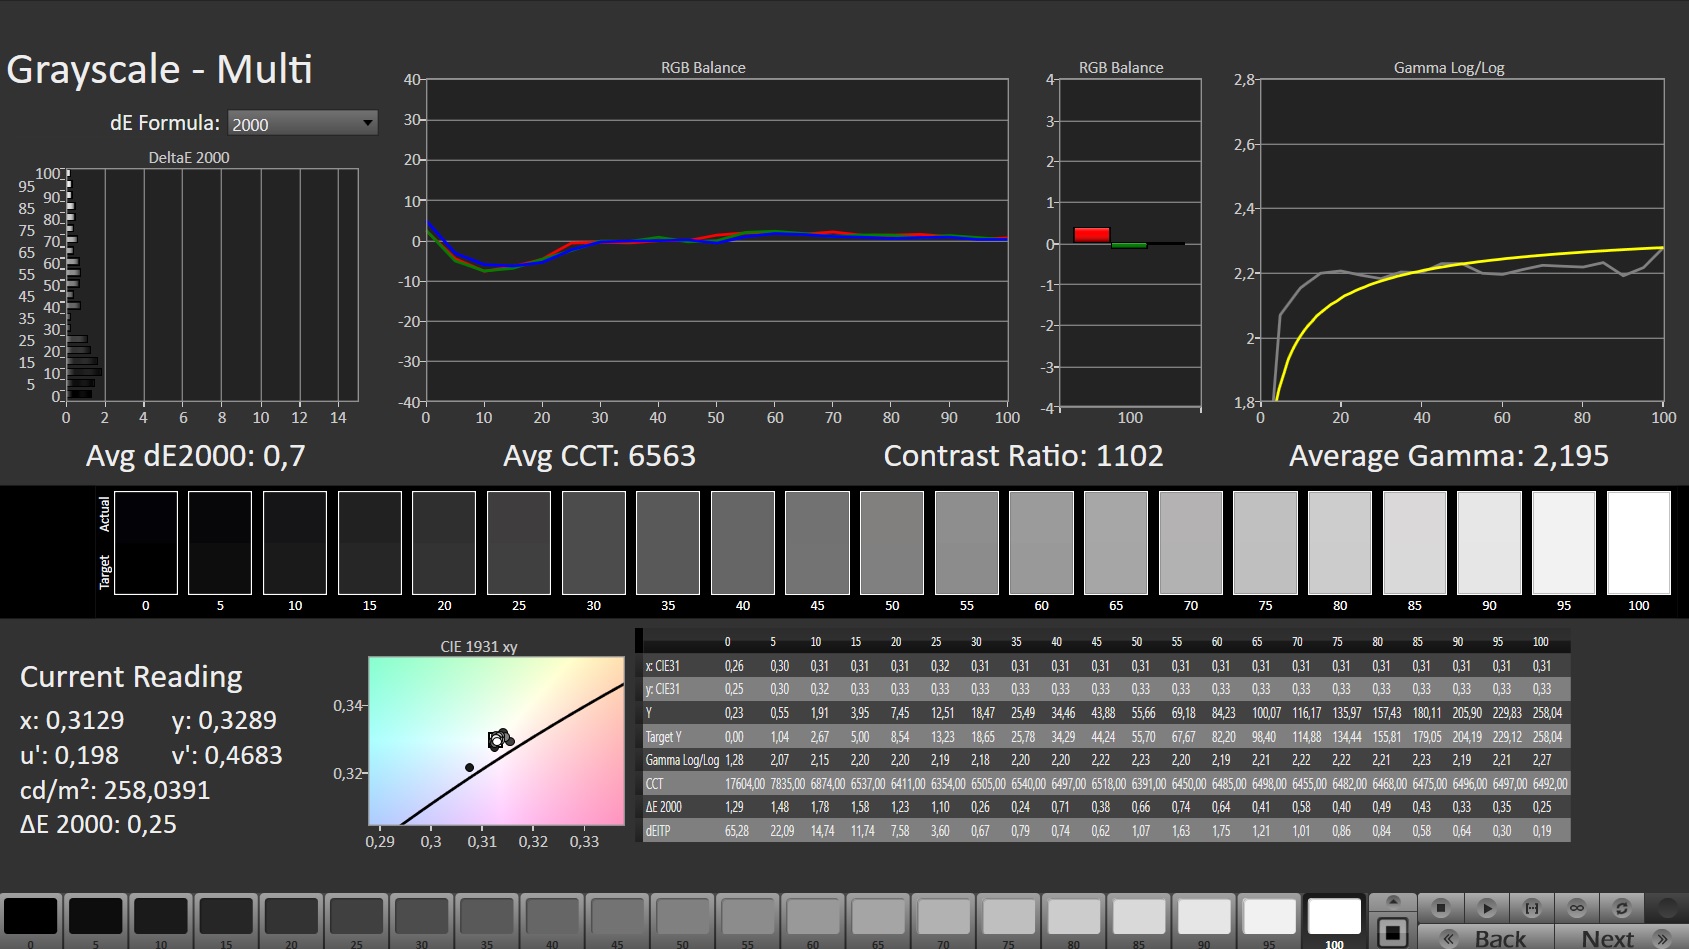
calibrated: 1.2
ΔE Greyscale Calman: 3.9 | ∀{0.09-98 Ø4.97}
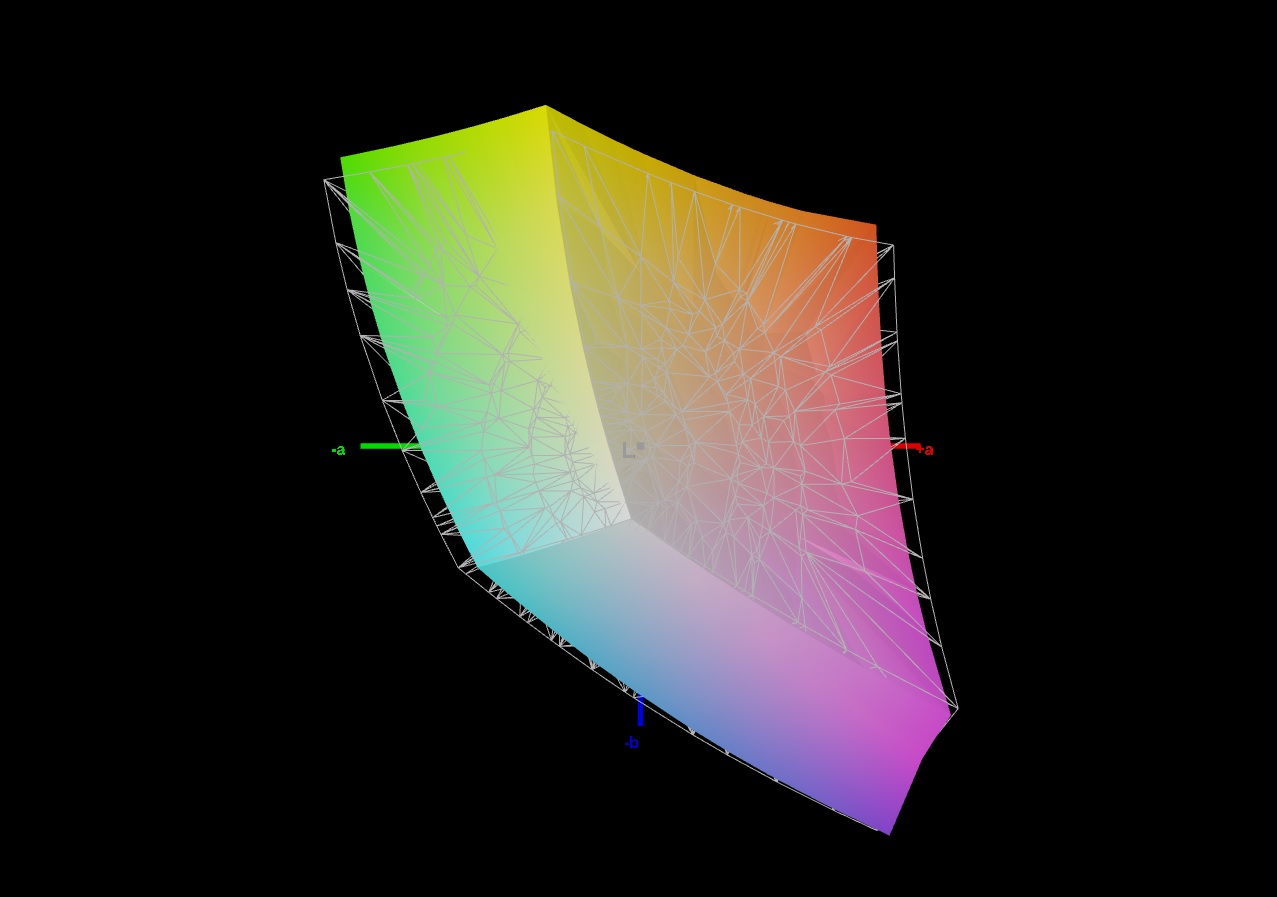
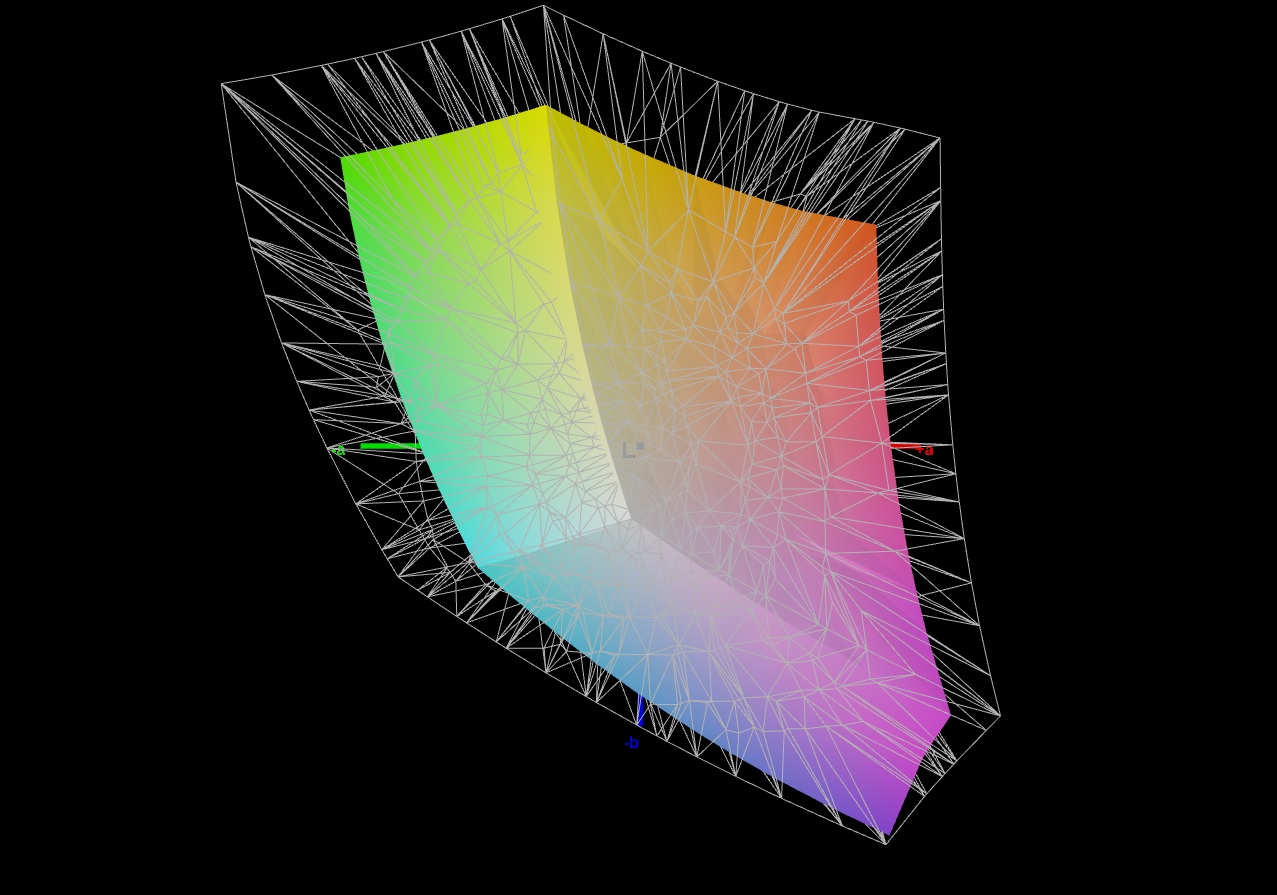
66.1% AdobeRGB 1998 (Argyll 3D)
92.5% sRGB (Argyll 3D)
64.4% Display P3 (Argyll 3D)
Gamma: 2.106
CCT: 7300 K
| Gigabyte A5 K1 BOEhydis NV156FHM-N4K (BOE08B3), IPS, 1920x1080, 15.6" | Asus TUF Gaming F15 FX507ZM TL156VDXP0101, IPS, 1920x1080, 15.6" | Lenovo Legion 5 15ACH6A-82NW0010GE LGD06A5, IPS, 1920x1080, 15.6" | MSI Alpha 15 B5EEK-008 AU Optronics B156HAN08.0, IPS, 1920x1080, 15.6" | Gigabyte A5 X1 AU Optronics B156HAN12.0, IPS, 1920x1080, 15.6" | |
|---|---|---|---|---|---|
| Display | 4% | 9% | 1% | 7% | |
| Display P3 Coverage (%) | 64.4 | 66.4 3% | 71.1 10% | 65.9 2% | 69.6 8% |
| sRGB Coverage (%) | 92.5 | 97 5% | 99.1 7% | 91.6 -1% | 98.6 7% |
| AdobeRGB 1998 Coverage (%) | 66.1 | 68.5 4% | 72.3 9% | 67 1% | 70.8 7% |
| Response Times | 13% | 17% | 44% | 25% | |
| Response Time Grey 50% / Grey 80% * (ms) | 14.5 ? | 5.6 ? 61% | 15 ? -3% | 5.06 ? 65% | 4.8 ? 67% |
| Response Time Black / White * (ms) | 9.5 ? | 12.8 ? -35% | 6 ? 37% | 7.44 ? 22% | 11.2 ? -18% |
| PWM Frequency (Hz) | |||||
| Screen | 27% | 7% | -10% | 3% | |
| Brightness middle (cd/m²) | 295 | 353.7 20% | 371 26% | 311 5% | 335 14% |
| Brightness (cd/m²) | 281 | 340 21% | 328 17% | 325 16% | 325 16% |
| Brightness Distribution (%) | 83 | 89 7% | 85 2% | 84 1% | 90 8% |
| Black Level * (cd/m²) | 0.29 | 0.34 -17% | 0.32 -10% | 0.22 24% | 0.4 -38% |
| Contrast (:1) | 1017 | 1040 2% | 1159 14% | 1414 39% | 838 -18% |
| Colorchecker dE 2000 * | 4.36 | 1.74 60% | 3.25 25% | 5.06 -16% | 2.63 40% |
| Colorchecker dE 2000 max. * | 6.92 | 3.63 48% | 6.33 9% | 8.37 -21% | 7.71 -11% |
| Colorchecker dE 2000 calibrated * | 1.2 | 0.5 58% | 1.11 7% | 2.62 -118% | 0.97 19% |
| Greyscale dE 2000 * | 3.9 | 2.1 46% | 4.94 -27% | 4.8 -23% | 4 -3% |
| Gamma | 2.106 104% | 2.3 96% | 2.45 90% | 2.12 104% | 2.129 103% |
| CCT | 7300 89% | 6257 104% | 6064 107% | 8002 81% | 7434 87% |
| Total Average (Program / Settings) | 15% /
20% | 11% /
9% | 12% /
-0% | 12% /
7% |
* ... smaller is better
Instead of a panel from AU Optronics, our test configuration of the A5 K1 had a BOE panel on board. Besides the illumination (the display struggles with visible screen bleeding), the brightness could also be better. An average of 281 cd/m² might be sufficient for most indoor environments, but you will quickly wish for a higher luminosity in brighter places like winter gardens, balconies or terraces. The more expensive brother still achieved 325 cd/m² here.
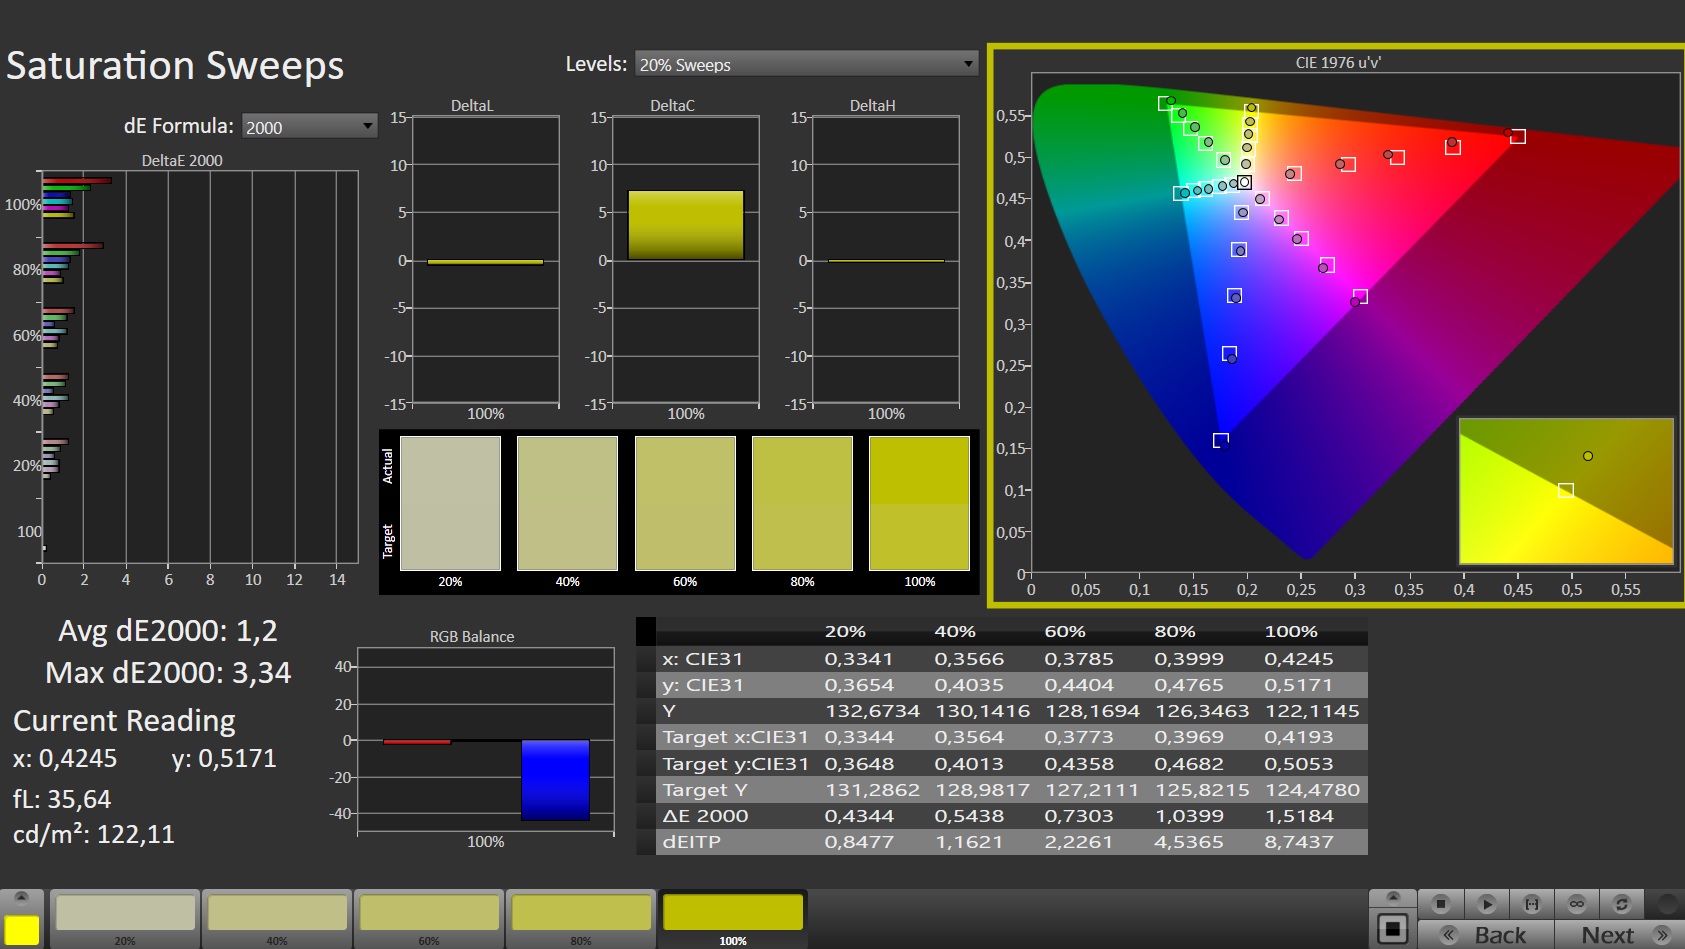
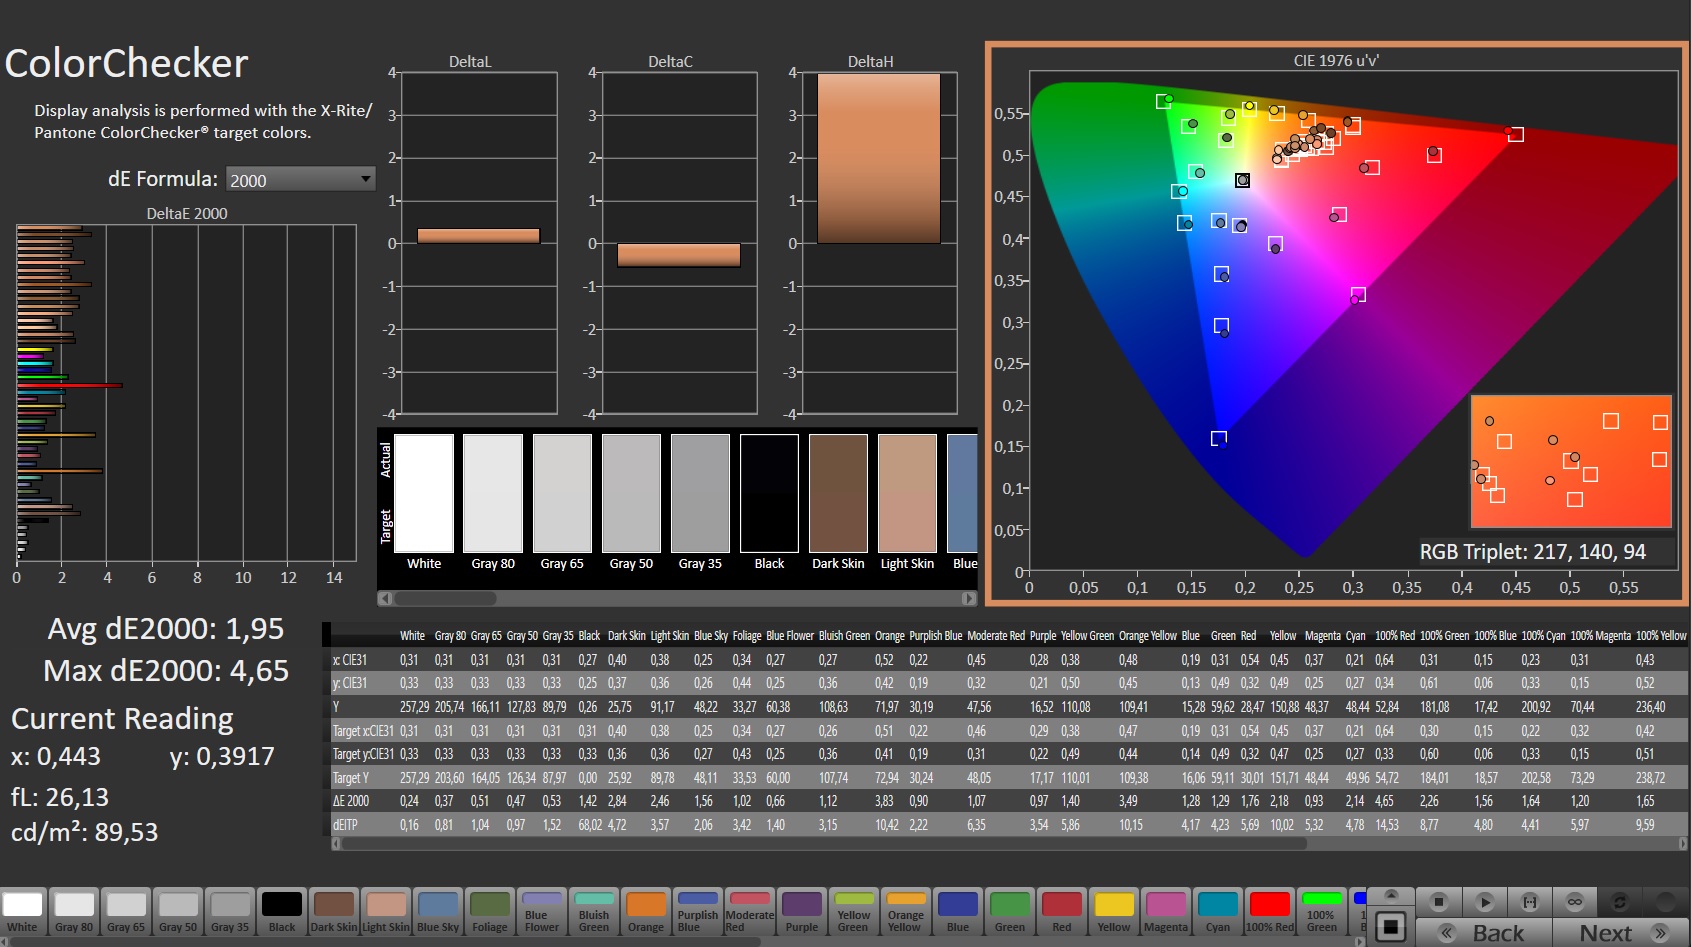
The advantage of the A5 K1 is the slightly lower black value (0.29 vs 0.4 cd/m²), which leads to a noticeably higher contrast on paper (1,107:1 vs 838:1). However, the differences are limited in practice because the A5 X1 offers a larger color space.

The latter is also slightly ahead in terms of color accuracy. Viewing angles and response times are satisfactory in both devices.
Display Response Times
| ↔ Response Time Black to White | ||
|---|---|---|
| 9.5 ms ... rise ↗ and fall ↘ combined | ↗ 5.5 ms rise | 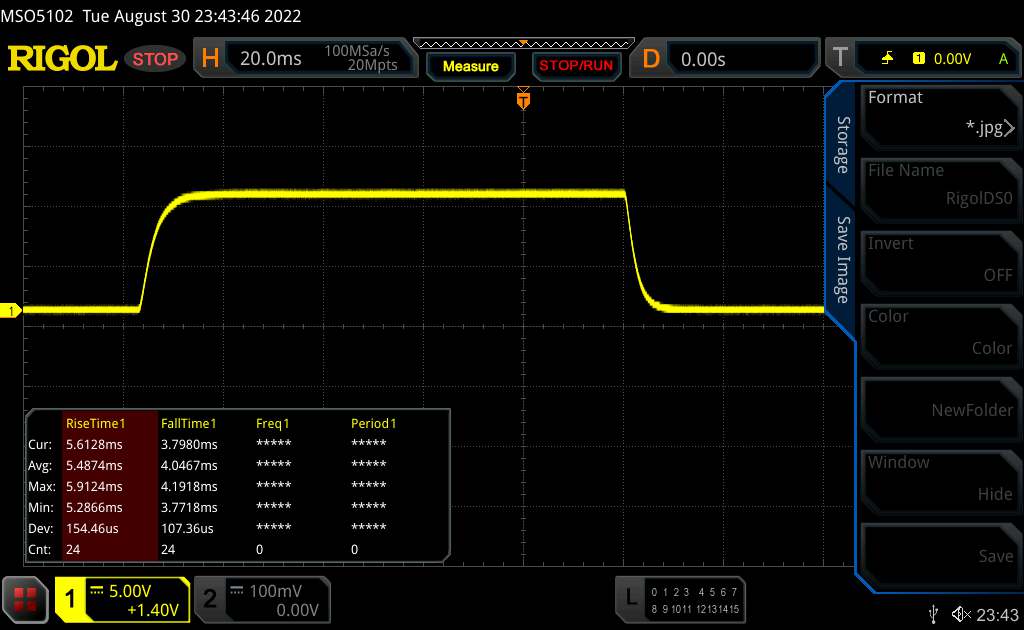 |
| ↘ 4 ms fall | ||
| The screen shows fast response rates in our tests and should be suited for gaming. In comparison, all tested devices range from 0.1 (minimum) to 240 (maximum) ms. » 26 % of all devices are better. This means that the measured response time is better than the average of all tested devices (19.9 ms). | ||
| ↔ Response Time 50% Grey to 80% Grey | ||
| 14.5 ms ... rise ↗ and fall ↘ combined | ↗ 6.8 ms rise | 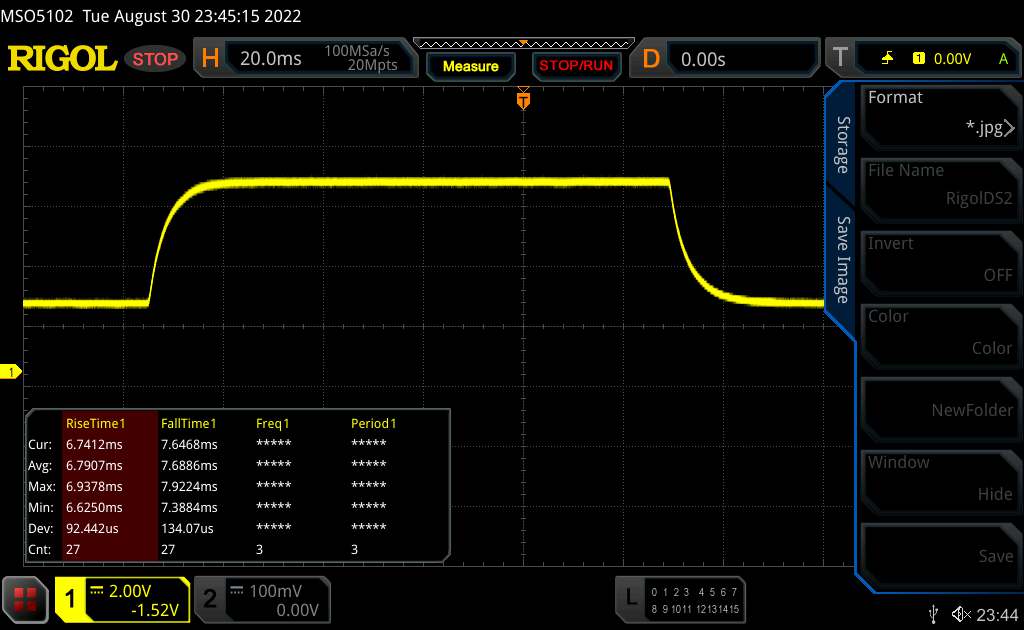 |
| ↘ 7.7 ms fall | ||
| The screen shows good response rates in our tests, but may be too slow for competitive gamers. In comparison, all tested devices range from 0.165 (minimum) to 636 (maximum) ms. » 29 % of all devices are better. This means that the measured response time is better than the average of all tested devices (31.1 ms). | ||
Screen Flickering / PWM (Pulse-Width Modulation)
| Screen flickering / PWM not detected |  | ||
In comparison: 52 % of all tested devices do not use PWM to dim the display. If PWM was detected, an average of 7801 (minimum: 5 - maximum: 343500) Hz was measured. | |||
Power
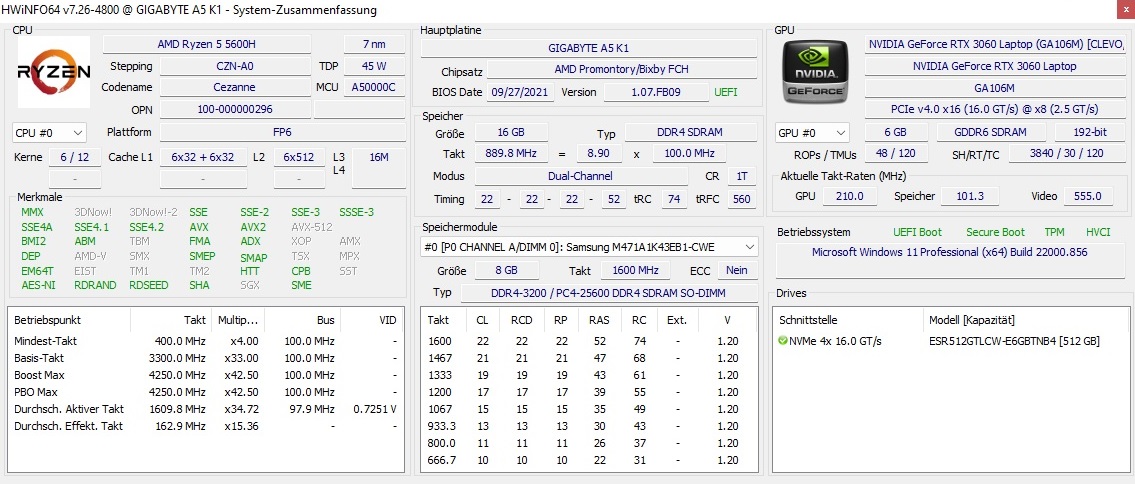
With a hexa-core CPU and a 6 GB GPU, the A5 K1 makes itself comfortable between the mid-range and the high-end. 16 GB of RAM are also not bad for the advertised price.
Test conditions
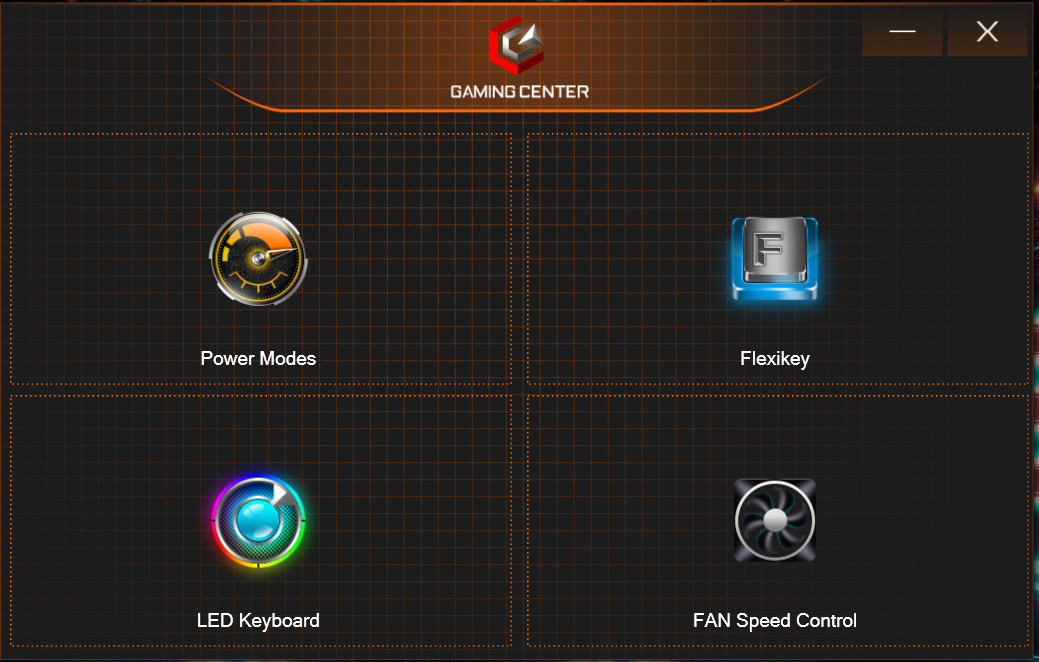
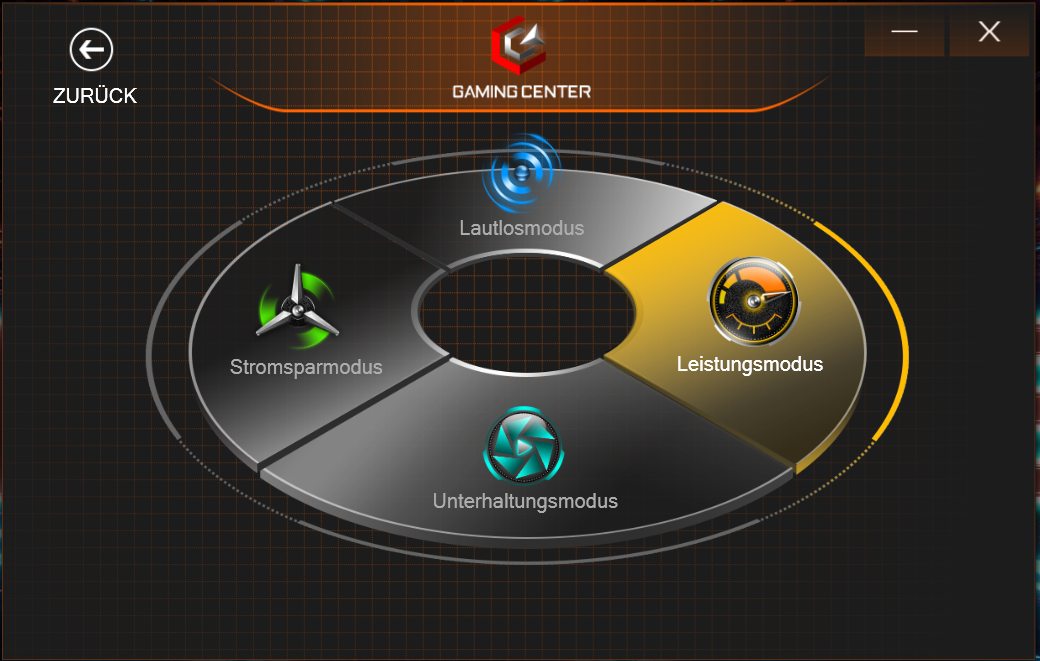
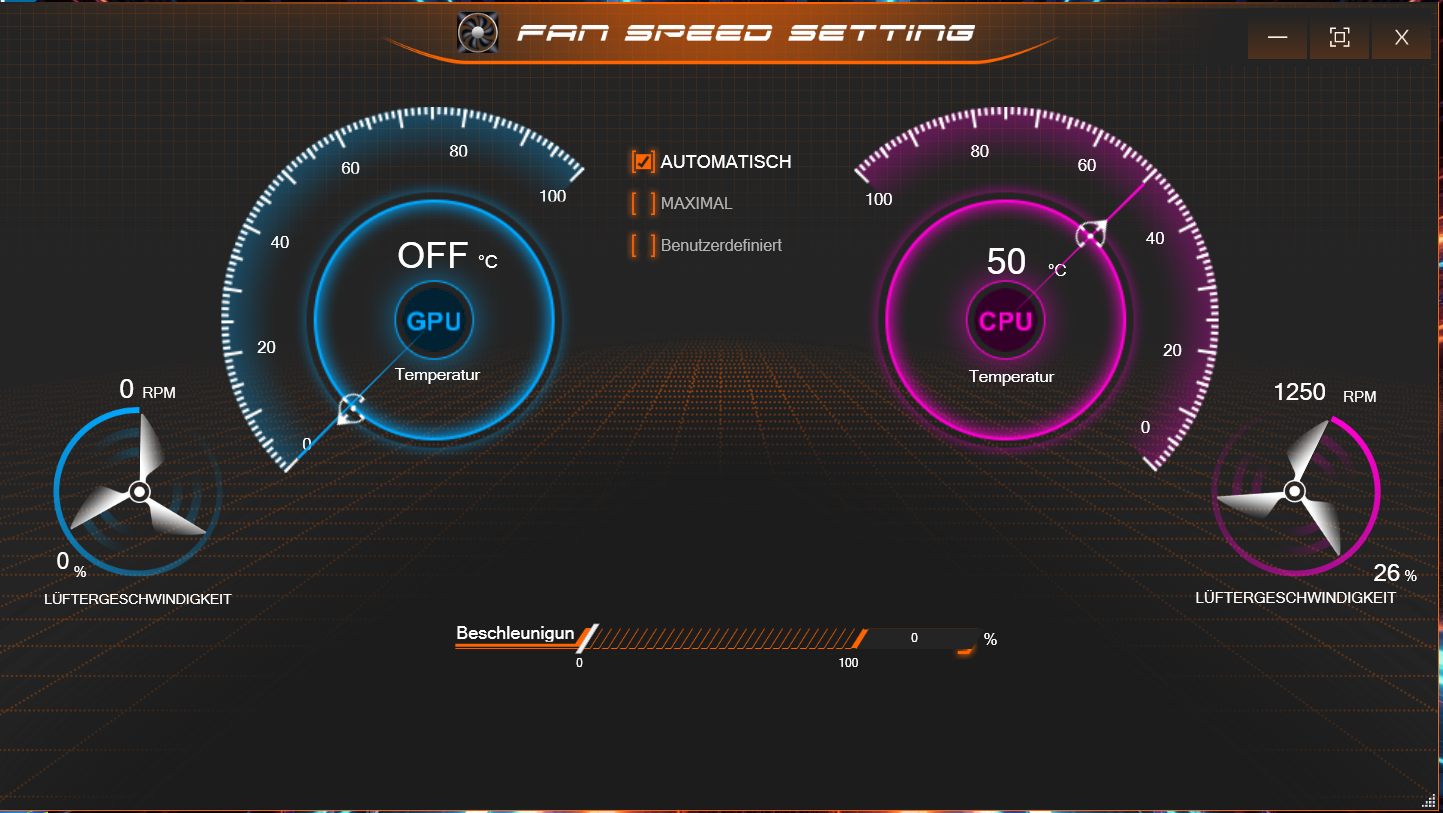
Among other things, the power mode can be changed in the preloaded Gaming Center, which is visually familiar from other Clevo barebones. Apart from the battery test, which was performed in entertainment mode, our measurements were taken with the power profile (including automatic fan speed setting). For a longer battery life and a lower operating noise, we recommend the power-saving mode and the silent mode, which does not quite live up to its name.
Processor
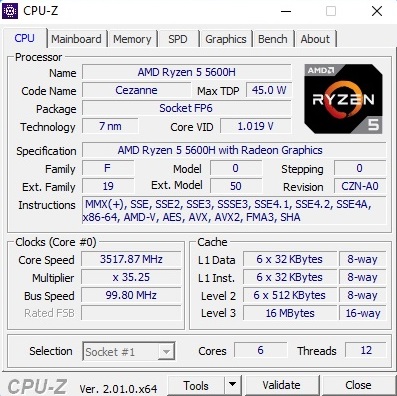
The Ryzen 5 5600H is an ideal companion for the GeForce RTX 3060. The six-core model from AMD's Cezanne generation offers 16 MB L3 cache and can process up to 12 threads in parallel via SMT. The TDP of the 7 nm chip is 45 watts. Although the Ryzen 5 5600H unsurprisingly cannot compete with the stronger AMD brothers Ryzen 7 5800H and Ryzen 9 5900HX, the processor delivers a good performance. In the loop test with Cinebench R15, the result remained very consistent and was on par with the Lenovo Legion 5, which is also equipped with a 5600H.
Cinebench R15 Multi Endurance test
Cinebench R23: Multi Core | Single Core
Cinebench R20: CPU (Multi Core) | CPU (Single Core)
Cinebench R15: CPU Multi 64Bit | CPU Single 64Bit
Blender: v2.79 BMW27 CPU
7-Zip 18.03: 7z b 4 | 7z b 4 -mmt1
Geekbench 5.5: Multi-Core | Single-Core
HWBOT x265 Benchmark v2.2: 4k Preset
LibreOffice : 20 Documents To PDF
R Benchmark 2.5: Overall mean
| CPU Performance rating | |
| Average of class Gaming | |
| Asus TUF Gaming F15 FX507ZM | |
| Gigabyte A5 X1 | |
| MSI Alpha 15 B5EEK-008 | |
| Lenovo Legion 5 15ACH6A-82NW0010GE | |
| Gigabyte A5 K1 | |
| Average AMD Ryzen 5 5600H | |
| Cinebench R23 / Multi Core | |
| Average of class Gaming (10488 - 40970, n=113, last 2 years) | |
| Asus TUF Gaming F15 FX507ZM | |
| Gigabyte A5 X1 | |
| MSI Alpha 15 B5EEK-008 | |
| Lenovo Legion 5 15ACH6A-82NW0010GE | |
| Gigabyte A5 K1 | |
| Average AMD Ryzen 5 5600H (7945 - 10416, n=13) | |
| Cinebench R23 / Single Core | |
| Average of class Gaming (1166 - 2356, n=113, last 2 years) | |
| Asus TUF Gaming F15 FX507ZM | |
| Gigabyte A5 X1 | |
| MSI Alpha 15 B5EEK-008 | |
| Gigabyte A5 K1 | |
| Lenovo Legion 5 15ACH6A-82NW0010GE | |
| Average AMD Ryzen 5 5600H (1316 - 1381, n=13) | |
| Cinebench R20 / CPU (Multi Core) | |
| Average of class Gaming (4029 - 16108, n=112, last 2 years) | |
| Asus TUF Gaming F15 FX507ZM | |
| Gigabyte A5 X1 | |
| MSI Alpha 15 B5EEK-008 | |
| Lenovo Legion 5 15ACH6A-82NW0010GE | |
| Gigabyte A5 K1 | |
| Average AMD Ryzen 5 5600H (3074 - 4059, n=16) | |
| Cinebench R20 / CPU (Single Core) | |
| Average of class Gaming (442 - 895, n=112, last 2 years) | |
| Asus TUF Gaming F15 FX507ZM | |
| Gigabyte A5 X1 | |
| MSI Alpha 15 B5EEK-008 | |
| Gigabyte A5 K1 | |
| Lenovo Legion 5 15ACH6A-82NW0010GE | |
| Average AMD Ryzen 5 5600H (527 - 538, n=15) | |
| Cinebench R15 / CPU Multi 64Bit | |
| Average of class Gaming (1578 - 6271, n=113, last 2 years) | |
| Asus TUF Gaming F15 FX507ZM | |
| Gigabyte A5 X1 | |
| MSI Alpha 15 B5EEK-008 | |
| Lenovo Legion 5 15ACH6A-82NW0010GE | |
| Gigabyte A5 K1 | |
| Average AMD Ryzen 5 5600H (1319 - 1723, n=16) | |
| Cinebench R15 / CPU Single 64Bit | |
| Average of class Gaming (188.8 - 343, n=112, last 2 years) | |
| Asus TUF Gaming F15 FX507ZM | |
| Gigabyte A5 X1 | |
| MSI Alpha 15 B5EEK-008 | |
| Gigabyte A5 K1 | |
| Lenovo Legion 5 15ACH6A-82NW0010GE | |
| Average AMD Ryzen 5 5600H (218 - 225, n=14) | |
| Blender / v2.79 BMW27 CPU | |
| Average AMD Ryzen 5 5600H (300 - 384, n=14) | |
| Lenovo Legion 5 15ACH6A-82NW0010GE | |
| Gigabyte A5 K1 | |
| MSI Alpha 15 B5EEK-008 | |
| Gigabyte A5 X1 | |
| Asus TUF Gaming F15 FX507ZM | |
| Average of class Gaming (80 - 330, n=110, last 2 years) | |
| 7-Zip 18.03 / 7z b 4 | |
| Average of class Gaming (33491 - 148086, n=111, last 2 years) | |
| Asus TUF Gaming F15 FX507ZM | |
| Gigabyte A5 X1 | |
| MSI Alpha 15 B5EEK-008 | |
| Gigabyte A5 K1 | |
| Lenovo Legion 5 15ACH6A-82NW0010GE | |
| Average AMD Ryzen 5 5600H (36315 - 46562, n=14) | |
| 7-Zip 18.03 / 7z b 4 -mmt1 | |
| Average of class Gaming (4199 - 7436, n=111, last 2 years) | |
| Gigabyte A5 X1 | |
| MSI Alpha 15 B5EEK-008 | |
| Gigabyte A5 K1 | |
| Asus TUF Gaming F15 FX507ZM | |
| Average AMD Ryzen 5 5600H (5213 - 5446, n=14) | |
| Lenovo Legion 5 15ACH6A-82NW0010GE | |
| Geekbench 5.5 / Multi-Core | |
| Average of class Gaming (6460 - 27010, n=111, last 2 years) | |
| Asus TUF Gaming F15 FX507ZM | |
| Gigabyte A5 X1 | |
| MSI Alpha 15 B5EEK-008 | |
| Gigabyte A5 K1 | |
| Lenovo Legion 5 15ACH6A-82NW0010GE | |
| Average AMD Ryzen 5 5600H (4990 - 7253, n=14) | |
| Geekbench 5.5 / Single-Core | |
| Average of class Gaming (986 - 2474, n=111, last 2 years) | |
| Asus TUF Gaming F15 FX507ZM | |
| Gigabyte A5 X1 | |
| MSI Alpha 15 B5EEK-008 | |
| Gigabyte A5 K1 | |
| Lenovo Legion 5 15ACH6A-82NW0010GE | |
| Average AMD Ryzen 5 5600H (1365 - 1445, n=14) | |
| HWBOT x265 Benchmark v2.2 / 4k Preset | |
| Average of class Gaming (11.5 - 44.3, n=111, last 2 years) | |
| Asus TUF Gaming F15 FX507ZM | |
| Gigabyte A5 X1 | |
| MSI Alpha 15 B5EEK-008 | |
| Gigabyte A5 K1 | |
| Lenovo Legion 5 15ACH6A-82NW0010GE | |
| Average AMD Ryzen 5 5600H (9.92 - 13.3, n=14) | |
| LibreOffice / 20 Documents To PDF | |
| Gigabyte A5 X1 | |
| Gigabyte A5 K1 | |
| Average AMD Ryzen 5 5600H (52.2 - 81.5, n=14) | |
| MSI Alpha 15 B5EEK-008 | |
| Lenovo Legion 5 15ACH6A-82NW0010GE | |
| Asus TUF Gaming F15 FX507ZM | |
| Average of class Gaming (19 - 88.8, n=111, last 2 years) | |
| R Benchmark 2.5 / Overall mean | |
| Average AMD Ryzen 5 5600H (0.526 - 0.596, n=14) | |
| Lenovo Legion 5 15ACH6A-82NW0010GE | |
| Gigabyte A5 K1 | |
| MSI Alpha 15 B5EEK-008 | |
| Gigabyte A5 X1 | |
| Asus TUF Gaming F15 FX507ZM | |
| Average of class Gaming (0.3439 - 0.759, n=112, last 2 years) | |
* ... smaller is better
AIDA64: FP32 Ray-Trace | FPU Julia | CPU SHA3 | CPU Queen | FPU SinJulia | FPU Mandel | CPU AES | CPU ZLib | FP64 Ray-Trace | CPU PhotoWorxx
| Performance rating | |
| Average of class Gaming | |
| Gigabyte A5 X1 | |
| MSI Alpha 15 B5EEK-008 | |
| Asus TUF Gaming F15 FX507ZM | |
| Lenovo Legion 5 15ACH6A-82NW0010GE | |
| Gigabyte A5 K1 | |
| Average AMD Ryzen 5 5600H | |
| AIDA64 / FP32 Ray-Trace | |
| Average of class Gaming (10227 - 85542, n=110, last 2 years) | |
| Gigabyte A5 X1 | |
| MSI Alpha 15 B5EEK-008 | |
| Lenovo Legion 5 15ACH6A-82NW0010GE | |
| Gigabyte A5 K1 | |
| Average AMD Ryzen 5 5600H (9181 - 12636, n=14) | |
| Asus TUF Gaming F15 FX507ZM | |
| AIDA64 / FPU Julia | |
| Average of class Gaming (51376 - 238426, n=110, last 2 years) | |
| Gigabyte A5 X1 | |
| MSI Alpha 15 B5EEK-008 | |
| Lenovo Legion 5 15ACH6A-82NW0010GE | |
| Gigabyte A5 K1 | |
| Average AMD Ryzen 5 5600H (51994 - 78250, n=14) | |
| Asus TUF Gaming F15 FX507ZM | |
| AIDA64 / CPU SHA3 | |
| Average of class Gaming (2180 - 9817, n=110, last 2 years) | |
| Gigabyte A5 X1 | |
| Asus TUF Gaming F15 FX507ZM | |
| MSI Alpha 15 B5EEK-008 | |
| Lenovo Legion 5 15ACH6A-82NW0010GE | |
| Gigabyte A5 K1 | |
| Average AMD Ryzen 5 5600H (1587 - 2675, n=14) | |
| AIDA64 / CPU Queen | |
| Average of class Gaming (49785 - 173351, n=101, last 2 years) | |
| Gigabyte A5 X1 | |
| Asus TUF Gaming F15 FX507ZM | |
| MSI Alpha 15 B5EEK-008 | |
| Gigabyte A5 K1 | |
| Lenovo Legion 5 15ACH6A-82NW0010GE | |
| Average AMD Ryzen 5 5600H (66699 - 77213, n=14) | |
| AIDA64 / FPU SinJulia | |
| Average of class Gaming (4424 - 33636, n=110, last 2 years) | |
| Gigabyte A5 X1 | |
| MSI Alpha 15 B5EEK-008 | |
| Asus TUF Gaming F15 FX507ZM | |
| Gigabyte A5 K1 | |
| Lenovo Legion 5 15ACH6A-82NW0010GE | |
| Average AMD Ryzen 5 5600H (8340 - 9159, n=14) | |
| AIDA64 / FPU Mandel | |
| Average of class Gaming (25115 - 128721, n=110, last 2 years) | |
| Gigabyte A5 X1 | |
| MSI Alpha 15 B5EEK-008 | |
| Lenovo Legion 5 15ACH6A-82NW0010GE | |
| Gigabyte A5 K1 | |
| Average AMD Ryzen 5 5600H (28268 - 43274, n=14) | |
| Asus TUF Gaming F15 FX507ZM | |
| AIDA64 / CPU AES | |
| Gigabyte A5 X1 | |
| MSI Alpha 15 B5EEK-008 | |
| Average of class Gaming (39258 - 247074, n=110, last 2 years) | |
| Lenovo Legion 5 15ACH6A-82NW0010GE | |
| Average AMD Ryzen 5 5600H (39852 - 98939, n=14) | |
| Asus TUF Gaming F15 FX507ZM | |
| Gigabyte A5 K1 | |
| AIDA64 / CPU ZLib | |
| Average of class Gaming (574 - 2531, n=110, last 2 years) | |
| Asus TUF Gaming F15 FX507ZM | |
| Gigabyte A5 X1 | |
| MSI Alpha 15 B5EEK-008 | |
| Lenovo Legion 5 15ACH6A-82NW0010GE | |
| Gigabyte A5 K1 | |
| Average AMD Ryzen 5 5600H (507 - 649, n=14) | |
| AIDA64 / FP64 Ray-Trace | |
| Average of class Gaming (5509 - 45446, n=110, last 2 years) | |
| Gigabyte A5 X1 | |
| MSI Alpha 15 B5EEK-008 | |
| Lenovo Legion 5 15ACH6A-82NW0010GE | |
| Gigabyte A5 K1 | |
| Average AMD Ryzen 5 5600H (4811 - 6652, n=14) | |
| Asus TUF Gaming F15 FX507ZM | |
| AIDA64 / CPU PhotoWorxx | |
| Average of class Gaming (12271 - 89891, n=110, last 2 years) | |
| Asus TUF Gaming F15 FX507ZM | |
| MSI Alpha 15 B5EEK-008 | |
| Gigabyte A5 K1 | |
| Gigabyte A5 X1 | |
| Average AMD Ryzen 5 5600H (7419 - 24746, n=14) | |
| Lenovo Legion 5 15ACH6A-82NW0010GE | |
System performance
Although it scored at the bottom of the test field in PCMark 10, the system performance of the A5 K1 is mostly convincing. 6.341 points are definitely respectable in view of the notebook's price.
CrossMark: Overall | Productivity | Creativity | Responsiveness
| PCMark 10 / Score | |
| Average of class Gaming (5828 - 11574, n=96, last 2 years) | |
| Asus TUF Gaming F15 FX507ZM | |
| Lenovo Legion 5 15ACH6A-82NW0010GE | |
| MSI Alpha 15 B5EEK-008 | |
| Gigabyte A5 X1 | |
| Average AMD Ryzen 5 5600H, NVIDIA GeForce RTX 3060 Laptop GPU (6341 - 6615, n=2) | |
| Gigabyte A5 K1 | |
| PCMark 10 / Essentials | |
| Average of class Gaming (8810 - 12600, n=100, last 2 years) | |
| Lenovo Legion 5 15ACH6A-82NW0010GE | |
| Asus TUF Gaming F15 FX507ZM | |
| Gigabyte A5 K1 | |
| Gigabyte A5 X1 | |
| MSI Alpha 15 B5EEK-008 | |
| Average AMD Ryzen 5 5600H, NVIDIA GeForce RTX 3060 Laptop GPU (9639 - 10127, n=2) | |
| PCMark 10 / Productivity | |
| Average of class Gaming (6845 - 18766, n=98, last 2 years) | |
| Gigabyte A5 X1 | |
| Lenovo Legion 5 15ACH6A-82NW0010GE | |
| Asus TUF Gaming F15 FX507ZM | |
| Average AMD Ryzen 5 5600H, NVIDIA GeForce RTX 3060 Laptop GPU (8829 - 9027, n=2) | |
| MSI Alpha 15 B5EEK-008 | |
| Gigabyte A5 K1 | |
| PCMark 10 / Digital Content Creation | |
| Average of class Gaming (7602 - 19657, n=98, last 2 years) | |
| Asus TUF Gaming F15 FX507ZM | |
| MSI Alpha 15 B5EEK-008 | |
| Lenovo Legion 5 15ACH6A-82NW0010GE | |
| Gigabyte A5 X1 | |
| Average AMD Ryzen 5 5600H, NVIDIA GeForce RTX 3060 Laptop GPU (7740 - 9026, n=2) | |
| Gigabyte A5 K1 | |
| CrossMark / Overall | |
| Average of class Gaming (1366 - 2409, n=98, last 2 years) | |
| Average AMD Ryzen 5 5600H, NVIDIA GeForce RTX 3060 Laptop GPU (n=1) | |
| MSI Alpha 15 B5EEK-008 | |
| CrossMark / Productivity | |
| Average of class Gaming (1386 - 2254, n=98, last 2 years) | |
| Average AMD Ryzen 5 5600H, NVIDIA GeForce RTX 3060 Laptop GPU (n=1) | |
| MSI Alpha 15 B5EEK-008 | |
| CrossMark / Creativity | |
| Average of class Gaming (1343 - 2729, n=98, last 2 years) | |
| MSI Alpha 15 B5EEK-008 | |
| Average AMD Ryzen 5 5600H, NVIDIA GeForce RTX 3060 Laptop GPU (n=1) | |
| CrossMark / Responsiveness | |
| Average of class Gaming (1226 - 2334, n=98, last 2 years) | |
| Average AMD Ryzen 5 5600H, NVIDIA GeForce RTX 3060 Laptop GPU (n=1) | |
| MSI Alpha 15 B5EEK-008 | |
| PCMark 10 Score | 6341 points | |
Help | ||
| AIDA64 / Memory Copy | |
| Average of class Gaming (21750 - 129946, n=110, last 2 years) | |
| Asus TUF Gaming F15 FX507ZM | |
| Gigabyte A5 K1 | |
| MSI Alpha 15 B5EEK-008 | |
| Gigabyte A5 X1 | |
| Average AMD Ryzen 5 5600H (20549 - 42141, n=14) | |
| Lenovo Legion 5 15ACH6A-82NW0010GE | |
| AIDA64 / Memory Read | |
| Average of class Gaming (22956 - 118858, n=110, last 2 years) | |
| Asus TUF Gaming F15 FX507ZM | |
| Gigabyte A5 K1 | |
| MSI Alpha 15 B5EEK-008 | |
| Gigabyte A5 X1 | |
| Average AMD Ryzen 5 5600H (22917 - 47595, n=14) | |
| Lenovo Legion 5 15ACH6A-82NW0010GE | |
| AIDA64 / Memory Write | |
| Average of class Gaming (22297 - 135096, n=110, last 2 years) | |
| Asus TUF Gaming F15 FX507ZM | |
| MSI Alpha 15 B5EEK-008 | |
| Gigabyte A5 K1 | |
| Gigabyte A5 X1 | |
| Average AMD Ryzen 5 5600H (20226 - 44872, n=14) | |
| Lenovo Legion 5 15ACH6A-82NW0010GE | |
| AIDA64 / Memory Latency | |
| Average of class Gaming (75.3 - 259, n=110, last 2 years) | |
| Lenovo Legion 5 15ACH6A-82NW0010GE | |
| MSI Alpha 15 B5EEK-008 | |
| Average AMD Ryzen 5 5600H (75 - 89.1, n=14) | |
| Gigabyte A5 X1 | |
| Gigabyte A5 K1 | |
| Asus TUF Gaming F15 FX507ZM | |
* ... smaller is better
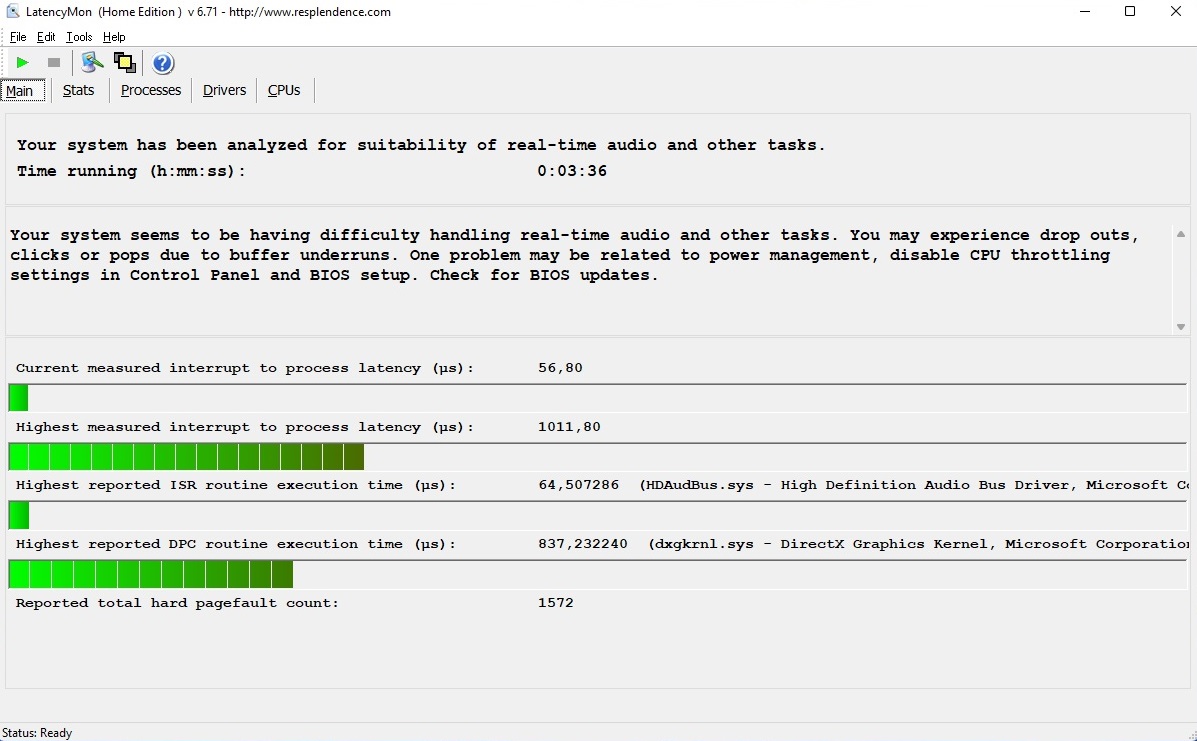
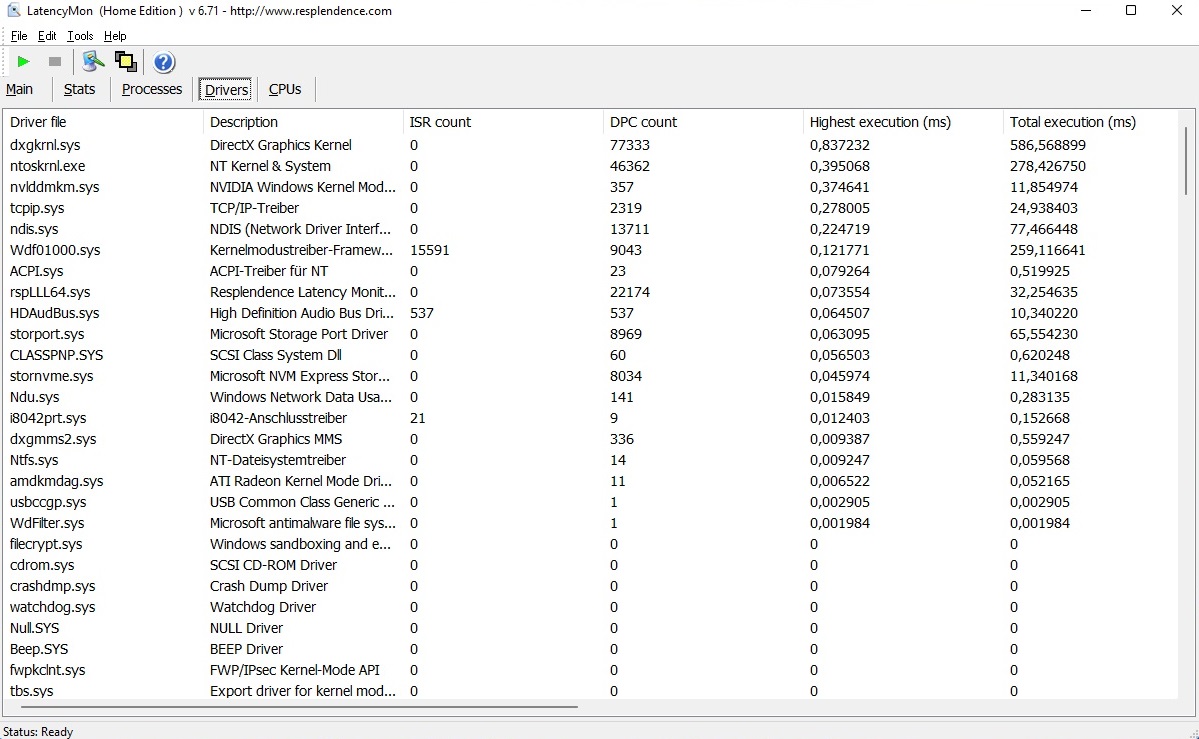
DPC latencies
The laptop does less well in terms of latency. According to the tool LatencyMon, those who want to edit audio or video in real time should rather look for an alternative (or do it manually), and many notebooks reveal weaknesses here.
| DPC Latencies / LatencyMon - interrupt to process latency (max), Web, Youtube, Prime95 | |
| Gigabyte A5 K1 | |
| MSI Alpha 15 B5EEK-008 | |
| Lenovo Legion 5 15ACH6A-82NW0010GE | |
| Asus TUF Gaming F15 FX507ZM | |
| Gigabyte A5 X1 | |
* ... smaller is better
Mass storage
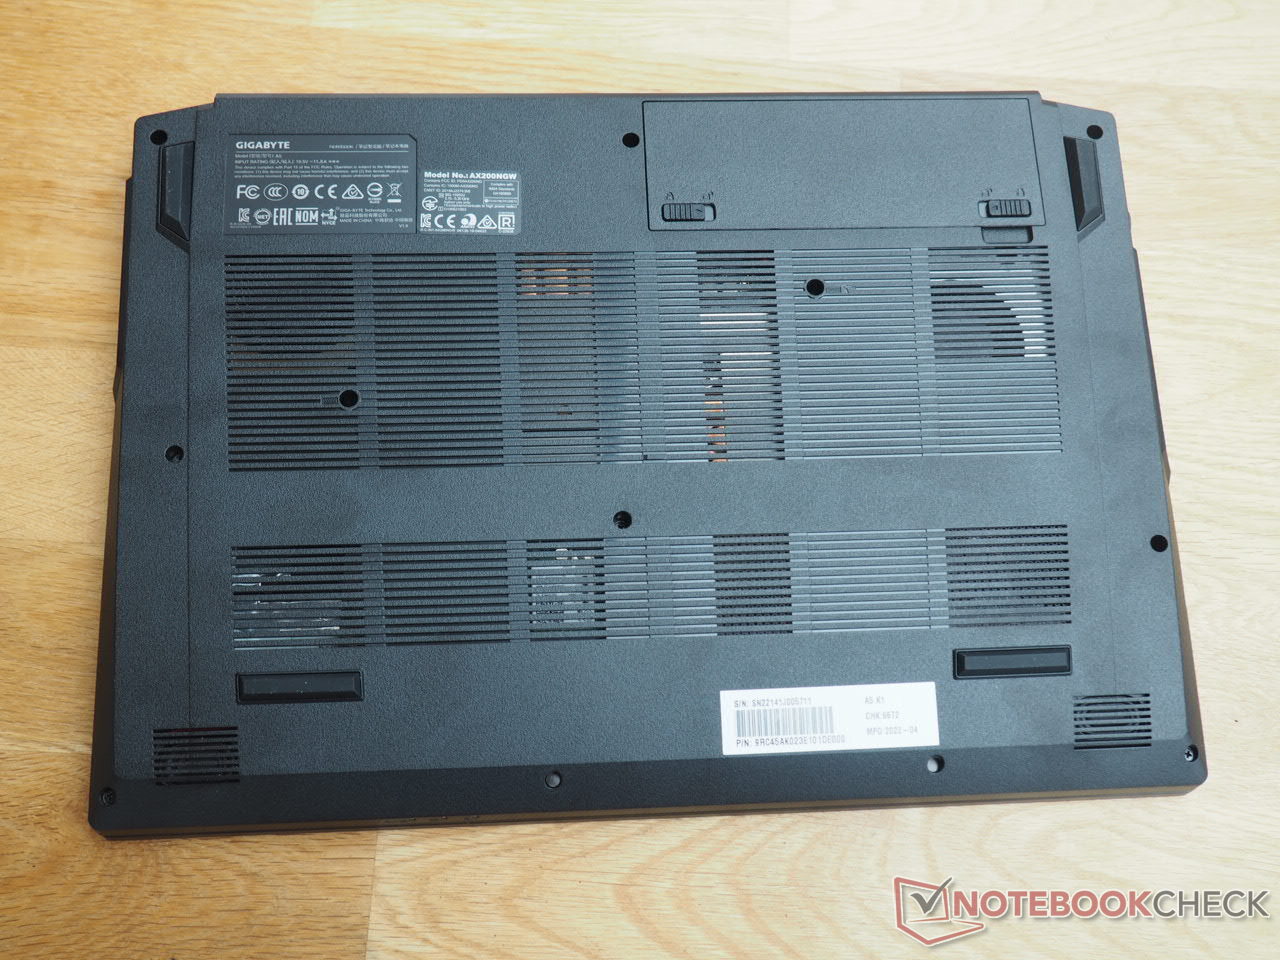
The installed 512 GB SSD is neither particularly fast nor particularly slow for an NVMe drive, but performs in the midfield of the comparison devices. We have to criticize the long-term performance in particular. In the long-term test with DiskSpd, the speed dropped massively after several runs and then settled at a medium level. On a positive note, the case can accommodate up to two M.2 drives (PCIe 2280) and a 2.5-inch drive.

| Drive Performance rating - Percent | |
| Average of class Gaming | |
| Asus TUF Gaming F15 FX507ZM | |
| Average ESR512GTLG-E6GBTNB4 | |
| Gigabyte A5 K1 | |
| MSI Alpha 15 B5EEK-008 | |
| Gigabyte A5 X1 | |
| Lenovo Legion 5 15ACH6A-82NW0010GE | |
* ... smaller is better
Read continuous power: DiskSpd Read Loop, Queue Depth 8
Graphics card
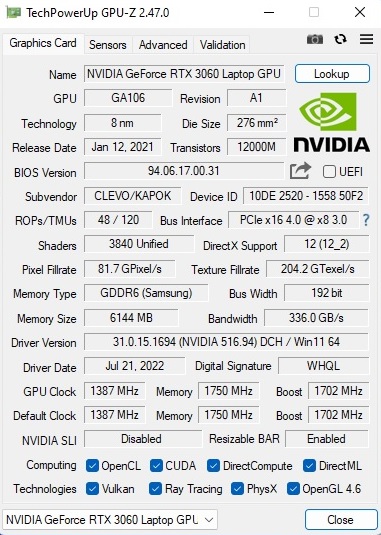
The GeForce RTX 3060 is a ray-tracing GPU based on Nvidia's Ampere architecture. The DirectX 12 model has 3,840 shader units, although the performance depends very much on the TGP setting. Gigabyte chooses a very high value for the RTX 3060 with a maximum of 130 watts, which can also be seen in the benchmark results. These are almost 10% better than the previously determined 3060 average. The RTX 3070, on the other hand, is about 20% faster in the GPU portion. The memory configuration is not quite up to date anymore. 6 GB VRAM already reaches its limits in demanding games - at least in higher resolutions and settings. Passionate gamers should at least use an 8 GB GPU.
| 3DMark Performance rating - Percent | |
| Average of class Gaming | |
| Gigabyte A5 X1 -1! | |
| Lenovo Legion 5 15ACH6A-82NW0010GE -1! | |
| Asus TUF Gaming F15 FX507ZM | |
| Gigabyte A5 K1 | |
| Average NVIDIA GeForce RTX 3060 Laptop GPU | |
| MSI Alpha 15 B5EEK-008 | |
| 3DMark 11 Performance | 22909 points | |
| 3DMark Cloud Gate Standard Score | 44621 points | |
| 3DMark Fire Strike Score | 19308 points | |
| 3DMark Time Spy Score | 8551 points | |
Help | ||
Gaming performance
In the native resolution of 1,920 x 1,080, the A5 K1 can run almost all current games very smoothly with high to maximum details. More than 60 FPS is not an exception, but rather the rule, which benefits the 144 Hz screen.
| The Witcher 3 | |
| 1920x1080 High Graphics & Postprocessing (Nvidia HairWorks Off) | |
| Average of class Gaming (181 - 341, n=3, last 2 years) | |
| Asus TUF Gaming F15 FX507ZM | |
| Gigabyte A5 X1 | |
| Gigabyte A5 K1 | |
| Average NVIDIA GeForce RTX 3060 Laptop GPU (81 - 186.8, n=41) | |
| Lenovo Legion 5 15ACH6A-82NW0010GE | |
| MSI Alpha 15 B5EEK-008 | |
| 1920x1080 Ultra Graphics & Postprocessing (HBAO+) | |
| Average of class Gaming (95 - 240, n=8, last 2 years) | |
| Gigabyte A5 X1 | |
| Asus TUF Gaming F15 FX507ZM | |
| Lenovo Legion 5 15ACH6A-82NW0010GE | |
| Gigabyte A5 K1 | |
| Average NVIDIA GeForce RTX 3060 Laptop GPU (58.2 - 91.5, n=48) | |
| MSI Alpha 15 B5EEK-008 | |
Analogous to the CPU loop, there were also some problems with the graphics card in the long-term test (60 minutes, The Witcher 3) did not show any abnormalities. The GeForce RTX 3060 ran with a stable frame rate.
Witcher 3 FPS-Diagram
| low | med. | high | ultra | |
|---|---|---|---|---|
| GTA V (2015) | 154.2 | 91.4 | ||
| The Witcher 3 (2015) | 153 | 78.8 | ||
| Dota 2 Reborn (2015) | 143.1 | 129.6 | 123.1 | 115.4 |
| Final Fantasy XV Benchmark (2018) | 84.8 | |||
| X-Plane 11.11 (2018) | 99.1 | 84.1 | 69.6 | |
| Strange Brigade (2018) | 172.9 | 149.1 | ||
| God of War (2022) | 74 | 52.8 | ||
| Rainbow Six Extraction (2022) | 155 | 125 | ||
| Dying Light 2 (2022) | 64.4 | |||
| Elden Ring (2022) | 60 | 60 | ||
| Elex 2 (2022) | 73 | 68.9 | ||
| Ghostwire Tokyo (2022) | 126 | 124 | ||
| Vampire Bloodhunt (2022) | 157 | 152 | ||
| F1 22 (2022) | 135 | 53 | ||
| The Quarry (2022) | 82.7 | 66.4 |
Emissions
Noise emissions
As expected, the high TGP of the RTX 3060 comes at the expense of noise development. When using performance mode, the 15-incher reaches a very high 56 to 58 dB(A) under load. This is an annoyingly loud level that forces the use of headphones, although some rivals get similarly loud - though these offer thinner chassis. The Clevo barebones usually have to accept a lot of criticism in idle mode and during simple tasks like office, video and web. However, the A5 K1 surprises positively here because the fans are partly inactive and the frequency and intensity of the start-up phases are limited by Clevo's standards. Nevertheless, the potential noise is one of the device's weak points.
Noise level
| Idle |
| 26 / 29 / 32 dB(A) |
| Load |
| 57 / 58 dB(A) |
 | ||
30 dB silent 40 dB(A) audible 50 dB(A) loud |
||
min: | ||
| Gigabyte A5 K1 R5 5600H, GeForce RTX 3060 Laptop GPU | Asus TUF Gaming F15 FX507ZM i7-12700H, GeForce RTX 3060 Laptop GPU | Lenovo Legion 5 15ACH6A-82NW0010GE R5 5600H, Radeon RX 6600M | MSI Alpha 15 B5EEK-008 R7 5800H, Radeon RX 6600M | Gigabyte A5 X1 R9 5900HX, GeForce RTX 3070 Laptop GPU | |
|---|---|---|---|---|---|
| Noise | 14% | 6% | 1% | 0% | |
| off / environment * (dB) | 26 | 23.2 11% | 25 4% | 25.49 2% | 25 4% |
| Idle Minimum * (dB) | 26 | 23.6 9% | 25 4% | 29.57 -14% | 27 -4% |
| Idle Average * (dB) | 29 | 23.6 19% | 25 14% | 29.57 -2% | 29 -0% |
| Idle Maximum * (dB) | 32 | 25.4 21% | 34.5 -8% | 29.57 8% | 32 -0% |
| Load Average * (dB) | 57 | 38 33% | 51.1 10% | 48.61 15% | 57 -0% |
| Witcher 3 ultra * (dB) | 56 | 54.1 3% | 59 -5% | 56 -0% | |
| Load Maximum * (dB) | 58 | 57.2 1% | 51.3 12% | 57.66 1% | 58 -0% |
* ... smaller is better
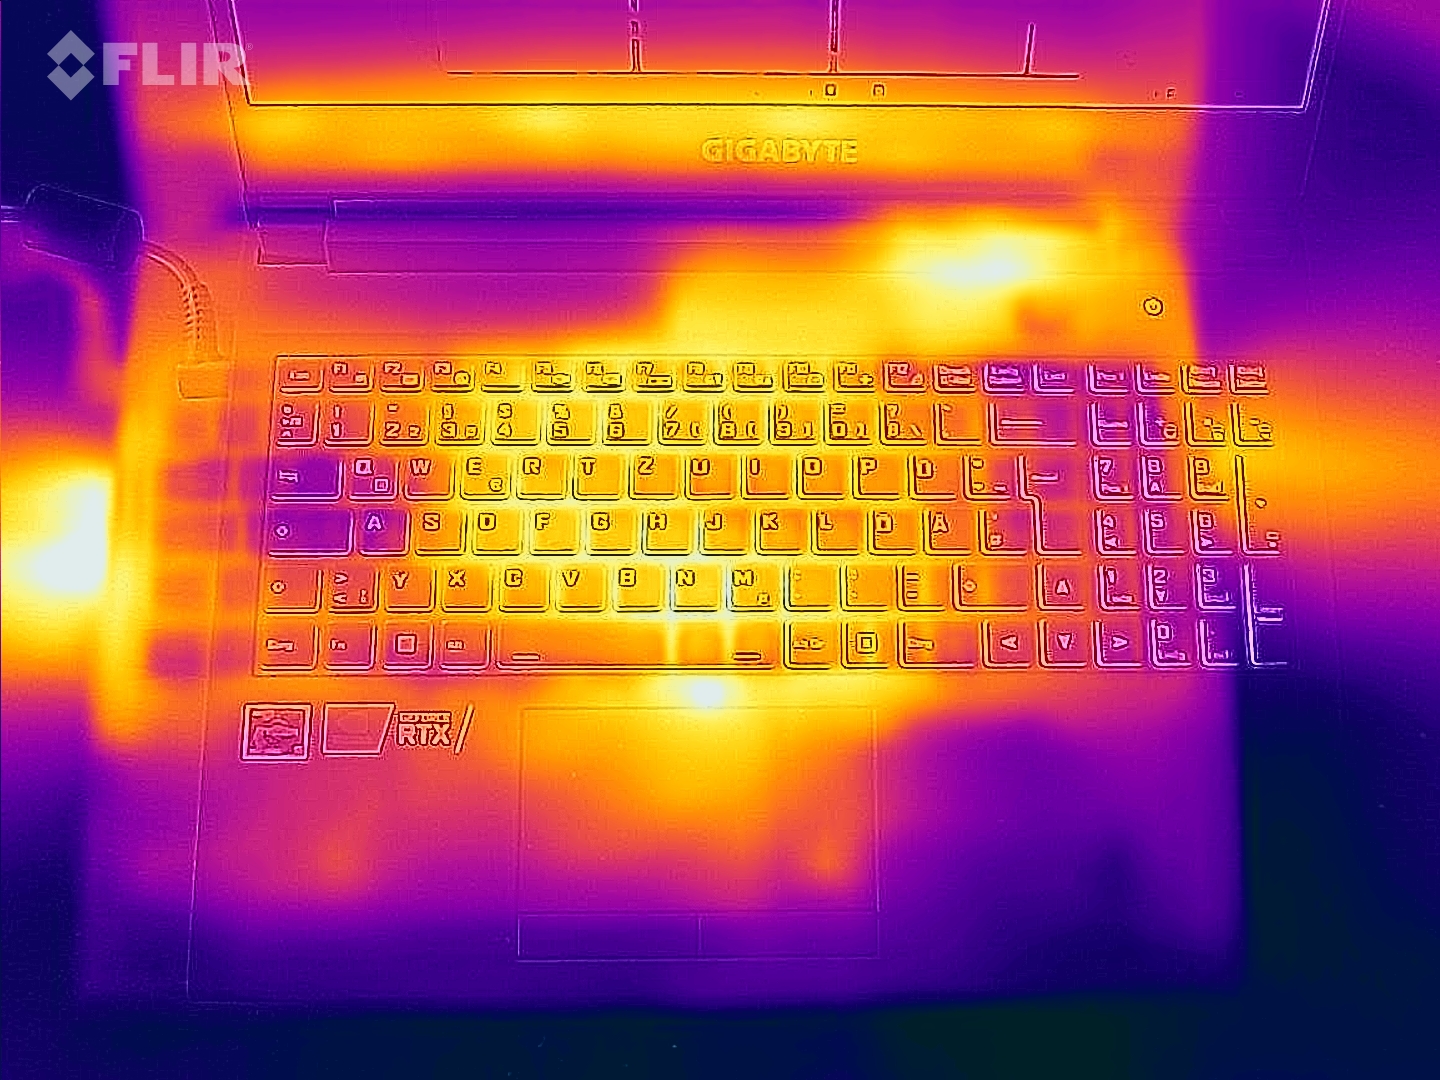
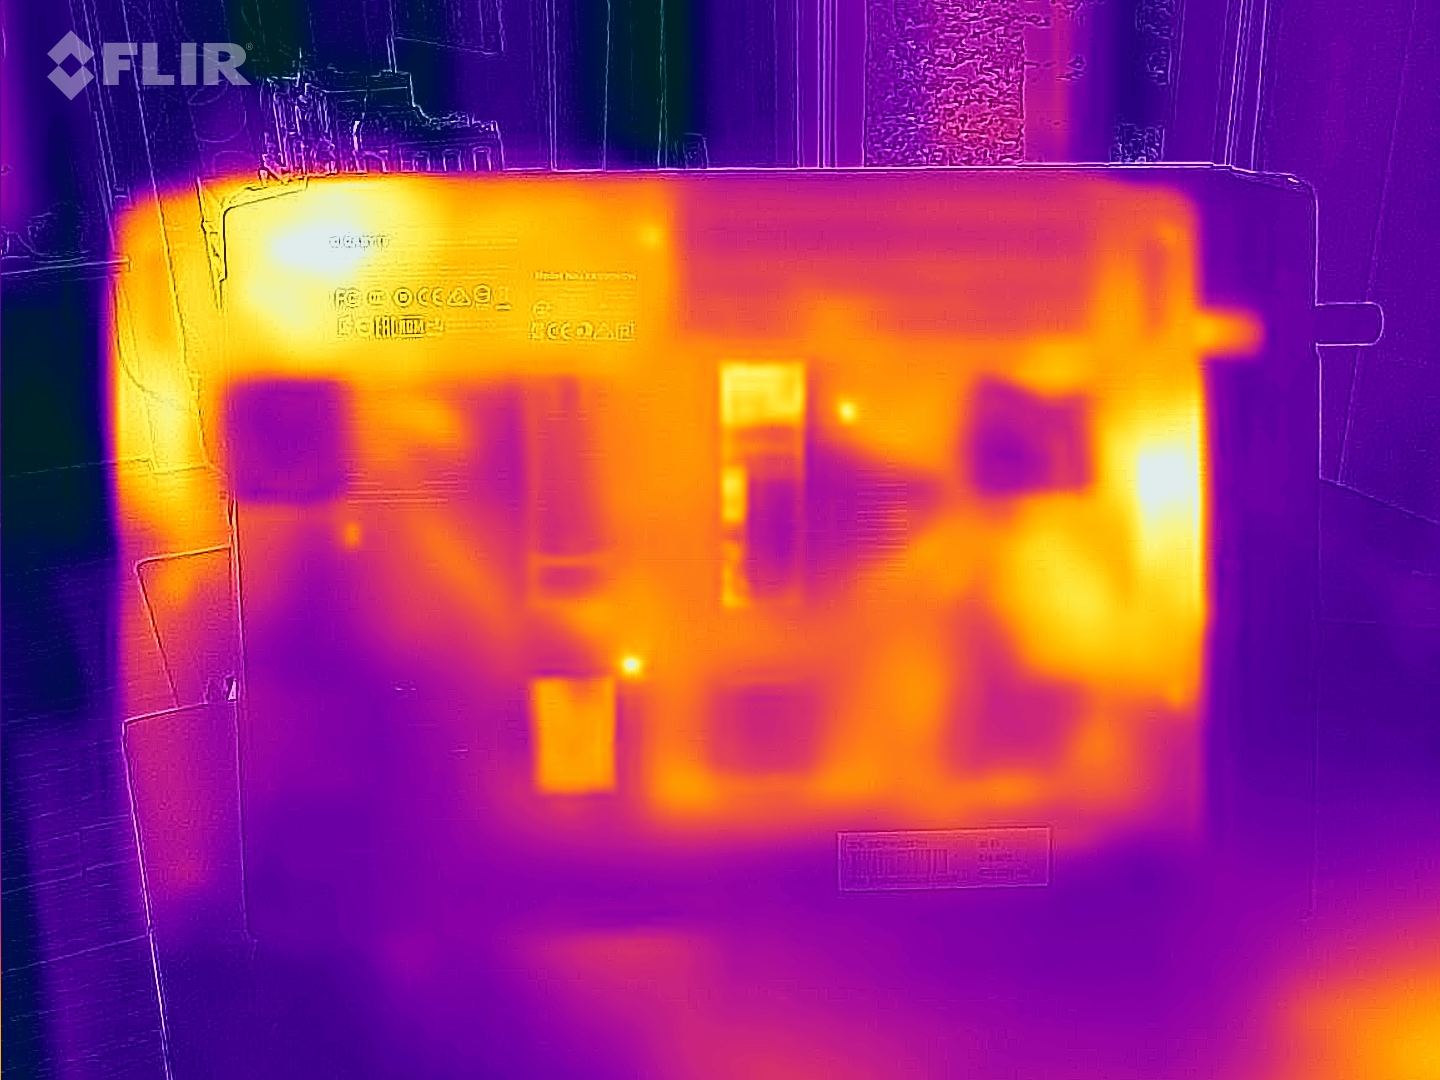
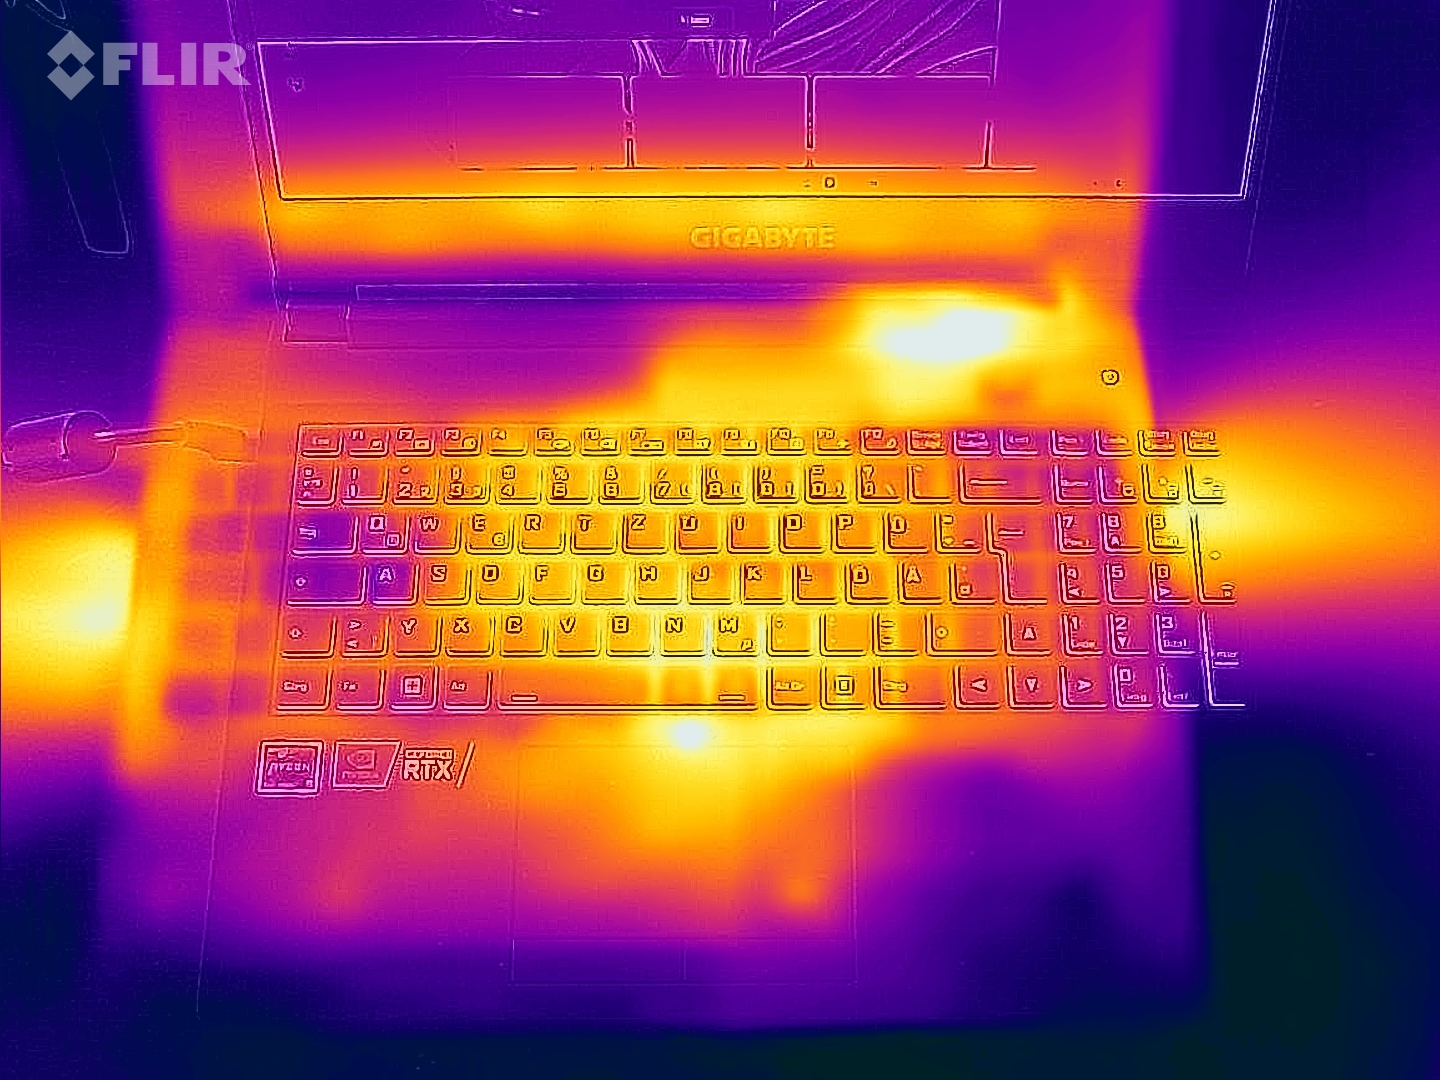
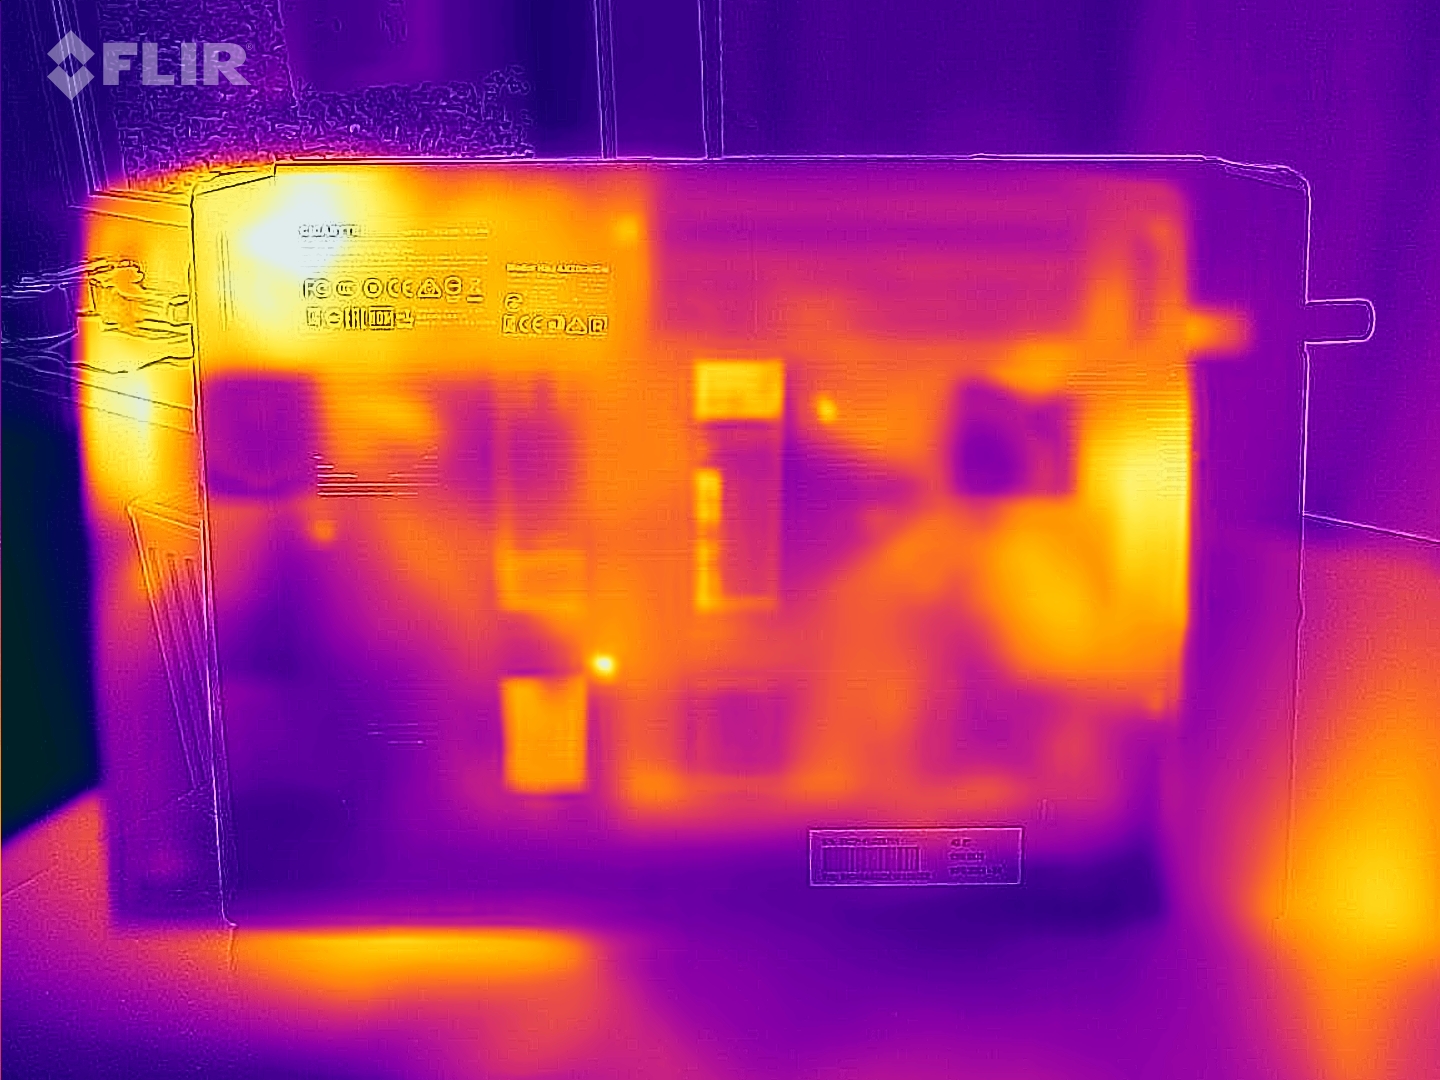
Temperature
The temperature development of the A5 K1 is also not brilliant - despite the generous height. A maximum of 50 °C (122 °F) on the upper side and 51 °C (123.8 °F) on the underside after 60 minutes of full load are more than many thinner laptops with comparable equipment.
(-) The maximum temperature on the upper side is 50 °C / 122 F, compared to the average of 40.4 °C / 105 F, ranging from 21.2 to 68.8 °C for the class Gaming.
(-) The bottom heats up to a maximum of 51 °C / 124 F, compared to the average of 43.2 °C / 110 F
(+) In idle usage, the average temperature for the upper side is 27.9 °C / 82 F, compared to the device average of 33.9 °C / 93 F.
(-) Playing The Witcher 3, the average temperature for the upper side is 42.7 °C / 109 F, compared to the device average of 33.9 °C / 93 F.
(-) The palmrests and touchpad can get very hot to the touch with a maximum of 44 °C / 111.2 F.
(-) The average temperature of the palmrest area of similar devices was 28.8 °C / 83.8 F (-15.2 °C / -27.4 F).
| Gigabyte A5 K1 R5 5600H, GeForce RTX 3060 Laptop GPU | Asus TUF Gaming F15 FX507ZM i7-12700H, GeForce RTX 3060 Laptop GPU | Lenovo Legion 5 15ACH6A-82NW0010GE R5 5600H, Radeon RX 6600M | MSI Alpha 15 B5EEK-008 R7 5800H, Radeon RX 6600M | Gigabyte A5 X1 R9 5900HX, GeForce RTX 3070 Laptop GPU | |
|---|---|---|---|---|---|
| Heat | -8% | 6% | 4% | 6% | |
| Maximum Upper Side * (°C) | 50 | 44.4 11% | 39.9 20% | 44.4 11% | 47 6% |
| Maximum Bottom * (°C) | 51 | 48.8 4% | 43.8 14% | 48.6 5% | 51 -0% |
| Idle Upper Side * (°C) | 30 | 37.8 -26% | 34.1 -14% | 31.2 -4% | 27 10% |
| Idle Bottom * (°C) | 33 | 39.6 -20% | 31.7 4% | 32.2 2% | 30 9% |
* ... smaller is better
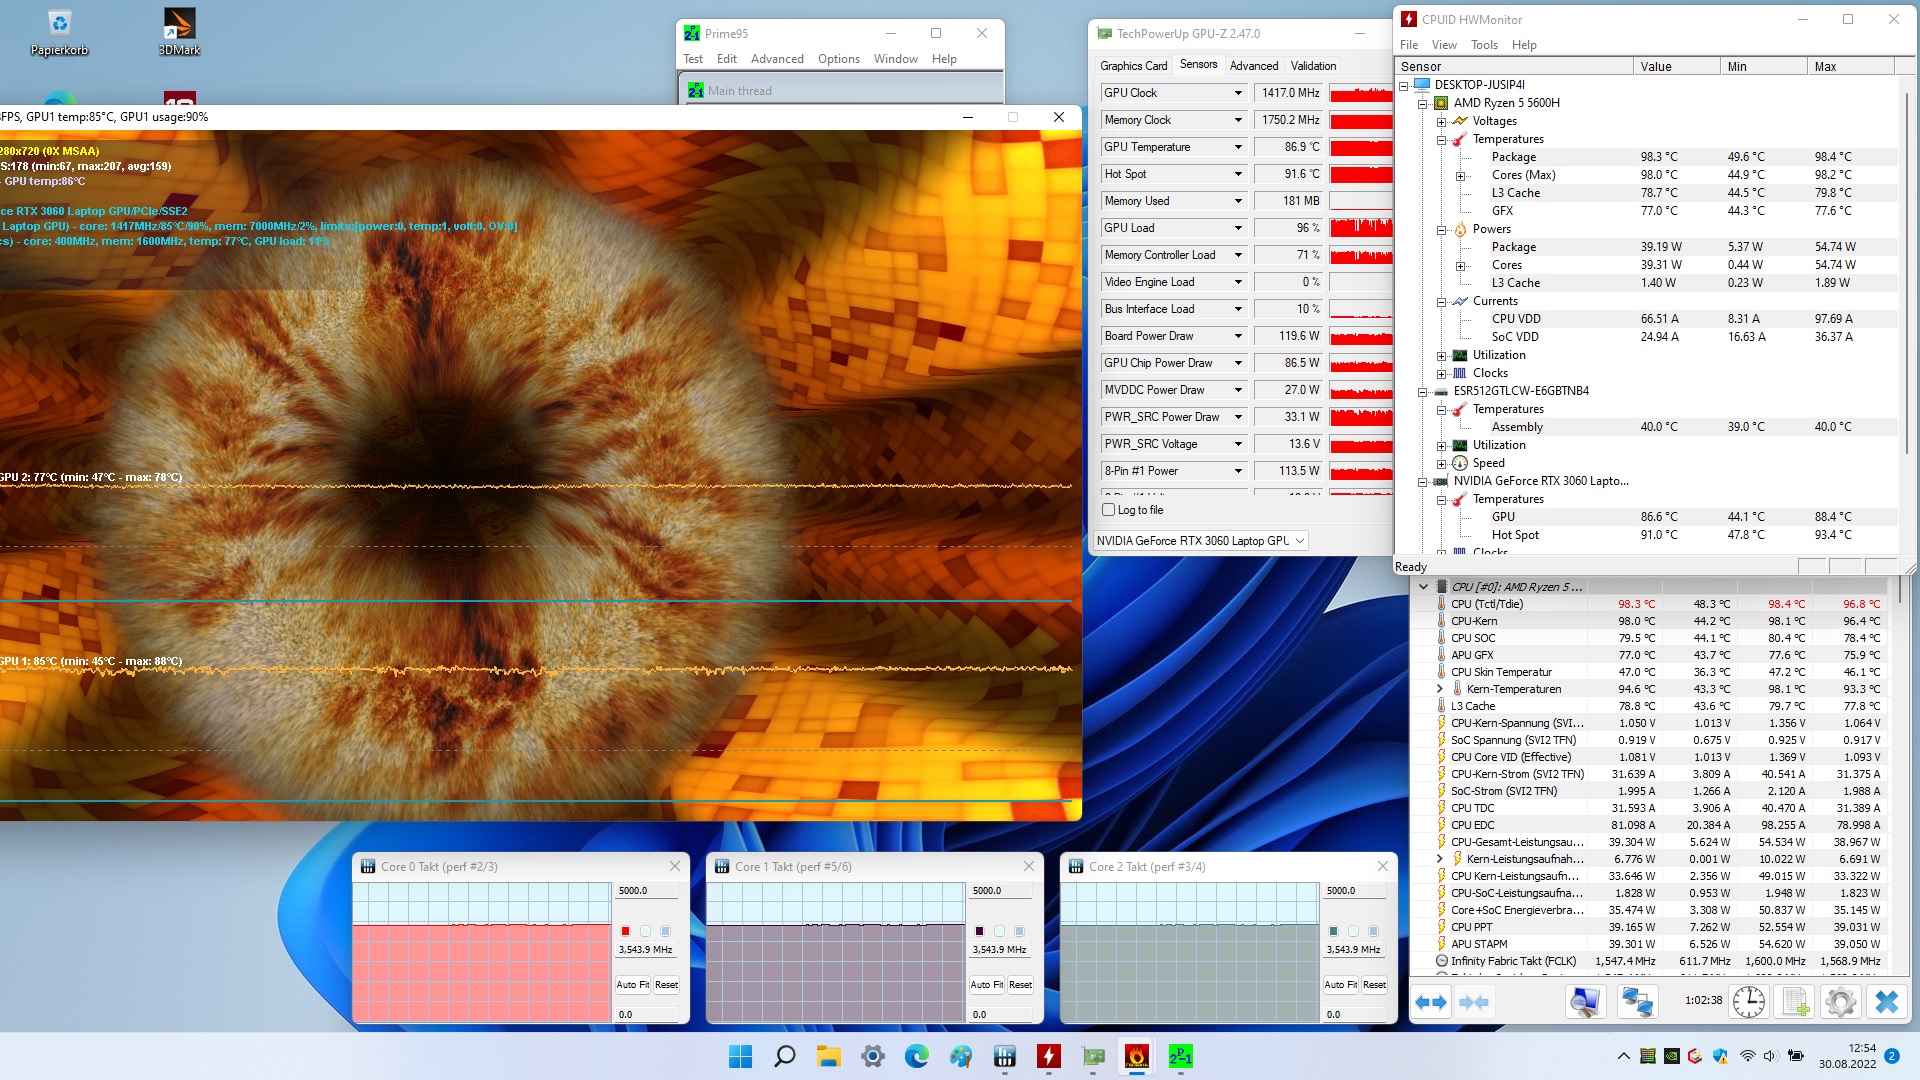
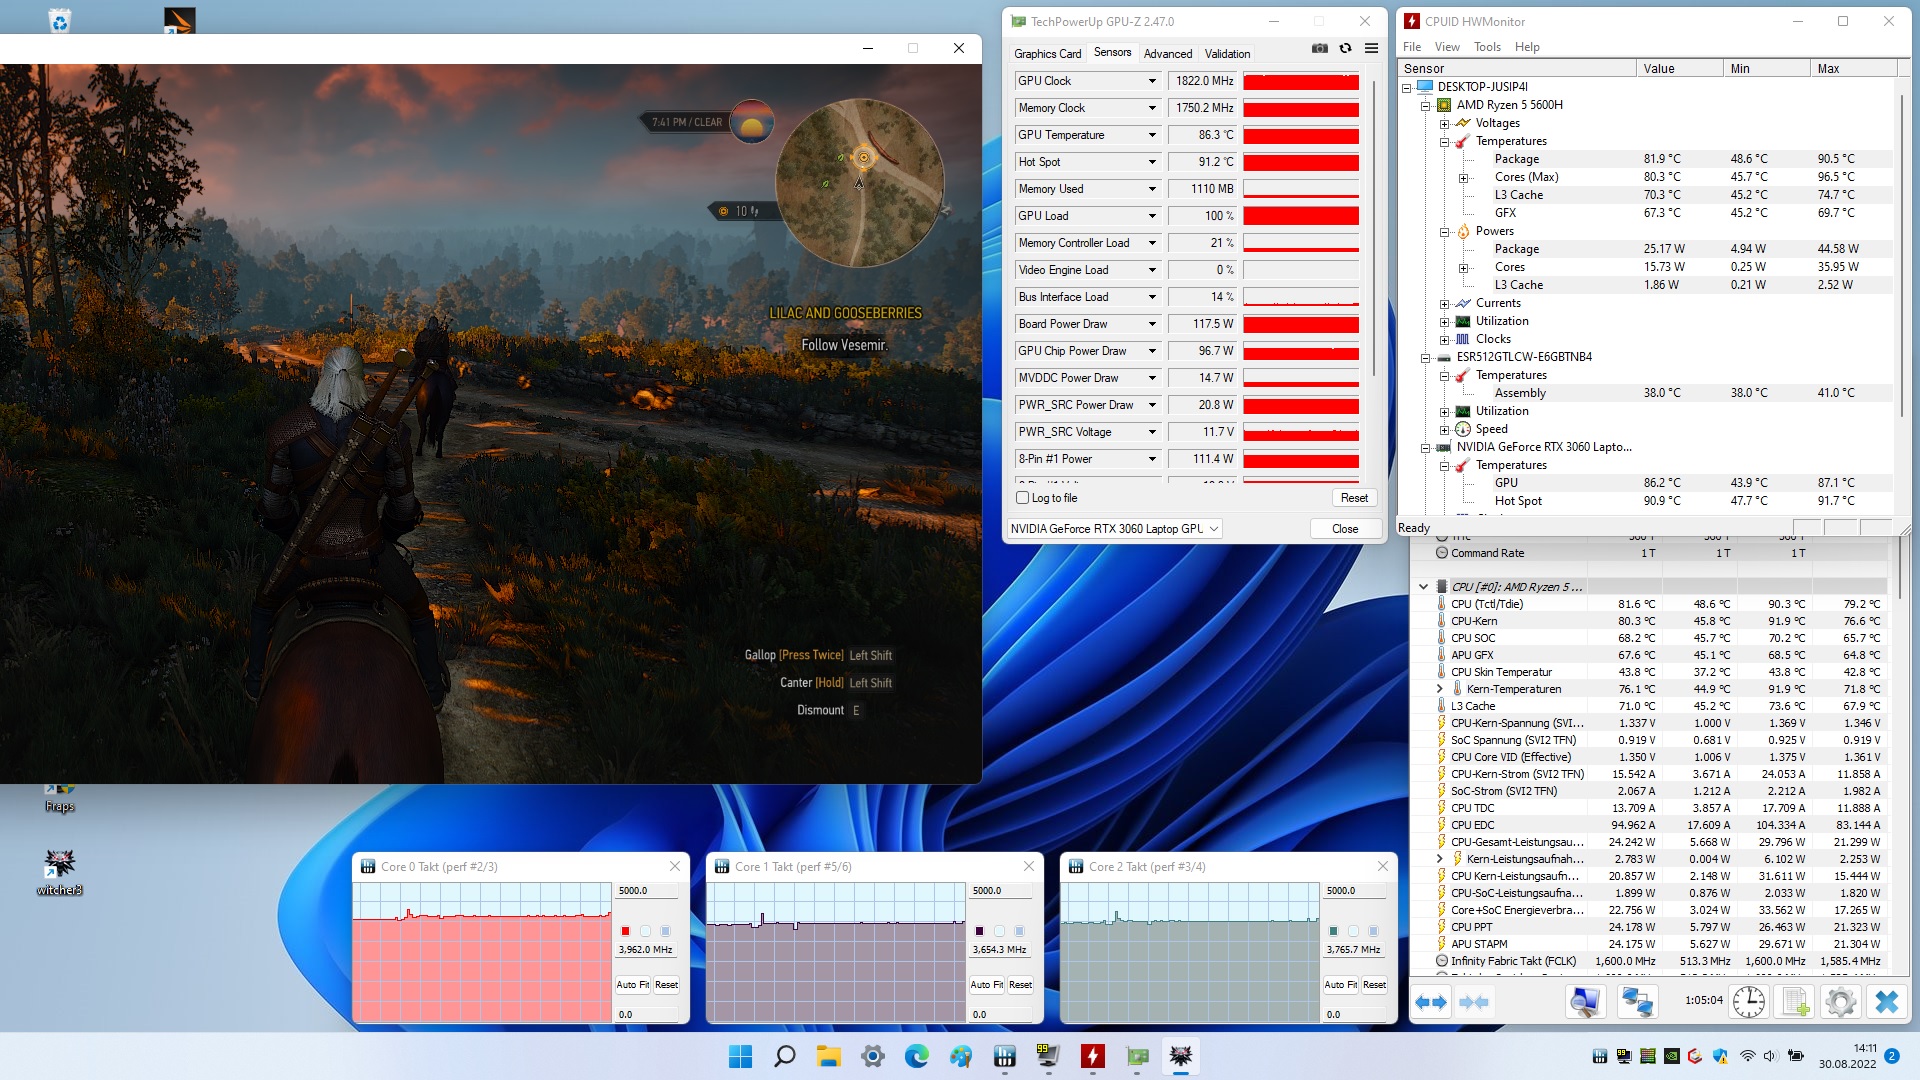
Stress test
The situation is not necessarily better inside the case. Although the CPU and GPU did not throttle during the stress test with the FurMark and Prime95 tools, which is not a matter of course, a maximum of 98 °C (208.4 °F) for the Ryzen 5 5600H and up to 88 °C (190.4 °F) for the GeForce RTX 3060 (data from the HWMonitor tool) are borderline.
Speaker
Gigabyte A5 K1 audio analysis
(+) | speakers can play relatively loud (82 dB)
Bass 100 - 315 Hz
(-) | nearly no bass - on average 28.4% lower than median
(±) | linearity of bass is average (14.8% delta to prev. frequency)
Mids 400 - 2000 Hz
(+) | balanced mids - only 4.9% away from median
(±) | linearity of mids is average (8.1% delta to prev. frequency)
Highs 2 - 16 kHz
(±) | higher highs - on average 6.2% higher than median
(±) | linearity of highs is average (8.4% delta to prev. frequency)
Overall 100 - 16.000 Hz
(±) | linearity of overall sound is average (22.8% difference to median)
Compared to same class
» 82% of all tested devices in this class were better, 5% similar, 13% worse
» The best had a delta of 6%, average was 18%, worst was 132%
Compared to all devices tested
» 67% of all tested devices were better, 6% similar, 27% worse
» The best had a delta of 4%, average was 24%, worst was 134%
Asus TUF Gaming F15 FX507ZM audio analysis
(±) | speaker loudness is average but good (76.7 dB)
Bass 100 - 315 Hz
(±) | reduced bass - on average 13.7% lower than median
(±) | linearity of bass is average (10.1% delta to prev. frequency)
Mids 400 - 2000 Hz
(±) | higher mids - on average 5.2% higher than median
(+) | mids are linear (4.9% delta to prev. frequency)
Highs 2 - 16 kHz
(+) | balanced highs - only 4.1% away from median
(±) | linearity of highs is average (8.6% delta to prev. frequency)
Overall 100 - 16.000 Hz
(±) | linearity of overall sound is average (15.9% difference to median)
Compared to same class
» 38% of all tested devices in this class were better, 7% similar, 56% worse
» The best had a delta of 6%, average was 18%, worst was 132%
Compared to all devices tested
» 25% of all tested devices were better, 5% similar, 70% worse
» The best had a delta of 4%, average was 24%, worst was 134%
Power management
Energy consumption
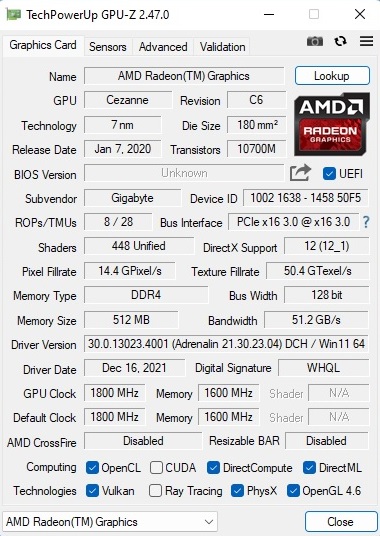
Thanks to graphics switching (Nvidia Optimus), the laptop is reasonably frugal in idle mode with 10 to 17 watts. Under load, we could coax between 113 and 245 watts out of the 15-inch laptop, which is a typical consumption for the installed hardware and the offered performance.
| Off / Standby | |
| Idle | |
| Load |
|
Key:
min: | |
| Gigabyte A5 K1 R5 5600H, GeForce RTX 3060 Laptop GPU | Asus TUF Gaming F15 FX507ZM i7-12700H, GeForce RTX 3060 Laptop GPU | Lenovo Legion 5 15ACH6A-82NW0010GE R5 5600H, Radeon RX 6600M | MSI Alpha 15 B5EEK-008 R7 5800H, Radeon RX 6600M | Gigabyte A5 X1 R9 5900HX, GeForce RTX 3070 Laptop GPU | Average of class Gaming | |
|---|---|---|---|---|---|---|
| Power Consumption | 1% | -6% | 18% | -5% | -27% | |
| Idle Minimum * (Watt) | 10 | 6.3 37% | 10 -0% | 9.1 9% | 10 -0% | 13.3 ? -33% |
| Idle Average * (Watt) | 12 | 9.8 18% | 13.2 -10% | 14.61 -22% | 12 -0% | 19 ? -58% |
| Idle Maximum * (Watt) | 17 | 26.5 -56% | 15.6 8% | 15.05 11% | 16 6% | 24.5 ? -44% |
| Load Average * (Watt) | 113 | 103.8 8% | 178 -58% | 77.8 31% | 124 -10% | 108.1 ? 4% |
| Witcher 3 ultra * (Watt) | 181.4 | 189 -4% | 181 -0% | 131 28% | 204 -12% | |
| Load Maximum * (Watt) | 245 | 241.9 1% | 180 27% | 114.42 53% | 272 -11% | 254 ? -4% |
* ... smaller is better
Power consumption - The Witcher 3 / Stresstest
Power consumption with external monitor
Battery life
The battery life is on par with the more expensive brother. Just under 7 hours of Internet surfing via WLAN (display brightness reduced to 150 cd/m²) are only beaten by some rivals. However, these also offer larger batteries (80+ Wh instead of 49 Wh).
| Gigabyte A5 K1 R5 5600H, GeForce RTX 3060 Laptop GPU, 48.96 Wh | Asus TUF Gaming F15 FX507ZM i7-12700H, GeForce RTX 3060 Laptop GPU, 90 Wh | Lenovo Legion 5 15ACH6A-82NW0010GE R5 5600H, Radeon RX 6600M, 80 Wh | MSI Alpha 15 B5EEK-008 R7 5800H, Radeon RX 6600M, 90 Wh | Gigabyte A5 X1 R9 5900HX, GeForce RTX 3070 Laptop GPU, 48.96 Wh | Average of class Gaming | |
|---|---|---|---|---|---|---|
| Battery runtime | -30% | 33% | 26% | -7% | 2% | |
| WiFi v1.3 (h) | 6.9 | 4.8 -30% | 9.2 33% | 8.7 26% | 6.4 -7% | 7.01 ? 2% |
| Reader / Idle (h) | 15.8 | 12.8 | 12.3 | 10.1 | 8.71 ? | |
| Load (h) | 1.1 | 2 | 1.5 | 1.3 | 1.47 ? | |
| H.264 (h) | 9.8 | 7.3 | 8.26 ? | |||
| Witcher 3 ultra (h) | 1.9 |
Pros
Cons
Verdict
If you ignore the price, the Gigabyte A5 K1 has a hard time against the similarly fast 15-inch competition. Besides the loud noise in 3D mode (performance mode), the high temperature development of the components should be mentioned on the downside. Despite the relatively thick case, the laptop gets very warm and loud under load, which does not exactly speak for the cooling system.
Speaking of the case: The chassis does not cut a particularly good figure in terms of quality. The plastic surfaces look rather cheap and also tend to rattle. In most other disciplines - be it the input devices, the screen, the connectivity or the battery runtime - the Gigabyte laptop is quite unspectacular and does not stand out from the crowd, neither positively nor negatively.
However, those who primarily pay attention to the price-performance ratio will get a pretty good offer with the A5 K1.
Most gaming notebooks under 1,000 Euros (~$993) are either slower or have to make do with a poorer display (keyword: color space).
Price and availability
The reviewed Gigabyte A5 K1 with Ryzen 5 5600H, GeForce RTX 3060, 16 GB RAM and 512 GB SSD is available for around 900 Euros (~$894) at various online stores (e.g. Notebooksbilliger).
Gigabyte A5 K1
- 09/01/2022 v7 (old)
Florian Glaser
Price comparison

