Notebookcheck Logo

Intel Celeron N2820

Intel N2820

The Intel Celeron N2820 is a power efficient dual-core SoC for entry-level notebooks. It is clocked at up to 2.4 GHz and part of the Bay Trail-M platform. Thanks to the specially optimized 22 nanometer low-power process (P1271) with tri-gate transistors, performance and energy efficiency have been significantly improved compared to previous Intel Atom CPUs.

Architecture

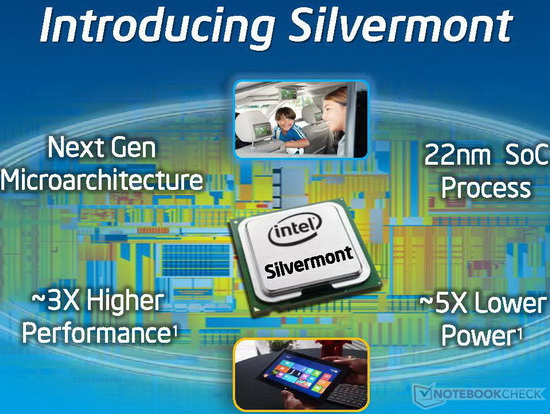
The processor cores are based on the new Silvermont architecture, which is an out-of-order design for the first time. The increased utilization of the pipeline and many other improvements (optimized branch prediction, increased buffers, enhanced decoders) have increased the performance per clock by about 50 percent. At the same time, however, the Hyper-Threading feature of the previous generation has been removed. Other major changes are the support for new instruction set extensions such as SSE 4.1 and 4.2 as well as AES-NI (depending on the model).

Performance

Thanks to the improved performance per clock, the Celeron N2820 is faster than previous Intel Atoms, e.g. the N2850. Therefore, the N2820 even competes with entry-level AMD APUs like the AMD E1-2500. For simple everyday tasks such as Internet or Office the performance is adequate, but not for complex software or modern games.

Graphics

The graphics unit of Bay Trail is based on the Intel Gen7 architecture, which supports DirectX 11 and is also found in the Ivy Bridge series (e.g. HD Graphics 4000). With only 4 EUs (Execution Units) and a relatively low clock speed of up to 756 MHz, the GPU is even slower than the HD Graphics (Ivy Bridge). Therefore, only older and less demanding games will run fluently.

Power Consumption

The entire SoC is rated at a TDP of 7.5 watts. Thus, the chip can be used in compact subnotebooks.

SeriesIntel Celeron
CodenameBay Trail-M

Series: Celeron Bay Trail-M

Intel Celeron N2940 compare1.83 - 2.25 GHz4 / 4 cores
Intel Celeron N2930 compare1.83 - 2.16 GHz4 / 4 cores
Intel Celeron N2920 compare1.86 - 2 GHz4 / 4 cores
Intel Celeron N2840 compare2.16 - 2.58 GHz2 / 2 cores
Intel Celeron N2910 compare1.6 GHz4 / 4 cores
Intel Celeron N2830 compare2.16 - 2.41 GHz2 / 2 cores
Intel Celeron N2820 « 2.17 - 2.39 GHz2 / 2 cores
Intel Celeron N2815 compare1.86 - 2.13 GHz2 / 2 cores
Intel Celeron N2810 compare2 GHz2 / 2 cores
Intel Celeron N2808 compare1.58 - 2.25 GHz2 / 2 cores
Intel Celeron N2807 compare1.58 - 2.16 GHz2 / 2 cores
Intel Celeron N2806 compare1.58 - 2 GHz2 / 2 cores
Intel Celeron N2805 compare1.46 GHz2 / 2 cores
Clock Rate2170 - 2390 MHz
Level 1 Cache112 KB
Level 2 Cache1 MB
Number of Cores / Threads2 / 2
Power Consumption (TDP = Thermal Design Power)7.5 Watt
Manufacturing Technology22 nm
Max. Temperature105 °C
SocketFCBGA1170
FeaturesHD Graphics (Bay Trail, 313 - 756 MHz), Wireless Display, Speedstep
GPUIntel HD Graphics (Bay Trail) (313 - 756 MHz)
64 Bit64 Bit support
Architecturex86
Starting Price$107 U.S.
Announcement Date12/01/2013
Product Link (external)Intel Celeron N2820

Benchmarks

Performance Rating - CB R15 + R20 + 7-Zip + X265 + Blender + 3DM11 CPU
8.8 pt (10%)
2.72 -69%
Intel Celeron N2820
8.82
12.2 38%
12.3 39%
13.2 50%
14.5 64%
15.1 71%
16 81%
16.9 92%
17.1 94%
17.5 98%
...
79.6 802%
0%
100%
Cinebench R23 - Cinebench R23 Multi Core
347 Points (1%)
Cinebench R20 - Cinebench R20 CPU (Multi Core)
143 Points (1%)
Cinebench R15 - Cinebench R15 CPU Multi 64 Bit
min: 46     avg: 58     median: 58 (1%)     max: 70 Points
05101520253035404550556065Tooltip
Cinebench R15 - Cinebench R15 CPU Single 64 Bit
min: 26     avg: 34.3     median: 37.9 (12%)     max: 39 Points
Cinebench R11.5 - Cinebench R11.5 CPU Multi 64 Bit
min: 0.51     avg: 0.7     median: 0.7 (1%)     max: 0.87 Points
Cinebench R11.5 - Cinebench R11.5 CPU Single 64 Bit
min: 0.29     avg: 0.4     median: 0.4 (1%)     max: 0.43 Points
Cinebench R10 - Cinebench R10 Rend. Single (32bit)
min: 900     avg: 1061     median: 1061 (6%)     max: 1222 points
Cinebench R10 - Cinebench R10 Rend. Multi (32bit)
min: 1635     avg: 2010     median: 2010 (1%)     max: 2385 points
wPrime 2.10 - wPrime 2.0 1024m *
1543 s (18%)
7-Zip 18.03 - 7-Zip 18.03 Multli Thread 4 runs
2891 MIPS (2%)
X264 HD Benchmark 4.0 - x264 Pass 1
26.5 fps (6%)
HWBOT x265 Benchmark v2.2 - HWBOT x265 4k Preset
0.4 fps (1%)
000.10.10.20.20.20.30.30.40.40.40.50.50.60.60.60.70.70.8Tooltip
Blender - Blender 2.79 BMW27 CPU *
9415 Seconds (66%)
R Benchmark 2.5 - R Benchmark 2.5 *
3.1 sec (67%)
3DMark 06 - CPU - 3DMark 06 - CPU
1418 Points (3%)
Super Pi mod 1.5 XS 1M - Super Pi mod 1.5 XS 1M *
36.5 s (8%)
Super Pi mod 1.5 XS 2M - Super Pi mod 1.5 XS 2M *
81.4 s (3%)
Super Pi Mod 1.5 XS 32M - Super Pi mod 1.5 XS 32M *
1696 s (8%)
3DMark - 3DMark Ice Storm Extreme Physics
10079 Points (8%)
3DMark - 3DMark Ice Storm Unlimited Physics
12137 Points (10%)
3DMark - 3DMark Cloud Gate Physics
min: 196     avg: 521     median: 520.5 (1%)     max: 845 Points
Geekbench 6 - Geekbench 6.0 Single-Core
178 points (6%)
Geekbench 6 - Geekbench 6.0 Multi-Core
309 points (2%)
Geekbench 5.4 - Geekbench 5.1 - 5.4 64 Bit Single-Core
221 points (10%)
Geekbench 5.4 - Geekbench 5.1 - 5.4 64 Bit Multi-Core
405 points (1%)
Geekbench 5.0 - Geekbench 5.0 64 Bit Single-Core
215 points (1%)
Geekbench 5.0 - Geekbench 5.0 64 Bit Multi-Core
393 points (1%)
Geekbench 4.1 - 4.4 - Geekbench 4.1 - 4.4 64 Bit Single-Core
min: 1093     avg: 1094     median: 1094 (11%)     max: 1095 points
Geekbench 4.1 - 4.4 - Geekbench 4.1 - 4.4 64 Bit Multi-Core
min: 1761     avg: 1763     median: 1762.5 (2%)     max: 1764 points
Geekbench 3 - Geekbench 3 32 Bit Multi-Core
1553 points (3%)
Geekbench 3 - Geekbench 3 64 Bit Multi-Core
1677 points (3%)
Geekbench 3 - Geekbench 3 64 Bit Single-Core
950 points (14%)
Geekbench 2 - 32 Bit - Geekbench Memory
2077 Points (19%)
Geekbench 2 - 32 Bit - Geekbench Floating Point
2008 Points (4%)
Geekbench 2 - 32 Bit - Geekbench Total Score
2165 Points (6%)
Mozilla Kraken 1.1 - Kraken 1.1 Total Score *
4659 ms (5%)
Sunspider - Sunspider 1.0 Total Score *
min: 372.9     avg: 522     median: 522 (6%)     max: 671 ms
WebXPRT 4 - WebXPRT 4 Score
29.1 Points (9%)
WebXPRT 3 - WebXPRT 3 Score
41.1 Points (10%)
- Range of benchmark values for this graphics card
- Average benchmark values for this graphics card
* Smaller numbers mean a higher performance

Add one or more devices and compare

In the following list you can select (and also search for) devices that should be added to the comparison. You can select more than one device.

restrict list: