Reviews for the Intel Celeron N3060 processor
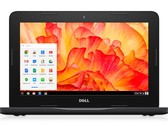
Dell Chromebook 11 3181 (Celeron N3060) Laptop Review
Dell's standard Chromebook 11 leaves quite a bit to be desired. A low quality display and cheap construction drag down the device. Additionally, the limits of Chrome OS and bugs with Android app compatibility leave a bad taste.
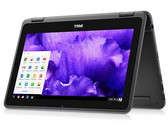
Intel Celeron N3060, HD Graphics 400 (Braswell), 11.6", 1.4 kgDell Chromebook 11 3181 2-in-1 (Celeron N3060) Convertible Review
The Dell Inspiron Chromebook 11 2-in-1 (also known as the Chromebook 11 3181 2-in-1) is a sturdy, well-built Chromebook targeted squarely at the education sector. While the design leaves much to be desired, it is a competent low-end machine and should be rugged enough to withstand the abuse of a classroom.
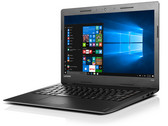
Intel Celeron N3060, HD Graphics 400 (Braswell), 11.6", 1.4 kgLenovo IdeaPad 100s-14IBR (N3060, HD 400) Laptop Review
Streaming machine. The IdeaPad 100s-14IBR benefits from silent operation, a fast memory card reader and a spare M.2-2280 slot. The device fails to stand out in other areas though.
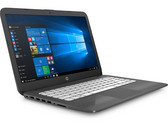
Intel Celeron N3060, HD Graphics 400 (Braswell), 14", 1.5 kgHP Stream 14 (N3060, HD400) Laptop Review
Affordable cloudbook. While the Stream 14 is mainly focused on cloud-assisted operation, we will check whether using it offline is possible too. We shall also look into whether the 32 GB of storage and Intel Celeron processor can make a convincing package.
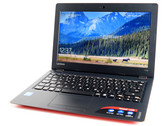
Intel Celeron N3060, HD Graphics 400 (Braswell), 14", 1.4 kgLenovo IdeaPad 110S (N3060, 32 GB) Subnotebook Review
Cheap entry-level laptop. Lenovo's IdeaPad 110S is a small, 11-inch subnotebook. The much too high power consumption takes its toll on the battery life. We report on how the compact entry-level device fares in terms of performance in our short review.
Intel Celeron N3060, HD Graphics 400 (Braswell), 11.6", 1.1 kgHP 250 G5 Y1V08UT: Intel HD Graphics 400 (Braswell), 15.60", 2 kg
Review » HP 250 G5 Y1V08UT (Celeron N3060, HD) Notebook Review
Acer Chromebook R 11 CB5-132T-C8ZW: Intel HD Graphics (Braswell), 11.60", 1.2 kg
Review » Acer Chromebook R 11 CB5-132T-C8ZW Preview
Samsung Chromebook Connect XE501C13-AD2BR: Intel HD Graphics 400 (Braswell), 11.60", 1.2 kg
External Review » Samsung Chromebook Connect XE501C13-AD2BR
Acer Aspire 3 A315-33-C876: Intel HD Graphics 400 (Braswell), 15.60", 2.1 kg
External Review » Acer Aspire 3 A315-33-C876
HP Stream 14-cb099ns: Intel HD Graphics 400 (Braswell), 14.00", 1.5 kg
External Review » HP Stream 14-cb099ns
Dell Chromebook 11 3181 2-in-1: Intel HD Graphics 400 (Braswell), 11.60", 1.4 kg
External Review » Dell Chromebook 11 3181 2-in-1
Samsung Chromebook 3 XE500C13-K03US: Intel HD Graphics 400 (Braswell), 11.60", 1.1 kg
External Review » Samsung Chromebook 3 XE500C13-K03US
Asus E406SA-BV004T: Intel HD Graphics 400 (Braswell), 14.00", 1.3 kg
External Review » Asus E406SA-BV004T
Acer Aspire 3 A315-33-C3JA: Intel HD Graphics 400 (Braswell), 15.60", 2.1 kg
External Review » Acer Aspire 3 A315-33-C3JA
HP Stream 11 Pro G3 Z2Z28ES: Intel HD Graphics 400 (Braswell), 11.60", 1.2 kg
External Review » HP Stream 11 Pro G3 Z2Z28ES
HP Stream 14-ax004nl: Intel HD Graphics 400 (Braswell), 14.00", 1.4 kg
External Review » HP Stream 14-ax004nl
HP 15-bs510ns: Intel HD Graphics 400 (Braswell), 15.60", 2.1 kg
External Review » HP 15-bs510ns
Acer Swift 1 SF114-31-C5NW: Intel HD Graphics 400 (Braswell), 14.00", 1.4 kg
External Review » Acer Swift 1 SF114-31-C5NW
Lenovo Ideapad 110S-11IBR: Intel HD Graphics 400 (Braswell), 11.60", 1.1 kg
External Review » Lenovo Ideapad 110S-11IBR
Acer Extensa 2519-C8HV: Intel HD Graphics 400 (Braswell), 15.60", 2.4 kg
External Review » Acer Extensa 2519-C8HV
Lenovo Yoga 300-11IBR-80M100UUSP: Intel HD Graphics 400 (Braswell), 11.60", 1.4 kg
External Review » Lenovo Yoga 300-11IBR-80M100UUSP
Lenovo Ideapad 110S-11IBR-80WG00ENSP: Intel HD Graphics 400 (Braswell), 11.60", 1.2 kg
External Review » Lenovo Ideapad 110S-11IBR-80WG00ENSP
HP Stream 11-aa001ns: Intel HD Graphics 400 (Braswell), 11.60", 1.4 kg
External Review » HP Stream 11-aa001ns
Medion Akoya S6219-MD60769: Intel HD Graphics 400 (Braswell), 15.60", 1.9 kg
External Review » Medion Akoya S6219-MD60769
HP 15-bs092NS: Intel HD Graphics 400 (Braswell), 15.60", 2.1 kg
External Review » HP 15-BS092NS
HP 14-bs002nh: Intel HD Graphics 400 (Braswell), 14.00", 1.7 kg
External Review » HP 14-bs002nh
Dell Inspiron 15 3552-0514: Intel HD Graphics 400 (Braswell), 15.60", 2.1 kg
External Review » Dell Inspiron 15 3552-0514
HP Chromebook 11 G5 X0P00EA: Intel HD Graphics 400 (Braswell), 11.60", 1.1 kg
External Review » HP Chromebook 11 G5 X0P00EA
Lenovo Yoga 300-11IBR-80M100X3SP: Intel HD Graphics 400 (Braswell), 11.60", 1.4 kg
External Review » Lenovo Yoga 300-11IBR-80M100X3SP
Dell Chromebook 11-3189-7D21X: Intel HD Graphics 400 (Braswell), 11.60", 1.5 kg
External Review » Dell Chromebook 11-3189-7D21X
HP Stream 14-ax005ns: Intel HD Graphics 400 (Braswell), 14.00", 1.4 kg
External Review » HP Stream 14-ax005ns
HP Stream 11-y002ns: Intel HD Graphics 400 (Braswell), 11.60", 1.2 kg
External Review » HP Stream 11-y002ns
Lenovo Ideapad 110-15IBR-80T70057SP: Intel HD Graphics 400 (Braswell), 15.60", 2.3 kg
External Review » Lenovo Ideapad 110-15IBR-80T70057SP
Asus D541SA-XO271D: ARM Mali-400 MP, 15.60", 1.8 kg
External Review » Asus D541SA-XO271D
Dell Chromebook 11 3180-RH02N: Intel HD Graphics 400 (Braswell), 11.60", 1.3 kg
External Review » Dell Chromebook 11 3180-RH02N
HP Stream 11-y010nr: Intel HD Graphics 400 (Braswell), 11.60", 1.2 kg
External Review » HP Stream 11-y010nr
Asus Transformer Book Flip TP201SA-FV0010T: Intel HD Graphics 400 (Braswell), 11.60", 1.3 kg
External Review » Asus Transformer Book Flip TP201SA-FV0010T
Asus D541SA-XO460T: Intel HD Graphics 400 (Braswell), 15.60", 1.8 kg
External Review » Asus D541SA-XO460T
HP 14-am090nd: Intel HD Graphics 400 (Braswell), 14.00", 1.9 kg
External Review » HP 14-am090nd
Samsung Chromebook 3 XE500C13-K04US: Intel HD Graphics 400 (Braswell), 11.60", 1.1 kg
External Review » Samsung Chromebook 3 XE500C13-K04US
Dell Inspiron 14-3451: Intel HD Graphics 400 (Braswell), 14.00", 1.8 kg
External Review » Dell Inspiron 14-3451
Lenovo IdeaPad 100s-14IBR 80R900K5GE: Intel HD Graphics 400 (Braswell), 14.00", 1.5 kg
External Review » Lenovo IdeaPad 100S-14IBR-80R900K5GE
HP Stream 11-y072ng: Intel HD Graphics 400 (Braswell), 11.60", 1.2 kg
External Review » HP Stream 11-y072ng
Asus L402SA: Intel HD Graphics 400 (Braswell), 14.00", 1.4 kg
External Review » Asus L402SA
Lenovo IdeaPad 100S-14IBR-80R900HXGE: Intel HD Graphics 400 (Braswell), 14.10", 1.5 kg
External Review » Lenovo IdeaPad 100S-14IBR-80R900HXGE
HP Stream 11-Y000NS: Intel HD Graphics 400 (Braswell), 11.60", 1.2 kg
External Review » HP Stream 11-Y000NS
Dell Chromebook 11-3180: Intel HD Graphics 400 (Braswell), 11.60", 1.3 kg
External Review » Dell Chromebook 11-3180
Dell Inspiron 11-3162 2017: Intel HD Graphics 400 (Braswell), 11.60", 1.2 kg
External Review » Dell Inspiron 11-3162 2017
HP Stream 11-AB001NS x360: Intel HD Graphics 400 (Braswell), 11.60", 1.4 kg
External Review » HP Stream 11-AB001NS x360
Asus EeeBook E202SA-FD0076T: Intel HD Graphics 400 (Braswell), 11.60", 1.3 kg
External Review » Asus EeeBook E202SA-FD0076T
Asus Transformer Book Flip TP201SA-FV0019T: Intel HD Graphics 400 (Braswell), 11.60", 1.4 kg
External Review » Asus Transformer Book Flip TP201SA-FV0019T
Acer Swift 1 SF114-31-C24: Intel HD Graphics 400 (Braswell), 14.00", 1.6 kg
External Review » Acer Swift 1 SF114-31-C24
HP Stream 14-ax003ns: Intel HD Graphics 400 (Braswell), 14.00", 1.4 kg
External Review » HP Stream 14-ax003ns
Lenovo IdeaPad 110S-11IBR-80WG0060FR: Intel HD Graphics 400 (Braswell), 11.60", 1.2 kg
External Review » Lenovo IdeaPad 110S-11IBR-80WG0060FR
Lenovo IdeaPad 110-15IBR-80T700BDSP: Intel HD Graphics 400 (Braswell), 15.60", 2.2 kg
External Review » Lenovo IdeaPad 110-15IBR-80T700BDSP
Dell Chromebook 11-3189: Intel HD Graphics 400 (Braswell), 11.60", 1.5 kg
External Review » Dell Chromebook 11-3189
Acer Swift 1 SF114-31-C534: Intel HD Graphics 400 (Braswell), 14.00", 1.6 kg
External Review » Acer Swift 1 SF114-31-C534
Asus Eeebook E202SA-FD0078T: Intel HD Graphics 400 (Braswell), 11.60", 1.3 kg
External Review » Asus Eeebook E202SA-FD0078T
Asus D540SA-XX620T: Intel HD Graphics 400 (Braswell), 15.60", 1.9 kg
External Review » Asus D540SA-XX620T
Acer Chromebook 11 N7 C731-C8VE: Intel HD Graphics 400 (Braswell), 11.60", 1.3 kg
External Review » Acer Chromebook 11 N7 C731-C8VE
HP Stream 14-AX001NS: Intel HD Graphics 400 (Braswell), 14.00", 1.4 kg
External Review » HP Stream 14-AX001NS
Lenovo Ideapad 110S-11IBR-80WG007TGE: Intel HD Graphics 400 (Braswell), 11.60", 1.2 kg
External Review » Lenovo Ideapad 110S-11IBR-80WG007TGE
Asus X541SA-XX038D: Intel HD Graphics (Braswell), 15.60", 2 kg
External Review » Asus X541SA-XX038D
Lenovo N22-20: Intel HD Graphics 400 (Braswell), 11.60", 1.2 kg
External Review » Lenovo N22-20
Asus D540SA-XX621D: Intel HD Graphics 400 (Braswell), 15.60", 2 kg
External Review » Asus D540SA-XX621D
HP Stream 14-AX000NF: Intel HD Graphics 400 (Braswell), 14.00", 1.4 kg
External Review » HP Stream 14-AX000NF
HP Stream 14-ax010nr: Intel HD Graphics 400 (Braswell), 14.00", 1.4 kg
External Review » HP Stream 14-ax010nr
HP Chromebook 11 G5: Intel HD Graphics 400 (Braswell), 11.60", 1.2 kg
External Review » HP Chromebook 11 G5
Acer Chromebook 14 CB3-431-C9WH: Intel HD Graphics 400 (Braswell), 14.00", 1.6 kg
External Review » Acer Chromebook 14 CB3-431-C9WH
Acer Chromebook R11 CB5-132T-C8ZW: Intel HD Graphics 400 (Braswell), 11.60", 1.2 kg
External Review » Acer Chromebook R11 CB5-132T-C8ZW
HP 15-ay042Nns: Intel HD Graphics 400 (Braswell), 15.60", 2.5 kg
External Review » HP 15-ay042Nns
Asus X540SA-XX311T: Intel HD Graphics 400 (Braswell), 15.60", 1.9 kg
External Review » Asus X540SA-XX311T
Asus X540SA-XX311D: Intel HD Graphics 400 (Braswell), 15.60", 2.4 kg
External Review » Asus X540SA-XX311D
Acer Chromebook 15 CB3-532-C47C: Intel HD Graphics 400 (Braswell), 15.60", 1.9 kg
External Review » Acer Chromebook 15 CB3-532-C47C
HP 17-x000nd: Intel HD Graphics 400 (Braswell), 17.30", 2.8 kg
External Review » HP 17-x000nd
Acer Chromebook 15 CB5-532-C47C: Intel HD Graphics 400 (Braswell), 15.60", 1.9 kg
External Review » Acer Chromebook 15 CB5-532-C47C
HP 250 G5: Intel HD Graphics 400 (Braswell), 15.60", 1.7 kg
External Review » HP 250 G5
Asus Chromebook C202SA-YS02: Intel HD Graphics 400 (Braswell), 11.60", 1.2 kg
External Review » Asus Chromebook C202SA-YS02