
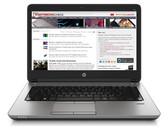
Review HP ProBook 645 G1 Notebook
14-inch business. The ProBook 645 is a 14-inch business laptop. Besides a matte screen, swift hard drive and good input devices, the laptop features classic business qualities like a docking port and a SmartCard reader. The laptop can also be furnished with an LTE modem.
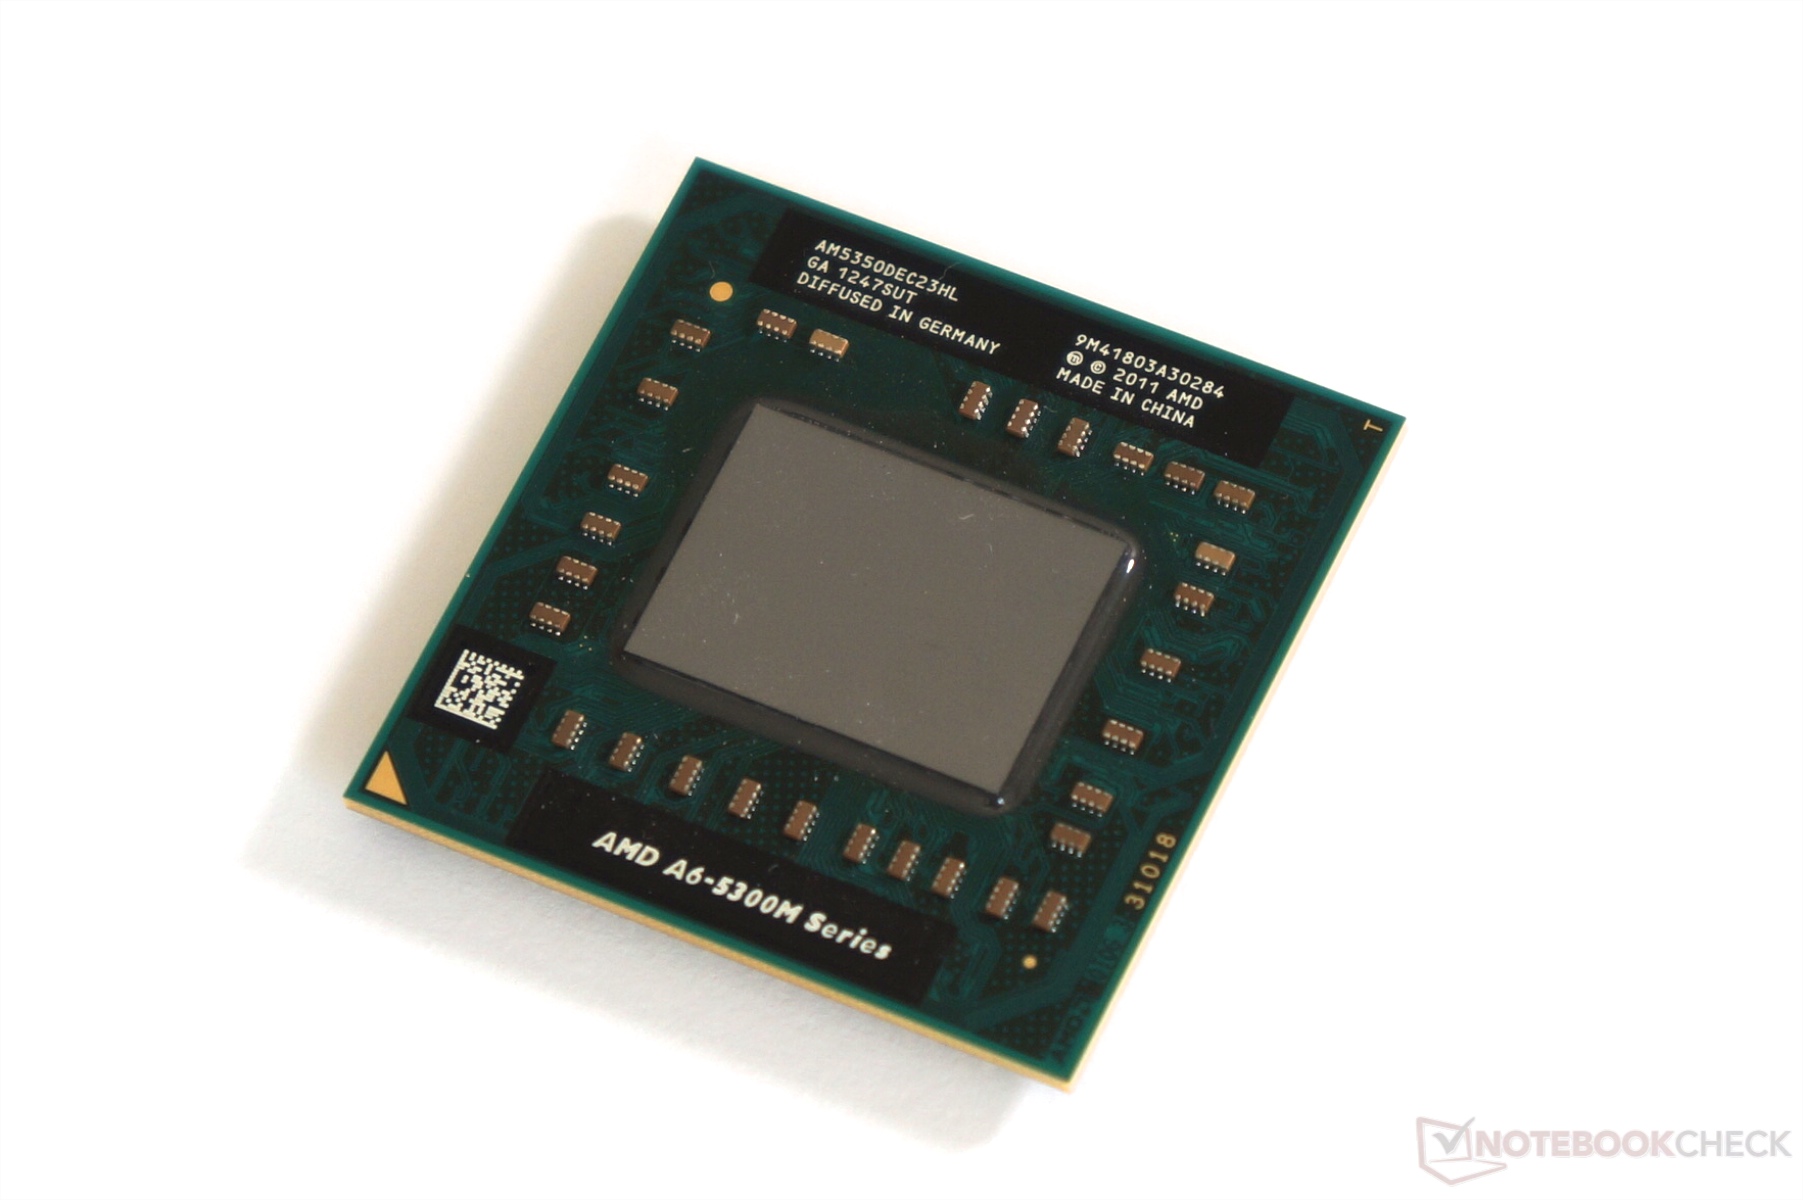
AMD A6-5350M, Radeon HD 8450G, 14", 2 kg