Reviews for the Intel Pentium N3700 processor
Acer Aspire ES1-731G Notebook Review
Home office. Acer combines a Braswell processor and a GeForce graphics core from the entry-level range. This will not create a gaming notebook. However, the laptop is indeed able to run some classic games. In addition, the Aspire brings other pros: It works quietly, comes with a decent keyboard and it has a big storage space.
Intel Pentium N3700, NVIDIA GeForce 910M, 17.3", 3 kgLenovo IdeaPad 300-15IBR Notebook Review
Daily companion. Large display, enough performance to handle the various daily tasks on might encounter and an attractive price point: Lenovo's IdeaPad 300 costs 450 Euro (~$500) and targets price-conscious consumers with basic needs.
Intel Pentium N3700, NVIDIA GeForce 920M, 15.6", 2.3 kgAcer Aspire ES1-731-P4A6 Notebook Review
Braswell Office. With the Acer Aspire ES1-731 you will get a simple 17.3-inch office notebook. It works quietly, requires little energy and delivers a decent keyboard.
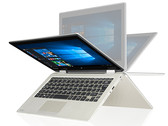
Intel Pentium N3700, HD Graphics (Braswell), 17.3", 3 kgToshiba Satellite Radius 11 L10W-C-108 Notebook Review
Convertible with a bad display. Toshiba's Satellite Radius 11 is a compact convertible, which is cooled passively. We did find some drawbacks during the review, so we are not really impressed by the device.
Intel Pentium N3700, HD Graphics (Braswell), 11.6", 1.3 kgAsus X540SA-XX106T: Intel HD Graphics (Braswell), 15.60", 2 kg
External Review » Asus X540SA-XX106T
Asus X555SJ: NVIDIA GeForce 920M, 15.60", 2.3 kg
External Review » Asus X555SJ
Acer Aspire Z3-700: Intel HD Graphics (Braswell), 17.30", 2 kg
External Review » Acer Aspire Z3-700
Acer Aspire ES1-331-P4HL: Intel HD Graphics (Braswell), 13.30", 1.5 kg
External Review » Acer Aspire ES1-331-P4HL
Medion Akoya S6219-MD60027: Intel HD Graphics (Braswell), 15.60", 1.9 kg
External Review » Medion Akoya S6219-MD60027
HP Pavilion 17-g148ng: Intel HD Graphics (Braswell), 17.30", 2.8 kg
External Review » HP Pavilion 17-g148ng
HP Pavilion 15-ab213ng: Intel HD Graphics (Braswell), 15.60", 2.3 kg
External Review » HP Pavilion 15-ab213ng
Toshiba Satellite Radius 11 L10W-C-108: Intel HD Graphics (Braswell), 11.60", 1.3 kg
External Review » Toshiba Satellite Radius 11 L10W-C-108
Asus A553SA: Intel HD Graphics (Braswell), 15.60", 2 kg
External Review » Asus A553SA
Asus X553SA-XX207D: Intel HD Graphics (Braswell), 15.60", 2 kg
External Review » Asus X553SA-XX207D
HP Pavilion 17-g122ng: Intel HD Graphics (Braswell), 17.30", 2.8 kg
External Review » HP Pavilion 17-g122ng
Acer TravelMate B116-M-P6JK: Intel HD Graphics (Braswell), 11.60", 1.3 kg
External Review » Acer TravelMate B116-M-P6JK
Dell Inspiron 15-3552: Intel HD Graphics (Braswell), 15.60", 2.1 kg
External Review » Dell Inspiron 15-3552
Asus VivoBook E403SA-US21: Intel HD Graphics (Braswell), 14.00", 1.5 kg
External Review » Asus VivoBook E403SA-US21
Toshiba Satellite Radius 11 L12W-C-10E: Intel HD Graphics (Braswell), 11.60", 1.4 kg
External Review » Toshiba Satellite Radius 11 L12W-C-10E
Dell Inspiron 14-3452: Intel HD Graphics (Braswell), 14.00", 1.7 kg
External Review » Dell Inspiron 14-3452
Acer Aspire ES1-531-P1N8: Intel HD Graphics (Braswell), 15.60", 2.4 kg
External Review » Acer Aspire ES1-531-P1N8
HP Pavilion 11-k000ng x360: Intel HD Graphics (Braswell), 11.60", 1.4 kg
External Review » HP Pavilion 11-k000ng x360
Acer Aspire R3-131T: Intel HD Graphics (Braswell), 11.60", 1.5 kg
External Review » Acer Aspire R3-131T