

Intel Pentium N3700 vs Intel Pentium N3710
Intel Pentium N3700
► remove from comparison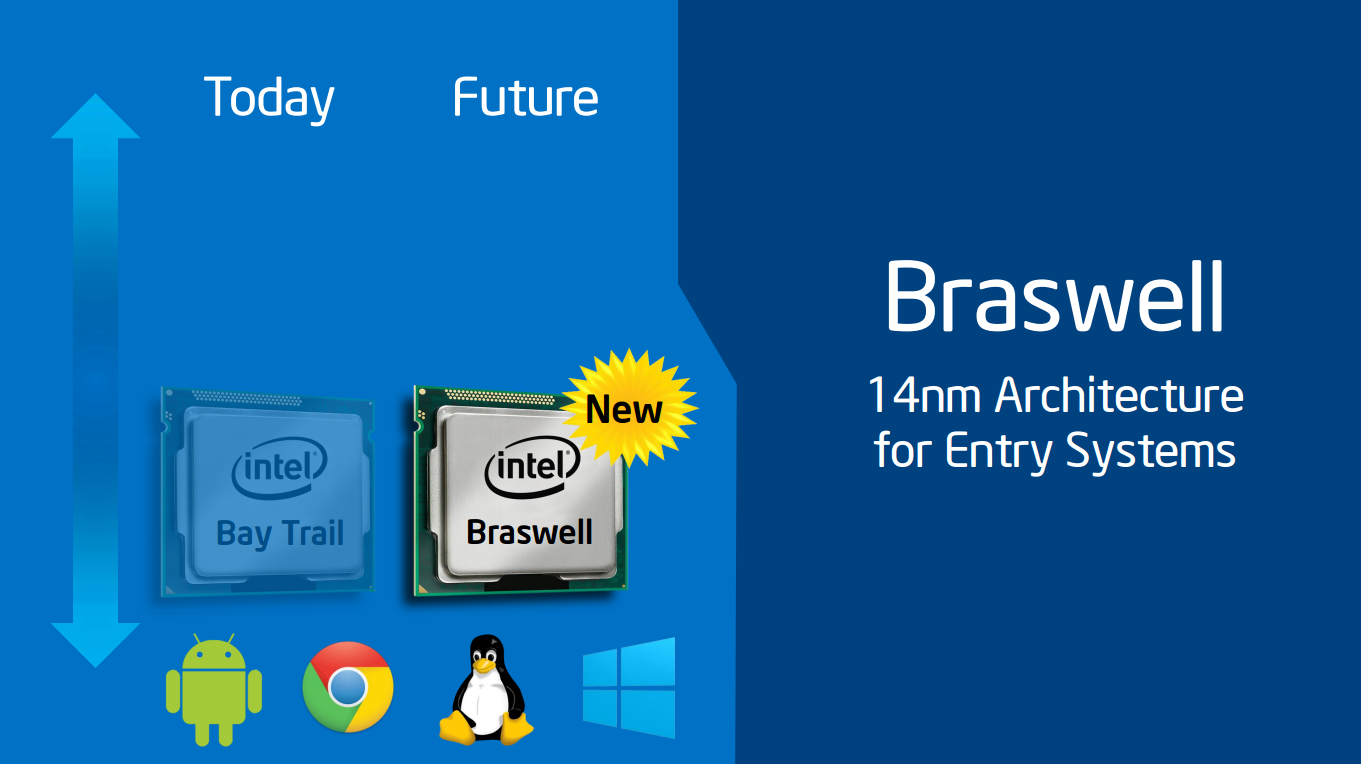
The Intel Pentium N3700 is a quad-core SoC for entry-level notebooks, which has been presented in early 2015. It is clocked at 1.6 - 2.4 GHz and part of the Braswell platform. Thanks to its new 14 nanometer low-power process (P1273) with tri-gate transistors, energy efficiency has been significantly improved compared to its predecessor Bay Trail (e.g. Pentium N3520). In addition to the CPU cores, the SoC offers a DirectX 11.2-capable GPU as well as a DDR3L Memory Controller (2x 64 bit, 25.6 GB/s).
Architecture
The processor cores are based on the Airmont architecture, which is basically a slightly modified shrink of the previous Silvermont core. While performance per clock has not been improved, the more efficient 14 nm process leads to a better utilization of the CPU Burst (alias Turbo Boost) and a therefore somewhat higher overall performance.
Performance
Compared to its predecessor Pentium N3520 (2.17 - 2.42 GHz) or the AMD APU A4-6210, the N3700 offers an almost identical performance. Using Windows, the CPU is adequate for everyday tasks such as Internet browsing or office applications, but may struggle in more demanding software.
Graphics
The HD Graphics (Braswell) is based on the Intel Gen8 architecture, which supports DirectX 11.2 and is also found in the Broadwell series (e.g. HD Graphics 5300). With 16 EUs (Execution Units) and a clock speed of up to 700 MHz, the GPU is about twice as fast as the HD Graphics (Bay Trail), but still not powerful enough to handle demanding 3D games of 2015. The GPU also supports 4K/H.265 video acceleration.
Power Consumption
The entire SoC is rated at an TDP of 6 watts (SDP 4 watts). Thus, the chip can be cooled passively.
Intel Pentium N3710
► remove from comparison
The Intel Pentium N3710 is a quad-core SoC for entry-level notebooks, which has been presented in early 2016. It is clocked at 1.1 - 2.56 GHz and part of the Braswell platform. Thanks to its new 14 nanometer low-power process (P1273) with tri-gate transistors, energy efficiency has been significantly improved compared to its predecessor Bay Trail (e.g. Pentium N3520). In addition to the CPU cores, the SoC offers a DirectX 11.2-capable GPU as well as a DDR3L Memory Controller (2x 64 bit, 25.6 GB/s).
It is the successor to the 2016 Pentium N3700 and offers a higher Boost clock of 2.56 versus 2.4 GHz but a lower base clock of only 1.1 versus 1.6 GHz. The GPU is technically still the same but now renamed to Intel HD Graphics 405.
Architecture
The processor cores are based on the Airmont architecture, which is basically a slightly modified shrink of the previous Silvermont core. While performance per clock has not been improved, the more efficient 14 nm process leads to a better utilization of the CPU Burst (alias Turbo Boost) and a therefore somewhat higher overall performance.
Performance
Compared to its predecessor the Pentium N3700, the N3710 can be faster if the Boost clock is held. If the cooling is not sufficient it may even be slower. In our first review sample, the N3710 was on par with a A6-5200 in Cinebench R15 and therefore slightly faster than the N3700. In the 3DMark 11 physics test however it was equally fast as the N3700. Using Windows, the CPU is adequate for everyday tasks such as Internet browsing or office applications, but may struggle in more demanding software.
Graphics
The HD Graphics 405 (Braswell) is based on the Intel Gen8 architecture, which supports DirectX 11.2 and is also found in the Broadwell series (e.g. HD Graphics 5300). With 16 EUs (Execution Units) and a clock speed of up to 700 MHz, the GPU is about twice as fast as the HD Graphics (Bay Trail), but still not powerful enough to handle demanding 3D games of 2015. The GPU also supports 4K/H.265 video acceleration.
Power Consumption
The entire SoC is rated at an TDP of 6 watts (SDP 4 watts). Thus, the chip can be cooled passively but is not in all devices.
| Model | Intel Pentium N3700 | Intel Pentium N3710 | ||||||||||||||||
| Codename | Braswell | Braswell | ||||||||||||||||
| Series | Intel Pentium | Intel Pentium | ||||||||||||||||
| Series: Pentium Braswell |
|
| ||||||||||||||||
| Clock | 1600 - 2400 MHz | 1600 - 2560 MHz | ||||||||||||||||
| L2 Cache | 2 MB | 2 MB | ||||||||||||||||
| Cores / Threads | 4 / 4 | 4 / 4 | ||||||||||||||||
| TDP | 6 Watt | 6 Watt | ||||||||||||||||
| Technology | 14 nm | 14 nm | ||||||||||||||||
| max. Temp. | 90 °C | 90 °C | ||||||||||||||||
| Socket | FCBGA1170 | FCBGA1170 | ||||||||||||||||
| Features | Intel HD Graphics (Braswell, 400 - 700 MHz), Wireless Display, Quick Sync, AES-NI, max. 8 GB Dual-Channel DDR3L-1600 (25,6 GB/s), 5x USB 3.0, 4x PCIe 2.0, 2x SATA 6.0 Gbit/s | Intel HD Graphics 405 (Braswell, 400 - 700 MHz), Wireless Display, Quick Sync, AES-NI, max. 8 GB Dual-Channel DDR3L-1600 (25,6 GB/s), 5x USB 3.0, 4x PCIe 2.0, 2x SATA 6.0 Gbit/s | ||||||||||||||||
| iGPU | Intel HD Graphics (Braswell) (400 - 700 MHz) | Intel HD Graphics 405 (Braswell) (400 - 700 MHz) | ||||||||||||||||
| Architecture | x86 | x86 | ||||||||||||||||
| $161 U.S. | $161 U.S. | |||||||||||||||||
| Announced | ||||||||||||||||||
| Manufacturer | ark.intel.com | ark.intel.com |

Benchmarks

Average Benchmarks Intel Pentium N3700 → 100% n=32
Average Benchmarks Intel Pentium N3710 → 114% n=32
* Smaller numbers mean a higher performance
1 This benchmark is not used for the average calculation