Notebook reviews with Intel HD Graphics 5300 graphics card
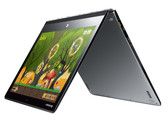
Lenovo Yoga 3 Pro 13 80HE004LGE Convertible Review
A lot of room for improvements. Lenovo charges around 1,000 Euros ($1112) for the Yoga 3 Pro. You will get a thin and attractive 13.3-inch convertible with a fo...
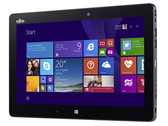
Intel Core M-5Y70 | Intel HD Graphics 5300 | 13.30" | 1.2 kgFujitsu Stylistic Q665 Tablet Review
Business tablet. The Stylistic Q665 is primarily aimed at companies. Its configuration and the available accessories are tailored for this group of customers. I...
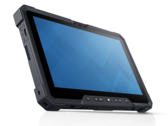
Intel Core M-5Y31 | Intel HD Graphics 5300 | 11.60" | 1.5 kgDell Latitude 12 Rugged Tablet Review
Tough. Rugged devices sometimes have to operate under the most adverse conditions. Dell's Latitude 12 Rugged tablet presents itself as a robust workhorse with s...
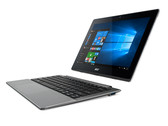
Intel Core M-5Y71 | Intel HD Graphics 5300 | 11.60" | 1.8 kgAcer Aspire Switch 11V SW5-173-614T Convertible Review
Rarity. The conventional hard drive in the dock makes Acer unique in the market. However, other features are disappointing, and thus, a list of controversial pr...
Intel Core M-5Y10c | Intel HD Graphics 5300 | 11.60" | 1.6 kgHP Elite x2 1011 G1 Convertible Review
Limited performance. HP advertises its new business detachable as: "The one device you need...". In fact, the Elite x2 is a versatile multi-talent, but it ultim...
Intel Core M-5Y51 | Intel HD Graphics 5300 | 11.60" | 1.7 kgAsus Zenbook UX305FA-FC004H: Intel Core M-5Y10, 13.30", 1.3 kg
Review » Asus Zenbook UX305FA Subnotebook Review
Lenovo Yoga 3 11 80J8001WGE: Intel Core M-5Y10c, 11.60", 1.1 kg
Review » Lenovo Yoga 3 11 Convertible Review
Apple MacBook 12 (Early 2015) 1.1 GHz: Intel Core M-5Y31, 12.00", 0.9 kg
Review » Apple MacBook 12 (Early 2015) 1.1 GHz Review
Review » Apple MacBook 12 (Early 2015) Notebook Preview
Asus Transformer Book T300FA-FE001H: Intel Core M-5Y10, 12.50", 1.6 kg
Review » Asus Transformer Book T300FA Convertible Review
Toshiba Portege Z20t-B-10C: Intel Core M-5Y71, 12.50", 1.5 kg
Review » Toshiba Portege Z20t-B Convertible Review
HP EliteBook Folio 1020 G1: Intel Core M-5Y51, 12.50", 1.2 kg
Review » HP EliteBook Folio 1020 G1 Ultrabook Review
Asus Transformer Book T300 Chi: Intel Core M-5Y71, 12.50", 1.4 kg
Review » Asus Transformer Book T300 Chi Convertible Review
Acer Aspire Switch 12 SW5-271-61X7: Intel Core M-5Y10c, 12.50", 1.5 kg
Review » Acer Aspire Switch 12 Convertible Review
Asus ZenBook UX305FA-FB003H: Intel Core M-5Y10, 13.30", 1.3 kg
Review » Asus Zenbook UX305 Subnotebook Review
Lenovo ThinkPad Helix 2: Intel Core M-5Y71, 11.60", 1.3 kg
Review » Lenovo ThinkPad Helix 2 Tablet Review
Dell Latitude 13 7350: Intel Core M-5Y10, 13.30", 1.7 kg
Review » Dell Latitude 13 7350 Convertible Review
Dell Venue 11 Pro 7140: Intel Core M-5Y10a, 10.80", 1.4 kg
Review » Dell Venue 11 Pro 7140 Convertible Tablet Review
HP Envy x2 15-c000ng: Intel Core M-5Y10, 15.60", 2.5 kg
Review » HP Envy x2 15-c000ng Convertible Review
Lenovo Yoga 3 Pro: Intel Core M-5Y70, 13.30", 1.2 kg
Review » Intel Core M-5Y70 "Broadwell" Review
HP Envy X2-j001ng: Intel Core M-5Y70, 13.30", 1.8 kg
Review » HP Envy x2-j001ng Convertible Review
Lenovo Yoga 3 Pro: Intel Core M-5Y70, 13.30", 1.2 kg
Review » Lenovo Yoga 3 Pro Convertible Review
Review » First Impressions: Lenovo Yoga 3 Pro in Review
Fujitsu Stylistic Q665: Intel Core M-5Y31, 11.60", 1.5 kg
External Review » Fujitsu Stylistic Q665
Asus UX305FA-FB033H: Intel Core M-5Y71, 13.30", 1.2 kg
External Review » Asus UX305FA-FB033H
Acer Aspire Switch 11V SW5-173-63NV: Intel Core M-5Y10c, 11.60", 1.6 kg
External Review » Acer Aspire Switch 11V SW5-173-63NV
HP EliteBook Folio 1020, Core M-5Y71: Intel Core M-5Y71, 12.50", 1.7 kg
External Review » HP EliteBook Folio 1020, Core M-5Y71
Asus UX305FA-FB012H: Intel Core M-5Y10c, 13.30", 1.2 kg
External Review » Asus UX305FA-FB012H
Lenovo ThinkPad Helix-20CG0019GE: Intel Core M-5Y71, 11.60", 1.4 kg
External Review » Lenovo ThinkPad Helix-20CG0019GE
Toshiba Portege Z20t-B-10E: Intel Core M-5Y31, 12.50", 1.5 kg
External Review » Toshiba Portege Z20t-B-10E
Dell Latitude 12 Rugged Tablet: Intel Core M-5Y71, 11.60", 1.8 kg
External Review » Dell Latitude 12 Rugged Tablet
Acer Aspire Switch 11V-SW5-173-62J8: Intel Core M-5Y10c, 11.60", 1.5 kg
External Review » Acer Aspire Switch 11V-SW5-173-62J8
Toshiba Portege Z20t-B-10C: Intel Core M-5Y71, 12.50", 1.5 kg
External Review » Toshiba Portege Z20t-B-10C
HP Elite x2 1011 G1: Intel Core M-5Y51, 11.60", 1.7 kg
External Review » HP Elite x2 1011 G1
Lenovo ThinkPad Helix-20CG001BMH: Intel Core M-5Y71, 11.60", 1.7 kg
External Review » Lenovo ThinkPad Helix-20CG001BMH
Toshiba Portege Z20t-B-107: Intel Core M-5Y51, 12.50", 1.6 kg
External Review » Toshiba Portege Z20t-B-107
Acer Aspire Switch 11 V SW5-173: Intel Core M-5Y10c, 11.60", 1.5 kg
External Review » Acer Aspire Switch 11 V SW5-173
Asus Zenbook UX305FA-FB033H: Intel Core M-5Y71, 13.30", 1.2 kg
External Review » Asus Zenbook UX305FA-FB033H
Toshiba Portege Z20t-B-10: Intel Core M-5Y71, 12.50", 1.5 kg
External Review » Toshiba Portege Z20t-B-10
HP EliteBook Folio 1020 G1: Intel Core M-5Y51, 12.50", 1.2 kg
External Review » HP EliteBook Folio 1020 G1
Toshiba Portege Z20t-B-10G: Intel Core M-5Y51, 12.50", 1.5 kg
External Review » Toshiba Portege Z20t-B-10G
Asus UX305FA-FB041H: Intel Core M-5Y10, 13.30", 1.2 kg
External Review » Asus UX305FA-FB041H
Lenovo ThinkPad Helix 2-20CHS02A00: Intel Core M-5Y70, 11.60", 1.4 kg
External Review » Lenovo ThinkPad Helix 2-20CHS02A00
HP Pavilion 11-n108TU x360: Intel Core M-5Y10c, 11.60", 1.4 kg
External Review » HP Pavilion 11-n108TU x360
Toshiba Portege Z20t-B-103: Intel Core M-5Y51, 12.50", 1.6 kg
External Review » Toshiba Portege Z20t-B-103
Asus Transformer Book T300FA-FE001H: Intel Core M-5Y10, 12.50", 1.6 kg
External Review » Asus Transformer Book T300FA-FE001H
Lenovo Yoga 3 11 80J8001WGE: Intel Core M-5Y10c, 11.60", 1.1 kg
External Review » Lenovo Yoga 3 11 80J8001WGE
HP Elite x2 1011 G1-L8D67UT: Intel Core M-5Y71, 11.60", 0.9 kg
External Review » HP Elite x2 1011 G1-L8D67UT
Lenovo Yoga 3 11: Intel Core M-5Y10c, 11.60", 1.2 kg
External Review » Lenovo Yoga 3 11
Dell Venue 11 Pro 7140: Intel Core M-5Y10a, 10.80", 1.4 kg
External Review » Dell Venue 11 Pro 7140
Asus Transformer Book T300 Chi: Intel Core M-5Y71, 12.50", 1.4 kg
External Review » Asus Transformer Book T300 Chi
Samsung 930X2K-K02US: Intel Core M-5Y31, 12.20", 0.9 kg
External Review » Samsung 930X2K-K02US
Asus Zenbook UX305FA-FC007H: Intel Core M-5Y10, 13.30", 1.2 kg
External Review » Asus Zenbook UX305FA-FC007H
Apple MacBook 12 (Early 2015) 1.1 GHz: Intel Core M-5Y31, 12.00", 0.9 kg
External Review » Apple MacBook 12 (Early 2015) 1.1 GHz
HP Envy x2 15-c000ng: Intel Core M-5Y10, 15.60", 2.5 kg
External Review » HP Envy x2 15-c000ng
Acer Aspire Switch 12 SW5-271-61X7: Intel Core M-5Y10c, 12.50", 1.5 kg
External Review » Acer Aspire Switch 12 SW5-271-61X7
Asus Zenbook UX305FA-ASM1: Intel Core M-5Y10, 13.30", 1.3 kg
External Review » Asus Zenbook UX305FA-ASM1
Asus Zenbook UX305FA-FC008H: Intel Core M-5Y10, 13.30", 1.2 kg
External Review » Asus Zenbook UX305FA-FC008H
Lenovo ThinkPad Helix 2: Intel Core M-5Y71, 11.60", 1.3 kg
External Review » Lenovo ThinkPad Helix 2
Toshiba Portege Z20t-B2112: Intel Core M-5Y71, 12.50", 1.5 kg
External Review » Toshiba Portege Z20t-B2112
Acer Aspire Switch 12: Intel Core M-5Y10a, 12.00", 1.2 kg
External Review » Acer Aspire Switch 12
HP Envy X2-j001nf: Intel Core M-5Y10, 13.30", 1.8 kg
External Review » HP Envy X2-j001nf
Dell Latitude 13 7350: Intel Core M-5Y10, 13.30", 1.7 kg
External Review » Dell Latitude 13 7350
Asus Transformer Book T300FA-FE010H: Intel Core M-5Y10a, 13.30", 1.5 kg
External Review » Asus Transformer Book T300FA-FE010H
HP Elitebook Folio 1020: Intel Core M-5Y51, 12.50", 1 kg
External Review » HP Elitebook Folio 1020
HP Envy X2-j001ng: Intel Core M-5Y70, 13.30", 1.8 kg
External Review » HP Envy X2-j001ng
Lenovo Yoga 3 Pro: Intel Core M-5Y70, 13.30", 1.2 kg
External Review » Lenovo Yoga 3 Pro
Asus ZenBook UX305FA-FB003H: Intel Core M-5Y10, 13.30", 1.3 kg
External Review » Asus ZenBook UX305