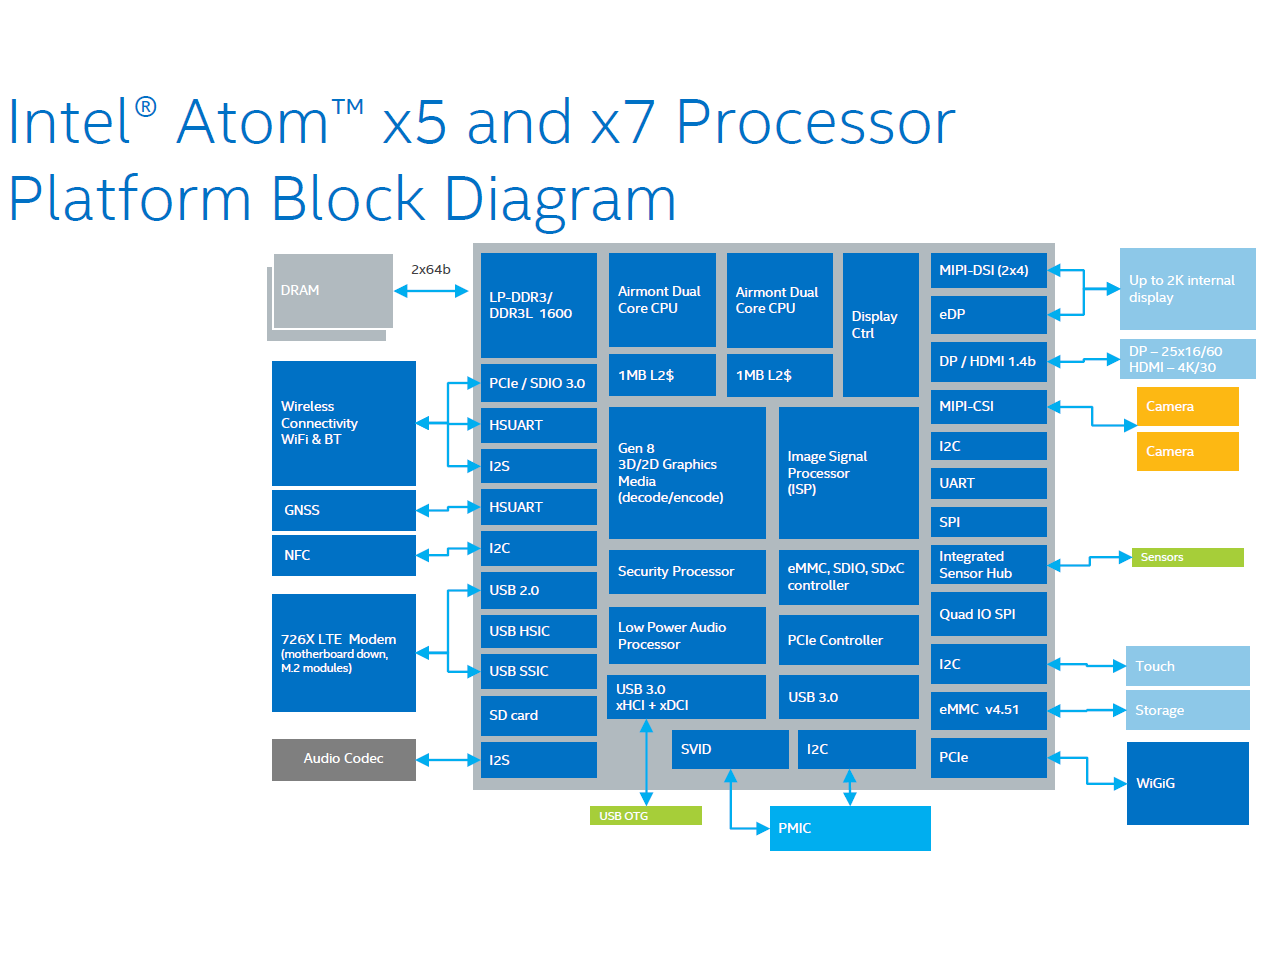
Reviews for the Intel Atom x5-Z8300 processor
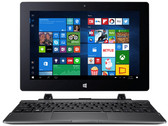
Acer Aspire Switch One 10 SW1-011-14UQ Notebook Review
A convertible laptop for home. Acer wants about 250 Euros (~$265) for their new 10.1-inch convertible Windows laptop: the Switch One. The few hundred bucks will get you a silent computer with long battery life - and a surprisingly bright, contrast-rich IPS display.
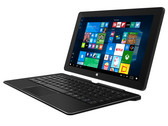
Intel Atom x5-Z8300, HD Graphics (Cherry Trail), 10.1", 1.3 kgTrekstor SurfTab duo W3 Convertible Review
Low-cost convertible. Approximately 230 to 250 Euros (~$245 to ~$267) have to be ponied up for Trekstor's 11.6-inch convertible. The buyer gets a device with a Cherry Trail processor and viewing-angle stable Full HD IPS panel. The device shows weaknesses in battery life, though.
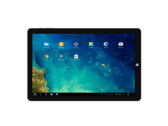
Intel Atom x5-Z8300, HD Graphics (Cherry Trail), 11.6", 1.5 kgChuwi Hi10 Pro Tablet Review
1-with-2. Android or Windows? Users of the Chuwi Hi10 Pro don't have to make that decision, since the Chinese hybrid tablet comes with both operating systems preinstalled. If the tablet is worth buying is the subject of our review.
Intel Atom x5-Z8300, HD Graphics (Cherry Trail), 10.1", 562 gVOYO VBook V3 Convertible Review
VOYOga. When looking for a bargain in the Windows convertible or 2-in-1 sector, buyers more frequently run into offers from the Far East markets whose dumping prices quickly obliterate any justified concerns regarding service life and possible warranty claims. With VOYO's V3, we are looking at a device that expertly plays around with the name.
Intel Atom x5-Z8300, HD Graphics (Cherry Trail), 13.3", 1.7 kgHP x2 210 G1 Convertible Review
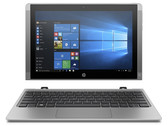
Long-lasting. This 10.1-inch HP convertible is available for around 400 Euros (~$445). The manufacturer provides an Intel Cherry Trail processor and long battery life. A Type-C USB interface is also included.
Intel Atom x5-Z8300, HD Graphics (Cherry Trail), 10.1", 1.2 kgChuwi Vi10 Ultimate 64GB: Intel HD Graphics (Cherry Trail), 10.60", 0.5 kg
Review » Chuwi Vi10 Ultimate 32GB Tablet Review
Acer Aspire Switch 10V SW5-014-1742: Intel HD Graphics (Cherry Trail), 10.10", 1.2 kg
Review » Acer Aspire Switch 10V SW5-014-1742 Notebook Review
Chuwi Hi12: Intel HD Graphics (Cherry Trail), 12.00", 0.8 kg
Review » Chuwi Hi12 Tablet Review
Chuwi Vi8 Plus (CWI519): Intel HD Graphics (Cherry Trail), 8.00", 0.3 kg
Review » Chuwi Vi8 Plus CWI519 Tablet Review
Toshiba Satellite Click 10 LX0W-C-104: Intel HD Graphics (Cherry Trail), 10.10", 1.1 kg
Review » Toshiba Satellite Click 10 LX0W-C-104 Convertible Review
Acer One 10 S1003-18U0: Intel HD Graphics (Cherry Trail), 10.10", 1.2 kg
External Review » Acer One 10 S1003-18U0
Acer Aspire Switch One 10 SW1-011-11AN: Intel HD Graphics (Cherry Trail), 10.10", 1.3 kg
External Review » Acer Aspire Switch One 10 SW1-011-11AN
Medion Akoya E2228T-MD60250: Intel HD Graphics (Cherry Trail), 15.60", 1.1 kg
External Review » Medion Akoya E2228T-MD60250
Prestigio MultiPad Visconte S PMP1020CE: Intel HD Graphics (Cherry Trail), 11.60", 0.6 kg
External Review » Prestigio MultiPad Visconte S PMP1020CE
Acer Aspire Switch One 10 SW1-011-194R: Intel HD Graphics (Cherry Trail), 10.10", 1.3 kg
External Review » Acer Aspire Switch One 10 SW1-011-194R
Trekstor SurfTab duo W3: Intel HD Graphics (Cherry Trail), 11.60", 1.5 kg
External Review » Trekstor SurfTab duo W3
Prestigio Multipad Visconte S: Intel HD Graphics (Cherry Trail), 11.60", 1.4 kg
External Review » Prestigio Multipad Visconte S
Prestigio Visconte Ecliptica: Intel HD Graphics (Cherry Trail), 13.30", 2.2 kg
External Review » Prestigio Visconte Ecliptica
Acer Aspire Switch 10E SW3-016-13YY: Intel HD Graphics (Cherry Trail), 10.10", 1.2 kg
External Review » Acer Aspire Switch 10E SW3-016-13YY
Chuwi Hi12: Intel HD Graphics (Cherry Trail), 12.00", 0.8 kg
External Review » Chuwi Hi12
Acer Aspire Switch 10V SW5-014: Intel HD Graphics (Cherry Trail), 10.10", 0.6 kg
External Review » Acer Aspire Switch 10V SW5-014
Chuwi LapBook: Intel HD Graphics (Cherry Trail), 15.60", 1.9 kg
External Review » Chuwi LapBook
Chuwi HiBook Pro: Intel HD Graphics (Cherry Trail), 10.10", 0.6 kg
External Review » Chuwi HiBook Pro
Asus Vivobook E200HA-FD0004TS: Intel HD Graphics (Cherry Trail), 11.60", 1 kg
External Review » Asus Vivobook E200HA-FD0004TS
Chuwi Hi10 Plus: Intel HD Graphics (Cherry Trail), 10.80", 0.7 kg
External Review » Chuwi Hi10 Plus
Trekstor SurfTab Twin 11.6 inch: Intel HD Graphics (Cherry Trail), 11.60", 1.4 kg
External Review » Trekstor SurfTab Twin 11.6 inch
Chuwi Hi10 Pro: Intel HD Graphics (Cherry Trail), 10.10", 0.6 kg
External Review » Chuwi Hi10 Pro
Medion Lifetab P10505: Intel HD Graphics (Cherry Trail), 10.10", 0.5 kg
External Review » Medion Lifetab P10505
Acer Aspire Switch 10V SW5-014-1742: Intel HD Graphics (Cherry Trail), 10.10", 1.2 kg
External Review » Acer Aspire Switch 10V SW5-014-1742
HP x2 210 G1: Intel HD Graphics (Cherry Trail), 10.10", 1.2 kg
External Review » HP x2 210 G1
Asus EeeBook X206HA-FD0018TS: Intel HD Graphics (Cherry Trail), 11.60", 1 kg
External Review » Asus EeeBook X206HA-FD0018TS
Asus VivoBook E200HA-FD0009TS: Intel HD Graphics (Cherry Trail), 11.60", 1 kg
External Review » Asus VivoBook E200HA-FD0009TS
HP Pavilion x2 10-n125tu: Intel HD Graphics (Cherry Trail), 10.10", 0.9 kg
External Review » HP Pavilion x2 10-n125tu
HP Envy 8 Note: Intel HD Graphics (Cherry Trail), 8.00", 0.4 kg
External Review » HP Envy 8 Note
Toshiba Satellite Click 10 LX0W-C-104: Intel HD Graphics (Cherry Trail), 10.10", 1.1 kg
External Review » Toshiba Satellite Click 10 LX0W-C-104
HP Pavilion x2 10-n182ng: Intel HD Graphics (Cherry Trail), 10.10", 1.2 kg
External Review » HP Pavilion x2 10-n182ng