Reviews for the Intel Core i3-3217U processor
Vizio CT14-A0 Notebook Review
A good first step. The TV maker makes a good first effort in its foray into the notebook market. Find out what we liked and didn't like about this early Ultrabook from the fast-growing electronics company.
Intel Core i3-3217U, HD Graphics 4000, 14", 1.5 kgReview Asus P550CA-XO522G Notebook
Entry-level business. Asus puts not one but two operating systems (Windows 7 Pro (64-bit) + Windows 8 Pro (64-bit)) in the P550CA-XO522G's box. Dedicated Windows 7 fans can use the laptop right away. Windows 8 first has to be installed via the included recovery DVD.
Intel Core i3-3217U, HD Graphics 4000, 15.6", 2.3 kg
Review Acer Aspire E1-470P-6659 Notebook
Basically basic. Cramming as much computer as possible into a case for $400 is a challenging and often perilous task. With their Aspire E1-470P, Acer takes another swipe at low-cost leadership in the Windows touchscreen category of devices. Was it worth the effort?
Intel Core i3-3217U, HD Graphics 4000, 14", 1.9 kg
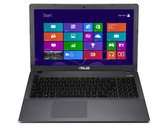
Review AsusPro P56CB-XO193G Ultrabook
Inexpensive business Ultrabook. The 21 mm thin business device from Asus has a 15.6-inch display and combines an Ivy Bridge processor, Nvidia's GT 740M and an SSD cache storage solution with a premium aluminum case. You can buy all that for just 650 Euros ($~851), but what are the drawbacks?
Intel Core i3-3217U, NVIDIA GeForce GT 740M, 15.6", 2.3 kg
Review MSI S30-i3U465 Slim Notebook
Slim, sleek and chic, MSI want you to make their subnotebook your daily companion. Clad completely in white, it should even be appropriate for the fashion-conscious "cosmopolitan ladies". Our test exposes whether the device performs well and for whom it is suitable. We can reveal this much: the S30 is really swift.
Intel Core i3-3217U, HD Graphics 4000, 13.3", 1.4 kgAsus VivoBook S300CA: Intel HD Graphics 4000, 13.30", 1.8 kg
Review » Review Asus VivoBook S300CA Subnotebook
Asus A56CB-XX053H: NVIDIA GeForce GT 740M, 15.60", 2.3 kg
Review » Review Asus A56CB-XX053H Notebook
Lenovo IdeaPad U510 MBM62GE: Intel HD Graphics 4000, 15.60", 2.2 kg
Review » Review Lenovo IdeaPad U510 Ultrabook
Asus VivoBook S200E-CT182H: Intel HD Graphics 4000, 11.60", 1.4 kg
Review » Review Asus VivoBook S200E Subnotebook
Toshiba Satellite C50-B-122: Intel HD Graphics 4000, 15.60", 2.2 kg
External Review » Toshiba Satellite C50-B-122
Asus ASUSPRO ESSENTIAL PU550CA: Intel HD Graphics 4000, 15.60", 2.5 kg
External Review » Asus ASUSPRO ESSENTIAL PU550CA
Acer Aspire E1-570G: NVIDIA GeForce GT 740M, 15.60", 2.3 kg
External Review » Acer Aspire E1-570G
Asus F552CL-SX138H: NVIDIA GeForce 710M, 15.60", 2.4 kg
External Review » Asus F552CL-SX138H
Lenovo IdeaPad S500-59392348: Intel HD Graphics 4000, 15.60", 2.3 kg
External Review » Lenovo IdeaPad S500-59392348
Packard Bell EasyNote TE69: Intel HD Graphics 4000, 15.60", 2.3 kg
External Review » Packard Bell EasyNote TE69
Asus Pro P56CB-XO193G Ultrabook: NVIDIA GeForce GT 740M, 15.60", 2.3 kg
External Review » Asus Pro P56CB-XO193G Ultrabook
Asus X550CA-XO153H: Intel HD Graphics 4000, 15.60", 2.3 kg
External Review » Asus X550CA-XO153H
Acer Aspire E1-470P-6659: Intel HD Graphics 4000, 14.00", 1.9 kg
External Review » Acer Aspire E1-470P-6659
Asus X550CC-XO229D: NVIDIA GeForce GT 720M, 15.60", 2.3 kg
External Review » Asus X550CC-XO229D
Lenovo IdeaPad S500-59397130: Intel HD Graphics 4000, 15.60", 2.4 kg
External Review » Lenovo IdeaPad S500-59397130
Samsung 530U3C-A09UK: Intel HD Graphics 4000, 13.30", 1.5 kg
External Review » Samsung 530U3C-A09UK
Sony Vaio SV-F1521C2E: Intel HD Graphics 4000, 15.60", 2.5 kg
External Review » Sony Vaio SV-F1521C2E
Asus K56CB-X0319H: NVIDIA GeForce GT 740M, 15.60", 2.3 kg
External Review » Asus K56CB-X0319H
Asus PU500CA-XO016X: Intel HD Graphics 4000, 15.60", 2 kg
External Review » Asus PU500CA-XO016X
HP Pavilion 14-b003sa: Intel HD Graphics 4000, 14.00", 1.8 kg
External Review » HP Pavilion 14-b003sa
Asus VivoBook S400CA-CA002H: Intel HD Graphics 4000, 14.00", 1.8 kg
External Review » Asus VivoBook S400CA-CA002H
Lenovo ThinkPad Edge E130-NZU8CGE: Intel HD Graphics 4000, 11.60", 1.5 kg
External Review » Lenovo ThinkPad Edge E130-NZU8CGE
Asus X550CA-DB31: Intel HD Graphics 3000, 15.60", 2.3 kg
External Review » Asus X550CA-DB31
Asus S46CA-WX074H: Intel HD Graphics 4000, 14.00", 2 kg
External Review » Asus S46CA-WX074H
Lenovo IdeaPad U510-59358176: Intel HD Graphics 4000, 15.60", 2.2 kg
External Review » Lenovo IdeaPad U510-59358176
Samsung 530U3C-A04PL: Intel HD Graphics 4000, 13.30", 1.5 kg
External Review » Samsung 530U3C-A04PL
HP Pavilion Sleekbook 15-b020sw: NVIDIA GeForce GT 630M, 15.60", 2.1 kg
External Review » HP Pavilion Sleekbook 15-b020sw
Toshiba Satellite U920t-102: Intel HD Graphics 4000, 12.50", 1.5 kg
External Review » Toshiba Satellite U920t-102
Acer Aspire M3-581TG-33214G52: NVIDIA GeForce GT 640M, 15.60", 2.1 kg
External Review » Acer Aspire M3-581TG-33214G52
Lenovo IdeaPad U510 MBM62GE: Intel HD Graphics 4000, 15.60", 2.2 kg
External Review » Lenovo IdeaPad U510 MBM62GE
HP Pavilion Sleekbook 14-b000sg: Intel HD Graphics 4000, 14.00", 1.8 kg
External Review » HP Pavilion Sleekbook 14-b000sg
Lenovo ThinkPad T430u-N3U89PB: NVIDIA GeForce GT 620M, 14.00", 1.9 kg
External Review » Lenovo ThinkPad T430u-N3U89PB
Samsung 530U3C-A03HU: Intel HD Graphics 4000, 13.30", 1.5 kg
External Review » Samsung 530U3C-A03HU
Samsung 540U3C-A02UK: Intel HD Graphics 4000, 13.30", 1.7 kg
External Review » Samsung 540U3C-A02UK
Asus S56CA-DH31: Intel HD Graphics 4000, 15.60", 2.2 kg
External Review » Asus S56CA-DH31
Acer Aspire V5-571P-6627: Intel HD Graphics 4000, 15.60", 2.4 kg
External Review » Acer Aspire V5-571P-6627
Asus VivoBook S300CA-C1016H: Intel HD Graphics 4000, 13.30", 1.8 kg
External Review » Asus VivoBook S300CA-C1016H
Asus VivoBook F202E-CT148H: Intel HD Graphics 4000, 11.60", 1.4 kg
External Review » Asus VivoBook F202E-CT148H
Asus VivoBook Q200E-BSI3T08: Intel HD Graphics 4000, 11.60", 1.4 kg
External Review » Asus VivoBook Q200E-BSI3T08
Asus VivoBook S400E-CA038H: Intel HD Graphics 4000, 14.00", 1.9 kg
External Review » Asus VivoBook S400E-CA038H
Dell Inspiron 15-3521: AMD Radeon HD 7670M, 15.60", 2.4 kg
External Review » Dell Inspiron 15-3521
Samsung 540U3C-A02UB: Intel HD Graphics 4000, 13.30", 1.7 kg
External Review » Samsung 540U3C-A02UB
Acer Aspire M3-581PT: Intel HD Graphics 4000, 15.60", 2.3 kg
External Review » Acer Aspire M3-581PT
Toshiba Satellite P845T-102: Intel HD Graphics 4000, 14.00", 2 kg
External Review » Toshiba Satellite P845T-102
Toshiba Satellite U940-100: Intel HD Graphics 4000, 14.00", 1.7 kg
External Review » Toshiba Satellite U940-100
Asus S56CA-XX024H: Intel HD Graphics 4000, 15.60", 2.3 kg
External Review » Asus S56CA-XX024H
Asus VivoBook X202E-DH31T: Intel HD Graphics 4000, 11.60", 1.3 kg
External Review » Asus VivoBook X202E-DH31T
Dell Inspiron 5521: Intel HD Graphics 4000, 15.60", 2.4 kg
External Review » Dell Inspiron 5521
Sony Vaio Duo 11 SV-D1121P2EB: Intel HD Graphics 4000, 11.60", 1.3 kg
External Review » Sony Vaio Duo 11 SV-D1121P2EB
Toshiba Satellite U945-S4380: Intel HD Graphics 4000, 14.00", 1.9 kg
External Review » Toshiba Satellite U945-S4380
Sony Vaio SV-T13122CXS: Intel HD Graphics 4000, 13.30", 1.6 kg
External Review » Sony Vaio SV-T13122CXS
Asus VivoBook X202E: Intel HD Graphics 4000, 11.60", 1.3 kg
External Review » Asus VivoBook X202E
Asus VivoBook S200E-CT182H: Intel HD Graphics 4000, 11.60", 1.4 kg
External Review » Asus VivoBook S200E-CT182H
Acer Aspire V5-571-6891: Intel HD Graphics 4000, 15.60", 2.3 kg
External Review » Acer Aspire V5-571-6891
Medion Akoya S4216 MD 99080: Intel HD Graphics 4000, 14.00", 1.9 kg
External Review » Medion Akoya S4216 MD 99080
Asus VivoBook S200E-C158H: Intel HD Graphics 4000, 11.60", 1.6 kg
External Review » Asus VivoBook S200E-C158H
Toshiba Satellite U920T-108: Intel HD Graphics 4000, 12.50", 1.5 kg
External Review » Toshiba Satellite U920T-108