Thanks to the faster P-cores and more E-cores, the i9-13900K is significantly faster than the old i9-12900K (especially in multi-threaded workloads). Compared to the Raphael AMD Ryzen 9 7950X (Zen 4) , the 13900K offers a slightly higher multi-thread-performance and a slightly lower single core performance. In games, the Intel CPU is currently the clear winner (at the time of announcement of the 7950X).
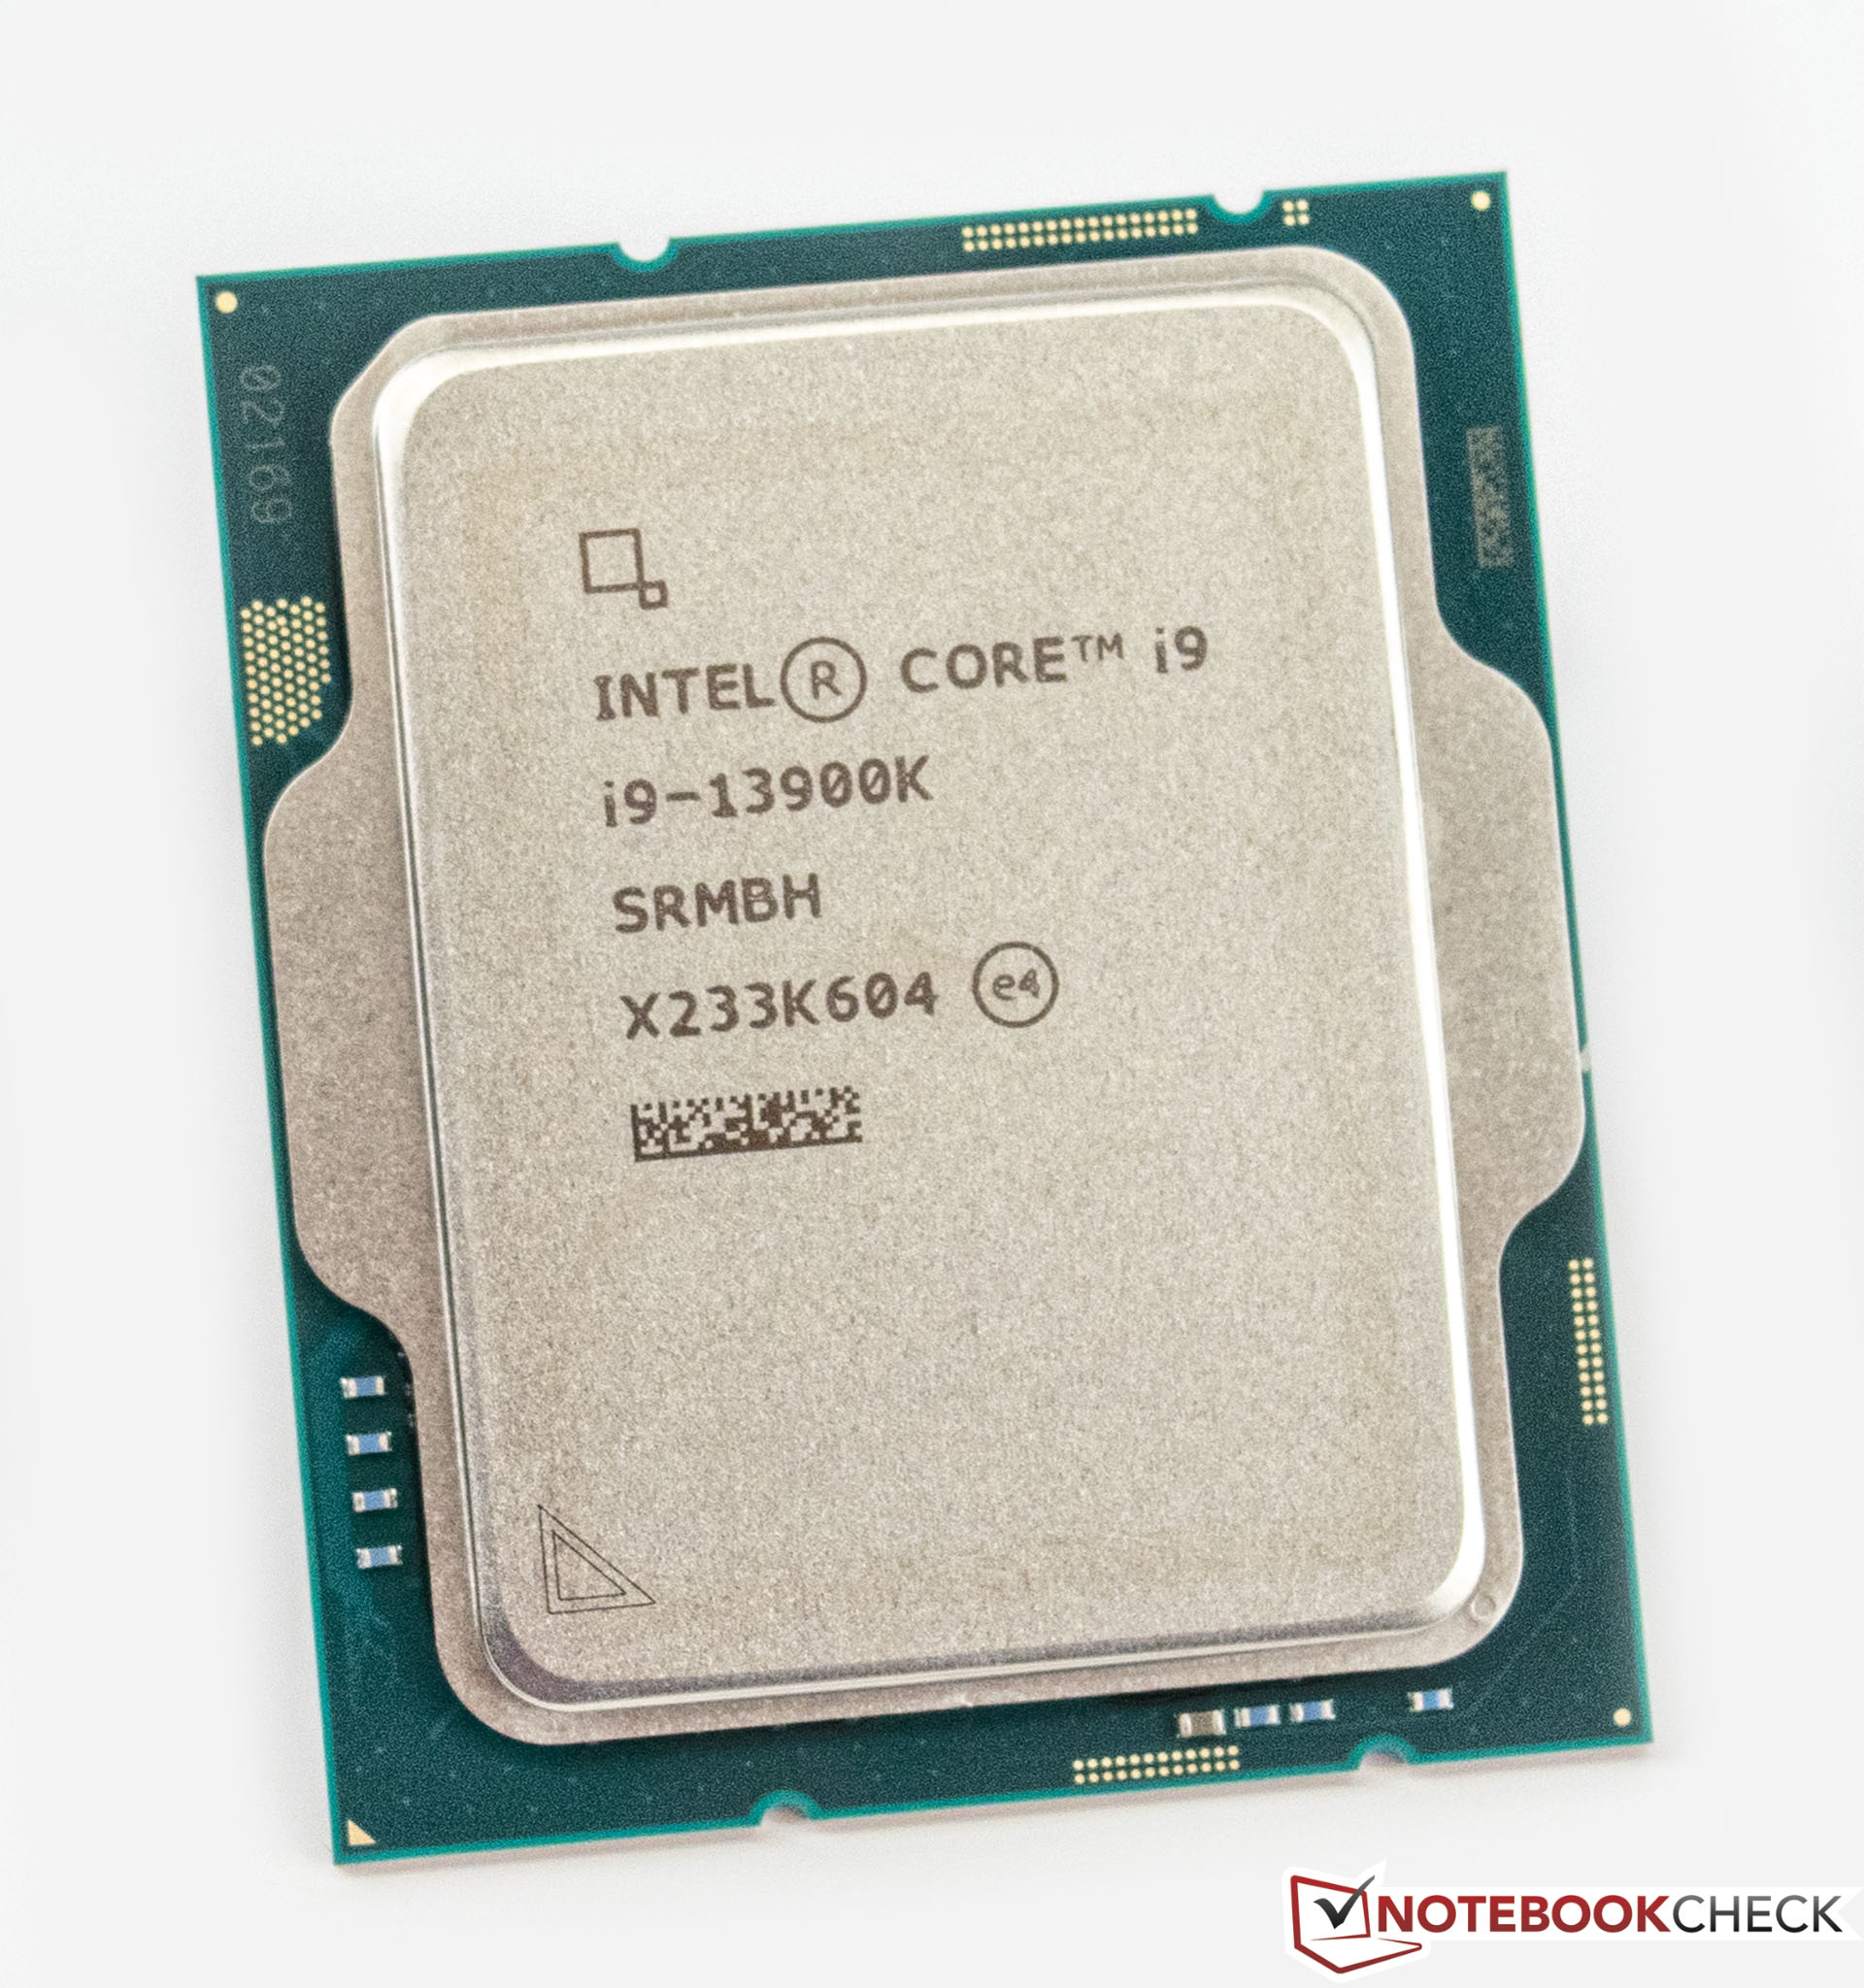
The 13900K is rated at 125 Watt TDP base power (PL1) and 253 Watt Turbo Power (PL2) and therefore slightly higher than the old i9-12900K .
Codename Raptor Lake Series Intel Raptor Lake-S Series: Raptor Lake-S Raptor Lake Clock Rate 3000 - 5800 MHz Level 2 Cache 32 MB Level 3 Cache 36 MB Number of Cores / Threads 24 / 32 Power Consumption (TDP = Thermal Design Power) 125 Watt Manufacturing Technology 10 nm Die Size 257 mm2 Max. Temperature 100 °C Socket LGA 1700 Features Intel UHD Graphics 770, DDR5 5600 MT/s, DDR4 3200 MT/s GPU Intel UHD Graphics 770 (300 - 1650 MHz)64 Bit 64 Bit support Architecture x86 Starting Price $589 U.S. Announcement Date 10/20/2022 Product Link (external) www.intel.com
Performance Rating - CB R15 + R20 + 7-Zip + X265 + Blender + 3DM11 CPU
...
Intel Core Ultra 5 250K Plus
AMD Ryzen 7 9850X3D
...
Cinebench R23 - Cinebench R23 Multi Core
min: 32592 avg: 37310 median: 38271.5 (36%) max: 40103 Points
CPU TDP ? TDP 125 W TDP 150 W 100% 95% 81%
...
Intel Core Ultra 7 270K Plus
...
Cinebench R23 - Cinebench R23 Single Core
min: 2203 avg: 2238 median: 2238.5 (91%) max: 2272 Points
CPU TDP ? TDP 125 W TDP 150 W 100% 99% 97%
...
AMD Ryzen 7 9850X3D
Intel Core Ultra 5 250K Plus
Intel Core Ultra 7 270K Plus
Cinebench R20 - Cinebench R20 CPU (Single Core)
min: 828 avg: 849 median: 849.5 (92%) max: 870 Points
CPU TDP ? TDP 125 W TDP 150 W 97% 100% 99%
...
Intel Core Ultra 5 250K Plus
AMD Ryzen 7 9850X3D
...
Intel Core Ultra 7 270K Plus
Cinebench R20 - Cinebench R20 CPU (Multi Core)
min: 13415 avg: 14459 median: 14620.5 (36%) max: 15181 Points
CPU TDP ? TDP 125 W TDP 150 W 100% 96% 88%
...
Intel Core Ultra 7 270K Plus
...
Cinebench R15 - Cinebench R15 CPU Multi 64 Bit
min: 5321 avg: 5798 median: 5805.5 (37%) max: 6191 Points
CPU TDP ? TDP 125 W TDP 150 W 97% 100% 89%
...
Intel Core Ultra 7 270K Plus
...
0 125 250 375 500 625 750 875 1000 1125 1250 1375 1500 1625 1750 1875 2000 2125 2250 2375 2500 2625 2750 2875 3000 3125 3250 3375 3500 3625 3750 3875 4000 4125 4250 4375 4500 4625 4750 4875 5000 5125 5250 5375 5500 5625 5750 5875 6000 6125 Tooltip Intel NUC13 Raptor Canyon: Ø4779 (4708.1-5265.93)
Gigabyte Aorus Waterforce X II 360 Pump: Balanced / Fan: Zero RPM: Ø5631 (5596.75-5654.51)
Gigabyte Aorus Waterforce X II 360 Pump: Balanced / Fan: Zero RPM: Ø5633 (5600.67-5670.54)
Gigabyte Aorus Waterforce X II 360 Pump: Balanced / Fan: Zero RPM: Ø5556 (5427.41-5672.15)
Schenker XMG SECTOR, i9 13900K, RTX 4090: Ø5917 (5893.62-5963.03)
Intel Core i9-13900K: Ø6182 (6045.95-6213.11)
Cinebench R15 - Cinebench R15 CPU Single 64 Bit
min: 299 avg: 314.1 median: 318 (88%) max: 328 Points
CPU TDP ? TDP 125 W TDP 150 W 95% 100% 99%
Cinebench R11.5 - Cinebench R11.5 CPU Multi 64 Bit
min: 62.2 avg: 67 median: 67.5 (84%) max: 70.78 Points
CPU TDP ? TDP 125 W TDP 150 W 100% 95% 88%
...
Intel Core Ultra 7 270K Plus
Cinebench R11.5 - Cinebench R11.5 CPU Single 64 Bit
min: 3.8 avg: 3.9 median: 3.9 (92%) max: 3.93 Points
CPU TDP ? TDP 125 W TDP 150 W 100% 99% 97%
...
Intel Core Ultra 5 250K Plus
AMD Ryzen 7 9850X3D
...
Cinebench R10 - Cinebench R10 Rend. Single (32bit)
min: 11661 avg: 11989 median: 12017.5 (73%) max: 12259 points
CPU TDP ? TDP 125 W TDP 150 W 100% 98% 97%
AMD Geode LX 800
...
Intel Core Ultra 5 250K Plus
Intel Core Ultra 7 270K Plus
Cinebench R10 - Cinebench R10 Rend. Multi (32bit)
min: 85342 avg: 88253 median: 87738 (64%) max: 92192 points
CPU TDP ? TDP 125 W TDP 150 W 98% 100% 100%
...
Intel Core Ultra 5 250K Plus
Intel Core Ultra 7 270K Plus
...
Cinebench R10 - Cinebench R10 Rend. Multi (64bit)
min: 132000 avg: 134526 median: 133567 (83%) max: 138969 Points
CPU TDP ? TDP 125 W TDP 150 W 95% 96% 100%
...
Intel Core Ultra 5 250K Plus
Intel Core Ultra 7 270K Plus
Cinebench R10 - Cinebench R10 Rend. Single (64bit)
min: 17418 avg: 17943 median: 17998.5 (22%) max: 18355 Points
CPU TDP ? TDP 125 W TDP 150 W 100% 98% 97%
...
Intel Core Ultra 5 250K Plus
Intel Core Ultra 7 270K Plus
...
Intel Core Ultra 7 270K Plus
wPrime 2.10 - wPrime 2.0 1024m *
min: 79.738 avg: 84.6 median: 84.2 (1%) max: 90.13 s
CPU TDP ? TDP 125 W TDP 150 W 100% 100% 100%
wPrime 2.10 - wPrime 2.0 32m *
min: 1.818 avg: 2.1 median: 2 (0%) max: 2.305 s
CPU TDP ? TDP 125 W TDP 150 W 100% 100% 100%
WinRAR - WinRAR 4.0
min: 13210 avg: 14265 median: 14271 (23%) max: 15309 points
CPU TDP ? TDP 125 W TDP 150 W 100% 98% 89%
7-Zip 18.03 - 7-Zip 18.03 Multi Thread 4 runs
min: 127201 avg: 142777 median: 146984 (84%) max: 148053 MIPS
...
Intel Core Ultra 7 270K Plus
7-Zip 18.03 - 7-Zip 18.03 Single Thread 4 runs
min: 7176 avg: 7343 median: 7272 (83%) max: 7539 MIPS
...
Intel Core Ultra 5 250K Plus
Intel Core Ultra 7 270K Plus
...
AMD Ryzen 7 9850X3D
X264 HD Benchmark 4.0 - x264 Pass 2
min: 247.5 avg: 261.5 median: 264.8 (7%) max: 269 fps
CPU TDP ? TDP 125 W TDP 150 W 100% 100% 93%
Intel Pentium 4 2.4 GHz
...
Intel Core Ultra 5 250K Plus
Intel Core Ultra 7 270K Plus
X264 HD Benchmark 4.0 - x264 Pass 1
min: 412 avg: 419 median: 419.3 (11%) max: 425.5 fps
CPU TDP ? TDP 125 W TDP 150 W 97% 100% 98%
...
Intel Core Ultra 5 250K Plus
Intel Core Ultra 7 270K Plus
HWBOT x265 Benchmark v2.2 - HWBOT x265 4k Preset
min: 34.5 avg: 39.9 median: 40.7 (72%) max: 42.6 fps
...
Intel Core Ultra 5 250K Plus
...
0 5 10 15 20 25 30 35 40 45 50 55 Tooltip Intel NUC13 Raptor Canyon: Ø34.1 (0.84-37.5)
Palit GeForce RTX 4090 GameRock OC: Ø40.5 (2.65-57.7)
Schenker XMG SECTOR, i9 13900K, RTX 4090: Ø39.7 (1.88-49.5)
Intel Core i9-13900K @253W: Ø40.9 (2.79-57)
Intel Core i9-13900K: Ø41.1 (1.46-48.4)
TrueCrypt - TrueCrypt Serpent
min: 2.6 avg: 2.9 median: 2.9 (85%) max: 3 GB/s
CPU TDP ? TDP 125 W TDP 150 W 100% 97% 87%
TrueCrypt - TrueCrypt Twofish
min: 5.2 avg: 5.4 median: 5.4 (93%) max: 5.4 GB/s
CPU TDP ? TDP 125 W TDP 150 W 100% 100% 96%
...
Intel Core Ultra 7 270K Plus
TrueCrypt - TrueCrypt AES
min: 20.5 avg: 23.3 median: 22.9 (60%) max: 27 GB/s
CPU TDP ? TDP 125 W TDP 150 W 100% 85% 76%
Blender - Blender 3.3 Classroom CPU *
min: 136 avg: 145.2 median: 140.5 (2%) max: 174 Seconds
CPU TDP ? TDP 125 W TDP 150 W 100% 100% 100%
Blender - Blender 2.79 BMW27 CPU *
min: 80 avg: 85.7 median: 84 (1%) max: 101 Seconds
CPU TDP ? TDP 125 W TDP 150 W 100% 100% 100%
...
Intel Core Ultra 7 270K Plus
...
R Benchmark 2.5 - R Benchmark 2.5 *
min: 0.3468 avg: 0.4 median: 0.4 (8%) max: 0.3911 sec
AMD Ryzen 7 9850X3D
Intel Core Ultra 7 270K Plus
...
3DMark 06 - CPU - 3DMark 06 - CPU
min: 19989 avg: 20578 median: 20192 (34%) max: 21934 Points
VIA C7-M C7-M-1200
...
Intel Core Ultra 7 270K Plus
...
Super Pi mod 1.5 XS 1M - Super Pi mod 1.5 XS 1M *
min: 5.655 avg: 5.7 median: 5.7 (1%) max: 5.86 s
CPU TDP ? TDP 125 W TDP 150 W 100% 100% 100%
Super Pi mod 1.5 XS 2M - Super Pi mod 1.5 XS 2M *
min: 12.287 avg: 12.6 median: 12.5 (1%) max: 13.193 s
CPU TDP ? TDP 125 W TDP 150 W 100% 100% 100%
Super Pi Mod 1.5 XS 32M - Super Pi mod 1.5 XS 32M *
min: 289.628 avg: 296.6 median: 293.3 (1%) max: 310.125 s
CPU TDP ? TDP 125 W TDP 150 W 100% 100% 100%
3DMark Vantage - 3DM Vant. Perf. CPU no Physx
min: 86915 avg: 97290 median: 96473 (71%) max: 112434 Points
...
...
Intel Core Ultra 7 270K Plus
3DMark 11 - 3DM11 Performance Physics
min: 29023 avg: 31289 median: 31187.5 (77%) max: 33181 Points
CPU TDP ? TDP 125 W TDP 150 W 100% 99% 92%
...
Intel Core Ultra 7 270K Plus
AMD Ryzen 7 9850X3D
...
3DMark - 3DMark Ice Storm Physics
min: 79257 avg: 97847 median: 97246.5 (79%) max: 111988 Points
CPU TDP ? TDP 125 W TDP 150 W 100% 91% 96%
3DMark - 3DMark Ice Storm Extreme Physics
min: 80320 avg: 96904 median: 97919.5 (79%) max: 102987 Points
CPU TDP ? TDP 125 W TDP 150 W 100% 93% 99%
3DMark - 3DMark Ice Storm Unlimited Physics
min: 83056 avg: 98634 median: 97311 (78%) max: 105981 Points
CPU TDP ? TDP 125 W TDP 150 W 100% 92% 93%
...
...
Intel Core Ultra 5 250K Plus
3DMark - 3DMark Cloud Gate Physics
min: 26626 avg: 29034 median: 29044.5 (73%) max: 30955 Points
CPU TDP ? TDP 125 W TDP 150 W 100% 98% 91%
...
Intel Core Ultra 7 270K Plus
3DMark - 3DMark Fire Strike Standard Physics
min: 46013 avg: 51456 median: 51140 (91%) max: 54226 Points
CPU TDP ? TDP 125 W TDP 150 W 100% 100% 89%
...
Intel Core Ultra 5 250K Plus
Intel Core Ultra 7 270K Plus
3DMark - 3DMark Time Spy CPU
min: 16236 avg: 20507 median: 20037 (84%) max: 22794 Points
CPU TDP ? TDP 125 W TDP 150 W 100% 95% 77%
...
Intel Core Ultra 5 250K Plus
Intel Core Ultra 7 270K Plus
...
Intel Core Ultra 7 270K Plus
Geekbench 6.6 - Geekbench 6.6 Single-Core
Geekbench 6.6 - Geekbench 6.6 Multi-Core
...
Intel Core Ultra 5 250K Plus
...
Geekbench 5.5 - Geekbench 5.1 - 5.5 64 Bit Single-Core
min: 2106 avg: 2237 median: 2286 (77%) max: 2290 points
Geekbench 5.5 - Geekbench 5.1 - 5.5 64 Bit Multi-Core
min: 22448 avg: 23743 median: 24033 (43%) max: 24157 points
...
Intel Core Ultra 5 250K Plus
Intel Core Ultra 7 270K Plus
Geekbench 5.0 - Geekbench 5.0 64 Bit Single-Core
min: 2148 avg: 2191 median: 2197 (10%) max: 2246 points
...
Intel Core Ultra 5 250K Plus
...
AMD Ryzen 7 9850X3D
Geekbench 5.0 - Geekbench 5.0 64 Bit Multi-Core
min: 22024 avg: 23446 median: 23664 (75%) max: 24021 points
...
Intel Core Ultra 5 250K Plus
Intel Core Ultra 7 270K Plus
Geekbench 4.4 - Geekbench 4.1 - 4.4 64 Bit Single-Core
min: 9218 avg: 9542 median: 9598 (87%) max: 9683 points
...
Intel Core Ultra 5 250K Plus
...
Geekbench 4.4 - Geekbench 4.1 - 4.4 64 Bit Multi-Core
min: 77347 avg: 84105 median: 85336 (81%) max: 86695 points
...
AMD Ryzen 7 9850X3D
Intel Core Ultra 5 250K Plus
...
Intel Core Ultra 7 270K Plus
Mozilla Kraken 1.1 - Kraken 1.1 Total Score *
min: 423 avg: 430.6 median: 432 (1%) max: 438 ms
WebXPRT 4 - WebXPRT 4 Score
min: 304 avg: 317.6 median: 316 (79%) max: 335 Points
...
Intel Core Ultra 5 250K Plus
...
WebXPRT 3 - WebXPRT 3 Score
min: 338 avg: 364 median: 368 (62%) max: 382 Points
...
Intel Core Ultra 7 270K Plus
Intel Core Ultra 5 250K Plus
...
CrossMark - CrossMark Overall
min: 2263 avg: 2497 median: 2580 (90%) max: 2589 Points
...
AMD Ryzen 7 9850X3D
Intel Core Ultra 5 250K Plus
Intel Core Ultra 7 270K Plus
Power Consumption - Prime95 Power Consumption - external Monitor *
min: 228 avg: 354.3 median: 359 (62%) max: 471 Watt
CPU TDP ? TDP 125 W TDP 150 W 100% 203% 323%
...
Intel Core Ultra 7 270K Plus
0 15 30 45 60 75 90 105 120 135 150 165 180 195 210 225 240 255 270 285 300 315 330 345 360 375 390 405 420 435 450 465 480 495 510 525 540 555 Tooltip Intel NUC13 Raptor Canyon: Ø228 (209-335)
Intel Core i9-13900K @253W: Ø355 (319-397)
Schenker XMG SECTOR, i9 13900K, RTX 4090: Ø363 (338-401)
Intel Core i9-13900K: Ø471 (414-561)
Power Consumption - Cinebench R15 Multi Power Consumption - external Monitor *
min: 349 avg: 392.5 median: 370.5 (68%) max: 480 Watt
CPU TDP ? TDP 125 W TDP 150 W 100% 261% 293%
...
Intel Core Ultra 7 270K Plus
0 15 30 45 60 75 90 105 120 135 150 165 180 195 210 225 240 255 270 285 300 315 330 345 360 375 390 405 420 435 450 465 480 495 510 525 540 Tooltip Intel NUC13 Raptor Canyon: Ø349 (264-406)
Intel Core i9-13900K @253W: Ø355 (216-438)
Schenker XMG SECTOR, i9 13900K, RTX 4090: Ø386 (377-426)
Intel Core i9-13900K: Ø480 (263-553)
Power Consumption - Idle Power Consumption - external Monitor *
min: 41.8 avg: 91.7 median: 94.4 (62%) max: 138.2 Watt
CPU TDP ? TDP 125 W TDP 150 W 100% 134% 214%
...
AMD Ryzen 7 9850X3D
...
0 5 10 15 20 25 30 35 40 45 50 55 60 65 70 75 80 85 90 95 100 105 110 115 120 125 130 135 140 145 150 155 160 165 Tooltip Intel NUC13 Raptor Canyon: Ø41.8 (39.3-51.5)
Intel Core i9-13900K @253W: Ø68.7 (64.7-80.3)
Asus TUF Gaming GeForce RTX 4070 Ti: Ø75.4 (74.8-78.8)
Gigabyte Aorus GeForce RTX 4070 Ti Master: Ø75.5 (74.3-77.8)
Intel Core i9-13900K: Ø84.2 (80.9-93.4)
Zotac Gaming GeForce RTX 4070 AMP Airo: Ø94.4 (84.3-115.5)
Gigabyte GeForce RTX 4080 Super Gaming OC: Ø96.2 (87.9-117.9)
Schenker XMG SECTOR, i9 13900K, RTX 4090: Ø96.7 (93.6-102.9)
NVIDIA GeForce RTX 4070 Super Founders Edition: Ø114.9 (103.1-136.5)
Gigabyte GeForce RTX 4070 Super Gaming OC 12G: Ø122.6 (114.8-153.4)
Asus TUF Gaming GeForce RTX 4070 Ti Super: Ø138.2 (129.5-168.8)
Power Consumption - Power Efficiency - Cinebench R15 Multi external Monitor
min: 12.9 avg: 15 median: 15.2 (11%) max: 16.8 Points per Watt
CPU TDP ? TDP 125 W TDP 150 W 77% 100% 90%
...
AMD Ryzen 7 9850X3D
...
- Range of benchmark values
- Average benchmark values
* Smaller numbers mean a higher performance
log 13. 04:04:03
#0 ran 0s before starting gpusingle class +0s ... 0s
#1 no ids found in url (should be separated by "_") +0s ... 0s
#2 not redirecting to Ajax server +0s ... 0s
#3 did not recreate cache, as it is less than 5 days old! Created at Thu, 11 Jun 2026 09:46:03 +0200 +0.005s ... 0.005s
#4 composed specs +0.015s ... 0.019s
#5 did output specs +0s ... 0.019s
#6 getting avg benchmarks for device 14625 +0.045s ... 0.064s
#7 got single benchmarks 14625 +0.045s ... 0.11s
#8 got avg benchmarks for devices +0s ... 0.11s
#9 min, max, avg, median took s +2.6s ... 2.709s
#10 return log +0.574s ... 3.283s