Notebookcheck Logo

Gigabyte GeForce RTX 4070 Super Gaming OC 12G Review: Beats the RTX 3090 and RX 7800 XT for a $50 premium over the Founders Edition

AD104 done just right. The Gigabyte GeForce RTX 4070 Super Gaming OC presents a faster AD104 die and better cooling that fully distinguishes it from the Founders Edition card. The RTX 4070 Super Gaming OC offers palpable gains over the RTX 3090 and the AMD Radeon RX 7800 XT. Our review looks into whether this is worth the US$50 moolah over the RTX 4070 Super Founders Edition.
Gigabyte GeForce RTX 4070 Super Gaming OC 12G in review

We recently reviewed the Nvidia GeForce RTX 4070 Super Founders Edition and saw it offer performance that is in line with the RTX 3090. Alongside the Founders Edition (FE), Nvidia's add-in board (AiB) partners have their own take on the new AD104 GPU with 7,168 CUDA cores.

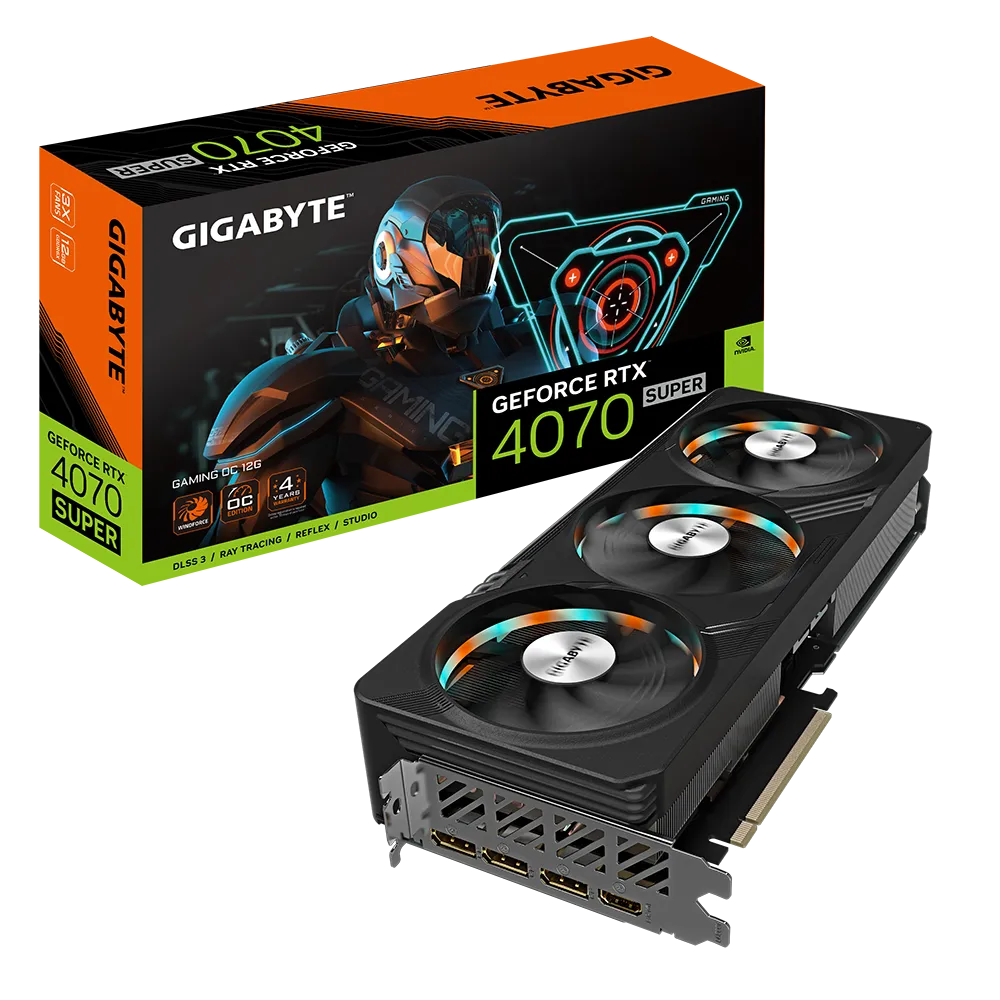
One such offering is the new Gigabyte GeForce RTX 4070 Super Gaming OC 12G.

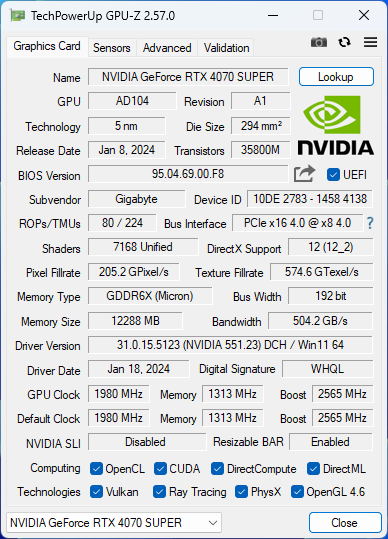
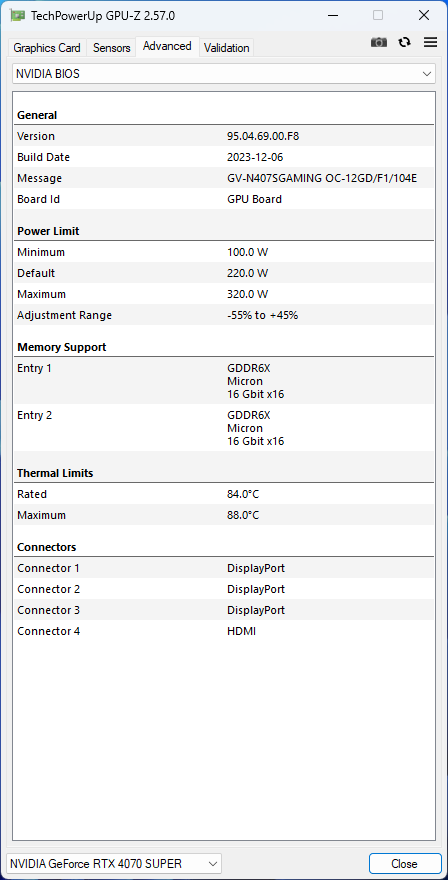
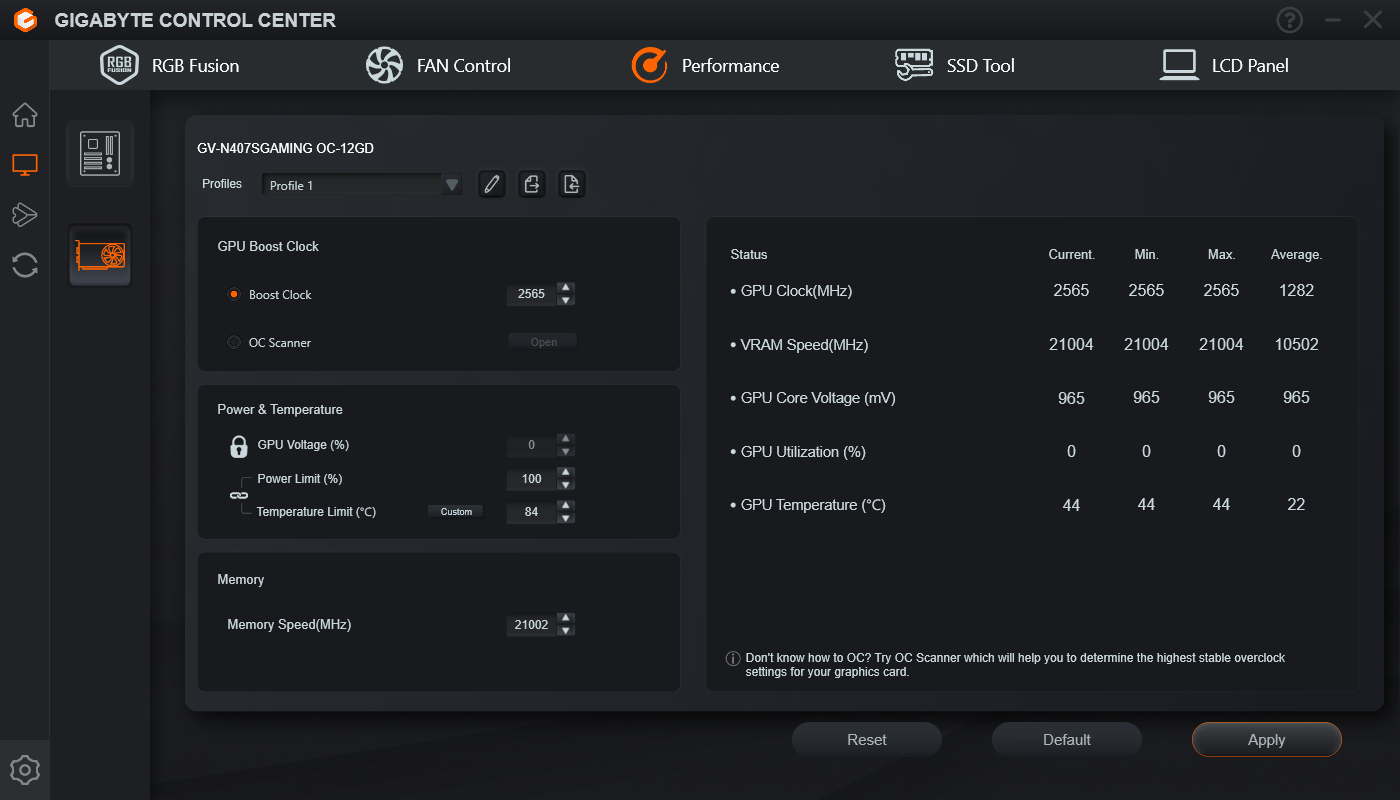
Obvious design changes from the Founders Edition apart, the Gigabyte GeForce RTX 4070 Super Gaming OC 12G also offers an increased boost of 2,565 MHz as opposed to the 2,475 MHz reference boost clock.

Additionally, Gigabyte's card also offers a higher power headroom with the ability to push up to 320 W compared to the RTX 4070 Super FE's 240 W max TGP.

The Gigabyte GeForce RTX 4070 Super Gaming OC 12G retails for ₹62,490 in India or US$650 in the U.S. The card comes with a standard three-year manufacturer warranty that is extendable by another year upon product registration. 

In this review, we see how well the RTX 4070 Super Gaming OC 12G's US$50 markup over the Founders Edition's US$599 MSRP translates into real-world benefits.

Comparison of the Gigabyte GeForce RTX 4070 Super Gaming OC 12G with other Nvidia GPUs

Specification RTX 4090 FE RTX 4080 Super FE RTX 4080 FE Asus TUF RTX 4070 Ti Gigabyte RTX 4070 Super Gaming OC Zotac RTX 4070 AMP Airo KFA2 RTX 4060 Ti EX RTX 3090 Ti FE RTX 3090 FE RTX 3080 Ti FE RTX 3070 FE Titan RTX
Chip AD102 AD103 AD103 AD104 AD104 AD104 AD106 GA102 GA102 GA102 GA104 TU102
FinFET Process Custom 4N Custom 4N Custom 4N Custom 4N Custom 4N Custom 4N Custom 4N 8 nm 8 nm 8 nm 8 nm 12 nm
CUDA Cores 16,384 10,240 9,728 7,680 7,168 5,888 4,352 10,752 10,496 10,240 5,888 4,608
Texture Units 512 320 304 240 224 184 136 336 328 320 184 288
Tensor Cores 512 4th Gen. 320 4th Gen. 304 4th Gen. 240 4th Gen. 224 4th Gen. 184 4th Gen. 136 4th Gen. 336 3rd Gen. 328 3rd Gen. 320 3rd Gen. 184 3rd Gen. 576 2nd Gen.
RT Cores 128 3rd Gen. 80 3rd Gen. 76 3rd Gen. 60 3rd Gen. 56 3rd Gen. 46 3rd Gen. 34 3rd Gen. 84 2nd Gen. 82 2nd Gen. 80 2nd Gen. 46 2nd Gen. 72
GPU Base Clock 2,235 MHz 2,295 MHz 2,205 MHz 2,310 MHz 1,980 MHz 1,920 MHz 2,310 MHz 1,560 MHz 1,395 MHz 1,365 MHz 1,500 MHz 1,350 MHz
GPU Boost Clock 2,520 MHz 2,550 MHz 2,505 MHz 2,760 MHz 2,565 MHz 2,535 MHz 2,535 MHz 1,860 MHz 1,695 MHz 1,665 MHz 1,750 MHz 1,770 MHz
Memory Bus 384-bit 256-bit 256-bit 192-bit 192-bit 192-bit 128-bit 384-bit 384-bit 384-bit 256-bit 384-bit
Memory Bandwidth 1,008 GB/s 736.3 GB/s 716.8 GB/s 504 GB/s 504 GB/s 504 GB/s 288 GB/s 1,008 GB/s 936 GB/s 912 GB/s 448 GB/s 672 GB/s
Video Memory 24 GB GDDR6X 16 GB GDDR6X 16 GB GDDR6X 12 GB GDDR6X 12 GB GDDR6X 12 GB GDDR6X 8 GB GDDR6 24 GB GDDR6X 24 GB GDDR6X 12 GB GDDR6X 8 GB GDDR6 24 GB GDDR6
Power Consumption 450 W 320 W 320 W 285 W 220 W 215 W 160 W 450 W 350 W 350 W 220 W 280 W

A tour of the Gigabyte GeForce RTX 4070 Super Gaming OC 12G

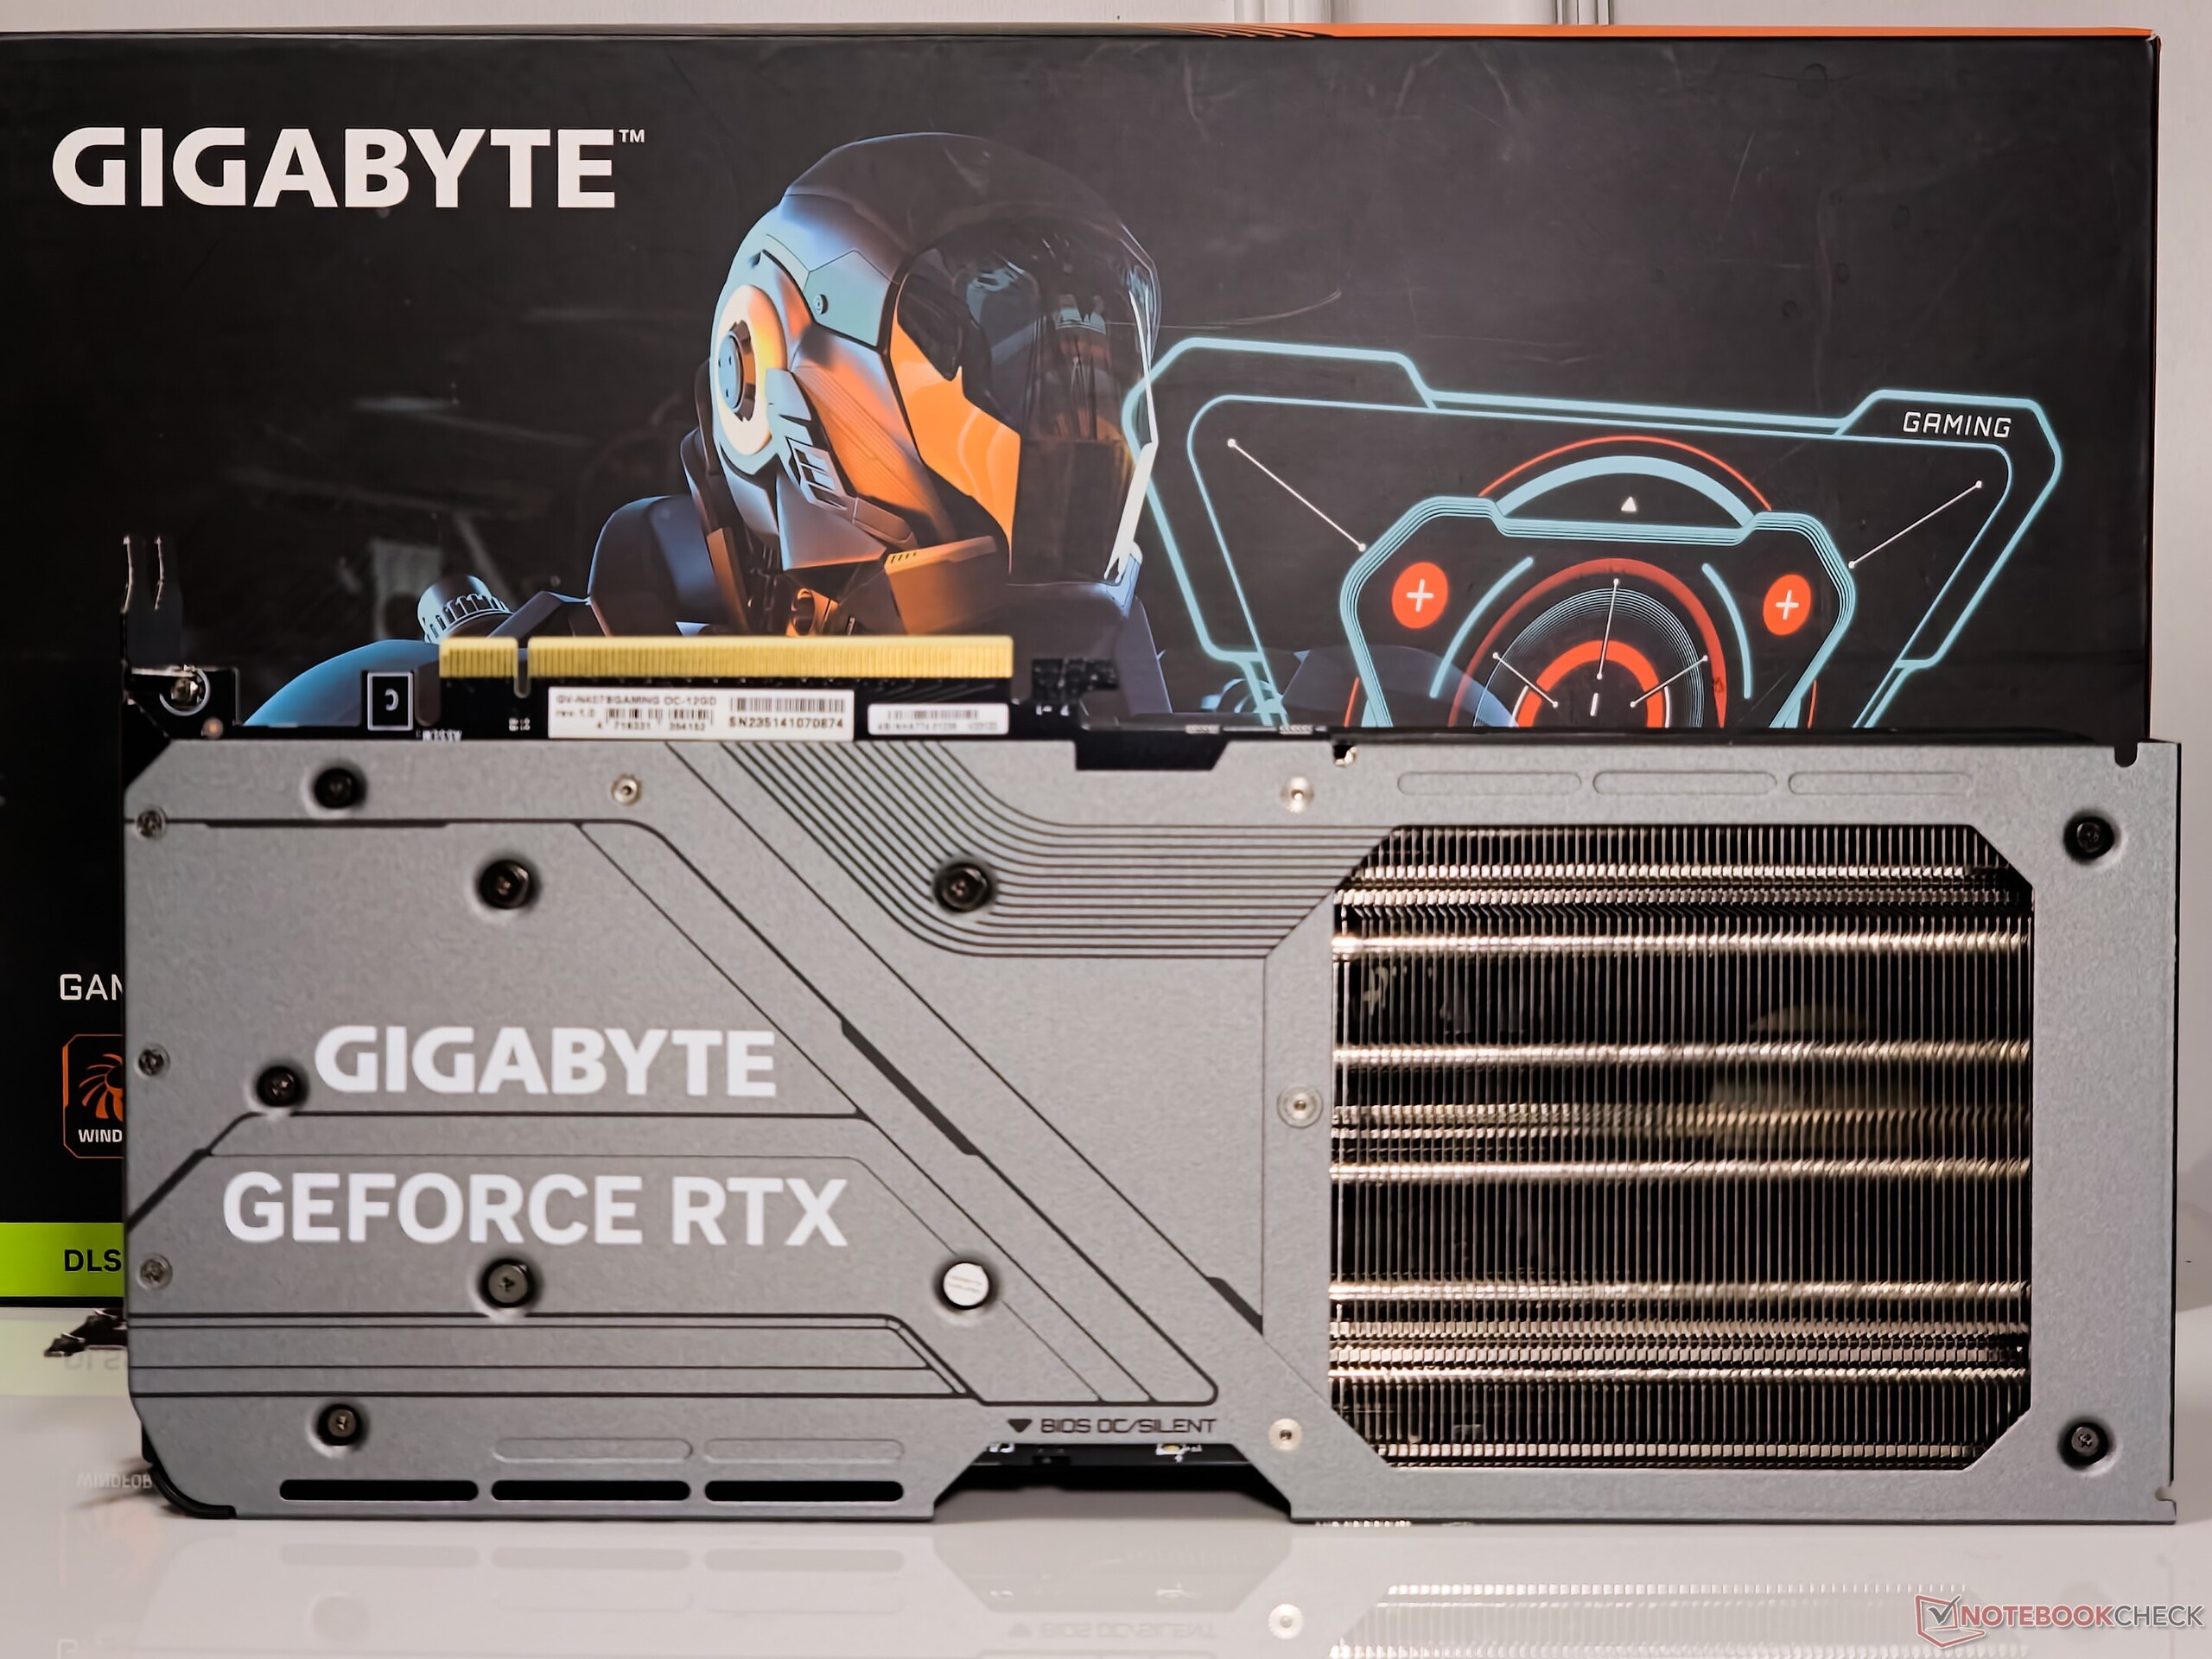
The Gigabyte GeForce RTX 4070 Super Gaming OC 12G looks exactly identical to its RTX 4070 predecessor. Therefore, the changes are internal and have to do with the new AD104 core itself.

Measuring 300 x 130 x 57.6 mm, the RTX 4070 Super Gaming OC easily fits in most ATX cases. Given the relatively lighter 1.26 kg weight of the card, Gigabyte does not provide any anti-sag bracket in the box.

The card's front shroud is plastic, but the backplate is made of high quality metal with adequate space for air exhaust what the company refers to as "Screen cooling".

Gigabyte GeForce RTX 4070 Super Gaming OC 12G: Front
Gigabyte GeForce RTX 4070 Super Gaming OC 12G: Rear
Gigabyte GeForce RTX 4070 Super Gaming OC 12G

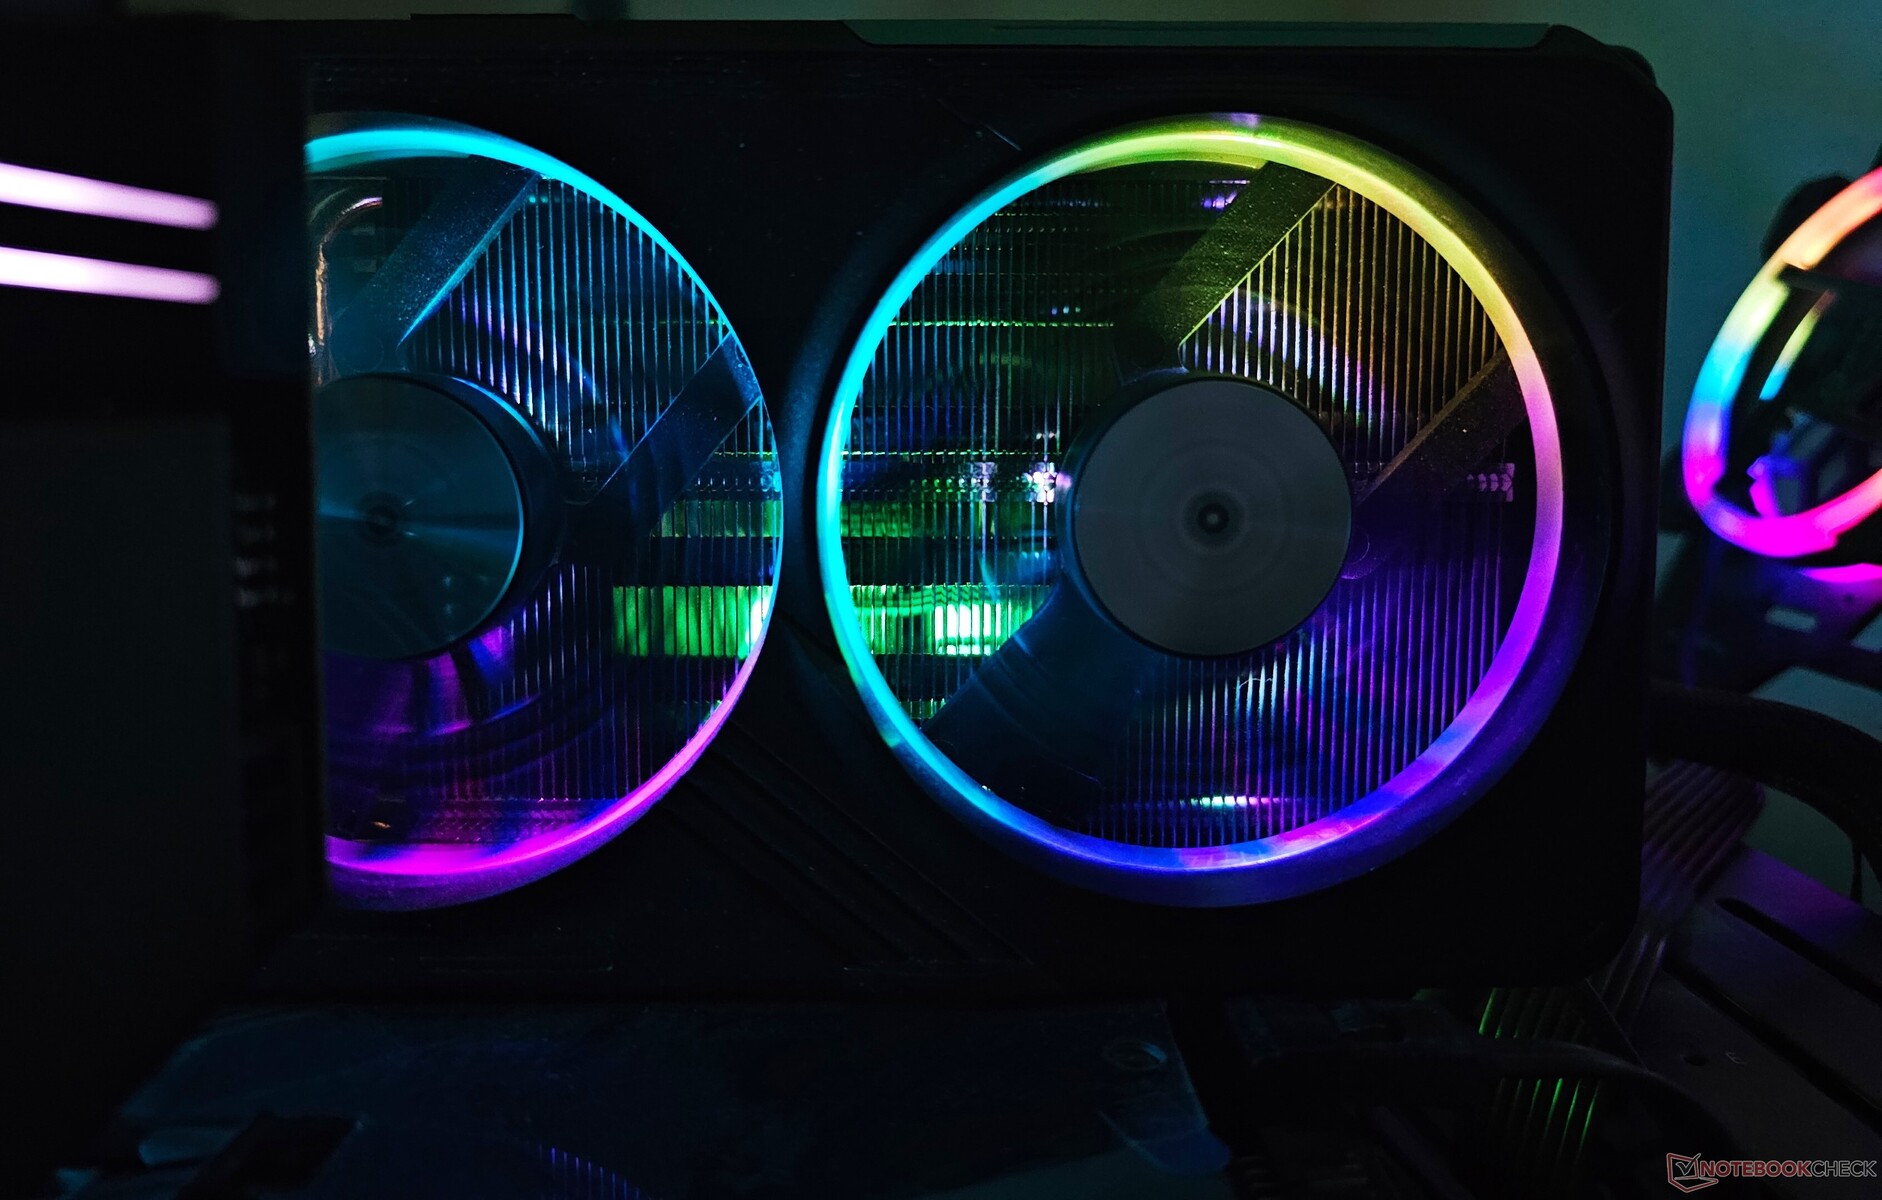
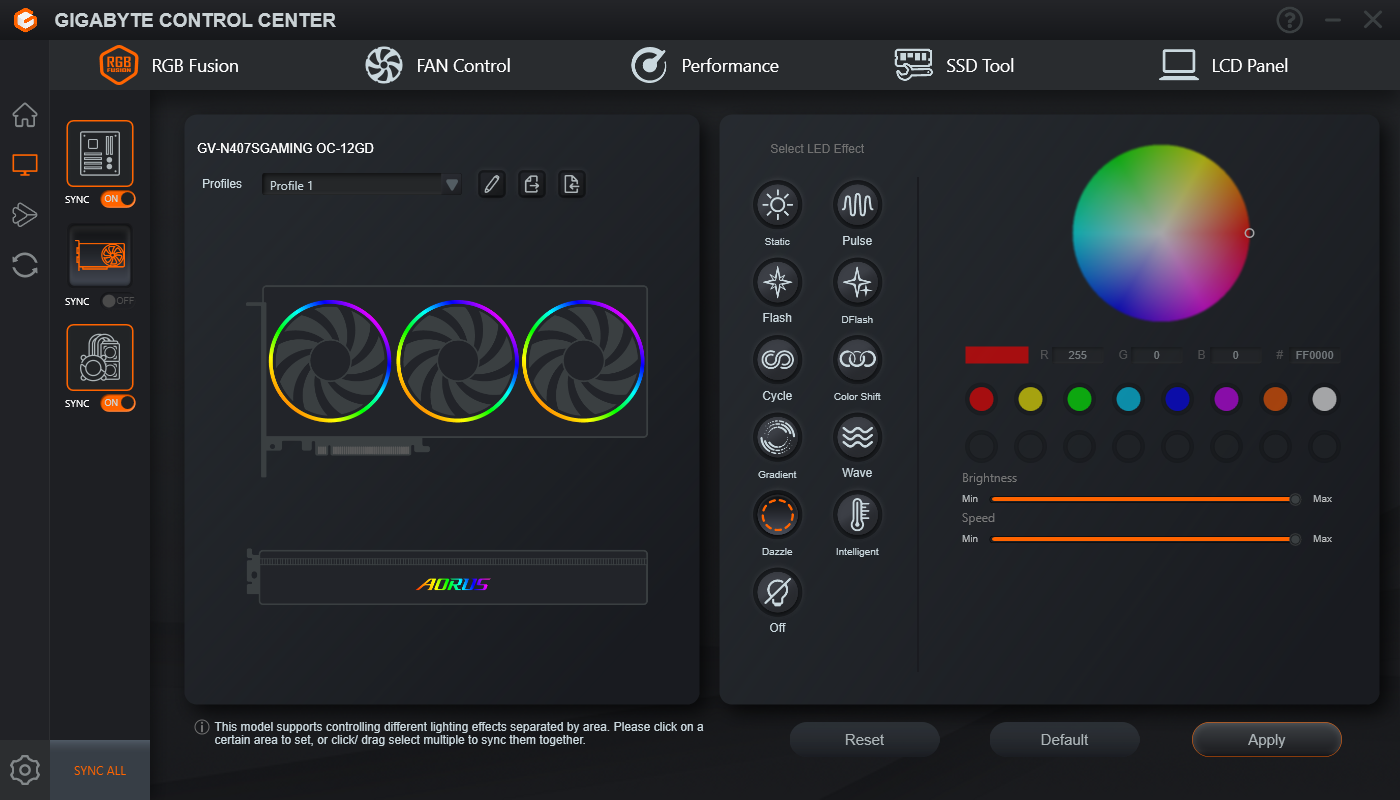
Gigabyte cards have somewhat of a different RGB aesthetic compared to their Aorus counterparts. While Aorus GPUs, such as the RTX 4070 Ti Master, have a discontiguous lighting system with individual LEDs on each fan fin, Gigabyte cards sport the more conventional RGB ring.

As to which looks better is a matter of preference, but the RGB implementation in Aorus cards is certainly more prominent and stands out.

The RTX 4070 Super Gaming OC also tries to mimic its Aorus counterpart by offering an LCD-esque panel on the top. However, this is not a programmable LCD display but just a fancy Gigabyte logo. Thankfully, it glows with customizable lighting.

While it is understandable that OEMs would want to make their brand label shine through, users would be more interested in showing off the GeForce RTX label in RGB as well. Unfortunately, this is not something that is seen with a lot of OEM cards.

Gigabyte RGB logo on the top
RGB effects on the fans

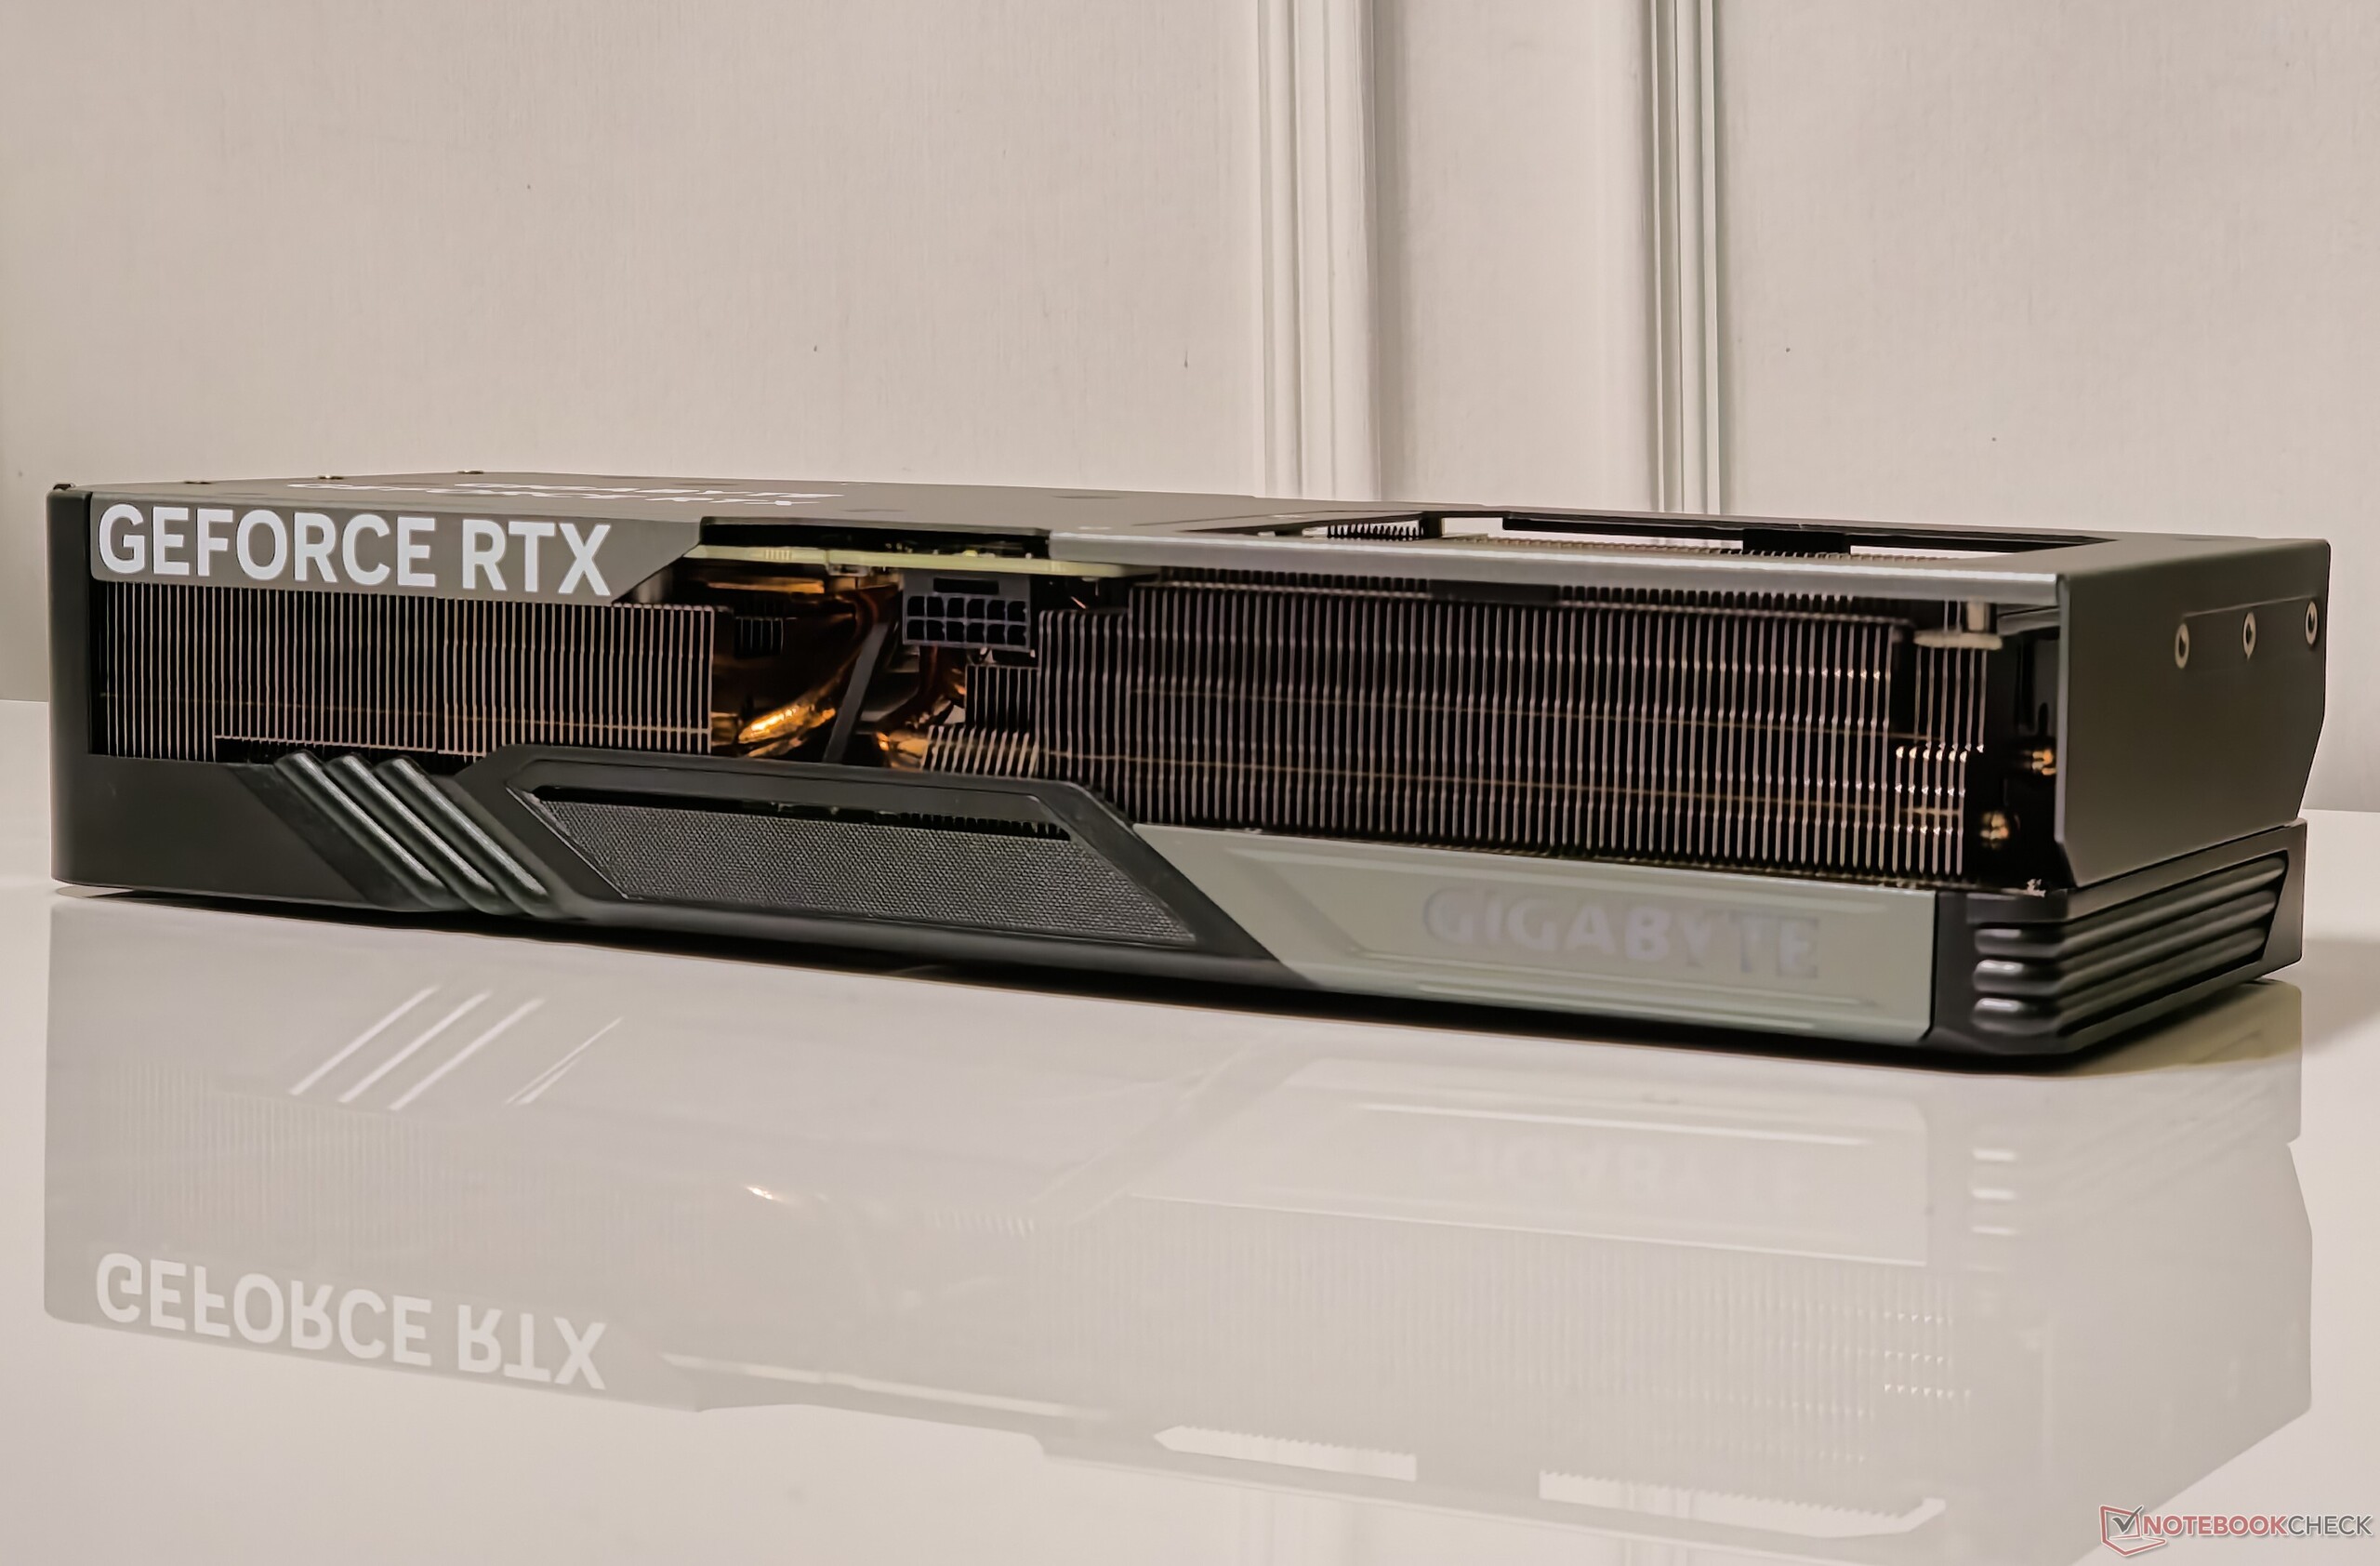
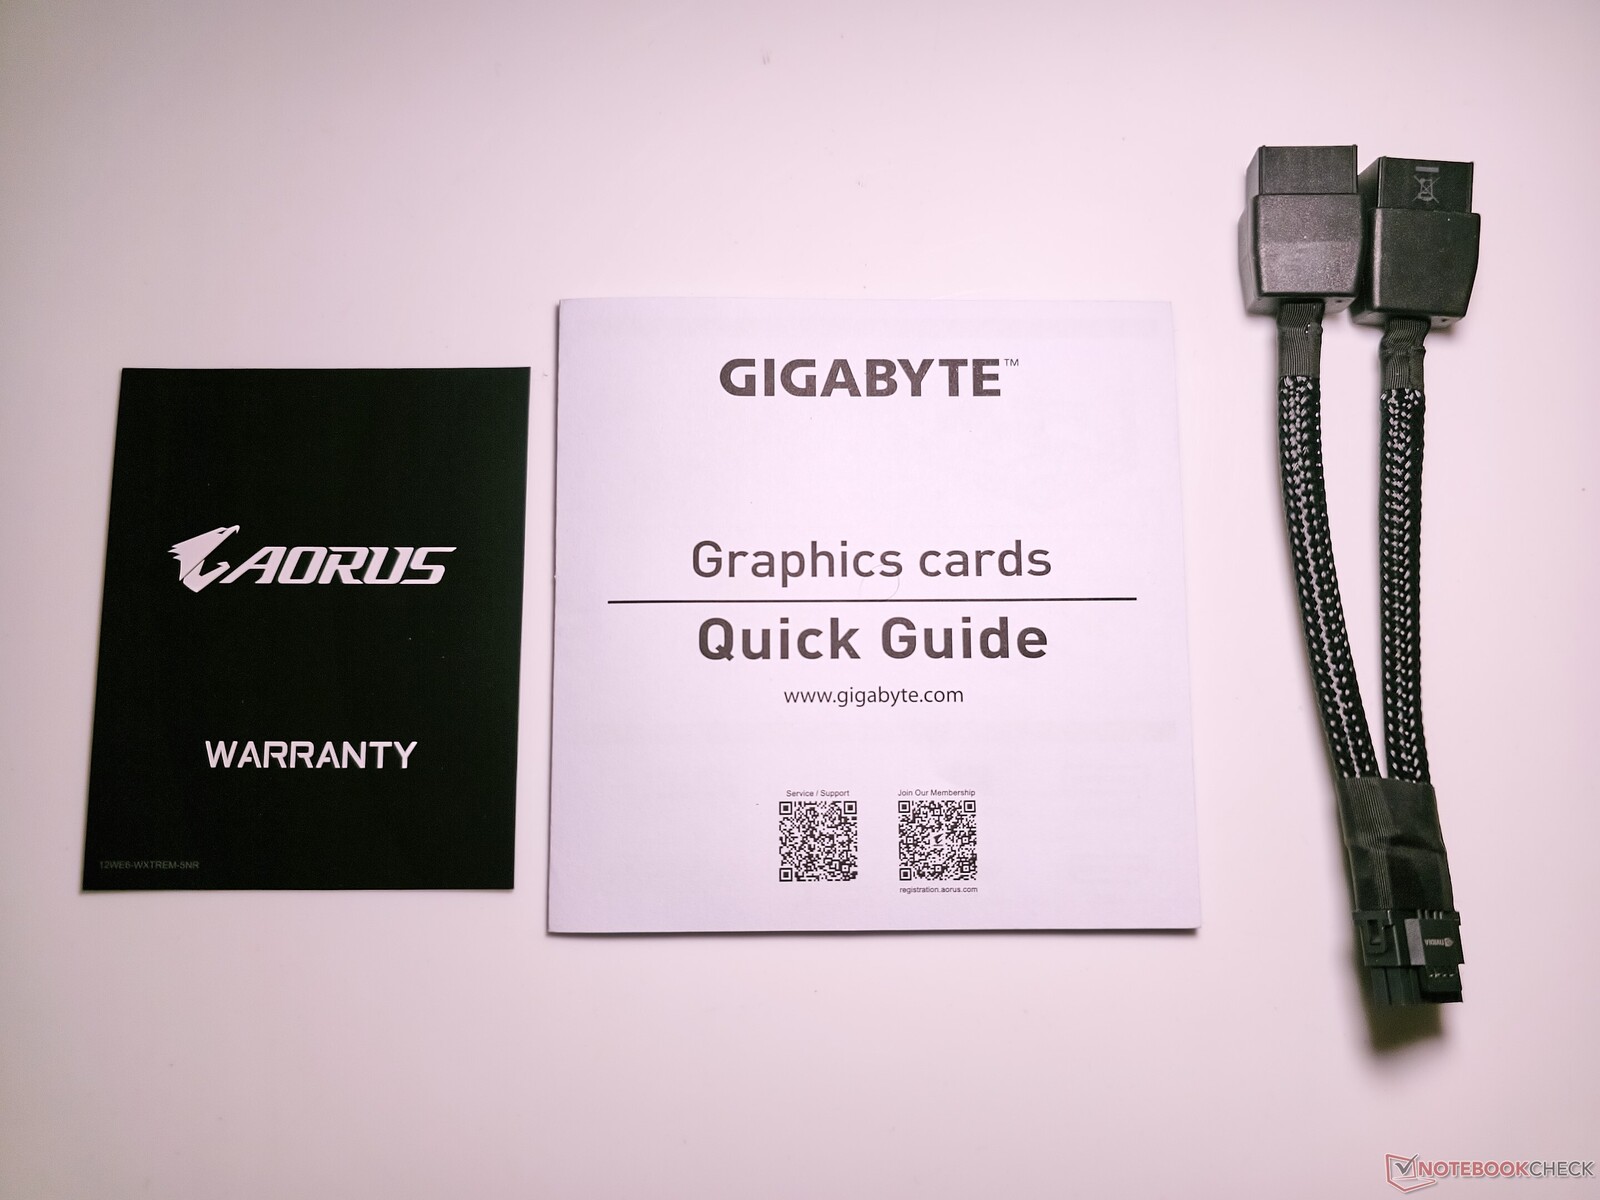
In the box, you get a warranty card, a Quick start guide, and a 12VHPWR to 2x 8-pin power connector.

The RTX 4070 Super Gaming OC offers the standard set of ports including 3x DisplayPort 1.4-out and 1x HDMI 2.1-out.

Also present is a dual-BIOS switch that can toggle between BIOS OC and Silent modes. The 12VHPWR connector fits snugly to the supplied cable with a satisfactory click. Beside the connector is an LED that indicates if there's any problem with the power connection.

12VHPWR connector
12VHPWR connector
3x DisplayPort 1.4-out, 1x HDMI 2.1a-out
Warranty card, Quick start guide, and 12VHPWR to 2x 8-pin power cable

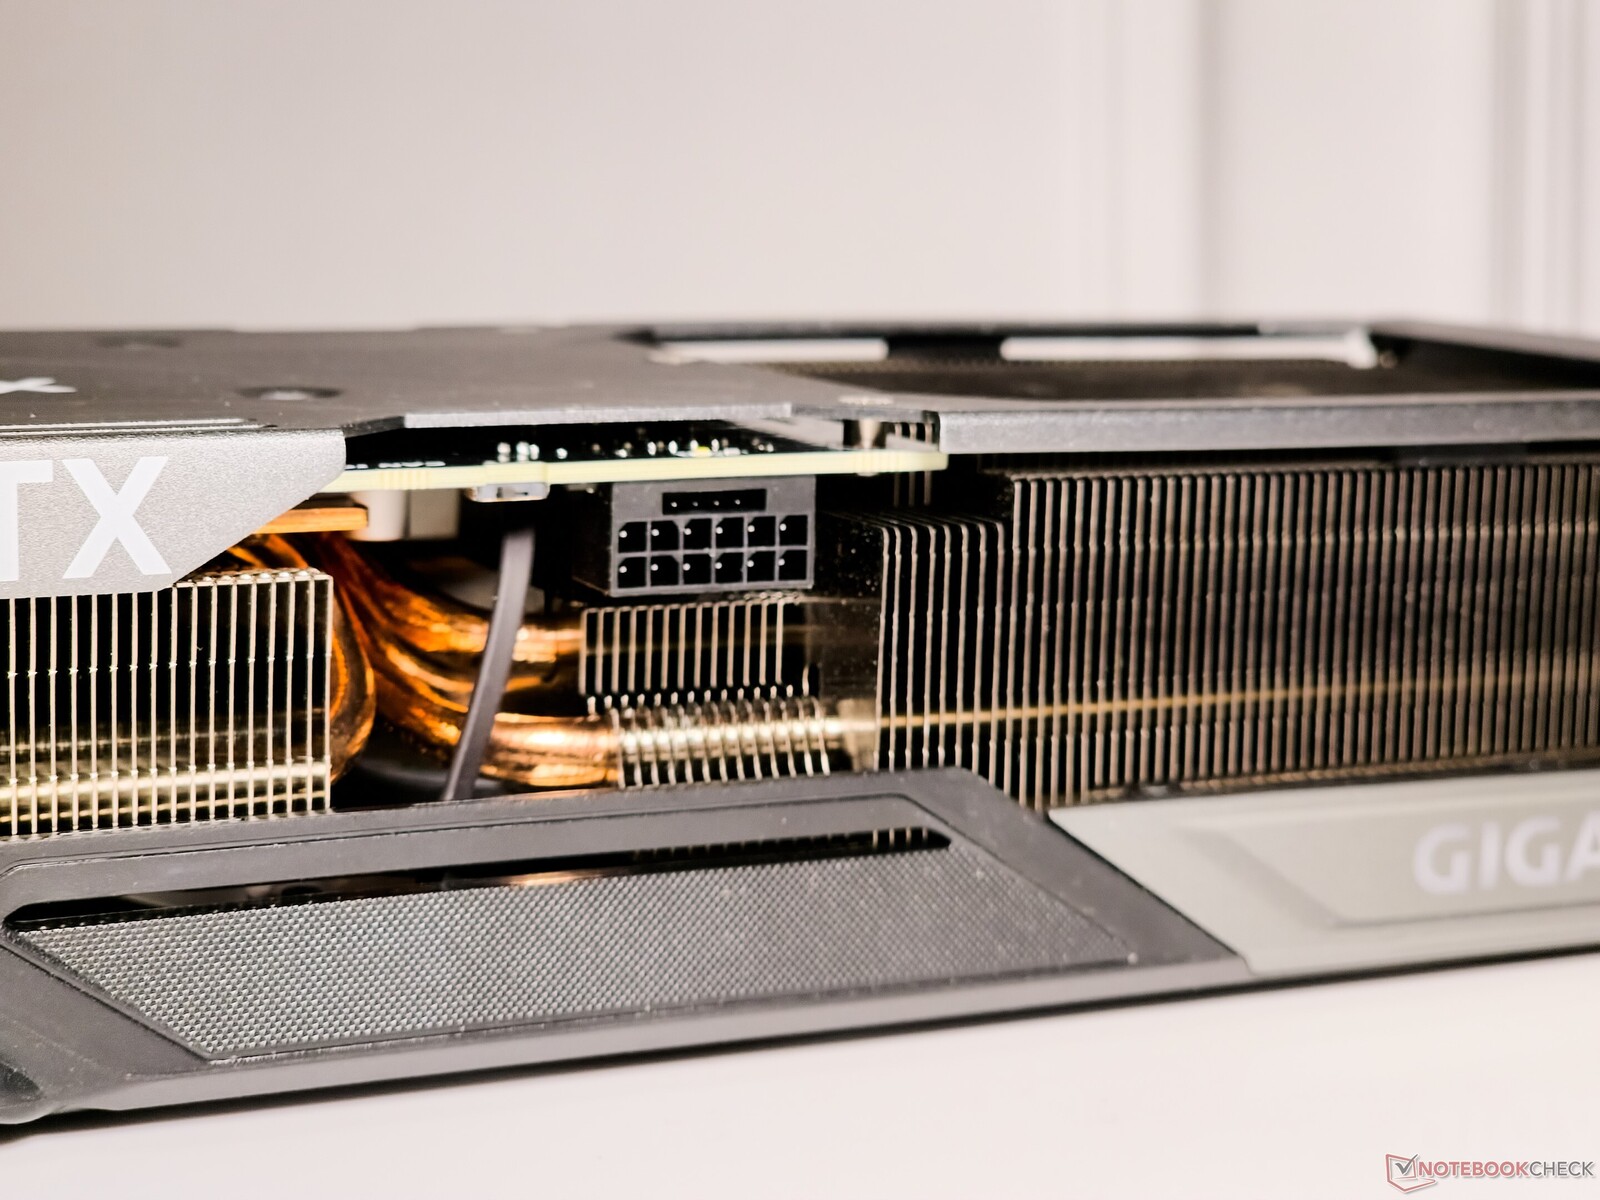
The Gigabyte GeForce RTX 4070 Super Gaming OC 12G can boost up to 2,565 MHz with a significant 45% higher TGP headroom up to 320 W.

GPU-Z: Gigabyte GeForce RTX 4070 Super Gaming OC 12G

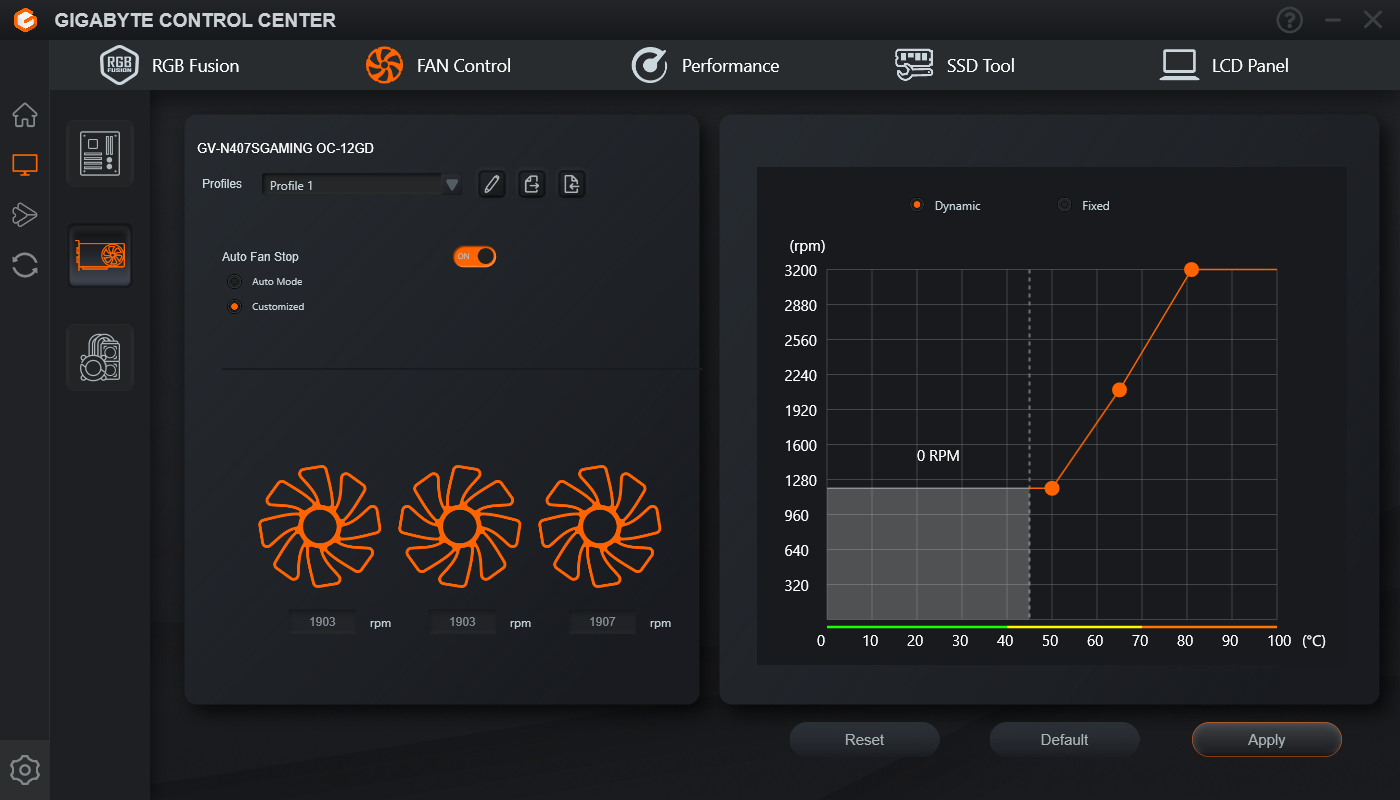
Gigabyte Control Center (GCC) helps control various aspects the RTX 4070 Super Gaming OC. The software has had hard days, but it has come a long way in terms of stability since our review of the Aorus RTX 4070 Ti Master.

During our time with the GPU, we didn't encounter any show-stopping bugs. Nevertheless, GCC needs further polish before it can be 100% relied upon.

Fan curve adjustment
GPU overclock settings
RGB controls
RGB controls

Test bench: RTX 4070 Super Gaming OC says Hi to the Intel Core i9-13900K

As has been our norm for many recent GPU reviews, our test system is based on the Intel Core i9-13900K and Z790 platform to ensure that the cards are not CPU bottlenecked. 

  • Cooler MasterFrame 700 test bench
  • Intel Core i9-13900K with PL1=PL2
  • Gigabyte Z790 Aorus Master motherboard
  • Gigabyte Aorus Gen4 2 TB NVMe SSD
  • Sabrent Rocket 4 Plus Gen4 2 TB NVMe SSD
  • 2x 16 GB Kingston Fury Renegade DDR5-6400 RAM with timings 32-39-39-80 at 1.40 V
  • Gigabyte M28U 4K 144 Hz monitor
  • Gigabyte Aorus Waterforce X II 360 AiO cooler
  • Cooler Master MVE Gold V2 1250 ATX 3.0 fully modular PSU

Windows 11 23H2 with the latest patches, together with Nvidia Game Ready Driver version 551.23 was used.

Based on our own testing, performance numbers from this config are pretty much comparable to those from an AMD Ryzen 9 7950X and X670E setup.

We would like to thank Cooler Master for supplying the test bench and PSU, Gigabyte for the motherboard, CPU, SSD, AiO cooler, and monitor, Sabrent for the SSD, and Kingston for the memory.

Synthetic benchmarks: Leads the RTX 4070 Super FE by a whisker

At the outset, the RTX 4070 Super Gaming OC and the Founders Edition perform on similar lines. We do see Gigabyte's GPU coming slight ahead of the FE card in individual tests, and this is expected given the slightly higher boosts with the RTX 4070 Super Gaming OC.

However, the gains aren't really noteworthy, and the performance delta is very well within the realm of run-to-run variations.

That being said, the RTX 4070 Super Gaming OC 12G continues its dominance over the AMD Radeon RX 7800 XT by scoring a cumulative 9% lead in synthetic tests while displaying RTX 3090 levels of performance.

Performance Rating
NVIDIA GeForce RTX 4090 Founders Edition
Intel Core i9-13900K, NVIDIA GeForce RTX 4090
99.8 pt
AMD Radeon RX 7900 XTX
AMD Ryzen 9 7950X, AMD Radeon RX 7900 XTX
83 pt
NVIDIA GeForce RTX 4080 Founders Edition
Intel Core i9-13900K, NVIDIA GeForce RTX 4080
81.4 pt
AMD Radeon RX 7900 XT
AMD Ryzen 9 7950X, AMD Radeon RX 7900 XT
73.4 pt
Gigabyte Aorus GeForce RTX 4070 Ti Master
Intel Core i9-13900K, NVIDIA GeForce RTX 4070 Ti
68 pt
Asus TUF Gaming GeForce RTX 4070 Ti
Intel Core i9-13900K, NVIDIA GeForce RTX 4070 Ti
67.9 pt
Average NVIDIA GeForce RTX 4070 Ti
 
67.2 pt
Zotac Gaming GeForce RTX 3090 Ti AMP Extreme Holo
AMD Ryzen 7 5800X3D, NVIDIA GeForce RTX 3090 Ti
66.5 pt
Sapphire AMD Radeon RX 6950 XT Nitro+ Pure
AMD Ryzen 9 5900X, AMD Radeon RX 6950 XT
62.8 pt
Gigabyte GeForce RTX 4070 Super Gaming OC 12G
Intel Core i9-13900K, NVIDIA GeForce RTX 4070 SUPER
62.7 pt
Average NVIDIA GeForce RTX 3080 Ti
 
62.1 pt
NVIDIA GeForce RTX 4070 Super Founders Edition
Intel Core i9-13900K, NVIDIA GeForce RTX 4070 SUPER
61.9 pt
Average NVIDIA GeForce RTX 3090
 
61.9 pt
AMD Radeon RX 7800 XT
AMD Ryzen 9 7950X, AMD Radeon RX 7800 XT
57.7 pt
AMD Radeon RX 6900 XT
AMD Ryzen 9 5950X, AMD Radeon RX 6900 XT
56.5 pt
Zotac Gaming GeForce RTX 4070 AMP Airo
Intel Core i9-13900K, NVIDIA GeForce RTX 4070
55 pt
AMD Radeon RX 6800 XT
AMD Ryzen 9 5950X, AMD Radeon RX 6800 XT
53.5 pt
Average NVIDIA GeForce RTX 3080
 
51.7 pt
Sapphire Pulse Radeon RX 7700 XT
AMD Ryzen 9 7950X, AMD Radeon RX 7700 XT
49.5 pt
Average of class Desktop
 
49.2 pt
Average NVIDIA Titan RTX
 
48.4 pt
Average NVIDIA GeForce RTX 3070
 
42.2 pt
Average NVIDIA GeForce RTX 4060 Ti 8G
 
41.6 pt
KFA2 GeForce RTX 4060 Ti EX, 16GB GDDR6
AMD Ryzen 9 7950X, NVIDIA GeForce RTX 4060 Ti 16G
40.1 pt
XFX Speedster QICK 308 Radeon RX 7600 Black Edition
AMD Ryzen 9 7950X, AMD Radeon RX 7600
36.4 pt
KFA2 GeForce RTX 4060 1-Click-OC 2X
AMD Ryzen 9 7950X, NVIDIA GeForce RTX 4060
35.4 pt
3DMark 11 / Performance GPU
NVIDIA GeForce RTX 4090 Founders Edition
Intel Core i9-13900K, NVIDIA GeForce RTX 4090
99834 Points +45%
NVIDIA GeForce RTX 4080 Founders Edition
Intel Core i9-13900K, NVIDIA GeForce RTX 4080
86838 Points +26%
AMD Radeon RX 7900 XTX
AMD Ryzen 9 7950X, AMD Radeon RX 7900 XTX
83322 Points +21%
AMD Radeon RX 7900 XT
AMD Ryzen 9 7950X, AMD Radeon RX 7900 XT
77784 Points +13%
Gigabyte Aorus GeForce RTX 4070 Ti Master
Intel Core i9-13900K, NVIDIA GeForce RTX 4070 Ti
76483 Points +11%
Asus TUF Gaming GeForce RTX 4070 Ti
Intel Core i9-13900K, NVIDIA GeForce RTX 4070 Ti
75990 Points +10%
Asus TUF Gaming GeForce RTX 4070 Ti
Intel Core i9-13900K, NVIDIA GeForce RTX 4070 Ti (Quiet BIOS)
75612 Points +10%
Average NVIDIA GeForce RTX 4070 Ti
  (74228 - 76483, n=5)
75509 Points +10%
Sapphire AMD Radeon RX 6950 XT Nitro+ Pure
AMD Ryzen 9 5900X, AMD Radeon RX 6950 XT
70480 Points +2%
Zotac Gaming GeForce RTX 3090 Ti AMP Extreme Holo
AMD Ryzen 7 5800X3D, NVIDIA GeForce RTX 3090 Ti
69481 Points +1%
Gigabyte GeForce RTX 4070 Super Gaming OC 12G
Intel Core i9-13900K, NVIDIA GeForce RTX 4070 SUPER
68894 Points
NVIDIA GeForce RTX 4070 Super Founders Edition
Intel Core i9-13900K, NVIDIA GeForce RTX 4070 SUPER
67852 Points -2%
AMD Radeon RX 7800 XT
AMD Ryzen 9 7950X, AMD Radeon RX 7800 XT
63292 Points -8%
Average NVIDIA GeForce RTX 3080 Ti
  (59799 - 62189, n=4)
60987 Points -11%
Average NVIDIA GeForce RTX 3090
  (55144 - 66934, n=17)
60853 Points -12%
Zotac Gaming GeForce RTX 4070 AMP Airo
Intel Core i9-13900K, NVIDIA GeForce RTX 4070
59510 Points -14%
AMD Radeon RX 6900 XT
AMD Ryzen 9 5950X, AMD Radeon RX 6900 XT
59119 Points -14%
Sapphire Pulse Radeon RX 7700 XT
AMD Ryzen 9 7950X, AMD Radeon RX 7700 XT
57340 Points -17%
Average NVIDIA GeForce RTX 3080
  (47287 - 57662, n=4)
53094 Points -23%
AMD Radeon RX 6800 XT
AMD Ryzen 9 5950X, AMD Radeon RX 6800 XT
52046 Points -24%
Average of class Desktop
  (650 - 104464, n=36, last 2 years)
49254 Points -29%
Average NVIDIA Titan RTX
  (43461 - 51863, n=30)
49062 Points -29%
Average NVIDIA GeForce RTX 4060 Ti 8G
  (47481 - 48363, n=3)
47882 Points -30%
XFX Speedster QICK 308 Radeon RX 7600 Black Edition
AMD Ryzen 9 7950X, AMD Radeon RX 7600
43430 Points -37%
KFA2 GeForce RTX 4060 Ti EX, 16GB GDDR6
AMD Ryzen 9 7950X, NVIDIA GeForce RTX 4060 Ti 16G
43112 Points -37%
Average NVIDIA GeForce RTX 3070
  (26812 - 46878, n=9)
40835 Points -41%
KFA2 GeForce RTX 4060 1-Click-OC 2X
AMD Ryzen 9 7950X, NVIDIA GeForce RTX 4060
38191 Points -45%
3DMark / Fire Strike Graphics
AMD Radeon RX 7900 XTX
AMD Ryzen 9 7950X, AMD Radeon RX 7900 XTX
66967 Points +35%
NVIDIA GeForce RTX 4090 Founders Edition
Intel Core i9-13900K, NVIDIA GeForce RTX 4090
65879 Points +33%
AMD Radeon RX 7900 XT
AMD Ryzen 9 7950X, AMD Radeon RX 7900 XT
63712 Points +28%
Sapphire AMD Radeon RX 6950 XT Nitro+ Pure
AMD Ryzen 9 5900X, AMD Radeon RX 6950 XT
60092 Points +21%
NVIDIA GeForce RTX 4080 Founders Edition
Intel Core i9-13900K, NVIDIA GeForce RTX 4080
58893 Points +18%
Asus TUF Gaming GeForce RTX 4070 Ti
Intel Core i9-13900K, NVIDIA GeForce RTX 4070 Ti
53729 Points +8%
Asus TUF Gaming GeForce RTX 4070 Ti
Intel Core i9-13900K, NVIDIA GeForce RTX 4070 Ti (Quiet BIOS)
52903 Points +6%
Average NVIDIA GeForce RTX 4070 Ti
  (52769 - 53736, n=5)
53299 Points +7%
Zotac Gaming GeForce RTX 3090 Ti AMP Extreme Holo
AMD Ryzen 7 5800X3D, NVIDIA GeForce RTX 3090 Ti
53110 Points +7%
Gigabyte Aorus GeForce RTX 4070 Ti Master
Intel Core i9-13900K, NVIDIA GeForce RTX 4070 Ti
52769 Points +6%
AMD Radeon RX 6900 XT
AMD Ryzen 9 5950X, AMD Radeon RX 6900 XT
50587 Points +2%
AMD Radeon RX 7800 XT
AMD Ryzen 9 7950X, AMD Radeon RX 7800 XT
50181 Points +1%
AMD Radeon RX 6800 XT
AMD Ryzen 9 5950X, AMD Radeon RX 6800 XT
49735 Points 0%
Gigabyte GeForce RTX 4070 Super Gaming OC 12G
Intel Core i9-13900K, NVIDIA GeForce RTX 4070 SUPER
49709 Points
NVIDIA GeForce RTX 4070 Super Founders Edition
Intel Core i9-13900K, NVIDIA GeForce RTX 4070 SUPER
48043 Points -3%
Average NVIDIA GeForce RTX 3080 Ti
  (45785 - 48709, n=4)
47180 Points -5%
Average NVIDIA GeForce RTX 3090
  (41298 - 49282, n=17)
46856 Points -6%
Zotac Gaming GeForce RTX 4070 AMP Airo
Intel Core i9-13900K, NVIDIA GeForce RTX 4070
43583 Points -12%
Sapphire Pulse Radeon RX 7700 XT
AMD Ryzen 9 7950X, AMD Radeon RX 7700 XT
42801 Points -14%
Average NVIDIA GeForce RTX 3080
  (37604 - 40910, n=2)
39257 Points -21%
Average NVIDIA Titan RTX
  (33377 - 40910, n=30)
36062 Points -27%
Average NVIDIA GeForce RTX 4060 Ti 8G
  (33762 - 34547, n=3)
34185 Points -31%
XFX Speedster QICK 308 Radeon RX 7600 Black Edition
AMD Ryzen 9 7950X, AMD Radeon RX 7600
32404 Points -35%
KFA2 GeForce RTX 4060 Ti EX, 16GB GDDR6
AMD Ryzen 9 7950X, NVIDIA GeForce RTX 4060 Ti 16G
32275 Points -35%
Average of class Desktop
  (523 - 70246, n=34, last 2 years)
31665 Points -36%
Average NVIDIA GeForce RTX 3070
  (20357 - 33270, n=7)
28949 Points -42%
KFA2 GeForce RTX 4060 1-Click-OC 2X
AMD Ryzen 9 7950X, NVIDIA GeForce RTX 4060
28111 Points -43%
3DMark / Fire Strike Ultra Graphics
NVIDIA GeForce RTX 4090 Founders Edition
Intel Core i9-13900K, NVIDIA GeForce RTX 4090
24276 Points +96%
AMD Radeon RX 7900 XTX
AMD Ryzen 9 7950X, AMD Radeon RX 7900 XTX
20214 Points +63%
NVIDIA GeForce RTX 4080 Founders Edition
Intel Core i9-13900K, NVIDIA GeForce RTX 4080
17122 Points +38%
AMD Radeon RX 7900 XT
AMD Ryzen 9 7950X, AMD Radeon RX 7900 XT
17078 Points +38%
Sapphire AMD Radeon RX 6950 XT Nitro+ Pure
AMD Ryzen 9 5900X, AMD Radeon RX 6950 XT
14978 Points +21%
Zotac Gaming GeForce RTX 3090 Ti AMP Extreme Holo
AMD Ryzen 7 5800X3D, NVIDIA GeForce RTX 3090 Ti
14026 Points +13%
Gigabyte Aorus GeForce RTX 4070 Ti Master
Intel Core i9-13900K, NVIDIA GeForce RTX 4070 Ti
13616 Points +10%
Asus TUF Gaming GeForce RTX 4070 Ti
Intel Core i9-13900K, NVIDIA GeForce RTX 4070 Ti
13546 Points +9%
Asus TUF Gaming GeForce RTX 4070 Ti
Intel Core i9-13900K, NVIDIA GeForce RTX 4070 Ti (Quiet BIOS)
13487 Points +9%
Average NVIDIA GeForce RTX 4070 Ti
  (13112 - 13616, n=5)
13390 Points +8%
AMD Radeon RX 6900 XT
AMD Ryzen 9 5950X, AMD Radeon RX 6900 XT
13370 Points +8%
AMD Radeon RX 6800 XT
AMD Ryzen 9 5950X, AMD Radeon RX 6800 XT
12626 Points +2%
AMD Radeon RX 7800 XT
AMD Ryzen 9 7950X, AMD Radeon RX 7800 XT
12529 Points +1%
Gigabyte GeForce RTX 4070 Super Gaming OC 12G
Intel Core i9-13900K, NVIDIA GeForce RTX 4070 SUPER
12389 Points
Average NVIDIA GeForce RTX 3090
  (11613 - 12587, n=14)
12289 Points -1%
Average NVIDIA GeForce RTX 3080 Ti
  (12050 - 12341, n=4)
12173 Points -2%
NVIDIA GeForce RTX 4070 Super Founders Edition
Intel Core i9-13900K, NVIDIA GeForce RTX 4070 SUPER
12086 Points -2%
Average NVIDIA GeForce RTX 3080
  (10645 - 10793, n=2)
10719 Points -13%
Sapphire Pulse Radeon RX 7700 XT
AMD Ryzen 9 7950X, AMD Radeon RX 7700 XT
10596 Points -14%
Average of class Desktop
  (141 - 24650, n=24, last 2 years)
10444 Points -16%
Zotac Gaming GeForce RTX 4070 AMP Airo
Intel Core i9-13900K, NVIDIA GeForce RTX 4070
10103 Points -18%
Average NVIDIA Titan RTX
  (8461 - 10793, n=29)
8868 Points -28%
Average NVIDIA GeForce RTX 3070
  (8043 - 8483, n=5)
8250 Points -33%
XFX Speedster QICK 308 Radeon RX 7600 Black Edition
AMD Ryzen 9 7950X, AMD Radeon RX 7600
7305 Points -41%
Average NVIDIA GeForce RTX 4060 Ti 8G
  (7152 - 7298, n=3)
7223 Points -42%
KFA2 GeForce RTX 4060 Ti EX, 16GB GDDR6
AMD Ryzen 9 7950X, NVIDIA GeForce RTX 4060 Ti 16G
7058 Points -43%
KFA2 GeForce RTX 4060 1-Click-OC 2X
AMD Ryzen 9 7950X, NVIDIA GeForce RTX 4060
5668 Points -54%
3DMark / Fire Strike Extreme Graphics
NVIDIA GeForce RTX 4090 Founders Edition
Intel Core i9-13900K, NVIDIA GeForce RTX 4090
44295 Points +78%
AMD Radeon RX 7900 XTX
AMD Ryzen 9 7950X, AMD Radeon RX 7900 XTX
39570 Points +59%
AMD Radeon RX 7900 XT
AMD Ryzen 9 7950X, AMD Radeon RX 7900 XT
33747 Points +36%
NVIDIA GeForce RTX 4080 Founders Edition
Intel Core i9-13900K, NVIDIA GeForce RTX 4080
33475 Points +35%
Sapphire AMD Radeon RX 6950 XT Nitro+ Pure
AMD Ryzen 9 5900X, AMD Radeon RX 6950 XT
29704 Points +19%
Gigabyte Aorus GeForce RTX 4070 Ti Master
Intel Core i9-13900K, NVIDIA GeForce RTX 4070 Ti
27167 Points +9%
Asus TUF Gaming GeForce RTX 4070 Ti
Intel Core i9-13900K, NVIDIA GeForce RTX 4070 Ti
26970 Points +8%
Asus TUF Gaming GeForce RTX 4070 Ti
Intel Core i9-13900K, NVIDIA GeForce RTX 4070 Ti (Quiet BIOS)
26925 Points +8%
Average NVIDIA GeForce RTX 4070 Ti
  (26470 - 27167, n=5)
26845 Points +8%
Zotac Gaming GeForce RTX 3090 Ti AMP Extreme Holo
AMD Ryzen 7 5800X3D, NVIDIA GeForce RTX 3090 Ti
26797 Points +8%
AMD Radeon RX 6900 XT
AMD Ryzen 9 5950X, AMD Radeon RX 6900 XT
26650 Points +7%
AMD Radeon RX 7800 XT
AMD Ryzen 9 7950X, AMD Radeon RX 7800 XT
25279 Points +2%
AMD Radeon RX 6800 XT
AMD Ryzen 9 5950X, AMD Radeon RX 6800 XT
25015 Points +1%
Gigabyte GeForce RTX 4070 Super Gaming OC 12G
Intel Core i9-13900K, NVIDIA GeForce RTX 4070 SUPER
24874 Points
NVIDIA GeForce RTX 4070 Super Founders Edition
Intel Core i9-13900K, NVIDIA GeForce RTX 4070 SUPER
24154 Points -3%
Average NVIDIA GeForce RTX 3090
  (22075 - 24730, n=14)
23806 Points -4%
Average NVIDIA GeForce RTX 3080 Ti
  (23127 - 24250, n=4)
23668 Points -5%
Zotac Gaming GeForce RTX 4070 AMP Airo
Intel Core i9-13900K, NVIDIA GeForce RTX 4070
21053 Points -15%
Sapphire Pulse Radeon RX 7700 XT
AMD Ryzen 9 7950X, AMD Radeon RX 7700 XT
21006 Points -16%
Average NVIDIA GeForce RTX 3080
  (20007 - 20861, n=2)
20434 Points -18%
Average of class Desktop
  (1053 - 44549, n=24, last 2 years)
20318 Points -18%
Average NVIDIA Titan RTX
  (16484 - 20861, n=29)
17649 Points -29%
Average NVIDIA GeForce RTX 4060 Ti 8G
  (15846 - 16250, n=3)
16051 Points -35%
Average NVIDIA GeForce RTX 3070
  (15503 - 16276, n=5)
15859 Points -36%
KFA2 GeForce RTX 4060 Ti EX, 16GB GDDR6
AMD Ryzen 9 7950X, NVIDIA GeForce RTX 4060 Ti 16G
15511 Points -38%
XFX Speedster QICK 308 Radeon RX 7600 Black Edition
AMD Ryzen 9 7950X, AMD Radeon RX 7600
14966 Points -40%
KFA2 GeForce RTX 4060 1-Click-OC 2X
AMD Ryzen 9 7950X, NVIDIA GeForce RTX 4060
13086 Points -47%
3DMark / Time Spy Graphics
NVIDIA GeForce RTX 4090 Founders Edition
Intel Core i9-13900K, NVIDIA GeForce RTX 4090
36101 Points +71%
AMD Radeon RX 7900 XTX
AMD Ryzen 9 7950X, AMD Radeon RX 7900 XTX
29699 Points +41%
NVIDIA GeForce RTX 4080 Founders Edition
Intel Core i9-13900K, NVIDIA GeForce RTX 4080
28133 Points +33%
AMD Radeon RX 7900 XT
AMD Ryzen 9 7950X, AMD Radeon RX 7900 XT
25874 Points +23%
Gigabyte Aorus GeForce RTX 4070 Ti Master
Intel Core i9-13900K, NVIDIA GeForce RTX 4070 Ti
23136 Points +10%
Asus TUF Gaming GeForce RTX 4070 Ti
Intel Core i9-13900K, NVIDIA GeForce RTX 4070 Ti
22982 Points +9%
Asus TUF Gaming GeForce RTX 4070 Ti
Intel Core i9-13900K, NVIDIA GeForce RTX 4070 Ti (Quiet BIOS)
22949 Points +9%
Average NVIDIA GeForce RTX 4070 Ti
  (22304 - 23136, n=5)
22791 Points +8%
Sapphire AMD Radeon RX 6950 XT Nitro+ Pure
AMD Ryzen 9 5900X, AMD Radeon RX 6950 XT
21719 Points +3%
Zotac Gaming GeForce RTX 3090 Ti AMP Extreme Holo
AMD Ryzen 7 5800X3D, NVIDIA GeForce RTX 3090 Ti
21645 Points +3%
Gigabyte GeForce RTX 4070 Super Gaming OC 12G
Intel Core i9-13900K, NVIDIA GeForce RTX 4070 SUPER
21117 Points
NVIDIA GeForce RTX 4070 Super Founders Edition
Intel Core i9-13900K, NVIDIA GeForce RTX 4070 SUPER
20867 Points -1%
AMD Radeon RX 7800 XT
AMD Ryzen 9 7950X, AMD Radeon RX 7800 XT
19369 Points -8%
Average NVIDIA GeForce RTX 3090
  (18685 - 20433, n=17)
19266 Points -9%
Average NVIDIA GeForce RTX 3080 Ti
  (19041 - 19460, n=4)
19237 Points -9%
AMD Radeon RX 6900 XT
AMD Ryzen 9 5950X, AMD Radeon RX 6900 XT
18210 Points -14%
Zotac Gaming GeForce RTX 4070 AMP Airo
Intel Core i9-13900K, NVIDIA GeForce RTX 4070
17847 Points -15%
AMD Radeon RX 6800 XT
AMD Ryzen 9 5950X, AMD Radeon RX 6800 XT
17603 Points -17%
Average NVIDIA GeForce RTX 3080
  (17467 - 17604, n=2)
17536 Points -17%
Average of class Desktop
  (173 - 37589, n=33, last 2 years)
17279 Points -18%
Sapphire Pulse Radeon RX 7700 XT
AMD Ryzen 9 7950X, AMD Radeon RX 7700 XT
16777 Points -21%
Average NVIDIA Titan RTX
  (14216 - 15283, n=29)
14884 Points -30%
Average NVIDIA GeForce RTX 4060 Ti 8G
  (13293 - 13549, n=3)
13423 Points -36%
KFA2 GeForce RTX 4060 Ti EX, 16GB GDDR6
AMD Ryzen 9 7950X, NVIDIA GeForce RTX 4060 Ti 16G
13359 Points -37%
Average NVIDIA GeForce RTX 3070
  (11043 - 13579, n=7)
12616 Points -40%
XFX Speedster QICK 308 Radeon RX 7600 Black Edition
AMD Ryzen 9 7950X, AMD Radeon RX 7600
11062 Points -48%
KFA2 GeForce RTX 4060 1-Click-OC 2X
AMD Ryzen 9 7950X, NVIDIA GeForce RTX 4060
10494 Points -50%
Unigine Heaven 4.0 / Extreme Preset DX11
NVIDIA GeForce RTX 4090 Founders Edition
Intel Core i9-13900K, NVIDIA GeForce RTX 4090
466 (11min - 1031max) fps +66%
NVIDIA GeForce RTX 4080 Founders Edition
Intel Core i9-13900K, NVIDIA GeForce RTX 4080
389.4 (11.3min - 813.1max) fps +39%
AMD Radeon RX 7900 XTX
AMD Ryzen 9 7950X, AMD Radeon RX 7900 XTX
357.6 fps +27%
AMD Radeon RX 7900 XT
AMD Ryzen 9 7950X, AMD Radeon RX 7900 XT
319.7 fps +14%
Gigabyte Aorus GeForce RTX 4070 Ti Master
Intel Core i9-13900K, NVIDIA GeForce RTX 4070 Ti
317.9 (52.3min - 701.6max) fps +13%
Asus TUF Gaming GeForce RTX 4070 Ti
Intel Core i9-13900K, NVIDIA GeForce RTX 4070 Ti
317.6 (57.8min - 692.1max) fps +13%
Average NVIDIA GeForce RTX 4070 Ti
  (312 - 319, n=4)
317 fps +13%
Zotac Gaming GeForce RTX 3090 Ti AMP Extreme Holo
AMD Ryzen 7 5800X3D, NVIDIA GeForce RTX 3090 Ti
308.5 (9.7min - 627.1max) fps +10%
Average NVIDIA GeForce RTX 3090
  (272 - 315, n=11)
300 fps +7%
Average NVIDIA GeForce RTX 3080 Ti
  (290 - 312, n=4)
300 fps +7%
Sapphire AMD Radeon RX 6950 XT Nitro+ Pure
AMD Ryzen 9 5900X, AMD Radeon RX 6950 XT
293.8 fps +5%
Gigabyte GeForce RTX 4070 Super Gaming OC 12G
Intel Core i9-13900K, NVIDIA GeForce RTX 4070 SUPER
280.8 (51.7min - 649.1max) fps
NVIDIA GeForce RTX 4070 Super Founders Edition
Intel Core i9-13900K, NVIDIA GeForce RTX 4070 SUPER
276.1 (50.9min - 603max) fps -2%
AMD Radeon RX 6900 XT
AMD Ryzen 9 5950X, AMD Radeon RX 6900 XT
259.5 (49.3min - 537.2max) fps -8%
Zotac Gaming GeForce RTX 4070 AMP Airo
Intel Core i9-13900K, NVIDIA GeForce RTX 4070
248 (11min - 572.3max) fps -12%
AMD Radeon RX 6800 XT
AMD Ryzen 9 5950X, AMD Radeon RX 6800 XT
247.9 fps -12%
Average NVIDIA GeForce RTX 3080
  (233 - 253, n=2)
243 fps -13%
AMD Radeon RX 7800 XT
AMD Ryzen 9 7950X, AMD Radeon RX 7800 XT
242.7 fps -14%
Average NVIDIA Titan RTX
  (207 - 248, n=12)
236 fps -16%
Average of class Desktop
  (4.5 - 472, n=24, last 2 years)
220 fps -22%
Sapphire Pulse Radeon RX 7700 XT
AMD Ryzen 9 7950X, AMD Radeon RX 7700 XT
211.7 fps -25%
Average NVIDIA GeForce RTX 3070
  (196.4 - 214, n=5)
206 fps -27%
Average NVIDIA GeForce RTX 4060 Ti 8G
  (178.9 - 181.6, n=3)
180.6 fps -36%
KFA2 GeForce RTX 4060 Ti EX, 16GB GDDR6
AMD Ryzen 9 7950X, NVIDIA GeForce RTX 4060 Ti 16G
174.8 fps -38%
KFA2 GeForce RTX 4060 1-Click-OC 2X
AMD Ryzen 9 7950X, NVIDIA GeForce RTX 4060
153.7 fps -45%
XFX Speedster QICK 308 Radeon RX 7600 Black Edition
AMD Ryzen 9 7950X, AMD Radeon RX 7600
148.1 fps -47%
Unigine Heaven 4.0 / Extreme Preset OpenGL
NVIDIA GeForce RTX 4090 Founders Edition
Intel Core i9-13900K, NVIDIA GeForce RTX 4090
443 (15min - 902max) fps +58%
AMD Radeon RX 7900 XTX
AMD Ryzen 9 7950X, AMD Radeon RX 7900 XTX
370.2 fps +32%
NVIDIA GeForce RTX 4080 Founders Edition
Intel Core i9-13900K, NVIDIA GeForce RTX 4080
364.2 (15min - 770.5max) fps +30%
AMD Radeon RX 7900 XT
AMD Ryzen 9 7950X, AMD Radeon RX 7900 XT
330.2 fps +18%
Gigabyte Aorus GeForce RTX 4070 Ti Master
Intel Core i9-13900K, NVIDIA GeForce RTX 4070 Ti
295.5 (50.3min - 602max) fps +6%
Average NVIDIA GeForce RTX 4070 Ti
  (291 - 297, n=4)
294 fps +5%
Asus TUF Gaming GeForce RTX 4070 Ti
Intel Core i9-13900K, NVIDIA GeForce RTX 4070 Ti
292.6 (15.2min - 600.3max) fps +5%
Zotac Gaming GeForce RTX 3090 Ti AMP Extreme Holo
AMD Ryzen 7 5800X3D, NVIDIA GeForce RTX 3090 Ti
292.5 (11.4min - 577.9max) fps +5%
Gigabyte GeForce RTX 4070 Super Gaming OC 12G
Intel Core i9-13900K, NVIDIA GeForce RTX 4070 SUPER
279.9 (14.2min - 655.5max) fps
NVIDIA GeForce RTX 4070 Super Founders Edition
Intel Core i9-13900K, NVIDIA GeForce RTX 4070 SUPER
276.1 (57.7min - 579max) fps -1%
Average NVIDIA GeForce RTX 3080 Ti
  (264 - 282, n=4)
274 fps -2%
Average NVIDIA GeForce RTX 3090
  (188.2 - 284, n=10)
270 fps -4%
AMD Radeon RX 7800 XT
AMD Ryzen 9 7950X, AMD Radeon RX 7800 XT
257.9 fps -8%
Average NVIDIA GeForce RTX 3080
  (232 - 243, n=2)
238 fps -15%
Zotac Gaming GeForce RTX 4070 AMP Airo
Intel Core i9-13900K, NVIDIA GeForce RTX 4070
230.2 (14.6min - 500.6max) fps -18%
Average NVIDIA Titan RTX
  (203 - 299, n=12)
223 fps -20%
Sapphire AMD Radeon RX 6950 XT Nitro+ Pure
AMD Ryzen 9 5900X, AMD Radeon RX 6950 XT
222.7 fps -20%
Sapphire Pulse Radeon RX 7700 XT
AMD Ryzen 9 7950X, AMD Radeon RX 7700 XT
213.2 fps -24%
Average of class Desktop
  (4 - 450, n=24, last 2 years)
209 fps -25%
AMD Radeon RX 6900 XT
AMD Ryzen 9 5950X, AMD Radeon RX 6900 XT
206.5 (8.2min - 453.7max) fps -26%
AMD Radeon RX 6800 XT
AMD Ryzen 9 5950X, AMD Radeon RX 6800 XT
204 fps -27%
Average NVIDIA GeForce RTX 3070
  (187.5 - 196.1, n=4)
192.5 fps -31%
Average NVIDIA GeForce RTX 4060 Ti 8G
  (173 - 176, n=3)
174.7 fps -38%
KFA2 GeForce RTX 4060 Ti EX, 16GB GDDR6
AMD Ryzen 9 7950X, NVIDIA GeForce RTX 4060 Ti 16G
170.3 fps -39%
XFX Speedster QICK 308 Radeon RX 7600 Black Edition
AMD Ryzen 9 7950X, AMD Radeon RX 7600
147.2 fps -47%
KFA2 GeForce RTX 4060 1-Click-OC 2X
AMD Ryzen 9 7950X, NVIDIA GeForce RTX 4060
147 fps -47%
Unigine Valley 1.0 / Extreme HD DirectX
NVIDIA GeForce RTX 4090 Founders Edition
Intel Core i9-13900K, NVIDIA GeForce RTX 4090
283 (80min - 527max) fps +31%
NVIDIA GeForce RTX 4080 Founders Edition
Intel Core i9-13900K, NVIDIA GeForce RTX 4080
277.5 (71.7min - 487.9max) fps +29%
AMD Radeon RX 7900 XTX
AMD Ryzen 9 7950X, AMD Radeon RX 7900 XTX
264.5 fps +23%
AMD Radeon RX 7900 XT
AMD Ryzen 9 7950X, AMD Radeon RX 7900 XT
243.3 fps +13%
Asus TUF Gaming GeForce RTX 4070 Ti
Intel Core i9-13900K, NVIDIA GeForce RTX 4070 Ti
230.3 (78.9min - 451.1max) fps +7%
Average NVIDIA GeForce RTX 3080 Ti
  (206 - 240, n=4)
228 fps +6%
Average NVIDIA GeForce RTX 3090
  (184.2 - 247, n=11)
225 fps +5%
Average NVIDIA GeForce RTX 4070 Ti
  (208 - 230, n=4)
218 fps +1%
Gigabyte GeForce RTX 4070 Super Gaming OC 12G
Intel Core i9-13900K, NVIDIA GeForce RTX 4070 SUPER
215.3 (73.3min - 409.2max) fps
NVIDIA GeForce RTX 4070 Super Founders Edition
Intel Core i9-13900K, NVIDIA GeForce RTX 4070 SUPER
213.8 (75min - 414.5max) fps -1%
Sapphire AMD Radeon RX 6950 XT Nitro+ Pure
AMD Ryzen 9 5900X, AMD Radeon RX 6950 XT
209.2 fps -3%
Gigabyte Aorus GeForce RTX 4070 Ti Master
Intel Core i9-13900K, NVIDIA GeForce RTX 4070 Ti
207.5 (75.3min - 371.2max) fps -4%
Zotac Gaming GeForce RTX 3090 Ti AMP Extreme Holo
AMD Ryzen 7 5800X3D, NVIDIA GeForce RTX 3090 Ti
201.7 (48.5min - 338.7max) fps -6%
AMD Radeon RX 6900 XT
AMD Ryzen 9 5950X, AMD Radeon RX 6900 XT
200.8 (53.4min - 359.1max) fps -7%
Zotac Gaming GeForce RTX 4070 AMP Airo
Intel Core i9-13900K, NVIDIA GeForce RTX 4070
195.2 (57.6min - 374.2max) fps -9%
AMD Radeon RX 7800 XT
AMD Ryzen 9 7950X, AMD Radeon RX 7800 XT
191.3 fps -11%
AMD Radeon RX 6800 XT
AMD Ryzen 9 5950X, AMD Radeon RX 6800 XT
190.6 fps -11%
Average NVIDIA GeForce RTX 3080
  (176.2 - 181.8, n=2)
179 fps -17%
Average NVIDIA Titan RTX
  (135 - 191.4, n=12)
173.3 fps -20%
Average NVIDIA GeForce RTX 3070
  (155.1 - 168.5, n=5)
161.2 fps -25%
Sapphire Pulse Radeon RX 7700 XT
AMD Ryzen 9 7950X, AMD Radeon RX 7700 XT
160.1 fps -26%
Average of class Desktop
  (3.7 - 292, n=24, last 2 years)
158.9 fps -26%
Average NVIDIA GeForce RTX 4060 Ti 8G
  (128.3 - 131.2, n=3)
129.8 fps -40%
KFA2 GeForce RTX 4060 Ti EX, 16GB GDDR6
AMD Ryzen 9 7950X, NVIDIA GeForce RTX 4060 Ti 16G
127.8 fps -41%
KFA2 GeForce RTX 4060 1-Click-OC 2X
AMD Ryzen 9 7950X, NVIDIA GeForce RTX 4060
115.3 fps -46%
XFX Speedster QICK 308 Radeon RX 7600 Black Edition
AMD Ryzen 9 7950X, AMD Radeon RX 7600
107.5 fps -50%
Unigine Valley 1.0 / Extreme HD Preset OpenGL
NVIDIA GeForce RTX 4090 Founders Edition
Intel Core i9-13900K, NVIDIA GeForce RTX 4090
315 (64min - 559max) fps +58%
NVIDIA GeForce RTX 4080 Founders Edition
Intel Core i9-13900K, NVIDIA GeForce RTX 4080
257 (79.3min - 462.8max) fps +29%
AMD Radeon RX 7900 XTX
AMD Ryzen 9 7950X, AMD Radeon RX 7900 XTX
254.2 fps +27%
Gigabyte Aorus GeForce RTX 4070 Ti Master
Intel Core i9-13900K, NVIDIA GeForce RTX 4070 Ti
230.9 (56.3min - 480.2max) fps +15%
AMD Radeon RX 7900 XT
AMD Ryzen 9 7950X, AMD Radeon RX 7900 XT
225.9 fps +13%
Zotac Gaming GeForce RTX 3090 Ti AMP Extreme Holo
AMD Ryzen 7 5800X3D, NVIDIA GeForce RTX 3090 Ti
208.4 (49.3min - 353max) fps +4%
Average NVIDIA GeForce RTX 4070 Ti
  (197.4 - 231, n=4)
208 fps +4%
Asus TUF Gaming GeForce RTX 4070 Ti
Intel Core i9-13900K, NVIDIA GeForce RTX 4070 Ti
206.8 (64.6min - 374.1max) fps +3%
Average NVIDIA GeForce RTX 3080 Ti
  (195.1 - 210, n=4)
204 fps +2%
Average NVIDIA GeForce RTX 3090
  (158.8 - 226, n=10)
203 fps +2%
NVIDIA GeForce RTX 4070 Super Founders Edition
Intel Core i9-13900K, NVIDIA GeForce RTX 4070 SUPER
200.4 (62.1min - 392.1max) fps 0%
Gigabyte GeForce RTX 4070 Super Gaming OC 12G
Intel Core i9-13900K, NVIDIA GeForce RTX 4070 SUPER
200 (63.6min - 393.8max) fps
AMD Radeon RX 7800 XT
AMD Ryzen 9 7950X, AMD Radeon RX 7800 XT
182 fps -9%
Sapphire AMD Radeon RX 6950 XT Nitro+ Pure
AMD Ryzen 9 5900X, AMD Radeon RX 6950 XT
176.9 fps -12%
Zotac Gaming GeForce RTX 4070 AMP Airo
Intel Core i9-13900K, NVIDIA GeForce RTX 4070
171.8 (61.5min - 301.3max) fps -14%
Average NVIDIA GeForce RTX 3080
  (163.8 - 172, n=2)
167.9 fps -16%
AMD Radeon RX 6900 XT
AMD Ryzen 9 5950X, AMD Radeon RX 6900 XT
167.4 (56.7min - 375.7max) fps -16%
AMD Radeon RX 6800 XT
AMD Ryzen 9 5950X, AMD Radeon RX 6800 XT
158.2 fps -21%
Average NVIDIA Titan RTX
  (139.2 - 181.2, n=12)
158.1 fps -21%
Average of class Desktop
  (3.4 - 315, n=24, last 2 years)
151.3 fps -24%
Sapphire Pulse Radeon RX 7700 XT
AMD Ryzen 9 7950X, AMD Radeon RX 7700 XT
143 fps -28%
Average NVIDIA GeForce RTX 3070
  (140.2 - 144.9, n=4)
142.7 fps -29%
Average NVIDIA GeForce RTX 4060 Ti 8G
  (116.5 - 118.8, n=3)
117.8 fps -41%
KFA2 GeForce RTX 4060 Ti EX, 16GB GDDR6
AMD Ryzen 9 7950X, NVIDIA GeForce RTX 4060 Ti 16G
114.9 fps -43%
KFA2 GeForce RTX 4060 1-Click-OC 2X
AMD Ryzen 9 7950X, NVIDIA GeForce RTX 4060
104.5 fps -48%
XFX Speedster QICK 308 Radeon RX 7600 Black Edition
AMD Ryzen 9 7950X, AMD Radeon RX 7600
94.8 fps -53%
Unigine Superposition / 720p Low
Asus TUF Gaming GeForce RTX 4070 Ti
Intel Core i9-13900K, NVIDIA GeForce RTX 4070 Ti
56132 Points +11%
NVIDIA GeForce RTX 4090 Founders Edition
Intel Core i9-13900K, NVIDIA GeForce RTX 4090
55915 Points +10%
NVIDIA GeForce RTX 4080 Founders Edition
Intel Core i9-13900K, NVIDIA GeForce RTX 4080
55670 Points +10%
Gigabyte Aorus GeForce RTX 4070 Ti Master
Intel Core i9-13900K, NVIDIA GeForce RTX 4070 Ti
55232 Points +9%
Average NVIDIA GeForce RTX 4070 Ti
  (48835 - 56396, n=4)
54149 Points +7%
Zotac Gaming GeForce RTX 4070 AMP Airo
Intel Core i9-13900K, NVIDIA GeForce RTX 4070
52713 Points +4%
NVIDIA GeForce RTX 4070 Super Founders Edition
Intel Core i9-13900K, NVIDIA GeForce RTX 4070 SUPER
50724 Points 0%
Gigabyte GeForce RTX 4070 Super Gaming OC 12G
Intel Core i9-13900K, NVIDIA GeForce RTX 4070 SUPER
50629 Points
Average NVIDIA GeForce RTX 3080 Ti
  (43163 - 50738, n=4)
47400 Points -6%
Average NVIDIA GeForce RTX 4060 Ti 8G
  (46504 - 47695, n=3)
47288 Points -7%
AMD Radeon RX 7900 XTX
AMD Ryzen 9 7950X, AMD Radeon RX 7900 XTX
47274 Points -7%
Average NVIDIA GeForce RTX 3090
  (33329 - 54879, n=10)
46049 Points -9%
AMD Radeon RX 7900 XT
AMD Ryzen 9 7950X, AMD Radeon RX 7900 XT
45904 Points -9%
KFA2 GeForce RTX 4060 1-Click-OC 2X
AMD Ryzen 9 7950X, NVIDIA GeForce RTX 4060
45864 Points -9%
AMD Radeon RX 7800 XT
AMD Ryzen 9 7950X, AMD Radeon RX 7800 XT
45745 Points -10%
Zotac Gaming GeForce RTX 3090 Ti AMP Extreme Holo
AMD Ryzen 7 5800X3D, NVIDIA GeForce RTX 3090 Ti
45444 Points -10%
Sapphire Pulse Radeon RX 7700 XT
AMD Ryzen 9 7950X, AMD Radeon RX 7700 XT
45299 Points -11%
KFA2 GeForce RTX 4060 Ti EX, 16GB GDDR6
AMD Ryzen 9 7950X, NVIDIA GeForce RTX 4060 Ti 16G
43851 Points -13%
XFX Speedster QICK 308 Radeon RX 7600 Black Edition
AMD Ryzen 9 7950X, AMD Radeon RX 7600
42477 Points -16%
Average NVIDIA Titan RTX
  (25622 - 50876, n=9)
40891 Points -19%
Average of class Desktop
  (2704 - 56132, n=22, last 2 years)
38418 Points -24%
AMD Radeon RX 6900 XT
AMD Ryzen 9 5950X, AMD Radeon RX 6900 XT
37023 Points -27%
AMD Radeon RX 6800 XT
AMD Ryzen 9 5950X, AMD Radeon RX 6800 XT
36452 Points -28%
Average NVIDIA GeForce RTX 3070
  (27330 - 40007, n=5)
34576 Points -32%
Sapphire AMD Radeon RX 6950 XT Nitro+ Pure
AMD Ryzen 9 5900X, AMD Radeon RX 6950 XT
33955 Points -33%
Average NVIDIA GeForce RTX 3080
  (30851 - 32183, n=2)
31517 Points -38%
Unigine Superposition / 1080p Extreme
NVIDIA GeForce RTX 4090 Founders Edition
Intel Core i9-13900K, NVIDIA GeForce RTX 4090
20729 Points +70%
AMD Radeon RX 7900 XTX
AMD Ryzen 9 7950X, AMD Radeon RX 7900 XTX
17264 Points +42%
NVIDIA GeForce RTX 4080 Founders Edition
Intel Core i9-13900K, NVIDIA GeForce RTX 4080
16623 Points +37%
AMD Radeon RX 7900 XT
AMD Ryzen 9 7950X, AMD Radeon RX 7900 XT
14181 Points +17%
Zotac Gaming GeForce RTX 3090 Ti AMP Extreme Holo
AMD Ryzen 7 5800X3D, NVIDIA GeForce RTX 3090 Ti
13803 Points +13%
Gigabyte Aorus GeForce RTX 4070 Ti Master
Intel Core i9-13900K, NVIDIA GeForce RTX 4070 Ti
13448 Points +11%
Asus TUF Gaming GeForce RTX 4070 Ti
Intel Core i9-13900K, NVIDIA GeForce RTX 4070 Ti
13266 Points +9%
Average NVIDIA GeForce RTX 4070 Ti
  (12837 - 13448, n=4)
13168 Points +8%
Average NVIDIA GeForce RTX 3090
  (11806 - 12694, n=11)
12209 Points 0%
Gigabyte GeForce RTX 4070 Super Gaming OC 12G
Intel Core i9-13900K, NVIDIA GeForce RTX 4070 SUPER
12163 Points
Average NVIDIA GeForce RTX 3080 Ti
  (12038 - 12347, n=4)
12139 Points 0%
Sapphire AMD Radeon RX 6950 XT Nitro+ Pure
AMD Ryzen 9 5900X, AMD Radeon RX 6950 XT
12079 Points -1%
NVIDIA GeForce RTX 4070 Super Founders Edition
Intel Core i9-13900K, NVIDIA GeForce RTX 4070 SUPER
12019 Points -1%
Average NVIDIA GeForce RTX 3080
  (10572 - 10822, n=2)
10697 Points -12%
AMD Radeon RX 6900 XT
AMD Ryzen 9 5950X, AMD Radeon RX 6900 XT
10683 Points -12%
AMD Radeon RX 7800 XT
AMD Ryzen 9 7950X, AMD Radeon RX 7800 XT
10145 Points -17%
Average of class Desktop
  (286 - 21332, n=22, last 2 years)
10122 Points -17%
AMD Radeon RX 6800 XT
AMD Ryzen 9 5950X, AMD Radeon RX 6800 XT
10046 Points -17%
Zotac Gaming GeForce RTX 4070 AMP Airo
Intel Core i9-13900K, NVIDIA GeForce RTX 4070
9764 Points -20%
Average NVIDIA Titan RTX
  (8916 - 9285, n=9)
9051 Points -26%
Sapphire Pulse Radeon RX 7700 XT
AMD Ryzen 9 7950X, AMD Radeon RX 7700 XT
8732 Points -28%
Average NVIDIA GeForce RTX 3070
  (8276 - 8507, n=5)
8354 Points -31%
KFA2 GeForce RTX 4060 Ti EX, 16GB GDDR6
AMD Ryzen 9 7950X, NVIDIA GeForce RTX 4060 Ti 16G
7712 Points -37%
Average NVIDIA GeForce RTX 4060 Ti 8G
  (7085 - 7833, n=3)
7438 Points -39%
XFX Speedster QICK 308 Radeon RX 7600 Black Edition
AMD Ryzen 9 7950X, AMD Radeon RX 7600
6419 Points -47%
KFA2 GeForce RTX 4060 1-Click-OC 2X
AMD Ryzen 9 7950X, NVIDIA GeForce RTX 4060
5974 Points -51%
Unigine Superposition / 4k Optimized
NVIDIA GeForce RTX 4090 Founders Edition
Intel Core i9-13900K, NVIDIA GeForce RTX 4090
32977 Points +107%
AMD Radeon RX 7900 XTX
AMD Ryzen 9 7950X, AMD Radeon RX 7900 XTX
23174 Points +46%
NVIDIA GeForce RTX 4080 Founders Edition
Intel Core i9-13900K, NVIDIA GeForce RTX 4080
22343 Points +40%
AMD Radeon RX 7900 XT
AMD Ryzen 9 7950X, AMD Radeon RX 7900 XT
18806 Points +18%
Zotac Gaming GeForce RTX 3090 Ti AMP Extreme Holo
AMD Ryzen 7 5800X3D, NVIDIA GeForce RTX 3090 Ti
18426 Points +16%
Sapphire AMD Radeon RX 6950 XT Nitro+ Pure
AMD Ryzen 9 5900X, AMD Radeon RX 6950 XT
17725 Points +11%
Gigabyte Aorus GeForce RTX 4070 Ti Master
Intel Core i9-13900K, NVIDIA GeForce RTX 4070 Ti
17290 Points +9%
Asus TUF Gaming GeForce RTX 4070 Ti
Intel Core i9-13900K, NVIDIA GeForce RTX 4070 Ti
17184 Points +8%
Average NVIDIA GeForce RTX 4070 Ti
  (16889 - 17290, n=4)
17118 Points +8%
Average NVIDIA GeForce RTX 3090
  (15794 - 16868, n=11)
16326 Points +3%
Average NVIDIA GeForce RTX 3080 Ti
  (16108 - 16412, n=4)
16199 Points +2%
Gigabyte GeForce RTX 4070 Super Gaming OC 12G
Intel Core i9-13900K, NVIDIA GeForce RTX 4070 SUPER
15913 Points
NVIDIA GeForce RTX 4070 Super Founders Edition
Intel Core i9-13900K, NVIDIA GeForce RTX 4070 SUPER
15803 Points -1%
AMD Radeon RX 6900 XT
AMD Ryzen 9 5950X, AMD Radeon RX 6900 XT
14955 Points -6%
Average of class Desktop
  (559 - 33488, n=21, last 2 years)
14724 Points -7%
Average NVIDIA GeForce RTX 3080
  (13984 - 14243, n=2)
14114 Points -11%
AMD Radeon RX 7800 XT
AMD Ryzen 9 7950X, AMD Radeon RX 7800 XT
13776 Points -13%
Zotac Gaming GeForce RTX 4070 AMP Airo
Intel Core i9-13900K, NVIDIA GeForce RTX 4070
13715 Points -14%
AMD Radeon RX 6800 XT
AMD Ryzen 9 5950X, AMD Radeon RX 6800 XT
13471 Points -15%
Average NVIDIA Titan RTX
  (11937 - 12644, n=9)
12203 Points -23%
Sapphire Pulse Radeon RX 7700 XT
AMD Ryzen 9 7950X, AMD Radeon RX 7700 XT
11256 Points -29%
Average NVIDIA GeForce RTX 3070
  (10544 - 10755, n=5)
10667 Points -33%
Average NVIDIA GeForce RTX 4060 Ti 8G
  (9579 - 9722, n=3)
9651 Points -39%
KFA2 GeForce RTX 4060 Ti EX, 16GB GDDR6
AMD Ryzen 9 7950X, NVIDIA GeForce RTX 4060 Ti 16G
9516 Points -40%
KFA2 GeForce RTX 4060 1-Click-OC 2X
AMD Ryzen 9 7950X, NVIDIA GeForce RTX 4060
7959 Points -50%
XFX Speedster QICK 308 Radeon RX 7600 Black Edition
AMD Ryzen 9 7950X, AMD Radeon RX 7600
7817 Points -51%
Unigine Superposition / 8k Optimized
NVIDIA GeForce RTX 4090 Founders Edition
Intel Core i9-13900K, NVIDIA GeForce RTX 4090
12826 Points +118%
AMD Radeon RX 7900 XTX
AMD Ryzen 9 7950X, AMD Radeon RX 7900 XTX
8751 Points +49%
NVIDIA GeForce RTX 4080 Founders Edition
Intel Core i9-13900K, NVIDIA GeForce RTX 4080
8556 Points +45%
Zotac Gaming GeForce RTX 3090 Ti AMP Extreme Holo
AMD Ryzen 7 5800X3D, NVIDIA GeForce RTX 3090 Ti
8213 Points +39%
Average NVIDIA GeForce RTX 3090
  (6969 - 7521, n=11)
7144 Points +21%
Average NVIDIA GeForce RTX 3080 Ti
  (6920 - 7161, n=4)
7070 Points +20%
AMD Radeon RX 7900 XT
AMD Ryzen 9 7950X, AMD Radeon RX 7900 XT
7034 Points +19%
Sapphire AMD Radeon RX 6950 XT Nitro+ Pure
AMD Ryzen 9 5900X, AMD Radeon RX 6950 XT
6645 Points +13%
Gigabyte Aorus GeForce RTX 4070 Ti Master
Intel Core i9-13900K, NVIDIA GeForce RTX 4070 Ti
6454 Points +10%
Asus TUF Gaming GeForce RTX 4070 Ti
Intel Core i9-13900K, NVIDIA GeForce RTX 4070 Ti
6427 Points +9%
Average NVIDIA GeForce RTX 4070 Ti
  (6380 - 6454, n=4)
6425 Points +9%
Average NVIDIA GeForce RTX 3080
  (6243 - 6346, n=2)
6295 Points +7%
Gigabyte GeForce RTX 4070 Super Gaming OC 12G
Intel Core i9-13900K, NVIDIA GeForce RTX 4070 SUPER
5892 Points
NVIDIA GeForce RTX 4070 Super Founders Edition
Intel Core i9-13900K, NVIDIA GeForce RTX 4070 SUPER
5844 Points -1%
Average of class Desktop
  (237 - 13008, n=21, last 2 years)
5826 Points -1%
AMD Radeon RX 6900 XT
AMD Ryzen 9 5950X, AMD Radeon RX 6900 XT
5764 Points -2%
Average NVIDIA Titan RTX
  (5255 - 5571, n=9)
5393 Points -8%
AMD Radeon RX 7800 XT
AMD Ryzen 9 7950X, AMD Radeon RX 7800 XT
5307 Points -10%
AMD Radeon RX 6800 XT
AMD Ryzen 9 5950X, AMD Radeon RX 6800 XT
5256 Points -11%
Zotac Gaming GeForce RTX 4070 AMP Airo
Intel Core i9-13900K, NVIDIA GeForce RTX 4070
5253 Points -11%
Average NVIDIA GeForce RTX 3070
  (4587 - 4695, n=5)
4624 Points -22%
Sapphire Pulse Radeon RX 7700 XT
AMD Ryzen 9 7950X, AMD Radeon RX 7700 XT
4085 Points -31%
Average NVIDIA GeForce RTX 4060 Ti 8G
  (3520 - 3571, n=3)
3546 Points -40%
KFA2 GeForce RTX 4060 Ti EX, 16GB GDDR6
AMD Ryzen 9 7950X, NVIDIA GeForce RTX 4060 Ti 16G
3517 Points -40%
KFA2 GeForce RTX 4060 1-Click-OC 2X
AMD Ryzen 9 7950X, NVIDIA GeForce RTX 4060
3066 Points -48%
XFX Speedster QICK 308 Radeon RX 7600 Black Edition
AMD Ryzen 9 7950X, AMD Radeon RX 7600
2964 Points -50%
3DMark 11 Performance
51572 points
3DMark Ice Storm Standard Score
279979 points
3DMark Cloud Gate Standard Score
81504 points
3DMark Fire Strike Score
41178 points
3DMark Fire Strike Extreme Score
24458 points
3DMark Time Spy Score
21292 points
Help

Compute performance: Right on the heels of the RTX 4070 Ti

Compute performance is virtually indistinguishable from the RTX 4070 Super FE. The RTX 4070 Super Gaming OC is able to convincingly beat the RTX 3090 Ti in V-Ray GPU tests while being 17% and 21% faster than the Zotac GeForce Gaming RTX 4070 AMP Airo in Blender 3.3 Classroom CUDA and Classroom Optix rendering, respectively.

The RTX 4070 Super Gaming OC is within striking distance of the Asus TUF Gaming GeForce RTX 4070 Ti and the Aorus RTX 4070 Ti Master in LuxMark Room. Sala tests have traditionally favored older AMD GPUs, but the RTX 4070 Super Gaming OC nevertheless manages a 27% lead over the AMD Radeon RX 7900 XTX.

V-Ray 5 Benchmark / GPU CUDA
NVIDIA GeForce RTX 4090 Founders Edition
Intel Core i9-13900K, NVIDIA GeForce RTX 4090 (5.0.1)
4224 mpaths +87%
NVIDIA GeForce RTX 4080 Founders Edition
Intel Core i9-13900K, NVIDIA GeForce RTX 4080 (5.0.1)
3067 mpaths +36%
Gigabyte Aorus GeForce RTX 4070 Ti Master
Intel Core i9-13900K, NVIDIA GeForce RTX 4070 Ti (5.0.1)
2371 mpaths +5%
Asus TUF Gaming GeForce RTX 4070 Ti
Intel Core i9-13900K, NVIDIA GeForce RTX 4070 Ti (5.0.1)
2322 mpaths +3%
Average NVIDIA GeForce RTX 4070 Ti
  (2278 - 2371, n=4)
2318 mpaths +3%
Gigabyte GeForce RTX 4070 Super Gaming OC 12G
Intel Core i9-13900K, NVIDIA GeForce RTX 4070 SUPER (5.0.1)
2254 mpaths
NVIDIA GeForce RTX 4070 Super Founders Edition
Intel Core i9-13900K, NVIDIA GeForce RTX 4070 SUPER (5.0.1)
2238 mpaths -1%
Zotac Gaming GeForce RTX 3090 Ti AMP Extreme Holo
AMD Ryzen 7 5800X3D, NVIDIA GeForce RTX 3090 Ti (5.0.1)
2195 mpaths -3%
Average NVIDIA GeForce RTX 3080 Ti
  (2045 - 2070, n=3)
2057 mpaths -9%
Average NVIDIA GeForce RTX 3090
  (1616 - 2131, n=14)
2019 mpaths -10%
Zotac Gaming GeForce RTX 4070 AMP Airo
Intel Core i9-13900K, NVIDIA GeForce RTX 4070 (5.0.1)
1874 mpaths -17%
Average of class Desktop
  (13 - 4322, n=27, last 2 years)
1808 mpaths -20%
Average NVIDIA GeForce RTX 4060 Ti 8G
  (1375 - 1400, n=2)
1388 mpaths -38%
KFA2 GeForce RTX 4060 Ti EX, 16GB GDDR6
AMD Ryzen 9 7950X, NVIDIA GeForce RTX 4060 Ti 16G (5.0.1)
1387 mpaths -38%
Average NVIDIA GeForce RTX 3070
  (1109 - 1422, n=2)
1266 mpaths -44%
KFA2 GeForce RTX 4060 1-Click-OC 2X
AMD Ryzen 9 7950X, NVIDIA GeForce RTX 4060 (5.0.1)
1246 mpaths -45%
Average NVIDIA Titan RTX
  (668 - 1052, n=7)
910 mpaths -60%
AMD Radeon RX 7800 XT
AMD Ryzen 9 7950X, AMD Radeon RX 7800 XT (5.0.1)
666 mpaths -70%
Sapphire Pulse Radeon RX 7700 XT
AMD Ryzen 9 7950X, AMD Radeon RX 7700 XT (5.0.1)
663 mpaths -71%
XFX Speedster QICK 308 Radeon RX 7600 Black Edition
AMD Ryzen 9 7950X, AMD Radeon RX 7600 (5.0.1)
662 mpaths -71%
Sapphire AMD Radeon RX 6950 XT Nitro+ Pure
AMD Ryzen 9 5900X, AMD Radeon RX 6950 XT (5.0.1)
383 mpaths -83%
V-Ray 5 Benchmark / GPU RTX
NVIDIA GeForce RTX 4090 Founders Edition
Intel Core i9-13900K, NVIDIA GeForce RTX 4090 (5.0.1)
5935 mpaths +90%
NVIDIA GeForce RTX 4080 Founders Edition
Intel Core i9-13900K, NVIDIA GeForce RTX 4080 (5.0.1)
4193 mpaths +34%
Average of class Desktop
  (992 - 6019, n=18, last 2 years)
3574 mpaths +14%
Gigabyte Aorus GeForce RTX 4070 Ti Master
Intel Core i9-13900K, NVIDIA GeForce RTX 4070 Ti (5.0.1)
3221 mpaths +3%
Asus TUF Gaming GeForce RTX 4070 Ti
Intel Core i9-13900K, NVIDIA GeForce RTX 4070 Ti (5.0.1)
3180 mpaths +2%
Average NVIDIA GeForce RTX 4070 Ti
  (3054 - 3221, n=4)
3151 mpaths +1%
Gigabyte GeForce RTX 4070 Super Gaming OC 12G
Intel Core i9-13900K, NVIDIA GeForce RTX 4070 SUPER (5.0.1)
3122 mpaths
NVIDIA GeForce RTX 4070 Super Founders Edition
Intel Core i9-13900K, NVIDIA GeForce RTX 4070 SUPER (5.0.1)
3088 mpaths -1%
Zotac Gaming GeForce RTX 3090 Ti AMP Extreme Holo
AMD Ryzen 7 5800X3D, NVIDIA GeForce RTX 3090 Ti (5.0.1)
2880 mpaths -8%
Average NVIDIA GeForce RTX 3090
  (2551 - 2979, n=14)
2813 mpaths -10%
Average NVIDIA GeForce RTX 3080 Ti
  (2727 - 2883, n=3)
2784 mpaths -11%
Zotac Gaming GeForce RTX 4070 AMP Airo
Intel Core i9-13900K, NVIDIA GeForce RTX 4070 (5.0.1)
2660 mpaths -15%
AMD Radeon RX 7800 XT
AMD Ryzen 9 7950X, AMD Radeon RX 7800 XT (5.0.1)
2024 mpaths -35%
Average NVIDIA GeForce RTX 4060 Ti 8G
  (1974 - 2024, n=2)
1999 mpaths -36%
KFA2 GeForce RTX 4060 Ti EX, 16GB GDDR6
AMD Ryzen 9 7950X, NVIDIA GeForce RTX 4060 Ti 16G (5.0.1)
1967 mpaths -37%
Sapphire Pulse Radeon RX 7700 XT
AMD Ryzen 9 7950X, AMD Radeon RX 7700 XT (5.0.1)
1967 mpaths -37%
KFA2 GeForce RTX 4060 1-Click-OC 2X
AMD Ryzen 9 7950X, NVIDIA GeForce RTX 4060 (5.0.1)
1856 mpaths -41%
Average NVIDIA GeForce RTX 3070
  (1610 - 1756, n=2)
1683 mpaths -46%
Average NVIDIA Titan RTX
  (1246 - 1348, n=7)
1299 mpaths -58%
V-Ray Benchmark Next 4.10 / GPU
NVIDIA GeForce RTX 4090 Founders Edition
Intel Core i9-13900K, NVIDIA GeForce RTX 4090 (v4.10.07 )
1847 mpaths +72%
NVIDIA GeForce RTX 4080 Founders Edition
Intel Core i9-13900K, NVIDIA GeForce RTX 4080 (v4.10.07 )
1455 mpaths +35%
NVIDIA GeForce RTX 4070 Super Founders Edition
Intel Core i9-13900K, NVIDIA GeForce RTX 4070 SUPER (v4.10.07 )
1075 mpaths 0%
Gigabyte GeForce RTX 4070 Super Gaming OC 12G
Intel Core i9-13900K, NVIDIA GeForce RTX 4070 SUPER (v4.10.07 )
1075 mpaths
Average NVIDIA GeForce RTX 4070 Ti
  (1056 - 1076, n=3)
1064 mpaths -1%
Asus TUF Gaming GeForce RTX 4070 Ti
Intel Core i9-13900K, NVIDIA GeForce RTX 4070 Ti (v4.10.07 )
1060 mpaths -1%
Gigabyte Aorus GeForce RTX 4070 Ti Master
Intel Core i9-13900K, NVIDIA GeForce RTX 4070 Ti (v4.10.07 )
1056 mpaths -2%
Zotac Gaming GeForce RTX 4070 AMP Airo
Intel Core i9-13900K, NVIDIA GeForce RTX 4070 (v4.10.07 )
966 mpaths -10%
Zotac Gaming GeForce RTX 3090 Ti AMP Extreme Holo
AMD Ryzen 7 5800X3D, NVIDIA GeForce RTX 3090 Ti (v4.10.07 )
902 mpaths -16%
Average NVIDIA GeForce RTX 3090
  (781 - 877, n=16)
856 mpaths -20%
Average NVIDIA GeForce RTX 3080 Ti
  (854 - 855, n=3)
854 mpaths -21%
Average of class Desktop
  (4 - 1880, n=29, last 2 years)
792 mpaths -26%
Average NVIDIA GeForce RTX 3080
  (636 - 643, n=2)
640 mpaths -40%
Average NVIDIA GeForce RTX 4060 Ti 8G
  (626 - 649, n=2)
638 mpaths -41%
KFA2 GeForce RTX 4060 Ti EX, 16GB GDDR6
AMD Ryzen 9 7950X, NVIDIA GeForce RTX 4060 Ti 16G (v4.10.07 )
620 mpaths -42%
KFA2 GeForce RTX 4060 1-Click-OC 2X
AMD Ryzen 9 7950X, NVIDIA GeForce RTX 4060 (v4.10.07 )
601 mpaths -44%
Average NVIDIA GeForce RTX 3070
  (464 - 508, n=4)
478 mpaths -56%
Average NVIDIA Titan RTX
  (386 - 439, n=16)
400 mpaths -63%
XFX Speedster QICK 308 Radeon RX 7600 Black Edition
AMD Ryzen 9 7950X, AMD Radeon RX 7600 (v4.10.07 )
221 mpaths -79%
AMD Radeon RX 7800 XT
AMD Ryzen 9 7950X, AMD Radeon RX 7800 XT (v4.10.07 )
220 mpaths -80%
Sapphire Pulse Radeon RX 7700 XT
AMD Ryzen 9 7950X, AMD Radeon RX 7700 XT (v4.10.07 )
220 mpaths -80%
AMD Radeon RX 6800 XT
AMD Ryzen 9 5950X, AMD Radeon RX 6800 XT (v4.10.07 )
157 mpaths -85%
Sapphire AMD Radeon RX 6950 XT Nitro+ Pure
AMD Ryzen 9 5900X, AMD Radeon RX 6950 XT (v4.10.07 )
137 mpaths -87%
Blender / v3.3 Classroom CUDA
KFA2 GeForce RTX 4060 1-Click-OC 2X
AMD Ryzen 9 7950X, NVIDIA GeForce RTX 4060 (3.3.3)
40 Seconds * -111%
Average NVIDIA Titan RTX
  ()
31 Seconds * -63%
Zotac Gaming GeForce RTX 4070 AMP Airo
Intel Core i9-13900K, NVIDIA GeForce RTX 4070 (3.3.3)
23 Seconds * -21%
Average NVIDIA GeForce RTX 3080 Ti
  (21 - 22, n=2)
21.5 Seconds * -13%
Average NVIDIA GeForce RTX 3090
  (20 - 22, n=11)
21.4 Seconds * -13%
NVIDIA GeForce RTX 4070 Super Founders Edition
Intel Core i9-13900K, NVIDIA GeForce RTX 4070 SUPER (3.3.3)
19 Seconds * -0%
Gigabyte GeForce RTX 4070 Super Gaming OC 12G
Intel Core i9-13900K, NVIDIA GeForce RTX 4070 SUPER (3.3.3)
19 Seconds *
Average NVIDIA GeForce RTX 4070 Ti
  (18 - 19, n=2)
18.5 Seconds * +3%
Gigabyte Aorus GeForce RTX 4070 Ti Master
Intel Core i9-13900K, NVIDIA GeForce RTX 4070 Ti (3.3.2)
18 Seconds * +5%
Average of class Desktop
  (10 - 23, n=15, last 2 years)
16.2 Seconds * +15%
Blender / v3.3 Classroom OPTIX/RTX
KFA2 GeForce RTX 4060 1-Click-OC 2X
AMD Ryzen 9 7950X, NVIDIA GeForce RTX 4060 (3.3.3)
21 Seconds * -91%
Average NVIDIA Titan RTX
  ()
21 Seconds * -91%
KFA2 GeForce RTX 4060 Ti EX, 16GB GDDR6
AMD Ryzen 9 7950X, NVIDIA GeForce RTX 4060 Ti 16G (3.3.3)
18 Seconds * -64%
Average NVIDIA GeForce RTX 4060 Ti 8G
  (18 - 18, n=2)
18 Seconds * -64%
Average NVIDIA GeForce RTX 3080 Ti
  (14 - 15, n=2)
14.5 Seconds * -32%
Zotac Gaming GeForce RTX 4070 AMP Airo
Intel Core i9-13900K, NVIDIA GeForce RTX 4070 (3.3.3)
14 Seconds * -27%
Average NVIDIA GeForce RTX 3090
  (13 - 14, n=11)
13.4 Seconds * -22%
Asus TUF Gaming GeForce RTX 4070 Ti
Intel Core i9-13900K, NVIDIA GeForce RTX 4070 Ti (3.3.2)
12 Seconds * -9%
Average NVIDIA GeForce RTX 4070 Ti
  (11 - 12, n=4)
11.5 Seconds * -5%
Gigabyte Aorus GeForce RTX 4070 Ti Master
Intel Core i9-13900K, NVIDIA GeForce RTX 4070 Ti (3.3.2)
11 Seconds * -0%
NVIDIA GeForce RTX 4070 Super Founders Edition
Intel Core i9-13900K, NVIDIA GeForce RTX 4070 SUPER (3.3.3)
11 Seconds * -0%
Gigabyte GeForce RTX 4070 Super Gaming OC 12G
Intel Core i9-13900K, NVIDIA GeForce RTX 4070 SUPER (3.3.3)
11 Seconds *
Average of class Desktop
  (7 - 15, n=17, last 2 years)
10.6 Seconds * +4%
NVIDIA GeForce RTX 4080 Founders Edition
Intel Core i9-13900K, NVIDIA GeForce RTX 4080 (3.3.0)
10 Seconds * +9%
NVIDIA GeForce RTX 4090 Founders Edition
Intel Core i9-13900K, NVIDIA GeForce RTX 4090 (3.3.0)
8 Seconds * +27%
LuxMark v2.0 64Bit / Room GPUs-only
NVIDIA GeForce RTX 4090 Founders Edition
Intel Core i9-13900K, NVIDIA GeForce RTX 4090
12730 Samples/s +54%
NVIDIA GeForce RTX 4080 Founders Edition
Intel Core i9-13900K, NVIDIA GeForce RTX 4080
10491 Samples/s +27%
Gigabyte Aorus GeForce RTX 4070 Ti Master
Intel Core i9-13900K, NVIDIA GeForce RTX 4070 Ti
8436 Samples/s +2%
Asus TUF Gaming GeForce RTX 4070 Ti
Intel Core i9-13900K, NVIDIA GeForce RTX 4070 Ti
8413 Samples/s +2%
NVIDIA GeForce RTX 4070 Super Founders Edition
Intel Core i9-13900K, NVIDIA GeForce RTX 4070 SUPER
8262 Samples/s 0%
Gigabyte GeForce RTX 4070 Super Gaming OC 12G
Intel Core i9-13900K, NVIDIA GeForce RTX 4070 SUPER
8257 Samples/s
Average NVIDIA GeForce RTX 4070 Ti
  (7625 - 8436, n=4)
8065 Samples/s -2%
Zotac Gaming GeForce RTX 4070 AMP Airo
Intel Core i9-13900K, NVIDIA GeForce RTX 4070
7402 Samples/s -10%
Zotac Gaming GeForce RTX 3090 Ti AMP Extreme Holo
AMD Ryzen 7 5800X3D, NVIDIA GeForce RTX 3090 Ti
6221 Samples/s -25%
Average NVIDIA GeForce RTX 3080 Ti
  (5772 - 6464, n=4)
6138 Samples/s -26%
Average NVIDIA GeForce RTX 3090
  (5727 - 5985, n=9)
5893 Samples/s -29%
Average of class Desktop
  (81 - 12730, n=23, last 2 years)
5398 Samples/s -35%
AMD Radeon RX 7900 XTX
AMD Ryzen 9 7950X, AMD Radeon RX 7900 XTX
5161 Samples/s -37%
Average NVIDIA GeForce RTX 3080
  (5112 - 5198, n=2)
5155 Samples/s -38%
Sapphire AMD Radeon RX 6950 XT Nitro+ Pure
AMD Ryzen 9 5900X, AMD Radeon RX 6950 XT
5097 Samples/s -38%
AMD Radeon RX 6900 XT
AMD Ryzen 9 5950X, AMD Radeon RX 6900 XT
5084 Samples/s -38%
AMD Radeon RX 6800 XT
AMD Ryzen 9 5950X, AMD Radeon RX 6800 XT
5057 Samples/s -39%
Average NVIDIA Titan RTX
  (4643 - 4703, n=2)
4673 Samples/s -43%
Average NVIDIA GeForce RTX 4060 Ti 8G
  (4558 - 4790, n=3)
4641 Samples/s -44%
KFA2 GeForce RTX 4060 Ti EX, 16GB GDDR6
AMD Ryzen 9 7950X, NVIDIA GeForce RTX 4060 Ti 16G
4570 Samples/s -45%
AMD Radeon RX 7900 XT
AMD Ryzen 9 7950X, AMD Radeon RX 7900 XT
4451 Samples/s -46%
KFA2 GeForce RTX 4060 1-Click-OC 2X
AMD Ryzen 9 7950X, NVIDIA GeForce RTX 4060
4063 Samples/s -51%
Average NVIDIA GeForce RTX 3070
  (2187 - 4293, n=3)
3588 Samples/s -57%
AMD Radeon RX 7800 XT
AMD Ryzen 9 7950X, AMD Radeon RX 7800 XT
3446 Samples/s -58%
Sapphire Pulse Radeon RX 7700 XT
AMD Ryzen 9 7950X, AMD Radeon RX 7700 XT
3258 Samples/s -61%
XFX Speedster QICK 308 Radeon RX 7600 Black Edition
AMD Ryzen 9 7950X, AMD Radeon RX 7600
2227 Samples/s -73%
LuxMark v2.0 64Bit / Sala GPUs-only
Sapphire AMD Radeon RX 6950 XT Nitro+ Pure
AMD Ryzen 9 5900X, AMD Radeon RX 6950 XT
31954 Samples/s +67%
AMD Radeon RX 6900 XT
AMD Ryzen 9 5950X, AMD Radeon RX 6900 XT
31400 Samples/s +64%
AMD Radeon RX 6800 XT
AMD Ryzen 9 5950X, AMD Radeon RX 6800 XT
28023 Samples/s +46%
NVIDIA GeForce RTX 4090 Founders Edition
Intel Core i9-13900K, NVIDIA GeForce RTX 4090
27828 Samples/s +45%
NVIDIA GeForce RTX 4080 Founders Edition
Intel Core i9-13900K, NVIDIA GeForce RTX 4080
24835 Samples/s +30%
Gigabyte Aorus GeForce RTX 4070 Ti Master
Intel Core i9-13900K, NVIDIA GeForce RTX 4070 Ti
20305 Samples/s +6%
Asus TUF Gaming GeForce RTX 4070 Ti
Intel Core i9-13900K, NVIDIA GeForce RTX 4070 Ti
20171 Samples/s +5%
Average NVIDIA GeForce RTX 4070 Ti
  (17719 - 20305, n=4)
19151 Samples/s 0%
Gigabyte GeForce RTX 4070 Super Gaming OC 12G
Intel Core i9-13900K, NVIDIA GeForce RTX 4070 SUPER
19131 Samples/s
NVIDIA GeForce RTX 4070 Super Founders Edition
Intel Core i9-13900K, NVIDIA GeForce RTX 4070 SUPER
19072 Samples/s 0%
Zotac Gaming GeForce RTX 3090 Ti AMP Extreme Holo
AMD Ryzen 7 5800X3D, NVIDIA GeForce RTX 3090 Ti
16046 Samples/s -16%
Average NVIDIA GeForce RTX 3080 Ti
  (14871 - 16438, n=4)
15612 Samples/s -18%
Zotac Gaming GeForce RTX 4070 AMP Airo
Intel Core i9-13900K, NVIDIA GeForce RTX 4070
15100 Samples/s -21%
AMD Radeon RX 7900 XTX
AMD Ryzen 9 7950X, AMD Radeon RX 7900 XTX
15019 Samples/s -21%
Average NVIDIA GeForce RTX 3090
  (14590 - 15242, n=9)
14945 Samples/s -22%
AMD Radeon RX 7900 XT
AMD Ryzen 9 7950X, AMD Radeon RX 7900 XT
13489 Samples/s -29%
Average NVIDIA GeForce RTX 3080
  (12797 - 12980, n=2)
12889 Samples/s -33%
Average of class Desktop
  (147 - 27828, n=23, last 2 years)
12288 Samples/s -36%
Average NVIDIA GeForce RTX 4060 Ti 8G
  (11159 - 11281, n=3)
11235 Samples/s -41%
KFA2 GeForce RTX 4060 Ti EX, 16GB GDDR6
AMD Ryzen 9 7950X, NVIDIA GeForce RTX 4060 Ti 16G
11226 Samples/s -41%
Average NVIDIA Titan RTX
  (10799 - 10996, n=2)
10898 Samples/s -43%
AMD Radeon RX 7800 XT
AMD Ryzen 9 7950X, AMD Radeon RX 7800 XT
10158 Samples/s -47%
Average NVIDIA GeForce RTX 3070
  (10096 - 10115, n=3)
10107 Samples/s -47%
KFA2 GeForce RTX 4060 1-Click-OC 2X
AMD Ryzen 9 7950X, NVIDIA GeForce RTX 4060
8991 Samples/s -53%
Sapphire Pulse Radeon RX 7700 XT
AMD Ryzen 9 7950X, AMD Radeon RX 7700 XT
8614 Samples/s -55%
XFX Speedster QICK 308 Radeon RX 7600 Black Edition
AMD Ryzen 9 7950X, AMD Radeon RX 7600
5583 Samples/s -71%
ComputeMark v2.1 / Normal, Score
NVIDIA GeForce RTX 4090 Founders Edition
Intel Core i9-13900K, NVIDIA GeForce RTX 4090
86583 Points +80%
AMD Radeon RX 7900 XTX
AMD Ryzen 9 7950X, AMD Radeon RX 7900 XTX
62963 Points +31%
NVIDIA GeForce RTX 4080 Founders Edition
Intel Core i9-13900K, NVIDIA GeForce RTX 4080
62720 Points +30%
AMD Radeon RX 7900 XT
AMD Ryzen 9 7950X, AMD Radeon RX 7900 XT
57570 Points +20%
Zotac Gaming GeForce RTX 3090 Ti AMP Extreme Holo
AMD Ryzen 7 5800X3D, NVIDIA GeForce RTX 3090 Ti
52258 Points +9%
Gigabyte Aorus GeForce RTX 4070 Ti Master
Intel Core i9-13900K, NVIDIA GeForce RTX 4070 Ti
52251 Points +8%
Average NVIDIA GeForce RTX 4070 Ti
  (51287 - 52251, n=4)
51747 Points +7%
Asus TUF Gaming GeForce RTX 4070 Ti
Intel Core i9-13900K, NVIDIA GeForce RTX 4070 Ti
51616 Points +7%
Average NVIDIA GeForce RTX 3080 Ti
  (47377 - 48892, n=4)
48266 Points 0%
Gigabyte GeForce RTX 4070 Super Gaming OC 12G
Intel Core i9-13900K, NVIDIA GeForce RTX 4070 SUPER
48163 Points
NVIDIA GeForce RTX 4070 Super Founders Edition
Intel Core i9-13900K, NVIDIA GeForce RTX 4070 SUPER
47808 Points -1%
Average NVIDIA GeForce RTX 3090
  (44948 - 49118, n=9)
47804 Points -1%
Sapphire AMD Radeon RX 6950 XT Nitro+ Pure
AMD Ryzen 9 5900X, AMD Radeon RX 6950 XT
44959 Points -7%
AMD Radeon RX 7800 XT
AMD Ryzen 9 7950X, AMD Radeon RX 7800 XT
43852 Points -9%
Zotac Gaming GeForce RTX 4070 AMP Airo
Intel Core i9-13900K, NVIDIA GeForce RTX 4070
41933 Points -13%
AMD Radeon RX 6900 XT
AMD Ryzen 9 5950X, AMD Radeon RX 6900 XT
40857 Points -15%
Average NVIDIA GeForce RTX 3080
  (39924 - 41594, n=2)
40759 Points -15%
AMD Radeon RX 6800 XT
AMD Ryzen 9 5950X, AMD Radeon RX 6800 XT
38823 Points -19%
Sapphire Pulse Radeon RX 7700 XT
AMD Ryzen 9 7950X, AMD Radeon RX 7700 XT
38363 Points -20%
Average of class Desktop
  (476 - 90920, n=24, last 2 years)
35064 Points -27%
KFA2 GeForce RTX 4060 Ti EX, 16GB GDDR6
AMD Ryzen 9 7950X, NVIDIA GeForce RTX 4060 Ti 16G
32285 Points -33%
Average NVIDIA GeForce RTX 4060 Ti 8G
  (31884 - 32410, n=3)
32125 Points -33%
Average NVIDIA GeForce RTX 3070
  (29330 - 30581, n=3)
30004 Points -38%
Average NVIDIA Titan RTX
  (27907 - 29830, n=3)
28802 Points -40%
XFX Speedster QICK 308 Radeon RX 7600 Black Edition
AMD Ryzen 9 7950X, AMD Radeon RX 7600
25119 Points -48%
KFA2 GeForce RTX 4060 1-Click-OC 2X
AMD Ryzen 9 7950X, NVIDIA GeForce RTX 4060
23841 Points -50%
ComputeMark v2.1 / Normal, QJuliaRayTrace
NVIDIA GeForce RTX 4090 Founders Edition
Intel Core i9-13900K, NVIDIA GeForce RTX 4090
31780 Points +60%
NVIDIA GeForce RTX 4080 Founders Edition
Intel Core i9-13900K, NVIDIA GeForce RTX 4080
24307 Points +22%
Gigabyte Aorus GeForce RTX 4070 Ti Master
Intel Core i9-13900K, NVIDIA GeForce RTX 4070 Ti
21619 Points +9%
Average NVIDIA GeForce RTX 4070 Ti
  (21107 - 21619, n=4)
21333 Points +7%
Asus TUF Gaming GeForce RTX 4070 Ti
Intel Core i9-13900K, NVIDIA GeForce RTX 4070 Ti
21276 Points +7%
Gigabyte GeForce RTX 4070 Super Gaming OC 12G
Intel Core i9-13900K, NVIDIA GeForce RTX 4070 SUPER
19861 Points
NVIDIA GeForce RTX 4070 Super Founders Edition
Intel Core i9-13900K, NVIDIA GeForce RTX 4070 SUPER
19738 Points -1%
Zotac Gaming GeForce RTX 3090 Ti AMP Extreme Holo
AMD Ryzen 7 5800X3D, NVIDIA GeForce RTX 3090 Ti
18550 Points -7%
AMD Radeon RX 7900 XTX
AMD Ryzen 9 7950X, AMD Radeon RX 7900 XTX
17915 Points -10%
Average NVIDIA GeForce RTX 3080 Ti
  (17050 - 17749, n=4)
17475 Points -12%
Average NVIDIA GeForce RTX 3090
  (16403 - 18223, n=10)
17454 Points -12%
Zotac Gaming GeForce RTX 4070 AMP Airo
Intel Core i9-13900K, NVIDIA GeForce RTX 4070
17091 Points -14%
AMD Radeon RX 7900 XT
AMD Ryzen 9 7950X, AMD Radeon RX 7900 XT
16990 Points -14%
Average NVIDIA GeForce RTX 3080
  (14718 - 15508, n=2)
15113 Points -24%
KFA2 GeForce RTX 4060 Ti EX, 16GB GDDR6
AMD Ryzen 9 7950X, NVIDIA GeForce RTX 4060 Ti 16G
13856 Points -30%
Average NVIDIA GeForce RTX 4060 Ti 8G
  (13563 - 13822, n=3)
13702 Points -31%
Sapphire AMD Radeon RX 6950 XT Nitro+ Pure
AMD Ryzen 9 5900X, AMD Radeon RX 6950 XT
13580 Points -32%
AMD Radeon RX 7800 XT
AMD Ryzen 9 7950X, AMD Radeon RX 7800 XT
13454 Points -32%
Average of class Desktop
  (159 - 33698, n=24, last 2 years)
13343 Points -33%
Sapphire Pulse Radeon RX 7700 XT
AMD Ryzen 9 7950X, AMD Radeon RX 7700 XT
12925 Points -35%
AMD Radeon RX 6900 XT
AMD Ryzen 9 5950X, AMD Radeon RX 6900 XT
12255 Points -38%
Average NVIDIA GeForce RTX 3070
  (11510 - 11816, n=3)
11665 Points -41%
AMD Radeon RX 6800 XT
AMD Ryzen 9 5950X, AMD Radeon RX 6800 XT
11304 Points -43%
KFA2 GeForce RTX 4060 1-Click-OC 2X
AMD Ryzen 9 7950X, NVIDIA GeForce RTX 4060
9916 Points -50%
Average NVIDIA Titan RTX
  (9418 - 10129, n=3)
9748 Points -51%
XFX Speedster QICK 308 Radeon RX 7600 Black Edition
AMD Ryzen 9 7950X, AMD Radeon RX 7600
8897 Points -55%
ComputeMark v2.1 / Normal, Mandel Scalar
NVIDIA GeForce RTX 4090 Founders Edition
Intel Core i9-13900K, NVIDIA GeForce RTX 4090
21571 Points +91%
AMD Radeon RX 7900 XTX
AMD Ryzen 9 7950X, AMD Radeon RX 7900 XTX
15458 Points +37%
NVIDIA GeForce RTX 4080 Founders Edition
Intel Core i9-13900K, NVIDIA GeForce RTX 4080
14733 Points +30%
AMD Radeon RX 7900 XT
AMD Ryzen 9 7950X, AMD Radeon RX 7900 XT
13989 Points +24%
Gigabyte Aorus GeForce RTX 4070 Ti Master
Intel Core i9-13900K, NVIDIA GeForce RTX 4070 Ti
12449 Points +10%
Zotac Gaming GeForce RTX 3090 Ti AMP Extreme Holo
AMD Ryzen 7 5800X3D, NVIDIA GeForce RTX 3090 Ti
12406 Points +10%
Asus TUF Gaming GeForce RTX 4070 Ti
Intel Core i9-13900K, NVIDIA GeForce RTX 4070 Ti
12320 Points +9%
Average NVIDIA GeForce RTX 4070 Ti
  (12126 - 12449, n=4)
12302 Points +9%
Sapphire AMD Radeon RX 6950 XT Nitro+ Pure
AMD Ryzen 9 5900X, AMD Radeon RX 6950 XT
11854 Points +5%
Gigabyte GeForce RTX 4070 Super Gaming OC 12G
Intel Core i9-13900K, NVIDIA GeForce RTX 4070 SUPER
11317 Points
AMD Radeon RX 7800 XT
AMD Ryzen 9 7950X, AMD Radeon RX 7800 XT
11209 Points -1%
Average NVIDIA GeForce RTX 3080 Ti
  (11049 - 11318, n=4)
11196 Points -1%
Average NVIDIA GeForce RTX 3090
  (10650 - 11564, n=10)
11162 Points -1%
NVIDIA GeForce RTX 4070 Super Founders Edition
Intel Core i9-13900K, NVIDIA GeForce RTX 4070 SUPER
11149 Points -1%
AMD Radeon RX 6900 XT
AMD Ryzen 9 5950X, AMD Radeon RX 6900 XT
10834 Points -4%
Sapphire Pulse Radeon RX 7700 XT
AMD Ryzen 9 7950X, AMD Radeon RX 7700 XT
10601 Points -6%
AMD Radeon RX 6800 XT
AMD Ryzen 9 5950X, AMD Radeon RX 6800 XT
10018 Points -11%
Average NVIDIA GeForce RTX 3080
  (9554 - 9938, n=2)
9746 Points -14%
Zotac Gaming GeForce RTX 4070 AMP Airo
Intel Core i9-13900K, NVIDIA GeForce RTX 4070
9578 Points -15%
Average of class Desktop
  (75 - 22731, n=24, last 2 years)
8325 Points -26%
KFA2 GeForce RTX 4060 Ti EX, 16GB GDDR6
AMD Ryzen 9 7950X, NVIDIA GeForce RTX 4060 Ti 16G
7454 Points -34%
Average NVIDIA GeForce RTX 4060 Ti 8G
  (7374 - 7511, n=3)
7431 Points -34%
Average NVIDIA GeForce RTX 3070
  (7042 - 7314, n=3)
7169 Points -37%
XFX Speedster QICK 308 Radeon RX 7600 Black Edition
AMD Ryzen 9 7950X, AMD Radeon RX 7600
6746 Points -40%
Average NVIDIA Titan RTX
  (5977 - 6406, n=3)
6184 Points -45%
KFA2 GeForce RTX 4060 1-Click-OC 2X
AMD Ryzen 9 7950X, NVIDIA GeForce RTX 4060
5153 Points -54%
ComputeMark v2.1 / Normal, Mandel Vector
NVIDIA GeForce RTX 4090 Founders Edition
Intel Core i9-13900K, NVIDIA GeForce RTX 4090
16199 Points +66%
AMD Radeon RX 7900 XTX
AMD Ryzen 9 7950X, AMD Radeon RX 7900 XTX
13737 Points +41%
AMD Radeon RX 7900 XT
AMD Ryzen 9 7950X, AMD Radeon RX 7900 XT
13022 Points +34%
NVIDIA GeForce RTX 4080 Founders Edition
Intel Core i9-13900K, NVIDIA GeForce RTX 4080
11772 Points +21%
Gigabyte Aorus GeForce RTX 4070 Ti Master
Intel Core i9-13900K, NVIDIA GeForce RTX 4070 Ti
10888 Points +12%
Asus TUF Gaming GeForce RTX 4070 Ti
Intel Core i9-13900K, NVIDIA GeForce RTX 4070 Ti
10771 Points +10%
Average NVIDIA GeForce RTX 4070 Ti
  (10541 - 10888, n=4)
10728 Points +10%
Zotac Gaming GeForce RTX 3090 Ti AMP Extreme Holo
AMD Ryzen 7 5800X3D, NVIDIA GeForce RTX 3090 Ti
10652 Points +9%
AMD Radeon RX 7800 XT
AMD Ryzen 9 7950X, AMD Radeon RX 7800 XT
9963 Points +2%
Gigabyte GeForce RTX 4070 Super Gaming OC 12G
Intel Core i9-13900K, NVIDIA GeForce RTX 4070 SUPER
9748 Points
Average NVIDIA GeForce RTX 3080 Ti
  (9513 - 9860, n=4)
9730 Points 0%
NVIDIA GeForce RTX 4070 Super Founders Edition
Intel Core i9-13900K, NVIDIA GeForce RTX 4070 SUPER
9629 Points -1%
Sapphire Pulse Radeon RX 7700 XT
AMD Ryzen 9 7950X, AMD Radeon RX 7700 XT
9568 Points -2%
Sapphire AMD Radeon RX 6950 XT Nitro+ Pure
AMD Ryzen 9 5900X, AMD Radeon RX 6950 XT
9555 Points -2%
Average NVIDIA GeForce RTX 3090
  (8038 - 10097, n=10)
9467 Points -3%
AMD Radeon RX 6900 XT
AMD Ryzen 9 5950X, AMD Radeon RX 6900 XT
8690 Points -11%
Zotac Gaming GeForce RTX 4070 AMP Airo
Intel Core i9-13900K, NVIDIA GeForce RTX 4070
8421 Points -14%
AMD Radeon RX 6800 XT
AMD Ryzen 9 5950X, AMD Radeon RX 6800 XT
8399 Points -14%
Average NVIDIA GeForce RTX 3080
  (7148 - 7540, n=2)
7344 Points -25%
Average of class Desktop
  (97 - 16942, n=24, last 2 years)
6936 Points -29%
Average NVIDIA GeForce RTX 4060 Ti 8G
  (6815 - 6929, n=3)
6854 Points -30%
KFA2 GeForce RTX 4060 Ti EX, 16GB GDDR6
AMD Ryzen 9 7950X, NVIDIA GeForce RTX 4060 Ti 16G
6852 Points -30%
XFX Speedster QICK 308 Radeon RX 7600 Black Edition
AMD Ryzen 9 7950X, AMD Radeon RX 7600
5764 Points -41%
Average NVIDIA GeForce RTX 3070
  (5364 - 6266, n=3)
5707 Points -41%
Average NVIDIA Titan RTX
  (4944 - 5440, n=3)
5158 Points -47%
KFA2 GeForce RTX 4060 1-Click-OC 2X
AMD Ryzen 9 7950X, NVIDIA GeForce RTX 4060
4916 Points -50%
ComputeMark v2.1 / Normal, Fluid 2DTexArr
AMD Radeon RX 7900 XTX
AMD Ryzen 9 7950X, AMD Radeon RX 7900 XTX
7315 Points +103%
NVIDIA GeForce RTX 4090 Founders Edition
Intel Core i9-13900K, NVIDIA GeForce RTX 4090
6567 Points +82%
AMD Radeon RX 7900 XT
AMD Ryzen 9 7950X, AMD Radeon RX 7900 XT
6460 Points +79%
NVIDIA GeForce RTX 4080 Founders Edition
Intel Core i9-13900K, NVIDIA GeForce RTX 4080
5523 Points +53%
Zotac Gaming GeForce RTX 3090 Ti AMP Extreme Holo
AMD Ryzen 7 5800X3D, NVIDIA GeForce RTX 3090 Ti
4886 Points +36%
Average NVIDIA GeForce RTX 3080 Ti
  (4453 - 4546, n=4)
4498 Points +25%
Average NVIDIA GeForce RTX 3090
  (4344 - 4608, n=10)
4492 Points +25%
AMD Radeon RX 7800 XT
AMD Ryzen 9 7950X, AMD Radeon RX 7800 XT
4489 Points +25%
Sapphire AMD Radeon RX 6950 XT Nitro+ Pure
AMD Ryzen 9 5900X, AMD Radeon RX 6950 XT
4455 Points +24%
Average NVIDIA GeForce RTX 3080
  (4087 - 4159, n=2)
4123 Points +15%
AMD Radeon RX 6800 XT
AMD Ryzen 9 5950X, AMD Radeon RX 6800 XT
3947 Points +10%
AMD Radeon RX 6900 XT
AMD Ryzen 9 5950X, AMD Radeon RX 6900 XT
3924 Points +9%
Average NVIDIA Titan RTX
  (3691 - 3828, n=3)
3757 Points +4%
Average NVIDIA GeForce RTX 4070 Ti
  (3566 - 3724, n=4)
3647 Points +1%
Gigabyte GeForce RTX 4070 Super Gaming OC 12G
Intel Core i9-13900K, NVIDIA GeForce RTX 4070 SUPER
3599 Points
NVIDIA GeForce RTX 4070 Super Founders Edition
Intel Core i9-13900K, NVIDIA GeForce RTX 4070 SUPER
3592 Points 0%
Gigabyte Aorus GeForce RTX 4070 Ti Master
Intel Core i9-13900K, NVIDIA GeForce RTX 4070 Ti
3590 Points 0%
Asus TUF Gaming GeForce RTX 4070 Ti
Intel Core i9-13900K, NVIDIA GeForce RTX 4070 Ti
3566 Points -1%
Zotac Gaming GeForce RTX 4070 AMP Airo
Intel Core i9-13900K, NVIDIA GeForce RTX 4070
3404 Points -5%
Average of class Desktop
  (60 - 6800, n=24, last 2 years)
2929 Points -19%
Average NVIDIA GeForce RTX 3070
  (2666 - 2706, n=3)
2692 Points -25%
Sapphire Pulse Radeon RX 7700 XT
AMD Ryzen 9 7950X, AMD Radeon RX 7700 XT
2666 Points -26%
Average NVIDIA GeForce RTX 4060 Ti 8G
  (2044 - 2060, n=3)
2049 Points -43%
KFA2 GeForce RTX 4060 Ti EX, 16GB GDDR6
AMD Ryzen 9 7950X, NVIDIA GeForce RTX 4060 Ti 16G
2039 Points -43%
KFA2 GeForce RTX 4060 1-Click-OC 2X
AMD Ryzen 9 7950X, NVIDIA GeForce RTX 4060
1912 Points -47%
XFX Speedster QICK 308 Radeon RX 7600 Black Edition
AMD Ryzen 9 7950X, AMD Radeon RX 7600
1878 Points -48%
ComputeMark v2.1 / Normal, Fluid 3DTex
NVIDIA GeForce RTX 4090 Founders Edition
Intel Core i9-13900K, NVIDIA GeForce RTX 4090
10465 Points +188%
AMD Radeon RX 7900 XTX
AMD Ryzen 9 7950X, AMD Radeon RX 7900 XTX
8537 Points +135%
AMD Radeon RX 7900 XT
AMD Ryzen 9 7950X, AMD Radeon RX 7900 XT
7109 Points +95%
NVIDIA GeForce RTX 4080 Founders Edition
Intel Core i9-13900K, NVIDIA GeForce RTX 4080
6385 Points +76%
Zotac Gaming GeForce RTX 3090 Ti AMP Extreme Holo
AMD Ryzen 7 5800X3D, NVIDIA GeForce RTX 3090 Ti
5764 Points +58%
Sapphire AMD Radeon RX 6950 XT Nitro+ Pure
AMD Ryzen 9 5900X, AMD Radeon RX 6950 XT
5515 Points +52%
Average NVIDIA GeForce RTX 3090
  (5246 - 5520, n=10)
5448 Points +50%
Average NVIDIA GeForce RTX 3080 Ti
  (5312 - 5422, n=4)
5368 Points +48%
AMD Radeon RX 6800 XT
AMD Ryzen 9 5950X, AMD Radeon RX 6800 XT
5154 Points +42%
AMD Radeon RX 6900 XT
AMD Ryzen 9 5950X, AMD Radeon RX 6900 XT
5154 Points +42%
AMD Radeon RX 7800 XT
AMD Ryzen 9 7950X, AMD Radeon RX 7800 XT
4736 Points +30%
Average NVIDIA GeForce RTX 3080
  (4417 - 4450, n=2)
4434 Points +22%
Average NVIDIA Titan RTX
  (3877 - 4027, n=3)
3955 Points +9%
Average NVIDIA GeForce RTX 4070 Ti
  (3683 - 3789, n=4)
3738 Points +3%
Gigabyte Aorus GeForce RTX 4070 Ti Master
Intel Core i9-13900K, NVIDIA GeForce RTX 4070 Ti
3705 Points +2%
NVIDIA GeForce RTX 4070 Super Founders Edition
Intel Core i9-13900K, NVIDIA GeForce RTX 4070 SUPER
3701 Points +2%
Asus TUF Gaming GeForce RTX 4070 Ti
Intel Core i9-13900K, NVIDIA GeForce RTX 4070 Ti
3683 Points +1%
Gigabyte GeForce RTX 4070 Super Gaming OC 12G
Intel Core i9-13900K, NVIDIA GeForce RTX 4070 SUPER
3638 Points
Average of class Desktop
  (65 - 10749, n=24, last 2 years)
3532 Points -3%
Zotac Gaming GeForce RTX 4070 AMP Airo
Intel Core i9-13900K, NVIDIA GeForce RTX 4070
3438 Points -5%
Average NVIDIA GeForce RTX 3070
  (2749 - 2791, n=3)
2772 Points -24%
Sapphire Pulse Radeon RX 7700 XT
AMD Ryzen 9 7950X, AMD Radeon RX 7700 XT
2603 Points -28%
Average NVIDIA GeForce RTX 4060 Ti 8G
  (2088 - 2090, n=3)
2089 Points -43%
KFA2 GeForce RTX 4060 Ti EX, 16GB GDDR6
AMD Ryzen 9 7950X, NVIDIA GeForce RTX 4060 Ti 16G
2085 Points -43%
KFA2 GeForce RTX 4060 1-Click-OC 2X
AMD Ryzen 9 7950X, NVIDIA GeForce RTX 4060
1943 Points -47%
XFX Speedster QICK 308 Radeon RX 7600 Black Edition
AMD Ryzen 9 7950X, AMD Radeon RX 7600
1835 Points -50%

* ... smaller is better

Gaming performance: Increased boosts result in minor but welcome gains over the RTX 4070 Super FE

The benefits of increased boost clocks start becoming apparent in gaming, particularly at Ultra settings from 1080p to 4K.

The higher clocks seem to afford a cumulative 5% performance advantage to the RTX 4070 Super Gaming OC over the RTX 4070 Super FE, which further slightly widens the delta with the RTX 3090 average by 7%.

When examined individually, maximum gains over the RTX 4070 Super FE were seen with The Witcher 3 1080p Ultra (+9%) and Shadow of the Tomb Raider QHD Ultra (+14%). Other games in the comparison showed relatively modest upticks in average fps.

Performance Rating - Percent
NVIDIA GeForce RTX 4090 Founders Edition
Intel Core i9-13900K, NVIDIA GeForce RTX 4090
99.8 pt
NVIDIA GeForce RTX 4080 Founders Edition
Intel Core i9-13900K, NVIDIA GeForce RTX 4080
85.2 pt
AMD Radeon RX 7900 XTX -3!
AMD Ryzen 9 7950X, AMD Radeon RX 7900 XTX
83.8 pt
AMD Radeon RX 7900 XT -3!
AMD Ryzen 9 7950X, AMD Radeon RX 7900 XT
74.6 pt
Asus TUF Gaming GeForce RTX 4070 Ti
Intel Core i9-13900K, NVIDIA GeForce RTX 4070 Ti
71.4 pt
Gigabyte Aorus GeForce RTX 4070 Ti Master
Intel Core i9-13900K, NVIDIA GeForce RTX 4070 Ti
71.3 pt
Zotac Gaming GeForce RTX 3090 Ti AMP Extreme Holo
AMD Ryzen 7 5800X3D, NVIDIA GeForce RTX 3090 Ti
71.1 pt
Average NVIDIA GeForce RTX 4070 Ti
 
70.2 pt
Gigabyte GeForce RTX 4070 Super Gaming OC 12G
Intel Core i9-13900K, NVIDIA GeForce RTX 4070 SUPER
65.4 pt
Average of class Desktop
 
65.2 pt
Sapphire AMD Radeon RX 6950 XT Nitro+ Pure
AMD Ryzen 9 5900X, AMD Radeon RX 6950 XT
62.4 pt
NVIDIA GeForce RTX 4070 Super Founders Edition
Intel Core i9-13900K, NVIDIA GeForce RTX 4070 SUPER
62.4 pt
Average NVIDIA GeForce RTX 3080 Ti
 
61.8 pt
Average NVIDIA GeForce RTX 3090
 
61.3 pt
AMD Radeon RX 7800 XT -3!
AMD Ryzen 9 7950X, AMD Radeon RX 7800 XT
57.6 pt
Zotac Gaming GeForce RTX 4070 AMP Airo
Intel Core i9-13900K, NVIDIA GeForce RTX 4070
57.1 pt
AMD Radeon RX 6900 XT
AMD Ryzen 9 5950X, AMD Radeon RX 6900 XT
54.1 pt
Average NVIDIA GeForce RTX 3080
 
53 pt
AMD Radeon RX 6800 XT -1!
AMD Ryzen 9 5950X, AMD Radeon RX 6800 XT
50.7 pt
Sapphire Pulse Radeon RX 7700 XT -3!
AMD Ryzen 9 7950X, AMD Radeon RX 7700 XT
48.5 pt
Average NVIDIA Titan RTX
 
45 pt
Average NVIDIA GeForce RTX 4060 Ti 8G -3!
 
42.2 pt
KFA2 GeForce RTX 4060 Ti EX, 16GB GDDR6 -3!
AMD Ryzen 9 7950X, NVIDIA GeForce RTX 4060 Ti 16G
41.4 pt
Average NVIDIA GeForce RTX 3070
 
40.8 pt
XFX Speedster QICK 308 Radeon RX 7600 Black Edition -3!
AMD Ryzen 9 7950X, AMD Radeon RX 7600
33.9 pt
KFA2 GeForce RTX 4060 1-Click-OC 2X -3!
AMD Ryzen 9 7950X, NVIDIA GeForce RTX 4060
33.5 pt
The Witcher 3
3840x2160 Ultra Graphics & Postprocessing (HBAO+)
NVIDIA GeForce RTX 4090 Founders Edition
Intel Core i9-13900K, NVIDIA GeForce RTX 4090
170.7 (154min, 154.59P1) fps +92%
NVIDIA GeForce RTX 4080 Founders Edition
Intel Core i9-13900K, NVIDIA GeForce RTX 4080
128 (113min, 114.12P1) fps +44%
AMD Radeon RX 7900 XTX
AMD Ryzen 9 7950X, AMD Radeon RX 7900 XTX
125.8 (9.5min, 66.1P0.1, 94.8P1) fps +41%
Average of class Desktop
  (55.9 - 178.6, n=20, last 2 years)
114.9 fps +29%
AMD Radeon RX 7900 XT
AMD Ryzen 9 7950X, AMD Radeon RX 7900 XT
109.4 (57.5min, 60.1P0.1, 86.2P1) fps +23%
Zotac Gaming GeForce RTX 3090 Ti AMP Extreme Holo
AMD Ryzen 7 5800X3D, NVIDIA GeForce RTX 3090 Ti
107.5 (97min, 97.56P1) fps +21%
Asus TUF Gaming GeForce RTX 4070 Ti
Intel Core i9-13900K, NVIDIA GeForce RTX 4070 Ti
98.3 (88min, 88.56P1) fps +10%
Average NVIDIA GeForce RTX 4070 Ti
  (92.4 - 98.3, n=4)
95.2 fps +7%
Average NVIDIA GeForce RTX 3080 Ti
  (93.1 - 96.4, n=4)
94.7 fps +6%
Gigabyte Aorus GeForce RTX 4070 Ti Master
Intel Core i9-13900K, NVIDIA GeForce RTX 4070 Ti
94.4 (86min, 86.46P1) fps +6%
Average NVIDIA GeForce RTX 3090
  (85.4 - 98.5, n=8)
93.4 fps +5%
Sapphire AMD Radeon RX 6950 XT Nitro+ Pure
AMD Ryzen 9 5900X, AMD Radeon RX 6950 XT
92.3 (10.8min, 48.8P0.1, 54.2P1) fps +4%
Gigabyte GeForce RTX 4070 Super Gaming OC 12G
Intel Core i9-13900K, NVIDIA GeForce RTX 4070 SUPER
89.1 (81min, 81.6P1) fps
NVIDIA GeForce RTX 4070 Super Founders Edition
Intel Core i9-13900K, NVIDIA GeForce RTX 4070 SUPER
84.5 (77min, 77P1) fps -5%
Average NVIDIA GeForce RTX 3080
  (78 - 85.7, n=2)
81.9 fps -8%
AMD Radeon RX 7800 XT
AMD Ryzen 9 7950X, AMD Radeon RX 7800 XT
80.4 fps -10%
Zotac Gaming GeForce RTX 4070 AMP Airo
Intel Core i9-13900K, NVIDIA GeForce RTX 4070
77.1 (69min, 69P1) fps -13%
AMD Radeon RX 6900 XT
AMD Ryzen 9 5950X, AMD Radeon RX 6900 XT
76.6 (70min, 70P1) fps -14%
Average NVIDIA Titan RTX
  ()
71.8 fps -19%
Sapphire Pulse Radeon RX 7700 XT
AMD Ryzen 9 7950X, AMD Radeon RX 7700 XT
64.4 (33min, 33.3P0.1, 56.3P1) fps -28%
Average NVIDIA GeForce RTX 3070
  (59 - 60.3, n=2)
59.7 fps -33%
Average NVIDIA GeForce RTX 4060 Ti 8G
  (53.9 - 54.3, n=3)
54.1 fps -39%
KFA2 GeForce RTX 4060 Ti EX, 16GB GDDR6
AMD Ryzen 9 7950X, NVIDIA GeForce RTX 4060 Ti 16G
53.1 fps -40%
XFX Speedster QICK 308 Radeon RX 7600 Black Edition
AMD Ryzen 9 7950X, AMD Radeon RX 7600
43.9 fps -51%
KFA2 GeForce RTX 4060 1-Click-OC 2X
AMD Ryzen 9 7950X, NVIDIA GeForce RTX 4060
43.7 fps -51%
3840x2160 High Graphics & Postprocessing (Nvidia HairWorks Off)
NVIDIA GeForce RTX 4090 Founders Edition
Intel Core i9-13900K, NVIDIA GeForce RTX 4090
274 (243min, 244.12P1) fps +100%
NVIDIA GeForce RTX 4080 Founders Edition
Intel Core i9-13900K, NVIDIA GeForce RTX 4080
204 (183min, 183.55P1) fps +49%
Zotac Gaming GeForce RTX 3090 Ti AMP Extreme Holo
AMD Ryzen 7 5800X3D, NVIDIA GeForce RTX 3090 Ti
172.9 (152min, 152.57P1) fps +26%
AMD Radeon RX 7900 XTX
AMD Ryzen 9 7950X, AMD Radeon RX 7900 XTX
163.8 (49.6min, 112P0.1, 134.1P1) fps +20%
Average of class Desktop
  (16.1 - 282, n=23, last 2 years)
163.8 fps +20%
AMD Radeon RX 7900 XT
AMD Ryzen 9 7950X, AMD Radeon RX 7900 XT
158.5 (83.2min, 111.2P0.1, 122.8P1) fps +16%
Average NVIDIA GeForce RTX 3080 Ti
  (149 - 156.8, n=4)
152.4 fps +11%
Asus TUF Gaming GeForce RTX 4070 Ti
Intel Core i9-13900K, NVIDIA GeForce RTX 4070 Ti
151.9 (137min, 138.12P1) fps +11%
Average NVIDIA GeForce RTX 3090
  (128 - 160.2, n=12)
151.5 fps +11%
Gigabyte Aorus GeForce RTX 4070 Ti Master
Intel Core i9-13900K, NVIDIA GeForce RTX 4070 Ti
148.7 (130min, 130.59P1) fps +9%
Average NVIDIA GeForce RTX 4070 Ti
  (143 - 151.9, n=4)
148.2 fps +8%
Sapphire AMD Radeon RX 6950 XT Nitro+ Pure
AMD Ryzen 9 5900X, AMD Radeon RX 6950 XT
139.7 (10.4min, 105.6P0.1, 118.6P1) fps +2%
Gigabyte GeForce RTX 4070 Super Gaming OC 12G
Intel Core i9-13900K, NVIDIA GeForce RTX 4070 SUPER
136.7 (121min, 121.87P1) fps
NVIDIA GeForce RTX 4070 Super Founders Edition
Intel Core i9-13900K, NVIDIA GeForce RTX 4070 SUPER
129.4 (117min, 117.31P1) fps -5%
AMD Radeon RX 6900 XT
AMD Ryzen 9 5950X, AMD Radeon RX 6900 XT
122 (105min, 105P1) fps -11%
Zotac Gaming GeForce RTX 4070 AMP Airo
Intel Core i9-13900K, NVIDIA GeForce RTX 4070
116.9 (102min, 102P1) fps -14%
Average NVIDIA GeForce RTX 3080
  (114 - 115, n=2)
114.5 fps -16%
AMD Radeon RX 7800 XT
AMD Ryzen 9 7950X, AMD Radeon RX 7800 XT
112.9 fps -17%
AMD Radeon RX 6800 XT
AMD Ryzen 9 5950X, AMD Radeon RX 6800 XT
110 (97min) fps -20%
Average NVIDIA Titan RTX
  (94 - 107.1, n=28)
102.4 fps -25%
Average NVIDIA GeForce RTX 3070
  (84 - 93.9, n=5)
89.3 fps -35%
Sapphire Pulse Radeon RX 7700 XT
AMD Ryzen 9 7950X, AMD Radeon RX 7700 XT
88.7 (73.3min, 74.7P0.1, 79.4P1) fps -35%
Average NVIDIA GeForce RTX 4060 Ti 8G
  (78.5 - 80.4, n=3)
79.3 fps -42%
KFA2 GeForce RTX 4060 Ti EX, 16GB GDDR6
AMD Ryzen 9 7950X, NVIDIA GeForce RTX 4060 Ti 16G
78.5 fps -43%
KFA2 GeForce RTX 4060 1-Click-OC 2X
AMD Ryzen 9 7950X, NVIDIA GeForce RTX 4060
67.5 fps -51%
XFX Speedster QICK 308 Radeon RX 7600 Black Edition
AMD Ryzen 9 7950X, AMD Radeon RX 7600
58.7 fps -57%
1920x1080 Ultra Graphics & Postprocessing (HBAO+)
NVIDIA GeForce RTX 4090 Founders Edition
Intel Core i9-13900K, NVIDIA GeForce RTX 4090
297 (271min, 271P1) fps +41%
AMD Radeon RX 7900 XTX
AMD Ryzen 9 7950X, AMD Radeon RX 7900 XTX
297 (41.3min, 167.7P0.1, 245P1) fps +41%
AMD Radeon RX 7900 XT
AMD Ryzen 9 7950X, AMD Radeon RX 7900 XT
265 (104.1min, 151.5P0.1, 214P1) fps +26%
NVIDIA GeForce RTX 4080 Founders Edition
Intel Core i9-13900K, NVIDIA GeForce RTX 4080
254 (227min, 227P1) fps +21%
Asus TUF Gaming GeForce RTX 4070 Ti
Intel Core i9-13900K, NVIDIA GeForce RTX 4070 Ti
230 (207min, 208.68P1) fps +10%
Average NVIDIA GeForce RTX 4070 Ti
  (217 - 230, n=4)
223 fps +6%
Gigabyte Aorus GeForce RTX 4070 Ti Master
Intel Core i9-13900K, NVIDIA GeForce RTX 4070 Ti
220 (199min, 199.56P1) fps +5%
Gigabyte GeForce RTX 4070 Super Gaming OC 12G
Intel Core i9-13900K, NVIDIA GeForce RTX 4070 SUPER
210 (188min, 188.28P1) fps
Sapphire AMD Radeon RX 6950 XT Nitro+ Pure
AMD Ryzen 9 5900X, AMD Radeon RX 6950 XT
205 (10.2min, 109.8P0.1, 161.2P1) fps -2%
Zotac Gaming GeForce RTX 3090 Ti AMP Extreme Holo
AMD Ryzen 7 5800X3D, NVIDIA GeForce RTX 3090 Ti (110% PT)
196.3 (192min, 193P1) fps -7%
Zotac Gaming GeForce RTX 3090 Ti AMP Extreme Holo
AMD Ryzen 7 5800X3D, NVIDIA GeForce RTX 3090 Ti (100% PT)
193.4 (173min, 173.56P1) fps -8%
NVIDIA GeForce RTX 4070 Super Founders Edition
Intel Core i9-13900K, NVIDIA GeForce RTX 4070 SUPER
191.9 (175min, 175P1) fps -9%
AMD Radeon RX 7800 XT
AMD Ryzen 9 7950X, AMD Radeon RX 7800 XT
189.6 fps -10%
Average NVIDIA GeForce RTX 3080 Ti
  (174 - 184.6, n=4)
180.2 fps -14%
Average NVIDIA GeForce RTX 3090
  (160 - 192.6, n=16)
179.9 fps -14%
Zotac Gaming GeForce RTX 4070 AMP Airo
Intel Core i9-13900K, NVIDIA GeForce RTX 4070
168.6 (150min, 150.7P1) fps -20%
Average of class Desktop
  (3.9 - 314, n=31, last 2 years)
168.6 fps -20%
Sapphire Pulse Radeon RX 7700 XT
AMD Ryzen 9 7950X, AMD Radeon RX 7700 XT
168.3 (89min, 96.5P0.1, 143.7P1) fps -20%
AMD Radeon RX 6900 XT
AMD Ryzen 9 5950X, AMD Radeon RX 6900 XT
163.6 (139min) fps -22%
AMD Radeon RX 6800 XT
AMD Ryzen 9 5950X, AMD Radeon RX 6800 XT
160 (138min) fps -24%
Average NVIDIA GeForce RTX 3080
  (145 - 152, n=2)
148.5 fps -29%
Average NVIDIA GeForce RTX 4060 Ti 8G
  (136.2 - 140.6, n=3)
139.1 fps -34%
Average NVIDIA Titan RTX
  (124 - 150, n=28)
137.7 fps -34%
KFA2 GeForce RTX 4060 Ti EX, 16GB GDDR6
AMD Ryzen 9 7950X, NVIDIA GeForce RTX 4060 Ti 16G
132.3 fps -37%
XFX Speedster QICK 308 Radeon RX 7600 Black Edition
AMD Ryzen 9 7950X, AMD Radeon RX 7600
122.5 fps -42%
KFA2 GeForce RTX 4060 1-Click-OC 2X
AMD Ryzen 9 7950X, NVIDIA GeForce RTX 4060
111.6 fps -47%
Average NVIDIA GeForce RTX 3070
  (52.8 - 132.2, n=7)
106.1 fps -49%
Metro Exodus
3840x2160 Ultra Quality AF:16x
NVIDIA GeForce RTX 4090 Founders Edition
Intel Core i9-13900K, NVIDIA GeForce RTX 4090
135 (72.48min) fps +77%
NVIDIA GeForce RTX 4080 Founders Edition
Intel Core i9-13900K, NVIDIA GeForce RTX 4080
105.7 (67.17min) fps +39%
AMD Radeon RX 7900 XTX
AMD Ryzen 9 7950X, AMD Radeon RX 7900 XTX
103.5 (66.43min) fps +36%
AMD Radeon RX 7900 XT
AMD Ryzen 9 7950X, AMD Radeon RX 7900 XT
86.9 (56.86min) fps +14%
Gigabyte Aorus GeForce RTX 4070 Ti Master
Intel Core i9-13900K, NVIDIA GeForce RTX 4070 Ti
85 (54.63min) fps +12%
Asus TUF Gaming GeForce RTX 4070 Ti
Intel Core i9-13900K, NVIDIA GeForce RTX 4070 Ti
84.5 (55.02min) fps +11%
Zotac Gaming GeForce RTX 3090 Ti AMP Extreme Holo
AMD Ryzen 7 5800X3D, NVIDIA GeForce RTX 3090 Ti
84.3 (52.3min) fps +11%
Average of class Desktop
  (8.47 - 138.5, n=23, last 2 years)
83.6 fps +10%
Average NVIDIA GeForce RTX 4070 Ti
  (81.2 - 85, n=4)
83.4 fps +10%
Gigabyte GeForce RTX 4070 Super Gaming OC 12G
Intel Core i9-13900K, NVIDIA GeForce RTX 4070 SUPER
76.1 (49.56min) fps
Average NVIDIA GeForce RTX 3080 Ti
  (74.2 - 77.1, n=4)
75.7 fps -1%
Sapphire AMD Radeon RX 6950 XT Nitro+ Pure
AMD Ryzen 9 5900X, AMD Radeon RX 6950 XT
75 (50.07min) fps -1%
Average NVIDIA GeForce RTX 3090
  (70.6 - 77.3, n=12)
75 fps -1%
NVIDIA GeForce RTX 4070 Super Founders Edition
Intel Core i9-13900K, NVIDIA GeForce RTX 4070 SUPER
72.8 (46.78min) fps -4%
AMD Radeon RX 6900 XT
AMD Ryzen 9 5950X, AMD Radeon RX 6900 XT
66.7 (42.71min) fps -12%
AMD Radeon RX 7800 XT
AMD Ryzen 9 7950X, AMD Radeon RX 7800 XT
66.7 (43.89min) fps -12%
Zotac Gaming GeForce RTX 4070 AMP Airo
Intel Core i9-13900K, NVIDIA GeForce RTX 4070
65 (41.89min) fps -15%
Average NVIDIA GeForce RTX 3080
  (64.1 - 65.9, n=2)
65 fps -15%
Sapphire Pulse Radeon RX 7700 XT
AMD Ryzen 9 7950X, AMD Radeon RX 7700 XT
57 (38.42min) fps -25%
AMD Radeon RX 6800 XT
AMD Ryzen 9 5950X, AMD Radeon RX 6800 XT
56.3 (40.14min) fps -26%
Average NVIDIA Titan RTX
  (51.3 - 57.9, n=27)
54.9 fps -28%
Average NVIDIA GeForce RTX 3070
  (48.3 - 49.7, n=5)
48.9 fps -36%
Average NVIDIA GeForce RTX 4060 Ti 8G
  (48.4 - 49.3, n=3)
48.8 fps -36%
KFA2 GeForce RTX 4060 Ti EX, 16GB GDDR6
AMD Ryzen 9 7950X, NVIDIA GeForce RTX 4060 Ti 16G
48.1 (32min) fps -37%
KFA2 GeForce RTX 4060 1-Click-OC 2X
AMD Ryzen 9 7950X, NVIDIA GeForce RTX 4060
38.3 (25.16min) fps -50%
XFX Speedster QICK 308 Radeon RX 7600 Black Edition
AMD Ryzen 9 7950X, AMD Radeon RX 7600
38.1 (25.45min) fps -50%
2560x1440 Ultra Quality AF:16x
NVIDIA GeForce RTX 4090 Founders Edition
Intel Core i9-13900K, NVIDIA GeForce RTX 4090
176 (81.25min) fps +46%
NVIDIA GeForce RTX 4080 Founders Edition
Intel Core i9-13900K, NVIDIA GeForce RTX 4080
155.1 (77.58min) fps +28%
AMD Radeon RX 7900 XTX
AMD Ryzen 9 7950X, AMD Radeon RX 7900 XTX
154.5 (90.83min) fps +28%
AMD Radeon RX 7900 XT
AMD Ryzen 9 7950X, AMD Radeon RX 7900 XT
135 (79.57min) fps +12%
Gigabyte Aorus GeForce RTX 4070 Ti Master
Intel Core i9-13900K, NVIDIA GeForce RTX 4070 Ti
132.3 (73.1min) fps +10%
Asus TUF Gaming GeForce RTX 4070 Ti
Intel Core i9-13900K, NVIDIA GeForce RTX 4070 Ti
132.1 (72.92min) fps +9%
Average NVIDIA GeForce RTX 4070 Ti
  (126.7 - 132.3, n=4)
130 fps +8%
Zotac Gaming GeForce RTX 3090 Ti AMP Extreme Holo
AMD Ryzen 7 5800X3D, NVIDIA GeForce RTX 3090 Ti
125.3 (64.48min) fps +4%
Gigabyte GeForce RTX 4070 Super Gaming OC 12G
Intel Core i9-13900K, NVIDIA GeForce RTX 4070 SUPER
120.8 (68.31min) fps
Average of class Desktop
  (14.8 - 181.3, n=23, last 2 years)
120.8 fps 0%
NVIDIA GeForce RTX 4070 Super Founders Edition
Intel Core i9-13900K, NVIDIA GeForce RTX 4070 SUPER
116.1 (66.05min) fps -4%
Sapphire AMD Radeon RX 6950 XT Nitro+ Pure
AMD Ryzen 9 5900X, AMD Radeon RX 6950 XT
115.5 (70.52min) fps -4%
Average NVIDIA GeForce RTX 3080 Ti
  (110 - 118, n=4)
114 fps -6%
Average NVIDIA GeForce RTX 3090
  (102 - 118.2, n=12)
113.2 fps -6%
Zotac Gaming GeForce RTX 4070 AMP Airo
Intel Core i9-13900K, NVIDIA GeForce RTX 4070
103.8 (60.52min) fps -14%
AMD Radeon RX 7800 XT
AMD Ryzen 9 7950X, AMD Radeon RX 7800 XT
102.6 (62.24min) fps -15%
AMD Radeon RX 6900 XT
AMD Ryzen 9 5950X, AMD Radeon RX 6900 XT
102 (59.52min) fps -16%
Average NVIDIA GeForce RTX 3080
  (92.2 - 97.4, n=2)
94.8 fps -22%
AMD Radeon RX 6800 XT
AMD Ryzen 9 5950X, AMD Radeon RX 6800 XT
94.6 (55.44min) fps -22%
Sapphire Pulse Radeon RX 7700 XT
AMD Ryzen 9 7950X, AMD Radeon RX 7700 XT
89.6 (55.65min) fps -26%
Average NVIDIA Titan RTX
  (69 - 92.9, n=26)
84 fps -30%
Average NVIDIA GeForce RTX 4060 Ti 8G
  (78.9 - 80.1, n=3)
79.4 fps -34%
KFA2 GeForce RTX 4060 Ti EX, 16GB GDDR6
AMD Ryzen 9 7950X, NVIDIA GeForce RTX 4060 Ti 16G
78.6 (46.09min) fps -35%
Average NVIDIA GeForce RTX 3070
  (74.4 - 78.3, n=5)
75.8 fps -37%
XFX Speedster QICK 308 Radeon RX 7600 Black Edition
AMD Ryzen 9 7950X, AMD Radeon RX 7600
64.9 (40.24min) fps -46%
KFA2 GeForce RTX 4060 1-Click-OC 2X
AMD Ryzen 9 7950X, NVIDIA GeForce RTX 4060
62.9 (36.84min) fps -48%
1920x1080 Ultra Quality AF:16x
NVIDIA GeForce RTX 4090 Founders Edition
Intel Core i9-13900K, NVIDIA GeForce RTX 4090
191.2 (84.99min) fps +27%
AMD Radeon RX 7900 XTX
AMD Ryzen 9 7950X, AMD Radeon RX 7900 XTX
183.5 (102.51min) fps +22%
NVIDIA GeForce RTX 4080 Founders Edition
Intel Core i9-13900K, NVIDIA GeForce RTX 4080
180 (82.56min) fps +20%
AMD Radeon RX 7900 XT
AMD Ryzen 9 7950X, AMD Radeon RX 7900 XT
164.6 (92.11min) fps +9%
Asus TUF Gaming GeForce RTX 4070 Ti
Intel Core i9-13900K, NVIDIA GeForce RTX 4070 Ti
161.4 (78.05min) fps +7%
Gigabyte Aorus GeForce RTX 4070 Ti Master
Intel Core i9-13900K, NVIDIA GeForce RTX 4070 Ti
161.2 (77.88min) fps +7%
Average NVIDIA GeForce RTX 4070 Ti
  (155.6 - 161.4, n=4)
158.8 fps +5%
Gigabyte GeForce RTX 4070 Super Gaming OC 12G
Intel Core i9-13900K, NVIDIA GeForce RTX 4070 SUPER
150.6 (76.71min) fps
Zotac Gaming GeForce RTX 3090 Ti AMP Extreme Holo
AMD Ryzen 7 5800X3D, NVIDIA GeForce RTX 3090 Ti
145.9 (68.14min) fps -3%
NVIDIA GeForce RTX 4070 Super Founders Edition
Intel Core i9-13900K, NVIDIA GeForce RTX 4070 SUPER
144.8 (73.65min) fps -4%
Sapphire AMD Radeon RX 6950 XT Nitro+ Pure
AMD Ryzen 9 5900X, AMD Radeon RX 6950 XT
140 (81.08min) fps -7%
Average NVIDIA GeForce RTX 3080 Ti
  (131 - 144.2, n=5)
135.4 fps -10%
Average NVIDIA GeForce RTX 3090
  (108 - 145, n=12)
135.3 fps -10%
Zotac Gaming GeForce RTX 4070 AMP Airo
Intel Core i9-13900K, NVIDIA GeForce RTX 4070
129.4 (68.29min) fps -14%
AMD Radeon RX 7800 XT
AMD Ryzen 9 7950X, AMD Radeon RX 7800 XT
128.5 (73.66min) fps -15%
AMD Radeon RX 6900 XT
AMD Ryzen 9 5950X, AMD Radeon RX 6900 XT
123 (67.67min) fps -18%
Average of class Desktop
  (5.22 - 194.7, n=27, last 2 years)
121.2 fps -20%
AMD Radeon RX 6800 XT
AMD Ryzen 9 5950X, AMD Radeon RX 6800 XT
115 (64.52min) fps -24%
Sapphire Pulse Radeon RX 7700 XT
AMD Ryzen 9 7950X, AMD Radeon RX 7700 XT
113.9 (65.05min) fps -24%
Average NVIDIA GeForce RTX 3080
  (111 - 116, n=2)
113.5 fps -25%
Average NVIDIA Titan RTX
  (73 - 116, n=27)
102.2 fps -32%
Average NVIDIA GeForce RTX 4060 Ti 8G
  (100.6 - 101.8, n=3)
101.1 fps -33%
KFA2 GeForce RTX 4060 Ti EX, 16GB GDDR6
AMD Ryzen 9 7950X, NVIDIA GeForce RTX 4060 Ti 16G
100 (54.12min) fps -34%
Average NVIDIA GeForce RTX 3070
  (91.3 - 97.7, n=5)
93.9 fps -38%
XFX Speedster QICK 308 Radeon RX 7600 Black Edition
AMD Ryzen 9 7950X, AMD Radeon RX 7600
83.5 (48.41min) fps -45%
KFA2 GeForce RTX 4060 1-Click-OC 2X
AMD Ryzen 9 7950X, NVIDIA GeForce RTX 4060
80.2 (41.91min) fps -47%
Control
3840x2160 High Quality Preset (DX11)
NVIDIA GeForce RTX 4090 Founders Edition
Intel Core i9-13900K, NVIDIA GeForce RTX 4090
107.7 (83.4min, 85.3P0.1, 91.1P1) fps +85%
AMD Radeon RX 7900 XTX
AMD Ryzen 9 7950X, AMD Radeon RX 7900 XTX
89.4 (46.8min, 48.3P0.1, 52.1P1) fps +54%
NVIDIA GeForce RTX 4080 Founders Edition
Intel Core i9-13900K, NVIDIA GeForce RTX 4080
82.6 (15.4min, 68.7P0.1, 71.9P1) fps +42%
AMD Radeon RX 7900 XT
AMD Ryzen 9 7950X, AMD Radeon RX 7900 XT
75.8 (40.1min, 41.7P0.1, 43.6P1) fps +30%
Zotac Gaming GeForce RTX 3090 Ti AMP Extreme Holo
AMD Ryzen 7 5800X3D, NVIDIA GeForce RTX 3090 Ti
73.9 (46.2min, 53.2P0.1, 62.6P1) fps +27%
Average of class Desktop
  (30.3 - 114.4, n=15, last 2 years)
66.5 fps +14%
Average NVIDIA GeForce RTX 4070 Ti
  (63.8 - 66.2, n=4)
65 fps +12%
Asus TUF Gaming GeForce RTX 4070 Ti
Intel Core i9-13900K, NVIDIA GeForce RTX 4070 Ti
64.9 (50min, 51.9P0.1, 56.5P1) fps +12%
Gigabyte Aorus GeForce RTX 4070 Ti Master
Intel Core i9-13900K, NVIDIA GeForce RTX 4070 Ti
64.9 (26.4min, 32.6P0.1, 55.9P1) fps +12%
Sapphire AMD Radeon RX 6950 XT Nitro+ Pure
AMD Ryzen 9 5900X, AMD Radeon RX 6950 XT
64.8 (33.1min, 33.6P0.1, 36.3P1) fps +11%
Average NVIDIA GeForce RTX 3080 Ti
  (63.9 - 64.9, n=3)
64.3 fps +10%
Average NVIDIA GeForce RTX 3090
  (61.3 - 66, n=5)
62.9 fps +8%
AMD Radeon RX 7800 XT
AMD Ryzen 9 7950X, AMD Radeon RX 7800 XT
58.2 (30.4min, 30.9P0.1, 32.7P1) fps 0%
Gigabyte GeForce RTX 4070 Super Gaming OC 12G
Intel Core i9-13900K, NVIDIA GeForce RTX 4070 SUPER
58.2 (43.4min, 48.2P0.1, 50.4P1) fps
NVIDIA GeForce RTX 4070 Super Founders Edition
Intel Core i9-13900K, NVIDIA GeForce RTX 4070 SUPER
57.4 (47.8min, 47.9P0.1, 50.2P1) fps -1%
Average NVIDIA GeForce RTX 3080
  (56.2 - 56.7, n=2)
56.5 fps -3%
AMD Radeon RX 6900 XT
AMD Ryzen 9 5950X, AMD Radeon RX 6900 XT
54.7 (39.8min, 41.7P0.1, 44.9P1) fps -6%
AMD Radeon RX 6900 XT
AMD Ryzen 9 5950X, AMD Radeon RX 6900 XT (SAM ENABLED)
53.9 (36.6min, 41.7P0.1, 43.5P1) fps -7%
AMD Radeon RX 6800 XT
AMD Ryzen 9 5950X, AMD Radeon RX 6800 XT
51.6 (46min) fps -11%
Zotac Gaming GeForce RTX 4070 AMP Airo
Intel Core i9-13900K, NVIDIA GeForce RTX 4070
50.2 (29.1min, 30P0.1, 37.6P1) fps -14%
Average NVIDIA Titan RTX
  (45.2 - 47.3, n=3)
46.5 fps -20%
Sapphire Pulse Radeon RX 7700 XT
AMD Ryzen 9 7950X, AMD Radeon RX 7700 XT
46.4 (24.9min, 25.5P0.1, 26.2P1) fps -20%
Average NVIDIA GeForce RTX 3070
  (40.6 - 42.3, n=3)
41.3 fps -29%
KFA2 GeForce RTX 4060 Ti EX, 16GB GDDR6
AMD Ryzen 9 7950X, NVIDIA GeForce RTX 4060 Ti 16G
36 (19.1min, 24.7P0.1, 31.1P1) fps -38%
Average NVIDIA GeForce RTX 4060 Ti 8G
  (34.3 - 37.3, n=3)
35.7 fps -39%
XFX Speedster QICK 308 Radeon RX 7600 Black Edition
AMD Ryzen 9 7950X, AMD Radeon RX 7600
31.3 (17.1min, 17.1P0.1, 17.6P1) fps -46%
KFA2 GeForce RTX 4060 1-Click-OC 2X
AMD Ryzen 9 7950X, NVIDIA GeForce RTX 4060
28.4 (20.2min, 21.3P0.1, 24.9P1) fps -51%
2560x1440 High Quality Preset (DX11)
NVIDIA GeForce RTX 4090 Founders Edition
Intel Core i9-13900K, NVIDIA GeForce RTX 4090
201 (84.1min, 146.6P0.1, 159P1) fps +74%
AMD Radeon RX 7900 XTX
AMD Ryzen 9 7950X, AMD Radeon RX 7900 XTX
184.9 (66.6min, 105.1P0.1, 121.7P1) fps +60%
NVIDIA GeForce RTX 4080 Founders Edition
Intel Core i9-13900K, NVIDIA GeForce RTX 4080
164.2 (59.2min, 121.2P0.1, 135.5P1) fps +42%
AMD Radeon RX 7900 XT
AMD Ryzen 9 7950X, AMD Radeon RX 7900 XT
156.4 (53.3min, 89.4P0.1, 95.9P1) fps +35%
Zotac Gaming GeForce RTX 3090 Ti AMP Extreme Holo
AMD Ryzen 7 5800X3D, NVIDIA GeForce RTX 3090 Ti
142.5 (51.8min, 81.9P0.1, 115.5P1) fps +23%
Sapphire AMD Radeon RX 6950 XT Nitro+ Pure
AMD Ryzen 9 5900X, AMD Radeon RX 6950 XT
133.5 (73.5min, 75.3P0.1, 83.4P1) fps +16%
Asus TUF Gaming GeForce RTX 4070 Ti
Intel Core i9-13900K, NVIDIA GeForce RTX 4070 Ti
130.6 (59min, 74P0.1, 107.3P1) fps +13%
Gigabyte Aorus GeForce RTX 4070 Ti Master
Intel Core i9-13900K, NVIDIA GeForce RTX 4070 Ti
130.6 (24.9min, 47.8P0.1, 108.8P1) fps +13%
Average of class Desktop
  (60.9 - 232, n=15, last 2 years)
129.4 fps +12%
Average NVIDIA GeForce RTX 3080 Ti
  (122 - 125.5, n=3)
123.8 fps +7%
Average NVIDIA GeForce RTX 4070 Ti
  (100 - 130.6, n=4)
121.9 fps +6%
Average NVIDIA GeForce RTX 3090
  (115.8 - 123.7, n=5)
120.4 fps +4%
AMD Radeon RX 7800 XT
AMD Ryzen 9 7950X, AMD Radeon RX 7800 XT
120.3 (60.2min, 62.9P0.1, 68.1P1) fps +4%
Gigabyte GeForce RTX 4070 Super Gaming OC 12G
Intel Core i9-13900K, NVIDIA GeForce RTX 4070 SUPER
115.5 (64.7min, 91.1P0.1, 96.7P1) fps
AMD Radeon RX 6900 XT
AMD Ryzen 9 5950X, AMD Radeon RX 6900 XT
113 (71.5min, 73.2P0.1, 79.6P1) fps -2%
AMD Radeon RX 6900 XT
AMD Ryzen 9 5950X, AMD Radeon RX 6900 XT (SAM ENABLED)
113 (68min, 71.3P0.1, 81.1P1) fps -2%
NVIDIA GeForce RTX 4070 Super Founders Edition
Intel Core i9-13900K, NVIDIA GeForce RTX 4070 SUPER
112.6 (83.1min, 89.4P0.1, 94.5P1) fps -3%
AMD Radeon RX 6800 XT
AMD Ryzen 9 5950X, AMD Radeon RX 6800 XT
108 (93min) fps -6%
Average NVIDIA GeForce RTX 3080
  (105 - 106, n=2)
105.5 fps -9%
Zotac Gaming GeForce RTX 4070 AMP Airo
Intel Core i9-13900K, NVIDIA GeForce RTX 4070
101.8 (15.7min, 26.9P0.1, 84P1) fps -12%
Sapphire Pulse Radeon RX 7700 XT
AMD Ryzen 9 7950X, AMD Radeon RX 7700 XT
96.1 (51.5min, 52P0.1, 55P1) fps -17%
Average NVIDIA Titan RTX
  (89 - 93.6, n=3)
91.5 fps -21%
Average NVIDIA GeForce RTX 3070
  (79.8 - 82.5, n=3)
81.2 fps -30%
Average NVIDIA GeForce RTX 4060 Ti 8G
  (69.2 - 75.3, n=3)
73.2 fps -37%
KFA2 GeForce RTX 4060 Ti EX, 16GB GDDR6
AMD Ryzen 9 7950X, NVIDIA GeForce RTX 4060 Ti 16G
73.1 (43.1min, 53.6P0.1, 62.7P1) fps -37%
XFX Speedster QICK 308 Radeon RX 7600 Black Edition
AMD Ryzen 9 7950X, AMD Radeon RX 7600
63.6 (33.4min, 34.3P0.1, 36.6P1) fps -45%
KFA2 GeForce RTX 4060 1-Click-OC 2X
AMD Ryzen 9 7950X, NVIDIA GeForce RTX 4060
58.4 (38.3min, 43.3P0.1, 50.2P1) fps -49%
1920x1080 High Quality Preset (DX11)
AMD Radeon RX 7900 XTX
AMD Ryzen 9 7950X, AMD Radeon RX 7900 XTX
240 (18.1min, 136.2P0.1, 151.8P1) fps +33%
NVIDIA GeForce RTX 4090 Founders Edition
Intel Core i9-13900K, NVIDIA GeForce RTX 4090
238 (14.4min, 62.9P0.1, 153.8P1) fps +32%
NVIDIA GeForce RTX 4080 Founders Edition
Intel Core i9-13900K, NVIDIA GeForce RTX 4080
233 (7.49min, 27.2P0.1, 156.1P1) fps +29%
AMD Radeon RX 7900 XT
AMD Ryzen 9 7950X, AMD Radeon RX 7900 XT
233 (67.8min, 133.8P0.1, 152.6P1) fps +29%
Zotac Gaming GeForce RTX 3090 Ti AMP Extreme Holo
AMD Ryzen 7 5800X3D, NVIDIA GeForce RTX 3090 Ti
209 (55.6min, 119.8P0.1, 162.7P1) fps +16%
Sapphire AMD Radeon RX 6950 XT Nitro+ Pure
AMD Ryzen 9 5900X, AMD Radeon RX 6950 XT
205 (45.2min, 129.1P0.1, 150.8P1) fps +14%
Asus TUF Gaming GeForce RTX 4070 Ti
Intel Core i9-13900K, NVIDIA GeForce RTX 4070 Ti
202 (88min, 151.4P0.1, 165P1) fps +12%
Gigabyte Aorus GeForce RTX 4070 Ti Master
Intel Core i9-13900K, NVIDIA GeForce RTX 4070 Ti
201 (51.3min, 64.4P0.1, 157.9P1) fps +12%
Average NVIDIA GeForce RTX 4070 Ti
  (196.6 - 202, n=4)
199.9 fps +11%
AMD Radeon RX 7800 XT
AMD Ryzen 9 7950X, AMD Radeon RX 7800 XT
190.1 (56.5min, 107.1P0.1, 118.1P1) fps +6%
Average NVIDIA GeForce RTX 3080 Ti
  (181 - 190.7, n=3)
186.2 fps +3%
Average of class Desktop
  (93.7 - 238, n=15, last 2 years)
181.3 fps +1%
Gigabyte GeForce RTX 4070 Super Gaming OC 12G
Intel Core i9-13900K, NVIDIA GeForce RTX 4070 SUPER
180.1 (66.2min, 132.5P0.1, 143.9P1) fps
Average NVIDIA GeForce RTX 3090
  (172.2 - 189.2, n=5)
179.9 fps 0%
AMD Radeon RX 6900 XT
AMD Ryzen 9 5950X, AMD Radeon RX 6900 XT
175 (56.8min, 96P0.1, 112P1) fps -3%
AMD Radeon RX 6900 XT
AMD Ryzen 9 5950X, AMD Radeon RX 6900 XT (SAM ENABLED)
174 (54min, 99P0.1, 112P1) fps -3%
NVIDIA GeForce RTX 4070 Super Founders Edition
Intel Core i9-13900K, NVIDIA GeForce RTX 4070 SUPER
172.7 (52.1min, 129.1P0.1, 139.6P1) fps -4%
AMD Radeon RX 6800 XT
AMD Ryzen 9 5950X, AMD Radeon RX 6800 XT
168 (145min) fps -7%
Zotac Gaming GeForce RTX 4070 AMP Airo
Intel Core i9-13900K, NVIDIA GeForce RTX 4070
159.5 (24.5min, 120.5P0.1, 131P1) fps -11%
Sapphire Pulse Radeon RX 7700 XT
AMD Ryzen 9 7950X, AMD Radeon RX 7700 XT
156.1 (52.1min, 85.6P0.1, 89.5P1) fps -13%
Average NVIDIA GeForce RTX 3080
  (151 - 155, n=2)
153 fps -15%
Average NVIDIA Titan RTX
  (135 - 141.9, n=3)
137.3 fps -24%
Average NVIDIA GeForce RTX 3070
  (117 - 124.9, n=3)
121.3 fps -33%
Average NVIDIA GeForce RTX 4060 Ti 8G
  (115.7 - 120.2, n=3)
118.1 fps -34%
KFA2 GeForce RTX 4060 Ti EX, 16GB GDDR6
AMD Ryzen 9 7950X, NVIDIA GeForce RTX 4060 Ti 16G
113.3 (49.6min, 62.7P0.1, 94.3P1) fps -37%
XFX Speedster QICK 308 Radeon RX 7600 Black Edition
AMD Ryzen 9 7950X, AMD Radeon RX 7600
100.3 (52.4min, 55.2P0.1, 57.3P1) fps -44%
KFA2 GeForce RTX 4060 1-Click-OC 2X
AMD Ryzen 9 7950X, NVIDIA GeForce RTX 4060
92.6 (60min, 71.7P0.1, 78.5P1) fps -49%
Borderlands 3
3840x2160 Badass Overall Quality (DX11)
NVIDIA GeForce RTX 4090 Founders Edition
Intel Core i9-13900K, NVIDIA GeForce RTX 4090
133.4 fps +94%
NVIDIA GeForce RTX 4080 Founders Edition
Intel Core i9-13900K, NVIDIA GeForce RTX 4080
95.7 fps +39%
AMD Radeon RX 7900 XTX
AMD Ryzen 9 7950X, AMD Radeon RX 7900 XTX
88.4 fps +28%
Zotac Gaming GeForce RTX 3090 Ti AMP Extreme Holo
AMD Ryzen 7 5800X3D, NVIDIA GeForce RTX 3090 Ti
83.8 fps +22%
Gigabyte Aorus GeForce RTX 4070 Ti Master
Intel Core i9-13900K, NVIDIA GeForce RTX 4070 Ti
74.9 fps +9%
AMD Radeon RX 7900 XT
AMD Ryzen 9 7950X, AMD Radeon RX 7900 XT
74.6 fps +8%
Average of class Desktop
  (5.54 - 133.4, n=22, last 2 years)
74.4 fps +8%
Asus TUF Gaming GeForce RTX 4070 Ti
Intel Core i9-13900K, NVIDIA GeForce RTX 4070 Ti
74.1 fps +8%
Average NVIDIA GeForce RTX 4070 Ti
  (71.9 - 74.9, n=4)
73.4 fps +7%
Average NVIDIA GeForce RTX 3090
  (68 - 75.3, n=13)
72.8 fps +6%
Average NVIDIA GeForce RTX 3080 Ti
  (71.2 - 74, n=4)
72.8 fps +6%
Gigabyte GeForce RTX 4070 Super Gaming OC 12G
Intel Core i9-13900K, NVIDIA GeForce RTX 4070 SUPER
68.9 fps
NVIDIA GeForce RTX 4070 Super Founders Edition
Intel Core i9-13900K, NVIDIA GeForce RTX 4070 SUPER
66.2 fps -4%
Average NVIDIA GeForce RTX 3080
  (61.5 - 61.9, n=2)
61.7 fps -10%
Sapphire AMD Radeon RX 6950 XT Nitro+ Pure
AMD Ryzen 9 5900X, AMD Radeon RX 6950 XT
59.9 fps -13%
AMD Radeon RX 6900 XT
AMD Ryzen 9 5950X, AMD Radeon RX 6900 XT (SAM ENABLED)
59.8 fps -13%
AMD Radeon RX 6900 XT
AMD Ryzen 9 5950X, AMD Radeon RX 6900 XT
57.1 fps -17%
Zotac Gaming GeForce RTX 4070 AMP Airo
Intel Core i9-13900K, NVIDIA GeForce RTX 4070
58.8 fps -15%
AMD Radeon RX 7800 XT
AMD Ryzen 9 7950X, AMD Radeon RX 7800 XT
57.9 fps -16%
AMD Radeon RX 6800 XT
AMD Ryzen 9 5950X, AMD Radeon RX 6800 XT
53.6 fps -22%
Sapphire Pulse Radeon RX 7700 XT
AMD Ryzen 9 7950X, AMD Radeon RX 7700 XT
48 fps -30%
Average NVIDIA Titan RTX
  (46 - 52.8, n=29)
47.3 fps -31%
Average NVIDIA GeForce RTX 3070
  (42.7 - 46.3, n=5)
44.3 fps -36%
Average NVIDIA GeForce RTX 4060 Ti 8G
  (43.1 - 43.7, n=3)
43.5 fps -37%
KFA2 GeForce RTX 4060 Ti EX, 16GB GDDR6
AMD Ryzen 9 7950X, NVIDIA GeForce RTX 4060 Ti 16G
42.5 fps -38%
XFX Speedster QICK 308 Radeon RX 7600 Black Edition
AMD Ryzen 9 7950X, AMD Radeon RX 7600
34.5 fps -50%
KFA2 GeForce RTX 4060 1-Click-OC 2X
AMD Ryzen 9 7950X, NVIDIA GeForce RTX 4060
33.8 fps -51%
2560x1440 Badass Overall Quality (DX11)
NVIDIA GeForce RTX 4090 Founders Edition
Intel Core i9-13900K, NVIDIA GeForce RTX 4090
190 fps +45%
NVIDIA GeForce RTX 4080 Founders Edition
Intel Core i9-13900K, NVIDIA GeForce RTX 4080
170.5 fps +30%
AMD Radeon RX 7900 XTX
AMD Ryzen 9 7950X, AMD Radeon RX 7900 XTX
152.2 fps +16%
Zotac Gaming GeForce RTX 3090 Ti AMP Extreme Holo
AMD Ryzen 7 5800X3D, NVIDIA GeForce RTX 3090 Ti
143.1 fps +9%
Gigabyte Aorus GeForce RTX 4070 Ti Master
Intel Core i9-13900K, NVIDIA GeForce RTX 4070 Ti
142 fps +8%
Asus TUF Gaming GeForce RTX 4070 Ti
Intel Core i9-13900K, NVIDIA GeForce RTX 4070 Ti
140.6 fps +7%
Average NVIDIA GeForce RTX 4070 Ti
  (134.3 - 142, n=4)
138.3 fps +5%
AMD Radeon RX 7900 XT
AMD Ryzen 9 7950X, AMD Radeon RX 7900 XT
135.2 fps +3%
Gigabyte GeForce RTX 4070 Super Gaming OC 12G
Intel Core i9-13900K, NVIDIA GeForce RTX 4070 SUPER
131.2 fps
NVIDIA GeForce RTX 4070 Super Founders Edition
Intel Core i9-13900K, NVIDIA GeForce RTX 4070 SUPER
125.4 fps -4%
Average NVIDIA GeForce RTX 3080 Ti
  (114 - 130.2, n=4)
124.5 fps -5%
Average NVIDIA GeForce RTX 3090
  (105 - 131.6, n=13)
123.8 fps -6%
Average of class Desktop
  (13.4 - 190, n=23, last 2 years)
120.8 fps -8%
Zotac Gaming GeForce RTX 4070 AMP Airo
Intel Core i9-13900K, NVIDIA GeForce RTX 4070
110.8 fps -16%
Sapphire AMD Radeon RX 6950 XT Nitro+ Pure
AMD Ryzen 9 5900X, AMD Radeon RX 6950 XT
110 fps -16%
AMD Radeon RX 6900 XT
AMD Ryzen 9 5950X, AMD Radeon RX 6900 XT (SAM ENABLED)
107 fps -18%
AMD Radeon RX 6900 XT
AMD Ryzen 9 5950X, AMD Radeon RX 6900 XT
105 fps -20%
AMD Radeon RX 7800 XT
AMD Ryzen 9 7950X, AMD Radeon RX 7800 XT
105.5 fps -20%
Average NVIDIA GeForce RTX 3080
  (95.7 - 103, n=2)
99.4 fps -24%
AMD Radeon RX 6800 XT
AMD Ryzen 9 5950X, AMD Radeon RX 6800 XT
93.6 fps -29%
Sapphire Pulse Radeon RX 7700 XT
AMD Ryzen 9 7950X, AMD Radeon RX 7700 XT
89.4 fps -32%
Average NVIDIA Titan RTX
  (74 - 93.1, n=29)
84.7 fps -35%
Average NVIDIA GeForce RTX 4060 Ti 8G
  (83.9 - 85.2, n=3)
84.4 fps -36%
KFA2 GeForce RTX 4060 Ti EX, 16GB GDDR6
AMD Ryzen 9 7950X, NVIDIA GeForce RTX 4060 Ti 16G
81.7 fps -38%
Average NVIDIA GeForce RTX 3070
  (75.1 - 82.9, n=5)
77.7 fps -41%
XFX Speedster QICK 308 Radeon RX 7600 Black Edition
AMD Ryzen 9 7950X, AMD Radeon RX 7600
65.7 fps -50%
KFA2 GeForce RTX 4060 1-Click-OC 2X
AMD Ryzen 9 7950X, NVIDIA GeForce RTX 4060
64.8 fps -51%
1920x1080 Badass Overall Quality (DX11)
NVIDIA GeForce RTX 4090 Founders Edition
Intel Core i9-13900K, NVIDIA GeForce RTX 4090
201 fps +21%
NVIDIA GeForce RTX 4080 Founders Edition
Intel Core i9-13900K, NVIDIA GeForce RTX 4080
199.4 fps +20%
Asus TUF Gaming GeForce RTX 4070 Ti
Intel Core i9-13900K, NVIDIA GeForce RTX 4070 Ti
186.9 fps +12%
Gigabyte Aorus GeForce RTX 4070 Ti Master
Intel Core i9-13900K, NVIDIA GeForce RTX 4070 Ti
185.3 fps +11%
AMD Radeon RX 7900 XTX
AMD Ryzen 9 7950X, AMD Radeon RX 7900 XTX
180.2 fps +8%
Average NVIDIA GeForce RTX 4070 Ti
  (171.4 - 186.9, n=4)
178.9 fps +7%
Zotac Gaming GeForce RTX 3090 Ti AMP Extreme Holo
AMD Ryzen 7 5800X3D, NVIDIA GeForce RTX 3090 Ti
173.3 fps +4%
AMD Radeon RX 7900 XT
AMD Ryzen 9 7950X, AMD Radeon RX 7900 XT
169.4 fps +2%
Gigabyte GeForce RTX 4070 Super Gaming OC 12G
Intel Core i9-13900K, NVIDIA GeForce RTX 4070 SUPER
166.6 fps
NVIDIA GeForce RTX 4070 Super Founders Edition
Intel Core i9-13900K, NVIDIA GeForce RTX 4070 SUPER
163.4 fps -2%
Zotac Gaming GeForce RTX 4070 AMP Airo
Intel Core i9-13900K, NVIDIA GeForce RTX 4070
154.5 fps -7%
Average NVIDIA GeForce RTX 3080 Ti
  (129 - 164.9, n=4)
151.5 fps -9%
Average NVIDIA GeForce RTX 3090
  (117 - 170.1, n=13)
150.7 fps -10%
AMD Radeon RX 7800 XT
AMD Ryzen 9 7950X, AMD Radeon RX 7800 XT
141.8 fps -15%
AMD Radeon RX 6900 XT
AMD Ryzen 9 5950X, AMD Radeon RX 6900 XT (SAM ENABLED)
131 fps -21%
AMD Radeon RX 6900 XT
AMD Ryzen 9 5950X, AMD Radeon RX 6900 XT
130 fps -22%
Average of class Desktop
  (6.48 - 201, n=26, last 2 years)
129.9 fps -22%
Sapphire AMD Radeon RX 6950 XT Nitro+ Pure
AMD Ryzen 9 5900X, AMD Radeon RX 6950 XT
128.5 fps -23%
Sapphire Pulse Radeon RX 7700 XT
AMD Ryzen 9 7950X, AMD Radeon RX 7700 XT
126.4 fps -24%
Average NVIDIA GeForce RTX 3080
  (117 - 128, n=2)
122.5 fps -26%
Average NVIDIA GeForce RTX 4060 Ti 8G
  (121.5 - 123.5, n=3)
122.3 fps -27%
AMD Radeon RX 6800 XT
AMD Ryzen 9 5950X, AMD Radeon RX 6800 XT
120 fps -28%
KFA2 GeForce RTX 4060 Ti EX, 16GB GDDR6
AMD Ryzen 9 7950X, NVIDIA GeForce RTX 4060 Ti 16G
117.3 fps -30%
Average NVIDIA Titan RTX
  (77.2 - 128.7, n=29)
112 fps -33%
Average NVIDIA GeForce RTX 3070
  (95.3 - 108.9, n=5)
100.6 fps -40%
XFX Speedster QICK 308 Radeon RX 7600 Black Edition
AMD Ryzen 9 7950X, AMD Radeon RX 7600
96.2 fps -42%
KFA2 GeForce RTX 4060 1-Click-OC 2X
AMD Ryzen 9 7950X, NVIDIA GeForce RTX 4060
93.9 fps -44%
Shadow of the Tomb Raider
3840x2160 Highest Preset AA:T
NVIDIA GeForce RTX 4090 Founders Edition
Intel Core i9-13900K, NVIDIA GeForce RTX 4090
182 fps +88%
NVIDIA GeForce RTX 4080 Founders Edition
Intel Core i9-13900K, NVIDIA GeForce RTX 4080
134 fps +39%
AMD Radeon RX 7900 XTX
AMD Ryzen 9 7950X, AMD Radeon RX 7900 XTX
130.1 fps +35%
AMD Radeon RX 7900 XT
AMD Ryzen 9 7950X, AMD Radeon RX 7900 XT
109.6 fps +13%
Zotac Gaming GeForce RTX 3090 Ti AMP Extreme Holo
AMD Ryzen 7 5800X3D, NVIDIA GeForce RTX 3090 Ti
106 fps +10%
Gigabyte Aorus GeForce RTX 4070 Ti Master
Intel Core i9-13900K, NVIDIA GeForce RTX 4070 Ti
104.9 fps +8%
Asus TUF Gaming GeForce RTX 4070 Ti
Intel Core i9-13900K, NVIDIA GeForce RTX 4070 Ti
104.4 fps +8%
Average NVIDIA GeForce RTX 4070 Ti
  (102.7 - 104.9, n=4)
103.8 fps +7%
Average of class Desktop
  (33 - 186, n=20, last 2 years)
103.4 fps +7%
Sapphire AMD Radeon RX 6950 XT Nitro+ Pure
AMD Ryzen 9 5900X, AMD Radeon RX 6950 XT
97.4 fps +1%
Gigabyte GeForce RTX 4070 Super Gaming OC 12G
Intel Core i9-13900K, NVIDIA GeForce RTX 4070 SUPER
96.7 fps
Average NVIDIA GeForce RTX 3090
  (89.3 - 99.7, n=12)
96.4 fps 0%
Average NVIDIA GeForce RTX 3080 Ti
  (93 - 98.6, n=3)
95.1 fps -2%
NVIDIA GeForce RTX 4070 Super Founders Edition
Intel Core i9-13900K, NVIDIA GeForce RTX 4070 SUPER
91.5 fps -5%
AMD Radeon RX 6900 XT
AMD Ryzen 9 5950X, AMD Radeon RX 6900 XT (SAM ENABLED)
86 fps -11%
AMD Radeon RX 6900 XT
AMD Ryzen 9 5950X, AMD Radeon RX 6900 XT
84 fps -13%
Average NVIDIA GeForce RTX 3080
  (83.9 - 87.9, n=2)
85.9 fps -11%
Zotac Gaming GeForce RTX 4070 AMP Airo
Intel Core i9-13900K, NVIDIA GeForce RTX 4070
83.7 fps -13%
AMD Radeon RX 7800 XT
AMD Ryzen 9 7950X, AMD Radeon RX 7800 XT
82.7 fps -14%
AMD Radeon RX 6800 XT
AMD Ryzen 9 5950X, AMD Radeon RX 6800 XT
79.6 fps -18%
Average NVIDIA Titan RTX
  (59 - 71.1, n=24)
66.9 fps -31%
Sapphire Pulse Radeon RX 7700 XT
AMD Ryzen 9 7950X, AMD Radeon RX 7700 XT
65.5 fps -32%
Average NVIDIA GeForce RTX 3070
  (61 - 63.5, n=4)
62.3 fps -36%
KFA2 GeForce RTX 4060 Ti EX, 16GB GDDR6
AMD Ryzen 9 7950X, NVIDIA GeForce RTX 4060 Ti 16G
58.5 fps -40%
Average NVIDIA GeForce RTX 4060 Ti 8G
  (58.1 - 58.7, n=3)
58.5 fps -40%
KFA2 GeForce RTX 4060 1-Click-OC 2X
AMD Ryzen 9 7950X, NVIDIA GeForce RTX 4060
46.4 fps -52%
XFX Speedster QICK 308 Radeon RX 7600 Black Edition
AMD Ryzen 9 7950X, AMD Radeon RX 7600
41.6 fps -57%
2560x1440 Highest Preset AA:T
NVIDIA GeForce RTX 4090 Founders Edition
Intel Core i9-13900K, NVIDIA GeForce RTX 4090
282 fps +50%
NVIDIA GeForce RTX 4080 Founders Edition
Intel Core i9-13900K, NVIDIA GeForce RTX 4080
248 fps +32%
AMD Radeon RX 7900 XTX
AMD Ryzen 9 7950X, AMD Radeon RX 7900 XTX
230 fps +22%
Gigabyte Aorus GeForce RTX 4070 Ti Master
Intel Core i9-13900K, NVIDIA GeForce RTX 4070 Ti
204 fps +9%
AMD Radeon RX 7900 XT
AMD Ryzen 9 7950X, AMD Radeon RX 7900 XT
203 fps +8%
Asus TUF Gaming GeForce RTX 4070 Ti
Intel Core i9-13900K, NVIDIA GeForce RTX 4070 Ti
202 fps +7%
Average NVIDIA GeForce RTX 4070 Ti
  (195.9 - 204, n=4)
199.9 fps +6%
Gigabyte GeForce RTX 4070 Super Gaming OC 12G
Intel Core i9-13900K, NVIDIA GeForce RTX 4070 SUPER
188 fps
Zotac Gaming GeForce RTX 3090 Ti AMP Extreme Holo
AMD Ryzen 7 5800X3D, NVIDIA GeForce RTX 3090 Ti
184 fps -2%
Sapphire AMD Radeon RX 6950 XT Nitro+ Pure
AMD Ryzen 9 5900X, AMD Radeon RX 6950 XT
184 fps -2%
Average of class Desktop
  (61 - 282, n=21, last 2 years)
173.6 fps -8%
Average NVIDIA GeForce RTX 3090
  (137 - 172.3, n=12)
165.6 fps -12%
NVIDIA GeForce RTX 4070 Super Founders Edition
Intel Core i9-13900K, NVIDIA GeForce RTX 4070 SUPER
165.3 fps -12%
Average NVIDIA GeForce RTX 3080 Ti
  (157 - 173.3, n=3)
164.8 fps -12%
AMD Radeon RX 6900 XT
AMD Ryzen 9 5950X, AMD Radeon RX 6900 XT (SAM ENABLED)
163 fps -13%
AMD Radeon RX 6900 XT
AMD Ryzen 9 5950X, AMD Radeon RX 6900 XT
155 fps -18%
Zotac Gaming GeForce RTX 4070 AMP Airo
Intel Core i9-13900K, NVIDIA GeForce RTX 4070
162.6 fps -14%
AMD Radeon RX 7800 XT
AMD Ryzen 9 7950X, AMD Radeon RX 7800 XT
158.1 fps -16%
Average NVIDIA GeForce RTX 3080
  (147 - 152, n=2)
149.5 fps -20%
AMD Radeon RX 6800 XT
AMD Ryzen 9 5950X, AMD Radeon RX 6800 XT
148 fps -21%
Sapphire Pulse Radeon RX 7700 XT
AMD Ryzen 9 7950X, AMD Radeon RX 7700 XT
131.9 fps -30%
Average NVIDIA GeForce RTX 4060 Ti 8G
  (119.3 - 121.2, n=3)
120.3 fps -36%
KFA2 GeForce RTX 4060 Ti EX, 16GB GDDR6
AMD Ryzen 9 7950X, NVIDIA GeForce RTX 4060 Ti 16G
119.6 fps -36%
Average NVIDIA Titan RTX
  (98 - 128, n=23)
117.8 fps -37%
Average NVIDIA GeForce RTX 3070
  (108 - 116, n=4)
113.2 fps -40%
KFA2 GeForce RTX 4060 1-Click-OC 2X
AMD Ryzen 9 7950X, NVIDIA GeForce RTX 4060
96 fps -49%
XFX Speedster QICK 308 Radeon RX 7600 Black Edition
AMD Ryzen 9 7950X, AMD Radeon RX 7600
89.3 fps -52%
1920x1080 Highest Preset AA:T
NVIDIA GeForce RTX 4090 Founders Edition
Intel Core i9-13900K, NVIDIA GeForce RTX 4090
306 fps +20%
NVIDIA GeForce RTX 4080 Founders Edition
Intel Core i9-13900K, NVIDIA GeForce RTX 4080
303 fps +19%
AMD Radeon RX 7900 XTX
AMD Ryzen 9 7950X, AMD Radeon RX 7900 XTX
301 fps +18%
AMD Radeon RX 7900 XT
AMD Ryzen 9 7950X, AMD Radeon RX 7900 XT
282 fps +11%
Asus TUF Gaming GeForce RTX 4070 Ti
Intel Core i9-13900K, NVIDIA GeForce RTX 4070 Ti
280 fps +10%
Gigabyte Aorus GeForce RTX 4070 Ti Master
Intel Core i9-13900K, NVIDIA GeForce RTX 4070 Ti
280 fps +10%
Average NVIDIA GeForce RTX 4070 Ti
  (263 - 280, n=4)
272 fps +7%
Gigabyte GeForce RTX 4070 Super Gaming OC 12G
Intel Core i9-13900K, NVIDIA GeForce RTX 4070 SUPER
255 fps
Zotac Gaming GeForce RTX 3090 Ti AMP Extreme Holo
AMD Ryzen 7 5800X3D, NVIDIA GeForce RTX 3090 Ti
244 fps -4%
NVIDIA GeForce RTX 4070 Super Founders Edition
Intel Core i9-13900K, NVIDIA GeForce RTX 4070 SUPER
244 fps -4%
Zotac Gaming GeForce RTX 4070 AMP Airo
Intel Core i9-13900K, NVIDIA GeForce RTX 4070
239 fps -6%
Sapphire AMD Radeon RX 6950 XT Nitro+ Pure
AMD Ryzen 9 5900X, AMD Radeon RX 6950 XT
227 fps -11%
AMD Radeon RX 7800 XT
AMD Ryzen 9 7950X, AMD Radeon RX 7800 XT
221 fps -13%
Average NVIDIA GeForce RTX 3080 Ti
  (178 - 238, n=3)
209 fps -18%
Average NVIDIA GeForce RTX 3090
  (145 - 240, n=14)
204 fps -20%
AMD Radeon RX 6900 XT
AMD Ryzen 9 5950X, AMD Radeon RX 6900 XT
202 fps -21%
AMD Radeon RX 6900 XT
AMD Ryzen 9 5950X, AMD Radeon RX 6900 XT (SAM ENABLED)
199 fps -22%
Average of class Desktop
  (10.5 - 306, n=24, last 2 years)
194.9 fps -24%
Sapphire Pulse Radeon RX 7700 XT
AMD Ryzen 9 7950X, AMD Radeon RX 7700 XT
194.1 fps -24%
AMD Radeon RX 6800 XT
AMD Ryzen 9 5950X, AMD Radeon RX 6800 XT
194 fps -24%
KFA2 GeForce RTX 4060 Ti EX, 16GB GDDR6
AMD Ryzen 9 7950X, NVIDIA GeForce RTX 4060 Ti 16G
182.7 fps -28%
Average NVIDIA GeForce RTX 4060 Ti 8G
  (181.6 - 184, n=3)
182.7 fps -28%
Average NVIDIA GeForce RTX 3080
  (177 - 185, n=2)
181 fps -29%
Average NVIDIA GeForce RTX 3070
  (138 - 160, n=4)
151.3 fps -41%
Average NVIDIA Titan RTX
  (106 - 178.8, n=24)
149.5 fps -41%
KFA2 GeForce RTX 4060 1-Click-OC 2X
AMD Ryzen 9 7950X, NVIDIA GeForce RTX 4060
148.1 fps -42%
XFX Speedster QICK 308 Radeon RX 7600 Black Edition
AMD Ryzen 9 7950X, AMD Radeon RX 7600
142.2 fps -44%
Mafia Definitive Edition
3840x2160 High Preset
NVIDIA GeForce RTX 4090 Founders Edition
Intel Core i9-13900K, NVIDIA GeForce RTX 4090
160.2 (42.5min, 66.5P0.1, 122.8P1) fps +93%
NVIDIA GeForce RTX 4080 Founders Edition
Intel Core i9-13900K, NVIDIA GeForce RTX 4080
115.6 (34.7min, 70.3P0.1, 99.3P1) fps +39%
Average of class Desktop
  (72.3 - 160.2, n=11, last 2 years)
100.8 fps +21%
Zotac Gaming GeForce RTX 3090 Ti AMP Extreme Holo
AMD Ryzen 7 5800X3D, NVIDIA GeForce RTX 3090 Ti
99.2 (29.7min, 56P0.1, 77.1P1) fps +19%
Asus TUF Gaming GeForce RTX 4070 Ti
Intel Core i9-13900K, NVIDIA GeForce RTX 4070 Ti
88.9 (34.4min, 62P0.1, 77.4P1) fps +7%
Average NVIDIA GeForce RTX 4070 Ti
  (88.2 - 88.9, n=2)
88.6 fps +6%
Gigabyte Aorus GeForce RTX 4070 Ti Master
Intel Core i9-13900K, NVIDIA GeForce RTX 4070 Ti
88.2 (38min, 50P0.1, 75.9P1) fps +6%
Average NVIDIA GeForce RTX 3090
  (84.5 - 89.1, n=2)
86.8 fps +4%
Average NVIDIA GeForce RTX 3080 Ti
  ()
86.6 fps +4%
Gigabyte GeForce RTX 4070 Super Gaming OC 12G
Intel Core i9-13900K, NVIDIA GeForce RTX 4070 SUPER
83.2 (15.8min, 31.9P0.1, 71P1) fps
NVIDIA GeForce RTX 4070 Super Founders Edition
Intel Core i9-13900K, NVIDIA GeForce RTX 4070 SUPER
80.5 (17.6min, 28.5P0.1, 67.4P1) fps -3%
Sapphire AMD Radeon RX 6950 XT Nitro+ Pure
AMD Ryzen 9 5900X, AMD Radeon RX 6950 XT
80.4 (44.2min, 56.8P0.1, 70.5P1) fps -3%
Average NVIDIA GeForce RTX 3080
  (78.1 - 78.2, n=2)
78.2 fps -6%
Zotac Gaming GeForce RTX 4070 AMP Airo
Intel Core i9-13900K, NVIDIA GeForce RTX 4070
72.3 (32.3min, 50.2P0.1, 64.6P1) fps -13%
AMD Radeon RX 6900 XT
AMD Ryzen 9 5950X, AMD Radeon RX 6900 XT
67 (32.3min, 41.7P0.1, 44.7P1) fps -19%
Average NVIDIA Titan RTX
  ()
63.4 fps -24%
AMD Radeon RX 6800 XT
AMD Ryzen 9 5950X, AMD Radeon RX 6800 XT
62.6 (28min, 37.6P0.1, 49.2P1) fps -25%
Average NVIDIA GeForce RTX 3070
  (55.2 - 56.6, n=2)
55.9 fps -33%
2560x1440 High Preset
NVIDIA GeForce RTX 4090 Founders Edition
Intel Core i9-13900K, NVIDIA GeForce RTX 4090
238 (71.6min, 84.3P0.1, 162.7P1) fps +47%
NVIDIA GeForce RTX 4080 Founders Edition
Intel Core i9-13900K, NVIDIA GeForce RTX 4080
214 (100.6min, 149.1P0.1, 172.3P1) fps +33%
Average of class Desktop
  (141.1 - 238, n=11, last 2 years)
181.4 fps +12%
Gigabyte Aorus GeForce RTX 4070 Ti Master
Intel Core i9-13900K, NVIDIA GeForce RTX 4070 Ti
175.5 (51.6min, 61P0.1, 140.4P1) fps +9%
Zotac Gaming GeForce RTX 3090 Ti AMP Extreme Holo
AMD Ryzen 7 5800X3D, NVIDIA GeForce RTX 3090 Ti
173.9 (73.1min, 101.4P0.1, 134.6P1) fps +8%
Average NVIDIA GeForce RTX 4070 Ti
  (171.9 - 175.5, n=2)
173.7 fps +8%
Asus TUF Gaming GeForce RTX 4070 Ti
Intel Core i9-13900K, NVIDIA GeForce RTX 4070 Ti
171.9 (100min, 119.6P0.1, 144.6P1) fps +6%
Gigabyte GeForce RTX 4070 Super Gaming OC 12G
Intel Core i9-13900K, NVIDIA GeForce RTX 4070 SUPER
161.5 (49min, 72.2P0.1, 133.4P1) fps
NVIDIA GeForce RTX 4070 Super Founders Edition
Intel Core i9-13900K, NVIDIA GeForce RTX 4070 SUPER
156.8 (45.5min, 105.1P0.1, 131P1) fps -3%
Sapphire AMD Radeon RX 6950 XT Nitro+ Pure
AMD Ryzen 9 5900X, AMD Radeon RX 6950 XT
156.2 (30min, 87.3P0.1, 114P1) fps -3%
Average NVIDIA GeForce RTX 3090
  (142.3 - 149, n=2)
145.7 fps -10%
Average NVIDIA GeForce RTX 3080 Ti
  ()
142 fps -12%
Zotac Gaming GeForce RTX 4070 AMP Airo
Intel Core i9-13900K, NVIDIA GeForce RTX 4070
141.1 (38.7min, 98.7P0.1, 118.6P1) fps -13%
Average NVIDIA GeForce RTX 3080
  (127 - 137, n=2)
132 fps -18%
AMD Radeon RX 6900 XT
AMD Ryzen 9 5950X, AMD Radeon RX 6900 XT
120 (17.6min, 61.2P0.1, 83.1P1) fps -26%
AMD Radeon RX 6800 XT
AMD Ryzen 9 5950X, AMD Radeon RX 6800 XT
112 (23.5min, 64P0.1, 80.8P1) fps -31%
Average NVIDIA Titan RTX
  ()
109 fps -33%
Average NVIDIA GeForce RTX 3070
  (98.1 - 98.7, n=2)
98.4 fps -39%
1920x1080 High Preset
NVIDIA GeForce RTX 4080 Founders Edition
Intel Core i9-13900K, NVIDIA GeForce RTX 4080
260 (58.1min, 133.7P0.1, 187.5P1) fps +15%
NVIDIA GeForce RTX 4090 Founders Edition
Intel Core i9-13900K, NVIDIA GeForce RTX 4090
255 (80.7min, 89.2P0.1, 169.4P1) fps +13%
Gigabyte Aorus GeForce RTX 4070 Ti Master
Intel Core i9-13900K, NVIDIA GeForce RTX 4070 Ti
249 (29.7min, 62.5P0.1, 182.6P1) fps +10%
Average NVIDIA GeForce RTX 4070 Ti
  (241 - 249, n=2)
245 fps +8%
Asus TUF Gaming GeForce RTX 4070 Ti
Intel Core i9-13900K, NVIDIA GeForce RTX 4070 Ti
241 (107.5min, 136.3P0.1, 183.2P1) fps +7%
Average of class Desktop
  (207 - 260, n=11, last 2 years)
232 fps +3%
Zotac Gaming GeForce RTX 3090 Ti AMP Extreme Holo
AMD Ryzen 7 5800X3D, NVIDIA GeForce RTX 3090 Ti
231 (84.7min, 116.2P0.1, 160.4P1) fps +2%
Gigabyte GeForce RTX 4070 Super Gaming OC 12G
Intel Core i9-13900K, NVIDIA GeForce RTX 4070 SUPER
226 (46.9min, 116P0.1, 163.2P1) fps
NVIDIA GeForce RTX 4070 Super Founders Edition
Intel Core i9-13900K, NVIDIA GeForce RTX 4070 SUPER
216 (100.5min, 122.8P0.1, 159.4P1) fps -4%
Zotac Gaming GeForce RTX 4070 AMP Airo
Intel Core i9-13900K, NVIDIA GeForce RTX 4070
207 (53.5min, 121.4P0.1, 159.4P1) fps -8%
Sapphire AMD Radeon RX 6950 XT Nitro+ Pure
AMD Ryzen 9 5900X, AMD Radeon RX 6950 XT
175.5 (38.6min, 86.6P0.1, 117.6P1) fps -22%
Average NVIDIA GeForce RTX 3080 Ti
  ()
163 fps -28%
Average NVIDIA GeForce RTX 3090
  (157 - 158.8, n=2)
157.9 fps -30%
Average NVIDIA GeForce RTX 3080
  (144 - 169, n=2)
156.5 fps -31%
AMD Radeon RX 6900 XT
AMD Ryzen 9 5950X, AMD Radeon RX 6900 XT
138 (32.8min, 68.1P0.1, 90.2P1) fps -39%
Average NVIDIA GeForce RTX 3070
  (124 - 132, n=2)
128 fps -43%
Average NVIDIA Titan RTX
  ()
123.7 fps -45%
AMD Radeon RX 6800 XT
AMD Ryzen 9 5950X, AMD Radeon RX 6800 XT
121 (23.7min, 68P0.1, 83.3P1) fps -46%

Ray tracing performance

These perceived gains percolate down to native ray tracing performance as well, though the uplift is relatively minor in the range of 2-7% depending on the game and resolution.

Ray tracing in Far Cry 6 1080p Ultra and Cyberpunk 2077 1.6 4K Ultra seems to be benefitting the most vis-à-vis the RTX 4070 Super FE.

Metro Exodus - 1920x1080 Ultra Quality DXR AF:16x
AMD Radeon RX 7900 XTX
AMD Ryzen 9 7950X, AMD Radeon RX 7900 XTX
141.2 (89.03min) fps +12%
NVIDIA GeForce RTX 4080 Founders Edition
Intel Core i9-13900K, NVIDIA GeForce RTX 4080
137.2 (68.42min) fps +9%
NVIDIA GeForce RTX 4090 Founders Edition
Intel Core i9-13900K, NVIDIA GeForce RTX 4090
135 (73.53min) fps +7%
Average NVIDIA GeForce RTX 4070 Ti
  (128.8 - 133.3, n=4)
130.9 fps +4%
Gigabyte Aorus GeForce RTX 4070 Ti Master
Intel Core i9-13900K, NVIDIA GeForce RTX 4070 Ti
129 (64.57min) fps +2%
Asus TUF Gaming GeForce RTX 4070 Ti
Intel Core i9-13900K, NVIDIA GeForce RTX 4070 Ti
128.8 (62.96min) fps +2%
Zotac Gaming GeForce RTX 3090 Ti AMP Extreme Holo
AMD Ryzen 7 5800X3D, NVIDIA GeForce RTX 3090 Ti
128.5 (64.07min) fps +2%
Gigabyte GeForce RTX 4070 Super Gaming OC 12G
Intel Core i9-13900K, NVIDIA GeForce RTX 4070 SUPER
126.3 (69.94min) fps
AMD Radeon RX 7900 XT
AMD Ryzen 9 7950X, AMD Radeon RX 7900 XT
124.3 (78.88min) fps -2%
NVIDIA GeForce RTX 4070 Super Founders Edition
Intel Core i9-13900K, NVIDIA GeForce RTX 4070 SUPER
121.7 (67.66min) fps -4%
Average of class Desktop
  (62.8 - 163.7, n=22, last 2 years)
119.4 fps -5%
Average NVIDIA GeForce RTX 3080 Ti
  (110 - 121.2, n=4)
114.8 fps -9%
Average NVIDIA GeForce RTX 3090
  (68.6 - 122.2, n=12)
111.4 fps -12%
Zotac Gaming GeForce RTX 4070 AMP Airo
Intel Core i9-13900K, NVIDIA GeForce RTX 4070
107.1 (58.82min) fps -15%
AMD Radeon RX 7800 XT
AMD Ryzen 9 7950X, AMD Radeon RX 7800 XT
98.4 (61.39min) fps -22%
Average NVIDIA GeForce RTX 3080
  (91.5 - 102, n=2)
96.8 fps -23%
AMD Radeon RX 6900 XT
AMD Ryzen 9 5950X, AMD Radeon RX 6900 XT
90.5 (55.53min) fps -28%
Sapphire Pulse Radeon RX 7700 XT
AMD Ryzen 9 7950X, AMD Radeon RX 7700 XT
88.1 (56.03min) fps -30%
Average NVIDIA Titan RTX
  (69 - 95.5, n=23)
86.1 fps -32%
AMD Radeon RX 6800 XT
AMD Ryzen 9 5950X, AMD Radeon RX 6800 XT
85.5 (52.71min) fps -32%
Average NVIDIA GeForce RTX 4060 Ti 8G
  (84.6 - 86.1, n=3)
85.2 fps -33%
KFA2 GeForce RTX 4060 Ti EX, 16GB GDDR6
AMD Ryzen 9 7950X, NVIDIA GeForce RTX 4060 Ti 16G
84.5 (47.97min) fps -33%
Average NVIDIA GeForce RTX 3070
  (80.4 - 83, n=5)
81.6 fps -35%
KFA2 GeForce RTX 4060 1-Click-OC 2X
AMD Ryzen 9 7950X, NVIDIA GeForce RTX 4060
67.2 (36.94min) fps -47%
XFX Speedster QICK 308 Radeon RX 7600 Black Edition
AMD Ryzen 9 7950X, AMD Radeon RX 7600
62.9 (40.28min) fps -50%
Control - 1920x1080 High Quality Preset & High Ray Tracing Preset (DX12)
NVIDIA GeForce RTX 4090 Founders Edition
Intel Core i9-13900K, NVIDIA GeForce RTX 4090
185.1 (103.4min, 132.2P0.1, 140.8P1) fps +59%
NVIDIA GeForce RTX 4080 Founders Edition
Intel Core i9-13900K, NVIDIA GeForce RTX 4080
162.8 (28.9min, 60.8P0.1, 129.4P1) fps +40%
AMD Radeon RX 7900 XTX
AMD Ryzen 9 7950X, AMD Radeon RX 7900 XTX
133.7 (23.2min, 92.6P0.1, 104.6P1) fps +15%
Zotac Gaming GeForce RTX 3090 Ti AMP Extreme Holo
AMD Ryzen 7 5800X3D, NVIDIA GeForce RTX 3090 Ti
130.8 (62.6min, 107.5P0.1, 113.8P1) fps +12%
Gigabyte Aorus GeForce RTX 4070 Ti Master
Intel Core i9-13900K, NVIDIA GeForce RTX 4070 Ti
129.1 (38.7min, 49.1P0.1, 101.2P1) fps +11%
Asus TUF Gaming GeForce RTX 4070 Ti
Intel Core i9-13900K, NVIDIA GeForce RTX 4070 Ti
128.3 (6.22min, 61.8P0.1, 107P1) fps +10%
Average NVIDIA GeForce RTX 4070 Ti
  (123.5 - 129.1, n=4)
126.7 fps +9%
Gigabyte GeForce RTX 4070 Super Gaming OC 12G
Intel Core i9-13900K, NVIDIA GeForce RTX 4070 SUPER
116.7 (28.4min, 92.4P0.1, 101.1P1) fps
Average of class Desktop
  (58.6 - 185.1, n=15, last 2 years)
116.6 fps 0%
AMD Radeon RX 7900 XT
AMD Ryzen 9 7950X, AMD Radeon RX 7900 XT
116.1 (8.47min, 62.1P0.1, 91.4P1) fps -1%
Average NVIDIA GeForce RTX 3080 Ti
  (111 - 120.6, n=3)
115.2 fps -1%
NVIDIA GeForce RTX 4070 Super Founders Edition
Intel Core i9-13900K, NVIDIA GeForce RTX 4070 SUPER
113.8 (66.1min, 87.5P0.1, 97.9P1) fps -2%
Average NVIDIA GeForce RTX 3090
  (91.4 - 122.6, n=5)
111.1 fps -5%
Zotac Gaming GeForce RTX 4070 AMP Airo
Intel Core i9-13900K, NVIDIA GeForce RTX 4070
101.8 (30.1min, 42.5P0.1, 86.1P1) fps -13%
Average NVIDIA GeForce RTX 3080
  (98.1 - 103, n=2)
100.6 fps -14%
Sapphire AMD Radeon RX 6950 XT Nitro+ Pure
AMD Ryzen 9 5900X, AMD Radeon RX 6950 XT
97.7 (7.66min, 62.8P0.1, 73.5P1) fps -16%
AMD Radeon RX 7800 XT
AMD Ryzen 9 7950X, AMD Radeon RX 7800 XT
96.1 (18.2min, 69.2P0.1, 76.4P1) fps -18%
Average NVIDIA Titan RTX
  (63 - 120, n=3)
88.1 fps -25%
Sapphire Pulse Radeon RX 7700 XT
AMD Ryzen 9 7950X, AMD Radeon RX 7700 XT
79.9 (18.5min, 55.7P0.1, 65.6P1) fps -32%
AMD Radeon RX 6900 XT
AMD Ryzen 9 5950X, AMD Radeon RX 6900 XT (SAM ENABLED)
76.2 (38.7min, 43.3P0.1, 62.8P1) fps -35%
AMD Radeon RX 6900 XT
AMD Ryzen 9 5950X, AMD Radeon RX 6900 XT
73.1 (31.6min, 40.9P0.1, 62.6P1) fps -37%
KFA2 GeForce RTX 4060 Ti EX, 16GB GDDR6
AMD Ryzen 9 7950X, NVIDIA GeForce RTX 4060 Ti 16G
73 (15.8min, 59.4P0.1, 63.3P1) fps -37%
Average NVIDIA GeForce RTX 4060 Ti 8G
  (72.5 - 73.6, n=3)
73 fps -37%
Average NVIDIA GeForce RTX 3070
  (57.9 - 75.1, n=3)
68.5 fps -41%
AMD Radeon RX 6800 XT
AMD Ryzen 9 5950X, AMD Radeon RX 6800 XT
66.9 (60min) fps -43%
KFA2 GeForce RTX 4060 1-Click-OC 2X
AMD Ryzen 9 7950X, NVIDIA GeForce RTX 4060
57.5 (14.9min, 44.3P0.1, 50.6P1) fps -51%
XFX Speedster QICK 308 Radeon RX 7600 Black Edition
AMD Ryzen 9 7950X, AMD Radeon RX 7600
51.7 (6.96min, 38.6P0.1, 42P1) fps -56%
Watch Dogs Legion - 1920x1080 Ultra Preset + Ultra Ray Tracing (DX12)
NVIDIA GeForce RTX 4090 Founders Edition
Intel Core i9-13900K, NVIDIA GeForce RTX 4090
115.7 (18.56min, 92.59P1) fps +27%
NVIDIA GeForce RTX 4080 Founders Edition
Intel Core i9-13900K, NVIDIA GeForce RTX 4080
111.6 (76.88min, 90.46P1) fps +23%
Gigabyte Aorus GeForce RTX 4070 Ti Master
Intel Core i9-13900K, NVIDIA GeForce RTX 4070 Ti
99.4 (37.32min, 77.35P1) fps +9%
Average NVIDIA GeForce RTX 4070 Ti
  (98.9 - 99.4, n=2)
99.2 fps +9%
Asus TUF Gaming GeForce RTX 4070 Ti
Intel Core i9-13900K, NVIDIA GeForce RTX 4070 Ti
98.9 (72.06min, 82.17P1) fps +9%
Gigabyte GeForce RTX 4070 Super Gaming OC 12G
Intel Core i9-13900K, NVIDIA GeForce RTX 4070 SUPER
91.1 (18.45min, 75.38P1) fps
Zotac Gaming GeForce RTX 3090 Ti AMP Extreme Holo
AMD Ryzen 7 5800X3D, NVIDIA GeForce RTX 3090 Ti
88.7 (50.06min, 72.42P1) fps -3%
Average NVIDIA GeForce RTX 3090
  (75.7 - 110, n=3)
88 fps -3%
NVIDIA GeForce RTX 4070 Super Founders Edition
Intel Core i9-13900K, NVIDIA GeForce RTX 4070 SUPER
87.8 (19.1min, 71.63P1) fps -4%
Average of class Desktop
  (35 - 115.7, n=14, last 2 years)
83.7 fps -8%
Zotac Gaming GeForce RTX 4070 AMP Airo
Intel Core i9-13900K, NVIDIA GeForce RTX 4070
75.3 (15.28min, 63.07P1) fps -17%
Average NVIDIA GeForce RTX 3080 Ti
  ()
75.1 fps -18%
AMD Radeon RX 6800 XT
AMD Ryzen 9 5950X, AMD Radeon RX 6800 XT
71.4 (47.71min, 55.63P1) fps -22%
Average NVIDIA GeForce RTX 3080
  (70.9 - 71.3, n=2)
71.1 fps -22%
Sapphire AMD Radeon RX 6950 XT Nitro+ Pure
AMD Ryzen 9 5900X, AMD Radeon RX 6950 XT
69 fps -24%
AMD Radeon RX 6900 XT
AMD Ryzen 9 5950X, AMD Radeon RX 6900 XT
55.6 (35.81min, 41.86P1) fps -39%
AMD Radeon RX 6900 XT
AMD Ryzen 9 5950X, AMD Radeon RX 6900 XT (SAM ENABLED)
55.5 (36.48min, 43.27P1) fps -39%
Average NVIDIA Titan RTX
  ()
55.4 fps -39%
Average NVIDIA GeForce RTX 3070
  (51.7 - 61, n=4)
55.1 fps -40%
Far Cry 6 - 1920x1080 Ultra Graphics Quality + HD Textures + DXR AA:T
NVIDIA GeForce RTX 4080 Founders Edition
Intel Core i9-13900K, NVIDIA GeForce RTX 4080
154 (125min) fps +7%
AMD Radeon RX 7900 XTX
AMD Ryzen 9 7950X, AMD Radeon RX 7900 XTX
152.1 (75min) fps +6%
NVIDIA GeForce RTX 4090 Founders Edition
Intel Core i9-13900K, NVIDIA GeForce RTX 4090
147 (125min) fps +2%
Asus TUF Gaming GeForce RTX 4070 Ti
Intel Core i9-13900K, NVIDIA GeForce RTX 4070 Ti
146 (122min) fps +1%
Gigabyte GeForce RTX 4070 Super Gaming OC 12G
Intel Core i9-13900K, NVIDIA GeForce RTX 4070 SUPER
144 (99min) fps
AMD Radeon RX 7900 XT
AMD Ryzen 9 7950X, AMD Radeon RX 7900 XT
143.6 (46min) fps 0%
Gigabyte Aorus GeForce RTX 4070 Ti Master
Intel Core i9-13900K, NVIDIA GeForce RTX 4070 Ti
139.5 (114min) fps -3%
Average NVIDIA GeForce RTX 4070 Ti
  (133.4 - 146, n=4)
138.9 fps -4%
Zotac Gaming GeForce RTX 4070 AMP Airo
Intel Core i9-13900K, NVIDIA GeForce RTX 4070
138 (108min) fps -4%
NVIDIA GeForce RTX 4070 Super Founders Edition
Intel Core i9-13900K, NVIDIA GeForce RTX 4070 SUPER
134 (119min) fps -7%
AMD Radeon RX 7800 XT
AMD Ryzen 9 7950X, AMD Radeon RX 7800 XT
129.4 (36min) fps -10%
Average of class Desktop
  (19.1 - 154, n=17, last 2 years)
125 fps -13%
Zotac Gaming GeForce RTX 3090 Ti AMP Extreme Holo
AMD Ryzen 7 5800X3D, NVIDIA GeForce RTX 3090 Ti
122 (95min) fps -15%
Average NVIDIA GeForce RTX 3080 Ti
  (112 - 128.6, n=2)
120.3 fps -16%
Average NVIDIA GeForce RTX 3090
  (76 - 138.2, n=8)
112.6 fps -22%
KFA2 GeForce RTX 4060 Ti EX, 16GB GDDR6
AMD Ryzen 9 7950X, NVIDIA GeForce RTX 4060 Ti 16G
111.1 (100min) fps -23%
Sapphire Pulse Radeon RX 7700 XT
AMD Ryzen 9 7950X, AMD Radeon RX 7700 XT
104.1 (18min) fps -28%
Average NVIDIA Titan RTX
  (97 - 109.3, n=2)
103.2 fps -28%
Sapphire AMD Radeon RX 6950 XT Nitro+ Pure
AMD Ryzen 9 5900X, AMD Radeon RX 6950 XT
101.6 (24min) fps -29%
Average NVIDIA GeForce RTX 4060 Ti 8G
  (61.9 - 88, n=2)
75 fps -48%
Average NVIDIA GeForce RTX 3080
  ()
73 fps -49%
Average NVIDIA GeForce RTX 3070
  ()
71 fps -51%
XFX Speedster QICK 308 Radeon RX 7600 Black Edition
AMD Ryzen 9 7950X, AMD Radeon RX 7600
63.6 (31min) fps -56%
KFA2 GeForce RTX 4060 1-Click-OC 2X
AMD Ryzen 9 7950X, NVIDIA GeForce RTX 4060
34.8 (13min) fps -76%
Dying Light 2 - 1920x1080 High Quality Raytracing
NVIDIA GeForce RTX 4090 Founders Edition
Intel Core i9-13900K, NVIDIA GeForce RTX 4090
130 (49min, 97.7P0.1, 106.7P1) fps +80%
NVIDIA GeForce RTX 4080 Founders Edition
Intel Core i9-13900K, NVIDIA GeForce RTX 4080
98.7 (37.6min, 46.5P0.1, 74.3P1) fps +37%
Average NVIDIA GeForce RTX 3080 Ti
  ()
83.5 fps +16%
Average of class Desktop
  (59.4 - 130, n=11, last 2 years)
83.5 fps +16%
Asus TUF Gaming GeForce RTX 4070 Ti
Intel Core i9-13900K, NVIDIA GeForce RTX 4070 Ti
82.9 (36.6min, 45.4P0.1, 69.2P1) fps +15%
Average NVIDIA GeForce RTX 4070 Ti
  (82.8 - 82.9, n=2)
82.9 fps +15%
Gigabyte Aorus GeForce RTX 4070 Ti Master
Intel Core i9-13900K, NVIDIA GeForce RTX 4070 Ti
82.8 (27.4min, 39.9P0.1, 59.6P1) fps +15%
Average NVIDIA Titan RTX
  ()
80.1 fps +11%
Zotac Gaming GeForce RTX 3090 Ti AMP Extreme Holo
AMD Ryzen 7 5800X3D, NVIDIA GeForce RTX 3090 Ti
76.4 (33.4min, 57.9P0.1, 62.6P1) fps +6%
Average NVIDIA GeForce RTX 3090
  (67.9 - 80.2, n=2)
74.1 fps +3%
Gigabyte GeForce RTX 4070 Super Gaming OC 12G
Intel Core i9-13900K, NVIDIA GeForce RTX 4070 SUPER
72.1 (43.6min, 49.9P0.1, 61.6P1) fps
NVIDIA GeForce RTX 4070 Super Founders Edition
Intel Core i9-13900K, NVIDIA GeForce RTX 4070 SUPER
70.9 (37min, 44.8P0.1, 58.5P1) fps -2%
Average NVIDIA GeForce RTX 3080
  ()
59.7 fps -17%
Zotac Gaming GeForce RTX 4070 AMP Airo
Intel Core i9-13900K, NVIDIA GeForce RTX 4070
59.4 (17.2min, 20.2P0.1, 49P1) fps -18%
Average NVIDIA GeForce RTX 3070
  ()
42.2 fps -41%
Cyberpunk 2077 1.6
3840x2160 Ray Tracing Ultra Preset (DLSS off)
NVIDIA GeForce RTX 4090 Founders Edition
Intel Core i9-13900K, NVIDIA GeForce RTX 4090 (1.6)
42.6 (32min) fps +102%
NVIDIA GeForce RTX 4080 Founders Edition
Intel Core i9-13900K, NVIDIA GeForce RTX 4080 (1.6)
30.7 (23.5min) fps +45%
Average of class Desktop
  (1.4 - 43.8, n=19, last 2 years)
24.4 fps +16%
Zotac Gaming GeForce RTX 3090 Ti AMP Extreme Holo
AMD Ryzen 7 5800X3D, NVIDIA GeForce RTX 3090 Ti (1.52)
24.3 (16.3min) fps +15%
Gigabyte Aorus GeForce RTX 4070 Ti Master
Intel Core i9-13900K, NVIDIA GeForce RTX 4070 Ti (1.61)
23.9 (18min) fps +13%
Asus TUF Gaming GeForce RTX 4070 Ti
Intel Core i9-13900K, NVIDIA GeForce RTX 4070 Ti (1.61)
23.7 (18.1min) fps +12%
Average NVIDIA GeForce RTX 4070 Ti
  (21.6 - 23.9, n=4)
23.2 fps +10%
Gigabyte GeForce RTX 4070 Super Gaming OC 12G
Intel Core i9-13900K, NVIDIA GeForce RTX 4070 SUPER (1.63)
21.1 (2.68min) fps
Average NVIDIA GeForce RTX 3090
  (19.8 - 22.1, n=5)
21 fps 0%
AMD Radeon RX 7900 XTX
AMD Ryzen 9 7950X, AMD Radeon RX 7900 XTX (1.61)
20.7 (14.4min) fps -2%
NVIDIA GeForce RTX 4070 Super Founders Edition
Intel Core i9-13900K, NVIDIA GeForce RTX 4070 SUPER (1.63)
20 (9.7min) fps -5%
Average NVIDIA GeForce RTX 3080 Ti
  ()
18.6 fps -12%
AMD Radeon RX 7900 XT
AMD Ryzen 9 7950X, AMD Radeon RX 7900 XT (1.61)
17.6 (12min) fps -17%
Zotac Gaming GeForce RTX 4070 AMP Airo
Intel Core i9-13900K, NVIDIA GeForce RTX 4070 (1.62)
15.3 (11.7min) fps -27%
AMD Radeon RX 7800 XT
AMD Ryzen 9 7950X, AMD Radeon RX 7800 XT (1.6)
13.7 (10.2min) fps -35%
Average NVIDIA Titan RTX
  ()
13.4 fps -36%
KFA2 GeForce RTX 4060 Ti EX, 16GB GDDR6
AMD Ryzen 9 7950X, NVIDIA GeForce RTX 4060 Ti 16G (1.6)
13.2 (10min) fps -37%
Average NVIDIA GeForce RTX 3080
  ()
12.1 fps -43%
Sapphire Pulse Radeon RX 7700 XT
AMD Ryzen 9 7950X, AMD Radeon RX 7700 XT (1.6)
11.5 (7.84min) fps -45%
Sapphire Pulse Radeon RX 7700 XT
AMD Ryzen 9 7950X, AMD Radeon RX 7700 XT (1.6)
11.5 (7.84min) fps -45%
Average NVIDIA GeForce RTX 3070
  (5.4 - 6.6, n=2)
6 fps -72%
Average NVIDIA GeForce RTX 4060 Ti 8G
  (2.2 - 3.2, n=3)
2.6 fps -88%
KFA2 GeForce RTX 4060 1-Click-OC 2X
AMD Ryzen 9 7950X, NVIDIA GeForce RTX 4060 (1.6)
2.19 (1.635min) fps -90%
XFX Speedster QICK 308 Radeon RX 7600 Black Edition
AMD Ryzen 9 7950X, AMD Radeon RX 7600 (1.6)
2.05 (0.904min) fps -90%
1920x1080 Ray Tracing Ultra Preset (DLSS off)
NVIDIA GeForce RTX 4090 Founders Edition
Intel Core i9-13900K, NVIDIA GeForce RTX 4090 (1.6)
118.4 (92min) fps +66%
NVIDIA GeForce RTX 4080 Founders Edition
Intel Core i9-13900K, NVIDIA GeForce RTX 4080 (1.6)
100.1 (77.6min) fps +40%
Gigabyte Aorus GeForce RTX 4070 Ti Master
Intel Core i9-13900K, NVIDIA GeForce RTX 4070 Ti (1.61)
82.5 (32.1min) fps +15%
Asus TUF Gaming GeForce RTX 4070 Ti
Intel Core i9-13900K, NVIDIA GeForce RTX 4070 Ti (1.61)
81 (62.6min) fps +13%
Average NVIDIA GeForce RTX 4070 Ti
  (78.9 - 82.5, n=4)
81 fps +13%
Average of class Desktop
  (23.8 - 130.1, n=20, last 2 years)
77.1 fps +8%
Zotac Gaming GeForce RTX 3090 Ti AMP Extreme Holo
AMD Ryzen 7 5800X3D, NVIDIA GeForce RTX 3090 Ti (1.52)
74.7 (57.7min) fps +4%
Gigabyte GeForce RTX 4070 Super Gaming OC 12G
Intel Core i9-13900K, NVIDIA GeForce RTX 4070 SUPER (1.63)
71.5 (56.7min) fps
Average NVIDIA GeForce RTX 3080 Ti
  ()
69.1 fps -3%
NVIDIA GeForce RTX 4070 Super Founders Edition
Intel Core i9-13900K, NVIDIA GeForce RTX 4070 SUPER (1.63)
68.9 (54.4min) fps -4%
Average NVIDIA GeForce RTX 3090
  (61.3 - 68, n=5)
65.5 fps -8%
AMD Radeon RX 7900 XTX
AMD Ryzen 9 7950X, AMD Radeon RX 7900 XTX (1.61)
64.6 (49.1min) fps -10%
Average NVIDIA GeForce RTX 3080
  ()
61.1 fps -15%
Zotac Gaming GeForce RTX 4070 AMP Airo
Intel Core i9-13900K, NVIDIA GeForce RTX 4070 (1.62)
60 (47.6min) fps -16%
AMD Radeon RX 7900 XT
AMD Ryzen 9 7950X, AMD Radeon RX 7900 XT (1.61)
57.1 (41.7min) fps -20%
KFA2 GeForce RTX 4060 Ti EX, 16GB GDDR6
AMD Ryzen 9 7950X, NVIDIA GeForce RTX 4060 Ti 16G (1.6)
49 (37min) fps -31%
Average NVIDIA GeForce RTX 4060 Ti 8G
  (48 - 49.6, n=3)
48.9 fps -32%
AMD Radeon RX 7800 XT
AMD Ryzen 9 7950X, AMD Radeon RX 7800 XT (1.6)
46 (33.3min) fps -36%
Average NVIDIA Titan RTX
  ()
43.3 fps -39%
Average NVIDIA GeForce RTX 3070
  (41.6 - 43.9, n=2)
42.8 fps -40%
Sapphire Pulse Radeon RX 7700 XT
AMD Ryzen 9 7950X, AMD Radeon RX 7700 XT (1.6)
39.8 (30min) fps -44%
Sapphire Pulse Radeon RX 7700 XT
AMD Ryzen 9 7950X, AMD Radeon RX 7700 XT (1.6)
39.8 (30min) fps -44%
Sapphire Pulse Radeon RX 7700 XT
AMD Ryzen 9 7950X, AMD Radeon RX 7700 XT (1.6)
39.8 (30min) fps -44%
KFA2 GeForce RTX 4060 1-Click-OC 2X
AMD Ryzen 9 7950X, NVIDIA GeForce RTX 4060 (1.6)
37.1 (27.9min) fps -48%
XFX Speedster QICK 308 Radeon RX 7600 Black Edition
AMD Ryzen 9 7950X, AMD Radeon RX 7600 (1.6)
22.4 (13.9min) fps -69%
Ghostwire Tokyo - 1920x1080 Highest Settings + Maximum Ray Tracing
NVIDIA GeForce RTX 4090 Founders Edition
Intel Core i9-13900K, NVIDIA GeForce RTX 4090
193.7 (38.5min, 66.5P0.1, 142.5P1) fps +46%
NVIDIA GeForce RTX 4080 Founders Edition
Intel Core i9-13900K, NVIDIA GeForce RTX 4080
166.2 (30.4min, 60P0.1, 115.2P1) fps +25%
Asus TUF Gaming GeForce RTX 4070 Ti
Intel Core i9-13900K, NVIDIA GeForce RTX 4070 Ti
139.3 (31.3min, 53.2P0.1, 89.7P1) fps +5%
Gigabyte Aorus GeForce RTX 4070 Ti Master
Intel Core i9-13900K, NVIDIA GeForce RTX 4070 Ti
138.7 (38.5min, 54.6P0.1, 89.8P1) fps +4%
Average NVIDIA GeForce RTX 4070 Ti
  (130.7 - 139.3, n=4)
136.5 fps +3%
AMD Radeon RX 7900 XTX
AMD Ryzen 9 7950X, AMD Radeon RX 7900 XTX
136.3 (39.1min, 76.4P0.1, 95.8P1) fps +3%
Average of class Desktop
  (55.9 - 193.7, n=13, last 2 years)
136.3 fps +3%
Gigabyte GeForce RTX 4070 Super Gaming OC 12G
Intel Core i9-13900K, NVIDIA GeForce RTX 4070 SUPER
132.9 (13.7min, 19.3P0.1, 81.6P1) fps
NVIDIA GeForce RTX 4070 Super Founders Edition
Intel Core i9-13900K, NVIDIA GeForce RTX 4070 SUPER
128.3 (23.1min, 40.3P0.1, 80.7P1) fps -3%
Zotac Gaming GeForce RTX 3090 Ti AMP Extreme Holo
AMD Ryzen 7 5800X3D, NVIDIA GeForce RTX 3090 Ti
120.2 (33.8min, 55.2P0.1, 79.1P1) fps -10%
Average NVIDIA GeForce RTX 3080 Ti
  ()
119.9 fps -10%
AMD Radeon RX 7900 XT
AMD Ryzen 9 7950X, AMD Radeon RX 7900 XT
116.5 (30.3min, 71.6P0.1, 78.1P1) fps -12%
Zotac Gaming GeForce RTX 4070 AMP Airo
Intel Core i9-13900K, NVIDIA GeForce RTX 4070
112.2 (16.9min, 37.9P0.1, 67.5P1) fps -16%
Average NVIDIA GeForce RTX 3090
  (106 - 122, n=3)
111.6 fps -16%
Average NVIDIA GeForce RTX 3080
  ()
97.9 fps -26%
AMD Radeon RX 7800 XT
AMD Ryzen 9 7950X, AMD Radeon RX 7800 XT
95.3 (30.1min, 39.9P0.1, 57.5P1) fps -28%
KFA2 GeForce RTX 4060 Ti EX, 16GB GDDR6
AMD Ryzen 9 7950X, NVIDIA GeForce RTX 4060 Ti 16G
89.1 (34.3min, 49.2P0.1, 52.3P1) fps -33%
Average NVIDIA GeForce RTX 4060 Ti 8G
  (88 - 90.4, n=3)
89.1 fps -33%
Sapphire Pulse Radeon RX 7700 XT
AMD Ryzen 9 7950X, AMD Radeon RX 7700 XT
82.5 (20.2min, 38.6P0.1, 48.8P1) fps -38%
Average NVIDIA Titan RTX
  (74.5 - 79, n=2)
76.8 fps -42%
Average NVIDIA GeForce RTX 3070
  ()
76.3 fps -43%
KFA2 GeForce RTX 4060 1-Click-OC 2X
AMD Ryzen 9 7950X, NVIDIA GeForce RTX 4060
72.3 (38min, 39.5P0.1, 40.8P1) fps -46%
XFX Speedster QICK 308 Radeon RX 7600 Black Edition
AMD Ryzen 9 7950X, AMD Radeon RX 7600
52.8 (26.9min, 27.7P0.1, 28.6P1) fps -60%
The Callisto Protocol - 1920x1080 Ultra Preset (without FSR Upscaling) + Full Ray-Tracing
AMD Radeon RX 7800 XT
AMD Ryzen 9 7950X, AMD Radeon RX 7800 XT
99.3 fps +2%
AMD Radeon RX 7900 XTX
AMD Ryzen 9 7950X, AMD Radeon RX 7900 XTX
98 fps 0%
Gigabyte GeForce RTX 4070 Super Gaming OC 12G
Intel Core i9-13900K, NVIDIA GeForce RTX 4070 SUPER
97.64 fps
NVIDIA GeForce RTX 4070 Super Founders Edition
Intel Core i9-13900K, NVIDIA GeForce RTX 4070 SUPER
94.09 fps -4%
Sapphire Pulse Radeon RX 7700 XT
AMD Ryzen 9 7950X, AMD Radeon RX 7700 XT
92.4 fps -5%
AMD Radeon RX 7900 XT
AMD Ryzen 9 7950X, AMD Radeon RX 7900 XT
89 fps -9%
Average NVIDIA GeForce RTX 4070 Ti
  (82.1 - 97.5, n=4)
88.8 fps -9%
Asus TUF Gaming GeForce RTX 4070 Ti
Intel Core i9-13900K, NVIDIA GeForce RTX 4070 Ti
88.58 fps -9%
Gigabyte Aorus GeForce RTX 4070 Ti Master
Intel Core i9-13900K, NVIDIA GeForce RTX 4070 Ti
87 fps -11%
KFA2 GeForce RTX 4060 Ti EX, 16GB GDDR6
AMD Ryzen 9 7950X, NVIDIA GeForce RTX 4060 Ti 16G
86.6 fps -11%
Average of class Desktop
  (50.2 - 97.6, n=7, last 2 years)
86 fps -12%
Zotac Gaming GeForce RTX 4070 AMP Airo
Intel Core i9-13900K, NVIDIA GeForce RTX 4070
82 fps -16%
Average NVIDIA GeForce RTX 4060 Ti 8G
  (66.8 - 90.7, n=3)
81.1 fps -17%
Average NVIDIA GeForce RTX 3080 Ti
  ()
76 fps -22%
Average NVIDIA GeForce RTX 3080
  ()
71.3 fps -27%
XFX Speedster QICK 308 Radeon RX 7600 Black Edition
AMD Ryzen 9 7950X, AMD Radeon RX 7600
65.8 fps -33%
Average NVIDIA GeForce RTX 3070
  ()
61.8 fps -37%
Average NVIDIA Titan RTX
  ()
58.7 fps -40%
low med. high ultraQHD4K DLSS4K
GTA V (2015) 188.3 187.9 186.9 158.8 147.2 166.6
The Witcher 3 (2015) 418 210 159.1 136.7
Dota 2 Reborn (2015) 250 228 221 209 202
Final Fantasy XV Benchmark (2018) 235 235 197.1 150.5 85.2
X-Plane 11.11 (2018) 233 196.4 152.4 129.1
Far Cry 5 (2018) 201 191 185 104
Strange Brigade (2018) 601 398 437 385 270 134.7
Shadow of the Tomb Raider (2018) 260 255 188 96.7
Metro Exodus (2019) 186.1 150.6 120.8 76.1
Control (2019) 180.1 115.5 69 58.2
Borderlands 3 (2019) 184.2 166.6 131.2 68.9
Mafia Definitive Edition (2020) 226 161.5 83.2
Watch Dogs Legion (2020) 142.3 109.2 63.4
Far Cry 6 (2021) 193.7 143.9 145.9 82.7
Dying Light 2 (2022) 157 108 54.5
Cyberpunk 2077 1.6 (2022) 161.8 146 92.8 44.9
Ghostwire Tokyo (2022) 284 291 194.8 92.7
F1 22 (2022) 381 403 340 136.3 88.8 44.6
The Callisto Protocol (2022) 216.05 155.69 123.75 78.04
F1 23 (2023) 380 406 357 125.9 81.2 69.7 40.7
Baldur's Gate 3 (2023) 203 203 142.7 119.7 71.7
Cyberpunk 2077 2.0 Phantom Liberty (2023) 162.1 141.9 89.6 38.9
Assassin's Creed Mirage (2023) 204 169 130 106 77
Alan Wake 2 (2023) 114.1 79.7 44.2 42.7
Call of Duty Modern Warfare 3 2023 (2023) 184 165 120 100 70
Avatar Frontiers of Pandora (2023) 129.9 101.2 67.6 60.5 34.6

Emissions: Higher noise but lower temps than RTX 4070 Super FE

The RTX 4070 Super Gaming OC features eight copper heatpipes

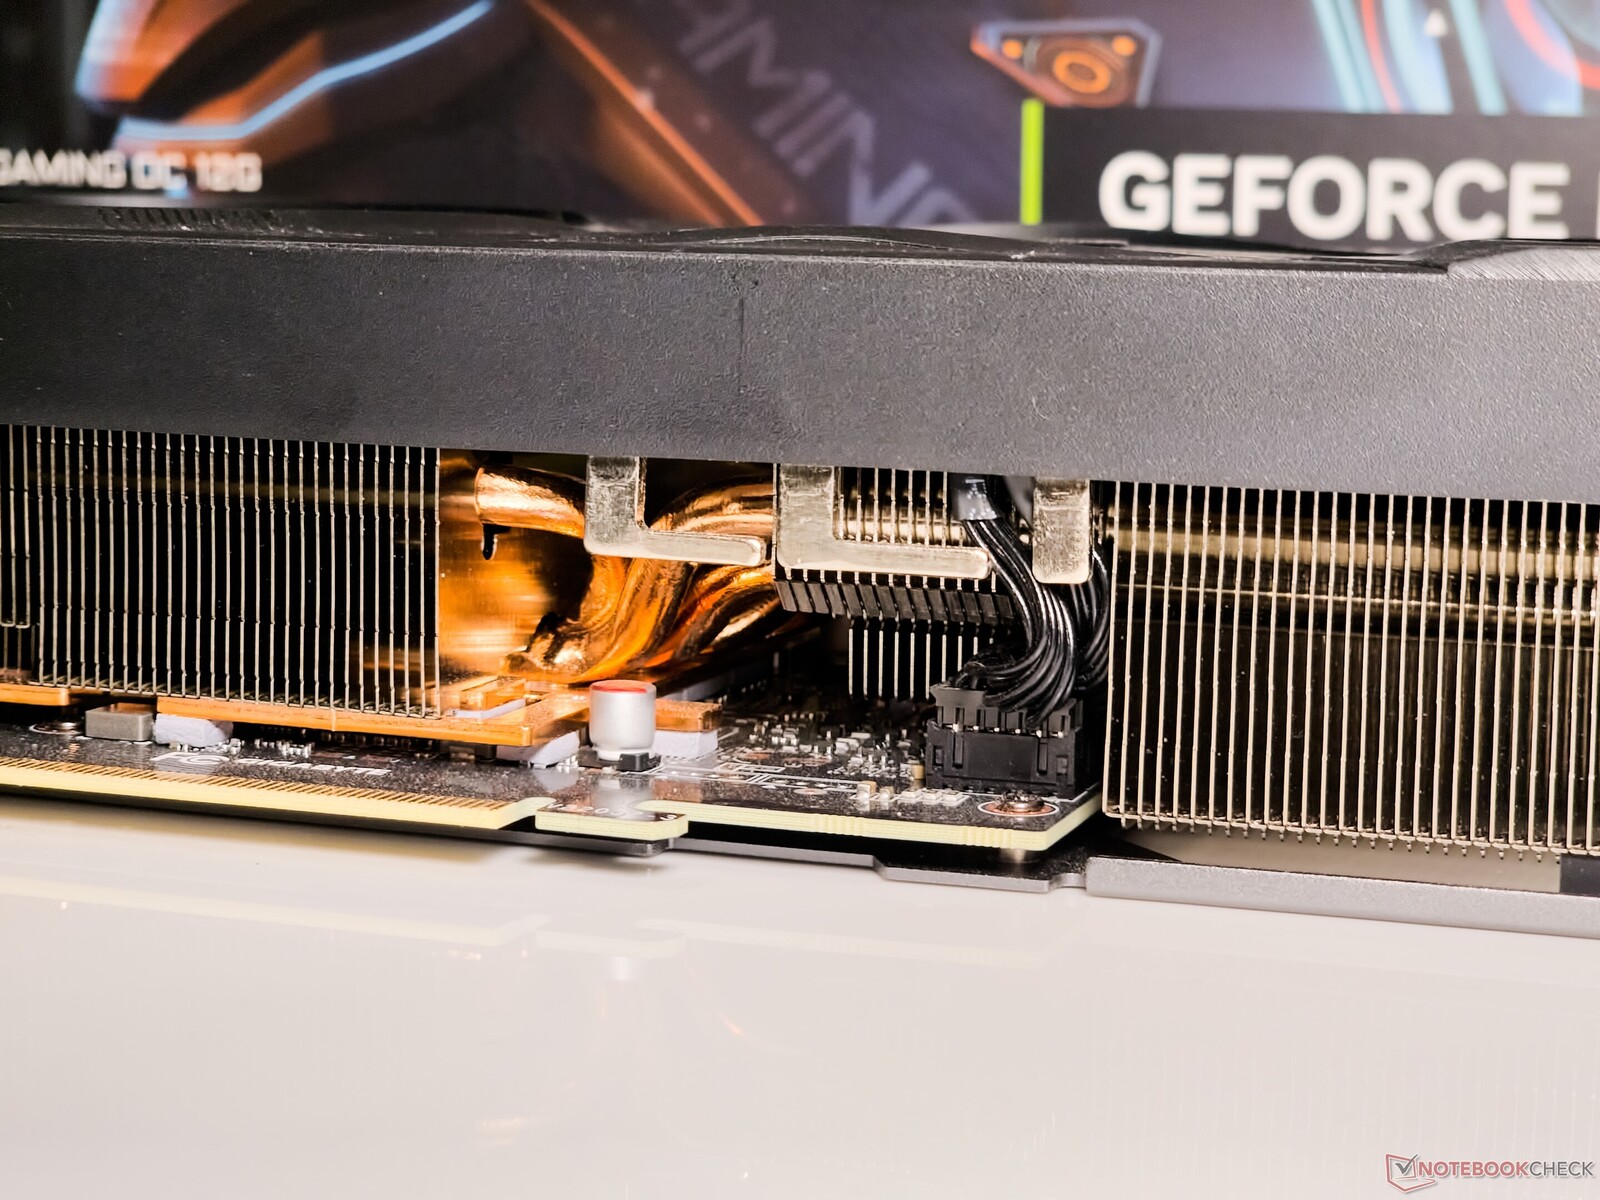
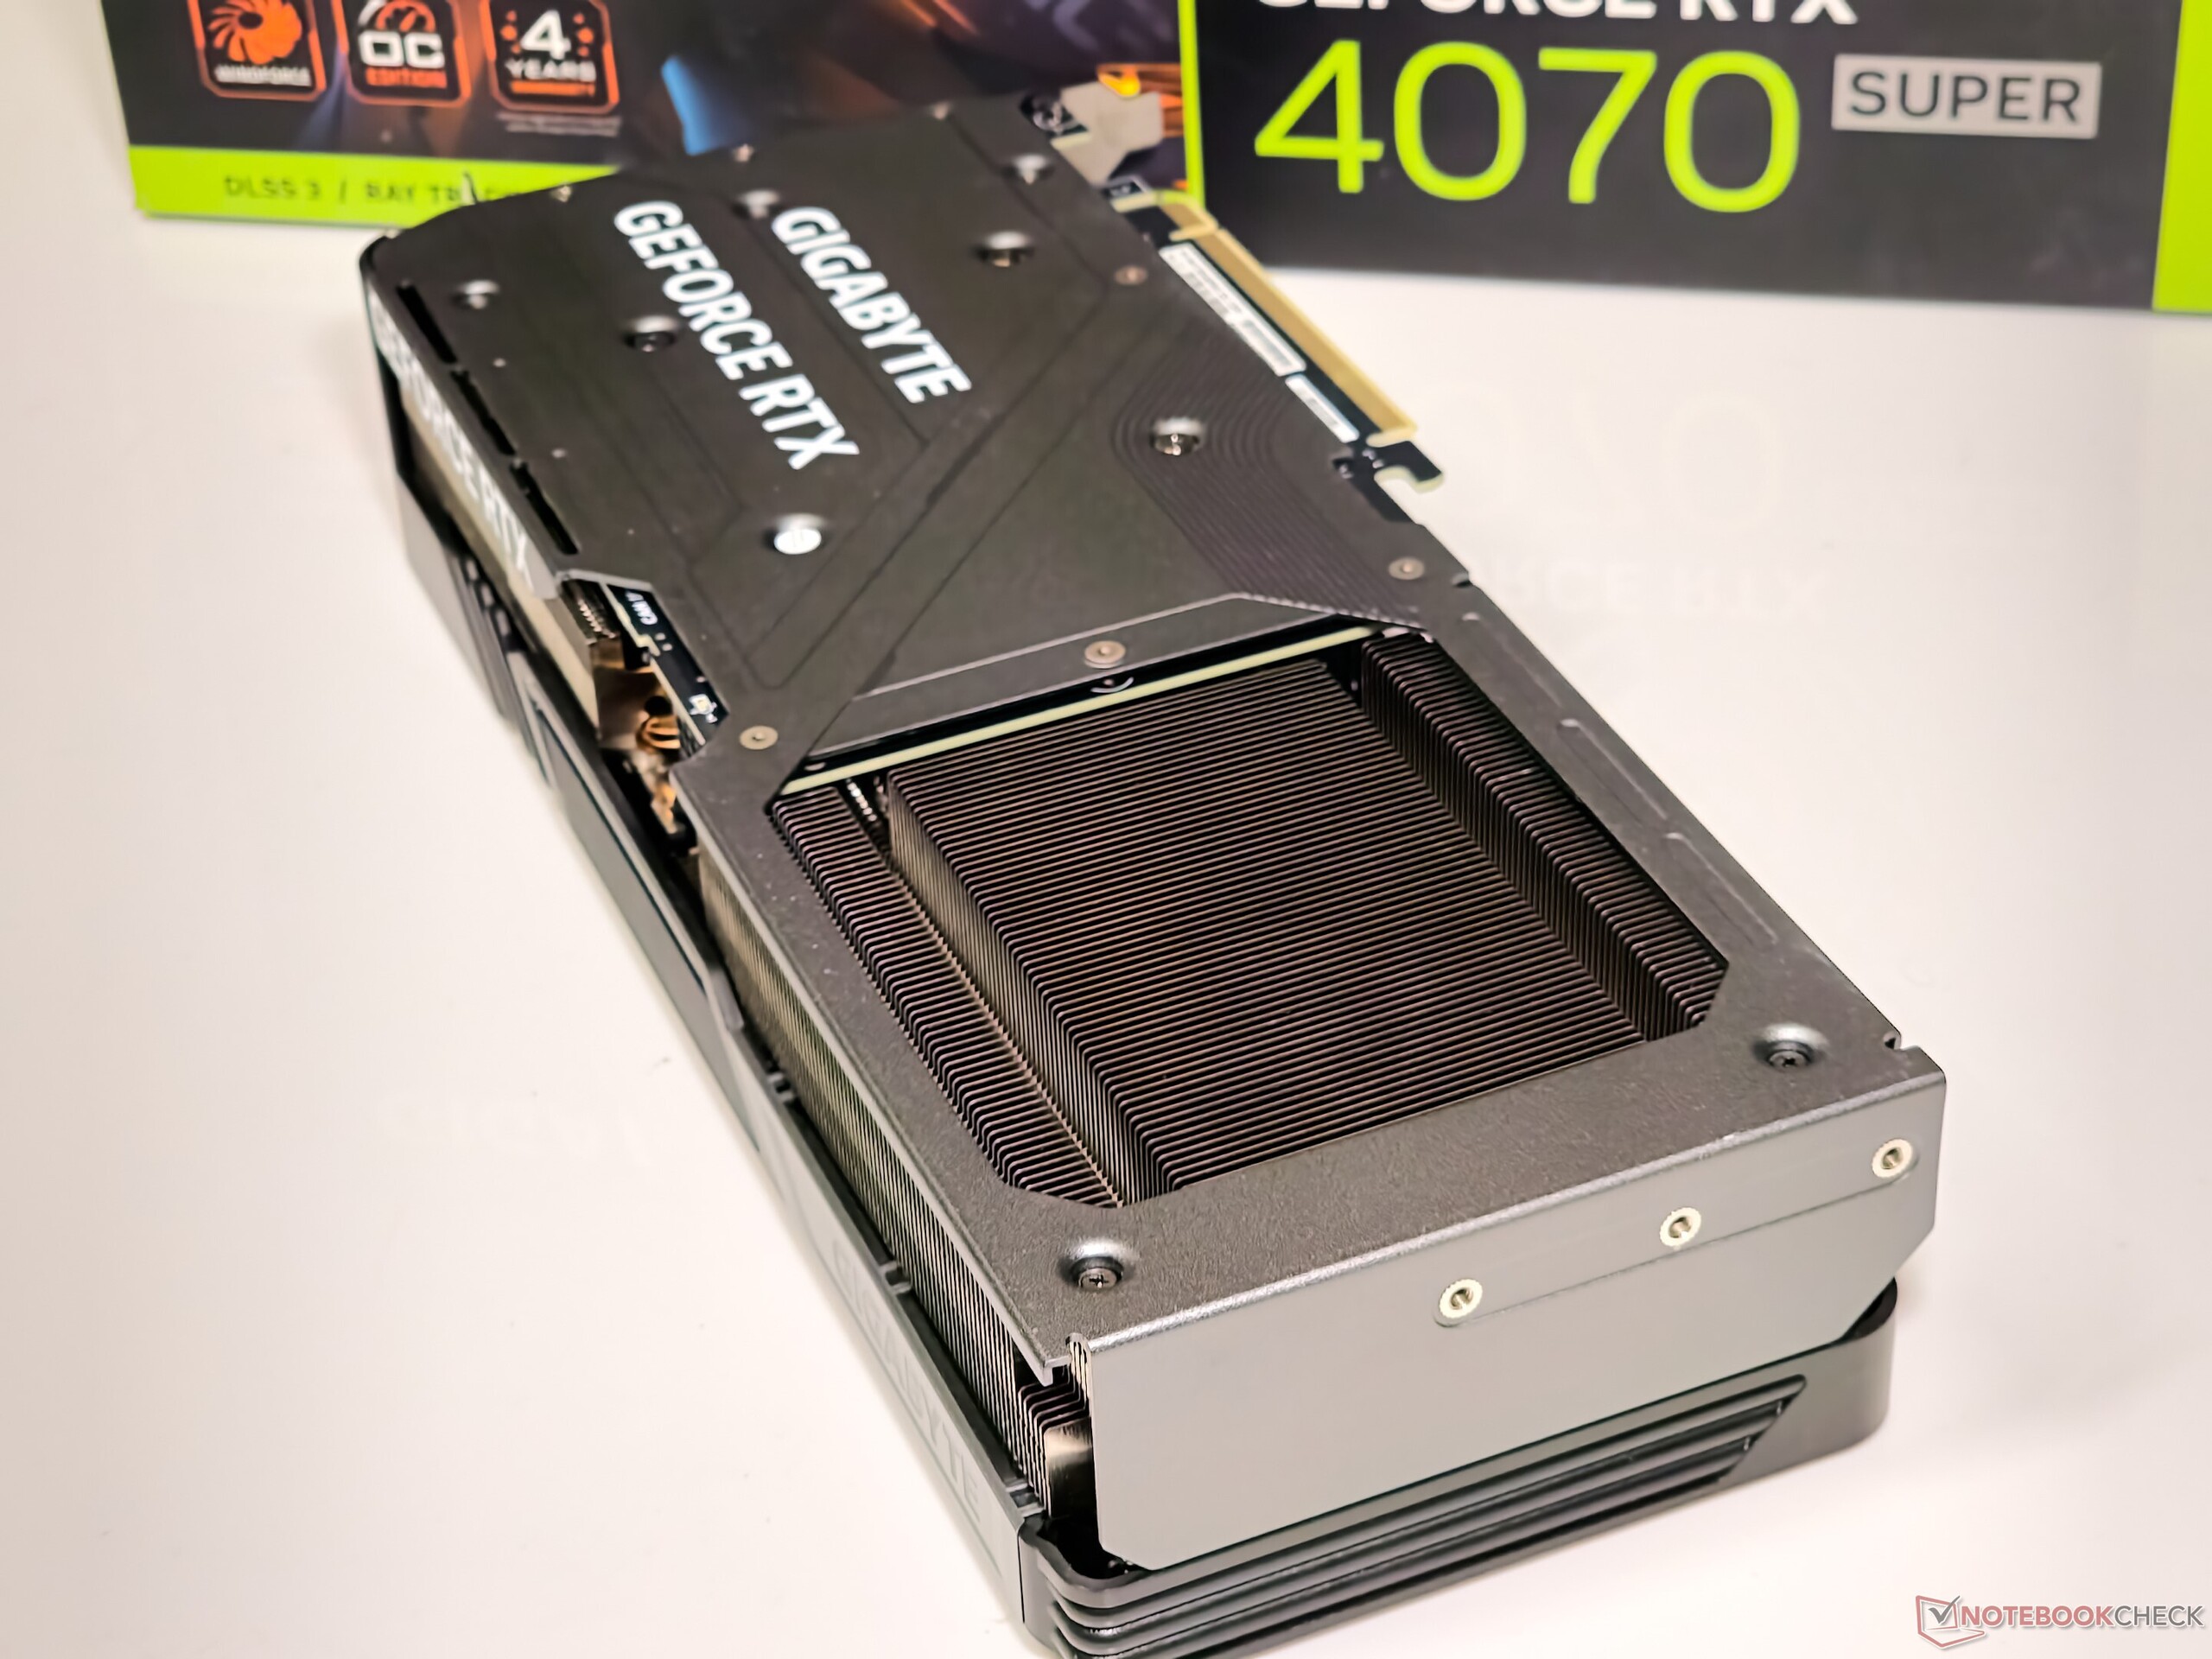
The Gigabyte RTX 4070 Super Gaming OC uses the company's proprietary WindForce cooling system with three 90 mm fans and a total of eight copper heatpipes

At least till the Turing generation, Nvidia's Founder Edition cards have typically struggled to show good heat and noise emission profiles compared to their AiB counterparts.

Things changed from Ampere and with Ada, we've seen how consistent and efficient Nvidia's new thermal design has been. The FE cards have set a high benchmark for AiB cards to match up to.
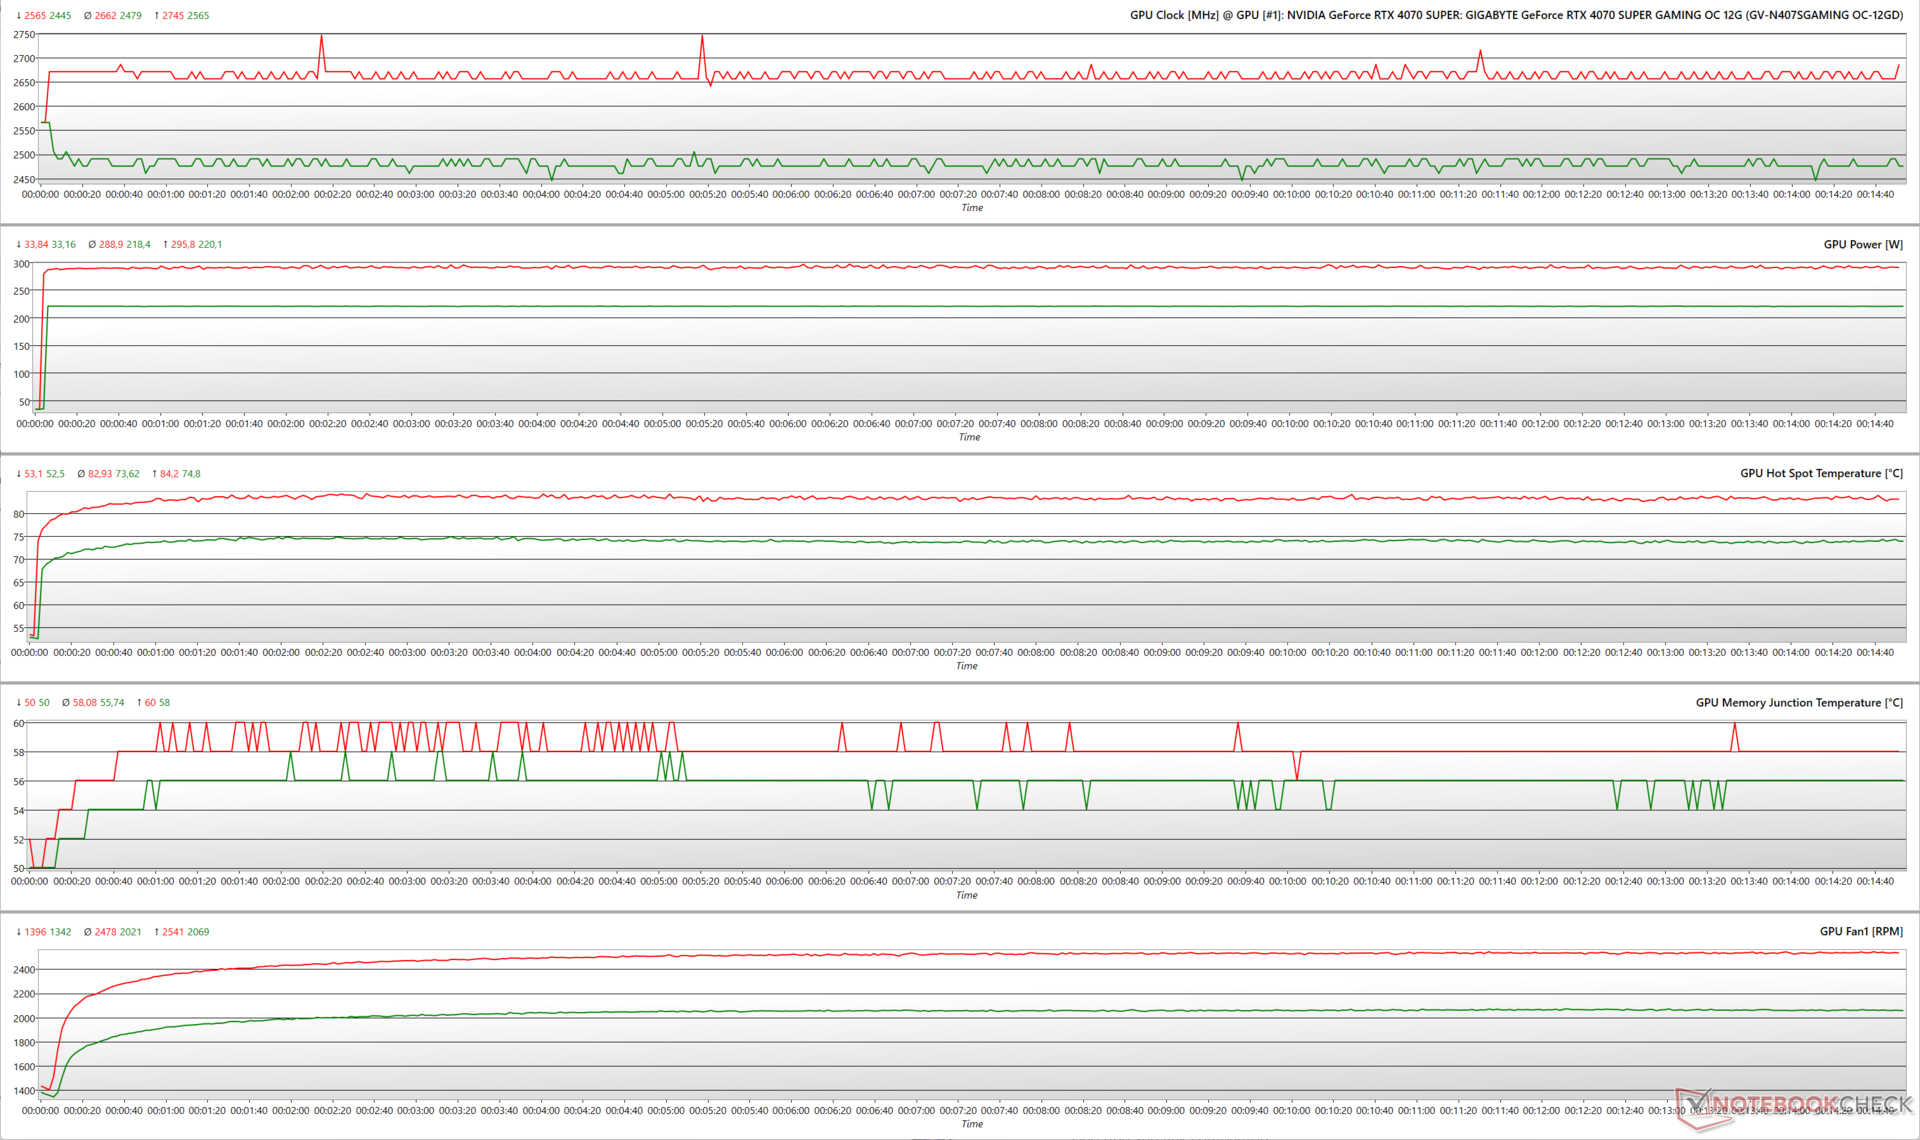
Stress tests

Since the RTX 4070 Super Gaming OC allows expanding the available power headroom by 45% up to 320 W, we stress tested the card at both 100% and 145% power targets (PTs) to see how various GPU parameters get influenced.

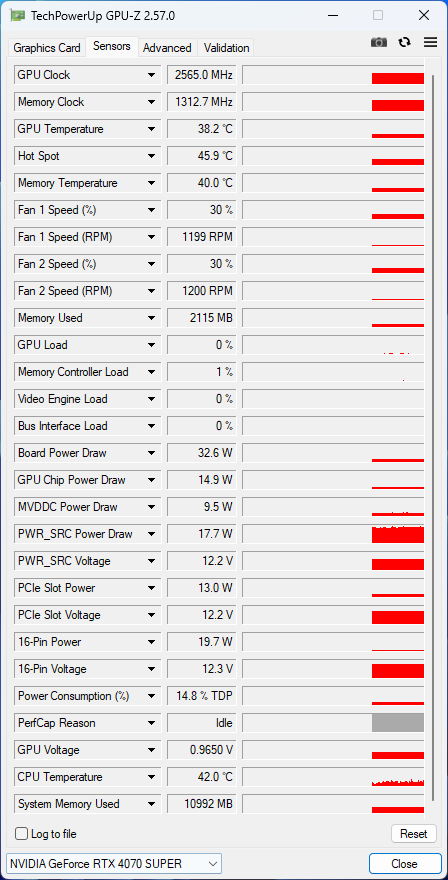
FurMark stress at 1280 x 720 with no AA sees the RTX 4070 Super Gaming OC boosting up to 2,565 MHz at 100% PT and 2,745 MHz at 145% PT. While the GPU is able to maximize the 220 W TGP at 100% PT, it can only utilize 296 W at 145% even though the theoretical value can go up to 320 W.

Naturally, increasing the power target also has an effect on the thermals. Hot spot temperatures at 100% PT hover close to the 74 °C mark on average and this increases to 83 °C average at 145% PT.

Consequentially, fan speeds increase by ~23% going from 100% PT to 145% PT.

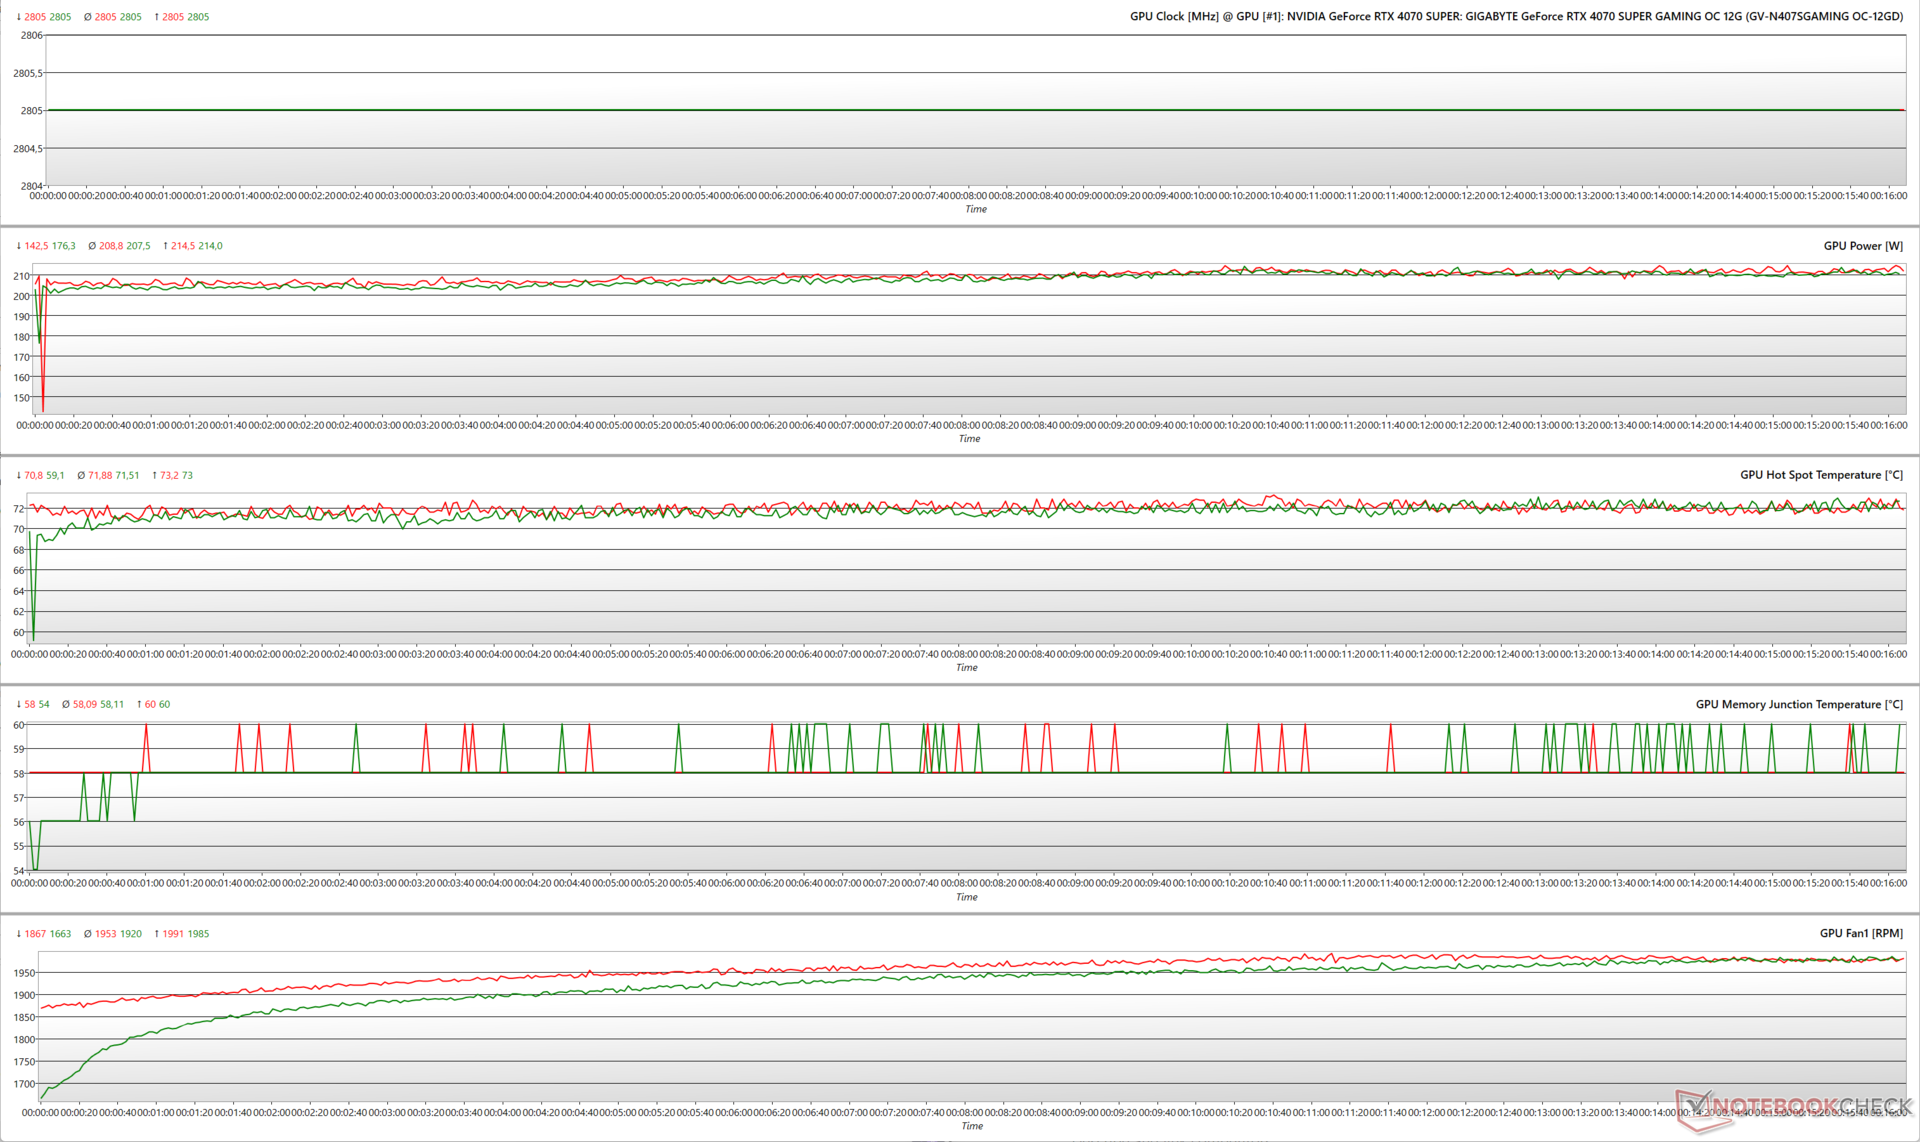
In a more real-life stress with The Witcher 3 at 1080p Ultra, we see that increasing the power target has no bearing at all on the clocks. Irrespective of the power target, the RTX 4070 Super Gaming OC maintains a rock steady 2,805 MHz while consuming between 208 to 214 W. Even the hot spot temperatures don't vary much between these power profiles.

These tests once again affirm Ada isn't dependent on TGP headroom to opportunistically boost clocks. In fact, RTX 4070 Super Gaming OC's max boost is still lower than that of the RTX 4070 Super FE (2,820 MHz). However, Gigabyte's implementation results in slightly better average core clocks (2,805 MHz) compared to that of the Founders Edition (2,776 MHz).

GPU parameters during FurMark stress (Green - 100% PT; Red - 145% PT; OC BIOS)
GPU parameters during The Witcher 3 stress at 1080p Ultra (Green - 100% PT; Red - 145% PT; OC BIOS)

The Witcher 3 FPS Chart

The RTX 4070 Super Gaming OC's triple-fan implementation does a good job in ensuring a well-sustained performance as evidenced by the steady frame rates we see with The Witcher 3 at 1080p Ultra and 4K Ultra settings.

0153045607590105120135150165180195Tooltip
Gigabyte GeForce RTX 4070 Super Gaming OC 12G i9-13900K, NVIDIA GeForce RTX 4070 SUPER; 1920x1080 Ultra Graphics & Postprocessing (HBAO+): Ø198.9 (195-202)
Gigabyte GeForce RTX 4070 Super Gaming OC 12G i9-13900K, NVIDIA GeForce RTX 4070 SUPER; 3840x2160 Ultra Graphics & Postprocessing (HBAO+): Ø88.6 (86-90)

Surface temperatures

At an ambient temperature of 22 °C, the front shroud remains relatively cool at 30 °C while the base of the backplate near the PCIe connector hits 44.5 °C. We measured 46.3 °C near the 12VHPWR connector.

Overall, the provided cooling system seems to be doing a decent job in maintaining tolerable surface temperatures under load.
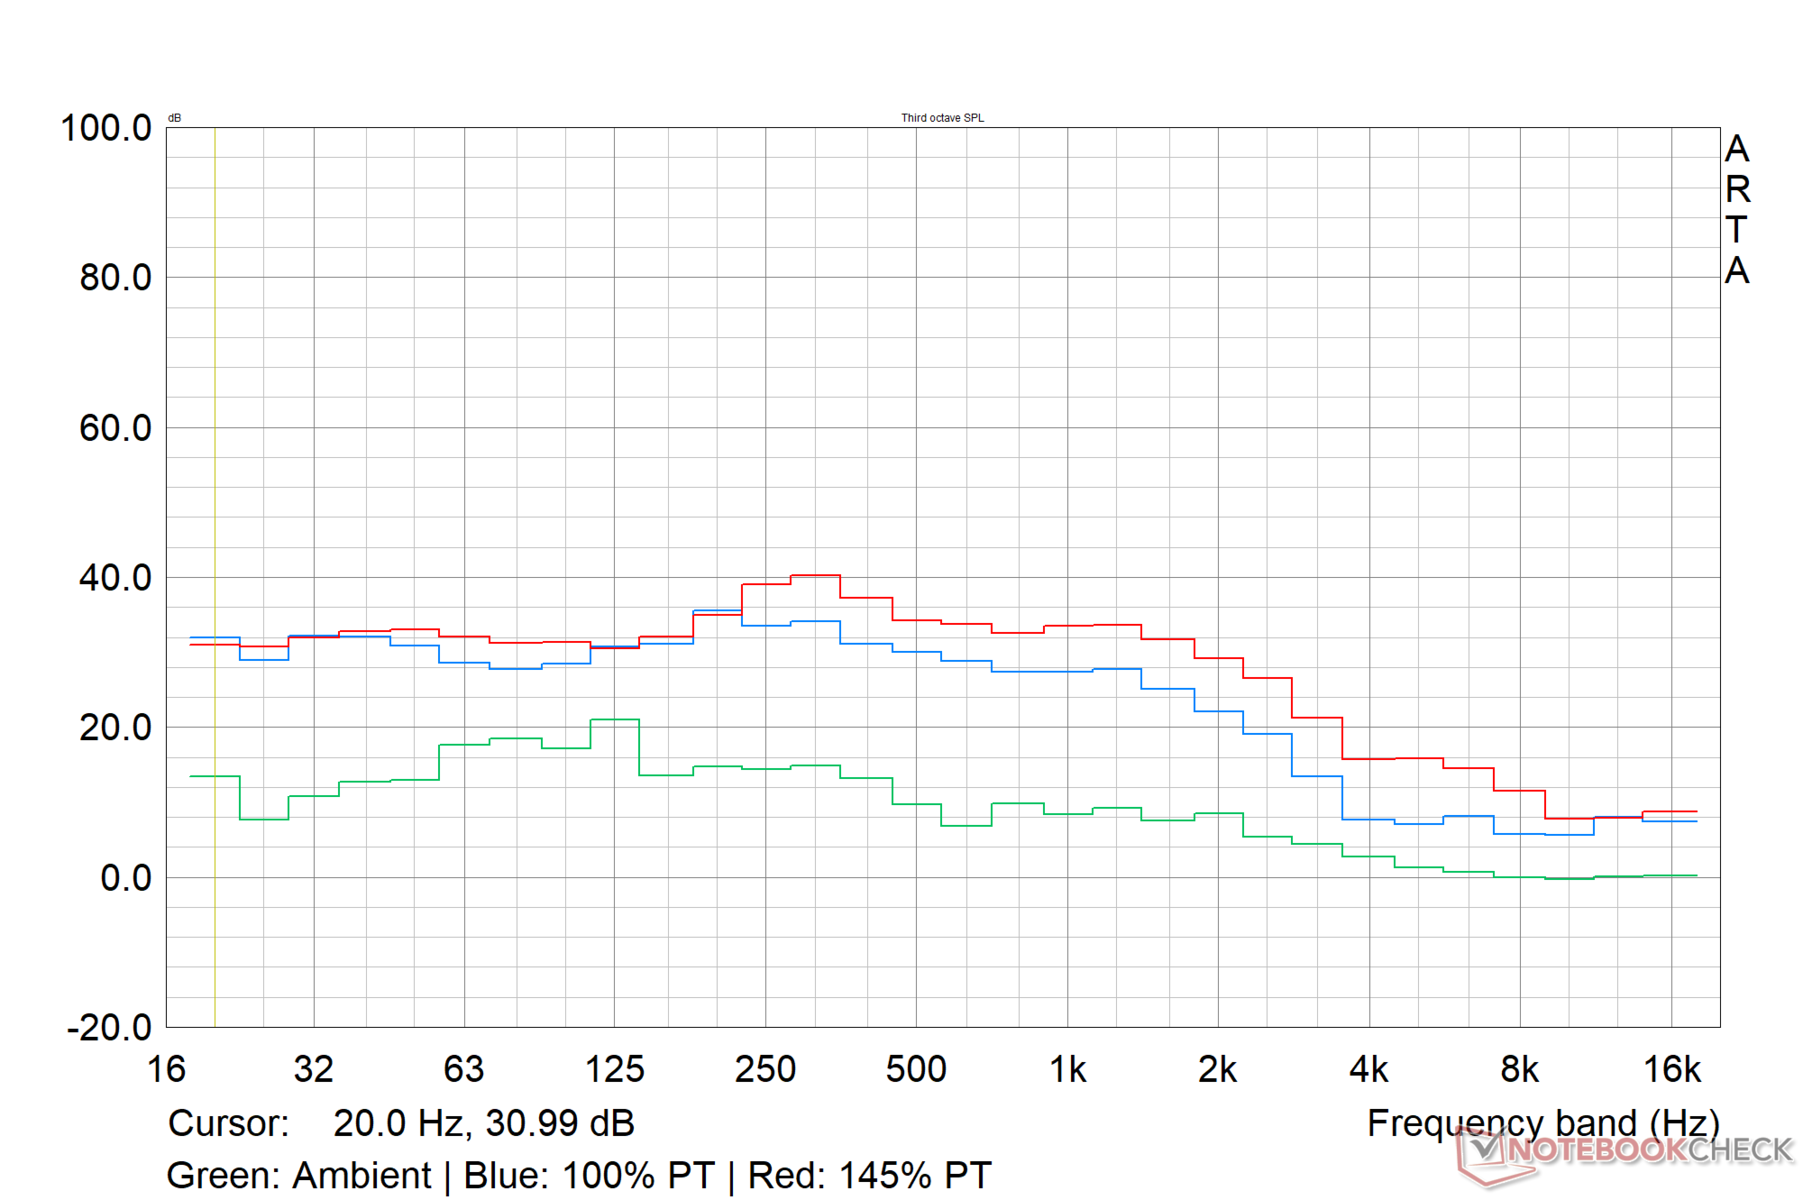
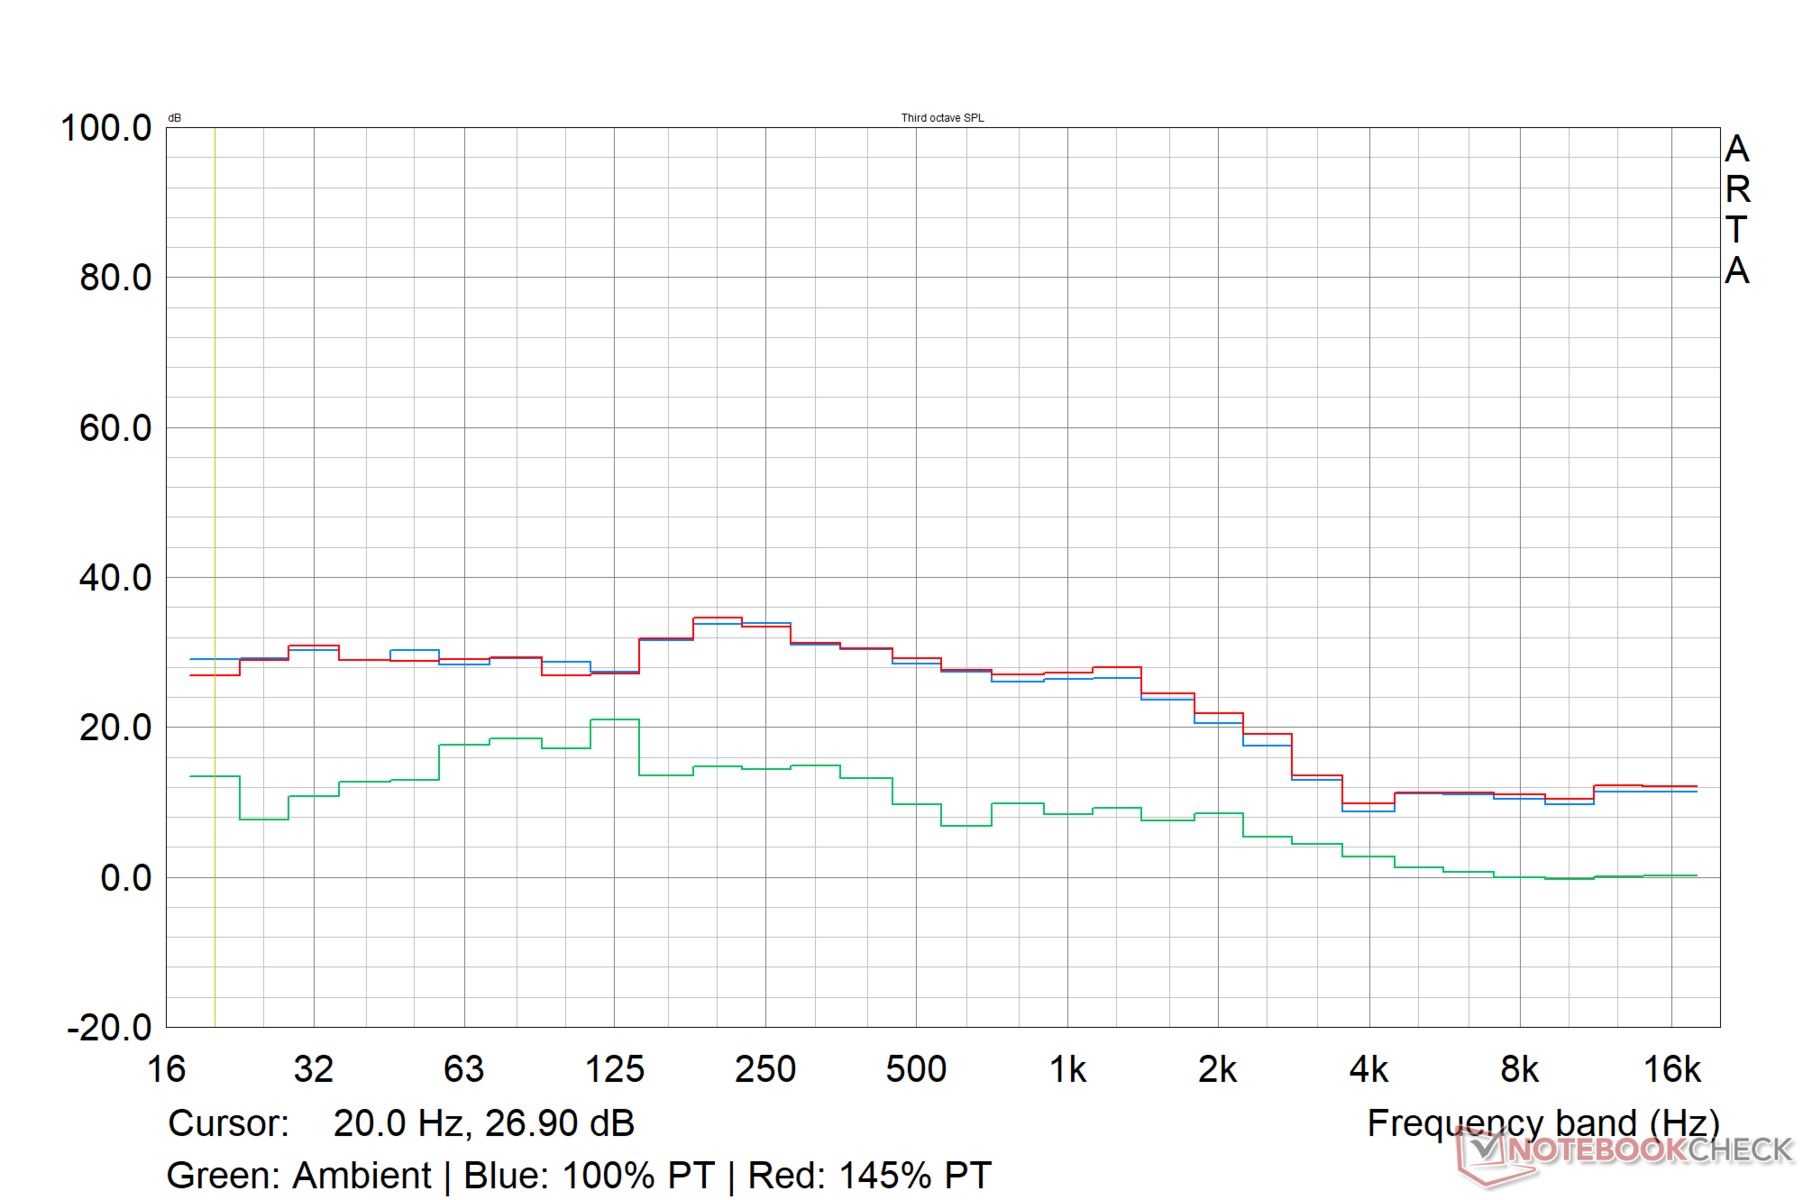
Surface temperatures: Front shroud
Surface temperatures: Backplate
Surface temperatures: 12VHPWR power connector

Noise levels

The triple WindForce fans have tolerable noise emissions under load

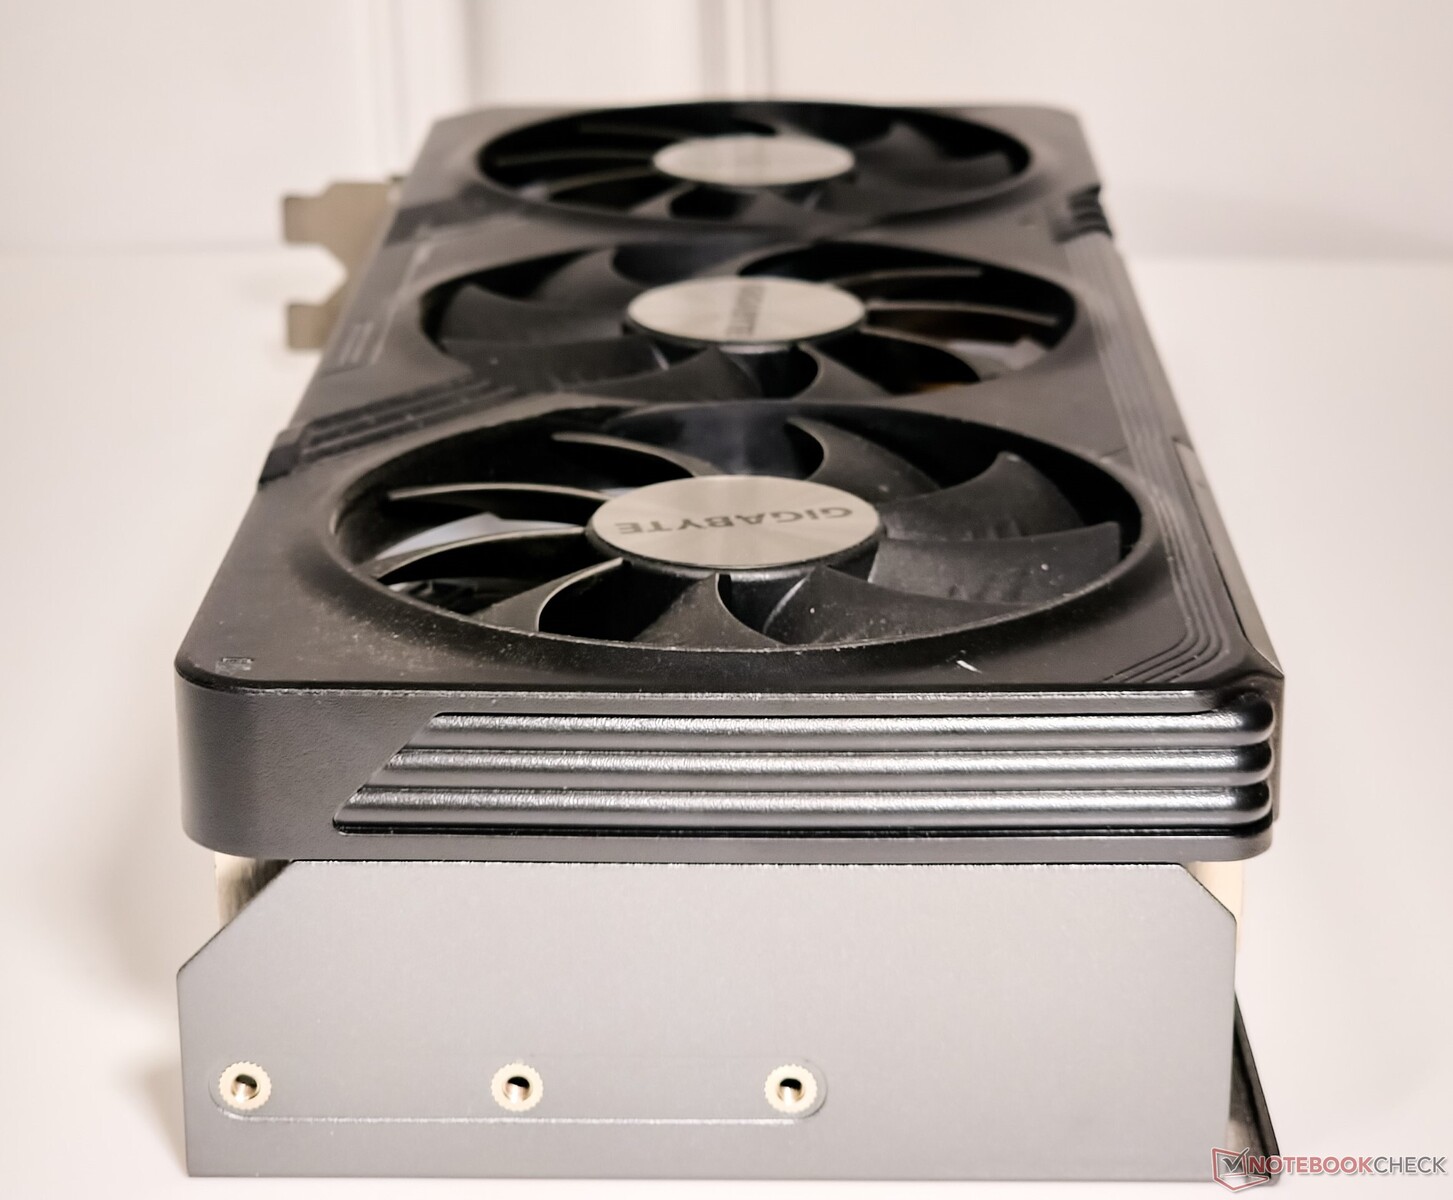
Of the three fans in the RTX 4070 Super Gaming OC, the left and right ones spin anti-clockwise while the center fan spins in the clockwise direction to provide a good counterbalance.

According to Gigabyte, these fans use a sleeve bearing with graphene nano lubricant that is claimed to offer life equivalent to that of a double ball bearing sans the noise.

Gigabyte implements a complete fan stop in idle and provides two VBIOS operating modes — BIOS OC and Silent. 

Practically speaking, we did not observe any tangible differences in measured sound pressure levels (SPL) during stress tests performed at both 100% and 145% power targets in either VBIOS modes.

Nevertheless, the maximum SPL we could record was 43.32 db(A) at 2,541 RPM — understandable considering the triple fan setup.

By contrast, the RTX 4070 Super Founders Edition's fans always remain below 35 dB(A) SPL. But the tradeoff is the 10 °C higher hot spot temperature and 14 °C higher memory junction temperature in the FE card compared to the RTX 4070 Super Gaming OC.

Ambient: 19.50 dB(A); System Idle: 24 dB(A)
Stress Test VBIOS Mode / Power Target Max. Fan Speed (RPM) Fan Noise dB(A)
FurMark 1280 x 720, no AA BIOS OC / 100% 2,069 37.70
FurMark 1280 x 720, no AA Silent BIOS / 100% 1,930 37.11
FurMark 1280 x 720, no AA BIOS OC / 145% 2,541 43.32
FurMark 1280 x 720, no AA Silent BIOS / 145% 2,366 42.72
The Witcher 3 1080p Ultra BIOS OC / 100% 1,985 35.88
The Witcher 3 1080p Ultra Silent BIOS / 100% 1,842 35.72
The Witcher 3 1080p Ultra BIOS OC / 145% 1,991 36.54
The Witcher 3 1080p Ultra Silent BIOS / 145% 1,878 35.8
RTX 4070 Super Gaming OC noise profile during FuMark stress (BIOS OC)
RTX 4070 Super Gaming OC noise profile during The Witcher 3 1080p Ultra stress (BIOS OC)

Energy Management: Excellent energy efficiency in gaming

Compared to the RTX 4070 Super FE, the Gigabyte RTX 4070 Super Gaming OC demonstrates a 6% improved power efficiency in The Witcher 3 1080p Ultra, putting it ahead of even the RTX 4090 Founders Edition. The Radeon RX 7900 XT still tops the efficiency charts but not by much.

Once again, we see that average power consumption from the wall remains unchanged even at a 145% power target while stressing with The Witcher 3 at 1080p Ultra. This confirms our observations in the game's stress test above that shows no TGP or clock differences at either power targets.

Power Consumption: External monitor

0255075100125150175200225250275300325350375400425Tooltip
Gigabyte GeForce RTX 4070 Super Gaming OC 12G; 1280x720 FurMark 1.19 GPU Stress Test (external Monitor); 145% PT, BIOS OC: Ø413 (403-440)
Gigabyte GeForce RTX 4070 Super Gaming OC 12G; 1280x720 FurMark 1.19 GPU Stress Test (external Monitor); 100% PT, BIOS OC: Ø335 (330-359)
Gigabyte GeForce RTX 4070 Super Gaming OC 12G; 1920x1080 The Witcher 3 ultra (external Monitor); 100% PT, BIOS OC: Ø388 (373-438)
Gigabyte GeForce RTX 4070 Super Gaming OC 12G; 1920x1080 The Witcher 3 ultra (external Monitor); 145% PT, BIOS OC: Ø388 (377-418)
Gigabyte GeForce RTX 4070 Super Gaming OC 12G; Idle 1min (external Monitor): Ø122.6 (114.8-153.4)
Power Consumption / FurMark 1.19 GPU Stress Test (external Monitor)
NVIDIA GeForce RTX 4090 Founders Edition
Intel Core i9-13900K, NVIDIA GeForce RTX 4090 (133% PT OC, Idle: 81.25 W)
704 (666min, 670P1 - 717max) Watt * -70%
NVIDIA GeForce RTX 4090 Founders Edition
Intel Core i9-13900K, NVIDIA GeForce RTX 4090 (100% PT, Idle: 81.25 W)
558 (551min, 553P1 - 566max) Watt * -35%
Zotac Gaming GeForce RTX 3090 Ti AMP Extreme Holo
AMD Ryzen 7 5800X3D, NVIDIA GeForce RTX 3090 Ti (110% PT, Idle: 102 W)
648 (629min, 637P1 - 658max) Watt * -57%
Zotac Gaming GeForce RTX 3090 Ti AMP Extreme Holo
AMD Ryzen 7 5800X3D, NVIDIA GeForce RTX 3090 Ti (100% PT; Quiet BIOS, Idle: 102 W)
599 (587min, 588P1 - 666max) Watt * -45%
Zotac Gaming GeForce RTX 3090 Ti AMP Extreme Holo
AMD Ryzen 7 5800X3D, NVIDIA GeForce RTX 3090 Ti (100% PT; Amplify BIOS, Idle: 102 W)
598 (584min, 595P1 - 608max) Watt * -45%
Sapphire AMD Radeon RX 6950 XT Nitro+ Pure
AMD Ryzen 9 5900X, AMD Radeon RX 6950 XT
564 (525min, 551P1 - 601max) Watt * -37%
AMD Radeon RX 7900 XTX
AMD Ryzen 9 7950X, AMD Radeon RX 7900 XTX (Idle: 86.5 W)
518 (501min, 502P1 - 525max) Watt * -25%
AMD Radeon RX 7900 XT
AMD Ryzen 9 7950X, AMD Radeon RX 7900 XT (Idle: 84.6 W)
513 (500min, 506P1 - 527max) Watt * -24%
Average NVIDIA GeForce RTX 3080
  (Idle: 492 - 505, n=2 W)
499 Watt * -21%
Average NVIDIA GeForce RTX 3090
  (Idle: 281 - 551, n=8 W)
469 Watt * -14%
NVIDIA GeForce RTX 4080 Founders Edition
Intel Core i9-13900K, NVIDIA GeForce RTX 4080 (110% PT, Idle: 78.45 W)
466 (461min, 462P1 - 488max) Watt * -13%
NVIDIA GeForce RTX 4080 Founders Edition
Intel Core i9-13900K, NVIDIA GeForce RTX 4080 (100% PT, Idle: 78.45 W)
429 (423min, 424P1 - 436max) Watt * -4%
Average NVIDIA GeForce RTX 3080 Ti
  (Idle: 427 - 513, n=3 W)
464 Watt * -12%
AMD Radeon RX 6900 XT
AMD Ryzen 9 5950X, AMD Radeon RX 6900 XT (Idle: 99.15 W)
456.8 (378.13min - 484.67max) Watt * -11%
AMD Radeon RX 6800 XT
AMD Ryzen 9 5950X, AMD Radeon RX 6800 XT (Idle: 99.5 W)
447.9 (413min - 484max) Watt * -8%
Gigabyte Aorus GeForce RTX 4070 Ti Master
Intel Core i9-13900K, NVIDIA GeForce RTX 4070 Ti (OC BIOS; 128% PT, Idle: 75.5 W)
446 (436min, 437P1 - 452max) Watt * -8%
Gigabyte Aorus GeForce RTX 4070 Ti Master
Intel Core i9-13900K, NVIDIA GeForce RTX 4070 Ti (OC BIOS; 100% PT, Idle: 75.5 W)
405 (397min, 398P1 - 416max) Watt * +2%
Gigabyte Aorus GeForce RTX 4070 Ti Master
Intel Core i9-13900K, NVIDIA GeForce RTX 4070 Ti (Silent BIOS; 100% PT, Idle: 75.5 W)
404 (396min, 398P1 - 417max) Watt * +2%
Asus TUF Gaming GeForce RTX 4070 Ti
Intel Core i9-13900K, NVIDIA GeForce RTX 4070 Ti (Perf BIOS / 110% PT, Idle: 75.4 W)
443 (440min, 440P1 - 465max) Watt * -7%
Asus TUF Gaming GeForce RTX 4070 Ti
Intel Core i9-13900K, NVIDIA GeForce RTX 4070 Ti (Quiet BIOS / 100% PT, Idle: 75.4 W)
410 (408min, 409P1 - 415max) Watt * +1%
Asus TUF Gaming GeForce RTX 4070 Ti
Intel Core i9-13900K, NVIDIA GeForce RTX 4070 Ti (Perf BIOS / 100% PT, Idle: 75.4 W)
406 (401min, 402P1 - 430max) Watt * +2%
Average NVIDIA GeForce RTX 4070 Ti
  (Idle: 404 - 451, n=8 W)
422 Watt * -2%
Average NVIDIA Titan RTX
  (Idle:  W)
419 Watt * -1%
Gigabyte GeForce RTX 4070 Super Gaming OC 12G
Intel Core i9-13900K, NVIDIA GeForce RTX 4070 SUPER (145% PT, BIOS OC, Idle: 122.6 W)
413 (403min, 404P1 - 440max) Watt *
Gigabyte GeForce RTX 4070 Super Gaming OC 12G
Intel Core i9-13900K, NVIDIA GeForce RTX 4070 SUPER (100% PT, BIOS OC, Idle: 122.6 W)
335 (330min, 330P1 - 359max) Watt * +19%
AMD Radeon RX 7800 XT
AMD Ryzen 9 7950X, AMD Radeon RX 7800 XT
408 (375min, 380P1 - 434max) Watt * +1%
Sapphire Pulse Radeon RX 7700 XT
AMD Ryzen 9 7950X, AMD Radeon RX 7700 XT
365 (359min, 360P1 - 373max) Watt * +12%
NVIDIA GeForce RTX 4070 Super Founders Edition
Intel Core i9-13900K, NVIDIA GeForce RTX 4070 SUPER (109% PT, Idle: 114.9 W)
355 (344min, 346P1 - 372max) Watt * +14%
NVIDIA GeForce RTX 4070 Super Founders Edition
Intel Core i9-13900K, NVIDIA GeForce RTX 4070 SUPER (100% PT, Idle: 114.9 W)
333 (321min, 323P1 - 351max) Watt * +19%
Zotac Gaming GeForce RTX 4070 AMP Airo
Intel Core i9-13900K, NVIDIA GeForce RTX 4070 (120% PT, Idle: 94.4 W)
351 (344min, 345P1 - 400max) Watt * +15%
Zotac Gaming GeForce RTX 4070 AMP Airo
Intel Core i9-13900K, NVIDIA GeForce RTX 4070 (100% PT, Idle: 94.4 W)
311 (307min, 307P1 - 371max) Watt * +25%
Average NVIDIA GeForce RTX 3070
  (Idle: 281 - 393, n=6 W)
348 Watt * +16%
XFX Speedster QICK 308 Radeon RX 7600 Black Edition
AMD Ryzen 9 7950X, AMD Radeon RX 7600
333 (323min, 325P1 - 352max) Watt * +19%
Average of class Desktop
  (Idle: 11.3 - 704, n=33, last 2 years W)
307 Watt * +26%
KFA2 GeForce RTX 4060 Ti EX, 16GB GDDR6
AMD Ryzen 9 7950X, NVIDIA GeForce RTX 4060 Ti 16G
304 (297min, 298P1 - 311max) Watt * +26%
KFA2 GeForce RTX 4060 1-Click-OC 2X
AMD Ryzen 9 7950X, NVIDIA GeForce RTX 4060
251 (244min, 245P1 - 259max) Watt * +39%
Power Consumption / The Witcher 3 ultra (external Monitor)
Sapphire AMD Radeon RX 6950 XT Nitro+ Pure
AMD Ryzen 9 5900X, AMD Radeon RX 6950 XT
589 (583min, 584P1 - 598max) Watt * -52%
Zotac Gaming GeForce RTX 3090 Ti AMP Extreme Holo
AMD Ryzen 7 5800X3D, NVIDIA GeForce RTX 3090 Ti (110% PT, Idle: 102 W)
569 (555min, 557P1 - 580max) Watt * -47%
Zotac Gaming GeForce RTX 3090 Ti AMP Extreme Holo
AMD Ryzen 7 5800X3D, NVIDIA GeForce RTX 3090 Ti (100% PT, Idle: 102 W)
561 (533min, 542P1 - 582max) Watt * -45%
NVIDIA GeForce RTX 4090 Founders Edition
Intel Core i9-13900K, NVIDIA GeForce RTX 4090 (133% PT OC, Idle: 81.25 W)
552 (541min, 545P1 - 569max) Watt * -42%
NVIDIA GeForce RTX 4090 Founders Edition
Intel Core i9-13900K, NVIDIA GeForce RTX 4090 (100% PT, Idle: 81.25 W)
499 (493min, 494P1 - 519max) Watt * -29%
AMD Radeon RX 7900 XTX
AMD Ryzen 9 7950X, AMD Radeon RX 7900 XTX (Idle: 86.5 W)
540 (527min, 530P1 - 564max) Watt * -39%
Average NVIDIA GeForce RTX 3090
  (Idle: 464 - 597, n=17 W)
524 Watt * -35%
Average NVIDIA GeForce RTX 3080 Ti
  (Idle: 490 - 528, n=3 W)
506 Watt * -30%
AMD Radeon RX 6800 XT
AMD Ryzen 9 5950X, AMD Radeon RX 6800 XT (Idle: 99.5 W)
505 (389min - 543max) Watt * -30%
Average NVIDIA GeForce RTX 3080
  (Idle: 498 - 505, n=2 W)
502 Watt * -29%
AMD Radeon RX 6900 XT
AMD Ryzen 9 5950X, AMD Radeon RX 6900 XT (Idle: 99.15 W)
488.3 (459.99min - 512.79max) Watt * -26%
NVIDIA GeForce RTX 4080 Founders Edition
Intel Core i9-13900K, NVIDIA GeForce RTX 4080 (110% PT, Idle: 78.45 W)
463 (451min, 453P1 - 481max) Watt * -19%
NVIDIA GeForce RTX 4080 Founders Edition
Intel Core i9-13900K, NVIDIA GeForce RTX 4080 (100% PT, Idle: 78.45 W)
420 (410min, 411P1 - 448max) Watt * -8%
AMD Radeon RX 7900 XT
AMD Ryzen 9 7950X, AMD Radeon RX 7900 XT (Idle: 84.6 W)
459 (451min, 453P1 - 488max) Watt * -18%
AMD Radeon RX 7800 XT
AMD Ryzen 9 7950X, AMD Radeon RX 7800 XT
425 (421min, 422P1 - 429max) Watt * -10%
Asus TUF Gaming GeForce RTX 4070 Ti
Intel Core i9-13900K, NVIDIA GeForce RTX 4070 Ti (Perf BIOS / 110% PT, Idle: 75.4 W)
422 (412min, 413P1 - 452max) Watt * -9%
Asus TUF Gaming GeForce RTX 4070 Ti
Intel Core i9-13900K, NVIDIA GeForce RTX 4070 Ti (Perf BIOS / 100% PT, Idle: 75.4 W)
419 (414min, 415P1 - 438max) Watt * -8%
Asus TUF Gaming GeForce RTX 4070 Ti
Intel Core i9-13900K, NVIDIA GeForce RTX 4070 Ti (Quiet BIOS / 100% PT, Idle: 75.4 W)
418 (411min, 412P1 - 433max) Watt * -8%
Average NVIDIA GeForce RTX 4070 Ti
  (Idle: 404 - 426, n=8 W)
415 Watt * -7%
Gigabyte Aorus GeForce RTX 4070 Ti Master
Intel Core i9-13900K, NVIDIA GeForce RTX 4070 Ti (Silent BIOS; 100% PT, Idle: 75.5 W)
414 (406min, 407P1 - 432max) Watt * -7%
Gigabyte Aorus GeForce RTX 4070 Ti Master
Intel Core i9-13900K, NVIDIA GeForce RTX 4070 Ti (OC BIOS; 128% PT, Idle: 75.5 W)
410 (401min, 403P1 - 435max) Watt * -6%
Gigabyte Aorus GeForce RTX 4070 Ti Master
Intel Core i9-13900K, NVIDIA GeForce RTX 4070 Ti (OC BIOS; 100% PT, Idle: 75.5 W)
404 (397min, 398P1 - 427max) Watt * -4%
Average NVIDIA Titan RTX
  (Idle: 371 - 463, n=27 W)
408 Watt * -5%
Average NVIDIA GeForce RTX 3070
  (Idle: 317 - 550, n=5 W)
401 Watt * -3%
Gigabyte GeForce RTX 4070 Super Gaming OC 12G
Intel Core i9-13900K, NVIDIA GeForce RTX 4070 SUPER (100% PT, BIOS OC, Idle: 122.6 W)
388 (373min, 375P1 - 438max) Watt *
Gigabyte GeForce RTX 4070 Super Gaming OC 12G
Intel Core i9-13900K, NVIDIA GeForce RTX 4070 SUPER (145% PT, BIOS OC, Idle: 122.6 W)
388 (377min, 377P1 - 418max) Watt * -0%
Sapphire Pulse Radeon RX 7700 XT
AMD Ryzen 9 7950X, AMD Radeon RX 7700 XT
384 (379min, 380P1 - 391max) Watt * +1%
NVIDIA GeForce RTX 4070 Super Founders Edition
Intel Core i9-13900K, NVIDIA GeForce RTX 4070 SUPER (109% PT, Idle: 114.9 W)
377 (365min, 366P1 - 407max) Watt * +3%
NVIDIA GeForce RTX 4070 Super Founders Edition
Intel Core i9-13900K, NVIDIA GeForce RTX 4070 SUPER (100% PT, Idle: 114.9 W)
372 (359min, 361P1 - 402max) Watt * +4%
Zotac Gaming GeForce RTX 4070 AMP Airo
Intel Core i9-13900K, NVIDIA GeForce RTX 4070 (120% PT, Idle: 94.4 W)
358 (348min, 350P1 - 400max) Watt * +8%
Zotac Gaming GeForce RTX 4070 AMP Airo
Intel Core i9-13900K, NVIDIA GeForce RTX 4070 (100% PT, Idle: 94.4 W)
353 (347min, 348P1 - 440max) Watt * +9%
Average of class Desktop
  (Idle: 19.1 - 569, n=37, last 2 years W)
354 Watt * +9%
XFX Speedster QICK 308 Radeon RX 7600 Black Edition
AMD Ryzen 9 7950X, AMD Radeon RX 7600
346 (340min, 341P1 - 351max) Watt * +11%
KFA2 GeForce RTX 4060 Ti EX, 16GB GDDR6
AMD Ryzen 9 7950X, NVIDIA GeForce RTX 4060 Ti 16G
310 (306min, 307P1 - 336max) Watt * +20%
KFA2 GeForce RTX 4060 1-Click-OC 2X
AMD Ryzen 9 7950X, NVIDIA GeForce RTX 4060
272 (264min, 266P1 - 297max) Watt * +30%
Power Consumption / Witcher 3 ultra Efficiency (external Monitor)
AMD Radeon RX 7900 XT
AMD Ryzen 9 7950X, AMD Radeon RX 7900 XT
0.577 fps per Watt +7%
AMD Radeon RX 7900 XTX
AMD Ryzen 9 7950X, AMD Radeon RX 7900 XTX
0.55 fps per Watt +2%
NVIDIA GeForce RTX 4080 Founders Edition
Intel Core i9-13900K, NVIDIA GeForce RTX 4080
0.549 fps per Watt +1%
Asus TUF Gaming GeForce RTX 4070 Ti
Intel Core i9-13900K, NVIDIA GeForce RTX 4070 Ti
0.545 fps per Watt +1%
Gigabyte GeForce RTX 4070 Super Gaming OC 12G
Intel Core i9-13900K, NVIDIA GeForce RTX 4070 SUPER
0.541 fps per Watt
NVIDIA GeForce RTX 4090 Founders Edition
Intel Core i9-13900K, NVIDIA GeForce RTX 4090
0.538 fps per Watt -1%
Average NVIDIA GeForce RTX 4070 Ti
  (0.509 - 0.548, n=4)
0.533 fps per Watt -1%
Gigabyte Aorus GeForce RTX 4070 Ti Master
Intel Core i9-13900K, NVIDIA GeForce RTX 4070 Ti
0.531 fps per Watt -2%
NVIDIA GeForce RTX 4070 Super Founders Edition
Intel Core i9-13900K, NVIDIA GeForce RTX 4070 SUPER
0.509 fps per Watt -6%
Zotac Gaming GeForce RTX 4070 AMP Airo
Intel Core i9-13900K, NVIDIA GeForce RTX 4070
0.4709 fps per Watt -13%
AMD Radeon RX 7800 XT
AMD Ryzen 9 7950X, AMD Radeon RX 7800 XT
0.4461 fps per Watt -18%
Sapphire Pulse Radeon RX 7700 XT
AMD Ryzen 9 7950X, AMD Radeon RX 7700 XT
0.4383 fps per Watt -19%
Average of class Desktop
  (0.1429 - 0.652, n=26, last 2 years)
0.437 fps per Watt -19%
KFA2 GeForce RTX 4060 Ti EX, 16GB GDDR6
AMD Ryzen 9 7950X, NVIDIA GeForce RTX 4060 Ti 16G
0.4268 fps per Watt -21%
KFA2 GeForce RTX 4060 1-Click-OC 2X
AMD Ryzen 9 7950X, NVIDIA GeForce RTX 4060
0.4103 fps per Watt -24%
Average NVIDIA GeForce RTX 3080 Ti
  (0.3496 - 0.3735, n=3)
0.3607 fps per Watt -33%
XFX Speedster QICK 308 Radeon RX 7600 Black Edition
AMD Ryzen 9 7950X, AMD Radeon RX 7600
0.354 fps per Watt -35%
Sapphire AMD Radeon RX 6950 XT Nitro+ Pure
AMD Ryzen 9 5900X, AMD Radeon RX 6950 XT
0.348 fps per Watt -36%
Zotac Gaming GeForce RTX 3090 Ti AMP Extreme Holo
AMD Ryzen 7 5800X3D, NVIDIA GeForce RTX 3090 Ti
0.345 fps per Watt -36%
Average NVIDIA GeForce RTX 3090
  (0.268 - 0.3954, n=14)
0.3429 fps per Watt -37%
Average NVIDIA Titan RTX
  (0.2926 - 0.385, n=26)
0.3382 fps per Watt -37%
AMD Radeon RX 6900 XT
AMD Ryzen 9 5950X, AMD Radeon RX 6900 XT
0.335 fps per Watt -38%
Average NVIDIA GeForce RTX 3070
  (0.22 - 0.3911, n=5)
0.3211 fps per Watt -41%
AMD Radeon RX 6800 XT
AMD Ryzen 9 5950X, AMD Radeon RX 6800 XT
0.3168 fps per Watt -41%
Average NVIDIA GeForce RTX 3080
  (0.291 - 0.301, n=2)
0.296 fps per Watt -45%
1280x720 FurMark 1.19 GPU Stress Test (external Monitor)
350.77
1920x1080 The Witcher 3 ultra (external Monitor)
357.59

* ... smaller is better

Pros

+ Good build quality
+ Decent RGB lighting effects
+ Perceivable gains in gaming over the RTX 3090 and Radeon RX 7800 XT compared to the Founders Edition
+ Capable WindForce triple-fan cooling system
+ Very energy efficient in gaming workloads

Cons

- Gigabyte Control Center is now usable but still needs polish
- 12 GB 192-bit VRAM can be limiting while dealing with heavy textures
- Higher fan noise levels
- No tangible fan noise difference between OC and Silent VBIOS modes
- Can surely use a price cut

Verdict: US$50 markup for the RTX 4070 Super Gaming OC isn't without advantages

Gigabyte GeForce RTX 4070 Super Gaming OC 12G. Review unit courtesy of Gigabyte India.

The Nvidia GeForce RTX 4070 Super Founders Edition (US$599 on Best Buy) is a highly capable AD104 card in its own right. But variety is the spice of life, so buyers also have a good selection of AiB partner cards to choose from.

The Gigabyte GeForce RTX 4070 Super Gaming OC 12G carries forward the same design language from last year. You get a nice metal backplate, a robust triple-fan 8-heatpipe cooling with ample ventilation, and a decent RGB aesthetic.

The RTX 4070 Super Gaming OC comes factory overclocked at 2,565 MHz. Although cumulative synthetic and compute tests do not see any tangible benefit, the OC does push the card well past the RTX 3090 average in gaming.

Gamers targeting 1440p Ultra at high frame rates will be pleased with the RTX 4070 Super Gaming OC. Good frame rates at 4K Ultra are not a pipedream, but modern titles will require a helping hand from upscalers.

If you're chasing frames with AD104 (and RGB), the Gigabyte GeForce RTX 4070 Super Gaming OC might be a better bet compared to the RTX 4070 Super Founders Edition as long as you don't mind the US$50 uptick for a 3-5% performance increase."

Gigabyte's WindForce cooling system proves to be quite effective in keeping the GPU cool without throttling worries. The triple-fan setup is a bit louder than what we have with the Founders Edition, but it's not a jet engine and does help in keeping the hot spot and memory temperatures low.

Technically, the VBIOS switch is redundant since you can very well play with the fan curves to your liking. But since it's there, we would like to see further refinements with the VBIOS modes. There is no perceivable difference in fan noise between these modes. Users who aren't very comfortable with custom fan curves would therefore be disappointed knowing that the Silent mode has a similar noise profile as the default BIOS OC option.

All in all, Gigabyte's take on the latest AD104 GPU in the form of the RTX 4070 Super Gaming OC succeeds for the most part. The RTX 4070 Super Gaming OC further widens the gap with the AMD Radeon RX 7800 XT (starting from US$490 on Amazon). The AMD card gets you more VRAM, but scales tilt towards Nvidia when it comes to DLSS frame generation and ray reconstruction technologies in addition to AMD's FSR and Intel XeSS upscalers.

And while you're at it, do keep a tab on stock clearance sales of the now EoL'd RTX 4070 Ti that may be available for prices close to or even lesser than the RTX 4070 Super.

Price and Availability

The Gigabyte GeForce RTX 4070 Super Gaming OC 12G currently retails for US$650 on Best Buy US and Amazon US.

In India, the card isn't listed yet on Amazon IN but officially carries a ₹62,490 MSRP with some price differences among local distributors.

Transparency

The present review sample was made available to the author as a loan by the manufacturer or a shop for the purposes of review. The lender had no influence on this review, nor did the manufacturer receive a copy of this review before publication. There was no obligation to publish this review.

Pricecompare

Read all 3 comments / answer
static version load dynamic
Loading Comments
Comment on this article
Please share our article, every link counts!
> Expert Reviews and News on Laptops, Smartphones and Tech Innovations > Reviews > Gigabyte GeForce RTX 4070 Super Gaming OC 12G Review: Beats the RTX 3090 and RX 7800 XT for a $50 premium over the Founders Edition
Vaidyanathan Subramaniam, 2024-02-16 (Update: 2024-02-16)