Gigabyte GeForce RTX 4080 Super Gaming OC 16G Review: Trades blows with the RX 7900 XTX for US$200 less than RTX 4080 non-Super

We have so far reviewed several new RTX 40 Super series GPUs including the RTX 4070 Super Founders Edition, Gigabyte RTX 4070 Super Gaming OC, and the Asus TUF Gaming RTX 4070 Ti Super.
Now, we have with us the Gigabyte GeForce RTX 4080 Super Gaming OC 16G — a mid-lifecycle refresh that fully supplants the previous RTX 4080 counterpart.
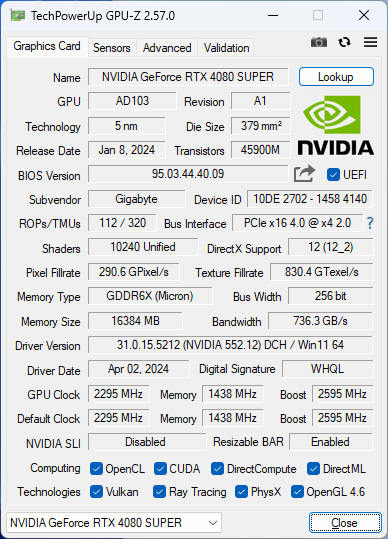
While the original RTX 4080 featured 9,728 CUDA cores, the new RTX 4080 Super fully maximizes the AD103 die by having all 10,240 CUDA cores firing at full capacity. This is only a 5% increase in shader count, which is not very impressive unlike the RTX 4070 Super (+21%) and the RTX 4070 Super Ti (+10%). The VRAM remains the same at 16 GB GDDR6X, but the overall bandwidth gets slightly bumped to 736.3 GB/s compared to the 716.8 GB/s with the RTX 4080 non-Super.
The RTX 4080 Super retails at a US$1,000 MSRP compared to the US$200 higher asking price of the original. Gigabyte's take on the RTX 4080 Super adds some extra perks for a nominal US$50 premium at US$1,050 MSRP.
In India, this GPU can be currently had in the ₹1,20,000 to ₹1,28,000 range depending on the retailer and comes with a standard three-year warranty extendable by an additional year.
In this review, we take a look at the Gigabyte RTX 4080 Super Gaming OC and see if the purported performance gains and pricing are reasonable, especially with Blackwell slated to launch later this year.
Comparison of the Gigabyte GeForce RTX 4080 Super Gaming OC 16G with other Nvidia GPUs
| Specification | RTX 4090 FE | Gigabyte RTX 4080 Super Gaming OC | RTX 4080 FE | Asus TUF RTX 4070 Ti Super | RTX 4070 Super FE | Zotac RTX 4070 AMP Airo | KFA2 RTX 4060 Ti EX | RTX 3090 Ti FE | RTX 3090 FE | RTX 3080 Ti FE | RTX 3070 FE | Titan RTX |
|---|---|---|---|---|---|---|---|---|---|---|---|---|
| Chip | AD102 | AD103 | AD103 | AD103 | AD104 | AD104 | AD106 | GA102 | GA102 | GA102 | GA104 | TU102 |
| FinFET Process | Custom 4N | Custom 4N | Custom 4N | Custom 4N | Custom 4N | Custom 4N | Custom 4N | 8 nm | 8 nm | 8 nm | 8 nm | 12 nm |
| CUDA Cores | 16,384 | 10,240 | 9,728 | 8,448 | 7,168 | 5,888 | 4,352 | 10,752 | 10,496 | 10,240 | 5,888 | 4,608 |
| Texture Units | 512 | 320 | 304 | 264 | 224 | 184 | 136 | 336 | 328 | 320 | 184 | 288 |
| Tensor Cores | 512 4th Gen. | 320 4th Gen. | 304 4th Gen. | 264 4th Gen. | 224 4th Gen. | 184 4th Gen. | 136 4th Gen. | 336 3rd Gen. | 328 3rd Gen. | 320 3rd Gen. | 184 3rd Gen. | 576 2nd Gen. |
| RT Cores | 128 3rd Gen. | 80 3rd Gen. | 76 3rd Gen. | 66 3rd Gen. | 56 3rd Gen. | 46 3rd Gen. | 34 3rd Gen. | 84 2nd Gen. | 82 2nd Gen. | 80 2nd Gen. | 46 2nd Gen. | 72 |
| GPU Base Clock | 2,235 MHz | 2,295 MHz | 2,205 MHz | 2,340 MHz | 1,980 MHz | 1,920 MHz | 2,310 MHz | 1,560 MHz | 1,395 MHz | 1,365 MHz | 1,500 MHz | 1,350 MHz |
| GPU Boost Clock | 2,520 MHz | 2,595 MHz | 2,505 MHz | 2,610 MHz | 2,475 MHz | 2,535 MHz | 2,535 MHz | 1,860 MHz | 1,695 MHz | 1,665 MHz | 1,750 MHz | 1,770 MHz |
| Memory Bus | 384-bit | 256-bit | 256-bit | 256-bit | 192-bit | 192-bit | 128-bit | 384-bit | 384-bit | 384-bit | 256-bit | 384-bit |
| Memory Bandwidth | 1,008 GB/s | 736.3 GB/s | 716.8 GB/s | 672 GB/s | 504 GB/s | 504 GB/s | 288 GB/s | 1,008 GB/s | 936 GB/s | 912 GB/s | 448 GB/s | 672 GB/s |
| Video Memory | 24 GB GDDR6X | 16 GB GDDR6X | 16 GB GDDR6X | 16 GB GDDR6X | 12 GB GDDR6X | 12 GB GDDR6X | 8 GB GDDR6 | 24 GB GDDR6X | 24 GB GDDR6X | 12 GB GDDR6X | 8 GB GDDR6 | 24 GB GDDR6 |
| Power Consumption | 450 W | 320 W | 320 W | 285 W | 220 W | 215 W | 160 W | 450 W | 350 W | 350 W | 220 W | 280 W |
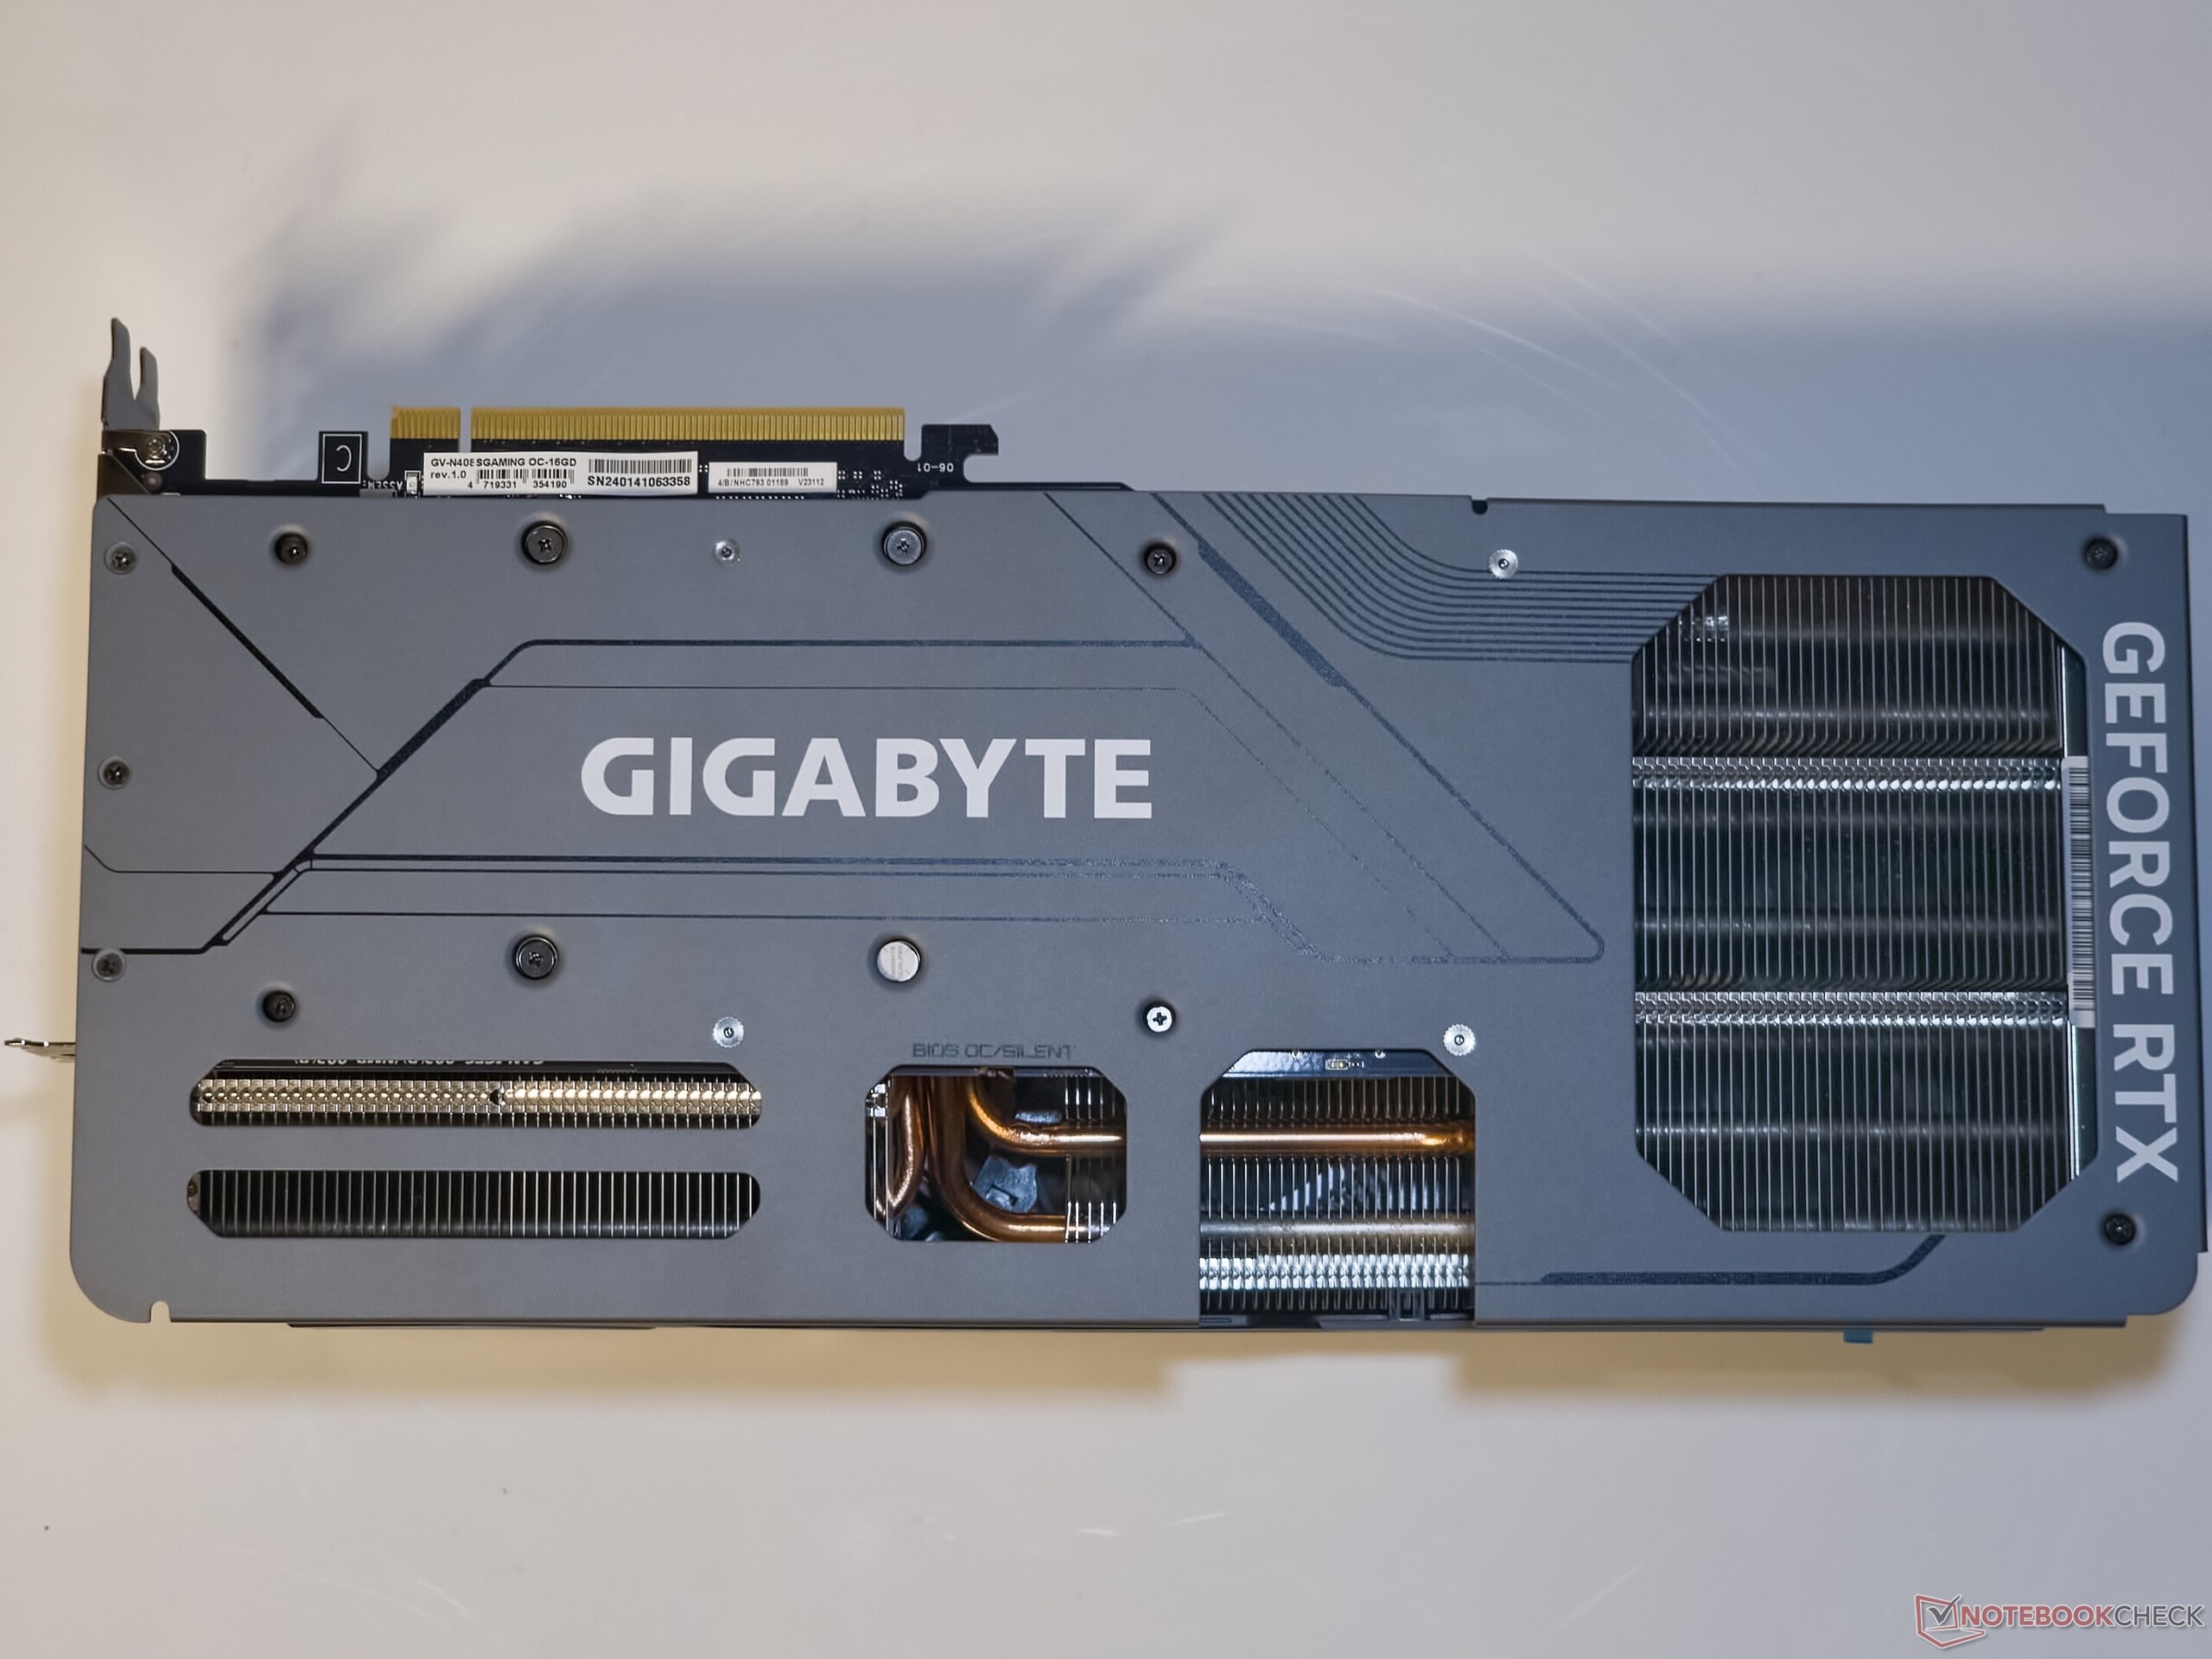
The Gigabyte GeForce RTX 4080 Super Gaming OC up close
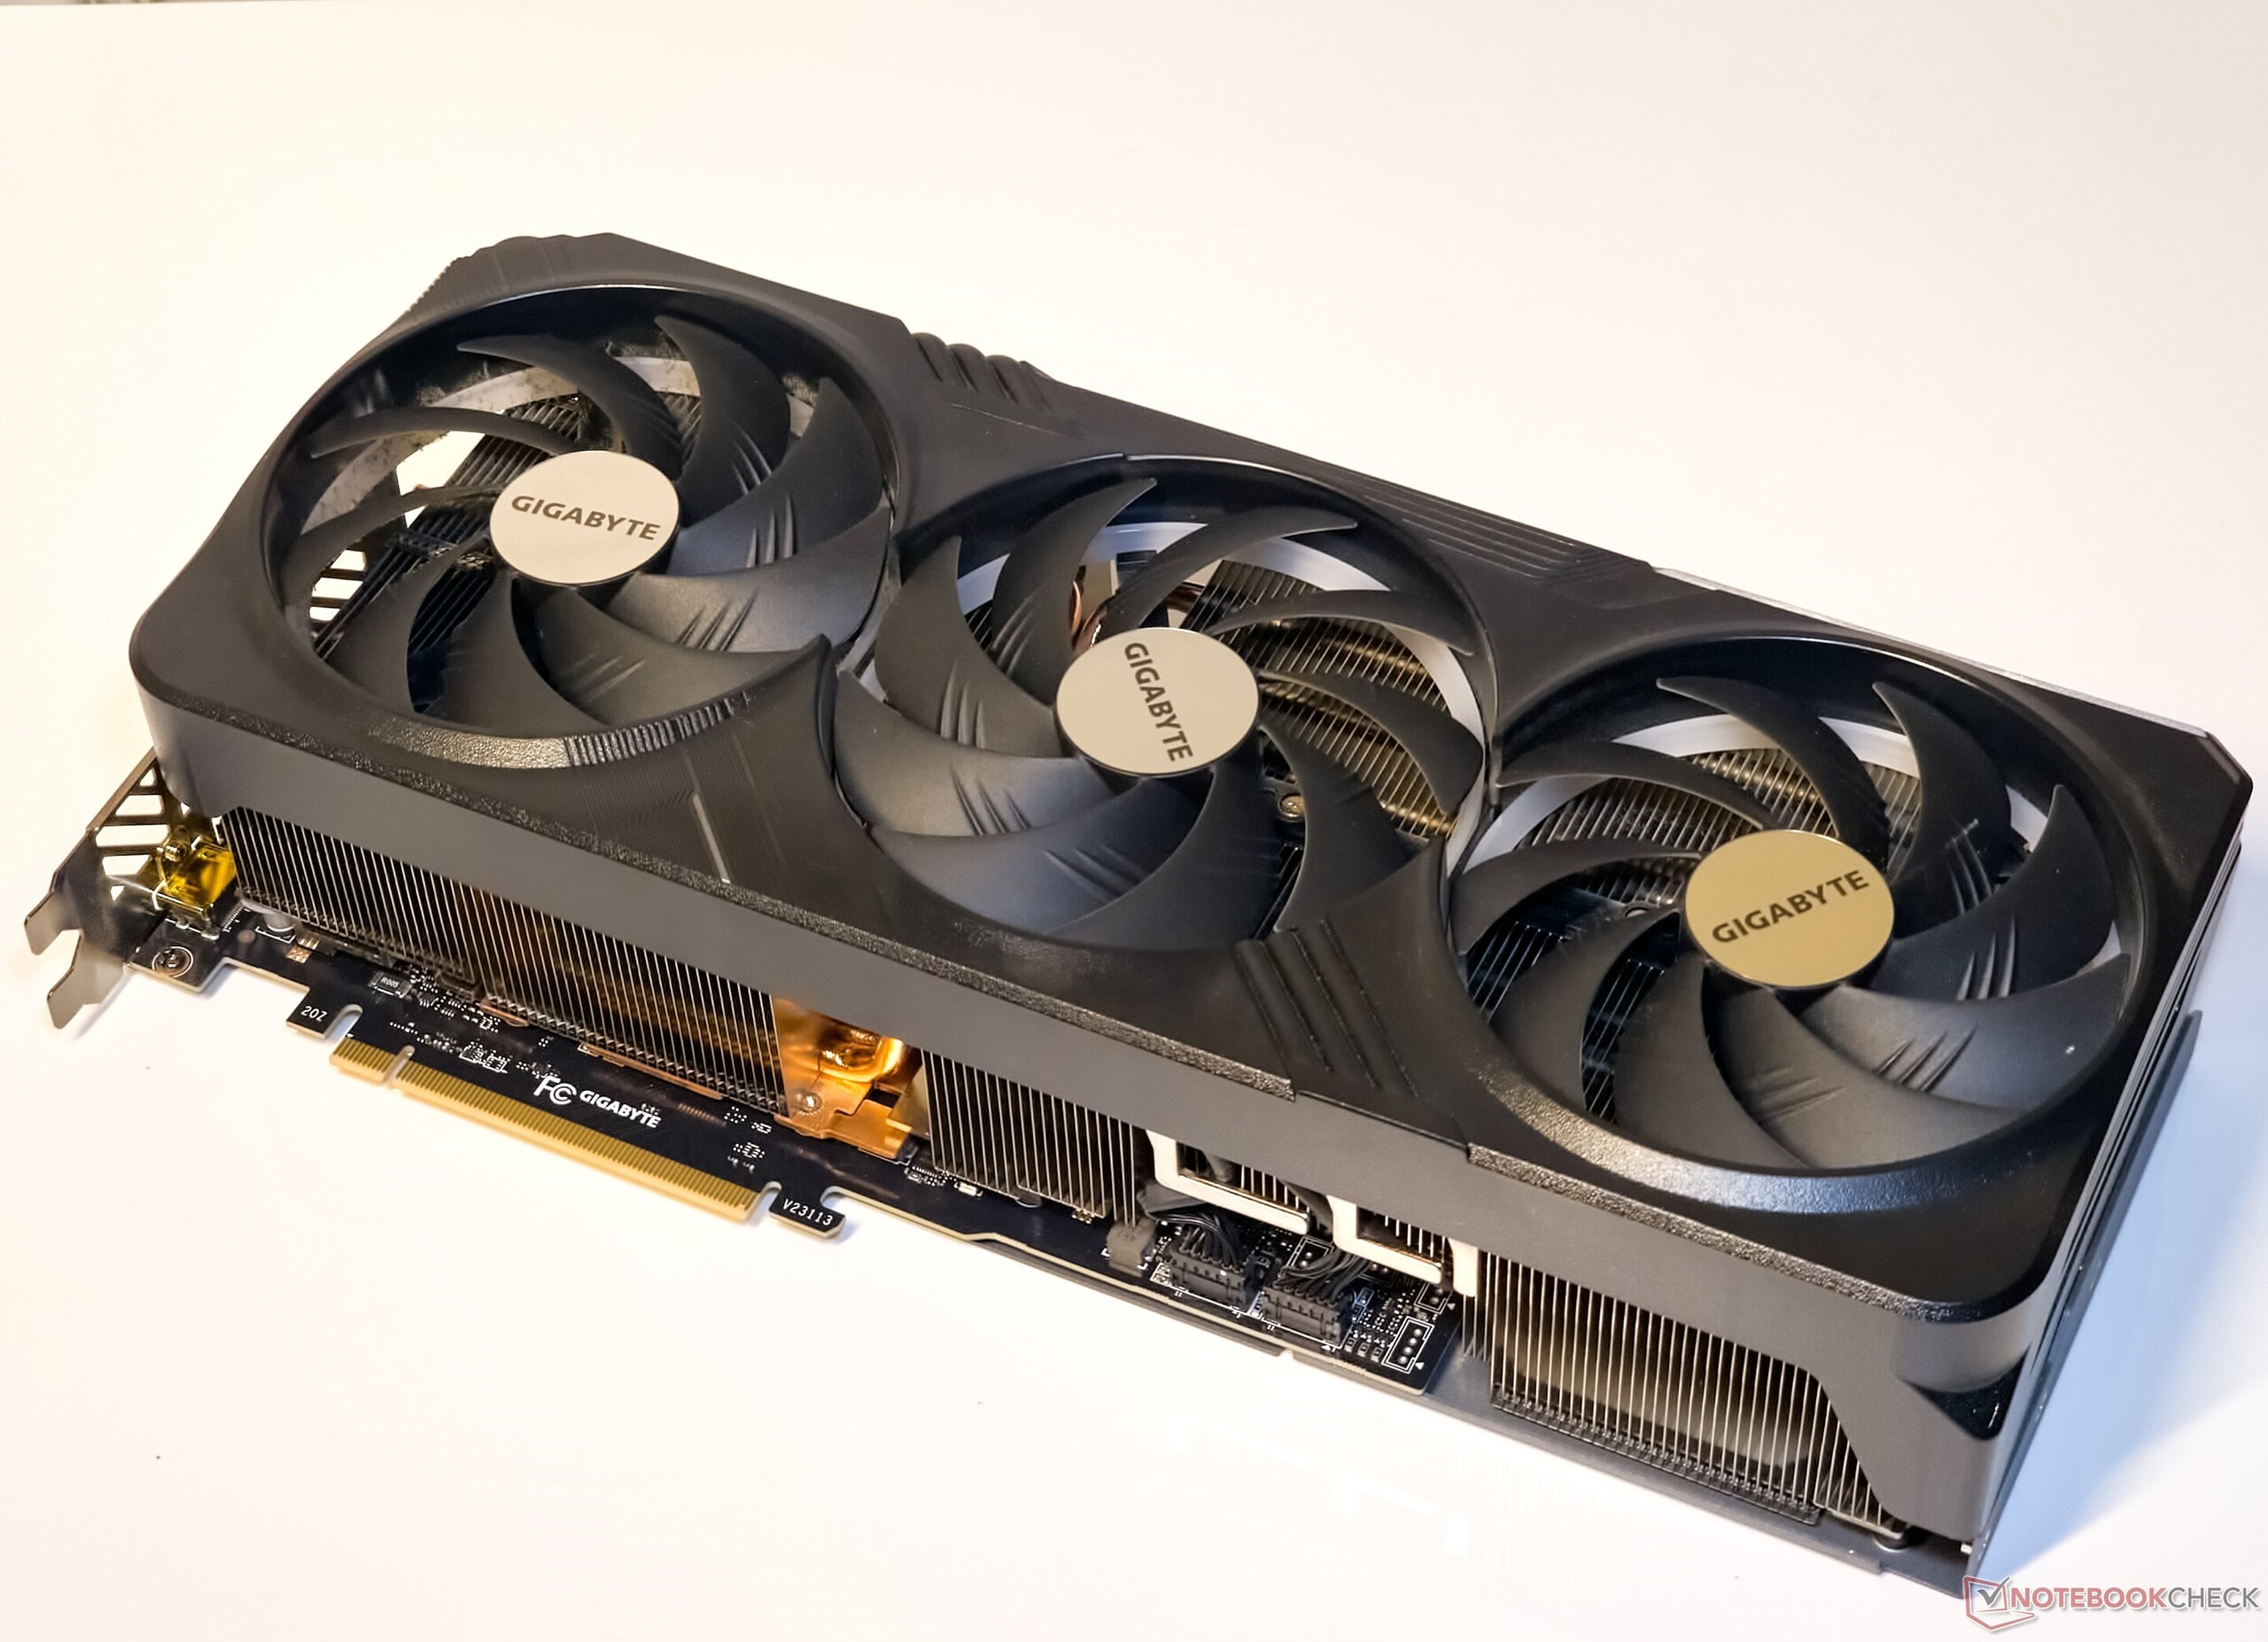
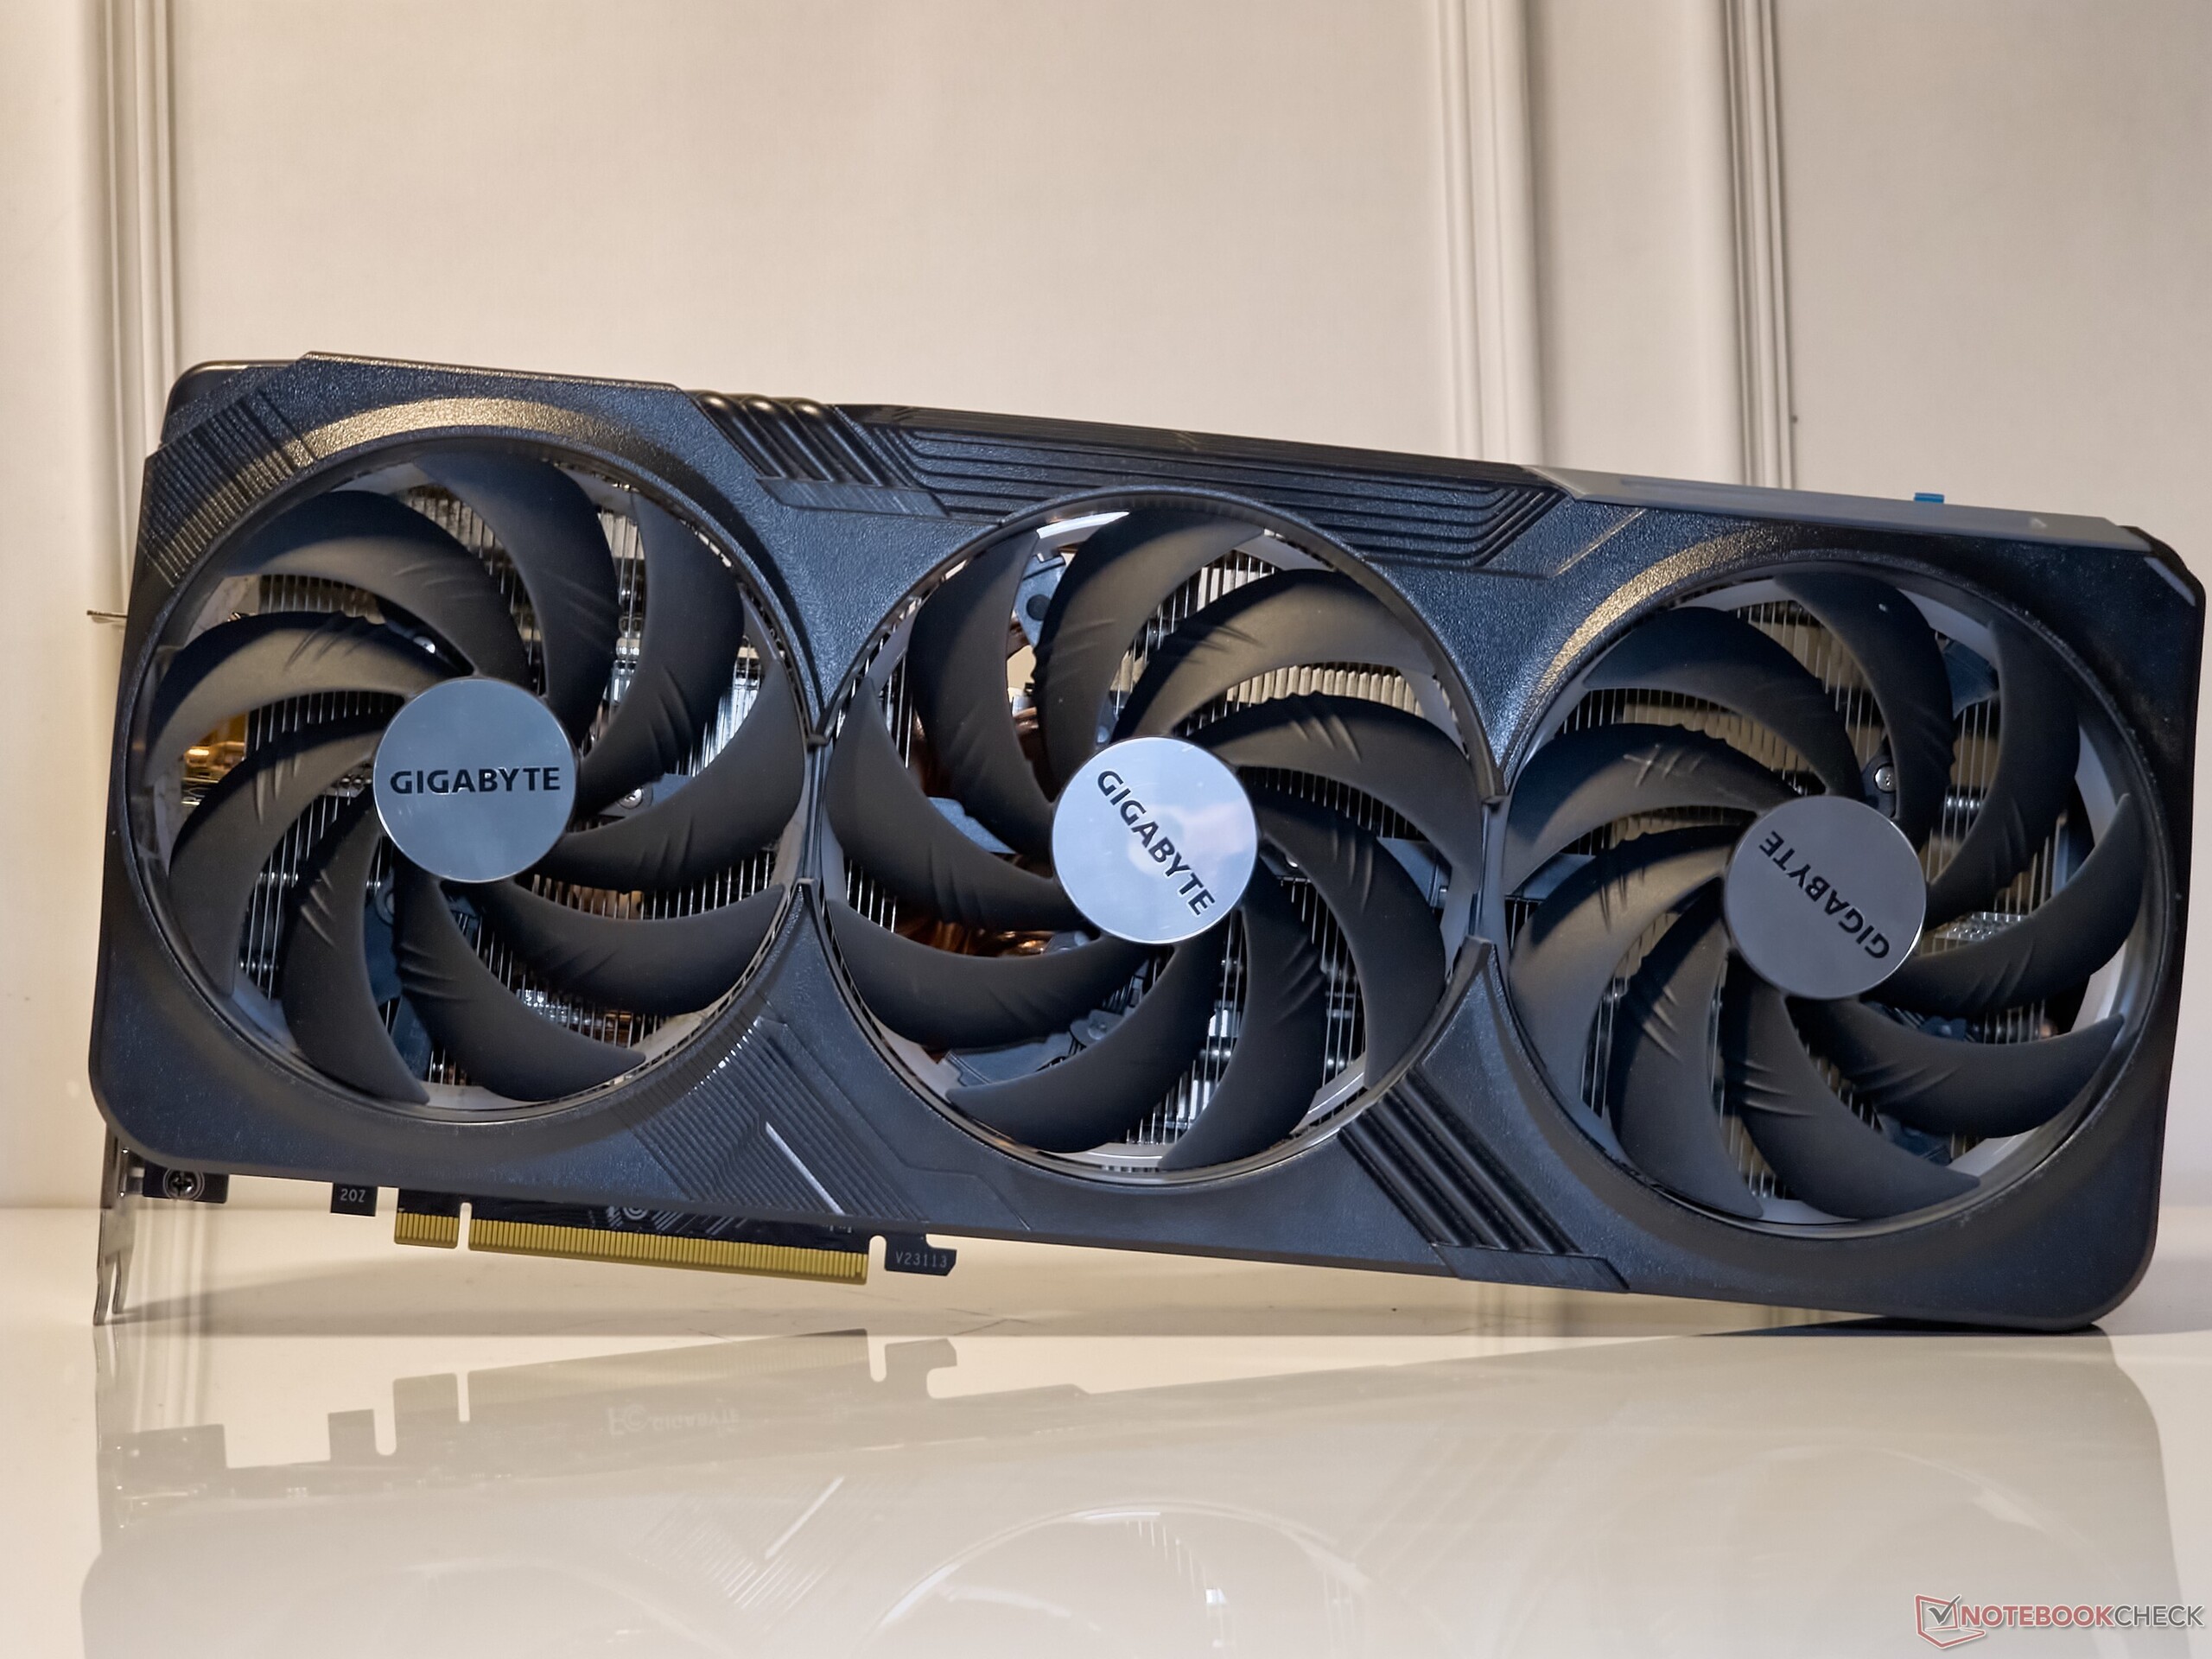
Gigabyte hasn't changed the design of the RTX 4080 Super Gaming OC 16G from its non-Super predecessor. At 342 x 150 x 75 mm and weighing about 1.74 kg, the RTX 4080 Super Gaming OC takes up nearly three PCIe slots on the board, so it stands to benefit from a larger case and an E-ATX motherboard ideally.
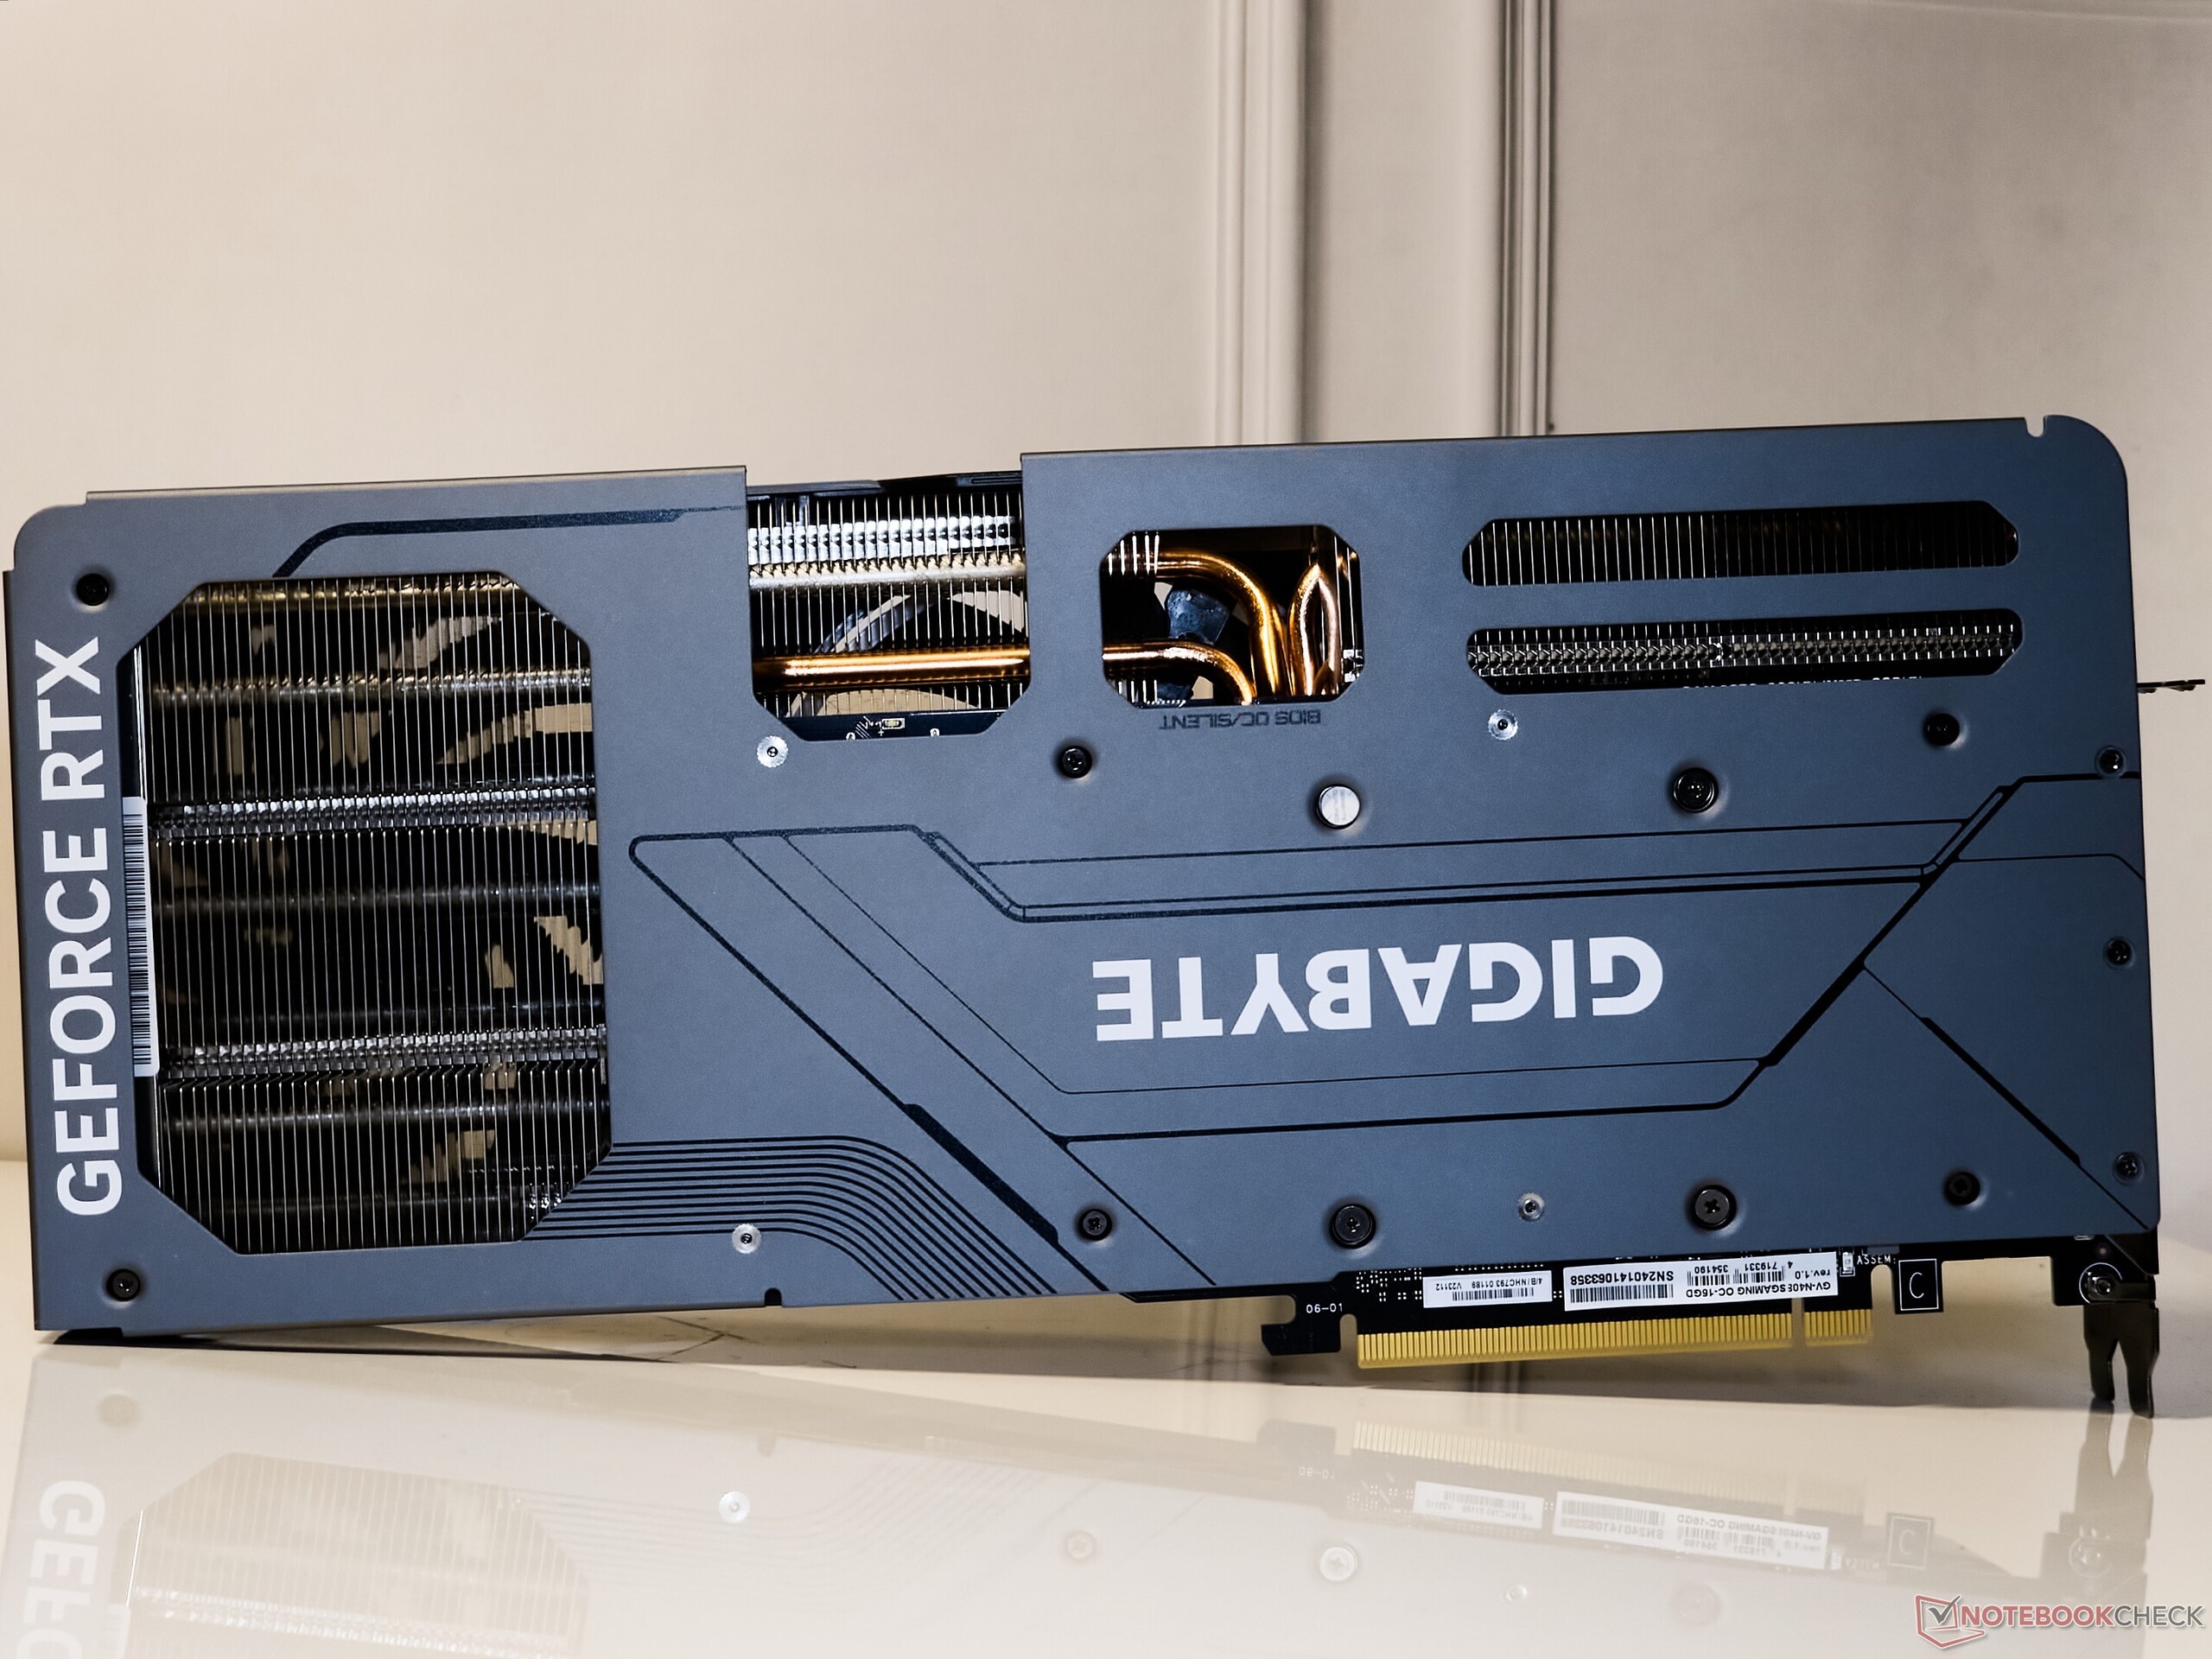
The card sports a plastic but sturdy front shroud and a metal backplate. The RGB effects are similar to what we've seen with the RTX 4070 Super Gaming OC — a glowing Gigabyte logo on top and ring lighting along the circumference of each fan.
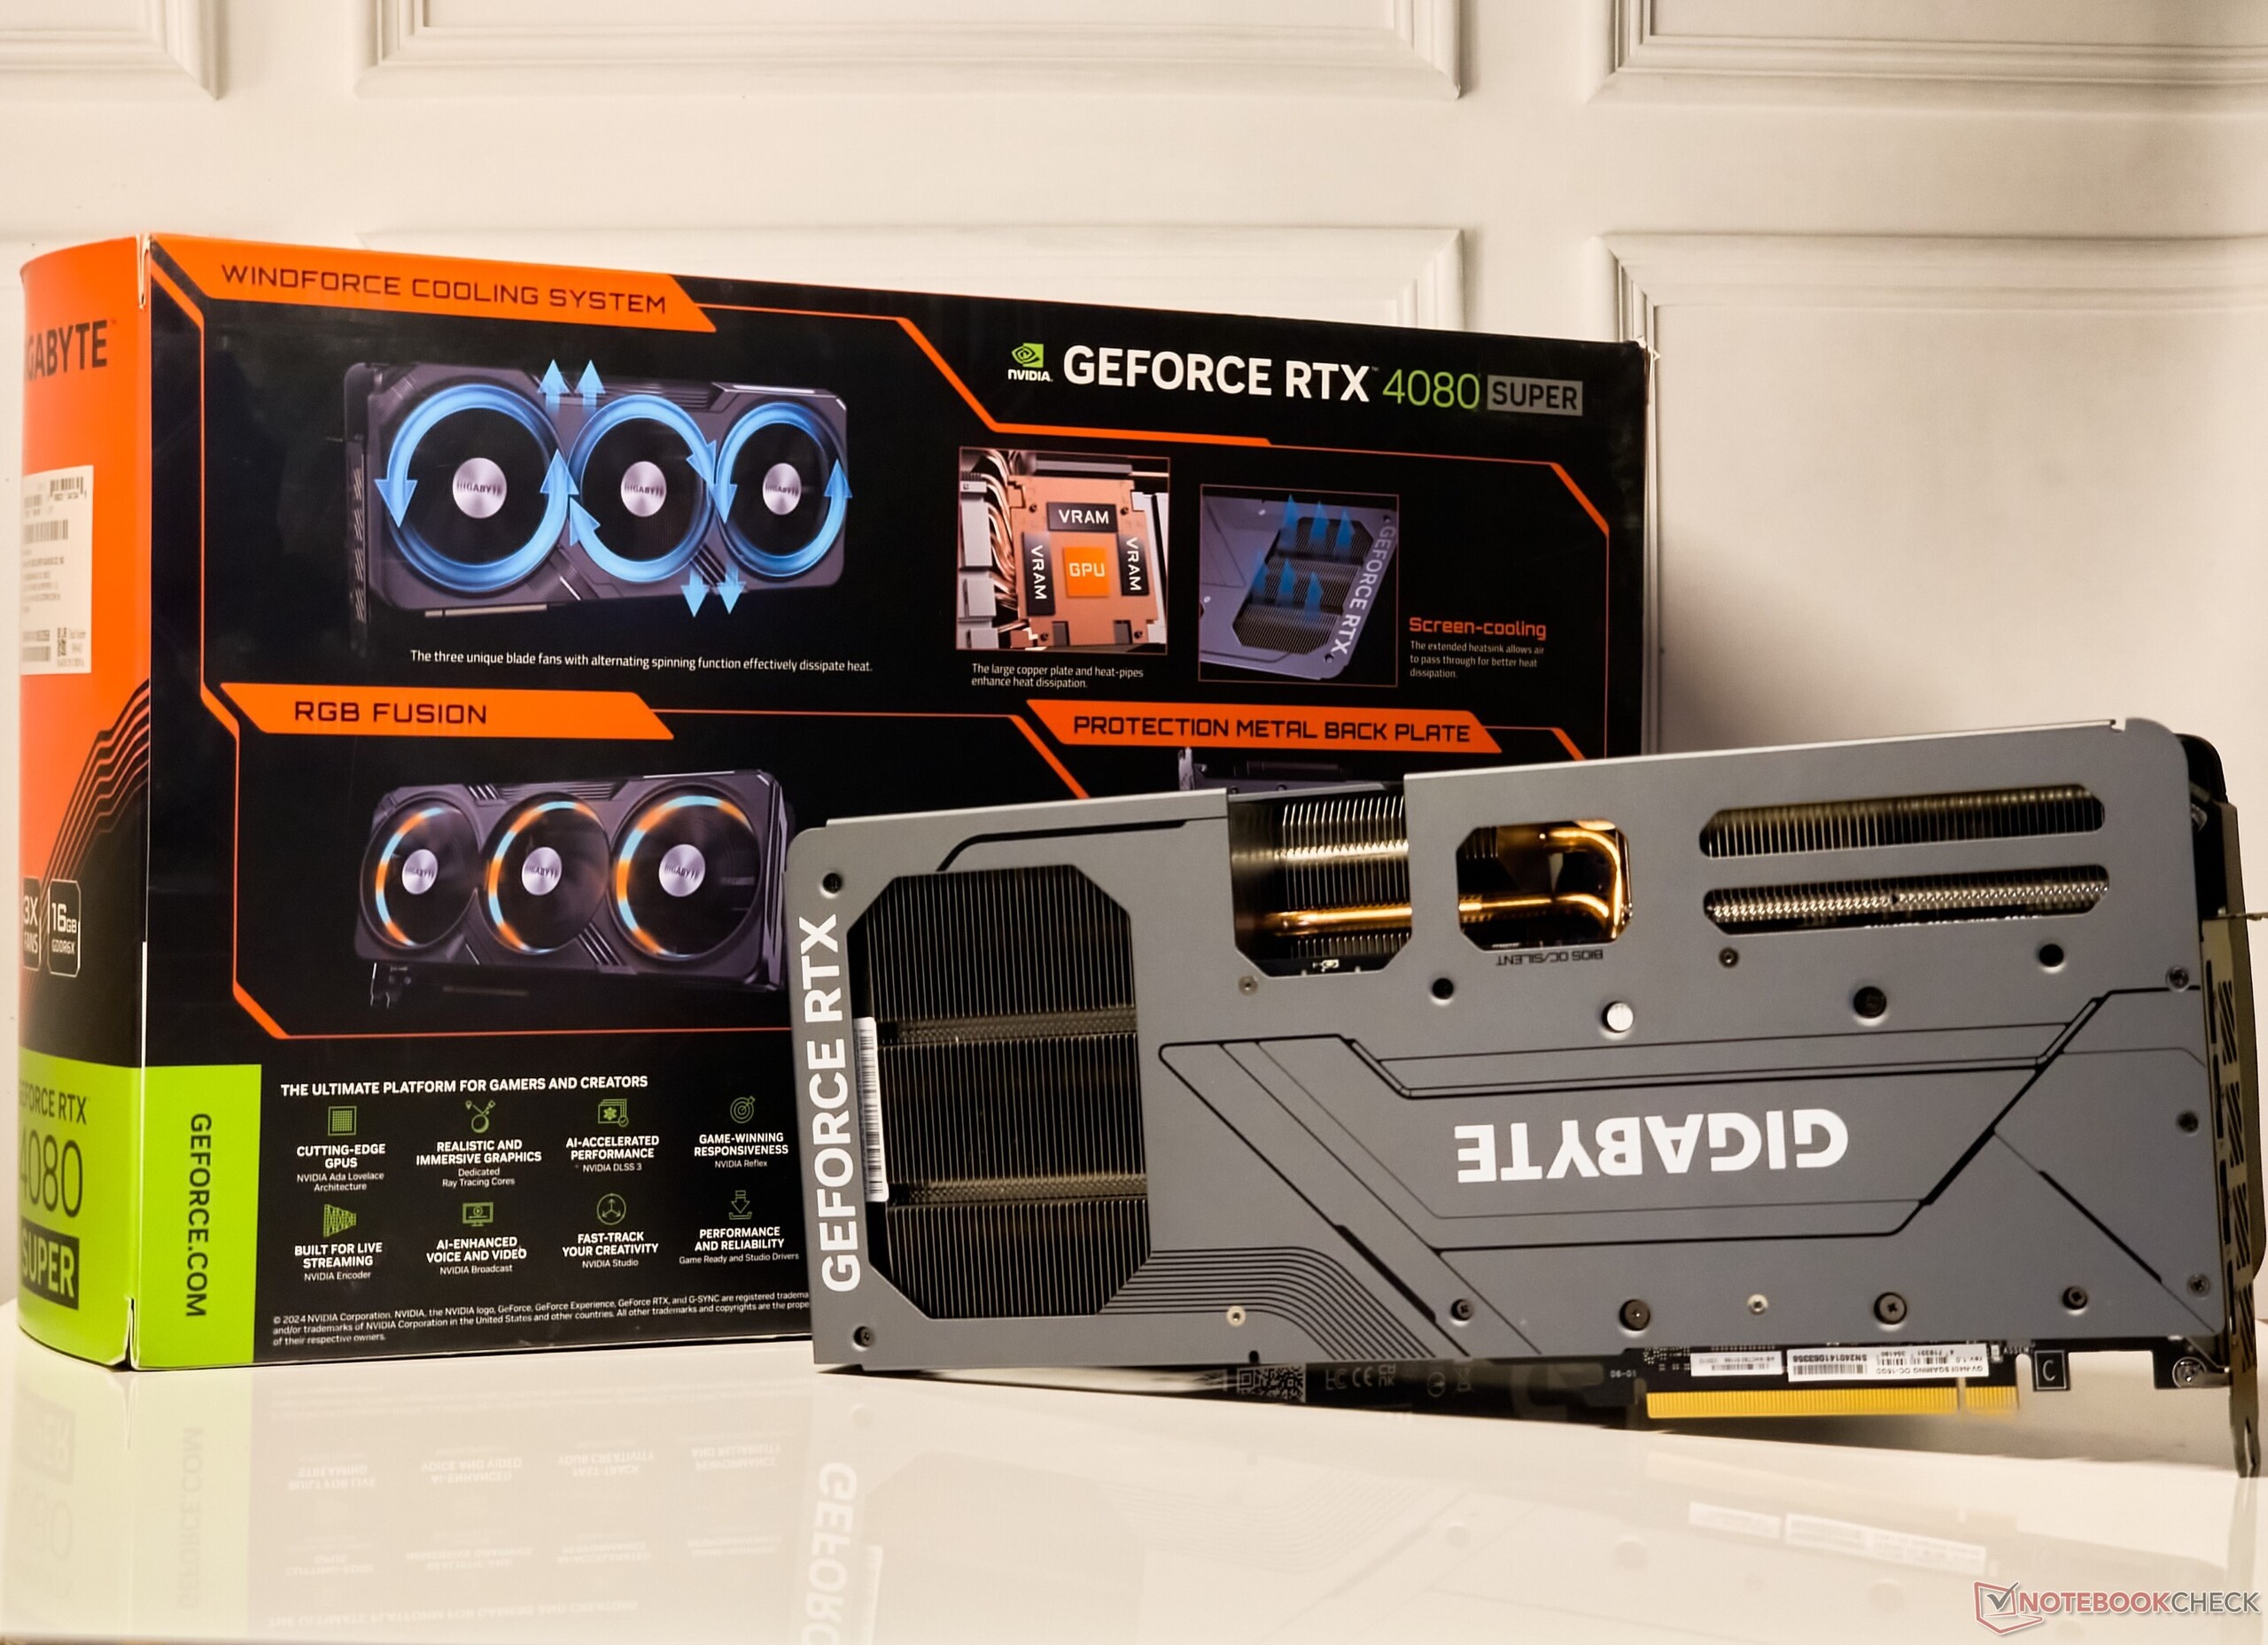

Box contents include a Quick start guide, warranty card, 12VHPWR to 3x 8-pin power connector, support brackets, and screws.
The RTX 4080 Super Gaming OC offers the standard set of ports including 3x DisplayPort 1.4-outs and 1x HDMI 2.1a-out.
As is standard with Gigabyte cards, a dual-BIOS switch is present to toggle between BIOS OC and Silent modes.
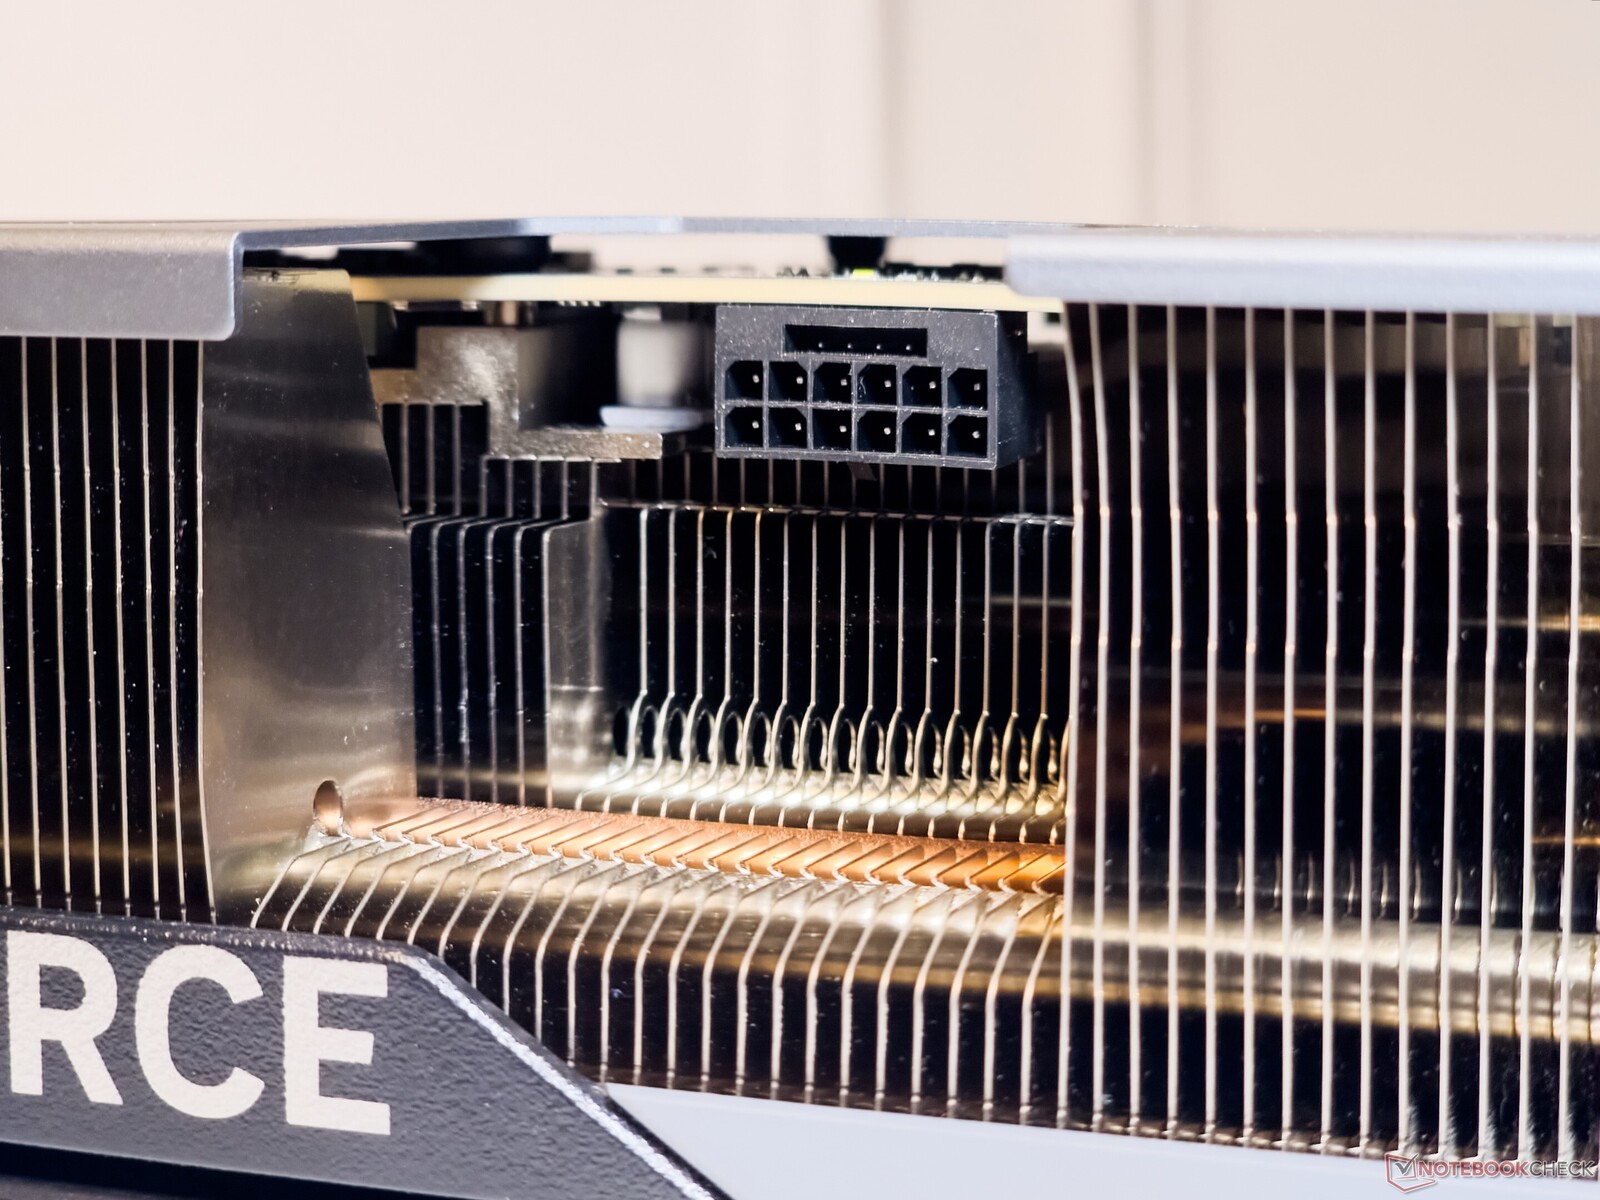
Power supply to the GPU is handled by the now-default 12VHPWR connector. We faced no issues in getting a snug fit with the PSU's PCIe Gen 5 16-pin connector. As a precautionary measure, Gigabyte also provides an LED indicator that glows to indicate any connection problems.


The Gigabyte GeForce RTX 4080 Super Gaming OC 16G can boost up to 2,595 MHz and has an added 25% power headroom to allow TGP increases up to 400 W.

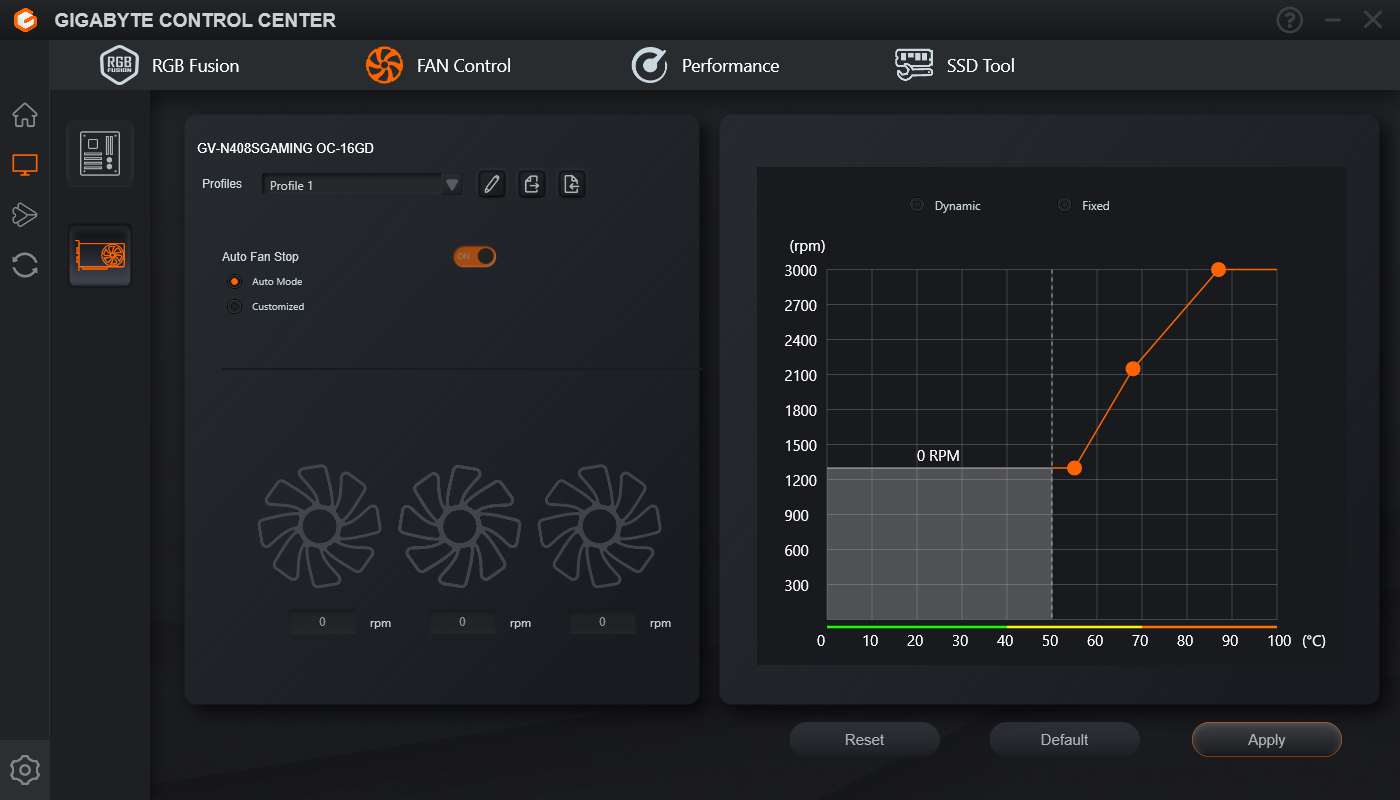
Aspects of the GPU such as overclocking, fan curves, and RGB effects can be controlled via Gigabyte Control Center.


Test bench: RTX 4080 Super Gaming OC together with the Core i9-13900K
Our test system continues to be based on the Intel Core i9-13900K and Z790 platform to ensure that the cards are not CPU bottlenecked. The configuration includes:
- Cooler MasterFrame 700 test bench
- Intel Core i9-13900K with PL1=PL2
- Gigabyte Z790 Aorus Master motherboard
- Gigabyte Aorus Gen4 2 TB NVMe SSD
- Sabrent Rocket 4 Plus Gen4 2 TB NVMe SSD
- 2x 16 GB Kingston Fury Renegade DDR5-6400 RAM with timings 32-39-39-80 at 1.40 V
- MSI MAG 274UPF 4K 144 Hz monitor
- Cooler Master MasterLiquid ML360L V2 ARGB AiO cooler
- Cooler Master MVE Gold V2 1250 ATX 3.0 fully modular PSU
Windows 11 23H2 with the latest patches, together with Nvidia Game Ready Driver version 552.12 was used.
Based on our internal testing, performance numbers from the Core i9-13900K and Z790 chipset are comparable to those from an AMD Ryzen 9 7950X and X670E setup.
We would like to thank Cooler Master for providing the test bench, cooler and PSU, Gigabyte for the motherboard, CPU, and SSD, Sabrent for the SSD, MSI for the monitor, and Kingston for the memory.
Synthetic benchmarks: 5% gains overall compared to the RTX 4080
Cumulative synthetic benchmark performance shows the RTX 4080 Super Gaming OC taking a 5% lead over the RTX 4080 Founders Edition (FE), which corresponds to an equivalent increase in CUDA cores. Larger deltas were observed between these two cards in 3DMark Port Royal (+7%) and 3DMark 11 Performance GPU (11%).
The RTX 4080 Super Gaming OC largely ties in with the AMD Radeon RX 7900 XTX in overall synthetic tests, but the latter shows decent gains in 3DMark Fire Strike and Time Spy.
Unigine scores show anywhere between a 2-5% gain with the RTX 4080 Super Gaming OC compared to the RTX 4080 Founders Edition.
The RTX 4090 Founders Edition continues to be the card to beat with 25% higher scores than the RTX 4080 Super Gaming OC.
3DMark 11: 1280x720 Performance GPU
3DMark: 1920x1080 Fire Strike Graphics | 3840x2160 Fire Strike Ultra Graphics | Fire Strike Extreme Graphics | 2560x1440 Time Spy Graphics | 2560x1440 Port Royal Graphics | 2560x1440 Speed Way Score
Unigine Heaven 4.0: Extreme Preset DX11 | Extreme Preset OpenGL
Unigine Valley 1.0: 1920x1080 Extreme HD DirectX AA:x8 | 1920x1080 Extreme HD Preset OpenGL AA:x8
Unigine Superposition: 1280x720 720p Low | 1920x1080 1080p Extreme | 3840x2160 4k Optimized | 7680x4320 8k Optimized
| Performance rating | |
| NVIDIA GeForce RTX 4090 Founders Edition | |
| AMD Radeon RX 7900 XTX | |
| Gigabyte GeForce RTX 4080 Super Gaming OC | |
| NVIDIA GeForce RTX 4080 Founders Edition | |
| Average of class Desktop | |
| AMD Radeon RX 7900 XT | |
| Asus TUF Gaming GeForce RTX 4070 Ti Super | |
| Gigabyte Aorus GeForce RTX 4070 Ti Master | |
| Asus TUF Gaming GeForce RTX 4070 Ti | |
| Average NVIDIA GeForce RTX 4070 Ti | |
| Gigabyte GeForce RTX 4070 Super Gaming OC 12G | |
| Average NVIDIA GeForce RTX 3090 | |
| Average NVIDIA GeForce RTX 3080 Ti | |
| NVIDIA GeForce RTX 4070 Super Founders Edition | |
| AMD Radeon RX 7800 XT | |
| Zotac Gaming GeForce RTX 4070 AMP Airo | |
| Average NVIDIA GeForce RTX 3080 -1! | |
| Sapphire Pulse Radeon RX 7700 XT | |
| Average NVIDIA Titan RTX | |
| Average NVIDIA GeForce RTX 4060 Ti 8G | |
| KFA2 GeForce RTX 4060 Ti EX, 16GB GDDR6 | |
| XFX Speedster QICK 308 Radeon RX 7600 Black Edition | |
| KFA2 GeForce RTX 4060 1-Click-OC 2X | |
| 3DMark / Speed Way Score | |
| NVIDIA GeForce RTX 4090 Founders Edition | |
| Gigabyte GeForce RTX 4080 Super Gaming OC | |
| Average of class Desktop (492 - 14564, n=42, last 2 years) | |
| NVIDIA GeForce RTX 4080 Founders Edition | |
| Asus TUF Gaming GeForce RTX 4070 Ti Super | |
| AMD Radeon RX 7900 XTX | |
| Gigabyte Aorus GeForce RTX 4070 Ti Master | |
| Average NVIDIA GeForce RTX 4070 Ti (5392 - 5546, n=6) | |
| Asus TUF Gaming GeForce RTX 4070 Ti | |
| Asus TUF Gaming GeForce RTX 4070 Ti (Quiet BIOS) | |
| Gigabyte GeForce RTX 4070 Super Gaming OC 12G | |
| Average NVIDIA GeForce RTX 3090 (5173 - 5299, n=4) | |
| Average NVIDIA GeForce RTX 3080 Ti (5195 - 5223, n=2) | |
| NVIDIA GeForce RTX 4070 Super Founders Edition | |
| AMD Radeon RX 7900 XT | |
| Zotac Gaming GeForce RTX 4070 AMP Airo | |
| AMD Radeon RX 7800 XT | |
| Average NVIDIA Titan RTX (3182 - 3205, n=3) | |
| Average NVIDIA GeForce RTX 4060 Ti 8G (3158 - 3206, n=3) | |
| KFA2 GeForce RTX 4060 Ti EX, 16GB GDDR6 | |
| Sapphire Pulse Radeon RX 7700 XT | |
| KFA2 GeForce RTX 4060 1-Click-OC 2X | |
| XFX Speedster QICK 308 Radeon RX 7600 Black Edition | |
| Unigine Heaven 4.0 / Extreme Preset DX11 | |
| NVIDIA GeForce RTX 4090 Founders Edition | |
| Gigabyte GeForce RTX 4080 Super Gaming OC | |
| AMD Radeon RX 7900 XTX | |
| NVIDIA GeForce RTX 4080 Founders Edition | |
| AMD Radeon RX 7900 XT | |
| Gigabyte Aorus GeForce RTX 4070 Ti Master | |
| Asus TUF Gaming GeForce RTX 4070 Ti | |
| Average of class Desktop (10.9 - 545, n=44, last 2 years) | |
| Average NVIDIA GeForce RTX 4070 Ti (298 - 319, n=5) | |
| Asus TUF Gaming GeForce RTX 4070 Ti Super | |
| Average NVIDIA GeForce RTX 3090 (272 - 315, n=12) | |
| Average NVIDIA GeForce RTX 3080 Ti (290 - 312, n=4) | |
| Gigabyte GeForce RTX 4070 Super Gaming OC 12G | |
| NVIDIA GeForce RTX 4070 Super Founders Edition | |
| Zotac Gaming GeForce RTX 4070 AMP Airo | |
| Average NVIDIA GeForce RTX 3080 (233 - 253, n=2) | |
| AMD Radeon RX 7800 XT | |
| Average NVIDIA Titan RTX (207 - 248, n=12) | |
| Sapphire Pulse Radeon RX 7700 XT | |
| Average NVIDIA GeForce RTX 4060 Ti 8G (170.7 - 181.6, n=4) | |
| KFA2 GeForce RTX 4060 Ti EX, 16GB GDDR6 | |
| KFA2 GeForce RTX 4060 1-Click-OC 2X | |
| XFX Speedster QICK 308 Radeon RX 7600 Black Edition | |
| Unigine Heaven 4.0 / Extreme Preset OpenGL | |
| NVIDIA GeForce RTX 4090 Founders Edition | |
| Gigabyte GeForce RTX 4080 Super Gaming OC | |
| AMD Radeon RX 7900 XTX | |
| NVIDIA GeForce RTX 4080 Founders Edition | |
| AMD Radeon RX 7900 XT | |
| Asus TUF Gaming GeForce RTX 4070 Ti Super | |
| Average of class Desktop (11.7 - 551, n=30, last 2 years) | |
| Gigabyte Aorus GeForce RTX 4070 Ti Master | |
| Average NVIDIA GeForce RTX 4070 Ti (291 - 297, n=4) | |
| Asus TUF Gaming GeForce RTX 4070 Ti | |
| Gigabyte GeForce RTX 4070 Super Gaming OC 12G | |
| NVIDIA GeForce RTX 4070 Super Founders Edition | |
| Average NVIDIA GeForce RTX 3080 Ti (264 - 282, n=4) | |
| Average NVIDIA GeForce RTX 3090 (188.2 - 284, n=11) | |
| AMD Radeon RX 7800 XT | |
| Average NVIDIA GeForce RTX 3080 (232 - 243, n=2) | |
| Zotac Gaming GeForce RTX 4070 AMP Airo | |
| Average NVIDIA Titan RTX (203 - 299, n=12) | |
| Sapphire Pulse Radeon RX 7700 XT | |
| Average NVIDIA GeForce RTX 4060 Ti 8G (173 - 176, n=3) | |
| KFA2 GeForce RTX 4060 Ti EX, 16GB GDDR6 | |
| XFX Speedster QICK 308 Radeon RX 7600 Black Edition | |
| KFA2 GeForce RTX 4060 1-Click-OC 2X | |
| Unigine Valley 1.0 / Extreme HD DirectX | |
| NVIDIA GeForce RTX 4090 Founders Edition | |
| Gigabyte GeForce RTX 4080 Super Gaming OC | |
| NVIDIA GeForce RTX 4080 Founders Edition | |
| AMD Radeon RX 7900 XTX | |
| AMD Radeon RX 7900 XT | |
| Asus TUF Gaming GeForce RTX 4070 Ti Super | |
| Asus TUF Gaming GeForce RTX 4070 Ti | |
| Average NVIDIA GeForce RTX 3080 Ti (206 - 240, n=4) | |
| Average NVIDIA GeForce RTX 3090 (184.2 - 247, n=12) | |
| Average NVIDIA GeForce RTX 4070 Ti (208 - 230, n=5) | |
| Gigabyte GeForce RTX 4070 Super Gaming OC 12G | |
| NVIDIA GeForce RTX 4070 Super Founders Edition | |
| Gigabyte Aorus GeForce RTX 4070 Ti Master | |
| Average of class Desktop (9.8 - 295, n=44, last 2 years) | |
| Zotac Gaming GeForce RTX 4070 AMP Airo | |
| AMD Radeon RX 7800 XT | |
| Average NVIDIA GeForce RTX 3080 (176.2 - 181.8, n=2) | |
| Average NVIDIA Titan RTX (135 - 191.4, n=12) | |
| Sapphire Pulse Radeon RX 7700 XT | |
| Average NVIDIA GeForce RTX 4060 Ti 8G (128.3 - 132.9, n=4) | |
| KFA2 GeForce RTX 4060 Ti EX, 16GB GDDR6 | |
| KFA2 GeForce RTX 4060 1-Click-OC 2X | |
| XFX Speedster QICK 308 Radeon RX 7600 Black Edition | |
| Unigine Superposition / 720p Low | |
| Asus TUF Gaming GeForce RTX 4070 Ti | |
| NVIDIA GeForce RTX 4090 Founders Edition | |
| Gigabyte Aorus GeForce RTX 4070 Ti Master | |
| Average NVIDIA GeForce RTX 4070 Ti (48835 - 56396, n=4) | |
| Zotac Gaming GeForce RTX 4070 AMP Airo | |
| Gigabyte GeForce RTX 4080 Super Gaming OC | |
| NVIDIA GeForce RTX 4080 Founders Edition | |
| NVIDIA GeForce RTX 4070 Super Founders Edition | |
| Gigabyte GeForce RTX 4070 Super Gaming OC 12G | |
| Asus TUF Gaming GeForce RTX 4070 Ti Super | |
| Average of class Desktop (4614 - 64541, n=27, last 2 years) | |
| Average NVIDIA GeForce RTX 3090 (33329 - 63518, n=11) | |
| Average NVIDIA GeForce RTX 3080 Ti (43163 - 50738, n=4) | |
| Average NVIDIA GeForce RTX 4060 Ti 8G (46504 - 47695, n=3) | |
| AMD Radeon RX 7900 XTX | |
| AMD Radeon RX 7900 XT | |
| KFA2 GeForce RTX 4060 1-Click-OC 2X | |
| AMD Radeon RX 7800 XT | |
| Sapphire Pulse Radeon RX 7700 XT | |
| KFA2 GeForce RTX 4060 Ti EX, 16GB GDDR6 | |
| XFX Speedster QICK 308 Radeon RX 7600 Black Edition | |
| Average NVIDIA Titan RTX (25622 - 50876, n=9) | |
| Average NVIDIA GeForce RTX 3080 (30851 - 32183, n=2) | |
| Unigine Superposition / 1080p Extreme | |
| NVIDIA GeForce RTX 4090 Founders Edition | |
| AMD Radeon RX 7900 XTX | |
| Gigabyte GeForce RTX 4080 Super Gaming OC | |
| Average of class Desktop (280 - 28841, n=30, last 2 years) | |
| NVIDIA GeForce RTX 4080 Founders Edition | |
| AMD Radeon RX 7900 XT | |
| Gigabyte Aorus GeForce RTX 4070 Ti Master | |
| Asus TUF Gaming GeForce RTX 4070 Ti Super | |
| Asus TUF Gaming GeForce RTX 4070 Ti | |
| Average NVIDIA GeForce RTX 4070 Ti (12837 - 13448, n=4) | |
| Average NVIDIA GeForce RTX 3090 (11806 - 12694, n=12) | |
| Gigabyte GeForce RTX 4070 Super Gaming OC 12G | |
| Average NVIDIA GeForce RTX 3080 Ti (12038 - 12347, n=4) | |
| NVIDIA GeForce RTX 4070 Super Founders Edition | |
| Average NVIDIA GeForce RTX 3080 (10572 - 10822, n=2) | |
| AMD Radeon RX 7800 XT | |
| Zotac Gaming GeForce RTX 4070 AMP Airo | |
| Average NVIDIA Titan RTX (8916 - 9285, n=9) | |
| Sapphire Pulse Radeon RX 7700 XT | |
| KFA2 GeForce RTX 4060 Ti EX, 16GB GDDR6 | |
| Average NVIDIA GeForce RTX 4060 Ti 8G (7085 - 7833, n=3) | |
| XFX Speedster QICK 308 Radeon RX 7600 Black Edition | |
| KFA2 GeForce RTX 4060 1-Click-OC 2X | |
| Unigine Superposition / 8k Optimized | |
| NVIDIA GeForce RTX 4090 Founders Edition | |
| Average of class Desktop (914 - 18770, n=42, last 2 years) | |
| AMD Radeon RX 7900 XTX | |
| Gigabyte GeForce RTX 4080 Super Gaming OC | |
| NVIDIA GeForce RTX 4080 Founders Edition | |
| Average NVIDIA GeForce RTX 3090 (6961 - 7521, n=12) | |
| Asus TUF Gaming GeForce RTX 4070 Ti Super | |
| Average NVIDIA GeForce RTX 3080 Ti (6920 - 7161, n=4) | |
| AMD Radeon RX 7900 XT | |
| Gigabyte Aorus GeForce RTX 4070 Ti Master | |
| Asus TUF Gaming GeForce RTX 4070 Ti | |
| Average NVIDIA GeForce RTX 4070 Ti (6276 - 6454, n=5) | |
| Average NVIDIA GeForce RTX 3080 (6243 - 6346, n=2) | |
| Gigabyte GeForce RTX 4070 Super Gaming OC 12G | |
| NVIDIA GeForce RTX 4070 Super Founders Edition | |
| Average NVIDIA Titan RTX (5255 - 5571, n=9) | |
| AMD Radeon RX 7800 XT | |
| Zotac Gaming GeForce RTX 4070 AMP Airo | |
| Sapphire Pulse Radeon RX 7700 XT | |
| Average NVIDIA GeForce RTX 4060 Ti 8G (3477 - 3571, n=4) | |
| KFA2 GeForce RTX 4060 Ti EX, 16GB GDDR6 | |
| KFA2 GeForce RTX 4060 1-Click-OC 2X | |
| XFX Speedster QICK 308 Radeon RX 7600 Black Edition | |
3DMark 11: 1280x720 Performance GPU
3DMark: 1920x1080 Fire Strike Graphics | 3840x2160 Fire Strike Ultra Graphics | Fire Strike Extreme Graphics | 2560x1440 Time Spy Graphics | 2560x1440 Port Royal Graphics | 2560x1440 Speed Way Score
Unigine Heaven 4.0: Extreme Preset DX11 | Extreme Preset OpenGL
Unigine Valley 1.0: 1920x1080 Extreme HD DirectX AA:x8 | 1920x1080 Extreme HD Preset OpenGL AA:x8
Unigine Superposition: 1280x720 720p Low | 1920x1080 1080p Extreme | 3840x2160 4k Optimized | 7680x4320 8k Optimized
| 3DMark 11 Performance | 57532 points | |
| 3DMark Ice Storm Standard Score | 294683 points | |
| 3DMark Cloud Gate Standard Score | 80761 points | |
| 3DMark Fire Strike Score | 45427 points | |
| 3DMark Fire Strike Extreme Score | 31385 points | |
| 3DMark Time Spy Score | 27111 points | |
Help | ||
Compute performance: Significant gains over the RX 7900 XTX
The RTX 4080 Super Gaming OC is able to finish the Blender CUDA Classroom render a second faster than the RTX 4080 FE and is about 3% faster in V-Ray 5 CUDA.
LuxMark Sala scores are tied between these two GPUs, and the RTX 4080 Super Gaming OC manages a massive 62% lead over the RX 7900 XTX in this test.
Although both the RX 7900 XT and RX 7900 XTX perform well in majority of ComputeMark tests, the RTX 4080 Super Gaming OC gets a significant advantage in the QJuliaRayTrace that pushes Gigabyte's card slightly ahead of the two AMD flagships in this benchmark.
Blender: v3.3 Classroom CUDA | v3.3 Classroom OPTIX/RTX
LuxMark v2.0 64Bit: Room GPUs-only | Sala GPUs-only
ComputeMark v2.1: 1024x600 Normal, Score | 1024x600 Normal, QJuliaRayTrace | 1024x600 Normal, Mandel Scalar | 1024x600 Normal, Mandel Vector | 1024x600 Normal, Fluid 2DTexArr | 1024x600 Normal, Fluid 3DTex
| V-Ray 5 Benchmark / GPU CUDA | |
| NVIDIA GeForce RTX 4090 Founders Edition (5.0.1) | |
| Gigabyte GeForce RTX 4080 Super Gaming OC (5.0.1) | |
| NVIDIA GeForce RTX 4080 Founders Edition | |
| Average of class Desktop (356 - 5824, n=40, last 2 years) | |
| Asus TUF Gaming GeForce RTX 4070 Ti Super (5.0.1) | |
| Gigabyte Aorus GeForce RTX 4070 Ti Master (5.0.1) | |
| Average NVIDIA GeForce RTX 4070 Ti (2278 - 2395, n=5) | |
| Asus TUF Gaming GeForce RTX 4070 Ti (5.0.1) | |
| Gigabyte GeForce RTX 4070 Super Gaming OC 12G (5.0.1) | |
| NVIDIA GeForce RTX 4070 Super Founders Edition (5.0.1) | |
| Average NVIDIA GeForce RTX 3080 Ti (2045 - 2070, n=3) | |
| Average NVIDIA GeForce RTX 3090 (1616 - 2131, n=15) | |
| Zotac Gaming GeForce RTX 4070 AMP Airo (5.0.1) | |
| KFA2 GeForce RTX 4060 Ti EX, 16GB GDDR6 (5.0.1) | |
| Average NVIDIA GeForce RTX 4060 Ti 8G (1375 - 1400, n=3) | |
| KFA2 GeForce RTX 4060 1-Click-OC 2X (5.0.1) | |
| Average NVIDIA Titan RTX (668 - 1052, n=7) | |
| AMD Radeon RX 7800 XT (5.0.1) | |
| Sapphire Pulse Radeon RX 7700 XT (5.0.1) | |
| XFX Speedster QICK 308 Radeon RX 7600 Black Edition (5.0.1) | |
| V-Ray 5 Benchmark / GPU RTX | |
| NVIDIA GeForce RTX 4090 Founders Edition (5.0.1) | |
| Average of class Desktop (1408 - 7496, n=35, last 2 years) | |
| Gigabyte GeForce RTX 4080 Super Gaming OC (5.0.1) | |
| NVIDIA GeForce RTX 4080 Founders Edition | |
| Asus TUF Gaming GeForce RTX 4070 Ti Super (5.0.1) | |
| Gigabyte Aorus GeForce RTX 4070 Ti Master (5.0.1) | |
| Asus TUF Gaming GeForce RTX 4070 Ti (5.0.1) | |
| Average NVIDIA GeForce RTX 4070 Ti (3054 - 3221, n=5) | |
| Gigabyte GeForce RTX 4070 Super Gaming OC 12G (5.0.1) | |
| NVIDIA GeForce RTX 4070 Super Founders Edition (5.0.1) | |
| Average NVIDIA GeForce RTX 3090 (2551 - 2979, n=15) | |
| Average NVIDIA GeForce RTX 3080 Ti (2727 - 2883, n=3) | |
| Zotac Gaming GeForce RTX 4070 AMP Airo (5.0.1) | |
| AMD Radeon RX 7800 XT (5.0.1) | |
| KFA2 GeForce RTX 4060 Ti EX, 16GB GDDR6 (5.0.1) | |
| Sapphire Pulse Radeon RX 7700 XT (5.0.1) | |
| Average NVIDIA GeForce RTX 4060 Ti 8G (1860 - 2024, n=3) | |
| KFA2 GeForce RTX 4060 1-Click-OC 2X (5.0.1) | |
| Average NVIDIA Titan RTX (1246 - 1348, n=7) | |
| Blender / v3.3 Classroom CUDA | |
| KFA2 GeForce RTX 4060 1-Click-OC 2X (3.3.3) | |
| Average NVIDIA Titan RTX (n=1) | |
| Average NVIDIA GeForce RTX 4060 Ti 8G (n=1) | |
| Zotac Gaming GeForce RTX 4070 AMP Airo (3.3.3) | |
| Average NVIDIA GeForce RTX 3080 Ti (21 - 22, n=2) | |
| Average NVIDIA GeForce RTX 3090 (20 - 22, n=13) | |
| NVIDIA GeForce RTX 4070 Super Founders Edition (3.3.3) | |
| Gigabyte GeForce RTX 4070 Super Gaming OC 12G (3.3.3) | |
| Average NVIDIA GeForce RTX 4070 Ti (18 - 19, n=3) | |
| Average of class Desktop (8 - 54, n=31, last 2 years) | |
| Gigabyte Aorus GeForce RTX 4070 Ti Master (3.3.2) | |
| Asus TUF Gaming GeForce RTX 4070 Ti Super (3.3.3) | |
| NVIDIA GeForce RTX 4080 Founders Edition (3.3.3) | |
| Gigabyte GeForce RTX 4080 Super Gaming OC (3.3.3) | |
| Blender / v3.3 Classroom OPTIX/RTX | |
| KFA2 GeForce RTX 4060 1-Click-OC 2X (3.3.3) | |
| Average NVIDIA Titan RTX (n=1) | |
| KFA2 GeForce RTX 4060 Ti EX, 16GB GDDR6 (3.3.3) | |
| Average NVIDIA GeForce RTX 4060 Ti 8G (17 - 18, n=3) | |
| Average NVIDIA GeForce RTX 3080 Ti (14 - 15, n=2) | |
| Zotac Gaming GeForce RTX 4070 AMP Airo (3.3.3) | |
| Average NVIDIA GeForce RTX 3090 (13 - 14, n=13) | |
| Asus TUF Gaming GeForce RTX 4070 Ti (3.3.2) | |
| Average NVIDIA GeForce RTX 4070 Ti (11 - 12, n=5) | |
| Gigabyte Aorus GeForce RTX 4070 Ti Master (3.3.2) | |
| NVIDIA GeForce RTX 4070 Super Founders Edition (3.3.3) | |
| Gigabyte GeForce RTX 4070 Super Gaming OC 12G (3.3.3) | |
| Average of class Desktop (5 - 19, n=30, last 2 years) | |
| Asus TUF Gaming GeForce RTX 4070 Ti Super (3.3.3) | |
| NVIDIA GeForce RTX 4080 Founders Edition (3.3.3) | |
| NVIDIA GeForce RTX 4090 Founders Edition (3.3.0) | |
| Gigabyte GeForce RTX 4080 Super Gaming OC (3.3.3) | |
| LuxMark v2.0 64Bit / Room GPUs-only | |
| NVIDIA GeForce RTX 4090 Founders Edition | |
| Gigabyte GeForce RTX 4080 Super Gaming OC | |
| NVIDIA GeForce RTX 4080 Founders Edition | |
| Asus TUF Gaming GeForce RTX 4070 Ti Super | |
| Average of class Desktop (370 - 14722, n=40, last 2 years) | |
| Gigabyte Aorus GeForce RTX 4070 Ti Master | |
| Asus TUF Gaming GeForce RTX 4070 Ti | |
| NVIDIA GeForce RTX 4070 Super Founders Edition | |
| Gigabyte GeForce RTX 4070 Super Gaming OC 12G | |
| Average NVIDIA GeForce RTX 4070 Ti (7625 - 8436, n=5) | |
| Zotac Gaming GeForce RTX 4070 AMP Airo | |
| Average NVIDIA GeForce RTX 3080 Ti (5772 - 6464, n=4) | |
| Average NVIDIA GeForce RTX 3090 (5727 - 5985, n=10) | |
| AMD Radeon RX 7900 XTX | |
| Average NVIDIA GeForce RTX 3080 (5112 - 5198, n=2) | |
| Average NVIDIA GeForce RTX 4060 Ti 8G (4558 - 5058, n=4) | |
| Average NVIDIA Titan RTX (4643 - 4703, n=2) | |
| KFA2 GeForce RTX 4060 Ti EX, 16GB GDDR6 | |
| AMD Radeon RX 7900 XT | |
| KFA2 GeForce RTX 4060 1-Click-OC 2X | |
| AMD Radeon RX 7800 XT | |
| Sapphire Pulse Radeon RX 7700 XT | |
| XFX Speedster QICK 308 Radeon RX 7600 Black Edition | |
| ComputeMark v2.1 / Normal, Score | |
| NVIDIA GeForce RTX 4090 Founders Edition | |
| Gigabyte GeForce RTX 4080 Super Gaming OC | |
| AMD Radeon RX 7900 XTX | |
| NVIDIA GeForce RTX 4080 Founders Edition | |
| Average of class Desktop (1629 - 120417, n=44, last 2 years) | |
| AMD Radeon RX 7900 XT | |
| Asus TUF Gaming GeForce RTX 4070 Ti Super | |
| Gigabyte Aorus GeForce RTX 4070 Ti Master | |
| Asus TUF Gaming GeForce RTX 4070 Ti | |
| Average NVIDIA GeForce RTX 4070 Ti (49909 - 52251, n=5) | |
| Average NVIDIA GeForce RTX 3080 Ti (47377 - 48892, n=4) | |
| Gigabyte GeForce RTX 4070 Super Gaming OC 12G | |
| NVIDIA GeForce RTX 4070 Super Founders Edition | |
| Average NVIDIA GeForce RTX 3090 (44948 - 49118, n=10) | |
| AMD Radeon RX 7800 XT | |
| Zotac Gaming GeForce RTX 4070 AMP Airo | |
| Average NVIDIA GeForce RTX 3080 (39924 - 41594, n=2) | |
| Sapphire Pulse Radeon RX 7700 XT | |
| KFA2 GeForce RTX 4060 Ti EX, 16GB GDDR6 | |
| Average NVIDIA GeForce RTX 4060 Ti 8G (29999 - 32410, n=4) | |
| Average NVIDIA Titan RTX (27907 - 29830, n=3) | |
| XFX Speedster QICK 308 Radeon RX 7600 Black Edition | |
| KFA2 GeForce RTX 4060 1-Click-OC 2X | |
| ComputeMark v2.1 / Normal, Mandel Scalar | |
| NVIDIA GeForce RTX 4090 Founders Edition | |
| AMD Radeon RX 7900 XTX | |
| Gigabyte GeForce RTX 4080 Super Gaming OC | |
| NVIDIA GeForce RTX 4080 Founders Edition | |
| AMD Radeon RX 7900 XT | |
| Average of class Desktop (490 - 28468, n=44, last 2 years) | |
| Asus TUF Gaming GeForce RTX 4070 Ti Super | |
| Gigabyte Aorus GeForce RTX 4070 Ti Master | |
| Asus TUF Gaming GeForce RTX 4070 Ti | |
| Average NVIDIA GeForce RTX 4070 Ti (11924 - 12449, n=5) | |
| Gigabyte GeForce RTX 4070 Super Gaming OC 12G | |
| AMD Radeon RX 7800 XT | |
| Average NVIDIA GeForce RTX 3080 Ti (11049 - 11318, n=4) | |
| NVIDIA GeForce RTX 4070 Super Founders Edition | |
| Average NVIDIA GeForce RTX 3090 (10650 - 11564, n=11) | |
| Sapphire Pulse Radeon RX 7700 XT | |
| Average NVIDIA GeForce RTX 3080 (9554 - 9938, n=2) | |
| Zotac Gaming GeForce RTX 4070 AMP Airo | |
| KFA2 GeForce RTX 4060 Ti EX, 16GB GDDR6 | |
| Average NVIDIA GeForce RTX 4060 Ti 8G (6996 - 7511, n=4) | |
| XFX Speedster QICK 308 Radeon RX 7600 Black Edition | |
| Average NVIDIA Titan RTX (5977 - 6406, n=3) | |
| KFA2 GeForce RTX 4060 1-Click-OC 2X | |
| ComputeMark v2.1 / Normal, Mandel Vector | |
| NVIDIA GeForce RTX 4090 Founders Edition | |
| AMD Radeon RX 7900 XTX | |
| AMD Radeon RX 7900 XT | |
| Gigabyte GeForce RTX 4080 Super Gaming OC | |
| Average of class Desktop (318 - 24838, n=44, last 2 years) | |
| NVIDIA GeForce RTX 4080 Founders Edition | |
| Gigabyte Aorus GeForce RTX 4070 Ti Master | |
| Asus TUF Gaming GeForce RTX 4070 Ti Super | |
| Asus TUF Gaming GeForce RTX 4070 Ti | |
| Average NVIDIA GeForce RTX 4070 Ti (10424 - 10888, n=5) | |
| AMD Radeon RX 7800 XT | |
| Gigabyte GeForce RTX 4070 Super Gaming OC 12G | |
| Average NVIDIA GeForce RTX 3080 Ti (9513 - 9860, n=4) | |
| NVIDIA GeForce RTX 4070 Super Founders Edition | |
| Sapphire Pulse Radeon RX 7700 XT | |
| Average NVIDIA GeForce RTX 3090 (8038 - 10097, n=11) | |
| Zotac Gaming GeForce RTX 4070 AMP Airo | |
| Average NVIDIA GeForce RTX 3080 (7148 - 7540, n=2) | |
| KFA2 GeForce RTX 4060 Ti EX, 16GB GDDR6 | |
| Average NVIDIA GeForce RTX 4060 Ti 8G (6419 - 6929, n=4) | |
| XFX Speedster QICK 308 Radeon RX 7600 Black Edition | |
| Average NVIDIA Titan RTX (4944 - 5440, n=3) | |
| KFA2 GeForce RTX 4060 1-Click-OC 2X | |
| ComputeMark v2.1 / Normal, Fluid 2DTexArr | |
| AMD Radeon RX 7900 XTX | |
| NVIDIA GeForce RTX 4090 Founders Edition | |
| AMD Radeon RX 7900 XT | |
| Gigabyte GeForce RTX 4080 Super Gaming OC | |
| NVIDIA GeForce RTX 4080 Founders Edition | |
| Average of class Desktop (188 - 8647, n=44, last 2 years) | |
| Asus TUF Gaming GeForce RTX 4070 Ti Super | |
| Average NVIDIA GeForce RTX 3080 Ti (4453 - 4546, n=4) | |
| AMD Radeon RX 7800 XT | |
| Average NVIDIA GeForce RTX 3090 (4344 - 4608, n=11) | |
| Average NVIDIA GeForce RTX 3080 (4087 - 4159, n=2) | |
| Average NVIDIA Titan RTX (3691 - 3828, n=3) | |
| Average NVIDIA GeForce RTX 4070 Ti (3539 - 3724, n=5) | |
| Gigabyte GeForce RTX 4070 Super Gaming OC 12G | |
| NVIDIA GeForce RTX 4070 Super Founders Edition | |
| Gigabyte Aorus GeForce RTX 4070 Ti Master | |
| Asus TUF Gaming GeForce RTX 4070 Ti | |
| Zotac Gaming GeForce RTX 4070 AMP Airo | |
| Sapphire Pulse Radeon RX 7700 XT | |
| KFA2 GeForce RTX 4060 Ti EX, 16GB GDDR6 | |
| Average NVIDIA GeForce RTX 4060 Ti 8G (1924 - 2060, n=4) | |
| KFA2 GeForce RTX 4060 1-Click-OC 2X | |
| XFX Speedster QICK 308 Radeon RX 7600 Black Edition | |
| ComputeMark v2.1 / Normal, Fluid 3DTex | |
| NVIDIA GeForce RTX 4090 Founders Edition | |
| AMD Radeon RX 7900 XTX | |
| Average of class Desktop (222 - 18731, n=44, last 2 years) | |
| AMD Radeon RX 7900 XT | |
| Gigabyte GeForce RTX 4080 Super Gaming OC | |
| NVIDIA GeForce RTX 4080 Founders Edition | |
| Average NVIDIA GeForce RTX 3090 (5246 - 5520, n=11) | |
| Average NVIDIA GeForce RTX 3080 Ti (5312 - 5422, n=4) | |
| Asus TUF Gaming GeForce RTX 4070 Ti Super | |
| AMD Radeon RX 7800 XT | |
| Average NVIDIA GeForce RTX 3080 (4417 - 4450, n=2) | |
| Average NVIDIA Titan RTX (3877 - 4027, n=3) | |
| Average NVIDIA GeForce RTX 4070 Ti (3616 - 3789, n=5) | |
| Gigabyte Aorus GeForce RTX 4070 Ti Master | |
| NVIDIA GeForce RTX 4070 Super Founders Edition | |
| Asus TUF Gaming GeForce RTX 4070 Ti | |
| Gigabyte GeForce RTX 4070 Super Gaming OC 12G | |
| Zotac Gaming GeForce RTX 4070 AMP Airo | |
| Sapphire Pulse Radeon RX 7700 XT | |
| KFA2 GeForce RTX 4060 Ti EX, 16GB GDDR6 | |
| Average NVIDIA GeForce RTX 4060 Ti 8G (1962 - 2090, n=4) | |
| KFA2 GeForce RTX 4060 1-Click-OC 2X | |
| XFX Speedster QICK 308 Radeon RX 7600 Black Edition | |
Blender: v3.3 Classroom CUDA | v3.3 Classroom OPTIX/RTX
LuxMark v2.0 64Bit: Room GPUs-only | Sala GPUs-only
ComputeMark v2.1: 1024x600 Normal, Score | 1024x600 Normal, QJuliaRayTrace | 1024x600 Normal, Mandel Scalar | 1024x600 Normal, Mandel Vector | 1024x600 Normal, Fluid 2DTexArr | 1024x600 Normal, Fluid 3DTex
* ... smaller is better
Gaming Performance: RX 7900 XTX edges ahead in raster
While the RTX 4090 still remains the most coveted GPU two years after its launch, the new RTX 4080 Super is Nvidia's mainstream flagship offering for gamers.
The RTX 4080 Super Gaming OC is 12% ahead of the RTX 4080 FE in cumulative gaming tests at 1080p, 1440p, and 4K Ultra while beating the RTX 3090 average by 28%.
The RX 7900 XTX still manages a 4% lead over the RTX 4080 Super Gaming OC, despite the latter showing good gains in F1 22, Borderlands 3, and Final Fantasy XV.
The RTX 4080 Super is able to achieve 100 fps in many AAA titles at 4K Ultra. Use of upscalers such as DLSS, FSR, and XeSS is recommended for a smoother gaming experience in texture-heavy modern titles including Cyberpunk 2077 2.0 Phantom Liberty, Alan Wake 2, and Avatar: Frontiers of Pandora.
The Witcher 3: 3840x2160 Ultra Graphics & Postprocessing (HBAO+) | 3840x2160 High Graphics & Postprocessing (Nvidia HairWorks Off) | 1920x1080 Ultra Graphics & Postprocessing (HBAO+)
Metro Exodus: 3840x2160 Ultra Quality AF:16x | 2560x1440 Ultra Quality AF:16x | 1920x1080 Ultra Quality AF:16x
Control: 3840x2160 High Quality Preset | 2560x1440 High Quality Preset | 1920x1080 High Quality Preset
Borderlands 3: 3840x2160 Badass Overall Quality (DX11) | 2560x1440 Badass Overall Quality (DX11) | 1920x1080 Badass Overall Quality (DX11)
Shadow of the Tomb Raider: 3840x2160 Highest Preset AA:T | 2560x1440 Highest Preset AA:T | 1920x1080 Highest Preset AA:T
F1 22: 3840x2160 Ultra High Preset AA:T AF:16x | 2560x1440 Ultra High Preset AA:T AF:16x | 1920x1080 Ultra High Preset AA:T AF:16x
Final Fantasy XV Benchmark: 3840x2160 High Quality | 2560x1440 High Quality | 1920x1080 High Quality
| Performance rating | |
| NVIDIA GeForce RTX 4090 Founders Edition | |
| AMD Radeon RX 7900 XTX | |
| Gigabyte GeForce RTX 4080 Super Gaming OC | |
| AMD Radeon RX 7900 XT | |
| NVIDIA GeForce RTX 4080 Founders Edition | |
| Asus TUF Gaming GeForce RTX 4070 Ti Super -1! | |
| Asus TUF Gaming GeForce RTX 4070 Ti | |
| Gigabyte Aorus GeForce RTX 4070 Ti Master | |
| Average NVIDIA GeForce RTX 4070 Ti | |
| Gigabyte GeForce RTX 4070 Super Gaming OC 12G | |
| Average NVIDIA GeForce RTX 3080 Ti | |
| Average NVIDIA GeForce RTX 3090 | |
| NVIDIA GeForce RTX 4070 Super Founders Edition | |
| AMD Radeon RX 7800 XT | |
| Zotac Gaming GeForce RTX 4070 AMP Airo | |
| Average NVIDIA GeForce RTX 3080 | |
| Sapphire Pulse Radeon RX 7700 XT | |
| Average NVIDIA Titan RTX | |
| Average NVIDIA GeForce RTX 4060 Ti 8G | |
| KFA2 GeForce RTX 4060 Ti EX, 16GB GDDR6 | |
| KFA2 GeForce RTX 4060 1-Click-OC 2X | |
| XFX Speedster QICK 308 Radeon RX 7600 Black Edition | |
| The Witcher 3 / Ultra Graphics & Postprocessing (HBAO+) | |
| NVIDIA GeForce RTX 4090 Founders Edition | |
| AMD Radeon RX 7900 XTX | |
| Gigabyte GeForce RTX 4080 Super Gaming OC | |
| NVIDIA GeForce RTX 4080 Founders Edition | |
| AMD Radeon RX 7900 XT | |
| Asus TUF Gaming GeForce RTX 4070 Ti Super | |
| Asus TUF Gaming GeForce RTX 4070 Ti | |
| Average NVIDIA GeForce RTX 4070 Ti (92.4 - 98.3, n=4) | |
| Average NVIDIA GeForce RTX 3080 Ti (93.1 - 96.4, n=4) | |
| Gigabyte Aorus GeForce RTX 4070 Ti Master | |
| Average NVIDIA GeForce RTX 3090 (85.4 - 98.5, n=10) | |
| Gigabyte GeForce RTX 4070 Super Gaming OC 12G | |
| NVIDIA GeForce RTX 4070 Super Founders Edition | |
| Average NVIDIA GeForce RTX 3080 (78 - 85.7, n=2) | |
| AMD Radeon RX 7800 XT | |
| Zotac Gaming GeForce RTX 4070 AMP Airo | |
| Average NVIDIA Titan RTX (n=1) | |
| Sapphire Pulse Radeon RX 7700 XT | |
| Average NVIDIA GeForce RTX 4060 Ti 8G (53.9 - 54.3, n=3) | |
| KFA2 GeForce RTX 4060 Ti EX, 16GB GDDR6 | |
| XFX Speedster QICK 308 Radeon RX 7600 Black Edition | |
| KFA2 GeForce RTX 4060 1-Click-OC 2X | |
| The Witcher 3 / High Graphics & Postprocessing (Nvidia HairWorks Off) | |
| NVIDIA GeForce RTX 4090 Founders Edition | |
| Gigabyte GeForce RTX 4080 Super Gaming OC | |
| NVIDIA GeForce RTX 4080 Founders Edition | |
| AMD Radeon RX 7900 XTX | |
| AMD Radeon RX 7900 XT | |
| Average NVIDIA GeForce RTX 3080 Ti (149 - 156.8, n=4) | |
| Average NVIDIA GeForce RTX 3090 (128 - 160.2, n=14) | |
| Asus TUF Gaming GeForce RTX 4070 Ti | |
| Gigabyte Aorus GeForce RTX 4070 Ti Master | |
| Average NVIDIA GeForce RTX 4070 Ti (143 - 151.9, n=4) | |
| Gigabyte GeForce RTX 4070 Super Gaming OC 12G | |
| NVIDIA GeForce RTX 4070 Super Founders Edition | |
| Zotac Gaming GeForce RTX 4070 AMP Airo | |
| Average NVIDIA GeForce RTX 3080 (114 - 115, n=2) | |
| AMD Radeon RX 7800 XT | |
| Average NVIDIA Titan RTX (94 - 107.1, n=28) | |
| Sapphire Pulse Radeon RX 7700 XT | |
| Average NVIDIA GeForce RTX 4060 Ti 8G (78.5 - 80.4, n=3) | |
| KFA2 GeForce RTX 4060 Ti EX, 16GB GDDR6 | |
| KFA2 GeForce RTX 4060 1-Click-OC 2X | |
| XFX Speedster QICK 308 Radeon RX 7600 Black Edition | |
| The Witcher 3 / Ultra Graphics & Postprocessing (HBAO+) | |
| NVIDIA GeForce RTX 4090 Founders Edition | |
| AMD Radeon RX 7900 XTX | |
| AMD Radeon RX 7900 XT | |
| NVIDIA GeForce RTX 4080 Founders Edition | |
| Gigabyte GeForce RTX 4080 Super Gaming OC | |
| Asus TUF Gaming GeForce RTX 4070 Ti | |
| Average NVIDIA GeForce RTX 4070 Ti (217 - 230, n=5) | |
| Gigabyte Aorus GeForce RTX 4070 Ti Master | |
| Asus TUF Gaming GeForce RTX 4070 Ti Super | |
| Gigabyte GeForce RTX 4070 Super Gaming OC 12G | |
| NVIDIA GeForce RTX 4070 Super Founders Edition | |
| AMD Radeon RX 7800 XT | |
| Average NVIDIA GeForce RTX 3090 (160 - 192.6, n=18) | |
| Average NVIDIA GeForce RTX 3080 Ti (174 - 184.6, n=4) | |
| Zotac Gaming GeForce RTX 4070 AMP Airo | |
| Sapphire Pulse Radeon RX 7700 XT | |
| Average NVIDIA GeForce RTX 3080 (145 - 152, n=2) | |
| Average NVIDIA GeForce RTX 4060 Ti 8G (134.1 - 140.6, n=4) | |
| Average NVIDIA Titan RTX (124 - 150, n=28) | |
| KFA2 GeForce RTX 4060 Ti EX, 16GB GDDR6 | |
| XFX Speedster QICK 308 Radeon RX 7600 Black Edition | |
| KFA2 GeForce RTX 4060 1-Click-OC 2X | |
| Metro Exodus / Ultra Quality | |
| NVIDIA GeForce RTX 4090 Founders Edition | |
| AMD Radeon RX 7900 XTX | |
| Gigabyte GeForce RTX 4080 Super Gaming OC | |
| NVIDIA GeForce RTX 4080 Founders Edition | |
| AMD Radeon RX 7900 XT | |
| Gigabyte Aorus GeForce RTX 4070 Ti Master | |
| Asus TUF Gaming GeForce RTX 4070 Ti | |
| Asus TUF Gaming GeForce RTX 4070 Ti Super | |
| Average NVIDIA GeForce RTX 4070 Ti (81.2 - 85, n=4) | |
| Gigabyte GeForce RTX 4070 Super Gaming OC 12G | |
| Average NVIDIA GeForce RTX 3080 Ti (74.2 - 77.1, n=4) | |
| Average NVIDIA GeForce RTX 3090 (70.6 - 77.3, n=12) | |
| NVIDIA GeForce RTX 4070 Super Founders Edition | |
| AMD Radeon RX 7800 XT | |
| Zotac Gaming GeForce RTX 4070 AMP Airo | |
| Average NVIDIA GeForce RTX 3080 (64.1 - 65.9, n=2) | |
| Sapphire Pulse Radeon RX 7700 XT | |
| Average NVIDIA Titan RTX (51.3 - 57.9, n=27) | |
| Average NVIDIA GeForce RTX 4060 Ti 8G (48.4 - 49.3, n=3) | |
| KFA2 GeForce RTX 4060 Ti EX, 16GB GDDR6 | |
| KFA2 GeForce RTX 4060 1-Click-OC 2X | |
| XFX Speedster QICK 308 Radeon RX 7600 Black Edition | |
| Metro Exodus / Ultra Quality | |
| NVIDIA GeForce RTX 4090 Founders Edition | |
| AMD Radeon RX 7900 XTX | |
| Gigabyte GeForce RTX 4080 Super Gaming OC | |
| AMD Radeon RX 7900 XT | |
| Gigabyte Aorus GeForce RTX 4070 Ti Master | |
| Asus TUF Gaming GeForce RTX 4070 Ti | |
| Asus TUF Gaming GeForce RTX 4070 Ti Super | |
| Average NVIDIA GeForce RTX 4070 Ti (126.7 - 132.3, n=4) | |
| NVIDIA GeForce RTX 4080 Founders Edition | |
| Gigabyte GeForce RTX 4070 Super Gaming OC 12G | |
| NVIDIA GeForce RTX 4070 Super Founders Edition | |
| Average NVIDIA GeForce RTX 3080 Ti (110 - 118, n=4) | |
| Average NVIDIA GeForce RTX 3090 (102 - 118.2, n=12) | |
| Zotac Gaming GeForce RTX 4070 AMP Airo | |
| AMD Radeon RX 7800 XT | |
| Average NVIDIA GeForce RTX 3080 (92.2 - 97.4, n=2) | |
| Sapphire Pulse Radeon RX 7700 XT | |
| Average NVIDIA Titan RTX (69 - 92.9, n=26) | |
| Average NVIDIA GeForce RTX 4060 Ti 8G (78.9 - 80.1, n=3) | |
| KFA2 GeForce RTX 4060 Ti EX, 16GB GDDR6 | |
| XFX Speedster QICK 308 Radeon RX 7600 Black Edition | |
| KFA2 GeForce RTX 4060 1-Click-OC 2X | |
| Metro Exodus / Ultra Quality | |
| NVIDIA GeForce RTX 4090 Founders Edition | |
| AMD Radeon RX 7900 XTX | |
| Gigabyte GeForce RTX 4080 Super Gaming OC | |
| AMD Radeon RX 7900 XT | |
| Asus TUF Gaming GeForce RTX 4070 Ti | |
| Gigabyte Aorus GeForce RTX 4070 Ti Master | |
| Average NVIDIA GeForce RTX 4070 Ti (155.6 - 161.4, n=4) | |
| Asus TUF Gaming GeForce RTX 4070 Ti Super | |
| Gigabyte GeForce RTX 4070 Super Gaming OC 12G | |
| NVIDIA GeForce RTX 4080 Founders Edition | |
| NVIDIA GeForce RTX 4070 Super Founders Edition | |
| Average NVIDIA GeForce RTX 3080 Ti (131 - 144.2, n=5) | |
| Average NVIDIA GeForce RTX 3090 (108 - 145, n=12) | |
| Zotac Gaming GeForce RTX 4070 AMP Airo | |
| AMD Radeon RX 7800 XT | |
| Sapphire Pulse Radeon RX 7700 XT | |
| Average NVIDIA GeForce RTX 3080 (111 - 116, n=2) | |
| Average NVIDIA Titan RTX (73 - 116, n=27) | |
| Average NVIDIA GeForce RTX 4060 Ti 8G (100.6 - 101.8, n=3) | |
| KFA2 GeForce RTX 4060 Ti EX, 16GB GDDR6 | |
| XFX Speedster QICK 308 Radeon RX 7600 Black Edition | |
| KFA2 GeForce RTX 4060 1-Click-OC 2X | |
| Control / High Quality Preset | |
| NVIDIA GeForce RTX 4090 Founders Edition | |
| AMD Radeon RX 7900 XTX | |
| Gigabyte GeForce RTX 4080 Super Gaming OC | |
| AMD Radeon RX 7900 XT | |
| NVIDIA GeForce RTX 4080 Founders Edition | |
| Asus TUF Gaming GeForce RTX 4070 Ti Super | |
| Average NVIDIA GeForce RTX 4070 Ti (63.8 - 66.2, n=4) | |
| Asus TUF Gaming GeForce RTX 4070 Ti | |
| Gigabyte Aorus GeForce RTX 4070 Ti Master | |
| Average NVIDIA GeForce RTX 3080 Ti (63.9 - 64.9, n=3) | |
| Average NVIDIA GeForce RTX 3090 (61.3 - 66, n=5) | |
| AMD Radeon RX 7800 XT | |
| Gigabyte GeForce RTX 4070 Super Gaming OC 12G | |
| NVIDIA GeForce RTX 4070 Super Founders Edition | |
| Average NVIDIA GeForce RTX 3080 (56.2 - 56.7, n=2) | |
| Zotac Gaming GeForce RTX 4070 AMP Airo | |
| Average NVIDIA Titan RTX (45.2 - 47.3, n=3) | |
| Sapphire Pulse Radeon RX 7700 XT | |
| KFA2 GeForce RTX 4060 Ti EX, 16GB GDDR6 | |
| Average NVIDIA GeForce RTX 4060 Ti 8G (34.3 - 37.3, n=3) | |
| XFX Speedster QICK 308 Radeon RX 7600 Black Edition | |
| KFA2 GeForce RTX 4060 1-Click-OC 2X | |
| Control / High Quality Preset | |
| NVIDIA GeForce RTX 4090 Founders Edition | |
| AMD Radeon RX 7900 XTX | |
| AMD Radeon RX 7900 XT | |
| Gigabyte GeForce RTX 4080 Super Gaming OC | |
| Asus TUF Gaming GeForce RTX 4070 Ti | |
| Gigabyte Aorus GeForce RTX 4070 Ti Master | |
| Asus TUF Gaming GeForce RTX 4070 Ti Super | |
| Average NVIDIA GeForce RTX 3080 Ti (122 - 125.5, n=3) | |
| Average NVIDIA GeForce RTX 4070 Ti (100 - 130.6, n=4) | |
| Average NVIDIA GeForce RTX 3090 (115.8 - 123.7, n=5) | |
| AMD Radeon RX 7800 XT | |
| NVIDIA GeForce RTX 4080 Founders Edition | |
| Gigabyte GeForce RTX 4070 Super Gaming OC 12G | |
| NVIDIA GeForce RTX 4070 Super Founders Edition | |
| Average NVIDIA GeForce RTX 3080 (105 - 106, n=2) | |
| Zotac Gaming GeForce RTX 4070 AMP Airo | |
| Sapphire Pulse Radeon RX 7700 XT | |
| Average NVIDIA Titan RTX (89 - 93.6, n=3) | |
| Average NVIDIA GeForce RTX 4060 Ti 8G (69.2 - 75.3, n=3) | |
| KFA2 GeForce RTX 4060 Ti EX, 16GB GDDR6 | |
| XFX Speedster QICK 308 Radeon RX 7600 Black Edition | |
| KFA2 GeForce RTX 4060 1-Click-OC 2X | |
| Control / High Quality Preset | |
| AMD Radeon RX 7900 XTX | |
| NVIDIA GeForce RTX 4090 Founders Edition | |
| AMD Radeon RX 7900 XT | |
| Gigabyte GeForce RTX 4080 Super Gaming OC | |
| Asus TUF Gaming GeForce RTX 4070 Ti | |
| Gigabyte Aorus GeForce RTX 4070 Ti Master | |
| Average NVIDIA GeForce RTX 4070 Ti (196.6 - 202, n=4) | |
| Asus TUF Gaming GeForce RTX 4070 Ti Super | |
| AMD Radeon RX 7800 XT | |
| Average NVIDIA GeForce RTX 3080 Ti (181 - 190.7, n=3) | |
| Gigabyte GeForce RTX 4070 Super Gaming OC 12G | |
| Average NVIDIA GeForce RTX 3090 (172.2 - 189.2, n=5) | |
| NVIDIA GeForce RTX 4070 Super Founders Edition | |
| NVIDIA GeForce RTX 4080 Founders Edition | |
| Zotac Gaming GeForce RTX 4070 AMP Airo | |
| Sapphire Pulse Radeon RX 7700 XT | |
| Average NVIDIA GeForce RTX 3080 (151 - 155, n=2) | |
| Average NVIDIA Titan RTX (135 - 141.9, n=3) | |
| Average NVIDIA GeForce RTX 4060 Ti 8G (115.7 - 120.2, n=3) | |
| KFA2 GeForce RTX 4060 Ti EX, 16GB GDDR6 | |
| XFX Speedster QICK 308 Radeon RX 7600 Black Edition | |
| KFA2 GeForce RTX 4060 1-Click-OC 2X | |
| Borderlands 3 / Badass Overall Quality (DX11) | |
| NVIDIA GeForce RTX 4090 Founders Edition | |
| Gigabyte GeForce RTX 4080 Super Gaming OC | |
| NVIDIA GeForce RTX 4080 Founders Edition | |
| AMD Radeon RX 7900 XTX | |
| Asus TUF Gaming GeForce RTX 4070 Ti Super | |
| Gigabyte Aorus GeForce RTX 4070 Ti Master | |
| AMD Radeon RX 7900 XT | |
| Asus TUF Gaming GeForce RTX 4070 Ti | |
| Average NVIDIA GeForce RTX 4070 Ti (71.9 - 74.9, n=4) | |
| Average NVIDIA GeForce RTX 3090 (68 - 75.3, n=13) | |
| Average NVIDIA GeForce RTX 3080 Ti (71.2 - 74, n=4) | |
| Gigabyte GeForce RTX 4070 Super Gaming OC 12G | |
| NVIDIA GeForce RTX 4070 Super Founders Edition | |
| Average NVIDIA GeForce RTX 3080 (61.5 - 61.9, n=2) | |
| Zotac Gaming GeForce RTX 4070 AMP Airo | |
| AMD Radeon RX 7800 XT | |
| Sapphire Pulse Radeon RX 7700 XT | |
| Average NVIDIA Titan RTX (46 - 52.8, n=29) | |
| Average NVIDIA GeForce RTX 4060 Ti 8G (43.1 - 43.7, n=3) | |
| KFA2 GeForce RTX 4060 Ti EX, 16GB GDDR6 | |
| XFX Speedster QICK 308 Radeon RX 7600 Black Edition | |
| KFA2 GeForce RTX 4060 1-Click-OC 2X | |
| Borderlands 3 / Badass Overall Quality (DX11) | |
| NVIDIA GeForce RTX 4090 Founders Edition | |
| Gigabyte GeForce RTX 4080 Super Gaming OC | |
| NVIDIA GeForce RTX 4080 Founders Edition | |
| AMD Radeon RX 7900 XTX | |
| Asus TUF Gaming GeForce RTX 4070 Ti Super | |
| Gigabyte Aorus GeForce RTX 4070 Ti Master | |
| Asus TUF Gaming GeForce RTX 4070 Ti | |
| Average NVIDIA GeForce RTX 4070 Ti (134.3 - 142, n=4) | |
| AMD Radeon RX 7900 XT | |
| Gigabyte GeForce RTX 4070 Super Gaming OC 12G | |
| NVIDIA GeForce RTX 4070 Super Founders Edition | |
| Average NVIDIA GeForce RTX 3080 Ti (114 - 130.2, n=4) | |
| Average NVIDIA GeForce RTX 3090 (105 - 131.6, n=13) | |
| Zotac Gaming GeForce RTX 4070 AMP Airo | |
| AMD Radeon RX 7800 XT | |
| Average NVIDIA GeForce RTX 3080 (95.7 - 103, n=2) | |
| Sapphire Pulse Radeon RX 7700 XT | |
| Average NVIDIA Titan RTX (74 - 93.1, n=29) | |
| Average NVIDIA GeForce RTX 4060 Ti 8G (83.9 - 85.2, n=3) | |
| KFA2 GeForce RTX 4060 Ti EX, 16GB GDDR6 | |
| XFX Speedster QICK 308 Radeon RX 7600 Black Edition | |
| KFA2 GeForce RTX 4060 1-Click-OC 2X | |
| Borderlands 3 / Badass Overall Quality (DX11) | |
| NVIDIA GeForce RTX 4090 Founders Edition | |
| Asus TUF Gaming GeForce RTX 4070 Ti | |
| Gigabyte GeForce RTX 4080 Super Gaming OC | |
| Gigabyte Aorus GeForce RTX 4070 Ti Master | |
| AMD Radeon RX 7900 XTX | |
| Average NVIDIA GeForce RTX 4070 Ti (171.4 - 186.9, n=4) | |
| NVIDIA GeForce RTX 4080 Founders Edition | |
| Asus TUF Gaming GeForce RTX 4070 Ti Super | |
| AMD Radeon RX 7900 XT | |
| Gigabyte GeForce RTX 4070 Super Gaming OC 12G | |
| NVIDIA GeForce RTX 4070 Super Founders Edition | |
| Zotac Gaming GeForce RTX 4070 AMP Airo | |
| Average NVIDIA GeForce RTX 3080 Ti (129 - 164.9, n=4) | |
| Average NVIDIA GeForce RTX 3090 (117 - 170.1, n=13) | |
| AMD Radeon RX 7800 XT | |
| Sapphire Pulse Radeon RX 7700 XT | |
| Average NVIDIA GeForce RTX 3080 (117 - 128, n=2) | |
| Average NVIDIA GeForce RTX 4060 Ti 8G (121.5 - 123.5, n=3) | |
| KFA2 GeForce RTX 4060 Ti EX, 16GB GDDR6 | |
| Average NVIDIA Titan RTX (77.2 - 128.7, n=29) | |
| XFX Speedster QICK 308 Radeon RX 7600 Black Edition | |
| KFA2 GeForce RTX 4060 1-Click-OC 2X | |
| Shadow of the Tomb Raider / Highest Preset | |
| NVIDIA GeForce RTX 4090 Founders Edition | |
| AMD Radeon RX 7900 XTX | |
| Gigabyte GeForce RTX 4080 Super Gaming OC | |
| NVIDIA GeForce RTX 4080 Founders Edition | |
| AMD Radeon RX 7900 XT | |
| Asus TUF Gaming GeForce RTX 4070 Ti Super | |
| Gigabyte Aorus GeForce RTX 4070 Ti Master | |
| Asus TUF Gaming GeForce RTX 4070 Ti | |
| Average NVIDIA GeForce RTX 4070 Ti (102.7 - 104.9, n=4) | |
| Gigabyte GeForce RTX 4070 Super Gaming OC 12G | |
| Average NVIDIA GeForce RTX 3090 (89.3 - 99.7, n=12) | |
| Average NVIDIA GeForce RTX 3080 Ti (93 - 98.6, n=3) | |
| NVIDIA GeForce RTX 4070 Super Founders Edition | |
| Average NVIDIA GeForce RTX 3080 (83.9 - 87.9, n=2) | |
| Zotac Gaming GeForce RTX 4070 AMP Airo | |
| AMD Radeon RX 7800 XT | |
| Average NVIDIA Titan RTX (59 - 71.1, n=24) | |
| Sapphire Pulse Radeon RX 7700 XT | |
| KFA2 GeForce RTX 4060 Ti EX, 16GB GDDR6 | |
| Average NVIDIA GeForce RTX 4060 Ti 8G (58.1 - 58.7, n=3) | |
| KFA2 GeForce RTX 4060 1-Click-OC 2X | |
| XFX Speedster QICK 308 Radeon RX 7600 Black Edition | |
| Shadow of the Tomb Raider / Highest Preset | |
| NVIDIA GeForce RTX 4090 Founders Edition | |
| AMD Radeon RX 7900 XTX | |
| Gigabyte GeForce RTX 4080 Super Gaming OC | |
| Asus TUF Gaming GeForce RTX 4070 Ti Super | |
| Gigabyte Aorus GeForce RTX 4070 Ti Master | |
| AMD Radeon RX 7900 XT | |
| Asus TUF Gaming GeForce RTX 4070 Ti | |
| Average NVIDIA GeForce RTX 4070 Ti (195.9 - 204, n=4) | |
| NVIDIA GeForce RTX 4080 Founders Edition | |
| Gigabyte GeForce RTX 4070 Super Gaming OC 12G | |
| Average NVIDIA GeForce RTX 3090 (137 - 172.3, n=12) | |
| NVIDIA GeForce RTX 4070 Super Founders Edition | |
| Average NVIDIA GeForce RTX 3080 Ti (157 - 173.3, n=3) | |
| Zotac Gaming GeForce RTX 4070 AMP Airo | |
| AMD Radeon RX 7800 XT | |
| Average NVIDIA GeForce RTX 3080 (147 - 152, n=2) | |
| Sapphire Pulse Radeon RX 7700 XT | |
| Average NVIDIA GeForce RTX 4060 Ti 8G (119.3 - 121.2, n=3) | |
| KFA2 GeForce RTX 4060 Ti EX, 16GB GDDR6 | |
| Average NVIDIA Titan RTX (98 - 128, n=23) | |
| KFA2 GeForce RTX 4060 1-Click-OC 2X | |
| XFX Speedster QICK 308 Radeon RX 7600 Black Edition | |
| Shadow of the Tomb Raider / Highest Preset | |
| NVIDIA GeForce RTX 4090 Founders Edition | |
| AMD Radeon RX 7900 XTX | |
| AMD Radeon RX 7900 XT | |
| Asus TUF Gaming GeForce RTX 4070 Ti | |
| Gigabyte Aorus GeForce RTX 4070 Ti Master | |
| Average NVIDIA GeForce RTX 4070 Ti (263 - 280, n=4) | |
| Gigabyte GeForce RTX 4080 Super Gaming OC | |
| Asus TUF Gaming GeForce RTX 4070 Ti Super | |
| Gigabyte GeForce RTX 4070 Super Gaming OC 12G | |
| NVIDIA GeForce RTX 4070 Super Founders Edition | |
| Zotac Gaming GeForce RTX 4070 AMP Airo | |
| NVIDIA GeForce RTX 4080 Founders Edition | |
| AMD Radeon RX 7800 XT | |
| Average NVIDIA GeForce RTX 3080 Ti (178 - 238, n=3) | |
| Average NVIDIA GeForce RTX 3090 (145 - 240, n=14) | |
| Sapphire Pulse Radeon RX 7700 XT | |
| KFA2 GeForce RTX 4060 Ti EX, 16GB GDDR6 | |
| Average NVIDIA GeForce RTX 4060 Ti 8G (181.6 - 184, n=3) | |
| Average NVIDIA GeForce RTX 3080 (177 - 185, n=2) | |
| Average NVIDIA Titan RTX (106 - 178.8, n=24) | |
| KFA2 GeForce RTX 4060 1-Click-OC 2X | |
| XFX Speedster QICK 308 Radeon RX 7600 Black Edition | |
The Witcher 3: 3840x2160 Ultra Graphics & Postprocessing (HBAO+) | 3840x2160 High Graphics & Postprocessing (Nvidia HairWorks Off) | 1920x1080 Ultra Graphics & Postprocessing (HBAO+)
Metro Exodus: 3840x2160 Ultra Quality AF:16x | 2560x1440 Ultra Quality AF:16x | 1920x1080 Ultra Quality AF:16x
Control: 3840x2160 High Quality Preset | 2560x1440 High Quality Preset | 1920x1080 High Quality Preset
Borderlands 3: 3840x2160 Badass Overall Quality (DX11) | 2560x1440 Badass Overall Quality (DX11) | 1920x1080 Badass Overall Quality (DX11)
Shadow of the Tomb Raider: 3840x2160 Highest Preset AA:T | 2560x1440 Highest Preset AA:T | 1920x1080 Highest Preset AA:T
F1 22: 3840x2160 Ultra High Preset AA:T AF:16x | 2560x1440 Ultra High Preset AA:T AF:16x | 1920x1080 Ultra High Preset AA:T AF:16x
Final Fantasy XV Benchmark: 3840x2160 High Quality | 2560x1440 High Quality | 1920x1080 High Quality
Ray tracing performance
Games such as Metro Exodus (non-Enhanced Edition), Control, and Far Cry 6 see the RX 7900 XTX managing to narrowly beat the RTX 4080 Super Gaming OC in native 1080p Ultra ray tracing.
That being said, the RTX 4080 Super Gaming OC manages anywhere between a 3-17% lead over the RTX 4080 FE in native res ray tracing.
| Alan Wake 2 | |
| 3840x2160 High Preset + High Ray Tracing + Quality DLSS + FG | |
| Average of class Desktop (26.2 - 152.7, n=18, last 2 years) | |
| Gigabyte GeForce RTX 4080 Super Gaming OC | |
| NVIDIA GeForce RTX 4080 Founders Edition | |
| Asus TUF Gaming GeForce RTX 4070 Ti Super | |
| Average NVIDIA GeForce RTX 4070 Ti (n=1) | |
| Gigabyte GeForce RTX 4070 Super Gaming OC 12G | |
| NVIDIA GeForce RTX 4070 Super Founders Edition | |
| Average NVIDIA GeForce RTX 4060 Ti 8G (n=1) | |
| 1920x1080 High Preset + High Ray Tracing | |
| Gigabyte GeForce RTX 4080 Super Gaming OC | |
| Asus TUF Gaming GeForce RTX 4070 Ti Super | |
| NVIDIA GeForce RTX 4080 Founders Edition | |
| Average NVIDIA GeForce RTX 4070 Ti (n=1) | |
| Average of class Desktop (23.8 - 132.2, n=28, last 2 years) | |
| Gigabyte GeForce RTX 4070 Super Gaming OC 12G | |
| NVIDIA GeForce RTX 4070 Super Founders Edition | |
| Average NVIDIA GeForce RTX 3090 (44.6 - 52, n=3) | |
| Average NVIDIA GeForce RTX 4060 Ti 8G (n=1) | |
| Average NVIDIA Titan RTX (n=1) | |
| Sapphire Pulse Radeon RX 7700 XT | |
| XFX Speedster QICK 308 Radeon RX 7600 Black Edition | |
| low | med. | high | ultra | QHD | 4K DLSS | 4K FSR | 4K | |
|---|---|---|---|---|---|---|---|---|
| GTA V (2015) | 188.2 | 188 | 186.9 | 165.4 | 164.6 | 163.6 | ||
| The Witcher 3 (2015) | 470 | 241 | 196.2 | 186.4 | ||||
| Dota 2 Reborn (2015) | 273 | 245 | 236 | 222 | 214 | |||
| Final Fantasy XV Benchmark (2018) | 235 | 236 | 225 | 193.5 | 117.8 | |||
| X-Plane 11.11 (2018) | 236 | 207 | 154.9 | 132.2 | ||||
| Far Cry 5 (2018) | 206 | 202 | 193 | 134 | ||||
| Strange Brigade (2018) | 626 | 519 | 501 | 480 | 389 | 197.3 | ||
| Shadow of the Tomb Raider (2018) | 271 | 262 | 224 | 127.5 | ||||
| Metro Exodus (2019) | 203 | 169.4 | 144.9 | 97.7 | ||||
| Control (2019) | 221 | 206 | 145 | 86.4 | 76.5 | |||
| Borderlands 3 (2019) | 184.4 | 186.3 | 161.6 | 97.6 | ||||
| Mafia Definitive Edition (2020) | 248 | 232 | 202 | 111.4 | ||||
| Watch Dogs Legion (2020) | 149 | 144.5 | 127 | 80.5 | ||||
| Far Cry 6 (2021) | 212 | 194.4 | 179.8 | 162.8 | 99.3 | |||
| Dying Light 2 (2022) | 217 | 165.9 | 123.7 | 65 | ||||
| Cyberpunk 2077 1.6 (2022) | 209 | 208 | 198.4 | 187.8 | 127.9 | 63 | ||
| Ghostwire Tokyo (2022) | 299 | 298 | 247 | 120 | ||||
| F1 22 (2022) | 368 | 166.4 | 112.9 | 59.2 | ||||
| F1 23 (2023) | 393 | 165.4 | 108.3 | 94.5 | 54.5 | |||
| Baldur's Gate 3 (2023) | 245 | 237 | 232 | 186.8 | 160.7 | 97.6 | ||
| Cyberpunk 2077 (2023) | 197.5 | 198.3 | 186.9 | 173.8 | 121.7 | 55.6 | ||
| Assassin's Creed Mirage (2023) | 243 | 191 | 158 | 135 | 101 | |||
| Alan Wake 2 (2023) | 130.1 | 122.4 | 90.1 | 77.6 | 53.5 | |||
| Avatar Frontiers of Pandora (2023) | 158.9 | 128.8 | 90.1 | 81.1 | 48.4 | |||
| Skull & Bones (2024) | 205 | 172 | 137 | 114 | 105 | 101 | 78 |
Emissions: Higher noise but relatively throttle-free performance under stress
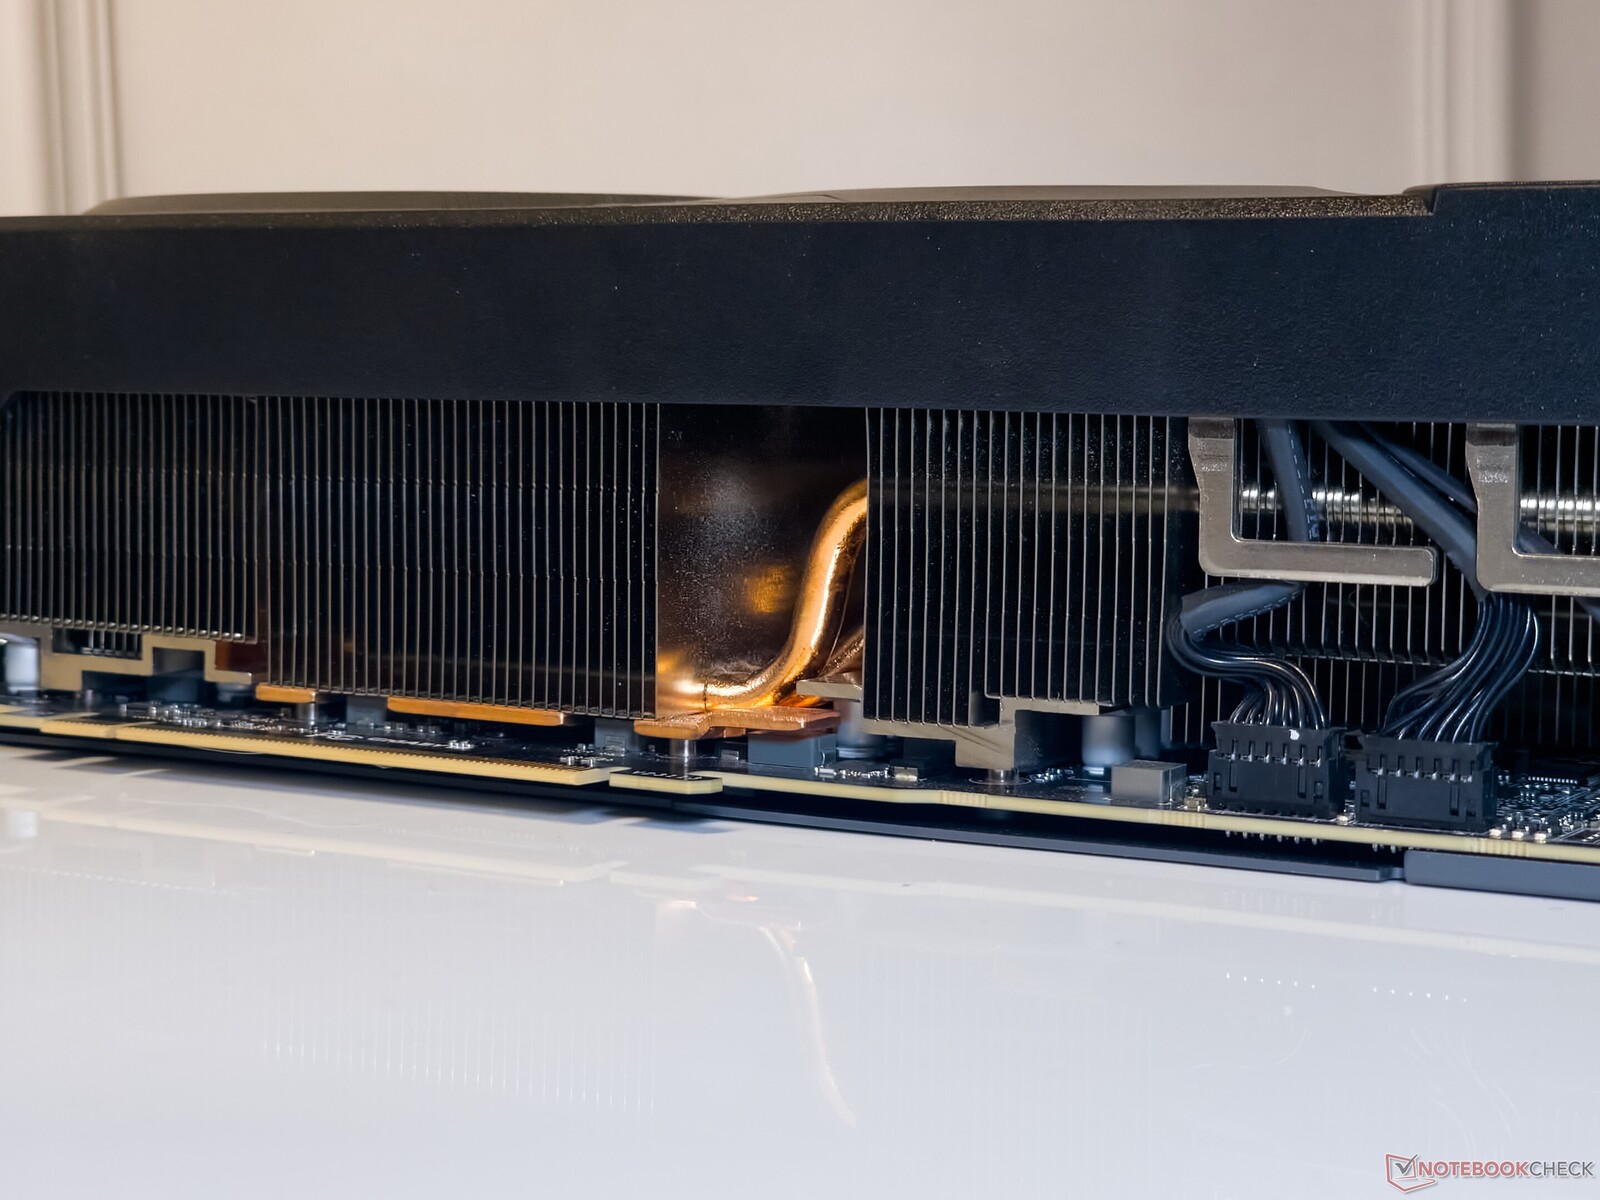
The RTX 4080 Super Gaming OC leverages Gigabyte's WindForce cooling system that is comprised of three 110 mm alternate spinning fans and nine heatpipes along with a direct contact copper plate.
According to Gigabyte, the sleeve bearing fans use a graphene nano lubricant that supposedly helps extend lifespan similar to double ball bearing fans.
The metal backplate features a large cut-out for air exhaust which is, in fact, an extension of the heatsink.
Stress tests
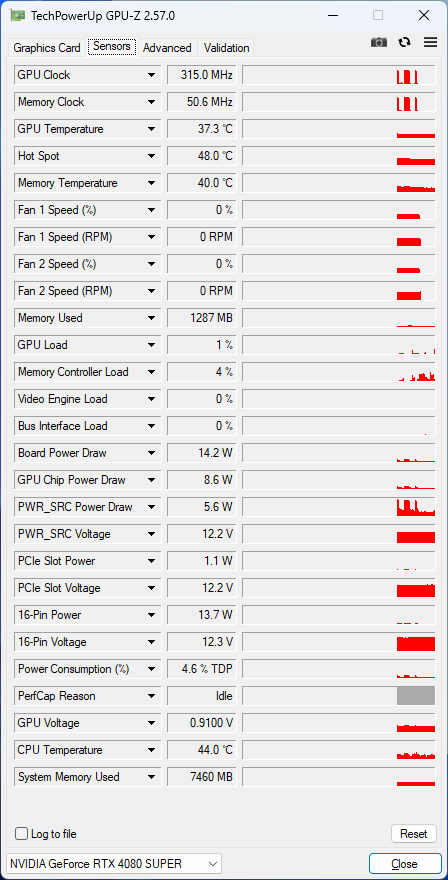
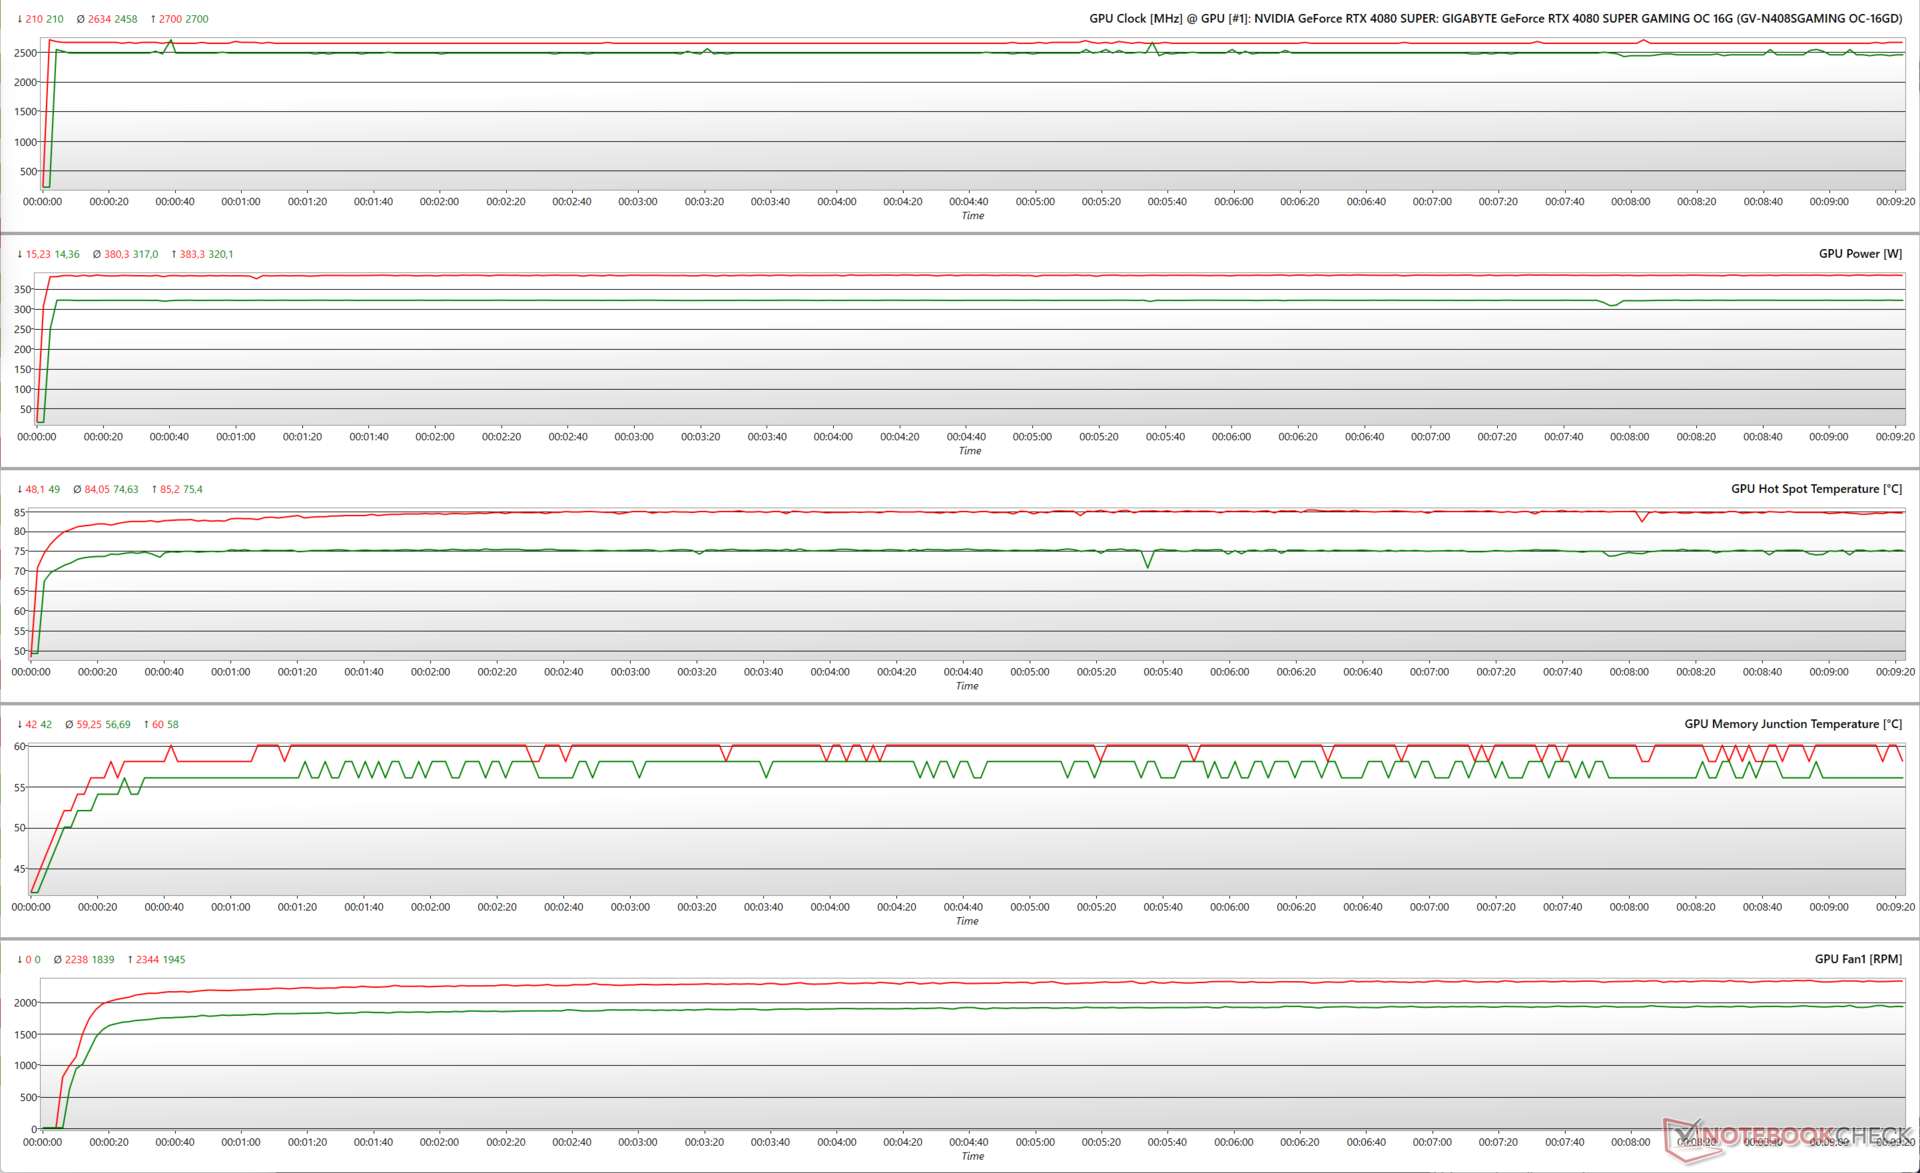
Stressing the RTX 4080 Super Gaming OC with FurMark (1,280 x 720, no AA) sees the GPU utilize the available 320 W TGP at a 100% power target (PT). This results in an average boost clock of 2,458 MHz and hotspot temperatures near the 75 °C mark.
At a 125% PT, the GPU is only able to make use of 383 W out of the 400 W that is theoretically available. This was observed previously with the RTX 4070 Super Gaming OC as well.
We see the GPU attaining average clocks of 2,634 MHz, with the hotspot temperature correspondingly rising to 84°C.
When running The Witcher 3 at 1080p Ultra, the RTX 4080 Super Gaming OC manages to sustain a steady 2,760 MHz clock at 100% PT while consuming 254 W.
As is the norm with Ada cards, increasing the power target in gaming workloads confers no apparent benefits. Parameters such as clock speed, power draw, and hotspot temperatures are identical in The Witcher 3 stress even at 125% PT.

The Witcher 3 FPS Chart
Gigabyte's WindForce cooling system seems to be working well to alleviate any throttling concerns. We observe no dip in frames while stress testing with The Witcher 3 at 1080p Ultra and 4K Ultra.
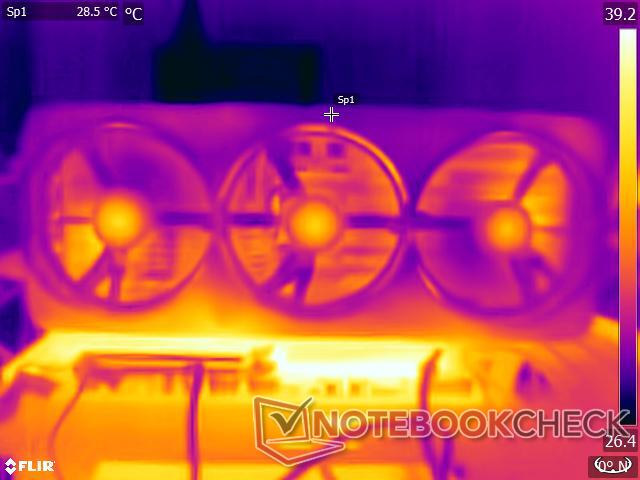
Surface temperatures
Surface temperatures under load are tolerable for the most part. At a 23 °C ambient temperature, the front plastic shroud remains relatively cool at 28.5 °C, while the metal back panel touches nearly 48 °C.
The region near the 12VHPWR connector also becomes quite warm, reaching 50 °C.


Noise levels

The RTX 4080 Super Gaming OC has a louder noise profile compared to what we've observed previously with the RTX 4070 Super Gaming OC.
That being said, the fans fully stop in idle and start revving up only after core temperatures touch the 55 °C mark as per the default fan curve.
Users can select between BIOS OC and Silent VBIOS modes, but we did not observe any significant differences between these two during testing. The VBIOS switch actually seems redundant as you can easily adjust fan curves to your liking in the Gigabyte Control Center app.
Nevertheless, we recorded a maximum sound pressure level (SPL) of 54.21 dB(A) while stressing the GPU with FurMark in the BIOS OC mode at a 125% PT.
Noise levels while gaming with The Witcher 3 at 1080p Ultra stayed below 50 dB(A) SPL in all tested modes.
| Stress Test | VBIOS Mode / Power Target | Max. Fan Speed (RPM) | Fan Noise dB(A) |
| FurMark 1280 x 720, no AA | BIOS OC / 100% | 1,937 | 49.37 |
| FurMark 1280 x 720, no AA | Silent BIOS / 100% | 1,997 | 50.09 |
| FurMark 1280 x 720, no AA | BIOS OC / 125% | 2,326 | 54.21 |
| FurMark 1280 x 720, no AA | Silent BIOS / 125% | 2,302 | 54.10 |
| The Witcher 3 1080p Ultra | BIOS OC / 100% | 1,814 | 48.24 |
| The Witcher 3 1080p Ultra | Silent BIOS / 100% | 1,801 | 48.66 |
| The Witcher 3 1080p Ultra | BIOS OC / 125% | 1,866 | 49.29 |
| The Witcher 3 1080p Ultra | Silent BIOS / 125% | 1,813 | 49.13 |
Energy Management: Comparable to the RTX 4080 FE at 100% PT
The RTX 4080 Super Gaming OC isn't the most frugal when it comes to power consumption given the powerful AD103 die but is still 20% more economical compared to the RX 7900 XTX.
The Gigabyte card's power consumption during FurMark and The Witcher 3 tests are comparable to that of the RTX 4080 FE at a 100% PT, while being 6% less efficient than the latter.
Power draws while playing The Witcher 3 at 1080p Ultra are only marginally higher going from 100% to 125% PT compared to a more perceivable 15% delta in FurMark.
Power Consumption: External monitor
| 1280x720 FurMark 1.19 GPU Stress Test (external Monitor) | |
| 1920x1080 The Witcher 3 ultra (external Monitor) | |
* ... smaller is better
Pros
Cons
Verdict: Incremental gains with full AD103 at reduced MSRP


The Gigabyte GeForce RTX 4080 Super Gaming OC 16G fully supplants its RTX 4080 predecessor for a lower asking price while offering 5% more shaders, a nominal 45 MHz boost, and slightly faster memory. Gigabyte has retained all familiar aspects of the last gen variant — a three-slot design, triple-fan WindForce setup with nine heatpipes, and decent RGB.
Overall, Gigabyte's card manages to inch ahead of the RTX 4080 Founders Edition in synthetics corresponding with the increase in shader counts. Deltas were surprisingly wider in gaming tests, but the exact gains, if any, will depend on the game itself and the resolution you are playing at.
The RTX 4090 Founders Edition (US$1,599 on Best Buy) still leads the charts, and Nvidia has little incentive to launch an RTX 4090 Ti or Super as Team Red appears nonchalant towards any attempts in disturbing the flagship status quo.
The Gigabyte RTX 4080 Super Gaming OC 16G offers great 4K gaming performance that only gets better with support for newer DLSS technologies. The US$50 uptick over the RTX 4080 Super FE isn't totally wasted, but the AMD Radeon RX 7900 XTX is an equally competent offering if you looking to save a bit more dough."
Nvidia looks to have played its cards right (pun intended) by slashing the RTX 4080 FE's MSRP by US$200. Ideally this should have been the price back in 2022 itself, but it took a bit of time before the AMD Radeon RX 7900 XTX (starting from US$926 on Amazon) arrived to offer any semblance of a competition.
Both cards are great for high-refresh rate 1440p and native 4K 60 fps gaming, but the RX 7900 XTX seems to be a better bet overall in terms of value for money in this segment.
However, the RTX 4080 Super Gaming OC comes with benefits that only Nvidia cards can offer at the moment. These include better overall ray tracing performance together with support for DLSS 3 frame generation and DLSS 3.5 ray reconstruction technologies, and massively improved power efficiency.
Gigabyte offers a decent feature set for the additional US$50 markup such as a highly capable cooler, dual VBIOS switch, good aesthetics, support brackets to prevent GPU sag, and a four-year warranty.
But does it make sense to drop a grand on a new GPU at this point? May be not. The RTX 4070 Super (starting from US$600 on Amazon) is already capable of decent 4K gaming with some upscaling help, and it may be prudent to wait and see what the upcoming Nvidia Blackwell and AMD RDNA 4 GPUs have to offer later this year.
The original RTX 4080 non-Super is officially EoL'd, but it is not a bad idea to hunt for some great bargains in your local market.
Price and Availability
The Gigabyte GeForce RTX 4080 Super Gaming OC 16G is officially priced at US$1,050 MSRP but is currently retailing for US$1,100 on both Amazon US and Best Buy US.
The card is not yet listed on Amazon India, but prices in local retail stores can range anywhere from ₹1,20,000 to ₹1,28,000.
Transparency
The selection of devices to be reviewed is made by our editorial team. The test sample was provided to the author as a loan by the manufacturer or retailer for the purpose of this review. The lender had no influence on this review, nor did the manufacturer receive a copy of this review before publication. There was no obligation to publish this review. As an independent media company, Notebookcheck is not subjected to the authority of manufacturers, retailers or publishers.
This is how Notebookcheck is testing
Every year, Notebookcheck independently reviews hundreds of laptops and smartphones using standardized procedures to ensure that all results are comparable. We have continuously developed our test methods for around 20 years and set industry standards in the process. In our test labs, high-quality measuring equipment is utilized by experienced technicians and editors. These tests involve a multi-stage validation process. Our complex rating system is based on hundreds of well-founded measurements and benchmarks, which maintains objectivity. Further information on our test methods can be found here.
Price comparison
